stephanie may - -orca
TRANSCRIPT
Molecular and Functional Characterisation of the
Chemopreventative Effects of Dietary Polyphenols in
Intestinal Cancer
Thesis submitted for the award of Ph.D.
By
Stephanie May
Cardiff School of Biosciences
The European Cancer Stem Cell Research Institute
Cardiff University
2013 - 2017

ii
Declarations
DECLARATION This work has not been submitted in substance for any other degree or award at this or any other university or place of learning, nor is being submitted concurrently in candidature for any degree or other award. Signed ..........………………………………………… (Candidate) Date …..…………………………….…… STATEMENT 1 This thesis is being submitted in partial fulfillment of the requirements for the degree of Ph.D. Signed ……….………………………………………… (Candidate) Date …..…………………………….…… STATEMENT 2 This thesis is the result of my own independent work/investigation, except where otherwise stated, and the thesis has not been edited by a third party beyond what is permitted by Cardiff University’s Policy on the Use of Third Party Editors by Research Degree Students. Other sources are acknowledged by explicit references. The views expressed are my own. Signed ……….………………………………………… (Candidate) Date ……..………………………….…… STATEMENT 3 I hereby give consent for my thesis, if accepted, to be available online in the University’s Open Access repository and for inter-library loan, and for the title and summary to be made available to outside organisations. Signed ……….………………………………………… (Candidate) Date ……..………………………….…… STATEMENT 4: PREVIOUSLY APPROVED BAR ON ACCESS I hereby give consent for my thesis, if accepted, to be available online in the University’s Open Access repository and for inter-library loans after expiry of a bar on access previously approved by the Academic Standards & Quality Committee. Signed ……….………………………………………… (Candidate) Date …………..…………………….……
24/05/2017
24/05/2017
24/05/2017
24/05/2017
24/05/2017
iii
Acknowledgements
After five months of extensive writing, today is the day: writing this note of thanks is the finishing
touch on my thesis. My Ph.D. has been a period of intense learning for me not only on a scientific level but
also on a personal level. I would like to reflect on the people who have supported and helped me
throughout this time.
First and foremost, I would like to thank my supervisors. I would like to thank Prof Alan Clarke,
whom sadly passed away before the completion of my Ph.D. I would like to thank him for his scientific
knowledge and guidance despite his aura of logical distortion, and for providing me with this opportunity
to pursue such an interesting and exciting project. Secondly, I would like to thank Dr Lee Parry for his
constant support, enthusiasm, coffee (and beer). Without his influence, I would not have had such an
insightful and enjoyable start to my scientific career. And thirdly, huge thanks go to Prof Ros John for her
unprecedented support during such a difficult time and whom without, this thesis would not have been
finished. I would also like to thank Tenovus Cancer Care, in particular the Jane Hodge foundation for kindly
funding my studentship. Thanks are also due to the BACR and Cardiff University Michael Banfill Scholarship
and William Morgan Thomas funds for supporting my attendance at conferences and ECSCRI for support
with binding this thesis.
Much of the research presented in this thesis would not have been possible without the technical
assistance and guidance from a number of individuals. Huge thanks go to Derek Scarborough and his team
for the copious amount of tissue processing and sectioning. Credit is due to Matt Zverev and Elaine Taylor
for genotyping and ear clipping of animals. I am particularly indebted to Elaine for her endless support and
assistance with animal procedures, dissections and IHC. I must also thank everyone in ECSCRI, in particular
the ARC group, old and present, for their friendship and guidance over the past 4 years, you have all been
a pleasure to work with. In particular, I would like to thank Dr Maddy Young for her time teaching me
techniques and willingly taking on the arduous task of reading my work. I’d also like to thank Dr Karen Reed
for her advice, support and scientific discussion and for her enjoyable company at several conferences. Last
but not least, I would like to thank Dr Valerie Méniel for always lending a helping hand and advice and for
being an ear to listen to when I’ve felt the pressure of Ph.D. life. This leads me in nicely to thank all my
amazing friends, especially Elaine and Lili Ordonez for your continued friendship, nights out and holidays.
You have both brought so much happiness and joy to my life.
On a more personal note, I owe my biggest thanks to my parents and grandparents, to whom this
thesis is dedicated. I am indebted to you for your unconditional love and support, financially, personally
and emotionally. Words cannot express how grateful I am for your selfless support throughout my school
and higher education, and for your continual encouragement to fulfil my academic goals. Thank you for
always being a phone call away and a smiley face to brighten my day.
“BEING A PH.D. STUDENT IS LIKE BECOMING ALL OF THE SEVEN DWARVES. IN THE BEGINNING YOU'RE DOPEY AND
BASHFUL. IN THE MIDDLE YOU ARE USUALLY SICK (SNEEZY), TIRED (SLEEPY), AND IRRITABLE (GRUMPY). BUT IN THE END, THEY CALL
YOU DOC, AND THEN YOU'RE HAPPY". RONALD T. AZUMA
iv
Contents
DECLARATIONS ..................................................................................................................................II
ACKNOWLEDGEMENTS .....................................................................................................................III
CONTENTS ........................................................................................................................................ IV
LIST OF FIGURES ............................................................................................................................... IX
LIST OF TABLES ................................................................................................................................. XI
ABBREVIATIONS AND DEFINITIONS ................................................................................................ XIII
ABSTRACT ..................................................................................................................................... XVII
1 GENERAL INTRODUCTION ........................................................................................................... 1
1.1 CANCER ................................................................................................................................. 1
1.1.1 Preventable cancers ........................................................................................................ 1
1.2 COLORECTAL CANCER ................................................................................................................ 2
1.3 ANATOMY AND FUNCTION OF THE MURINE INTESTINE ....................................................................... 2
1.4 SMALL INTESTINAL HISTOLOGY ..................................................................................................... 5
1.4.1 Enterocytes..................................................................................................................... 5
1.4.2 Goblet Cells .................................................................................................................... 5
1.4.3 Enteroendocrine Cells ..................................................................................................... 6
1.4.4 Paneth Cells .................................................................................................................... 6
1.5 INTESTINAL STEM CELLS............................................................................................................. 8
1.5.1 Identification of ISCs ....................................................................................................... 9
1.5.2 Stem cell niche .............................................................................................................. 11
1.5.3 Stem cell division .......................................................................................................... 11
1.6 MAINTENANCE OF INTESTINAL HOMEOSTASIS ................................................................................ 12
1.6.1 Wnt Signalling Pathways .............................................................................................. 13
1.6.1.1 Canonical Wnt Signalling ......................................................................................................13
1.6.2 Notch signalling ............................................................................................................ 14
1.6.3 TGF-β/BMP signalling ................................................................................................... 15
1.6.4 Hedgehog Signalling ..................................................................................................... 16
1.7 PATHWAYS IMPLICATED IN CRC ................................................................................................. 19
1.7.1 Molecular subtypes of CRC ............................................................................................ 19
1.7.1.1 Fearon and Vogelstein genetic model of progression ............................................................19
1.7.1.2 Consensus molecular subtypes (CMS) of CRC ........................................................................19
1.7.2 Wnt and Cancer ............................................................................................................ 22
1.8 ISC AS THE CELLS OF ORIGIN OF CRC ........................................................................................... 22
1.9 CANCER STEM CELLS............................................................................................................... 23
v
1.10 MODELLING CRC................................................................................................................... 26
1.10.1 Spatio‐temporal control of gene expression in vivo using Cre-loxP technology ............. 26
1.10.1.1 AhCre Transgene ................................................................................................................27
1.10.1.2 VillinCreERT2 and Lgr5CreERT2 Transgenes............................................................................27
1.10.2 Compound mutant mouse models of CRC .................................................................... 28
1.10.2.1 In vivo genome editing and organoid transplantation ..........................................................28
1.10.3 Ex vivo culture of ISCs.................................................................................................. 31
1.10.4 Ex vivo culture of Apc deficient cells ............................................................................ 32
1.11 CRC THERAPY ....................................................................................................................... 33
1.12 CHEMOPREVENTION ............................................................................................................... 37
1.12.1 Dietary polyphenols .................................................................................................... 38
1.12.1.1 Anthocyanins .....................................................................................................................39
1.12.2 Black Raspberries........................................................................................................ 42
1.12.2.1 Chemopreventive Studies of Black Raspberries ...................................................................43
1.12.2.1.1 Chemopreventive Studies of Black Raspberries in Oral Cancer .....................................43
1.12.2.1.2 Chemopreventive Studies of Black Raspberries in Oesophageal Cancer ........................43
1.12.2.1.3 Chemopreventive Studies of Black Raspberries in Colorectal Cancer ............................44
1.13 AIMS AND OBJECTIVES ............................................................................................................ 46
2 MATERIALS AND METHODS ...................................................................................................... 48
2.1 EXPERIMENTAL ANIMALS ......................................................................................................... 48
Animal Husbandry ........................................................................................................ 48
2.1.1.1 Colony Maintenance ............................................................................................................48
2.1.1.2 Breeding ..............................................................................................................................48
2.2 GENETIC MOUSE MODELS ....................................................................................................... 48
2.3 EXPERIMENTAL PROCEDURES .................................................................................................... 48
Ear biopsy for identification and genotyping ................................................................. 49
Polymerase Chain Reaction (PCR) Genotyping ............................................................... 49
2.3.2.1 DNA Extraction.....................................................................................................................49
2.3.2.2 PCR Protocol ........................................................................................................................49
2.3.2.3 Visualisation of PCR Products ...............................................................................................49
2.4 EXPERIMENTAL COHORTS......................................................................................................... 52
Administration of Diet................................................................................................... 52
2.4.1.1 Administration of 10% Black Raspberry Powder ....................................................................52
2.4.1.2 Administration of AIN76A Diet..............................................................................................52
2.4.1.3 Administration of 10% Black Raspberry Pellets ......................................................................52
Induction of Cre-recombinase ....................................................................................... 54
2.4.2.1 Administration of beta-Napthoflavone .................................................................................54
2.4.2.2 Administration of tamoxifen .................................................................................................54
Labelling cells in vivo during S-phase by administration of 5-Bromo-2-deoxyuridine ....... 55
vi
2.5 TISSUE SAMPLE PREPARATION................................................................................................... 55
Dissection of organs...................................................................................................... 55
Dissection of Intestines ................................................................................................. 55
Formalin fixation of tissues ........................................................................................... 55
Processing of fixed tissue .............................................................................................. 56
Sectioning of fixed tissue ............................................................................................... 56
Freezing tissue .............................................................................................................. 56
Epithelial cell extraction using Weiser preparation ........................................................ 56
2.6 HISTOLOGICAL ANALYSIS .......................................................................................................... 57
Preparation of sections for staining or IHC .................................................................... 57
Haematoxylin and Eosin (H&E) staining ........................................................................ 57
Cell type specific stains ................................................................................................. 57
2.6.3.1 Alcian blue staining ..............................................................................................................57
2.6.3.2 Grimelius silver staining........................................................................................................58
Immunohistochemistry ................................................................................................. 58
2.6.4.1 Antigen Retrieval..................................................................................................................58
2.6.4.2 Blocking of endogenous peroxidises .....................................................................................59
2.6.4.3 Blocking of non-specific antibody binding .............................................................................59
2.6.4.4 Primary antibody incubation ................................................................................................59
2.6.4.5 Secondary antibody incubation ............................................................................................60
2.6.4.6 Signal amplification ..............................................................................................................60
2.6.4.7 Visualisation of antibody binding ..........................................................................................60
2.6.4.8 Counterstaining, dehydration and mounting of slides............................................................60
2.7 CELL COUNTING .................................................................................................................... 62
Crypt Size...................................................................................................................... 62
Mitotic index ................................................................................................................ 62
Apoptotic index ............................................................................................................ 62
Scoring of specific cell types .......................................................................................... 63
Counting in wildtype and aberrant crypts (Apcfl/fl crypts)................................................ 63
2.8 IN SITU HYBRIDISATION ............................................................................................................ 63
Transformation of competent cells with cDNA vectors ................................................... 63
Plasmid DNA extraction and probe linearisation ............................................................ 64
DIG labelling of probes .................................................................................................. 64
Probe hybridisation ....................................................................................................... 65
Post-hybridisation treatment ........................................................................................ 65
Signal detection ............................................................................................................ 66
2.9 QUANTITATIVE REVERSE TRANSCRIPTION POLYMERASE CHAIN REACTION (QRT-PCR) RNA ISOLATION ....... 68
Tissue homogenisation ................................................................................................. 68
RNA extraction and purification .................................................................................... 68

vii
DNase treatment .......................................................................................................... 68
cDNA Synthesis ............................................................................................................. 69
Gene expression analysis .............................................................................................. 69
2.9.5.1 Sybr Green gene expression analysis.....................................................................................69
2.9.5.2 TaqMan gene expression analysis .........................................................................................69
2.9.5.3 Analysis of qRT-PCR data ......................................................................................................70
2.10 INTESTINAL ORGANOID CULTURE ................................................................................................ 71
Extraction of intestinal Apcfl/fl crypts ............................................................................ 71
Counting and seeding crypts ....................................................................................... 72
Organoid growth media .............................................................................................. 72
Passaging organoids to single cells.............................................................................. 73
Organoid formation efficiency assay ........................................................................... 74
2.10.5.1 A readout of ‘stemness’ ......................................................................................................74
2.10.5.2 Ex vivo application of BRB-derived Anthocyanin extract ......................................................74
2.10.5.3 CellTiter-Glo® Luminescent Cell Viability Assay ....................................................................74
2.10.5.4 Preparation of BRB-derived Anthocyanin (AC) extract .........................................................75
2.10.5.5 A readout of the effects of ex vivo application of BRBs on organoid forming efficiency .........75
2.10.5.6 A readout of the effects of ex vivo application of BRBs on the self-renewal efficiency of Apc
deficient cells to form organoids.........................................................................................................................75
2.11 DATA AND STATISTICAL ANALYSIS .............................................................................................. 77
Mann Whitney U test .................................................................................................. 77
Kolmogorov-Smirnov test ............................................................................................ 77
Kaplan Meier survival analysis .................................................................................... 77
3 INVESTIGATING THE EFFECT OF BLACK RASPBERRIES ON NORMAL AND WNT-ACTIVATED
MURINE SMALL INTESTINE ............................................................................................................................ 78
3.1 INTRODUCTION ..................................................................................................................... 78
3.2 RESULTS .............................................................................................................................. 79
3.2.1 Examining homeostasis and the consequence of acute loss of Apc driven by AhCre in the
context of BRB diet ................................................................................................................................. 79
3.2.2 Evaluating the effect of BRBs on differentiation in gut homeostasis and Apc loss driven by
AhCre .................................................................................................................................... 85
3.2.3 10% BRB diet altered ISC gene expression in wildtype and Apcfl/fl small intestine ............ 90
3.2.4 Evaluating the Wnt target genes in the context of BRBs in wildtype and Apcfl/fl small
intestine .................................................................................................................................... 93
3.2.5 Assessing whether BRB treatment rescued the phenotype induced by acute Apc loss
driven by the AhCre transgene................................................................................................................ 96
3.2.6 Examining homeostasis and the consequence of acute loss of Apc driven by the
VillinCreERT2 transgene in the context of BRB diet ................................................................................. 103

viii
3.3 DISCUSSION........................................................................................................................ 107
3.3.1 Evaluating the effect of BRBs on intestinal homeostasis .............................................. 107
3.3.2 Evaluating the effect of BRBs on acute loss of Apc in the intestine ............................... 109
3.4 SUMMARY AND FUTURE DIRECTIONS ........................................................................................ 116
4 FUNCTIONAL ANALYSIS OF POTENTIAL TUMOUR INITIATING CELLS EXPOSED TO BRB ............ 118
4.1 INTRODUCTION ................................................................................................................... 118
4.2 RESULTS ............................................................................................................................ 119
4.2.1 BRBs have no overt effect on organoid formation efficiency of Apc deficient crypts ...... 119
4.2.2 Apc deficient organoids are sensitive to increasing concentration of BRBs ................... 122
4.2.3 BRB-derived anthocyanins reduce the self-renewal ability of Apcfl/fl deficient cells ........ 125
4.3 DISCUSSION........................................................................................................................ 129
4.3.1 Organoid forming efficiency of Apcfl/fl crypts is not affected by BRBs ............................ 129
4.3.2 BRB-derived ACs limit the self-renewal efficiency of Apcfl/fl cells ................................... 131
4.4 SUMMARY AND FUTURE DIRECTIONS ........................................................................................ 132
5 INVESTIGATING THE LONG-TERM EFFECTS OF 10% BRBS ON WILDTYPE INTESTINE AND APC
LOSS-DRIVEN INTESTINAL TUMOURIGENESIS .............................................................................................. 134
5.1 INTRODUCTION ................................................................................................................... 134
5.2 RESULTS ............................................................................................................................ 135
5.2.1 Long-term feeding of BRBs does not influence body weight ......................................... 135
5.2.2 Long-term feeding of 10% BRBs significantly increased survival of mice following deletion
of Apc in ISCs 138
5.3 DISCUSSION........................................................................................................................ 140
5.3.1 Evaluating the effect of long-term BRB feeding on body weight ................................... 140
5.3.2 Long-term feeding on BRBs prolongs life of tumour bearing mice ................................ 141
5.4 SUMMARY AND FUTURE DIRECTIONS ........................................................................................ 141
6 GENERAL DISCUSSION ............................................................................................................. 143
BRBS AND INTESTINAL HOMEOSTASIS ....................................................................................... 144
BRBS, APC DEFICIENCY AND INTESTINAL STEM CELL INTERACTIONS ................................................... 146
USING MOUSE MODELS AND ORGANOID CULTURE TO MODEL BRB INTERVENTION IN HUMAN CRC ........... 154
POTENTIAL USE OF BRBS AS A CRC PREVENTATIVE ....................................................................... 158
7 REFERENCE LIST ...................................................................................................................... 161
8 SUPPLEMENTARY MATERIAL................................................................................................... 186
ix
List of Figures
Figure 1.1 Histology of the mouse small and large intestine .............................................................................. 4
Figure 1.2 Schematic representation of the mammalian small intestinal epithelium .......................................... 7
Figure 1.3 Location of putative intestinal stem cell markers ............................................................................ 10
Figure 1.4 Diagrammatic representation of the potential outcomes of intestinal stem cell division ................. 12
Figure 1.5 Schematic outline of four major signalling pathways involved in regulating intestinal homeostasis . 17
Figure 1.6 Interactions between the signalling pathways that govern intestinal homeostasis .......................... 18
Figure 1.7 The Fearon-Vogelstein model of CRC initiation and progression ..................................................... 21
Figure 1.8 The origin of cancer theories .......................................................................................................... 25
Figure 1.9 Cre-loxP technology for genetically engineered mouse models of CRC ............................................ 30
Figure 1.10 Organoids grown from wildtype and Apcfl/fl crypts ........................................................................ 33
Figure 1.11 Cancer stem cell and chemotherapy ............................................................................................. 35
Figure 1.12 Picture of yellow, red, purple and black raspberries ...................................................................... 42
Figure 3.1 Feeding of 10% BRBs had no effect on the gross architecture of the normal murine small intestine
but further increased crypt size following Apc loss .......................................................................................... 82
Figure 3.2 The chemopreventative effects of 10% BRBs characterised by scoring of histological mitosis, Ki67
and BrdU from AhCre Apc+/+ and AhCre Apcfl/fl small intestine ......................................................................... 83
Figure 3.3 The chemopreventative effects of 10% BRBs, characterised by scoring of histological apoptotic
figures and CC3 immunohistochemistry from AhCre Apc+/+
and AhCre Apcfl/fl
small intestine ........................... 84
Figure 3.4 Two-week feeding of 10% BRBs increased enteroendocrine cells in wildtype and Apc deficient small
intestine ......................................................................................................................................................... 87
Figure 3.5 Two-week feeding of 10% BRBs increased the number of goblet cells in Apc deficient small intestine
...................................................................................................................................................................... 88
Figure 3.6 Two-week feeding of 10% BRBs attenuated the perturbed differentiation of Paneth cells following
acute loss of Apc in the murine small intestine................................................................................................ 89
Figure 3.7 Feeding of 10% BRBs altered the expression of some ISC markers in normal and Apc deficient small
intestine ......................................................................................................................................................... 92
Figure 3.8 Alterations in Wnt target gene expression in AhCre Apc+/+
and Apcfl/fl
small intestine in the context of
10% BRB diet .................................................................................................................................................. 95
Figure 4.1 Effect of in vivo exposure to 10% freeze-dried BRB diet on Apc deficient crypts ability to form
organoids ex vivo .......................................................................................................................................... 121
Figure 4.2 IC50 curves for BRB-derived anthocyanins (ACs) ............................................................................ 124
Figure 4.3 Organoid formation efficiency and size following exposure of Apc deficient crypts to BRB-derived
ACs............................................................................................................................................................... 126
x
Figure 4.4 Organoid formation efficiency (self-renewal efficiency) and size following exposure of Apc deficient
single cells to BRB-derived ACs. .................................................................................................................... 127
Figure 5.1 Average % change in body weight of Lgr5CreERT2 Apc+/+ and Apcfl/fl mice in the context of BRB diet
.................................................................................................................................................................... 137
Figure 5.2 Overall survival curve of Lgr5CreERT2 Apc+/+ (dashed lines) and Apcfl/fl mice (solid lines) on the AIN76A
(blue) and 10% freeze-dried BRB diet (red) post induction with tamoxifen .................................................... 139
Figure 6.1 Schematic representation of the hypotheses generated from these studies on ISC dynamics in the
context of BRB exposure............................................................................................................................... 152
Figure 6.2 Schematic representation of the hypothesis that BRB intervention limits the competitive advantage
of Apc deficient clones.................................................................................................................................. 153
Figure S 8.1 H&E stained intestinal sections showing mitotic and apoptotic bodies in AhCre Apc+/+ and Apcfl/fl
mice fed control and 10% BRB diet ............................................................................................................... 186
Figure S 8.2 Representative images of Ki67 and BrdU stained intestinal sections of AhCre Apc+/+ and Apcfl/fl mice
fed control and 10% BRB diet ....................................................................................................................... 187
Figure S 8.3 Assessment of proliferation in VillinCreERT2 Apc+/+ and Apcfl/fl mice in the context of 10% BRB diet.
.................................................................................................................................................................... 188
Figure S 8.4 Assessment of cell death in VillinCreERT2 Apc+/+ and Apcfl/fl mice in the context of 10% BRB diet. 189
Figure S 8.5 Two-week feeding of 10% BRBs increased enteroendocrine cells in VillinCreERT2 Apc+/+ and Apcfl/fl
small intestine .............................................................................................................................................. 190
Figure S 8.6 Two-week feeding of 10% BRBs increased the number of goblet cells in VillinCreERT2 Apcfl/fl small
intestine ....................................................................................................................................................... 191
Figure S 8.7 Two-week feeding of 10% BRBs had no effect on Paneth cell differentiation in VillinCreERT2 Apc+/+
and Apcfl/fl mice ............................................................................................................................................ 192
Figure S 8.8 Alterations in ISC marker gene expression in VillinCreERT2 Apc+/+ and Apcfl/fl in the context of 10%
BRB diet ....................................................................................................................................................... 193
Figure S 8.9 Alterations in Wnt target gene expression in VillinCreERT2 Apc+/+ and Apcfl/fl in the context of 10%
BRB diet ....................................................................................................................................................... 193

xi
List of Tables
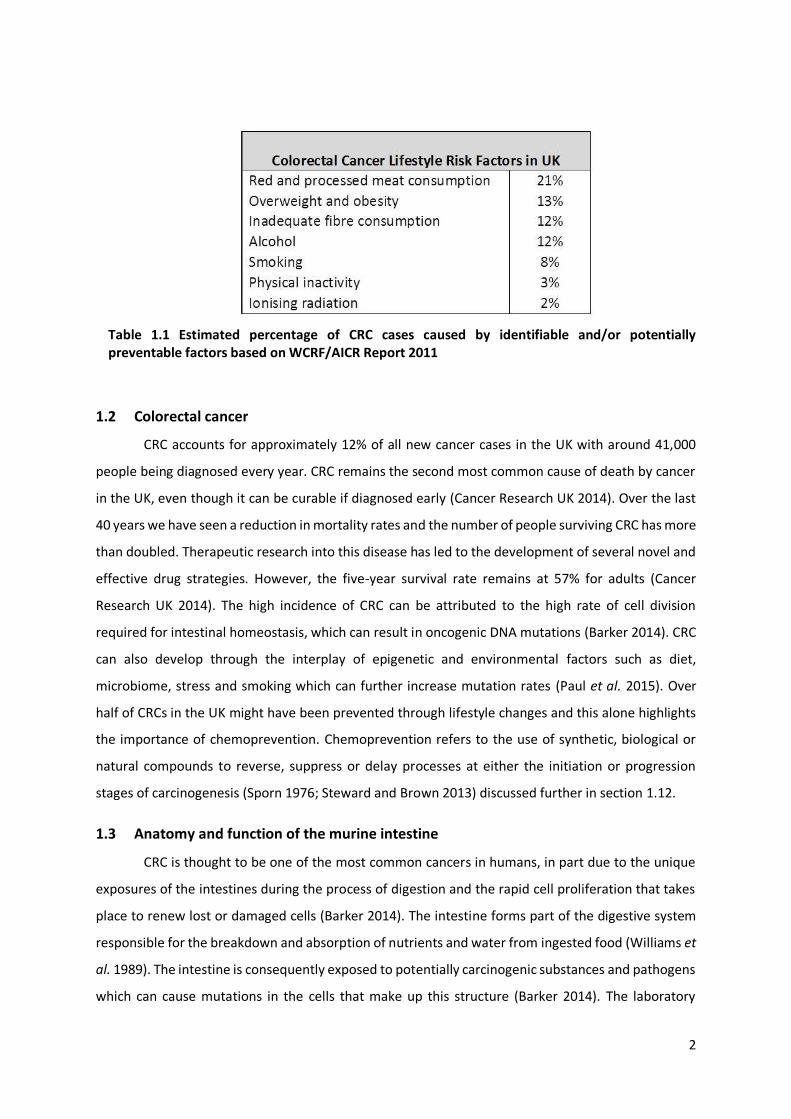
Table 1.1 Estimated percentage of CRC cases caused by identifiable and/or potentially preventable factors
based on WCRF/AICR Report 2011 .................................................................................................................... 2
Table 1.2 Summary of commonly used targeted therapeutic drugs against metastatic colorectal cancer ......... 36
Table 1.3 Approximate content of anthocyanin in different edible berry fruits ................................................ 41
Table 2.1 Outline of the transgenic mouse models utilised in this thesis ......................................................... 48
Table 2.2 Genotyping PCR reaction conditions ................................................................................................ 51
Table 2.3 Outline of the primer sequences used for PCR and the product sizes ............................................... 51
Table 2.4 Components of the purified rodent AIN76A control diet .................................................................. 53
Table 2.5 Components of the modified AIN76A purified rodent diet with 10% w/w black raspberry powder ... 54
Table 2.6 Constituents of Weiser Solution for epithelial cell extraction ........................................................... 57
Table 2.7 Constituents of the solutions required for Grimelius staining of enteroendocrine cells..................... 58
Table 2.8 Outline of antibodies and conditions used for immunohistochemistry (IHC) ..................................... 61
Table 2.9 Constituents required to perform a restriction digest on plasmid DNA ............................................. 67
Table 2.10 Constituents for the solutions required for post hybridisation treatment ....................................... 67
Table 2.11 Constituents of the DIG-labelling mix to produce a DIG-labelled riboprobe .................................... 67
Table 2.12 Recipe for cDNA synthesis ............................................................................................................. 70
Table 2.13 Outline of primer details used for qRT-PCR analysis by SYBR green and Taqman assays .................. 71
Table 2.14 Recipe for organoid culture medium for Apcfl/fl organoids including all growth factors .................... 73
Table 2.15 Outline of the preparation of BRB-derived anthocyanin (AC) concentrations .................................. 76
Table 3.1 Raw data counts from histological and IHC stained AhCre Apc+/+ and Apcfl/fl intestinal sections
exposed to control and 10% freeze-dried BRB powdered diets ........................................................................ 98
Table 3.2 Raw fold change in gene expression of cell type, stem cell and Wnt target gene markers in AhCre
Apc+/+ and Apcfl/fl intestinal tissue exposed to control and 10% freeze-dried BRB diets .................................... 99
Table 3.3 Summary of observed changes in histological and IHC markers in AhCre and VillinCreERT2 Apc+/+ and
Apcfl/fl intestinal sections following intervention with control and 10% freeze-dried BRB diets ....................... 100
Table 3.4 Summary of observed changes in gene expression of intestinal stem cell markers in AhCre and
VillinCreERT2 Apc+/+ and Apcfl/fl intestinal tissue following intervention with control and 10% freeze-dried BRB
diets ............................................................................................................................................................. 101
Table 3.5 Summary of observed changes in gene expression of Wnt target gene markers in AhCre and
VillinCreERT2 Apc+/+ and Apcfl/fl intestinal tissue following intervention with control and 10% freeze-dried BRB
diets ............................................................................................................................................................. 102
Table 3.6 Raw data counts from histological and IHC stained VillinCreERT2 Apc+/+ and Apcfl/fl intestinal sections
exposed to control and 10% freeze-dried BRB powdered diets ...................................................................... 105
Table 3.7 Raw fold change in gene expression of cell type, stem cell and Wnt target gene markers in
VillinCreERT2 Apc+/+ and Apcfl/fl intestinal tissue exposed to control and 10% freeze-dried BRB diets ............... 106

xii
Table 4.1 Organoid forming efficiency (%) and average organoid diameter (μm) of Apc deficient cells following
(A) in vivo exposure to AIN76A or 10% freeze-dried BRB diet and (B) exposure to BRB-derived anthocyanins
(AC) ex vivo .................................................................................................................................................. 128
xiii
Abbreviations and Definitions
Symbols
°C= Degrees Celsius
βNF = β-napthoflavone
∆ = Delta
μg = Micrograms
μl = Microlitre
μm = Micrometre
μM = Micromolar
fl/fl = Homozygously floxed allele
fl/+ = Heterozygously floxed allele
+/+ = Wildtype allele
A
AC = Anthocyanin
ACF = Aberrant Crypt Foci
Ah = Aryl hydrocarbon
AICR = American Institute for Cancer Research
AML = Acute myelocitic leukemia
AOM = Azoxymethane
APC = Adenomatous Polyposis Coli
Ascl2 = Achaete Scute like 2
AXIN2 = Axis Inhibitor Protein 2
B
BCSC = Breast cancer stem cell
BE = Barrett’s esophagus
Bmi1 = Polycomb ring finger oncogene
BMP = Bone Morphogenic Protein
bp = Base Pair
BRB = Black Raspberry
BrdU = 5’-bromo-2-deoxyuridine
BSA = Bovine Serum Albumin
C
CBC cells = Crypt Base Columnar cells
CC3 = Cleaved-caspase 3
cDNA = Complementary DNA
CD133 = Prominin1
CMS = Consensus molecular subtypes
Cox-2 = Cyclooxygenase 2
CRC = Colorectal Cancer
Cre = Cre recombinase
CreERT2 = Cre recombinase-Estrogen receptor
fusion transgene
CSC = Cancer Stem Cell
CSL = CBF1/RBP-Jκ/Suppressor of
Hairless/LAG-1. A transcription factor
important within the Notch signalling pathway
CT = Cycle threshold
CYP1A1 = Cytochrome P4501A1
D
DAB= Diaminobenzidine
DCAMKL-1 = Doublecortin and calcium/
calmodulin-dependent protein Kinase-Like-1
DCC = Deleted in colorectal cancer
DEPC= Diethylpyrocarbonate
dH2O = Distilled H2O
ddH2O = Double Distilled H2O
Dhh = Desert Hedgehog
DIG = Digoxigenin
Dkk1 = Dickkopf1, a Wnt inhibitor
Dll1 = Delta-Like Ligand 1, a notch ligand
Dll4 = Delta-Like Ligand 4, a notch ligand
DMEM/F12 = Dulbecco’s Modified Eagle
Medium, nutrient mixture F12
DNA = Deoxyribonucleic Acid
DNase = Deoxyribonuclease
xiv
DNMT = DNA Methyltransferase
dNTP = Deoxynucleotide triphosphate
DSH = Dishevelled
DSS = Dextran Sodium Sulphate
DTT = Dithiothreitol
E
EAC = Esophageal adenocarcinoma
EDTA = Ethylenediaminetetraacetic acid
EGCG = Epigallocatechin gallate
EGF = Epidermal Growth Factor
EGFR = Epidermal Growth Factor Receptor
EGTA = Ethyleneglycoltetraacetic acid
ENU = Ethylnitrosurea
EphB = Ephrin receptor B
EpCAM = Epithelial Cell Adhesion Molecule
ER = Estrogen Receptor
EtOH = Ethanol
F
FACs = Fluorescence Activated Cell Sorting
FAP = Familial Adenamatous Polyposis
FOXL1 = Forkhead Box L1
Fw = Fresh weight
Fzd = Frizzled
G
g = Gram
GEMM = Genetically Engineered Mouse
Model
gDNA = Genomic Deoxyribonucleic Acid
GFP = Green Fluorescent Protein
GSK-3 = Glycogen Synthase Kinase-3
H
H&E = Haematoxylin and Eosin
HBSS = Hanks Balanced Salt Solution
Hes1 = Hairy and enhancer of split-1
HFD = High-fat diet
HopX = Homeodomain-only protein X
hr = Hour
HRP = Horse Radish Peroxidase
I
IC50 = The concentration of AC required to
reduce organoid viability by half
IEN = Intraepithelial neoplasia
IHC = Immunohistochemistry
Ihh = Indian Hedgehog
IP = Intraperitoneal
ISC = Intestinal Stem Cell
K
kg = Kilogram
KRAS = Kirsten Rat Sarcoma viral oncogene
homolog
L
L = Litre
lb = Pound (weight)
LDL = Low Density Lipoprotein
LEF = Lymphoid Enhancer-Binding Factor 1
LOH = Loss of heterozygosity
LoxP = Locus of crossover of
Bacteriophage P1
Lgr5 = Leucine-rich repeat containing G
protein coupled receptor 5
LPS = Lipopolysaccharide
LRC = Label Retaining Cells
Lrig1 = Leucine-Rich Repeats and
Immunoglobulin-Like Domains
LRP = Low density lipoprotein receptor related
protein complex
M
xv
mCRC = Metastatic colorectal cancer
mg = Milligram
Min = Multiple Intestinal Neoplasia
mins = Minutes
ml = Millilitre
mM = Millimolar
mRNA = Messenger Ribonucleic Acid
MSI = Microsatellite instability
Msi1 = Musashi RNA-Binding Protein
mTERT = Mouse telomerase reverse
transcriptase
Muc2 = Mucin 2
N
n = Number
NGS = Normal Goat Serum
NICD = Notch Intracellular Domain
NMBA = N-nitrosomethylbenzylamine
NOD/SCID = Non-obese diabetic/severe
combined immune deficiency
NRS = Normal Rabbit Serum
O
Olfm4 = Olfactomedin 4
O/N = Overnight
P
PBS = Phosphate Buffered Saline
PBS/T = Phosphate Buffered Saline with 0.1%
Tween
PCR = Polymerase Chain Reaction
PI = Post induction
PKA = Protein Kinase A
PLL = Poly-L-Lysine coated slides
PUFAs = Polyunsaturated fatty acids
Q
qRT-PCR = Quantitative Reverse Transcription
Polymerase Chain Reaction
R
RFP = Red Fluorescent Protein
RNA = Ribonucleic Acid
RNase = Ribonuclease
Rnf43 = Ring Finger Protein 43
ROCK = Rho-associated protein kinase
ROS = Reactive oxygen species
rpm = Revolutions per minute
R-Smad = Receptor regulated Smad
Rspo1 = R-spondin 1
RT = Room Temperature
S
SCC = Squamous Cell Carcinoma
SDS = Sodium Dodecyl Sulphate
secs = Seconds
SEM = Standard error of mean
Sfrp = Secreted frizzled related protein
Shh = Sonic Hedgehog
SMADs = Intracellular proteins important
within BMP signalling
T
TA = Transit amplifying
TACE = Tumour Necrosis Factor-α-Converting
Enzyme
TBE = Tris borate EDTA
Taq = DNA polymerase derived from
Thermus aquaticus
TBS/T = Tris Buffered Saline with 0.1% Tween
TCF = T cell-specific transcription factor
TGF-α = Transforming Growth Factor-α
TGF-β = Transforming Growth Factor-β

xvi
Tnfrsf19 = Tumour Necrosis Factor Receptor
Superfamily Member 19
U
UC = Ulcerative Colitis
UV = Ultra Violet
V
VEGF = Vascular Endothelial Growth Factor
VEGFR = Vascular Endothelial Growth Factor
Receptor
VillinCreERT2 = Villin Cre recombinase Estrogen
Receptor Transgene
W
W = Watts
WCRF = World Cancer Research Fund
Wnt = Wingless
WT = Wild Type
w/v = Weight per volume
w/w = Weight per weight
Z
Znrf3 = Zinc and Ring Finger 3
123
+4 = Crypt cell located 4 cells from the top of
the Paneth cells
2D = Two dimensional
3D = Three dimensional
5-FU = 5’-fluorouracil

xvii
Abstract
It is estimated that over half of colorectal cancer (CRC) cases in the UK are preventable
through lifestyle changes. Perhaps unsurprisingly, bowel cancer is strongly linked to dietary choices.
Diets that are high in fat and low in fibre are associated with increased risk of cancer while diets rich
in fruit, vegetables and fibre have a reduced risk. Several studies have investigated the effect of certain
dietary components in CRC initiation and development. Previous work, in humans and animals, has
demonstrated that the polyphenols found in black raspberries (BRBs) have chemopreventative and
therapeutic effects. However, the exact mechanism for these effects remain unknown. As CRC can
originate from an intestinal stem cell (ISC) it is possible that the chemopreventative role is due to the
impact BRBs have on the normal and/or malignant ISCs. This thesis aimed to investigate the
chemopreventative effect of BRBS on normal intestinal tissue and on the initial and later stages of
intestinal tumourigenesis, in the context of ISC dynamics and activated Wnt signalling. This was
achieved using a Cre-loxP based approach to conditionally delete Apc (the negative regulator of the
Wnt signalling pathway) within different compartments of the adult murine intestinal epithelium and
also utilised the 3D intestinal organoid system.
Exposure to a BRB enriched diet is reported here to be well tolerated in mice and have no
major detrimental effects on normal intestinal homeostasis and health. Feeding of BRB diet 2 weeks
prior to Apc gene ablation is shown to partially attenuate the ‘crypt-progenitor’ phenotype typical of
acute Apc loss. In this context of activated Wnt signalling, BRBs altered ISC dynamics in vivo and
reduced the self-renewal capacity of Apc deficient cells ex vivo. Additionally, long-term feeding of BRB
diet was shown to significantly improve survival of mice which developed macroscopic stem-cell
derived Wnt-driven adenomas.
Together, these data are the first evidence that BRBs play a role in CRC chemoprevention by
protectively regulating the ISC compartment. These findings further support the use of BRB
intervention in cancer prevention in the context of Wnt-driven tumourigenesis.
1
1 General Introduction
1.1 Cancer
In 2014 the number of deaths from cancer in the UK was 163,444, accounting for about 29%
of deaths. There are approximately 350,000 new cancer cases in the UK each year, and 14.1 million
worldwide (Ferlay et al. 2015). Of the new cancer cases each year in the UK, lung, breast, bowel and
prostate cancers represent over half (Parkin et al. 2011). With the ever-increasing ageing population
it is anticipated that the number of cases will continue to rise. The risk of developing cancer depends
on several factors including inherited and acquired genetic mutations. Furthermore, a number of
environmental factors are known to contribute to the increased risk of cancer, which includes
smoking, exposure to sunlight, obesity, high alcohol consumption, lack of exercise and poor diet
(Whiteman and Wilson 2016).
1.1.1 Preventable cancers
Within the UK around 4 in 10 cancer cases a year (42%) are linked to lifestyle factors. The
largest single cause of cancer is smoking, which is estimated to cause 19% of cancers, predominately
in the lung. Thus, the most effective way to lower cancer risk is to eliminate tobacco use. Dietary
factors also play a significant role in the aetiology of many cancers (around 9% of cancers in the UK),
particularly bowel cancer. High fat/low fibre diets and diets high in red and processed meat are
associated with increased risk whereas high fruit, vegetable and fibre intake decreases the risk of this
disease (WCRF/AICR 2011 ). Risk factors closely linked to dietary factors are being overweight or obese
and limited physical activity, which are estimated to contribute to 5% and 1% of cancer cases
respectively. Cancers highly related to these lifestyle factors include aero-digestive and colorectal
cancers (CRC). Table 1.1 highlights the main lifestyle factors attributable to CRC in the UK (WCRF/AICR
2011).
While several studies report the link between diet and cancer risk, the precise mechanisms
are not well understood. For example, high fibre diets have been shown to be protective in CRC (Chan
and Giovannucci 2010). This may be due to the role of fibre in diluting carcinogens found in the faecal
content, reducing transit time through the colon or through the production of short chain fatty acids
(the preferred respiratory fuel of colonocytes) from anaerobic bacterial fermentation which has been
found to induce cell death (Chan and Giovannucci 2010). One area of intense research centres on the
protective role of bioactive phytochemicals, in particular polyphenols, in CRC (discussed further in
1.12). Understanding the chemopreventative mechanisms underpinning dietary compounds requires
both large-scale epidemiological studies and studies using animal models.
2
1.2 Colorectal cancer
CRC accounts for approximately 12% of all new cancer cases in the UK with around 41,000
people being diagnosed every year. CRC remains the second most common cause of death by cancer
in the UK, even though it can be curable if diagnosed early (Cancer Research UK 2014). Over the last
40 years we have seen a reduction in mortality rates and the number of people surviving CRC has more
than doubled. Therapeutic research into this disease has led to the development of several novel and
effective drug strategies. However, the five-year survival rate remains at 57% for adults (Cancer
Research UK 2014). The high incidence of CRC can be attributed to the high rate of cell division
required for intestinal homeostasis, which can result in oncogenic DNA mutations (Barker 2014). CRC
can also develop through the interplay of epigenetic and environmental factors such as diet,
microbiome, stress and smoking which can further increase mutation rates (Paul et al. 2015). Over
half of CRCs in the UK might have been prevented through lifestyle changes and this alone highlights
the importance of chemoprevention. Chemoprevention refers to the use of synthetic, biological or
natural compounds to reverse, suppress or delay processes at either the initiation or progression
stages of carcinogenesis (Sporn 1976; Steward and Brown 2013) discussed further in section 1.12.
1.3 Anatomy and function of the murine intestine
CRC is thought to be one of the most common cancers in humans, in part due to the unique
exposures of the intestines during the process of digestion and the rapid cell proliferation that takes
place to renew lost or damaged cells (Barker 2014). The intestine forms part of the digestive system
responsible for the breakdown and absorption of nutrients and water from ingested food (Williams et
al. 1989). The intestine is consequently exposed to potentially carcinogenic substances and pathogens
which can cause mutations in the cells that make up this structure (Barker 2014). The laboratory
Table 1.1 Estimated percentage of CRC cases caused by identifiable and/or potentially preventable factors based on WCRF/AICR Report 2011

3
mouse is widely used to study human genetics and model human cancers. Aside from the fact that
mice are small, cheap and easy to use, they share extensive physiological, molecular and genetic
similarities to humans, which makes them one of the best models to study human disease (Frese and
Tuveson 2007). Structurally, the intestine is an open-ended tube that runs from the stomach to the
anus, approximately 7.5 metres long in humans (Drake et al. 2005) and approxiamtely 49 cm in mice
(Fox et al. 2006). This is divided into the small and large intestine.
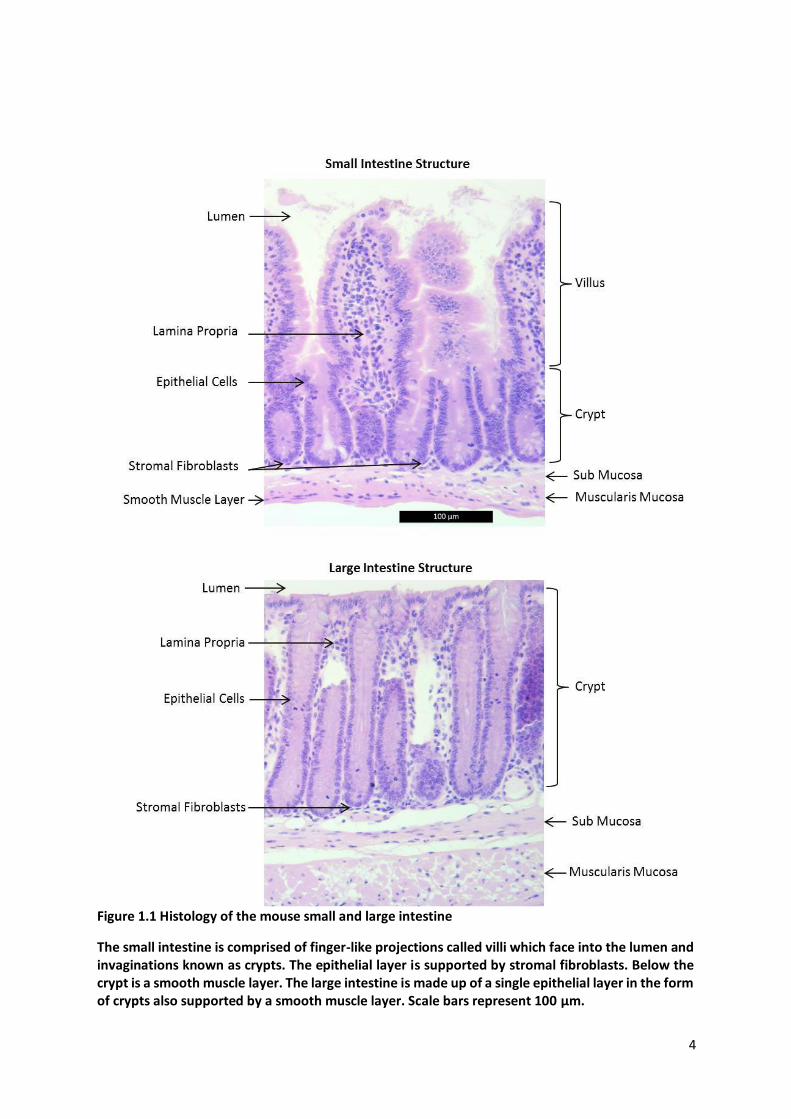
The small intestine has three segments, the duodenum, the jejunum and the ileum. The
luminal surface of the small intestine is covered in a single layer of polarised epithelial cells. The
epithelial sheet is arranged into invaginations called the crypts of Lieberkühn (commonly known as
crypts), which sit within the lamina propria (Williams et al. 1989). The lamina propria forms a
supportive matrix of mesenchymal (stromal) fibroblasts around the crypts and extends into the villus.
The villi are finger-like projections, which extend from the crypts that function to increase the surface
area to enable maximal nutrient absorption. Encased within the lamina propria compartment of the
small intestine is a blood supply, which carries absorbed nutrients, and lacteals, which transports lipids
in the form of lipoproteins. The wall of the small intestine consists of a smooth muscle layer. This is
responsible for the peristaltic action, which is essential for the movement of material through the
intestine (Williams et al. 1989). The small intestine also contains nodules of lymphoid tissue called
Peyer’s patches, which are responsible for immune surveillance against pathogens that enter the body
through ingestion (Williams et al. 1989). Figure 1.1 shows the small intestine structure.
The large intestine consists of the caecum, colon, rectum and anal canal. The large intestine
is where the majority of the water is absorbed from ingested foodstuffs, and where faecal material is
stored before egestion through the rectum and anal canal (Williams et al. 1989). Similar to the small
intestine, the large intestine is composed of a single layer of columnar epithelium however, unlike the
small intestine, the crypts are elongated without any villus projections and thus the epithelium is a
flat surface (Williams et al. 1989) (Figure 1.1). The majority of the cells that make up the large intestine
are the mucus secreting cells, whereas in comparison to the small intestine the most abundant cells
are the absorptive cells (Barker et al. 2008).
4
Figure 1.1 Histology of the mouse small and large intestine
The small intestine is comprised of finger-like projections called villi which face into the lumen and invaginations known as crypts. The epithelial layer is supported by stromal fibroblasts. Below the crypt is a smooth muscle layer. The large intestine is made up of a single epithelial layer in the form of crypts also supported by a smooth muscle layer. Scale bars represent 100 µm.
5
1.4 Small intestinal histology
The small intestinal epithelium is a highly regulated tissue, with six or more independent
crypts feeding each villus (Barker et al. 2008). The epithelial layer is rapidly renewed every 5 - 6 days
in humans and every 2 - 3 days in the mouse (Creamer 1967; Wright and Alison 1984), a process driven
by the proliferative compartment within the crypts. This proliferation is pivotal for the generation and
maintenance of the intestinal crypts. However, high cell turnover can contribute to cancer risk through
de novo mutations during DNA replication (Tomasetti and Vogelstein 2015). The intestinal epithelium
has a rapid turnover of cells which is maintained by the adult stem cell populations at the base of the
crypt, which can produce any of the epithelial lineages in the intestine influenced by its
microenvironment, or “niche” (Medema and Vermeulen 2011). The intestinal stem cells (ISCs) reside
at the base of the crypt and give rise to their progeny, the transit amplifying (TA) cells (Figure 1.2).
These cells divide 4 - 5 times as they migrate up towards the crypt-villus junction where they terminally
differentiate. The intestine contains four main types of differentiated cells; the absorptive enterocytes
and the secretory lineage of cells including goblet cells, enteroendocrine cells and Paneth cells (Barker
et al. 2008). The differentiated cells with the exception of the Paneth cells, which reside at the bottom
of the crypt, migrate up the villus where they are shed from the villus apex and are replaced by the
constant renewal and migration of cells from the crypts (Marshman et al. 2002) (Figure 1.2).
1.4.1 Enterocytes
The enterocytes are the most abundant cell type found in the villi and are responsible for the
absorption of nutrients from the intestinal lumen and secretion of hydrolytic enzymes which aid the
breakdown of food. They are specialised, tightly packed cells that maintain cell polarity and also form
an epithelial barrier against microbes (Barker 2014). These cells can be identified by their expression
of the enzyme alkaline phosphatase.
1.4.2 Goblet Cells
The mucin secreting goblet cells lubricate and protect the intestinal epithelium from the
aggressive environment and mechanical stress of food movement. Commonly found in higher number
towards the distal end of the small intestine the goblet cells provide extra lubrication to aid the
movement of compacting faecal matter towards the colon (Barker 2014). They are also involved in
repairing damaged tissue by secreting trefoil proteins. In the normal intestine goblet cells are found
throughout the villus, and most commonly at the crypt-villus junction. The goblet cells are easily
identified by alcian blue staining which stains acidic mucins present in goblet cells.
6
1.4.3 Enteroendocrine Cells
Found throughout the crypt-villus axis are the enteroendocrine cells. These cells secrete
hormones that facilitate the digestive functions of the intestine, including serotonine and secretin
which act to facilitate gut movement and water homeostasis respectively (Schonhoff et al. 2004)
These cells can be identified by their ability to reduce silver ions, forming black deposits when stained
with grimelius silver.
1.4.4 Paneth Cells
It has long been thought that intestinal stem cells give rise to cells that terminally differentiate
at the crypt-villus axis and either that migrate up the villus or in the instance of Paneth cells localise
to the base of the crypt (Barker et al. 2008). It has recently been reported that Paneth cells arise
directly from the quiescent intestinal cells as these cells are the precursors that are committed to
differentiate into the secretory cell lineages (Buczacki et al. 2013). Paneth cells are long-lived secretory
cells which constitute the ISC niche.
Cell positioning in the crypt-villus structure is also governed by a bidirectional gradient of Eph
receptors and ephrin ligands, in particular EphB2, EphB3 and ephrin-B ligands. EphB2 is reported to
be expressed throughout the proliferative region of the crypt, peaking at cell position 4 – 6 and
decreases in concentration further up the crypt, mirroring Wnt gradients (discussed in section 1.6)
(Batlle et al. 2002; Scoville et al. 2008). EphB3 is highly expressed in the stem cell compartment below
position 4 and in Paneth cells, although it is often weakly expressed in some precursor cells. However,
ephrin-B ligands are highly expressed in differentiated cells and decrease in expression towards to the
crypt base but are completely absent within Paneth cells (Batlle et al. 2002; Scoville et al. 2008). These
differential gradients of EphB-ephrin receptor expression cause cell compartmentalisation. Paneth cell
positon is thus confined to the crypt base due to their high expression of EphB3 but not EphB2 or
ephrin-B receptors (Batlle et al. 2002; Scoville et al. 2008).
Paneth cells are responsible for the protection and immunity within the crypt by secreting a
range of anti-microbials such as cryptdins (Barker et al. 2008), enzymes including lysozyme and other
factors including TGF-α and Wnt3a (Bevins and Salzman 2011). The ISC niche refers to the
microenvironment in which the ISCs are located. The niche is comprised of epithelial and stromal cells
as well as a range of ligands which interact with the ISCs to regulate cell fate see section 1.5.2.

7
Figu
re 1
.2 S
chem
atic
rep
rese
nta
tio
n o
f th
e m
amm
alia
n s
mal
l in
test
inal
ep
ith
eliu
m
Cry
pt
bas
e co
lum
nar
ce
lls (C
BC
s, r
ed) d
ivid
e to
pro
du
ce p
roge
nit
or
tran
sit
amp
lifyi
ng
(TA
, pal
e y
ello
w)
cells
. As
TA c
ells
mig
rate
up
th
rou
gh t
he
cry
pt-
villu
s ax
is t
hey
bec
om
e m
ore
dif
fere
nti
ated
. Dif
fere
nti
ate
d g
ob
let
(dar
k b
lue
), e
nte
rocy
tes
(lig
ht
blu
e) a
nd
en
tero
end
ocr
ine
(bri
ght
pin
k) c
ells
res
ide
in t
he
villu
s.
Thes
e ce
lls c
on
tin
ue
to m
igra
te a
lon
g th
e vi
llus
wh
ere
the
y ar
e e
ven
tual
ly s
hed
into
th
e in
test
inal
lum
en.
Pan
eth
cel
ls (
bri
gh
t ye
llow
) o
n t
he
oth
er h
and
m
igra
te t
ow
ard
s th
e b
ase
of
the
cryp
t w
her
e th
ey s
up
po
rt t
he
ste
m c
ell
nic
he
, w
hic
h c
on
tain
s st
rom
al c
ells
(p
ale
ora
nge
). T
he
inte
stin
al e
pit
hel
ium
is
sup
po
rted
by
a sm
oo
th m
usc
le la
yer
(pal
e p
ink)
th
at f
acili
tate
s th
e m
ove
men
t o
f fo
od
.
8
1.5 Intestinal Stem Cells
Stem cells are defined by two features; multipotency and self-renewal. Multipotency refers to
the ability of undifferentiated stem cells to differentiate into all cell types within the tissue in which
they reside (Barker et al. 2008). The dual ability of ISCs to indefinitely self-renew whilst simultaneously
generating functioning epithelium makes them potential targets for regenerative medicine.
Furthermore, these properties make stem cells targets for therapeutic strategies against cancer as, in
some instances, ISCs are thought to be the cell of origin of mutations that promote carcinogenesis.
Under normal circumstances ISCs cycle slowly (quiescent) and they readily undergo apoptosis
following genetic insult. However, mutations in ISCs are also passed to all their daughter cells (Potten
et al. 1978; Orford and Scadden 2008).
Previous studies have suggested that the ISC compartment is comprised of two distinct ISC
populations. Cheng and Leblond identified the crypt base columnar cells (CBC), which are interspersed
between the Paneth cells and are thought to be responsible for intestinal homeostasis (Cheng and
Leblond 1974). This paper also reported that CBC cells have the ability to self-renew and are
multipotent, thus supporting their role as stem cells. The CBC cells form part of the “stem cell zone”
model for the intestine. This model proposes that the CBC stem cells exist within a stem-cell permissive
environment or niche (see section 1.5.2), and the stem cell progeny leave this environment to
differentiate into the intestinal cell lineages maintaining intestinal homeostasis (Bjerknes and Cheng
1999). However, the CBC cells were found to be rapidly cycling which is in contrast to the view that
stem cells are slowly cycling (or quiescent) in order to preserve genome integrity.
The second proposed stem cell to exist alongside the CBCs is the +4 quiescent stem cells
(Potten et al. 1974). These cells are resistant to damage but respond to an injury by becoming active
after intestinal trauma to limit the accumulation of DNA damage in long-lived adult stem cells (Tian et
al. 2011; Barker 2014). It has been proposed that these cells are a “reserve” stem cell potential
population that are capable of replacing CBCs following injury (Montgomery et al. 2011). The
quiescent cells in the +4 position within the crypt are thought to be a location of ISCs due to their DNA
label retaining ability of thymidine labels when actively dividing over extended periods of time (Potten
et al. 1974; Baker 2014).
The above evidence led to the hypothesis that there are two pools of ISCs that are active
during homeostasis or during intestinal damage. The theory postulates that the cycling CBC cells are
responsible for intestinal homeostasis, while a separate quiescent population, or population with
‘reverse stem cell potential’ only divide when injury occurs to the actively dividing stem cells. Three
seminal papers have suggested that committed progenitor cells (both secretory and absorptive
lineages) are extremely plastic and have the potential to revert to a stem cell state when subjected to
9
injury or stress (van Es et al. 2012; Buczacki et al. 2013; Tetteh et al. 2016a). These data argue against
the traditional view of an adult-stem cell hierarchy in the intestinal crypt such that several committed
progenitors have the potential to dedifferentiate into a stem cell-like cell when exposed to the ISC
niche and stress
1.5.1 Identification of ISCs
There has been considerable controversy regarding the true stem cells of the mouse intestine
(Barker et al. 2012). As a result there have been several suggested potential stem cell markers based
on positional information of gene expression. However, positional information alone is inadequate
evidence to define genes as markers of the ISC. Despite this, several gene markers have been proposed
through genetic lineage tracing, xenograft transplantation (Barker and Clevers 2007) and in situ
hybridisation (Gregorieff et al. 2005).
The generation of mouse models (see section 1.10) and the use of in vivo lineage tracing have
identified leucine-rich repeat containing G-protein coupled receptor 5 (Lgr5), a target gene of the Wnt
(Wingless) signalling pathway (discussed in section 1.6.1), to be a marker of the rapidly dividing CBC
cells (Barker et al. 2007). This led to the development of a genetically engineered mouse model
(GEMM) which expressed GFP (green fluorescent protein) in the Lgr5+ stem cells (Barker et al. 2007).
This model was subsequently used to identify Olfactomedin-4 (Olfm4), Achaete Scute-Like 2 (Ascl2)
and Tumour necrosis factor receptor superfamily member 19 (Tnfrsf19) as markers of the CBC stem
cell (van der Flier et al. 2009a; van der Flier et al. 2009b). The role of Ascl2 as a regulator of the CBC
stem cells was confirmed when in vivo genetic ablation of Ascl2 resulted in the rapid death of ISCs,
and overexpression of the gene resulted in the expansion of the stem cell zone (van der Flier et al.
2009b). Other proposed CBC ISC markers include Hairy and enhancer of split-1 (Hes1), Musashi
homolog 1 (Msi1) (Kayahara et al. 2003), Ring Finger Protein 43 (Rnf43) and Zinc and Ring Finger 3
(Znrf3) (Koo et al. 2012).
Several markers of the +4 quiescent stem cell have been proposed, including Prominin1
(CD133), Homeodomain-only protein X (HopX), Mouse telomerase reverse transcriptase (mTERT),
Leucine-rich repeats and immunoglobulin-like domains protein 1 (Lrig1) and Polycomb ring finger
oncogene (Bmi1) (Sangiorgi and Capecchi 2008; Zhu et al. 2009; Montgomery et al. 2011; Takeda et
al. 2011; Powell et al. 2012). The complexity in identifying markers that distinguish between distinct
subsets of cells limits the use of some of these genes as true markers of the +4 stem cell (Barker et al.
2012; Beumer and Clevers 2016). In particular Bmi1 is commonly found throughout the proliferative
zone of the crypt, including in the Lgr5+ CBC cells (Montgomery et al. 2011; Itzkovitz et al. 2012; Muñoz
et al. 2012; Powell et al. 2012) and Bmi1+ cells have been reported to generate CBC cells during
homeostasis (Tian et al. 2011; Li et al. 2014). It is evident that more research is required to define
10
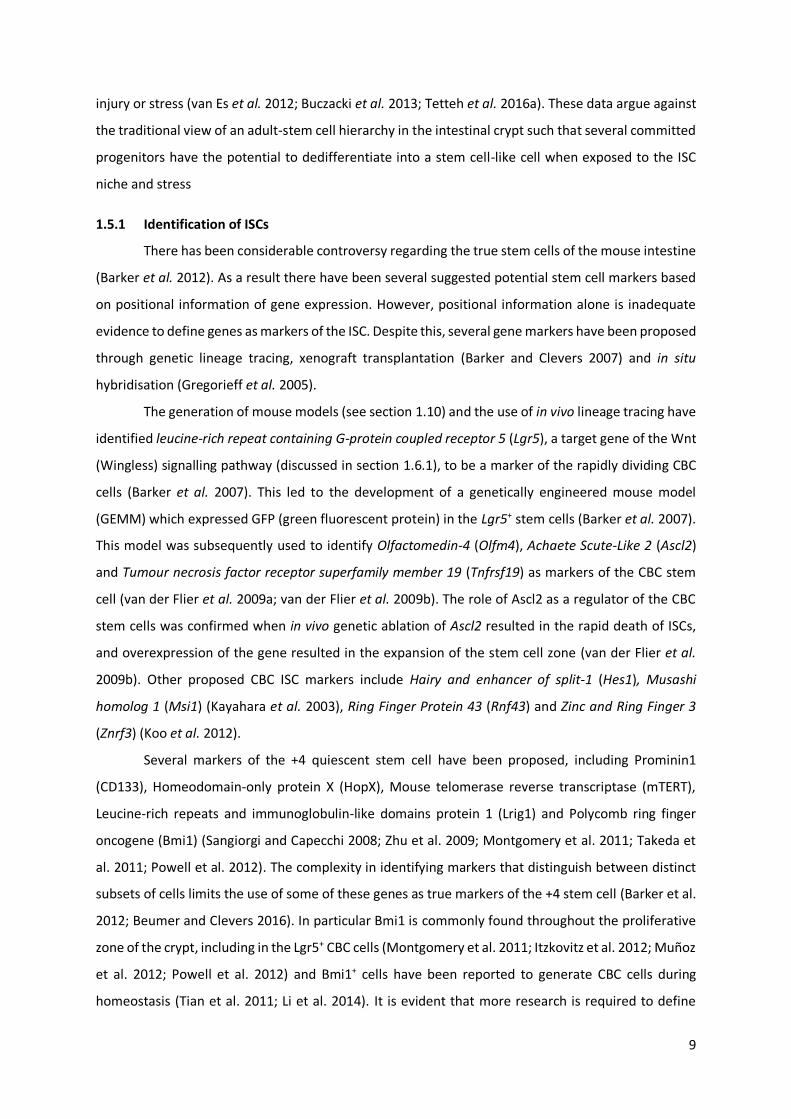
markers associated with the +4 cells and to determine their homeostatic potential and relationship
with CBCs. However, it can be concluded that stem cell markers appear as a gradient across CBCs and
+4 cells, with only a few markers being uniquely expressed in CBCs (Muñoz et al. 2012). Figure 1.3
represents the commonly used markers of the ISC populations.
Figure 1.3 Location of putative intestinal stem cell markers
Proposed location and characteristics of ISC markers of the crypt base columnar cells (red) and +4 quiescent stem cell (orange).

11
1.5.2 Stem cell niche
The microenvironment that surrounds and nurtures ISCs is described as the stem cell niche. It
is believed that the stem cell niche plays a role in maintaining a balance between stem cell quiescence
and activity in order to establish homeostasis and safeguard against excessive stem cell expansion
which could result in tumourigenesis. The intestinal niche is composed of the nearby proliferating and
differentiating epithelial cells, surrounding mesenchymal cells such as blood vessels, intraepithelial
lymphocytes, and fibroblasts and the extracellular matrix, which all provide stem cells with a range of
signals. We have just started to understand the signals provided by the niche and how they help
regulate self-renewal and differentiation of ISCs (Moore and Lemischka 2006; Umar 2010). It is
apparent that a number of signalling pathways play important roles in the regulation of ISCs including
Wnt, Notch, BMP and Hedgehog (discussed in section 1.6).
It has long been thought that Paneth cells are one of the main constituents of the ISC niche.
This is because they express a range of ligands, in particular Wnt3, but also TGF-α and Dll4 (a Notch
ligand) and antimicrobial factors (Ootani et al. 2009; Sato et al. 2009; Bevins and Salzman 2011; Sato
et al. 2011b). The importance of Paneth cells to the stem cell niche is supported by a study which
showed co-culturing of Lgr5+ cells with Paneth cells increased the efficiency of ISCs to form intestinal
organoids ex vivo (see section 1.10.3 on organoid culture) (Sato et al. 2011b). However, in vivo studies
have shown that conditional Wnt3 deletion and Paneth cell ablation did not affect the maintenance
of the ISC niche (Durand et al. 2012; Farin et al. 2012). These data propose that surrounding non-
epithelial cells provide sources of Wnt ligands. Recent stuides have confirmed the role of non-
epithelial cells in the maintenace of the ISC compartment. Kabiri et al. highlighted that organoids can
form and expand in the absence of epithelial derived Wnts if supplemented with an intestinal
myofibroblast-enriched stromal fraction that produces endogenous Wnt and R-spondin (Kabiri et al.
2014).
This highlights the importance of Wnt signalling in maintaining and regulating ISCs and their
supporting niche.
1.5.3 Stem cell division
The DNA label retaining ability of stem cells led to the idea that stem cells divide
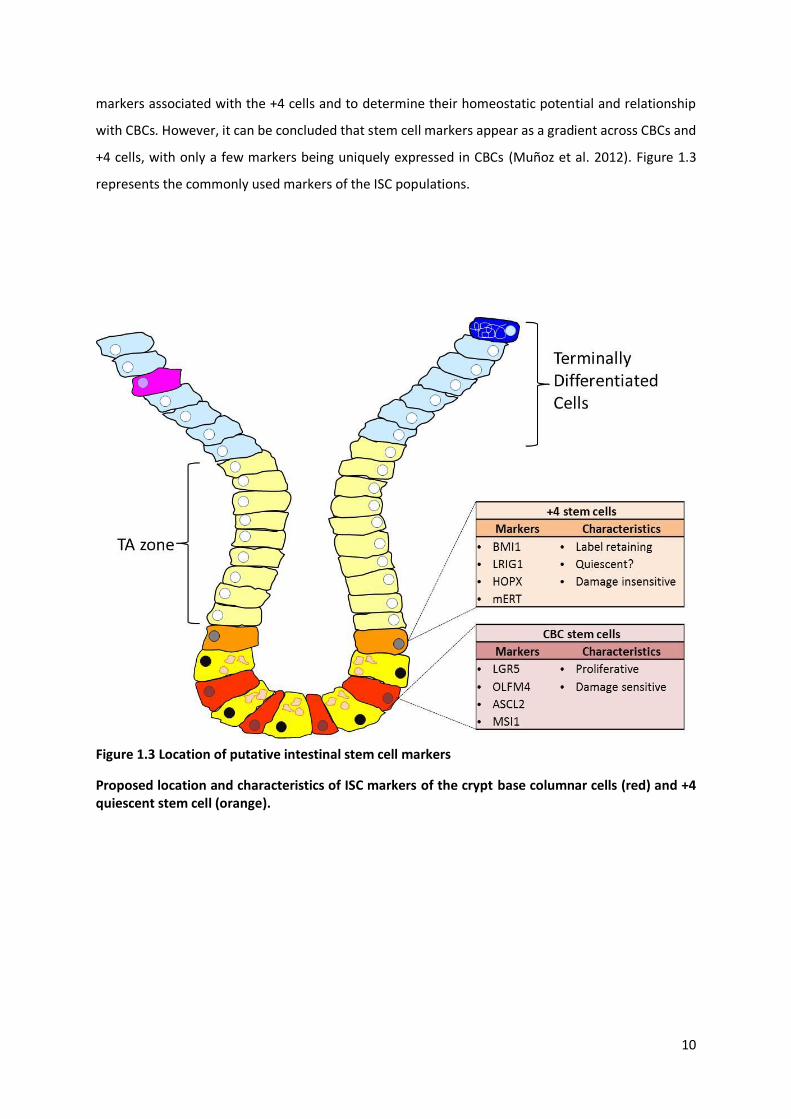
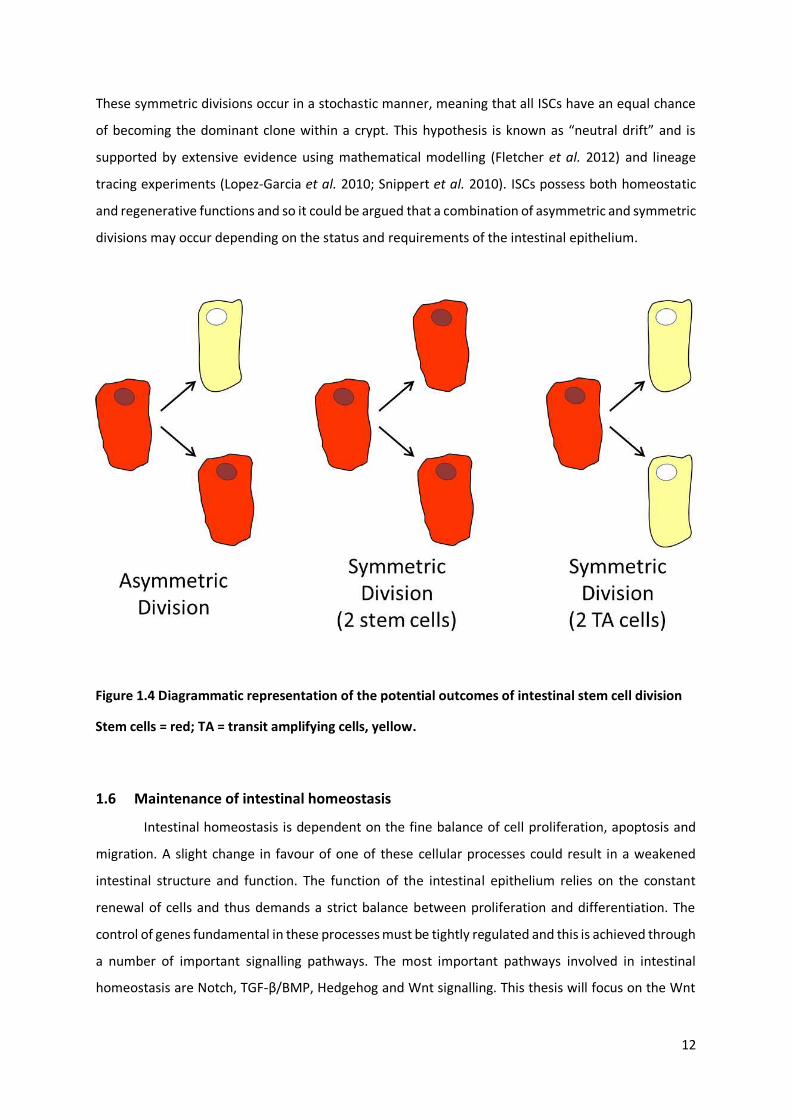
asymmetrically to produce one ISC and one TA cell (Potten et al. 2002; Smith 2005) (Figure 1.4) This
form of division is known as “invariant asymmetry”. However, asymmetric divisions do not support
the phenomena that intestinal crypts appear to drive towards monoclonality (Loeffler et al. 1993).
This means that over time an entire crypt will have descended from a single ISC. More recent studies
reported that ISCs can divide symmetrically to produce either two TA cells or two ISCs (Figure 1.4).
12
These symmetric divisions occur in a stochastic manner, meaning that all ISCs have an equal chance
of becoming the dominant clone within a crypt. This hypothesis is known as “neutral drift” and is
supported by extensive evidence using mathematical modelling (Fletcher et al. 2012) and lineage
tracing experiments (Lopez-Garcia et al. 2010; Snippert et al. 2010). ISCs possess both homeostatic
and regenerative functions and so it could be argued that a combination of asymmetric and symmetric
divisions may occur depending on the status and requirements of the intestinal epithelium.
1.6 Maintenance of intestinal homeostasis
Intestinal homeostasis is dependent on the fine balance of cell proliferation, apoptosis and
migration. A slight change in favour of one of these cellular processes could result in a weakened
intestinal structure and function. The function of the intestinal epithelium relies on the constant
renewal of cells and thus demands a strict balance between proliferation and differentiation. The
control of genes fundamental in these processes must be tightly regulated and this is achieved through
a number of important signalling pathways. The most important pathways involved in intestinal
homeostasis are Notch, TGF-β/BMP, Hedgehog and Wnt signalling. This thesis will focus on the Wnt
Figure 1.4 Diagrammatic representation of the potential outcomes of intestinal stem cell division
Stem cells = red; TA = transit amplifying cells, yellow.
13
signalling pathway due to its roles in stem cell renewal but will very briefly describe the roles of the
other signalling pathways.
1.6.1 Wnt Signalling Pathways
Wnt signalling is indispensable for embryonic development and tissue homeostasis. The Wnt
pathways have been extensively studied and are known as the canonical Wnt/β-catenin pathway, the
non-canonical planar cell polarity pathway and the non-canonical Wnt/calcium pathway. Planar
polarity pathway is responsible for regulating cell shape through cytoskeletal changes (Zallen 2007)
and the Wnt/calcium pathway controls calcium levels within cells (Kohn and Moon 2005). These two
pathways are extremely important for planar cell polarity and extension movements during
gastrulation or neuronal and epithelial cell migration, but they have distinctive roles compared to the
canonical pathway. The canonical Wnt pathway is fundamental in development and maintenance of
gut homeostasis through its regulation of several biological processes which include regulation of the
stem cell pool, proliferation, differentiation and apoptosis. The canonical Wnt pathway is often
implicated in many CRCs and other diseases due to its role in regulating ISC dynamics. For this reason
this thesis will focus on the canonical Wnt pathway.
1.6.1.1 Canonical Wnt Signalling
The stem cell population and intestinal homeostasis is regulated by the canonical Wnt/β-
catenin signalling pathway. This pathway also has important roles in embryonic development due to
its role in establishing basic body pattern.
When the Wnt pathway is in its ‘off state’ (Figure 1.5), i.e. in the absence of a Wnt signal,
dishevelled (DSH) is sequestered by the Frizzled (FZD) receptor. This allows the intracellular proteins
which constitute the destruction complex, APC and AXIN, to be phosphorylated by glycogen synthase
kinase-3β (GSK3). This enhances the ability of the destruction complex to bind and phosphorylate β-
catenin. Phosphorylated β-catenin is targeted for degradation via the ubiquitin proteasome pathway
(Logan and Nusse 2004), and thus cytoplasmic β-catenin levels are reduced.
The presence of a Wnt ligand binding to a Wnt receptor (FZD/low density lipoprotein (LDL)
receptor-related protein (LRP) complex) induces an intracellular signalling pathway. DSH is released
from FZD and binds to AXIN disrupting the destruction complex and inhibiting its ability to bind β-
catenin. β-catenin is stabilised and accumulates in the cytoplasm. It can then translocate into the
nucleus where it binds to the T-cell factor and lymphoid enhancer factor (TCF/LEF) which initiates the
transcription of several downstream Wnt target genes (Behrens et al. 1996; Clevers and van de
Wetering 1997) (Figure 1.5).
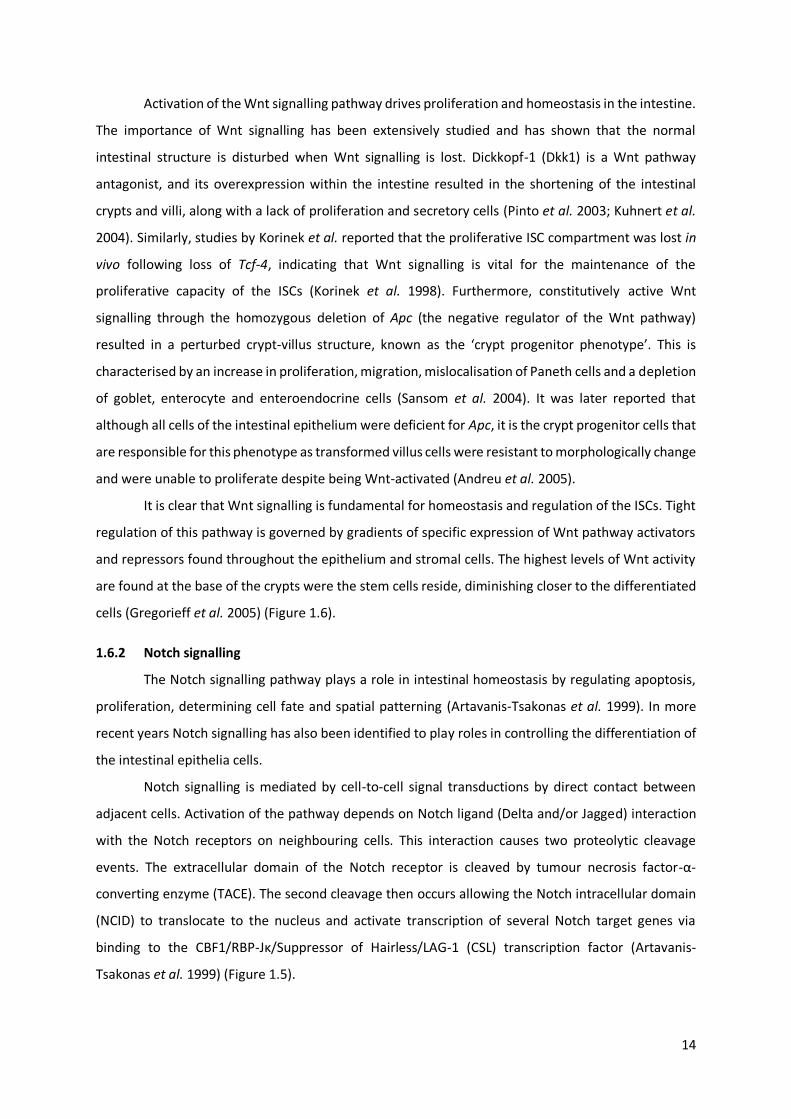
14
Activation of the Wnt signalling pathway drives proliferation and homeostasis in the intestine.
The importance of Wnt signalling has been extensively studied and has shown that the normal
intestinal structure is disturbed when Wnt signalling is lost. Dickkopf-1 (Dkk1) is a Wnt pathway
antagonist, and its overexpression within the intestine resulted in the shortening of the intestinal
crypts and villi, along with a lack of proliferation and secretory cells (Pinto et al. 2003; Kuhnert et al.
2004). Similarly, studies by Korinek et al. reported that the proliferative ISC compartment was lost in
vivo following loss of Tcf-4, indicating that Wnt signalling is vital for the maintenance of the
proliferative capacity of the ISCs (Korinek et al. 1998). Furthermore, constitutively active Wnt
signalling through the homozygous deletion of Apc (the negative regulator of the Wnt pathway)
resulted in a perturbed crypt-villus structure, known as the ‘crypt progenitor phenotype’. This is
characterised by an increase in proliferation, migration, mislocalisation of Paneth cells and a depletion
of goblet, enterocyte and enteroendocrine cells (Sansom et al. 2004). It was later reported that
although all cells of the intestinal epithelium were deficient for Apc, it is the crypt progenitor cells that
are responsible for this phenotype as transformed villus cells were resistant to morphologically change
and were unable to proliferate despite being Wnt-activated (Andreu et al. 2005).
It is clear that Wnt signalling is fundamental for homeostasis and regulation of the ISCs. Tight
regulation of this pathway is governed by gradients of specific expression of Wnt pathway activators
and repressors found throughout the epithelium and stromal cells. The highest levels of Wnt activity
are found at the base of the crypts were the stem cells reside, diminishing closer to the differentiated
cells (Gregorieff et al. 2005) (Figure 1.6).
1.6.2 Notch signalling
The Notch signalling pathway plays a role in intestinal homeostasis by regulating apoptosis,
proliferation, determining cell fate and spatial patterning (Artavanis-Tsakonas et al. 1999). In more
recent years Notch signalling has also been identified to play roles in controlling the differentiation of
the intestinal epithelia cells.
Notch signalling is mediated by cell-to-cell signal transductions by direct contact between
adjacent cells. Activation of the pathway depends on Notch ligand (Delta and/or Jagged) interaction
with the Notch receptors on neighbouring cells. This interaction causes two proteolytic cleavage
events. The extracellular domain of the Notch receptor is cleaved by tumour necrosis factor-α-
converting enzyme (TACE). The second cleavage then occurs allowing the Notch intracellular domain
(NCID) to translocate to the nucleus and activate transcription of several Notch target genes via
binding to the CBF1/RBP-Jκ/Suppressor of Hairless/LAG-1 (CSL) transcription factor (Artavanis-
Tsakonas et al. 1999) (Figure 1.5).
15
Notch is predominately active in the intestinal crypts were it is thought to keep progenitor
cells in an undifferentiated state. It is proposed to do this via up-regulation of the transcription factor
Hes1. Hes1 functions to repress the expression of Math1 which is essential for the specification of the
intestinal secretory progenitors (van Es et al. 2005). The importance of Math1 expression to commit
progenitor cells to the secretory lineage was shown through the use of mouse models. Math1-/- mice
resulted in a lack of goblet, enteroendocrine and Paneth cells in the intestine (Yang et al. 2001; Van
Es et al. 2010). In addition, immature progenitor cells have been shown to convert into terminally
differentiated secretory cells upon Notch inhibition in vivo (Van Es et al. 2010; VanDussen and
Samuelson 2010). The conversion of progenitor cells into differentiated secretory cells upon Notch
inhibition in the intestine is further supported by studies by Pellegrinet et al. They showed that Delta-
like1 (Dll1) and Delta-like4 (Dll4) (Notch ligands) loss in vivo, ablated the stem cell population
suggesting that Notch signalling also plays a role in maintaining stemness (Pellegrinet et al. 2011).
Extensive in vivo murine studies have highlighted the fundamental role of Notch signalling in
intestinal homeostasis and its importance of maintaining crypt progenitor status and stemness. Notch
works in parallel with Wnt to prevent differentiation while Wnt regulates proliferation. Figure 1.6
highlights the interactions between the signalling pathways.
1.6.3 TGF-β/BMP signalling
The transforming growth factor beta (TGF-β)/bone morphogenetic protein (BMP) signalling
pathway plays a fundamental role in embryonic development whereby it mainly regulates cell growth
and proliferation. It also plays roles in differentiation, apoptosis and homeostasis. Pathway activation
is dependent on ligand and type II receptor binding which allows dimerization with the type I receptor,
consequently resulting in the phosphorylation of type I receptors cytoplasmic domain. The
phosphorylated receptors can then recruit and phosphorylate Smad 2/3 proteins (TGF-β), or the Smad
1/5/8 proteins (BMP). Phosphorylated Smads are then known as receptor regulated Smads (R- Smad).
The R- Smads are able to dissociate from the receptor and bind to Smad 4, forming a co-Smad, enabling
it to enter the nucleus. Smad 4 is then able to activate transcription (Figure 1.5). The pathway is
inactivated by the binding of inhibitory Smads (Smad 6 and 7) to Smad 4 instead of the R-Smad,
preventing its translocation into the nucleus. The expression of TGF-β ligands are predominately at
the tip of the villus notably in the lamina propria, but also in the muscularis. TGF-β/BMP signalling
works in coordination with the rapid cell turnover of the intestine to prevent growth and proliferation
(Barnard et al. 1989; Massagué et al. 2000). Members of this pathway are not usually found in the
crypts of the small or large intestine. Noggin, an inhibitor of the BMP pathway, is found within the
submucosal layer around the intestinal crypts (He et al. 2004).
16
1.6.4 Hedgehog Signalling
The Hedgehog signalling pathway is regulated by two membrane spanning proteins known as
Patched and Smoothened. When the pathway is inactivated, i.e. no ligand present, Patched functions
to supress the activation of Smoothened. This enables protein kinase A (PKA) to post-translationally
modify the transcription factors Gli2/3. This preferentially targets Gli2 for degradation leaving a
truncated Gli3 which can translocate to the nucleus and transcriptionally repress the Hedgehog target
genes. In the presence of the Hedgehog ligands, Sonic Hedgehog (Shh), Indian Hedgehog (Ihh) or
Desert Hedgehog (Dhh), the Patched receptor is unable to supress Smoothened. Activated
Smoothened prevents the phosphorylation and subsequent degradation of Gli2. Active Gli2/3 is able
to translocate to the nucleus and activate transcription of Hedgehog target genes (Madison et al.
2009) (Figure 1.5). Previous studies have shown that Hedgehog signalling is an upstream regulator of
the canonical Wnt signalling pathway. The transcription factors FoxL1 and FoxF1 are Hedgehog target
genes (Madison et al. 2009). It has been shown that deletion of FoxL1 significantly down-regulates
BMP ligands, consequently activating Wnt signalling (Kaestner et al. 1997). This was recently
supported by two studies by Kosinski et al. and van Dop et al. They reported that loss of Ihh within the
intestinal epithlieum caused a lack of normal crypt-villus architecture characterised by a marked
increase in proliferation, expansion of the stem cell population, crypt fission, an increase in secretory
cells but a lack of enterocyte differentiation and loss of the cellular components of the muscularis
mucosa (Kosinski et al. 2010; van Dop et al. 2010). Mechanistic studies highlighted that this was due
to the down-regualtion of BMPs simultaneously with up-regulation of Wnt signalling. Kosinski et al.
also highlighted that Ihh signals to the stromal and smooth muscle fibroblasts in a paracrine manner
(Kosinski et al. 2010). The findings from these studies implied that Hedgehog signalling is an inhibitor
of the Wnt pathway by up-regulation of BMP signals, and its tight regulation is partially responsible
for Wnt activation in normal gut homeostasis (Figure 1.6Figure 1.6 highlights these interactions).
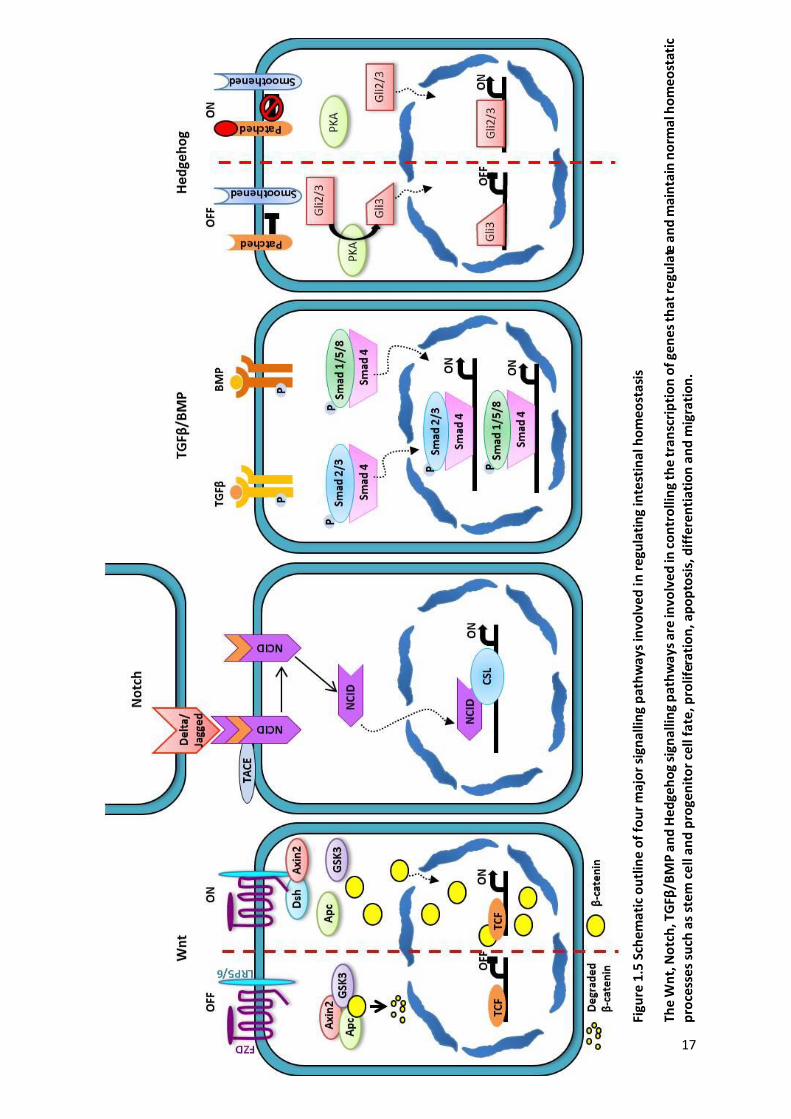
17
Figu
re 1
.5 S
chem
atic
ou
tlin
e o
f fo
ur
maj
or
sign
allin
g p
ath
way
s in
volv
ed in
reg
ula
tin
g in
test
inal
ho
meo
stas
is
Th
e W
nt,
No
tch
, TG
Fβ/B
MP
an
d H
ed
geh
og
sign
alli
ng
pa
thw
ays
are
invo
lve
d in
co
ntr
olli
ng
the
tra
nsc
rip
tio
n o
f ge
ne
s th
at
regu
late
an
d m
ain
tain
no
rmal
ho
meo
stat
ic
pro
cess
es
such
as
ste
m c
ell
an
d p
roge
nit
or
cell
fate
, pro
lifer
atio
n, a
po
pto
sis,
dif
fere
nti
atio
n a
nd
mig
rati
on
.

18
Figu
re 1
.6 I
nte
ract
ion
s b
etw
een
th
e si
gnal
ling
pat
hw
ays
that
go
vern
inte
stin
al h
om
eo
sta
sis
The
sign
allin
g p
ath
way
s th
at r
egu
late
pro
lifer
atio
n, c
ell d
eat
h a
nd
dif
fere
nti
atio
n a
re fu
nd
ame
nta
l to
inte
stin
al h
om
eost
asis
an
d m
ust
be
tigh
tly
regu
late
d.
The
can
on
ical
Wn
t p
ath
way
dri
ves
pro
lifer
atio
n o
f st
em
an
d p
roge
nit
or
cells
to
re
pla
ce c
ells
th
at a
re s
hed
fro
m t
he
top
of
the
villu
s. W
nt
sign
allin
g is
fu
nd
amen
tal
to m
ain
tain
an
d s
tem
an
d p
roge
nit
or
fate
an
d t
hu
s, t
his
pat
hw
ays
is t
igh
tly
con
tro
lled
by
inte
ract
ion
s w
ith
oth
er s
ign
allin
g p
ath
way
s.
Epit
hel
ial
cells
in
th
e st
em
ce
ll co
mp
artm
ent
secr
ete
Hed
geh
og
ligan
ds
that
act
ivat
e H
edge
ho
g s
ign
allin
g in
nei
ghb
ou
rin
g n
ich
e st
rom
al c
ells
. Th
is u
p-
regu
late
s th
e p
rod
uct
ion
of
BM
P a
gon
ists
, wh
ich
inh
ibit
Wn
t si
gnal
ling
in a
dja
cen
t ep
ith
elia
l ce
lls. B
MP
sig
nal
ling
can
be
inh
ibit
ed
by
the
pre
sen
ce o
f th
e B
MP
an
tago
nis
t, N
ogg
in,
in t
he
sub
mu
cosa
l la
yer
aro
un
d t
he
cry
pts
. In
ad
dit
ion
to
Wn
t si
gnal
ling,
No
tch
sig
nal
ling
mai
nta
ins
pro
gen
ito
r ce
lls i
n a
n
un
dif
fere
nti
ated
sta
te w
ith
in t
he
cryp
t co
mp
artm
ent.
Th
e h
igh
est
leve
ls o
f W
nt
and
No
tch
are
fo
un
d a
t th
e b
ase
of
the
cryp
t, d
ecre
asin
g al
on
g th
e cr
ypt
stru
ctu
re. H
edge
ho
g an
d B
MP
sig
nal
ling
are
low
est
in t
he
cry
pt
bu
t in
cre
ase
up
th
e c
ryp
t in
to
th
e vi
llus
com
par
tmen
t.
19
1.7 Pathways implicated in CRC
Cancer arises when cells within a certain area of the body divide uncontrollably (Shen 2011).
Intestinal homeostasis is governed by signalling pathways that regulate cell proliferation and stem cell
dynamics (see section 1.6). The very same signalling pathways are thus, unsurprisingly, associated with
CRC initiation and progression.
1.7.1 Molecular subtypes of CRC
1.7.1.1 Fearon and Vogelstein genetic model of progression
In 1990, it was proposed that sporadic CRC developed and progressed as a result of an
accumulation of genetic mutations (Fearon and Vogelstein 1990). Through the use of genetic and
histopathological data, Fearon and Vogelstein put forward a model of the genetic progression of CRC
from normal intestinal epithelium, to dysplastic tissue, then adenoma through to metastatic
carcinoma (Fearon and Vogelstein 1990). Using methods of measuring the frequency of gene
mutations present at different stages of human CRC, it was proposed that the loss of function of APC
in the intestine was sufficient to initiate the development of a benign adenoma. The accumulation of
several other gene mutations including KRAS (Kirsten rat sarcoma viral oncogene homologue)
activating mutations, loss of heterozygosity at the 5q and 18q locus and mutations in Deleted in
colorectal cancer (DCC) and p53 instigate disease progression and malignancy (Fearon and Vogelstein
1990) (Figure 1.7). It is important to note that although genetic alterations in these genes often
presented in this order, progression to more advanced tumours is due to the gradual accumulation of
mutations rather than following this specific sequence of events. However, initiation and progression
of CRC is much more complex than this proposed model and as such, CRC can be classified into four
consensus molecular subtypes (CMS), discussed below, in order to improve clinical stratification and
aid therapeutic decisions and effective interventions.
1.7.1.2 Consensus molecular subtypes (CMS) of CRC
Through the use of large-scale data sharing and analytics, an international expert consortium
have recently described four CMS subgroups of CRC characterised by different molecular and clinical
features (Guinney et al. 2015). Although more research is required in order to confirm this
classification system, these subgroups may prove useful in bettering clinical trial design and provide
more effective therapeutics strategies dependent on tumour taxonomy.
CMS1 (MSI Immune, 14%): CRC classified in this group are characteristic of microsatellite
instability (MSI) and hypermutations due to deregulated DNA mismatch repair due to
hypermethyaltion and thus silencing of DNA mismatch repair gene promoters. In addition, these
20
tumours frequently presented with strong immune activation (Guinney et al. 2015; Müller et al. 2016).
Patients with CMS1 CRC had poor survival outcomes following relapse (Guinney et al. 2015, Müller et
al. 2016).
CMS2 (Canonical, 37%): Tumours from this subgroup predominately presented with epithelial
differentiation signatures with marked activation of the WNT and MYC signalling pathways. Tumour
suppressor genes were often lost in this subgroup while oncogenes had several more copy numbers
(Guinney et al. 2015; Müller et al. 2016). However, patients with CMS2 tumours typically had the best
survival outcomes after relapse (Guinney et al. 2015; Müller et al. 2016).
CMS3 (Metabolic, 13%): Akin to CMS2 tumours, CMS3 CRCs also have epithelial signatures but
with enrichment of several metabolic pathways. These tumours frequently present with KRAS
mutations (Guinney et al. 2015), which has previously been reported to maintain tumour cells by
metabolic adaptations (Ying et al. 2012).
CMS4 (Mesenchymal, 23%): CRCs in this subgroup have enhanced TGF-β activation and
increased expression of genes involved in epithelial–mesenchymal transition which ultimately results
in stromal invasion and metastasis. In addition, these tumours often presented with increased
angiogenesis, inflammation and matrix remodelling (Guinney et al. 2015; Müller et al. 2016). CMS4
patients had increased risk of metastasis, worse relapse-free survival and worse overall survival than
patients with other subgroups (Guinney et al. 2015; Müller et al. 2016).
The remaining 13% represents a group of tumours with mixed features and thus could not be
classified. This group is likely to represent a transition phenotype or intratumoral heterogeneity
(Guinney et al. 2015)

21
Figu
re 1
.7 T
he
Fear
on
-Vo
gels
tein
mo
del
of
CR
C in
itia
tio
n a
nd
pro
gres
sio
n
The
sch
emat
ic d
iagr
am r
epre
sen
ts t
he
pro
po
sed
ste
pw
ise
pro
gre
ssio
n t
o m
eta
sta
tic
colo
rect
al c
ance
r fr
om
no
rmal
inte
stin
al e
pit
he
lium
. Lo
ss o
f A
PC
is t
ho
ugh
t to
be
th
e in
itia
tin
g ev
ent
in t
um
ou
r fo
rmat
ion
. Su
bse
qu
ent
acti
vati
on
of
the
KR
AS
on
coge
ne
an
d l
oss
of
the
18
q c
hro
mo
som
e re
sult
s in
th
e ge
ner
atio
n o
f ad
van
ced
ad
eno
carc
ino
mas
. Met
asta
sis
is d
rive
n b
y lo
ss o
f th
e tu
mo
ur
sup
pre
sso
r p
53.
22
1.7.2 Wnt and Cancer
As described in section 1.6.1.1 Apc is one of the negative regulators involved in the destruction
of β-catenin in the Wnt signalling pathway. Inactivating mutations in APC are seen in more than 80%
of CRC tumours and are thought to be the initiating event in this malignant disease (Powell et al. 1992;
Leslie 2002). Loss of functional APC results in the accumulation of nuclear β-catenin and subsequently
causes the constitutive transcription of several Wnt target genes involved in the initial and progressive
stages of CRC (Komiya and Habas 2008). Exploiting therapeutics to target this pathway could aid in the
prevention and treatment of CRC.
Other characterised mutations involved in the development of CRC include activating
mutations of β-catenin (Ctnnb1) which are seen in less than 5% of CRCs. Activating mutations in the
gene encoding β-catenin enables this protein to escape from proteasomeal degradation and thus
causes constitutive activation of the signalling pathway (Morin et al. 1997). Axin (AXIN1) is a scaffold
protein involved in stabilising the destruction complex which marks β-catenin for degradation.
Mutations in AXIN1 have been reported in CRC cell lines (Webster et al. 2000) which suggests that
mutations in this component of the Wnt pathway are likely to augment Wnt signalling due to
ineffective degradation of β-catenin. Wnt activation has also been reported through mutations in the
transcription factor TCF4 which has been found in microsatellite-unstable CRCs. Mutations in TCF4
produce a truncated protein which is more transcriptionally active resulting in the up-regulation of
genes involved in proliferation, migration and survival (Duval et al. 2000).
Therapeutically targeting the Wnt signalling pathway holds great promise for the treatment
of CRC. Several studies are working on the development of novel Wnt inhibitors to target colorectal
tumourigenesis and metastasis (Dihlmann and von Knebel Doeberitz 2005). It is important to fully
eludicate the interactions involved between Wnt signalling in the normal intestinal epithlieum and
CRC in order to develop effective and novel strategies. Therapeutics which target this signalling
pathway have been effective, however drug specificity, toxicity and undesirable side effects still
remain a problem. Again, this highlights the importance of investigation into chemopreventative
therapeutics.
1.8 ISC as the cells of origin of CRC
It has been proposed that stem cells are the cells of origin of many cancers including ISCs. This
concept in colorectal tumourigenesis evolved after a study in 2009 whereby Apc was deleted
specifically in the long-lived ISC cells through the expression of a Cre recombinase driven by an Lgr5
promoter (see section 1.10.1.2). The study reported that these mice developed microadenomas in the
intestine and within 3-5 weeks they had rapidly developed into adenomas. This is in contrast to mice

23
which were deficient of Apc in the progenitor and early differentiated cells of the intestine, as they
rarely developed large adenomas even after 30 weeks (Barker et al. 2009). It is thought that ISCs are
the cell or origin of CRC because when Apc is mutated in Lgr5+ cells, which represent the ISCs, they
repopulate the entire crypt and villus with Apc deficient cells and thus enable tumourigenesis.
Whereas, due to the rapid turnover of the intestinal epithelium, when Apc is lost in the differentiated
cells these are rapidly lost from the villus and unable to instigate tumourigenesis. This work highlights
the importance of ISCs and cancer development; such that stem cells have the aptitude to indefinitely
self-renew and potentially accumulate mutations (Barker 2014). Mutations which lead to an expansion
of the ISC population mean there are large numbers of cells with the potential to initiate
carcinogenesis. It is important to note that although ISCs have been described as the cell of origin of
CRC, it has been shown that other epithelial cells have the potential to drive tumourigenesis but
cancers derived from the ISC population are much more aggressive (Barker et al. 2009).
1.9 Cancer Stem Cells
As a result of the complexity and heterogeneity of tumours, the specific molecular mechanism
of how tumours develop is still not clearly defined. The idea that cancer stem cells (CSCs) are the cells
which propagate tumourigenesis have been of great interest over the years. The ‘stochastic’ theory
for cancer growth argues cancer cells are not part of a hierarchical system and all cell types have an
equal intrinsic potential to divide and contribute to malignancy, but the fate of the individual cells to
tumour bulk cells or self-renewal is completely random (Figure 1.8). It was also thought that the
phenotypical differences between tumours were due to the genomic instability of cells and influences
from the microenvironment (Lobo et al. 2007).
Cells that are present within a tumour closely resemble the cells of the tissue in which they
were derived. Furthermore, they have similar responses and interactions with the environment and
molecular control mechanisms, suggesting that the tumour forming cells are organised into a
hierarchy with differing cell potencies (Tan et al. 2006). This idea developed the cancer stem cell
hypothesis (Figure 1.8), which proposes that only a sub-population of cancer cells have the ability to
populate and maintain a tumour, as well as enabling metastasis. This hypothesis is supported with a
substantial amount of evidence which have shown that blood cancers such as leukaemia (Lapidot et
al. 1994) and a range of solid tumours, including breast (Al-Hajj et al. 2003), liver (Ma et al. 2007),
colon (O’Brien et al. 2007) and brain (Singh et al. 2004), develop from a sub-population of cells when
transplanted into an immune deficient mouse, therefore providing evidence against the ‘stochastic’
theory of cancer development. The clinical implications surrounding the cancer stem cell hypothesis
could have profound effects in the battle to find a cure for cancer. Therapeutics targeting the CSC
population are essential in the prevention and treatment of this malignant disease. However, it is
24
possible that by only killing the stem cells within the tumour, non-stem cell or quiescent stem cell
populations could revert to stem-cell like cells and repopulate a tumour. Identification of novel and
effective therapeutics against CSCs rely heavily on the ability to identify pools of tumour driving cells,
highlighting the importance of identifying and confirming specific markers for CSCs in each type of
cancer.
CD133 was the first surface marker identified for the ISCs in intestinal cancer. CD133 was
enriched in the proliferative cells and these cells were found to have a high tumour-initiating ability
when transplanted into non-obese diabetic/severe combined immune deficiency (NOD/SCID) mice
when compared to CD133- cells (O’Brien et al. 2007). Similarly in human brain and liver tumours, only
CD133+ cells were capable of tumour initiation in NOD/SCID mice (Singh et al. 2004; Suetsugu et al.
2006). In addition to this, it was also found that a subpopulation of CRC cells that highly expressed
epithelial cell adhesion molecule (EpCAM) and CD44 (a known breast CSC marker) were the only cells
capable of engraftment in NOD/SCID mice forming lesions which were morphologically similar to the
primary human tumour (Dalerba et al. 2007). This suggested that EpCAM and CD44 can act as CSC
markers. Other intestinal CSC markers identified through similar techniques as CD133, CD44 and
EpCAM include D166, CD29, CD24 and Lgr5 (Vermeulen et al. 2008).
Identification of these cell surface markers enabled Barker and colleagues, and Zhu and
colleagues to provide strong evidence in favour of the ISC being the origin of CRC. As described in
section 1.8 conditional activation of the Wnt pathway through deletion of Apc specifically within Lgr5+
cells resulted in adenoma formation (Barker et al. 2009). Similarly, mice with Wnt activation through
a β-catenin mutation resulted in gross alteration in the crypt-villus architecture and a marked
expansion of CD133+ cells at the base of the crypt (CD133 has been shown to co-express with Lgr5).
Lineage tracing of CD133+ cells revealed that daughter cells repopulated the entire intestinal
epithelium with neoplastic tissue (Zhu et al. 2009). Furthermore, the use of a R26R-Confetti
Crereporter validated that Lgr5+ CSCs were capable of promoting intestinal adenoma growth and
generated the different cell types within adenomas (Schepers et al. 2012). Crossing of Lgr5 knock in
mice with the R26R-Confetti Cre mouse resulted in single Lgr5+ cells being randomly labelled with one
of four floursecent reporters encoded by the R26R-Confetti allele (blue, red, yellow or green) and thus
cells were analysed through lineage tracing techniques (Livet et al. 2007; Snippert et al. 2010). It has
also been shown that Lgr5+ adenoma cells were intermingled between Paneth cells suggesting that,
like normal ISCs, CSCs may require an environmental niche (Schepers et al. 2012). However, Lgr5+
sorted intestinal tumour cells have not yet been shown capable of engraftment in immune deficient
mice suggesting that they lack self-renewal abilities despite being multipotent (Schepers et al. 2012).
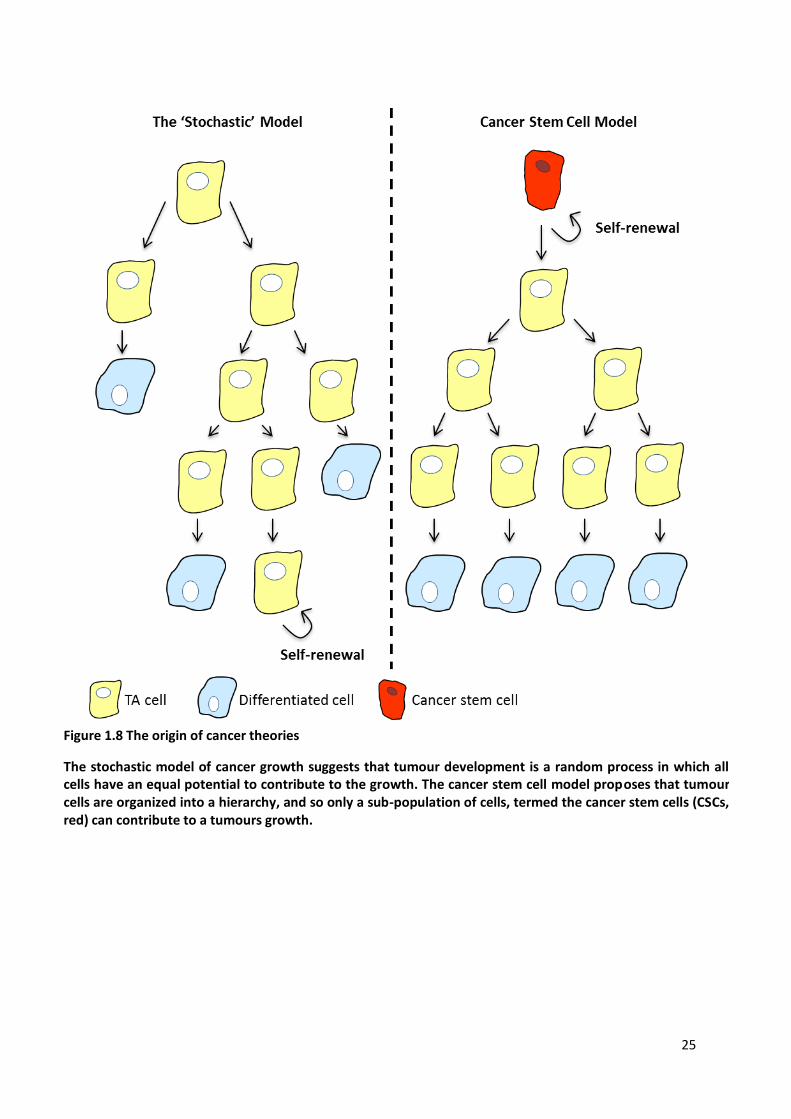
25
Figure 1.8 The origin of cancer theories
The stochastic model of cancer growth suggests that tumour development is a random process in which all cells have an equal potential to contribute to the growth. The cancer stem cell model proposes that tumour cells are organized into a hierarchy, and so only a sub-population of cells, termed the cancer stem cells (CSCs, red) can contribute to a tumours growth.
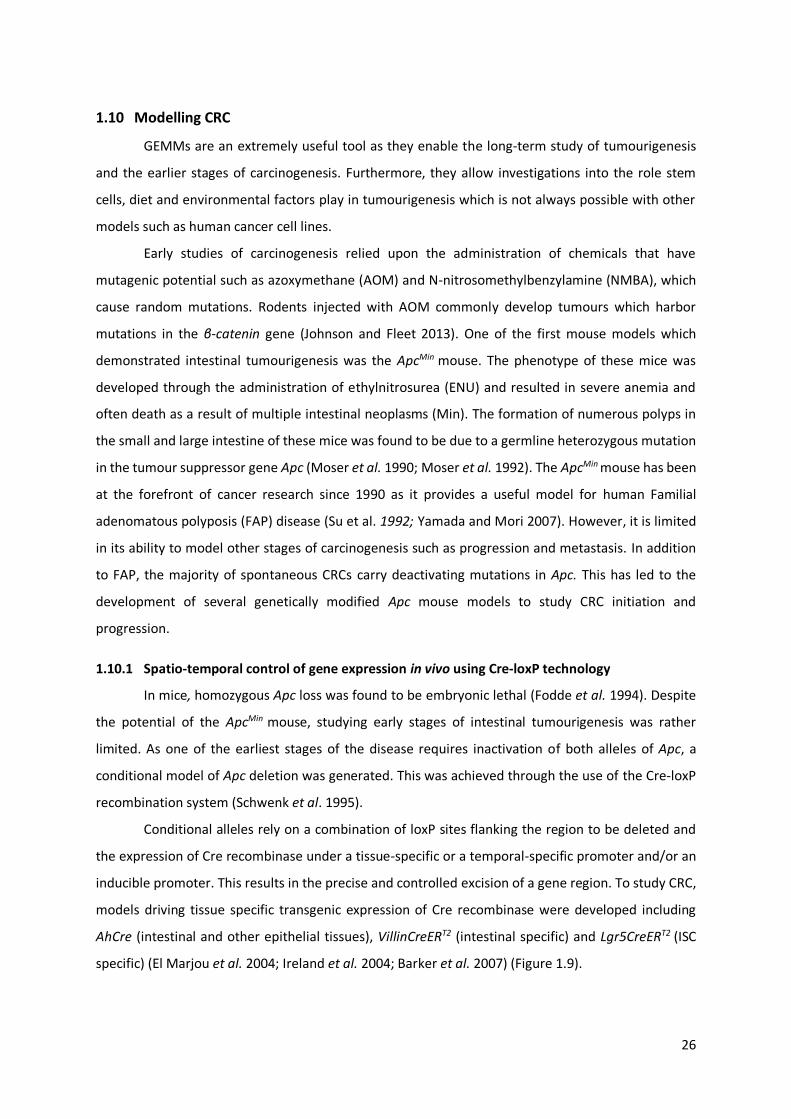
26
1.10 Modelling CRC
GEMMs are an extremely useful tool as they enable the long-term study of tumourigenesis
and the earlier stages of carcinogenesis. Furthermore, they allow investigations into the role stem
cells, diet and environmental factors play in tumourigenesis which is not always possible with other
models such as human cancer cell lines.
Early studies of carcinogenesis relied upon the administration of chemicals that have
mutagenic potential such as azoxymethane (AOM) and N-nitrosomethylbenzylamine (NMBA), which
cause random mutations. Rodents injected with AOM commonly develop tumours which harbor
mutations in the β-catenin gene (Johnson and Fleet 2013). One of the first mouse models which
demonstrated intestinal tumourigenesis was the ApcMin mouse. The phenotype of these mice was
developed through the administration of ethylnitrosurea (ENU) and resulted in severe anemia and
often death as a result of multiple intestinal neoplasms (Min). The formation of numerous polyps in
the small and large intestine of these mice was found to be due to a germline heterozygous mutation
in the tumour suppressor gene Apc (Moser et al. 1990; Moser et al. 1992). The ApcMin mouse has been
at the forefront of cancer research since 1990 as it provides a useful model for human Familial
adenomatous polyposis (FAP) disease (Su et al. 1992; Yamada and Mori 2007). However, it is limited
in its ability to model other stages of carcinogenesis such as progression and metastasis. In addition
to FAP, the majority of spontaneous CRCs carry deactivating mutations in Apc. This has led to the
development of several genetically modified Apc mouse models to study CRC initiation and
progression.
1.10.1 Spatio‐temporal control of gene expression in vivo using Cre-loxP technology
In mice, homozygous Apc loss was found to be embryonic lethal (Fodde et al. 1994). Despite
the potential of the ApcMin mouse, studying early stages of intestinal tumourigenesis was rather
limited. As one of the earliest stages of the disease requires inactivation of both alleles of Apc, a
conditional model of Apc deletion was generated. This was achieved through the use of the Cre-loxP
recombination system (Schwenk et al. 1995).
Conditional alleles rely on a combination of loxP sites flanking the region to be deleted and
the expression of Cre recombinase under a tissue-specific or a temporal-specific promoter and/or an
inducible promoter. This results in the precise and controlled excision of a gene region. To study CRC,
models driving tissue specific transgenic expression of Cre recombinase were developed including
AhCre (intestinal and other epithelial tissues), VillinCreERT2 (intestinal specific) and Lgr5CreERT2 (ISC
specific) (El Marjou et al. 2004; Ireland et al. 2004; Barker et al. 2007) (Figure 1.9).
27
1.10.1.1 AhCre Transgene
AhCre was developed to study the conditional loss of function of genes targeted to the
intestinal crypt (Ireland et al. 2004). This line was generated by cloning the cytochrome P4501A1
(CYP1A1) promoter upstream of Cre recombinase (Ireland et al. 2004). The CYP1A1 promoter is usually
transcriptionally silent, but is up-regulated on exposure to lipophilic xenobiotics, such as β-
napthoflavone (βNF), which bind to the aryl hydrocarbon (Ah) receptor (Ireland et al. 2004). The
application of βNF activates the CYP1A1 promoter initiating transcription of the Cre recombinase.
Activated Cre recombinase protein drives recombination at loxP sites (Figure 1.9). The Ah promoter
induces recombination selectively in the epithelia of the GI tract and near constitutive recombination
in the small intestine, liver and other tissues. Background recombination is thought to be a result of
leaky expression of Cre during development. Although induction results in recombination in the
intestinal epithelium, morphological changes occur in the crypt, with small changes seen in the lower
villus. However, changes in the villus are thought to be from migration of cells from the crypt (Ireland
et al. 2004).
1.10.1.2 VillinCreERT2 and Lgr5CreERT2 Transgenes
In addition to the AhCre transgene the Villin and Lgr5 promoters drive DNA recombination in
the entire intestinal epithelia and ISC compartment respectively. These lines were generated by
cloning the Villin and Lgr5 promoters upstream of a Cre recombinase ERT2 insert (El Marjou et al. 2004;
Barker et al. 2007). The VillinCreERT2 and Lgr5CreERT2 transgene encode a Cre recombinase estrogen-
receptor (ER) linked protein which enables conditional tissue specific knock out of genes by freeing
Cre recombinase upon administration of tamoxifen (Marsh et al. 2008) (Figure 1.9).
Deletion of the Apc gene through the use of Lgr5CreERT2 Apcfl/fl mouse not only enables
investigation into the interaction of ISCs and carcinogenesis but also allows lineage tracing events of
individual cells by using a lacZ reporter gene or fluorescent reporters such red fluorescent protein
(RFP).
The majority of GEMMs develop tumours in the small intestine however, most human CRCs
are found in the colon. In humans, there are approximately 150 times as many colonic stem cell
divisions than small ISC divisions. It is important to note that mice commonly develop more small
intestinal tumours rather than tumours of the colon, this may be because the number of stem divisions
is the opposite in mice (Tomasetti and Vogelstein 2015). This provides plausible reasoning for why we
analyse the small intestine when investigating human CRCs in murine models. Clevers group have very
recently developed an inducible mouse model (Car1CreER) that specifically develops colon tumours and
faithfully recapitulates human colon cancer in terms of latency, intestinal location, and molecular
signature (Tetteh et al. 2016b). Carbonic anhydrase I (Car1) is a gene that is specifically expressed in

28
the colonic epiethelium and so Cre induction drives gene recombination specifically in the cecum and
proximal colon (Tetteh et al. 2016b). This mouse model will be fundamental for cancer research in the
future. It will enable the mechanism of tumour intiation from differentiated cells to be identifed and
for investigations into novel therapeutic strategies for the treatment of proximal cancers. However,
as Apc mutations alone rarely result in invasive adenomas, mouse models encompassing later
mutations within the adenoma-carcinome sequence have been developed to produce more accurate
models of human CRC (Jackstadt and Sansom 2016).
1.10.2 Compound mutant mouse models of CRC
In order to make in vivo models of CRC more patient-relevant, mouse models combining
mutations in Apc with other gene mutations leads to the more advanced and invasive tumours. KRAS
is typically mutated in approxiamtely 40% of human CRC following APC loss (Fearon and Vogelstein
1990). The combination of APC and KRAS mutations is thought to be the early event leading to CRC
progression (Jackstadt and Sansom 2016). Mouse models that combine Apc mutation and abberant
Kras expression had a high tumour burden and increased number of invasive tumour cells which is not
seen with Kras muatations alone (Sansom et al. 2006). However, these mice need to be culled before
tumours have the ability to metastasise due to tumor burden (Jackstadt and Sansom 2016), which
impedes their use to reflect the human disease. Similarily, the combination of Apc mutations with loss
of function of the TGF-β signalliing pathway (for example mutations in SMAD4) in compound mice,
which commonly leads to CRC progression in humans, results in invasive but not metastatic
adenocarcinomas (Munoz et al. 2006). Gain-of-function mutations in TP53 are commonly founf in
human CRCs. Compound mutant mice expressing mutant Tp53 and Apc loss contain tumours with an
invasive phenotype (Muller et al. 2009).
Recent advancements have enabled mouse models to model CRC metastasis through in vivo
genome editing and organoid transplantation (Roper et al. 2017) (organoids are discussed in more
detail in section 1.10.3).
1.10.2.1 In vivo genome editing and organoid transplantation
GEMMs have provided a basis in which to identify and funcitonally assess genes that are
involved in homeostasis and cancer. Mouse models which develop tumours in the small intestine are
limited due to high tumour burden and humans rarely develop small intestinal tumours. In addition
these models are often expensive and time consuming (Roper et al. 2017). Colon specific Cres such as
the Car1 driven Cre (Tetteh et al. 2016b) are limited by the slow latency of tumour growth (Roper et
al. 2017).
29
Recent work has developed a genome editing system that enables one or several genes
involved in CRC initiation and progression to be mutated in wildtype mice. This system is known as the
CRISPR-Cas9 nuclease genome editing system (Sánchez-Rivera and Jacks 2015). The bacterial CRISPR-
Cas9 technology enables gene editing by acting on the normal response of an organism to respond to
and eliminate invading genetic material (Jinek et al. 2012). Foreign DNA is incorporated into the
CRISPR locus in the genome of bacteria where it is transcribed and processed to produce small RNAs.
Small RNAs are then used to localise Cas9 endonucleases to the invading DNA sequence which
subsequently results in the excision of foreign DNA (Jinek et al. 2012). This system has been adapted
to target Cas9 proteins to remove whole or parts of genes involved in carcinogenesis (Sánchez-Rivera
and Jacks 2015).
Of particular interest currently, is utilising this CRISPR-Cas9 system to induce gene editing in
normal intestinal organoids to mimic the sequential loss and gain of functions of genes involved
human CRC initiation and progression and then orthotopically transplant these organoids in to specific
mouse tissue to visualise and assess metastasis (Roper et al. 2017). Recent work by Yilmaz’s group and
others have successfully utilised this system to model CRC and metastasis (de Sousa e Melo et al.2017;
Roper et al. 2017). In particular, this system has been utilised to induce individual or combinational
gene mutations in Apc, Trp53, Kras in mouse and human colon organoids which were capable of
engraftment in the distal colon of wildtype and immunodeficient mice. Orthotopic transplantation of
mutant Apc, Kras and Trp53 organoids into these mice resulted in metastasis to the liver, which
modelled advanced human CRCs which metastatic ability (Roper et al. 2017).
This in situ epithelial gene editing system and orthotopic transplantation provides several
benefits over the standard GEMM of CRC we currently utilise. It enables tumours to develop in the
relevant tissue and quickly and advanced tumours recapitulate the genetic complexity and
pathological features of human CRC including metastasis, which is often hard to achieve in GEMMs
(Roper et al. 2017).
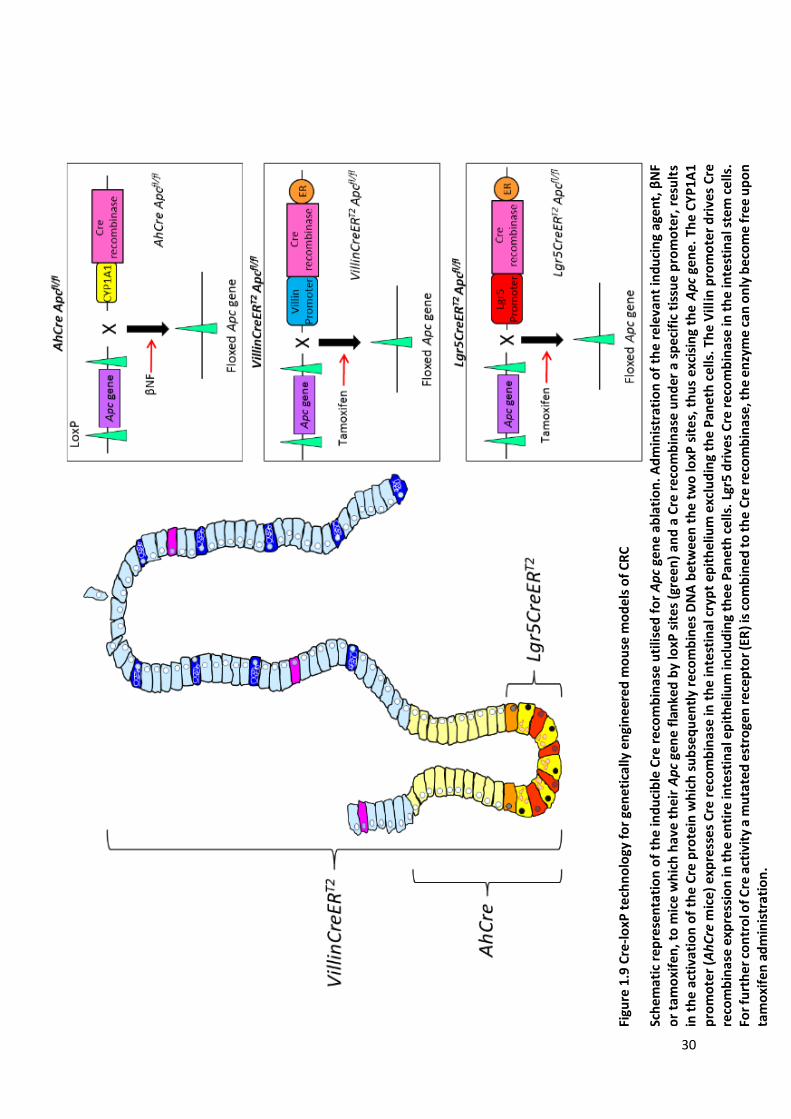
30
Figu
re 1
.9 C
re-l
oxP
te
chn
olo
gy f
or
gen
etic
ally
en
gin
eere
d m
ou
se m
od
els
of
CR
C
Sch
emat
ic r
epre
sen
tati
on
of
the
ind
uci
ble
Cre
rec
om
bin
ase
uti
lise
d f
or
Ap
c ge
ne
ab
lati
on
. Ad
min
istr
atio
n o
f th
e re
leva
nt
ind
uci
ng
agen
t, β
NF
or
tam
oxi
fen
, to
mic
e w
hic
h h
ave
thei
r A
pc
gen
e fl
anke
d b
y lo
xP s
ite
s (g
ree
n)
and
a C
re r
eco
mb
inas
e u
nd
er a
sp
ecif
ic t
issu
e p
rom
ote
r, r
esu
lts
in t
he
acti
vati
on
of
the
Cre
pro
tein
wh
ich
su
bse
qu
entl
y re
com
bin
es D
NA
bet
wee
n t
he
two
loxP
sit
es,
th
us
exci
sin
g th
e A
pc
gen
e. T
he
CY
P1A
1
pro
mo
ter
(Ah
Cre
mic
e) e
xpre
sses
Cre
rec
om
bin
ase
in t
he
inte
stin
al c
ryp
t e
pit
he
lium
exc
lud
ing
the
Pan
eth
cel
ls. T
he
Vill
in p
rom
ote
r d
rive
s C
re
reco
mb
inas
e ex
pre
ssio
n in
th
e en
tire
inte
stin
al e
pit
hel
ium
incl
ud
ing
the
e P
ane
th c
ells
. Lg
r5 d
rive
s C
re r
eco
mb
inas
e in
th
e in
test
inal
ste
m c
ells
. Fo
r fu
rth
er c
on
tro
l of C
re a
ctiv
ity
a m
uta
ted
est
roge
n r
ece
pto
r (E
R) i
s co
mb
ine
d t
o t
he
Cre
re
com
bin
ase,
th
e en
zym
e c
an o
nly
bec
om
e fr
ee u
po
n
tam
oxi
fen
ad
min
istr
atio
n.
31
1.10.3 Ex vivo culture of ISCs
Over the years many culture systems have been established to look at intestinal crypt
physiology and the self-renewal ability of the intestinal stem cells. These culture systems were among
the first to report of clonogenic assays for epithelial cells from both murine and human normal
intestinal and colonic epithelium. The main drawback of these culture techniques was their inability
to sustain long-term culturing of cells (Perreault and Beaulieu 1996; Whitehead et al. 1999).
In 2009 Sato et al. described a method which enabled the long-term culture of mouse
intestinal organoids from single crypts. The organoids form from expanding crypts which have
undergone several crypt fission events giving rise to structures with villus-like epithelial regions (Figure
1.10A). In addition, Sato et al. were able to grow organoids from single Lgr5+ cells, which were
indistinguishable in morphology from those which formed from individual crypts (Sato et al. 2009).
The organoids contained the main types of differentiated cells throughout the organoids structure
and the Paneth cells were dispersed between the ISCs at the crypt base. They also report that only the
Lgr5-GFPhigh cells were capable of forming organoids, reinforcing Lgr5 expression as a marker of the
ISCs (Barker et al. 2007).
The establishment of this long-term culture system depended on growing organoids in the
presence of the requirements of the intestinal epithelium in vivo. Firstly, organoids were grown in
matrigel, which enables the cells to grow 3-dimensionally, but also prevents cell anoikis when outside
of the normal tissue context due to the rich presence of laminin in the matrigel. Secondly, the addition
of certain growth factors is fundamental to the growth of intestinal organoids. As Wnt signalling is
fundamental for crypt proliferation, R-spondin 1 (Rspo1), a ligand for Lgr5, is required in the growth
medium to activate Wnt signals within the crypts (Kim et al. 2005; Kim et al. 2008). In addition, BMP
signalling is essential for cellular differentiation and has been shown to negatively regulate the
number of ISCs. Suppression of this pathway is vital for increasing the self-renewal efficiency of ISCs
to aid organoid growth (Haramis et al. 2004; He et al. 2004). This is achieved through the addition of
Noggin, a BMP inhibitor in the culture medium. Epidermal growth factor (EGF) is also utilised in
organoid crypt culture due to its involvement in cellular proliferation, differentiation and survival
(Dignass and Sturm 2001).
When single cells are seeded in matrigel the “stem cell niche” is no longer present to support
cell growth and survival, thus cells die immediately. To combat this, additional growth factors are
added to the culture medium. The Notch signalling pathway is fundamental in regulating cell-cell
communications (Li et al. 1998). In the absence of Paneth cells, activation of the Notch pathway in
Lgr5+ cells is not possible, for this reason Jagged, a notch ligand, is added. Rho-associated protein
32
kinases (ROCK) have been shown to be involved in detachment-induced cell death. To prevent anoikis
of single ISCs a ROCK inhibitor, Y27632 is used (Watanabe et al. 2007; Sato et al. 2009).
The applications of this intestinal organoid system are extensive. It provides a solid platform
in which to investigate basic stem cell biology but it also proves to be an extremely useful tool for
clinical investigations including regenerative medicine, drug testing and disease modelling of epithelial
derived diseases (Date and Sato 2015).
1.10.4 Ex vivo culture of Apc deficient cells
In addition to culturing ISCs and crypts from normal epithelium, this organoid culturing system
enables the expansion of cells from both murine and human tumours. This has proven extremely
beneficial in understanding tumour development, as organoids derived from adenomas recapitulate
the events seen at all stages of adenoma progression. In addition, they are an exceptionally useful tool
for use in drug screening assays as a way of stratifying medicines to an individual’s needs.
It has previously been reported that cells of the small intestine with Apc loss are capable of
forming organoids but are cyst-like in their structure (Jarde et al. 2013) (Figure 1.10B). Where normal
organoids develop from an initial sphere their growth is characterised by budding of crypt-like
structures and differentiated cell types. In contrast, cyst-like organoids maintain their spherical shape
throughout growth and tend to lack differentiated cells. As a result of over activation of Wnt signalling
either in vitro (Sato et al. 2011b; Onuma et al. 2013) or from the cells derived from adenomas (Sato et
al. 2011a) cyst-like organoids are capable of growing in the absence of R-spondins. Germann et al.
later reported that the organoids derived from cells deficient of Apc have a high organoid forming and
self-renewal efficiency compared to cells with normally functioning Apc (Germann et al. 2014). These
results confirm that the combination of an expansion in proliferative ISCs with hyperactive Wnt
signalling is capable of initiating tumour formation. Thus, cyst-like organoids are a good model in
which the earliest stages of Apc loss recapitulate in vivo tumourigenesis (Barker et al. 2009; Schepers
et al. 2012).
Organoids derived from mouse and human tumours are providing a platform in which to
understand cancer development, stratify individual treatments and better predict patients’ response
to therapies. However, organoid culture lacks essential components of in vivo models (microbiome,
immune cells, vasculature etc) and so this reductionist approach can often impede analysis of tumour
development with the native microenvironment (Hollins and Parry 2016) (discussed in more detail in
sections 4.2.2 and 6.3).

33
1.11 CRC Therapy
Current therapies for CRC depend largely on the tumours’ stage of progression with surgery
remaining the mainstay of treatment for CRC confined to the intestine (Bilchik et al. 2005).
Conventional methods are often used to remove tumours and to prevent reoccurrence after surgery.
In some instances patients may receive neo-adjuvant chemotherapy to reduce the tumour size before
surgical removal (Bilchik et al. 2005). Although surgery can remove the majority of the tumour tissue,
it cannot be guaranteed that all the cancer cells are removed. As a result of this chemotherapy is often
used as an adjuvant treatment to eliminate remaining cancer cells and to prevent recurrence (Jessup
et al. 2005). Chemotherapy is a standard of care in cancer treatment due to the observation that it
often reduces tumour burden and improves survival outcomes. However, patients whom which
chemotherapy has previously been successful frequently progress to a refractory state, this is
commonly known as acquired or secondary resistance. The failure of many chemotherapeutic drugs
can be attributed to this acquired resistance. It is known that intratumoural heterogeneity is
responsible for acquired resistance (Vidal et al. 2014). The current cytotoxic chemotherapeutics target
the rapidly dividing cells of the tumour bulk which accounts for about 99% of the tumour. But these
therapies have very little effect against the CSCs which tend to cycle slower (Stoian et al. 2016).
Evidence has shown that CSC populations develop resistance to conventional therapeutics and as a
result, enables cancer recurrence and metastasis due to their ability to reform the tumour following
treatment (Bu et al. 2014; Volk-Draper et al. 2014) (Figure 1.11). This has been shown in vivo and in
vitro across a range of cancers including acute myelocitic leukemia (AML) (Gerber et al. 2012),
Figure 1.10 Organoids grown from wildtype and Apcfl/fl crypts
(A) Wildtype organoids have budding crypts projections. (B) Apc deficient organoids have a cyst-like morphology.
34
pancreatic cancer (Tajima et al. 2012) and gliobalstomas (Liu et al. 2006). Chemotherapeutic agents
are often associated with many undesirable side effects such as hair loss, fatigue, mouth sores and
heightened chance of infection. Accordingly, this has led research to aim at understanding CSCs
response and sensitivity to drug treatments, emphasising the importance of understanding the
molecular mechanisms in which drug therapies exert their anti-tumourigenic properties. It is clear that
targeting CSCs specifically is required in the treatment of cancer however, this in itself also poses
problems. Due to the similarities between ISCs and CSCs, novel therapies would need to distinguish
between them in order to prevent any damage to the normal tissue which could be detrimental to
life. In addition, as normal ISCs work in close association with its surrounding stem cell niche, it is likely
that CSCs may also regulate and depend on its own microenvironment. If this is so, simply targeting
the CSCs alone may not be an effective therapy, as the ‘niche’ may be able to aid the reversion of
other cells to have stem-cell-like properties.
Targeted therapies, unlike the traditional cytotoxic chemotherapeutics which target any
rapidly diving cell, interfere specifically with the proliferating process of cancer cells by inhibiting
molecules vital for tumour development and survival. Due to having a better understanding of the
molecular pathways involved in colorectal carcinogenesis, several targeted therapies have been
established to exploit the pathways cancers use. Targeted therapies have advanced treatment of CRC
(Johnston 2014), but they have only had a small impact on longer-term survival rates (Jonker et al.
2007). The median survival is around 2 years (Ohhara et al. 2016). Table 1.2 outlines some of the
commonly utilised targeted therapies. Akin to conventional therapeutics, targeted therapies are also
associated with complications and undesirable side effects. This emphasises the importance of cancer
prevention and the development of alternative treatments. Several recent in vitro and in vivo studies
have demonstrated the chemopreventative potential of naturally occurring dietary components
which have a profound potential to target CSC self-renewal and vastly improve outcomes for patients
(Huderson et al. 2013; Toden et al. 2016).

35
Figu
re 1
.11
Can
cer
ste
m c
ell a
nd
ch
emo
ther
apy
The
CSC
hyp
oth
esis
pro
po
ses
that
tu
mo
ur
dev
elo
pm
ent
is d
rive
n b
y a
sub
po
pu
lati
on
of s
elf
-ren
ewin
g ca
nce
r st
em
cel
ls (r
ed).
Cu
rren
t co
nve
nti
on
al
ther
apie
s ta
rget
th
e ra
pid
ly d
ivid
ing
cells
, red
uci
ng
the
tu
mo
ur
bu
lk (
blu
e)
the
reb
y re
du
cin
g tu
mo
ur
size
. Ho
wev
er, t
hey
hav
e li
ttle
eff
ect
on
th
e C
SCs.
Re
mai
nin
g C
SCs
dri
ves
tum
ou
r fo
rmat
ion
an
d r
elap
se.
Ther
apie
s w
hic
h s
pec
ific
ally
tar
get
the
CSC
s m
ay e
nab
le t
um
ou
r re
gres
sio
n a
nd
p
reve
nt
tum
ou
r m
etas
tasi
s, a
nd
so
no
vel t
her
apeu
tics
wh
ich
ta
rge
ts t
he
CSC
po
pu
lati
on
s m
ay h
ave
mo
re b
enef
icia
l eff
ect
clin
ical
ly.
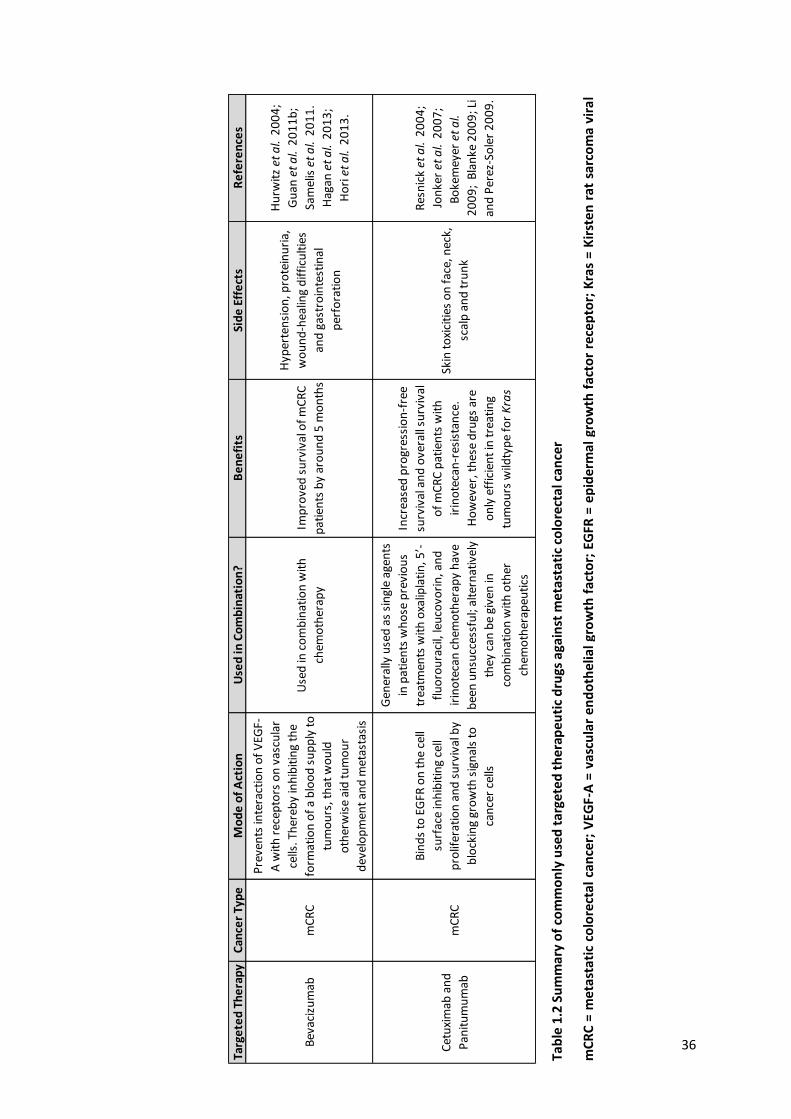
36
Targ
ete
d T
he
rap
yC
ance
r Ty
pe
Mo
de
of
Act
ion
Use
d in
Co
mb
inat
ion
?B
en
efi
tsSi
de
Eff
ect
sR
efe
ren
ces
Bev
aciz
um
ab
mC
RC
Pre
ven
ts in
tera
ctio
n o
f V
EGF-
A w
ith
rec
epto
rs o
n v
ascu
lar
cells
. Th
ereb
y in
hib
itin
g th
e
form
atio
n o
f a
blo
od
su
pp
ly t
o
tum
ou
rs, t
hat
wo
uld
oth
erw
ise
aid
tu
mo
ur
dev
elo
pm
ent
and
met
asta
sis
Use
d in
co
mb
inat
ion
wit
h
chem
oth
erap
y
Imp
rove
d s
urv
ival
of
mC
RC
pat
ien
ts b
y ar
ou
nd
5 m
on
ths
Hyp
erte
nsi
on
, pro
tein
uri
a,
wo
un
d-h
ealin
g d
iffi
cult
ies
and
gas
tro
inte
stin
al
per
fora
tio
n
Hu
rwit
z et
al.
20
04
;
Gu
an e
t a
l. 2
01
1b
;
Sam
elis
et
al.
20
11
.
Hag
an e
t a
l. 2
01
3;
Ho
ri e
t a
l. 2
01
3.
Cet
uxi
mab
an
d
Pan
itu
mu
mab
m
CR
C
Bin
ds
to E
GFR
on
th
e ce
ll
surf
ace
inh
ibit
ing
cell
pro
lifer
atio
n a
nd
su
rviv
al b
y
blo
ckin
g gr
ow
th s
ign
als
to
can
cer
cells
Gen
eral
ly u
sed
as
sin
gle
agen
ts
in p
atie
nts
wh
ose
pre
vio
us
trea
tmen
ts w
ith
oxa
lipla
tin
, 5’-
flu
oro
ura
cil,
leu
covo
rin
, an
d
irin
ote
can
ch
emo
ther
apy
hav
e
bee
n u
nsu
cces
sfu
l; al
tern
ativ
ely
they
can
be
give
n in
com
bin
atio
n w
ith
oth
er
chem
oth
erap
euti
cs
Incr
ease
d p
rogr
essi
on
-fre
e
surv
ival
an
d o
vera
ll su
rviv
al
of
mC
RC
pat
ien
ts w
ith
irin
ote
can
-res
ista
nce
.
Ho
wev
er, t
hes
e d
rugs
are
on
ly e
ffic
ien
t in
tre
atin
g
tum
ou
rs w
ildty
pe
for
Kra
s
Skin
to
xici
ties
on
fac
e, n
eck,
scal
p a
nd
tru
nk
Res
nic
k et
al.
20
04
;
Jon
ker
et a
l. 2
00
7;
Bo
kem
eyer
et
al.
20
09
; B
lan
ke 2
00
9; L
i
and
Per
ez-S
ole
r 2
00
9.
Tab
le 1
.2 S
um
mar
y o
f co
mm
on
ly u
sed
tar
gete
d t
her
apeu
tic
dru
gs a
gain
st m
etas
tati
c co
lore
ctal
can
cer
mC
RC
= m
etas
tati
c co
lore
ctal
can
cer;
VEG
F-A
= v
ascu
lar
end
oth
elia
l gro
wth
fac
tor;
EG
FR =
ep
ide
rmal
gro
wth
fac
tor
rece
pto
r; K
ras
= K
irst
en
rat
sar
com
a vi
ral
on
coge
ne
ho
mo
logu
e.

37
1.12 Chemoprevention
The combination of an increasing ageing population and an increase in cancer incidence
globally, together with the limitations of the therapeutic agents currently used in clinic, means there
is an increasing demand for strategies for cancer prevention. An approach with great interest and
potential is chemoprevention. Chemoprevention is defined as the “use of natural, synthetic or
biological agents to reverse, suppress or prevent either the initial phases of carcinogenesis or the
progression of premalignant cells to invasive disease” (Sporn 1976; Steward and Brown 2013).
One of the most studied drugs in CRC chemoprevention in humans is aspirin (Ulrich et al.
2006). Colon adenomas and invasive carcinomas often have increased levels of prostaglandins (Singh-
Ranger 2016). Prostaglandins are fatty acids produced by cyclooxygenase (COX) enzymes during
inflammation and thus, have a key role in cancer progression (Singh-Ranger 2016). Aspirin acts to
inhibit COX activity and so aids in supressing the inflammatory process (Singh-Ranger 2016). As it often
takes years for benign polyps to become cancerous, studies in to the use of aspirin as a long-term
cancer preventative have been possible. A study by Rothwell et al. investigated the effect of aspirin
(75 mg - 300 mg daily) on CRC incidence and mortality over 20 years during and after the start of five
randomised clinical trial studies. Analysis of pooled individual patient data revealed that allocation to
aspirin (75 mg a day, there was no added benefit of concentrations above this dose) for 5 or more
years reduced the long-term incidence of CRC, reduced the risk of developing right-sided cancer by
around 70% and reduced the risk of mortality due to CRC (Rothwell et al. 2010). It was shown that the
largest benefit of long-term aspirin use was for prevention of proximal colon cancer where
sigmoidoscopy and colonoscopy screening were usually not effective enough measures for prevention
(Rothwell et al. 2010). It has been reported that high doses of aspirin ≥ 500 mg daily reduce long-term
incidence of CRC (Rothwell et al. 2010) but higher doses are often associated with several adverse
effects such as increased incidence of gastrointestinal bleeding (in a dose-dependent manner) and
increased risk of hemorrhagic stroke, which could limit the chemopreventative potential for long-term
aspirin administration (U.S. Preventive Services Task Force 2007), as the potential risks may outweigh
the benefits. As a result it is thought that agents that are dietary derived may have the largest effects
throughout the entire process of malignancy with fewer adverse effects (Steward and Brown 2013).
Previous studies have shown that a diet consisting of a high intake of red meat, saturated fats,
refined carbohydrates (Willett et al. 1990) and alcohol (Giovannucci et al. 1995) correlate to
significantly increased risk of CRC. However, a diet containing a high level of dietary fibre (Peters et al.
2003), folate (Sanjoaquin et al. 2005), fruit, vegetables (Millen et al. 2007), antioxidant vitamins and
calcium (McCullough et al. 2003) appears to have a protective effect against the development of
intestinal tumourigenesis.
38
Antioxidants are chemicals which scavenge and neutralise free radicals and reactive oxygen
species (ROS) which are naturally produced chemicals in the body (Diplock et al. 1998). However,
accumulation of these species can be detrimental. High concentrations of free radicals and ROS can
cause DNA and protein damage which could potentiate the development of cancer from initiation to
progression (Diplock et al. 1998). Endogenous antioxidants produced by the body remove free radicals
and prevent cellular damage. However, the body heavily relies on the exogenous sources of
antioxidants mainly from the diet (Valko et al. 2007). Polyphenols are commonly found in fruit and
vegetables and are a major source of antioxidants in our diet. Several studies have characterised the
anti-tumourigenic properties of dietary polyphenols in vitro and in vivo (discussed below), highlighting
their potential use as chemopreventative agents
1.12.1 Dietary polyphenols
Over recent years several nutritional polyphenols have been investigated for their
chemopreventative properties to alter cancer associated modifications. The most abundant
antioxidants in our food are the polyphenols and several studies have shown them to be
chemopreventative at the initiation and progression stages of carcinogenesis (Wang et al. 2013e).
Based upon their chemical structure, nutritional polyphenols can be divided into several groups which
include the flavonoids, phenolic acids, stilbenes and lignans (Bravo 1998; Manach et al. 2004). The
flavonoids can be further divided into six subgroups, flavonols, flavones, isoflavones, flavanones,
anthocyanidins and flavanols (catechins and proanthocyanidins). Although this thesis will briefly talk
about some compounds in these subclasses it will mainly focus on the anthocyanidins.
With the increasing interest in dietary components there is growing evidence suggesting that
plant-derived compounds have several protective biological roles including strong antioxidant, anti-
inflammatory (Nijveldt et al. 2001), anti-carcinogenic (Middleton et al. 2000), anti-neurodegenerative
(Soobrattee et al. 2006), anti-allergic, anti-thrombotic (Manach et al. 2004), and anti-viral (Lee et al.
2016) properties.
Epigallocatechin gallate (EGCG) is a catechin abundantly found in white and green tea, and
has exceptional antioxidant activity that exceeds Vitamin C and E. Previous studies have shown that
EGCG has chemopreventative properties through its ability to induce cell cycle arrest and apoptosis in
several types of cancer cells, in vitro and in vivo (Ahmad et al. 2000). Specifically in a variety of
colorectal cell lines, EGCG inhibited both EGFR (Shimizu et al. 2005) and vascular endothelial growth
factor receptor (VEGFR) (Shimizu et al. 2010) which are utilised by cancer cells for tumour
development, angiogenesis and metastasis, thereby exerting growth inhibitory effects on cancer cells.
In addition, Adachi et al. found that EGCG specifically induced the internalisation of EGFR in colon
cancer cells and thus elicited its chemopreventive effects by limiting activation of the EGF receptor
39
(Adachi et al. 2008). Thus, this inhibited downstream activation of pathways involved in cell
proliferation and survival. It was recently shown that EGCG prevented colon cancer cell growth
through inhibition of the Wnt/β-catenin signalling pathway. EGCG induced the phosphorylation of β-
catenin targeting it for degradation but via a pathway independent of GSK3 mediated phosphorylation
(Oh et al. 2014). However, the concentrations of EGCG used in these culture conditions were much
higher than the physiological concentrations shown to be effective in animals (Moiseeva et al. 2007).
These studies have shown promising results but haven’t investigated the effect of EGCG on the CSCs.
Recent studies have shown 5-FU resistant cell lines have an enhanced spheroid forming capacity
suggestive of an increased CSC population. Exposure to EGCG limited the ability of 5-FU resistant cells
to form spheroids and enhanced their sensitivity to 5-FU treatment. These results were also validated
through in vivo experiments. The growth of spheroid derived CSCs which were xenografted into nude
mice were significantly inhibited. These data indicated that EGCG induced sensitisation to 5-FU by
specifically targeting the CSCs of CRC and suggested that EGCG could be used as an additional therapy
with conventional chemotherapeutic agents (Toden et al. 2016).
Resveratrol, a natural phytoalexin found in a range of plants and grapes is classified as a
stilbene. Studies have shown that resveratrol was capable of supressing growth of both Wnt-activated
cells and Wnt-driven human CRC cell lines, revealing a novel therapeutic for Wnt-driven
tumourigenesis in vitro (Hope et al. 2008; Chen et al. 2012). In addition to suppressing proliferation of
the human CRC cell line, it has been reported that resveratrol can induce apoptosis. However, these
effects were only visible at high concentrations. The preventive effects of resveratrol have also been
investigated in vivo using a murine model of ApcMin. Loss of Apc was induced using benzo(a)pyrene.
The study reported that resveratrol induced apoptosis, arrested cell proliferation and growth of
tumour cells and reduced tumour burden in ApcMin mice (Huderson et al. 2013). Resveratrol has been
evaluated as a dietary supplement in a CRC prevention trial. It was found that resveratrol reduced Wnt
signalling, supporting the in vitro work presented by Chen and colleagues. It was also shown that
CD133 expression in the colonic epithelium was reduced following treatment with resveratrol,
suggesting that it may target the CSCs. From this resveratrol is now under phase II clinical studies
(Martinez et al. 2010). These data indicate that the anti-tumourigenic effects of some dietary
compounds are via regulation of CSC populations.
1.12.1.1 Anthocyanins
The most abundant flavonoid found in fruit and vegetables are the anthocyanins.
Anthocyanins are responsible for the variety of bright colours, most notably red, blue, purple and
black, in leaves, stems, roots, flowers and fruits of plants (Wang and Stoner 2008). Anthocyanins are
important in plants due to its ability to impart bright colours which helps in attracting animals for

40
pollination and seed dispersal. They also have defensive roles in plants helping to protect against
extreme ultra violet (UV) exposure and providing antioxidant and antibacterial properties against
viruses, bacteria, fungi and oxidative stress (Kong et al. 2003). In humans, anthocyanins have also been
seen to be strong antioxidants and have anti-cancer and anti-inflammatory properties (Seeram 2008).
In the USA it is estimated that the daily intake of anthocyanins is around 180 - 215 mg, approximately
nine fold more than other dietary flavonoids which are consumed at about 23 mg/day (Wang and
Stoner 2008). These natural anthocyanins are well represented in our diet as they occur in red, blue
and purple fruits and vegetables such as carrots, onions and aubergines, and red wine but most
abundantly in the berry fruits (Table 1.3) (Manach et al. 2004; Mazza 2007), having as high as 1480 mg
of anthocyanin/ 100 g fresh weight berry (Wu et al. 2004). The concentration of anthocyanins in fruits
is dependent on the cultiviator, growing conditions and season. Over 400 different anthocyanins have
been identified but the 6 most common anthocyanidins (the sugar-free counterparts of anthocyanins)
are pelargonidin, cyanidin, delphinidin, peonidin, petunidin, and malvidin, with cyanidin being the
most abundant in nature. One berry known for its particularly high anthocyanin content is the black
raspberry (BRB) (approximately 607 mg/ 100 g fresh weight) (Table 1.3). Studies have indicated that
BRB anthocyanins have chemoprotective roles (Stoner et al. 2007; Kresty et al. 2016b) and thus may
have a potential use as a chemopreventative strategy against CRC (discussed in more detail in section
1.12.2). The anthocyanins in BRBS have been identified as cyanidin-3-glucoside, cyanidin-3-
sambubioside, cyanidin-3-xylosylrutinoside, cyanidin-3-rutinoside and pelargonidin-3-rutinoside (Tian
et al. 2006).
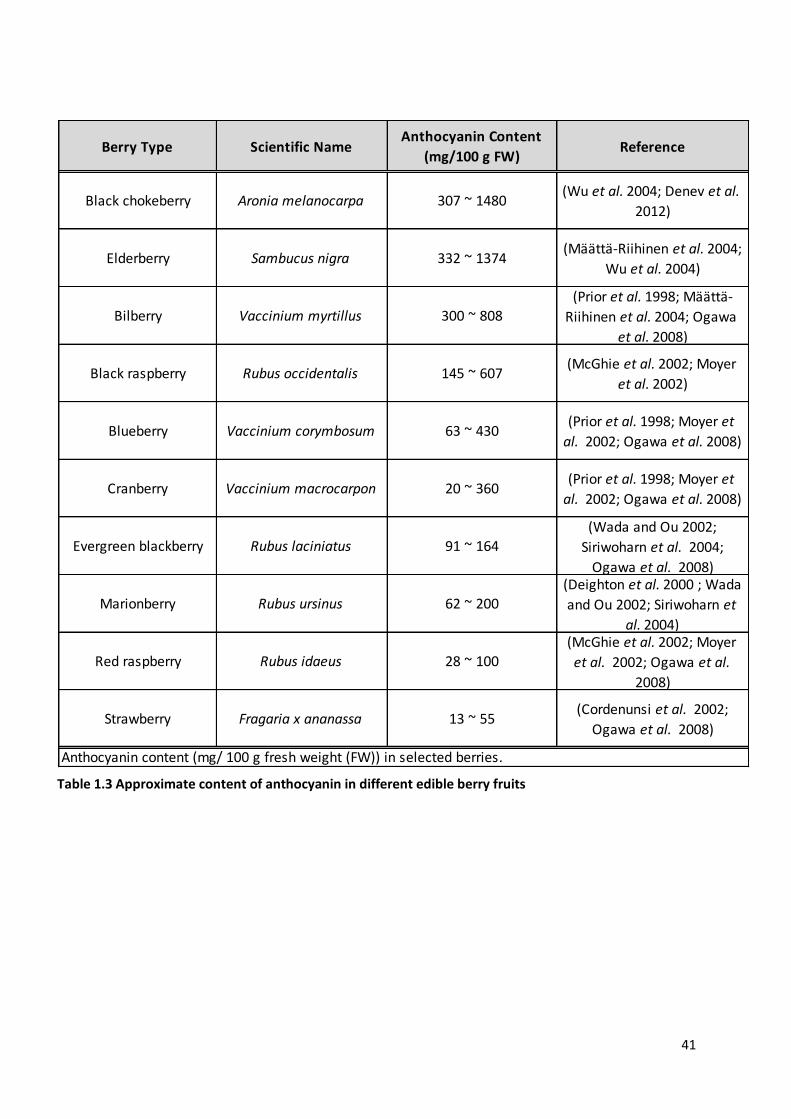
41
Berry Type Scientific NameAnthocyanin Content
(mg/100 g FW)Reference
Black chokeberry Aronia melanocarpa 307 ~ 1480(Wu et al. 2004; Denev et al.
2012)
Elderberry Sambucus nigra 332 ~ 1374(Määttä-Riihinen et al. 2004;
Wu et al. 2004)
Bilberry Vaccinium myrtillus 300 ~ 808(Prior et al. 1998; Määttä-
Riihinen et al. 2004; Ogawa
et al. 2008)
Black raspberry Rubus occidentalis 145 ~ 607(McGhie et al. 2002; Moyer
et al. 2002)
Blueberry Vaccinium corymbosum 63 ~ 430(Prior et al. 1998; Moyer et
al. 2002; Ogawa et al. 2008)
Cranberry Vaccinium macrocarpon 20 ~ 360(Prior et al. 1998; Moyer et
al. 2002; Ogawa et al. 2008)
Evergreen blackberry Rubus laciniatus 91 ~ 164(Wada and Ou 2002;
Siriwoharn et al. 2004;
Ogawa et al. 2008)
Marionberry Rubus ursinus 62 ~ 200(Deighton et al. 2000 ; Wada
and Ou 2002; Siriwoharn et
al. 2004)
Red raspberry Rubus idaeus 28 ~ 100(McGhie et al. 2002; Moyer
et al. 2002; Ogawa et al.
2008)
Strawberry Fragaria x ananassa 13 ~ 55(Cordenunsi et al. 2002;
Ogawa et al. 2008)
Anthocyanin content (mg/ 100 g fresh weight (FW)) in selected berries.
Table 1.3 Approximate content of anthocyanin in different edible berry fruits
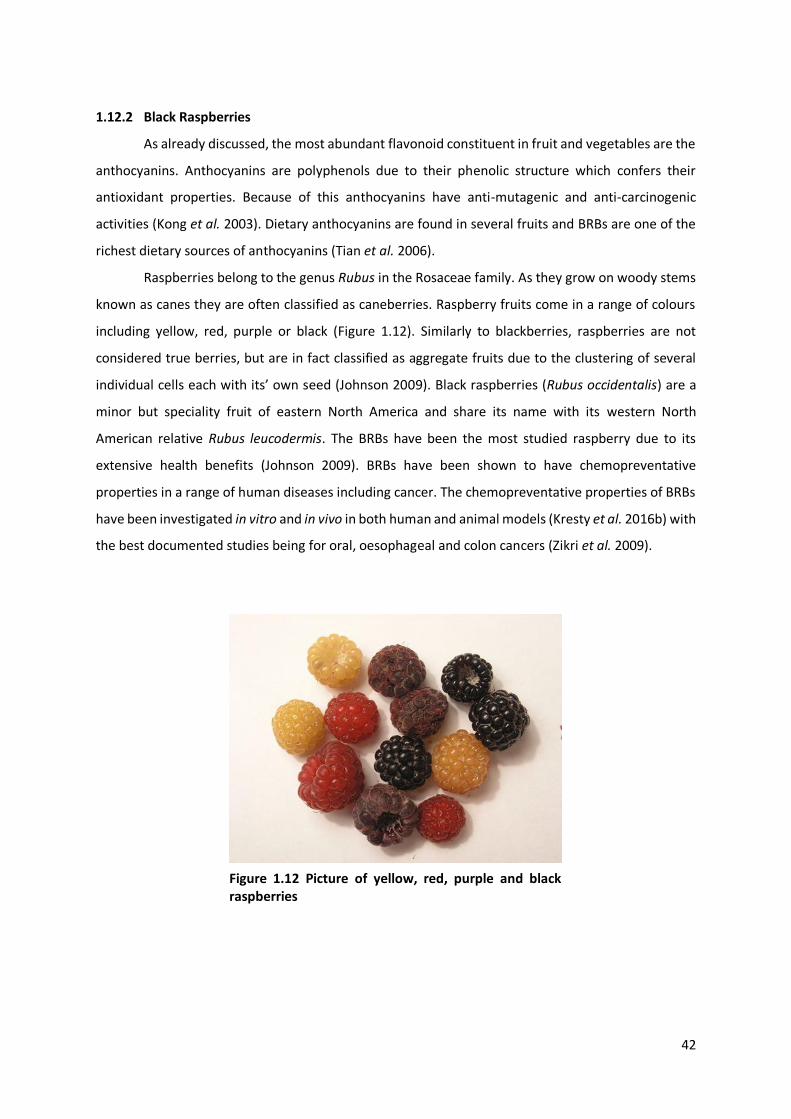
42
1.12.2 Black Raspberries
As already discussed, the most abundant flavonoid constituent in fruit and vegetables are the
anthocyanins. Anthocyanins are polyphenols due to their phenolic structure which confers their
antioxidant properties. Because of this anthocyanins have anti-mutagenic and anti-carcinogenic
activities (Kong et al. 2003). Dietary anthocyanins are found in several fruits and BRBs are one of the
richest dietary sources of anthocyanins (Tian et al. 2006).
Raspberries belong to the genus Rubus in the Rosaceae family. As they grow on woody stems
known as canes they are often classified as caneberries. Raspberry fruits come in a range of colours
including yellow, red, purple or black (Figure 1.12). Similarly to blackberries, raspberries are not
considered true berries, but are in fact classified as aggregate fruits due to the clustering of several
individual cells each with its’ own seed (Johnson 2009). Black raspberries (Rubus occidentalis) are a
minor but speciality fruit of eastern North America and share its name with its western North
American relative Rubus leucodermis. The BRBs have been the most studied raspberry due to its
extensive health benefits (Johnson 2009). BRBs have been shown to have chemopreventative
properties in a range of human diseases including cancer. The chemopreventative properties of BRBs
have been investigated in vitro and in vivo in both human and animal models (Kresty et al. 2016b) with
the best documented studies being for oral, oesophageal and colon cancers (Zikri et al. 2009).
Figure 1.12 Picture of yellow, red, purple and black raspberries
43
1.12.2.1 Chemopreventive Studies of Black Raspberries
1.12.2.1.1 Chemopreventive Studies of Black Raspberries in Oral Cancer
In 2006, a study investigated the effects of freeze-dried BRB ethanol extracts at varying
concentrations on cell lines derived from human oral squamous cell carcinoma (SCC) tumours in vitro.
The results indicated that the extract had anti-proliferative effects on human oral SCC in a dose-
dependent manner. The study also reported that BRBs were sufficient to induce apoptosis and
terminal differentiation and supressed the translation of VEGF, thereby inhibiting angiogenesis which
would aid tumour development (Rodrigo et al. 2006). These results highlighted the potential of BRBs
as a chemopreventive therapy. In later years freeze-dried BRBs went into clinical studies. In patients
with oral intraepithelial neoplasia (IEN), topical application of a 10% freeze-dried BRB gel was
administered to the ventrolateral side of the tongue. The gel was applied here due to the high
incidence of oral IEN and SCC found in that area. To ensure optimal delivery the gel was applied four
times a day for 6 weeks, administering 0.5 g of BRB each application. Results showed that the lesional
grade decreased in 41% of patients, 23% had an increase in lesional grade and 35% of participants
remained at a stable state. The study also concluded that freeze-dried BRB gel is safe to use as none
of the candidates developed BRB gel associated toxicities (Shumway et al. 2008).
The successes of this study lead to the development of a multi-centred placebo controlled
trial, investigating the efficacy of the BRB gel over a 3 month period. The same dosing regime was
utilised in patients with confirmed oral IEN. The study reported that patients treated with the BRB gel
had a significant reduction in the size and grade of lesions compared to lesions which were treated
with a placebo gel which continued to increase in size (Mallery et al. 2014). The chemopreventive
properties of BRBs are supported by these data.
1.12.2.1.2 Chemopreventive Studies of Black Raspberries in Oesophageal Cancer
In 2001, in vivo studies using a rat model of NMBA-induced oesophageal tumourigenesis
reported that feeding of 5 and 10% lyophilised BRBs for 2 weeks prior to induction with NMBA and
then throughout a 30 week time period, significantly reduced tumour multiplicity by 39 and 49%
respectively (Kresty et al. 2001). These results along with other preclinical animal studies (Kresty
(Kresty et al. 2001; Stoner et al. 2006; Lechner et al. 2008; Zikri et al. 2009) led to the development of
a phase I pilot study in patients with Barrett’s esophagus (BE). BE is the known precursor lesion for
oesophageal adenocarcinoma (EAC) and is becoming a much more common cancer with fairly poor
survival rates. In order to determine the long-term tolerability of BRBs in oesophageal cancer, a 6
month pilot study was performed. Patients confirmed to have BE were administered lyophilised or
freeze-dried BRB powder at 32 and 45 g once daily to women and men respectively. These weights
44
were determined based on preclinical studies which showed 5 and 10% BRBs were sufficient to inhibit
tumourigenesis in rodents and approximately equated to 1.5 and 2 cups of whole fruit respectively
(Kresty et al. 2001; Stoner et al. 2006; Lechner et al. 2008; Zikri et al. 2009). The BRBs were mixed with
6 ounces of water and taken every morning. Results showed that lyophilised BRBs were generally well
tolerated with a few adverse effects including epigastric pain, diarrhoea and constipation (Kresty et
al. 2016a).
In addition, the chemopreventive properties of BRBs in oesophageal cancer have been linked
in part, to their effects on inflammation. Exposure to diets of 6.1% BRB or an anthocyanin-enriched
fraction derived from BRBs, inhibited tumourigenesis in an NMBA-induced rat model of oesophageal
cancer by inhibiting genes associated with inflammation such as COX-2 (cyclooxygenase-2) an enzyme
expressed during the inflammatory process (Peiffer et al. 2014). Furthermore, a diet containing 5%
BRBs has recently been shown to inhibit NMBA-induced rat oesophageal tumourigenesis by inhibiting
Wnt signalling via the reactivation of silenced Wnt pathway antagonists such as Sfrp4 (Secreted
frizzled related protein 4) (Huang et al. 2016). These data highlight the potential of BRBs to prevent
Wnt-driven tumourigenesis. Mutations in the Wnt signalling pathway are the most common drivers
of colorectal cancer, and the chemopreventive potential of BRBs has been investigated in several
models of CRC.
1.12.2.1.3 Chemopreventive Studies of Black Raspberries in Colorectal Cancer
In 2001 a study investigated the chemopreventive effects of lyophilised BRBs in a rat model
of AOM-induced aberrant crypt foci (ACF) (Harris et al. 2001). ACF are early morphological changes
that occur in rodents following exposure to a colon-specific carcinogen such as AOM (Suzuki et al.
2004). It is quite common in patients that develop sporadic or heredity forms of CRC to see similar
lesions (Stevens et al. 2007), thus these rodent models recapitulate genetic, morphological and
cellular changes that are present in human CRCs.
Following treatment with AOM, rats were fed 0, 2.5, 5 or 10% freeze-dried BRB diet for 9 and
33 weeks to analyse the number of ACF and tumours. ACF multiplicity decreased compared to the
controls (0% BRB diet) following treatment with 2.5, 5 and 10% BRB diet by 36%, 24%, and 21%
respectively. Similarly the total tumour multiplicity decreased 42%, 45%, and 71% respectively and
also the adenocarcinoma multiplicity reduced in a likewise dose-dependent manner. These results are
indicative that BRBs were sufficient in reducing tumourigenesis in an AOM-induced rodent model of
colon carcinogenesis (Harris et al. 2001).
Previous studies by Wang et al. reported an association between BRB derived anthocyanins
and decreased hypermethylation status seen in CRC. The data suggested that BRBs could play a role
in modulating epigenetic events (Wang et al. 2013c). Epigenetics is defined as the study of heritable
45
changes in gene expression that do not involve changes to the DNA sequence; this commonly involves
DNA methylation and modification to histones which has been reviewed in detail by Allis and Jenuwein
(2016). Treatment with BRB-derived anthocyanins for three days at 0.5, 5, and 25 μg/ml suppressed
DNA methyltransferase (DNMT) (an enzyme involved in methylating DNA) activity in three human CRC
cell lines. Negative regulators of the Wnt signalling pathway (SFRP2/5 and WIF1) were reactivated
presumably via demethylation of gene promoters. The group also found that anthocyanins induced
apoptosis and caused cell cycle arrest in these CRC cell lines (Wang et al. 2013b).
In vivo studies have shown the chemopreventive effects of BRBs in rodent models of
chemically induced CRC and oesophageal tumourigenesis (Harris et al. 2001; Kresty et al. 2001)
however, they did not provide a mechanistic insight to how BRBs exert their preventative effects. In
2010, Bi and colleagues performed in vivo experiments in two murine models of human CRC to
investigate whether BRBs would inhibit tumourigenesis and to determine a potential mechanism of
action. The two mouse models used were Apc1638+/- which develop tumours as a result of only having
one functional allele of Apc which leads to aberrant Wnt signalling (Fodde et al. 1994) and the Muc2-
/- mouse which develop intestinal tumours in response to chronic inflammation (Velcich et al. 2002).
A 12-week feeding of 10% freeze-dried BRBs in the diet significantly decreased tumour incidence and
tumour multiplicity in Apc1638+/- mice by 45% and 60% respectively. Similarly in Muc2-/- mice, feeding
of BRBs reduced tumour incidence and multiplicity by 50%. Levels of proliferation and differentiation
were assessed and BRBs were found to inhibit proliferation in both animal models but had no effect
on goblet cell differentiation. Mechanistic studies reported that BRBs elicited anti-tumour effects in
Apc1638+/- mice through inhibiting Wnt/β-catenin signalling whereas in the Muc2-/- mouse BRBs down-
regulated cytokines commonly associated with inflammation (Bi et al. 2010).
The hereditary disease FAP is characterised by an early onset of colonic polyposis and
increased risk of developing CRC. A key phase Ib study was conducted to investigate whether BRBs
were able to regress rectal polyps in FAP patients. Patients were divided into two groups. Group 1
received placebo powder slurry taken orally 3 times a day (60 g/day in total) and two BRB rectal
suppositories at night (each containing 720 mg BRB powder), group 2 received a BRB powder slurry 3
times a day (60 g/day in total) plus two BRB rectal suppositories. Treatments were continued for 9
months. The study highlighted that BRB suppositories were sufficient to regress rectal polyps of FAP
patients with no added benefit of oral BRB powder. Additionally, cellular proliferation and DNMT
expression was decreased in adenomas from patients that responded to BRB treatment. These results
suggested that BRBs may be a potential alternative treatment for FAP patients (Wang et al. 2014).
These data are supported by another study that found oral administration of BRBs (60 g/day) for 4
weeks impacted epigenetic marks. Specifically, methylation of several genes involved in Wnt

46
signalling, proliferation, apoptosis and angiogenesis were reduced. This was associated with DNMT
down-regulation (Wang et al. 2011) and further supported the protective effect of BRBs in a clinical
setting.
Further evidence for the preventative roles of BRBs has been shown by Wang et al. who
reported that a dextran sodium sulphate (DSS)-induced ulcerative colitis (UC) murine model fed a 5%
BRB diet had reduced colonic ulceration, decreased activity of immune cells and promoter
demethylation of tumour suppressor genes (Wang et al. 2013d). UC is characterised by chronic
inflammation of the colon, which induces the release and accumulation of pro-inflammatory cytokines
within the colon epithelium. This biological process is associated with an increase in DNMT activity
and silencing of tumour suppressor genes and Wnt signalling antagonists alongside promoter
methylation (Wang et al. 2013d), potentially leading to colorectal carcinogenesis. This data is
supported by mouse models of UC which have the potential to progress to carcinogenesis (Wang et
al. 2013c).
More recently the beneficial effects of BRBs have been attributed to metabolic changes in
human CRC patients which may contribute towards an overall positive impact against CRC (Pan et al.
2015). In brief, urine and plasma samples were taken from CRC patients before and after BRB
treatment. Patients consumed 60 g/day of BRB powder slurry for 1 - 9 weeks. Results indicated that
metabolites associated with amino acid, energy, carbohydrate, lipid metabolism and xenobiotics were
altered which could represent changes in the metabolic pathways utilised by tumours. The results
varied between patients potentially as a result of different diets among patients, sample preparation
and patient ethnicity. In addition, the level of apoptosis was increased after BRB treatment (Pan et al.
2015).
Current data suggests that BRBs could exert their effects at different stages of tumour
development but the precise molecular mechanisms are unknown. Determining the molecular
mechanism by which these dietary compounds employ their anti-tumourigenic properties, and how
they modulate our epigenome will increase their relevance and efficacy as chemopreventative
strategies. Previous studies have shown very promising results in vitro and in vivo in both animals and
patients at different stages of colorectal tumourigenesis, however, they have not addressed a
fundamental question, ‘What effect do BRBs have on the intestinal stem cell and cancer stem cell
populations in normal and malignant tissue?’
1.13 Aims and Objectives
There is strong supporting evidence indicating aberrant Wnt signalling is sufficient to initiate
intestinal tumourigenesis. The link between intestinal carcinogenesis and the ISC population is very
clear, as the ISCs have been identified as a “cell of origin” of CRC (Barker et al. 2008) and the early
47
stages of tumourigenesis are characterised by an expansion of the ISC compartment and a loss of
differentiation following conditional homozygous loss of the Apc gene (Sansom et al. 2004). Diet plays
a significant role in the aetiology of CRC, but there is a limited understanding of the
chemopreventative mechanisms that underpin these associations. Previous research has indicated a
protective role of the dietary polyphenols found in BRBs (Kresty et al. 2016b); however there is very
little research on the effect of BRBs on a malignant ISC population.
Hypothesis: That BRB polyphenols will suppress Wnt-driven tumourigenesis through
alteration of the Wnt signature modulating the intestinal stem cell compartment.
To begin to test this hypothesis, the action of dietary polyphenols on Wnt-driven
tumourigenesis was examined in vivo and ex vivo, focusing on the ISC population at the initial stages
of adenoma formation and on long-term intestinal tumourigenesis. Chapter 3 describes the
application of dietary BRBs on normal intestinal homeostasis and in the short-term Apc floxed model
using the AhCre Apcfl/fl and VillinCreERT2 Apcfl/fl mouse models. Chapter 4 describes the effect of BRB
polyphenols in the intestinal crypt culture model, where individual Apc deficient cells form intestinal
organoids ex vivo (Sato et al. 2009). Chapter 5 describes the effect of BRBs on long-term intestinal
tumourigenesis using the Lgr5CreERT2 Apcfl/fl mouse model.
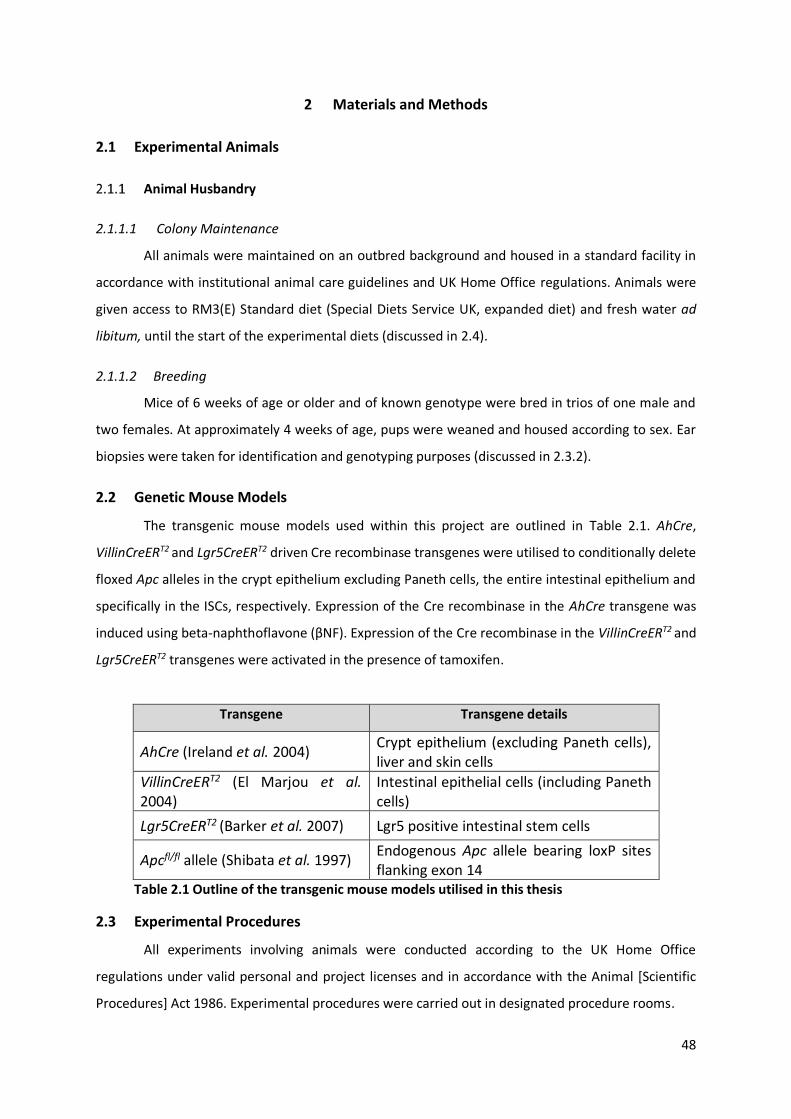
48
2 Materials and Methods
2.1 Experimental Animals
Animal Husbandry
2.1.1.1 Colony Maintenance
All animals were maintained on an outbred background and housed in a standard facility in
accordance with institutional animal care guidelines and UK Home Office regulations. Animals were
given access to RM3(E) Standard diet (Special Diets Service UK, expanded diet) and fresh water ad
libitum, until the start of the experimental diets (discussed in 2.4).
2.1.1.2 Breeding
Mice of 6 weeks of age or older and of known genotype were bred in trios of one male and
two females. At approximately 4 weeks of age, pups were weaned and housed according to sex. Ear
biopsies were taken for identification and genotyping purposes (discussed in 2.3.2).
2.2 Genetic Mouse Models
The transgenic mouse models used within this project are outlined in Table 2.1. AhCre,
VillinCreERT2 and Lgr5CreERT2 driven Cre recombinase transgenes were utilised to conditionally delete
floxed Apc alleles in the crypt epithelium excluding Paneth cells, the entire intestinal epithelium and
specifically in the ISCs, respectively. Expression of the Cre recombinase in the AhCre transgene was
induced using beta-naphthoflavone (βNF). Expression of the Cre recombinase in the VillinCreERT2 and
Lgr5CreERT2 transgenes were activated in the presence of tamoxifen.
Transgene Transgene details
AhCre (Ireland et al. 2004) Crypt epithelium (excluding Paneth cells), liver and skin cells
VillinCreERT2 (El Marjou et al. 2004)
Intestinal epithelial cells (including Paneth cells)
Lgr5CreERT2 (Barker et al. 2007) Lgr5 positive intestinal stem cells
Apcfl/fl allele (Shibata et al. 1997) Endogenous Apc allele bearing loxP sites flanking exon 14
Table 2.1 Outline of the transgenic mouse models utilised in this thesis
2.3 Experimental Procedures
All experiments involving animals were conducted according to the UK Home Office
regulations under valid personal and project licenses and in accordance with the Animal [Scientific
Procedures] Act 1986. Experimental procedures were carried out in designated procedure rooms.
49
Ear biopsy for identification and genotyping
To allow individual identification of animals’, ear biopsies were taken using a 2mm ear punch
(Harvard apparatus). DNA extracted from these biopsies was used for genotyping (see section 2.3.2).
Polymerase Chain Reaction (PCR) Genotyping
In order to genotype weaned mice, PCR was performed on genomic DNA (gDNA) extracted
from ear biopsies. Genotyping was also performed at time of death to ensure each mouse was
correctly assigned to the experimental cohorts. PCR was kindly performed by Matthew Zverev and
Elaine Taylor.
2.3.2.1 DNA Extraction
Mouse ear biopsies were collected at weaning and temporarily stored at -20°C to prevent
degradation. Each tissue sample was digested in 250 µl lysis buffer (VWR) containing 0.4 mg/ml
proteinase K (Sigma), overnight (O/N) at 42°C with agitation. The protein was precipitated by the
addition of 100 µl of protein precipitation solution (VWR). The solution was mixed by inversion and
protein and insoluble debris was pelleted by centrifugation at 13000 rpm for 10 mins. The supernatant
was added to a fresh eppendorf containing 250 µl of isopropanol (Thermo Fisher Scientific) to
precipitate the DNA. The solution was mixed by inversion and centrifuged at 13000 rpm for 15 mins.
The supernatant was discarded and the pellet was left to air dry for an hour before resuspending in
250 µl of Milli-Q water. For short-term storage gDNA was left at room temperature (RT) or stored at
4°C for longer-term storage.
2.3.2.2 PCR Protocol
PCR was carried out in 96 well semi skirted straight side pates (Alpha Labs). gDNA (3 µl)
extracted from ear biopsies as described above, was added to each well. Then 47 µl of PCR mix (see
Table 2.2) containing an appropriate DNA polymerase and buffer (Table 2.2) was added to each well.
A control well was also made using the same PCR mix but with dH20 instead of the DNA. The 96 well
plates were then sealed with aluminium foil seals (Star Lab), and air bubbles were removed by tapping
the plates on a hard surface. The reactions were run in a GS4 thermocycler (G storm). Reaction
mixtures and cycling times for each PCR are outlined in Table 2.2. Primer sequences are shown in Table
2.3Table 2.3.
2.3.2.3 Visualisation of PCR Products
PCR products were visualised by gel electrophoresis using 2% agarose gels. The gels were
made by dissolving agarose (Eurogentec) 2% [w/v] in 1X Tris Borate EDTA (TBE) buffer (National
Diagnostic) and heated in a microwave until boiling. The solution was then cooled under a running tap
50
with agitation and 14 µl of Safe View fluorescent nucleic acid stain (NBS biological) was added per 400
ml. The gel solution was then poured into 2 clean moulds (Bio-Rad) and combs were added to create
wells. Once set, the combs were carefully removed and the gels placed into an electrophoresis tank
and covered with 1X TBE solution with Safe View (10 μl Safe View/100 ml 1X TBE). 5 μl of loading dye
(50% Glycerol (Sigma), 50% dH20, 0.1% bromophenol blue (Sigma)) was added to PCR product samples
that utilised clear buffer and were gently mixed by pipetting. 20 μl of the PCR samples were added to
individual wells of the agarose gel and run alongside a molecular weight marker. The gel was run at
120 V for approximately 30 mins or until the loading dye had run more than half way across the gel.
The gel was then visualised for PCR products using a GelDoc UV Transilluminator (Bio-Rad) and images
taken using the GelDoc software (Bio-Rad). PCR product sizes are outline in Table 2.3.
DNA extraction, PCR and visualisation of PCR products were repeated on all experimental mice
following dissection to re-confirm the original PCR genotyping.
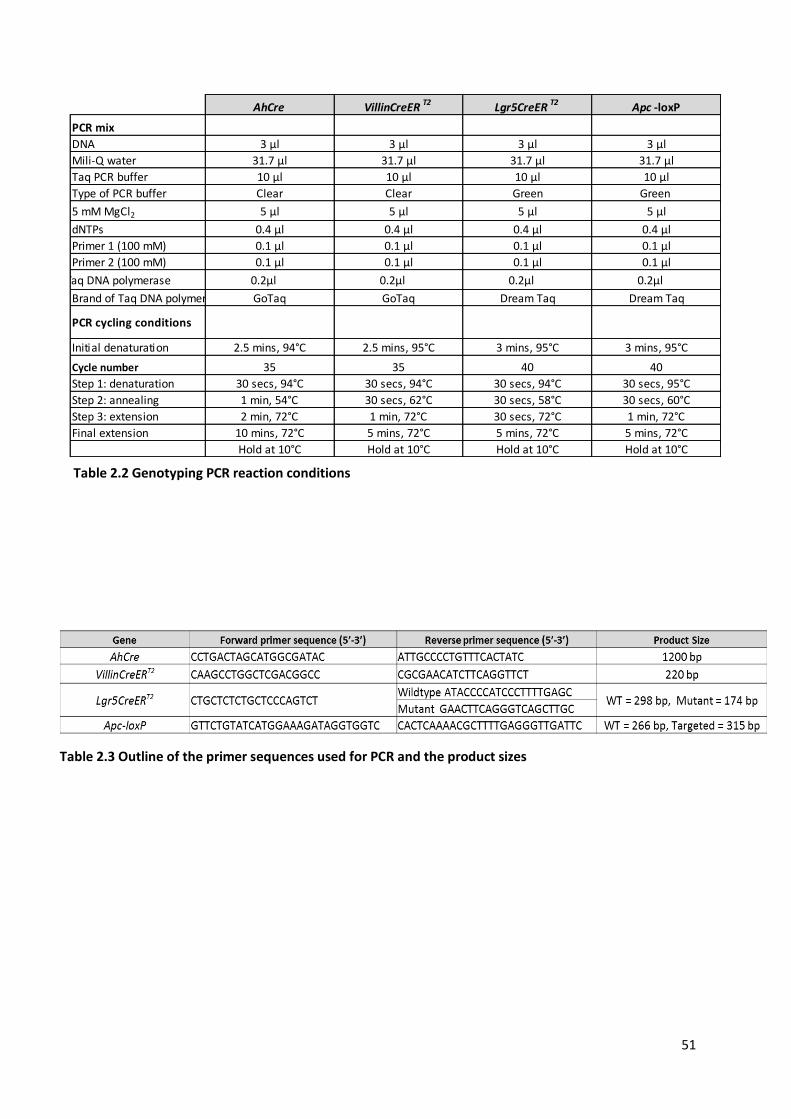
51
AhCre VillinCreER T2 Lgr5CreER T2 Apc -loxP
PCR mix
DNA 3 µl 3 µl 3 µl 3 µl
Mili-Q water 31.7 µl 31.7 µl 31.7 µl 31.7 µl
Taq PCR buffer 10 µl 10 µl 10 µl 10 µl
Type of PCR buffer Clear Clear Green Green
5 mM MgCl2 5 µl 5 µl 5 µl 5 µl
dNTPs 0.4 µl 0.4 µl 0.4 µl 0.4 µl
Primer 1 (100 mM) 0.1 µl 0.1 µl 0.1 µl 0.1 µl
Primer 2 (100 mM) 0.1 µl 0.1 µl 0.1 µl 0.1 µl
Taq DNA polymerase 0.2µl 0.2µl 0.2µl 0.2µl
Brand of Taq DNA polymerase GoTaq GoTaq Dream Taq Dream Taq
PCR cycling conditions
Initial denaturation 2.5 mins, 94°C 2.5 mins, 95°C 3 mins, 95°C 3 mins, 95°C
Cycle number 35 35 40 40
Step 1: denaturation 30 secs, 94°C 30 secs, 94°C 30 secs, 94°C 30 secs, 95°C
Step 2: annealing 1 min, 54°C 30 secs, 62°C 30 secs, 58°C 30 secs, 60°C
Step 3: extension 2 min, 72°C 1 min, 72°C 30 secs, 72°C 1 min, 72°C
Final extension 10 mins, 72°C 5 mins, 72°C 5 mins, 72°C 5 mins, 72°C
Hold at 10°C Hold at 10°C Hold at 10°C Hold at 10°C
Table 2.2 Genotyping PCR reaction conditions
Table 2.3 Outline of the primer sequences used for PCR and the product sizes
52
2.4 Experimental Cohorts
After the genotype of mice had been ascertained by PCR, mice of appropriate age were
randomly placed into control and experimental cohorts. Where possible housing of single mice was
avoided, in most cases animals were housed in cages with other mice. Mice were given fresh water
and food ad libitum and were fed either the control or experimental diets discussed below, or in the
absence of the control diet remained on the RM3(E) standard diet. After 2 weeks of feeding on their
respective diets, Cre recombinase mediated recombination of the Apc allele was induced. Mice were
monitored closely and short-term mice were sacrificed at days 4 and 5-post induction and long-term
cohorts when they became symptomatic of an intestinal tumour phenotype (paling of feet/tail,
piloerection, hunching of the body) or any other signs of loss of condition. Injections were performed
using a 1 ml syringe (BD Plastipak) and 25 G needle (BD microlance).
Administration of Diet
2.4.1.1 Administration of 10% Black Raspberry Powder
Experimental AhCre mice were given access to 10% freeze-dried BRB powder supplemented
in AIN76A powder ad libitum throughout the length of the experiment. Control mice were fed on the
standard RM3(E) mouse diet. Mice were started on the BRB diet two weeks prior to induction.
Administration of BRB powder was performed by Lucie Stocking and Kirsty Greenow.
2.4.1.2 Administration of AIN76A Diet
VillinCreERT2 and Lgr5CreERT2 mice in control cohorts were given access to the AIN76A purified
rodent diet ad libitum throughout the length of the experiment. Control mice were started on the diet
two weeks before induction. The diet was manufactured by Dyets Inc (diet formulation shown in Table
2.4).
2.4.1.3 Administration of 10% Black Raspberry Pellets
Experimental cohorts of VillinCreERT2 and Lgr5CreERT2 mice were given access to the modified
AIN76A purified rodent diet with 10% w/w black raspberry powder ad libitum throughout the
experiment (diet formulation shown in Table 2.5). Dyets Inc manufactured the diet. The black
raspberry powder was purchased from Berrihealth, USA.
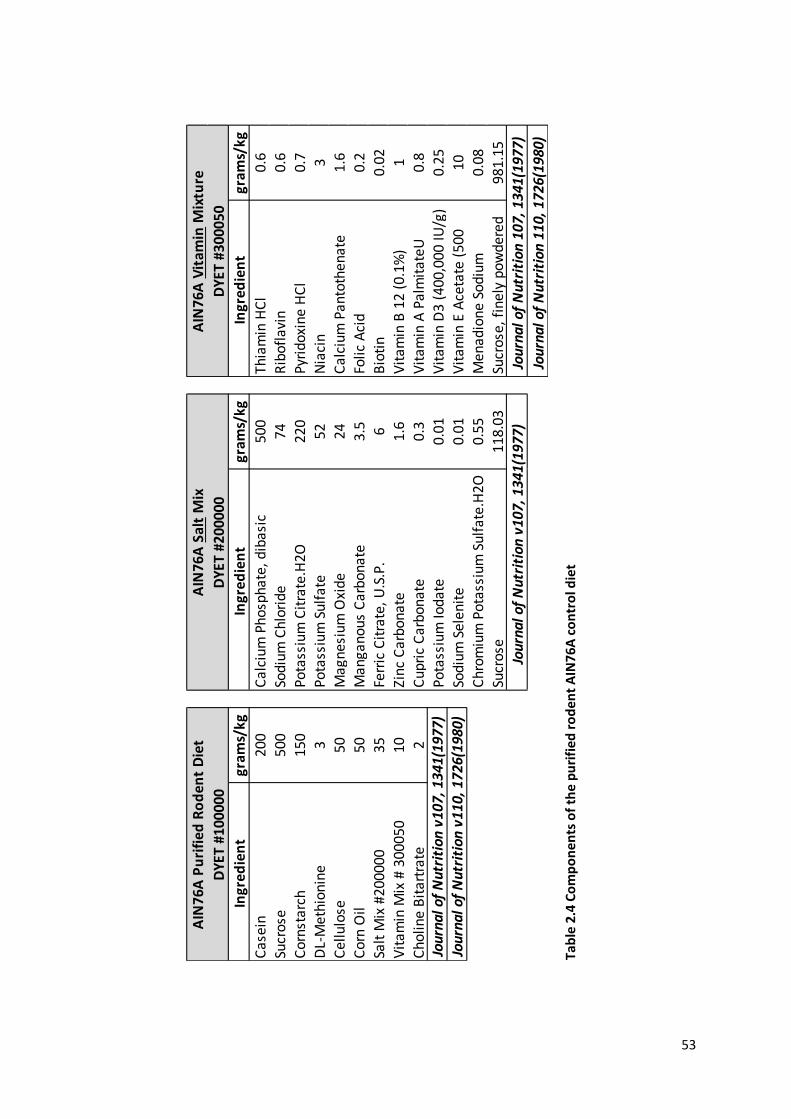
53
Ingr
edie
nt
gram
s/kg
Ingr
edie
nt
gram
s/kg
Ingr
edie
nt
gram
s/kg
Cas
ein
200
Cal
cium
Pho
spha
te, d
ibas
ic50
0Th
iam
in H
Cl
0.6
Sucr
ose
500
Sodi
um C
hlor
ide
74R
ibof
lavi
n0.
6
Cor
nsta
rch
150
Pota
ssiu
m C
itra
te.H
2O22
0Py
rido
xine
HC
l0.
7D
L-M
ethi
onin
e3
Pota
ssiu
m S
ulfa
te52
Nia
cin
3
Cel
lulo
se50
Mag
nesi
um O
xide
24C
alci
um P
anto
then
ate
1.6
Cor
n O
il50
Man
gano
us C
arbo
nate
3.5
Folic
Aci
d0.
2Sa
lt M
ix #
2000
0035
Ferr
ic C
itra
te, U
.S.P
.6
Bio
tin
0.02
Vit
amin
Mix
# 3
0005
010
Zinc
Car
bona
te1.
6V
itam
in B
12
(0.1
%)
1
Cho
line
Bit
artr
ate
2C
upri
c C
arbo
nate
0.3
Vit
amin
A P
alm
itat
eU
0.8
Pota
ssiu
m Io
date
0.01
Vit
amin
D3
(400
,000
IU/g
)0.
25
Sodi
um S
elen
ite
0.01
Vit
amin
E A
ceta
te (
500
10C
hrom
ium
Pot
assi
um S
ulfa
te.H
2O0.
55M
enad
ione
Sod
ium
0.
08
Sucr
ose
118.
03Su
cros
e, f
inel
y po
wde
red
981.
15
AIN
76A
Pu
rifi
ed R
od
ent
Die
t
DYE
T #1
0000
0
Jour
nal o
f N
utri
tion
v10
7, 1
341(
1977
)
Jour
nal o
f N
utri
tion
v11
0, 1
726(
1980
)
AIN
76A
Sal
t M
ix
DYE
T #2
0000
0
Jour
nal o
f N
utri
tion
v10
7, 1
341(
1977
)
AIN
76A
Vit
amin
Mix
ture
DYE
T #3
0005
0
Jour
nal o
f N
utri
tion
107
, 134
1(19
77)
Jour
nal o
f N
utri
tion
110
, 172
6(19
80)
Tab
le 2
.4 C
om
po
ne
nts
of
the
pu
rifi
ed
ro
de
nt
AIN
76
A c
on
tro
l die
t

54
Induction of Cre-recombinase
2.4.2.1 Administration of beta-Napthoflavone
Cre recombinase from the AhCre transgene was induced by intraperitoneal injections (IP) of
βNF (Sigma). Stocks of 10 mg/ml were produced by dissolving powdered βNF in corn oil (Sigma) by
heating to 99°C in a water bath. When the βNF had completely dissolved, aliquots were frozen in small
amber glass bottles at -20°C and defrosted when needed. Prior to induction, the βNF was defrosted
and heated to 80°C in a water bath. Mice were administered with 3 x 80 mg/kg over 12 hrs by IP
injection. Induction of AhCre recombinase was performed by Lucie Stocking and Kirsty Greenow.
2.4.2.2 Administration of tamoxifen
Induction of Cre recombinase activity in mice bearing the VillinCreERT2 and Lgr5CreERT2
transgenes was controlled by tamoxifen binding to a mutated ERT2 receptor fused to the Cre
recombinase protein. Stocks of 10 mg/ml tamoxifen (Sigma) were produced by dissolving tamoxifen
in corn oil in a water bath at 99°C. Samples were aliquoted and frozen at -20°C until required.
Tamoxifen was defrosted by heating to 80°C in a water bath. VillinCreERT2 mice received 3 x 60 mg/kg
tamoxifen over 12 hrs by IP injection. Lgr5CreERT2 mice were administered with 80 mg/kg tamoxifen
via IP injection daily, for four consecutive days.
Ingredient grams/kg
Casein 200
DL-Methionine 3
Sucrose 400
Cornstarch 150
Corn Oil 50
Cellulose 50
Mineral Mix #200000 35
Vitamin Mix # 300050 10
Choline Bitartrate 2
Black Raspberry Powder* 100
Modified AIN76A Purified Rodent Diet with 10% w/w Black
Raspberry Powder
The Ohio State University, Bruce Casto, August 23, 2013
Journal of Nutrition v110, 1726(1980)
*Black Raspberry Powder was supplied by Berrihealth, USA
Journal of Nutrition v107, 1341(1977)
DYET #103649
Table 2.5 Components of the modified AIN76A purified rodent diet with 10% w/w black raspberry powder

55
Labelling cells in vivo during S-phase by administration of 5-Bromo-2-deoxyuridine
To determine the rate of cell migration, animals were IP injected with 200 μl of 5-Bromo-2-
deoxyuridine (BrdU, Thermo Fisher Scientific) either 2 or 24 hrs prior to sacrifice. BrdU, a thymidine
analogue is bioavailable for 2 hrs and is incorporated in newly synthesised DNA strands during S-phase
of the cell cycle.
2.5 Tissue Sample Preparation
In order to avoid degradation of RNA (Ribonucleic acid) and protein, all tissues were dissected
immediately after animal sacrifice. Dissection and tissue harvesting of AhCre mice only was performed
by Lucie Stocking and Kirsty Greenow.
Dissection of organs
Mice were culled by cervical dislocation. The abdomen was sprayed with 70% ethanol and the
abdominal cavity was opened by cutting through the skin and smooth muscle wall. The intestines were
dissected out first (see section 2.5.2). The heart, lungs, kidney, liver and spleen were dissected out
and fixed as described in section 2.5.3. Part of the small and large intestines, kidney, liver and spleen
were also frozen.
Dissection of Intestines
The stomach and intestines were carefully dissected out and the attached mesentery was
removed. The stomach and caecum were removed and discarded. The small and large intestine were
then flushed with water or 1X PBS (phosphate buffered saline; 1.44 g Sodium Phosphate Dibasic
anhydride (Na2HPO4, Fluka), 8 g Sodium Chloride (NaCl, Sigma), 0.2 g Potassium Chloride (KCl, Fisher
Scientific), 0.24 g Potassium Phosphate Monobasic (KH2PO4, Sigma), made up to 1 L in dH2O to pH 7.4)
to remove the contents of the intestine and were then fixed as described in section 2.5.3. The small
intestine was cut into several sections. The gut sections were either opened longitudinally and rolled
into ‘swiss roll-like’ structures and secured with a needle or sectioned transversely. A section of small
intestine was frozen (AhCre and Lgr5CreERT2) or used for epithelial cell extraction using Weiser
preparation (VillinCreERT2) (described in 2.5.7). In addition, for some of the long-term cohorts,
tumours were also dissected and frozen. The large intestine across all cohorts was also opened
longitudinally and rolled into ‘swiss roll-like’ structures, and a small section was frozen for RNA
extraction.
Formalin fixation of tissues
All tissues were fixed in ice cold 10% neutral buffered formalin (Sigma) for 24 hrs at 4°C.
Samples were then stored in 70% ethanol (EtOH) in distilled H2O (dH2O) at 4°C until processing.
56
Processing of fixed tissue
After fixation, all tissues were placed in a cassette (Fisher) and processed using an automatic
processor (Leica TP1050). The tissues were incubated in an increasing gradient of alcohols for
dehydration (70% EtOH for 1 hr, 95% EtOH for 1 hr, 2 x 100% EtOH for 1 hr 30 mins and 100% EtOH
for 2 hrs), then in xylene (2 x 2 hrs). The tissues were then placed in liquid paraffin for 1 hr and then
twice more for 2 hrs. The samples were removed and embedded in paraffin wax by hand and allowed
to harden.
Sectioning of fixed tissue
Tissues were then prepared for either H&E and cell type staining (described in sections 2.6.1,
2.6.2 and 2.6.3) or immunohistochemistry (IHC) (described in section 2.6.4). Paraffin embedded
tissues were cut to 5 micron sections using a microtome (Leica RM2135) and placed on Poly-L-Lysine
(PLL) coated slides and baked at 58°C for 24 hrs.
Paraffin embedding and sectioning was performed by Derek Scarborough.
Freezing tissue
Sections of the liver, kidney, spleen, small and large intestine were placed into individual
lockable microtubes and placed on dry ice until frozen. The samples were then stored at -80°C until
required. Where possible, intestinal tumour tissue and adjacent normal tissue from long-term cohorts
was also frozen on dry ice.
Epithelial cell extraction using Weiser preparation
To avoid interference from stromal and smooth muscle compartments in subsequent RNA
analysis, the intestinal epithelium was extracted from the small intestine of VillinCreERT2 cohorts. This
was achieved by using a Weiser preparation. The second 10 cm of the small intestine closest to the
pyloric junction was dissected out and flushed with ice cold 1X PBS (Gibco). The gut was then opened
longitudinally and incubated in 15 ml of ice cold Wesier solution (recipe in Table 2.6) for 10 minutes
with agitation. The supernatant was retained and kept on ice. The intestine was incubated in a further
15 ml of Wesier solution, this was repeated twice. The fractions were combined and centrifuged at
1500 rpm for 5 mins. The supernatant was discarded and the pellet was washed twice in 20 mls of ice
cold 1X PBS. The pellet was then resuspended in 3 mls of PBS and aliquoted into three 1.5 ml
eppendorfs, which were then centrifuged at 2000 rpm. The supernatant was discarded and the
samples were stored at -80°C until required for RNA extraction (described in 2.9).

57
2.6 Histological Analysis
Preparation of sections for staining or IHC
Paraffin embedded tissue sections on PLL slides were dewaxed by placing in a bath of xylene
for 2 x 5 min incubations to remove all the paraffin wax. The sections were then rehydrated through
2 min incubations down a decreasing gradient of EtOH baths; 2 x 100%, 1 x 95%, 1 x 70%). The slides
were then placed in water in preparation for IHC staining.
Haematoxylin and Eosin (H&E) staining
Phenotypic analysis was possible by staining tissue sections with haematoxylin to stain the cell
nuclei and eosin to mark the cytoplasm. Paraffin embedded tissue sections on PLL coated slides were
dewaxed and rehydrated as previously described. The sections were then immersed in a bath of
Mayer’s Haemalum (R. A. Lamb) for 45 secs and then washed in running tap water for 5 mins. The
sections were then counterstained in an aqueous solution of 1% Eosin (R. A. Lamb) for 5 mins before
washing in running tap water to remove excess stain. The sections were then dehydrated, cleared and
mounted as described in section 2.6.4.8.
Cell type specific stains
2.6.3.1 Alcian blue staining
Alcian blue stains the mucins present in the goblet cells. PLL sections were dewaxed and
rehydrated as previously described, then immersed in a bath of alcian blue staining solutions (1%
Alcian blue (Sigma), 3% Acetic acid (Fisher Scientific) in dH2O at pH 2.5) for 5 mins then washed in
1M Na2HPO4 (Fluka) 5.56 ml
1M KH2PO4 (Sigma) 8 ml
5M NaCl (Sigma) 19.2 ml
1M KCl (Fisher Scientific) 1.5 ml
1M Na3 Citrate (Fisher Scientific) 27 ml
Sucrose (Sigma) 15 g
D-sorbital (Sigma) 10 g
0.5M EGTA (Sigma) 8 ml
0.5M EDTA (Sigma) 12 ml
0.5mM DTT* (Sigma) 0.077 g
*DTT must be added fresh on the day of use
Weiser Solution for 1 Litre
Table 2.6 Constituents of Weiser Solution for epithelial cell extraction

58
dH2O for 5 mins. Slides were then counterstained in 0.1% nuclear fast red in 5% aluminium sulphate
(Sigma) for 5 mins and washed in running tap water before dehydrating, clearing and mounting as
described in section 2.6.4.8.
2.6.3.2 Grimelius silver staining
Grimelius silver staining was utilised to stain for argyrophilic granules in enteroendocrine cells.
PLL tissue sections were dewaxed and dehydrated as previously described; all glassware was rinsed in
ultrapure double distilled water (ddH2O) (Sigma) to remove any reducing agents that were present.
Solutions were freshly prepared following the recipe in Table 2.7. Slides were immersed in a preheated
silver solution at 60°C for 3 hrs, then incubated in a reducing solution at 45°C for 1 min or until the
tissue sections had a yellow background. Slides were then dehydrated, cleared and mounted as
described in section 2.6.4.8.
Immunohistochemistry
IHC was performed for the visualisation of the presence and location of various proteins within
the tissue sections. A generic protocol is described below; the specific conditions for each target are
outlined in Table 2.8. PLL slides were dewaxed and rehydrated as previously described in section 2.6.1.
2.6.4.1 Antigen Retrieval
Antigens were unmasked by heating the tissue sections in 1X citrate buffer (2.94 g Sodium
citrate tribasic dehydrate (Sigma) in 1 L dH2O, pH 6) either in a boiling water bath, microwave or
pressure cooker. For retrieval using the water bath method, adequate citrate buffer was preheated to
Acetate Buffer pH 5.6 10 ml
ddH2O 87 ml
1% Silver Nitrate (Fisher Scientific) 3 ml
0.2M Acetic Acid (Sigma) 4.8 ml
0.2M Sodium Acetate (Fisher Scientific) 45.2 ml
ddH2O 50 ml
Hydroquinone (Fluka) 1 g
Sodium Sulfite (Fisher Scientific) 5 g
ddH2O 100 ml
Silver Solution
Acetate Buffer pH 5.6
Reducer Solution
Table 2.7 Constituents of the solutions required for Grimelius staining of enteroendocrine cells
59
99.9°C in a glass coplin jar (R. A. Lamb) before the slides were immersed. Retrieval of antigens using
the microwave was achieved by heating adequate buffer in a plastic container for 5 mins in a domestic
microwave at 1000W. The slides were then immersed in the hot buffer using a plastic slide rack and
further heated at full power (1000W) for 3 x 5 mins. For pressure cooker retrieval, adequate citrate
buffer was heated in a pressure cooker without pressure in a domestic microwave for 5 mins at full
power. Slides were then immersed in the solution in a plastic slide rack and heated under pressure
until the yellow indicator rose. The microwave was then reduced to 300W and the solution heated for
a further 15 mins. Special care was taken to ensure the slides did not boil dry and where necessary
additional citrate buffer was added.
Following boiling, the slides were left to cool at RT (in citrate buffer) for 1 hr before washing
in dH2O or wash buffer. The wash buffers utilised were PBS or TBS/T (tris buffered saline/ 0.1% Tween,
(NaCl 8.8 g, Tris-base 2.4 g in 1 L dH2O (pH7.6), 1 ml Tween-20).
2.6.4.2 Blocking of endogenous peroxidises
Activity of endogenous peroxidases within tissue samples was blocked by treatment with
hydrogen peroxide. Tissue sections were incubated in a 3% hydrogen peroxide solution in dH20 (30%
stock, Sigma) or in a commercial peroxidise blocking solution (Envision+ Kit, DAKO) at RT with
agitation. The slides were then washed 3 x 5 mins in wash buffer at RT with agitation. Specific blocking
and washing conditions can be found in Table 2.8.
2.6.4.3 Blocking of non-specific antibody binding
Non-specific binding of antibodies was blocked by incubating the tissue sections in a serum
that is derived from a species that is different from the species that the primary antibody was raised
in. A hydrophobic barrier pen (ImmEdge, Vector Labs) was utilised to draw an outline around the tissue
sections. The serum was diluted to an appropriate concentration in wash buffer (see Table 2.8) and
added to each slide and left to incubate at RT for 30 mins. Following the incubation period, the serum
block was removed without washing the slides and the primary antibody was added.
2.6.4.4 Primary antibody incubation
The tissue sections were then incubated with a primary antibody diluted to a working
concentration in blocking serum (see Table 2.8). The slides were incubated at either RT for 1 hr or O/N
at 4°C, in a humidified slide chamber. To remove unbound residual primary antibody the slides were
washed 3 x 5 mins in wash buffer at RT with agitation, before incubating with the secondary antibody.
60
2.6.4.5 Secondary antibody incubation
Secondary antibodies were either a biotinylated antibody diluted to a working concentration
in blocking serum or a HRP-conjugated antibody from the Envision+ kit (DAKO). Secondary antibodies
were applied to the slides, and incubated for an optimised amount of time at RT (see Table 2.8 for
specific conditions). Slides were then washed 3 x 5 mins in wash buffer at RT with agitation.
2.6.4.6 Signal amplification
When a biotinylated secondary antibody was used, an additional signal amplification step was
required. A Vectastain Avidin-Biotin Complex (ABC) kit (Vector labs) allows the binding of a HRP to the
biotin of the secondary antibody. The ABC reagents were prepared according to the manufacturer’s
instructions, 30 mins prior to use and left at RT. The tissue sections were then incubated in the ABC
reagent for 30 mins at RT in a humidified chamber before washing 3 x 5 mins in wash buffer.
2.6.4.7 Visualisation of antibody binding
Detection of the antigen was achieved by the 3,3’-diaminobenzidine (DAB) method for
colourimetric detection producing a brown coloured stain. The sections were incubated at RT with
DAB reagents (DAKO), prepared according to the manufacturers’ instructions (1 drop DAB chromogen
per 1ml DAB substrate buffer) for around 5 - 10 mins until a brown stain was observed. The sections
were then washed in 2 x 5 mins in wash buffer and 1 x 5 mins in dH20.
2.6.4.8 Counterstaining, dehydration and mounting of slides
Sections were counterstained with Mayer’s Haemulum (R. A. Lamb) for 45 secs followed by
thorough washing in running tap water for 5 mins.
The sections were then dehydrated by washing in increasing concentrations of alcohol baths
(1 × 5 mins 70% EtOH, 1 × 5 mins 95% EtOH, 2 × 5 mins 100% EtOH). The slides were then cleared in 2
x 5 min incubations in xylene. The slides were then removed from the xylene, mounted in DPX
mounting medium (Thermo Scientific) and appropriately sized coverslips were applied. The slides
were left to air dry in a fume hood.
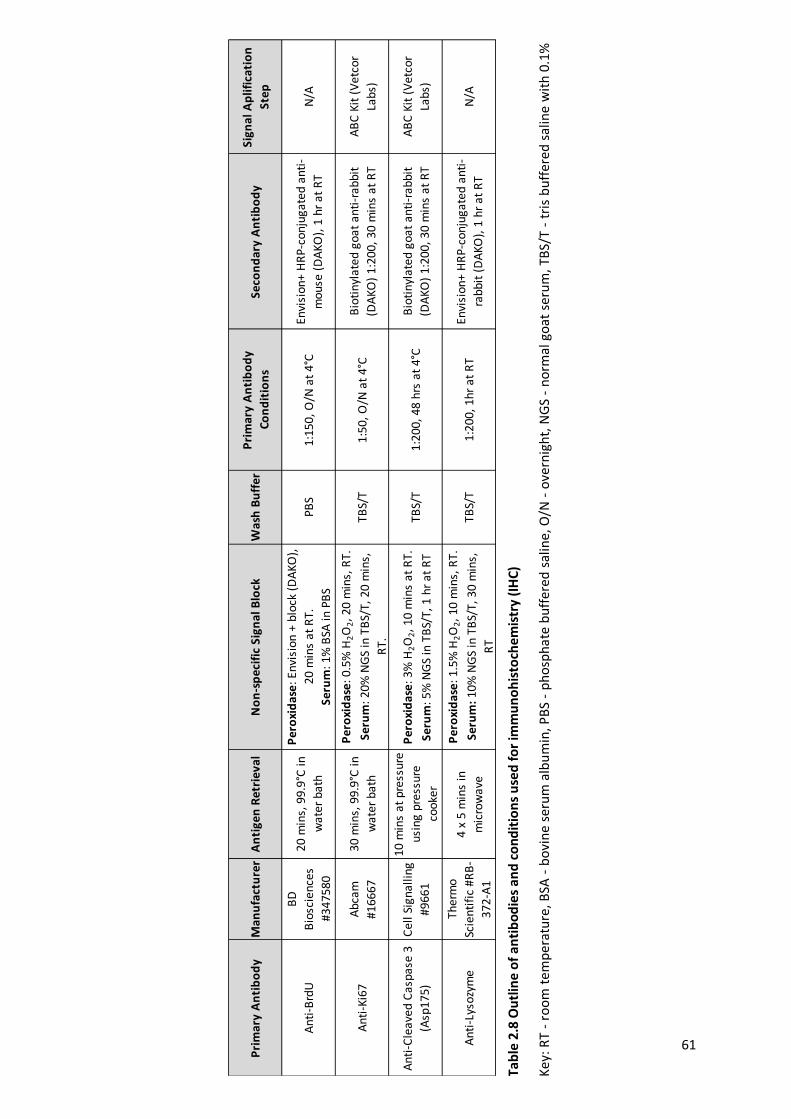
61
Pri
mar
y A
nti
bo
dy
Man
ufa
ctu
rer
An
tig
en
Ret
rie
va
l N
on
-sp
eci
fic
Sig
na
l Blo
ckW
ash
Bu
ffe
rP
rim
ary
An
tib
od
y
Co
nd
itio
ns
Se
con
da
ry A
nti
bo
dy
S
ign
al A
plif
ica
tio
n
Ste
p
An
ti-B
rdU
BD
Bio
scie
nce
s
#3
47
58
0
20
min
s, 9
9.9
°C in
wa
ter
ba
th
Pe
roxi
da
se: E
nvi
sio
n +
blo
ck (
DA
KO
),
20
min
s a
t R
T.
Se
rum
: 1%
BSA
in P
BS
PB
S1
:15
0,
O/N
at
4°C
En
visi
on
+ H
RP
-co
nju
ga
ted
an
ti-
mo
use
(D
AK
O),
1 h
r a
t R
TN
/A
An
ti-K
i67
Ab
cam
#1
66
67
30
min
s, 9
9.9
°C in
wa
ter
ba
th
Pe
roxi
da
se: 0
.5%
H2O
2,
20
min
s, R
T.
Se
rum
: 20
% N
GS
in T
BS/
T,
20
min
s,
RT
.
TB
S/T
1:5
0,
O/N
at
4°C
Bio
tin
yla
ted
go
at
an
ti-r
ab
bit
(DA
KO
) 1
:20
0,
30
min
s a
t R
T
AB
C K
it (
Ve
tco
r
Lab
s)
An
ti-C
lea
ved
Ca
spa
se 3
(Asp
17
5)
Ce
ll Si
gn
alli
ng
#9
66
1
10
min
s a
t p
ress
ure
usi
ng
pre
ssu
re
coo
ker
Pe
roxi
da
se: 3
% H
2O
2,
10
min
s a
t R
T.
Se
rum
: 5%
NG
S in
TB
S/T
, 1
hr
at
RT
TB
S/T
1:2
00
, 4
8 h
rs a
t 4
°CB
ioti
nyl
ate
d g
oa
t a
nti
-ra
bb
it
(DA
KO
) 1
:20
0,
30
min
s a
t R
T
AB
C K
it (
Ve
tco
r
Lab
s)
An
ti-L
yso
zym
e
Th
erm
o
Scie
nti
fic
#R
B-
37
2-A
1
4 x
5 m
ins
in
mic
row
ave
Pe
roxi
da
se: 1
.5%
H2O
2,
10
min
s, R
T.
Se
rum
: 1
0%
NG
S in
TB
S/T
, 3
0 m
ins,
RT
TB
S/T
1:2
00
, 1
hr
at
RT
En
visi
on
+ H
RP
-co
nju
ga
ted
an
ti-
rab
bit
(D
AK
O),
1 h
r a
t R
TN
/A
Tab
le 2
.8 O
utl
ine
of
anti
bo
die
s an
d c
on
dit
ion
s u
sed
fo
r im
mu
no
his
toch
emis
try
(IH
C)
Ke
y: R
T -
roo
m t
emp
erat
ure
, BSA
- b
ovi
ne
seru
m a
lbu
min
, PB
S -
ph
osp
hat
e b
uff
ered
sal
ine,
O/N
- o
vern
igh
t, N
GS
- n
orm
al g
oat
ser
um
, TB
S/T
- tr
is b
uff
ered
sal
ine
wit
h 0
.1%
twe
en, N
/A -
no
t ap
plic
able
62
2.7 Cell Counting
Quantification of histological sections was performed on an Olympus BX43 light microscope
fitted with a Leica Mc170 HD camera and with the aid of Leica Application Suite (Version 4.6.1, Build
324) software, or Zeiss Axio Scan.Z1 slide scanner and ZEN image analysis software. Scoring was
performed from areas that were not crosscut and free from other staining artifacts. For all
comparisons, at least three biological replicates per cohort were analysed which allowed statistical
analysis.
Crypt Size
Crypt size was scored by counting the total number of epithelial cells in a single line from the
base to the top of the crypt. For the AhCre mouse model 25 whole crypts were scored, whereas 50
half crypts were scored from VillinCreERT2 mice.
Mitotic index
Mitotic cells were identified on H&E stained tissue sections based on their morphological
appearance. The number of mitotic figures was scored per crypt from 25 whole crypts (AhCre) or 50
half crypts (VillinCreERT2). The average (mean) number of mitoses per animal was calculated and then
the mean across the cohorts was determined. Standard error of mean (SEM) was calculated by
Graphpad Prism6 software. Significance of any differences was determined using Mann Whitney U
statistical test (see section 2.11.1).
Ki67 and BrdU positively stained sections were scored as a proxy of proliferation. For both
mouse models, Ki67 positive cells were counted from 25 whole crypts and analysed the same way as
mitoses. The number of BrdU positive cells were scored from 50 half crypts from the base of the crypt
to the villus tip, which enabled positional data to be collected to assess cell migration. The sum of
BrdU positive cells at each cell position (position #1 = crypt base) was calculated per mouse. The
average number of cells at each position was calculated per cohort and the cumulative frequencies
were determined. Statistical differences were determined using Kolmogorov-Smirnov test (see section
2.11.2).
Apoptotic index
Apoptotic bodies were identified from H&E stained tissue sections based on their
morphological appearance. Scoring was conducted in the same way as per the scoring of mitotic cells.
Caspase-3 stained sections were scored for apoptotic cells to confirm histological based
scoring. The number of CC3 positive stained cells per crypt was counted from 25 whole crypts per

63
animal for both AhCre and VillinCreERT2 models. The mean values, SEM and significance were
conducted as described in section 2.11.
Scoring of specific cell types
Numbers of enteroendocrine, goblet and Paneth cells were counted from grimelius silver,
alcian blue and lysozyme stained tissue sections respectively. Goblet cells were counted from 25 whole
crypts per section for both AhCre and VillinCreERT2 models, while enteroendocrine cells were scored
from 50 half crypts for AhCre mice or 25 full crypts for VillinCreERT2 mice. Means, SEM and statistical
differences were achieved as described in section 2.11. Paneth cells were scored from 50 half crypts
per mouse for both models. Paneth cells were scored from the base of the crypt to the villus tip, which
allowed positional data to be collected and analysed as per BrdU positivity (see section 2.7.2).
Counting in wildtype and aberrant crypts (Apcfl/fl crypts)
Positive cells in wildtype crypts were counted from the base of the crypt up to the defined
crypt-villus junction. Apcfl/fl mice do not have defined crypt compartments, so the numbers of cells in
the aberrant proliferative region were counted in a single line up to a visible crypt-villus junction.
2.8 In situ hybridisation
In situ hybridization was used on gut PLL sections in order to evaluate the location and
expression of Olfm4 mRNA. In situ hybridisation utilises digoxigenin (DIG) labelled anti-sense RNA
probes complementary to the target mRNA sequence. Successful binding of the probe is visualised by
the presence of a purple stain, produced by an enzyme substrate reaction. BM purple is a chromogenic
substrate for the alkaline phosphatase enzyme on an anti-DIG alkaline phosphatase-conjugated
antibody. Previously published probes for Olfm4 were kindly provided by Han Clevers’ group (van der
Flier et al. 2009a) cloned into a pBluescript vector flanked by a promoter sequence for T3 and T7 RNA
polymerase.
Due to probe sensitivity, all glassware used in this protocol was treated at 200°C O/N in a
baking oven. All dH2O was treated with diethylpyrocarbonate (DEPC, Sigma) and autoclaved.
Transformation of competent cells with cDNA vectors
For long-term use the probes were amplified by transfection into competent Escherichia coli
(E.coli) cells. JM109 E.coli cells (50 μl, Promega) were incubated on ice for 30 mins with 1 μg
plasmid DNA. The cells were then heat shocked at 42°C for 45 secs before placing back on ice for a
further 2 mins. To the cells, 1 ml SOC medium (Invitrogen) was added and incubated in a shaking
incubator at 37°C for 2 hrs. Agar plates containing ampicillin were made by dissolving four LB agar
pellets (Q BioGene) in 500 ml dH20 heated to 50°C and then autoclaved twice. When cool enough 500
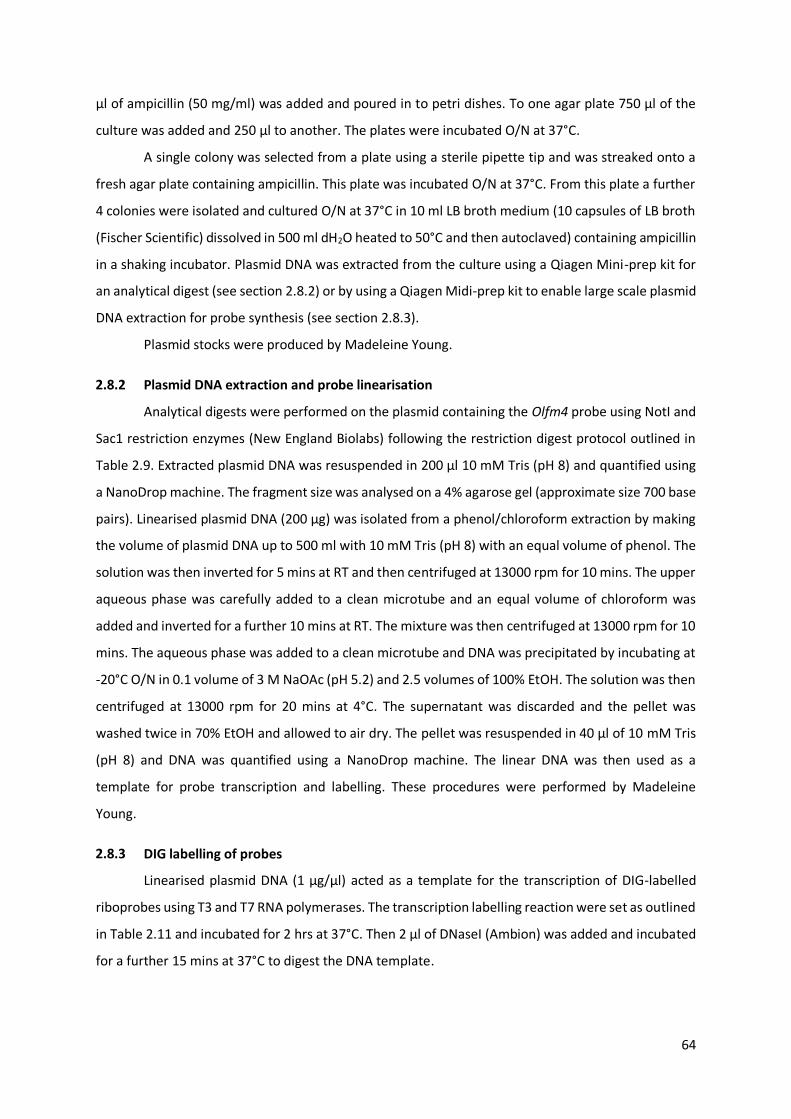
64
μl of ampicillin (50 mg/ml) was added and poured in to petri dishes. To one agar plate 750 μl of the
culture was added and 250 μl to another. The plates were incubated O/N at 37°C.
A single colony was selected from a plate using a sterile pipette tip and was streaked onto a
fresh agar plate containing ampicillin. This plate was incubated O/N at 37°C. From this plate a further
4 colonies were isolated and cultured O/N at 37°C in 10 ml LB broth medium (10 capsules of LB broth
(Fischer Scientific) dissolved in 500 ml dH2O heated to 50°C and then autoclaved) containing ampicillin
in a shaking incubator. Plasmid DNA was extracted from the culture using a Qiagen Mini-prep kit for
an analytical digest (see section 2.8.2) or by using a Qiagen Midi-prep kit to enable large scale plasmid
DNA extraction for probe synthesis (see section 2.8.3).
Plasmid stocks were produced by Madeleine Young.
Plasmid DNA extraction and probe linearisation
Analytical digests were performed on the plasmid containing the Olfm4 probe using NotI and
Sac1 restriction enzymes (New England Biolabs) following the restriction digest protocol outlined in
Table 2.9. Extracted plasmid DNA was resuspended in 200 μl 10 mM Tris (pH 8) and quantified using
a NanoDrop machine. The fragment size was analysed on a 4% agarose gel (approximate size 700 base
pairs). Linearised plasmid DNA (200 μg) was isolated from a phenol/chloroform extraction by making
the volume of plasmid DNA up to 500 ml with 10 mM Tris (pH 8) with an equal volume of phenol. The
solution was then inverted for 5 mins at RT and then centrifuged at 13000 rpm for 10 mins. The upper
aqueous phase was carefully added to a clean microtube and an equal volume of chloroform was
added and inverted for a further 10 mins at RT. The mixture was then centrifuged at 13000 rpm for 10
mins. The aqueous phase was added to a clean microtube and DNA was precipitated by incubating at
-20°C O/N in 0.1 volume of 3 M NaOAc (pH 5.2) and 2.5 volumes of 100% EtOH. The solution was then
centrifuged at 13000 rpm for 20 mins at 4°C. The supernatant was discarded and the pellet was
washed twice in 70% EtOH and allowed to air dry. The pellet was resuspended in 40 μl of 10 mM Tris
(pH 8) and DNA was quantified using a NanoDrop machine. The linear DNA was then used as a
template for probe transcription and labelling. These procedures were performed by Madeleine
Young.
DIG labelling of probes
Linearised plasmid DNA (1 μg/μl) acted as a template for the transcription of DIG-labelled
riboprobes using T3 and T7 RNA polymerases. The transcription labelling reaction were set as outlined
in Table 2.11 and incubated for 2 hrs at 37°C. Then 2 μl of DNaseI (Ambion) was added and incubated
for a further 15 mins at 37°C to digest the DNA template.

65
To precipitate out the DIG-labelled riboprobe, 2µl of 3 M NaOAc (pH 5.3) and 50 µl EtOH were
added and incubated O/N at -20°C. This was then centrifuged at 15000 rpm for 20 mins at 4°C. The
pellet was then washed twice in 70% EtOH and air dried before resuspending in 100 μl DEPC H2O. The
probes were aliquoted and stored at -80°C until needed.
Probe hybridisation
PLL sections were dewaxed (2 x 10 mins xylene) and rehydrated (2 x 1 min 100% EtOH, 30 secs
in 95%, 85%, 70%, 50% and 30% EtOH). The slides were then transferred to 1X saline for 5 mins then
washed in 1X PBS in DEPC H2O for 5 mins. Endogenous alkaline phosphatase activity was blocked by
incubating the slides in 250 ml of 6% hydrogen peroxide (diluted from 30% stock, Sigma, in 10X PBS in
DEPC H2O) for 30 mins. The slides were then washed 2 x 5 mins in PBS. The slides were then refixed in
RNase free 4% paraformaldehyde (Sigma) for 20 mins on ice and then washed 2 x 5 mins in PBS. The
sections were then incubated in proteinase K for 5 mins (20 mg/ml proteinase K in 1 M Tris (pH 8), 0.5
M EDTA (pH 8) in DEPC H2O), washed 2 x 5 mins PBS and post-fixed in 4% paraformaldehyde for 5 mins
to prevent the tissue from disintegrating. The slides were then washed for 2 mins in DEPC H2O. Then
the slides were incubated in acetic anhydride solution (2 M Acetic anhydride in 0.1 M triethanolamine
hydrochloride) for 10 mins with agitation and washed 2 x 5 mins PBS and once in 1X saline. The slides
were then dehydrated in increasing EtOH baths (30% EtOH for 30 secs, 70% EtOH for 5 mins, 30 secs
in 85% and 95% EtOH, 2 x 30 secs in 100% EtOH) and allowed to air dry for 30 - 60 mins ready for
probing. The Olfm4 probe was diluted 1:100 in hybridisation buffer (5X saline sodium citrate buffer
(SSC, Sigma), 50% formamide (Sigma), 5% Sodium dodecyl sulphate (SDS), 1 mg/ml heparin, 1 mg/ml
calf liver tRNA) and heated to 80°C for 3 mins. The slides were placed in dark moisture chambers
(containing 2.5 ml 20X SSC pH 7 (Sigma), 5 ml formamide and 2.5 ml DEPC H2O) and incubated with
100 μl of the probe O/N at 65°C. Cover slips and parafilm were placed on top of each slide to prevent
dehydration.
Post-hybridisation treatment
Following probe hybridisation, the slides were washed once in pre-warmed 200 ml of 5X SSC
(pH 5) at 65°C for 15 mins. Then the slides were incubated twice in pre-warmed solution I (Table 2.10)
at 65°C for 30 mins and 3 x 10 mins washes at RT in solution II (Table 2.10). The slides were then
incubated at 37°C for 45 mins in solution II with 4 μl of 10 mg/ml RNase H. Following this the slides
were washed once more in solution II at RT for 5 mins and then incubated 2 times in solution III (Table
2.10) for 30 mins at 65°C. The slides were then washed 2 x 10 mins in PBS/T at RT and then preblocked
in 100 μl of 10% sheep serum in PBS/T in a dark, moist chamber at RT for 2 - 3 hrs. The anti-DIG alkaline
phosphatase conjugated antibody (Roche) was prepared by heating in 1% heat-inactivated sheep

66
serum in PBS/T containing 3 mg/ml mouse intestinal powder at 70°C for 30 mins. 100 μl of prepared
antibody was added to each slide and incubated O/N at 4°C in a dark, moist chamber.
Signal detection
The sections were washed 3 x 5 mins in PBS/T and then a further 3 x 30 mins in PBS/T. The
slides were then preconditioned to inhibit endogenous alkaline phosphatase activity by washing 3 x 5
mins in NTMT buffer (10 ml of 5 M NaCl, 50 ml of 1 M Tris HCl (pH 9.5), 25 ml of 1 M MgCl2, 0.5 ml of
0.1% Tween-20 and 0.5ml of 2 M Levamisole (Sigma) made up to 500 ml with DEPC H2O) at RT. A
hydrophobic barrier was drawn around the tissue and 1 ml of the substrate, BM purple, was added to
each slide and incubated in the dark at 4°C for 24 - 72 hrs until a strong colour developed. Once a
sufficient colour was present the slides were then washed in PBS/T for 10 mins and then H2O for 30
mins. The sections were then counterstained with eosin (Sigma) and excess stain removed by washing
in running H2O. The slides were then dipped in xylene to clear and then allowed to air dry before
mounting in DPX medium.

67
RNase free H20 to 200 µl
Plasmid DNA 30 µg
Restriction Enzyme 10 µl
Buffer (10X, NEB) 20 µl
BSA (1X, NEB) 1 µl
Transcription buffer (10X, Roche) 1 µl
DIG RNA labellimg mix (10 mM, Roche) 2 µl
RNA polymerase (Roche) 2 µl
Rnase inhibitor (Promega) 1 µl
DEPC H20 12 µl
Linearised plasmid DNA (1 µg/µl) 1 µl
Formamide (Sigma) 200 ml
20X SSC (pH 5, Sigma) 100 ml
10% SDS (Sigma) 40 ml
DEPC H20 60 ml
5 M NaCl 100 ml
1 M Tris HCl (pH 7.5) 10 ml
Tween 20 (Sigma) 1 ml
DEPC H20 to 1000 ml
Formamide (Sigma) 200 ml
20X SSC (pH 5, Sigma) 40 ml
DEPC H20 160 ml
Restriction Digest
DIG RNA labelling mix
Post-hybridisation solutions
Solution I
Solution II
Solution III
Table 2.10 Constituents for the solutions required for post hybridisation treatment riboprobe
RNase free H20 to 200 µl
Plasmid DNA 30 µg
Restriction Enzyme 10 µl
Buffer (10X, NEB) 20 µl
BSA (1X, NEB) 1 µl
Transcription buffer (10X, Roche) 1 µl
DIG RNA labellimg mix (10 mM, Roche) 2 µl
RNA polymerase (Roche) 2 µl
Rnase inhibitor (Promega) 1 µl
DEPC H20 12 µl
Linearised plasmid DNA (1 µg/µl) 1 µl
Formamide (Sigma) 200 ml
20X SSC (pH 5, Sigma) 100 ml
10% SDS (Sigma) 40 ml
DEPC H20 60 ml
5 M NaCl 100 ml
1 M Tris HCl (pH 7.5) 10 ml
Tween 20 (Sigma) 1 ml
DEPC H20 to 1000 ml
Formamide (Sigma) 200 ml
20X SSC (pH 5, Sigma) 40 ml
DEPC H20 160 ml
Restriction Digest
DIG RNA labelling mix
Post-hybridisation solutions
Solution I
Solution II
Solution III
Table 2.11 Constituents of the DIG-labelling mix to produce a DIG-labelled riboprobe
RNase free H20 to 200 µl
Plasmid DNA 30 µg
Restriction Enzyme 10 µl
Buffer (10X, NEB) 20 µl
BSA (1X, NEB) 1 µl
Transcription buffer (10X, Roche) 1 µl
DIG RNA labellimg mix (10 mM, Roche) 2 µl
RNA polymerase (Roche) 2 µl
Rnase inhibitor (Promega) 1 µl
DEPC H20 12 µl
Linearised plasmid DNA (1 µg/µl) 1 µl
Formamide (Sigma) 200 ml
20X SSC (pH 5, Sigma) 100 ml
10% SDS (Sigma) 40 ml
DEPC H20 60 ml
5 M NaCl 100 ml
1 M Tris HCl (pH 7.5) 10 ml
Tween 20 (Sigma) 1 ml
DEPC H20 to 1000 ml
Formamide (Sigma) 200 ml
20X SSC (pH 5, Sigma) 40 ml
DEPC H20 160 ml
Restriction Digest
DIG RNA labelling mix
Post-hybridisation solutions
Solution I
Solution II
Solution III
Table 2.9 Constituents required to perform a restriction digest on plasmid DNA

68
2.9 Quantitative Reverse Transcription Polymerase Chain Reaction (qRT-PCR) RNA
isolation
qRT-PCR was used to evaluate the relative expression levels of genes in small intestinal tissue.
RNA was extracted using Trizol, from frozen intestinal sections or epithelial cell extracts isolated by a
Weiser preparation (discussed in section 2.5.7). Extracted RNA was used as a template for cDNA
(complementary DNA) synthesis. Care was taken during RNA isolation to ensure all consumables and
equipment used was RNase-free. Bench tops and pipettes were treated with RNaseZAP (Sigma). A
minimum of 3 mice per experimental cohort were assessed for gene expression changes.
Tissue homogenisation
Intestinal tissue or epithelial cell extracts were removed from storage and placed on dry ice
to prevent defrosting. The tissues were placed in 1ml Trizol (Ambion) in homogenising lysing matrix D
tubes (MP Biomedicals). Whole tissues were homogenised using a Precellys 24 homogeniser (Bertin
Technologies) at 6000 rpm for 2 cycles of 45 secs, epithelial cell extracts were only homogenised for
15 secs.
RNA extraction and purification
All samples were kept on ice during RNA isolation to prevent tissue degradation. Following
homogenisation, the samples were left to settle on ice to disperse bubbles. The samples were then
centrifuged at 13000 rpm for 10 mins at RT to pellet insoluble material. Subsequently the supernatant
was transferred to RNase/DNase free 1.5 ml microcentrifuge tubes and 200 µl of chilled chloroform
(Sigma) was added. Each sample was shaken vigorously prior to incubation on ice for 15 mins. The
samples were then centrifuged at 13000 rpm for 15 mins at 4°C, separating the aqueous phase from
the organic phase. The aqueous upper phase was transferred to clean microcentrifuge tubes
containing 500 µl of isopropanol (Fischer Scientific). Care was taken to ensure none of the organic
phase was retained. The samples were then mixed and left to incubate O/N at 4°C to precipitate out
the RNA. After incubation, the samples were centrifuged at 13000 rpm for 15 mins at RT. The
supernatant was discarded and the pellet was washed with 500 µl chilled 70% EtOH, and then
centrifuged at 13000 rpm for 5 mins at RT. The supernatant was discarded and the pellet allowed to
air dry for 10 mins. The pellets were resuspended in 50 µl of RNase free H2O by heating to 65°C for 10
mins. The RNA was quantified using a NanoDrop 2000 (Thermo Scientific).
DNase treatment
Contaminating DNA from purified RNA samples was removed by using a TURBO DNA-freeTM
kit (Ambion). To each sample 0.1 volume 10X TURBO DNase buffer and 1 µl TURBO DNase was added,
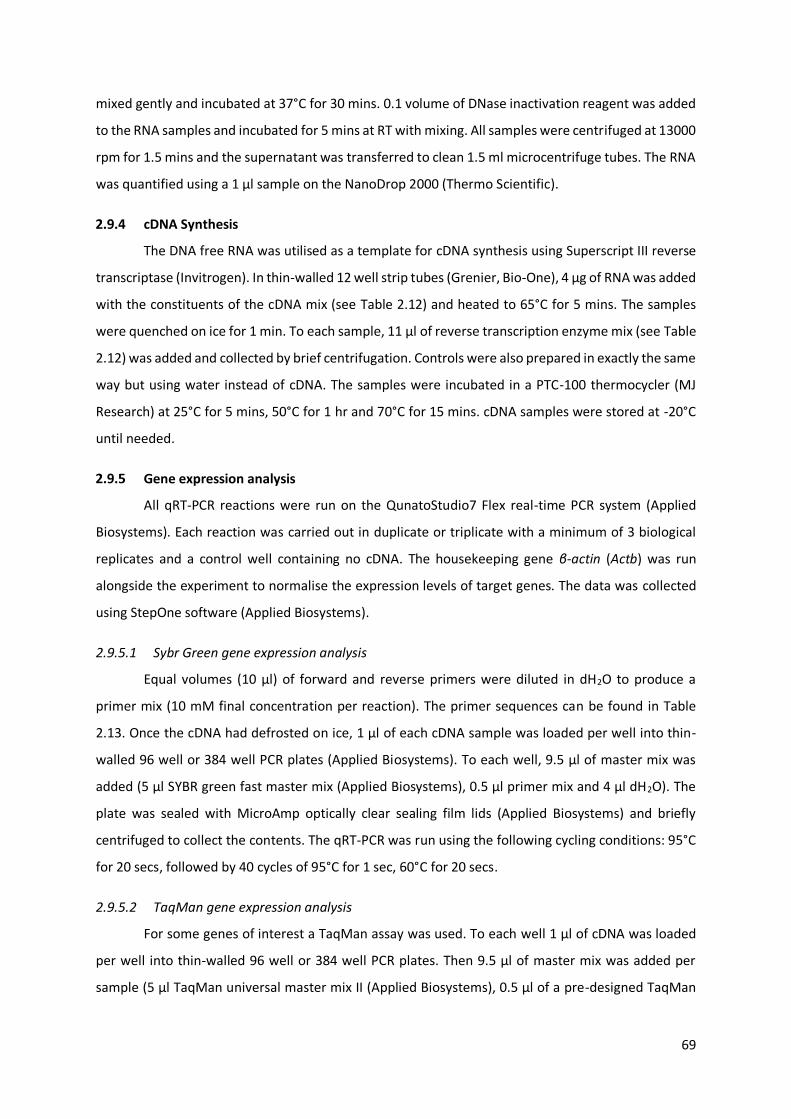
69
mixed gently and incubated at 37°C for 30 mins. 0.1 volume of DNase inactivation reagent was added
to the RNA samples and incubated for 5 mins at RT with mixing. All samples were centrifuged at 13000
rpm for 1.5 mins and the supernatant was transferred to clean 1.5 ml microcentrifuge tubes. The RNA
was quantified using a 1 µl sample on the NanoDrop 2000 (Thermo Scientific).
cDNA Synthesis
The DNA free RNA was utilised as a template for cDNA synthesis using Superscript III reverse
transcriptase (Invitrogen). In thin-walled 12 well strip tubes (Grenier, Bio-One), 4 µg of RNA was added
with the constituents of the cDNA mix (see Table 2.12) and heated to 65°C for 5 mins. The samples
were quenched on ice for 1 min. To each sample, 11 µl of reverse transcription enzyme mix (see Table
2.12) was added and collected by brief centrifugation. Controls were also prepared in exactly the same
way but using water instead of cDNA. The samples were incubated in a PTC-100 thermocycler (MJ
Research) at 25°C for 5 mins, 50°C for 1 hr and 70°C for 15 mins. cDNA samples were stored at -20°C
until needed.
Gene expression analysis
All qRT-PCR reactions were run on the QunatoStudio7 Flex real-time PCR system (Applied
Biosystems). Each reaction was carried out in duplicate or triplicate with a minimum of 3 biological
replicates and a control well containing no cDNA. The housekeeping gene β-actin (Actb) was run
alongside the experiment to normalise the expression levels of target genes. The data was collected
using StepOne software (Applied Biosystems).
2.9.5.1 Sybr Green gene expression analysis
Equal volumes (10 μl) of forward and reverse primers were diluted in dH2O to produce a
primer mix (10 mM final concentration per reaction). The primer sequences can be found in Table
2.13. Once the cDNA had defrosted on ice, 1 μl of each cDNA sample was loaded per well into thin-
walled 96 well or 384 well PCR plates (Applied Biosystems). To each well, 9.5 μl of master mix was
added (5 μl SYBR green fast master mix (Applied Biosystems), 0.5 μl primer mix and 4 μl dH2O). The
plate was sealed with MicroAmp optically clear sealing film lids (Applied Biosystems) and briefly
centrifuged to collect the contents. The qRT-PCR was run using the following cycling conditions: 95°C
for 20 secs, followed by 40 cycles of 95°C for 1 sec, 60°C for 20 secs.
2.9.5.2 TaqMan gene expression analysis
For some genes of interest a TaqMan assay was used. To each well 1 μl of cDNA was loaded
per well into thin-walled 96 well or 384 well PCR plates. Then 9.5 μl of master mix was added per
sample (5 μl TaqMan universal master mix II (Applied Biosystems), 0.5 μl of a pre-designed TaqMan
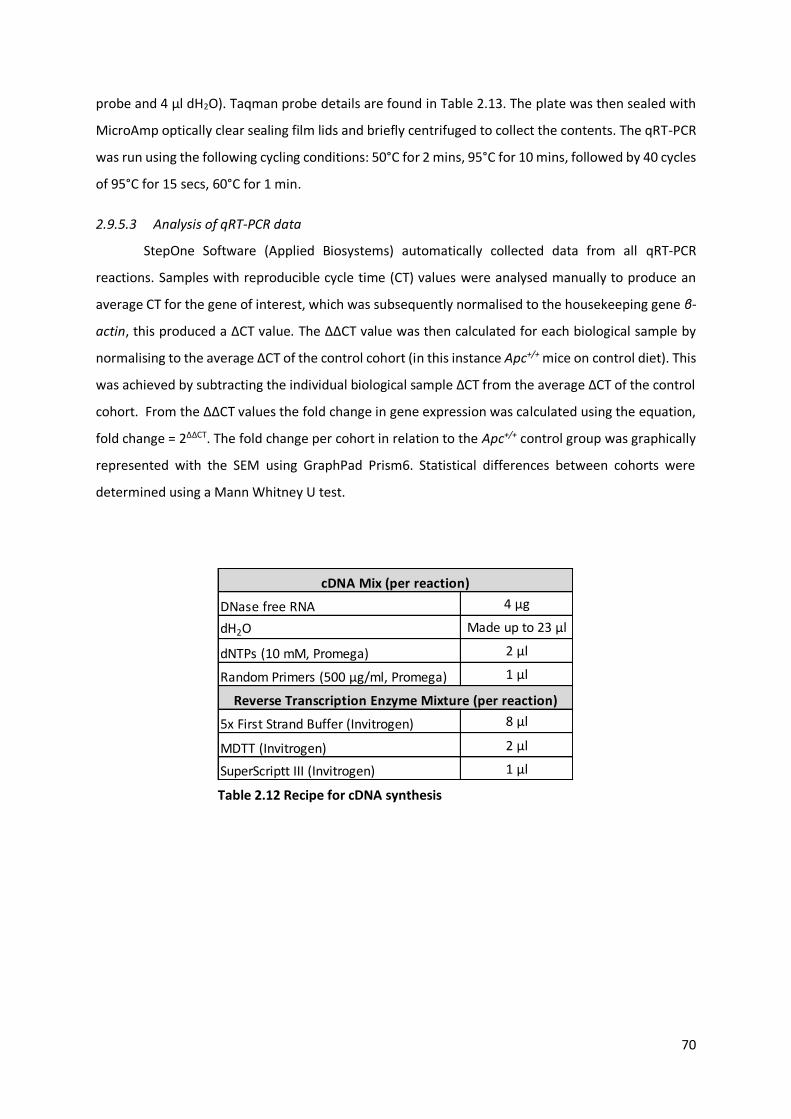
70
probe and 4 μl dH2O). Taqman probe details are found in Table 2.13. The plate was then sealed with
MicroAmp optically clear sealing film lids and briefly centrifuged to collect the contents. The qRT-PCR
was run using the following cycling conditions: 50°C for 2 mins, 95°C for 10 mins, followed by 40 cycles
of 95°C for 15 secs, 60°C for 1 min.
2.9.5.3 Analysis of qRT-PCR data
StepOne Software (Applied Biosystems) automatically collected data from all qRT-PCR
reactions. Samples with reproducible cycle time (CT) values were analysed manually to produce an
average CT for the gene of interest, which was subsequently normalised to the housekeeping gene β-
actin, this produced a ΔCT value. The ΔΔCT value was then calculated for each biological sample by
normalising to the average ΔCT of the control cohort (in this instance Apc+/+ mice on control diet). This
was achieved by subtracting the individual biological sample ΔCT from the average ΔCT of the control
cohort. From the ΔΔCT values the fold change in gene expression was calculated using the equation,
fold change = 2ΔΔCT. The fold change per cohort in relation to the Apc+/+ control group was graphically
represented with the SEM using GraphPad Prism6. Statistical differences between cohorts were
determined using a Mann Whitney U test.
DNase free RNA 4 µg
dH2O Made up to 23 µl
dNTPs (10 mM, Promega) 2 µl
Random Primers (500 µg/ml, Promega) 1 µl
5x First Strand Buffer (Invitrogen) 8 µl
MDTT (Invitrogen) 2 µl
SuperScriptt III (Invitrogen) 1 µl
Reverse Transcription Enzyme Mixture (per reaction)
cDNA Mix (per reaction)
Table 2.12 Recipe for cDNA synthesis
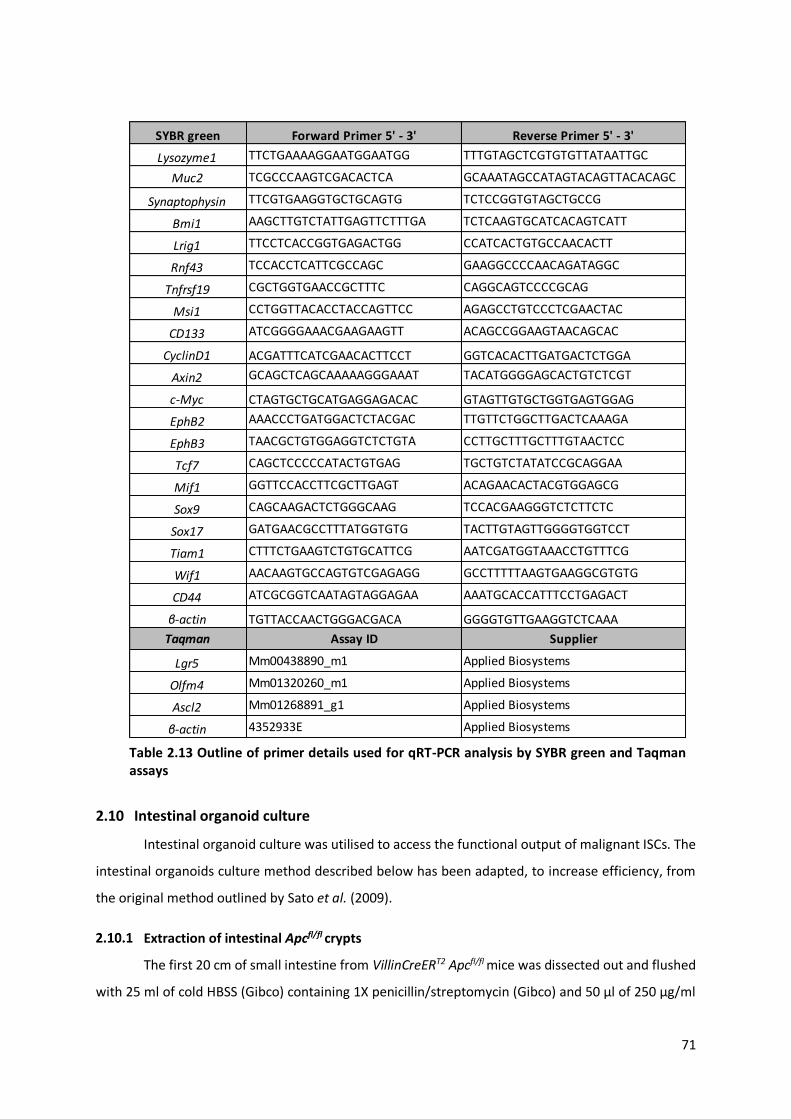
71
2.10 Intestinal organoid culture
Intestinal organoid culture was utilised to access the functional output of malignant ISCs. The
intestinal organoids culture method described below has been adapted, to increase efficiency, from
the original method outlined by Sato et al. (2009).
Extraction of intestinal Apcfl/fl crypts
The first 20 cm of small intestine from VillinCreERT2 Apcfl/fl mice was dissected out and flushed
with 25 ml of cold HBSS (Gibco) containing 1X penicillin/streptomycin (Gibco) and 50 µl of 250 µg/ml
SYBR green Forward Primer 5' - 3' Reverse Primer 5' - 3'
Lysozyme1 TTCTGAAAAGGAATGGAATGG TTTGTAGCTCGTGTGTTATAATTGC
Muc2 TCGCCCAAGTCGACACTCA GCAAATAGCCATAGTACAGTTACACAGC
Synaptophysin TTCGTGAAGGTGCTGCAGTG TCTCCGGTGTAGCTGCCG
Bmi1 AAGCTTGTCTATTGAGTTCTTTGA TCTCAAGTGCATCACAGTCATT
Lrig1 TTCCTCACCGGTGAGACTGG CCATCACTGTGCCAACACTT
Rnf43 TCCACCTCATTCGCCAGC GAAGGCCCCAACAGATAGGC
Tnfrsf19 CGCTGGTGAACCGCTTTC CAGGCAGTCCCCGCAG
Msi1 CCTGGTTACACCTACCAGTTCC AGAGCCTGTCCCTCGAACTAC
CD133 ATCGGGGAAACGAAGAAGTT ACAGCCGGAAGTAACAGCAC
CyclinD1 ACGATTTCATCGAACACTTCCT GGTCACACTTGATGACTCTGGA
Axin2 GCAGCTCAGCAAAAAGGGAAAT TACATGGGGAGCACTGTCTCGT
c-Myc CTAGTGCTGCATGAGGAGACAC GTAGTTGTGCTGGTGAGTGGAG
EphB2 AAACCCTGATGGACTCTACGAC TTGTTCTGGCTTGACTCAAAGA
EphB3 TAACGCTGTGGAGGTCTCTGTA CCTTGCTTTGCTTTGTAACTCC
Tcf7 CAGCTCCCCCATACTGTGAG TGCTGTCTATATCCGCAGGAA
Mif1 GGTTCCACCTTCGCTTGAGT ACAGAACACTACGTGGAGCG
Sox9 CAGCAAGACTCTGGGCAAG TCCACGAAGGGTCTCTTCTC
Sox17 GATGAACGCCTTTATGGTGTG TACTTGTAGTTGGGGTGGTCCT
Tiam1 CTTTCTGAAGTCTGTGCATTCG AATCGATGGTAAACCTGTTTCG
Wif1 AACAAGTGCCAGTGTCGAGAGG GCCTTTTTAAGTGAAGGCGTGTG
CD44 ATCGCGGTCAATAGTAGGAGAA AAATGCACCATTTCCTGAGACT
β‐actin TGTTACCAACTGGGACGACA GGGGTGTTGAAGGTCTCAAA
Taqman Assay ID Supplier
Lgr5 Mm00438890_m1 Applied Biosystems
Olfm4 Mm01320260_m1 Applied Biosystems
Ascl2 Mm01268891_g1 Applied Biosystems
β‐actin 4352933E Applied Biosystems
Table 2.13 Outline of primer details used for qRT-PCR analysis by SYBR green and Taqman assays
72
fungizone (Invitrogen). The intestine was then opened longitudinally and firmly scraped with a glass
coverslip in order to remove the villi compartment. The scraped intestine was then cut into 0.5 mm
pieces and placed in 25 ml cold HBSS containing 1X penicillin/streptomycin and 50 µl of fungizone. The
solution was gently shaken before being transferred into a primary tissue culture hood where
subsequent steps were performed under sterile conditions. The antibiotic containing solution was
removed and the intestinal pieces were washed four times in HBSS, with gentle shaking between each
wash. The intestine was then incubated for 5 mins at RT with 10 ml of 8 mM EDTA (Fluka) in HBSS. The
solution was shaken vigorously to remove more of the villi and then the supernatant was discarded.
The intestine was incubated for a further 30 mins in 10 ml of 8 mM EDTA but on ice. Again, the solution
was shaken vigorously, but the supernatant fraction was removed and retained as this contained
crypts. This fraction was immediately diluted 1:1 in DMEM/F12 (Gibco) containing 1X glutamax
(Gibco). 10 ml HBSS was added to the intestine, shaken vigorously and the supernatant added to the
first fraction. This was repeated once more. The combined fractions containing crypts were
centrifuged at 600 rpm for 5 mins to remove any single cells. The pellet was then resuspended in 10
ml HBSS and centrifuged at 800 rpm for 3 mins. The pellet was then resuspended in 10 ml DMEM/F12
and passed through a 70 µm cell strainer (Falcon) to remove any clumps. The crypt suspension was
kept on ice.
Counting and seeding crypts
The number of crypts was counted from three 10 µl crypt suspension aliquots using a Olympus
CKX41 brightfield microscope with an Olympus SC100 camera. The appropriate volume of crypt
suspension required to seed 200 crypts per well was calculated. This volume was aliquoted into an
appropriate tube and centrifuged at 1000 rpm for 3 mins. The supernatant was removed and 20 µl of
DMEM/F12 was added to resuspend the crypts prior to further dilution in the appropriate volume of
matrigel (Phenol-free, growth factor reduced matrigel, VWR) and seeded into pre-warmed Nunclon
U-bottom plates (Thermo Scientific). In 24 well plates 50 µl of matrigel/crypt suspension was seeded,
and 96 well plates were seeded with 10 µl of matrigel/crypt suspension.
Organoid growth media
The organoid growth media was made up as in Table 2.14 and 100 µl was added to each well
of a 96 well plate and 500 µl was added to each well of a 24 well plate, once the matrigel had set. The
plates were returned to the incubator immediately. The media was changed every 2 - 4 days.
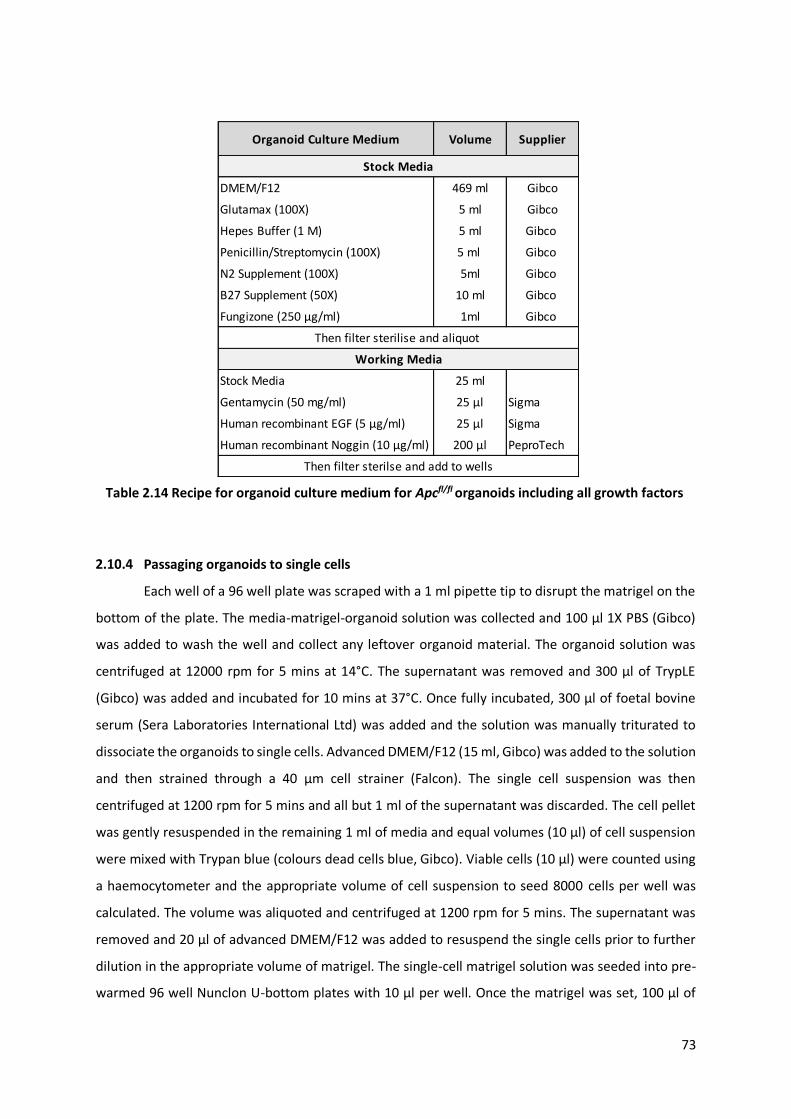
73
Passaging organoids to single cells
Each well of a 96 well plate was scraped with a 1 ml pipette tip to disrupt the matrigel on the
bottom of the plate. The media-matrigel-organoid solution was collected and 100 µl 1X PBS (Gibco)
was added to wash the well and collect any leftover organoid material. The organoid solution was
centrifuged at 12000 rpm for 5 mins at 14°C. The supernatant was removed and 300 µl of TrypLE
(Gibco) was added and incubated for 10 mins at 37°C. Once fully incubated, 300 µl of foetal bovine
serum (Sera Laboratories International Ltd) was added and the solution was manually triturated to
dissociate the organoids to single cells. Advanced DMEM/F12 (15 ml, Gibco) was added to the solution
and then strained through a 40 µm cell strainer (Falcon). The single cell suspension was then
centrifuged at 1200 rpm for 5 mins and all but 1 ml of the supernatant was discarded. The cell pellet
was gently resuspended in the remaining 1 ml of media and equal volumes (10 µl) of cell suspension
were mixed with Trypan blue (colours dead cells blue, Gibco). Viable cells (10 µl) were counted using
a haemocytometer and the appropriate volume of cell suspension to seed 8000 cells per well was
calculated. The volume was aliquoted and centrifuged at 1200 rpm for 5 mins. The supernatant was
removed and 20 µl of advanced DMEM/F12 was added to resuspend the single cells prior to further
dilution in the appropriate volume of matrigel. The single-cell matrigel solution was seeded into pre-
warmed 96 well Nunclon U-bottom plates with 10 µl per well. Once the matrigel was set, 100 µl of
Organoid Culture Medium Volume Supplier
DMEM/F12 469 ml Gibco
Glutamax (100X) 5 ml Gibco
Hepes Buffer (1 M) 5 ml Gibco
Penicillin/Streptomycin (100X) 5 ml Gibco
N2 Supplement (100X) 5ml Gibco
B27 Supplement (50X) 10 ml Gibco
Fungizone (250 µg/ml) 1ml Gibco
Stock Media 25 ml
Gentamycin (50 mg/ml) 25 µl Sigma
Human recombinant EGF (5 µg/ml) 25 µl Sigma
Human recombinant Noggin (10 µg/ml) 200 µl PeproTech
Stock Media
Working Media
Then filter sterilise and aliquot
Then filter sterilse and add to wells
Table 2.14 Recipe for organoid culture medium for Apcfl/fl organoids including all growth factors
74
media (as described in section 2.10.3) was applied to each well. For the first 3 days, the ROCK inhibitor
Y27632 (Sigma) was added to each well at a concentration of 10 µl/ml of media. After 3 days the media
was changed to the standard Apcfl/fl media.
Organoid formation efficiency assay
2.10.5.1 A readout of ‘stemness’
Intestinal crypts were harvested from VillinCreERT2 Apcfl/fl mice fed for 2 weeks on either the
AIN76A diet or 10% freeze-dried BRB diet 3 days after induction with tamoxifen. A minimum of 20
wells of a 96 well plate were seeded at 200 crypts/well in 10 µl matrigel per well. Media was added to
each well and changed every 2 days. The plates were read at day 1 and day 7 using the Gelcount
(Oxford Optronix) machine and analysed to produce a readout for the proportion of seeded crypts
that grew into organoids.
2.10.5.2 Ex vivo application of BRB-derived Anthocyanin extract
To access the efficiency of Apc deficient cells to form organoids in the continual presence of
BRBs, a BRB-derived anthocyanin extract was utilised. The extract was kindly provided to us by our
collaborators, Li-Shu Wang’s group from the Medical College of Wisconsin, USA. The anthocyanins
were extracted from whole BRBs; the extraction method has been extensively described by Wang et
al. (2009). The BRB-derived anthoycanin syrup was provided at a concentration 160.4 µM/g and kept
at -20°C until required.
2.10.5.3 CellTiter-Glo® Luminescent Cell Viability Assay
To determine an appropriate concentration of AC extract to use in subsequent organoid
experiments, a CellTiter-Glo® 3D luminescent cell viability assay was performed. Apcfl/fl organoids were
passaged to single cell as described in section 2.10.4 and reseeded in matrigel at 8000 cells/well in
Corning® white 96 well plates with clear flat bottoms. A minimum of 3 wells were used per AC dose.
100 µl of intestinal organoid media containing 10 µl/ml of ROCK inhibitor was added to each
well for the first 3 days. On day 4 post seeding, 100 µl of different concentrations of AC extract in
organoid media, without ROCK inhibitor (described in detail in section 2.10.5.4) were added to the
wells for 4 days.
CellTiter-Glo® 3D reagent was left to defrost at RT for 30 mins before use. The organoid plate
was also left at RT for 30 mins. The AC media was removed from the wells and placed into wells of a
new 96 well plate. 50 µl of media was replaced into the respective well and 50 µl of CellTiter-Glo®
reagent was added to each well. The plate lid was returned and then wrapped in tin foil. The plate was
incubated with CellTiter-Glo® reagent for 30 mins in a shaking incubator at 200 rpm. Following
75
incubation, luminescence was read on the CLARIOstar plate reader (BMG Labteck). An IC50 from the
CellTiter-Glo® Luminescent assay was determined using the software, XLFit add-on for Microsoft Excel.
2.10.5.4 Preparation of BRB-derived Anthocyanin (AC) extract
For the initial CellTiter-Glo® Luminescent Cell Viability assay, the maximum concentration of
AC extract utilised was 500 µg/ml, however this did not produce a complete graph. Therefore the
experiment was repeated with higher concentrations of AC media, maximum concentration was
16000 µg/ml.
The anthocyanin solution (160.4 µM/g) was diluted in filter-sterilised dH2O to produce a
concentration of 500 mg/ml (0.1 g in 200 µl dH2O) or 1000 mg/ml (0.05 g in 50 µl dH2O). The AC
solutions were then diluted 1:10 in filter sterilised dH2O to 50 mg/ml or 100 mg/ml and were then
filter sterilised using a 10 ml syringe (BD Plastipak) and 0.22 µm filter unit (Millipore). Serial dilutions
from each stock were produced as outlined in Table 2.15. To achieve final concentrations ranging
between 0 - 500 µg/ml and 0 - 16000 µg/ml, each dilution was then mixed with appropriate volumes
of organoid media see Table 2.15.
2.10.5.5 A readout of the effects of ex vivo application of BRBs on organoid forming efficiency
Intestines from VillinCreERT2 Apcfl/fl mice were harvested and crypts were isolated as described
in section 2.10.1. Wells were seeded at 200 crypts/ well in 10 µl matrigel in 96 well plates. Fresh media
containing AC extracts spanning serial concentrations between 0 – 500 µg/ml were added to 4 wells
per mouse (100 µl), and changed twice a week. The AC plates were read at day 1 and day 7 and the
data analysed for the proportion of seeded crypts that grew into organoids and for the organoid size.
Four biological replicates were used. Mann Whitney U tests were used to determine statistical
significance.
2.10.5.6 A readout of the effects of ex vivo application of BRBs on the self-renewal efficiency of Apc
deficient cells to form organoids
To determine the effect of ex vivo application of BRB-derived ACs on the self-renewal ability
of Apcfl/fl cells, organoids at day 7 after treatment with the respective doses of AC (0 – 500 µg/ml) from
section 2.10.5.5, were passaged to single cells. The cells were then reseeded in matrigel at 8000 cells
per well and fresh AC media was applied at the same concentration previously exposed to. The media
was changed twice in a week. A plate read was taken at day 7 and analysed using the Gelcount
software to evaluate the proportion of organoids that formed from single cells and the average
organoid size. Statistical significance was determined using Mann Whitney U test.
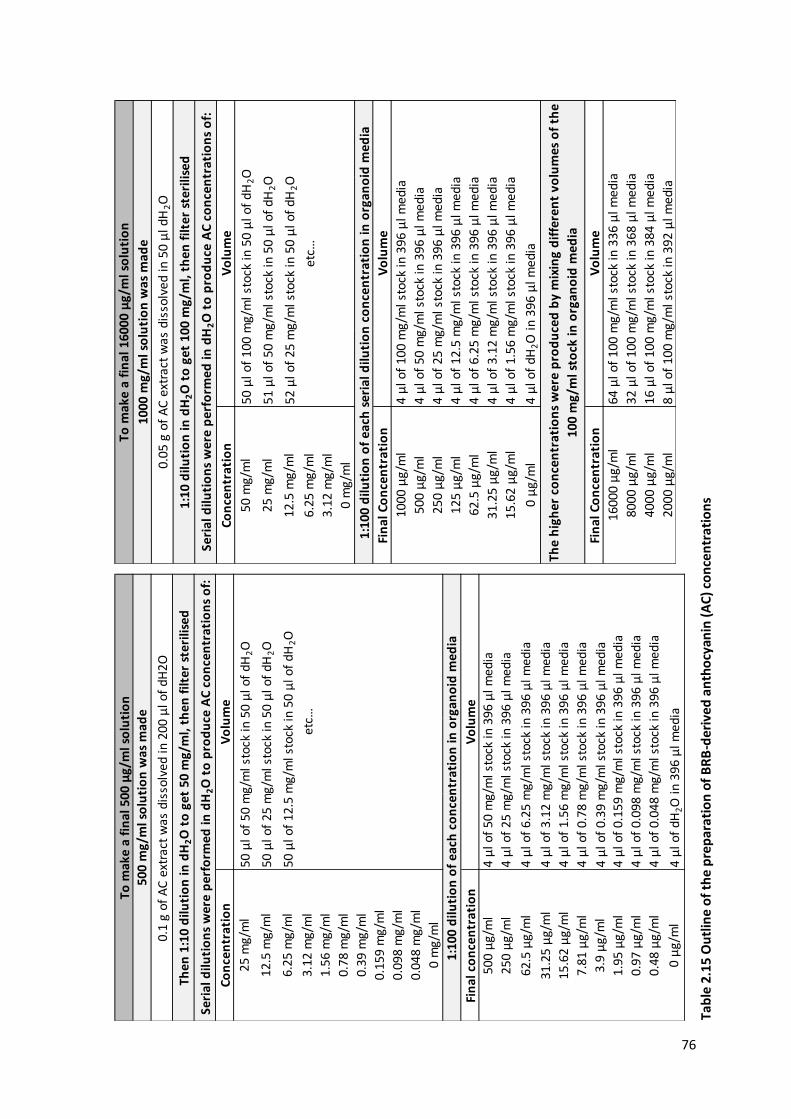
76
1600
0 μ
g/m
l
Con
cen
trat
ion
0 m
g/m
l
3.12
mg/
ml
6.25
mg/
ml
12.5
mg/
ml
25 m
g/m
l
50 m
g/m
l
The
hig
her
co
nce
ntr
atio
ns
wer
e p
rod
uce
d b
y m
ixin
g d
iffe
ren
t vo
lum
es o
f th
e
100
mg/
ml s
tock
in o
rgan
oid
med
ia
Fin
al C
on
cen
trat
ion
Vo
lum
e
8 μ
l of
100
mg/
ml s
tock
in 3
92 μ
l med
ia
16 μ
l of
100
mg/
ml s
tock
in 3
84 μ
l med
ia
32 μ
l of
100
mg/
ml s
tock
in 3
68 μ
l med
ia
64 μ
l of
100
mg/
ml s
tock
in 3
36 μ
l med
ia
2000
μg/
ml
4000
μg/
ml
8000
μg/
ml
1000
μg/
ml
4 μ
l of
dH2O
in 3
96 μ
l med
ia
4 μ
l of
1.56
mg/
ml s
tock
in 3
96 μ
l med
ia
4 μ
l of
3.12
mg/
ml s
tock
in 3
96 μ
l med
ia
4 μ
l of
6.25
mg/
ml s
tock
in 3
96 μ
l med
ia
4 μ
l of
12.5
mg/
ml s
tock
in 3
96 μ
l med
ia
4 μ
l of
25 m
g/m
l sto
ck in
396
μl m
edia
4 μ
l of
50 m
g/m
l sto
ck in
396
μl m
edia
4 μ
l of
100
mg/
ml s
tock
in 3
96 μ
l med
ia
1:10
0 d
iluti
on
of
each
ser
ial d
iluti
on
co
nce
ntr
atio
n in
org
ano
id m
edia
Vo
lum
eFi
nal
Co
nce
ntr
atio
n
0 μ
g/m
l
15.6
2 μ
g/m
l
31.2
5 μ
g/m
l
62.5
μg/
ml
125
μg/
ml
250
μg/
ml
500
μg/
ml
Seri
al d
iluti
on
s w
ere
per
form
ed in
dH
2O
to
pro
du
ce A
C co
nce
ntr
atio
ns
of:
Vo
lum
e
50 μ
l of
100
mg/
ml s
tock
in 5
0 μ
l of
dH2O
51 μ
l of
50 m
g/m
l sto
ck in
50
μl o
f dH
2O
52 μ
l of
25 m
g/m
l sto
ck in
50
μl o
f dH
2O
etc…
To m
ake
a fi
nal
160
00 μ
g/m
l so
luti
on
1000
mg/
ml s
olu
tio
n w
as m
ade
0.05
g o
f A
C e
xtra
ct w
as d
isso
lved
in 5
0 μ
l dH
2O
1:10
dilu
tio
n in
dH
2O
to
get
100
mg/
ml,
then
filt
er s
teri
lised
50 μ
l of
50 m
g/m
l sto
ck in
50
μl o
f dH
2O
4 μ
l of
1.56
mg/
ml s
tock
in 3
96 μ
l med
ia
4 μ
l of
3.12
mg/
ml s
tock
in 3
96 μ
l med
ia
4 μ
l of
0.39
mg/
ml s
tock
in 3
96 μ
l med
ia
0.1
g of
AC
ext
ract
was
dis
solv
ed in
200
μl o
f dH
2O
4 μ
l of
dH2O
in 3
96 μ
l med
ia
4 μ
l of
0.04
8 m
g/m
l sto
ck in
396
μl m
edia
4 μ
l of
0.09
8 m
g/m
l sto
ck in
396
μl m
edia
4 μ
l of
0.15
9 m
g/m
l sto
ck in
396
μl m
edia
4 μ
l of
0.78
mg/
ml s
tock
in 3
96 μ
l med
ia
25 m
g/m
l
etc…
Vo
lum
eCo
nce
ntr
atio
n
0.39
mg/
ml
0.78
mg/
ml
1.56
mg/
ml
3.12
mg/
ml
6.25
mg/
ml
12.5
mg/
ml
50 μ
l of
12.5
mg/
ml s
tock
in 5
0 μ
l of
dH2O
50 μ
l of
25 m
g/m
l sto
ck in
50
μl o
f dH
2O
0 μ
g/m
l
0 m
g/m
l
0.04
8 m
g/m
l
0.09
8 m
g/m
l
0.15
9 m
g/m
l
4 μ
l of
6.25
mg/
ml s
tock
in 3
96 μ
l med
ia
4 μ
l of
25 m
g/m
l sto
ck in
396
μl m
edia
4 μ
l of
50 m
g/m
l sto
ck in
396
μl m
edia
Vo
lum
e
1:10
0 d
iluti
on
of
each
co
nce
ntr
atio
n in
org
ano
id m
edia
500
μg/
ml
Fin
al c
on
cen
trat
ion
0.48
μg/
ml
0.97
μg/
ml
1.95
μg/
ml
3.9
μg/
ml
7.81
μg/
ml
15.6
2 μ
g/m
l
31.2
5 μ
g/m
l
62.5
μg/
ml
250
μg/
ml
To m
ake
a fi
nal
500
μg/
ml s
olu
tio
n50
0 m
g/m
l so
luti
on
was
mad
e
Then
1:1
0 d
iluti
on
in d
H2O
to
get
50
mg/
ml,
then
filt
er s
teri
lised
Seri
al d
iluti
on
s w
ere
per
form
ed in
dH
2O
to
pro
du
ce A
C co
nce
ntr
atio
ns
of:
Tab
le 2
.15
Ou
tlin
e o
f th
e p
rep
arat
ion
of
BR
B-d
eriv
ed a
nth
ocy
anin
(A
C)
con
cen
trat
ion
s

77
2.11 Data and Statistical Analysis
All data was represented graphically using GraphPad Prism6. The same programme performed
all statistical analysis and calculated the cohort means and SEM.
Mann Whitney U test
To detect statistical differences between non-parametric data sets the Mann Whitney U two-
tailed test was performed unless otherwise stated. For analysis of acute loss of Apc using the AhCre
mouse model the Mann Whitney U one-tailed test was used due to a small n number (number of mice
per cohort). Significant differences were accepted when p values were less than or equal to (≤) 0.05.
Kolmogorov-Smirnov test
Distributions of cells in crypts or aberrant areas were recorded in a specific manner using
Microsoft Office Excel. Cells were scored from the base of the intestinal crypt (position #1), along the
crypt-villus axis in a single line until the tip of the villi. Positively stained cells were recorded as 1 and
negatively stained cells were recorded as 0 over 50 half crypts per biological replicate. The sum of cells
at each position within the crypt-villus structure were calculated and averaged per cohort. The
cumulative frequency for each cohort was then calculated and graphically represented as an XY plot
in GraphPad Prism6. To determine whether the distribution between two datasets was significantly
different a Kolmogorov-Smirnov test was performed. Statistically significant differences were
determined when p values were less than or equal to (≤) 0.05.
Kaplan Meier survival analysis
A survival curve was generated using GraphPad Prism6. Statistical analysis was conducted
using the Log-rank (Mantel-Cox) test and Gehan-Breslow-Wilcoxon test for significance. A significant
difference between data sets was accepted when p values ≤ 0.05.
78
3 Investigating the effect of black raspberries on normal and Wnt-activated murine
small intestine
3.1 Introduction
Wnt signalling is a key pathway in intestinal homeostasis. Numerous studies suggest that
deregulation of this pathway through the loss of the APC tumour suppressor is an initiating event in
the development of human intestinal tumourigenesis, and mutations in APC are present in
approximately 80% of CRC cases (Powell et al. 1992; Leslie et al. 2002). In vivo murine models of Wnt-
driven CRC, in addition to providing insights regarding tumourigenesis, also provide useful tools for
identifying and investigating the effect of novel therapeutic and chemopreventative strategies for
intestinal tumourigenesis.
It has long been known that our diet is strongly associated with cancer risk, such that certain
dietary constituents are associated with increased risk of developing CRC (red/ processed meats, lack
of dietary fibre) while others have a reduced risk (fruits and vegetables) (WCRF/AICR 2011). Despite
this we have a very limited understanding of the mechanisms that underpin these associations. The
potential chemopreventative effects of BRBs have been extensively investigated, and have been
shown to have a range of anti-tumourigenic effects at both the initiation and progression stages of
CRC development in both animal and human studies (Bi et al. 2010; Wang et al. 2013b; Wang et al.
2013c). Despite the promising results of BRB treatment in in vitro and in vivo models of murine and
human CRC, one fundamental question has not been addressed, ‘what effect do BRBs have on the
normal and malignant ISC populations?’ as the ISCs are thought to be the origin of CRC (Baker et al.
2009).
This chapter aimed to characterise, by histological and gene expression analysis, the effects
BRBs had on the phenotype of normal small intestine (Apc+/+ mouse) and at the earliest stage of
intestinal cancer initiation (Apcfl/fl mouse). In order to achieve this two different mouse models were
utilised: the AhCre and VillinCreERT2 systems to drive recombination of Apc within the mouse intestinal
epithelium. Cre recombinase under the control of the Ah promoter is expressed in the crypt epithelium
excluding the Paneth cells. AhCre mice were fed ad libitum on a standard diet (RM3(E) standard diet
= control diet) or a 10% freeze-dried BRB powder in AIN76A powder) 2 weeks prior to induction. The
AIN76A diet, basal matched to BRB diet was not available at the time of this experiment so mice
assigned to the control cohorts remained on the standard in house diet. Homozygous deletion of Apc
was achieved by injection with βNF. The Villin promoter drives Cre expression in the entire intestinal
epithelium including the Paneth cells. VillinCreERT2 mice were started on an AIN76A pellet or a 10%
BRB powder supplemented in an AIN76A pelleted diet (ad libitum) 2 weeks prior to induction.
Recombination of the Apc allele was achieved by tamoxifen injection. In both models, Apc loss resulted
79
in dysregulated β-catenin localisation, expansion of the stem cell population, perturbed
differentiation, migration, proliferation and apoptosis (Sansom et al. 2004; Andreu et al. 2005)
suggesting that perturbation of the ISC compartment plays a vital role in tumourigenesis. Due to these
phenotypes, particular attention was paid to the effects of BRBs on cell differentiation, ISC markers
and Wnt target genes as a readout to evaluate the effect BRBs had on the ISCs.
3.2 Results
3.2.1 Examining homeostasis and the consequence of acute loss of Apc driven by AhCre in the
context of BRB diet
To understand how BRBs mediate their chemopreventative effects, the effect of BRBs on
homeostasis of the normal and Apc deficient murine small intestine was investigated. Age matched
(136 days old) AhCre Apc+/+ and AhCre Apcfl/fl mice were started on the control or 10% freeze-dried
BRB diets. After two weeks of feeding on their respective diet, mice (150 days old) were induced by IP
injection of βNF and then culled 5 days later before harvesting of their intestine and organs. Mice
remained on their respective diets throughout the experiment. Tissue was dissected as previously
described (section 2.5) and the intestines were rolled into ‘swiss-roll’ like structures and quick fixed in
formalin, sectioned to 5 microns, and mounted onto slides in preparation for H&E staining and IHC.
Cell scoring was counted from 25 full or 50 half crypts as outlined in Section 2.7. Table 3.1 and Table
3.2 represents all the parameters investigated and results obtained in this chapter.
Any immediate changes to crypt architecture as a result of BRB exposure were investigated
by scoring the number of cells per crypt in H&E stained sections (Figure 3.1A). Feeding of BRBs had no
effect on the number of cells per crypt in Apc+/+ mice when compared to the wildtype control (Apc+/+
control = 45.59 ± 1.86 (SEM) vs Apc+/+ BRB = 43.43 ± 1.23; Figure 3.1B, Table 3.1). Cre-mediated Apc
loss in the murine small intestine resulted in a significant increase in the number of cells per crypt
(Apc+/+ control = 45.59 ± 1.86 vs Apcfl/fl control= 135.7 ± 3.83; Figure 3.1B, Table 3.1) as previously
reported and consistent with efficient Cre induced deletion of Apc (Sansom et al. 2004). Unexpectedly,
BRB treatment amplified this phenotype with a further increase in the number of cells in the aberrant
Apcfl/fl crypt (Apcfl/fl control = 135.7 ± 3.83 vs Apcfl/fl BRB = 153.7 ± 1.73; Figure 3.1B, Table 3.1).
To gain further insight into this architectural change the role of BRBs in crypt homeostasis was
examined. Cell proliferation was determined by using three complimentary approaches: counting of
mitotic bodies in H&E stained intestinal sections, Ki67 immunostaining and BrdU incorporation (Figure
S 8.1 and Figure S 8.2). Based on analysis of mitotic bodies, BRBs had no significant effect on cell
division in wildtype (Apc+/+ control = 1.69 ± 0.20 vs Apc+/+ BRB = 2.37 ± 0.24) or Apc deficient crypts
(Apcfl/fl control = 4.63 ± 0.095 vs Apcfl/fl BRB = 6.87 ± 0.66; Figure 3.2A, Table 3.1). This data was

80
supported by analysis of the marker Ki67, which is a marker of all active phases of the cell cycle except
G0 and is used as a proxy measure of proliferation. There was no difference in scoring of Ki67 positive
cells between control and BRB treated wildtype samples (Apc+/+ control = 34.83 ± 0.69 vs Apc+/+ BRB =
37.08 ± 1.49; Figure 3.2B, Table 3.1) or between control and BRB treated Apc samples (Apcfl/fl control
= 123.7 ± 9.61 vs Apcfl/fl BRB = 127.5 ± 7.21; Figure 3.2B, Table 3.1). As expected the number of mitotic
figures (Apc+/+ control = 1.69 ± 0.20 vs Apcfl/fl control = 4.63 ± 0.95; Figure 3.2A, Table 3.1) and Ki67
positive cells (Apc+/+ control = 34.83 ± 0.69 vs Apcfl/fl control = 123.7 ± 9.61; Figure 3.2B. Table 3.1) were
increased by 2.7 fold and 3.5 fold respectively following Apc deletion compared to wildtype. However,
analysis of BrdU, a thymidine analogue incorporated into newly synthesised DNA strands (Duque and
Rakic 2011), suggested that BRBs influenced the cell cycle. Apcfl/fl mice were administered with BrdU
2 and 24 hrs prior to culling. There was no statistical difference in the number of BrdU positive cells in
control fed Apcfl/fl mice over 24 hrs (2 hr Apcfl/fl control = 40.68 ± 3.33 vs 24 hr Apcfl/fl control = 33.94 ±
5.68; p value = 0.2000 one-tailed Mann Whitney U test; Figure 3.2C). However, BRB exposed mice had
an increased number of BrdU positive cells over 24 hrs (2 hr Apcfl/fl BRB = 49.49 ± 5.10 vs 24 hr Apcfl/fl
BRB = 71.05 ± 0.75; p value = 0.0286 one-tailed Mann Whitney U test; Figure 3.2C). When analysing
the number of BrdU positive cells in the context of BRB treatment, there was no statistical difference
between Apcfl/fl control diet and BRB treated mice at the 2 hr time point (2 hr Apcfl/fl control = 40.68 ±
3.33 vs 2 hr Apcfl/fl BRB = 49.49 ± 5.01, Figure 3.2C, Table 3.1), but there was a significant 2 fold increase
at 24 hrs (24 hr Apcfl/fl control = 33.94 ± 5.68 vs 24 hr Apcfl/fl BRB = 71.05 ± 0.75; Figure 3.2C, Table 3.1).
The 2 fold increase in BrdU positive cells at 24 hrs corresponded with a restoration of cell migration
along the crypt-villus axis, which is supressed in Apc deficient intestine (Sansom et al. 2004). BrdU
positive cells moved 10 cell positions (at the 50% cumulative frequency) over 24 hrs in the Apcfl/fl
control fed diet (Figure 3.2D), consistent with previously published studies by Méniel et al. (2013).
BRBs reinstated migration along the Apcfl/fl crypt-villus axis as BrdU-positive cells moved 25 cell
positions over 24 hrs (Figure 3.2E), 15 cell positions further than the control fed mice.
Changes in proliferation and migration are associated with changes in cell death upon acute
Apc loss driven by the AhCre transgene (Sansom et al. 2004). To assess changes in apoptosis in the
context of BRBs, the number of apoptotic bodies was scored from H&E (Figure S 8.1) and cleaved-
caspase 3 (CC3) stained intestinal sections (Figure 3.3A). Overall, exposure to BRBs was found to
increase the amount of cell death in wildtype and Apcfl/fl mice. Quantification of apoptotic bodies
revealed a significant 3.6 fold increase in the number of apoptotic bodies in BRB exposed wildtype
crypts relative to wildtype control (Apc+/+ control = 0.23 ± 0.08 vs Apc+/+ BRB = 0.83 ± 0.17; Figure 3.3B,
Table 3.1). Following acute loss of Apc, the number of apoptotic bodies was significantly increased
(Apc+/+ control = 0.23 ± 0.08 vs Apcfl/fl control = 2.06 ± 0.33, Figure 3.3B, Table 3.1) as previously
81
reported. There was a non-significant 2.1 fold increase in apoptotic bodies in BRB treated Apcfl/fl
relative to Apcfl/fl control fed mice (Apcfl/fl control = 2.06 ± 0.33 vs Apcfl/fl BRB = 4.37 ± 1.25; Figure 3.3B,
Table 3.1). There was a large variation in apoptotic body counts within the BRB-treated Apc-deleted
samples which meant the study was underpowered for this particular measurement. The power of a
statistical test refers to the chance that the result will be statistically significant when it should, such
that the alternative hypothesis is actually true and not due to chance. The power of any statistical test
relies upon certain interrelated factors; a study with a low power has a reduced chance of identifying
a true effect. In the instance of apoptosis in BRB fed Apcfl/fl mice, the statistical power was 58.6% for
a sample size of 3 at a 95% confidence interval. The probability that this result would be statistically
significant if the cohort size was increased to 6 would be over 80% (Lenth 2001). Consequently, other
markers of apoptosis were applied to the samples.
CC3 is a marker of the sequential activation of the caspase cascade in apoptosis.
Quantification of CC3 positive cells from CC3 IHC (Figure 3.3A) revealed no difference between control
and BRB wildtype samples (Apc+/+ control = 0.86 ± 0.28 vs Apc+/+ BRB = 1.35 ± 0.37, Figure 3.3C, Table
3.1). Apc loss within the crypt cells resulted in a significant increase (6.7 fold) in the number of CC3
positive cells relative to wildtype (Apc+/+ control = 0.86 ± 0.28 vs Apcfl/fl control = 5.78 ± 0.50). There
was also a statistically significant difference between control treated and BRB treated Apc samples
with a further increase (2.7 fold) in the number of CC3 positive cells (Apcfl/fl control = 5.78 ± 0.50 vs
Apcfl/fl BRB = 15.61 ± 2.45; Figure 3.3C, Table 3.1).
Together, these data demonstrate that short-term exposure to freeze-dried BRBs had little
effect on normal gut homeostasis with only small increases in mitosis and apoptosis. However, BRBs
play a significant role in the Apc deficient epithelia with potential anti-tumourigenic effects on
apoptosis and migration alongside potential pro-tumourigenic increases in proliferation and crypt size.
Due to the short-term nature of this model we were unable to assess the net outcome of these
changes in the context of chemoprevention.

82
Figure 3.1 Feeding of 10% BRBs had no effect on the gross architecture of the normal murine small intestine but further increased crypt size following Apc loss
(A) H&E stained intestinal tissue sections highlight the intestinal epithelial cells. Mitotic cells are depicted by white arrows and apoptotic bodies are marked with black arrows. (B) Scoring of epithelial cells reported no effect of BRB on the number of cells per crypt in wildtype mice. Apc loss significantly altered the cellular phenotype of the small intestine (A iii) characterised by a marked increase in cell number and proliferative compartment. Exposure of Apc deficient intestine to BRBs resulted in a significantly larger crypt (A iv) than control. * P value ≤ 0.05, n ≥ 3, one-tailed Mann Whitney U test. Error bars represent SEM. Scale bars represent 100 μm.
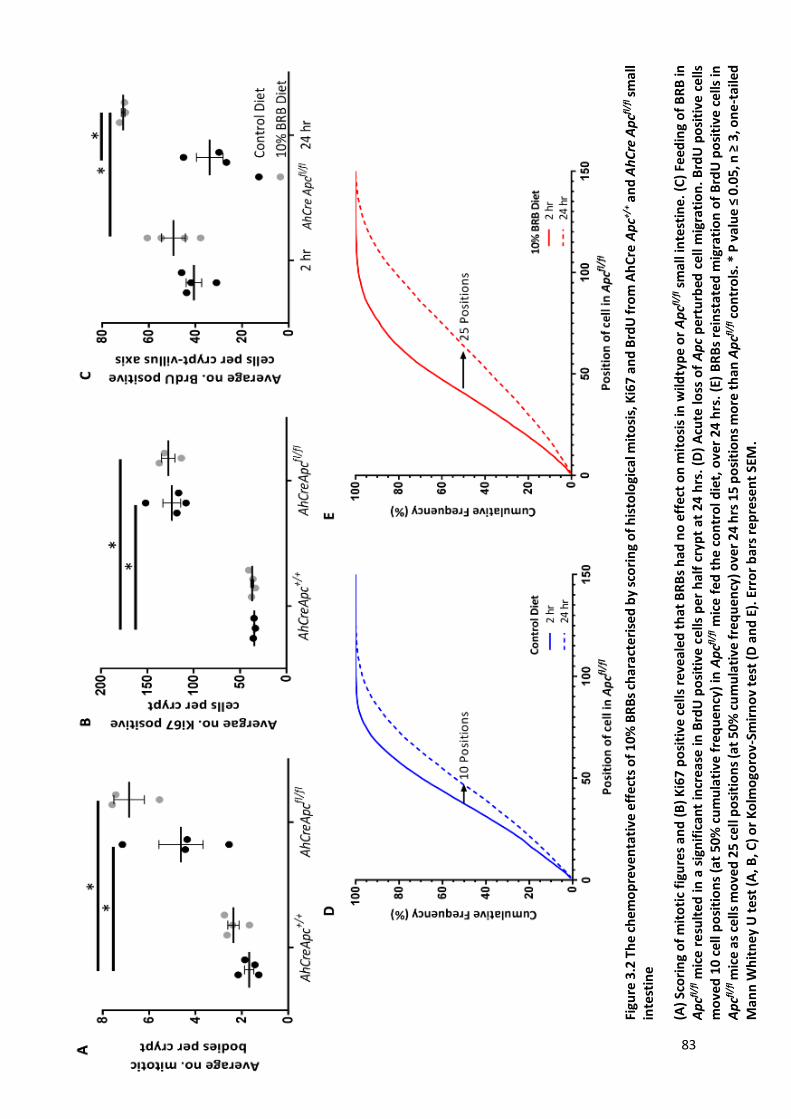
83
Figu
re 3
.2 T
he
chem
op
reve
nta
tive
eff
ects
of
10%
BR
Bs
char
acte
rise
d b
y sc
ori
ng
of
his
tolo
gica
l mit
osi
s, K
i67
an
d B
rdU
fro
m A
hC
re A
pc+/
+ an
d A
hC
re A
pcfl
/fl s
mal
l in
test
ine
(A)
Sco
rin
g o
f m
ito
tic
figu
res
and
(B
) K
i67
po
siti
ve c
ells
re
veal
ed
th
at B
RB
s h
ad n
o e
ffe
ct o
n m
ito
sis
in w
ildty
pe
or
Ap
cfl/f
l sm
all i
nte
stin
e. (
C)
Feed
ing
of
BR
B in
A
pcfl
/fl m
ice
resu
lte
d in
a s
ign
ific
ant
incr
ease
in B
rdU
po
siti
ve c
ells
pe
r h
alf
cryp
t at
24
hrs
. (D
) A
cute
loss
of
Ap
c p
ertu
rbed
cel
l mig
rati
on
. B
rdU
po
siti
ve c
ells
m
ove
d 1
0 ce
ll p
osi
tio
ns
(at
50%
cu
mu
lati
ve f
req
uen
cy)
in A
pcfl
/fl m
ice
fed
th
e co
ntr
ol d
iet,
ove
r 24
hrs
. (E
) B
RB
s re
inst
ated
mig
rati
on
of
Brd
U p
osi
tive
cel
ls in
A
pcfl
/fl m
ice
as c
ells
mo
ved
25
cell
po
siti
on
s (a
t 50
% c
um
ula
tive
fre
qu
en
cy) o
ver
24
hrs
15
po
siti
on
s m
ore
th
an A
pcfl
/fl c
on
tro
ls. *
P v
alu
e ≤
0.0
5, n
≥ 3
, on
e-t
aile
d
Man
n W
hit
ney
U t
est
(A
, B, C
) o
r K
olm
ogo
rov-
Smir
no
v te
st (
D a
nd
E).
Err
or
bar
s re
pre
sen
t SE
M.

84
Figure 3.3 The chemopreventative effects of 10% BRBs, characterised by scoring of histological apoptotic
figures and CC3 immunohistochemistry from AhCre Apc+/+
and AhCre Apcfl/fl
small intestine
(A) Representative images of CC3 staining in wildtype and Apcfl/fl
crypt exposed to control and BRB diet. (B) Scoring of apoptotic bodies revealed that BRBs significantly increased cell death in wildtype but not
Apcfl/fl
small intestine. (C) However, scoring of CC3 positive cells per crypt showed that BRBs did not affect
the number of CC3 cells in wildtype mice but significantly increased CC3 positivity in Apcfl/fl
mice. * P value ≤ 0.05, n ≥ 3, one-tailed Mann Whitney U test. Error bars represent SEM. Scale bars represent 100 μm.
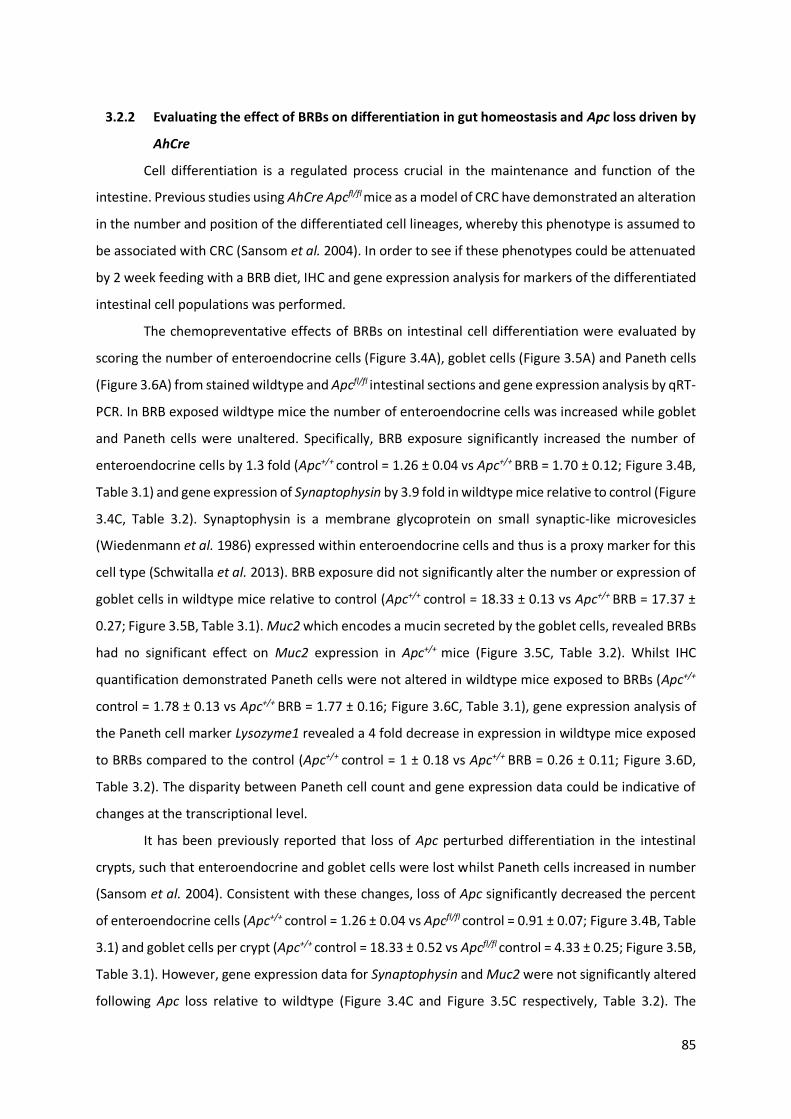
85
3.2.2 Evaluating the effect of BRBs on differentiation in gut homeostasis and Apc loss driven by
AhCre
Cell differentiation is a regulated process crucial in the maintenance and function of the
intestine. Previous studies using AhCre Apcfl/fl mice as a model of CRC have demonstrated an alteration
in the number and position of the differentiated cell lineages, whereby this phenotype is assumed to
be associated with CRC (Sansom et al. 2004). In order to see if these phenotypes could be attenuated
by 2 week feeding with a BRB diet, IHC and gene expression analysis for markers of the differentiated
intestinal cell populations was performed.
The chemopreventative effects of BRBs on intestinal cell differentiation were evaluated by
scoring the number of enteroendocrine cells (Figure 3.4A), goblet cells (Figure 3.5A) and Paneth cells
(Figure 3.6A) from stained wildtype and Apcfl/fl intestinal sections and gene expression analysis by qRT-
PCR. In BRB exposed wildtype mice the number of enteroendocrine cells was increased while goblet
and Paneth cells were unaltered. Specifically, BRB exposure significantly increased the number of
enteroendocrine cells by 1.3 fold (Apc+/+ control = 1.26 ± 0.04 vs Apc+/+ BRB = 1.70 ± 0.12; Figure 3.4B,
Table 3.1) and gene expression of Synaptophysin by 3.9 fold in wildtype mice relative to control (Figure
3.4C, Table 3.2). Synaptophysin is a membrane glycoprotein on small synaptic-like microvesicles
(Wiedenmann et al. 1986) expressed within enteroendocrine cells and thus is a proxy marker for this
cell type (Schwitalla et al. 2013). BRB exposure did not significantly alter the number or expression of
goblet cells in wildtype mice relative to control (Apc+/+ control = 18.33 ± 0.13 vs Apc+/+ BRB = 17.37 ±
0.27; Figure 3.5B, Table 3.1). Muc2 which encodes a mucin secreted by the goblet cells, revealed BRBs
had no significant effect on Muc2 expression in Apc+/+ mice (Figure 3.5C, Table 3.2). Whilst IHC
quantification demonstrated Paneth cells were not altered in wildtype mice exposed to BRBs (Apc+/+
control = 1.78 ± 0.13 vs Apc+/+ BRB = 1.77 ± 0.16; Figure 3.6C, Table 3.1), gene expression analysis of
the Paneth cell marker Lysozyme1 revealed a 4 fold decrease in expression in wildtype mice exposed
to BRBs compared to the control (Apc+/+ control = 1 ± 0.18 vs Apc+/+ BRB = 0.26 ± 0.11; Figure 3.6D,
Table 3.2). The disparity between Paneth cell count and gene expression data could be indicative of
changes at the transcriptional level.
It has been previously reported that loss of Apc perturbed differentiation in the intestinal
crypts, such that enteroendocrine and goblet cells were lost whilst Paneth cells increased in number
(Sansom et al. 2004). Consistent with these changes, loss of Apc significantly decreased the percent
of enteroendocrine cells (Apc+/+ control = 1.26 ± 0.04 vs Apcfl/fl control = 0.91 ± 0.07; Figure 3.4B, Table
3.1) and goblet cells per crypt (Apc+/+ control = 18.33 ± 0.52 vs Apcfl/fl control = 4.33 ± 0.25; Figure 3.5B,
Table 3.1). However, gene expression data for Synaptophysin and Muc2 were not significantly altered
following Apc loss relative to wildtype (Figure 3.4C and Figure 3.5C respectively, Table 3.2). The

86
number of Paneth cells were increased following acute loss of Apc (Apc+/+ control = 1.78 ± 0.13 vs
Apcfl/fl control= 5.86 ± 1.02; Figure 3.6C, Table 3.1). Consistent with Paneth cell scoring, loss of Apc
resulted in a significant increase in Lysozyme1 expression (by 2.7 fold) relative to the wildtype control
(Apc+/+ control = 1 ± 0.18 vs Apcfl/fl control = 2.72 ± 0.69; Figure 3.6D, Table 3.2).
Analysis of the cell types revealed that BRBs partially reinstated differentiation in Apc deficient
crypts. BRB feeding increased the number of enteroendocrine (Apcfl/fl control = 0.91 ± 0.07 vs Apcfl/fl
BRB = 1.26 ± 0.09; Figure 3.4B, Table 3.1) and goblet cells (Apcfl/fl control = 4.33 ± 0.25 vs Apcfl/fl BRB =
7.82 ± 0.24; Figure 3.5B, Table 3.1) by 1.3 fold and 1.8 fold respectively, relative to the Apcfl/fl control.
However, gene expression data did not corroborate these findings as Synaptophysin (Apcfl/fl control =
1.11 ± 0.18 vs Apcfl/fl BRB = 1.87 ± 0.59; Figure 3.4C, Table 3.2) and Muc2 (Apcfl/fl control = 0.88 ± 0.24
vs Apcfl/fl BRB = 0.40 ± 0.22; Figure 3.5C, Table 3.2) gene expressions were not significantly altered. The
lack of significance in these tests suggests that the study was underpowered for these particular
markers which could be addressed by increasing the cohort size in a subsequent study. BRB treatment
resulted in a significant decrease (56%) in the number of Paneth cells in Apc deficient intestine relative
to Apcfl/fl control (Apcfl/fl control = 5.86 ± 1.02 vs Apcfl/fl BRB= 2.57 ± 0.21; Figure 3.6C, Table 3.1).
Consistent with this, BRBs significantly decreased Lysozyme1 gene expression, by 4 fold, in Apcfl/fl mice
compared to Apcfl/fl control (Apcfl/fl control = 2.72 ± 0.69 vs Apcfl/fl BRB= 0.67 ± 0.14; Figure 3.6D, Table
3.2). Previous studies have reported that in addition to an increased number of Paneth cells, acute
loss of Apc perturbed the positioning of Paneth cells such that they were no longer confined to the
crypt base (Sansom et al. 2004). Therefore, Paneth cell position was next evaluated. Paneth cell
position was not altered in wildtype mice exposed to BRBs where they remained confined to the crypt
base akin to wildtype controls (Apc+/+ control = red line vs Apc+/+ BRB = blue line, n = 4, p value = >0.999,
Kolmogorov-Smirnov test, Figure 3.6B). In support of previous work, loss of Apc significantly mis-
localised Paneth cells throughout the crypt-villus structure (Apc+/+ control = red line vs Apcfl/fl control =
orange line, n = 4, p value = <0.0001, Kolmogorov-Smirnov test, Figure 3.6B). BRBs were able to
partially restore Paneth cell position in Apc deficient crypts. Although the Paneth cells were still mis-
localised they were significantly lower down the crypt-villus axis compared to the Apcfl/fl controls
(Apcfl/fl control = orange line vs n = 4, Apcfl/fl BRB = green line, n = 3, p value = <0.0001, Kolmogorov-
Smirnov test, Figure 3.6B).
Taken together, these data show that a 2 week feeding of 10% BRB powder was sufficient to
attenuate the crypt-progenitor phenotype observed following acute Apc loss, by partially reinstating
differentiation and cell positioning within the crypts. A summary of these findings can be found in
Table 3.3.
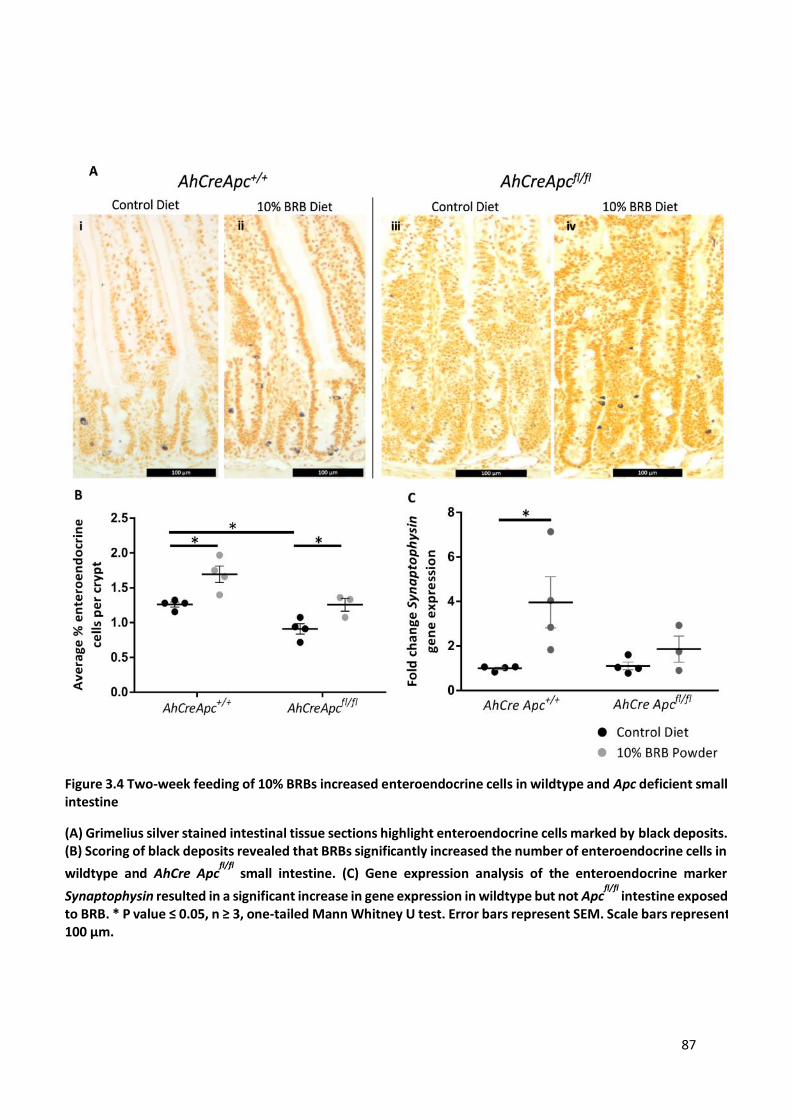
87
Figure 3.4 Two-week feeding of 10% BRBs increased enteroendocrine cells in wildtype and Apc deficient small intestine
(A) Grimelius silver stained intestinal tissue sections highlight enteroendocrine cells marked by black deposits. (B) Scoring of black deposits revealed that BRBs significantly increased the number of enteroendocrine cells in
wildtype and AhCre Apcfl/fl
small intestine. (C) Gene expression analysis of the enteroendocrine marker
Synaptophysin resulted in a significant increase in gene expression in wildtype but not Apcfl/fl
intestine exposed to BRB. * P value ≤ 0.05, n ≥ 3, one-tailed Mann Whitney U test. Error bars represent SEM. Scale bars represent 100 μm.
88
Figure 3.5 Two-week feeding of 10% BRBs increased the number of goblet cells in Apc deficient small intestine
(A) Alcian blue stained intestinal tissue sections show goblet cells in blue. (B) BRBs had no effect on the number of goblet cells in wildtype intestine but significantly increased the average % of goblet cells in the aberrant crypt region, following acute loss of Apc in the intestine driven by the AhCre transgene. (C) Gene expression
analysis of the goblet cell marker Muc2 was not altered in wildtype or Apcfl/fl
small intestine in the context of BRBs. * P value ≤ 0.05, n ≥ 3, one-tailed Mann Whitney U test. Error bars represent SEM. Scale bars represent 100 μm.
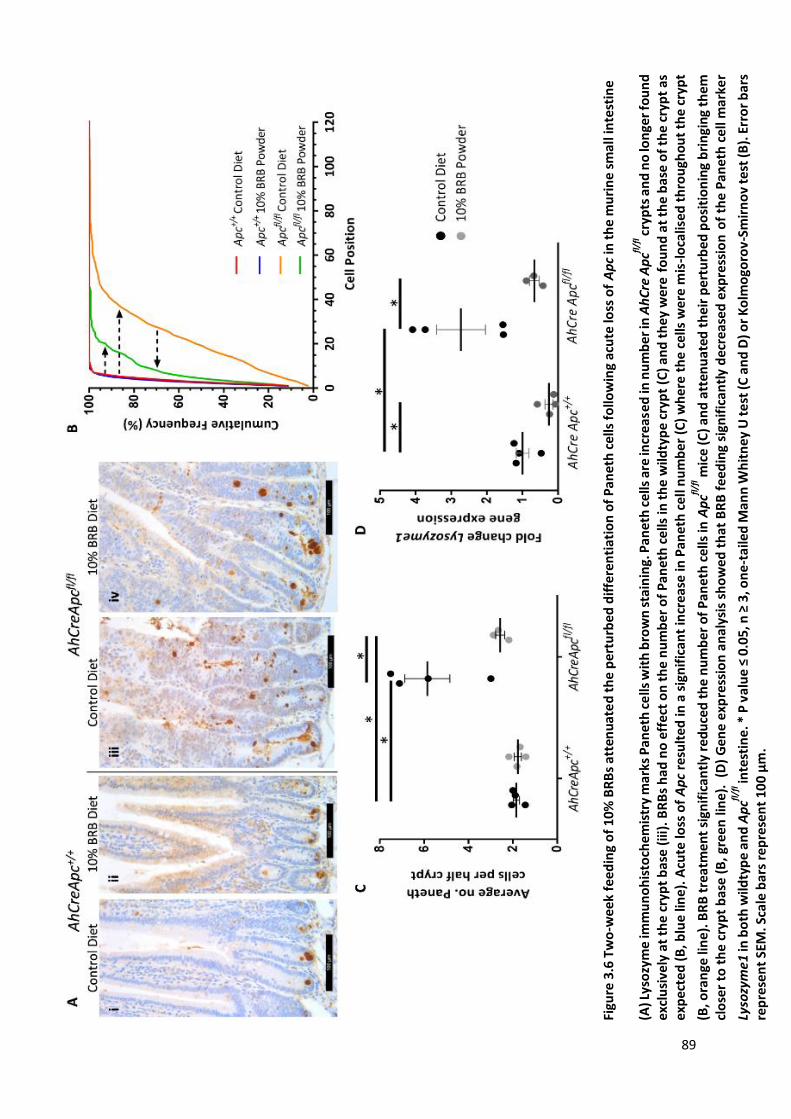
89
Figu
re 3
.6 T
wo
-wee
k fe
edin
g o
f 10
% B
RB
s at
ten
uat
ed
th
e p
ert
urb
ed
dif
fere
nti
atio
n o
f P
ane
th c
ells
fo
llow
ing
acu
te lo
ss o
f A
pc
in t
he
mu
rin
e sm
all i
nte
stin
e
(A) L
yso
zym
e im
mu
no
his
toch
emis
try
mar
ks P
anet
h c
ells
wit
h b
row
n s
tain
ing.
Pan
eth
ce
lls a
re in
crea
sed
in n
um
ber
in A
hC
re A
pcfl
/fl c
ryp
ts a
nd
no
lon
ger
fou
nd
ex
clu
sive
ly a
t th
e c
ryp
t b
ase
(iii)
. BR
Bs
had
no
eff
ect
on
th
e n
um
be
r o
f P
ane
th c
ells
in t
he
wild
typ
e cr
ypt
(C)
and
th
ey w
ere
fo
un
d a
t th
e b
ase
of
the
cryp
t as
ex
pec
ted
(B
, blu
e lin
e). A
cute
loss
of
Ap
c re
sult
ed
in a
sig
nif
ican
t in
cre
ase
in P
ane
th c
ell
nu
mb
er
(C)
wh
ere
th
e ce
lls w
ere
mis
-lo
calis
ed t
hro
ugh
ou
t th
e cr
ypt
(B, o
ran
ge li
ne)
. BR
B t
reat
men
t si
gnif
ican
tly
red
uce
d t
he
nu
mb
er o
f P
anet
h c
ells
in A
pcfl
/fl m
ice
(C)
and
att
enu
ated
th
eir
per
turb
ed p
osi
tio
nin
g b
rin
gin
g th
em
clo
ser
to t
he
cryp
t b
ase
(B, g
reen
lin
e).
(D
) G
ene
exp
ress
ion
an
alys
is s
ho
we
d t
hat
BR
B f
ee
din
g si
gnif
ican
tly
dec
reas
ed e
xpre
ssio
n o
f th
e P
anet
h c
ell m
arke
r
Lyso
zym
e1 in
bo
th w
ildty
pe
and
Ap
cfl/f
l inte
stin
e. *
P v
alu
e ≤
0.0
5, n
≥ 3
, on
e-t
aile
d M
ann
Wh
itn
ey
U t
est
(C
an
d D
) o
r K
olm
ogo
rov-
Smir
no
v te
st (
B).
Err
or
bar
s re
pre
sen
t SE
M. S
cale
bar
s re
pre
sen
t 10
0 μ
m.
90
3.2.3 10% BRB diet altered ISC gene expression in wildtype and Apcfl/fl small intestine
As previously outlined in sections 1.5 and 1.8 the ISCs (specifically the Lgr5+ population) are
pivotal in the regeneration of the intestinal tissue and are thought to be the origin of CSCs (Barker et
al. 2009). Potentially, an expansion of the ISC population could result in an increased number of cells
of origin and thus augment tumourigenesis. Previous animal, cell line and human based studies of the
chemopreventative effects of BRBs have not addressed the effects of BRBs on ISCs or CSCs. Therefore,
this thesis sought to investigate the effects of BRBs on the normal and malignant ISC populations. A
number of putative ISC markers were analysed in control and BRB fed AhCre Apc+/+ and Apcfl/fl samples
by qRT-PCR analysis. Results for all markers can be found in Table 3.2. Only statistically significant
changes as a result of BRB exposure are graphically represented (Figure 3.7). Loss of Apc resulted in a
significant increase in all ISC associated genes analysed (Table 3.2), consistent with an expansion in
the ISC compartment (Sansom et al. 2004). The majority of these markers followed a similar trend of
further up-regulation in Apcfl/fl mice when exposed to BRBs, but these changes were not found to be
significant (Table 3.2).
Overall, feeding of BRBs reduced the expression of putative stem cell markers in wildtype and
Apc deficient intestine, with the exception of Ascl2 which increased in BRB exposed Apcfl/fl intestine.
In wildtype intestine, Lgr5 and Olfm4 gene expressions were significantly down-regulated by 3.5 and
4.7 fold respectively, by BRB exposure relative to wildtype controls (Lgr5 Apc+/+ control = 1 ± 0.05 vs
Apc+/+ BRB = 0.28 ± 0.11; Figure 3.7A, Table 3.2; Olfm4 Apc+/+ control = 1 ± 0.08 vs Apc+/+ BRB = 0.21 ±
0.03; Figure 3.7A, Table 3.2). Ascl2 gene expression was non-significantly decreased by 2.3 fold in BRB
treated wildtype mice compared to wildtype control (Apc+/+ control = 1 ± 0.10 vs Apc+/+ BRB = 0.44 ±
0.20; Figure 3.7A, Table 3.2).
Exposure of Apc deficient mice to BRBs resulted in a non-significant down-regulation in Lgr5
expression (Apcfl/fl control = 4.99 ± 1.18 vs Apcfl/fl BRB= 2.17 ± 0.69; Figure 3.7A, Table 3.2). There was
large variation in gene expression of Lgr5 in the Apcfl/fl control cohort which were not explained by
differences in sex. A second study with a larger cohort size will be required to determine the relevance
of these findings. Additionally, Olfm4 gene expression was significantly decreased in Apc deficient
intestine following BRB treatment, relative to Apcfl/fl control (Apcfl/fl control = 4.97 ± 0.88 vs Apcfl/fl BRB
= 1.14 ± 0.45; Figure 3.7A, Table 3.2). Contradictory to Lgr5 and Olfm4 data, Ascl2 gene expression
was further up-regulated in Apc deficient mice following BRB treatment (Apcfl/fl control = 7.08 ± 0.37
vs Apcfl/fl BRB = 13.05 ± 1.35; Figure 3.7A, Table 3.2).
To further evaluate the effect of BRBs on Olfm4 expression in both wildtype and Apcfl/fl
intestine, in situ hybridisation was performed. In wildtype small intestine, in situ hybridisation
revealed Olfm4 was expressed at the base of the crypt (Figure 3.7B i). When evaluating the effects of

91
BRBs in wildtype mice, the expression of Olfm4 was still restricted to the crypt base, but the probe
signal appeared weaker (Figure 3.7B ii). Acute loss of Apc resulted in an expansion of the Olfm4
positive zone (Figure 3.7B iii), consistent with an increased stem cell zone and expansion in the
proliferative area (Sansom et al. 2004). BRB treatment did not limit the zone of Olfm4 expression in
the Apc deficient crypt, but the probe signal appeared reduced compared to the Apcfl/fl control (Figure
3.7B iv). This suggested that there was a reduction in Olfm4 expression and thus a potential reduction
in the malignant ISC population. Due to tissue disruption by proteinase K in the in situ hybridisation
technique, it was not possible to count the number of cells stained for Olfm4 using this approach.
Importantly, this method is not quantitative, and potential differences can only be determined
through representative images. Nonetheless, the apparent reduction in probe signal of Olfm4 in both
the wildtype and Apcfl/fl intestine supported the significant decrease in Olfm4 gene expression
revealed by qRT-PCR analysis (Figure 3.7A). Together, the Olfm4 data showed a reduction in stem cell
marker expression in the context of BRB feeding. However, from this it was not possible to determine
whether feeding of BRBs alter the number of stem cells. Alterations in ISC gene expression in wildtype
and Apcfl/fl mice in the context of BRBs are summarised in Table 3.4.
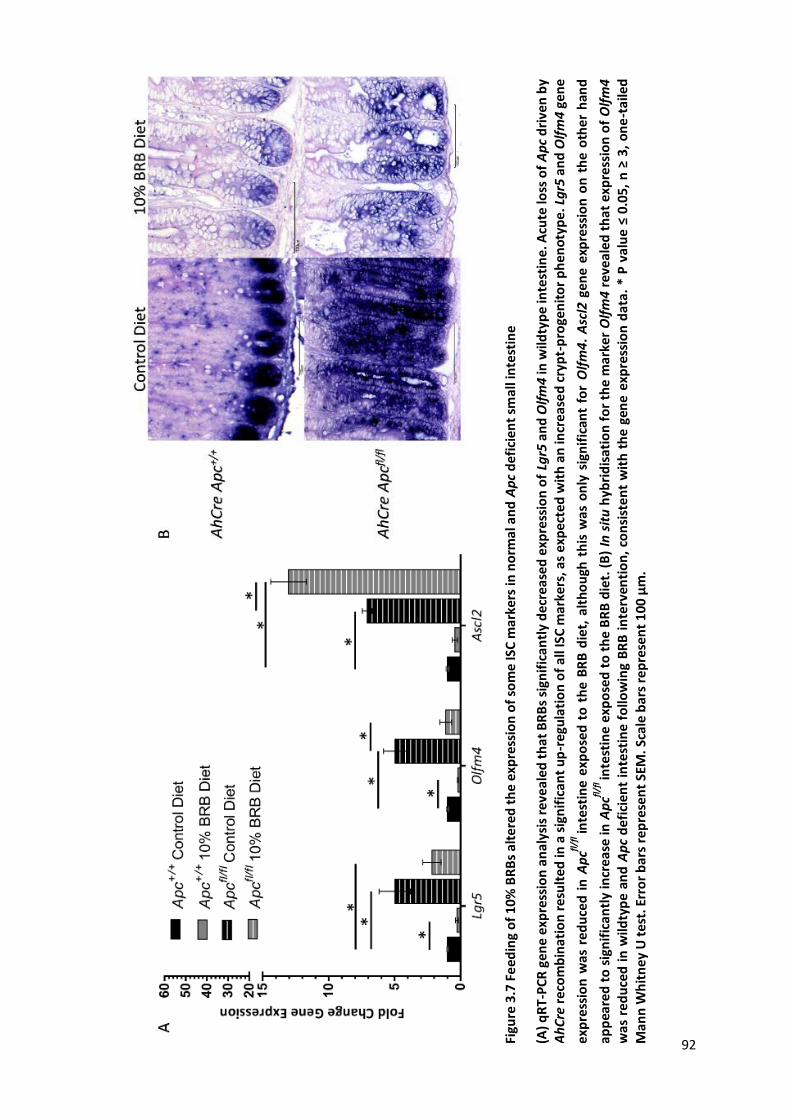
92
Figu
re 3
.7 F
eed
ing
of
10%
BR
Bs
alte
red
th
e ex
pre
ssio
n o
f so
me
ISC
mar
kers
in n
orm
al a
nd
Ap
c d
efi
cien
t sm
all i
nte
stin
e
(A)
qR
T-P
CR
gen
e ex
pre
ssio
n a
nal
ysis
rev
eale
d t
hat
BR
Bs
sign
ific
antl
y d
ecr
eas
ed
exp
ress
ion
of
Lgr5
an
d O
lfm
4 in
wild
typ
e in
test
ine.
Acu
te lo
ss o
f A
pc
dri
ven
by
Ah
Cre
rec
om
bin
atio
n r
esu
lted
in a
sig
nif
ican
t u
p-r
egu
lati
on
of
all I
SC m
arke
rs, a
s ex
pec
ted
wit
h a
n in
crea
sed
cry
pt-
pro
gen
ito
r p
hen
oty
pe.
Lg
r5 a
nd
Olf
m4
gen
e
exp
ress
ion
was
red
uce
d i
n A
pcfl
/fl in
test
ine
exp
ose
d t
o t
he
BR
B d
iet,
alt
ho
ugh
th
is w
as o
nly
sig
nif
ican
t fo
r O
lfm
4.
Asc
l2 g
ene
exp
ress
ion
on
th
e o
ther
han
d
app
eare
d t
o s
ign
ific
antl
y in
crea
se in
Ap
cfl/f
l in
test
ine
exp
ose
d t
o t
he
BR
B d
iet.
(B
) In
sit
u h
ybri
dis
atio
n f
or
the
mar
ker
Olf
m4
rev
eale
d t
hat
exp
ress
ion
of
Olf
m4
w
as r
edu
ced
in
wild
typ
e an
d A
pc
def
icie
nt
inte
stin
e fo
llow
ing
BR
B i
nte
rven
tio
n,
con
sist
en
t w
ith
th
e ge
ne
exp
ress
ion
dat
a. *
P v
alu
e ≤
0.0
5,
n ≥
3,
on
e-t
aile
d
Man
n W
hit
ney
U t
est.
Err
or
bar
s re
pre
sen
t SE
M. S
cale
bar
s re
pre
sen
t 1
00 µ
m.

93
3.2.4 Evaluating the Wnt target genes in the context of BRBs in wildtype and Apcfl/fl small
intestine
The Wnt signalling pathway is fundamental for embryonic development and maintenance of
intestinal homeostasis (see section 1.6.1). CRC is thought to initiate from mutations in genes that
encode proteins involved in the Wnt pathway, specifically in the ISC. It could be hypothesised that
alterations in ISC markers could be as a consequence of, or related to, changes in Wnt signalling. Thus,
expression levels of Wnt target genes were next determined. As with the previous section, only
statistically significant changes as a result of BRB feeding are graphically represented (Figure 3.8), with
all data presented in Table 3.2. As acute Apc loss within the intestine results in constitutively activated
Wnt signalling, the majority of Wnt target genes were up-regulated in the Apc deficient intestine, as
expected.
As summarised in section 1.6.1, β-catenin binds with TCF to activate transcription of Wnt
target genes and thus, Tcf7 gene expression can be used as a readout of Wnt activation. BRB treatment
significantly increased Tcf7 gene expression in both wildtype and Apcfl/fl intestine by approximately 3.3
fold each when compared to their appropriate controls (Apc+/+ control = 1 ± 0.05 vs Apc+/+ BRB = 3.32
± 1.25; Apcfl/fl control = 3.28 ± 0.42 vs Apcfl/fl BRB = 11.16 ± 1.94; Figure 3.8, Table 3.2). This suggests
that BRBs enhanced transcription of Wnt signalling targets in both wildtype and Apc deficient
intestine.
Two proteins involved in regulating proliferation and the cell cycle in normal intestine are
CyclinD1 and EphB receptors (Gregorieff et al. 2005; Holmberg et al. 2006). CyclinD1 is involved in the
regulation of the cell cycle, specifically in the transition from G1 to S phase, while the EphB2 receptor
promotes proliferation in the normal intestinal epithelium (Holmberg et al. 2006). Expression analysis
for CyclinD1 and EphB2 revealed that BRB exposure significantly reduced the expression levels of these
genes in wildtype intestine by 3 and 2 fold respectively relative to wildtype controls (CyclinD1 = Apc+/+
control = 1 ± 0.07 vs Apc+/+ BRB = 0.34 ± 0.10. EphB2 = Apc+/+ control = 1 ± 0.04 vs Apc+/+ BRB = 0.53 ±
0.15; Figure 3.8, Table 3.2). This suggests that in a wildtype setting, BRBs inhibited markers of
proliferation at the transcriptional level, despite having no effect on proliferation at the cellular level
(Figure 3.2). The expression levels of CyclinD1 and EphB2 were also assessed in the Apc deficient
intestine in the context of BRBs. BRBs did not significantly affect the expression of CyclinD1 in Apc
deficient intestine relative to Apcfl/fl control (Apcfl/fl control = 3.91 ± 0.47 vs Apcfl/fl BRB = 4.49 ± 2.20;
Figure 3.8, Table 3.2). It has been previously reported that EphB2 has a dual function in the intestine
such that it acts as tumour suppressor in colon tumourigenesis (Batlle et al. 2005). However, EphB2
expression was significantly increased by 4.5 fold following Apc loss, but this is consistent with studies
by Holik et al. (2014). BRBs did not significantly affect EphB2 expression in Apcfl/fl mice, although
94
expression appeared to reduce by 2 fold compared to Apcfl/fl control (Apcfl/fl control = 4.46 ± 1.21 vs
Apcfl/fl BRB = 1.99 ± 0.42; Figure 3.8, Table 3.2). In addition to EphB2, the macrophage migration
inhibitory factor (MIF) which is a pro-inflammatory cytokine (Lue et al. 2002) has been reported to
control cell proliferation, differentiation, angiogenesis, tumour progression and metastasis in
intestinal tumourigenesis (Chesney et al. 1999; Sun et al. 2005), Specifically, increased MIF expression
has been linked to enhanced proliferation of murine colon cancer cells and a loss of differentiation
(He et al. 2004). The gene expression of Mif1 non-significantly increased by 3 fold in BRB treated
wildtype mice relative to wildtype control (Apc+/+ control = 1 ± 0.13 vs Apc+/+ BRB = 3.04 ± 0.75; Figure
3.8, Table 3.2). Despite reports that Mif1 expression increases with increased tissue dysplasia (Wilson
et al. 2005), acute loss of Apc did not result in a significant up-regulation of Mif1 gene expression
(Apc+/+ control = 1 ± 0. 13 vs Apcfl/fl control= 2.55 ± 0.77; Figure 3.8, Table 3.2). BRB treatment resulted
in a significant 5 fold increase in Mif1 gene expression in Apcfl/fl mice compared to the Apcfl/fl control
(Apcfl/fl control = 2.55 ± 0.77 vs Apcfl/fl BRB = 13.36 ± 5.50; Figure 3.8, Table 3.2). This suggests that BRBs
may have some pro-carcinogenic effects in the intestine.
Sox proteins are regulators of cell fate specification and differentiation within the intestine.
Some Sox proteins are antagonists of Wnt signalling while others act as Wnt agonists. Sox9 is thought
to be a negative regulator of the Wnt signalling pathway as conditional deletion of Sox9 in the murine
intestine prevented Paneth cell differentiation and resulted in the up-regulation of several Wnt target
genes such as CyclinD1, leading to intestinal hyperplasia (Bastide et al. 2007; Mori-Akiyama et al.
2007). Sox17 has also been identified as a negative regulator of the Wnt signalling pathway (Sinner et
al. 2007). It is present in normal intestinal epithelium but it is commonly silenced in intestinal
neoplasia and CRC (Fu et al. 2010). Gene expression analysis revealed that in wildtype mice Sox9
expression was non-significantly increased by 3 fold (Apc+/+ control = 1 ± 0.15 vs Apc+/+ BRB = 3.24 ±
0.92; Figure 3.8, Table 3.2), while Sox17 expression was significantly up-regulated by 12 fold in the
context of BRB feeding. (Apc+/+ control = 1 ± 0.13 vs Apc+/+ BRB = 11.96 ± 5.67; Figure 3.8, Table 3.2).
Both genes were up-regulated following Apc loss as expected. BRB treatment further increased Sox9
gene expression in Apcfl/fl mice in comparison to the Apcfl/fl control (Apcfl/fl control = 4.56 ± 0.79 vs Apcfl/fl
BRB = 18.37 ± 4.98; Figure 3.8, Table 3.2). However, Sox17 expression was not significantly altered by
BRBs in Apcfl/fl mice (Apcfl/fl control = 119.8 ± 20.54 vs Apcfl/fl BRB = 90.65 ± 39.26; Figure 3.8, Table 3.2).
Taken together, these results suggest that at the transcriptional level BRBs reduced markers
of proliferation while up-regulating transcription of Wnt repressor genes in wildtype mice.
Hypothetically, this could suggest one of two possibilities. Firstly is that BRBs may reduce the number
of stem cells and thus, may reduce the number of cells that have the potential to be transformed. The
second being that the presence of BRBs may minimise the impact of mutations that do occur by
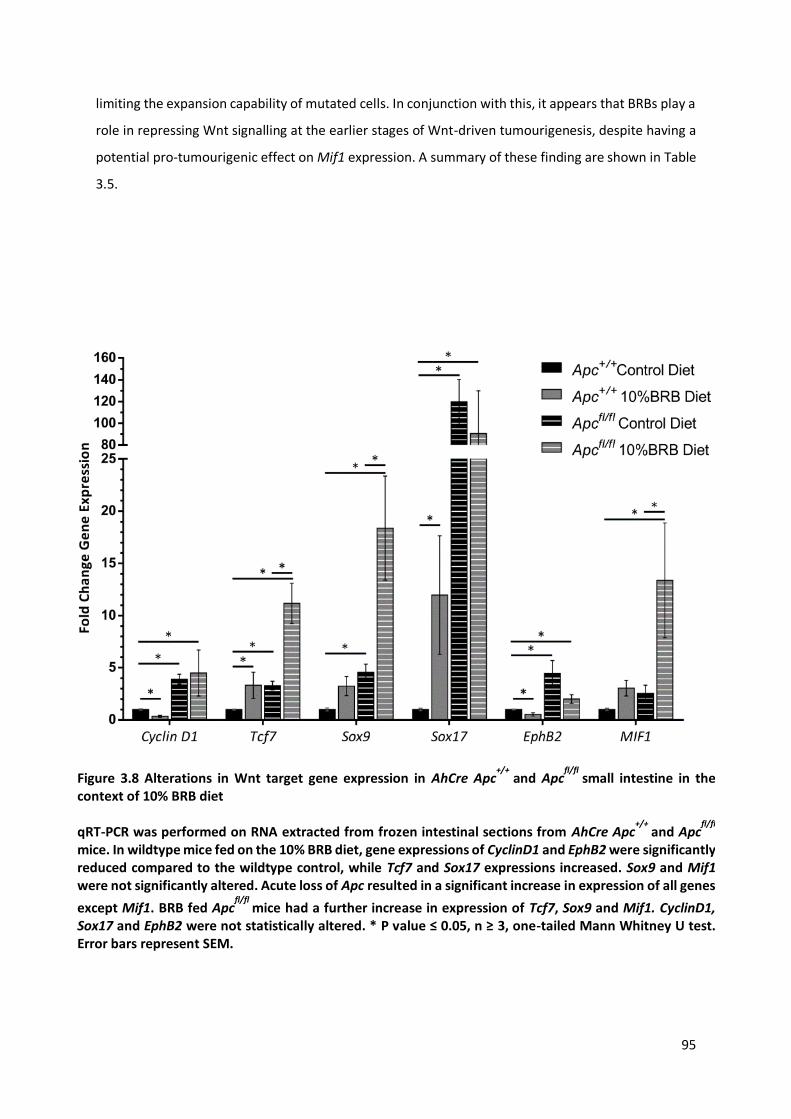
95
limiting the expansion capability of mutated cells. In conjunction with this, it appears that BRBs play a
role in repressing Wnt signalling at the earlier stages of Wnt-driven tumourigenesis, despite having a
potential pro-tumourigenic effect on Mif1 expression. A summary of these finding are shown in Table
3.5.
Figure 3.8 Alterations in Wnt target gene expression in AhCre Apc+/+
and Apcfl/fl
small intestine in the context of 10% BRB diet
qRT-PCR was performed on RNA extracted from frozen intestinal sections from AhCre Apc+/+
and Apcfl/fl
mice. In wildtype mice fed on the 10% BRB diet, gene expressions of CyclinD1 and EphB2 were significantly reduced compared to the wildtype control, while Tcf7 and Sox17 expressions increased. Sox9 and Mif1 were not significantly altered. Acute loss of Apc resulted in a significant increase in expression of all genes
except Mif1. BRB fed Apcfl/fl
mice had a further increase in expression of Tcf7, Sox9 and Mif1. CyclinD1, Sox17 and EphB2 were not statistically altered. * P value ≤ 0.05, n ≥ 3, one-tailed Mann Whitney U test. Error bars represent SEM.

96
3.2.5 Assessing whether BRB treatment rescued the phenotype induced by acute Apc loss driven
by the AhCre transgene
The ultimate goal of most therapeutic strategies is to restore disease phenotypes to a normal
setting. Therefore, this thesis set out to determine whether the 10% freeze-dried BRB diet normalised
the aberrant crypt-progenitor phenotype, characteristic of acute Apc loss, to a normal level.
Histological analysis, IHC counts and gene expression data for cell population markers, stem cell
markers and Wnt target genes were compared from control treated wildtype mice and AhCre Apcfl/fl
BRB treated mice. Complete rescue to a normal phenotype is indicated by no significant difference (p
value ≥ 0.05) between wildtype controls and BRB fed Apcfl/fl mice as determined by Mann Whitney U
statistical tests. The results and p values for all parameters can be found in Table 3.1 and Table 3.2.
Acute loss of Apc driven by the AhCre promoter resulted in a significant increase in mitosis
and apoptosis (Figure 3.2C and Figure 3.3C respectively) consistent with previous studies (Sansom et
al. 2004). BRB treatment in this mouse model did not restore cell proliferation or cell death to normal
levels, but a further increase in CC3 number in Apcfl/fl mice could be anti-tumourigenic. In addition,
BRBs re-established cell migration in the aberrant crypts that arrested upon Apc loss (Figure 3.2E). The
crypt-progenitor phenotype is characteristic of altered cell differentiation such that enteroendocrine
and goblet cells are significantly reduced in number (Figure 3.4 and Figure 3.5 respectively, Table 3.1)
and Paneth cells were mis-localised and dramatically increased (Figure 3.6B and C respectively), to
support an increased stem cell zone (Sansom et al. 2004). When comparing BRB treated Apcfl/fl with
wildtype controls, the BRB treatment restored enteroendocrine and Paneth cell phenotypes to within
the normal wildtype range (Figure 3.4B and Figure 3.6C, Table 3.1). Similarly, Synaptophysin and
Lysoyme1 gene expression were rescued by BRB treatment (Figure 3.4C and Figure 3.6D, Table 3.2),
however Synaptophysin expression was not altered upon acute Apc loss. In addition, BRBs were only
partly able to reinstate Paneth cell position. Despite positioned significantly lower in the aberrant
crypt compared to the Apcfl/fl control (Figure 3.6B green line vs orange line), Paneth cells were still mis-
located in comparison to the wildtype control (Figure 3.6B red line vs green line). For goblet cells, an
intermediate phenotype was observed between wildtype control and BRB treated Apcfl/fl
measurements, suggesting partial rescue of the Apc phenotype by the BRB treatment (Figure 3.5B,
Table 3.1). In contrast, gene expression for Muc2 was not returned to normal wildtype levels by BRBs.
Taken together, these readouts for differentiation indicate that BRBs restored, at least in part, the
majority of differentiated cell populations to within normal homeostatic levels.
It is evident that BRBs affect stem cell dynamics as seen by the significant alteration in the
gene expression of the stem cell markers Lgr5, Olfm4 and Ascl2 in the aberrant Apc deficient crypt
compared to Apcfl/fl controls (Figure 3.7, Table 3.2). Although BRBs appeared to reduce expression of

97
Lgr5 and Olfm4 in Apcfl/fl only the Olfm4 data was significant (Figure 3.7A). No statistical difference (p
value = 0.3143, one-tailed Mann Whitney U test) between Olfm4 levels in wildtype control and BRB
Apcfl/fl mice highlights the extent of rescue, such that Olfm4 was returned to within normal levels.
The expression levels of the Wnt target genes CyclinD1, Tcf7, Sox9, Sox17, EphB2 and Mif1
were not returned to within normal levels of wildtype mice. As described in section 3.2.3, the
expression levels of Tcf7, Sox9 and Mif1 were significantly increased in BRB fed Apcfl/fl mice (Figure 3.8,
Table 3.2). It could be hypothesised that enhanced expression of Wnt targets could be pro-
tumourigenic due to the role Wnt signalling plays in stem cell and progenitor cell fate. However, some
of these targets can act as Wnt repressors and so the significance of these increases are discussed in
section 3.3. These findings are summarised in Table 3.3, Table 3.4 and Table 3.5.
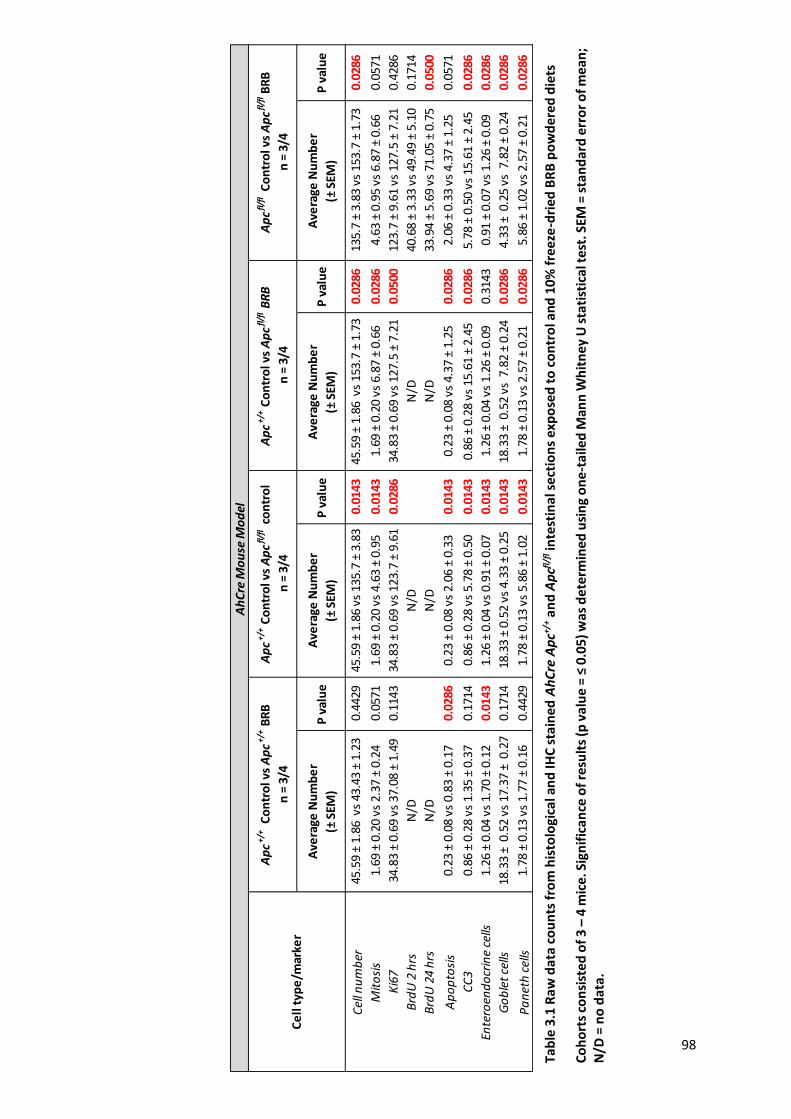
98
Ave
rage
Nu
mb
er
(± S
EM)
P v
alu
eA
vera
ge N
um
be
r
(± S
EM)
P v
alu
eA
vera
ge N
um
be
r
(± S
EM)
P v
alu
eA
vera
ge N
um
be
r
(± S
EM)
P v
alu
e
Cel
l nu
mb
er45
.59
± 1.
86 v
s 43
.43
± 1.
230.
4429
45.5
9 ±
1.86
vs
135.
7 ±
3.83
0.01
4345
.59
± 1.
86 v
s 15
3.7
± 1.
730.
0286
135.
7 ±
3.83
vs
153.
7 ±
1.73
0.02
86
Mit
osi
s1.
69 ±
0.2
0 vs
2.3
7 ±
0.24
0.05
711.
69 ±
0.2
0 vs
4.6
3 ±
0.95
0.01
431.
69 ±
0.2
0 vs
6.8
7 ±
0.66
0.02
864.
63 ±
0.9
5 vs
6.8
7 ±
0.66
0.05
71
Ki6
734
.83
± 0.
69 v
s 37
.08
± 1.
490.
1143
34.8
3 ±
0.69
vs
123.
7 ±
9.61
0.02
8634
.83
± 0.
69 v
s 12
7.5
± 7.
210.
0500
123.
7 ±
9.61
vs
127.
5 ±
7.21
0.42
86
Brd
U 2
hrs
N/D
N/D
N/D
40.6
8 ±
3.33
vs
49.4
9 ±
5.10
0.17
14
Brd
U 2
4 h
rsN
/DN
/DN
/D33
.94
± 5.
69 v
s 71
.05
± 0.
750.
0500
Ap
op
tosi
s0.
23 ±
0.0
8 vs
0.8
3 ±
0.17
0.02
860.
23 ±
0.0
8 vs
2.0
6 ±
0.33
0.01
430.
23 ±
0.0
8 vs
4.3
7 ±
1.25
0.02
862.
06 ±
0.3
3 vs
4.3
7 ±
1.25
0.05
71
CC
30.
86 ±
0.2
8 vs
1.3
5 ±
0.37
0.17
140.
86 ±
0.2
8 vs
5.7
8 ±
0.50
0.01
430.
86 ±
0.2
8 vs
15.
61 ±
2.4
50.
0286
5.78
± 0
.50
vs 1
5.61
± 2
.45
0.02
86
Ente
roen
do
crin
e ce
lls1.
26 ±
0.0
4 vs
1.7
0 ±
0.12
0.01
431.
26 ±
0.0
4 vs
0.9
1 ±
0.07
0.01
431.
26 ±
0.0
4 vs
1.2
6 ±
0.09
0.31
430.
91 ±
0.0
7 vs
1.2
6 ±
0.09
0.02
86
Go
ble
t ce
lls18
.33
± 0
.52
vs 1
7.37
± 0
.27
0.17
1418
.33
± 0.
52 v
s 4.
33 ±
0.2
50.
0143
18.3
3 ±
0.5
2 vs
7.8
2 ±
0.24
0.02
864.
33 ±
0.2
5 vs
7.8
2 ±
0.24
0.02
86
Pa
net
h c
ells
1.78
± 0
.13
vs 1
.77
± 0.
160.
4429
1.78
± 0
.13
vs 5
.86
± 1.
020.
0143
1.78
± 0
.13
vs 2
.57
± 0.
210.
0286
5.86
± 1
.02
vs 2
.57
± 0.
210.
0286
Ce
ll t
ype
/mar
ker
Ap
c+
/+ C
on
tro
l vs
Ap
c+
/+ B
RB
n =
3/4
Ap
c+
/+ C
on
tro
l vs
Ap
cfl
/fl c
on
tro
l
n =
3/4
Ap
c+
/+ C
on
tro
l vs
Ap
cfl
/fl B
RB
n =
3/4
Ap
cfl
/fl C
on
tro
l vs
Ap
cfl
/fl B
RB
n =
3/4
Ah
Cre
Mo
use
Mo
del
Tab
le 3
.1 R
aw
dat
a co
un
ts f
rom
his
tolo
gica
l an
d IH
C s
tain
ed A
hC
re A
pc+/
+ an
d A
pcfl
/fl in
test
inal
se
ctio
ns
exp
ose
d t
o c
on
tro
l an
d 1
0%
fre
eze
-dri
ed B
RB
po
wd
ered
die
ts
Co
ho
rts
con
sist
ed
of
3 –
4 m
ice.
Sig
nif
ican
ce o
f re
sult
s (p
val
ue
= ≤
0.0
5) w
as d
ete
rmin
ed
usi
ng
on
e-t
aile
d M
ann
Wh
itn
ey U
sta
tist
ical
te
st. S
EM =
sta
nd
ard
err
or
of m
ean
; N
/D =
no
dat
a.
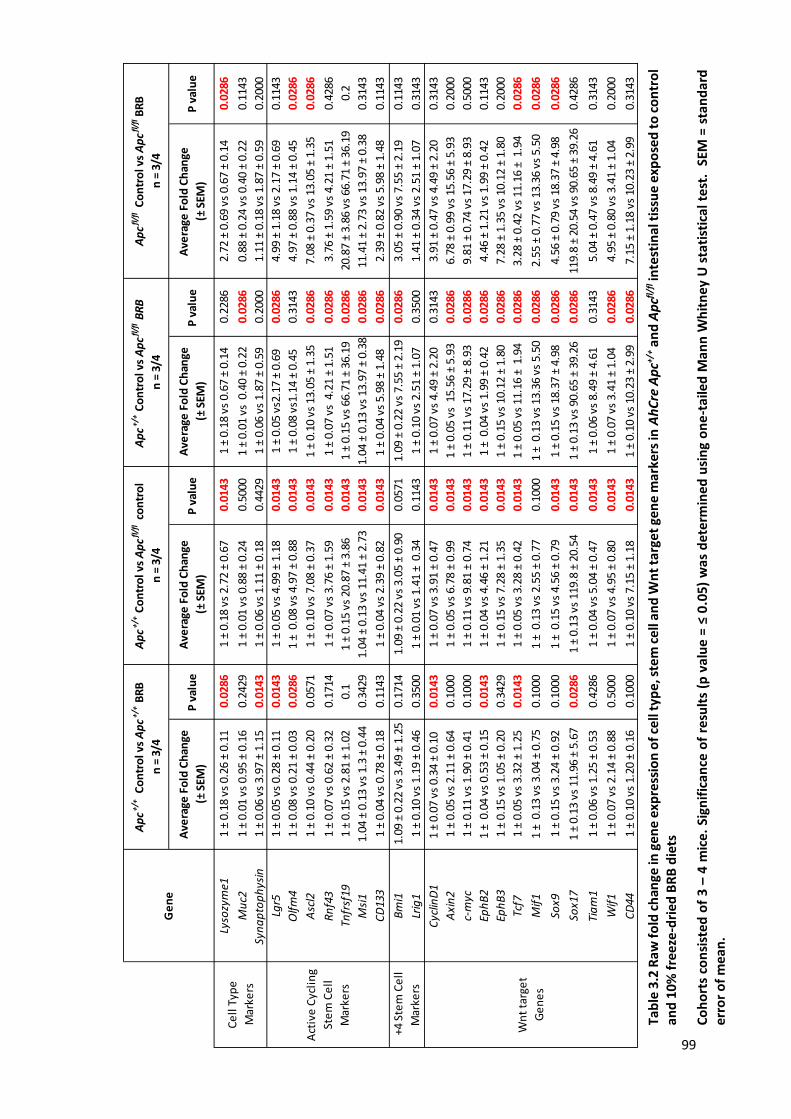
99
Ave
rage
Fo
ld C
han
ge
(± S
EM)
P v
alu
eA
vera
ge F
old
Ch
ange
(± S
EM)
P v
alu
eA
vera
ge F
old
Ch
ange
(± S
EM)
P v
alu
eA
vera
ge F
old
Ch
ange
(± S
EM)
P v
alu
e
Lyso
zym
e11
± 0.
18 v
s 0.
26 ±
0.1
10.
0286
1 ±
0.18
vs
2.72
± 0
.67
0.01
431
± 0.
18 v
s 0.
67 ±
0.1
40.
2286
2.72
± 0
.69
vs 0
.67
± 0.
140.
0286
Mu
c21
± 0.
01 v
s 0.
95 ±
0.1
60.
2429
1 ±
0.01
vs
0.88
± 0
.24
0.50
001
± 0.
01 v
s 0
.40
± 0.
220.
0286
0.88
± 0
.24
vs 0
.40
± 0.
220.
1143
Syn
ap
top
hys
in1
± 0.
06 v
s 3.
97 ±
1.1
50.
0143
1 ±
0.06
vs
1.11
± 0
.18
0.44
291
± 0.
06 v
s 1.
87 ±
0.5
90.
2000
1.11
± 0
.18
vs 1
.87
± 0.
590.
2000
Lgr5
1 ±
0.05
vs
0.28
± 0
.11
0.01
431
± 0.
05 v
s 4.
99 ±
1.1
80.
0143
1 ±
0.05
vs2
.17
± 0.
690.
0286
4.99
± 1
.18
vs 2
.17
± 0.
690.
1143
Olf
m4
1 ±
0.08
vs
0.21
± 0
.03
0.02
861
± 0
.08
vs 4
.97
± 0.
880.
0143
1 ±
0.08
vs1
.14
± 0.
450.
3143
4.97
± 0
.88
vs 1
.14
± 0.
450.
0286
Asc
l21
± 0.
10 v
s 0.
44 ±
0.2
00.
0571
1 ±
0.10
vs
7.08
± 0
.37
0.01
431
± 0.
10 v
s 13
.05
± 1.
350.
0286
7.08
± 0
.37
vs 1
3.05
± 1
.35
0.02
86
Rn
f43
1 ±
0.07
vs
0.62
± 0
.32
0.17
141
± 0.
07 v
s 3.
76 ±
1.5
90.
0143
1 ±
0.07
vs
4.2
1 ±
1.51
0.02
863.
76 ±
1.5
9 vs
4.2
1 ±
1.51
0.42
86
Tnfr
sf19
1 ±
0.15
vs
2.81
± 1
.02
0.1
1 ±
0.15
vs
20.8
7 ±
3.86
0.01
431
± 0.
15 v
s 66
.71
± 36
.19
0.02
8620
.87
± 3.
86 v
s 66
.71
± 36
.19
0.2
Msi
11.
04 ±
0.1
3 vs
1.3
± 0
.44
0.34
291.
04 ±
0.1
3 vs
11.
41 ±
2.7
30.
0143
1.04
± 0
.13
vs 1
3.97
± 0
.38
0.02
8611
.41
± 2.
73 v
s 13
.97
± 0.
380.
3143
CD
133
1 ±
0.04
vs
0.78
± 0
.18
0.11
431
± 0.
04 v
s 2.
39 ±
0.8
20.
0143
1 ±
0.04
vs
5.98
± 1
.48
0.02
862.
39 ±
0.8
2 vs
5.9
8 ±
1.48
0.11
43
Bm
i11.
09 ±
0.2
2 vs
3.4
9 ±
1.25
0.17
141.
09 ±
0.2
2 vs
3.0
5 ±
0.90
0.05
711.
09 ±
0.2
2 vs
7.5
5 ±
2.19
0.02
863.
05 ±
0.9
0 vs
7.5
5 ±
2.19
0.11
43
Lrig
11
± 0.
10 v
s 1.
19 ±
0.4
60.
3500
1 ±
0.01
vs
1.41
± 0
.34
0.11
431
± 0.
10 v
s 2.
51 ±
1.0
70.
3500
1.41
± 0
.34
vs 2
.51
± 1.
070.
3143
Cyc
linD
11
± 0.
07 v
s 0.
34 ±
0.1
0 0.
0143
1 ±
0.07
vs
3.91
± 0
.47
0.01
431
± 0.
07 v
s 4.
49 ±
2.2
00.
3143
3.91
± 0
.47
vs 4
.49
± 2.
200.
3143
Axi
n2
1 ±
0.05
vs
2.11
± 0
.64
0.10
001
± 0.
05 v
s 6.
78 ±
0.9
90.
0143
1 ±
0.05
vs
15.
56 ±
5.9
30.
0286
6.78
± 0
.99
vs 1
5.56
± 5
.93
0.20
00
c-m
yc1
± 0.
11 v
s 1.
90 ±
0.4
10.
1000
1 ±
0.11
vs
9.81
± 0
.74
0.01
431
± 0.
11 v
s 17
.29
± 8.
930.
0286
9.81
± 0
.74
vs 1
7.29
± 8
.93
0.50
00
Eph
B2
1 ±
0.0
4 vs
0.5
3 ±
0.15
0.01
431
± 0.
04 v
s 4.
46 ±
1.2
10.
0143
1 ±
0.0
4 vs
1.9
9 ±
0.42
0.02
864.
46 ±
1.2
1 vs
1.9
9 ±
0.42
0.11
43
Eph
B3
1 ±
0.15
vs
1.05
± 0
.20
0.34
291
± 0.
15 v
s 7.
28 ±
1.3
50.
0143
1 ±
0.15
vs
10.1
2 ±
1.80
0.02
867.
28 ±
1.3
5 vs
10.
12 ±
1.8
00.
2000
Tcf7
1 ±
0.05
vs
3.32
± 1
.25
0.01
431
± 0.
05 v
s 3.
28 ±
0.4
20.
0143
1 ±
0.05
vs
11.1
6 ±
1.9
40.
0286
3.28
± 0
.42
vs 1
1.16
± 1
.94
0.02
86
Mif
11
± 0
.13
vs 3
.04
± 0.
750.
1000
1 ±
0.1
3 vs
2.5
5 ±
0.77
0.10
001
± 0
.13
vs 1
3.36
vs
5.50
0.02
862.
55 ±
0.7
7 vs
13.
36 v
s 5.
500.
0286
Sox9
1 ±
0.15
vs
3.24
± 0
.92
0.10
001
± 0
.15
vs 4
.56
± 0.
790.
0143
1 ±
0.15
vs
18.3
7 ±
4.98
0.02
864.
56 ±
0.7
9 vs
18.
37 ±
4.9
80.
0286
Sox1
71
± 0.
13 v
s 11
.96
± 5.
670.
0286
1 ±
0.13
vs
119.
8 ±
20.5
40.
0143
1 ±
0.13
vs
90.6
5 ±
39.2
60.
0286
119.
8 ±
20.5
4 vs
90.
65 ±
39.
260.
4286
Tia
m1
1 ±
0.06
vs
1.25
± 0
.53
0.42
861
± 0.
04 v
s 5.
04 ±
0.4
70.
0143
1 ±
0.06
vs
8.49
± 4
.61
0.31
435.
04 ±
0.4
7 vs
8.4
9 ±
4.61
0.31
43
Wif
11
± 0.
07 v
s 2.
14 ±
0.8
80.
5000
1 ±
0.07
vs
4.95
± 0
.80
0.01
431
± 0.
07 v
s 3.
41 ±
1.0
40.
0286
4.95
± 0
.80
vs 3
.41
± 1.
040.
2000
CD
441
± 0.
10 v
s 1.
20 ±
0.1
60.
1000
1 ±
0.10
vs
7.15
± 1
.18
0.01
431
± 0.
10 v
s 10
.23
± 2.
990.
0286
7.15
± 1
.18
vs 1
0.23
± 2
.99
0.31
43
Ap
c+/
+ C
on
tro
l vs
Ap
cfl/
fl c
on
tro
l
n =
3/4
Ce
ll T
ype
Mar
kers
Wn
t ta
rge
t
Ge
ne
s
Ge
ne
Ap
c+/
+ C
on
tro
l vs
Ap
c+/
+ B
RB
n =
3/4
Ap
c+/
+ C
on
tro
l vs
Ap
cfl/
fl B
RB
n =
3/4
.+4
Ste
m C
ell
Mar
kers
Act
ive
Cyc
lin
g
Ste
m C
ell
Mar
kers
Ap
cfl/
fl C
on
tro
l vs
Ap
cfl/
fl B
RB
n =
3/4
Tab
le 3
.2 R
aw
fo
ld c
han
ge in
gen
e ex
pre
ssio
n o
f ce
ll ty
pe,
ste
m c
ell
and
Wn
t ta
rge
t ge
ne
mar
kers
in A
hC
re A
pc+/
+ an
d A
pcfl
/fl in
test
inal
tis
sue
exp
ose
d t
o c
on
tro
l an
d 1
0% f
reez
e-d
ried
BR
B d
iets
Co
ho
rts
con
sist
ed
of
3 –
4 m
ice.
Sig
nif
ican
ce o
f re
sult
s (p
val
ue
= ≤
0.0
5)
was
de
term
ine
d u
sin
g o
ne
-tai
led
Man
n W
hit
ney
U s
tati
stic
al t
est
. S
EM =
sta
nd
ard
er
ror
of
mea
n.

100
Ap
c+/
+ C
on
tro
l
vs
Ap
c+/
+ B
RB
Ap
c+/
+ Co
ntr
ol
vs
Ap
cfl
/fl C
on
tro
l
Ap
c+/
+ C
on
tro
l
vs
Ap
cfl
/fl B
RB
Ap
cfl
/fl C
on
tro
l
vs
Ap
cfl
/fl B
RB
Ap
c+/
+ C
on
tro
l
vs
Ap
c+/
+ B
RB
Ap
c+/
+ Co
ntr
ol
vs
Ap
cfl
/fl C
on
tro
l
Ap
c+/
+ C
on
tro
l
vs
Ap
cfl
/fl B
RB
Ap
cfl
/fl C
on
tro
l
vs
Ap
cfl
/fl B
RB
Effe
ct o
f B
RB
s o
n
no
rmal
inte
stin
e
Effe
ct o
f ac
ute
loss
of
Ap
c R
escu
e o
f A
pc
fl/f
l
to w
ildty
pe?
Effe
ct o
f B
RB
s o
n
pre
-mal
ign
ant
inte
stin
e
Effe
ct o
f B
RB
s o
n
no
rmal
inte
stin
e
Effe
ct o
f ac
ute
loss
of
Ap
c R
escu
e o
f A
pc
fl/f
l
to w
ildty
pe?
Effe
ct o
f B
RB
s o
n
pre
-mal
ign
ant
inte
stin
e
Ce
ll n
um
be
r↔
C
ell
nu
mb
er
↔
↔
Mit
osi
s
M
ito
sis
Ki6
7↔
↔K
i67
↔
↔
Brd
U n
o. 2
hrs
N/D
N/D
N/D
B
rdU
no
. 2 h
rs↔
↔B
rdU
no
. 24
hrs
N/D
N/D
N/D
B
rdU
no
. 24
hrs
N/D
N/D
N/D
N/D
Brd
U m
igra
tio
nN
/DM
ove
d 1
0
po
siti
on
sN
/DM
ove
d 2
5
po
siti
on
sB
rdU
mig
rati
on
N/D
N/D
N/D
N/D
Ap
op
tosi
s
A
po
pto
sis
↔
CC
3↔
C
C3
Ente
roe
nd
ocr
ine
no
.
↔
En
tero
en
do
crin
e n
o.
Go
ble
t ce
ll n
o.
↔
Go
ble
t ce
ll n
o.
↔
Pan
eth
ce
ll↔
P
ane
th c
ell
↔
Pan
eth
ce
ll p
osi
tio
n↔
Mis
loca
lised
Mis
loca
lised
Mis
loca
lised
bu
t
clo
ser
to c
ryp
t
bas
e
Pan
eth
ce
ll p
osi
tio
n↔
Mis
loca
lised
Mis
loca
lised
Mis
loca
lised
Lyso
zym
e1
↔
Ly
sozy
me1
↔
Syn
ap
top
hys
in
↔
Sy
na
pto
ph
ysin
↔↔
↔
Muc
2↔
↔
M
uc2
↔
↔
Vill
inC
reER
T2 M
ouse
Mod
elA
hC
re M
ouse
Mod
el
Ta
ble
3.3
Su
mm
ary
of
ob
serv
ed c
han
ges
in h
isto
logi
cal a
nd
IHC
mar
kers
in A
hC
re a
nd
Vill
inC
reER
T2 A
pc+/
+ an
d A
pcfl
/fl in
test
inal
sec
tio
ns
follo
win
g in
terv
enti
on
wit
h
con
tro
l an
d 1
0%
fre
eze
-dri
ed B
RB
die
ts
↔ =
no
ch
ange
; ↓
larg
e b
lue
arro
w =
sig
nif
ican
t d
ecre
ase
; ↓
smal
l b
lue
arr
ow
= n
on
-sig
nif
ican
t d
ecr
eas
e; ↑
lar
ge r
ed a
rro
w =
sig
nif
ican
t in
crea
se;
↑sm
all
red
arr
ow
= n
on
-sig
nif
ican
t in
crea
se; N
/D =
no
dat
a.
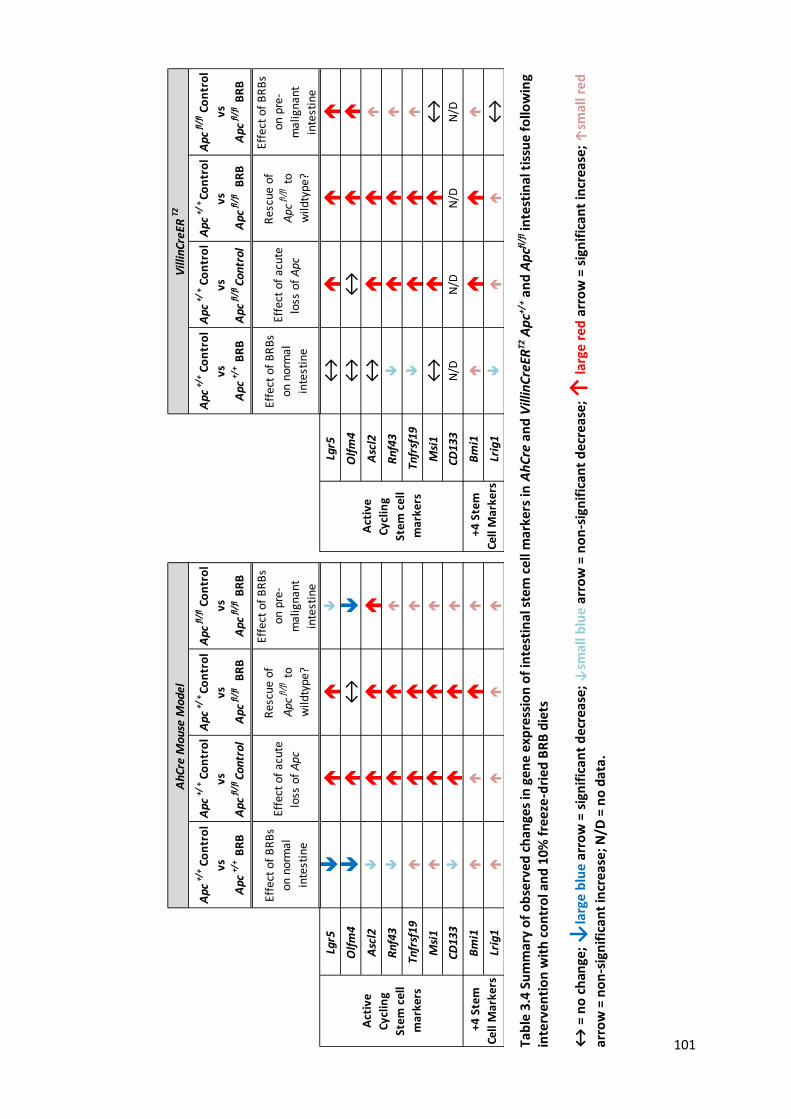
101
Apc
+/+
Con
tro
l
vs
Apc
+/+ B
RB
Apc
+/+ C
on
tro
l
vs
Apc
fl/f
l Cont
rol
Apc
+/+ Co
ntr
ol
vs
Apc
fl/f
l BR
B
Apc
fl/f
l Co
ntr
ol
vs
Apc
fl/f
l BR
B
Apc
+/+
Con
tro
l
vs
Apc
+/+ B
RB
Apc
+/+ C
on
tro
l
vs
Apc
fl/f
l Cont
rol
Apc
+/+ Co
ntr
ol
vs
Apc
fl/f
l BR
B
Apc
fl/f
l Co
ntr
ol
vs
Apc
fl/f
l BR
B
Effe
ct o
f B
RB
s
on n
orm
al
inte
stin
e
Effe
ct o
f ac
ute
loss
of
Apc
Res
cue
of
Apc
fl/f
l to
wild
type
?
Effe
ct o
f B
RB
s
on p
re-
mal
igna
nt
inte
stin
e
Effe
ct o
f B
RB
s
on n
orm
al
inte
stin
e
Effe
ct o
f ac
ute
loss
of
Apc
Res
cue
of
Apc
fl/f
l to
wild
type
?
Effe
ct o
f B
RB
s
on p
re-
mal
igna
nt
inte
stin
e
Lgr5
Lgr5
↔
Olf
m4
↔
Olf
m4
↔↔
Asc
l2
A
scl2
↔
Rnf
43
R
nf43
Tnfr
sf19
Tnfr
sf19
Msi
1
M
si1
↔
↔
CD13
3
CD
133
N/D
N/D
N/D
N/D
Bm
i1
B
mi1
Lrig
1
Lr
ig1
↔
AhC
re M
ouse
Mod
elV
illin
CreE
RT2
Act
ive
Cycl
ing
Stem
cel
l
mar
kers
.+4
Ste
m
Cell
Mar
kers
Act
ive
Cycl
ing
Stem
cel
l
mar
kers
.+4
Ste
m
Cell
Mar
kers
Tab
le 3
.4 S
um
mar
y o
f o
bse
rved
ch
ange
s in
gen
e ex
pre
ssio
n o
f in
test
inal
ste
m c
ell
mar
kers
in A
hC
re a
nd
Vill
inC
reER
T2 A
pc+/
+ an
d A
pcfl
/fl in
test
inal
tis
sue
follo
win
g in
terv
enti
on
wit
h c
on
tro
l an
d 1
0% f
reez
e-d
ried
BR
B d
iets
↔ =
no
ch
ange
; ↓
larg
e b
lue
arro
w =
sig
nif
ican
t d
ecre
ase;
↓sm
all b
lue
arro
w =
no
n-s
ign
ific
ant
dec
reas
e; ↑
larg
e re
d a
rro
w =
sig
nif
ican
t in
crea
se;
↑sm
all r
ed
arro
w =
no
n-s
ign
ific
ant
incr
eas
e; N
/D =
no
da
ta.

102
Ap
c+/
+ C
on
tro
l
vs
Ap
c+/
+ B
RB
Ap
c+/
+ Co
ntr
ol
vs
Ap
cfl
/fl C
on
tro
l
Ap
c+/
+ C
on
tro
l
vs
Ap
cfl
/fl B
RB
Ap
cfl
/fl C
on
tro
l
vs
Ap
cfl
/fl B
RB
Ap
c+/
+ C
on
tro
l
vs
Ap
c+/
+ B
RB
Ap
c+/
+ Co
ntr
ol
vs
Ap
cfl
/fl C
on
tro
l
Ap
c+/
+ C
on
tro
l
vs
Ap
cfl
/fl B
RB
Ap
cfl
/fl C
on
tro
l
vs
Ap
cfl
/fl B
RB
Eff
ect
of
BR
Bs
on
no
rma
l in
test
ine
Eff
ect
of
acu
te
loss
of
Ap
c R
esc
ue
of
Ap
cfl
/fl
to w
ild
typ
e?
Eff
ect
of
BR
Bs
on
pre
-ma
lig
na
nt
inte
stin
e
Eff
ect
of
BR
Bs
on
no
rma
l in
test
ine
Eff
ect
of
acu
te
loss
of
Ap
c R
esc
ue
of
Ap
cfl
/fl
to w
ild
typ
e?
Eff
ect
of
BR
Bs
on
pre
-ma
lig
na
nt
inte
stin
e
Cy
clin
D1
Cy
clin
D1
↔↔
↔↔
Axi
n2
Axi
n2
↔
c-m
yc
c-m
yc
↔
Ep
hB
2
E
ph
B2
↔
↔
Ep
hB
3↔
E
ph
B3
↔
Tcf
7
T
cf7
↔
Mif
1
M
if1
↔
Sox9
Sox9
Sox1
7
So
x17
N/D
N/D
N/D
N/D
Tia
m1
Tia
m1
N/D
N/D
N/D
N/D
Wif
1
W
if1
N/D
N/D
N/D
N/D
CD
44
CD
44
N/D
N/D
N/D
N/D
Vil
lin
Cre
ER
T2 M
ou
se M
od
el
Wn
t
targ
et
ge
ne
s
Ah
Cre
Mo
use
Mo
de
l
Wn
t
targ
et
ge
ne
s
Tab
le 3
.5 S
um
mar
y o
f o
bse
rved
ch
ange
s in
gen
e ex
pre
ssio
n o
f W
nt
targ
et
gen
e m
arke
rs i
n A
hC
re a
nd
Vill
inC
reER
T2 A
pc+/
+ an
d A
pcfl
/fl i
nte
stin
al
tiss
ue
fo
llow
ing
inte
rven
tio
n w
ith
co
ntr
ol a
nd
10%
fre
eze
-dri
ed B
RB
die
ts
↔ =
no
ch
ange
; ↓
larg
e b
lue
arro
w =
sig
nif
ican
t d
ecre
ase
; ↓
smal
l blu
e a
rro
w =
no
n-s
ign
ific
ant
dec
reas
e; ↑
larg
e re
d a
rro
w =
sig
nif
ican
t in
crea
se;
↑sm
all r
ed
arro
w =
no
n-s
ign
ific
ant
incr
ease
; N/D
= n
o d
ata.
103
3.2.6 Examining homeostasis and the consequence of acute loss of Apc driven by the
VillinCreERT2 transgene in the context of BRB diet
The findings in the AhCre mouse models suggested that BRBs have anti-tumourigenic
properties at the early stages of intestinal tumourigenesis. To further evaluate on these findings, the
VillinCreERT2 Apc+/+ and Apcfl/fl mouse models were used. This model differs from the AhCre model such
that, upon induction, Apc is lost from the entire intestinal epithelium (crypt and villus) including the
Paneth cells, in contrast to the AhCre transgene which recombines only in the crypt epithelium
excluding the Paneth cells. Despite the differences in sites of expression of these Cre lines, the
phenotypes are similar (Andreu et al. 2005).
The phenotype of both control and experimental mice were characterised using the same
endpoints as the AhCre mouse model, with the following differences. Aged matched 12 - 13 weeks
old, (45 - 52 days younger than AhCre mice) VillinCreERT2 Apc+/+ and VillinCreERT2 Apcfl/fl mice were fed
ad libitum on either the control diet, AIN76A pellets (rather than the standard mouse chow used in
the AhCre study) or a 10% freeze-dried BRB powder supplemented in AIN76A pellets. A pelleted diet
rather than a powdered version was used for logistical reasons. The powdered diet was wasteful as it
dropped from the feeding troughs and mixed with the bedding, which also lowered the cleanliness of
the cages. VillinCreERT2 mice were sacrificed at day 4 post induction, rather than day 5, as previous
studies found that at this time point, Apc loss resulted in a dramatic enlargement of the crypt
compartment, accompanied with an increase in proliferation, apoptosis and a diminished cell
migration. These mice also presented with symptoms of severe illness within 4 days and were culled
to prevent further suffering (Andreu et al. 2005). The method of Cre activation was also different; Cre
expression (ISC and progenitor compartment) in AhCre mice required the presence of βNF while Cre
expression under the Villin promoter (entire intestinal epithelium) was driven by tamoxifen injection.
Tamoxifen can be less well tolerated in mice than βNF, and so for this reason VillinCreERT2 mice were
injected with a reduced dose of tamoxifen at 3 x 60 mg/kg rather than 80 mg/kg as with βNF. The
different inducing concentration could affect the recombination efficiency and affect gene loss in
certain cell types differently (Parry et al. 2013). RNA was extracted from isolated epithelial cells rather
than from whole frozen tissue for gene expression analyses, which leaves a purer extract of epithelial
cells without the underlying muscle and stromal cells. Table 3.6 and Table 3.7 represents the data of
the findings of the short-term effects of 10% freeze-dried BRB diet on the normal intestine, in Apc
deficient intestine and the effects of acute loss of Apc in the context of the VillinCreERT2 mouse model.
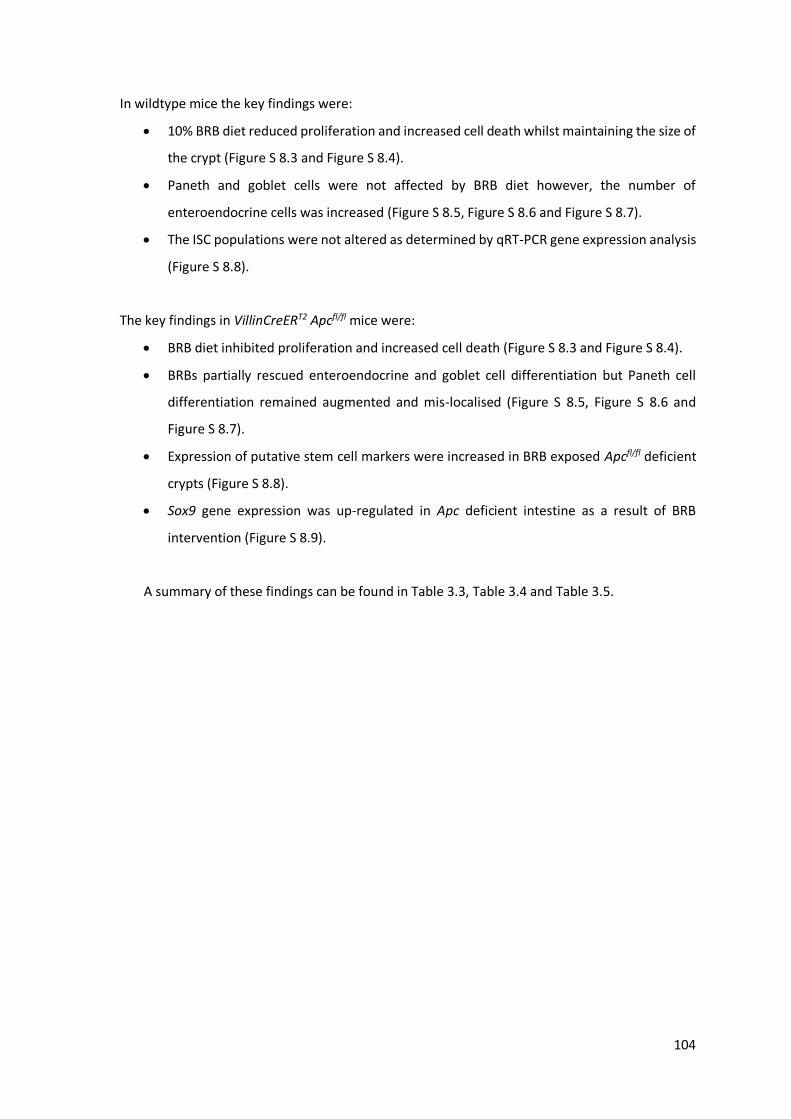
104
In wildtype mice the key findings were:
10% BRB diet reduced proliferation and increased cell death whilst maintaining the size of
the crypt (Figure S 8.3 and Figure S 8.4).
Paneth and goblet cells were not affected by BRB diet however, the number of
enteroendocrine cells was increased (Figure S 8.5, Figure S 8.6 and Figure S 8.7).
The ISC populations were not altered as determined by qRT-PCR gene expression analysis
(Figure S 8.8).
The key findings in VillinCreERT2 Apcfl/fl mice were:
BRB diet inhibited proliferation and increased cell death (Figure S 8.3 and Figure S 8.4).
BRBs partially rescued enteroendocrine and goblet cell differentiation but Paneth cell
differentiation remained augmented and mis-localised (Figure S 8.5, Figure S 8.6 and
Figure S 8.7).
Expression of putative stem cell markers were increased in BRB exposed Apcfl/fl deficient
crypts (Figure S 8.8).
Sox9 gene expression was up-regulated in Apc deficient intestine as a result of BRB
intervention (Figure S 8.9).
A summary of these findings can be found in Table 3.3, Table 3.4 and Table 3.5.
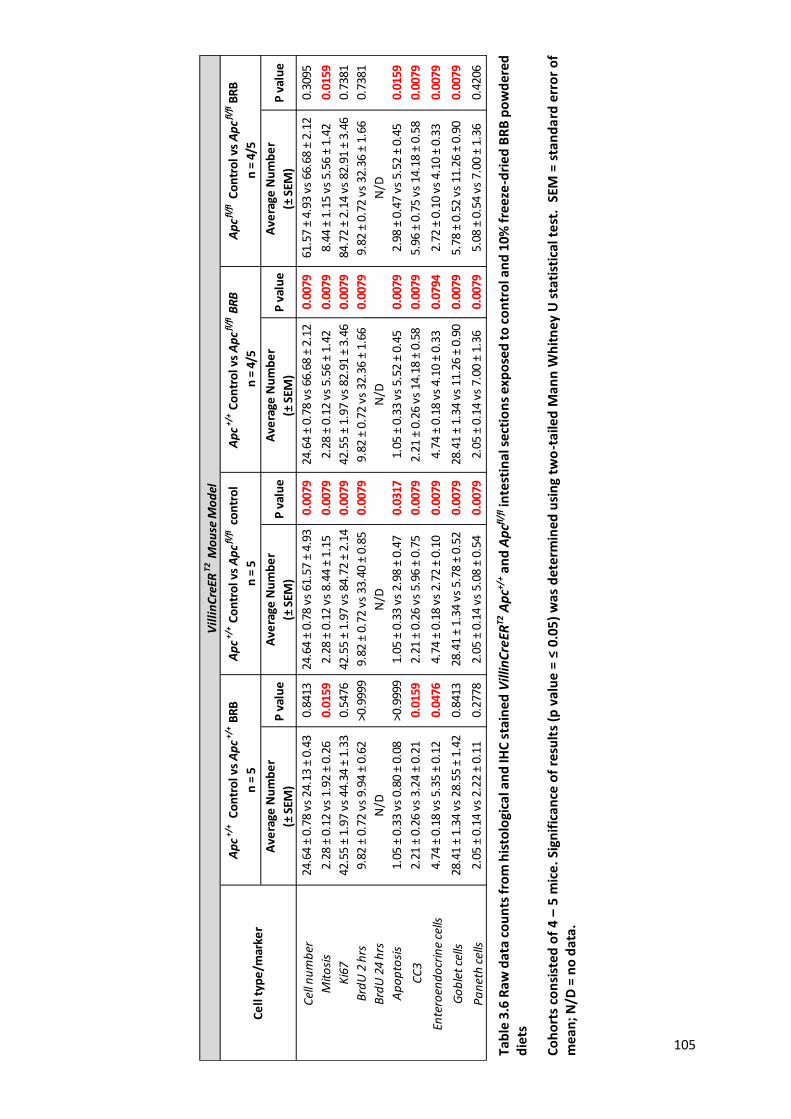
105
Ave
rage
Nu
mb
er
(± S
EM)
P v
alu
eA
vera
ge N
um
be
r
(± S
EM)
P v
alu
eA
vera
ge N
um
be
r
(± S
EM)
P v
alu
eA
vera
ge N
um
be
r
(± S
EM)
P v
alu
e
Cel
l nu
mb
er24
.64
± 0.
78 v
s 24
.13
± 0.
430.
8413
24.6
4 ±
0.78
vs
61.5
7 ±
4.93
0.00
7924
.64
± 0.
78 v
s 66
.68
± 2.
120.
0079
61.5
7 ±
4.93
vs
66.6
8 ±
2.12
0.30
95
Mit
osi
s2.
28 ±
0.1
2 vs
1.9
2 ±
0.26
0.01
592.
28 ±
0.1
2 vs
8.4
4 ±
1.15
0.00
792.
28 ±
0.1
2 vs
5.5
6 ±
1.42
0.00
798.
44 ±
1.1
5 vs
5.5
6 ±
1.42
0.01
59
Ki6
742
.55
± 1.
97 v
s 44
.34
± 1.
330.
5476
42.5
5 ±
1.97
vs
84.7
2 ±
2.14
0.00
7942
.55
± 1.
97 v
s 82
.91
± 3.
460.
0079
84.7
2 ±
2.14
vs
82.9
1 ±
3.46
0.73
81
Brd
U 2
hrs
9.82
± 0
.72
vs 9
.94
± 0.
62>0
.999
99.
82 ±
0.7
2 vs
33.
40 ±
0.8
50.
0079
9.82
± 0
.72
vs 3
2.36
± 1
.66
0.00
799.
82 ±
0.7
2 vs
32.
36 ±
1.6
60.
7381
Brd
U 2
4 h
rsN
/DN
/DN
/DN
/D
Ap
op
tosi
s1.
05 ±
0.3
3 vs
0.8
0 ±
0.08
>0.9
999
1.05
± 0
.33
vs 2
.98
± 0.
470.
0317
1.05
± 0
.33
vs 5
.52
± 0.
450.
0079
2.98
± 0
.47
vs 5
.52
± 0.
450.
0159
CC
32.
21 ±
0.2
6 vs
3.2
4 ±
0.21
0.01
592.
21 ±
0.2
6 vs
5.9
6 ±
0.75
0.00
792.
21 ±
0.2
6 vs
14.
18 ±
0.5
80.
0079
5.96
± 0
.75
vs 1
4.18
± 0
.58
0.00
79
Ente
roen
do
crin
e ce
lls4.
74 ±
0.1
8 vs
5.3
5 ±
0.12
0.04
764.
74 ±
0.1
8 vs
2.7
2 ±
0.10
0.00
794.
74 ±
0.1
8 vs
4.1
0 ±
0.33
0.07
942.
72 ±
0.1
0 vs
4.1
0 ±
0.33
0.00
79
Go
ble
t ce
lls28
.41
± 1.
34 v
s 28
.55
± 1.
420.
8413
28.4
1 ±
1.34
vs
5.78
± 0
.52
0.00
7928
.41
± 1.
34 v
s 11
.26
± 0.
900.
0079
5.78
± 0
.52
vs 1
1.26
± 0
.90
0.00
79
Pa
net
h c
ells
2.05
± 0
.14
vs 2
.22
± 0.
110.
2778
2.05
± 0
.14
vs 5
.08
± 0.
540.
0079
2.05
± 0
.14
vs 7
.00
± 1.
360.
0079
5.08
± 0
.54
vs 7
.00
± 1.
360.
4206
Ap
c+/
+ C
on
tro
l vs
Ap
cfl/
fl B
RB
n =
4/5
Ce
ll t
ype
/mar
ker
Ap
c+/
+ C
on
tro
l vs
Ap
c+/
+ B
RB
n =
5
Ap
c+/
+ C
on
tro
l vs
Ap
cfl/
fl c
on
tro
l
n =
5
Ap
cfl/
fl C
on
tro
l vs
Ap
cfl/
fl B
RB
n =
4/5
Vil
lin
Cre
ERT2
Mo
use
Mo
del
Tab
le 3
.6 R
aw
dat
a co
un
ts f
rom
his
tolo
gica
l an
d IH
C s
tain
ed V
illin
Cre
ERT2
Ap
c+/+ a
nd
Ap
cfl/f
l inte
stin
al s
ecti
on
s ex
po
sed
to
co
ntr
ol a
nd
10
% f
reez
e-d
ried
BR
B p
ow
der
ed
die
ts
Co
ho
rts
con
sist
ed
of
4 –
5 m
ice
. Sig
nif
ican
ce o
f re
sult
s (p
val
ue
= ≤
0.0
5)
was
de
term
ine
d u
sin
g tw
o-t
aile
d M
ann
Wh
itn
ey U
sta
tist
ical
te
st.
SEM
= s
tan
da
rd e
rro
r o
f m
ean
; N/D
= n
o d
ata.
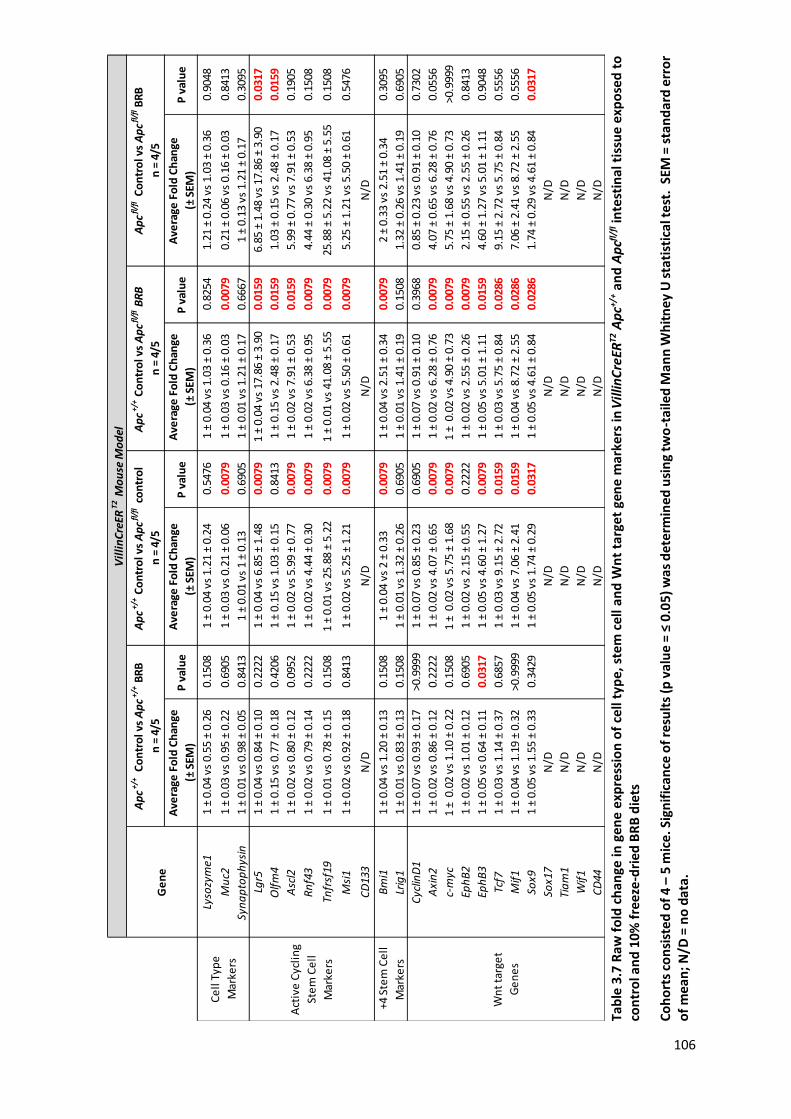
106
Ave
rage
Fo
ld C
han
ge
(± S
EM)
P v
alu
eA
vera
ge F
old
Ch
ange
(± S
EM)
P v
alu
eA
vera
ge F
old
Ch
ange
(± S
EM)
P v
alu
eA
vera
ge F
old
Ch
ange
(± S
EM)
P v
alu
e
Lyso
zym
e11
± 0.
04 v
s 0.
55 ±
0.2
60.
1508
1 ±
0.04
vs
1.21
± 0
.24
0.54
761
± 0.
04 v
s 1.
03 ±
0.3
60.
8254
1.21
± 0
.24
vs 1
.03
± 0.
360.
9048
Mu
c21
± 0.
03 v
s 0.
95 ±
0.2
20.
6905
1 ±
0.03
vs
0.21
± 0
.06
0.00
791
± 0.
03 v
s 0.
16 ±
0.0
30.
0079
0.21
± 0
.06
vs 0
.16
± 0.
030.
8413
Syn
ap
top
hys
in1
± 0.
01 v
s 0.
98 ±
0.0
50.
8413
1 ±
0.01
vs
1 ±
0.13
0.69
051
± 0.
01 v
s 1.
21 ±
0.1
70.
6667
1 ±
0.13
vs
1.21
± 0
.17
0.30
95
Lgr5
1 ±
0.04
vs
0.84
± 0
.10
0.22
221
± 0.
04 v
s 6.
85 ±
1.4
80.
0079
1 ±
0.04
vs
17.8
6 ±
3.90
0.01
596.
85 ±
1.4
8 vs
17.
86 ±
3.9
00.
0317
Olf
m4
1 ±
0.15
vs
0.77
± 0
.18
0.42
061
± 0.
15 v
s 1.
03 ±
0.1
50.
8413
1 ±
0.15
vs
2.48
± 0
.17
0.01
591.
03 ±
0.1
5 vs
2.4
8 ±
0.17
0.01
59
Asc
l21
± 0.
02 v
s 0.
80 ±
0.1
20.
0952
1 ±
0.02
vs
5.99
± 0
.77
0.00
791
± 0.
02 v
s 7.
91 ±
0.5
30.
0159
5.99
± 0
.77
vs 7
.91
± 0.
530.
1905
Rn
f43
1 ±
0.02
vs
0.79
± 0
.14
0.22
221
± 0.
02 v
s 4.
44 ±
0.3
00.
0079
1 ±
0.02
vs
6.38
± 0
.95
0.00
794.
44 ±
0.3
0 vs
6.3
8 ±
0.95
0.15
08
Tnfr
sf19
1 ±
0.01
vs
0.78
± 0
.15
0.15
081
± 0.
01 v
s 25
.88
± 5.
220.
0079
1 ±
0.01
vs
41.0
8 ±
5.55
0.00
7925
.88
± 5.
22 v
s 41
.08
± 5.
550.
1508
Msi
11
± 0.
02 v
s 0.
92 ±
0.1
80.
8413
1 ±
0.02
vs
5.25
± 1
.21
0.00
791
± 0.
02 v
s 5.
50 ±
0.6
10.
0079
5.25
± 1
.21
vs 5
.50
± 0.
610.
5476
CD
133
N/D
N/D
N/D
N/D
Bm
i11
± 0.
04 v
s 1.
20 ±
0.1
30.
1508
1 ±
0.04
vs
2 ±
0.33
0.00
791
± 0.
04 v
s 2.
51 ±
0.3
40.
0079
2 ±
0.33
vs
2.51
± 0
.34
0.30
95
Lrig
11
± 0.
01 v
s 0.
83 ±
0.1
30.
1508
1 ±
0.01
vs
1.32
± 0
.26
0.69
051
± 0.
01 v
s 1.
41 ±
0.1
90.
1508
1.32
± 0
.26
vs 1
.41
± 0.
190.
6905
Cyc
linD
11
± 0.
07 v
s 0.
93 ±
0.1
7>0
.999
91
± 0.
07 v
s 0.
85 ±
0.2
30.
6905
1 ±
0.07
vs
0.91
± 0
.10
0.39
680.
85 ±
0.2
3 vs
0.9
1 ±
0.10
0.73
02
Axi
n2
1 ±
0.02
vs
0.86
± 0
.12
0.22
221
± 0.
02 v
s 4.
07 ±
0.6
50.
0079
1 ±
0.02
vs
6.28
± 0
.76
0.00
794.
07 ±
0.6
5 vs
6.2
8 ±
0.76
0.05
56
c-m
yc1
± 0
.02
vs 1
.10
± 0.
220.
1508
1 ±
0.0
2 vs
5.7
5 ±
1.68
0.00
791
± 0
.02
vs 4
.90
± 0.
730.
0079
5.75
± 1
.68
vs 4
.90
± 0.
73>0
.999
9
Eph
B2
1 ±
0.02
vs
1.01
± 0
.12
0.69
051
± 0.
02 v
s 2.
15 ±
0.5
50.
2222
1 ±
0.02
vs
2.55
± 0
.26
0.00
792.
15 ±
0.5
5 vs
2.5
5 ±
0.26
0.84
13
Eph
B3
1 ±
0.05
vs
0.64
± 0
.11
0.03
171
± 0.
05 v
s 4.
60 ±
1.2
70.
0079
1 ±
0.05
vs
5.01
± 1
.11
0.01
594.
60 ±
1.2
7 vs
5.0
1 ±
1.11
0.90
48
Tcf7
1 ±
0.03
vs
1.14
± 0
.37
0.68
571
± 0.
03 v
s 9.
15 ±
2.7
20.
0159
1 ±
0.03
vs
5.75
± 0
.84
0.02
869.
15 ±
2.7
2 vs
5.7
5 ±
0.84
0.55
56
Mif
11
± 0.
04 v
s 1.
19 ±
0.3
2>0
.999
91
± 0.
04 v
s 7.
06 ±
2.4
10.
0159
1 ±
0.04
vs
8.72
± 2
.55
0.02
867.
06 ±
2.4
1 vs
8.7
2 ±
2.55
0.55
56
Sox9
1 ±
0.05
vs
1.55
± 0
.33
0.34
291
± 0.
05 v
s 1.
74 ±
0.2
90.
0317
1 ±
0.05
vs
4.61
± 0
.84
0.02
861.
74 ±
0.2
9 vs
4.6
1 ±
0.84
0.03
17
Sox1
7N
/DN
/DN
/DN
/D
Tia
m1
N/D
N/D
N/D
N/D
Wif
1N
/DN
/DN
/DN
/D
CD
44N
/DN
/DN
/DN
/D
Ap
c+/
+ C
on
tro
l vs
Ap
cfl/
fl B
RB
n =
4/5
Act
ive
Cyc
lin
g
Ste
m C
ell
Mar
kers
Ce
ll T
ype
Mar
kers
Wn
t ta
rge
t
Ge
ne
s
.+4
Ste
m C
ell
Mar
kers
Vil
lin
Cre
ERT2
Mo
use
Mo
del
Ge
ne
Ap
c+/
+ C
on
tro
l vs
Ap
c+/
+ B
RB
n =
4/5
Ap
cfl/
fl C
on
tro
l vs
Ap
cfl/
fl B
RB
n =
4/5
Ap
c+/
+ C
on
tro
l vs
Ap
cfl/
fl c
on
tro
l
n =
4/5
Tab
le 3
.7 R
aw
fo
ld c
ha
nge
in g
en
e e
xpre
ssio
n o
f ce
ll ty
pe
, st
em
cel
l a
nd
Wn
t ta
rge
t ge
ne
ma
rke
rs in
Vill
inC
reER
T2 A
pc+/
+ an
d A
pcfl
/fl in
test
inal
tis
sue
exp
ose
d t
o
con
tro
l an
d 1
0% f
reez
e-d
ried
BR
B d
iets
Co
ho
rts
con
sist
ed
of
4 –
5 m
ice.
Sig
nif
ican
ce o
f re
sult
s (p
val
ue
= ≤
0.0
5)
was
de
term
ine
d u
sin
g tw
o-t
aile
d M
ann
Wh
itn
ey U
sta
tist
ical
te
st.
SEM
= s
tan
dar
d e
rro
r o
f m
ean
; N/D
= n
o d
ata.

107
3.3 Discussion
Wnt signalling is a key pathway in intestinal homeostasis and deregulation of this pathway
through the loss of the APC tumour suppressor is a key event in the initiation and development of
intestinal tumourigenesis. It is also widely known that diet plays a significant role in the aetiology of
many human diseases, in particular colorectal tumourigenesis. Previous studies have indicated a
protective role for bioactive phytochemicals, such as the polyphenols (anthocyanins), found in high
levels in BRBs (Stoner 2009), but despite this there has been little research on the effect of BRBs on
the normal and malignant ISC populations, the cells thought to be the ‘cell of origin’ of many cancers.
Taking into consideration this previous work, it was hypothesised that BRBs may be an attractive
chemopreventative therapeutic by suppressing Wnt-driven tumourigenesis through alteration of the
Wnt signature and an altered ISC compartment. However, before the potential benefits of BRB at the
earliest stages of tumourigenesis could be addressed, it was important to first evaluate their effect, if
any, on intestinal homeostasis.
3.3.1 Evaluating the effect of BRBs on intestinal homeostasis
A key aim of this work was determine whether the addition of BRB to the diet had an impact
on normal intestinal homeostasis. This was investigated in two mouse models, AhCre Apc+/+ and
VillinCreERT2 Apc+/+. To control for the effects of Cre expression or response to induction agents both
models were appropriately induced (enabling subsequent comparison to be made with mice co
ntaining a loxP flanked Apc). Overall, short-term feeding of BRBs had no major detrimental effects on
intestinal homeostasis in either model. However, there were some significant differences in data
obtained from the two models, which could reflect the experimental design as discussed below.
These differences are likley attributable to external factors in relation to the diet as the
cohorts of BRB fed mice were compared to appropriately treated control mice. 1) The control diet
used in the AhCre studies was not basal matched to the BRB diet. It is possible that this could either,
exaggerate the effects of BRB treatment, or the phenotypic differences could be attributable to other
components of the BRB diet. 2) The animal studies for the AhCre powdered BRB experiment was
started in 2008, whereas the VillinCreERT2 studies began in 2013. Due to time elapsed between these
experiments it was necessary to buy a new diet as the shelf life of BRB diets range between 3 - 6
months depending on storage conditions. The production of the diets in different years could result
in different chemopreventive potential of the two diets, possibly due to differences in polyphenol
content (Wang 2006). If this is the case, it could be argued that the pelleted BRB diet used in the
VillinCreERT2 experiments may have less polyphenol content and thus did not elicit the same effect on
Wnt signalling and stem cell dynamics. 3) Although all animals were maintained on an outbred
108
background, the mice used in the AhCre studies were from different colonies and backgrounds. This
could also explain the large variations between individual animals within cohorts. 4) The number of
animals in each cohort utilised in these studies was relatively low (n = 3 - 5). Previous work using
genetic models indicated that this number would be sufficient to confidently detect changes in the
intestine. In a dietary study, where changes might be more subtle, this number might be too small to
consistently detect changes in both models.
While feeding of BRBs resulted in no perturbations in the gross histology of the small intestine
in either wildtype model, cell death was consistently increased. Differentiation was not grossly altered
as evidenced by the normal representation of the majority of cell types. However, the number of
enteroendocrine cells was increased, again in both models. The enteroendocrine cells are often
described as the chemo sensors of the intestinal epithelium and dietary modifications have previously
been shown to affect this population of cells (Moran-Ramos et al. 2012; Gribble and Reimann 2016).
For example, the small intestines of rats fed a high-fat diet (HFD), which has been shown to enhance
tumourigenesis (Beyaz et al. 2016), were lacking subpopulations of enteroendocrine cells which were
responsible for inhibition of food intake and gastric acid production (Sakar et al. 2014). This could alter
the hormone balance and ultimately limit the effectiveness of homeostasis and signalling pathways
that would normally restrain eating. Although the specific populations of enteroendocrine cells were
not determined in this thesis, it could be hypothesised that this population of cells were up-regulated
in response to a change in dietary composition. This subsequently maintained the normal number of
cells per crypt structure by counteracting the increase in cell death, and maintained the normal
homeostatic and motility functions of the gut. Furthermore, the BRB-induced increase in cell death
may change the cancer risk in these models. Cell death is the mechanism by which damaged or
abnormal cells are lost from the tissue. Cancer cells employ several mechanisms to evade this process
(Fernald and Kurokawa 2013) and so agents which can limit a cancer cells resistance to apoptosis will
have valuable benefits. Although the studies described herein have not determined which cells
underwent apoptosis, it could be hypothesised that cell death occurring in the stem cell population or
progenitor cells would lower the tumourigenic potential should a mutation occur. In addition, it could
also be that BRBs increase the sensitivity of these cells to damage which results in more apoptosis. It
has been previously shown that a different dietary compound, curcumin the active component in
turmeric and its derivatives sensitise resistant CSCs to chemo and radio therapies (Ramasamy et al.
2015). It may be possible that BRBs work in a similar way to sensitise cells to death. A decrease in cell
proliferation was observed in the VillinCreERT2 model but not in the AhCre model. This could be in
accordance with the increase in cell death, such that BRBs limit the risk of mutations being retained
within the normal intestine by reducing the number of highly proliferative daughters. BRB feeding also
109
reduced the expression of important stem cell markers in the AhCre mouse while expression of these
three genes were not altered in the VillinCreERT2 mouse. This could infer that BRBs limit the activity or
reduce the number of the active stem cells, while not detrimentally altering gut architecture or
function. It was also found that BRBs alter Wnt signalling but to a lesser extent in the VillinCreERT2
model.
Overall, the data suggested that BRB intervention induced relatively small changes and did
not grossly disturb the normal homeostatic function of normal intestinal tissue. The consistent
changes between these models are likely to be a true reflection of the effect of BRBs on wildtype
intestine, while the differences observed between models require further investigation to determine
the actual extent of the effect. It is also important to note that while mice are an excellent platform
to study the links between diet, genetics and cancer they are not human. There are a number of
genetically modified murine models that are powerful and useful tools for studying the mechanism of
human disease and homeostasis however, the inherent physiological differences between mouse and
man limits the use of animal studies to suitably predict human responses.
Taken together, these findings indicate that BRBs are well tolerated and maintain intestinal
homeostasis. Thus, if BRBs were used for chemopreventative strategies in CRC, there should be no
adverse effects on the normal intestinal tissue in the short-term. While this holds promise, there are
differences between mouse and man so further work will be required.
3.3.2 Evaluating the effect of BRBs on acute loss of Apc in the intestine
Another key aim of this work was to evaluate the effects of BRB in the diet at the earliest
stages of colorectal tumourigenesis. Previous studies have reported that oral consumption of BRBs
are well tolerated by humans and have been shown to have protective effects at the early stages of
oral dysplasia (Shumway et al. 2008; Mallery et al. 2014). However, animal and human based studies
of the intestine have only studied the beneficial effects of BRBs at later stages of tumour formation
(Bi et al. 2010; Wang et al. 2014). Based on these data, it was predicted that, in the models presented
here, BRBs would exert protective effects at the earliest stages of tumourigenesis. Moreover, due to
the evidence that ISCs are the ‘cell of origin’ of CRC (Barker et al. 2009), it is also crucial to understand
how diet influences the ISCs, which has not currrently been addressed in BRB studies. The earliest
stages of intestinal cancer have been well documented in the context of homozygous deletion of Apc
in the intestinal epithelium as described previously (Sansom et al. 2004; Andreu et al. 2005). This thesis
supports the phenotype typical of Apc loss. The present study was conducted, therefore, to determine
whether BRBs were able to prevent the phenotype typical of acute Apc loss within the intestinal
epithelium, to determine whether BRBs influence ISCs, and to what extent the phenotype was rescued
in relation to wildtype mice.
110
Two mouse models, AhCre Apcfl/fl and VillinCreERT2 Apcfl/fl, were utilised to investigate the
chemopreventative effects of BRBs at the earliest stages of tumourigenesis with particular focus on
the ISC population. The mouse models used resulted in homozygous recombination of the Apc allele,
when injected with the relevant inducing agent. The major difference was Ah-drives recombination in
the ISC and progenitor compartment, while Villin drove Cre in the entire intestinal epithelium including
the Paneth cells.
Both the AhCre Apcfl/fl and VillinCreERT2 Apcfl/fl models showed changes indicating that ISC
function or number may be altered by BRBs. One model (VillinCreERT2 Apcfl/fl) showed a decrease in
proliferation with an increased expression of ISC associated genes, with a concordant up-regulation in
Wnt target genes. The other model (AhCre Apcfl/fl) showed an increased cell cycle and migratory
pattern, with decreased expression of ISC markers but an increase in Wnt targets. Additionally, both
models showed that short-term feeding of BRBs partially attenuated the crypt-progenitor phenotype
by reinstating differentiation and inducing cell death, processes which are associated with tumour
inhibition. Enhanced cell death by BRB administration is consistent with previously published work
that showed BRBs or its AC derivatives induced cell death in preneoplastic oesophageal tissue (Wang
et al. 2009) and in premalignant oral lesions in humans (Mallery et al. 2008; Mallery et al. 2014).
Additionally, increased cell death by BRBs has been reported in cell lines of rat esophageal epithelial
cells (Zikri et al. 2009), human cell lines of oral SCC (Rodrigo et al. 2006), cervical cancer (Zhang et al.
2011) and CRC (Wang et al. 2013b), in animal models and humans of Wnt-driven CRC and FAP (Wang
et al. 2013c; Wang et al. 2014). Although the majority of these studies investigated the role of BRBs in
cancer settings rather than premalignant tissue, they provide compelling evidence that BRBs have pro-
apoptotic properties in tumourigenesis. Taken together, these data indicate that BRBs may limit the
risk of developing CRC by reducing the number of proliferative daughter cells.
Aside from the difference in diet regime as outlined in the wildtype discussion (Section 3.3.1),
it is likely that the expression of Cre recombinase in different cell types influenced the data obtained.
Although the consequences of Wnt deregulation in the differentiated region of the villus in the
VillinCreERT2 Apcfl/fl model has not been characterised in this thesis, it has been previously reported
that the crypt and villus react differently to Wnt/ β-catenin signalling. The immediate consequence of
acute Apc loss in the crypt compartment resulted in severe changes, whereas Apc loss in the villus
compartment, resulted in cells becoming resistant to morphological change and proliferation despite
activation of the Wnt/ β-catenin signalling pathway (Andreu et al. 2005). The number of Apc deficient
cells in the VillinCreERT2 model outweighs the number of Apc deficient cells in the AhCre model, thus
it could be argued that any changes in the crypt compartment of VillinCreERT2 mice will be heavily
influenced or even masked by the villus compartment. In addition, RNA and gene expression data in
111
the VillinCreERT2 model was extracted from whole epithelial cell extracts consisting of both the crypt
and villus compartments and so may not be a true representation of the effects of BRB within the
proliferative and stem cell zones due to loss of Apc within the villus.
BRBs partially restored enteroendocrine and goblet cell differentiation in both animal models
utilised in this thesis. This is in contrast to previously published work that observed no alteration in
goblet cell differentiation (Bi et al. 2010). However, the work published by Bi et al. (2010) evaluated
the effect of BRBs on differentation in two tumour bearing murine models rather than the premaligant
tissue described here. Furthermore, this body of work did not investigate other cell type populations
and so did not provide an overall examination of intestinal differentation in the context of BRBs and
Apc loss. Apc deficiency abrogated cell migration, such that mutated cells were retained within the
crypt and not shed from the epithelium, potentially enabling tumour formation. Although only
investigated in one model (AhCre Apcfl/fl) due to time constraints, BRBs improved migration along the
crypt-villus axis. This suggested that BRBs may elicit chemopreventative effects by enabling cell
migration such that Apc deficient cells capable of initiating tumour formation are lost from the
epithelium. In accordance with this,
Aside from regulating cell proliferation within intestinal crypts, EphB2 also functions to
coordinate migration such that it maintains the normal crypt-villus architecture (Batlle et al. 2002).
BRB feeding in AhCre Apcfl/fl mice resulted in a two-fold decrease in EphB2 gene expression. A potential
loss of genes that usually control cell position within the crypt-villus cells could result in cells usually
confined to the certain areas localising to different regions and thus initiating migration along the
crypt-villus axis, which in the context of Apc deficiency could eliminate transformed cells. However,
this will need to be explored in more detail with a larger cohort size. The caveat to this experiment is
that it did not provide insight in to the mechanism of how BRBs reinstall migration. Homeostasis and
normal functioning of the small intestine is maintained by shedding of cells at the villus tip at the same
rate as cell division at the crypt base. This is to ensure that the gut barrier is maintained at all times to
prevent the entry of harmful microorganisms and toxins. In instances of inflammation which can
predispose to cancer, the rate of cell shedding can exceed the rate at which new cells are generated
(Guan et al. 2011a; Kiesslich et al. 2012). Previous studies have investigated this phenomenon to
better understand the mechanisms involved in cell migration and found that cell shedding occurred
in parallel to apoptosis in the context of an inflammatory response, specifically as a result of
administration of the lipopolysaccharide (LPS) in mice (Williams et al. 2013). Thus it could be assumed
that certain stimuli, in this instance presence of BRBs, resulted in epithelial cell apoptosis and warrant
migration to repair the temporary gap formed when apoptotic cells are shed into the lumen. However,
it was not possible to investigate this at the present time and so scoring of CC3 positive in the villus
112
tip for apoptotic and shed cells will need to be analysed in subsequent studies following the methods
outlined by Williams et al. (2013). Additionally, it may be possible that, in the context of the AhCre
model, Apc loss arrested the cell cycle at the G2/M checkpoint, which has been previously seen in the
liver following Wnt activation (Feng et al. 2012). BRBs may initiate the transition to mitosis which could
explain why BRB exposed Apc deficient crypts are larger and have more BrdU positive cells than the
control treated crypts despite an increase in cell death. In support of this notion, it has recently been
shown that the velocity of villus cell migration is tightly coupled to the rate of crypt cell production
and in such mitotic pressure is the driving force for cell migration (Parker et al. 2017). In this instance,
it is likely that BRBs increase proliferation to drive migration and thus shedding of Apc deficient cells
to prevent initiation and progression of intestinal tumourigenesis. Future work will need to evaluate
markers of the cell cycle to determine if BRBs initiate cell cycle progression in the context of Apc
deficiency.
This thesis used proxy readouts (gene expression, cell types and migrations) to measure the
effect of BRBs on ISC dynamics and Wnt signalling. However, these studies did not determine the
intrinsic effect on a malignant stem cell population. Previous studies have proposed that ISCs are the
cell of origin of CRC, as deletion of Apc specifically within the Lgr5+ ISCs propagated tumour formation
by repopulating the entire crypt and villus epithelium with Apc deficient cells (Barker et al. 2009).
Although not well understood, diet-induced physiological cues are likely to influence ISC biology
(Mihaylova et al. 2014). The effect of dietary components on the malignant ISC populations is at the
core of cancer research and studies are beginning to provide insight on the mechanisms involved in
dietary induced stem cell dynamics. Recent studies have shown that the Lgr5+ stem cells are extremely
sensitive to dietary factors. Natural polyphenols such as curcumin and long-chain polyunsaturated
fatty acids (PUFAs) have been found, in animal models, to synergistically promote targeted apoptosis
in DNA damaged Lgr5+ stem cells and reduce nuclear β-catenin levels in ACF at the pretumour stage
(Kim et al. 2016a). Epidemiological studies report a link between obesity and high fat diets to a
heightened risk of developing intestinal cancer (Wu et al. 2016). A recent study found that high fat
diet augmented the self-renewal ability of ISCs and enhanced the stemness and tumourigenic ability
of progenitor cells. In addition, high fat diet resulted in more adenomas and carcinomas, possibly due
to the fact there were more ISCs as a result of the diet (Beyaz et al. 2016). Due to the association of
high fruit and fibre diets to reduced CRC risk, it could be predicted that BRBs have the opposite effects
on stem cells than that of high fat diets.
The potential chemopreventative effects of BRBs may be explained by a reduction in gene
expression of the active ISC markers in the AhCre system. Although this reduction in stem cell marker
expression is not consistent with an increased proliferative index or Wnt target gene expression, it

113
may be possible that ISCs respond differently to other cells within the epithelium that are altered as a
result of BRB exposure, as highlighted by the results from the VillinCreERT2 model. Gene expression
of the main stem cell markers, Lgr5 and Olfm4, were decreased in the AhCre model but up-regulated
in the VillinCreERT2 model. This could imply that either, in the AhCre model the number of stem cells
are reduced following BRB treatment, or the same number of stem cells exist but their expression is
down-regulated or in the context of the VillinCreERT2 model, the number and/ or activity of malignant
ISCs is enhanced. Ascl2 is commonly up-regulated in the early stages of intestinal neoplasia. Previous
studies have suggested a role of Ascl2 in promoting proliferation and migration (Jubb et al. 2006).
Thus, although Ascl2 co-localises with Lgr5 in the ISCs (van der Flier et al. 2009b), its up-regualtion in
Apc deficient crypts exposed to BRB may be correlated with an increased proliferative and migration
status, rather than an ISC signature. Additionally, BRBs have been shown to exert chemopreventative
effects by alterating epigentic biomarkers and demethylating tumour supressor genes commonly
silenced in CRC (Wang et al. 2011; Wang et al. 2013c). Ascl2 is imprinted at the early stages of intestinal
development (Tunster et al. 2016), and although it is not epigenetically imprinted in the adult murine
intestine (van der Flier et al. 2009b), it may be possible that the nutri-epigentic effects of BRBs
influence Ascl2 gene expression.
BRBs induced alterations in expression of Wnt target genes in both models, with Sox9 being
consistently up-regulated. Olfm4 and Sox9 have been reported to have an antagonist effect on the
Wnt signalling pathway (Bastide et al. 2007; Liu et al. 2016). In the context of Olfm4 as a Wnt repressor,
it could be assumed that a reduction in Olfm4 expression as a result of BRB treatment could limit the
antagonistic effect on Wnt signalling and thus promote tumourigenesis. However, the “just right”
model proposes that a specific level of Wnt activity is required for tumourigenesis and levels of Wnt
signalling below or above this threshold compromises tumour development (Albuquerque et al. 2002).
Thus, a reduction of Olfm4 (and its repressive role) and an increase in Wnt target gene expression by
BRBs could potentially increase Wnt signalling such that there is ‘too much Wnt’ incompatible for
tumour initiation. Furthermore, Olfm4 is also a direct target of the Notch signalling pathway and
inhibition of Notch results in CBC loss, enhanced differentiation and apoptosis. Olfm4 expression has
been found to be dependent on Notch signalling, which maintains progenitor cells, and thus it could
therefore be predicted that BRBs repress Notch signalling thereby reducing Olfm4 gene expression
and subsequently increasing the number of differentiated cells (VanDussen et al. 2012). It is evident
that there is cross talk between Wnt and Notch signalling pathways and repression of one pathway
could down-regulate the other. However, targets of the Notch signalling pathway will need to be
investigated to evaluate the effects of BRBs on Notch’s involvement in loss or gain of stem cell marker
expression.
114
While this thesis has already outlined the logistical difference in control diet and potential
influence of different BRB diet from different years, it is important to determine which model is most
likely to represent true changes in the ISC population.
1) It is possible that the inconsistent stem cell marker expression levels between the two models
may represent differential recombination efficiency within the ISC compartment. Directly
comparing the effect of BRBs on the ISCs requires the same level of recombination within the
two mouse models. It has been previously reported that in order to achieve similar
recombination within the ISCs, both AhCre and VillinCreERT2 models required 3 x IP injections
with 80 mg/kg over 24 hours of βNF and tamoxifen respectively (Parry et al. 2013). In the
VillinCreERT2 model utilised herein, mice received 3 x IP 60 mg/kg tamoxifen as recent
experiments using VillinCreERT2 Apcfl/fl mice injected with 3 x 80 mg/kg tamoxifen presented
with signs of illness much earlier than previously reported by Andreu et al. (2005). Thus, to
enable mice to reach the desired endpoint (day 4 post induction) a lower dose of tamoxifen
was administered. It is therefore possible that Apc recombination within the ISCs was less
efficient in the VillinCreERT2 model than in the AhCre system, rendering it a less reliable
system for modelling the effects of BRB on Wnt activated ISC populations.
2) As previous studies have outlined that the two models described here induce recombination
in the ISC population (irrespective of recombination rate), the mechanisms underlying the
different ISC response to BRB diet could be linked to the fact that the two Cre systems
differentially drive recombination within other cell types. Cre expression under the control
of the VillinCreERT2 transgene drives recombination in differentiated cells, most notably
Paneth cells which constitute the ISC niche, whereas this population of cells is spared in the
AhCre model (El Marjou et al. 2004; Ireland et al. 2004). The ‘cancer stem cell’ hypothesis
proposes that only a subpopulation of cells i.e. stem cells, are capable of initiating and
progressing tumourigenesis (Tan et al. 2006). It is also important to note that tumours are
thought to arise from mutations which arise within a single ISC, rather than from mutations
which occur globally through the tissue (Barker et al. 2009). In order to evaluate the real
effect of BRB diet on ISCs in a tumour relevant model it is beneficial to analyse Apc loss in the
ISCs alone, such that other cell types do not interfere with the stem cell dynamics that would
normally occur following injury or mutation, especially if those cells influence the stem cell
niche. In this instance, as the VillinCreERT2 model deletes Apc in the Paneth cell, the resulting
Wnt-over activation within the ISC niche could negatively influence malignant ISC dynamics.
This could therefore portray an enhanced stem cell marker expression that would have a
115
deleterious impact on the intestine and could potentiate tumourigenesis. This is in contrast
to the AhCre model, in which the Paneth cells are spared from Apc gene ablation, and
therefore may better recapitulate the events leading to tumourigenesis, and thus better
reflects actual stem cell marker alterations. Despite our assumption that increased Wnt
activation drives tumourigenesis, there is growing evidence that over-activation of Wnt
signalling can have a tumour protective effect within the intestine (Albuquerque et al. 2002;
Méniel et al. 2013). In this instance, expression of some Wnt target genes were upregualted
in both the BRB fed AhCre and VillinCreERT2 models, which could infer that BRBs elicit an
enhanced Wnt response to hinder tumourigenesis.
3) There has been a lot of controversy over the published ISC markers (Tian et al. 2011; Barker
et al. 2012; Muñoz et al. 2012) as many markers do not have functional roles in the
maintenance of the ISC population. As some ISC marker genes are also Wnt target genes, it
is important to remember that changes in expression levels within the whole intestinal
epithelium may not represent changes to the functional stem cell population, rather indicate
a response to Wnt activation within differentiated epithelial cells. Within the context of
global Apc deletion, identification of the ISC population becomes even more challenging, and
so the difference in the results observed between AhCre and VillinCreERT2 may be the direct
result of Wnt-activation on a different number of cells or a different cell population (such as
the Paneth cells), and not the result of an expansion/ reduction of the functional ISC
compartment. In addition, it is also possible that, in the instance of the VillinCreERT2 model,
differentiated cell populations have dedifferentiated and reverted to have stem-cell like
properties (Schwitalla et al. 2013). It is not possible from this data to distinguish whether such
changes reflect a dedifferentiated population reacquiring Lgr5+ expression or a direct effect
on ISC marker expression. The AhCre system does not result in Wnt-activated differentiated
cells and so is unlikely that these differentiated populations will revert to stem-like cells.
Taking into consideration the discussion above, it is likely that the AhCre system is a more reliable
model than the VillinCreERT2 model used here to examine ISC changes especially in the context of
dietary intervention. Future work will need to investigate the effect of BRBs on the ISC population
more specifically. However, taken together, these observations provide some evidence that BRBs
mediate chemopreventative and anti-tumourigenic properties at the earliest stages of cancer
initiation.
116
3.4 Summary and Future Directions
In summary, three major conclusions can be drawn from the data presented in this chapter.
First, 2 week feeding of 10% freeze-dried BRBs had no harmful effect on the normal intestine.
Secondly, BRBs exerted chemopreventive effects by partially reinstating the cell differentiation
pathways that are severely perturbed following acute Apc loss, induced cell death and reinstated
migration. Thus, BRBs attenuated the premalignant intestine phenotype. And finally, BRBs altered the
expression of the stem cell compartment and Wnt target genes.
The data presented here suggests two things:
1) The numbers of stem cells are altered after BRB feeding and/ or
2) BRBs effect the expression and thus potentially affect the functional output of the ISCs..
Therefore, it is important to determine the number of ISCs present per crypt following feeding
of BRBs. The lack of reliable and adequate antibodies targeting stem cell markers has hindered the
progression of ISC research and understanding the important interactions between ISCs and
carcinogenesis. The recently developed RNAscope® in situ hybridisation technology enables sensitive
and reliable identification of stem cell-specific gene expression at a single RNA transcript level (Wang
et al. 2012). Studies have reliably identified distinct ISC populations (Yan et al. 2012) and alterations
in stem cell expression in different grade human colorectal tumours through the use of RNAscope®
technology (Baker et al. 2015). This technique has vastly improved our ability to identify the intestinal
stem cells and would reliably identify and enable quantification of the number of stem cells in control
and BRB treated tissue.
It is also important to note that qRT-PCR gene expression analysis is a powerful tool used to
investigate transcriptional behaviour by quantifying the number of mRNA transcripts present for a
given gene. However, due to post transcriptional regulation, mRNA quantification does not necessarily
correlate to protein activity. The gene expression data presented in this chapter provides some
evidence that Wnt signalling is further enhanced in Wnt-activated crypts following acute Apc loss. This
could support the ‘just-right’ hypothesis such that a certain level of Wnt activation is required for
tumour growth and levels either side of the threshold hinders tumourigenesis (Albuquerque et al.
2002). To test this hypothesis it would be beneficial to analyse the effect of BRBs on proteins involved
in Wnt signalling. Western blotting or global gene expression analysis through the use of RNA-
sequencing may provide an extensive and more informative readout of gene and protein changes that
occur in this experimental setup. It wold also be useful to perform gene and protein analysis for
markers of the cell cycle to ascertain whether BRBs influence cycle cell dynamics. Additionally, due to
the complicated cross talk between several signalling pathways, it would also be useful to investigate

117
the effect of BRBs on the Notch and Hedgehog signalling pathways, due to their involvement in the
stem cell niche (Moore and Lemischka 2006; Umar 2010; Clevers et al. 2014).
Taken together, these findings provide evidence of the therapeutic potential of BRBs as a
chemopreventative strategy at the earliest stages of tumourigenesis.

118
4 Functional analysis of potential tumour initiating cells exposed to BRB
4.1 Introduction
The work outlined in chapter 3 described how crypt dynamics and gene expressions
were altered following feeding of 10% freeze-dried BRB diet in two murine models of Wnt
deregulation in the intestine. Acute Apc loss in the intestine is characterised by increased
stem-like cells and a lack of differentiation and migration (Sansom et al. 2004). Apc mutations
can lead to an expansion of the ISC compartment and thus result in more cells with the
potential to instigate tumourigenesis. It was found that BRBs partially reinstated cell
differentiation and migration immediately following gene ablation of Apc and altered ISC
marker gene expression. Specifically, in the AhCre Apcfl/fl mouse model, BRBs decreased Olfm4
and to some extent Lgr5 gene expression. Hypothetically, these observations could reflect a
decrease in the number of stem cells present or activity of the stem cells within the Apc
deficient cell population. However, as outlined in chapter 3, Olfm4 and Lgr5 were used as
markers of gene expression and may not represent functional changes in the stem cell
compartment. Additionally, the data from gene expression and in situ hybridisation did not
permit the determination of the number of stem cells present per crypt.
This chapter aimed to evaluate the effect of BRBs on the stemness and self-renewal
properties of Apc deficient cells. In order to achieve this, the ex vivo three dimensional (3D)
culture system was utilised to grow intestinal organoids from intestinal crypts or ISCs. These
cultures produce self-renewing intestinal organoids that can be expanded indefinitely in
culture (Sato et al. 2009). The ability of intestinal organoids to develop in 3D simulates the
physiology, shape and dynamics of the in vivo intestinal epithelium (Young and Reed 2016).
The increased physiological relevance of this technique has led to advances in our
understanding of the normal and malignant ISC and is becoming routinely used for
translational research and drug discovery (Hollins and Parry 2016). It has been shown in
wildtype organoids, that formation and self-renewal efficiency provide a good readout of the
functional capacity of the ISC compartment (Young 2013). In an Apcfl/fl model however, it is
not known whether only ISCs are capable of forming organoids and, Apc deficient organoids
do not functionally differentiate. This indicates that organoid formation in an Apcfl/fl model
may not be a direct readout of the number of ISCs but may give an insight into the capacity of
cells to initiate tumour formation. Self-renewal however, is a hallmark of ISCs and so may be
more accurate readout of stem cell capacity within a Wnt deregulated intestine. Thus in this
chapter, ex vivo culture of Apc deficient crypts and single cells enabled us to obtain a

119
functional readout of ISC and tumour forming capacity after exposure to BRBs by determining
the efficiency of organoid formation and self-renewal.
4.2 Results
4.2.1 BRBs have no overt effect on organoid formation efficiency of Apc deficient crypts
To determine whether BRBs had any overt effect on the functional output and
number of Apc deficient cells, a stem cell functionality assay was performed to quantify the
organoid forming efficiency in the context of BRBs. VillinCreERT2 Apcfl/fl mice were randomly
assigned to two cohorts: AIN76A diet (control) or 10% BRB diet, n = 4 mice per group. Mice
were fed for 2 weeks on either the AIN76A pelleted diet or 10% freeze-dried BRB powder
supplemented in AIN76A pellets, before Cre-induced Apc gene ablation and remained on their
respective diets until culled at day 3 post induction. Acute Apc loss was driven by IP tamoxifen
induction of Cre recombinase under the control of the VillinCreERT2 promoter. This induced
Apc loss specifically in the intestinal epithelium including in the Paneth cells. On day 3 post
induction, mice were culled and the intestine was harvested as described in section 2.10.1
and prepared using the crypt culture method (Section 2.10). Crypts were cultured without
the Wnt activator R-spondin to select for organoids derived from Apc deficient ISCs. The
number of organoids formed was counted using the Gelcount, Oxford Optronix plate reader
at day 1 and day 7 post crypt seeding. This crypt culture method has been shown to result
in the development of cyst-like organoids forming at days 1 - 2, characteristic of Apc loss (Sato
et al. 2009). This crypt culture method enabled the quantification of organoid forming
efficiency of Apcfl/fl intestinal crypts as a proxy readout for the potential number of cells
capable of initiating tumourigenesis (Yilmaz et al. 2012; Beyaz et al. 2016). Organoid forming
efficiency refers to the percentage of seeded crypts/cells that have formed functional
organoids over 7 days. Any alterations to crypt dynamics, as a result of feeding on BRBs, would
have been established in vivo prior to seeding ex vivo. Using this methodology it was possible
to determine whether prior exposure to BRBs had any effect on the overall size and number
of organoids that formed.
Feeding of BRBs had no effect on the organoid forming efficiency of Apcfl/fl crypts
compared to the control (Figure 4.1A and C, Table 4.1A). Crypts pre-exposed to both control
and BRB diet grew into organoids over 7 days, increasing in size as described by Sato et al.
(2009), (Figure 4.1B, Table 4.1A). Pre-treated BRBs Apcfl/fl organoids were 15% larger than
control treated organoids at day 7, but this was not found to be statistically significant (Figure
4.1B, Table 4.1A). Taken together, this data indicated that exposure of the normal intestinal

120
epithelia to BRBs did not overtly alter the organoid forming behaviour and growth capacity of
these cells following Apc deletion and removal of BRBs once cultured.
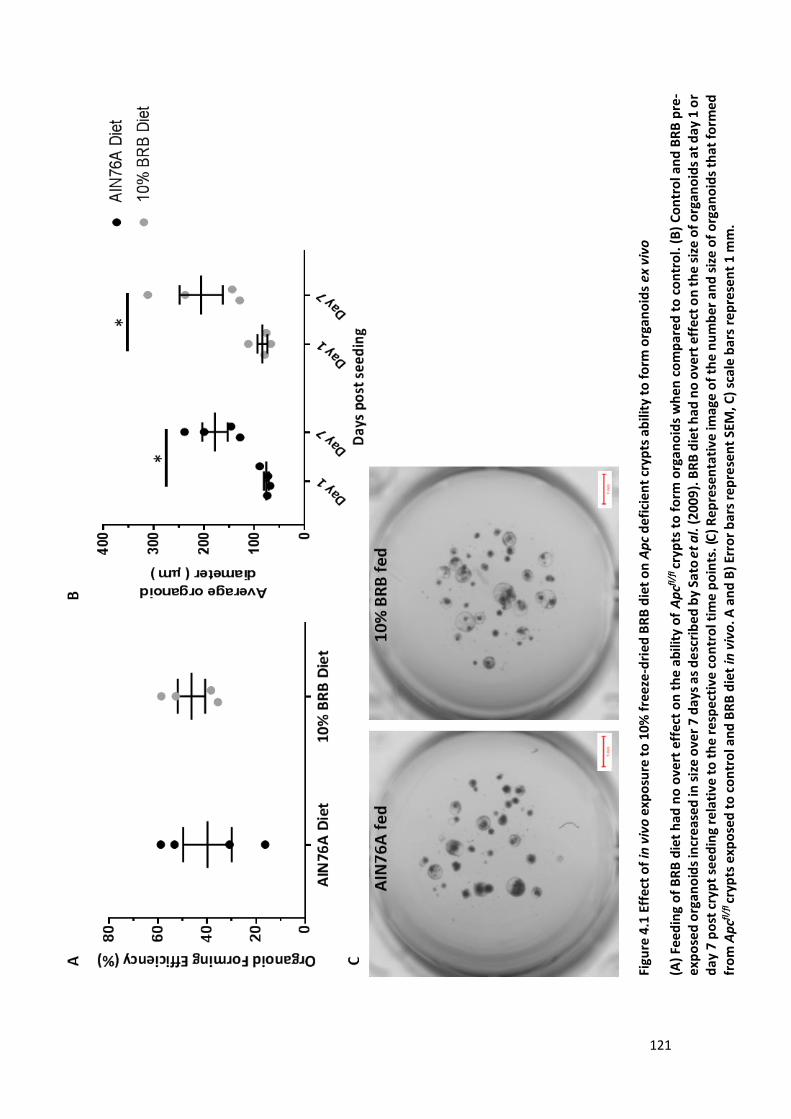
121
Figu
re 4
.1 E
ffec
t o
f in
viv
o e
xpo
sure
to
10%
fre
eze
-dri
ed
BR
B d
iet
on
Ap
c d
efi
cie
nt
cryp
ts a
bili
ty t
o f
orm
org
ano
ids
ex v
ivo
(A)
Feed
ing
of
BR
B d
iet
had
no
ove
rt e
ffec
t o
n t
he
ab
ility
of
Ap
cfl/f
l cr
ypts
to
fo
rm o
rga
no
ids
wh
en c
om
par
ed t
o c
on
tro
l. (
B)
Co
ntr
ol a
nd
BR
B p
re-
exp
ose
d o
rga
no
ids
incr
eas
ed
in s
ize
ove
r 7
da
ys a
s d
esc
rib
ed
by
Sato
et
al.
(2
00
9).
BR
B d
iet
had
no
ove
rt e
ffec
t o
n t
he
size
of
org
ano
ids
at d
ay 1
or
da
y 7
po
st c
ryp
t se
ed
ing
rela
tive
to
th
e r
esp
ect
ive
co
ntr
ol t
ime
po
ints
. (C
) R
ep
rese
nta
tive
imag
e o
f th
e n
um
ber
an
d s
ize
of
org
ano
ids
that
fo
rmed
fr
om
Ap
cfl/f
l cryp
ts e
xpo
sed
to
co
ntr
ol a
nd
BR
B d
iet
in v
ivo
. A a
nd
B)
Erro
r b
ars
rep
rese
nt
SEM
, C)
scal
e b
ars
rep
rese
nt
1 m
m.

122
4.2.2 Apc deficient organoids are sensitive to increasing concentration of BRBs
In the previous section Apc deficient organoids derived from BRB exposed intestines
were selected and maintained in the absence of BRBs. Thus, the previously reported BRB
mediated in vivo down-regulation of ISC is likely to be lost and any selective pressure applied
may fail to manifest or be rapidly lost in the ex vivo culture. Therefore, the next experiment
set out to evaluate the effects of continual exposure to BRBs on Apc deficient organoids.
It was not possible to dissolve freeze-dried BRB powder in the intestinal culture
medium, so an anthocyanin (AC) extract (containing cyanidin-3-O-glucoside, cyanidin-3-O-
xylosylrutinoside and cyanidin-3-O-rutinoside) extracted from fresh BRBs was utilised, as
these are, at least in part, responsible for the chemopreventative effects of BRBs (Wang et al.
2013b). The BRB-derived AC solution was provided by our collaborators (Li-Shu Wang, Medical
College of Wisconsin, USA). Previous studies from this group have used BRB-derived ACs in
cell culture work and showed that 0.5, 5, and 25 μg/ml of AC solution suppressed the activity
of DNA methylation proteins in 3 human CRC cell lines that are commonly unregulated in
cancer. Additionally, they reported that BRB-derived ACs inhibited proliferation and enhanced
apoptosis of these cells (Wang et al. 2013b). Human cell lines have several benefits, they are
a good platform for screening and characterising cancer therapeutics, they retain many
genetic, epigenetic and gene expression features of cancers, they are easy to handle and
manipulate (Vargo-Gogola and Rosen 2007) and they enable analysis of homogenous
populations within a tumour (Vargo-Gogola and Rosen 2007; van Staveren et al. 2009).
However, cell lines do have their limitations which question their relevance in future studies.
The drawbacks of cell lines are that they are generally established from aggressive and
metastatic tumours which restrict their use in cancer progression studies and early drug
interventions (Ferreira et al. 2013). Cell culture is not a true representation of the
environment of the primary tumour (Vargo-Gogola and Rosen 2007) and can often lead to
alterations in cell morphology, gene expression and pathways (van Staveren et al. 2009). In
vivo tumours are comprised of heterogeneous cell populations; this natural heterogeneity is
lost in in vitro cultures (Vargo-Gogola and Rosen 2007). The use of organoids as a model of
cancer has been a major breakthrough in research and is now a widely used tool for studying
basic and clinical biology. Although 3D organoid models have some limitations such that, the
lack of a native microenvironment impedes analysis of stem cell interactions with their typical
niche, they recapitulate a number of biological interactions in vivo. They are near-
physiological models for studying stem cells, they enable analysis of cell-cell and cell-matrix
interactions and contain heterogeneous populations of the original tissue. The organoid

123
modelling system has bridged the gap between in vitro culture studies and in vivo animal
models. As the work by Wang et al. studied the effects of ACs in human cell lines (Wang et al.
2013b), and as the concentration of active components might vary between preparations, it
was important to determine an appropriate range of concentrations to use on murine Apc
deficient intestinal organoids and to evaluate the effect of these concentrations of BRB-
derived ACs on murine intestinal crypt dynamics.
The CellTiter-Glo® luminescent cell viability assay was utilised to determine the IC50 of
the AC solution for murine organoids (IC50 refers to the concentration of AC required to reduce
organoid viability by half). This assay determines the number of viable cells or organoids based
on their ATP output, which indicates the presence of metabolically active organoids. The
luminescence signal was read using the CLARIOstar plate reader and Xlfit software was utilised
to calculate the IC50 value. Based on a previous study (Wang et al. 2013b) a BRB-derived AC
stock solution (160.4 μM/g) was utilised to generate serial concentrations ranging from 0
μg/ml (no AC extract) to 500 μg/ml. As the concentrations used proved too low to reach 100%
cell death, the data was extrapolated using the XLfit software to give an estimated IC50 of 11.6
mg/ml (Figure 4.2A). This indicated that 500 μg/ml of BRB-derived ACs were not sufficiently
toxic to the organoids to cause complete cell death. In addition, it was apparent that organoid
sensitivity to ACs manifested at concentrations above 15.6 μg/ml, as cell viability started to
decrease in a dose-dependent manner. To establish a complete cell viability readout, the
concentration of AC extract was increased to 16 mg/ml to cover the 11.6 mg/ml concentration
determined by the IC50. Concentrations between 15.6 μg/ml and 16 mg/ml produced a graph
which plateaued at the bottom allowing an IC50 of 1.4 mg/ml to be determined (Figure 4.2B).
In addition, this data also indicated that organoid viability decreased in a dose-dependent
manner, as changes in viability began to decline at AC concentrations between 15.6 - 500
μg/ml.
Together, these results indicated that concentrations of AC extract between 15.6 and
500 μg/ml shows some but not complete toxicity and therefore, have some potential
chemopreventative effects by reducing the viability of Apc deficient organoids.
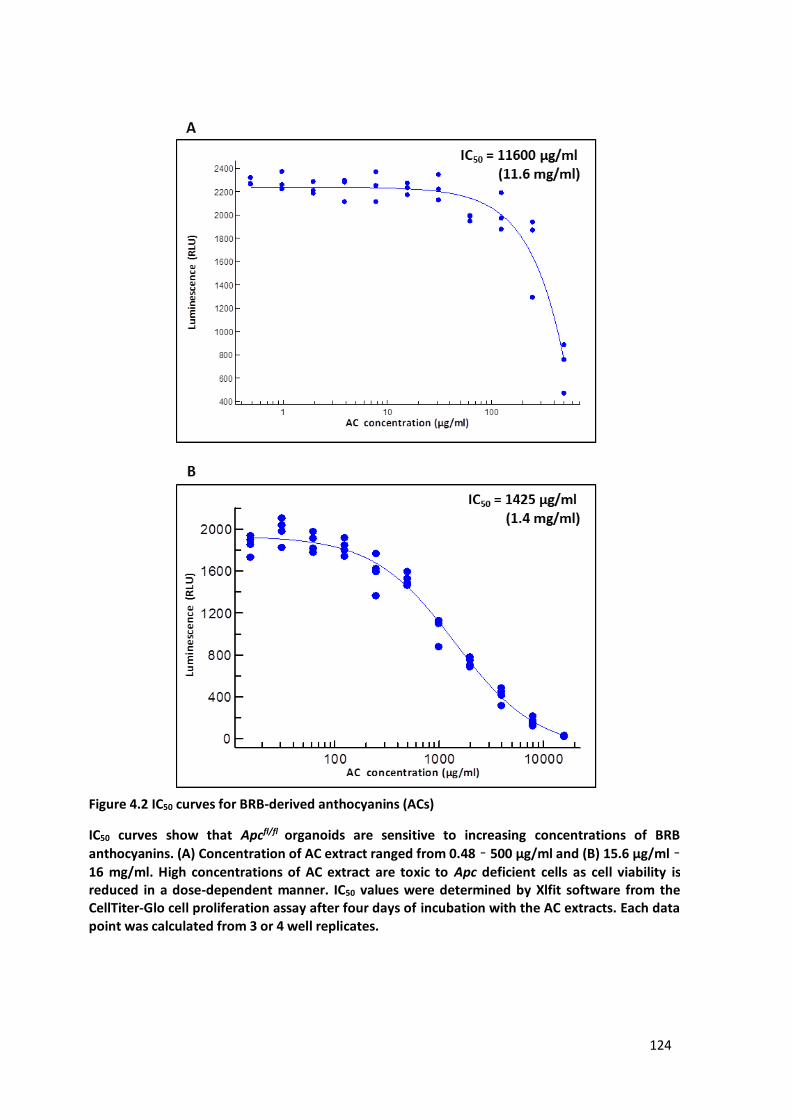
124
Figure 4.2 IC50 curves for BRB-derived anthocyanins (ACs)
IC50 curves show that Apcfl/fl organoids are sensitive to increasing concentrations of BRB
anthocyanins. (A) Concentration of AC extract ranged from 0.48 – 500 μg/ml and (B) 15.6 μg/ml –
16 mg/ml. High concentrations of AC extract are toxic to Apc deficient cells as cell viability is reduced in a dose-dependent manner. IC50 values were determined by Xlfit software from the CellTiter-Glo cell proliferation assay after four days of incubation with the AC extracts. Each data point was calculated from 3 or 4 well replicates.
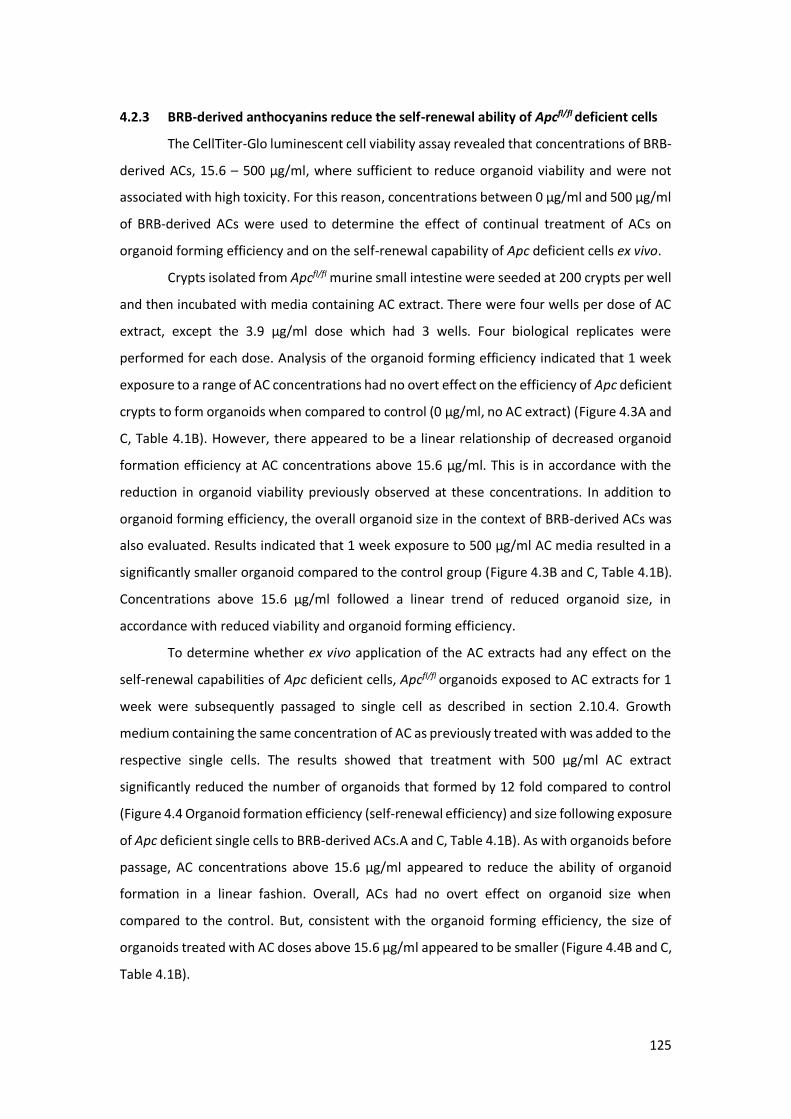
125
4.2.3 BRB-derived anthocyanins reduce the self-renewal ability of Apcfl/fl deficient cells
The CellTiter-Glo luminescent cell viability assay revealed that concentrations of BRB-
derived ACs, 15.6 – 500 μg/ml, where sufficient to reduce organoid viability and were not
associated with high toxicity. For this reason, concentrations between 0 μg/ml and 500 μg/ml
of BRB-derived ACs were used to determine the effect of continual treatment of ACs on
organoid forming efficiency and on the self-renewal capability of Apc deficient cells ex vivo.
Crypts isolated from Apcfl/fl murine small intestine were seeded at 200 crypts per well
and then incubated with media containing AC extract. There were four wells per dose of AC
extract, except the 3.9 μg/ml dose which had 3 wells. Four biological replicates were
performed for each dose. Analysis of the organoid forming efficiency indicated that 1 week
exposure to a range of AC concentrations had no overt effect on the efficiency of Apc deficient
crypts to form organoids when compared to control (0 μg/ml, no AC extract) (Figure 4.3A and
C, Table 4.1B). However, there appeared to be a linear relationship of decreased organoid
formation efficiency at AC concentrations above 15.6 μg/ml. This is in accordance with the
reduction in organoid viability previously observed at these concentrations. In addition to
organoid forming efficiency, the overall organoid size in the context of BRB-derived ACs was
also evaluated. Results indicated that 1 week exposure to 500 μg/ml AC media resulted in a
significantly smaller organoid compared to the control group (Figure 4.3B and C, Table 4.1B).
Concentrations above 15.6 μg/ml followed a linear trend of reduced organoid size, in
accordance with reduced viability and organoid forming efficiency.
To determine whether ex vivo application of the AC extracts had any effect on the
self-renewal capabilities of Apc deficient cells, Apcfl/fl organoids exposed to AC extracts for 1
week were subsequently passaged to single cell as described in section 2.10.4. Growth
medium containing the same concentration of AC as previously treated with was added to the
respective single cells. The results showed that treatment with 500 μg/ml AC extract
significantly reduced the number of organoids that formed by 12 fold compared to control
(Figure 4.4 Organoid formation efficiency (self-renewal efficiency) and size following exposure
of Apc deficient single cells to BRB-derived ACs.A and C, Table 4.1B). As with organoids before
passage, AC concentrations above 15.6 μg/ml appeared to reduce the ability of organoid
formation in a linear fashion. Overall, ACs had no overt effect on organoid size when
compared to the control. But, consistent with the organoid forming efficiency, the size of
organoids treated with AC doses above 15.6 μg/ml appeared to be smaller (Figure 4.4B and C,
Table 4.1B).
126
In summary, exposing Apc deficient crypts to ACs ex vivo had no overt effect on the
percentage of cells capable of forming an organoid. In contrast, maintaining these organoids
in the presence of AC significantly slowed their growth and resulted in fewer cells capable of
self-renewing.
Figure 4.3 Organoid formation efficiency and size following exposure of Apc deficient crypts to BRB-derived ACs
(A) Scatter-plot diagram showing organoid forming efficiency of Apcfl/fl crypts in the presence of BRB-derived ACs. ACs had no significant effect on the efficiency of crypts to form organoids however, concentrations above 15.6 µg/ml appeared to be reduce efficiency linearly. (B) Scatter-plot diagram showing 500 µg/ml of AC reduced the average diameter of Apc deficient organoids when compared to control. Similarly, concentrations between 15.6 – 250 µg/ml appeared to reduce organoids diameter in a linear trend. (C) Representative image of the number of organoids that formed following exposure to 0 µg/ml and 500 µg/ml of AC extract. * P value ≤ 0.05, n ≥ 3, two-tailed Mann Whitney U test. Error bars represent SEM. Scale bars represent 1 mm.
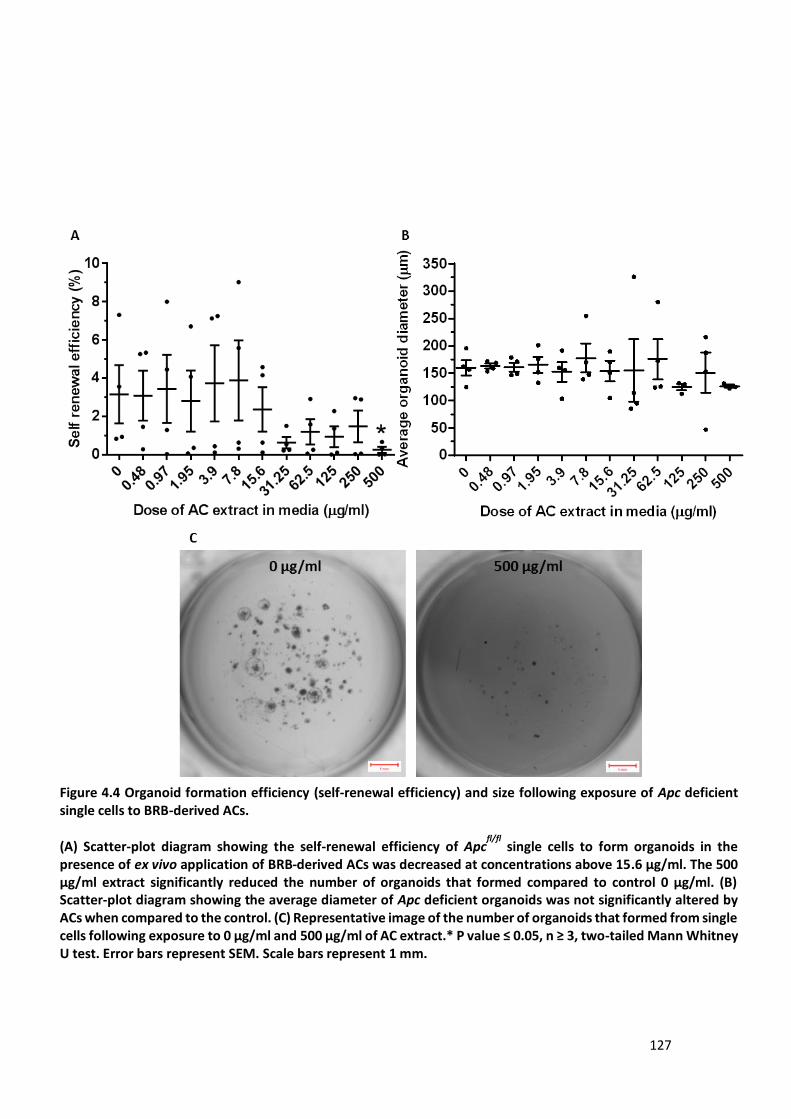
127
Figure 4.4 Organoid formation efficiency (self-renewal efficiency) and size following exposure of Apc deficient single cells to BRB-derived ACs.
(A) Scatter-plot diagram showing the self-renewal efficiency of Apcfl/fl
single cells to form organoids in the presence of ex vivo application of BRB-derived ACs was decreased at concentrations above 15.6 μg/ml. The 500 μg/ml extract significantly reduced the number of organoids that formed compared to control 0 μg/ml. (B) Scatter-plot diagram showing the average diameter of Apc deficient organoids was not significantly altered by ACs when compared to the control. (C) Representative image of the number of organoids that formed from single cells following exposure to 0 μg/ml and 500 μg/ml of AC extract.* P value ≤ 0.05, n ≥ 3, two-tailed Mann Whitney U test. Error bars represent SEM. Scale bars represent 1 mm.
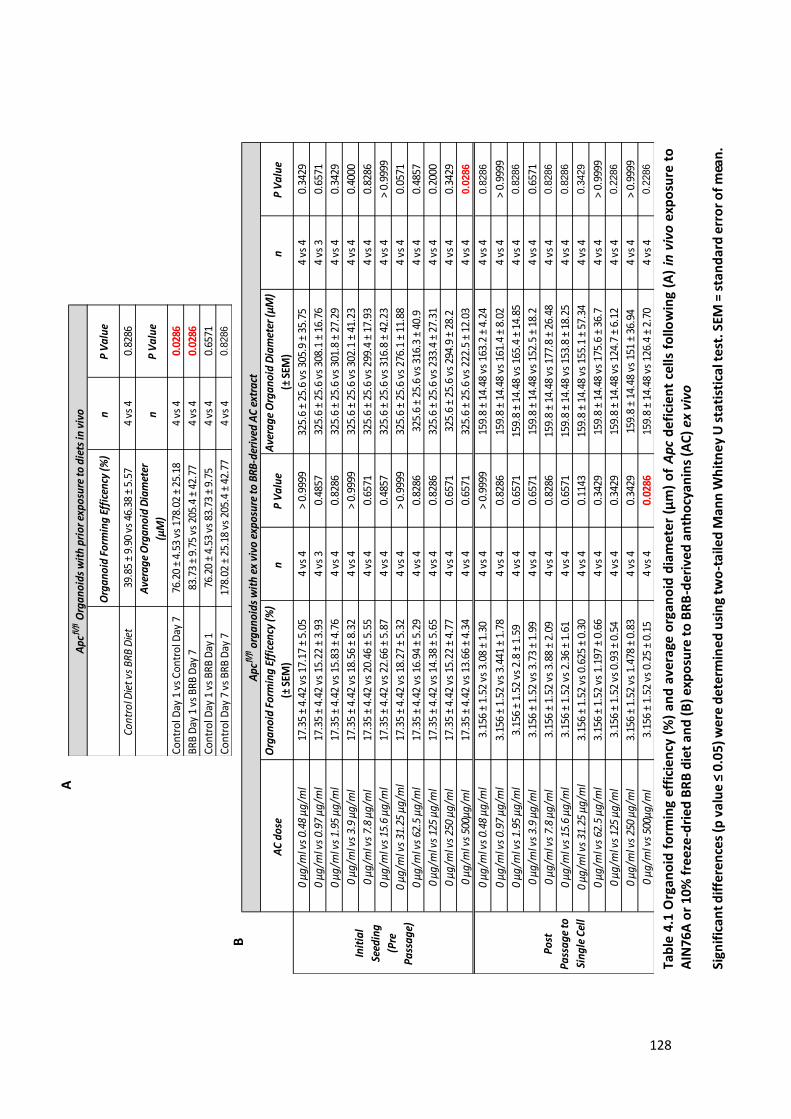
128
AC
dose
Org
anoi
d Fo
rmin
g Ef
fice
ncy
(%)
(± S
EM)
nP
Val
ueA
vera
ge O
rgan
oid
Dia
met
er (μ
M)
(± S
EM)
nP
Val
ue
0 μg
/ml v
s 0.
48 μ
g/m
l 17
.35
± 4.
42 v
s 17
.17
± 5.
054
vs 4
> 0.
9999
325.
6 ±
25.6
vs
305.
9 ±
35.7
5 4
vs 4
0.34
29
0 μg
/ml v
s 0.
97 μ
g/m
l 17
.35
± 4.
42 v
s 15
.22
± 3.
934
vs 3
0.48
5732
5.6
± 25
.6 v
s 30
8.1
± 16
.76
4 vs
30.
6571
0 μg
/ml v
s 1.
95 μ
g/m
l 17
.35
± 4.
42 v
s 15
.83
± 4.
764
vs 4
0.82
8632
5.6
± 25
.6 v
s 30
1.8
± 27
.29
4 vs
40.
3429
0 μg
/ml v
s 3.
9 μg
/ml
17.3
5 ±
4.42
vs
18.5
6 ±
8.32
4 vs
4>
0.99
9932
5.6
± 25
.6 v
s 30
2.1
± 41
.23
4 vs
40.
4000
0 μg
/ml v
s 7.
8 μg
/ml
17.3
5 ±
4.42
vs
20.4
6 ±
5.55
4 vs
40.
6571
325.
6 ±
25.6
vs
299.
4 ±
17.9
34
vs 4
0.82
86
0 μg
/ml v
s 15
.6 μ
g/m
l 17
.35
± 4.
42 v
s 22
.66
± 5.
874
vs 4
0.48
5732
5.6
± 25
.6 v
s 31
6.8
± 42
.23
4 vs
4>
0.99
99
0 μg
/ml v
s 31
.25
μg/m
l 17
.35
± 4.
42 v
s 18
.27
± 5.
324
vs 4
> 0.
9999
325.
6 ±
25.6
vs
276.
1 ±
11.8
84
vs 4
0.05
71
0 μg
/ml v
s 62
.5 μ
g/m
l 17
.35
± 4.
42 v
s 16
.94
± 5.
294
vs 4
0.82
8632
5.6
± 25
.6 v
s 31
6.3
± 40
.94
vs 4
0.48
57
0 μg
/ml v
s 12
5 μg
/ml
17.3
5 ±
4.42
vs
14.3
8 ±
5.65
4 vs
40.
8286
325.
6 ±
25.6
vs
233.
4 ±
27.3
14
vs 4
0.20
00
0 μg
/ml v
s 25
0 μg
/ml
17.3
5 ±
4.42
vs
15.2
2 ±
4.77
4 vs
40.
6571
325.
6 ±
25.6
vs
294.
9 ±
28.2
4 vs
40.
3429
0 μg
/ml v
s 50
0μg/
ml
17.3
5 ±
4.42
vs
13.6
6 ±
4.34
4 vs
40.
6571
325.
6 ±
25.6
vs
222.
5 ±
12.0
34
vs 4
0.0
286
0 μg
/ml v
s 0.
48 μ
g/m
l 3.
156
± 1.
52 v
s 3.
08 ±
1.3
04
vs 4
> 0.
9999
159.
8 ±
14.4
8 vs
163
.2 ±
4.2
44
vs 4
0.8
286
0 μg
/ml v
s 0.
97 μ
g/m
l 3.
156
± 1.
52 v
s 3.
441
± 1.
784
vs 4
0.82
8615
9.8
± 14
.48
vs 1
61.4
± 8
.02
4 vs
4>
0.99
99
0 μg
/ml v
s 1.
95 μ
g/m
l 3.
156
± 1.
52 v
s 2.
8 ±
1.59
4 vs
40.
6571
159.
8 ±
14.4
8 vs
165
.4 ±
14.
854
vs 4
0.8
286
0 μg
/ml v
s 3.
9 μg
/ml
3.15
6 ±
1.52
vs
3.73
± 1
.99
4 vs
40.
6571
159.
8 ±
14.4
8 vs
152
.5 ±
18.
24
vs 4
0.65
71
0 μg
/ml v
s 7.
8 μg
/ml
3.15
6 ±
1.52
vs
3.88
± 2
.09
4 vs
40.
8286
159.
8 ±
14.4
8 vs
177
.8 ±
26.
484
vs 4
0.8
286
0 μg
/ml v
s 15
.6 μ
g/m
l 3.
156
± 1.
52 v
s 2.
36 ±
1.6
14
vs 4
0.65
7115
9.8
± 14
.48
vs 1
53.8
± 1
8.25
4 vs
40.8
286
0 μg
/ml v
s 31
.25
μg/m
l 3.
156
± 1.
52 v
s 0.
625
± 0.
304
vs 4
0.11
4315
9.8
± 14
.48
vs 1
55.1
± 5
7.34
4 vs
40.3
429
0 μg
/ml v
s 62
.5 μ
g/m
l 3.
156
± 1.
52 v
s 1.
197
± 0.
664
vs 4
0.34
2915
9.8
± 14
.48
vs 1
75.6
± 3
6.7
4 vs
4>
0.99
99
0 μg
/ml v
s 12
5 μg
/ml
3.15
6 ±
1.52
vs
0.93
± 0
.54
4 vs
40.
3429
159.
8 ±
14.4
8 vs
124
.7 ±
6.1
24
vs 4
0.2
286
0 μg
/ml v
s 25
0 μg
/ml
3.15
6 ±
1.52
vs
1.47
8 ±
0.83
4 vs
40.
3429
159.
8 ±
14.4
8 vs
151
± 3
6.94
4 vs
4>
0.99
99
0 μg
/ml v
s 50
0μg/
ml
3.15
6 ±
1.52
vs
0.25
± 0
.15
4 vs
40.
0286
159.
8 ±
14.4
8 vs
126
.4 ±
2.7
04
vs 4
0.2
286
Init
ial
Seed
ing
(Pre
Pass
age)
Post
Pass
age
to
Sing
le C
ell
Apc
fl/fl
orga
noid
s w
ith
ex v
ivo
expo
sure
to B
RB-d
eriv
ed A
C ex
trac
t
Org
ano
id F
orm
ing
Effi
cenc
y (%
)n
P V
alue
Cont
rol D
iet v
s BR
B D
iet
39.8
5 ±
9.90
vs
46.3
8 ±
5.57
4 vs
40.
8286
Ave
rag
e O
rga
noid
Dia
met
er
(μM
)n
P V
alue
Con
trol
Day
1 v
s C
ontr
ol D
ay 7
76.2
0 ±
4.53
vs
178.
02 ±
25.
184
vs 4
0.02
86
BRB
Day
1 v
s BR
B D
ay 7
83.7
3 ±
9.75
vs
205.
4 ±
42.7
74
vs 4
0.02
86
Con
trol
Day
1 v
s BR
B D
ay 1
76.2
0 ±
4.53
vs
83.7
3 ±
9.75
4 vs
40.
6571
Con
trol
Day
7 v
s BR
B D
ay 7
178.
02 ±
25.
18 v
s 20
5.4
± 42
.77
4 vs
40.8
286
Apc
fl/fl
Org
ano
ids
wit
h pr
ior e
xpo
sure
to d
iets
in v
ivo
A
B
Tab
le 4
.1 O
rgan
oid
fo
rmin
g ef
fici
ency
(%
) an
d a
vera
ge o
rgan
oid
dia
me
ter
(μm
) o
f A
pc
def
icie
nt
cells
fo
llow
ing
(A)
in v
ivo
exp
osu
re t
o
AIN
76A
or
10%
fre
eze
-dri
ed B
RB
die
t an
d (
B)
exp
osu
re t
o B
RB
-der
ived
an
tho
cyan
ins
(AC
) ex
viv
o
Sign
ific
ant
dif
fere
nce
s (p
val
ue
≤ 0.
05)
wer
e d
ete
rmin
ed
usi
ng
two
-ta
iled
Man
n W
hit
ne
y U
sta
tist
ica
l te
st. S
EM =
sta
nd
ard
err
or
of
mea
n.
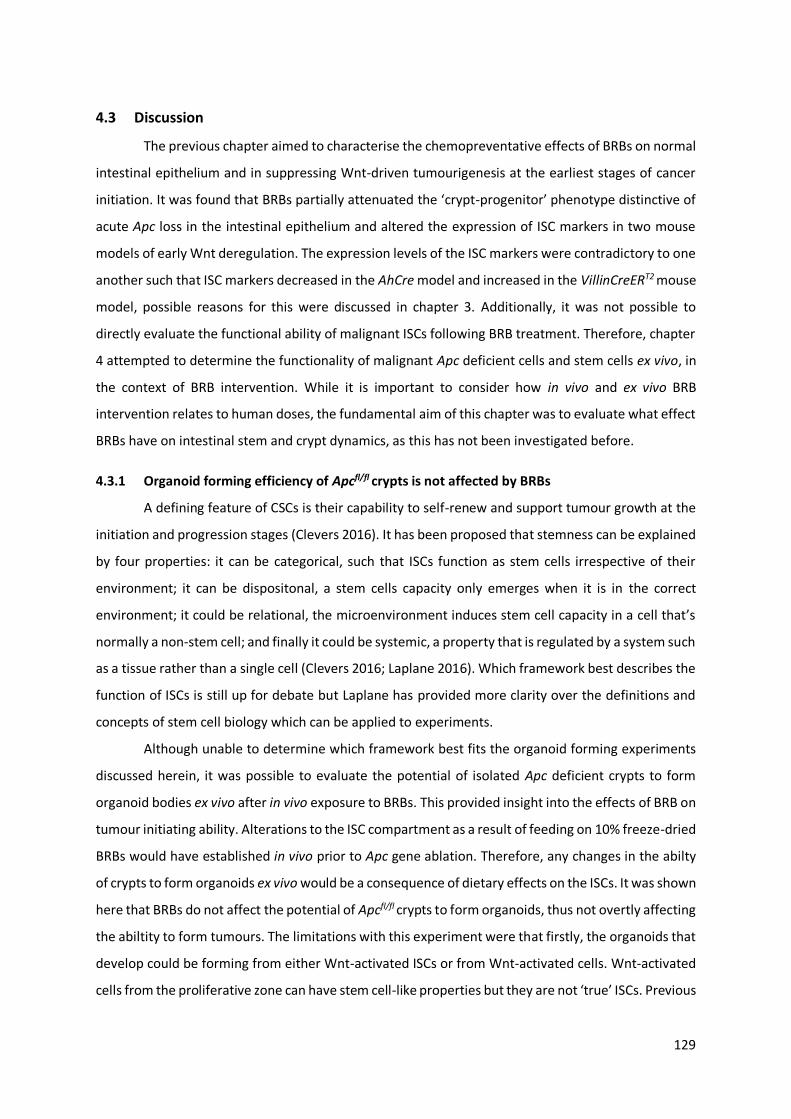
129
4.3 Discussion
The previous chapter aimed to characterise the chemopreventative effects of BRBs on normal
intestinal epithelium and in suppressing Wnt-driven tumourigenesis at the earliest stages of cancer
initiation. It was found that BRBs partially attenuated the ‘crypt-progenitor’ phenotype distinctive of
acute Apc loss in the intestinal epithelium and altered the expression of ISC markers in two mouse
models of early Wnt deregulation. The expression levels of the ISC markers were contradictory to one
another such that ISC markers decreased in the AhCre model and increased in the VillinCreERT2 mouse
model, possible reasons for this were discussed in chapter 3. Additionally, it was not possible to
directly evaluate the functional ability of malignant ISCs following BRB treatment. Therefore, chapter
4 attempted to determine the functionality of malignant Apc deficient cells and stem cells ex vivo, in
the context of BRB intervention. While it is important to consider how in vivo and ex vivo BRB
intervention relates to human doses, the fundamental aim of this chapter was to evaluate what effect
BRBs have on intestinal stem and crypt dynamics, as this has not been investigated before.
4.3.1 Organoid forming efficiency of Apcfl/fl crypts is not affected by BRBs
A defining feature of CSCs is their capability to self-renew and support tumour growth at the
initiation and progression stages (Clevers 2016). It has been proposed that stemness can be explained
by four properties: it can be categorical, such that ISCs function as stem cells irrespective of their
environment; it can be dispositonal, a stem cells capacity only emerges when it is in the correct
environment; it could be relational, the microenvironment induces stem cell capacity in a cell that’s
normally a non-stem cell; and finally it could be systemic, a property that is regulated by a system such
as a tissue rather than a single cell (Clevers 2016; Laplane 2016). Which framework best describes the
function of ISCs is still up for debate but Laplane has provided more clarity over the definitions and
concepts of stem cell biology which can be applied to experiments.
Although unable to determine which framework best fits the organoid forming experiments
discussed herein, it was possible to evaluate the potential of isolated Apc deficient crypts to form
organoid bodies ex vivo after in vivo exposure to BRBs. This provided insight into the effects of BRB on
tumour initiating ability. Alterations to the ISC compartment as a result of feeding on 10% freeze-dried
BRBs would have established in vivo prior to Apc gene ablation. Therefore, any changes in the abilty
of crypts to form organoids ex vivo would be a consequence of dietary effects on the ISCs. It was shown
here that BRBs do not affect the potential of Apcfl/fl crypts to form organoids, thus not overtly affecting
the abiltity to form tumours. The limitations with this experiment were that firstly, the organoids that
develop could be forming from either Wnt-activated ISCs or from Wnt-activated cells. Wnt-activated
cells from the proliferative zone can have stem cell-like properties but they are not ‘true’ ISCs. Previous
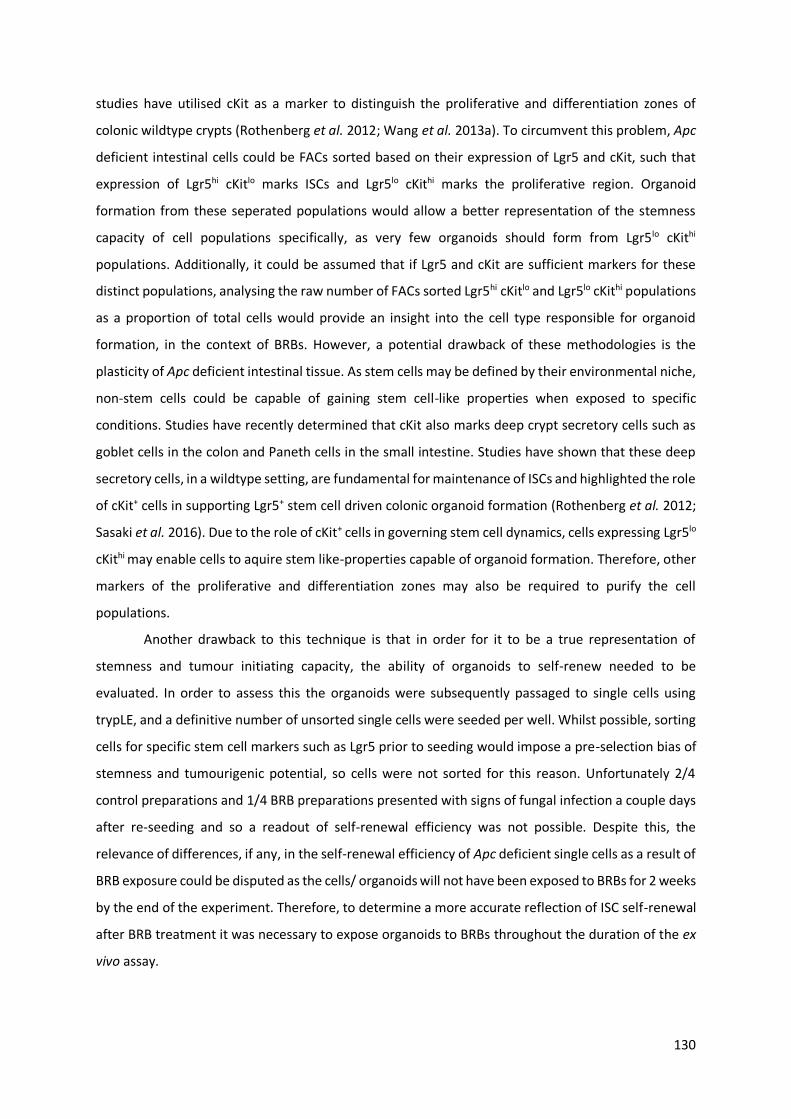
130
studies have utilised cKit as a marker to distinguish the proliferative and differentiation zones of
colonic wildtype crypts (Rothenberg et al. 2012; Wang et al. 2013a). To circumvent this problem, Apc
deficient intestinal cells could be FACs sorted based on their expression of Lgr5 and cKit, such that
expression of Lgr5hi cKitlo marks ISCs and Lgr5lo cKithi marks the proliferative region. Organoid
formation from these seperated populations would allow a better representation of the stemness
capacity of cell populations specifically, as very few organoids should form from Lgr5lo cKithi
populations. Additionally, it could be assumed that if Lgr5 and cKit are sufficient markers for these
distinct populations, analysing the raw number of FACs sorted Lgr5hi cKitlo and Lgr5lo cKithi populations
as a proportion of total cells would provide an insight into the cell type responsible for organoid
formation, in the context of BRBs. However, a potential drawback of these methodologies is the
plasticity of Apc deficient intestinal tissue. As stem cells may be defined by their environmental niche,
non-stem cells could be capable of gaining stem cell-like properties when exposed to specific
conditions. Studies have recently determined that cKit also marks deep crypt secretory cells such as
goblet cells in the colon and Paneth cells in the small intestine. Studies have shown that these deep
secretory cells, in a wildtype setting, are fundamental for maintenance of ISCs and highlighted the role
of cKit+ cells in supporting Lgr5+ stem cell driven colonic organoid formation (Rothenberg et al. 2012;
Sasaki et al. 2016). Due to the role of cKit+ cells in governing stem cell dynamics, cells expressing Lgr5lo
cKithi may enable cells to aquire stem like-properties capable of organoid formation. Therefore, other
markers of the proliferative and differentiation zones may also be required to purify the cell
populations.
Another drawback to this technique is that in order for it to be a true representation of
stemness and tumour initiating capacity, the ability of organoids to self-renew needed to be
evaluated. In order to assess this the organoids were subsequently passaged to single cells using
trypLE, and a definitive number of unsorted single cells were seeded per well. Whilst possible, sorting
cells for specific stem cell markers such as Lgr5 prior to seeding would impose a pre-selection bias of
stemness and tumourigenic potential, so cells were not sorted for this reason. Unfortunately 2/4
control preparations and 1/4 BRB preparations presented with signs of fungal infection a couple days
after re-seeding and so a readout of self-renewal efficiency was not possible. Despite this, the
relevance of differences, if any, in the self-renewal efficiency of Apc deficient single cells as a result of
BRB exposure could be disputed as the cells/ organoids will not have been exposed to BRBs for 2 weeks
by the end of the experiment. Therefore, to determine a more accurate reflection of ISC self-renewal
after BRB treatment it was necessary to expose organoids to BRBs throughout the duration of the ex
vivo assay.

131
4.3.2 BRB-derived ACs limit the self-renewal efficiency of Apcfl/fl cells
As previously outlined, in order to achieve a better representation of the effect of BRBs on the
self-renewal efficiency of ISCs, Apcfl/fl cells would need to be continual exposed to BRBs. Anthocyanins
have been shown, in part, to be responsible for the chemopreventative effects of BRBs in cancer
(Wang et al. 2009). As other studies have utilised BRB-derived ACs in cell culture studies (Wang et al.
2009; Wang et al. 2013b) and due to the diffculties in dissolving freeze-dried BRB powder in organoid
media, it was decided to use ACs in the subsequent self-renewal assays.
Characterising the responsiveness of each model system to novel therapeutics is important
and can be achieved through the use of the CellTiter-Glo® luminescent cell viability assay. Presented
herein, initial assays with 4 day exposure to ACs up to concentrations of 500 μg/ml resulted in the
reduction of cell viability. However, these concentrations were not sufficient to completely reduce the
activity of all the Apc deficient organoids, as shown by an incomplete dose-response curve (Figure
4.2A). The IC50 generated from this graph was approximately 11.6 mg/ml and despite the fact that the
Xlfit software was able to fit a dose-response curve to the data, how meaningful this IC50 is still needs
to be determined. As the data did not have a bottom plateau which would define ‘0’, it would not be
possible to accurately define ‘50’. To overcome this problem, the concentration of AC used in a
subsequent assay was increased to 16 mg/ml. This assay did provide a complete dose-response curve
with an IC50 value of 1.4 mg/ml. These data implied that higher doses of AC are toxic as the ATP
luminescence signal at 16 mg/ml produced a near zero reading. However, it may be possible that the
signal at this dose may have been quenched by the purple colour of the media. Promega have reported
that luminescence intensity can differ dependent on the type of culture media that was used. For
example, medium containing no phenol red had a ̴5% increase in luminescence compared to medium
containing standard phenol red concentrations. Additionally, media containing twice the normal
concentration of phenol red had a ̴2% decrease in luminescence (Promega 2015). In order to
determine whether this signal was quenched it would be beneficial to repeat this assay including
control wells containing matrigel with no organoids with the highest doses of AC media to determine
background luminescence signals. In addition, as the CellTiter-Glo® assay was set up as per
manufacturers’ instructions, equal volume of CellTitre-Glo® reagent was mixed with equal volume of
AC organoid media, future experiments could mix equal volumes of CellTitre-Glo® reagent with
organoid growth medium without any ACs. Lastly, it would be very useful to determine the effects of
BRBs on wildtype organoids. In order to relate this to human studies, it is important to make sure that
BRBs and their AC derivatives have no adverse effect on normal intestinal tissue. Performing cell
viability and self-renewal assays on wildtype organoids would reveal whether or not the cytotoxic
effects of ACs are specific to Apc deficient organoids. Our group have previously reported that growing

132
wildtype organoids from single cells, even with the addition of Wnt3a, EGF, Noggin, Rspo1 and the
ROCK inhibitor Y-27632, resulted in a very low organoid forming efficiency (<0.03%) (Young 2013).
Sato et al. managed to grow wildtype organoids from sorted single Lgr5hi cells, but this required the
addition of the Notch-agonist peptide, Jagged1 (Li et al. 1998), to the growth factor medium, but the
organoid forming efficiency was still low (6%) (Sato et al. 2009). At the time of the cell viability and
self-renewal assays discussed herein, Jagged1 was not available in the lab and so growing organoids
from wildtype single cells was not possible. It would be beneficial to repeat these assays using wildtype
preparations with Jagged1 peptide in the future.
The lack of significance in the self-renewal assay using AC doses 15.6 – 250 μg/ml could be
attributed to the statistical power of the test and there were a number of variables that could
determine this. Firstly, the number of wells used per dose of AC was 3 or 4 and the number of
organoids that grew was very variable between wells and biological replicates. Previous work by Young
established that in order to provide an accurate readout of stemness (in the context of wildtype
organoids), the absolute minimum number of wells required was 6 and numbers below this provided
varied results (Young 2013). Despite this, these self-renewal results indicated that 500 μg/ml AC
reduced the ability of cells to propagate into organoids thereby potentially limiting the stemness/
tumour initiating ability of Apc deficient cells.
4.4 Summary and Future Directions
In summary, the data presented in this chapter indicated that BRB-derived ACs do not overtly
affect the capacity of an already established malignant ISC to form organoids but do limit the efficiency
of these ISCs/ Apc deficient cells to self-renew. These preliminary findings are novel in the context of
BRB chemoprevention of CRC and these studies warrant a more in-depth analysis of the effects of
BRBs and ACs on malignant ISC populations.
A reduction in the ability of malignant Apcfl/fl cells to self-renewal holds great promise for the
use of BRBs as a CRC preventative strategy that targets the CSC populations. However, it is important
to elucidate whether BRBs reduce the stemness of non-malignant ISCs and so further investigation
into the effect of ex vivo application of ACs on wildtype ISC is necessary. In addition, the self-renewal
assays showed that higher doses of AC extract reduced the ability of Apc deficient cells to re-establish
into new organoids. As with chapter 3, these studies do not provide insight in to whether BRBs reduce
the number of ISCs or simply reduce their stem cell potential. It could be hypothesised that the
reduction in organoid formation is a result of having fewer stem cells present following BRB treatment.
To test this hypothesis it would be beneficial to use the Lgr5CreERT2-EGFP+ mouse model. Induction of
this mouse using tamoxifen drives recombination specifically within the ISCs and consequently these
cells are identified by GFP (green fluorescent protein) fluorescence. Crypt preparations from

133
Lgr5CreERT2-EGFP+ Apc+/+ and Apcfl/fl mice could be analysed by flow cytometry to assess the level of
GFP signal, as a readout for the number of ISCs or utilise the methods outlined by Wang et al. to sort
cells based on their stem cell and proliferative markers (Wang et al. 2013a). It would also be useful to
assess proliferation and apoptosis rates of intestinal organoids following exposure to ACs, as it is likely
that reduced cell viability is linked to these molecular processes. It would be beneficial to determine
whether the reduction in organoid viability is due to AC-induced cell death or AC-induced metabolic
changes that limit the ability of organoids to proliferate. In addition, performing gene expression
analysis for stem cell and Wnt target genes in organoids exposed to AC concentrations would provide
insightful data on the impact of BRBs on normal and malignant stem cells. These experiments will
provide a more in depth analysis on the effects of BRB-derived ACs on wildtype and Apc deficient cells
in a system that closely resembles the in vivo setting.
134
5 Investigating the long-term effects of 10% BRBs on wildtype intestine and Apc
loss-driven intestinal tumourigenesis
5.1 Introduction
Work described in chapters 3 and 4 suggested that short-term exposure to BRBs had
chemopreventative effects at the earliest stages of intestinal tumourigenesis, in part, by
attenuating the phenotype of acute Apc loss in the intestine and reducing the capacity of
malignant ISCs to self-renew. In addition, it was shown that short-term exposure to BRBs had
no major detrimental effects on normal gut homeostasis. Previous studies have shown that
BRBs reduced intestinal tumours by 45% in an animal model of Wnt-driven tumourigenesis (Bi
et al. 2010) and were sufficient in regressing rectal polyps in patients with FAP disease (Wang
et al. 2014). These studies present evidence for the use of freeze-dried BRBs as a therapeutic
strategy for intestinal tissues with Apc mutations. Mechanistic experiments from these studies
highlighted that tumour development was supressed by inhibition of the Wnt/ β-catenin
signalling pathway, and by altering epigenetic marks in FAP polyps. Despite these promising
results, these published studies did not examine the potential effect of BRBs on the intestinal
and cancer stem cell populations. As the ISCs are considered a ‘cell of origin’ of CRC (Barker et
al. 2009), it is necessary to understand the interactions between BRBs and stem cells.
This chapter describes the effect of long-term feeding on BRBs. The longer-term effect
of BRBs on both normal and malignant ISCs was examined. This was achieved by utilising the
Lgr5CreERT2 mouse model, which was previously used to demonstrate that ISCs are the cell of
origin for murine CRC (Barker et al. 2009). In this model Cre is expressed solely in the active
ISCs. Combining this model with the Apcfl/fl allele enables us to evaluate the human disease
situation more closely. Cohorts of Lgr5CreER T2 Apc+/+ (wildtype Apc allele with Lgr5CreER T2
transgene = equivalent to a wildtype control) and Lgr5CreERT2 Apcfl/fl (homozygously floxed
Apc allele with Lgr5CreERT2 transgene) mice were randomly assigned into two groups and fed
ad libitum on a control diet (AIN76A pellets) or a 10% freeze-dried BRB powder supplemented
in AIN76A pellets for an initial period of two weeks. After two weeks of feeding on their
respective diet, all mice were induced by IP injections of tamoxifen over four consecutive days.
This resulted in recombination of the Apc allele in the ISCs of mice bearing the loxP flanked
Apc allele (i.e. Lgr5CreERT2 Apcfl/fl mice). Mice were then aged for a maximum of 190 days post
induction (wildtype) or until they became symptomatic of disease and had to be sacrificed,
and the appropriate tissues were dissected. Mice remained on their respective diets
throughout the experiment.

135
5.2 Results
5.2.1 Long-term feeding of BRBs does not influence body weight
Due to the links between obesity and intestinal tumourigenesis (Beyaz et al. 2016)
mice were weighed to determine whether long-term feeding of 10% freeze-dried BRBs
influenced body weight. Aged matched (11 - 14 weeks) wildtype and Apcfl/fl mice were
randomly assigned to control or BRB treated cohorts (wildtype n = 6 and Apcfl/fl control diet n
= 11, BRB diet n = 10). All experimental mice were weighed weekly with the initial
measurement taken before starting on the AIN76A or BRB diets (represented as 100% body
weight at -14 days, Figure 5.1). All four cohorts were IP injected with tamoxifen, which
controlled for any weight change induced by tamoxifen administration.
Long-term feeding on BRB diet did not alter the average % body weight of wildtype
mice relative to control (AIN76A). However, both wildtype cohorts appeared to increase in
weight with increased age. Two week feeding (-14 to 0 days post induction (PI)) on either the
AIN76A or BRB diet did not alter the body weight of wildtype mice (Figure 5.1A). After a further
16 and 30 days on their respective diets (30 and 44 days in total), the body weight of wildtype
mice was still not significantly altered. At 80 days PI (94 days on diets); wildtype mice fed both
diets were significantly heavier than at 30 days post induction (Figure 5.1A). An increase in
body weight would be expected with increasing age. At 180 days PI (194 days on diets), the
body weight of wildtype mice fed the AIN76A or BRB diet were not altered when compared
to their weights at 80 days PI. Despite a gradual increase in body weight over the duration of
the experiment, long-term feeding of BRBs did not affect the average body weight of wildtype
mice in relation to the AIN76A fed mice at each time point. Adult mice were a minimum of 11
weeks of age before starting on their respective diet. Several studies have shown that with
increasing age mice continue to increase in body weight, but the rate of weight gain decreases
the older the mouse becomes (Robertson 1926; Gall and Kyle 1968). Although mice on control
and BRB diet were slightly heavier at 180 days PI (minimum 38 weeks of age) than they were
at 80 days PI (minimum 22 weeks of age), the lack of significance in weight change is likely to
reflect the start of the plateau in weight gain.
Long-term feeding on a BRB diet did not alter the average % body weight of Apcfl/fl
mice when compared to Apcfl/fl AIN76A fed mice. However, AIN76A mice appeared to increase
in weight initially and lost weight quicker than BRB exposed mice when symptomatic of
disease. Apcfl/fl mouse body weight was not altered after being on the control and BRB diets
for 2 weeks (Figure 5.1B). Up to 16 days PI (30 days on diets) control and BRB fed Apcfl/fl mice
were heavier by 6% (control: 0 days PI = 99%, n = 11 vs 16 days PI = 105%, n = 8, p value =
136
0.0091, Mann Whitney U test, Figure 5.1B) and 4% respectively, but this change was only
found to be significant for control mice. Apcfl/fl mice on the control diet started to present with
signs of illness, possibly from tumour burden as a result of loss of Apc, at 20 days PI (Figure
5.1). In accordance with onset of intestinal disease, the body weight of control fed Apcfl/fl mice
which had survived to 30 days PI (44 days on diet) were significantly reduced by approximately
7% (16 days PI = 105%, n = 8 vs 30 days PI = 98%, n = 6, p value = 0.0080, Mann Whitney U
test, Figure 5.1B). While BRB treated Apcfl/fl mice at 30 days PI had lost 3% of their body weight
on average, it was not found to be significant and suggested that BRBs have a protective effect
against disease onset. The final weight measurement taken for Apcfl/fl mice was just before
sacrifice, when mice presented with symptoms of illness including loss of weight (no more
than 25% of original body weight), paling of feet and tail, piloerection and abdominal pinching
and hunching. Apcfl/fl mice fed on the control and BRB diets had significantly reduced in weight
at the time of sacrifice by 12% and 20% respectively when compared to their body weights at
30 days PI (control diet: 30 days PI = 98%, n = 6 vs death = 86%, n = 7, p value = 0.035. BRB
diet: 30 days PI = 102%, n = 8, vs death = 82%, n = 10, p value = < 0.0001, Mann Whitney U
test, Figure 5.1B). It is apparent that the reduction in body weight is due to illness and not as
a result of feeding on the specific diets. This is supported by the wildtype data in Figure 5.1A
that indicated at all-time points there was no significant change in the weight profile between
control and BRB fed mice. However, as the average body weight of BRB treated Apcfl/fl mice
were marginally higher than the control mice at the each time point it suggested that body
weight of BRB treated Apcfl/fl mice was maintained for longer, and subsequently lost slower
when mice become symptomatic of disease.

137
Figure 5.1 Average % change in body weight of Lgr5CreERT2 Apc+/+ and Apcfl/fl mice in the context of BRB diet
All mice were started on their respective diets 2 weeks (-14 days) before induction with tamoxifen (0). (A) The average weight of wildtype mice (Apc+/+) was not altered by feeding on AIN76A (control) or 10% freeze-dried BRB diet for 30 days post induction (44 days on diets in total). After a further 50 days on the diet (80 days post induction) AIN76A and BRB fed mice weighed significantly more, consistent with gaining weight with increased age. At 180 days post induction (194 days on diets) both AIN76A and BRB fed mice had not significantly increased in body weight compared to 80 days post induction. There was no significant difference in weight between AIN76A and BRB fed wildtype mice at any time point. This suggested that long-term feeding of BRBs does not adversely affect body weight. (B) The average weight of Apcfl/fl mice was not altered following 2 week feeding on their respective diet. Apcfl/fl mice fed the AIN76A diet increased in body weight following a further 16 days on the diet, while BRB exposed mouse body weight was not significantly altered. At 30 days post induction (44 days on diet), body weight of AIN76A mice significantly decreased in accordance with onset of illness, but BRB fed mice maintained their weight. At time of death, both AIN76A and BRB fed mice weighed significantly less than at 30 days post induction. n.b. measurements for Apcfl/fl do not include all mice measured initially as not all Apcfl/fl
mice survived to these time points. * P value ≤ 0.05, n = 6 - 11, two-tailed Mann Whitney U test. Error bars represent SEM.

138
5.2.2 Long-term feeding of 10% BRBs significantly increased survival of mice following
deletion of Apc in ISCs
Long-term feeding on BRB diet did not affect the lifespan of wildtype mice but
significantly prolonged the life of tumour bearing Apcfl/fl mice.
At 190 days post tamoxifen induction, Lgr5CreERT2 Apc+/+ BRB fed mice (n = 6) and 5/6
Lgr5CreERT2 Apc+/+ control mice showed no signs of ill health and so were culled (p value =
0.3173, Log-rank (Mantel-Cox) test and Gehan-Breslow-Wilcoxon test, Figure 5.2). One
wildtype control mouse was sacrificed at 134 days post induction when it showed evidence of
paling feet and abdominal hunching. Upon dissection it presented with abnormal looking
kidneys, they were discoloured, rough and dehydrated in appearance. Since Cre expression
under the Lgr5 promoter is not expressed in the kidney upon induction with the relevant
inducing agent, the decline in health of this wildtype control could be attributed to the normal
process of ageing. Lgr5CreERT2 Apcfl/fl mice fed on the control and BRB diets started showing
symptoms of ill health at 20 and 28 days post induction, respectively. Survival analysis
revealed that feeding of BRBs prior to deletion of Apc within the ISCs, and continued feeding
post induction, significantly increased the lifespan of tumour bearing mice by 22 days
compared to the Apcfl/fl controls (Apcfl/fl control median survival = 32 days, Apcfl/fl BRB median
survival = 54 days, n = 15, p value = 0.0343 Log-rank (Mantel-Cox) test, p value = 0.0032 Gehan-
Breslow-Wilcoxon test, Figure 5.2). The small and large intestine was harvested from the mice
at time of culling. The intestinal sections were fixed ready for counting of histological markers.
Due to this approach of tissue preparation it was not possible to determine tumour burden.
This is because the Lgr5CreERT2 Apcfl/fl model develops a ‘blanket’ of adenomas at the stomach
end of the small intestine, making it very difficult to identify discrete tumours. As previous
studies using mouse models of Apc driven tumourigenesis have shown BRBs to reduce tumour
burden, it could be hypothesised that mice survived longer as a result of a lessened tumour
burden.

139
Figure 5.2 Overall survival curve of Lgr5CreERT2 Apc+/+ (dashed lines) and Apcfl/fl mice (solid lines) on the AIN76A (blue) and 10% freeze-dried BRB diet (red) post induction with tamoxifen
Wildtype mice did not present with signs of ill health so were culled at 190 days post induction. There was no statistical difference in wildtype survival, p value = 0.3173, n = 6 vs 6, Log-Rank statistical test. The median lifespan of Apcfl/fl mice was increased by 22 days post induction by feeding on the 10% BRB diet compared to the AIN76A diet, * p value = 0.0343, n = 15 vs 15, Long-rank statistical test.

140
5.3 Discussion
5.3.1 Evaluating the effect of long-term BRB feeding on body weight
A key aim of the work was to determine whether long-term feeding of BRBs had any
detrimental effect on the health of animals. This can be evaluated by measuring weight gain or loss
over the length of the experiment. This was investigated in both a non-tumour bearing (Lgr5CreERT2
Apc+/+) and intestinal Apcfl/fl driven tumour setting (Lgr5CreERT2 Apcfl/fl) in the context of control and
BRB diet.
The body weights of wildtype and Apcfl/fl mice were not affected by long-term feeding on BRBs
in relation to the AIN76A fed controls. This is consistent with studies that have shown in a model of
rat oesophagoduodenal anastomosis which mimics the development of human oesophageal
adenocarcinomas, BRB feeding did not alter the weight of animals in relation control animals (Aiyer et
al. 2014). The limitation of this study is that the rats were only administered BRBs for 4 weeks and so
longer-term exposure in this model could have different results. In addition, in a study of carcinogen
induced oesophageal cancer in rats fed 10% BRBs over a period of 30 weeks, weights of animals was
not altered on BRBs until the last 3 weeks of the study when rats on BRBs had lower body weights
compared to vehicle treated rats (Kresty et al. 2001). However, the authors have not addressed why
these animals lost weight. In relation to the study described herein, the work described by Kresty et
al. (2001) in models of oesophageal tumourigenesis was performed for a longer duration than the
work here using the Lgr5CreERT2 Apcfl/fl model of intestinal tumourigenesis. Despite this it would not
be possible to evaluate the effect of BRBs in Lgr5CreERT2 Apcfl/fl mouse model as the phenotype of
intestinal tumour burden occurred quicker than the phenotype of oesophageal tumourigenesis in rats.
However, in the context of the results described in this chapter it can be concluded that BRBs do not
adversely affect mouse weight.
On average, mice fed the BRB-enriched diet had similar body weights to their respective
controls; however this experiment did not evaluate whether feeding patterns were altered. Although
the addition of BRB powder to the AIN76A diet occurred at the expense of sucrose it is possible that
the sugar content between the two diets were slightly different, as BRB anthocyanidins contain sugar
moieties. In order to have a better understanding of the associations that underpins the
chemopreventive effects of freeze-dried BRBs in CRC it may be beneficial to analyse dietary intake
among cohorts and perform metabolomics studies to evaluate whether biomarkers and glucose and
hormone levels are altered as a result of BRB feeding.
141
5.3.2 Long-term feeding on BRBs prolongs life of tumour bearing mice
The second aim of this work was to determine, if any, the long-term effect of BRBs on non-
tumour and tumour mice. All but one wildtype mouse fed both the AIN76A and 10% freeze-dried BRB
diet presented with no signs of illness at 190 days post induction. The experiment was terminated at
this time point due to time restrictions. While feeding on BRBs did not alter the lifespan of wildtype
mice, it improved the survival of Apcfl/fl mice which developed macroscopic stem-cell derived Wnt-
driven adenomas. This is the first time that exposure to BRBs has been reported to increase the
survival of a Wnt-driven tumourigenic mouse model, and thus supports the use of BRBs as a novel
therapeutic strategy in preventing and managing CRC.
Despite this promising result, the work described in this chapter did not provide an insight
into how BRBs improved survival. Previously published work has shown that 12-week feeding of 10%
BRB diet in two distinctive models of intestinal and CRC cancer, reduced tumour burden and
multiplicity by targeting several pathways. It was found in one model of Apc inactivation, that BRBs
inhibited intestinal tumourigenesis by supressing Wnt/ β-catenin signalling, and in the other model of
inflammation-driven colon tumourigenesis by dampening down chronic inflammation (Bi et al. 2010).
From this study it is evident that BRBs reduced tumour incidence and this is also supported by various
other studies in rodent models of oesophageal cancer (Kresty et al. 2001), chemically induced colon
cancer (Harris et al. 2001) and regression of polyps in FAP patients (Wang et al. 2014). Despite the
reduction in tumour burden these studies propose different mechanisms of action (i.e. epigenetic
alterations, suppression of various signalling pathways such as Wnt, regulation of inflammatory
processes, oxidative stress etc.) and in some clinical studies report some non-responders to BRB
treatment. This could be attributed to the natural heterogeneity among patients and within tumours.
In addition, the method of BRB administration and concentration varied across studies and could be a
possible reason for the different outcomes.
This thesis is the first to investigate the effects of BRB-enriched diet on ISCs, specifically in the
context of gene loss. Unlike in human disease, the Lgr5CreERT2 Apcfl/fl mouse model does not require
a second hit of Apc loss for tumour initiation. Using this model, it is evident that BRBs play a significant
role in supressing initiation or growth of CRC, which is relevant at the ISC level.
5.4 Summary and Future Directions
In summary, two major conclusions can be made from the data presented in this chapter.
Firstly, long-term feeding on BRBs is well tolerated and did not have any adverse effect on body weight
in wildtype or tumour bearing mice. Secondly, 10% freeze-dried BRBs in the diet prolonged the life of
tumour bearing mice that result from chronic loss of Apc in the ISCs.

142
Taken together, in combination with previously published data, these results indicated that
BRBs display chemopreventative effects against colorectal tumourigenesis, at least in part, by
influencing the normal and/ or malignant ISCs. This provides more evidence for the use of BRBs as a
natural chemopreventive option. However, several interesting questions remain unanswered with
regard to stem cell dynamics and dosing regimens and thus warrant further investigation.
As Wnt signalling has been attributed to the development of both human and murine CRC
(Powell et al. 1992; Leslie et al. 2002) and previous studies have shown that BRBs supressed Wnt/ β-
catenin signalling (Bi et al. 2010), it would also be beneficial to determine the effects of BRBs on the
Wnt status in the Lgr5CreERT2 Apcfl/fl mice. This could be achieved by analysing the number of cells that
contain nuclear and cytoplasmic β-catenin using IHC. In addition to this, qRT-PCR gene expression
analysis could be performed for Wnt target genes on normal adjacent tissue and tumour tissues that
were frozen at time of dissection. As previously outlined, tumour number was not determined from
Apcfl/fl mice fed the AIN76A or BRB diets. It is important to evaluate whether BRB exposed mice
survived longer as a result of a reduced tumour burden. A recent study by Phesse et al. estimated
tumour burden of Lgr5CreERT2 Apcfl/fl mice by measuring the area of adenomas on H&E stained
histological cross sections of ‘swiss-rolled’ intestines and normalising to the length of the intestine per
mouse (Phesse et al. 2014). In addition, it would also be beneficial to count the number of small
intestinal lesions or ACF from H&E and β-catenin stained Lgr5CreERT2 Apcfl/fl intestines at an earlier
time point when tumours have manifested. To evaluate this, separate cohorts of Lgr5CreERT2 Apcfl/fl
fed the AIN76A and BRB diets were dissected at 20 days post induction. The intestinal sections have
been stained for H&E and β-catenin IHC and are waiting to be analysed for tumour number. Therefore,
the number of tumours in control and BRB fed mice could be determined using these techniques in
the future.
Several studies have outlined the chemopreventative effects of BRBs, but the fundamental
question of what effect BRBs have on the intestinal and cancer stem cells has not been investigated.
Although this thesis has identified gene expression changes of ISC markers and a reduction in ISC self-
renew capacity ex vivo, it is still necessary to determine the number of stem cells that are present
following BRB treatment. As the Lgr5CreERT2 model drives GFP expression in Lgr5+ stem cells (Barker
et al. 2007), immunohistochemistry for GFP could be performed on formalin-fixed paraffin-embedded
intestinal tissue from Lgr5CreERT2 Apc+/+ and Apcfl/fl mice 20 days post induction. This would enable
quantification of the number of stem cells depicted by GFP positivity in the context of BRB treatment.
If this is unsuccessful RNAscope® in situ hybridization technology for Lgr5 in the same mouse models
could be used or quantified by the amount of GFP fluorescence in control and BRB fed mice from FACs
sorted intestinal epithelial cells, which would represent the percentage of Lgr5+ ISCs.
143
6 General Discussion
CRC is the fourth most common cancer type in the UK, but accounts for the second most
deaths by cancer after lung cancer (CRUK 2014). With an ever-increasing ageing population, CRC
incidence continues to rise despite improvements in survival rates. It is known that CRC develops
through interplay of genetic, epigenetic and environmental factors but what is most surprising and
not readily made aware of is that over half of new CRC cases could have been prevented by lifestyle
changes (Hou et al. 2013). This highlights the importance of understanding and determining novel
chemopreventative strategies that can delay, reverse or inhibit the process of carcinogenesis (Sporn
1976; Steward and Brown 2013).
Several studies have reported an association between diet and cancer risk, in particular in
CRC. Diets high in fat have been linked to an increased risk whereas diets rich in fibre and fruit result
in a reduced risk (WCRF/AICR 2011). The specific mechanisms that underpin these interactions are not
well understood. Previous work has evaluated the use of several nutritional polyphenols as naturally
occurring chemopreventive agents. The protective roles of the polyphenols found in BRBs have been
extensively studied in cell lines, animal models and in human patients at the initiation and progression
stages of CRC (Kula and Krauze-Baranowska 2016). Evidence from cell line studies and human CRC
patients has shown that BRBs were responsible for epigenetically reactivating silenced Wnt pathway
antagonists. Animal based studies (Bi et al. 2010), supported by human studies of CRC (Wang et al.
2011) and FAP disease (Wang et al. 2014) reported that BRBs were sufficient to inhibit tumourigenesis
and regress FAP polyps, providing further evidence of the chemopreventative properties of dietary
polyphenols. While this holds great promise for cancer prevention, these studies are limited as the
effect of BRBs on both normal and malignant ISC populations have not been investigated.
The majority of CRCs are known to initiate from mutations that activate the Wnt signalling
pathway, with the most common gene mutations occurring in the Wnt antagonist APC. For many years
the cell of origin remained elusive however, in 2009 Clevers’ group identified the intestinal CBCs as
the cell of origin of intestinal cancer in murine models (Barker et al. 2009). This work emphasises the
relationship between ISCs and carcinogenesis.
The aim of this thesis was to explore applications of BRB to address the following questions, in the
context of normal and malignant ISCs:
1. Do BRBs adversely affect normal homeostasis of the murine adult intestine?
2. What are the chemopreventative effects of BRBs at the earliest stages of intestinal
tumourigenesis following homozygous deletion of Apc?
3. What effect do BRBs have on long-term Wnt-driven tumourigenesis?
144
This chapter aimed to explore to what extent the above three objectives have been achieved and the
contributions made by this thesis.
BRBs and intestinal homeostasis
Chapter 3 described work investigating the short-term effects of dietary BRB supplement on
normal murine small intestinal homeostasis. Investigations revealed that 2 week feeding on 10% BRB
powder, in two mouse models, did not perturb the gross structure of the small intestine. BRBs had no
effect on the differentiated goblet and Paneth cell types. However, proliferation decreased while cell
death and enteroendocrine differentiation increased in the context of BRBs. Although there is limited
data on the effect of dietary polyphenols on strictly ‘normal’ tissues, it is known that the
enteroendocrine cell population are specifically sensitive to dietary changes due to their role as chemo
sensors within the gut (Moran-Ramos et al. 2012; Gribble and Reimann 2016). A recent study
highlighted that the number of enteroendocrine cells in the intestine reduced in the context of high
fat diet (HFD) (Beyaz et al. 2016). As HFDs have been associated with increased risk of developing
cancer, it could be hypothesised that diets which maintain or enhance enteroendocrine differentiation
promotes normal homeostasis and lowers the risk of cancer.
Intestinal homeostasis depends on a balance between asymmetric and symmetric ISC
divisions and the ratio of stem or differentiated daughter cells that are produced (Stine and Matunis
2013). Thus, stem cells may play a vital role in how tissues adapt to diet-induced physiological states.
Chapter 3 also evaluated the effect of BRBs on normal ISCs. Gene expression data of putative markers
revealed that in one short-term wildtype model, AhCre, either ISC marker expression levels or total
ISC number may be altered by BRBs, concordant with alterations in Wnt target genes, while no
alteration in ISC expression was noted in the second model, VillinCreERT2. These data indicated that
BRBs may protect normal intestinal tissue from genetic insult by limiting the ISC capacity and number
of highly proliferative daughter cells. However, these potential changes do not occur at the expense
of survival, as long-term feeding of BRBs did not affect the lifespan or weight (and thus, health) of
wildtype mice as described in chapter 5. Thus, a change in the ISC population did not have any adverse
effect on intestinal homeostasis. This is supported by several studies which have shown that intestinal
homeostasis is not perturbed following the complete loss of Lgr5-expressing cells (Tian et al. 2011;
Yan et al. 2012). In addition, administration of BRBs has been reported to be well tolerated by humans
in several clinical trials of oral, oesophageal and colorectal cancers (Stoner et al. 2005; Kresty et al.
2006; Shumway et al. 2008; Wang et al. 2011), with only mild disturbances including diarrhea and
constipation which was resolved within a few days (Kresty et al. 2006; Wang et al. 2011). This indicates
that any adverse effects of BRBs on normal tissue could be minimal if used as a cancer therapeutic
which is supported by no change in weight of wildtype or Apc deficient mice as a result of BRB diet.

145
Despite this, some patients in a study of BRB intervention in Barrett’s esophagus (BE) experienced
weight gain (Kresty et al. 2006). This is in contrast to the results presented herein that show long-term
feeding on BRBs in wildtype ( ̴7 months) and Wnt-driven tumour bearing mice (average duration on
BRB diet ̴ 3 months) had no adverse effects on body weight when compared to mice fed a matched
basal diet. The authors’ reported that patients were not advised to modify their usual diet and
suggested that the extra caloric intake from BRBs could be responsible for the weight gain (Kresty et
al. 2006). However, the study explains that whilst compliance of berry consumption was documented,
consumption of other food stuffs consumed was not recorded. Only 2 out of 10 patients who
completed the trial reported considerable weight gain (14 lb), and so it could be possible that weight
gain was related to consumption of other dietary components that the researchers were unaware of.
Despite this, this result should not be disregarded, as it warrants further investigation and
consideration for dietary interventions in patients as obesity is a major risk factor associated with the
progression of many cancers.
The major caveat of the work described in chapter 3 is that the control diet used in the AhCre
experiments was not basal matched to the BRB diet, due to availability of the AIN76A control diet at
the time. However, there were several direct comparisons between the two short-term models which
enable us to confidently conclude that BRBs enhanced cell death and enteroendocrine differentiation
in wildtype mice, whilst not overtly affecting the intestinal homeostasis and ongoing health of the
animal. Thus, further analysis of the proliferation, ISC and Wnt target gene changes are warranted in
order to ascertain whether these alterations are truly the case of addition of BRBs to the diet. It is also
important to note that the number of animals utilised in the short-term feeding experiments were
relatively low. A cohort size of 3 animals had the ability to detect a statistical change at the power of
58.6% which may not be sufficient to detect subtle changes that are likely to occur in dietary
intervention studies, therefore warranting larger cohort sizes in subsequent studies.
To my knowledge, this is the first study to investigate the effect of BRB intervention on
wildtype murine intestine without any precancerous or tumour settings. Taken together, the data
presented in this thesis indicated that BRBs have no major detrimental effects on the health of mice.
This is important because, in human cancer patients the majority of tissue is normal, which means
there should be minimal detrimental effect on normal tissue and reduced side effects if BRBs were
used as a potential chemotherapeutic against cancer. However, these studies only evaluated the
effect of BRBs on Wnt signalling, which presents the question ‘what effect do BRBs have on other
signalling pathways crucial for intestinal homeostasis?’ To potentially resolve this issue, Western
blotting, qRT-PCR and IHC analysis could be performed for targets involved in the Notch, Hedgehog
and TGF-β/BMP signalling pathways. This work is also hindered by the lack of specific ISCs markers

146
which limits our ability to definitively characterise and identify the ISC populations. As stem cell
dynamics may be altered in the context of BRBs it is fundamental that a mechanism of action is
elucidated. Performing the stemness organoid forming and self-renewal assays in the presence of
BRB-derived ACs will provide further insight into the effect of BRBs on the ISCs however, it will not aid
in determining whether the number of stem cells are altered or provide information regarding stem
cell-niche interactions. The newly developed RNAscope® technology enables the reliable detection of
stem cells at the level of a single RNA transcript (Wang et al. 2012), and will allow quantification of the
number of stem cells present in control and BRB fed wildtype mice. This line of analysis is currently
being pursued within our laboratory on the two short-term wildtype models, control and BRB fed
AhCre Apc+/+ and VillinCreERT2 Apc+/+ mice.
The data presented here suggests that BRBs may protect normal intestinal tissue from
neoplastic changes in the future however, the relevance of the model system must be considered.
Whilst murine models represent an invaluable tool for evaluating the links between genetics, diet,
health and disease the differences between mouse and humans restricts their use to confidently
predict human responses. The majority of clinical studies evaluating the effects of BRBs in humans
have been in a premalignant or cancer setting; however in the phase I clinical study by Wang et al.
biopsies of adjacent normal tissue was taken alongside colorectal adenocarcinomas from 20 patients
before and after 1 – 9 weeks of BRB powder intervention (Wang et al. 2011). Although the adjacent
normal tissue biopsies are not strictly wildtype, as they have been taken from CRC patients, it would
be useful to determine the number of stem cells present following BRB administration1, this could be
achieved through the RNAscope®2 technology of stem cell markers on paraffin embedded tissue
sections. Additionally, characterisation of proliferation, apoptosis, differentiation and cell migration
would also be beneficial to establish if BRB treatment in humans supports the data obtained from
mouse models.
BRBs, Apc deficiency and intestinal stem cell interactions
Initial work described in this thesis (chapter 3) examined the effects of BRBs on the immediate
loss of Apc in the murine small intestine. This was achieved by conditional deletion of both copies of
the Apc gene within the crypt epithelium (excluding Paneth cells, AhCre Apcfl/fl) and the entire
intestinal epithelium (VillinCreERT2 Apcfl/fl), which has been previously reported to cause aberrant Wnt
1 Formalin-fixed paraffin-embedded blocks containing normal adjacent tissue biopsies from CRC
patients before and after intervention with BRBs were kindly provided in collaboration with Dr Li-Shu Wang, Medical College of Wisconsin, USA.
2 The normal adjacent tissue sections from CRC patients are currently undergoing RNAscope® in situ hybridisation for the putative stem cell markers LGR5 and OLFM4 in collaboration with Prof Owen Sansom’s
group, Beatson Institute, CRUK centre Glasgow, UK.
147
signalling, expansion of the crypt compartment, enhanced proliferation and apoptosis and abrogated
differentiation and migration (Sansom et al. 2004; Andreu et al. 2005). The continual proliferation,
lack of migration and cell sloughing leads to retention of mutant cells and tumour initiation. The
restoration of apoptosis and increased differentiation by BRBs likely reduces the tumourigenicity of
the mutant cells. This present study is the first to report partial rescue of the cellular differentiation
pathways by BRBs in murine models of intestinal dysfunction. Work by Bi and colleagues reported that
12-week feeding of BRBs had no effect on goblet cell differentiation in two murine models of intestinal
tumourigenesis (Bi et al. 2010). Clearly, there is some discrepency between the data reported here
and that of the published data by Bi et al. (2010). The limitation of their study is that, firstly,
differentiation was not broadly investigated, such that Paneth and enteroendocrine cells were not
evaluated and secondly, the number of goblet cells was assessed from normal adjacent tissue and not
from premaligant or tumour tissue. Thus, their data may be better compared to the wildtype data
described in chapter 3, such that goblet cell differentiation was not altered by BRB in the normal
intestine. Despite this, BRBs have been documented to have protective roles in modulating host
immune differentiation of myeloid cells in chronic inflammation and tumour settings (Mace et al.
2014), thereby providing further evidence in support of the beneficial effects of BRBs in cancer
prevention. The AhCre data supports the notion that BRBs protectively modulate cell differentiation.
In addition, BRBs were also found to increase rate of migration of cells along the crypt-villus axis, and
thus increase the likelihood of eliminating Apc deficient cells from the epithelium that are capable of
initiating tumourigenesis. Due to time constraints migration was only evaluated in the AhCre
experiments, however intestinal tissue sections from VillinCreERT2 Apcfl/fl mice have been stained for
BrdU IHC and are awaiting analysis.
Current cytotoxic therapies have shown promise in the treatment of CRC by reducing the size
of tumours (Corrie et al. 2008). The bulk of a tumour is comprised of rapidly dividing cells that are
targeted by chemo and radio therapies. One of the contributing factors to the shortcomings of current
cancer therapies is the fundamental notion that CSCs have a slower cycling time and thus develops
resistance to therapeutics, enabling the reestablishment of tumourigenesis, metastasis and relapse
(Kim et al. 2016b). This limits the suitability of several cancer therapeutics and highlights two areas for
improvement 1) the requirement for a better understanding of the mechanisms underlying malignant
stem cell populations and 2) the need for novel therapeutic strategies which can target these
populations without the adverse side effects associated with many current regimes. Chapters 3 and 4
highlighted that altering the diet, in this instance short-term feeding on BRBs in vivo, or exposure to
BRB-derived anthocyanins ex vivo, is enough to alter stem cell dynamics. The expression of putative
stem cell markers, Lgr5 and Olfm4, were down-regulated when crypt dynamics were altered as a
148
consequence of acute Apc loss driven by the Ah transgene, in the context of BRB intervention. While
Apc loss within the entire intestinal epithelium mediated by the VillinCreERT2 transgene resulted in the
up-regulation of these markers in the context of BRBs. This highlighted how ISC response to BRB diet
is influenced by the cell types which are Apc deficient, which is discussed in more detail later on.
However, organoid studies revealed that whilst prior treatment with BRBs had no effect on the ability
of Apc deficient crypts to form organoids, the ability of Apc deficient cells to form organoids following
disruption to single cell was greatly inhibited by ACs. This indicates that ACs influence self-renewal
and therefore ISC activity. This supports the in vivo data (AhCre) which showed a lower level of ISC
marker expression as a result of the BRB diet. This is significant for three reasons. Firstly, this is the
first study to evaluate the chemopreventative effect of BRBs against a malignant stem cell population.
These data therefore represent the first evidence indicating that BRB-derived ACs prevented the self-
renewal of Wnt-activated, and thus pro-tumourigenic, ISCs. Secondly, this suggests that BRB-derived
ACs are sufficient to prevent malignant stem cell self-renew. And thus, BRBs may be a useful
intervention that targets the CSC population. Finally, the correlation between the ex vivo data and the
in vivo expression levels indicates that the self-renewal assay described here is a useful indication of
ISC capacity.
Several naturally occurring dietary compounds have already been reported to target the stem
cell population in disease settings. For example, resveratrol, found in the skin of grapes and several
edible berries, has been shown to inhibit Wnt signalling and the proliferative nature of breast cancer
stem-like cells (BCSCs) in vitro and in vivo, thereby limiting their ability to form mammospheres (Fu et
al. 2014). Quercetin, found in many fruits, vegetables, leaves and grains, has been reported to reduce
the self-renewal capacity of pancreatic cancer cells enriched in CSC markers to form spheroids,
induced apoptosis and reduced expression of CSC and metastatic markers. Studies have reported that
curcumin potentially targets CSCs by down-regulating Wnt signalling in breast (Kakarala et al. 2009),
gastric, intestine, and colon cancer cells (Park et al. 2005), and inhibiting Wnt and Hedgehog pathways
in medulloblastoma cancer cells (Elamin et al. 2010). Additionally, curcumin sensitised quiescent
leukemic cells (Gardane et al. 2016) and previously resistant colorectal CSCs to conventional
chemotherapeutics (Kanwar et al. 2011) and targeted therapies (Yu et al. 2009; Nautiyal et al. 2011).
These naturally occurring dietary compounds show great potential for irradiating the CSC populations
with far fewer toxic side effects. It is likely that the mechanism which underpins the chemotherapeutic
effects of BRBs in limiting the self-renewal ability of malignant cells, is similar to those reported for
other dietary compounds. This warrants further investigation into novel intervention strategies using
dietary phytochemicals that target CSCs, specifically in the context of the BRB intervention.
149
One interpretation of the data presented herein is that the rate and site of recombination
between the two short-term models has a critical impact on BRB response. Wnt-activation in all
differentiated cells in particular Paneth cells had a profound effect on the ISC marker expression,
which limits the use of the VillinCreERT2 model to accurately reflect true changes in ISC marker
expression, especially in the context of BRB intervention. As briefly touched on, there remains
controversy over the relevance of certain markers of the ISCs, as some markers are also targets in
particular pathways. In the results described herein, it was found that the stem cell marker Ascl2 was
up-regulated in the AhCre Apcfl/fl mouse following BRB treatment, which is contradictory to the Lgr5
and Olfm4 patterns. While this could be interpreted as enhancing ‘stemness’, previous work in the
group found that entopic overexpression of Ascl2 in the ApcMin mouse had no effect on tumour
formation or survival in a Wnt dependent setting (Reed et al. 2012). Thus taking this into
consideration, it is possible that an increase in Ascl2 expression following BRB intervention does not
contribute to tumourigenesis in Wnt-activated intestinal epithelial. Aside from being markers of the
ISC population, Lgr5, Olfm4 and Ascl2 have functional roles in the intestine however, their roles still
remain elusive. Several studies have reported that LGR5 functions as a receptor of R-spondins in stem
cells, and thus is an activator of the Wnt signalling pathway (Carmon et al. 2012). In the context of the
AhCre mouse model, a reduction in Lgr5 gene expression could represent a decrease in the number
of Lgr5 receptors, and potentially fewer stem cells. This could decrease the risk of Wnt-driven
tumourigenesis by down-regulating the Wnt signalling pathway. OLFM4 has been reported to be a
Wnt pathway antagonist, by competing with ligands for the frizzled receptors at the cell surface,
especially in APC deficient intestinal tissue (Liu et al. 2016). Thus, down-regulation of Olfm4 expression
could result in reduced Olfm4 protein to negatively regulate the Wnt signalling pathway, which could
potentiate intestinal tumourigenesis. However, OLFM4 has also been documented as a target gene of
the Wnt signalling pathway (Liu et al. 2016) and so its down-regulation in the AhCre Apcfl/fl model
following BRB treatment may simply be related to decreased Wnt signals and stem cell potential. Ascl2
is a Wnt target and has been reported to be a ‘Wnt-responsive master transcription factor’ that
governs Lgr5+ stem cell identity (Yan and Kuo 2015), as deletion of Ascl2 in mice resulted in a loss of
Lgr5+ ISCs (van der Flier et al. 2009b). Findings from Schuijers et al. report a mechanism whereby Ascl2
regulates its own expression via an autoactivatory loop dependent on previous Wnt/R-spondin
thresholds. Cells which were subjected to a ‘low-Wnt-signal’ required a stronger Wnt signal to up-
regulate Ascl2 expression, whereas cells from a ‘high-Wnt-signal’ environment did not and thus Ascl2
can act as transcriptional switch for stemness (Schuijers et al. 2015). It could be predicted from these
findings, that the previously high levels of Wnt activation and enhanced stem cell potential in Apcfl/fl
crypts enhanced Ascl2 transcription to try and maintain the reduction in active cycling stem cell
150
identity that occurs following BRB treament. Another prediction that can be made from the findings
by Schuijers is that the intestinal epithelium maintains a state of plasticity such that queiscent stem
cell populations, committed progenitors and mature differentated cells may be able to interconvert
to a stem cell state when presented with an appropriate signal (Schuijers et al. 2015).
This thesis is the first to investigate the effects of BRB-enriched diet on ISCs, specifically in the
context of gene loss. The organoid work however, is limited by its inability to fully recapitulate the in
vivo microenvironment of mice and humans, and provide an insight into whether the number or
function of malignant ISCs is affected by BRB intervention. Unlike in human disease, the Lgr5CreERT2
Apcfl/fl mouse model does not require a second hit of Apc loss for tumour initiation. Using this model,
it suggests that BRBs play a significant role in supressing initiation or growth of CRC, which is relevant
at the ISC level, as BRB intervention significantly prolonged the lifespan of mice bearing ISC derived
tumours (chapter 5). Given that recent data in the literature has indicated that tumour and polyp
incidence is reduced following BRB intervention in animal and human based studies (Bi et al. 2010;
Wang et al. 2011; Wang et al. 2014), it could be hypothesised that, in the context of BRB feeding, the
lifespan of tumour bearing mice is prolonged due to a reduced tumour burden. Although tumour
burden has not been determined in this thesis, intestinal tissue sections at 20 days post induction have
been stained with H&E and β-catenin IHC and are waiting to be analysed for tumour number and
grade. The question that remains is, ‘what is the net effect on the ISC population?’ Knowledge of the
ISC population and dynamics presents two potential hypotheses;
1) The BRB diet reduces the number of ISCs before induction such that initiation of
tumourigenesis is reduced by limiting the number of cells which have the potential to
form tumours when transformed (Figure 6.1A).
2) BRBs act to inhibit the proliferative and self-renewal nature of the transformed/
malignant ISCs (or CSCs) which give rise to intestinal lesions (Figure 6.1B).
Previous work by Beyaz et al. has shown that high-fat diet increased the number and self-
renewal capacity of ISCs in vivo, enhancing their tumourigenic potential (Beyaz et al. 2016), so it is
likely that BRBs may also interfere with stem cell dynamics. A separate study by Doug Winton’s group
have reported that certain oncogenic mutations, including heterozygous and homozygous loss of Apc
within the ISC compartment, confer a competitive advantage to mutated stem cells over neighbouring
stem cells. This advantage is conferred by the preferential division of these mutant stem cells to
produce two ISC daughter cells instead of two TA cells, thereby skewing neutral drift. This skew to
neutral drift increases the chances of the mutated clone becoming represented in every cell within
the crypt, a process known as crypt fixation. By acting on the normal dynamics of stem cell
151
replacement (Lopez-Garcia et al. 2010; Snippert et al. 2010), Apc+/- clones had a slight advantage over
wildtype cells, while Apc-/- mutant clones had a much greater selective fitness and were able to fix
within the crypt, such that the mutant clones were retained whilst wildtype cells were lost from the
crypt (Vermeulen et al. 2013). This led to a third hypothesis, such that it may be possible that exposure
of malignant Apc ISCs to BRBs in vivo limits the competitive advantage of Apc loss such that the normal
neutral drift within the intestinal crypt is restored, reducing the frequency at which oncogenic
mutations are fixed within the crypt and able to initiate tumourigenesis (Figure 6.2). However, in order
to investigate whether this hypothesis is correct, lineage tracing technology will need to be applied to
the AhCreERT2 Apcfl/fl mouse model containing a RFP reporter. For this experiment it is important that
only an individual Apcfl/fl-RFP clone is induced per crypt. Therefore, titrated doses of βNF (40 mg/kg)
and tamoxifen (0.15 mg) would need to be administered following 2-week feeding on either the
control diet or BRB diet. RFP clone sizes could then be quantified over time by scoring the amount of
RFP within the crypt base circumference. The neutral drift model (clonal fitness of mutated stem cells
in the context of BRB diet) can be determined through a Bayesian mathematical model as discussed
by Vermeulen et al. (2013).
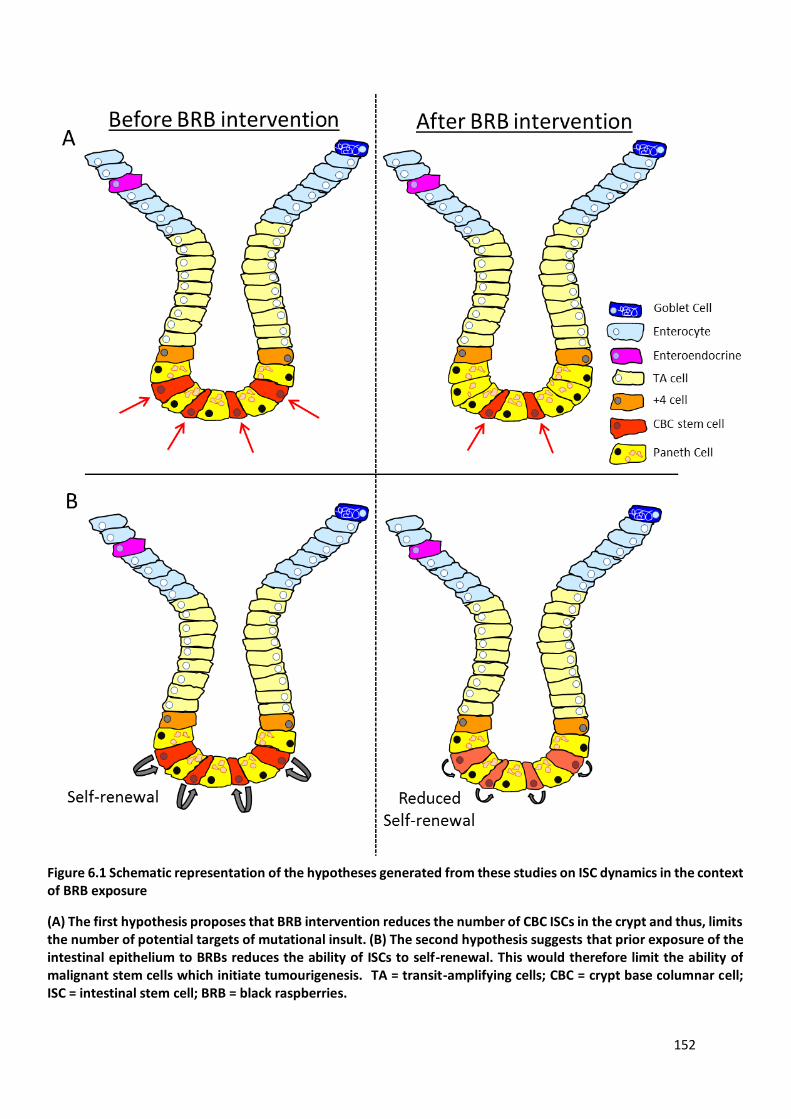
152
Figure 6.1 Schematic representation of the hypotheses generated from these studies on ISC dynamics in the context of BRB exposure
(A) The first hypothesis proposes that BRB intervention reduces the number of CBC ISCs in the crypt and thus, limits the number of potential targets of mutational insult. (B) The second hypothesis suggests that prior exposure of the intestinal epithelium to BRBs reduces the ability of ISCs to self-renewal. This would therefore limit the ability of malignant stem cells which initiate tumourigenesis. TA = transit-amplifying cells; CBC = crypt base columnar cell; ISC = intestinal stem cell; BRB = black raspberries.
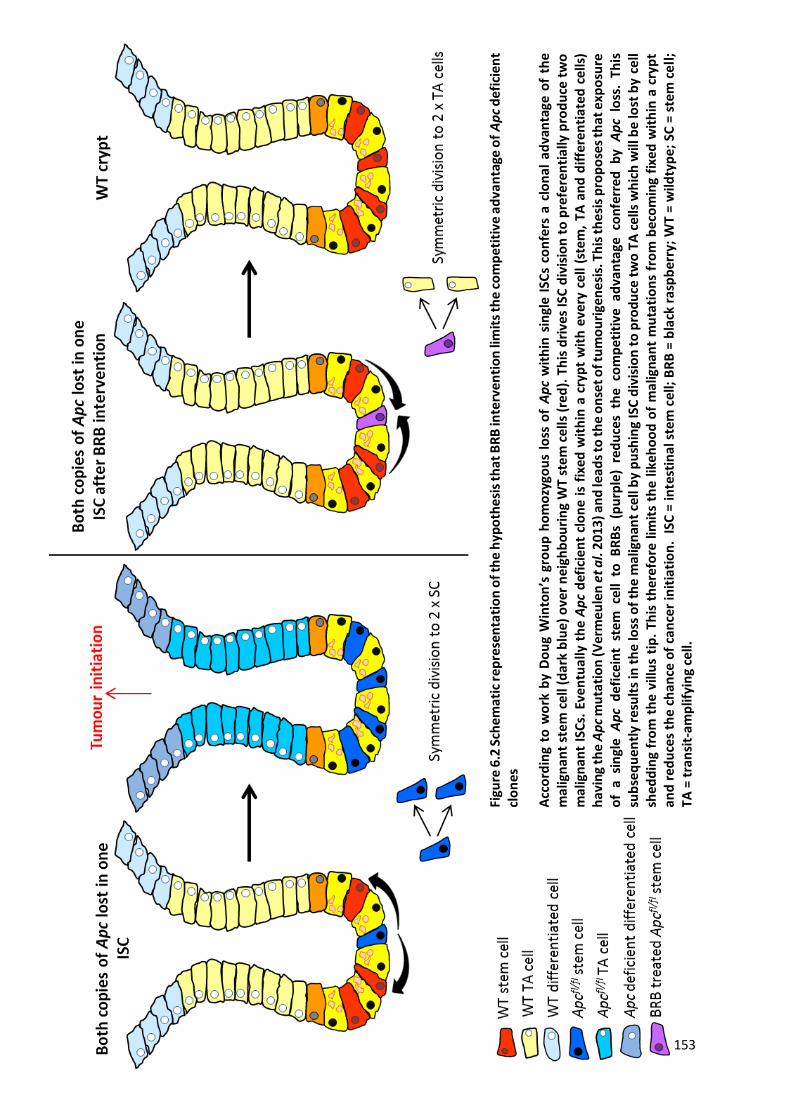
153
Figu
re 6
.2 S
chem
atic
re
pre
sen
tati
on
of t
he
hyp
oth
esi
s th
at B
RB
inte
rven
tio
n li
mit
s th
e co
mp
etit
ive
adva
nta
ge o
f A
pc
def
icie
nt
clo
nes
Acc
ord
ing
to w
ork
by
Do
ug
Win
ton
’s g
rou
p h
om
ozy
gou
s lo
ss o
f A
pc
wit
hin
sin
gle
ISC
s co
nfe
rs a
clo
nal
ad
van
tage
of
the
mal
ign
ant
ste
m c
ell (
dar
k b
lue
) o
ver
ne
igh
bo
uri
ng
WT
ste
m c
ells
(re
d).
Th
is d
rive
s IS
C d
ivis
ion
to
pre
fere
nti
ally
pro
du
ce t
wo
m
alig
nan
t IS
Cs.
Eve
ntu
ally
th
e A
pc
def
icie
nt
clo
ne
is
fixe
d w
ith
in a
cry
pt
wit
h e
very
cel
l (s
tem
, TA
an
d d
iffe
ren
tiat
ed
cel
ls)
hav
ing
the
Ap
c m
uta
tio
n (V
erm
eu
len
et
al.
20
13
) an
d le
ads
to t
he
on
set
of t
um
ou
rige
nes
is. T
his
th
esis
pro
po
ses
that
exp
osu
re
of
a si
ngl
e A
pc
def
icei
nt
stem
cel
l to
BR
Bs
(pu
rple
) re
du
ces
the
com
pet
itiv
e ad
van
tage
co
nfe
rred
by
Ap
c lo
ss.
This
su
bse
qu
entl
y re
sult
s in
th
e lo
ss o
f th
e m
alig
nan
t ce
ll b
y p
ush
ing
ISC
div
isio
n t
o p
rod
uce
tw
o T
A c
ells
wh
ich
will
be
lost
by
cell
sh
edd
ing
fro
m t
he
villu
s ti
p.
This
th
ere
fore
lim
its
the
lik
eho
od
of
mal
ign
ant
mu
tati
on
s fr
om
bec
om
ing
fixe
d w
ith
in a
cry
pt
and
red
uce
s th
e ch
ance
of
can
cer
init
iati
on
. IS
C =
inte
stin
al s
tem
cel
l; B
RB
= b
lack
ras
pb
erry
; W
T =
wild
typ
e; S
C =
ste
m c
ell
; TA
= t
ran
sit-
amp
lifyi
ng
cell.
154
Using mouse models and organoid culture to model BRB intervention in human CRC
The data presented here represent the first body of work exploring the chemopreventative as
opposed to chemotherapeutic properties of BRBs. The term chemoprevention refers to the efforts of
naturally occurring, synthetic or biological agents to delay, block or inhibit the process of
carcinogenesis often by disrupting the molecular mechanisms that drive tumourigenesis (Steward and
Brown 2013; Landis-Piwowar and Iyer 2014). The principle of chemoprevention is to 1) reduce the
number of people that develop cancer and thus reduce the number of people that require treatment,
2) expand the window of opportunity to efficiently treat and detect lower grade tumours and 3) lessen
the risk of relapse following treatment (Fleet 2014).
The role of diet in the aetiology of CRC has been studied in great detail but the precise
mechanisms that underpin these associations are not well understood. Human studies are
complicated and often limited as they cannot determine cause and effort relationships or identify the
underlying mechanisms that make certain dietary components beneficial or detrimental to disease,
making disease modelling essential. Preclinical animal models, which enable genetic manipulation of
genes involved in carcinogenesis, were chosen for this study exploring the potential role of BRBs as a
chemopreventative as the mouse anatomy, physiology and genetics share many important similarities
to that of humans (Chinwalla et al. 2002; Mestas and Hughes 2004; Corpet and Pierre 2005; Shay et
al. 2013) and common pathways involved in cancer are present in both species (Frese and Tuveson
2007). In addition, the animal models enabled the translation of data derived from previously
described studies exploring the role of BRBs using a cell line based system into an in vivo model in the
presence of an intact immune system and microbiome. Although these mouse models provide a more
functionally relevant model than cell line work, the limitations due to the differences between mice
and humans must be considered when trying to predict the effect of BRB supplement in humans. For
example it has been found that human tumours are more heterogeneous than mouse tumours
(McIntyre et al. 2015), which could reflect differences in lifespan, variations in diet and the
microbiome (Nguyen et al. 2015). Due to the natural diversity and heterogeneity of human CRCs,
understanding the molecular mechanisms of cancer and the cause and effect relationship of dietary
interventions in this context is not possible from a single mouse model.
Mouse models which utilise Cre-mediated bialleic loss of Apc have proved invaluable tools for
understanding the mechanisms that underpin early tumourigenesis and allow control over when
dietary interventions are introduced with respect to gene mutations, which is beneficial when
investigating preventative strategies. Therefore, these mouse models were utilised in this thesis.
However, it must be considered that the majority of sporadic human CRCs do not occur from
simultaneous loss of both Apc alleles, and so the effect of BRB diet on tumourigenesis could be

155
different in this context. In both sporadic and inherited CRC in humans, one allele of Apc is mutated
(either sporadically or due to an inherited mutation), and at a later date the second allele is mutated.
Generally, a chemopreventative would be successful in this scenario if it was capable of limiting the
rate at which loss of heterozygosity (LOH) occurred. LOH refers to the loss of the functional copy of a
gene in a situation where the other allele is already non-functional due to an inherited mutation. BRBs
were shown here to increase migration and alter ISC dynamics in such a way that would likely decrease
the likelihood of a clone which had lost its second allele of Apc being retained in the crypt, thereby
reducing the rate at which LOH initiated tumourigenesis. However, to more accurately recapitulate
the events that lead to tumourigenesis in humans, heterozygous mouse models of Apc loss (e.g.
ApcMin/+) could be used. This approach is limited by the long tumour latency and as such was beyond
the scope of this study.
Another way in which the mouse models used here are limited in modelling human CRC is
tumour location. CRC patients present with tumours within the large intestine whereas primary
tumours in mouse models predominantly develop in the small intestine (Fleet 2014; Jackstadt and
Sansom 2016). This contrasting tumour location pattern may result in discrepancies between disease
development and response to BRB diet. For example the ApcMin/+ model develop a large number of
polyps in both the small and large intestine, with morbidity occurring as a result of tumour burden
rather than advancement of the disease (metastasis is rarely reported in this model) (Moser et al.
1990). In contrast, human FAP disease and sporadic CRCs preferentially develop in the distal colon and
are usually detected at later stages due to disease progression. In addition, human CRCs can take
several years to emerge and progress to an advanced state. Although beneficial in terms of performing
experiments, the latency of tumours from GEMM models is relatively short (Green and Hudson 2005)
and may limit the use of animals to translate to human studies however, models of Apc heterozygosity
could be used to evaluate the effect of BRBs on FAP and advanced CRC in future studies. Recent work
by Tomasetti and Vogelstein has highlighted that while the number of human colonic stem cells
division is 150 times more than that of the small intestine, stem cell division in the murine colon and
small intestine are in fact the opposite to that of humans (Tomasetti and Vogelstein 2015). Taken
together, with the similarities in tumour make-up and the pathways involved in tumourigenesis,
GEMMs serve as vital tools to investigate the mechanisms of human disease. There are several colon-
specific Cres (Hinoi et al. 2007; Robanus-Maandag et al. 2010; Tetteh et al. 2016b) that may overcome
the issues with tumour burden and location within the intestine and aid the evaluation into later stage
disease. While studies have shown that the tumours which arise in colon-specific Cre systems have
very similar morphology to human cancers (Robanus-Maandag et al. 2010), the rates of stem cell
division may not always reflect the dynamics of human stem cells, and so changes in murine ISC

156
dynamics as a result of BRB intervention may not directly translate to an equivalent change in humans.
However, these models of colon-specific tumourigenesis could be utilised in future experiments of
BRB intervention, especially in the context of BRB rectal suppository interventions to better predict
the outcome of FAP and CRC patients as in Wang et al. (2014) and to further the studies described
here.
Several studies have identified that stem cells can be influenced by extrinsic and
environmental factors (Tomasetti and Vogelstein 2015; Wu et al. 2016). This thesis provides the first
evidence that BRB diet influences ISC dynamics and prolongs the lifespan of mice bearing Wnt-driven
ISC derived tumours. The results described herein also support previous preclinical and clinical studies
that BRB diet is well tolerated and not associated with any serious side effects in normal tissue when
used as a cancer preventative or therapeutic. In the context of BRB intervention, several preclinical
mouse studies (Kresty et al. 2001; Wang et al. 2009; Bi et al. 2010) have been translated in to the clinic
in human trials (Kresty et al. 2006; Wang et al. 2011; Wang et al. 2014). The promising results
generated from these in vivo mouse studies in reducing tumour burden, latency and multiplicity have
seen some positive results in human tumour response to BRBs in reducing tumour size and severity.
This provides scope for advancing the preclinical studies outlined here to clinical trials. However, in
some CRC and FAP patients BRB intervention was reported to have no effect, possibly due to tumour
heterogeneity and differences between patients microbiome, and so this highlights the need for other
models of human disease to accurately recapitulate and predict human response to drug and
chemopreventative therapies.
Organoid culture (Sato et al. 2009), is proving to be a fundamental tool in human biology by
bridging the gaps between 2D (two dimensional) cell culture studies and in vivo mouse and human
studies (Fatehullah et al. 2016). This system allows the development of near-physiological tissue from
mouse and human intestinal and CRC tissue (Sato et al. 2011b) and from human colonic stem cells
(Jung et al. 2011). This makes organoids a more clinically relevant model that is likely to translate to
in vivo studies unlike 2D culture systems. In addition, ex vivo culture of murine and human tissue has
many advantages over animal models as it enables genetic alterations to be established easily and
quickly from minimal starting material. The role of adult stem cells in homeostasis, tissue regeneration
and disease, especially in the context of dietary intervention, can be investigated without influence
from the local microenvironment as with the BRB organoid studies performed herein. The complex
mechanisms which underlie human disease which cannot be investigated in mouse models can be
studied from patient-derived tissue and novel interventions can be exploited to better predict
individual patient outcomes to therapies (Huch and Koo 2015). As with any system there are always
limitations. As the current method for culturing organoids takes a reductionist approach there is a lack
157
of native microenvironment, stroma, extracellular matrix, vasculature, immune system and
microbiome which precludes ISC studies with their surrounding niche and in drug development studies
(Fatehullah et al. 2016; Hollins and Parry 2016). However, the utility of mouse organoids to
recapitulate the in vivo scenario is shown in this study where AC-reduced self-renewal of Apc deficient
cells in intestinal organoid culture supported a down-regulation of ISC marker expression in vivo. This
suggests that the combination of animal and organoid studies can complement each other in
chemoprevention and mechanistic studies. In support of this, these two systems have also started to
elucidate the mechanisms that link high-fat diet and CRC (Beyaz et al. 2016).
The need for organoids to replicate the environment of human disease is critical to aid our
understanding of the mechanisms that underpin cancer and the involvement of our environment.
Holistic representation of the intestinal environment through co-culturing would make murine and
human organoids even more relevant (Sato et al. 2011b; Kabiri et al. 2014; Lindemans et al. 2015;
VanDussen et al. 2015; Beyaz et al. 2016; Nozaki et al. 2016). Co-culturing systems combined with
microfluidic techniques would closely mimic the in vivo interactions between the microenvironment
and intestine or tumour tissue (Ramadan et al. 2013; Gracz et al. 2015), and these techniques could
be implemented in future studies to better predict patient outcomes to BRB intervention and
understand the true influence of diet on ISCs and their microenvironment. Additionally, in order for
organoid culture to be more clinically relevant in the future, a system needs to be developed that
replicates the in vivo human system, encompassing administration of dietary compounds to the apical
surface whilst in the presence of an intact immune system, stem cell niche and microbiome. This is
because the current system enables organoids to form such that the apical surface faces the inside of
the 3D structure with the basal surface having direct contact with the matrigel and exogenous dietary
compounds. BRB anthocyanins administered orally are absorbed from the intestinal lumen by the cells
of the stomach and small and large intestines. While studies report that ACs are highly permeable
across the gastrointestinal mucosa and can reside at high concentrations in the intestinal tissue some
ACs, such as cyanidin-3-glucoside, have been reported to be absorbed by the gut and enter the
systemic circulation (Fang 2014). However, AC concentrations in the blood are often lower than in
intestinal tissue (Fang 2014). Several studies have suggested that pharmacologically relevant
concentrations of ACs could be achieved within the intestinal tissue following exposure at the luminal
surface and thus can exert chemopreventative and therapeutic effects locally (Fang 2014; Kamiloglu
et al. 2015). Therefore, it may be beneficial in the future for dietary components to be injected into
individual organoids (Ogaki et al. 2015) in order to understand the interactions of diet on ISCs and
cancer in a clinically relevant multi-factorial setting.

158
Potential use of BRBs as a CRC preventative
Preclinical data from mouse models and organoid culture may not accurately reflect human
response to dietary and drug interventions. However, several studies using mouse models have been
directly translated into humans, including the use of curcumin in preventing colorectal neoplasia
(Carroll et al. 2011), and aspirin in preventing hereditary CRC (Burn et al. 2011). While further work is
required to determine the mechanisms that link environmental factors and CRC, the potential of BRBs
to be implicated as a CRC preventative is indisputable, as daily administration of BRBs have shown to
reduce colorectal tumour and polyp numbers and severity in humans (Wang et al. 2011; Wang et al.
2014). This thesis and previously published work have identified some of the pleiotropic effects of
BRBs on cell death, differentiation, inflammation, epigenetic regulations, the metabolome and
malignant ISC dynamics at the premalignant and malignant stages of intestinal tumourigenesis. This
highlights their potential for therapeutic cancer intervention; however it also highlights the complexity
of the involvement of extrinsic factors in carcinogenesis. Moreover, translation into the clinic has not
been simple, with varied responses occurring among patients (Wang et al. 2011; Wang et al. 2014).
This is likely to reflect the heterogeneity among individuals and within tumours, differences in
molecular signalling and enzyme activity near the tumour and differences in patients’ microbiota and
metabolism (Kula and Krauze-Baranowska 2016).
It is important to note that chemoprevention is not trying to radicalise our lifestyle, but
identify ways in which to adopt a healthier lifestyle and lessen the risks of developing cancer. Patient
compliance (Ropka et al. 2010) is a rate limiting step in the success of chemopreventive strategies
(that have substantial scientific evidence), and so it is important that such strategies are easy to adhere
to. While it remains difficult to accurately estimate the beneficial amount of BRB consumption for
individual patients, the purpose of chemoprevention in the context of this thesis was to evaluate
whether prior exposure to BRBs was sufficient to limit tumourigenesis, rather than intervene with
BRBs after cancer diagnosis like the studies by Wang et al. (2011), Wang et al. (2014) and Pan et al.
(2015) where BRBs were administered after patients were diagnosed with CRC or FAP disease. Putting
this aside, it is necessary that the regime is simple and doesn’t require the consumption of hundreds
of berries a day which is not a sustainable lifestyle change. In clinical studies, patients consumed 20 g
of freeze-dried BRB powder in 100 ml water, three times a day. The total of 60 g of freeze-dried BRB
powder has been reported to approximately equate to 1.3 lbs of fresh BRBs a day which is equivalent
to a 7% rodent BRB powder diet (Wang et al. 2011). However, as freeze-dried BRB powder have been
shown to have chemopreventative effects in murine cancers at concentrations of 5 – 10%, it is likely
that BRB concentrations that span this range will be beneficial in humans.

159
BRB powder is widely available as a food supplement for human consumption from health
shops. However, the concentration of dose widely advised is approximately 10 fold lower (Swanson
Health Products 2017) than shown effective as a therapeutic in human studies of CRC (Wang et al.
2011; Wang et al. 2014) and lower still than the equivalent concentration shown herein to have a
chemopreventative effect in mice (10% rodent diet approximately equates to 85 g of freeze-dried BRB
powder). As with many food supplements the utility of this treatment and effective concentration
range needs to be further investigated before public uptake.
The organoid studies described herein and cell culture and animal-based studies already
published (Wang et al. 2009; Zikri et al. 2009; Wang et al. 2013b) have reported some of the
chemopreventative and therapeutic effects of BRB-derived anthocyanins, cyanidin-3-O-glucoside,
cyanidin-3-O-xylosylrutinoside and cyanidin-3-O-rutinoside, against cancer. Specifically, results
reported in this thesis revealed that 500 µg/ml of BRB-derived ACs significantly reduced the ability of
Apc deficient cells to self-renew. Approximately, 500 µg/ml of this BRB AC extract equated to 0.0147
g of freeze-dried BRB powder, which is approximately 4000 fold lower than the concentration of
anthocyanins in 60 g/day BRB slurry administered in humans, and approximately 100 fold lower than
the AC content in 1.4 g of BRB suppositories administered to FAP patients daily. However, it is
important to note that in this thesis, the AC extract was added directly to the organoids rather than
orally as reported by Wang et al. (2011); Wang et al. (2014) and Pan et al. (2015). Thus, higher doses
of AC would need to be administered orally to get a desired concentratin of 500 µg/ml to the cells,
after absorption and metabolism. Despite this, it is clear that AC doses of 500 µg/ml and rodent diets
of 10% freeze-dried BRB powder have chemopreventative effects at different stages of intestinal
tumourigenesis which highlights their potential use for cancer prevention and intervention. Whilst a
precise concentration and dosing regime still needs to be determined for optimal cancer prevention
and treatment, the combination of previously published data and results reported in this thesis
highlight that diets of 10% BRB diet do have tissue specific effects. However, more research is required
to determine a precise mechanism of action and to further predict patient response to BRB
intervention. Future work could focus on identifying whether a single anthocyanin is responsible for
the cancer inhibitory effects of BRBs or a combination. Additionally, it would also be beneficial to
determine whether the consumption of several berry fruit powders have synergistic effects in
preventing CRC.
In summary, BRB intervention in mice is well tolerated and has chemopreventative effects
against CRC initiation and progression without causing gastric side effects within normal tissue. BRBs
and their AC derivatives have pleiotropic effects in both mice and humans. This study represents the

160
first evidence that one of the mechanisms of action of the BRB diet in preventing CRC is through
regulation of the ISC population.

161
7 Reference List
WCRF/AICR World Cancer Research Fund, American Institute for Cancer Research. Continuous Update Project Colorectal Cancer 2011 Report. Food, nutrition, physical activity, and the prevention of colorectal cancer. Washington DC: WCRF. 2011. (1977). Report of the American Institute of Nutrition Ad Hoc Committee on Standards for Nutritional Studies. The Journal of Nutrition 107:1340-1348. (1980). Second report of the ad hoc committee for experimental animals. Journal of Nutrition 107:1726. Adachi, S., Nagao, T., To, S., Joe, A. K., Shimizu, M., Matsushima-Nishiwaki, R., Kozawa, O. et al. (2008). (−)-Epigallocatechin gallate causes internalization of the epidermal growth factor receptor in human colon cancer cells. Carcinogenesis 29:1986-1993. Ahmad, N., Cheng, P. and Mukhtar, H. (2000). Cell Cycle Dysregulation by Green Tea Polyphenol Epigallocatechin-3-Gallate. Biochemical and Biophysical Research Communications 275:328-334. Aiyer, H., Li, Y., Reuter, N. and Martin, R. (2014). Dietary black raspberry boosts cellular antioxidant defenses in reflux-induced esophagitis. Cancer Research 68:5480. Al-Hajj, M., Wicha, M. S., Benito-Hernandez, A., Morrison, S. J. and Clarke, M. F. (2003). Prospective identification of tumorigenic breast cancer cells. Proceedings of the National Academy of Sciences 100:3983-3988. Albuquerque, C., Breukel, C., van der Luijt, R., Fidalgo, P., Lage, P., Slors, F. J. M., Leitão, C. N. et al. (2002). The ‘just-right’ signaling model: APC somatic mutations are selected based on a specific level of activation of the β-catenin signaling cascade. Human Molecular Genetics 11:1549-1560. Allis, C. D. and Jenuwein, T. (2016). The molecular hallmarks of epigenetic control. Nat Rev Genet 17:487-500. Andreu, P., Colnot, S., Godard, C., Gad, S., Chafey, P., Niwa-Kawakita, M., Laurent-Puig, P. et al. (2005). Crypt-restricted proliferation and commitment to the Paneth cell lineage following Apc loss in the mouse intestine. Development 132:1443-1451. Artavanis-Tsakonas, S., Rand , M. D. and Lake, R. J. (1999). Notch Signaling: Cell Fate Control and Signal Integration in Development. Science 284:770-776. Baker, A.-M., Graham, T. A., Elia, G., Wright, N. A. and Rodriguez-Justo, M. (2015). Characterization of LGR5 stem cells in colorectal adenomas and carcinomas. Scientific Reports 5:8654. Barker, N. (2014). Adult intestinal stem cells: critical drivers of epithelial homeostasis and regeneration. Nature Reviews Molecular Cell Biology 15:19–33. Barker, N. and Clevers, H. (2007). Tracking Down the Stem Cells of the Intestine: Strategies to Identify Adult Stem Cells. Gastroenterology 133:1755-1760. Barker, N., Ridgway, R. A., van Es, J. H., van de Wetering, M., Begthel, H., van der Born, M., Danenberg, E. et al. (2009). Crypt stem cells as the cells-of-origin of intestinal cancer. Nature 457:608-611.
162
Barker, N., van de Wetering, M. and Clevers, H. (2008). The intestinal stem cell. Genes & Development 22:1856-1864. Barker, N., van Es, J. H., Kuipers, J., Kujala, P., van den Born, M., Cozijnsen, M., Haegebarth, A. et al. (2007). Identification of stem cells in small intestine and colon by marker gene Lgr5. Nature 449:1003-1007. Barker, N., van Oudenaarden, A. and Clevers, H. (2012). Identifying the Stem Cell of the Intestinal Crypt: Strategies and Pitfalls. Cell Stem Cell 11:452-460. Barnard, J. A., Beauchamp, R. D., Coffey, R. J. and Moses, H. L. (1989). Regulation of intestinal epithelial cell growth by transforming growth factor type beta. Proceedings of the National Academy of Sciences 86:1578-1582. Bastide, P., Darido, C., Pannequin, J., Kist, R., Robine, S., Marty-Double, C., Bibeau, F. et al. (2007). Sox9 regulates cell proliferation and is required for Paneth cell differentiation in the intestinal epithelium. The Journal of Cell Biology 178:635-648. Batlle, E., Bacani, J., Begthel, H., Jonkeer, S., Gregorieff, A., van de Born, M., Malats, N. et al. (2005). EphB receptor activity suppresses colorectal cancer progression. Nature 435:1126-1130. Batlle, E., Henderson, J. T., Beghtel, H., van den Born, M. M. W., Sancho, E., Huls, G., Meeldijk, J. et al. (2002). β-Catenin and TCF Mediate Cell Positioning in the Intestinal Epithelium by Controlling the Expression of EphB/EphrinB. Cell 111:251-263. Behrens, J., von Kries, J. P., Kühl, M., Bruhn, L., Wedlich, D., Grosschedl, R. and Birchmeier, W. (1996). Functional interaction of beta-catenin with the transcription factor LEF-1. Nature 382:638-642. Beumer, J. and Clevers, H. (2016). Regulation and plasticity of intestinal stem cells during homeostasis and regeneration. Development 143:3639. Bevins, C. L. and Salzman, N. H. (2011). Paneth cells, antimicrobial peptides and maintenance of intestinal homeostasis. Nature Reviews Microbiology 9:356-368. Beyaz, S., Mana, M. D., Roper, J., Kedrin, D., Saadatpour, A., Hong, S.-J., Bauer-Rowe, K. E. et al. (2016). High-fat diet enhances stemness and tumorigenicity of intestinal progenitors. Nature 531:53-58. Bi, X., Fang, W., Wang, L.-S., Stoner, G. D. and Yang, W. (2010). Black Raspberries Inhibit Intestinal Tumorigenesis in Apc1638+/- and Muc2-/- Mouse Models of Colorectal Cancer. Cancer Prevention Research 3:1443-1450. Bilchik , A. J., Graeme, P., Curley , A., S., Strasberg , S., Saltz , L., Adam, R. et al. (2005). Neoadjuvant Chemotherapy for Metastatic Colon Cancer: A Cautionary Note. Journal of Clinical Oncology 23:9073-9078. Bjerknes, M. and Cheng, H. (1999). Clonal analysis of mouse intestinal epithelial progenitors. Gastroenterology 116:7-14. Blanke, C. D. (2009). Dual-Antibody Therapy in Advanced ColorectalCancer: Gather Ye Rosebuds While Ye May. Journal of Clinical Oncology 27:655-658.

163
Bokemeyer, C., Bondarenko, I., Makhson, A., Hartmann, J. T., Aparicio, J., de Braud, F., Donea, S. et al. (2009). Fluorouracil, Leucovorin, and Oxaliplatin With and Without Cetuximab in the First-Line Treatment of Metastatic Colorectal Cancer. Journal of Clinical Oncology 27:663-671. Bravo, L. (1998). Polyphenols: chemistry, dietary sources, metabolism, and nutritional significance. Nutrition Reviews 56:317–333. Bu, H., He, X., Zhang, Z., Yin, Q., Yu, H. and Li, Y. (2014). A TPGS-incorporating nanoemulsion of paclitaxel circumvents drug resistance in breast cancer. International Journal of Pharmaceutics 471:206-213. Buczacki, S. J. A., Zecchini, H. I., Nicholson, A. M., Russell, R., Vermeulen, L., Kemp, R. and Winton, D. J. (2013). Intestinal label-retaining cells are secretory precursors expressing Lgr5. Nature 495:65-69. Burn, J., Gerdes, A.-M., Macrae, F., Mecklin, J.-P., Moeslein, G., Olschwang, S., Eccles, D. et al. (2011). Long-term effect of aspirin on cancer risk in carriers of hereditary colorectal cancer: an analysis from the CAPP2 randomised controlled trial. Lancet 378:2081-2087. Cancer Research UK 2014. http://www.cancerresearchuk.org/health-professional/cancer-statistics/statistics-by-cancer-type/bowel-cancer. Acessed online October 2016. Carmon, K. S., Lin, Q., Gong, X., Thomas, A. and Liu, Q. (2012). LGR5 Interacts and Cointernalizes with Wnt Receptors To Modulate Wnt/β-Catenin Signaling. Molecular and Cellular Biology 32:2054-2064. Carroll, R. E., Benya, R. V., Turgeon, D. K., Vareed, S., Neuman, M., Rodriguez, L., Kakarala, M. et al. (2011). Phase IIA Clinical Trial of Curcumin for the Prevention of Colorectal Neoplasia. Cancer prevention research (Philadelphia, Pa.) 4:354-364. Chan, A. T. and Giovannucci, E. L. (2010). Primary Prevention of Colorectal Cancer. Gastroenterology 138:2029-2043.e2010. Chen, H.-J., Hsu, L.-S., Shia, Y.-T., Lin, M.-W. and Lin, C.-M. (2012). The β-catenin/TCF complex as a novel target of resveratrol in the Wnt/β-catenin signaling pathway. Biochemical Pharmacology 84:1143-1153. Cheng, H. and Leblond, C. P. (1974). Origin, differentiation and renewal of the four main epithelial cell types in the mouse small intestine V. Unitarian theory of the origin of the four epithelial cell types. American Journal of Anatomy 141:537-561. Chesney, J., Metz, C., Bacher, M., Peng, T., Meinhardt, A. and Bucala, R. (1999). An essential role for macrophage migration inhibitory factor (MIF) in angiogenesis and the growth of a murine lymphoma. Molecular Medicine 5:181-191. Chinwalla, A. T., Cook, L. L., Delehaunty, K. D., Fewell, G. A., Fulton, L. A., Fulton, R. S., Graves, T. A. et al. (2002). Initial sequencing and comparative analysis of the mouse genome. Nature 420:520-562. Clevers, H. (2016). Cancer therapy: Defining stemness. Nature 534:176-177. Clevers, H., Loh, K. M. and Nusse, R. (2014). An integral program for tissue renewal and regeneration: Wnt signaling and stem cell control. Science 346:1248012.

164
Clevers, H. and van de Wetering, M. (1997). TCF/LEF factor earn their wings. Trends in Genetics 13:485-489. Cordenunsi, B. R., Oliveira do Nascimento, J. R., Genovese, M. I. and Lajolo, F. M. (2002). Influence of Cultivar on Quality Parameters and Chemical Composition of Strawberry Fruits Grown in Brazil. Journal of Agricultural and Food Chemistry 50:2581-2586. Corpet, D. E. and Pierre, F. (2005). How good are rodent models of carcinogenesis in predicting efficacy in humans? A systematic review and meta-analysis of colon chemoprevention in rats, mice and men. European Journal of Cancer 41:1911-1922. Corrie, P. G. (2008). Cytotoxic chemotherapy: clinical aspects. Medicine 36: 24-28. Creamer, B. (1967). The turnover of the epithelium of the small intestine. British Medical Bulletin 23:226-230. CRUK. (2014). [Online]. Available at: http://www.cancerresearchuk.org/health-professional/cancer-statistics/statistics-by-cancer-type/bowel-cancer#heading-Zero [Accessed: February 2017]. Dalerba, P., Dylla, S. J., Park, I. K., Liu, R., Wang, X., Cho, R. W., Hoey, T. et al. (2007). Phenotypic characterization of human colorectal cancer stem cells. Proc Natl Acad Sci USA 104. Date, S. and Sato, T. (2015). Mini-Gut Organoids:Reconstitution of the Stem Cell Niche. The Annual Review of Cell and Developmental Biology 31:269–289. Deighton, N., Brennan, R. and Davies, H. V. (2000). Antioxidant properties of domesticated and wild Rubus species. Journal of the Science of Food and Agriculture 80:1307–1313. Denev, P. N., Kratchanov, C. G., Ciz, M., Lojek, A. and Kratchanova, M. G. (2012). Bioavailability and Antioxidant Activity of Black Chokeberry (Aronia melanocarpa) Polyphenols: in vitro and in vivo Evidences and Possible Mechanisms of Action: A Review. Comprehensive Reviews in Food Science and Food Safety 11:471-489. de Sousa e Melo, F., Kurtova, A. V., Harnoss, J. M., Kljavin, N., Hoeck, J. D., Hung, J., Anderson, J. E. et al. (2017). A distinct role for Lgr5+ stem cells in primary and metastatic colon cancer. Nature 543:676–680. Dignass, A. U. and Sturm, A. (2001). Peptide growth factors in the intestine. European Journal of Gastroenterology & Hepatology 13:763–770. Dihlmann, S. and von Knebel Doeberitz, M. (2005). Wnt/β-catenin-pathway as a molecular target for future anti-cancer therapeutics. International Journal of Cancer 113:515-524. Diplock, A. T., Charleux, J. L., Crozier-Willi, G., Kok, F. J., Rice-Evans, C., Roberfroid, M., Stahl, W. et al. (1998). Functional food science and defence against reactive oxidative species. British Journal of Nutrition 80:S77-S112. Drake, R. L., Vogl, A. W. and Mitchell, A. W. M. (2005). Gray's anatomy for students. Third ed. Philadelphia: Elsevier/Churchill Livingstone. p312-320.
165
Duque, A. and Rakic, P. (2011). Different effects of BrdU and (3)H-Thymidine incorporation into DNA on cell proliferation, position and fate. The Journal of neuroscience : the official journal of the Society for Neuroscience 31:15205-15217. Durand, A., Donahue, B., Peignon, G., Letourneur, F., Cagnard, N., Slomianny, C., Perret, C. et al. (2012). Functional intestinal stem cells after Paneth cell ablation induced by the loss of transcription factor Math1 (Atoh1). Proceedings of the National Academy of Sciences of the United States of America 109:8965-8970. Duval, A., Rolland, S., Tubacher, E., Bui, H., Thomas, G. and Hamelin, R. (2000). The human T-cell transcription factor-4 gene: structure, extensive characterization of alternative splicings, and mutational analysis in colorectal cancer cell lines. Cancer Research 60:3872-3879. El Marjou, F., Janssen, K. J., Chang, B. H.-J., Li, M., Hindie, V., Chan, L., Louvard, D. et al. (2004). Tissue-Specific and Inducible Cre-Mediated Recombination in the Gut Epithelium. Genesis 39:186 –193. Elamin, M. H., Shinwari, Z., Hendrayani, S. F., Al-Hindi, H., Al-Shail, E., Khafaga, Y., Al-kofide, A. et al. (2010). Curcumin inhibits the sonic hedgehog signaling pathway and triggers apoptosis in medulloblastoma cells. Molecular Carcinogenesis 49:302-314. Fang, J. (2014). Bioavailability of anthocyanins. Drug Metabolism Reviews 46:508-520. Farin, H. F., Van Es, J. H. and Clevers, H. (2012). Redundant Sources of Wnt Regulate Intestinal Stem Cells and Promote Formation of Paneth Cells. Gastroenterology 143:1518-1529.e1517. Fatehullah, A., Tan, S. H. and Barker, N. (2016). Organoids as an in vitro model of human development and disease. Nat Cell Biol 18:246-254. Fearon, E. R. and Vogelstein, B. (1990). A genetic model for colorectal tumorigenesis. Cell 61:759-767. Feng, G. J., Cotta, W., Wei, X. Q., Poetz, O., Evans, R., Jardé, T., Reed, K. et al. (2012). Conditional Disruption of Axin1 Leads to Development of Liver Tumors in Mice. Gastroenterology 143:1650-1659. Ferlay, J., Soerjomataram, I., Dikshit, R., Eser, S., Mathers, C., Rebelo, M., Parkin, D. M. et al. (2015). Cancer incidence and mortality worldwide: Sources, methods and major patterns in GLOBOCAN 2012. International Journal of Cancer 136:E359-E386. Fernald, K. and Kurokawa, M. (2013). Evading apoptosis in cancer. Trends in Cell Biology 23:620-633. Ferreira, D., Adega, F. and Chaves, R. (2013). The Importance of Cancer Cell Lines as in vitro Models in Cancer Methylome Analysis and Anticancer Drugs Testing. Fleet, J. C. (2014). Animal models of gastrointestinal and liver diseases. New mouse models for studying dietary prevention of colorectal cancer. American Journal of Physiology - Gastrointestinal and Liver Physiology 307:G249-G259. Fletcher, A. G., Breward, C. J. W. and Jonathan Chapman, S. (2012). Mathematical modeling of monoclonal conversion in the colonic crypt. Journal of Theoretical Biology 300:118-133.

166
Fodde, R., Edelmann, W., Yang, K., van Leeuwen, C., Carlson, C., Renault, B., Breukel, C. et al. (1994). A targeted chain-termination mutation in the mouse Apc gene results in multiple intestinal tumors. Proceedings of the National Academy of Sciences of the United States of America 91:8969-8973. Fox, J. G., Barthold, S., Davisson, M., Newcomer, C. E., Quimby, F. W. and Smith, A. (2006). The Mouse in Biomedical Research: Normative Biology, Husbandry, and Models.American College of Laboratory Animal Medicine. Elsevier Science, pp. 65-67. Frese, K. K. and Tuveson, D. A. (2007). Maximizing mouse cancer models. Nat Rev Cancer 7:654-658. Fu, D.-Y., Wang, Z.-M., Li, C., Wang, B.-L., Shen, Z.-Z., Huang, W. and Shao, Z.-M. (2010). Sox17, the canonical Wnt antagonist, is epigenetically inactivated by promoter methylation in human breast cancer. Breast Cancer Research and Treatment 119:601-612. Fu, Y., Chang, H., Peng, X., Bai, Q., Yi, L., Zhou, Y., Zhu, J. et al. (2014). Resveratrol Inhibits Breast Cancer Stem-Like Cells and Induces Autophagy via Suppressing Wnt/β-Catenin Signaling Pathway. PLOS ONE 9:e102535. Gall, G. A. E. and Kyle, W. H. (1968). Growth of the Laboratory Mouse. Theoretical and Applied Genetics 38:304-308. Gardane, A., Poonawala, M. and Vaidya, A. (2016). Curcumin sensitizes quiescent leukemic cells to antimitotic drug 5-fluorouracil by inducing proliferative responses in them. Journal of Cancer Metastasis and Treatment 2:245-252 Gerber, J. M., Smith, B. D., Ngwang, B., Zhang, H., Vala, M. S., Morsberger, L., S., G. et al. (2012). A clinically relevant population of leukemic CD34(+)CD38(-) cells in acute myeloid leukemia. Blood 119:3571-3577. Germann, M., Xu, H., Malaterre, J., Sampurno, S., Huyghe, M., Cheasley, D., Fre, S. et al. (2014). Tripartite interactions between Wnt signaling, Notch and Myb for stem/progenitor cell functions during intestinal tumorigenesis. Stem Cell Research 13:355–366. Giovannucci, E., Rimm, E. B., Ascherio, A., Stampfer, M. J., Colditz, G. A. and Willett, W. C. (1995). Alcohol, low-methionine--low-folate diets, and risk of colon cancer in men. Journal of the National Cancer Institute 87:265-273. Gracz, A. D., Williamson, I. A., Roche, K. C., Johnston, M. J., Wang, F., Wang, Y., Attayek, P. J. et al. (2015). A high throughput platform for stem cell-niche co-cultures and downstream gene expression analysis. Nature cell biology 17:340-349. Green, J. E. and Hudson, T. (2005). The promise of genetically engineered mice for cancer prevention studies. Nat Rev Cancer 5:184-198. Gregorieff, A., Pinto, D., Begthel, H., Destrée, O., Kielman, M. and Clevers, H. (2005). Expression pattern of Wnt signaling components in the adult intestine. Gastroenterology 129:628-638. Gribble, F. M. and Reimann, F. (2016). Enteroendocrine Cells: Chemosensors in the Intestinal Epithelium. Annual Review of Physiology 78:277-299.
167
Guan, Y., Watson, A. J. M., Marchiando, A. M., Bradford, E., Shen, L., Turner, J. R. and Montrose, M. H. (2011a). Redistribution of the tight junction protein ZO-1 during physiological shedding of mouse intestinal epithelial cells. American Journal of Physiology - Cell Physiology 300:C1404-C1414. Guan, Z. Z., Xu, J. M., Luo, R. C., Feng, F. Y., Wang, L. W., Shen, L., Yu, S. Y. et al. (2011b). Efficacy and safety of bevacizumab plus chemotherapy in Chinese patients with metastatic colorectal cancer: a randomized phase III ARTIST trial. Chinese Journal of Cancer 30:682–689. Guinney, J., Dienstmann, R., Wang, X., de Reyniès, A., Schlicker, A., Soneson, C., Marisa, L. et al. (2015). The consensus molecular subtypes of colorectal cancer. Nature medicine 21:1350-1356. Hagan, S., Orr, M. C. M. and Doyle, B. (2013). Targeted therapies in colorectal cancer — an integrative view by PPPM. EPMA Journal 4:3. Haramis , A. P., Begthel, H., van den Born, M., van Es, J., Jonkheer, S., Offerhaus, G. J. and Clevers, H. (2004). De novo crypt formation and juvenile polyposis on BMP inhibition in mouse intestine. Science 303:1684-1686. Harris, G. K., Gupta, A., Nines, R. G., Kresty, L. A., Habib, S. G., Frankel, W. L., LaPerle, K. et al. (2001). Effects of lyophilized black raspberries on azoxymethane-induced colon cancer and 8-hydroxy-2′-deoxyguanosine levels in the fischer 344 rat. Nutrition and Cancer 40:125-133. He, X. C., Zhang, J., Tong, W. G., Tawfik, O., Ross, J., Scoville, D. H., Tian, Q. et al. (2004). BMP signaling inhibits intestinal stem cell self-renewal through suppression of Wnt- β -catenin signaling. Nature Genetics 36:1117-1121. Hinoi, T., Akyol, A., Theisen, B. K., Ferguson, D. O., Greenson, J. K., Williams, B. O., Cho, K. R. et al. (2007). Mouse Model of Colonic Adenoma-Carcinoma Progression Based on Somatic Apc Inactivation. Cancer Research 67:9721. Holik, A. Z., Young, M., Krzystyniak, J., Williams, G. T., Metzger, D., Shorning, B. Y. and Clarke, A. R. (2014). Brg1 Loss Attenuates Aberrant Wnt-Signalling and Prevents Wnt-Dependent Tumourigenesis in the Murine Small Intestine. PLoS Genetics 10:e1004453. Holmberg, J., Genander, M., Halford, M. M., Annerén, C., Sondell, M., Chumley, M. J., Silvany, R. E. et al. (2006). EphB Receptors Coordinate Migration and Proliferation in the Intestinal Stem Cell Niche. Cell 125:1151-1163. Hope, C., Kestutis, P., Marina, P., Moyer, M. P., Johal, K. S., Woo, J., Santoso, C. et al. (2008). Low concentrations of resveratrol inhibit Wnt signal throughput in colon-derived cells: Implications for colon cancer prevention. Molecular nutrition & food research 52:S52-S61. Hori, N., Iwasa, S., Hashimoto, H., Yanai, T., Kato, K., Hamaguchi, T., Yamada, Y. et al. (2013). Reasons for avoidance of bevacizumab with first-line FOLFOX for advanced colorectal cancer. International Journal of Clinical Oncology 18:435-438. Hou, N., Huo, D. and Dignam, J. J. (2013). Prevention of colorectal cancer and dietary management. Chinese clinical oncology 2:13-13.
168
Huang, Y.-W., Gu, F., Dombkowski, A., Wang, L.-S. and Stoner, G. D. (2016). Black raspberries demethylate Sfrp4, a WNT pathway antagonist, in rat esophageal squamous cell papilloma. Molecular Carcinogenesis 55:1867-1875. Huch, M. and Koo, B.-K. (2015). Modeling mouse and human development using organoid cultures. Development 142:3113. Huderson, A. C., Myers, J. N., Niaz, M. S., Washington, M. K. and Ramesh, A. (2013). Chemoprevention of benzo(a)pyrene-induced colon polyps in Apc(Min) mice by resveratrol. The Journal of nutritional biochemistry 24:713-724. Hurwitz, H., Fehrenbacher, L., Novotny, W., Cartwright, T., Hainsworth, J., Heim, W., Berlin, J. et al. (2004). Bevacizumab plus irinotecan, fluorouracil, and leucovorin for metastatic colorectal cancer. The New England Journal of Medicine 350:2335-2342. Ireland, H., Kemp, R., Houghton, C., Howard, L., Clarke, A. R., Sansom, O. J. and Winton, D. J. (2004). Inducible cre-mediated control of gene expression in the murine gastrointestinal tract: effect of loss of β-catenin. Gastroenterology 126:1236-1246. Itzkovitz, S., Lyubimova, A., Blat, I. C., Maynard, M., van Es, J., Lees, J., Jacks, T. et al. (2012). Single-molecule transcript counting of stem-cell markers in the mouse intestine. Nat Cell Biol 14:106-114. Jackstadt, R. and Sansom, O. J. (2016). Mouse models of intestinal cancer. The Journal of Pathology 238:141-151. Jarde, T., Evans, R. J., McQuillan, K. L., Parry, L., Feng, G. J., Alvares, B., Clarke, A. R. et al. (2013). In vivo and in vitro models for the therapeutic targeting of Wnt signaling using a Tet-O[Delta]N89[beta]-catenin system. Oncogene 32:883-893. Jessup, J. M., Stewart, A., Greene, F. L. and Minsky, B. D. (2005). Adjuvant Chemotherapy for Stage III Colon Cancer Implications of Race/Ethnicity, Age, and Differentiation. The Journal of American Medical Association 294:2703-2711. Jinek, M., Chylinski, K., Fonfara, I., Hauer, M., Doudna, J. A., and Charpentier, E. (2012). A Programmable Dual-RNA–Guided DNA Endonuclease in Adaptive Bacterial Immunity. Science 337: 816-821. Johnson, J. (2009). Effect of Black Raspberry Extracts on Colon Cancer Cell Proliferation. Thesis Master of Science, The Ohio State University. Johnson, R. L. and Fleet, J. C. (2013). Animal Models of Colorectal Cancer. Cancer metastasis reviews 32:39-61. Johnston, P. G. (2014). Identification of Clinically Relevant Molecular Subtypes in Colorectal Cancer: The Dawning of a New Era. The Oncologist 19:568-573. Jonker, D. J., O'Callaghan, C. J., Karapetis, C. S., Zalcberg, J. R., Tu, D., Au, H. J., Berry, S. R. et al. (2007). Cetuximab for the treatment of colorectal cancer. The New England Journal of Medicine 357:2040-2048.
169
Jubb, A. M., Chalasani, S., Frantz, G. D., Smits, R., Grabsch, H. I., Kavi, V., Maughan, N. J. et al. (2006). Achaete-scute like 2 (ascl2) is a target of Wnt signalling and is upregulated in intestinal neoplasia. Oncogene 25:3445-3457. Jung, P., Sato, T., Merlos-Suarez, A., Barriga, F. M., Iglesias, M., Rossell, D., Auer, H. et al. (2011). Isolation and in vitro expansion of human colonic stem cells. Nat Med 17:1225-1227. Kabiri, Z., Greicius, G., Madan, B., Biechele, S., Zhong, Z., Zaribafzadeh, H., Edison et al. (2014). Stroma provides an intestinal stem cell niche in the absence of epithelial Wnts. Development 141:2206. Kaestner, K. H., Silberg, D. G., Traber, P. G. and Schütz, G. (1997). The mesenchymal winged helix transcription factor Fkh6 is required for the control of gastrointestinal proliferation and differentiation. Genes and Development 11:1583-1595. Kakarala, M., Brenner, D. E., Korkaya, H., Cheng, C., Tazi, K., Ginestier, C., Liu, S. et al. (2009). Targeting breast stem cells with the cancer preventive compounds curcumin and piperine. Breast Cancer Res Treat 122. Kamiloglu, S., Capanoglu, E., Grootaert, C. and Van Camp, J. (2015). Anthocyanin Absorption and Metabolism by Human Intestinal Caco-2 Cells—A Review. International Journal of Molecular Sciences 16:21555-21574. Kanwar, S. S., Yu, Y., Nautiyal, J., Patel, B. B., Padhye, S., Sarkar, F. H. and Majumdar, A. P. N. (2011). Difluorinated-curcumin (CDF): a novel curcumin analog is a potent inhibitor of colon cancer stem-like cells. Pharm Res 28:827. Kayahara, T., Sawada, M., Takaishi, S., Fukui, H., Seno, H., Fukuzawa, H., Suzuki, K. et al. (2003). Candidate markers for stem and early progenitor cells, Musashi-1 and Hes1, are expressed in crypt base columnar cells of mouse small intestine. FEBS Letters 535:131-135. Kiesslich, R., Duckworth, C. A., Moussata, D., Gloeckner, A., Lim, L. G., Goetz, M., Pritchard, D. M. et al. (2012). Local barrier dysfunction identified by confocal laser endomicroscopy predicts relapse in inflammatory bowel disease. Gut 61:1146-1153. Kim, E., Davidson, L. A., Zoh, R. S., Hensel, M. E., Salinas, M. L., Patil, B. S., Jayaprakasha, G. K. et al. (2016a). Rapidly cycling Lgr5+ stem cells are exquisitely sensitive to extrinsic dietary factors that modulate colon cancer risk. Cell Death Dis 7:e2460. Kim, K. A., Kakitani, M., Zhao, J., Oshima, T., Tang, T., Binnerts, M., Liu, Y. et al. (2005). Mitogenic influence of human R-spondin1 on the intestinal epithelium. Science 309:1256-1259. Kim, K. A., Wagle, M., Tran, K., Zhan, X., Dixon, M. A., Liu, S., Gros, D. et al. (2008). R-Spondin family members regulate the Wnt pathway by a common mechanism. Molecular biology of the cell 19:2588-2596. Kim, Y. J., Siegler, E. L., Siriwon, N. and Wang, P. (2016b). Therapeutic strategies for targeting cancer stem cells. Journal of Cancer Metastasis and Treatment 2:233-242. Kohn, A. D. and Moon, R. T. (2005). Wnt and calcium signaling: beta-catenin-independent pathways. Cell Calcium 38:439-446.
170
Komiya, Y. and Habas, R. (2008). Wnt signal transduction pathways. Organogenesis 4:68-75. Kong, J., Chia, L., Goh, N., Chia, T. and Brouillard, R. (2003). Analysis and biological activities of anthocyanins. Phytochemistry 64:933. Koo, B.-K., Spit, M., Jordens, I., Low, T. Y., Stange, D. E., van de Wetering, M., van Es, J. H. et al. (2012). Tumour suppressor RNF43 is a stem-cell E3 ligase that induces endocytosis of Wnt receptors. Nature 488:665-669. Korinek, V., Barker, N., Moerer, P., van Donselaar, E., Huls, G., Peters, P. J. and Clevers, H. (1998). Depletion of epithelial stem-cell compartments in the small intestine of mice lacking Tcf-4. Nature Genetics 19:379-383. Kosinski, C., Stange, D. E., Xu, C., Chan, A. S., Ho, C., Yuen, S. T., Mifflin, R. C. et al. (2010). Indian hedgehog regulates intestinal stem cell fate through epithelial-mesenchymal interactions during development. Gastroenterology 139:893-903. Kresty, L. A., Frankel, W. L., Hammond, C. D., Baird, M. E., Mele, J. M., Stoner, G. D. and Fromkes, J. J. (2006). Transitioning From Preclinical to Clinical Chemopreventive Assessments of Lyophilized Black Raspberries: Interim Results Show Berries Modulate Markers of Oxidative Stress in Barrett's Esophagus Patients. Nutrition and Cancer 54:148-156. Kresty, L. A., Fromkes, J. J., Frankel, W. L., Hammond, C. D., Seeram, N. P., Baird, M. and Stoner, G. D. (2016a). A phase I pilot study evaluating the beneficial effects of black raspberries in patients with Barrett’s esophagus. Oncotarget; Advance Online Publications: Page 2. Kresty, L. A., Mallery, S. R. and Stoner, G. D. (2016b). Black raspberries in cancer clinical trials: Past, present and future. Journal of berry research 6:251-261. Kresty, L. A., Morse, M. A., Morgan, C., Carlton, P. S., Lu, J., Gupta, A., Blackwood, M. et al. (2001). Chemoprevention of Esophageal Tumorigenesis by Dietary Administration of Lyophilized Black Raspberries. Cancer Research 61:6112. Kuhnert, F., Davis, C. R., Wang, H. T., Chu, P., Lee, M., Yuan, J., Nusse, R. et al. (2004). Essential requirement for Wnt signaling in proliferation of adult small intestine and colon revealed by adenoviral expression of Dickkopf-1. Proceedings of the National Academy of Sciences of the United States of America 101:266-271. Kula, M. and Krauze-Baranowska, M. (2016). Rubus occidentalis: The black raspberry—its potential in the prevention of cancer. Nutrition and Cancer 68:18-28. Landis-Piwowar, K. R. and Iyer, N. R. (2014). Cancer Chemoprevention: Current State of the Art. Cancer Growth and Metastasis 7:19-25. Lapidot, T., Sirard, C., Vormoor, J., Murdoch, B., Hoang, T., Caceres-Cortes, J., Minden, M. et al. (1994). A cell initiating human acute myeloid leukaemia after transplantation into SCID mice. Nature 367:645-648. Laplane, L. (2016). Cancer Stem Cells: Philosophy and Therapies. Harvard University Press Abstract only.
171
Lechner, J. F., Reen, R. K., Dombkowski, A. A., Cukovic, D., Salagrama, S., Wang, L. S. and Stoner, G. D. (2008). Effects of a black raspberry diet on gene expression in the rat esophagus. Nutrition Cancer 1:61-69. Lee, J.-H., Oh, M., Seok, J. H., Kim, S., Lee, D. B., Bae, G., Bae, H.-I. et al. (2016). Antiviral Effects of Black Raspberry (Rubus coreanus) Seed and Its Gallic Acid against Influenza Virus Infection. Viruses 8:157. Leslie, A., Carey, F. A., Pratt, N. R. and Steele, R. J. C. (2002). The Colorectal Adenoma-Carcinoma Sequence. British Journal of Surgery 89:845-860. Li, L., Milner, L. A., Deng, Y., Iwata, M., Banta, A., Graf, L., Marcovina, S. et al. (1998). The human homolog of rat Jagged1 expressed by marrow stroma inhibits differentiation of 32D cells through interaction with Notch1. Immunity 8:43-55. Li, N., Yousefi, M., Nakauka-Ddamba, A., Jain, R., Tobias, J., Epstein, Jonathan A., Jensen, Shane T. et al. (2014). Single-Cell Analysis of Proxy Reporter Allele-Marked Epithelial Cells Establishes Intestinal Stem Cell Hierarchy. Stem Cell Reports 3:876-891. Li, T. and Perez-Soler, R. (2009). Skin toxicities associated with epidermal growth factor receptor inhibitors. Targeted Oncology 4:107–119. Lindemans, C. A., Calafiore, M., Mertelsmann, A. M., O'Connor, M. H., Dudakov, J. A., Jenq, R. R., Velardi, E. et al. (2015). Interleukin-22 Promotes Intestinal Stem Cell-Mediated Epithelial Regeneration. Nature 528:560-564. Liu, G., Yuan, X., Zeng, Z., Tunici, P., Ng, H., Abdulkadir, I. R., Lu, L. et al. (2006). Analysis of gene expression and chemoresistance of CD133+ cancer stem cells in glioblastoma. Molecular Cancer 5:67. Liu, W., Li, H., Hong, S. H., Piszczek, G. P., Chen, W. and Rodgers, G. P. (2016). Olfactomedin 4 deletion induces colon adenocarcinoma in Apc(Min/+) mice. Oncogene 35:5237-5247. Livet, J., Weissman, T.A., Kang, H., Draft, R.W., Lu, J., Bennis, R.A., Sanes, J.R. and Lichtman, J.W. (2007). Transgenic strategies for combinatorial expression of fluorescent proteins in the nervous system. Nature 450: 56–62. Lobo, N. A., Shimono, Y., Qian, D. and Clarke, M. F. (2007). The biology of cancer stem cells. Annual Review of Cell and Developmental Biology 23:675-699. Loeffler, M., Birke, A., Winton, D. and Potten, C. (1993). Somatic Mutation, Monoclonality and Stochastic Models of Stem Cell Organization in the Intestinal Crypt. Journal of Theoretical Biology 160:471-491. Logan, C. Y. and Nusse, R. (2004). The Wnt signaling pathway in development and disease. Annual Review of Cell and Developmental Biology 20:781-810. Lopez-Garcia, C., Klein, A. M., Simons, B. D. and Winton, D. J. (2010). Intestinal Stem Cell Replacement Follows a Pattern of Neutral Drift. Science 330:822. Lue, H., Kleemann, R., Calandra, T., Roger, T. and Bernhagen, J. (2002). Macrophage migration inhibitory factor (MIF): mechanisms of action and role in disease. Microbes and Infection 4:449-460.

172
Ma, S., Chan, K. W., Hu, L., Lee, T. K., Wo, J. Y., Ng, I. O., Zheng, B. J. et al. (2007). Identification and characterization of tumorigenic liver cancer stem/progenitor cells. Gastroenterology 132:2542-2556. Mace, T. A., King, S. A., Ameen, Z., Elnaggar, O., Young, G., Riedl, K. M., Schwartz, S. J. et al. (2014). Bioactive compounds or metabolites from black raspberries modulate T lymphocyte proliferation, myeloid cell differentiation and Jak/STAT signaling. Cancer immunology, immunotherapy : CII 63:889-900. Madison, B. B., McKenna, L. B., Dolson, D., Epstein, D. J. and Kaestner, K. H. (2009). FoxF1 and FoxL1 Link Hedgehog Signaling and the Control of Epithelial Proliferation in the Developing Stomach and Intestine. The Journal of Biological Chemistry 284:5936–5944. Mallery, S. R., Tong, M., Shumway, B. S., Curran, A. E., Larsen, P. E., Ness, G. M., Kennedy, K. S. et al. (2014). Topical Application of a Mucoadhesive Freeze-Dried Black Raspberry Gel Induces Clinical and Histologic Regression and Reduces Loss of Heterozygosity Events in Premalignant Oral Intraepithelial Lesions.: Results from a Multi-Centered, Placebo Controlled Clinical Trial. Clinical cancer research : an official journal of the American Association for Cancer Research 20:1910-1924. Mallery, S. R., Zwick, J. C., Pei, P., Tong, M., Larsen, P. E., Shumway, B. S., Lu, B. et al. (2008). Topical Application of a Bioadhesive Black Raspberry Gel Modulates Gene Expression and Reduces Cyclooxygenase 2 Protein in Human Premalignant Oral Lesions. Cancer research 68:4945-4957. Manach, C., Scalbert, A., Morand, C., Remesy, C. and Jimenez, L. (2004). Polyphenols: food sources and bioavailability. The American Journal of Clinical Nutrition 79:727–747. Marsh, V., Winton, D. J., Williams, G. T., Dubois, N., Trumpp, A., Sansom, O. J. and Clarke, A. R. (2008). Epithelial Pten is dispensible for intestinal homeostasis but supresses adenoma development and progression after Apc mutation. Nature Genetics 40:1436-1444. Marshman, E., Booth, C. and Potten, C. S. (2002). The intestinal epithelial stem cell. Bioessays 24:91-98. Martinez, M., Hope, C., Planutis, K., Planutiene, M., Pontello, A., Duarte, B., Albers, C. G. et al. (2010). Dietary grape-derived resveratrol for colon cancer prevention. Journal of Clinical Oncology (Meeting Abstracts) 28:3622. Massagué, J., Blain, S. W. and Lo, R. S. (2000). TGFbeta signaling in growth control, cancer, and heritable disorders. Cell 103:295-309. Mazza, G. (2007). Anthocyanins and heart health. Ann. Ist. Super. Sanità 43:369-374. McCullough, M. L., Robertson, A. S., Rodriguez, C., Jacobs, E. J., Chao, A., Carolyn, J., Calle, E. E. et al. (2003). Calcium, vitamin D, dairy products, and risk of colorectal cancer in the Cancer Prevention Study II Nutrition Cohort (United States). Cancer Causes Control 14:1-12. McGhie, T. K., Hall, H. K., Ainge, G. D. and Mowat, A. D. eds. (2002). Breeding Rubus Cultivars for High Anthocyanin Content and High Antioxidant Capacity. International Society for Horticultural Science (ISHS), Leuven, Belgium. McIntyre, R. E., Buczacki, S. J. A., Arends, M. J. and Adams, D. J. (2015). Mouse models of colorectal cancer as preclinical models. Bioessays 37:909-920.
173
Medema, J. P. and Vermeulen, L. (2011). Microenvironmental regulation of stem cells in intestinal homeostasis and cancer. Nature Reviews Molecular Cell Biology 474:318–326. Mestas, J. and Hughes, C. C. W. (2004). Of Mice and Not Men: Differences between Mouse and Human Immunology. The Journal of Immunology 172:2731. Middleton, J., E., Kandaswami, C. and Theoharides, T. C. (2000). The effects of plant flavonoids on mammalian cells: implications for inflammation, heart disease, and cancer. Pharmacological Reviews 52:673–751. Mihaylova, M. M., Sabatini, D. M. and Yilmaz, Ö. H. (2014). Dietary and Metabolic Control of Stem Cell Function in Physiology and Cancer. Cell stem cell 14:292-305. Millen, A. E., Subar, A. F., Graubard, B. I., Peters, U., Hayes, R. B., Weissfeld, J. L., Yokochi, L. A. et al. (2007). Fruit and vegetable intake and prevalence of colorectal adenoma in a cancer screening trial. American Journal of Clinical Nutrition 86:1754-1764. Moiseeva, E. P., Almeida, G. M., Jones, G. D. D. and Manson, M. M. (2007). Extended treatment with physiologic concentrations of dietary phytochemicals results in altered gene expression, reduced growth, and apoptosis of cancer cells. Molecular Cancer Therapeutics 6:3071. Montgomery, R. K., Carlone, D. L., Richmond, C. A., Farilla, L., Kranendonk, M. E. G., Henderson, D. E., Baffour-Awuah, N. Y. et al. (2011). Mouse telomerase reverse transcriptase (mTert) expression marks slowly cycling intestinal stem cells. Proceedings of the National Academy of Sciences 108:179-184. Moore, K. A. and Lemischka, I. R. (2006). Stem Cells and Their Niches. Science 311:1880. Moran-Ramos, S., Tovar, A. R. and Torres, N. (2012). Diet: Friend or Foe of Enteroendocrine Cells—How It Interacts with Enteroendocrine Cells. Advances in Nutrition 3:8-20. Morin, P. J., Sparks, A. B., Korinek, V., Barker, N., Clevers, H., Vogelstein, B. and Kinzler, K. W. (1997). Activation of beta-catenin-Tcf signaling in colon cancer by mutations in beta-catenin or APC. Science 275:1787-1790. Mori–Akiyama, Y., van den Born, M., van Es, J. H., Hamilton, S. R., Adams, H. P., Zhang, J., Clevers, H. et al. (2007). SOX9 Is Required for the Differentiation of Paneth Cells in the Intestinal Epithelium. Gastroenterology 133:539-546. Moser, A. R., Dove, W. R., Roth, K. A. and Gordonll, J. I. (1992). The Min (multiple intestinal neoplasia) mutation: its effect on gut epithelial cell differentiation and interaction with a modifier system. The Journal of Cell Biology 116:1517-1526. Moser, A. R., Pitot, H. C. and Dove, W. F. (1990). A dominant mutation that predisposes to multiple intestinal neoplasia in the mouse. Science 247:322. Moyer, R. A., Hummer, K. E., Finn, C. E., Frei, B. and Wrolstad, R. E. (2002). Anthocyanins, Phenolics, and Antioxidant Capacity in Diverse Small Fruits: Vaccinium, Rubus, and Ribes. Journal of Agricultural and Food Chemistry 50:519-525.

174
Muller, P. A., Caswell, P. T., Doyle, B., et al. (2009). Mutant p53 drives invasion by promoting integrin recycling. Cell 139:1327–1341. Munoz, N. M., Upton, M., Rojas, A., et al. (2006). Transforming growth factor beta receptor type II inactivation induces the malignant transformation of intestinal neoplasms initiated by Apc mutation. Cancer research 66:9837–9844. Muñoz, J., Stange, D. E., Schepers, A. G., van de Wetering, M., Koo, B.-K., Itzkovitz, S., Volckmann, R. et al. (2012). The Lgr5 intestinal stem cell signature: robust expression of proposed quiescent ‘+4' cell markers. The EMBO Journal 31:3079-3091. Määttä-Riihinen, K. R., Kamal-Eldin, A., Mattila, P. H., González-Paramás, A. M. and Törrönen, A. R. (2004). Distribution and Contents of Phenolic Compounds in Eighteen Scandinavian Berry Species. Journal of Agricultural and Food Chemistry 52:4477-4486. Méniel, V., Song, F., Phesse, T., Young, M., Poetz, O., Parry, L., Jenkins, J. R. et al. (2013). Cited1 Deficiency Suppresses Intestinal Tumorigenesis. PLOS Genetics 9:e1003638. Müller, M. F., Ibrahim, A. E. K., and Arends, M. J.(2016). Molecular pathological classification of colorectal cancer. Virchows Arch 469:125–134. Nautiyal, J., Kanwar, S. S., Yu, Y. and Majumdar, A. P. (2011). Combination of dasatinib and curcumin eliminates chemo-resistant colon cancer cells. J Mol Signal 6:7. Nguyen, T. L. A., Vieira-Silva, S., Liston, A. and Raes, J. (2015). How informative is the mouse for human gut microbiota research? Disease Models & Mechanisms 8:1-16. Nijveldt, R. J., van Nood, E., van Hoorn, D. E., Boelens, P. G., van Norren, K. and van Leeuwen, P. A. (2001). Flavonoids: a review of probable mechanisms of action and potential applications. The American Journal of Clinical Nutrition 74:418–425. Nozaki, K., Mochizuki, W., Matsumoto, Y., Matsumoto, T., Fukuda, M., Mizutani, T., Watanabe, M. et al. (2016). Co-culture with intestinal epithelial organoids allows efficient expansion and motility analysis of intraepithelial lymphocytes. Journal of Gastroenterology 51:206-213. Ogaki, S., Morooka, M., Otera, K. and Kume, S. (2015). A cost-effective system for differentiation of intestinal epithelium from human induced pluripotent stem cells. Scientific Reports 5:17297. Ogawa, K., Sakakibara, H., Iwata, R., Ishii, T., Sato, T., Goda, T., Shimoi, K. et al. (2008). Anthocyanin Composition and Antioxidant Activity of the Crowberry (Empetrum nigrum) and Other Berries. Journal of Agricultural and Food Chemistry 56:4457-4462. Oh, S., Gwak, J., Park, S. and Yang, C. S. (2014). Green tea polyphenol EGCG suppresses Wnt/β-catenin signaling by promoting GSK-3β- and PP2A-independent β-catenin phosphorylation/degradation. BioFactors (Oxford, England) 40:586-595. Ohhara, Y., Fukuda, N., Takeuchi, S., Honma, R., Shimizu, Y., Kinoshita, I. and Dosaka-Akita, H. (2016). Role of targeted therapy in metastatic colorectal cancer. World Journal of Gastrointestinal Oncology 8:642–655.
175
Onuma, K., Ochiai, M., Orihashi, K., Takahashi, M., Imai, T., Nakagama, H. and Hippo, Y. (2013). Genetic reconstitution of tumorigenesis in primary intestinal cells. Proceedings of the National Academy of Sciences 110:11127-11132. Ootani, A., Li, X., Sangiorgi, E., Ho, Q. T., Ueno, H., Toda, S., Sugihara, H. et al. (2009). Sustained in vitro intestinal epithelial culture within a Wnt-dependent stem cell niche. Nat Med 15:701-706. Orford, K. W. and Scadden, D. T. (2008). Deconstructing stem cell self-renewal: genetic insights into cell-cycle regulation. Nat Rev Genet 9:115-128. O’Brien, C. A., Pollett, A., Gallinger, S. and Dick, J. E. (2007). A human colon cancer cell capable of initiating tumour growth in immunodeficient mice. Nature 445:106-110. Pan, P., Skaer, C. W., Stirdivant, S. M., Young, M. R., Stoner, G. D., Lechner, J. F., Huang, Y.-W. et al. (2015). Beneficial regulation of metabolic profiles by black raspberries in human colorectal cancer patients. Cancer prevention research (Philadelphia, Pa.) 8:743-750. Park, C. H., Hahm, E. R., Park, S., Kim, H. K. and Yang, C. H. (2005). The inhibitory mechanism of curcumin and its derivative against beta-catenin/Tcf signaling. FEBS Lett 579: 2965–2971. Parker, A., Maclaren, O. J., Fletcher, A. G., Muraro, D., Kreuzaler, P. A., Byrne, H. M., Maini, P. K., Watson, A. J., Pin, C. (2017). Cell proliferation within small intestinal crypts is the principal driving force for cell migration on villi. FASEB J 31:636-649. Parkin, D. M., Boyd, L. and Walker, L. C. (2011). The fraction of cancer attributable to lifestyle and environmental factors in the UK in 2010. Britsih Journal of Cancer 105:S77-S81. Parry, L., Young, M., El Marjou, F. and Clarke, A. R. (2013). Evidence for a Crucial Role of Paneth Cells in Mediating the Intestinal Response to Injury. Stem Cells 31:776-785. Paul, B., Barnes, S., Demark-Wahnefried, W., Morrow, C., Salvador, C., Skibola, C. and Tollefsbol, T. O. (2015). Influences of diet and the gut microbiome on epigenetic modulation in cancer and other diseases. Clinical Epigenetics 7:112. Peiffer, D. S., Zimmerman, N. P., Wang, L.-S., Ransom, B. W. S., Carmella, S. G., Kuo, C.-T., Siddiqui, J. et al. (2014). Chemoprevention of Esophageal Cancer with Black Raspberries, Their Component Anthocyanins, and a Major Anthocyanin Metabolite, Protocatechuic Acid. Cancer Prevention Research 7:574. Pellegrinet, L., Rodilla, V., Liu, Z., Chen, S., Koch, U., Espinosa, L., Kaestner, K. H. et al. (2011). Dll1- and Dll4-mediated Notch signaling is required for homeostasis of intestinal stem cells. Gastroenterology 140:1230–1240.e1237. Perreault, N. and Beaulieu, J.-F. (1996). Use of the Dissociating Enzyme Thermolysin to Generate Viable Human Normal Intestinal Epithelial Cell Cultures. Experimental cell research 224:354–364. Peters, U., Sinha, R., Chatterjee, N., Subar, A. F., Ziegler, R. G., Kulldorff, M., Bresalier, R. et al. (2003). Dietary fibre and colorectal adenoma in a colorectal cancer early detection programme. Lancet 361:1491-1495.

176
Phesse, T. J., Buchert, M., Stuart, S., Flanagan, D. J., Faux, M., Afshar-Sterle, S., Walker, F. et al. (2014). Partial inhibition of gp130-Jak-Stat3 signaling prevents Wnt–β-catenin–mediated intestinal tumor growth and regeneration. Science Signaling 7:ra92. Pinto, D., Gregorieff, A., Begthel, H. and Clevers, H. (2003). Canonical Wnt signals are essential for homeostasis of the intestinal epithelium. Genes and Development 17:1709-1713. Potten, C. S., Hume, W. J., Reid, P. and Cairns, J. (1978). The segregation of DNA in epithelial stem cells. Cell 15:899-906. Potten, C. S., Kovacs, L. and Hamilton, E. (1974). Continuous labelling studies on mouse skin and intestine. Cell Proliferation 7:271-283. Potten, C. S., Owen, G. and Booth, D. (2002). Intestinal stem cells protect their genome by selective segregation of template DNA strands. Journal of Cell Science 115:2381. Powell, A. E., Wang, Y., Li, Y., Poulin, E. J., Means, A. L., Washington, M. K., Higginbotham, J. N. et al. (2012). The Pan-ErbB Negative Regulator Lrig1 Is an Intestinal Stem Cell Marker that Functions as a Tumor Suppressor. Cell 149:146-158. Powell, S. M., Zilz, N., Beazer-Barclay, Y., Bryan, T. M., Hamilton, S. R., Thibodeau, S. N., Vogelstein, B. et al. (1992). APC mutations occur early during colorectal tumorigenesis. Nature 359:235-237. Prior, R. L., Cao, G., Martin, A., Sofic, E., McEwen, J., O'Brien, C., Lischner, N. et al. (1998). Antioxidant Capacity As Influenced by Total Phenolic and Anthocyanin Content, Maturity, and Variety of Vaccinium Species. Journal of Agricultural and Food Chemistry 46:2686-2693. Promega. (2015). CellTiter-Glo ® Luminescent Cell Viability Assay: Technical Bulletin. USA. Ramadan, Q., Jafarpoorchekab, H., Huang, C., Silacci, P., Carrara, S., Koklu, G., Ghaye, J. et al. (2013). NutriChip: nutrition analysis meets microfluidics. Lab on a Chip 13:196-203. Ramasamy, T. S., Ayob, A. Z., Myint, H. H. L., Thiagarajah, S. and Amini, F. (2015). Targeting colorectal cancer stem cells using curcumin and curcumin analogues: insights into the mechanism of the therapeutic efficacy. Cancer Cell International 15:96. Reed, K. R., Tunster, S. J., Young, M., Carrico, A., John, R. M. and Clarke, A. R. (2012). Entopic overexpression of Ascl2 does not accelerate tumourigenesis in ApcMin mice. Gut 61:1435-1438. Resnick, M. B., Routhier, J., Konkin, T., Sabo, E. and Pricolo, V. E. (2004). Epidermal growth factor receptor, c-MET, beta-catenin, and p53 expression as prognostic indicators in stage II colon cancer : a tissue microarray study. Clinical Cancer Research 10:3069-3075. Robanus-Maandag, E. C., Koelink, P. J., Breukel, C., Salvatori, D. C. F., Jagmohan-Changur, S. C., Bosch, C. A. J., Verspaget, H. W. et al. (2010). A new conditional Apc-mutant mouse model for colorectal cancer. Carcinogenesis 31:946-952. Robertson, T. B. (1926). The Analysis of the Growth of the Normal White Mouse into its Constituent Processes. The Journal of General Physiology 8:463-507.

177
Rodrigo, K. A., Rawal, Y., Renner, R. J., Schwartz, S. J., Tian, Q., Larsen, P. E. and Mallery, S. R. (2006). Suppression of the Tumorigenic Phenotype in Human Oral Squamous Cell Carcinoma Cells by an Ethanol Extract Derived From Freeze-Dried Black Raspberries. Nutrition and cancer 54:58-68. Roper, J., Tammela, T., Cetinbas, N. M., Akkad, A., Roghanian, A., Rickelt, S., Almeqdadi M., et al. (2017). In vivo genome editing and organoid transplantation models of colorectal cancer and metastasis. Nature Biotechnology doi:10.1038/nbt.3836. Ropka, M. E., Keim, J. and Philbrick, J. T. (2010). Patient Decisions About Breast Cancer Chemoprevention: A Systematic Review and Meta-Analysis. Journal of Clinical Oncology 28:3090-3095. Rothenberg, M. E., Nusse, Y., Kalisky, T., Lee, J. J., Dalerba, P., Scheeren, F., Lobo, N. et al. (2012). Identification of a cKit+ Colonic Crypt Base Secretory Cell That Supports Lgr5+ Stem Cells in Mice. Gastroenterology 142:1195-1205.e1196. Rothwell, P. M., Wilson, M., Elwin, C.-E., Norrving, B., Algra, A., Warlow, C. P. and Meade, T.W. (2010). Long-term eff ect of aspirin on colorectal cancer incidence and mortality: 20-year follow-up of five randomised trials. Lancet 376:1741-50. Sakar, Y., Duca, F. A., Langelier, B., Devime, F., Blottiere, H., Delorme, C., Renault, P. et al. (2014). Impact of high-fat feeding on basic helix-loop-helix transcription factors controlling enteroendocrine cell differentiation. Int J Obes 38:1440-1448. Samelis, G. F., Ekmektzoglou, K. A., Tsiakou, A. and Konstadoulakis, M. (2011). The continuation of bevacizumab following disease progression in patients with metastatic colorectal cancer offers a survival benefit. Hepatogastroenterology 58:1968-1971. Sánchez-Rivera, F. J. and Jacks, T. (2015). Applications of the CRISPR-Cas9 system in cancer biology. Nat. Rev. Cancer 15:387–395. Sangiorgi, E. and Capecchi, M. R. (2008). Bmi1 is expressed in vivo in intestinal stem cells. Nature genetics 40:915-920. Sanjoaquin, M. A., Allen, N., Couto, E., Roddam, A. W. and Key, T. J. (2005). Folate intake and colorectal cancer risk: a meta-analytical approach. International Journal of Cancer 113:825-828. Sansom, O. J., Reed, K. R., Hayes, A. J., Ireland, H., Brinkmann, H., Newton, I. P., Batlle, E. et al. (2004). Loss of Apc in vivo immediately perturbs Wnt signaling, differentiation, and migration. Genes and Development 18:1385-1390. Sansom, O. J., Meniel, V., Wilkins, J.A., Cole, A. M., Oien, K. A., Marsh, V., Jamieson, T. J., et al. (2006). Loss of Apc allows phenotypic manifestation of the transforming properties of an endogenous K‐ras oncogene in vivo. Proc Natl Acad Sci USA 103:14122–14127. Sasaki, N., Sachs, N., Wiebrands, K., Ellenbroek, S. I. J., Fumagalli, A., Lyubimova, A., Begthel, H. et al. (2016). Reg4+ deep crypt secretory cells function as epithelial niche for Lgr5+ stem cells in colon. Proceedings of the National Academy of Sciences 113:E5399-E5407.
178
Sato, T., Stange, D. E., Ferrante, M., Vries, R. G. J., van Es, J. H., van den Brink, S., van Houdt, W. J. et al. (2011a). Long-term Expansion of Epithelial Organoids From Human Colon, Adenoma, Adenocarcinoma, and Barrett's Epithelium. Gastroenterology 141:1762–1772. Sato, T., van Es, J. H., Snippert, H. J., Stange, D. E., Vries, R. G., van den Born, M., Barker, N. et al. (2011b). Paneth cells constitute the niche for Lgr5 stem cells in intestinal crypts. Nature 469:415-418. Sato, T., Vries, R. G., Snippert, H. J., van de Wetering, M., Barker, N., Stange, D. E., van Es, J. H. et al. (2009). Single Lgr5 stem cells build crypt–villus structures in vitro without a mesenchymal niche. Nature 459:262-266. Schepers, A. G., Snippert, H. J., Stange , D. E., van den Born , M., van Es , J. H., van de Wetering , M. and Clevers, H. (2012). Lineage Tracing Reveals Lgr5+ Stem Cell Activity in Mouse Intestinal Adenomas. Science 337:730–735.
Schonhoff, S. E., Giel-Moloney, M. and Leiter, A. B. (2004). Minireview: Development and Differentiation of Gut Endocrine Cells. Endocrinology 145:2639-2644. Schwenk, F., Baron, U. and Rajewsky, K. (1995). A cre-transgenic mouse strain for the ubiquitous deletion of loxP-flanked gene segments including deletion in germ cells. Nucleic Acids Research 23:5080-5081. Schwitalla, S., Fingerle, Alexander A., Cammareri, P., Nebelsiek, T., Göktuna, Serkan I., Ziegler, Paul K., Canli, O. et al. (2013). Intestinal Tumorigenesis Initiated by Dedifferentiation and Acquisition of Stem-Cell-like Properties. Cell 152:25-38. Scoville, D. H., Sato, T., He, X. C., and Li, L. (2008). Current View: Intestinal Stem Cells and Signaling. Gastroenterology 134:849–864. Seeram, N. P. (2008). Berry Fruits for Cancer Prevention: Current Status and Future Prospects. Journal of Agricultural and Food Chemistry 56:630-635. Shay, T., Jojic, V., Zuk, O., Rothamel, K., Puyraimond-Zemmour, D., Feng, T., Wakamatsu, E. et al. (2013). Conservation and divergence in the transcriptional programs of the human and mouse immune systems. Proceedings of the National Academy of Sciences of the United States of America 110:2946-2951. Shen, Z. (2011). Genomic instability and cancer: an introduction. Journal of Molecular Cell Biology 3:1-3. Shibata, H., Toyama, K., Shioya, H., Ito, M., Hirota, M., Hasegawa, S., Matsumoto, H. et al. (1997). Rapid Colorectal Adenoma Formation Initiated by Conditional Targeting of the Apc Gene. Science 278:120. Shimizu, M., Deguchi, A., Lim, J. T. E., Moriwaki, H., Kopelovich, L. and Weinstein, I. B. (2005). (−)-Epigallocatechin Gallate and Polyphenon E Inhibit Growth and Activation of the Epidermal Growth Factor Receptor and Human Epidermal Growth Factor Receptor-2 Signaling Pathways in Human Colon Cancer Cells. Clinical Cancer Research 11:2735-2746. Shimizu, M., Shirakami, Y., Sakai, H., Yasuda, Y., Kubota, M., Adachi, S., Tsurumi, H. et al. (2010). (−)-Epigallocatechin gallate inhibits growth and activation of the VEGF/VEGFR axis in human colorectal cancer cells. Chemico-Biological Interactions 185:247-252.

179
Singh-Ranger, G. (2016). The role of aspirin in colorectal cancer chemoprevention. Critical Reviews in Oncology/Hematology 104:87–90. Shumway, B. S., Kresty, L. A., Larsen, P. E., Zwick, J. C., Lu, B., Fields, H. W., Mumper, R. J. et al. (2008). Effects of a Topically Applied Bioadhesive Berry Gel on Loss of Heterozygosity Indices in Premalignant Oral Lesions. Clinical cancer research : an official journal of the American Association for Cancer Research 14:2421-2430. Singh, S. K., Hawkins, C., Clarke, I. D., Squire, J. A., Bayani, J., Hide, T., Henkelman, R. M. et al. (2004). Identification of human brain tumour initiating cells. Nature 432:396-401. Sinner, D., Kordich, J. J., Spence, J. R., Opoka, R., Rankin, S., Lin, S.-C. J., Jonatan, D. et al. (2007). Sox17 and Sox4 Differentially Regulate β-Catenin/T-Cell Factor Activity and Proliferation of Colon Carcinoma Cells. Molecular and Cellular Biology 27:7802-7815. Siriwoharn, T., Wrolstad, R. E., Finn, C. E. and Pereira, C. B. (2004). Influence of Cultivar, Maturity, and Sampling on Blackberry (Rubus L. Hybrids) Anthocyanins, Polyphenolics, and Antioxidant Properties. Journal of Agricultural and Food Chemistry 52:8021-8030. Smith, G. H. (2005). Label-retaining epithelial cells in mouse mammary gland divide asymmetrically and retain their template DNA strands. Development 132:681. Snippert, H. J., van der Flier, L. G., Sato, T., van Es, J. H., van den Born, M., Kroon-Veenboer, C., Barker, N. et al. (2010). Intestinal Crypt Homeostasis Results from Neutral Competition between Symmetrically Dividing Lgr5 Stem Cells. Cell 143:134-144. Soobrattee, M. A., Bahorun, T. and Aruoma, O. I. (2006). Chemopreventive actions of polyphenolic compounds in cancer. Biofactors 27:19-35. Sporn, M. B. (1976). Approaches to Prevention of Epithelial Cancer during the Preneoplastic Period. Cancer Research 36:2699-2702. Stevens, R. G., Swede, H., Heinen, C. D., Jablonski, M., Grupka, M., Ross, B., Parente, M. et al. (2007). Aberrant crypt foci in patients with a positive family history of sporadic colorectal cancer. Cancer Letters 248:262-268. Steward, W. P. and Brown, K. (2013). Cancer chemoprevention: a rapidly evolving field. British Journal of Cancer 109:1-7. Stine, R. R. and Matunis, E. L. (2013). Stem Cell Competition: Finding Balance in the Niche. Trends in cell biology 23:357-364. Stoian, M., Stoica, V. and Radulian, G. (2016). Stem cells and colorectal carcinogenesis. Journal of Medicine and Life 6:6-11. Stoner, G. D. (2009). Foodstuffs for Preventing Cancer: The Preclinical and Clinical Development of Berries. Cancer Prevention Research 2:187. Stoner, G. D., Chen, T., Kresty, L. A., Aziz, R. M., Reinemann, T. and Nines, R. (2006). Protection Against Esophageal Cancer in Rodents With Lyophilized Berries: Potential Mechanisms. Nutrition and cancer 54:33-46.
180
Stoner, G. D., Sardo, C., Apseloff, G., Mullet, D., Wargo, W., Pound, V., Singh, A. et al. (2005). Pharmacokinetics of Anthocyanins and Ellagic Acid in Healthy Volunteers Fed Freeze-Dried Black Raspberries Daily for 7 Days. The Journal of Clinical Pharmacology 45:1153-1164. Stoner, G. D., Wang, L.-S., Zikri, N., Chen, T., S. Hecht, S., Huang, C., Sardo, C. et al. (2007). Cancer Prevention with Freeze-dried Berries and Berry Components. Seminars in cancer biology 17:403-410. Su, L. K., Kinzler, K. W., Vogelstein, B., Preisinger, A. C., Moser, A. R., Luongo, C., Gould, K. A. et al. (1992). Multiple intestinal neoplasia caused by a mutation in the murine homolog of the APC gene. Science 256:668. Suetsugu, A., Nagaki, M., Aoki, H., Motohashi, T., Kunisada, T. and Moriwaki, H. (2006). Characterization of CD133+ hepatocellular carcinoma cells as cancer stem/progenitor cells. Biochemical and Biophysical Research Communications 351:820-824. Sun, B., Nishihira, J., Yoshiki, T., Kondo, M., Sato, Y., Sasaki, F. and Todo, S. (2005). Macrophage Migration Inhibitory Factor Promotes Tumor Invasion and Metastasis via the Rho-Dependent Pathway. Clinical Cancer Research 11:1050. Suzuki, R., Kohno, H., Sugie, S. and Tanaka, T. (2004). Sequential observations on the occurrence of preneoplastic and neoplastic lesions in mouse colon treated with azoxymethane and dextran sodium sulfate. Cancer Science 95:721-727. Swanson Health Products. (2017). Nutri-Fruit Black Raspberry Powder [Online]. Available at: http://www.swansonvitamins.com/nutri-fruit-freeze-dried-black-raspberry-powder-5-oz-pwdr. [Accessed: 08/02/2017]. Tajima, H., Ohta, T., Kitagawa, H., Okamoto, K., Sakai, S., Kinoshita, J., Makino, I. et al. (2012). Neoadjuvant chemotherapy with gemcitabine for pancreatic cancer increases in situ expression of the apoptosis marker M30 and stem cell marker CD44. Oncology Letters 3:1186-1190. Takeda, N., Jain, R., LeBoeuf, M. R., Wang, Q., Lu, M. M. and Epstein, J. A. (2011). Interconversion Between Intestinal Stem Cell Populations in Distinct Niches. Science 334:1420. Tan, B. T., Park, C. Y., Ailles, L. E. and Weissm, I. R. (2006). The cancer stem cell hypothesis: a work in progress. Laboratory Investigation 86:1203–1207. Tetteh, Paul W., Basak, O., Farin, Henner F., Wiebrands, K., Kretzschmar, K., Begthel, H., van den Born, M. et al. (2016a). Replacement of Lost Lgr5-Positive Stem Cells through Plasticity of Their Enterocyte-Lineage Daughters. Cell Stem Cell 18:203-213. Tetteh, P. W., Kretzschmar, K., Begthel, H., van den Born, M., Korving, J., Morsink, F., Farin, H. et al. (2016b). Generation of an inducible colon-specific Cre enzyme mouse line for colon cancer research. Proceedings of the National Academy of Sciences 113:11859-11864. Tian, H., Biehs, B., Warming, S., Leong, K. G., Rangell, L., Klein, O. D. and de Sauvage, F. J. (2011). A reserve stem cell population in small intestine renders Lgr5-positive cells dispensable. Nature 478:255-259.
181
Tian, Q., Giusti, M. M., Stoner, G. D. and Schwartz, S. J. (2006). Characterization of a new anthocyanin in black raspberries (Rubus occidentalis) by liquid chromatography electrospray ionization tandem mass spectrometry. Food Chemistry 94:465-468. Toden, S., Tran, H.-M., Tovar-Camargo, O. A., Okugawa, Y. and Goel, A. (2016). Epigallocatechin-3-gallate targets cancer stem-like cells and enhances 5-fluorouracil chemosensitivity in colorectal cancer. Oncotarget 7:16158-16171. Tomasetti, C. and Vogelstein, B. (2015). Variation in cancer risk among tissues can be explained by the number of stem cell divisions. Science (New York, N.Y.) 347:78-81. Tunster, S. J., McNamara, G. I., Creeth, H. D. J. and John, R. M. (2016). Increased dosage of the imprinted Ascl2 gene restrains two key endocrine lineages of the mouse Placenta. Developmental Biology 418:55-65. Ulrich, C. M., Bigler, J., and Potter, J. D. (2006). Non-steroidal anti-inflammatory drugs for cancer prevention: promise, perils and pharmacogenetics. Nat Rev Cancer 6:130. Umar, S. (2010). Intestinal Stem Cells. Current gastroenterology reports 12:340-348. U.S. Preventive Services Task Force. (2007). Routine Aspirin or Nonsteroidal Anti-inflammatory Drugs for the Primary Prevention of Colorectal Cancer: U.S. Preventive Services Task Force Recommendation Statement. Ann Intern Med 146:361-364. Valko, M., Leibfritz, D., Moncol, J., Cronin, M. T., Mazur, M. and Telser, J. (2007). Free radicals and antioxidants in normal physiological functions and human disease. The International Journal of Biochemistry & Cell Biology 39:44-84. van der Flier, L. G., Haegebarth, A., Stange, D. E., van de Wetering, M. and Clevers, H. (2009a). OLFM4 Is a Robust Marker for Stem Cells in Human Intestine and Marks a Subset of Colorectal Cancer Cells. Gastroenterology 137:15-17. van der Flier, L. G., van Gijn, M. E., Hatzis, P., Kujala, P., Haegebarth, A., Stange, D. E., Begthel, H. et al. (2009b). Transcription Factor Achaete Scute-Like 2 Controls Intestinal Stem Cell Fate. Cell 136:903-912. van Dop, W. A., Heijmans, J., Büller, N. V., Snoek, S. A., Rosekrans, S. L., Wassenberg, E. A., van den Bergh Weerman, M. A. et al. (2010). Loss of Indian Hedgehog activates multiple aspects of a wound healing response in the mouse intestine. Gastroenterology 139:1665-1676. van Es, J. H., de Geest, N., van de Born, M., Clevers, H. and Hassan, B. A. (2010). Intestinal stem cells lacking the Math1 tumour suppressor are refractory to Notch inhibitors. Nature Communications 1:1-5. van Es, J. H., Sato, T., van de Wetering, M., Lyubimova, A., Yee Nee, A. N., Gregorieff, A., Sasaki, N. et al. (2012). Dll1+ secretory progenitor cells revert to stem cells upon crypt damage. Nat Cell Biol 14:1099-1104. van Es, J. H., van Gijn, M. E., Riccio, O., van den Born, M., Vooijs, M., Begthel, H., Cozijnsen, M. et al. (2005). Notch/[gamma]-secretase inhibition turns proliferative cells in intestinal crypts and adenomas into goblet cells. Nature 435:959-963.
182
van Staveren, W. C. G., Solís, D. Y. W., Hébrant, A., Detours, V., Dumont, J. E. and Maenhaut, C. (2009). Human cancer cell lines: Experimental models for cancer cells in situ? For cancer stem cells? Biochimica et Biophysica Acta (BBA) - Reviews on Cancer 1795:92-103. VanDussen, K. L., Carulli, A. J., Keeley, T. M., Patel, S. R., Puthoff, B. J., Magness, S. T., Tran, I. T. et al. (2012). Notch signaling modulates proliferation and differentiation of intestinal crypt base columnar stem cells. Development 139:488. VanDussen, K. L., Marinshaw, J. M., Shaikh, N., Miyoshi, H., Moon, C., Tarr, P. I., Ciorba, M. A. et al. (2015). Development of an enhanced human gastrointestinal epithelial culture system to facilitate patient-based assays. Gut 64:911-920. VanDussen, K. L. and Samuelson, L. C. (2010). Mouse Atonal Homolog 1 Directs Intestinal Progenitors to Secretory Cell Rather than Absorptive Cell Fate. Developmental Biology 346:215–223. Vargo-Gogola, T. and Rosen, J. M. (2007). Modelling breast cancer: one size does not fit all. Nat Rev Cancer 7:659-672. Velcich, A., Yang, W., Heyer, J., Fragale, A., Nicholas, C., Viani, S., Kucherlapati, R. et al. (2002). Colorectal Cancer in Mice Genetically Deficient in the Mucin Muc2. Science 295:1726. Vermeulen, L., Morrissey, E., van der Heijden, M., Nicholson, A. M., Sottoriva, A., Buczacki, S., Kemp, R. et al. (2013). Defining Stem Cell Dynamics in Models of Intestinal Tumor Initiation. Science 342:995. Vermeulen , L., Todaro , M., de Sousa Mello , F., Sprick , M. R., Kemper , K., Perez Alea , M., Richel , D. J. et al. (2008). Single-cell cloning of colon cancer stem cells reveals a multi-lineage differentiation capacity. Proceedings of the National Academy of Sciences of the United States of America 105:13427–13432. Vidal, S. J., Rodriguez-Bravo, V., Galsky, M., Cordon-Cardo, C. and Domingo-Domenech, J. (2014). Targeting cancer stem cells to suppress acquired chemotherapy resistance. Oncogene 33:4451-4463. Volk-Draper, L., Hall, K., Griggs, C., Rajput, S., Kohio, P., DeNardo, D. and Ran, S. (2014). Paclitaxel therapy promotes breast cancer metastasis in a TLR4-dependent manner. Cancer Research 74:5421-5434. Wada, L. and Ou, B. (2002). Antioxidant Activity and Phenolic Content of Oregon Caneberries. Journal of Agricultural and Food Chemistry 50:3495-3500. Wang, F., Flanagan, J., Su, N., Wang, L.-C., Bui, S., Nielson, A., Wu, X. et al. (2012). RNAscope: A Novel in Situ RNA Analysis Platform for Formalin-Fixed, Paraffin-Embedded Tissues. The Journal of Molecular Diagnostics : JMD 14:22-29. Wang, F., Scoville, D., He, X. C., Mahe, M. M., Box, A., Perry, J. M., Smith, N. R. et al. (2013a). Isolation and Characterization of Intestinal Stem Cells Based on Surface Marker Combinations and Colony-Formation Assay. Gastroenterology 145:383-395.e381-321. Wang, L.-S., Arnold, M., Huang, Y.-W., Sardo, C., Seguin, C., Martin, E., Huang, T. H. M. et al. (2011). Modulation of Genetic and Epigenetic Biomarkers of Colorectal Cancer in Humans by Black Raspberries: A Phase I Pilot Study. Clinical Cancer Research 17:598.
183
Wang, L.-S., Burke, C. A., Hasson, H., Kuo, C.-T., Molmenti, C. L. S., Seguin, C., Liu, P. et al. (2014). A Phase Ib Study of the Effects of Black Raspberries on Rectal Polyps in Patients with Familial Adenomatous Polyposis. Cancer Prevention Research 7:666. Wang, L.-S., Hecht, S. S., Carmella, S. G., Yu, N., Larue, B., Henry, C., McIntyre, C. et al. (2009). Anthocyanins in Black Raspberries Prevent Esophageal Tumors in Rats. Cancer prevention research (Philadelphia, Pa.) 2:84-93. Wang, L.-S., Kuo, C.-T., Cho, S.-J., Seguin, C., Siddiqui, J., Stoner, K., Weng, Y.-I. et al. (2013b). Black Raspberry-Derived Anthocyanins Demethylate Tumor Suppressor Genes Through the Inhibition of DNMT1 and DNMT3B in Colon Cancer Cells. Nutrition and Cancer 65:118-125. Wang, L.-S., Kuo, C.-T., Huang, T. H. M., Yearsley, M., Oshima, K., Stoner, G. D., Yu, J. et al. (2013c). Black Raspberries Protectively Regulate Methylation of Wnt Pathway Genes in Precancerous Colon Tissue. Cancer prevention research (Philadelphia, Pa.) 6:1317-1327. Wang, L.-S., Kuo, C.-T., Stoner, K., Yearsley, M., Oshima, K., Yu, J., Huang, T. H. M. et al. (2013d). Dietary black raspberries modulate DNA methylation in dextran sodium sulfate (DSS)-induced ulcerative colitis. Carcinogenesis 34:2842-2850. Wang, L.-S. and Stoner, G. D. (2008). Anthocyanins and their role in cancer prevention. Cancer Letters 269:281-290. Wang, S. Y. (2006). Effect of Pre-harvest Conditions on Antioxidant Capacity in Fruits. Acta Horticulturae 712:299-305. Wang, Z.-J., Ohnaka, K., Morita, M., Toyomura, K., Kono, S., Ueki, T., Tanaka, M. et al. (2013e). Dietary polyphenols and colorectal cancer risk: The Fukuoka colorectal cancer study. World Journal of Gastroenterology 19:2683–2690. Watanabe, K., Ueno, M., Kamiya, D., Nishiyama, A., Matsumura, M., Wataya, T., Takahashi, J. B. et al. (2007). A ROCK inhibitor permits survival of dissociated human embryonic stem cells. Nat Biotech 25:681-686. Webster, M. T., Rozycka, M., Sara, E., Davis, E., Smalley, M., Young, N., Dale, T. C. et al. (2000). Sequence variants of the axin gene in breast, colon, and other cancers: an analysis of mutations that interfere with GSK3 binding. Genes Chromosomes Cancer 28:443–453. Whitehead, R. H., Demmler, K., Rockman, S. P. and Watson, N. K. (1999). Clonogenic Growth of Epithelial Cells From Normal Colonic Mucosa From Both Mice and Humans. Gastroenterology 117:858–865. Wiedenmann, B., Franke, W. W., Kuhn, C., Moll, R. and Gould, V. E. (1986). Synaptophysin: A marker protein for neuroendocrine cells and neoplasms. Proceedings of the National Academy of Sciences 83:3500-3504. Willett, W. C., Stampfer, M. J., Colditz, G. A., Rosner, B. A. and Speizer, F. E. (1990). Relation of meat, fat, and fiber intake to the risk of colon cancer in a prospective study among women. The New England Journal of Medicine 323:1664-1672.
184
Williams, J. M., Duckworth, C. A., Watson, A. J. M., Frey, M. R., Miguel, J. C., Burkitt, M. D., Sutton, R. et al. (2013). A mouse model of pathological small intestinal epithelial cell apoptosis and shedding induced by systemic administration of lipopolysaccharide. Disease Models & Mechanisms 6:1388-1399. Williams, P. L., Warwick, R., Dyson, M. and Bannister, L. H. (1989). Gray’s anatomy. 37th ed. Churchill Livingstone. Wright, N. A. and Alison, M. (1984). The Biology of the Epithelial Cell Populations. Clarendon, Oxford. Wu, S., Powers, S., Zhu, W. and Hannun, Y. A. (2016). Substantial contribution of extrinsic risk factors to cancer development. Nature 529:43-47. Wu, X., Gu, L., Prior, R. L. and McKay, S. (2004). Characterization of Anthocyanins and Proanthocyanidins in Some Cultivars of Ribes, Aronia, and Sambucus and Their Antioxidant Capacity. Journal of Agricultural and Food Chemistry 52:7846-7856. Yamada, Y. and Mori, H. (2007). Multistep carcinogenesis of the colon in ApcMin/+ mouse. Cancer Science 98:6-10. Yan, K. S., Chia, L. A., Li, X., Ootani, A., Su, J., Lee, J. Y., Su, N. et al. (2012). The intestinal stem cell markers Bmi1 and Lgr5 identify two functionally distinct populations. Proceedings of the National Academy of Sciences of the United States of America 109:466-471. Yan, K.S. and Kuo, C.J. (2015). Ascl2 Reinforces Intestinal Stem Cell Identity. Cell Stem Cell 16:105-106. Yang, Q., Bermingham, N. A., Finegold, M. J. and Zoghbi, H. Y. (2001). Requirement of Math1 for secretory cell lineage commitment in the mouse intestine. Science 294:2155-2158. Ying, H.,Kimmelman, A. C.,Lyssiotis, C. A.,Hua, S.,Chu, G. C.,Fletcher-Sananikone, E.,Locasale, J. W. et al. (2012).Oncogenic Kras maintains pancreatic tumors through regulation of anabolic glucose metabolism. Cell 149:656-70. Young, M. A. (2013). The effects of aberrant Wnt signalling on the murine intestinal stem cell compartment. Thesis Ph.D., Cardiff University. Yu, Y., Kanwar, S. S., Patel, B. B., Nautiyal, J., Sarkar, F. H. and Majumdar, A. P. (2009). Elimination of colon cancer stem-like cells by the combination of curcumin and FOLFOX. Translat Oncol 2. Zallen, J. A. (2007). Planar polarity and tissue morphogenesis. Cell 129:1051-1063. Zhang, Z., Knobloch, T. J., Seamon, L. G., Stoner, G. D., Cohn, D. E., Paskett, E. D., Fowler, J. M. et al. (2011). A black raspberry extract inhibits proliferation and regulates apoptosis in cervical cancer cells. Gynecologic oncology 123:401-406. Zhu, L., Gibson, P., Currle, D. S., Tong, Y., Richardson, R. J., Bayazitov, I. T., Poppleton, H. et al. (2009). Prominin 1 marks intestinal stem cells that are susceptible to neoplastic transformation. Nature 457:603-607.

185
Zikri, N. N., Riedl, K. M., Wang, L.-S., Lechner, J. F., Schwartz, S. J. and Stoner, G. D. (2009). Black Raspberry Components Inhibit Proliferation, Induce Apoptosis and Modulate Gene Expression in Rat Esophageal Epithelial Cells. Nutrition and cancer 61:816-826.

186
8 Supplementary Material
Figure S 8.1 H&E stained intestinal sections showing mitotic and apoptotic bodies in AhCre Apc+/+ and Apcfl/fl mice fed control and 10% BRB diet
(A) Scoring of mitotic figures (white arrows) and apoptotic bodies (black arrows) were analsyed from H&E stained intestinal sections. BRB feeding in wildtype mice had no significant effect on the number of mitoses but significantly increased apoptosis when compared to wildtype control fed mice. (iii) Acute loss of Apc resulted in more mitotic bodies per crypt when compared to wildtype control fed mice (i). Apcfl/fl mice exposed to BRB diet had more mitotic figures than Apcfl/fl mice control fed mice but this was not significant. However, BRB feeding significantly increased apoptosis in Apcfl/fl mice. *P value ≤ 0.05, n ≥ 3, one-tailed Mann Whitney U test.
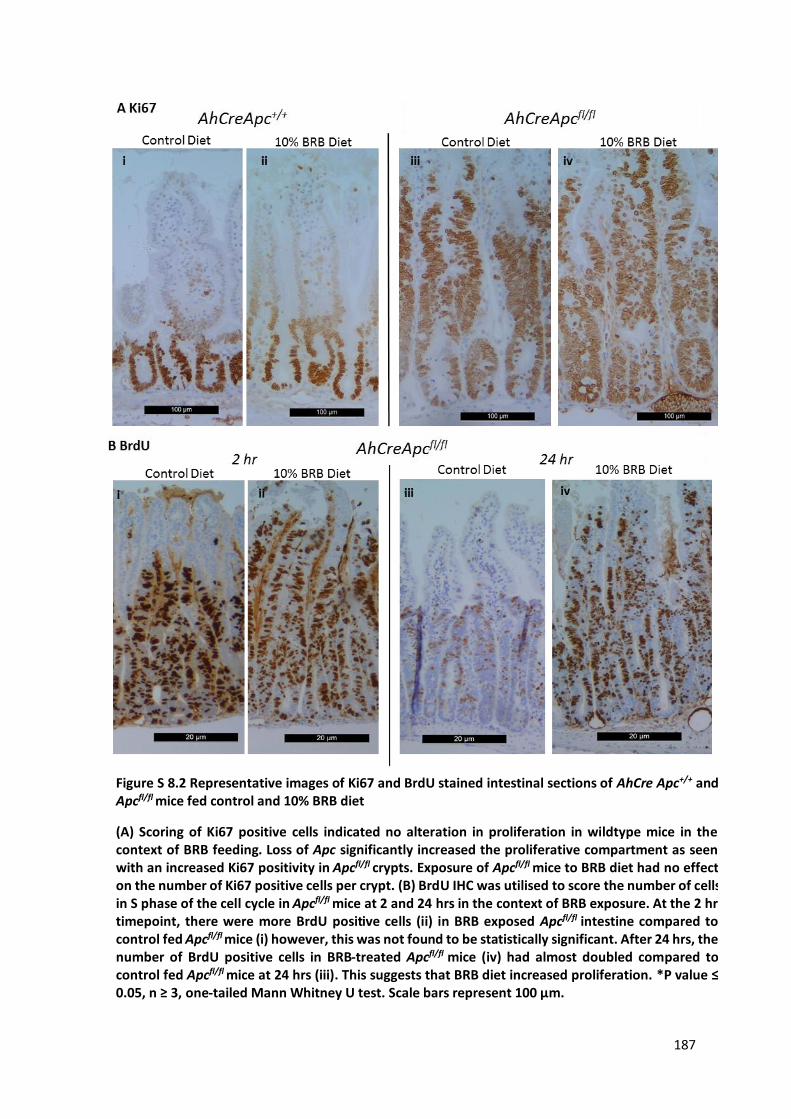
187
Figure S 8.2 Representative images of Ki67 and BrdU stained intestinal sections of AhCre Apc+/+ and Apcfl/fl mice fed control and 10% BRB diet
(A) Scoring of Ki67 positive cells indicated no alteration in proliferation in wildtype mice in the context of BRB feeding. Loss of Apc significantly increased the proliferative compartment as seen with an increased Ki67 positivity in Apcfl/fl crypts. Exposure of Apcfl/fl mice to BRB diet had no effect on the number of Ki67 positive cells per crypt. (B) BrdU IHC was utilised to score the number of cells in S phase of the cell cycle in Apcfl/fl mice at 2 and 24 hrs in the context of BRB exposure. At the 2 hr timepoint, there were more BrdU positive cells (ii) in BRB exposed Apcfl/fl intestine compared to control fed Apcfl/fl mice (i) however, this was not found to be statistically significant. After 24 hrs, the number of BrdU positive cells in BRB-treated Apcfl/fl mice (iv) had almost doubled compared to control fed Apcfl/fl mice at 24 hrs (iii). This suggests that BRB diet increased proliferation. *P value ≤ 0.05, n ≥ 3, one-tailed Mann Whitney U test. Scale bars represent 100 µm.
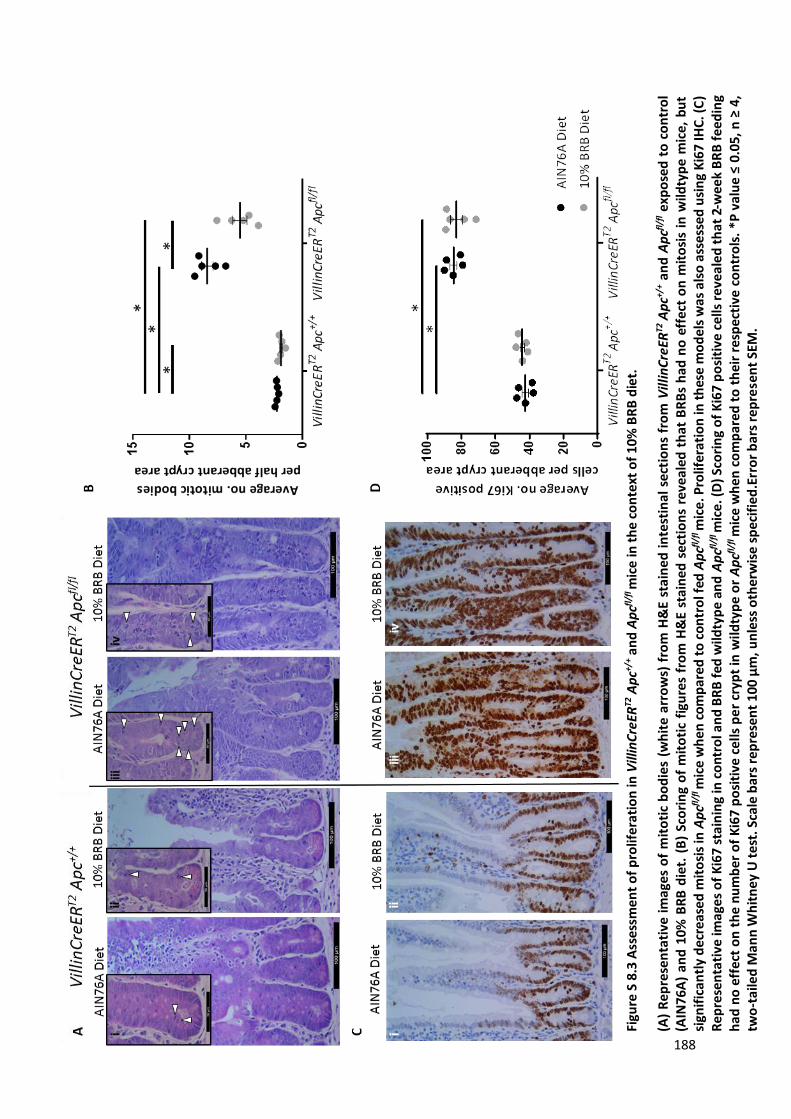
188
Figu
re S
8.3
Ass
essm
ent
of
pro
lifer
atio
n in
Vill
inC
reER
T2 A
pc+/
+ an
d A
pcfl
/fl m
ice
in t
he
co
nte
xt o
f 1
0%
BR
B d
iet.
(A)
Re
pre
sen
tati
ve i
mag
es o
f m
ito
tic
bo
die
s (w
hit
e a
rro
ws)
fro
m H
&E
sta
ine
d i
nte
stin
al s
ect
ion
s fr
om
Vill
inC
reER
T2 A
pc+/
+ an
d A
pcfl
/fl e
xpo
sed
to
co
ntr
ol
(AIN
76A
) an
d 1
0% B
RB
die
t. (
B)
Sco
rin
g o
f m
ito
tic
figu
res
fro
m H
&E
sta
ine
d s
ect
ion
s re
veal
ed
th
at B
RB
s h
ad n
o e
ffec
t o
n m
ito
sis
in w
ildty
pe
mic
e, b
ut
sign
ific
antl
y d
ecre
ased
mit
osi
s in
Ap
cfl/f
l mic
e w
hen
co
mp
ared
to
co
ntr
ol f
ed A
pcfl
/fl m
ice.
Pro
lifer
atio
n in
th
ese
mo
del
s w
as a
lso
ass
esse
d u
sin
g K
i67
IHC
. (C
) R
ep
rese
nta
tive
imag
es o
f K
i67
stai
nin
g in
co
ntr
ol a
nd
BR
B f
ed w
ildty
pe
an
d A
pcfl
/fl m
ice
. (D
) Sc
ori
ng
of
Ki6
7 p
osi
tive
cel
ls r
eve
ale
d t
ha
t 2-
wee
k B
RB
fee
din
g h
ad n
o e
ffec
t o
n t
he
nu
mb
er o
f K
i67
po
siti
ve c
ells
pe
r cr
ypt
in w
ildty
pe
or
Ap
cfl/f
l m
ice
wh
en
co
mp
ared
to
th
eir
resp
ecti
ve c
on
tro
ls.
*P v
alu
e ≤
0.0
5, n
≥ 4
, tw
o-t
aile
d M
ann
Wh
itn
ey U
te
st. S
cale
bar
s re
pre
sen
t 10
0 µ
m, u
nle
ss o
the
rwis
e s
pe
cifi
ed
.Err
or
bar
s re
pre
sen
t SE
M.
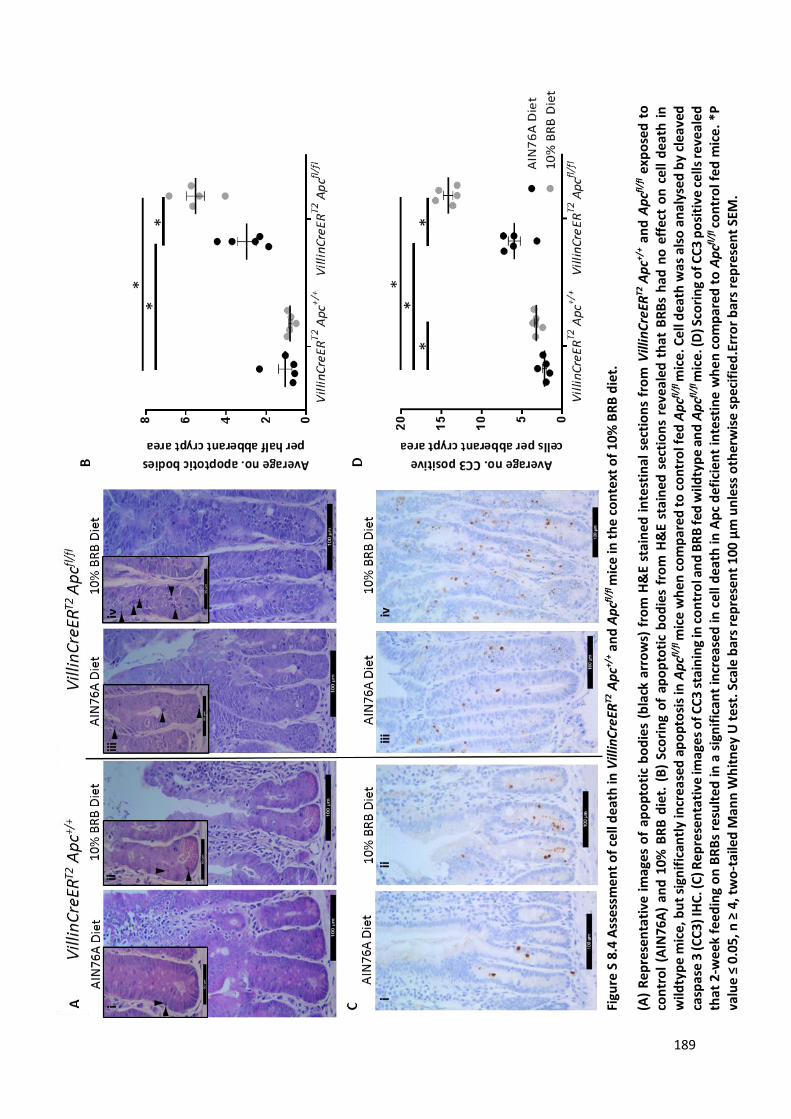
189
Figu
re S
8.4
Ass
essm
ent
of
cell
dea
th in
Vill
inC
reER
T2 A
pc+/
+ an
d A
pcfl
/fl m
ice
in t
he
co
nte
xt o
f 1
0%
BR
B d
iet.
(A)
Re
pre
sen
tati
ve i
mag
es o
f ap
op
toti
c b
od
ies
(bla
ck a
rro
ws)
fro
m H
&E
sta
ine
d i
nte
stin
al s
ect
ion
s fr
om
Vill
inC
reER
T2 A
pc+/
+ an
d A
pcfl
/fl e
xpo
sed
to
co
ntr
ol
(AIN
76A
) an
d 1
0% B
RB
die
t. (
B)
Sco
rin
g o
f ap
op
toti
c b
od
ies
fro
m H
&E
sta
ine
d s
ect
ion
s re
veal
ed t
hat
BR
Bs
had
no
eff
ect
on
cel
l d
eath
in
w
ildty
pe
mic
e, b
ut
sign
ific
antl
y in
crea
sed
ap
op
tosi
s in
Ap
cfl/f
l mic
e w
he
n c
om
par
ed
to
co
ntr
ol f
ed A
pcfl
/fl m
ice.
Cel
l dea
th w
as a
lso
an
alys
ed b
y cl
eave
d
casp
ase
3 (C
C3)
IHC
. (C
) Re
pre
sen
tati
ve im
ages
of C
C3
sta
inin
g in
co
ntr
ol a
nd
BR
B fe
d w
ildty
pe
an
d A
pcfl
/fl m
ice.
(D) S
cori
ng
of C
C3
po
siti
ve c
ells
rev
eale
d
that
2-w
eek
feed
ing
on
BR
Bs
resu
lted
in a
sig
nif
ican
t in
crea
sed
in c
ell d
eath
in A
pc
def
icie
nt
inte
stin
e w
he
n c
om
par
ed t
o A
pcfl
/fl co
ntr
ol f
ed m
ice
. *P
va
lue
≤ 0.
05, n
≥ 4
, tw
o-t
aile
d M
ann
Wh
itn
ey U
te
st. S
cale
bar
s re
pre
sen
t 1
00
µm
un
less
oth
erw
ise
spec
ifie
d.E
rro
r b
ars
rep
rese
nt
SEM
.
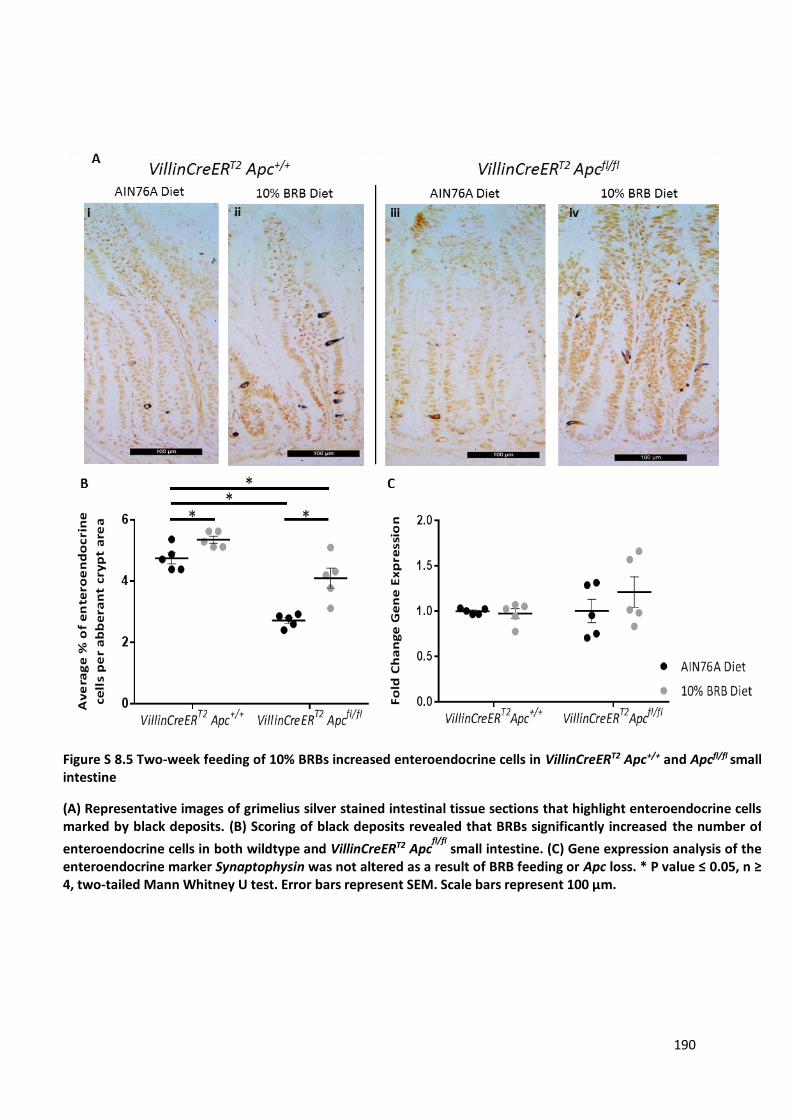
190
Figure S 8.5 Two-week feeding of 10% BRBs increased enteroendocrine cells in VillinCreERT2 Apc+/+ and Apcfl/fl small intestine
(A) Representative images of grimelius silver stained intestinal tissue sections that highlight enteroendocrine cells marked by black deposits. (B) Scoring of black deposits revealed that BRBs significantly increased the number of
enteroendocrine cells in both wildtype and VillinCreERT2 Apcfl/fl
small intestine. (C) Gene expression analysis of the enteroendocrine marker Synaptophysin was not altered as a result of BRB feeding or Apc loss. * P value ≤ 0.05, n ≥ 4, two-tailed Mann Whitney U test. Error bars represent SEM. Scale bars represent 100 μm.

191
Figure S 8.6 Two-week feeding of 10% BRBs increased the number of goblet cells in VillinCreERT2 Apcfl/fl small intestine
(A) Representative images of alcian blue stained intestinal tissue sections that show goblet cells in blue. (B) BRBs had no effect on the number of goblet cells in wildtype intestine but significantly increased the average percent of goblet cells in the aberrant crypt region following acute loss of Apc in the intestine driven by the VillinCreERT2
transgene. (C) Gene expression analysis of the goblet cell marker Muc2 was not altered in wildtype or Apcfl/fl
small intestine in the context of BRBs. * P value ≤ 0.05, n ≥ 4, two-tailed Mann Whitney U test. Error bars represent SEM. Scale bars represent 100 μm.
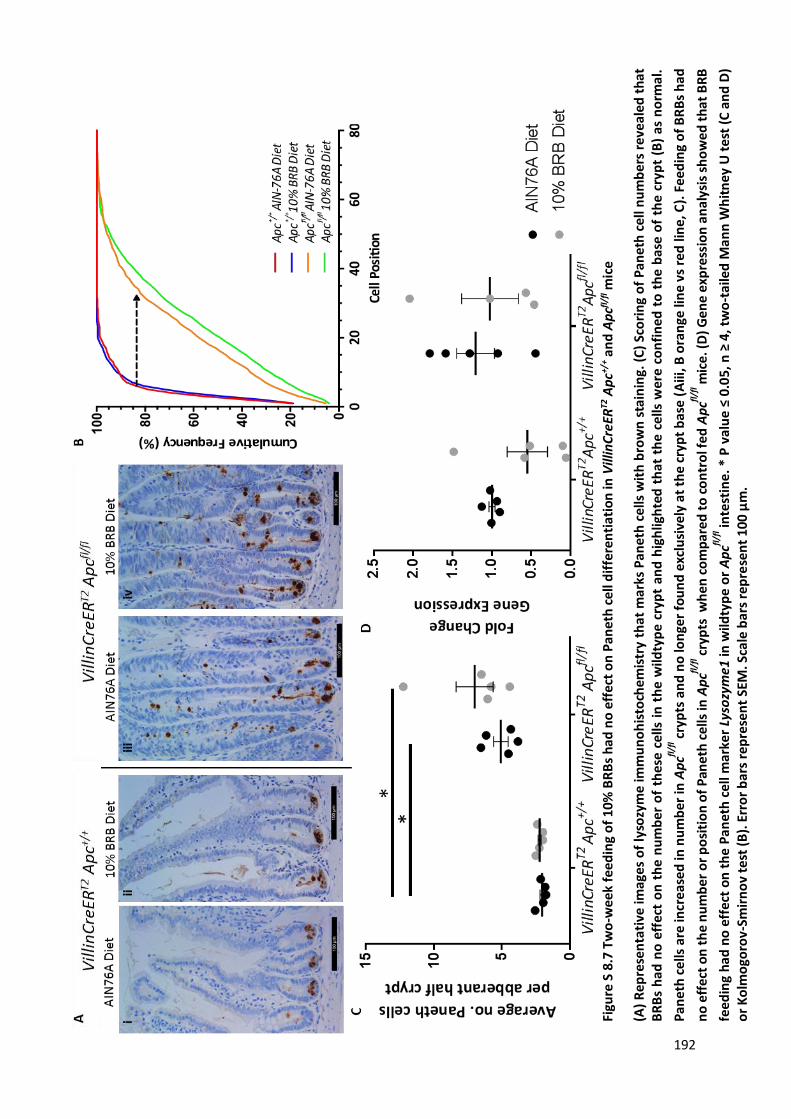
192
Figu
re S
8.7
Tw
o-w
eek
feed
ing
of
10%
BR
Bs
had
no
eff
ect
on
Pan
eth
ce
ll d
iffe
ren
tiat
ion
in V
illin
Cre
ERT2
Ap
c+/+ a
nd
Ap
cfl/f
l mic
e
(A)
Re
pre
sen
tati
ve im
ages
of
lyso
zym
e im
mu
no
his
toch
emis
try
tha
t m
arks
Pan
eth
ce
lls w
ith
bro
wn
sta
inin
g. (
C)
Sco
rin
g o
f P
anet
h c
ell n
um
ber
s re
veal
ed t
hat
B
RB
s h
ad n
o e
ffec
t o
n t
he
nu
mb
er o
f th
ese
cells
in
th
e w
ildty
pe
cry
pt
and
hig
hlig
hte
d t
hat
th
e ce
lls w
ere
con
fin
ed t
o t
he
bas
e o
f th
e cr
ypt
(B)
as n
orm
al.
Pan
eth
cel
ls a
re in
crea
sed
in n
um
ber
in A
pcfl
/fl c
ryp
ts a
nd
no
lon
ger
fou
nd
exc
lusi
vely
at
the
cryp
t b
ase
(Aiii
, B o
ran
ge li
ne
vs r
ed li
ne,
C).
Fee
din
g o
f B
RB
s h
ad
no
eff
ect
on
th
e n
um
ber
or
po
siti
on
of
Pan
eth
cel
ls in
Ap
cfl/f
l cry
pts
wh
en
co
mp
are
d t
o c
on
tro
l fed
Ap
cfl/f
l mic
e. (
D)
Gen
e ex
pre
ssio
n a
nal
ysis
sh
ow
ed t
hat
BR
B
feed
ing
had
no
eff
ect
on
th
e P
anet
h c
ell m
arke
r Ly
sozy
me1
in w
ildty
pe
or
Ap
cfl/f
l inte
stin
e.
* P
va
lue
≤ 0
.05
, n
≥ 4
, tw
o-t
aile
d M
ann
Wh
itn
ey U
te
st (
C a
nd
D)
or
Ko
lmo
goro
v-Sm
irn
ov
test
(B
). E
rro
r b
ars
rep
rese
nt
SEM
. Sca
le b
ars
rep
rese
nt
10
0 μ
m.
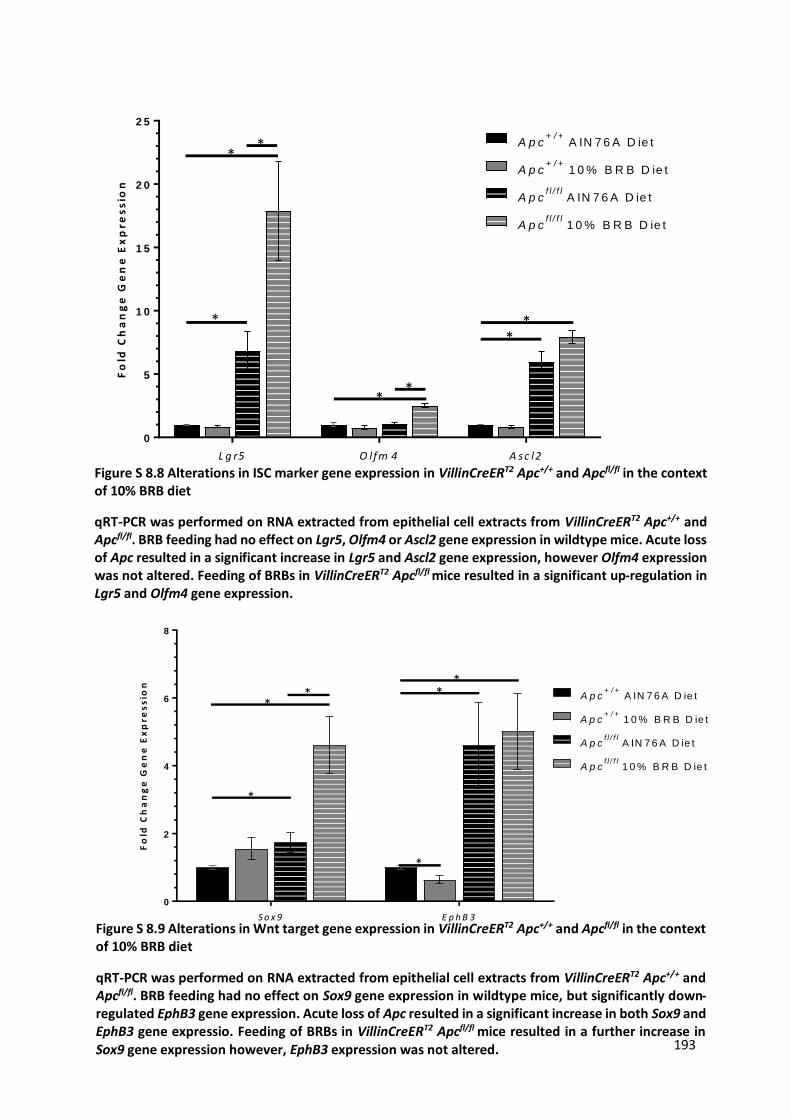
193
Fo
ld C
ha
ng
e G
en
e E
xp
res
sio
n
L g r5 O lfm 4 A sc l2
0
5
1 0
1 5
2 0
2 5
A p c+ / +
A IN 7 6 A D ie t
A p c+ / +
1 0 % B R B D ie t
A p cf l / f l
A IN 7 6 A D ie t
A p cf l / f l
1 0 % B R B D ie t
*
**
*
*
*
*
Figure S 8.8 Alterations in ISC marker gene expression in VillinCreERT2 Apc+/+ and Apcfl/fl in the context of 10% BRB diet
qRT-PCR was performed on RNA extracted from epithelial cell extracts from VillinCreERT2 Apc+/+ and Apcfl/fl. BRB feeding had no effect on Lgr5, Olfm4 or Ascl2 gene expression in wildtype mice. Acute loss of Apc resulted in a significant increase in Lgr5 and Ascl2 gene expression, however Olfm4 expression was not altered. Feeding of BRBs in VillinCreERT2 Apcfl/fl mice resulted in a significant up-regulation in Lgr5 and Olfm4 gene expression.
Figure S 8.9 Alterations in Wnt target gene expression in VillinCreERT2 Apc+/+ and Apcfl/fl in the context of 10% BRB diet
qRT-PCR was performed on RNA extracted from epithelial cell extracts from VillinCreERT2 Apc+/+ and Apcfl/fl. BRB feeding had no effect on Sox9 gene expression in wildtype mice, but significantly down-regulated EphB3 gene expression. Acute loss of Apc resulted in a significant increase in both Sox9 and EphB3 gene expressio. Feeding of BRBs in VillinCreERT2 Apcfl/fl mice resulted in a further increase in Sox9 gene expression however, EphB3 expression was not altered.
S o x 9 E p h B 3
0
2
4
6
8
Fo
ld C
ha
ng
e G
en
e E
xp
res
sio
n
A p c+ / +
A IN 7 6 A D ie t
A p c+ / +
1 0 % B R B D ie t
A p cf l / f l
A IN 7 6 A D ie t
A p cf l / f l
1 0 % B R B D ie t
*
*
*
**
*