neutrino oscillation effects in soudan 2 upward-stopping muons
TRANSCRIPT

arX
iv:h
ep-e
x/05
0706
8v1
15
Jul 2
005 Neutrino Oscillation Effects in Soudan-2
Upward-stopping Muons
W.W.M. Allison3, G.J. Alner4, D.S. Ayres1, G.D. Barr3, W.L. Barrett6,P.M. Border2, J.H. Cobb3, D.J.A. Cockerill4, H. Courant2, D.M. Demuth2,
T.H. Fields1, H.R. Gallagher5, M.C. Goodman1, T. Kafka5,S.M.S. Kasahara2, P.J. Litchfield2, W.A. Mann5, M.L. Marshak2,
W.H. Miller2, L. Mualem2, J.K. Nelson2,a, A. Napier5, W.P. Oliver5,G.F. Pearce4, E.A. Peterson2, D.A. Petyt2, K. Ruddick2, M. Sanchez5,b,
J. Schneps5, A. Sousa5, J.L. Thron1,c, N. West3
1Argonne National Laboratory, Argonne, IL 604392University of Minnesota, Minneapolis, MN 55455
3Department of Physics, University of Oxford, Oxford OX1 3RH, UK4Rutherford Appleton Laboratory, Chilton, Didcot, Oxfordshire OX11 0QX, UK
5Tufts University, Medford, MA 021556Western Washington University, Bellingham, WA 98225
aNow at the College of William and Mary, Williamsburg, VA 23187.
bNow at Harvard University, Cambridge, MA 02138.
cNow at Los Alamos National Laboratory, Los Alamos, NM 87545.
February 7, 2008
Abstract
Upward-going stopping muons initiated by atmospheric νµ and νµ interactions in the rockbelow the Soudan 2 detector have been isolated, together with a companion sample of neutrino-induced single muons, created within the detector, which travel downwards and exit. Thedownward-going sample is consistent with the atmospheric-neutrino flux prediction, but theupward-going sample exhibits a sizeable depletion. Both are consistent with previously reportedSoudan-2 neutrino-oscillation results. Inclusion of the two samples in an all-event likelihood anal-ysis, using recent 3D-atmospheric-neutrino-flux calculations, reduces both the allowed oscillationparameter region and the probability of the no-oscillation hypothesis.
PACS numbers: 14.60.Lm, 14.60.Pq, 96.40.Tv

1 Introduction
The recently published neutrino oscillation analysis of the Soudan-2 atmospheric-neutrinodata [1] used only Fully Contained (FC) events and Partially Contained (PC) events inwhich the neutrino interaction vertex was contained within the Soudan 2 tracking calorime-ter. Not utilized by that study were two additional, topologically very similar, categoriesfor which further analysis was needed to separate the samples and to eliminate their non-neutrino background. Using nomenclature introduced by the MACRO experiment [2], thetwo categories are labelled as UpStop events and InDown events.
UpStop events are upward-going stopping muons which arise from charged-current νµ andνµ interactions occurring in the rock surrounding the Soudan 2 cavern; only the final statemuon is detected as a stopping, non-interacting track in the detector. The muon may beaccompanied by a small number of hits from a decay electron near its stopping point.
InDown events are νµ and νµ interactions in the detector yielding downward going, exitingmuons with three or fewer hits arising from hadronic track(s) at the production vertex.Approximately 65% of these InDown events are quasi-elastic interactions with low energyprotons. Interactions having more than three hadronic hits at their primary vertex wereincluded in the PC sample analyzed previously [1].
Separation of these two neutrino event samples is made possible by the fine-grain imagingof the Soudan-2 honeycomb-lattice tracking calorimeter. Their angular distributions exhibitfeatures which are indicative of atmospheric νµ → ντ oscillations. The samples can beincorporated in a straightforward way into the likelihood analysis described in Ref. [1]. Theirinclusion has enabled an improved determination of the νµ → ντ oscillation parameters fromthis experiment and a more stringent rejection of the no oscillation hypothesis.
Analyses of upward through-going muons [2, 3, 4, 5], and stopping muons [2, 4, 6, 7]have been previously reported. Whereas through-going muon samples originate from a broadhigh-energy neutrino spectrum having a mean Eν of approximately 100 GeV, UpStop eventsoriginate predominantly from interactions with 1 ≤ Eν ≤ 20 GeV. Consequently they providedifferent constraints for oscillation scenarios. Among the underground tracking calorimeterexperiments, MACRO has provided the most detailed treatment to date of UpStop andInDown events. In that experiment it was not possible to separate the two categories, so theywere analyzed as a combined sample. Clearly, it is advantageous to separate the samples,since comparison of their zenith angle distributions can provide additional discriminationbetween low (≈ 10−3 eV2) versus high (≥ 10−2 eV2) values of ∆m2.
2 Detector and data exposure
Soudan 2 was a 963 metric ton (770 tons fiducial) iron tracking calorimeter with a honeycombgeometry which operated as a time-projection chamber. The detector was located at a depthof 2070 meters–water–equivalent on the 27th level of the Soudan Underground Mine StatePark in northern Minnesota. The calorimeter started data taking in April 1989 and ceasedoperation in June 2001 by which time a total exposure (fiducial exposure) of 7.36 kton-years(5.90 kton-years) had been obtained.
2

The calorimeter’s tracking elements were 1 m long, 1.5 cm diameter hytrel plastic drifttubes filled with an argon-CO2 gas mixture. The tubes were encased in a honeycomb matrixof 1.6 mm thick corrugated steel plates. Electrons deposited in the gas by the passage ofcharged particles drifted to the tube ends under the influence of an electric field. At thetube ends the electrons were amplified by vertical anode wires which read out a columnof tubes. A horizontal cathode strip read out the induced charge and the third coordinatewas provided by the drift time. The ionization deposited was measured by the anode pulseheight. The calorimeter produced three-dimensional track hits with a spatial resolution ofapproximately 1 cm3 and separated by an average of about 3 mm of steel. The corrugatedplates, interleaved with drift tubes, were stacked to form 1×1×2.5 m3, 4.3-ton modules fromwhich the calorimeter was assembled in building-block fashion [8].
Surrounding the tracking calorimeter on all sides, but mounted on the cavern surfacesand well separated from the outer surfaces of the calorimeter, was a 1700 m2 Veto Shieldarray of two or three layers of proportional tubes [9]. The shield recorded the presence ofcosmic ray muons coincident in time with events in the main calorimeter and thus identifiedbackground events, either produced directly by the muons or initiated by secondary particlescoming from muon interactions in the rock walls of the cavern. Additionally, for neutrino-induced muons which enter or exit the tracking calorimeter, the shield array recorded themuon in time-coincidence with the event in the central detector.
3 Separation of UpStop and InDown Events
The event imaging afforded by the Soudan 2 tracking calorimeter made it possible to dis-tinguish the topologically similar UpStop and InDown events. Events of both types wereisolated during routine processing.
Events were classified as UpStop candidates if they satisfied the following criteria:
(1) The track was muon-like, devoid of kinks or scatter vertices.
(2) The track length was greater than 100 cm.
(3) The muon endpoint occured in a live detector region. An event was removed if thecandidate endpoint occured in the inactive region between modules.
(4) Track ionization and straggling were consistent with the hypothesis of an upward-goingmuon which ranges to stopping. That is, near the edge of the detector the track wasstraight and lightly ionizing while, near the interior end, the track exhibited multiplescattering and/or heavy ionization.
(5) Associated hits at the track endpoint, if any, had to be consistent with an electronshower from muon decay.
An anode-versus-cathode view of an UpStop data event is shown in Fig. 1 where multiplescattering can be discerned as the muon ranges to stopping. Endpoint decay hits, the threehits modestly displaced from the muon endpoint in Fig. 1, are observed in some events (withhigher probability for µ+ than for µ− since the former do not undergo nuclear absorptionwithin iron nuclei).
3

Figure 1: An UpStop data event recorded in the anode-cathode matched view (front view of the calorimeter).Typically, multiple scattering becomes pronounced as the muon approaches its range endpoint. The endpointdecay shower of three hits favors identification as a µ+rather than a µ−.
InDown events were required to satisfy criteria 1-3 above and in addition:
(4) The muon track was straight and lightly ionizing at its interior end. Near the edge ofthe detector the track might, but need not, have exhibited ranging behavior in the formof multiple scattering and/or heavy ionization.
(5) Associated hits near the interior end of the track, if present, must have been consistentwith hits from a proton or π± track, lying in a straight line and heavily ionizing.
These topological features are exhibited by the InDown data event shown in Fig. 2. Atthe event vertex, the muon is accompanied by a track of two hits for which the ionization isrelatively heavy. This pattern is typical of a recoil proton. The event of Fig. 2 is a candidatequasi-elastic νµ n → µ−p.
There were a few events which could not be resolved as UpStop or InDown, the directionof the track being undetermined. Fortunately, ambiguous cases were rare for tracks whichhave visible lengths exceeding one meter in the detector. For the purpose of analysis, suchevents were retained as an Ambiguous category.
4 Event processing and simulation
Both UpStop and InDown data events were selected in the Partially Contained event sample,and were processed as described in Ref. [1]. The Monte Carlo sample of the contained-vertexInDown events was also part of the routine data processing, in which Monte-Carlo events
4

Figure 2: An InDown data event recorded in the cathode versus time view (calorimeter side view). Themuon emerges from an event vertex which is well contained; its trajectory, a straight line initially, undergoessmall angle deflection as the ranging muon approaches the detector floor. A proton recoil of two hits isvisible at the vertex.
were inserted into and processed together with the data stream, their identity only beingrevealed in the final analysis stage. However, additional simulations, not included in themain data processing, were needed for the neutrino interactions in the rock surrounding thecavern, which give rise to UpStop events [10].
4.1 Simulation of upward-stopping muon events
The GEANT Monte Carlo program together with modified Soudan-2 software provided theUpStop simulation (UpStop-MC). A total of 68.7 million neutrino interactions in greenstonerock were simulated. The event vertices were distributed randomly through rock volumeswhich were centered on the Soudan 2 cavern. Since high-energy charged-current (CC) eventscan project muons to the cavern from more remote rock than low-energy events, the dimen-sions of the primary rock volumes were chosen to increase with increasing Eν . Final-stateparticles were tracked through the rock by GEANT and fourvectors of particles that reachedthe veto-shield array were saved. These were then passed through the Soudan-2 Monte Carloto produce realistic detector hits superimposed on detector noise represented by random-trigger records.
UpStop-MC events were then processed through the standard Soudan-2 triggering, recon-struction and selection software for PC events. For UpStop-MC events yielding ionizationwithin the tracking calorimeter (71,000 events), the survival rates decreased monotonicallywith increasing primary Eν , reflecting the diminishing probability for muons from energeticevents to stop in the detector. Survival rates ranged from 12.8% for events with Eν ≤ 10
5
GeV, to 2.5% for events with Eν ≥ 40 GeV.
4.2 UpStop cuts and scanning
The PC selection filter required candidate tracks to penetrate to the fiducial region whilenot being through-going. Additional requirements, detailed in Ref. [1], were imposed inorder to reject the high-flux background of downward-going cosmic-ray muons. A total of7662 UpStop-MC events passed the filter and simulated trigger requirements. However, only34% of these events yielded a potentially interesting topology in the detector. Consequently,additional cuts were applied to the true kinematic variables to reject those events whichwere certain not to pass the subsequent analysis cuts. These cuts (existence of a final-statemuon with cosine zenith angle, cos θz < +0.05, and energy Eµ upon arrival at the detectorwithin the range 350 MeV < Eµ < 3500 MeV) were designed to ensure that the event hadan upward-going muon that stopped within the calorimeter fiducial volume [10]. A 54%sample of the surviving events was then scanned by physicists, using scanning rules identicalto those used for PC data event scanning. The additional criteria given in Sec. 3 were alsoapplied to both data and MC events. All events which satisfied the scanning criteria werethen reconstructed manually using the experiment’s standard interactive graphics software.Only the reconstructed sample was used in the subsequent analysis. It contained a factor of25 more events than the data sample.
4.3 MC event rate normalization
The atmospheric neutrino flux used to generate the UpStop events was the one-dimensionalcalculation of the Bartol group [11], modulated by the solar cycle as described in Ref. [1].Other fluxes were simulated by applying correctional weights to the generated events. Forconsistency with Ref. [1], the numbers and plots in Sects. 5 and 6 were weighted to cor-respond to the updated 1D Bartol-96 flux [12]. The oscillation analysis of Sect. 7 of thispaper used the latest three-dimensional fluxes from the Bartol group [13] and Battistoni etal. [14]. The neutrino cross sections were those encoded in NEUGEN3 [15]. The targetnuclear composition was that of Soudan rock, described in Ref. [16]. The effect of Pauliblocking in elastic and quasi-elastic reactions was accounted for, however nuclear effects onresonance production and on deep inelastic scattering final states were neglected.
The event rate calculations have a sizable systematic error. For the comparison of thisdata with the MC presented in Sections 5 and 6, a normalization factor of 0.85, determinedfrom the measured νe rate, assuming no oscillations, was applied. In the oscillation analysisdescribed in Sec. 7 the overall normalization was a free “nuisance” parameter.
5 Event rates and backgrounds
5.1 Backgrounds in UpStop events
Two sources of background events were considered:
6

(1) Cosmic-ray muons which scatter in the rock and eventually enter the detector in anupward direction.
(2) Charged hadronic tracks, especially pions, produced at large angles in interactions ofcosmic-ray muons in the rock surrounding the detector.
Unlike experiments which are situated under mountains, the flat overburden at Soudanensures that the flux of cosmic-ray muons becomes less than the flux of neutrino-producedmuons significantly above horizontal angles [16]. Thus the background from the first sourceis negligible.
Hadronic interactions of neutrons produced in cosmic ray interactions were shown in Ref.[1] to be a background to contained neutrino events. A similar, related, flux of chargedhadrons also emerges from the cavern walls and enters the detector.
There are two distinguishing features of entering hadronic tracks:
(1) Veto-Shield signal: In addition to the Veto Shield hit corresponding to the passage ofthe hadron track, there are likely to be extra hits due to other particles produced inthe muon interaction. In general, the track in the detector will not be aligned withthese extra hits. It is thus useful to distinguish between the total number of in-timeVeto Shield hits (nV S
all ) and the number of in-time hits geometrically associated with theincoming/leaving track (nV S
trk ).
(2) Range: Hadronic tracks have a limited range in the detector before stopping or inter-acting.
Figure 3: Distributions of Veto-Shield hit counts versus track range, (a) for UpStop data candidates and (b)for UpStop Monte Carlo events, prior to muon length cuts.
Fig. 3 shows nV Sall versus the range of the stopping track for each event of the UpStop data
(Fig. 3a) and of the MC (Fig. 3b). A clear excess of data events with large nV Sall and small
7

Figure 4: Distribution of track range for candidate UpStop data events (crosses) compared to the neutrinoMonte Carlo sample (shaded histogram), for events with visible track length exceeding one meter. Thedistributions (normalized to the events with > 500 g/cm2) are shown (a) before and (b) after the requirementnV S
all = nV Strk has been applied. Fig. 4b shows good agreement between the data and the neutrino MC.
range is observed, corresponding to the expectation for incoming hadronic tracks. However,at track lengths beyond the hadronic range, the data is consistent with the UpStop MC. Thebackground signature is emphasized in Fig. 4a which shows the projection onto the rangeaxis of the UpStop data (points with errors) and the MC (shaded histogram). The MC isnormalized to the data with range > 500 g/cm2 (> 3.8 pion interaction lengths). Fig. 4bshows the same distributions but with the additional constraint that nV S
all = nV Strk , i.e. all
Veto-Shield hits must be geometrically associated with the incoming track. The MC is thenin good agreement with the data. However, to ensure that the residual hadronic backgroundis negligible, a cut requiring the track range to be greater than 260 g/cm2, corresponding to
8

two pion interaction lengths, is also applied. Since the calorimeter is, to good approximation,a uniform medium of 1.6 g/cm3 density, the range requirement corresponds to a minimumtrack length requirement of ∼160 cm. The effective muon momentum threshold for UpStopand InDown events is pµ ≥ 530 MeV/c.
Finally, the cosine of the zenith angle, cosθz , of the reconstructed UpStop track is requiredto be smaller than +0.05.
5.2 UpStop backgrounds using hadronic scatter events
The PC data analysis also recorded events with an incoming track making a hadronic scatter.A sample of 25 data events was obtained which can be used to gauge the background fromincoming non-scattering hadrons. A representative event is the upward-going, stopping,charged pion track shown in Fig. 5. There are two coincident hits in the shield which arein close proximity to the track’s entrance point into the cavern, hence nV S
trk = 2. There is anadditional coincident hit in the shield floor, hence nV S
all = 3. Inside the detector, the trackscatters and stops. The scatter, which gives rise to a recoil proton, plus the track ionization,identifies the track as a π± rather than a µ± or a proton.
Figure 5: A scattering upgoing pion track (data event) accompanied by three time-coincident Veto Shieldhits.
Distributions of cosθz and of track range versus nV Sall for the incoming hadronic sample are
shown in Fig. 6. Fig. 6a shows that most of the events are downgoing. Among the seven
9

Figure 6: Distributions of (a) cosθz and (b) the number of coincident veto shield hits versus the track range,for events which exhibit hadronic scatters. In Fig. 6(a), the shaded (open) histogram includes events whereall the in-time Veto-Shield hits are (are not) associated with the detected track.
upward-going tracks, five have nV Sall > nV S
trk (open histogram); the remaining two events withnV S
all = nV Strk (shaded histogram) are close to horizontal, and have short range. No hadronic
events pass the shield and track length selections for upgoing tracks (ignoring their visiblescatters). On the basis of this observation, plus the agreement in track range distributionsbetween the UpStop data and the neutrino MC of Fig. 4, backgrounds from non-scatteringcharged pions and protons are estimated to contribute less than two events to the UpStopdata and are hereafter neglected.
5.3 Backgrounds in InDown events
A potential background for InDown events arises from downward, through-going cosmic raymuons whose entrance into the detector was not detected due to a rare episode of poor or non-existent ionization drifting within a calorimeter module. Great care was taken to record allsuch incidents during data taking and additional checks were made by studying individualmodule efficiencies as a function of time. A special scan was carried out which rejectedevents for which there was a possibility of such an occurrence. Additional discriminationagainst this background was provided by the active shield array, since through-going muonsyielded pairs of time-coincident hits having widely separated spatial locations. Using thesame minimum track range as was used for the UpStop sample (≥ 260 g/cm2), no InDownevents had nV S
all > nV Strk . Other backgrounds for PC events were shown to be negligible in Ref.
[1], thus the InDown sample was assumed to be background-free in the analysis presentedbelow.
10

5.4 Event rates
A final sample of 1081 fully reconstructed UpStop-MC events was retained for subsequentanalysis. Within this simulation sample, 80% of events originate with neutrino interactionshaving Eν ≤ 10 GeV. Charged-current quasi-elastic scattering accounts for about one thirdof the interactions. The neutrino fraction νµ /(νµ + νµ) of the sample is 64%.
The numbers of candidate data neutrino events which survive are listed in Table 1, wherethe MC numbers have been scaled to an exposure of 5.90 fiducial kton-years and include thefactor of 0.85 to normalize to the νe event rate of Ref. [1]. Comparison of the data withthe neutrino MC predictions, the sum of columns 2 and 3, shows that the observed InDownrate is consistent with the prediction, whereas the UpStop data rate appears suppressed bya factor of approximately two. These trends are in agreement with the expectation from theoscillation analysis of Ref. [1]. Note also the small size of the ambiguous sample and thesmall misidentification rate between the UpStop and InDown samples.
Table 1: Numbers of data and Monte Carlo events which pass all cuts. The no-oscillation MC event rate isnormalized to the measured e-flavor event rate of Ref. [1] assuming no oscillations.
Assigned as No-osc. MC Truth DataInDown UpStop
InDown 12.4±1.4 0.3±0.1 16UpStop 1.8±0.5 53.3±1.8 26Ambig 0.8±0.3 3.4±0.4 2
6 Energy and angular distributions of UpStop/InDown neutrinos
The neutrino energy, Eν , for Monte Carlo UpStop and InDown events is shown in Fig. 7.The UpStop events have an average Eν of 6.2 GeV. In contrast, the InDown events havelower Eν values with an average of 2.4 GeV.
Figure 7: Comparison of the primary Eν spectra for UpStop and InDown events.
11
The muon track provides a good estimator for the incident neutrino direction. For UpStopevents the average angle between the incoming neutrino and the muon is 11◦. For the lowerenergy InDown sample, the average angle is 13◦.
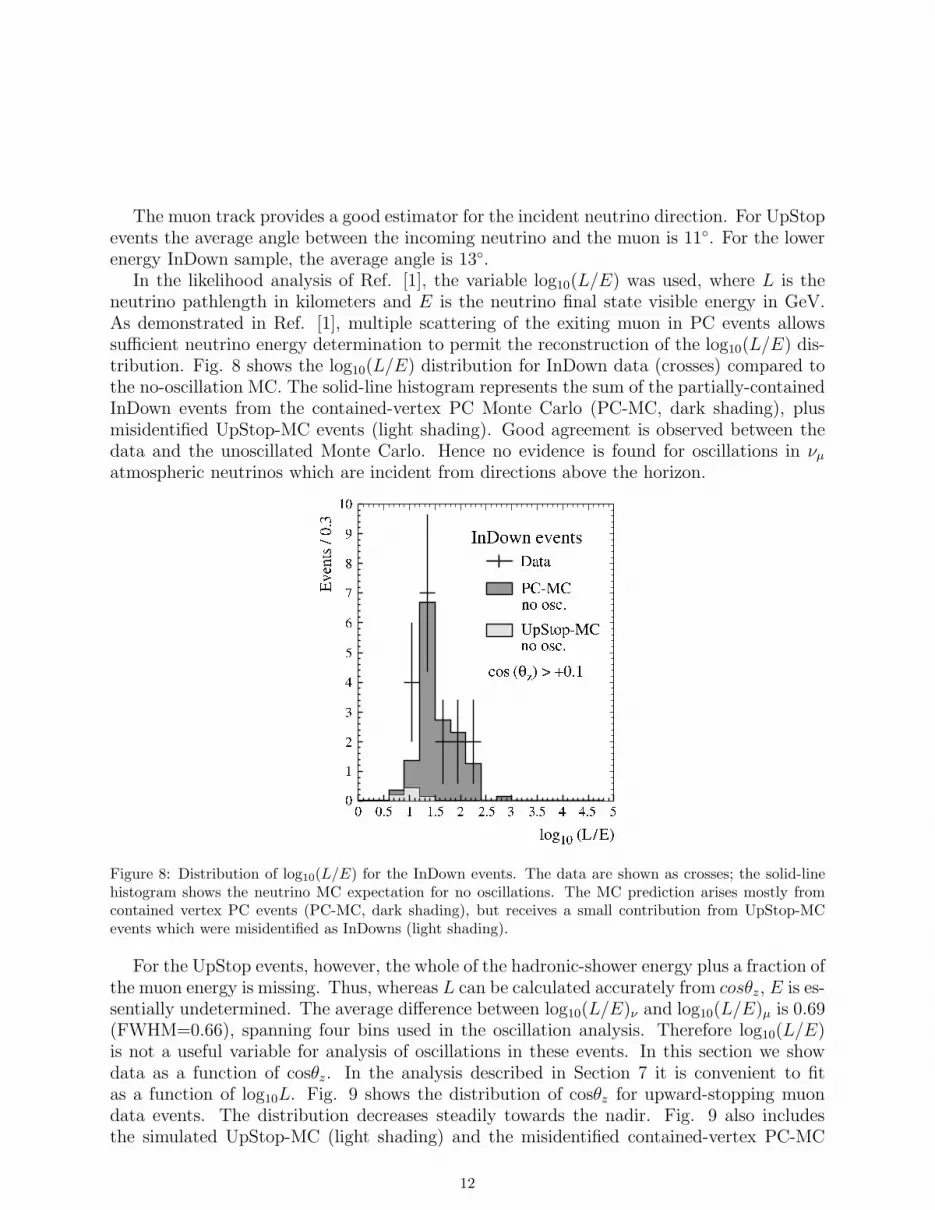
In the likelihood analysis of Ref. [1], the variable log10(L/E) was used, where L is theneutrino pathlength in kilometers and E is the neutrino final state visible energy in GeV.As demonstrated in Ref. [1], multiple scattering of the exiting muon in PC events allowssufficient neutrino energy determination to permit the reconstruction of the log10(L/E) dis-tribution. Fig. 8 shows the log10(L/E) distribution for InDown data (crosses) compared tothe no-oscillation MC. The solid-line histogram represents the sum of the partially-containedInDown events from the contained-vertex PC Monte Carlo (PC-MC, dark shading), plusmisidentified UpStop-MC events (light shading). Good agreement is observed between thedata and the unoscillated Monte Carlo. Hence no evidence is found for oscillations in νµ
atmospheric neutrinos which are incident from directions above the horizon.
Figure 8: Distribution of log10(L/E) for the InDown events. The data are shown as crosses; the solid-linehistogram shows the neutrino MC expectation for no oscillations. The MC prediction arises mostly fromcontained vertex PC events (PC-MC, dark shading), but receives a small contribution from UpStop-MCevents which were misidentified as InDowns (light shading).
For the UpStop events, however, the whole of the hadronic-shower energy plus a fraction ofthe muon energy is missing. Thus, whereas L can be calculated accurately from cosθz, E is es-sentially undetermined. The average difference between log10(L/E)ν and log10(L/E)µ is 0.69(FWHM=0.66), spanning four bins used in the oscillation analysis. Therefore log10(L/E)is not a useful variable for analysis of oscillations in these events. In this section we showdata as a function of cosθz. In the analysis described in Section 7 it is convenient to fitas a function of log10L. Fig. 9 shows the distribution of cosθz for upward-stopping muondata events. The distribution decreases steadily towards the nadir. Fig. 9 also includesthe simulated UpStop-MC (light shading) and the misidentified contained-vertex PC-MC
12

Figure 9: Distribution of cosθz for the UpStop events. The crosses represent the data, and the solid-linehistogram shows the expected MC distribution for no oscillations. Light and dark-shaded areas show thecontributions of UpStop and InDown events for no oscillations.
(dark shading) distributions, for the no-oscillation case. Significant disagreement betweenthe neutrino UpStop events and the no-oscillation expectation is apparent towards the nadir,which is consistent with the loss of upward-going µ-flavor events due to oscillations.
The distributions of Figs. 8 and 9 imply constraints on neutrino oscillation scenarios.These samples have been included in a likelihood analysis together with all the other neutrinoevents from the experiment. The method and the results of this global fit to Soudan-2neutrino data are described in Section 7 below.
7 Oscillation analysis
7.1 Outline of the method
The oscillation analysis is a bin-free likelihood analysis based on the prescription of Feldmanand Cousins [17]. A detailed description of the method can be found in Ref. [1] and is notrepeated here. The main points of the analysis are:
(1) As reported in Ref. [7] and confirmed by Ref. [1], the distributions of neutrino-inducede-flavor data events are consistent with the null oscillation MC predictions, up to anoverall normalization. Only the µ-flavor data exhibit oscillation effects. Thus thisanalysis assumes two flavor νµ → ντ oscillations.
(2) The FC and PC samples described in Ref. [1] are used unchanged in the present analysis.The InDown events are added to the PC muon-flavor sample, and the Ambiguous events
13

are used only in the overall normalization. The UpStop events are treated as a newcategory and analyzed as a function of log10L rather than as a function of log10(L/E).
(3) A likelihood function for the data is constructed as a function of ∆m2, the mass-squareddifference, and of sin2 2θ, where θ is the mixing angle, using probability density functions(pdf’s) determined from the MC sample. Details of the formalism are given in Ref. [1].
(4) The summed negative log likelihood is evaluated at each point on a 15 × 80 grid ofsin2 2θ × log10(∆m2) with sin2 2θ varied between 0.0 and 1.0 and ∆m2 varied between10−5 and 100 eV2. The lowest negative log likelihood on the grid is found and ∆L, thedifference between the lowest value and the value in each (sin2 2θ, ∆m2 ) grid square, isplotted.
(5) A background contribution of non-neutrino events arising from neutrons and gammasproduced by muon interactions in the rock around the detector is added to the likelihoodfunction. The background contribution only affects the FC events; the PC events andthe new InDown and UpStop events are treated as background-free.
(6) The overall normalization of the MC and the amounts of background in the differentFC event samples, estimated using shield-tagged data events and the depth distributionof the event vertices, are nuisance parameters whose values are optimized at each gridsquare.
(7) The allowed confidence level regions are calculated by the method of Feldman andCousins [17]. That is, MC experiments are generated and analyzed at each grid square tocalculate the expected likelihood rise for a given confidence level based on the statisticaland systematic errors at that grid square. In addition to the systematic errors describedin Ref. [1], a 10% systematic error on the relative normalization of the UpStop eventsto the remainder of the data was allowed. The latter error represents uncertaintiesin density and nuclear composition of rock below the detector, and uncertainties withvariation of neutrino cross sections in rock versus iron.
(8) The analysis of Ref. [1] used the one-dimensional flux calculation of the Bartol group[12]. This analysis uses their new three-dimensional calculation [13] and compares itwith their 1D calculation and with the 3D calculation of Battistoni et al. [14].
The 44 new data events documented here are added to the 488 data events of the previousanalysis. However, the new events are “high resolution” µ-flavor events, those most sensitiveto oscillations, consequently they enhance the sensitivity afforded by the 167 events of thattype in the previous analysis.
7.2 Oscillation results
The values of ∆L are plotted in Fig. 10 as a function of sin2 2θ and log10(∆m2). Theresulting surface is similar to that reported in Ref. [1]. The main difference is that thelikelihood rise for the grid square with the lowest values of ∆m2 and sin2 2θ (called theno oscillation point) is 16.0 compared with 11.3 for the previous analysis. The new data
14

Figure 10: The data likelihood difference, ∆L, plotted as a function of sin2 2θ and log10(∆m2).
has significantly increased the discrimination against the no-oscillation hypothesis, mostlybecause of the large suppression of the UpStop data compared to the MC prediction. Theprobability of the validity of the no-oscillation hypothesis is discussed in Sect. 7.3.
The ∆L surface in Fig. 10 exhibits two nearly equal minima, one at the grid squarecentered at ∆m2 = 0.0017 eV2, sin2 2θ = 0.97, and one at ∆m2 = 0.0052 eV2, sin2 2θ= 0.97. The first minimum is the “best fit point” of this analysis, while the second minimumwas the best fit point in the previous analysis [1]. The difference of ∆L between the two isonly 0.18. There is a small rise in likelihood between the two minima which peaks at about1.8 in the region of the Super-K best-fit point. However, the 90%-confidence-level limit ofthis analysis, determined in Sect. 7.3, contains all of the Super-K allowed region. The valueof the flux normalization at the best fit point is 91% of the Bartol-3D prediction [13].
Although the analysis is carried out using the log-likelihood function, it is useful to eval-uate the goodness of the fit by projecting out the distributions for the various data sets andcalculating a χ2 for the data compared to the MC prediction. Fig. 11a shows the data forthe total muon PC sample (including the InDown events) and Fig. 11b shows the UpStopevents, compared to the MC predictions.
The PC events are in good agreement with the no-oscillation histogram, but disagree,particularly at low L/E (downward going ν events), with the prediction at the highest
15
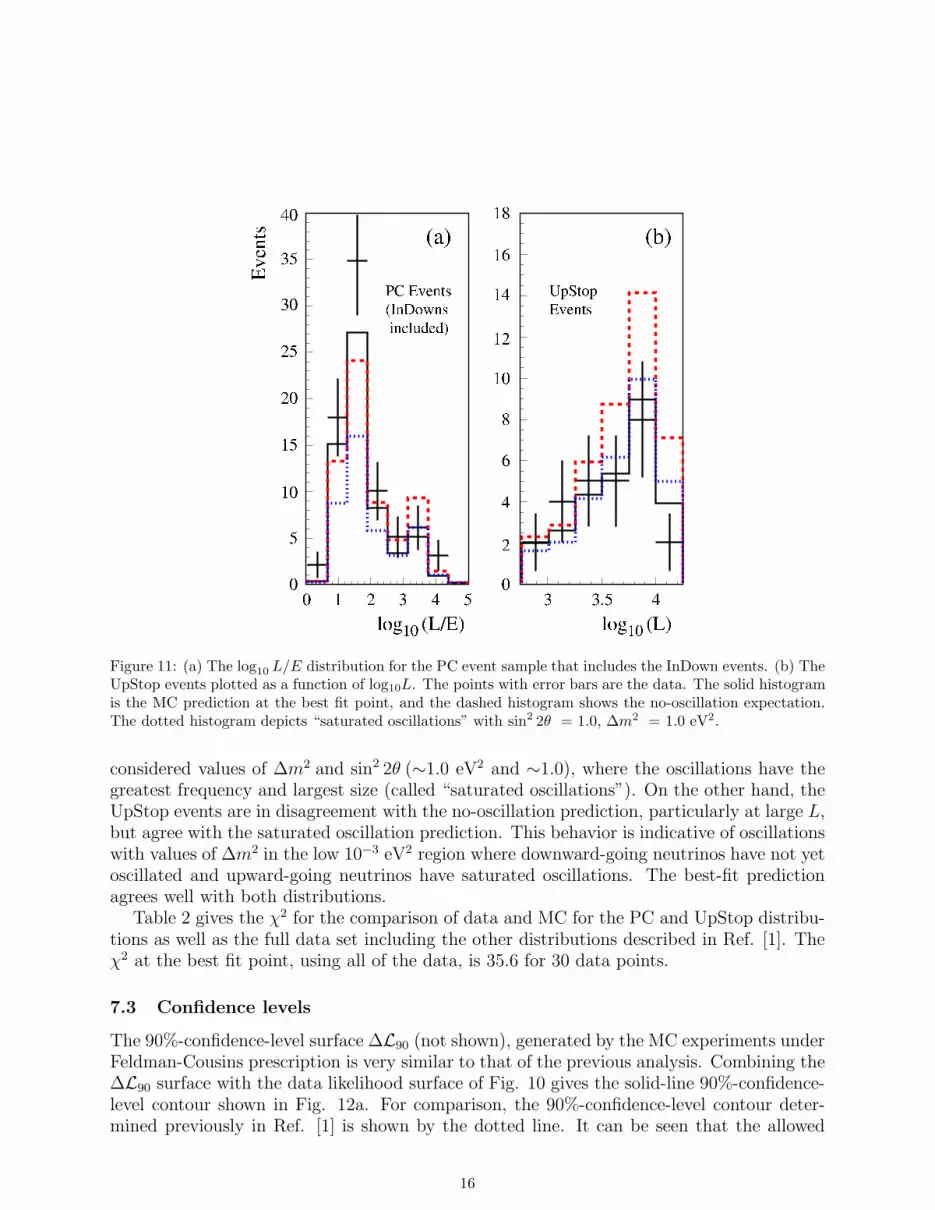
Figure 11: (a) The log10 L/E distribution for the PC event sample that includes the InDown events. (b) TheUpStop events plotted as a function of log10L. The points with error bars are the data. The solid histogramis the MC prediction at the best fit point, and the dashed histogram shows the no-oscillation expectation.The dotted histogram depicts “saturated oscillations” with sin2 2θ = 1.0, ∆m2 = 1.0 eV2.
considered values of ∆m2 and sin2 2θ (∼1.0 eV2 and ∼1.0), where the oscillations have thegreatest frequency and largest size (called “saturated oscillations”). On the other hand, theUpStop events are in disagreement with the no-oscillation prediction, particularly at large L,but agree with the saturated oscillation prediction. This behavior is indicative of oscillationswith values of ∆m2 in the low 10−3 eV2 region where downward-going neutrinos have not yetoscillated and upward-going neutrinos have saturated oscillations. The best-fit predictionagrees well with both distributions.
Table 2 gives the χ2 for the comparison of data and MC for the PC and UpStop distribu-tions as well as the full data set including the other distributions described in Ref. [1]. Theχ2 at the best fit point, using all of the data, is 35.6 for 30 data points.
7.3 Confidence levels
The 90%-confidence-level surface ∆L90 (not shown), generated by the MC experiments underFeldman-Cousins prescription is very similar to that of the previous analysis. Combining the∆L90 surface with the data likelihood surface of Fig. 10 gives the solid-line 90%-confidence-level contour shown in Fig. 12a. For comparison, the 90%-confidence-level contour deter-mined previously in Ref. [1] is shown by the dotted line. It can be seen that the allowed
16

Table 2: The χ2 for comparisons of the data to various MC predictions for the PC events, the UpStop events,and the full data set.
χ2/Number of data pointsPC UpStop All data
Best fit 5.0/5 0.6/4 35.6/30No oscillations 5.9/5 7.9/4 66.6/30Saturated oscillations 19.8/5 1.9/4 63.2/30
Figure 12: (a) The 90% confidence allowed region from the Feldman-Cousins analysis of this work (solidline), compared to that of Ref. [1] [1] (dotted line). (b) Contours at 68%, 90%, and 95% confidence level(dotted line, thick solid line, and dashed line respectively), compared to the 90% sensitivity contour (thinsolid line).
17

region is more restrictive and that some of the contour structure indicated by the previousanalysis has been smoothed. This is due to the fact that the likelihood surface is rather flatat the base of the valley and small changes in the data can move the contours substantiallyin this region.
Fig.12b shows the 68%, 90% and 95% contours, a further indication of the shape of thelikelihood surface. Also displayed in Fig.12b is the 90% sensitivity contour obtained from theMonte Carlo experiments, which denotes the expected 90% contour for experiments with thisstatistical precision and systematic errors. As was the case in Ref. [1], the 90%-CL contourfrom this analysis is more restrictive than the estimated sensitivity contour, due, in part, toa small mismatch of the overall event-rate normalization in the electron and muon samples.
The probability of no oscillations can be calculated, under the Feldman-Cousins prescrip-tion and including all of the systematic effects, by generating experiments at the minimum∆m2 and sin2 2θ grid square and counting those MC experiments that give a larger likelihooddifference than 16.0. In 500,000 simulated experiments, 16 had a larger likelihood differencegiving a probability of 3.2 × 10⁻⁵ for the no-oscillation hypothesis.
For UpStop muons and upward-going contained vertex events, the initiating neutrinomay experience Mikheev-Smirnov-Wolfenstein (MSW) resonance and other matter effectsas a result of the traversal of thousands of kilometers of terrestrial matter. The magnitudeof matter-induced deviations from vacuum oscillations was studied using simulated eventsamples; the samples were weighted in accordance with three-neutrino mixing and the nor-mal mass hierarchy, using the approximation of a uniform (path-weighted mean) terrestrialdensity [19]. For the range of plausible ∆m2 values, it was found that matter effects, evenwith maximally allowed mixing angles, can only introduce a few percent additional depletionof muon-flavor neutrinos beyond that which results from νµ → ντ vacuum oscillations [20].Since the scale of such deviations is well below the statistical sensitivity afforded by the data,matter effects were neglected in this analysis.
7.4 Flux model comparison and event rate normalization
The analysis of this data has been carried out for three different atmospheric neutrino fluxcalculations: (i) the one-dimensional flux calculation of the Bartol group [12], (ii) the Bartolthree-dimensional calculation [13], and (iii) the three-dimensional calculation of Battistoniet al. [14]. As well as the flux prediction, the analysis requires an estimate of the heightin the atmosphere at which the neutrino is produced. This is particularly important forneutrinos coming from overhead where the path in the atmosphere is a large fraction ofthe total path length. A parameterization of the pion and muon decay heights was madeusing the formalism of Ref. [18] for the one-dimensional Bartol calculation. A similarparameterization for decay heights was prepared for the three-dimensional Bartol case. Thelatter parameterization was also used for predictions based upon the Battistoni et al. flux.
Fig. 13 shows the 90%-CL region for the three cases. There is a small change from theone- to three-dimensional flux models, however the three-dimensional models of Bartol andBattistoni et al. give almost identical results. The only significant difference between thethree cases is in the absolute normalization of the flux. At the best-fit point of this analysis,the normalization factor (number of events observed/calculated) for the Bartol 1D flux is
18

Figure 13: The 90%-confidence-level allowed region for three atmospheric-neutrino flux calculations. Thedotted curve is based upon the 1D-model of the Bartol group from 1996 [12]. The more recent 3D calculationsof Battistoni et al. [14] and of the Bartol group [13] lead to the dashed and solid curve, respectively.
0.86, while for the Bartol 3D flux the factor is 0.91 and for the Battistoni et al. flux it is1.02.
The authors of the flux calculations typically quote large errors of ±20% on the absolutenormalization, due to the uncertainties on the incoming cosmic-ray fluxes and on nucleus-aircross sections. There are also significant errors on the neutrino cross sections. It is thus ofinterest to determine the experimental error on the ratio of the measured to the predictedevent rate. The experimental event rate is proportional to the incident neutrino flux, theneutrino cross sections in the detector, and the detector acceptance. This experiment canthus determine the normalization of the atmospheric neutrino flux at the Soudan-2 site timesthe neutrino cross sections encoded in the NEUGEN3 program [15], for an iron calorimeterwith a given energy threshold. Translation of this normalization factor to other experimentsat the Soudan site and at other sites is possible in principle. However it requires knowledgeof the relative neutrino fluxes at the different sites and the ratio of the neutrino cross sectionsif a different detector medium or a different neutrino generator is used.
The event-rate normalization factor for Soudan 2 is subject to the following errors:
(1) The total number of neutrino events observed in this experiment above an energy thresh-old of 300 MeV, obtained from Table I of Ref. [1] and Table 2 of this paper, is 481.2±26.2(±5.4%). The error includes the statistical error and the error on the background sub-traction.
(2) The statistical error on the Monte Carlo sample is ±1.6%.
(3) The variation of the fitted normalization factor over the 68% confidence region of theoscillation parameters is ±3%. The Feldman-Cousins analysis includes the systematic
19

errors associated with the background subtraction, cross section uncertainties and en-ergy scale uncertainties.
(4) Depending on the value of θ23, νe → νµ oscillations with the solar parameters couldchange the flux of νe that have traversed the Earth [21, 22]. The change can be positiveor negative depending on whether θ23 is smaller or greater than 45o. Using the Super-K limits for sin2 2θ23 and recent values for the solar oscillation parameters [7, 23], anuncertainty of ±3.3% in the calculated electron-event rate is estimated.
(5) Uncertainty arises in the rate of multi-GeV muon events due to matter effects [20]. A±1.6% error contribution to the event rate calculation is inferred.
(6) Any mismatch between the Monte Carlo representation of the detector and realitycould introduce a relative error in the acceptance of the two and thus an error in thenormalization ratio. Detailed studies of individual event channels revealed no significantdifferences [24, 25]. The relative proportions of different event types and event rejectionmodes in data versus Monte Carlo samples were studied. A ±2% systematic error,estimated from the maximum differences found between the data and Monte Carlo, hasbeen assigned to account for uncertainties arising from geometric acceptance and otherresidual effects.
Based upon the ±8% quadrature sum of these errors, an overall normalization factor of0.91±0.07 is determined for this analysis. This normalization is specific to the Soudan 2site, the detector medium, the Bartol 3D flux, and to the neutrino cross sections encoded inthe NEUGEN3 event generator. It is averaged over the years 1989-2001, one full solar cycle.The same percentage error, ±8%, is applicable to the Soudan-2 normalization factors givenabove for the Bartol 1D and Battistoni et al. 3D atmospheric fluxes.
As a check, a normalization which is mostly independent of the νµ → ντ oscillation pa-rameters can be obtained from the total electron sample of contained and partially containedevents. Table I of Ref. [1] lists 208.7±15.9 background-subtracted electron-neutrino eventsto be compared with an expected rate from the 3D Bartol prediction of 238.1 events, yieldinga normalization factor of 0.88±0.07, where the error is just statistical from the number ofevents and does not include the contribution from νe → νµ oscillations or the other errorsources detailed above.
8 Conclusions
Samples of upward stopping muons produced by neutrino interactions in the rock belowthe Soudan-2 detector and partially-contained events with downward-going muons producedin the detector have been separately isolated. These two new data sets provide additionalsupport and constraints for the hypothesis of atmospheric-neutrino oscillations. The flux ofupward stopping neutrino-induced muon events is observed to be suppressed by a factor ofapproximately two, while downward-going muon events are not suppressed. An oscillationanalysis using the method described in Ref. [1] and adding this new data gives a morerestrictive 90%-confidence-level allowed region of ∆m2 and sin2 2θ . The probability of theno-oscillation hypothesis is reduced by more than a factor of 10, to 3.2 × 10⁻⁵.
20

Figure 14: The Soudan 2 90% confidence allowed region in sin2 2θ, ∆m2 (solid line) compared with theallowed regions of MACRO (dot-and-dashed line) [27], and of the Super-K zenith angle [7] (dotted line) andL/E [26] (dashed line) analyses.
The data have been analyzed using three models of the atmospheric flux at the northerngeomagnetic latitude of this experiment. The models include two recent three-dimensionalflux calculations and an older one-dimensional calculation. The oscillation parameters arefound to be essentially independent of the flux calculation. The normalization factor forthe experiment, 0.91±0.07, is the measured event rate divided by the calculated event ratewhere the latter is the convolution of neutrino fluxes of the Bartol 3D flux calculation withneutrino cross sections encoded in NEUGEN3. The denominator for this ratio containselements which are specific to the Soudan-2 detector analysis, and site. Consequently, thenormalization factor cannot be compared in a straightforward way to other experimentsat other geomagnetic latitudes with different detector media and using different neutrinointeraction generators.
Comparison of this experiment’s revised 90% CL allowed region with the most recentSuper-K [7, 26] and MACRO [27] allowed regions is shown in Fig. 14. This result is in goodagreement with both experiments.
Acknowledgments
This work was supported by the U.S. Department of Energy, the U.K. Particle Physics andAstronomy Research Council, and the State and University of Minnesota. We gratefullyacknowledge the Minnesota Department of Natural Resources for allowing us to use thefacilities of the Soudan Underground Mine State Park. We warmly thank the Soudan 2 minecrew for their dedicated work throughout the duration of the experiment.
21

References
[1] Soudan 2 Collaboration, M. Sanchez et al., Phys. Rev. D 68, 113004 (2003).
[2] MACRO Collaboration, M. Ambrosio et al., Eur. Phys. J. C 36, 323 (2004).
[3] Kamiokande Collaboration, Y. Oyama et al., Phys. Rev. D 39, 1481 (1989); S.Hatakeyama et al., Phys. Rev. Lett. 81, 2016 (1998).
[4] IMB Collaboration, R. Becker-Szendy et al., Phys. Rev. Lett. 69, 1010 (1992); R. Clarket al., Phys. Rev. Lett. 79, 345 (1997).
[5] Super-Kamiokande Collaboration, Y. Fukuda et al., Phys. Rev. Lett. 82, 2644 (1999);Phys. Rev. Lett. 85, 3999 (2000).
[6] Frejus Collaboration, K. Daum et al., Z. Phys. C 66, 417 (1995).
[7] Super-Kamiokande Collaboration, Y. Ashie et al., eprint hep-ex/0501064, submitted toPhys. Rev. D.
[8] Soudan 2 Collaboration, W.W.M. Allison et al., Nucl. Instr. Meth. A 376, 36 (1996);Nucl. Instr. Meth. A 381, 385 (1996).
[9] Soudan 2 Collaboration, W.P. Oliver et al., Nucl. Instr. Meth. A 276, 371 (1989).
[10] T. Kafka, H.R. Gallagher, W.A. Mann, J.K. Nelson, Soudan-2 note PDK-803, June2003.
[11] G. Barr, T.K. Gaisser and T. Stanev, Phys. Rev. D 39, 3532 (1989).
[12] V. Agrawal, T.K. Gaisser, P. Lipari and T. Stanev, Phys. Rev. D 53, 1314 (1996).
[13] G.D. Barr, T.K. Gaisser, P. Lipari, S. Robbins, and T. Stanev, Phys. Rev. D 70, 023006(2004).
[14] G. Battistoni et al., Astropart. Phys. 12, 315 (2000); G. Battistoni, A. Ferrari, T.Montaruli, and P.R. Sala, eprint astro-ph/0207035, July 2002. Flux tables for the Soudansite are available at http://www.mi.infn.it/battist/neutrino.html.
[15] G. Barr, D.Phil thesis, University of Oxford, 1987; H.M. Gallagher and M.C. Goodman,MINOS note NuMI-112, Nov. 1995; H. Gallagher, Nucl. Phys. B (Proc. Suppl.) 112,188 (2002).
[16] Soudan 2 Collaboration, D. Demuth et al., Astropart. Phys. 20, 533 (2004); D. M.Demuth, PhD thesis, University of Minnesota, 1999.
[17] G.J. Feldman and R.D. Cousins, Phys. Rev. D 57, 3873 (1998).
[18] H. Gallagher and K. Ruddick, Soudan-2 note PDK-784, Jan. 2002.
[19] M.C. Gonzalez-Garcia and Y. Nir, Rev. Mod. Phys. 75, 345 (2003).
22

[20] W.A. Mann, K. Galdamez, T. Kafka, and A. Sousa, Soudan-2 note PDK-811, Sept.2004.
[21] O.L.G. Peres and A.Yu. Smirnov, Phys. Lett. B 456, 204 (1999); Nucl. Phys. B (Proc.Suppl.) 110, 355 (2002).
[22] W.A. Mann and M. Roberto, Soudan-2 note PDK-807, July 2003.
[23] KamLAND Collaboration, T. Araki et al., Phys. Rev. Lett. 94, 081801 (2005).
[24] Soudan 2 Collaboration, J. Chung et al., Phys. Rev. D 66, 032004 (2002).
[25] R.T. Thompson, W.A. Mann, and M.A. Said, Soudan-2 note PDK-791, August 2002.
[26] Super-Kamiokande Collaboration, Y. Ashie et al., Phys. Rev. Lett. 93, 101801 (2004).
[27] MACRO Collaboration, M. Ambrosio et al., Phys. Lett. B 566, 35 (2003).
23