upward electrical discharges from thunderstorm tops
TRANSCRIPT

© 2008 Nature Publishing Group
LETTERS
Upward electrical dischargesfrom thunderstormsPAUL R. KREHBIEL1*, JEREMY A. RIOUSSET2*, VICTOR P. PASKO2, RONALD J. THOMAS3,WILLIAM RISON3, MARK A. STANLEY4 AND HARALD E. EDENS1
1Physics Department, New Mexico Tech, Socorro, New Mexico 87801, USA2CSSL Laboratory, Penn State University, University Park, Pennsylvania 16802, USA3Electrical Engineering Department, New Mexico Tech, Socorro, New Mexico 87801, USA4114 Mesa Verde Road, Jemez Springs, New Mexico 87025, USA*e-mail: [email protected]; [email protected]
Published online: 23 March 2008; doi:10.1038/ngeo162
Thunderstorms occasionally produce upward discharges, calledblue jets and gigantic jets, that propagate out of the storm toptowards or up to the ionosphere1–4. Whereas the various typesof intracloud and cloud-to-ground lightning are reasonably wellunderstood, the cause and nature of upward discharges remainsa mystery. Here, we present a combination of observationaland modelling results that indicate two principal ways in whichupward discharges can be produced. The modelling indicatesthat blue jets occur as a result of electrical breakdown betweenthe upper storm charge and the screening charge attracted tothe cloud top; they are predicted to occur 5–10 s or less aftera cloud-to-ground or intracloud discharge produces a suddencharge imbalance in the storm. An observation is presented ofan upward discharge that supports this basic mechanism. Incontrast, we find that gigantic jets begin as a normal intraclouddischarge between dominant mid-level charge and a screening-depleted upper-level charge, that continues to propagate out ofthe top of the storm. Observational support for this mechanismcomes from similarity with ‘bolt-from-the-blue’ discharges5 andfrom data on the polarity of gigantic jets6. We conclude thatupward discharges are analogous to cloud-to-ground lightning.Our explanation provides a unifying view of how lightningescapes from a thundercloud.
Classical, normally electrified thunderstorms have a dominantdipolar electrical structure consisting of mid-level negative andupper-level positive charges, augmented by lower positive chargeand negative screening charge at the upper cloud boundary7,8
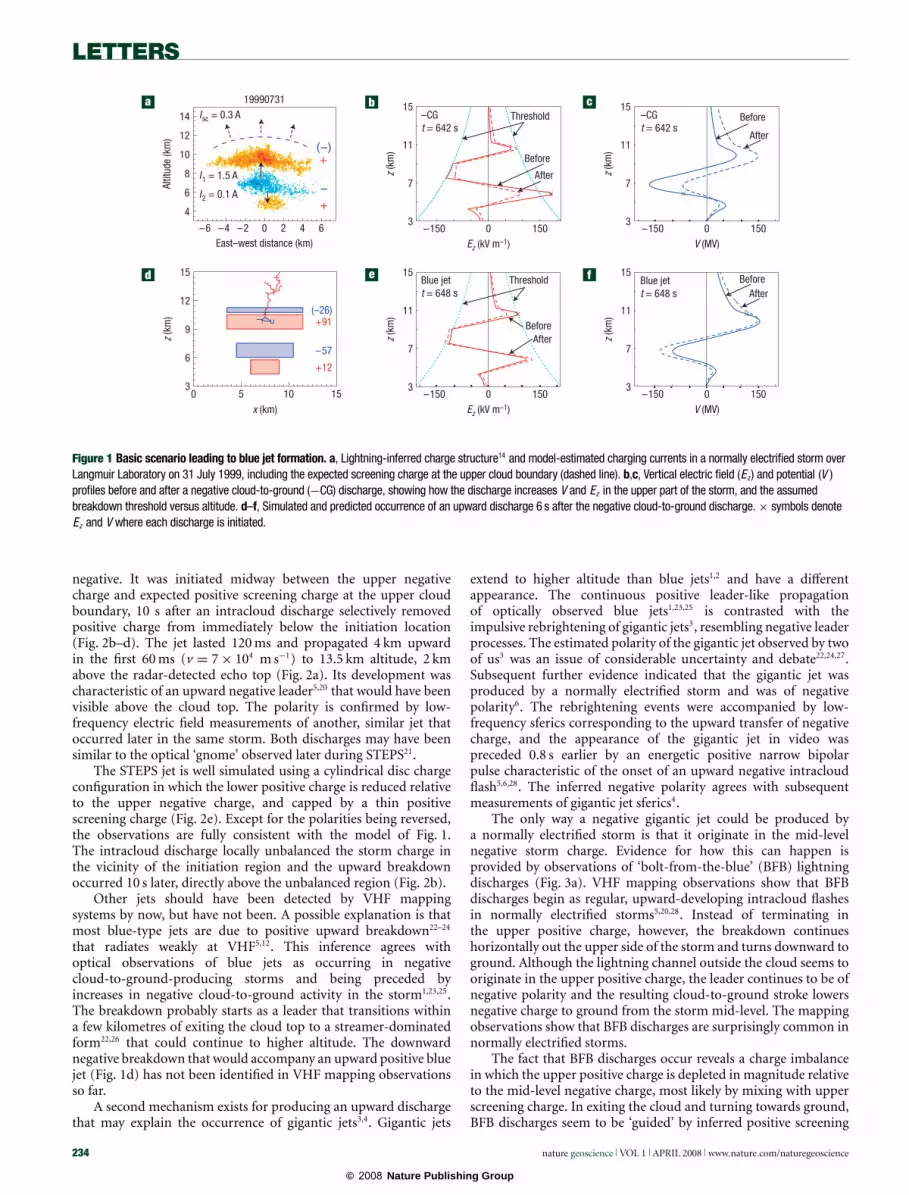
(Fig. 1a). The storm charges and electric fields build up with timeas a result of charging currents, believed to be precipitation driven8,until a breakdown threshold is reached. At this point, bidirectionaldischarges occur9,10, producing different lightning types dependingon where the triggering occurs first.
Discharges that escape the storm are possible when thebreakdown is triggered between adjacent unbalanced chargeregions, such as occur in the lower and upper parts of storms11–13.Thus, breakdown triggered between the mid-level negative andlower positive charges usually escapes the storm downward tobecome a negative cloud-to-ground discharge14 (Fig. 1b). Theability of the discharge to continue through the lower positivecharge region is aided by the presence of an overall negativecharge imbalance in the storm, which biases the storm potentials
negatively and imparts a strongly negative initial potential (‘× ’ inFig. 1c) to the downward-developing leader.
Normally electrified storms tend to develop an overallnegative charge imbalance with time as a result of the negativescreening charge flowing to the cloud top15 (Isc in Fig. 1a).The negative charge is intermittently lowered to ground bynegative cloud-to-ground discharges, thereby helping charge theglobal atmospheric electric circuit7. Simple electrodynamic modelcalculations (see the Supplementary Information) show that theeffect of a negative cloud-to-ground discharge is to suddenlychange the storm’s net charge from negative to positive. As aresult, the cloud potential quickly shifts towards positive values(Fig. 1c) and the electric field is enhanced in the upper part ofthe storm16 (Fig. 1b). Continued charging can lead to a dischargebeing triggered in the upper part of the storm within a fewseconds (Fig. 1e,f), which would be expected to escape upwardabove the cloud top. The upward discharge would have the samepolarity as the upper storm charge, namely positive for a normallyelectrified storm producing negative cloud-to-ground discharges.The triggering is suppressed if the screening charge is mixed into theupper storm charge, but if such mixing is weak or absent, upwarddischarges are predicted to occur commonly. The fact that jets areinfrequent implies that mixing of the screening charge is normallystrong in storms.
That an upper-level discharge, once triggered, would propagateupward above the cloud top is illustrated in Fig. 1d using resultsfrom a stochastic lightning simulation model17. The breakdownescapes upward because of the strong positive potential (∼150 MV)in the upper part of the storm, which is imparted to the developingleader channel, coupled with the lack of a potential barrier forupward propagation13 (Fig. 1f).
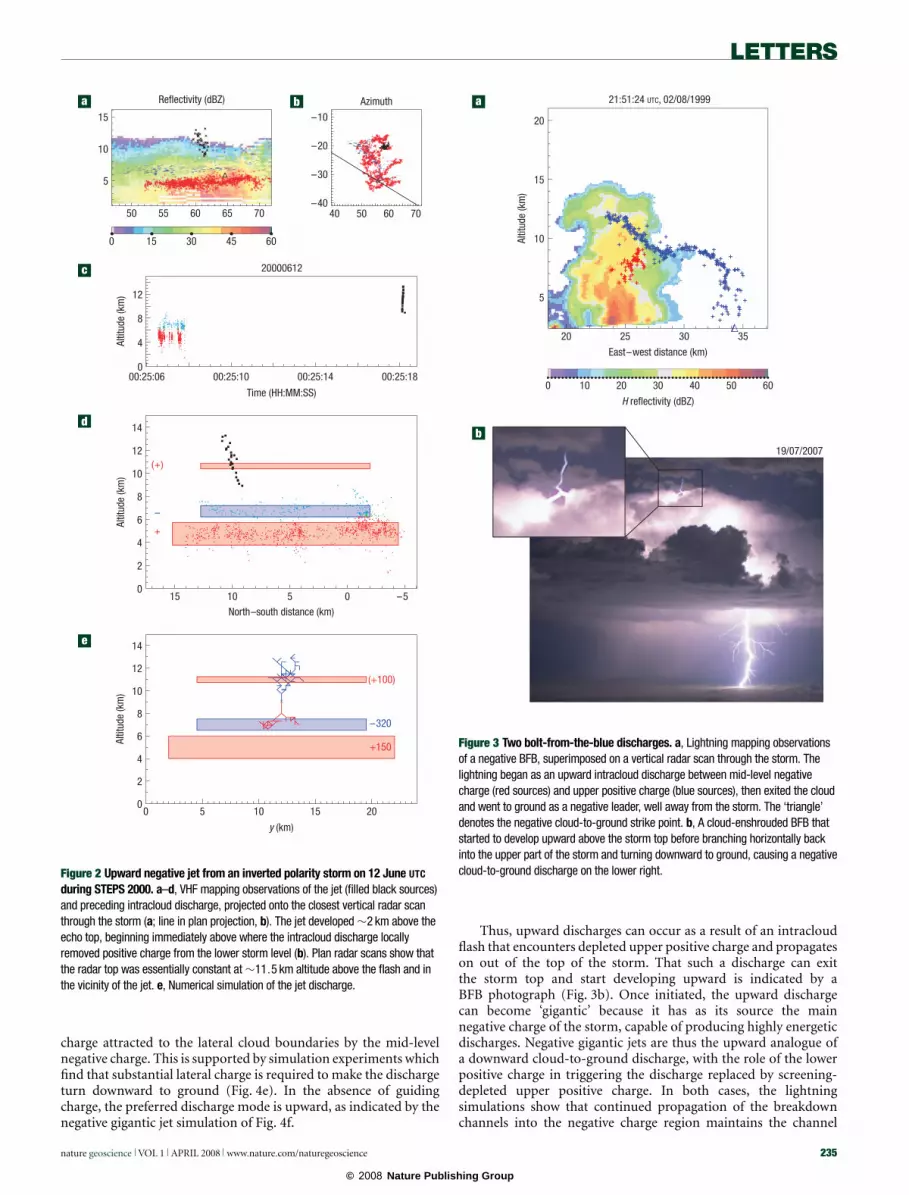
Figure 2 shows observations of an upward jet that agree with thebasic mechanism described above. The observation was obtainedwith a three-dimensional very high-frequency (VHF) lightningmapping array5 during the Severe Thunderstorm Electrificationand Precipitation Study18 (STEPS 2000), and was only recentlydiscovered in the STEPS data. Until then no upward dischargeshad been seen or confirmed in the VHF mapping data. The jetoccurred in a decaying storm system that had an inverted electricalstructure19 and was producing intracloud discharges between anupper layer of negative charge and positive charge below the
nature geoscience VOL 1 APRIL 2008 www.nature.com/naturegeoscience 233
© 2008 Nature Publishing Group
LETTERS
BeforeAfter
Blue jett = 648 s
Blue jett = 648 s
Threshold
BeforeAfter
Before
After
Threshold
Before
After
19990731
Isc = 0.3 A
I1 = 1.5 A
I2 = 0.1 A6
8
10
12
Altit
ude
(km
)
4
–4 –2 0 2 4
14
East–west distance (km)–6 6
(–26)+91
+12
–57
5 10
x (km)
0 15
6
9
12
z (k
m)
3
15
0Ez (kV m–1)
–150 150
0Ez (kV m–1)
–150 150
0V (MV)
–150 150
0V (MV)
–150 150
11
7
z (k
m)
3
15
11
7
z (k
m)
3
15
11
7
z (k
m)
3
15
11
7
z (k
m)
3
15–CGt = 642 s
–CGt = 642 s
a b c
d e f
Figure 1 Basic scenario leading to blue jet formation. a, Lightning-inferred charge structure14 and model-estimated charging currents in a normally electrified storm overLangmuir Laboratory on 31 July 1999, including the expected screening charge at the upper cloud boundary (dashed line). b,c, Vertical electric field (Ez ) and potential (V )profiles before and after a negative cloud-to-ground (−CG) discharge, showing how the discharge increases V and Ez in the upper part of the storm, and the assumedbreakdown threshold versus altitude. d–f, Simulated and predicted occurrence of an upward discharge 6 s after the negative cloud-to-ground discharge. × symbols denoteEz and V where each discharge is initiated.
negative. It was initiated midway between the upper negativecharge and expected positive screening charge at the upper cloudboundary, 10 s after an intracloud discharge selectively removedpositive charge from immediately below the initiation location(Fig. 2b–d). The jet lasted 120 ms and propagated 4 km upwardin the first 60 ms (v = 7 × 10⁴ m s−1) to 13.5 km altitude, 2 kmabove the radar-detected echo top (Fig. 2a). Its development wascharacteristic of an upward negative leader5,20 that would have beenvisible above the cloud top. The polarity is confirmed by low-frequency electric field measurements of another, similar jet thatoccurred later in the same storm. Both discharges may have beensimilar to the optical ‘gnome’ observed later during STEPS21.
The STEPS jet is well simulated using a cylindrical disc chargeconfiguration in which the lower positive charge is reduced relativeto the upper negative charge, and capped by a thin positivescreening charge (Fig. 2e). Except for the polarities being reversed,the observations are fully consistent with the model of Fig. 1.The intracloud discharge locally unbalanced the storm charge inthe vicinity of the initiation region and the upward breakdownoccurred 10 s later, directly above the unbalanced region (Fig. 2b).
Other jets should have been detected by VHF mappingsystems by now, but have not been. A possible explanation is thatmost blue-type jets are due to positive upward breakdown22–24
that radiates weakly at VHF5,12. This inference agrees withoptical observations of blue jets as occurring in negativecloud-to-ground-producing storms and being preceded byincreases in negative cloud-to-ground activity in the storm1,23,25.The breakdown probably starts as a leader that transitions withina few kilometres of exiting the cloud top to a streamer-dominatedform22,26 that could continue to higher altitude. The downwardnegative breakdown that would accompany an upward positive bluejet (Fig. 1d) has not been identified in VHF mapping observationsso far.
A second mechanism exists for producing an upward dischargethat may explain the occurrence of gigantic jets3,4. Gigantic jets
extend to higher altitude than blue jets1,2 and have a differentappearance. The continuous positive leader-like propagationof optically observed blue jets1,23,25 is contrasted with theimpulsive rebrightening of gigantic jets3, resembling negative leaderprocesses. The estimated polarity of the gigantic jet observed by twoof us3 was an issue of considerable uncertainty and debate22,24,27.Subsequent further evidence indicated that the gigantic jet wasproduced by a normally electrified storm and was of negativepolarity6. The rebrightening events were accompanied by low-frequency sferics corresponding to the upward transfer of negativecharge, and the appearance of the gigantic jet in video waspreceded 0.8 s earlier by an energetic positive narrow bipolarpulse characteristic of the onset of an upward negative intracloudflash5,6,28. The inferred negative polarity agrees with subsequentmeasurements of gigantic jet sferics4.
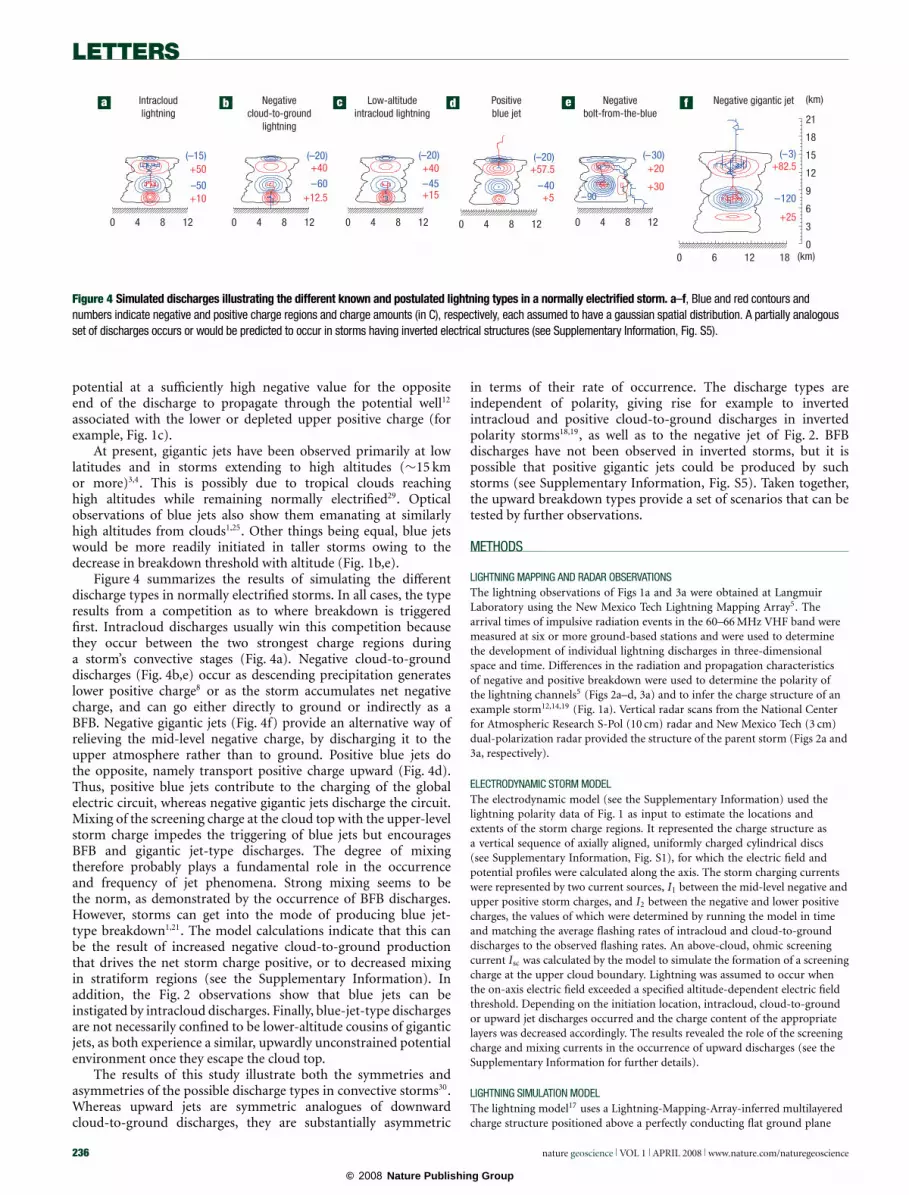
The only way a negative gigantic jet could be produced bya normally electrified storm is that it originate in the mid-levelnegative storm charge. Evidence for how this can happen isprovided by observations of ‘bolt-from-the-blue’ (BFB) lightningdischarges (Fig. 3a). VHF mapping observations show that BFBdischarges begin as regular, upward-developing intracloud flashesin normally electrified storms5,20,28. Instead of terminating inthe upper positive charge, however, the breakdown continueshorizontally out the upper side of the storm and turns downward toground. Although the lightning channel outside the cloud seems tooriginate in the upper positive charge, the leader continues to be ofnegative polarity and the resulting cloud-to-ground stroke lowersnegative charge to ground from the storm mid-level. The mappingobservations show that BFB discharges are surprisingly common innormally electrified storms.
The fact that BFB discharges occur reveals a charge imbalancein which the upper positive charge is depleted in magnitude relativeto the mid-level negative charge, most likely by mixing with upperscreening charge. In exiting the cloud and turning towards ground,BFB discharges seem to be ‘guided’ by inferred positive screening
234 nature geoscience VOL 1 APRIL 2008 www.nature.com/naturegeoscience
© 2008 Nature Publishing Group
LETTERS
Altit
ude
(km
)
y (km)
+150
Altit
ude
(km
)
North–south distance (km)
Altit
ude
(km
)
20000612
Time (HH:MM:SS)
Azimuth
5
Reflectivity (dBZ)
15
10
50 55 60 65 70
0 15 30 45 60
–10
–20
–40
–30
40 50 60 70
4
8
12
000:25:1800:25:1400:25:1000:25:06
2
4
6
8
10
12
0
14
15
0 5 10 15 20
10 5 0 –5
0
2
4
6
8
10
12
14
(+100)
+150
–320
a b
c
d
e
Figure 2 Upward negative jet from an inverted polarity storm on 12 June UTC
during STEPS 2000. a–d, VHF mapping observations of the jet (filled black sources)and preceding intracloud discharge, projected onto the closest vertical radar scanthrough the storm (a; line in plan projection, b). The jet developed ∼2 km above theecho top, beginning immediately above where the intracloud discharge locallyremoved positive charge from the lower storm level (b). Plan radar scans show thatthe radar top was essentially constant at ∼11.5 km altitude above the flash and inthe vicinity of the jet. e, Numerical simulation of the jet discharge.
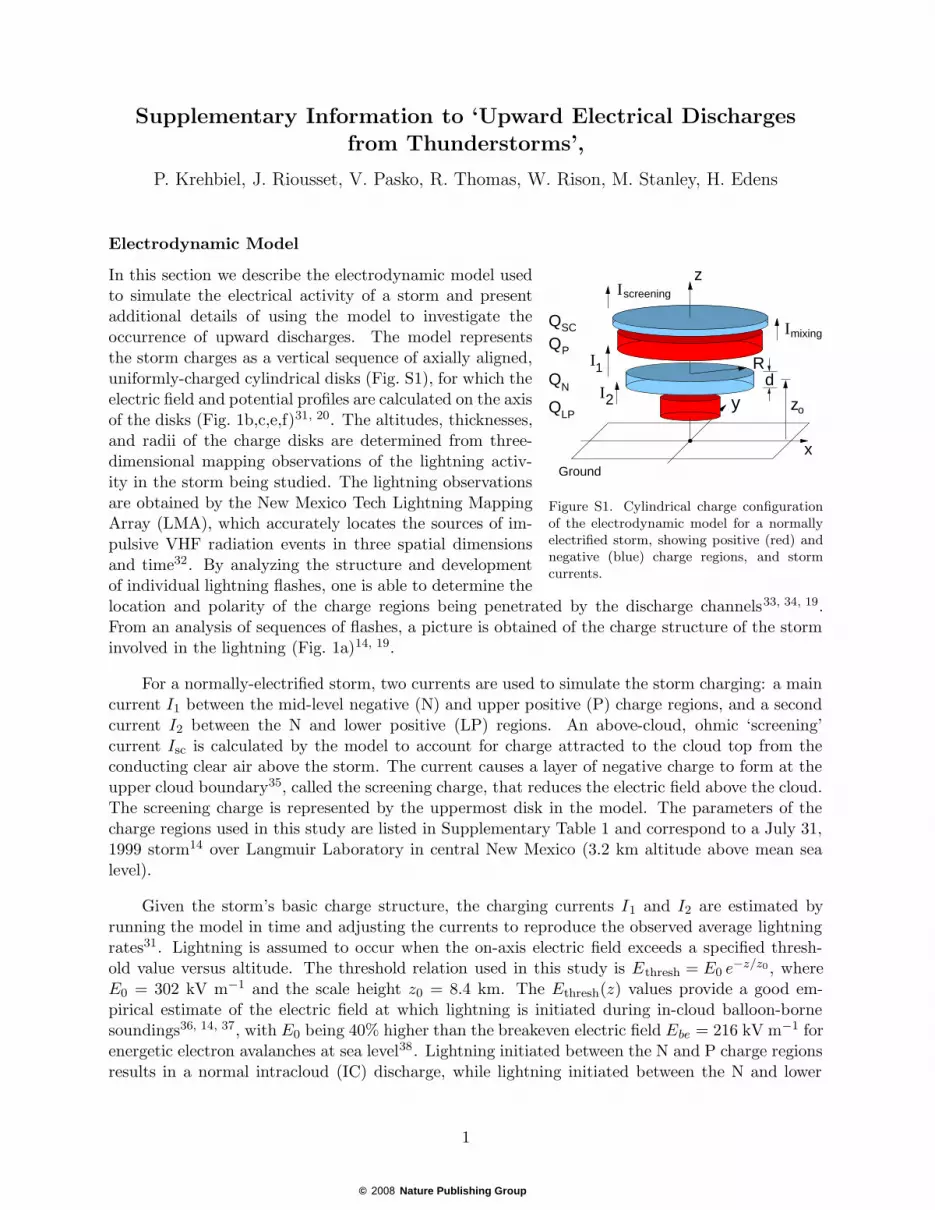
charge attracted to the lateral cloud boundaries by the mid-levelnegative charge. This is supported by simulation experiments whichfind that substantial lateral charge is required to make the dischargeturn downward to ground (Fig. 4e). In the absence of guidingcharge, the preferred discharge mode is upward, as indicated by thenegative gigantic jet simulation of Fig. 4f.
21:51:24 UTC, 02/08/1999
H reflectivity (dBZ)
East–west distance (km)
Altit
ude
(km
)
19/07/2007
Δ
20
15
10
5
35302520
0 10 20 30 40 50 60
a
b
Figure 3 Two bolt-from-the-blue discharges. a, Lightning mapping observationsof a negative BFB, superimposed on a vertical radar scan through the storm. Thelightning began as an upward intracloud discharge between mid-level negativecharge (red sources) and upper positive charge (blue sources), then exited the cloudand went to ground as a negative leader, well away from the storm. The ‘triangle’denotes the negative cloud-to-ground strike point. b, A cloud-enshrouded BFB thatstarted to develop upward above the storm top before branching horizontally backinto the upper part of the storm and turning downward to ground, causing a negativecloud-to-ground discharge on the lower right.
Thus, upward discharges can occur as a result of an intracloudflash that encounters depleted upper positive charge and propagateson out of the top of the storm. That such a discharge can exitthe storm top and start developing upward is indicated by aBFB photograph (Fig. 3b). Once initiated, the upward dischargecan become ‘gigantic’ because it has as its source the mainnegative charge of the storm, capable of producing highly energeticdischarges. Negative gigantic jets are thus the upward analogue ofa downward cloud-to-ground discharge, with the role of the lowerpositive charge in triggering the discharge replaced by screening-depleted upper positive charge. In both cases, the lightningsimulations show that continued propagation of the breakdownchannels into the negative charge region maintains the channel
nature geoscience VOL 1 APRIL 2008 www.nature.com/naturegeoscience 235
© 2008 Nature Publishing Group
LETTERS
(km)
+25
+82.5
(km)
+30
+20
+5
+57.5
+12.5
+40
+15
+40
Intracloudlightning
Low-altitudeintracloud lightning
Positive blue jet
Negativebolt-from-the-blue
Negative gigantic jetNegativecloud-to-ground
lightning
0 4 8 12 0 4 8 12 0 4 8 12 0 4 8 12 0 4 8 12
0 6 12 18
+10
+50
–50
(–15) (–20)
–60
(–20)
–45
(–20) (–30)
–90
(–3)
–120–40
0
3
6
9
12
15
18
21
a b c d e f
Figure 4 Simulated discharges illustrating the different known and postulated lightning types in a normally electrified storm. a–f, Blue and red contours andnumbers indicate negative and positive charge regions and charge amounts (in C), respectively, each assumed to have a gaussian spatial distribution. A partially analogousset of discharges occurs or would be predicted to occur in storms having inverted electrical structures (see Supplementary Information, Fig. S5).
potential at a sufficiently high negative value for the oppositeend of the discharge to propagate through the potential well12
associated with the lower or depleted upper positive charge (forexample, Fig. 1c).
At present, gigantic jets have been observed primarily at lowlatitudes and in storms extending to high altitudes (∼15 kmor more)3,4. This is possibly due to tropical clouds reachinghigh altitudes while remaining normally electrified29. Opticalobservations of blue jets also show them emanating at similarlyhigh altitudes from clouds1,25. Other things being equal, blue jetswould be more readily initiated in taller storms owing to thedecrease in breakdown threshold with altitude (Fig. 1b,e).
Figure 4 summarizes the results of simulating the differentdischarge types in normally electrified storms. In all cases, the typeresults from a competition as to where breakdown is triggeredfirst. Intracloud discharges usually win this competition becausethey occur between the two strongest charge regions duringa storm’s convective stages (Fig. 4a). Negative cloud-to-grounddischarges (Fig. 4b,e) occur as descending precipitation generateslower positive charge8 or as the storm accumulates net negativecharge, and can go either directly to ground or indirectly as aBFB. Negative gigantic jets (Fig. 4f) provide an alternative way ofrelieving the mid-level negative charge, by discharging it to theupper atmosphere rather than to ground. Positive blue jets dothe opposite, namely transport positive charge upward (Fig. 4d).Thus, positive blue jets contribute to the charging of the globalelectric circuit, whereas negative gigantic jets discharge the circuit.Mixing of the screening charge at the cloud top with the upper-levelstorm charge impedes the triggering of blue jets but encouragesBFB and gigantic jet-type discharges. The degree of mixingtherefore probably plays a fundamental role in the occurrenceand frequency of jet phenomena. Strong mixing seems to bethe norm, as demonstrated by the occurrence of BFB discharges.However, storms can get into the mode of producing blue jet-type breakdown1,21. The model calculations indicate that this canbe the result of increased negative cloud-to-ground productionthat drives the net storm charge positive, or to decreased mixingin stratiform regions (see the Supplementary Information). Inaddition, the Fig. 2 observations show that blue jets can beinstigated by intracloud discharges. Finally, blue-jet-type dischargesare not necessarily confined to be lower-altitude cousins of giganticjets, as both experience a similar, upwardly unconstrained potentialenvironment once they escape the cloud top.
The results of this study illustrate both the symmetries andasymmetries of the possible discharge types in convective storms30.Whereas upward jets are symmetric analogues of downwardcloud-to-ground discharges, they are substantially asymmetric
in terms of their rate of occurrence. The discharge types areindependent of polarity, giving rise for example to invertedintracloud and positive cloud-to-ground discharges in invertedpolarity storms18,19, as well as to the negative jet of Fig. 2. BFBdischarges have not been observed in inverted storms, but it ispossible that positive gigantic jets could be produced by suchstorms (see Supplementary Information, Fig. S5). Taken together,the upward breakdown types provide a set of scenarios that can betested by further observations.
METHODS
LIGHTNING MAPPING AND RADAR OBSERVATIONSThe lightning observations of Figs 1a and 3a were obtained at LangmuirLaboratory using the New Mexico Tech Lightning Mapping Array5. Thearrival times of impulsive radiation events in the 60–66 MHz VHF band weremeasured at six or more ground-based stations and were used to determinethe development of individual lightning discharges in three-dimensionalspace and time. Differences in the radiation and propagation characteristicsof negative and positive breakdown were used to determine the polarity ofthe lightning channels5 (Figs 2a–d, 3a) and to infer the charge structure of anexample storm12,14,19 (Fig. 1a). Vertical radar scans from the National Centerfor Atmospheric Research S-Pol (10 cm) radar and New Mexico Tech (3 cm)dual-polarization radar provided the structure of the parent storm (Figs 2a and3a, respectively).
ELECTRODYNAMIC STORM MODELThe electrodynamic model (see the Supplementary Information) used thelightning polarity data of Fig. 1 as input to estimate the locations andextents of the storm charge regions. It represented the charge structure asa vertical sequence of axially aligned, uniformly charged cylindrical discs(see Supplementary Information, Fig. S1), for which the electric field andpotential profiles were calculated along the axis. The storm charging currentswere represented by two current sources, I1 between the mid-level negative andupper positive storm charges, and I2 between the negative and lower positivecharges, the values of which were determined by running the model in timeand matching the average flashing rates of intracloud and cloud-to-grounddischarges to the observed flashing rates. An above-cloud, ohmic screeningcurrent Isc was calculated by the model to simulate the formation of a screeningcharge at the upper cloud boundary. Lightning was assumed to occur whenthe on-axis electric field exceeded a specified altitude-dependent electric fieldthreshold. Depending on the initiation location, intracloud, cloud-to-groundor upward jet discharges occurred and the charge content of the appropriatelayers was decreased accordingly. The results revealed the role of the screeningcharge and mixing currents in the occurrence of upward discharges (see theSupplementary Information for further details).
LIGHTNING SIMULATION MODELThe lightning model17 uses a Lightning-Mapping-Array-inferred multilayeredcharge structure positioned above a perfectly conducting flat ground plane
236 nature geoscience VOL 1 APRIL 2008 www.nature.com/naturegeoscience

© 2008 Nature Publishing Group
LETTERS
(see main text and Fig. 1a). The thundercloud and lightning discharge aremodelled in a three-dimensional cartesian domain using equidistant grids.The electric potential on the side and upper boundaries is calculated so thatthe contributions of all the charges within the simulation domain as well astheir ground images are accounted for. These boundary conditions effectivelyrepresent ‘open boundaries’. The potential at any point in the simulationdomain is calculated with a successive overrelaxation method using thecloud charge structure and the boundary conditions described above. Thedevelopment of bidirectional leaders starts when the cloud charges createan ambient field that exceeds a predefined threshold Einit anywhere in thesimulation domain. Although controlled by different processes, the propagationthresholds of the positive and negative leaders are known to require nearlyidentical fields, which in the present study were assumed to be equal to theinitiation threshold (Einit = E±
th = ±2.16 kV cm−1 at sea level)17. The initiationand propagation thresholds are assumed to scale with altitude z proportionallyto the atmospheric neutral density N (z). The simulated leader channelpropagates iteratively; at each step, one and only one link is added at either thepositive or negative end of the tree. Every point P of the discharge is scannedfor its neighbours P′. Among the points P′ which form with P a potentialdifference with corresponding electric field E(P,P′) such that E(P,P′) ≥ E+
th orE(P,P′) ≤ E−
th, one is chosen to form the next stage of propagation according tothe probability p(P,P′) = |E(P,P′)−E±
th|/∑
P,P′ |E(P,P′)−E±
th| (refs 17,22).After addition of the new segment, the potential is updated to ensure the overallneutrality of the equipotential channel17. The model therefore uses a fractalapproach to introduce stochasticity in a self-consistent model of the lightningchannel, which fully satisfies Kasemir’s hypothesis of equipotentiality andoverall neutrality of the discharge9,11.
LIGHTNING PHOTOGRAPHThe BFB photograph of Fig. 3b was taken with a 38 s time exposure fromLangmuir laboratory at 3,230 m altitude, 30 km distance from the storm, usingan infrared-modified 6 megapixel Canon 300D digital single-lens reflex camerafitted with a Nikon 35 mm/2.0 lens set at f/5.6. The ISO-setting was 100, withoutnoise reduction.
Received 17 January 2008; accepted 26 February 2008; published 23 March 2008.
References1. Wescott, E. M., Sentman, D., Osborne, D., Hampton, D. & Heavner, M. Preliminary results from the
Sprites94 aircraft campaign: 2. Blue jets. Geophys. Res. Lett. 22, 1209–1212 (1995).2. Boeck, W. L. et al. Observations of lightning in the stratosphere. J. Geophys. Res.
100, 1465–1475 (1995).3. Pasko, V. P., Stanley, M. A., Matthews, J. D., Inan, U. S. & Wood, T. G. Electrical discharge from a
thundercloud top to the lower ionosphere. Nature 416, 152–154 (2002).4. Su, H. T. et al. Gigantic jets between a thundercloud and the ionosphere. Nature 423, 974–976 (2003).5. Rison, W., Thomas, R. J., Krehbiel, P. R., Hamlin, T. & Harlin, J. A GPS-based three-dimensional
lightning mapping system: Initial observations in central New Mexico. Geophys. Res. Lett.26, 3573–3576 (1999).
6. Mathews, J. D. et al. Electromagnetic signatures of the Puerto Rico blue jet and its parentthunderstorm. Eos Trans. AGU 83, F91 (2002); Fall Meet. Suppl., Abstract A62D-02.
7. Krehbiel, P. R. The Earth’s Electrical Environment 90–113 (Nat’l. Academy Press, Washington, 1986).8. Williams, E. R. The tripolar structure of thunderstorms. J. Geophys. Res. 94, 13151–13167 (1989).
9. Kasemir, H. W. A contribution to the electrostatic theory of a lightning discharge. J. Geophys. Res.65, 1873–1878 (1960).
10. Mazur, V. & Ruhnke, L. H. Common physical processes in natural and artificially triggered lightning.J. Geophys. Res. 94, 12913–12930 (1993).
11. Mazur, V. & Ruhnke, L. H. Model of electric charges in thunderstorms and associated lightning.J. Geophys. Res. 103, 23299–23308 (1998).
12. Coleman, L. M. et al. Effects of charge and electrostatic potential on lightning propagation.J. Geophys. Res. 108, 4298 (2003).
13. Raizer, Y. P., Milikh, G. M. & Shneider, M. N. On the mechanism of blue jet formation andpropagation. Geophys. Res. Lett. 33, L23801 (2006).
14. Marshall, T. C. et al. Observed electric fields associated with lightning initiation. Geophys. Res. Lett.32, L03813 (2005).
15. Wilson, C. T. R. Investigations on lightning discharges and on the electric field of thunderstorms.Phil. Trans. R. Soc. Lond. A 221, 73–115 (1921).
16. Wilson, C. T. R. A theory of thundercloud electricity. Proc. R. Soc. Lond. A 236, 297–317 (1956).17. Riousset, J. A., Pasko, V. P., Krehbiel, P. R., Thomas, R. J. & Rison, W. Three-dimensional fractal
modeling of intracloud lightning discharge in a New Mexico thunderstorm and comparison withlightning mapping observations. J. Geophys. Res. 112, D15203 (2007).
18. Lang, T. J. et al. The severe thunderstorm electrification and precipitation study. Bull. Am. Meteorol.Soc. 85, 1107–1125 (2004).
19. Rust, W. D. et al. Inverted-polarity electrical structures in thunderstorms in the Severe ThunderstormElectrification and Precipitation Study (STEPS). Atmos. Res. 76, 247–271 (2005).
20. Behnke, S. A., Thomas, R. J., Krehbiel, P. R. & Rison, W. Initial leader velocities during intracloudlightning: Possible evidence for a runaway breakdown effect. J. Geophys. Res. 110, D10207 (2005).
21. Lyons, W. A. et al. Upward electrical discharges from thunderstorm tops. Bull. Am. Meteorol. Soc.84, 445–454 (2003).
22. Pasko, V. P. & George, J. J. Three-dimensional modeling of blue jets and blue starters. J. Geophys. Res.107, 1458 (2002).
23. Wescott, E. M., Stenbaek-Nielsen, H. C., Huet, P., Heavner, M. J. & Moudry, D. R. New evidence forthe brightness and ionization of blue jets and blue starters. J. Geophys. Res. 106, 21549–21554 (2001).
24. Raizer, Y. P., Milikh, G. M. & Shneider, M. N. Leader–streamers nature of blue jets. J. Atmos. Sol. Terr.Phys. 69, 925–938 (2007).
25. Wescott, E. M., Sentman, D. D., Heavner, M. J., Hampton, D. L. & Vaughan, O. H. Jr. Blue jets: Theirrelationship to lightning and very large hailfall, and their physical mechanisms for their production.J. Atmos. Sol. Terr. Phys. 60, 713–724 (1998).
26. Petrov, N. I. & Petrova, G. N. Physical mechanisms for the development of lightning dischargesbetween a thundercloud and the ionosphere. Tech. Phys. 44, 472–475 (1999).
27. Sukhorukov, A. I. & Stubbe, P. Problems of blue jet theories. J. Atmos. Sol. Terr. Phys.23, 725–732 (1998).
28. Thomas, R. J. et al. Observations of VHF source powers radiated by lightning. Geophys. Res. Lett.28, 143–146 (2001).
29. Williams, E. R. et al. Lightning flashes conducive to the production and escape of gamma radiation tospace. J. Geophys. Res. 111, D16209 (2006).
30. Williams, E. R. Problems in lightning physics—the role of polarity asymmetry. Plasma Sources Sci.Technol. 15, S91–S108 (2006).
AcknowledgementsWe thank E. R. Williams for comments on the paper and further references. T. Hamlin, J. Harlin,S. Kieft, W. Winn and S. Hunyady contributed to the operation and data processing of the LightningMapping Array at Langmuir Laboratory and during STEPS. The radar data of Fig. 2a were obtained bythe National Center for Atmospheric Research S-Pol radar. The work was supported by the Physicaland Dynamical Meteorology and Aeronomy Programs of the National Science Foundation.Correspondence and requests for materials should be addressed to P.R.K. or J.A.R.Supplementary Information accompanies this paper on www.nature.com/naturegeoscience.
Author contributionsP.R.K. drafted the manuscript and developed the electrodynamic model. J.A.R. carried out thelightning simulations, prepared the figures and drafted the methods section. J.A.R. and V.P.P. developedthe lightning simulation model. W.R., R.J.T. and P.R.K. developed the Lightning Mapping Array,conducted the field programs and carried out the data analyses for the study. M.A.S. carried outlow-frequency measurements and analyses. H.E.E. obtained the photograph of Fig. 3b. All authorscontributed to discussion of the results and preparation of the manuscript.
Reprints and permission information is available online at http://npg.nature.com/reprintsandpermissions/
nature geoscience VOL 1 APRIL 2008 www.nature.com/naturegeoscience 237
Supplementary Information to ‘Upward Electrical Discharges
from Thunderstorms’,
P. Krehbiel, J. Riousset, V. Pasko, R. Thomas, W. Rison, M. Stanley, H. Edens
Electrodynamic Model
QLP
QN
QP
QSC
I1
2Id
Imixing
zo
screeningI
y
z
x
R
Ground
Figure S1. Cylindrical charge configurationof the electrodynamic model for a normallyelectrified storm, showing positive (red) andnegative (blue) charge regions, and stormcurrents.
In this section we describe the electrodynamic model usedto simulate the electrical activity of a storm and presentadditional details of using the model to investigate theoccurrence of upward discharges. The model representsthe storm charges as a vertical sequence of axially aligned,uniformly-charged cylindrical disks (Fig. S1), for which theelectric field and potential profiles are calculated on the axisof the disks (Fig. 1b,c,e,f)31, 20. The altitudes, thicknesses,and radii of the charge disks are determined from three-dimensional mapping observations of the lightning activ-ity in the storm being studied. The lightning observationsare obtained by the New Mexico Tech Lightning MappingArray (LMA), which accurately locates the sources of im-pulsive VHF radiation events in three spatial dimensionsand time32. By analyzing the structure and developmentof individual lightning flashes, one is able to determine thelocation and polarity of the charge regions being penetrated by the discharge channels33, 34, 19.From an analysis of sequences of flashes, a picture is obtained of the charge structure of the storminvolved in the lightning (Fig. 1a)14, 19.
For a normally-electrified storm, two currents are used to simulate the storm charging: a maincurrent I1 between the mid-level negative (N) and upper positive (P) charge regions, and a secondcurrent I2 between the N and lower positive (LP) regions. An above-cloud, ohmic ‘screening’current Isc is calculated by the model to account for charge attracted to the cloud top from theconducting clear air above the storm. The current causes a layer of negative charge to form at theupper cloud boundary35, called the screening charge, that reduces the electric field above the cloud.The screening charge is represented by the uppermost disk in the model. The parameters of thecharge regions used in this study are listed in Supplementary Table 1 and correspond to a July 31,1999 storm14 over Langmuir Laboratory in central New Mexico (3.2 km altitude above mean sealevel).
Given the storm’s basic charge structure, the charging currents I1 and I2 are estimated byrunning the model in time and adjusting the currents to reproduce the observed average lightningrates31. Lightning is assumed to occur when the on-axis electric field exceeds a specified thresh-old value versus altitude. The threshold relation used in this study is Ethresh = E0 e−z/z0 , whereE0 = 302 kV m−1 and the scale height z0 = 8.4 km. The Ethresh(z) values provide a good em-pirical estimate of the electric field at which lightning is initiated during in-cloud balloon-bornesoundings36, 14, 37, with E0 being 40% higher than the breakeven electric field Ebe = 216 kV m−1 forenergetic electron avalanches at sea level38. Lightning initiated between the N and P charge regionsresults in a normal intracloud (IC) discharge, while lightning initiated between the N and lower
1
© 2008 Nature Publishing Group

positive regions results in a negative cloud-to-ground (−CG) discharge. IC discharges were nomi-nally assumed to reduce the pre-flash storm charges by 50% of the lesser of charges QN and QP .CG discharges reduced QN and QLP by 50% each (assuming |QLP | < |QN |), with the differencebeing the charge lowered to ground. The resulting changes in QN and QP were typically 30-40 C,comparable to values determined from lightning electric field change measurements39, 40, 41.
During the active stage of the July 31, 1999 storm, the storm produced 9 negative CG flashesand 30 IC flashes over a 14 min. time interval31. These average flashing rates are reproduced by themodel for an upward charging current I1 = 1.5 A between the main dipolar (N, P) charge regionsand a downward current I2 = −0.1 A into the lower positive charge (Fig. 1a). The average screeningcurrent to the cloud top was Isc = 0.31 A. To match the relative IC and CG rates, the criteria forCG discharges needed to be more stringent than that obtained from the threshold relation itself;this was accomplished by requiring the electric field E to exceed the breakdown threshold over anominal vertical distance of 500 m before a CG flash was initiated (Fig. 1b).
Fig. S2 shows the variation of the storm charges and currents with time. During the first400 s, I1 and I2 have the values that reproduce the average flashing rates. The storm behaves asa classic relaxation oscillator wherein the charging currents produce linear charge increases thatare periodically relaxed by IC discharges and, less often, by CG discharges. The electric fieldand screening current above the cloud are predominantly upward-directed, corresponding to thedownward transport of negative screening charge to the cloud top. This steadily drives the overallstorm charge toward negative values until a −CG occurs (Fig. S2b). The sudden removal of negativecharge causes the overall storm charge to revert to a positive value, at which point the cycle repeats.Actual storms are not as deterministic as the simple model, but exhibit similar basic behavior.
An important result of the model calculations has been that, when the cloud-top screeningcurrent and charge are accounted for, discharges are predicted to be initiated regularly between theupper positive (P) and negative screening (SC) charges in the uppermost part of the storm31, 42.Due to the imbalance in the magnitudes of the two charges, such breakdown would be expectedto escape the cloud upward. The fact that upward jets do not occur in most storms leads tothe conclusion that the screening charge is normally dissipated in some way, most likely by beingmixed into the upper positive charge. Because atmospheric ions quickly become immobilized oncloud particles inside the storm43, such mixing would occur by convective overturning and turbulentprocesses or by a non-linear field-limiting process44, 45, rather than by steady ohmic conduction∗.The degree of mixing required to suppress the upper level breakdown is relatively strong; for thesimulations of this study (including those of Fig. S2) the mixing was such that a non-replenishedscreening charge would be relaxed away exponentially with a time constant τmix ' 60 s.
For a given mixing rate, the model simulations indicate that upper level discharges can occurif the charging currents in the storm are increased. This is seen after t = 400 s in Fig. S2. Atthat time both currents are doubled in magnitude, to I1 = 3.0 A and I2 = −0.2 A. This has theimmediate effect of doubling the IC and CG flashing rates. In addition, over the next few minutesit also causes the net storm charge to drift toward an average positive value (Fig. S2b). The shiftin net charge increases the vertical electric field in the upper part of the storm and leads to twoupper-level discharges being triggered in the simulation. Electric field and potential profiles for thefirst of the indicated discharges, at t = 648 s, have been presented in Fig. 1. The discharges would
∗Ion attachment causes electrical conduction currents to be negigibly small in clouds46; the model thus assumesthe electrical conductivity to be zero inside the storm.
2
© 2008 Nature Publishing Group

0 100 200 300 400 500 600 700 800 900 1000−100
−50
0
50
100
Cha
rge,
C
Charge vs. time, 073199 storm
0 100 200 300 400 500 600 700 800 900 1000−100
−50
0
50
100
Time, seconds
Net storm charge, mixing, and screening currents vs. time
Cha
rge,
C; C
urre
nt, m
A/1
0
I1 = +1.5 A
I2 = −0.1 A
I1 = +3 A
I2 = −0.2 A
ScreeningUpper (+)Main (−)Lower (+)
Qnet
Imixing
Iscreening
(b)
(a)
Figure S2: Model-calculated temporal variation of the storm charges and currents, showing the behaviorthat reproduces the average CG and IC flashing rates (t = 0 to 400 s) and the effect of doubling the chargingcurrents (starting at t = 400 s). During the initial time interval, the screening current drives the overallstorm charge Qnet toward negative values, while −CG discharges suddenly change the net charge to positivevalues (red line, panel b). The effect of increasing the charging current is to double the IC and CG flashingrates and to cause Qnet to develop a positive offset. The latter leads to the occurrence of upward discharges(red arrows), which cause changes in the screening charge, net charge, and mixing current (black line, panela; red and blue lines, panel b).
transport positive charge upward (Fig. 1d) and are consistent with being of the blue jet variety.They are predicted to occur shortly after a CG discharge removes negative charge from the storm,which maximizes the storm’s positive charge (Fig. S2b) and increases the vertical electric field inthe upper part of the cloud (Fig. 1b).
The primary impetus for the onset of upper level discharges in the above simulation is theincreased rate of occurrence of −CG discharges. This is indicated by the simulation of Fig. S3.Instead of increasing both charging currents, I1 remains constant at 1.5 A and only the lowerpositive charging current I2 is increased, in this case by a factor of three, to I2 = −0.3 A. Thisincreases the −CG rate correspondingly while the IC rate remains essentially as before. As inFig. S2, the net storm charge drifts to an average positive value and upper-level discharges areindicated to start several minutes later, again shortly after −CG discharges. The positive chargebuild-up results from the increased rate at which the CGs remove negative charge from the storm.
The above results indicate that BJs can occur during episodes of enhanced −CG activity orincreased overall lightning rates. The simulation of Fig. S4 illustrates how reduced mixing of thescreening charge can also result in BJs, at normal charging rates. In this simulation no mixing isassumed and the charging rates are left at their original value throughout the full time interval.Upward discharges are predicted to occur frequently, nearly as often as the −CG flashes, andwithout the storm needing to develop average net positive charge. Both features result from the
3
© 2008 Nature Publishing Group

0 100 200 300 400 500 600 700 800 900 1000−100
−50
0
50
100
Cha
rge,
C
Charge vs. time, 073199 storm
0 100 200 300 400 500 600 700 800 900 1000−100
−50
0
50
100
Time, seconds
Net storm charge, mixing, and screening currents vs. time
Cha
rge,
C; C
urre
nt, m
A/1
0
I1 = +1.5 A
I2 = −0.1 A
I1 = +1.5 A
I2 = −0.3 A
ScreeningUpper (+)Main (−)Lower (+)
Qnet
Imixing
Iscreening
(a)
(b)
Figure S3: Same as Fig. S2, except that only the lower positive charging current I2 is increased, showingthat the drift to net positive storm charge and the occurrence of upward discharges results from the increasein the −CG flashing rate.
electric field in the upper part of the cloud not being reduced by mixing. The upward dischargescontinue to be instigated by −CG flashes, but the increased favorability for such breakdown isreflected in some upward discharges occurring after an intervening IC flash and also during theinitiating CG (Fig. S4b). The STEPS jet of Fig. 2 occurred in a relatively stratiform part of thestorm and its occurrence may have benefited from reduced mixing.
In all simulations, the screening charge plays the same role in enhancing the electric field andtriggering blue jet discharges as the lower positive charge plays in triggering −CG discharges.†
While −CG discharges occur on their own, BJs require a charge-imbalancing precursor discharge(such as a −CG) to make their triggering possible. In addition, rather than being triggered imme-diately during the precursor, as in Wilson’s original suggestion16, the breakdown is often delayed5 to 10 s or so after the initiating flash. In the simulations, the delay is manifested by the electricfield not immediately exceeding the breakdown threshold after the CG, so that additional chargingis required for the threshold to be reached. The basic reason for the time delay is more subtlethan this, however, and has to do with a) the buildup of conditions favorable to blue jets occurringgradually with time, and b) the fact that, after each CG, the BJs have to compete with normal ICflashes to be the next discharge in the storm‡. That upward discharges compete with intracloud
†Rather than being initiated in the clear air above the cloud boundary and requiring an unrealistically strongelectric field above the cloud for the discharge to propagate upward, as in the study by Sukhorukov et al.
47, theabove-cloud field is reduced by the screening charge (Fig. 1e) and the upward discharges are triggered in the cloudinterior. The breakdown develops upward primarily by virtue of its channels being maintained at the high electricpotential of the upper part of the storm (Fig. 1f). In addition, the upward breakdown is not restricted to be ofnegative polarity.
‡In particular, after each CG discharge the possibility exists of the next discharge being an IC flash between theN and P charge regions or upper-level breakdown between the P and negative screening charge (e.g., Fig. 1b). IC
4
© 2008 Nature Publishing Group

0 100 200 300 400 500 600 700 800 900 1000−100
−50
0
50
100
Cha
rge,
C
Charge vs. time, 073199 storm
0 100 200 300 400 500 600 700 800 900 1000−100
−50
0
50
100
Time, seconds
Net storm charge and screening current vs. time (no mixing)
Cha
rge,
C; C
urre
nt, m
A/1
0
I1 = +1.5 A
I2 = −0.1 A
ScreeningUpper (+)Main (−)Lower (+)
Qnet
Iscreen
(b)
(a)
Figure S4: Same as Fig. S2, except that the screening charge is not mixed into the upper positive charge,showing the occurrence of a number of upward discharges are predicted to occur in the absence of suchmixing. The charging currents remained constant throughout the full time interval. The storm does notneed to develop a net positive charge for the upward discharges to be triggered, and upward discharges arepredicted to occur almost as often as −CG discharges.
flashes, and are usually preempted by the ICs, is an important point seen both in the electrody-namic calculations and in the lightning simulations that has not been fully considered in previousstudies22, 48, 13. Finally, BJs are not precluded from being triggered immediately during the pre-cursor discharge. This can happen either by chance or by the precursor removing a large fractionof the mid-level charge.
Assuming that upward discharges reduce the upper positive and screening charges by 50%each, analogous to CG discharges, the net upward charge transfer is typically +40-45 C, somewhatlarger in magnitude than the −CG charge amounts.
Supporting Discussion
The electrodynamic simulations suggest that blue jet discharges occur in parts of a storm wheremixing of the screening charge is reduced, and/or during episodes of enhanced CG activity in astorm. Both scenarios are consistent with observational data on BJs, as discussed in the main partof the paper and in more detail below. For storms having enhanced −CG activity, the increased rateat which negative charge is lowered to ground causes the storm to develop an average net positive
flashes almost always win this competition by virtue of the N and P regions being charged actively by the mainstorm current, I1. (By contrast, the screening charge is derived from the passive screening current.) As conditionsfollowing each CG flash become increasingly favorable for an upward discharge, the way the discharge finally happensis by getting close enough to being triggered to win the competition during the post-CG charging interval, ratherthan waiting to be produced immediately during a later CG. These features of the simulations are supported by theobservational result that BJs do not occur simultaneously with other discharges in the storm.
5
© 2008 Nature Publishing Group

charge, thereby increasing the clear-air flow of negative screening charge to the cloud boundary.The equilibrium average positive charge would be such that the increased negative screening influxbalances the average outflux due to the −CG discharges. Because of the exponential increase ofclear-air electrical conductivity with altitude, most of the negative charge flow is to the upper cloudboundary. Blue jets provide an alternate way of balancing the negative CG outflux (equivalently, apositive charge influx), by transporting positive charge out of the upper cloud boundary. Similarly,negative blue jets would tend to be produced by inverted polarity storms following episodes ofenhanced +CG activity.
As noted in a number of studies, storms have periods of increased cloud-to-ground lightning,both negative49, 50 and positive34, 51. In this and previous studies52, model calculations indicatethat the CG rate is controlled primarily by the amount of lower storm charge. For example, inFigs. S2 through S4, −CG discharges were initiated whenever the lower positive charge increasedto ∼15-20 C, more or less independent of the net storm charge and of the intracloud activity.This indicates that the rate at which −CGs occur depends primarily on the strength of the lowerpositive charging current I2 and leads to the inference or prediction that blue jets are favored in astorm when the lower positive charging increases. Such a situation would be expected when hailor graupel is being produced by a storm, due to reverse-polarity (positive) charging of hail duringhail-ice crystal collisions8, 50, 52.
The prediction that blue jets would be preceded by CG discharges is consistent with the limitedobservational evidence of storms that produce such discharges. The studies by Wescott et al.53, 25
found a statistical increase in the cumulative number of −CG discharges a few seconds prior to theoccurrences of the blue jets and blue starters, followed by a decrease in the number of −CGs for afew seconds after the occurrences. The effect was most pronounced for blue jets but was also seenfor blue starters. 10 out of 27 temporally isolated blue jets were found to have occurred within 1 safter a National Lightning Detection Network (NLDN)-indicated −CG discharge within 15 km ofthe jet25. An additional 11 −CGs occurred 1 to 5 s prior to the jet occurrences. Analogous resultswere obtained for blue starters53. The reduction or apparent ‘lull’ in the −CG activity followingthe jets and starters would have reflected the time before the next −CG occurred. The startersand jets did not appear to be associated with particular lightning discharges, as most starters werefound to ‘arise out of the anvil during a quiet (lightning) interval.’ However, the occurrence of−CG flashes prior to the upward discharges was considered possibly to be a ‘factor in creatingthe electric field configuration leading to the initiation of (the) blue starters and jets.’ The bluestarters were found to be loosely concentrated near the centroid of the overall −CG activity, andalso somewhat near the location of reported large hail.§ In a later study23, a single blue jet wasobserved to occur within 4 s of a −CG discharge 14 km from the estimated location of the jet.
The recent report of a gigantic discharge over northeastern Mexico55, published while thispaper was in review, shows a possible similar correlation with CG activity. The discharge occurredfollowing a 4-minute increase in the NLDN-detected +CG rate in one of two storms that couldhave been the source of the event. The increase culminated in a 20-s ‘jump’ in the +CG rate, to
§We note that the jet-producing Arkansas storm system was similar to the June 11 STEPS storm54 that producedthe negative jet of Fig. 2, in that both produced severe winds and hail and developed above 15 km altitude in theirconvective cores. The STEPS storm and other storms like it19, 51, 56 generally consist of a combination of inverted-and normal-polarity electrical structures, and produce both positive and negative CGs. The Arkansas storm mayhave been partially or substantially inverted as well, raising the question whether some of the Arkansas jets were likethe STEPS jet and were negative rather than positive polarity.
6
© 2008 Nature Publishing Group

Figure S5: Illustrative lightning simulations for normal- and inverted-polarity storms, showing the fourpossible types of upward discharges, classified by initiation mechanism (blue jet and gigantic jet) and upwardpolarity (+ and −). Also shown for reference are the common forms of IC and CG flashes in normal andinverted storms. Blue jets will tend to be initiated by a precursor discharge (either CG or IC) that causes acharge imbalance in the storm.
one flash every 5 s, prior to the discharge’s occurrence. The upward discharge was thought to be ofnegative polarity and to have originated in the upper negative charge of an inverted-polarity storm.If so it would have been a large blue jet-type discharge similar in its initiation mechanism to theSTEPS jet of Fig. 2, but in a storm with a higher cloud top (∼14 km above mean sea level).
We have classified upward discharges into two basic categories or types: ‘blue’ jets (BJs) and‘gigantic’ jets (GJs). Heretofore, the two types have been distinguished primarily in terms of theirmaximum altitudes, and possibly their polarities, with blue jets (including blue starters) developingup to lower altitudes than gigantic jets, and appearing to transport positive charge upward, whilegigantic jets transport negative charge upward. If it is assumed that the two types are producedby normally electrified storms, as the observational information has indicated, the present studyindicates that the distinguishing characteristic between them is where they are initiated relative tothe storm charges. The resulting breakdown scenarios give rise to positive blue jets (+BJs) andnegative gigantic jets (−GJs).
In addition to the above, the observations of Fig. 2 show that negative upward jets can beproduced by inverted polarity storms. We identify this as a negative blue jet (−BJ) based on whereit was initiated relative to the storm charges. By extension, the inverted-storm analog of a −GJwould be a +GJ, with each polarity of GJ having as its source the main or mid-level charge of thestorm. The four possible types of upward discharges are summarized in Fig. S5.
***********
7
© 2008 Nature Publishing Group

Table S1: Heights and extents of charge regions for cylindrical disk model; storm of July 31, 1999over Langmuir Laboratory (3 km MSL), and average charge values corresponding to the observedlightning rates.
Charge Layer Altitude Altitude Depth Radius Avg. Charge(km AGLa ) (km MSLb ) (km) (km) (C)
Screening (SC) 8.00 11.00 0.5 4.0 −20Upper Positive (P) 6.75 9.75 1.5 4.0 +60Mid-level Negative (N) 3.75 6.75 1.5 3.0 −58Lower Positive (LP) 2.00 5.00 1.5 1.5 +13
a AGL, above ground level; b MSL, above mean sea level
References
1. Wescott, E. M., Sentman, D., Osborne, D., Hampton, D. & Heavner, M. Preliminary resultsfrom the Sprites94 aircraft campaign: 2. Blue jets. Geophys. Res. Lett. 22(10), 1209–1212(1995).
2. Boeck, W. L. et al. Observations of lightning in the stratosphere. J. Geophys. Res. 100,1465–1475 (1995).
3. Pasko, V. P., Stanley, M. A., Matthews, J. D., Inan, U. S. & Wood, T. G. Electrical dischargefrom a thundercloud top to the lower ionosphere. Nature 416, 152–154 (2002).
4. Su, H. T. et al. Gigantic jets between a thundercloud and the ionosphere. Nature 423, 974–976(2003).
5. Rison, W., Thomas, R. J., Krehbiel, P. R., Hamlin, T. & Harlin, J. A GPS-based three-dimensional lightning mapping system: Initial observations in central New Mexico. Geophys.
Res. Lett. 26(23), 3573–3576 (1999).
6. Mathews, J. D., Stanley, M. A., Pasko, V. P., Wood, T. G., Inan, U. S., Heavner, M. J.& Cummer, S. A. Electromagnetic signatures of the Puerto Rico blue jet and its parentthunderstorm. Eos Trans. AGU 83(47) (2002). Fall Meet. Suppl., Abstract A62D-02.
7. Krehbiel, P. R. The electrical structure of thunderstorms, in The Earth’s Electrical Environ-ment, 90–113, Nat’l. Academy Press, Washington, D.C., 1986.
8. Williams, E. R. The tripolar structure of thunderstorms. J. Geophys. Res. 94(D11), 13151–13167 (1989).
9. Kasemir, H. W. A contribution to the electrostatic theory of a lightning discharge. J. Geophys.
Res. 65(7), 1873–1878 (1960).
10. Mazur, V. & Ruhnke, L. H. Common physical processes in natural and artificially triggeredlightning. J. Geophys. Res. 94, 12913–12930 (1993).
11. Mazur, V. & Ruhnke, L. H. Model of electric charges in thunderstorms and associated lightning.J. Geophys. Res. 103(D18), 23299–23308 (1998).
8
© 2008 Nature Publishing Group

12. Coleman, L. M. et al. Effects of charge and electrostatic potential on lightning propagation. J.
Geophys. Res. 108(D9), 4298 (2003).
13. Raizer, Y. P., Milikh, G. M. & Shneider, M. N. On the mechanism of blue jet formation andpropagation. Geophys. Res. Lett. 33(23), L23801 (2006).
14. Marshall, T. C. et al. Observed electric fields associated with lightning initiation. Geophys.
Res. Lett. 32(3), L03813 (2005).
15. Wilson, C. T. R. Investigations on lightning discharges and on the electric field of thunder-storms. Phil. Trans. Roy. Soc. Lond., A 221, 73–115 (1921).
16. Wilson, C. T. R. A theory of thundercloud electricity. Proc. Roy. Soc. Lond., A 236, 297-317(1956).
17. Riousset, J. A., Pasko, V. P., Krehbiel, P. R., Thomas, R. J. & Rison, W. Three-dimensionalfractal modeling of intracloud lightning discharge in a New Mexico thunderstorm and compar-ison with lightning mapping observations. J. Geophys. Res. 112(D15203) (2007).
18. Lang, T. J. et al. The severe thunderstorm electrification and precipitation study. Bull. Am.
Meteorol. Soc. 85(8), 1107–1125 (2004).
19. Rust, W. D. et al. Inverted-polarity electrical structures in thunderstorms in the Severe Thun-derstorm Electrification and Precipitation Study (STEPS). Atmos. Res. 76(1–4), 247–271(2005).
20. Behnke, S. A., Thomas, R. J., Krehbiel, P. R. & Rison, W. Initial leader velocities duringintracloud lightning: Possible evidence for a runaway breakdown effect. J. Geophys. Res. 110,D10207 (2005).
21. Lyons, W. A. et al. Upward electrical discharges from thunderstorm tops. Bull. Am. Meteorol.
Soc. 84(4), 445–454 (2003).
22. Pasko, V. P. & George, J. J. Three-dimensional modeling of blue jets and blue starters. J.
Geophys. Res. 107(A12), 1458 (2002).
23. Wescott, E. M., Stenbaek-Nielsen, H. C., Huet, P., Heavner, M. J. & Moudry, D. R. Newevidence for the brightness and ionization of blue jets and blue starters. J. Geophys. Res.
106(A10), 21549–21554 (2001).
24. Raizer, Y. P., Milikh, G. M. & Shneider, M. N. Leader–streamers nature of blue jets. J. Atmos.
Solar-Terr. Phys. 69(8), 925–938 (2007).
25. Wescott, E. M., Sentman, D. D., Heavner, M. J., Hampton, D. L. & Vaughan Jr., O. H. Bluejets: their relationship to lightning and very large hailfall, and their physical mechanisms fortheir production. J. Atmos. Solar Terr. Phys. 60, 713–724 (1998).
26. Petrov, N. I. & Petrova, G. N. Physical mechanisms for the development of lightning dischargesbetween a thundercloud and the ionosphere. Tech. Phys. 44, 472–475 (1999).
27. Sukhorukov, A. I. & Stubbe, P. Problems of blue jet theories. J. Atmos. Solar Terr. Phys.
23(13), 725–732 (1998).
9
© 2008 Nature Publishing Group

28. Thomas, R. J. et al. Observations of VHF source powers radiated by lightning. Geophys. Res.
Lett. 28(1), 143–146 (2001).
29. Williams, E. R. et al. Lightning flashes conducive to the production and escape of gammaradiation to space. J. Geophys. Res. 111, D16209 (2006).
30. Williams, E. R. Problems in lightning physics - the role of polarity asymmetry. Plasma Sources
Sci.& Tech. 15(2), S91-S108 (2006).
31. Krehbiel, P. R. et al. Thunderstorm charge studies using a simple cylindrical charge model,electric field measurements, and lightning mapping observations. Eos Trans. AGU 85(47)(2004). Fall Meet. Suppl., Abstract AE23A-0843.
32. Thomas, R. J. et al. Accuracy of the Lightning Mapping Array. J. Geophys. Res. 109, D14207(2004).
33. Thomas, R. J. et al. New Mexico thunderstorms observed by the lightning mapping array,an overview of one season. Eos Trans. AGU 83(47) (2002). Fall Meet. Suppl., AbstractA71B-0097.
34. Hamlin, T. D. The New Mexico Tech Lightning Mapping Array. Ph. D. Dissertation, NewMexico Inst. Mining & Tech., available at http://hdl.handle.net/10136/40, 164 pp., (2004).
35. Brown, K. A., Krehbiel, P. R., Moore, C. B. & Sargent, G. N. Electrical screening layers aroundelectrified clouds. J. Geophys. Res. 76, 2825-2835 (1971).
36. Marshall, T. C., McCarthy, M. P. & Rust, W. D. Electric field magnitudes and lightninginitiation in thunderstorms. J. Geophys. Res. 100, 7097-7103 (1995).
37. Stolzenburg, M. et al. Electric field values observed near lightning flash initiations. Geophys.
Res. Letts. 34, L04804, doi:10.1029/2006GL028777, (2007).
38. Gurevich, A. V. & Zybin, K. P. Runaway breakdown and electric discharges in thunderstorms.Phys. Uspekhi 44, 1119-1140 (2001).
39. Krehbiel, P. R., Brook, M. & McCrory, R. A. An analysis of the charge structure of lightningdischarges to ground. J. Geophys. Res. 84, 2432-2456 (1979).
40. Krehbiel, P. R. An analysis of the electric field change produced by lightning. Ph. D. Dis-sertation, Univ. Manchester Inst. Sci. & Tech., available at http://hdl.handle.net/10136/92,459 pp. (1981).
41. Uman, M. A. The Lightning Discharge. Acad. Press, 377 pp. (1987).
42. Krehbiel, P. R. On the initiation of upward lightning discharges above thunderstorms. Eos
Trans. AGU 86(18) (2005). Jt. Assem. Suppl., Abstract AE11A-05.
43. Pruppacher, H. R. & J. D. Klett Microphysics of Clouds and Precipitation. D. Reidel, Dor-drecht, (1978).
44. Eack, K. B., Beasley, W. H., Rust, W. D., Marshall, T. C. & Stolzenberg, M. Initial resultsfrom simultaneous observation of X rays and electric fields in a thunderstorm. J. Geophys. Res.
101, 29637-29640 (1996).
10
© 2008 Nature Publishing Group

45. Dwyer, J. R. A fundamental limit on electric fields in air. Geophys. Res. Letts. 30, 2055doi:10.1029/2003GL017781 (2003).
46. Rust, W. D. & Moore, C. B. Electrical conditions near the bases of thunderclouds over NewMexico, Quart. J. Roy. Met. Soc. 100, 450-468 (1974).
47. Sukhorukov, J. R., Mishin, E. V., Stubbe, P. & Rycroft, M. J. On blue jet dynamics. Geophys.
Res. Letts. 23, 1625-1628 (1996).
48. Tong, L., Nanbu, K. & Fukunishi, H. Randomly stepped model for upward electrical dischargefrom top of thundercloud. J. Phys. Soc. Japan 74, 1093-1095 (2005).
49. Goodman, S. J. & MacGorman, D. R. Cloud-to-ground lightning activity in mesoscale convec-tive complexes. Mon. Weath. Rev. 114, 2320-2328 (1986).
50. Brown, R. A., Kaufman, C. A., & MacGorman, D. R. Cloud-to-ground lightning associatedwith the evolution of a multicell storm. J. Geophys. Res. 107, 4397 (2002).
51. Weins, K. C., Rutledge, S. A. & Tessendorf, S. A. The 29 June 2000 supercell observed duringSTEPS. Part II: Lightning and charge structure. J. Atmos. Sci. 62, 4151-4177 (2005).
52. Mansell, E. R., MacGorman, D. R., Ziegler, C. L., Straka, J. M. Charge structure and lightningsensitivity in a simulated multicell thunderstorm. J. Geophys. Res. 110, D12101 (2005).
53. Wescott, E. M. et al. Blue starters: Brief upward discharges from an intense Arkansas thun-derstorm. Geophys. Res. Letts. 23, 2153-2156 (1996).
54. Lang, T. J. & Rutledge, S. A. Kinematic, microphysical, and electrical aspects of an asymmetricbow-echo mesoscale convective system observed during STEPS 2000. J. Geophys. Res. in press,(2008).
55. van der Velde, O. et al. Analysis of the first gigantic jet recorded over continental NorthAmerica. J. Geophys. Res. 112, D20104 (2007).
56. MacGorman, D. R. et al. TELEX: The Thunderstorm Electrification and Lightning Experi-ment. Bull. Amer. Meteorol. Soc. in press, (2008).
11
© 2008 Nature Publishing Group