gentrification or upward social mobility: the canal zone
TRANSCRIPT
150 S o f i e V e r m e u l e n & E r i c C o r i j n
Gentrification or uPward social moBility: the canal ZoneSofie Vermeulen & Eric Corijn
It cannot be said that contemporary Brussels is living with its waterways. Within the city the river Senne has been vaulted, deteriorating into a drainage channel. Its tributary, the Maelbeek, once fed 58 ponds. They are presently reduced to six. The river Woluwe, flowing from Watermael-Boisfort to the Senne in Vilvorde, forms the third valley of the Brussels-Capital Region. The city is built straight across the valleys, so to speak ‘against the current’. The only really visible waterway is the industrial canal, or more exactly the canals: a Sea Canal connecting Antwerp and Brussels up to the Beco docks and a more shallow and narrow canal leading from the docks to Charleroi. In 1561, Mary of Hungary connected Brussels with the sea by way of the Willebroeck Canal. It ended at the present Place Sainte-Cathérine. In 1832, its course was adapted to join the Brussels-Charleroi Canal.
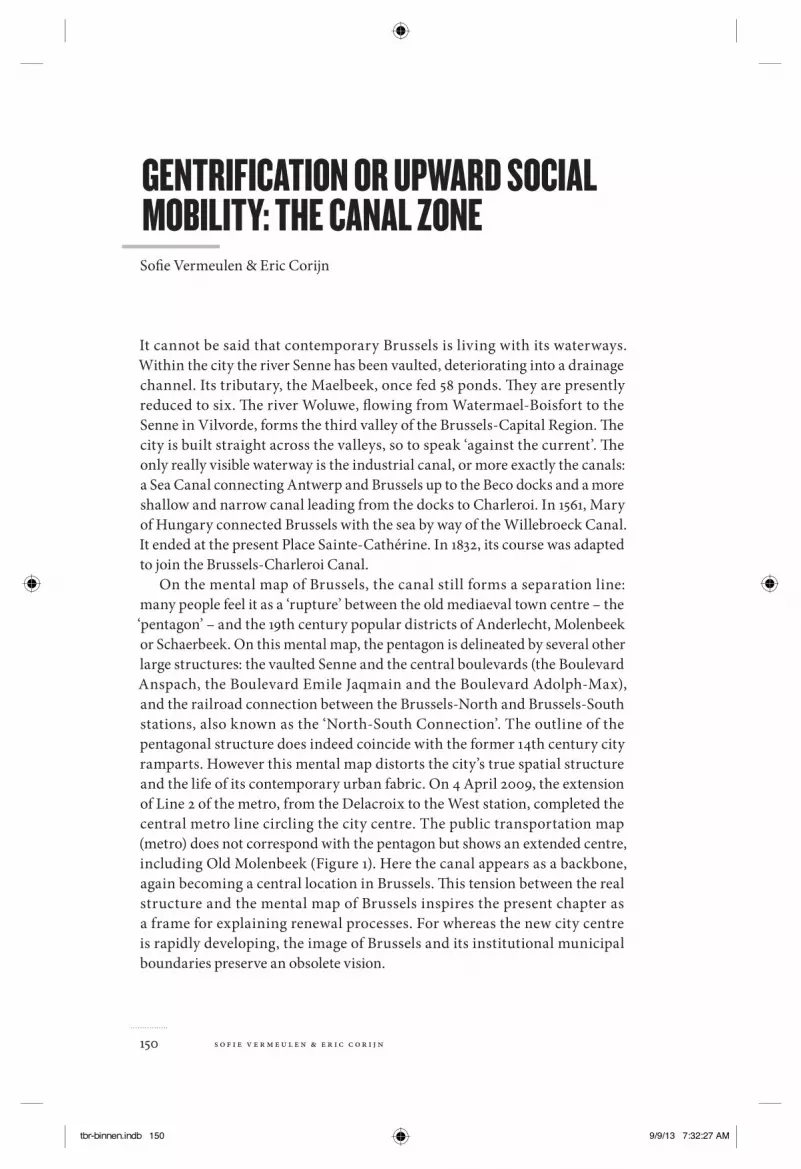
On the mental map of Brussels, the canal still forms a separation line: many people feel it as a ‘rupture’ between the old mediaeval town centre – the ‘pentagon’ – and the 19th century popular districts of Anderlecht, Molenbeek or Schaerbeek. On this mental map, the pentagon is delineated by several other large structures: the vaulted Senne and the central boulevards (the Boulevard Anspach, the Boulevard Emile Jaqmain and the Boulevard Adolph-Max), and the railroad connection between the Brussels-North and Brussels-South stations, also known as the ‘North-South Connection’. The outline of the pentagonal structure does indeed coincide with the former 14th century city ramparts. However this mental map distorts the city’s true spatial structure and the life of its contemporary urban fabric. On 4 April 2009, the extension of Line 2 of the metro, from the Delacroix to the West station, completed the central metro line circling the city centre. The public transportation map (metro) does not correspond with the pentagon but shows an extended centre, including Old Molenbeek (Figure 1). Here the canal appears as a backbone, again becoming a central location in Brussels. This tension between the real structure and the mental map of Brussels inspires the present chapter as a frame for explaining renewal processes. For whereas the new city centre is rapidly developing, the image of Brussels and its institutional municipal boundaries preserve an obsolete vision.
tbr-binnen.indb 150 9/9/13 7:32:27 AM

151G e n t r i f i c a t i o n o r u p wa r d s o c i a l m o b i l i t y : t h e C a n a l Z o n e
Fig. 1. The Brussels Canal Zone - Emerging projects (Nov 2011-March 2012)Cartography: Vermeulen & De Zwarte Hond. Adapted from AWB (2011).
tbr-binnen.indb 151 9/9/13 7:32:27 AM

152 S o f i e V e r m e u l e n & E r i c C o r i j n
between opportUnities And strAtegic plAnning
Today the area is confronted with several challenges and tensions which have only recently occurred on the poltical agenda. Figure 1 presents a non-exhaustive overview of all the mushrooming projects in the Canal Zone that have been intiated by either private, public or semi-public actors between November 2011 and March 2012. Some of them are of small scale or are rather monofunctional in their envisioned functional programme. Others focus on a mixed development, both on local and larger spatial scales. Over the last years, the public authorities in Brussels have initiatited different types of urban (renewal) projects and investment programmes in the Canal Zone. The regional planning frame1 defines different strategic development zones (14 Leverage Zones and 14 Zones of Regional Interest (ZIR)). A large number of them are (partly) located in the perimeter of the Canal Zone (eight Leverage Zones2 and eight Zones of Regional Interest).3 Apart from these specific areas, a series of 37 socio-economic projects have been initiatied in the frame of the European EFRO-FEDER programme on regional development (EFRO-FEDER, 2007). They are all located in (a part of) the Canal Zone, the Priority Intervention Zone (ZIP-PIZ). The neighbourhood contracts were created in the beginning of the 90s. The development programmes aim for the renovation of public space, punctual housing projects and socio-economic activities on the local scale in a transversal way. This programme is underpinned by a contractual collaboration between the region and the muncipalities (Berger, 2008; Noël, 2009). Next to the delimitation of all these investment areas, the 90s were characterised by an area in which the renovation and support of housing would be priority4 (Guérin, Mauffroy, & Raynau, 2007; Noël, 2009; Wayens, 2009). An important part of this area largely stretches across the central Canal Zone, adjacent to the northwestern border of the small ringroad.
1 Here we aim at the double-layered planning frame applicable on the administrative territory of the Brussels-Capital Region, including a strategic and transversal spatial development plan (PRD II, gewOP II, 2002) and a regional land use plan (PRAS-GBP, 2001).
2 The Leverage Zones encompass the site of the Military Hospital, the shunting yard Schaerbeek-Formation, and the railway sites of Weststation, Midi and Forest. Other Leverage Zones are the former maritime complex Tour & Taxis, a Leverage Zone called the Canal Zone, and the Erasmus site (PRD, GewOP, 2002).
3 These are Helihaven and Gaucheret, just opposite the Tour & Taxis site on the right bank of the canal, the the bridge Van Praet connecting Schaerbeek to Laken, Van Volxem in Saint-Gilles/Forest and the former Verterinary School in Anderlecht. A part of these Zones of Regional Interest (ZIR-GGB) overlap with the Leverage Zones of which Weststation, Midi (City Port) and Tour & Taxis belong to the perimeter of the Brussels Canal Zone.
4 This area is called de Ruimte voor Versterkte Ontwikkeling van Huisvesting en Renovatie (RVOHR) in Dutch or l’Espace du Développement Renforcé du Logement (EDRL) in French.
tbr-binnen.indb 152 9/9/13 7:32:27 AM

153G e n t r i f i c a t i o n o r u p wa r d s o c i a l m o b i l i t y : t h e C a n a l Z o n e
The regional government5 produces and manages middle class housing and a series of industrial terrains. Finally, a series of infrastructural projects have been initiated which have been financed via a federal funding programme specificly oriented towards Brussels, the Beliris fund. An example of a lingering project is that of the renovation of the junction of the Ninoofsepoort (but which is currently gathering speed again).
Besides the numerous projects initiated by the government, real estate developers are showing increasing interest (e.g. Atenor, Project T&T, Mestdagh, and so on) in the area. A policy of opportunity needs to be transformed into a development vision for the Canal Zone. This is perhaps the greatest challenge if Brussels wants to cope in a socially inclusive manner with the consequences of its current rapid demographic growth.
The pressure from the many real estate projects is not the only factor. Other dynamics are at work. Between 2008 and 2009, civil society and academics joined forces. The ‘Etats Généraux de Bruxelles’ (Citizens’ Forum of Brussels) gave an overview of Brussels society and formulated the key challenges. Sixteen scientific memoranda on sixteen topics were debated on an equal number of discussion evenings with the participation of 2600 people. In the final session, the Canal Zone and its many young inhabitants were the focus of attention. At the same time, Platform Kanal, a network of citizens and actors in the area, published its first trilingual newspaper, the ‘Journal Kanal’. The paper not only painted a diverse picture of the district’s activities, but also called for a large-scale networking effort within the civil society in order to actively monitor developments in the Canal Zone. Since then, the Canal Zone has become a central issue in Brussels’ planning discussions. On 23 March 2009, the urban associations BRAL and Disturb organised a well-attended debate on the future of the Brussels Canal Zone, with introductory presentations by Brussels’ Bouwmeester (Master Architect), the residents’ association Quartier Maritime, Platform Kanal and the coordinating cell ADT/ATO.6 The Brussels Citizens University, from 1-13 October 2010, likewise stressed the importance of the diversity and the central role of the Canal Zone. Also the ‘official’ regional urban project – the Brussels GewOp (2002) – is due to be revised. The regional coalition agreement of 12 July 2009 decided to initiate a review. The third regional development plan for Brussels boasts a new adjective: the Regional Plan for Sustainable Development (PRDD- GPDO). One of the main
5 This is done via a para-public institution, SDRB-GOMB, de Gewestelijke Ontwikkelingsmaatschappij voor het Brussels Hoofdstedelijk Gewest or Société de Développement pour la Région de Bruxelles-Capitale.
6 Agentschap voor Territoriale Ontwikkeling van het Brussels Gewest, Agency for the Territorial Development of the Brussels Region. The ADT-ATO is a semi-public organisation established in 2008 and charged by the regional government with the development of ten Strategic Development Areas as defined in the Plan for International Development of Brussels (PDI-PIO, 2007).
tbr-binnen.indb 153 9/9/13 7:32:27 AM

154 S o f i e V e r m e u l e n & E r i c C o r i j n
focal points, also of the commissioned preliminary studies, is the development of a new image for the Canal Zone. This is one of the priorities of the Agency for Territorial Development.
It can therefore be stated that since 2009 the awakening to the dynamics and the planning needs of the Canal Zone has accelerated. Initially, they were defined mainly for the central section, but soon they were extended to the northern and southern parts. In a word, the Canal Zone occupies a prominent place in the Brussels public debate. As an indication of the way these challenges are rooted in the past, we will present a brief summary of several decisive historical studies of the urban planning developments and changes concerning town planning in the Brussels Canal Zone.
trAces of the pAst
The Brussels Canal Zone still shows remarkable traces of its historical past. Some traces are still visible; others have been erased over time. Within the built-up area today one finds a heterogeneous collection of past and present images and symbols that are anachronistically placed next to each other. This urban tissue can be read as a palimpsest, a piece of parchment that has been written over and over again. Former working-class areas with typical workman’s houses and often abandoned monumental breweries reside side by side; second-hand car sellers are located next to some renovated industrial cranes along the quays as silent witnesses of the industrial past. The slaughterhouse is located near a bunch of large retail shops. A small yachting club is found next to an urban inland seaport. In the Canal Zone one finds the older and newer types of industry, ranging from scrap depots or high-tech science parks, to new film and recording studios. Commercial retail and catering range from teahouses and hip bars to top design and oriental furniture or tapestry shops.
The Canal Zone’s history, its industrialisation and urbanisation, is tightly connected to the economic development of the city. Furthermore, the Canal Zone witnessed parallel initiatives of demolition, renewal, embellishment and protection of architectural and industrial heritage and resulted in the particular diversity of the built-up environment, but also shaped the daily practices of its residents and visitors. In the last few decades Brussels shifted from an industrial to a post-Fordist economy which inevitably affected this zone.
tbr-binnen.indb 154 9/9/13 7:32:27 AM

155G e n t r i f i c a t i o n o r u p wa r d s o c i a l m o b i l i t y : t h e C a n a l Z o n e
the Abc-Axis: connecting Antwerp, brUssels And chArleroi (1551-1863)
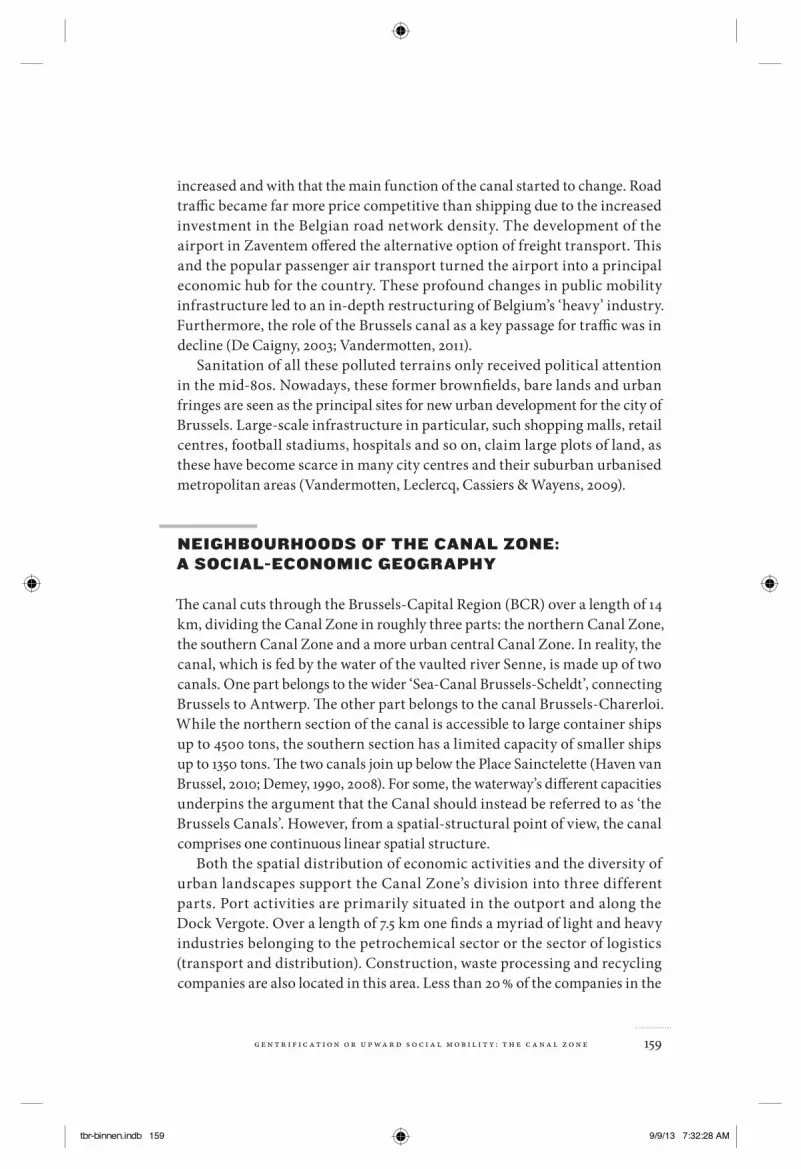
Since the early ages the Brussels settlement used the river to transport goods and passengers to Antwerp. Unfortunately, the river Senne had – and still has – a remarkably unstable water f low and was difficult to navigate. That is why, starting in the 15th century, local Brussels tradesmen increasingly pleaded for a canal between Brussels and Antwerp. The digging of the canal between Brussels and Willebroek started in 1551. It opened up ten years later in 1561. Since the 17th century, numerous propositions were made to extend the Brussels canal towards the industrial basin (silon wallon) of Charleroi. In 1827, only 150 years after the first ‘building permit’, the digging of the canal Brussels-Charleroi began. After some interruptions in the construction works due to a rise in costs, the canal Brussels-Charleroi opened in 1863. Once the Canal Brussels-Charleroi was connected to the Canal Brussels-Willebroeck via the ‘Connection Canal’, the ABC-axis was finally realised. Figure 2 shows an overview of the successive stages of the canal development and the replacement of the inner port towards the periphery.
Throughout mediaeval times, the meandering Senne had a highly variable water f lux. Industrialisation, dense housing conditions and an absent wastewater system, turned the river Senne into an open sewage. The canal that connected Brussels with Willebroek in 1551 did not provide any solution to this unhygienic situation. By the middle of the 19th century, several epidemics felled parts of the population living in the city centre. Some politicians attributed this to the unhygienic role of the river Senne. This was indeed true, yet the same politicians also used these epidemics as an opportunistic and rhetorical argument for a vast make-over and re-embellishment of the city centre. Brussels had its own hygienist movement. Many city elites (with higher purchasing power) left the city centre for the peripheral suburbs, which were then located in the current Leopold Quarter and the Louise District. In order to nurture the cities’ tax base, the public government of the city of Brussels aimed at re-attracting these elites with a large investment in city centre renewal. A period marked by architectural design resulted in several proposals for renovating the new central boulevards as well as in outstanding Art Nouveau housing, luxury hotels and covered shopping galleries with the ‘flagships projects’ of the time (Deligne, 2003; Demey, 1990).
By 1865, the mayor of Brussels, Jules Anspach, favoured the design of architect Leon Suys for vaulting about 2 km of the river Senne in the city centre. Next to the vaulting, a construction of several ‘overflows’ was undertaken. They would serve as water reservoirs for excessive rainfall to avoid flooding. The design also proposed a complete renewal of what is now called the Boulevard
tbr-binnen.indb 155 9/9/13 7:32:27 AM

156 S o f i e V e r m e u l e n & E r i c C o r i j n
Anspach, and implied the expropriation of over 1100 dwellings (Demey, 1990). Suys’ design was subject to large resistance because of the foreseen expropriation, but also the high construction costs did not evoke much sympathy. However, the resistance could not prevent the adoption of the mayor’s plans. The first construction works vaulted a small part of 2km of the river, between 1867 and 1871. In order to achieve these works, the river flow was temporary redirected. The rest of the river Senne, about 6 km, took longer because of the interruptions due to both world wars; the vaulting was completed between 1931 and 1955 (Deligne, 2003; Demey, 2008). To date, the canal serves as a water reservoir to prevent flooding which clarifies the relatively low water level in the inner city, between the outport and Dock Biestebroeck.
becoming An inlAnd seAport (from the 1850s)
The successive expansions of the intra-muros port led to serious traffic congestion between and alongside the docks, which negatively impacted surrounding trade. And secondly, the lengthening of the canal towards Charleroi led to lower water levels in Brussels. Consequently, several docks in Brussels’ intra-muros port were regularly out of water. The inner port gradually relocated away from the historical city centre and the current port took shape. Port equipment and infrastructure, related installations such as cranes, and of course all the economic and trade activities relocated to the northern part of the 19th century belt (also referred to as the second urban belt of Brussels). (Demey, 1990, 2008).
Fig. 2. The evolution of the river Senne into two canalsCarthography: Vermeulen. Adapted from Van Brabant (2009).
tbr-binnen.indb 156 9/9/13 7:32:28 AM

157G e n t r i f i c a t i o n o r u p wa r d s o c i a l m o b i l i t y : t h e C a n a l Z o n e
At the same time as the canal towards Charleroi was opened, debate began on enlarging and modernising the canal towards Antwerp. In 1900 the works for the ‘extra muros’ inland seaport started. The last inner-city docks were filled in. However, the overall completion of the planned modernisation works only finished in 1993, about 90 years later. The modernisation works also consisted in constructing a railway station for freight transport on the site of Tour & Taxis, after a design made by the architects Henri Van de Velde and Constant Bosmans. The specific location next to the canal led the public authorities to dub the multimodal transport site as a ‘maritime railway station’. The economic activities at the site had a major spatial impact on the surrounding neighbourhoods and fuelled its importance in the region. By the 60s the maritime station employed about 3000 people (Vanderhulst, Ngoma, & Kempen, 2010).
To sum up, all the modernisation works – from the relocation of the intra-muros port towards the outer-pentagon, over straightening of the canal trajectory and the reorganisation of the water drainage between the river Senne and the canal, to the development of the Tour & Taxis site – led both to the Brussels port becoming an inland seaport and a ‘regular’ coal canal becoming a Sea Canal (Figure 2). On a more general scale, the works also instigated further industrialisation by the renewal of water-bound economic activity in the Brussels Canal Zone.
tbr-binnen.indb 157 9/9/13 7:32:28 AM

158 S o f i e V e r m e u l e n & E r i c C o r i j n
Industrial heyday
Over the 19th century, industrialisation in Brussels rapidly increased, especially in the Canal Zone. Factories of all sorts such as breweries, steel industries, lead factories and so on, sprung up along the canal. Due to a growing demand for different types of coal, shipping increased. From the 20th century onwards, coke was imported from Germany, England and Poland and shipped via the canals Willebroeck, Brussels and Charleroi (De Caigny, 2003). The developed railway system instigated expanding activities in storage and transshipment. Initially the right bank of the canal became largely industrialised. Later on, industrialisation expanded towards the swampier left bank. At the time, the industrial basin stretched out over the municipalities of Molenbeek-Saint-Jean, Anderlecht, Brussels, Laken and Neder-over-Heembeek.
Brussels’ industry experienced its heyday from the post-Second World War period until the 1960s. Around 1970 about 164,000 people were employed in the industrial sector (Vandermotten, 2011). With its numerous warehouses and large service supply such as customs, the site of Tour & Taxis proved to be a nodal point for both industrial activities and employment until the end of the 80s. By the 20th century, the industrial basin of Brussels stretched from the city of Vilvorde in the north to Clabecq in the south and was the principal site of industrial employment of the country, even ahead of Liège, Antwerp and Ghent (De Caigny, 2003).
De-industrialisation: a changing role for the canal as an ABC-axis?
Since the 1950s, the Walloon coke industry experienced a severe decline. The production of charcoal decreased, which in turn had an important impact on the iron and steel industry. Steel industry relocated nearer to the coast, towards Ghent and Dunkirk. Consequently, the importance of the inward port of Brussels declined. From the 50s onwards fewer factories opted for a location along the canal and numerous industries in the area closed their doors. Both Brussels’ industry and industrial activities in Vilvorde saw a decrease in their economic activities (De Caigny, 2003).
By the 70s Brussels’ industry started to dwindle, impacted by the rapid growth of the service sector (the third sector). As such, the post-industrial restructuring that took place in Brussels resembled that of many other European and US cities. Many industries closed down, economic recession led to social conflicts. The closing of the Volkswagen car factory in Forest, for example, brought about important strikes in the 60s. Territories attributed to industrial land use fell sharply. In sum, economic differences between regions
tbr-binnen.indb 158 9/9/13 7:32:28 AM
159G e n t r i f i c a t i o n o r u p wa r d s o c i a l m o b i l i t y : t h e C a n a l Z o n e
increased and with that the main function of the canal started to change. Road traffic became far more price competitive than shipping due to the increased investment in the Belgian road network density. The development of the airport in Zaventem offered the alternative option of freight transport. This and the popular passenger air transport turned the airport into a principal economic hub for the country. These profound changes in public mobility infrastructure led to an in-depth restructuring of Belgium’s ‘heavy’ industry. Furthermore, the role of the Brussels canal as a key passage for traffic was in decline (De Caigny, 2003; Vandermotten, 2011).
Sanitation of all these polluted terrains only received political attention in the mid-80s. Nowadays, these former brownfields, bare lands and urban fringes are seen as the principal sites for new urban development for the city of Brussels. Large-scale infrastructure in particular, such shopping malls, retail centres, football stadiums, hospitals and so on, claim large plots of land, as these have become scarce in many city centres and their suburban urbanised metropolitan areas (Vandermotten, Leclercq, Cassiers & Wayens, 2009).
neighboUrhoods of the cAnAl Zone: A sociAl-economic geogrAphy
The canal cuts through the Brussels-Capital Region (BCR) over a length of 14 km, dividing the Canal Zone in roughly three parts: the northern Canal Zone, the southern Canal Zone and a more urban central Canal Zone. In reality, the canal, which is fed by the water of the vaulted river Senne, is made up of two canals. One part belongs to the wider ‘Sea-Canal Brussels-Scheldt’, connecting Brussels to Antwerp. The other part belongs to the canal Brussels-Charerloi. While the northern section of the canal is accessible to large container ships up to 4500 tons, the southern section has a limited capacity of smaller ships up to 1350 tons. The two canals join up below the Place Sainctelette (Haven van Brussel, 2010; Demey, 1990, 2008). For some, the waterway’s different capacities underpins the argument that the Canal should instead be referred to as ‘the Brussels Canals’. However, from a spatial-structural point of view, the canal comprises one continuous linear spatial structure.
Both the spatial distribution of economic activities and the diversity of urban landscapes support the Canal Zone’s division into three different parts. Port activities are primarily situated in the outport and along the Dock Vergote. Over a length of 7.5 km one finds a myriad of light and heavy industries belonging to the petrochemical sector or the sector of logistics (transport and distribution). Construction, waste processing and recycling companies are also located in this area. Less than 20 % of the companies in the
tbr-binnen.indb 159 9/9/13 7:32:28 AM

160 S o f i e V e r m e u l e n & E r i c C o r i j n
outport use the canal as a mode of sustainable transportation inland (Haven van Brussel, 2010). The same is true for port-related activities in the southern part of the Canal Zone, outside the pentagon.
The central Canal Zone is characterised by a very dense urban fabric. Here, economic activities are not functionally related to the canal. While this part still comprises numerous depots and workshops dating from the 19th and 20th century, many of them are vacant or have been reconverted over the last decennia (Brussels-Capital Region & Brussels Regional Development Agency, 2012; Wermiel, 2013). The southern part of the canal one finds additional port activities related to the petrochemical and construction economies, yet these port economies are not as abundant compared to those located in the northern Canal Zone. They define the urban landscape to some extent, especially along the Dock Biestebroeck in Anderlecht. Furthermore, economy goes hand-in-hand with recreation. The popular residential boats, the recreational boulevard and playgrounds along the Dock Biestebroeck give the Brussels Canal Zone a certain character.
So far, some points have been made concerning the urban morphology and the economic activities one finds in the Brussels Canal Zone. This illustrates the heterogeneity of the Brussels Canal Zone. An analysis starting from a municipal perspective would not sufficiently represent this diversity since social changes related to housing, exclusion and urban migration often operate at multiple scales, ranging from the local to the global. Furthermore, to gain a detailed understanding of the challenges at stake, there is a need for a micro-sociologic analysis in order to contextualise dynamics in a multi-scalar way. To present such a socially comprehensive narrative and avoid an administrative limitation of the social geography of the canal, the Brussels Canal Zone is analysed from the perspective of the neighbourhood. Before entering into this specific analysis, the following section frames the Canal Zone development in the context of larger systemic shifts and sets out the specific challenges ahead.
brUssels’ post-fordist shift
The present development of the Canal Zone is embedded in the transformation of Brussels from the capital of industrial Belgium into a small metropolis, the capital of Europe in an era of post-industrial globalisation. Today a tension is building between the economic functional development of the area and its residential function.
For decades the Canal Zone has been subjected to various spatial and social developments, presenting a prime example of what Doreen Massey (1984) called the ‘geological metaphor’. The spatial structure of the city is layered, as
tbr-binnen.indb 160 9/9/13 7:32:28 AM

161G e n t r i f i c a t i o n o r u p wa r d s o c i a l m o b i l i t y : t h e C a n a l Z o n e
a result of the successive ‘sediments’ the different accumulation regimes have left behind in the course of time. Each historical period is characterised by a dominant socio-economic model, an accumulation regime comprising the dominant mode of production. This installs a particular social relationship, a social model, reflecting the economic position of the many. This social relationship also presents spatial characteristics, ways of connecting housing and work, places for industry, shopping or entertainment. This spatiality in turn forms the context for the socio-cultural reproduction of the same social relationships. Each accumulation regime has, so to speak, a specific spatial disposition, creating the environment of the social order. Space is therefore both a product and a medium of society. The interaction between space as a product and space as a medium develops in stages, in long waves as it were. There are periods of ‘symbiosis’, of successful reproduction, and there are periods of crisis. When the economic structure changes, it impacts the space, disturbing the social environment. When this happens, the spatial structure is no longer adapted and tensions and shifts arise. The Canal Zone is in such a stage.
As explained before, this is the area where in the 19th century the industrial revolution entered Brussels. It coincided with the urban expansion beyond the mediaeval ramparts, beyond the pentagon. This was a classic industrialisa-tion: factories, surrounded by (poor) housing for their workers. At the start of the 20th century, social and political struggle and the rising standard of living they created, led to the first suburbanisation movements. This was the era of social housing and garden cities, the start of the second, residential Brussels belt. In the working class neighbourhoods of the Canal Zone, space was created for renovation and new people. Several of these neighbourhoods have remained ‘places of arrival’ in the city. New workers coming to the city settled in the cheapest districts. Especially after the Second World War, with the economic boom of the 60s, the working class neighbourhoods changed appearances. In the heydays of ‘Fordism’, with 5 % economic growth and a socially-programmed rising standard of living, these neighbourhoods were abandoned. Acquiring a house of one’s own, most often in the more affordable suburbs, buying a car to commute to work, purchasing durable appliances in order to alleviate the domestic economy of the working wife, became the vectors of economic success. The economy boomed, leading to a rapid sub-urbanisation. The available (lowly paid) jobs on the labour market and the (cheaper) units on the housing market were occupied by newcomers, guest workers and immigrants. They aspired to the same upward social mobility and to an analogous move to the better residential districts. They wanted to assimilate. But they were blocked by the crisis of the 80s. Mass unemployment and pay freezes halted social and territorial mobility. The working class neighbourhoods of the Canal Zone became migrant neighbourhoods. They
tbr-binnen.indb 161 9/9/13 7:32:28 AM

162 S o f i e V e r m e u l e n & E r i c C o r i j n
concentrated unemployment, discrimination and neglect, finally earning the label of ‘underprivileged neighbourhoods’. At the time, there was no Brussels government that could offer a response. The market and national politics steered the direction.
In this context of changing social paradigms – from an industrial welfare state to a neoliberal competitive urban service economy – the neighbourhood, as a place of socio-cultural reproduction, was also changing its nature. Meert and Kesteloot (1999; 2000) refer to Polanyi (1944) and Mingione (1991) in their analysis of socio-economic spheres of integration. In our society, integration in the market exchanges, mostly through the earning of income on the labour market, is the dominant survival strategy. Most people try to sell their labour to an employer, in exchange for wages. The value of labour depends on the degree of schooling and specific skills and also on social negotiations determining wages, working conditions and the social security system. This system becomes the backbone of (occasional) redistribution when people drop out of the labour market. In this way the sick, the old, the unemployed and the disabled receive a replacement income.
According to Polanyi, this is the second integration mechanism. Through central collection (taxes and contributions), resources and services remain generally available. This includes various forms of replacement incomes and benefits, together with public services such as education and healthcare. In the classic welfare state, both integration mechanisms – market and welfare – work together, founded on a principle of general employment and the solidary redistribution it supports. In principle everyone works and benefits recipients are the exceptions.
Once economic integration through work becomes inaccessible for a large part of the population, redistribution mechanisms and their legitimacy come under fire. They become part of a debate on ‘solidarity’ and ‘social integration’, regulating not only inclusion but also and primarily exclusion. Segmentation and fragmentation of society come under discussion. People refer to a multicultural society with communities as important social building blocks.
In this context Polanyi’s third economic integration mechanism gains importance. ‘Reciprocity’ is the exchange of giving and taking, of favours and favours in return, within social networks with ‘fixed’ members, most often defined by family ties, ethnic and cultural communities or neighbourhood networks. This reciprocity is mainly local, between more or less acquainted people, and responds to very precise needs and demands. It requires a measure of proximity. Reciprocity is the foundation of communities.
These three economic integration models always work together in a certain relationship, in which the balance can change according to the mode of production, the accumulation regime or the location and social group. In
tbr-binnen.indb 162 9/9/13 7:32:28 AM

163G e n t r i f i c a t i o n o r u p wa r d s o c i a l m o b i l i t y : t h e C a n a l Z o n e
so-called underprivileged neighbourhoods, the exclusion from the labour market and partly from the welfare system is relatively large, forcing people to rely more on network solidarity than elsewhere. The so-called informal economy combines market exchanges with reciprocity in a semi-legal regulation. Kesteloot and Meert (1993) have documented this soundly for the neighbourhoods in the Canal Zone.
In the neoliberal crisis years of the 80s and 90s, the Canal Zone becomes isolated. The residents fall back on more local and social networks, as society evolves towards a more international tertiary economy, supported by the new middle classes. Various parts of the zone are thrown upon their own resources and develop their own particularity. This involves demographic characteris-tics: migrants, the unemployed, youth, and so on. A local ethnic economy comes into being. Communitarianism develops, as people look for their own religious or ethnic identity. In this evolution, neighbourhoods are claimed as proprietary territories. Both the dominant group and the underprivileged divide the city. Within the neighbourhood, specific rules of conduct evolve into general social directives. When these are expressed overly explicitly, conflicts with the police arise. Or conflicts with newcomers or visitors refusing to submit to the local particularity.
Apart from these endogenous developments, the neighbourhoods are impacted by two paradoxical exogenous factors. On the one hand, the inter-nationalisation and tertiarisation of Brussels influences the housing market, consisting for a very large part of rental housing. In this respect, Brussels is a special case. It has relatively few social housing and property owners but a great many rental accommodations (Bernard & Van Mieghem, 2005; Bernard, Zimmer, & Surkin, 2009; Corijn & Vloeberghs, 2009). The upward pressure on prices in the neighbourhoods and gentrification areas east of the pentagon pushes the lowest income categories towards the cheaper neighbourhoods across the canal, increasing their population density and poverty even more. On the other hand, the lower prices in the Canal Zone attract enterprising newcomers. This again starts some gentrification of both economic activities and inhabitants.
Although the neighbourhood of the Rue A. Dansaert is a typical example of upgrading since the 80s and 90s, with a dislodgement of inhabitants and activities, the left bank of the Canal Zone in particular is still characterised by relative isolation and exclusion from the dominant economic trends. This socio-geographic fragmentation, reinforced by the institutional division of the region in various municipalities, creates territorially different combinations of the three integration mechanisms mentioned above. In general it can be said that the market economy dominates and is supplemented by redistribution, but this is less so in the underprivileged neighbourhoods. Market economy
tbr-binnen.indb 163 9/9/13 7:32:28 AM

164 S o f i e V e r m e u l e n & E r i c C o r i j n
can only integrate part of the population. A large group has to rely on redistribution and reciprocity, on several forms of ‘welfare’. Redistribution is mostly controlled by local public authorities and administrations, informal economy by social networks. Both processes create a degree of localism.
This means the functioning of spatiality is supported differently according to the population group and its position in the balance of social power. Again it will be useful to explicitly examine several theoretical or analytical tools. Lefebvre (1974) already suggested the need of a distinction between ‘conceived space’ (‘espace conçu’), ‘experienced space’ (‘espace vécu’) and ‘perceived space’ (‘espace perçu’). ‘Conceived space’ is the result of the production of space. It is the space of the planners, the architects, of finance and government, instituting a spatial disposition of society. Spatial practices combine production and use, reproduction of social and spatial practices. Here the perceived space, ‘espace perçu’ of daily life comes into being. This perception is in turn represented in ‘experienced’ space, ‘espace vécu’, combining experience with meaningful images and symbols. This chapter is not the place for a critical discussion of the difficulties of this approach. Let it suffice to point at the plurality of spatiality, the different positions and perspectives of social actors, and the conflicts arising from the combination of perspectives that form the daily life of the city. In her analysis of the public dimension in the urban context, Lyn Lofland (1998) also develops a triple division. Next to public space and private space, she distinguished parochial space. In public space, all rules of publicity and accessibility apply, whereas private space, apart from some general codes of conduct, is subjected to the particular. But the most frequent variant is the third form, in which the public dimension submits to private or group regulation and exclusively functions as such. One urban public space is constantly put under pressure by both others, which are also always present. The private, individualised, egocentric use of space and the subcultural, group related presence of social practices, mark the public space and make it special, with its specific symbolic order.7 This particular dialectic between the triads transforms each space into a local specificity. As a large gap exists/develops between the planned space and the general public dimension and the perceived and experienced space of the parochial or privatised space, the control and accessibility of the space become sources of tension. This can be observed in several squares of the Canal Zone: a tension between local regulatory and control mechanisms and the general, public rules. A tension between localism and generality, between communitarianism and socialisation.
As stated in the introduction, we believe that presently the regional dynamics are putting this relative isolation under pressure. This is happening
7 See Corijn (2011) for more information on the subject.
tbr-binnen.indb 164 9/9/13 7:32:28 AM

165G e n t r i f i c a t i o n o r u p wa r d s o c i a l m o b i l i t y : t h e C a n a l Z o n e
in a paradoxical manner. On the one hand, the regional market economy is growing. Supported by the aff luent population, it tends to expand its activities towards the second belt and the periphery. On the other hand, the metropolitan development needs to preserve a strong centrality. This function expands to the west, intruding on the territory of the underprivileged neighbourhoods. This defines the exact interactions and challenges for the area. A new relationship between space as product and space as medium is on the agenda. The metropolitan functions will very probably return to the Canal Zone. Existing initiatives and trends point in that direction. The market will create new openings for both production and consumption. This activity partly conflicts with the local economic situation, with its strong components of ‘redistribution’ and ‘reciprocity’.
Three scenarios can be envisaged. Either the underprivileged neighbour-hoods shield themselves from this new centrality and maintain the current survival economy through a form of ghettoisation, creating a ‘no-go zone’. This is a very improbable scenario. Or the market exchange expands its role in the area, importing its own personnel from other city districts and demanding that the Canal Zone spatially adapts to this new economic development. This is form of (revanchist) gentrification, doubtlessly leading to dislodgement of both the residential function and the local economy. It is a plausible but socially undesirable scenario. In the third scenario, the local residents succeed in participating in the new developments, turn them their way, make the other two economic integration mechanisms compatible with the market, and ‘profit’ from the dynamics. This scenario requires two fundamental conditions. Firstly, the local residents have to be socially and culturally prepared to participate in these metropolitan central functions. This primarily means openness towards, in their perception, ‘foreign’ urban users, in other words, an opening up of the communitarian regimes. Secondly, the market must submit to this scenario and cede the directing function to the government and politics. This implicates a rather profound shift of political balances and ways of government. This third scenario is undoubtedly the most difficult, but also the most sustainable and socially sound solution. We therefore need to develop a more precise analysis of the population of the Canal Zone.
tbr-binnen.indb 165 9/9/13 7:32:28 AM
166 S o f i e V e r m e u l e n & E r i c C o r i j n
twenty-five neighboUrhoods
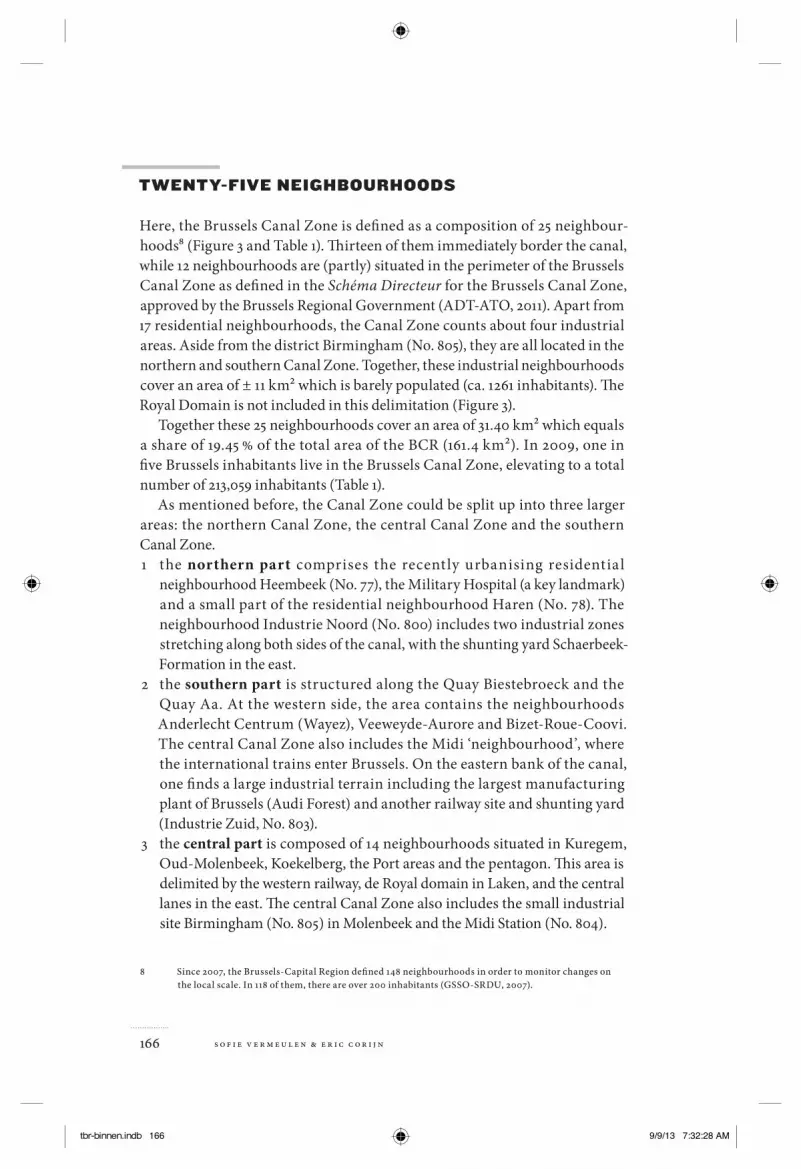
Here, the Brussels Canal Zone is defined as a composition of 25 neighbour-hoods8 (Figure 3 and Table 1). Thirteen of them immediately border the canal, while 12 neighbourhoods are (partly) situated in the perimeter of the Brussels Canal Zone as defined in the Schéma Directeur for the Brussels Canal Zone, approved by the Brussels Regional Government (ADT-ATO, 2011). Apart from 17 residential neighbourhoods, the Canal Zone counts about four industrial areas. Aside from the district Birmingham (No. 805), they are all located in the northern and southern Canal Zone. Together, these industrial neighbourhoods cover an area of ± 11 km2 which is barely populated (ca. 1261 inhabitants). The Royal Domain is not included in this delimitation (Figure 3).
Together these 25 neighbourhoods cover an area of 31.40 km2 which equals a share of 19.45 % of the total area of the BCR (161.4 km2). In 2009, one in five Brussels inhabitants live in the Brussels Canal Zone, elevating to a total number of 213,059 inhabitants (Table 1).
As mentioned before, the Canal Zone could be split up into three larger areas: the northern Canal Zone, the central Canal Zone and the southern Canal Zone.
the 1 northern part comprises the recently urbanising residential neighbourhood Heembeek (No. 77), the Military Hospital (a key landmark) and a small part of the residential neighbourhood Haren (No. 78). The neighbourhood Industrie Noord (No. 800) includes two industrial zones stretching along both sides of the canal, with the shunting yard Schaerbeek-Formation in the east.the 2 southern part is structured along the Quay Biestebroeck and the Quay Aa. At the western side, the area contains the neighbourhoods Anderlecht Centrum (Wayez), Veeweyde-Aurore and Bizet-Roue-Coovi. The central Canal Zone also includes the Midi ‘neighbourhood’, where the international trains enter Brussels. On the eastern bank of the canal, one finds a large industrial terrain including the largest manufacturing plant of Brussels (Audi Forest) and another railway site and shunting yard (Industrie Zuid, No. 803).the 3 central part is composed of 14 neighbourhoods situated in Kuregem, Oud-Molenbeek, Koekelberg, the Port areas and the pentagon. This area is delimited by the western railway, de Royal domain in Laken, and the central lanes in the east. The central Canal Zone also includes the small industrial site Birmingham (No. 805) in Molenbeek and the Midi Station (No. 804).
8 Since 2007, the Brussels-Capital Region defined 148 neighbourhoods in order to monitor changes on the local scale. In 118 of them, there are over 200 inhabitants (GSSO-SRDU, 2007).
tbr-binnen.indb 166 9/9/13 7:32:28 AM

167G e n t r i f i c a t i o n o r u p wa r d s o c i a l m o b i l i t y : t h e C a n a l Z o n e
Table 1: Selected neighbourhoods located in the Brussels Canal ZoneSource: Wijkmonitoring, 2012. Data 2009 and calculations made by author.
tbr-binnen.indb 167 9/9/13 7:32:29 AM

168 S o f i e V e r m e u l e n & E r i c C o r i j n
the northern And soUthern cAnAl Zone
The northern and southern Canal Zone (21.92 km2) strongly differ from the central Canal Zone. About half of the area of both parts (10.25 km2) is used for secondary activities such as industry, logistics and transports. As a result, both peripheral zones are less inhabited compared to the central Canal Zone: only one third of the total population of the Canal Zone lives in these parts. The northern Canal Zone (10.36 km2) counts 17,094 inhabitants, mainly living in the neighbourhoods Heembeek and Haren, while the area of the southern canal is of the same size (11.56 km2) yet includes seven much more populated neighbourhoods (64,90 inhabitants). In terms of demographic structure, levels of education, annual revenues, housing and neighbourhood satisfaction, both the northern and southern Canal Zone converge towards the regional averages. When excluding both industrial neighbourhoods (Industrie Noord and Industrie Zuid), about a quarter of the population (23.4 %) are youngsters (17 years old), while 15.6 % are above 65 years old and about half of the population are single (42.6 %). The average annual income per inhabitant in both zones is
Fig. 3. The Brussels Canal Zone: a mosaic of 25 neighbourhoodsCarthography: Vermeulen. Realised by means of UrbIS © Distribution and Copyright BRIC (2013).
tbr-binnen.indb 168 9/9/13 7:32:29 AM

169G e n t r i f i c a t i o n o r u p wa r d s o c i a l m o b i l i t y : t h e C a n a l Z o n e
slightly lower than the regional average (€ 11,681 against € 13,126 a year) and one person in five is unemployed (19.95 % in 2008). Three out of every four people have a Belgian identity card (76.93 %). About 60 % is employed in the public sector or works as a white collar employee in the private sector. Nearly two people out of three (61.3 %) live in a house built after 1961.
So in general, the northern and southern Canal Zone neighbourhoods can be characterised as lower to middle class neighbourhoods, with a relatively recent housing stock with an average level of comfort and a rather large percentage of people with a Belgian identity card. Of course one has to take into account the internal differences between the seven neighbourhoods. Besides, caution is required regarding some regional averages, which can be utterly problematic in Brussels (especially concerning unemployment rates and high school drop-out rates for example). But they face different challenges than those being faced by neighbourhoods located in the central Canal Zone. For example, traditional environmental issues come to the fore due to the presence of industry. The northern Canal Zone faces environmental nuisance related to the petrochemical industry and the incinerator and there are discussions regarding the redevelopment of the shunting yard Schaerbeek-Formation or the localisation of a new prison in Haren. The southern Canal Zone is subject of discussion concerning the redevelopment of the Quay de Biestebroek in Anderlecht in terms of balancing recreational and port-related activities. The demographic expansion the region is witnessing today also impacts the central zones in terms of housing development. Typical questions are: do these neighbourhoods have to absorb the demographic expansion which is mainly situated in the central Canal Zone? And to what extent is the region capable of guiding a spatial development balancing industrial activities and residential development?
the centrAl cAnAl Zone
The central Canal Zone has a very different character in comparison to the northern and southern areas. Firstly, the morphology of the urban fabric is much more complex. Successive cycles of socio-economic development such as of industrial Fordism, the rise of the welfare state and post-modern developement, involve different types of urban expansion in line with specific societal demands. This results in a rapidly changing functional use of the existing urban fabric. Some original functions of buildings remain the same, for example depots and warehouses or working class dwellings, and the canal remains a principal road for industrial transport. Other dynamics represent reconversion strategies, such as the transformation of factories or
tbr-binnen.indb 169 9/9/13 7:32:29 AM

170 S o f i e V e r m e u l e n & E r i c C o r i j n
warehouses into lofts or new tertiary economic centres, working class housing becomes middle class while the canal is reshaped as a recreational water front. On top of this reconversion and re-use, new constructions replace or fill in detoriated the urban fabric. First, the resulting spatial outlay presents a highly diverse fabric of highly populated neighbourhoods, a dense network of urban functions such as public and social services, commercial and cultural activities, which is less observed in the northern and southern Canal Zone. Secondly, the neighbourhoods in the central Canal Zone are completely diverse in terms of their inhabitants. Some neighbourhoods continue to be identified as popular, while others are increasingly subject to an urban make-over: public spaces are renovated, housing stock improved and a greater part of the population reclaims the city centre. In particular, the western part of the central Canal Zone disposes of one of the more affordable housing stock in the Brussels-Capital Region. As a result, both poor and young families find homes in these neighbourhoods. Furthermore, the neighbourhoods in the central Canal Zone have always served as ‘neighbourhoods of arrival’ (Saunders, 2011; Van de Candelaere, 2012). Brussels has always been a city of migration, yet the mechanisms of the housing market influence the residential patterns of foreigners in Brussels at large. While those coming from more well-off western areas found homes mainly in the south-eastern districts of the Brussels-Capital Region, others ended up in Molenbeek, Anderlecht or the city centre. As a result, the central neighbourhoods have always been a mixture of many different cultures and present a very specific demographic and ethnic structure.
The central part, including 14 neighbourhoods, counts 131,275 inhabitants which are distributed over 54,549 households (2009). The main characteristics observed are:
An increasing population. — In the 90s some of the neighbourhoods felt the urban exodus to which the Brussels-Capital Region was subjected. Recently, this trend has changed: in the central Canal Zone, a population growth of ca. 20 % was observed between 2001 and 2009 (BISA-IBSA, 2013).One third of the total population (33.62 % in 2009) is of foreign —nationality.9 Most of them have a Mediterranean background: the Moroccans are the largest group (ca. 12 %), followed by the French (ca. 2.5 %), the Italians (2.4 %), the Turks (2.1 %) and the Spanish (1.5 %). The Portuguese, Greek or Congolese all represent about 1 % of the people living in the central Canal Zone (Cosmopolis, 2010). An increasing number of eastern European
9 These numbers do not cover eventual changes in nationality, nor do they represent cultural or ethnic backgrounds of inhabitants.
tbr-binnen.indb 170 9/9/13 7:32:30 AM

171G e n t r i f i c a t i o n o r u p wa r d s o c i a l m o b i l i t y : t h e C a n a l Z o n e
migrants and Brazilians are located in the central Canal Zone. On the regional level, it is estimated that one in two inhabitants has non-Belgian roots (Vandecandelaere, 2012).A large share of youngsters and young adults and relatively fewer elderly —persons. About one inhabitant in three is under 17 years old, while 20.38 % of those living here are between 18 and 29 years old meaning that nearly 40 % of the population is under 30. The latter group lives in the neighbourhoods Dansaert and Begijnhof-Diksmuide in particular. Those of retirement age (over 65 years) are poorly represented in these neighbourhoods (7.8 %).Very low revenues per inhabitant yet some extreme internal differences. —In 2009 the average annual income in the neighbourhoods of the central Canal Zone came close to € 8200 a year per inhabitant. This is about 30 % lower compared to the regional average (ca. € 13,100 per capita per year). In some neighbourhoods such as Historical Molenbeek (No. 16) or Weststation (No. 15), incomes decrease to about 43 % of the regional average. In terms of financial capital, the neighbourhoods in the central Canal Zone are the most fragile of the BCR, except the districts Dansaert and Begijnhof-Diksmuide. For the latter, revenues are still lower than the regional average but by 10-20 %. These low incomes represent the relative popular character of the neighbourhoods and the high rates of unemployment, especially amongst young people.10An unqualified housing stock lacking basic comfort. — Although investment programmes have focussed on renovation and construction over the last years, a big challenge remains. In 2001, one in five dwellings still lacked basic comfort (central heating and a private bathroom) and was relatively small (64 m2, or 26 m2 per inhabitant). About two thirds of the dwellings (68.5 %) were rented. The overall age of the housing stock (about 60 % was built before the Second World War) contributes to these low levels of housing conditions.A lack of public space and a low appreciation of the direct environment — . Although Brussels is generally considered a green city due to its many parks, the Foret de Soigne and the Royal Domain, the central Canal Zone remarkably lacks public (green) areas. High rates of impermeable surfaces and a lack of public green areas contribute to the generally negative perception that inhabitants have of this area in terms of tidiness, peace, the esthetic appeal of buildings and air pollution.
10 Although one has to take into account the young demographic structure of those neighborhoods when looking at unemployment rates, the levels still remain alarmingly high (see for example Corijn & Vloeberghs, 2009).
tbr-binnen.indb 171 9/9/13 7:32:30 AM
172 S o f i e V e r m e u l e n & E r i c C o r i j n
A cAse of gentrificAtion And sociAl exclUsion?
Socio-spatial patterns in cities largely depend on the demographic structure of those living there and the socio-economic and cultural profiles of the neighbourhoods. As Kesteloot illustrates in his book, the dual socio-spatial structure of Brussels is largely inf luenced by the dynamics regulating the housing market. The more deprived neighbourhoods of the city are largely situated in the central Canal Zone. Hence, negative side effects of gentrification processes in these neighbourhoods have to be monitored with particular attention in order to avoid processes of social exclusion of the most vulnerable groups. But what is meant by the term ‘gentrification’?
Crossing the Brussels canal from Molenbeek to the Bourse, presents an interesting showcase of the pocket gentrification of the central Canal Zone (Van Criekingen, 2006; Van Criekingen & Decroly, 2003). A walk along the axis connecting both spots presents different stages of a relatively slow gentrification processes. While the neighbourhood Dansaert changed from a popular area in the 70s towards a trendy design neighbourhood today, the Chaussée de Gand became a vivid shopping street providing oriental food, furniture, tapestries, halal meat and so on.
Gentrification
Gentrification is an often used term referring to a process of urban change
in a neighbourhood that is related to ‘… the influx of ‘different’ people to those
there already – a new class of highly educated, highly skilled and highly paid
residents are moving in.’ (Lees, Slater, & Wyly, 2008). The term emerged in the
60s in London and has been coined by sociologist Ruth Glass. In describing the
social transition of different neighbourhoods in London, she used the term
gentrification to refer to the arrival of the ‘gentry’ and an outflux of – poorer –
West-Indian migrants living there.
Current theories on gentrification assemble two strands of scholarship
(Lees & Ley, 2008). One strand focussed on the structural dynamics of the
housing market and the impact this had on socio-spatial exclusion (see for
example, Smith (1996)). The other strand revealed insights on the impact
of individual newcomers on the atmosphere and living conditions in such
neighbourhoods (see for instance, Carpenter & Lees (1995)). In Brussels,
gentrification remains somehow limited (Van Criekingen, 2006). An example of
such a process is illustrated by the case Rue A. Dansaert – Chaussée de Gand in
the central Canal Zone.
tbr-binnen.indb 172 9/9/13 7:32:30 AM

173G e n t r i f i c a t i o n o r u p wa r d s o c i a l m o b i l i t y : t h e C a n a l Z o n e
Historical Molenbeek
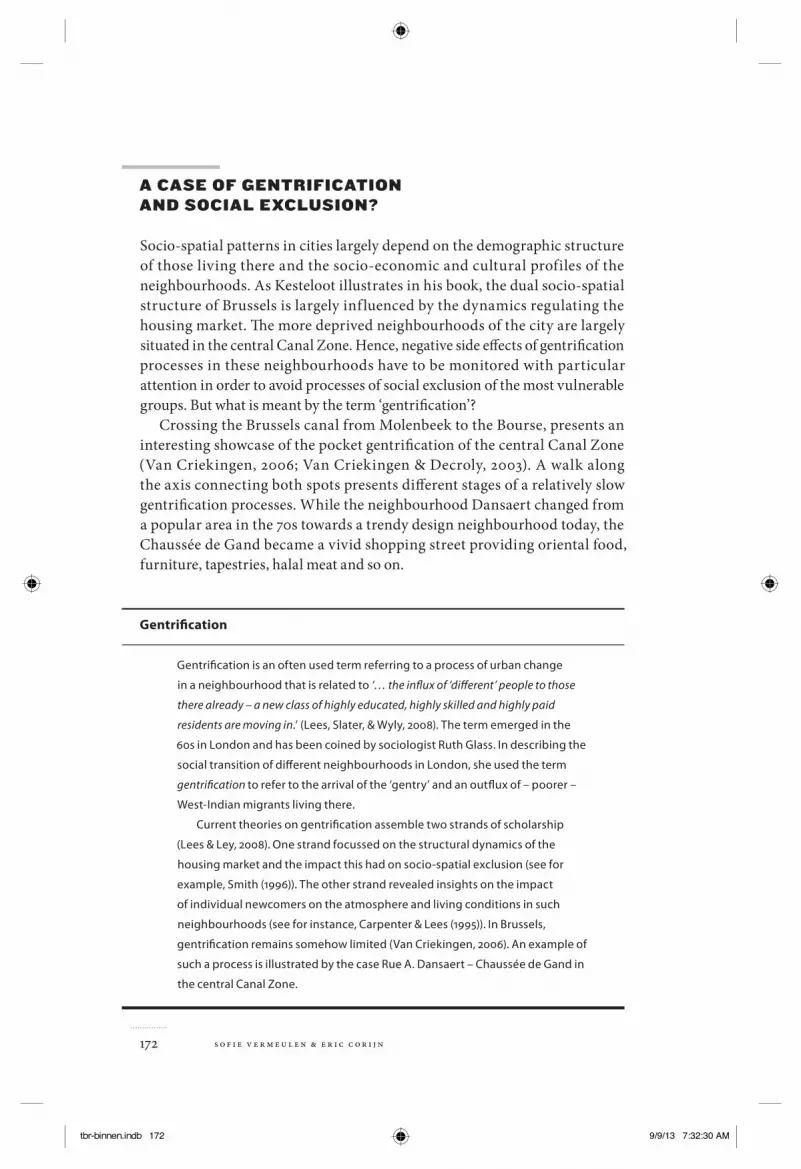
The neighbourhood of Historical Molenbeek (0.71 km2) is located at the west bank of the Canal in the municipality of Molenbeek-Saint-Jean (Figure 4). This neighbour hood, urbanised in industrial times, is one of the most densely populated in the BCR today: in 2010 the district counted over 18,000 inhabitants, resulting in a population density of 25,439 inhabitants per m2, which is nearly four times more than the regional average of 6,751 inh/km2 (IBSA-BISA, 2010). The eastern border of the neighbourhood is adjacent to the Brussels Canal and the western side borders the inner ring road that is part of the pentagon. The Chaussée the Gand is the central shopping street of the area, yet other structuring spaces are the Parvis Saint-Jean-Baptiste and the church, the city hall, the parc Bonnevie, and the Rue Ribaucourt. At the north-eastern side, the very busy Avenue Leopld II functions as a rather strict barrier while the western border of the neighbourhood is much less linear. Since industrial times, Historical Molenbeek functioned as a neighbourhood hosting newcomers to the city. This is ref lected in the figures relating to population growth. While the region suffered an urban exodus in the 80s, the neighbourhood only experienced a slightly diminished population (–1.4 %). This was completely reversed during the 90s: 1,557 new inhabitants settled in the area between 1991 and 2001, corresponding to a net growth of 11.3 %, versus 2.0 % in the BCR (Cosmopolis, 2008a).
The average household in Historical Molenbeek is slightly larger compared to the regional average (2.78 versus 2.09 persons per household). Although the share of single households is similar to the regional average (one in two households), the neighbourhood counts a significant amount of large households compared to other districts. Furthermore, the district has a high number of children and youngsters. Although adults between 30 and 44 years old cover the largest share in the population (22.86 %), pupils between 6 and 17 years old are the second-largest group in the area (20.06 %). Including babies (0-3 years) and toddlers (3-5 years), this share surges up to 32.91 %! In other words: about one person in three is under 19 years old. This could be partly explained by the presence of larger migrant families. Another reason lies in the arrival of young families, looking for affordable housing which becomes particularly difficult in Brussels (IBSA-BISA, 2010).
The culturally diverse and migrant atmosphere in Historical Molenbeek is largely the result of the various ethnic roots and the many different lifestyles of its inhabitats. In 2010, 30.43 % of the inhabitants had Belgian nationality, against 69.57 %. The largest group is of North African nationality (12.62 %), the second largest group hails from the Europen Union (7.36 %). Figures from 2006 indicate that the French follow Morrocans in terms of share of
tbr-binnen.indb 173 9/9/13 7:32:30 AM

174 S o f i e V e r m e u l e n & E r i c C o r i j n
the population. In third place are the Turks, while the Italians, Pakistani and Spanish come next (BISA-IBSA, 2010). A recent and increasing trend is that people from other African countries and eastern European countries settle in Historical Molenbeek. Although the street’s atmosphere in Molenbeek is largely Morrocan at first sight, it is also influenced by Mediterranean, African, Belgian, Asian and European lifestyles.
As mentioned above, the neighbourhood counts a large number of big families to the detriment of singles. These numbers date from 2006 so trends might have slightly changed over the past seven years, yet at the time about one family in five counted over five people. While the regional average for single households is approaching one person in two (ca. 50 %), the share lowers to 38.1 % in Historical Molenbeek. The same is true for couples without children (18.4 % against 23.8 % in the BCR).
This neighbourhood is a typical popular neighbourhood and as such it was severely hit by deindustrialisation and a rising service- and knowledge-based economy. Unemployment rates are particularly high and worrying: while Brussels reaches a rate of 22.05 %, this percentage is twice as high in Historical Molenbeek (42 %).11 The relative situation of impoverishement in which many families live is also ref lected in the low welfare index of the district that is only half of the regional average (42.02 versus 84.23 in 2007). The same ratio is observed in the avarege annual income per inhabitant: while the regional average equals an annual income of € 12,746 per capita, the level is twice as low in the district of Historical Molenbeek (€ 6,361).
While the BCR counts a dominant share of tenants (72.82 % in 2001), the property structure in the housing market is slightly lower in the aforementioned district (59.02 %). Given the many residential projects that have been initiated over the last ten years (see Figure 1), these trends have probably changed. Nevertheless, the residential structure in the municipality of Molenbeek remains partly resistant regarding fast non-guided gentrification processes. This could be clarified in part by the specific housing/property structure. Firstly, the municipality of Molenbeek provides a relatively large share of social housing (11 %). Seconldy, Charles (2006) describes how Turkish and Morroccan migrants bought dilapidated houses in deprived neighbourhoods during the 80s. By renting out part of the property, these living spaces became a de facto social housing in the BCR and especially in the most deprived neighbourhoods located in the inner city centre. Given
11 These numbers have to be considered carefully: calcualtions of unemployment rates include the age group of 15-17 years. Since the Belgian federal law stipulates compulsory education until the age of 18 years old, and given the young age structure, these numbers can be considered as slightly over-estimated. However, this is a side note and the main trend remains: a large share of the population does not receive an income out of a formal job (Corijn & Vloeberghs, 2009).
tbr-binnen.indb 174 9/9/13 7:32:30 AM

175G e n t r i f i c a t i o n o r u p wa r d s o c i a l m o b i l i t y : t h e C a n a l Z o n e
its status as a neighbourhood of arrival, the residential mobility has always been significant since the beginning of the 90s, at ca. 70 % (IBSA-BISA, 2013; Cosmopolis, 2008b).
Gentrification processes
Standing on the Parvis of the church Saint-Jean-Baptiste, the first big concrete church in Brussels, we observe the main contrast in this neighbourhood. It is a classic popular neighbourhood, nearby to the city centre, that became a typical migrant neighbourhood in the 80s. The spaces and the buildings remind us of the proletarian past. The activities and the use of public space show us the existing dominance of Mediterranean populations. A bit further, the Count de Flandres metro station shows the damage done to the urban fabric by the construction of the metro. The scar has not been fully repaired, even if the monumental police office shows the presence of the state in this part of the city. The centre of Molenbeek needs an urban renewal, to which the transformation of the existing parking lot in front of the town hall into an animated square, devoted to people rather than cars, will contribute.
Upon entering the shopping street, the Chaussée de Gand, the commercial character, the products, prices, shopkeepers and clients change remarkably. This street, located in the neighbourhood of Historical Molenbeek (municipality of Saint-Jean-Molenbeek), is another example of ethnic entre-preneurship, as is also evidenced by the Rue Brabant (see Cassiers in this book). Out of the 384 shops located in the neighbourhood, the most important concentration is situated in the Chaussée de Gand. The shops are principally oriented towards daily commodities. Food stores are the most abundant (25 %), followed by textile shops in textile (21 %), then decoration and furniture stores (13 %). At 7 %, the weakest category is that of the hotel and catering industry (Mommens, 2011). Around 62 % of the shopkeepers are of Moroccan background, 10 % have a Belgian nationality and 8 % have Turkish roots. Over the years Southern European and Belgian storeowners have been steadily replaced by Moroccan shopkeepers (Vandecandelaere, 2012). The products sold are principally oriented towards the ethnic group the shopkeepers belong to. At the same time, ‘the gentifiers’ living in the area consume good mainly outside the neighbourhood, i.e. in the city centre. So, consumption patterns of the ethnic groups living in Molenbeek and the others are largely non-congruent in spatial terms (Mommens, 2011).
The commercial activities in the Chaussée de Gand face relatively high rates of failure due to a saturation of the commercial sectors in which they operate. Also, the competences of shop-keeping could be raised (customer service, variable price settings, decoration of shop windows, management of deliveries
tbr-binnen.indb 175 9/9/13 7:32:30 AM

176 S o f i e V e r m e u l e n & E r i c C o r i j n
and so on). An economic upgrading of local trade could encourage more mixing between the different local communities. Nevertheless, the issue of residential and social exclusion has been raised several times. That is because the neighbourhood is subject to different forms of relatively slow gentrification processes (Van Criekingen, 2006). The housing project Rive Gauche is a prime example. It was developed in 1995 on a vacant terrain above the metro line at the stop ‘Comte de Flandre’ through a public-private partnership. Once commercialised, the project attracted many young and highly educated families. Criticisms have been expressed regarding the negative side effects that the newcomers will eventually bring about.
Fig. 4. Gentrification in the neighbourhoods Historical Molenbeek & Dansaert.Cartography: Vermeulen. Adapted from Cosmopolis (2010). Realised by means of UrbIS ©.
tbr-binnen.indb 176 9/9/13 7:32:30 AM

177G e n t r i f i c a t i o n o r u p wa r d s o c i a l m o b i l i t y : t h e C a n a l Z o n e
Mommens (2011) advances several arguments from an ethnic entre-preneur ship perspective. In order to avoid residential displacement of the most under privileged, several conditions have to be strategically planned on the policy side. The trend of isolation, deprivation and negative perception could be countered if different elements are combined: economic upgrading, support of the locally-embedded character of trade and sufficient supply of accessible and qualitative housing and public space.
His fieldwork revealed that although entrepreneurs are willing to adapt and open up towards a different clientele, policy-makers are reluctant to believe that local trade could play an integrating role between the local communities living in Molen beek. This case illustrates the potential of a locally-embedded ethnic economy in terms of social mobility, social mix and positive identification related to integrative mechanisms via local trade for residents and visitors of the neighbourhood.
Rue A. Dansaert
The Dansaert neighbourhood (0.52 km2) on the east bank of the canal, is located in the City of Brussels, one of 19 municipalities in the Brussels-Capital Region. Today about 8,500 people live there (BISA-IBSA, 2010). As the neigh-bourhoud’s name indicates, the Rue A. Dansaert, running from the Porte de Flandre at the canal towards the Bourse at the Boulevard Anspach, structures the neighbourhood at large. Population densities are 2.3 times higher compared to the regional average (16,171.44 inh./km2 versus 6,751.29 inh./km2). In line with the general urban exodus Brussels witnessed during the 90s, the neighbourhood Dansaert also lost about 9 % of its population between 1991 and 2001 (Cosmopolis, 2008b). From 2001 onwards population grew by 12.8 %, with a particular concentration in the southern part of the neighbourhood near Bourse.
The size of households is small compared to the region (1.89 people versus 2.09 people in 2009). In 2009, more than one resident in three was between 30 and 44 years old. The second largest group are young adults between the ages of 18 and 29 (21.27 %), in a way reflecting the presence of many institutions for higher education located in the neighbourhood. Both young children (0-5 years) and pupils (6-17 years) represent about 10 % of the population. As such, the age structure of the neighbourhood Dansaert is slightly older compared to those of other neighbourhoods located in the central Canal Zone (IBSA-BISA, 2013).
More than one third of the residents (36.84 %) have a nationality other than Belgian (2010), a figure 6.5 % higher compared to the BCR average (30.02 %).
tbr-binnen.indb 177 9/9/13 7:32:31 AM

178 S o f i e V e r m e u l e n & E r i c C o r i j n
The largest group amongst them are those from other European countries (20.56 %), which matches the average observed in the region. 6.36 % have a North African nationality (Morocco, Algeria, Libya, etc.), which is nearly twice as high as the regional average. The remaining group adds up to 10 % and are made up of other nationalities (5.09 %), sub-Saharan African (3.56 %), from OECD countries (0.98 %) and Turks (0.30 %). As such, the neighbourhood Dansaert mixes Belgian, European and North African influences.
The neighbourhood counts many singles and unrelated people living together (62.47 % in 2006). Couples with children left the neighbourhood during the 90s, yet over the last years their share has stabilised at 14.39 % (2006). Single-parent families are comparative to the regional average (7.98 % against 8.77 %). Unemployment rates in the neighbourhood elevate up to 25.10 % (22.05 % in the BCR), and are unevenly distributed within the neighbourhood. Rates are higher amongst foreigners and students. Furthermore, the overall welfare-index of the neighbourhoods is lower compared to the regional average (74.10 against 83.45), reflecting a slightly lower average annual income of € 11,602/year compared to the region (€ 12,746/year).
In 2001, about 80.3 % of the housing market was occupied by tenants, which was particularly high in comparison to the regional average (55.6 %). Recent numbers are currently lacking. The neighbourhood is subject to high rates of residential mobility, which could be partly clarified by the many students and singles living here. Generally, these groups in particular are living in a transitional period of their lives (IBSA,BISA, 2013; Cosmopolis, 2008b).
Different stages of gentrification
In the area of the left bank of the canal one can see initial stages of gentrifi-ca tion. Rue A. Dansaert is one of the most visible examples of achieved gentrification in Brussels. Here, a rather limited process of gentrification had set in by the 70s. This was due to a generational turnover. Three different stages of gentrification could be illustrated by looking at three different sections of the Rue A. Dansaert (Corijn & De Lannoy, 2000; Rijdams, 2011). We start off at the canal and walk in the direction of the Bourse.
The first stage of gentrification includes the influx of pioneers. By the end of 70s, the neighbourhood Dansaert witnessed a generational shift, which left several commercial properties vacant. The combination of the central location, the architectural quality of several buildings and relatively low rental prices, attracted several pioneers to the neighbourhood. Examples were fashion boutiques such as ‘Comme des garçons’ and ‘Stijl’, which were reacting against the high-brow haute-couture located in the Louise-neighbourhood. Initially, they established themselves in the third section, which will be defined below.
tbr-binnen.indb 178 9/9/13 7:32:31 AM

179G e n t r i f i c a t i o n o r u p wa r d s o c i a l m o b i l i t y : t h e C a n a l Z o n e
Today, this first stage of gentrification can be observed between the Porte de Flandre and Place du Nouveau Marché aux Grains (at the junction with Rue Léon Lepage). On the one hand there are bars and fashion designers such as the Café Walvis, Bar Bistro, La Belle Equipe, Christa Reniers, Marc Jacobs and less well known designers. Some of the dynamics depend of the entrepre-neurial activities of architect and café builder Nicolay. On the other hand you can still find other polular commercial activities like football cafés (L’équateur
– Barcelona), night shops and call shops, Kind & Gezin, a protestant church, a muslim hairdresser (only women) and student dwellings.
A second stage of gentrification coul be related to the change in status of a neighbourhood from popular into trendy. From this point on, not only pioneers such as designers and artists or those belonging to ‘the creative class’ live here. The neighbourhood starts to attract real estate developers, more mainstream residents or traditional commercial activities responding to a new consumption. Each city shows different responses, but generally housing prices start to rise. This second stage of gentrification could be observed between Place du Nouveau Marché aux Grains and Rue du Vieux Marché aux Grains (section 2). Here one finds a series of design and fashion shops such as Hoet, Annemie Verbeke, La belle et la bête. On the renovated Place du Nouveau Marché a range of cafés such as Chou de Bruxelles and the cultural community centre De Markten form a hotspot for leisure. A bank, the Flemish Erasmushogeschool and the Rits Café are also located nearby. Recently, the popular drycleaner Pressing nr. 1 was replaced by another fashion designer (ba&sh).
The third stage of gentrification can be observed in the third section between Le Vieux Marché aux Grains and the Bourse at Boulevard Anspach. The main streaming of the trendy status instigated a plain commercial shift. In parallel, several young artists settled in, bought a house and real estate prices of both housing and commercial buildings elevated. Original pioneers leave and are gradually replaced by more well-off inhabitants, well-known fashion designers and multinational chains. On Rue A. Dansaert, this stage can be illustrated by the food chains MacDonalds, Exki and Pain Quotidien. Larger fashion brands have also moved into the area, such as fashion designer Marc Jacobs, IKKS, Filippa K, Diesel, G-STAR, Princesse TamTam, Sandro, Cotélac, Olivier Strelli, etc. Furthermore, this section has a mixture of residential apartment blocks and a varied range of commercial acitivities on the ground f loor. Here one finds middle range restaurants (Kasbah, Bonsoir Clara, Como Como), a handful of Asian restaurants, some gadget and furniture shops (a tea shop, a chinese gift shop, and the designer shop Kartell), two well-known Brussels bars (L’Archiduc and Le Coq) and two well-known cultural places: the book shop Passa Porta and the Beurs schouwburg. Finally, this section is
tbr-binnen.indb 179 9/9/13 7:32:31 AM

180 S o f i e V e r m e u l e n & E r i c C o r i j n
characterised by two symbolic places or landmarks: the Beursschouwburg and the Mariott Hotel. The latter achieved a symbolic status in the 90s but which is no longer observable today. Until 2000, the hotel, then called Hotel Central, was subject to real estate speculation. In the 90s the hotel was occupied for ten days by a group of squatters in order to find an alternative for this disused yet valuable central building (Verstockt, 1996; De Morgen, 1994).
Of course these stages are spatially mobile in time. In the 80s, the first stages of gentrification of the Rue A. Dansaert were observed in the section between Anspach and Rue du Vieux Marché aux Grains. In time, this stage gradually shifted up towards the canal, expanding onto the Rue des Chartreux (Rijdams, 2011).
SECTION 1: gentrification stage 1: Porte de Flandre and Place du Nouveau —Marché aux GrainsSECTION 2: gentrification stage 2: Place du Nouveau Marché aux Grains – —Rue du Vieux Marché aux GrainsSECTION 3: gentrification stage 3: La Bourse – Rue du Vieux Marché aux —Grains
Neighbourhoods of arrival: Policy-guided gentrification?
The central Canal Zone is composed of several neighbourhoods that always functioned as ‘neighbourhoods of arrival’. During industrial times, the popular districts witnessed an influx of Flemish and Walloon migrants. Later on, Mediterranean migrants gradually replaced the population, and over the last ten years the enlargement of the EU fuelled a new influx of newcomers from eastern European countries (Saunders, 2010; Vandecandelaere, 2012). Usually, however, people desire to leave the neighbourhood as soon as possible, partly due to the overall negative reputation of several neighbourhoods.
In Brussels, civi l society and engaged academics of ten perceive gentrification as a negative process a priori (Rijdams, 2011). As a result, everything that has to do with urban development, renovation of public space, embellishment or the arrival of upper-class retail or catering industries, is a priori judged as ‘bad’. Although one has to be very cautious about policies that exclude those already marginalised, one has to admit some neighbourhoods deal with a negative reputation in such a way that once residents are able to, they move away as quickly as possible. In our opinion, neglecting this desire is proof of a patriarchal attitude.
While preconditions must be set in order to avoid social exclusion, a direct result of such an approach is the stigmatisation of particular groups: whenever highly educated, newcomers are too easily categorised as ‘gentrifiers’ that
tbr-binnen.indb 180 9/9/13 7:32:31 AM
181G e n t r i f i c a t i o n o r u p wa r d s o c i a l m o b i l i t y : t h e C a n a l Z o n e
should take on this responsibility, while those that move out and who have a ‘deprived socio-economic profile’ are the victims of the gentrifiers. Such arguments fall in the trap of ecological fallacy and presuppose a type of complot theory. However, it might be more correct to talk about a convergence of different processes that typify processes of gentrification. Without preconditions concerning social mobility and social mixing that strive for a minimal quality of life and level of welfare, the interaction between planning initiatives, housing market dynamics, governance and policy changes, result in social exclusion of those most vulnerable. An urban development collectively defining such principles and complementing this with multicultural and local community building could enforce the overall quality and social cohesion in neighbourhoods.
Whatever the social dynamics, nobody will ever dispute the fact that these neighbourhoods are at the centre of the Brussels metropolitan region. That centrality will determine prices of land and real estate developments and the types of activity attracted. It is only in the declining phase of deindustrialisa-tion and rapid suburbanisation of Brussels’ development that these central neighbourhoods have been ‘allowed’ to have an ethnocentered development. Today the metropolitan dynamics are back. The Canal Zone is the structuring axis. An enlarged centre is being developed. The challenge is to not follow a Dansaert trajectory where populations were relocated and new activities brought their own workers and their own public. This time it should be an opportunity for upward social mobility of the residents, if they are ready to broaden their public to the city as a whole. That is the tension between gentrification and upward social mobility at stake in this poor ‘croissant’ of Brussels.
References
ADT-ATO (2011). — Opstelling van een masterplan voor de Kanaalzone. [online]. http://www.adt-ato.irisnet.be/sites/default/files/20120306-leafletNL.pdf.Berger, M. (2008). Répondre en citoyen ordinaire. Pour une étude ethnopragma- —tique des engagements profanes. Tracés(2), pp. 191-208.Bernard, N., & Van Mieghem, W. (2005). — La crise du logement à Bruxelles. Problème d’accès et/ou de pénurie. Brussels: Bruylant.Bernard, N., Zimmer, P., & Surkin, J. (2009). Housing, control over land use and —public space. Brussels Studies No. 13.Brussels-Capital Region & Brussels Regional Development Agency (2012). —Production Activities Observatory. Evolution 1997-2011. Brussels: AATL-BROH.
tbr-binnen.indb 181 9/9/13 7:32:31 AM

182 S o f i e V e r m e u l e n & E r i c C o r i j n
[online]. Retrieved from 18/06/2013 http://urbanisme.irisnet.be/publications/pdf/observatoire-des-activites-productives.Carpenter, J., & Lees, L. (1995). Gentrification in New York, London and Paris: An —International Comparison. International Journal of Urban and Regional Research, 19(2), pp. 286-303.Charles, J. (2006 — ). From Poor Tenants to Resident Landlords: De Facto Social Housing Homeownership in Brussels. [online]. Presented at Seminar Home Ownership in Europe: Policy and Research Issues, ENHR, Delft, 23rd November. Retrieved 17/05/2013 from http://repository.tudelft.nl/.Cosmopolis (2008a). — Wijkfiche – 16. Historisch Molenbeek / Molenbeek Historique. In opdracht van de VGC. versie 1. 22/09/2008. Brussels: Cosmopolis.Cosmopolis (2008b). Wijkfiche – 2. Dansaert. In opdracht van de VGC. versie 1. —22/09/2008. Brussels: Cosmopolis.Corijn, E., & De Lannoy, W. (2000). — Crossing Brussels. La qualité de la différence. De kwaliteit van het verschil. Brussels: VUBPRESS.Corijn, E., & Vloeberghs, E. (2009). — Brussel! Brussels: VUBPRESS.Corijn, E. (2011). Het publiek domein als producent van stedelijkheid | The public —domain as producer of urbanity. In Vlaams Bouwmeester (Ed.), Openbaarheid. Over publiek domein, planning en restruimte. Brussels: Cahier 3, pp. 113-127 and pp. 216-224.De Caigny, S. (2003). New Economic Geography als bedrijfshistorische —invalshoek: de transformatie van de kanaalzone ten noorden van Brussel tot een industriegebied in het interbellum. Belgisch Tijdschrift voor Nieuwste Geschiedenis, XXXIII(3-4), pp. 535-575.Deligne, C. (2003). — Bruxelles et sa rivière. Genèse d’un territoire urbain (12e-18e siècle). Turnhout: Brepols.Demey, T. (1990). — Bruxelles. Chronique d’une capitale en chantier. Tome 1. Du voûtement de la Senne à la jonction Nord-Midi. Brussels: Lagrain Editions C.F.C.Demey, T. (2008). — Un canal dans Bruxelles, bassin de vie et d’emploi. Brussels: Badeaux.De Morgen (1994). — A Total Stop to the Construction of New Offices and Hotels in the Capital. Retrieved 17/05/2013, from https://groups.google.com/forum/?fromgroups#!topic/alt.planning.urban/xb_3SPls1HU.EFRO-FEDER (2007). — Doelstelling 2013. Samen investeren in stedelijke ontwikkeling. Ontwerp van operationeel programma voorgesteld door het Brussels Hoofdstedelijk Gewest als Doelstelling ‘concurrentievermogen en werkgelegenheid’ voor de periode 2007-2013. (V070912-ca). Brussels: Retrieved from http://brussel.irisnet.be/files-nl/over-het-gewest/sg/efro-feder/operationeel-programma.GSSO-SRDU (2007). — Uitwerking van een wijkmonitoring die het hele grondgebied van het Brussels Hoofdstedelijk Gewest bestrijkt. Fase Wijken. Eindrapport.
tbr-binnen.indb 182 9/9/13 7:32:31 AM

183G e n t r i f i c a t i o n o r u p wa r d s o c i a l m o b i l i t y : t h e C a n a l Z o n e
Afbakening van wijken. Julie 2007. Brussels: IGEAT, Cosmopolis, Gédap, Interface demography, ISEG.Guérin, A., Mauffroy, L., & Raynau, F. (2007). — Brussel verandert …! 10 jaar stedelijk beleid in het Brussels Hoofdstedelijk Gewest : 1995-2005. Brussels: GSSO.Haven Van Brussel (2010). — Socio-economisch belang van de havenbedrijven. Brussel: Actiris.Jacobs, R. (2004). — Een geschiedenis van Brussel. Tielt: Uitgeverij Lannoo.Kesteloot, C. & Meert, H. (2000). — Segregation and Economic Integration of Immigrants in Brussels. In Body-Gendrot, S. & Martiniello, M. (Eds). Minorities in European Cities. The Dynamics of Social Integration and Social Exclusion at the Neighbourhood Level. London: MacMillan, pp. 54-72.Kesteloot, C. & Meert H. (1993). Informele economie: sociaal-economische functies —en geografische dimensies van een dubbelzinnig verschijnsel. Ruimtelijke Planning, 1(4), pp. 51-94.Lees, L., & Ley, D. (2008). Introduction to Special Issue on Gentrification and —Public Policy. Urban Studies, 45(12), pp. 2379-2384.Lees, L., Slater, T., & Wyly, E.K. (2008). — Gentrification: Routledge New York.Lefebvre, H. (1974). — La production de l’espace. Paris: Anthropos.Lofland, L. H. (1998). — The Public Realm: Exploring the City’s Quintessential Social Theory: Aldine de Gruyter.Massey, D. (1984). — Spatial Divisions of Labour. Social Structures and the Geography of Production. London: Macmillan.Meert, H. & Kesteloot, C. (1999). Sociaal-ruimtelijke kenmerken van economische —integratiesferen. Tijdschrift van de Belgische Vereniging voor Aardrijkskundige Studies, 68(2), pp. 249-281.Meert, H. & Kesteloot, C. (1994). Lage-inkomensgroepen in de grootstad. —Informele economie en overlevingsstrategieën. In Nieuwsbrief Steunpunt Werkgelegenheid, Arbeid, Vorming, 4(2-3), pp. 156-159.Meert, H., Mistiaen P. & Kesteloot, C. (1994). Maatschappelijke fragmentatie in —Brussel, overlevingsstrategieën in Kuregem en vormgevende opwaardering van gemarginaliseerde buurten. Planologisch Nieuws, 14(4), pp. 323-340.Meert, H., Mistiaen P. & Kesteloot, C. (1997). The Geography of Survival: —Household Strategies in Urban Settings. Tijdschrift voor Sociale en Economische Geografie, 88(2), pp. 169-181.Meert, H. (2000). L’intérêt supérieur du bas Molenbeek. Het hogere belang van —laag Molenbeek. In Corijn, E & Dellanoi, W. (Eds.), La qualité de la difference. De kwaliteit van het verschil (pp. 86-100). Brussels: VUBPRESS.Mingione E. (1991). — Fragmented Societies, a Sociology of Economic Life Beyond the Market Paradigm. Oxford: Basil Blackwell.Mommens, K. (2011). — Etnisch ondernemerschap in gentrifiërend Historisch Molenbeek. Vrije Universiteit Brussel - KULeuven, Unpublished Master Thesis.
tbr-binnen.indb 183 9/9/13 7:32:31 AM

184 S o f i e V e r m e u l e n & E r i c C o r i j n
Noël, F. (2009). Het stadsvernieuwingsbeleid in de wijken: op de kruising van —stedenbouwkundige en sociale actie. Brussel [over] 20 jaar. (7 ed., pp. 213-233). Brussels: ATO-ADT.Polanyi (1957 [1944]). — The Great Transformation. Boston: Beacon Press.Rijdams, M. (2011). — Gentrificatie in de praktijk. Lezing gegeven in het kader van een gastles i.o.v. S. Gatz.Saunders, D. (2010). — Arrival City: How the Largest Migration in History is Reshaping our World: Cornerstone Digital.Smith, N. (1996). — The New Urban Frontier: Gentrification and the Revanchist City. London: Routledge.Van Brabant, P. (2009). Educatief dossier. — Een blik op de stedenbouwkundige ontwikkeling van Brussel. Brussels: Museum van de Stad Brussel.Van Criekingen, M. (2006). What is Happening to Brussels’ Inner-City —Neighbourhoods? Selective Migration from Areas Undergoing Gentrification. Brussels Studies, No. 21.Van Criekingen, M., & Decroly, J.-M. (2003). Revisiting the Diversity of —Gentrification: Neighbourhood Renewal Processes in Brussels and Montreal. Urban Studies, 40(12), 2451-2468. doi: 10.1080/0042098032000136156.Vandecandelaere, H. (2012). — In Brussel. Een reis door de wereld. Berchem: EPO.Vanderhulst, G., Ngoma, N., & Kempen, O. (2010). — Tour & Taxis. Un quartier en mouvement/ a district in motion/Een wijk in beweging. Brussels: Racine.Vandermotten, C. (2011). Les configurations de l’espace économique et la crise —politique en Belgique. EchoGéo, 15. Retrieved from http://echogeo.revues.org/12359.Vandermotten, C., Leclercq, E., Cassiers, T., & Wayens, B. (2009). The Brussels —Economy. Brussels Studies, No. 13.Verstockt, D. (1996). Hotel Central: Renovation in Brussels. — Habitat Central Conference. 12/01/1996. Brussels, Beursschouwburg. Retrieved 17/05/2013, from https://groups.google.com/forum/?fromgroups#!topic/alt.planning.urban/xb_3SPls1HU.Wayens, B. (2009). Territorialiteit en wijken: ontstaan en (re)productie van het —stadsmozaïek. In P. Dejemeppe, C. Mouchart, C. Piersotte, F. Raynaud & D. Van de Putte (Eds.), Brussel [over] 20 jaar. (pp. 85-109). Brussels: Agentschap voor Territoriale Ontwikkeling.Wermiel, S. (2013). — Creating a Typology of Warehouses for Brussels and Beyond. Brussels: Innoviris project.
tbr-binnen.indb 184 9/9/13 7:32:31 AM

185G e n t r i f i c a t i o n o r u p wa r d s o c i a l m o b i l i t y : t h e C a n a l Z o n e
Consulted maps & databases
PRAS/GBP (2001) —Regional Land Use Plan of BrusselsMinisterie van het Brussels Hoofdstedelijk Gewest (2001). Gewestelijk Bestemmingsplan [Online]. Consulted on 17/05/2013. Retrieved from http://urbanisme.irisnet.be/.
PRD II/ GewOP II (2002) —Regional Development Plan of BrusselsMinisterie van het Brussels Hoofdstedelijk Gewest. (2002). Gewestelijk Ontwikkelingsplan. [GeWop]. (2002). [Online]. Consulted on 17/05/2013. Retrieved from http://stedenbouw.irisnet.be.
PRDD-GPDO (2013) —Sustainable Regional Development Plan of BrusselsBrussels Hoofdstedelijk Gewest, 2013. Gewestelijk plan voor duurzame ontwikkeling. Krachtlijnen. Brussel. 40870 [Online]. 20/03/2013. Consulted on 17/05/2013. Retrieved from: http://www.adt-ato.irisnet.be/sites/default/files/documents/Introductie_ontwerp_GPDO_NL.pdf.
PDI-PIO (2007) —The Plan for International Development of BrusselsBrussels Hoofdstedelijk Gewest. 2013 [2007]. Plan de Développment International de Bruxelles. Plan voor de Internationale Ontwikkeling voor Brussel. Brussel. [Online] 20/12/2008. Update: 2013. Consulted on 17/05/2013. Retrieved from http://www.demainbruxelles.be/fr.
IBSA- BISA (2010; 2013) —Data wijkmonitoring. Monitoring des Quartiers [online GIS-database]. Consulted 17/05/2013. Retrieved from https://wijkmonitoring.irisnet.be/.
Cosmopolis (2007) —Databank Wijkfiches in opdracht van de Vlaamse Gemeenschapscommissie[not publicly available].
tbr-binnen.indb 185 9/9/13 7:32:31 AM