multi-criteria partner selection in virtual organizations
TRANSCRIPT

Toni Jarimo and Ahti Salo. 2008. Multicriteria partner selection in virtual organisationswith transportation costs and other network interdependencies. Helsinki University ofTechnology, Systems Analysis Laboratory, Research Report E22.
© 2008 by authors

Helsinki University of Technology
Systems Analysis Laboratory Research Reports E22, May 2008
MULTI-CRITERIA PARTNER SELECTION IN VIRTUAL
ORGANISATIONS WITH TRANSPORTATION COSTS AND OTHER
NETWORK INTERDEPENDENCIES
Toni Jarimo Ahti Salo
AB TEKNILLINEN KORKEAKOULU
TEKNISKA HÖGSKOLAN
HELSINKI UNIVERSITY OF TECHNOLOGY
TECHNISCHE UNIVERSITÄT HELSINKI
UNIVERSITE DE TECHNOLOGIE D’HELSINKI

Distribution: Systems Analysis Laboratory Helsinki University of Technology P.O. Box 1100 FIN-02015 HUT, FINLAND Tel. +358-9-451 3056 Fax. +358-9-451 3096 [email protected] This report is available at www.e-reports.sal.hut.fi/pdf/E22.pdf Series E - Electronic Reports www.e-reports.sal.hut.fi ISBN 978-951-22-9390-2 ISSN 1456-5218

Title: Multi-Criteria Partner Selection in Virtual Organisations With Transportation Costs and Other Network Interdependencies
Authors: Toni Jarimo Nokia Corporation P.O. Box 226, FI-00045 Nokia Group, FINLAND [email protected] Ahti Salo Systems Analysis Laboratory Helsinki University of Technology P.O. Box 1100, 02015 HUT, FINLAND [email protected] www.sal.hut.fi/Personnel/Homepages/AhtiS.html Date: May, 2008 Status: Systems Analysis Laboratory Research Reports E22 May 2008 Abstract: In this paper we study how the selection of partners in a virtual
organisation (VO) can be assisted through mixed integer linear programming (MILP) models. Additionally to fixed and variable costs, we present extensions that accommodate transportation costs, capacity risk-measures, and inter-organisational dependencies such as the success of past collaboration. Experiences from a real case study indicate that these models are helpful in VO decision making; computational experiments suggest that the models are tractable. In general, the MILP models are potentially applicable to a variety of portfolio selection problems.
Keywords: partner selection, multiple criteria, virtual organisation, mixed integer linear
programming, portfolio selection.

1
Multi-Criteria Partner Selection in Virtual OrganisationsWith Transportation Costs and Other Network
Interdependencies
Toni Jarimo and Ahti Salo
Abstract— In this paper we study how the selection of partners in avirtual organisation (VO) can be assisted through mixed integer linearprogramming (MILP) models. Additionally to fixed and variable costs, wepresent extensions that accommodate transportation costs, capacity risk-measures, and inter-organisational dependencies such as the success ofpast collaboration. Experiences from a real case study indicate that thesemodels are helpful in VO decision making; computational experimentssuggest that the models are tractable. In general, the MILP models arepotentially applicable to a variety of portfolio selection problems.
NOMENCLATURE
ParametersCi,j distribution for candidatei’s capacity on taskjck
i,j kth element ofCi,j
ea,b intensity of earlier collaboration between candidatesaandb
fi fixed cost of candidatei’s work on the projectfi,j fixed cost of candidatei’s work on taskj of the projecti index for candidatesj index for project’s tasksk index for the candidates’ capacity distributionsm number of candidatesn number of tasks in the projectpi,j(k) probability that candidatei’s realised capacity on task
j is cki,j
ta,b unit transportation cost between candidatesa andbvi,j variable cost of candidatei’s work on taskjwj workload of taskjδr′,r′′ quantity of transportation required between tasksr′ and
r′′
Variablesxi,j candidatei’s work allocation on taskjyi takes value one ifi is selected into the VO; zero
otherwiseyi,j takes value one ifi performs work on taskj; zero
otherwiseza,b takes value one if both candidatesa andb are selected
into the VO; zero otherwisezr
a,b takes value one if candidatesa and b perform tasksr′ and r′′, respectively, and transportation is requiredbetween tasksr′ andr′′; zero otherwise
I. I NTRODUCTION
Collaborative networks are becoming more important in global andregional business, thanks to their ability to combine organisationalcompetences. But when individual companies seek efficiency gainsby focusing on their core competences while outsourcing non-coreoperations, the number and complexity of inter-firm transactions
T. Jarimo is with Nokia Corporation, P.O. Box 226, FI-00045 Nokia Group,Finland, e-mail: [email protected].
A. Salo is with the Systems Analysis Laboratory at Helsinki University ofTechnology, Finland.
Manuscript received April 16, 2007; revised September 14, 2007 andJanuary 8, 2008. This research was conducted during T. Jarimo’s employmentat VTT Technical Research Centre of Finland and was partly funded by theECOLEAD project of the European Commission and by the COBTEC projectof the Finnish Funding Agency for Technology and Innovation (Tekes) andthe National Workplace Development Programme (Tykes).
grows [1]. This calls for the development and deployment of decisionsupport models that help companies in the management of suchrelationships. Towards this end, several researchers have introducedthe idea of a ‘club’ that consists of a set of member-organisations,with a mutually agreed cooperation structure for the creation oftemporaryvirtual organisations(VO) [2]–[4]. We call this club avirtual organisation breeding environment(VBE) [3], [5], which ischaracterised by a common ICT infrastructure, strategy, and processesfor agile VO creation, among others.
Specifically, we focus on the problem of selecting VO partners ina VBE. This is essentially a multi-criteria optimisation problem forwhich we develop a mixed integer linear programming (MILP) modelin order to allocate work among potential VO partners, taking intoaccount fixed and variable work costs, transportation costs, risks ofcapacity shortfall, and inter-organisational dependencies. We extendthe formulation and application of earlier models [6] in three ways.First, the set of Pareto-efficient configurations are identified usingan additive value function. Second, transportation costs are explicitlymodelled. Third, a real-life application is presented to illustrate theuse of our models. Our MILP models are potentially applicable alsoto otherportfolio selectionproblems, where a subset of elements isto be chosen from a larger set with respect to multiple constraintsand criteria [7]–[9].
Several authors have developed VO partner selection methods forminimising a single criterion, most notably the total life cycle costsdefined in terms of production, operation, and transportation costs, forinstance [10], [11]. However, many ‘soft’ factors—such as corporateculture and social relations—that influence the VO performancecannot be captured by pure cost models. This motivates the use ofmulti-criteria models for VO partner selection [12], [13].
The explicit consideration of risks [14], [15] and inter-organisational dependencies [16], [17], in particular, are novel fea-tures that are motivated by real partner-selection problems, such asour case example. Although trust, cultural homogeneity, and successof past collaboration are highly relevant to partner selection [18],[19], only few authors have formally or practically addressed these.
The rest of this paper is structured as follows. Section II developsthe MILP model for VO partner selection. Section III presents a real-life case example and illustrates the use of our MILP model. Finally,Section IV concludes.
II. A M ODEL OF COLLABORATION
A. Parameters and Variables
We model VO partner selection as a work-allocation problemwhereM = {1, . . . , m} denotes the set of candidate partners in theVBE. At the outset, the VBE identifies a business opportunity whichis to be addressed by carrying out a project for the Customer. Theproject tasks are denoted byN = {1, . . . , n} so that the workloadwj of j ∈ N is measured in relevant units (e.g. person months). Thenotation follows an earlier version of this model [6].
The decision variable is the work-allocation matrixXm×n whoseelementxi,j denotes the amount of work on taskj that is assignedto candidatei. The following auxiliary variables are helpful in modelformulation. Let
yi =
{0, if xi,j = 0 ∀ j ∈ N1, if xi,j > 0 for at least onej ∈ N.
Thus, yi is equal to one if candidatei performs some work in theproject, and zero otherwise. Also, let
yi,j =
{0, if xi,j = 01, if xi,j > 0.
2
These variables are distinct in thatyi indicates whether or notcandidatei is involved in the project, whileyi,j indicates which taskscandidatei is involved in. Thus, ifyi = 0 for somei, thenyi,j = 0∀j; and if yi = 1 for somei, thenyi,j = 1 for at least onej.
Capacity information is given through discrete probability distri-butions so thatck
i,j denotes thekth element ofCi,j and pi,j(k) isthe corresponding probability. Without loss of generality, it can beassumed that the possible capacities are sorted in descending orderso thatc1
i,j = maxk cki,j . Because the probabilities add up to one,
the expected capacity that candidatei devotes to taskj is
E[Ci,j ] =∑
k
pi,j(k)cki,j ∀ i ∈ M, j ∈ N.
B. Objective Function
Our basic model accounts for the candidates’ variable and fixedcosts through a single cost criterion
minX,Y
Cost(X, Y ) =
m∑i=1
fiyi +
n∑j=1
m∑i=1
(vi,jxi,j + fi,jyi,j), (1)
where the work allocation matrixXm×n contains thex’s and thematrix Ym×(n+1) contains they’s. In the objective function, the firstsum term captures fixed costs due to the introduction of partners, andthe double-sum term covers fixed and variable costs of the work thepartners perform on their respective tasks.
C. Constraints
Two types of constraints are needed to ensure the fulfilment ofproject requirements and the feasibility of the optimal solution. Inorder to satisfy project requirements, the workload of each task hasto be completed, i.e.
m∑i=1
xi,j ≥ wj ∀ j ∈ N. (2)
The workload assigned to a candidate must not exceed maximumcapacity
xi,j ≤ c1i,j ∀ i ∈ M, j ∈ N.
Alternatively, the workload of the partner can be bounded by itsexpected capacity (i.e.xi,j ≤ E[Ci,j ]), because the partner may notbe able to devote its maximum capacity to the task. Finally, workloadsmust be non-negative:
xi,j ≥ 0 ∀ i ∈ M, j ∈ N.
To ensure feasibility, the binaryyi’s must satisfy the constraints:
yi ≥∑
j∈Nxi,j∑
j∈Nwj
− ε and yi ≤∑
j∈Nxi,j∑
j∈Nwj
− ε + 1
∀ i ∈ M. (3)
The numerators denote the total amount of work that is allocated tocandidatei while the denominator is the total workload of the project:thus, these quotients are equal to the proportion of the project’sworkload that is allocated to candidatei. Furthermore,ε correspondsto the proportion of the total workload that a candidate must exceedso as to be a relevant VO partner. Thus,yi = 1 if at leastε × 100percent of the project’s workload is allocated to candidatei, andyi = 0 otherwise.
In the first expression of (3), the denominator ensures that theright hand is less than one (if it were larger than one, the modelwould become infeasible becauseyi is a zero-one variable). A similarargument holds for the denominator in the other inequality, too.
3
r′′1
r′
δ1,3 = 5
2
(a) Task orderfor assembly
1 2
3 4
9
39
1
6
9
(b) Unit trans-portation costs
1 1
3 4
5× 0
5× 1
5× 6
5× 9
Candidates
for Task 1
Candidates
for Task 3
(c) Costs of possible trans-portation routes
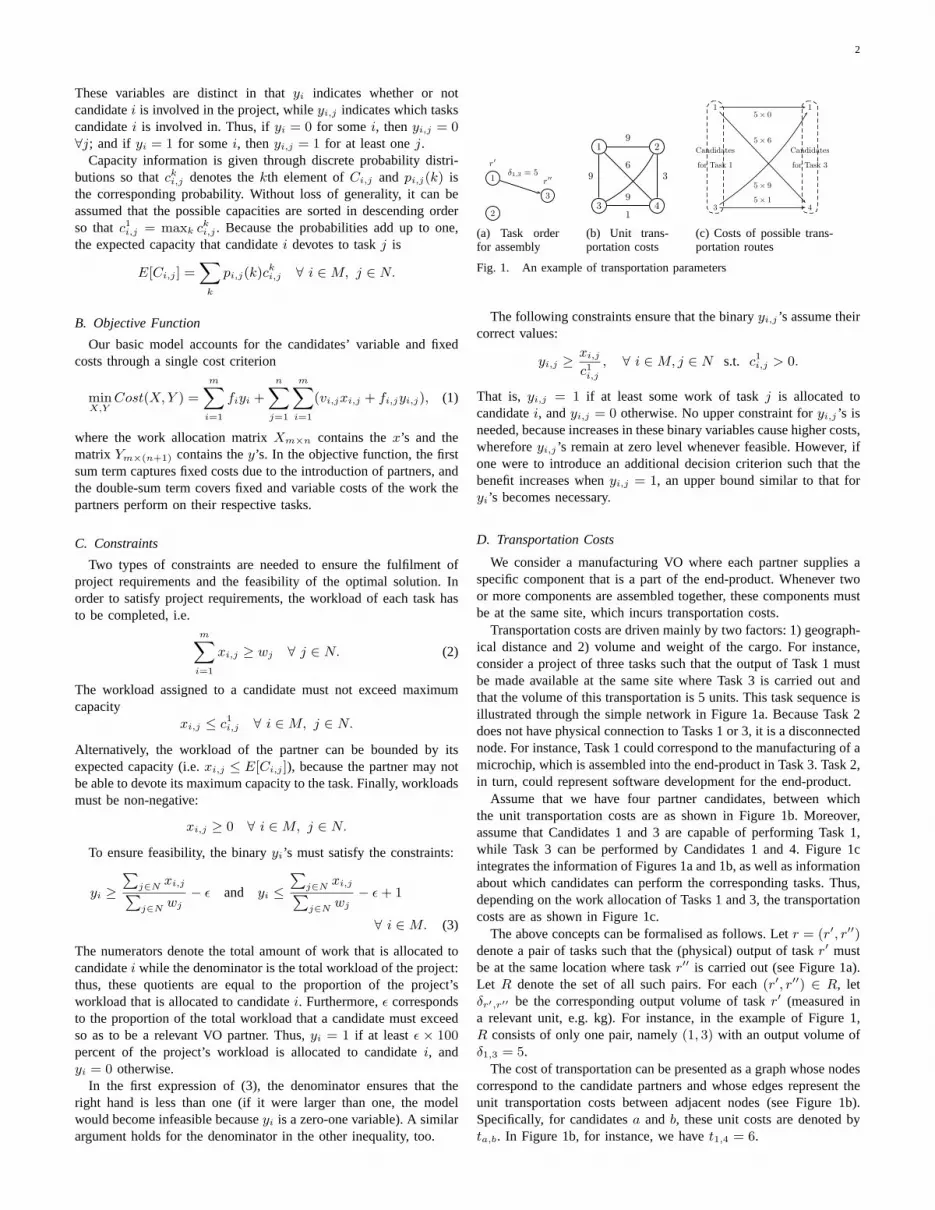
Fig. 1. An example of transportation parameters
The following constraints ensure that the binaryyi,j ’s assume theircorrect values:
yi,j ≥xi,j
c1i,j
, ∀ i ∈ M, j ∈ N s.t. c1i,j > 0.
That is, yi,j = 1 if at least some work of taskj is allocated tocandidatei, andyi,j = 0 otherwise. No upper constraint foryi,j ’s isneeded, because increases in these binary variables cause higher costs,whereforeyi,j ’s remain at zero level whenever feasible. However, ifone were to introduce an additional decision criterion such that thebenefit increases whenyi,j = 1, an upper bound similar to that foryi’s becomes necessary.
D. Transportation Costs
We consider a manufacturing VO where each partner supplies aspecific component that is a part of the end-product. Whenever twoor more components are assembled together, these components mustbe at the same site, which incurs transportation costs.
Transportation costs are driven mainly by two factors: 1) geograph-ical distance and 2) volume and weight of the cargo. For instance,consider a project of three tasks such that the output of Task 1 mustbe made available at the same site where Task 3 is carried out andthat the volume of this transportation is 5 units. This task sequence isillustrated through the simple network in Figure 1a. Because Task 2does not have physical connection to Tasks 1 or 3, it is a disconnectednode. For instance, Task 1 could correspond to the manufacturing of amicrochip, which is assembled into the end-product in Task 3. Task 2,in turn, could represent software development for the end-product.
Assume that we have four partner candidates, between whichthe unit transportation costs are as shown in Figure 1b. Moreover,assume that Candidates 1 and 3 are capable of performing Task 1,while Task 3 can be performed by Candidates 1 and 4. Figure 1cintegrates the information of Figures 1a and 1b, as well as informationabout which candidates can perform the corresponding tasks. Thus,depending on the work allocation of Tasks 1 and 3, the transportationcosts are as shown in Figure 1c.
The above concepts can be formalised as follows. Letr = (r′, r′′)denote a pair of tasks such that the (physical) output of taskr′ mustbe at the same location where taskr′′ is carried out (see Figure 1a).Let R denote the set of all such pairs. For each(r′, r′′) ∈ R, letδr′,r′′ be the corresponding output volume of taskr′ (measured ina relevant unit, e.g. kg). For instance, in the example of Figure 1,R consists of only one pair, namely(1, 3) with an output volume ofδ1,3 = 5.
The cost of transportation can be presented as a graph whose nodescorrespond to the candidate partners and whose edges represent theunit transportation costs between adjacent nodes (see Figure 1b).Specifically, for candidatesa and b, these unit costs are denoted byta,b. In Figure 1b, for instance, we havet1,4 = 6.

3
For each pair(r′, r′′) ∈ R, we have two sets of candidates, i.e.1) those that are capable of performing taskr′ and 2) those thatare capable of performing taskr′′ (see Figure 1c). These two setsare connected by edges between the candidates such that each edgerepresents the transportation cost from one candidate to another, inaccordance with the relation(r′, r′′). For instance, if Candidate 1were to perform Task 1 and Candidate 4 were to perform Task 4,the transportation costs would be5× 6 = 30, becauseδ1,3 = 5 andt1,4 = 6.
Transportation costs can now be incorporated into our MILP modelas follows. For any given pair of tasksr = (r′, r′′), we define thebinary variablezr
a,b
zra,b =
{0, if ya,r′ = 0 or yb,r′′ = 01, if ya,r′ = 1 andyb,r′′ = 1
∀ r ∈ R, a, b ∈ M s.t. c1a,r′ ≥ wr′ andc1
b,r′′ ≥ wr′′ ,
where this definition applies for all pairs of candidates(a, b) suchthat a is capable of performing taskr′ and b can perform taskr′′.Thus, zr
a,b is one if tasksr′ and r′′ are enabled by transportationbetween candidatesa and b; otherwisezr
a,b is zero. In addition, thefollowing constraints are needed:
zra,b ≤
ya,r′ + yb,r′′
2and zr
a,b ≥ ya,r′ + yb,r′′ − 1.
The first of these constraints ensures thatzra,b is zero if tasksr′ and
r′′ are not allocated to candidatesa andb, respectively. The secondconstraint ensures thatzr
a,b is one if candidatesa andb work on tasksr′ andr′′, respectively.
The total transportation costs can now be written as
CostTRANS =∑r∈R
δr′,r′′ta,bzra,b.
The above cost function is linear, thus the objective function (1)remains linear even when transportation costs are accounted for.
E. Capacity Risks
Risk management is vital due to the possibly adverse impact ofuncertainties in the partners’ individual or collaborative behaviour.Hallikas et al. [20] suggest that there are two main sources ofuncertainties, namelycustomer demandand customer delivery, i.e.supply. Because the VO partner selection process is triggered by abusiness opportunity—orrealised demand—demand risks are herenot very relevant, because there are usually no risks with customerpayments (excluding force majeure events such as bankruptcy). Inour case, we therefore focus on capacity fluctuations that call forthe reconfiguration of the VO. Thus, capacities are modelled throughdiscrete probability distributions.
Among alternative measures for the management of capacity risks,we give precedence toexpected downside risk(EDR) [21]. EDRcan be interpreted as the expected shortfall from a given targetvalue (i.e. the amount of work that is allocated to a partner). Itis therefore more meaningful than variance-based measures whichindicate ‘risk’ whenever there are capacity uncertainties, althoughthe decision maker (DM) is not faced with risks when the availablecapacity exceeds the required level. EDR also belongs to the familyof mean-risk dominance models and shares their desirable properties[8], [22].
In our model, the EDR of Candidatei’s work allocation on taskjis
ρEDRi,j =
∑k
cki,j
<xi,j
pi,j(k)(xi,j − cki,j).
1 2
3 4
2
1
Fig. 2. An example of candidates’ collaboration history
That is, ρEDRi,j is the expected downside difference between the
amount of work on taskj that is allocated to Candidatei, on onehand, andi’s capacity on this task, on the other hand. The summationis taken over the eventsck
i,j that result in capacity shortfall, subjectto the allocation of workloadxi,j .
In order to incorporate EDR into our model, letck+i,j ≥ 0 and
ck−i,j ≥ 0, denote the positive and negative difference ofck
i,j − xi,j
for any givencki,j ∈ Ci,j . The correct values ofck+
i,j andck−i,j can be
ensured through constraints
xi,j − ck−i,j + ck+
i,j = cki,j ∀ i ∈ M, j ∈ N, ck
i,j ∈ Ci,j .
The formula for EDR becomes
ρEDRi,j =
∑k
pi,j(k)ck−i,j ,
where the summation is taken over the probability distributionpi,j(k). However, only capacity realisations below the target levelcontribute to the risk measure, becauseck−
i,j ’s are equal to zerootherwise. The total EDR of a VO configuration can thus be expressedas the sum
∑i
∑jρEDR
i,j .EDR-based risk management can be captured by our MILP model
either through goal programming (e.g. through linear constraints suchas ρEDR
i,j ≤ EDRmax) or by aggregating risks and costs through avalue function. Both approaches require parameter estimates, either interms of accepted risk-levels(EDRmax) or through the explicationof tradeoffs between cost and capacity risk. Furthermore, one canassociate lower accepted risk-levels or higher cost-of-risk with criticaltasks.
F. Inter-organisational Dependencies
In partner selection, for instance, it is unrealistic to estimate thetransaction costs that are likely to arise during the entire VO life-cycle; it is therefore more practical to study non-monetary indicatorsthat influence the size of transaction costs over the VO life-cycle.One such indicator—which can be measured relatively easily—is thenumber of past collaboration activities among partner candidates. Itis reasonable to assume that the more intensely the companies havecollaborated earlier, the better they know each other’s ways of action,which reduces the transaction costs of collaboration. In contrast,examples of measurable indicators that may result inincreasedtrans-action costs include geographical distance and linguistic difference.We refer to these and related indicators asnetwork preparednesscriteria.
The network preparedness criteria differ from traditional selectioncriteria (e.g. cost or quality) in that their measurement involves twoor more companies (one cannot measure ‘geographical distance’ fora single company). The following formulation shows how inter-organisational dependencies are incorporated into our model, usingcollaboration history as an example of network preparedness criteria.For instance, Figure 2 illustrates the collaboration history of fourfictitious companies. Here, Companies 2 and 3 have collaborated inone past project, and Companies 3 and 4 have collaborated in twoearlier projects. Company 1 has no earlier collaboration with others.

4
Let za,b ∈ {0, 1} be a binary variable which indicates whether ornot a particularpair of candidates is selected into the VO. Formally,we let
za,b =
{0, if ya = 0 or yb = 01, if ya = 1 andyb = 1.
In other words,za,b is one if some work is allocated to bothcandidatesa andb, and zero if work is allocated to neither candidateor only to one of them. Hence,za,b shows whether apair oforganisations is selected into the VO. This enables objective functionsthat account for inter-organisational dependencies, of which thecollaboration history in Figure 2 is but one example.
For z, we need the constraints
za,b ≤ya + yb
2and za,b ≥ ya + yb − 1 ∀ {a, b} ⊂ M,
The former constraint ensures thatza,b is strictly less than one ifeitherya or yb is zero. The latter one thatza,b is one if bothya andyb are equal to one.
We next define a quantitative measure for collaboration history.First, let ea,b denote the number of earlier collaboration activitiesbetween companiesa and b, and letemax be the maximum numberof earlier collaboration activities of a single candidate. For instance,in Figure 2, we havee2,3 = 1, e3,4 = 2, and emax = 3, which isdue to Candidate 3.
When the VBE has a documented collaboration history, the fol-lowing linear measure can be used to approximate the benefits ofearlier collaboration
γLIN(Y, Z) =∑i∈M
emaxyi −∑
a,b∈Ma<b
ea,bza,b. (4)
Here,Z is them×m matrix ofz’s. The first sum inγLIN increases byemax whenever the number of partners in the VO configuration growsby one, while the second subtracts the number of earlier collaborationactivities of the new partner. Hence,γLIN increases whenever a newpartner is added into the configuration, unless this new partner hasemax collaboration activities with the partners that are already partof the configuration. If the DM prefers a small number of partnersand an active collaboration history, then a configuration with a smallγLIN is preferred to one with a largeγLIN.
The network preparedness criteria can be incorporated into ourMILP model through the introduction of a suitable cost functionor the adoption of a multi-criteria approach. In practise, the multi-criteria approach is likely to be dominant, since measuring inter-organisational dependencies in monetary terms may be difficult. Forinstance, the collaboration measureγLIN can be employed as a newcriterion, apart from costs and risks.
III. C ASE STUDY: MAGNETIC CLUTCH PROTOTYPE FORLORRIES
We illustrate the use of the model with a partner-selection exampleof an existing VBE, theVirtuelle Fabrik AG (http://www.vfeb.ch).This VBE operates in North-Eastern Switzerland and offers theservices of some 70 companies in the field of machinery manufacture.Recently, it has carried out projects for car and energy industries, forinstance.
A. Project Description
We applied our MILP model to a real-life case of Virtuelle Fabrik,where partners were to be selected for a project ordered by a largeGerman car manufacturer. The aim of the project was to deviseand construct a prototype magnetic clutch to be used in lorries. Weperformed the case study in close collaboration with the managerof Virtuelle Fabrik, who also contributed by suggesting many of the
AE&P
Alwo
Amsonic
Beni Burtscher
Brunner
Bühler
CCB
Fornara
Humbel
Innotool
Knobel
Okey AG
OMB
SchulerSchär EngineeringSIG
SMA
Sulzer AG
Unima AGVF AG
Wiftech
Fig. 3. Intensity of past collaboration between the partner candidates ofVirtuelle Fabrik
features that are contained in our model. Here, we illustrate the modelwith real data.
The project was broken down into nine tasks, which were 1) Grind-ing, 2) Gear milling, 3) Metal sheet forming, 4) Milling and turningof bigger parts, 5) Welding, 6) Bending of pipes, 7) Engineering,8) Milling and turning of smaller parts, and 9) Project management.These tasks had to follow a tight schedule set by the end customer. Foreach task, there were two to five partner candidates, some of whichwere candidates for several tasks. The total number of candidateswas 21. They were chosen on the basis of their competences andavailability.
There were three selection criteria in the following order ofdeclining priority: 1) minimise delay risks, 2) maximise earliercollaboration, and 3) minimise costs. The project had a tight schedule,thus minimisation of risks was most important. Moreover, successfulcollaboration history was expected to contribute to finishing theproject in time. Costs were the least important criterion.
We aggregated the different objectives through anadditive valuefunction, which reflects the DM’s preferences for the relative impor-tance of the selection criteria [9]. The value of a VO configurationto the DM is the weighted sum of scores on each criterion. Becausethe additive value function is linear, it can be readily maximised inthe MILP framework.
Each partner candidate was given a probability distribution forfinishing the tasks in time based on historical performance. Onlythe probabilities associated with the capacity distributions had to beestimated, because the candidates’ costs for finishing the tasks wereknown and data on the candidates’ collaboration history was readilyavailable. In Figure 3, each square represents a partner candidate ofthe case and the links between the candidates represent the number ofpast joint projects; a thicker line between two candidates represents agreater number of joint projects in the past. Candidates that have hadno earlier collaboration with other candidates are not connected (i.e.Okey AG, Schuler, Schar Engineering, SIG, and Unima AG). Out ofthe 288 parameters that were estimated or taken from databases, 210pertained to the collaboration history of Figure 3: with 21 candidatesthere are maximum(212−21)/2 = 210 links between the candidates.However, only 23 of these were non-zero, representing the 23 linksof the network. Costs and capacity distributions were described by26 and 52 parameter values, respectively.
One full workday was used to explain the model to the DM, gatherdata, estimate parameters, and interpret the results. The DM was
5
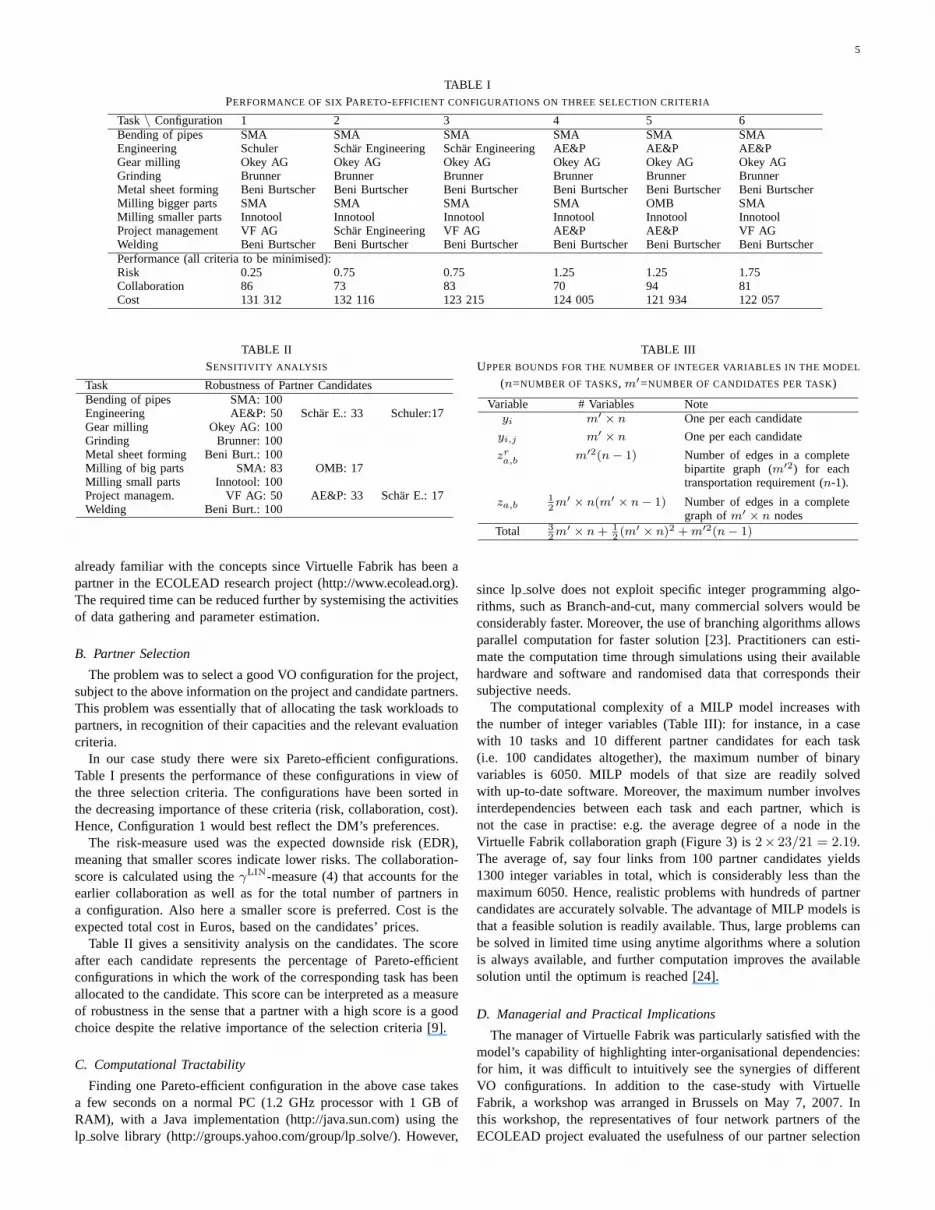
TABLE IPERFORMANCE OF SIXPARETO-EFFICIENT CONFIGURATIONS ON THREE SELECTION CRITERIA
Task\ Configuration 1 2 3 4 5 6Bending of pipes SMA SMA SMA SMA SMA SMAEngineering Schuler Schar Engineering Schar Engineering AE&P AE&P AE&PGear milling Okey AG Okey AG Okey AG Okey AG Okey AG Okey AGGrinding Brunner Brunner Brunner Brunner Brunner BrunnerMetal sheet forming Beni Burtscher Beni Burtscher Beni Burtscher Beni Burtscher Beni Burtscher Beni BurtscherMilling bigger parts SMA SMA SMA SMA OMB SMAMilling smaller parts Innotool Innotool Innotool Innotool Innotool InnotoolProject management VF AG Schar Engineering VF AG AE&P AE&P VF AGWelding Beni Burtscher Beni Burtscher Beni Burtscher Beni Burtscher Beni Burtscher Beni BurtscherPerformance (all criteria to be minimised):Risk 0.25 0.75 0.75 1.25 1.25 1.75Collaboration 86 73 83 70 94 81Cost 131 312 132 116 123 215 124 005 121 934 122 057
TABLE IISENSITIVITY ANALYSIS
Task Robustness of Partner CandidatesBending of pipes SMA: 100Engineering AE&P: 50 Schar E.: 33 Schuler:17Gear milling Okey AG: 100Grinding Brunner: 100Metal sheet forming Beni Burt.: 100Milling of big parts SMA: 83 OMB: 17Milling small parts Innotool: 100Project managem. VF AG: 50 AE&P: 33 Schar E.: 17Welding Beni Burt.: 100
already familiar with the concepts since Virtuelle Fabrik has been apartner in the ECOLEAD research project (http://www.ecolead.org).The required time can be reduced further by systemising the activitiesof data gathering and parameter estimation.
B. Partner Selection
The problem was to select a good VO configuration for the project,subject to the above information on the project and candidate partners.This problem was essentially that of allocating the task workloads topartners, in recognition of their capacities and the relevant evaluationcriteria.
In our case study there were six Pareto-efficient configurations.Table I presents the performance of these configurations in view ofthe three selection criteria. The configurations have been sorted inthe decreasing importance of these criteria (risk, collaboration, cost).Hence, Configuration 1 would best reflect the DM’s preferences.
The risk-measure used was the expected downside risk (EDR),meaning that smaller scores indicate lower risks. The collaboration-score is calculated using theγLIN-measure (4) that accounts for theearlier collaboration as well as for the total number of partners ina configuration. Also here a smaller score is preferred. Cost is theexpected total cost in Euros, based on the candidates’ prices.
Table II gives a sensitivity analysis on the candidates. The scoreafter each candidate represents the percentage of Pareto-efficientconfigurations in which the work of the corresponding task has beenallocated to the candidate. This score can be interpreted as a measureof robustness in the sense that a partner with a high score is a goodchoice despite the relative importance of the selection criteria [9].
C. Computational Tractability
Finding one Pareto-efficient configuration in the above case takesa few seconds on a normal PC (1.2 GHz processor with 1 GB ofRAM), with a Java implementation (http://java.sun.com) using thelp solve library (http://groups.yahoo.com/group/lpsolve/). However,
TABLE IIIUPPER BOUNDS FOR THE NUMBER OF INTEGER VARIABLES IN THE MODEL
(n=NUMBER OF TASKS, m′=NUMBER OF CANDIDATES PER TASK)
Variable # Variables Noteyi m′ × n One per each candidate
yi,j m′ × n One per each candidate
zra,b m′2(n− 1) Number of edges in a complete
bipartite graph (m′2) for eachtransportation requirement (n-1).
za,b12m′ × n(m′ × n− 1) Number of edges in a complete
graph ofm′ × n nodesTotal 3
2m′ × n + 1
2(m′ × n)2 + m′2(n− 1)
since lpsolve does not exploit specific integer programming algo-rithms, such as Branch-and-cut, many commercial solvers would beconsiderably faster. Moreover, the use of branching algorithms allowsparallel computation for faster solution [23]. Practitioners can esti-mate the computation time through simulations using their availablehardware and software and randomised data that corresponds theirsubjective needs.
The computational complexity of a MILP model increases withthe number of integer variables (Table III): for instance, in a casewith 10 tasks and 10 different partner candidates for each task(i.e. 100 candidates altogether), the maximum number of binaryvariables is 6050. MILP models of that size are readily solvedwith up-to-date software. Moreover, the maximum number involvesinterdependencies between each task and each partner, which isnot the case in practise: e.g. the average degree of a node in theVirtuelle Fabrik collaboration graph (Figure 3) is2× 23/21 = 2.19.The average of, say four links from 100 partner candidates yields1300 integer variables in total, which is considerably less than themaximum 6050. Hence, realistic problems with hundreds of partnercandidates are accurately solvable. The advantage of MILP models isthat a feasible solution is readily available. Thus, large problems canbe solved in limited time using anytime algorithms where a solutionis always available, and further computation improves the availablesolution until the optimum is reached [24].
D. Managerial and Practical Implications
The manager of Virtuelle Fabrik was particularly satisfied with themodel’s capability of highlighting inter-organisational dependencies:for him, it was difficult to intuitively see the synergies of differentVO configurations. In addition to the case-study with VirtuelleFabrik, a workshop was arranged in Brussels on May 7, 2007. Inthis workshop, the representatives of four network partners of theECOLEAD project evaluated the usefulness of our partner selection

6
models, using the above Virtuelle Fabrik case as a demonstrator. Thefour networks were CeBeNetwork (http://www.cebenetwork.com),IECOS (http://www.iecos.com), ISOIN (http://www.isoin.net), andSwiss Microtech (http://www.swissmicrotech.ch). The users com-pared the Virtuelle Fabrik case with the conditions of their ownnetworks and shared their comments with the researchers.
First, the following summarises the functionalities the users appre-ciate in the models:
• Objective comparison of the partner candidates’ capabilities andperformance with respect to multiple criteria was deemed useful.Since partner selection is a daily process for network managers,they appreciated the possibility of quick comparisons of theexpected performance of alternative VO configurations.
• Systematic use of historical performance data in partner selec-tion was considered to improve the expected performance ofVOs. In particular, the ability to account for the references aboutpast collaboration was seen useful.
• The users saw that the models would reduce subjective assess-ment and the risk of forgetting small or new VBE members thathave only a few references in collaborative projects but highpotential.
Second, according to the users, the models could be furtherimproved as follows:
• Many of the users would like to see the models operationalisedinto software tools with graphic web interface. They also wishto further customise the models for their networks and integratethem with other management systems.
• The users would like to see how differentprojectsare relatedto each other, in terms of e.g. common partners and risks.This would facilitate holistic project portfolio and resourcemanagement for the VBE.
• The networks would need a web questionnaire for VBE mem-bers to gather the input for databases. The databases need to becomprehensive enough to facilitate the use of the models.
The above encouraging comments from the end-user communityreflect the practical relevance of the models.
IV. CONCLUSIONS
The models developed in this paper extend earlier research throughthe consideration of multiple criteria, risks of individual VO failuresand inter-organisational dependencies. These extensions enable thedevelopment of decision support systems that help the DM assessalternative VO configurations: indeed, experiences from our casestudy with a real VBE suggest that such systems can be very usefulwhen the DM seeks to identify Pareto-efficient VO configurations.
Because the VBE supports the creation of VOs from a relativelystable set of members, it is in a good position to collect data on itsmembers. Numerical parameter estimates can be typically obtainedby using accumulated databases, by soliciting expert opinions, orby collecting bids from candidate partners. In cases where it isdifficult to acquire complete information about all relevant modelparameters (e.g. candidate’s performance, DM’s preferences for theevaluation criteria), methods that deal with incomplete informationcan be useful.
Our MILP models are relevant for a broad range of problemswhere a subset of candidates must be selected from a large set inview of multiple constraints and criteria. Such portfolio selectionproblems are common in the management of project, patent, andproduct portfolios, to name but some examples. These MILP modelsare also flexible in that constraints or objective functions can bereadily modified. Computationally, they are tractable in problems withhundreds of partner candidates.
REFERENCES
[1] R. Gulati, N. Nohria, and A. Zaheer, “Strategic networks,”Strat. Man.J., vol. 21, no. 3, pp. 203–215, 2000.
[2] H. C. W. Lau and E. T. T. Wong, “Partner selection and informationinfrastructure of a virtual enterprise network,”Int. J. Comput. Integr.Manuf., vol. 14, no. 2, pp. 186–193, March-April 2001.
[3] L. M. Camarinha-Matos and H. Afsarmanesh, “Elements of a base VEinfrastructure,”Comput. Industry, vol. 51, pp. 139–163, 2003.
[4] M. Tølle and P. Bernus, “Reference models supporting enterprise net-works and virtual enterprises,”Int. J. Network. Virt. Org., vol. 2, no. 1,pp. 2–15, 2003.
[5] J. Plisson, P. Ljubic, I. Mozetic, and N. Lavrac, “An ontology for virtualorganization breeding environments,”IEEE Trans. Syst., Man, Cybern.C, vol. 37, no. 6, pp. 1327–1341, Nov. 2007.
[6] T. Jarimo and U. Pulkkinen, “A multi-criteria mathematical programmingmodel for agile virtual organization creation,” inCollaborative Networksand Their Breeding Environments, ser. IFIP International Federation forInformation Processing, L. M. Camarinha-Matos, H. Afsarmanesh, andA. Ortiz, Eds., vol. 186. Boston: Springer, 2005, pp. 127–134.
[7] C. Stummer and K. Heidenberger, “Interactive R&D portfolio analysiswith project interdependencies and time profiles of multiple objectives,”IEEE Trans. Eng. Manage., vol. 50, no. 2, pp. 175–183, May 2003.
[8] J. Gustafsson and A. Salo, “Contingent portfolio programming for themanagement of risky projects,”Oper. Res., vol. 53, no. 6, pp. 946–956,November-December 2005.
[9] J. Liesio, P. Mild, and A. Salo, “Preference programming for robustportfolio modeling and project selection,”Eur. J. Oper. Res., vol. 181,no. 3, pp. 1488–1505, 2007.
[10] C. S. Ko, T. Kim, and H. Hwang, “External partner selection using tabusearch heuristics in distributed manufacturing,”Int. J. Prod. Res., vol. 39,no. 17, pp. 3959–3974, 2001.
[11] D. Z. Feng and M. Yamashiro, “A pragmatic approach for optimalselection of plant-specific process plans in a virtual enterprise,”Prod.Plan. Control, vol. 14, no. 6, pp. 562–570, Sept. 2003.
[12] L. M. Meade, D. H. Liles, and J. Sarkis, “Justifying strategic alliancesand partnering: a prerequisite for virtual enterprising,”Omega, vol. 25,no. 1, pp. 29–42, Feb. 1997.
[13] L. Mikhailov, “Fuzzy analytical approach to partnership selection information of virtual enterprises,”Omega, vol. 30, pp. 393–401, 2002.
[14] W. H. Ip, M. Huang, K. L. Yung, and D. Wang, “Genetic algorithm so-lution for a risk-based partner selection problem in a virtual enterprise,”Comput. Oper. Res., vol. 30, pp. 213–231, 2003.
[15] S. Talluri, R. Narasimhan, and A. Nair, “Vendor performance with supplyrisk: A chance-constrained DEA approach,”Int. J. Prod. Econ., vol. 100,no. 2, pp. 212–222, 2006.
[16] S. Talluri, R. C. Baker, and J. Sarkis, “A framework for designingefficient value chain networks,”Int. J. Prod. Econ., vol. 62, pp. 133–144,1999.
[17] M. Fischer, H. Jhn, and T. Teich, “Optimizing the selection of partnersin production networks,”Robot. Comp.-Integrated Manufact., vol. 20,pp. 593–601, 2004.
[18] P. S. Ring and A. H. Van de Ven, “Developmental processes of coop-erative interorganizational relationships,”Acad. Manage. Rev., vol. 19,no. 1, pp. 90–118, 1994.
[19] N. Lavrac, P. Ljubic, T. Urbancic, G. Papa, M. Jermol, and S. Bollhal-ter, “Trust modeling for networked organizations using reputation andcollaboration estimates,”IEEE Trans. Syst., Man, Cybern. C, vol. 37,no. 3, pp. 429–439, May 2007.
[20] J. Hallikas, I. Karvonen, U. Pulkkinen, V.-M. Virolainen, and M. Tuomi-nen, “Risk management processes in supplier networks,”Int. J. Prod.Econ., vol. 90, no. 1, pp. 47–58, July 2004.
[21] G. D. Eppen, R. K. Martin, and L. Schrage, “A scenario approach tocapacity planning,”Oper. Res., vol. 37, no. 4, pp. 517–527, 1989.
[22] P. C. Fishburn, “Mean-risk analysis with risk associated with below-target returns,”Amer. Econ. Rev., vol. 67, no. 2, pp. 116–126, Mar.1977.
[23] B. Gendron and T. G. Crainic, “Parallel branch-and-bound algorithms:Survey and synthesis,”Oper. Res., vol. 42, no. 6, pp. 1042–1066, 1994.
[24] K. J. Lee, Y. S. Chang, H. R. Choi, H. S. Kim, Y. J. Park, and B. J.Park, “A time-bound framework for negotiation and decision making ofvirtual manufacturing enterprise,”J. Org. Comp. Elect. Com., vol. 14,no. 1, pp. 27–41, 2004.