moris user guide - mass gis
TRANSCRIPT
10/4/2016 1
M */ User Guide The HTML version of this document is available at http://maps.massgis.state.ma.us/map_ol/moris_users_documentation.htm.
Table of Contents
Introduction……………………………………………………………………………………………………………………………… 2
Getting Started…………………………………………………………………………………………………………………………… 3
Tools……………………………………………………………………………………………………………………………………... 4
Adding Data Layers……………………………………………………………………………………………………………………… 6
Adding Data Layers by Searching……………………………………………………………………………………………………….. 7
Adding Data Layers from External Sources……………………………………………………………………………………………... 8
Data Layers with Scale Dependencies…………………………………………………………………………………………………... 9
Reordering Data Layers……………………………………………………………………………………………………………….... 10
Navigating the Map…………………………………………………………………………………………………………………….. 11
Customizing Data Layers………………………………………………………………………………………………………………. 13
Customizing the Map…………………………………………………………………………………………………………………... 14
Removing Data Layers…………………………………………………………………………………………………………………. 15
Viewing Metadata………………………………………………………………………………………………………………………. 16
Searching for a Location……………………………………………………………………………………………………………….. 17
Identifying Features…………………………………………………………………………………………………………………….. 19
Measuring Length or Area…………………………………………………………………………………………………………….... 23
Draw a Buffer……………………………………………………………………………………………………………....................... 24
Bookmarking/Sharing a Map…………………………………………………………………………………………………………... 25
Open to an Address....................………………………………………………………………………………………………………... 26
Downloading Data……………………………………………………………………………………………………………………… 28
Printing and Saving a Map Image……………………………………………………………………………………………………… 31
Editing Data…………………………………………………………………………………………………………………………….. 32
Accessibility……………………………………………………………………………………………………………………………. 34
Using MORIS on a Mac………………………………………………………………………………………………………………... 36
Problems? Questions? Comments?.……………………………………………………………………………………………………. 37
Terms and Conditions: By using MORIS you agree to the following terms. *Please note: MORIS is one of a family of many applications, all built on the same template. Some other versions include
OLIVER (the MassGIS Online Data Viewer) and MuniMapper. This user guide applies to all these applications, you may substitute “OLIVER,” “MuniMapper,” etc. for “MORIS” as you read this guide.

10/4/2016 2
Introduction
Background
MORIS, the Massachusetts Ocean Resource Information System, is an online mapping tool created by the Massachusetts
Office of Coastal Zone Management (CZM), the Office of Geographic Information (MassGIS), SeaPlan (formerly
Massachusetts Ocean Partnership), Applied Science Associates (ASA), Charlton Galvarino, and PeopleGIS. MORIS can
be used to search, display, and share spatial data pertaining to Massachusetts coastal and ocean resources. Users can
quickly create and share maps and download data for use in a Geographic Information System (GIS). MORIS connects to
MassGIS’s GeoServer-based web mapping service.
What do I need to run MORIS?
MORIS is run through a web browser. At this time, the application fully works in Google Chrome, Internet Explorer,
Mozilla Firefox, and Safari. The latest versions of these browsers are recommended. Currently Google Chrome 27,
Internet Explorer 10, Mozilla Firefox 21, and Safari 5.1.7 have been thoroughly tested, but the application also works in
older versions of these browsers.
This is a publication of the Massachusetts Office of Coastal Zone Management (CZM) within the Executive Office of
Energy and Environmental Affairs (EEA) pursuant to National Oceanic and Atmospheric Administration (NOAA) Award
No. NA10NOS4190183 and the Office of Geographic Information (MassGIS). This publication is funded (in part) by a
grant/cooperative agreement from NOAA. Views expressed herein are those of the author(s) and do not necessarily reflect
the views of NOAA or any of its sub-agencies.
10/4/2016 3
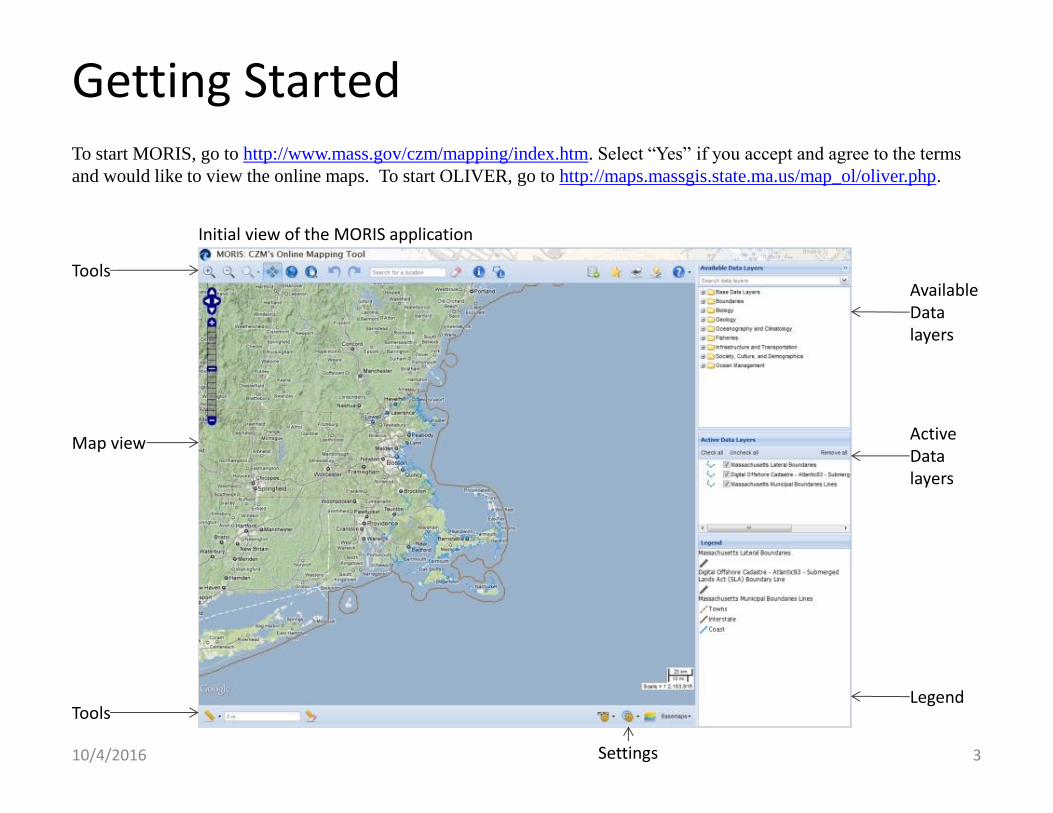
Getting Started To start MORIS, go to http://www.mass.gov/czm/mapping/index.htm. Select “Yes” if you accept and agree to the terms
and would like to view the online maps. To start OLIVER, go to http://maps.massgis.state.ma.us/map_ol/oliver.php.
Initial view of the MORIS application
Tools
Map view
Tools
Available Data layers
Active Data layers
Legend
Settings
10/4/2016 4
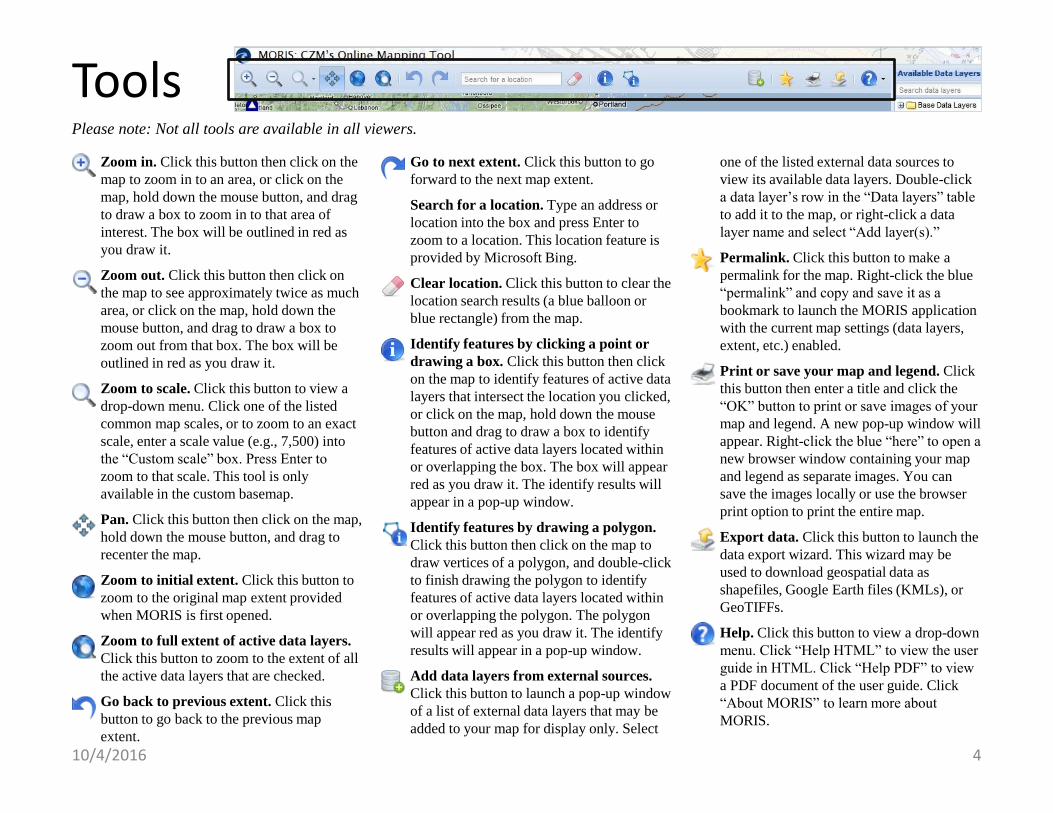
Tools Please note: Not all tools are available in all viewers.
Zoom in. Click this button then click on the
map to zoom in to an area, or click on the
map, hold down the mouse button, and drag
to draw a box to zoom in to that area of
interest. The box will be outlined in red as
you draw it.
Zoom out. Click this button then click on
the map to see approximately twice as much
area, or click on the map, hold down the
mouse button, and drag to draw a box to
zoom out from that box. The box will be
outlined in red as you draw it.
Zoom to scale. Click this button to view a
drop-down menu. Click one of the listed
common map scales, or to zoom to an exact
scale, enter a scale value (e.g., 7,500) into
the “Custom scale” box. Press Enter to
zoom to that scale. This tool is only
available in the custom basemap.
Pan. Click this button then click on the map,
hold down the mouse button, and drag to
recenter the map.
Zoom to initial extent. Click this button to
zoom to the original map extent provided
when MORIS is first opened.
Zoom to full extent of active data layers.
Click this button to zoom to the extent of all
the active data layers that are checked.
Go back to previous extent. Click this
button to go back to the previous map
extent.
Go to next extent. Click this button to go
forward to the next map extent.
Search for a location. Type an address or
location into the box and press Enter to
zoom to a location. This location feature is
provided by Microsoft Bing.
Clear location. Click this button to clear the
location search results (a blue balloon or
blue rectangle) from the map.
Identify features by clicking a point or
drawing a box. Click this button then click
on the map to identify features of active data
layers that intersect the location you clicked,
or click on the map, hold down the mouse
button and drag to draw a box to identify
features of active data layers located within
or overlapping the box. The box will appear
red as you draw it. The identify results will
appear in a pop-up window.
Identify features by drawing a polygon.
Click this button then click on the map to
draw vertices of a polygon, and double-click
to finish drawing the polygon to identify
features of active data layers located within
or overlapping the polygon. The polygon
will appear red as you draw it. The identify
results will appear in a pop-up window.
Add data layers from external sources.
Click this button to launch a pop-up window
of a list of external data layers that may be
added to your map for display only. Select
one of the listed external data sources to
view its available data layers. Double-click
a data layer’s row in the “Data layers” table
to add it to the map, or right-click a data
layer name and select “Add layer(s).”
Permalink. Click this button to make a
permalink for the map. Right-click the blue
“permalink” and copy and save it as a
bookmark to launch the MORIS application
with the current map settings (data layers,
extent, etc.) enabled.
Print or save your map and legend. Click
this button then enter a title and click the
“OK” button to print or save images of your
map and legend. A new pop-up window will
appear. Right-click the blue “here” to open a
new browser window containing your map
and legend as separate images. You can
save the images locally or use the browser
print option to print the entire map.
Export data. Click this button to launch the
data export wizard. This wizard may be
used to download geospatial data as
shapefiles, Google Earth files (KMLs), or
GeoTIFFs.
Help. Click this button to view a drop-down
menu. Click “Help HTML” to view the user
guide in HTML. Click “Help PDF” to view
a PDF document of the user guide. Click
“About MORIS” to learn more about
MORIS.
10/4/2016 5
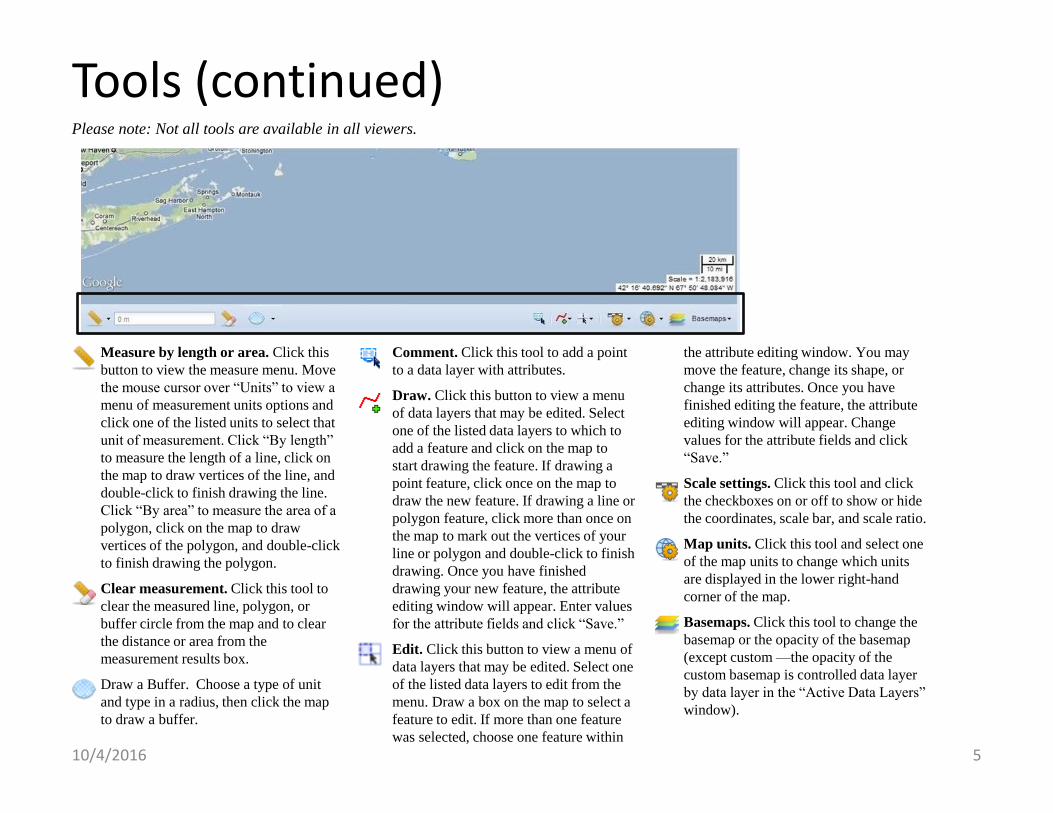
Tools (continued) Please note: Not all tools are available in all viewers.
Measure by length or area. Click this
button to view the measure menu. Move
the mouse cursor over “Units” to view a
menu of measurement units options and
click one of the listed units to select that
unit of measurement. Click “By length”
to measure the length of a line, click on
the map to draw vertices of the line, and
double-click to finish drawing the line.
Click “By area” to measure the area of a
polygon, click on the map to draw
vertices of the polygon, and double-click
to finish drawing the polygon.
Clear measurement. Click this tool to
clear the measured line, polygon, or
buffer circle from the map and to clear
the distance or area from the
measurement results box.
Draw a Buffer. Choose a type of unit
and type in a radius, then click the map
to draw a buffer.
Comment. Click this tool to add a point
to a data layer with attributes.
Draw. Click this button to view a menu
of data layers that may be edited. Select
one of the listed data layers to which to
add a feature and click on the map to
start drawing the feature. If drawing a
point feature, click once on the map to
draw the new feature. If drawing a line or
polygon feature, click more than once on
the map to mark out the vertices of your
line or polygon and double-click to finish
drawing. Once you have finished
drawing your new feature, the attribute
editing window will appear. Enter values
for the attribute fields and click “Save.”
Edit. Click this button to view a menu of
data layers that may be edited. Select one
of the listed data layers to edit from the
menu. Draw a box on the map to select a
feature to edit. If more than one feature
was selected, choose one feature within
the attribute editing window. You may
move the feature, change its shape, or
change its attributes. Once you have
finished editing the feature, the attribute
editing window will appear. Change
values for the attribute fields and click
“Save.”
Scale settings. Click this tool and click
the checkboxes on or off to show or hide
the coordinates, scale bar, and scale ratio.
Map units. Click this tool and select one
of the map units to change which units
are displayed in the lower right-hand
corner of the map.
Basemaps. Click this tool to change the
basemap or the opacity of the basemap
(except custom —the opacity of the
custom basemap is controlled data layer
by data layer in the “Active Data Layers”
window).
10/4/2016 6
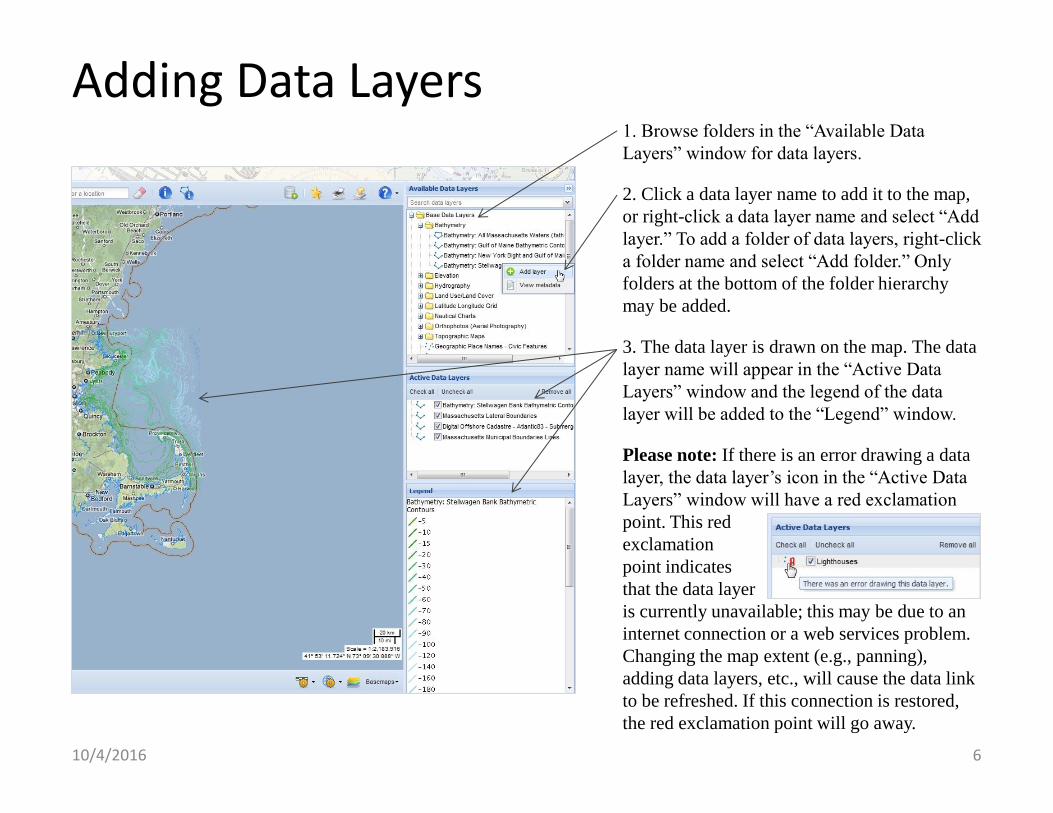
Adding Data Layers 1. Browse folders in the “Available Data
Layers” window for data layers.
2. Click a data layer name to add it to the map,
or right-click a data layer name and select “Add
layer.” To add a folder of data layers, right-click
a folder name and select “Add folder.” Only
folders at the bottom of the folder hierarchy
may be added.
3. The data layer is drawn on the map. The data
layer name will appear in the “Active Data
Layers” window and the legend of the data
layer will be added to the “Legend” window.
Please note: If there is an error drawing a data
layer, the data layer’s icon in the “Active Data
Layers” window will have a red exclamation
point. This red
exclamation
point indicates
that the data layer
is currently unavailable; this may be due to an
internet connection or a web services problem.
Changing the map extent (e.g., panning),
adding data layers, etc., will cause the data link
to be refreshed. If this connection is restored,
the red exclamation point will go away.
10/4/2016 7
Adding Data Layers by Searching
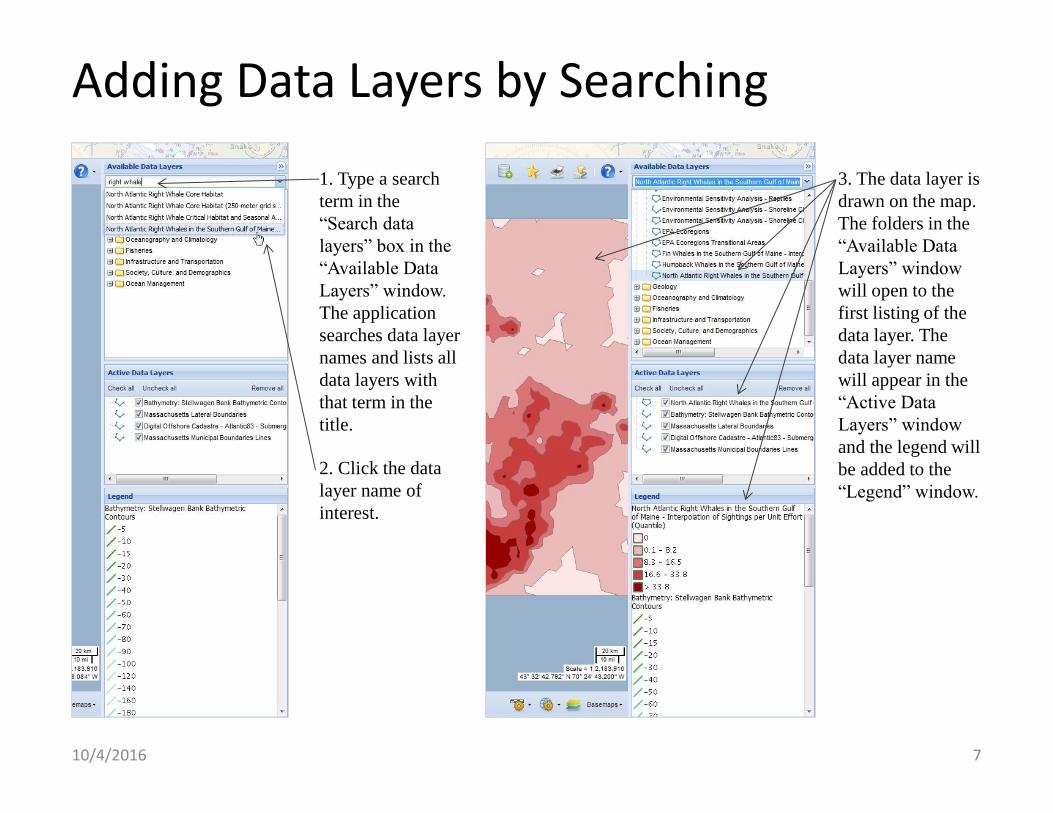
1. Type a search
term in the
“Search data
layers” box in the
“Available Data
Layers” window.
The application
searches data layer
names and lists all
data layers with
that term in the
title.
2. Click the data
layer name of
interest.
3. The data layer is
drawn on the map.
The folders in the
“Available Data
Layers” window
will open to the
first listing of the
data layer. The
data layer name
will appear in the
“Active Data
Layers” window
and the legend will
be added to the
“Legend” window.
10/4/2016 8
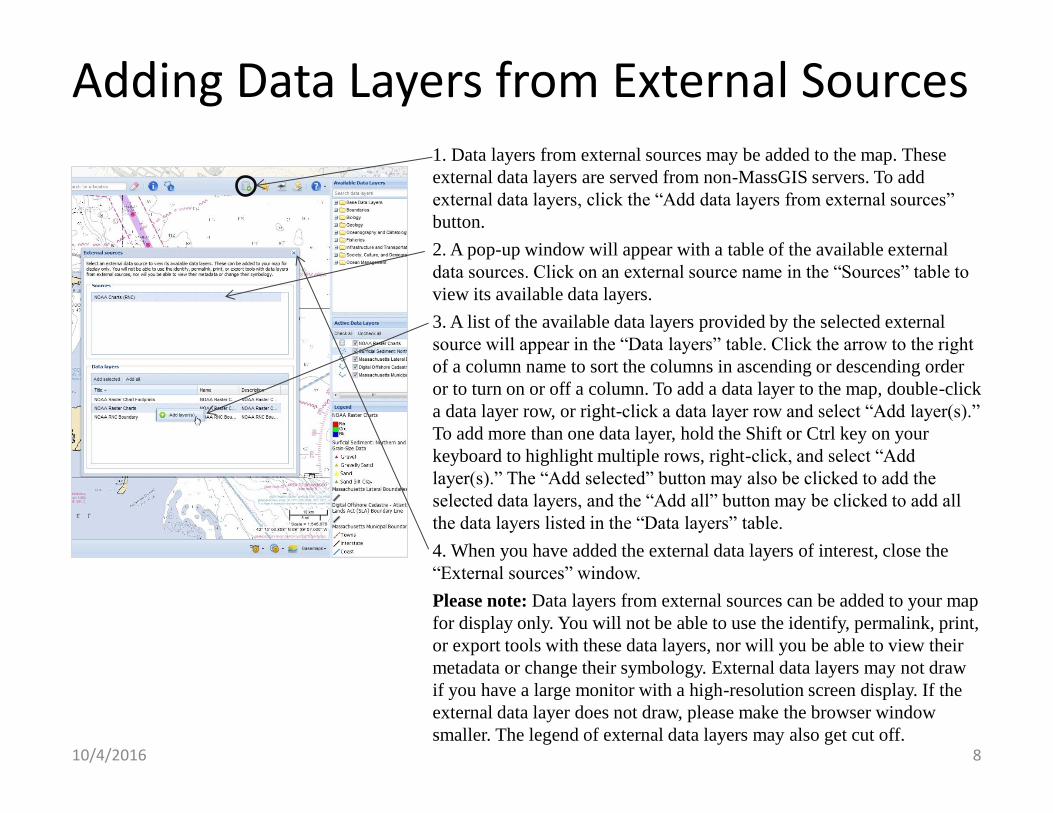
Adding Data Layers from External Sources 1. Data layers from external sources may be added to the map. These
external data layers are served from non-MassGIS servers. To add
external data layers, click the “Add data layers from external sources”
button.
2. A pop-up window will appear with a table of the available external
data sources. Click on an external source name in the “Sources” table to
view its available data layers.
3. A list of the available data layers provided by the selected external
source will appear in the “Data layers” table. Click the arrow to the right
of a column name to sort the columns in ascending or descending order
or to turn on or off a column. To add a data layer to the map, double-click
a data layer row, or right-click a data layer row and select “Add layer(s).”
To add more than one data layer, hold the Shift or Ctrl key on your
keyboard to highlight multiple rows, right-click, and select “Add
layer(s).” The “Add selected” button may also be clicked to add the
selected data layers, and the “Add all” button may be clicked to add all
the data layers listed in the “Data layers” table.
4. When you have added the external data layers of interest, close the
“External sources” window.
Please note: Data layers from external sources can be added to your map
for display only. You will not be able to use the identify, permalink, print,
or export tools with these data layers, nor will you be able to view their
metadata or change their symbology. External data layers may not draw
if you have a large monitor with a high-resolution screen display. If the
external data layer does not draw, please make the browser window
smaller. The legend of external data layers may also get cut off.
10/4/2016 9
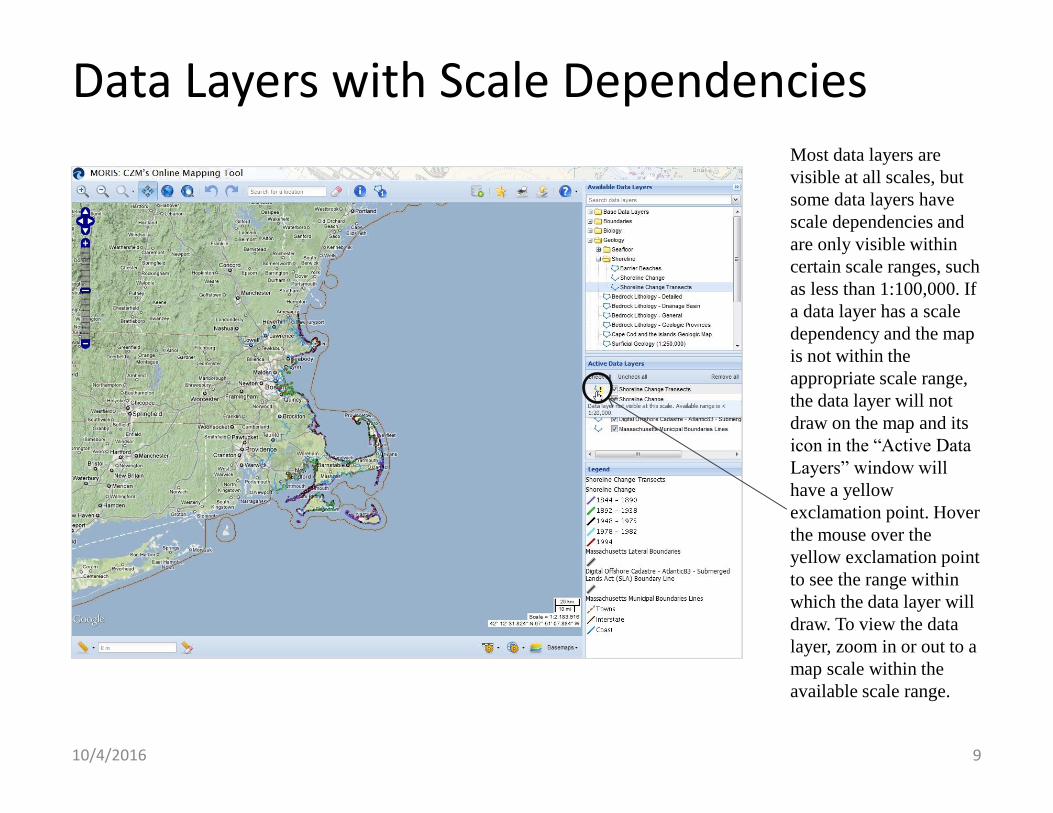
Data Layers with Scale Dependencies Most data layers are
visible at all scales, but
some data layers have
scale dependencies and
are only visible within
certain scale ranges, such
as less than 1:100,000. If
a data layer has a scale
dependency and the map
is not within the
appropriate scale range,
the data layer will not
draw on the map and its
icon in the “Active Data
Layers” window will
have a yellow
exclamation point. Hover
the mouse over the
yellow exclamation point
to see the range within
which the data layer will
draw. To view the data
layer, zoom in or out to a
map scale within the
available scale range.
10/4/2016 10
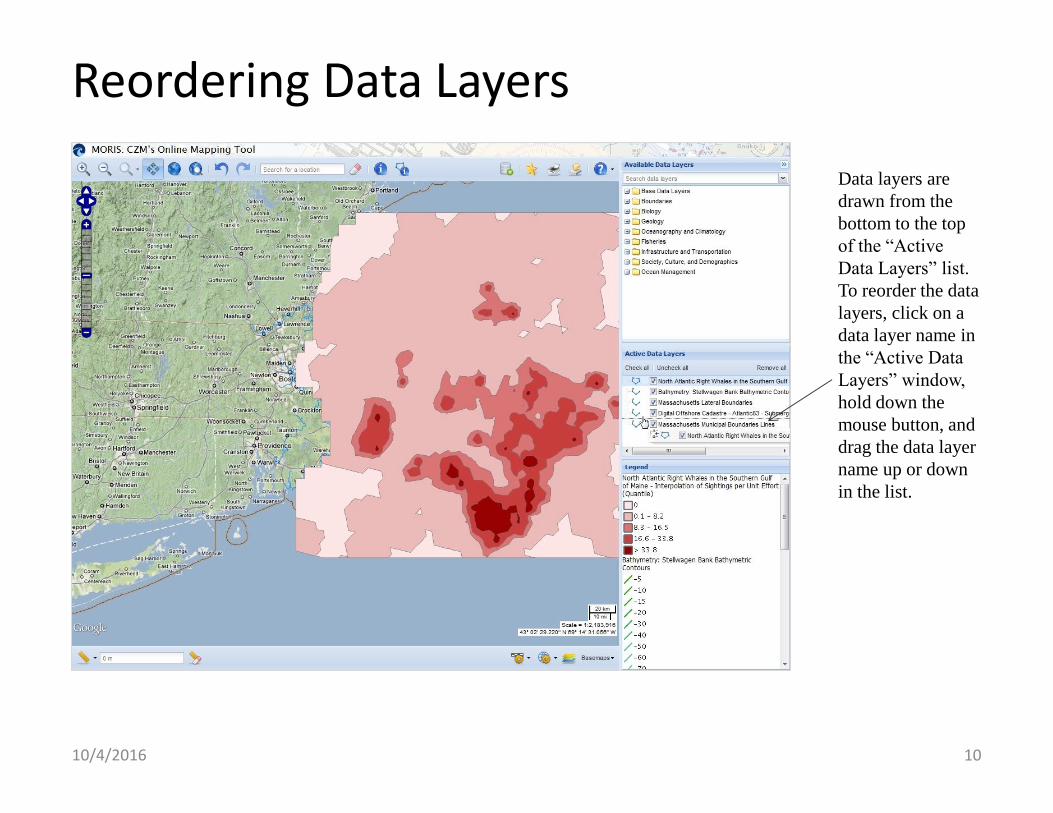
Reordering Data Layers
Data layers are
drawn from the
bottom to the top
of the “Active
Data Layers” list.
To reorder the data
layers, click on a
data layer name in
the “Active Data
Layers” window,
hold down the
mouse button, and
drag the data layer
name up or down
in the list.
10/4/2016 11
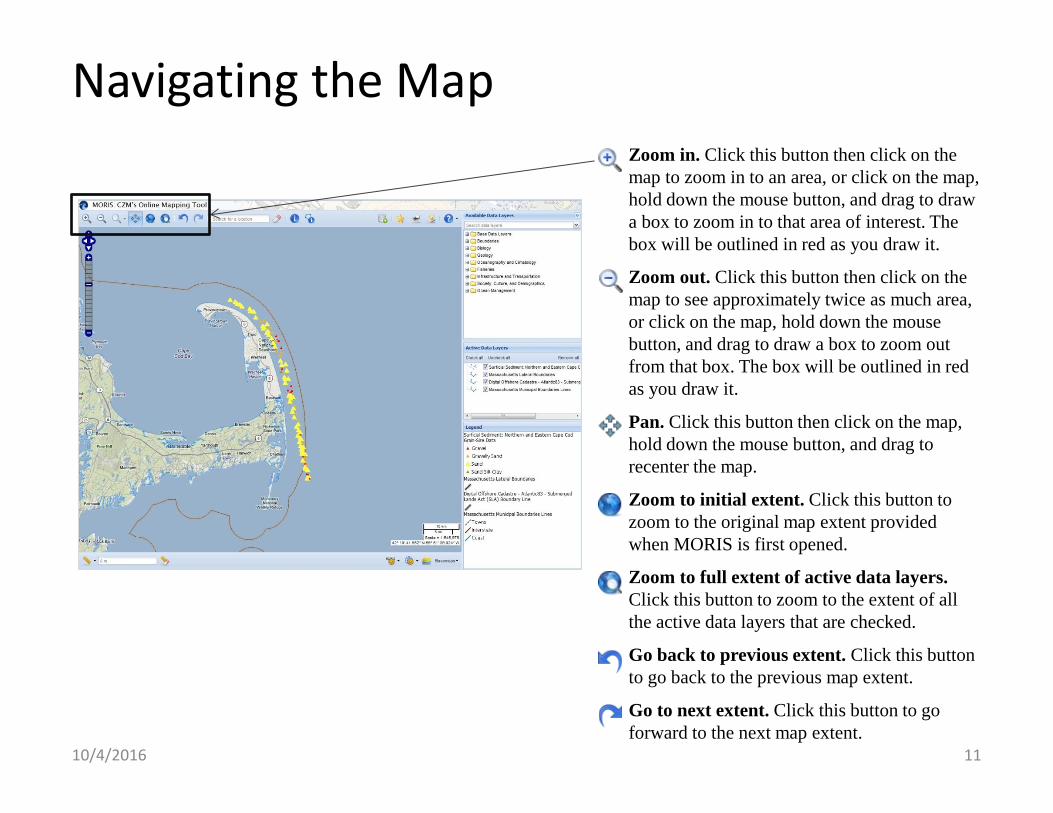
Navigating the Map Zoom in. Click this button then click on the
map to zoom in to an area, or click on the map,
hold down the mouse button, and drag to draw
a box to zoom in to that area of interest. The
box will be outlined in red as you draw it.
Zoom out. Click this button then click on the
map to see approximately twice as much area,
or click on the map, hold down the mouse
button, and drag to draw a box to zoom out
from that box. The box will be outlined in red
as you draw it.
Pan. Click this button then click on the map,
hold down the mouse button, and drag to
recenter the map.
Zoom to initial extent. Click this button to
zoom to the original map extent provided
when MORIS is first opened.
Zoom to full extent of active data layers.
Click this button to zoom to the extent of all
the active data layers that are checked.
Go back to previous extent. Click this button
to go back to the previous map extent.
Go to next extent. Click this button to go
forward to the next map extent.
10/4/2016 12
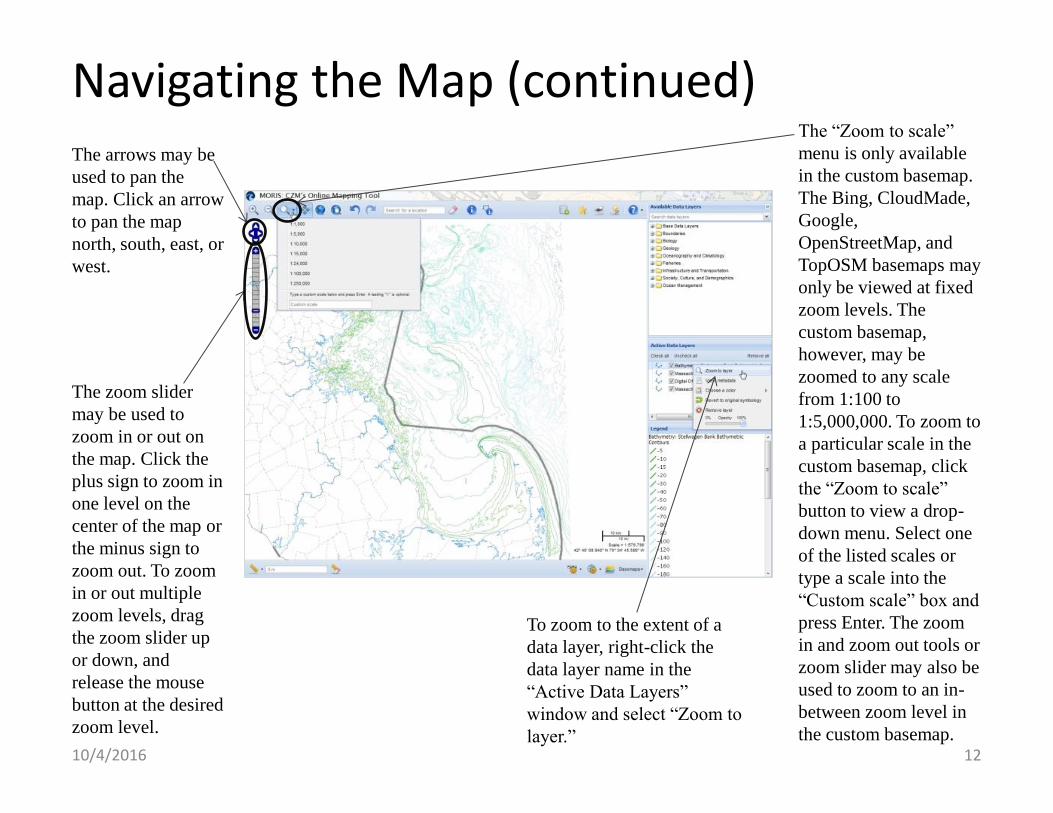
Navigating the Map (continued) The arrows may be
used to pan the
map. Click an arrow
to pan the map
north, south, east, or
west.
The zoom slider
may be used to
zoom in or out on
the map. Click the
plus sign to zoom in
one level on the
center of the map or
the minus sign to
zoom out. To zoom
in or out multiple
zoom levels, drag
the zoom slider up
or down, and
release the mouse
button at the desired
zoom level.
The “Zoom to scale”
menu is only available
in the custom basemap.
The Bing, CloudMade,
Google,
OpenStreetMap, and
TopOSM basemaps may
only be viewed at fixed
zoom levels. The
custom basemap,
however, may be
zoomed to any scale
from 1:100 to
1:5,000,000. To zoom to
a particular scale in the
custom basemap, click
the “Zoom to scale”
button to view a drop-
down menu. Select one
of the listed scales or
type a scale into the
“Custom scale” box and
press Enter. The zoom
in and zoom out tools or
zoom slider may also be
used to zoom to an in-
between zoom level in
the custom basemap.
To zoom to the extent of a
data layer, right-click the
data layer name in the
“Active Data Layers”
window and select “Zoom to
layer.”
10/4/2016 13
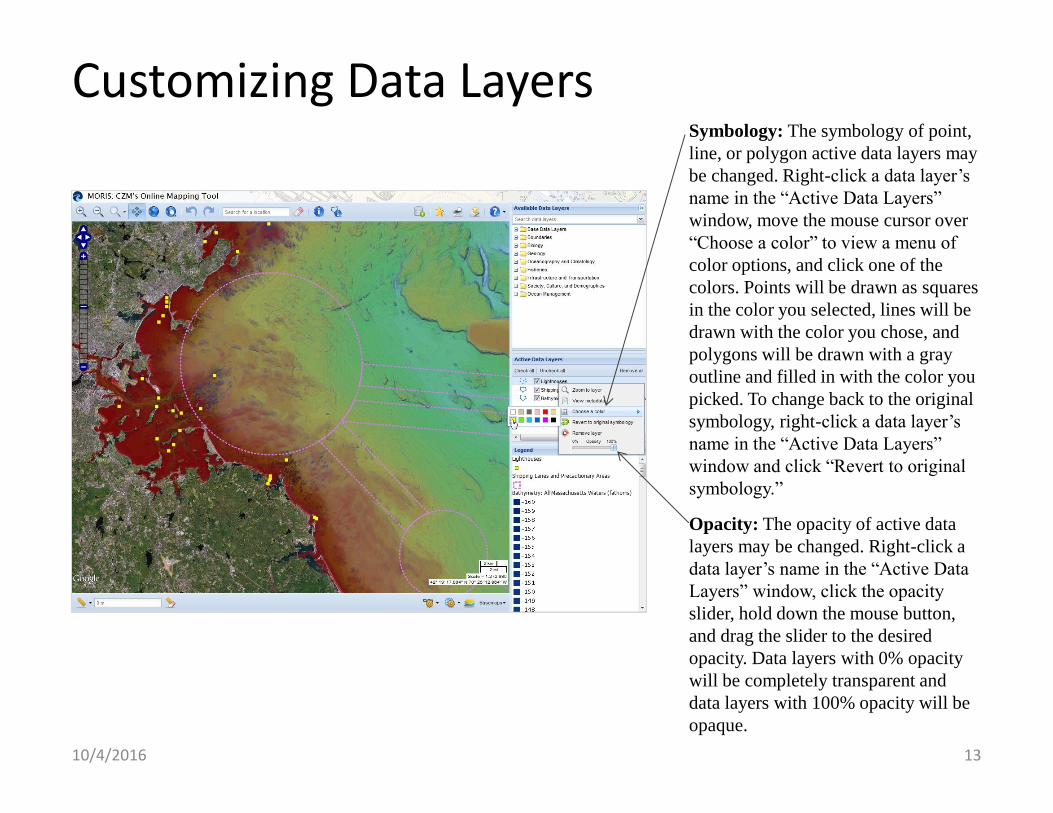
Customizing Data Layers Symbology: The symbology of point,
line, or polygon active data layers may
be changed. Right-click a data layer’s
name in the “Active Data Layers”
window, move the mouse cursor over
“Choose a color” to view a menu of
color options, and click one of the
colors. Points will be drawn as squares
in the color you selected, lines will be
drawn with the color you chose, and
polygons will be drawn with a gray
outline and filled in with the color you
picked. To change back to the original
symbology, right-click a data layer’s
name in the “Active Data Layers”
window and click “Revert to original
symbology.”
Opacity: The opacity of active data
layers may be changed. Right-click a
data layer’s name in the “Active Data
Layers” window, click the opacity
slider, hold down the mouse button,
and drag the slider to the desired
opacity. Data layers with 0% opacity
will be completely transparent and
data layers with 100% opacity will be
opaque.

10/4/2016 14
Customizing the Map Windows: The “Available Data Layers,” “Active Data Layers,” and “Legend”
windows may be minimized or resized. Click the arrows icon ( ) to minimize the
three windows. To resize a window, move the mouse cursor over the edge of a
window, hold down the mouse button, and drag the window edge to the desired
height or width.
Scale settings: The coordinates, scale bar, and scale ratio in the
lower right-hand corner of the map may be turned on or off. Click
the “Scale settings” button to view a menu and click on or off the
checkboxes to show or hide the coordinates, scale bar, and scale
ratio.
Map units: When the cursor is over the map, the latitude and
longitude of the cursor’s location are displayed in the lower
right-hand corner of the map. To change the units of the
latitude and longitude, click the “Map units” button to view a
menu and select one of the listed options.
Basemaps: To change the basemap, click the “Basemaps”
button to view a menu and select one of the listed options.
The opacity of the current basemap may also be changed.
Click the “Basemaps” button to view the menu, click the
opacity slider, hold down the mouse button, and drag the
slider to the desired opacity. This feature is not available for
the custom basemap—the opacity of custom is controlled data
layer by data layer in the “Active Data Layers” window. The
metadata, or text documentation, for each basemap may also
be viewed. To view the metadata of a basemap, click the
“Basemaps” button to view the menu, move the mouse cursor
over the basemap of interest, and click “View metadata.” A
pop-up window will appear with the basemap’s metadata.
10/4/2016 15
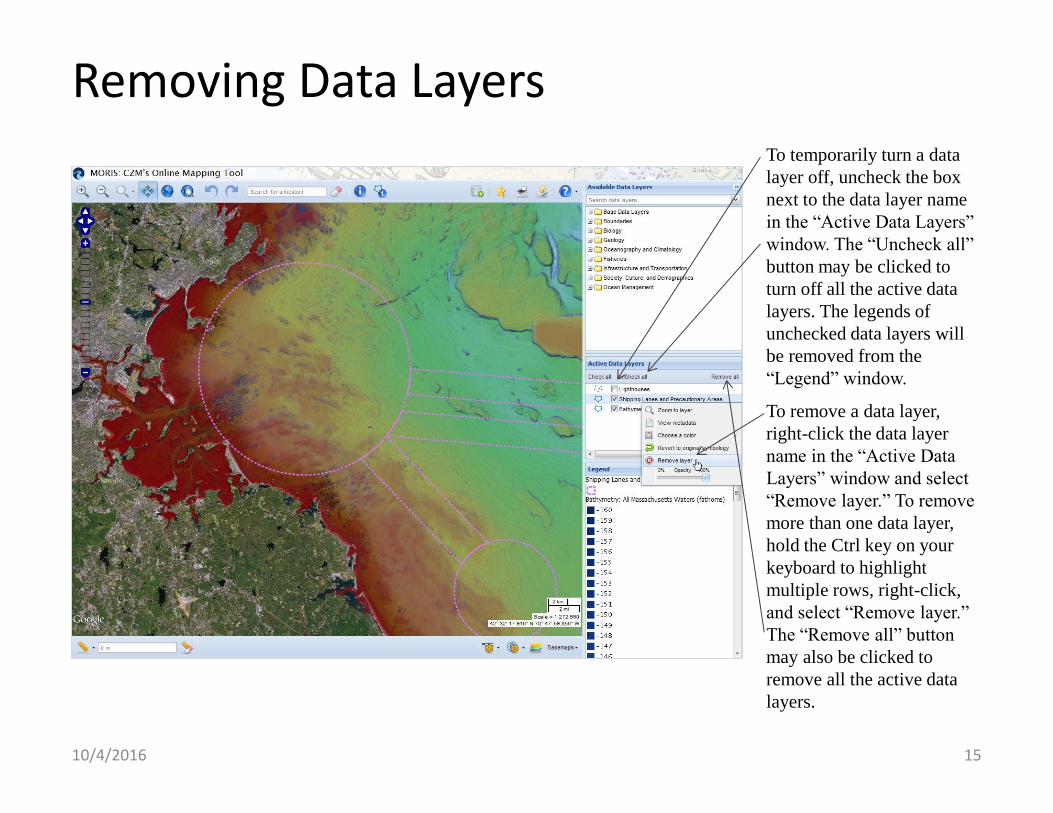
Removing Data Layers To temporarily turn a data
layer off, uncheck the box
next to the data layer name
in the “Active Data Layers”
window. The “Uncheck all”
button may be clicked to
turn off all the active data
layers. The legends of
unchecked data layers will
be removed from the
“Legend” window.
To remove a data layer,
right-click the data layer
name in the “Active Data
Layers” window and select
“Remove layer.” To remove
more than one data layer,
hold the Ctrl key on your
keyboard to highlight
multiple rows, right-click,
and select “Remove layer.”
The “Remove all” button
may also be clicked to
remove all the active data
layers.
10/4/2016 16
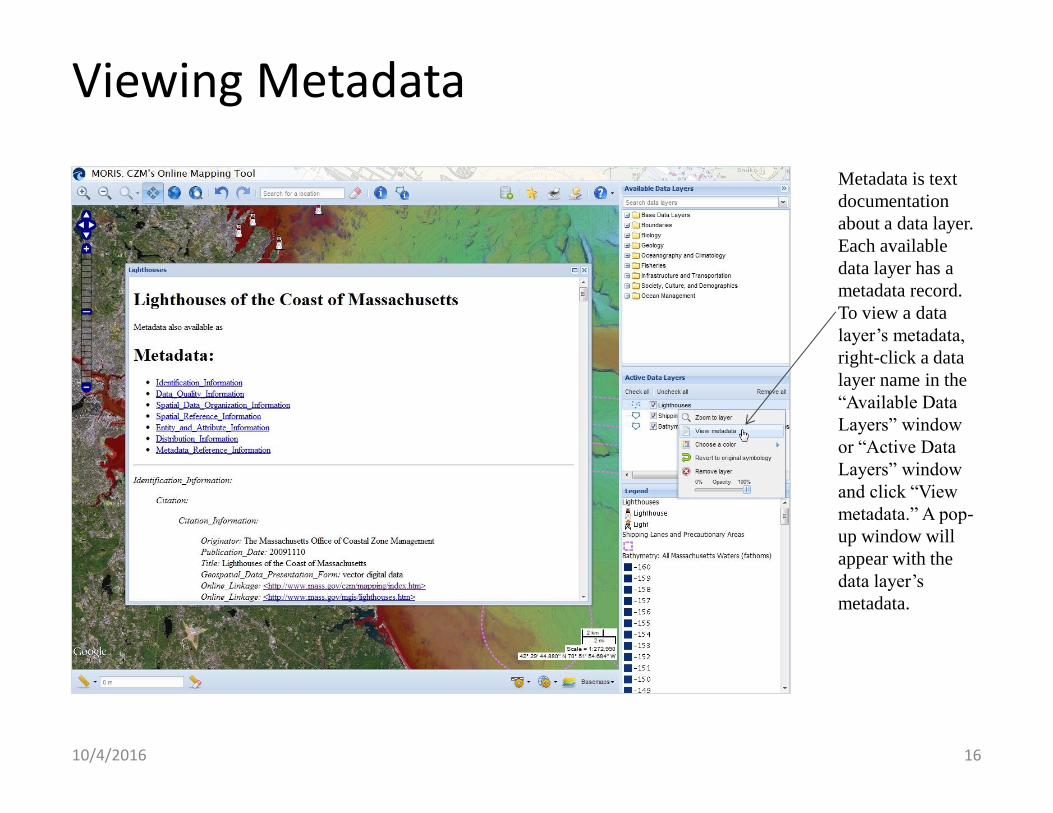
Viewing Metadata
Metadata is text
documentation
about a data layer.
Each available
data layer has a
metadata record.
To view a data
layer’s metadata,
right-click a data
layer name in the
“Available Data
Layers” window
or “Active Data
Layers” window
and click “View
metadata.” A pop-
up window will
appear with the
data layer’s
metadata.
10/4/2016 17
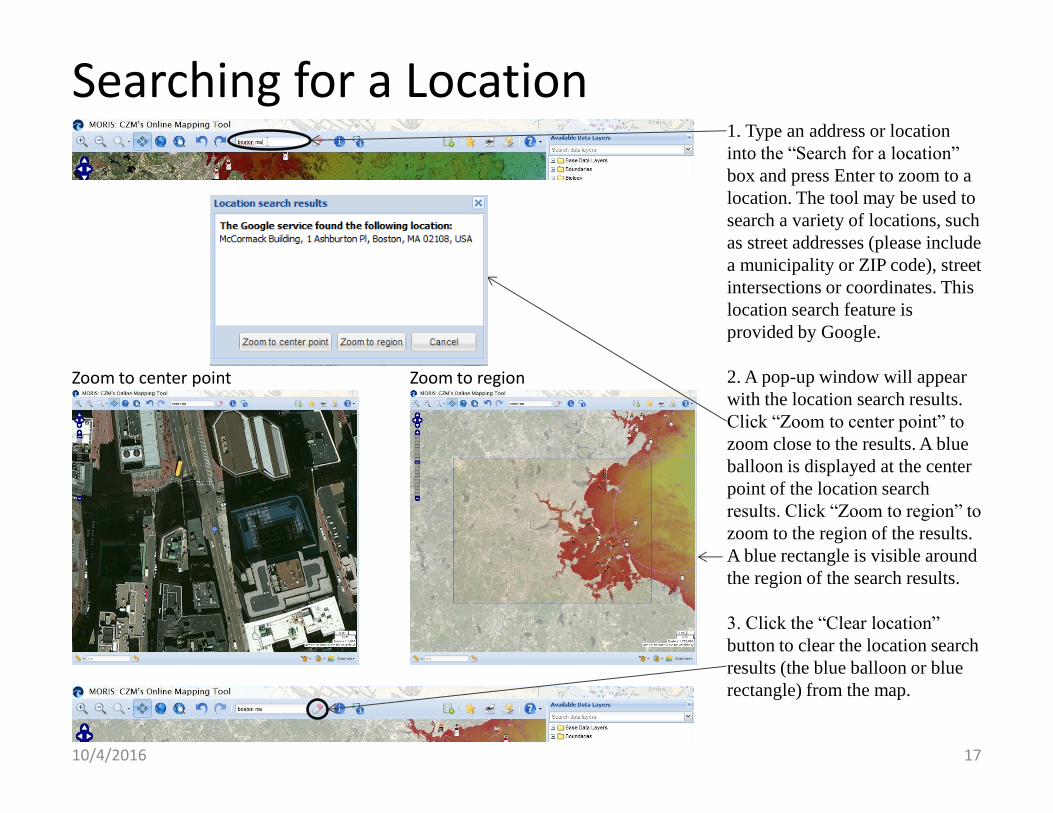
Searching for a Location
Zoom to center point Zoom to region
1. Type an address or location
into the “Search for a location”
box and press Enter to zoom to a
location. The tool may be used to
search a variety of locations, such
as street addresses (please include
a municipality or ZIP code), street
intersections or coordinates. This
location search feature is
provided by Google.
2. A pop-up window will appear
with the location search results.
Click “Zoom to center point” to
zoom close to the results. A blue
balloon is displayed at the center
point of the location search
results. Click “Zoom to region” to
zoom to the region of the results.
A blue rectangle is visible around
the region of the search results.
3. Click the “Clear location”
button to clear the location search
results (the blue balloon or blue
rectangle) from the map.
10/4/2016 18
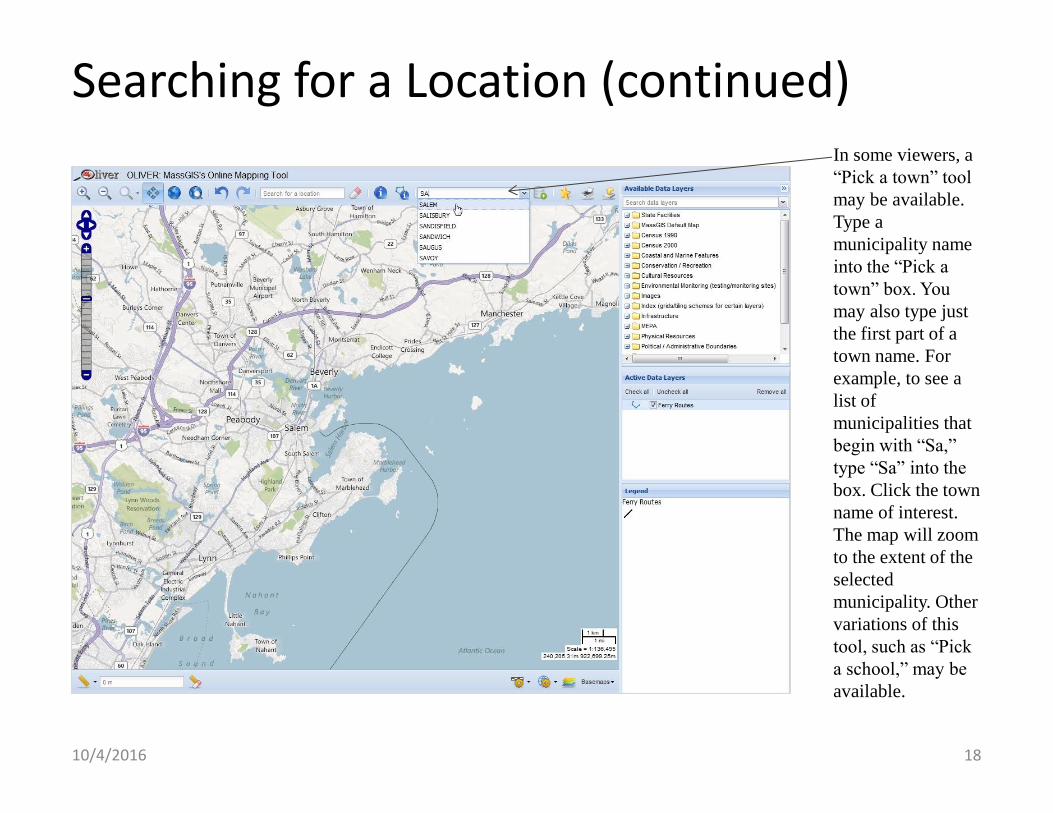
Searching for a Location (continued) In some viewers, a
“Pick a town” tool
may be available.
Type a
municipality name
into the “Pick a
town” box. You
may also type just
the first part of a
town name. For
example, to see a
list of
municipalities that
begin with “Sa,”
type “Sa” into the
box. Click the town
name of interest.
The map will zoom
to the extent of the
selected
municipality. Other
variations of this
tool, such as “Pick
a school,” may be
available.
10/4/2016 19
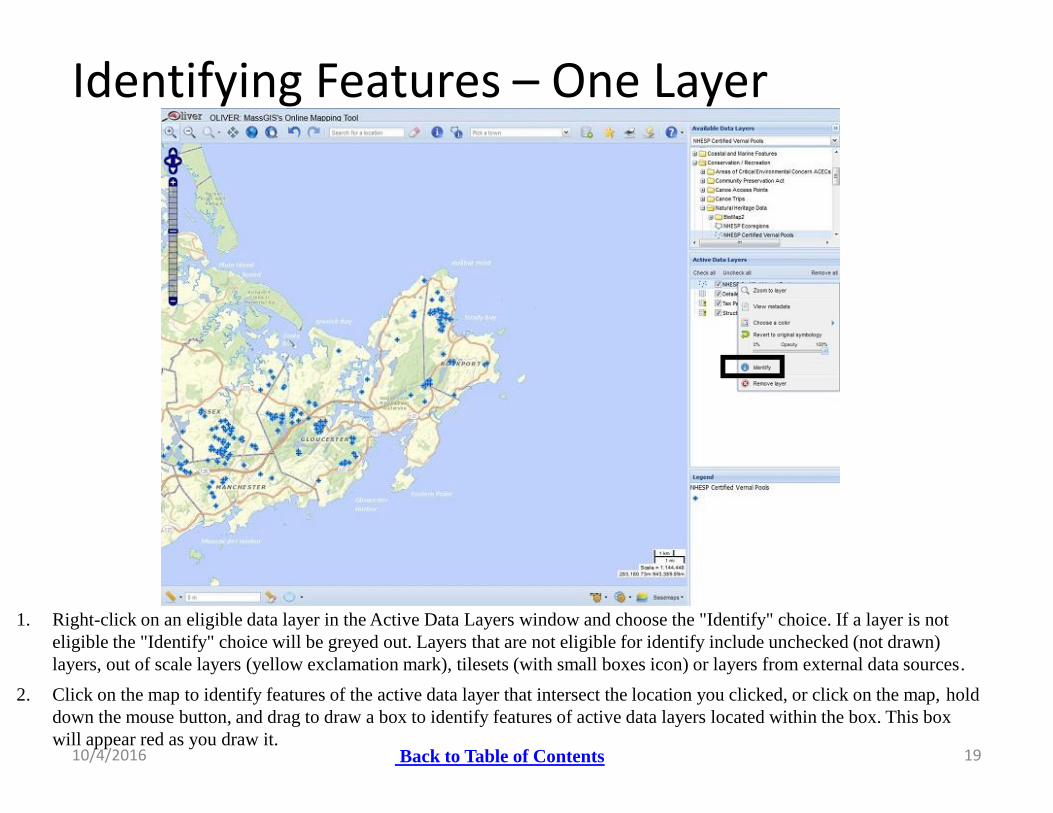
Identifying Features – One Layer
1. Right-click on an eligible data layer in the Active Data Layers window and choose the "Identify" choice. If a layer is not
eligible the "Identify" choice will be greyed out. Layers that are not eligible for identify include unchecked (not drawn)
layers, out of scale layers (yellow exclamation mark), tilesets (with small boxes icon) or layers from external data sources.
2. Click on the map to identify features of the active data layer that intersect the location you clicked, or click on the map, hold
down the mouse button, and drag to draw a box to identify features of active data layers located within the box. This box
will appear red as you draw it. Back to Table of Contents
10/4/2016 20
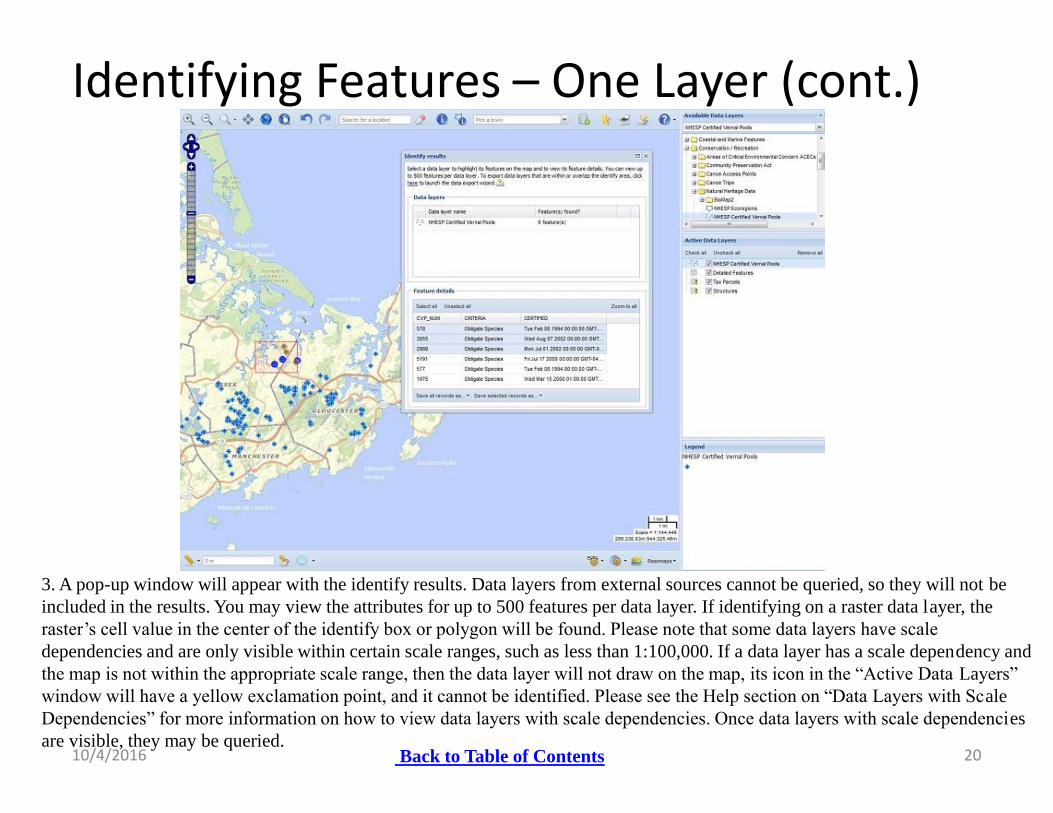
Identifying Features – One Layer (cont.)
3. A pop-up window will appear with the identify results. Data layers from external sources cannot be queried, so they will not be
included in the results. You may view the attributes for up to 500 features per data layer. If identifying on a raster data layer, the
raster’s cell value in the center of the identify box or polygon will be found. Please note that some data layers have scale
dependencies and are only visible within certain scale ranges, such as less than 1:100,000. If a data layer has a scale dependency and
the map is not within the appropriate scale range, then the data layer will not draw on the map, its icon in the “Active Data Layers”
window will have a yellow exclamation point, and it cannot be identified. Please see the Help section on “Data Layers with Scale
Dependencies” for more information on how to view data layers with scale dependencies. Once data layers with scale dependencies
are visible, they may be queried. Back to Table of Contents
10/4/2016 21
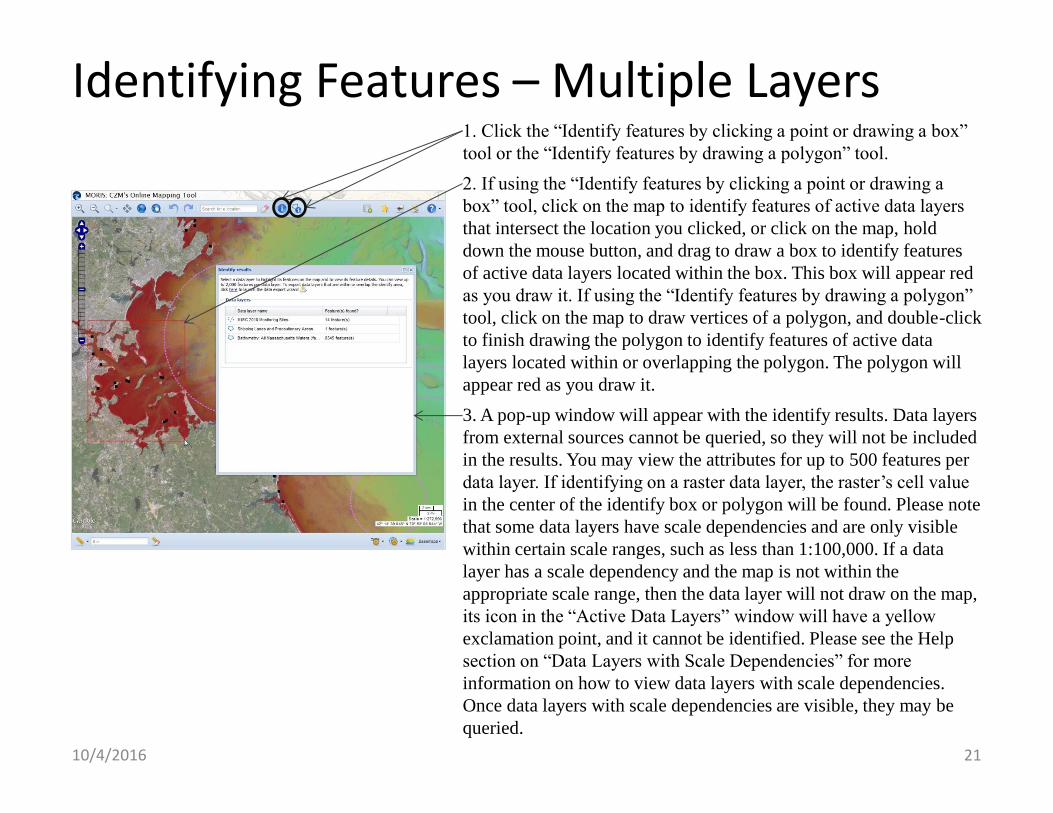
Identifying Features – Multiple Layers 1. Click the “Identify features by clicking a point or drawing a box”
tool or the “Identify features by drawing a polygon” tool.
2. If using the “Identify features by clicking a point or drawing a
box” tool, click on the map to identify features of active data layers
that intersect the location you clicked, or click on the map, hold
down the mouse button, and drag to draw a box to identify features
of active data layers located within the box. This box will appear red
as you draw it. If using the “Identify features by drawing a polygon”
tool, click on the map to draw vertices of a polygon, and double-click
to finish drawing the polygon to identify features of active data
layers located within or overlapping the polygon. The polygon will
appear red as you draw it.
3. A pop-up window will appear with the identify results. Data layers
from external sources cannot be queried, so they will not be included
in the results. You may view the attributes for up to 500 features per
data layer. If identifying on a raster data layer, the raster’s cell value
in the center of the identify box or polygon will be found. Please note
that some data layers have scale dependencies and are only visible
within certain scale ranges, such as less than 1:100,000. If a data
layer has a scale dependency and the map is not within the
appropriate scale range, then the data layer will not draw on the map,
its icon in the “Active Data Layers” window will have a yellow
exclamation point, and it cannot be identified. Please see the Help
section on “Data Layers with Scale Dependencies” for more
information on how to view data layers with scale dependencies.
Once data layers with scale dependencies are visible, they may be
queried.
10/4/2016 22
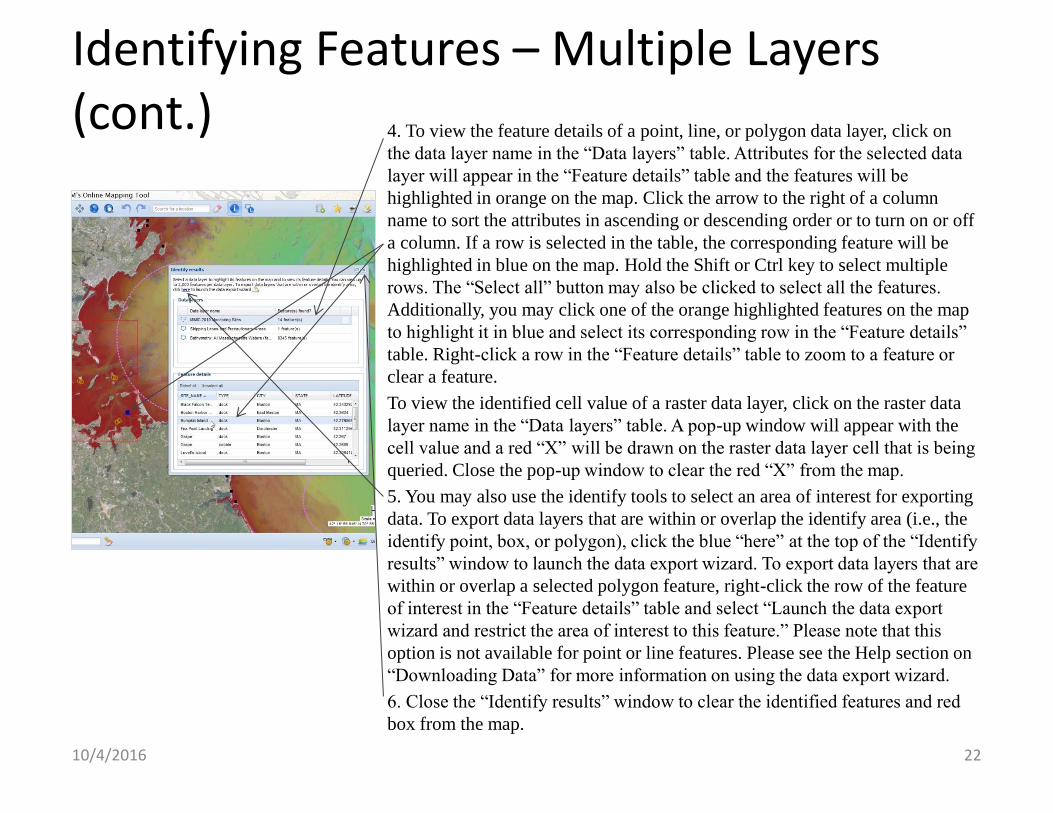
Identifying Features – Multiple Layers (cont.) 4. To view the feature details of a point, line, or polygon data layer, click on
the data layer name in the “Data layers” table. Attributes for the selected data
layer will appear in the “Feature details” table and the features will be
highlighted in orange on the map. Click the arrow to the right of a column
name to sort the attributes in ascending or descending order or to turn on or off
a column. If a row is selected in the table, the corresponding feature will be
highlighted in blue on the map. Hold the Shift or Ctrl key to select multiple
rows. The “Select all” button may also be clicked to select all the features.
Additionally, you may click one of the orange highlighted features on the map
to highlight it in blue and select its corresponding row in the “Feature details”
table. Right-click a row in the “Feature details” table to zoom to a feature or
clear a feature.
To view the identified cell value of a raster data layer, click on the raster data
layer name in the “Data layers” table. A pop-up window will appear with the
cell value and a red “X” will be drawn on the raster data layer cell that is being
queried. Close the pop-up window to clear the red “X” from the map.
5. You may also use the identify tools to select an area of interest for exporting
data. To export data layers that are within or overlap the identify area (i.e., the
identify point, box, or polygon), click the blue “here” at the top of the “Identify
results” window to launch the data export wizard. To export data layers that are
within or overlap a selected polygon feature, right-click the row of the feature
of interest in the “Feature details” table and select “Launch the data export
wizard and restrict the area of interest to this feature.” Please note that this
option is not available for point or line features. Please see the Help section on
“Downloading Data” for more information on using the data export wizard.
6. Close the “Identify results” window to clear the identified features and red
box from the map.
10/4/2016 23
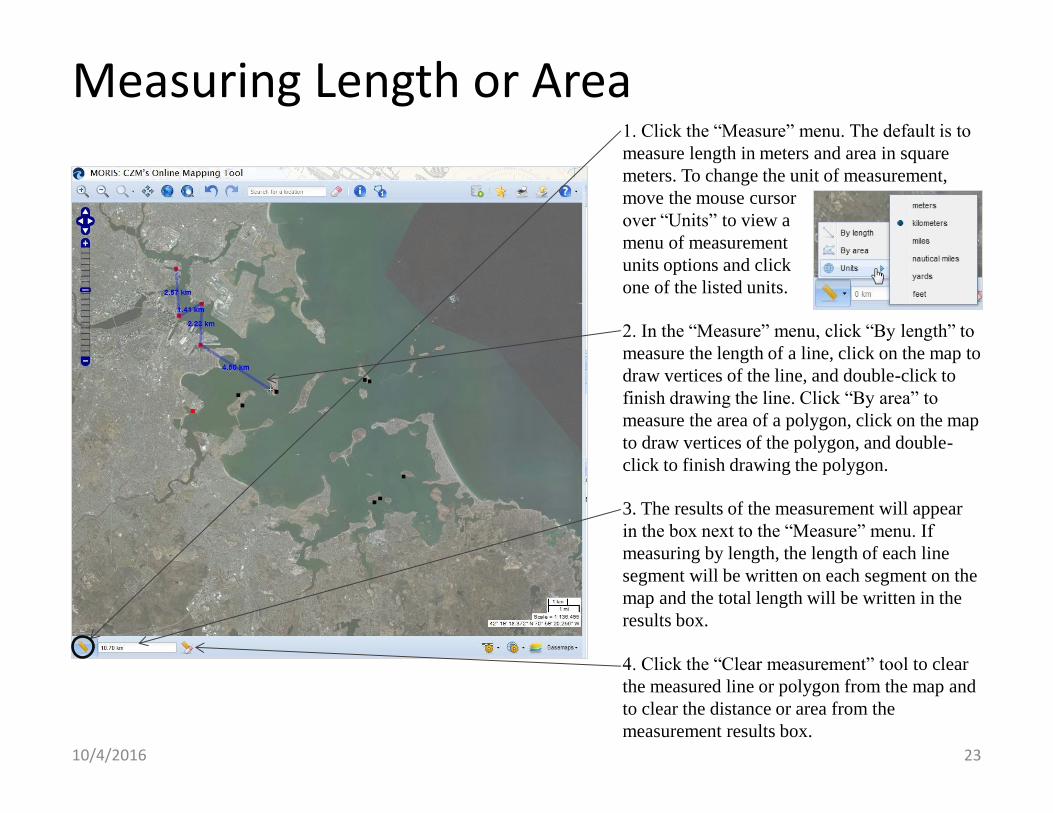
Measuring Length or Area 1. Click the “Measure” menu. The default is to
measure length in meters and area in square
meters. To change the unit of measurement,
move the mouse cursor
over “Units” to view a
menu of measurement
units options and click
one of the listed units.
2. In the “Measure” menu, click “By length” to
measure the length of a line, click on the map to
draw vertices of the line, and double-click to
finish drawing the line. Click “By area” to
measure the area of a polygon, click on the map
to draw vertices of the polygon, and double-
click to finish drawing the polygon.
3. The results of the measurement will appear
in the box next to the “Measure” menu. If
measuring by length, the length of each line
segment will be written on each segment on the
map and the total length will be written in the
results box.
4. Click the “Clear measurement” tool to clear
the measured line or polygon from the map and
to clear the distance or area from the
measurement results box.
10/4/2016 24
Draw a Buffer
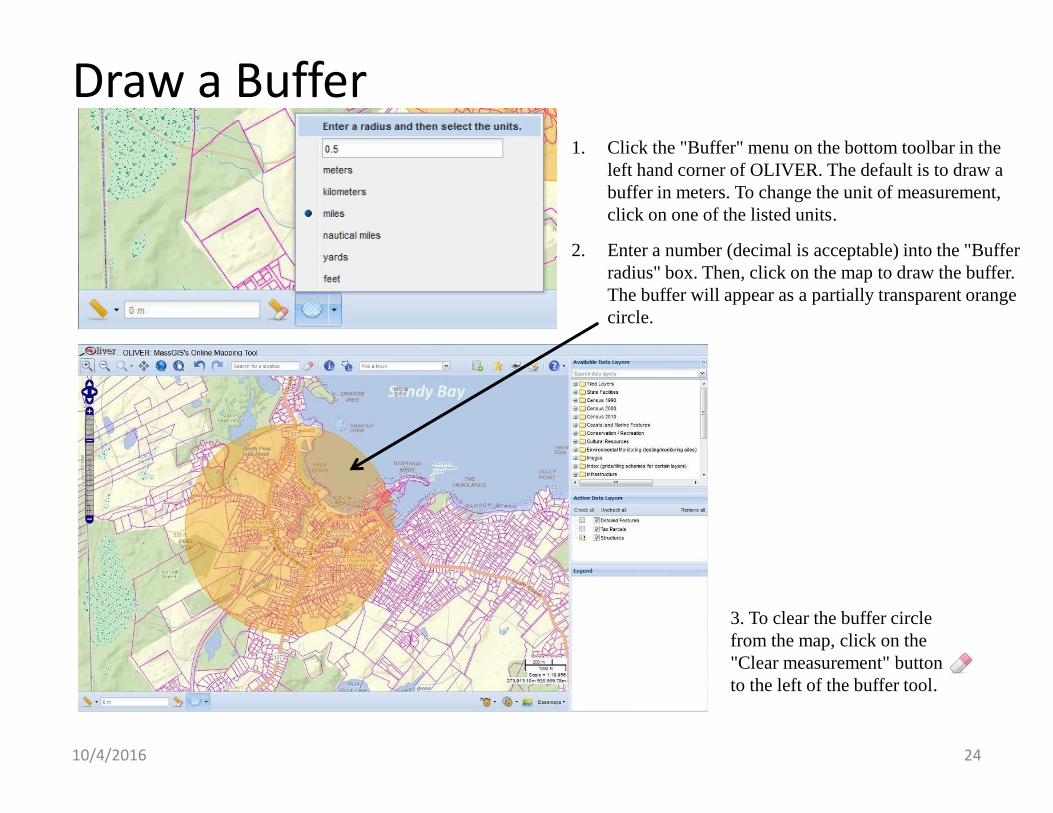
3. To clear the buffer circle
from the map, click on the
"Clear measurement" button
to the left of the buffer tool.
1. Click the "Buffer" menu on the bottom toolbar in the
left hand corner of OLIVER. The default is to draw a
buffer in meters. To change the unit of measurement,
click on one of the listed units.
2. Enter a number (decimal is acceptable) into the "Buffer
radius" box. Then, click on the map to draw the buffer.
The buffer will appear as a partially transparent orange
circle.
10/4/2016 25
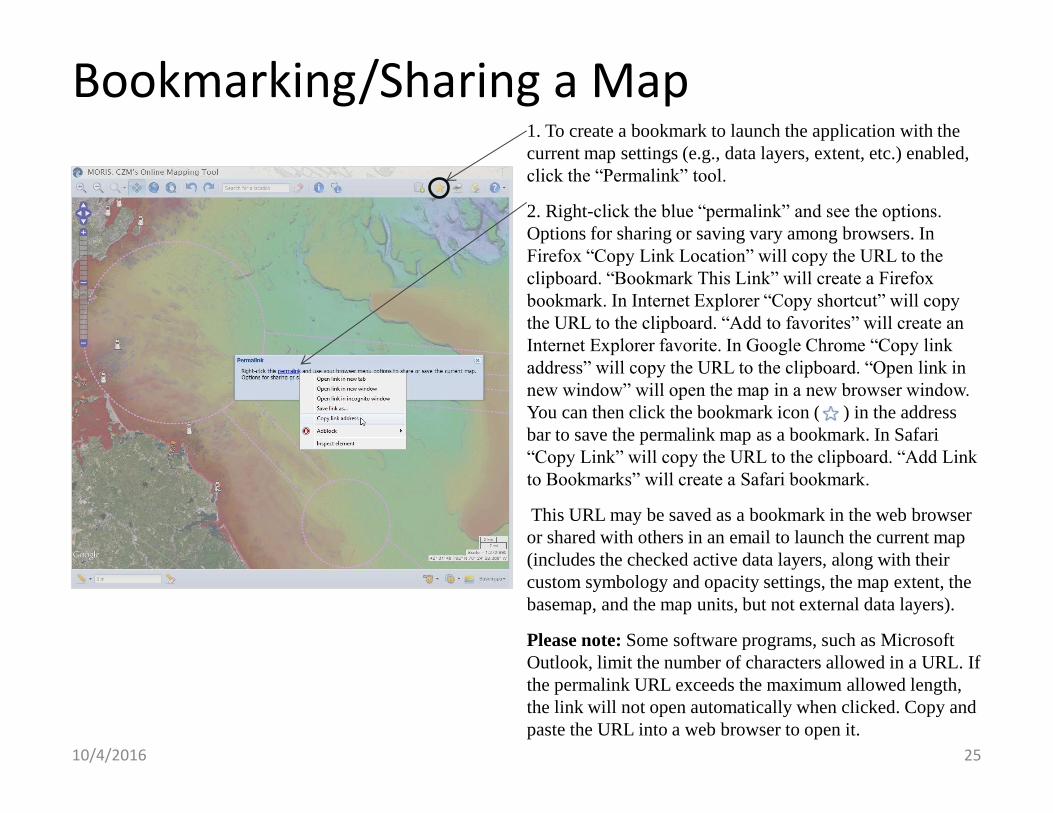
Bookmarking/Sharing a Map 1. To create a bookmark to launch the application with the
current map settings (e.g., data layers, extent, etc.) enabled,
click the “Permalink” tool.
2. Right-click the blue “permalink” and see the options.
Options for sharing or saving vary among browsers. In
Firefox “Copy Link Location” will copy the URL to the
clipboard. “Bookmark This Link” will create a Firefox
bookmark. In Internet Explorer “Copy shortcut” will copy
the URL to the clipboard. “Add to favorites” will create an
Internet Explorer favorite. In Google Chrome “Copy link
address” will copy the URL to the clipboard. “Open link in
new window” will open the map in a new browser window.
You can then click the bookmark icon ( ) in the address
bar to save the permalink map as a bookmark. In Safari
“Copy Link” will copy the URL to the clipboard. “Add Link
to Bookmarks” will create a Safari bookmark.
This URL may be saved as a bookmark in the web browser
or shared with others in an email to launch the current map
(includes the checked active data layers, along with their
custom symbology and opacity settings, the map extent, the
basemap, and the map units, but not external data layers).
Please note: Some software programs, such as Microsoft
Outlook, limit the number of characters allowed in a URL. If
the permalink URL exceeds the maximum allowed length,
the link will not open automatically when clicked. Copy and
paste the URL into a web browser to open it.
10/4/2016 26
Open to an address MORIS/OLIVER can be opened zoomed to an address by adding the address to the URL. Two options are available: 1) Google geocoding service Add ?gcType=Bing&gcAddress=1 Ashburton Pl,02108&gcZoomTo=center where gcType= is an address of any format and gcZoomTo= either "center" (for a blue balloon) or "region" for a more zoomed out map and a light blue outlined region box. Samples: http://maps.massgis.state.ma.us/map_ol/oliver.php?gcType=Google&gcAddress=1%20Ashburton%20Pl,%2002108&gcZoomTo=center http://maps.massgis.state.ma.us/map_ol/oliver.php?gcType=Google&gcAddress=1%20Ashburton%20Pl,%20Boston&gcZoomTo=region http://maps.massgis.state.ma.us/map_ol/oliver.php?gcType=Google&gcAddress=Fenway%20Park&gcZoomTo=center http://maps.massgis.state.ma.us/map_ol/oliver.php?gcType=Google&gcAddress=Park St. and Beacon St. Boston&gcZoomTo=center (when supplying an intersection, use "and" instead of "+" between the street names) http://maps.massgis.state.ma.us/map_ol/oliver.php?gcType=Google&gcAddress=McCormack%20Building,%20Boston&gcZoomTo=center http://maps.massgis.state.ma.us/map_ol/oliver.php?gcType=Google&gcAddress=42.35935%20-71.06237&gcZoomTo=center Latitude and Longitude may be used in decimal degrees format. 2) MassGIS geocoding service using base streets Use up to 4 parameters: &gcAddress= &gcCity= &gcState= &gcZipcode= &gcZoomTo is not applicable for the MassGIS geocoding service &gcAddress is required Either &gcCity or &gcZipcode are required &gcState is optional Samples: http://maps.massgis.state.ma.us/map_ol/oliver.php?gcType=MassGIS&gcAddress=1 Ashburton Pl.&gcCity=Boston http://maps.massgis.state.ma.us/map_ol/oliver.php?gcType=MassGIS&gcAddress=100 Willard St.&gcZipcode=03071
10/4/2016 27
Downloading Data
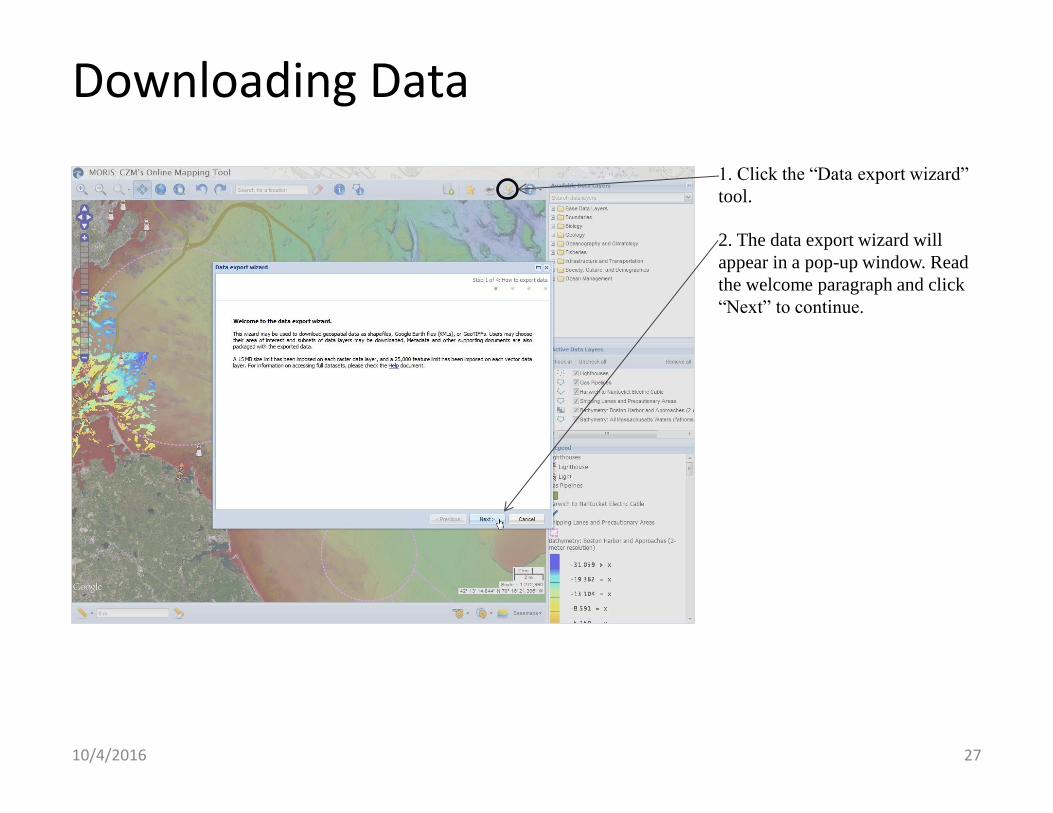
1. Click the “Data export wizard”
tool.
2. The data export wizard will
appear in a pop-up window. Read
the welcome paragraph and click
“Next” to continue.
10/4/2016 28
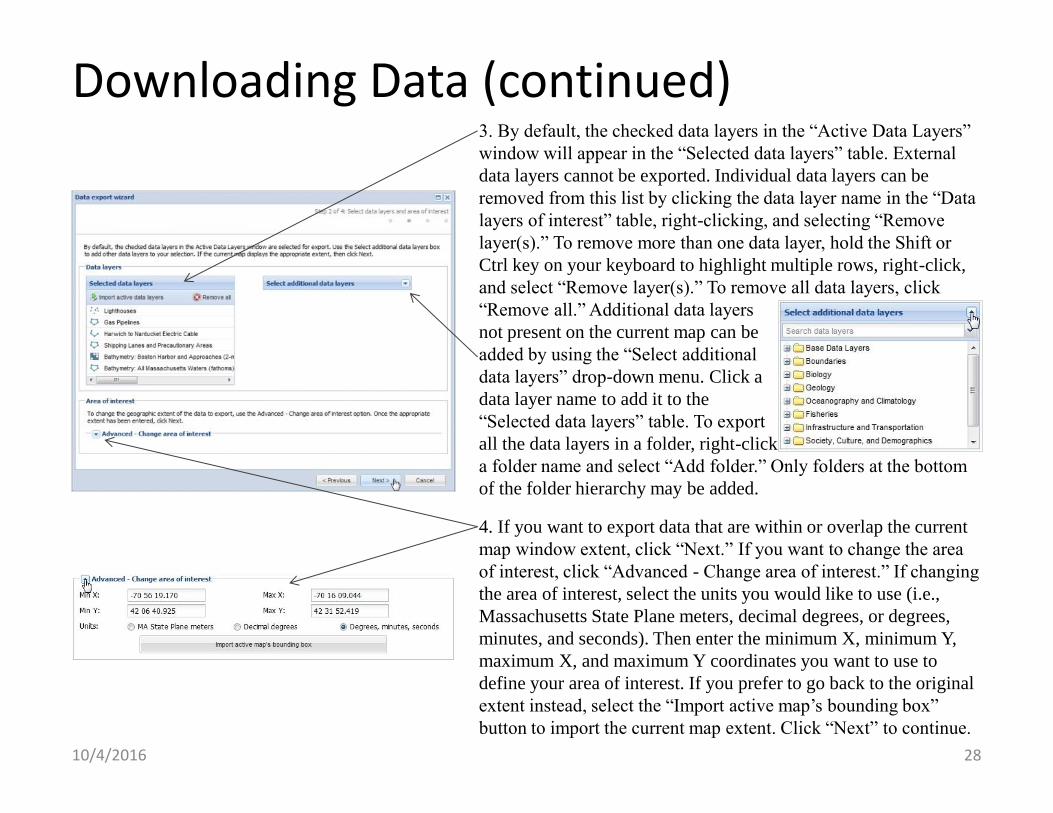
Downloading Data (continued) 3. By default, the checked data layers in the “Active Data Layers”
window will appear in the “Selected data layers” table. External
data layers cannot be exported. Individual data layers can be
removed from this list by clicking the data layer name in the “Data
layers of interest” table, right-clicking, and selecting “Remove
layer(s).” To remove more than one data layer, hold the Shift or
Ctrl key on your keyboard to highlight multiple rows, right-click,
and select “Remove layer(s).” To remove all data layers, click
“Remove all.” Additional data layers
not present on the current map can be
added by using the “Select additional
data layers” drop-down menu. Click a
data layer name to add it to the
“Selected data layers” table. To export
all the data layers in a folder, right-click
a folder name and select “Add folder.” Only folders at the bottom
of the folder hierarchy may be added.
4. If you want to export data that are within or overlap the current
map window extent, click “Next.” If you want to change the area
of interest, click “Advanced - Change area of interest.” If changing
the area of interest, select the units you would like to use (i.e.,
Massachusetts State Plane meters, decimal degrees, or degrees,
minutes, and seconds). Then enter the minimum X, minimum Y,
maximum X, and maximum Y coordinates you want to use to
define your area of interest. If you prefer to go back to the original
extent instead, select the “Import active map’s bounding box”
button to import the current map extent. Click “Next” to continue.
10/4/2016 29
Downloading Data (continued)
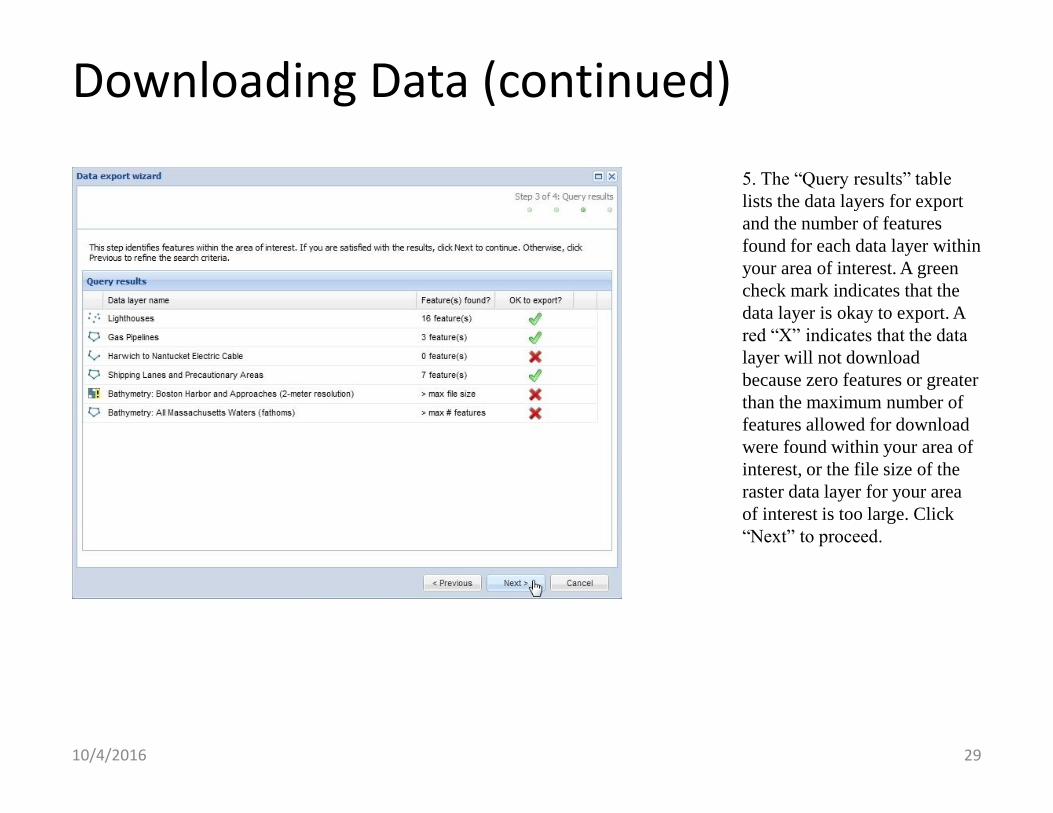
5. The “Query results” table
lists the data layers for export
and the number of features
found for each data layer within
your area of interest. A green
check mark indicates that the
data layer is okay to export. A
red “X” indicates that the data
layer will not download
because zero features or greater
than the maximum number of
features allowed for download
were found within your area of
interest, or the file size of the
raster data layer for your area
of interest is too large. Click
“Next” to proceed.
10/4/2016 30
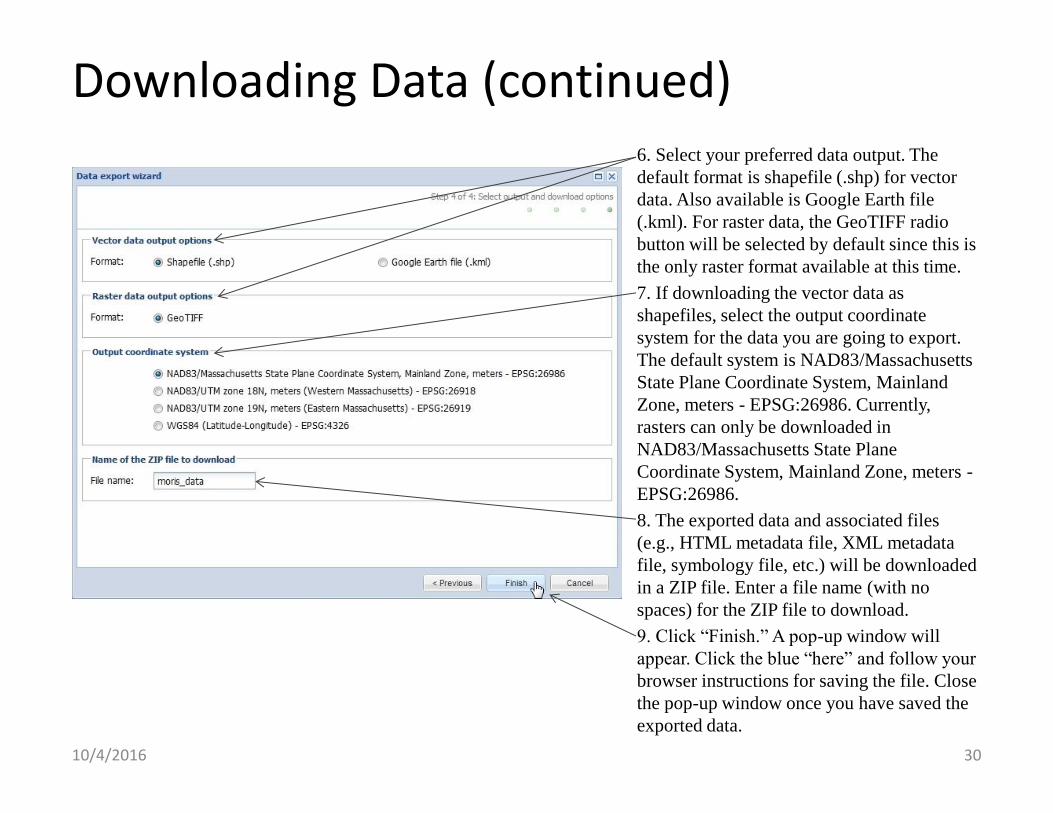
Downloading Data (continued) 6. Select your preferred data output. The
default format is shapefile (.shp) for vector
data. Also available is Google Earth file
(.kml). For raster data, the GeoTIFF radio
button will be selected by default since this is
the only raster format available at this time.
7. If downloading the vector data as
shapefiles, select the output coordinate
system for the data you are going to export.
The default system is NAD83/Massachusetts
State Plane Coordinate System, Mainland
Zone, meters - EPSG:26986. Currently,
rasters can only be downloaded in
NAD83/Massachusetts State Plane
Coordinate System, Mainland Zone, meters -
EPSG:26986.
8. The exported data and associated files
(e.g., HTML metadata file, XML metadata
file, symbology file, etc.) will be downloaded
in a ZIP file. Enter a file name (with no
spaces) for the ZIP file to download.
9. Click “Finish.” A pop-up window will
appear. Click the blue “here” and follow your
browser instructions for saving the file. Close
the pop-up window once you have saved the
exported data.
10/4/2016 31
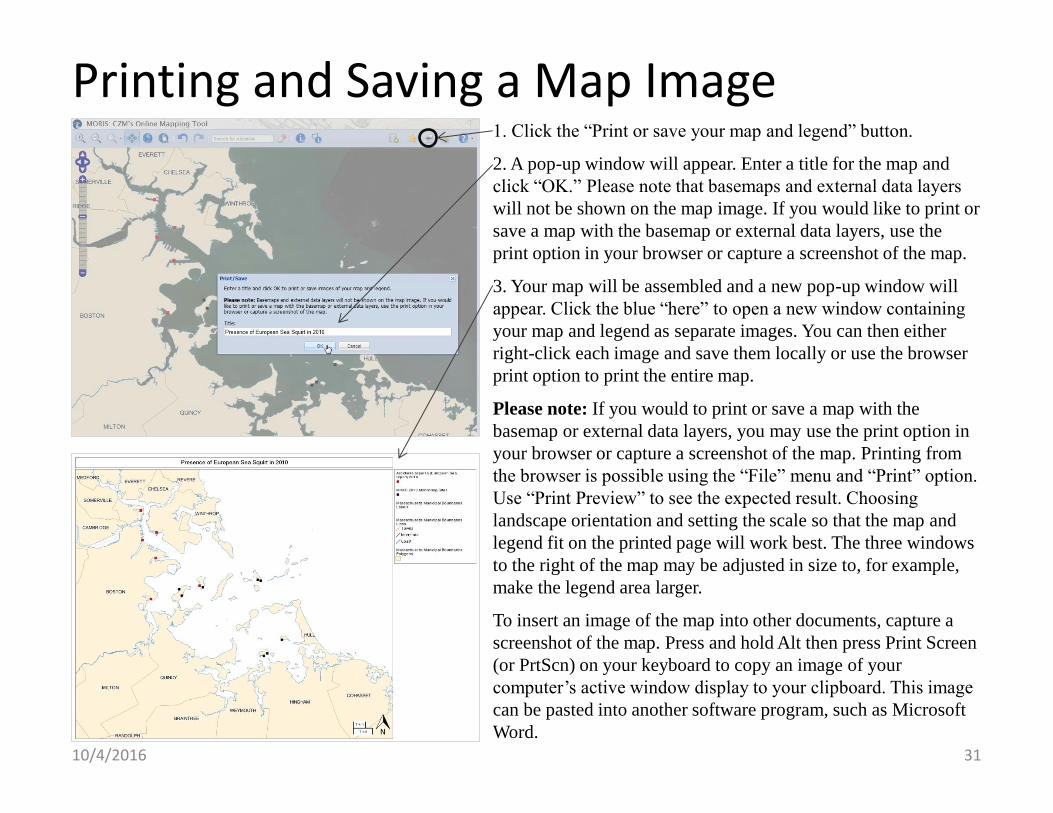
Printing and Saving a Map Image 1. Click the “Print or save your map and legend” button.
2. A pop-up window will appear. Enter a title for the map and
click “OK.” Please note that basemaps and external data layers
will not be shown on the map image. If you would like to print or
save a map with the basemap or external data layers, use the
print option in your browser or capture a screenshot of the map.
3. Your map will be assembled and a new pop-up window will
appear. Click the blue “here” to open a new window containing
your map and legend as separate images. You can then either
right-click each image and save them locally or use the browser
print option to print the entire map.
Please note: If you would to print or save a map with the
basemap or external data layers, you may use the print option in
your browser or capture a screenshot of the map. Printing from
the browser is possible using the “File” menu and “Print” option.
Use “Print Preview” to see the expected result. Choosing
landscape orientation and setting the scale so that the map and
legend fit on the printed page will work best. The three windows
to the right of the map may be adjusted in size to, for example,
make the legend area larger.
To insert an image of the map into other documents, capture a
screenshot of the map. Press and hold Alt then press Print Screen
(or PrtScn) on your keyboard to copy an image of your
computer’s active window display to your clipboard. This image
can be pasted into another software program, such as Microsoft
Word.
10/4/2016 32
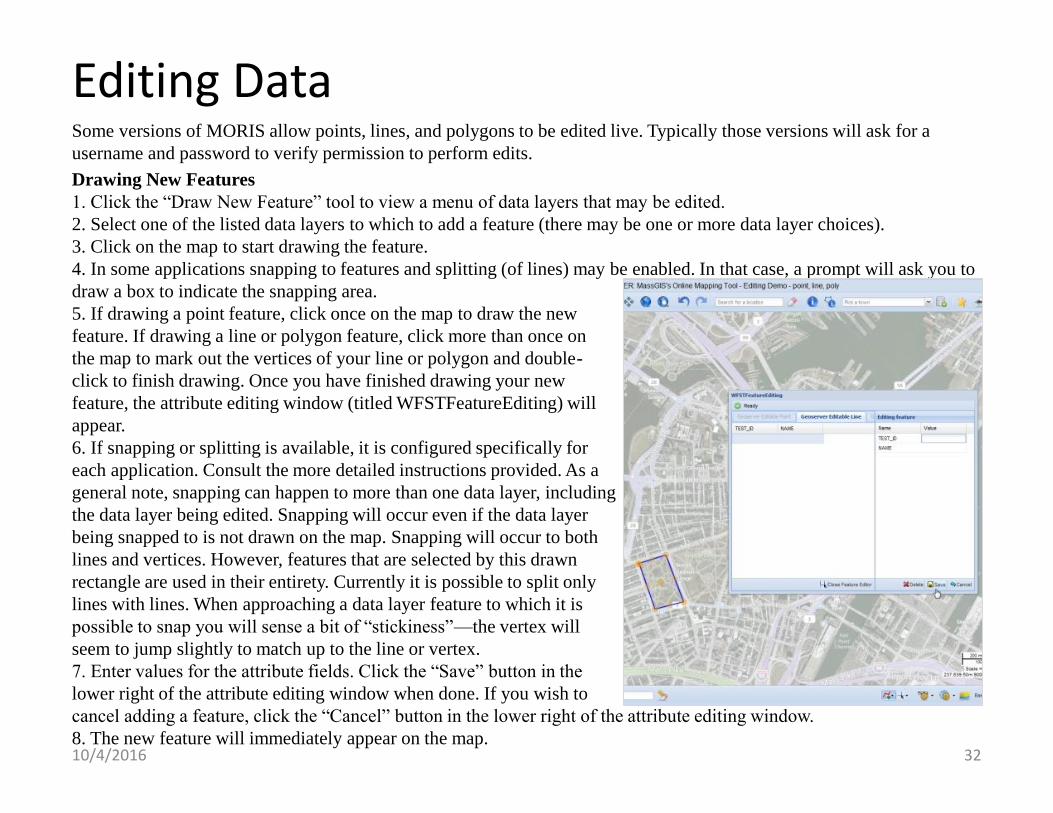
Editing Data Some versions of MORIS allow points, lines, and polygons to be edited live. Typically those versions will ask for a
username and password to verify permission to perform edits.
Drawing New Features
1. Click the “Draw New Feature” tool to view a menu of data layers that may be edited.
2. Select one of the listed data layers to which to add a feature (there may be one or more data layer choices).
3. Click on the map to start drawing the feature.
4. In some applications snapping to features and splitting (of lines) may be enabled. In that case, a prompt will ask you to
draw a box to indicate the snapping area.
5. If drawing a point feature, click once on the map to draw the new
feature. If drawing a line or polygon feature, click more than once on
the map to mark out the vertices of your line or polygon and double-
click to finish drawing. Once you have finished drawing your new
feature, the attribute editing window (titled WFSTFeatureEditing) will
appear.
6. If snapping or splitting is available, it is configured specifically for
each application. Consult the more detailed instructions provided. As a
general note, snapping can happen to more than one data layer, including
the data layer being edited. Snapping will occur even if the data layer
being snapped to is not drawn on the map. Snapping will occur to both
lines and vertices. However, features that are selected by this drawn
rectangle are used in their entirety. Currently it is possible to split only
lines with lines. When approaching a data layer feature to which it is
possible to snap you will sense a bit of “stickiness”—the vertex will
seem to jump slightly to match up to the line or vertex.
7. Enter values for the attribute fields. Click the “Save” button in the
lower right of the attribute editing window when done. If you wish to
cancel adding a feature, click the “Cancel” button in the lower right of the attribute editing window.
8. The new feature will immediately appear on the map.
10/4/2016 33
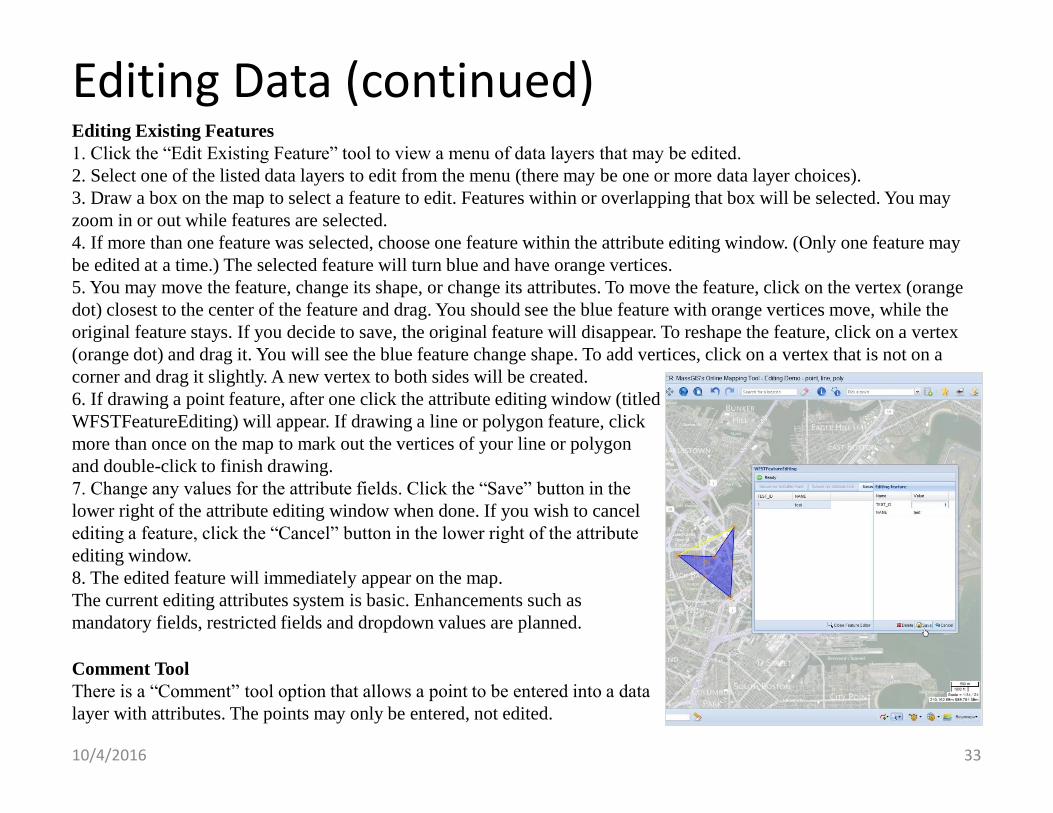
Editing Data (continued) Editing Existing Features
1. Click the “Edit Existing Feature” tool to view a menu of data layers that may be edited.
2. Select one of the listed data layers to edit from the menu (there may be one or more data layer choices).
3. Draw a box on the map to select a feature to edit. Features within or overlapping that box will be selected. You may
zoom in or out while features are selected.
4. If more than one feature was selected, choose one feature within the attribute editing window. (Only one feature may
be edited at a time.) The selected feature will turn blue and have orange vertices.
5. You may move the feature, change its shape, or change its attributes. To move the feature, click on the vertex (orange
dot) closest to the center of the feature and drag. You should see the blue feature with orange vertices move, while the
original feature stays. If you decide to save, the original feature will disappear. To reshape the feature, click on a vertex
(orange dot) and drag it. You will see the blue feature change shape. To add vertices, click on a vertex that is not on a
corner and drag it slightly. A new vertex to both sides will be created.
6. If drawing a point feature, after one click the attribute editing window (titled
WFSTFeatureEditing) will appear. If drawing a line or polygon feature, click
more than once on the map to mark out the vertices of your line or polygon
and double-click to finish drawing.
7. Change any values for the attribute fields. Click the “Save” button in the
lower right of the attribute editing window when done. If you wish to cancel
editing a feature, click the “Cancel” button in the lower right of the attribute
editing window.
8. The edited feature will immediately appear on the map.
The current editing attributes system is basic. Enhancements such as
mandatory fields, restricted fields and dropdown values are planned.
Comment Tool
There is a “Comment” tool option that allows a point to be entered into a data
layer with attributes. The points may only be entered, not edited.
10/4/2016 34
Accessibility In order to address accessibility guidelines under the Massachusetts Information Technology Division’s Enterprise IT
Accessibility Standards, several enhancements have been added to the latest version of MORIS:
• Keyboard equivalents for menu items (see next page for listing)
• Ability to change the focus with the tab key
• Labels for inputs
• Semantic HTML, e.g., specific header elements for sections of the page
• Clear information on table column headings
Users should note that MORIS contained a number of accessible elements already in its first OpenLayers version:
• Documentation is provided in HTML as well as PDF format. The two formats are clearly labeled by type. Both the
HTML and PDF documentation provides good navigation and alternative text for images. The HTML
documentation has been validated and checked successfully against several accessibility websites.
• The data provided on the map visually is also available through DBF download in text format.
• Data provided in compressed format (.zip) is also provided in uncompressed format.
• As an alternative to searching for data in folders and subfolders, MORIS offers an input box. The user can enter
part of a text string and data layers with that string anywhere in the title will appear in a drop-down list. For
example, if the user types “z” choices come up, and when “o” is added, those choices are narrowed to those with
“zo” such as “Coastal Zone” and “Zoning District Outlines.”
• Additional software is not required—MORIS runs inside a web browser (the previous version of MORIS required
a separate software installation).
10/4/2016 35
Accessibility (continued) For those users who prefer to skip mouse movement, keyboard shortcuts to drive map operations, change focus, or open
menus or dialogs are listed below. These key mappings have been tested in Firefox. (Note: Not all tools may be provided
in MORIS or other applications.)
• To select the Zoom in tool: Ctrl-Alt-z
• To select the Zoom out tool: Ctrl-Alt-o
• To open the Zoom to scale menu: Ctrl-Alt-s
• To select the Pan tool: Ctrl-Alt-p
• To zoom to the initial extent: Ctrl-Alt-i
• To zoom to the full extent of active data layers: Ctrl-Alt-m
• To give focus to the Search for a location box: Ctrl-Alt-l
• To open the Permalink tool: Ctrl-Alt-k
• To open the Print/Save tool: Ctrl-Alt-w
• To open the data export wizard: Ctrl-Alt-x
• To view the Help drop-down menu: Ctrl-Alt-q
• To give focus to the Available Data Layers search box: Ctrl-Alt-y
• To open the Measure tool menu: Ctrl-Alt-a
• To open the Scale settings menu: Ctrl-Alt-g
• To open the Map units menu: Ctrl-Alt-u
• To open the Basemaps menu: Ctrl-Alt-b
• To open the Comment tool dialog: Ctrl-Alt-t
If you require additional accommodations or information, please contact Aleda Freeman at [email protected].
10/4/2016 36
Using MORIS on a Mac This user guide was written using a Windows PC. Below are some tips for using MORIS on a Mac.
Right-Clicking
Some of the tools and menus are accessed by right-clicking (e.g., to zoom to the extent of a data layer, right-click the data
layer name in the “Active Data Layers” window and select “Zoom to layer”). If your Mac mouse has one button, you
may right-click by holding down the Control key and then clicking with the mouse.
Highlighting Multiple Rows
To highlight multiple rows, hold the Shift or Command key on your keyboard and then click the rows of interest. After
identifying features, users may highlight multiple rows in the “Feature details” table in the “Identify results” pop-up
window. Users may also remove more than one data layer from the “Selected data layers” table in the “Data export
wizard” by highlighting multiple rows.
Saving a Map Image
To insert an image of the map into other documents, capture a screenshot of the map. Click Command-Shift-4 on your
keyboard, then the space bar, then click a window to save an image file of the selected window on the desktop. Click
Command-Control-Shift-4 on your keyboard, then the space bar, then click a window to copy an image of the selected
window to your clipboard. This image can be pasted into another software program, such as Microsoft Word.
10/4/2016 37
Problems? Questions? Comments? Troubleshooting
If the map does not initially load in Internet Explorer, go to the “Tools” menu and click “Internet Options.” Click on the
“Security” tab and click the button “Default level.” Click the “Apply” button and the “OK” button and then reload the
MORIS page.
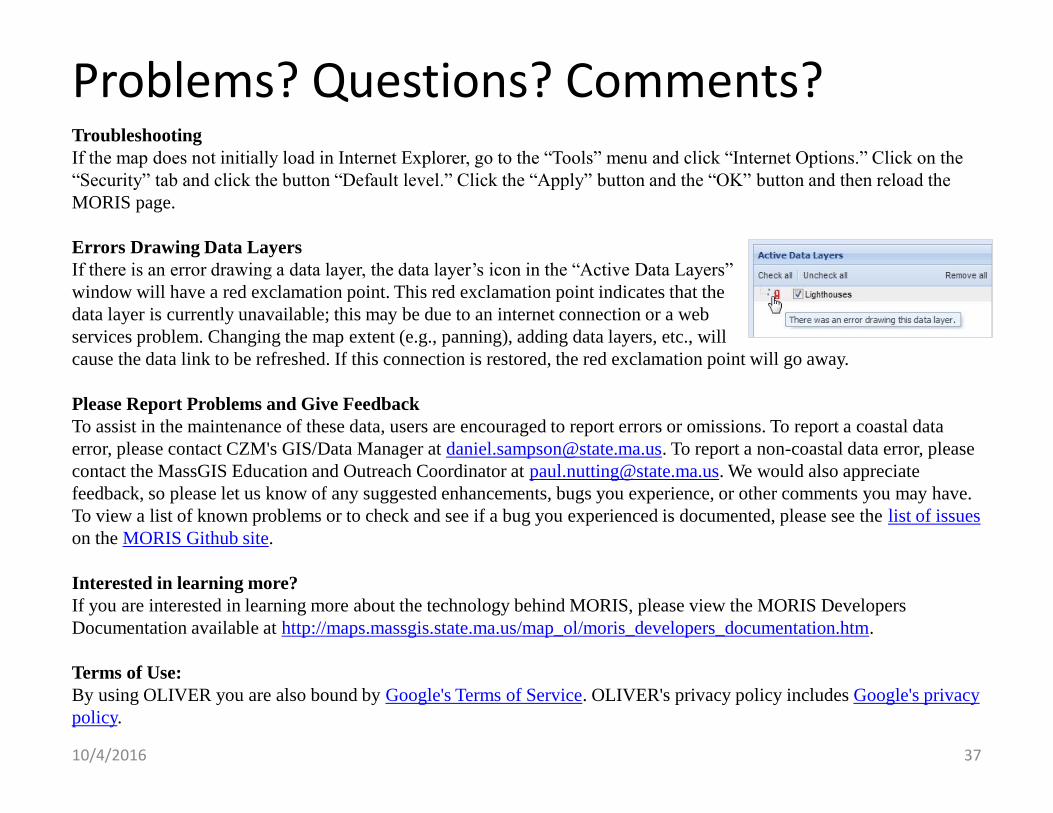
Errors Drawing Data Layers
If there is an error drawing a data layer, the data layer’s icon in the “Active Data Layers”
window will have a red exclamation point. This red exclamation point indicates that the
data layer is currently unavailable; this may be due to an internet connection or a web
services problem. Changing the map extent (e.g., panning), adding data layers, etc., will
cause the data link to be refreshed. If this connection is restored, the red exclamation point will go away.
Please Report Problems and Give Feedback
To assist in the maintenance of these data, users are encouraged to report errors or omissions. To report a coastal data
error, please contact CZM's GIS/Data Manager at [email protected]. To report a non-coastal data error, please
contact the MassGIS Education and Outreach Coordinator at [email protected]. We would also appreciate
feedback, so please let us know of any suggested enhancements, bugs you experience, or other comments you may have.
To view a list of known problems or to check and see if a bug you experienced is documented, please see the list of issues
on the MORIS Github site.
Interested in learning more?
If you are interested in learning more about the technology behind MORIS, please view the MORIS Developers
Documentation available at http://maps.massgis.state.ma.us/map_ol/moris_developers_documentation.htm.
Terms of Use:
By using OLIVER you are also bound by Google's Terms of Service. OLIVER's privacy policy includes Google's privacy
policy.