monthly-, medium-, and short-range flood warning: testing the limits of predictability
TRANSCRIPT
METEOROLOGICAL APPLICATIONSMeteorol. Appl. 16: 77–90 (2009)Published online in Wiley InterScience(www.interscience.wiley.com) DOI: 10.1002/met.140
Monthly-, medium-, and short-range flood warning: testingthe limits of predictability
J. Thielen,a* K. Bogner,a F. Pappenberger,b M. Kalas,a M. del Medicoa and A. de Rooa
a EC, Joint Research Centre, Institute for Environment and Sustainability, Ispra, Italyb European Centre for Medium-Range Weather Forecasts, Reading, UK
ABSTRACT: This paper describes a case study that explores the limits of the predictability of floods, by combiningforecasts with multiple spatial and temporal resolutions. Monthly, medium- and short range numerical weather prediction(NWP) data are input to the European Flood Alert System for a flood event that affected rivers in Romania in October2007. The NWP data comprise ensembles and deterministic forecasts of different spatial resolutions and lead times fromdifferent weather prediction models. Results are explored in terms of the individual NWP components as well as theensemble. In this case study, ensembles of monthly weather forecasts contribute only marginally to the early warning,although some indication is given as early as 3 weeks before the event. The 15-day medium-range weather forecastsproduce early flood warning information 9 to 11 days in advance. As the event draws nearer and is in range to be capturedby the higher resolution ensemble forecasts, the spatial extent of the event is forecast with much more precision thanwith the medium-range. A novel post-processing method for the calculation of river discharge is applied to those stationswhere observations are available, and is able to correct for time-shifts and to improve the quantitative forecast. The studyillustrates how a combination of forecasts and post-processing improves the lead time for early flood warnings by 2 to3 days, while remaining reliable also in the short-range. Copyright 2009 Royal Meteorological Society
KEY WORDS ensemble flood forecasting; discharge post-processing; early flood warning; skill scores; ARMAXSS;COSMO-LEPS; ECMWF; EFAS
Received 13 October 2008; Revised 9 January 2009; Accepted 16 January 2009
1. Introduction
The skill of weather prediction has steadily improvedover the past years through higher resolution models,improved physics, remote sensing data and better dataassimilation methods. The skill of predicting intense pre-cipitation has, however, remained low and has barelyincreased over the past decade (Hamill et al., 2007).Pappenberger and Buizza (2008) have found no longterm trend of precipitation skill for the Danube area,but it is worth pointing out that more positive trendshave been detected in routine evaluations of the ECMWFoperational, high-resolution forecasts of more extremeprecipitation thresholds. As Richardson et al. (2008)have documented, 12-month running average equitablethreat scores of operational, high-resolution forecastsover Europe verified against synop station data have beencontinuously improving, especially for the predictionof 5 and 10 mm day−1 thresholds. McBride and Ebert(2000) have shown that for seven global weather fore-casting models tested over Australia the skill falls dra-matically for rainfall occurrence thresholds greater than10 mm day−1, implying that the models are much bet-ter at predicting the occurrence of rain than they are atpredicting the magnitude and location of the peak values.
* Correspondence to: J. Thielen, EC, Joint Research Centre, Institutefor Environment and Sustainability, Ispra, Italy.E-mail: [email protected]
Error and uncertainty significantly increase at longer leadtimes.
Most hydrological services therefore rely either onobservations only or on short-term deterministic rainfallforecasts of up to 2 days or less, because the unpre-dictable degree of uncertainty at longer lead times ren-ders the results unreliable and therefore not useful fordecision-making (Demeritt et al., 2007). Lately, however,the hydrological community is increasingly looking atthe use of ensemble prediction systems (EPS) instead ofsingle (deterministic) forecasts for flood warning timesbeyond 48 h. EPS have already become an integral part ofoperational weather forecasts over the past years (Molteniet al., 1996; Buizza et al., 1999, 2007b; Palmer andHagedorn, 2006). They are designed to give a measure ofthe predictability of the weather and the uncertainty in themodel solution for lead times up to 2 weeks, which wouldbe considered well outside the range of predictability fordeterministic models.
In 1999 the ‘European Flood Forecasting System’(EFFS, 1999–2003) project became the first Euro-pean research project to address early flood warn-ing based on EPS (de Roo, 2003; Kwadijk, 2003;Gouweleeuw et al., 2004, 2005; Bartholmes and Todini,2005; Pappenberger et al., 2005). The findings clearlyshowed the great potential for using EPS to increaseflood early warning time, but equally highlighted theneed for: further research on the interpretation of the
Copyright 2009 Royal Meteorological Society

78 J. THIELEN ET AL.
results; sufficient events for statistical analysis; post-processing of the ‘raw’ output; and ways to commu-nicate the results to end users and decision-makers.In the light of these results the European Commis-sion created the European Flood Alert System (EFAS).In 2004 the ‘Hydrological Ensemble Prediction Experi-ment’ (HEPEX, see http://hydis8.eng.uci.edu/hepex) fol-lowed as an international initiative to foster interdisci-plinary dialogue between the meteorological and hydro-logical communities (Schaake et al., 2006, 2007; Thielenet al., 2008) and to promote ensemble prediction systemsfor floods, droughts and general water management onshort, medium and seasonal scales. Since then, EPS-basedresearch has become a dominant feature of hydrologicalresearch and applications on all time scales (see publi-cations on research projects, such as: Mesoscale AlpineProgramme Demonstration of Probabilistic Hydrologicaland Atmospheric Simulation of Flood Events (MAP D-PHASE), (Zappa et al., 2008); Prevention, Informationand Early Warning (PREVIEW), (Buizza et al., 2007a;Bogner and Kalas, 2008); and other research projects onensembles, including: Roulin et al. (2007); Bartholmeset al. (2009); Hopson and Webster (2008); Olsson andLindstrom (2008); Thirel et al. (2008). See also the fullreview by Cloke and Pappenberger, 2008a).
While the number of research projects on EPS hasincreased rapidly, the implementation of EPS in opera-tional hydrological services has been much slower (Clokeand Pappenberger, 2008a). Apart from practical problemssuch as the need for intensive computing power facili-ties or the mismatch between meteorological grid spacingand hydrologically relevant units, there are other morefundamental issues. Probabilistic forecasting needs to beassessed statistically over a sufficient number of eventsand not only on a case study basis. Treating events withhigh return periods makes it, however, unlikely that asufficient number of events is available to determine thereliability of the forecasts, even if ‘hindcasts’ over a suf-ficiently long time period were systematically providedwith the same model and parameterization.
The use of probabilistic flood forecasting for riskassessment and risk-based decision-making in floodwarning is still one of the greatest challenges for the sci-entific community. The responsibility of the modellersto interpret the probabilistic results and to communi-cate them efficiently to end-users (in research, opera-tional forecasting centres or the public) and decision-makers, is even greater than for the classical deterministicapproaches. This challenge is present in the majority ofEuropean operational forecasting centres, as highlightedin the recent report of the EXCIFF initiative (ExchangeCircle for International Flood Forecasting, 2005).
In this paper, the performance of EFAS when usingEPS at different spatio-temporal resolutions is studied inrespect to hydrological predictions (Pappenberger et al.,2008 and Cloke and Pappenberger, 2008b). Monthlyweather forecasts, global EPS and limited-area EPS(LEPS) are evaluated for a flood event that took place inRomania in 2007 and that has already been the subject of
research with multiple EPS (Pappenberger et al., 2008).Clearly the results of this study can only be indicativesince the results are based on one flood event only. Inorder to test the conclusions, longer time series need tobe evaluated and the limits of the approach further testedwith flood events at different spatial and temporal scales.In Section 2 of this paper, a brief description of EFAS andits set-up, data inputs and methodologies, is presented.In addition, a novel method for discharge EPS post-processing is proposed that aims at rendering the resultsmore useful for decision-makers. A brief description ofthe case study is given in Section 3. Section 4 describesbriefly the rainfall forecast fields, the resulting floodforecast information at the different lead times, and thepossible improvements after application of the novel post-processing routine. Conclusions are drawn in Section 5.
2. Description of EFAS set-up, input data andmethodology used in this study
2.1. European flood alert system (EFAS) set-up
The aim of the European Flood Alert System (EFAS)is to increase preparedness for floods in trans-nationalEuropean river basins. Since 2005 EFAS has been provid-ing local water authorities and the European Commissionwith early flood warning information up to 10 days inadvance based on EPS and deterministic forecasts fromdifferent weather services (so-called ‘poor man’s ensem-bles’) The investigation of probabilistic flood forecastingresults with case studies and statistical analyses as wellas their effective communication to flood forecasters asearly warning information, are the predominant tasksof EFAS (Ramos et al., 2007; Bartholmes et al., 2009;Thielen et al., 2009; Younis et al., 2008). EFAS incor-porates operationally available global and limited areamodel EPS as well as deterministic forecasts from differ-ent meteorological models. This multi-model approachensures that forecasts are based on different numericalimplementations, data assimilation schemes and grid res-olutions, which can have a substantial impact in gen-erating the full spectrum of possible solutions. This isparticularly important at the ‘tails’ of the distributions,where the extreme rainfall events that cause flooding arecaptured (Pappenberger et al., 2008).
The operational EFAS has been developed on twomain pillars. The first is the state-of-the-art meteorolog-ical input data including several EPS and deterministicforecasts. The meteorological data used in the study aredescribed in Section 2.2. The second pillar of EFAS isa strong geographical information system (GIS) compo-nent designed to make effective use of the existing spatialdata sets relevant for hydrological processes and to pro-vide estimates of stream flow and other information at anypoint along the river system. The LISFLOOD model isa dynamic GIS-based hydrological rainfall-runoff-routingmodel (van der Knijff and de Roo, 2006; van der Kni-jff et al., 2008). It is a hybrid between a conceptual andphysical rainfall-runoff model combined with a routing
Copyright 2009 Royal Meteorological Society Meteorol. Appl. 16: 77–90 (2009)DOI: 10.1002/met

TESTING THE BOUNDARIES OF PREDICTABILITY FOR FLOODS 79
module in the river channel. Whenever possible, modelparameters are derived from physical information, e.g.soil maps and land-use maps The remaining parametersare calibrated based on discharge observations (Pappen-berger et al., 2004; Mo et al., 2006; van der Knijff andde Roo, 2006; Feyen et al., 2007).
EFAS results are explored on an event basis whencritical flood warning levels are exceeded. Four warninglevels (low, medium, high and severe) are derived froma 16-year reference (1990–2006) LISFLOOD simulationdriven by weather observations. The highest simulateddischarge represents the highest critical threshold (severe)and the 99% quantile, the second highest critical thresh-old (high), the medium warning level is defined by 98%quantile and the low warning level by the 97% quantile.A flood event is defined when the discharge exceeds atleast the high threshold. Results are viewed as time seriesrepresentations of flood hazard exceedances at point loca-tions as well as combined flood hazard maps (Ramoset al., 2007).
EFAS aims to forecast fluvial floods that are mostlycaused by large synoptic scale weather phenomena suchas widespread severe or prolonged precipitation thatnumerical weather prediction models are likely to captureconsistently as the event approaches. While this princi-ple of ‘Let’s wait and see the next forecast’ is oftenintuitively used when results are uncertain, Bartholmeset al. (2009) have demonstrated statistically that intro-ducing the principle of temporal ‘persistence’ (wherebya river pixel is flagged at ‘risk of flooding’ only if theevent is forecast on three consecutive 12-hourly forecasts)considerably increases the skill of the flood forecast. Forthis study this implies that control points with detailedinformation on river pixels are only created if an eventhas been forecast twice within 24 h by forecasts basedon VAREPS (Variable Resolution EPS) or VAR.
For this study EFAS was set up for the entire Danuberiver basin with a spatial grid resolution of 5 × 5 km.Time steps vary depending on the input data as indicatedin Section 2.2. Only the 1200 forecasts are evaluatedfor this study. Although the model is run for the entireDanube, the case study analysis is restricted to Romania,the country affected by the flooding of October 2007.
2.2. Input data for this study
Meteorological station data of precipitation, tempera-ture and estimated potential evaporation are derivedfrom the meteorological data archive of the AGRI-CULTURE unit at the DG Joint Research Centre(http://www.agrifish.jrc.it). This database holds meteoro-logical data from about 1000 stations reporting regularlyacross Europe from 1974. These data are extracted, inter-polated and used to calculate the initial conditions at thestart up of the flood forecast situation. For Romania about22 rainfall stations are available.
Hydrological station data have been provided by theRomanian hydrological services as average daily data(0600–0600). These data have been used for comparison
and post-processing of the discharge output as describedin Section 2.4. The weather forecast data-sets used for thisstudy are listed in Table I. The longest-range forecasts arethe monthly forecasts provided by the European Centrefor Medium-Range Weather Forecasts (ECMWF). Theyare available once a week every Thursday, have a leadtime of 30 days and contain 51 ensembles. The medium-range VAREPS, also provided by ECMWF, are providedtwice a day and have a lead time of 15 days. Bothmonthly and VAREPS forecasts have staggered temporaland spatial resolutions. The shortest range EPS forecastsare COSMO-LEPS provided by ARPA-SIM (Marsigliet al., 2001, 2008). COSMO-LEPS has a lead time of5 days and a total of 16 members. The spatial resolutionis 10 km throughout. In addition to the three sets of EPSthe two deterministic weather forecasts from ECMWFand the German Weather Service (DWD) are also used.The DWD input data is a composite consisting of datafrom the regional model (Lokal Modell) with a spatialresolution of 7 km for the first 3 days, and the globalmodel (Global Modell) with a spatial resolution of 40 kmfor the remaining 4 days.
2.3. Updating of river flow with the ARMAXSSmodel
EFAS is grid-based and there provides warnings alongrivers also at locations at which no measurements areavailable. Remotely sensed river information could beused to update river discharges (Schumann et al., 2005;Matgen et al., 2007). However, current operational sub-systems rely predominantly on point measurements.Since the latter are also available to the EFAS forecastsystem, the updating procedure is implemented for thoseriver pixels only where observations are available. Themethod is mainly based on the idea to decompose the dis-charge data (observed and simulated) at multiple scalesand construct a state-space model at each scale.
The wavelet transformation decomposes the time seriesinto different resolution levels and provides a way ofanalyzing a signal in both time and frequency domains(e.g. Carmona et al., 1998). The reason this decompo-sition has been applied is that the difference betweenobserved and simulated discharge will be caused by dif-ferent time-scale processes (e.g. snowmelt processes canlast for several weeks while flash floods occur within atime-scale of a few hours). An Auto-Regressive Mov-ing Average with Exogenous Input (ARMAX) modelin state-space form, also called dynamic linear model(DLM), is applied for updating the state variables ateach scale. State-space models have been introduced inKalman (1960) and Kalman and Bucy (1961), and anexcellent treatment of ARMAX models and their equiv-alent state-space form is given by Shumway and Stoffer(2006). More details about this error correction methodcan be found in Bogner and Kalas (2008).
Copyright 2009 Royal Meteorological Society Meteorol. Appl. 16: 77–90 (2009)DOI: 10.1002/met

80 J. THIELEN ET AL.
Table I. Specification of the meteorological forecasting data used for this study.
Acronym Provider Lead timein days
Spatialresolution
Ensemblemembers
Forecastingfrequency
Forecasts processedfor this study
EFAStime step
MON(part ofVAREPS)
ECMWF 30 ca. 40 km(T399/L62) for thefirst 10 days, andca. 80 km(T255/L62) fordays 11–30)
50 and 1control run
EveryThursday ofthe month
27 September2007 1200
Daily
4 October2007 120011 October2007 1200
VAREPS ECMWF 15 ca. 40 km(T399/L62) for thefirst 10 days, andca. 80 km(T255/L62) fordays 11–15)
50 and 1control run
Twice daily Daily 1200 from 1October 2007 until31 October 2007
Daily
COSMO-LEPS
ARPA-SIM
5 10 km 16 (nocontrol)
Once daily Daily 1200 from 1October 2007 until31 October 2007
6 hourly
DWD Germanweatherservice(DWD)
3 7 km 1 Twice daily Daily 1200 from 1October 2007 until31 October 2007
Hourly
3. The October 2007 floods in Romania
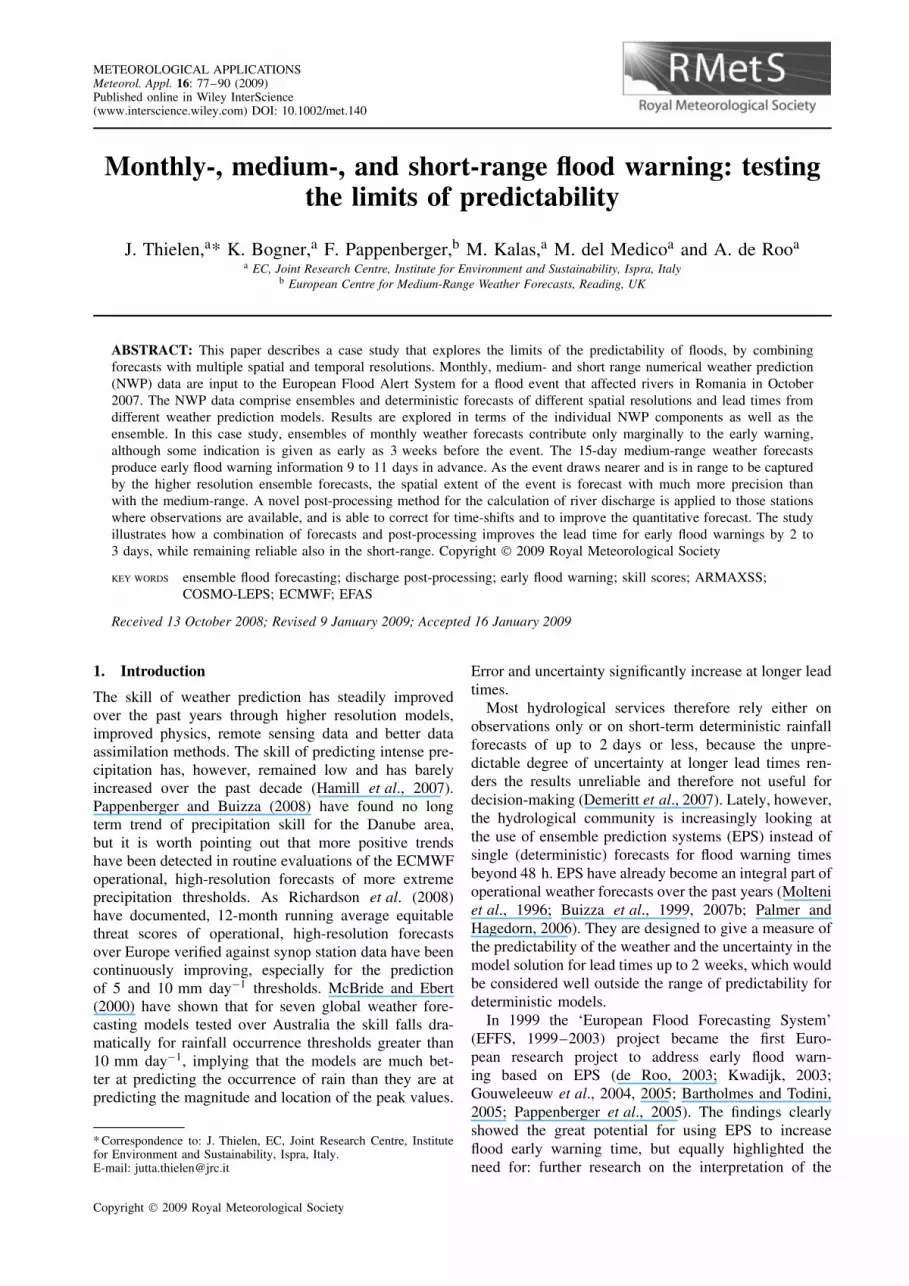
In October 2007 the Danube river basin received aboveaverage rainfalls in the Balkan region and Romania(Figure 1(a)), compared with the EFAS reference period(1990–2004). Consequently, the hydrological regime ofalmost all Romanian rivers was above the monthly meanmulti-annual values. In the last 10 days of the month theprecipitation regime exceeded the normal values for thewhole month due to the high instability of the weatherand torrential rainfall, especially during the days 20–24October. Figure 1(b) also clearly demonstrates that thereis not a linear relationship between excess of rainfall andflood hazard. While a relatively large region in south-eastern Europe received higher than average rainfalls,flooding was only observed in Romanian tributaries tothe Danube.
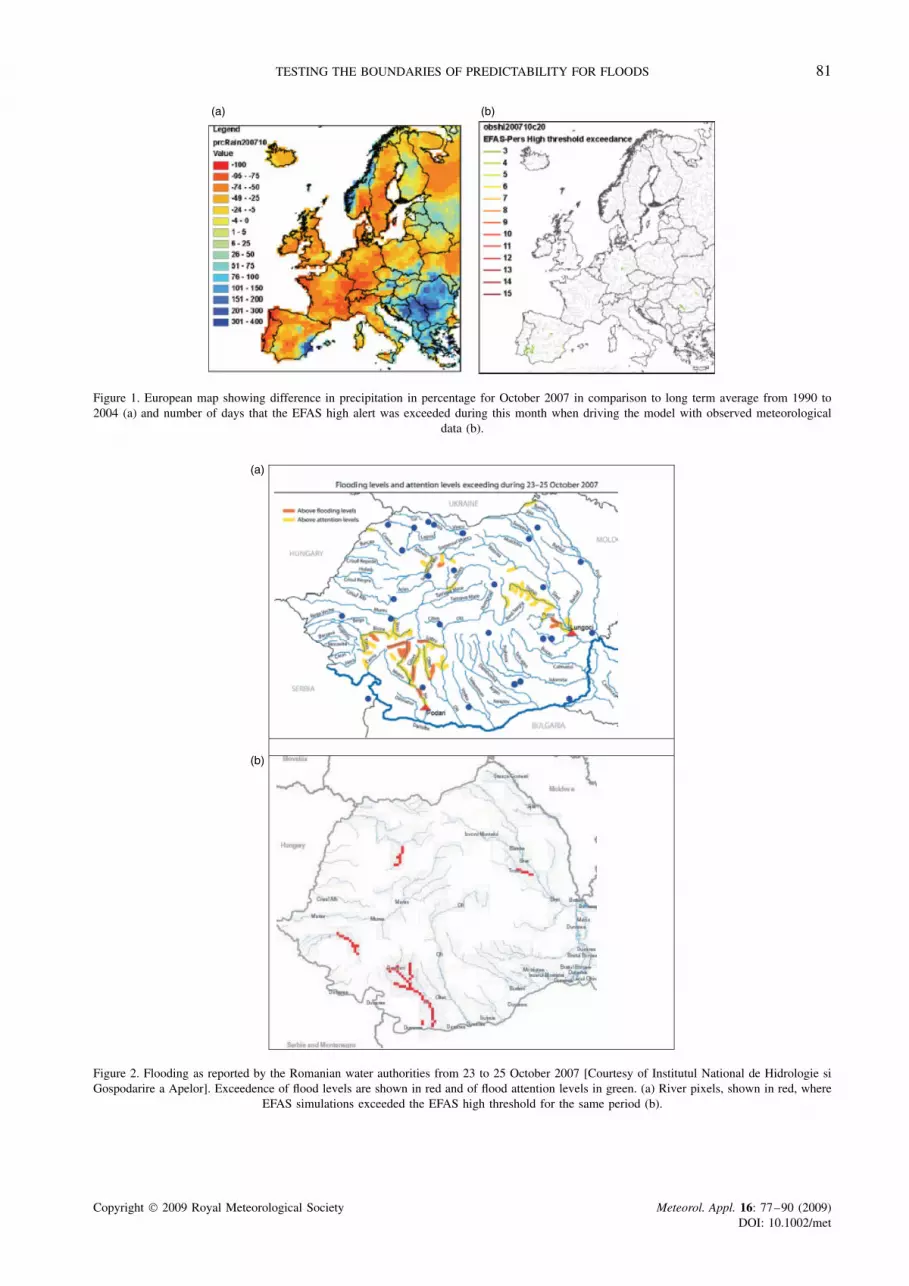
Flooding levels were exceeded on 23–25 October inthe middle and lower basin of the Olt river, in the upperbasin of the Jiu river and in the lower basin of the Siret.Flood attention levels were exceeded on many riversacross the country (Figure 2(a)). Localized flooding wasalso observed in tributaries of the rivers Somes and Tisza.A second event affected the country just a few days afterthe initial flooding and affected particularly the north-west of the country. Figure 2(b) illustrates that whenLISFLOOD is driven by observed weather data, andafter the EFAS flood thresholds are applied, the eventis reproduced very well. The figure shows that the EFAShigh threshold corresponds roughly to the national floodlevel. At a few places the EFAS high level was only just
exceeded, e.g. in the Jiu, while in reality the flood levelwas not quite reached.
4. Presentation of results
4.1. Observed and forecast rainfall fields
4.1.1. Observations
The total rainfall from 20 to 25 October 2007 as estimatedfrom the observed data available for this study, is shownin Figure 3(a). Due to the coarse raingauge network thespatial rainfall pattern shown here is quite coarse. Thewhole country was affected by rainfall and the maincentres of high rainfall accumulates are in the southwest,northwest and east of the country.
4.1.2. Monthly rainfall forecasts
Rainfall probabilities of monthly rainfall forecasts (MON)from 4 October 2007, 3 to 4 weeks before the floodevent, show a high probability of exceeding the 100and 150 mm rainfall thresholds along the Adriatic coast.In Figure 3(a) data exceeding the 100 mm threshold areshown as shaded areas while those exceeding the 150 mmare shown as contour lines. The country borders are alsoshown. For Romania there is a 20–30% probability ofexceeding the 100 mm threshold in the western part of thecountry but only few EPS accumulated rainfalls exceed150 mm (Figure 3(b)).
Copyright 2009 Royal Meteorological Society Meteorol. Appl. 16: 77–90 (2009)DOI: 10.1002/met
TESTING THE BOUNDARIES OF PREDICTABILITY FOR FLOODS 81
(a) (b)
Figure 1. European map showing difference in precipitation in percentage for October 2007 in comparison to long term average from 1990 to2004 (a) and number of days that the EFAS high alert was exceeded during this month when driving the model with observed meteorological
data (b).
(a)
(b)
Figure 2. Flooding as reported by the Romanian water authorities from 23 to 25 October 2007 [Courtesy of Institutul National de Hidrologie siGospodarire a Apelor]. Exceedence of flood levels are shown in red and of flood attention levels in green. (a) River pixels, shown in red, where
EFAS simulations exceeded the EFAS high threshold for the same period (b).
Copyright 2009 Royal Meteorological Society Meteorol. Appl. 16: 77–90 (2009)DOI: 10.1002/met

82 J. THIELEN ET AL.
(a) (b)
(c) (d)
Figure 3. The accumulated rainfalls from 20 to 25 October 2007 as derived from gauge observations available for this study (www.agrifish.jrc.it)(a). Probabilities of MON20071004 1200 forecasts to exceed the 100 (shaded) and 150 (contoured) mm accumulated rainfalls over the 30 dayperiod (b), of VAR20071015 1200 forecasts to exceed the 100 (shaded) and 150 (contoured) mm accumulated rainfalls over the 15 day period
(c), of COS20071019 1200 forecasts to exceed the 100 (shaded) and 150 (contoured) mm accumulated rainfalls over the 5 day period (d).
4.1.3. Medium-range rainfall forecasts
Figure 3(c) shows the percentages of EPS membersexceeding 100 and 150 mm over the full forecastingperiod for the VAREPS forecast of 15 October 2007.For better visual comparison, the same accumulation
thresholds as for the monthly forecasts (Figure 3(b)) arechosen, despite the different forecasting periods. Rainfallprobabilities from VAREPS on 15 October 2007, 7 to9 days before the flooding, show up to 15% probabilityfor rainfall accumulates to exceed 100 mm 15 day−1 and
Copyright 2009 Royal Meteorological Society Meteorol. Appl. 16: 77–90 (2009)DOI: 10.1002/met

TESTING THE BOUNDARIES OF PREDICTABILITY FOR FLOODS 83
(a)
(b)
Figure 4. Overview map of percentage of maximum number of monthly EPS exceeding the EFAS high alert on 2007092712 forecasts (a) and2007100412 forecasts (b). This figure is available in colour online at www.interscience.wiley.com/ma
about 5% probability of exceeding 150 mm 15 day−1
in the southwest (Jiu, Olt, and Mures catchments) andeast (Siret) of Romania, thus capturing the region oflater flood events correctly but with a low probability.Consistent with the monthly forecasts, much higherprobabilities are simulated along the Adriatic coast, butflooding was not reported there. Two days later andthereafter, from the forecast of 17 October 2007 onwards(not shown), the probabilities increase considerably upto 33% for the 100 mm 15 day−1 and to 15% for the150 mm 15 day−1 thresholds, while the regions of heavy
rainfalls are more sharply defined for the Siret andthe Jiu.
4.1.4. Short-range rainfall forecasts
Results from COSMO-LEPS reflect the higher spatialvariability of the rainfall fields due to the higher grid res-olution. Although already present in the COSMO-LEPSforecasts from 18 October 2007, it is the rainfall prob-abilities from 19 October 2007 that show clearly a highprobability of rainfall exceeding the 100 and 150 mmthresholds for a hook-shaped region across Romania that
Copyright 2009 Royal Meteorological Society Meteorol. Appl. 16: 77–90 (2009)DOI: 10.1002/met

84 J. THIELEN ET AL.
(a)
(b)
Figure 5. (a) Flood probability map from VAR20071015 1200 (b) and history diagrams of current and previous forecasts for the stationhighlighted with a red square for the DWD, ECMWF deterministic and VAREPS. Shown are the highest threshold exceedances for each day(green = low threshold exceeded, yellow∼medium, red∼high and magenta∼severe). For VAR the percentage of EPS exceeding the EFAS high
alert (VAR>HAL) and the EFAS severe alert (VAR>SAL) are shown.
closely follows the terrain of the Carpathian Mountains.According to COSMO-LEPS there is a probability ofmore than 50% that a rainfall total of 150 mm will beexceeded over the next 5 days in the upstream parts ofmany tributaries to the Danube including the Jiu and Olt,but also the Arges and Siret (Figure 3(d)).
4.2. Flood forecasting
4.2.1. Monthly flood forecasts
The earliest monthly forecast that could have captured theevent was that of 27 September 2007, 3 weeks before
the event (lead time 27 days). Figure 4 illustrates thehighest number of EPS members exceeding the EFAShigh alert threshold during the 4 week period. It isnoticeable that almost throughout the catchment thethreshold is exceeded by 5–10% of the EPS members.This is due to the rapidly increasing spread in EPSafter the second week of forecast and should thereforenot be translated into a flood probability. Instead thoseriver stretches where a significantly higher number ofEPS members exceed the EFAS high threshold should beconsidered. In this forecast there are two areas of possibleflooding: firstly the upper Danube and parts of the Sava,
Copyright 2009 Royal Meteorological Society Meteorol. Appl. 16: 77–90 (2009)DOI: 10.1002/met

TESTING THE BOUNDARIES OF PREDICTABILITY FOR FLOODS 85
alert (VAR>SAL) are shown.
(a)
(b)
Figure 6. (a) Flood probability map from VAR20071019 1200 (b) and history diagrams of current and previous forecasts for the stationhighlighted with a red square for the DWD, ECMWF deterministic and VAREPS. Shown are the highest threshold exceedences for each day(green = low threshold exceeded, yellow∼medium, red∼high and magenta∼severe). For VAR the percentage of EPS exceeding the EFAS high
alert (VAR>HAL) and the EFAS severe alert (VAR>SAL) are shown.
and secondly the Romanian tributaries to the Tisza, inparticular the Koroes and Mures. The highest percentageof EPS members exceeding the EFAS high alert thresholdis 38% in the Sava (Figure 4(a)).
One week later, in the forecast of 4 October (lead time20 days), the event in the upper Danube is no longerforecast, while for the Romanian tributaries to the Tiszathe event remains visible in the maps (Figure 4(b)), and
Copyright 2009 Royal Meteorological Society Meteorol. Appl. 16: 77–90 (2009)DOI: 10.1002/met
86 J. THIELEN ET AL.
percentages of almost 70% are reached. In addition to theoverview maps, the monthly results are summarized asweekly information. These suggest that the flood peaksand flood extents would be biggest in the fourth week ofOctober (i.e. 21–28).
4.2.2. Medium-range flood forecasts
VAREPS are identical with the monthly forecasts for thefirst 15 days. Therefore, in line with the results fromthe monthly forecasts, the flood simulations based onVAREPS (hereafter VAR) from 4 October 2007 do not yetindicate any particular flood hazard. A few EPS membersexceeding the EFAS high alert are simulated within thenormal spread of EPS towards the end of the forecastingperiod. The first indication for flooding shows up in VARfrom 14 October, but according to EFAS persistence rules(Thielen et al., 2009; see also Section 2.1), only in thefollowing forecast of 15 October those river pixels againexceeding the EFAS high threshold are marked at risk offlooding (Figure 5). The forecast from 15 October showsthat mostly the Siret river basin is forecast (persistently)at risk of flooding starting with a low probability from21 October onwards, and has the highest probability ofmore than 50% for 24–25 October. On 15 October theEPS information is supported for the first time by thedeterministic ECWMF forecasts (EUD).
In the subsequent days, although the forecast rainfallsshift daily the centre of heavy precipitation across Roma-nia, flooding remains forecast predominantly for the Siretfrom the 24 October 2007 onwards. The forecasts sud-denly change on the 19 October 2007 when all majorrivers in the country are forecast with a probability ofmore than 50% to be at risk of flooding (Figure 6).
Figure 6 illustrates that from 16 October onwards forall rivers flood threshold exceedences are simulated withat least five EPS for 22–23 October onwards and thatthe number of EPS in VAR exceeding the thresholds ismostly increasing. The highest number of EPS exceedingthe thresholds is simulated for 26 October. In particularfor Olt and Siret there is also a considerable numberof EPS exceeding the EFAS severe alert. Except forthe Siret, the deterministic ECMWF forecasts (EUD) donot support the VAR information. Visualization of thehydrographs (an example is given for Olt, Point 3 fromFigure 7) shows that almost 50% of all EPS just exceedthe EFAS high alert and that 25% of all EPS get close toor exceed the EFAS severe alert level.
EUD-based forecasts simulate potential floodingmostly east of the Olt (included) and the central-northernparts of the country with Mures and Tisza tributaries. TheJiu is not simulated at risk of flooding at all by EUD.On 21 October the EUD-based forecast indicate poten-tial flooding only for parts of the Siret while the signaldisappears entirely for all other rivers.
On 24 October flooding is forecast within the next2 days for the lower parts of the Siret and Jiu, whileother rivers previously forecast at risk of flooding suchas the Mures, Olt or Ialomita, do not show up any more.
Tributaries to the Tisza in the northwest of the countryare forecast with a second peak for the 2–3 November,and thus a second flood event.
4.2.3. Short-range flood forecasts
The first flood forecast based on COSMO-LEPS (here-after COS) that captured the event may have been thatfrom 19 October. Figure 8 shows the overview maps ofEPS above EFAS severe flood threshold for both COS(right) and VAR (left) for 19 and 21 October. The areasat risk of exceeding the EFAS severe alert (flooding verylikely) are much more sharply defined by COS than VAR.COS in particularly identifies the Jiu river with 16 out of16 EPS exceeding the EFAS severe flood threshold. ForOlt and Siret only smaller tributaries are identified witharound 25% probability. Results from VAR are, in con-trast, much more widely spread across Romania and thewhole Danube basin. With VAR the region simulated atrisk of flooding is shifted eastwards, affecting the Oltrather than Jiu.
The first day that the DWD-based forecasts couldcapture the flood event was on 17 October onwards.The first day that DWD-based results exceeded the EFAShigh alert was on 19 October in the Jiu. A day later allmajor tributaries to the Danube, Jiu, Olt, Ialomita, Argesand Siret exceed the EFAS high alert threshold. On 22October even the severe alert threshold is exceeded inthe Jiu. The bi-polar distribution of the flooding for theJiu in the west and Siret in the east is, therefore, wellcaptured by the DWD-based forecasts.
4.3. Summary of uncalibrated outputs
The analysis of the discharge predictions (Sections 4.2.1to 4.2.3) clearly show that flood forecasts based on EPScan considerably increase the flood early warning time,compared with the deterministic forecasts. Furthermore,it suggests that the use of multiple weather forecastsand EPS at different lead times and resolutions can bebeneficial compared with single EPS. For this study therewere not sufficient monthly EPS to draw conclusions ontheir performance. From an initial analysis they wouldappear, however, to be useful for a general outlook ortrend, if interpreted cautiously. More research is neededin this regard. In contrast, VAR provided in this case aconvincing early flood warning lead time of 7 to 8 days,that flooding is likely to occur in one or several Romaniantributaries to the Danube. This early warning is confirmedin subsequent forecasts. In terms of quantitative results,however, VAR simulates flooding that is too widespread,while underestimating the peak in those rivers whereflooding did occur. From the 19 October onwards COSprovided quantitatively better results than VAR andwould have allowed a flood forecaster to pinpoint therivers at risk of flooding.
4.4. Improving flood forecasts through post-processing
At the Lungoci station on the Siret river the hydrologicalmodel simulates the discharge quite well and the error
Copyright 2009 Royal Meteorological Society Meteorol. Appl. 16: 77–90 (2009)DOI: 10.1002/met

TESTING THE BOUNDARIES OF PREDICTABILITY FOR FLOODS 87
Figure 7. Hydrographs for point 3 in Figure 4. Shown are box-plot diagrams of discharges calculated with VAREPS as input with indicationof min and max, 25–50 and 75% quantiles. In addition the hydrographs based on the deterministic DWD (black line) and ECMWF forecasts(brown line) are shown. EFAS thresholds are indicated in colour with green (low flood thresholds), yellow (medium), red (high) and magenta
(severe). At the top with inverse distance the upstream rainfalls forecast with DWD and EUD are indicated.
(a) (b)
(c) (d)
Figure 8. Overview maps of EPS above EFAS severe threshold for (a) VAR on 19 October 2007 1200, (b) COS on 19 October 2007 1200, (c)VAR on 21 October 2007 1200, and (d) COS on 21 October 2007 1200.
Copyright 2009 Royal Meteorological Society Meteorol. Appl. 16: 77–90 (2009)DOI: 10.1002/met

88 J. THIELEN ET AL.
Siret
Forecast time [h]
Q[m
3 /s]
6h 18h 30h 42h 54h 66h 78h 90h 108h 126h
050
010
0015
00 10/18/07 10/19/07 10/20/07 10/21/07 10/22/07 10/23/07 10/24/07 10/25/07 10/26/07
Siret
Forecast time [h]
Q[m
3 /s]
6h 18h 30h 42h 54h 66h 78h 90h 102h 114h 126h
050
010
0015
00 10/20/07 10/21/07 10/22/07 10/23/07 10/24/07 10/25/07 10/26/07(a) (b)
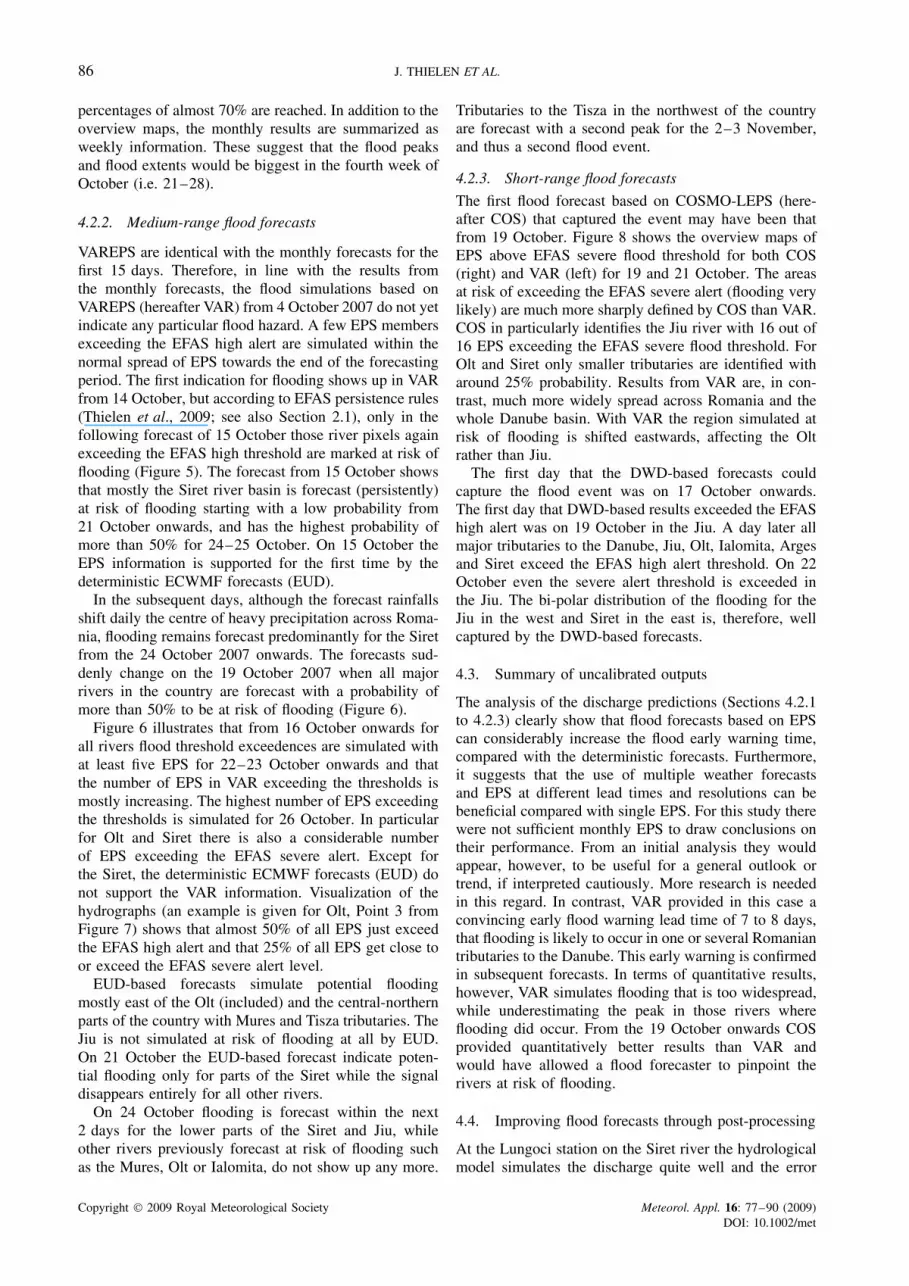
Figure 9. Forecast for the Siret river at the station Lungoci from the 17 and 19 October 2007. COSMO VAREPSsimulated observed.
(a) (b)
Figure 10. Forecast for the Jiu river at the station Podardi from the 17 and 19 October 2007 with and without error corrected COSMO-LEPS.COSMO-corr COSMO simulated observed.
between observed and simulated discharge, taking theobserved precipitation data as input, is negligible. There-fore, any correction of the ensemble members would notimprove the forecast quality. In Figure 9 the results of theCOSMO-LEPS and the VAREPS are shown, indicating apossible flood event almost 9 days ahead. The observeddischarge is covered by the spread of both EPS and thetiming and peak discharge of the flood is forecast almostperfectly.
A big discrepancy between the observed and simulatedpeak discharge exists, however, in the Jiu river. The rea-son there is such a big shift in the timing of the flood peakin October 2007 has not yet been clarified. In additionthe possible causes for the underestimation must be ana-lyzed in order to improve the flood forecasting system. Itshould be mentioned that the error correction methodol-ogy described above is just an additional tool to improvethe system by the application of statistical methods. InFigure 10 the results for the Podardi station on the Jiuriver are shown, taking the 16 ensemble members of theCOSMO-LEPS as input to the LISFLOOD model andcorrecting each of the 16 predicted discharge series by
the described methodology. A first indication of the pos-sibility of a flood occurrence can be seen almost 7 daysahead (Figure 10(a)). In Figure 10(b) one can see howthe applied methodology improved the timing of the peak.The negative time shift could be eliminated and thereforethe flood event of October 2007 would have been fore-cast quite well almost 4 to 5 days ahead, although thepeak discharge is still underestimated (Figure 10).
5. Conclusions
A seamless forecasting suite for floods using multiplelong-, medium- and short-range weather forecasts asinput, is presented for a widespread event in Romaniawith locally severe flooding. The approach is driven bymultiple spatio-temporal scaled inputs as well as multipleweather forecasting models and ensemble predictionsystems. The early flood warning approach explored hereis based on threshold exceedence and takes into accountthe persistence of the signals to decrease significantlythe number of false alarm rates without significantlycorrupting hit rates.
Copyright 2009 Royal Meteorological Society Meteorol. Appl. 16: 77–90 (2009)DOI: 10.1002/met

TESTING THE BOUNDARIES OF PREDICTABILITY FOR FLOODS 89
Results for this case study show conclusive proba-bilistic flood forecasts that complement each other atdifferent lead times and resolutions. While the poten-tial benefits of monthly forecasts must be investigatedfurther with longer time series and statistical analysis,the results suggest that they can indicate the tendencyof areas at risk of flooding 3 to 4 weeks in advance.Clear localization of the event in space and time seemsto be beyond the scope of these forecasts. In contrast,the 15-day VAREPS forecasts implemented in 2007 atECMWF show qualitative and quantitative good results.They allow the forecasting, with a high probability, ofa flood event with an early warning lead time of 7 to9 days. The forecasts indicate, however, a more widelyspread flooding than actually occurred. Those forecastsdriven with the higher-resolution limited-area model EPS(COSMO-LEPS) allow, 4 days before the event, a com-paratively good identification of the areas most at risk.These results are persistent throughout the forecasts.In comparison with the deterministic forecasts whichshow rather intermittent behaviour and little consistencybetween the DWD and ECMWF forecasts, the probabilis-tic results are much more coherent and complement eachother.
Overall, the paper has shown how flood forecastingat different temporal and spatial scales can produce aseamless suite of forecasts ranging from qualitative earlywarning information to quantitative reliable short-terminformation. For the case study presented, the benefit ofusing ensembles compared with deterministic forecastsis clearly demonstrated for the medium range, but alsoshort ranges up to 5 days. Furthermore, there is a clearindication that post-processing of discharge ensemblescan reduce the uncertainty bounds further to a moremeaningful level for decision-making.
Acknowledgements
The authors gratefully acknowledge the support of allstaff of the JRC’s Institute for Environment and Sustain-ability (IES) that contributed to the preparation of thecase. Special thanks to Hadewij Sint for help with GlSwork and improving figures. The authors also wish tothank the German Weather Service, the European Centrefor Medium-Range Weather Forecasts, ARPA-SIM, theRomanian Water Authorities and E. Anghel in particular,and the JRC’s Institute for Protection and Security of theCitizen (IPSC) for providing data. This work is fundedby the EC PREVIEW (FP6-Work Package: Plain Floods)program (http://www.preview-risk.com).
References
Bartholmes JC, Thielen J, Ramos MH, Gentilini S. 2009. TheEuropean Flood Alert System EFAS – Part 2: Statistical skillassessment of probabilistic and deterministic operational forecasts.Hydrology and Earth System Sciences 13: 141–153.
Bartholmes JC, Todini E. 2005. Coupling meteorological andhydrological models for flood forecasting. Hydrology and EarthSystem Sciences 9: 333–346.
Bogner K, Kalas M. 2008. Error correction methods and evaluation ofan ensemble based hydrological forecasting system for the UpperDanube catchment. Atmospheric Science Letters 9: 95–102.
Buizza R, Asensio H, Balint G, Bartholmes J, Bliefernicht J, Bogner K,Chavaux F, de Roo A, Donnadille J, Ducrocq V, Edlund C, KotroniV, Krahe P, Kunz M, Lacire K, Lelay M, Marsigli C, Milelli M,Montani A, Pappenberger F, Rabufetti D, Ramos M-H, Ritter B,Schipper JW, Steiner P, Thielen-del Pozo J, Vincendon B. 2007a.EURORISK/PREVIEW Report on the Technical Quality, FunctionalQuality and Forecast Value of Meteorological and HydrologicalForecasts. ECMWF Research Department Technical Memorandumn. 516, ECMWF: Shinfield Park, Reading RG2-9AX.
Buizza R, Bidlot J-R, Wedi N, Fuentes M, Hamrud M, Holt G,Vitart F. 2007b. The new ECMWF VAREPS. Quarterly Journal ofthe Royal Meteorological Society 133: 681–695.
Buizza R, Hollingsworth A, Lalaurette F, Ghelli A. 1999. Probabilisticpredictions of precipitation using the ECMWF ensemble predictionsystem. Weather and Forecasting 14: 168–189.
Carmona R, Hwang WL, Torresani B. 1998. Practical Time-FrequencyAnalysis: Gabor and Wavelet Transforms with an Implementation inS. Academic Press: New York.
Cloke HL, Pappenberger F. 2008a. Operational Flood Forecasting:Review of Ensemble Techniques, ECMWF Technical MemorandumNr. 574. ECMWF: Reading, UK.
Cloke HL, Pappenberger F. 2008b. Evaluating forecasts of extremeevents for hydrological applications: an approach for screeningunfamiliar performance measures. Meteorological Applications15(1): 181–197.
Demeritt D, Cloke H, Pappenberger F, Thielen J, Bartholmes J,Ramos M-H. 2007. Ensemble predictions and perceptions of risk,uncertainty, and error in flood forecasting. Environmental Hazards7(2): 115–127.
de Roo A, Bartholmes J, Bates PD, Beven K, Bongioannini-Cerlini B,Gouweleeuw B, Heise E, Hils M, Hollingsworth M, Holst B,Horritt M, Hunter N, Kwadijk J, Pappenburger F, Reggiani P,Rivin G, Sattler K, Sprokkereef E, Thielen J, Todini E, Van Dijk M.2003. Development of a European flood forecasting system.International Journal of River Basin Management 1(1): 49–59.
EXCIFF. 2005. Flood forecasting in France. Review of the currentstatus and future prospects. In, MEDD & JRC (eds.). EuropeanExchange Circle on Flood Forecasting (EXCIFF), Proceedings ofthe 1st workshop, 14–15 April 2005, Toulouse.
Feyen L, Vrugt JA, O Nuallainc B, van der Knijff J, de Roo A.2007. Parameter optimisation and uncertainty assessment for large-scale streamflow simulation with the LISFLOOD model. Journal ofHydrology 332(3–4): 276–289.
Gouweleeuw B, Reggiani P, De Roo A (eds). 2004. A European FloodForecasting System EFFS. Full Report. European Report EUR21208. EC DG JRC & WL Delft Hydraulics. Office for OfficialPublications of the European Communities: Luxembourg; 304.
Gouweleeuw B, Thielen J, Franchello G, De Roo A, Buizza R.2005. Flood forecasting using medium-range probabilistic weatherprediction. Hydrology and Earth System Sciences 9(4): 365–380.
Hamill TM, Hagedorn R, Whitaker JS. 2007. Probabilistic forecastcalibration using ECMWF and GFS ensemble forecasts. Part II:precipitation. Monthly Weather Review 136(7): 2620–2632.
Hopson T, Webster P. 2008. Three-Tier flood and precipitationforecasting scheme for south-east asia, http://cfab2.eas.gatech.edu/,Accessed 8th May 2008.
Kalman RE. 1960. A new approach to linear filtering and predictionproblems. Transactions of the ASME–Journal of Basic Engineering82: 35–45.
Kalman RE, Bucy RS. 1961. New results in linear filtering andprediction theory. Transactions of the ASME-Journal of BasicEngineering 83: 95–107.
Kwadijk J. 2003. EFFS – European Flood Forecasting System. Finalreport of Contract EVG1-CT-1999-00011 (http://effs.wldelft.nl).
Marsigli C, Montani A, Nerozzi F, Paccagnella T, Tibaldi S, MolteniF, Buizza R. 2001. A strategy for High–Resolution EnsemblePrediction. Part II: Limited–area experiments in four Alpine floodevents. Quarterly Journal of the Royal Meteorological Society 127:2095–2115.
Marsigli C, Montani A, Paccagnella T. 2008. A spatial verificationmethod applied to the evaluation of high-resolution ensembleforecasts. Meteorological Applications 15: 125–143.
Matgen P, Schumann G, Henry JB, Hoffmann L, Pfister L. 2007.Integration of SAR-derived river inundation areas, high-precisiontopographic data and a river flow model toward near real-time flood
Copyright 2009 Royal Meteorological Society Meteorol. Appl. 16: 77–90 (2009)DOI: 10.1002/met

90 J. THIELEN ET AL.
management. International Journal of Applied Earth Observationand Geoinformation 9(3): 247–263.
McBride JL, Ebert EE. 2000. Verification of quantitative precipitationforecasts from operational numerical weather prediction models overAustralia. Weather and Forecasting 15: 103–121.
Mo XG, Pappenberger F, Beven K, Liu SX, De Roo A, Lin ZH.2006. Parameter conditioning and prediction uncertainties ofthe LISFLOOD-WB distributed hydrological model. HydrologicalSciences Journal-Journal Des Sciences Hydrologiques 51(1): 45–65.
Molteni F, Buizza R, Palmer TN, Petroliagis T. 1996. The ECMWFensemble prediction system: Methodology and validation. QuarterlyJournal of the Royal Meteorological Society 122(529): 73–119.
Olsson J, Lindstrom G. 2008. Evaluation and calibration of operationalhydrological ensemble forecasts in Sweden. Journal of Hydrology350(1–2): 14–24.
Palmer T, Hagedorn R (eds). 2006. Predictability of Weather Climate.Cambridge University Press: Cambridge; 702.
Pappenberger F, Buizza R. 2008. The Skill of ECMWF Precipitationand Temperature Predictions in the Danube Basin as Forcingsof Hydrological Models. ECMWF Research Department TechnicalMemorandum n. 558, ECMWF: Shinfield Park, Reading RG2-9AX.
Pappenberger F, Beven KJ, de Roo A, Thielen J, Gouweleeuw B.2004. Uncertainty analysis of the rainfall runoff model LisFloodwithin the Generalized Likelihood Uncertainty Estimation (GLUE).International Journal of River Basin Management 2(2): 123–133.
Pappenberger F, Beven K, Hunter N, Bates P, Gouweleeuw B, Thie-len J, de Roo A. 2005. Cascading model uncertainty from mediumrange weather forecasts (10 days) through a rainfall-runoff modelto flood inundation predictions within the European Flood Fore-casting System (EFFS). Hydrology and Earth System Sciences 9(4):381–393.
Pappenberger F, Scipal K, Buizza R. 2008. Hydrological aspectsof meteorological verification. Atmospheric Science Letters 9(2):43–52.
Ramos M-H, Bartholmes J, Thielen-del Pozo J. 2007. Developmentof decision support products based on ensemble forecasts in theEuropean flood alert system. Atmospheric Science Letters 8(4):113–119.
Richardson DS, Bidlot J, Ferranti L, Ghelli A, Janousek M, Leut-becher M, Prates F, Vitart F, Zsoter E. 2008. Verification statis-tics and evalvations of ECMWF forecasts in 2007–2008. ECMWFResearch Department Technical Memorandum no. 578. ECMWF:Reading, UK.
Roulin E. 2007. Skill and relative economic value of medium-rangehydrological ensemble predictions. Hydrology and Earth SystemSciences 11: 725–737.
Schaake J, Franz K, Bradley A, Buizza R. 2006. The hydrologicensemble prediction experiment (HEPEX). Hydrology and EarthSystem Sciences Discussions 3(5): 3321–3332.
Schaake JC, Hamill TM, Buizza R, Clark M. 2007. HEPEX: thehydrological ensemble prediction experiment. Bulletin of theAmerican Meteorological Society 88: 1541–1547.
Schumann G, Henry JB, Hoffmann L, Pfister L, Matgen P, Pappen-berger F. 2005. Demonstrating the high potential of remote sensingin hydraulic modelling and near real-time flood risk management. InRSPSoc and NERC Eartch Observation Conference: 6th -9th Septem-ber 2005, University of Plymouth.
Shumway RH, Stoffer DS. 2006. Time Series Analysis and itsApplications: With R Examples, 2nd edn. Springer: New York.
Thielen J, Bartholmes J, Ramos M.-H, de Roo A. 2009. The Europeanflood alert system-part 1: Concept and development. Hydrology andEarth System Sciences 13: 125–140.
Thielen J, Schaake J, Hartman R, Buizza R. 2008. Aims, challengesand progress of the Hydrological Ensemble Prediction Experiment(HEPEX) following the third HEPEX workshop held in Stresa 27 to29 June 2007. Atmospheric Science Letters 9: 29–35.
Thirel G, Rousset-Regimbeau F, Martin E, Habets F. 2008. On theimpacts of short-range meteorological forecasts for ensemble streamflow predictions. Journal of Hydrology 9(6): 130.
van der Knijff J, De Roo A. 2006. LISFLOOD distributed waterbalance and flood simulation model, User Manuel. EuropeanCommission. EUR22166EN, 88.
van der Knijff JM, Younis J, De Roo APJ. 2008. LISFLOOD: aGIS-based distributed model for river basin scale water balanceand flood simulation. International Journal of GeographicalInformation Science http://dx.doi.org/10.1080/13658810802549154.http://www.informaworld.com/10.1080/1365881080254.9154.
Younis J, Ramos M-H, Thielen J. 2008. EFAS forecasts for the March-April 2006 flood in the Czech part of the Elbe River Basin – a casestudy. Atmospheric Science Letters 9: 88–94.
Zappa M, Rotach MW, Arpagaus M, Dorninger M, Hegg C, Mon-tani A, Ranzi R, Ament F, Germann U, Grossi G, Jaum S, Rossi A,Vogt S, Walser A, Wehrhand J, Wunram C. 2008. MAP D-PHASE;real-time demonstration of hydrological ensemble prediction sys-tems. Atmospheric Science Letters 9: 80–87.
Copyright 2009 Royal Meteorological Society Meteorol. Appl. 16: 77–90 (2009)DOI: 10.1002/met