flood forecasting and warning network
TRANSCRIPT
GOVERNMENT OF INDIA
CENTRAL WATER COMMISSION FLOOD FORECAST MONITORING DIRECTORATE
Flood Situation of river Narmada in Hoshangabad and Mandla
Flood Situation of river Musi in Hyderabad and River Mahanadi in Odisha
FLOOD FORECASTING AND WARNING NETWORK
PERFORMANCE APPRAISAL REPORT 2020
NEW DELHI - 110066 AUGUST, 2021
i
Member(RM)
Central Water Commission Sewa Bhawan, R. K. Puram
NewDelhi-110066
PREFACE
Central Water Commission had started Flood Forecasting & Warning services in India in November, 1958 by setting up one forecasting station at Old Delhi Bridge, for the national capital, on the river Yamuna. Its network of Flood Forecasting and Warning Stations gradually extended throughout the country covering almost all the major inter-state flood prone river basins.
During 2020, the flood forecasting services are expanded to 328 stations which
comprised of 198 level and 130 inflow forecast stations in 20 major river basins. It covered 22 States besides Union Territories of NCT Delhi, Jammu & Kashmir and Daman & Diu. The flood forecasting activities of the Commission are being performed every year from May to December through its 29 field Divisions which issue flood forecasts and warnings to the civil authorities of the states as well as to other organizations of the Central & State Governments, as and when the river water level touches or is expected to cross the warning level at the level flood forecasting stations. During Flood Season 2020, level forecasts were issued for 129 stations out of 198 stations and inflow forecasts were issued for 88 reservoir/ dam/barrages out of 130 inflow stations. The inflow forecasts are formulated whenever the inflow into the reservoirs exceeds the threshold value fixed by the respective project authorities for reservoir regulation as well as flood moderation.
During the year 2020 flood season,7 Flood Forecast stations flowed in Extreme Flood situation. Severe Flood situation was witnessed in 88 Flood Forecasting Stations and 34 Flood forecast stations witnessed Above Normal Flood Situation. The major flood events this year was the Extreme Floods witnessed in Assam ,Bihar, Chattisgarh, Uttar Pradesh, Uttarakhand, Madhya Pradesh, Maharashtra, Odisha, Andhra Pradesh, Tamilnadu, Telangana and Karnataka state.
During the year 2020, 11721 forecasts were issued out of which 11198 forecasts (95.54%) were found to be within the limits of accuracy. The number of level forecasts issued during the year 2020 were 8243 out of which 8133 (98.67%) was within the limit of accuracy of ± 0.15 m. The number of inflow forecasts issued were 3478 out of which 3065 (88.13%) was within limits of accuracy of ±20%. Daily Flood Situation Reports cum Advisories (DFSITREPcA) based on 5-day rainfall warning of IMD were issued on daily basis. Advisories about Extreme floods in Assam, Bihar, Chattisgarh, Uttar Pradesh, Uttarakhand, Madhya Pradesh, Maharashtra, Odisha, Andhra Pradesh, Tamilnadu, Telangana and Karnataka were issued in DFSITREPcA for taking up relief and rescue operations in advance which were well appreciated by the beneficiaries at both National and State Levels.
ii
Rainfall-Runoff advisories based on the satellite estimates of rainfall, AWS/ARG data of IMD/CWC as well as the rainfall forecast products of Weather Research and Forecast (WRF) model at a resolution of 0.25mx0.25m was continued in 2020 flood season and was put in Uniform Resource Locator(URL)http://120.57.32.251/. CWC wishes to place its acknowledgements for the services provided by IMD through its Hydromel & Numerical Weather Prediction and AWS Lab units in the Headquarters, Pune as well as various FMOs of IMD.
The level of performance achieved, has been possible as a result of the dedicated
team work of the officers and staff manning the various activities of hydro-meteorological observations & flood forecasting and monitoring of the field offices.
Flood Forecast Monitoring (FFM) Directorate plays an important role in compiling the information received from various field offices at Headquarters and issues daily bulletins which are sent to all stakeholders. I wish to place on record my deep appreciations of the efforts put in by the officers and staff of FFM, FCA - 1 and FCA - 2 Directorates in carrying out the flood forecasting work with utmost devotion & dedication. The staff of FFM Directorate, along with other supporting staff from other Directorates/Wings during flood duties in the flood season of 2020 also deserves all appreciation in keeping the control room fully functional on all the weekdays, including holidays, Saturdays & Sundays. The control room was kept operational round the clock throughout the flood season.
It is hoped that the momentum gained in expanding the flood forecasting
network, improving performance of the forecast and adopting various modernization including in the field of dissemination techniques will be further accelerated to achieve greater effectiveness of each and every forecast with the help of mathematical modelling supported by real-time data from telemetry.
Suggestions/ comments of the users of this report with a view to further enhance
its usefulness are welcomed and will be in corporate in the next edition.
New Delhi (Ranjan Kumar Sinha) August,2021 Member (RM)
iii
CONTENTS
EXECUTIVE SUMMARY
0.1
0.2 0.3
Meteorological Situation
Flood Situation Flood Forecasting Performance
1
2 2
Salient features of Flood Forecasting System 3
CHAPTER- 1 NATIONAL FLOOD FORECASTING NETWORK
Flood forecasting services
Flood forecasting network in the country Classifications of various flood situations Standard Operating Procedure for Flood Forecasting & Warning Inflow Forecast
Data Communication System
Damage due to floods/ heavy rains between 1953 to 2020 Analysis of Performance of Flood Forecasting Network Organisational set-up of Flood Forecasting Network
4 1.1 4 1.2 4 1.3 6
1.4 7
1.5 8
1.6 8 1.7 9 1.8 10 1.9 10
CHAPTER-2 ROLE OF IMD IN FF ACTIVITIES 15 2.0
2.1 Role of IMD Model based quantitative precipitation forecast
15 16
2.2 South-west monsoon 17 2.3 Highlights of south-west monsoon 18 2.4 Onset an Advance of south-west monsoon 2020 19 2.5 Chief Synoptic features 20 2.6
2.7 2.8 2.9 2.10 2.11 2.12 2.13
Withdrawal of Southwest Monsoon High impact weather events Rainfall distribution Indian Northeast monsoon Onset phase Synoptic scale weather system during the NEM 2020 Other synoptic scale weather system Summary
24 25 26 26 27 27 28 28
CHAPTER -3 3.1 3.2 3.3
SIGNIFICANT FLOOD EVENTS General An Overview of Flood Events Extreme flood situation (2018-2020)
29 29 29 31
CHAPTER -4 4.1
FLOOD FORECAST PERFORMANCE Flood Forecasting evaluation-criteria & procedure
33
33 4.2 Evaluation Criteria for stage/ inflow forecasting 33 4.3 Flood forecasting activities 33 4.4 Riverwise Details Of Flood Forecasting Activities & 32 Accuracy Of Forecast
4.5 Statewise Flood forecasting performance 36 4.6 An overview of forecasting performance 44
CHAPTER -5 5 RESPONSE FROM USER AGENCIES 46 5.1 General 46 5.2 Appreciation letters received during flood season 2020 46
iv
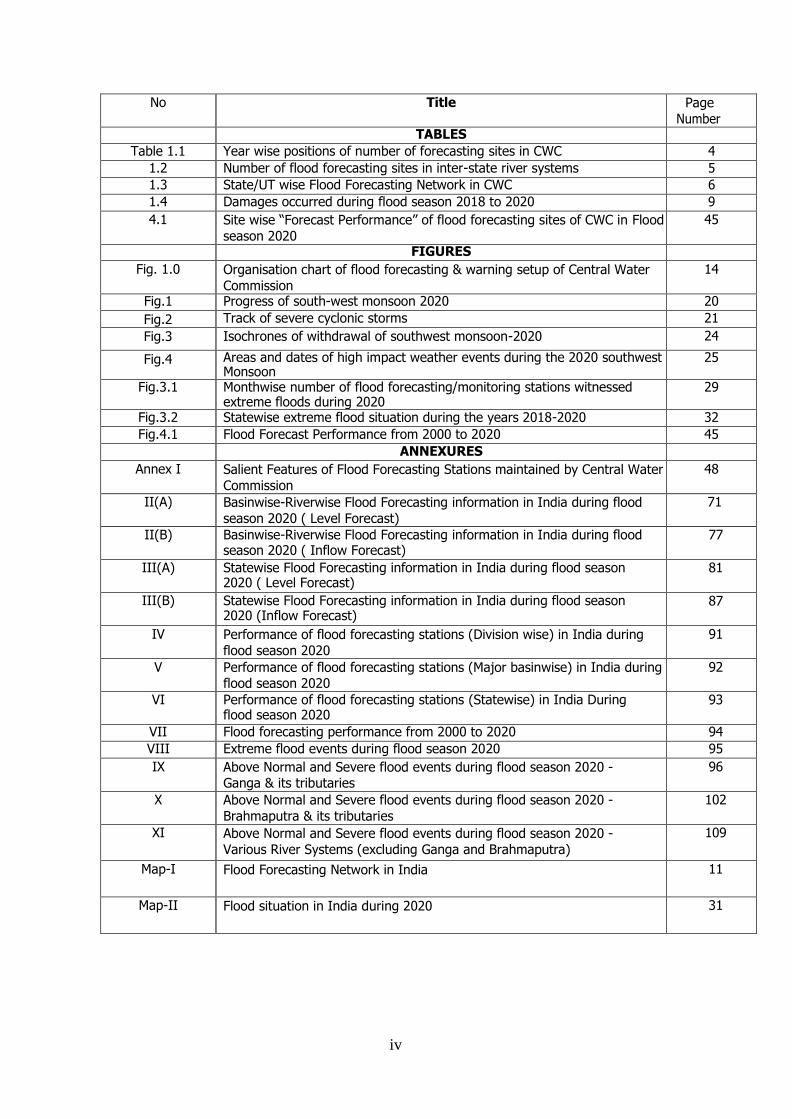
No Title Page
Number TABLES
Table 1.1 Year wise positions of number of forecasting sites in CWC 4
1.2 Number of flood forecasting sites in inter-state river systems 5
1.3 State/UT wise Flood Forecasting Network in CWC 6
1.4 Damages occurred during flood season 2018 to 2020 9
4.1 Site wise “Forecast Performance” of flood forecasting sites of CWC in Flood
season 2020
45
FIGURES
Fig. 1.0 Organisation chart of flood forecasting & warning setup of Central Water
Commission
14
Fig.1 Progress of south-west monsoon 2020 20
Fig.2 Track of severe cyclonic storms 21
Fig.3 Isochrones of withdrawal of southwest monsoon-2020 24
Fig.4 Areas and dates of high impact weather events during the 2020 southwest Monsoon
25
Fig.3.1 Monthwise number of flood forecasting/monitoring stations witnessed extreme floods during 2020
29
Fig.3.2 Statewise extreme flood situation during the years 2018-2020 32
Fig.4.1 Flood Forecast Performance from 2000 to 2020 45 ANNEXURES
Annex I Salient Features of Flood Forecasting Stations maintained by Central Water
Commission
48
II(A) Basinwise-Riverwise Flood Forecasting information in India during flood
season 2020 ( Level Forecast)
71
II(B) Basinwise-Riverwise Flood Forecasting information in India during flood season 2020 ( Inflow Forecast)
77
III(A) Statewise Flood Forecasting information in India during flood season 2020 ( Level Forecast)
81
III(B) Statewise Flood Forecasting information in India during flood season 2020 (Inflow Forecast)
87
IV Performance of flood forecasting stations (Division wise) in India during
flood season 2020
91
V Performance of flood forecasting stations (Major basinwise) in India during flood season 2020
92
VI Performance of flood forecasting stations (Statewise) in India During flood season 2020
93
VII Flood forecasting performance from 2000 to 2020 94
VIII Extreme flood events during flood season 2020 95
IX Above Normal and Severe flood events during flood season 2020 - Ganga & its tributaries
96
X Above Normal and Severe flood events during flood season 2020 -
Brahmaputra & its tributaries
102
XI Above Normal and Severe flood events during flood season 2020 -
Various River Systems (excluding Ganga and Brahmaputra)
109
Map-I Flood Forecasting Network in India 11
Map-II Flood situation in India during 2020 31

v
1
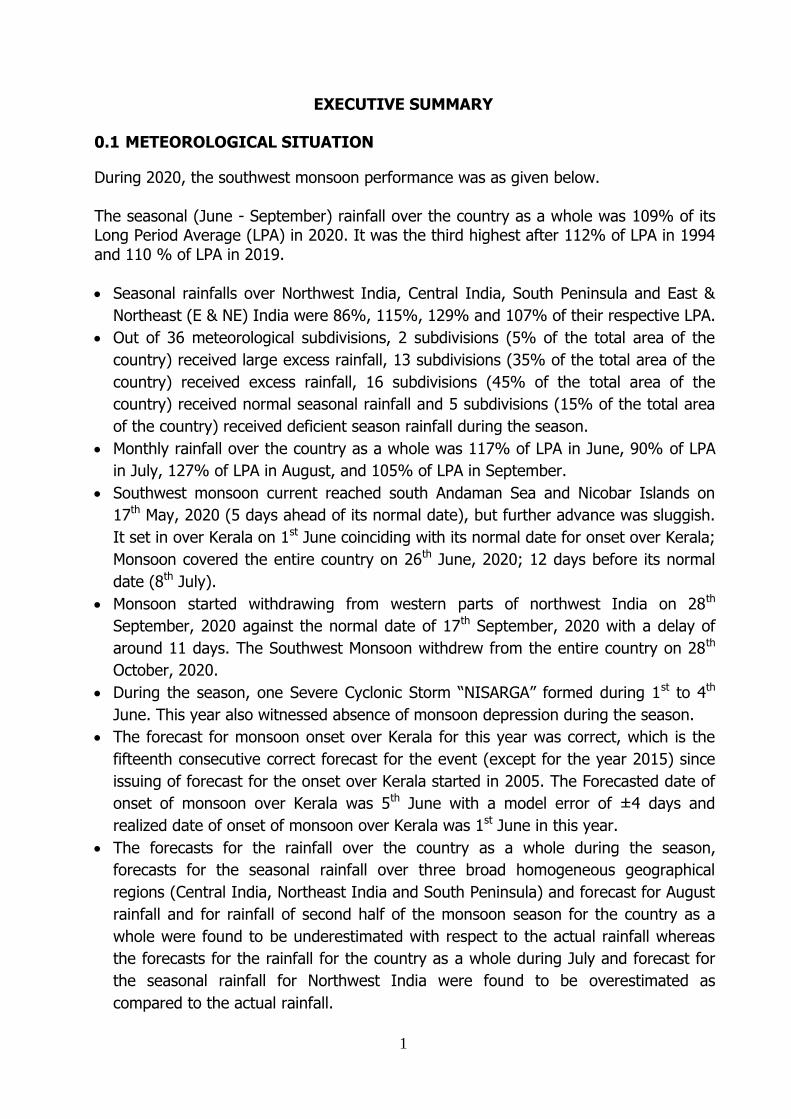
EXECUTIVE SUMMARY
0.1 METEOROLOGICAL SITUATION
During 2020, the southwest monsoon performance was as given below. The seasonal (June - September) rainfall over the country as a whole was 109% of its Long Period Average (LPA) in 2020. It was the third highest after 112% of LPA in 1994 and 110 % of LPA in 2019.
Seasonal rainfalls over Northwest India, Central India, South Peninsula and East &
Northeast (E & NE) India were 86%, 115%, 129% and 107% of their respective LPA.
Out of 36 meteorological subdivisions, 2 subdivisions (5% of the total area of the
country) received large excess rainfall, 13 subdivisions (35% of the total area of the
country) received excess rainfall, 16 subdivisions (45% of the total area of the
country) received normal seasonal rainfall and 5 subdivisions (15% of the total area
of the country) received deficient season rainfall during the season.
Monthly rainfall over the country as a whole was 117% of LPA in June, 90% of LPA
in July, 127% of LPA in August, and 105% of LPA in September.
Southwest monsoon current reached south Andaman Sea and Nicobar Islands on
17th May, 2020 (5 days ahead of its normal date), but further advance was sluggish.
It set in over Kerala on 1st June coinciding with its normal date for onset over Kerala;
Monsoon covered the entire country on 26th June, 2020; 12 days before its normal
date (8th July).
Monsoon started withdrawing from western parts of northwest India on 28th
September, 2020 against the normal date of 17th September, 2020 with a delay of
around 11 days. The Southwest Monsoon withdrew from the entire country on 28th
October, 2020.
During the season, one Severe Cyclonic Storm “NISARGA” formed during 1st to 4th
June. This year also witnessed absence of monsoon depression during the season.
The forecast for monsoon onset over Kerala for this year was correct, which is the
fifteenth consecutive correct forecast for the event (except for the year 2015) since
issuing of forecast for the onset over Kerala started in 2005. The Forecasted date of
onset of monsoon over Kerala was 5th June with a model error of ±4 days and
realized date of onset of monsoon over Kerala was 1st June in this year.
The forecasts for the rainfall over the country as a whole during the season,
forecasts for the seasonal rainfall over three broad homogeneous geographical
regions (Central India, Northeast India and South Peninsula) and forecast for August
rainfall and for rainfall of second half of the monsoon season for the country as a
whole were found to be underestimated with respect to the actual rainfall whereas
the forecasts for the rainfall for the country as a whole during July and forecast for
the seasonal rainfall for Northwest India were found to be overestimated as
compared to the actual rainfall.
2
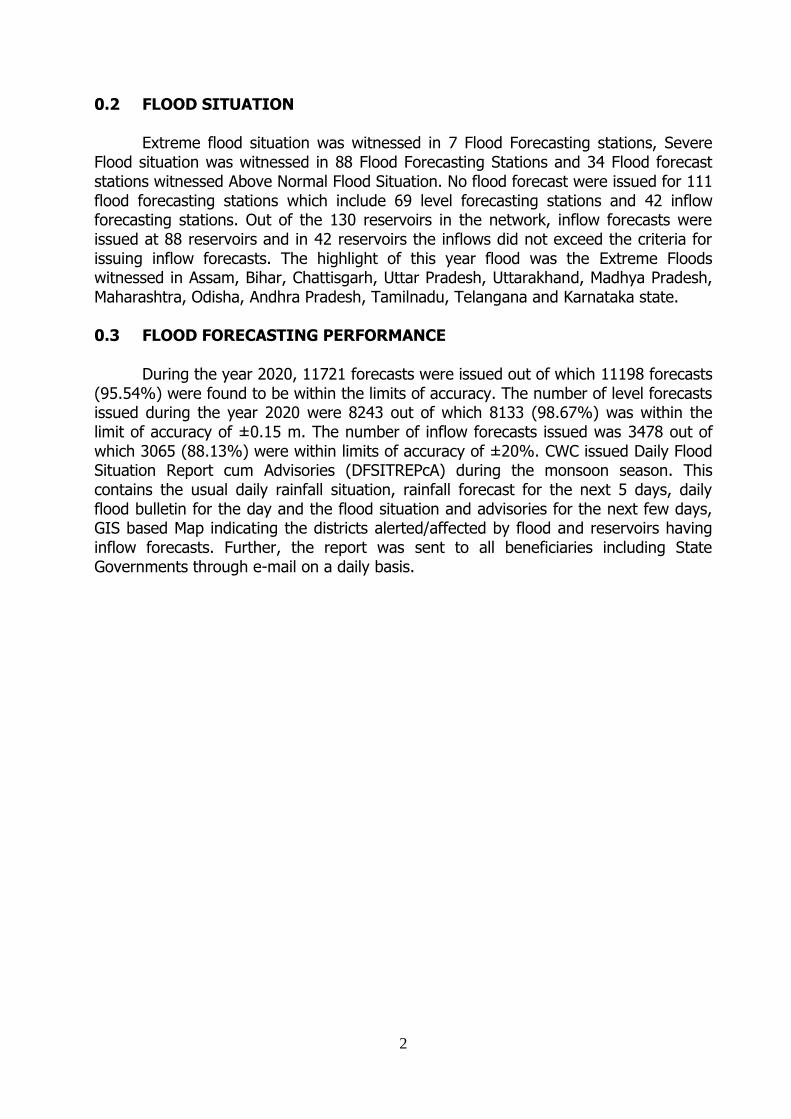
0.2 FLOOD SITUATION
Extreme flood situation was witnessed in 7 Flood Forecasting stations, Severe Flood situation was witnessed in 88 Flood Forecasting Stations and 34 Flood forecast stations witnessed Above Normal Flood Situation. No flood forecast were issued for 111 flood forecasting stations which include 69 level forecasting stations and 42 inflow forecasting stations. Out of the 130 reservoirs in the network, inflow forecasts were issued at 88 reservoirs and in 42 reservoirs the inflows did not exceed the criteria for issuing inflow forecasts. The highlight of this year flood was the Extreme Floods witnessed in Assam, Bihar, Chattisgarh, Uttar Pradesh, Uttarakhand, Madhya Pradesh, Maharashtra, Odisha, Andhra Pradesh, Tamilnadu, Telangana and Karnataka state. 0.3 FLOOD FORECASTING PERFORMANCE
During the year 2020, 11721 forecasts were issued out of which 11198 forecasts
(95.54%) were found to be within the limits of accuracy. The number of level forecasts issued during the year 2020 were 8243 out of which 8133 (98.67%) was within the limit of accuracy of ±0.15 m. The number of inflow forecasts issued was 3478 out of which 3065 (88.13%) were within limits of accuracy of ±20%. CWC issued Daily Flood Situation Report cum Advisories (DFSITREPcA) during the monsoon season. This contains the usual daily rainfall situation, rainfall forecast for the next 5 days, daily flood bulletin for the day and the flood situation and advisories for the next few days, GIS based Map indicating the districts alerted/affected by flood and reservoirs having inflow forecasts. Further, the report was sent to all beneficiaries including State Governments through e-mail on a daily basis.
3
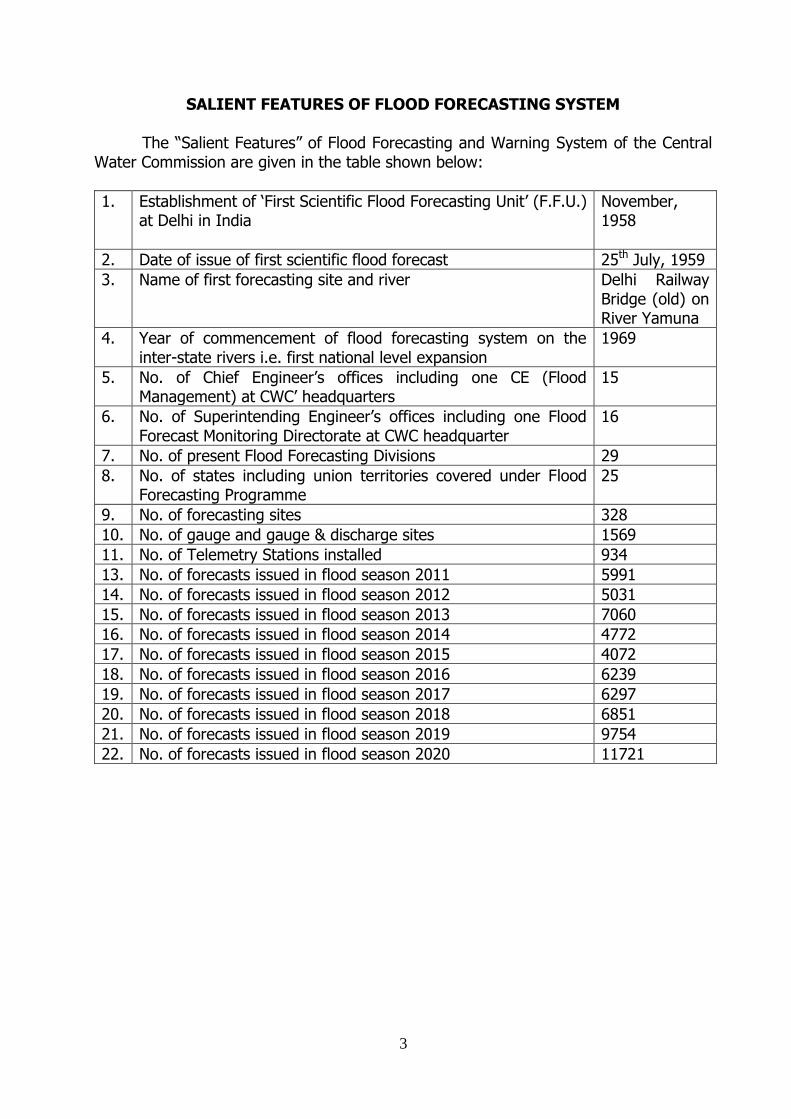
SALIENT FEATURES OF FLOOD FORECASTING SYSTEM
The “Salient Features” of Flood Forecasting and Warning System of the Central Water Commission are given in the table shown below:
1. Establishment of „First Scientific Flood Forecasting Unit‟ (F.F.U.) at Delhi in India
November, 1958
2. Date of issue of first scientific flood forecast 25th July, 1959
3. Name of first forecasting site and river Delhi Railway Bridge (old) on River Yamuna
4. Year of commencement of flood forecasting system on the inter-state rivers i.e. first national level expansion
1969
5. No. of Chief Engineer‟s offices including one CE (Flood Management) at CWC‟ headquarters
15
6. No. of Superintending Engineer‟s offices including one Flood Forecast Monitoring Directorate at CWC headquarter
16
7. No. of present Flood Forecasting Divisions 29
8. No. of states including union territories covered under Flood Forecasting Programme
25
9. No. of forecasting sites 328
10. No. of gauge and gauge & discharge sites 1569
11. No. of Telemetry Stations installed 934
13. No. of forecasts issued in flood season 2011 5991
14. No. of forecasts issued in flood season 2012 5031
15. No. of forecasts issued in flood season 2013 7060
16. No. of forecasts issued in flood season 2014 4772
17. No. of forecasts issued in flood season 2015 4072
18. No. of forecasts issued in flood season 2016 6239
19. No. of forecasts issued in flood season 2017 6297
20. No. of forecasts issued in flood season 2018 6851
21. No. of forecasts issued in flood season 2019 9754
22. No. of forecasts issued in flood season 2020 11721
4
CHAPTER - 1
NATIONAL FLOOD FORECASTING NETWORK
1.1 FLOOD FORECASTING SERVICES Flood causes considerable damage to human lives and property almost every
year. About one third of total flood prone area (40 mHa assessed by the Rashtriya Barh Ayog) of the country has been provided with reasonable protection against flood of a low magnitude due to techno-economic constraints; but there is no protection from floods of higher magnitude. Since adoption of National Flood Policy by Government of India in 1954, it was realized that a total protection against flood by structural means alone is not possible and that optimum solution would consist of a mixture of structural and non-structural measures. Therefore, stress has been laid on non-structural measures like flood forecasting and warning, which is most important among such means to minimize the damage potential from floods. Accurate and timely flood forecasts and advance warning have, therefore, to be aimed for providing valuable time to the people and to civil authorities in taking preventive measures like evacuation, relief and rehabilitation measures, preparedness for flood fighting by engineering authorities, etc. and thus mitigating such loses from floods. 1.2 FLOOD FORECASTING NETWORK IN THE COUNTRY
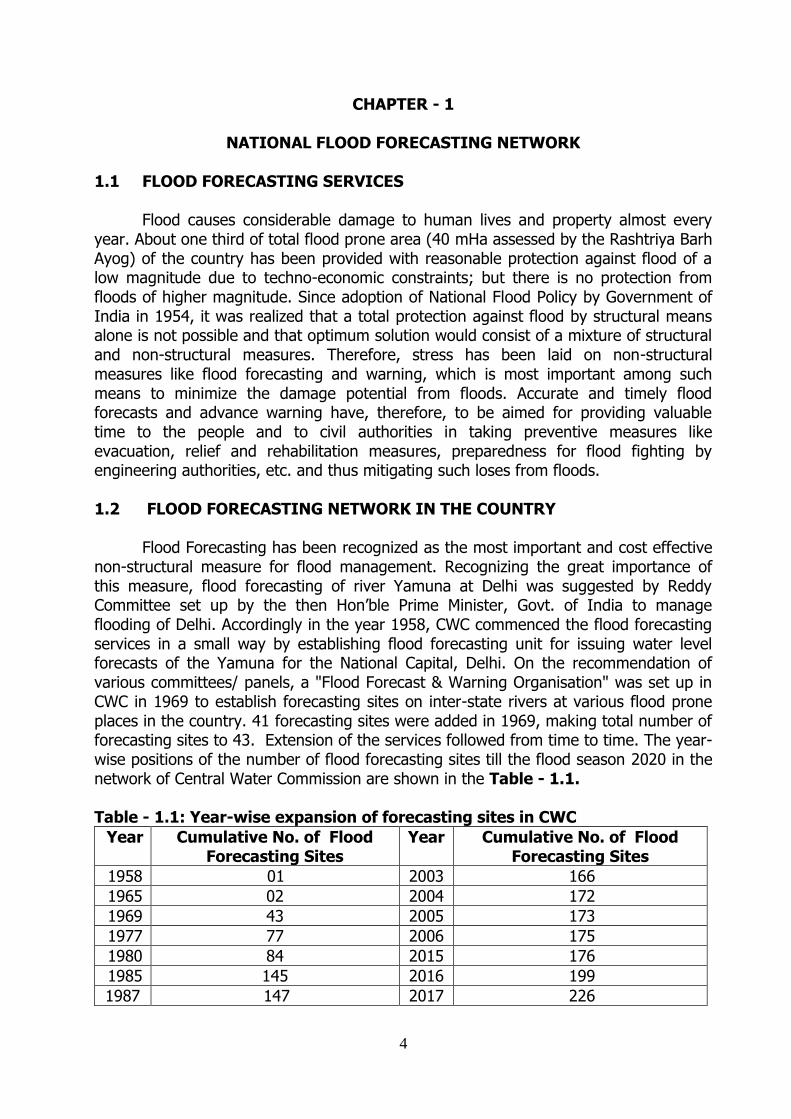
Flood Forecasting has been recognized as the most important and cost effective non-structural measure for flood management. Recognizing the great importance of this measure, flood forecasting of river Yamuna at Delhi was suggested by Reddy Committee set up by the then Hon‟ble Prime Minister, Govt. of India to manage flooding of Delhi. Accordingly in the year 1958, CWC commenced the flood forecasting services in a small way by establishing flood forecasting unit for issuing water level forecasts of the Yamuna for the National Capital, Delhi. On the recommendation of various committees/ panels, a "Flood Forecast & Warning Organisation" was set up in CWC in 1969 to establish forecasting sites on inter-state rivers at various flood prone places in the country. 41 forecasting sites were added in 1969, making total number of forecasting sites to 43. Extension of the services followed from time to time. The year-wise positions of the number of flood forecasting sites till the flood season 2020 in the network of Central Water Commission are shown in the Table - 1.1. Table - 1.1: Year-wise expansion of forecasting sites in CWC
Year Cumulative No. of Flood Forecasting Sites
Year Cumulative No. of Flood Forecasting Sites
1958 01 2003 166
1965 02 2004 172
1969 43 2005 173
1977 77 2006 175
1980 84 2015 176
1985 145 2016 199
1987 147 2017 226
5
1990 157 2018 249
2001 159 2019 325
2002 161 2020 328
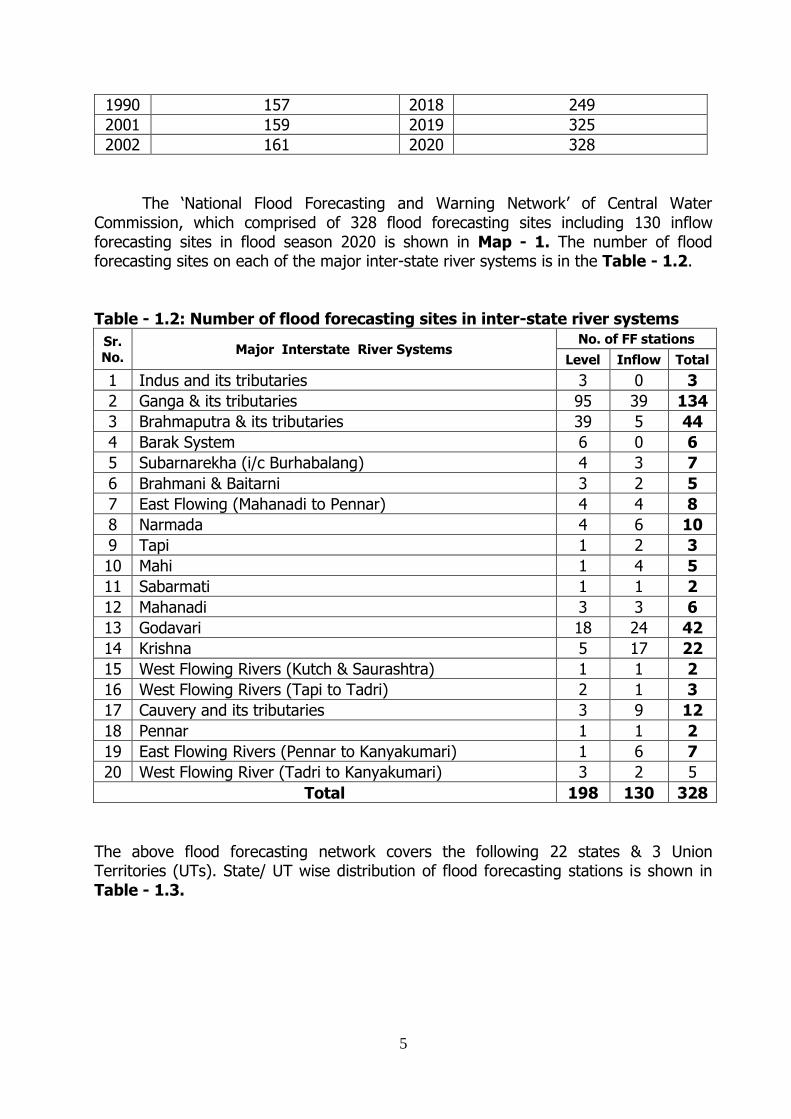
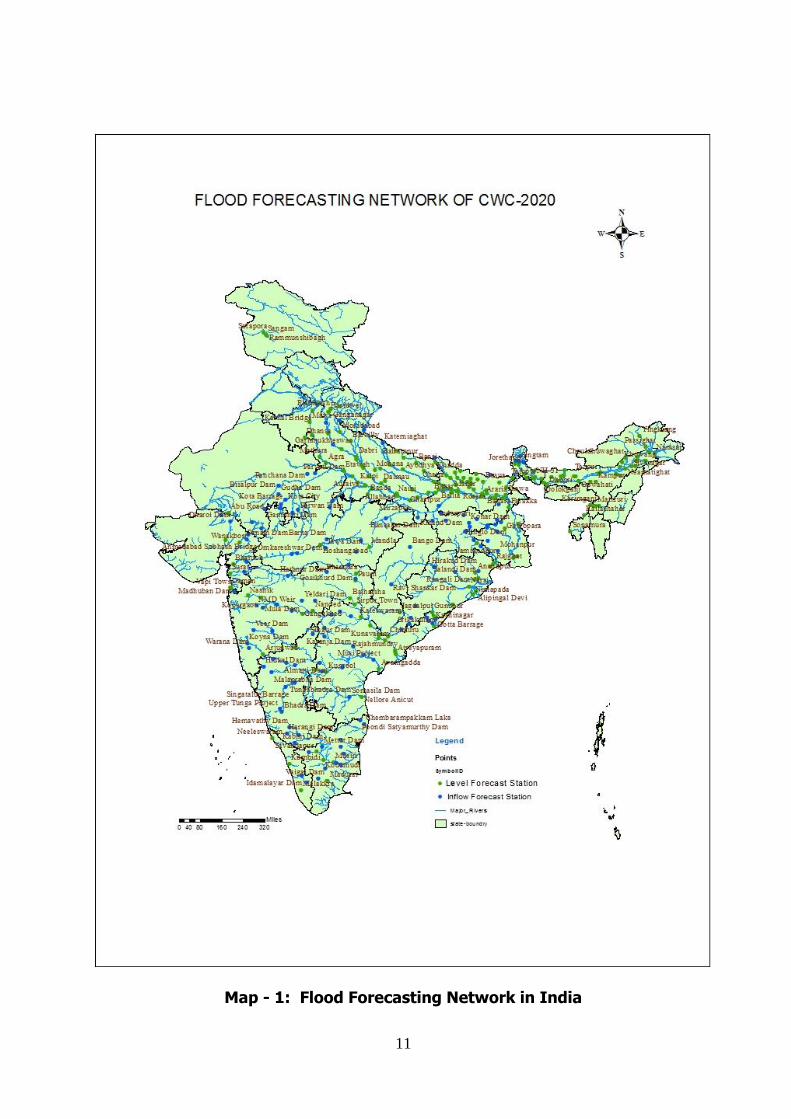
The „National Flood Forecasting and Warning Network‟ of Central Water Commission, which comprised of 328 flood forecasting sites including 130 inflow forecasting sites in flood season 2020 is shown in Map - 1. The number of flood forecasting sites on each of the major inter-state river systems is in the Table - 1.2. Table - 1.2: Number of flood forecasting sites in inter-state river systems
Sr. No.
Major Interstate River Systems No. of FF stations
Level Inflow Total
1 Indus and its tributaries 3 0 3
2 Ganga & its tributaries 95 39 134
3 Brahmaputra & its tributaries 39 5 44
4 Barak System 6 0 6
5 Subarnarekha (i/c Burhabalang) 4 3 7
6 Brahmani & Baitarni 3 2 5
7 East Flowing (Mahanadi to Pennar) 4 4 8
8 Narmada 4 6 10
9 Tapi 1 2 3
10 Mahi 1 4 5
11 Sabarmati 1 1 2
12 Mahanadi 3 3 6
13 Godavari 18 24 42
14 Krishna 5 17 22
15 West Flowing Rivers (Kutch & Saurashtra) 1 1 2
16 West Flowing Rivers (Tapi to Tadri) 2 1 3
17 Cauvery and its tributaries 3 9 12
18 Pennar 1 1 2
19 East Flowing Rivers (Pennar to Kanyakumari) 1 6 7
20 West Flowing River (Tadri to Kanyakumari) 3 2 5
Total 198 130 328
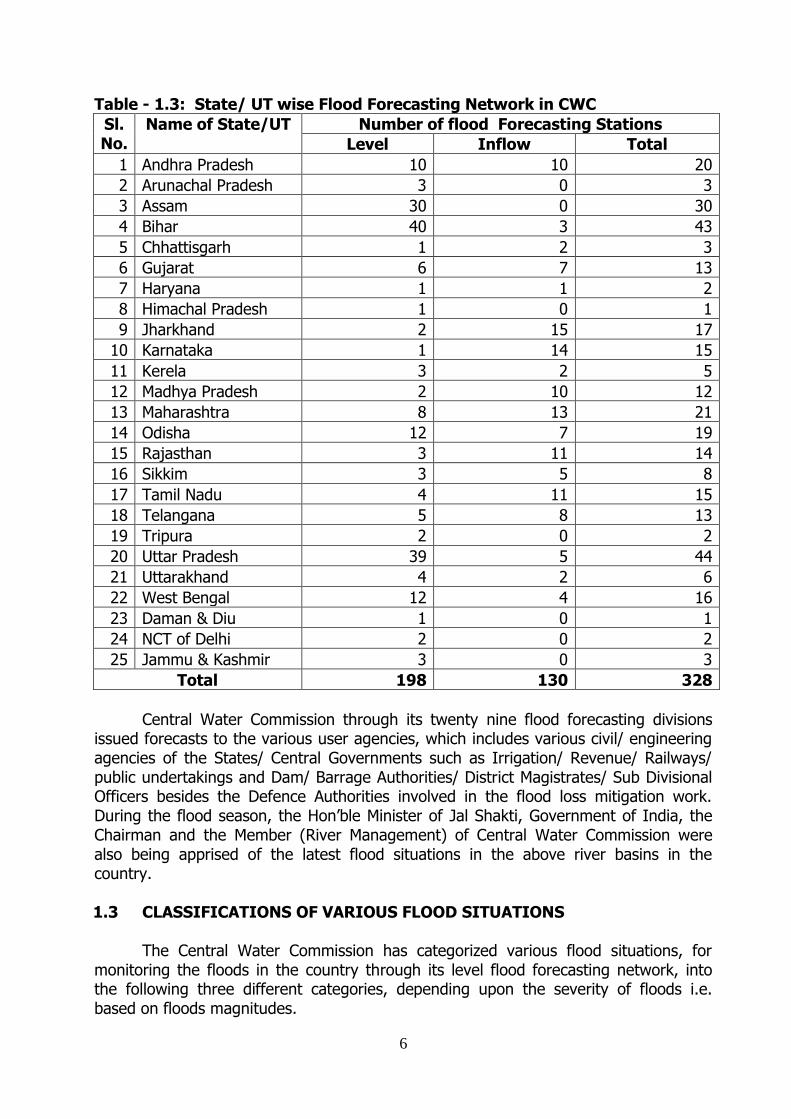
The above flood forecasting network covers the following 22 states & 3 Union Territories (UTs). State/ UT wise distribution of flood forecasting stations is shown in Table - 1.3.
6
Table - 1.3: State/ UT wise Flood Forecasting Network in CWC
Sl. No.
Name of State/UT Number of flood Forecasting Stations
Level Inflow Total
1 Andhra Pradesh 10 10 20
2 Arunachal Pradesh 3 0 3
3 Assam 30 0 30
4 Bihar 40 3 43
5 Chhattisgarh 1 2 3
6 Gujarat 6 7 13
7 Haryana 1 1 2
8 Himachal Pradesh 1 0 1
9 Jharkhand 2 15 17
10 Karnataka 1 14 15
11 Kerela 3 2 5
12 Madhya Pradesh 2 10 12
13 Maharashtra 8 13 21
14 Odisha 12 7 19
15 Rajasthan 3 11 14
16 Sikkim 3 5 8
17 Tamil Nadu 4 11 15
18 Telangana 5 8 13
19 Tripura 2 0 2
20 Uttar Pradesh 39 5 44
21 Uttarakhand 4 2 6
22 West Bengal 12 4 16
23 Daman & Diu 1 0 1
24 NCT of Delhi 2 0 2
25 Jammu & Kashmir 3 0 3
Total 198 130 328
Central Water Commission through its twenty nine flood forecasting divisions
issued forecasts to the various user agencies, which includes various civil/ engineering agencies of the States/ Central Governments such as Irrigation/ Revenue/ Railways/ public undertakings and Dam/ Barrage Authorities/ District Magistrates/ Sub Divisional Officers besides the Defence Authorities involved in the flood loss mitigation work. During the flood season, the Hon‟ble Minister of Jal Shakti, Government of India, the Chairman and the Member (River Management) of Central Water Commission were also being apprised of the latest flood situations in the above river basins in the country. 1.3 CLASSIFICATIONS OF VARIOUS FLOOD SITUATIONS
The Central Water Commission has categorized various flood situations, for monitoring the floods in the country through its level flood forecasting network, into the following three different categories, depending upon the severity of floods i.e. based on floods magnitudes.
7
(i) ABOVE NORMAL FLOOD
The river is said to be in ‘ABOVE NORMAL’ situation at any water level stations when the water level of the river touches or crosses the warning level, but remains below the danger level of the forecasting site. (ii) SEVERE FLOOD
If the water level of the river touches or crosses its danger level, but remains below the Highest Flood Level of the site (commonly known as „HFL‟) then the flood situation is called the „SEVERE FLOOD’ situation.
(iii) EXTREME FLOOD
The flood situation is said to be ‘EXTREME FLOOD’ when the water level of the
river touches or crosses the „HIGHEST FLOOD LEVEL’ recorded at any water level station so far. 1.4 STANDARD OPERATING PROCEDURE (SOP) FOR FLOOD FORECASTING
& WARNING
The basic activity of data collection, its transmission and dissemination of flood forecasts to the local administration is carried out by the field divisions of CWC. The modelling centres and Divisional Flood Control Rooms (DFCR) are located in the premises of the field divisions. The field divisions perform these activities as per existing Manual on Flood Forecasting which contains the following critical activities as the general SOPs:
1. Nomination of Nodal Officers of CWC for interaction with the Nodal Officers of concerned State Governments before monsoon every year.
2. Gearing up of flood forecasting network before monsoon every year. 3. Operation of Divisional Flood Control Room (DFCR) during monsoon every year. 4. Operation of Central Flood Control Room (CFCR) during monsoon every year. 5. Issue of flood forecasts to designated officers of concerned State and
transmission thereof through FAX/ Telephone/ E-mail/ Special Messengers during monsoon every year.
6. Sending flood alerts through SMS on Mobile Phones to the concerned officers of State/ Central Government during severe (3 hourly updates) and extreme (1 hourly updates) flood situations and uploading of Flood Forecasts and hourly water level data in CWC‟s Flood Forecasting Website as per Standard Operating procedure (SOP) for issuing alerts and electronic messaging in the event of disaster situations issued by Ministry of Home Affairs from time to time.
For the purpose of dissemination of alerts to PMO/ Cabinet Secretariat, a uniform
system has been devised by categorizing each type of alert in stages- Yellow, Orange and Red.
Categories of alerts for flood in respect of level forecasts is as indicated below.
8
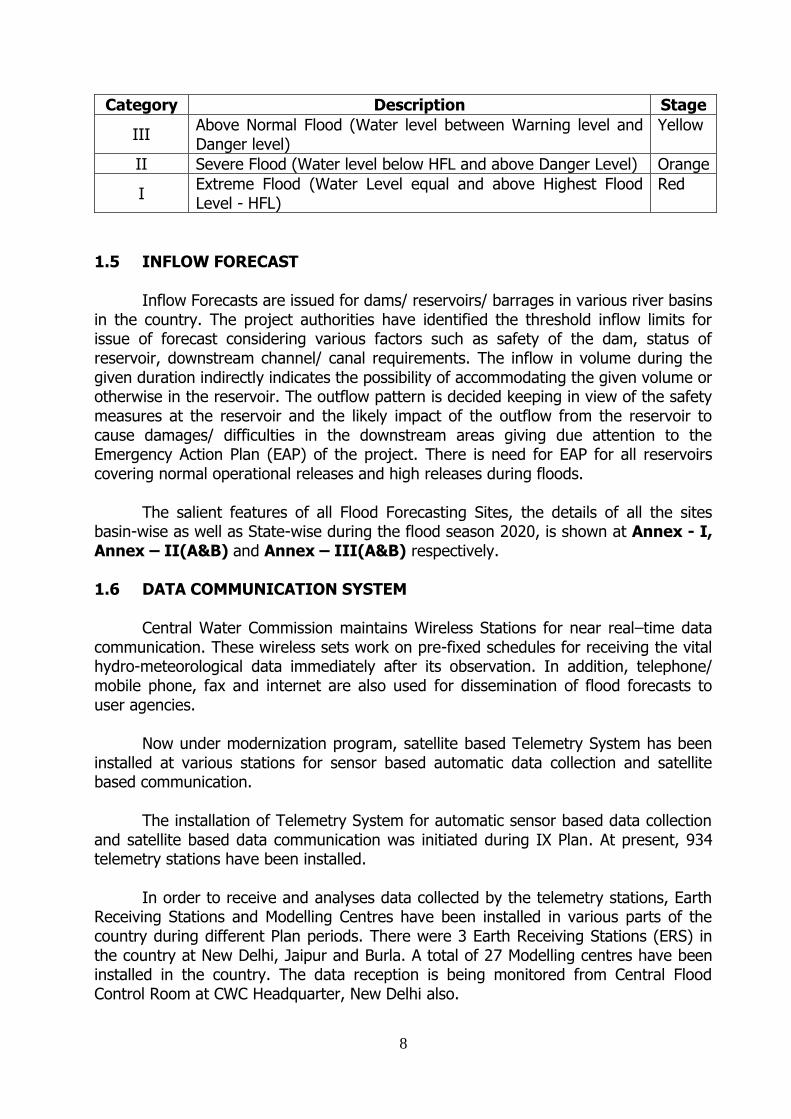
Category Description Stage
III Above Normal Flood (Water level between Warning level and Danger level)
Yellow
II Severe Flood (Water level below HFL and above Danger Level) Orange
I Extreme Flood (Water Level equal and above Highest Flood Level - HFL)
Red
1.5 INFLOW FORECAST
Inflow Forecasts are issued for dams/ reservoirs/ barrages in various river basins in the country. The project authorities have identified the threshold inflow limits for issue of forecast considering various factors such as safety of the dam, status of reservoir, downstream channel/ canal requirements. The inflow in volume during the given duration indirectly indicates the possibility of accommodating the given volume or otherwise in the reservoir. The outflow pattern is decided keeping in view of the safety measures at the reservoir and the likely impact of the outflow from the reservoir to cause damages/ difficulties in the downstream areas giving due attention to the Emergency Action Plan (EAP) of the project. There is need for EAP for all reservoirs covering normal operational releases and high releases during floods.
The salient features of all Flood Forecasting Sites, the details of all the sites
basin-wise as well as State-wise during the flood season 2020, is shown at Annex - I, Annex – II(A&B) and Annex – III(A&B) respectively. 1.6 DATA COMMUNICATION SYSTEM
Central Water Commission maintains Wireless Stations for near real–time data communication. These wireless sets work on pre-fixed schedules for receiving the vital hydro-meteorological data immediately after its observation. In addition, telephone/ mobile phone, fax and internet are also used for dissemination of flood forecasts to user agencies.
Now under modernization program, satellite based Telemetry System has been installed at various stations for sensor based automatic data collection and satellite based communication.
The installation of Telemetry System for automatic sensor based data collection and satellite based data communication was initiated during IX Plan. At present, 934 telemetry stations have been installed.
In order to receive and analyses data collected by the telemetry stations, Earth
Receiving Stations and Modelling Centres have been installed in various parts of the country during different Plan periods. There were 3 Earth Receiving Stations (ERS) in the country at New Delhi, Jaipur and Burla. A total of 27 Modelling centres have been installed in the country. The data reception is being monitored from Central Flood Control Room at CWC Headquarter, New Delhi also.
9
The data received was used mainly by the divisions issuing forecast by MIKE-11. Also, it is planned to transfer data observed through telemetry to WIMS software for flood forecasting activities.
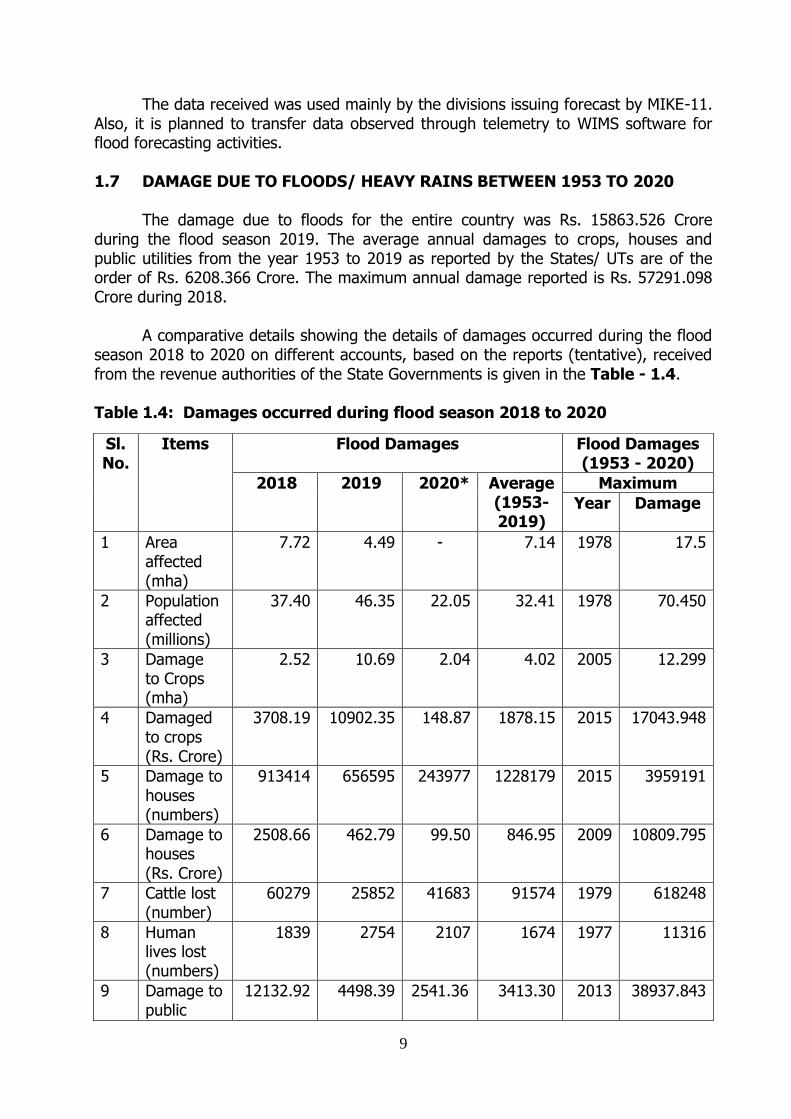
1.7 DAMAGE DUE TO FLOODS/ HEAVY RAINS BETWEEN 1953 TO 2020
The damage due to floods for the entire country was Rs. 15863.526 Crore during the flood season 2019. The average annual damages to crops, houses and public utilities from the year 1953 to 2019 as reported by the States/ UTs are of the order of Rs. 6208.366 Crore. The maximum annual damage reported is Rs. 57291.098 Crore during 2018.
A comparative details showing the details of damages occurred during the flood season 2018 to 2020 on different accounts, based on the reports (tentative), received from the revenue authorities of the State Governments is given in the Table - 1.4. Table 1.4: Damages occurred during flood season 2018 to 2020
Sl. No.
Items Flood Damages Flood Damages (1953 - 2020)
2018 2019 2020* Average (1953-2019)
Maximum
Year Damage
1 Area affected (mha)
7.72 4.49 - 7.14 1978 17.5
2
Population affected (millions)
37.40 46.35 22.05 32.41 1978 70.450
3 Damage to Crops (mha)
2.52 10.69 2.04 4.02 2005 12.299
4 Damaged to crops (Rs. Crore)
3708.19 10902.35 148.87 1878.15 2015 17043.948
5 Damage to houses (numbers)
913414 656595 243977 1228179 2015 3959191
6 Damage to houses (Rs. Crore)
2508.66 462.79 99.50 846.95 2009 10809.795
7 Cattle lost (number)
60279 25852 41683 91574 1979 618248
8 Human lives lost (numbers)
1839 2754 2107 1674 1977 11316
9 Damage to public
12132.92 4498.39 2541.36 3413.30 2013 38937.843
10
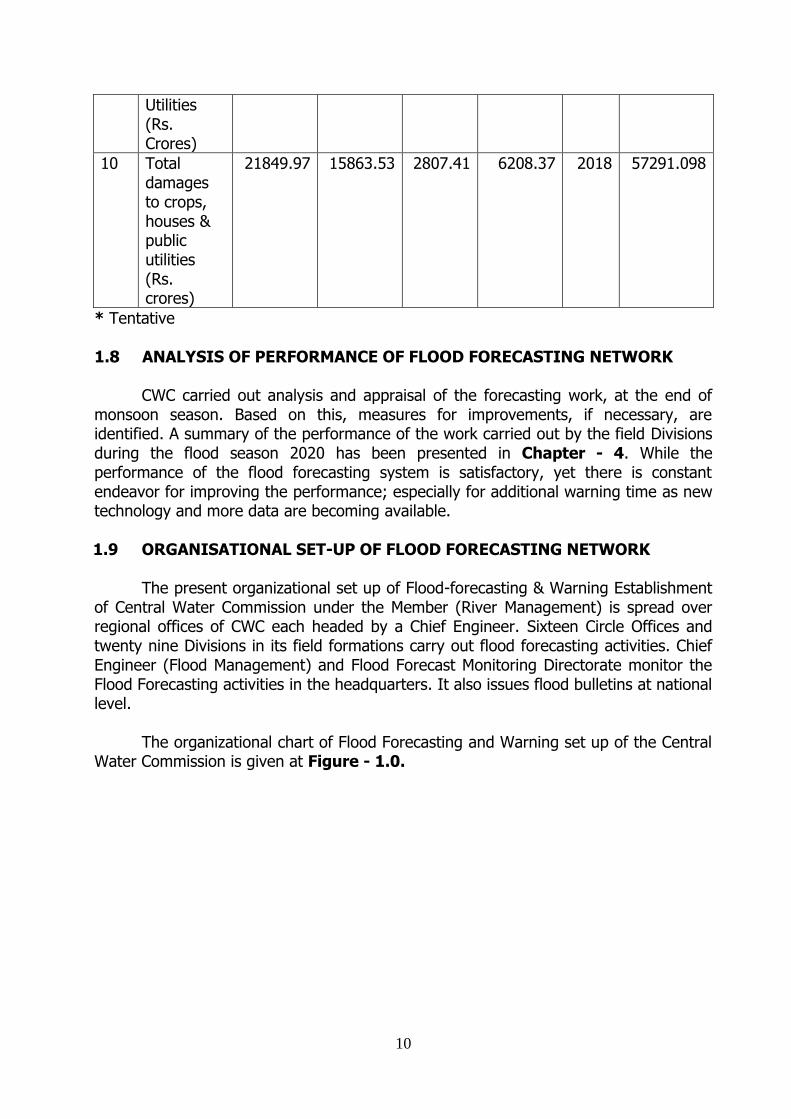
* Tentative 1.8 ANALYSIS OF PERFORMANCE OF FLOOD FORECASTING NETWORK
CWC carried out analysis and appraisal of the forecasting work, at the end of
monsoon season. Based on this, measures for improvements, if necessary, are identified. A summary of the performance of the work carried out by the field Divisions during the flood season 2020 has been presented in Chapter - 4. While the performance of the flood forecasting system is satisfactory, yet there is constant endeavor for improving the performance; especially for additional warning time as new technology and more data are becoming available. 1.9 ORGANISATIONAL SET-UP OF FLOOD FORECASTING NETWORK
The present organizational set up of Flood-forecasting & Warning Establishment
of Central Water Commission under the Member (River Management) is spread over regional offices of CWC each headed by a Chief Engineer. Sixteen Circle Offices and twenty nine Divisions in its field formations carry out flood forecasting activities. Chief Engineer (Flood Management) and Flood Forecast Monitoring Directorate monitor the Flood Forecasting activities in the headquarters. It also issues flood bulletins at national level.
The organizational chart of Flood Forecasting and Warning set up of the Central
Water Commission is given at Figure - 1.0.
Utilities (Rs. Crores)
10 Total damages to crops, houses & public utilities (Rs. crores)
21849.97 15863.53 2807.41 6208.37 2018 57291.098
11
Map - 1: Flood Forecasting Network in India
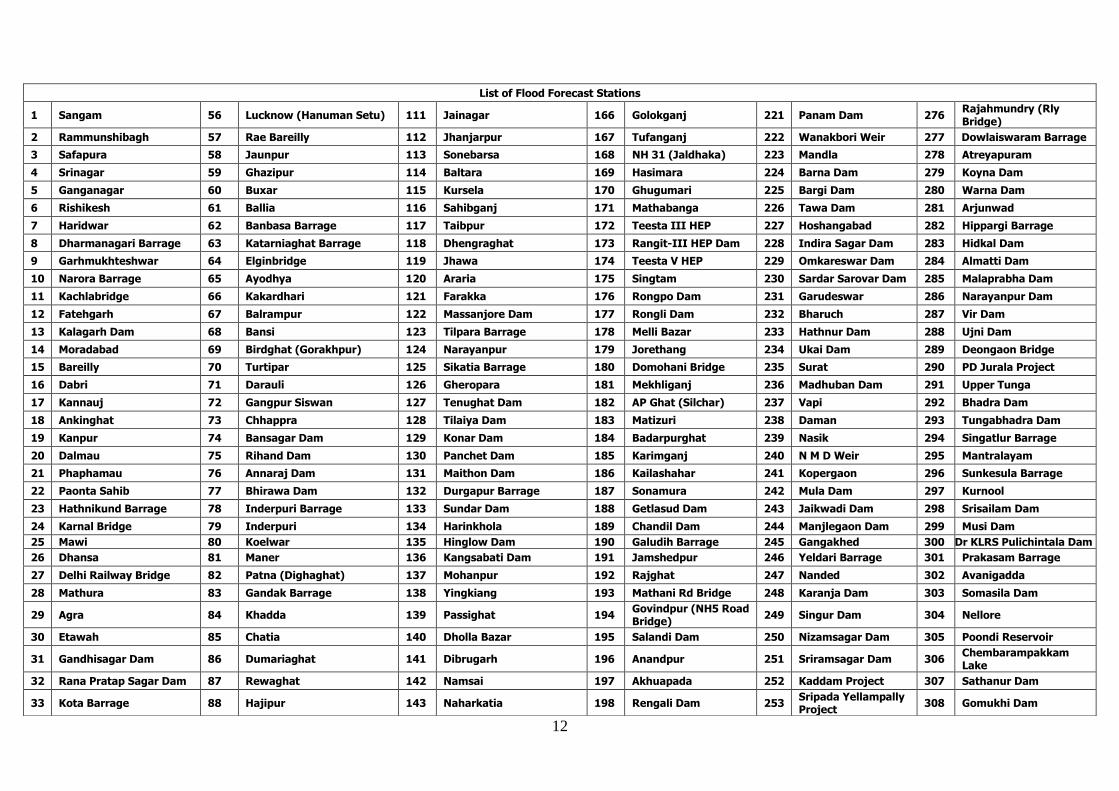
12
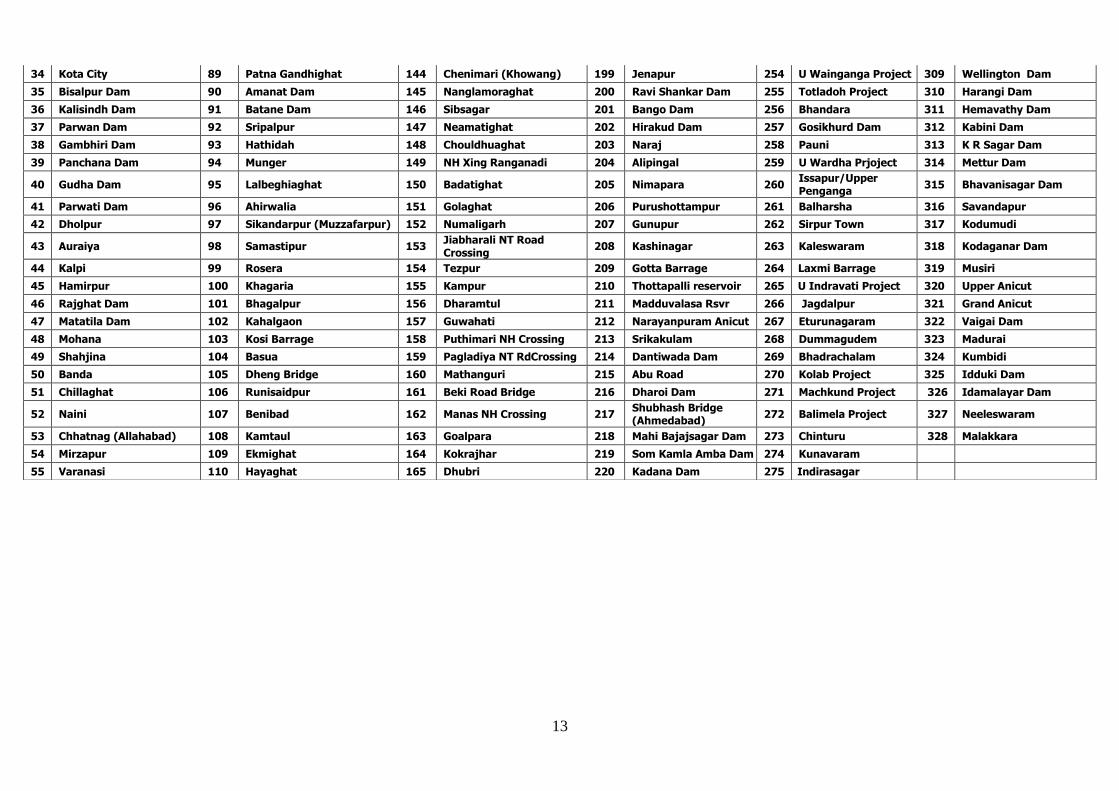
List of Flood Forecast Stations
1 Sangam 56 Lucknow (Hanuman Setu) 111 Jainagar 166 Golokganj 221 Panam Dam 276 Rajahmundry (Rly Bridge)
2 Rammunshibagh 57 Rae Bareilly 112 Jhanjarpur 167 Tufanganj 222 Wanakbori Weir 277 Dowlaiswaram Barrage
3 Safapura 58 Jaunpur 113 Sonebarsa 168 NH 31 (Jaldhaka) 223 Mandla 278 Atreyapuram
4 Srinagar 59 Ghazipur 114 Baltara 169 Hasimara 224 Barna Dam 279 Koyna Dam
5 Ganganagar 60 Buxar 115 Kursela 170 Ghugumari 225 Bargi Dam 280 Warna Dam
6 Rishikesh 61 Ballia 116 Sahibganj 171 Mathabanga 226 Tawa Dam 281 Arjunwad
7 Haridwar 62 Banbasa Barrage 117 Taibpur 172 Teesta III HEP 227 Hoshangabad 282 Hippargi Barrage
8 Dharmanagari Barrage 63 Katarniaghat Barrage 118 Dhengraghat 173 Rangit-III HEP Dam 228 Indira Sagar Dam 283 Hidkal Dam
9 Garhmukhteshwar 64 Elginbridge 119 Jhawa 174 Teesta V HEP 229 Omkareswar Dam 284 Almatti Dam
10 Narora Barrage 65 Ayodhya 120 Araria 175 Singtam 230 Sardar Sarovar Dam 285 Malaprabha Dam
11 Kachlabridge 66 Kakardhari 121 Farakka 176 Rongpo Dam 231 Garudeswar 286 Narayanpur Dam
12 Fatehgarh 67 Balrampur 122 Massanjore Dam 177 Rongli Dam 232 Bharuch 287 Vir Dam
13 Kalagarh Dam 68 Bansi 123 Tilpara Barrage 178 Melli Bazar 233 Hathnur Dam 288 Ujni Dam
14 Moradabad 69 Birdghat (Gorakhpur) 124 Narayanpur 179 Jorethang 234 Ukai Dam 289 Deongaon Bridge
15 Bareilly 70 Turtipar 125 Sikatia Barrage 180 Domohani Bridge 235 Surat 290 PD Jurala Project
16 Dabri 71 Darauli 126 Gheropara 181 Mekhliganj 236 Madhuban Dam 291 Upper Tunga
17 Kannauj 72 Gangpur Siswan 127 Tenughat Dam 182 AP Ghat (Silchar) 237 Vapi 292 Bhadra Dam
18 Ankinghat 73 Chhappra 128 Tilaiya Dam 183 Matizuri 238 Daman 293 Tungabhadra Dam
19 Kanpur 74 Bansagar Dam 129 Konar Dam 184 Badarpurghat 239 Nasik 294 Singatlur Barrage
20 Dalmau 75 Rihand Dam 130 Panchet Dam 185 Karimganj 240 N M D Weir 295 Mantralayam
21 Phaphamau 76 Annaraj Dam 131 Maithon Dam 186 Kailashahar 241 Kopergaon 296 Sunkesula Barrage
22 Paonta Sahib 77 Bhirawa Dam 132 Durgapur Barrage 187 Sonamura 242 Mula Dam 297 Kurnool
23 Hathnikund Barrage 78 Inderpuri Barrage 133 Sundar Dam 188 Getlasud Dam 243 Jaikwadi Dam 298 Srisailam Dam
24 Karnal Bridge 79 Inderpuri 134 Harinkhola 189 Chandil Dam 244 Manjlegaon Dam 299 Musi Dam
25 Mawi 80 Koelwar 135 Hinglow Dam 190 Galudih Barrage 245 Gangakhed 300 Dr KLRS Pulichintala Dam
26 Dhansa 81 Maner 136 Kangsabati Dam 191 Jamshedpur 246 Yeldari Barrage 301 Prakasam Barrage
27 Delhi Railway Bridge 82 Patna (Dighaghat) 137 Mohanpur 192 Rajghat 247 Nanded 302 Avanigadda
28 Mathura 83 Gandak Barrage 138 Yingkiang 193 Mathani Rd Bridge 248 Karanja Dam 303 Somasila Dam
29 Agra 84 Khadda 139 Passighat 194 Govindpur (NH5 Road Bridge)
249 Singur Dam 304 Nellore
30 Etawah 85 Chatia 140 Dholla Bazar 195 Salandi Dam 250 Nizamsagar Dam 305 Poondi Reservoir
31 Gandhisagar Dam 86 Dumariaghat 141 Dibrugarh 196 Anandpur 251 Sriramsagar Dam 306 Chembarampakkam Lake
32 Rana Pratap Sagar Dam 87 Rewaghat 142 Namsai 197 Akhuapada 252 Kaddam Project 307 Sathanur Dam
33 Kota Barrage 88 Hajipur 143 Naharkatia 198 Rengali Dam 253 Sripada Yellampally Project
308 Gomukhi Dam
13
34 Kota City 89 Patna Gandhighat 144 Chenimari (Khowang) 199 Jenapur 254 U Wainganga Project 309 Wellington Dam
35 Bisalpur Dam 90 Amanat Dam 145 Nanglamoraghat 200 Ravi Shankar Dam 255 Totladoh Project 310 Harangi Dam
36 Kalisindh Dam 91 Batane Dam 146 Sibsagar 201 Bango Dam 256 Bhandara 311 Hemavathy Dam
37 Parwan Dam 92 Sripalpur 147 Neamatighat 202 Hirakud Dam 257 Gosikhurd Dam 312 Kabini Dam
38 Gambhiri Dam 93 Hathidah 148 Chouldhuaghat 203 Naraj 258 Pauni 313 K R Sagar Dam
39 Panchana Dam 94 Munger 149 NH Xing Ranganadi 204 Alipingal 259 U Wardha Prjoject 314 Mettur Dam
40 Gudha Dam 95 Lalbeghiaghat 150 Badatighat 205 Nimapara 260 Issapur/Upper Penganga
315 Bhavanisagar Dam
41 Parwati Dam 96 Ahirwalia 151 Golaghat 206 Purushottampur 261 Balharsha 316 Savandapur
42 Dholpur 97 Sikandarpur (Muzzafarpur) 152 Numaligarh 207 Gunupur 262 Sirpur Town 317 Kodumudi
43 Auraiya 98 Samastipur 153 Jiabharali NT Road Crossing
208 Kashinagar 263 Kaleswaram 318 Kodaganar Dam
44 Kalpi 99 Rosera 154 Tezpur 209 Gotta Barrage 264 Laxmi Barrage 319 Musiri
45 Hamirpur 100 Khagaria 155 Kampur 210 Thottapalli reservoir 265 U Indravati Project 320 Upper Anicut
46 Rajghat Dam 101 Bhagalpur 156 Dharamtul 211 Madduvalasa Rsvr 266 Jagdalpur 321 Grand Anicut
47 Matatila Dam 102 Kahalgaon 157 Guwahati 212 Narayanpuram Anicut 267 Eturunagaram 322 Vaigai Dam
48 Mohana 103 Kosi Barrage 158 Puthimari NH Crossing 213 Srikakulam 268 Dummagudem 323 Madurai
49 Shahjina 104 Basua 159 Pagladiya NT RdCrossing 214 Dantiwada Dam 269 Bhadrachalam 324 Kumbidi
50 Banda 105 Dheng Bridge 160 Mathanguri 215 Abu Road 270 Kolab Project 325 Idduki Dam
51 Chillaghat 106 Runisaidpur 161 Beki Road Bridge 216 Dharoi Dam 271 Machkund Project 326 Idamalayar Dam
52 Naini 107 Benibad 162 Manas NH Crossing 217 Shubhash Bridge (Ahmedabad)
272 Balimela Project 327 Neeleswaram
53 Chhatnag (Allahabad) 108 Kamtaul 163 Goalpara 218 Mahi Bajajsagar Dam 273 Chinturu 328 Malakkara
54 Mirzapur 109 Ekmighat 164 Kokrajhar 219 Som Kamla Amba Dam 274 Kunavaram
55 Varanasi 110 Hayaghat 165 Dhubri 220 Kadana Dam 275 Indirasagar
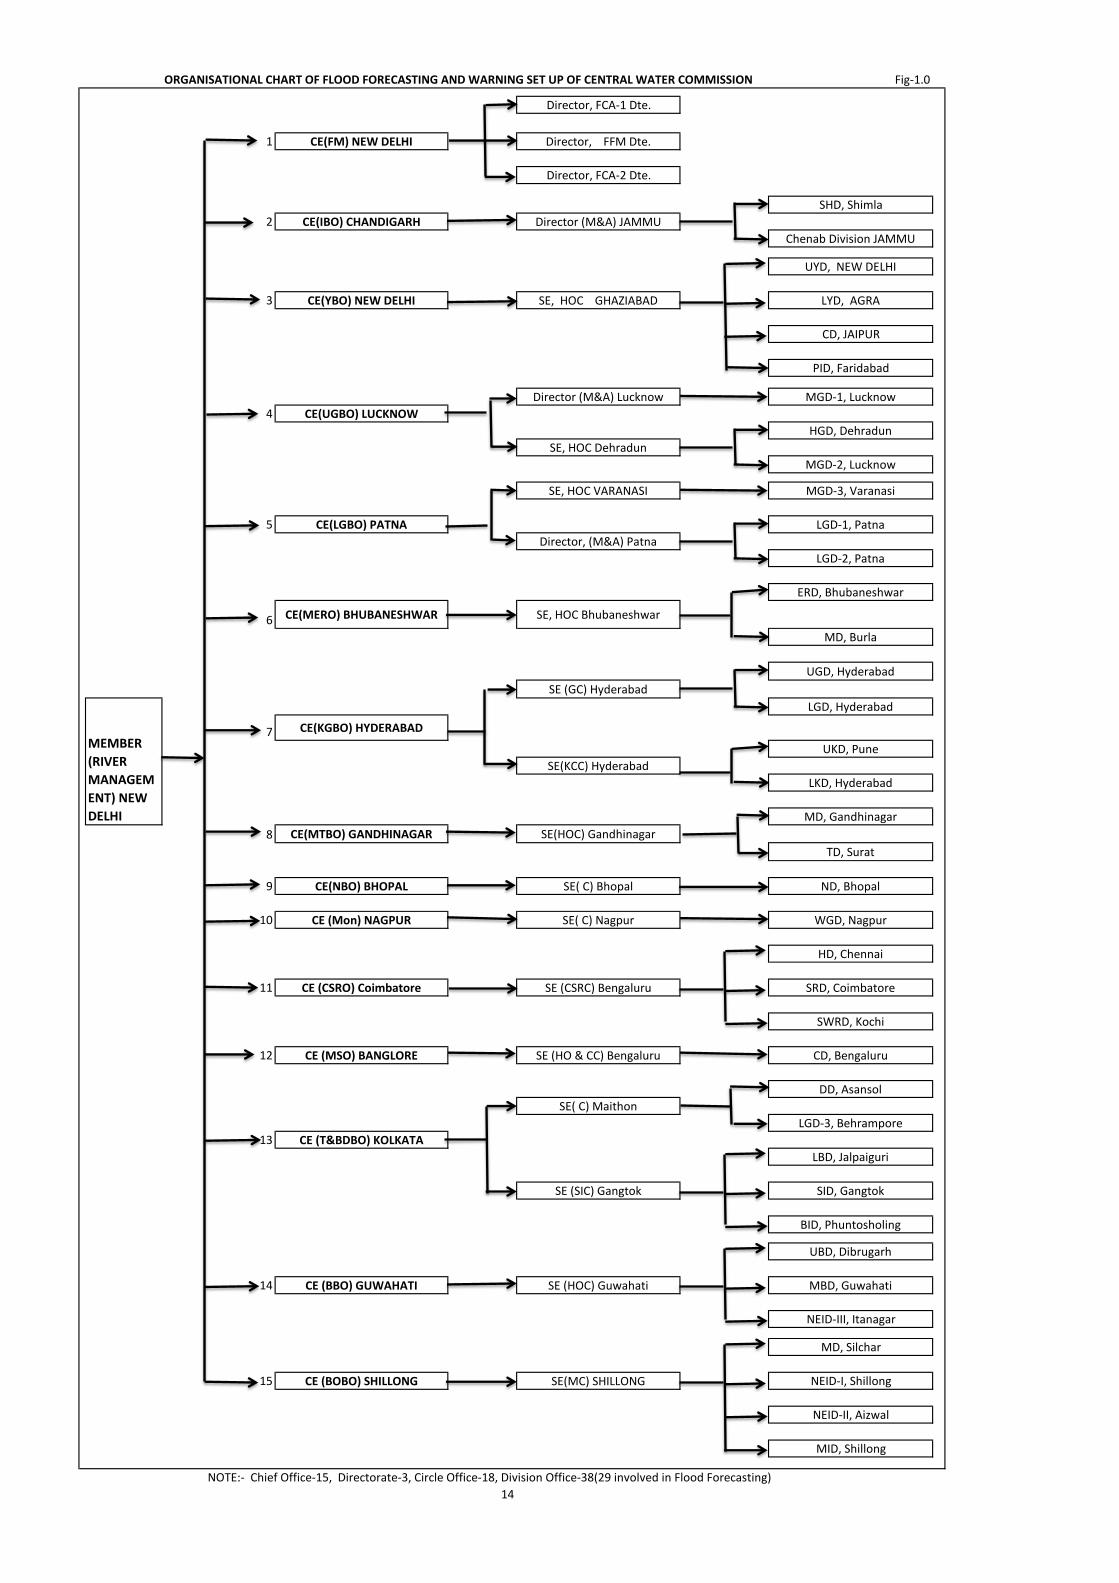
ORGANISATIONAL CHART OF FLOOD FORECASTING AND WARNING SET UP OF CENTRAL WATER COMMISSION Fig-1.0
Director, FCA-1 Dte.
1 CE(FM) NEW DELHI Director, FFM Dte.
Director, FCA-2 Dte.
SHD, Shimla
2 CE(IBO) CHANDIGARH Director (M&A) JAMMU
Chenab Division JAMMU
UYD, NEW DELHI
3 CE(YBO) NEW DELHI SE, HOC GHAZIABAD LYD, AGRA
CD, JAIPUR
PID, Faridabad
Director (M&A) Lucknow MGD-1, Lucknow
4 CE(UGBO) LUCKNOW
HGD, Dehradun
SE, HOC Dehradun
MGD-2, Lucknow
SE, HOC VARANASI MGD-3, Varanasi
5 CE(LGBO) PATNA LGD-1, Patna
Director, (M&A) Patna
LGD-2, Patna
ERD, Bhubaneshwar
6 CE(MERO) BHUBANESHWAR SE, HOC Bhubaneshwar
MD, Burla
UGD, Hyderabad
SE (GC) Hyderabad
LGD, Hyderabad
7 CE(KGBO) HYDERABAD
UKD, Pune
SE(KCC) Hyderabad
LKD, Hyderabad
MD, Gandhinagar
8 CE(MTBO) GANDHINAGAR SE(HOC) Gandhinagar
TD, Surat
9 CE(NBO) BHOPAL SE( C) Bhopal ND, Bhopal
10 CE (Mon) NAGPUR SE( C) Nagpur WGD, Nagpur
HD, Chennai
11 CE (CSRO) Coimbatore SE (CSRC) Bengaluru SRD, Coimbatore
SWRD, Kochi
12 CE (MSO) BANGLORE SE (HO & CC) Bengaluru CD, Bengaluru
DD, Asansol
SE( C) Maithon
LGD-3, Behrampore
13 CE (T&BDBO) KOLKATA
LBD, Jalpaiguri
SE (SIC) Gangtok SID, Gangtok
BID, Phuntosholing
UBD, Dibrugarh
14 CE (BBO) GUWAHATI SE (HOC) Guwahati MBD, Guwahati
NEID-III, Itanagar
MD, Silchar
15 CE (BOBO) SHILLONG SE(MC) SHILLONG NEID-I, Shillong
NEID-II, Aizwal
MID, Shillong
14
NOTE:- Chief Office-15, Directorate-3, Circle Office-18, Division Office-38(29 involved in Flood Forecasting)
MEMBER
(RIVER
MANAGEM
ENT) NEW
DELHI
15
CHAPTER – 2
ROLE OF IMD IN FLOOD FORECAST ACTIVITIES
2.0 ROLE OF IMD
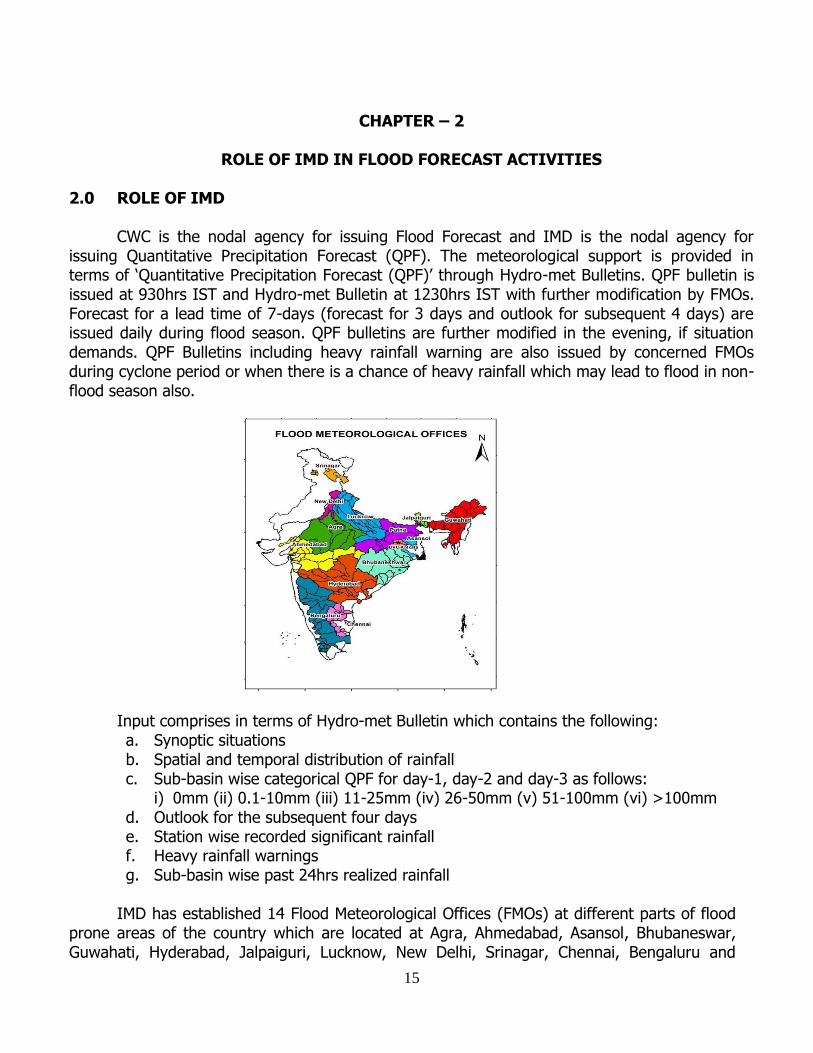
CWC is the nodal agency for issuing Flood Forecast and IMD is the nodal agency for issuing Quantitative Precipitation Forecast (QPF). The meteorological support is provided in terms of ‘Quantitative Precipitation Forecast (QPF)’ through Hydro-met Bulletins. QPF bulletin is issued at 930hrs IST and Hydro-met Bulletin at 1230hrs IST with further modification by FMOs. Forecast for a lead time of 7-days (forecast for 3 days and outlook for subsequent 4 days) are issued daily during flood season. QPF bulletins are further modified in the evening, if situation demands. QPF Bulletins including heavy rainfall warning are also issued by concerned FMOs during cyclone period or when there is a chance of heavy rainfall which may lead to flood in non-flood season also.
Input comprises in terms of Hydro-met Bulletin which contains the following: a. Synoptic situations b. Spatial and temporal distribution of rainfall c. Sub-basin wise categorical QPF for day-1, day-2 and day-3 as follows:
i) 0mm (ii) 0.1-10mm (iii) 11-25mm (iv) 26-50mm (v) 51-100mm (vi) >100mm d. Outlook for the subsequent four days e. Station wise recorded significant rainfall f. Heavy rainfall warnings g. Sub-basin wise past 24hrs realized rainfall
IMD has established 14 Flood Meteorological Offices (FMOs) at different parts of flood
prone areas of the country which are located at Agra, Ahmedabad, Asansol, Bhubaneswar, Guwahati, Hyderabad, Jalpaiguri, Lucknow, New Delhi, Srinagar, Chennai, Bengaluru and
Fig1.0
16
Patna which caters to the river catchments of Yamuna, Narmada, Tapi, Ajoy, Mayuraksi and Kangasbati, Mahanandi, Brahmani and Subernarekha, Brahmaputra, Dhansiri and Barak, Godavari and Krishna, Cauvery, Teesta, Ganga and Sharada, and Sahibi, Kosi, Baghmati, Gandak, etc. IMD also provides similar support to Damodar Valley Corporation (DVC) for the river basins Barakar and Damodar. Flood Meteorological Offices (FMOs, 14 in all over India) of India Meteorological Department provide Meteorological support to Flood Forecasting Divisions (FFDs) of Central Water Commission (CWC) to help them issue ‘Flood warnings/Flood alerts’. The performance of QPF is verified for the monsoon season annually. 2.1 MODEL BASED QUANTITATIVE PRECIPITATION FORECAST
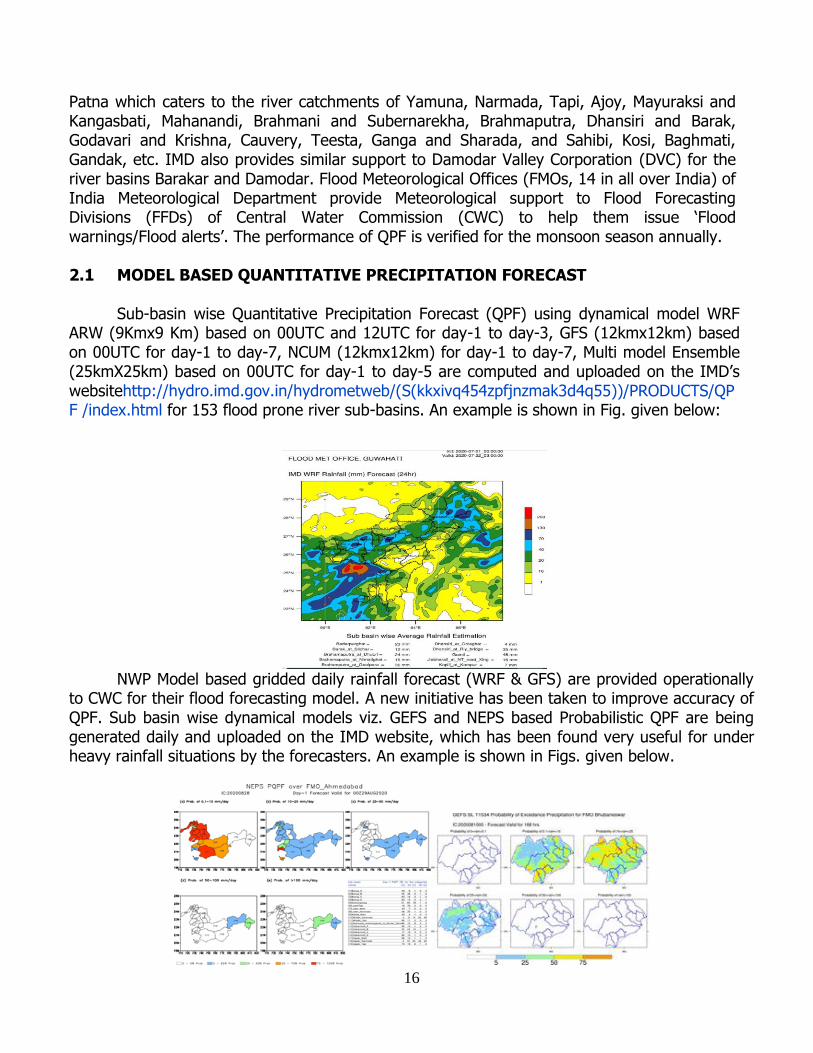
Sub-basin wise Quantitative Precipitation Forecast (QPF) using dynamical model WRF ARW (9Kmx9 Km) based on 00UTC and 12UTC for day-1 to day-3, GFS (12kmx12km) based on 00UTC for day-1 to day-7, NCUM (12kmx12km) for day-1 to day-7, Multi model Ensemble (25kmX25km) based on 00UTC for day-1 to day-5 are computed and uploaded on the IMD’s websitehttp://hydro.imd.gov.in/hydrometweb/(S(kkxivq454zpfjnzmak3d4q55))/PRODUCTS/QPF /index.html for 153 flood prone river sub-basins. An example is shown in Fig. given below:
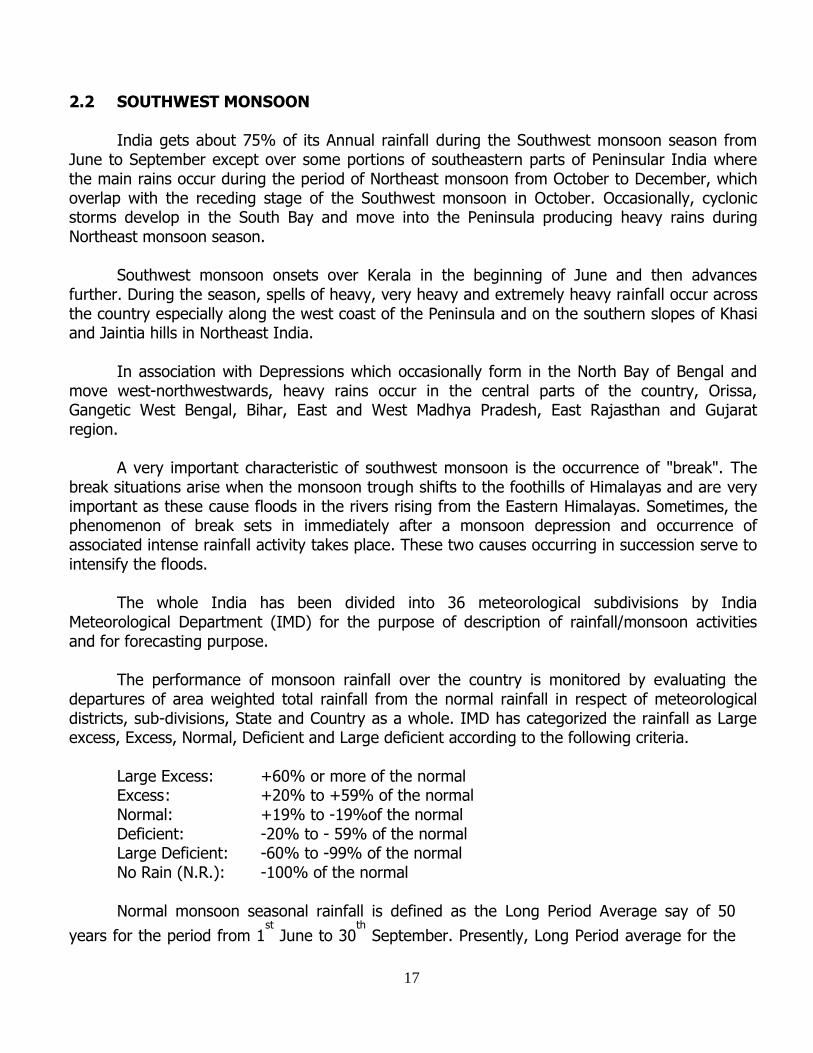
NWP Model based gridded daily rainfall forecast (WRF & GFS) are provided operationally to CWC for their flood forecasting model. A new initiative has been taken to improve accuracy of QPF. Sub basin wise dynamical models viz. GEFS and NEPS based Probabilistic QPF are being generated daily and uploaded on the IMD website, which has been found very useful for under heavy rainfall situations by the forecasters. An example is shown in Figs. given below.
17
2.2 SOUTHWEST MONSOON
India gets about 75% of its Annual rainfall during the Southwest monsoon season from June to September except over some portions of southeastern parts of Peninsular India where the main rains occur during the period of Northeast monsoon from October to December, which overlap with the receding stage of the Southwest monsoon in October. Occasionally, cyclonic storms develop in the South Bay and move into the Peninsula producing heavy rains during Northeast monsoon season.
Southwest monsoon onsets over Kerala in the beginning of June and then advances further. During the season, spells of heavy, very heavy and extremely heavy rainfall occur across the country especially along the west coast of the Peninsula and on the southern slopes of Khasi and Jaintia hills in Northeast India.
In association with Depressions which occasionally form in the North Bay of Bengal and
move west-northwestwards, heavy rains occur in the central parts of the country, Orissa, Gangetic West Bengal, Bihar, East and West Madhya Pradesh, East Rajasthan and Gujarat region.
A very important characteristic of southwest monsoon is the occurrence of "break". The break situations arise when the monsoon trough shifts to the foothills of Himalayas and are very important as these cause floods in the rivers rising from the Eastern Himalayas. Sometimes, the phenomenon of break sets in immediately after a monsoon depression and occurrence of associated intense rainfall activity takes place. These two causes occurring in succession serve to intensify the floods.
The whole India has been divided into 36 meteorological subdivisions by India Meteorological Department (IMD) for the purpose of description of rainfall/monsoon activities and for forecasting purpose.
The performance of monsoon rainfall over the country is monitored by evaluating the departures of area weighted total rainfall from the normal rainfall in respect of meteorological districts, sub-divisions, State and Country as a whole. IMD has categorized the rainfall as Large excess, Excess, Normal, Deficient and Large deficient according to the following criteria.
Large Excess: +60% or more of the normal Excess : +20% to +59% of the normal
Normal: +19% to -19%of the normal Deficient: -20% to - 59% of the normal
Large Deficient: -60% to -99% of the normal No Rain (N.R.): -100% of the normal
Normal monsoon seasonal rainfall is defined as the Long Period Average say of 50
years for the period from 1st June to 30
th September. Presently, Long Period average for the
18
years 1961 to 2010 is being used to define normal. For the country as a whole the normal
rainfall during the period from 1st June to 30
th September is 88 cm. 2.3 HIGHLIGHTS OF SOUTH-WEST MONSOON 2020
The seasonal (June-September) rainfall over the country as a whole was 109% of its Long
Period Average (LPA) in 2020. It was the third highest after 112% of LPA in 1994 and 110 %
of LPA in 2019.
Seasonal rainfalls over Northwest India, Central India, South Peninsula and East & Northeast (E & NE) India were 86%, 115%, 129% and 107% of their respective LPA.
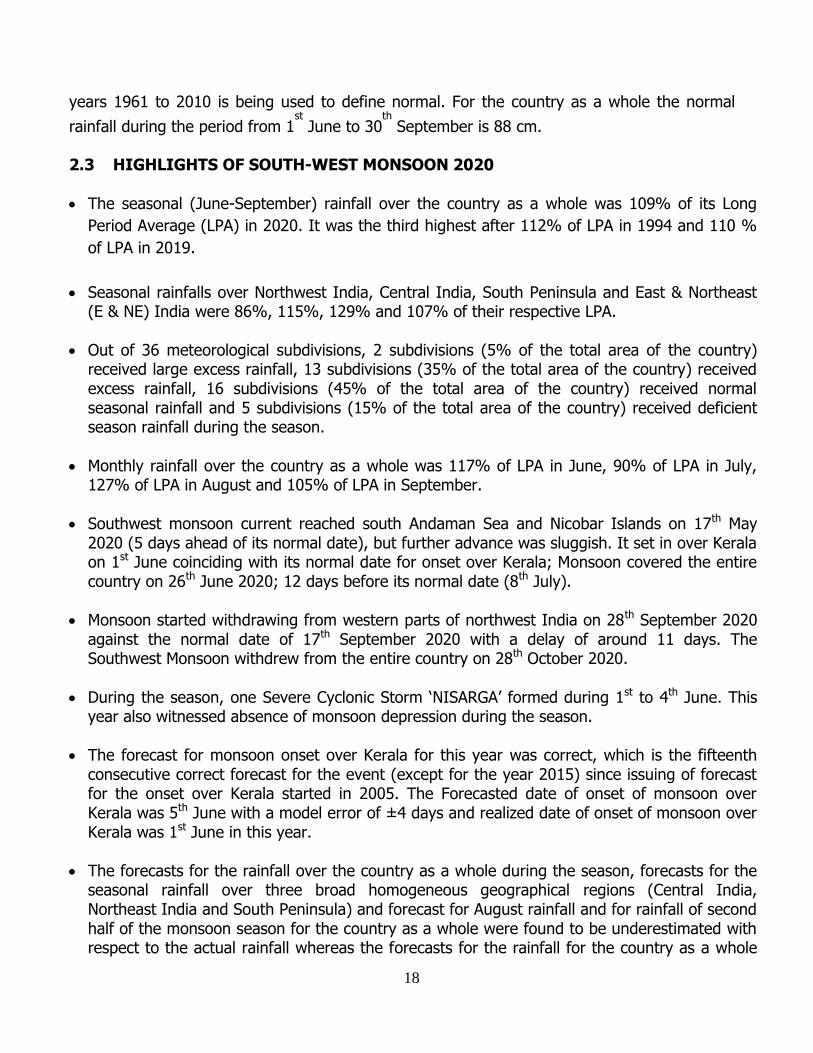
Out of 36 meteorological subdivisions, 2 subdivisions (5% of the total area of the country) received large excess rainfall, 13 subdivisions (35% of the total area of the country) received excess rainfall, 16 subdivisions (45% of the total area of the country) received normal seasonal rainfall and 5 subdivisions (15% of the total area of the country) received deficient season rainfall during the season.
Monthly rainfall over the country as a whole was 117% of LPA in June, 90% of LPA in July, 127% of LPA in August and 105% of LPA in September.
Southwest monsoon current reached south Andaman Sea and Nicobar Islands on 17th May
2020 (5 days ahead of its normal date), but further advance was sluggish. It set in over Kerala on 1st June coinciding with its normal date for onset over Kerala; Monsoon covered the entire country on 26th June 2020; 12 days before its normal date (8th July).
Monsoon started withdrawing from western parts of northwest India on 28th September 2020
against the normal date of 17th September 2020 with a delay of around 11 days. The Southwest Monsoon withdrew from the entire country on 28th October 2020.
During the season, one Severe Cyclonic Storm ‘NISARGA’ formed during 1st to 4th June. This year also witnessed absence of monsoon depression during the season.
The forecast for monsoon onset over Kerala for this year was correct, which is the fifteenth
consecutive correct forecast for the event (except for the year 2015) since issuing of forecast for the onset over Kerala started in 2005. The Forecasted date of onset of monsoon over Kerala was 5th June with a model error of ±4 days and realized date of onset of monsoon over Kerala was 1st June in this year.
The forecasts for the rainfall over the country as a whole during the season, forecasts for the seasonal rainfall over three broad homogeneous geographical regions (Central India, Northeast India and South Peninsula) and forecast for August rainfall and for rainfall of second half of the monsoon season for the country as a whole were found to be underestimated with respect to the actual rainfall whereas the forecasts for the rainfall for the country as a whole
19
during July and forecast for the seasonal rainfall for Northwest India were found to be overestimated as compared to the actual rainfall.
2.4 ONSET AND ADVANCE OF SOUTHWEST MONSOON 2020
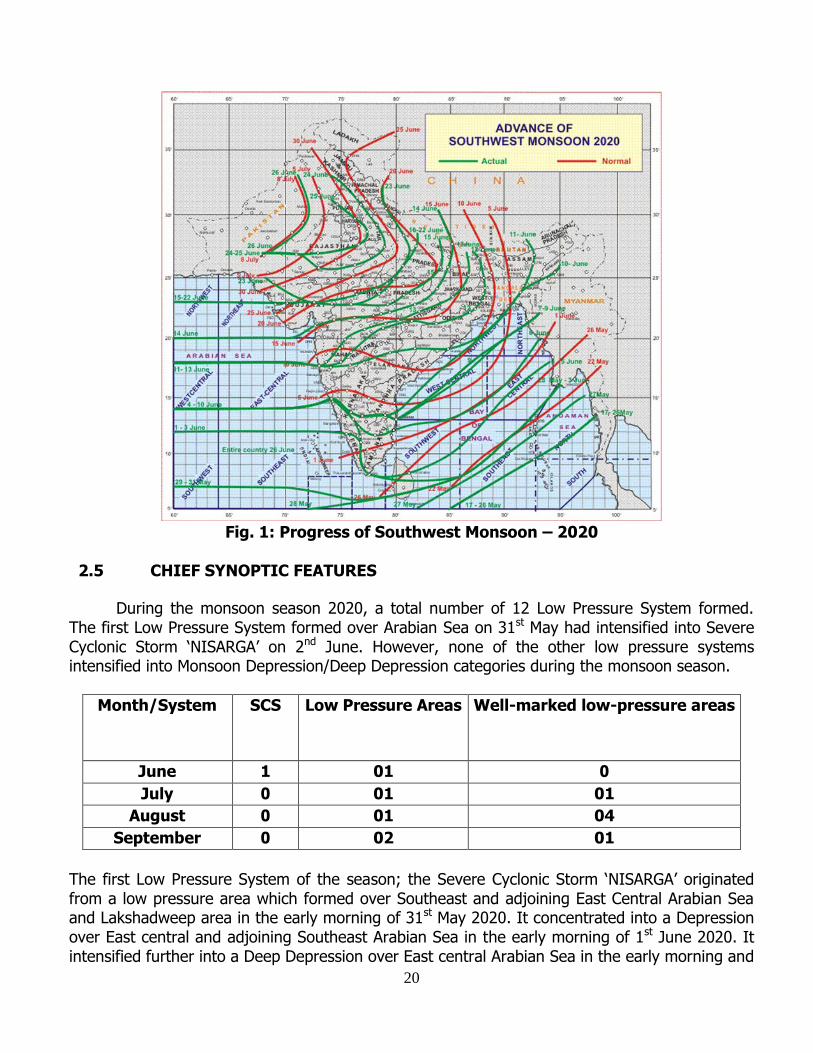
The South West Monsoon (SWM) arrived over Andaman Sea on 17th May 2020, 5 days before its normal date of arrival, however its further advancement was hindered by the formation and intensification of the Super Cyclonic Storm ‘Amphan’ over the Bay of Bengal. The SWM arrived over Kerala on its normal date i.e. on 1st June. Further advancement over the country is observed to be almost close to the normal date (with deviation of ±3-4 days) for most parts of the central India. Advancement of the SWM over northwest India has taken place about 5-10 days earlier than the normal date. Monsoon covered entire country on 26th June against the normal date of 08th July. Thus, monsoon set in over the entire country 12 days before its normal date. Fig. 1 shows the isochrones of advance of monsoon 2020.
20
Fig. 1: Progress of Southwest Monsoon – 2020
2.5 CHIEF SYNOPTIC FEATURES
During the monsoon season 2020, a total number of 12 Low Pressure System formed. The first Low Pressure System formed over Arabian Sea on 31st May had intensified into Severe Cyclonic Storm ‘NISARGA’ on 2nd June. However, none of the other low pressure systems intensified into Monsoon Depression/Deep Depression categories during the monsoon season.
Month/System SCS Low Pressure Areas Well-marked low-pressure areas
June 1 01 0
July 0 01 01
August 0 01 04
September 0 02 01
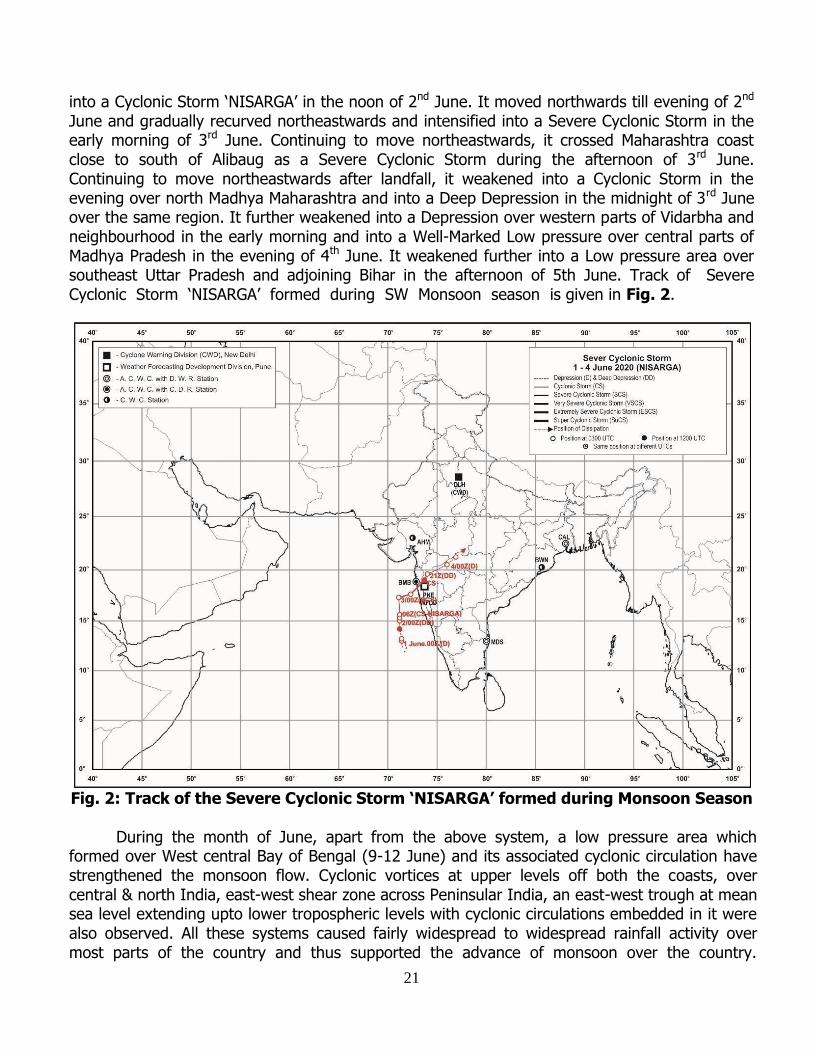
The first Low Pressure System of the season; the Severe Cyclonic Storm ‘NISARGA’ originated from a low pressure area which formed over Southeast and adjoining East Central Arabian Sea and Lakshadweep area in the early morning of 31st May 2020. It concentrated into a Depression over East central and adjoining Southeast Arabian Sea in the early morning of 1st June 2020. It intensified further into a Deep Depression over East central Arabian Sea in the early morning and
21
into a Cyclonic Storm ‘NISARGA’ in the noon of 2nd June. It moved northwards till evening of 2nd June and gradually recurved northeastwards and intensified into a Severe Cyclonic Storm in the early morning of 3rd June. Continuing to move northeastwards, it crossed Maharashtra coast close to south of Alibaug as a Severe Cyclonic Storm during the afternoon of 3rd June. Continuing to move northeastwards after landfall, it weakened into a Cyclonic Storm in the evening over north Madhya Maharashtra and into a Deep Depression in the midnight of 3rd June over the same region. It further weakened into a Depression over western parts of Vidarbha and neighbourhood in the early morning and into a Well-Marked Low pressure over central parts of Madhya Pradesh in the evening of 4th June. It weakened further into a Low pressure area over southeast Uttar Pradesh and adjoining Bihar in the afternoon of 5th June. Track of Severe Cyclonic Storm ‘NISARGA’ formed during SW Monsoon season is given in Fig. 2.
Fig. 2: Track of the Severe Cyclonic Storm ‘NISARGA’ formed during Monsoon Season
During the month of June, apart from the above system, a low pressure area which formed over West central Bay of Bengal (9-12 June) and its associated cyclonic circulation have strengthened the monsoon flow. Cyclonic vortices at upper levels off both the coasts, over central & north India, east-west shear zone across Peninsular India, an east-west trough at mean sea level extending upto lower tropospheric levels with cyclonic circulations embedded in it were also observed. All these systems caused fairly widespread to widespread rainfall activity over most parts of the country and thus supported the advance of monsoon over the country.
22
Towards the end of the month, the monsoon trough shifted northwards with its eastern part close to the foot hills of Himalayas (during 27 June-2 July).
During the month of July, many unfavorable features of monsoon appeared resulting in
deficient rainfall for the country. The weak monsoon in July was mainly due to absence of any major monsoon disturbance over Bay of Bengal and due to the prevalence of a weak cross equatorial flow in general. Absence of any major systems caused the monsoon trough also weak. The monsoon trough lay to the north of the normal position or close to the foothills of the Himalayas on many days during the month. It resulted in frequent and prolonged floods over northeastern India, Bihar and adjoining areas of East Uttar Pradesh. At the same time, major parts of central and northwest India received deficient rainfall.
However, in the first week of July, with the formation of two low pressure areas; one over
coastal Saurashtra and neighbourhood (5-12 July) and the other over Northwest Bay of Bengal off Odisha-Gangetic West Bengal coast (5-6 July) and their associated cyclonic circulations tilting southwards with height, monsoon trough was observed in its normal/south of its normal position during 3-8 July. The low pressure area which formed over coastal Saurashtra and neighbourhood, became well marked on 6th over Kutch and neighbourhood. In addition to this low pressure area, an off- shore trough, a shear zone along 16° N and the monsoon trough to the south of its normal position resulted in widespread rainfall activity over Gujarat State and over coastal & interior parts of Maharashtra and the other low pressure area over Bay of Bengal caused widespread rainfall activity over eastern parts of India.
During the subsequent three weeks of July, an off-shore trough along south Maharashtra
and Kerala coasts, cyclonic vortices over north Konkan coast and east-west shear zone across peninsular India caused widespread/fairly widespread rainfall with heavy to very heavy rainfall activity along the west coast and adjoining interior parts of peninsular India. In the same period, the interactions of the eastern end of monsoon trough (which lay north/close to foot hills of Himalayas) with the cyclonic circulations and convergence of strong south-westerly to southerly winds from Bay of Bengal over east and northeast India triggered monsoon activity over northeast and adjoining east India. The interaction of western end of monsoon trough with the systems in westerlies, circulations in the lower tropospheric levels and moisture incursions from the Arabian Sea caused widespread/fairly widespread rainfall with heavy rainfall over Western Himalayan Region, plains of northwest India & adjoining central & west India during third and fourth week of the month.
A coherent Madden Julian Oscillation (MJO) signal was not evident during June and on
most days of July. Only towards the end of July upto mid of August, the signal became active and slight eastward propagation from Indian Ocean to the maritime continent was seen.
In association with absence of low pressure systems over the Bay of Bengal, shifting of
monsoon trough to the foothills on many days and unfavourable conditions like MJO, the monsoon rainfall was deficient in July across central India. At the same time it caused flood over northeastern States, Bihar and East Uttar Pradesh on a few occasions.
23
As the MJO moved eastwards over the Indian seas, the Arabian Sea and Bay of Bengal became convectively active in August. The formation of five low pressure systems over the North Bay of Bengal in succession out of which four of them became well marked (4-10 , 9-11, 13-18, 19-26 and 24-31 August) and their west-northwestward movement across central India upto Gujarat and south Rajasthan, active MJO, active Monsoon trough mostly south of its normal position and stronger winds reaching up to 50-60 kmph in lower levels over Arabian Sea during a few days in the month led to active monsoon conditions over most parts of the country and caused significantly higher than normal rainfall over central and western parts of India during the month of August.
During the month, strengthening of the monsoon flow in the Arabian Sea, led to
convergence of strong low level westerlies along the west coast. Also, the presence of cyclonic vortices, off-shore trough, east-west shear zone over peninsular India caused widespread rainfall/thundershowers along the west coast, over parts of Peninsular India, Gujarat state, Konkan & Goa and Madhya Maharashtra. System in westerlies and convergence of moist low level winds from Arabian Sea, cyclonic circulations over northwest India and presence of strong easterlies due to the presence of low pressure systems caused scattered to fairly widespread rainfall/thunderstorms over Western Himalayan Region and adjoining parts of northwest India during the month.
Due to active monsoon conditions, riverine floods occurred over Odisha, Telangana,
Madhya Pradesh, Maharashtra, Gujarat and Rajasthan. The active monsoon conditions consecutively for 4 weeks led to excess rainfall activity over the country.
Fairly widespread to widespread rainfall/thunderstorms over parts of Northeast and
adjoining parts of East India with heavy to very heavy rainfall was also observed during the first, second and the last week of August due to the convergence of moist south-westerlies to southerlies from the Bay of Bengal and presence of cyclonic vortices in the lower levels.
A weak MJO re-entered eastern Indian Ocean in late August and propagated eastwards
into maritime continent with weak amplitude by the end of monsoon season. From the last week of August till the formation of a low pressure area off north Andhra
coast on 13 September, either the western or the eastern end of monsoon trough remained north of its normal position or close to foot hills of Himalayas. Heat Low also started weakening. The low pressure area which formed on 13th September subsequently became Well Marked Low and dissipated over Telangana and adjoining south Chhattisgarh. It triggered monsoon activity over Central and Peninsular India. After the dissipation of the low pressure area on 16th, the monsoon trough lay north of its normal position and regained it near-normal position with the formation of another low pressure system on 20th over Northeast Bay of Bengal and neighbourhood. This low pressure system dissipated over east Bihar and neighbourhood on 26th. East Uttar Pradesh, Bihar and Sub Himalayan West Bengal experienced widespread rainfall/thunderstorms due to this system. The monsoon trough became disorganized on 28th September. Apart from the above two low pressure systems in the month, another low-pressure system (6-8 September) formed over Southeast and adjoining East central Arabian Sea and in
24
conjunction with an east-west shear zone over south peninsula caused widespread rainfall activity over south Peninsular India, Lakshadweep area and coastal and interior parts of Maharashtra during the first week of the month. Circulation features favoring convergence of strong moist winds from the Bay of Bengal in the lower tropospheric levels and the alignment of monsoon trough over northeast India and adjoining east India continued to trigger the monsoon activity over the region during the month.
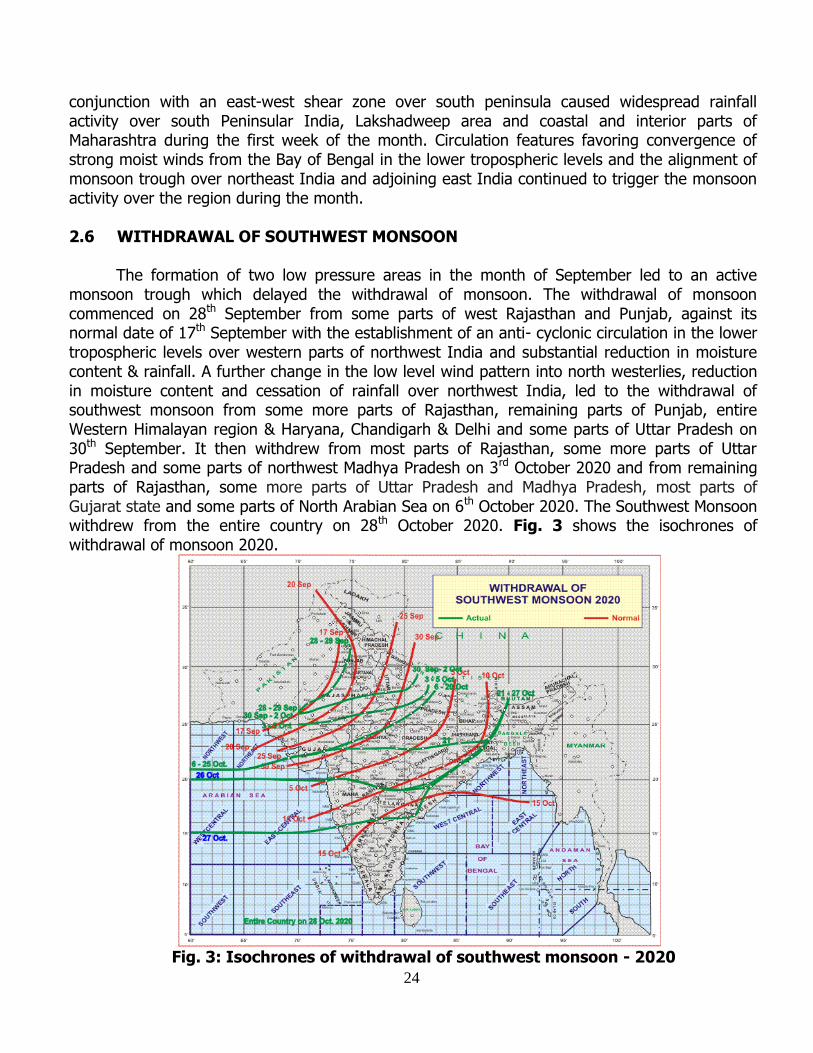
2.6 WITHDRAWAL OF SOUTHWEST MONSOON
The formation of two low pressure areas in the month of September led to an active
monsoon trough which delayed the withdrawal of monsoon. The withdrawal of monsoon commenced on 28th September from some parts of west Rajasthan and Punjab, against its normal date of 17th September with the establishment of an anti- cyclonic circulation in the lower tropospheric levels over western parts of northwest India and substantial reduction in moisture content & rainfall. A further change in the low level wind pattern into north westerlies, reduction in moisture content and cessation of rainfall over northwest India, led to the withdrawal of southwest monsoon from some more parts of Rajasthan, remaining parts of Punjab, entire Western Himalayan region & Haryana, Chandigarh & Delhi and some parts of Uttar Pradesh on 30th September. It then withdrew from most parts of Rajasthan, some more parts of Uttar Pradesh and some parts of northwest Madhya Pradesh on 3rd October 2020 and from remaining parts of Rajasthan, some more parts of Uttar Pradesh and Madhya Pradesh, most parts of Gujarat state and some parts of North Arabian Sea on 6th October 2020. The Southwest Monsoon withdrew from the entire country on 28th October 2020. Fig. 3 shows the isochrones of withdrawal of monsoon 2020.
Fig. 3: Isochrones of withdrawal of southwest monsoon - 2020
25
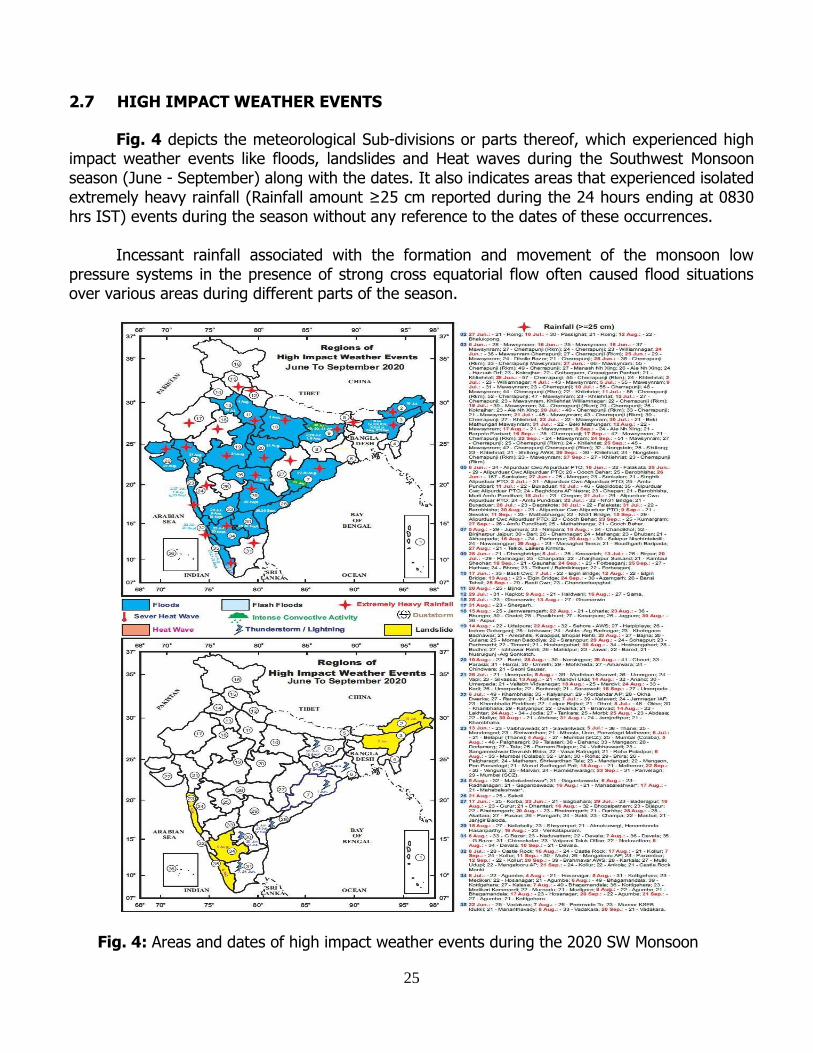
2.7 HIGH IMPACT WEATHER EVENTS
Fig. 4 depicts the meteorological Sub-divisions or parts thereof, which experienced high impact weather events like floods, landslides and Heat waves during the Southwest Monsoon season (June - September) along with the dates. It also indicates areas that experienced isolated extremely heavy rainfall (Rainfall amount ≥25 cm reported during the 24 hours ending at 0830 hrs IST) events during the season without any reference to the dates of these occurrences.
Incessant rainfall associated with the formation and movement of the monsoon low
pressure systems in the presence of strong cross equatorial flow often caused flood situations over various areas during different parts of the season.
Fig. 4: Areas and dates of high impact weather events during the 2020 SW Monsoon
26
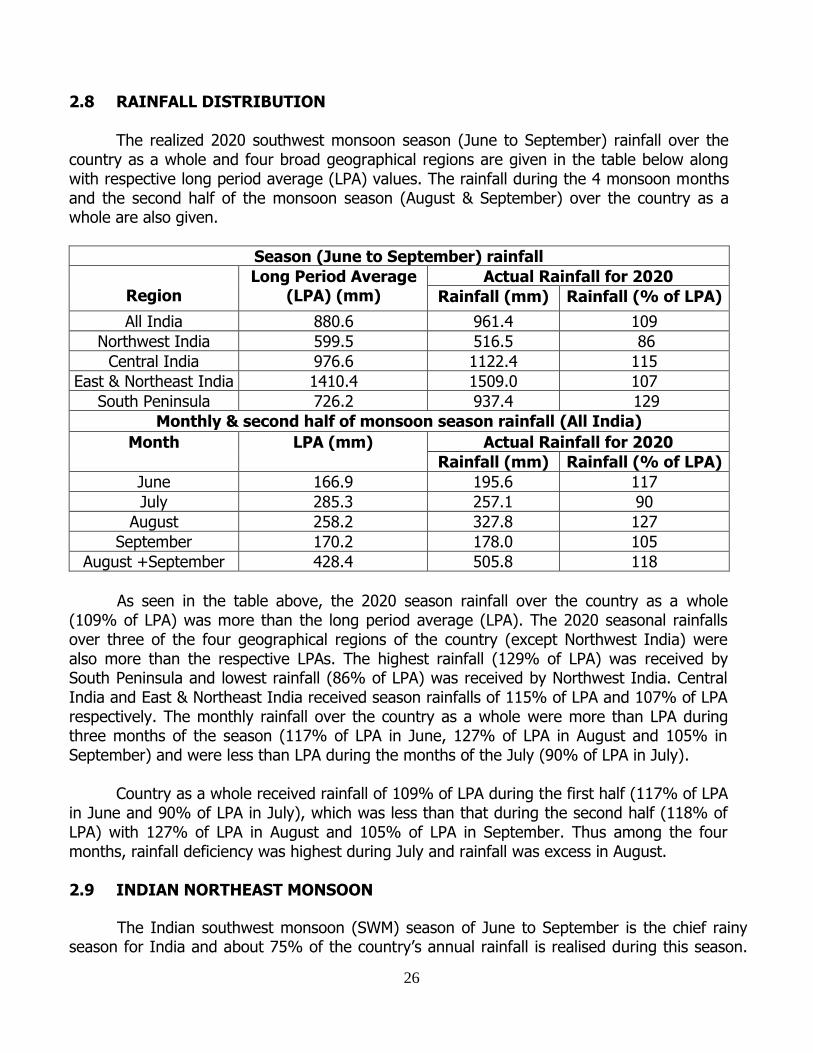
2.8 RAINFALL DISTRIBUTION
The realized 2020 southwest monsoon season (June to September) rainfall over the country as a whole and four broad geographical regions are given in the table below along with respective long period average (LPA) values. The rainfall during the 4 monsoon months and the second half of the monsoon season (August & September) over the country as a whole are also given.
Season (June to September) rainfall
Region
Long Period Average (LPA) (mm)
Actual Rainfall for 2020
Rainfall (mm) Rainfall (% of LPA)
All India 880.6 961.4 109
Northwest India 599.5 516.5 86
Central India 976.6 1122.4 115
East & Northeast India 1410.4 1509.0 107
South Peninsula 726.2 937.4 129
Monthly & second half of monsoon season rainfall (All India)
Month LPA (mm) Actual Rainfall for 2020
Rainfall (mm) Rainfall (% of LPA)
June 166.9 195.6 117
July 285.3 257.1 90
August 258.2 327.8 127
September 170.2 178.0 105
August +September 428.4 505.8 118
As seen in the table above, the 2020 season rainfall over the country as a whole
(109% of LPA) was more than the long period average (LPA). The 2020 seasonal rainfalls over three of the four geographical regions of the country (except Northwest India) were also more than the respective LPAs. The highest rainfall (129% of LPA) was received by South Peninsula and lowest rainfall (86% of LPA) was received by Northwest India. Central India and East & Northeast India received season rainfalls of 115% of LPA and 107% of LPA respectively. The monthly rainfall over the country as a whole were more than LPA during three months of the season (117% of LPA in June, 127% of LPA in August and 105% in September) and were less than LPA during the months of the July (90% of LPA in July).
Country as a whole received rainfall of 109% of LPA during the first half (117% of LPA
in June and 90% of LPA in July), which was less than that during the second half (118% of LPA) with 127% of LPA in August and 105% of LPA in September. Thus among the four months, rainfall deficiency was highest during July and rainfall was excess in August. 2.9 INDIAN NORTHEAST MONSOON
The Indian southwest monsoon (SWM) season of June to September is the chief rainy season for India and about 75% of the country’s annual rainfall is realised during this season.
27
Subsequent to the withdrawal of SWM, the northeast monsoon (NEM), a small scale monsoon confined to parts of southern peninsular India comprising of the meteorological sub-divisions of Tamil Nadu, Puducherry & Karaikal (TN), Kerala & Mahe (KER), Coastal Andhra Pradesh & Yanam (CAP), Telangana, Rayalaseema (RYS) and South Interior Karnataka (SIK) occurs. For the subdivision of TN, the normal SWM seasonal rainfall realised is only about 36% (336.1 mm) of its annual rainfall (939.3 mm) as this subdivision comes under the rain-shadow region during the SWM. The northeast monsoon (NEM) season of October to December (OND) is the chief rainy season for this sub-division with approx 48% (449.7 mm) of its annual rainfall realised during this season and hence its performance is a key factor for this regional agricultural activities.
Further, the NEM season is also the primary cyclone season for the North Indian Ocean
(NIO) basin comprising of the Bay of Bengal (BOB) and the Arabian Sea (AS). Cyclonic disturbances (CDs; low pressure systems (LPS) with maximum sustained surface wind speed (MSW) of 17 knots or more forming over BOB and moving west/northwest wards affect the coastal areas of southeastern peninsular India and also contributes significantly to NEM rainfall. As such, the NEM season assumes importance from the agricultural and Water Management as well as disaster management perspectives.
Prior to the commencement of NEM rains, after the withdrawal of SWM up to 15°N,
reversal of low level winds from southwesterly to northeasterly occurs. The normal date of setting in of easterlies over the southeastern peninsular India is 14th October. The normal rainfall received over the five NEM sub-divisions during OND is TN- 449.7 mm, KER- 491.6 mm, CAP- 338.1 mm, RYS- 223.3 mm, Telangana- 123.3 mm and SIK- 204.1 mm. However, the NEM seasonal rainfall shows a high degree of variability with 27% co-efficient of variation.
The NEM rainfall is influenced by global climate parameters such as ENSO (El Nino/La Nina & Southern Oscillation Index), Indian Ocean Dipole (IOD) and Madden-Julian Oscillation (MJO). El Nino, positive IOD and MJO in phase 2-4 with amplitude greater than one are generally associated with good NEM rainfall. 2.10 ONSET PHASE During October 2020, La Nina and positive SOI conditions prevailed over the equatorial Pacific region; IOD was neutral and MJO was generally in phase 5-8. As such La Nina & positive SOI, and MJO in the western hemisphere were not favourable for good NEM activity. Further, two low pressure systems over the BOB- (i) a Deep Depression (DD) during 11th -14th October 2020 that crossed north Andhra Pradesh coast near Kakinada and (ii) a Depression (D) during 22nd - 24th October 2020 that crossed West Bengal–Bangladesh coasts extended the southwest monsoon activity upto the last week of October 2020. 2.11 SYNOPTIC SCALE WEATHER SYSTEMS DURING THE NEM-2020 SEASON
Cyclones and Depressions over the Bay-of Bengal during October-December 2020, six major low pressure systems (LPS) formed over the NIO – four over the BOB and two over the
28
AS. Of these the four LPS that formed over the BOB influenced the NEM activity. Brief life history of these four LPS (based on the preliminary reports on these LPS of RSMC, IMD New Delhi) - (i) Deep Depression over the BOB during 11th – 14th October 2020 (ii) Depression over the BOB during 22nd – 24th October 2020 (iii) Very Severe Cyclonic Storm (VSCS) NIVAR over BOB during 22nd – 26th November 2020 and (iv) Cyclonic Storm (CS) BUREVI over the BOB during 30th November – 05th December 2020. 2.12 OTHER SYNOPTIC SCALE WEATHER SYSTEMS
Aside from the cyclones and depressions that affected the performance of NEM 2020, other major synoptic scale weather systems that influenced the NEM 2020 were the transient easterly wave troughs across the peninsular India. During the period October-December 2020, frequent easterly wave troughs that moved across peninsular India from east to west contributed significantly to the NEM rainfall during the season. Analysis of Hovmoller plots of 6-hrly meridional wind along 10°N latitude at 700 hPa for the period 1st October–31st December 2020 indicated four easterly wave troughs that moved across the peninsular India– (i) 8th - 12th November 2020, (ii) 12th - 16th November 2020, (iii) 12th - 16th December 2020 and (iv) 26th - 30th December 2020. 2.13 SUMMARY The onset of NEM 2020 over the southeastern parts of peninsular India took place on 28th October [delay of 8 days from the normal date of onset (20th October)]. Despite a late onset, except Kerala, all other subdivisions benefited by the NEM (TN, CAP, RYS & SIK) received normal to excess rainfall during the season (Oct-Dec 2020). Under the influence of extended SWM, CAP, RYS & SIK received normal rainfall in October, but, TN & KER ended up deficient during the month. In November, except KER, which came under deficient category, all other subdivisions received normal/above normal rainfall with RYS recording +122% excess. In December all the five subdivisions received normal/above normal rainfall with RYS and TN recording +99% and +87% excess rainfall. Two cyclones– VSCS Nivar and CS Burevi as well as passage of easterly wave trough across peninsular India contributed significantly towards NEM activity during November and December. The NEM season extended into first half of January 2021 also and cessation of NEM rains over the peninsular India took place on 19th January 2021.
29
CHAPTER – 3
SIGNIFICANT FLOOD EVENTS
3.1 GENERAL
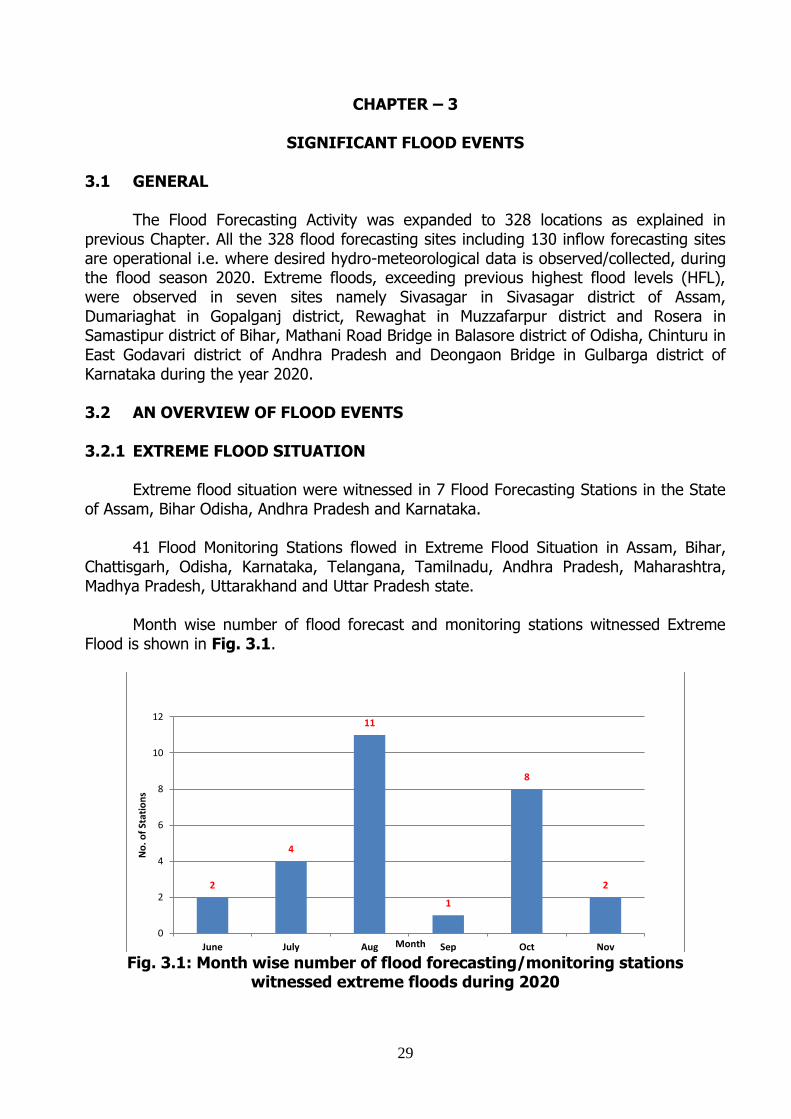
The Flood Forecasting Activity was expanded to 328 locations as explained in previous Chapter. All the 328 flood forecasting sites including 130 inflow forecasting sites are operational i.e. where desired hydro-meteorological data is observed/collected, during the flood season 2020. Extreme floods, exceeding previous highest flood levels (HFL), were observed in seven sites namely Sivasagar in Sivasagar district of Assam, Dumariaghat in Gopalganj district, Rewaghat in Muzzafarpur district and Rosera in Samastipur district of Bihar, Mathani Road Bridge in Balasore district of Odisha, Chinturu in East Godavari district of Andhra Pradesh and Deongaon Bridge in Gulbarga district of Karnataka during the year 2020. 3.2 AN OVERVIEW OF FLOOD EVENTS
3.2.1 EXTREME FLOOD SITUATION Extreme flood situation were witnessed in 7 Flood Forecasting Stations in the State of Assam, Bihar Odisha, Andhra Pradesh and Karnataka. 41 Flood Monitoring Stations flowed in Extreme Flood Situation in Assam, Bihar, Chattisgarh, Odisha, Karnataka, Telangana, Tamilnadu, Andhra Pradesh, Maharashtra, Madhya Pradesh, Uttarakhand and Uttar Pradesh state.
Month wise number of flood forecast and monitoring stations witnessed Extreme Flood is shown in Fig. 3.1.
Fig. 3.1: Month wise number of flood forecasting/monitoring stations
witnessed extreme floods during 2020
2
4
11
1
8
2
0
2
4
6
8
10
12
June July Aug Sep Oct Nov
No
. of
Stat
ion
s
Month
30
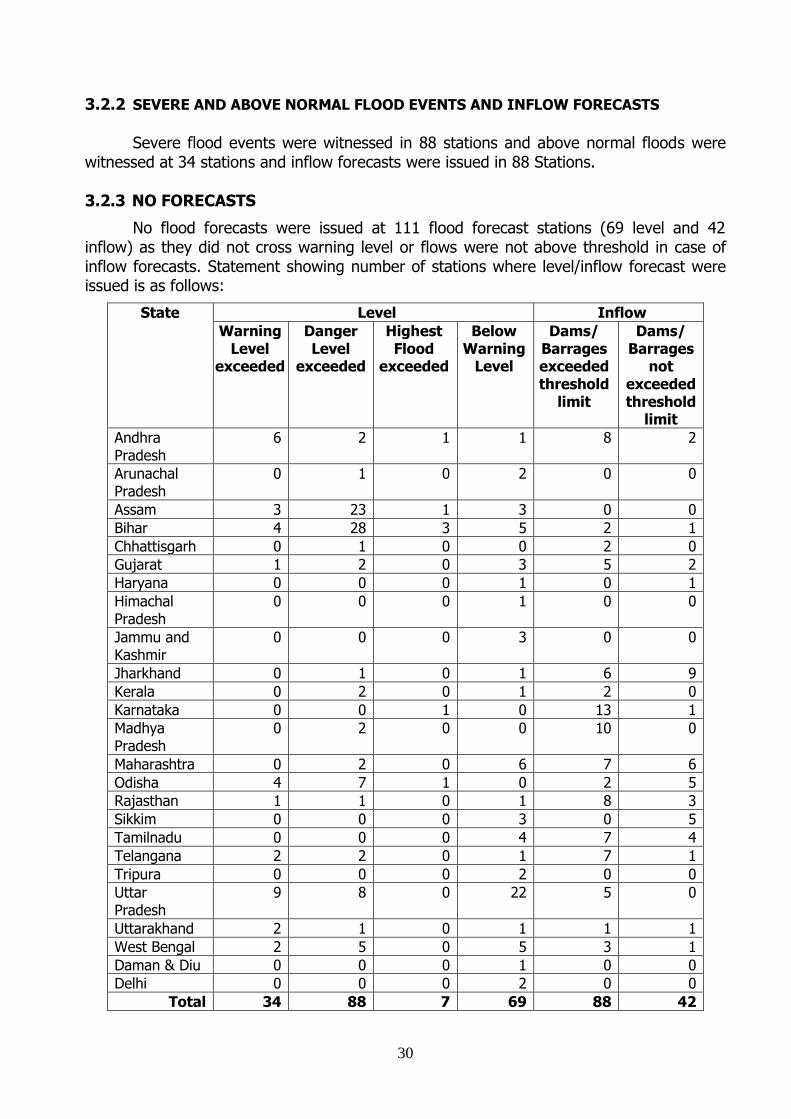
3.2.2 SEVERE AND ABOVE NORMAL FLOOD EVENTS AND INFLOW FORECASTS
Severe flood events were witnessed in 88 stations and above normal floods were witnessed at 34 stations and inflow forecasts were issued in 88 Stations. 3.2.3 NO FORECASTS
No flood forecasts were issued at 111 flood forecast stations (69 level and 42 inflow) as they did not cross warning level or flows were not above threshold in case of inflow forecasts. Statement showing number of stations where level/inflow forecast were issued is as follows:
State Level Inflow
Warning Level
exceeded
Danger Level
exceeded
Highest Flood
exceeded
Below Warning
Level
Dams/ Barrages exceeded threshold
limit
Dams/ Barrages
not exceeded threshold
limit
Andhra Pradesh
6 2 1 1 8 2
Arunachal Pradesh
0 1 0 2 0 0
Assam 3 23 1 3 0 0
Bihar 4 28 3 5 2 1
Chhattisgarh 0 1 0 0 2 0
Gujarat 1 2 0 3 5 2
Haryana 0 0 0 1 0 1
Himachal Pradesh
0 0 0 1 0 0
Jammu and Kashmir
0 0 0 3 0 0
Jharkhand 0 1 0 1 6 9
Kerala 0 2 0 1 2 0
Karnataka 0 0 1 0 13 1
Madhya Pradesh
0 2 0 0 10 0
Maharashtra 0 2 0 6 7 6
Odisha 4 7 1 0 2 5
Rajasthan 1 1 0 1 8 3
Sikkim 0 0 0 3 0 5
Tamilnadu 0 0 0 4 7 4
Telangana 2 2 0 1 7 1
Tripura 0 0 0 2 0 0
Uttar Pradesh
9 8 0 22 5 0
Uttarakhand 2 1 0 1 1 1
West Bengal 2 5 0 5 3 1
Daman & Diu 0 0 0 1 0 0
Delhi 0 0 0 2 0 0
Total 34 88 7 69 88 42
31
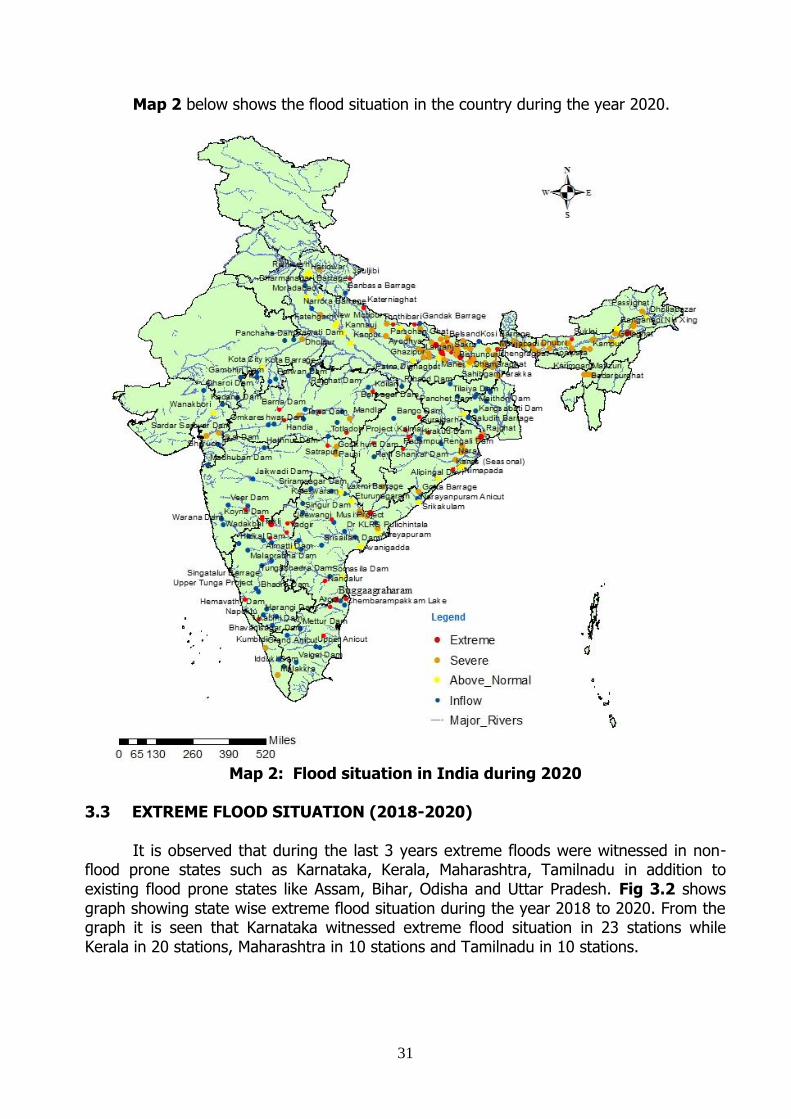
Map 2 below shows the flood situation in the country during the year 2020.
Map 2: Flood situation in India during 2020
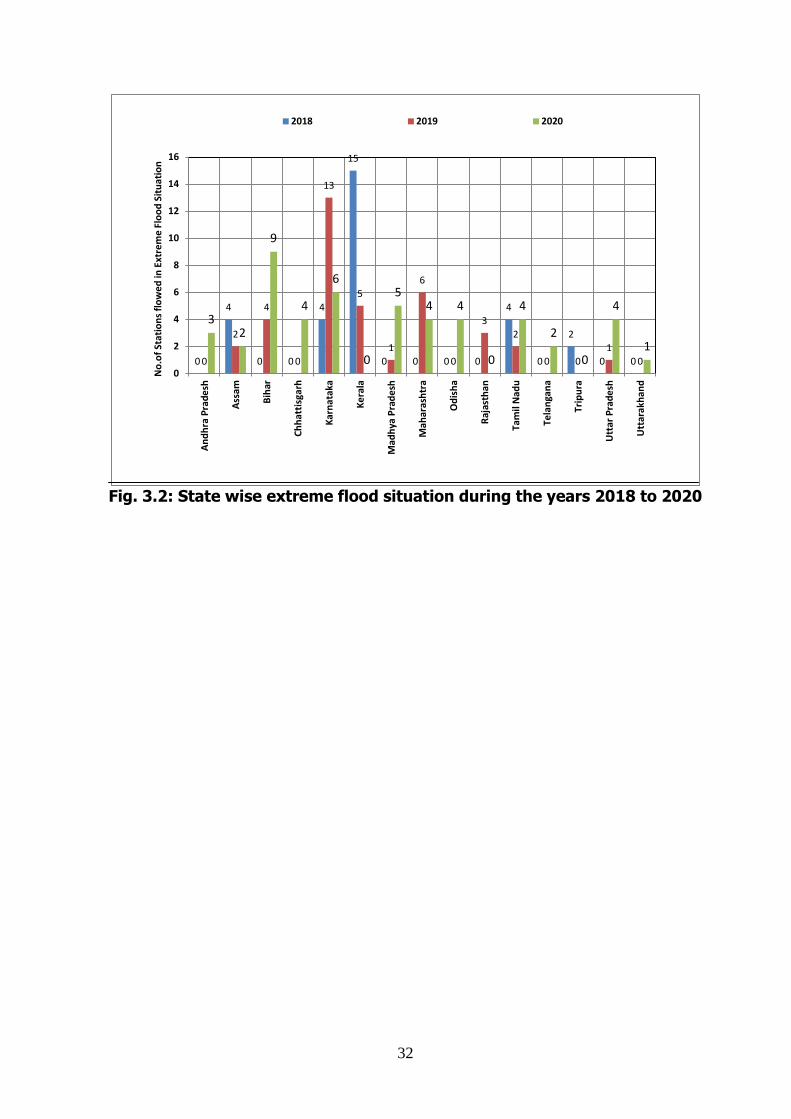
3.3 EXTREME FLOOD SITUATION (2018-2020) It is observed that during the last 3 years extreme floods were witnessed in non-flood prone states such as Karnataka, Kerala, Maharashtra, Tamilnadu in addition to existing flood prone states like Assam, Bihar, Odisha and Uttar Pradesh. Fig 3.2 shows graph showing state wise extreme flood situation during the year 2018 to 2020. From the graph it is seen that Karnataka witnessed extreme flood situation in 23 stations while Kerala in 20 stations, Maharashtra in 10 stations and Tamilnadu in 10 stations.
32
Fig. 3.2: State wise extreme flood situation during the years 2018 to 2020
0
4
0 0
4
15
0 0 0 0
4
0
2
0 0 0
2
4
0
13
5
1
6
0
3
2
0 0
1
0
3 2
9
4
6
0
5 4 4
0
4
2
0
4
1
0
2
4
6
8
10
12
14
16
An
dh
ra P
rad
esh
Ass
am
Bih
ar
Ch
hat
tisg
arh
Kar
nat
aka
Ke
rala
Mad
hya
Pra
de
sh
Mah
aras
htr
a
Od
ish
a
Raj
asth
an
Tam
il N
adu
Tela
nga
na
Trip
ura
Utt
ar P
rad
esh
Utt
arak
han
d
No
.of
Stat
ion
s fl
ow
ed
in E
xtre
me
Flo
od
Sit
uat
ion
2018 2019 2020
33
CHAPTER - 4
FLOOD FORECAST PERFORMANCE
4.1 FLOOD FORECASTING EVALUATION - CRITERIA & PROCEDURE
A number of techniques are being utilised for formulation of river stage and inflow forecasts by Central Water Commission. While inflow forecast is being provided for assisting project authorities in reservoir regulation, the stage forecast is done for warning the civil and engineering authorities about the predicted water level well ahead of its occurrence. An accurate forecast is one where the forecast level and corresponding actual observed level exactly synchronize or have such a small difference that it can be taken as reasonably accurate. In an ideal situation, not only the forecast and the corresponding observed value of river stage/inflow should be the same but also the time of such occurrence should be the same as that predicted.
4.2 EVALUATION CRITERIA FOR STAGE/INFLOW FORECASTING
As per present practice, all the level and inflow forecasts are being judged by the single criteria of accuracy i.e. the actual level attained is within ±15cm of forecasted value for stage forecasts and the actual inflow/volume received in the dam/barrage is within ±20% of the forecasted value for inflow forecast.
The forecast of incoming flood gives the water level or inflow and ‘time’ of occurrences. It is also observed that in many cases the levels attained were found within permissible limit of accuracy but the time of occurrence was not the same. 4.3 FLOOD FORECASTING ACTIVITIES
The flood forecasting activities like data collection, forecast formulation and its
dissemination during 2020 covered various river basins and States. A total of 11721 forecast were issued during 2020. The performance of flood forecasting Division wise, Major Basin wise, State wise and for the period 2000 to 2020 are given from Annex - IV to VII. 4.4 RIVER WISE DETAILS OF FLOOD FORECASTING ACTIVITES & ACCURACY
OF FORECAST 4.4.1 INDUS BASIN
During the flood season 2020, no forecast was issued for Jhelum basin.
4.4.2 BRAHMAPUTRA BASIN
During the flood season 2020, analysis of the flood forecasts issued reveals that 3289 forecasts (28.06% of 11721 forecast) were issued for 30 sites (30 level Forecast Sites) located on the main Brahmaputra and tributaries. Out of these, 3249 forecasts (98.78%) were found within permissible limit of accuracy.
34
4.4.3 BARAK AND OTHER BASIN
During the flood season 2020, 200 forecasts (1.70% of 11721) were issued for 4 (4 level) Sites. All forecasts were found within permissible limit of accuracy.
4.4.4 GANGA BASIN
One new Level Forecasting site Dholpur was added during 2020 flood season. During the flood season 2020, 4897 forecasts (41.78 % of 11721) were issued for 85 sites (59 level and 26 inflow), out of total 134 sites (95 level and 39 inflow Forecast) located on the main Ganga and its tributaries. No forecast was issued for the remaining 49 sites. Out of these, 4757 forecasts (97.14%) were found within permissible limit of accuracy. 4.4.5 GODAVARI BASIN
Two new Inflow Forecasting sites namely Indirasagar (Polavaram) and Laxmi
Barrage were added during 2020 flood season. During the flood season 2020, 352 forecasts (3% of 11721) were issued for 24 (12 level and 12 inflow) of the 42 sites (18 level and 24 inflow) on Godavari Basin and 303 (86.08%) forecasts were found within permissible limit of accuracy. No forecasts were issued for remaining 18 sites.
4.4.6 KRISHNA BASIN
During the flood season 2020, 1407 forecasts (12.00% of 11721) were issued for 20 forecasting sites out of 22 sites. Out of 1407 forecasts issued, 1295 forecasts were found to be within limit with an accuracy of 92.04%. No forecasts were issued for the remaining 2 sites. 4.4.7 CAUVERY BASIN
During the flood season 2020, 651 forecasts (5.55 % of 11721) were issued for 8 inflow forecasting sites and 562 forecasts (86.33%) were found within permissible limit of accuracy. No level forecast was issued during 2020. 4.4.8 SUBARNAREKHA BASIN INCLUDING BURHABALANG
During the flood season 2020, 150 forecasts (1.28% of 11721) were issued for 4 forecasting sites (3 level and 1 inflow). Out of 150 forecast, 121 forecasts were found to be within permissible limit of accuracy (80.67%). No forecasts were issued for remaining 3 sites. 4.4.9 BRAHMANI AND BAITARNI BASIN
During the flood season 2020, 31 forecasts (0.26% of 11721) were issued for 4 (3 level and 1 inflow) forecasting sites. Out of 31 forecast (22 level and 9 inflow) issued, 19
35
(15 level and 4 inflow) forecasts were found to be within permissible limit with 61.29% of accuracy.
4.4.10 MAHANADI BASIN
During the flood season 2020, 143 forecasts (1.22% of 11721) were issued for all the 6 forecasting sites (3 level and 3 inflow). Out of 143 (30 level forecast and 113 inflow forecast) forecast issued, 139 forecasts was found to be within limit with an accuracy of 97.20%. 4.4.11 EAST FLOWING BETWEEN MAHANADI AND PENNAR BASIN
During the flood season 2020, 42 forecasts (0.36% of 11721) were issued for 6
forecasting site (4 level and 2 inflow). Out of 42 (27 level and 15 inflow) forecast issued, 35 forecasts (23 level and 12 inflow) were found to be within limit with an accuracy of 83.33%. 4.4.12 PENNAR BASIN
During the flood season 2020, 66 forecasts (0.56% of 11721) were issued for both
the forecasting sites (1 level and 1 inflow). Out of 66 (2 level and 64 inflow) forecast issued, 50 forecasts were found to be within limit with an accuracy of 75.76%. 4.4.13 EAST FLOWING BETWEEN PENNAR AND KANYAKUMARI BASIN
During the flood season 2020, 22 forecasts (0.18% of 11721) were issued for 3 forecasting sites (3 inflow) out of 6 (6 inflow) sites. Out of 22 inflow forecasts issued, 9 forecasts were found to be within limit with an accuracy of 40.91%. No forecasts were issued for the remaining site.
4.4.14 MAHI BASIN
During the flood season 2020, 25 (0.21% of 11721) forecast were issued for 3 (1 level and 2 inflow) forecasting site. All forecasts were within permissible limit with 100% accuracy. No forecasts were issued for the remaining sites. 4.4.15 SABARMATI BASIN
During the flood season 2020, 6 inflow forecast (0.05% of 11721) were issued with 100% accuracy. No level forecast was issued. 4.4.16 NARMADA BASIN
During the flood season 2020, 274 forecasts (2.33% of 11721) were issued for 4
level forecast site and 6 inflow forecast stations. Out of 274 forecast issued, 272 forecasts
were found to be within limit with an accuracy of 99.27%.
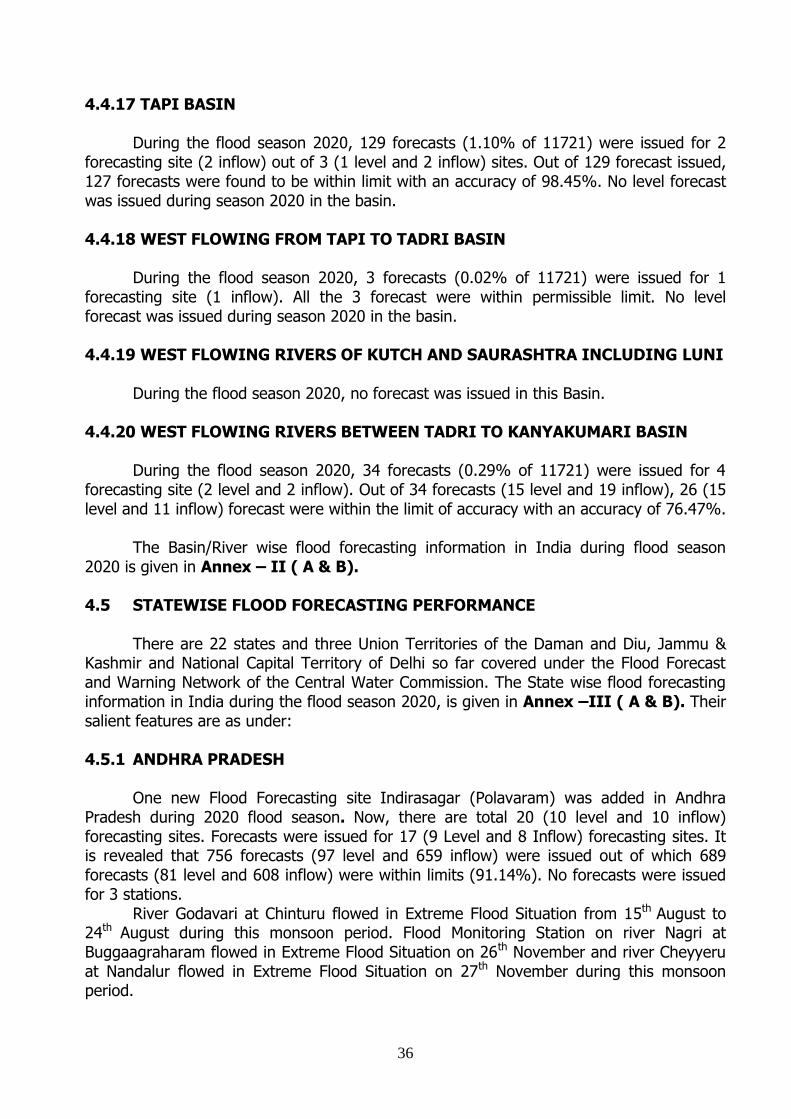
36
4.4.17 TAPI BASIN During the flood season 2020, 129 forecasts (1.10% of 11721) were issued for 2
forecasting site (2 inflow) out of 3 (1 level and 2 inflow) sites. Out of 129 forecast issued, 127 forecasts were found to be within limit with an accuracy of 98.45%. No level forecast was issued during season 2020 in the basin.
4.4.18 WEST FLOWING FROM TAPI TO TADRI BASIN
During the flood season 2020, 3 forecasts (0.02% of 11721) were issued for 1
forecasting site (1 inflow). All the 3 forecast were within permissible limit. No level forecast was issued during season 2020 in the basin.
4.4.19 WEST FLOWING RIVERS OF KUTCH AND SAURASHTRA INCLUDING LUNI
During the flood season 2020, no forecast was issued in this Basin.
4.4.20 WEST FLOWING RIVERS BETWEEN TADRI TO KANYAKUMARI BASIN During the flood season 2020, 34 forecasts (0.29% of 11721) were issued for 4
forecasting site (2 level and 2 inflow). Out of 34 forecasts (15 level and 19 inflow), 26 (15 level and 11 inflow) forecast were within the limit of accuracy with an accuracy of 76.47%.
The Basin/River wise flood forecasting information in India during flood season 2020 is given in Annex – II ( A & B). 4.5 STATEWISE FLOOD FORECASTING PERFORMANCE
There are 22 states and three Union Territories of the Daman and Diu, Jammu &
Kashmir and National Capital Territory of Delhi so far covered under the Flood Forecast and Warning Network of the Central Water Commission. The State wise flood forecasting information in India during the flood season 2020, is given in Annex –III ( A & B). Their salient features are as under:
4.5.1 ANDHRA PRADESH One new Flood Forecasting site Indirasagar (Polavaram) was added in Andhra Pradesh during 2020 flood season. Now, there are total 20 (10 level and 10 inflow) forecasting sites. Forecasts were issued for 17 (9 Level and 8 Inflow) forecasting sites. It is revealed that 756 forecasts (97 level and 659 inflow) were issued out of which 689 forecasts (81 level and 608 inflow) were within limits (91.14%). No forecasts were issued for 3 stations.
River Godavari at Chinturu flowed in Extreme Flood Situation from 15th August to 24th August during this monsoon period. Flood Monitoring Station on river Nagri at Buggaagraharam flowed in Extreme Flood Situation on 26th November and river Cheyyeru at Nandalur flowed in Extreme Flood Situation on 27th November during this monsoon period.
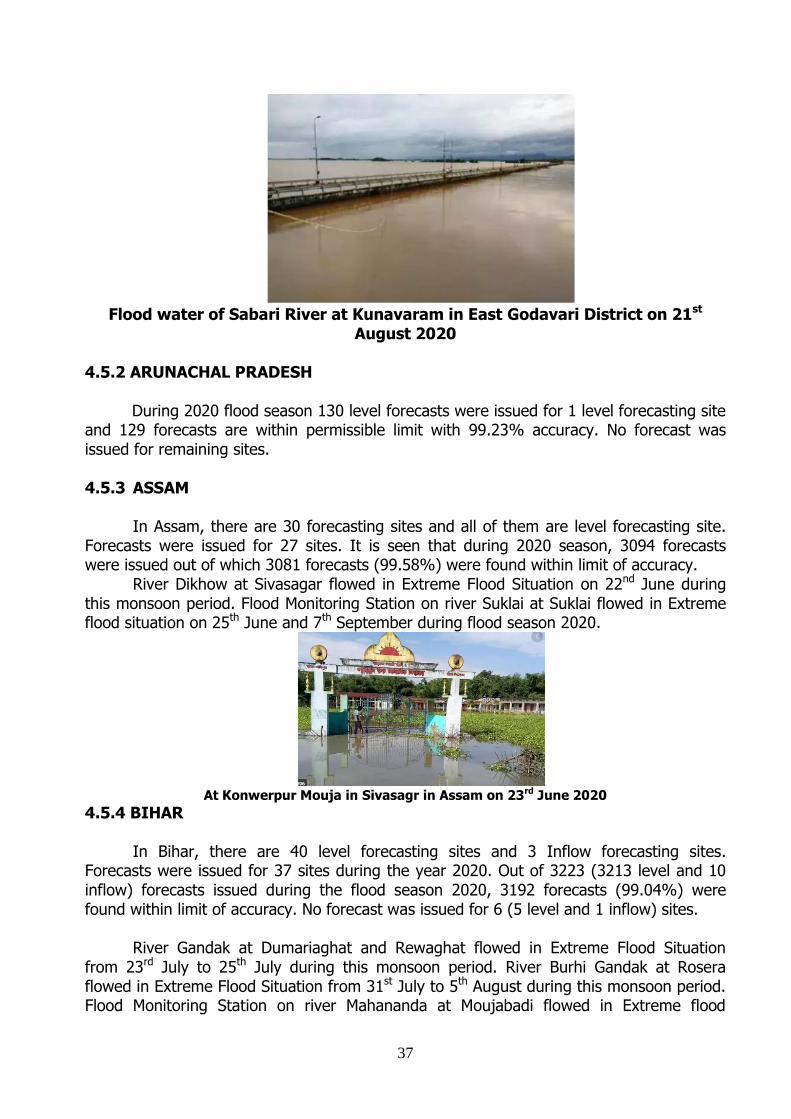
37
Flood water of Sabari River at Kunavaram in East Godavari District on 21st
August 2020
4.5.2 ARUNACHAL PRADESH During 2020 flood season 130 level forecasts were issued for 1 level forecasting site and 129 forecasts are within permissible limit with 99.23% accuracy. No forecast was issued for remaining sites. 4.5.3 ASSAM In Assam, there are 30 forecasting sites and all of them are level forecasting site. Forecasts were issued for 27 sites. It is seen that during 2020 season, 3094 forecasts were issued out of which 3081 forecasts (99.58%) were found within limit of accuracy.
River Dikhow at Sivasagar flowed in Extreme Flood Situation on 22nd June during this monsoon period. Flood Monitoring Station on river Suklai at Suklai flowed in Extreme flood situation on 25th June and 7th September during flood season 2020.
At Konwerpur Mouja in Sivasagr in Assam on 23rd June 2020
4.5.4 BIHAR In Bihar, there are 40 level forecasting sites and 3 Inflow forecasting sites. Forecasts were issued for 37 sites during the year 2020. Out of 3223 (3213 level and 10 inflow) forecasts issued during the flood season 2020, 3192 forecasts (99.04%) were found within limit of accuracy. No forecast was issued for 6 (5 level and 1 inflow) sites.
River Gandak at Dumariaghat and Rewaghat flowed in Extreme Flood Situation from 23rd July to 25th July during this monsoon period. River Burhi Gandak at Rosera flowed in Extreme Flood Situation from 31st July to 5th August during this monsoon period. Flood Monitoring Station on river Mahananda at Moujabadi flowed in Extreme flood
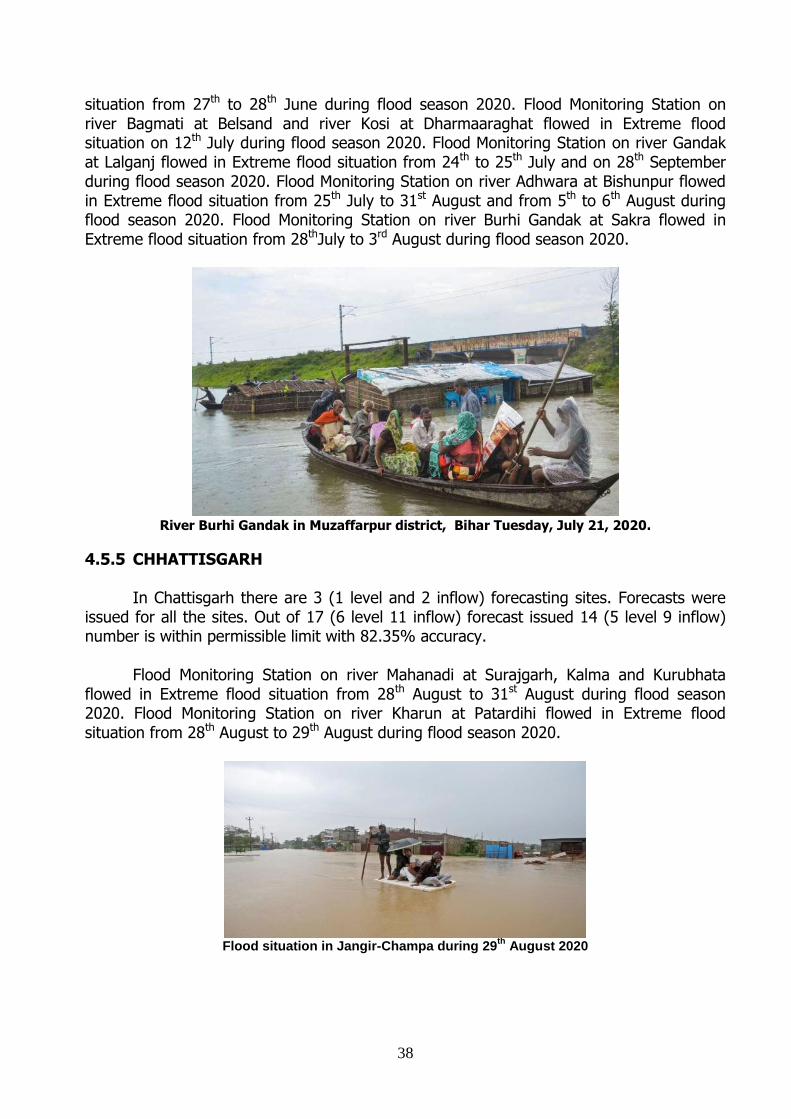
38
situation from 27th to 28th June during flood season 2020. Flood Monitoring Station on river Bagmati at Belsand and river Kosi at Dharmaaraghat flowed in Extreme flood situation on 12th July during flood season 2020. Flood Monitoring Station on river Gandak at Lalganj flowed in Extreme flood situation from 24th to 25th July and on 28th September during flood season 2020. Flood Monitoring Station on river Adhwara at Bishunpur flowed in Extreme flood situation from 25th July to 31st August and from 5th to 6th August during flood season 2020. Flood Monitoring Station on river Burhi Gandak at Sakra flowed in Extreme flood situation from 28thJuly to 3rd August during flood season 2020.
River Burhi Gandak in Muzaffarpur district, Bihar Tuesday, July 21, 2020.
4.5.5 CHHATTISGARH
In Chattisgarh there are 3 (1 level and 2 inflow) forecasting sites. Forecasts were issued for all the sites. Out of 17 (6 level 11 inflow) forecast issued 14 (5 level 9 inflow) number is within permissible limit with 82.35% accuracy.
Flood Monitoring Station on river Mahanadi at Surajgarh, Kalma and Kurubhata flowed in Extreme flood situation from 28th August to 31st August during flood season 2020. Flood Monitoring Station on river Kharun at Patardihi flowed in Extreme flood situation from 28th August to 29th August during flood season 2020.
Flood situation in Jangir-Champa during 29
th August 2020
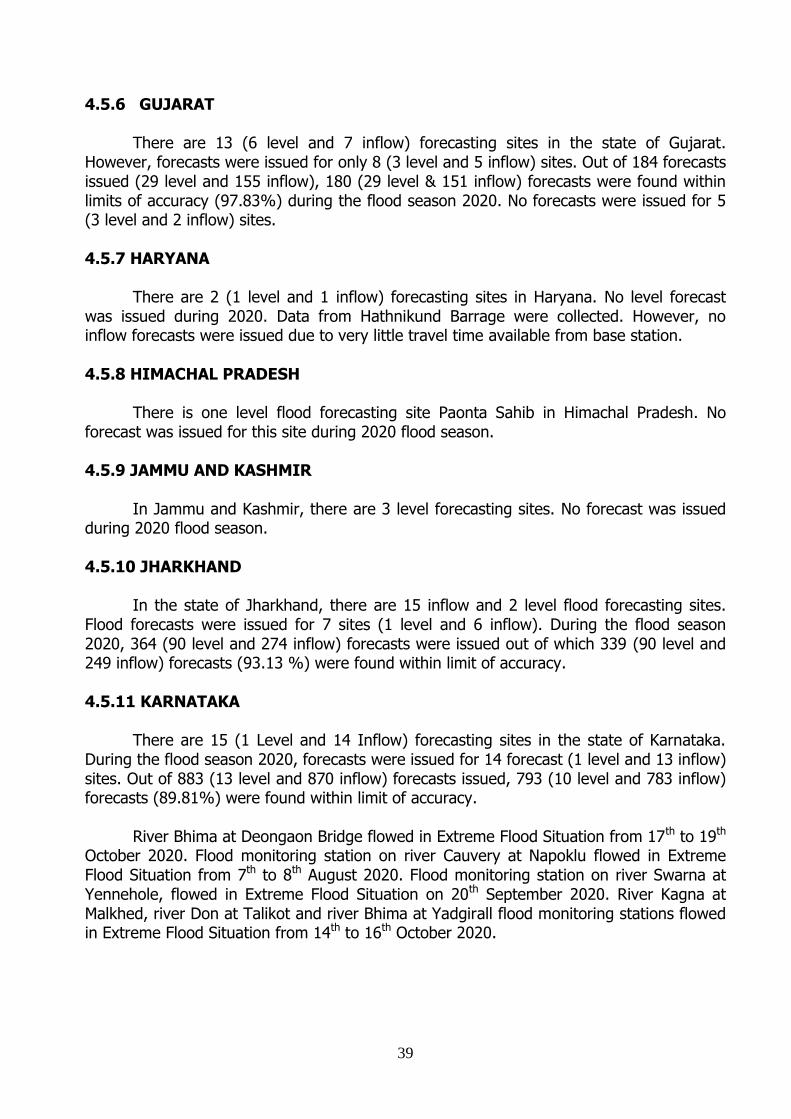
39
4.5.6 GUJARAT
There are 13 (6 level and 7 inflow) forecasting sites in the state of Gujarat. However, forecasts were issued for only 8 (3 level and 5 inflow) sites. Out of 184 forecasts issued (29 level and 155 inflow), 180 (29 level & 151 inflow) forecasts were found within limits of accuracy (97.83%) during the flood season 2020. No forecasts were issued for 5 (3 level and 2 inflow) sites. 4.5.7 HARYANA
There are 2 (1 level and 1 inflow) forecasting sites in Haryana. No level forecast was issued during 2020. Data from Hathnikund Barrage were collected. However, no inflow forecasts were issued due to very little travel time available from base station. 4.5.8 HIMACHAL PRADESH
There is one level flood forecasting site Paonta Sahib in Himachal Pradesh. No
forecast was issued for this site during 2020 flood season. 4.5.9 JAMMU AND KASHMIR
In Jammu and Kashmir, there are 3 level forecasting sites. No forecast was issued during 2020 flood season. 4.5.10 JHARKHAND
In the state of Jharkhand, there are 15 inflow and 2 level flood forecasting sites. Flood forecasts were issued for 7 sites (1 level and 6 inflow). During the flood season 2020, 364 (90 level and 274 inflow) forecasts were issued out of which 339 (90 level and 249 inflow) forecasts (93.13 %) were found within limit of accuracy. 4.5.11 KARNATAKA
There are 15 (1 Level and 14 Inflow) forecasting sites in the state of Karnataka. During the flood season 2020, forecasts were issued for 14 forecast (1 level and 13 inflow) sites. Out of 883 (13 level and 870 inflow) forecasts issued, 793 (10 level and 783 inflow) forecasts (89.81%) were found within limit of accuracy.
River Bhima at Deongaon Bridge flowed in Extreme Flood Situation from 17th to 19th October 2020. Flood monitoring station on river Cauvery at Napoklu flowed in Extreme Flood Situation from 7th to 8th August 2020. Flood monitoring station on river Swarna at Yennehole, flowed in Extreme Flood Situation on 20th September 2020. River Kagna at Malkhed, river Don at Talikot and river Bhima at Yadgirall flood monitoring stations flowed in Extreme Flood Situation from 14th to 16th October 2020.
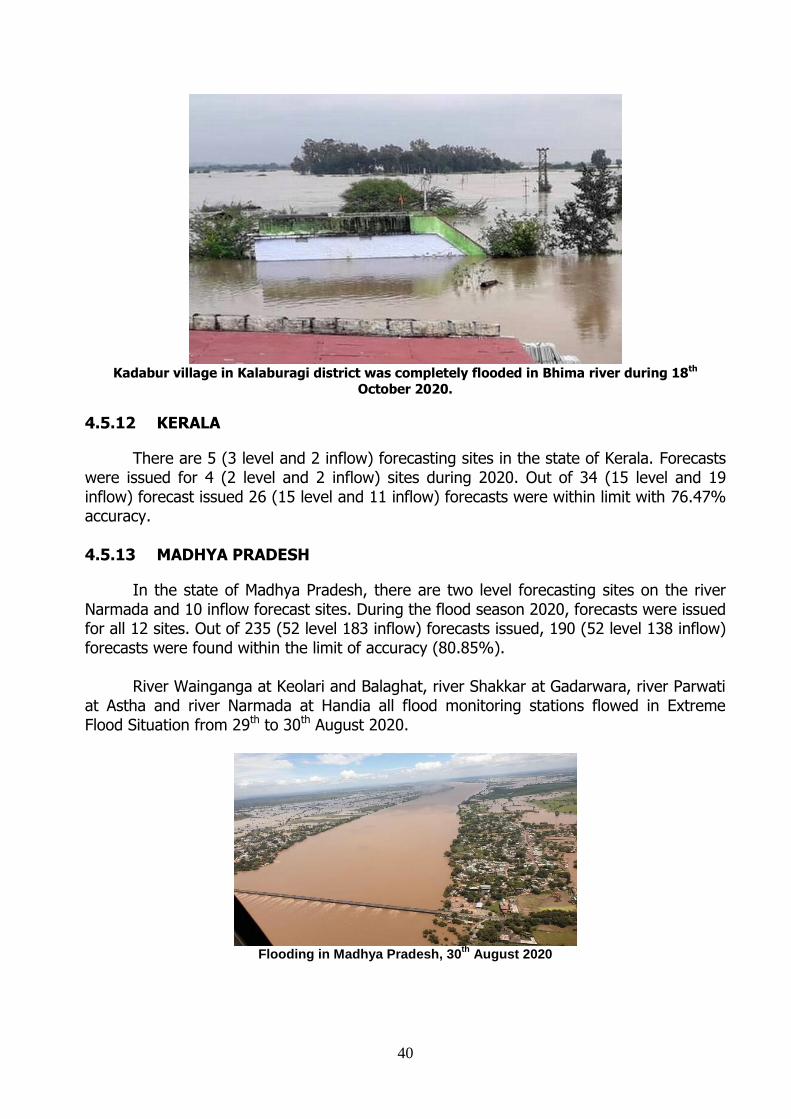
40
Kadabur village in Kalaburagi district was completely flooded in Bhima river during 18th
October 2020.
4.5.12 KERALA
There are 5 (3 level and 2 inflow) forecasting sites in the state of Kerala. Forecasts were issued for 4 (2 level and 2 inflow) sites during 2020. Out of 34 (15 level and 19 inflow) forecast issued 26 (15 level and 11 inflow) forecasts were within limit with 76.47% accuracy.
4.5.13 MADHYA PRADESH
In the state of Madhya Pradesh, there are two level forecasting sites on the river Narmada and 10 inflow forecast sites. During the flood season 2020, forecasts were issued for all 12 sites. Out of 235 (52 level 183 inflow) forecasts issued, 190 (52 level 138 inflow) forecasts were found within the limit of accuracy (80.85%).
River Wainganga at Keolari and Balaghat, river Shakkar at Gadarwara, river Parwati at Astha and river Narmada at Handia all flood monitoring stations flowed in Extreme Flood Situation from 29th to 30th August 2020.
Flooding in Madhya Pradesh, 30
th August 2020
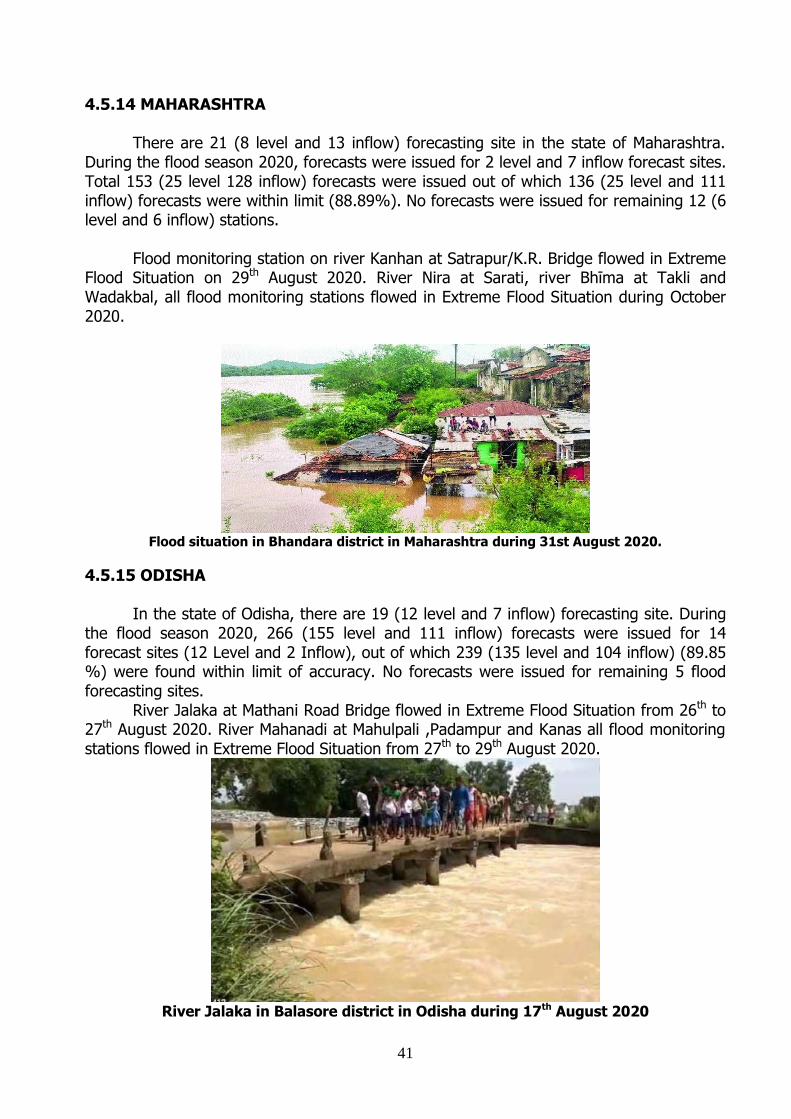
41
4.5.14 MAHARASHTRA
There are 21 (8 level and 13 inflow) forecasting site in the state of Maharashtra. During the flood season 2020, forecasts were issued for 2 level and 7 inflow forecast sites. Total 153 (25 level 128 inflow) forecasts were issued out of which 136 (25 level and 111 inflow) forecasts were within limit (88.89%). No forecasts were issued for remaining 12 (6 level and 6 inflow) stations.
Flood monitoring station on river Kanhan at Satrapur/K.R. Bridge flowed in Extreme Flood Situation on 29th August 2020. River Nira at Sarati, river Bhīma at Takli and Wadakbal, all flood monitoring stations flowed in Extreme Flood Situation during October 2020.
Flood situation in Bhandara district in Maharashtra during 31st August 2020.
4.5.15 ODISHA
In the state of Odisha, there are 19 (12 level and 7 inflow) forecasting site. During the flood season 2020, 266 (155 level and 111 inflow) forecasts were issued for 14 forecast sites (12 Level and 2 Inflow), out of which 239 (135 level and 104 inflow) (89.85 %) were found within limit of accuracy. No forecasts were issued for remaining 5 flood forecasting sites.
River Jalaka at Mathani Road Bridge flowed in Extreme Flood Situation from 26th to 27th August 2020. River Mahanadi at Mahulpali ,Padampur and Kanas all flood monitoring stations flowed in Extreme Flood Situation from 27th to 29th August 2020.
River Jalaka in Balasore district in Odisha during 17th August 2020
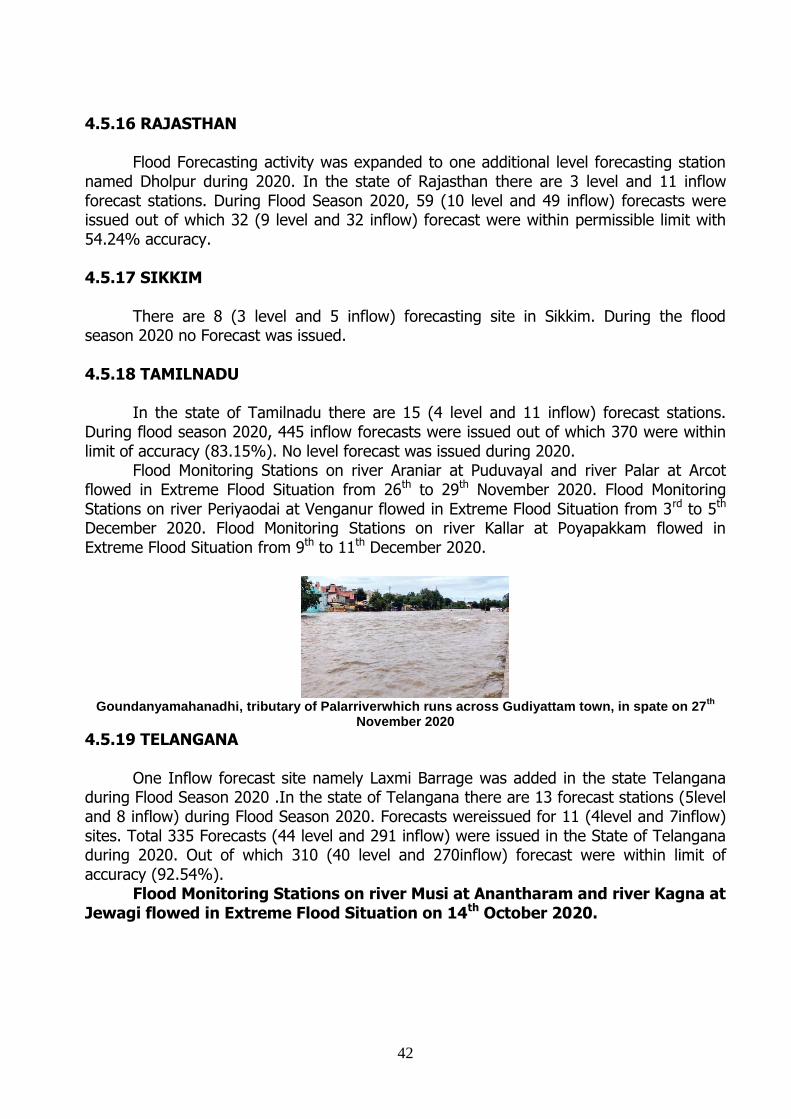
42
4.5.16 RAJASTHAN
Flood Forecasting activity was expanded to one additional level forecasting station named Dholpur during 2020. In the state of Rajasthan there are 3 level and 11 inflow forecast stations. During Flood Season 2020, 59 (10 level and 49 inflow) forecasts were issued out of which 32 (9 level and 32 inflow) forecast were within permissible limit with 54.24% accuracy. 4.5.17 SIKKIM
There are 8 (3 level and 5 inflow) forecasting site in Sikkim. During the flood season 2020 no Forecast was issued. 4.5.18 TAMILNADU
In the state of Tamilnadu there are 15 (4 level and 11 inflow) forecast stations. During flood season 2020, 445 inflow forecasts were issued out of which 370 were within limit of accuracy (83.15%). No level forecast was issued during 2020.
Flood Monitoring Stations on river Araniar at Puduvayal and river Palar at Arcot flowed in Extreme Flood Situation from 26th to 29th November 2020. Flood Monitoring Stations on river Periyaodai at Venganur flowed in Extreme Flood Situation from 3rd to 5th December 2020. Flood Monitoring Stations on river Kallar at Poyapakkam flowed in Extreme Flood Situation from 9th to 11th December 2020.
Goundanyamahanadhi, tributary of Palarriverwhich runs across Gudiyattam town, in spate on 27
th
November 2020
4.5.19 TELANGANA
One Inflow forecast site namely Laxmi Barrage was added in the state Telangana during Flood Season 2020 .In the state of Telangana there are 13 forecast stations (5level and 8 inflow) during Flood Season 2020. Forecasts wereissued for 11 (4level and 7inflow) sites. Total 335 Forecasts (44 level and 291 inflow) were issued in the State of Telangana during 2020. Out of which 310 (40 level and 270inflow) forecast were within limit of accuracy (92.54%).
Flood Monitoring Stations on river Musi at Anantharam and river Kagna at Jewagi flowed in Extreme Flood Situation on 14th October 2020.
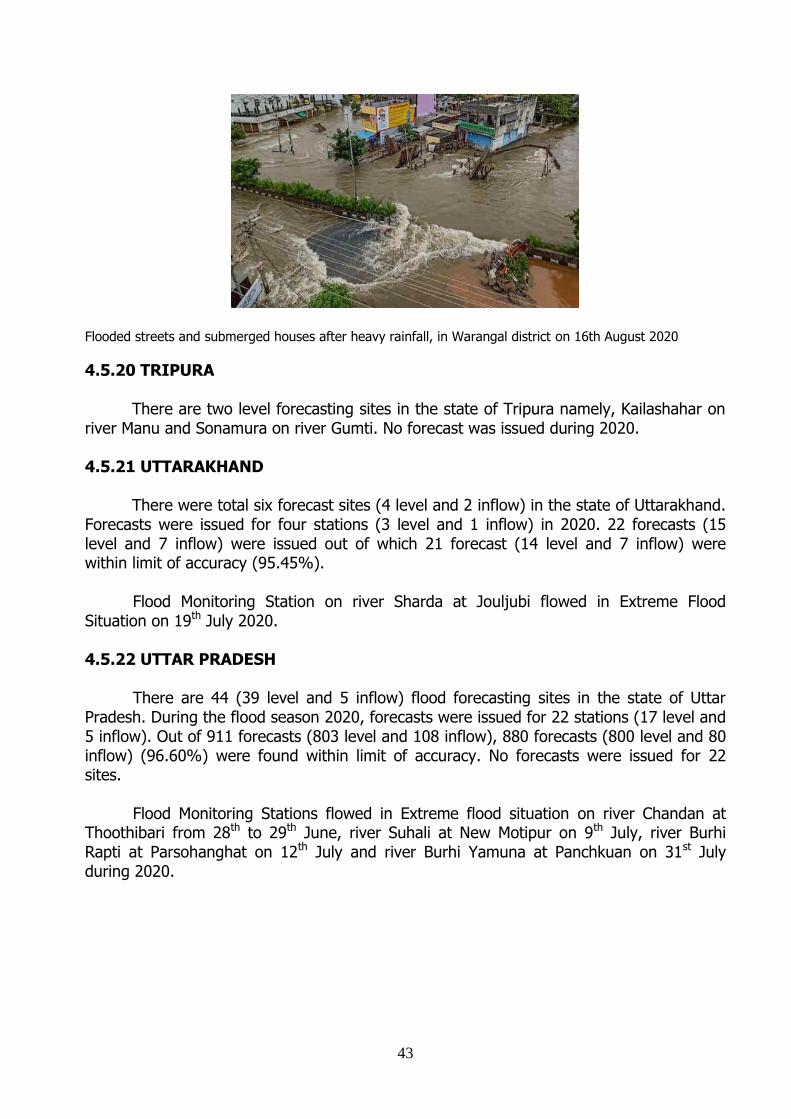
43
Flooded streets and submerged houses after heavy rainfall, in Warangal district on 16th August 2020
4.5.20 TRIPURA
There are two level forecasting sites in the state of Tripura namely, Kailashahar on river Manu and Sonamura on river Gumti. No forecast was issued during 2020.
4.5.21 UTTARAKHAND
There were total six forecast sites (4 level and 2 inflow) in the state of Uttarakhand.
Forecasts were issued for four stations (3 level and 1 inflow) in 2020. 22 forecasts (15 level and 7 inflow) were issued out of which 21 forecast (14 level and 7 inflow) were within limit of accuracy (95.45%).
Flood Monitoring Station on river Sharda at Jouljubi flowed in Extreme Flood
Situation on 19th July 2020. 4.5.22 UTTAR PRADESH
There are 44 (39 level and 5 inflow) flood forecasting sites in the state of Uttar Pradesh. During the flood season 2020, forecasts were issued for 22 stations (17 level and 5 inflow). Out of 911 forecasts (803 level and 108 inflow), 880 forecasts (800 level and 80 inflow) (96.60%) were found within limit of accuracy. No forecasts were issued for 22 sites.
Flood Monitoring Stations flowed in Extreme flood situation on river Chandan at
Thoothibari from 28th to 29th June, river Suhali at New Motipur on 9th July, river Burhi Rapti at Parsohanghat on 12th July and river Burhi Yamuna at Panchkuan on 31st July during 2020.
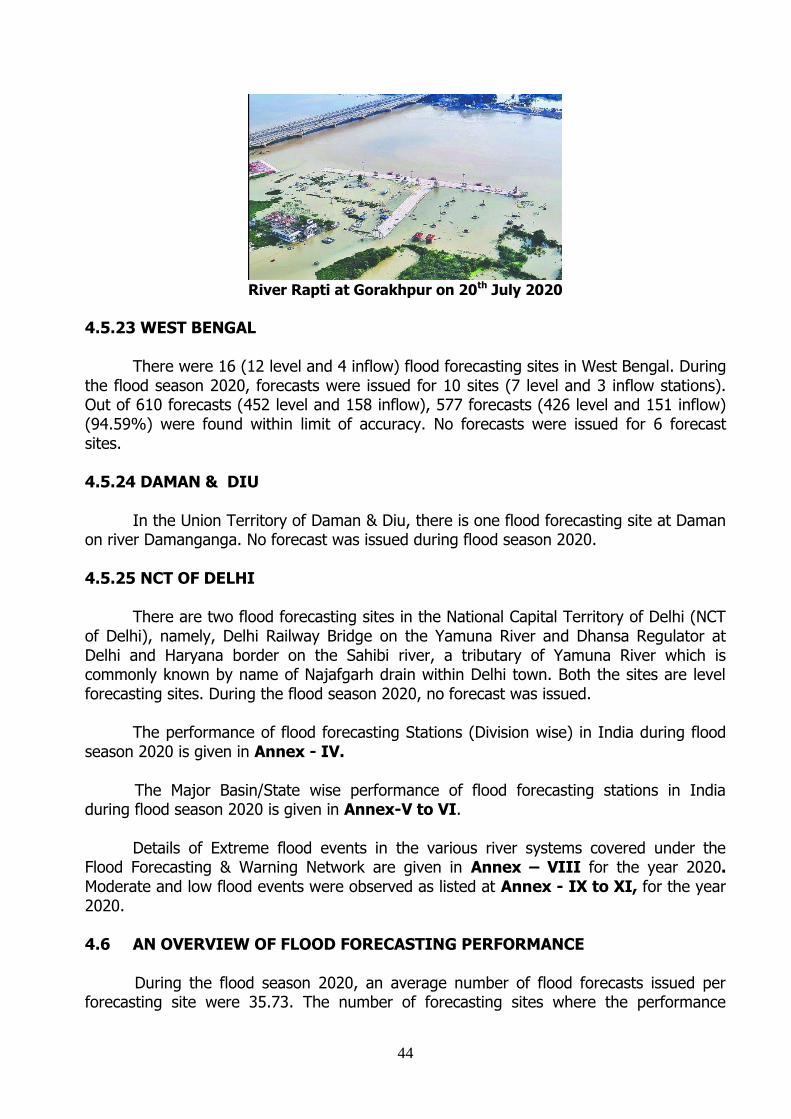
44
River Rapti at Gorakhpur on 20th July 2020
4.5.23 WEST BENGAL There were 16 (12 level and 4 inflow) flood forecasting sites in West Bengal. During the flood season 2020, forecasts were issued for 10 sites (7 level and 3 inflow stations). Out of 610 forecasts (452 level and 158 inflow), 577 forecasts (426 level and 151 inflow) (94.59%) were found within limit of accuracy. No forecasts were issued for 6 forecast sites. 4.5.24 DAMAN & DIU
In the Union Territory of Daman & Diu, there is one flood forecasting site at Daman on river Damanganga. No forecast was issued during flood season 2020.
4.5.25 NCT OF DELHI
There are two flood forecasting sites in the National Capital Territory of Delhi (NCT of Delhi), namely, Delhi Railway Bridge on the Yamuna River and Dhansa Regulator at Delhi and Haryana border on the Sahibi river, a tributary of Yamuna River which is commonly known by name of Najafgarh drain within Delhi town. Both the sites are level forecasting sites. During the flood season 2020, no forecast was issued. The performance of flood forecasting Stations (Division wise) in India during flood season 2020 is given in Annex - IV.
The Major Basin/State wise performance of flood forecasting stations in India during flood season 2020 is given in Annex-V to VI.
Details of Extreme flood events in the various river systems covered under the Flood Forecasting & Warning Network are given in Annex – VIII for the year 2020. Moderate and low flood events were observed as listed at Annex - IX to XI, for the year 2020. 4.6 AN OVERVIEW OF FLOOD FORECASTING PERFORMANCE
During the flood season 2020, an average number of flood forecasts issued per forecasting site were 35.73. The number of forecasting sites where the performance
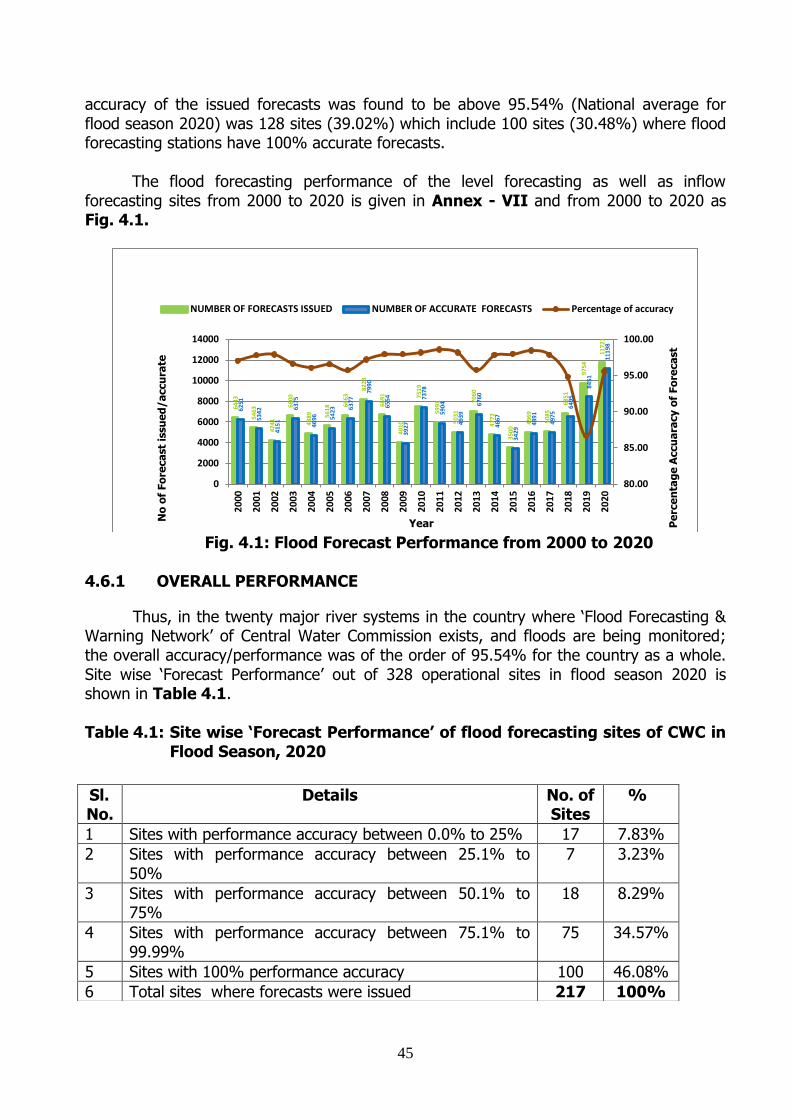
45
accuracy of the issued forecasts was found to be above 95.54% (National average for flood season 2020) was 128 sites (39.02%) which include 100 sites (30.48%) where flood forecasting stations have 100% accurate forecasts.
The flood forecasting performance of the level forecasting as well as inflow
forecasting sites from 2000 to 2020 is given in Annex - VII and from 2000 to 2020 as Fig. 4.1.
Fig. 4.1: Flood Forecast Performance from 2000 to 2020
4.6.1 OVERALL PERFORMANCE
Thus, in the twenty major river systems in the country where ‘Flood Forecasting & Warning Network’ of Central Water Commission exists, and floods are being monitored; the overall accuracy/performance was of the order of 95.54% for the country as a whole. Site wise ‘Forecast Performance’ out of 328 operational sites in flood season 2020 is shown in Table 4.1.
Table 4.1: Site wise ‘Forecast Performance’ of flood forecasting sites of CWC in
Flood Season, 2020
6443
5463
4241
6600
48
89 56
18 66
63 82
23
6691
4010
75
19
59
91
50
31
7060
4772
35
00
4969
5085
6851
9754
1172
1
6251
5342
4151
6375
4696
54
23 63
77 79
90
6554
3927
7378
5904
4939
6760
4667
34
29
4891
4975
6495
8451
1119
8
80.00
85.00
90.00
95.00
100.00
0
2000
4000
6000
8000
10000
12000
14000
20
00
20
01
20
02
20
03
20
04
20
05
20
06
20
07
20
08
20
09
20
10
20
11
20
12
20
13
20
14
20
15
20
16
20
17
20
18
20
19
20
20
Pe
rce
nta
ge
Accu
ara
cy o
f Fo
reca
st
No
of
Fo
reca
st
issu
ed
/a
ccu
rate
Year
NUMBER OF FORECASTS ISSUED NUMBER OF ACCURATE FORECASTS Percentage of accuracy
Sl. No.
Details No. of Sites
%
1 Sites with performance accuracy between 0.0% to 25% 17 7.83%
2 Sites with performance accuracy between 25.1% to 50%
7 3.23%
3 Sites with performance accuracy between 50.1% to 75%
18 8.29%
4 Sites with performance accuracy between 75.1% to 99.99%
75 34.57%
5 Sites with 100% performance accuracy 100 46.08%
6 Total sites where forecasts were issued 217 100%
46
CHAPTER - 5
RESPONSE FROM USER AGENCIES
5.1 GENERAL
Central Water Commission performs the Flood Forecasting and Warning job on flood prone interstate river basins in the country. It issues the forecast to the users such as various civil and engineering departments of the state and central governments including, railway, defense, revenues authorities, public sector undertakings besides National Disaster Management Cell in the Ministry of Home Affairs, who are responsible for taking timely flood fighting measures, rescue operations including shifting of flood affected people to safer places etc.
Though the various state government agencies in-charge of the flood management and relief operations generally do not give their views in writing on usefulness of the flood forecasting activities of CWC, yet some of them do write to the Central Water Commission conveying their views on the usefulness of the flood forecasts received by them.
5.2 APPRECIATION LETTERS RECEIVED DURING FLOOD SEASON 2020
Abstract of some of the messages received by our field unit during the flood season 2020 are given below:
5.2.1 Office of the Superintending Engineer, Irrigation Circle, Vijayawada (Lr.
no: SE/IC/VJA/DB/JTO-I/411CE dt 23.12.2020)
On the above subject, it is submitted that the flood forecasts issued by Central Water Commission authorities were very effectively utilized in operation and management of flood during the season 2020 for releasing the floods from Prakasam Barrage into the river and at Avanigadda, under the jurisdiction of this circle. Based on the forecast given, we have taken decision in operation of gates and management of storages. We are very much thankful for the cooperation rendered by the CWC Authorities. 5.2.2 Superintending Engineer, Krishna Bhagya Jala Nigam Limited,
Narayanapur (Lr No. KBJNL/O & MC-1/PB-1/2020-21/2755 dt 14.12.2020)
During 2020 flood season, the forecast data provided was useful and helped to manage the flood effectively. The forecast data provided by CWC was in line with the actual data realized. We further look forward to receive data in future for better water and flood management.

47
ANNEXURES-I to XI
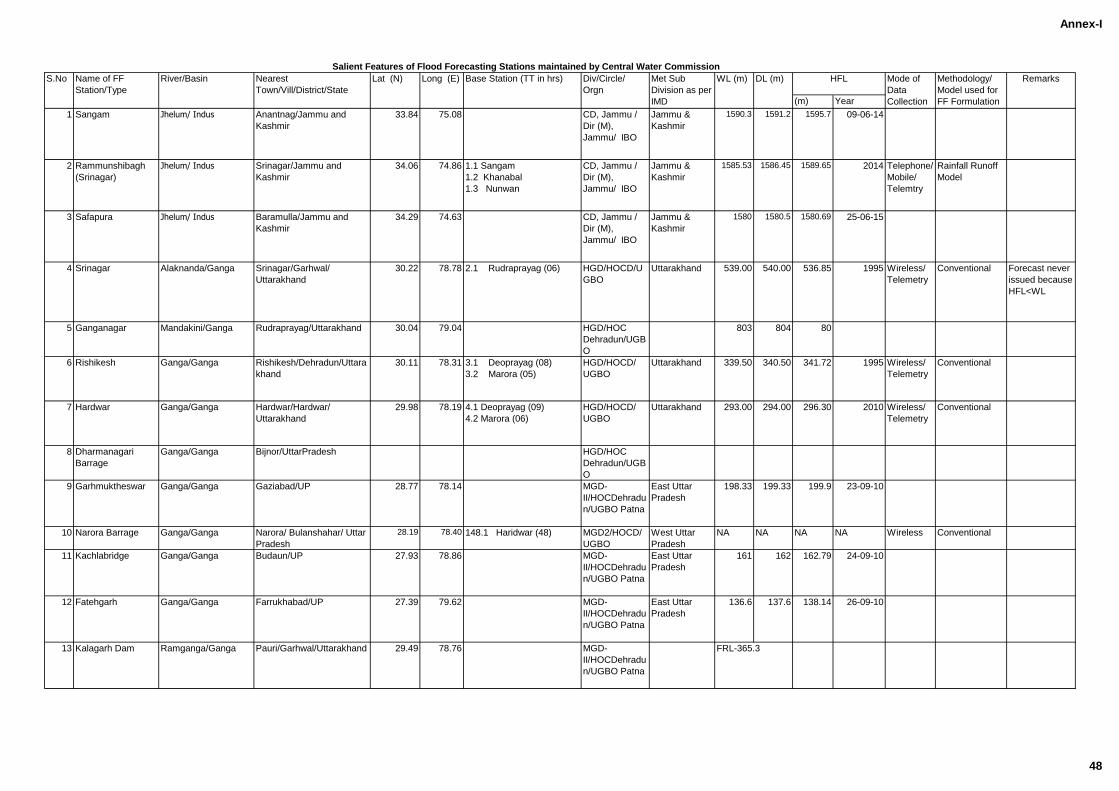
Annex-I
(m) Year
1 Sangam Jhelum/ Indus Anantnag/Jammu and
Kashmir
33.84 75.08 CD, Jammu /
Dir (M),
Jammu/ IBO
Jammu &
Kashmir
1590.3 1591.2 1595.7 09-06-14
2 Rammunshibagh
(Srinagar)
Jhelum/ Indus Srinagar/Jammu and
Kashmir
34.06 74.86 1.1 Sangam
1.2 Khanabal
1.3 Nunwan
CD, Jammu /
Dir (M),
Jammu/ IBO
Jammu &
Kashmir
1585.53 1586.45 1589.65 2014 Telephone/
Mobile/
Telemtry
Rainfall Runoff
Model
3 Safapura Jhelum/ Indus Baramulla/Jammu and
Kashmir
34.29 74.63 CD, Jammu /
Dir (M),
Jammu/ IBO
Jammu &
Kashmir
1580 1580.5 1580.69 25-06-15
4 Srinagar Alaknanda/Ganga Srinagar/Garhwal/
Uttarakhand
30.22 78.78 2.1 Rudraprayag (06) HGD/HOCD/U
GBO
Uttarakhand 539.00 540.00 536.85 1995 Wireless/
Telemetry
Conventional Forecast never
issued because
HFL<WL
5 Ganganagar Mandakini/Ganga Rudraprayag/Uttarakhand 30.04 79.04 HGD/HOC
Dehradun/UGB
O
803 804 80
6 Rishikesh Ganga/Ganga Rishikesh/Dehradun/Uttara
khand
30.11 78.31 3.1 Deoprayag (08)
3.2 Marora (05)
HGD/HOCD/
UGBO
Uttarakhand 339.50 340.50 341.72 1995 Wireless/
Telemetry
Conventional
7 Hardwar Ganga/Ganga Hardwar/Hardwar/
Uttarakhand
29.98 78.19 4.1 Deoprayag (09)
4.2 Marora (06)
HGD/HOCD/
UGBO
Uttarakhand 293.00 294.00 296.30 2010 Wireless/
Telemetry
Conventional
8 Dharmanagari
Barrage
Ganga/Ganga Bijnor/UttarPradesh HGD/HOC
Dehradun/UGB
O
9 Garhmuktheswar Ganga/Ganga Gaziabad/UP 28.77 78.14 MGD-
II/HOCDehradu
n/UGBO Patna
East Uttar
Pradesh
198.33 199.33 199.9 23-09-10
10 Narora Barrage Ganga/Ganga Narora/ Bulanshahar/ Uttar
Pradesh
28.19 78.40 148.1 Haridwar (48) MGD2/HOCD/
UGBO
West Uttar
Pradesh
NA NA NA NA Wireless Conventional
11 Kachlabridge Ganga/Ganga Budaun/UP 27.93 78.86 MGD-
II/HOCDehradu
n/UGBO Patna
East Uttar
Pradesh
161 162 162.79 24-09-10
12 Fatehgarh Ganga/Ganga Farrukhabad/UP 27.39 79.62 MGD-
II/HOCDehradu
n/UGBO Patna
East Uttar
Pradesh
136.6 137.6 138.14 26-09-10
13 Kalagarh Dam Ramganga/Ganga Pauri/Garhwal/Uttarakhand 29.49 78.76 MGD-
II/HOCDehradu
n/UGBO Patna
FRL-365.3
Remarks
Salient Features of Flood Forecasting Stations maintained by Central Water Commission
S.No Name of FF
Station/Type
River/Basin Nearest
Town/Vill/District/State
Lat (N) Long (E) Base Station (TT in hrs) Div/Circle/
Orgn
Met Sub
Division as per
IMD
WL (m) DL (m) HFL Mode of
Data
Collection
Methodology/
Model used for
FF Formulation
48
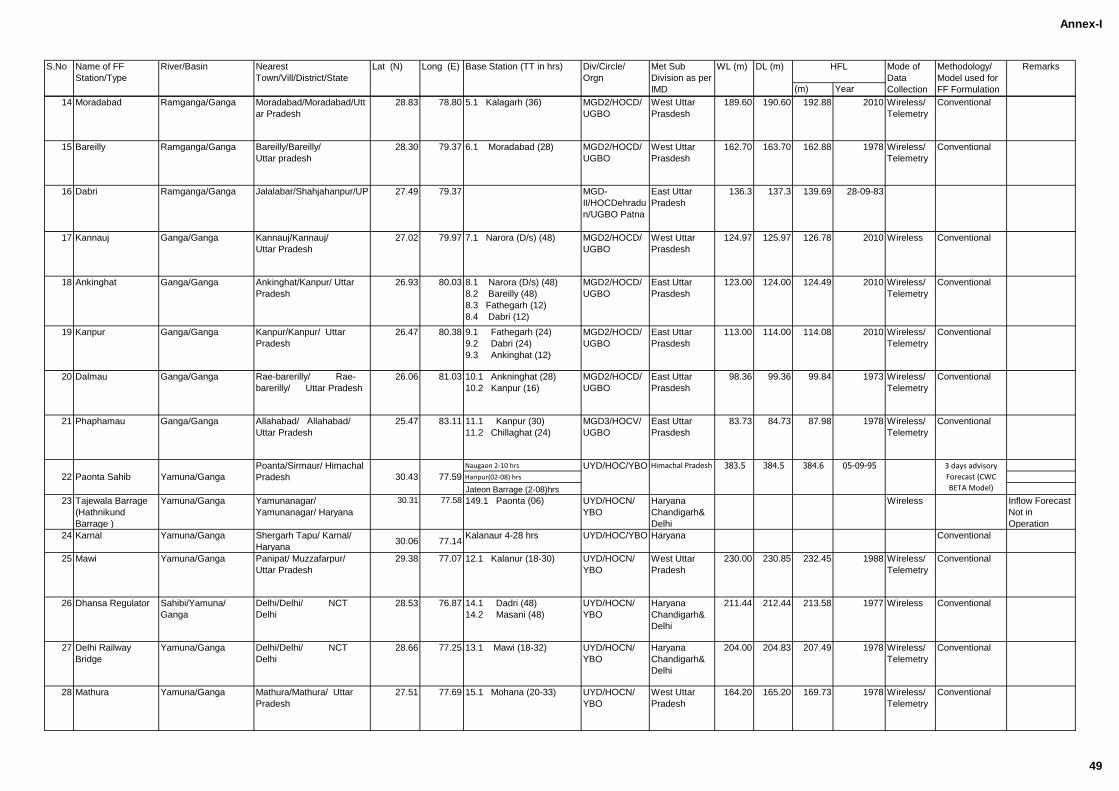
Annex-I
(m) Year
RemarksS.No Name of FF
Station/Type
River/Basin Nearest
Town/Vill/District/State
Lat (N) Long (E) Base Station (TT in hrs) Div/Circle/
Orgn
Met Sub
Division as per
IMD
WL (m) DL (m) HFL Mode of
Data
Collection
Methodology/
Model used for
FF Formulation
14 Moradabad Ramganga/Ganga Moradabad/Moradabad/Utt
ar Pradesh
28.83 78.80 5.1 Kalagarh (36) MGD2/HOCD/
UGBO
West Uttar
Prasdesh
189.60 190.60 192.88 2010 Wireless/
Telemetry
Conventional
15 Bareilly Ramganga/Ganga Bareilly/Bareilly/
Uttar pradesh
28.30 79.37 6.1 Moradabad (28) MGD2/HOCD/
UGBO
West Uttar
Prasdesh
162.70 163.70 162.88 1978 Wireless/
Telemetry
Conventional
16 Dabri Ramganga/Ganga Jalalabar/Shahjahanpur/UP 27.49 79.37 MGD-
II/HOCDehradu
n/UGBO Patna
East Uttar
Pradesh
136.3 137.3 139.69 28-09-83
17 Kannauj Ganga/Ganga Kannauj/Kannauj/
Uttar Pradesh
27.02 79.97 7.1 Narora (D/s) (48) MGD2/HOCD/
UGBO
West Uttar
Prasdesh
124.97 125.97 126.78 2010 Wireless Conventional
18 Ankinghat Ganga/Ganga Ankinghat/Kanpur/ Uttar
Pradesh
26.93 80.03 8.1 Narora (D/s) (48)
8.2 Bareilly (48)
8.3 Fathegarh (12)
8.4 Dabri (12)
MGD2/HOCD/
UGBO
East Uttar
Prasdesh
123.00 124.00 124.49 2010 Wireless/
Telemetry
Conventional
19 Kanpur Ganga/Ganga Kanpur/Kanpur/ Uttar
Pradesh
26.47 80.38 9.1 Fathegarh (24)
9.2 Dabri (24)
9.3 Ankinghat (12)
MGD2/HOCD/
UGBO
East Uttar
Prasdesh
113.00 114.00 114.08 2010 Wireless/
Telemetry
Conventional
20 Dalmau Ganga/Ganga Rae-barerilly/ Rae-
barerilly/ Uttar Pradesh
26.06 81.03 10.1 Ankninghat (28)
10.2 Kanpur (16)
MGD2/HOCD/
UGBO
East Uttar
Prasdesh
98.36 99.36 99.84 1973 Wireless/
Telemetry
Conventional
21 Phaphamau Ganga/Ganga Allahabad/ Allahabad/
Uttar Pradesh
25.47 83.11 11.1 Kanpur (30)
11.2 Chillaghat (24)
MGD3/HOCV/
UGBO
East Uttar
Prasdesh
83.73 84.73 87.98 1978 Wireless/
Telemetry
Conventional
Naugaon 2-10 hrs
Haripur(02-08) hrs
Jateon Barrage (2-08)hrs
23 Tajewala Barrage
(Hathnikund
Barrage )
Yamuna/Ganga Yamunanagar/
Yamunanagar/ Haryana
30.31 77.58 149.1 Paonta (06) UYD/HOCN/
YBO
Haryana
Chandigarh&
Delhi
Wireless Inflow Forecast
Not in
Operation
24 Karnal Yamuna/Ganga Shergarh Tapu/ Karnal/
Haryana30.06 77.14
Kalanaur 4-28 hrs UYD/HOC/YBO Haryana Conventional
25 Mawi Yamuna/Ganga Panipat/ Muzzafarpur/
Uttar Pradesh
29.38 77.07 12.1 Kalanur (18-30) UYD/HOCN/
YBO
West Uttar
Pradesh
230.00 230.85 232.45 1988 Wireless/
Telemetry
Conventional
26 Dhansa Regulator Sahibi/Yamuna/
Ganga
Delhi/Delhi/ NCT
Delhi
28.53 76.87 14.1 Dadri (48)
14.2 Masani (48)
UYD/HOCN/
YBO
Haryana
Chandigarh&
Delhi
211.44 212.44 213.58 1977 Wireless Conventional
27 Delhi Railway
Bridge
Yamuna/Ganga Delhi/Delhi/ NCT
Delhi
28.66 77.25 13.1 Mawi (18-32) UYD/HOCN/
YBO
Haryana
Chandigarh&
Delhi
204.00 204.83 207.49 1978 Wireless/
Telemetry
Conventional
28 Mathura Yamuna/Ganga Mathura/Mathura/ Uttar
Pradesh
27.51 77.69 15.1 Mohana (20-33) UYD/HOCN/
YBO
West Uttar
Pradesh
164.20 165.20 169.73 1978 Wireless/
Telemetry
Conventional
05-09-95 3 days advisory
Forecast (CWC
BETA Model)
384.6Himachal Pradesh 383.5 384.5
22
UYD/HOC/YBO
Paonta Sahib Yamuna/Ganga
Poanta/Sirmaur/ Himachal
Pradesh 30.43 77.59
49
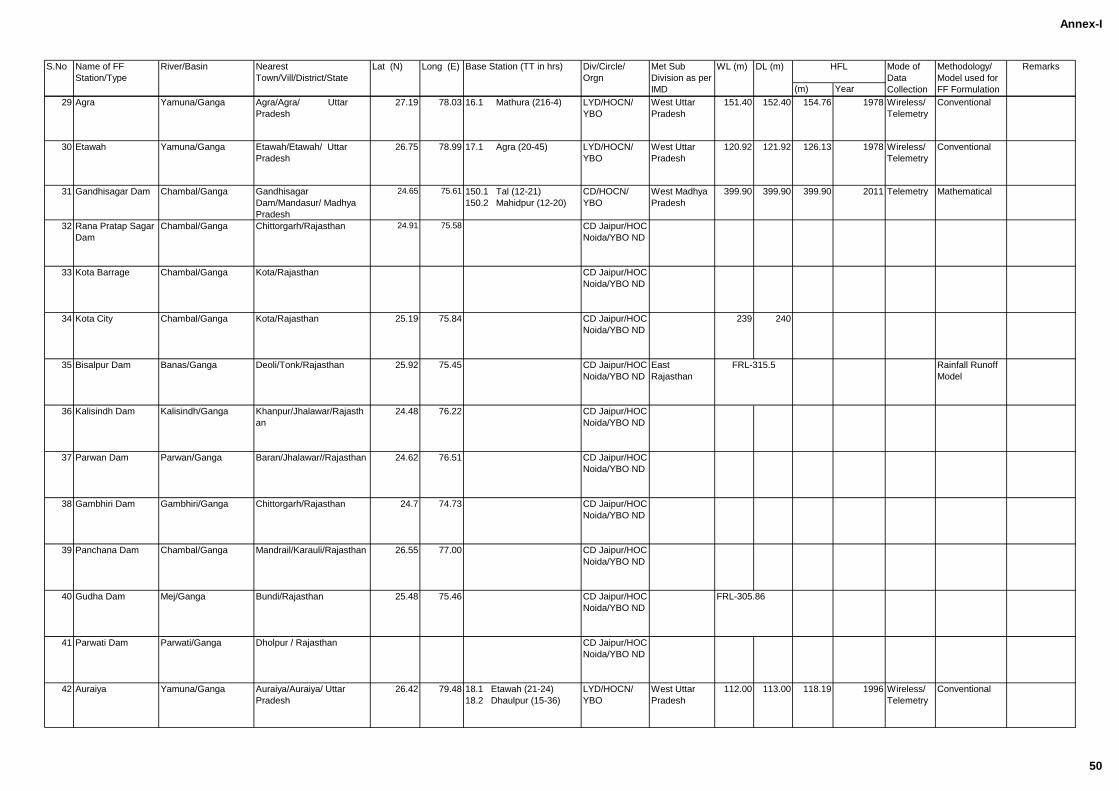
Annex-I
(m) Year
RemarksS.No Name of FF
Station/Type
River/Basin Nearest
Town/Vill/District/State
Lat (N) Long (E) Base Station (TT in hrs) Div/Circle/
Orgn
Met Sub
Division as per
IMD
WL (m) DL (m) HFL Mode of
Data
Collection
Methodology/
Model used for
FF Formulation
29 Agra Yamuna/Ganga Agra/Agra/ Uttar
Pradesh
27.19 78.03 16.1 Mathura (216-4) LYD/HOCN/
YBO
West Uttar
Pradesh
151.40 152.40 154.76 1978 Wireless/
Telemetry
Conventional
30 Etawah Yamuna/Ganga Etawah/Etawah/ Uttar
Pradesh
26.75 78.99 17.1 Agra (20-45) LYD/HOCN/
YBO
West Uttar
Pradesh
120.92 121.92 126.13 1978 Wireless/
Telemetry
Conventional
31 Gandhisagar Dam Chambal/Ganga Gandhisagar
Dam/Mandasur/ Madhya
Pradesh
24.65 75.61 150.1 Tal (12-21)
150.2 Mahidpur (12-20)
CD/HOCN/
YBO
West Madhya
Pradesh
399.90 399.90 399.90 2011 Telemetry Mathematical
32 Rana Pratap Sagar
Dam
Chambal/Ganga Chittorgarh/Rajasthan 24.91 75.58 CD Jaipur/HOC
Noida/YBO ND
33 Kota Barrage Chambal/Ganga Kota/Rajasthan CD Jaipur/HOC
Noida/YBO ND
34 Kota City Chambal/Ganga Kota/Rajasthan 25.19 75.84 CD Jaipur/HOC
Noida/YBO ND
239 240
35 Bisalpur Dam Banas/Ganga Deoli/Tonk/Rajasthan 25.92 75.45 CD Jaipur/HOC
Noida/YBO ND
East
Rajasthan
Rainfall Runoff
Model
36 Kalisindh Dam Kalisindh/Ganga Khanpur/Jhalawar/Rajasth
an
24.48 76.22 CD Jaipur/HOC
Noida/YBO ND
37 Parwan Dam Parwan/Ganga Baran/Jhalawar//Rajasthan 24.62 76.51 CD Jaipur/HOC
Noida/YBO ND
38 Gambhiri Dam Gambhiri/Ganga Chittorgarh/Rajasthan 24.7 74.73 CD Jaipur/HOC
Noida/YBO ND
39 Panchana Dam Chambal/Ganga Mandrail/Karauli/Rajasthan 26.55 77.00 CD Jaipur/HOC
Noida/YBO ND
40 Gudha Dam Mej/Ganga Bundi/Rajasthan 25.48 75.46 CD Jaipur/HOC
Noida/YBO ND
41 Parwati Dam Parwati/Ganga Dholpur / Rajasthan CD Jaipur/HOC
Noida/YBO ND
42 Auraiya Yamuna/Ganga Auraiya/Auraiya/ Uttar
Pradesh
26.42 79.48 18.1 Etawah (21-24)
18.2 Dhaulpur (15-36)
LYD/HOCN/
YBO
West Uttar
Pradesh
112.00 113.00 118.19 1996 Wireless/
Telemetry
Conventional
FRL-315.5
FRL-305.86
50
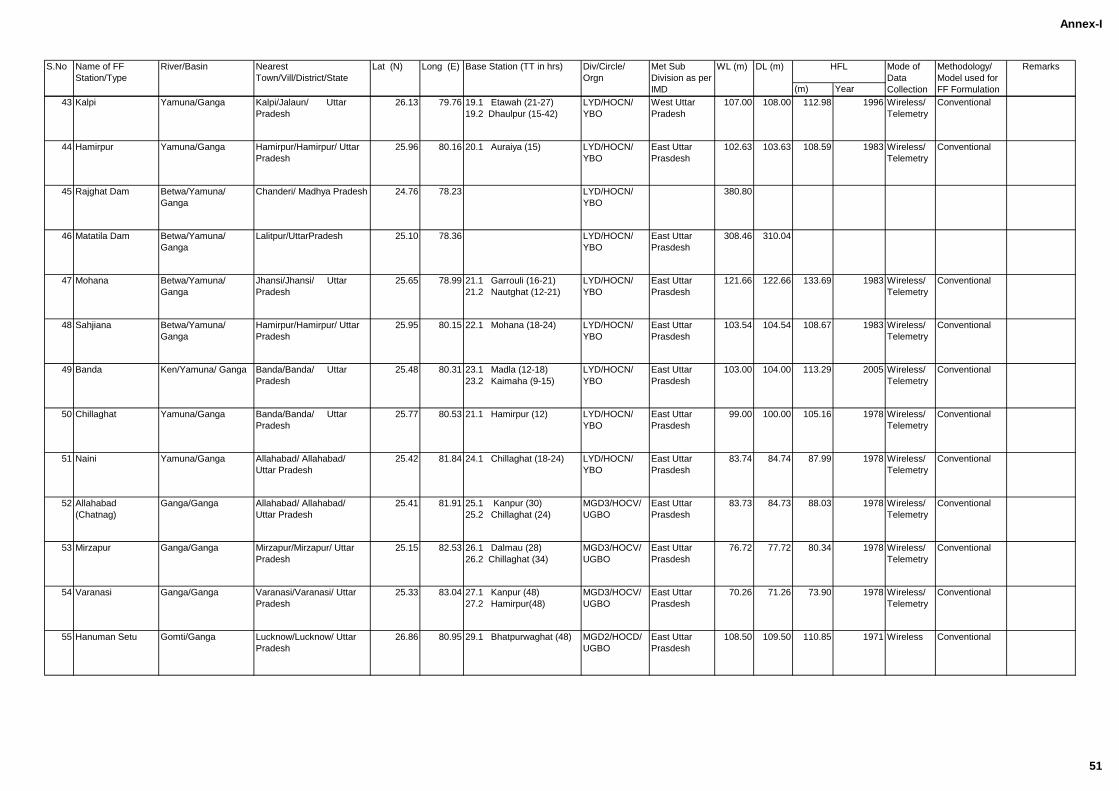
Annex-I
(m) Year
RemarksS.No Name of FF
Station/Type
River/Basin Nearest
Town/Vill/District/State
Lat (N) Long (E) Base Station (TT in hrs) Div/Circle/
Orgn
Met Sub
Division as per
IMD
WL (m) DL (m) HFL Mode of
Data
Collection
Methodology/
Model used for
FF Formulation
43 Kalpi Yamuna/Ganga Kalpi/Jalaun/ Uttar
Pradesh
26.13 79.76 19.1 Etawah (21-27)
19.2 Dhaulpur (15-42)
LYD/HOCN/
YBO
West Uttar
Pradesh
107.00 108.00 112.98 1996 Wireless/
Telemetry
Conventional
44 Hamirpur Yamuna/Ganga Hamirpur/Hamirpur/ Uttar
Pradesh
25.96 80.16 20.1 Auraiya (15) LYD/HOCN/
YBO
East Uttar
Prasdesh
102.63 103.63 108.59 1983 Wireless/
Telemetry
Conventional
45 Rajghat Dam Betwa/Yamuna/
Ganga
Chanderi/ Madhya Pradesh 24.76 78.23 LYD/HOCN/
YBO
380.80
46 Matatila Dam Betwa/Yamuna/
Ganga
Lalitpur/UttarPradesh 25.10 78.36 LYD/HOCN/
YBO
East Uttar
Prasdesh
308.46 310.04
47 Mohana Betwa/Yamuna/
Ganga
Jhansi/Jhansi/ Uttar
Pradesh
25.65 78.99 21.1 Garrouli (16-21)
21.2 Nautghat (12-21)
LYD/HOCN/
YBO
East Uttar
Prasdesh
121.66 122.66 133.69 1983 Wireless/
Telemetry
Conventional
48 Sahjiana Betwa/Yamuna/
Ganga
Hamirpur/Hamirpur/ Uttar
Pradesh
25.95 80.15 22.1 Mohana (18-24) LYD/HOCN/
YBO
East Uttar
Prasdesh
103.54 104.54 108.67 1983 Wireless/
Telemetry
Conventional
49 Banda Ken/Yamuna/ Ganga Banda/Banda/ Uttar
Pradesh
25.48 80.31 23.1 Madla (12-18)
23.2 Kaimaha (9-15)
LYD/HOCN/
YBO
East Uttar
Prasdesh
103.00 104.00 113.29 2005 Wireless/
Telemetry
Conventional
50 Chillaghat Yamuna/Ganga Banda/Banda/ Uttar
Pradesh
25.77 80.53 21.1 Hamirpur (12) LYD/HOCN/
YBO
East Uttar
Prasdesh
99.00 100.00 105.16 1978 Wireless/
Telemetry
Conventional
51 Naini Yamuna/Ganga Allahabad/ Allahabad/
Uttar Pradesh
25.42 81.84 24.1 Chillaghat (18-24) LYD/HOCN/
YBO
East Uttar
Prasdesh
83.74 84.74 87.99 1978 Wireless/
Telemetry
Conventional
52 Allahabad
(Chatnag)
Ganga/Ganga Allahabad/ Allahabad/
Uttar Pradesh
25.41 81.91 25.1 Kanpur (30)
25.2 Chillaghat (24)
MGD3/HOCV/
UGBO
East Uttar
Prasdesh
83.73 84.73 88.03 1978 Wireless/
Telemetry
Conventional
53 Mirzapur Ganga/Ganga Mirzapur/Mirzapur/ Uttar
Pradesh
25.15 82.53 26.1 Dalmau (28)
26.2 Chillaghat (34)
MGD3/HOCV/
UGBO
East Uttar
Prasdesh
76.72 77.72 80.34 1978 Wireless/
Telemetry
Conventional
54 Varanasi Ganga/Ganga Varanasi/Varanasi/ Uttar
Pradesh
25.33 83.04 27.1 Kanpur (48)
27.2 Hamirpur(48)
MGD3/HOCV/
UGBO
East Uttar
Prasdesh
70.26 71.26 73.90 1978 Wireless/
Telemetry
Conventional
55 Hanuman Setu Gomti/Ganga Lucknow/Lucknow/ Uttar
Pradesh
26.86 80.95 29.1 Bhatpurwaghat (48) MGD2/HOCD/
UGBO
East Uttar
Prasdesh
108.50 109.50 110.85 1971 Wireless Conventional
51
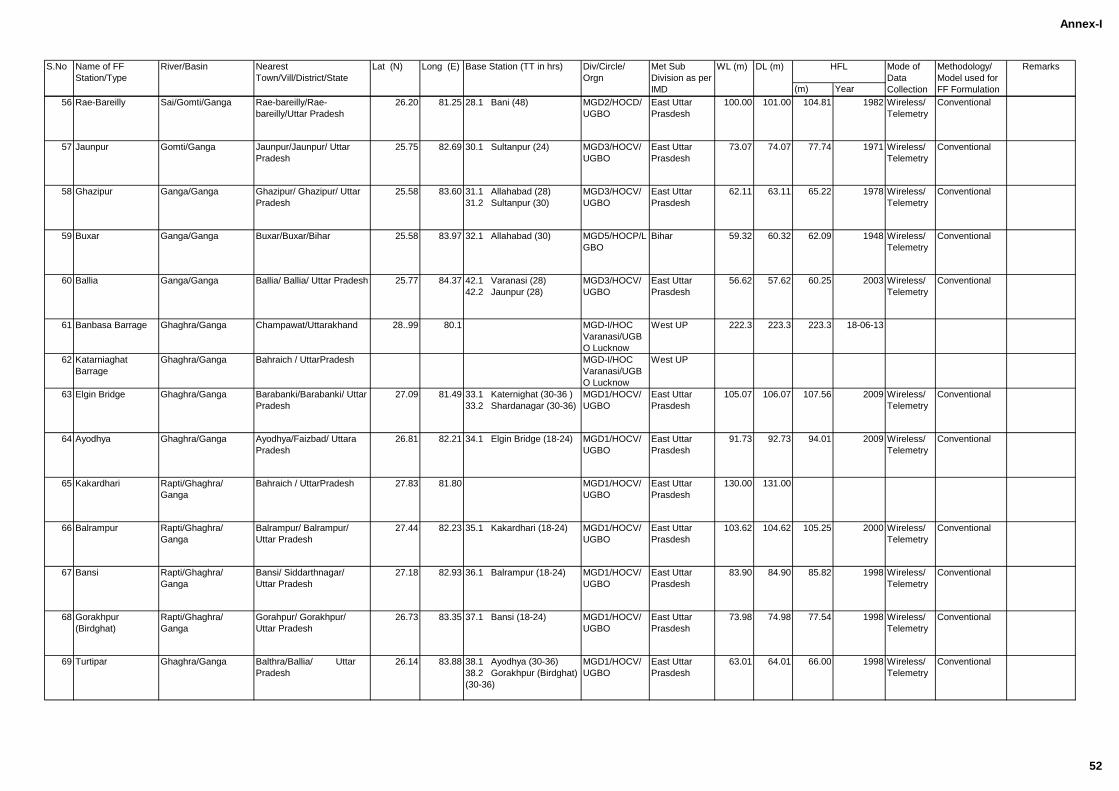
Annex-I
(m) Year
RemarksS.No Name of FF
Station/Type
River/Basin Nearest
Town/Vill/District/State
Lat (N) Long (E) Base Station (TT in hrs) Div/Circle/
Orgn
Met Sub
Division as per
IMD
WL (m) DL (m) HFL Mode of
Data
Collection
Methodology/
Model used for
FF Formulation
56 Rae-Bareilly Sai/Gomti/Ganga Rae-bareilly/Rae-
bareilly/Uttar Pradesh
26.20 81.25 28.1 Bani (48) MGD2/HOCD/
UGBO
East Uttar
Prasdesh
100.00 101.00 104.81 1982 Wireless/
Telemetry
Conventional
57 Jaunpur Gomti/Ganga Jaunpur/Jaunpur/ Uttar
Pradesh
25.75 82.69 30.1 Sultanpur (24) MGD3/HOCV/
UGBO
East Uttar
Prasdesh
73.07 74.07 77.74 1971 Wireless/
Telemetry
Conventional
58 Ghazipur Ganga/Ganga Ghazipur/ Ghazipur/ Uttar
Pradesh
25.58 83.60 31.1 Allahabad (28)
31.2 Sultanpur (30)
MGD3/HOCV/
UGBO
East Uttar
Prasdesh
62.11 63.11 65.22 1978 Wireless/
Telemetry
Conventional
59 Buxar Ganga/Ganga Buxar/Buxar/Bihar 25.58 83.97 32.1 Allahabad (30) MGD5/HOCP/L
GBO
Bihar 59.32 60.32 62.09 1948 Wireless/
Telemetry
Conventional
60 Ballia Ganga/Ganga Ballia/ Ballia/ Uttar Pradesh 25.77 84.37 42.1 Varanasi (28)
42.2 Jaunpur (28)
MGD3/HOCV/
UGBO
East Uttar
Prasdesh
56.62 57.62 60.25 2003 Wireless/
Telemetry
Conventional
61 Banbasa Barrage Ghaghra/Ganga Champawat/Uttarakhand 28..99 80.1 MGD-I/HOC
Varanasi/UGB
O Lucknow
West UP 222.3 223.3 223.3 18-06-13
62 Katarniaghat
Barrage
Ghaghra/Ganga Bahraich / UttarPradesh MGD-I/HOC
Varanasi/UGB
O Lucknow
West UP
63 Elgin Bridge Ghaghra/Ganga Barabanki/Barabanki/ Uttar
Pradesh
27.09 81.49 33.1 Katernighat (30-36 )
33.2 Shardanagar (30-36)
MGD1/HOCV/
UGBO
East Uttar
Prasdesh
105.07 106.07 107.56 2009 Wireless/
Telemetry
Conventional
64 Ayodhya Ghaghra/Ganga Ayodhya/Faizbad/ Uttara
Pradesh
26.81 82.21 34.1 Elgin Bridge (18-24) MGD1/HOCV/
UGBO
East Uttar
Prasdesh
91.73 92.73 94.01 2009 Wireless/
Telemetry
Conventional
65 Kakardhari Rapti/Ghaghra/
Ganga
Bahraich / UttarPradesh 27.83 81.80 MGD1/HOCV/
UGBO
East Uttar
Prasdesh
130.00 131.00
66 Balrampur Rapti/Ghaghra/
Ganga
Balrampur/ Balrampur/
Uttar Pradesh
27.44 82.23 35.1 Kakardhari (18-24) MGD1/HOCV/
UGBO
East Uttar
Prasdesh
103.62 104.62 105.25 2000 Wireless/
Telemetry
Conventional
67 Bansi Rapti/Ghaghra/
Ganga
Bansi/ Siddarthnagar/
Uttar Pradesh
27.18 82.93 36.1 Balrampur (18-24) MGD1/HOCV/
UGBO
East Uttar
Prasdesh
83.90 84.90 85.82 1998 Wireless/
Telemetry
Conventional
68 Gorakhpur
(Birdghat)
Rapti/Ghaghra/
Ganga
Gorahpur/ Gorakhpur/
Uttar Pradesh
26.73 83.35 37.1 Bansi (18-24) MGD1/HOCV/
UGBO
East Uttar
Prasdesh
73.98 74.98 77.54 1998 Wireless/
Telemetry
Conventional
69 Turtipar Ghaghra/Ganga Balthra/Ballia/ Uttar
Pradesh
26.14 83.88 38.1 Ayodhya (30-36)
38.2 Gorakhpur (Birdghat)
(30-36)
MGD1/HOCV/
UGBO
East Uttar
Prasdesh
63.01 64.01 66.00 1998 Wireless/
Telemetry
Conventional
52
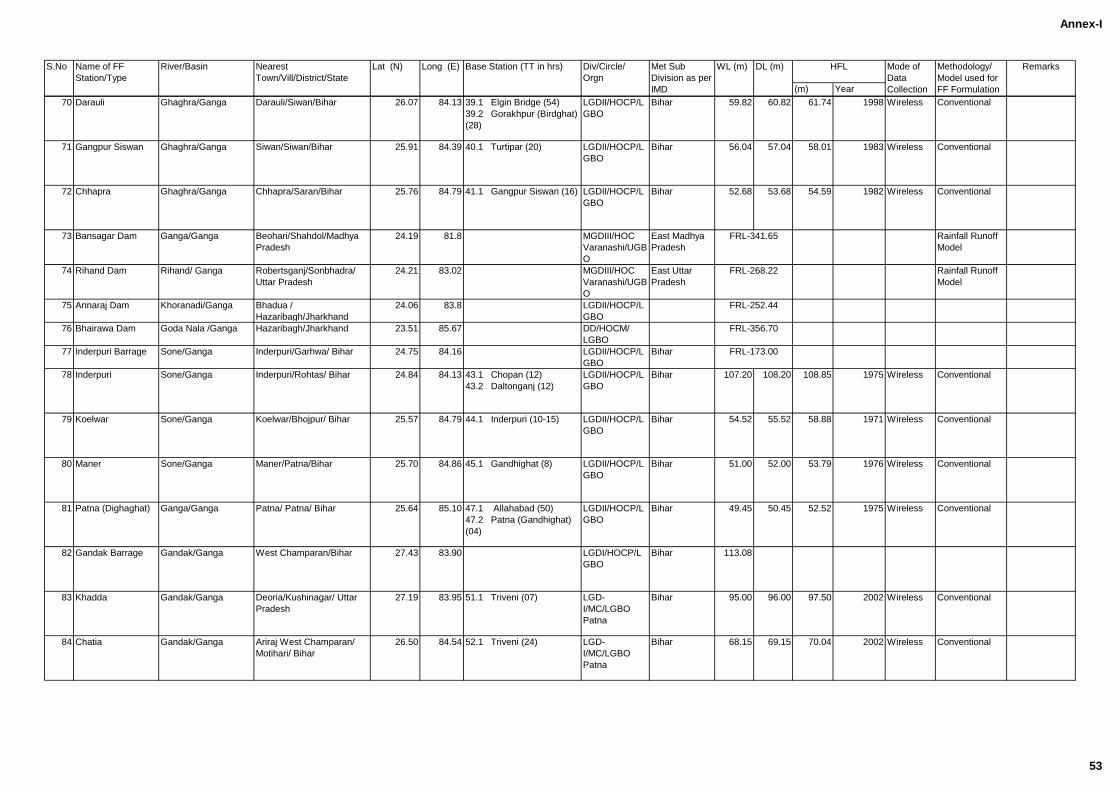
Annex-I
(m) Year
RemarksS.No Name of FF
Station/Type
River/Basin Nearest
Town/Vill/District/State
Lat (N) Long (E) Base Station (TT in hrs) Div/Circle/
Orgn
Met Sub
Division as per
IMD
WL (m) DL (m) HFL Mode of
Data
Collection
Methodology/
Model used for
FF Formulation
70 Darauli Ghaghra/Ganga Darauli/Siwan/Bihar 26.07 84.13 39.1 Elgin Bridge (54)
39.2 Gorakhpur (Birdghat)
(28)
LGDII/HOCP/L
GBO
Bihar 59.82 60.82 61.74 1998 Wireless Conventional
71 Gangpur Siswan Ghaghra/Ganga Siwan/Siwan/Bihar 25.91 84.39 40.1 Turtipar (20) LGDII/HOCP/L
GBO
Bihar 56.04 57.04 58.01 1983 Wireless Conventional
72 Chhapra Ghaghra/Ganga Chhapra/Saran/Bihar 25.76 84.79 41.1 Gangpur Siswan (16) LGDII/HOCP/L
GBO
Bihar 52.68 53.68 54.59 1982 Wireless Conventional
73 Bansagar Dam Ganga/Ganga Beohari/Shahdol/Madhya
Pradesh
24.19 81.8 MGDIII/HOC
Varanashi/UGB
O
East Madhya
Pradesh
Rainfall Runoff
Model
74 Rihand Dam Rihand/ Ganga Robertsganj/Sonbhadra/
Uttar Pradesh
24.21 83.02 MGDIII/HOC
Varanashi/UGB
O
East Uttar
Pradesh
Rainfall Runoff
Model
75 Annaraj Dam Khoranadi/Ganga Bhadua /
Hazaribagh/Jharkhand
24.06 83.8 LGDII/HOCP/L
GBO
76 Bhairawa Dam Goda Nala /Ganga Hazaribagh/Jharkhand 23.51 85.67 DD/HOCM/
LGBO
77 Inderpuri Barrage Sone/Ganga Inderpuri/Garhwa/ Bihar 24.75 84.16 LGDII/HOCP/L
GBO
Bihar
78 Inderpuri Sone/Ganga Inderpuri/Rohtas/ Bihar 24.84 84.13 43.1 Chopan (12)
43.2 Daltonganj (12)
LGDII/HOCP/L
GBO
Bihar 107.20 108.20 108.85 1975 Wireless Conventional
79 Koelwar Sone/Ganga Koelwar/Bhojpur/ Bihar 25.57 84.79 44.1 Inderpuri (10-15) LGDII/HOCP/L
GBO
Bihar 54.52 55.52 58.88 1971 Wireless Conventional
80 Maner Sone/Ganga Maner/Patna/Bihar 25.70 84.86 45.1 Gandhighat (8) LGDII/HOCP/L
GBO
Bihar 51.00 52.00 53.79 1976 Wireless Conventional
81 Patna (Dighaghat) Ganga/Ganga Patna/ Patna/ Bihar 25.64 85.10 47.1 Allahabad (50)
47.2 Patna (Gandhighat)
(04)
LGDII/HOCP/L
GBO
Bihar 49.45 50.45 52.52 1975 Wireless Conventional
82 Gandak Barrage Gandak/Ganga West Champaran/Bihar 27.43 83.90 LGDI/HOCP/L
GBO
Bihar 113.08
83 Khadda Gandak/Ganga Deoria/Kushinagar/ Uttar
Pradesh
27.19 83.95 51.1 Triveni (07) LGD-
I/MC/LGBO
Patna
Bihar 95.00 96.00 97.50 2002 Wireless Conventional
84 Chatia Gandak/Ganga Ariraj West Champaran/
Motihari/ Bihar
26.50 84.54 52.1 Triveni (24) LGD-
I/MC/LGBO
Patna
Bihar 68.15 69.15 70.04 2002 Wireless Conventional
FRL-173.00
FRL-252.44
FRL-356.70
FRL-341.65
FRL-268.22
53
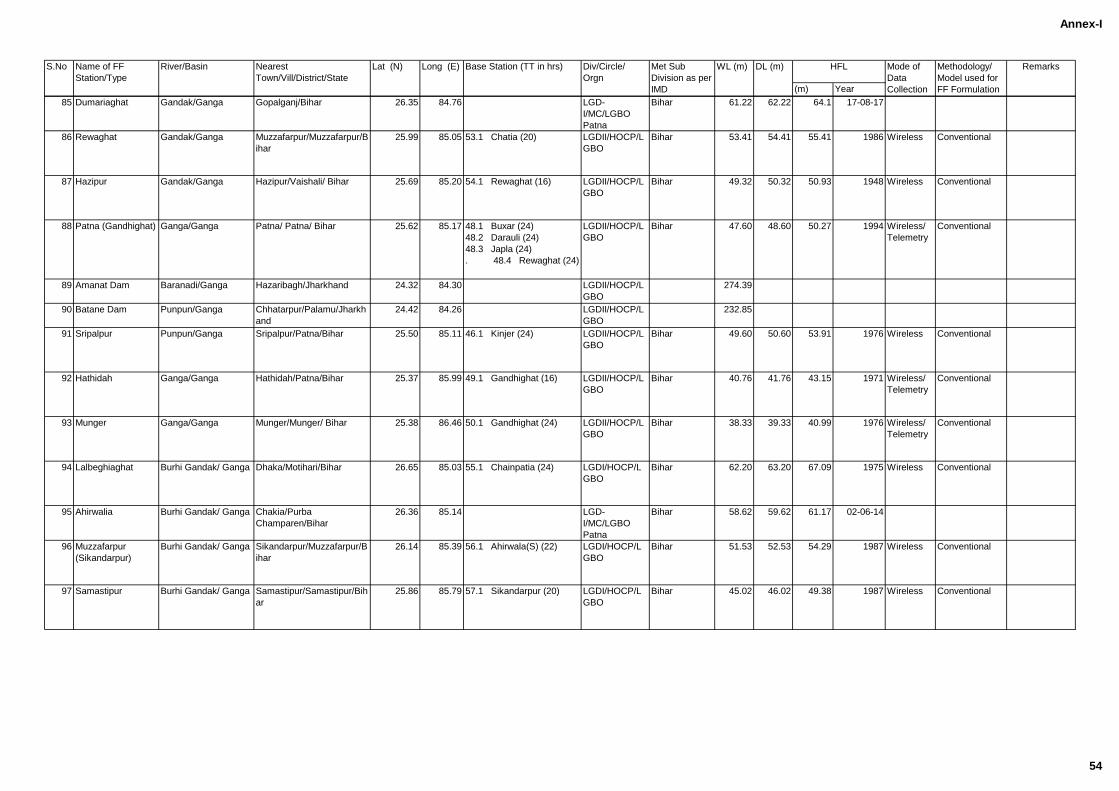
Annex-I
(m) Year
RemarksS.No Name of FF
Station/Type
River/Basin Nearest
Town/Vill/District/State
Lat (N) Long (E) Base Station (TT in hrs) Div/Circle/
Orgn
Met Sub
Division as per
IMD
WL (m) DL (m) HFL Mode of
Data
Collection
Methodology/
Model used for
FF Formulation
85 Dumariaghat Gandak/Ganga Gopalganj/Bihar 26.35 84.76 LGD-
I/MC/LGBO
Patna
Bihar 61.22 62.22 64.1 17-08-17
86 Rewaghat Gandak/Ganga Muzzafarpur/Muzzafarpur/B
ihar
25.99 85.05 53.1 Chatia (20) LGDII/HOCP/L
GBO
Bihar 53.41 54.41 55.41 1986 Wireless Conventional
87 Hazipur Gandak/Ganga Hazipur/Vaishali/ Bihar 25.69 85.20 54.1 Rewaghat (16) LGDII/HOCP/L
GBO
Bihar 49.32 50.32 50.93 1948 Wireless Conventional
88 Patna (Gandhighat) Ganga/Ganga Patna/ Patna/ Bihar 25.62 85.17 48.1 Buxar (24)
48.2 Darauli (24)
48.3 Japla (24)
. 48.4 Rewaghat (24)
LGDII/HOCP/L
GBO
Bihar 47.60 48.60 50.27 1994 Wireless/
Telemetry
Conventional
89 Amanat Dam Baranadi/Ganga Hazaribagh/Jharkhand 24.32 84.30 LGDII/HOCP/L
GBO
274.39
90 Batane Dam Punpun/Ganga Chhatarpur/Palamu/Jharkh
and
24.42 84.26 LGDII/HOCP/L
GBO
232.85
91 Sripalpur Punpun/Ganga Sripalpur/Patna/Bihar 25.50 85.11 46.1 Kinjer (24) LGDII/HOCP/L
GBO
Bihar 49.60 50.60 53.91 1976 Wireless Conventional
92 Hathidah Ganga/Ganga Hathidah/Patna/Bihar 25.37 85.99 49.1 Gandhighat (16) LGDII/HOCP/L
GBO
Bihar 40.76 41.76 43.15 1971 Wireless/
Telemetry
Conventional
93 Munger Ganga/Ganga Munger/Munger/ Bihar 25.38 86.46 50.1 Gandhighat (24) LGDII/HOCP/L
GBO
Bihar 38.33 39.33 40.99 1976 Wireless/
Telemetry
Conventional
94 Lalbeghiaghat Burhi Gandak/ Ganga Dhaka/Motihari/Bihar 26.65 85.03 55.1 Chainpatia (24) LGDI/HOCP/L
GBO
Bihar 62.20 63.20 67.09 1975 Wireless Conventional
95 Ahirwalia Burhi Gandak/ Ganga Chakia/Purba
Champaren/Bihar
26.36 85.14 LGD-
I/MC/LGBO
Patna
Bihar 58.62 59.62 61.17 02-06-14
96 Muzzafarpur
(Sikandarpur)
Burhi Gandak/ Ganga Sikandarpur/Muzzafarpur/B
ihar
26.14 85.39 56.1 Ahirwala(S) (22) LGDI/HOCP/L
GBO
Bihar 51.53 52.53 54.29 1987 Wireless Conventional
97 Samastipur Burhi Gandak/ Ganga Samastipur/Samastipur/Bih
ar
25.86 85.79 57.1 Sikandarpur (20) LGDI/HOCP/L
GBO
Bihar 45.02 46.02 49.38 1987 Wireless Conventional
54
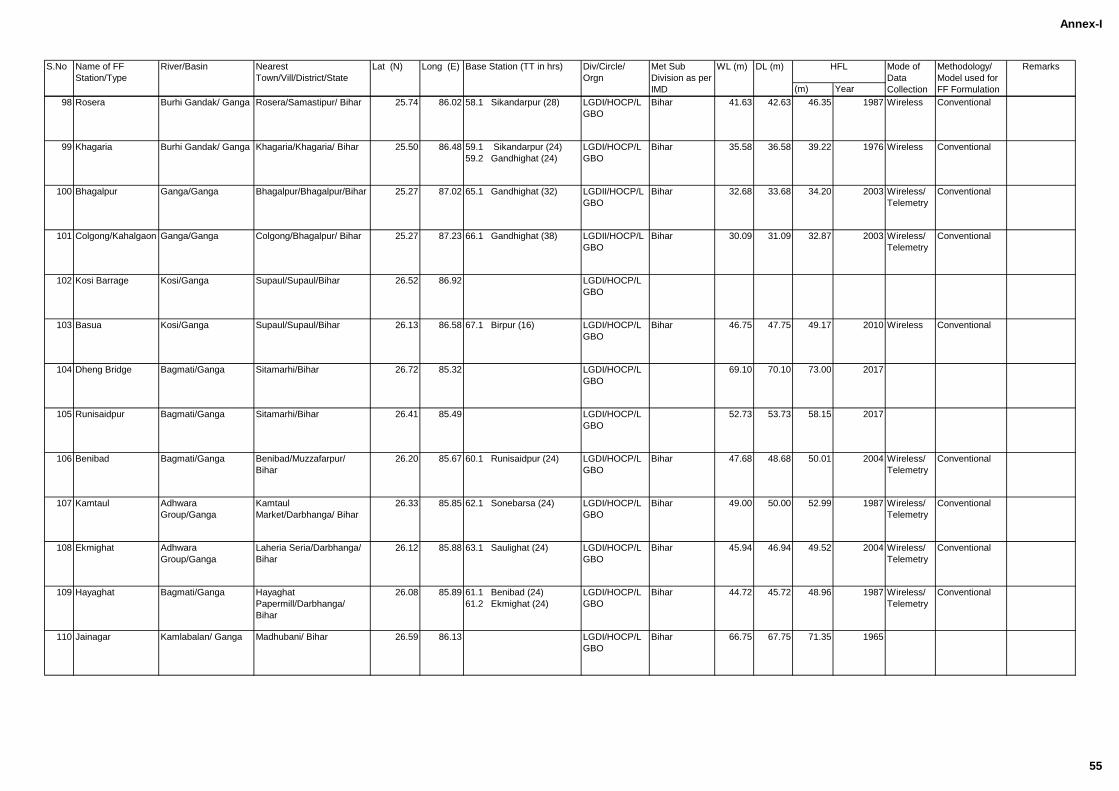
Annex-I
(m) Year
RemarksS.No Name of FF
Station/Type
River/Basin Nearest
Town/Vill/District/State
Lat (N) Long (E) Base Station (TT in hrs) Div/Circle/
Orgn
Met Sub
Division as per
IMD
WL (m) DL (m) HFL Mode of
Data
Collection
Methodology/
Model used for
FF Formulation
98 Rosera Burhi Gandak/ Ganga Rosera/Samastipur/ Bihar 25.74 86.02 58.1 Sikandarpur (28) LGDI/HOCP/L
GBO
Bihar 41.63 42.63 46.35 1987 Wireless Conventional
99 Khagaria Burhi Gandak/ Ganga Khagaria/Khagaria/ Bihar 25.50 86.48 59.1 Sikandarpur (24)
59.2 Gandhighat (24)
LGDI/HOCP/L
GBO
Bihar 35.58 36.58 39.22 1976 Wireless Conventional
100 Bhagalpur Ganga/Ganga Bhagalpur/Bhagalpur/Bihar 25.27 87.02 65.1 Gandhighat (32) LGDII/HOCP/L
GBO
Bihar 32.68 33.68 34.20 2003 Wireless/
Telemetry
Conventional
101 Colgong/Kahalgaon Ganga/Ganga Colgong/Bhagalpur/ Bihar 25.27 87.23 66.1 Gandhighat (38) LGDII/HOCP/L
GBO
Bihar 30.09 31.09 32.87 2003 Wireless/
Telemetry
Conventional
102 Kosi Barrage Kosi/Ganga Supaul/Supaul/Bihar 26.52 86.92 LGDI/HOCP/L
GBO
103 Basua Kosi/Ganga Supaul/Supaul/Bihar 26.13 86.58 67.1 Birpur (16) LGDI/HOCP/L
GBO
Bihar 46.75 47.75 49.17 2010 Wireless Conventional
104 Dheng Bridge Bagmati/Ganga Sitamarhi/Bihar 26.72 85.32 LGDI/HOCP/L
GBO
69.10 70.10 73.00 2017
105 Runisaidpur Bagmati/Ganga Sitamarhi/Bihar 26.41 85.49 LGDI/HOCP/L
GBO
52.73 53.73 58.15 2017
106 Benibad Bagmati/Ganga Benibad/Muzzafarpur/
Bihar
26.20 85.67 60.1 Runisaidpur (24) LGDI/HOCP/L
GBO
Bihar 47.68 48.68 50.01 2004 Wireless/
Telemetry
Conventional
107 Kamtaul Adhwara
Group/Ganga
Kamtaul
Market/Darbhanga/ Bihar
26.33 85.85 62.1 Sonebarsa (24) LGDI/HOCP/L
GBO
Bihar 49.00 50.00 52.99 1987 Wireless/
Telemetry
Conventional
108 Ekmighat Adhwara
Group/Ganga
Laheria Seria/Darbhanga/
Bihar
26.12 85.88 63.1 Saulighat (24) LGDI/HOCP/L
GBO
Bihar 45.94 46.94 49.52 2004 Wireless/
Telemetry
Conventional
109 Hayaghat Bagmati/Ganga Hayaghat
Papermill/Darbhanga/
Bihar
26.08 85.89 61.1 Benibad (24)
61.2 Ekmighat (24)
LGDI/HOCP/L
GBO
Bihar 44.72 45.72 48.96 1987 Wireless/
Telemetry
Conventional
110 Jainagar Kamlabalan/ Ganga Madhubani/ Bihar 26.59 86.13 LGDI/HOCP/L
GBO
Bihar 66.75 67.75 71.35 1965
55
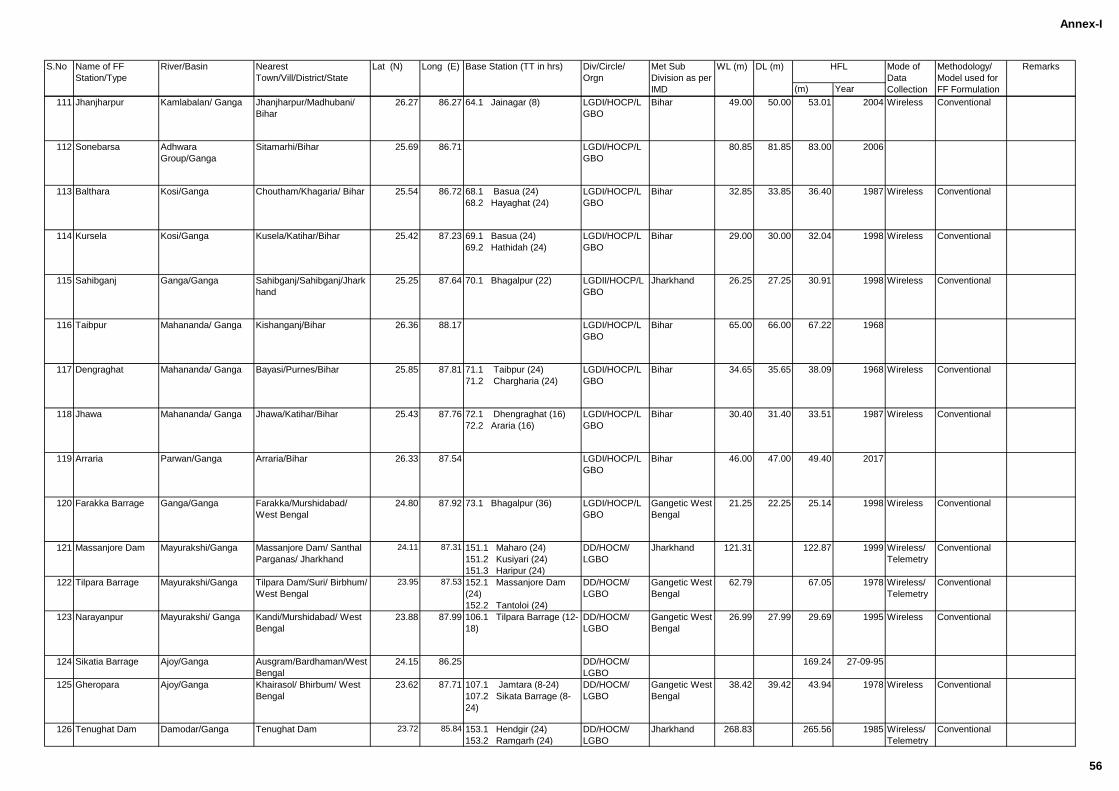
Annex-I
(m) Year
RemarksS.No Name of FF
Station/Type
River/Basin Nearest
Town/Vill/District/State
Lat (N) Long (E) Base Station (TT in hrs) Div/Circle/
Orgn
Met Sub
Division as per
IMD
WL (m) DL (m) HFL Mode of
Data
Collection
Methodology/
Model used for
FF Formulation
111 Jhanjharpur Kamlabalan/ Ganga Jhanjharpur/Madhubani/
Bihar
26.27 86.27 64.1 Jainagar (8) LGDI/HOCP/L
GBO
Bihar 49.00 50.00 53.01 2004 Wireless Conventional
112 Sonebarsa Adhwara
Group/Ganga
Sitamarhi/Bihar 25.69 86.71 LGDI/HOCP/L
GBO
80.85 81.85 83.00 2006
113 Balthara Kosi/Ganga Choutham/Khagaria/ Bihar 25.54 86.72 68.1 Basua (24)
68.2 Hayaghat (24)
LGDI/HOCP/L
GBO
Bihar 32.85 33.85 36.40 1987 Wireless Conventional
114 Kursela Kosi/Ganga Kusela/Katihar/Bihar 25.42 87.23 69.1 Basua (24)
69.2 Hathidah (24)
LGDI/HOCP/L
GBO
Bihar 29.00 30.00 32.04 1998 Wireless Conventional
115 Sahibganj Ganga/Ganga Sahibganj/Sahibganj/Jhark
hand
25.25 87.64 70.1 Bhagalpur (22) LGDII/HOCP/L
GBO
Jharkhand 26.25 27.25 30.91 1998 Wireless Conventional
116 Taibpur Mahananda/ Ganga Kishanganj/Bihar 26.36 88.17 LGDI/HOCP/L
GBO
Bihar 65.00 66.00 67.22 1968
117 Dengraghat Mahananda/ Ganga Bayasi/Purnes/Bihar 25.85 87.81 71.1 Taibpur (24)
71.2 Chargharia (24)
LGDI/HOCP/L
GBO
Bihar 34.65 35.65 38.09 1968 Wireless Conventional
118 Jhawa Mahananda/ Ganga Jhawa/Katihar/Bihar 25.43 87.76 72.1 Dhengraghat (16)
72.2 Araria (16)
LGDI/HOCP/L
GBO
Bihar 30.40 31.40 33.51 1987 Wireless Conventional
119 Arraria Parwan/Ganga Arraria/Bihar 26.33 87.54 LGDI/HOCP/L
GBO
Bihar 46.00 47.00 49.40 2017
120 Farakka Barrage Ganga/Ganga Farakka/Murshidabad/
West Bengal
24.80 87.92 73.1 Bhagalpur (36) LGDI/HOCP/L
GBO
Gangetic West
Bengal
21.25 22.25 25.14 1998 Wireless Conventional
121 Massanjore Dam Mayurakshi/Ganga Massanjore Dam/ Santhal
Parganas/ Jharkhand
24.11 87.31 151.1 Maharo (24)
151.2 Kusiyari (24)
151.3 Haripur (24)
DD/HOCM/
LGBO
Jharkhand 121.31 122.87 1999 Wireless/
Telemetry
Conventional
122 Tilpara Barrage Mayurakshi/Ganga Tilpara Dam/Suri/ Birbhum/
West Bengal
23.95 87.53 152.1 Massanjore Dam
(24)
152.2 Tantoloi (24)
DD/HOCM/
LGBO
Gangetic West
Bengal
62.79 67.05 1978 Wireless/
Telemetry
Conventional
123 Narayanpur Mayurakshi/ Ganga Kandi/Murshidabad/ West
Bengal
23.88 87.99 106.1 Tilpara Barrage (12-
18)
DD/HOCM/
LGBO
Gangetic West
Bengal
26.99 27.99 29.69 1995 Wireless Conventional
124 Sikatia Barrage Ajoy/Ganga Ausgram/Bardhaman/West
Bengal
24.15 86.25 DD/HOCM/
LGBO
169.24 27-09-95
125 Gheropara Ajoy/Ganga Khairasol/ Bhirbum/ West
Bengal
23.62 87.71 107.1 Jamtara (8-24)
107.2 Sikata Barrage (8-
24)
DD/HOCM/
LGBO
Gangetic West
Bengal
38.42 39.42 43.94 1978 Wireless Conventional
126 Tenughat Dam Damodar/Ganga Tenughat Dam 23.72 85.84 153.1 Hendgir (24)
153.2 Ramgarh (24)
DD/HOCM/
LGBO
Jharkhand 268.83 265.56 1985 Wireless/
Telemetry
Conventional
56
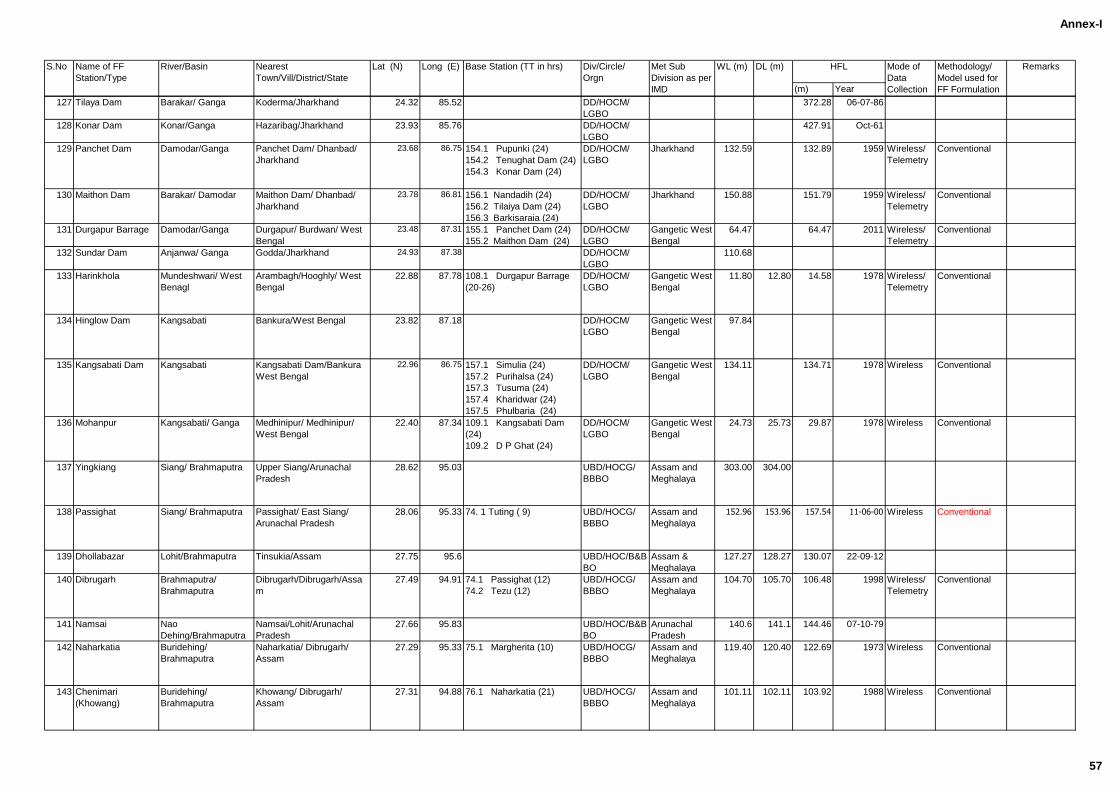
Annex-I
(m) Year
RemarksS.No Name of FF
Station/Type
River/Basin Nearest
Town/Vill/District/State
Lat (N) Long (E) Base Station (TT in hrs) Div/Circle/
Orgn
Met Sub
Division as per
IMD
WL (m) DL (m) HFL Mode of
Data
Collection
Methodology/
Model used for
FF Formulation
127 Tilaya Dam Barakar/ Ganga Koderma/Jharkhand 24.32 85.52 DD/HOCM/
LGBO
372.28 06-07-86
128 Konar Dam Konar/Ganga Hazaribag/Jharkhand 23.93 85.76 DD/HOCM/
LGBO
427.91 Oct-61
129 Panchet Dam Damodar/Ganga Panchet Dam/ Dhanbad/
Jharkhand
23.68 86.75 154.1 Pupunki (24)
154.2 Tenughat Dam (24)
154.3 Konar Dam (24)
DD/HOCM/
LGBO
Jharkhand 132.59 132.89 1959 Wireless/
Telemetry
Conventional
130 Maithon Dam Barakar/ Damodar Maithon Dam/ Dhanbad/
Jharkhand
23.78 86.81 156.1 Nandadih (24)
156.2 Tilaiya Dam (24)
156.3 Barkisaraia (24)
DD/HOCM/
LGBO
Jharkhand 150.88 151.79 1959 Wireless/
Telemetry
Conventional
131 Durgapur Barrage Damodar/Ganga Durgapur/ Burdwan/ West
Bengal
23.48 87.31 155.1 Panchet Dam (24)
155.2 Maithon Dam (24)
DD/HOCM/
LGBO
Gangetic West
Bengal
64.47 64.47 2011 Wireless/
Telemetry
Conventional
132 Sundar Dam Anjanwa/ Ganga Godda/Jharkhand 24.93 87.38 DD/HOCM/
LGBO
110.68
133 Harinkhola Mundeshwari/ West
Benagl
Arambagh/Hooghly/ West
Bengal
22.88 87.78 108.1 Durgapur Barrage
(20-26)
DD/HOCM/
LGBO
Gangetic West
Bengal
11.80 12.80 14.58 1978 Wireless/
Telemetry
Conventional
134 Hinglow Dam Kangsabati Bankura/West Bengal 23.82 87.18 DD/HOCM/
LGBO
Gangetic West
Bengal
97.84
135 Kangsabati Dam Kangsabati Kangsabati Dam/Bankura
West Bengal
22.96 86.75 157.1 Simulia (24)
157.2 Purihalsa (24)
157.3 Tusuma (24)
157.4 Kharidwar (24)
157.5 Phulbaria (24)
DD/HOCM/
LGBO
Gangetic West
Bengal
134.11 134.71 1978 Wireless Conventional
136 Mohanpur Kangsabati/ Ganga Medhinipur/ Medhinipur/
West Bengal
22.40 87.34 109.1 Kangsabati Dam
(24)
109.2 D P Ghat (24)
DD/HOCM/
LGBO
Gangetic West
Bengal
24.73 25.73 29.87 1978 Wireless Conventional
137 Yingkiang Siang/ Brahmaputra Upper Siang/Arunachal
Pradesh
28.62 95.03 UBD/HOCG/
BBBO
Assam and
Meghalaya
303.00 304.00
138 Passighat Siang/ Brahmaputra Passighat/ East Siang/
Arunachal Pradesh
28.06 95.33 74. 1 Tuting ( 9) UBD/HOCG/
BBBO
Assam and
Meghalaya
152.96 153.96 157.54 11-06-00 Wireless Conventional
139 Dhollabazar Lohit/Brahmaputra Tinsukia/Assam 27.75 95.6 UBD/HOC/B&B
BO
Assam &
Meghalaya
127.27 128.27 130.07 22-09-12
140 Dibrugarh Brahmaputra/
Brahmaputra
Dibrugarh/Dibrugarh/Assa
m
27.49 94.91 74.1 Passighat (12)
74.2 Tezu (12)
UBD/HOCG/
BBBO
Assam and
Meghalaya
104.70 105.70 106.48 1998 Wireless/
Telemetry
Conventional
141 Namsai Nao
Dehing/Brahmaputra
Namsai/Lohit/Arunachal
Pradesh
27.66 95.83 UBD/HOC/B&B
BO
Arunachal
Pradesh
140.6 141.1 144.46 07-10-79
142 Naharkatia Buridehing/
Brahmaputra
Naharkatia/ Dibrugarh/
Assam
27.29 95.33 75.1 Margherita (10) UBD/HOCG/
BBBO
Assam and
Meghalaya
119.40 120.40 122.69 1973 Wireless Conventional
143 Chenimari
(Khowang)
Buridehing/
Brahmaputra
Khowang/ Dibrugarh/
Assam
27.31 94.88 76.1 Naharkatia (21) UBD/HOCG/
BBBO
Assam and
Meghalaya
101.11 102.11 103.92 1988 Wireless Conventional
57
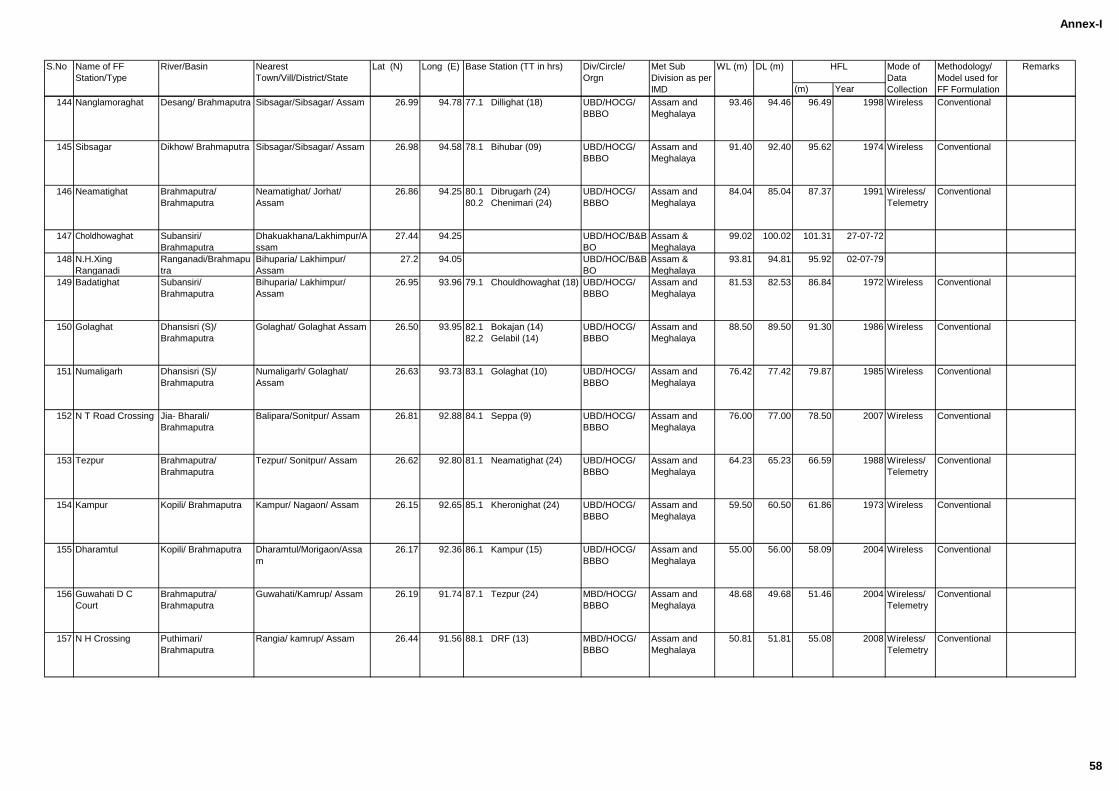
Annex-I
(m) Year
RemarksS.No Name of FF
Station/Type
River/Basin Nearest
Town/Vill/District/State
Lat (N) Long (E) Base Station (TT in hrs) Div/Circle/
Orgn
Met Sub
Division as per
IMD
WL (m) DL (m) HFL Mode of
Data
Collection
Methodology/
Model used for
FF Formulation
144 Nanglamoraghat Desang/ Brahmaputra Sibsagar/Sibsagar/ Assam 26.99 94.78 77.1 Dillighat (18) UBD/HOCG/
BBBO
Assam and
Meghalaya
93.46 94.46 96.49 1998 Wireless Conventional
145 Sibsagar Dikhow/ Brahmaputra Sibsagar/Sibsagar/ Assam 26.98 94.58 78.1 Bihubar (09) UBD/HOCG/
BBBO
Assam and
Meghalaya
91.40 92.40 95.62 1974 Wireless Conventional
146 Neamatighat Brahmaputra/
Brahmaputra
Neamatighat/ Jorhat/
Assam
26.86 94.25 80.1 Dibrugarh (24)
80.2 Chenimari (24)
UBD/HOCG/
BBBO
Assam and
Meghalaya
84.04 85.04 87.37 1991 Wireless/
Telemetry
Conventional
147 Choldhowaghat Subansiri/
Brahmaputra
Dhakuakhana/Lakhimpur/A
ssam
27.44 94.25 UBD/HOC/B&B
BO
Assam &
Meghalaya
99.02 100.02 101.31 27-07-72
148 N.H.Xing
Ranganadi
Ranganadi/Brahmapu
tra
Bihuparia/ Lakhimpur/
Assam
27.2 94.05 UBD/HOC/B&B
BO
Assam &
Meghalaya
93.81 94.81 95.92 02-07-79
149 Badatighat Subansiri/
Brahmaputra
Bihuparia/ Lakhimpur/
Assam
26.95 93.96 79.1 Chouldhowaghat (18) UBD/HOCG/
BBBO
Assam and
Meghalaya
81.53 82.53 86.84 1972 Wireless Conventional
150 Golaghat Dhansisri (S)/
Brahmaputra
Golaghat/ Golaghat Assam 26.50 93.95 82.1 Bokajan (14)
82.2 Gelabil (14)
UBD/HOCG/
BBBO
Assam and
Meghalaya
88.50 89.50 91.30 1986 Wireless Conventional
151 Numaligarh Dhansisri (S)/
Brahmaputra
Numaligarh/ Golaghat/
Assam
26.63 93.73 83.1 Golaghat (10) UBD/HOCG/
BBBO
Assam and
Meghalaya
76.42 77.42 79.87 1985 Wireless Conventional
152 N T Road Crossing Jia- Bharali/
Brahmaputra
Balipara/Sonitpur/ Assam 26.81 92.88 84.1 Seppa (9) UBD/HOCG/
BBBO
Assam and
Meghalaya
76.00 77.00 78.50 2007 Wireless Conventional
153 Tezpur Brahmaputra/
Brahmaputra
Tezpur/ Sonitpur/ Assam 26.62 92.80 81.1 Neamatighat (24) UBD/HOCG/
BBBO
Assam and
Meghalaya
64.23 65.23 66.59 1988 Wireless/
Telemetry
Conventional
154 Kampur Kopili/ Brahmaputra Kampur/ Nagaon/ Assam 26.15 92.65 85.1 Kheronighat (24) UBD/HOCG/
BBBO
Assam and
Meghalaya
59.50 60.50 61.86 1973 Wireless Conventional
155 Dharamtul Kopili/ Brahmaputra Dharamtul/Morigaon/Assa
m
26.17 92.36 86.1 Kampur (15) UBD/HOCG/
BBBO
Assam and
Meghalaya
55.00 56.00 58.09 2004 Wireless Conventional
156 Guwahati D C
Court
Brahmaputra/
Brahmaputra
Guwahati/Kamrup/ Assam 26.19 91.74 87.1 Tezpur (24) MBD/HOCG/
BBBO
Assam and
Meghalaya
48.68 49.68 51.46 2004 Wireless/
Telemetry
Conventional
157 N H Crossing Puthimari/
Brahmaputra
Rangia/ kamrup/ Assam 26.44 91.56 88.1 DRF (13) MBD/HOCG/
BBBO
Assam and
Meghalaya
50.81 51.81 55.08 2008 Wireless/
Telemetry
Conventional
58
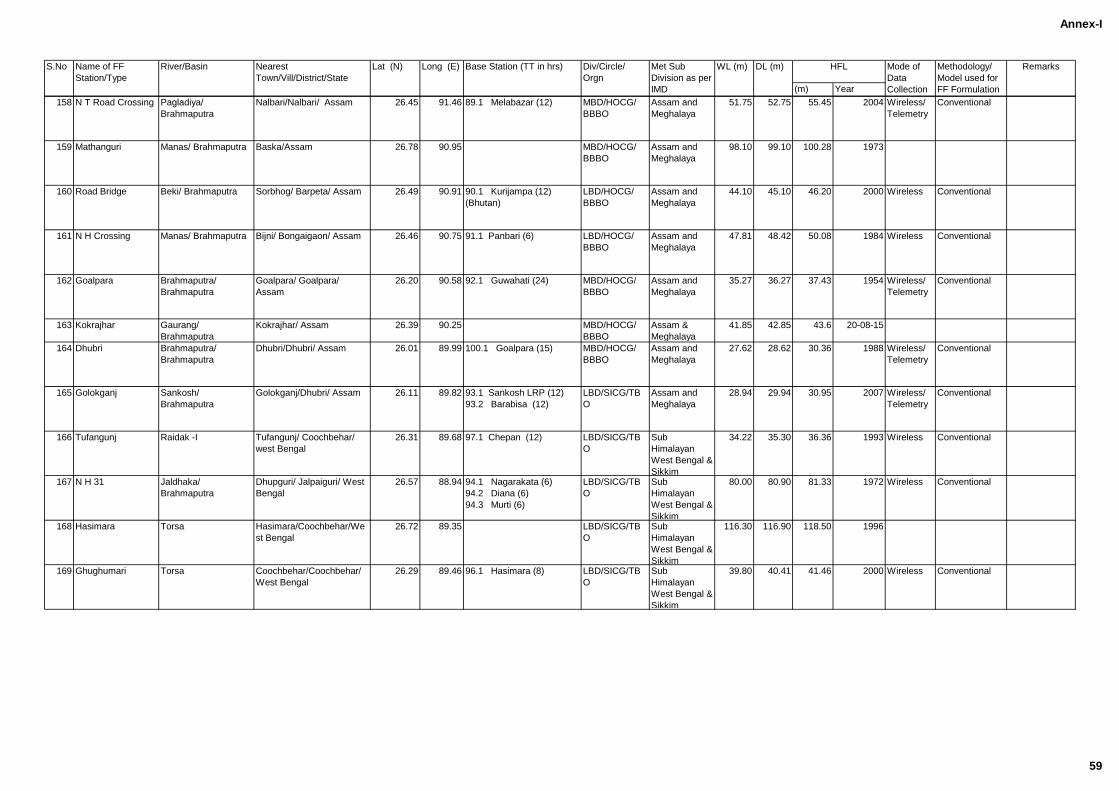
Annex-I
(m) Year
RemarksS.No Name of FF
Station/Type
River/Basin Nearest
Town/Vill/District/State
Lat (N) Long (E) Base Station (TT in hrs) Div/Circle/
Orgn
Met Sub
Division as per
IMD
WL (m) DL (m) HFL Mode of
Data
Collection
Methodology/
Model used for
FF Formulation
158 N T Road Crossing Pagladiya/
Brahmaputra
Nalbari/Nalbari/ Assam 26.45 91.46 89.1 Melabazar (12) MBD/HOCG/
BBBO
Assam and
Meghalaya
51.75 52.75 55.45 2004 Wireless/
Telemetry
Conventional
159 Mathanguri Manas/ Brahmaputra Baska/Assam 26.78 90.95 MBD/HOCG/
BBBO
Assam and
Meghalaya
98.10 99.10 100.28 1973
160 Road Bridge Beki/ Brahmaputra Sorbhog/ Barpeta/ Assam 26.49 90.91 90.1 Kurijampa (12)
(Bhutan)
LBD/HOCG/
BBBO
Assam and
Meghalaya
44.10 45.10 46.20 2000 Wireless Conventional
161 N H Crossing Manas/ Brahmaputra Bijni/ Bongaigaon/ Assam 26.46 90.75 91.1 Panbari (6) LBD/HOCG/
BBBO
Assam and
Meghalaya
47.81 48.42 50.08 1984 Wireless Conventional
162 Goalpara Brahmaputra/
Brahmaputra
Goalpara/ Goalpara/
Assam
26.20 90.58 92.1 Guwahati (24) MBD/HOCG/
BBBO
Assam and
Meghalaya
35.27 36.27 37.43 1954 Wireless/
Telemetry
Conventional
163 Kokrajhar Gaurang/
Brahmaputra
Kokrajhar/ Assam 26.39 90.25 MBD/HOCG/
BBBO
Assam &
Meghalaya
41.85 42.85 43.6 20-08-15
164 Dhubri Brahmaputra/
Brahmaputra
Dhubri/Dhubri/ Assam 26.01 89.99 100.1 Goalpara (15) MBD/HOCG/
BBBO
Assam and
Meghalaya
27.62 28.62 30.36 1988 Wireless/
Telemetry
Conventional
165 Golokganj Sankosh/
Brahmaputra
Golokganj/Dhubri/ Assam 26.11 89.82 93.1 Sankosh LRP (12)
93.2 Barabisa (12)
LBD/SICG/TB
O
Assam and
Meghalaya
28.94 29.94 30.95 2007 Wireless/
Telemetry
Conventional
166 Tufangunj Raidak -I Tufangunj/ Coochbehar/
west Bengal
26.31 89.68 97.1 Chepan (12) LBD/SICG/TB
O
Sub
Himalayan
West Bengal &
Sikkim
34.22 35.30 36.36 1993 Wireless Conventional
167 N H 31 Jaldhaka/
Brahmaputra
Dhupguri/ Jalpaiguri/ West
Bengal
26.57 88.94 94.1 Nagarakata (6)
94.2 Diana (6)
94.3 Murti (6)
LBD/SICG/TB
O
Sub
Himalayan
West Bengal &
Sikkim
80.00 80.90 81.33 1972 Wireless Conventional
168 Hasimara Torsa Hasimara/Coochbehar/We
st Bengal
26.72 89.35 LBD/SICG/TB
O
Sub
Himalayan
West Bengal &
Sikkim
116.30 116.90 118.50 1996
169 Ghughumari Torsa Coochbehar/Coochbehar/
West Bengal
26.29 89.46 96.1 Hasimara (8) LBD/SICG/TB
O
Sub
Himalayan
West Bengal &
Sikkim
39.80 40.41 41.46 2000 Wireless Conventional
59
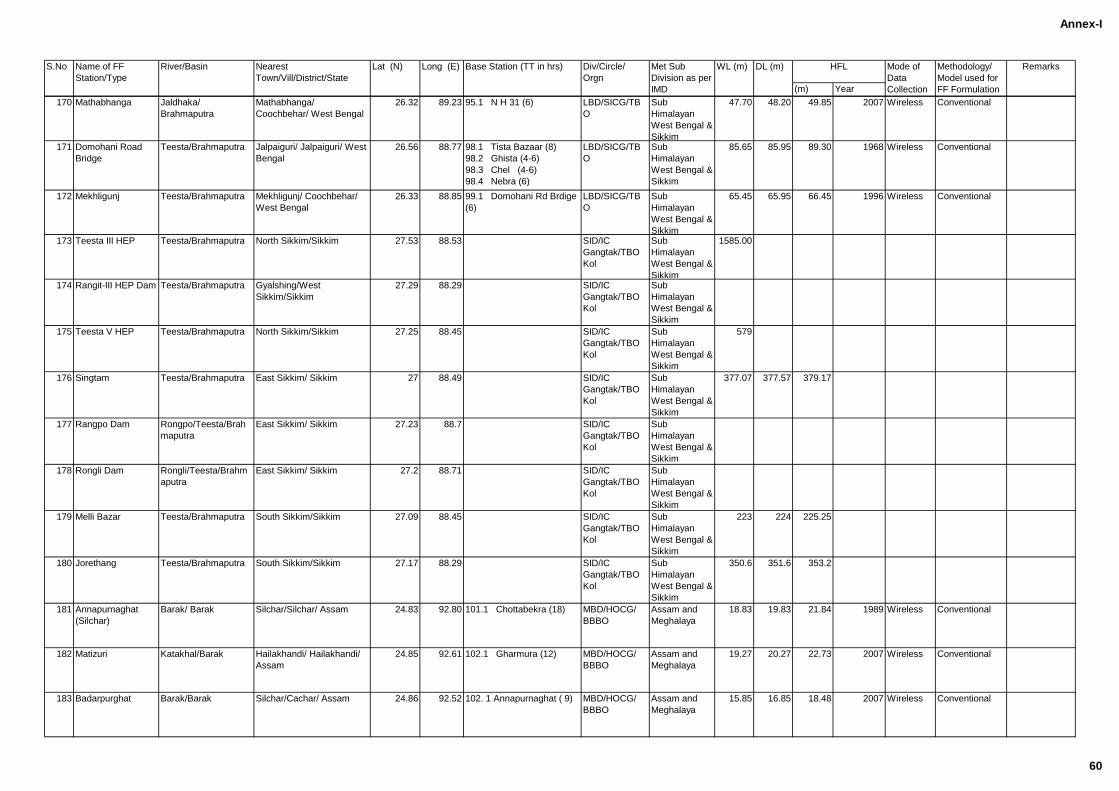
Annex-I
(m) Year
RemarksS.No Name of FF
Station/Type
River/Basin Nearest
Town/Vill/District/State
Lat (N) Long (E) Base Station (TT in hrs) Div/Circle/
Orgn
Met Sub
Division as per
IMD
WL (m) DL (m) HFL Mode of
Data
Collection
Methodology/
Model used for
FF Formulation
170 Mathabhanga Jaldhaka/
Brahmaputra
Mathabhanga/
Coochbehar/ West Bengal
26.32 89.23 95.1 N H 31 (6) LBD/SICG/TB
O
Sub
Himalayan
West Bengal &
Sikkim
47.70 48.20 49.85 2007 Wireless Conventional
171 Domohani Road
Bridge
Teesta/Brahmaputra Jalpaiguri/ Jalpaiguri/ West
Bengal
26.56 88.77 98.1 Tista Bazaar (8)
98.2 Ghista (4-6)
98.3 Chel (4-6)
98.4 Nebra (6)
LBD/SICG/TB
O
Sub
Himalayan
West Bengal &
Sikkim
85.65 85.95 89.30 1968 Wireless Conventional
172 Mekhligunj Teesta/Brahmaputra Mekhligunj/ Coochbehar/
West Bengal
26.33 88.85 99.1 Domohani Rd Brdige
(6)
LBD/SICG/TB
O
Sub
Himalayan
West Bengal &
Sikkim
65.45 65.95 66.45 1996 Wireless Conventional
173 Teesta III HEP Teesta/Brahmaputra North Sikkim/Sikkim 27.53 88.53 SID/IC
Gangtak/TBO
Kol
Sub
Himalayan
West Bengal &
Sikkim
1585.00
174 Rangit-III HEP Dam Teesta/Brahmaputra Gyalshing/West
Sikkim/Sikkim
27.29 88.29 SID/IC
Gangtak/TBO
Kol
Sub
Himalayan
West Bengal &
Sikkim
175 Teesta V HEP Teesta/Brahmaputra North Sikkim/Sikkim 27.25 88.45 SID/IC
Gangtak/TBO
Kol
Sub
Himalayan
West Bengal &
Sikkim
579
176 Singtam Teesta/Brahmaputra East Sikkim/ Sikkim 27 88.49 SID/IC
Gangtak/TBO
Kol
Sub
Himalayan
West Bengal &
Sikkim
377.07 377.57 379.17
177 Rangpo Dam Rongpo/Teesta/Brah
maputra
East Sikkim/ Sikkim 27.23 88.7 SID/IC
Gangtak/TBO
Kol
Sub
Himalayan
West Bengal &
Sikkim
178 Rongli Dam Rongli/Teesta/Brahm
aputra
East Sikkim/ Sikkim 27.2 88.71 SID/IC
Gangtak/TBO
Kol
Sub
Himalayan
West Bengal &
Sikkim
179 Melli Bazar Teesta/Brahmaputra South Sikkim/Sikkim 27.09 88.45 SID/IC
Gangtak/TBO
Kol
Sub
Himalayan
West Bengal &
Sikkim
223 224 225.25
180 Jorethang Teesta/Brahmaputra South Sikkim/Sikkim 27.17 88.29 SID/IC
Gangtak/TBO
Kol
Sub
Himalayan
West Bengal &
Sikkim
350.6 351.6 353.2
181 Annapurnaghat
(Silchar)
Barak/ Barak Silchar/Silchar/ Assam 24.83 92.80 101.1 Chottabekra (18) MBD/HOCG/
BBBO
Assam and
Meghalaya
18.83 19.83 21.84 1989 Wireless Conventional
182 Matizuri Katakhal/Barak Hailakhandi/ Hailakhandi/
Assam
24.85 92.61 102.1 Gharmura (12) MBD/HOCG/
BBBO
Assam and
Meghalaya
19.27 20.27 22.73 2007 Wireless Conventional
183 Badarpurghat Barak/Barak Silchar/Cachar/ Assam 24.86 92.52 102. 1 Annapurnaghat ( 9) MBD/HOCG/
BBBO
Assam and
Meghalaya
15.85 16.85 18.48 2007 Wireless Conventional
60
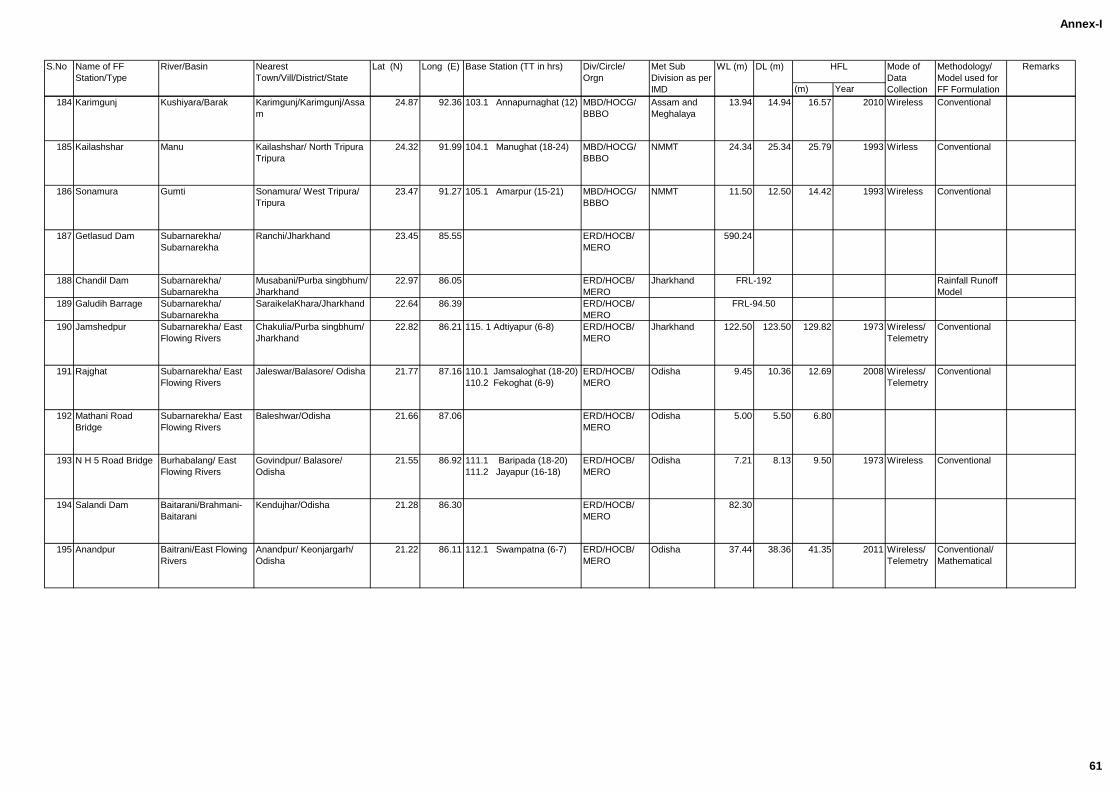
Annex-I
(m) Year
RemarksS.No Name of FF
Station/Type
River/Basin Nearest
Town/Vill/District/State
Lat (N) Long (E) Base Station (TT in hrs) Div/Circle/
Orgn
Met Sub
Division as per
IMD
WL (m) DL (m) HFL Mode of
Data
Collection
Methodology/
Model used for
FF Formulation
184 Karimgunj Kushiyara/Barak Karimgunj/Karimgunj/Assa
m
24.87 92.36 103.1 Annapurnaghat (12) MBD/HOCG/
BBBO
Assam and
Meghalaya
13.94 14.94 16.57 2010 Wireless Conventional
185 Kailashshar Manu Kailashshar/ North Tripura
Tripura
24.32 91.99 104.1 Manughat (18-24) MBD/HOCG/
BBBO
NMMT 24.34 25.34 25.79 1993 Wirless Conventional
186 Sonamura Gumti Sonamura/ West Tripura/
Tripura
23.47 91.27 105.1 Amarpur (15-21) MBD/HOCG/
BBBO
NMMT 11.50 12.50 14.42 1993 Wireless Conventional
187 Getlasud Dam Subarnarekha/
Subarnarekha
Ranchi/Jharkhand 23.45 85.55 ERD/HOCB/
MERO
590.24
188 Chandil Dam Subarnarekha/
Subarnarekha
Musabani/Purba singbhum/
Jharkhand
22.97 86.05 ERD/HOCB/
MERO
Jharkhand Rainfall Runoff
Model
189 Galudih Barrage Subarnarekha/
Subarnarekha
SaraikelaKhara/Jharkhand 22.64 86.39 ERD/HOCB/
MERO
190 Jamshedpur Subarnarekha/ East
Flowing Rivers
Chakulia/Purba singbhum/
Jharkhand
22.82 86.21 115. 1 Adtiyapur (6-8) ERD/HOCB/
MERO
Jharkhand 122.50 123.50 129.82 1973 Wireless/
Telemetry
Conventional
191 Rajghat Subarnarekha/ East
Flowing Rivers
Jaleswar/Balasore/ Odisha 21.77 87.16 110.1 Jamsaloghat (18-20)
110.2 Fekoghat (6-9)
ERD/HOCB/
MERO
Odisha 9.45 10.36 12.69 2008 Wireless/
Telemetry
Conventional
192 Mathani Road
Bridge
Subarnarekha/ East
Flowing Rivers
Baleshwar/Odisha 21.66 87.06 ERD/HOCB/
MERO
Odisha 5.00 5.50 6.80
193 N H 5 Road Bridge Burhabalang/ East
Flowing Rivers
Govindpur/ Balasore/
Odisha
21.55 86.92 111.1 Baripada (18-20)
111.2 Jayapur (16-18)
ERD/HOCB/
MERO
Odisha 7.21 8.13 9.50 1973 Wireless Conventional
194 Salandi Dam Baitarani/Brahmani-
Baitarani
Kendujhar/Odisha 21.28 86.30 ERD/HOCB/
MERO
82.30
195 Anandpur Baitrani/East Flowing
Rivers
Anandpur/ Keonjargarh/
Odisha
21.22 86.11 112.1 Swampatna (6-7) ERD/HOCB/
MERO
Odisha 37.44 38.36 41.35 2011 Wireless/
Telemetry
Conventional/
Mathematical
FRL-192
FRL-94.50
61
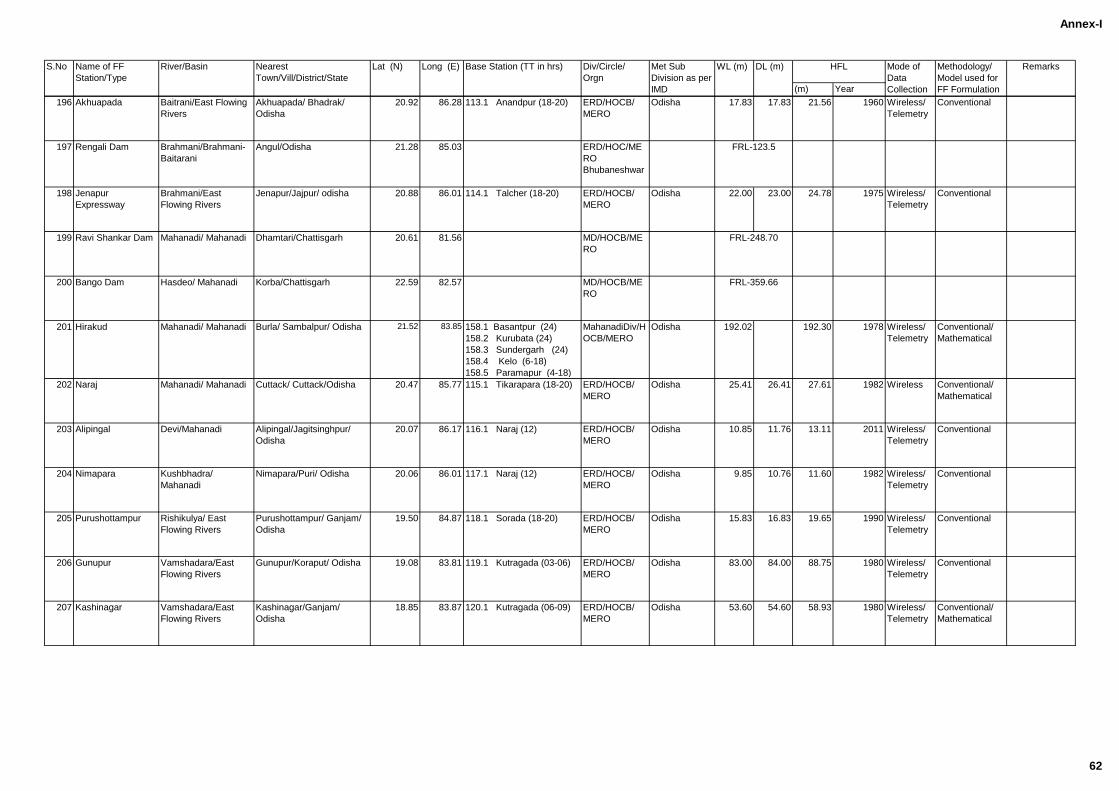
Annex-I
(m) Year
RemarksS.No Name of FF
Station/Type
River/Basin Nearest
Town/Vill/District/State
Lat (N) Long (E) Base Station (TT in hrs) Div/Circle/
Orgn
Met Sub
Division as per
IMD
WL (m) DL (m) HFL Mode of
Data
Collection
Methodology/
Model used for
FF Formulation
196 Akhuapada Baitrani/East Flowing
Rivers
Akhuapada/ Bhadrak/
Odisha
20.92 86.28 113.1 Anandpur (18-20) ERD/HOCB/
MERO
Odisha 17.83 17.83 21.56 1960 Wireless/
Telemetry
Conventional
197 Rengali Dam Brahmani/Brahmani-
Baitarani
Angul/Odisha 21.28 85.03 ERD/HOC/ME
RO
Bhubaneshwar
198 Jenapur
Expressway
Brahmani/East
Flowing Rivers
Jenapur/Jajpur/ odisha 20.88 86.01 114.1 Talcher (18-20) ERD/HOCB/
MERO
Odisha 22.00 23.00 24.78 1975 Wireless/
Telemetry
Conventional
199 Ravi Shankar Dam Mahanadi/ Mahanadi Dhamtari/Chattisgarh 20.61 81.56 MD/HOCB/ME
RO
200 Bango Dam Hasdeo/ Mahanadi Korba/Chattisgarh 22.59 82.57 MD/HOCB/ME
RO
201 Hirakud Mahanadi/ Mahanadi Burla/ Sambalpur/ Odisha 21.52 83.85 158.1 Basantpur (24)
158.2 Kurubata (24)
158.3 Sundergarh (24)
158.4 Kelo (6-18)
158.5 Paramapur (4-18)
MahanadiDiv/H
OCB/MERO
Odisha 192.02 192.30 1978 Wireless/
Telemetry
Conventional/
Mathematical
202 Naraj Mahanadi/ Mahanadi Cuttack/ Cuttack/Odisha 20.47 85.77 115.1 Tikarapara (18-20) ERD/HOCB/
MERO
Odisha 25.41 26.41 27.61 1982 Wireless Conventional/
Mathematical
203 Alipingal Devi/Mahanadi Alipingal/Jagitsinghpur/
Odisha
20.07 86.17 116.1 Naraj (12) ERD/HOCB/
MERO
Odisha 10.85 11.76 13.11 2011 Wireless/
Telemetry
Conventional
204 Nimapara Kushbhadra/
Mahanadi
Nimapara/Puri/ Odisha 20.06 86.01 117.1 Naraj (12) ERD/HOCB/
MERO
Odisha 9.85 10.76 11.60 1982 Wireless/
Telemetry
Conventional
205 Purushottampur Rishikulya/ East
Flowing Rivers
Purushottampur/ Ganjam/
Odisha
19.50 84.87 118.1 Sorada (18-20) ERD/HOCB/
MERO
Odisha 15.83 16.83 19.65 1990 Wireless/
Telemetry
Conventional
206 Gunupur Vamshadara/East
Flowing Rivers
Gunupur/Koraput/ Odisha 19.08 83.81 119.1 Kutragada (03-06) ERD/HOCB/
MERO
Odisha 83.00 84.00 88.75 1980 Wireless/
Telemetry
Conventional
207 Kashinagar Vamshadara/East
Flowing Rivers
Kashinagar/Ganjam/
Odisha
18.85 83.87 120.1 Kutragada (06-09) ERD/HOCB/
MERO
Odisha 53.60 54.60 58.93 1980 Wireless/
Telemetry
Conventional/
Mathematical
FRL-123.5
FRL-248.70
FRL-359.66
62
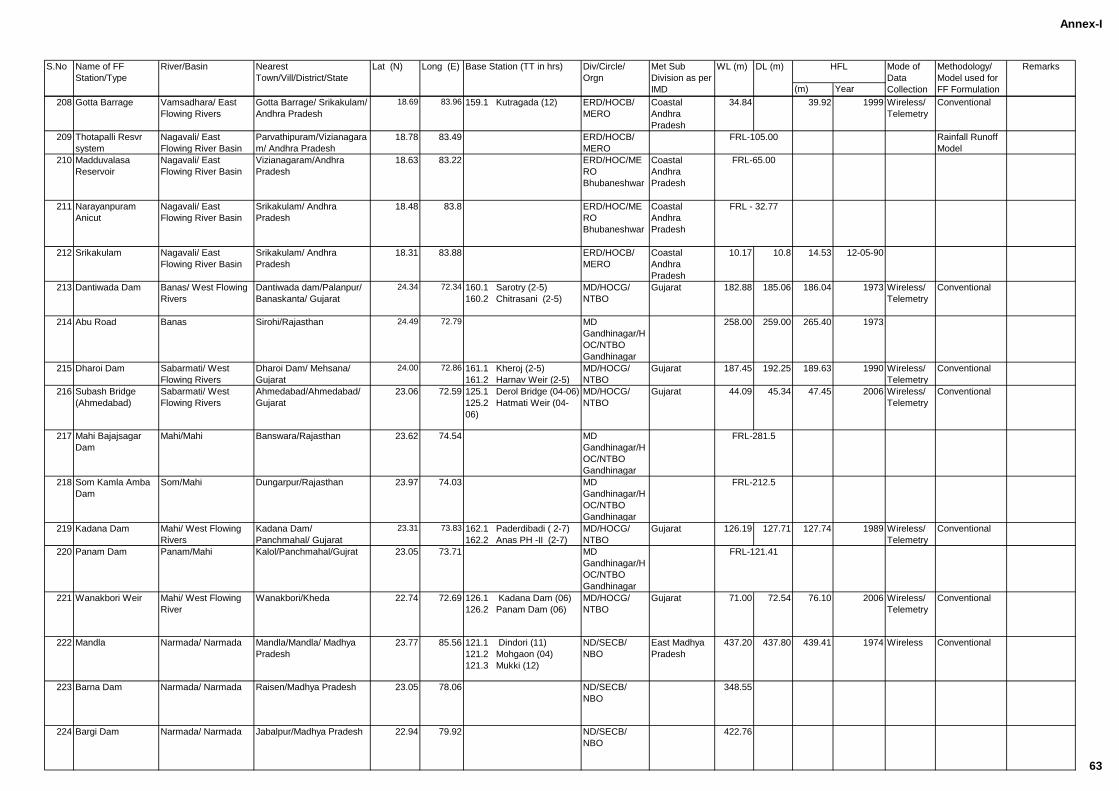
Annex-I
(m) Year
RemarksS.No Name of FF
Station/Type
River/Basin Nearest
Town/Vill/District/State
Lat (N) Long (E) Base Station (TT in hrs) Div/Circle/
Orgn
Met Sub
Division as per
IMD
WL (m) DL (m) HFL Mode of
Data
Collection
Methodology/
Model used for
FF Formulation
208 Gotta Barrage Vamsadhara/ East
Flowing Rivers
Gotta Barrage/ Srikakulam/
Andhra Pradesh
18.69 83.96 159.1 Kutragada (12) ERD/HOCB/
MERO
Coastal
Andhra
Pradesh
34.84 39.92 1999 Wireless/
Telemetry
Conventional
209 Thotapalli Resvr
system
Nagavali/ East
Flowing River Basin
Parvathipuram/Vizianagara
m/ Andhra Pradesh
18.78 83.49 ERD/HOCB/
MERO
Rainfall Runoff
Model
210 Madduvalasa
Reservoir
Nagavali/ East
Flowing River Basin
Vizianagaram/Andhra
Pradesh
18.63 83.22 ERD/HOC/ME
RO
Bhubaneshwar
Coastal
Andhra
Pradesh
211 Narayanpuram
Anicut
Nagavali/ East
Flowing River Basin
Srikakulam/ Andhra
Pradesh
18.48 83.8 ERD/HOC/ME
RO
Bhubaneshwar
Coastal
Andhra
Pradesh
212 Srikakulam Nagavali/ East
Flowing River Basin
Srikakulam/ Andhra
Pradesh
18.31 83.88 ERD/HOCB/
MERO
Coastal
Andhra
Pradesh
10.17 10.8 14.53 12-05-90
213 Dantiwada Dam Banas/ West Flowing
Rivers
Dantiwada dam/Palanpur/
Banaskanta/ Gujarat
24.34 72.34 160.1 Sarotry (2-5)
160.2 Chitrasani (2-5)
MD/HOCG/
NTBO
Gujarat 182.88 185.06 186.04 1973 Wireless/
Telemetry
Conventional
214 Abu Road Banas Sirohi/Rajasthan 24.49 72.79 MD
Gandhinagar/H
OC/NTBO
Gandhinagar
258.00 259.00 265.40 1973
215 Dharoi Dam Sabarmati/ West
Flowing Rivers
Dharoi Dam/ Mehsana/
Gujarat
24.00 72.86 161.1 Kheroj (2-5)
161.2 Harnav Weir (2-5)
MD/HOCG/
NTBO
Gujarat 187.45 192.25 189.63 1990 Wireless/
Telemetry
Conventional
216 Subash Bridge
(Ahmedabad)
Sabarmati/ West
Flowing Rivers
Ahmedabad/Ahmedabad/
Gujarat
23.06 72.59 125.1 Derol Bridge (04-06)
125.2 Hatmati Weir (04-
06)
MD/HOCG/
NTBO
Gujarat 44.09 45.34 47.45 2006 Wireless/
Telemetry
Conventional
217 Mahi Bajajsagar
Dam
Mahi/Mahi Banswara/Rajasthan 23.62 74.54 MD
Gandhinagar/H
OC/NTBO
Gandhinagar
218 Som Kamla Amba
Dam
Som/Mahi Dungarpur/Rajasthan 23.97 74.03 MD
Gandhinagar/H
OC/NTBO
Gandhinagar
219 Kadana Dam Mahi/ West Flowing
Rivers
Kadana Dam/
Panchmahal/ Gujarat
23.31 73.83 162.1 Paderdibadi ( 2-7)
162.2 Anas PH -II (2-7)
MD/HOCG/
NTBO
Gujarat 126.19 127.71 127.74 1989 Wireless/
Telemetry
Conventional
220 Panam Dam Panam/Mahi Kalol/Panchmahal/Gujrat 23.05 73.71 MD
Gandhinagar/H
OC/NTBO
Gandhinagar
221 Wanakbori Weir Mahi/ West Flowing
River
Wanakbori/Kheda 22.74 72.69 126.1 Kadana Dam (06)
126.2 Panam Dam (06)
MD/HOCG/
NTBO
Gujarat 71.00 72.54 76.10 2006 Wireless/
Telemetry
Conventional
222 Mandla Narmada/ Narmada Mandla/Mandla/ Madhya
Pradesh
23.77 85.56 121.1 Dindori (11)
121.2 Mohgaon (04)
121.3 Mukki (12)
ND/SECB/
NBO
East Madhya
Pradesh
437.20 437.80 439.41 1974 Wireless Conventional
223 Barna Dam Narmada/ Narmada Raisen/Madhya Pradesh 23.05 78.06 ND/SECB/
NBO
348.55
224 Bargi Dam Narmada/ Narmada Jabalpur/Madhya Pradesh 22.94 79.92 ND/SECB/
NBO
422.76
FRL-212.5
FRL-121.41
FRL-105.00
FRL - 32.77
FRL-65.00
FRL-281.5
63
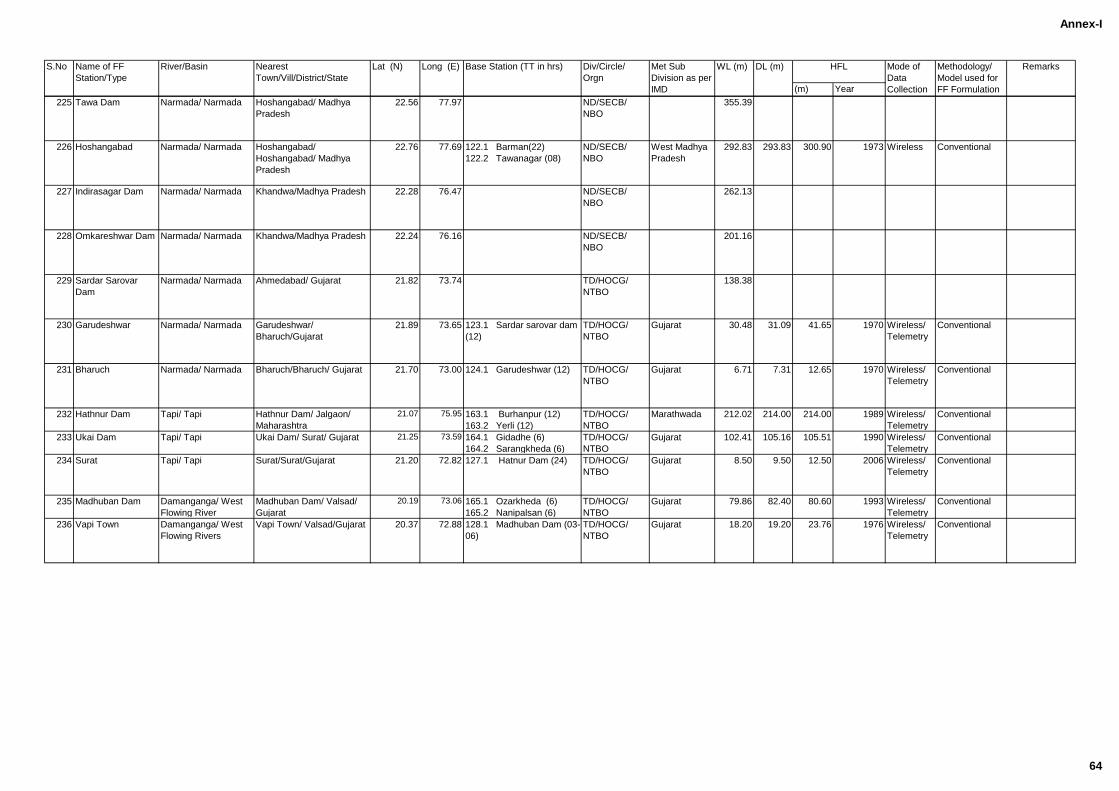
Annex-I
(m) Year
RemarksS.No Name of FF
Station/Type
River/Basin Nearest
Town/Vill/District/State
Lat (N) Long (E) Base Station (TT in hrs) Div/Circle/
Orgn
Met Sub
Division as per
IMD
WL (m) DL (m) HFL Mode of
Data
Collection
Methodology/
Model used for
FF Formulation
225 Tawa Dam Narmada/ Narmada Hoshangabad/ Madhya
Pradesh
22.56 77.97 ND/SECB/
NBO
355.39
226 Hoshangabad Narmada/ Narmada Hoshangabad/
Hoshangabad/ Madhya
Pradesh
22.76 77.69 122.1 Barman(22)
122.2 Tawanagar (08)
ND/SECB/
NBO
West Madhya
Pradesh
292.83 293.83 300.90 1973 Wireless Conventional
227 Indirasagar Dam Narmada/ Narmada Khandwa/Madhya Pradesh 22.28 76.47 ND/SECB/
NBO
262.13
228 Omkareshwar Dam Narmada/ Narmada Khandwa/Madhya Pradesh 22.24 76.16 ND/SECB/
NBO
201.16
229 Sardar Sarovar
Dam
Narmada/ Narmada Ahmedabad/ Gujarat 21.82 73.74 TD/HOCG/
NTBO
138.38
230 Garudeshwar Narmada/ Narmada Garudeshwar/
Bharuch/Gujarat
21.89 73.65 123.1 Sardar sarovar dam
(12)
TD/HOCG/
NTBO
Gujarat 30.48 31.09 41.65 1970 Wireless/
Telemetry
Conventional
231 Bharuch Narmada/ Narmada Bharuch/Bharuch/ Gujarat 21.70 73.00 124.1 Garudeshwar (12) TD/HOCG/
NTBO
Gujarat 6.71 7.31 12.65 1970 Wireless/
Telemetry
Conventional
232 Hathnur Dam Tapi/ Tapi Hathnur Dam/ Jalgaon/
Maharashtra
21.07 75.95 163.1 Burhanpur (12)
163.2 Yerli (12)
TD/HOCG/
NTBO
Marathwada 212.02 214.00 214.00 1989 Wireless/
Telemetry
Conventional
233 Ukai Dam Tapi/ Tapi Ukai Dam/ Surat/ Gujarat 21.25 73.59 164.1 Gidadhe (6)
164.2 Sarangkheda (6)
TD/HOCG/
NTBO
Gujarat 102.41 105.16 105.51 1990 Wireless/
Telemetry
Conventional
234 Surat Tapi/ Tapi Surat/Surat/Gujarat 21.20 72.82 127.1 Hatnur Dam (24) TD/HOCG/
NTBO
Gujarat 8.50 9.50 12.50 2006 Wireless/
Telemetry
Conventional
235 Madhuban Dam Damanganga/ West
Flowing River
Madhuban Dam/ Valsad/
Gujarat
20.19 73.06 165.1 Ozarkheda (6)
165.2 Nanipalsan (6)
TD/HOCG/
NTBO
Gujarat 79.86 82.40 80.60 1993 Wireless/
Telemetry
Conventional
236 Vapi Town Damanganga/ West
Flowing Rivers
Vapi Town/ Valsad/Gujarat 20.37 72.88 128.1 Madhuban Dam (03-
06)
TD/HOCG/
NTBO
Gujarat 18.20 19.20 23.76 1976 Wireless/
Telemetry
Conventional
64
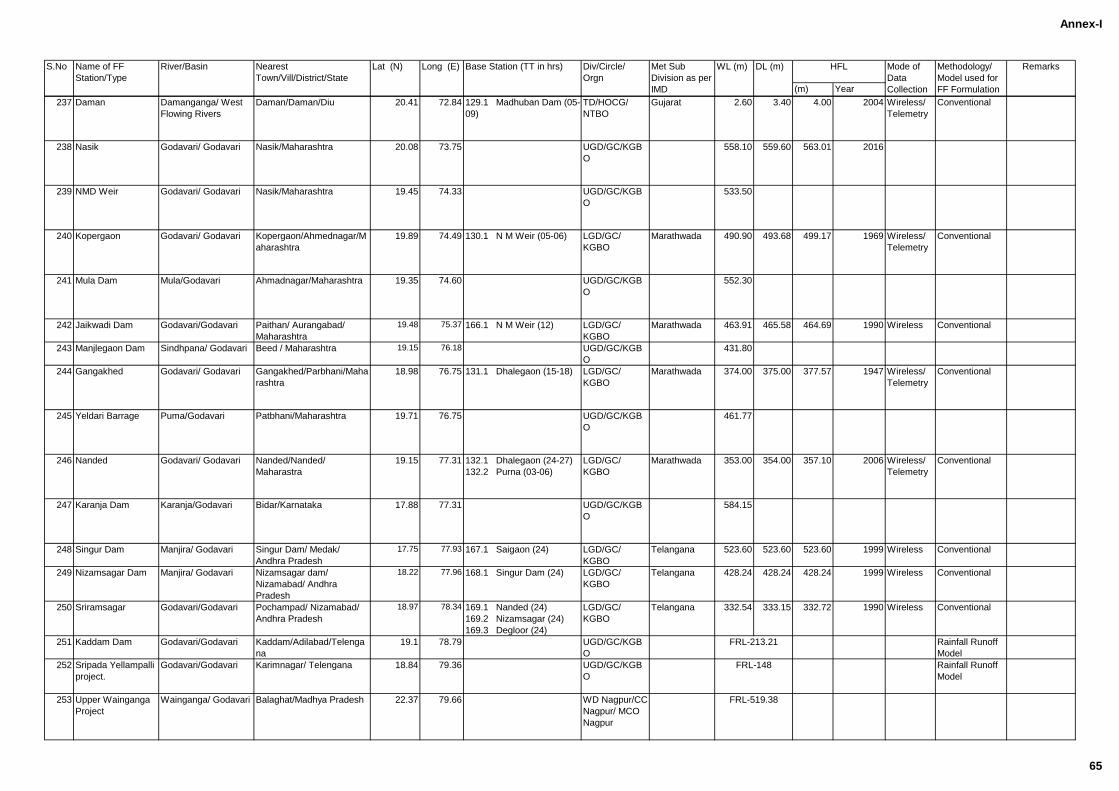
Annex-I
(m) Year
RemarksS.No Name of FF
Station/Type
River/Basin Nearest
Town/Vill/District/State
Lat (N) Long (E) Base Station (TT in hrs) Div/Circle/
Orgn
Met Sub
Division as per
IMD
WL (m) DL (m) HFL Mode of
Data
Collection
Methodology/
Model used for
FF Formulation
237 Daman Damanganga/ West
Flowing Rivers
Daman/Daman/Diu 20.41 72.84 129.1 Madhuban Dam (05-
09)
TD/HOCG/
NTBO
Gujarat 2.60 3.40 4.00 2004 Wireless/
Telemetry
Conventional
238 Nasik Godavari/ Godavari Nasik/Maharashtra 20.08 73.75 UGD/GC/KGB
O
558.10 559.60 563.01 2016
239 NMD Weir Godavari/ Godavari Nasik/Maharashtra 19.45 74.33 UGD/GC/KGB
O
533.50
240 Kopergaon Godavari/ Godavari Kopergaon/Ahmednagar/M
aharashtra
19.89 74.49 130.1 N M Weir (05-06) LGD/GC/
KGBO
Marathwada 490.90 493.68 499.17 1969 Wireless/
Telemetry
Conventional
241 Mula Dam Mula/Godavari Ahmadnagar/Maharashtra 19.35 74.60 UGD/GC/KGB
O
552.30
242 Jaikwadi Dam Godavari/Godavari Paithan/ Aurangabad/
Maharashtra
19.48 75.37 166.1 N M Weir (12) LGD/GC/
KGBO
Marathwada 463.91 465.58 464.69 1990 Wireless Conventional
243 Manjlegaon Dam Sindhpana/ Godavari Beed / Maharashtra 19.15 76.18 UGD/GC/KGB
O
431.80
244 Gangakhed Godavari/ Godavari Gangakhed/Parbhani/Maha
rashtra
18.98 76.75 131.1 Dhalegaon (15-18) LGD/GC/
KGBO
Marathwada 374.00 375.00 377.57 1947 Wireless/
Telemetry
Conventional
245 Yeldari Barrage Puma/Godavari Patbhani/Maharashtra 19.71 76.75 UGD/GC/KGB
O
461.77
246 Nanded Godavari/ Godavari Nanded/Nanded/
Maharastra
19.15 77.31 132.1 Dhalegaon (24-27)
132.2 Purna (03-06)
LGD/GC/
KGBO
Marathwada 353.00 354.00 357.10 2006 Wireless/
Telemetry
Conventional
247 Karanja Dam Karanja/Godavari Bidar/Karnataka 17.88 77.31 UGD/GC/KGB
O
584.15
248 Singur Dam Manjira/ Godavari Singur Dam/ Medak/
Andhra Pradesh
17.75 77.93 167.1 Saigaon (24) LGD/GC/
KGBO
Telangana 523.60 523.60 523.60 1999 Wireless Conventional
249 Nizamsagar Dam Manjira/ Godavari Nizamsagar dam/
Nizamabad/ Andhra
Pradesh
18.22 77.96 168.1 Singur Dam (24) LGD/GC/
KGBO
Telangana 428.24 428.24 428.24 1999 Wireless Conventional
250 Sriramsagar Godavari/Godavari Pochampad/ Nizamabad/
Andhra Pradesh
18.97 78.34 169.1 Nanded (24)
169.2 Nizamsagar (24)
169.3 Degloor (24)
LGD/GC/
KGBO
Telangana 332.54 333.15 332.72 1990 Wireless Conventional
251 Kaddam Dam Godavari/Godavari Kaddam/Adilabad/Telenga
na
19.1 78.79 UGD/GC/KGB
O
Rainfall Runoff
Model
252 Sripada Yellampalli
project.
Godavari/Godavari Karimnagar/ Telengana 18.84 79.36 UGD/GC/KGB
O
Rainfall Runoff
Model
253 Upper Wainganga
Project
Wainganga/ Godavari Balaghat/Madhya Pradesh 22.37 79.66 WD Nagpur/CC
Nagpur/ MCO
Nagpur
FRL-148
FRL-213.21
FRL-519.38
65
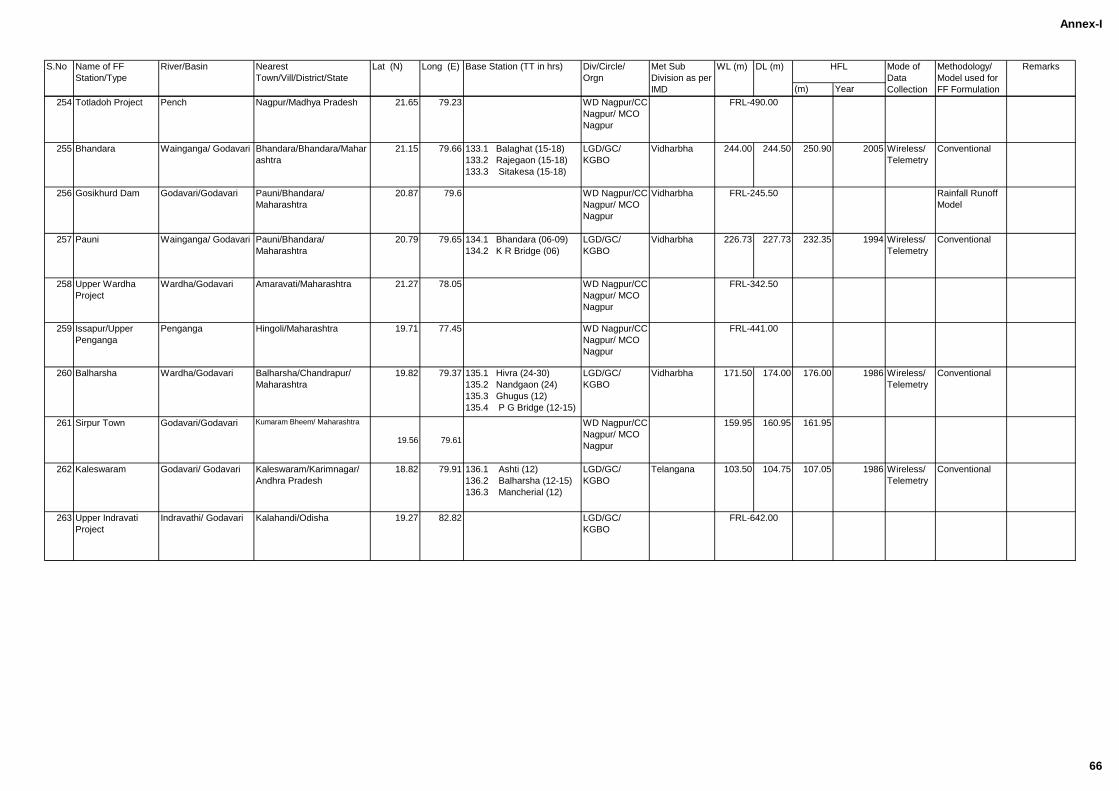
Annex-I
(m) Year
RemarksS.No Name of FF
Station/Type
River/Basin Nearest
Town/Vill/District/State
Lat (N) Long (E) Base Station (TT in hrs) Div/Circle/
Orgn
Met Sub
Division as per
IMD
WL (m) DL (m) HFL Mode of
Data
Collection
Methodology/
Model used for
FF Formulation
254 Totladoh Project Pench Nagpur/Madhya Pradesh 21.65 79.23 WD Nagpur/CC
Nagpur/ MCO
Nagpur
255 Bhandara Wainganga/ Godavari Bhandara/Bhandara/Mahar
ashtra
21.15 79.66 133.1 Balaghat (15-18)
133.2 Rajegaon (15-18)
133.3 Sitakesa (15-18)
LGD/GC/
KGBO
Vidharbha 244.00 244.50 250.90 2005 Wireless/
Telemetry
Conventional
256 Gosikhurd Dam Godavari/Godavari Pauni/Bhandara/
Maharashtra
20.87 79.6 WD Nagpur/CC
Nagpur/ MCO
Nagpur
Vidharbha Rainfall Runoff
Model
257 Pauni Wainganga/ Godavari Pauni/Bhandara/
Maharashtra
20.79 79.65 134.1 Bhandara (06-09)
134.2 K R Bridge (06)
LGD/GC/
KGBO
Vidharbha 226.73 227.73 232.35 1994 Wireless/
Telemetry
Conventional
258 Upper Wardha
Project
Wardha/Godavari Amaravati/Maharashtra 21.27 78.05 WD Nagpur/CC
Nagpur/ MCO
Nagpur
259 Issapur/Upper
Penganga
Penganga Hingoli/Maharashtra 19.71 77.45 WD Nagpur/CC
Nagpur/ MCO
Nagpur
260 Balharsha Wardha/Godavari Balharsha/Chandrapur/
Maharashtra
19.82 79.37 135.1 Hivra (24-30)
135.2 Nandgaon (24)
135.3 Ghugus (12)
135.4 P G Bridge (12-15)
LGD/GC/
KGBO
Vidharbha 171.50 174.00 176.00 1986 Wireless/
Telemetry
Conventional
261 Sirpur Town Godavari/Godavari Kumaram Bheem/ Maharashtra
19.56 79.61
WD Nagpur/CC
Nagpur/ MCO
Nagpur
159.95 160.95 161.95
262 Kaleswaram Godavari/ Godavari Kaleswaram/Karimnagar/
Andhra Pradesh
18.82 79.91 136.1 Ashti (12)
136.2 Balharsha (12-15)
136.3 Mancherial (12)
LGD/GC/
KGBO
Telangana 103.50 104.75 107.05 1986 Wireless/
Telemetry
Conventional
263 Upper Indravati
Project
Indravathi/ Godavari Kalahandi/Odisha 19.27 82.82 LGD/GC/
KGBO
FRL-342.50
FRL-441.00
FRL-245.50
FRL-490.00
FRL-642.00
66
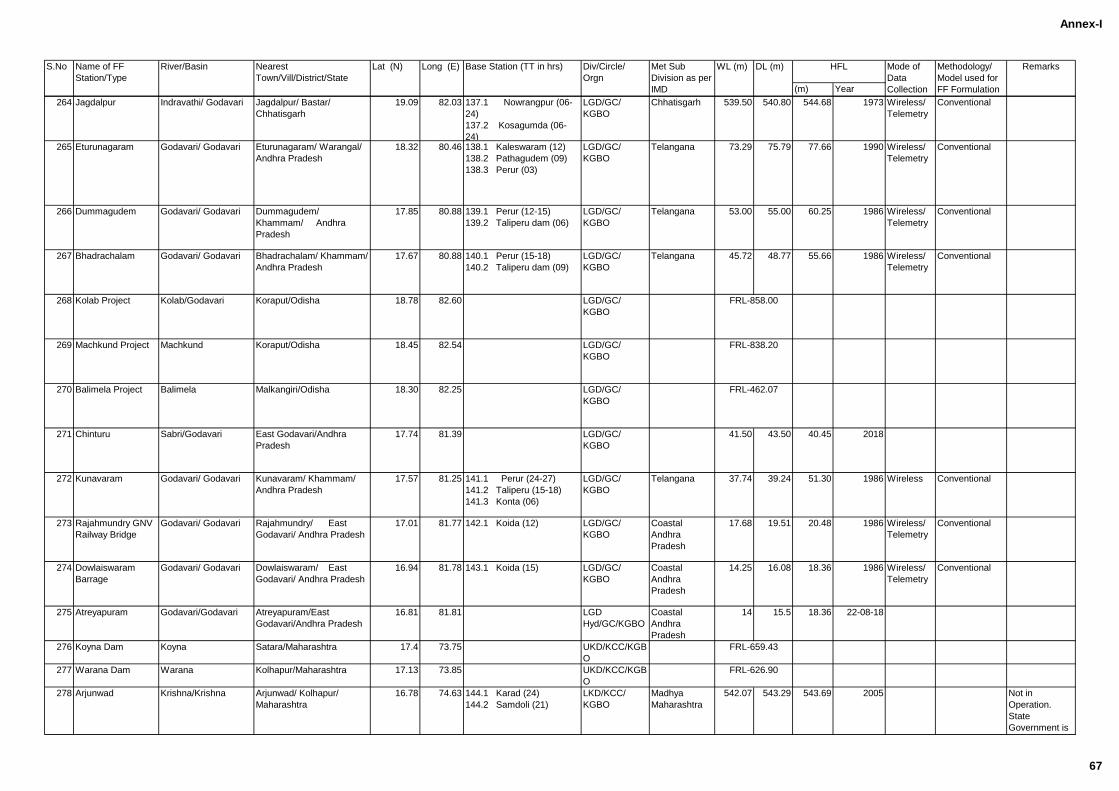
Annex-I
(m) Year
RemarksS.No Name of FF
Station/Type
River/Basin Nearest
Town/Vill/District/State
Lat (N) Long (E) Base Station (TT in hrs) Div/Circle/
Orgn
Met Sub
Division as per
IMD
WL (m) DL (m) HFL Mode of
Data
Collection
Methodology/
Model used for
FF Formulation
264 Jagdalpur Indravathi/ Godavari Jagdalpur/ Bastar/
Chhatisgarh
19.09 82.03 137.1 Nowrangpur (06-
24)
137.2 Kosagumda (06-
24)
LGD/GC/
KGBO
Chhatisgarh 539.50 540.80 544.68 1973 Wireless/
Telemetry
Conventional
265 Eturunagaram Godavari/ Godavari Eturunagaram/ Warangal/
Andhra Pradesh
18.32 80.46 138.1 Kaleswaram (12)
138.2 Pathagudem (09)
138.3 Perur (03)
LGD/GC/
KGBO
Telangana 73.29 75.79 77.66 1990 Wireless/
Telemetry
Conventional
266 Dummagudem Godavari/ Godavari Dummagudem/
Khammam/ Andhra
Pradesh
17.85 80.88 139.1 Perur (12-15)
139.2 Taliperu dam (06)
LGD/GC/
KGBO
Telangana 53.00 55.00 60.25 1986 Wireless/
Telemetry
Conventional
267 Bhadrachalam Godavari/ Godavari Bhadrachalam/ Khammam/
Andhra Pradesh
17.67 80.88 140.1 Perur (15-18)
140.2 Taliperu dam (09)
LGD/GC/
KGBO
Telangana 45.72 48.77 55.66 1986 Wireless/
Telemetry
Conventional
268 Kolab Project Kolab/Godavari Koraput/Odisha 18.78 82.60 LGD/GC/
KGBO
269 Machkund Project Machkund Koraput/Odisha 18.45 82.54 LGD/GC/
KGBO
270 Balimela Project Balimela Malkangiri/Odisha 18.30 82.25 LGD/GC/
KGBO
271 Chinturu Sabri/Godavari East Godavari/Andhra
Pradesh
17.74 81.39 LGD/GC/
KGBO
41.50 43.50 40.45 2018
272 Kunavaram Godavari/ Godavari Kunavaram/ Khammam/
Andhra Pradesh
17.57 81.25 141.1 Perur (24-27)
141.2 Taliperu (15-18)
141.3 Konta (06)
LGD/GC/
KGBO
Telangana 37.74 39.24 51.30 1986 Wireless Conventional
273 Rajahmundry GNV
Railway Bridge
Godavari/ Godavari Rajahmundry/ East
Godavari/ Andhra Pradesh
17.01 81.77 142.1 Koida (12) LGD/GC/
KGBO
Coastal
Andhra
Pradesh
17.68 19.51 20.48 1986 Wireless/
Telemetry
Conventional
274 Dowlaiswaram
Barrage
Godavari/ Godavari Dowlaiswaram/ East
Godavari/ Andhra Pradesh
16.94 81.78 143.1 Koida (15) LGD/GC/
KGBO
Coastal
Andhra
Pradesh
14.25 16.08 18.36 1986 Wireless/
Telemetry
Conventional
275 Atreyapuram Godavari/Godavari Atreyapuram/East
Godavari/Andhra Pradesh
16.81 81.81 LGD
Hyd/GC/KGBO
Coastal
Andhra
Pradesh
14 15.5 18.36 22-08-18
276 Koyna Dam Koyna Satara/Maharashtra 17.4 73.75 UKD/KCC/KGB
O
277 Warana Dam Warana Kolhapur/Maharashtra 17.13 73.85 UKD/KCC/KGB
O
278 Arjunwad Krishna/Krishna Arjunwad/ Kolhapur/
Maharashtra
16.78 74.63 144.1 Karad (24)
144.2 Samdoli (21)
LKD/KCC/
KGBO
Madhya
Maharashtra
542.07 543.29 543.69 2005 Not in
Operation.
State
Government is
not interested
FRL-626.90
FRL-858.00
FRL-838.20
FRL-462.07
FRL-659.43
67
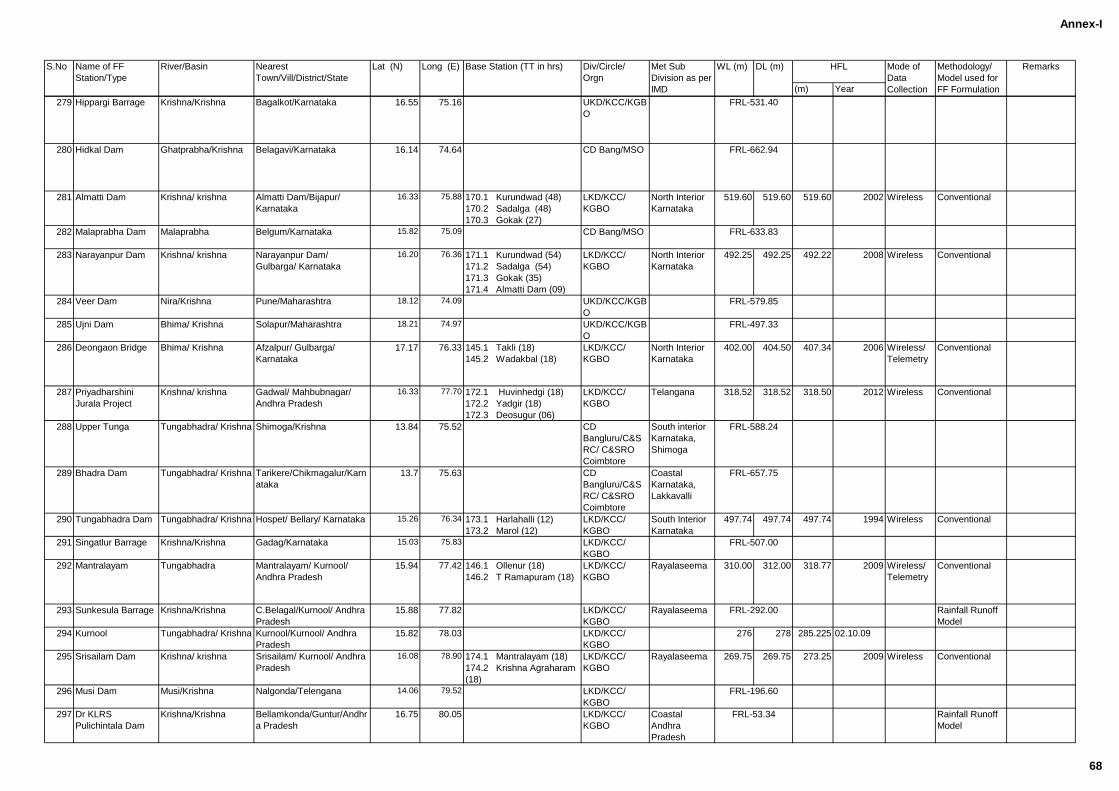
Annex-I
(m) Year
RemarksS.No Name of FF
Station/Type
River/Basin Nearest
Town/Vill/District/State
Lat (N) Long (E) Base Station (TT in hrs) Div/Circle/
Orgn
Met Sub
Division as per
IMD
WL (m) DL (m) HFL Mode of
Data
Collection
Methodology/
Model used for
FF Formulation
279 Hippargi Barrage Krishna/Krishna Bagalkot/Karnataka 16.55 75.16 UKD/KCC/KGB
O
280 Hidkal Dam Ghatprabha/Krishna Belagavi/Karnataka 16.14 74.64 CD Bang/MSO
281 Almatti Dam Krishna/ krishna Almatti Dam/Bijapur/
Karnataka
16.33 75.88 170.1 Kurundwad (48)
170.2 Sadalga (48)
170.3 Gokak (27)
LKD/KCC/
KGBO
North Interior
Karnataka
519.60 519.60 519.60 2002 Wireless Conventional
282 Malaprabha Dam Malaprabha Belgum/Karnataka 15.82 75.09 CD Bang/MSO
283 Narayanpur Dam Krishna/ krishna Narayanpur Dam/
Gulbarga/ Karnataka
16.20 76.36 171.1 Kurundwad (54)
171.2 Sadalga (54)
171.3 Gokak (35)
171.4 Almatti Dam (09)
LKD/KCC/
KGBO
North Interior
Karnataka
492.25 492.25 492.22 2008 Wireless Conventional
284 Veer Dam Nira/Krishna Pune/Maharashtra 18.12 74.09 UKD/KCC/KGB
O
285 Ujni Dam Bhima/ Krishna Solapur/Maharashtra 18.21 74.97 UKD/KCC/KGB
O
286 Deongaon Bridge Bhima/ Krishna Afzalpur/ Gulbarga/
Karnataka
17.17 76.33 145.1 Takli (18)
145.2 Wadakbal (18)
LKD/KCC/
KGBO
North Interior
Karnataka
402.00 404.50 407.34 2006 Wireless/
Telemetry
Conventional
287 Priyadharshini
Jurala Project
Krishna/ krishna Gadwal/ Mahbubnagar/
Andhra Pradesh
16.33 77.70 172.1 Huvinhedgi (18)
172.2 Yadgir (18)
172.3 Deosugur (06)
LKD/KCC/
KGBO
Telangana 318.52 318.52 318.50 2012 Wireless Conventional
288 Upper Tunga Tungabhadra/ Krishna Shimoga/Krishna 13.84 75.52 CD
Bangluru/C&S
RC/ C&SRO
Coimbtore
South interior
Karnataka,
Shimoga
289 Bhadra Dam Tungabhadra/ Krishna Tarikere/Chikmagalur/Karn
ataka
13.7 75.63 CD
Bangluru/C&S
RC/ C&SRO
Coimbtore
Coastal
Karnataka,
Lakkavalli
290 Tungabhadra Dam Tungabhadra/ Krishna Hospet/ Bellary/ Karnataka 15.26 76.34 173.1 Harlahalli (12)
173.2 Marol (12)
LKD/KCC/
KGBO
South Interior
Karnataka
497.74 497.74 497.74 1994 Wireless Conventional
291 Singatlur Barrage Krishna/Krishna Gadag/Karnataka 15.03 75.83 LKD/KCC/
KGBO
292 Mantralayam Tungabhadra Mantralayam/ Kurnool/
Andhra Pradesh
15.94 77.42 146.1 Ollenur (18)
146.2 T Ramapuram (18)
LKD/KCC/
KGBO
Rayalaseema 310.00 312.00 318.77 2009 Wireless/
Telemetry
Conventional
293 Sunkesula Barrage Krishna/Krishna C.Belagal/Kurnool/ Andhra
Pradesh
15.88 77.82 LKD/KCC/
KGBO
Rayalaseema Rainfall Runoff
Model
294 Kurnool Tungabhadra/ Krishna Kurnool/Kurnool/ Andhra
Pradesh
15.82 78.03 LKD/KCC/
KGBO
276 278 285.225 02.10.09
295 Srisailam Dam Krishna/ krishna Srisailam/ Kurnool/ Andhra
Pradesh
16.08 78.90 174.1 Mantralayam (18)
174.2 Krishna Agraharam
(18)
LKD/KCC/
KGBO
Rayalaseema 269.75 269.75 273.25 2009 Wireless Conventional
296 Musi Dam Musi/Krishna Nalgonda/Telengana 14.06 79.52 LKD/KCC/
KGBO
297 Dr KLRS
Pulichintala Dam
Krishna/Krishna Bellamkonda/Guntur/Andhr
a Pradesh
16.75 80.05 LKD/KCC/
KGBO
Coastal
Andhra
Pradesh
Rainfall Runoff
Model
FRL-662.94
FRL-633.83
FRL-579.85
FRL-497.33
FRL-507.00
FRL-588.24
FRL-53.34
FRL-292.00
FRL-196.60
FRL-657.75
FRL-531.40
68
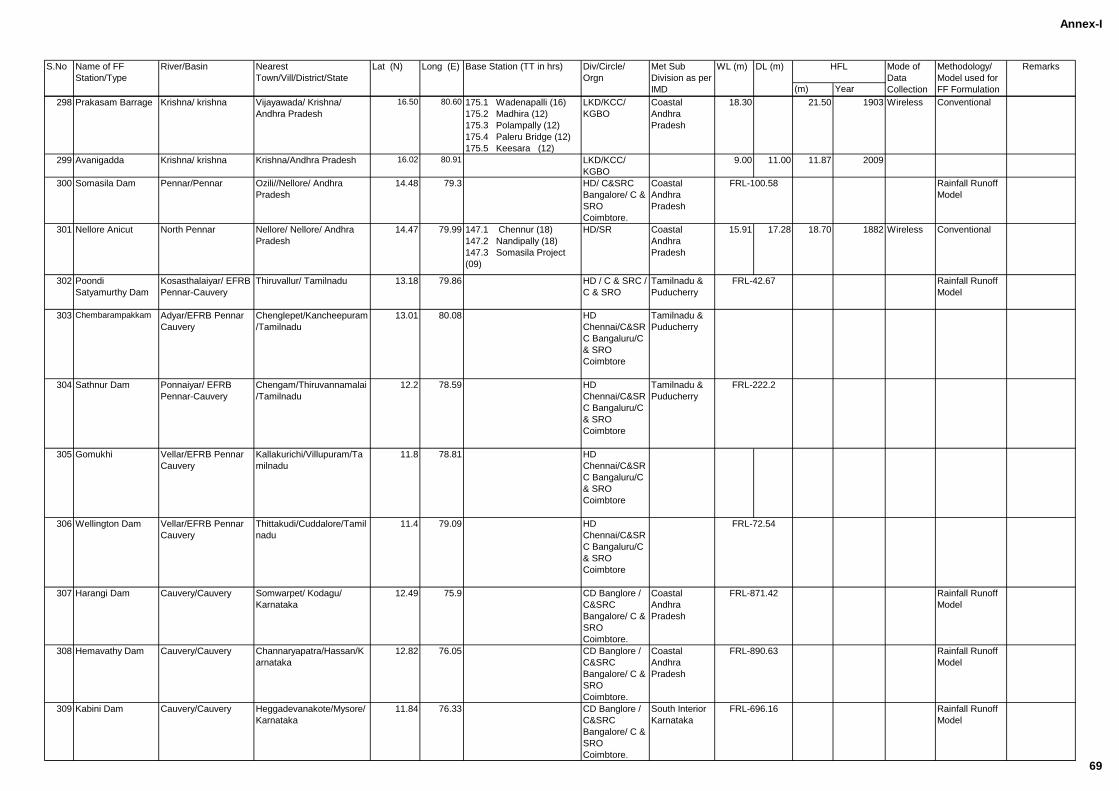
Annex-I
(m) Year
RemarksS.No Name of FF
Station/Type
River/Basin Nearest
Town/Vill/District/State
Lat (N) Long (E) Base Station (TT in hrs) Div/Circle/
Orgn
Met Sub
Division as per
IMD
WL (m) DL (m) HFL Mode of
Data
Collection
Methodology/
Model used for
FF Formulation
298 Prakasam Barrage Krishna/ krishna Vijayawada/ Krishna/
Andhra Pradesh
16.50 80.60 175.1 Wadenapalli (16)
175.2 Madhira (12)
175.3 Polampally (12)
175.4 Paleru Bridge (12)
175.5 Keesara (12)
LKD/KCC/
KGBO
Coastal
Andhra
Pradesh
18.30 21.50 1903 Wireless Conventional
299 Avanigadda Krishna/ krishna Krishna/Andhra Pradesh 16.02 80.91 LKD/KCC/
KGBO
9.00 11.00 11.87 2009
300 Somasila Dam Pennar/Pennar Ozili//Nellore/ Andhra
Pradesh
14.48 79.3 HD/ C&SRC
Bangalore/ C &
SRO
Coimbtore.
Coastal
Andhra
Pradesh
Rainfall Runoff
Model
301 Nellore Anicut North Pennar Nellore/ Nellore/ Andhra
Pradesh
14.47 79.99 147.1 Chennur (18)
147.2 Nandipally (18)
147.3 Somasila Project
(09)
HD/SR Coastal
Andhra
Pradesh
15.91 17.28 18.70 1882 Wireless Conventional
302 Poondi
Satyamurthy Dam
Kosasthalaiyar/ EFRB
Pennar-Cauvery
Thiruvallur/ Tamilnadu 13.18 79.86 HD / C & SRC /
C & SRO
Tamilnadu &
Puducherry
Rainfall Runoff
Model
303 Chembarampakkam Adyar/EFRB Pennar
Cauvery
Chenglepet/Kancheepuram
/Tamilnadu
13.01 80.08 HD
Chennai/C&SR
C Bangaluru/C
& SRO
Coimbtore
Tamilnadu &
Puducherry
304 Sathnur Dam Ponnaiyar/ EFRB
Pennar-Cauvery
Chengam/Thiruvannamalai
/Tamilnadu
12.2 78.59 HD
Chennai/C&SR
C Bangaluru/C
& SRO
Coimbtore
Tamilnadu &
Puducherry
305 Gomukhi Vellar/EFRB Pennar
Cauvery
Kallakurichi/Villupuram/Ta
milnadu
11.8 78.81 HD
Chennai/C&SR
C Bangaluru/C
& SRO
Coimbtore
306 Wellington Dam Vellar/EFRB Pennar
Cauvery
Thittakudi/Cuddalore/Tamil
nadu
11.4 79.09 HD
Chennai/C&SR
C Bangaluru/C
& SRO
Coimbtore
307 Harangi Dam Cauvery/Cauvery Somwarpet/ Kodagu/
Karnataka
12.49 75.9 CD Banglore /
C&SRC
Bangalore/ C &
SRO
Coimbtore.
Coastal
Andhra
Pradesh
Rainfall Runoff
Model
308 Hemavathy Dam Cauvery/Cauvery Channaryapatra/Hassan/K
arnataka
12.82 76.05 CD Banglore /
C&SRC
Bangalore/ C &
SRO
Coimbtore.
Coastal
Andhra
Pradesh
Rainfall Runoff
Model
309 Kabini Dam Cauvery/Cauvery Heggadevanakote/Mysore/
Karnataka
11.84 76.33 CD Banglore /
C&SRC
Bangalore/ C &
SRO
Coimbtore.
South Interior
Karnataka
Rainfall Runoff
Model
FRL-696.16
FRL-222.2
FRL-72.54
FRL-890.63
FRL-871.42
FRL-100.58
FRL-42.67
69
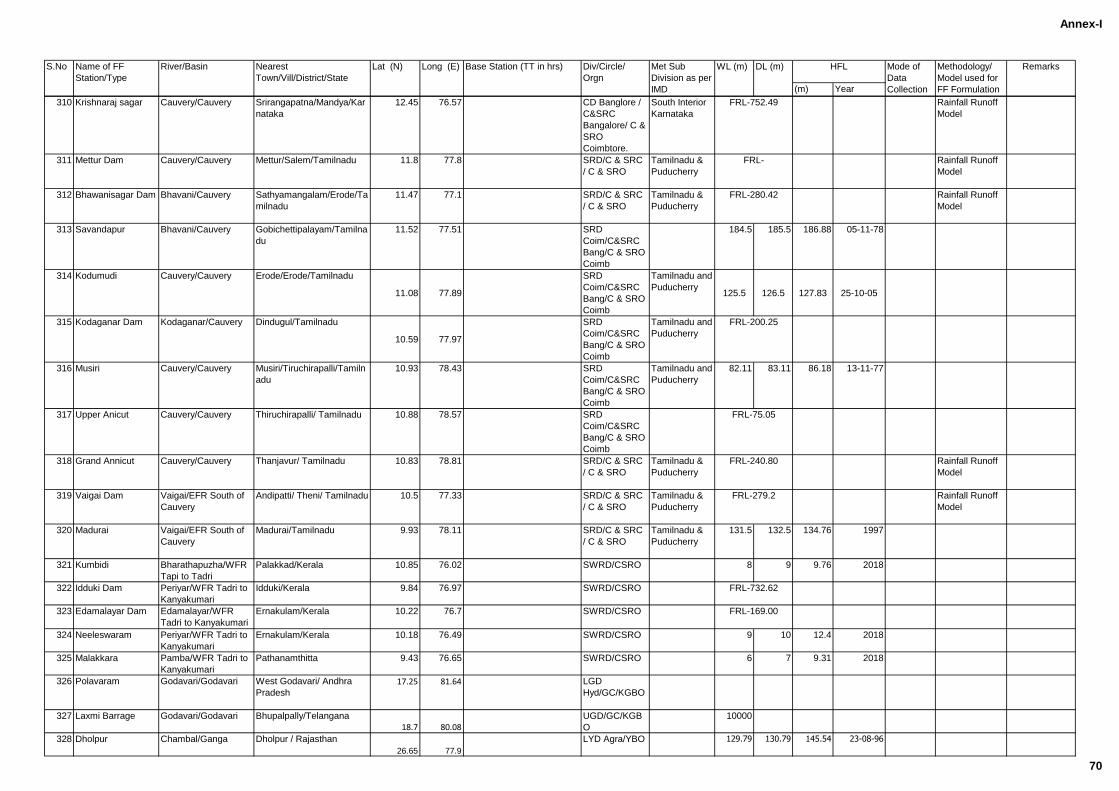
Annex-I
(m) Year
RemarksS.No Name of FF
Station/Type
River/Basin Nearest
Town/Vill/District/State
Lat (N) Long (E) Base Station (TT in hrs) Div/Circle/
Orgn
Met Sub
Division as per
IMD
WL (m) DL (m) HFL Mode of
Data
Collection
Methodology/
Model used for
FF Formulation
310 Krishnaraj sagar Cauvery/Cauvery Srirangapatna/Mandya/Kar
nataka
12.45 76.57 CD Banglore /
C&SRC
Bangalore/ C &
SRO
Coimbtore.
South Interior
Karnataka
Rainfall Runoff
Model
311 Mettur Dam Cauvery/Cauvery Mettur/Salem/Tamilnadu 11.8 77.8 SRD/C & SRC
/ C & SRO
Tamilnadu &
Puducherry
Rainfall Runoff
Model
312 Bhawanisagar Dam Bhavani/Cauvery Sathyamangalam/Erode/Ta
milnadu
11.47 77.1 SRD/C & SRC
/ C & SRO
Tamilnadu &
Puducherry
Rainfall Runoff
Model
313 Savandapur Bhavani/Cauvery Gobichettipalayam/Tamilna
du
11.52 77.51 SRD
Coim/C&SRC
Bang/C & SRO
Coimb
184.5 185.5 186.88 05-11-78
314 Kodumudi Cauvery/Cauvery Erode/Erode/Tamilnadu
11.08 77.89
SRD
Coim/C&SRC
Bang/C & SRO
Coimb
Tamilnadu and
Puducherry125.5 126.5 127.83 25-10-05
315 Kodaganar Dam Kodaganar/Cauvery Dindugul/Tamilnadu
10.59 77.97
SRD
Coim/C&SRC
Bang/C & SRO
Coimb
Tamilnadu and
Puducherry
316 Musiri Cauvery/Cauvery Musiri/Tiruchirapalli/Tamiln
adu
10.93 78.43 SRD
Coim/C&SRC
Bang/C & SRO
Coimb
Tamilnadu and
Puducherry
82.11 83.11 86.18 13-11-77
317 Upper Anicut Cauvery/Cauvery Thiruchirapalli/ Tamilnadu 10.88 78.57 SRD
Coim/C&SRC
Bang/C & SRO
Coimb
318 Grand Annicut Cauvery/Cauvery Thanjavur/ Tamilnadu 10.83 78.81 SRD/C & SRC
/ C & SRO
Tamilnadu &
Puducherry
Rainfall Runoff
Model
319 Vaigai Dam Vaigai/EFR South of
Cauvery
Andipatti/ Theni/ Tamilnadu 10.5 77.33 SRD/C & SRC
/ C & SRO
Tamilnadu &
Puducherry
Rainfall Runoff
Model
320 Madurai Vaigai/EFR South of
Cauvery
Madurai/Tamilnadu 9.93 78.11 SRD/C & SRC
/ C & SRO
Tamilnadu &
Puducherry
131.5 132.5 134.76 1997
321 Kumbidi Bharathapuzha/WFR
Tapi to Tadri
Palakkad/Kerala 10.85 76.02 SWRD/CSRO 8 9 9.76 2018
322 Idduki Dam Periyar/WFR Tadri to
Kanyakumari
Idduki/Kerala 9.84 76.97 SWRD/CSRO
323 Edamalayar Dam Edamalayar/WFR
Tadri to Kanyakumari
Ernakulam/Kerala 10.22 76.7 SWRD/CSRO
324 Neeleswaram Periyar/WFR Tadri to
Kanyakumari
Ernakulam/Kerala 10.18 76.49 SWRD/CSRO 9 10 12.4 2018
325 Malakkara Pamba/WFR Tadri to
Kanyakumari
Pathanamthitta 9.43 76.65 SWRD/CSRO 6 7 9.31 2018
326 Polavaram Godavari/Godavari West Godavari/ Andhra
Pradesh
17.25 81.64 LGD
Hyd/GC/KGBO
327 Laxmi Barrage Godavari/Godavari Bhupalpally/Telangana
18.7 80.08UGD/GC/KGB
O
10000
328 Dholpur Chambal/Ganga Dholpur / Rajasthan
26.65 77.9
LYD Agra/YBO 129.79 130.79 145.54 23-08-96
FRL-200.25
FRL-732.62
FRL-169.00
FRL-75.05
FRL-240.80
FRL-280.42
FRL-279.2
FRL-
FRL-752.49
70
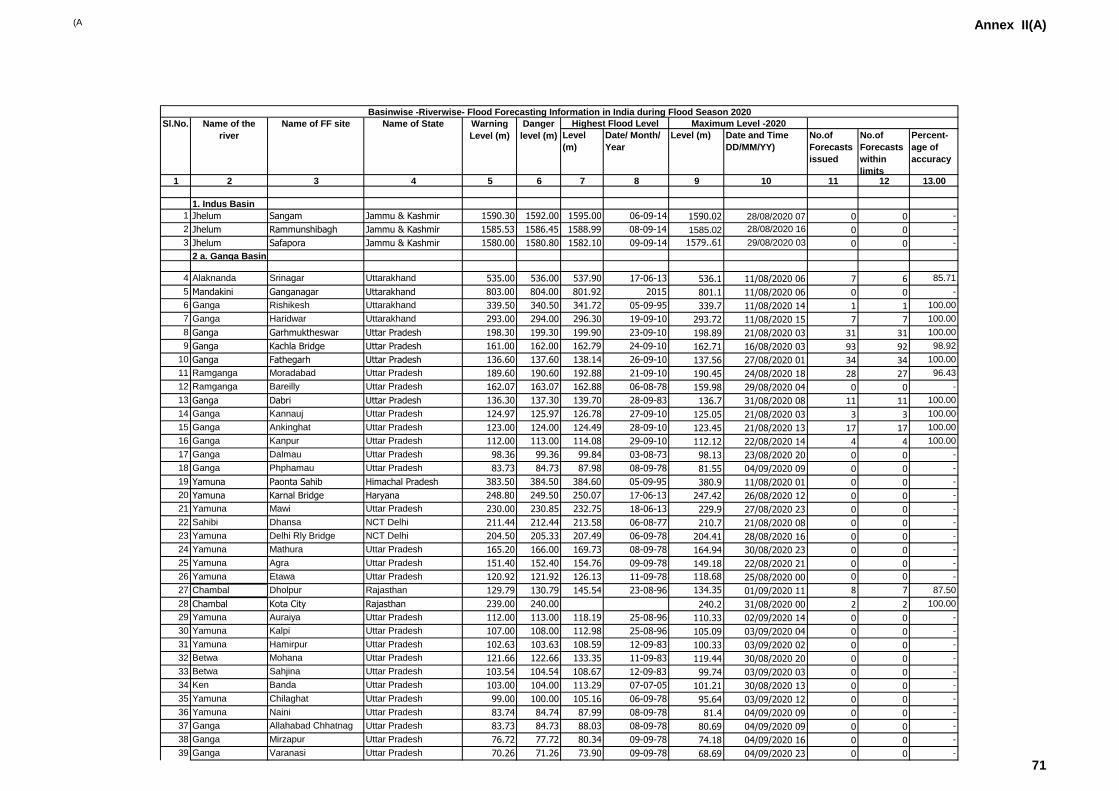
(A Annex II(A)
Level
(m)
Date/ Month/
Year
Level (m) Date and Time
DD/MM/YY)
No.of
Forecasts
issued
No.of
Forecasts
within
limits
Percent-
age of
accuracy
1 2 3 4 5 6 7 8 9 10 11 12 13.00
1. Indus Basin
1 Jhelum Sangam Jammu & Kashmir 1590.30 1592.00 1595.00 06-09-14 1590.02 28/08/2020 07 0 0 -
2 Jhelum Rammunshibagh Jammu & Kashmir 1585.53 1586.45 1588.99 08-09-14 1585.02 28/08/2020 16 0 0 -
3 Jhelum Safapora Jammu & Kashmir 1580.00 1580.80 1582.10 09-09-14 1579..61 29/08/2020 03 0 0 -
2 a. Ganga Basin
4 Alaknanda Srinagar Uttarakhand 535.00 536.00 537.90 17-06-13 536.1 11/08/2020 06 7 6 85.71
5 Mandakini Ganganagar Uttarakhand 803.00 804.00 801.92 2015 801.1 11/08/2020 06 0 0 -
6 Ganga Rishikesh Uttarakhand 339.50 340.50 341.72 05-09-95 339.7 11/08/2020 14 1 1 100.00
7 Ganga Haridwar Uttarakhand 293.00 294.00 296.30 19-09-10 293.72 11/08/2020 15 7 7 100.00
8 Ganga Garhmuktheswar Uttar Pradesh 198.30 199.30 199.90 23-09-10 198.89 21/08/2020 03 31 31 100.00
9 Ganga Kachla Bridge Uttar Pradesh 161.00 162.00 162.79 24-09-10 162.71 16/08/2020 03 93 92 98.92
10 Ganga Fathegarh Uttar Pradesh 136.60 137.60 138.14 26-09-10 137.56 27/08/2020 01 34 34 100.00
11 Ramganga Moradabad Uttar Pradesh 189.60 190.60 192.88 21-09-10 190.45 24/08/2020 18 28 27 96.43
12 Ramganga Bareilly Uttar Pradesh 162.07 163.07 162.88 06-08-78 159.98 29/08/2020 04 0 0 -
13 Ganga Dabri Uttar Pradesh 136.30 137.30 139.70 28-09-83 136.7 31/08/2020 08 11 11 100.00
14 Ganga Kannauj Uttar Pradesh 124.97 125.97 126.78 27-09-10 125.05 21/08/2020 03 3 3 100.00
15 Ganga Ankinghat Uttar Pradesh 123.00 124.00 124.49 28-09-10 123.45 21/08/2020 13 17 17 100.00
16 Ganga Kanpur Uttar Pradesh 112.00 113.00 114.08 29-09-10 112.12 22/08/2020 14 4 4 100.00
17 Ganga Dalmau Uttar Pradesh 98.36 99.36 99.84 03-08-73 98.13 23/08/2020 20 0 0 -
18 Ganga Phphamau Uttar Pradesh 83.73 84.73 87.98 08-09-78 81.55 04/09/2020 09 0 0 -
19 Yamuna Paonta Sahib Himachal Pradesh 383.50 384.50 384.60 05-09-95 380.9 11/08/2020 01 0 0 -
20 Yamuna Karnal Bridge Haryana 248.80 249.50 250.07 17-06-13 247.42 26/08/2020 12 0 0 -
21 Yamuna Mawi Uttar Pradesh 230.00 230.85 232.75 18-06-13 229.9 27/08/2020 23 0 0 -
22 Sahibi Dhansa NCT Delhi 211.44 212.44 213.58 06-08-77 210.7 21/08/2020 08 0 0 -
23 Yamuna Delhi Rly Bridge NCT Delhi 204.50 205.33 207.49 06-09-78 204.41 28/08/2020 16 0 0 -
24 Yamuna Mathura Uttar Pradesh 165.20 166.00 169.73 08-09-78 164.94 30/08/2020 23 0 0 -
25 Yamuna Agra Uttar Pradesh 151.40 152.40 154.76 09-09-78 149.18 22/08/2020 21 0 0 -
26 Yamuna Etawa Uttar Pradesh 120.92 121.92 126.13 11-09-78 118.68 25/08/2020 00 0 0 -
27 Chambal Dholpur Rajasthan 129.79 130.79 145.54 23-08-96 134.35 01/09/2020 11 8 7 87.50
28 Chambal Kota City Rajasthan 239.00 240.00 240.2 31/08/2020 00 2 2 100.00
29 Yamuna Auraiya Uttar Pradesh 112.00 113.00 118.19 25-08-96 110.33 02/09/2020 14 0 0 -
30 Yamuna Kalpi Uttar Pradesh 107.00 108.00 112.98 25-08-96 105.09 03/09/2020 04 0 0 -
31 Yamuna Hamirpur Uttar Pradesh 102.63 103.63 108.59 12-09-83 100.33 03/09/2020 02 0 0 -
32 Betwa Mohana Uttar Pradesh 121.66 122.66 133.35 11-09-83 119.44 30/08/2020 20 0 0 -
33 Betwa Sahjina Uttar Pradesh 103.54 104.54 108.67 12-09-83 99.74 03/09/2020 03 0 0 -
34 Ken Banda Uttar Pradesh 103.00 104.00 113.29 07-07-05 101.21 30/08/2020 13 0 0 -
35 Yamuna Chilaghat Uttar Pradesh 99.00 100.00 105.16 06-09-78 95.64 03/09/2020 12 0 0 -
36 Yamuna Naini Uttar Pradesh 83.74 84.74 87.99 08-09-78 81.4 04/09/2020 09 0 0 -
37 Ganga Allahabad Chhatnag Uttar Pradesh 83.73 84.73 88.03 08-09-78 80.69 04/09/2020 09 0 0 -
38 Ganga Mirzapur Uttar Pradesh 76.72 77.72 80.34 09-09-78 74.18 04/09/2020 16 0 0 -
39 Ganga Varanasi Uttar Pradesh 70.26 71.26 73.90 09-09-78 68.69 04/09/2020 23 0 0 -
Basinwise -Riverwise- Flood Forecasting Information in India during Flood Season 2020
Sl.No. Name of the
river
Name of FF site Name of State Warning
Level (m)
Danger
level (m)
Highest Flood Level Maximum Level -2020
71
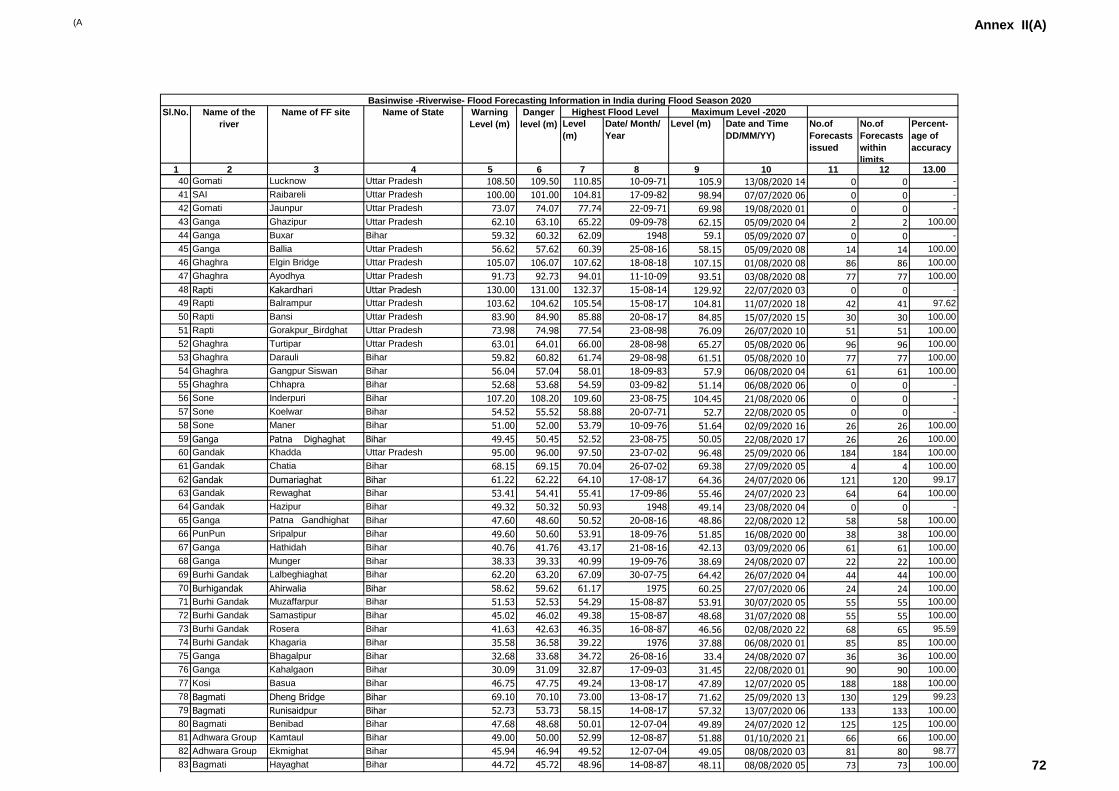
(A Annex II(A)
Level
(m)
Date/ Month/
Year
Level (m) Date and Time
DD/MM/YY)
No.of
Forecasts
issued
No.of
Forecasts
within
limits
Percent-
age of
accuracy
1 2 3 4 5 6 7 8 9 10 11 12 13.00
Basinwise -Riverwise- Flood Forecasting Information in India during Flood Season 2020
Sl.No. Name of the
river
Name of FF site Name of State Warning
Level (m)
Danger
level (m)
Highest Flood Level Maximum Level -2020
40 Gomati Lucknow Uttar Pradesh 108.50 109.50 110.85 10-09-71 105.9 13/08/2020 14 0 0 -
41 SAI Raibareli Uttar Pradesh 100.00 101.00 104.81 17-09-82 98.94 07/07/2020 06 0 0 -
42 Gomati Jaunpur Uttar Pradesh 73.07 74.07 77.74 22-09-71 69.98 19/08/2020 01 0 0 -
43 Ganga Ghazipur Uttar Pradesh 62.10 63.10 65.22 09-09-78 62.15 05/09/2020 04 2 2 100.00
44 Ganga Buxar Bihar 59.32 60.32 62.09 1948 59.1 05/09/2020 07 0 0 -
45 Ganga Ballia Uttar Pradesh 56.62 57.62 60.39 25-08-16 58.15 05/09/2020 08 14 14 100.00
46 Ghaghra Elgin Bridge Uttar Pradesh 105.07 106.07 107.62 18-08-18 107.15 01/08/2020 08 86 86 100.00
47 Ghaghra Ayodhya Uttar Pradesh 91.73 92.73 94.01 11-10-09 93.51 03/08/2020 08 77 77 100.00
48 Rapti Kakardhari Uttar Pradesh 130.00 131.00 132.37 15-08-14 129.92 22/07/2020 03 0 0 -
49 Rapti Balrampur Uttar Pradesh 103.62 104.62 105.54 15-08-17 104.81 11/07/2020 18 42 41 97.62
50 Rapti Bansi Uttar Pradesh 83.90 84.90 85.88 20-08-17 84.85 15/07/2020 15 30 30 100.00
51 Rapti Gorakpur_Birdghat Uttar Pradesh 73.98 74.98 77.54 23-08-98 76.09 26/07/2020 10 51 51 100.00
52 Ghaghra Turtipar Uttar Pradesh 63.01 64.01 66.00 28-08-98 65.27 05/08/2020 06 96 96 100.00
53 Ghaghra Darauli Bihar 59.82 60.82 61.74 29-08-98 61.51 05/08/2020 10 77 77 100.00
54 Ghaghra Gangpur Siswan Bihar 56.04 57.04 58.01 18-09-83 57.9 06/08/2020 04 61 61 100.00
55 Ghaghra Chhapra Bihar 52.68 53.68 54.59 03-09-82 51.14 06/08/2020 06 0 0 -
56 Sone Inderpuri Bihar 107.20 108.20 109.60 23-08-75 104.45 21/08/2020 06 0 0 -
57 Sone Koelwar Bihar 54.52 55.52 58.88 20-07-71 52.7 22/08/2020 05 0 0 -
58 Sone Maner Bihar 51.00 52.00 53.79 10-09-76 51.64 02/09/2020 16 26 26 100.00
59 Ganga Patna Dighaghat Bihar 49.45 50.45 52.52 23-08-75 50.05 22/08/2020 17 26 26 100.00
60 Gandak Khadda Uttar Pradesh 95.00 96.00 97.50 23-07-02 96.48 25/09/2020 06 184 184 100.00
61 Gandak Chatia Bihar 68.15 69.15 70.04 26-07-02 69.38 27/09/2020 05 4 4 100.00
62 Gandak Dumariaghat Bihar 61.22 62.22 64.10 17-08-17 64.36 24/07/2020 06 121 120 99.17
63 Gandak Rewaghat Bihar 53.41 54.41 55.41 17-09-86 55.46 24/07/2020 23 64 64 100.00
64 Gandak Hazipur Bihar 49.32 50.32 50.93 1948 49.14 23/08/2020 04 0 0 -
65 Ganga Patna Gandhighat Bihar 47.60 48.60 50.52 20-08-16 48.86 22/08/2020 12 58 58 100.00
66 PunPun Sripalpur Bihar 49.60 50.60 53.91 18-09-76 51.85 16/08/2020 00 38 38 100.00
67 Ganga Hathidah Bihar 40.76 41.76 43.17 21-08-16 42.13 03/09/2020 06 61 61 100.00
68 Ganga Munger Bihar 38.33 39.33 40.99 19-09-76 38.69 24/08/2020 07 22 22 100.00
69 Burhi Gandak Lalbeghiaghat Bihar 62.20 63.20 67.09 30-07-75 64.42 26/07/2020 04 44 44 100.00
70 Burhigandak Ahirwalia Bihar 58.62 59.62 61.17 1975 60.25 27/07/2020 06 24 24 100.00
71 Burhi Gandak Muzaffarpur Bihar 51.53 52.53 54.29 15-08-87 53.91 30/07/2020 05 55 55 100.00
72 Burhi Gandak Samastipur Bihar 45.02 46.02 49.38 15-08-87 48.68 31/07/2020 08 55 55 100.00
73 Burhi Gandak Rosera Bihar 41.63 42.63 46.35 16-08-87 46.56 02/08/2020 22 68 65 95.59
74 Burhi Gandak Khagaria Bihar 35.58 36.58 39.22 1976 37.88 06/08/2020 01 85 85 100.00
75 Ganga Bhagalpur Bihar 32.68 33.68 34.72 26-08-16 33.4 24/08/2020 07 36 36 100.00
76 Ganga Kahalgaon Bihar 30.09 31.09 32.87 17-09-03 31.45 22/08/2020 01 90 90 100.00
77 Kosi Basua Bihar 46.75 47.75 49.24 13-08-17 47.89 12/07/2020 05 188 188 100.00
78 Bagmati Dheng Bridge Bihar 69.10 70.10 73.00 13-08-17 71.62 25/09/2020 13 130 129 99.23
79 Bagmati Runisaidpur Bihar 52.73 53.73 58.15 14-08-17 57.32 13/07/2020 06 133 133 100.00
80 Bagmati Benibad Bihar 47.68 48.68 50.01 12-07-04 49.89 24/07/2020 12 125 125 100.00
81 Adhwara Group Kamtaul Bihar 49.00 50.00 52.99 12-08-87 51.88 01/10/2020 21 66 66 100.00
82 Adhwara Group Ekmighat Bihar 45.94 46.94 49.52 12-07-04 49.05 08/08/2020 03 81 80 98.77
83 Bagmati Hayaghat Bihar 44.72 45.72 48.96 14-08-87 48.11 08/08/2020 05 73 73 100.00 72
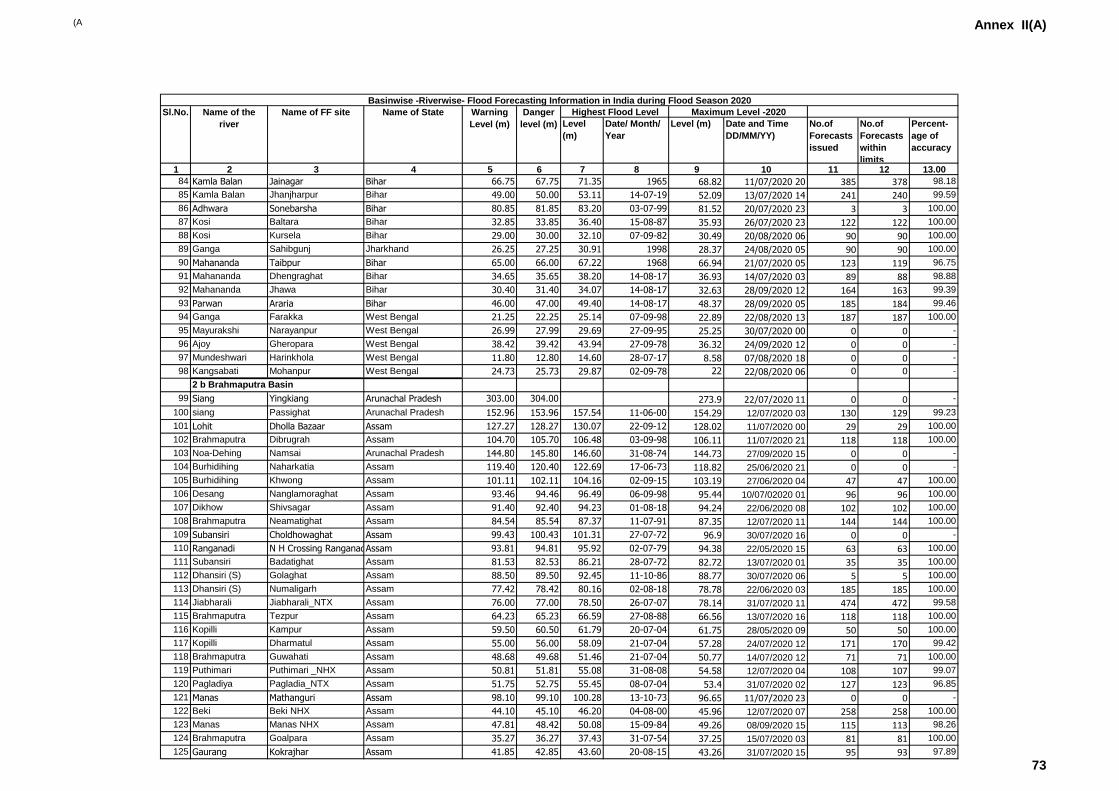
(A Annex II(A)
Level
(m)
Date/ Month/
Year
Level (m) Date and Time
DD/MM/YY)
No.of
Forecasts
issued
No.of
Forecasts
within
limits
Percent-
age of
accuracy
1 2 3 4 5 6 7 8 9 10 11 12 13.00
Basinwise -Riverwise- Flood Forecasting Information in India during Flood Season 2020
Sl.No. Name of the
river
Name of FF site Name of State Warning
Level (m)
Danger
level (m)
Highest Flood Level Maximum Level -2020
84 Kamla Balan Jainagar Bihar 66.75 67.75 71.35 1965 68.82 11/07/2020 20 385 378 98.18
85 Kamla Balan Jhanjharpur Bihar 49.00 50.00 53.11 14-07-19 52.09 13/07/2020 14 241 240 99.59
86 Adhwara Sonebarsha Bihar 80.85 81.85 83.20 03-07-99 81.52 20/07/2020 23 3 3 100.00
87 Kosi Baltara Bihar 32.85 33.85 36.40 15-08-87 35.93 26/07/2020 23 122 122 100.00
88 Kosi Kursela Bihar 29.00 30.00 32.10 07-09-82 30.49 20/08/2020 06 90 90 100.00
89 Ganga Sahibgunj Jharkhand 26.25 27.25 30.91 1998 28.37 24/08/2020 05 90 90 100.00
90 Mahananda Taibpur Bihar 65.00 66.00 67.22 1968 66.94 21/07/2020 05 123 119 96.75
91 Mahananda Dhengraghat Bihar 34.65 35.65 38.20 14-08-17 36.93 14/07/2020 03 89 88 98.88
92 Mahananda Jhawa Bihar 30.40 31.40 34.07 14-08-17 32.63 28/09/2020 12 164 163 99.39
93 Parwan Araria Bihar 46.00 47.00 49.40 14-08-17 48.37 28/09/2020 05 185 184 99.46
94 Ganga Farakka West Bengal 21.25 22.25 25.14 07-09-98 22.89 22/08/2020 13 187 187 100.00
95 Mayurakshi Narayanpur West Bengal 26.99 27.99 29.69 27-09-95 25.25 30/07/2020 00 0 0 -
96 Ajoy Gheropara West Bengal 38.42 39.42 43.94 27-09-78 36.32 24/09/2020 12 0 0 -
97 Mundeshwari Harinkhola West Bengal 11.80 12.80 14.60 28-07-17 8.58 07/08/2020 18 0 0 -
98 Kangsabati Mohanpur West Bengal 24.73 25.73 29.87 02-09-78 22 22/08/2020 06 0 0 -
2 b Brahmaputra Basin
99 Siang Yingkiang Arunachal Pradesh 303.00 304.00 273.9 22/07/2020 11 0 0 -
100 siang Passighat Arunachal Pradesh 152.96 153.96 157.54 11-06-00 154.29 12/07/2020 03 130 129 99.23
101 Lohit Dholla Bazaar Assam 127.27 128.27 130.07 22-09-12 128.02 11/07/2020 00 29 29 100.00
102 Brahmaputra Dibrugrah Assam 104.70 105.70 106.48 03-09-98 106.11 11/07/2020 21 118 118 100.00
103 Noa-Dehing Namsai Arunachal Pradesh 144.80 145.80 146.60 31-08-74 144.73 27/09/2020 15 0 0 -
104 Burhidihing Naharkatia Assam 119.40 120.40 122.69 17-06-73 118.82 25/06/2020 21 0 0 -
105 Burhidihing Khwong Assam 101.11 102.11 104.16 02-09-15 103.19 27/06/2020 04 47 47 100.00
106 Desang Nanglamoraghat Assam 93.46 94.46 96.49 06-09-98 95.44 10/07/02020 01 96 96 100.00
107 Dikhow Shivsagar Assam 91.40 92.40 94.23 01-08-18 94.24 22/06/2020 08 102 102 100.00
108 Brahmaputra Neamatighat Assam 84.54 85.54 87.37 11-07-91 87.35 12/07/2020 11 144 144 100.00
109 Subansiri Choldhowaghat Assam 99.43 100.43 101.31 27-07-72 96.9 30/07/2020 16 0 0 -
110 Ranganadi N H Crossing RanganadiAssam 93.81 94.81 95.92 02-07-79 94.38 22/05/2020 15 63 63 100.00
111 Subansiri Badatighat Assam 81.53 82.53 86.21 28-07-72 82.72 13/07/2020 01 35 35 100.00
112 Dhansiri (S) Golaghat Assam 88.50 89.50 92.45 11-10-86 88.77 30/07/2020 06 5 5 100.00
113 Dhansiri (S) Numaligarh Assam 77.42 78.42 80.16 02-08-18 78.78 22/06/2020 03 185 185 100.00
114 Jiabharali Jiabharali_NTX Assam 76.00 77.00 78.50 26-07-07 78.14 31/07/2020 11 474 472 99.58
115 Brahmaputra Tezpur Assam 64.23 65.23 66.59 27-08-88 66.56 13/07/2020 16 118 118 100.00
116 Kopilli Kampur Assam 59.50 60.50 61.79 20-07-04 61.75 28/05/2020 09 50 50 100.00
117 Kopilli Dharmatul Assam 55.00 56.00 58.09 21-07-04 57.28 24/07/2020 12 171 170 99.42
118 Brahmaputra Guwahati Assam 48.68 49.68 51.46 21-07-04 50.77 14/07/2020 12 71 71 100.00
119 Puthimari Puthimari _NHX Assam 50.81 51.81 55.08 31-08-08 54.58 12/07/2020 04 108 107 99.07
120 Pagladiya Pagladia_NTX Assam 51.75 52.75 55.45 08-07-04 53.4 31/07/2020 02 127 123 96.85
121 Manas Mathanguri Assam 98.10 99.10 100.28 13-10-73 96.65 11/07/2020 23 0 0 -
122 Beki Beki NHX Assam 44.10 45.10 46.20 04-08-00 45.96 12/07/2020 07 258 258 100.00
123 Manas Manas NHX Assam 47.81 48.42 50.08 15-09-84 49.26 08/09/2020 15 115 113 98.26
124 Brahmaputra Goalpara Assam 35.27 36.27 37.43 31-07-54 37.25 15/07/2020 03 81 81 100.00
125 Gaurang Kokrajhar Assam 41.85 42.85 43.60 20-08-15 43.26 31/07/2020 15 95 93 97.89
73
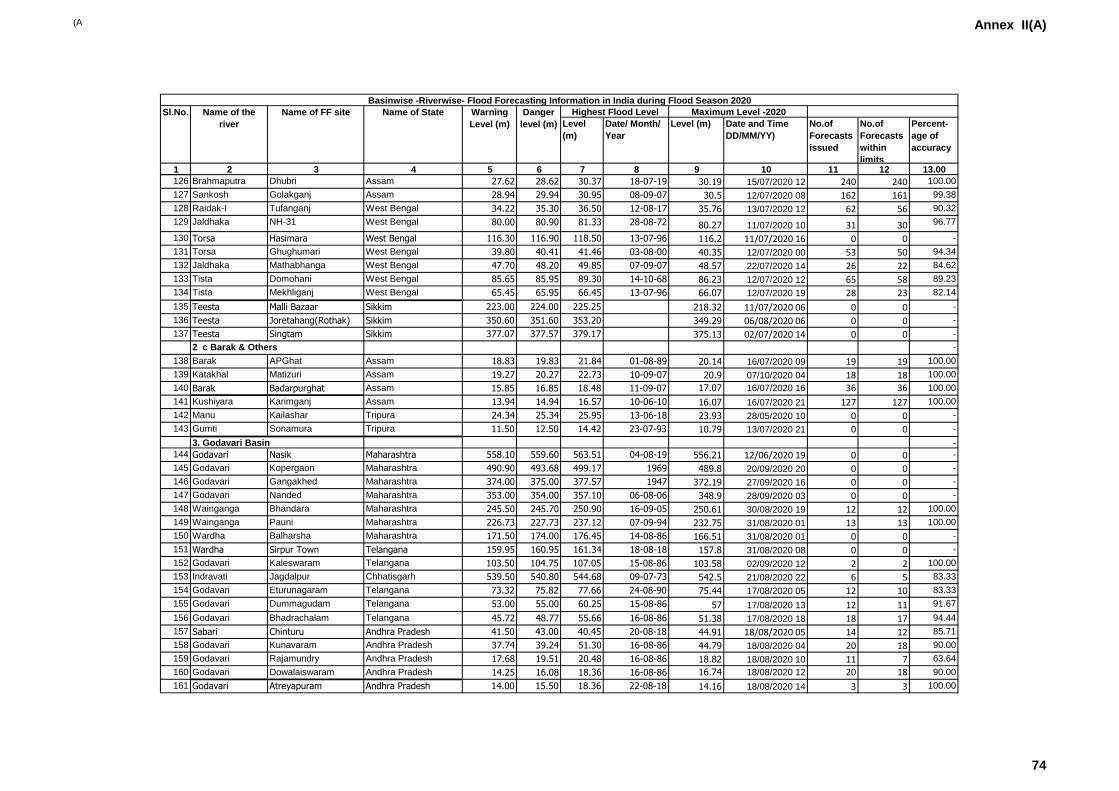
(A Annex II(A)
Level
(m)
Date/ Month/
Year
Level (m) Date and Time
DD/MM/YY)
No.of
Forecasts
issued
No.of
Forecasts
within
limits
Percent-
age of
accuracy
1 2 3 4 5 6 7 8 9 10 11 12 13.00
Basinwise -Riverwise- Flood Forecasting Information in India during Flood Season 2020
Sl.No. Name of the
river
Name of FF site Name of State Warning
Level (m)
Danger
level (m)
Highest Flood Level Maximum Level -2020
126 Brahmaputra Dhubri Assam 27.62 28.62 30.37 18-07-19 30.19 15/07/2020 12 240 240 100.00
127 Sankosh Golakganj Assam 28.94 29.94 30.95 08-09-07 30.5 12/07/2020 08 162 161 99.38
128 Raidak-I Tufanganj West Bengal 34.22 35.30 36.50 12-08-17 35.76 13/07/2020 12 62 56 90.32
129 Jaldhaka NH-31 West Bengal 80.00 80.90 81.33 28-08-72 80.27 11/07/2020 10 31 30 96.77
130 Torsa Hasimara West Bengal 116.30 116.90 118.50 13-07-96 116.2 11/07/2020 16 0 0 -
131 Torsa Ghughumari West Bengal 39.80 40.41 41.46 03-08-00 40.35 12/07/2020 00 53 50 94.34
132 Jaldhaka Mathabhanga West Bengal 47.70 48.20 49.85 07-09-07 48.57 22/07/2020 14 26 22 84.62
133 Tista Domohani West Bengal 85.65 85.95 89.30 14-10-68 86.23 12/07/2020 12 65 58 89.23
134 Tista Mekhliganj West Bengal 65.45 65.95 66.45 13-07-96 66.07 12/07/2020 19 28 23 82.14
135 Teesta Malli Bazaar Sikkim 223.00 224.00 225.25 218.32 11/07/2020 06 0 0 -
136 Teesta Joretahang(Rothak) Sikkim 350.60 351.60 353.20 349.29 06/08/2020 06 0 0 -
137 Teesta Singtam Sikkim 377.07 377.57 379.17 375.13 02/07/2020 14 0 0 -
2 c Barak & Others -
138 Barak APGhat Assam 18.83 19.83 21.84 01-08-89 20.14 16/07/2020 09 19 19 100.00
139 Katakhal Matizuri Assam 19.27 20.27 22.73 10-09-07 20.9 07/10/2020 04 18 18 100.00
140 Barak Badarpurghat Assam 15.85 16.85 18.48 11-09-07 17.07 16/07/2020 16 36 36 100.00
141 Kushiyara Karimganj Assam 13.94 14.94 16.57 10-06-10 16.07 16/07/2020 21 127 127 100.00
142 Manu Kailashar Tripura 24.34 25.34 25.95 13-06-18 23.93 28/05/2020 10 0 0 -
143 Gumti Sonamura Tripura 11.50 12.50 14.42 23-07-93 10.79 13/07/2020 21 0 0 -
3. Godavari Basin -
144 Godavari Nasik Maharashtra 558.10 559.60 563.51 04-08-19 556.21 12/06/2020 19 0 0 -
145 Godavari Kopergaon Maharashtra 490.90 493.68 499.17 1969 489.8 20/09/2020 20 0 0 -
146 Godavari Gangakhed Maharashtra 374.00 375.00 377.57 1947 372.19 27/09/2020 16 0 0 -
147 Godavari Nanded Maharashtra 353.00 354.00 357.10 06-08-06 348.9 28/09/2020 03 0 0 -
148 Wainganga Bhandara Maharashtra 245.50 245.70 250.90 16-09-05 250.61 30/08/2020 19 12 12 100.00
149 Wainganga Pauni Maharashtra 226.73 227.73 237.12 07-09-94 232.75 31/08/2020 01 13 13 100.00
150 Wardha Balharsha Maharashtra 171.50 174.00 176.45 14-08-86 166.51 31/08/2020 01 0 0 -
151 Wardha Sirpur Town Telangana 159.95 160.95 161.34 18-08-18 157.8 31/08/2020 08 0 0 -
152 Godavari Kaleswaram Telangana 103.50 104.75 107.05 15-08-86 103.58 02/09/2020 12 2 2 100.00
153 Indravati Jagdalpur Chhatisgarh 539.50 540.80 544.68 09-07-73 542.5 21/08/2020 22 6 5 83.33
154 Godavari Eturunagaram Telangana 73.32 75.82 77.66 24-08-90 75.44 17/08/2020 05 12 10 83.33
155 Godavari Dummagudam Telangana 53.00 55.00 60.25 15-08-86 57 17/08/2020 13 12 11 91.67
156 Godavari Bhadrachalam Telangana 45.72 48.77 55.66 16-08-86 51.38 17/08/2020 18 18 17 94.44
157 Sabari Chinturu Andhra Pradesh 41.50 43.00 40.45 20-08-18 44.91 18/08/2020 05 14 12 85.71
158 Godavari Kunavaram Andhra Pradesh 37.74 39.24 51.30 16-08-86 44.79 18/08/2020 04 20 18 90.00
159 Godavari Rajamundry Andhra Pradesh 17.68 19.51 20.48 16-08-86 18.82 18/08/2020 10 11 7 63.64
160 Godavari Dowalaiswaram Andhra Pradesh 14.25 16.08 18.36 16-08-86 16.74 18/08/2020 12 20 18 90.00
161 Godavari Atreyapuram Andhra Pradesh 14.00 15.50 18.36 22-08-18 14.16 18/08/2020 14 3 3 100.00
74
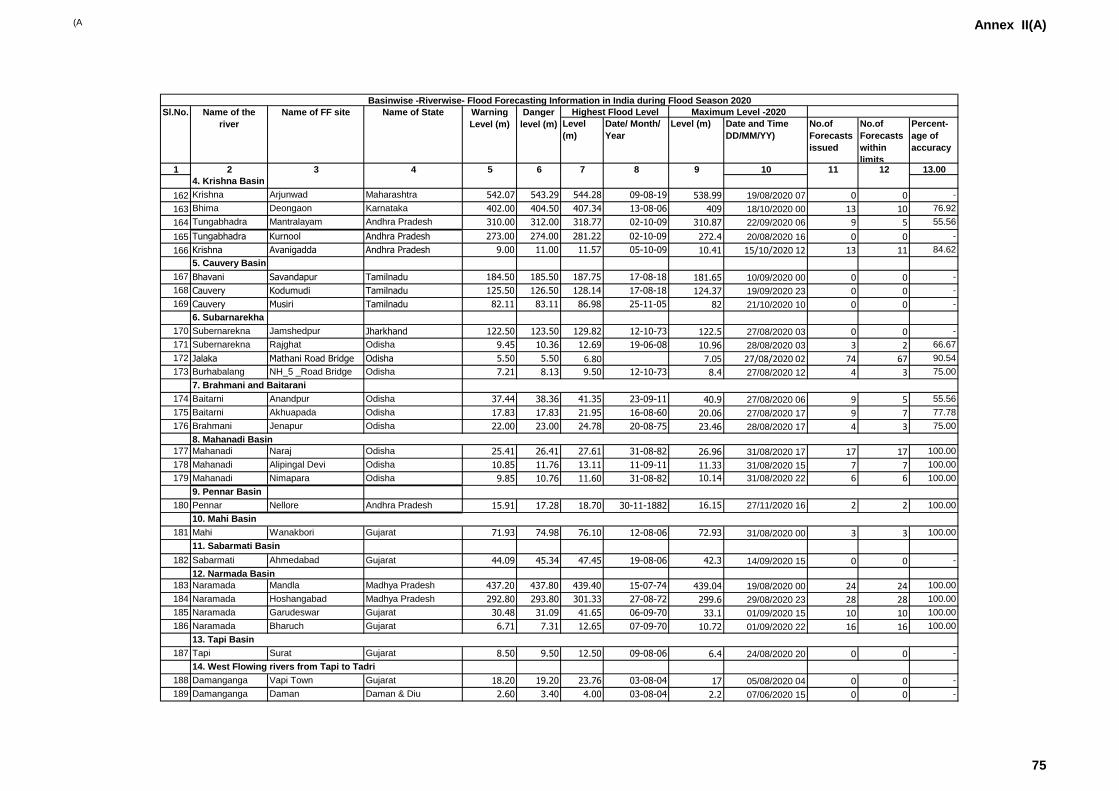
(A Annex II(A)
Level
(m)
Date/ Month/
Year
Level (m) Date and Time
DD/MM/YY)
No.of
Forecasts
issued
No.of
Forecasts
within
limits
Percent-
age of
accuracy
1 2 3 4 5 6 7 8 9 10 11 12 13.00
Basinwise -Riverwise- Flood Forecasting Information in India during Flood Season 2020
Sl.No. Name of the
river
Name of FF site Name of State Warning
Level (m)
Danger
level (m)
Highest Flood Level Maximum Level -2020
4. Krishna Basin
162 Krishna Arjunwad Maharashtra 542.07 543.29 544.28 09-08-19 538.99 19/08/2020 07 0 0 -
163 Bhima Deongaon Karnataka 402.00 404.50 407.34 13-08-06 409 18/10/2020 00 13 10 76.92
164 Tungabhadra Mantralayam Andhra Pradesh 310.00 312.00 318.77 02-10-09 310.87 22/09/2020 06 9 5 55.56
165 Tungabhadra Kurnool Andhra Pradesh 273.00 274.00 281.22 02-10-09 272.4 20/08/2020 16 0 0 -
166 Krishna Avanigadda Andhra Pradesh 9.00 11.00 11.57 05-10-09 10.41 15/10/2020 12 13 11 84.62
5. Cauvery Basin
167 Bhavani Savandapur Tamilnadu 184.50 185.50 187.75 17-08-18 181.65 10/09/2020 00 0 0 -
168 Cauvery Kodumudi Tamilnadu 125.50 126.50 128.14 17-08-18 124.37 19/09/2020 23 0 0 -
169 Cauvery Musiri Tamilnadu 82.11 83.11 86.98 25-11-05 82 21/10/2020 10 0 0 -
6. Subarnarekha
170 Subernarekna Jamshedpur Jharkhand 122.50 123.50 129.82 12-10-73 122.5 27/08/2020 03 0 0 -
171 Subernarekna Rajghat Odisha 9.45 10.36 12.69 19-06-08 10.96 28/08/2020 03 3 2 66.67
172 Jalaka Mathani Road Bridge Odisha 5.50 5.50 6.80 7.05 27/08/2020 02 74 67 90.54
173 Burhabalang NH_5 _Road Bridge Odisha 7.21 8.13 9.50 12-10-73 8.4 27/08/2020 12 4 3 75.00
7. Brahmani and Baitarani
174 Baitarni Anandpur Odisha 37.44 38.36 41.35 23-09-11 40.9 27/08/2020 06 9 5 55.56
175 Baitarni Akhuapada Odisha 17.83 17.83 21.95 16-08-60 20.06 27/08/2020 17 9 7 77.78
176 Brahmani Jenapur Odisha 22.00 23.00 24.78 20-08-75 23.46 28/08/2020 17 4 3 75.00
8. Mahanadi Basin
177 Mahanadi Naraj Odisha 25.41 26.41 27.61 31-08-82 26.96 31/08/2020 17 17 17 100.00
178 Mahanadi Alipingal Devi Odisha 10.85 11.76 13.11 11-09-11 11.33 31/08/2020 15 7 7 100.00
179 Mahanadi Nimapara Odisha 9.85 10.76 11.60 31-08-82 10.14 31/08/2020 22 6 6 100.00
9. Pennar Basin
180 Pennar Nellore Andhra Pradesh 15.91 17.28 18.70 30-11-1882 16.15 27/11/2020 16 2 2 100.00
181 Mahi Wanakbori Gujarat 71.93 74.98 76.10 12-08-06 72.93 31/08/2020 00 3 3 100.00
11. Sabarmati Basin
182 Sabarmati Ahmedabad
Shubhash Bridge
Gujarat 44.09 45.34 47.45 19-08-06 42.3 14/09/2020 15 0 0 -
12. Narmada Basin
183 Naramada Mandla Madhya Pradesh 437.20 437.80 439.40 15-07-74 439.04 19/08/2020 00 24 24 100.00
184 Naramada Hoshangabad Madhya Pradesh 292.80 293.80 301.33 27-08-72 299.6 29/08/2020 23 28 28 100.00
185 Naramada Garudeswar Gujarat 30.48 31.09 41.65 06-09-70 33.1 01/09/2020 15 10 10 100.00
186 Naramada Bharuch Gujarat 6.71 7.31 12.65 07-09-70 10.72 01/09/2020 22 16 16 100.00
187 Tapi Surat Gujarat 8.50 9.50 12.50 09-08-06 6.4 24/08/2020 20 0 0 -
14. West Flowing rivers from Tapi to Tadri
188 Damanganga Vapi Town Gujarat 18.20 19.20 23.76 03-08-04 17 05/08/2020 04 0 0 -
189 Damanganga Daman Daman & Diu 2.60 3.40 4.00 03-08-04 2.2 07/06/2020 15 0 0 -
10. Mahi Basin
13. Tapi Basin
75
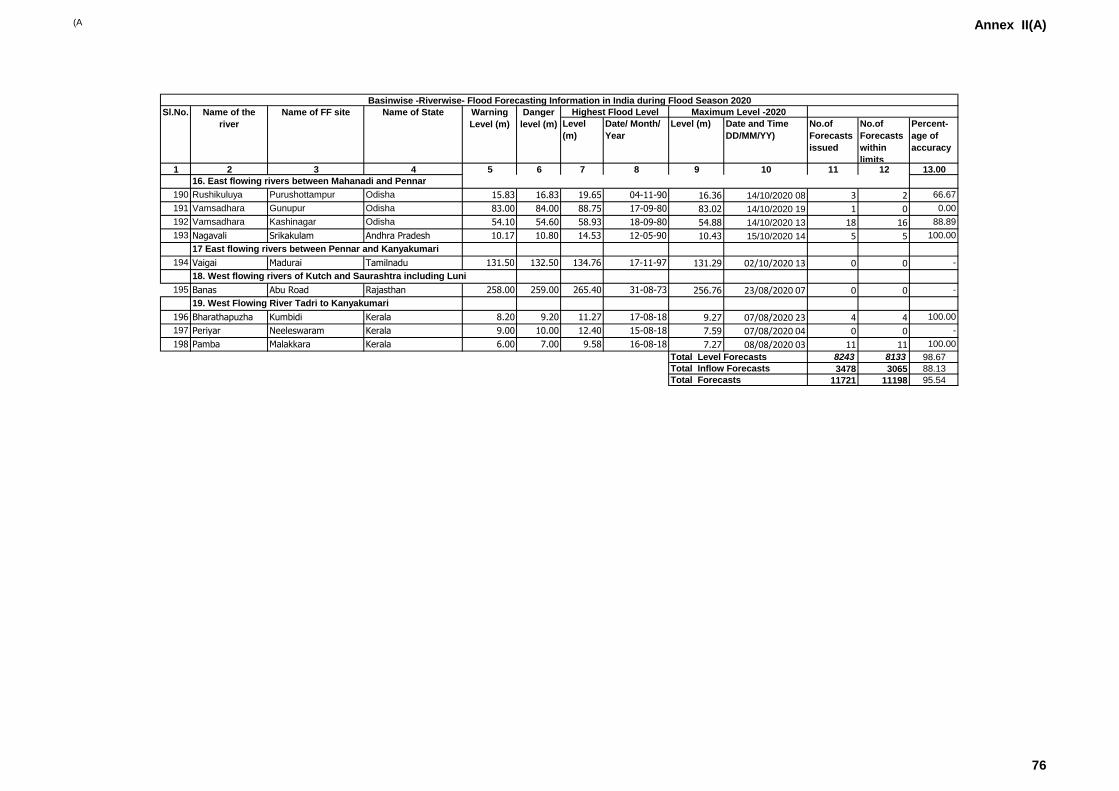
(A Annex II(A)
Level
(m)
Date/ Month/
Year
Level (m) Date and Time
DD/MM/YY)
No.of
Forecasts
issued
No.of
Forecasts
within
limits
Percent-
age of
accuracy
1 2 3 4 5 6 7 8 9 10 11 12 13.00
Basinwise -Riverwise- Flood Forecasting Information in India during Flood Season 2020
Sl.No. Name of the
river
Name of FF site Name of State Warning
Level (m)
Danger
level (m)
Highest Flood Level Maximum Level -2020
16. East flowing rivers between Mahanadi and Pennar
190 Rushikuluya Purushottampur Odisha 15.83 16.83 19.65 04-11-90 16.36 14/10/2020 08 3 2 66.67
191 Vamsadhara Gunupur Odisha 83.00 84.00 88.75 17-09-80 83.02 14/10/2020 19 1 0 0.00
192 Vamsadhara Kashinagar Odisha 54.10 54.60 58.93 18-09-80 54.88 14/10/2020 13 18 16 88.89
193 Nagavali Srikakulam Andhra Pradesh 10.17 10.80 14.53 12-05-90 10.43 15/10/2020 14 5 5 100.00
17 East flowing rivers between Pennar and Kanyakumari
194 Vaigai Madurai Tamilnadu 131.50 132.50 134.76 17-11-97 131.29 02/10/2020 13 0 0 -
18. West flowing rivers of Kutch and Saurashtra including Luni
195 Banas Abu Road Rajasthan 258.00 259.00 265.40 31-08-73 256.76 23/08/2020 07 0 0 -
19. West Flowing River Tadri to Kanyakumari
196 Bharathapuzha Kumbidi Kerala 8.20 9.20 11.27 17-08-18 9.27 07/08/2020 23 4 4 100.00
197 Periyar Neeleswaram Kerala 9.00 10.00 12.40 15-08-18 7.59 07/08/2020 04 0 0 -
198 Pamba Malakkara Kerala 6.00 7.00 9.58 16-08-18 7.27 08/08/2020 03 11 11 100.00
Total Level Forecasts 8243 8133 98.67
Total Inflow Forecasts 3478 3065 88.13
Total Forecasts 11721 11198 95.54
76
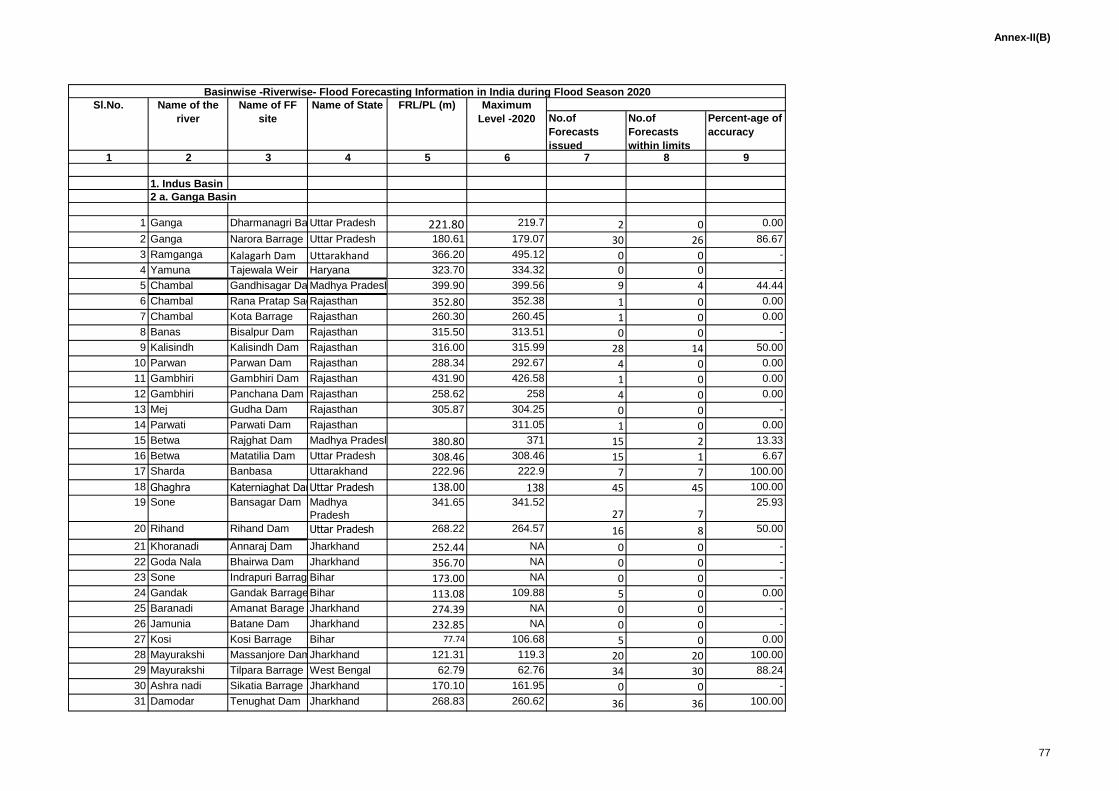
Annex-II(B)
No.of
Forecasts
issued
No.of
Forecasts
within limits
Percent-age of
accuracy
1 2 3 4 5 6 7 8 9
1. Indus Basin
2 a. Ganga Basin
1 Ganga Dharmanagri BarrageUttar Pradesh 221.80 219.7 2 0 0.00
2 Ganga Narora Barrage Uttar Pradesh 180.61 179.07 30 26 86.67
3 Ramganga Kalagarh Dam Uttarakhand 366.20 495.12 0 0 -
4 Yamuna Tajewala Weir Haryana 323.70 334.32 0 0 -
5 Chambal Gandhisagar DamMadhya Pradesh 399.90 399.56 9 4 44.44
6 Chambal Rana Pratap SagarRajasthan 352.80 352.38 1 0 0.00
7 Chambal Kota Barrage Rajasthan 260.30 260.45 1 0 0.00
8 Banas Bisalpur Dam Rajasthan 315.50 313.51 0 0 -
9 Kalisindh Kalisindh Dam Rajasthan 316.00 315.99 28 14 50.00
10 Parwan Parwan Dam Rajasthan 288.34 292.67 4 0 0.00
11 Gambhiri Gambhiri Dam Rajasthan 431.90 426.58 1 0 0.00
12 Gambhiri Panchana Dam Rajasthan 258.62 258 4 0 0.00
13 Mej Gudha Dam Rajasthan 305.87 304.25 0 0 -
14 Parwati Parwati Dam Rajasthan 311.05 1 0 0.00
15 Betwa Rajghat Dam Madhya Pradesh 380.80 371 15 2 13.33
16 Betwa Matatilia Dam Uttar Pradesh 308.46 308.46 15 1 6.67
17 Sharda Banbasa Uttarakhand 222.96 222.9 7 7 100.00
18 Ghaghra Katerniaghat DamUttar Pradesh 138.00 138 45 45 100.00
19 Sone Bansagar Dam Madhya
Pradesh
341.65 341.5227 7
25.93
20 Rihand Rihand Dam Uttar Pradesh 268.22 264.57 16 8 50.00
21 Khoranadi Annaraj Dam Jharkhand 252.44 NA 0 0 -
22 Goda Nala Bhairwa Dam Jharkhand 356.70 NA 0 0 -
23 Sone Indrapuri BarrageBihar 173.00 NA 0 0 -
24 Gandak Gandak Barrage Bihar 113.08 109.88 5 0 0.00
25 Baranadi Amanat Barage Jharkhand 274.39 NA 0 0 -
26 Jamunia Batane Dam Jharkhand 232.85 NA 0 0 -
27 Kosi Kosi Barrage Bihar 77.74 106.68 5 0 0.00
28 Mayurakshi Massanjore DamJharkhand 121.31 119.3 20 20 100.00
29 Mayurakshi Tilpara Barrage West Bengal 62.79 62.76 34 30 88.24
30 Ashra nadi Sikatia Barrage Jharkhand 170.10 161.95 0 0 -
31 Damodar Tenughat Dam Jharkhand 268.83 260.62 36 36 100.00
Basinwise -Riverwise- Flood Forecasting Information in India during Flood Season 2020
Sl.No. Name of the
river
Name of FF
site
Name of State FRL/PL (m) Maximum
Level -2020
77
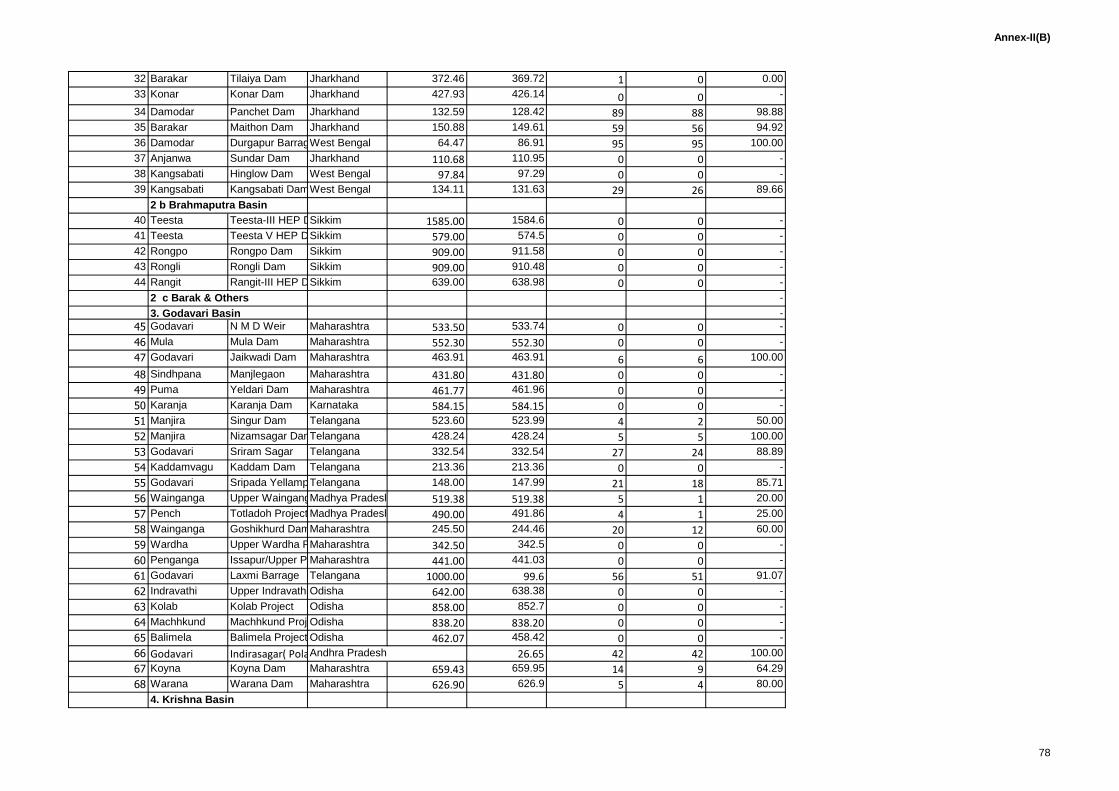
Annex-II(B)
32 Barakar Tilaiya Dam Jharkhand 372.46 369.72 1 0 0.00
33 Konar Konar Dam Jharkhand 427.93 426.14 0 0 -
34 Damodar Panchet Dam Jharkhand 132.59 128.42 89 88 98.88
35 Barakar Maithon Dam Jharkhand 150.88 149.61 59 56 94.92
36 Damodar Durgapur BarrageWest Bengal 64.47 86.91 95 95 100.00
37 Anjanwa Sundar Dam Jharkhand 110.68 110.95 0 0 -
38 Kangsabati Hinglow Dam West Bengal 97.84 97.29 0 0 -
39 Kangsabati Kangsabati DamWest Bengal 134.11 131.63 29 26 89.66
2 b Brahmaputra Basin
40 Teesta Teesta-III HEP Dam ChungtangSikkim 1585.00 1584.6 0 0 -
41 Teesta Teesta V HEP Dam SingtamSikkim 579.00 574.5 0 0 -
42 Rongpo Rongpo Dam Sikkim 909.00 911.58 0 0 -
43 Rongli Rongli Dam Sikkim 909.00 910.48 0 0 -
44 Rangit Rangit-III HEP DamSikkim 639.00 638.98 0 0 -
2 c Barak & Others -
3. Godavari Basin -
45 Godavari N M D Weir Maharashtra 533.50 533.74 0 0 -
46 Mula Mula Dam Maharashtra 552.30 552.30 0 0 -
47 Godavari Jaikwadi Dam Maharashtra 463.91 463.91 6 6 100.00
48 Sindhpana Manjlegaon Maharashtra 431.80 431.80 0 0 -
49 Puma Yeldari Dam Maharashtra 461.77 461.96 0 0 -
50 Karanja Karanja Dam Karnataka 584.15 584.15 0 0 -
51 Manjira Singur Dam Telangana 523.60 523.99 4 2 50.00
52 Manjira Nizamsagar DamTelangana 428.24 428.24 5 5 100.00
53 Godavari Sriram Sagar Telangana 332.54 332.54 27 24 88.89
54 Kaddamvagu Kaddam Dam Telangana 213.36 213.36 0 0 -
55 Godavari Sripada Yellampally DamTelangana 148.00 147.99 21 18 85.71
56 Wainganga Upper Wainganga ProjectMadhya Pradesh 519.38 519.38 5 1 20.00
57 Pench Totladoh Project Madhya Pradesh 490.00 491.86 4 1 25.00
58 Wainganga Goshikhurd DamMaharashtra 245.50 244.46 20 12 60.00
59 Wardha Upper Wardha ProjectMaharashtra 342.50 342.5 0 0 -
60 Penganga Issapur/Upper Penganga ProjectMaharashtra 441.00 441.03 0 0 -
61 Godavari Laxmi Barrage Telangana 1000.00 99.6 56 51 91.07
62 Indravathi Upper Indravathi ProjectOdisha 642.00 638.38 0 0 -
63 Kolab Kolab Project Odisha 858.00 852.7 0 0 -
64 Machhkund Machhkund ProjectOdisha 838.20 838.20 0 0 -
65 Balimela Balimela Project Odisha 462.07 458.42 0 0 -
66 Godavari Indirasagar( Polavaram)Andhra Pradesh 26.65 42 42 100.00
67 Koyna Koyna Dam Maharashtra 659.43 659.95 14 9 64.29
68 Warana Warana Dam Maharashtra 626.90 626.9 5 4 80.00
4. Krishna Basin
78
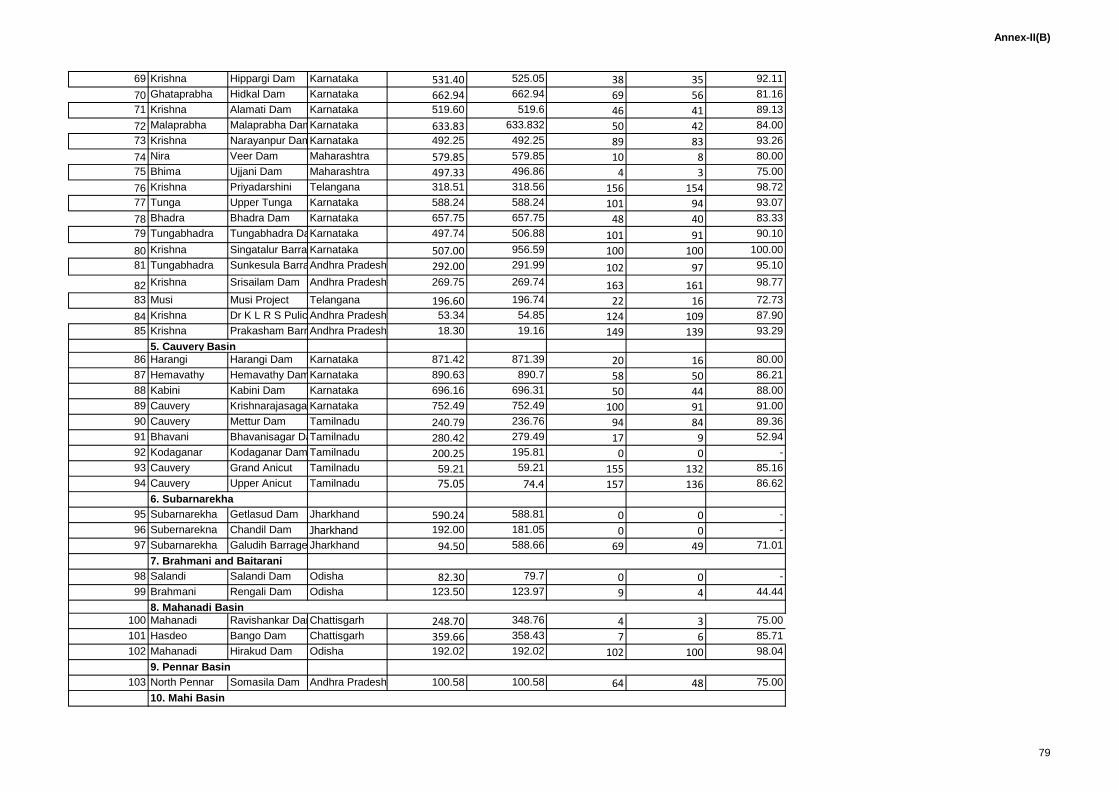
Annex-II(B)
69 Krishna Hippargi Dam Karnataka 531.40 525.05 38 35 92.11
70 Ghataprabha Hidkal Dam Karnataka 662.94 662.94 69 56 81.16
71 Krishna Alamati Dam Karnataka 519.60 519.6 46 41 89.13
72 Malaprabha Malaprabha DamKarnataka 633.83 633.832 50 42 84.00
73 Krishna Narayanpur DamKarnataka 492.25 492.25 89 83 93.26
74 Nira Veer Dam Maharashtra 579.85 579.85 10 8 80.00
75 Bhima Ujjani Dam Maharashtra 497.33 496.86 4 3 75.00
76 Krishna Priyadarshini Telangana 318.51 318.56 156 154 98.72
77 Tunga Upper Tunga Karnataka 588.24 588.24 101 94 93.07
78 Bhadra Bhadra Dam Karnataka 657.75 657.75 48 40 83.33
79 Tungabhadra Tungabhadra DamKarnataka 497.74 506.88 101 91 90.10
80 Krishna Singatalur BarrageKarnataka 507.00 956.59 100 100 100.00
81 Tungabhadra Sunkesula BarrageAndhra Pradesh 292.00 291.99 102 97 95.10
82 Krishna Srisailam Dam Andhra Pradesh 269.75 269.74 163 161 98.77
83 Musi Musi Project Telangana 196.60 196.74 22 16 72.73
84 Krishna Dr K L R S Pulichintala DamAndhra Pradesh 53.34 54.85 124 109 87.90
85 Krishna Prakasham BarrageAndhra Pradesh 18.30 19.16 149 139 93.29
5. Cauvery Basin
86 Harangi Harangi Dam Karnataka 871.42 871.39 20 16 80.00
87 Hemavathy Hemavathy DamKarnataka 890.63 890.7 58 50 86.21
88 Kabini Kabini Dam Karnataka 696.16 696.31 50 44 88.00
89 Cauvery KrishnarajasagarKarnataka 752.49 752.49 100 91 91.00
90 Cauvery Mettur Dam Tamilnadu 240.79 236.76 94 84 89.36
91 Bhavani Bhavanisagar DamTamilnadu 280.42 279.49 17 9 52.94
92 Kodaganar Kodaganar Dam Tamilnadu 200.25 195.81 0 0 -
93 Cauvery Grand Anicut Tamilnadu 59.21 59.21 155 132 85.16
94 Cauvery Upper Anicut Tamilnadu 75.05 74.4 157 136 86.62
6. Subarnarekha
95 Subarnarekha Getlasud Dam Jharkhand 590.24 588.81 0 0 -
96 Subernarekna Chandil Dam Jharkhand 192.00 181.05 0 0 -
97 Subarnarekha Galudih Barrage Jharkhand 94.50 588.66 69 49 71.01
7. Brahmani and Baitarani
98 Salandi Salandi Dam Odisha 82.30 79.7 0 0 -
99 Brahmani Rengali Dam Odisha 123.50 123.97 9 4 44.44
8. Mahanadi Basin
100 Mahanadi Ravishankar DamChattisgarh 248.70 348.76 4 3 75.00
101 Hasdeo Bango Dam Chattisgarh 359.66 358.43 7 6 85.71
102 Mahanadi Hirakud Dam Odisha 192.02 192.02 102 100 98.04
9. Pennar Basin
103 North Pennar Somasila Dam Andhra Pradesh 100.58 100.58 64 48 75.00
10. Mahi Basin
79
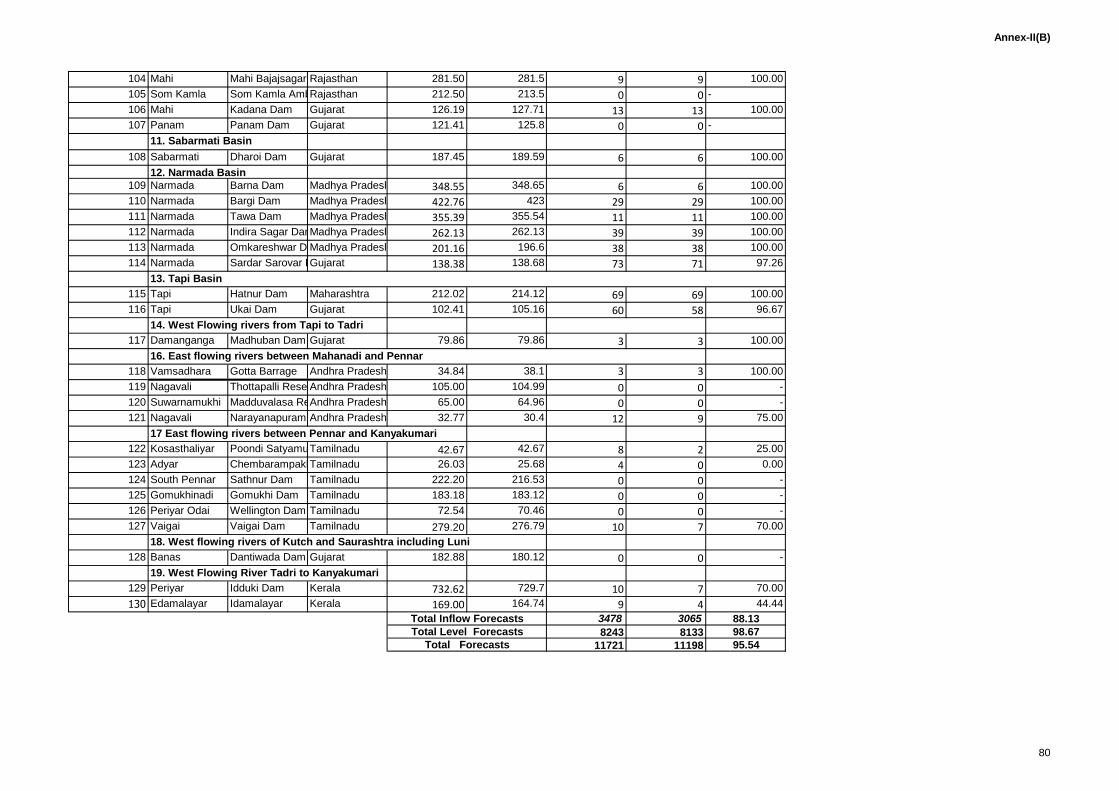
Annex-II(B)
104 Mahi Mahi Bajajsagar DamRajasthan 281.50 281.5 9 9 100.00
105 Som Kamla Som Kamla Amba DamRajasthan 212.50 213.5 0 0 -
106 Mahi Kadana Dam Gujarat 126.19 127.71 13 13 100.00
107 Panam Panam Dam Gujarat 121.41 125.8 0 0 -
11. Sabarmati Basin
108 Sabarmati Dharoi Dam Gujarat 187.45 189.59 6 6 100.00
12. Narmada Basin
109 Narmada Barna Dam Madhya Pradesh 348.55 348.65 6 6 100.00
110 Narmada Bargi Dam Madhya Pradesh 422.76 423 29 29 100.00
111 Narmada Tawa Dam Madhya Pradesh 355.39 355.54 11 11 100.00
112 Narmada Indira Sagar DamMadhya Pradesh 262.13 262.13 39 39 100.00
113 Narmada Omkareshwar Dam Madhya Pradesh 201.16 196.6 38 38 100.00
114 Narmada Sardar Sarovar DamGujarat 138.38 138.68 73 71 97.26
115 Tapi Hatnur Dam Maharashtra 212.02 214.12 69 69 100.00
116 Tapi Ukai Dam Gujarat 102.41 105.16 60 58 96.67
14. West Flowing rivers from Tapi to Tadri
117 Damanganga Madhuban Dam Gujarat 79.86 79.86 3 3 100.00
16. East flowing rivers between Mahanadi and Pennar
118 Vamsadhara Gotta Barrage Andhra Pradesh 34.84 38.1 3 3 100.00
119 Nagavali Thottapalli Reservoir SchemeAndhra Pradesh 105.00 104.99 0 0 -
120 Suwarnamukhi Madduvalasa ReservoirAndhra Pradesh 65.00 64.96 0 0 -
121 Nagavali Narayanapuram AnicutAndhra Pradesh 32.77 30.4 12 9 75.00
17 East flowing rivers between Pennar and Kanyakumari
122 Kosasthaliyar Poondi Satyamurthy reservoirTamilnadu 42.67 42.67 8 2 25.00
123 Adyar ChembarampakkamTamilnadu 26.03 25.68 4 0 0.00
124 South Pennar Sathnur Dam Tamilnadu 222.20 216.53 0 0 -
125 Gomukhinadi Gomukhi Dam Tamilnadu 183.18 183.12 0 0 -
126 Periyar Odai Wellington Dam Tamilnadu 72.54 70.46 0 0 -
127 Vaigai Vaigai Dam Tamilnadu 279.20 276.79 10 7 70.00
18. West flowing rivers of Kutch and Saurashtra including Luni
128 Banas Dantiwada Dam Gujarat 182.88 180.12 0 0 -
19. West Flowing River Tadri to Kanyakumari
129 Periyar Idduki Dam Kerala 732.62 729.7 10 7 70.00
130 Edamalayar Idamalayar Kerala 169.00 164.74 9 4 44.44
3478 3065 88.13
8243 8133 98.67
11721 11198 95.54
Total Inflow Forecasts
Total Level Forecasts
Total Forecasts
13. Tapi Basin
80
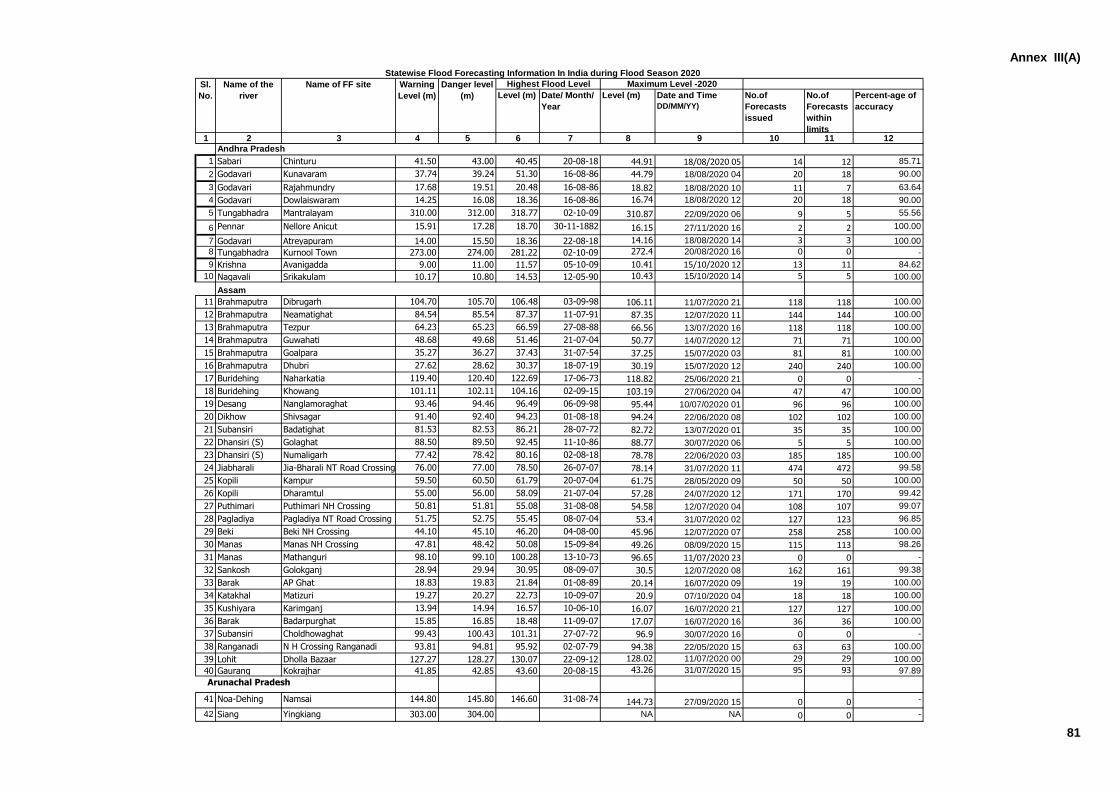
Annex III(A)
Level (m) Date/ Month/
Year
Level (m) Date and Time
DD/MM/YY)
No.of
Forecasts
issued
No.of
Forecasts
within
limits
Percent-age of
accuracy
1 2 3 4 5 6 7 8 9 10 11 12
Andhra Pradesh
1 Sabari Chinturu 41.50 43.00 40.45 20-08-18 44.91 18/08/2020 05 14 12 85.71
2 Godavari Kunavaram 37.74 39.24 51.30 16-08-86 44.79 18/08/2020 04 20 18 90.00
3 Godavari Rajahmundry 17.68 19.51 20.48 16-08-86 18.82 18/08/2020 10 11 7 63.64
4 Godavari Dowlaiswaram 14.25 16.08 18.36 16-08-86 16.74 18/08/2020 12 20 18 90.00
5 Tungabhadra Mantralayam 310.00 312.00 318.77 02-10-09 310.87 22/09/2020 06 9 5 55.56
6 Pennar Nellore Anicut 15.91 17.28 18.70 30-11-1882 16.15 27/11/2020 16 2 2 100.00
7 Godavari Atreyapuram 14.00 15.50 18.36 22-08-18 14.16 18/08/2020 14 3 3 100.00
8 Tungabhadra Kurnool Town 273.00 274.00 281.22 02-10-09 272.4 20/08/2020 16 0 0 -
9 Krishna Avanigadda 9.00 11.00 11.57 05-10-09 10.41 15/10/2020 12 13 11 84.62
10 Nagavali Srikakulam 10.17 10.80 14.53 12-05-90 10.43 15/10/2020 14 5 5 100.00
Assam
11 Brahmaputra Dibrugarh 104.70 105.70 106.48 03-09-98 106.11 11/07/2020 21 118 118 100.00
12 Brahmaputra Neamatighat 84.54 85.54 87.37 11-07-91 87.35 12/07/2020 11 144 144 100.00
13 Brahmaputra Tezpur 64.23 65.23 66.59 27-08-88 66.56 13/07/2020 16 118 118 100.00
14 Brahmaputra Guwahati 48.68 49.68 51.46 21-07-04 50.77 14/07/2020 12 71 71 100.00
15 Brahmaputra Goalpara 35.27 36.27 37.43 31-07-54 37.25 15/07/2020 03 81 81 100.00
16 Brahmaputra Dhubri 27.62 28.62 30.37 18-07-19 30.19 15/07/2020 12 240 240 100.00
17 Buridehing Naharkatia 119.40 120.40 122.69 17-06-73 118.82 25/06/2020 21 0 0 -
18 Buridehing Khowang 101.11 102.11 104.16 02-09-15 103.19 27/06/2020 04 47 47 100.00
19 Desang Nanglamoraghat 93.46 94.46 96.49 06-09-98 95.44 10/07/02020 01 96 96 100.00
20 Dikhow Shivsagar 91.40 92.40 94.23 01-08-18 94.24 22/06/2020 08 102 102 100.00
21 Subansiri Badatighat 81.53 82.53 86.21 28-07-72 82.72 13/07/2020 01 35 35 100.00
22 Dhansiri (S) Golaghat 88.50 89.50 92.45 11-10-86 88.77 30/07/2020 06 5 5 100.00
23 Dhansiri (S) Numaligarh 77.42 78.42 80.16 02-08-18 78.78 22/06/2020 03 185 185 100.00
24 Jiabharali Jia-Bharali NT Road Crossing 76.00 77.00 78.50 26-07-07 78.14 31/07/2020 11 474 472 99.58
25 Kopili Kampur 59.50 60.50 61.79 20-07-04 61.75 28/05/2020 09 50 50 100.00
26 Kopili Dharamtul 55.00 56.00 58.09 21-07-04 57.28 24/07/2020 12 171 170 99.42
27 Puthimari Puthimari NH Crossing 50.81 51.81 55.08 31-08-08 54.58 12/07/2020 04 108 107 99.07
28 Pagladiya Pagladiya NT Road Crossing 51.75 52.75 55.45 08-07-04 53.4 31/07/2020 02 127 123 96.85
29 Beki Beki NH Crossing 44.10 45.10 46.20 04-08-00 45.96 12/07/2020 07 258 258 100.00
30 Manas Manas NH Crossing 47.81 48.42 50.08 15-09-84 49.26 08/09/2020 15 115 113 98.26
31 Manas Mathanguri 98.10 99.10 100.28 13-10-73 96.65 11/07/2020 23 0 0 -
32 Sankosh Golokganj 28.94 29.94 30.95 08-09-07 30.5 12/07/2020 08 162 161 99.38
33 Barak AP Ghat 18.83 19.83 21.84 01-08-89 20.14 16/07/2020 09 19 19 100.00
34 Katakhal Matizuri 19.27 20.27 22.73 10-09-07 20.9 07/10/2020 04 18 18 100.00
35 Kushiyara Karimganj 13.94 14.94 16.57 10-06-10 16.07 16/07/2020 21 127 127 100.00
36 Barak Badarpurghat 15.85 16.85 18.48 11-09-07 17.07 16/07/2020 16 36 36 100.00
37 Subansiri Choldhowaghat 99.43 100.43 101.31 27-07-72 96.9 30/07/2020 16 0 0 -
38 Ranganadi N H Crossing Ranganadi 93.81 94.81 95.92 02-07-79 94.38 22/05/2020 15 63 63 100.00
39 Lohit Dholla Bazaar 127.27 128.27 130.07 22-09-12 128.02 11/07/2020 00 29 29 100.00
40 Gaurang Kokrajhar 41.85 42.85 43.60 20-08-15 43.26 31/07/2020 15 95 93 97.89
Arunachal Pradesh
41 Noa-Dehing Namsai 144.80 145.80 146.60 31-08-74 144.73 27/09/2020 15 0 0 -
42 Siang Yingkiang 303.00 304.00 NA NA 0 0 -
Statewise Flood Forecasting Information In India during Flood Season 2020
Sl.
No.
Name of the
river
Name of FF site Warning
Level (m)
Danger level
(m)
Highest Flood Level Maximum Level -2020
81
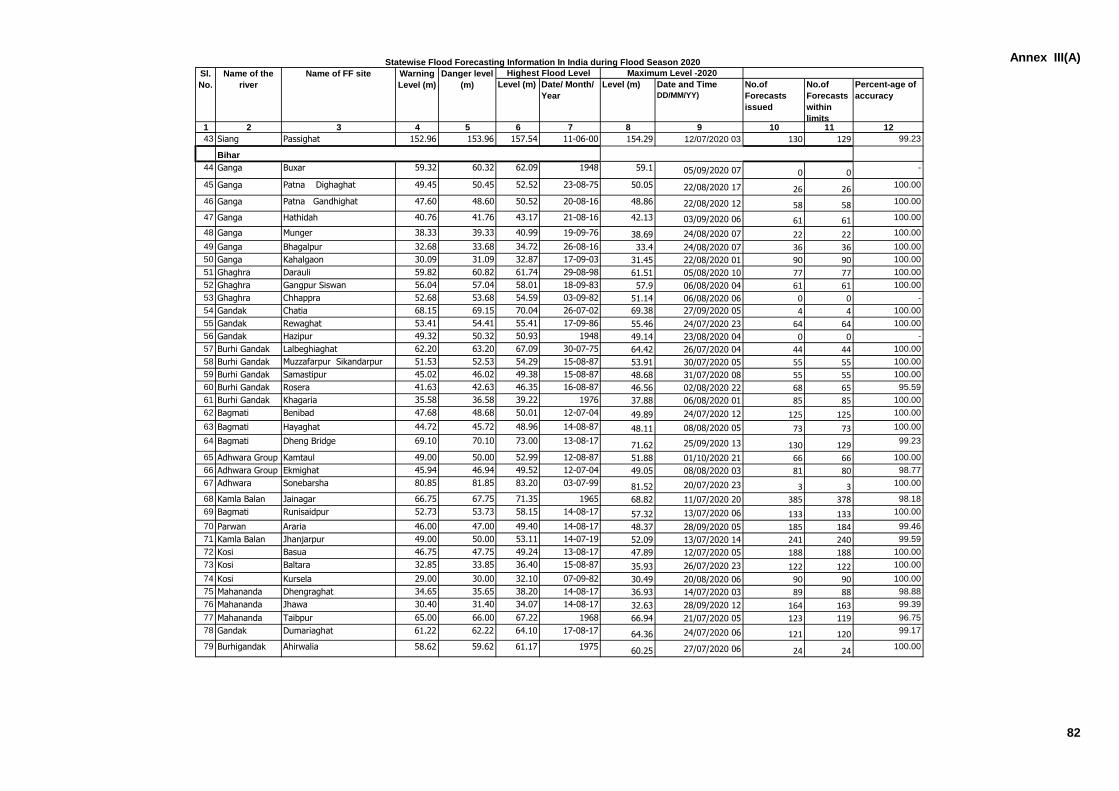
Annex III(A)
Level (m) Date/ Month/
Year
Level (m) Date and Time
DD/MM/YY)
No.of
Forecasts
issued
No.of
Forecasts
within
limits
Percent-age of
accuracy
1 2 3 4 5 6 7 8 9 10 11 12
Statewise Flood Forecasting Information In India during Flood Season 2020
Sl.
No.
Name of the
river
Name of FF site Warning
Level (m)
Danger level
(m)
Highest Flood Level Maximum Level -2020
43 Siang Passighat 152.96 153.96 157.54 11-06-00 154.29 12/07/2020 03 130 129 99.23
44 Ganga Buxar 59.32 60.32 62.09 1948 59.1 05/09/2020 07 0 0-
45 Ganga Patna Dighaghat 49.45 50.45 52.52 23-08-75 50.05 22/08/2020 17 26 26 100.00
46 Ganga Patna Gandhighat 47.60 48.60 50.52 20-08-16 48.86 22/08/2020 12 58 58 100.00
47 Ganga Hathidah 40.76 41.76 43.17 21-08-16 42.13 03/09/2020 06 61 61 100.00
48 Ganga Munger 38.33 39.33 40.99 19-09-76 38.69 24/08/2020 07 22 22 100.00
49 Ganga Bhagalpur 32.68 33.68 34.72 26-08-16 33.4 24/08/2020 07 36 36 100.00
50 Ganga Kahalgaon 30.09 31.09 32.87 17-09-03 31.45 22/08/2020 01 90 90 100.00
51 Ghaghra Darauli 59.82 60.82 61.74 29-08-98 61.51 05/08/2020 10 77 77 100.00
52 Ghaghra Gangpur Siswan 56.04 57.04 58.01 18-09-83 57.9 06/08/2020 04 61 61 100.00
53 Ghaghra Chhappra 52.68 53.68 54.59 03-09-82 51.14 06/08/2020 06 0 0 -
54 Gandak Chatia 68.15 69.15 70.04 26-07-02 69.38 27/09/2020 05 4 4 100.00
55 Gandak Rewaghat 53.41 54.41 55.41 17-09-86 55.46 24/07/2020 23 64 64 100.00
56 Gandak Hazipur 49.32 50.32 50.93 1948 49.14 23/08/2020 04 0 0 -
57 Burhi Gandak Lalbeghiaghat 62.20 63.20 67.09 30-07-75 64.42 26/07/2020 04 44 44 100.00
58 Burhi Gandak Muzzafarpur Sikandarpur 51.53 52.53 54.29 15-08-87 53.91 30/07/2020 05 55 55 100.00
59 Burhi Gandak Samastipur 45.02 46.02 49.38 15-08-87 48.68 31/07/2020 08 55 55 100.00
60 Burhi Gandak Rosera 41.63 42.63 46.35 16-08-87 46.56 02/08/2020 22 68 65 95.59
61 Burhi Gandak Khagaria 35.58 36.58 39.22 1976 37.88 06/08/2020 01 85 85 100.00
62 Bagmati Benibad 47.68 48.68 50.01 12-07-04 49.89 24/07/2020 12 125 125 100.00
63 Bagmati Hayaghat 44.72 45.72 48.96 14-08-87 48.11 08/08/2020 05 73 73 100.00
64 Bagmati Dheng Bridge 69.10 70.10 73.00 13-08-1771.62 25/09/2020 13 130 129 99.23
65 Adhwara Group Kamtaul 49.00 50.00 52.99 12-08-87 51.88 01/10/2020 21 66 66 100.00
66 Adhwara Group Ekmighat 45.94 46.94 49.52 12-07-04 49.05 08/08/2020 03 81 80 98.77
67 Adhwara Sonebarsha 80.85 81.85 83.20 03-07-99 81.52 20/07/2020 23 3 3 100.00
68 Kamla Balan Jainagar 66.75 67.75 71.35 1965 68.82 11/07/2020 20 385 378 98.18
69 Bagmati Runisaidpur 52.73 53.73 58.15 14-08-17 57.32 13/07/2020 06 133 133 100.00
70 Parwan Araria 46.00 47.00 49.40 14-08-17 48.37 28/09/2020 05 185 184 99.46
71 Kamla Balan Jhanjarpur 49.00 50.00 53.11 14-07-19 52.09 13/07/2020 14 241 240 99.59
72 Kosi Basua 46.75 47.75 49.24 13-08-17 47.89 12/07/2020 05 188 188 100.00
73 Kosi Baltara 32.85 33.85 36.40 15-08-87 35.93 26/07/2020 23 122 122 100.00
74 Kosi Kursela 29.00 30.00 32.10 07-09-82 30.49 20/08/2020 06 90 90 100.00
75 Mahananda Dhengraghat 34.65 35.65 38.20 14-08-17 36.93 14/07/2020 03 89 88 98.88
76 Mahananda Jhawa 30.40 31.40 34.07 14-08-17 32.63 28/09/2020 12 164 163 99.39
77 Mahananda Taibpur 65.00 66.00 67.22 1968 66.94 21/07/2020 05 123 119 96.75
78 Gandak Dumariaghat 61.22 62.22 64.10 17-08-17 64.36 24/07/2020 06 121 120 99.17
79 Burhigandak Ahirwalia 58.62 59.62 61.17 197560.25 27/07/2020 06 24 24 100.00
Bihar
82
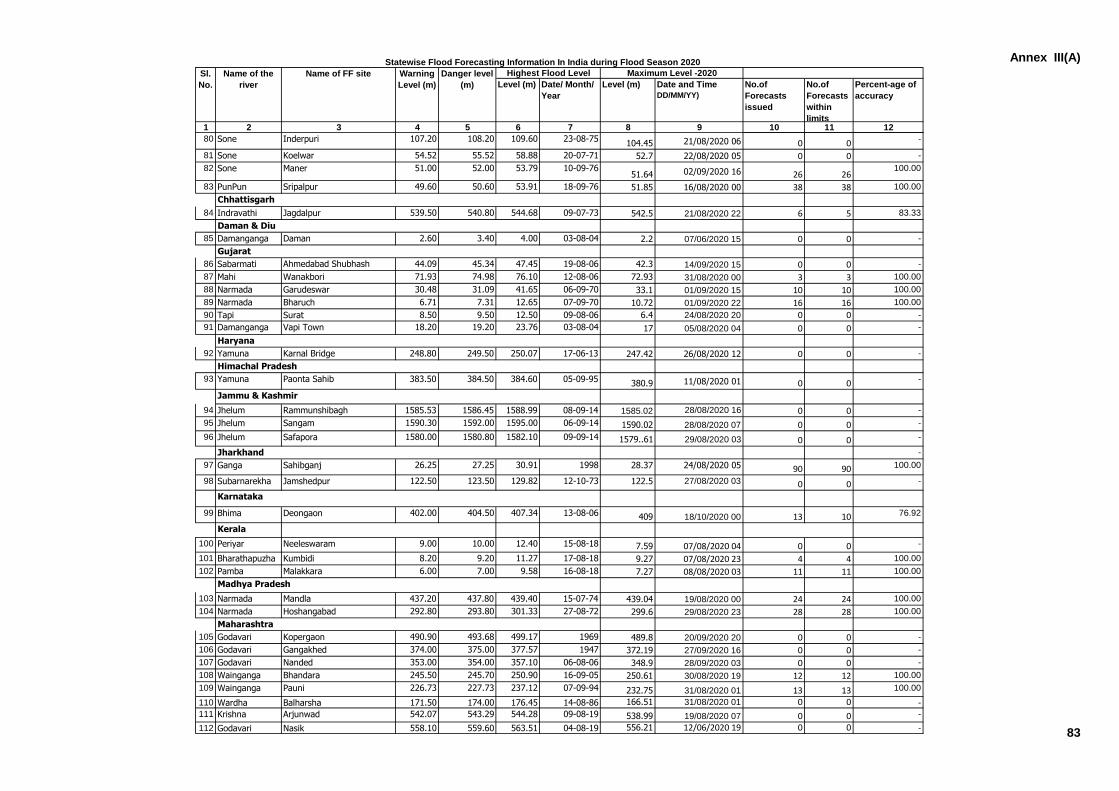
Annex III(A)
Level (m) Date/ Month/
Year
Level (m) Date and Time
DD/MM/YY)
No.of
Forecasts
issued
No.of
Forecasts
within
limits
Percent-age of
accuracy
1 2 3 4 5 6 7 8 9 10 11 12
Statewise Flood Forecasting Information In India during Flood Season 2020
Sl.
No.
Name of the
river
Name of FF site Warning
Level (m)
Danger level
(m)
Highest Flood Level Maximum Level -2020
80 Sone Inderpuri 107.20 108.20 109.60 23-08-75104.45 21/08/2020 06 0 0 -
81 Sone Koelwar 54.52 55.52 58.88 20-07-71 52.7 22/08/2020 05 0 0 -
82 Sone Maner 51.00 52.00 53.79 10-09-7651.64 02/09/2020 16 26 26
100.00
83 PunPun Sripalpur 49.60 50.60 53.91 18-09-76 51.85 16/08/2020 00 38 38 100.00
84 Indravathi Jagdalpur 539.50 540.80 544.68 09-07-73 542.5 21/08/2020 22 6 5 83.33
85 Damanganga Daman 2.60 3.40 4.00 03-08-04 2.2 07/06/2020 15 0 0 -
86 Sabarmati Ahmedabad Shubhash
Bridge
44.09 45.34 47.45 19-08-06 42.3 14/09/2020 15 0 0 -
87 Mahi Wanakbori 71.93 74.98 76.10 12-08-06 72.93 31/08/2020 00 3 3 100.00
88 Narmada Garudeswar 30.48 31.09 41.65 06-09-70 33.1 01/09/2020 15 10 10 100.00
89 Narmada Bharuch 6.71 7.31 12.65 07-09-70 10.72 01/09/2020 22 16 16 100.00
90 Tapi Surat 8.50 9.50 12.50 09-08-06 6.4 24/08/2020 20 0 0 -
91 Damanganga Vapi Town 18.20 19.20 23.76 03-08-04 17 05/08/2020 04 0 0 -
92 Yamuna Karnal Bridge 248.80 249.50 250.07 17-06-13 247.42 26/08/2020 12 0 0 -
93 Yamuna Paonta Sahib 383.50 384.50 384.60 05-09-95380.9 11/08/2020 01 0 0 -
94 Jhelum Rammunshibagh 1585.53 1586.45 1588.99 08-09-14 1585.02 28/08/2020 16 0 0 -
95 Jhelum Sangam 1590.30 1592.00 1595.00 06-09-14 1590.02 28/08/2020 07 0 0 -
96 Jhelum Safapora 1580.00 1580.80 1582.10 09-09-14 1579..61 29/08/2020 03 0 0 -
-
97 Ganga Sahibganj 26.25 27.25 30.91 1998 28.37 24/08/2020 05 90 90 100.00
98 Subarnarekha Jamshedpur 122.50 123.50 129.82 12-10-73 122.5 27/08/2020 03 0 0 -
Karnataka
99 Bhima Deongaon 402.00 404.50 407.34 13-08-06 409 18/10/2020 00 13 10 76.92
Kerala
100 Periyar Neeleswaram 9.00 10.00 12.40 15-08-18 7.59 07/08/2020 04 0 0 -
101 Bharathapuzha Kumbidi 8.20 9.20 11.27 17-08-18 9.27 07/08/2020 23 4 4 100.00
102 Pamba Malakkara 6.00 7.00 9.58 16-08-18 7.27 08/08/2020 03 11 11 100.00
Madhya Pradesh
103 Narmada Mandla 437.20 437.80 439.40 15-07-74 439.04 19/08/2020 00 24 24 100.00
104 Narmada Hoshangabad 292.80 293.80 301.33 27-08-72 299.6 29/08/2020 23 28 28 100.00
Maharashtra
105 Godavari Kopergaon 490.90 493.68 499.17 1969 489.8 20/09/2020 20 0 0 -
106 Godavari Gangakhed 374.00 375.00 377.57 1947 372.19 27/09/2020 16 0 0 -
107 Godavari Nanded 353.00 354.00 357.10 06-08-06 348.9 28/09/2020 03 0 0 -
108 Wainganga Bhandara 245.50 245.70 250.90 16-09-05 250.61 30/08/2020 19 12 12 100.00
109 Wainganga Pauni 226.73 227.73 237.12 07-09-94 232.75 31/08/2020 01 13 13 100.00
110 Wardha Balharsha 171.50 174.00 176.45 14-08-86 166.51 31/08/2020 01 0 0 -
111 Krishna Arjunwad 542.07 543.29 544.28 09-08-19 538.99 19/08/2020 07 0 0 -
112 Godavari Nasik 558.10 559.60 563.51 04-08-19 556.21 12/06/2020 19 0 0 -
Daman & Diu
Gujarat
Haryana
Jharkhand
Himachal Pradesh
Jammu & Kashmir
Chhattisgarh
83
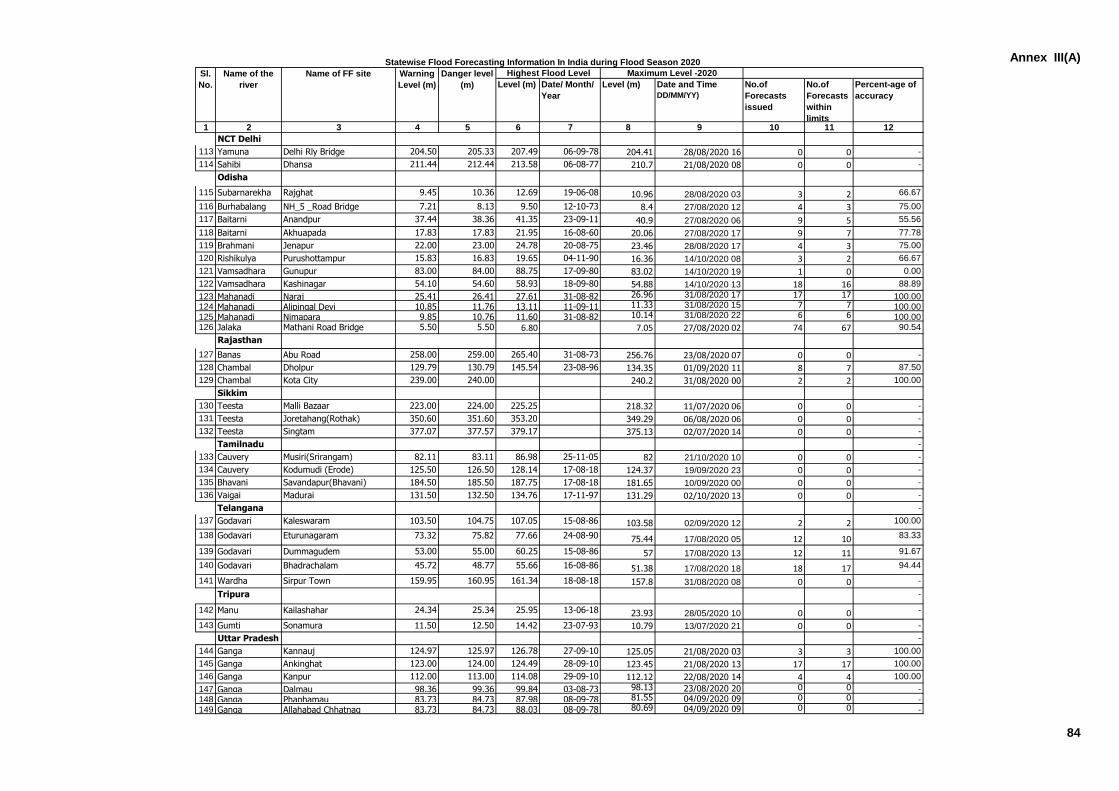
Annex III(A)
Level (m) Date/ Month/
Year
Level (m) Date and Time
DD/MM/YY)
No.of
Forecasts
issued
No.of
Forecasts
within
limits
Percent-age of
accuracy
1 2 3 4 5 6 7 8 9 10 11 12
Statewise Flood Forecasting Information In India during Flood Season 2020
Sl.
No.
Name of the
river
Name of FF site Warning
Level (m)
Danger level
(m)
Highest Flood Level Maximum Level -2020
NCT Delhi
113 Yamuna Delhi Rly Bridge 204.50 205.33 207.49 06-09-78 204.41 28/08/2020 16 0 0 -
114 Sahibi Dhansa 211.44 212.44 213.58 06-08-77 210.7 21/08/2020 08 0 0 -
Odisha
115 Subarnarekha Rajghat 9.45 10.36 12.69 19-06-08 10.96 28/08/2020 03 3 2 66.67
116 Burhabalang NH_5 _Road Bridge 7.21 8.13 9.50 12-10-73 8.4 27/08/2020 12 4 3 75.00
117 Baitarni Anandpur 37.44 38.36 41.35 23-09-11 40.9 27/08/2020 06 9 5 55.56
118 Baitarni Akhuapada 17.83 17.83 21.95 16-08-60 20.06 27/08/2020 17 9 7 77.78
119 Brahmani Jenapur 22.00 23.00 24.78 20-08-75 23.46 28/08/2020 17 4 3 75.00
120 Rishikulya Purushottampur 15.83 16.83 19.65 04-11-90 16.36 14/10/2020 08 3 2 66.67
121 Vamsadhara Gunupur 83.00 84.00 88.75 17-09-80 83.02 14/10/2020 19 1 0 0.00
122 Vamsadhara Kashinagar 54.10 54.60 58.93 18-09-80 54.88 14/10/2020 13 18 16 88.89
123 Mahanadi Naraj 25.41 26.41 27.61 31-08-82 26.96 31/08/2020 17 17 17 100.00124 Mahanadi Alipingal Devi 10.85 11.76 13.11 11-09-11 11.33 31/08/2020 15 7 7 100.00125 Mahanadi Nimapara 9.85 10.76 11.60 31-08-82 10.14 31/08/2020 22 6 6 100.00126 Jalaka Mathani Road Bridge 5.50 5.50 6.80 7.05 27/08/2020 02 74 67 90.54
Rajasthan
127 Banas Abu Road 258.00 259.00 265.40 31-08-73 256.76 23/08/2020 07 0 0 -
128 Chambal Dholpur 129.79 130.79 145.54 23-08-96 134.35 01/09/2020 11 8 7 87.50
129 Chambal Kota City 239.00 240.00 240.2 31/08/2020 00 2 2 100.00
Sikkim
130 Teesta Malli Bazaar 223.00 224.00 225.25 218.32 11/07/2020 06 0 0 -
131 Teesta Joretahang(Rothak) 350.60 351.60 353.20 349.29 06/08/2020 06 0 0 -
132 Teesta Singtam 377.07 377.57 379.17 375.13 02/07/2020 14 0 0 -
Tamilnadu -
133 Cauvery Musiri(Srirangam) 82.11 83.11 86.98 25-11-05 82 21/10/2020 10 0 0 -
134 Cauvery Kodumudi (Erode) 125.50 126.50 128.14 17-08-18 124.37 19/09/2020 23 0 0 -
135 Bhavani Savandapur(Bhavani) 184.50 185.50 187.75 17-08-18 181.65 10/09/2020 00 0 0 -
136 Vaigai Madurai 131.50 132.50 134.76 17-11-97 131.29 02/10/2020 13 0 0 -
Telangana -
137 Godavari Kaleswaram 103.50 104.75 107.05 15-08-86 103.58 02/09/2020 12 2 2 100.00
138 Godavari Eturunagaram 73.32 75.82 77.66 24-08-90 75.44 17/08/2020 05 12 10 83.33
139 Godavari Dummagudem 53.00 55.00 60.25 15-08-86 57 17/08/2020 13 12 11 91.67
140 Godavari Bhadrachalam 45.72 48.77 55.66 16-08-86 51.38 17/08/2020 18 18 17 94.44
141 Wardha Sirpur Town 159.95 160.95 161.34 18-08-18 157.8 31/08/2020 08 0 0 -
Tripura -
142 Manu Kailashahar 24.34 25.34 25.95 13-06-18 23.93 28/05/2020 10 0 0 -
143 Gumti Sonamura 11.50 12.50 14.42 23-07-93 10.79 13/07/2020 21 0 0 -
Uttar Pradesh -
144 Ganga Kannauj 124.97 125.97 126.78 27-09-10 125.05 21/08/2020 03 3 3 100.00
145 Ganga Ankinghat 123.00 124.00 124.49 28-09-10 123.45 21/08/2020 13 17 17 100.00
146 Ganga Kanpur 112.00 113.00 114.08 29-09-10 112.12 22/08/2020 14 4 4 100.00
147 Ganga Dalmau 98.36 99.36 99.84 03-08-73 98.13 23/08/2020 20 0 0 -148 Ganga Phaphamau 83.73 84.73 87.98 08-09-78 81.55 04/09/2020 09 0 0 -149 Ganga Allahabad Chhatnag 83.73 84.73 88.03 08-09-78 80.69 04/09/2020 09 0 0 -
84
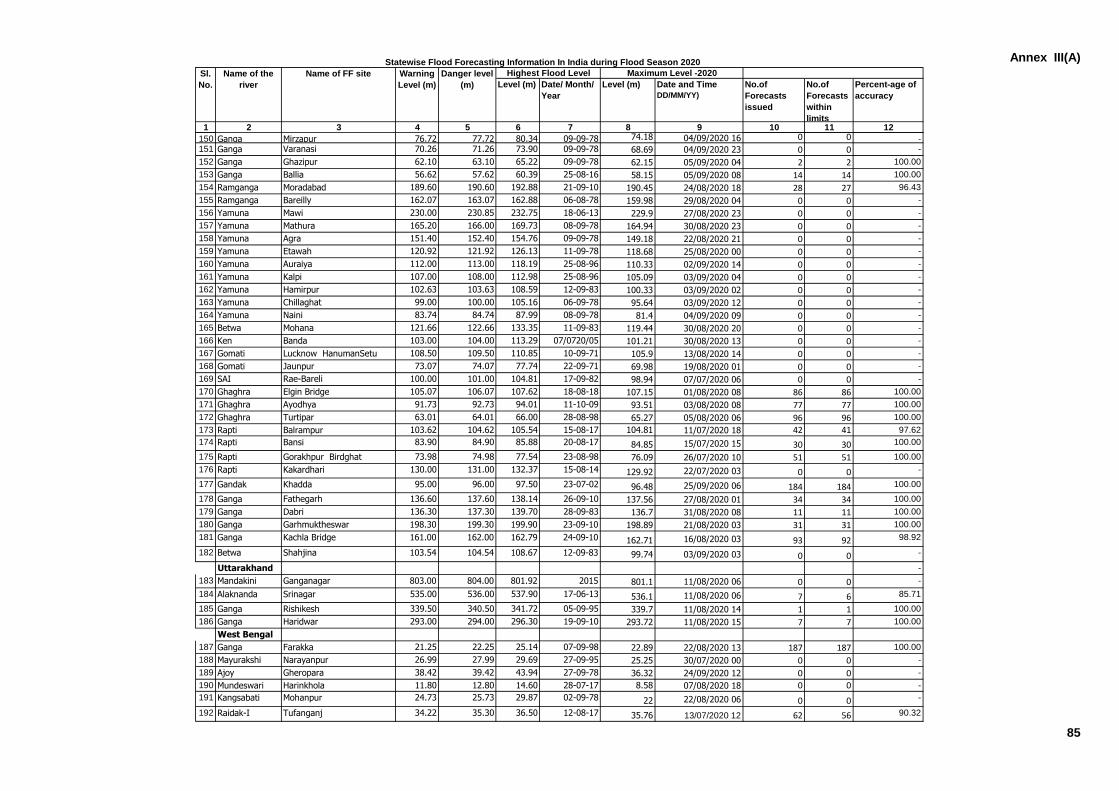
Annex III(A)
Level (m) Date/ Month/
Year
Level (m) Date and Time
DD/MM/YY)
No.of
Forecasts
issued
No.of
Forecasts
within
limits
Percent-age of
accuracy
1 2 3 4 5 6 7 8 9 10 11 12
Statewise Flood Forecasting Information In India during Flood Season 2020
Sl.
No.
Name of the
river
Name of FF site Warning
Level (m)
Danger level
(m)
Highest Flood Level Maximum Level -2020
150 Ganga Mirzapur 76.72 77.72 80.34 09-09-78 74.18 04/09/2020 16 0 0 -151 Ganga Varanasi 70.26 71.26 73.90 09-09-78 68.69 04/09/2020 23 0 0 -
152 Ganga Ghazipur 62.10 63.10 65.22 09-09-78 62.15 05/09/2020 04 2 2 100.00
153 Ganga Ballia 56.62 57.62 60.39 25-08-16 58.15 05/09/2020 08 14 14 100.00
154 Ramganga Moradabad 189.60 190.60 192.88 21-09-10 190.45 24/08/2020 18 28 27 96.43
155 Ramganga Bareilly 162.07 163.07 162.88 06-08-78 159.98 29/08/2020 04 0 0 -
156 Yamuna Mawi 230.00 230.85 232.75 18-06-13 229.9 27/08/2020 23 0 0 -
157 Yamuna Mathura 165.20 166.00 169.73 08-09-78 164.94 30/08/2020 23 0 0 -
158 Yamuna Agra 151.40 152.40 154.76 09-09-78 149.18 22/08/2020 21 0 0 -
159 Yamuna Etawah 120.92 121.92 126.13 11-09-78 118.68 25/08/2020 00 0 0 -
160 Yamuna Auraiya 112.00 113.00 118.19 25-08-96 110.33 02/09/2020 14 0 0 -
161 Yamuna Kalpi 107.00 108.00 112.98 25-08-96 105.09 03/09/2020 04 0 0 -
162 Yamuna Hamirpur 102.63 103.63 108.59 12-09-83 100.33 03/09/2020 02 0 0 -
163 Yamuna Chillaghat 99.00 100.00 105.16 06-09-78 95.64 03/09/2020 12 0 0 -
164 Yamuna Naini 83.74 84.74 87.99 08-09-78 81.4 04/09/2020 09 0 0 -
165 Betwa Mohana 121.66 122.66 133.35 11-09-83 119.44 30/08/2020 20 0 0 -
166 Ken Banda 103.00 104.00 113.29 07/0720/05 101.21 30/08/2020 13 0 0 -
167 Gomati Lucknow HanumanSetu 108.50 109.50 110.85 10-09-71 105.9 13/08/2020 14 0 0 -
168 Gomati Jaunpur 73.07 74.07 77.74 22-09-71 69.98 19/08/2020 01 0 0 -
169 SAI Rae-Bareli 100.00 101.00 104.81 17-09-82 98.94 07/07/2020 06 0 0 -
170 Ghaghra Elgin Bridge 105.07 106.07 107.62 18-08-18 107.15 01/08/2020 08 86 86 100.00
171 Ghaghra Ayodhya 91.73 92.73 94.01 11-10-09 93.51 03/08/2020 08 77 77 100.00
172 Ghaghra Turtipar 63.01 64.01 66.00 28-08-98 65.27 05/08/2020 06 96 96 100.00
173 Rapti Balrampur 103.62 104.62 105.54 15-08-17 104.81 11/07/2020 18 42 41 97.62
174 Rapti Bansi 83.90 84.90 85.88 20-08-17 84.85 15/07/2020 15 30 30 100.00
175 Rapti Gorakhpur Birdghat 73.98 74.98 77.54 23-08-98 76.09 26/07/2020 10 51 51 100.00
176 Rapti Kakardhari 130.00 131.00 132.37 15-08-14 129.92 22/07/2020 03 0 0 -
177 Gandak Khadda 95.00 96.00 97.50 23-07-02 96.48 25/09/2020 06 184 184 100.00
178 Ganga Fathegarh 136.60 137.60 138.14 26-09-10 137.56 27/08/2020 01 34 34 100.00
179 Ganga Dabri 136.30 137.30 139.70 28-09-83 136.7 31/08/2020 08 11 11 100.00
180 Ganga Garhmuktheswar 198.30 199.30 199.90 23-09-10 198.89 21/08/2020 03 31 31 100.00
181 Ganga Kachla Bridge 161.00 162.00 162.79 24-09-10 162.71 16/08/2020 03 93 92 98.92
182 Betwa Shahjina 103.54 104.54 108.67 12-09-83 99.74 03/09/2020 03 0 0 -
Uttarakhand -
183 Mandakini Ganganagar 803.00 804.00 801.92 2015 801.1 11/08/2020 06 0 0 -
184 Alaknanda Srinagar 535.00 536.00 537.90 17-06-13 536.1 11/08/2020 06 7 6 85.71
185 Ganga Rishikesh 339.50 340.50 341.72 05-09-95 339.7 11/08/2020 14 1 1 100.00
186 Ganga Haridwar 293.00 294.00 296.30 19-09-10 293.72 11/08/2020 15 7 7 100.00
West Bengal
187 Ganga Farakka 21.25 22.25 25.14 07-09-98 22.89 22/08/2020 13 187 187 100.00
188 Mayurakshi Narayanpur 26.99 27.99 29.69 27-09-95 25.25 30/07/2020 00 0 0 -
189 Ajoy Gheropara 38.42 39.42 43.94 27-09-78 36.32 24/09/2020 12 0 0 -
190 Mundeswari Harinkhola 11.80 12.80 14.60 28-07-17 8.58 07/08/2020 18 0 0 -
191 Kangsabati Mohanpur 24.73 25.73 29.87 02-09-78 22 22/08/2020 06 0 0 -
192 Raidak-I Tufanganj 34.22 35.30 36.50 12-08-17 35.76 13/07/2020 12 62 56 90.32
85
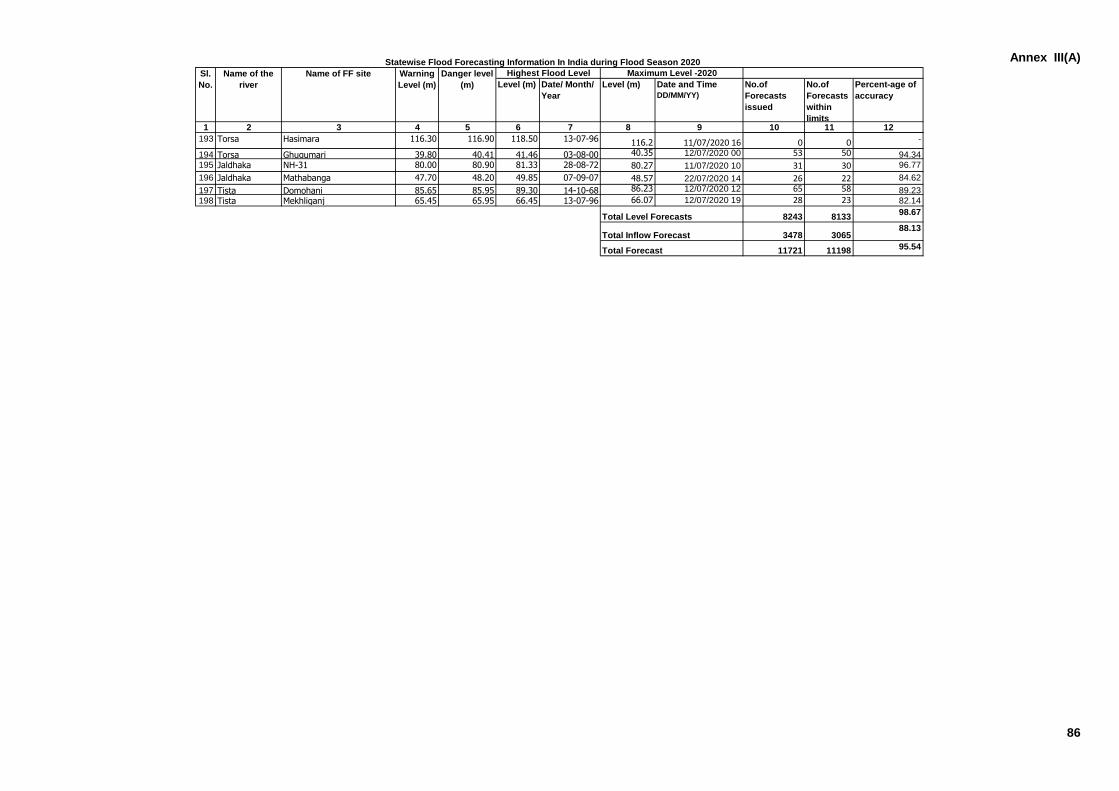
Annex III(A)
Level (m) Date/ Month/
Year
Level (m) Date and Time
DD/MM/YY)
No.of
Forecasts
issued
No.of
Forecasts
within
limits
Percent-age of
accuracy
1 2 3 4 5 6 7 8 9 10 11 12
Statewise Flood Forecasting Information In India during Flood Season 2020
Sl.
No.
Name of the
river
Name of FF site Warning
Level (m)
Danger level
(m)
Highest Flood Level Maximum Level -2020
193 Torsa Hasimara 116.30 116.90 118.50 13-07-96 116.2 11/07/2020 16 0 0 -
194 Torsa Ghugumari 39.80 40.41 41.46 03-08-00 40.35 12/07/2020 00 53 50 94.34195 Jaldhaka NH-31 80.00 80.90 81.33 28-08-72 80.27 11/07/2020 10 31 30 96.77
196 Jaldhaka Mathabanga 47.70 48.20 49.85 07-09-07 48.57 22/07/2020 14 26 22 84.62
197 Tista Domohani 85.65 85.95 89.30 14-10-68 86.23 12/07/2020 12 65 58 89.23198 Tista Mekhliganj 65.45 65.95 66.45 13-07-96 66.07 12/07/2020 19 28 23 82.14
Total Level Forecasts 8243 813398.67
Total Inflow Forecast 3478 306588.13
Total Forecast 11721 11198 95.54
86
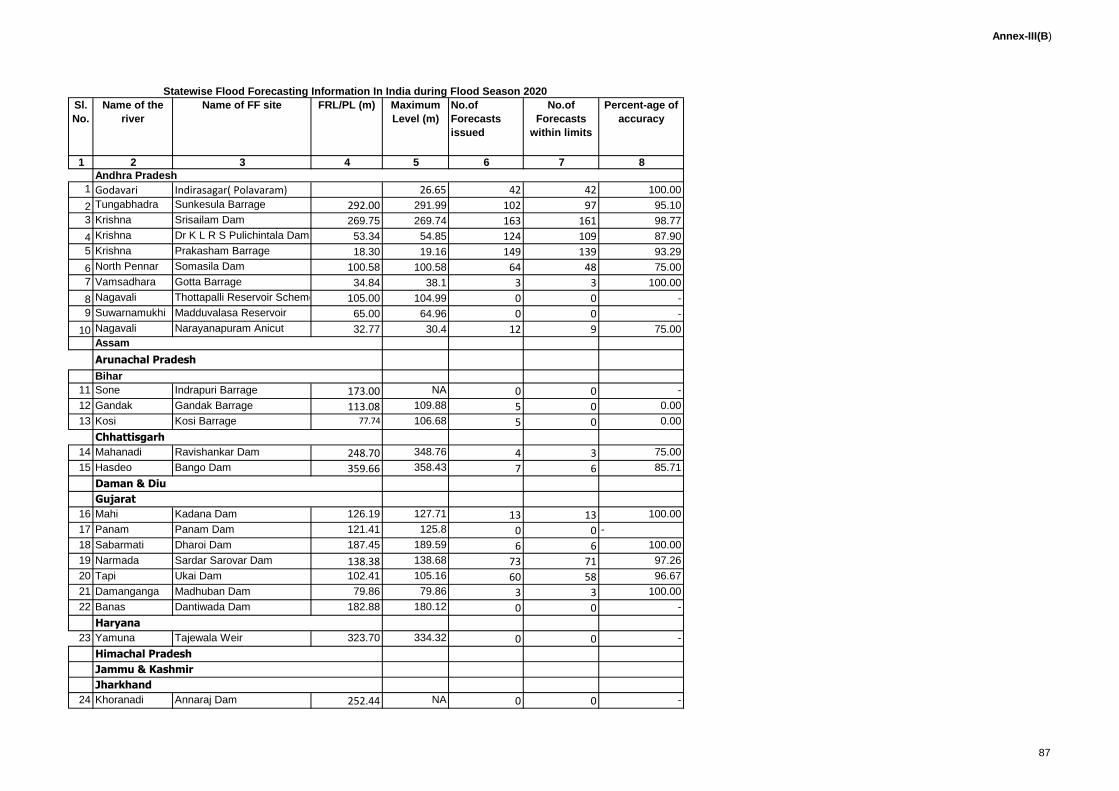
Annex-III(B)
1 2 3 4 5 6 7 8
Andhra Pradesh
1 Godavari Indirasagar( Polavaram) 26.65 42 42 100.00
2 Tungabhadra Sunkesula Barrage 292.00 291.99 102 97 95.10
3 Krishna Srisailam Dam 269.75 269.74 163 161 98.77
4 Krishna Dr K L R S Pulichintala Dam 53.34 54.85 124 109 87.90
5 Krishna Prakasham Barrage 18.30 19.16 149 139 93.29
6 North Pennar Somasila Dam 100.58 100.58 64 48 75.00
7 Vamsadhara Gotta Barrage 34.84 38.1 3 3 100.00
8 Nagavali Thottapalli Reservoir Scheme 105.00 104.99 0 0 -
9 Suwarnamukhi Madduvalasa Reservoir 65.00 64.96 0 0 -
10 Nagavali Narayanapuram Anicut 32.77 30.4 12 9 75.00
11 Sone Indrapuri Barrage 173.00 NA 0 0 -
12 Gandak Gandak Barrage 113.08 109.88 5 0 0.00
13 Kosi Kosi Barrage 77.74 106.68 5 0 0.00
14 Mahanadi Ravishankar Dam 248.70 348.76 4 3 75.00
15 Hasdeo Bango Dam 359.66 358.43 7 6 85.71
16 Mahi Kadana Dam 126.19 127.71 13 13 100.00
17 Panam Panam Dam 121.41 125.8 0 0 -
18 Sabarmati Dharoi Dam 187.45 189.59 6 6 100.00
19 Narmada Sardar Sarovar Dam 138.38 138.68 73 71 97.26
20 Tapi Ukai Dam 102.41 105.16 60 58 96.67
21 Damanganga Madhuban Dam 79.86 79.86 3 3 100.00
22 Banas Dantiwada Dam 182.88 180.12 0 0 -
23 Yamuna Tajewala Weir 323.70 334.32 0 0 -
Himachal Pradesh
Jammu & Kashmir
24 Khoranadi Annaraj Dam 252.44 NA 0 0 -
Assam
Arunachal Pradesh
FRL/PL (m) Maximum
Level (m)
No.of
Forecasts
issued
Jharkhand
Bihar
Chhattisgarh
Daman & Diu
Gujarat
Haryana
Statewise Flood Forecasting Information In India during Flood Season 2020
Sl.
No.
Name of the
river
Name of FF site No.of
Forecasts
within limits
Percent-age of
accuracy
87
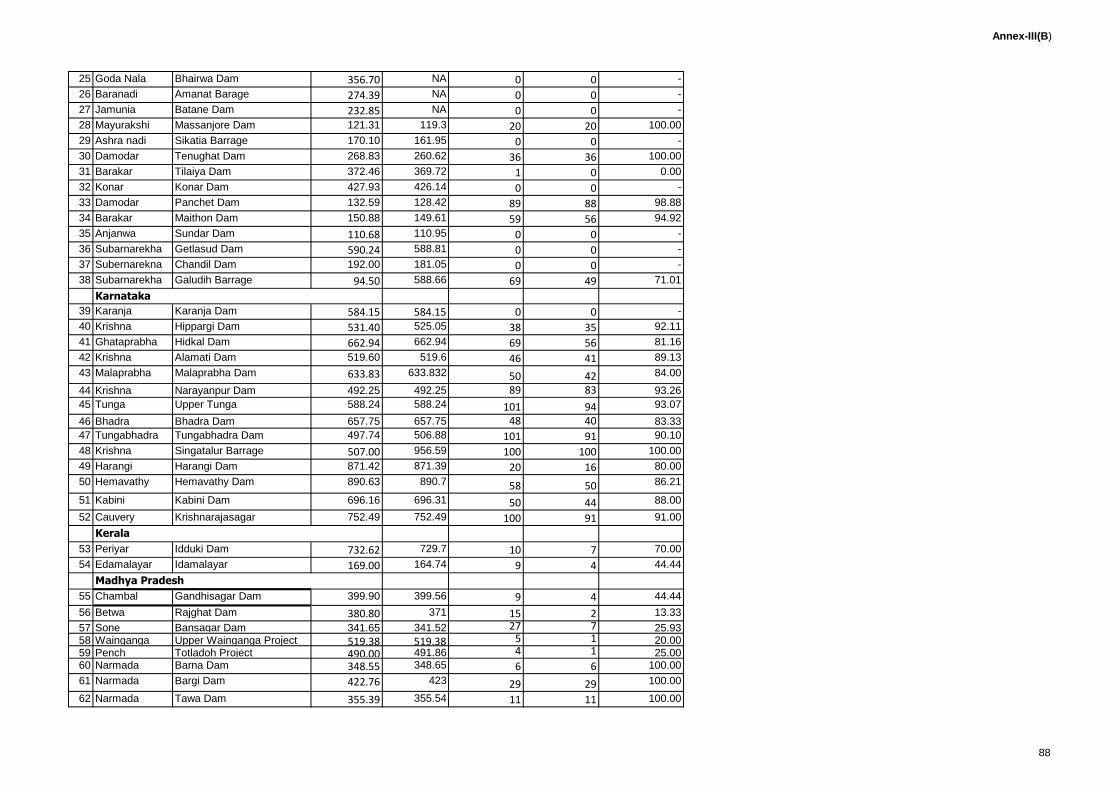
Annex-III(B)
25 Goda Nala Bhairwa Dam 356.70 NA 0 0 -
26 Baranadi Amanat Barage 274.39 NA 0 0 -
27 Jamunia Batane Dam 232.85 NA 0 0 -
28 Mayurakshi Massanjore Dam 121.31 119.3 20 20 100.00
29 Ashra nadi Sikatia Barrage 170.10 161.95 0 0 -
30 Damodar Tenughat Dam 268.83 260.62 36 36 100.00
31 Barakar Tilaiya Dam 372.46 369.72 1 0 0.00
32 Konar Konar Dam 427.93 426.14 0 0 -
33 Damodar Panchet Dam 132.59 128.42 89 88 98.88
34 Barakar Maithon Dam 150.88 149.61 59 56 94.92
35 Anjanwa Sundar Dam 110.68 110.95 0 0 -
36 Subarnarekha Getlasud Dam 590.24 588.81 0 0 -
37 Subernarekna Chandil Dam 192.00 181.05 0 0 -
38 Subarnarekha Galudih Barrage 94.50 588.66 69 49 71.01
Karnataka
39 Karanja Karanja Dam 584.15 584.15 0 0 -
40 Krishna Hippargi Dam 531.40 525.05 38 35 92.11
41 Ghataprabha Hidkal Dam 662.94 662.94 69 56 81.16
42 Krishna Alamati Dam 519.60 519.6 46 41 89.13
43 Malaprabha Malaprabha Dam 633.83 633.832 50 42 84.00
44 Krishna Narayanpur Dam 492.25 492.25 89 83 93.26
45 Tunga Upper Tunga 588.24 588.24 101 94 93.07
46 Bhadra Bhadra Dam 657.75 657.75 48 40 83.33
47 Tungabhadra Tungabhadra Dam 497.74 506.88 101 91 90.10
48 Krishna Singatalur Barrage 507.00 956.59 100 100 100.00
49 Harangi Harangi Dam 871.42 871.39 20 16 80.00
50 Hemavathy Hemavathy Dam 890.63 890.7 58 50 86.21
51 Kabini Kabini Dam 696.16 696.31 50 44 88.00
52 Cauvery Krishnarajasagar 752.49 752.49 100 91 91.00
53 Periyar Idduki Dam 732.62 729.7 10 7 70.00
54 Edamalayar Idamalayar 169.00 164.74 9 4 44.44
55 Chambal Gandhisagar Dam 399.90 399.56 9 4 44.44
56 Betwa Rajghat Dam 380.80 371 15 2 13.33
57 Sone Bansagar Dam 341.65 341.52 27 7 25.9358 Wainganga Upper Wainganga Project 519.38 519.38 5 1 20.0059 Pench Totladoh Project 490.00 491.86 4 1 25.0060 Narmada Barna Dam 348.55 348.65 6 6 100.00
61 Narmada Bargi Dam 422.76 423 29 29 100.00
62 Narmada Tawa Dam 355.39 355.54 11 11 100.00
Madhya Pradesh
Kerala
88
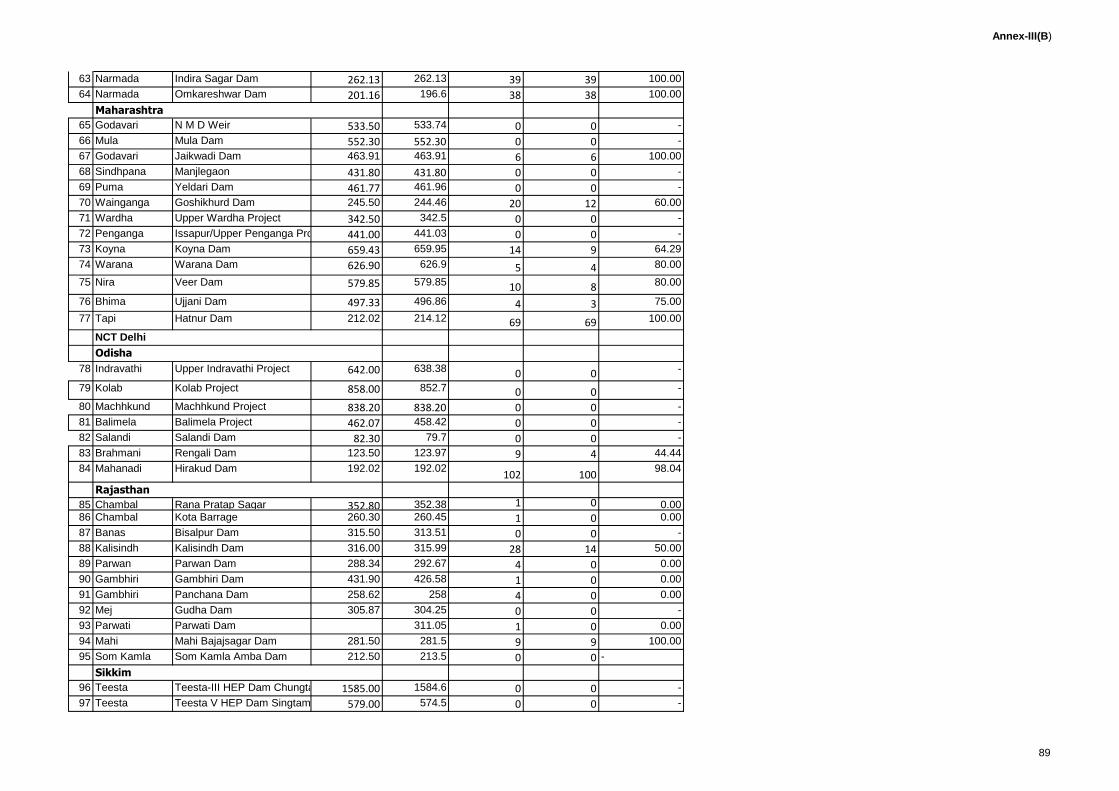
Annex-III(B)
63 Narmada Indira Sagar Dam 262.13 262.13 39 39 100.00
64 Narmada Omkareshwar Dam 201.16 196.6 38 38 100.00
65 Godavari N M D Weir 533.50 533.74 0 0 -
66 Mula Mula Dam 552.30 552.30 0 0 -
67 Godavari Jaikwadi Dam 463.91 463.91 6 6 100.00
68 Sindhpana Manjlegaon 431.80 431.80 0 0 -
69 Puma Yeldari Dam 461.77 461.96 0 0 -
70 Wainganga Goshikhurd Dam 245.50 244.46 20 12 60.00
71 Wardha Upper Wardha Project 342.50 342.5 0 0 -
72 Penganga Issapur/Upper Penganga Project 441.00 441.03 0 0 -
73 Koyna Koyna Dam 659.43 659.95 14 9 64.29
74 Warana Warana Dam 626.90 626.9 5 4 80.00
75 Nira Veer Dam 579.85 579.85 10 8 80.00
76 Bhima Ujjani Dam 497.33 496.86 4 3 75.00
77 Tapi Hatnur Dam 212.02 214.12 69 69 100.00
NCT Delhi
78 Indravathi Upper Indravathi Project 642.00 638.38 0 0 -
79 Kolab Kolab Project 858.00 852.7 0 0 -
80 Machhkund Machhkund Project 838.20 838.20 0 0 -
81 Balimela Balimela Project 462.07 458.42 0 0 -
82 Salandi Salandi Dam 82.30 79.7 0 0 -
83 Brahmani Rengali Dam 123.50 123.97 9 4 44.44
84 Mahanadi Hirakud Dam 192.02 192.02102 100
98.04
85 Chambal Rana Pratap Sagar 352.80 352.38 1 0 0.0086 Chambal Kota Barrage 260.30 260.45 1 0 0.00
87 Banas Bisalpur Dam 315.50 313.51 0 0 -
88 Kalisindh Kalisindh Dam 316.00 315.99 28 14 50.00
89 Parwan Parwan Dam 288.34 292.67 4 0 0.00
90 Gambhiri Gambhiri Dam 431.90 426.58 1 0 0.00
91 Gambhiri Panchana Dam 258.62 258 4 0 0.00
92 Mej Gudha Dam 305.87 304.25 0 0 -
93 Parwati Parwati Dam 311.05 1 0 0.00
94 Mahi Mahi Bajajsagar Dam 281.50 281.5 9 9 100.00
95 Som Kamla Som Kamla Amba Dam 212.50 213.5 0 0 -
96 Teesta Teesta-III HEP Dam Chungtang 1585.00 1584.6 0 0 -
97 Teesta Teesta V HEP Dam Singtam 579.00 574.5 0 0 -
Rajasthan
Sikkim
Maharashtra
Odisha
89
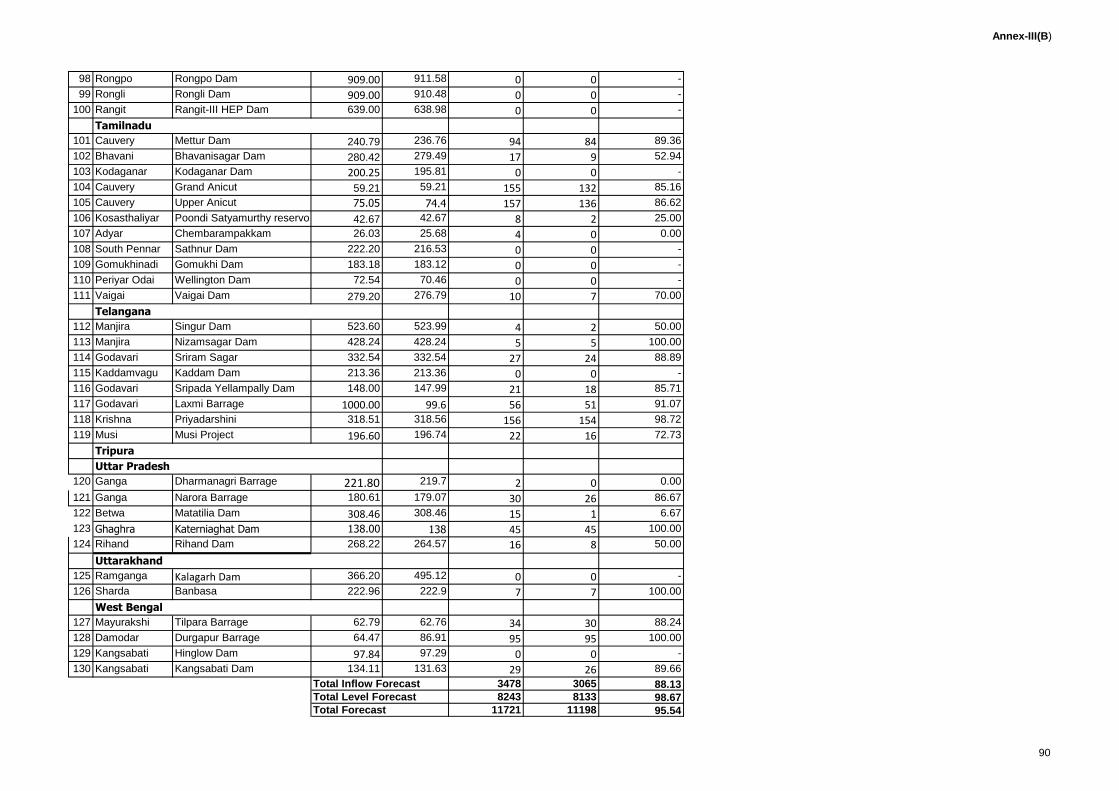
Annex-III(B)
98 Rongpo Rongpo Dam 909.00 911.58 0 0 -
99 Rongli Rongli Dam 909.00 910.48 0 0 -
100 Rangit Rangit-III HEP Dam 639.00 638.98 0 0 -
101 Cauvery Mettur Dam 240.79 236.76 94 84 89.36
102 Bhavani Bhavanisagar Dam 280.42 279.49 17 9 52.94
103 Kodaganar Kodaganar Dam 200.25 195.81 0 0 -
104 Cauvery Grand Anicut 59.21 59.21 155 132 85.16
105 Cauvery Upper Anicut 75.05 74.4 157 136 86.62
106 Kosasthaliyar Poondi Satyamurthy reservoir 42.67 42.67 8 2 25.00
107 Adyar Chembarampakkam 26.03 25.68 4 0 0.00
108 South Pennar Sathnur Dam 222.20 216.53 0 0 -
109 Gomukhinadi Gomukhi Dam 183.18 183.12 0 0 -
110 Periyar Odai Wellington Dam 72.54 70.46 0 0 -
111 Vaigai Vaigai Dam 279.20 276.79 10 7 70.00
112 Manjira Singur Dam 523.60 523.99 4 2 50.00
113 Manjira Nizamsagar Dam 428.24 428.24 5 5 100.00
114 Godavari Sriram Sagar 332.54 332.54 27 24 88.89
115 Kaddamvagu Kaddam Dam 213.36 213.36 0 0 -
116 Godavari Sripada Yellampally Dam 148.00 147.99 21 18 85.71
117 Godavari Laxmi Barrage 1000.00 99.6 56 51 91.07
118 Krishna Priyadarshini 318.51 318.56 156 154 98.72
119 Musi Musi Project 196.60 196.74 22 16 72.73
120 Ganga Dharmanagri Barrage 221.80 219.7 2 0 0.00
121 Ganga Narora Barrage 180.61 179.07 30 26 86.67
122 Betwa Matatilia Dam 308.46 308.46 15 1 6.67
123 Ghaghra Katerniaghat Dam 138.00 138 45 45 100.00
124 Rihand Rihand Dam 268.22 264.57 16 8 50.00
125 Ramganga Kalagarh Dam 366.20 495.12 0 0 -
126 Sharda Banbasa 222.96 222.9 7 7 100.00
127 Mayurakshi Tilpara Barrage 62.79 62.76 34 30 88.24
128 Damodar Durgapur Barrage 64.47 86.91 95 95 100.00
129 Kangsabati Hinglow Dam 97.84 97.29 0 0 -
130 Kangsabati Kangsabati Dam 134.11 131.63 29 26 89.66
Total Inflow Forecast 3478 3065 88.13Total Level Forecast 8243 8133 98.67Total Forecast 11721 11198 95.54
Uttarakhand
West Bengal
Tamilnadu
Telangana
Tripura
Uttar Pradesh
90
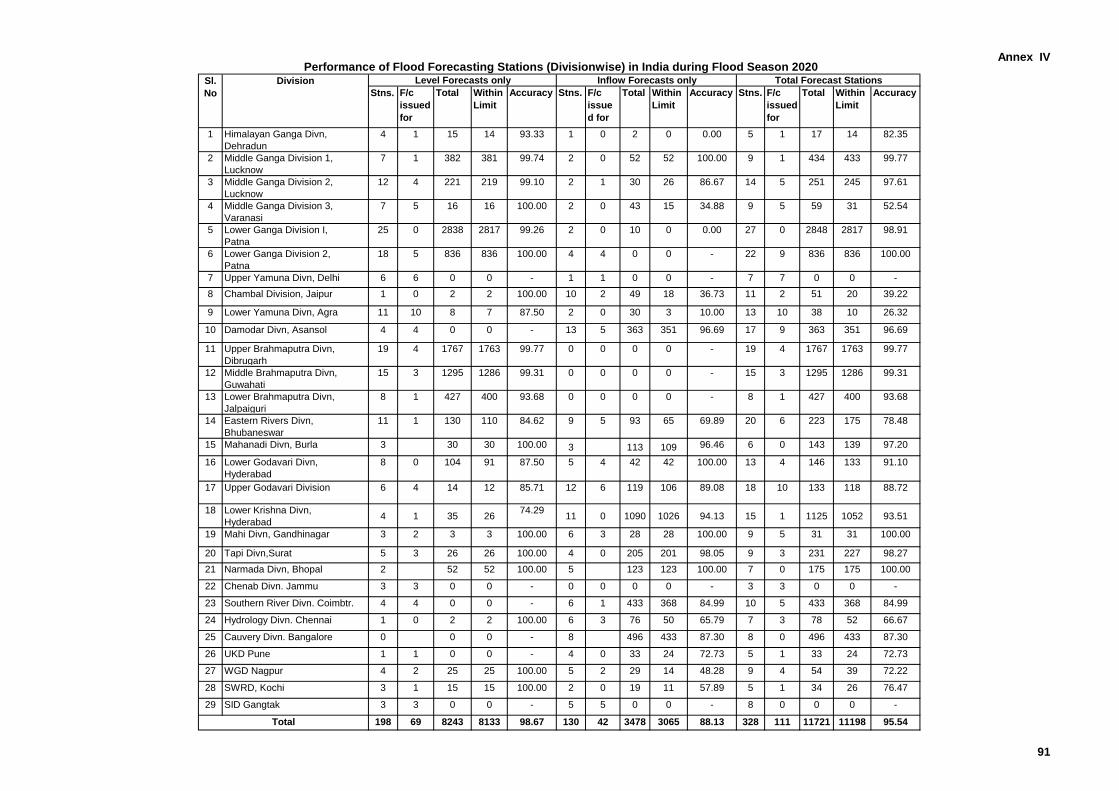
Annex IV
Stns. F/c
issued
for
Total Within
Limit
Accuracy Stns. F/c
issue
d for
Total Within
Limit
Accuracy Stns. F/c
issued
for
Total Within
Limit
Accuracy
1 Himalayan Ganga Divn,
Dehradun
4 1 15 14 93.33 1 0 2 0 0.00 5 1 17 14 82.35
2 Middle Ganga Division 1,
Lucknow
7 1 382 381 99.74 2 0 52 52 100.00 9 1 434 433 99.77
3 Middle Ganga Division 2,
Lucknow
12 4 221 219 99.10 2 1 30 26 86.67 14 5 251 245 97.61
4 Middle Ganga Division 3,
Varanasi
7 5 16 16 100.00 2 0 43 15 34.88 9 5 59 31 52.54
5 Lower Ganga Division I,
Patna
25 0 2838 2817 99.26 2 0 10 0 0.00 27 0 2848 2817 98.91
6 Lower Ganga Division 2,
Patna
18 5 836 836 100.00 4 4 0 0 - 22 9 836 836 100.00
7 Upper Yamuna Divn, Delhi 6 6 0 0 - 1 1 0 0 - 7 7 0 0 -
8 Chambal Division, Jaipur 1 0 2 2 100.00 10 2 49 18 36.73 11 2 51 20 39.22
9 Lower Yamuna Divn, Agra 11 10 8 7 87.50 2 0 30 3 10.00 13 10 38 10 26.32
10 Damodar Divn, Asansol 4 4 0 0 - 13 5 363 351 96.69 17 9 363 351 96.69
11 Upper Brahmaputra Divn,
Dibrugarh
19 4 1767 1763 99.77 0 0 0 0 - 19 4 1767 1763 99.77
12 Middle Brahmaputra Divn,
Guwahati
15 3 1295 1286 99.31 0 0 0 0 - 15 3 1295 1286 99.31
13 Lower Brahmaputra Divn,
Jalpaiguri
8 1 427 400 93.68 0 0 0 0 - 8 1 427 400 93.68
14 Eastern Rivers Divn,
Bhubaneswar
11 1 130 110 84.62 9 5 93 65 69.89 20 6 223 175 78.48
15 Mahanadi Divn, Burla 3 30 30 100.00 3 113 109 96.46 6 0 143 139 97.20
16 Lower Godavari Divn,
Hyderabad
8 0 104 91 87.50 5 4 42 42 100.00 13 4 146 133 91.10
17 Upper Godavari Division 6 4 14 12 85.71 12 6 119 106 89.08 18 10 133 118 88.72
18 Lower Krishna Divn,
Hyderabad4 1 35 26
74.2911 0 1090 1026 94.13 15 1 1125 1052 93.51
19 Mahi Divn, Gandhinagar 3 2 3 3 100.00 6 3 28 28 100.00 9 5 31 31 100.00
20 Tapi Divn,Surat 5 3 26 26 100.00 4 0 205 201 98.05 9 3 231 227 98.27
21 Narmada Divn, Bhopal 2 52 52 100.00 5 123 123 100.00 7 0 175 175 100.00
22 Chenab Divn. Jammu 3 3 0 0 - 0 0 0 0 - 3 3 0 0 -
23 Southern River Divn. Coimbtr. 4 4 0 0 - 6 1 433 368 84.99 10 5 433 368 84.99
24 Hydrology Divn. Chennai 1 0 2 2 100.00 6 3 76 50 65.79 7 3 78 52 66.67
25 Cauvery Divn. Bangalore 0 0 0 - 8 496 433 87.30 8 0 496 433 87.30
26 UKD Pune 1 1 0 0 - 4 0 33 24 72.73 5 1 33 24 72.73
27 WGD Nagpur 4 2 25 25 100.00 5 2 29 14 48.28 9 4 54 39 72.22
28 SWRD, Kochi 3 1 15 15 100.00 2 0 19 11 57.89 5 1 34 26 76.47
29 SID Gangtak 3 3 0 0 - 5 5 0 0 - 8 0 0 0 -
198 69 8243 8133 98.67 130 42 3478 3065 88.13 328 111 11721 11198 95.54Total
Performance of Flood Forecasting Stations (Divisionwise) in India during Flood Season 2020Sl.
No
Division Level Forecasts only Inflow Forecasts only Total Forecast Stations
91
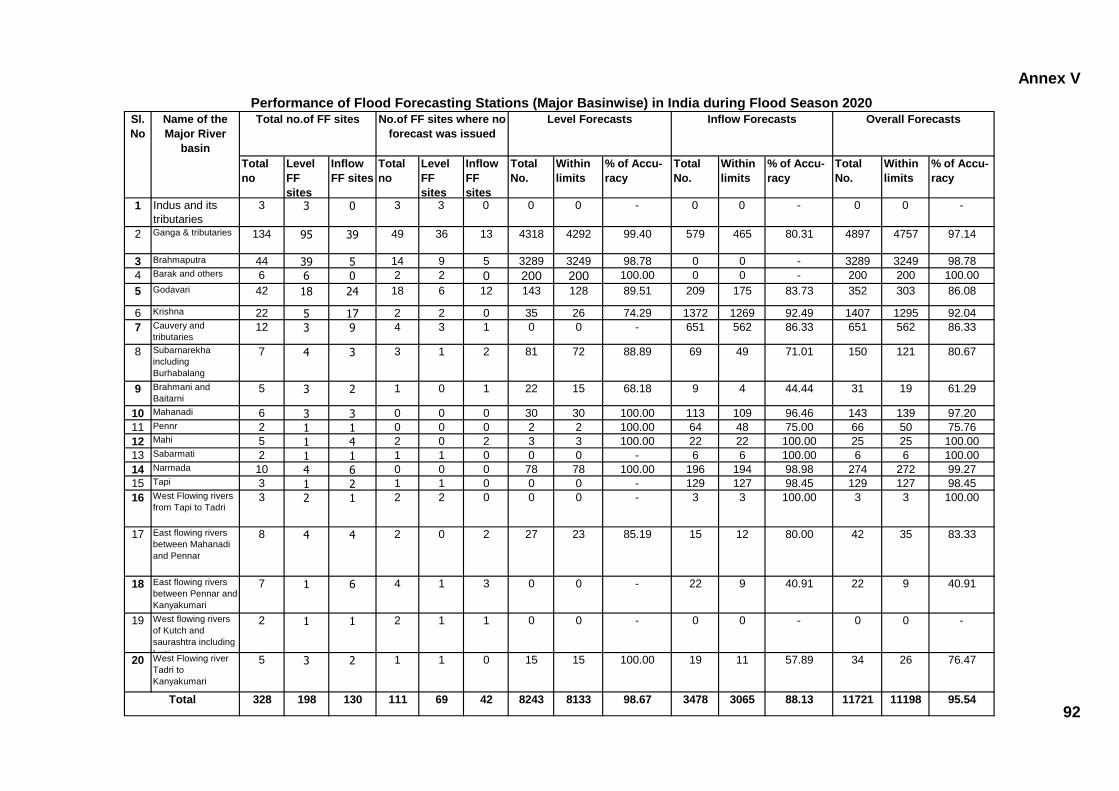
Annex V
Total
no
Level
FF
sites
Inflow
FF sites
Total
no
Level
FF
sites
Inflow
FF
sites
Total
No.
Within
limits
% of Accu-
racy
Total
No.
Within
limits
% of Accu-
racy
Total
No.
Within
limits
% of Accu-
racy
1 Indus and its
tributaries
3 3 0 3 3 0 0 0 - 0 0 - 0 0 -
2 Ganga & tributaries 134 95 39 49 36 13 4318 4292 99.40 579 465 80.31 4897 4757 97.14
3 Brahmaputra 44 39 5 14 9 5 3289 3249 98.78 0 0 - 3289 3249 98.78
4 Barak and others 6 6 0 2 2 0 200 200 100.00 0 0 - 200 200 100.00
5 Godavari 42 18 24 18 6 12 143 128 89.51 209 175 83.73 352 303 86.08
6 Krishna 22 5 17 2 2 0 35 26 74.29 1372 1269 92.49 1407 1295 92.04
7 Cauvery and
tributaries 12 3 9 4 3 1 0 0 - 651 562 86.33 651 562 86.33
8 Subarnarekha
including
Burhabalang
7 4 3 3 1 2 81 72 88.89 69 49 71.01 150 121 80.67
9 Brahmani and
Baitarni5 3 2 1 0 1 22 15 68.18 9 4 44.44 31 19 61.29
10 Mahanadi 6 3 3 0 0 0 30 30 100.00 113 109 96.46 143 139 97.20
11 Pennr 2 1 1 0 0 0 2 2 100.00 64 48 75.00 66 50 75.76
12 Mahi 5 1 4 2 0 2 3 3 100.00 22 22 100.00 25 25 100.00
13 Sabarmati 2 1 1 1 1 0 0 0 - 6 6 100.00 6 6 100.00
14 Narmada 10 4 6 0 0 0 78 78 100.00 196 194 98.98 274 272 99.27
15 Tapi 3 1 2 1 1 0 0 0 - 129 127 98.45 129 127 98.45
16 West Flowing rivers
from Tapi to Tadri3 2 1 2 2 0 0 0 - 3 3 100.00 3 3 100.00
17 East flowing rivers
between Mahanadi
and Pennar
8 4 4 2 0 2 27 23 85.19 15 12 80.00 42 35 83.33
18 East flowing rivers
between Pennar and
Kanyakumari
7 1 6 4 1 3 0 0 - 22 9 40.91 22 9 40.91
19 West flowing rivers
of Kutch and
saurashtra including
Luni
2 1 1 2 1 1 0 0 - 0 0 - 0 0 -
20 West Flowing river
Tadri to
Kanyakumari
5 3 2 1 1 0 15 15 100.00 19 11 57.89 34 26 76.47
328 198 130 111 69 42 8243 8133 98.67 3478 3065 88.13 11721 11198 95.54Total
Performance of Flood Forecasting Stations (Major Basinwise) in India during Flood Season 2020Sl.
No
Name of the
Major River
basin
Total no.of FF sites No.of FF sites where no
forecast was issued
Level Forecasts Inflow Forecasts Overall Forecasts
92
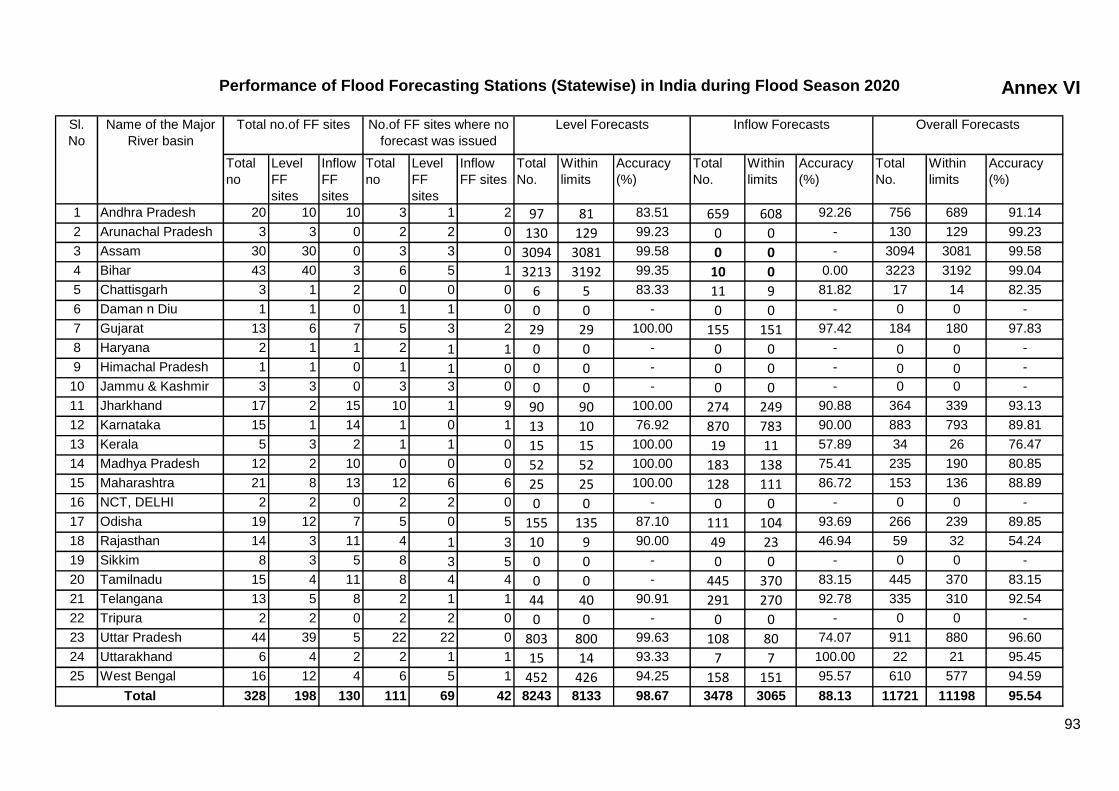
Annex VI
Total
no
Level
FF
sites
Inflow
FF
sites
Total
no
Level
FF
sites
Inflow
FF sites
Total
No.
Within
limits
Accuracy
(%)
Total
No.
Within
limits
Accuracy
(%)
Total
No.
Within
limits
Accuracy
(%)
1 Andhra Pradesh 20 10 10 3 1 2 97 81 83.51 659 608 92.26 756 689 91.14
2 Arunachal Pradesh 3 3 0 2 2 0 130 129 99.23 0 0 - 130 129 99.23
3 Assam 30 30 0 3 3 0 3094 3081 99.58 0 0 - 3094 3081 99.58
4 Bihar 43 40 3 6 5 1 3213 3192 99.35 10 0 0.00 3223 3192 99.04
5 Chattisgarh 3 1 2 0 0 0 6 5 83.33 11 9 81.82 17 14 82.35
6 Daman n Diu 1 1 0 1 1 0 0 0 - 0 0 - 0 0 -
7 Gujarat 13 6 7 5 3 2 29 29 100.00 155 151 97.42 184 180 97.83
8 Haryana 2 1 1 2 1 1 0 0 - 0 0 - 0 0 -
9 Himachal Pradesh 1 1 0 1 1 0 0 0 - 0 0 - 0 0 -
10 Jammu & Kashmir 3 3 0 3 3 0 0 0 - 0 0 - 0 0 -
11 Jharkhand 17 2 15 10 1 9 90 90 100.00 274 249 90.88 364 339 93.13
12 Karnataka 15 1 14 1 0 1 13 10 76.92 870 783 90.00 883 793 89.81
13 Kerala 5 3 2 1 1 0 15 15 100.00 19 11 57.89 34 26 76.47
14 Madhya Pradesh 12 2 10 0 0 0 52 52 100.00 183 138 75.41 235 190 80.85
15 Maharashtra 21 8 13 12 6 6 25 25 100.00 128 111 86.72 153 136 88.89
16 NCT, DELHI 2 2 0 2 2 0 0 0 - 0 0 - 0 0 -
17 Odisha 19 12 7 5 0 5 155 135 87.10 111 104 93.69 266 239 89.85
18 Rajasthan 14 3 11 4 1 3 10 9 90.00 49 23 46.94 59 32 54.24
19 Sikkim 8 3 5 8 3 5 0 0 - 0 0 - 0 0 -
20 Tamilnadu 15 4 11 8 4 4 0 0 - 445 370 83.15 445 370 83.15
21 Telangana 13 5 8 2 1 1 44 40 90.91 291 270 92.78 335 310 92.54
22 Tripura 2 2 0 2 2 0 0 0 - 0 0 - 0 0 -
23 Uttar Pradesh 44 39 5 22 22 0 803 800 99.63 108 80 74.07 911 880 96.60
24 Uttarakhand 6 4 2 2 1 1 15 14 93.33 7 7 100.00 22 21 95.45
25 West Bengal 16 12 4 6 5 1 452 426 94.25 158 151 95.57 610 577 94.59
328 198 130 111 69 42 8243 8133 98.67 3478 3065 88.13 11721 11198 95.54Total
Performance of Flood Forecasting Stations (Statewise) in India during Flood Season 2020
Sl.
No
Name of the Major
River basin
Total no.of FF sites No.of FF sites where no
forecast was issued
Level Forecasts Inflow Forecasts Overall Forecasts
93
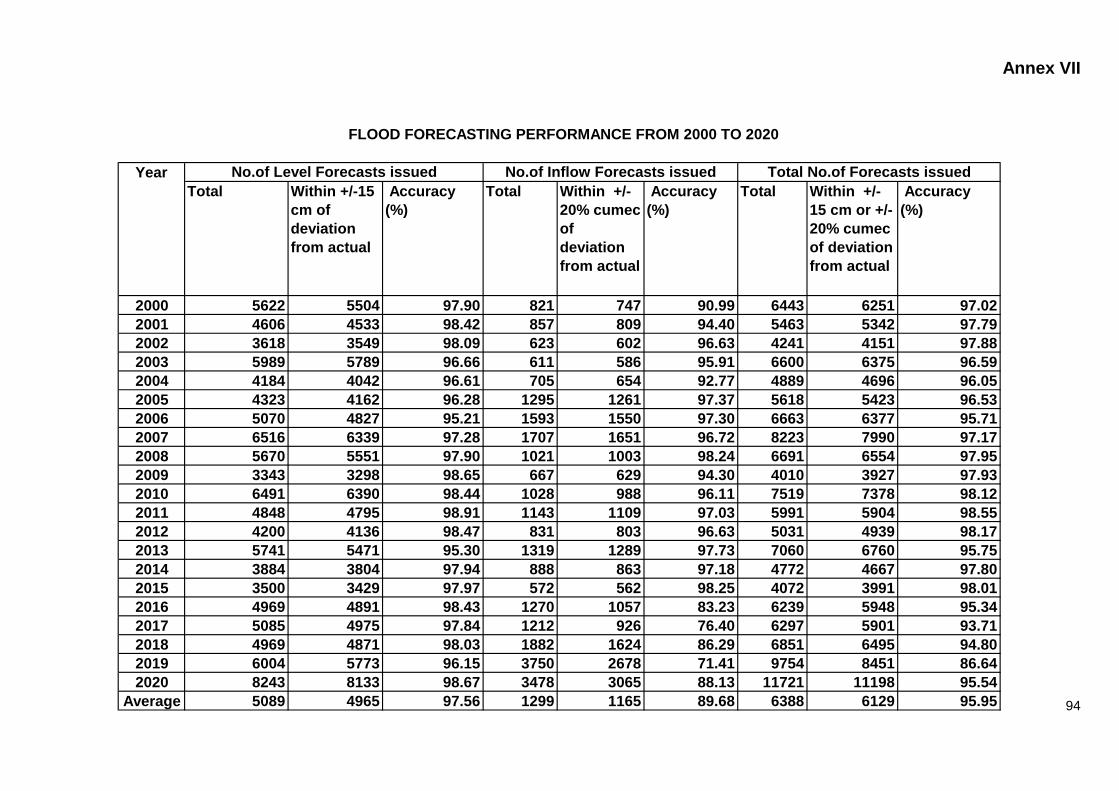
Annex VII
Total Within +/-15
cm of
deviation
from actual
Accuracy
(%)
Total Within +/-
20% cumec
of
deviation
from actual
Accuracy
(%)
Total Within +/-
15 cm or +/-
20% cumec
of deviation
from actual
Accuracy
(%)
2000 5622 5504 97.90 821 747 90.99 6443 6251 97.02
2001 4606 4533 98.42 857 809 94.40 5463 5342 97.79
2002 3618 3549 98.09 623 602 96.63 4241 4151 97.88
2003 5989 5789 96.66 611 586 95.91 6600 6375 96.59
2004 4184 4042 96.61 705 654 92.77 4889 4696 96.05
2005 4323 4162 96.28 1295 1261 97.37 5618 5423 96.53
2006 5070 4827 95.21 1593 1550 97.30 6663 6377 95.71
2007 6516 6339 97.28 1707 1651 96.72 8223 7990 97.17
2008 5670 5551 97.90 1021 1003 98.24 6691 6554 97.95
2009 3343 3298 98.65 667 629 94.30 4010 3927 97.93
2010 6491 6390 98.44 1028 988 96.11 7519 7378 98.12
2011 4848 4795 98.91 1143 1109 97.03 5991 5904 98.55
2012 4200 4136 98.47 831 803 96.63 5031 4939 98.17
2013 5741 5471 95.30 1319 1289 97.73 7060 6760 95.75
2014 3884 3804 97.94 888 863 97.18 4772 4667 97.80
2015 3500 3429 97.97 572 562 98.25 4072 3991 98.01
2016 4969 4891 98.43 1270 1057 83.23 6239 5948 95.34
2017 5085 4975 97.84 1212 926 76.40 6297 5901 93.71
2018 4969 4871 98.03 1882 1624 86.29 6851 6495 94.80
2019 6004 5773 96.15 3750 2678 71.41 9754 8451 86.64
2020 8243 8133 98.67 3478 3065 88.13 11721 11198 95.54
Average 5089 4965 97.56 1299 1165 89.68 6388 6129 95.95
FLOOD FORECASTING PERFORMANCE FROM 2000 TO 2020
Year No.of Level Forecasts issued No.of Inflow Forecasts issued Total No.of Forecasts issued
94
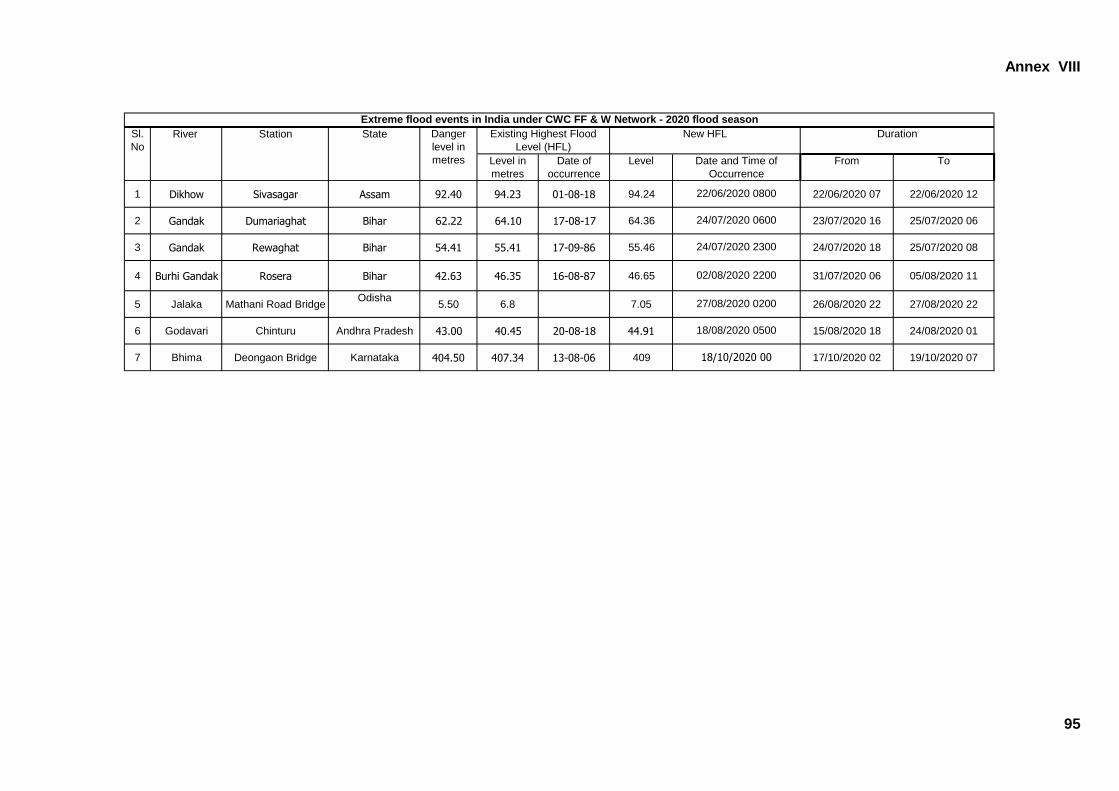
Annex VIII
Level in
metres
Date of
occurrence
Level From To
1 Dikhow Sivasagar Assam 92.40 94.23 01-08-18 94.24 22/06/2020 07 22/06/2020 12
2 Gandak Dumariaghat Bihar 62.22 64.10 17-08-17 64.36 23/07/2020 16 25/07/2020 06
3 Gandak Rewaghat Bihar 54.41 55.41 17-09-86 55.46 24/07/2020 18 25/07/2020 08
4 Burhi Gandak Rosera Bihar 42.63 46.35 16-08-87 46.65 31/07/2020 06 05/08/2020 11
5 Jalaka Mathani Road BridgeOdisha
5.50 6.8 7.05 26/08/2020 22 27/08/2020 22
6 Godavari Chinturu Andhra Pradesh 43.00 40.45 20-08-18 44.91 15/08/2020 18 24/08/2020 01
7 Bhima Deongaon Bridge Karnataka 404.50 407.34 13-08-06 409 17/10/2020 02 19/10/2020 07
24/07/2020 2300
02/08/2020 2200
22/06/2020 0800
24/07/2020 0600
18/10/2020 00
27/08/2020 0200
18/08/2020 0500
Extreme flood events in India under CWC FF & W Network - 2020 flood season
Sl.
No
River Station
Date and Time of
Occurrence
State Danger
level in
metres
Existing Highest Flood
Level (HFL)
DurationNew HFL
95
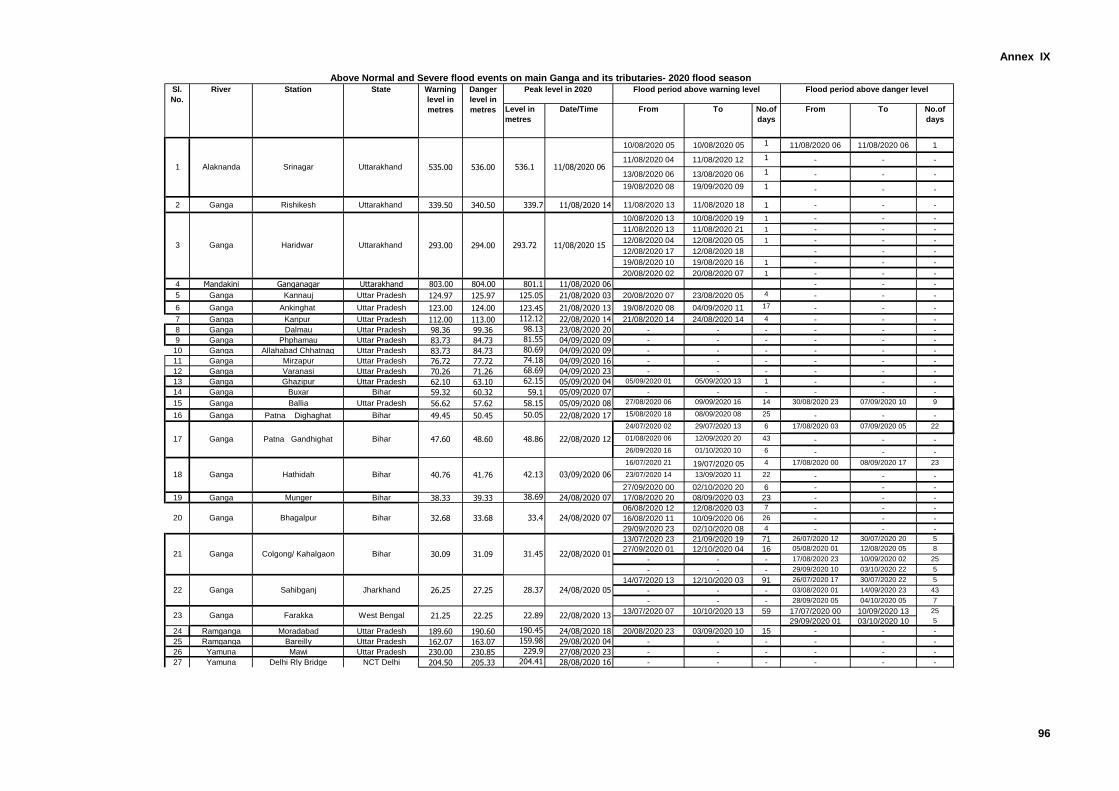
Annex IX
Level in
metres
Date/Time From To No.of
days
From To No.of
days
10/08/2020 05 10/08/2020 05 1 11/08/2020 06 11/08/2020 06 1
11/08/2020 04 11/08/2020 12 1 - - -
13/08/2020 06 13/08/2020 06 1 - - -
19/08/2020 08 19/09/2020 09 1 - - -
2 Ganga Rishikesh Uttarakhand 339.50 340.50 339.7 11/08/2020 14 11/08/2020 13 11/08/2020 18 1 - - -
10/08/2020 13 10/08/2020 19 1 - - -
11/08/2020 13 11/08/2020 21 1 - - -
12/08/2020 04 12/08/2020 05 1 - - -
12/08/2020 17 12/08/2020 18 - - -
19/08/2020 10 19/08/2020 16 1 - - -
20/08/2020 02 20/08/2020 07 1 - - -
4 Mandakini Ganganagar Uttarakhand 803.00 804.00 801.1 11/08/2020 06 - - -
5 Ganga Kannauj Uttar Pradesh 124.97 125.97 125.05 21/08/2020 03 20/08/2020 07 23/08/2020 05 4 - - -
6 Ganga Ankinghat Uttar Pradesh 123.00 124.00 123.45 21/08/2020 13 19/08/2020 08 04/09/2020 11 17 - - -
7 Ganga Kanpur Uttar Pradesh 112.00 113.00 112.12 22/08/2020 14 21/08/2020 14 24/08/2020 14 4 - - -
8 Ganga Dalmau Uttar Pradesh 98.36 99.36 98.13 23/08/2020 20 - - - - - -
9 Ganga Phphamau Uttar Pradesh 83.73 84.73 81.55 04/09/2020 09 - - - - - -
10 Ganga Allahabad Chhatnag Uttar Pradesh 83.73 84.73 80.69 04/09/2020 09 - - - - - -
11 Ganga Mirzapur Uttar Pradesh 76.72 77.72 74.18 04/09/2020 16 - - - - - -
12 Ganga Varanasi Uttar Pradesh 70.26 71.26 68.69 04/09/2020 23 - - - - - -
13 Ganga Ghazipur Uttar Pradesh 62.10 63.10 62.15 05/09/2020 04 05/09/2020 01 05/09/2020 13 1 - - -
14 Ganga Buxar Bihar 59.32 60.32 59.1 05/09/2020 07 - - - - - -
15 Ganga Ballia Uttar Pradesh 56.62 57.62 58.15 05/09/2020 08 27/08/2020 06 09/09/2020 16 14 30/08/2020 23 07/09/2020 10 9
16 Ganga Patna Dighaghat Bihar 49.45 50.45 50.05 22/08/2020 17 15/08/2020 18 08/09/2020 08 25 - - -
24/07/2020 02 29/07/2020 13 6 17/08/2020 03 07/09/2020 05 22
01/08/2020 06 12/09/2020 20 43 - - -
26/09/2020 16 01/10/2020 10 6 - - -
16/07/2020 21 19/07/2020 05 4 17/08/2020 00 08/09/2020 17 23
23/07/2020 14 13/09/2020 11 22 - - -
27/09/2020 00 02/10/2020 20 6 - - -
19 Ganga Munger Bihar 38.33 39.33 38.69 24/08/2020 07 17/08/2020 20 08/09/2020 03 23 - - -
06/08/2020 12 12/08/2020 03 7 - - -
16/08/2020 11 10/09/2020 06 26 - - -
29/09/2020 23 02/10/2020 08 4 - - -
13/07/2020 23 21/09/2020 19 71 26/07/2020 12 30/07/2020 20 5
27/09/2020 01 12/10/2020 04 16 05/08/2020 01 12/08/2020 05 8
- - - 17/08/2020 23 10/09/2020 02 25
- - - 29/09/2020 10 03/10/2020 22 5
14/07/2020 13 12/10/2020 03 91 26/07/2020 17 30/07/2020 22 5
- - - 03/08/2020 01 14/09/2020 23 43
- - - 28/09/2020 05 04/10/2020 05 7
13/07/2020 07 10/10/2020 13 59 17/07/2020 00 10/09/2020 13 25
29/09/2020 01 03/10/2020 10 5
24 Ramganga Moradabad Uttar Pradesh 189.60 190.60 190.45 24/08/2020 18 20/08/2020 23 03/09/2020 10 15 - - -
25 Ramganga Bareilly Uttar Pradesh 162.07 163.07 159.98 29/08/2020 04 - - - - - -
26 Yamuna Mawi Uttar Pradesh 230.00 230.85 229.9 27/08/2020 23 - - - - - -
27 Yamuna Delhi Rly Bridge NCT Delhi 204.50 205.33 204.41 28/08/2020 16 - - - - - -
Alaknanda Srinagar1 Uttarakhand 535.00 536.00
21.25 22.25
Ganga
Bihar
27.25
32.68 33.68
30.09
Ganga Hathidah Bihar 40.76 41.76
Patna Gandhighat Bihar
3 Ganga Haridwar Uttarakhand 293.00 294.00
21 Colgong/ Kahalgaon
23 Ganga Farakka West Bengal
Ganga
47.60 48.6017
Jharkhand
Ganga Bhagalpur
18
Bihar20
Ganga22 Sahibganj
48.86
33.4
31.45
28.37
22.89
42.13 03/09/2020 06
24/08/2020 07
22/08/2020 01
24/08/2020 05
22/08/2020 12
22/08/2020 13
Above Normal and Severe flood events on main Ganga and its tributaries- 2020 flood seasonSl.
No.
River Station State Warning
level in
metres
Danger
level in
metres
Flood period above danger level Peak level in 2020 Flood period above warning level
536.1 11/08/2020 06
293.72 11/08/2020 15
31.09
26.25
96
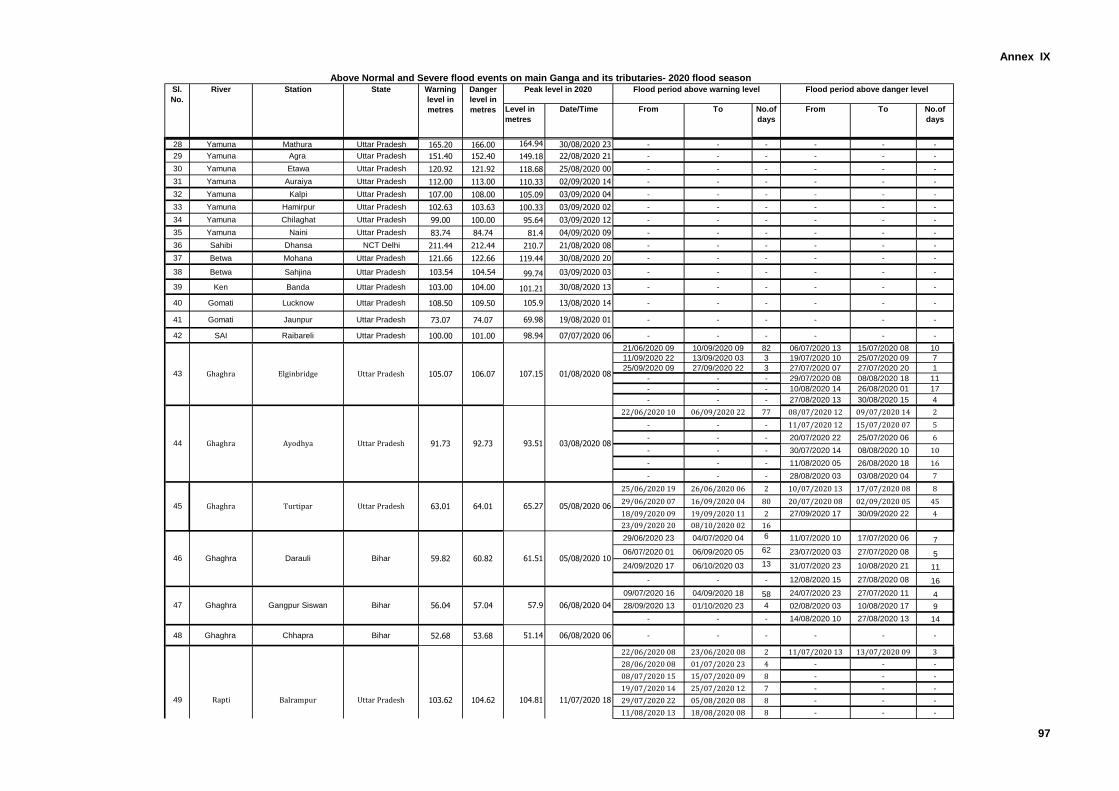
Annex IX
Level in
metres
Date/Time From To No.of
days
From To No.of
days
Alaknanda Srinagar1 Uttarakhand 535.00 536.00
Above Normal and Severe flood events on main Ganga and its tributaries- 2020 flood seasonSl.
No.
River Station State Warning
level in
metres
Danger
level in
metres
Flood period above danger level Peak level in 2020 Flood period above warning level
536.1 11/08/2020 06
28 Yamuna Mathura Uttar Pradesh 165.20 166.00 164.94 30/08/2020 23 - - - - - -
29 Yamuna Agra Uttar Pradesh 151.40 152.40 149.18 22/08/2020 21 - - - - - -
30 Yamuna Etawa Uttar Pradesh 120.92 121.92 118.68 25/08/2020 00 - - - - - -
31 Yamuna Auraiya Uttar Pradesh 112.00 113.00 110.33 02/09/2020 14 - - - - - -
32 Yamuna Kalpi Uttar Pradesh 107.00 108.00 105.09 03/09/2020 04 - - - - - -
33 Yamuna Hamirpur Uttar Pradesh 102.63 103.63 100.33 03/09/2020 02 - - - - - -
34 Yamuna Chilaghat Uttar Pradesh 99.00 100.00 95.64 03/09/2020 12 - - - - - -
35 Yamuna Naini Uttar Pradesh 83.74 84.74 81.4 04/09/2020 09 - - - - - -
36 Sahibi Dhansa NCT Delhi 211.44 212.44 210.7 21/08/2020 08 - - - - - -
37 Betwa Mohana Uttar Pradesh 121.66 122.66 119.44 30/08/2020 20 - - - - - -
38 Betwa Sahjina Uttar Pradesh 103.54 104.54 99.74 03/09/2020 03 - - - - - -
39 Ken Banda Uttar Pradesh 103.00 104.00 101.21 30/08/2020 13 - - - - - -
40 Gomati Lucknow Uttar Pradesh 108.50 109.50 105.9 13/08/2020 14 - - - - - -
41 Gomati Jaunpur Uttar Pradesh 73.07 74.07 69.98 19/08/2020 01 - - - - - -
42 SAI Raibareli Uttar Pradesh 100.00 101.00 98.94 07/07/2020 06 - - - - - -
21/06/2020 09 10/09/2020 09 82 06/07/2020 13 15/07/2020 08 10
11/09/2020 22 13/09/2020 03 3 19/07/2020 10 25/07/2020 09 7
25/09/2020 09 27/09/2020 22 3 27/07/2020 07 27/07/2020 20 1
- - - 29/07/2020 08 08/08/2020 18 11
- - - 10/08/2020 14 26/08/2020 01 17
- - - 27/08/2020 13 30/08/2020 15 4
22/06/2020 10 06/09/2020 22 77 08/07/2020 12 09/07/2020 14 2
- - - 11/07/2020 12 15/07/2020 07 5
- - - 20/07/2020 22 25/07/2020 06 6
- - - 30/07/2020 14 08/08/2020 10 10
- - - 11/08/2020 05 26/08/2020 18 16
- - - 28/08/2020 03 03/08/2020 04 7
25/06/2020 19 26/06/2020 06 2 10/07/2020 13 17/07/2020 08 8
29/06/2020 07 16/09/2020 04 80 20/07/2020 08 02/09/2020 05 45
18/09/2020 09 19/09/2020 11 2 27/09/2020 17 30/09/2020 22 4
23/09/2020 20 08/10/2020 02 16
29/06/2020 23 04/07/2020 04 6 11/07/2020 10 17/07/2020 06 7
06/07/2020 01 06/09/2020 05 62 23/07/2020 03 27/07/2020 08 5
24/09/2020 17 06/10/2020 03 13 31/07/2020 23 10/08/2020 21 11
- - - 12/08/2020 15 27/08/2020 08 16
09/07/2020 16 04/09/2020 18 58 24/07/2020 23 27/07/2020 11 4
28/09/2020 13 01/10/2020 23 4 02/08/2020 03 10/08/2020 17 9
- - - 14/08/2020 10 27/08/2020 13 14
48 Ghaghra Chhapra Bihar 52.68 53.68 51.14 06/08/2020 06 - - - - - -
22/06/2020 08 23/06/2020 08 2 11/07/2020 13 13/07/2020 09 3
28/06/2020 08 01/07/2020 23 4 - - -
08/07/2020 15 15/07/2020 09 8 - - -
19/07/2020 14 25/07/2020 12 7 - - -
29/07/2020 22 05/08/2020 08 8 - - -
11/08/2020 13 18/08/2020 08 8 - - -
Elginbridge Uttar Pradesh 105.07
44 Ghaghra Ayodhya
49
46 Ghaghra
Ghaghra
Rapti Uttar Pradesh
Gangpur Siswan
03/08/2020 08
65.27 05/08/2020 06
Ghaghra
92.73
106.07
64.0163.01
91.73
107.15 01/08/2020 08
93.51
Darauli Bihar
47
45
Uttar Pradesh
Ghaghra Turtipar Uttar Pradesh
61.51 05/08/2020 10
57.9 06/08/2020 04
104.81 11/07/2020 18
57.04
60.8259.82
103.62 104.62
Bihar 56.04
Balrampur
43
97
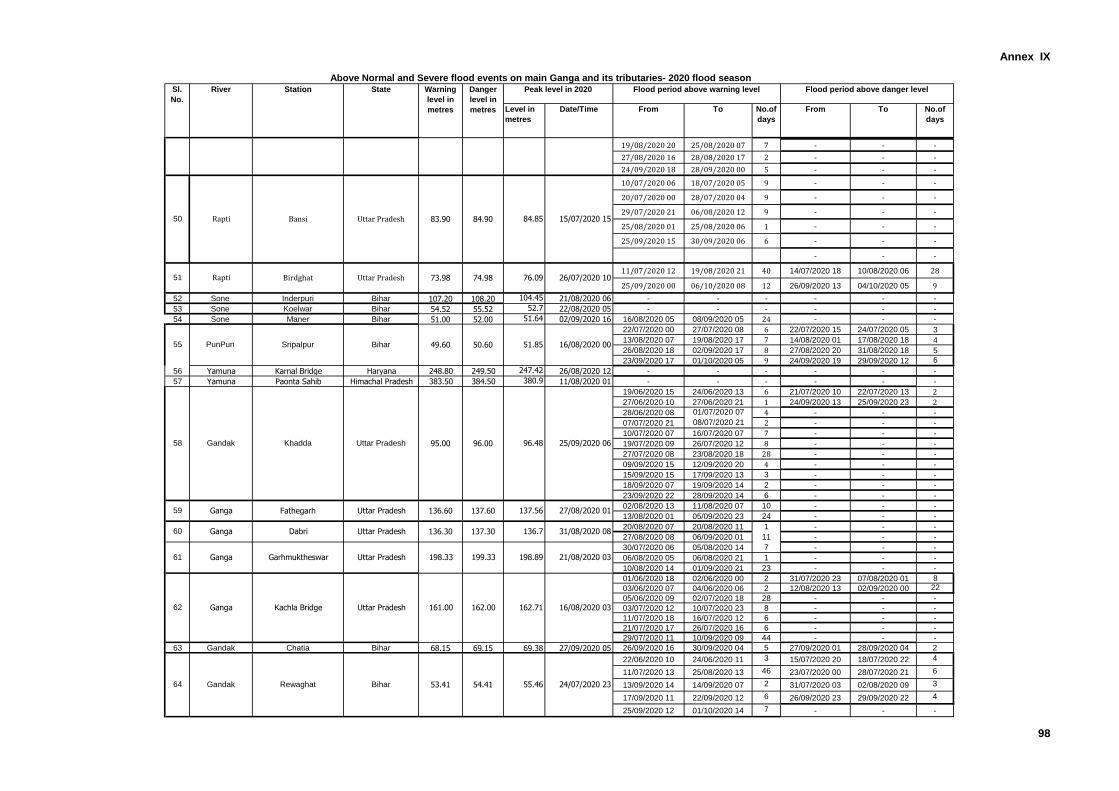
Annex IX
Level in
metres
Date/Time From To No.of
days
From To No.of
days
Alaknanda Srinagar1 Uttarakhand 535.00 536.00
Above Normal and Severe flood events on main Ganga and its tributaries- 2020 flood seasonSl.
No.
River Station State Warning
level in
metres
Danger
level in
metres
Flood period above danger level Peak level in 2020 Flood period above warning level
536.1 11/08/2020 06
19/08/2020 20 25/08/2020 07 7 - - -
27/08/2020 16 28/08/2020 17 2 - - -
24/09/2020 18 28/09/2020 00 5 - - -
10/07/2020 06 18/07/2020 05 9 - - -
20/07/2020 00 28/07/2020 04 9 - - -
29/07/2020 21 06/08/2020 12 9 - - -
25/08/2020 01 25/08/2020 06 1 - - -
25/09/2020 15 30/09/2020 06 6 - - -
- - -
11/07/2020 12 19/08/2020 21 40 14/07/2020 18 10/08/2020 06 28
25/09/2020 00 06/10/2020 08 12 26/09/2020 13 04/10/2020 05 9
52 Sone Inderpuri Bihar 107.20 108.20 104.45 21/08/2020 06 - - - - - -
53 Sone Koelwar Bihar 54.52 55.52 52.7 22/08/2020 05 - - - - - -
54 Sone Maner Bihar 51.00 52.00 51.64 02/09/2020 16 16/08/2020 05 08/09/2020 05 24 - - -
22/07/2020 00 27/07/2020 08 6 22/07/2020 15 24/07/2020 05 3
13/08/2020 07 19/08/2020 17 7 14/08/2020 01 17/08/2020 18 4
26/08/2020 18 02/09/2020 17 8 27/08/2020 20 31/08/2020 18 5
23/09/2020 17 01/10/2020 05 9 24/09/2020 19 29/09/2020 12 6
56 Yamuna Karnal Bridge Haryana 248.80 249.50 247.42 26/08/2020 12 - - - - - -
57 Yamuna Paonta Sahib Himachal Pradesh 383.50 384.50 380.9 11/08/2020 01 - - - - - -
19/06/2020 15 24/06/2020 13 6 21/07/2020 10 22/07/2020 13 2
27/06/2020 10 27/06/2020 21 1 24/09/2020 13 25/09/2020 23 2
28/06/2020 08 01/07/2020 07 4 - - -
07/07/2020 21 08/07/2020 21 2 - - -
10/07/2020 07 16/07/2020 07 7 - - -
19/07/2020 09 26/07/2020 12 8 - - -
27/07/2020 08 23/08/2020 18 28 - - -
09/09/2020 15 12/09/2020 20 4 - - -
15/09/2020 15 17/09/2020 13 3 - - -
18/09/2020 07 19/09/2020 14 2 - - -
23/09/2020 22 28/09/2020 14 6 - - -
02/08/2020 13 11/08/2020 07 10 - - -
13/08/2020 01 05/09/2020 23 24 - - -
20/08/2020 07 20/08/2020 11 1 - - -
27/08/2020 08 06/09/2020 01 11 - - -
30/07/2020 06 05/08/2020 14 7 - - -
06/08/2020 05 06/08/2020 21 1 - - -
10/08/2020 14 01/09/2020 21 23 - - -
01/06/2020 18 02/06/2020 00 2 31/07/2020 23 07/08/2020 01 8
03/06/2020 07 04/06/2020 06 2 12/08/2020 13 02/09/2020 00 22
05/06/2020 09 02/07/2020 18 28 - - -
03/07/2020 12 10/07/2020 23 8 - - -
11/07/2020 18 16/07/2020 12 6 - - -
21/07/2020 17 26/07/2020 16 6 - - -
29/07/2020 11 10/09/2020 09 44 - - -
63 Gandak Chatia Bihar 68.15 69.15 69.38 27/09/2020 05 26/09/2020 16 30/09/2020 04 5 27/09/2020 01 28/09/2020 04 2
22/06/2020 10 24/06/2020 11 3 15/07/2020 20 18/07/2020 22 4
11/07/2020 13 25/08/2020 13 46 23/07/2020 00 28/07/2020 21 6
13/09/2020 14 14/09/2020 07 2 31/07/2020 03 02/08/2020 09 3
17/09/2020 11 22/09/2020 12 6 26/09/2020 23 29/09/2020 22 4
25/09/2020 12 01/10/2020 14 7 - - -
62 Ganga Kachla Bridge Uttar Pradesh
64 Gandak Rewaghat Bihar
49 Rapti Uttar Pradesh
Bansi Uttar Pradesh
58 Gandak Khadda Uttar Pradesh
61 Ganga Garhmuktheswar Uttar Pradesh
Rapti
104.81 11/07/2020 18
51.85 16/08/2020 00
95.00 96.00 96.48 25/09/2020 06
74.98
84.90 84.85 15/07/2020 15
103.62 104.62
49.60 50.60
83.90
161.00 162.00 162.71 16/08/2020 03
55.46 24/07/2020 2353.41 54.41
Balrampur
50
51
Bihar SripalpurPunPun 55
21/08/2020 03
59 Ganga Fathegarh
60
198.33 199.33
137.60
136.30 137.30
136.60Uttar Pradesh
DabriGanga
76.09 26/07/2020 10Rapti Birdghat Uttar Pradesh 73.98
Uttar Pradesh
137.56 27/08/2020 01
136.7 31/08/2020 08
198.89
98
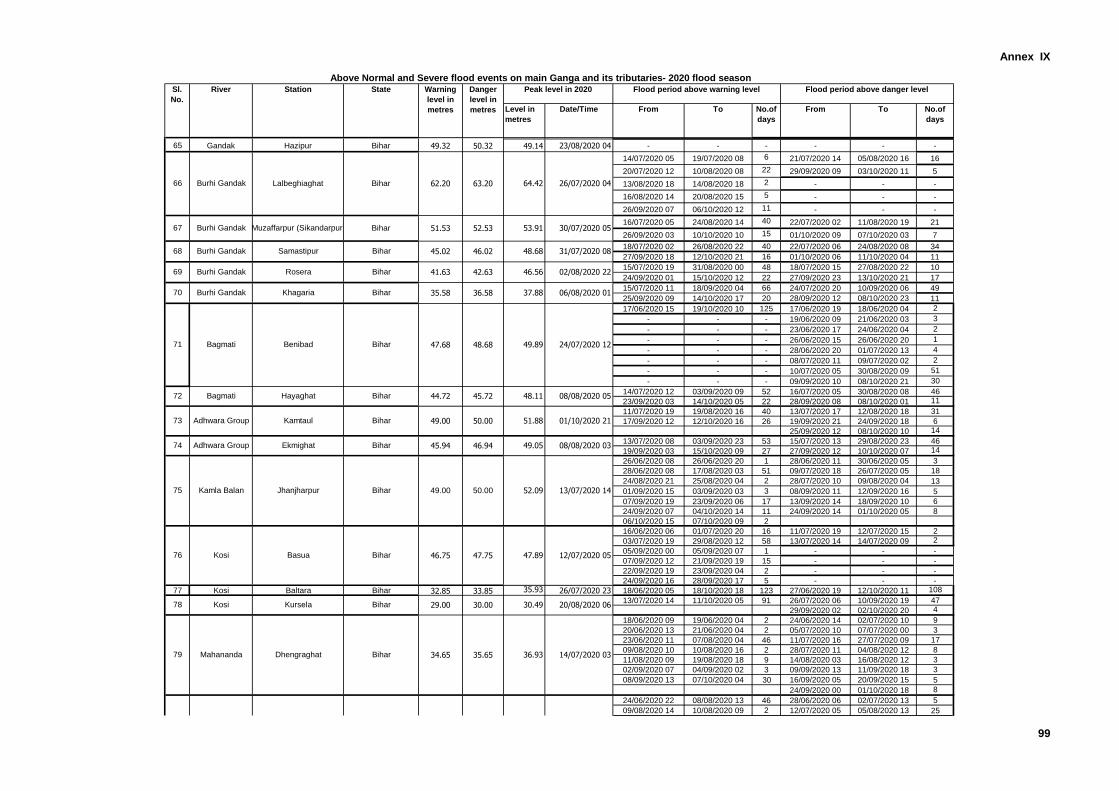
Annex IX
Level in
metres
Date/Time From To No.of
days
From To No.of
days
Alaknanda Srinagar1 Uttarakhand 535.00 536.00
Above Normal and Severe flood events on main Ganga and its tributaries- 2020 flood seasonSl.
No.
River Station State Warning
level in
metres
Danger
level in
metres
Flood period above danger level Peak level in 2020 Flood period above warning level
536.1 11/08/2020 06
65 Gandak Hazipur Bihar 49.32 50.32 49.14 23/08/2020 04 - - - - - -
14/07/2020 05 19/07/2020 08 6 21/07/2020 14 05/08/2020 16 16
20/07/2020 12 10/08/2020 08 22 29/09/2020 09 03/10/2020 11 5
13/08/2020 18 14/08/2020 18 2 - - -
16/08/2020 14 20/08/2020 15 5 - - -
26/09/2020 07 06/10/2020 12 11 - - -
16/07/2020 05 24/08/2020 14 40 22/07/2020 02 11/08/2020 19 21
26/09/2020 03 10/10/2020 10 15 01/10/2020 09 07/10/2020 03 7
18/07/2020 02 26/08/2020 22 40 22/07/2020 06 24/08/2020 08 34
27/09/2020 18 12/10/2020 21 16 01/10/2020 06 11/10/2020 04 11
15/07/2020 19 31/08/2020 00 48 18/07/2020 15 27/08/2020 22 10
24/09/2020 01 15/10/2020 12 22 27/09/2020 23 13/10/2020 21 17
15/07/2020 11 18/09/2020 04 66 24/07/2020 20 10/09/2020 06 49
25/09/2020 09 14/10/2020 17 20 28/09/2020 12 08/10/2020 23 11
17/06/2020 15 19/10/2020 10 125 17/06/2020 19 18/06/2020 04 2
- - - 19/06/2020 09 21/06/2020 03 3
- - - 23/06/2020 17 24/06/2020 04 2
- - - 26/06/2020 15 26/06/2020 20 1
- - - 28/06/2020 20 01/07/2020 13 4
- - - 08/07/2020 11 09/07/2020 02 2
- - - 10/07/2020 05 30/08/2020 09 51
- - - 09/09/2020 10 08/10/2020 21 30
14/07/2020 12 03/09/2020 09 52 16/07/2020 05 30/08/2020 08 46
23/09/2020 03 14/10/2020 05 22 28/09/2020 08 08/10/2020 01 11
11/07/2020 19 19/08/2020 16 40 13/07/2020 17 12/08/2020 18 31
17/09/2020 12 12/10/2020 16 26 19/09/2020 21 24/09/2020 18 6
25/09/2020 12 08/10/2020 10 14
13/07/2020 08 03/09/2020 23 53 15/07/2020 13 29/08/2020 23 46
19/09/2020 03 15/10/2020 09 27 27/09/2020 12 10/10/2020 07 14
26/06/2020 08 26/06/2020 20 1 28/06/2020 11 30/06/2020 05 3
28/06/2020 08 17/08/2020 03 51 09/07/2020 18 26/07/2020 05 18
24/08/2020 21 25/08/2020 04 2 28/07/2020 10 09/08/2020 04 13
01/09/2020 15 03/09/2020 03 3 08/09/2020 11 12/09/2020 16 5
07/09/2020 19 23/09/2020 06 17 13/09/2020 14 18/09/2020 10 6
24/09/2020 07 04/10/2020 14 11 24/09/2020 14 01/10/2020 05 8
06/10/2020 15 07/10/2020 09 2
16/06/2020 06 01/07/2020 20 16 11/07/2020 19 12/07/2020 15 2
03/07/2020 19 29/08/2020 12 58 13/07/2020 14 14/07/2020 09 2
05/09/2020 00 05/09/2020 07 1 - - -
07/09/2020 12 21/09/2020 19 15 - - -
22/09/2020 19 23/09/2020 04 2 - - -
24/09/2020 16 28/09/2020 17 5 - - -
77 Kosi Baltara Bihar 32.85 33.85 35.93 26/07/2020 23 18/06/2020 05 18/10/2020 18 123 27/06/2020 19 12/10/2020 11 108
13/07/2020 14 11/10/2020 05 91 26/07/2020 06 10/09/2020 19 47
29/09/2020 02 02/10/2020 20 4
18/06/2020 09 19/06/2020 04 2 24/06/2020 14 02/07/2020 10 9
20/06/2020 13 21/06/2020 04 2 05/07/2020 10 07/07/2020 00 3
23/06/2020 11 07/08/2020 04 46 11/07/2020 16 27/07/2020 09 17
09/08/2020 10 10/08/2020 16 2 28/07/2020 11 04/08/2020 12 8
11/08/2020 09 19/08/2020 18 9 14/08/2020 03 16/08/2020 12 3
02/09/2020 07 04/09/2020 02 3 09/09/2020 13 11/09/2020 18 3
08/09/2020 13 07/10/2020 04 30 16/09/2020 05 20/09/2020 15 5
24/09/2020 00 01/10/2020 18 8
24/06/2020 22 08/08/2020 13 46 28/06/2020 06 02/07/2020 13 5
09/08/2020 14 10/08/2020 09 2 12/07/2020 05 05/08/2020 13 25
75 Kamla Balan Jhanjharpur Bihar 49.00 50.00
78 Kosi Kursela Bihar
Muzaffarpur (Sikandarpur) Bihar 51.53 52.53
73 Adhwara Group Kamtaul
Burhi Gandak68 Samastipur Bihar
67 Burhi Gandak
36.58
74 Adhwara Group Ekmighat Bihar
72 Bagmati Hayaghat
46.75 47.75
Mahananda80 Jhawa Bihar
79 Mahananda Dhengraghat
66 Bihar
48.11 08/08/2020 05
47.68
41.63 42.63 46.56 02/08/2020 22
64.42 26/07/2020 04
53.91 30/07/2020 05
48.68
62.20 63.20
45.02 46.02
51.88 01/10/2020 21
49.05 08/08/2020 03
52.09 13/07/2020 14
47.89 12/07/2020 05
32.63 28/09/2020 12
30.49 20/08/2020 06
36.93 14/07/2020 03
69 Burhi Gandak
30.40
70 Burhi Gandak
71 Bagmati Benibad Bihar
76 Kosi Basua
35.58
31.40
34.65 35.65
45.94 46.94
44.72 45.72
Bihar 49.00 50.00
Bihar
Bihar
Bihar
29.00 30.00
37.88 06/08/2020 01
49.89 24/07/2020 12
Burhi Gandak Lalbeghiaghat
Khagaria Bihar
Rosera Bihar
48.68 31/07/2020 08
99
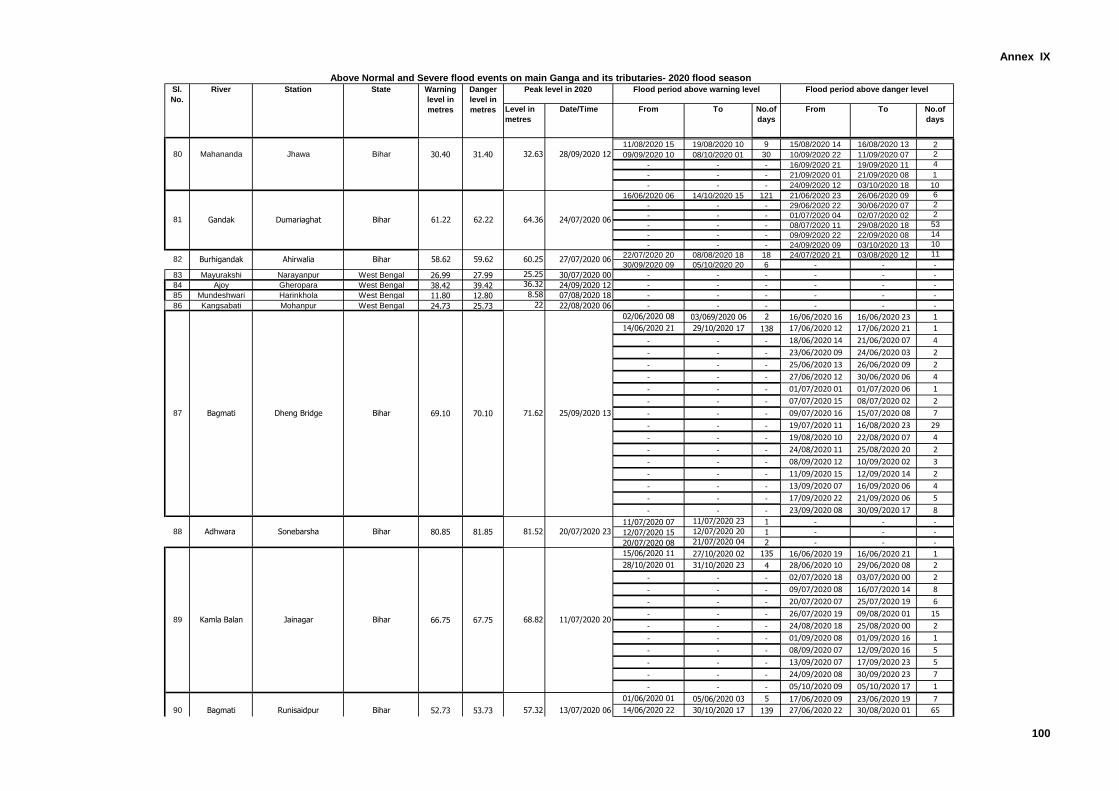
Annex IX
Level in
metres
Date/Time From To No.of
days
From To No.of
days
Alaknanda Srinagar1 Uttarakhand 535.00 536.00
Above Normal and Severe flood events on main Ganga and its tributaries- 2020 flood seasonSl.
No.
River Station State Warning
level in
metres
Danger
level in
metres
Flood period above danger level Peak level in 2020 Flood period above warning level
536.1 11/08/2020 06
11/08/2020 15 19/08/2020 10 9 15/08/2020 14 16/08/2020 13 2
09/09/2020 10 08/10/2020 01 30 10/09/2020 22 11/09/2020 07 2
- - - 16/09/2020 21 19/09/2020 11 4
- - - 21/09/2020 01 21/09/2020 08 1
- - - 24/09/2020 12 03/10/2020 18 10
16/06/2020 06 14/10/2020 15 121 21/06/2020 23 26/06/2020 09 6
- - - 29/06/2020 22 30/06/2020 07 2
- - - 01/07/2020 04 02/07/2020 02 2
- - - 08/07/2020 11 29/08/2020 18 53
- - - 09/09/2020 22 22/09/2020 08 14
- - - 24/09/2020 09 03/10/2020 13 10
22/07/2020 20 08/08/2020 18 18 24/07/2020 21 03/08/2020 12 11
30/09/2020 09 05/10/2020 20 6 - - -
83 Mayurakshi Narayanpur West Bengal 26.99 27.99 25.25 30/07/2020 00 - - - - - -
84 Ajoy Gheropara West Bengal 38.42 39.42 36.32 24/09/2020 12 - - - - - -
85 Mundeshwari Harinkhola West Bengal 11.80 12.80 8.58 07/08/2020 18 - - - - - -
86 Kangsabati Mohanpur West Bengal 24.73 25.73 22 22/08/2020 06 - - - - - -
02/06/2020 08 03/069/2020 06 2 16/06/2020 16 16/06/2020 23 1
14/06/2020 21 29/10/2020 17 138 17/06/2020 12 17/06/2020 21 1
- - - 18/06/2020 14 21/06/2020 07 4
- - - 23/06/2020 09 24/06/2020 03 2
- - - 25/06/2020 13 26/06/2020 09 2
- - - 27/06/2020 12 30/06/2020 06 4
- - - 01/07/2020 01 01/07/2020 06 1
- - - 07/07/2020 15 08/07/2020 02 2
- - - 09/07/2020 16 15/07/2020 08 7
- - - 19/07/2020 11 16/08/2020 23 29
- - - 19/08/2020 10 22/08/2020 07 4
- - - 24/08/2020 11 25/08/2020 20 2
- - - 08/09/2020 12 10/09/2020 02 3
- - - 11/09/2020 15 12/09/2020 14 2
- - - 13/09/2020 07 16/09/2020 06 4
- - - 17/09/2020 22 21/09/2020 06 5
- - - 23/09/2020 08 30/09/2020 17 8
11/07/2020 07 11/07/2020 23 1 - - -
12/07/2020 15 12/07/2020 20 1 - - -
20/07/2020 08 21/07/2020 04 2 - - -
15/06/2020 11 27/10/2020 02 135 16/06/2020 19 16/06/2020 21 1
28/10/2020 01 31/10/2020 23 4 28/06/2020 10 29/06/2020 08 2
- - - 02/07/2020 18 03/07/2020 00 2
- - - 09/07/2020 08 16/07/2020 14 8
- - - 20/07/2020 07 25/07/2020 19 6
- - - 26/07/2020 19 09/08/2020 01 15
- - - 24/08/2020 18 25/08/2020 00 2
- - - 01/09/2020 08 01/09/2020 16 1
- - - 08/09/2020 07 12/09/2020 16 5
- - - 13/09/2020 07 17/09/2020 23 5
- - - 24/09/2020 08 30/09/2020 23 7
- - - 05/10/2020 09 05/10/2020 17 1
01/06/2020 01 05/06/2020 03 5 17/06/2020 09 23/06/2020 19 7
14/06/2020 22 30/10/2020 17 139 27/06/2020 22 30/08/2020 01 65
82 Burhigandak Ahirwalia Bihar 58.62 59.62
61.22 62.22
53.73
Kamla Balan89 Jainagar Bihar 66.75 67.75
88 Adhwara Sonebarsha Bihar
87 Bagmati Dheng Bridge Bihar
Bagmati90 Runisaidpur Bihar 52.73
Mahananda80 Jhawa Bihar
81 Gandak Dumariaghat Bihar 64.36 24/07/2020 06
32.63 28/09/2020 12
60.25 27/07/2020 06
69.10 70.10 71.62 25/09/2020 13
80.85 81.85 81.52 20/07/2020 23
68.82 11/07/2020 20
57.32 13/07/2020 06
30.40 31.40
100
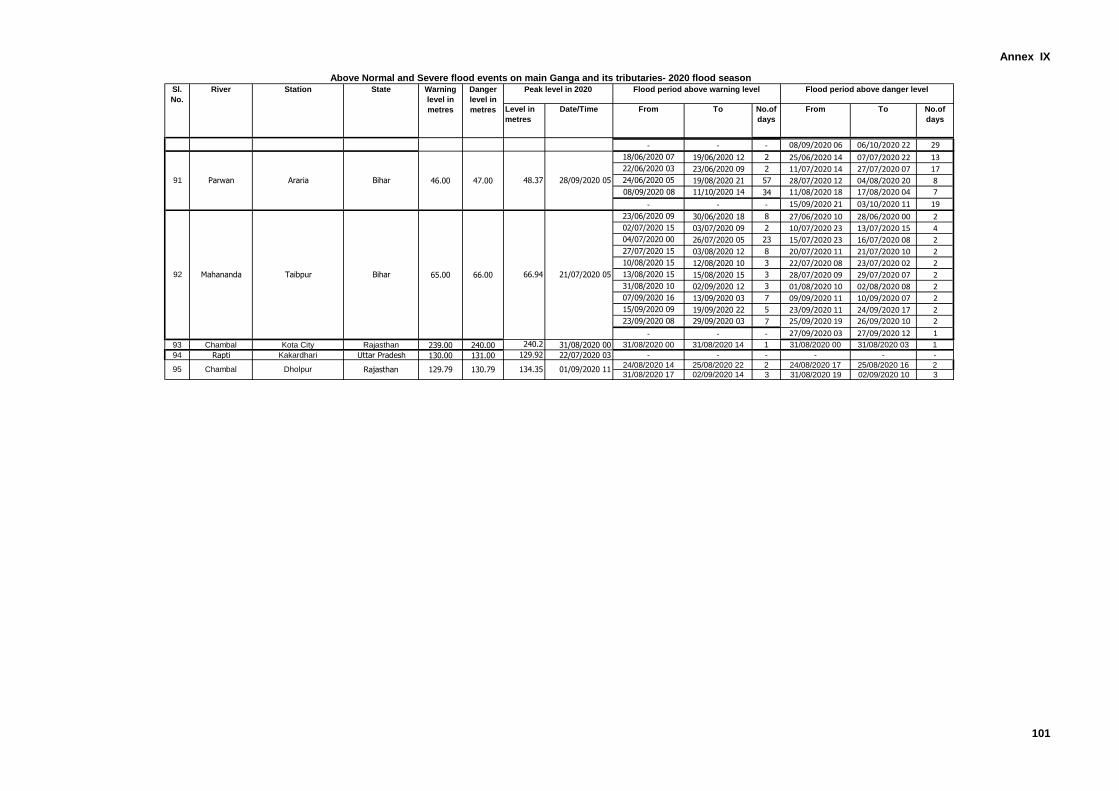
Annex IX
Level in
metres
Date/Time From To No.of
days
From To No.of
days
Alaknanda Srinagar1 Uttarakhand 535.00 536.00
Above Normal and Severe flood events on main Ganga and its tributaries- 2020 flood seasonSl.
No.
River Station State Warning
level in
metres
Danger
level in
metres
Flood period above danger level Peak level in 2020 Flood period above warning level
536.1 11/08/2020 06
- - - 08/09/2020 06 06/10/2020 22 29
18/06/2020 07 19/06/2020 12 2 25/06/2020 14 07/07/2020 22 13
22/06/2020 03 23/06/2020 09 2 11/07/2020 14 27/07/2020 07 17
24/06/2020 05 19/08/2020 21 57 28/07/2020 12 04/08/2020 20 8
08/09/2020 08 11/10/2020 14 34 11/08/2020 18 17/08/2020 04 7
- - - 15/09/2020 21 03/10/2020 11 19
23/06/2020 09 30/06/2020 18 8 27/06/2020 10 28/06/2020 00 2
02/07/2020 15 03/07/2020 09 2 10/07/2020 23 13/07/2020 15 4
04/07/2020 00 26/07/2020 05 23 15/07/2020 23 16/07/2020 08 2
27/07/2020 15 03/08/2020 12 8 20/07/2020 11 21/07/2020 10 2
10/08/2020 15 12/08/2020 10 3 22/07/2020 08 23/07/2020 02 2
13/08/2020 15 15/08/2020 15 3 28/07/2020 09 29/07/2020 07 2
31/08/2020 10 02/09/2020 12 3 01/08/2020 10 02/08/2020 08 2
07/09/2020 16 13/09/2020 03 7 09/09/2020 11 10/09/2020 07 2
15/09/2020 09 19/09/2020 22 5 23/09/2020 11 24/09/2020 17 2
23/09/2020 08 29/09/2020 03 7 25/09/2020 19 26/09/2020 10 2
- - - 27/09/2020 03 27/09/2020 12 1
93 Chambal Kota City Rajasthan 239.00 240.00 240.2 31/08/2020 00 31/08/2020 00 31/08/2020 14 1 31/08/2020 00 31/08/2020 03 1
94 Rapti Kakardhari Uttar Pradesh 130.00 131.00 129.92 22/07/2020 03 - - - - - -
24/08/2020 14 25/08/2020 22 2 24/08/2020 17 25/08/2020 16 2
31/08/2020 17 02/09/2020 14 3 31/08/2020 19 02/09/2020 10 395 Chambal Dholpur Rajasthan 129.79 130.79 134.35 01/09/2020 11
91 Parwan Araria Bihar
53.73
47.00
Mahananda92 Taibpur Bihar
Bagmati90 Runisaidpur Bihar 52.73
46.00 48.37 28/09/2020 05
65.00 66.00 66.94 21/07/2020 05
57.32 13/07/2020 06
101
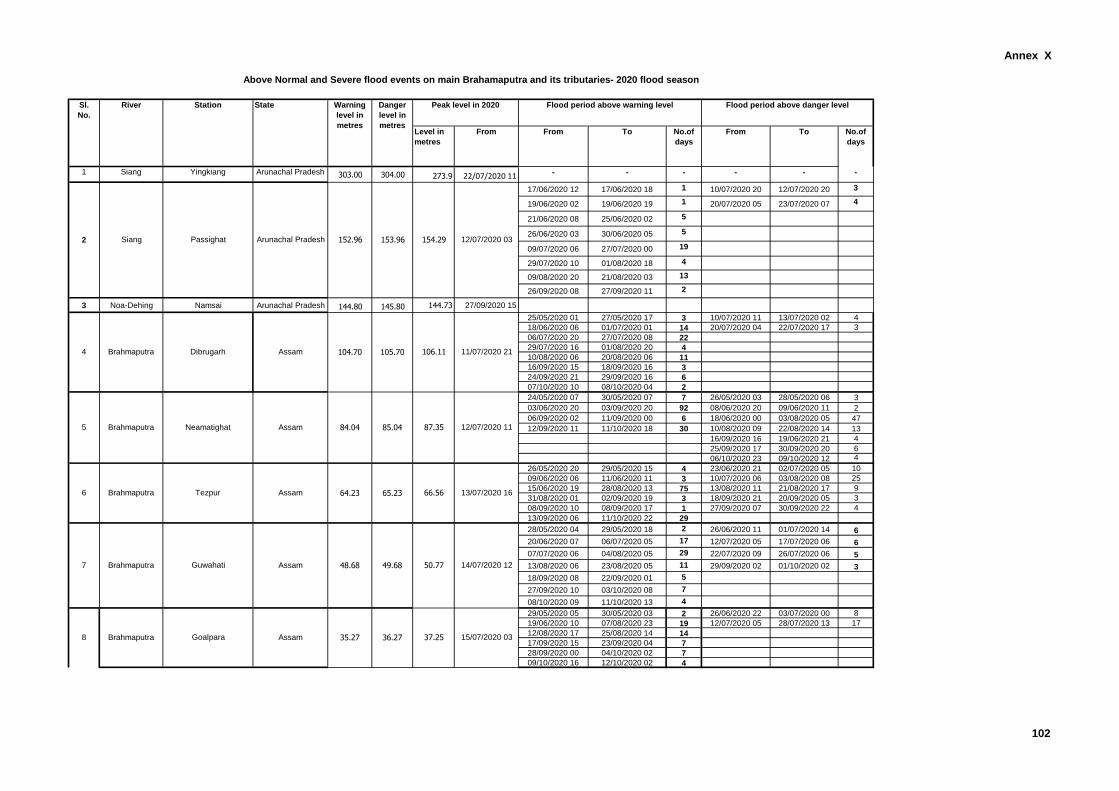
Annex X
Level in
metres
From From To No.of
days
From To No.of
days
1 Siang Yingkiang Arunachal Pradesh 303.00 304.00 273.9 22/07/2020 11 - - - - - -
17/06/2020 12 17/06/2020 18 1 10/07/2020 20 12/07/2020 20 3
19/06/2020 02 19/06/2020 19 1 20/07/2020 05 23/07/2020 07 4
21/06/2020 08 25/06/2020 02 5
26/06/2020 03 30/06/2020 05 5
09/07/2020 06 27/07/2020 00 19
29/07/2020 10 01/08/2020 18 4
09/08/2020 20 21/08/2020 03 13
26/09/2020 08 27/09/2020 11 2
3 Noa-Dehing Namsai Arunachal Pradesh 144.80 145.80 144.73 27/09/2020 15
25/05/2020 01 27/05/2020 17 3 10/07/2020 11 13/07/2020 02 4
18/06/2020 06 01/07/2020 01 14 20/07/2020 04 22/07/2020 17 3
06/07/2020 20 27/07/2020 08 22
29/07/2020 16 01/08/2020 20 4
10/08/2020 06 20/08/2020 06 11
16/09/2020 15 18/09/2020 16 3
24/09/2020 21 29/09/2020 16 6
07/10/2020 10 08/10/2020 04 2
24/05/2020 07 30/05/2020 07 7 26/05/2020 03 28/05/2020 06 3
03/06/2020 20 03/09/2020 20 92 08/06/2020 20 09/06/2020 11 2
06/09/2020 02 11/09/2020 00 6 18/06/2020 00 03/08/2020 05 47
12/09/2020 11 11/10/2020 18 30 10/08/2020 09 22/08/2020 14 13
16/09/2020 16 19/06/2020 21 4
25/09/2020 17 30/09/2020 20 6
06/10/2020 23 09/10/2020 12 4
26/05/2020 20 29/05/2020 15 4 23/06/2020 21 02/07/2020 05 10
09/06/2020 06 11/06/2020 11 3 10/07/2020 06 03/08/2020 08 25
15/06/2020 19 28/08/2020 13 75 13/08/2020 11 21/08/2020 17 9
31/08/2020 01 02/09/2020 19 3 18/09/2020 21 20/09/2020 05 3
08/09/2020 10 08/09/2020 17 1 27/09/2020 07 30/09/2020 22 4
13/09/2020 06 11/10/2020 22 29
28/05/2020 04 29/05/2020 18 2 26/06/2020 11 01/07/2020 14 6
20/06/2020 07 06/07/2020 05 17 12/07/2020 05 17/07/2020 06 6
07/07/2020 06 04/08/2020 05 29 22/07/2020 09 26/07/2020 06 5
13/08/2020 06 23/08/2020 05 11 29/09/2020 02 01/10/2020 02 3
18/09/2020 08 22/09/2020 01 5
27/09/2020 10 03/10/2020 08 7
08/10/2020 09 11/10/2020 13 4
29/05/2020 05 30/05/2020 03 2 26/06/2020 22 03/07/2020 00 8
19/06/2020 10 07/08/2020 23 19 12/07/2020 05 28/07/2020 13 17
12/08/2020 17 25/08/2020 14 14
17/09/2020 15 23/09/2020 04 7
28/09/2020 00 04/10/2020 02 7
09/10/2020 16 12/10/2020 02 4
154.29 12/07/2020 03
106.11 11/07/2020 21
87.35 12/07/2020 11
66.56 13/07/2020 16
48.68 50.77 14/07/2020 12
37.25 15/07/2020 038 Assam
Siang Passighat Arunachal Pradesh 152.96
Brahmaputra Tezpur Assam 64.236
Above Normal and Severe flood events on main Brahamaputra and its tributaries- 2020 flood season
State Warning
level in
metres
Danger
level in
metres
Peak level in 2020 Flood period above warning level Flood period above danger level Sl.
No.
River Station
7
Brahmaputra Goalpara
Brahmaputra Guwahati Assam
2
85.04
65.23
153.96
5 Brahmaputra Neamatighat Assam 84.04
4 Brahmaputra Dibrugarh Assam 104.70 105.70
35.27 36.27
49.68
102
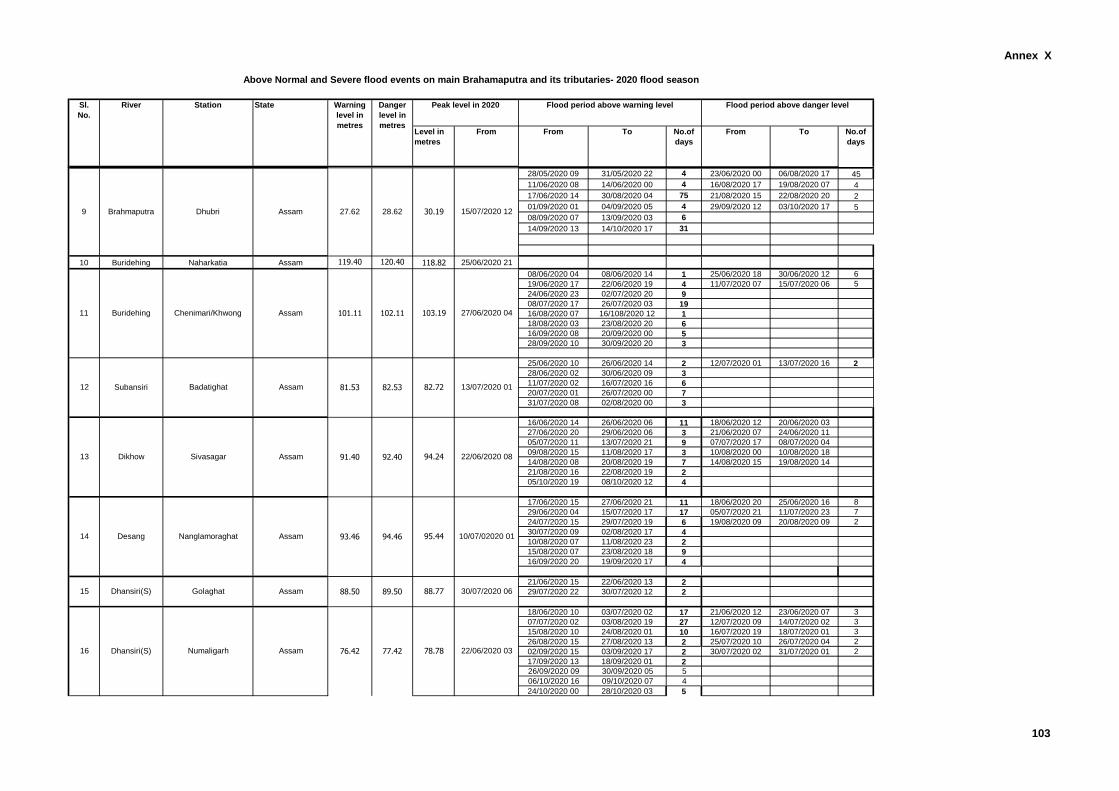
Annex X
Level in
metres
From From To No.of
days
From To No.of
days
Above Normal and Severe flood events on main Brahamaputra and its tributaries- 2020 flood season
State Warning
level in
metres
Danger
level in
metres
Peak level in 2020 Flood period above warning level Flood period above danger level Sl.
No.
River Station
28/05/2020 09 31/05/2020 22 4 23/06/2020 00 06/08/2020 17 45
11/06/2020 08 14/06/2020 00 4 16/08/2020 17 19/08/2020 07 4
17/06/2020 14 30/08/2020 04 75 21/08/2020 15 22/08/2020 20 2
01/09/2020 01 04/09/2020 05 4 29/09/2020 12 03/10/2020 17 5
08/09/2020 07 13/09/2020 03 6
14/09/2020 13 14/10/2020 17 31
10 Buridehing Naharkatia Assam 119.40 120.40 118.82 25/06/2020 21
08/06/2020 04 08/06/2020 14 1 25/06/2020 18 30/06/2020 12 6
19/06/2020 17 22/06/2020 19 4 11/07/2020 07 15/07/2020 06 5
24/06/2020 23 02/07/2020 20 9
08/07/2020 17 26/07/2020 03 19
16/08/2020 07 16/108/2020 12 1
18/08/2020 03 23/08/2020 20 6
16/09/2020 08 20/09/2020 00 5
28/09/2020 10 30/09/2020 20 3
25/06/2020 10 26/06/2020 14 2 12/07/2020 01 13/07/2020 16 2
28/06/2020 02 30/06/2020 09 3
11/07/2020 02 16/07/2020 16 6
20/07/2020 01 26/07/2020 00 7
31/07/2020 08 02/08/2020 00 3
16/06/2020 14 26/06/2020 06 11 18/06/2020 12 20/06/2020 03
27/06/2020 20 29/06/2020 06 3 21/06/2020 07 24/06/2020 11
05/07/2020 11 13/07/2020 21 9 07/07/2020 17 08/07/2020 04
09/08/2020 15 11/08/2020 17 3 10/08/2020 00 10/08/2020 18
14/08/2020 08 20/08/2020 19 7 14/08/2020 15 19/08/2020 14
21/08/2020 16 22/08/2020 19 2
05/10/2020 19 08/10/2020 12 4
17/06/2020 15 27/06/2020 21 11 18/06/2020 20 25/06/2020 16 8
29/06/2020 04 15/07/2020 17 17 05/07/2020 21 11/07/2020 23 7
24/07/2020 15 29/07/2020 19 6 19/08/2020 09 20/08/2020 09 2
30/07/2020 09 02/08/2020 17 4
10/08/2020 07 11/08/2020 23 2
15/08/2020 07 23/08/2020 18 9
16/09/2020 20 19/09/2020 17 4
21/06/2020 15 22/06/2020 13 2
29/07/2020 22 30/07/2020 12 2
18/06/2020 10 03/07/2020 02 17 21/06/2020 12 23/06/2020 07 3
07/07/2020 02 03/08/2020 19 27 12/07/2020 09 14/07/2020 02 3
15/08/2020 10 24/08/2020 01 10 16/07/2020 19 18/07/2020 01 3
26/08/2020 15 27/08/2020 13 2 25/07/2020 10 26/07/2020 04 2
02/09/2020 15 03/09/2020 17 2 30/07/2020 02 31/07/2020 01 2
17/09/2020 13 18/09/2020 01 2
26/09/2020 09 30/09/2020 05 5
06/10/2020 16 09/10/2020 07 4
24/10/2020 00 28/10/2020 03 5
76.42 77.42
Subansiri12 Badatighat Assam 81.53 82.53 82.72 13/07/2020 01
78.78 22/06/2020 03
92.40 94.24 22/06/2020 08
93.46 94.46 95.44 10/07/02020 01
89.5088.50 88.77 30/07/2020 06
28.62 30.19 15/07/2020 12
101.11 102.11 103.19 27/06/2020 04
27.62
91.4013 Dikhow Sivasagar Assam
9
Buridehing Chenimari/Khwong Assam
Dhansiri(S) Numaligarh
Brahmaputra Dhubri
Golaghat
Assam
Assam16
Dhansiri(S)
11
Assam15
14 Desang Nanglamoraghat Assam
103
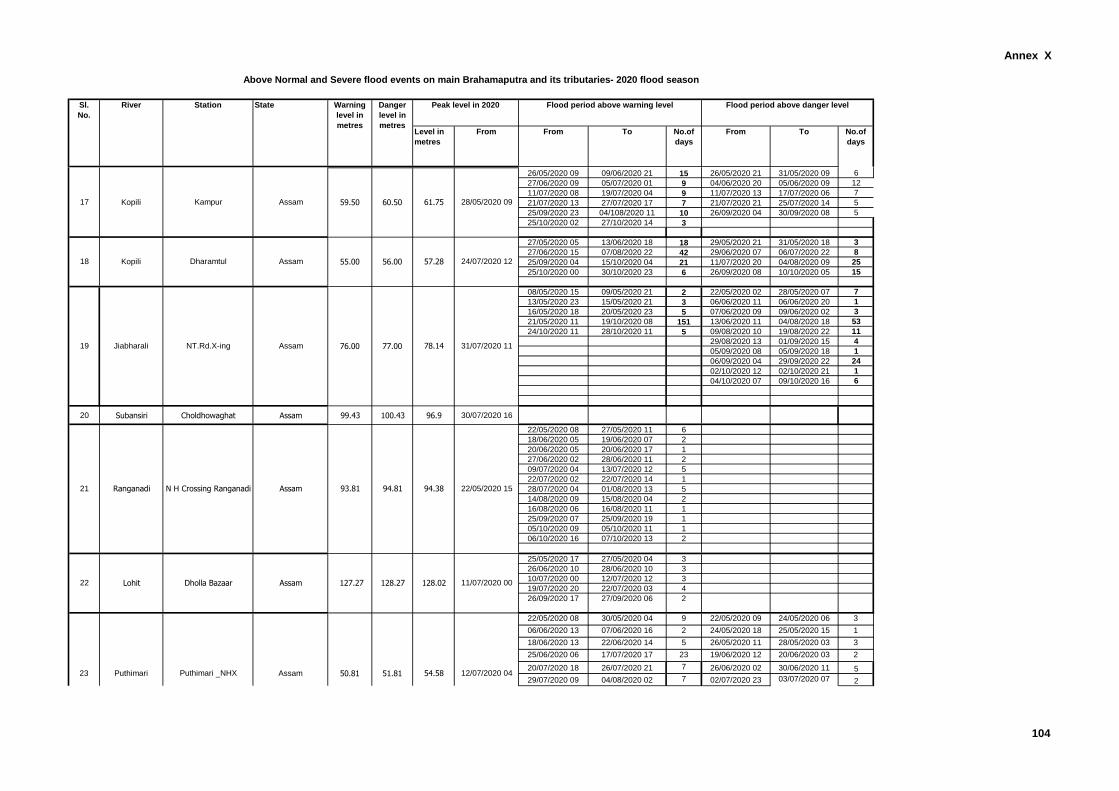
Annex X
Level in
metres
From From To No.of
days
From To No.of
days
Above Normal and Severe flood events on main Brahamaputra and its tributaries- 2020 flood season
State Warning
level in
metres
Danger
level in
metres
Peak level in 2020 Flood period above warning level Flood period above danger level Sl.
No.
River Station
26/05/2020 09 09/06/2020 21 15 26/05/2020 21 31/05/2020 09 6
27/06/2020 09 05/07/2020 01 9 04/06/2020 20 05/06/2020 09 12
11/07/2020 08 19/07/2020 04 9 11/07/2020 13 17/07/2020 06 7
21/07/2020 13 27/07/2020 17 7 21/07/2020 21 25/07/2020 14 5
25/09/2020 23 04/108/2020 11 10 26/09/2020 04 30/09/2020 08 5
25/10/2020 02 27/10/2020 14 3
27/05/2020 05 13/06/2020 18 18 29/05/2020 21 31/05/2020 18 3
27/06/2020 15 07/08/2020 22 42 29/06/2020 07 06/07/2020 22 8
25/09/2020 04 15/10/2020 04 21 11/07/2020 20 04/08/2020 09 25
25/10/2020 00 30/10/2020 23 6 26/09/2020 08 10/10/2020 05 15
08/05/2020 15 09/05/2020 21 2 22/05/2020 02 28/05/2020 07 7
13/05/2020 23 15/05/2020 21 3 06/06/2020 11 06/06/2020 20 1
16/05/2020 18 20/05/2020 23 5 07/06/2020 09 09/06/2020 02 3
21/05/2020 11 19/10/2020 08 151 13/06/2020 11 04/08/2020 18 53
24/10/2020 11 28/10/2020 11 5 09/08/2020 10 19/08/2020 22 11
29/08/2020 13 01/09/2020 15 4
05/09/2020 08 05/09/2020 18 1
06/09/2020 04 29/09/2020 22 24
02/10/2020 12 02/10/2020 21 1
04/10/2020 07 09/10/2020 16 6
20 Subansiri Choldhowaghat Assam 99.43 100.43 96.9 30/07/2020 16
22/05/2020 08 27/05/2020 11 6
18/06/2020 05 19/06/2020 07 2
20/06/2020 05 20/06/2020 17 1
27/06/2020 02 28/06/2020 11 2
09/07/2020 04 13/07/2020 12 5
22/07/2020 02 22/07/2020 14 1
28/07/2020 04 01/08/2020 13 5
14/08/2020 09 15/08/2020 04 2
16/08/2020 06 16/08/2020 11 1
25/09/2020 07 25/09/2020 19 1
05/10/2020 09 05/10/2020 11 1
06/10/2020 16 07/10/2020 13 2
25/05/2020 17 27/05/2020 04 3
26/06/2020 10 28/06/2020 10 3
10/07/2020 00 12/07/2020 12 3
19/07/2020 20 22/07/2020 03 4
26/09/2020 17 27/09/2020 06 2
22/05/2020 08 30/05/2020 04 9 22/05/2020 09 24/05/2020 06 3
06/06/2020 13 07/06/2020 16 2 24/05/2020 18 25/05/2020 15 1
18/06/2020 13 22/06/2020 14 5 26/05/2020 11 28/05/2020 03 3
25/06/2020 06 17/07/2020 17 23 19/06/2020 12 20/06/2020 03 2
20/07/2020 18 26/07/2020 21 7 26/06/2020 02 30/06/2020 11 5
29/07/2020 09 04/08/2020 02 7 02/07/2020 23 03/07/2020 07 2
94.38 22/05/2020 15
127.27 128.02 11/07/2020 00
93.81 94.81
128.27
78.14 31/07/2020 11
59.50 60.50 61.75 28/05/2020 09
57.28 24/07/2020 1255.00 56.00
54.58 12/07/2020 0451.8150.81
77.0076.00
Dholla Bazaar Assam
18 Kopili
21 Ranganadi N H Crossing Ranganadi Assam
Assam
Jiabharali NT.Rd.X-ing
Puthimari _NHX Assam23 Puthimari
Dharamtul
17 AssamKopili Kampur
19 Assam
22 Lohit
104
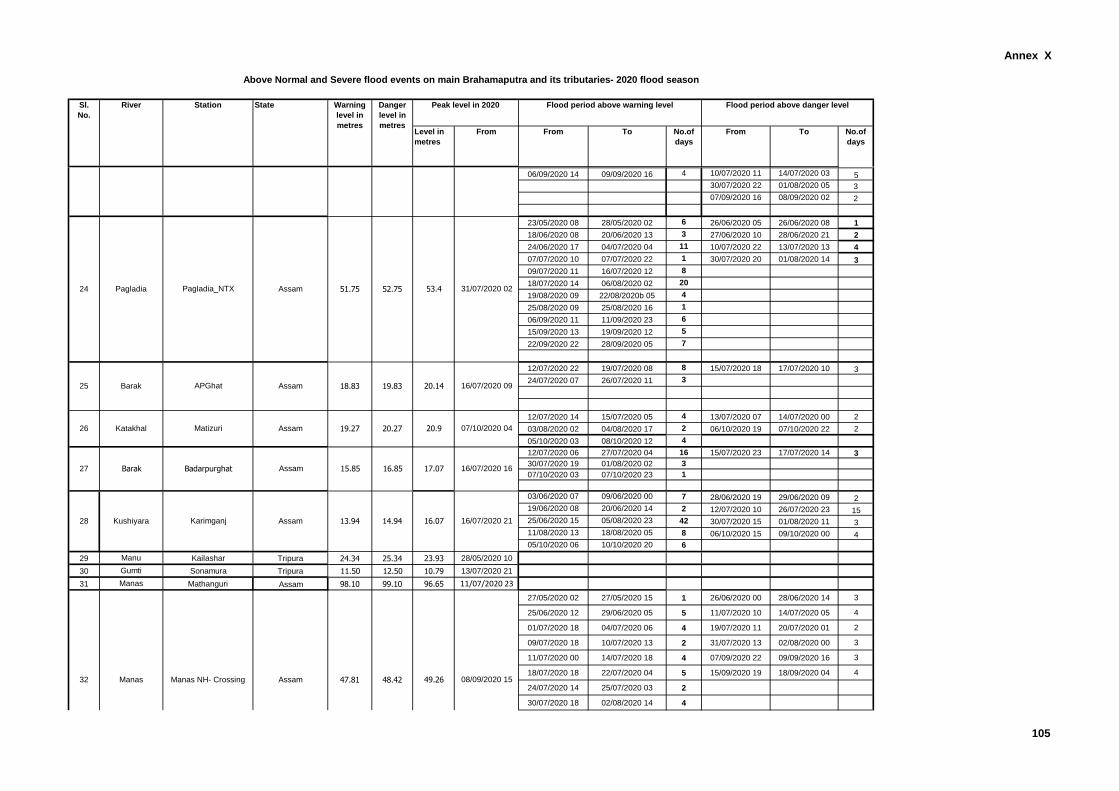
Annex X
Level in
metres
From From To No.of
days
From To No.of
days
Above Normal and Severe flood events on main Brahamaputra and its tributaries- 2020 flood season
State Warning
level in
metres
Danger
level in
metres
Peak level in 2020 Flood period above warning level Flood period above danger level Sl.
No.
River Station
06/09/2020 14 09/09/2020 16 4 10/07/2020 11 14/07/2020 03 5
30/07/2020 22 01/08/2020 05 3
07/09/2020 16 08/09/2020 02 2
23/05/2020 08 28/05/2020 02 6 26/06/2020 05 26/06/2020 08 1
18/06/2020 08 20/06/2020 13 3 27/06/2020 10 28/06/2020 21 2
24/06/2020 17 04/07/2020 04 11 10/07/2020 22 13/07/2020 13 4
07/07/2020 10 07/07/2020 22 1 30/07/2020 20 01/08/2020 14 3
09/07/2020 11 16/07/2020 12 8
18/07/2020 14 06/08/2020 02 20
19/08/2020 09 22/08/2020b 05 4
25/08/2020 09 25/08/2020 16 1
06/09/2020 11 11/09/2020 23 6
15/09/2020 13 19/09/2020 12 5
22/09/2020 22 28/09/2020 05 7
12/07/2020 22 19/07/2020 08 8 15/07/2020 18 17/07/2020 10 3
24/07/2020 07 26/07/2020 11 3
12/07/2020 14 15/07/2020 05 4 13/07/2020 07 14/07/2020 00 2
03/08/2020 02 04/08/2020 17 2 06/10/2020 19 07/10/2020 22 2
05/10/2020 03 08/10/2020 12 4
12/07/2020 06 27/07/2020 04 16 15/07/2020 23 17/07/2020 14 3
30/07/2020 19 01/08/2020 02 3
07/10/2020 03 07/10/2020 23 1
03/06/2020 07 09/06/2020 00 7 28/06/2020 19 29/06/2020 09 2
19/06/2020 08 20/06/2020 14 2 12/07/2020 10 26/07/2020 23 15
25/06/2020 15 05/08/2020 23 42 30/07/2020 15 01/08/2020 11 3
11/08/2020 13 18/08/2020 05 8 06/10/2020 15 09/10/2020 00 4
05/10/2020 06 10/10/2020 20 6
29 Manu Kailashar Tripura 24.34 25.34 23.93 28/05/2020 10
30 Gumti Sonamura Tripura 11.50 12.50 10.79 13/07/2020 21
31 Manas Mathanguri Assam 98.10 99.10 96.65 11/07/2020 23
27/05/2020 02 27/05/2020 15 1 26/06/2020 00 28/06/2020 14 3
25/06/2020 12 29/06/2020 05 5 11/07/2020 10 14/07/2020 05 4
01/07/2020 18 04/07/2020 06 4 19/07/2020 11 20/07/2020 01 2
09/07/2020 18 10/07/2020 13 2 31/07/2020 13 02/08/2020 00 3
11/07/2020 00 14/07/2020 18 4 07/09/2020 22 09/09/2020 16 3
18/07/2020 18 22/07/2020 04 5 15/09/2020 19 18/09/2020 04 4
24/07/2020 14 25/07/2020 03 2
30/07/2020 18 02/08/2020 14 4
16.07 16/07/2020 21
08/09/2020 1547.81 48.42 49.26
15.85 16.85 17.07 16/07/2020 16
54.58 12/07/2020 04
51.75 53.4 31/07/2020 02
18.83 19.83 20.14 16/07/2020 09
52.75
51.8150.81
19.27 20.27 20.9 07/10/2020 04
13.94 14.94
32 Manas Manas NH- Crossing Assam
28
Assam
Kushiyara
25 Barak APGhat
Assam
Katakhal Matizuri Assam26
Puthimari _NHX Assam
24 Pagladia Pagladia_NTX Assam
23 Puthimari
Karimganj
27 Barak Badarpurghat Assam
105
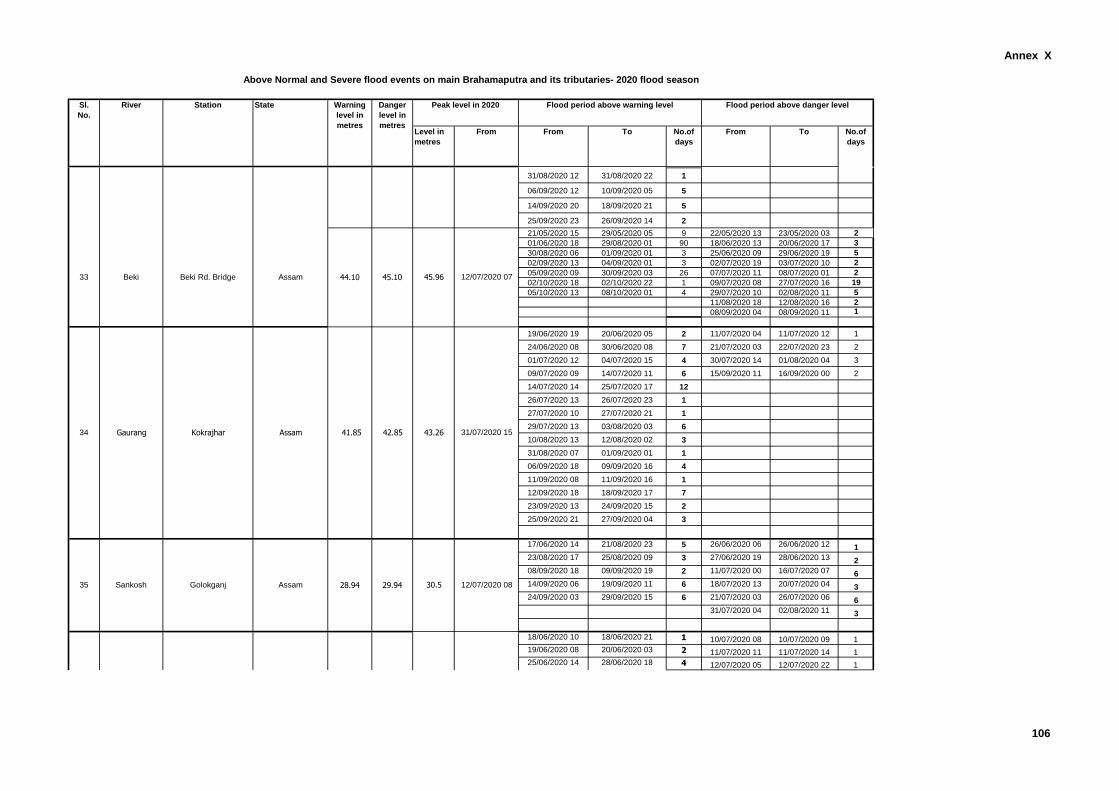
Annex X
Level in
metres
From From To No.of
days
From To No.of
days
Above Normal and Severe flood events on main Brahamaputra and its tributaries- 2020 flood season
State Warning
level in
metres
Danger
level in
metres
Peak level in 2020 Flood period above warning level Flood period above danger level Sl.
No.
River Station
31/08/2020 12 31/08/2020 22 1
06/09/2020 12 10/09/2020 05 5
14/09/2020 20 18/09/2020 21 5
25/09/2020 23 26/09/2020 14 2
21/05/2020 15 29/05/2020 05 9 22/05/2020 13 23/05/2020 03 2
01/06/2020 18 29/08/2020 01 90 18/06/2020 13 20/06/2020 17 3
30/08/2020 06 01/09/2020 01 3 25/06/2020 09 29/06/2020 19 5
02/09/2020 13 04/09/2020 01 3 02/07/2020 19 03/07/2020 10 2
05/09/2020 09 30/09/2020 03 26 07/07/2020 11 08/07/2020 01 2
02/10/2020 18 02/10/2020 22 1 09/07/2020 08 27/07/2020 16 19
05/10/2020 13 08/10/2020 01 4 29/07/2020 10 02/08/2020 11 5
11/08/2020 18 12/08/2020 16 2
08/09/2020 04 08/09/2020 11 1
19/06/2020 19 20/06/2020 05 2 11/07/2020 04 11/07/2020 12 1
24/06/2020 08 30/06/2020 08 7 21/07/2020 03 22/07/2020 23 2
01/07/2020 12 04/07/2020 15 4 30/07/2020 14 01/08/2020 04 3
09/07/2020 09 14/07/2020 11 6 15/09/2020 11 16/09/2020 00 2
14/07/2020 14 25/07/2020 17 12
26/07/2020 13 26/07/2020 23 1
27/07/2020 10 27/07/2020 21 1
29/07/2020 13 03/08/2020 03 6
10/08/2020 13 12/08/2020 02 3
31/08/2020 07 01/09/2020 01 1
06/09/2020 18 09/09/2020 16 4
11/09/2020 08 11/09/2020 16 1
12/09/2020 18 18/09/2020 17 7
23/09/2020 13 24/09/2020 15 2
25/09/2020 21 27/09/2020 04 3
17/06/2020 14 21/08/2020 23 5 26/06/2020 06 26/06/2020 12 1
23/08/2020 17 25/08/2020 09 3 27/06/2020 19 28/06/2020 13 2
08/09/2020 18 09/09/2020 19 2 11/07/2020 00 16/07/2020 07 6
14/09/2020 06 19/09/2020 11 6 18/07/2020 13 20/07/2020 04 3
24/09/2020 03 29/09/2020 15 6 21/07/2020 03 26/07/2020 06 6
31/07/2020 04 02/08/2020 11 3
18/06/2020 10 18/06/2020 21 1 10/07/2020 08 10/07/2020 09 1
19/06/2020 08 20/06/2020 03 2 11/07/2020 11 11/07/2020 14 1
25/06/2020 14 28/06/2020 18 4 12/07/2020 05 12/07/2020 22 1
86.23 12/07/2020 12
08/09/2020 1547.81 48.42
12/07/2020 07
41.85 42.85 43.26 31/07/2020 15
49.26
45.96
28.94 30.5 12/07/2020 08
85.65 85.95
35
W.B.
Assam
34 Gaurang Kokrajhar Assam
Beki Rd. Bridge
29.94
44.10 45.10
Assam
32 Manas Manas NH- Crossing Assam
Sankosh Golokganj
33 Beki
36 Teesta Domohani
106
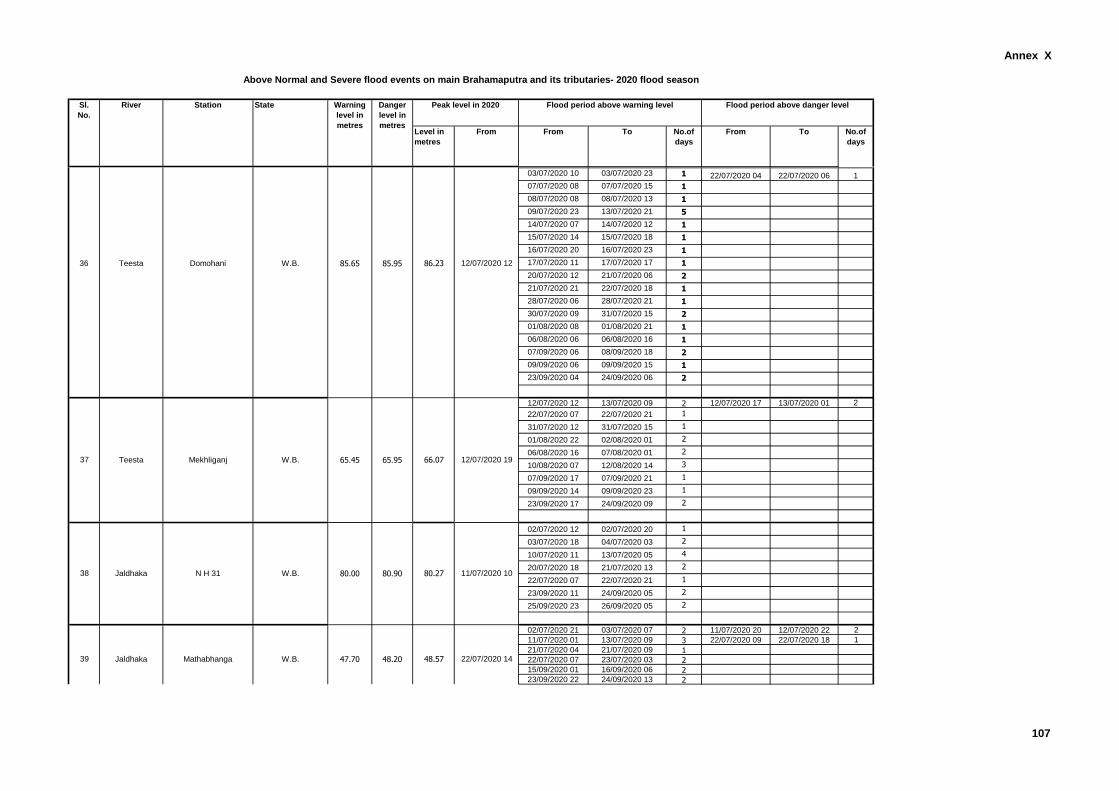
Annex X
Level in
metres
From From To No.of
days
From To No.of
days
Above Normal and Severe flood events on main Brahamaputra and its tributaries- 2020 flood season
State Warning
level in
metres
Danger
level in
metres
Peak level in 2020 Flood period above warning level Flood period above danger level Sl.
No.
River Station
03/07/2020 10 03/07/2020 23 1 22/07/2020 04 22/07/2020 06 1
07/07/2020 08 07/07/2020 15 1
08/07/2020 08 08/07/2020 13 1
09/07/2020 23 13/07/2020 21 5
14/07/2020 07 14/07/2020 12 1
15/07/2020 14 15/07/2020 18 1
16/07/2020 20 16/07/2020 23 1
17/07/2020 11 17/07/2020 17 1
20/07/2020 12 21/07/2020 06 2
21/07/2020 21 22/07/2020 18 1
28/07/2020 06 28/07/2020 21 1
30/07/2020 09 31/07/2020 15 2
01/08/2020 08 01/08/2020 21 1
06/08/2020 06 06/08/2020 16 1
07/09/2020 06 08/09/2020 18 2
09/09/2020 06 09/09/2020 15 1
23/09/2020 04 24/09/2020 06 2
12/07/2020 12 13/07/2020 09 2 12/07/2020 17 13/07/2020 01 2
22/07/2020 07 22/07/2020 21 1
31/07/2020 12 31/07/2020 15 1
01/08/2020 22 02/08/2020 01 2
06/08/2020 16 07/08/2020 01 2
10/08/2020 07 12/08/2020 14 3
07/09/2020 17 07/09/2020 21 1
09/09/2020 14 09/09/2020 23 1
23/09/2020 17 24/09/2020 09 2
02/07/2020 12 02/07/2020 20 1
03/07/2020 18 04/07/2020 03 2
10/07/2020 11 13/07/2020 05 4
20/07/2020 18 21/07/2020 13 2
22/07/2020 07 22/07/2020 21 1
23/09/2020 11 24/09/2020 05 2
25/09/2020 23 26/09/2020 05 2
02/07/2020 21 03/07/2020 07 2 11/07/2020 20 12/07/2020 22 2
11/07/2020 01 13/07/2020 09 3 22/07/2020 09 22/07/2020 18 1
21/07/2020 04 21/07/2020 09 122/07/2020 07 23/07/2020 03 215/09/2020 01 16/09/2020 06 223/09/2020 22 24/09/2020 13 2
86.23 12/07/2020 12
11/07/2020 1080.27
65.45 65.95 66.07 12/07/2020 19
48.57 22/07/2020 1447.70 48.20
85.65
80.00 80.90
85.95
Teesta Mekhliganj
W.B.
Mathabhanga W.B.
36 Teesta Domohani
39 Jaldhaka
Jaldhaka N H 31 W.B.
W.B.37
38
107
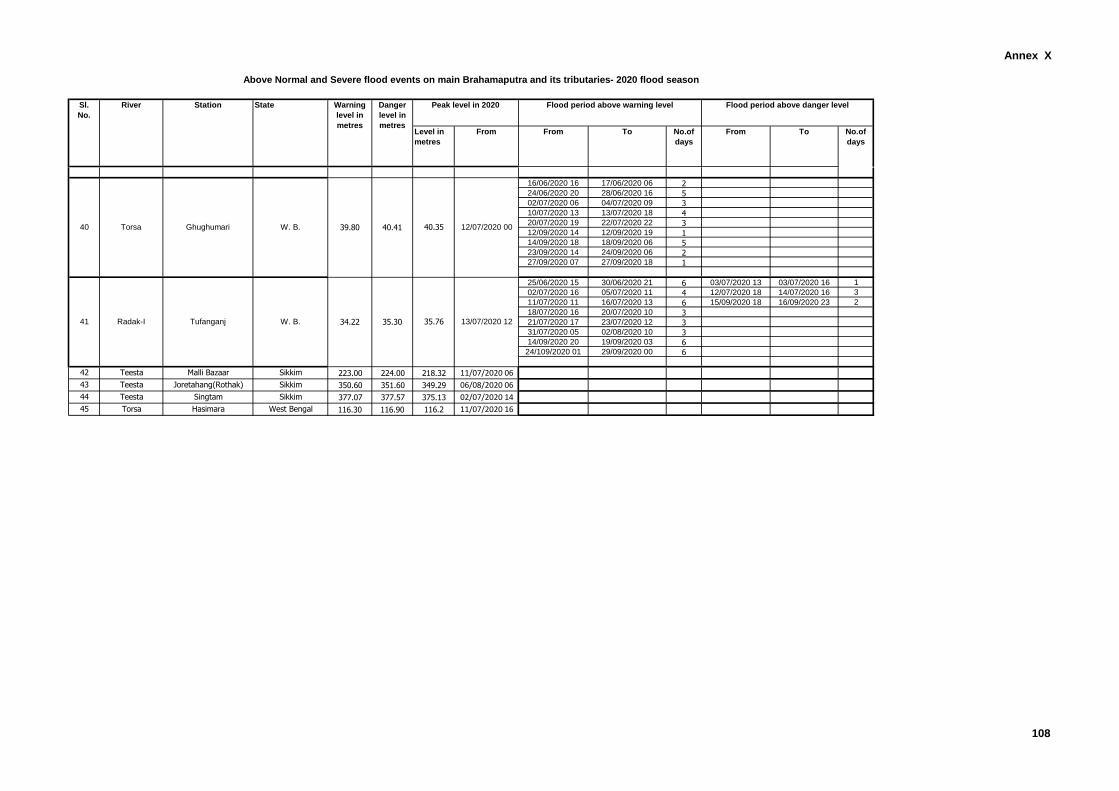
Annex X
Level in
metres
From From To No.of
days
From To No.of
days
Above Normal and Severe flood events on main Brahamaputra and its tributaries- 2020 flood season
State Warning
level in
metres
Danger
level in
metres
Peak level in 2020 Flood period above warning level Flood period above danger level Sl.
No.
River Station
16/06/2020 16 17/06/2020 06 224/06/2020 20 28/06/2020 16 502/07/2020 06 04/07/2020 09 310/07/2020 13 13/07/2020 18 420/07/2020 19 22/07/2020 22 312/09/2020 14 12/09/2020 19 114/09/2020 18 18/09/2020 06 523/09/2020 14 24/09/2020 06 227/09/2020 07 27/09/2020 18 1
25/06/2020 15 30/06/2020 21 6 03/07/2020 13 03/07/2020 16 1
02/07/2020 16 05/07/2020 11 4 12/07/2020 18 14/07/2020 16 3
11/07/2020 11 16/07/2020 13 6 15/09/2020 18 16/09/2020 23 2
18/07/2020 16 20/07/2020 10 321/07/2020 17 23/07/2020 12 331/07/2020 05 02/08/2020 10 314/09/2020 20 19/09/2020 03 6
24/109/2020 01 29/09/2020 00 6
42 Teesta Malli Bazaar Sikkim 223.00 224.00 218.32 11/07/2020 06
43 Teesta Joretahang(Rothak) Sikkim 350.60 351.60 349.29 06/08/2020 06
44 Teesta Singtam Sikkim 377.07 377.57 375.13 02/07/2020 14
45 Torsa Hasimara West Bengal 116.30 116.90 116.2 11/07/2020 16
34.22 35.30 35.76 13/07/2020 12
48.57 22/07/2020 14
39.80 40.41 40.35 12/07/2020 00
47.70 48.20
41 Radak-I Tufanganj W. B.
Mathabhanga W.B.39 Jaldhaka
40 Torsa Ghughumari W. B.
108
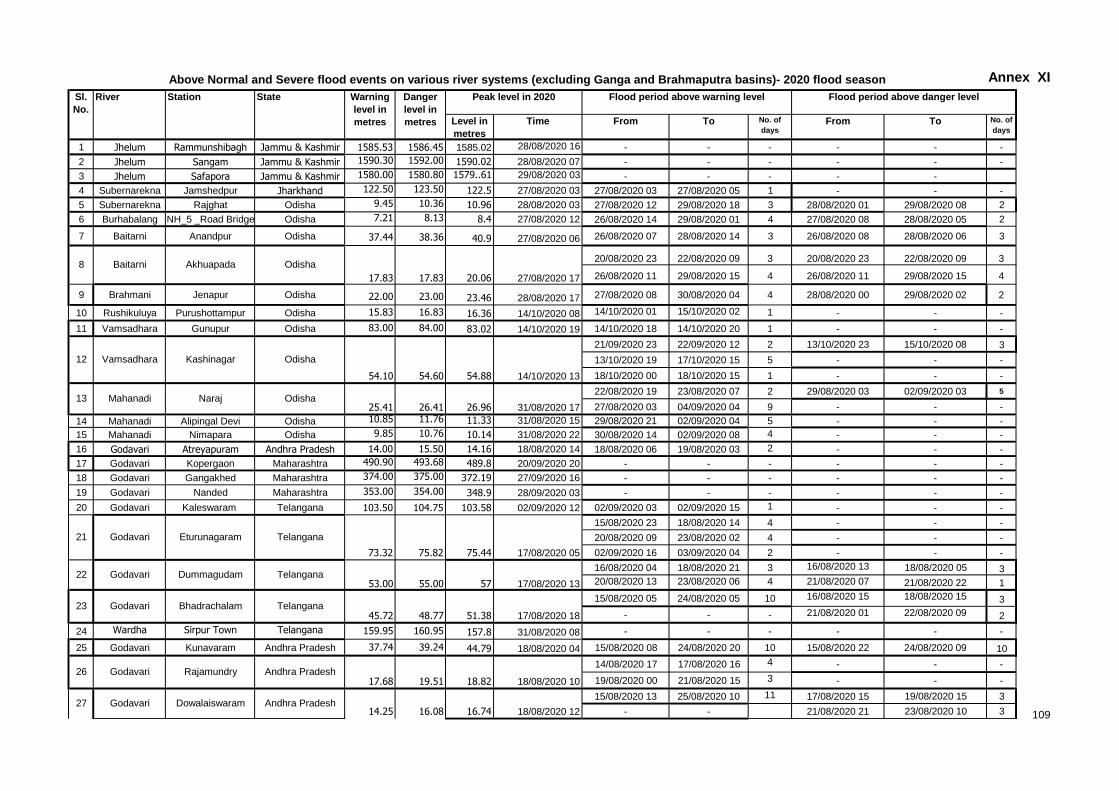
Annex XI
Station
Level in
metres
Time From To No. of
daysFrom To No. of
days
1 Jhelum Rammunshibagh Jammu & Kashmir 1585.53 1586.45 1585.02 28/08/2020 16 - - - - - -
2 Jhelum Sangam Jammu & Kashmir 1590.30 1592.00 1590.02 28/08/2020 07 - - - - - -
3 Jhelum Safapora Jammu & Kashmir 1580.00 1580.80 1579..61 29/08/2020 03 - - - - -
4 Subernarekna Jamshedpur Jharkhand 122.50 123.50 122.5 27/08/2020 03 27/08/2020 03 27/08/2020 05 1 - - -
5 Subernarekna Rajghat Odisha 9.45 10.36 10.96 28/08/2020 03 27/08/2020 12 29/08/2020 18 3 28/08/2020 01 29/08/2020 08 2
6 Burhabalang NH_5 _Road Bridge Odisha 7.21 8.13 8.4 27/08/2020 12 26/08/2020 14 29/08/2020 01 4 27/08/2020 08 28/08/2020 05 2
7 Baitarni Anandpur Odisha 37.44 38.36 40.9 27/08/2020 06 26/08/2020 07 28/08/2020 14 3 26/08/2020 08 28/08/2020 06 3
20/08/2020 23 22/08/2020 09 3 20/08/2020 23 22/08/2020 09 3
26/08/2020 11 29/08/2020 15 4 26/08/2020 11 29/08/2020 15 4
9 Brahmani Jenapur Odisha 22.00 23.00 23.46 28/08/2020 17 27/08/2020 08 30/08/2020 04 4 28/08/2020 00 29/08/2020 02 2
10 Rushikuluya Purushottampur Odisha 15.83 16.83 16.36 14/10/2020 08 14/10/2020 01 15/10/2020 02 1 - - -
11 Vamsadhara Gunupur Odisha 83.00 84.00 83.02 14/10/2020 19 14/10/2020 18 14/10/2020 20 1 - - -
21/09/2020 23 22/09/2020 12 2 13/10/2020 23 15/10/2020 08 3
13/10/2020 19 17/10/2020 15 5 - - -
18/10/2020 00 18/10/2020 15 1 - - -
22/08/2020 19 23/08/2020 07 2 29/08/2020 03 02/09/2020 03 5
27/08/2020 03 04/09/2020 04 9 - - -
14 Mahanadi Alipingal Devi Odisha 10.85 11.76 11.33 31/08/2020 15 29/08/2020 21 02/09/2020 04 5 - - -
15 Mahanadi Nimapara Odisha 9.85 10.76 10.14 31/08/2020 22 30/08/2020 14 02/09/2020 08 4 - - -
16 Godavari Atreyapuram Andhra Pradesh 14.00 15.50 14.16 18/08/2020 14 18/08/2020 06 19/08/2020 03 2 - - -
17 Godavari Kopergaon Maharashtra 490.90 493.68 489.8 20/09/2020 20 - - - - - -
18 Godavari Gangakhed Maharashtra 374.00 375.00 372.19 27/09/2020 16 - - - - - -
19 Godavari Nanded Maharashtra 353.00 354.00 348.9 28/09/2020 03 - - - - - -
20 Godavari Kaleswaram Telangana 103.50 104.75 103.58 02/09/2020 12 02/09/2020 03 02/09/2020 15 1 - - -
15/08/2020 23 18/08/2020 14 4 - - -
20/08/2020 09 23/08/2020 02 4 - - -
02/09/2020 16 03/09/2020 04 2 - - -
16/08/2020 04 18/08/2020 21 3 16/08/2020 13 18/08/2020 05 3
20/08/2020 13 23/08/2020 06 4 21/08/2020 07 21/08/2020 22 1
15/08/2020 05 24/08/2020 05 10 16/08/2020 15 18/08/2020 15 3
- - - 21/08/2020 01 22/08/2020 09 2
24 Wardha Sirpur Town Telangana 159.95 160.95 157.8 31/08/2020 08 - - - - - -
25 Godavari Kunavaram Andhra Pradesh 37.74 39.24 44.79 18/08/2020 04 15/08/2020 08 24/08/2020 20 10 15/08/2020 22 24/08/2020 09 10
14/08/2020 17 17/08/2020 16 4 - - -
19/08/2020 00 21/08/2020 15 3 - - -
15/08/2020 13 25/08/2020 10 11 17/08/2020 15 19/08/2020 15 3
- - 21/08/2020 21 23/08/2020 10 3
54.10 54.60 54.88 14/10/2020 13
26.96 31/08/2020 17
75.44 17/08/2020 05
23 Godavari
12 Vamsadhara Kashinagar Odisha
13 Mahanadi Naraj Odisha
22 Dummagudam Telangana
21 Godavari Eturunagaram
2618.82 18/08/2020 10
Telangana
Godavari
Dowalaiswaram Andhra Pradesh
Bhadrachalam Telangana
27 Godavari
Godavari Rajamundry Andhra Pradesh
8 Baitarni Akhuapada Odisha
17.83
Above Normal and Severe flood events on various river systems (excluding Ganga and Brahmaputra basins)- 2020 flood season
Sl.
No.
River Danger
level in
metres
Peak level in 2020State Warning
level in
metres
Flood period above danger level Flood period above warning level
20.06 27/08/2020 1717.83
51.38
73.32 75.82
25.41 26.41
57 17/08/2020 13
14.25 16.08
53.00 55.00
45.72 48.77 17/08/2020 18
16.74 18/08/2020 12
17.68 19.51
109
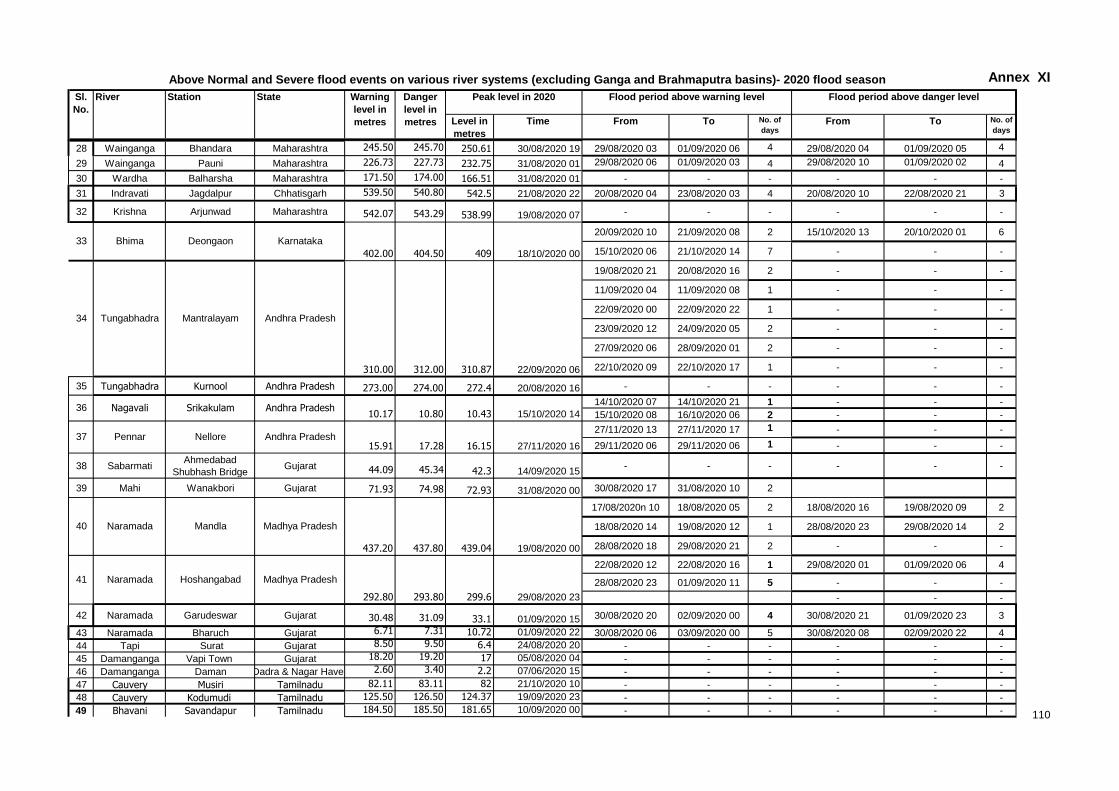
Annex XI
Station
Level in
metres
Time From To No. of
daysFrom To No. of
days
Above Normal and Severe flood events on various river systems (excluding Ganga and Brahmaputra basins)- 2020 flood season
Sl.
No.
River Danger
level in
metres
Peak level in 2020State Warning
level in
metres
Flood period above danger level Flood period above warning level
28 Wainganga Bhandara Maharashtra 245.50 245.70 250.61 30/08/2020 19 29/08/2020 03 01/09/2020 06 4 29/08/2020 04 01/09/2020 05 4
29 Wainganga Pauni Maharashtra 226.73 227.73 232.75 31/08/2020 01 29/08/2020 06 01/09/2020 03 4 29/08/2020 10 01/09/2020 02 4
30 Wardha Balharsha Maharashtra 171.50 174.00 166.51 31/08/2020 01 - - - - - -
31 Indravati Jagdalpur Chhatisgarh 539.50 540.80 542.5 21/08/2020 22 20/08/2020 04 23/08/2020 03 4 20/08/2020 10 22/08/2020 21 3
32 Krishna Arjunwad Maharashtra 542.07 543.29 538.99 19/08/2020 07 - - - - - -
20/09/2020 10 21/09/2020 08 2 15/10/2020 13 20/10/2020 01 6
15/10/2020 06 21/10/2020 14 7 - - -
19/08/2020 21 20/08/2020 16 2 - - -
11/09/2020 04 11/09/2020 08 1 - - -
22/09/2020 00 22/09/2020 22 1 - - -
23/09/2020 12 24/09/2020 05 2 - - -
27/09/2020 06 28/09/2020 01 2 - - -
22/10/2020 09 22/10/2020 17 1 - - -
35 Tungabhadra Kurnool Andhra Pradesh 273.00 274.00 272.4 20/08/2020 16 - - - - - -
14/10/2020 07 14/10/2020 21 1 - - -
15/10/2020 08 16/10/2020 06 2 - - -
27/11/2020 13 27/11/2020 17 1 - - -
29/11/2020 06 29/11/2020 06 1 - - -
38 SabarmatiAhmedabad
Shubhash BridgeGujarat 44.09 45.34 42.3 14/09/2020 15
- - - - - -
39 Mahi Wanakbori Gujarat 71.93 74.98 72.93 31/08/2020 00 30/08/2020 17 31/08/2020 10 2
17/08/2020n 10 18/08/2020 05 2 18/08/2020 16 19/08/2020 09 2
18/08/2020 14 19/08/2020 12 1 28/08/2020 23 29/08/2020 14 2
28/08/2020 18 29/08/2020 21 2 - - -
22/08/2020 12 22/08/2020 16 1 29/08/2020 01 01/09/2020 06 4
28/08/2020 23 01/09/2020 11 5 - - -
- - -
42 Naramada Garudeswar Gujarat 30.48 31.09 33.1 01/09/2020 15 30/08/2020 20 02/09/2020 00 4 30/08/2020 21 01/09/2020 23 3
43 Naramada Bharuch Gujarat 6.71 7.31 10.72 01/09/2020 22 30/08/2020 06 03/09/2020 00 5 30/08/2020 08 02/09/2020 22 4
44 Tapi Surat Gujarat 8.50 9.50 6.4 24/08/2020 20 - - - - - -
45 Damanganga Vapi Town Gujarat 18.20 19.20 17 05/08/2020 04 - - - - - -
46 Damanganga Daman Dadra & Nagar Haveli 2.60 3.40 2.2 07/06/2020 15 - - - - - -
47 Cauvery Musiri Tamilnadu 82.11 83.11 82 21/10/2020 10 - - - - - -
48 Cauvery Kodumudi Tamilnadu 125.50 126.50 124.37 19/09/2020 23 - - - - - -
49 Bhavani Savandapur Tamilnadu 184.50 185.50 181.65 10/09/2020 00 - - - - - -
402.00 404.50 409 18/10/2020 00
310.00 312.00
33
40
34
36
41 Madhya Pradesh
Nagavali Srikakulam Andhra Pradesh
Bhima Deongaon Karnataka
Naramada Mandla Madhya Pradesh
Tungabhadra Mantralayam Andhra Pradesh
10.17 10.80
437.20 437.80
310.87 22/09/2020 06
10.43 15/10/2020 14
292.80 293.80 299.6 29/08/2020 23
37 Pennar Nellore Andhra Pradesh15.91 17.28 16.15 27/11/2020 16
439.04 19/08/2020 00
Naramada Hoshangabad
110
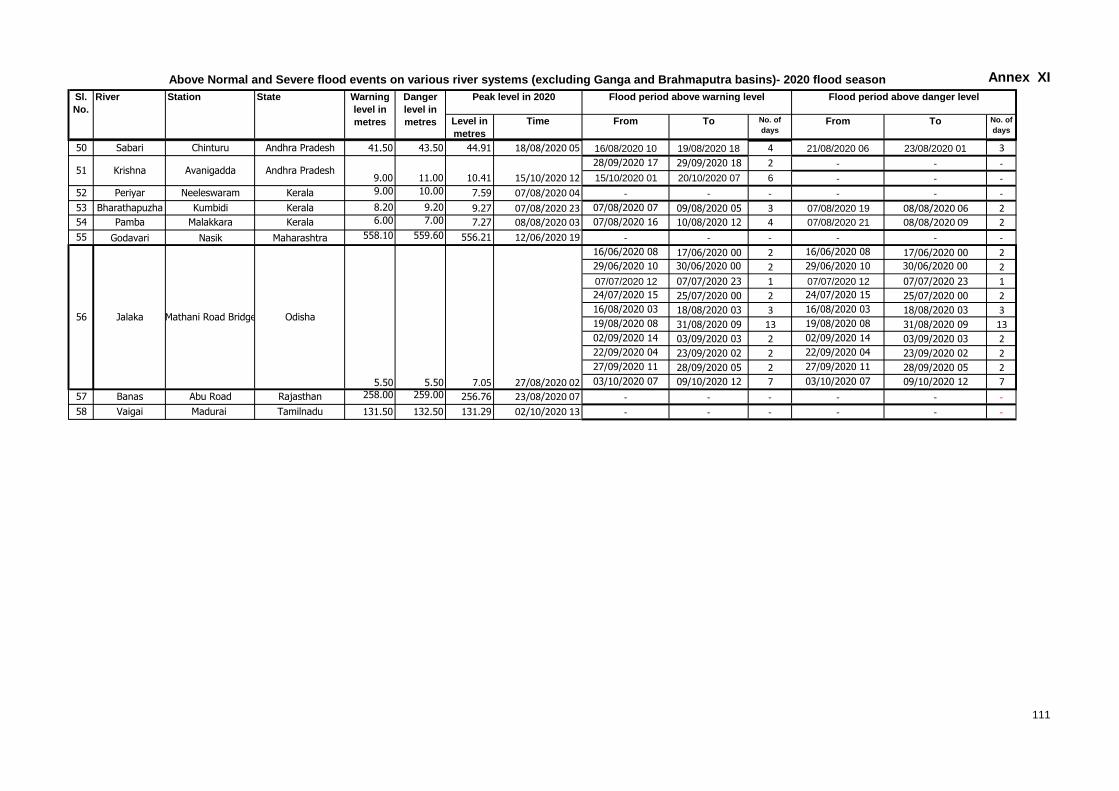
Annex XI
Station
Level in
metres
Time From To No. of
daysFrom To No. of
days
Above Normal and Severe flood events on various river systems (excluding Ganga and Brahmaputra basins)- 2020 flood season
Sl.
No.
River Danger
level in
metres
Peak level in 2020State Warning
level in
metres
Flood period above danger level Flood period above warning level
50 Sabari Chinturu Andhra Pradesh 41.50 43.50 44.91 18/08/2020 05 16/08/2020 10 19/08/2020 18 4 21/08/2020 06 23/08/2020 01 3
28/09/2020 17 29/09/2020 18 2 - - -
15/10/2020 01 20/10/2020 07 6 - - -
52 Periyar Neeleswaram Kerala 9.00 10.00 7.59 07/08/2020 04 - - - - - -
53 Bharathapuzha Kumbidi Kerala 8.20 9.20 9.27 07/08/2020 23 07/08/2020 07 09/08/2020 05 3 07/08/2020 19 08/08/2020 06 2
54 Pamba Malakkara Kerala 6.00 7.00 7.27 08/08/2020 03 07/08/2020 16 10/08/2020 12 4 07/08/2020 21 08/08/2020 09 2
55 Godavari Nasik Maharashtra 558.10 559.60 556.21 12/06/2020 19 - - - - - -
16/06/2020 08 17/06/2020 00 2 16/06/2020 08 17/06/2020 00 229/06/2020 10 30/06/2020 00 2 29/06/2020 10 30/06/2020 00 2
07/07/2020 12 07/07/2020 23 1 07/07/2020 12 07/07/2020 23 124/07/2020 15 25/07/2020 00 2 24/07/2020 15 25/07/2020 00 216/08/2020 03 18/08/2020 03 3 16/08/2020 03 18/08/2020 03 319/08/2020 08 31/08/2020 09 13 19/08/2020 08 31/08/2020 09 1302/09/2020 14 03/09/2020 03 2 02/09/2020 14 03/09/2020 03 222/09/2020 04 23/09/2020 02 2 22/09/2020 04 23/09/2020 02 227/09/2020 11 28/09/2020 05 2 27/09/2020 11 28/09/2020 05 2
03/10/2020 07 09/10/2020 12 7 03/10/2020 07 09/10/2020 12 7
57 Banas Abu Road Rajasthan 258.00 259.00 256.76 23/08/2020 07 - - - - - -
58 Vaigai Madurai Tamilnadu 131.50 132.50 131.29 02/10/2020 13 - - - - - -
56 Jalaka Mathani Road Bridge Odisha
Krishna Avanigadda
5.50 5.50 7.05 27/08/2020 02
Andhra Pradesh9.00 11.00 10.41 15/10/2020 12
51
111

Publication No. CWC/2021/76
