mobility implication on beverage industry
TRANSCRIPT
TRENDS IN MOBILE TECHNOLOGY AND IT’S IMPACT ON SALES FORCEAUTOMATION STRATEGY FOR A BEVERAGE COMPANY IN VIETNAM
A Research Project
Submitted to the Faculty of the
Manchester Business School
In partial fulfillment of the requirements
For the degree of
Master of Business Administration
By
Sunil Singh,
Student No 7630509
March 2013
ii

© Copyright, Sunil Singh 2013
All rights reserved
iii
I certify that I have read this manuscript and that, in my judgment, it is fully adequate in scope and quality as a research project for the degree of Master of Business Administration
__________________________________ ____________Dr. Shelen Ho March 2013Project Supervisor
iv
ACKNOWLEDGMENTS
Head of IT, ABC Indochina
Director Sales, ABC Vietnam
CEO, Nokia Vietnam,
Director, Visa Money, Visa Singapore
Research Analyst, Nielson Vietnam
My project Supervisor
& my family
v
ABSTRACT
This article addresses the two research questions, what is
the level of sales force automation across ABC bottlers in
Indochina Region and how is it correlated to market size,
market complexity and Sales Performance? What are key trends
in mobility technology and how these trends are expected to
impact sales processes for ABC in Vietnam market? It deals
with the understanding current sales force automation
implementation at a beverage global company and understands
impacts of mobility technology trends on its sales processes
in a key market in Indochina region. It highlights current
research in this area and identifies the research gap for
the further researches. This research paper will provide
information about the mobility trends and its implications
to the beverage company in Vietnam and will show a path for
future research in the area of sales force automation
implementation, which is the gaining significant importance
in executing customer relationship strategy. vi
Keywords: Sales force Automation, customer relationship
management strategy, Beverage industry
vii
TABLE OF CONTENTS
Acknowledgments..........................................iv
Abstract..................................................v
Table of Contents........................................vi
List of Tables..........................................vii
List of Figures........................................viii
[C & t Chapter I: Chapter Title, Use upper and lower case] 1
[C & t Chapter II: Chapter Title, Use upper and lower case]..........................................................2
[C & t Chapter III: Chapter Title, Use upper and lower case]..........................................................3
[C & t Chapter IV: Chapter Title, Use upper and lower case]..........................................................4
[C & t Chapter V: Chapter Title, Use upper and lower case] 5
References................................................6
[Click and type Appendix A: Appendix Title, use upper/lower]..........................................................7
[Click and type Appendix B: Appendix Title, use upper/lower]..........................................................9
viii
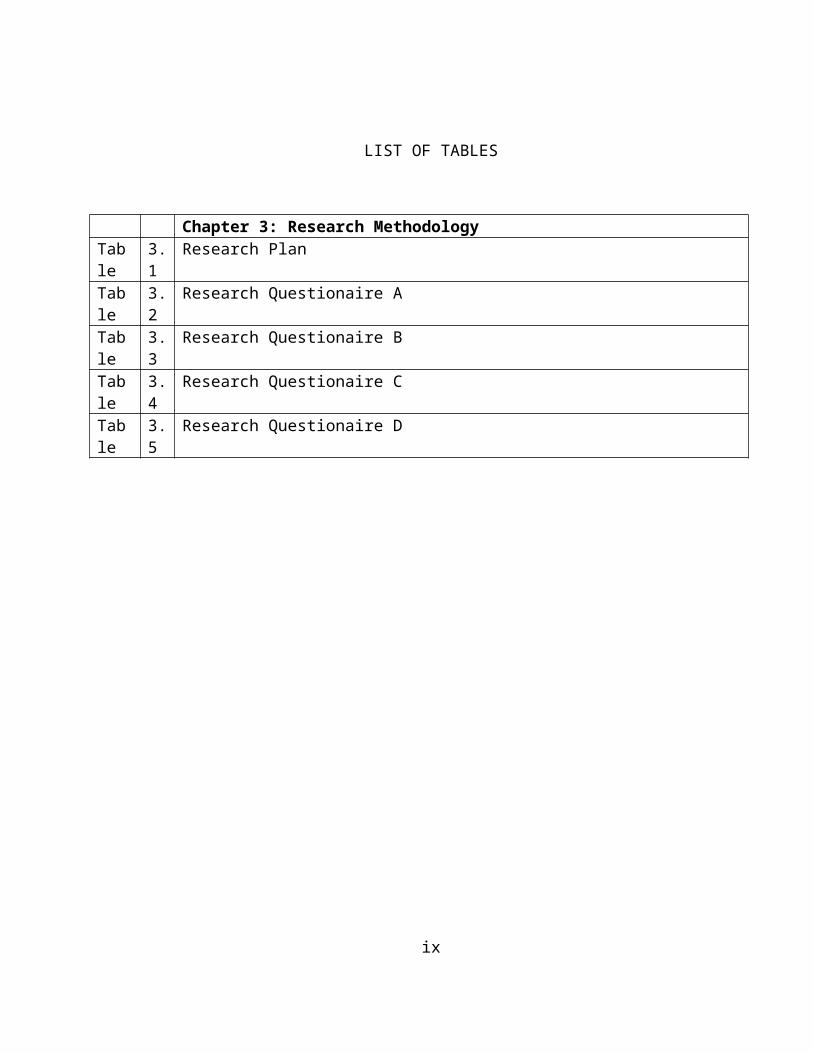
LIST OF TABLES
Chapter 3: Research MethodologyTable
3.1
Research Plan
Table
3.2
Research Questionaire A
Table
3.3
Research Questionaire B
Table
3.4
Research Questionaire C
Table
3.5
Research Questionaire D
ix
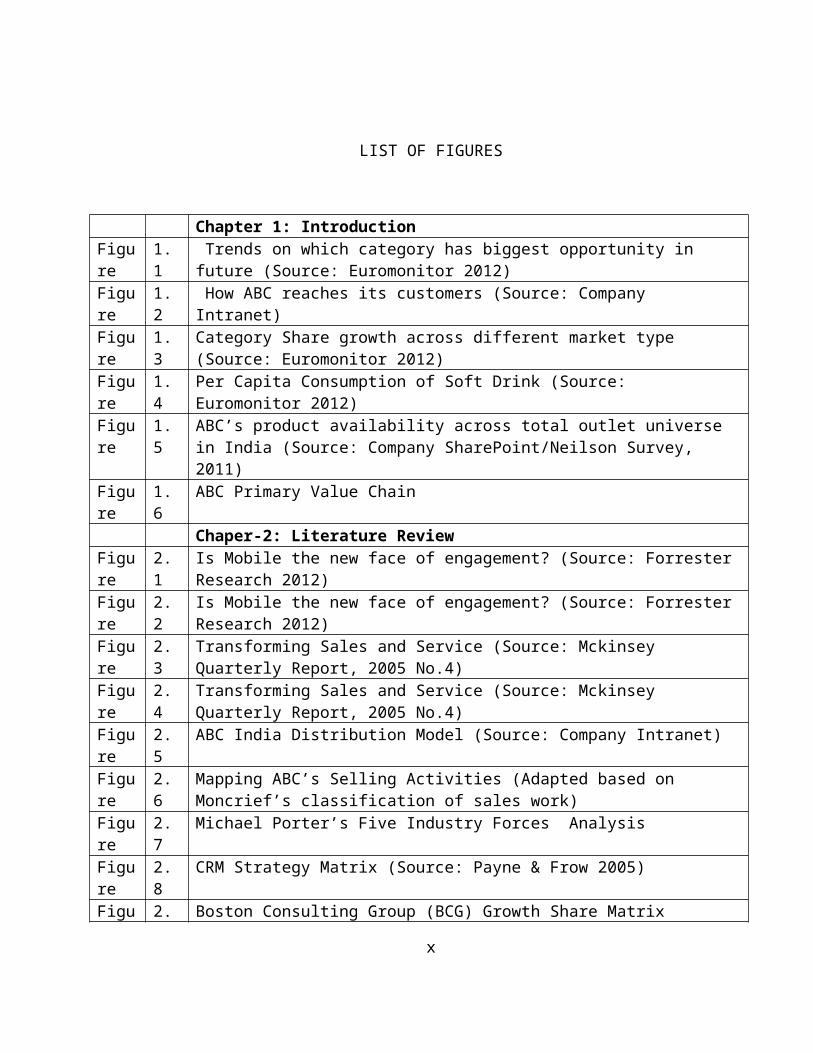
LIST OF FIGURES
Chapter 1: IntroductionFigure
1.1
Trends on which category has biggest opportunity in future (Source: Euromonitor 2012)
Figure
1.2
How ABC reaches its customers (Source: Company Intranet)
Figure
1.3
Category Share growth across different market type (Source: Euromonitor 2012)
Figure
1.4
Per Capita Consumption of Soft Drink (Source: Euromonitor 2012)
Figure
1.5
ABC’s product availability across total outlet universe in India (Source: Company SharePoint/Neilson Survey, 2011)
Figure
1.6
ABC Primary Value Chain
Chaper-2: Literature ReviewFigure
2.1
Is Mobile the new face of engagement? (Source: ForresterResearch 2012)
Figure
2.2
Is Mobile the new face of engagement? (Source: ForresterResearch 2012)
Figure
2.3
Transforming Sales and Service (Source: Mckinsey Quarterly Report, 2005 No.4)
Figure
2.4
Transforming Sales and Service (Source: Mckinsey Quarterly Report, 2005 No.4)
Figure
2.5
ABC India Distribution Model (Source: Company Intranet)
Figure
2.6
Mapping ABC’s Selling Activities (Adapted based on Moncrief’s classification of sales work)
Figure
2.7
Michael Porter’s Five Industry Forces Analysis
Figure
2.8
CRM Strategy Matrix (Source: Payne & Frow 2005)
Figu 2. Boston Consulting Group (BCG) Growth Share Matrix
x
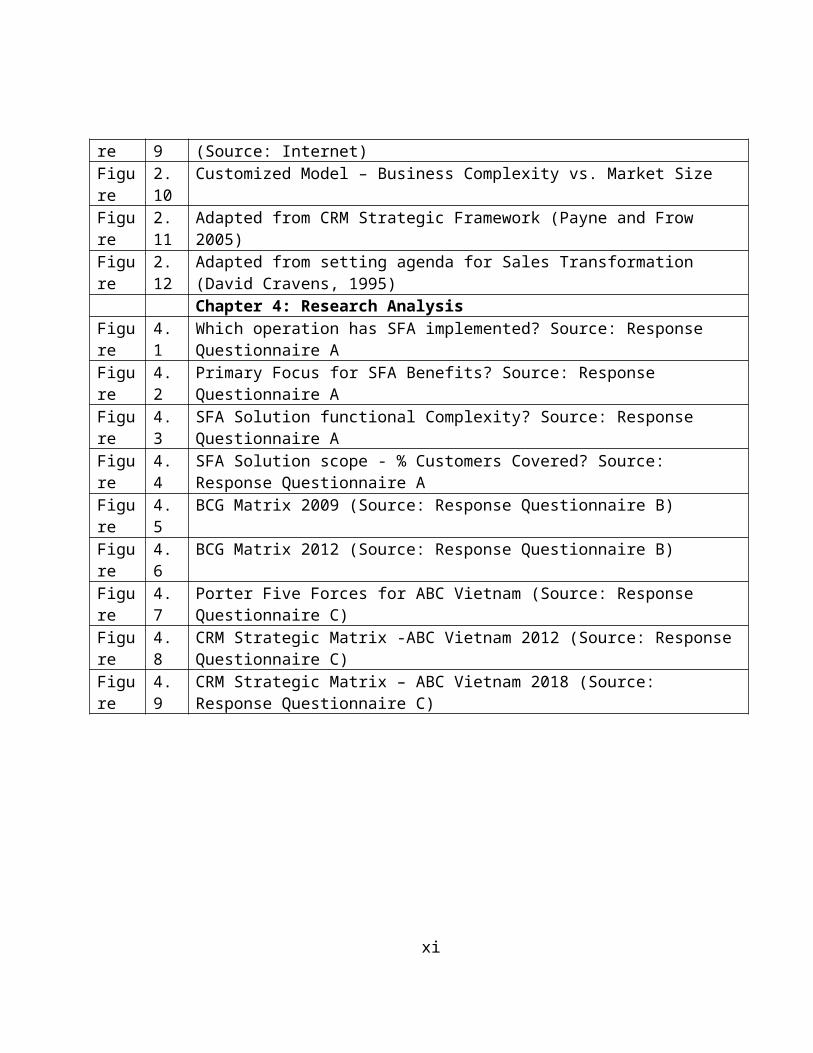
re 9 (Source: Internet)Figure
2.10
Customized Model – Business Complexity vs. Market Size
Figure
2.11
Adapted from CRM Strategic Framework (Payne and Frow 2005)
Figure
2.12
Adapted from setting agenda for Sales Transformation (David Cravens, 1995)Chapter 4: Research Analysis
Figure
4.1
Which operation has SFA implemented? Source: Response Questionnaire A
Figure
4.2
Primary Focus for SFA Benefits? Source: Response Questionnaire A
Figure
4.3
SFA Solution functional Complexity? Source: Response Questionnaire A
Figure
4.4
SFA Solution scope - % Customers Covered? Source: Response Questionnaire A
Figure
4.5
BCG Matrix 2009 (Source: Response Questionnaire B)
Figure
4.6
BCG Matrix 2012 (Source: Response Questionnaire B)
Figure
4.7
Porter Five Forces for ABC Vietnam (Source: Response Questionnaire C)
Figure
4.8
CRM Strategic Matrix -ABC Vietnam 2012 (Source: ResponseQuestionnaire C)
Figure
4.9
CRM Strategic Matrix – ABC Vietnam 2018 (Source: Response Questionnaire C)
xi
12
[C & T CHAPTER I: CHAPTER TITLE, USE UPPER AND LOWER CASE]
[Click and type Text (Body Text style), Use styles for
more headings]
13
[C & T CHAPTER II: CHAPTER TITLE, USE UPPER AND LOWER CASE]
[Click and type Text (Body Text style), Use styles for
more headings]
14
[C & T CHAPTER III: CHAPTER TITLE, USE UPPER AND LOWER CASE]
[Click and type Text (Body Text style), Use styles for
more headings]

15
[C & T CHAPTER IV: CHAPTER TITLE, USE UPPER AND LOWER CASE]
[Click and type Text (Body Text style), Use styles for
more headings]

16
[C & T CHAPTER V: CHAPTER TITLE, USE UPPER AND LOWER CASE]
[Click and type Text (Body Text style), Use styles for
more headings]
17
REFERENCES
Chapter 1
1. Gebauer, J., & Shaw, M. J. (2004). “Success Factors and
Impacts of Mobile Business Applications: Results from a
Mobile e- Procurement Study.” International Journal of
Electronic Commerce, 8(3), 19-41.
2. Nah, F., Siau, K., & Sheng, H. (2005). “The VALUE of Mobile
Applications: A Utility Company Study” Communications of the
ACM, 48(2), 85-90.
3. “Soft Drinks 2010 Trends and Future Directions” (2011, 01).
Retrieved 07, 2012, from WWW.EUROMONITOR.COM
4. “How ABC reaches its customers”, Retrieved 07, 2012, from
WWW.HCCBPL.IN
18
5. KO Analyst Report. Retrieved 08, 2012, (2010, 12). from
WWW.NYSE.COM
6. Beverage Industry Research. Retrieved 08, 2012, (2010, 12).
from WWW.VALUELINE.COM
7. Company Financial Report. Retrieved 08, 2012, from www.coca-
cola.com
8. “ABC’s product availability across total outlet universe in
India”. Retrieved 08, 2012, from www.nielson.com
9. ABC’s Financial Report 10K SEC Filing. Retrieved 08, 2012,
from www.abc.com
Chapter 2
10. Kotler, P. (1994), “Marketing Management, Analysis, Planning,
Implementation, and Control” Prentice-Hall, Englewood Cliffs,
NJ.
19
11. Baumgartner, T., John, R.H. & Naucler, T. (2005)
“Transforming Sales and Service”, Mckinsey Quarterly, No. 4,
pp. 80-91.
12. Ted Schadler and John C. McCarthy (2012) “Mobile Is The New
Face Of Engagement”, Forrester Research, pp. 3-10
13. Geoffrey Moore (2011), “Systems of Engagement and the Future
of Enterprise IT”, AIIM Whitepaper, pp. 5-15
14. Basole, R.C. and DeMillo, R.A., “Enterprise IT and
Transformation”, Chapter 11 in W.B. Rouse (Ed.) Enterprise
Transformation: Understanding and Enabling Fundamental
Change, John Wiley (2006), New York
15. Mikko Lipasti and Tapio Schrey (2007) “MOBILE SOLUTIONS IN
BUSINESS PROCESSES” Publications in Telecommunications
Software and Multimedia, pp. 74-78
20
16. Newell F. and Seth Godin (2003), “Why CRM Doesn’t Work: How
to win by letting customers Manage the relationship” New
York: Bloomberg Press
17. “BUILDING A MOBILITY STRATEGY - Seven Insights to Promote
Workforce Productivity and Minimize Risk ” Retrieved 08,
2012, from www.executiveboard.com/IT
18. B. Joseph Pine II, James H. Gilmore (1999), “The Experience
Economy: Work Is Theatre & Every Business a Stage” Harvard
Business Press, 2011
19. Kerin, Roger, Hartley, Steven, Rudelius, William. Marketing.
Irwin/McGraw-Hill, 2009
20. William C Moncrief, “Selling activity and sales position
taxonomies for industrial Sales forces”, Journal of Marketing
Research, Volume 23, August 1986, pages 261 - 270.
21. Porter, M.E. (2008) "The Five Competitive Forces That Shape
Strategy", Harvard Business Review, January 2008, pp. 79–93
22. Roberts, M., Liu, R. Hazard, K. (2005) “Strategy,
Technology, and Organizational Alignment: Key Components of
21
CRM Success.” Database Marketing & Customer Strategy
Management, pp. 315-326
23. Payne A. & Frow P. (2005), “A strategic Framework for CRM”
Journal of Marketing, Vol. 69, No. 4, pp. 167-176
24. Payne A. & Frow P. (2006), “Customer Relationship
Management. From Strategy to implementation” Journal of
Marketing, Vol. 22, pp. 135-168
25. BCG Growth Share Matrix, Retrieved on 8th September 2012 from
http://en.wikipedia.org/wiki/Growth-share_matrix
26. Jagdish N Sheth, “The Future of Relationship Marketing”,
Journal of Services Marketing, Volume 16, Number 7, 2002,
pages 590 – 592
27. Bill Donaldson, “Sales Management, Principles, Process and
Practice, 3rd Edition”
28. William C Moncrief, “Selling activity and sales position
taxonomies for industrial salesforces”, Journal of Marketing
Research, Volume 23, August 1986, pages 261 - 270.
22
29. David W Cravens, “The changing role of the salesforce”,
Marketing Management, Volume 4, Number 2, Fall 1995, pages 49
- 57.
Chapter 3
30. Maykut, P., & Morehouse, R. (1994). The qualitative posture:
Indwelling. In Beginning qualitative research: A philosophic
and practical guide (pp.n25–40) London: Falmer Press.
31. Denzin, NK & Lincoln, YS. (1994). "Introduction: Entering the
field of qualitative research." In NK Denzin and YS Lincoln
(Eds.) Handbook of Qualitative Research pp. 1-17 Thousand
Oaks: Sage Publications.
32. David Silverman (1993). “Beginning Research”. Interpreting
Qualitative Data. Methods for Analysing Talk, Text and
Interaction. Londres: Sage Publications.
33. Guba, E. G., & Lincoln, Y. S. (1994). Competing paradigms in
qualitative research. In N. K. Denzin & Y. S. Lincoln (Eds.),
Handbook of qualitative research (pp. 105-117). London: Sage.
23
34. Bryman, A. (2004). Social Research Methods (2 ed.). Oxford:
Oxford University Press.
35. Bryman, A. (2004) ‘Triangulation’, in M. Lewis-Beck, A.
Bryman, and T. F. Liao (eds.) Encyclopedia of Social Science
Research Methods, Thousand Oaks, Sage.
36. Rindfleisch, Aric and Christine Moorman (2001), “The
Acquisition and Utilization of Information in New Product
Alliances: A Strength-of-Ties Perspective,” Journal of
Marketing, 65 (April), 1–18.
37. Jap, Sandy D. (1999), “Pie-Expansion Efforts: Collaboration
Processes in Buyer-Supplier Relationships,” Journal of
Marketing Research, 36 (November), 461-475.
38. Erin Anderson (2004), “Challenges and Advances in Marketing
Strategy Field Research,” in Assessing Marketing Strategy
Performance. Christine Moorman and Donald R. Lehmann, eds.
Cambridge, MA: Marketing Science Institute, 269-292.
39. Ostroff, Cheri, Angelo J. Kinicki, and Mark A. Clark (2002),
“Substantive and Operational Issues of Response Bias Across
24
Levels of Analysis: An Example of Climate-Satisfaction
Relationships,” Journal of Applied Psychology, 87 (2), 355-
368.
40. Podsakoff, Philip M. and Dennis Organ (1986), “Self-Reports
in Organizational Research: Problems and Prospects,” Journal
of Management, 12 (4), 531-544.
41. Van Bruggen, Gerrit, Gary Lilien, and Manish Kacker (2002),
“Informants in Organizational Marketing Research: Why Use
Multiple Informants and How to Aggregate Responses,” Journal
of Marketing Research, 39 (November), 469-478.
42. Adèr, H.J. (2008). Chapter 14: Phases and initial steps in
data analysis. In H.J. Adèr & G.J. Mellenbergh (Eds.) (with
contributions by D.J. Hand), Advising on Research Methods: A
consultant's companion (pp. 333–356). Huizen, the
Netherlands: Johannes van Kessel Publishing.
Chapter 4
43. Porter, M.E. (2008) "The Five Competitive Forces That Shape
Strategy", Harvard Business Review, January 2008, pp. 79–93
25
44. “Soft Drinks in Vietnam Trends and Future Directions” (2013,
01). Retrieved 01, 2013, from www.euromonitor.com
Chapter 5
45. Newell F. and Seth Godin (2003), “Why CRM Doesn’t Work: How
to win by letting customers Manage the relationship” New
York: Bloomberg Press
46. Porter, M.E. (2008) "The Five Competitive Forces That Shape
Strategy", Harvard Business Review, January 2008, pp. 79–93
47. Mikko Lipasti and Tapio Schrey (2007) “MOBILE SOLUTIONS IN
BUSINESS PROCESSES” Publications in Telecommunications
Software and Multimedia, pp. 74-78
48. B. Joseph Pine II, James H. Gilmore (1999), “The Experience
Economy: Work Is Theatre & Every Business a Stage” Harvard
Business Press, 2011
49. Basole, R.C. and DeMillo, R.A., “Enterprise IT and
Transformation”, Chapter 11 in W.B. Rouse (Ed.) Enterprise
Transformation: Understanding and Enabling Fundamental
Change, John Wiley (2006), New York

26
50. Kerin, Roger, Hartley, Steven, Rudelius, William. Marketing.
Irwin/McGraw-Hill, 2009

27
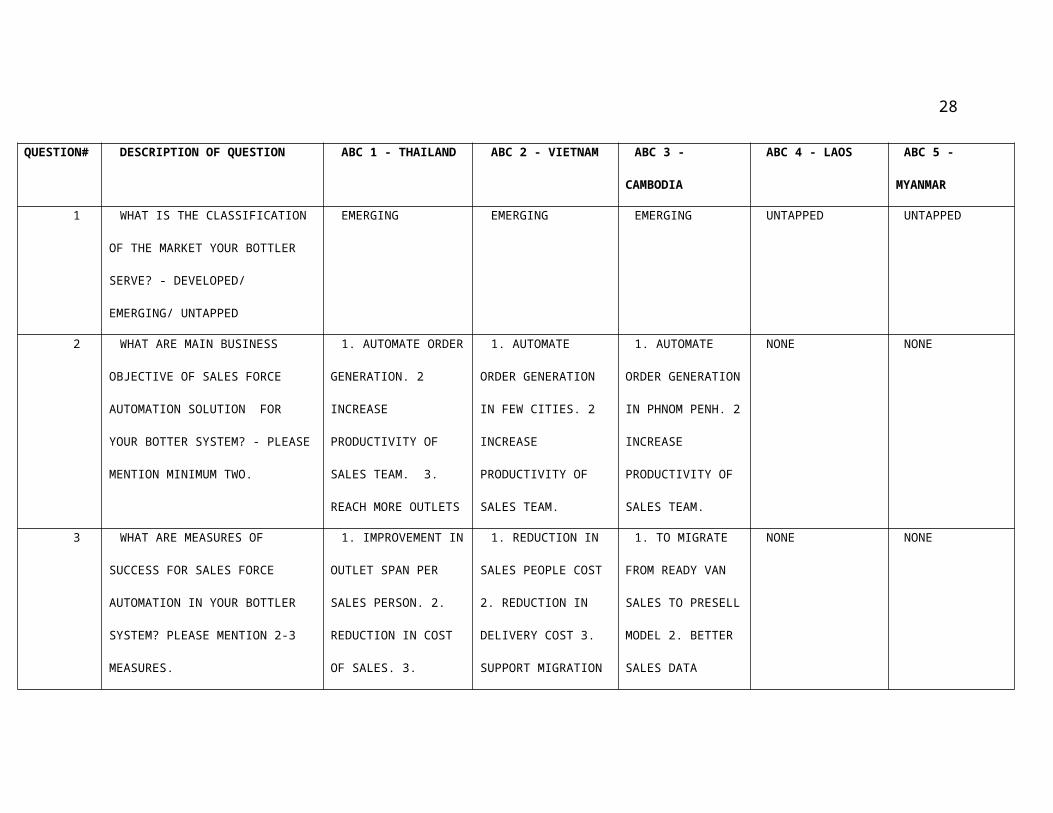
APPENDIX A: SURVEY RESPONSES – QUESTIONAIRE A-D
28
QUESTION# DESCRIPTION OF QUESTION ABC 1 - THAILAND ABC 2 - VIETNAM ABC 3 -
CAMBODIA
ABC 4 - LAOS ABC 5 -
MYANMAR
1 WHAT IS THE CLASSIFICATION
OF THE MARKET YOUR BOTTLER
SERVE? - DEVELOPED/
EMERGING/ UNTAPPED
EMERGING EMERGING EMERGING UNTAPPED UNTAPPED
2 WHAT ARE MAIN BUSINESS
OBJECTIVE OF SALES FORCE
AUTOMATION SOLUTION FOR
YOUR BOTTER SYSTEM? - PLEASE
MENTION MINIMUM TWO.
1. AUTOMATE ORDER
GENERATION. 2
INCREASE
PRODUCTIVITY OF
SALES TEAM. 3.
REACH MORE OUTLETS
1. AUTOMATE
ORDER GENERATION
IN FEW CITIES. 2
INCREASE
PRODUCTIVITY OF
SALES TEAM.
1. AUTOMATE
ORDER GENERATION
IN PHNOM PENH. 2
INCREASE
PRODUCTIVITY OF
SALES TEAM.
NONE NONE
3 WHAT ARE MEASURES OF
SUCCESS FOR SALES FORCE
AUTOMATION IN YOUR BOTTLER
SYSTEM? PLEASE MENTION 2-3
MEASURES.
1. IMPROVEMENT IN
OUTLET SPAN PER
SALES PERSON. 2.
REDUCTION IN COST
OF SALES. 3.
1. REDUCTION IN
SALES PEOPLE COST
2. REDUCTION IN
DELIVERY COST 3.
SUPPORT MIGRATION
1. TO MIGRATE
FROM READY VAN
SALES TO PRESELL
MODEL 2. BETTER
SALES DATA
NONE NONE
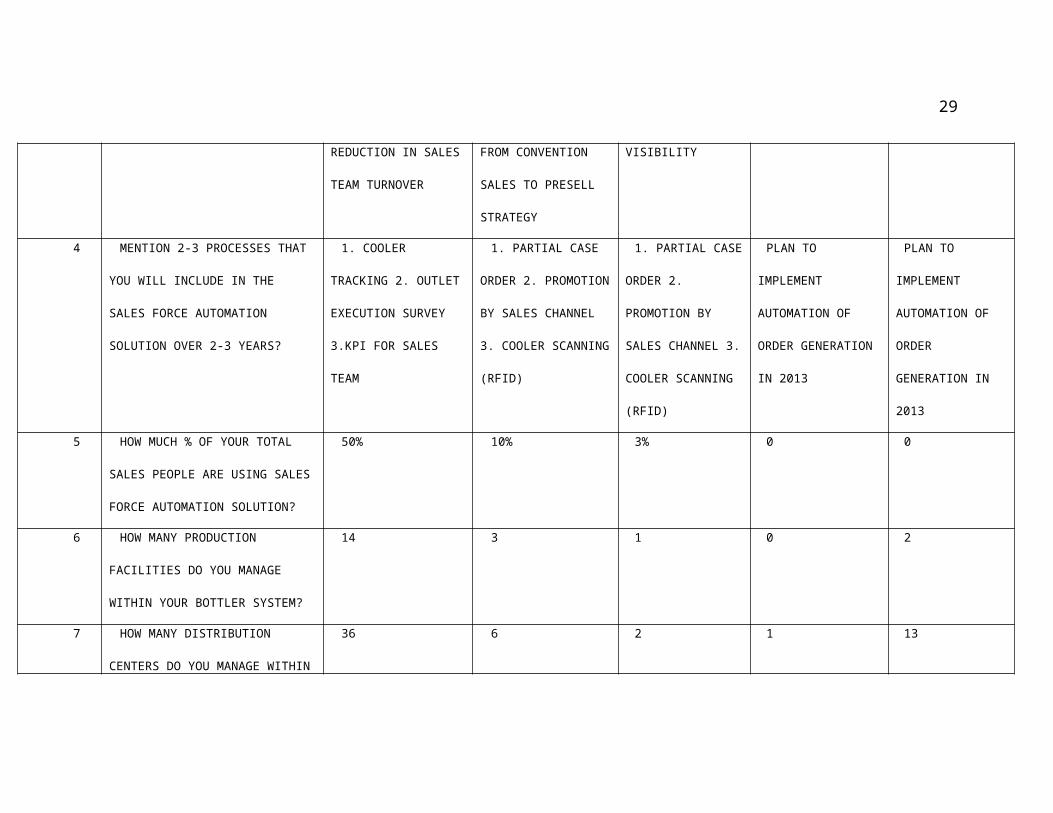
29
REDUCTION IN SALES
TEAM TURNOVER
FROM CONVENTION
SALES TO PRESELL
STRATEGY
VISIBILITY
4 MENTION 2-3 PROCESSES THAT
YOU WILL INCLUDE IN THE
SALES FORCE AUTOMATION
SOLUTION OVER 2-3 YEARS?
1. COOLER
TRACKING 2. OUTLET
EXECUTION SURVEY
3.KPI FOR SALES
TEAM
1. PARTIAL CASE
ORDER 2. PROMOTION
BY SALES CHANNEL
3. COOLER SCANNING
(RFID)
1. PARTIAL CASE
ORDER 2.
PROMOTION BY
SALES CHANNEL 3.
COOLER SCANNING
(RFID)
PLAN TO
IMPLEMENT
AUTOMATION OF
ORDER GENERATION
IN 2013
PLAN TO
IMPLEMENT
AUTOMATION OF
ORDER
GENERATION IN
2013
5 HOW MUCH % OF YOUR TOTAL
SALES PEOPLE ARE USING SALES
FORCE AUTOMATION SOLUTION?
50% 10% 3% 0 0
6 HOW MANY PRODUCTION
FACILITIES DO YOU MANAGE
WITHIN YOUR BOTTLER SYSTEM?
14 3 1 0 2
7 HOW MANY DISTRIBUTION
CENTERS DO YOU MANAGE WITHIN
36 6 2 1 13
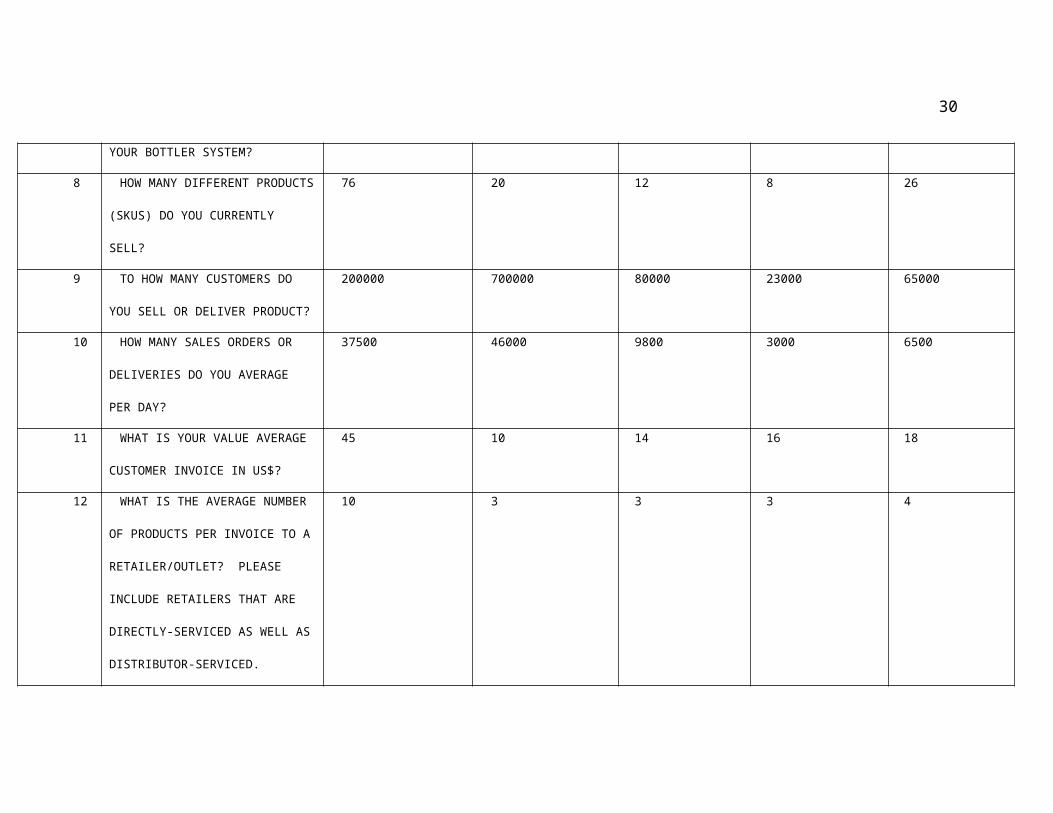
30
YOUR BOTTLER SYSTEM?
8 HOW MANY DIFFERENT PRODUCTS
(SKUS) DO YOU CURRENTLY
SELL?
76 20 12 8 26
9 TO HOW MANY CUSTOMERS DO
YOU SELL OR DELIVER PRODUCT?
200000 700000 80000 23000 65000
10 HOW MANY SALES ORDERS OR
DELIVERIES DO YOU AVERAGE
PER DAY?
37500 46000 9800 3000 6500
11 WHAT IS YOUR VALUE AVERAGE
CUSTOMER INVOICE IN US$?
45 10 14 16 18
12 WHAT IS THE AVERAGE NUMBER
OF PRODUCTS PER INVOICE TO A
RETAILER/OUTLET? PLEASE
INCLUDE RETAILERS THAT ARE
DIRECTLY-SERVICED AS WELL AS
DISTRIBUTOR-SERVICED.
10 3 3 3 4
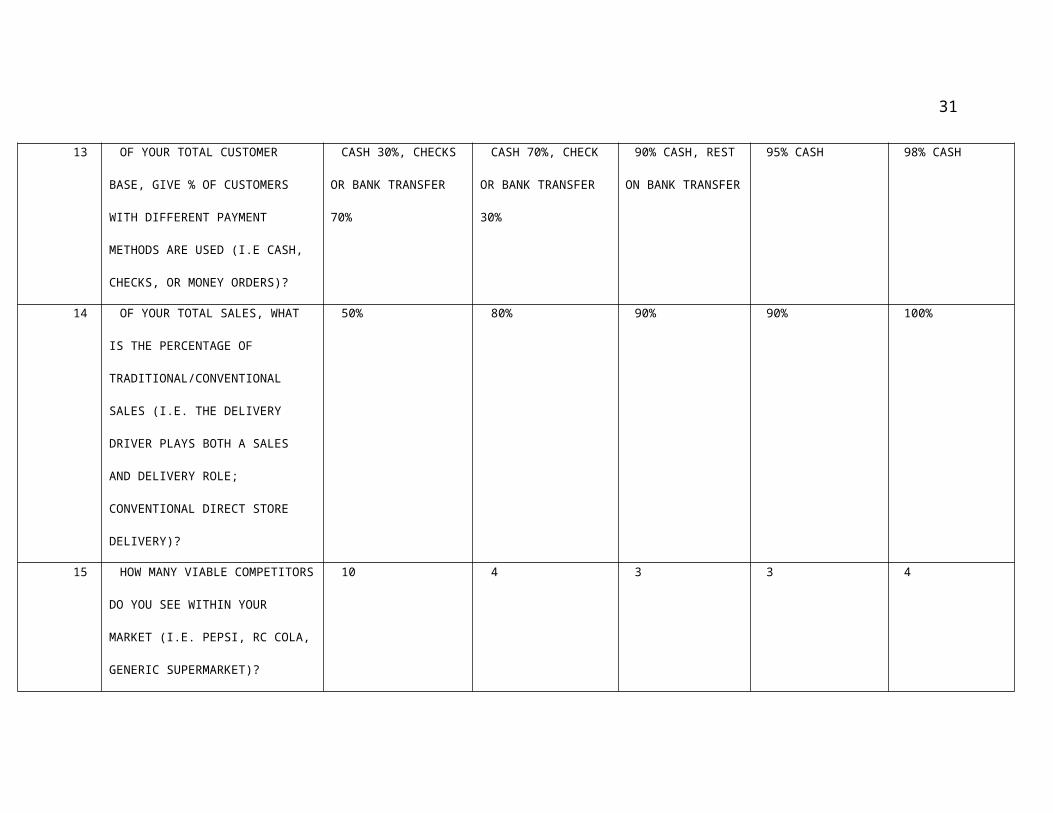
31
13 OF YOUR TOTAL CUSTOMER
BASE, GIVE % OF CUSTOMERS
WITH DIFFERENT PAYMENT
METHODS ARE USED (I.E CASH,
CHECKS, OR MONEY ORDERS)?
CASH 30%, CHECKS
OR BANK TRANSFER
70%
CASH 70%, CHECK
OR BANK TRANSFER
30%
90% CASH, REST
ON BANK TRANSFER
95% CASH 98% CASH
14 OF YOUR TOTAL SALES, WHAT
IS THE PERCENTAGE OF
TRADITIONAL/CONVENTIONAL
SALES (I.E. THE DELIVERY
DRIVER PLAYS BOTH A SALES
AND DELIVERY ROLE;
CONVENTIONAL DIRECT STORE
DELIVERY)?
50% 80% 90% 90% 100%
15 HOW MANY VIABLE COMPETITORS
DO YOU SEE WITHIN YOUR
MARKET (I.E. PEPSI, RC COLA,
GENERIC SUPERMARKET)?
10 4 3 3 4
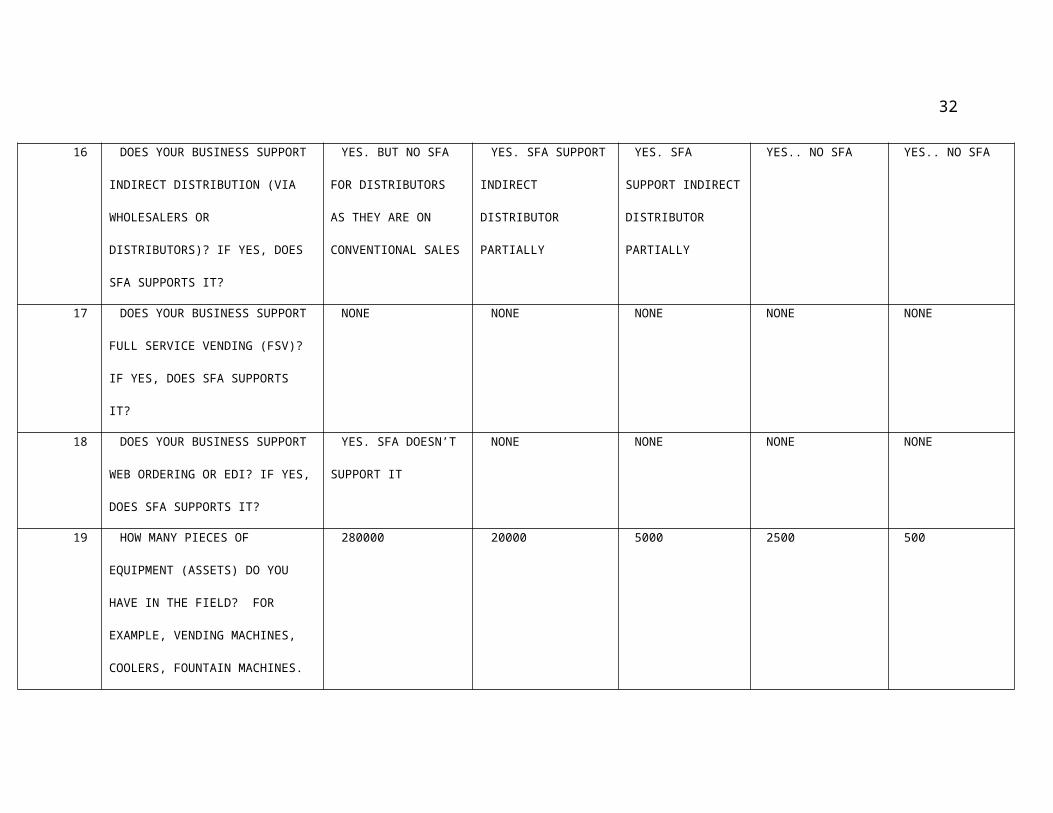
32
16 DOES YOUR BUSINESS SUPPORT
INDIRECT DISTRIBUTION (VIA
WHOLESALERS OR
DISTRIBUTORS)? IF YES, DOES
SFA SUPPORTS IT?
YES. BUT NO SFA
FOR DISTRIBUTORS
AS THEY ARE ON
CONVENTIONAL SALES
YES. SFA SUPPORT
INDIRECT
DISTRIBUTOR
PARTIALLY
YES. SFA
SUPPORT INDIRECT
DISTRIBUTOR
PARTIALLY
YES.. NO SFA YES.. NO SFA
17 DOES YOUR BUSINESS SUPPORT
FULL SERVICE VENDING (FSV)?
IF YES, DOES SFA SUPPORTS
IT?
NONE NONE NONE NONE NONE
18 DOES YOUR BUSINESS SUPPORT
WEB ORDERING OR EDI? IF YES,
DOES SFA SUPPORTS IT?
YES. SFA DOESN’T
SUPPORT IT
NONE NONE NONE NONE
19 HOW MANY PIECES OF
EQUIPMENT (ASSETS) DO YOU
HAVE IN THE FIELD? FOR
EXAMPLE, VENDING MACHINES,
COOLERS, FOUNTAIN MACHINES.
280000 20000 5000 2500 500
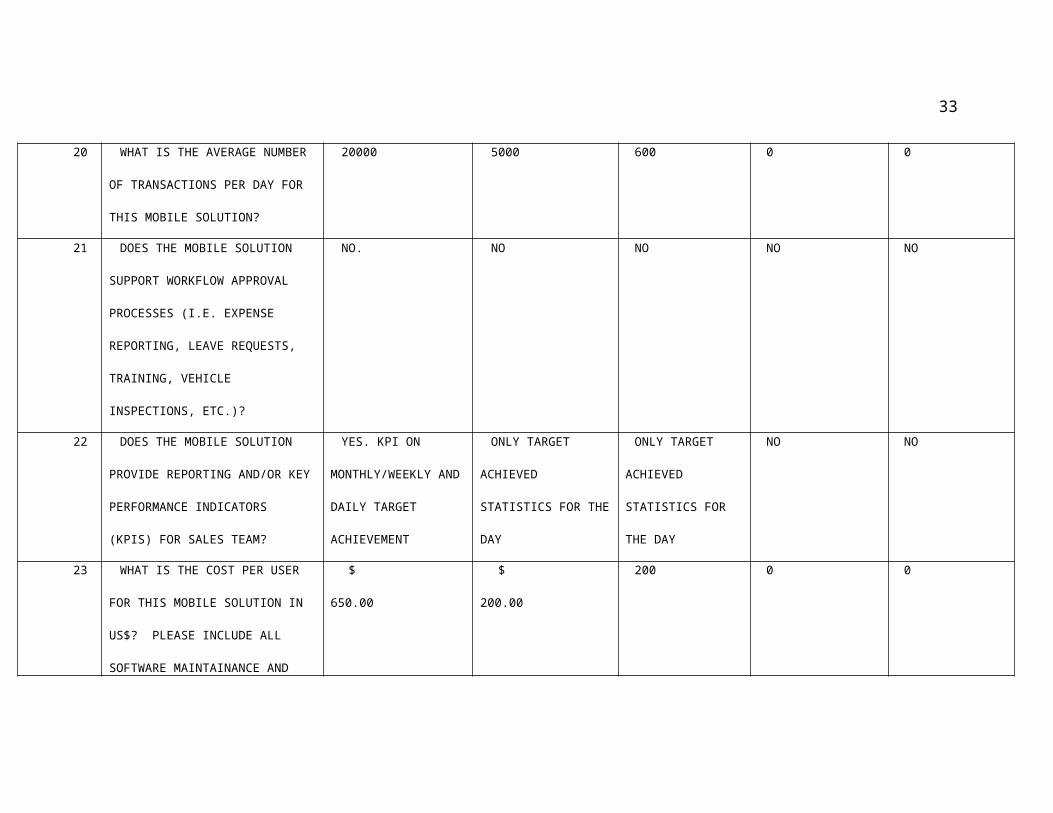
33
20 WHAT IS THE AVERAGE NUMBER
OF TRANSACTIONS PER DAY FOR
THIS MOBILE SOLUTION?
20000 5000 600 0 0
21 DOES THE MOBILE SOLUTION
SUPPORT WORKFLOW APPROVAL
PROCESSES (I.E. EXPENSE
REPORTING, LEAVE REQUESTS,
TRAINING, VEHICLE
INSPECTIONS, ETC.)?
NO. NO NO NO NO
22 DOES THE MOBILE SOLUTION
PROVIDE REPORTING AND/OR KEY
PERFORMANCE INDICATORS
(KPIS) FOR SALES TEAM?
YES. KPI ON
MONTHLY/WEEKLY AND
DAILY TARGET
ACHIEVEMENT
ONLY TARGET
ACHIEVED
STATISTICS FOR THE
DAY
ONLY TARGET
ACHIEVED
STATISTICS FOR
THE DAY
NO NO
23 WHAT IS THE COST PER USER
FOR THIS MOBILE SOLUTION IN
US$? PLEASE INCLUDE ALL
SOFTWARE MAINTAINANCE AND
$
650.00
$
200.00
200 0 0
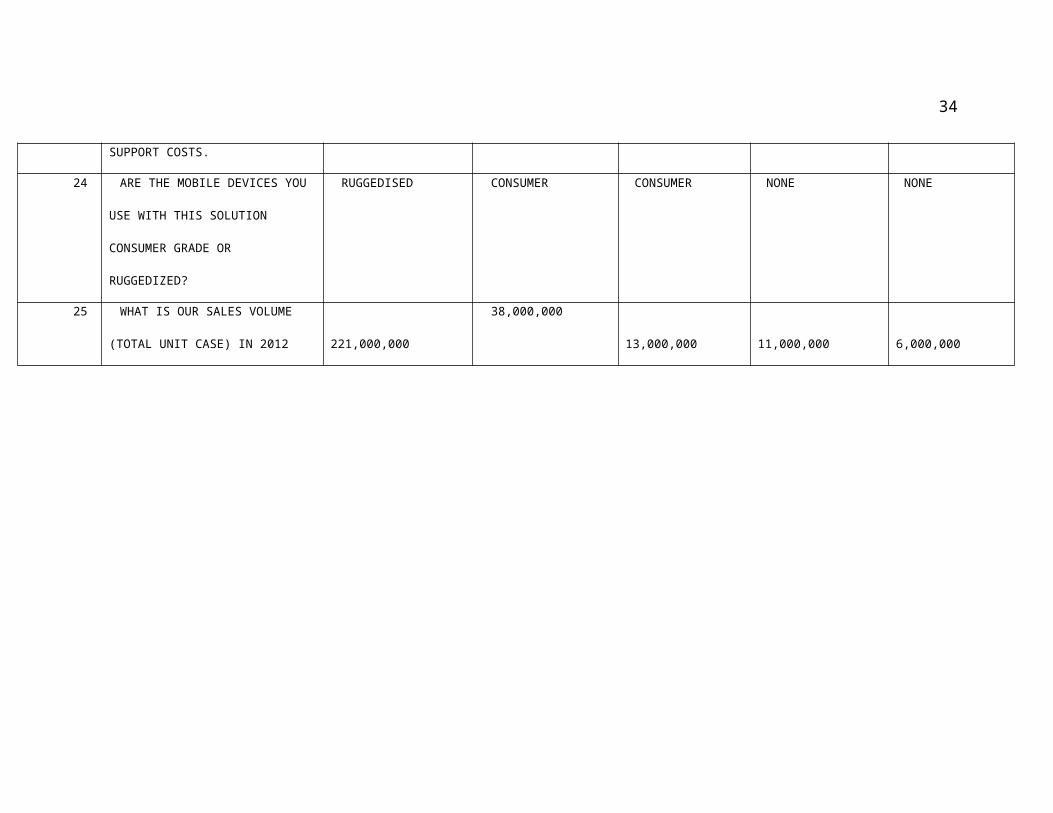
34
SUPPORT COSTS.
24 ARE THE MOBILE DEVICES YOU
USE WITH THIS SOLUTION
CONSUMER GRADE OR
RUGGEDIZED?
RUGGEDISED CONSUMER CONSUMER NONE NONE
25 WHAT IS OUR SALES VOLUME
(TOTAL UNIT CASE) IN 2012
221,000,000
38,000,000
13,000,000
11,000,000
6,000,000
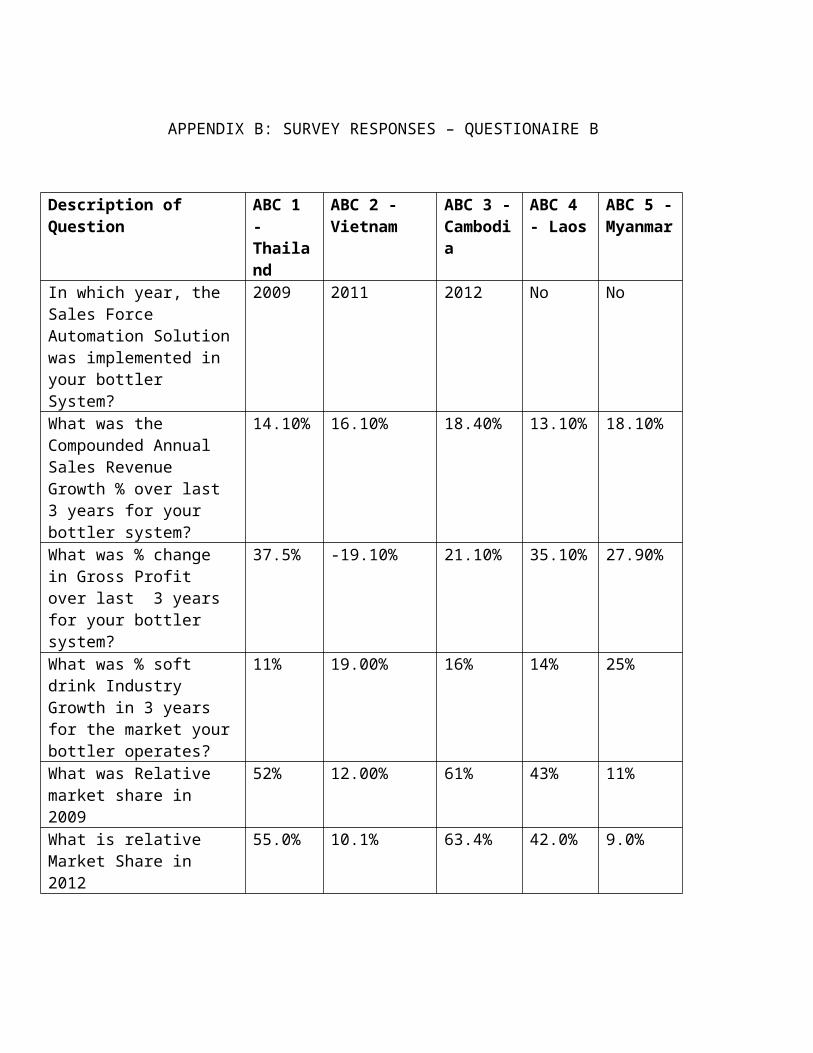
APPENDIX B: SURVEY RESPONSES – QUESTIONAIRE B
Description of Question
ABC 1 - Thailand
ABC 2 - Vietnam
ABC 3 -Cambodia
ABC 4 - Laos
ABC 5 -Myanmar
In which year, the Sales Force Automation Solutionwas implemented in your bottler System?
2009 2011 2012 No No
What was the Compounded Annual Sales Revenue Growth % over last 3 years for your bottler system?
14.10% 16.10% 18.40% 13.10% 18.10%
What was % change in Gross Profit over last 3 years for your bottler system?
37.5% -19.10% 21.10% 35.10% 27.90%
What was % soft drink Industry Growth in 3 years for the market yourbottler operates?
11% 19.00% 16% 14% 25%
What was Relative market share in 2009
52% 12.00% 61% 43% 11%
What is relative Market Share in 2012
55.0% 10.1% 63.4% 42.0% 9.0%
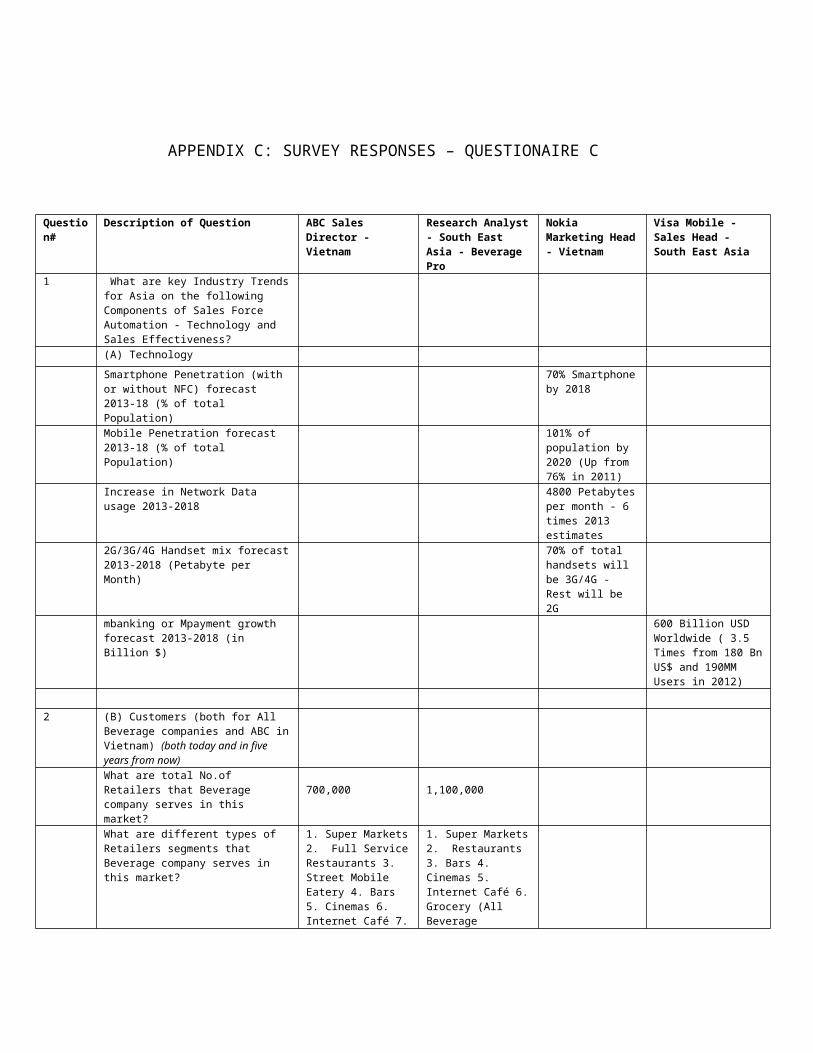
APPENDIX C: SURVEY RESPONSES – QUESTIONAIRE C
Question#
Description of Question ABC Sales Director - Vietnam
Research Analyst- South East Asia - Beverage Pro
Nokia Marketing Head- Vietnam
Visa Mobile - Sales Head - South East Asia
1 What are key Industry Trendsfor Asia on the following Components of Sales Force Automation - Technology and Sales Effectiveness?
(A) Technology Smartphone Penetration (with or without NFC) forecast 2013-18 (% of total Population)
70% Smartphoneby 2018
Mobile Penetration forecast 2013-18 (% of total Population)
101% of population by 2020 (Up from 76% in 2011)
Increase in Network Data usage 2013-2018
4800 Petabytesper month - 6 times 2013 estimates
2G/3G/4G Handset mix forecast2013-2018 (Petabyte per Month)
70% of total handsets will be 3G/4G - Rest will be 2G
mbanking or Mpayment growth forecast 2013-2018 (in Billion $)
600 Billion USD Worldwide ( 3.5 Times from 180 BnUS$ and 190MM Users in 2012)
2 (B) Customers (both for All
Beverage companies and ABC inVietnam) (both today and in five years from now)What are total No.of Retailers that Beverage company serves in this market?
700,000
1,100,000
What are different types of Retailers segments that Beverage company serves in this market?
1. Super Markets2. Full ServiceRestaurants 3. Street Mobile Eatery 4. Bars 5. Cinemas 6. Internet Café 7.
1. Super Markets2. Restaurants 3. Bars 4. Cinemas 5. Internet Café 6.Grocery (All Beverage
Grocery (For ABCand All others)
Companies)
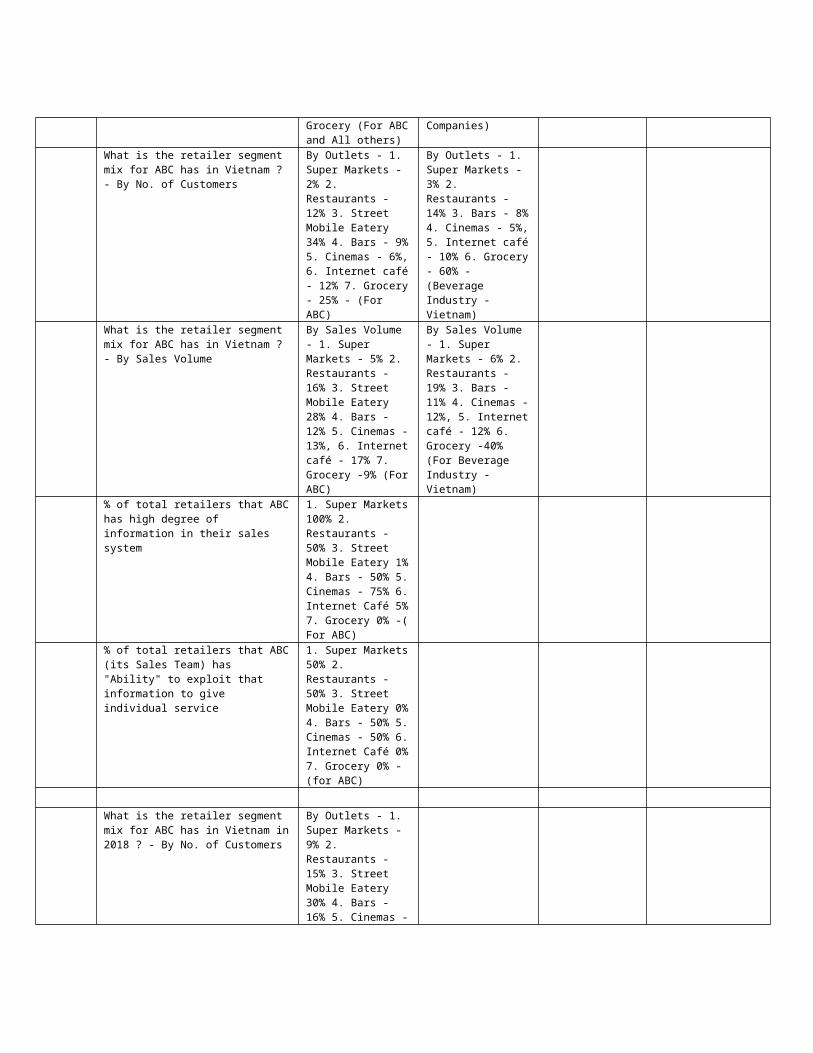
What is the retailer segment mix for ABC has in Vietnam ? - By No. of Customers
By Outlets - 1. Super Markets - 2% 2. Restaurants - 12% 3. Street Mobile Eatery 34% 4. Bars - 9%5. Cinemas - 6%,6. Internet café- 12% 7. Grocery- 25% - (For ABC)
By Outlets - 1. Super Markets - 3% 2. Restaurants - 14% 3. Bars - 8%4. Cinemas - 5%,5. Internet café- 10% 6. Grocery- 60% - (Beverage Industry - Vietnam)
What is the retailer segment mix for ABC has in Vietnam ? - By Sales Volume
By Sales Volume - 1. Super Markets - 5% 2. Restaurants - 16% 3. Street Mobile Eatery 28% 4. Bars - 12% 5. Cinemas -13%, 6. Internetcafé - 17% 7. Grocery -9% (ForABC)
By Sales Volume - 1. Super Markets - 6% 2. Restaurants - 19% 3. Bars - 11% 4. Cinemas -12%, 5. Internetcafé - 12% 6. Grocery -40% (For Beverage Industry - Vietnam)
% of total retailers that ABChas high degree of information in their sales system
1. Super Markets100% 2. Restaurants - 50% 3. Street Mobile Eatery 1%4. Bars - 50% 5.Cinemas - 75% 6.Internet Café 5%7. Grocery 0% -(For ABC)
% of total retailers that ABC(its Sales Team) has "Ability" to exploit that information to give individual service
1. Super Markets50% 2. Restaurants - 50% 3. Street Mobile Eatery 0%4. Bars - 50% 5.Cinemas - 50% 6.Internet Café 0%7. Grocery 0% - (for ABC)
What is the retailer segment mix for ABC has in Vietnam in2018 ? - By No. of Customers
By Outlets - 1. Super Markets - 9% 2. Restaurants - 15% 3. Street Mobile Eatery 30% 4. Bars - 16% 5. Cinemas -
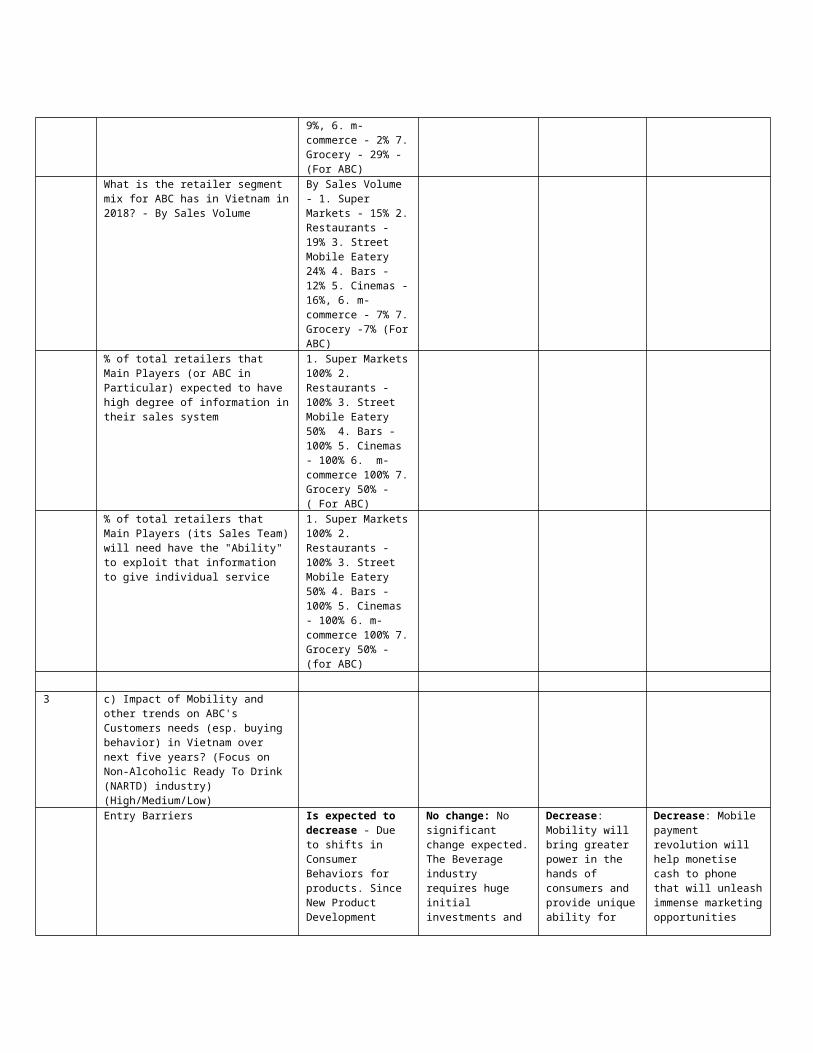
9%, 6. m-commerce - 2% 7.Grocery - 29% - (For ABC)
What is the retailer segment mix for ABC has in Vietnam in2018? - By Sales Volume
By Sales Volume - 1. Super Markets - 15% 2.Restaurants - 19% 3. Street Mobile Eatery 24% 4. Bars - 12% 5. Cinemas -16%, 6. m-commerce - 7% 7.Grocery -7% (ForABC)
% of total retailers that Main Players (or ABC in Particular) expected to have high degree of information intheir sales system
1. Super Markets100% 2. Restaurants - 100% 3. Street Mobile Eatery 50% 4. Bars - 100% 5. Cinemas - 100% 6. m-commerce 100% 7.Grocery 50% -( For ABC)
% of total retailers that Main Players (its Sales Team)will need have the "Ability" to exploit that information to give individual service
1. Super Markets100% 2. Restaurants - 100% 3. Street Mobile Eatery 50% 4. Bars - 100% 5. Cinemas - 100% 6. m-commerce 100% 7.Grocery 50% - (for ABC)
3 c) Impact of Mobility and
other trends on ABC's Customers needs (esp. buying behavior) in Vietnam over next five years? (Focus on Non-Alcoholic Ready To Drink (NARTD) industry) (High/Medium/Low)Entry Barriers Is expected to
decrease - Due to shifts in Consumer Behaviors for products. Since New Product Development
No change: No significant change expected.The Beverage industry requires huge initial investments and
Decrease: Mobility will bring greater power in the hands of consumers and provide uniqueability for
Decrease: Mobile payment revolution will help monetise cash to phone that will unleashimmense marketingopportunities
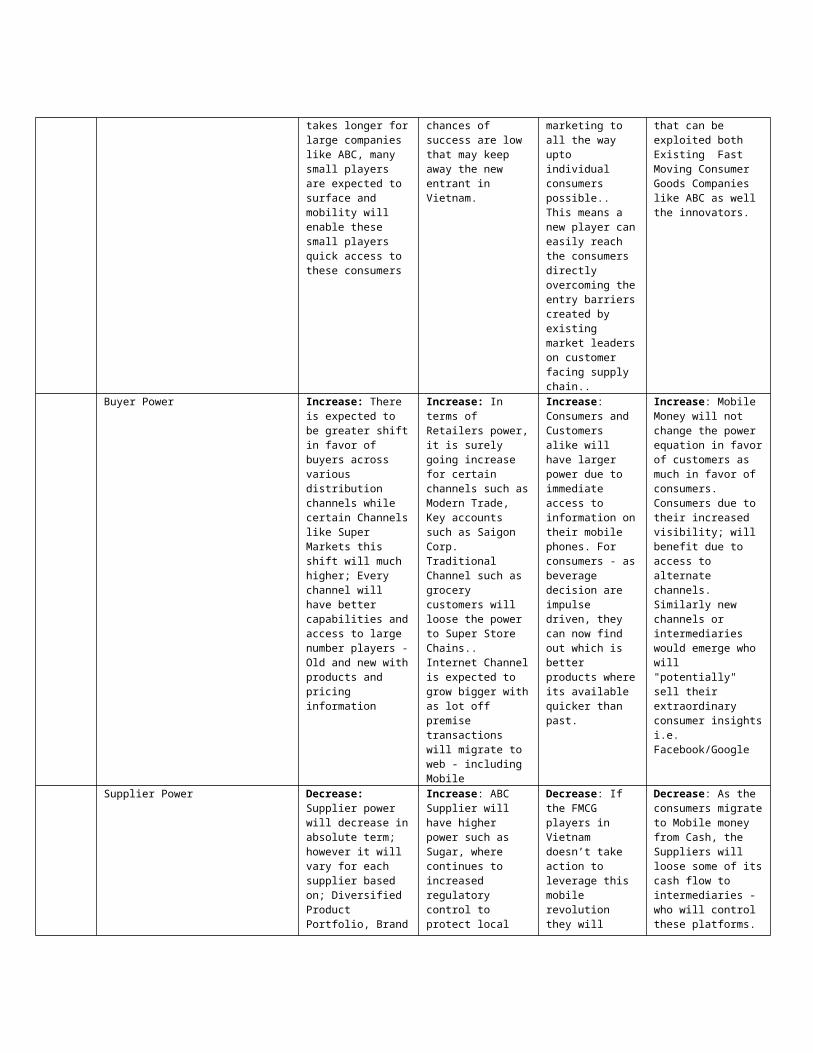
takes longer forlarge companies like ABC, many small players are expected to surface and mobility will enable these small players quick access to these consumers
chances of success are low that may keep away the new entrant in Vietnam.
marketing to all the way upto individual consumers possible.. This means a new player caneasily reach the consumers directly overcoming theentry barrierscreated by existing market leaderson customer facing supply chain..
that can be exploited both Existing Fast Moving Consumer Goods Companies like ABC as well the innovators.
Buyer Power Increase: There is expected to be greater shiftin favor of buyers across various distribution channels while certain Channelslike Super Markets this shift will much higher; Every channel will have better capabilities andaccess to large number players -Old and new withproducts and pricing information
Increase: In terms of Retailers power,it is surely going increase for certain channels such asModern Trade, Key accounts such as Saigon Corp. Traditional Channel such as grocery customers will loose the power to Super Store Chains.. Internet Channelis expected to grow bigger withas lot off premise transactions will migrate to web - including Mobile
Increase: Consumers and Customers alike will have larger power due to immediate access to information ontheir mobile phones. For consumers - asbeverage decision are impulse driven, they can now find out which is better products whereits available quicker than past.
Increase: Mobile Money will not change the power equation in favorof customers as much in favor of consumers. Consumers due to their increased visibility; will benefit due to access to alternate channels. Similarly new channels or intermediaries would emerge who will "potentially" sell their extraordinary consumer insightsi.e. Facebook/Google
Supplier Power Decrease: Supplier power will decrease inabsolute term; however it will vary for each supplier based on; Diversified Product Portfolio, Brand
Increase: ABC Supplier will have higher power such as Sugar, where continues to increased regulatory control to protect local
Decrease: If the FMCG players in Vietnam doesn’t take action to leverage this mobile revolution they will
Decrease: As the consumers migrateto Mobile money from Cash, the Suppliers will loose some of itscash flow to intermediaries - who will control these platforms.
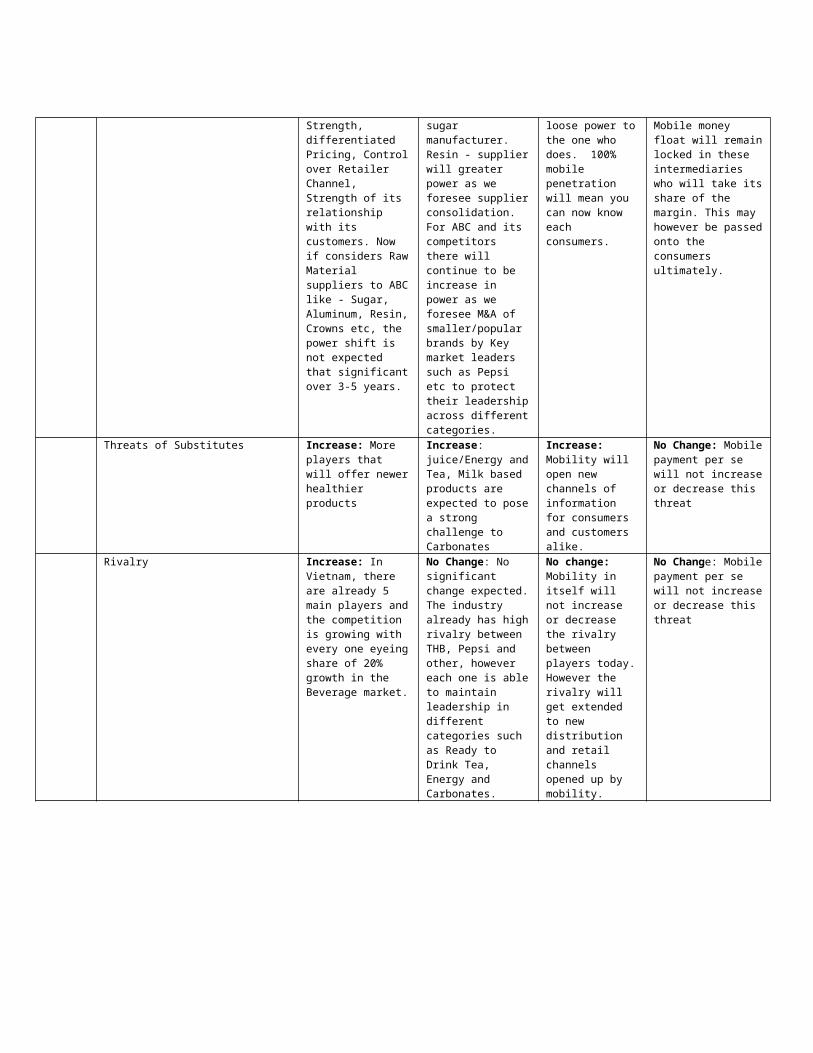
Strength, differentiated Pricing, Controlover Retailer Channel, Strength of its relationship with its customers. Now if considers RawMaterial suppliers to ABClike - Sugar, Aluminum, Resin,Crowns etc, the power shift is not expected that significantover 3-5 years.
sugar manufacturer. Resin - supplierwill greater power as we foresee supplierconsolidation. For ABC and its competitors there will continue to be increase in power as we foresee M&A of smaller/popular brands by Key market leaders such as Pepsi etc to protect their leadershipacross differentcategories.
loose power tothe one who does. 100% mobile penetration will mean you can now know each consumers.
Mobile money float will remainlocked in these intermediaries who will take itsshare of the margin. This may however be passedonto the consumers ultimately.
Threats of Substitutes Increase: More players that will offer newerhealthier products
Increase: juice/Energy andTea, Milk based products are expected to posea strong challenge to Carbonates
Increase: Mobility will open new channels of information for consumers and customers alike.
No Change: Mobilepayment per se will not increaseor decrease this threat
Rivalry Increase: In Vietnam, there are already 5 main players andthe competition is growing with every one eyeingshare of 20% growth in the Beverage market.
No Change: No significant change expected.The industry already has highrivalry between THB, Pepsi and other, however each one is ableto maintain leadership in different categories such as Ready to Drink Tea, Energy and Carbonates.
No change: Mobility in itself will not increase or decrease the rivalry between players today.However the rivalry will get extended to new distribution and retail channels opened up by mobility.
No Change: Mobilepayment per se will not increaseor decrease this threat
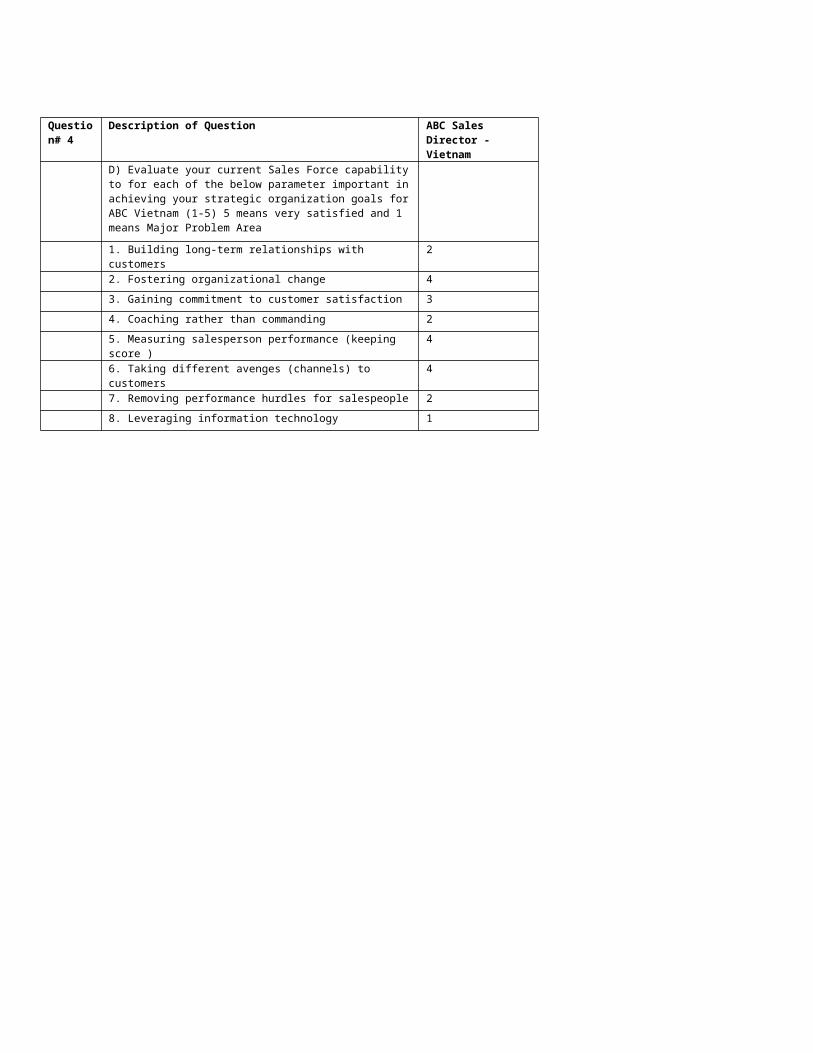
Question# 4
Description of Question ABC Sales Director - Vietnam
D) Evaluate your current Sales Force capabilityto for each of the below parameter important inachieving your strategic organization goals forABC Vietnam (1-5) 5 means very satisfied and 1 means Major Problem Area
1. Building long-term relationships with customers
2
2. Fostering organizational change 43. Gaining commitment to customer satisfaction 34. Coaching rather than commanding 25. Measuring salesperson performance (keeping score )
4
6. Taking different avenges (channels) to customers
4
7. Removing performance hurdles for salespeople 28. Leveraging information technology 1
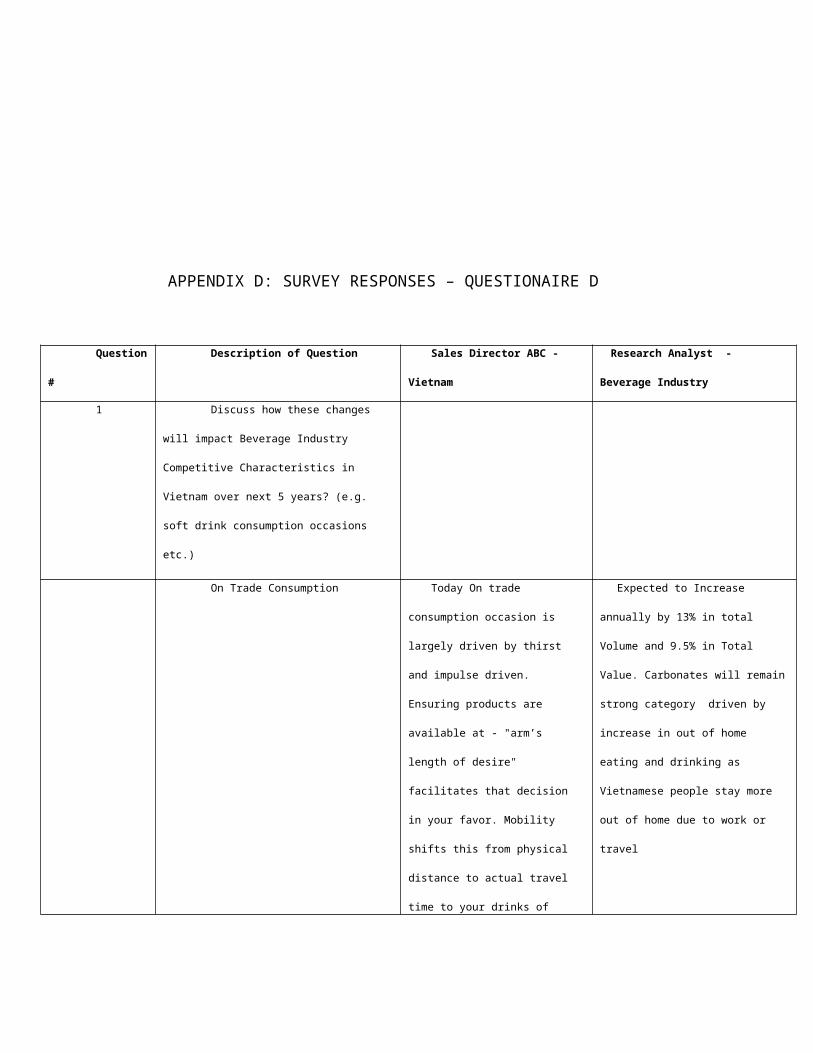
APPENDIX D: SURVEY RESPONSES – QUESTIONAIRE D
Question
#
Description of Question Sales Director ABC -
Vietnam
Research Analyst -
Beverage Industry
1 Discuss how these changes
will impact Beverage Industry
Competitive Characteristics in
Vietnam over next 5 years? (e.g.
soft drink consumption occasions
etc.)
On Trade Consumption Today On trade
consumption occasion is
largely driven by thirst
and impulse driven.
Ensuring products are
available at - "arm’s
length of desire"
facilitates that decision
in your favor. Mobility
shifts this from physical
distance to actual travel
time to your drinks of
Expected to Increase
annually by 13% in total
Volume and 9.5% in Total
Value. Carbonates will remain
strong category driven by
increase in out of home
eating and drinking as
Vietnamese people stay more
out of home due to work or
travel
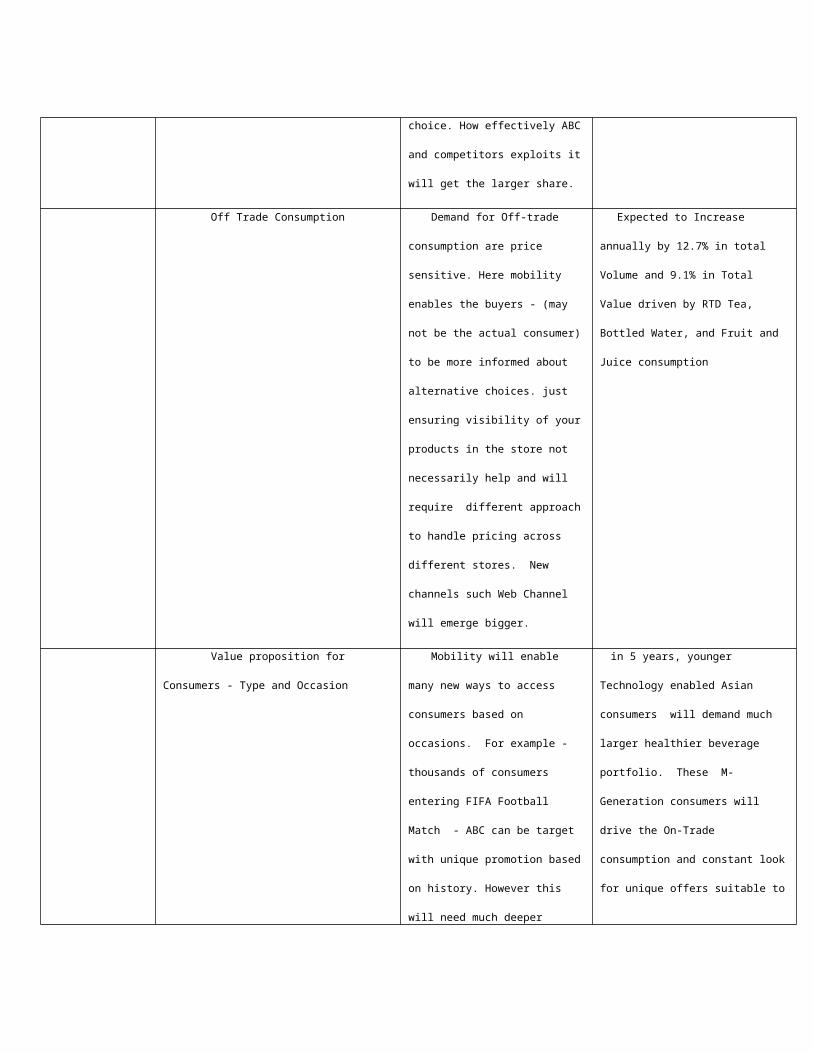
choice. How effectively ABC
and competitors exploits it
will get the larger share.
Off Trade Consumption Demand for Off-trade
consumption are price
sensitive. Here mobility
enables the buyers - (may
not be the actual consumer)
to be more informed about
alternative choices. just
ensuring visibility of your
products in the store not
necessarily help and will
require different approach
to handle pricing across
different stores. New
channels such Web Channel
will emerge bigger.
Expected to Increase
annually by 12.7% in total
Volume and 9.1% in Total
Value driven by RTD Tea,
Bottled Water, and Fruit and
Juice consumption
Value proposition for
Consumers - Type and Occasion
Mobility will enable
many new ways to access
consumers based on
occasions. For example -
thousands of consumers
entering FIFA Football
Match - ABC can be target
with unique promotion based
on history. However this
will need much deeper
in 5 years, younger
Technology enabled Asian
consumers will demand much
larger healthier beverage
portfolio. These M-
Generation consumers will
drive the On-Trade
consumption and constant look
for unique offers suitable to
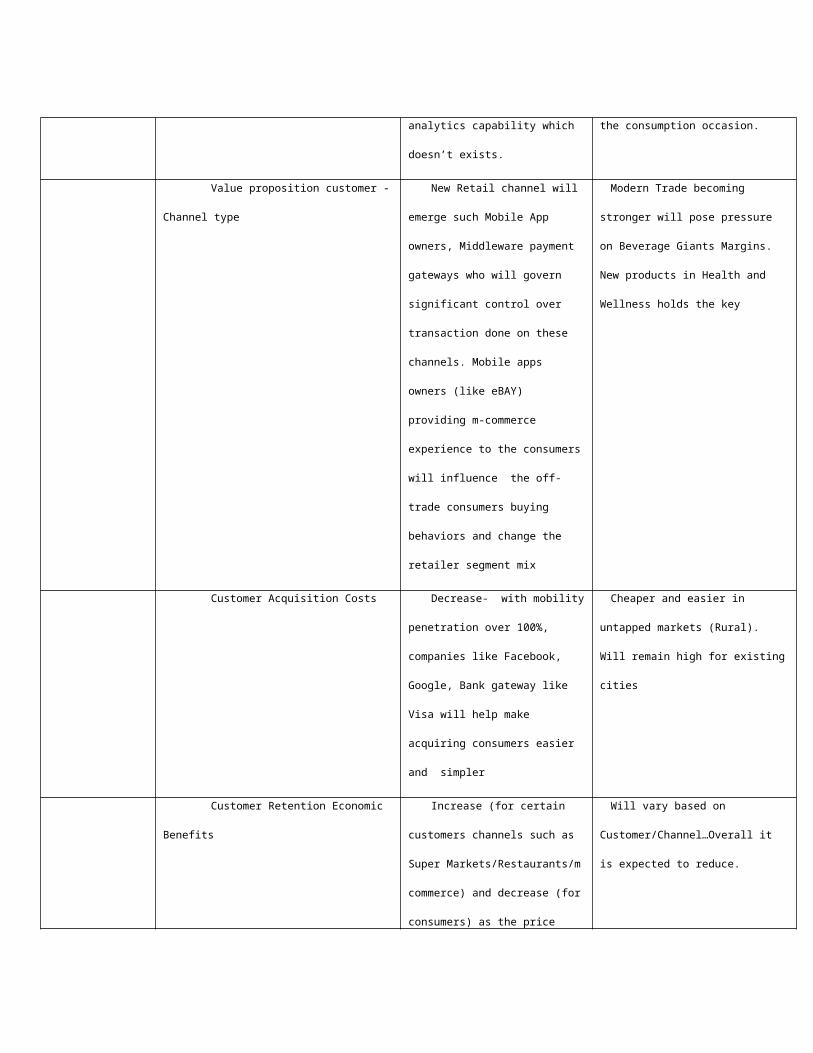
analytics capability which
doesn’t exists.
the consumption occasion.
Value proposition customer -
Channel type
New Retail channel will
emerge such Mobile App
owners, Middleware payment
gateways who will govern
significant control over
transaction done on these
channels. Mobile apps
owners (like eBAY)
providing m-commerce
experience to the consumers
will influence the off-
trade consumers buying
behaviors and change the
retailer segment mix
Modern Trade becoming
stronger will pose pressure
on Beverage Giants Margins.
New products in Health and
Wellness holds the key
Customer Acquisition Costs Decrease- with mobility
penetration over 100%,
companies like Facebook,
Google, Bank gateway like
Visa will help make
acquiring consumers easier
and simpler
Cheaper and easier in
untapped markets (Rural).
Will remain high for existing
cities
Customer Retention Economic
Benefits
Increase (for certain
customers channels such as
Super Markets/Restaurants/m
commerce) and decrease (for
consumers) as the price
Will vary based on
Customer/Channel…Overall it
is expected to reduce.
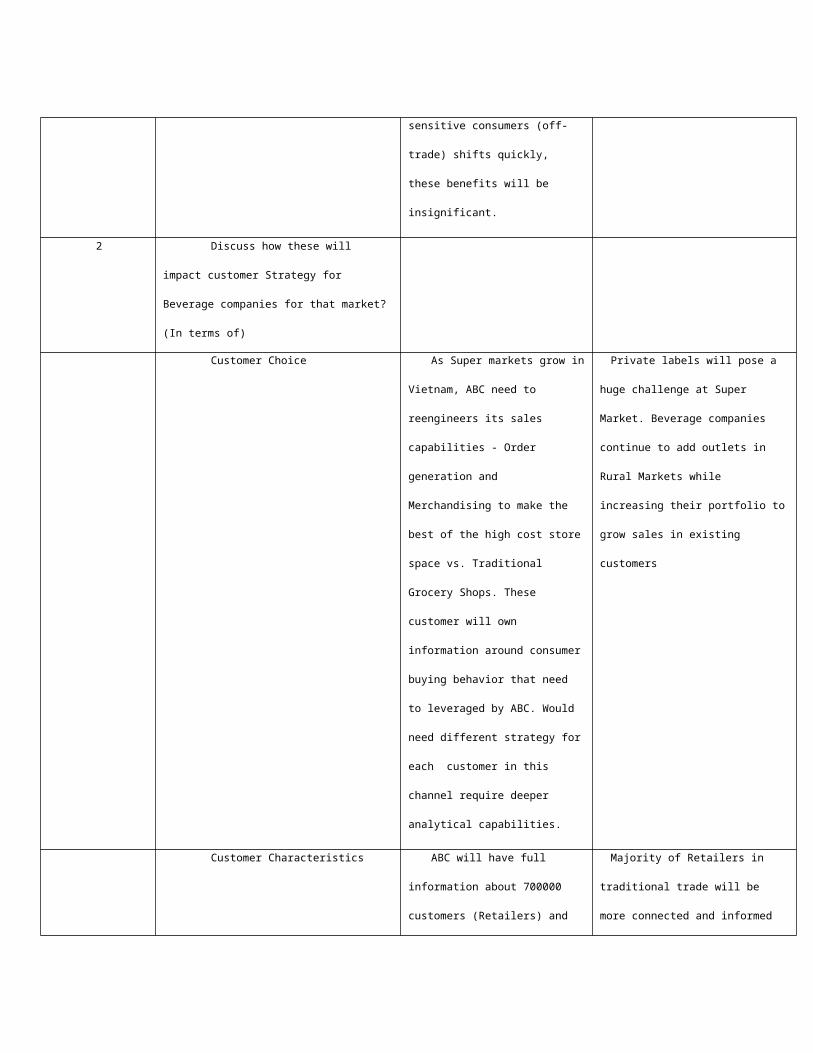
sensitive consumers (off-
trade) shifts quickly,
these benefits will be
insignificant.
2 Discuss how these will
impact customer Strategy for
Beverage companies for that market?
(In terms of)
Customer Choice As Super markets grow in
Vietnam, ABC need to
reengineers its sales
capabilities - Order
generation and
Merchandising to make the
best of the high cost store
space vs. Traditional
Grocery Shops. These
customer will own
information around consumer
buying behavior that need
to leveraged by ABC. Would
need different strategy for
each customer in this
channel require deeper
analytical capabilities.
Private labels will pose a
huge challenge at Super
Market. Beverage companies
continue to add outlets in
Rural Markets while
increasing their portfolio to
grow sales in existing
customers
Customer Characteristics ABC will have full
information about 700000
customers (Retailers) and
Majority of Retailers in
traditional trade will be
more connected and informed
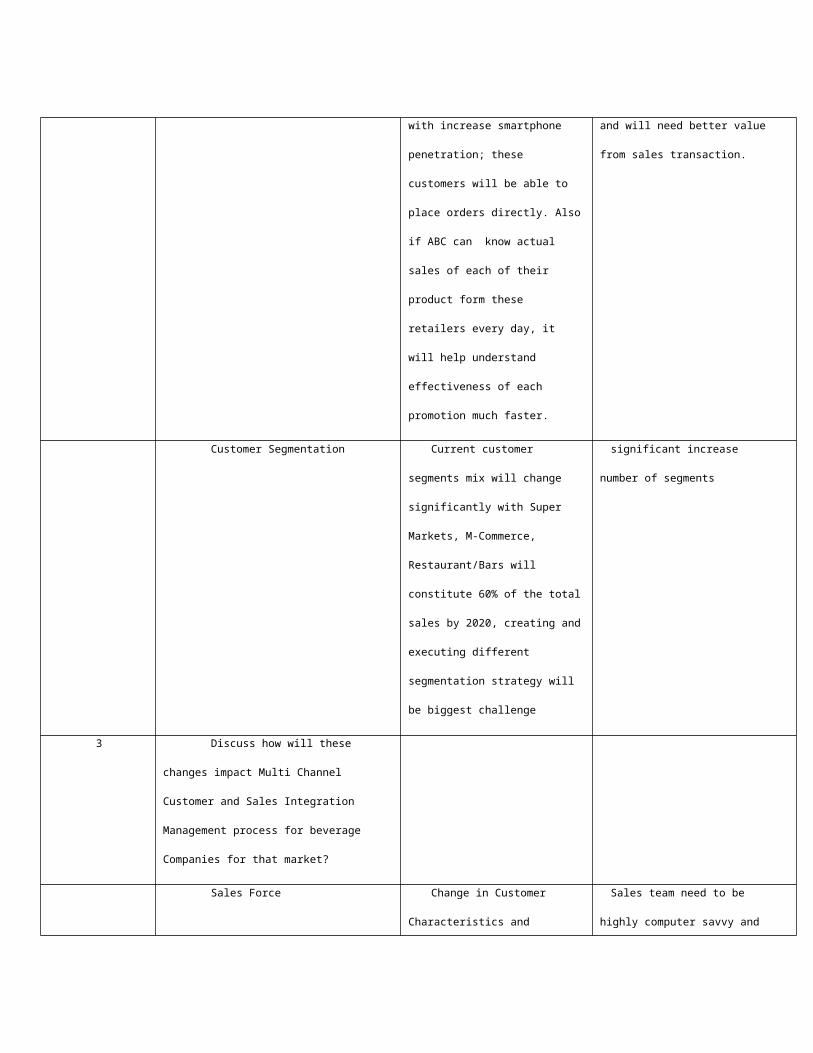
with increase smartphone
penetration; these
customers will be able to
place orders directly. Also
if ABC can know actual
sales of each of their
product form these
retailers every day, it
will help understand
effectiveness of each
promotion much faster.
and will need better value
from sales transaction.
Customer Segmentation Current customer
segments mix will change
significantly with Super
Markets, M-Commerce,
Restaurant/Bars will
constitute 60% of the total
sales by 2020, creating and
executing different
segmentation strategy will
be biggest challenge
significant increase
number of segments
3 Discuss how will these
changes impact Multi Channel
Customer and Sales Integration
Management process for beverage
Companies for that market?
Sales Force Change in Customer
Characteristics and
Sales team need to be
highly computer savvy and
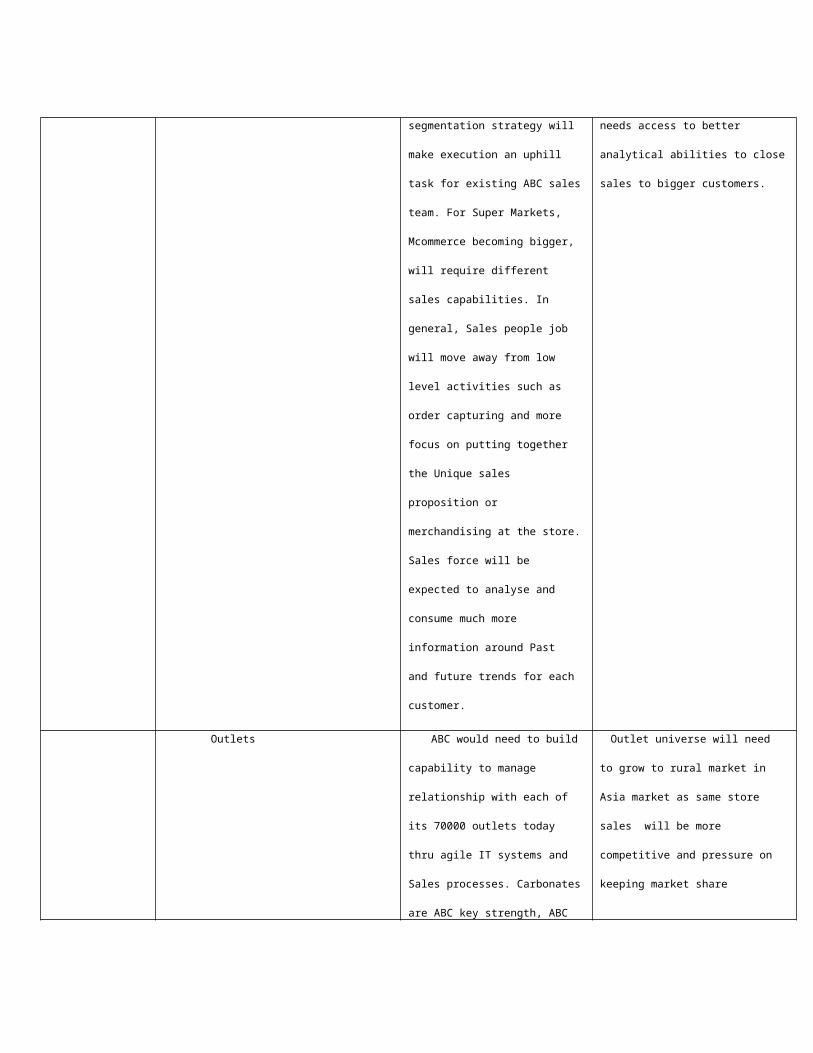
segmentation strategy will
make execution an uphill
task for existing ABC sales
team. For Super Markets,
Mcommerce becoming bigger,
will require different
sales capabilities. In
general, Sales people job
will move away from low
level activities such as
order capturing and more
focus on putting together
the Unique sales
proposition or
merchandising at the store.
Sales force will be
expected to analyse and
consume much more
information around Past
and future trends for each
customer.
needs access to better
analytical abilities to close
sales to bigger customers.
Outlets ABC would need to build
capability to manage
relationship with each of
its 70000 outlets today
thru agile IT systems and
Sales processes. Carbonates
are ABC key strength, ABC
Outlet universe will need
to grow to rural market in
Asia market as same store
sales will be more
competitive and pressure on
keeping market share
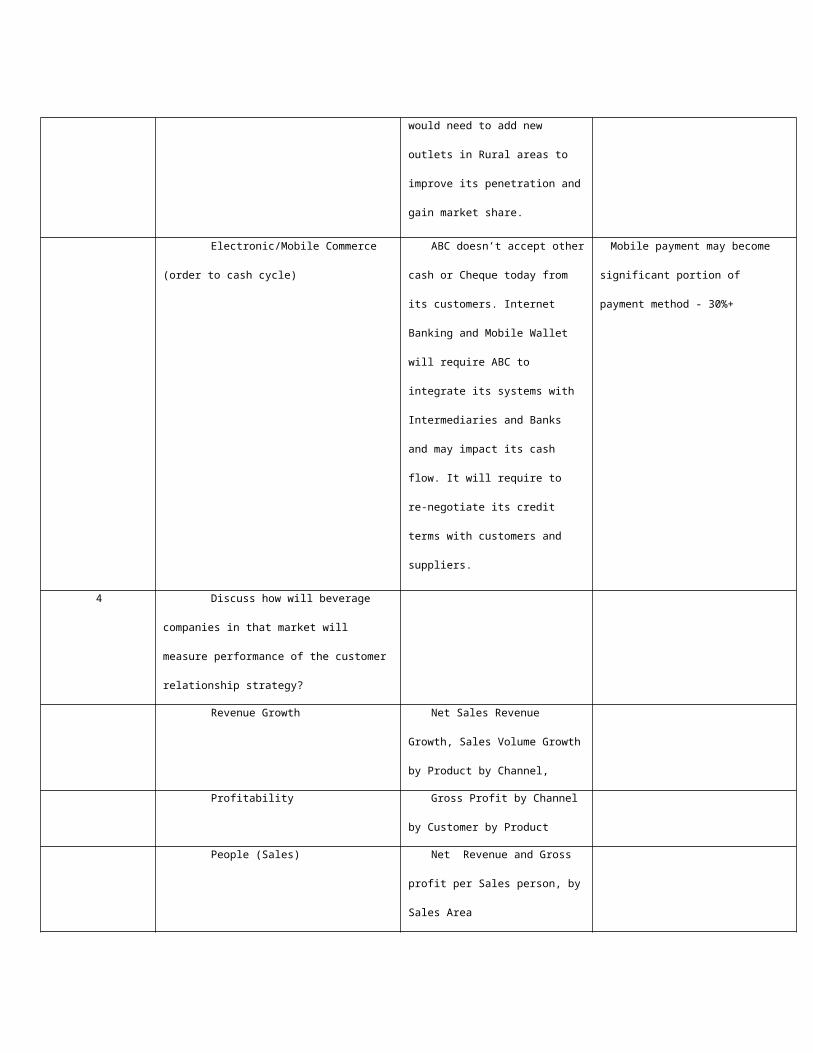
would need to add new
outlets in Rural areas to
improve its penetration and
gain market share.
Electronic/Mobile Commerce
(order to cash cycle)
ABC doesn’t accept other
cash or Cheque today from
its customers. Internet
Banking and Mobile Wallet
will require ABC to
integrate its systems with
Intermediaries and Banks
and may impact its cash
flow. It will require to
re-negotiate its credit
terms with customers and
suppliers.
Mobile payment may become
significant portion of
payment method - 30%+
4 Discuss how will beverage
companies in that market will
measure performance of the customer
relationship strategy?
Revenue Growth Net Sales Revenue
Growth, Sales Volume Growth
by Product by Channel,
Profitability Gross Profit by Channel
by Customer by Product
People (Sales) Net Revenue and Gross
profit per Sales person, by
Sales Area
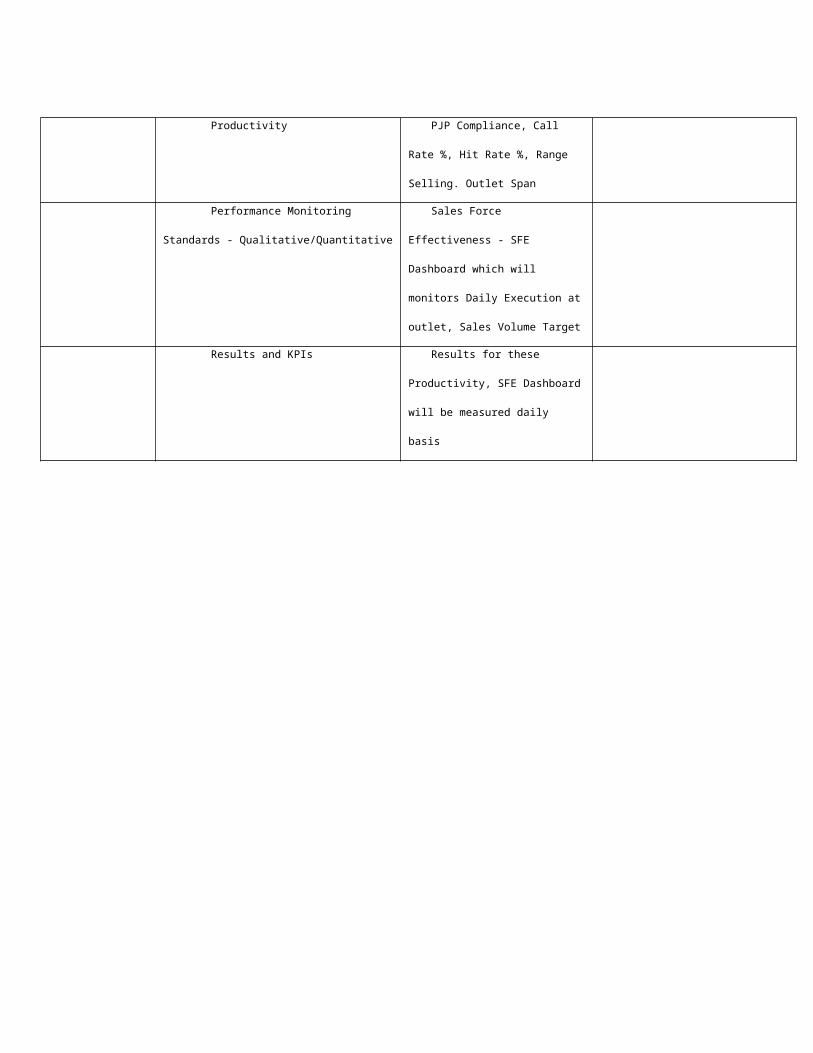
Productivity PJP Compliance, Call
Rate %, Hit Rate %, Range
Selling. Outlet Span
Performance Monitoring
Standards - Qualitative/Quantitative
Sales Force
Effectiveness - SFE
Dashboard which will
monitors Daily Execution at
outlet, Sales Volume Target
Results and KPIs Results for these
Productivity, SFE Dashboard
will be measured daily
basis