restaurant, food & beverage market research
TRANSCRIPT
Richard K. Miller & Associates ————— since 1972 —————
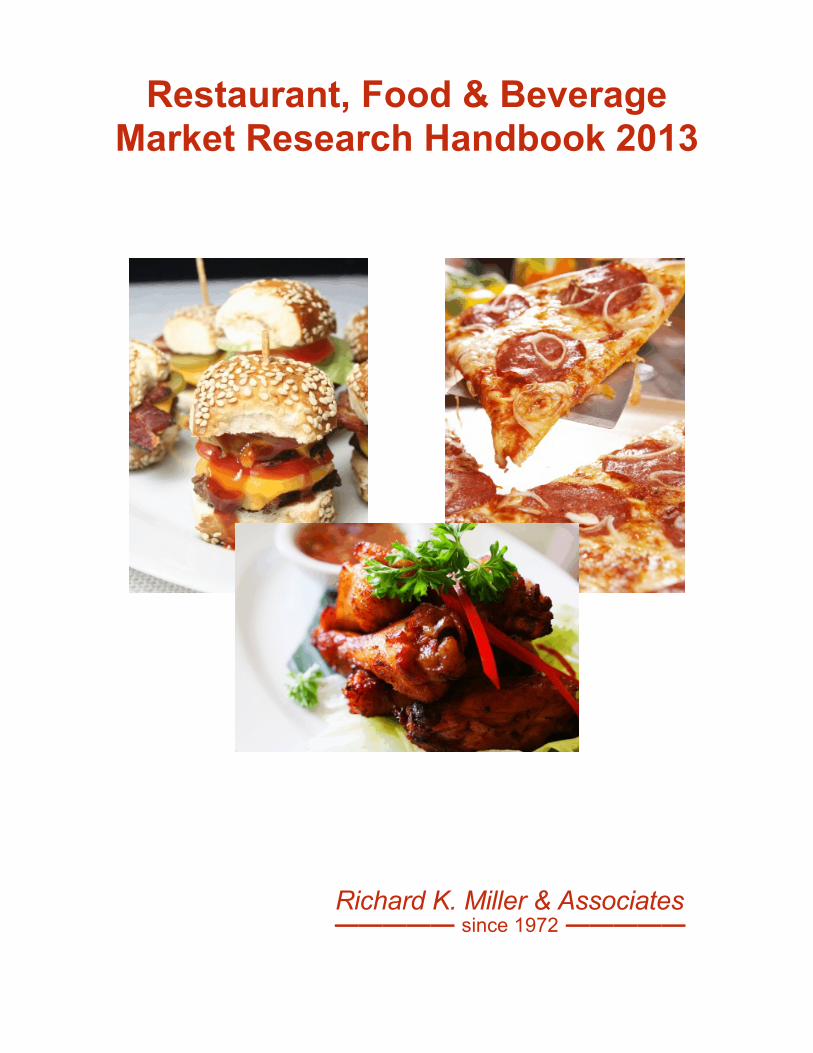
Restaurant, Food & BeverageMarket Research Handbook 2013
RESTAURANT, FOOD & BEVERAGE
MARKET RESEARCH HANDBOOK 2013
14th Edition
RKMA MARKET RESEARCH HANDBOOK SERIES
By: Richard K. Miller and Kelli Washington
Published by:
Richard K. Miller & Associates4132 Atlanta Highway, Suite 110Loganville, GA 30052(888) 928-7562www.rkma.com
Richard K. Miller & Associates————— since 1972 —————
RESTAURANT, FOOD & BEVERAGE
MARKET RESEARCH HANDBOOK 2013
14th Edition
RKMA MARKET RESEARCH HANDBOOK SERIES
Copyright © 2013 by Richard K. Miller & Associates
All rights reserved. Printed in the United States of America.
Use of the electronic edition of this publication is limited to internal use within the purchasing organization.
The electronic edition may be stored on computers, Intranets, servers, and networks by organizationswhich have purchased this publication, and those for which an employee has made such purchase. Copies, including multiple copies, may be printed from the electronic edition for use within the purchasingorganization.
Libraries may store the electronic edition on an archival database or proxy server for access by libraryusers.
Governmental agencies purchasing this publication may share the content within the agency ordepartment. Universities and colleges may share the information within their campus, but not with otheruniversities. Membership associations may use the information within their internal organization, but maynot distribute to their membership.
This publication may not be stored on Internet websites, nor may it be file-shared through the Internet.
This publication may not be resold or distributed without prior written agreement with the publisher.
While every attempt is made to provide accurate information, the author and publisher cannot be heldaccountable for any errors or omissions.
ISBN Number: 1-57783-188-89781577831884
Richard K. Miller & Associates4132 Atlanta Highway, Suite 110Loganville, GA 30052(888) 928-7562www.rkma.com

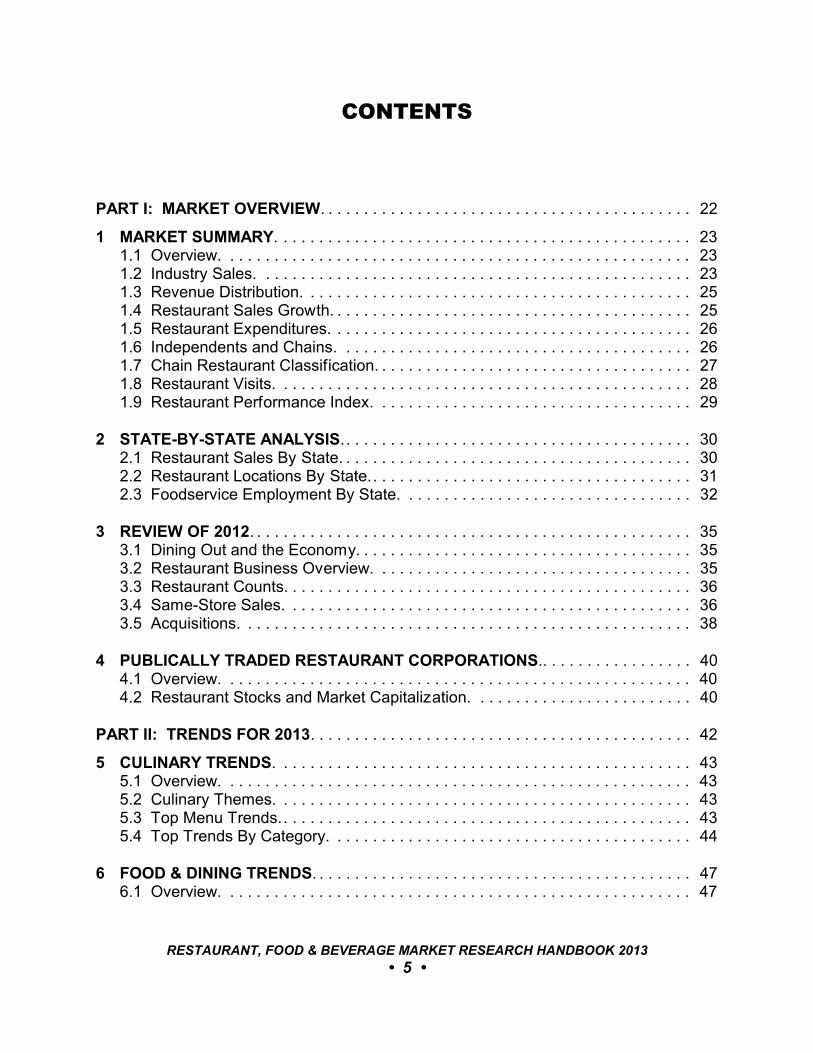
CONTENTS
PART I: MARKET OVERVIEW. . . . . . . . . . . . . . . . . . . . . . . . . . . . . . . . . . . . . . . . . . 22
1 MARKET SUMMARY. . . . . . . . . . . . . . . . . . . . . . . . . . . . . . . . . . . . . . . . . . . . . . . 231.1 Overview. . . . . . . . . . . . . . . . . . . . . . . . . . . . . . . . . . . . . . . . . . . . . . . . . . . . . 231.2 Industry Sales. . . . . . . . . . . . . . . . . . . . . . . . . . . . . . . . . . . . . . . . . . . . . . . . . 231.3 Revenue Distribution. . . . . . . . . . . . . . . . . . . . . . . . . . . . . . . . . . . . . . . . . . . . 251.4 Restaurant Sales Growth. . . . . . . . . . . . . . . . . . . . . . . . . . . . . . . . . . . . . . . . . 251.5 Restaurant Expenditures. . . . . . . . . . . . . . . . . . . . . . . . . . . . . . . . . . . . . . . . . 261.6 Independents and Chains. . . . . . . . . . . . . . . . . . . . . . . . . . . . . . . . . . . . . . . . 261.7 Chain Restaurant Classification. . . . . . . . . . . . . . . . . . . . . . . . . . . . . . . . . . . . 271.8 Restaurant Visits. . . . . . . . . . . . . . . . . . . . . . . . . . . . . . . . . . . . . . . . . . . . . . . 281.9 Restaurant Performance Index. . . . . . . . . . . . . . . . . . . . . . . . . . . . . . . . . . . . 29
2 STATE-BY-STATE ANALYSIS. . . . . . . . . . . . . . . . . . . . . . . . . . . . . . . . . . . . . . . . 302.1 Restaurant Sales By State. . . . . . . . . . . . . . . . . . . . . . . . . . . . . . . . . . . . . . . . 302.2 Restaurant Locations By State.. . . . . . . . . . . . . . . . . . . . . . . . . . . . . . . . . . . . 312.3 Foodservice Employment By State. . . . . . . . . . . . . . . . . . . . . . . . . . . . . . . . . 32
3 REVIEW OF 2012. . . . . . . . . . . . . . . . . . . . . . . . . . . . . . . . . . . . . . . . . . . . . . . . . . 353.1 Dining Out and the Economy. . . . . . . . . . . . . . . . . . . . . . . . . . . . . . . . . . . . . . 353.2 Restaurant Business Overview. . . . . . . . . . . . . . . . . . . . . . . . . . . . . . . . . . . . 353.3 Restaurant Counts. . . . . . . . . . . . . . . . . . . . . . . . . . . . . . . . . . . . . . . . . . . . . . 363.4 Same-Store Sales. . . . . . . . . . . . . . . . . . . . . . . . . . . . . . . . . . . . . . . . . . . . . . 363.5 Acquisitions. . . . . . . . . . . . . . . . . . . . . . . . . . . . . . . . . . . . . . . . . . . . . . . . . . . 38
4 PUBLICALLY TRADED RESTAURANT CORPORATIONS.. . . . . . . . . . . . . . . . . 404.1 Overview. . . . . . . . . . . . . . . . . . . . . . . . . . . . . . . . . . . . . . . . . . . . . . . . . . . . . 404.2 Restaurant Stocks and Market Capitalization. . . . . . . . . . . . . . . . . . . . . . . . . 40
PART II: TRENDS FOR 2013. . . . . . . . . . . . . . . . . . . . . . . . . . . . . . . . . . . . . . . . . . . 42
5 CULINARY TRENDS. . . . . . . . . . . . . . . . . . . . . . . . . . . . . . . . . . . . . . . . . . . . . . . 435.1 Overview. . . . . . . . . . . . . . . . . . . . . . . . . . . . . . . . . . . . . . . . . . . . . . . . . . . . . 435.2 Culinary Themes. . . . . . . . . . . . . . . . . . . . . . . . . . . . . . . . . . . . . . . . . . . . . . . 435.3 Top Menu Trends.. . . . . . . . . . . . . . . . . . . . . . . . . . . . . . . . . . . . . . . . . . . . . . 435.4 Top Trends By Category. . . . . . . . . . . . . . . . . . . . . . . . . . . . . . . . . . . . . . . . . 44
6 FOOD & DINING TRENDS. . . . . . . . . . . . . . . . . . . . . . . . . . . . . . . . . . . . . . . . . . . 476.1 Overview. . . . . . . . . . . . . . . . . . . . . . . . . . . . . . . . . . . . . . . . . . . . . . . . . . . . . 47
RESTAURANT, FOOD & BEVERAGE MARKET RESEARCH HANDBOOK 2013
• 5 •
6.2 Andrew Freeman & Co.. . . . . . . . . . . . . . . . . . . . . . . . . . . . . . . . . . . . . . . . . . 476.3 Baum + Whiteman. . . . . . . . . . . . . . . . . . . . . . . . . . . . . . . . . . . . . . . . . . . . . . 496.4 Bon Appétit.. . . . . . . . . . . . . . . . . . . . . . . . . . . . . . . . . . . . . . . . . . . . . . . . . . . 536.5 Culinary Visions. . . . . . . . . . . . . . . . . . . . . . . . . . . . . . . . . . . . . . . . . . . . . . . . 556.6 Epicurious. . . . . . . . . . . . . . . . . . . . . . . . . . . . . . . . . . . . . . . . . . . . . . . . . . . . 586.7 Flavor Forecast. . . . . . . . . . . . . . . . . . . . . . . . . . . . . . . . . . . . . . . . . . . . . . . . 596.8 Mintel. . . . . . . . . . . . . . . . . . . . . . . . . . . . . . . . . . . . . . . . . . . . . . . . . . . . . . . . 606.9 Sterling-Rice Group. . . . . . . . . . . . . . . . . . . . . . . . . . . . . . . . . . . . . . . . . . . . . 616.10 Supermarket Guru. . . . . . . . . . . . . . . . . . . . . . . . . . . . . . . . . . . . . . . . . . . . . 626.11 Technomic. . . . . . . . . . . . . . . . . . . . . . . . . . . . . . . . . . . . . . . . . . . . . . . . . . . 646.12 The Food Channel. . . . . . . . . . . . . . . . . . . . . . . . . . . . . . . . . . . . . . . . . . . . . 676.13 Market Resources. . . . . . . . . . . . . . . . . . . . . . . . . . . . . . . . . . . . . . . . . . . . . 69
PART III: CITY-BY-CITY ANALYSIS. . . . . . . . . . . . . . . . . . . . . . . . . . . . . . . . . . . . . 71
7 DINING OUT. . . . . . . . . . . . . . . . . . . . . . . . . . . . . . . . . . . . . . . . . . . . . . . . . . . . . . 727.1 Metropolitan Areas. . . . . . . . . . . . . . . . . . . . . . . . . . . . . . . . . . . . . . . . . . . . . . 727.2 Market Resources. . . . . . . . . . . . . . . . . . . . . . . . . . . . . . . . . . . . . . . . . . . . . . 72
8 QUICK-SERVICE RESTAURANT VISITS. . . . . . . . . . . . . . . . . . . . . . . . . . . . . . . 738.1 Metropolitan Areas. . . . . . . . . . . . . . . . . . . . . . . . . . . . . . . . . . . . . . . . . . . . . . 738.2 Market Resources. . . . . . . . . . . . . . . . . . . . . . . . . . . . . . . . . . . . . . . . . . . . . . 73
9 LARGEST CHAINS IN METROPOLITAN AREAS. . . . . . . . . . . . . . . . . . . . . . . . . 749.1 Largest Chains and Unit Counts. . . . . . . . . . . . . . . . . . . . . . . . . . . . . . . . . . . 748.2 Market Resources. . . . . . . . . . . . . . . . . . . . . . . . . . . . . . . . . . . . . . . . . . . . . . 88
10 RESTAURANT SALES. . . . . . . . . . . . . . . . . . . . . . . . . . . . . . . . . . . . . . . . . . . . 8910.1 Overview. . . . . . . . . . . . . . . . . . . . . . . . . . . . . . . . . . . . . . . . . . . . . . . . . . . 8910.2 Restaurant Sales, Unit Counts, and Sales Per Unit. . . . . . . . . . . . . . . . . . 89
11 CONSUMER SPENDING AT RESTAURANTS. . . . . . . . . . . . . . . . . . . . . . . . . 11111.1 Overview. . . . . . . . . . . . . . . . . . . . . . . . . . . . . . . . . . . . . . . . . . . . . . . . . . 11111.2 Per Capita Spending. . . . . . . . . . . . . . . . . . . . . . . . . . . . . . . . . . . . . . . . . 111
12 MARKET GROWTH POTENTIAL. . . . . . . . . . . . . . . . . . . . . . . . . . . . . . . . . . . 13312.1 Overview. . . . . . . . . . . . . . . . . . . . . . . . . . . . . . . . . . . . . . . . . . . . . . . . . . 13312.2 Growth Potential for MSAs. . . . . . . . . . . . . . . . . . . . . . . . . . . . . . . . . . . . 13312.3 Market Resources. . . . . . . . . . . . . . . . . . . . . . . . . . . . . . . . . . . . . . . . . . . 155
13 TOP MARKETS FOR QSR GROWTH. . . . . . . . . . . . . . . . . . . . . . . . . . . . . . . . 15613.1 Top 40 Markets For Quick-Service Restaurant Expansion. . . . . . . . . . . . 156
RESTAURANT, FOOD & BEVERAGE MARKET RESEARCH HANDBOOK 2013
• 6 •
PART IV: MARKET SEGMENTS. . . . . . . . . . . . . . . . . . . . . . . . . . . . . . . . . . . . . . . 158
14 CASUAL-DINING RESTAURANTS. . . . . . . . . . . . . . . . . . . . . . . . . . . . . . . . . . 15914.1 Profile. . . . . . . . . . . . . . . . . . . . . . . . . . . . . . . . . . . . . . . . . . . . . . . . . . . . 15914.2 Overview. . . . . . . . . . . . . . . . . . . . . . . . . . . . . . . . . . . . . . . . . . . . . . . . . . 159
15 CATERING & BANQUETS. . . . . . . . . . . . . . . . . . . . . . . . . . . . . . . . . . . . . . . . 16115.1 Profile. . . . . . . . . . . . . . . . . . . . . . . . . . . . . . . . . . . . . . . . . . . . . . . . . . . . 16115.2 Overview. . . . . . . . . . . . . . . . . . . . . . . . . . . . . . . . . . . . . . . . . . . . . . . . . . 16115.3 Market Resources. . . . . . . . . . . . . . . . . . . . . . . . . . . . . . . . . . . . . . . . . . . 162
16 COFFEESHOPS. . . . . . . . . . . . . . . . . . . . . . . . . . . . . . . . . . . . . . . . . . . . . . . . 16316.1 Profile. . . . . . . . . . . . . . . . . . . . . . . . . . . . . . . . . . . . . . . . . . . . . . . . . . . . 16316.2 Overview. . . . . . . . . . . . . . . . . . . . . . . . . . . . . . . . . . . . . . . . . . . . . . . . . . 163
17 CONTRACT-MANAGED FOODSERVICE. . . . . . . . . . . . . . . . . . . . . . . . . . . . . 16517.1 Profile. . . . . . . . . . . . . . . . . . . . . . . . . . . . . . . . . . . . . . . . . . . . . . . . . . . . 16517.2 Overview. . . . . . . . . . . . . . . . . . . . . . . . . . . . . . . . . . . . . . . . . . . . . . . . . . 166
18 CONVENIENCE STORE FOODSERVICE. . . . . . . . . . . . . . . . . . . . . . . . . . . . . 16718.1 Profile. . . . . . . . . . . . . . . . . . . . . . . . . . . . . . . . . . . . . . . . . . . . . . . . . . . . 16718.2 Overview. . . . . . . . . . . . . . . . . . . . . . . . . . . . . . . . . . . . . . . . . . . . . . . . . . 167
19 FAMILY-DINING RESTAURANTS. . . . . . . . . . . . . . . . . . . . . . . . . . . . . . . . . . . 16919.1 Profile. . . . . . . . . . . . . . . . . . . . . . . . . . . . . . . . . . . . . . . . . . . . . . . . . . . . 16919.2 Overview. . . . . . . . . . . . . . . . . . . . . . . . . . . . . . . . . . . . . . . . . . . . . . . . . . 169
20 FAST-CASUAL RESTAURANTS.. . . . . . . . . . . . . . . . . . . . . . . . . . . . . . . . . . . 17120.1 Profile. . . . . . . . . . . . . . . . . . . . . . . . . . . . . . . . . . . . . . . . . . . . . . . . . . . . 17120.2 Overview. . . . . . . . . . . . . . . . . . . . . . . . . . . . . . . . . . . . . . . . . . . . . . . . . . 17120.3 Comparison of Quick-Service and Fast-Casual.. . . . . . . . . . . . . . . . . . . . 173
21 FINE-DINING. . . . . . . . . . . . . . . . . . . . . . . . . . . . . . . . . . . . . . . . . . . . . . . . . . . 17521.1 Profile. . . . . . . . . . . . . . . . . . . . . . . . . . . . . . . . . . . . . . . . . . . . . . . . . . . . 17521.2 Overview. . . . . . . . . . . . . . . . . . . . . . . . . . . . . . . . . . . . . . . . . . . . . . . . . . 175
22 FOOD CONCESSIONS AT AIRPORTS.. . . . . . . . . . . . . . . . . . . . . . . . . . . . . . 17822.1 Profile. . . . . . . . . . . . . . . . . . . . . . . . . . . . . . . . . . . . . . . . . . . . . . . . . . . . 17822.2 Overview. . . . . . . . . . . . . . . . . . . . . . . . . . . . . . . . . . . . . . . . . . . . . . . . . . 17822.3 Market Resources. . . . . . . . . . . . . . . . . . . . . . . . . . . . . . . . . . . . . . . . . . . 181
23 FOOD CONCESSIONS AT SPORTS VENUES.. . . . . . . . . . . . . . . . . . . . . . . . 18223.1 Market Assessment. . . . . . . . . . . . . . . . . . . . . . . . . . . . . . . . . . . . . . . . . . 18223.2 Overview. . . . . . . . . . . . . . . . . . . . . . . . . . . . . . . . . . . . . . . . . . . . . . . . . . 182
RESTAURANT, FOOD & BEVERAGE MARKET RESEARCH HANDBOOK 2013
• 7 •
24 FOOD TRUCKS. . . . . . . . . . . . . . . . . . . . . . . . . . . . . . . . . . . . . . . . . . . . . . . . . 18424.1 Profile. . . . . . . . . . . . . . . . . . . . . . . . . . . . . . . . . . . . . . . . . . . . . . . . . . . . 18424.2 Overview. . . . . . . . . . . . . . . . . . . . . . . . . . . . . . . . . . . . . . . . . . . . . . . . . . 184
25 MALL-BASED RESTAURANTS & FOOD COURTS. . . . . . . . . . . . . . . . . . . . . 18725.1 Profile. . . . . . . . . . . . . . . . . . . . . . . . . . . . . . . . . . . . . . . . . . . . . . . . . . . . 18725.2 Overview. . . . . . . . . . . . . . . . . . . . . . . . . . . . . . . . . . . . . . . . . . . . . . . . . . 18725.3 Market Resources. . . . . . . . . . . . . . . . . . . . . . . . . . . . . . . . . . . . . . . . . . . 188
26 PIZZA. . . . . . . . . . . . . . . . . . . . . . . . . . . . . . . . . . . . . . . . . . . . . . . . . . . . . . . . . 18926.1 Profile. . . . . . . . . . . . . . . . . . . . . . . . . . . . . . . . . . . . . . . . . . . . . . . . . . . . 18926.2 Trends. . . . . . . . . . . . . . . . . . . . . . . . . . . . . . . . . . . . . . . . . . . . . . . . . . . . 189
27 QUICK-SERVICE RESTAURANTS. . . . . . . . . . . . . . . . . . . . . . . . . . . . . . . . . . 19127.1 Profile. . . . . . . . . . . . . . . . . . . . . . . . . . . . . . . . . . . . . . . . . . . . . . . . . . . . 19127.2 Overview. . . . . . . . . . . . . . . . . . . . . . . . . . . . . . . . . . . . . . . . . . . . . . . . . . 19127.3 The QSR Customer. . . . . . . . . . . . . . . . . . . . . . . . . . . . . . . . . . . . . . . . . . 193
28 SNACKS.. . . . . . . . . . . . . . . . . . . . . . . . . . . . . . . . . . . . . . . . . . . . . . . . . . . . . . 19528.1 Profile. . . . . . . . . . . . . . . . . . . . . . . . . . . . . . . . . . . . . . . . . . . . . . . . . . . . 19528.2 Overview. . . . . . . . . . . . . . . . . . . . . . . . . . . . . . . . . . . . . . . . . . . . . . . . . . 19528.3 Trends. . . . . . . . . . . . . . . . . . . . . . . . . . . . . . . . . . . . . . . . . . . . . . . . . . . . 196
29 SUPERMARKET FOODSERVICE. . . . . . . . . . . . . . . . . . . . . . . . . . . . . . . . . . . 19829.1 Profile. . . . . . . . . . . . . . . . . . . . . . . . . . . . . . . . . . . . . . . . . . . . . . . . . . . . 19829.2 Overview. . . . . . . . . . . . . . . . . . . . . . . . . . . . . . . . . . . . . . . . . . . . . . . . . . 19829.3 Trends. . . . . . . . . . . . . . . . . . . . . . . . . . . . . . . . . . . . . . . . . . . . . . . . . . . . 199
PART V: MARKET LEADERS. . . . . . . . . . . . . . . . . . . . . . . . . . . . . . . . . . . . . . . . . 201
30 LARGEST BAKERY CAFE CHAINS. . . . . . . . . . . . . . . . . . . . . . . . . . . . . . . . . 20230.1 Largest Chains. . . . . . . . . . . . . . . . . . . . . . . . . . . . . . . . . . . . . . . . . . . . . 20230.2 Market Resources. . . . . . . . . . . . . . . . . . . . . . . . . . . . . . . . . . . . . . . . . . . 202
31 LARGEST BURGER CHAINS. . . . . . . . . . . . . . . . . . . . . . . . . . . . . . . . . . . . . . 20331.1 Largest Chains. . . . . . . . . . . . . . . . . . . . . . . . . . . . . . . . . . . . . . . . . . . . . 20331.2 Market Resources. . . . . . . . . . . . . . . . . . . . . . . . . . . . . . . . . . . . . . . . . . . 205
32 LARGEST FAMILY-DINING CHAINS. . . . . . . . . . . . . . . . . . . . . . . . . . . . . . . . 20632.1 Largest Chains. . . . . . . . . . . . . . . . . . . . . . . . . . . . . . . . . . . . . . . . . . . . . 20632.2 Market Resources. . . . . . . . . . . . . . . . . . . . . . . . . . . . . . . . . . . . . . . . . . . 206
RESTAURANT, FOOD & BEVERAGE MARKET RESEARCH HANDBOOK 2013
• 8 •
33 LARGEST FAST-CASUAL RESTAURANT CHAINS.. . . . . . . . . . . . . . . . . . . . 20733.1 Largest Chains. . . . . . . . . . . . . . . . . . . . . . . . . . . . . . . . . . . . . . . . . . . . . 20733.2 Market Resources. . . . . . . . . . . . . . . . . . . . . . . . . . . . . . . . . . . . . . . . . . . 209
34 LARGEST MEXICAN RESTAURANT CHAINS. . . . . . . . . . . . . . . . . . . . . . . . . 21034.1 Largest Chains. . . . . . . . . . . . . . . . . . . . . . . . . . . . . . . . . . . . . . . . . . . . . 21034.2 Market Resources. . . . . . . . . . . . . . . . . . . . . . . . . . . . . . . . . . . . . . . . . . . 211
35 LARGEST PIZZA CHAINS.. . . . . . . . . . . . . . . . . . . . . . . . . . . . . . . . . . . . . . . . 21235.1 Largest Chains. . . . . . . . . . . . . . . . . . . . . . . . . . . . . . . . . . . . . . . . . . . . . 21235.2 Market Resources. . . . . . . . . . . . . . . . . . . . . . . . . . . . . . . . . . . . . . . . . . . 214
36 LARGEST QUICK-SERVICE RESTAURANT CHAINS. . . . . . . . . . . . . . . . . . . 21536.1 Top Chains. . . . . . . . . . . . . . . . . . . . . . . . . . . . . . . . . . . . . . . . . . . . . . . . 21536.2 Largest QSR Chains By Category. . . . . . . . . . . . . . . . . . . . . . . . . . . . . . . 216
37 LARGEST SANDWICH CHAINS. . . . . . . . . . . . . . . . . . . . . . . . . . . . . . . . . . . . 21937.1 Largest Chains. . . . . . . . . . . . . . . . . . . . . . . . . . . . . . . . . . . . . . . . . . . . . 21937.2 Market Resources. . . . . . . . . . . . . . . . . . . . . . . . . . . . . . . . . . . . . . . . . . . 221
38 TOP 200 CHAINS.. . . . . . . . . . . . . . . . . . . . . . . . . . . . . . . . . . . . . . . . . . . . . . . 22238.1 Overview. . . . . . . . . . . . . . . . . . . . . . . . . . . . . . . . . . . . . . . . . . . . . . . . . . 22238.2 Largest Chains. . . . . . . . . . . . . . . . . . . . . . . . . . . . . . . . . . . . . . . . . . . . . 222
39 TOP CHAINS BY SEGMENT. . . . . . . . . . . . . . . . . . . . . . . . . . . . . . . . . . . . . . . 22739.1 Overview. . . . . . . . . . . . . . . . . . . . . . . . . . . . . . . . . . . . . . . . . . . . . . . . . . 22738.2 Segment Assessment. . . . . . . . . . . . . . . . . . . . . . . . . . . . . . . . . . . . . . . . 227
40 TOP FOODSERVICE DISTRIBUTORS. . . . . . . . . . . . . . . . . . . . . . . . . . . . . . . 23240.1 Ranking By Annual Sales. . . . . . . . . . . . . . . . . . . . . . . . . . . . . . . . . . . . . 23240.2 Market Resources. . . . . . . . . . . . . . . . . . . . . . . . . . . . . . . . . . . . . . . . . . . 232
41 TOP FRANCHISED BRANDS. . . . . . . . . . . . . . . . . . . . . . . . . . . . . . . . . . . . . . 23341.1 Number of Franchised Units. . . . . . . . . . . . . . . . . . . . . . . . . . . . . . . . . . . 23341.2 Market Resources. . . . . . . . . . . . . . . . . . . . . . . . . . . . . . . . . . . . . . . . . . . 233
42 TOP RESTAURANT FRANCHISEES. . . . . . . . . . . . . . . . . . . . . . . . . . . . . . . . 23442.1 Market Leaders. . . . . . . . . . . . . . . . . . . . . . . . . . . . . . . . . . . . . . . . . . . . . 23442.2 Top 100 Restaurant Franchise Companies. . . . . . . . . . . . . . . . . . . . . . . . 23442.3 Market Resources. . . . . . . . . . . . . . . . . . . . . . . . . . . . . . . . . . . . . . . . . . . 236
RESTAURANT, FOOD & BEVERAGE MARKET RESEARCH HANDBOOK 2013
• 9 •
43 TOP GROWTH CHAINS. . . . . . . . . . . . . . . . . . . . . . . . . . . . . . . . . . . . . . . . . . 23743.1 Systemwide Sales Growth.. . . . . . . . . . . . . . . . . . . . . . . . . . . . . . . . . . . . 23743.2 Market Resources. . . . . . . . . . . . . . . . . . . . . . . . . . . . . . . . . . . . . . . . . . . 241
44 TOP INDEPENDENT RESTAURANTS. . . . . . . . . . . . . . . . . . . . . . . . . . . . . . . 24244.1 Rank By Annual Gross Revenue. . . . . . . . . . . . . . . . . . . . . . . . . . . . . . . . 242
45 TOP MULTI-CHAIN OPERATORS. . . . . . . . . . . . . . . . . . . . . . . . . . . . . . . . . . 24345.1 Largest Multi-Brand Restaurant Companies. . . . . . . . . . . . . . . . . . . . . . . 243
46 TOP MULTI-CONCEPT OPERATORS. . . . . . . . . . . . . . . . . . . . . . . . . . . . . . . 24546.1 Largest Companies. . . . . . . . . . . . . . . . . . . . . . . . . . . . . . . . . . . . . . . . . . 24546.2 Largest Multi-Concept Operators.. . . . . . . . . . . . . . . . . . . . . . . . . . . . . . . 24546.3 Profiles.. . . . . . . . . . . . . . . . . . . . . . . . . . . . . . . . . . . . . . . . . . . . . . . . . . . 245
47 TOP NIGHTCLUBS & BARS. . . . . . . . . . . . . . . . . . . . . . . . . . . . . . . . . . . . . . . 25447.1 Top Clubs. . . . . . . . . . . . . . . . . . . . . . . . . . . . . . . . . . . . . . . . . . . . . . . . . 254
PART VI: THE CUSTOMER. . . . . . . . . . . . . . . . . . . . . . . . . . . . . . . . . . . . . . . . . . . 257
48 CUSTOMER DEMOGRAPHICS.. . . . . . . . . . . . . . . . . . . . . . . . . . . . . . . . . . . . 25848.1 Overview. . . . . . . . . . . . . . . . . . . . . . . . . . . . . . . . . . . . . . . . . . . . . . . . . . 25848.2 Breakfast at Full-Service Restaurants. . . . . . . . . . . . . . . . . . . . . . . . . . . . 25848.3 Breakfast at Quick-Service Restaurants. . . . . . . . . . . . . . . . . . . . . . . . . . 26048.4 Lunch at Full-Service Restaurants.. . . . . . . . . . . . . . . . . . . . . . . . . . . . . . 26248.5 Lunch at Quick-Service Restaurants. . . . . . . . . . . . . . . . . . . . . . . . . . . . . 26348.6 Dinner at Full-Service Restaurants. . . . . . . . . . . . . . . . . . . . . . . . . . . . . . 26548.7 Dinner at Quick-Service Restaurants. . . . . . . . . . . . . . . . . . . . . . . . . . . . 26748.8 Dining While Traveling.. . . . . . . . . . . . . . . . . . . . . . . . . . . . . . . . . . . . . . . 26848.9 Snacks at Quick-Service Restaurants. . . . . . . . . . . . . . . . . . . . . . . . . . . . 27048.10 Spending by Age. . . . . . . . . . . . . . . . . . . . . . . . . . . . . . . . . . . . . . . . . . . 27248.11 Spending by Household Income. . . . . . . . . . . . . . . . . . . . . . . . . . . . . . . 27248.12 Spending by Household Type. . . . . . . . . . . . . . . . . . . . . . . . . . . . . . . . . 27248.13 Spending by Race and Ethnicity. . . . . . . . . . . . . . . . . . . . . . . . . . . . . . . 27248.14 Spending by Region. . . . . . . . . . . . . . . . . . . . . . . . . . . . . . . . . . . . . . . . 27248.15 Spending by Education. . . . . . . . . . . . . . . . . . . . . . . . . . . . . . . . . . . . . . 27348.16 Market Resources. . . . . . . . . . . . . . . . . . . . . . . . . . . . . . . . . . . . . . . . . . 273
49 CUSTOMER PROFILE.. . . . . . . . . . . . . . . . . . . . . . . . . . . . . . . . . . . . . . . . . . . 27449.1 Restaurant Visits By Age. . . . . . . . . . . . . . . . . . . . . . . . . . . . . . . . . . . . . . 27449.2 The Full-Service Dining Customer.. . . . . . . . . . . . . . . . . . . . . . . . . . . . . . 27549.3 The Quick-Service Dining Customer. . . . . . . . . . . . . . . . . . . . . . . . . . . . . 27549.4 Regular Customers. . . . . . . . . . . . . . . . . . . . . . . . . . . . . . . . . . . . . . . . . . 276
RESTAURANT, FOOD & BEVERAGE MARKET RESEARCH HANDBOOK 2013
• 10 •

49.5 Families Dining Out. . . . . . . . . . . . . . . . . . . . . . . . . . . . . . . . . . . . . . . . . . 27749.6 Value-Focused Customers. . . . . . . . . . . . . . . . . . . . . . . . . . . . . . . . . . . . 27749.7 What Customers Want. . . . . . . . . . . . . . . . . . . . . . . . . . . . . . . . . . . . . . . 278
50 CUSTOMER SATISFACTION. . . . . . . . . . . . . . . . . . . . . . . . . . . . . . . . . . . . . . 28050.1 Overview. . . . . . . . . . . . . . . . . . . . . . . . . . . . . . . . . . . . . . . . . . . . . . . . . . 28050.2 Factors Contributing To High Customer Satisfaction.. . . . . . . . . . . . . . . . 28050.3 Market Resources. . . . . . . . . . . . . . . . . . . . . . . . . . . . . . . . . . . . . . . . . . . 291
51 HISPANIC-AMERICAN CUSTOMERS.. . . . . . . . . . . . . . . . . . . . . . . . . . . . . . . 29251.1 Overview. . . . . . . . . . . . . . . . . . . . . . . . . . . . . . . . . . . . . . . . . . . . . . . . . . 29251.2 Market Assessment. . . . . . . . . . . . . . . . . . . . . . . . . . . . . . . . . . . . . . . . . . 29251.3 Hispanic Restaurant Patronage.. . . . . . . . . . . . . . . . . . . . . . . . . . . . . . . . 29351.4 Hispanic Menu Preferences. . . . . . . . . . . . . . . . . . . . . . . . . . . . . . . . . . . 294
52 MILLENNIAL CUSTOMERS. . . . . . . . . . . . . . . . . . . . . . . . . . . . . . . . . . . . . . . 29652.1 Overview. . . . . . . . . . . . . . . . . . . . . . . . . . . . . . . . . . . . . . . . . . . . . . . . . . 29652.2 Restaurant Visits By Millennials.. . . . . . . . . . . . . . . . . . . . . . . . . . . . . . . . 29652.3 Dining Priorities. . . . . . . . . . . . . . . . . . . . . . . . . . . . . . . . . . . . . . . . . . . . . 29752.4 Restaurant Interactions Online and Mobile. . . . . . . . . . . . . . . . . . . . . . . . 298
53 RESTAURANT & MENU PREFERENCES. . . . . . . . . . . . . . . . . . . . . . . . . . . . 30053.1 Why Consumers Dine Out.. . . . . . . . . . . . . . . . . . . . . . . . . . . . . . . . . . . . 30053.2 Factors In Choosing A Restaurant.. . . . . . . . . . . . . . . . . . . . . . . . . . . . . . 30153.3 Factors In Choosing A Menu Item. . . . . . . . . . . . . . . . . . . . . . . . . . . . . . . 302
54 SOCIAL NETWORKING. . . . . . . . . . . . . . . . . . . . . . . . . . . . . . . . . . . . . . . . . . 30454.1 Overview. . . . . . . . . . . . . . . . . . . . . . . . . . . . . . . . . . . . . . . . . . . . . . . . . . 30454.2 Restaurant Social Media Index. . . . . . . . . . . . . . . . . . . . . . . . . . . . . . . . . 30454.3 Facebook.. . . . . . . . . . . . . . . . . . . . . . . . . . . . . . . . . . . . . . . . . . . . . . . . . 30754.4 Twitter. . . . . . . . . . . . . . . . . . . . . . . . . . . . . . . . . . . . . . . . . . . . . . . . . . . . 30954.5 Market Resources. . . . . . . . . . . . . . . . . . . . . . . . . . . . . . . . . . . . . . . . . . . 310
PART VII: DINING TRENDS & ANALYSES. . . . . . . . . . . . . . . . . . . . . . . . . . . . . . . 311
55 BURGERS & SANDWICHES.. . . . . . . . . . . . . . . . . . . . . . . . . . . . . . . . . . . . . . 31255.1 Overview. . . . . . . . . . . . . . . . . . . . . . . . . . . . . . . . . . . . . . . . . . . . . . . . . . 31255.2 Hamburgers.. . . . . . . . . . . . . . . . . . . . . . . . . . . . . . . . . . . . . . . . . . . . . . . 31255.3 Hot Dogs & Sausages. . . . . . . . . . . . . . . . . . . . . . . . . . . . . . . . . . . . . . . . 31355.4 Other Sandwiches. . . . . . . . . . . . . . . . . . . . . . . . . . . . . . . . . . . . . . . . . . . 31455.5 Market Resources. . . . . . . . . . . . . . . . . . . . . . . . . . . . . . . . . . . . . . . . . . . 315
RESTAURANT, FOOD & BEVERAGE MARKET RESEARCH HANDBOOK 2013
• 11 •
56 CELEBRITY CHEFS. . . . . . . . . . . . . . . . . . . . . . . . . . . . . . . . . . . . . . . . . . . . . 31656.1 Cooking Shows On Television.. . . . . . . . . . . . . . . . . . . . . . . . . . . . . . . . . 31656.2 Top-Earning Chefs. . . . . . . . . . . . . . . . . . . . . . . . . . . . . . . . . . . . . . . . . . 31656.3 Chef Business Ventures. . . . . . . . . . . . . . . . . . . . . . . . . . . . . . . . . . . . . . 31756.4 Chef-Inspired Restaurant Concepts. . . . . . . . . . . . . . . . . . . . . . . . . . . . . 319
57 CHILDREN’S MEALS. . . . . . . . . . . . . . . . . . . . . . . . . . . . . . . . . . . . . . . . . . . . 32157.1 The Kids LiveWell Initiative. . . . . . . . . . . . . . . . . . . . . . . . . . . . . . . . . . . . 32157.2 Healthful Kids’ Menus At QSRs. . . . . . . . . . . . . . . . . . . . . . . . . . . . . . . . . 32157.3 School Meals. . . . . . . . . . . . . . . . . . . . . . . . . . . . . . . . . . . . . . . . . . . . . . . 32257.4 Market Resources. . . . . . . . . . . . . . . . . . . . . . . . . . . . . . . . . . . . . . . . . . . 323
58 CUISINE. . . . . . . . . . . . . . . . . . . . . . . . . . . . . . . . . . . . . . . . . . . . . . . . . . . . . . . 32458.1 Regional Cuisine. . . . . . . . . . . . . . . . . . . . . . . . . . . . . . . . . . . . . . . . . . . . 32458.2 Ethnic Cuisine. . . . . . . . . . . . . . . . . . . . . . . . . . . . . . . . . . . . . . . . . . . . . . 327
59 CUSTOMER SERVICE. . . . . . . . . . . . . . . . . . . . . . . . . . . . . . . . . . . . . . . . . . . 32859.1 Ranking Customer Priorities. . . . . . . . . . . . . . . . . . . . . . . . . . . . . . . . . . . 32859.2 Customer Service Strategies. . . . . . . . . . . . . . . . . . . . . . . . . . . . . . . . . . . 32859.3 Team Service. . . . . . . . . . . . . . . . . . . . . . . . . . . . . . . . . . . . . . . . . . . . . . 32959.4 Top Restaurants For Service.. . . . . . . . . . . . . . . . . . . . . . . . . . . . . . . . . . 330
60 DAYPARTS. . . . . . . . . . . . . . . . . . . . . . . . . . . . . . . . . . . . . . . . . . . . . . . . . . . . 33160.1 Daypart Spending and Traffic. . . . . . . . . . . . . . . . . . . . . . . . . . . . . . . . . . 33160.2 Breakfast. . . . . . . . . . . . . . . . . . . . . . . . . . . . . . . . . . . . . . . . . . . . . . . . . . 33260.3 Lunch.. . . . . . . . . . . . . . . . . . . . . . . . . . . . . . . . . . . . . . . . . . . . . . . . . . . . 33360.4 Dinner. . . . . . . . . . . . . . . . . . . . . . . . . . . . . . . . . . . . . . . . . . . . . . . . . . . . 334
61 DINING & THE INTERNET. . . . . . . . . . . . . . . . . . . . . . . . . . . . . . . . . . . . . . . . 33661.1 Consumer Use Of The Internet For Dining Activities.. . . . . . . . . . . . . . . . 33661.2 Restaurant Websites. . . . . . . . . . . . . . . . . . . . . . . . . . . . . . . . . . . . . . . . . 33861.3 Online Reservations. . . . . . . . . . . . . . . . . . . . . . . . . . . . . . . . . . . . . . . . . 33961.4 Online Reviews. . . . . . . . . . . . . . . . . . . . . . . . . . . . . . . . . . . . . . . . . . . . . 33961.5 Social Networking. . . . . . . . . . . . . . . . . . . . . . . . . . . . . . . . . . . . . . . . . . . 33961.6 Online Ordering. . . . . . . . . . . . . . . . . . . . . . . . . . . . . . . . . . . . . . . . . . . . . 34061.7 In-Restaurant Ordering Via Tablet.. . . . . . . . . . . . . . . . . . . . . . . . . . . . . . 341
62 DINING WHILE TRAVELING. . . . . . . . . . . . . . . . . . . . . . . . . . . . . . . . . . . . . . . 34262.1 Traveler Dining. . . . . . . . . . . . . . . . . . . . . . . . . . . . . . . . . . . . . . . . . . . . . 34262.2 Culinary Destinations.. . . . . . . . . . . . . . . . . . . . . . . . . . . . . . . . . . . . . . . . 34262.3 Sampling Tours. . . . . . . . . . . . . . . . . . . . . . . . . . . . . . . . . . . . . . . . . . . . . 34362.4 Culinary Arts Programs. . . . . . . . . . . . . . . . . . . . . . . . . . . . . . . . . . . . . . . 34362.5 Winery Tours. . . . . . . . . . . . . . . . . . . . . . . . . . . . . . . . . . . . . . . . . . . . . . . 34462.6 American Whiskey Trail.. . . . . . . . . . . . . . . . . . . . . . . . . . . . . . . . . . . . . . 345
RESTAURANT, FOOD & BEVERAGE MARKET RESEARCH HANDBOOK 2013
• 12 •
63 DINING WITH ENTERTAINMENT. . . . . . . . . . . . . . . . . . . . . . . . . . . . . . . . . . . 34763.1 Overview. . . . . . . . . . . . . . . . . . . . . . . . . . . . . . . . . . . . . . . . . . . . . . . . . . 34763.2 Live Music and Dining. . . . . . . . . . . . . . . . . . . . . . . . . . . . . . . . . . . . . . . . 34863.3 Theme Restaurants. . . . . . . . . . . . . . . . . . . . . . . . . . . . . . . . . . . . . . . . . . 34863.4 Experiential Restaurants. . . . . . . . . . . . . . . . . . . . . . . . . . . . . . . . . . . . . . 34963.5 Mystery Dinner Theaters. . . . . . . . . . . . . . . . . . . . . . . . . . . . . . . . . . . . . . 35063.6 Dinner and a Movie. . . . . . . . . . . . . . . . . . . . . . . . . . . . . . . . . . . . . . . . . . 35063.7 Speakeasies. . . . . . . . . . . . . . . . . . . . . . . . . . . . . . . . . . . . . . . . . . . . . . . 35163.8 Novel Restaurants. . . . . . . . . . . . . . . . . . . . . . . . . . . . . . . . . . . . . . . . . . . 352
64 DOG-FRIENDLY RESTAURANTS.. . . . . . . . . . . . . . . . . . . . . . . . . . . . . . . . . . 35464.1 Overview. . . . . . . . . . . . . . . . . . . . . . . . . . . . . . . . . . . . . . . . . . . . . . . . . . 35464.2 Dog-friendly Restaurants. . . . . . . . . . . . . . . . . . . . . . . . . . . . . . . . . . . . . . 35464.3 Dog Menus. . . . . . . . . . . . . . . . . . . . . . . . . . . . . . . . . . . . . . . . . . . . . . . . 355
65 FOOD & WINE FESTIVALS.. . . . . . . . . . . . . . . . . . . . . . . . . . . . . . . . . . . . . . . 35665.1 Overview. . . . . . . . . . . . . . . . . . . . . . . . . . . . . . . . . . . . . . . . . . . . . . . . . . 35665.2 Prominent Food Festivals. . . . . . . . . . . . . . . . . . . . . . . . . . . . . . . . . . . . . 35665.3 Market Resources. . . . . . . . . . . . . . . . . . . . . . . . . . . . . . . . . . . . . . . . . . . 357
66 HOLIDAY DINING. . . . . . . . . . . . . . . . . . . . . . . . . . . . . . . . . . . . . . . . . . . . . . . 35866.1 Overview. . . . . . . . . . . . . . . . . . . . . . . . . . . . . . . . . . . . . . . . . . . . . . . . . . 35866.2 Birthdays. . . . . . . . . . . . . . . . . . . . . . . . . . . . . . . . . . . . . . . . . . . . . . . . . . 35866.3 Valentine’s Day. . . . . . . . . . . . . . . . . . . . . . . . . . . . . . . . . . . . . . . . . . . . . 35966.4 Mother’s Day. . . . . . . . . . . . . . . . . . . . . . . . . . . . . . . . . . . . . . . . . . . . . . . 35966.5 Father’s Day. . . . . . . . . . . . . . . . . . . . . . . . . . . . . . . . . . . . . . . . . . . . . . . 36066.6 Easter. . . . . . . . . . . . . . . . . . . . . . . . . . . . . . . . . . . . . . . . . . . . . . . . . . . . 36066.7 New Year’s Eve. . . . . . . . . . . . . . . . . . . . . . . . . . . . . . . . . . . . . . . . . . . . . 36066.8 Thanksgiving. . . . . . . . . . . . . . . . . . . . . . . . . . . . . . . . . . . . . . . . . . . . . . . 36066.9 St. Patrick’s Day. . . . . . . . . . . . . . . . . . . . . . . . . . . . . . . . . . . . . . . . . . . . 36166.10 Oktoberfest. . . . . . . . . . . . . . . . . . . . . . . . . . . . . . . . . . . . . . . . . . . . . . . 36166.11 Super Bowl Sunday. . . . . . . . . . . . . . . . . . . . . . . . . . . . . . . . . . . . . . . . . 361
67 LATE-NIGHT HOURS. . . . . . . . . . . . . . . . . . . . . . . . . . . . . . . . . . . . . . . . . . . . 36367.1 Overview. . . . . . . . . . . . . . . . . . . . . . . . . . . . . . . . . . . . . . . . . . . . . . . . . . 36367.2 Late-Night Customer Demographics. . . . . . . . . . . . . . . . . . . . . . . . . . . . . 36367.3 Late-Night Operations. . . . . . . . . . . . . . . . . . . . . . . . . . . . . . . . . . . . . . . . 364
68 LICENSING. . . . . . . . . . . . . . . . . . . . . . . . . . . . . . . . . . . . . . . . . . . . . . . . . . . . 36668.1 Market Assessment. . . . . . . . . . . . . . . . . . . . . . . . . . . . . . . . . . . . . . . . . . 36668.2 Case Studies. . . . . . . . . . . . . . . . . . . . . . . . . . . . . . . . . . . . . . . . . . . . . . . 36668.3 Market Trends. . . . . . . . . . . . . . . . . . . . . . . . . . . . . . . . . . . . . . . . . . . . . . 36868.4 Market Resources. . . . . . . . . . . . . . . . . . . . . . . . . . . . . . . . . . . . . . . . . . . 369
RESTAURANT, FOOD & BEVERAGE MARKET RESEARCH HANDBOOK 2013
• 13 •
69 LOCALLY SOURCED & ORGANIC FOOD. . . . . . . . . . . . . . . . . . . . . . . . . . . . 37069.1 Local & Organic Preferences Among Consumers. . . . . . . . . . . . . . . . . . . 37069.2 Locavores. . . . . . . . . . . . . . . . . . . . . . . . . . . . . . . . . . . . . . . . . . . . . . . . . 37169.3 Local Sourcing At Limited-Service Restaurants. . . . . . . . . . . . . . . . . . . . 37269.4 Chef- and Restaurant-owned Farms. . . . . . . . . . . . . . . . . . . . . . . . . . . . . 37369.5 Organic Menus. . . . . . . . . . . . . . . . . . . . . . . . . . . . . . . . . . . . . . . . . . . . . 374
70 LOYALTY PROGRAMS. . . . . . . . . . . . . . . . . . . . . . . . . . . . . . . . . . . . . . . . . . . 37570.1 Overview. . . . . . . . . . . . . . . . . . . . . . . . . . . . . . . . . . . . . . . . . . . . . . . . . . 37570.2 Restaurant Programs. . . . . . . . . . . . . . . . . . . . . . . . . . . . . . . . . . . . . . . . 37570.3 Customer Participation. . . . . . . . . . . . . . . . . . . . . . . . . . . . . . . . . . . . . . . 37570.4 Social Networking With Loyalty Customers. . . . . . . . . . . . . . . . . . . . . . . . 375
71 NON-TRADITIONAL RESTAURANT SITES. . . . . . . . . . . . . . . . . . . . . . . . . . . 37771.1 Pop-Up Restaurants. . . . . . . . . . . . . . . . . . . . . . . . . . . . . . . . . . . . . . . . . 37771.2 Restaurants At Auto Dealerships. . . . . . . . . . . . . . . . . . . . . . . . . . . . . . . 37871.3 Restaurants At Car Washes. . . . . . . . . . . . . . . . . . . . . . . . . . . . . . . . . . . 37871.4 Restaurants At Museums and Tourist Attractions. . . . . . . . . . . . . . . . . . . 37871.5 Restaurants At Parks and Botanical Gardens. . . . . . . . . . . . . . . . . . . . . . 37971.6 Restaurants At Retail Stores. . . . . . . . . . . . . . . . . . . . . . . . . . . . . . . . . . . 379
72 NUTRITION. . . . . . . . . . . . . . . . . . . . . . . . . . . . . . . . . . . . . . . . . . . . . . . . . . . . 38272.1 Healthful Dining. . . . . . . . . . . . . . . . . . . . . . . . . . . . . . . . . . . . . . . . . . . . . 38272.2 Portion Control.. . . . . . . . . . . . . . . . . . . . . . . . . . . . . . . . . . . . . . . . . . . . . 38372.3 Menu Labeling. . . . . . . . . . . . . . . . . . . . . . . . . . . . . . . . . . . . . . . . . . . . . . 38372.4 Trans Fat. . . . . . . . . . . . . . . . . . . . . . . . . . . . . . . . . . . . . . . . . . . . . . . . . . 38472.5 Reduced Sodium. . . . . . . . . . . . . . . . . . . . . . . . . . . . . . . . . . . . . . . . . . . . 384
73 RESTRICTIVE DIET MENUS.. . . . . . . . . . . . . . . . . . . . . . . . . . . . . . . . . . . . . . 38673.1 Overview. . . . . . . . . . . . . . . . . . . . . . . . . . . . . . . . . . . . . . . . . . . . . . . . . . 38673.2 Gluten-Free Menu Items. . . . . . . . . . . . . . . . . . . . . . . . . . . . . . . . . . . . . . 38673.3 Kosher Cuisine. . . . . . . . . . . . . . . . . . . . . . . . . . . . . . . . . . . . . . . . . . . . . 38773.4 Halal Foods. . . . . . . . . . . . . . . . . . . . . . . . . . . . . . . . . . . . . . . . . . . . . . . . 38873.5 Vegetarian Cuisine. . . . . . . . . . . . . . . . . . . . . . . . . . . . . . . . . . . . . . . . . . 388
74 SEAFOOD. . . . . . . . . . . . . . . . . . . . . . . . . . . . . . . . . . . . . . . . . . . . . . . . . . . . . 39074.1 Seafood Entrees in Restaurants. . . . . . . . . . . . . . . . . . . . . . . . . . . . . . . . 39074.2 Trends. . . . . . . . . . . . . . . . . . . . . . . . . . . . . . . . . . . . . . . . . . . . . . . . . . . . 39074.3 Sustainable Seafood. . . . . . . . . . . . . . . . . . . . . . . . . . . . . . . . . . . . . . . . . 39074.4 Labeling. . . . . . . . . . . . . . . . . . . . . . . . . . . . . . . . . . . . . . . . . . . . . . . . . . . 392
RESTAURANT, FOOD & BEVERAGE MARKET RESEARCH HANDBOOK 2013
• 14 •
75 SNACKING.. . . . . . . . . . . . . . . . . . . . . . . . . . . . . . . . . . . . . . . . . . . . . . . . . . . . 39475.1 Overview. . . . . . . . . . . . . . . . . . . . . . . . . . . . . . . . . . . . . . . . . . . . . . . . . . 39475.2 Market Assessment. . . . . . . . . . . . . . . . . . . . . . . . . . . . . . . . . . . . . . . . . . 39575.3 Snack Food Trends. . . . . . . . . . . . . . . . . . . . . . . . . . . . . . . . . . . . . . . . . . 396
76 TAKEOUT & DELIVERY. . . . . . . . . . . . . . . . . . . . . . . . . . . . . . . . . . . . . . . . . . 39776.1 Market Assessment. . . . . . . . . . . . . . . . . . . . . . . . . . . . . . . . . . . . . . . . . . 39776.2 Takeout and The American Lifestyle. . . . . . . . . . . . . . . . . . . . . . . . . . . . . 39776.3 The Takeout and Delivery Customer. . . . . . . . . . . . . . . . . . . . . . . . . . . . . 39776.4 Pizza Delivery. . . . . . . . . . . . . . . . . . . . . . . . . . . . . . . . . . . . . . . . . . . . . . 39876.5 Quick-Service Carryout and Delivery.. . . . . . . . . . . . . . . . . . . . . . . . . . . . 39876.6 Takeout At Full-Service Chains. . . . . . . . . . . . . . . . . . . . . . . . . . . . . . . . . 39976.7 Takeout for Offices and Elsewhere. . . . . . . . . . . . . . . . . . . . . . . . . . . . . . 39976.8 Takeout Packaging. . . . . . . . . . . . . . . . . . . . . . . . . . . . . . . . . . . . . . . . . . 399
77 VALUE-FOCUSED DINING. . . . . . . . . . . . . . . . . . . . . . . . . . . . . . . . . . . . . . . . 40177.1 Overview. . . . . . . . . . . . . . . . . . . . . . . . . . . . . . . . . . . . . . . . . . . . . . . . . . 40177.2 Trading Down. . . . . . . . . . . . . . . . . . . . . . . . . . . . . . . . . . . . . . . . . . . . . . 40177.3 Promotions. . . . . . . . . . . . . . . . . . . . . . . . . . . . . . . . . . . . . . . . . . . . . . . . 40377.4 Off-Peak Specials. . . . . . . . . . . . . . . . . . . . . . . . . . . . . . . . . . . . . . . . . . . 403
PART VIII: BEVERAGE TRENDS & ANALYSES. . . . . . . . . . . . . . . . . . . . . . . . . . . 405
78 BEVERAGE CONSUMPTION & SPENDING. . . . . . . . . . . . . . . . . . . . . . . . . . 40678.1 Beverage Consumption. . . . . . . . . . . . . . . . . . . . . . . . . . . . . . . . . . . . . . . 40678.2 Beverage Spending. . . . . . . . . . . . . . . . . . . . . . . . . . . . . . . . . . . . . . . . . . 40678.3 Alcoholic Beverages. . . . . . . . . . . . . . . . . . . . . . . . . . . . . . . . . . . . . . . . . 40778.4 Nonalcoholic Beverages. . . . . . . . . . . . . . . . . . . . . . . . . . . . . . . . . . . . . . 411
79 BEER. . . . . . . . . . . . . . . . . . . . . . . . . . . . . . . . . . . . . . . . . . . . . . . . . . . . . . . . . 41279.1 Market Assessment. . . . . . . . . . . . . . . . . . . . . . . . . . . . . . . . . . . . . . . . . . 41279.2 Market Leaders. . . . . . . . . . . . . . . . . . . . . . . . . . . . . . . . . . . . . . . . . . . . . 41379.3 Top Domestic Beer Brands. . . . . . . . . . . . . . . . . . . . . . . . . . . . . . . . . . . . 41479.4 Demographics. . . . . . . . . . . . . . . . . . . . . . . . . . . . . . . . . . . . . . . . . . . . . . 41479.5 Craft Beer. . . . . . . . . . . . . . . . . . . . . . . . . . . . . . . . . . . . . . . . . . . . . . . . . 41579.6 Imported Beer. . . . . . . . . . . . . . . . . . . . . . . . . . . . . . . . . . . . . . . . . . . . . . 41679.7 Flavored Malt Beverages.. . . . . . . . . . . . . . . . . . . . . . . . . . . . . . . . . . . . . 41679.8 On-Premise. . . . . . . . . . . . . . . . . . . . . . . . . . . . . . . . . . . . . . . . . . . . . . . . 417
80 DISTILLED SPIRITS. . . . . . . . . . . . . . . . . . . . . . . . . . . . . . . . . . . . . . . . . . . . . 41880.1 Market Assessment. . . . . . . . . . . . . . . . . . . . . . . . . . . . . . . . . . . . . . . . . . 41880.2 Major Brands. . . . . . . . . . . . . . . . . . . . . . . . . . . . . . . . . . . . . . . . . . . . . . . 42080.3 Whiskey.. . . . . . . . . . . . . . . . . . . . . . . . . . . . . . . . . . . . . . . . . . . . . . . . . . 421
RESTAURANT, FOOD & BEVERAGE MARKET RESEARCH HANDBOOK 2013
• 15 •
80.4 Vodka. . . . . . . . . . . . . . . . . . . . . . . . . . . . . . . . . . . . . . . . . . . . . . . . . . . . 42380.5 Rum.. . . . . . . . . . . . . . . . . . . . . . . . . . . . . . . . . . . . . . . . . . . . . . . . . . . . . 42580.6 Tequila.. . . . . . . . . . . . . . . . . . . . . . . . . . . . . . . . . . . . . . . . . . . . . . . . . . . 42780.7 Gin. . . . . . . . . . . . . . . . . . . . . . . . . . . . . . . . . . . . . . . . . . . . . . . . . . . . . . . 42880.8 Brandy and Cognac.. . . . . . . . . . . . . . . . . . . . . . . . . . . . . . . . . . . . . . . . . 42980.9 Cordials. . . . . . . . . . . . . . . . . . . . . . . . . . . . . . . . . . . . . . . . . . . . . . . . . . . 430
81 WINE. . . . . . . . . . . . . . . . . . . . . . . . . . . . . . . . . . . . . . . . . . . . . . . . . . . . . . . . . 43281.1 Market Assessment. . . . . . . . . . . . . . . . . . . . . . . . . . . . . . . . . . . . . . . . . . 43281.2 U.S. Wine Exports. . . . . . . . . . . . . . . . . . . . . . . . . . . . . . . . . . . . . . . . . . . 43381.3 Market Leaders. . . . . . . . . . . . . . . . . . . . . . . . . . . . . . . . . . . . . . . . . . . . . 43381.4 Wine Consumer Characteristics. . . . . . . . . . . . . . . . . . . . . . . . . . . . . . . . 43381.5 Champagne and Sparkling Wine.. . . . . . . . . . . . . . . . . . . . . . . . . . . . . . . 43481.6 Oneophiles. . . . . . . . . . . . . . . . . . . . . . . . . . . . . . . . . . . . . . . . . . . . . . . . 435
82 REFRESHMENT & FUNCTIONAL BEVERAGES. . . . . . . . . . . . . . . . . . . . . . . 43682.1 Carbonated Soft Drinks. . . . . . . . . . . . . . . . . . . . . . . . . . . . . . . . . . . . . . . 43682.2 Consumption Demographics. . . . . . . . . . . . . . . . . . . . . . . . . . . . . . . . . . . 43882.3 Sports Beverages. . . . . . . . . . . . . . . . . . . . . . . . . . . . . . . . . . . . . . . . . . . 43882.4 Energy Drinks. . . . . . . . . . . . . . . . . . . . . . . . . . . . . . . . . . . . . . . . . . . . . . 43982.5 Juice & Fruit Drinks. . . . . . . . . . . . . . . . . . . . . . . . . . . . . . . . . . . . . . . . . . 441
83 COFFEE & TEA. . . . . . . . . . . . . . . . . . . . . . . . . . . . . . . . . . . . . . . . . . . . . . . . . 44483.1 Coffee Consumption. . . . . . . . . . . . . . . . . . . . . . . . . . . . . . . . . . . . . . . . . 44483.2 RTD Coffee. . . . . . . . . . . . . . . . . . . . . . . . . . . . . . . . . . . . . . . . . . . . . . . . 44583.3 Coffeeshops. . . . . . . . . . . . . . . . . . . . . . . . . . . . . . . . . . . . . . . . . . . . . . . 44583.4 Tea Consumption. . . . . . . . . . . . . . . . . . . . . . . . . . . . . . . . . . . . . . . . . . . 44583.5 RTD Tea. . . . . . . . . . . . . . . . . . . . . . . . . . . . . . . . . . . . . . . . . . . . . . . . . . 44683.6 Tea Stores and Tea Bars. . . . . . . . . . . . . . . . . . . . . . . . . . . . . . . . . . . . . 447
84 BOTTLED WATER.. . . . . . . . . . . . . . . . . . . . . . . . . . . . . . . . . . . . . . . . . . . . . . 44884.1 Consumption and Spending. . . . . . . . . . . . . . . . . . . . . . . . . . . . . . . . . . . 44884.2 Consumption Demographics. . . . . . . . . . . . . . . . . . . . . . . . . . . . . . . . . . . 44984.3 Market Leaders. . . . . . . . . . . . . . . . . . . . . . . . . . . . . . . . . . . . . . . . . . . . . 44984.4 Market Drivers. . . . . . . . . . . . . . . . . . . . . . . . . . . . . . . . . . . . . . . . . . . . . . 450
85 MILK.. . . . . . . . . . . . . . . . . . . . . . . . . . . . . . . . . . . . . . . . . . . . . . . . . . . . . . . . . 45185.1 Consumption and Dairy Production. . . . . . . . . . . . . . . . . . . . . . . . . . . . . . 45185.2 Consumer Spending. . . . . . . . . . . . . . . . . . . . . . . . . . . . . . . . . . . . . . . . . 45185.3 Market Drivers. . . . . . . . . . . . . . . . . . . . . . . . . . . . . . . . . . . . . . . . . . . . . . 451
86 BEVERAGE SERVICE IN RESTAURANTS & BARS. . . . . . . . . . . . . . . . . . . . 45386.1 Market Assessment. . . . . . . . . . . . . . . . . . . . . . . . . . . . . . . . . . . . . . . . . . 45386.2 Refreshment and Nonalcoholic Beverage Service in Restaurants. . . . . . 454
RESTAURANT, FOOD & BEVERAGE MARKET RESEARCH HANDBOOK 2013
• 16 •
86.3 Alcoholic Beverage Service in Full-Service Restaurants. . . . . . . . . . . . . . 45486.4 Alcoholic Beverage Service In Limited-Service Restaurants. . . . . . . . . . . 45786.5 Nonalcoholic Cocktails. . . . . . . . . . . . . . . . . . . . . . . . . . . . . . . . . . . . . . . 45886.6 Happy Hours. . . . . . . . . . . . . . . . . . . . . . . . . . . . . . . . . . . . . . . . . . . . . . . 46086.7 Beverage-Only Restaurant Occasions. . . . . . . . . . . . . . . . . . . . . . . . . . . 461
PART IX: AWARD WINNERS. . . . . . . . . . . . . . . . . . . . . . . . . . . . . . . . . . . . . . . . . . 462
87 BEST NEW CHEFS. . . . . . . . . . . . . . . . . . . . . . . . . . . . . . . . . . . . . . . . . . . . . . 46387.1 Overview. . . . . . . . . . . . . . . . . . . . . . . . . . . . . . . . . . . . . . . . . . . . . . . . . . 46387.2 Award Winners 2012. . . . . . . . . . . . . . . . . . . . . . . . . . . . . . . . . . . . . . . . . 46387.3 Recent Award Winners. . . . . . . . . . . . . . . . . . . . . . . . . . . . . . . . . . . . . . . 463
88 BEST NEW RESTAURANTS. . . . . . . . . . . . . . . . . . . . . . . . . . . . . . . . . . . . . . . 46688.1 Lists For 2012. . . . . . . . . . . . . . . . . . . . . . . . . . . . . . . . . . . . . . . . . . . . . . 466
89 BENCHMARK AWARDS. . . . . . . . . . . . . . . . . . . . . . . . . . . . . . . . . . . . . . . . . . 46989.1 Overview. . . . . . . . . . . . . . . . . . . . . . . . . . . . . . . . . . . . . . . . . . . . . . . . . . 46989.2 Award Winners 2012. . . . . . . . . . . . . . . . . . . . . . . . . . . . . . . . . . . . . . . . . 46989.3 Recent Award Winners. . . . . . . . . . . . . . . . . . . . . . . . . . . . . . . . . . . . . . . 469
90 BEVERAGE EXCELLENCE AWARDS. . . . . . . . . . . . . . . . . . . . . . . . . . . . . . . 47190.1 Overview. . . . . . . . . . . . . . . . . . . . . . . . . . . . . . . . . . . . . . . . . . . . . . . . . . 47190.2 Award Winners 2013. . . . . . . . . . . . . . . . . . . . . . . . . . . . . . . . . . . . . . . . . 47190.3 Award Winners 2012. . . . . . . . . . . . . . . . . . . . . . . . . . . . . . . . . . . . . . . . . 47290.4 Award Winners 2011. . . . . . . . . . . . . . . . . . . . . . . . . . . . . . . . . . . . . . . . . 473
91 CHAIN RESTAURANT CONSUMERS’ CHOICE AWARDS. . . . . . . . . . . . . . . 47491.1 Overview. . . . . . . . . . . . . . . . . . . . . . . . . . . . . . . . . . . . . . . . . . . . . . . . . . 47491.2 Award Winners 2013. . . . . . . . . . . . . . . . . . . . . . . . . . . . . . . . . . . . . . . . . 47491.3 Market Resources. . . . . . . . . . . . . . . . . . . . . . . . . . . . . . . . . . . . . . . . . . . 474
92 CONSUMER PICKS.. . . . . . . . . . . . . . . . . . . . . . . . . . . . . . . . . . . . . . . . . . . . . 47592.1 Overview. . . . . . . . . . . . . . . . . . . . . . . . . . . . . . . . . . . . . . . . . . . . . . . . . . 47592.2 Favorites By Segment. . . . . . . . . . . . . . . . . . . . . . . . . . . . . . . . . . . . . . . . 47592.3 Favorites By Demographic. . . . . . . . . . . . . . . . . . . . . . . . . . . . . . . . . . . . 47692.4 Market Resources. . . . . . . . . . . . . . . . . . . . . . . . . . . . . . . . . . . . . . . . . . . 477
93 CUSTOMER SATISFACTION. . . . . . . . . . . . . . . . . . . . . . . . . . . . . . . . . . . . . . 47893.1 Overview. . . . . . . . . . . . . . . . . . . . . . . . . . . . . . . . . . . . . . . . . . . . . . . . . . 47893.2 ACSI Scores. . . . . . . . . . . . . . . . . . . . . . . . . . . . . . . . . . . . . . . . . . . . . . . 47893.3 Customer Satisfaction Scores. . . . . . . . . . . . . . . . . . . . . . . . . . . . . . . . . . 47893.4 Market Resources. . . . . . . . . . . . . . . . . . . . . . . . . . . . . . . . . . . . . . . . . . . 479
RESTAURANT, FOOD & BEVERAGE MARKET RESEARCH HANDBOOK 2013
• 17 •

94 DINERS’ CHOICE AWARDS. . . . . . . . . . . . . . . . . . . . . . . . . . . . . . . . . . . . . . . 48094.1 Overview. . . . . . . . . . . . . . . . . . . . . . . . . . . . . . . . . . . . . . . . . . . . . . . . . . 48094.2 Best Restaurant. . . . . . . . . . . . . . . . . . . . . . . . . . . . . . . . . . . . . . . . . . . . . 48094.3 Best Service. . . . . . . . . . . . . . . . . . . . . . . . . . . . . . . . . . . . . . . . . . . . . . . 48394.4 Brunch. . . . . . . . . . . . . . . . . . . . . . . . . . . . . . . . . . . . . . . . . . . . . . . . . . . . 48594.5 Fit For Foodies Restaurants. . . . . . . . . . . . . . . . . . . . . . . . . . . . . . . . . . . 48794.6 Hot Spots. . . . . . . . . . . . . . . . . . . . . . . . . . . . . . . . . . . . . . . . . . . . . . . . . . 49094.7 Kid-Friendly Restaurants. . . . . . . . . . . . . . . . . . . . . . . . . . . . . . . . . . . . . . 49294.8 Late-Night Dining. . . . . . . . . . . . . . . . . . . . . . . . . . . . . . . . . . . . . . . . . . . . 49394.9 Most Notable Wine Lists. . . . . . . . . . . . . . . . . . . . . . . . . . . . . . . . . . . . . . 49694.10 Most Romantic Restaurants. . . . . . . . . . . . . . . . . . . . . . . . . . . . . . . . . . 49894.11 Most Scenic Views. . . . . . . . . . . . . . . . . . . . . . . . . . . . . . . . . . . . . . . . . 50094.12 Outdoor Dining. . . . . . . . . . . . . . . . . . . . . . . . . . . . . . . . . . . . . . . . . . . . 50394.13 Top American Cuisine. . . . . . . . . . . . . . . . . . . . . . . . . . . . . . . . . . . . . . . 505
95 DISTINGUISHED RESTAURANTS. . . . . . . . . . . . . . . . . . . . . . . . . . . . . . . . . . 50895.1 Overview. . . . . . . . . . . . . . . . . . . . . . . . . . . . . . . . . . . . . . . . . . . . . . . . . . 50895.2 List Of Distinguished Restaurants 2013. . . . . . . . . . . . . . . . . . . . . . . . . . 508
96 FAVORITE LIMITED-SERVICE RESTAURANTS. . . . . . . . . . . . . . . . . . . . . . . 52196.1 Overview. . . . . . . . . . . . . . . . . . . . . . . . . . . . . . . . . . . . . . . . . . . . . . . . . . 52196.2 Top Chains By Segment. . . . . . . . . . . . . . . . . . . . . . . . . . . . . . . . . . . . . . 52196.3 Market Resources. . . . . . . . . . . . . . . . . . . . . . . . . . . . . . . . . . . . . . . . . . . 522
97 FINE-DINING HALL OF FAME. . . . . . . . . . . . . . . . . . . . . . . . . . . . . . . . . . . . . 52397.1 List of Inductees. . . . . . . . . . . . . . . . . . . . . . . . . . . . . . . . . . . . . . . . . . . . 523
98 FIVE- AND FOUR-DIAMOND AWARDS. . . . . . . . . . . . . . . . . . . . . . . . . . . . . . 52698.1 Five-Diamnd Award Winners. . . . . . . . . . . . . . . . . . . . . . . . . . . . . . . . . . . 52698.2 Four-Diamnd Award Winners. . . . . . . . . . . . . . . . . . . . . . . . . . . . . . . . . . 528
99 FUTURE 50. . . . . . . . . . . . . . . . . . . . . . . . . . . . . . . . . . . . . . . . . . . . . . . . . . . . 54499.1 Overview. . . . . . . . . . . . . . . . . . . . . . . . . . . . . . . . . . . . . . . . . . . . . . . . . . 54499.2 Fastest Growing Chains 2012. . . . . . . . . . . . . . . . . . . . . . . . . . . . . . . . . . 54499.3 Market Resources. . . . . . . . . . . . . . . . . . . . . . . . . . . . . . . . . . . . . . . . . . . 545
100 GREAT STEAK HOUSES. . . . . . . . . . . . . . . . . . . . . . . . . . . . . . . . . . . . . . . . 546100.1 Overview. . . . . . . . . . . . . . . . . . . . . . . . . . . . . . . . . . . . . . . . . . . . . . . . 546100.2 List Of Recognitions 2013.. . . . . . . . . . . . . . . . . . . . . . . . . . . . . . . . . . 546
101 HOT CONCEPTS!. . . . . . . . . . . . . . . . . . . . . . . . . . . . . . . . . . . . . . . . . . . . . . 547101.1 Award Recipients 2012. . . . . . . . . . . . . . . . . . . . . . . . . . . . . . . . . . . . . 547101.2 Recent Designations.. . . . . . . . . . . . . . . . . . . . . . . . . . . . . . . . . . . . . . 547101.3 Market Resources. . . . . . . . . . . . . . . . . . . . . . . . . . . . . . . . . . . . . . . . . 549
RESTAURANT, FOOD & BEVERAGE MARKET RESEARCH HANDBOOK 2013
• 18 •
102 JAMES BEARD FOUNDATION AWARDS. . . . . . . . . . . . . . . . . . . . . . . . . . . 550102.1 Overview. . . . . . . . . . . . . . . . . . . . . . . . . . . . . . . . . . . . . . . . . . . . . . . . 550102.2 Award Winners 2012. . . . . . . . . . . . . . . . . . . . . . . . . . . . . . . . . . . . . . 550102.3 Recent Award Winners. . . . . . . . . . . . . . . . . . . . . . . . . . . . . . . . . . . . . 551102.4 Market Resources. . . . . . . . . . . . . . . . . . . . . . . . . . . . . . . . . . . . . . . . . 552
103 MENU MASTERS. . . . . . . . . . . . . . . . . . . . . . . . . . . . . . . . . . . . . . . . . . . . . . 553103.1 Overview. . . . . . . . . . . . . . . . . . . . . . . . . . . . . . . . . . . . . . . . . . . . . . . . 553103.2 Winners By Category. . . . . . . . . . . . . . . . . . . . . . . . . . . . . . . . . . . . . . 553103.3 Market Resources. . . . . . . . . . . . . . . . . . . . . . . . . . . . . . . . . . . . . . . . . 556
104 MICHELIN 3-STAR RESTAURANTS. . . . . . . . . . . . . . . . . . . . . . . . . . . . . . . 557104.1 Overview. . . . . . . . . . . . . . . . . . . . . . . . . . . . . . . . . . . . . . . . . . . . . . . . 557104.2 Chicago 3-Star Restaurants. . . . . . . . . . . . . . . . . . . . . . . . . . . . . . . . . 557104.3 New York 3-Star Restaurants. . . . . . . . . . . . . . . . . . . . . . . . . . . . . . . . 557104.4 San Francisco 3-Star Restaurants. . . . . . . . . . . . . . . . . . . . . . . . . . . . 557
105 MILLENNIALS’ FAVORITE RESTAURANT CHAINS. . . . . . . . . . . . . . . . . . . 558105.1 Overview. . . . . . . . . . . . . . . . . . . . . . . . . . . . . . . . . . . . . . . . . . . . . . . . 558105.2 Favorite Restaurant Chains. . . . . . . . . . . . . . . . . . . . . . . . . . . . . . . . . 559105.3 Market Resources. . . . . . . . . . . . . . . . . . . . . . . . . . . . . . . . . . . . . . . . . 559
106 RESTAURANT NEIGHBOR AWARD. . . . . . . . . . . . . . . . . . . . . . . . . . . . . . . 560106.1 Award Winners 2012. . . . . . . . . . . . . . . . . . . . . . . . . . . . . . . . . . . . . . 560
107 SELECTIONS: BON APPÉTIT. . . . . . . . . . . . . . . . . . . . . . . . . . . . . . . . . . . . 561107.1 Overview. . . . . . . . . . . . . . . . . . . . . . . . . . . . . . . . . . . . . . . . . . . . . . . . 561107.2 Best Restaurant and Snack Shops Sepections. . . . . . . . . . . . . . . . . . 561
108 SELECTIONS: DINERS, DRIVE-INS & DIVES. . . . . . . . . . . . . . . . . . . . . . . . 565108.1 Overview. . . . . . . . . . . . . . . . . . . . . . . . . . . . . . . . . . . . . . . . . . . . . . . . 565108.2 List Of Featured Restaurants. . . . . . . . . . . . . . . . . . . . . . . . . . . . . . . . 565
109 SELECTIONS: FOOD & WINE. . . . . . . . . . . . . . . . . . . . . . . . . . . . . . . . . . . . 579109.1 Overview. . . . . . . . . . . . . . . . . . . . . . . . . . . . . . . . . . . . . . . . . . . . . . . . 579109.2 America’s Best. . . . . . . . . . . . . . . . . . . . . . . . . . . . . . . . . . . . . . . . . . . 579
110 SELECTIONS: GAYOT. . . . . . . . . . . . . . . . . . . . . . . . . . . . . . . . . . . . . . . . . . 589110.1 Overview. . . . . . . . . . . . . . . . . . . . . . . . . . . . . . . . . . . . . . . . . . . . . . . . 589110.2 Top 40 List 2012. . . . . . . . . . . . . . . . . . . . . . . . . . . . . . . . . . . . . . . . . . 589110.3 Top 10 By Segment. . . . . . . . . . . . . . . . . . . . . . . . . . . . . . . . . . . . . . . 590
RESTAURANT, FOOD & BEVERAGE MARKET RESEARCH HANDBOOK 2013
• 19 •
111 SELECTIONS: THE DAILY MEAL. . . . . . . . . . . . . . . . . . . . . . . . . . . . . . . . . 596111.1 Overview. . . . . . . . . . . . . . . . . . . . . . . . . . . . . . . . . . . . . . . . . . . . . . . . 596111.2 Top Selections 2012. . . . . . . . . . . . . . . . . . . . . . . . . . . . . . . . . . . . . . . 596111.3 Market Resources. . . . . . . . . . . . . . . . . . . . . . . . . . . . . . . . . . . . . . . . . 602
112 SELECTIONS: TRAVEL + LEISURE. . . . . . . . . . . . . . . . . . . . . . . . . . . . . . . 603112.1 Overview. . . . . . . . . . . . . . . . . . . . . . . . . . . . . . . . . . . . . . . . . . . . . . . . 603112.2 Restaurant and Beverage Service Selections.. . . . . . . . . . . . . . . . . . . 603
113 SELECTIONS: ZAGAT. . . . . . . . . . . . . . . . . . . . . . . . . . . . . . . . . . . . . . . . . . 611113.1 Best Burgers. . . . . . . . . . . . . . . . . . . . . . . . . . . . . . . . . . . . . . . . . . . . . 611113.2 Best Business Lunch. . . . . . . . . . . . . . . . . . . . . . . . . . . . . . . . . . . . . . 613113.3 Best Sandwiches. . . . . . . . . . . . . . . . . . . . . . . . . . . . . . . . . . . . . . . . . 614113.4 Best Service. . . . . . . . . . . . . . . . . . . . . . . . . . . . . . . . . . . . . . . . . . . . . 615113.5 Business Trip Dining. . . . . . . . . . . . . . . . . . . . . . . . . . . . . . . . . . . . . . . 617113.6 Hotel Restaurants. . . . . . . . . . . . . . . . . . . . . . . . . . . . . . . . . . . . . . . . . 625113.7 Market Resources. . . . . . . . . . . . . . . . . . . . . . . . . . . . . . . . . . . . . . . . . 627
114 STAR DIAMOND AWARD.. . . . . . . . . . . . . . . . . . . . . . . . . . . . . . . . . . . . . . . 628114.1 Overview. . . . . . . . . . . . . . . . . . . . . . . . . . . . . . . . . . . . . . . . . . . . . . . . 628114.2 Five Star Diamond Awards 2013. . . . . . . . . . . . . . . . . . . . . . . . . . . . . 628
115 THE NRN 50. . . . . . . . . . . . . . . . . . . . . . . . . . . . . . . . . . . . . . . . . . . . . . . . . . 630115.1 Overview. . . . . . . . . . . . . . . . . . . . . . . . . . . . . . . . . . . . . . . . . . . . . . . . 630115.2 Breakout Brands 2013. . . . . . . . . . . . . . . . . . . . . . . . . . . . . . . . . . . . . 630115.3 Market Resources. . . . . . . . . . . . . . . . . . . . . . . . . . . . . . . . . . . . . . . . . 632
116 TOP BEER BARS. . . . . . . . . . . . . . . . . . . . . . . . . . . . . . . . . . . . . . . . . . . . . . 633116.1 Award Winners 2013. . . . . . . . . . . . . . . . . . . . . . . . . . . . . . . . . . . . . . 633
117 TOP RESTAURANT BRANDS. . . . . . . . . . . . . . . . . . . . . . . . . . . . . . . . . . . . 637117.1 Overview. . . . . . . . . . . . . . . . . . . . . . . . . . . . . . . . . . . . . . . . . . . . . . . . 637117.2 Top Brand Scores 2011. . . . . . . . . . . . . . . . . . . . . . . . . . . . . . . . . . . . 637117.3 Market Resources. . . . . . . . . . . . . . . . . . . . . . . . . . . . . . . . . . . . . . . . . 637
118 WINE SPECTATOR GRAND AWARD. . . . . . . . . . . . . . . . . . . . . . . . . . . . . . 638118.1 Overview. . . . . . . . . . . . . . . . . . . . . . . . . . . . . . . . . . . . . . . . . . . . . . . . 638118.2 Award Recipients 2012. . . . . . . . . . . . . . . . . . . . . . . . . . . . . . . . . . . . . 638
RESTAURANT, FOOD & BEVERAGE MARKET RESEARCH HANDBOOK 2013
• 20 •
PART X: FOOD & BEVERAGE DESIGNATIONS. . . . . . . . . . . . . . . . . . . . . . . . . . . 641
119 NATIONAL FOOD & BEVERAGE HOLIDAYS. . . . . . . . . . . . . . . . . . . . . . . . 642119.1 Overview. . . . . . . . . . . . . . . . . . . . . . . . . . . . . . . . . . . . . . . . . . . . . . . . 642119.2 National Food & Beverage Days.. . . . . . . . . . . . . . . . . . . . . . . . . . . . . 642119.3 National Food & Beverage Weeks. . . . . . . . . . . . . . . . . . . . . . . . . . . . 653119.4 National Food & Beverage Months. . . . . . . . . . . . . . . . . . . . . . . . . . . . 654
120 STATE FOODS. . . . . . . . . . . . . . . . . . . . . . . . . . . . . . . . . . . . . . . . . . . . . . . . 658120.1 Overview. . . . . . . . . . . . . . . . . . . . . . . . . . . . . . . . . . . . . . . . . . . . . . . . 658120.2 List of Official State Foods. . . . . . . . . . . . . . . . . . . . . . . . . . . . . . . . . . 658
APPENDIX A - ACADEMIC PROGRAMS. . . . . . . . . . . . . . . . . . . . . . . . . . . . . . . . . 662
APPENDIX B - ANALYSTS & MARKET CONSULTANTS. . . . . . . . . . . . . . . . . . . . 668
APPENDIX C - ASSOCIATIONS. . . . . . . . . . . . . . . . . . . . . . . . . . . . . . . . . . . . . . . . 671
APPENDIX D - PERIODICALS. . . . . . . . . . . . . . . . . . . . . . . . . . . . . . . . . . . . . . . . . 673
APPENDIX E - STATE RESTAURANT ASSOCIATIONS. . . . . . . . . . . . . . . . . . . . . 675
REFERENCES. . . . . . . . . . . . . . . . . . . . . . . . . . . . . . . . . . . . . . . . . . . . . . . . . . . . . . 680
RESTAURANT, FOOD & BEVERAGE MARKET RESEARCH HANDBOOK 2013
• 21 •

PART I: MARKET OVERVIEW
RESTAURANT, FOOD & BEVERAGE MARKET RESEARCH HANDBOOK 2013
• 22 •
1
MARKET SUMMARY
1.1 OverviewThere are more than 980,000 restaurant and foodservice locations in the United
States. The restaurant share of the food dollar is approximately 48%. The industryemploys 13.1 million people.
1.2 Industry SalesAccording to the National Restaurant Association (www.restaurant.org), total
restaurant industry sales are projected to reach $660.5 billion in 2013, an increase of3.5%, or 0.8% on an inflation-adjusted basis. Sales reached $636.4 billion in 2012. Distribution for 2013 is as follows:COMMERCIAL RESTAURANT SERVICES• Restaurants: $441.9 billion• Retail, vending, recreation, mobile, and other: $ 62.4 billion• Managed services: $ 45.6 billion• Hotel restaurants: $ 33.2 billion• Bars and taverns: $ 19.5 billion• Total: $602.5 billion
NONCOMMERCIAL RESTAURANT SERVICES• Total: $ 55.4 billion
MILITARY RESTAURANT SERVICES• Total: $ 2.5 billion
Sales at full-service restaurants are projected to reach $208.1 billion in 2013, anincrease of 2.9% over 2012 and a real growth rate of 0.2%. Sales at quick-servicerestaurants are projected to reach approximately $188.1 billion in 2013, an increase of4.9% over 2011 and a real growth rate of 1.7%.
The National Restaurant Association projects food and beverage sales forrestaurant and foodservice segments in 2013 as follows (change from 2012 inparenthesis):EATING AND DRINKING PLACES• Full-service restaurants: $208.69 billion (2.9%)• Quick-service restaurants: $188.12 billion (4.9%)
RESTAURANT, FOOD & BEVERAGE MARKET RESEARCH HANDBOOK 2013
• 23 •
• Snack and nonalcoholic beverage bars: $ 29.06 billion (4.3%)• Bars and taverns: $ 19.46 billion (0.1%)• Social caterers: $ 8.38 billion (2.9%)• Cafeterias, grill-buffets, and buffets: $ 8.27 billion (0.1%)• Total: $461.34 billion (3.8%)
RETAIL AND LODGING• Retail-host restaurants: $ 35.21 billion (3.5%)• Hotel/accommodation restaurants: $ 33.15 billion (4.8%)• Recreation and sports (includes movies,
bowling lanes, recreation, and sport centers): $ 14.09 billion (2.2%)• Vending and non-store retailers (includes sales of
hot food, sandwiches, pastries, coffee, and other hot beverages): $ 12.46 billion (3.7%)
• Mobile caterers: $ 680 million (3.9%)• Total: $ 95.59 billion (3.8%)
FOODSERVICE CONTRACTOR-MANAGED SERVICES• Colleges and universities: $ 14.54 billion (3.2%)• Manufacturing and industrial plants: $ 7.78 billion (5.2%)• Primary and secondary schools: $ 6.46 billion (3.8%)• Recreation and sports centers: $ 6.08 billion (4.0%)• Hospitals and nursing homes: $ 5.65 billion (5.5%)• Commercial and office buildings: $ 2.82 billion (2.8%)• In-transit foodservice (airlines): $ 2.28 billion (3.2%)• Total: $ 45.62 billion (4.0%)
NONCOMMERCIAL RESTAURANT SERVICES(Businesses, educational, governmental, or institutional organizations which operate their own restaurantservices)
• Hospitals (includes voluntary, proprietary hospitals, long-term general, TB, nervous and mental hospitals, state and local short-term hospitals, and federal hospitals): $ 17.00 billion (4.5%)
• Clubs, sporting, and recreational camps: $ 9.71 billion (2.5%)• Nursing homes (includes homes for the aged, blind,
orphaned, and the mentally and physically disabled): $ 8.21 billion (2.6%)• Public and parochial elementary, secondary schools: $ 7.05 billion (3.4%)• Colleges and universities: $ 7.65 billion (2.9%)• Community centers: $ 3.05 billion (3.7%)• Transportation: $ 2.30 billion (4.8%)• Employee restaurant services: $ 431 million (3.7%)• Total: $ 55.40 billion (3.5%)
RESTAURANT, FOOD & BEVERAGE MARKET RESEARCH HANDBOOK 2013
• 24 •
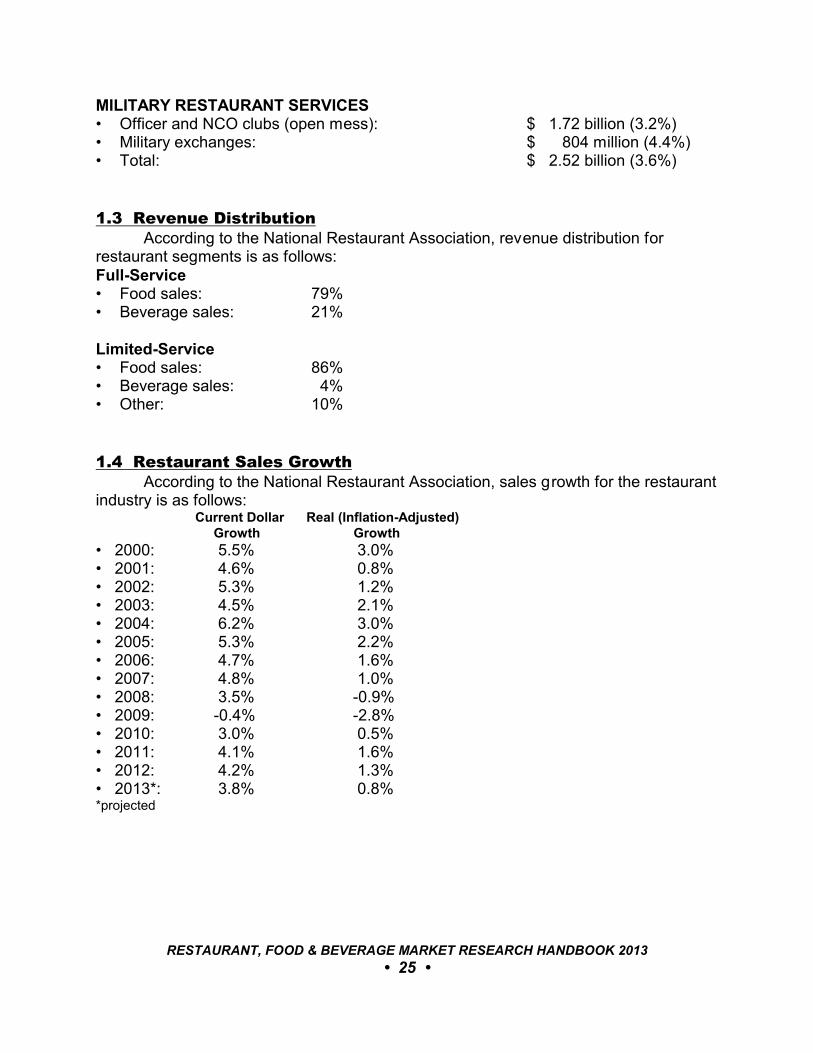
MILITARY RESTAURANT SERVICES• Officer and NCO clubs (open mess): $ 1.72 billion (3.2%)• Military exchanges: $ 804 million (4.4%)• Total: $ 2.52 billion (3.6%)
1.3 Revenue DistributionAccording to the National Restaurant Association, revenue distribution for
restaurant segments is as follows:Full-Service• Food sales: 79%• Beverage sales: 21%
Limited-Service• Food sales: 86%• Beverage sales: 4%• Other: 10%
1.4 Restaurant Sales GrowthAccording to the National Restaurant Association, sales growth for the restaurant
industry is as follows: Current Dollar Real (Inflation-Adjusted) Growth Growth
• 2000: 5.5% 3.0%• 2001: 4.6% 0.8%• 2002: 5.3% 1.2%• 2003: 4.5% 2.1%• 2004: 6.2% 3.0%• 2005: 5.3% 2.2%• 2006: 4.7% 1.6%• 2007: 4.8% 1.0%• 2008: 3.5% -0.9%• 2009: -0.4% -2.8%• 2010: 3.0% 0.5%• 2011: 4.1% 1.6%• 2012: 4.2% 1.3%• 2013*: 3.8% 0.8%*projected
RESTAURANT, FOOD & BEVERAGE MARKET RESEARCH HANDBOOK 2013
• 25 •
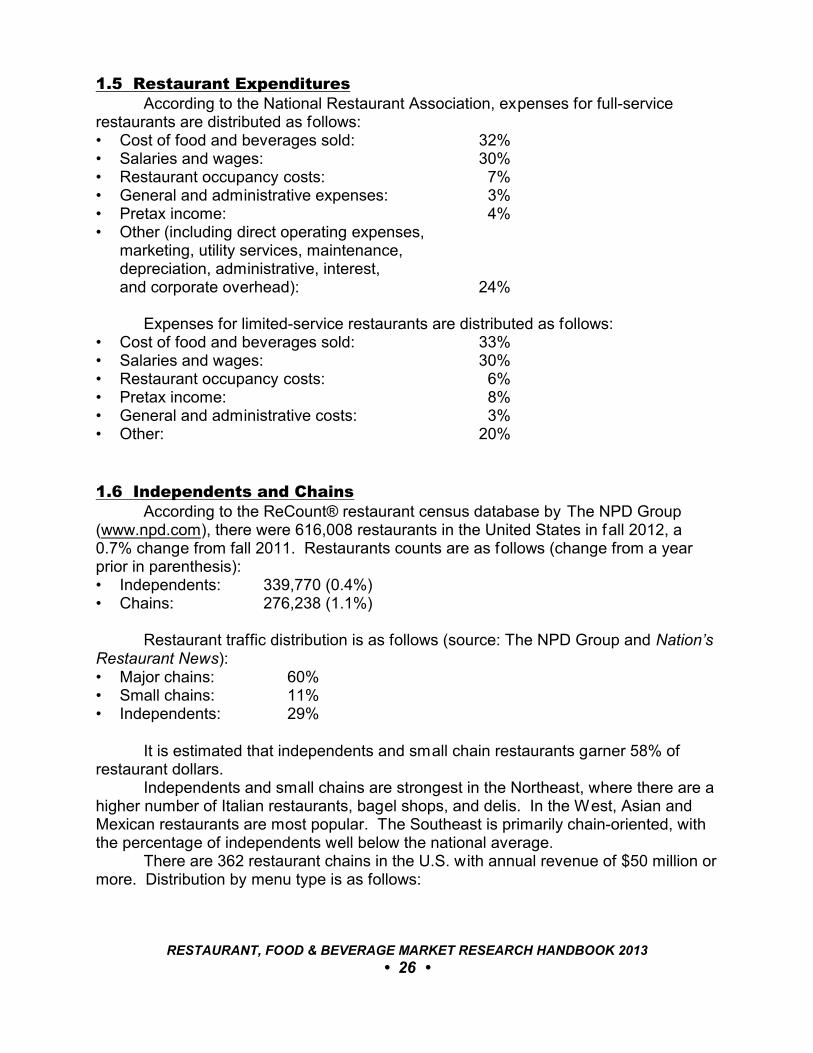
1.5 Restaurant ExpendituresAccording to the National Restaurant Association, expenses for full-service
restaurants are distributed as follows:• Cost of food and beverages sold: 32%• Salaries and wages: 30%• Restaurant occupancy costs: 7%• General and administrative expenses: 3%• Pretax income: 4%• Other (including direct operating expenses,
marketing, utility services, maintenance, depreciation, administrative, interest, and corporate overhead): 24%
Expenses for limited-service restaurants are distributed as follows:• Cost of food and beverages sold: 33%• Salaries and wages: 30%• Restaurant occupancy costs: 6%• Pretax income: 8%• General and administrative costs: 3%• Other: 20%
1.6 Independents and ChainsAccording to the ReCount® restaurant census database by The NPD Group
(www.npd.com), there were 616,008 restaurants in the United States in fall 2012, a0.7% change from fall 2011. Restaurants counts are as follows (change from a yearprior in parenthesis):• Independents: 339,770 (0.4%)• Chains: 276,238 (1.1%)
Restaurant traffic distribution is as follows (source: The NPD Group and Nation’sRestaurant News):• Major chains: 60%• Small chains: 11%• Independents: 29%
It is estimated that independents and small chain restaurants garner 58% ofrestaurant dollars.
Independents and small chains are strongest in the Northeast, where there are ahigher number of Italian restaurants, bagel shops, and delis. In the West, Asian andMexican restaurants are most popular. The Southeast is primarily chain-oriented, withthe percentage of independents well below the national average.
There are 362 restaurant chains in the U.S. with annual revenue of $50 million ormore. Distribution by menu type is as follows:
RESTAURANT, FOOD & BEVERAGE MARKET RESEARCH HANDBOOK 2013
• 26 •
• Casual-dining: 196• Quick-service and fast-casual: 99• Pizza: 37• Snacks, ice cream, and coffeehouses: 30
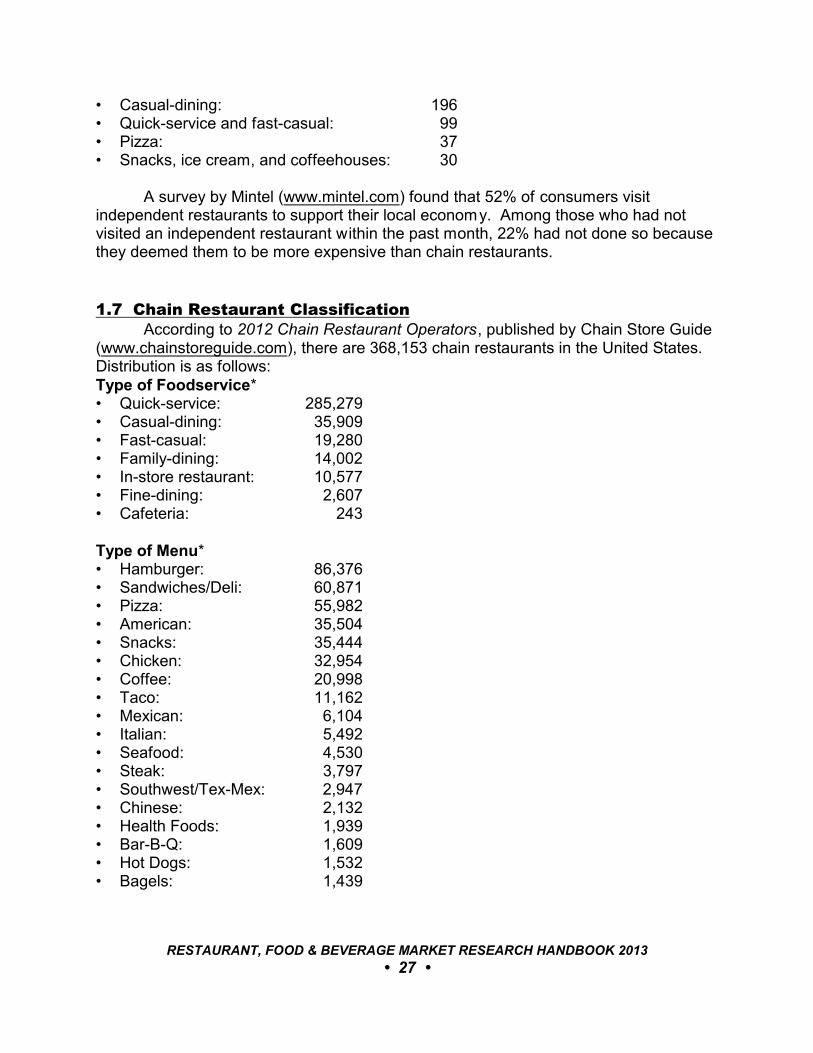
A survey by Mintel (www.mintel.com) found that 52% of consumers visitindependent restaurants to support their local economy. Among those who had notvisited an independent restaurant within the past month, 22% had not done so becausethey deemed them to be more expensive than chain restaurants.
1.7 Chain Restaurant ClassificationAccording to 2012 Chain Restaurant Operators, published by Chain Store Guide
(www.chainstoreguide.com), there are 368,153 chain restaurants in the United States. Distribution is as follows:Type of Foodservice*• Quick-service: 285,279• Casual-dining: 35,909• Fast-casual: 19,280• Family-dining: 14,002• In-store restaurant: 10,577• Fine-dining: 2,607• Cafeteria: 243
Type of Menu*• Hamburger: 86,376• Sandwiches/Deli: 60,871• Pizza: 55,982• American: 35,504• Snacks: 35,444• Chicken: 32,954• Coffee: 20,998• Taco: 11,162• Mexican: 6,104• Italian: 5,492• Seafood: 4,530• Steak: 3,797• Southwest/Tex-Mex: 2,947• Chinese: 2,132• Health Foods: 1,939• Bar-B-Q: 1,609• Hot Dogs: 1,532• Bagels: 1,439
RESTAURANT, FOOD & BEVERAGE MARKET RESEARCH HANDBOOK 2013
• 27 •
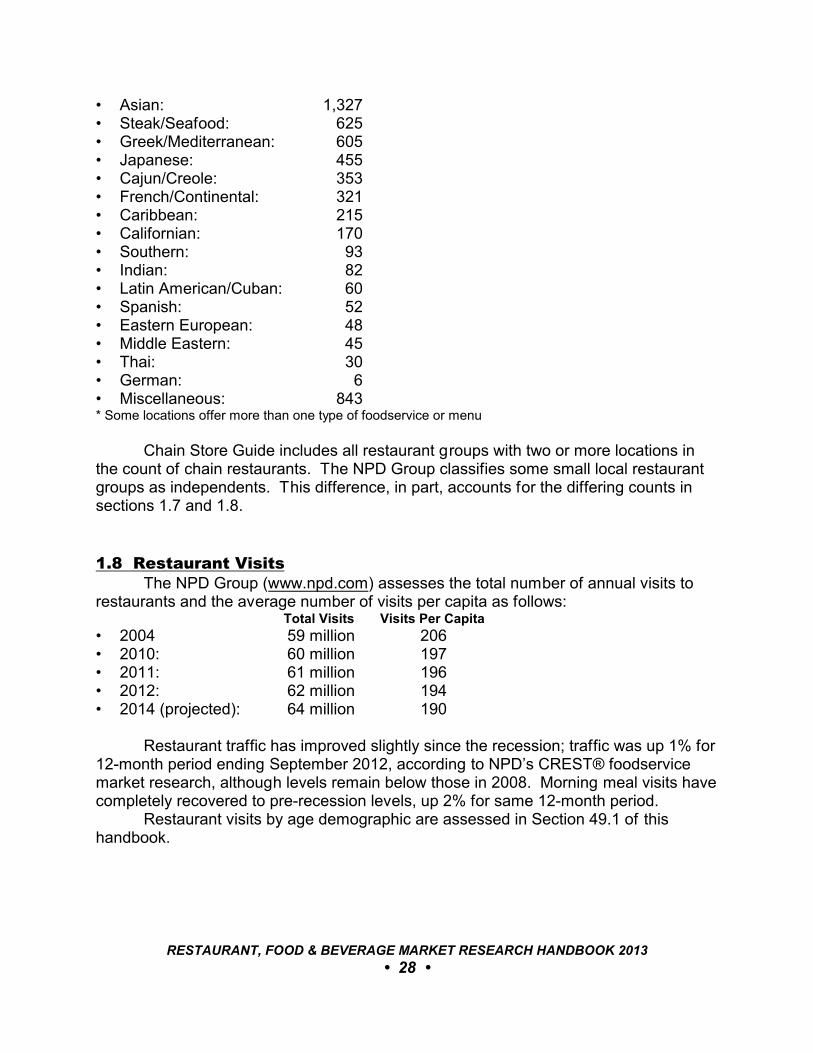
• Asian: 1,327• Steak/Seafood: 625• Greek/Mediterranean: 605• Japanese: 455• Cajun/Creole: 353• French/Continental: 321• Caribbean: 215• Californian: 170• Southern: 93• Indian: 82• Latin American/Cuban: 60• Spanish: 52• Eastern European: 48• Middle Eastern: 45• Thai: 30• German: 6• Miscellaneous: 843* Some locations offer more than one type of foodservice or menu
Chain Store Guide includes all restaurant groups with two or more locations inthe count of chain restaurants. The NPD Group classifies some small local restaurantgroups as independents. This difference, in part, accounts for the differing counts insections 1.7 and 1.8.
1.8 Restaurant VisitsThe NPD Group (www.npd.com) assesses the total number of annual visits to
restaurants and the average number of visits per capita as follows: Total Visits Visits Per Capita
• 2004 59 million 206• 2010: 60 million 197• 2011: 61 million 196• 2012: 62 million 194• 2014 (projected): 64 million 190
Restaurant traffic has improved slightly since the recession; traffic was up 1% for12-month period ending September 2012, according to NPD’s CREST® foodservicemarket research, although levels remain below those in 2008. Morning meal visits havecompletely recovered to pre-recession levels, up 2% for same 12-month period.
Restaurant visits by age demographic are assessed in Section 49.1 of this handbook.
RESTAURANT, FOOD & BEVERAGE MARKET RESEARCH HANDBOOK 2013
• 28 •
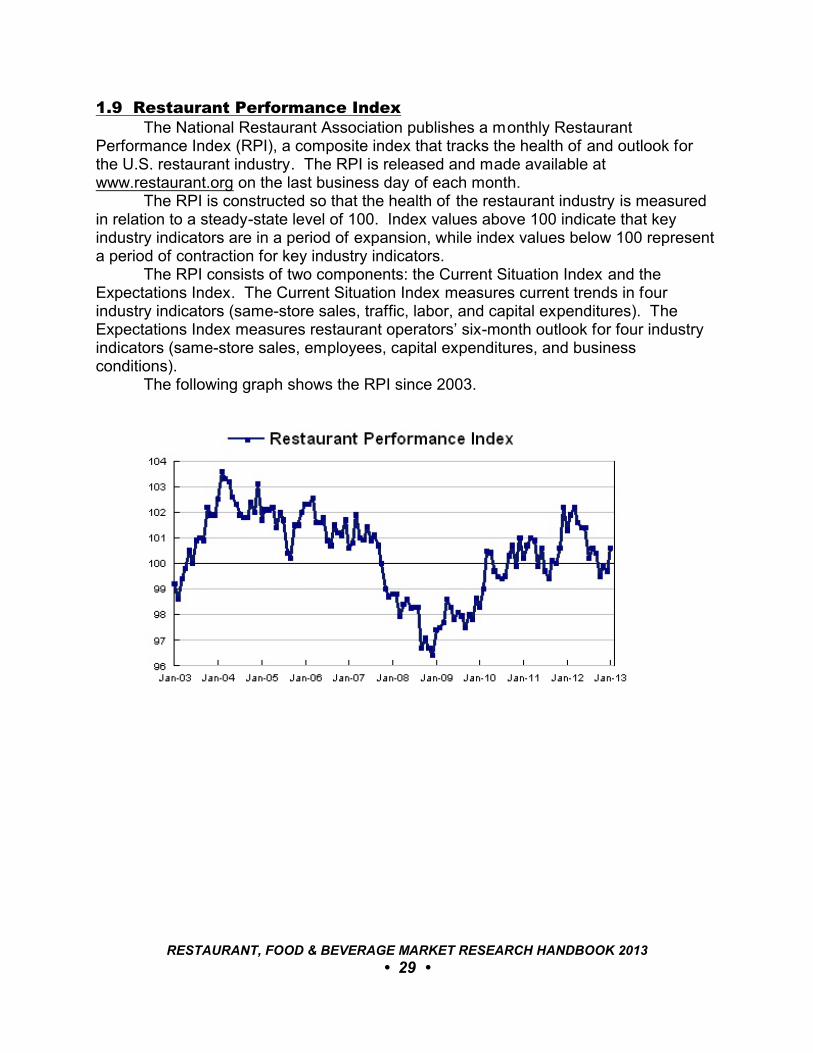
1.9 Restaurant Performance IndexThe National Restaurant Association publishes a monthly Restaurant
Performance Index (RPI), a composite index that tracks the health of and outlook forthe U.S. restaurant industry. The RPI is released and made available atwww.restaurant.org on the last business day of each month.
The RPI is constructed so that the health of the restaurant industry is measuredin relation to a steady-state level of 100. Index values above 100 indicate that keyindustry indicators are in a period of expansion, while index values below 100 representa period of contraction for key industry indicators.
The RPI consists of two components: the Current Situation Index and theExpectations Index. The Current Situation Index measures current trends in fourindustry indicators (same-store sales, traffic, labor, and capital expenditures). TheExpectations Index measures restaurant operators’ six-month outlook for four industryindicators (same-store sales, employees, capital expenditures, and businessconditions).
The following graph shows the RPI since 2003.
RESTAURANT, FOOD & BEVERAGE MARKET RESEARCH HANDBOOK 2013
• 29 •
2
STATE-BY-STATE ANALYSIS
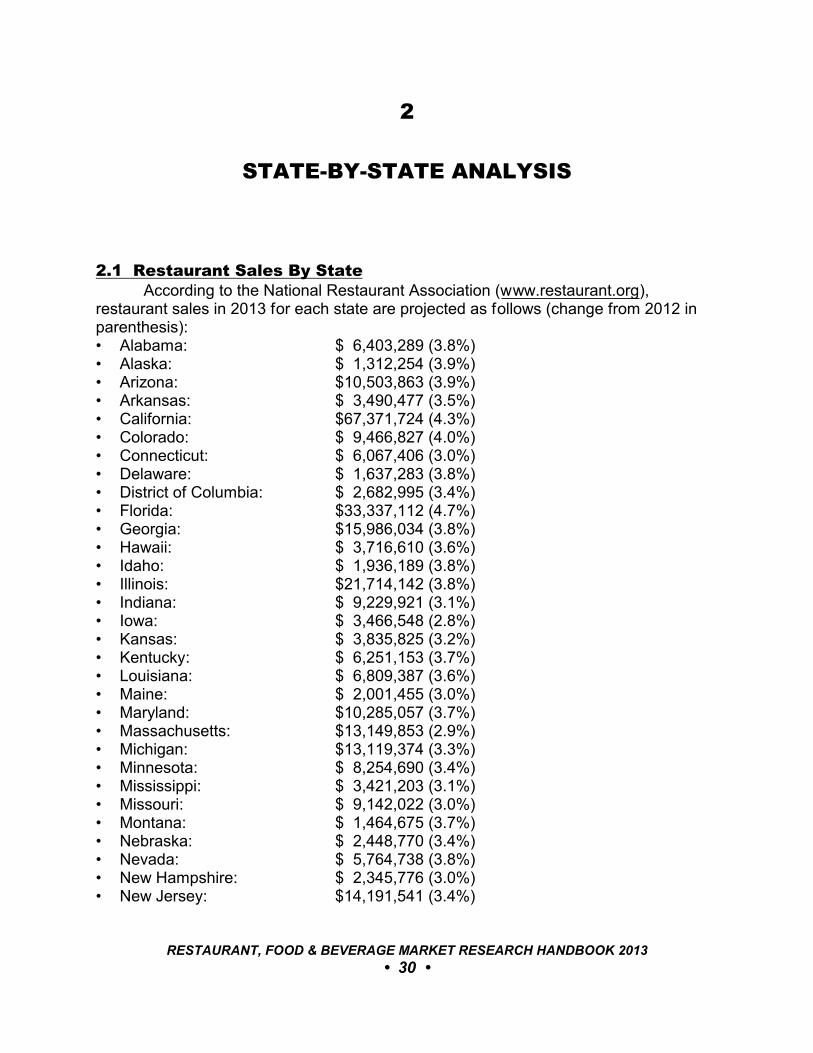
2.1 Restaurant Sales By StateAccording to the National Restaurant Association (www.restaurant.org),
restaurant sales in 2013 for each state are projected as follows (change from 2012 inparenthesis):• Alabama: $ 6,403,289 (3.8%)• Alaska: $ 1,312,254 (3.9%)• Arizona: $10,503,863 (3.9%)• Arkansas: $ 3,490,477 (3.5%)• California: $67,371,724 (4.3%)• Colorado: $ 9,466,827 (4.0%)• Connecticut: $ 6,067,406 (3.0%)• Delaware: $ 1,637,283 (3.8%)• District of Columbia: $ 2,682,995 (3.4%)• Florida: $33,337,112 (4.7%)• Georgia: $15,986,034 (3.8%)• Hawaii: $ 3,716,610 (3.6%)• Idaho: $ 1,936,189 (3.8%)• Illinois: $21,714,142 (3.8%)• Indiana: $ 9,229,921 (3.1%)• Iowa: $ 3,466,548 (2.8%)• Kansas: $ 3,835,825 (3.2%)• Kentucky: $ 6,251,153 (3.7%)• Louisiana: $ 6,809,387 (3.6%)• Maine: $ 2,001,455 (3.0%)• Maryland: $10,285,057 (3.7%)• Massachusetts: $13,149,853 (2.9%)• Michigan: $13,119,374 (3.3%)• Minnesota: $ 8,254,690 (3.4%)• Mississippi: $ 3,421,203 (3.1%)• Missouri: $ 9,142,022 (3.0%)• Montana: $ 1,464,675 (3.7%)• Nebraska: $ 2,448,770 (3.4%)• Nevada: $ 5,764,738 (3.8%)• New Hampshire: $ 2,345,776 (3.0%)• New Jersey: $14,191,541 (3.4%)
RESTAURANT, FOOD & BEVERAGE MARKET RESEARCH HANDBOOK 2013
• 30 •
• New Mexico: $ 3,129,817 (3.7%)• New York: $33,569,546 (3.9%)• North Carolina: $15,435,412 (3.9%)• North Dakota: $ 849,118 (4.8%)• Ohio: $17,417,199 (3.6%)• Oklahoma: $ 5,134,492 (3.9%)• Oregon: $ 6,491,411 (3.4%)• Pennsylvania: $17,835,462 (3.2%)• Rhode Island: $ 1,942,577 (2.5%)• South Carolina: $ 7,508,674 (3.6%)• South Dakota: $ 1,069,386 (3.7%)• Tennessee: $ 9,858,243 (3.4%)• Texas: $40,810,368 (5.0%)• Utah: $ 3,505,627 (4.1%)• Vermont: $ 858,493 (2.6%)• Virginia: $13,913,952 (3.7%)• Washington: $10,887,655 (3.5%)• West Virginia: $ 2,157,663 (2.6%)• Wisconsin: $ 7,336,231 (3.1%)• Wyoming: $ 849,182 (3.8%)
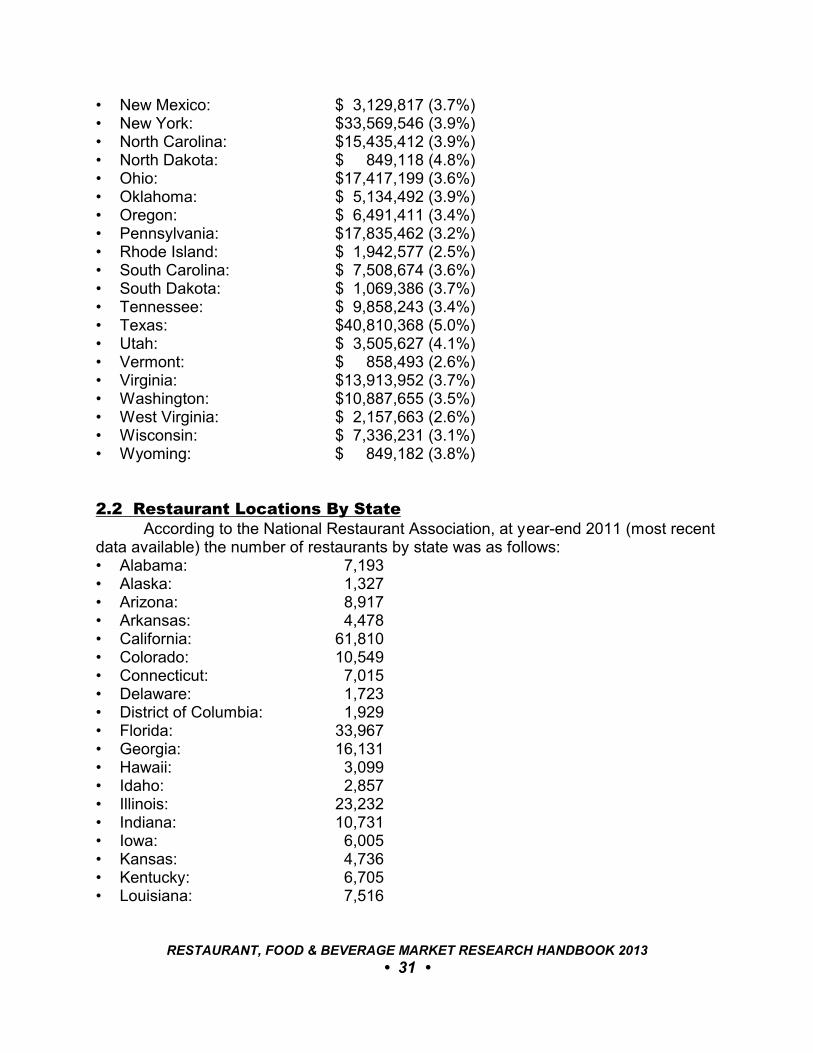
2.2 Restaurant Locations By StateAccording to the National Restaurant Association, at year-end 2011 (most recent
data available) the number of restaurants by state was as follows:• Alabama: 7,193• Alaska: 1,327• Arizona: 8,917• Arkansas: 4,478• California: 61,810• Colorado: 10,549• Connecticut: 7,015• Delaware: 1,723• District of Columbia: 1,929• Florida: 33,967• Georgia: 16,131• Hawaii: 3,099• Idaho: 2,857• Illinois: 23,232• Indiana: 10,731• Iowa: 6,005• Kansas: 4,736• Kentucky: 6,705• Louisiana: 7,516
RESTAURANT, FOOD & BEVERAGE MARKET RESEARCH HANDBOOK 2013
• 31 •

• Maine: 2,955• Maryland: 10,234• Massachusetts: 14,179• Michigan: 16,565• Minnesota: 10,028• Mississippi: 4,234• Missouri: 10,462• Montana: 2,561• Nebraska: 3,753• Nevada: 5,316• New Hampshire: 2,853• New Jersey: 17,308• New Mexico: 2,913• New York: 38,596• North Carolina: 16,035• North Dakota: 1,570• Ohio: 21,535• Oklahoma: 5,728• Oregon: 8,569• Pennsylvania: 24,397• Rhode Island: 2,640• South Carolina: 7,643• South Dakota: 1,788• Tennessee: 8,937• Texas: 35,805• Utah: 4,115• Vermont: 1,321• Virginia: 13,646• Washington: 13,557• West Virginia: 3,129• Wisconsin: 12,002• Wyoming: 1,234
2.3 Foodservice Employment By StateAccording to 2013 Restaurant Industry Forecast by the National Restaurant
Association, 13.11 million people are employed in the restaurant and foodservicesector, a figure which is projected to increase at an average national rate of 0.9%through 2023.
Current restaurant employment and the projected average annual increasethrough 2023 are as follows:
Employment Increase
• Alabama: 167,200 1.3%• Alaska: 27,700 1.3%
RESTAURANT, FOOD & BEVERAGE MARKET RESEARCH HANDBOOK 2013
• 32 •
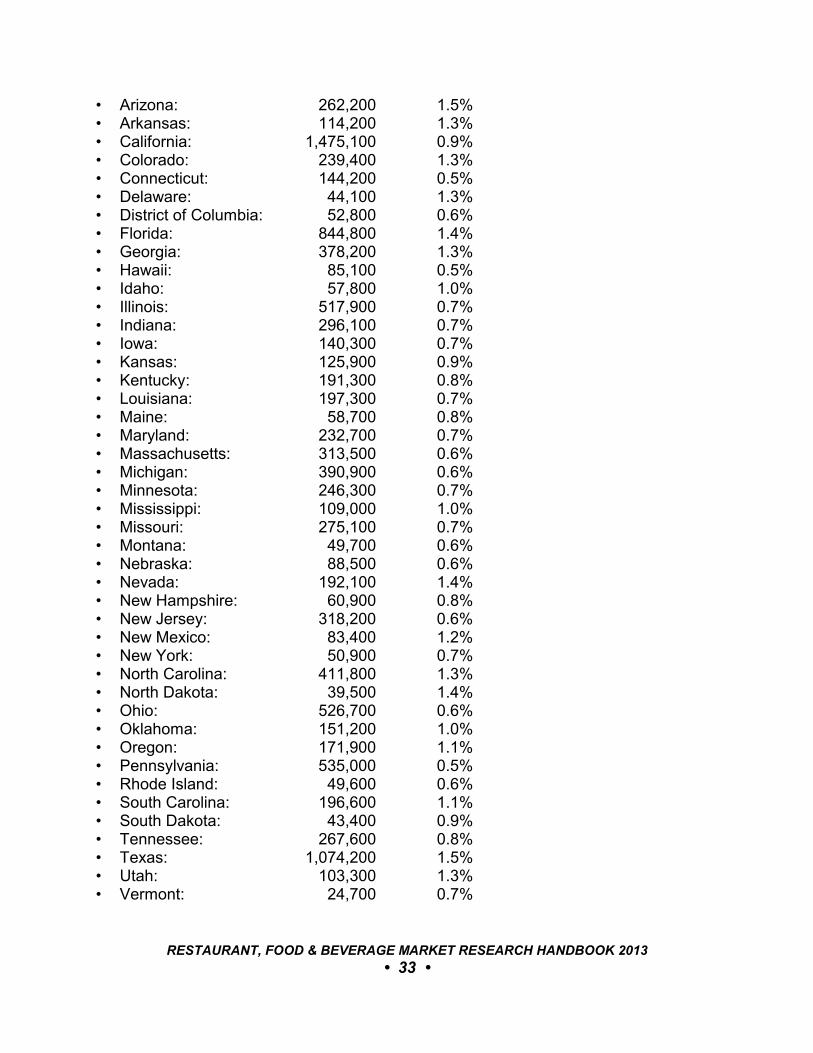
• Arizona: 262,200 1.5%• Arkansas: 114,200 1.3%• California: 1,475,100 0.9%• Colorado: 239,400 1.3%• Connecticut: 144,200 0.5%• Delaware: 44,100 1.3%• District of Columbia: 52,800 0.6%• Florida: 844,800 1.4%• Georgia: 378,200 1.3%• Hawaii: 85,100 0.5%• Idaho: 57,800 1.0%• Illinois: 517,900 0.7%• Indiana: 296,100 0.7%• Iowa: 140,300 0.7%• Kansas: 125,900 0.9%• Kentucky: 191,300 0.8%• Louisiana: 197,300 0.7%• Maine: 58,700 0.8%• Maryland: 232,700 0.7%• Massachusetts: 313,500 0.6%• Michigan: 390,900 0.6%• Minnesota: 246,300 0.7%• Mississippi: 109,000 1.0%• Missouri: 275,100 0.7%• Montana: 49,700 0.6%• Nebraska: 88,500 0.6%• Nevada: 192,100 1.4%• New Hampshire: 60,900 0.8%• New Jersey: 318,200 0.6%• New Mexico: 83,400 1.2%• New York: 50,900 0.7%• North Carolina: 411,800 1.3%• North Dakota: 39,500 1.4%• Ohio: 526,700 0.6%• Oklahoma: 151,200 1.0%• Oregon: 171,900 1.1%• Pennsylvania: 535,000 0.5%• Rhode Island: 49,600 0.6%• South Carolina: 196,600 1.1%• South Dakota: 43,400 0.9%• Tennessee: 267,600 0.8%• Texas: 1,074,200 1.5%• Utah: 103,300 1.3%• Vermont: 24,700 0.7%
RESTAURANT, FOOD & BEVERAGE MARKET RESEARCH HANDBOOK 2013
• 33 •
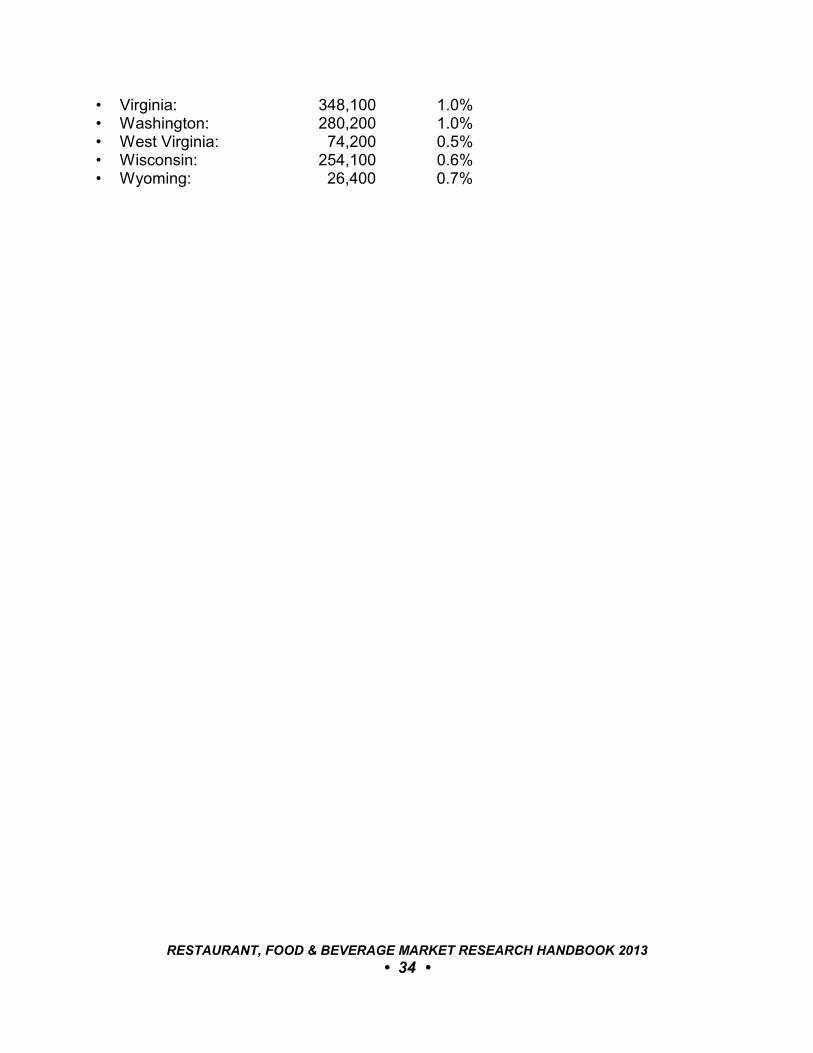
• Virginia: 348,100 1.0%• Washington: 280,200 1.0%• West Virginia: 74,200 0.5%• Wisconsin: 254,100 0.6%• Wyoming: 26,400 0.7%
RESTAURANT, FOOD & BEVERAGE MARKET RESEARCH HANDBOOK 2013
• 34 •
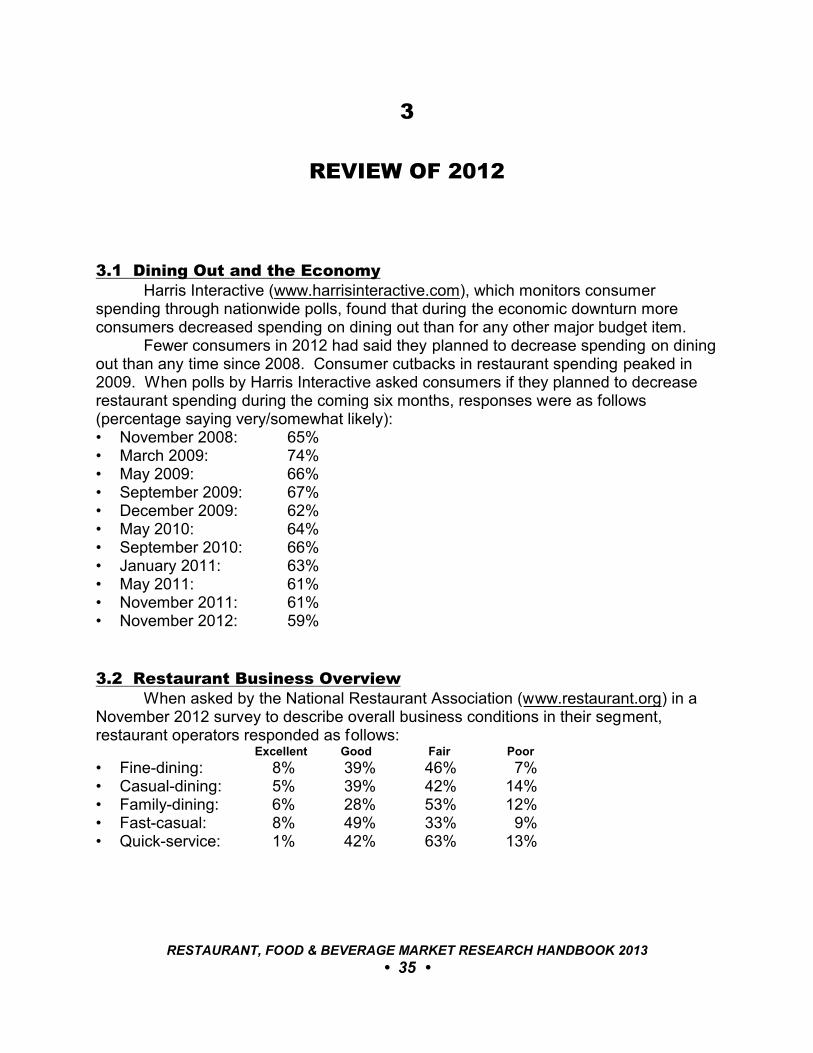
3
REVIEW OF 2012
3.1 Dining Out and the EconomyHarris Interactive (www.harrisinteractive.com), which monitors consumer
spending through nationwide polls, found that during the economic downturn moreconsumers decreased spending on dining out than for any other major budget item.
Fewer consumers in 2012 had said they planned to decrease spending on diningout than any time since 2008. Consumer cutbacks in restaurant spending peaked in2009. When polls by Harris Interactive asked consumers if they planned to decreaserestaurant spending during the coming six months, responses were as follows(percentage saying very/somewhat likely):• November 2008: 65%• March 2009: 74%• May 2009: 66%• September 2009: 67%• December 2009: 62%• May 2010: 64%• September 2010: 66%• January 2011: 63%• May 2011: 61%• November 2011: 61%• November 2012: 59%
3.2 Restaurant Business OverviewWhen asked by the National Restaurant Association (www.restaurant.org) in a
November 2012 survey to describe overall business conditions in their segment,restaurant operators responded as follows:
Excellent Good Fair Poor
• Fine-dining: 8% 39% 46% 7% • Casual-dining: 5% 39% 42% 14% • Family-dining: 6% 28% 53% 12% • Fast-casual: 8% 49% 33% 9% • Quick-service: 1% 42% 63% 13%
RESTAURANT, FOOD & BEVERAGE MARKET RESEARCH HANDBOOK 2013
• 35 •

When asked to compare their anticipated profitability in 2013 with 2012,responses were as follows:
Better Same Worse
• Fine-dining: 41% 41% 18% • Casual-dining: 38% 41% 20% • Family-dining: 39% 46% 15% • Fast-casual: 42% 43% 15% • Quick-service: 26% 45% 29%
3.3 Restaurant CountsAccording to The NPD Group, restaurant unit counts (taken each fall) have been
as follows:• 2005: 571,290• 2006: 571,143• 2007: 579,558• 2008: 582,930• 2009: 585,088• 2010: 583,500• 2011: 611,566• 2012: 616,566
_________________________________________________________________
“There were 4,442 more restaurants in the U.S.in fall 2012 than there were in fall 2011.”
The NPD Group, 1/23/13 _________________________________________________________________
3.4 Same-Store SalesSame-store sales at chain restaurants for the most recently reported quarter*
compared with the same quarter a year prior are as follows (sources: company reportsand Nation’s Restaurant News):Casual-Dining• Del Frisco’s Double Eagle Steak House: 16.6%• Kona Grill: 10.6%• Fleming’s Rime Steakhouse and Wine Bar: 10.1%• Bonefish Grill: 7.4%• Sullivan’s Steakhouse: 6.9%• Red Lobster: 6.8%
RESTAURANT, FOOD & BEVERAGE MARKET RESEARCH HANDBOOK 2013
• 36 •
• BJ’s Restaurant & Brewhouse: 6.5%• Carrabba’s Italian Grill: 6.3%• LongHorn Steakhouse: 6.0%• Outback Steakhouse: 6.0%• Buffalo Wild Wings Grill & Bar (corporate): 5.7%• The Capital Grille: 5.7%• Buffalo Wild Wings Grill & Bar (franchised): 4.2%• Texas Roadhouse (corporate): 4.0%• Texas Roadhouse (franchised): 3.7%• Seasons 52: 2.9%• Maggiano’s Little Italy: 2.8%• Ruth’s Chris Steakhouse: 2.6%• Red Robin Gourmet Burgers (corporate): 2.1%• Brio Tuscan Grille: 2.0%• Chili’s Grill & Bar: 1.4%• The Cheesecake Factory: 0.8%• Bahama Breeze: 0.5%• Bravo! Cucino Italiana: 0.5%• Mitchell’s Fish Market: - 0.7%• Ruby Tuesday (franchised): - 0.6%• Applebee’s Neighborhood Grill & Bar: - 0.3%• Famous Dave’s (corporate): - 0.1%• Famous Dave’s (franchised): - 1.0%• Olive Garden: - 2.5%• Ruby Tuesday (corporate): - 4.2%• Mimi’s Cafe: - 4.8%
Quick-Service• McDonald’s: 7.1%• Popeye’s Louisiana Kitchen: 5.9%• Jack in the Box: 5.8%• Steak ‘n Shake: 5.5%• Wendy’s (corporate): 5.1%• Wendy’s (franchised): 4.2%• Burger King: - 0.3%• Sonic: - 0.1%• Yum! Brands: - 3.0%
Fast-Casual• Chipotle Mexican Grill: 11.1%• Panera Bread: 4.4%• Qdoba Mexican Grill: 4.3%• Einstein Bros. Bagels/Noah New York Bagels: 1.0%• Così (corporate): - 3.0%
RESTAURANT, FOOD & BEVERAGE MARKET RESEARCH HANDBOOK 2013
• 37 •
Family-Dining and Buffet• Luby’s/Fudrucker’s: 3.5%• Denny’s (corporate): 1.1%• Denny’s (franchised): 0.8%• Frisch’s Big Boy (corporate): 0.4%• Bob Evans Restaurants: - 1.5%• IHOP: - 1.5%• Cracker Barrel Old Country Store: - 1.6%
Pizza• Papa John’s Pizza: 5.3%• Domino’s Pizza: 3.0%• Pizza Inn: 2.7%• Chuck E. Cheese’s (corporate): - 6.3%
Coffee and Snack• Starbucks Coffee: 10.0%• Dunkin’ Donuts: 7.4%• Tim Hortons (U.S.): 6.3%• Baskin-Robbins: 5.8%• Caribou Coffee (corporate): 4.1%• Krispy Kreme Doughnuts: 4.0%• Jamba Juice (corporate): 3.3%
* as of February 2013
3.5 AcquisitionsThe following were major restaurant chain acquisitions in 2012:
Buyer Deal Value
• Burger King (minority holding): Justice Holdings Ltd. $1.4 billion• P.F. Chang’s China Bistro Inc.: Centerbridge Partners $1.1 billion• Yard House: Darden Restaurants Inc. $ 585 million• Centerplate Inc.: Olympus Partners and
Centerplate management $ 551 million• Fogo de Chão: Thomas H. Lee Partners $ 400 million• O’Charley’s Inc.: Fidelity National Financial Inc. $ 221 million• La Boulange: Starbucks Corp.: $ 100 million• J. Alexander’s Corp.: Fidelity National Financial: $ 72 million• Lime Fresh Mexican Grill: Ruby Tuesday Inc. $ 24 million• Pizza Hut (36 restaurants): NPC International Inc. $ 19 million• Cheeseburger in Paradise: Luby’s Inc. $ 11 million• Tully’s Coffee (retail only): Kachi Partners: $ 4 million• Burger King (278 restaurants): Carrols Restaurant Group Inc. Undisclosed
RESTAURANT, FOOD & BEVERAGE MARKET RESEARCH HANDBOOK 2013
• 38 •
• Talbott Teas: Jamba Inc. Undisclosed• Texas Steakhouse & Saloon: Presidian Capital Undisclosed• Wild Wing Cafe: Axum Capital Partners Undisclosed
RESTAURANT, FOOD & BEVERAGE MARKET RESEARCH HANDBOOK 2013
• 39 •
4
PUBLICALLY TRADED RESTAURANT CORPORATIONS
4.1 OverviewStocks for 19 restaurant corporations are traded on the New York Stock
Exchange and 30 are traded on Nasdaq. The combined market capitalization for these49 companies is $237.64 billion (as of February 2013).
4.2 Restaurant Stocks and Market CapitalizationPublically traded restaurant corporations and their market capitalization are as
follows:Company Ticker Market Cap
• McDonald’s Corp.: MCD $96.33 billion• Starbucks Corp.: SBUX $42.28 billion• Yum! Brands: YUM $29.74 billion• Chipotle Mexican Grill: CMG $ 9.85 billion• Tim Hortons: THI $ 7.74 billion• Burger King: BKW $ 6.23 billion• Darden Restaurants: DRI $ 6.06 billion• Panera Bread Co.: PNRA $ 4.80 billion• Dunkin Brands: DNKN $ 3.88 billion• Dominos Pizza: DPZ $ 2.71 billion• Brinker International: EAT $ 2.46 billion• Bloomin’ Brands: BLMN $ 2.27 billion• Wendy’s International: WEN $ 2.01 billion• Cheesecake Factory: CAKE $ 1.78 billion• Diversified Restaurant Holdings: DRH $ 1.78 billion• CBRL Group: CBRL $ 1.55 billion• Buffalo Wild Wings: BWLD $ 1.40 billion• DineEquity: DIN $ 1.36 billion• Papa John’s International: PZZA $ 1.31 billion• Jack in the Box: JACK $ 1.26 billion• Texas Roadhouse: TXRH $ 1.26 billion• Bob Evans Farms: BOBE $ 1.22 billion• BJ’s Restaurants: BJRI $ 899.3 million• Krispy Kreme: KKD $ 846.6 million• AFC Enterprises: AFCE $ 700.9 million
RESTAURANT, FOOD & BEVERAGE MARKET RESEARCH HANDBOOK 2013
• 40 •
• Sonic Corp.: SONC $ 628.6 million• CEC Entertainment: CEC $ 572.6 million• Biglari Holdings: BH $ 530.2 million• Red Robin Gourmet Burgers: RRGB $ 530.0 million• Denny’s Corp.: DENN $ 481.8 million• Ruby Tuesday: RT $ 462.7 million• Del Frisco’s Restaurant Group: DFRG $ 425.5 million• Fiesta Restaurant Group: FRGI $ 416.5 million• Ignite Restaurant Group: IRG $ 383.2 million• Chuy’s Holdings Inc.: CHUY $ 371.8 million• Bravo Brio Restaurant Group: BBRG $ 295.8 million• Ruth’s Chris Steak House: RUTH $ 269.7 million• Einstein Noah: BAGL $ 221.6 million• Jamba, Inc.: JMBA $ 204.9 million• Luby’s, Inc.: LUB $ 204.4 million• Nathan’s Famous: NATH $ 184.3 million• Carrols Restaurant Group: TAST $ 145.6 million• Frisch’s Resturant: FRS $ 93.8 million• Kona Grill: KONA $ 74.5 million• Famous Dave’s: DAVE $ 71.5 million• Cosi, Inc.: COSI $ 60.5 million• Ark Restaurants: ARKR $ 57.4 million• Pizza Inn: PZZI $ 29.5 million• Granite City Food: GCFB $ 16.5 million• Flanigan’s Enterprises: BDL $ 14.3 million• Chanticleer Holdings: HOTR $ 7.4 million
RESTAURANT, FOOD & BEVERAGE MARKET RESEARCH HANDBOOK 2013
• 41 •

PART II: TRENDS FOR 2013
RESTAURANT, FOOD & BEVERAGE MARKET RESEARCH HANDBOOK 2013
• 42 •
5
CULINARY TRENDS
5.1 OverviewThe National Restaurant Association (www.restaurant.org) surveys member
chefs of the American Culinary Federation (www.acfchefs.org) annually asking them torank over 200 culinary items. The survey serves as the basis for a list of ‘hot trends’ forthe coming year. This chapter presents the 2013 list.
5.2 Culinary ThemesThe top culinary themes for 2013 are as follows:
1. Environmental sustainability2. Children’s nutrition3. Hyper-local sourcing (e.g., restaurant gardens)4. Gluten-free cuisine5. Health/nutrition
5.3 Top Menu TrendsChefs of the American Culinary Federation rank the top menu trends for 2013 as
follows:Full-Service Restaurants1. Locally sourced meats and seafood2. Locally grown produce3. Healthful kids’ meals4. Environmental sustainability as a culinary theme5. Children’s nutrition as a culinary theme6. New cuts of meat (e.g., Denver steak, pork flat iron, teres major)7. Hyper-local sourcing (e.g., restaurant gardens)8. Gluten-free cuisine9. Sustainable seafood10. Whole-grain items in kids’ meals11. Farm/estate-branded items12. Non-wheat noodles/pasta (e.g., quinoa, rice, buckwheat)13. Nontraditional fish (e.g., branzino, Arctic char, barramundi)
RESTAURANT, FOOD & BEVERAGE MARKET RESEARCH HANDBOOK 2013
• 43 •
14. Ethnic-inspired breakfast items (e.g., Asian-flavored syrups, chorizo scrambledeggs, coconut-milk pancakes)
15. Fruit/vegetable children’s side items16. Health/nutrition as a culinary theme17. Half-portions/smaller portions for a smaller price18. House-made/artisanal ice cream19. Black/forbidden rice20. Food trucks
Quick-Service Restaurants1. Gluten-free items2. Locally sourced produce3. Healthful kids’ meals4. Fruit/vegetable sides in kids’ meals5. Locally sourced meat or seafood6. Artisanal/house-made items7. Low-fat/nonfat milk or 100% juice options in kids’ meals8. Whole-grain items9. Lower-sodium items10. Lower-calorie items11. Sweet potato fries12. Sustainable food items13. Lower-fat items14. Energy drinks15. Mini-desserts/dessert bites16. Spicy items17. Organic items18. Entree salads19. Vegetarian entrèes20. “Build-your-own” items
5.4 Top Trends By CategoryBy food category, the following are the top trends for 2013:
Appetizers 1. House-cured meats/charcuterie2. Vegetarian appetizers3. Ethnic/street-food-inspired appetizers (e.g., tempura, taquitos, kabobs, hummus)4. Amuse bouche/bite-size hors d’oeuvre5. Flatbread appetizers
RESTAURANT, FOOD & BEVERAGE MARKET RESEARCH HANDBOOK 2013
• 44 •
Breakfast/Brunch 1. Ethnic-inspired breakfast items (e.g., Asian-flavored syrups, chorizo scrambled
eggs, coconut-milk pancakes)2. Traditional ethnic breakfast items (e.g., huevos rancheros, shakshuka, ashta,
Japanese)3. Fresh-fruit breakfast items4. Prix fixe brunches5. Chicken and waffles
Desserts 1. House-made/artisanal ice cream2. Bite-size/mini-desserts3. Savory desserts4. Deconstructed classic desserts5. Dessert flights/combos
Ethnic Cuisines and Flavors 1. Peruvian cuisine2. Regional ethnic cuisine3. Ethnic fusion cuisine4. Korean cuisine5. Southeast Asian cuisine (e.g., Thai, Vietnamese, Malaysian)
Kids’ Meals 1. Healthful kids’ meals2. Whole-grain items in kids’ meals3. Fruit/vegetable children’s side items4. Oven-baked items in kids’ meals (e.g., baked chicken fingers, oven-baked fries)5. Children’s portions of adult menu items
Main Dishes/ Center of the Plate 1. Locally sourced meats and seafood2. New cuts of meat (e.g., Denver steak, pork flat iron, teres major)3. Sustainable seafood4. Nontraditional fish (e.g., branzino, Arctic char, barramundi)5. Half-portions/smaller portions for a smaller price
Nonalcoholic Beverages1. House-made soft drink/soda/pop2. Gourmet lemonade (e.g., house-made, freshly muddled)3. Organic coffee 4. Specialty iced tea (e.g., Thai-style, Southern/sweet, flavored)5. Coconut water
RESTAURANT, FOOD & BEVERAGE MARKET RESEARCH HANDBOOK 2013
• 45 •
Preparation Methods 1. Fermenting2. Pickling3. Sous vide4. Liquid nitrogen chilling/freezing5. Smoking
Produce 1. Locally grown produce2. Organic produce3. Superfruit (e.g., açai, goji berry, mangosteen)4. Heirloom apples5. Exotic fruits (e.g., rambutan, dragon fruit, paw paw, guava)
Sides/Starches 1. Non-wheat noodles/pasta (e.g., quinoa, rice, buckwheat)2. Black/forbidden rice 3. Quinoa4. Red rice5. Pickled vegetables
Other Food Items/ Ingredients 1. Farm/estate-branded items2. Artisan cheeses3. Ethnic cheeses (e.g., queso fresco, paneer, lebneh, halloumi)4. Non-wheat flour (e.g., peanut, millet, barley, rice)5. Ancient grains (e.g., kamut, spelt, amaranth)
RESTAURANT, FOOD & BEVERAGE MARKET RESEARCH HANDBOOK 2013
• 46 •

6
FOOD & DINING TRENDS
6.1 OverviewThis chapter provides summaries of forecasts for dining trends in 2013 based on
the assessments of the following analysts and media sources:• Andrew Freeman & Co. (www.afandco.com)• Baum + Whiteman (www.baumwhiteman.com)• Bon Appétit (www.bonappetit.com)• Culinary Visions (www.culinaryvisions.org)• Epicurious (www.epicurious.com)• Flavor Forecast (www.flavorforecast.com)• Mintel (www.mintel.com)• Sterling-Rice Group (www.srg.com)• Supermarket Guru (www.supermarketguru.com)• Technomic (www.technomic.com)• The Food Channel (www.foodchannel.com)
6.2 Andrew Freeman & Co.How Restaurant Trends Will Shape A New Reality In 2013, a report by Andrew
Freeman & Co., forecasts the following restaurant and dining trends:A Juice Fix For All• Fresh squeezed and cold processed juices offer unique flavor combinations and
convenience as well as health benefits.
Blow Out The Bar• Forget fine-dining and blow out the bar, enhancing the menu with casual food for
appetites of all sizes. Offer one menu of sophisticated, approachable, andshareable food including enticing bar snacks and heartier options.
Call for a Toast!• Everyone’s “toast”ing. Toast it, slather it with sweet or savory items and watch
guests enjoy any time of day. Perfect for snacking and for sharing.
RESTAURANT, FOOD & BEVERAGE MARKET RESEARCH HANDBOOK 2013
• 47 •
Counter Culture• Guests are sitting front and center at kitchen counters, watching and interacting
directly with the chefs who serve them. Chefs are showing off with 20 or morecourses spread out over multiple hours. It’s a one of a kind experience that lasts alifetime, or maybe it seems like it.
Couples’ Kitchen• Culinary couples are opening exciting new restaurants, sharing a common dream
and making it a reality. Benefits include shared work and responsibility, laborsavings, and a more personal home-spun feel. It’s the new mom & pop shop.
Drunken Bar Snacks• The bar and snacks are coming together with drunken bar snacks featuring classic
bar foods flavored with ingredients from the bar.
From Rush-In With Love• Chefs trained in fine-dining are speeding things up with new fast-casual
restaurants featuring counter service, speedy delivery, and a concise menufocusing on one narrowly defined concept.
Get Board• Boards are the new baskets. Offer a selection of house made breads and custom
flavored spreads served straight from a bread board.
Go Against The Grain With Gluten-Free Menus • Offer attractive options for this growing subset of the population.
Keep On Truckin’• Food trucks haven’t run out of gas, they’re becoming permanent fixtures. Take
advantage of smaller build-out fees and increased mobility to increase brandawareness. Offer mobile outlets in destination areas or outsource foodservices tolocal vendors.
Next Mex• With an increasingly savvy world-traveling clientele, skilled native cooks, and a
bevy of people who love Mexican food, expect more restaurants to focus on thesophisticated side of Mexican cuisine and the melding of Mexican home cookingwith local ideals.
On a Roll• Sandwich shops are creating their own customized rolls designed to show their
stuffings.
RESTAURANT, FOOD & BEVERAGE MARKET RESEARCH HANDBOOK 2013
• 48 •

One Bite Wonders• Pay-per-the-piece pre-appetizer courses priced less than $5 each are enjoyed by
guests and can be a revenue generator.
Prove It• Gain credibility with official certification: LEED, Monterey Bay Aquarium Seafood
Watch Alliance, Demeter, EverBlue, LEAF, etc.
Road Scholars• Chefs are traveling the world and bringing ingredients and new menu dishes
inspired directly by their travels, regardless of the types of food they serve.
The New ABCs• Argentina, Brazil and Chile! Or Asados (Argentine barbeque), Borgoña (Chilean
beverage of chilled red wine and strawberries), and Chimichurri (Argentine salsaverde). Or perhaps Alfajores (dulce de leche cookies), Brigadeiros (Brazilianchocolate and condensed milk candies), and Cachaça/Caipirinhas (Braziliancocktails).
The Perfect Fixe• Restaurants are returning to fixed price menus and not just for fine dining. Reap
the rewards of an improving economy, manage costs and tables better, andimprove returns.
Track Record• Educate cooks and servers so they know where things come from. Share favorite
purveyors on the website or on Facebook. But keep it out of every dish descriptionon the menu. People get tired of hearing it.
We’re Really Open• Open kitchens are back. Chefs are delivering food. Move the “back of house” up
front.
6.3 Baum + WhitemanBaum + Whiteman annually develops lists of restaurant and hotel food trends.
The following is Baum + Whiteman’s Food and Dining Trends for 2013:Artisan Drinks Bubbling• Upscale restaurants, pushing for differentiation, are making their own artisan sodas
using fresh and local ingredients. And several bottlers of flavored waters are addingreal juice to their products.
• Behind all this stirring: Consumers are abandoning colas in droves, seeking “fresh”beverages or fruit-flavored carbonates and smoothies with the illusion of health.
RESTAURANT, FOOD & BEVERAGE MARKET RESEARCH HANDBOOK 2013
• 49 •
• For quick-service restaurants, beverage sales are a big bright spot with growingnumbers of snack-time beverage-only sales.
Aye, Robot• Driven by ‘the need for speed’ industry-wide moves accelerate getting food into
customers’ hands. • Sprinkles, a Los Angeles-based cupcake chain, made headlines with its pink 24-
hour Cupcake ATM that sells 1,000 cupcakes daily to people who want to beat in-store lines or demand an after-hours sugar fix. Meanwhile, McDonalds is bringingits touch screen order-and-pay kiosks from Europe to the United States to speedservice and cut lines.
• The following are some overseas examples of creative foodservice automation: - A Lay’s machine in Argentina churns out warm, salted chips from real potatoes
and sells them by the bag. - A butcher in Spain has a 24-hour vending machine for prepared meals,
sausages, steaks, meatballs; in-store customers can use it during businesshours, bypassing sales clerks.
- In France, a 24-hour machine sells freshly baked baguettes. - In Korea, Coca-Cola introduced an interactive dance machine – customers
imitate dance steps shown on a large screen and the machine rewards them withbottles of soda.
- In Singapore, customers lovingly hug a vending machine to dispense their bottleof Coca-Cola.
Bars Are Where The Flavor Action Is• Looking for future flavors? Keep keen eyes on artisan cocktails. Ambitious
bartenders (whose numbers grow exponentially) are infusing vodka, gin, and rumwith mango, kiwi, and other house-made exotica (even dried fruit) as they stretchthe notion of hand-crafted cocktails.
• Flavor researchers (and chefs, too) should refocus on the bar: cocktails of pureedand muddled melons, syrups of lemongrass, rosemary, pomegranate, cinnamon,cardamom, and ginger, among other esoterica; flavored vinegars going into oldfashions shrubs, smoked ice cubes, yuzu bitters, chocolate-chile bitters, sangriavariations no one’s heard of in Spain.
• Restaurant and hotel chains, straining to step away from bottled and powderedshortcuts, are playing catch-up … but training hundreds of bartenders can be akiller.
• All this artisan stuff is expensive, and cocktails are regularly crossing the $15 line …so there’s lots of inflation at the bar. Wines-by-the-glass, too, are galloping in price. An $8 glass once came from an $8 bottle; now we’re seeing $12 glasses from $10bottles … what recession?
RESTAURANT, FOOD & BEVERAGE MARKET RESEARCH HANDBOOK 2013
• 50 •
Bread Trends• Look for more elaborate breads and rolls. Restaurants are baking in-house to save
costs and to ramp up distinctiveness, especially with sandwiches, emphasizing an‘artisan’ at work.
Bundling Gets Bigger• Since the recession, bundles are getting increasing play at casual-dining chains:
Chili’s and Golden Corral’s 2-for-$20, periodic bargain dinners-for-two at RedLobster and T.G.I. Friday’s, and Olive Garden’s ‘Buy Dinner And Get A Free EntreeTo Take Home’ promotion. The Palm had a three-course dinner for $39.95 andMorton’s introduced a $29.95 lunch package. Outback offers four courses for $15;their objective is to fill seats at any cost and to stem to tide of people trading down.
Everyone Wants To Be Chipotle• Consumers are trading down like crazy … bypassing casual dinnerhouses …
leaping from full-service restaurants directly to fast-casual formats … sacrificingservice but believing the food is still “fresh.”
• We’re seeing fast-casual service systems applied to pizza, fish and chicken, Greekfood, noodles, Asian food, hot dogs, and taquerias.
• Because fast-casual concepts seem fresh and new, they serve as an entry point tosample new ethnic cuisines, especially for Millennials. Customizable sushi, Indian-inflected wraps, and a banh mi version of Subway are examples.
• Hotels are pondering fast-casual takeaway spaces as tablecloth restaurants slump.
Fast-Food Strikes Back• At the bottom of the price chain, fast-feeders are taking new measures to compete
with fast-casual competition. Menu boards are sprouting higher-priced options andburger chains, smitten by the “gourmet” boom, are adding higher-priced items($4.50-$6.00) while at the same time maintaining their 99¢ or $1 leaders. Watch forgilded burgers (guacamole, pineapple, mushrooms, crispy onions), pepped-upsauces, ethnic touches, lots of fancier buns, and a bit more customization.
Fields Of Greens• Kale is trickling down to mass-market restaurants, as are beet greens, chard, turnip
greens, and mustard greens. Seaweed is an ingredient in bread; in flavored salt; incrackers; in breakfast cereals; in butter; toasted and sprinkled on f ries, fish, andpasta; and in packaged snacks flavored with wasabi, olive oil, and sesame seeds.
Large Format Meals• Whole animal or whole bird dinners are expanding, triggered by successful nose-to-
tail dinners across the country and by large format meals. The following areexamples:
RESTAURANT, FOOD & BEVERAGE MARKET RESEARCH HANDBOOK 2013
• 51 •
- Momofuko’s $200 Korean ‘bo saam’ family-style meals include a dozen oysters,a whole roasted pork shoulder, BBQ sauce, kimchee, and lettuce in which towrap the meat. It’s available at lunch or only before or after peak dinner hours.
- A Summer 2012 special at Daniel Boulud’s DBGB ($495) included an entire pigfor up to eight people plus headcheese as a starter, a mountain of side dishes,and baked Alaska.
- Grace Restaurant (Portland, ME) offers a “whole beast” lamb dinner for six toeight people including harissa-spiked lamb tartare, cured lamb “bresaola,”rigatoni with smoked lamb shoulder, and leg of lamb stuffed with pine nuts andcorn. Like many such feasts, it requires 72 hours’ notice; the cost is $65 perperson.
- Specialty dinners at Mozza, in Los Angeles, include a whole hog multi-courseextravaganza of various body parts served family style for up to 30.
- For groups of four to eight people, Wong (New York City) offers a duck-focusedmeal: duck in lettuce wraps, duck buns, duck meatballs, whole duck two ways,duck broth, and duck fat ice cream with plums. The cost is $65 per person; 48hours notice is required.
Law Suits • Natural. Organic. Artisanal. Local. Claims like these are under intense scrutiny by
bloggers, journalists, nutritionists – and, of course, lawyers. Keep your eyes onGeneral Mills and Pepsico suits (among others) over genetically modifiedingredients conflicting with “natural” claims. There are also suits against Cabot,Yoplait and other yogurt companies over whether their “Greek” yogurt is the realthing. Nutella agreed to a label overhaul in 2012.
Snackification Of America• We’re eating less at every meal but more than making up for it with endless
snacking and Americans’ waistlines prove it. Snacks account for one in five eatingoccasions; multiple snacks now qualify as America’s “fourth meal.”
• All-hours grazing is seen across the economic spectrum: Food trucks define a newmarket for creative, portable food; hotel lobbies have morphed into living-diningrooms, giving rise to social snacking and all-day drinking; and breakfast is goingupscale, being served at all hours.
Suppliers Opening Own-Brand Stores• Blame it, perhaps, on the wildly successful Apple Store. Food suppliers and
manufacturers are launching their own restaurant startups. Their primary aim: Toraise their brands’ visibility and build powerful appeals to consumers. Some ofthese are for promotional purposes, but some are actual restaurant operationsslated for expansion. The following are examples:
- Anheuser Busch-InBev is featuring its global breweries at airports with a chain ofBelgian Beer Cafes serving their own brands – Stella, Hoegaarden, Leffe – alongwith food options.
RESTAURANT, FOOD & BEVERAGE MARKET RESEARCH HANDBOOK 2013
• 52 •
- Barilla announced plans to launch branded pasta restaurants in 2013 to enhancethe company’s pasta products in supermarkets and, presumably, amongrestaurant food buyers and customers. A competitive manufacturer, PastificioRana, is opening a long-delayed fresh pasta restaurant in New York’s Chelseamarket, the first unit of a chain.
- Dannon and Chobani have opened flagship yogurt bars in Manhattan. Dannonsells a choice of traditional and Greek-style yogurt, a retail segment that’sdoubled in five years with no sign of slowing. Chobani, the largest U.S. purveyorof its kind, sells only Greek yogurt curated by “yogurt masters.”
- Ghirardelli Chocolate opened a soda fountain/chocolate shop at DisneyCalifornia Adventure. This will be followed by shops at the Palace Hotel in SanFrancisco and Harrah’s Carnaval Court in Las Vegas.
- Smithfield Foods opened a pork-centric restaurant. Taste of Smithfield,combined with a specialty retail store. The store is in Smithfield, Virginia.
- Vogue magazine announced plans to open a Vogue Café in a mammoth shoestore in Dubai; a GQ bar also in a hotel there. Publisher Condé Nast already hasbranded food and beverage venues in Kiev, Moscow, and Istanbul.
6.4 Bon AppétitBon Appetit’s editors identified the following food trends for 2013:
Blond(ie) is the New Brown(ie)• For dessert snobs, blondies have always been a pale imitation of their darker
inspiration. But now the fairer-hued bar is coming into its own. In New York City,Stellina sells a Dirty Blondie with peanut butter and toffee. And in San Francisco,Black Jet Baking Co. adds brown butter and Maldon sea salt to set a new standardfor what the classic un-brownie should be.
Chicken-Focused Concepts• Now that better-raised, better-tasting birds are more available, restaurateurs like
Jean-Georges Vongerichten (Simply Chicken in New York City) are openingconcepts. Other new concepts include Bantam & Biddy (Atlanta, GA), ChickenScratch (Dallas, TX), Fresa’s (Austin, TX), Pecking Order (Chicago, IL), and WingWings (San Francisco, CA).
Fresh Horseradish• Pale, knotty, and not especially sexy, horseradish is all of a sudden everywhere on
menus, adding a peppery hit to ceviches, as a garnish for short ribs, or as a toppingfor smoked salmon tartines.
Grapefruit’s New Main Squeeze• It turns out that The Paloma, not the Margarita, is Mexico’s most beloved cocktail,
and it’s making inroads north of the border. Basic versions contain nothing more
RESTAURANT, FOOD & BEVERAGE MARKET RESEARCH HANDBOOK 2013
• 53 •
than tequila, grapefruit-flavored soda, and ice.
Hang Time With Chefs• Not long ago, the great chefs kept to themselves. But thanks to a new crop of
culinary events, foodies can mingle with and even question such culinary rock stars. Favorite events include the Southern Foodways Alliance symposium, Mesamérica inMexico City, and Copenhagen’s MAD Symposium, curated by Noma’s RenéRedzepi.
Kitchen Collaborations• The Good & Evil chocolate bar ($18, www.eclatcocolate.com) combines the talents
of Eric Ripert, Anthony Bourdain, and Christopher Curtin, owner of Éclat Chocolate. More culinary mashups are in the works as brewers join forces with restaurants(Brooklyn Brewery and NYC ramen spot Ippudo) and musicians get with coffeeroasters (James Murphy and Blue Bottle Coffee).
Sriracha’s Competition• The Korean chile paste gochujang is catching fire outside of Koreatowns. Think
bold miso meets that stuff in the rooster bottle. Dab it on egg sandwiches or sliders,toss with chicken wings, or try it in the bibimbap.
Tea Party People• Tea is the new coffee, complete with equipment, techniques, and tons of varieties.
The Alterna-Egg• Chefs are moving out of the henhouse, ditching chicken eggs in favor of their larger
and tastier siblings: duck eggs.
The Cemita: Spanish for Big Mac• This sandwich, from the Mexican state of Puebla, joins the banh mi, cubano, and
panino as part of our lunchtime canon. The cemita is a specialty menu item atCascabel Taqueria (New York, NY), Cemita (Brooklyn, NY), Cemitas Puebla(Chicago, IL), El Chucho (Washington, DC), and Nido (Oakland, CA).
The King of Crustaceans• Sorry, Maine lobsters, Carolina blue crabs, and Georgia shrimp, but Dungeness
crab now rules the crustacean kingdom. Chefs across America have caught on,tossing it with pasta, piling it on grilled toast, even smoking it.
The New Daily Grind• Milling your own flour may seem like something out of an episode of Frontier House,
but freshly ground whole grains are packed with the vitamins, fiber, and flavor thatthe industrial stuff lacks.
RESTAURANT, FOOD & BEVERAGE MARKET RESEARCH HANDBOOK 2013
• 54 •
The Next Course: Bread• The hottest thing since sliced bread is, well, bread. Bread that’s so good that it gets
its own course, like the sourdough fried in pork fat and served with house-madebutter at Matthew Lightner’s Atera (New York City) and the bread courses atOxheart (Houston, TX) and Blanca (Brooklyn, NY).
The Next D.I.Y. Staple: Yogurt• First Greek was the darling of the active culture-obsessed crowd, then the Icelandic
version stormed the dairy case. Yogurt’s next move? A home invasion. Homemade yogurt is creamier and less tangy than the store-bought stuff. Plus,despite all those counter-hogging devices you’ve seen, it requires no specialequipment to make – just a little patience. With your own jar in the fridge, we predictit’ll work its way into your salad dressings, chicken marinades, or rich stews.
What Your Bartender Is Drinking• The Italian digestivo Fernet-Branca is the after-work shot of choice among those
who make drinks. It can also be used in cocktails to lend an astringency orroundness.
6.5 Culinary VisionsSince 2002, Culinary Visions has collected insight into menu trends from chefs,
foodservice professionals, and consumer foodies. This insight provides the basis for anannual list of food trends.
Culinary Visions’ 2013 Food Trends is as follows:24/7 Snacking• Meal times have expanded from the traditional three to seven as snacking increases
among time-starved Americans’ hectic schedules. Small plates are no longer atrend; they are just part of the way Americans eat today. Major restaurant chainshave re-imagined menus with snack items like popcorn, pickles, cotton candy,olives, and deviled eggs. Consumers can choose to have a bite or try it all.
• New age vending machines offering customization and fresh food are breakingvending out of its desperate food reputation. Look for greater variety of offeringsand more healthful options to feed this 24/7 on demand food culture in all segmentsof the industry.
Canning, Curing, and Cutting in House• As the push toward local is finding its way into almost every segment, chefs are
moving toward preservation. Pickling is proving to be a popular way for chefs to addtheir personal touch and showcase a unique aspect of using local ingredients yearround.
RESTAURANT, FOOD & BEVERAGE MARKET RESEARCH HANDBOOK 2013
• 55 •
• A few years ago there was little expectation that nose-to-tail would move beyond afew independent chefs who embraced it as a novelty. Nose-to-tail is a sustainablepractice that is expanding awareness of a wider range of meat cuts and goingmainstream. Fast-casual restaurants, college and university campuses, and otherfoodservice segments are experimenting and finding a receptive consumeraudience.
Catering to Kids• Chain restaurants have cracked the code on healthful, family-friendly dining.
Family-dining is now benefitting from chefs who bring their culinary training and theirfamily heritage along with their own kids into affordable, casual restaurants. Catering to food allergies and preferences is second nature to parent-chefs, whichmakes their restaurants even more appealing. Families are finding new ways toshare their evening meal together and dispense with the takeout containers orcleaning up their own kitchen.
• The chefs who create these family friendly restaurants are welcomed into localneighborhoods where residents recognize their value to the community becausethey have seen the positive impact chefs can have on young consumers’ respectand understanding of food. Chefs who work in school kitchens are bringing a newlevel of nutrition literacy and good taste to the consumers of tomorrow.
Fashionable Plates• The parallels between food and fashion have always captivated the senses. From
artfully presented entrèes to couture condiments, innovative chefs are feeding thesenses of consumers with an appreciation for fashionable plates.
Home and Away Flavors• Look for a rediscovery of regional American cooking as chefs continue to explore
the culinary cultures from cities and towns around the country. Memphis, Harlem,and New Orleans are all playing a part in bringing these regional American cuisinesto the forefront.
• This will be the year for destination flavors that are fresh, hot and sweet. Nichecuisines are slowly making their way onto menus, giving consumers an opportunityto expand their palates. Chefs are using ingredients as a way to bring these flavorsto the menu; look for ginger, cinnamon, exotic citrus, sriracha, chiles, andsweet-heat blends like honey and harissa.
Liquid Luxuries• The beverage industry has been a hotbed of innovation across all fronts. Healthful,
handcrafted, heady, hearty, and happy are just a few adjectives to describe thelatest in beverages. Amber spirits, house made tonics, and bitters have created awhole new bar scene. Non-alcoholic beverages are getting a flavor boost with freshginger soda, handcrafted sodas, and exotic lemongrass-flavored iced teas. Juicesand smoothies have become the elixir of our day with unique, delicious, and
RESTAURANT, FOOD & BEVERAGE MARKET RESEARCH HANDBOOK 2013
• 56 •
sometimes palate-challenging blends of fruits and vegetables. Even desserts likemilkshakes and floats have moved to the beverage menu.
Menus on the Move• Food trucks have become part of the culinary landscape in major cities, and have
migrated to industrial areas and college campuses. They are more than a newdelivery system; they are leading the charge in finding new ways to deliver a trulyunique dining experience.
• Look for innovative menus to move to even more unexpected venues enticing allkinds of consumers. For the farm-to-table crowd, farmers are renting their fields tochefs and their guests. For adventurous fine diners, Diner en Blanc (a flash mob ofupscale diners decked out in white bring their own lavish meal to a public place) hasbeen exported from Paris to nine cities in the U.S. and twenty worldwide. Thepop-up dinner is the experiential antidote to a tight economy taking advantage ofunderutilized real estate all over the country. There are always options for thewell-heeled consumer to drop a bundle for the promise not to be dropped from adinner table suspended by a crane.
Pure Food• Real food, pure and simple, is the secret to successful new products. Nothing sells
like pure and simple as consumers clamor for clean fuels for their bodies anddemystified ingredient statements for their minds.
Reversing the Flow• Conventional wisdom in the food business has looked to fine-dining and cutting-
edge independent chefs to drive the trends. Today many leading chefs are inspiredby the street markets of Asia and Latin America and the classic American state fairswhich have stimulated fun and exciting ways to serve food.
Vegetable Concoctions• From hyper local to exotic foreign lands, vegetables have become an undeniable
part of the healthful culinary landscape. And selling the farm is all the rage withentrepreneurs and large enterprises alike. From school lunch to gourmet retailshops, consumers are ravenous for vegetables. The latest twist is stem-to-rootcooking with fruits and vegetables. This trend is about making a lot more thanflavorful stocks – look for leaves, pits, rinds, stems, seeds, and peels to turn up ontrendy menus.
• Kale is taking over healthy menus in quick-service restaurants and on collegecampuses. School foodservice operators are turning vegetables into super heroeswith kid-appealing names like power punch broccoli and x-ray vision carrots. Frenchfries are evolving from potatoes to sweet potatoes, eggplant, zucchini. and a widerrange of vegetables. Everything about today’s vegetables is chic and appealingincluding those sporting a black color like garlic and mushrooms.
RESTAURANT, FOOD & BEVERAGE MARKET RESEARCH HANDBOOK 2013
• 57 •
6.6 EpicuriousEpicurious, a Condé Nast blog, predicts the following culinary trends for 2013:
Collaborations• The food world can take a lesson from Grant Achatz and Daniel Humm, chefs who
switched restaurant spaces for 21st Century Limited. Achatz’s Alinea cooked itssignature fare in Humm’s 11 Madison Park space for a week in September andHumm followed suit in October in Chicago. And in the aftermath of SuperstormSandy, restaurants like Hill Country and Rob’s Bistro in Madison, New Jersey,offered temporary work to servers, bussers, prep cooks, and other kitchen workersdisplaced by the storm.
Culinary Profession: Artisan Food Producer• The rise of the artisan market includes the emergence of the dedicated purveyor,
the expert in one focused food specialty. Enter the sriracha maker, the mayonnaisemaster, and the mustard queen. This is their time.
Esoteric Ingredient: Sumac• With several new books on Middle Eastern cooking (Jerusalem, The Lebanese
Kitchen, to name two), sumac will likely make an appearance in a pantry near you. Look for this tart but fruity powdered spice at specialty purveyors like Penzeys anduse it to spice up eggs or make za’atar.
Hot Cuisine: Brazilian• With the upcoming World Cup in Brazil, Brazilian fare is about to take the world by
storm. Churrascaria, check! Pão de queijo, check!
Hot Dessert: Vegetables• 2013 will be the year of vegetables. They’re even in dessert. Battersby in Brooklyn
offers a Fennel Panna Cotta, Michel Richard (Washington, DC) makes a MapleParsnip Cake, and there’s Avocado Mousse at Tilth in Seattle.
Hot Dish: Vegetable Plate• The vegetable plate is not just for vegetarians anymore. Seasonal vegetable mains
at Fat Radish (New York City) and Philadelphia’s Supper are good examples.
Hot Liquor: Mezcal• Handcrafted from wild agave plants, mezcal has always been an artisanal product
historically seen as tequila’s poorer cousin. But with a massive PR push by theMexican government and producers making more of this smoky spirit availablestateside, it’s only a matter of time before mezcal finds its way into a cocktail nearyou.
RESTAURANT, FOOD & BEVERAGE MARKET RESEARCH HANDBOOK 2013
• 58 •
Hot Vegetable: Cauliflower• This cruciferous friend is finally taking center plate with restaurants like Chicago’s
Girl and the Goat (where it’s roasted), Sunday Suppers (where it’s fried) in Brooklyn,and the National in Athens, Georgia (where it’s soupified), showcasing the vegetableas a starring player.
Restaurant Technology• Comodo’s Instagram menu and the rise of the iPad in the dining room mean it’s only
a matter of time before more restaurants opt for pixilation over paper.
6.7 Flavor ForecastSince 2001, the Flavor Forecast (www.flavorforecast.com) has spotlighted
emerging trends that are expected to drive flavor innovation over the next several years. The forecast is developed by McCormick & Company.
The Flavor Forecast 2013 is as follows:Empowered Eating• Farro Grain, Blackberry & Clove – Healthy ancient grain rediscovered with powerful
hits of fruit and spice• Market-Fresh Broccoli & Dukkah (blend of cumin, coriander, sesame and nuts) –
Satisfying flavors and textures, mixing unexpected varieties of broccoli with MiddleEastern spice blend
Global My Way• Japanese Katsu Sauce & Oregano – Tangy flavors of BBQ and steak sauce create
the next go-to condiment• Anise & Cajeta (Mexican caramel sauce) – Sweet, rich delight transports desserts
and savory dishes to new places
Hidden Potential• Hearty Meat Cuts, Plantain & Stick Cinnamon – A new take on meat and potatoes,
these ingredients inspire creative approaches that unlock their full flavor potential• Artichoke, Paprika & Hazelnut – Ingredients you thought you knew invite new
explorations, unleashing their deliciously versatile starring qualities
No Apologies Necessary• Decadent Bitter Chocolate, Sweet Basil & Passion Fruit – An intensely indulgent
combo that delights all the senses• Black Rum, Charred Orange & Allspice – An instant tropical getaway, this sultry
collision balances richness and warmth
RESTAURANT, FOOD & BEVERAGE MARKET RESEARCH HANDBOOK 2013
• 59 •

Personally Handcrafted• Cider, Sage & Molasses – Rustic and comforting, this combo brings natural
goodness to every meal of the day• Smoked Tomato, Rosemary, Chile Peppers & Sweet Onion – Smoky, sweet, and
spicy flavors energize handcrafted ketchup, sauces, jams, and more
6.8 MintelMintel identified the following four trends that are expected to impact the
restaurant industry in 2013:24/7 Hunger• From roaming food trucks to self-serve coffee kiosks and fancier vending machines,
fresh, high quality food is available in more places and whenever customers want it. Such all-access eating means that traditional restaurants need to adjust theirbusiness models and find ways to stay nimble to keep up with the many new wayspeople can feed their cravings.
Clean Food, Clean Conscience• While 2012’s “pink slime” story may have simmered down, each new food safety
scare leaves a residue that will continue for years to come. Growing consumerconcern about food quality, processing and safety means that operators can’t cutcorners when it comes to ingredient sourcing. Whether it’s “cage-free eggs” or“made-on-premises,” choosing the right menu language is as important as choosingthe right ingredients in building customers’ trust.
Liquid Assets• Beverages have always been a reliable profit center for restaurants, but relying on
these add-on sales isn’t as easy as pouring a big gulp any longer. Today’s gourmetcocktails, craft beers, and super-nutritional juices and smoothies have raisedexpectations for the beverage category. Keeping up with the waves of innovationwill become a vital part of all segments of the foodservice industry.
Where’s The Beef?• Most commodity prices have risen, but none more than beef. With consumer
confidence still low, now is not the time for restaurants to institute drastic price hikes. From smaller steaks to premium chicken positioning, operators will use clever menutactics to defray high ingredient prices in 2013.
RESTAURANT, FOOD & BEVERAGE MARKET RESEARCH HANDBOOK 2013
• 60 •
6.9 Sterling-Rice GroupSterling-Rice Group foresees the following as cutting-edge dining trends in 2013:
American Artisans Save You A Trip To Europe• For years, budding food artisans have sprung up in the U.S., crafting everything
from cocktails to charcuterie. And as their craze becomes a lifestyle, you can counton every major American city to proudly sport local, artisan foodie destinations in2013.
Asian Influences American Comfort Food• The fresh, spice-forward flavors of Thailand, Vietnam, and Korea will work their way
into our menu. Expect to walk into a classic American diner and see options likeVietnamese chicken sandwiches, sriracha mayo, or Korean-glazed pork ribs.
Chefs Watch Your Weight• Butter, bacon, and cream have been chefs’ best friends since the beginning of time.
But in 2013, chefs will be working quietly behind the scenes to make dishes betterfor you with ingredients like brown rice, high-fiber grains, and vitamin-rich veggiebroths.
Fruit � Sweet• In 2013, chefs will be far less interested in highlighting the sugary, honey tastes of
melons, peaches, and the like. Instead, they will lace fruit with savory flavors,bringing naturally refreshing and sweet touches to appetizers, soups, veggie sides,and even meaty entrèes.
Kids’ Menus Grow Up• In 2013, we’ll see less hot dogs, mac ‘n cheese, and grilled cheese on our little
ones’ plates. Instead, more fruits, a variety of veggies, protein-rich grains, andauthentic Asian flavors will push kids’ menus into the realm of adult dining.
No Diner Left Behind• To accommodate vegetarians, vegans, gluten-freers, wheat-freers, kiddos, and
eco-conscious diners, restaurants will offer all-inclusive menus and service. Sodon’t be surprised when your server asks for your allergy list the next time you order.
Popcorn Is The Snack Of 2013• Light, crispy, and equally delicious with sweet or savory flavors, this popped whole
grain is addictive, not to mention low in fat and calories. Which is why in 2013,expect popcorn to explode (no pun intended) as a bar snack, crouton, ice cream,and more.
RESTAURANT, FOOD & BEVERAGE MARKET RESEARCH HANDBOOK 2013
• 61 •

Small Plates For Me Only• As American dining evolves from tapas, sharing will go by the wayside in 2013.
With menus offering small, singular servings of meat, veggies, and starches, we’ll beable to enjoy a perfectly sized meal of whatever it is we’re craving. On our own.
Sour Gets Its Day• Finally, the American dining scene will move beyond sweet, salty, and fatty. Next
year we’ll have a plethora of tart, acidic, and bitter flavors to choose from, as menusand grocery stores feature flavors like fermented cherry juice, varietal vinegars, andeven sour beer.
Veggies Take Over The Plate• Forget resigning veggies to your salad plate. In 2013, you’ll find garden-grown
foods as entrèes (cauliflower steaks), starches (squash noodles), and even deliciousbeverages (celery juice cocktails).
6.10 Supermarket GuruPhil Lampert, editor of the Supermarket Guru (www.supermarketguru.com),
identified the following trends to watch in the food industry in 2013:Breakfast Becomes the Most Important Meal of the Day• Ninety percent (90%) of U.S. consumers say they eat breakfast every day, but the
conversation is shifting to what foods are best to eat for breakfast, and takingbreakfast foods into other day parts. Breakfast foods are typically high in protein(e.g., eggs, egg whites, yogurts, milk) and as the nation continues to focus on highprotein foods, look for these less expensive proteins to replace the higher pricedmeats for some meal occasions.
Evolution of Frozen Foods• According to The NPD Group’s National Eating Trends, fewer meals are made from
scratch (59% in 2012, down from 72% in 1984) as many Americans don’t have timeto spend in the kitchen. In 2013, the myth that home-cooked is always morenutritious than frozen gets debunked and marketing extols facts like frozen fruits andvegetables are typically harvested in season and flash frozen – and cost less,reinforcing the FDA statement that there is virtually no nutritional difference betweenfresh and frozen fruits and vegetables.
Men in the Supermarket and Kitchen• Men and dads are getting more comfortable and powerful in the kitchen. Look for
supermarkets to increase their focus on men in 2013 as they’ve become moreactive in shopping, meal planning, and cooking. According to a June 2012 surveyfrom Cone Communications, more dads than moms (52% compared with 46%) planmeals for the week ahead. Some supermarkets experimented with “man aisles” —
RESTAURANT, FOOD & BEVERAGE MARKET RESEARCH HANDBOOK 2013
• 62 •
look for this concept to expand to multiple locations in the store featuringmale-oriented foods, recipes, and other promotional tools to make shopping andimpulse buying more targeted.
New Proteins• The U.S. Department of Agriculture estimates the cost of both beef and chicken will
increase by at least 5% due to the 2012 drought and declining supply. A major shiftis anticipated in the nation’s protein food supply away from meat-based proteins andshifting to meatless proteins like eggs, nut butters, tofu, beans, and legumes, withan increase in awareness and consumption of vegetarian and vegan meals.
Smart Home, Smartphone• Smartphones and technology are prevalent in the food industry, but the newest
wave of technology includes smartphones that network with kitchen appliances andallow consumers to do everything from checking how much milk they have left in therefrigerator, to turning the oven on from another room. The next generation ofmobile apps may determine if fruits and vegetables are ripe, if frozen foods havebeen kept at the correct temperature, and even test for foodborne bacteria – apersonal “food lab” in every shopper’s pocket.
Snacking and Mini-Meals• Think smaller bites and more frequent eating patterns that reduce overall portion
size and increase variety. Restaurants will add more small plates and appetizers tothe menu while grocery stores and food companies will offer new snacks withappropriate pre-portioned options to take the guesswork out of portion sizes. According to The NPD Group, more than half of Americans snack two to three timesper day, while one in five eating occasions is a snack.
Sustainability• The National Resource Defense Council (www.nrdc.org) estimates 40% of food
goes uneaten each month in the United States. The Eco Pulse Survey from theShelton Group (www.sheltongrp.com) reports 39% of Americans feel the most“green guilt” for wasting food, almost double the number who feel guilty about notrecycling.
The Boomer Reality of Diabetes, High Blood Pressure and Heart Disease• Studies by The NPD Group show that nutrition and healthy eating habits are top
meal-planning priorities for Baby Boomers. A recent study by ConAgra Foods foundthat eating canned tomatoes provides the greatest source of antioxidants toAmericans’ diets – more than any other non-starchy vegetable. People who tend toeat low-fat diets rich in fruits and vegetables tend to have a decreased risk of cancerand heart disease. Boomers will focus on their intake of antioxidants as theycontinue their search for the fountain of youth. Boomers will control more than halfthe dollars spent on grocery foods by 2015, look for more heart-healthy
RESTAURANT, FOOD & BEVERAGE MARKET RESEARCH HANDBOOK 2013
• 63 •
antioxidant-rich foods including oily fish such as salmon, as well as green tea, sweetpotatoes, dark leafy greens, popcorn, berries, and whole grains to take oversupermarket shelves.
The Impact of Millennials• In 2013 supermarkets and food companies will cater more toward Millennial
consumers with affordable foods that are flavorful and ethnically diverse. Millennials, those born between 1982 and 2001, will represent 19% of thepopulation by 2020, and will have double their current buying power forfood-at-home. Millennials also love food, and their passionate interest is led by theirdesire to understand where foods are from, preparation, and how food is served. Arecent study by Jefferies Alix Partners (www.alixpartners.com) found that Millennialsare also deal seekers and are much more focused on finding the lowest price overbrand loyalty.
The Story Behind Our Food• 2013 will be a transitional year as on-package claims proliferate and confuse. Look
as supermarkets take on the role of gatekeeper and actually demand proof andtransparency of claims before they will permit products to be sold on their shelves. The role of retail dietitians will increase as their influence and education becomemore important to everyday buying decisions. Consumers are reading labels andselecting their foods more holistically based on all the “food factors” including taste,ingredients, source and nutritional composition, as well as who is making their foodalong with an understanding of impact on the environment.
6.11 TechnomicTechnomic foresees the following restaurant trends in 2013:
Chicken Surprise• Yes, chicken is ubiquitous thanks to its always-reasonable price and remarkable
versatility, but now it’s actually trendy as well. New quick-service and fast-casualfried-chicken concepts are popping up, offering Southern or spicy takes on a classic. And now that Latin-accented marinated chicken has established a niche, Africanperi-peri chicken may be next.
Fast-Casual Goes Globe-Trotting• Success in the exploding fast-casual sector is no longer limited to bakery cafes and
Mexican concepts. Build-your-own-better-burger chains and gourmet brick-ovenpizza restaurants have been on the rise for some time, but now we’re also seeingmore ethnic foods and flavors – from American barbecue to Southeast Asian soups,and from sandwiches to Mediterranean and Middle Eastern fare.
RESTAURANT, FOOD & BEVERAGE MARKET RESEARCH HANDBOOK 2013
• 64 •
Great Grains• Recognized as nutrition powerhouses – packed with protein as well as texture and
full, rich taste – grains are also playing star roles on trendy menus. Dishes likepolenta, couscous, or bulgur are central to some of today’s hottest ethnic cuisines. And a number of grains – quinoa, amaranth, millet, wild rice, corn, oats, andbuckwheat – do not contain gluten, so they’re being nudged to the fore as part of themovement to gluten-free eating.
More Is More• On the other hand, there’s an opposite value-as-volume movement. Look for more
deals like Pizza Hut’s Big Dinner Box (two pizzas with multiple sides) or OliveGarden’s Dinner Today & Dinner Tomorrow (a dine-in meal plus a to-go meal), aswell as multi-course feasts for two, four or more – even whole-hog pig roasts.
Noodle-Shop Noodles• Ramen done right is a long way from dorm fare; it’s nutritious, subtle, satisfying, and
redolent of exotic Far East street markets. Look for ramen, udon, soba, cellophaneand rice noodles to show up in hearty layered bowls, fragrant soups and evenmixed-texture salads, not only in a burgeoning number of big-city noodle shops butin seafood and varied-menu restaurants as well.
Restaurants Thirsty For Differentiation Turn To Beverages• Trends include fresh fruit (especially tropical fruit) beverages; natural energy drinks;
housemade sodas; cocktails made with candy-like flavored vodkas; microdistilleryliquors that promote drinking locally; regional craft brews starring in beer-and-foodpairings; and the rise of hard ciders.
Retro Rising: Diner And Deli Fare• Concepts of many types are looking to the menus of traditional and contemporary
diners and delis for inspiration. We’ll see a proliferation of premium diner- anddeli-inspired meaty sandwiches, full-flavored soups, even pickles – from traditionaldill cukes to pickled red onion.
South America – The Next Frontier• Just as diners who love Asian fare have explored beyond Chinese to develop a
taste for Thai and Vietnamese, those who favor Mexican are now looking furthersouth – all the way to Brazil, Argentina, and Peru. We’ll see mainstreaming ofSouth American-style grilled meats, chimichurri sauce, ceviche, SouthAmerican-Asian fusion seafood dishes and iconic drinks, from Brazil’s caipirinha toPeru’s pisco sour.
Vegetables Take Their Star Turn• As more diners discover the joys of occasional meatless meals, the flirtation with
vegetarian fare evolves into flexitarian fascination with actual vegetables. That
RESTAURANT, FOOD & BEVERAGE MARKET RESEARCH HANDBOOK 2013
• 65 •

means not only innovative salads but also creative presentations of roasted orsteamed veggies, even the assertive ones like carrots, kale or Brussels sprouts. Vegetables at the center of the plate are welcomed by diners – who continue toseek fresh, local, healthful fare – as well as operators squeezed by rising costs forproteins.
According to Technomic, the major developments influencing adult beverages in2013 will include the following:Beer Comes To The Table In High-End Restaurants• Extensive beer lists developed with the same care as wine lists take hold at
upscale-casual and fine-dining restaurants, where beer’s food-friendly nature furtherenhances the dining experience.
Beer Gardens Indoors And Out• The communal experience of the beer garden goes beyond the major markets. The
hottest trends in beer, food, and socializing come to life in large open spaces – bothindoors and outside – devoted to the casual enjoyment and exploration of beer andfood as beer gardens show up in markets from New York to New Orleans andbeyond.
Digital Drinks• Wine, cocktail, and beer lists presented on digital tablets put descriptive information,
photos, and even food-pairing suggestions at guests’ fingertips in bars andrestaurants, while in-store tablets and digital kiosks provide product details, ratingsand serving suggestions at retail. Smartphone apps, along with QR codes oneverything from packaging to menus, also immediately connect consumers tointeresting drink information.
Mixers Matter• The quality trend prompts bar pros to apply the same stringent standards to
selecting and showcasing mixers, juice, flavorings, purees, bitters, and other drinkingredients as they do to the alcohol components.
New Drinks On Tap• Innovative dispensing systems at bars and restaurants bring spirits and cocktails to
the tap, sometimes even at patrons’ tables. Keg wines also deliver unique vintagesin a fresh format.
Next-Level Ciders• Hard cider’s growth continues, thanks to the broad appeal and food-friendly flavor
profiles, not to mention increased distribution and marketing support as majorsupplier companies are now playing in the category. New flavored varieties furtherbolster the category in both retail and restaurant/bar outlets.
RESTAURANT, FOOD & BEVERAGE MARKET RESEARCH HANDBOOK 2013
• 66 •
Next-Level Retailing• Adult beverage retailing takes an upscale turn, moving from “package store” to
“bottle shop” concepts that focus on eclectic spirits, wine, and beer offerings, handselling of products and attention to the overall customer experience. In-store sippingand sampling proliferates, thanks to legislative changes, and growler filling stationsfind favor in convenience and grocery outlets.
Unexpected Flavors In Unexpected Places• Confectionary flavors in vodka provide ongoing excitement, but flavors show up and
take some categories in new directions. Canadian whisky appeals to younger adultswith flavored expressions, while rum and tequila continue to deliver new flavorexperiences. The duality of sweet-and-savory and other flavor combinations takeflavored vodkas into new realms, as do unique and unexpected offerings that inspireat-home and professional bartenders alike.
Whiskey Wows• From whiskey-flavored liquors to flavored whiskeys, and from single barrel bourbons
to new takes on rye, whiskey’s appeal grows. In bars and restaurants, the storiedbrown spirit attracts more young adults and women, while consumers experimentwith both traditional and new expressions for at-home enjoyment.
Wines Go Sweet• The sweet wine trend continues, with varietals including Moscato showing up in
table wines and in pink sparklers on menus across the country. Red blends alsoproliferate, delivering a range of flavor profiles, many of which skew toward thesweet and medium-bodied end of the spectrum to appeal particularly to Millennials.
6.12 The Food ChannelThe Food Channel (www.foodchannel.com) in conjunction with CultureWaves®
and the International Food Futurists® compiles an annual list of the top 10 food trendsforeseen for the coming year. The 2013 Trends Forecast is as follows:Brunch Becomes The New Fourth Meal• The late-morning meal that usurps breakfast and lunch is becoming the hot new
meal occasion. You can find eateries that feature karaoke during brunch or offer afree-flowing Bloody Mary Bar. There is even a bowling alley that hosts a brunch,serving such choices as fried chicken, buttermilk pancakes, and cinnamon toastpizza. So stay up late, then sleep in, and enjoy the new fourth meal.
Comfort Food With An Ethnic Accent• Younger generations have expanded what fits into this nostalgic category, with an
emphasis on ethnic cuisines. Comfort food for the twenty- and thirty-somethingcrowd includes choices like Japanese ramen, Korean kimchi, Chinese pot stickers,
RESTAURANT, FOOD & BEVERAGE MARKET RESEARCH HANDBOOK 2013
• 67 •
sun cakes and Vietnamese pho. Look for new twists in 2013 like jumbo-sized “mansushi.”
Cooking To A Tea• Earl Grey and other tea flavors are starting to be used in cooking. The consumption
of tea, in general, is growing and now it’s moving beyond beverage onto theingredient list for some menu items. Teas have great names and can help spice upa menu in many ways. Look for tea rubs, the way there are coffee and cocoa rubs. Tea … it’s not just for drinking anymore.
Here’s The Skinny• We’re finally starting to see the obesity trend level off a bit with a growing number of
Americans striving to eat healthier. But a developing subset of the movement to eatsmarter is a new desire to be – not just at a healthy weight – but actually skinny. The “skinny-fit” trend is moving from a blue jeans category to a way of eating, andsome restaurants are responding with tiny portions that cater to this vanity-drivencrowd. This is a trend to watch in 2013.
Home Bakers Hone Skills• High-end specialty bakery products are becoming widely accessible for home use.
It’s never been easier to get professional restaurant quality ingredients and supplies. At-home bakers have found a new way to make what used to be hard ... well, if noteasy, at least easier. Thanks to new parchments, new pans, new recipes, andtutorials, baking up fancy pastries at home is becoming a more realistic goal. Premium French pastries are getting incorporated into more desserts and into morebreakfast/brunch items, and more people embracing the idea for home cooking. The French Pastry School of Kennedy-King College in Chicago is expanding forthose thinking about going pro, as well as some who are simply serious aboutgetting really good at it.
Illegal Dining• Years ago we called out Clandestine Dining, where people were setting up pop-up
restaurants that you had to be invited to in order to even know they existed. Thencame along food trucks and people started to realize that restaurant food couldshow up in unexpected places. Now in 2013, it’s “hush dining,” fueled by Twitterand the spirit of entrepreneurship – but not legally licensed as a business. Thereare a lot of people out there with great ideas on how to change a meal, make it theirown, and make it the way nobody else has – but they don’t have the capital or thetime to start a restaurant. So they’re printing business cards and setting up a Twitteraccount, going to farmers markets and utilizing word of mouth to create an on-orderkitchen out of their home. It’s half thrill of the hunt and half genuinely homemade(with a little black market appeal thrown in the mix) that eggs on diners looking forthe next food truck and the next dive – beyond social media. It’s an evolution ofboth pop-up dining and of food trucks, and we think, while business licenses are
RESTAURANT, FOOD & BEVERAGE MARKET RESEARCH HANDBOOK 2013
• 68 •
there for a reason, it will be interesting to see how this evolves new ideas and newapproaches to the difficult business of running a restaurant.
Seasonals For All Seasons• Traditional seasons are getting stretched out, with people making things like
pumpkin muffins in the summer. The health benefits and the flavor are turning thefall favorite into a year-round flavor in all kinds of dishes. Chefs have increased theiruse of pumpkin on menus by nearly 40% in the last two years. Tomatoes havebeen an all-year staple for years, but new breakthroughs in agri-science are makingthe off-season varieties actually worth eating. Then there’s the continuation of thecanning trend (which we spotlighted last year), that lets folks enjoy the bounty ofsummer all winter long.
Smokin’ Hot • Smoking – as in smoked foods and beverages – is big and getting bigger. At the
dinner table, it’s going way beyond barbecue, and the trend is spreading. We’restarting to see things like smoked cocktails, smoked olive oil, and even smokedwater. Nordic/Scandinavian cuisine is one to watch in the coming year, too, andyou’ll find a variety of smoked food choices driving that trend.
The Prix-Fixe Is In• “No choice” is becoming the new choice when it comes to dining out. The
European-style prix-fixe (fixed menu) is making its way to American shores. Fine-dining establishments offer a limited range of set choices, and are holding firm on nosubstitutions. It’s trickling down to the casual-dining segment, too. Chains arebundling a selection of appetizer-entrèe-dessert three-course meals for two for avalue price.
The Rise Of The Supermarket Concierge• Grocery stores have executive chefs, offer cooking classes, and have specialists
who can direct you to the best cheese, best meats, and best baked goods. Webegan to see it a few years ago when we predicted the rise in butchers, and it’sgone beyond. Cooking classes are everywhere – sponsored by grocery stores,private caterers, and restaurants. The supermarket concierge is the next logicalstep in the progression.
6.13 Market ResourcesAndrew Freeman & Co., 101 Townsend Street, Suite 303, San Francisco, CA 94107.(415) 781-5700. (www.afandco.com)
Baum + Whiteman, 912 President Street, Brooklyn, NY 11215. (781) 622-0200.(www.baumwhiteman.com)
RESTAURANT, FOOD & BEVERAGE MARKET RESEARCH HANDBOOK 2013
• 69 •
Bon Appétit, 4 Times Square, 5th Floor, New York, NY 10036. (212) 286-3535.(www.bonappetit.com)
Culinary Visions, 445 West Erie Street, Suite 107, Chicago, IL 60654. (312) 280-4757.(www.culinaryvisions.org)
Mintel, 333 W. Wacker Drive, Suite 1100, Chicago, IL 60606. (312) 932-0400. (www.mintel.com)
Sterling-Rice Group,1801 13th Street, Suite 400, Boulder, CO 80302. (303) 381-6400.(www.srg.com)
SupermarketGuru.com, 3015 Main Street, Suite 320, Santa Monica, CA 90405.(310) 392-0448. (www.supermarketguru.com)
Technomic, Inc., 300 South Riverside Plaza, Suite 1200 South, Chicago, IL 60606. (312) 876-0004. (www.technomic.com)
RESTAURANT, FOOD & BEVERAGE MARKET RESEARCH HANDBOOK 2013
• 70 •

PART III: CITY-BY-CITY ANALYSIS
RESTAURANT, FOOD & BEVERAGE MARKET RESEARCH HANDBOOK 2013
• 71 •
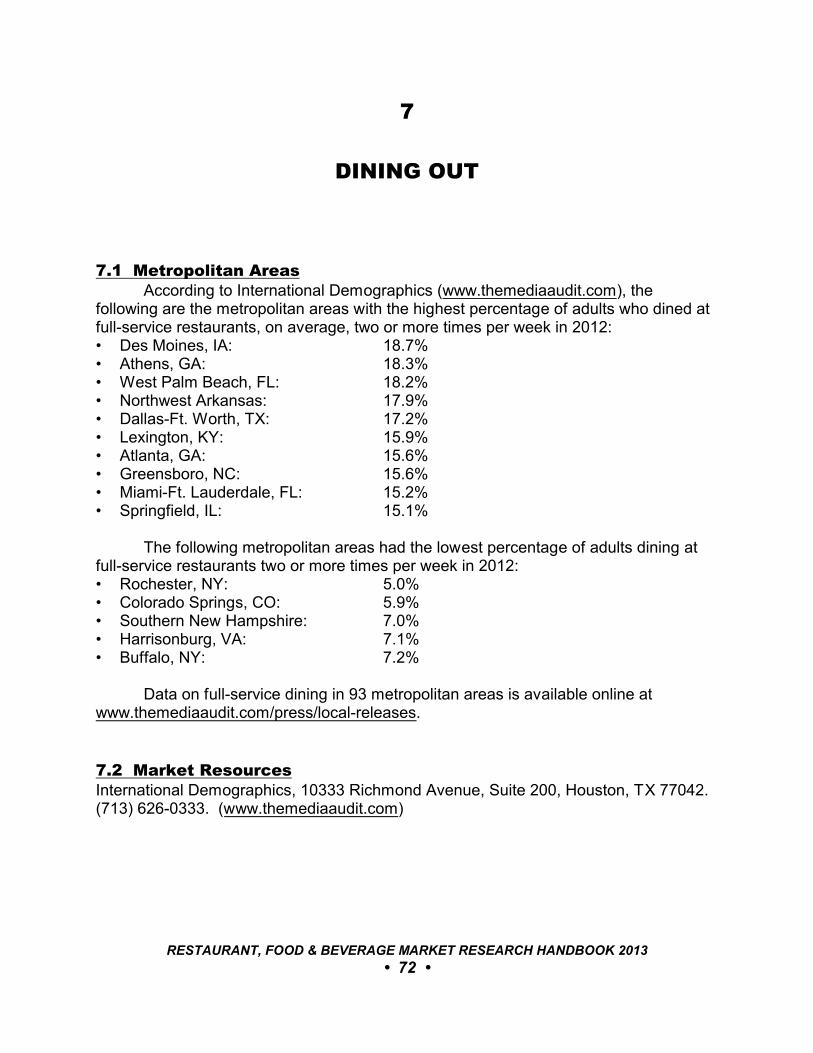
7
DINING OUT
7.1 Metropolitan AreasAccording to International Demographics (www.themediaaudit.com), the
following are the metropolitan areas with the highest percentage of adults who dined atfull-service restaurants, on average, two or more times per week in 2012:• Des Moines, IA: 18.7%• Athens, GA: 18.3%• West Palm Beach, FL: 18.2%• Northwest Arkansas: 17.9%• Dallas-Ft. Worth, TX: 17.2%• Lexington, KY: 15.9%• Atlanta, GA: 15.6%• Greensboro, NC: 15.6%• Miami-Ft. Lauderdale, FL: 15.2%• Springfield, IL: 15.1%
The following metropolitan areas had the lowest percentage of adults dining atfull-service restaurants two or more times per week in 2012:• Rochester, NY: 5.0%• Colorado Springs, CO: 5.9%• Southern New Hampshire: 7.0%• Harrisonburg, VA: 7.1%• Buffalo, NY: 7.2%
Data on full-service dining in 93 metropolitan areas is available online atwww.themediaaudit.com/press/local-releases.
7.2 Market ResourcesInternational Demographics, 10333 Richmond Avenue, Suite 200, Houston, TX 77042. (713) 626-0333. (www.themediaaudit.com)
RESTAURANT, FOOD & BEVERAGE MARKET RESEARCH HANDBOOK 2013
• 72 •
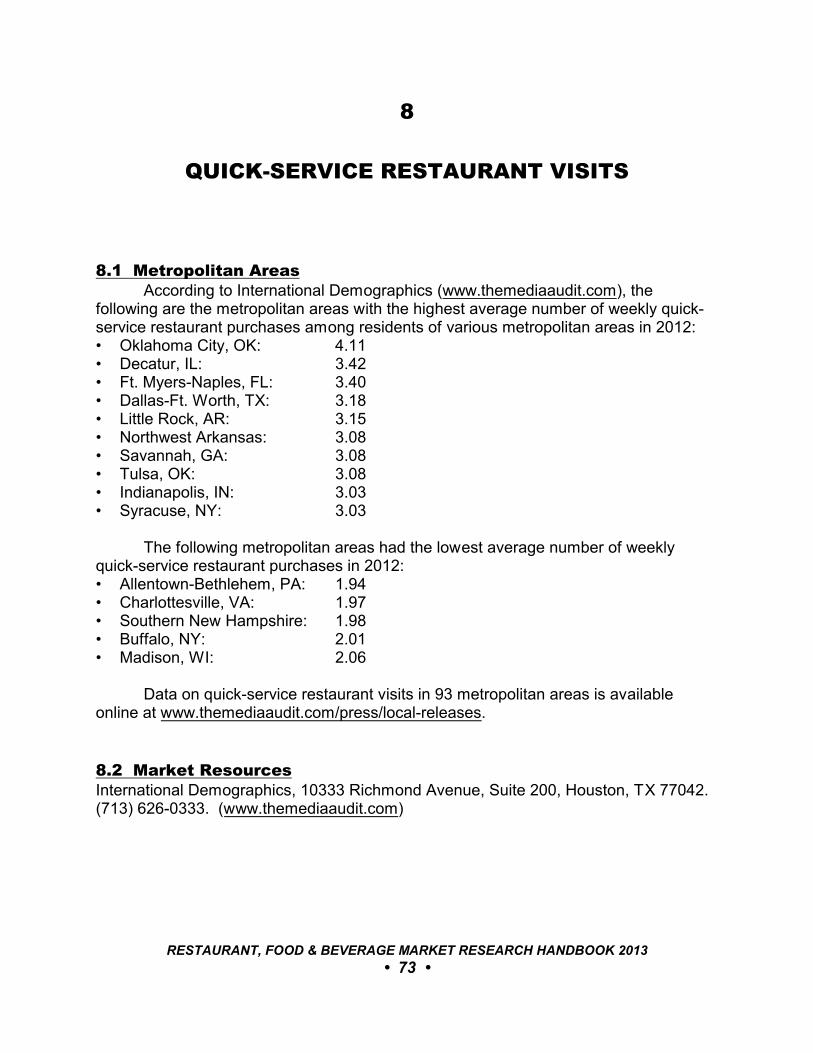
8
QUICK-SERVICE RESTAURANT VISITS
8.1 Metropolitan AreasAccording to International Demographics (www.themediaaudit.com), the
following are the metropolitan areas with the highest average number of weekly quick-service restaurant purchases among residents of various metropolitan areas in 2012:• Oklahoma City, OK: 4.11• Decatur, IL: 3.42• Ft. Myers-Naples, FL: 3.40• Dallas-Ft. Worth, TX: 3.18• Little Rock, AR: 3.15• Northwest Arkansas: 3.08• Savannah, GA: 3.08• Tulsa, OK: 3.08• Indianapolis, IN: 3.03• Syracuse, NY: 3.03
The following metropolitan areas had the lowest average number of weeklyquick-service restaurant purchases in 2012:• Allentown-Bethlehem, PA: 1.94• Charlottesville, VA: 1.97• Southern New Hampshire: 1.98• Buffalo, NY: 2.01• Madison, WI: 2.06
Data on quick-service restaurant visits in 93 metropolitan areas is availableonline at www.themediaaudit.com/press/local-releases.
8.2 Market ResourcesInternational Demographics, 10333 Richmond Avenue, Suite 200, Houston, TX 77042. (713) 626-0333. (www.themediaaudit.com)
RESTAURANT, FOOD & BEVERAGE MARKET RESEARCH HANDBOOK 2013
• 73 •
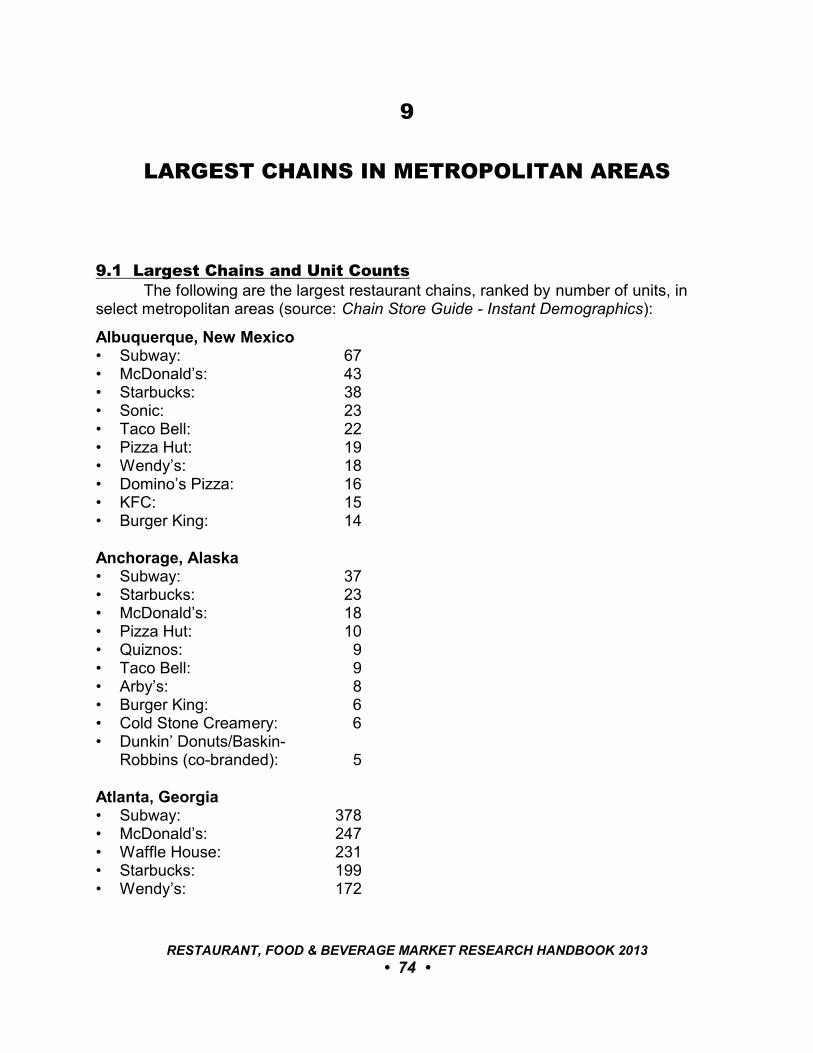
9
LARGEST CHAINS IN METROPOLITAN AREAS
9.1 Largest Chains and Unit CountsThe following are the largest restaurant chains, ranked by number of units, in
select metropolitan areas (source: Chain Store Guide - Instant Demographics):
Albuquerque, New Mexico• Subway: 67• McDonald’s: 43• Starbucks: 38• Sonic: 23• Taco Bell: 22• Pizza Hut: 19• Wendy’s: 18• Domino’s Pizza: 16• KFC: 15• Burger King: 14
Anchorage, Alaska• Subway: 37• Starbucks: 23• McDonald’s: 18• Pizza Hut: 10• Quiznos: 9• Taco Bell: 9• Arby’s: 8• Burger King: 6• Cold Stone Creamery: 6• Dunkin’ Donuts/Baskin-
Robbins (co-branded): 5
Atlanta, Georgia• Subway: 378• McDonald’s: 247• Waffle House: 231• Starbucks: 199• Wendy’s: 172
RESTAURANT, FOOD & BEVERAGE MARKET RESEARCH HANDBOOK 2013
• 74 •
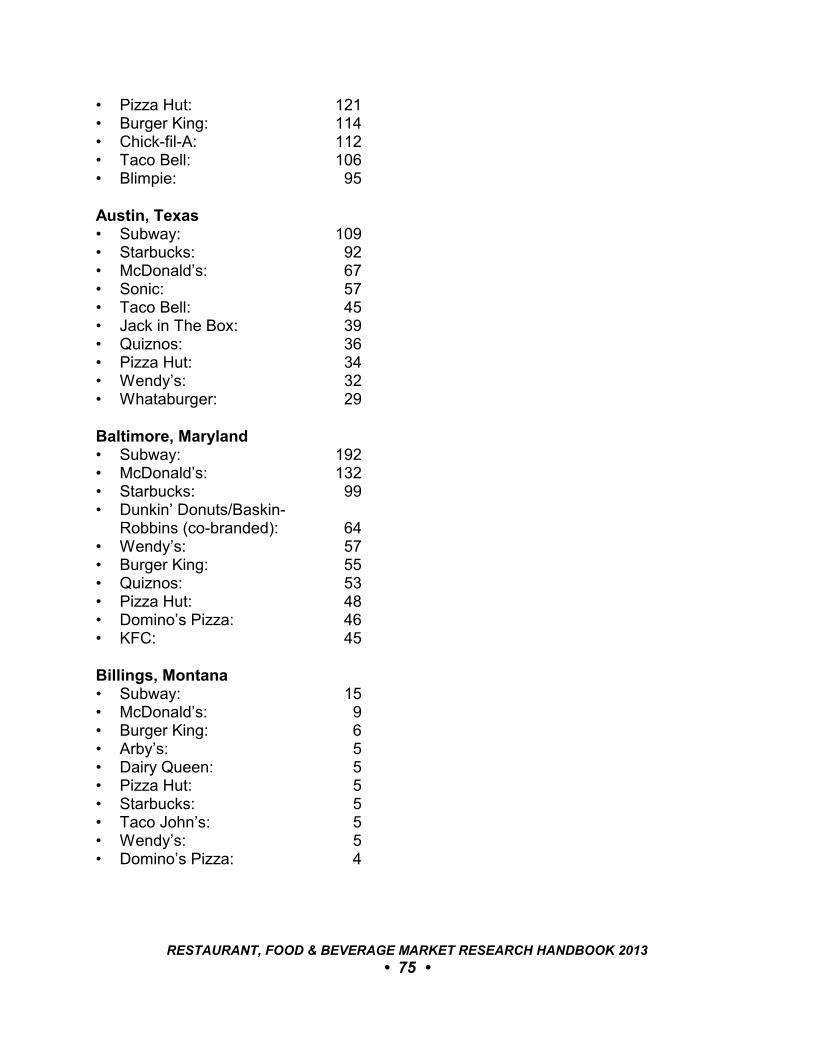
• Pizza Hut: 121• Burger King: 114• Chick-fil-A: 112• Taco Bell: 106• Blimpie: 95
Austin, Texas• Subway: 109• Starbucks: 92• McDonald’s: 67• Sonic: 57• Taco Bell: 45• Jack in The Box: 39• Quiznos: 36• Pizza Hut: 34• Wendy’s: 32• Whataburger: 29
Baltimore, Maryland• Subway: 192• McDonald’s: 132• Starbucks: 99• Dunkin’ Donuts/Baskin-
Robbins (co-branded): 64• Wendy’s: 57• Burger King: 55• Quiznos: 53• Pizza Hut: 48• Domino’s Pizza: 46• KFC: 45
Billings, Montana• Subway: 15• McDonald’s: 9• Burger King: 6• Arby’s: 5• Dairy Queen: 5• Pizza Hut: 5• Starbucks: 5• Taco John’s: 5• Wendy’s: 5• Domino’s Pizza: 4
RESTAURANT, FOOD & BEVERAGE MARKET RESEARCH HANDBOOK 2013
• 75 •
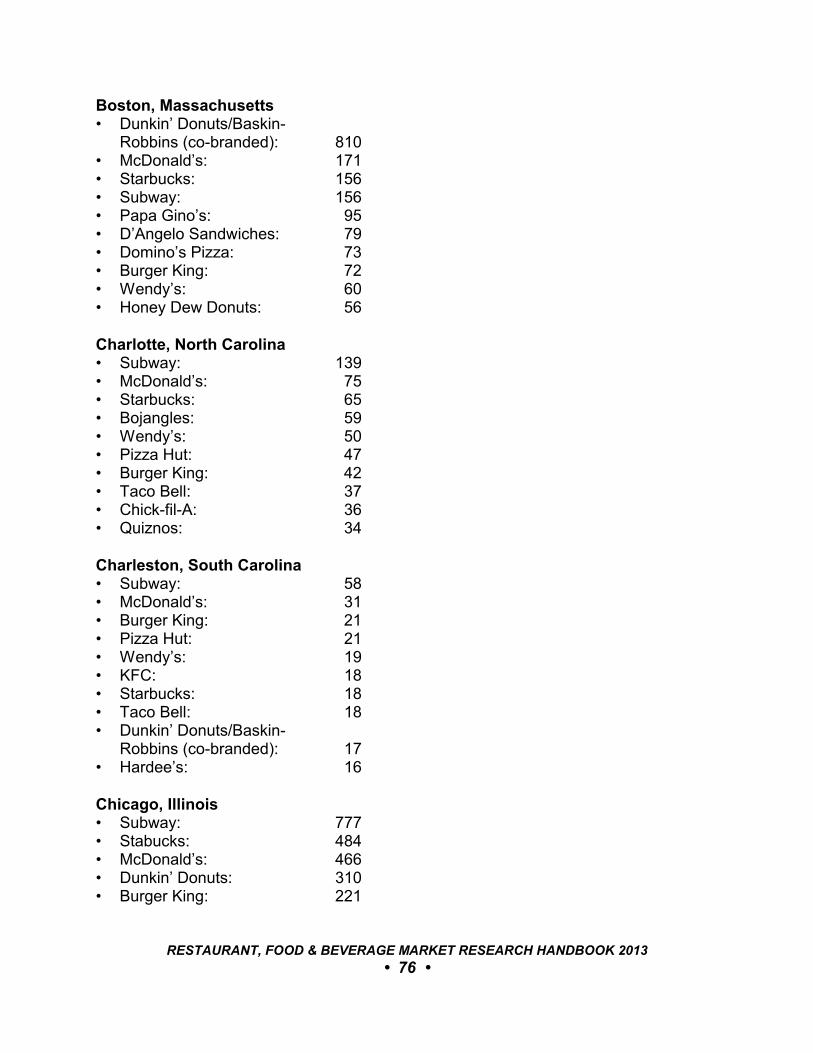
Boston, Massachusetts• Dunkin’ Donuts/Baskin-
Robbins (co-branded): 810• McDonald’s: 171• Starbucks: 156• Subway: 156• Papa Gino’s: 95• D’Angelo Sandwiches: 79• Domino’s Pizza: 73• Burger King: 72• Wendy’s: 60• Honey Dew Donuts: 56
Charlotte, North Carolina• Subway: 139• McDonald’s: 75• Starbucks: 65• Bojangles: 59• Wendy’s: 50• Pizza Hut: 47• Burger King: 42• Taco Bell: 37• Chick-fil-A: 36• Quiznos: 34
Charleston, South Carolina• Subway: 58• McDonald’s: 31• Burger King: 21• Pizza Hut: 21• Wendy’s: 19• KFC: 18• Starbucks: 18• Taco Bell: 18• Dunkin’ Donuts/Baskin-
Robbins (co-branded): 17• Hardee’s: 16
Chicago, Illinois• Subway: 777• Stabucks: 484• McDonald’s: 466• Dunkin’ Donuts: 310• Burger King: 221
RESTAURANT, FOOD & BEVERAGE MARKET RESEARCH HANDBOOK 2013
• 76 •
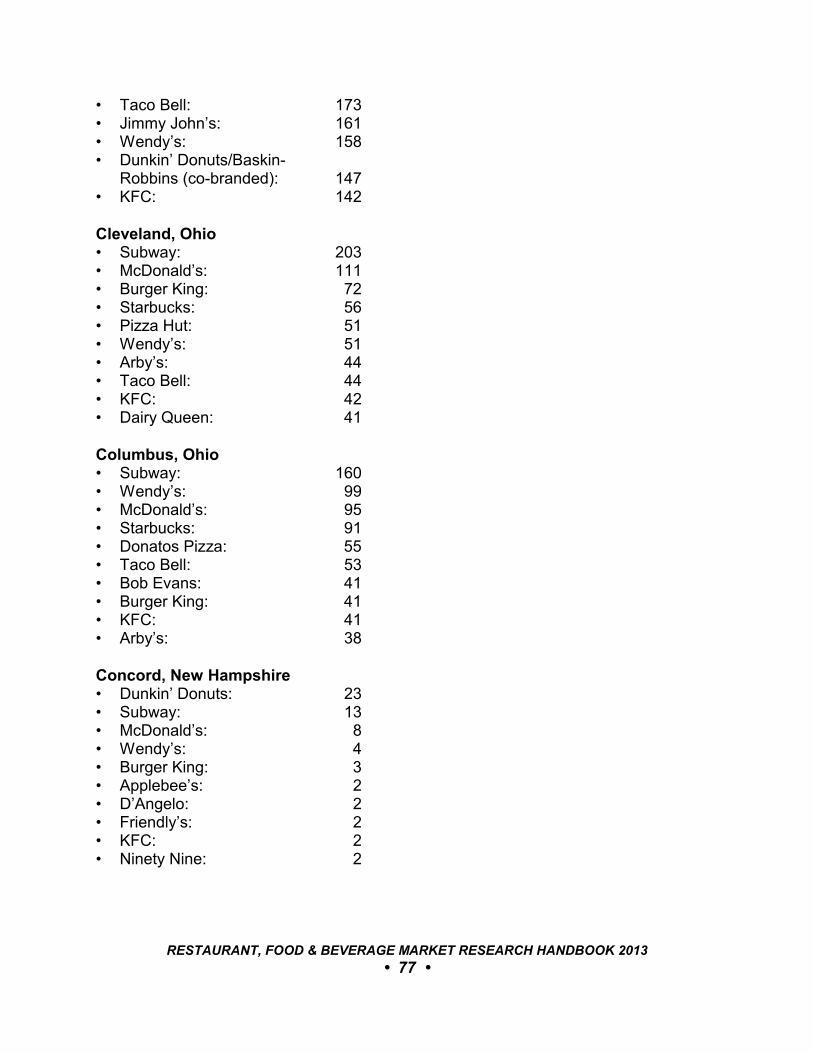
• Taco Bell: 173• Jimmy John’s: 161• Wendy’s: 158• Dunkin’ Donuts/Baskin-
Robbins (co-branded): 147• KFC: 142
Cleveland, Ohio• Subway: 203• McDonald’s: 111• Burger King: 72• Starbucks: 56• Pizza Hut: 51• Wendy’s: 51• Arby’s: 44• Taco Bell: 44• KFC: 42• Dairy Queen: 41
Columbus, Ohio• Subway: 160• Wendy’s: 99• McDonald’s: 95• Starbucks: 91• Donatos Pizza: 55• Taco Bell: 53• Bob Evans: 41• Burger King: 41• KFC: 41• Arby’s: 38
Concord, New Hampshire• Dunkin’ Donuts: 23• Subway: 13• McDonald’s: 8• Wendy’s: 4• Burger King: 3• Applebee’s: 2• D’Angelo: 2• Friendly’s: 2• KFC: 2• Ninety Nine: 2
RESTAURANT, FOOD & BEVERAGE MARKET RESEARCH HANDBOOK 2013
• 77 •
Denver, Colorado• Starbucks: 254• Subway: 173• McDonald’s: 122• Taco Bell: 76• Burger King: 68• Wendy’s: 63• Quiznos: 60• Pizza Hut: 51• Chipotle Mexican Grill: 48• Dairy Queen: 47
Des Moines, Iowa• Subway: 41• McDonald’s: 29• Starbucks: 22• Burger King: 19• Dairy Queen: 15• Pizza Hut: 15• Quiznos: 15• Arby’s: 13• Taco John’s: 13• Godfather’s Pizza: 12
Hartford, Connecticut• Dunkin’ Donuts: 174• Subway: 114• McDonald’s: 56• Starbucks: 28• Burger King: 24• Friendly’s: 19• Wendy’s: 19• KFC: 18• Taco Bell: 16• Domino’s: 14
Houston, Texas• Subway: 378• McDonald’s: 289• Starbucks: 255• Jack In The Box: 203• Sonic: 175• Domino’s Pizza: 121• Taco Bell: 121
RESTAURANT, FOOD & BEVERAGE MARKET RESEARCH HANDBOOK 2013
• 78 •
• Pizza Hut: 117• Church’s Chicken: 111• Whataburger: 111
Honolulu, Hawaii• Subway: 89• Starbucks: 52• McDonald’s: 49• L&L Hawaiian Barbecue: 33• Jamba Juice: 25• Jack In The Box: 21• Burger King: 20• Dunkin’ Donuts/Baskin-
Robbins (co-branded): 19• Papa John’s: 15• The Coffee Bean & Tea Leaf: 14
Indianapolis, Indiana• Subway: 152• McDonald’s: 99• Starbucks: 86• Taco Bell: 53• Burger King: 52• Wendy’s: 51• Arby’s: 49• Dairy Queen: 49• Pizza Hut: 49• Papa John’s Pizza: 37
Jacksonville, Florida• Subway: 104• McDonald’s: 74• Starbucks: 50• Wendy’s: 44• Burger King: 39• Dunkin’ Donuts: 37• Pizza Hut: 35• Domino’s Pizza: 35• KFC: 29• Firehouse Subs: 25
Las Vegas, Nevada• Starbucks: 156• Subway: 138• McDonald’s: 105
RESTAURANT, FOOD & BEVERAGE MARKET RESEARCH HANDBOOK 2013
• 79 •
• Jack in the Box: 57• Panda Express: 57• Taco Bell: 49• Burger King: 43• Pizza Hut: 42• Quiznos: 41• Port of Subs: 38
Little Rock, Arkansas• Subway: 67• Sonic: 43• McDonald’s: 38• Taco Bell: 22• Burger King: 21• Starbucks: 21• Wendy’s: 21• Pizza Pro: 20• Pizza Hut: 19• KFC: 18
Los Angeles, California• Starbucks Coffee: 774• Subway: 755• McDonald’s: 455• Jack in the Box: 308• Taco Bell: 268• Quiznos: 225• Pizza Hut: 217• Dunkin’ Donuts/Baskin-
Robbins (co-branded): 213• El Pollo Loco: 213• Burger King: 197
Louisville, Kentucky• Subway: 111• McDonald’s: 72• Dairy Queen: 43• Taco Bell: 39• Arby’s: 38• KFC: 37• Wendy’s: 36• Starbucks: 35• Dominos: 34• Papa John’s Pizza: 34
RESTAURANT, FOOD & BEVERAGE MARKET RESEARCH HANDBOOK 2013
• 80 •

Madison, Wisconsin• Subway: 57• McDonald’s: 32• Pizza Hut: 19• Culver’s: 17• Cousins Subs: 15• Starbucks: 13• Taco Bell: 13• Arby’s: 12• Dippin’ Dots: 11• KFC: 10
Miami, Florida• Subway: 375• McDonald’s 238• Starbucks: 200• Burger King: 157• Wendy’s: 144• Dunkin’ Donuts: 139• Quiznos: 98• KFC: 92• Pizza Hut: 86• Domino’s Pizza: 80
Milwaukee, Wisconsin• Subway: 111• McDonald’s: 81• Cousins Subs: 63• Starbucks: 53• Pizza Hut: 34• Taco Bell: 34• Culver’s: 29• Burger King: 27• Dairy Queen: 27• KFC: 22
Minneapolis, Minnesota• Subway: 265• Caribou Coffee: 184• McDonald’s: 133• Dairy Queen: 116• Starbucks: 108• Domino’s Pizza: 78• Burger King: 75
RESTAURANT, FOOD & BEVERAGE MARKET RESEARCH HANDBOOK 2013
• 81 •
• Taco Bell: 64• Arby’s: 57• Jimmy John’s: 56
Mobile, Alabama• Subway: 35• McDonald’s: 30• Waffle House: 19• Pizza Hut: 15• Church’s Chicken: 13• Burger King: 10• Checkers Drive-In: 10• Sonic Drive-In: 10• Hardee’s: 9• Starbucks Coffee: 9
Montgomery, Alabama• Subway: 42• McDonald’s: 22• Hardee’s: 13• Pizza Hut: 11• Wendy’s: 11• KFC: 10• Sonic: 9• Taco Bell: 9• Waffle House: 9• Church’s Chicken: 8
Nashville, Tennessee• Subway: 133• McDonald’s: 81• Sonic: 60• Starbucks: 47• Taco Bell: 45• Wendy’s: 44• Pizza Hut: 40• Waffle House: 34• Arby’s: 32• KFC: 31
New Orleans, Louisiana• Subway: 120• McDonald’s: 71• Smoothie King: 42
RESTAURANT, FOOD & BEVERAGE MARKET RESEARCH HANDBOOK 2013
• 82 •
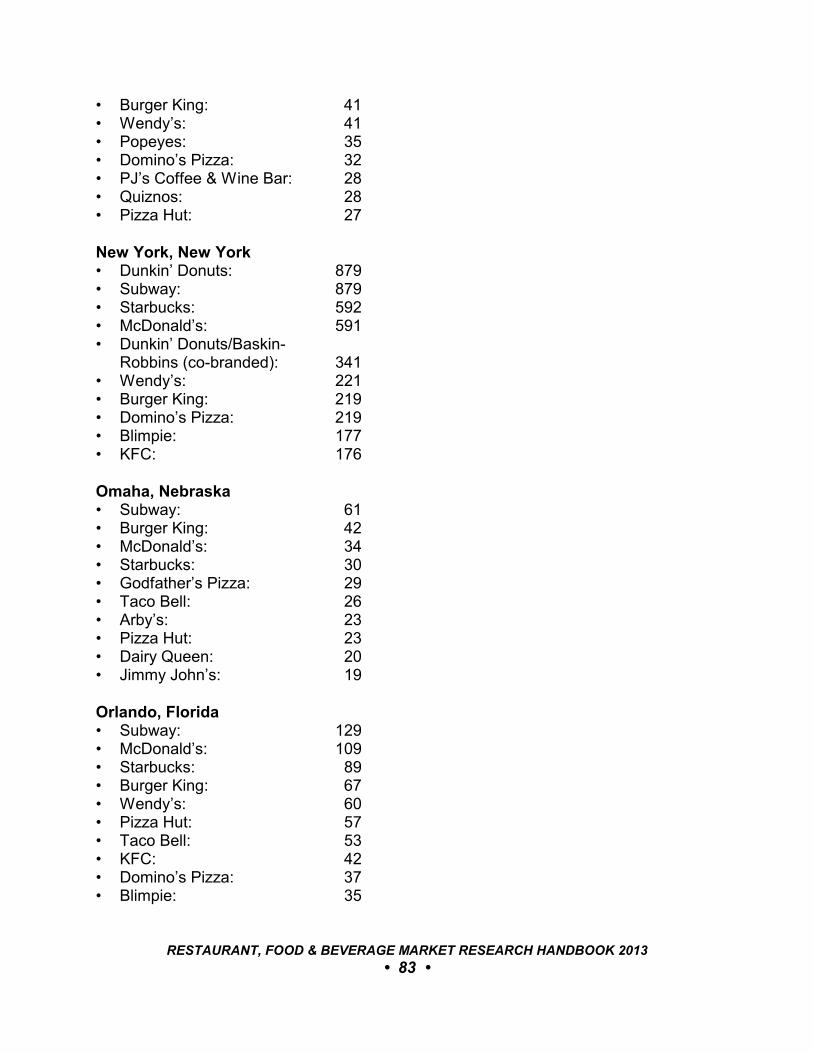
• Burger King: 41• Wendy’s: 41• Popeyes: 35• Domino’s Pizza: 32• PJ’s Coffee & Wine Bar: 28• Quiznos: 28• Pizza Hut: 27
New York, New York• Dunkin’ Donuts: 879• Subway: 879• Starbucks: 592• McDonald’s: 591• Dunkin’ Donuts/Baskin-
Robbins (co-branded): 341• Wendy’s: 221• Burger King: 219• Domino’s Pizza: 219• Blimpie: 177• KFC: 176
Omaha, Nebraska• Subway: 61• Burger King: 42• McDonald’s: 34• Starbucks: 30• Godfather’s Pizza: 29• Taco Bell: 26• Arby’s: 23• Pizza Hut: 23• Dairy Queen: 20• Jimmy John’s: 19
Orlando, Florida• Subway: 129• McDonald’s: 109• Starbucks: 89• Burger King: 67• Wendy’s: 60• Pizza Hut: 57• Taco Bell: 53• KFC: 42• Domino’s Pizza: 37• Blimpie: 35
RESTAURANT, FOOD & BEVERAGE MARKET RESEARCH HANDBOOK 2013
• 83 •
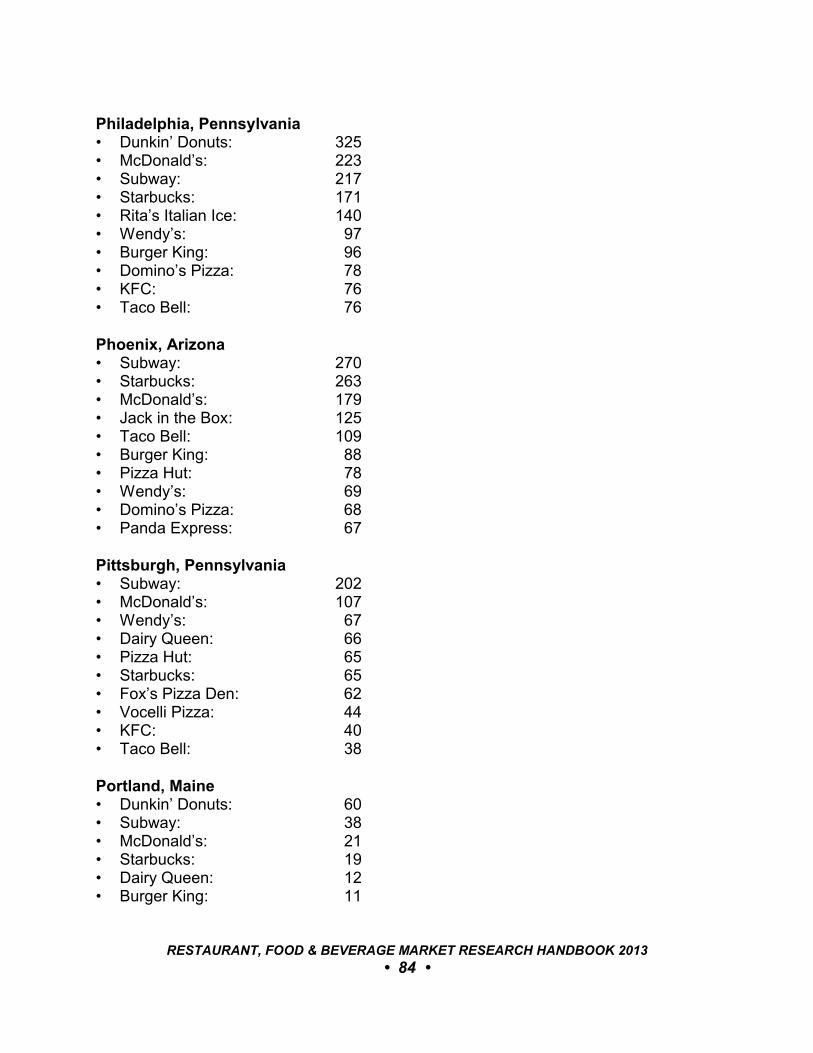
Philadelphia, Pennsylvania• Dunkin’ Donuts: 325• McDonald’s: 223• Subway: 217• Starbucks: 171• Rita’s Italian Ice: 140• Wendy’s: 97• Burger King: 96• Domino’s Pizza: 78• KFC: 76• Taco Bell: 76
Phoenix, Arizona• Subway: 270• Starbucks: 263• McDonald’s: 179• Jack in the Box: 125• Taco Bell: 109• Burger King: 88• Pizza Hut: 78• Wendy’s: 69• Domino’s Pizza: 68• Panda Express: 67
Pittsburgh, Pennsylvania• Subway: 202• McDonald’s: 107• Wendy’s: 67• Dairy Queen: 66• Pizza Hut: 65• Starbucks: 65• Fox’s Pizza Den: 62• Vocelli Pizza: 44• KFC: 40• Taco Bell: 38
Portland, Maine• Dunkin’ Donuts: 60• Subway: 38• McDonald’s: 21• Starbucks: 19• Dairy Queen: 12• Burger King: 11
RESTAURANT, FOOD & BEVERAGE MARKET RESEARCH HANDBOOK 2013
• 84 •
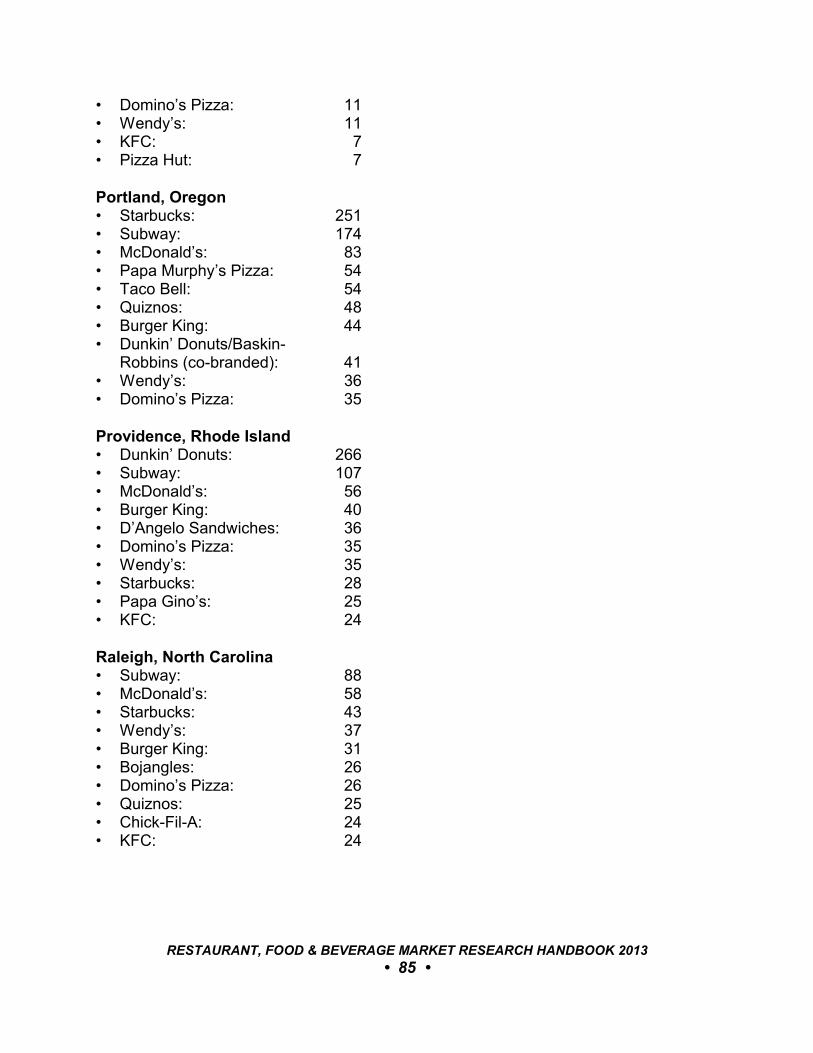
• Domino’s Pizza: 11• Wendy’s: 11• KFC: 7• Pizza Hut: 7
Portland, Oregon• Starbucks: 251• Subway: 174• McDonald’s: 83• Papa Murphy’s Pizza: 54• Taco Bell: 54• Quiznos: 48• Burger King: 44• Dunkin’ Donuts/Baskin-
Robbins (co-branded): 41• Wendy’s: 36• Domino’s Pizza: 35
Providence, Rhode Island• Dunkin’ Donuts: 266• Subway: 107• McDonald’s: 56• Burger King: 40• D’Angelo Sandwiches: 36• Domino’s Pizza: 35• Wendy’s: 35• Starbucks: 28• Papa Gino’s: 25• KFC: 24
Raleigh, North Carolina• Subway: 88• McDonald’s: 58• Starbucks: 43• Wendy’s: 37• Burger King: 31• Bojangles: 26• Domino’s Pizza: 26• Quiznos: 25• Chick-Fil-A: 24• KFC: 24
RESTAURANT, FOOD & BEVERAGE MARKET RESEARCH HANDBOOK 2013
• 85 •
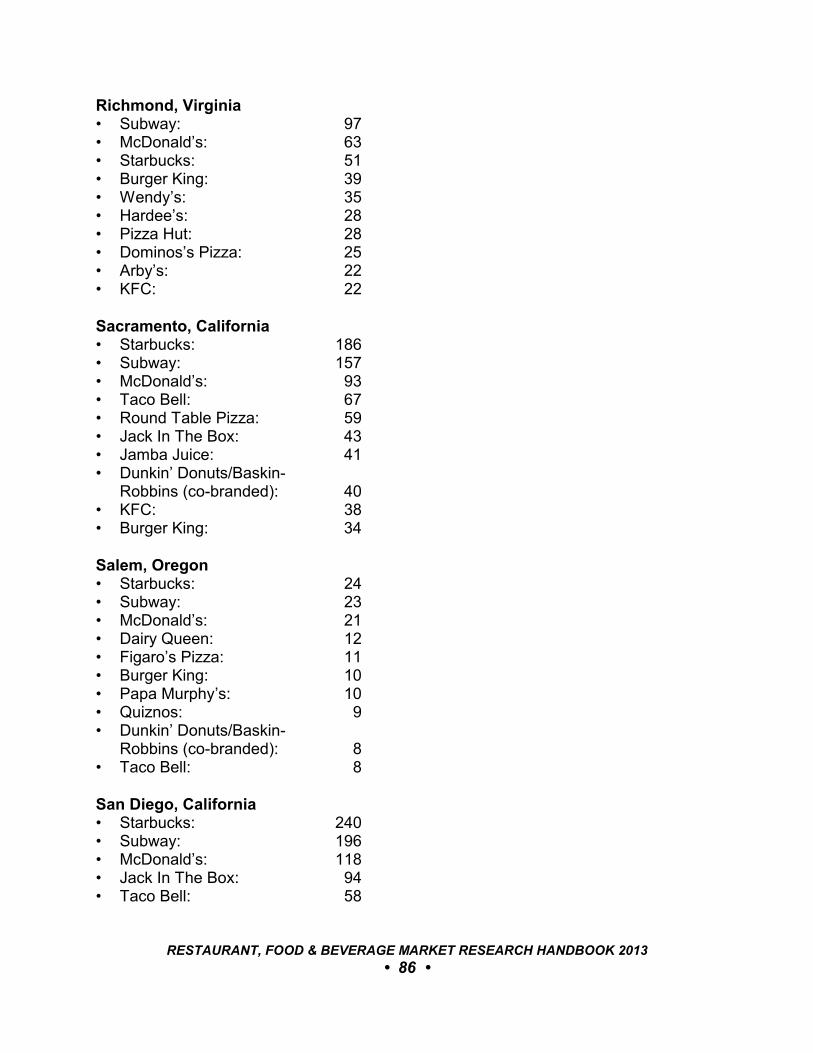
Richmond, Virginia• Subway: 97• McDonald’s: 63• Starbucks: 51• Burger King: 39• Wendy’s: 35• Hardee’s: 28• Pizza Hut: 28• Dominos’s Pizza: 25• Arby’s: 22• KFC: 22
Sacramento, California• Starbucks: 186• Subway: 157• McDonald’s: 93• Taco Bell: 67• Round Table Pizza: 59• Jack In The Box: 43• Jamba Juice: 41• Dunkin’ Donuts/Baskin-
Robbins (co-branded): 40• KFC: 38• Burger King: 34
Salem, Oregon• Starbucks: 24• Subway: 23• McDonald’s: 21• Dairy Queen: 12• Figaro’s Pizza: 11• Burger King: 10• Papa Murphy’s: 10• Quiznos: 9• Dunkin’ Donuts/Baskin-
Robbins (co-branded): 8• Taco Bell: 8
San Diego, California• Starbucks: 240• Subway: 196• McDonald’s: 118• Jack In The Box: 94• Taco Bell: 58
RESTAURANT, FOOD & BEVERAGE MARKET RESEARCH HANDBOOK 2013
• 86 •
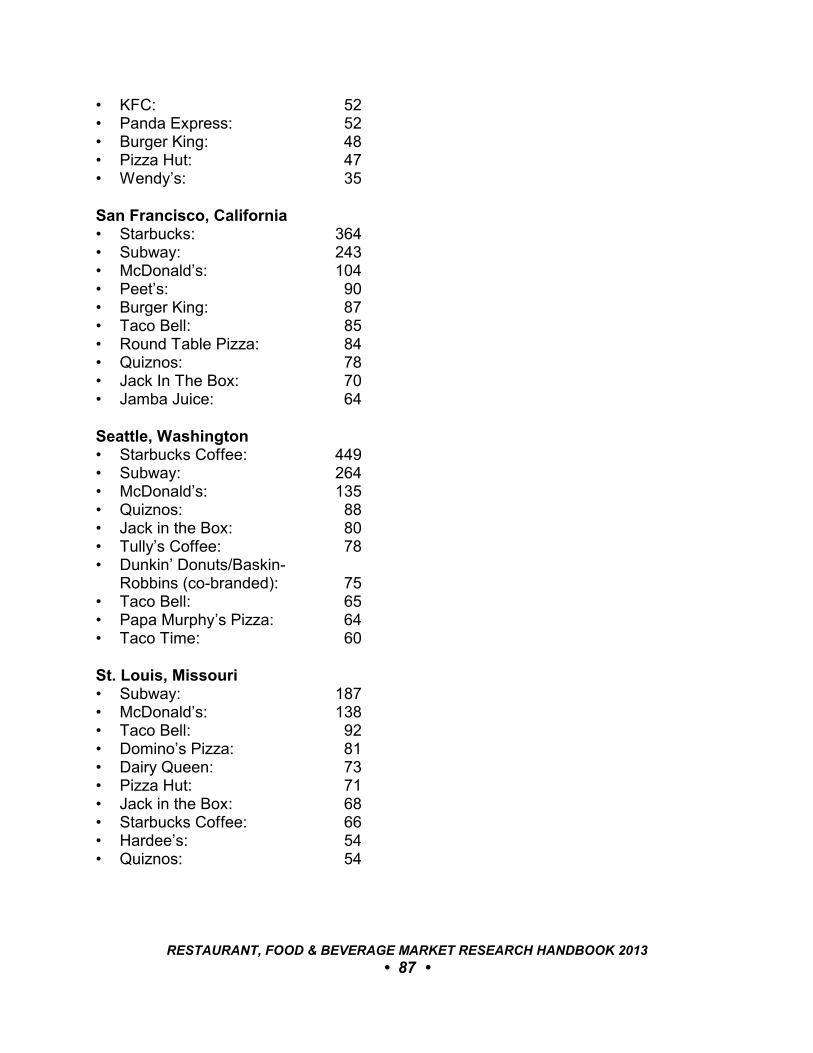
• KFC: 52• Panda Express: 52• Burger King: 48• Pizza Hut: 47• Wendy’s: 35
San Francisco, California• Starbucks: 364• Subway: 243• McDonald’s: 104• Peet’s: 90• Burger King: 87• Taco Bell: 85• Round Table Pizza: 84• Quiznos: 78• Jack In The Box: 70• Jamba Juice: 64
Seattle, Washington• Starbucks Coffee: 449• Subway: 264• McDonald’s: 135• Quiznos: 88• Jack in the Box: 80• Tully’s Coffee: 78• Dunkin’ Donuts/Baskin-
Robbins (co-branded): 75• Taco Bell: 65• Papa Murphy’s Pizza: 64• Taco Time: 60
St. Louis, Missouri• Subway: 187• McDonald’s: 138• Taco Bell: 92• Domino’s Pizza: 81• Dairy Queen: 73• Pizza Hut: 71• Jack in the Box: 68• Starbucks Coffee: 66• Hardee’s: 54• Quiznos: 54
RESTAURANT, FOOD & BEVERAGE MARKET RESEARCH HANDBOOK 2013
• 87 •
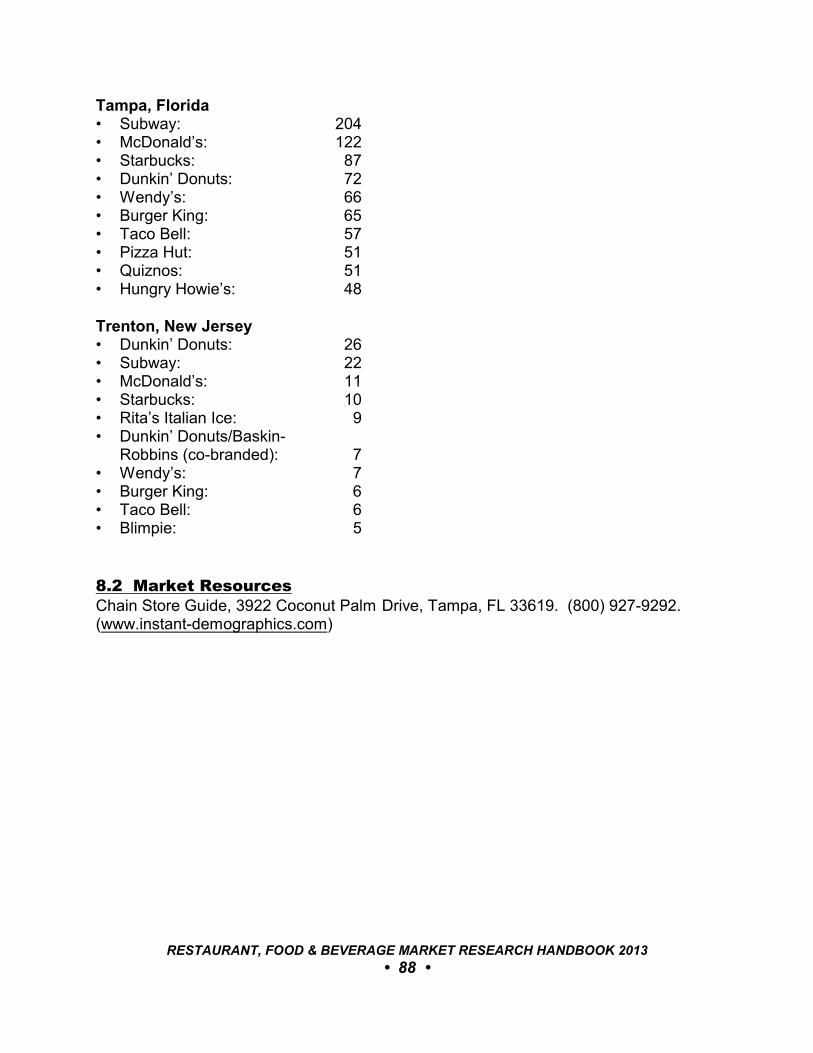
Tampa, Florida• Subway: 204• McDonald’s: 122• Starbucks: 87• Dunkin’ Donuts: 72• Wendy’s: 66• Burger King: 65• Taco Bell: 57• Pizza Hut: 51• Quiznos: 51• Hungry Howie’s: 48
Trenton, New Jersey• Dunkin’ Donuts: 26• Subway: 22• McDonald’s: 11• Starbucks: 10• Rita’s Italian Ice: 9• Dunkin’ Donuts/Baskin-
Robbins (co-branded): 7• Wendy’s: 7• Burger King: 6• Taco Bell: 6• Blimpie: 5
8.2 Market ResourcesChain Store Guide, 3922 Coconut Palm Drive, Tampa, FL 33619. (800) 927-9292.(www.instant-demographics.com)
RESTAURANT, FOOD & BEVERAGE MARKET RESEARCH HANDBOOK 2013
• 88 •
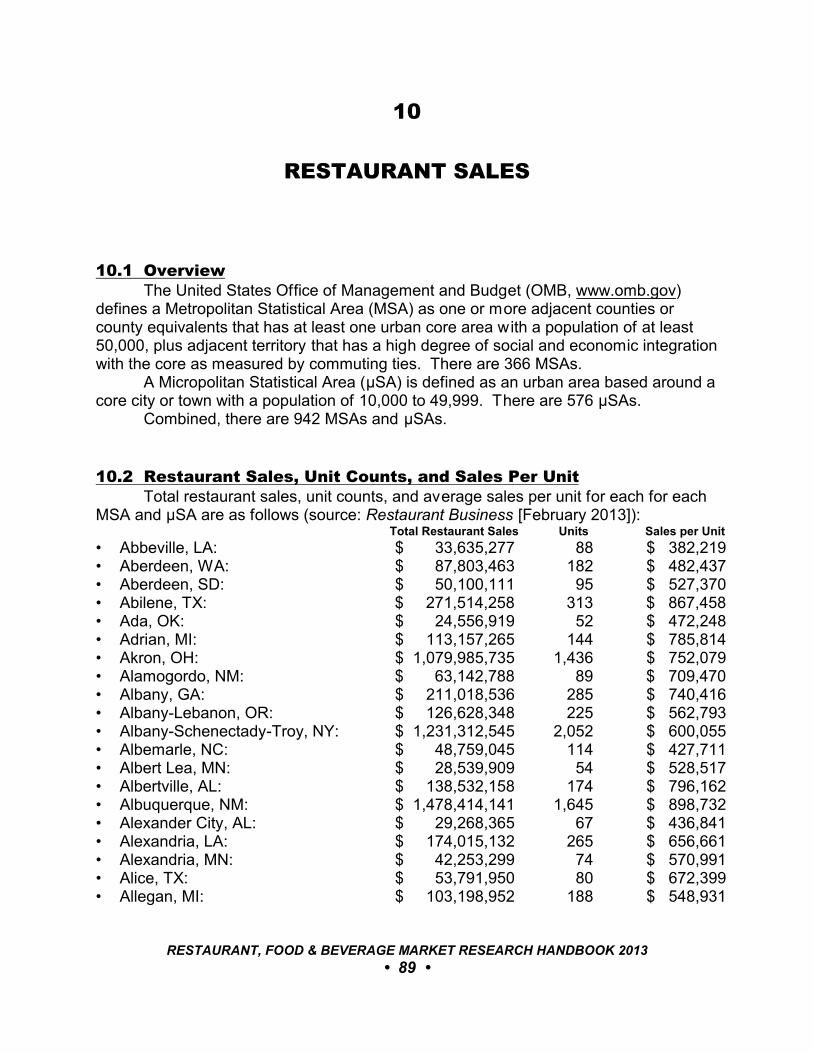
10
RESTAURANT SALES
10.1 OverviewThe United States Office of Management and Budget (OMB, www.omb.gov)
defines a Metropolitan Statistical Area (MSA) as one or more adjacent counties orcounty equivalents that has at least one urban core area with a population of at least50,000, plus adjacent territory that has a high degree of social and economic integrationwith the core as measured by commuting ties. There are 366 MSAs.
A Micropolitan Statistical Area (ìSA) is defined as an urban area based around acore city or town with a population of 10,000 to 49,999. There are 576 ìSAs.
Combined, there are 942 MSAs and ìSAs.
10.2 Restaurant Sales, Unit Counts, and Sales Per UnitTotal restaurant sales, unit counts, and average sales per unit for each for each
MSA and ìSA are as follows (source: Restaurant Business [February 2013]): Total Restaurant Sales Units Sales per Unit
• Abbeville, LA: $ 33,635,277 88 $ 382,219• Aberdeen, WA: $ 87,803,463 182 $ 482,437• Aberdeen, SD: $ 50,100,111 95 $ 527,370• Abilene, TX: $ 271,514,258 313 $ 867,458• Ada, OK: $ 24,556,919 52 $ 472,248• Adrian, MI: $ 113,157,265 144 $ 785,814• Akron, OH: $ 1,079,985,735 1,436 $ 752,079• Alamogordo, NM: $ 63,142,788 89 $ 709,470• Albany, GA: $ 211,018,536 285 $ 740,416• Albany-Lebanon, OR: $ 126,628,348 225 $ 562,793• Albany-Schenectady-Troy, NY: $ 1,231,312,545 2,052 $ 600,055• Albemarle, NC: $ 48,759,045 114 $ 427,711• Albert Lea, MN: $ 28,539,909 54 $ 528,517• Albertville, AL: $ 138,532,158 174 $ 796,162• Albuquerque, NM: $ 1,478,414,141 1,645 $ 898,732• Alexander City, AL: $ 29,268,365 67 $ 436,841• Alexandria, LA: $ 174,015,132 265 $ 656,661• Alexandria, MN: $ 42,253,299 74 $ 570,991• Alice, TX: $ 53,791,950 80 $ 672,399• Allegan, MI: $ 103,198,952 188 $ 548,931
RESTAURANT, FOOD & BEVERAGE MARKET RESEARCH HANDBOOK 2013
• 89 •
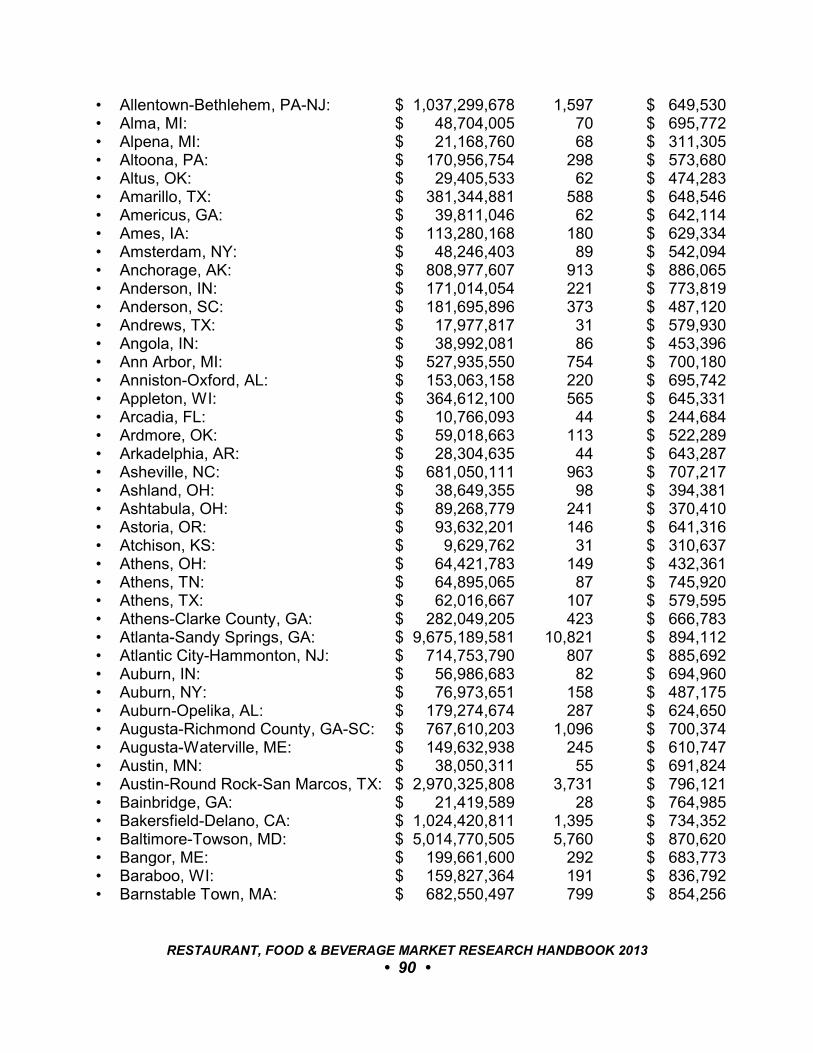
• Allentown-Bethlehem, PA-NJ: $ 1,037,299,678 1,597 $ 649,530• Alma, MI: $ 48,704,005 70 $ 695,772• Alpena, MI: $ 21,168,760 68 $ 311,305• Altoona, PA: $ 170,956,754 298 $ 573,680• Altus, OK: $ 29,405,533 62 $ 474,283• Amarillo, TX: $ 381,344,881 588 $ 648,546• Americus, GA: $ 39,811,046 62 $ 642,114• Ames, IA: $ 113,280,168 180 $ 629,334• Amsterdam, NY: $ 48,246,403 89 $ 542,094• Anchorage, AK: $ 808,977,607 913 $ 886,065• Anderson, IN: $ 171,014,054 221 $ 773,819• Anderson, SC: $ 181,695,896 373 $ 487,120• Andrews, TX: $ 17,977,817 31 $ 579,930• Angola, IN: $ 38,992,081 86 $ 453,396• Ann Arbor, MI: $ 527,935,550 754 $ 700,180• Anniston-Oxford, AL: $ 153,063,158 220 $ 695,742• Appleton, WI: $ 364,612,100 565 $ 645,331• Arcadia, FL: $ 10,766,093 44 $ 244,684• Ardmore, OK: $ 59,018,663 113 $ 522,289• Arkadelphia, AR: $ 28,304,635 44 $ 643,287• Asheville, NC: $ 681,050,111 963 $ 707,217• Ashland, OH: $ 38,649,355 98 $ 394,381• Ashtabula, OH: $ 89,268,779 241 $ 370,410• Astoria, OR: $ 93,632,201 146 $ 641,316• Atchison, KS: $ 9,629,762 31 $ 310,637• Athens, OH: $ 64,421,783 149 $ 432,361• Athens, TN: $ 64,895,065 87 $ 745,920• Athens, TX: $ 62,016,667 107 $ 579,595• Athens-Clarke County, GA: $ 282,049,205 423 $ 666,783• Atlanta-Sandy Springs, GA: $ 9,675,189,581 10,821 $ 894,112• Atlantic City-Hammonton, NJ: $ 714,753,790 807 $ 885,692• Auburn, IN: $ 56,986,683 82 $ 694,960• Auburn, NY: $ 76,973,651 158 $ 487,175• Auburn-Opelika, AL: $ 179,274,674 287 $ 624,650• Augusta-Richmond County, GA-SC: $ 767,610,203 1,096 $ 700,374• Augusta-Waterville, ME: $ 149,632,938 245 $ 610,747• Austin, MN: $ 38,050,311 55 $ 691,824• Austin-Round Rock-San Marcos, TX: $ 2,970,325,808 3,731 $ 796,121• Bainbridge, GA: $ 21,419,589 28 $ 764,985• Bakersfield-Delano, CA: $ 1,024,420,811 1,395 $ 734,352• Baltimore-Towson, MD: $ 5,014,770,505 5,760 $ 870,620• Bangor, ME: $ 199,661,600 292 $ 683,773• Baraboo, WI: $ 159,827,364 191 $ 836,792• Barnstable Town, MA: $ 682,550,497 799 $ 854,256
RESTAURANT, FOOD & BEVERAGE MARKET RESEARCH HANDBOOK 2013
• 90 •
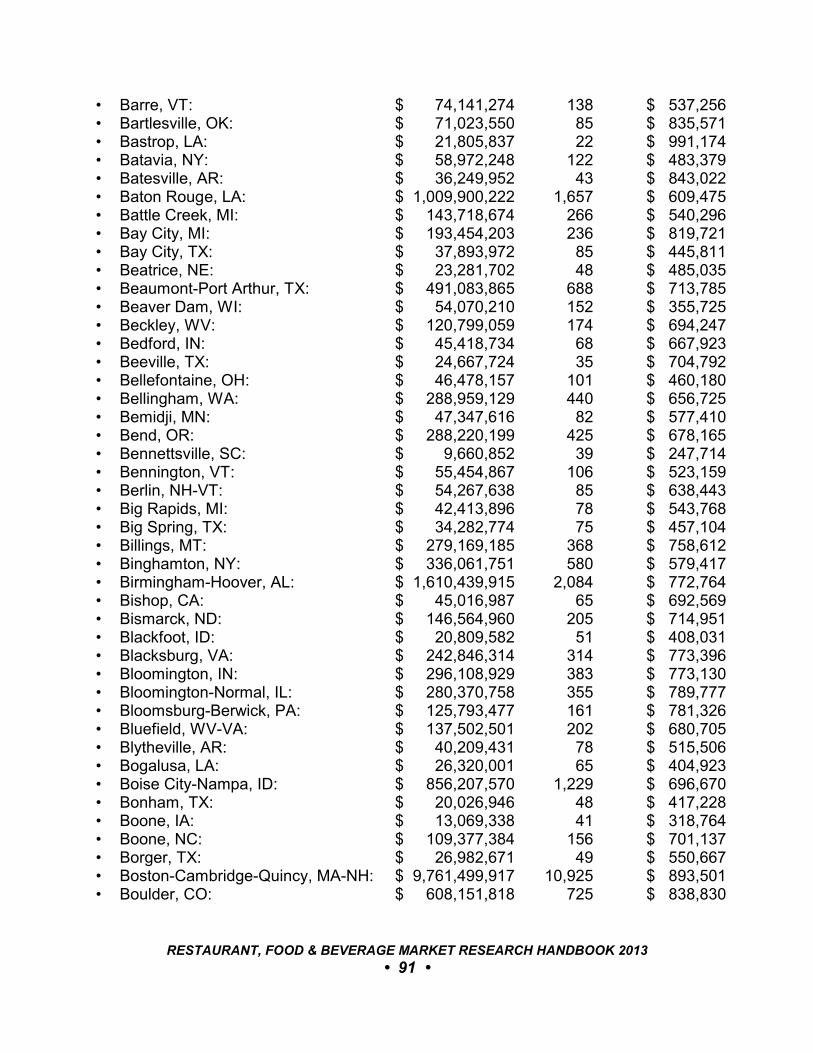
• Barre, VT: $ 74,141,274 138 $ 537,256• Bartlesville, OK: $ 71,023,550 85 $ 835,571• Bastrop, LA: $ 21,805,837 22 $ 991,174• Batavia, NY: $ 58,972,248 122 $ 483,379• Batesville, AR: $ 36,249,952 43 $ 843,022• Baton Rouge, LA: $ 1,009,900,222 1,657 $ 609,475• Battle Creek, MI: $ 143,718,674 266 $ 540,296• Bay City, MI: $ 193,454,203 236 $ 819,721• Bay City, TX: $ 37,893,972 85 $ 445,811• Beatrice, NE: $ 23,281,702 48 $ 485,035• Beaumont-Port Arthur, TX: $ 491,083,865 688 $ 713,785• Beaver Dam, WI: $ 54,070,210 152 $ 355,725• Beckley, WV: $ 120,799,059 174 $ 694,247• Bedford, IN: $ 45,418,734 68 $ 667,923• Beeville, TX: $ 24,667,724 35 $ 704,792• Bellefontaine, OH: $ 46,478,157 101 $ 460,180• Bellingham, WA: $ 288,959,129 440 $ 656,725• Bemidji, MN: $ 47,347,616 82 $ 577,410• Bend, OR: $ 288,220,199 425 $ 678,165• Bennettsville, SC: $ 9,660,852 39 $ 247,714• Bennington, VT: $ 55,454,867 106 $ 523,159• Berlin, NH-VT: $ 54,267,638 85 $ 638,443• Big Rapids, MI: $ 42,413,896 78 $ 543,768• Big Spring, TX: $ 34,282,774 75 $ 457,104• Billings, MT: $ 279,169,185 368 $ 758,612• Binghamton, NY: $ 336,061,751 580 $ 579,417• Birmingham-Hoover, AL: $ 1,610,439,915 2,084 $ 772,764• Bishop, CA: $ 45,016,987 65 $ 692,569• Bismarck, ND: $ 146,564,960 205 $ 714,951• Blackfoot, ID: $ 20,809,582 51 $ 408,031• Blacksburg, VA: $ 242,846,314 314 $ 773,396• Bloomington, IN: $ 296,108,929 383 $ 773,130• Bloomington-Normal, IL: $ 280,370,758 355 $ 789,777• Bloomsburg-Berwick, PA: $ 125,793,477 161 $ 781,326• Bluefield, WV-VA: $ 137,502,501 202 $ 680,705• Blytheville, AR: $ 40,209,431 78 $ 515,506• Bogalusa, LA: $ 26,320,001 65 $ 404,923• Boise City-Nampa, ID: $ 856,207,570 1,229 $ 696,670• Bonham, TX: $ 20,026,946 48 $ 417,228• Boone, IA: $ 13,069,338 41 $ 318,764• Boone, NC: $ 109,377,384 156 $ 701,137• Borger, TX: $ 26,982,671 49 $ 550,667• Boston-Cambridge-Quincy, MA-NH: $ 9,761,499,917 10,925 $ 893,501• Boulder, CO: $ 608,151,818 725 $ 838,830
RESTAURANT, FOOD & BEVERAGE MARKET RESEARCH HANDBOOK 2013
• 91 •
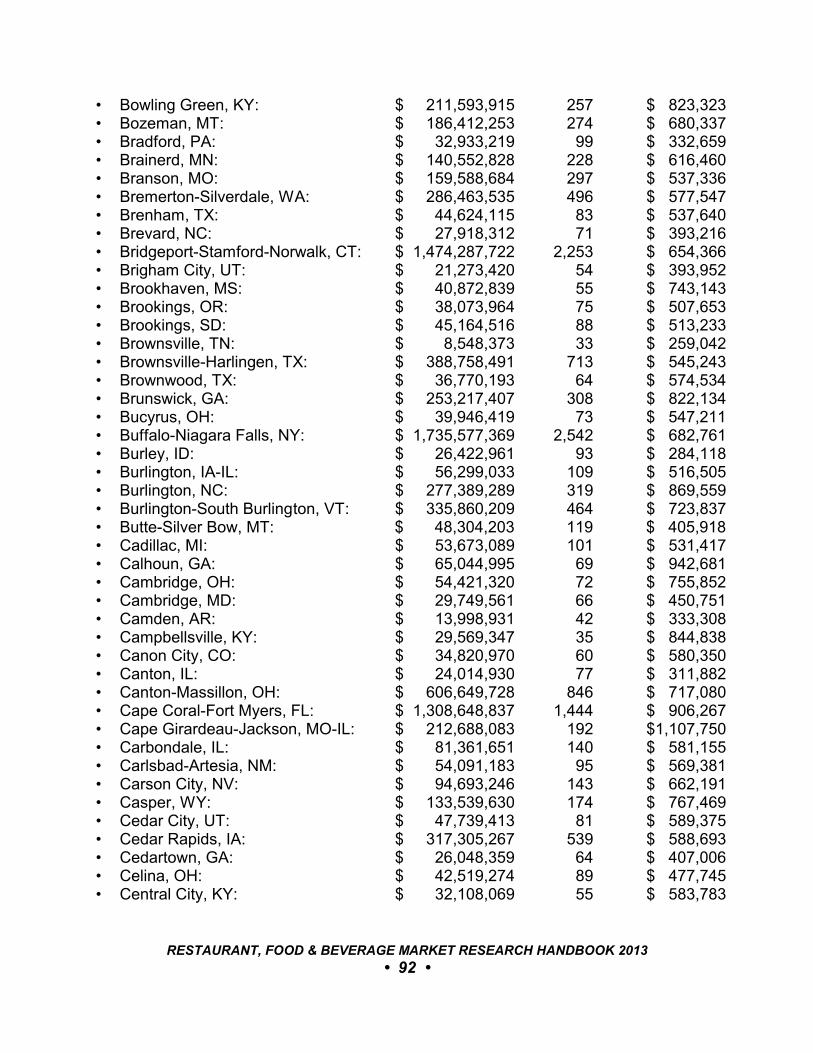
• Bowling Green, KY: $ 211,593,915 257 $ 823,323• Bozeman, MT: $ 186,412,253 274 $ 680,337• Bradford, PA: $ 32,933,219 99 $ 332,659• Brainerd, MN: $ 140,552,828 228 $ 616,460• Branson, MO: $ 159,588,684 297 $ 537,336• Bremerton-Silverdale, WA: $ 286,463,535 496 $ 577,547• Brenham, TX: $ 44,624,115 83 $ 537,640• Brevard, NC: $ 27,918,312 71 $ 393,216• Bridgeport-Stamford-Norwalk, CT: $ 1,474,287,722 2,253 $ 654,366• Brigham City, UT: $ 21,273,420 54 $ 393,952• Brookhaven, MS: $ 40,872,839 55 $ 743,143• Brookings, OR: $ 38,073,964 75 $ 507,653• Brookings, SD: $ 45,164,516 88 $ 513,233• Brownsville, TN: $ 8,548,373 33 $ 259,042• Brownsville-Harlingen, TX: $ 388,758,491 713 $ 545,243• Brownwood, TX: $ 36,770,193 64 $ 574,534• Brunswick, GA: $ 253,217,407 308 $ 822,134• Bucyrus, OH: $ 39,946,419 73 $ 547,211• Buffalo-Niagara Falls, NY: $ 1,735,577,369 2,542 $ 682,761• Burley, ID: $ 26,422,961 93 $ 284,118• Burlington, IA-IL: $ 56,299,033 109 $ 516,505• Burlington, NC: $ 277,389,289 319 $ 869,559• Burlington-South Burlington, VT: $ 335,860,209 464 $ 723,837• Butte-Silver Bow, MT: $ 48,304,203 119 $ 405,918• Cadillac, MI: $ 53,673,089 101 $ 531,417• Calhoun, GA: $ 65,044,995 69 $ 942,681• Cambridge, OH: $ 54,421,320 72 $ 755,852• Cambridge, MD: $ 29,749,561 66 $ 450,751• Camden, AR: $ 13,998,931 42 $ 333,308• Campbellsville, KY: $ 29,569,347 35 $ 844,838• Canon City, CO: $ 34,820,970 60 $ 580,350• Canton, IL: $ 24,014,930 77 $ 311,882• Canton-Massillon, OH: $ 606,649,728 846 $ 717,080• Cape Coral-Fort Myers, FL: $ 1,308,648,837 1,444 $ 906,267• Cape Girardeau-Jackson, MO-IL: $ 212,688,083 192 $1,107,750• Carbondale, IL: $ 81,361,651 140 $ 581,155• Carlsbad-Artesia, NM: $ 54,091,183 95 $ 569,381• Carson City, NV: $ 94,693,246 143 $ 662,191• Casper, WY: $ 133,539,630 174 $ 767,469• Cedar City, UT: $ 47,739,413 81 $ 589,375• Cedar Rapids, IA: $ 317,305,267 539 $ 588,693• Cedartown, GA: $ 26,048,359 64 $ 407,006• Celina, OH: $ 42,519,274 89 $ 477,745• Central City, KY: $ 32,108,069 55 $ 583,783
RESTAURANT, FOOD & BEVERAGE MARKET RESEARCH HANDBOOK 2013
• 92 •

• Centralia, IL: $ 31,958,949 60 $ 532,649• Centralia, WA: $ 78,061,646 166 $ 470,251• Chambersburg, PA: $ 145,501,201 247 $ 589,074• Champaign-Urbana, IL: $ 298,771,814 541 $ 552,258• Charleston, SC: $ 1,364,844,032 1,596 $ 855,165• Charleston, WV: $ 382,246,606 645 $ 592,630• Charleston-Mattoon, IL: $ 76,209,722 144 $ 529,234• Charlotte-Gastonia, NC-SC: $ 3,141,593,615 3,686 $ 852,304• Charlottesville, VA: $ 441,635,039 495 $ 892,192• Chattanooga, TN-GA: $ 927,222,269 1,185 $ 782,466• Chester, SC: $ 18,702,814 49 $ 381,690• Cheyenne, WY: $ 169,487,763 165 $1,027,199• Chicago, IL-IN-WI: $ 306,387,642 471 $ 650,505• Chillicothe, OH: $ 95,064,083 129 $ 736,931• Cincinnati-Middletown, OH-KY-IN: $17,907,377,409 21,188 $ 845,166• Chico, CA: $ 3,516,748,846 4,295 $ 818,801• Claremont, NH: $ 20,141,159 71 $ 283,678• Clarksburg, WV: $ 125,745,439 173 $ 726,852• Clarksdale, MS: $ 14,674,421 35 $ 419,269• Clarksville, TN-KY: $ 337,401,547 513 $ 657,703• Clearlake, CA: $ 37,788,261 138 $ 273,828• Cleveland, MS: $ 43,463,054 58 $ 749,363• Cleveland, TN: $ 130,337,253 191 $ 682,394• Cleveland-Elyria-Mentor, OH: $ 3,360,337,651 4,736 $ 709,531• Clewiston, FL: $ 30,994,998 61 $ 508,115• Clinton, IA: $ 44,869,407 98 $ 457,851• Clovis, NM: $ 56,410,467 78 $ 723,211• Coeur d’Alene, ID: $ 180,907,014 340 $ 532,079• Coffeyville, KS: $ 31,140,540 60 $ 519,009• Coldwater, MI: $ 73,047,302 74 $ 987,126• College Station-Bryan, TX: $ 338,322,208 492 $ 687,647• Colorado Springs, CO: $ 962,797,779 1,234 $ 780,225• Columbia, MO: $ 251,934,518 386 $ 652,680• Columbia, SC: $ 1,029,855,970 1,485 $ 693,506• Columbia, TN: $ 119,374,834 160 $ 746,093• Columbus, GA-AL: $ 550,252,189 639 $ 861,115• Columbus, IN: $ 103,832,485 129 $ 804,903• Columbus, MS: $ 102,011,979 118 $ 864,508• Columbus, NE: $ 36,157,469 54 $ 669,583• Columbus, OH: $ 3,559,194,109 4,107 $ 866,617• Concord, NH: $ 200,199,715 284 $ 704,929• Connersville, IN: $ 27,709,017 44 $ 629,750• Cookeville, TN: $ 164,871,384 216 $ 763,293• Coos Bay, OR: $ 77,463,754 156 $ 496,563
RESTAURANT, FOOD & BEVERAGE MARKET RESEARCH HANDBOOK 2013
• 93 •
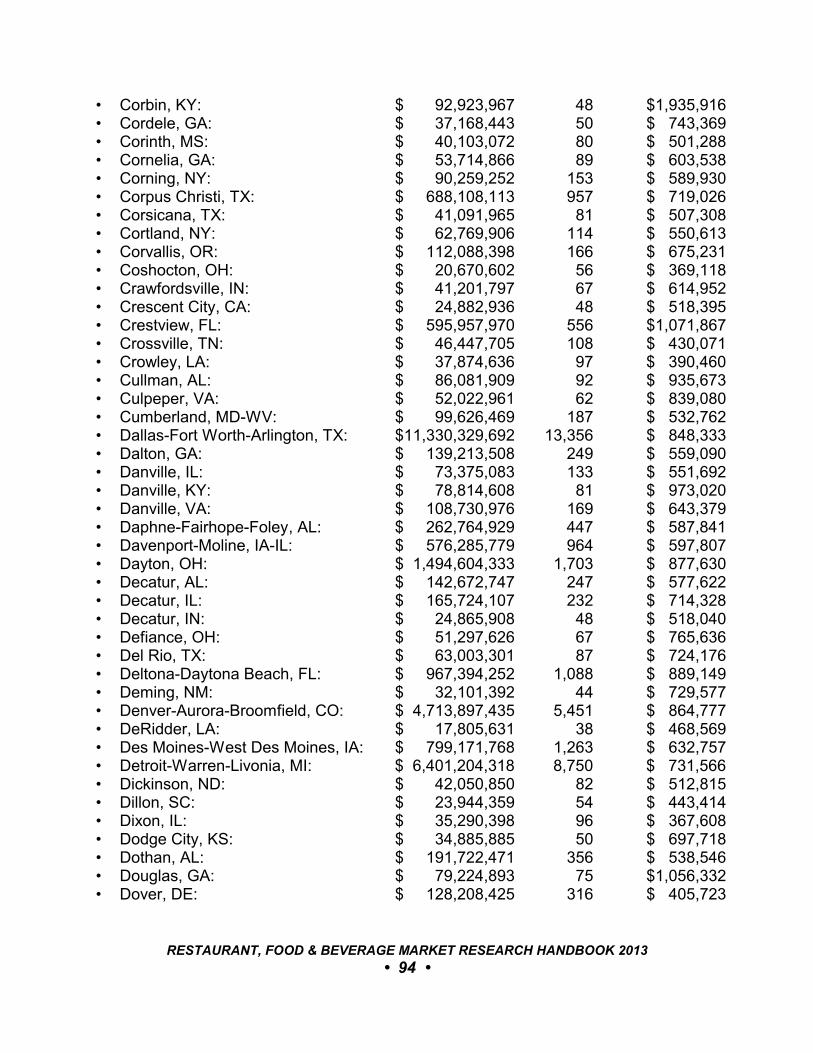
• Corbin, KY: $ 92,923,967 48 $1,935,916• Cordele, GA: $ 37,168,443 50 $ 743,369• Corinth, MS: $ 40,103,072 80 $ 501,288• Cornelia, GA: $ 53,714,866 89 $ 603,538• Corning, NY: $ 90,259,252 153 $ 589,930• Corpus Christi, TX: $ 688,108,113 957 $ 719,026• Corsicana, TX: $ 41,091,965 81 $ 507,308• Cortland, NY: $ 62,769,906 114 $ 550,613• Corvallis, OR: $ 112,088,398 166 $ 675,231• Coshocton, OH: $ 20,670,602 56 $ 369,118• Crawfordsville, IN: $ 41,201,797 67 $ 614,952• Crescent City, CA: $ 24,882,936 48 $ 518,395• Crestview, FL: $ 595,957,970 556 $1,071,867• Crossville, TN: $ 46,447,705 108 $ 430,071• Crowley, LA: $ 37,874,636 97 $ 390,460• Cullman, AL: $ 86,081,909 92 $ 935,673• Culpeper, VA: $ 52,022,961 62 $ 839,080• Cumberland, MD-WV: $ 99,626,469 187 $ 532,762• Dallas-Fort Worth-Arlington, TX: $11,330,329,692 13,356 $ 848,333• Dalton, GA: $ 139,213,508 249 $ 559,090• Danville, IL: $ 73,375,083 133 $ 551,692• Danville, KY: $ 78,814,608 81 $ 973,020• Danville, VA: $ 108,730,976 169 $ 643,379• Daphne-Fairhope-Foley, AL: $ 262,764,929 447 $ 587,841• Davenport-Moline, IA-IL: $ 576,285,779 964 $ 597,807• Dayton, OH: $ 1,494,604,333 1,703 $ 877,630• Decatur, AL: $ 142,672,747 247 $ 577,622• Decatur, IL: $ 165,724,107 232 $ 714,328• Decatur, IN: $ 24,865,908 48 $ 518,040• Defiance, OH: $ 51,297,626 67 $ 765,636• Del Rio, TX: $ 63,003,301 87 $ 724,176• Deltona-Daytona Beach, FL: $ 967,394,252 1,088 $ 889,149• Deming, NM: $ 32,101,392 44 $ 729,577• Denver-Aurora-Broomfield, CO: $ 4,713,897,435 5,451 $ 864,777• DeRidder, LA: $ 17,805,631 38 $ 468,569• Des Moines-West Des Moines, IA: $ 799,171,768 1,263 $ 632,757• Detroit-Warren-Livonia, MI: $ 6,401,204,318 8,750 $ 731,566• Dickinson, ND: $ 42,050,850 82 $ 512,815• Dillon, SC: $ 23,944,359 54 $ 443,414• Dixon, IL: $ 35,290,398 96 $ 367,608• Dodge City, KS: $ 34,885,885 50 $ 697,718• Dothan, AL: $ 191,722,471 356 $ 538,546• Douglas, GA: $ 79,224,893 75 $1,056,332• Dover, DE: $ 128,208,425 316 $ 405,723
RESTAURANT, FOOD & BEVERAGE MARKET RESEARCH HANDBOOK 2013
• 94 •
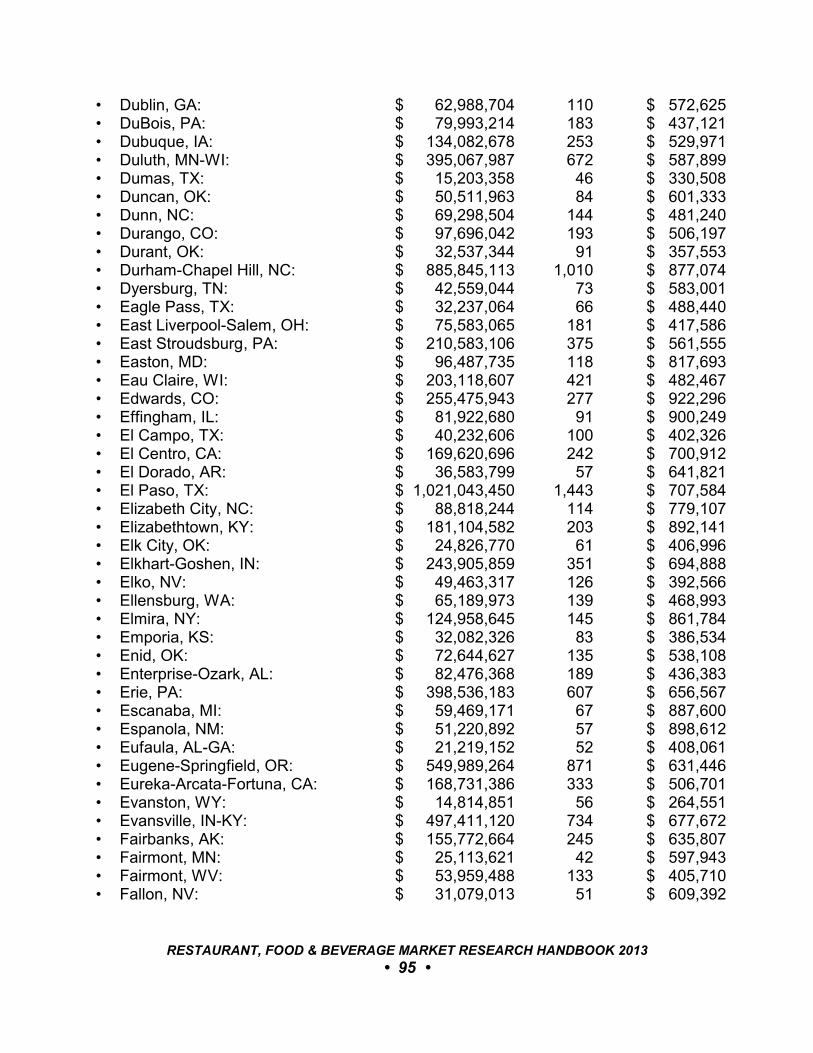
• Dublin, GA: $ 62,988,704 110 $ 572,625• DuBois, PA: $ 79,993,214 183 $ 437,121• Dubuque, IA: $ 134,082,678 253 $ 529,971• Duluth, MN-WI: $ 395,067,987 672 $ 587,899• Dumas, TX: $ 15,203,358 46 $ 330,508• Duncan, OK: $ 50,511,963 84 $ 601,333• Dunn, NC: $ 69,298,504 144 $ 481,240• Durango, CO: $ 97,696,042 193 $ 506,197• Durant, OK: $ 32,537,344 91 $ 357,553• Durham-Chapel Hill, NC: $ 885,845,113 1,010 $ 877,074• Dyersburg, TN: $ 42,559,044 73 $ 583,001• Eagle Pass, TX: $ 32,237,064 66 $ 488,440• East Liverpool-Salem, OH: $ 75,583,065 181 $ 417,586• East Stroudsburg, PA: $ 210,583,106 375 $ 561,555• Easton, MD: $ 96,487,735 118 $ 817,693• Eau Claire, WI: $ 203,118,607 421 $ 482,467• Edwards, CO: $ 255,475,943 277 $ 922,296• Effingham, IL: $ 81,922,680 91 $ 900,249• El Campo, TX: $ 40,232,606 100 $ 402,326• El Centro, CA: $ 169,620,696 242 $ 700,912• El Dorado, AR: $ 36,583,799 57 $ 641,821• El Paso, TX: $ 1,021,043,450 1,443 $ 707,584• Elizabeth City, NC: $ 88,818,244 114 $ 779,107• Elizabethtown, KY: $ 181,104,582 203 $ 892,141• Elk City, OK: $ 24,826,770 61 $ 406,996• Elkhart-Goshen, IN: $ 243,905,859 351 $ 694,888• Elko, NV: $ 49,463,317 126 $ 392,566• Ellensburg, WA: $ 65,189,973 139 $ 468,993• Elmira, NY: $ 124,958,645 145 $ 861,784• Emporia, KS: $ 32,082,326 83 $ 386,534• Enid, OK: $ 72,644,627 135 $ 538,108• Enterprise-Ozark, AL: $ 82,476,368 189 $ 436,383• Erie, PA: $ 398,536,183 607 $ 656,567• Escanaba, MI: $ 59,469,171 67 $ 887,600• Espanola, NM: $ 51,220,892 57 $ 898,612• Eufaula, AL-GA: $ 21,219,152 52 $ 408,061• Eugene-Springfield, OR: $ 549,989,264 871 $ 631,446• Eureka-Arcata-Fortuna, CA: $ 168,731,386 333 $ 506,701• Evanston, WY: $ 14,814,851 56 $ 264,551• Evansville, IN-KY: $ 497,411,120 734 $ 677,672• Fairbanks, AK: $ 155,772,664 245 $ 635,807• Fairmont, MN: $ 25,113,621 42 $ 597,943• Fairmont, WV: $ 53,959,488 133 $ 405,710• Fallon, NV: $ 31,079,013 51 $ 609,392
RESTAURANT, FOOD & BEVERAGE MARKET RESEARCH HANDBOOK 2013
• 95 •

• Fargo, ND-MN: $ 277,064,508 448 $ 618,448• Faribault-Northfield, MN: $ 77,669,587 101 $ 769,006• Farmington, MO: $ 76,698,616 108 $ 710,172• Farmington, NM: $ 135,142,388 202 $ 669,022• Fayetteville, AR-MO: $ 588,713,305 887 $ 663,713• Fayetteville, NC: $ 462,367,344 677 $ 682,965• Fergus Falls, MN: $ 44,602,657 103 $ 433,036• Fernley, NV: $ 27,253,184 79 $ 344,977• Findlay, OH: $ 144,684,361 176 $ 822,070• Fitzgerald, GA: $ 13,049,005 39 $ 334,590• Flagstaff, AZ: $ 323,602,829 348 $ 929,893• Flint, MI: $ 519,166,076 808 $ 642,532• Florence, SC: $ 232,037,315 365 $ 635,719• Florence-Muscle Shoals, AL: $ 169,286,168 277 $ 611,141• Fond du Lac, WI: $ 115,455,222 196 $ 589,057• Forest City, NC: $ 84,951,862 102 $ 832,861• Forrest City, AR: $ 20,770,424 30 $ 692,347• Fort Collins-Loveland, CO: $ 520,034,456 684 $ 760,284• Fort Dodge, IA: $ 49,545,588 57 $ 869,221• Fort Leonard Wood, MO: $ 73,739,469 99 $ 744,843• Fort Madison-Keokuk, IA-MO: $ 40,343,580 100 $ 403,436• Fort Morgan, CO: $ 25,476,698 48 $ 530,765• Fort Payne, AL: $ 66,191,064 93 $ 711,732• Fort Polk South, LA: $ 42,341,734 82 $ 516,363• Fort Smith, AR-OK: $ 300,554,281 544 $ 552,489• Fort Valley, GA: $ 39,537,809 45 $ 878,618• Fort Wayne, IN: $ 581,396,988 811 $ 716,889• Frankfort, IN: $ 36,571,818 50 $ 731,436• Frankfort, KY: $ 88,616,682 142 $ 624,061• Fredericksburg, TX: $ 35,331,877 58 $ 609,170• Freeport, IL: $ 64,487,245 107 $ 602,685• Fremont, OH: $ 100,405,968 124 $ 809,726• Fremont, NE: $ 49,348,512 91 $ 542,291• Fresno, CA: $ 998,654,540 1,637 $ 610,052• Gadsden, AL: $ 117,821,710 159 $ 741,017• Gaffney, SC: $ 45,869,783 86 $ 533,370• Gainesville, FL: $ 383,629,042 572 $ 670,680• Gainesville, GA: $ 194,840,957 313 $ 622,495• Gainesville, TX: $ 48,918,862 66 $ 741,195• Galesburg, IL: $ 76,401,093 161 $ 474,541• Gallup, NM: $ 117,733,258 105 $1,121,269• Garden City, KS: $ 69,769,305 63 $1,107,449• Gardnerville Ranchos, NV: $ 84,442,385 118 $ 715,613• Georgetown, SC: $ 127,067,292 179 $ 709,873
RESTAURANT, FOOD & BEVERAGE MARKET RESEARCH HANDBOOK 2013
• 96 •
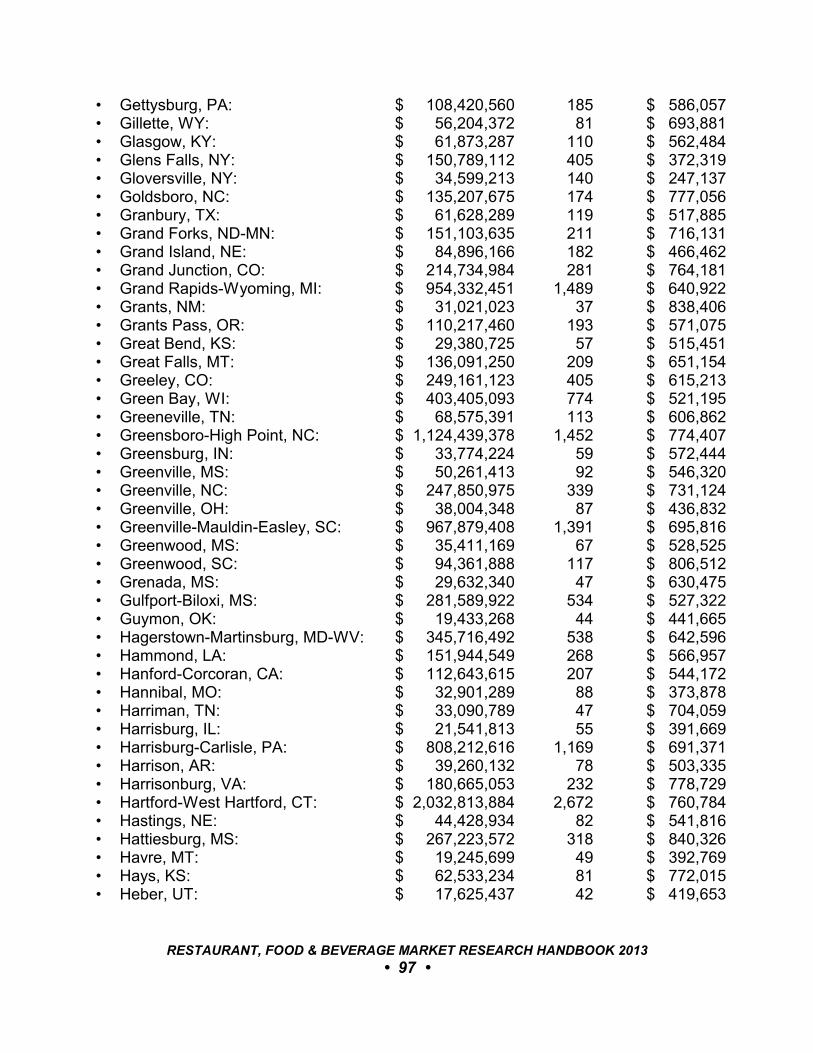
• Gettysburg, PA: $ 108,420,560 185 $ 586,057• Gillette, WY: $ 56,204,372 81 $ 693,881• Glasgow, KY: $ 61,873,287 110 $ 562,484• Glens Falls, NY: $ 150,789,112 405 $ 372,319• Gloversville, NY: $ 34,599,213 140 $ 247,137• Goldsboro, NC: $ 135,207,675 174 $ 777,056• Granbury, TX: $ 61,628,289 119 $ 517,885• Grand Forks, ND-MN: $ 151,103,635 211 $ 716,131• Grand Island, NE: $ 84,896,166 182 $ 466,462• Grand Junction, CO: $ 214,734,984 281 $ 764,181• Grand Rapids-Wyoming, MI: $ 954,332,451 1,489 $ 640,922• Grants, NM: $ 31,021,023 37 $ 838,406• Grants Pass, OR: $ 110,217,460 193 $ 571,075• Great Bend, KS: $ 29,380,725 57 $ 515,451• Great Falls, MT: $ 136,091,250 209 $ 651,154• Greeley, CO: $ 249,161,123 405 $ 615,213• Green Bay, WI: $ 403,405,093 774 $ 521,195• Greeneville, TN: $ 68,575,391 113 $ 606,862• Greensboro-High Point, NC: $ 1,124,439,378 1,452 $ 774,407• Greensburg, IN: $ 33,774,224 59 $ 572,444• Greenville, MS: $ 50,261,413 92 $ 546,320• Greenville, NC: $ 247,850,975 339 $ 731,124• Greenville, OH: $ 38,004,348 87 $ 436,832• Greenville-Mauldin-Easley, SC: $ 967,879,408 1,391 $ 695,816• Greenwood, MS: $ 35,411,169 67 $ 528,525• Greenwood, SC: $ 94,361,888 117 $ 806,512• Grenada, MS: $ 29,632,340 47 $ 630,475• Gulfport-Biloxi, MS: $ 281,589,922 534 $ 527,322• Guymon, OK: $ 19,433,268 44 $ 441,665• Hagerstown-Martinsburg, MD-WV: $ 345,716,492 538 $ 642,596• Hammond, LA: $ 151,944,549 268 $ 566,957• Hanford-Corcoran, CA: $ 112,643,615 207 $ 544,172• Hannibal, MO: $ 32,901,289 88 $ 373,878• Harriman, TN: $ 33,090,789 47 $ 704,059• Harrisburg, IL: $ 21,541,813 55 $ 391,669• Harrisburg-Carlisle, PA: $ 808,212,616 1,169 $ 691,371• Harrison, AR: $ 39,260,132 78 $ 503,335• Harrisonburg, VA: $ 180,665,053 232 $ 778,729• Hartford-West Hartford, CT: $ 2,032,813,884 2,672 $ 760,784• Hastings, NE: $ 44,428,934 82 $ 541,816• Hattiesburg, MS: $ 267,223,572 318 $ 840,326• Havre, MT: $ 19,245,699 49 $ 392,769• Hays, KS: $ 62,533,234 81 $ 772,015• Heber, UT: $ 17,625,437 42 $ 419,653
RESTAURANT, FOOD & BEVERAGE MARKET RESEARCH HANDBOOK 2013
• 97 •

• Helena, MT: $ 97,981,482 178 $ 550,458• Helena-West Helena, AR: $ 10,205,462 25 $ 408,218• Henderson, NC: $ 67,551,779 74 $ 912,862• Hereford, TX: $ 17,337,574 38 $ 456,252• Hickory-Lenoir-Morganton, NC: $ 427,146,453 581 $ 735,192• Hilo, HI: $ 310,929,480 487 $ 638,459• Hilton Head Island-Beaufort, SC: $ 419,841,429 519 $ 808,943• Hinesville-Fort Stewart, GA: $ 88,441,561 126 $ 701,917• Hobbs, NM: $ 78,924,180 130 $ 607,109• Holland-Grand Haven, MI: $ 276,176,129 375 $ 736,470• Homosassa Springs, FL: $ 140,338,740 199 $ 705,220• Honolulu, HI: $ 2,301,953,866 2,375 $ 969,244• Hood River, OR: $ 40,328,634 68 $ 593,068• Hope, AR: $ 19,563,970 31 $ 631,096• Hot Springs, AR: $ 144,858,966 264 $ 548,708• Houghton, MI: $ 37,262,411 93 $ 400,671• Houma-Bayou Cane-Thibodaux, LA: $ 256,914,953 467 $ 550,139• Houston-Sugar Land-Baytown, TX: $ 8,596,031,036 11,980 $ 717,532• Hudson, NY: $ 65,057,236 130 $ 500,440• Humboldt, TN: $ 43,566,582 93 $ 468,458• Huntingdon, PA: $ 20,102,306 68 $ 295,622• Huntington, IN: $ 42,735,961 76 $ 562,315• Huntington-Ashland, WV-KY-OH: $ 332,008,528 463 $ 717,081• Huntsville, AL: $ 662,641,438 819 $ 809,086• Huntsville, TX: $ 46,077,747 109 $ 422,732• Huron, SD: $ 11,011,258 39 $ 282,340• Hutchinson, KS: $ 80,092,966 115 $ 696,461• Hutchinson, MN: $ 32,635,693 65 $ 502,088• Idaho Falls, ID: $ 158,508,037 238 $ 666,000• Indiana, PA: $ 125,027,772 130 $ 961,752• Indianapolis-Carmel, IN: $ 3,167,372,194 3,521 $ 899,566• Indianola, MS: $ 4,992,151 36 $ 138,671• Iowa City, IA: $ 222,084,078 350 $ 634,526• Iron Mountain, MI-WI: $ 40,372,751 72 $ 560,733• Ithaca, NY: $ 192,969,097 248 $ 778,101• Jackson, MI: $ 172,575,161 290 $ 595,087• Jackson, MS: $ 948,781,183 1,063 $ 892,551• Jackson, TN: $ 278,940,208 278 $1,003,382• Jackson, WY-ID: $ 93,193,896 110 $ 847,217• Jacksonville, FL: $ 2,471,545,348 3,068 $ 805,588• Jacksonville, IL: $ 58,640,517 88 $ 666,370• Jacksonville, NC: $ 232,942,085 227 $1,026,177• Jacksonville, TX: $ 32,861,675 71 $ 462,840• Jamestown, ND: $ 19,362,516 46 $ 420,924
RESTAURANT, FOOD & BEVERAGE MARKET RESEARCH HANDBOOK 2013
• 98 •
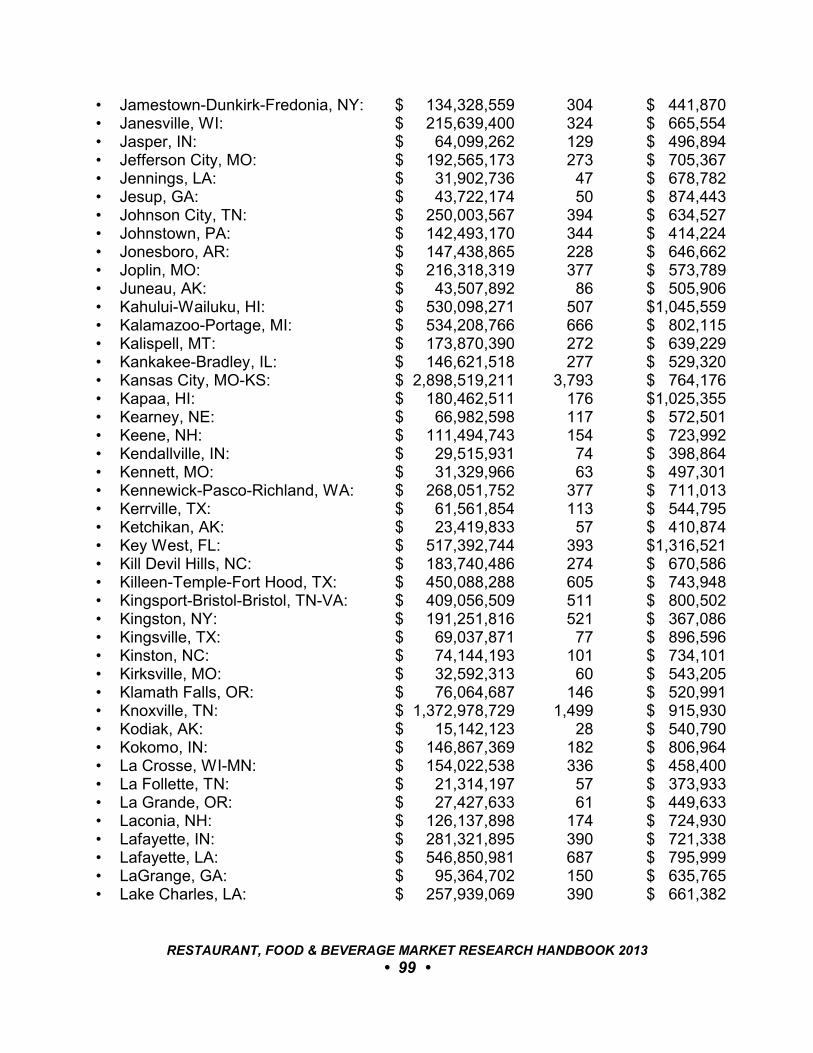
• Jamestown-Dunkirk-Fredonia, NY: $ 134,328,559 304 $ 441,870• Janesville, WI: $ 215,639,400 324 $ 665,554• Jasper, IN: $ 64,099,262 129 $ 496,894• Jefferson City, MO: $ 192,565,173 273 $ 705,367• Jennings, LA: $ 31,902,736 47 $ 678,782• Jesup, GA: $ 43,722,174 50 $ 874,443• Johnson City, TN: $ 250,003,567 394 $ 634,527• Johnstown, PA: $ 142,493,170 344 $ 414,224• Jonesboro, AR: $ 147,438,865 228 $ 646,662• Joplin, MO: $ 216,318,319 377 $ 573,789• Juneau, AK: $ 43,507,892 86 $ 505,906• Kahului-Wailuku, HI: $ 530,098,271 507 $1,045,559• Kalamazoo-Portage, MI: $ 534,208,766 666 $ 802,115• Kalispell, MT: $ 173,870,390 272 $ 639,229• Kankakee-Bradley, IL: $ 146,621,518 277 $ 529,320• Kansas City, MO-KS: $ 2,898,519,211 3,793 $ 764,176• Kapaa, HI: $ 180,462,511 176 $1,025,355• Kearney, NE: $ 66,982,598 117 $ 572,501• Keene, NH: $ 111,494,743 154 $ 723,992• Kendallville, IN: $ 29,515,931 74 $ 398,864• Kennett, MO: $ 31,329,966 63 $ 497,301• Kennewick-Pasco-Richland, WA: $ 268,051,752 377 $ 711,013• Kerrville, TX: $ 61,561,854 113 $ 544,795• Ketchikan, AK: $ 23,419,833 57 $ 410,874• Key West, FL: $ 517,392,744 393 $1,316,521• Kill Devil Hills, NC: $ 183,740,486 274 $ 670,586• Killeen-Temple-Fort Hood, TX: $ 450,088,288 605 $ 743,948• Kingsport-Bristol-Bristol, TN-VA: $ 409,056,509 511 $ 800,502• Kingston, NY: $ 191,251,816 521 $ 367,086• Kingsville, TX: $ 69,037,871 77 $ 896,596• Kinston, NC: $ 74,144,193 101 $ 734,101• Kirksville, MO: $ 32,592,313 60 $ 543,205• Klamath Falls, OR: $ 76,064,687 146 $ 520,991• Knoxville, TN: $ 1,372,978,729 1,499 $ 915,930• Kodiak, AK: $ 15,142,123 28 $ 540,790• Kokomo, IN: $ 146,867,369 182 $ 806,964• La Crosse, WI-MN: $ 154,022,538 336 $ 458,400• La Follette, TN: $ 21,314,197 57 $ 373,933• La Grande, OR: $ 27,427,633 61 $ 449,633• Laconia, NH: $ 126,137,898 174 $ 724,930• Lafayette, IN: $ 281,321,895 390 $ 721,338• Lafayette, LA: $ 546,850,981 687 $ 795,999• LaGrange, GA: $ 95,364,702 150 $ 635,765• Lake Charles, LA: $ 257,939,069 390 $ 661,382
RESTAURANT, FOOD & BEVERAGE MARKET RESEARCH HANDBOOK 2013
• 99 •
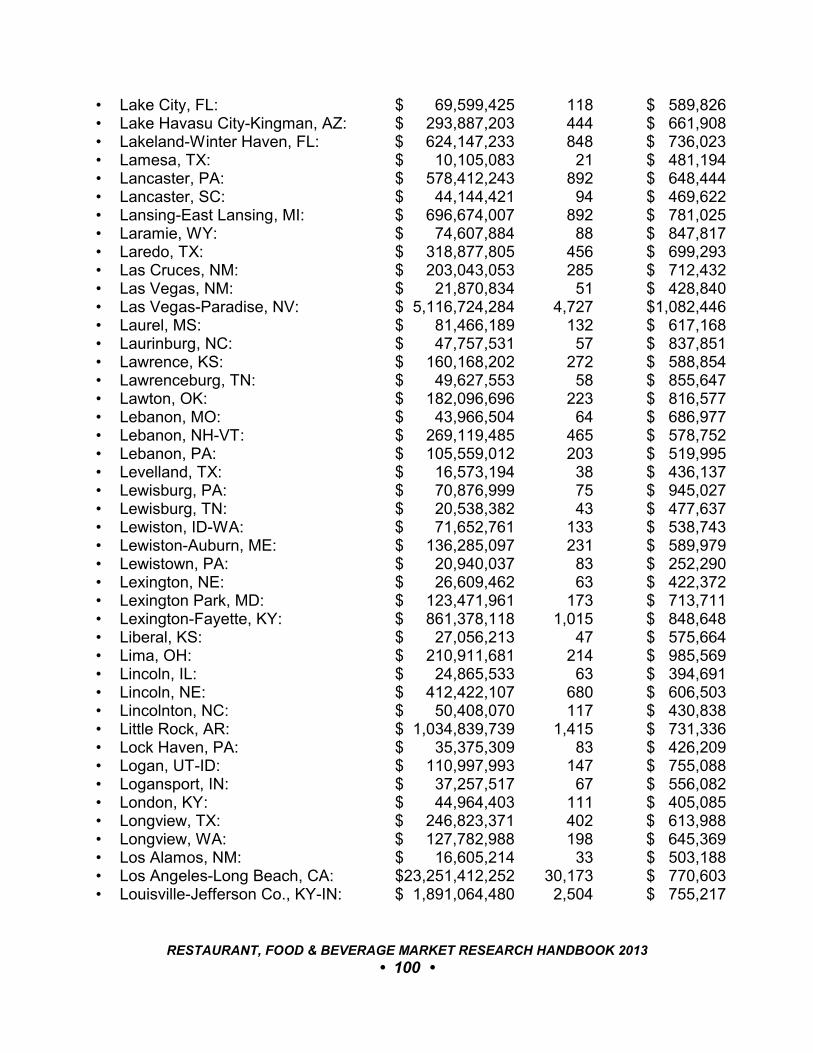
• Lake City, FL: $ 69,599,425 118 $ 589,826• Lake Havasu City-Kingman, AZ: $ 293,887,203 444 $ 661,908• Lakeland-Winter Haven, FL: $ 624,147,233 848 $ 736,023• Lamesa, TX: $ 10,105,083 21 $ 481,194• Lancaster, PA: $ 578,412,243 892 $ 648,444• Lancaster, SC: $ 44,144,421 94 $ 469,622• Lansing-East Lansing, MI: $ 696,674,007 892 $ 781,025• Laramie, WY: $ 74,607,884 88 $ 847,817• Laredo, TX: $ 318,877,805 456 $ 699,293• Las Cruces, NM: $ 203,043,053 285 $ 712,432• Las Vegas, NM: $ 21,870,834 51 $ 428,840• Las Vegas-Paradise, NV: $ 5,116,724,284 4,727 $1,082,446• Laurel, MS: $ 81,466,189 132 $ 617,168• Laurinburg, NC: $ 47,757,531 57 $ 837,851• Lawrence, KS: $ 160,168,202 272 $ 588,854• Lawrenceburg, TN: $ 49,627,553 58 $ 855,647• Lawton, OK: $ 182,096,696 223 $ 816,577• Lebanon, MO: $ 43,966,504 64 $ 686,977• Lebanon, NH-VT: $ 269,119,485 465 $ 578,752• Lebanon, PA: $ 105,559,012 203 $ 519,995• Levelland, TX: $ 16,573,194 38 $ 436,137• Lewisburg, PA: $ 70,876,999 75 $ 945,027• Lewisburg, TN: $ 20,538,382 43 $ 477,637• Lewiston, ID-WA: $ 71,652,761 133 $ 538,743• Lewiston-Auburn, ME: $ 136,285,097 231 $ 589,979• Lewistown, PA: $ 20,940,037 83 $ 252,290• Lexington, NE: $ 26,609,462 63 $ 422,372• Lexington Park, MD: $ 123,471,961 173 $ 713,711• Lexington-Fayette, KY: $ 861,378,118 1,015 $ 848,648• Liberal, KS: $ 27,056,213 47 $ 575,664• Lima, OH: $ 210,911,681 214 $ 985,569• Lincoln, IL: $ 24,865,533 63 $ 394,691• Lincoln, NE: $ 412,422,107 680 $ 606,503• Lincolnton, NC: $ 50,408,070 117 $ 430,838• Little Rock, AR: $ 1,034,839,739 1,415 $ 731,336• Lock Haven, PA: $ 35,375,309 83 $ 426,209• Logan, UT-ID: $ 110,997,993 147 $ 755,088• Logansport, IN: $ 37,257,517 67 $ 556,082• London, KY: $ 44,964,403 111 $ 405,085• Longview, TX: $ 246,823,371 402 $ 613,988• Longview, WA: $ 127,782,988 198 $ 645,369• Los Alamos, NM: $ 16,605,214 33 $ 503,188• Los Angeles-Long Beach, CA: $23,251,412,252 30,173 $ 770,603• Louisville-Jefferson Co., KY-IN: $ 1,891,064,480 2,504 $ 755,217
RESTAURANT, FOOD & BEVERAGE MARKET RESEARCH HANDBOOK 2013
• 100 •
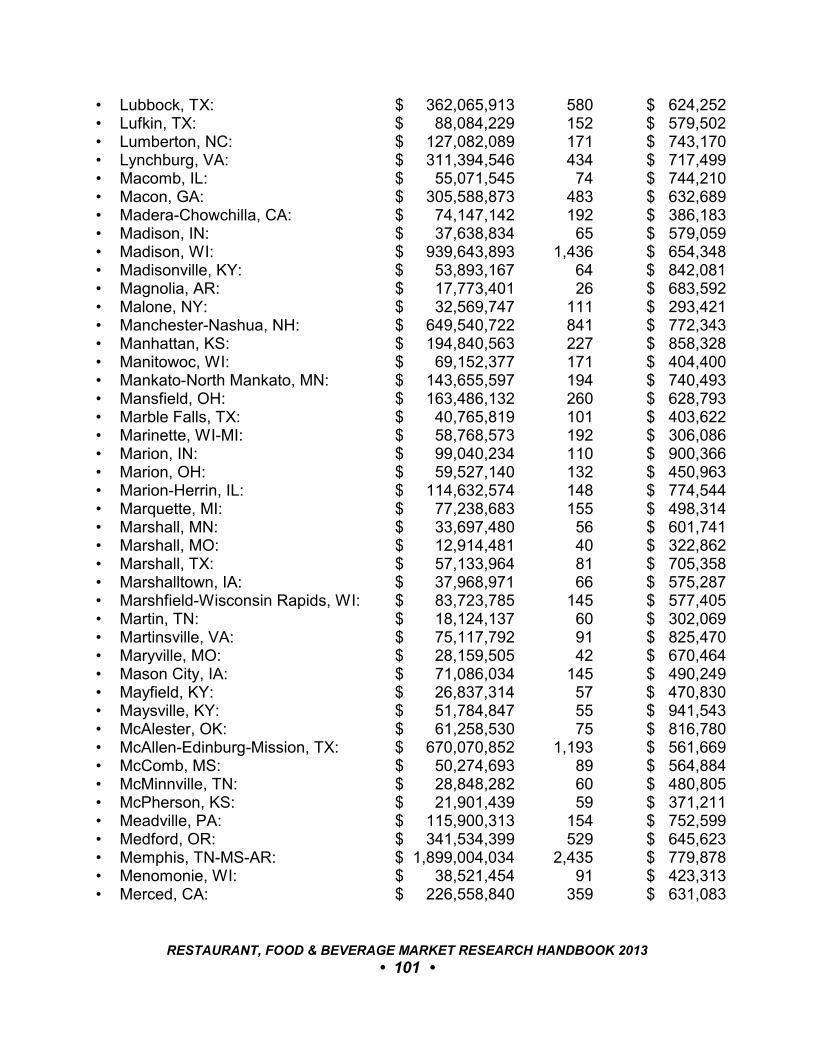
• Lubbock, TX: $ 362,065,913 580 $ 624,252• Lufkin, TX: $ 88,084,229 152 $ 579,502• Lumberton, NC: $ 127,082,089 171 $ 743,170• Lynchburg, VA: $ 311,394,546 434 $ 717,499• Macomb, IL: $ 55,071,545 74 $ 744,210• Macon, GA: $ 305,588,873 483 $ 632,689• Madera-Chowchilla, CA: $ 74,147,142 192 $ 386,183• Madison, IN: $ 37,638,834 65 $ 579,059• Madison, WI: $ 939,643,893 1,436 $ 654,348• Madisonville, KY: $ 53,893,167 64 $ 842,081• Magnolia, AR: $ 17,773,401 26 $ 683,592• Malone, NY: $ 32,569,747 111 $ 293,421• Manchester-Nashua, NH: $ 649,540,722 841 $ 772,343• Manhattan, KS: $ 194,840,563 227 $ 858,328• Manitowoc, WI: $ 69,152,377 171 $ 404,400• Mankato-North Mankato, MN: $ 143,655,597 194 $ 740,493• Mansfield, OH: $ 163,486,132 260 $ 628,793• Marble Falls, TX: $ 40,765,819 101 $ 403,622• Marinette, WI-MI: $ 58,768,573 192 $ 306,086• Marion, IN: $ 99,040,234 110 $ 900,366• Marion, OH: $ 59,527,140 132 $ 450,963• Marion-Herrin, IL: $ 114,632,574 148 $ 774,544• Marquette, MI: $ 77,238,683 155 $ 498,314• Marshall, MN: $ 33,697,480 56 $ 601,741• Marshall, MO: $ 12,914,481 40 $ 322,862• Marshall, TX: $ 57,133,964 81 $ 705,358• Marshalltown, IA: $ 37,968,971 66 $ 575,287• Marshfield-Wisconsin Rapids, WI: $ 83,723,785 145 $ 577,405• Martin, TN: $ 18,124,137 60 $ 302,069• Martinsville, VA: $ 75,117,792 91 $ 825,470• Maryville, MO: $ 28,159,505 42 $ 670,464• Mason City, IA: $ 71,086,034 145 $ 490,249• Mayfield, KY: $ 26,837,314 57 $ 470,830• Maysville, KY: $ 51,784,847 55 $ 941,543• McAlester, OK: $ 61,258,530 75 $ 816,780• McAllen-Edinburg-Mission, TX: $ 670,070,852 1,193 $ 561,669• McComb, MS: $ 50,274,693 89 $ 564,884• McMinnville, TN: $ 28,848,282 60 $ 480,805• McPherson, KS: $ 21,901,439 59 $ 371,211• Meadville, PA: $ 115,900,313 154 $ 752,599• Medford, OR: $ 341,534,399 529 $ 645,623• Memphis, TN-MS-AR: $ 1,899,004,034 2,435 $ 779,878• Menomonie, WI: $ 38,521,454 91 $ 423,313• Merced, CA: $ 226,558,840 359 $ 631,083
RESTAURANT, FOOD & BEVERAGE MARKET RESEARCH HANDBOOK 2013
• 101 •

• Meridian, MS: $ 115,826,286 170 $ 681,331• Merrill, WI: $ 19,231,728 69 $ 278,721• Mexico, MO: $ 22,234,429 34 $ 653,954• Miami, OK: $ 19,544,032 52 $ 375,847• Miami-Fort Lauderdale, FL: $ 9,966,220,387 11,854 $ 840,747• Michigan City-La Porte, IN: $ 132,884,354 263 $ 505,264• Middlesborough, KY: $ 37,281,373 53 $ 703,422• Midland, MI: $ 99,876,966 151 $ 661,437• Midland, TX: $ 228,144,709 291 $ 784,002• Milledgeville, GA: $ 68,263,352 109 $ 626,269• Milwaukee-Waukesha-W. Allis, WI: $ 2,299,574,705 3,366 $ 683,177• Minden, LA: $ 22,266,989 72 $ 309,264• Mineral Wells, TX: $ 30,293,896 64 $ 473,342• Minneapolis, MN-WI: $ 5,815,450,996 5,652 $1,028,919• Minot, ND: $ 97,918,649 198 $ 494,539• Missoula, MT: $ 202,767,566 298 $ 680,428• Mitchell, SD: $ 28,957,999 60 $ 482,633• Moberly, MO: $ 18,820,726 40 $ 470,518• Mobile, AL: $ 572,710,768 737 $ 777,084• Modesto, CA: $ 751,653,730 930 $ 808,230• Monroe, LA: $ 233,860,741 357 $ 655,072• Monroe, MI: $ 177,044,109 228 $ 776,509• Monroe, WI: $ 32,622,830 83 $ 393,046• Montgomery, AL: $ 485,661,245 692 $ 701,823• Montrose, CO: $ 39,544,294 71 $ 556,962• Morehead City, NC: $ 121,893,289 218 $ 559,144• Morgan City, LA: $ 44,923,092 103 $ 436,147• Morgantown, WV: $ 166,720,986 330 $ 505,215• Morristown, TN: $ 144,934,810 200 $ 724,674• Moscow, ID: $ 39,209,877 85 $ 461,293• Moses Lake, WA: $ 82,530,234 156 $ 529,040• Moultrie, GA: $ 32,246,524 64 $ 503,852• Mount Airy, NC: $ 93,723,609 160 $ 585,773• Mount Pleasant, MI: $ 71,877,774 122 $ 589,162• Mount Pleasant, TX: $ 37,505,251 50 $ 750,105• Mount Sterling, KY: $ 34,518,719 54 $ 639,236• Mount Vernon, IL: $ 57,498,788 68 $ 845,570• Mount Vernon, OH: $ 51,970,801 103 $ 504,571• Mount Vernon-Anacortes, WA: $ 172,676,342 310 $ 557,020• Mountain Home, AR: $ 40,543,908 93 $ 435,956• Mountain Home, ID: $ 29,958,609 47 $ 637,417• Muncie, IN: $ 163,003,939 201 $ 810,965• Murray, KY: $ 52,517,942 75 $ 700,239• Muscatine, IA: $ 39,950,285 91 $ 439,014
RESTAURANT, FOOD & BEVERAGE MARKET RESEARCH HANDBOOK 2013
• 102 •
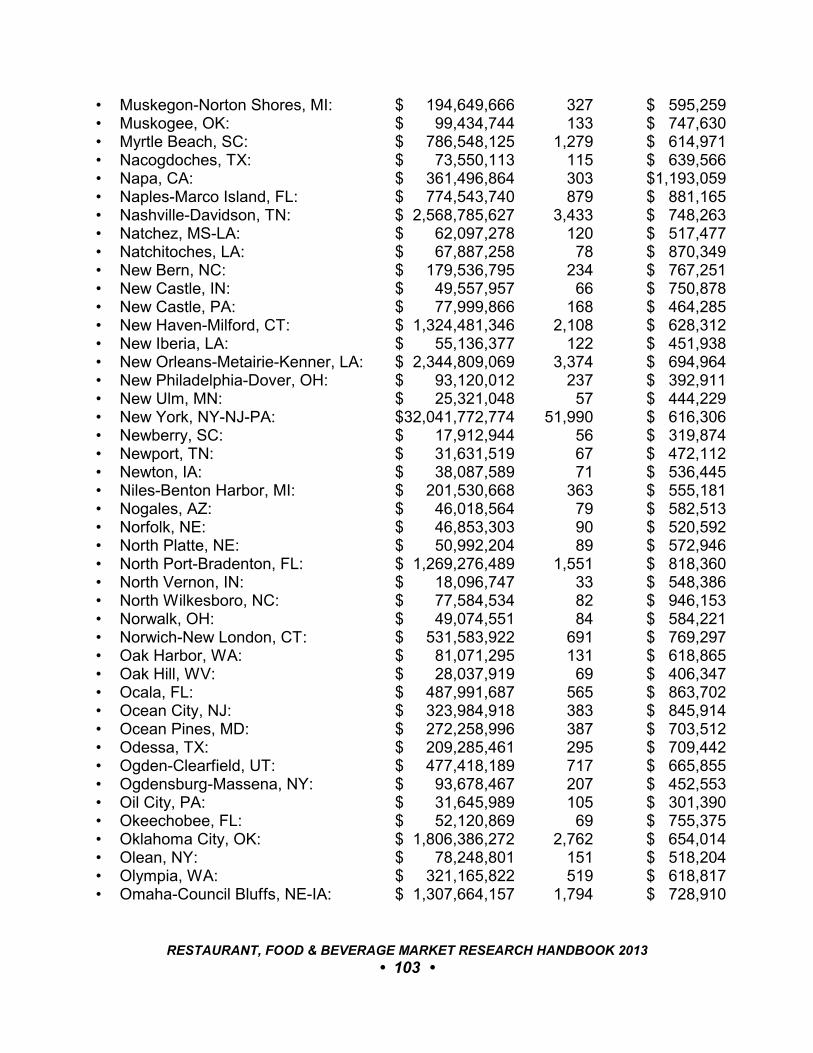
• Muskegon-Norton Shores, MI: $ 194,649,666 327 $ 595,259• Muskogee, OK: $ 99,434,744 133 $ 747,630• Myrtle Beach, SC: $ 786,548,125 1,279 $ 614,971• Nacogdoches, TX: $ 73,550,113 115 $ 639,566• Napa, CA: $ 361,496,864 303 $1,193,059• Naples-Marco Island, FL: $ 774,543,740 879 $ 881,165• Nashville-Davidson, TN: $ 2,568,785,627 3,433 $ 748,263• Natchez, MS-LA: $ 62,097,278 120 $ 517,477• Natchitoches, LA: $ 67,887,258 78 $ 870,349• New Bern, NC: $ 179,536,795 234 $ 767,251• New Castle, IN: $ 49,557,957 66 $ 750,878• New Castle, PA: $ 77,999,866 168 $ 464,285• New Haven-Milford, CT: $ 1,324,481,346 2,108 $ 628,312• New Iberia, LA: $ 55,136,377 122 $ 451,938• New Orleans-Metairie-Kenner, LA: $ 2,344,809,069 3,374 $ 694,964• New Philadelphia-Dover, OH: $ 93,120,012 237 $ 392,911• New Ulm, MN: $ 25,321,048 57 $ 444,229• New York, NY-NJ-PA: $32,041,772,774 51,990 $ 616,306• Newberry, SC: $ 17,912,944 56 $ 319,874• Newport, TN: $ 31,631,519 67 $ 472,112• Newton, IA: $ 38,087,589 71 $ 536,445• Niles-Benton Harbor, MI: $ 201,530,668 363 $ 555,181• Nogales, AZ: $ 46,018,564 79 $ 582,513• Norfolk, NE: $ 46,853,303 90 $ 520,592• North Platte, NE: $ 50,992,204 89 $ 572,946• North Port-Bradenton, FL: $ 1,269,276,489 1,551 $ 818,360• North Vernon, IN: $ 18,096,747 33 $ 548,386• North Wilkesboro, NC: $ 77,584,534 82 $ 946,153• Norwalk, OH: $ 49,074,551 84 $ 584,221• Norwich-New London, CT: $ 531,583,922 691 $ 769,297• Oak Harbor, WA: $ 81,071,295 131 $ 618,865• Oak Hill, WV: $ 28,037,919 69 $ 406,347• Ocala, FL: $ 487,991,687 565 $ 863,702• Ocean City, NJ: $ 323,984,918 383 $ 845,914• Ocean Pines, MD: $ 272,258,996 387 $ 703,512• Odessa, TX: $ 209,285,461 295 $ 709,442• Ogden-Clearfield, UT: $ 477,418,189 717 $ 665,855• Ogdensburg-Massena, NY: $ 93,678,467 207 $ 452,553• Oil City, PA: $ 31,645,989 105 $ 301,390• Okeechobee, FL: $ 52,120,869 69 $ 755,375• Oklahoma City, OK: $ 1,806,386,272 2,762 $ 654,014• Olean, NY: $ 78,248,801 151 $ 518,204• Olympia, WA: $ 321,165,822 519 $ 618,817• Omaha-Council Bluffs, NE-IA: $ 1,307,664,157 1,794 $ 728,910
RESTAURANT, FOOD & BEVERAGE MARKET RESEARCH HANDBOOK 2013
• 103 •
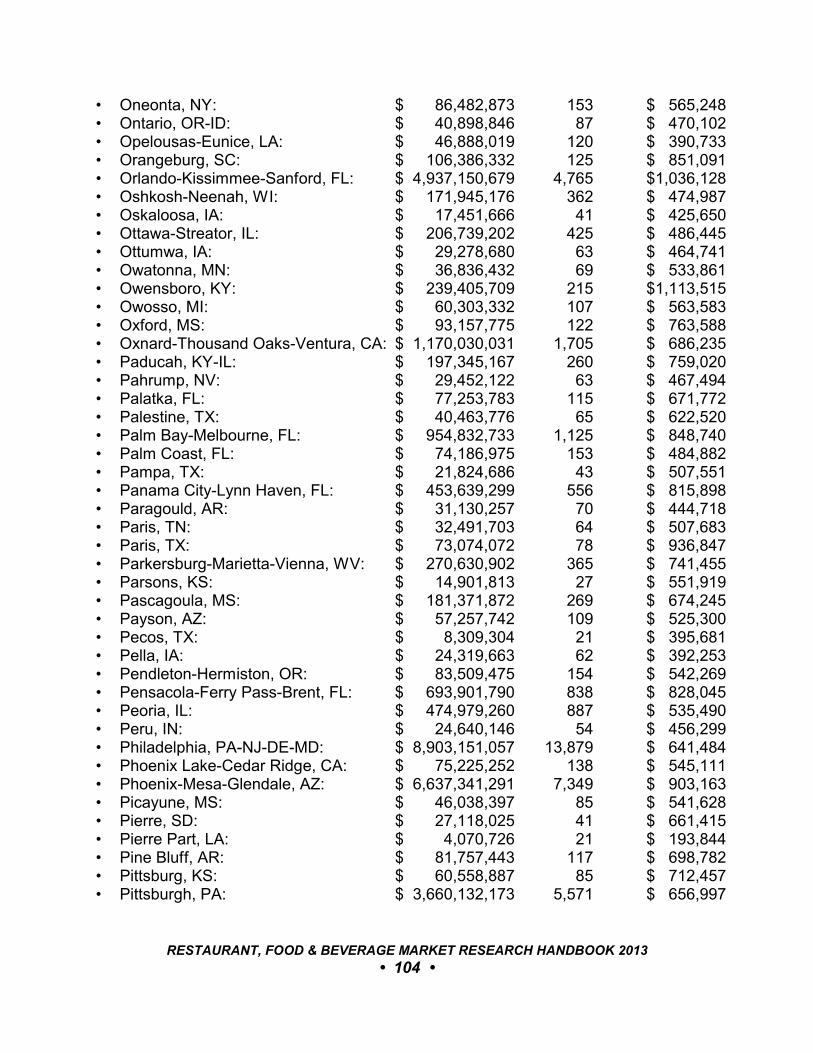
• Oneonta, NY: $ 86,482,873 153 $ 565,248• Ontario, OR-ID: $ 40,898,846 87 $ 470,102• Opelousas-Eunice, LA: $ 46,888,019 120 $ 390,733• Orangeburg, SC: $ 106,386,332 125 $ 851,091• Orlando-Kissimmee-Sanford, FL: $ 4,937,150,679 4,765 $1,036,128• Oshkosh-Neenah, WI: $ 171,945,176 362 $ 474,987• Oskaloosa, IA: $ 17,451,666 41 $ 425,650• Ottawa-Streator, IL: $ 206,739,202 425 $ 486,445• Ottumwa, IA: $ 29,278,680 63 $ 464,741• Owatonna, MN: $ 36,836,432 69 $ 533,861• Owensboro, KY: $ 239,405,709 215 $1,113,515• Owosso, MI: $ 60,303,332 107 $ 563,583• Oxford, MS: $ 93,157,775 122 $ 763,588• Oxnard-Thousand Oaks-Ventura, CA: $ 1,170,030,031 1,705 $ 686,235 • Paducah, KY-IL: $ 197,345,167 260 $ 759,020• Pahrump, NV: $ 29,452,122 63 $ 467,494• Palatka, FL: $ 77,253,783 115 $ 671,772• Palestine, TX: $ 40,463,776 65 $ 622,520• Palm Bay-Melbourne, FL: $ 954,832,733 1,125 $ 848,740• Palm Coast, FL: $ 74,186,975 153 $ 484,882• Pampa, TX: $ 21,824,686 43 $ 507,551• Panama City-Lynn Haven, FL: $ 453,639,299 556 $ 815,898• Paragould, AR: $ 31,130,257 70 $ 444,718• Paris, TN: $ 32,491,703 64 $ 507,683• Paris, TX: $ 73,074,072 78 $ 936,847• Parkersburg-Marietta-Vienna, WV: $ 270,630,902 365 $ 741,455• Parsons, KS: $ 14,901,813 27 $ 551,919• Pascagoula, MS: $ 181,371,872 269 $ 674,245• Payson, AZ: $ 57,257,742 109 $ 525,300• Pecos, TX: $ 8,309,304 21 $ 395,681• Pella, IA: $ 24,319,663 62 $ 392,253• Pendleton-Hermiston, OR: $ 83,509,475 154 $ 542,269• Pensacola-Ferry Pass-Brent, FL: $ 693,901,790 838 $ 828,045• Peoria, IL: $ 474,979,260 887 $ 535,490• Peru, IN: $ 24,640,146 54 $ 456,299• Philadelphia, PA-NJ-DE-MD: $ 8,903,151,057 13,879 $ 641,484• Phoenix Lake-Cedar Ridge, CA: $ 75,225,252 138 $ 545,111• Phoenix-Mesa-Glendale, AZ: $ 6,637,341,291 7,349 $ 903,163• Picayune, MS: $ 46,038,397 85 $ 541,628• Pierre, SD: $ 27,118,025 41 $ 661,415• Pierre Part, LA: $ 4,070,726 21 $ 193,844• Pine Bluff, AR: $ 81,757,443 117 $ 698,782• Pittsburg, KS: $ 60,558,887 85 $ 712,457• Pittsburgh, PA: $ 3,660,132,173 5,571 $ 656,997
RESTAURANT, FOOD & BEVERAGE MARKET RESEARCH HANDBOOK 2013
• 104 •
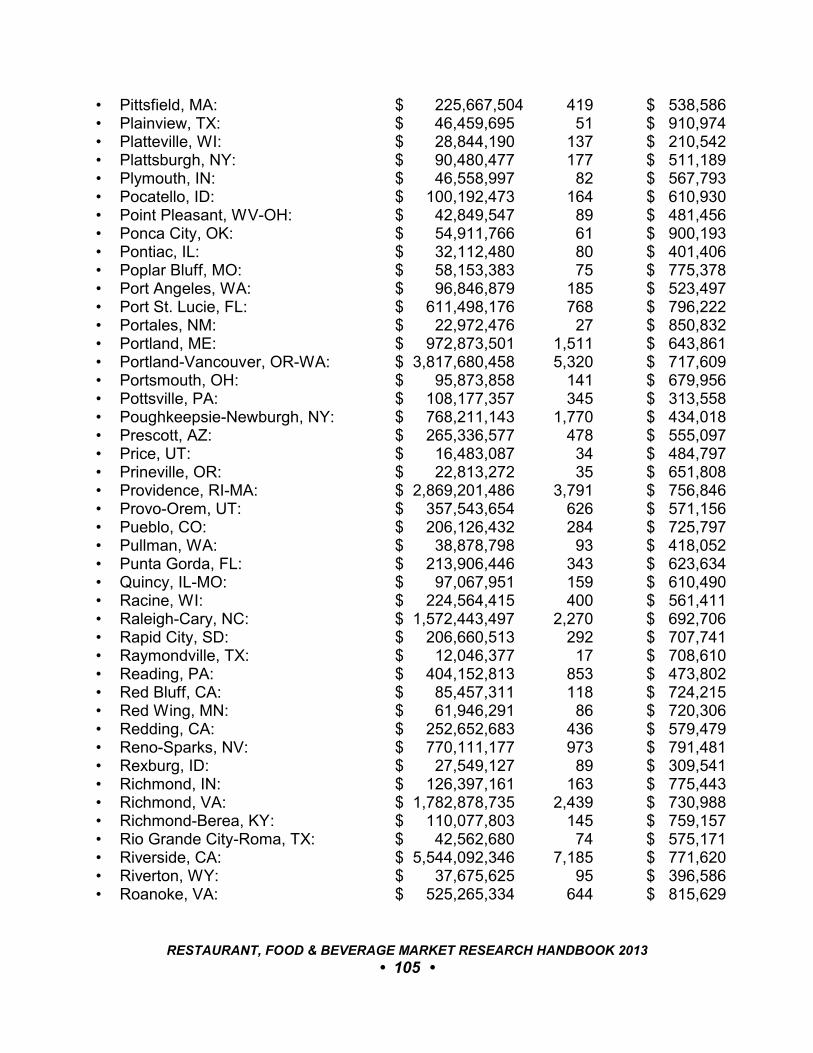
• Pittsfield, MA: $ 225,667,504 419 $ 538,586• Plainview, TX: $ 46,459,695 51 $ 910,974• Platteville, WI: $ 28,844,190 137 $ 210,542• Plattsburgh, NY: $ 90,480,477 177 $ 511,189• Plymouth, IN: $ 46,558,997 82 $ 567,793• Pocatello, ID: $ 100,192,473 164 $ 610,930• Point Pleasant, WV-OH: $ 42,849,547 89 $ 481,456• Ponca City, OK: $ 54,911,766 61 $ 900,193• Pontiac, IL: $ 32,112,480 80 $ 401,406• Poplar Bluff, MO: $ 58,153,383 75 $ 775,378• Port Angeles, WA: $ 96,846,879 185 $ 523,497• Port St. Lucie, FL: $ 611,498,176 768 $ 796,222• Portales, NM: $ 22,972,476 27 $ 850,832• Portland, ME: $ 972,873,501 1,511 $ 643,861• Portland-Vancouver, OR-WA: $ 3,817,680,458 5,320 $ 717,609• Portsmouth, OH: $ 95,873,858 141 $ 679,956• Pottsville, PA: $ 108,177,357 345 $ 313,558• Poughkeepsie-Newburgh, NY: $ 768,211,143 1,770 $ 434,018• Prescott, AZ: $ 265,336,577 478 $ 555,097• Price, UT: $ 16,483,087 34 $ 484,797• Prineville, OR: $ 22,813,272 35 $ 651,808• Providence, RI-MA: $ 2,869,201,486 3,791 $ 756,846• Provo-Orem, UT: $ 357,543,654 626 $ 571,156• Pueblo, CO: $ 206,126,432 284 $ 725,797• Pullman, WA: $ 38,878,798 93 $ 418,052• Punta Gorda, FL: $ 213,906,446 343 $ 623,634• Quincy, IL-MO: $ 97,067,951 159 $ 610,490• Racine, WI: $ 224,564,415 400 $ 561,411• Raleigh-Cary, NC: $ 1,572,443,497 2,270 $ 692,706• Rapid City, SD: $ 206,660,513 292 $ 707,741• Raymondville, TX: $ 12,046,377 17 $ 708,610• Reading, PA: $ 404,152,813 853 $ 473,802• Red Bluff, CA: $ 85,457,311 118 $ 724,215• Red Wing, MN: $ 61,946,291 86 $ 720,306• Redding, CA: $ 252,652,683 436 $ 579,479• Reno-Sparks, NV: $ 770,111,177 973 $ 791,481• Rexburg, ID: $ 27,549,127 89 $ 309,541• Richmond, IN: $ 126,397,161 163 $ 775,443• Richmond, VA: $ 1,782,878,735 2,439 $ 730,988• Richmond-Berea, KY: $ 110,077,803 145 $ 759,157• Rio Grande City-Roma, TX: $ 42,562,680 74 $ 575,171• Riverside, CA: $ 5,544,092,346 7,185 $ 771,620• Riverton, WY: $ 37,675,625 95 $ 396,586• Roanoke, VA: $ 525,265,334 644 $ 815,629
RESTAURANT, FOOD & BEVERAGE MARKET RESEARCH HANDBOOK 2013
• 105 •
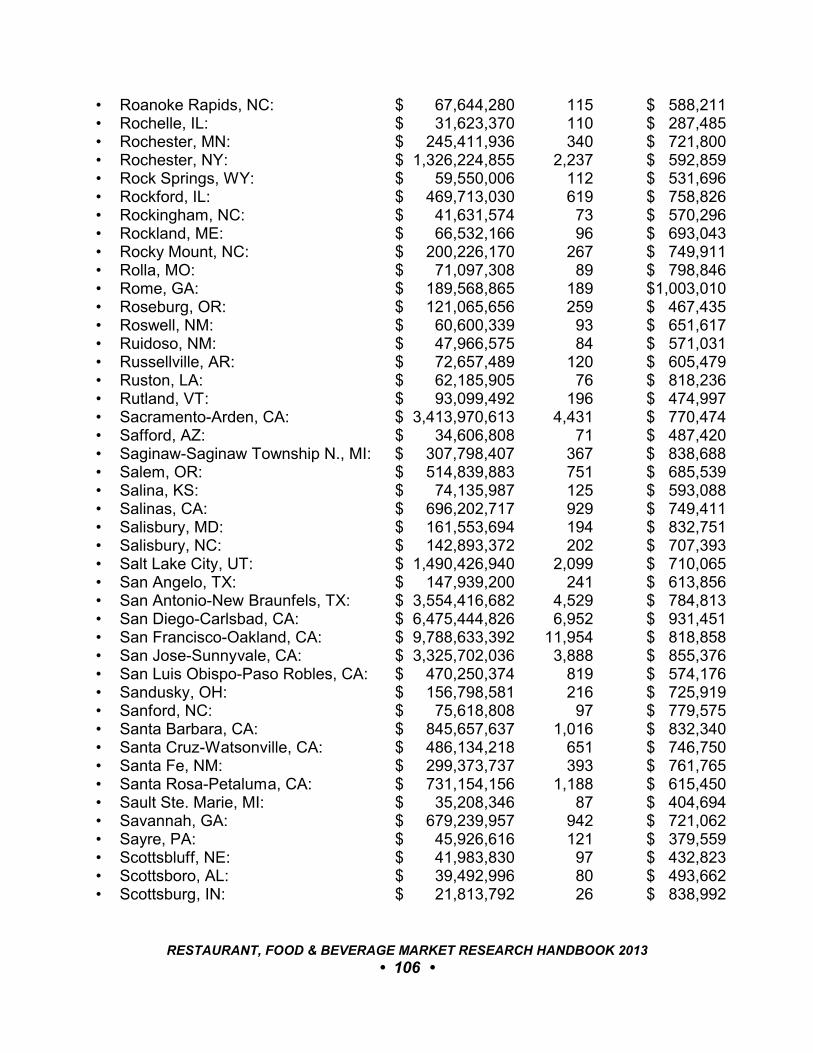
• Roanoke Rapids, NC: $ 67,644,280 115 $ 588,211• Rochelle, IL: $ 31,623,370 110 $ 287,485• Rochester, MN: $ 245,411,936 340 $ 721,800• Rochester, NY: $ 1,326,224,855 2,237 $ 592,859• Rock Springs, WY: $ 59,550,006 112 $ 531,696• Rockford, IL: $ 469,713,030 619 $ 758,826• Rockingham, NC: $ 41,631,574 73 $ 570,296• Rockland, ME: $ 66,532,166 96 $ 693,043• Rocky Mount, NC: $ 200,226,170 267 $ 749,911• Rolla, MO: $ 71,097,308 89 $ 798,846• Rome, GA: $ 189,568,865 189 $1,003,010• Roseburg, OR: $ 121,065,656 259 $ 467,435• Roswell, NM: $ 60,600,339 93 $ 651,617• Ruidoso, NM: $ 47,966,575 84 $ 571,031• Russellville, AR: $ 72,657,489 120 $ 605,479• Ruston, LA: $ 62,185,905 76 $ 818,236• Rutland, VT: $ 93,099,492 196 $ 474,997• Sacramento-Arden, CA: $ 3,413,970,613 4,431 $ 770,474• Safford, AZ: $ 34,606,808 71 $ 487,420• Saginaw-Saginaw Township N., MI: $ 307,798,407 367 $ 838,688• Salem, OR: $ 514,839,883 751 $ 685,539• Salina, KS: $ 74,135,987 125 $ 593,088• Salinas, CA: $ 696,202,717 929 $ 749,411• Salisbury, MD: $ 161,553,694 194 $ 832,751• Salisbury, NC: $ 142,893,372 202 $ 707,393• Salt Lake City, UT: $ 1,490,426,940 2,099 $ 710,065• San Angelo, TX: $ 147,939,200 241 $ 613,856• San Antonio-New Braunfels, TX: $ 3,554,416,682 4,529 $ 784,813• San Diego-Carlsbad, CA: $ 6,475,444,826 6,952 $ 931,451• San Francisco-Oakland, CA: $ 9,788,633,392 11,954 $ 818,858• San Jose-Sunnyvale, CA: $ 3,325,702,036 3,888 $ 855,376• San Luis Obispo-Paso Robles, CA: $ 470,250,374 819 $ 574,176• Sandusky, OH: $ 156,798,581 216 $ 725,919• Sanford, NC: $ 75,618,808 97 $ 779,575• Santa Barbara, CA: $ 845,657,637 1,016 $ 832,340• Santa Cruz-Watsonville, CA: $ 486,134,218 651 $ 746,750• Santa Fe, NM: $ 299,373,737 393 $ 761,765• Santa Rosa-Petaluma, CA: $ 731,154,156 1,188 $ 615,450• Sault Ste. Marie, MI: $ 35,208,346 87 $ 404,694• Savannah, GA: $ 679,239,957 942 $ 721,062• Sayre, PA: $ 45,926,616 121 $ 379,559• Scottsbluff, NE: $ 41,983,830 97 $ 432,823• Scottsboro, AL: $ 39,492,996 80 $ 493,662• Scottsburg, IN: $ 21,813,792 26 $ 838,992
RESTAURANT, FOOD & BEVERAGE MARKET RESEARCH HANDBOOK 2013
• 106 •
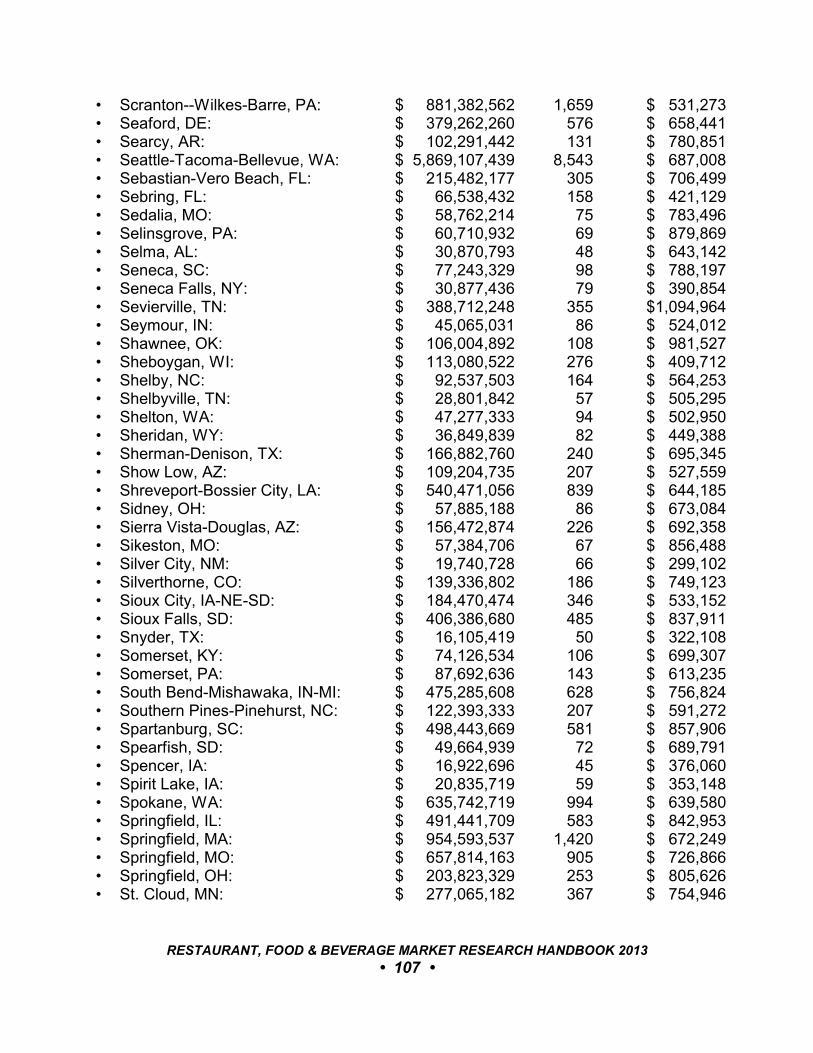
• Scranton--Wilkes-Barre, PA: $ 881,382,562 1,659 $ 531,273• Seaford, DE: $ 379,262,260 576 $ 658,441• Searcy, AR: $ 102,291,442 131 $ 780,851• Seattle-Tacoma-Bellevue, WA: $ 5,869,107,439 8,543 $ 687,008• Sebastian-Vero Beach, FL: $ 215,482,177 305 $ 706,499• Sebring, FL: $ 66,538,432 158 $ 421,129• Sedalia, MO: $ 58,762,214 75 $ 783,496• Selinsgrove, PA: $ 60,710,932 69 $ 879,869• Selma, AL: $ 30,870,793 48 $ 643,142• Seneca, SC: $ 77,243,329 98 $ 788,197• Seneca Falls, NY: $ 30,877,436 79 $ 390,854• Sevierville, TN: $ 388,712,248 355 $1,094,964• Seymour, IN: $ 45,065,031 86 $ 524,012• Shawnee, OK: $ 106,004,892 108 $ 981,527• Sheboygan, WI: $ 113,080,522 276 $ 409,712• Shelby, NC: $ 92,537,503 164 $ 564,253• Shelbyville, TN: $ 28,801,842 57 $ 505,295• Shelton, WA: $ 47,277,333 94 $ 502,950• Sheridan, WY: $ 36,849,839 82 $ 449,388• Sherman-Denison, TX: $ 166,882,760 240 $ 695,345• Show Low, AZ: $ 109,204,735 207 $ 527,559• Shreveport-Bossier City, LA: $ 540,471,056 839 $ 644,185• Sidney, OH: $ 57,885,188 86 $ 673,084• Sierra Vista-Douglas, AZ: $ 156,472,874 226 $ 692,358• Sikeston, MO: $ 57,384,706 67 $ 856,488• Silver City, NM: $ 19,740,728 66 $ 299,102• Silverthorne, CO: $ 139,336,802 186 $ 749,123• Sioux City, IA-NE-SD: $ 184,470,474 346 $ 533,152• Sioux Falls, SD: $ 406,386,680 485 $ 837,911• Snyder, TX: $ 16,105,419 50 $ 322,108• Somerset, KY: $ 74,126,534 106 $ 699,307• Somerset, PA: $ 87,692,636 143 $ 613,235• South Bend-Mishawaka, IN-MI: $ 475,285,608 628 $ 756,824• Southern Pines-Pinehurst, NC: $ 122,393,333 207 $ 591,272• Spartanburg, SC: $ 498,443,669 581 $ 857,906• Spearfish, SD: $ 49,664,939 72 $ 689,791• Spencer, IA: $ 16,922,696 45 $ 376,060• Spirit Lake, IA: $ 20,835,719 59 $ 353,148• Spokane, WA: $ 635,742,719 994 $ 639,580• Springfield, IL: $ 491,441,709 583 $ 842,953• Springfield, MA: $ 954,593,537 1,420 $ 672,249• Springfield, MO: $ 657,814,163 905 $ 726,866• Springfield, OH: $ 203,823,329 253 $ 805,626• St. Cloud, MN: $ 277,065,182 367 $ 754,946
RESTAURANT, FOOD & BEVERAGE MARKET RESEARCH HANDBOOK 2013
• 107 •
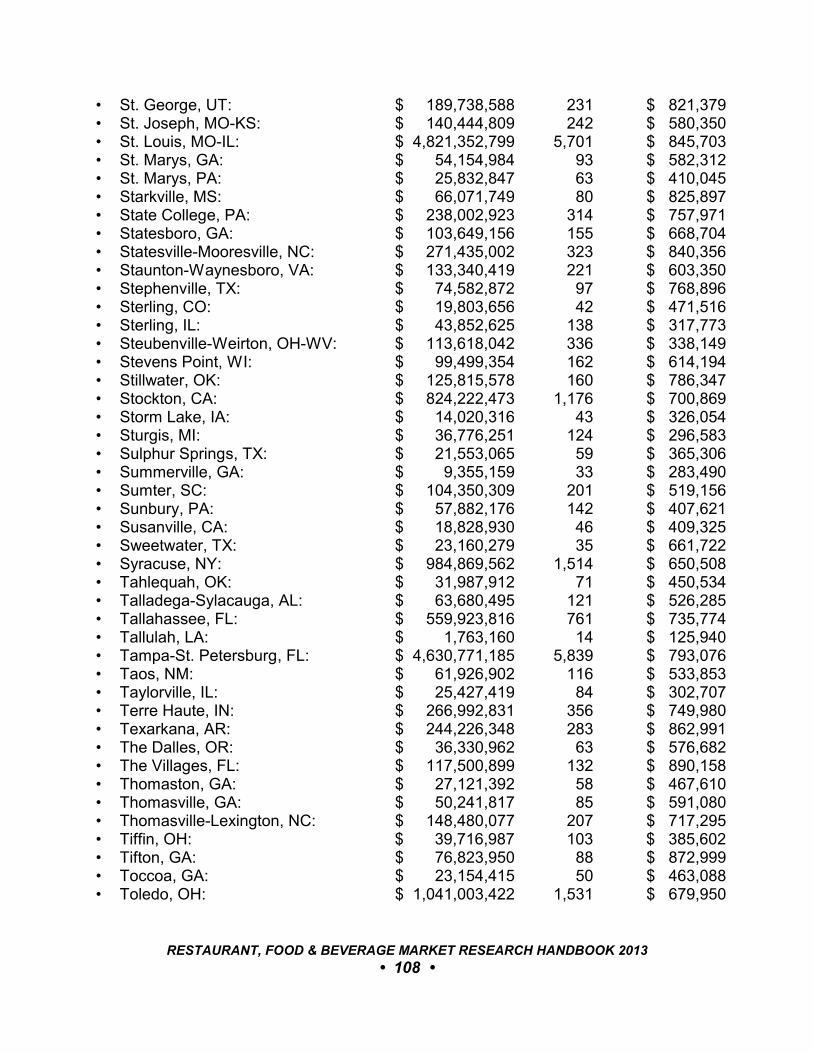
• St. George, UT: $ 189,738,588 231 $ 821,379• St. Joseph, MO-KS: $ 140,444,809 242 $ 580,350• St. Louis, MO-IL: $ 4,821,352,799 5,701 $ 845,703• St. Marys, GA: $ 54,154,984 93 $ 582,312• St. Marys, PA: $ 25,832,847 63 $ 410,045• Starkville, MS: $ 66,071,749 80 $ 825,897• State College, PA: $ 238,002,923 314 $ 757,971• Statesboro, GA: $ 103,649,156 155 $ 668,704• Statesville-Mooresville, NC: $ 271,435,002 323 $ 840,356• Staunton-Waynesboro, VA: $ 133,340,419 221 $ 603,350• Stephenville, TX: $ 74,582,872 97 $ 768,896• Sterling, CO: $ 19,803,656 42 $ 471,516• Sterling, IL: $ 43,852,625 138 $ 317,773• Steubenville-Weirton, OH-WV: $ 113,618,042 336 $ 338,149• Stevens Point, WI: $ 99,499,354 162 $ 614,194• Stillwater, OK: $ 125,815,578 160 $ 786,347• Stockton, CA: $ 824,222,473 1,176 $ 700,869• Storm Lake, IA: $ 14,020,316 43 $ 326,054• Sturgis, MI: $ 36,776,251 124 $ 296,583• Sulphur Springs, TX: $ 21,553,065 59 $ 365,306• Summerville, GA: $ 9,355,159 33 $ 283,490• Sumter, SC: $ 104,350,309 201 $ 519,156• Sunbury, PA: $ 57,882,176 142 $ 407,621• Susanville, CA: $ 18,828,930 46 $ 409,325• Sweetwater, TX: $ 23,160,279 35 $ 661,722• Syracuse, NY: $ 984,869,562 1,514 $ 650,508• Tahlequah, OK: $ 31,987,912 71 $ 450,534• Talladega-Sylacauga, AL: $ 63,680,495 121 $ 526,285• Tallahassee, FL: $ 559,923,816 761 $ 735,774• Tallulah, LA: $ 1,763,160 14 $ 125,940• Tampa-St. Petersburg, FL: $ 4,630,771,185 5,839 $ 793,076• Taos, NM: $ 61,926,902 116 $ 533,853• Taylorville, IL: $ 25,427,419 84 $ 302,707• Terre Haute, IN: $ 266,992,831 356 $ 749,980• Texarkana, AR: $ 244,226,348 283 $ 862,991• The Dalles, OR: $ 36,330,962 63 $ 576,682• The Villages, FL: $ 117,500,899 132 $ 890,158• Thomaston, GA: $ 27,121,392 58 $ 467,610 • Thomasville, GA: $ 50,241,817 85 $ 591,080• Thomasville-Lexington, NC: $ 148,480,077 207 $ 717,295• Tiffin, OH: $ 39,716,987 103 $ 385,602• Tifton, GA: $ 76,823,950 88 $ 872,999• Toccoa, GA: $ 23,154,415 50 $ 463,088• Toledo, OH: $ 1,041,003,422 1,531 $ 679,950
RESTAURANT, FOOD & BEVERAGE MARKET RESEARCH HANDBOOK 2013
• 108 •
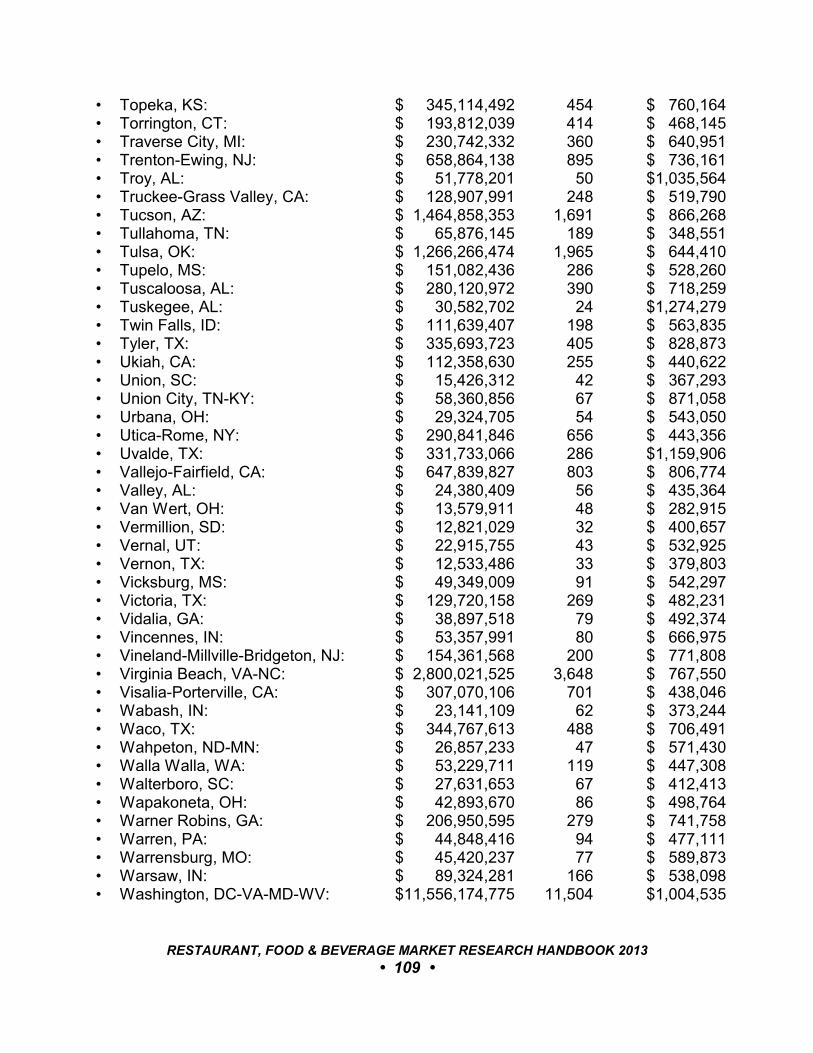
• Topeka, KS: $ 345,114,492 454 $ 760,164• Torrington, CT: $ 193,812,039 414 $ 468,145• Traverse City, MI: $ 230,742,332 360 $ 640,951• Trenton-Ewing, NJ: $ 658,864,138 895 $ 736,161• Troy, AL: $ 51,778,201 50 $1,035,564• Truckee-Grass Valley, CA: $ 128,907,991 248 $ 519,790• Tucson, AZ: $ 1,464,858,353 1,691 $ 866,268• Tullahoma, TN: $ 65,876,145 189 $ 348,551• Tulsa, OK: $ 1,266,266,474 1,965 $ 644,410• Tupelo, MS: $ 151,082,436 286 $ 528,260• Tuscaloosa, AL: $ 280,120,972 390 $ 718,259• Tuskegee, AL: $ 30,582,702 24 $1,274,279• Twin Falls, ID: $ 111,639,407 198 $ 563,835• Tyler, TX: $ 335,693,723 405 $ 828,873• Ukiah, CA: $ 112,358,630 255 $ 440,622• Union, SC: $ 15,426,312 42 $ 367,293• Union City, TN-KY: $ 58,360,856 67 $ 871,058• Urbana, OH: $ 29,324,705 54 $ 543,050• Utica-Rome, NY: $ 290,841,846 656 $ 443,356• Uvalde, TX: $ 331,733,066 286 $1,159,906• Vallejo-Fairfield, CA: $ 647,839,827 803 $ 806,774• Valley, AL: $ 24,380,409 56 $ 435,364• Van Wert, OH: $ 13,579,911 48 $ 282,915• Vermillion, SD: $ 12,821,029 32 $ 400,657• Vernal, UT: $ 22,915,755 43 $ 532,925• Vernon, TX: $ 12,533,486 33 $ 379,803• Vicksburg, MS: $ 49,349,009 91 $ 542,297• Victoria, TX: $ 129,720,158 269 $ 482,231• Vidalia, GA: $ 38,897,518 79 $ 492,374• Vincennes, IN: $ 53,357,991 80 $ 666,975• Vineland-Millville-Bridgeton, NJ: $ 154,361,568 200 $ 771,808• Virginia Beach, VA-NC: $ 2,800,021,525 3,648 $ 767,550• Visalia-Porterville, CA: $ 307,070,106 701 $ 438,046• Wabash, IN: $ 23,141,109 62 $ 373,244• Waco, TX: $ 344,767,613 488 $ 706,491• Wahpeton, ND-MN: $ 26,857,233 47 $ 571,430• Walla Walla, WA: $ 53,229,711 119 $ 447,308• Walterboro, SC: $ 27,631,653 67 $ 412,413• Wapakoneta, OH: $ 42,893,670 86 $ 498,764• Warner Robins, GA: $ 206,950,595 279 $ 741,758• Warren, PA: $ 44,848,416 94 $ 477,111• Warrensburg, MO: $ 45,420,237 77 $ 589,873• Warsaw, IN: $ 89,324,281 166 $ 538,098 • Washington, DC-VA-MD-WV: $11,556,174,775 11,504 $1,004,535
RESTAURANT, FOOD & BEVERAGE MARKET RESEARCH HANDBOOK 2013
• 109 •
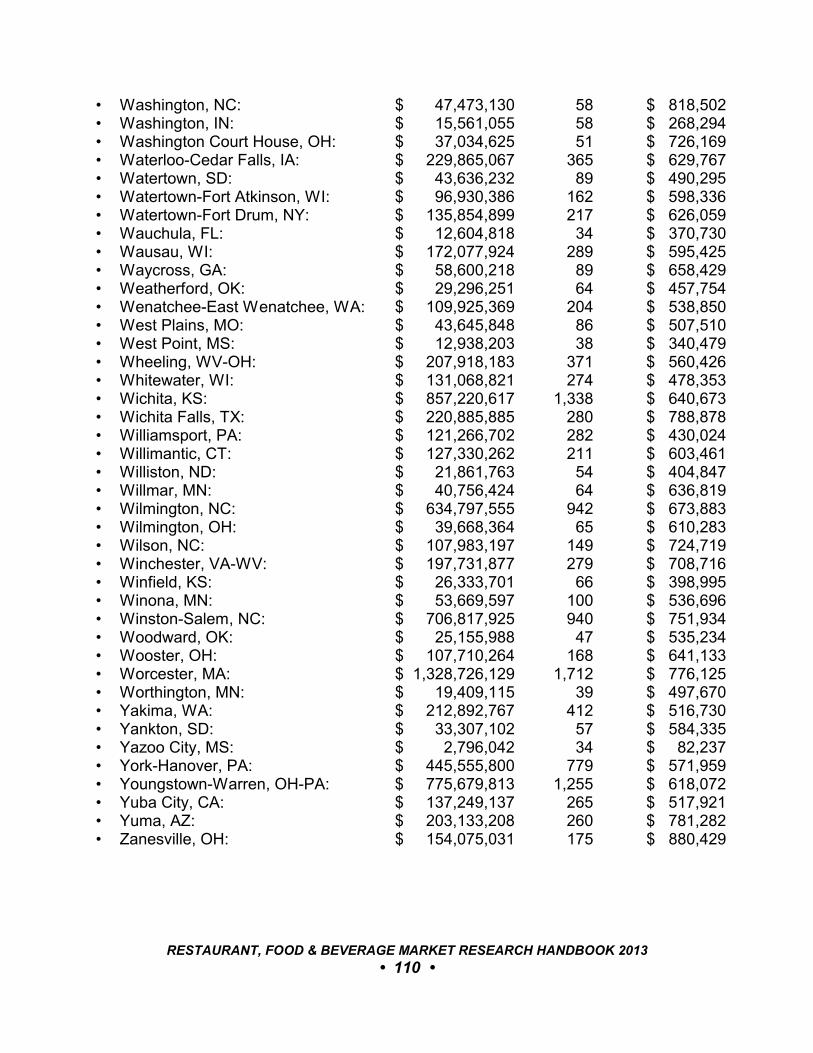
• Washington, NC: $ 47,473,130 58 $ 818,502• Washington, IN: $ 15,561,055 58 $ 268,294• Washington Court House, OH: $ 37,034,625 51 $ 726,169• Waterloo-Cedar Falls, IA: $ 229,865,067 365 $ 629,767• Watertown, SD: $ 43,636,232 89 $ 490,295• Watertown-Fort Atkinson, WI: $ 96,930,386 162 $ 598,336• Watertown-Fort Drum, NY: $ 135,854,899 217 $ 626,059• Wauchula, FL: $ 12,604,818 34 $ 370,730• Wausau, WI: $ 172,077,924 289 $ 595,425• Waycross, GA: $ 58,600,218 89 $ 658,429• Weatherford, OK: $ 29,296,251 64 $ 457,754• Wenatchee-East Wenatchee, WA: $ 109,925,369 204 $ 538,850• West Plains, MO: $ 43,645,848 86 $ 507,510• West Point, MS: $ 12,938,203 38 $ 340,479• Wheeling, WV-OH: $ 207,918,183 371 $ 560,426• Whitewater, WI: $ 131,068,821 274 $ 478,353• Wichita, KS: $ 857,220,617 1,338 $ 640,673• Wichita Falls, TX: $ 220,885,885 280 $ 788,878• Williamsport, PA: $ 121,266,702 282 $ 430,024• Willimantic, CT: $ 127,330,262 211 $ 603,461• Williston, ND: $ 21,861,763 54 $ 404,847• Willmar, MN: $ 40,756,424 64 $ 636,819• Wilmington, NC: $ 634,797,555 942 $ 673,883• Wilmington, OH: $ 39,668,364 65 $ 610,283• Wilson, NC: $ 107,983,197 149 $ 724,719• Winchester, VA-WV: $ 197,731,877 279 $ 708,716• Winfield, KS: $ 26,333,701 66 $ 398,995• Winona, MN: $ 53,669,597 100 $ 536,696• Winston-Salem, NC: $ 706,817,925 940 $ 751,934• Woodward, OK: $ 25,155,988 47 $ 535,234• Wooster, OH: $ 107,710,264 168 $ 641,133• Worcester, MA: $ 1,328,726,129 1,712 $ 776,125• Worthington, MN: $ 19,409,115 39 $ 497,670• Yakima, WA: $ 212,892,767 412 $ 516,730• Yankton, SD: $ 33,307,102 57 $ 584,335• Yazoo City, MS: $ 2,796,042 34 $ 82,237• York-Hanover, PA: $ 445,555,800 779 $ 571,959• Youngstown-Warren, OH-PA: $ 775,679,813 1,255 $ 618,072• Yuba City, CA: $ 137,249,137 265 $ 517,921• Yuma, AZ: $ 203,133,208 260 $ 781,282• Zanesville, OH: $ 154,075,031 175 $ 880,429
RESTAURANT, FOOD & BEVERAGE MARKET RESEARCH HANDBOOK 2013
• 110 •
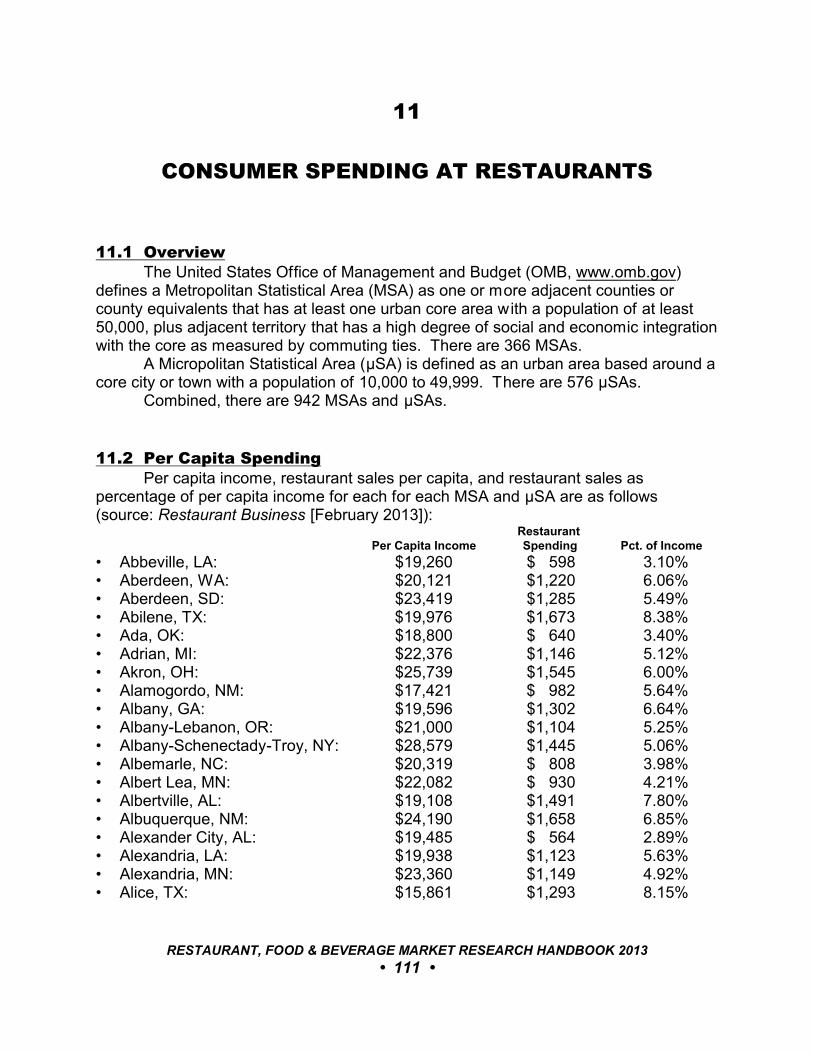
11
CONSUMER SPENDING AT RESTAURANTS
11.1 OverviewThe United States Office of Management and Budget (OMB, www.omb.gov)
defines a Metropolitan Statistical Area (MSA) as one or more adjacent counties orcounty equivalents that has at least one urban core area with a population of at least50,000, plus adjacent territory that has a high degree of social and economic integrationwith the core as measured by commuting ties. There are 366 MSAs.
A Micropolitan Statistical Area (ìSA) is defined as an urban area based around acore city or town with a population of 10,000 to 49,999. There are 576 ìSAs.
Combined, there are 942 MSAs and ìSAs.
11.2 Per Capita SpendingPer capita income, restaurant sales per capita, and restaurant sales as
percentage of per capita income for each for each MSA and ìSA are as follows(source: Restaurant Business [February 2013]):
Restaurant Per Capita Income Spending Pct. of Income
• Abbeville, LA: $19,260 $ 598 3.10%• Aberdeen, WA: $20,121 $1,220 6.06%• Aberdeen, SD: $23,419 $1,285 5.49%• Abilene, TX: $19,976 $1,673 8.38%• Ada, OK: $18,800 $ 640 3.40%• Adrian, MI: $22,376 $1,146 5.12%• Akron, OH: $25,739 $1,545 6.00%• Alamogordo, NM: $17,421 $ 982 5.64%• Albany, GA: $19,596 $1,302 6.64%• Albany-Lebanon, OR: $21,000 $1,104 5.25%• Albany-Schenectady-Troy, NY: $28,579 $1,445 5.06%• Albemarle, NC: $20,319 $ 808 3.98%• Albert Lea, MN: $22,082 $ 930 4.21%• Albertville, AL: $19,108 $1,491 7.80%• Albuquerque, NM: $24,190 $1,658 6.85%• Alexander City, AL: $19,485 $ 564 2.89%• Alexandria, LA: $19,938 $1,123 5.63%• Alexandria, MN: $23,360 $1,149 4.92%• Alice, TX: $15,861 $1,293 8.15%
RESTAURANT, FOOD & BEVERAGE MARKET RESEARCH HANDBOOK 2013
• 111 •
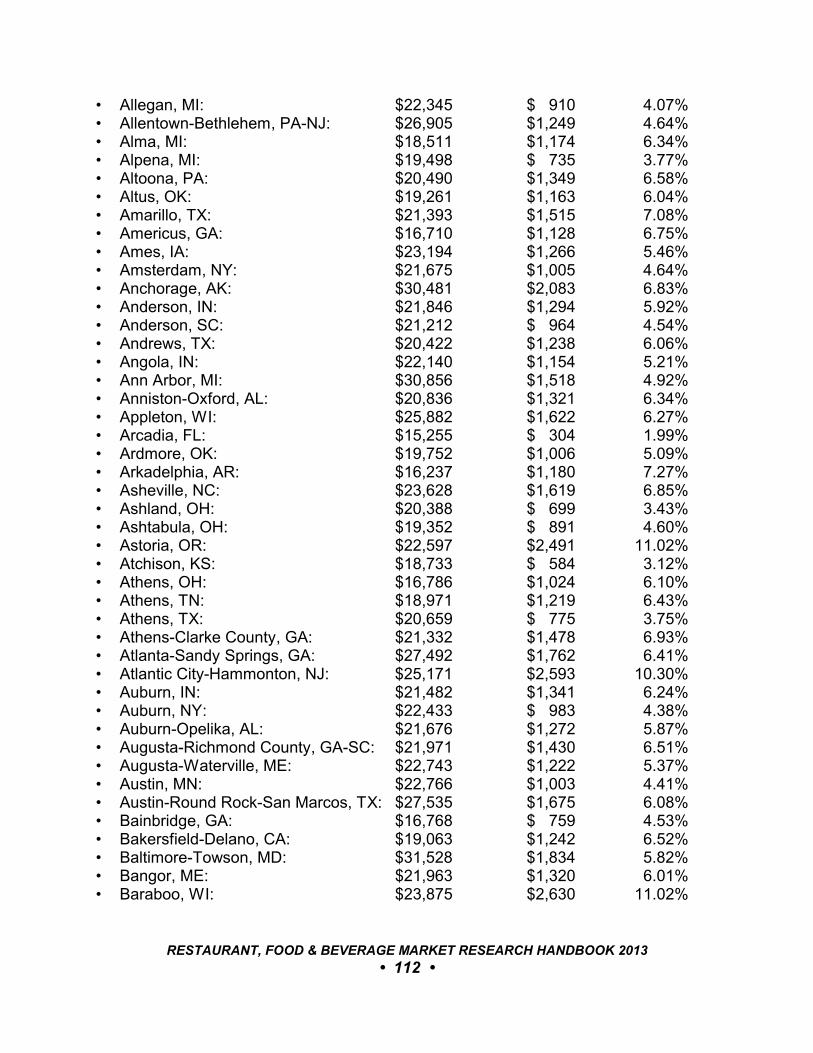
• Allegan, MI: $22,345 $ 910 4.07%• Allentown-Bethlehem, PA-NJ: $26,905 $1,249 4.64%• Alma, MI: $18,511 $1,174 6.34%• Alpena, MI: $19,498 $ 735 3.77%• Altoona, PA: $20,490 $1,349 6.58%• Altus, OK: $19,261 $1,163 6.04%• Amarillo, TX: $21,393 $1,515 7.08%• Americus, GA: $16,710 $1,128 6.75%• Ames, IA: $23,194 $1,266 5.46%• Amsterdam, NY: $21,675 $1,005 4.64%• Anchorage, AK: $30,481 $2,083 6.83%• Anderson, IN: $21,846 $1,294 5.92%• Anderson, SC: $21,212 $ 964 4.54%• Andrews, TX: $20,422 $1,238 6.06%• Angola, IN: $22,140 $1,154 5.21%• Ann Arbor, MI: $30,856 $1,518 4.92%• Anniston-Oxford, AL: $20,836 $1,321 6.34%• Appleton, WI: $25,882 $1,622 6.27%• Arcadia, FL: $15,255 $ 304 1.99%• Ardmore, OK: $19,752 $1,006 5.09%• Arkadelphia, AR: $16,237 $1,180 7.27%• Asheville, NC: $23,628 $1,619 6.85%• Ashland, OH: $20,388 $ 699 3.43%• Ashtabula, OH: $19,352 $ 891 4.60%• Astoria, OR: $22,597 $2,491 11.02%• Atchison, KS: $18,733 $ 584 3.12%• Athens, OH: $16,786 $1,024 6.10%• Athens, TN: $18,971 $1,219 6.43%• Athens, TX: $20,659 $ 775 3.75%• Athens-Clarke County, GA: $21,332 $1,478 6.93%• Atlanta-Sandy Springs, GA: $27,492 $1,762 6.41%• Atlantic City-Hammonton, NJ: $25,171 $2,593 10.30%• Auburn, IN: $21,482 $1,341 6.24%• Auburn, NY: $22,433 $ 983 4.38%• Auburn-Opelika, AL: $21,676 $1,272 5.87%• Augusta-Richmond County, GA-SC: $21,971 $1,430 6.51%• Augusta-Waterville, ME: $22,743 $1,222 5.37%• Austin, MN: $22,766 $1,003 4.41%• Austin-Round Rock-San Marcos, TX: $27,535 $1,675 6.08%• Bainbridge, GA: $16,768 $ 759 4.53%• Bakersfield-Delano, CA: $19,063 $1,242 6.52%• Baltimore-Towson, MD: $31,528 $1,834 5.82%• Bangor, ME: $21,963 $1,320 6.01%• Baraboo, WI: $23,875 $2,630 11.02%
RESTAURANT, FOOD & BEVERAGE MARKET RESEARCH HANDBOOK 2013
• 112 •
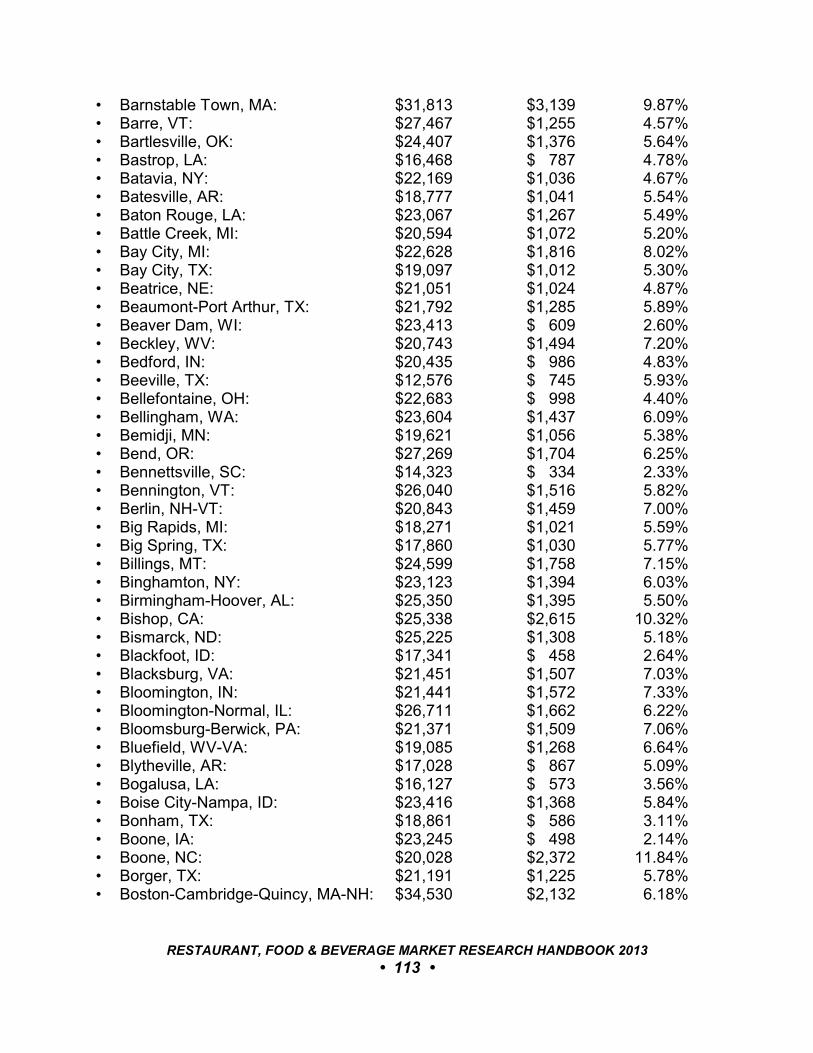
• Barnstable Town, MA: $31,813 $3,139 9.87%• Barre, VT: $27,467 $1,255 4.57%• Bartlesville, OK: $24,407 $1,376 5.64%• Bastrop, LA: $16,468 $ 787 4.78%• Batavia, NY: $22,169 $1,036 4.67%• Batesville, AR: $18,777 $1,041 5.54%• Baton Rouge, LA: $23,067 $1,267 5.49%• Battle Creek, MI: $20,594 $1,072 5.20%• Bay City, MI: $22,628 $1,816 8.02%• Bay City, TX: $19,097 $1,012 5.30%• Beatrice, NE: $21,051 $1,024 4.87%• Beaumont-Port Arthur, TX: $21,792 $1,285 5.89%• Beaver Dam, WI: $23,413 $ 609 2.60%• Beckley, WV: $20,743 $1,494 7.20%• Bedford, IN: $20,435 $ 986 4.83%• Beeville, TX: $12,576 $ 745 5.93%• Bellefontaine, OH: $22,683 $ 998 4.40%• Bellingham, WA: $23,604 $1,437 6.09%• Bemidji, MN: $19,621 $1,056 5.38%• Bend, OR: $27,269 $1,704 6.25%• Bennettsville, SC: $14,323 $ 334 2.33%• Bennington, VT: $26,040 $1,516 5.82%• Berlin, NH-VT: $20,843 $1,459 7.00%• Big Rapids, MI: $18,271 $1,021 5.59%• Big Spring, TX: $17,860 $1,030 5.77%• Billings, MT: $24,599 $1,758 7.15%• Binghamton, NY: $23,123 $1,394 6.03%• Birmingham-Hoover, AL: $25,350 $1,395 5.50%• Bishop, CA: $25,338 $2,615 10.32%• Bismarck, ND: $25,225 $1,308 5.18%• Blackfoot, ID: $17,341 $ 458 2.64%• Blacksburg, VA: $21,451 $1,507 7.03%• Bloomington, IN: $21,441 $1,572 7.33%• Bloomington-Normal, IL: $26,711 $1,662 6.22%• Bloomsburg-Berwick, PA: $21,371 $1,509 7.06%• Bluefield, WV-VA: $19,085 $1,268 6.64%• Blytheville, AR: $17,028 $ 867 5.09%• Bogalusa, LA: $16,127 $ 573 3.56%• Boise City-Nampa, ID: $23,416 $1,368 5.84%• Bonham, TX: $18,861 $ 586 3.11%• Boone, IA: $23,245 $ 498 2.14%• Boone, NC: $20,028 $2,372 11.84%• Borger, TX: $21,191 $1,225 5.78%• Boston-Cambridge-Quincy, MA-NH: $34,530 $2,132 6.18%
RESTAURANT, FOOD & BEVERAGE MARKET RESEARCH HANDBOOK 2013
• 113 •

• Boulder, CO: $34,080 $2,014 5.91%• Bowling Green, KY: $21,785 $1,713 7.86%• Bozeman, MT: $24,611 $1,987 8.07%• Bradford, PA: $19,322 $ 765 3.96%• Brainerd, MN: $22,174 $1,528 6.89%• Branson, MO: $20,568 $1,977 9.61%• Bremerton-Silverdale, WA: $28,140 $1,166 4.14%• Brenham, TX: $21,398 $1,337 6.25%• Brevard, NC: $21,716 $ 915 4.22%• Bridgeport-Stamford-Norwalk, CT: $42,983 $1,604 3.73%• Brigham City, UT: $18,658 $ 430 2.30%• Brookhaven, MS: $18,026 $1,163 6.45%• Brookings, OR: $21,790 $1,807 8.29%• Brookings, SD: $21,466 $1,494 6.96%• Brownsville, TN: $17,148 $ 457 2.67%• Brownsville-Harlingen, TX: $12,732 $ 954 7.50%• Brownwood, TX: $19,296 $ 950 4.92%• Brunswick, GA: $24,675 $2,467 10.00%• Bucyrus, OH: $20,149 $ 933 4.63%• Buffalo-Niagara Falls, NY: $24,536 $1,568 6.39%• Burley, ID: $16,792 $ 637 3.79%• Burlington, IA-IL: $21,876 $1,156 5.28%• Burlington, NC: $21,297 $1,796 8.43%• Burlington-South Burlington, VT: $27,712 $1,595 5.75%• Butte-Silver Bow, MT: $21,403 $1,451 6.78%• Cadillac, MI: $19,055 $1,165 6.11%• Calhoun, GA: $18,943 $1,229 6.49%• Cambridge, OH: $18,045 $1,367 7.58%• Cambridge, MD: $23,827 $ 913 3.83%• Camden, AR: $17,199 $ 464 2.70%• Campbellsville, KY: $18,449 $1,199 6.50%• Canon City, CO: $18,945 $ 732 3.86%• Canton, IL: $20,583 $ 665 3.23%• Canton-Massillon, OH: $22,812 $1,490 6.53%• Cape Coral-Fort Myers, FL: $28,797 $2,112 7.33%• Cape Girardeau-Jackson, MO-IL: $21,418 $2,269 10.59%• Carbondale, IL: $19,518 $1,420 7.27%• Carlsbad-Artesia, NM: $21,189 $ 995 4.70%• Carson City, NV: $24,673 $1,650 6.69%• Casper, WY: $25,080 $1,716 6.84%• Cedar City, UT: $16,385 $1,024 6.25%• Cedar Rapids, IA: $25,937 $1,213 4.68%• Cedartown, GA: $17,954 $ 625 3.48%• Celina, OH: $22,107 $1,049 4.74%
RESTAURANT, FOOD & BEVERAGE MARKET RESEARCH HANDBOOK 2013
• 114 •
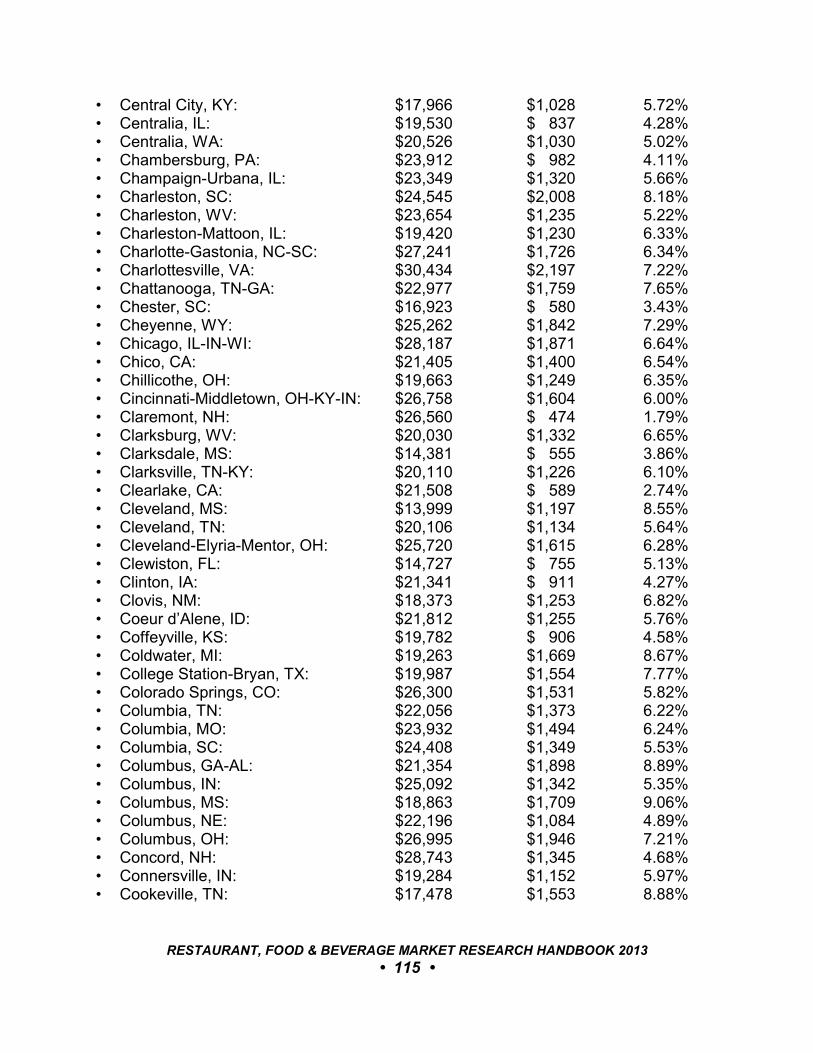
• Central City, KY: $17,966 $1,028 5.72%• Centralia, IL: $19,530 $ 837 4.28%• Centralia, WA: $20,526 $1,030 5.02%• Chambersburg, PA: $23,912 $ 982 4.11%• Champaign-Urbana, IL: $23,349 $1,320 5.66%• Charleston, SC: $24,545 $2,008 8.18%• Charleston, WV: $23,654 $1,235 5.22%• Charleston-Mattoon, IL: $19,420 $1,230 6.33%• Charlotte-Gastonia, NC-SC: $27,241 $1,726 6.34%• Charlottesville, VA: $30,434 $2,197 7.22%• Chattanooga, TN-GA: $22,977 $1,759 7.65%• Chester, SC: $16,923 $ 580 3.43%• Cheyenne, WY: $25,262 $1,842 7.29%• Chicago, IL-IN-WI: $28,187 $1,871 6.64%• Chico, CA: $21,405 $1,400 6.54%• Chillicothe, OH: $19,663 $1,249 6.35%• Cincinnati-Middletown, OH-KY-IN: $26,758 $1,604 6.00%• Claremont, NH: $26,560 $ 474 1.79%• Clarksburg, WV: $20,030 $1,332 6.65%• Clarksdale, MS: $14,381 $ 555 3.86%• Clarksville, TN-KY: $20,110 $1,226 6.10%• Clearlake, CA: $21,508 $ 589 2.74%• Cleveland, MS: $13,999 $1,197 8.55%• Cleveland, TN: $20,106 $1,134 5.64%• Cleveland-Elyria-Mentor, OH: $25,720 $1,615 6.28%• Clewiston, FL: $14,727 $ 755 5.13%• Clinton, IA: $21,341 $ 911 4.27%• Clovis, NM: $18,373 $1,253 6.82%• Coeur d’Alene, ID: $21,812 $1,255 5.76%• Coffeyville, KS: $19,782 $ 906 4.58%• Coldwater, MI: $19,263 $1,669 8.67%• College Station-Bryan, TX: $19,987 $1,554 7.77%• Colorado Springs, CO: $26,300 $1,531 5.82%• Columbia, TN: $22,056 $1,373 6.22%• Columbia, MO: $23,932 $1,494 6.24%• Columbia, SC: $24,408 $1,349 5.53%• Columbus, GA-AL: $21,354 $1,898 8.89%• Columbus, IN: $25,092 $1,342 5.35%• Columbus, MS: $18,863 $1,709 9.06%• Columbus, NE: $22,196 $1,084 4.89%• Columbus, OH: $26,995 $1,946 7.21%• Concord, NH: $28,743 $1,345 4.68%• Connersville, IN: $19,284 $1,152 5.97%• Cookeville, TN: $17,478 $1,553 8.88%
RESTAURANT, FOOD & BEVERAGE MARKET RESEARCH HANDBOOK 2013
• 115 •
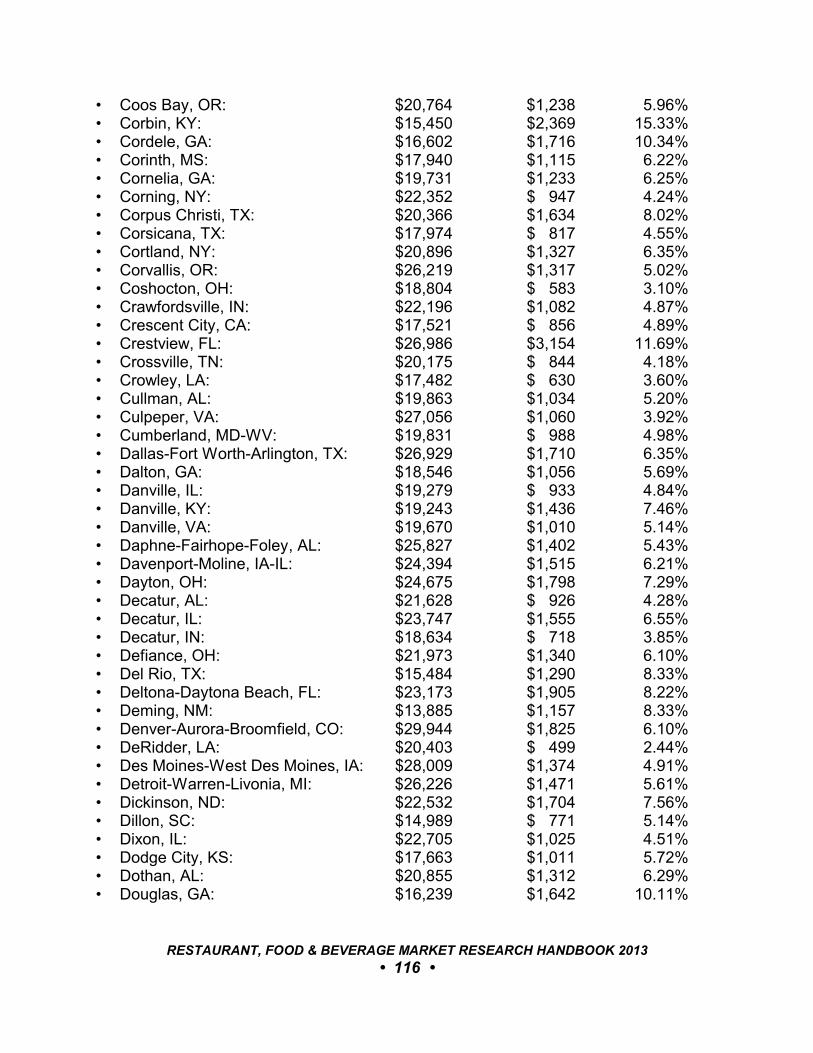
• Coos Bay, OR: $20,764 $1,238 5.96%• Corbin, KY: $15,450 $2,369 15.33%• Cordele, GA: $16,602 $1,716 10.34%• Corinth, MS: $17,940 $1,115 6.22%• Cornelia, GA: $19,731 $1,233 6.25%• Corning, NY: $22,352 $ 947 4.24%• Corpus Christi, TX: $20,366 $1,634 8.02%• Corsicana, TX: $17,974 $ 817 4.55%• Cortland, NY: $20,896 $1,327 6.35%• Corvallis, OR: $26,219 $1,317 5.02%• Coshocton, OH: $18,804 $ 583 3.10%• Crawfordsville, IN: $22,196 $1,082 4.87%• Crescent City, CA: $17,521 $ 856 4.89%• Crestview, FL: $26,986 $3,154 11.69%• Crossville, TN: $20,175 $ 844 4.18%• Crowley, LA: $17,482 $ 630 3.60%• Cullman, AL: $19,863 $1,034 5.20%• Culpeper, VA: $27,056 $1,060 3.92%• Cumberland, MD-WV: $19,831 $ 988 4.98%• Dallas-Fort Worth-Arlington, TX: $26,929 $1,710 6.35%• Dalton, GA: $18,546 $1,056 5.69%• Danville, IL: $19,279 $ 933 4.84%• Danville, KY: $19,243 $1,436 7.46%• Danville, VA: $19,670 $1,010 5.14%• Daphne-Fairhope-Foley, AL: $25,827 $1,402 5.43%• Davenport-Moline, IA-IL: $24,394 $1,515 6.21%• Dayton, OH: $24,675 $1,798 7.29%• Decatur, AL: $21,628 $ 926 4.28%• Decatur, IL: $23,747 $1,555 6.55%• Decatur, IN: $18,634 $ 718 3.85%• Defiance, OH: $21,973 $1,340 6.10%• Del Rio, TX: $15,484 $1,290 8.33%• Deltona-Daytona Beach, FL: $23,173 $1,905 8.22%• Deming, NM: $13,885 $1,157 8.33%• Denver-Aurora-Broomfield, CO: $29,944 $1,825 6.10%• DeRidder, LA: $20,403 $ 499 2.44%• Des Moines-West Des Moines, IA: $28,009 $1,374 4.91%• Detroit-Warren-Livonia, MI: $26,226 $1,471 5.61%• Dickinson, ND: $22,532 $1,704 7.56%• Dillon, SC: $14,989 $ 771 5.14%• Dixon, IL: $22,705 $1,025 4.51%• Dodge City, KS: $17,663 $1,011 5.72%• Dothan, AL: $20,855 $1,312 6.29%• Douglas, GA: $16,239 $1,642 10.11%
RESTAURANT, FOOD & BEVERAGE MARKET RESEARCH HANDBOOK 2013
• 116 •
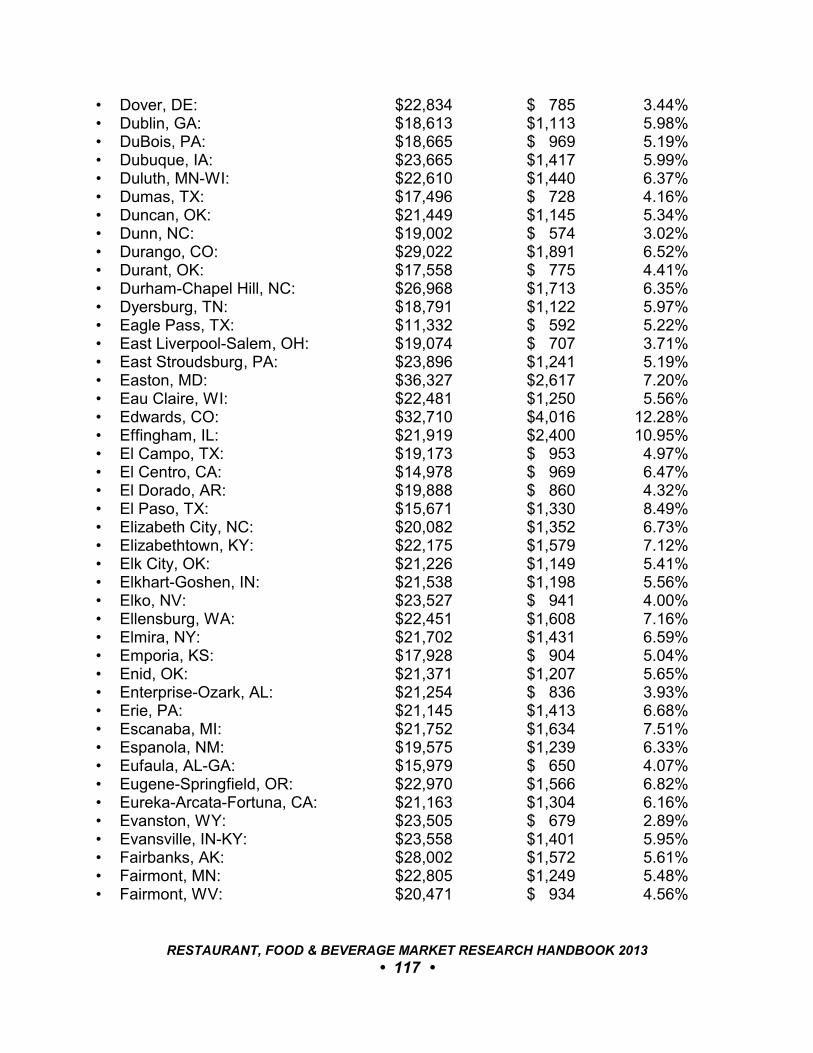
• Dover, DE: $22,834 $ 785 3.44%• Dublin, GA: $18,613 $1,113 5.98%• DuBois, PA: $18,665 $ 969 5.19%• Dubuque, IA: $23,665 $1,417 5.99%• Duluth, MN-WI: $22,610 $1,440 6.37%• Dumas, TX: $17,496 $ 728 4.16%• Duncan, OK: $21,449 $1,145 5.34%• Dunn, NC: $19,002 $ 574 3.02%• Durango, CO: $29,022 $1,891 6.52%• Durant, OK: $17,558 $ 775 4.41%• Durham-Chapel Hill, NC: $26,968 $1,713 6.35%• Dyersburg, TN: $18,791 $1,122 5.97%• Eagle Pass, TX: $11,332 $ 592 5.22%• East Liverpool-Salem, OH: $19,074 $ 707 3.71%• East Stroudsburg, PA: $23,896 $1,241 5.19%• Easton, MD: $36,327 $2,617 7.20%• Eau Claire, WI: $22,481 $1,250 5.56%• Edwards, CO: $32,710 $4,016 12.28%• Effingham, IL: $21,919 $2,400 10.95%• El Campo, TX: $19,173 $ 953 4.97%• El Centro, CA: $14,978 $ 969 6.47%• El Dorado, AR: $19,888 $ 860 4.32%• El Paso, TX: $15,671 $1,330 8.49%• Elizabeth City, NC: $20,082 $1,352 6.73%• Elizabethtown, KY: $22,175 $1,579 7.12%• Elk City, OK: $21,226 $1,149 5.41%• Elkhart-Goshen, IN: $21,538 $1,198 5.56%• Elko, NV: $23,527 $ 941 4.00%• Ellensburg, WA: $22,451 $1,608 7.16%• Elmira, NY: $21,702 $1,431 6.59%• Emporia, KS: $17,928 $ 904 5.04%• Enid, OK: $21,371 $1,207 5.65%• Enterprise-Ozark, AL: $21,254 $ 836 3.93%• Erie, PA: $21,145 $1,413 6.68%• Escanaba, MI: $21,752 $1,634 7.51%• Espanola, NM: $19,575 $1,239 6.33%• Eufaula, AL-GA: $15,979 $ 650 4.07%• Eugene-Springfield, OR: $22,970 $1,566 6.82%• Eureka-Arcata-Fortuna, CA: $21,163 $1,304 6.16%• Evanston, WY: $23,505 $ 679 2.89%• Evansville, IN-KY: $23,558 $1,401 5.95%• Fairbanks, AK: $28,002 $1,572 5.61%• Fairmont, MN: $22,805 $1,249 5.48%• Fairmont, WV: $20,471 $ 934 4.56%
RESTAURANT, FOOD & BEVERAGE MARKET RESEARCH HANDBOOK 2013
• 117 •

• Fallon, NV: $23,219 $1,193 5.14%• Fargo, ND-MN: $25,157 $1,324 5.26%• Faribault-Northfield, MN: $23,344 $1,219 5.22%• Farmington, MO: $17,953 $1,187 6.61%• Farmington, NM: $18,816 $1,059 5.63%• Fayetteville, AR-MO: $21,430 $1,220 5.69%• Fayetteville, NC: $20,399 $1,260 6.18%• Fergus Falls, MN: $21,432 $ 792 3.70%• Fernley, NV: $21,659 $ 481 2.22%• Findlay, OH: $24,839 $1,935 7.79%• Fitzgerald, GA: $16,269 $ 486 2.98%• Flagstaff, AZ: $22,767 $2,487 10.92%• Flint, MI: $21,823 $1,246 5.71%• Florence, SC: $20,731 $1,147 5.53%• Florence-Muscle Shoals, AL: $21,237 $1,158 5.45%• Fond du Lac, WI: $23,448 $1,137 4.85%• Forest City, NC: $18,355 $1,332 7.26%• Forrest City, AR: $13,494 $ 800 5.93%• Fort Collins-Loveland, CO: $27,887 $1,733 6.22%• Fort Dodge, IA: $21,139 $1,285 6.08%• Fort Leonard Wood, MO: $17,825 $1,555 8.72%• Fort Madison-Keokuk, IA-MO: $20,945 $ 948 4.52%• Fort Morgan, CO: $17,752 $ 910 5.12%• Fort Payne, AL: $17,331 $ 935 5.39%• Fort Polk South, LA: $18,713 $ 917 4.90%• Fort Smith, AR-OK: $18,745 $1,010 5.39%• Fort Valley, GA: $18,602 $1,456 7.83%• Fort Wayne, IN: $23,736 $1,384 5.83%• Frankfort, IN: $20,439 $1,054 5.16%• Frankfort, KY: $24,499 $1,241 5.07%• Fredericksburg, TX: $27,497 $1,418 5.16%• Freeport, IL: $21,569 $1,408 6.53%• Fremont, OH: $22,702 $1,684 7.42%• Fremont, NE: $21,038 $1,372 6.52%• Fresno, CA: $18,692 $1,073 5.74%• Gadsden, AL: $19,789 $1,124 5.68%• Gaffney, SC: $18,247 $ 832 4.56%• Gainesville, FL: $22,802 $1,410 6.18%• Gainesville, GA: $21,148 $1,030 4.87%• Gainesville, TX: $22,797 $1,225 5.37%• Galesburg, IL: $19,751 $1,127 5.70%• Gallup, NM: $12,954 $1,645 12.70%• Garden City, KS: $18,371 $1,619 8.81%• Gardnerville Ranchos, NV: $32,208 $1,783 5.54%
RESTAURANT, FOOD & BEVERAGE MARKET RESEARCH HANDBOOK 2013
• 118 •
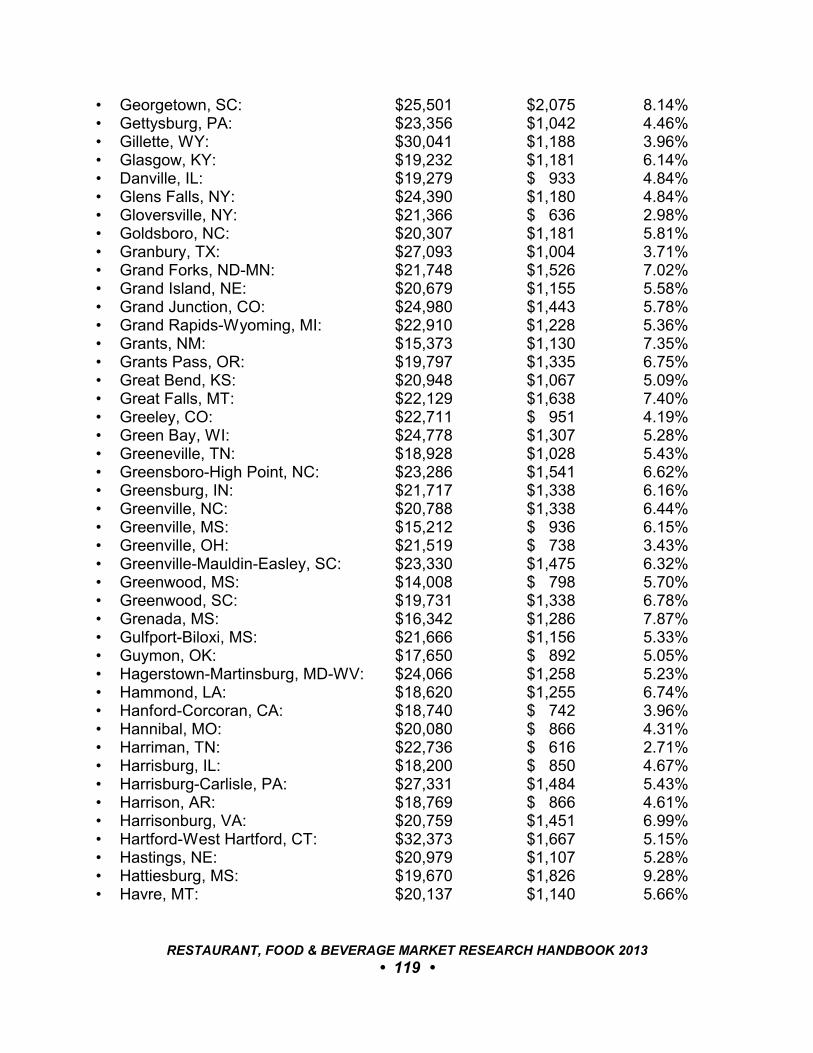
• Georgetown, SC: $25,501 $2,075 8.14%• Gettysburg, PA: $23,356 $1,042 4.46%• Gillette, WY: $30,041 $1,188 3.96%• Glasgow, KY: $19,232 $1,181 6.14%• Danville, IL: $19,279 $ 933 4.84%• Glens Falls, NY: $24,390 $1,180 4.84%• Gloversville, NY: $21,366 $ 636 2.98%• Goldsboro, NC: $20,307 $1,181 5.81%• Granbury, TX: $27,093 $1,004 3.71%• Grand Forks, ND-MN: $21,748 $1,526 7.02%• Grand Island, NE: $20,679 $1,155 5.58%• Grand Junction, CO: $24,980 $1,443 5.78%• Grand Rapids-Wyoming, MI: $22,910 $1,228 5.36%• Grants, NM: $15,373 $1,130 7.35%• Grants Pass, OR: $19,797 $1,335 6.75%• Great Bend, KS: $20,948 $1,067 5.09%• Great Falls, MT: $22,129 $1,638 7.40%• Greeley, CO: $22,711 $ 951 4.19%• Green Bay, WI: $24,778 $1,307 5.28%• Greeneville, TN: $18,928 $1,028 5.43%• Greensboro-High Point, NC: $23,286 $1,541 6.62%• Greensburg, IN: $21,717 $1,338 6.16%• Greenville, NC: $20,788 $1,338 6.44%• Greenville, MS: $15,212 $ 936 6.15%• Greenville, OH: $21,519 $ 738 3.43%• Greenville-Mauldin-Easley, SC: $23,330 $1,475 6.32%• Greenwood, MS: $14,008 $ 798 5.70%• Greenwood, SC: $19,731 $1,338 6.78%• Grenada, MS: $16,342 $1,286 7.87%• Gulfport-Biloxi, MS: $21,666 $1,156 5.33%• Guymon, OK: $17,650 $ 892 5.05%• Hagerstown-Martinsburg, MD-WV: $24,066 $1,258 5.23%• Hammond, LA: $18,620 $1,255 6.74%• Hanford-Corcoran, CA: $18,740 $ 742 3.96%• Hannibal, MO: $20,080 $ 866 4.31%• Harriman, TN: $22,736 $ 616 2.71%• Harrisburg, IL: $18,200 $ 850 4.67%• Harrisburg-Carlisle, PA: $27,331 $1,484 5.43%• Harrison, AR: $18,769 $ 866 4.61%• Harrisonburg, VA: $20,759 $1,451 6.99%• Hartford-West Hartford, CT: $32,373 $1,667 5.15%• Hastings, NE: $20,979 $1,107 5.28%• Hattiesburg, MS: $19,670 $1,826 9.28%• Havre, MT: $20,137 $1,140 5.66%
RESTAURANT, FOOD & BEVERAGE MARKET RESEARCH HANDBOOK 2013
• 119 •
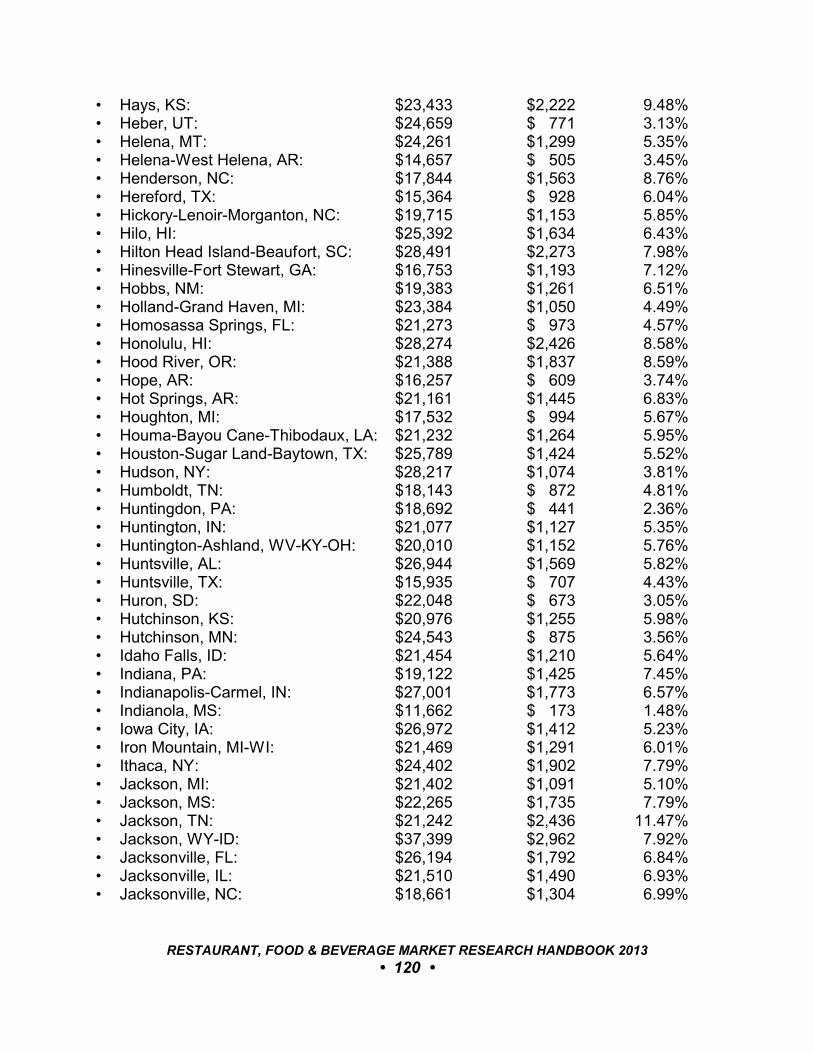
• Hays, KS: $23,433 $2,222 9.48%• Heber, UT: $24,659 $ 771 3.13%• Helena, MT: $24,261 $1,299 5.35%• Helena-West Helena, AR: $14,657 $ 505 3.45%• Henderson, NC: $17,844 $1,563 8.76%• Hereford, TX: $15,364 $ 928 6.04%• Hickory-Lenoir-Morganton, NC: $19,715 $1,153 5.85%• Hilo, HI: $25,392 $1,634 6.43%• Hilton Head Island-Beaufort, SC: $28,491 $2,273 7.98%• Hinesville-Fort Stewart, GA: $16,753 $1,193 7.12%• Hobbs, NM: $19,383 $1,261 6.51%• Holland-Grand Haven, MI: $23,384 $1,050 4.49%• Homosassa Springs, FL: $21,273 $ 973 4.57%• Honolulu, HI: $28,274 $2,426 8.58%• Hood River, OR: $21,388 $1,837 8.59%• Hope, AR: $16,257 $ 609 3.74%• Hot Springs, AR: $21,161 $1,445 6.83%• Houghton, MI: $17,532 $ 994 5.67%• Houma-Bayou Cane-Thibodaux, LA: $21,232 $1,264 5.95%• Houston-Sugar Land-Baytown, TX: $25,789 $1,424 5.52%• Hudson, NY: $28,217 $1,074 3.81%• Humboldt, TN: $18,143 $ 872 4.81%• Huntingdon, PA: $18,692 $ 441 2.36%• Huntington, IN: $21,077 $1,127 5.35%• Huntington-Ashland, WV-KY-OH: $20,010 $1,152 5.76%• Huntsville, AL: $26,944 $1,569 5.82%• Huntsville, TX: $15,935 $ 707 4.43%• Huron, SD: $22,048 $ 673 3.05%• Hutchinson, KS: $20,976 $1,255 5.98%• Hutchinson, MN: $24,543 $ 875 3.56%• Idaho Falls, ID: $21,454 $1,210 5.64%• Indiana, PA: $19,122 $1,425 7.45%• Indianapolis-Carmel, IN: $27,001 $1,773 6.57%• Indianola, MS: $11,662 $ 173 1.48%• Iowa City, IA: $26,972 $1,412 5.23%• Iron Mountain, MI-WI: $21,469 $1,291 6.01%• Ithaca, NY: $24,402 $1,902 7.79%• Jackson, MI: $21,402 $1,091 5.10%• Jackson, MS: $22,265 $1,735 7.79%• Jackson, TN: $21,242 $2,436 11.47%• Jackson, WY-ID: $37,399 $2,962 7.92%• Jacksonville, FL: $26,194 $1,792 6.84%• Jacksonville, IL: $21,510 $1,490 6.93%• Jacksonville, NC: $18,661 $1,304 6.99%
RESTAURANT, FOOD & BEVERAGE MARKET RESEARCH HANDBOOK 2013
• 120 •
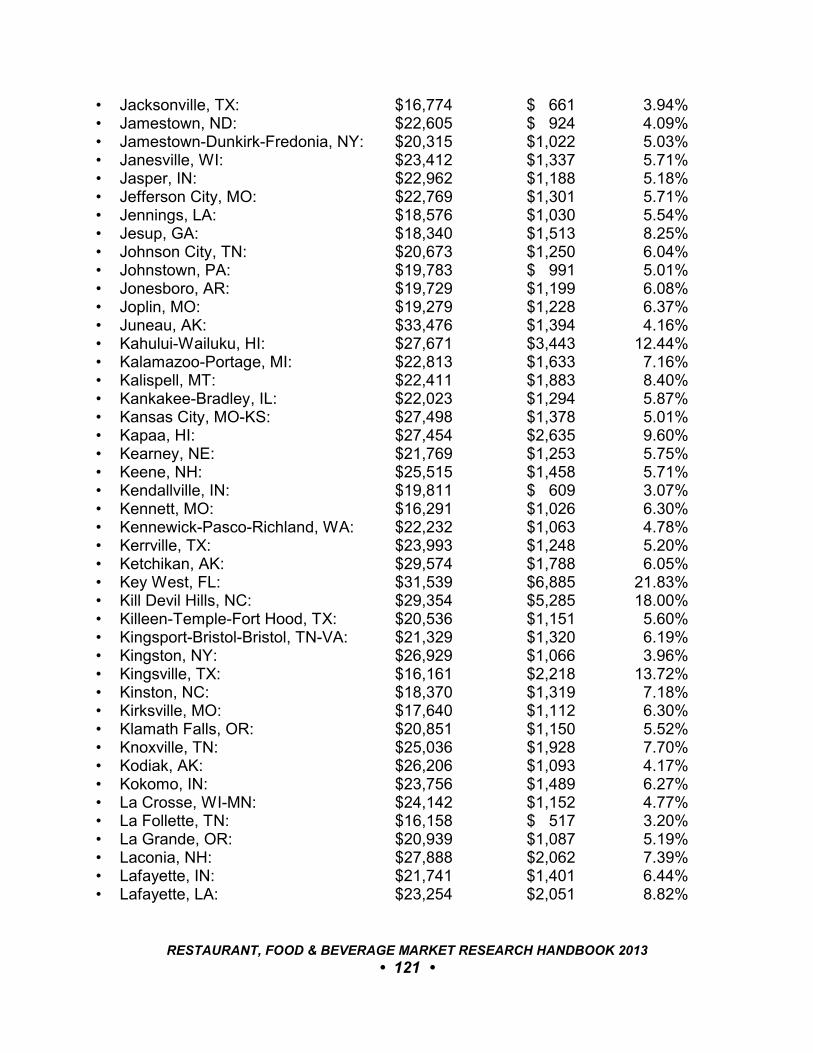
• Jacksonville, TX: $16,774 $ 661 3.94%• Jamestown, ND: $22,605 $ 924 4.09%• Jamestown-Dunkirk-Fredonia, NY: $20,315 $1,022 5.03%• Janesville, WI: $23,412 $1,337 5.71%• Jasper, IN: $22,962 $1,188 5.18%• Jefferson City, MO: $22,769 $1,301 5.71%• Jennings, LA: $18,576 $1,030 5.54%• Jesup, GA: $18,340 $1,513 8.25%• Johnson City, TN: $20,673 $1,250 6.04%• Johnstown, PA: $19,783 $ 991 5.01%• Jonesboro, AR: $19,729 $1,199 6.08%• Joplin, MO: $19,279 $1,228 6.37%• Juneau, AK: $33,476 $1,394 4.16%• Kahului-Wailuku, HI: $27,671 $3,443 12.44%• Kalamazoo-Portage, MI: $22,813 $1,633 7.16%• Kalispell, MT: $22,411 $1,883 8.40%• Kankakee-Bradley, IL: $22,023 $1,294 5.87%• Kansas City, MO-KS: $27,498 $1,378 5.01%• Kapaa, HI: $27,454 $2,635 9.60%• Kearney, NE: $21,769 $1,253 5.75%• Keene, NH: $25,515 $1,458 5.71%• Kendallville, IN: $19,811 $ 609 3.07%• Kennett, MO: $16,291 $1,026 6.30%• Kennewick-Pasco-Richland, WA: $22,232 $1,063 4.78%• Kerrville, TX: $23,993 $1,248 5.20%• Ketchikan, AK: $29,574 $1,788 6.05%• Key West, FL: $31,539 $6,885 21.83%• Kill Devil Hills, NC: $29,354 $5,285 18.00%• Killeen-Temple-Fort Hood, TX: $20,536 $1,151 5.60%• Kingsport-Bristol-Bristol, TN-VA: $21,329 $1,320 6.19%• Kingston, NY: $26,929 $1,066 3.96%• Kingsville, TX: $16,161 $2,218 13.72%• Kinston, NC: $18,370 $1,319 7.18%• Kirksville, MO: $17,640 $1,112 6.30%• Klamath Falls, OR: $20,851 $1,150 5.52%• Knoxville, TN: $25,036 $1,928 7.70%• Kodiak, AK: $26,206 $1,093 4.17%• Kokomo, IN: $23,756 $1,489 6.27%• La Crosse, WI-MN: $24,142 $1,152 4.77%• La Follette, TN: $16,158 $ 517 3.20%• La Grande, OR: $20,939 $1,087 5.19%• Laconia, NH: $27,888 $2,062 7.39%• Lafayette, IN: $21,741 $1,401 6.44%• Lafayette, LA: $23,254 $2,051 8.82%
RESTAURANT, FOOD & BEVERAGE MARKET RESEARCH HANDBOOK 2013
• 121 •
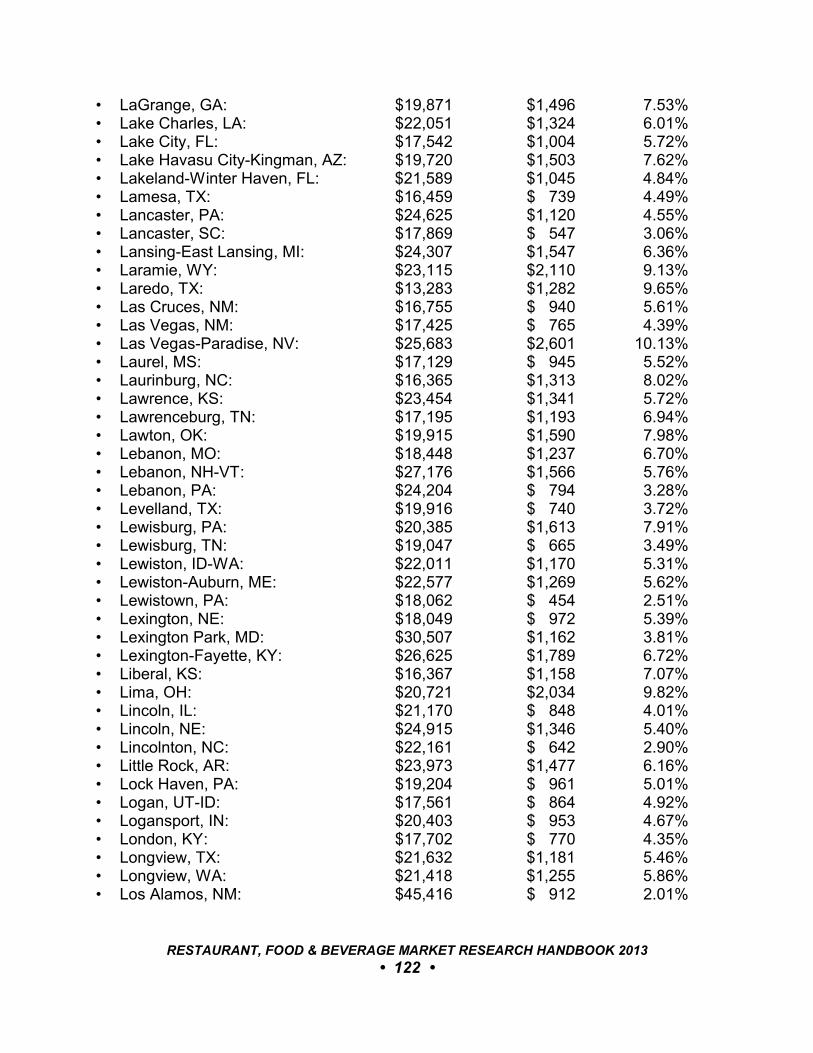
• LaGrange, GA: $19,871 $1,496 7.53%• Lake Charles, LA: $22,051 $1,324 6.01%• Lake City, FL: $17,542 $1,004 5.72%• Lake Havasu City-Kingman, AZ: $19,720 $1,503 7.62%• Lakeland-Winter Haven, FL: $21,589 $1,045 4.84%• Lamesa, TX: $16,459 $ 739 4.49%• Lancaster, PA: $24,625 $1,120 4.55%• Lancaster, SC: $17,869 $ 547 3.06%• Lansing-East Lansing, MI: $24,307 $1,547 6.36%• Laramie, WY: $23,115 $2,110 9.13%• Laredo, TX: $13,283 $1,282 9.65%• Las Cruces, NM: $16,755 $ 940 5.61%• Las Vegas, NM: $17,425 $ 765 4.39%• Las Vegas-Paradise, NV: $25,683 $2,601 10.13%• Laurel, MS: $17,129 $ 945 5.52%• Laurinburg, NC: $16,365 $1,313 8.02%• Lawrence, KS: $23,454 $1,341 5.72%• Lawrenceburg, TN: $17,195 $1,193 6.94%• Lawton, OK: $19,915 $1,590 7.98%• Lebanon, MO: $18,448 $1,237 6.70%• Lebanon, NH-VT: $27,176 $1,566 5.76%• Lebanon, PA: $24,204 $ 794 3.28%• Levelland, TX: $19,916 $ 740 3.72%• Lewisburg, PA: $20,385 $1,613 7.91%• Lewisburg, TN: $19,047 $ 665 3.49%• Lewiston, ID-WA: $22,011 $1,170 5.31%• Lewiston-Auburn, ME: $22,577 $1,269 5.62%• Lewistown, PA: $18,062 $ 454 2.51%• Lexington, NE: $18,049 $ 972 5.39%• Lexington Park, MD: $30,507 $1,162 3.81%• Lexington-Fayette, KY: $26,625 $1,789 6.72%• Liberal, KS: $16,367 $1,158 7.07%• Lima, OH: $20,721 $2,034 9.82%• Lincoln, IL: $21,170 $ 848 4.01%• Lincoln, NE: $24,915 $1,346 5.40%• Lincolnton, NC: $22,161 $ 642 2.90%• Little Rock, AR: $23,973 $1,477 6.16%• Lock Haven, PA: $19,204 $ 961 5.01%• Logan, UT-ID: $17,561 $ 864 4.92%• Logansport, IN: $20,403 $ 953 4.67%• London, KY: $17,702 $ 770 4.35%• Longview, TX: $21,632 $1,181 5.46%• Longview, WA: $21,418 $1,255 5.86%• Los Alamos, NM: $45,416 $ 912 2.01%
RESTAURANT, FOOD & BEVERAGE MARKET RESEARCH HANDBOOK 2013
• 122 •

• Los Angeles-Long Beach, CA: $26,048 $1,777 6.82%• Louisville-Jefferson Co., KY-IN: $25,073 $1,482 5.91%• Lubbock, TX: $21,469 $1,292 6.02%• Lufkin, TX: $18,184 $1,041 5.73%• Lumberton, NC: $13,905 $ 968 6.96%• Lynchburg, VA: $22,527 $1,237 5.49%• Macomb, IL: $16,852 $1,702 10.10%• Macon, GA: $21,078 $1,349 6.40%• Madera-Chowchilla, CA: $17,122 $ 490 2.86%• Madison, IN: $20,723 $1,126 5.43%• Madison, WI: $29,753 $1,646 5.53%• Madisonville, KY: $20,910 $1,169 5.59%• Magnolia, AR: $19,052 $ 753 3.95%• Malone, NY: $20,081 $ 657 3.27%• Manchester-Nashua, NH: $31,017 $1,602 5.17%• Manhattan, KS: $20,739 $1,541 7.43%• Manitowoc, WI: $23,772 $ 836 3.52%• Mankato-North Mankato, MN: $23,606 $1,530 6.48%• Mansfield, OH: $20,744 $1,324 6.38%• Marble Falls, TX: $22,837 $ 886 3.88%• Marinette, WI-MI: $20,891 $ 876 4.19%• Marion, IN: $19,583 $1,441 7.36%• Marion, OH: $19,219 $ 908 4.72%• Marion-Herrin, IL: $21,399 $1,759 8.22%• Marquette, MI: $21,380 $1,177 5.51%• Marshall, MN: $21,510 $1,358 6.31%• Marshall, MO: $19,264 $ 568 2.95%• Marshall, TX: $20,738 $ 872 4.21%• Marshalltown, IA: $22,288 $ 957 4.29%• Marshfield-Wisconsin Rapids, WI: $23,940 $1,109 4.63%• Martin, TN: $17,628 $ 542 3.07%• Martinsville, VA: $19,252 $1,085 5.63%• Maryville, MO: $18,889 $1,275 6.75%• Mason City, IA: $23,198 $1,386 5.98%• Mayfield, KY: $18,834 $ 708 3.76%• Maysville, KY: $18,011 $1,660 9.21%• McAlester, OK: $19,899 $1,329 6.68%• McAllen-Edinburg-Mission, TX: $12,261 $ 875 7.14%• McComb, MS: $16,628 $ 952 5.72%• McMinnville, TN: $17,943 $ 706 3.93%• McPherson, KS: $22,553 $ 756 3.35%• Meadville, PA: $19,274 $1,306 6.77%• Medford, OR: $23,289 $1,661 7.13%• Memphis, TN-MS-AR: $23,040 $1,441 6.25%
RESTAURANT, FOOD & BEVERAGE MARKET RESEARCH HANDBOOK 2013
• 123 •
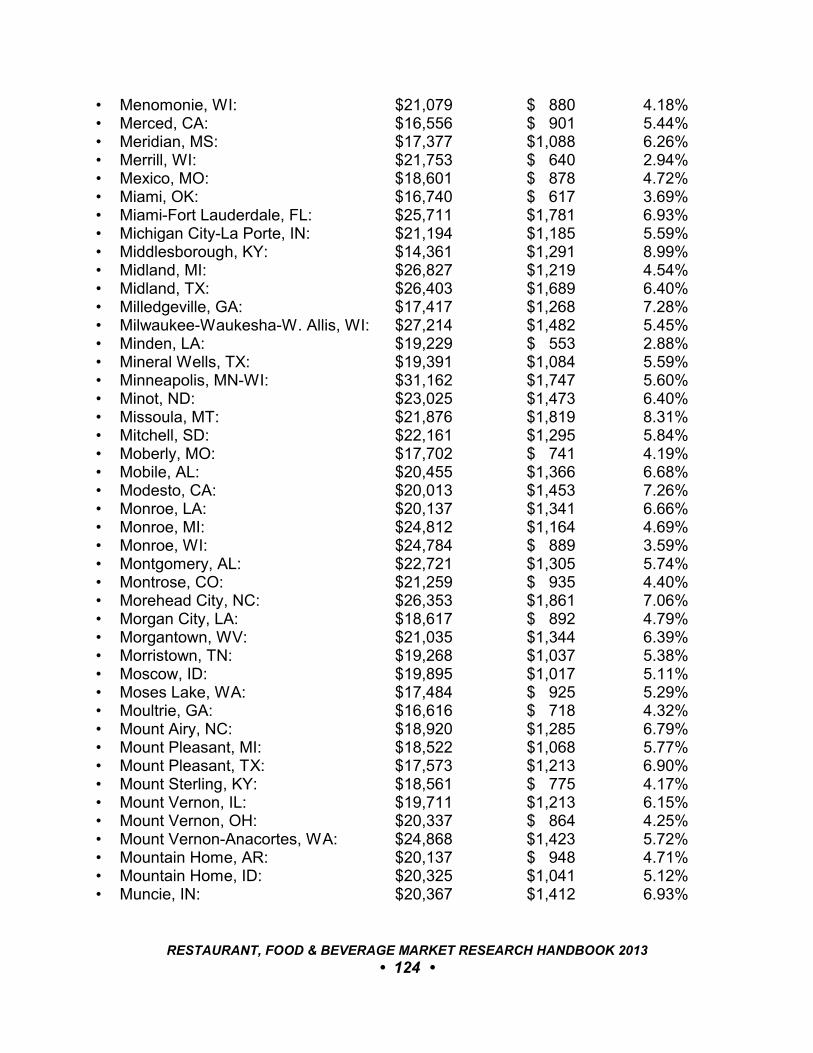
• Menomonie, WI: $21,079 $ 880 4.18%• Merced, CA: $16,556 $ 901 5.44%• Meridian, MS: $17,377 $1,088 6.26%• Merrill, WI: $21,753 $ 640 2.94%• Mexico, MO: $18,601 $ 878 4.72%• Miami, OK: $16,740 $ 617 3.69%• Miami-Fort Lauderdale, FL: $25,711 $1,781 6.93%• Michigan City-La Porte, IN: $21,194 $1,185 5.59%• Middlesborough, KY: $14,361 $1,291 8.99%• Midland, MI: $26,827 $1,219 4.54%• Midland, TX: $26,403 $1,689 6.40%• Milledgeville, GA: $17,417 $1,268 7.28%• Milwaukee-Waukesha-W. Allis, WI: $27,214 $1,482 5.45%• Minden, LA: $19,229 $ 553 2.88%• Mineral Wells, TX: $19,391 $1,084 5.59%• Minneapolis, MN-WI: $31,162 $1,747 5.60%• Minot, ND: $23,025 $1,473 6.40%• Missoula, MT: $21,876 $1,819 8.31%• Mitchell, SD: $22,161 $1,295 5.84%• Moberly, MO: $17,702 $ 741 4.19%• Mobile, AL: $20,455 $1,366 6.68%• Modesto, CA: $20,013 $1,453 7.26%• Monroe, LA: $20,137 $1,341 6.66%• Monroe, MI: $24,812 $1,164 4.69%• Monroe, WI: $24,784 $ 889 3.59%• Montgomery, AL: $22,721 $1,305 5.74%• Montrose, CO: $21,259 $ 935 4.40%• Morehead City, NC: $26,353 $1,861 7.06%• Morgan City, LA: $18,617 $ 892 4.79%• Morgantown, WV: $21,035 $1,344 6.39%• Morristown, TN: $19,268 $1,037 5.38%• Moscow, ID: $19,895 $1,017 5.11%• Moses Lake, WA: $17,484 $ 925 5.29%• Moultrie, GA: $16,616 $ 718 4.32%• Mount Airy, NC: $18,920 $1,285 6.79%• Mount Pleasant, MI: $18,522 $1,068 5.77%• Mount Pleasant, TX: $17,573 $1,213 6.90%• Mount Sterling, KY: $18,561 $ 775 4.17%• Mount Vernon, IL: $19,711 $1,213 6.15%• Mount Vernon, OH: $20,337 $ 864 4.25%• Mount Vernon-Anacortes, WA: $24,868 $1,423 5.72%• Mountain Home, AR: $20,137 $ 948 4.71%• Mountain Home, ID: $20,325 $1,041 5.12%• Muncie, IN: $20,367 $1,412 6.93%
RESTAURANT, FOOD & BEVERAGE MARKET RESEARCH HANDBOOK 2013
• 124 •
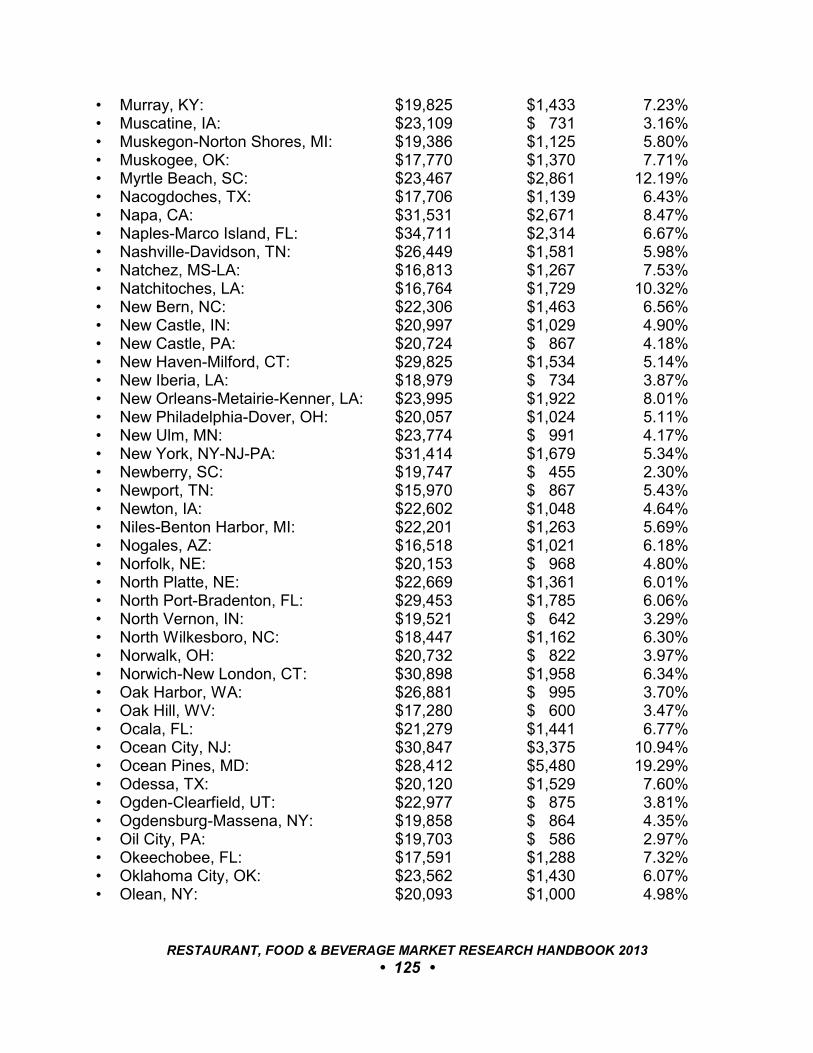
• Murray, KY: $19,825 $1,433 7.23%• Muscatine, IA: $23,109 $ 731 3.16%• Muskegon-Norton Shores, MI: $19,386 $1,125 5.80%• Muskogee, OK: $17,770 $1,370 7.71%• Myrtle Beach, SC: $23,467 $2,861 12.19%• Nacogdoches, TX: $17,706 $1,139 6.43%• Napa, CA: $31,531 $2,671 8.47%• Naples-Marco Island, FL: $34,711 $2,314 6.67%• Nashville-Davidson, TN: $26,449 $1,581 5.98%• Natchez, MS-LA: $16,813 $1,267 7.53%• Natchitoches, LA: $16,764 $1,729 10.32%• New Bern, NC: $22,306 $1,463 6.56%• New Castle, IN: $20,997 $1,029 4.90%• New Castle, PA: $20,724 $ 867 4.18%• New Haven-Milford, CT: $29,825 $1,534 5.14%• New Iberia, LA: $18,979 $ 734 3.87%• New Orleans-Metairie-Kenner, LA: $23,995 $1,922 8.01%• New Philadelphia-Dover, OH: $20,057 $1,024 5.11%• New Ulm, MN: $23,774 $ 991 4.17%• New York, NY-NJ-PA: $31,414 $1,679 5.34%• Newberry, SC: $19,747 $ 455 2.30%• Newport, TN: $15,970 $ 867 5.43%• Newton, IA: $22,602 $1,048 4.64%• Niles-Benton Harbor, MI: $22,201 $1,263 5.69%• Nogales, AZ: $16,518 $1,021 6.18%• Norfolk, NE: $20,153 $ 968 4.80%• North Platte, NE: $22,669 $1,361 6.01%• North Port-Bradenton, FL: $29,453 $1,785 6.06%• North Vernon, IN: $19,521 $ 642 3.29%• North Wilkesboro, NC: $18,447 $1,162 6.30%• Norwalk, OH: $20,732 $ 822 3.97%• Norwich-New London, CT: $30,898 $1,958 6.34%• Oak Harbor, WA: $26,881 $ 995 3.70%• Oak Hill, WV: $17,280 $ 600 3.47%• Ocala, FL: $21,279 $1,441 6.77%• Ocean City, NJ: $30,847 $3,375 10.94%• Ocean Pines, MD: $28,412 $5,480 19.29%• Odessa, TX: $20,120 $1,529 7.60%• Ogden-Clearfield, UT: $22,977 $ 875 3.81%• Ogdensburg-Massena, NY: $19,858 $ 864 4.35%• Oil City, PA: $19,703 $ 586 2.97%• Okeechobee, FL: $17,591 $1,288 7.32%• Oklahoma City, OK: $23,562 $1,430 6.07%• Olean, NY: $20,093 $1,000 4.98%
RESTAURANT, FOOD & BEVERAGE MARKET RESEARCH HANDBOOK 2013
• 125 •
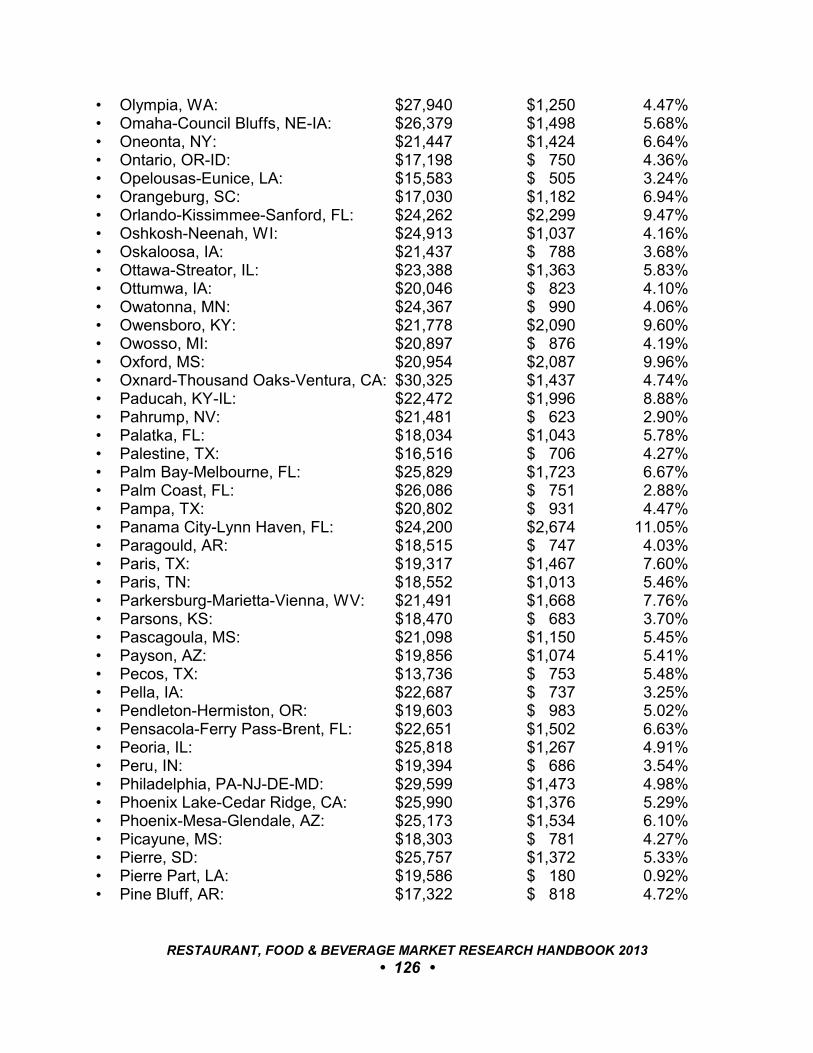
• Olympia, WA: $27,940 $1,250 4.47%• Omaha-Council Bluffs, NE-IA: $26,379 $1,498 5.68%• Oneonta, NY: $21,447 $1,424 6.64%• Ontario, OR-ID: $17,198 $ 750 4.36%• Opelousas-Eunice, LA: $15,583 $ 505 3.24%• Orangeburg, SC: $17,030 $1,182 6.94%• Orlando-Kissimmee-Sanford, FL: $24,262 $2,299 9.47%• Oshkosh-Neenah, WI: $24,913 $1,037 4.16%• Oskaloosa, IA: $21,437 $ 788 3.68%• Ottawa-Streator, IL: $23,388 $1,363 5.83%• Ottumwa, IA: $20,046 $ 823 4.10%• Owatonna, MN: $24,367 $ 990 4.06%• Owensboro, KY: $21,778 $2,090 9.60%• Owosso, MI: $20,897 $ 876 4.19%• Oxford, MS: $20,954 $2,087 9.96%• Oxnard-Thousand Oaks-Ventura, CA: $30,325 $1,437 4.74%• Paducah, KY-IL: $22,472 $1,996 8.88%• Pahrump, NV: $21,481 $ 623 2.90%• Palatka, FL: $18,034 $1,043 5.78%• Palestine, TX: $16,516 $ 706 4.27%• Palm Bay-Melbourne, FL: $25,829 $1,723 6.67%• Palm Coast, FL: $26,086 $ 751 2.88%• Pampa, TX: $20,802 $ 931 4.47%• Panama City-Lynn Haven, FL: $24,200 $2,674 11.05%• Paragould, AR: $18,515 $ 747 4.03%• Paris, TX: $19,317 $1,467 7.60%• Paris, TN: $18,552 $1,013 5.46%• Parkersburg-Marietta-Vienna, WV: $21,491 $1,668 7.76%• Parsons, KS: $18,470 $ 683 3.70%• Pascagoula, MS: $21,098 $1,150 5.45%• Payson, AZ: $19,856 $1,074 5.41%• Pecos, TX: $13,736 $ 753 5.48%• Pella, IA: $22,687 $ 737 3.25%• Pendleton-Hermiston, OR: $19,603 $ 983 5.02%• Pensacola-Ferry Pass-Brent, FL: $22,651 $1,502 6.63%• Peoria, IL: $25,818 $1,267 4.91%• Peru, IN: $19,394 $ 686 3.54%• Philadelphia, PA-NJ-DE-MD: $29,599 $1,473 4.98%• Phoenix Lake-Cedar Ridge, CA: $25,990 $1,376 5.29%• Phoenix-Mesa-Glendale, AZ: $25,173 $1,534 6.10%• Picayune, MS: $18,303 $ 781 4.27%• Pierre, SD: $25,757 $1,372 5.33%• Pierre Part, LA: $19,586 $ 180 0.92%• Pine Bluff, AR: $17,322 $ 818 4.72%
RESTAURANT, FOOD & BEVERAGE MARKET RESEARCH HANDBOOK 2013
• 126 •
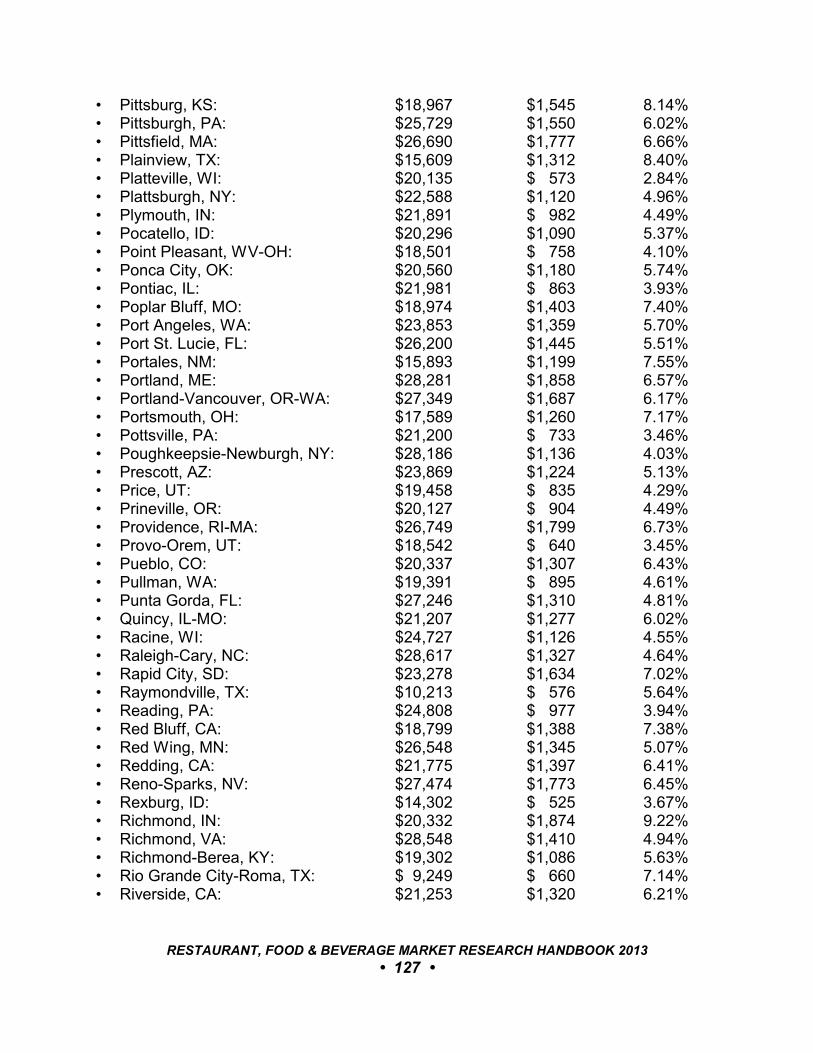
• Pittsburg, KS: $18,967 $1,545 8.14%• Pittsburgh, PA: $25,729 $1,550 6.02%• Pittsfield, MA: $26,690 $1,777 6.66%• Plainview, TX: $15,609 $1,312 8.40%• Platteville, WI: $20,135 $ 573 2.84%• Plattsburgh, NY: $22,588 $1,120 4.96%• Plymouth, IN: $21,891 $ 982 4.49%• Pocatello, ID: $20,296 $1,090 5.37%• Point Pleasant, WV-OH: $18,501 $ 758 4.10%• Ponca City, OK: $20,560 $1,180 5.74%• Pontiac, IL: $21,981 $ 863 3.93%• Poplar Bluff, MO: $18,974 $1,403 7.40%• Port Angeles, WA: $23,853 $1,359 5.70%• Port St. Lucie, FL: $26,200 $1,445 5.51%• Portales, NM: $15,893 $1,199 7.55%• Portland, ME: $28,281 $1,858 6.57%• Portland-Vancouver, OR-WA: $27,349 $1,687 6.17%• Portsmouth, OH: $17,589 $1,260 7.17%• Pottsville, PA: $21,200 $ 733 3.46%• Poughkeepsie-Newburgh, NY: $28,186 $1,136 4.03%• Prescott, AZ: $23,869 $1,224 5.13%• Price, UT: $19,458 $ 835 4.29%• Prineville, OR: $20,127 $ 904 4.49%• Providence, RI-MA: $26,749 $1,799 6.73%• Provo-Orem, UT: $18,542 $ 640 3.45%• Pueblo, CO: $20,337 $1,307 6.43%• Pullman, WA: $19,391 $ 895 4.61%• Punta Gorda, FL: $27,246 $1,310 4.81%• Quincy, IL-MO: $21,207 $1,277 6.02%• Racine, WI: $24,727 $1,126 4.55%• Raleigh-Cary, NC: $28,617 $1,327 4.64%• Rapid City, SD: $23,278 $1,634 7.02%• Raymondville, TX: $10,213 $ 576 5.64%• Reading, PA: $24,808 $ 977 3.94%• Red Bluff, CA: $18,799 $1,388 7.38%• Red Wing, MN: $26,548 $1,345 5.07%• Redding, CA: $21,775 $1,397 6.41%• Reno-Sparks, NV: $27,474 $1,773 6.45%• Rexburg, ID: $14,302 $ 525 3.67%• Richmond, IN: $20,332 $1,874 9.22%• Richmond, VA: $28,548 $1,410 4.94%• Richmond-Berea, KY: $19,302 $1,086 5.63%• Rio Grande City-Roma, TX: $ 9,249 $ 660 7.14%• Riverside, CA: $21,253 $1,320 6.21%
RESTAURANT, FOOD & BEVERAGE MARKET RESEARCH HANDBOOK 2013
• 127 •
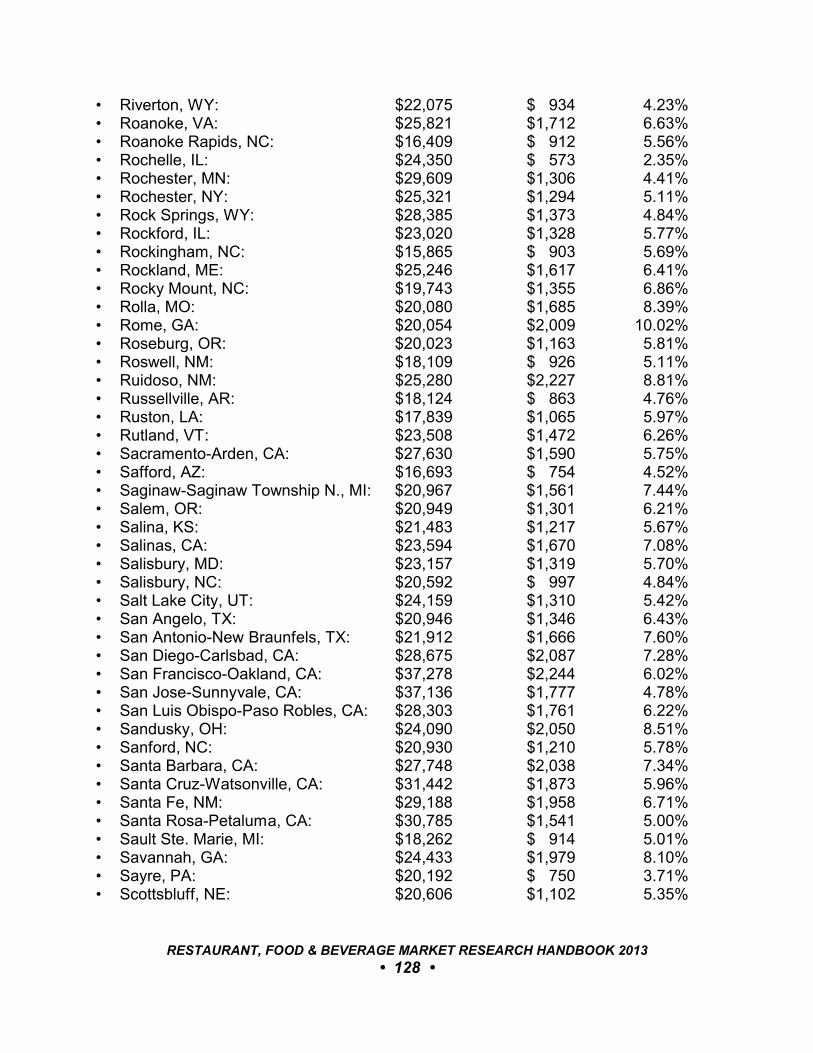
• Riverton, WY: $22,075 $ 934 4.23%• Roanoke, VA: $25,821 $1,712 6.63%• Roanoke Rapids, NC: $16,409 $ 912 5.56%• Rochelle, IL: $24,350 $ 573 2.35%• Rochester, MN: $29,609 $1,306 4.41%• Rochester, NY: $25,321 $1,294 5.11%• Rock Springs, WY: $28,385 $1,373 4.84%• Rockford, IL: $23,020 $1,328 5.77%• Rockingham, NC: $15,865 $ 903 5.69%• Rockland, ME: $25,246 $1,617 6.41%• Rocky Mount, NC: $19,743 $1,355 6.86%• Rolla, MO: $20,080 $1,685 8.39%• Rome, GA: $20,054 $2,009 10.02%• Roseburg, OR: $20,023 $1,163 5.81%• Roswell, NM: $18,109 $ 926 5.11%• Ruidoso, NM: $25,280 $2,227 8.81%• Russellville, AR: $18,124 $ 863 4.76%• Ruston, LA: $17,839 $1,065 5.97%• Rutland, VT: $23,508 $1,472 6.26%• Sacramento-Arden, CA: $27,630 $1,590 5.75%• Safford, AZ: $16,693 $ 754 4.52%• Saginaw-Saginaw Township N., MI: $20,967 $1,561 7.44%• Salem, OR: $20,949 $1,301 6.21%• Salina, KS: $21,483 $1,217 5.67%• Salinas, CA: $23,594 $1,670 7.08%• Salisbury, MD: $23,157 $1,319 5.70%• Salisbury, NC: $20,592 $ 997 4.84%• Salt Lake City, UT: $24,159 $1,310 5.42%• San Angelo, TX: $20,946 $1,346 6.43%• San Antonio-New Braunfels, TX: $21,912 $1,666 7.60%• San Diego-Carlsbad, CA: $28,675 $2,087 7.28%• San Francisco-Oakland, CA: $37,278 $2,244 6.02%• San Jose-Sunnyvale, CA: $37,136 $1,777 4.78%• San Luis Obispo-Paso Robles, CA: $28,303 $1,761 6.22%• Sandusky, OH: $24,090 $2,050 8.51%• Sanford, NC: $20,930 $1,210 5.78%• Santa Barbara, CA: $27,748 $2,038 7.34%• Santa Cruz-Watsonville, CA: $31,442 $1,873 5.96%• Santa Fe, NM: $29,188 $1,958 6.71%• Santa Rosa-Petaluma, CA: $30,785 $1,541 5.00%• Sault Ste. Marie, MI: $18,262 $ 914 5.01%• Savannah, GA: $24,433 $1,979 8.10%• Sayre, PA: $20,192 $ 750 3.71%• Scottsbluff, NE: $20,606 $1,102 5.35%
RESTAURANT, FOOD & BEVERAGE MARKET RESEARCH HANDBOOK 2013
• 128 •
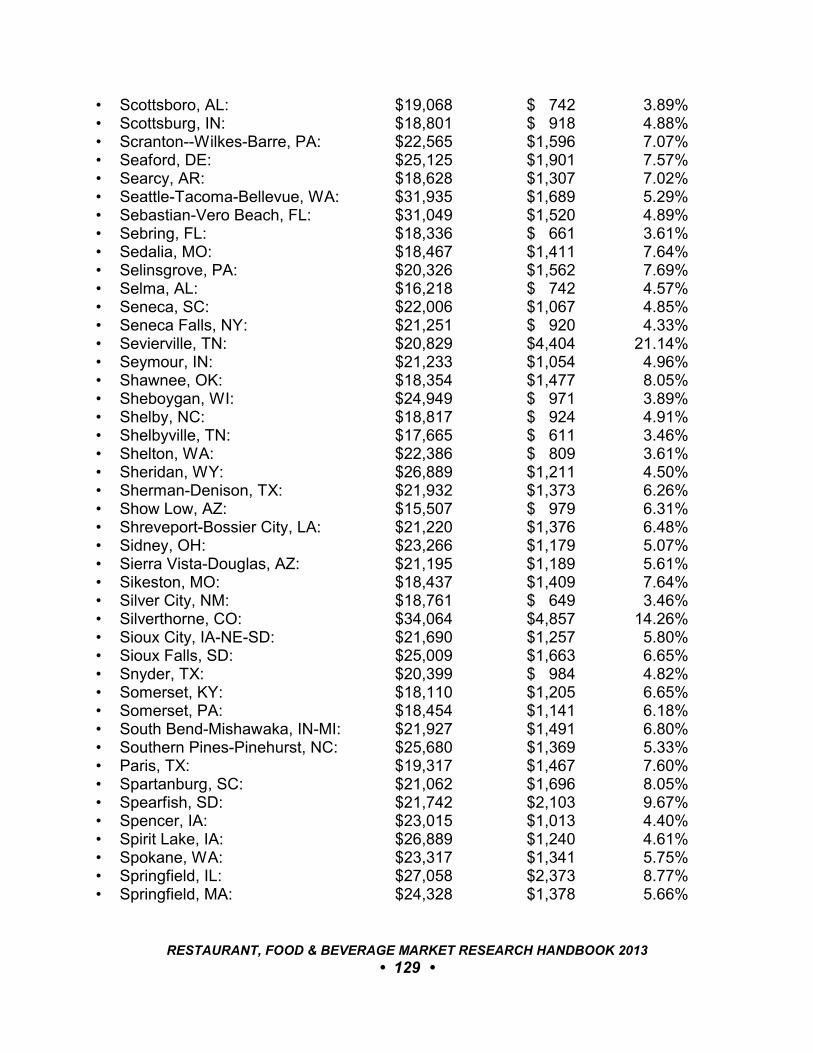
• Scottsboro, AL: $19,068 $ 742 3.89%• Scottsburg, IN: $18,801 $ 918 4.88%• Scranton--Wilkes-Barre, PA: $22,565 $1,596 7.07%• Seaford, DE: $25,125 $1,901 7.57%• Searcy, AR: $18,628 $1,307 7.02%• Seattle-Tacoma-Bellevue, WA: $31,935 $1,689 5.29%• Sebastian-Vero Beach, FL: $31,049 $1,520 4.89%• Sebring, FL: $18,336 $ 661 3.61%• Sedalia, MO: $18,467 $1,411 7.64%• Selinsgrove, PA: $20,326 $1,562 7.69%• Selma, AL: $16,218 $ 742 4.57%• Seneca, SC: $22,006 $1,067 4.85%• Seneca Falls, NY: $21,251 $ 920 4.33%• Sevierville, TN: $20,829 $4,404 21.14%• Seymour, IN: $21,233 $1,054 4.96%• Shawnee, OK: $18,354 $1,477 8.05%• Sheboygan, WI: $24,949 $ 971 3.89%• Shelby, NC: $18,817 $ 924 4.91%• Shelbyville, TN: $17,665 $ 611 3.46%• Shelton, WA: $22,386 $ 809 3.61%• Sheridan, WY: $26,889 $1,211 4.50%• Sherman-Denison, TX: $21,932 $1,373 6.26%• Show Low, AZ: $15,507 $ 979 6.31%• Shreveport-Bossier City, LA: $21,220 $1,376 6.48%• Sidney, OH: $23,266 $1,179 5.07%• Sierra Vista-Douglas, AZ: $21,195 $1,189 5.61%• Sikeston, MO: $18,437 $1,409 7.64%• Silver City, NM: $18,761 $ 649 3.46%• Silverthorne, CO: $34,064 $4,857 14.26%• Sioux City, IA-NE-SD: $21,690 $1,257 5.80%• Sioux Falls, SD: $25,009 $1,663 6.65%• Snyder, TX: $20,399 $ 984 4.82%• Somerset, KY: $18,110 $1,205 6.65%• Somerset, PA: $18,454 $1,141 6.18%• South Bend-Mishawaka, IN-MI: $21,927 $1,491 6.80%• Southern Pines-Pinehurst, NC: $25,680 $1,369 5.33%• Paris, TX: $19,317 $1,467 7.60%• Spartanburg, SC: $21,062 $1,696 8.05%• Spearfish, SD: $21,742 $2,103 9.67%• Spencer, IA: $23,015 $1,013 4.40%• Spirit Lake, IA: $26,889 $1,240 4.61%• Spokane, WA: $23,317 $1,341 5.75%• Springfield, IL: $27,058 $2,373 8.77%• Springfield, MA: $24,328 $1,378 5.66%
RESTAURANT, FOOD & BEVERAGE MARKET RESEARCH HANDBOOK 2013
• 129 •
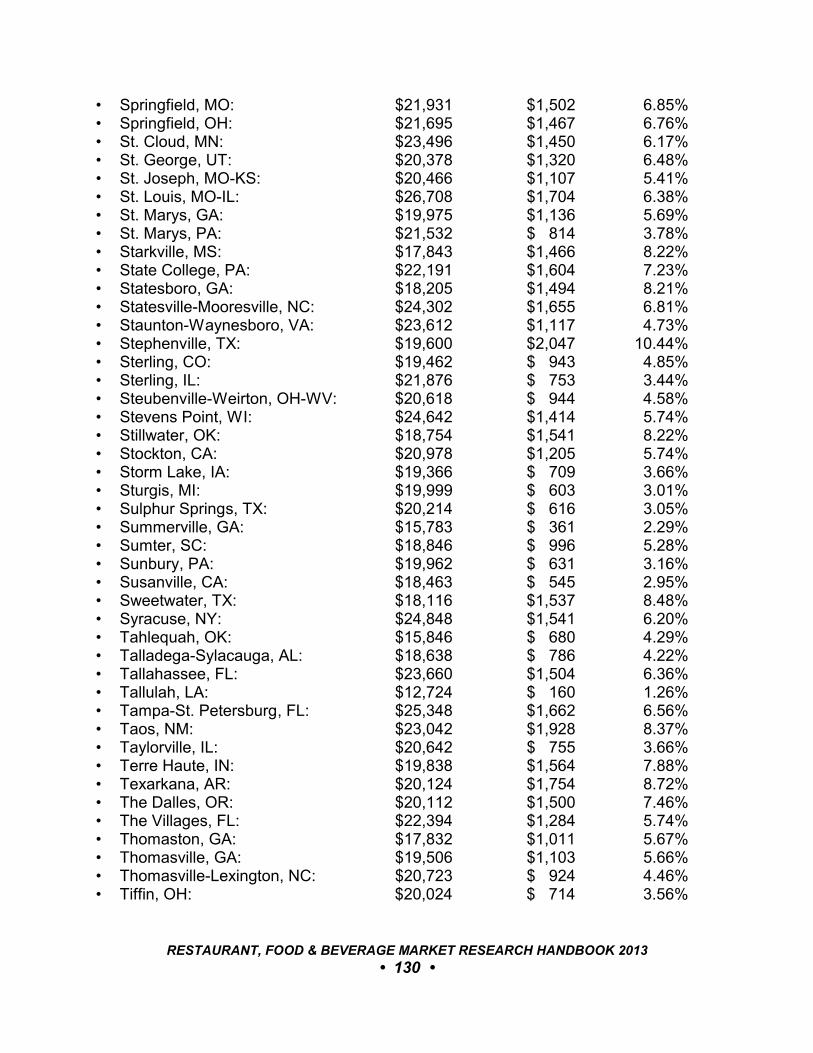
• Springfield, MO: $21,931 $1,502 6.85%• Springfield, OH: $21,695 $1,467 6.76%• St. Cloud, MN: $23,496 $1,450 6.17%• St. George, UT: $20,378 $1,320 6.48%• St. Joseph, MO-KS: $20,466 $1,107 5.41%• St. Louis, MO-IL: $26,708 $1,704 6.38%• St. Marys, GA: $19,975 $1,136 5.69%• St. Marys, PA: $21,532 $ 814 3.78%• Starkville, MS: $17,843 $1,466 8.22%• State College, PA: $22,191 $1,604 7.23%• Statesboro, GA: $18,205 $1,494 8.21%• Statesville-Mooresville, NC: $24,302 $1,655 6.81%• Staunton-Waynesboro, VA: $23,612 $1,117 4.73%• Stephenville, TX: $19,600 $2,047 10.44%• Sterling, CO: $19,462 $ 943 4.85%• Sterling, IL: $21,876 $ 753 3.44%• Steubenville-Weirton, OH-WV: $20,618 $ 944 4.58%• Stevens Point, WI: $24,642 $1,414 5.74%• Stillwater, OK: $18,754 $1,541 8.22%• Stockton, CA: $20,978 $1,205 5.74%• Storm Lake, IA: $19,366 $ 709 3.66%• Sturgis, MI: $19,999 $ 603 3.01%• Sulphur Springs, TX: $20,214 $ 616 3.05%• Summerville, GA: $15,783 $ 361 2.29%• Sumter, SC: $18,846 $ 996 5.28%• Sunbury, PA: $19,962 $ 631 3.16%• Susanville, CA: $18,463 $ 545 2.95%• Sweetwater, TX: $18,116 $1,537 8.48%• Syracuse, NY: $24,848 $1,541 6.20%• Tahlequah, OK: $15,846 $ 680 4.29%• Talladega-Sylacauga, AL: $18,638 $ 786 4.22%• Tallahassee, FL: $23,660 $1,504 6.36%• Tallulah, LA: $12,724 $ 160 1.26%• Tampa-St. Petersburg, FL: $25,348 $1,662 6.56%• Taos, NM: $23,042 $1,928 8.37%• Taylorville, IL: $20,642 $ 755 3.66%• Terre Haute, IN: $19,838 $1,564 7.88%• Texarkana, AR: $20,124 $1,754 8.72%• The Dalles, OR: $20,112 $1,500 7.46%• The Villages, FL: $22,394 $1,284 5.74%• Thomaston, GA: $17,832 $1,011 5.67%• Thomasville, GA: $19,506 $1,103 5.66%• Thomasville-Lexington, NC: $20,723 $ 924 4.46%• Tiffin, OH: $20,024 $ 714 3.56%
RESTAURANT, FOOD & BEVERAGE MARKET RESEARCH HANDBOOK 2013
• 130 •

• Tifton, GA: $19,164 $1,808 9.43%• Toccoa, GA: $18,018 $ 920 5.11%• Toledo, OH: $23,619 $1,552 6.57%• Topeka, KS: $23,722 $1,477 6.22%• Torrington, CT: $33,558 $1,011 3.01%• Traverse City, MI: $24,574 $1,621 6.60%• Trenton-Ewing, NJ: $33,767 $1,776 5.26%• Troy, AL: $17,334 $1,674 9.65%• Truckee-Grass Valley, CA: $30,036 $1,327 4.42%• Tucson, AZ: $23,427 $1,467 6.26%• Tullahoma, TN: $20,667 $ 653 3.16%• Tulsa, OK: $23,684 $1,329 5.61%• Tupelo, MS: $19,514 $1,114 5.71%• Tuscaloosa, AL: $21,482 $1,296 6.03%• Tuskegee, AL: $15,884 $1,417 8.92%• Twin Falls, ID: $19,139 $1,124 5.87%• Tyler, TX: $22,144 $1,605 7.25%• Ukiah, CA: $22,819 $1,295 5.68%• Union, SC: $18,340 $ 570 3.11%• Union City, TN-KY: $19,328 $1,537 7.95%• Urbana, OH: $21,689 $ 738 3.40%• Utica-Rome, NY: $22,140 $1,004 4.53%• Uvalde, TX: $15,499 $1,045 6.74%• Valdosta, GA: $19,452 $2,452 12.61%• Vallejo-Fairfield, CA: $26,903 $1,574 5.85%• Valley, AL: $17,326 $ 710 4.10%• Van Wert, OH: $21,283 $ 481 2.26%• Vermillion, SD: $18,051 $ 956 5.30%• Vernal, UT: $21,032 $ 721 3.43%• Vernon, TX: $19,441 $ 899 4.63%• Vicksburg, MS: $20,308 $1,030 5.07%• Victoria, TX: $21,494 $1,112 5.17%• Vidalia, GA: $17,283 $1,077 6.23%• Vincennes, IN: $19,763 $1,404 7.10%• Vineland-Millville-Bridgeton, NJ: $20,698 $ 960 4.64%• Virginia Beach, VA-NC: $26,040 $1,651 6.34%• Visalia-Porterville, CA: $16,515 $ 701 4.25%• Wabash, IN: $20,817 $ 714 3.43%• Waco, TX: $19,606 $1,462 7.46%• Wahpeton, ND-MN: $21,427 $1,199 5.60%• Walla Walla, WA: $20,437 $ 890 4.36%• Walterboro, SC: $17,595 $ 701 3.99%• Wapakoneta, OH: $23,743 $ 919 3.87%• Warner Robins, GA: $23,649 $1,528 6.46%
RESTAURANT, FOOD & BEVERAGE MARKET RESEARCH HANDBOOK 2013
• 131 •
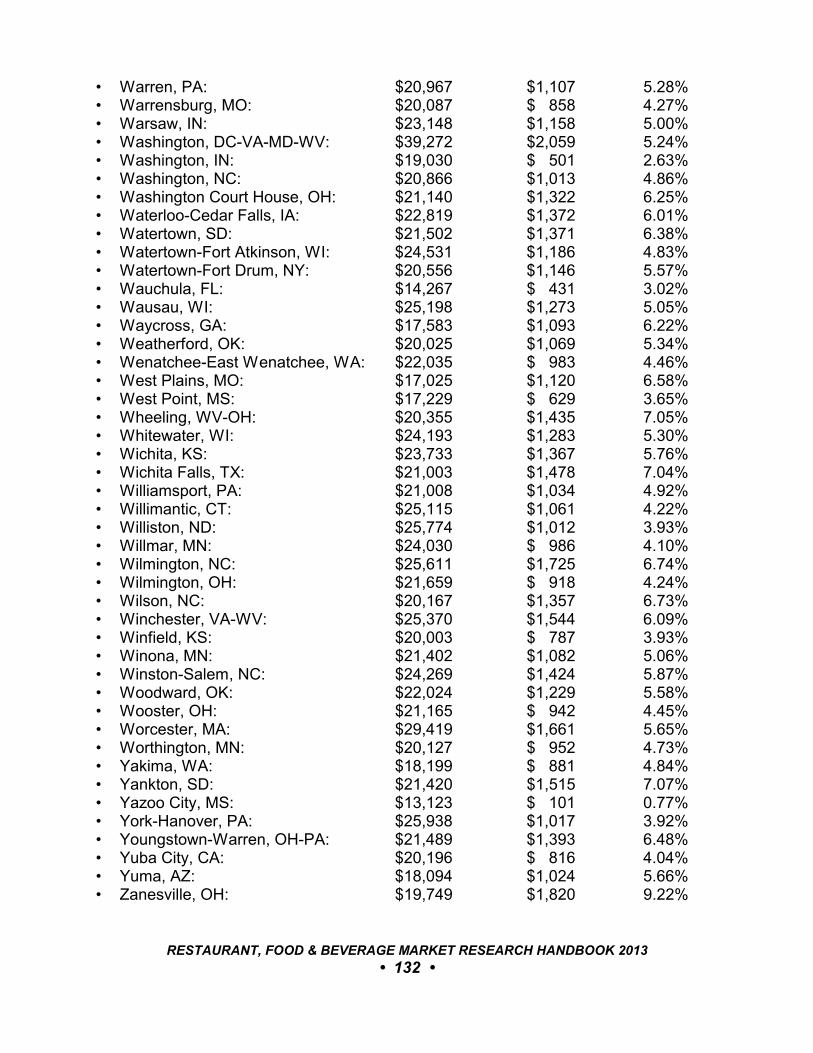
• Warren, PA: $20,967 $1,107 5.28%• Warrensburg, MO: $20,087 $ 858 4.27%• Warsaw, IN: $23,148 $1,158 5.00%• Washington, DC-VA-MD-WV: $39,272 $2,059 5.24%• Washington, IN: $19,030 $ 501 2.63%• Washington, NC: $20,866 $1,013 4.86%• Washington Court House, OH: $21,140 $1,322 6.25%• Waterloo-Cedar Falls, IA: $22,819 $1,372 6.01%• Watertown, SD: $21,502 $1,371 6.38%• Watertown-Fort Atkinson, WI: $24,531 $1,186 4.83%• Watertown-Fort Drum, NY: $20,556 $1,146 5.57%• Wauchula, FL: $14,267 $ 431 3.02%• Wausau, WI: $25,198 $1,273 5.05%• Waycross, GA: $17,583 $1,093 6.22%• Weatherford, OK: $20,025 $1,069 5.34%• Wenatchee-East Wenatchee, WA: $22,035 $ 983 4.46%• West Plains, MO: $17,025 $1,120 6.58%• West Point, MS: $17,229 $ 629 3.65%• Wheeling, WV-OH: $20,355 $1,435 7.05%• Whitewater, WI: $24,193 $1,283 5.30%• Wichita, KS: $23,733 $1,367 5.76%• Wichita Falls, TX: $21,003 $1,478 7.04%• Williamsport, PA: $21,008 $1,034 4.92%• Willimantic, CT: $25,115 $1,061 4.22%• Williston, ND: $25,774 $1,012 3.93%• Willmar, MN: $24,030 $ 986 4.10%• Wilmington, NC: $25,611 $1,725 6.74%• Wilmington, OH: $21,659 $ 918 4.24%• Wilson, NC: $20,167 $1,357 6.73%• Winchester, VA-WV: $25,370 $1,544 6.09%• Winfield, KS: $20,003 $ 787 3.93%• Winona, MN: $21,402 $1,082 5.06%• Winston-Salem, NC: $24,269 $1,424 5.87%• Woodward, OK: $22,024 $1,229 5.58%• Wooster, OH: $21,165 $ 942 4.45%• Worcester, MA: $29,419 $1,661 5.65%• Worthington, MN: $20,127 $ 952 4.73%• Yakima, WA: $18,199 $ 881 4.84%• Yankton, SD: $21,420 $1,515 7.07%• Yazoo City, MS: $13,123 $ 101 0.77%• York-Hanover, PA: $25,938 $1,017 3.92%• Youngstown-Warren, OH-PA: $21,489 $1,393 6.48%• Yuba City, CA: $20,196 $ 816 4.04%• Yuma, AZ: $18,094 $1,024 5.66%• Zanesville, OH: $19,749 $1,820 9.22%
RESTAURANT, FOOD & BEVERAGE MARKET RESEARCH HANDBOOK 2013
• 132 •
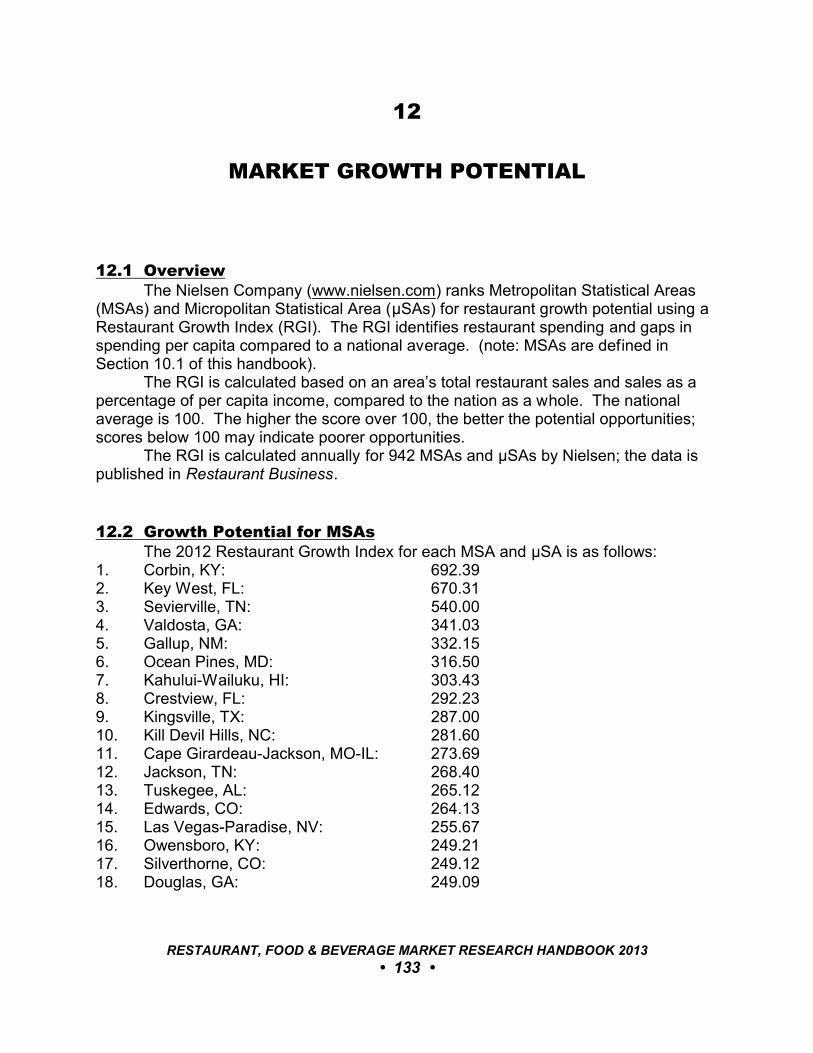
12
MARKET GROWTH POTENTIAL
12.1 OverviewThe Nielsen Company (www.nielsen.com) ranks Metropolitan Statistical Areas
(MSAs) and Micropolitan Statistical Area (ìSAs) for restaurant growth potential using aRestaurant Growth Index (RGI). The RGI identifies restaurant spending and gaps inspending per capita compared to a national average. (note: MSAs are defined inSection 10.1 of this handbook).
The RGI is calculated based on an area’s total restaurant sales and sales as apercentage of per capita income, compared to the nation as a whole. The nationalaverage is 100. The higher the score over 100, the better the potential opportunities;scores below 100 may indicate poorer opportunities.
The RGI is calculated annually for 942 MSAs and ìSAs by Nielsen; the data ispublished in Restaurant Business.
12.2 Growth Potential for MSAsThe 2012 Restaurant Growth Index for each MSA and ìSA is as follows:
1. Corbin, KY: 692.392. Key West, FL: 670.313. Sevierville, TN: 540.004. Valdosta, GA: 341.035. Gallup, NM: 332.156. Ocean Pines, MD: 316.507. Kahului-Wailuku, HI: 303.438. Crestview, FL: 292.239. Kingsville, TX: 287.0010. Kill Devil Hills, NC: 281.6011. Cape Girardeau-Jackson, MO-IL: 273.6912. Jackson, TN: 268.4013. Tuskegee, AL: 265.1214. Edwards, CO: 264.1315. Las Vegas-Paradise, NV: 255.6716. Owensboro, KY: 249.2117. Silverthorne, CO: 249.1218. Douglas, GA: 249.09
RESTAURANT, FOOD & BEVERAGE MARKET RESEARCH HANDBOOK 2013
• 133 •
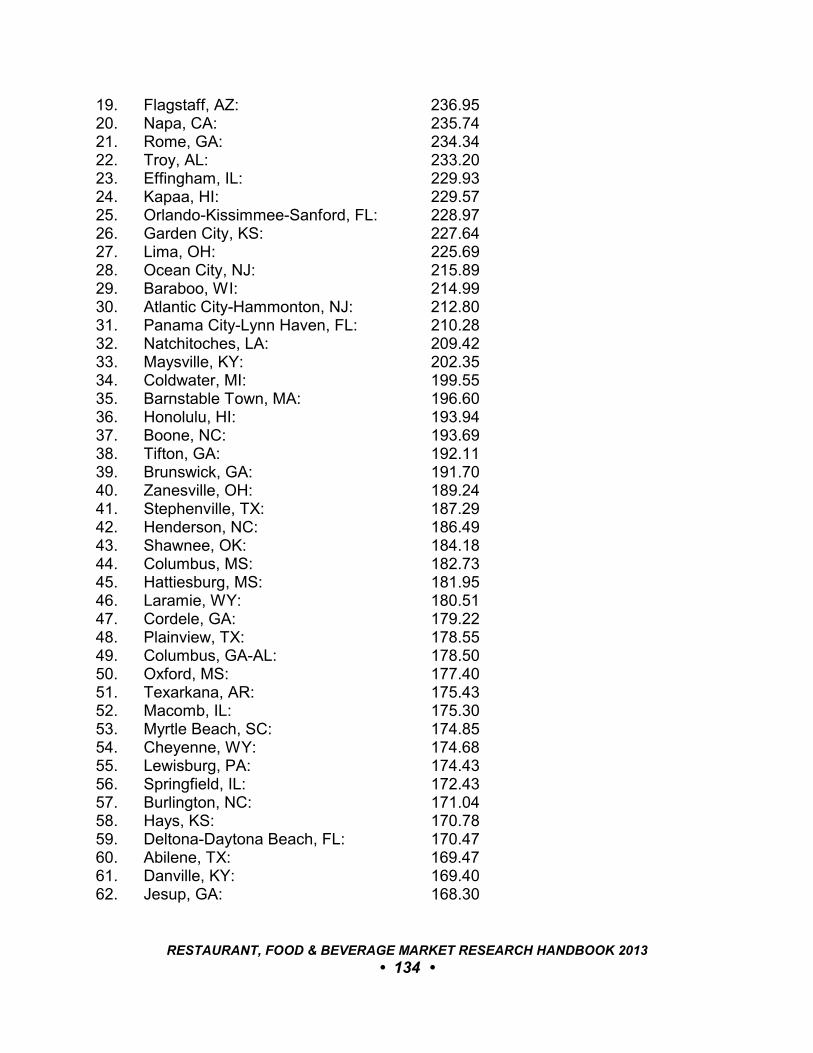
19. Flagstaff, AZ: 236.9520. Napa, CA: 235.7421. Rome, GA: 234.3422. Troy, AL: 233.2023. Effingham, IL: 229.9324. Kapaa, HI: 229.5725. Orlando-Kissimmee-Sanford, FL: 228.9726. Garden City, KS: 227.6427. Lima, OH: 225.6928. Ocean City, NJ: 215.8929. Baraboo, WI: 214.9930. Atlantic City-Hammonton, NJ: 212.8031. Panama City-Lynn Haven, FL: 210.2832. Natchitoches, LA: 209.4233. Maysville, KY: 202.3534. Coldwater, MI: 199.5535. Barnstable Town, MA: 196.6036. Honolulu, HI: 193.9437. Boone, NC: 193.6938. Tifton, GA: 192.1139. Brunswick, GA: 191.7040. Zanesville, OH: 189.2441. Stephenville, TX: 187.2942. Henderson, NC: 186.4943. Shawnee, OK: 184.1844. Columbus, MS: 182.7345. Hattiesburg, MS: 181.9546. Laramie, WY: 180.5147. Cordele, GA: 179.2248. Plainview, TX: 178.5549. Columbus, GA-AL: 178.5050. Oxford, MS: 177.4051. Texarkana, AR: 175.4352. Macomb, IL: 175.3053. Myrtle Beach, SC: 174.8554. Cheyenne, WY: 174.6855. Lewisburg, PA: 174.4356. Springfield, IL: 172.4357. Burlington, NC: 171.0458. Hays, KS: 170.7859. Deltona-Daytona Beach, FL: 170.4760. Abilene, TX: 169.4761. Danville, KY: 169.4062. Jesup, GA: 168.30
RESTAURANT, FOOD & BEVERAGE MARKET RESEARCH HANDBOOK 2013
• 134 •
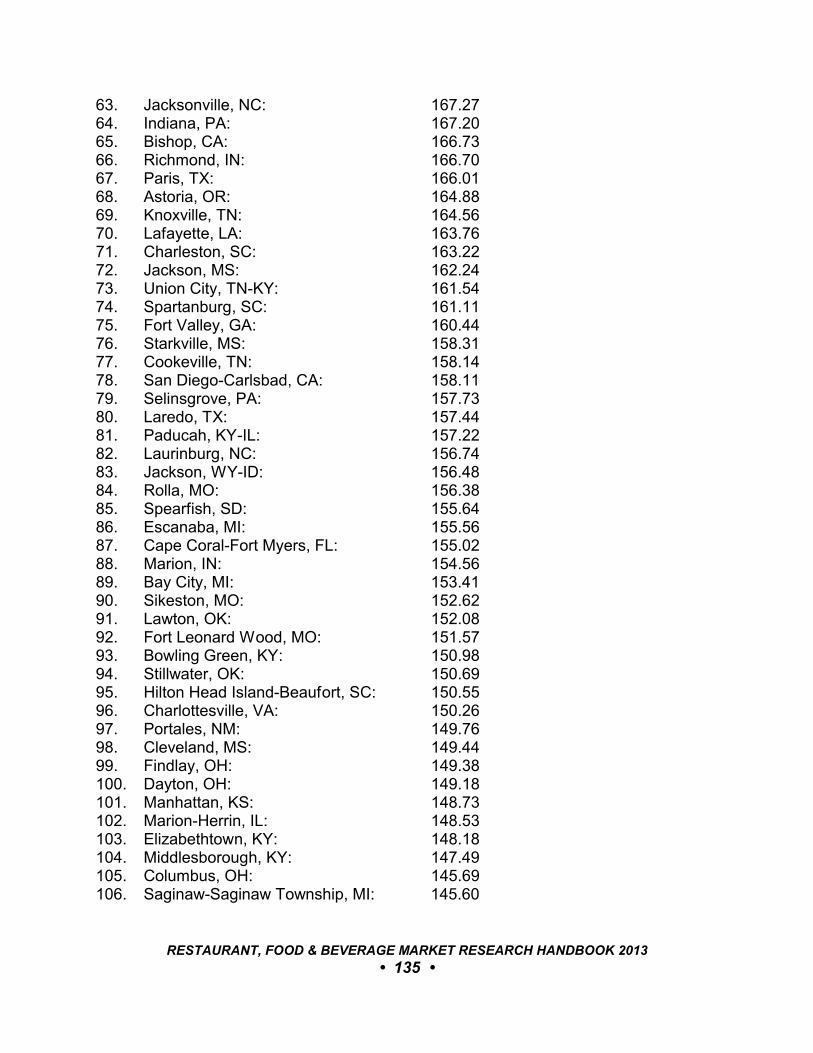
63. Jacksonville, NC: 167.2764. Indiana, PA: 167.2065. Bishop, CA: 166.7366. Richmond, IN: 166.7067. Paris, TX: 166.0168. Astoria, OR: 164.8869. Knoxville, TN: 164.5670. Lafayette, LA: 163.7671. Charleston, SC: 163.2272. Jackson, MS: 162.2473. Union City, TN-KY: 161.5474. Spartanburg, SC: 161.1175. Fort Valley, GA: 160.4476. Starkville, MS: 158.3177. Cookeville, TN: 158.1478. San Diego-Carlsbad, CA: 158.1179. Selinsgrove, PA: 157.7380. Laredo, TX: 157.4481. Paducah, KY-IL: 157.2282. Laurinburg, NC: 156.7483. Jackson, WY-ID: 156.4884. Rolla, MO: 156.3885. Spearfish, SD: 155.6486. Escanaba, MI: 155.5687. Cape Coral-Fort Myers, FL: 155.0288. Marion, IN: 154.5689. Bay City, MI: 153.4190. Sikeston, MO: 152.6291. Lawton, OK: 152.0892. Fort Leonard Wood, MO: 151.5793. Bowling Green, KY: 150.9894. Stillwater, OK: 150.6995. Hilton Head Island-Beaufort, SC: 150.5596. Charlottesville, VA: 150.2697. Portales, NM: 149.7698. Cleveland, MS: 149.4499. Findlay, OH: 149.38100. Dayton, OH: 149.18101. Manhattan, KS: 148.73102. Marion-Herrin, IL: 148.53103. Elizabethtown, KY: 148.18104. Middlesborough, KY: 147.49105. Columbus, OH: 145.69106. Saginaw-Saginaw Township, MI: 145.60
RESTAURANT, FOOD & BEVERAGE MARKET RESEARCH HANDBOOK 2013
• 135 •
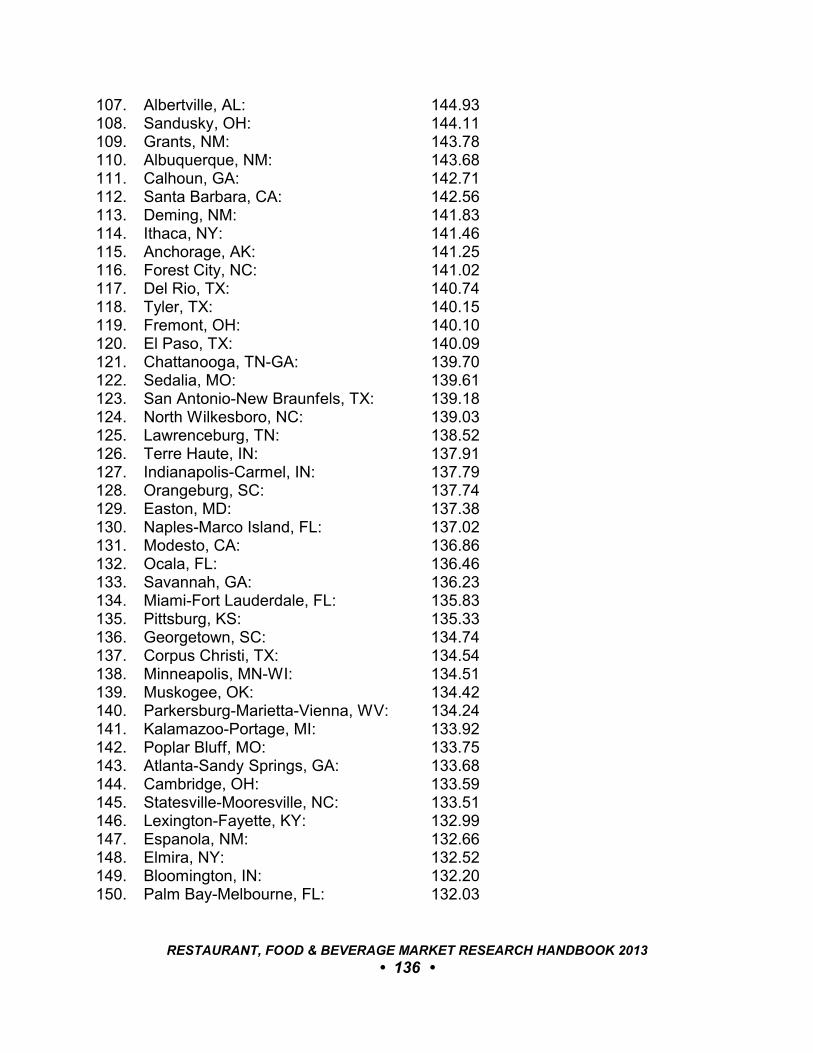
107. Albertville, AL: 144.93108. Sandusky, OH: 144.11109. Grants, NM: 143.78110. Albuquerque, NM: 143.68111. Calhoun, GA: 142.71112. Santa Barbara, CA: 142.56113. Deming, NM: 141.83114. Ithaca, NY: 141.46115. Anchorage, AK: 141.25116. Forest City, NC: 141.02117. Del Rio, TX: 140.74118. Tyler, TX: 140.15119. Fremont, OH: 140.10120. El Paso, TX: 140.09121. Chattanooga, TN-GA: 139.70122. Sedalia, MO: 139.61123. San Antonio-New Braunfels, TX: 139.18124. North Wilkesboro, NC: 139.03125. Lawrenceburg, TN: 138.52126. Terre Haute, IN: 137.91127. Indianapolis-Carmel, IN: 137.79128. Orangeburg, SC: 137.74129. Easton, MD: 137.38130. Naples-Marco Island, FL: 137.02131. Modesto, CA: 136.86132. Ocala, FL: 136.46133. Savannah, GA: 136.23134. Miami-Fort Lauderdale, FL: 135.83135. Pittsburg, KS: 135.33136. Georgetown, SC: 134.74137. Corpus Christi, TX: 134.54138. Minneapolis, MN-WI: 134.51139. Muskogee, OK: 134.42140. Parkersburg-Marietta-Vienna, WV: 134.24141. Kalamazoo-Portage, MI: 133.92142. Poplar Bluff, MO: 133.75143. Atlanta-Sandy Springs, GA: 133.68144. Cambridge, OH: 133.59145. Statesville-Mooresville, NC: 133.51146. Lexington-Fayette, KY: 132.99147. Espanola, NM: 132.66148. Elmira, NY: 132.52149. Bloomington, IN: 132.20150. Palm Bay-Melbourne, FL: 132.03
RESTAURANT, FOOD & BEVERAGE MARKET RESEARCH HANDBOOK 2013
• 136 •
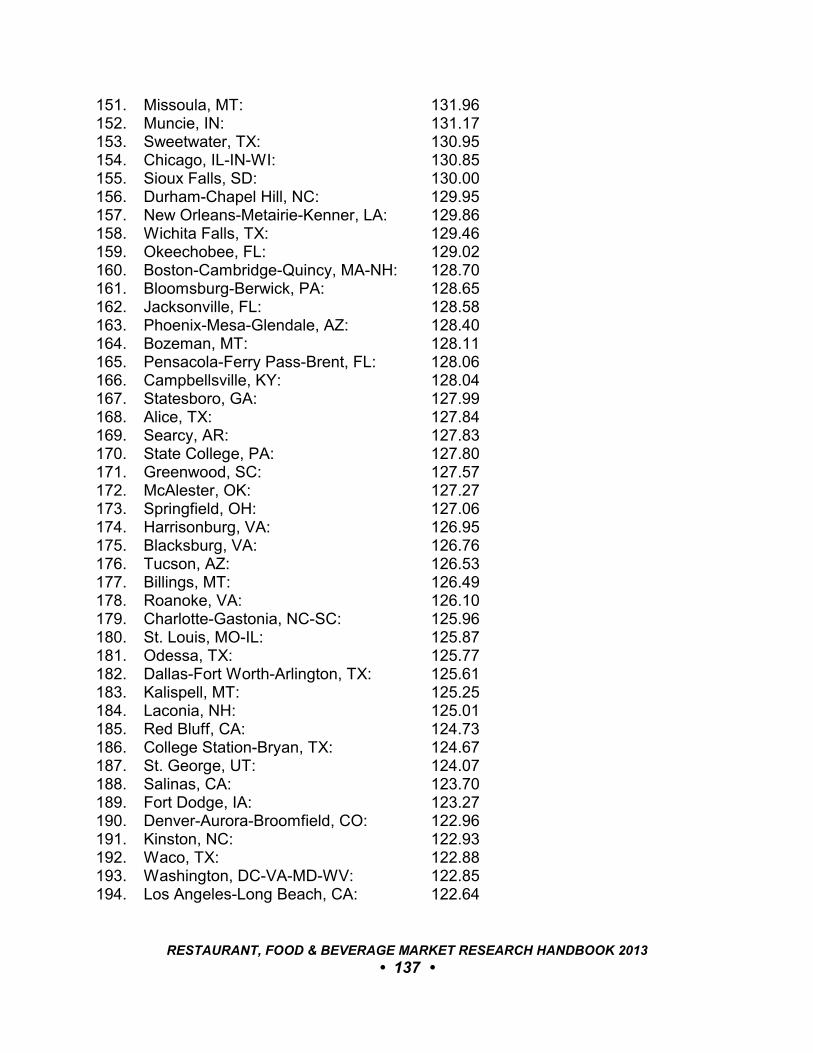
151. Missoula, MT: 131.96152. Muncie, IN: 131.17153. Sweetwater, TX: 130.95154. Chicago, IL-IN-WI: 130.85155. Sioux Falls, SD: 130.00156. Durham-Chapel Hill, NC: 129.95157. New Orleans-Metairie-Kenner, LA: 129.86158. Wichita Falls, TX: 129.46159. Okeechobee, FL: 129.02160. Boston-Cambridge-Quincy, MA-NH: 128.70161. Bloomsburg-Berwick, PA: 128.65162. Jacksonville, FL: 128.58163. Phoenix-Mesa-Glendale, AZ: 128.40164. Bozeman, MT: 128.11165. Pensacola-Ferry Pass-Brent, FL: 128.06166. Campbellsville, KY: 128.04167. Statesboro, GA: 127.99168. Alice, TX: 127.84169. Searcy, AR: 127.83170. State College, PA: 127.80171. Greenwood, SC: 127.57172. McAlester, OK: 127.27173. Springfield, OH: 127.06174. Harrisonburg, VA: 126.95175. Blacksburg, VA: 126.76176. Tucson, AZ: 126.53177. Billings, MT: 126.49178. Roanoke, VA: 126.10179. Charlotte-Gastonia, NC-SC: 125.96180. St. Louis, MO-IL: 125.87181. Odessa, TX: 125.77182. Dallas-Fort Worth-Arlington, TX: 125.61183. Kalispell, MT: 125.25184. Laconia, NH: 125.01185. Red Bluff, CA: 124.73186. College Station-Bryan, TX: 124.67187. St. George, UT: 124.07188. Salinas, CA: 123.70189. Fort Dodge, IA: 123.27190. Denver-Aurora-Broomfield, CO: 122.96191. Kinston, NC: 122.93192. Waco, TX: 122.88193. Washington, DC-VA-MD-WV: 122.85194. Los Angeles-Long Beach, CA: 122.64
RESTAURANT, FOOD & BEVERAGE MARKET RESEARCH HANDBOOK 2013
• 137 •
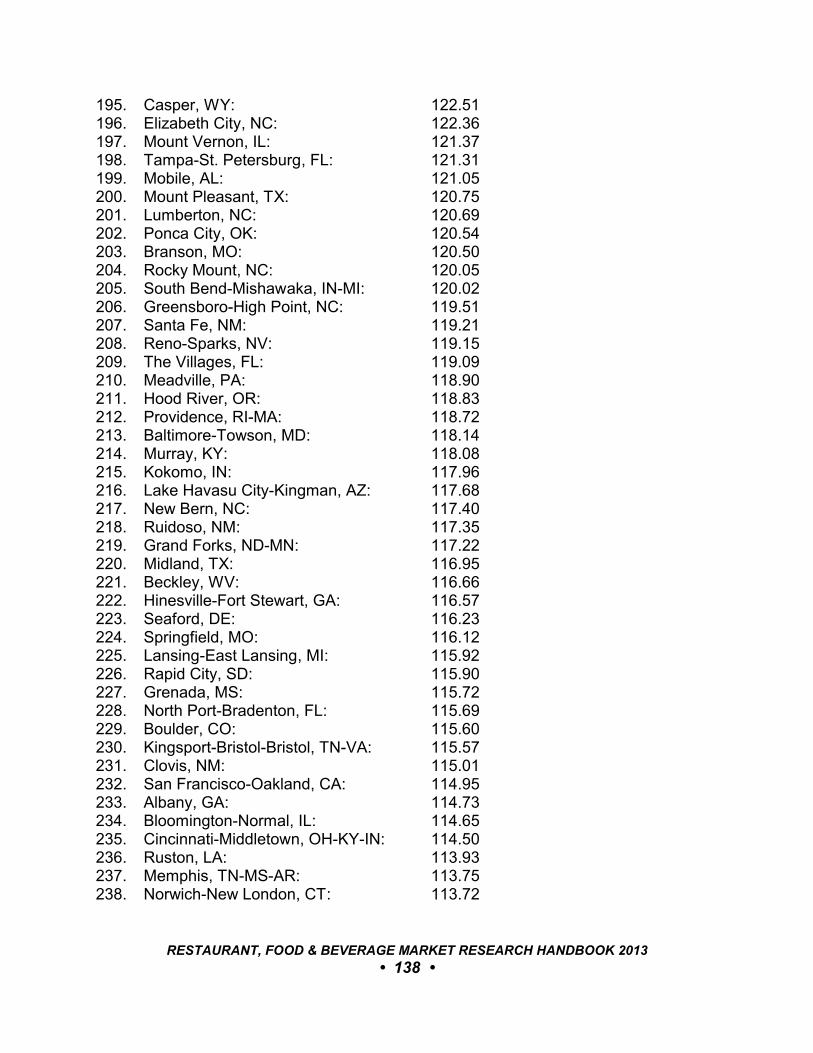
195. Casper, WY: 122.51196. Elizabeth City, NC: 122.36197. Mount Vernon, IL: 121.37198. Tampa-St. Petersburg, FL: 121.31199. Mobile, AL: 121.05200. Mount Pleasant, TX: 120.75201. Lumberton, NC: 120.69202. Ponca City, OK: 120.54203. Branson, MO: 120.50204. Rocky Mount, NC: 120.05205. South Bend-Mishawaka, IN-MI: 120.02206. Greensboro-High Point, NC: 119.51207. Santa Fe, NM: 119.21208. Reno-Sparks, NV: 119.15209. The Villages, FL: 119.09210. Meadville, PA: 118.90211. Hood River, OR: 118.83212. Providence, RI-MA: 118.72213. Baltimore-Towson, MD: 118.14214. Murray, KY: 118.08215. Kokomo, IN: 117.96216. Lake Havasu City-Kingman, AZ: 117.68217. New Bern, NC: 117.40218. Ruidoso, NM: 117.35219. Grand Forks, ND-MN: 117.22220. Midland, TX: 116.95221. Beckley, WV: 116.66222. Hinesville-Fort Stewart, GA: 116.57223. Seaford, DE: 116.23224. Springfield, MO: 116.12225. Lansing-East Lansing, MI: 115.92226. Rapid City, SD: 115.90227. Grenada, MS: 115.72228. North Port-Bradenton, FL: 115.69229. Boulder, CO: 115.60230. Kingsport-Bristol-Bristol, TN-VA: 115.57231. Clovis, NM: 115.01232. San Francisco-Oakland, CA: 114.95233. Albany, GA: 114.73234. Bloomington-Normal, IL: 114.65235. Cincinnati-Middletown, OH-KY-IN: 114.50236. Ruston, LA: 113.93237. Memphis, TN-MS-AR: 113.75238. Norwich-New London, CT: 113.72
RESTAURANT, FOOD & BEVERAGE MARKET RESEARCH HANDBOOK 2013
• 138 •

239. Wilson, NC: 113.71240. Portsmouth, OH: 113.64241. Cullman, AL: 113.57242. Virginia Beach, VA-NC: 113.48243. Asheville, NC: 113.01244. Austin-Round Rock-San Marcos, TX: 112.94245. Clarksburg, WV: 112.73246. Great Falls, MT: 112.44247. Mankato-North Mankato, MN: 111.95248. Brookhaven, MS: 111.83249. Athens, TN: 111.83250. Riverside, CA: 111.82251. Warner Robins, GA: 111.78252. LaGrange, GA: 111.61253. Bakersfield-Delano, CA: 111.59254. Salisbury, MD: 110.63255. Vincennes, IN: 110.51256. Bastrop, LA: 110.42257. Topeka, KS: 110.37258. Fort Collins-Loveland, CO: 110.23259. Vallejo-Fairfield, CA: 110.10260. Huntsville, AL: 109.90261. Bartlesville, OK: 109.85262. Greenville, NC: 109.80263. Madisonville, KY: 109.78264. Farmington, MO: 109.53265. Canton-Massillon, OH: 109.24266. Chillicothe, OH: 109.22267. Decatur, IL: 109.12268. Arkadelphia, AR: 109.07269. Tallahassee, FL: 109.06270. Batesville, AR: 108.99271. Defiance, OH: 108.93272. Pueblo, CO: 108.80273. St. Cloud, MN: 108.67274. Somerset, KY: 108.50275. Martinsville, VA: 108.47276. Lafayette, IN: 108.43277. Columbia, TN: 108.32278. Athens-Clarke County, GA: 107.72279. Jacksonville, IL: 107.69280. Lebanon, MO: 107.40281. Medford, OR: 107.38282. Amarillo, TX: 107.10
RESTAURANT, FOOD & BEVERAGE MARKET RESEARCH HANDBOOK 2013
• 139 •
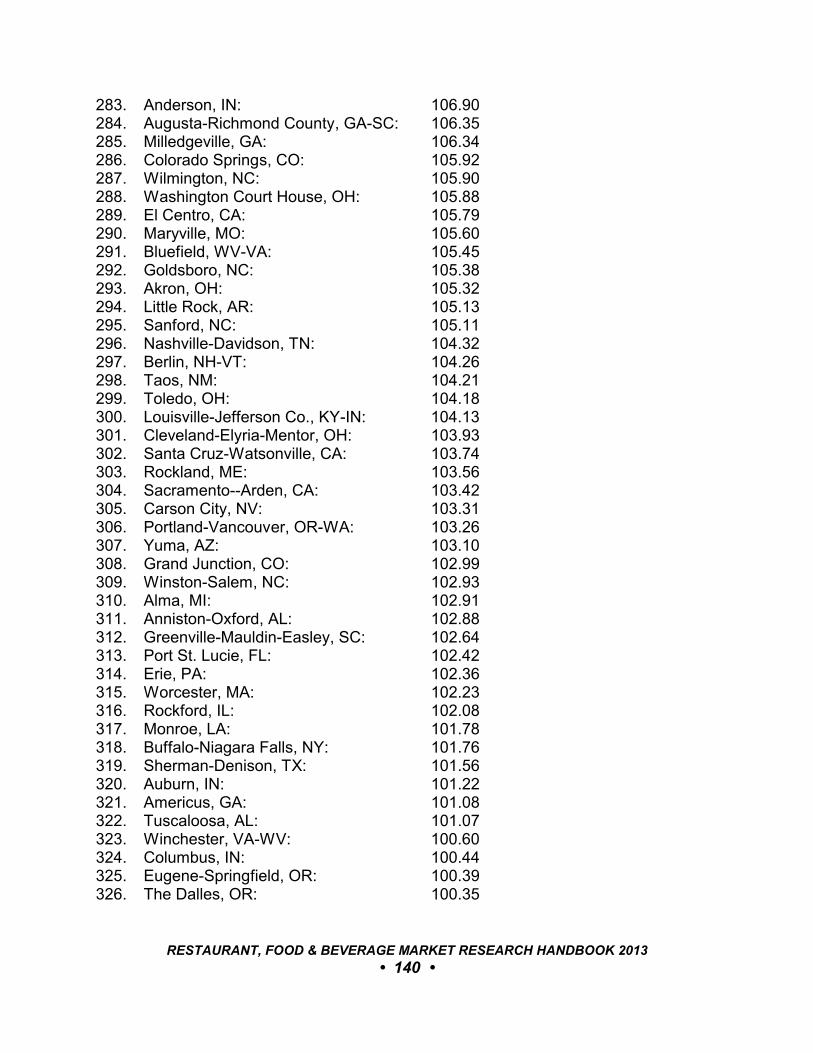
283. Anderson, IN: 106.90284. Augusta-Richmond County, GA-SC: 106.35285. Milledgeville, GA: 106.34286. Colorado Springs, CO: 105.92287. Wilmington, NC: 105.90288. Washington Court House, OH: 105.88289. El Centro, CA: 105.79290. Maryville, MO: 105.60291. Bluefield, WV-VA: 105.45292. Goldsboro, NC: 105.38293. Akron, OH: 105.32294. Little Rock, AR: 105.13295. Sanford, NC: 105.11296. Nashville-Davidson, TN: 104.32297. Berlin, NH-VT: 104.26298. Taos, NM: 104.21299. Toledo, OH: 104.18300. Louisville-Jefferson Co., KY-IN: 104.13301. Cleveland-Elyria-Mentor, OH: 103.93302. Santa Cruz-Watsonville, CA: 103.74303. Rockland, ME: 103.56304. Sacramento--Arden, CA: 103.42305. Carson City, NV: 103.31306. Portland-Vancouver, OR-WA: 103.26307. Yuma, AZ: 103.10308. Grand Junction, CO: 102.99309. Winston-Salem, NC: 102.93310. Alma, MI: 102.91311. Anniston-Oxford, AL: 102.88312. Greenville-Mauldin-Easley, SC: 102.64313. Port St. Lucie, FL: 102.42314. Erie, PA: 102.36315. Worcester, MA: 102.23316. Rockford, IL: 102.08317. Monroe, LA: 101.78318. Buffalo-Niagara Falls, NY: 101.76319. Sherman-Denison, TX: 101.56320. Auburn, IN: 101.22321. Americus, GA: 101.08322. Tuscaloosa, AL: 101.07323. Winchester, VA-WV: 100.60324. Columbus, IN: 100.44325. Eugene-Springfield, OR: 100.39326. The Dalles, OR: 100.35
RESTAURANT, FOOD & BEVERAGE MARKET RESEARCH HANDBOOK 2013
• 140 •
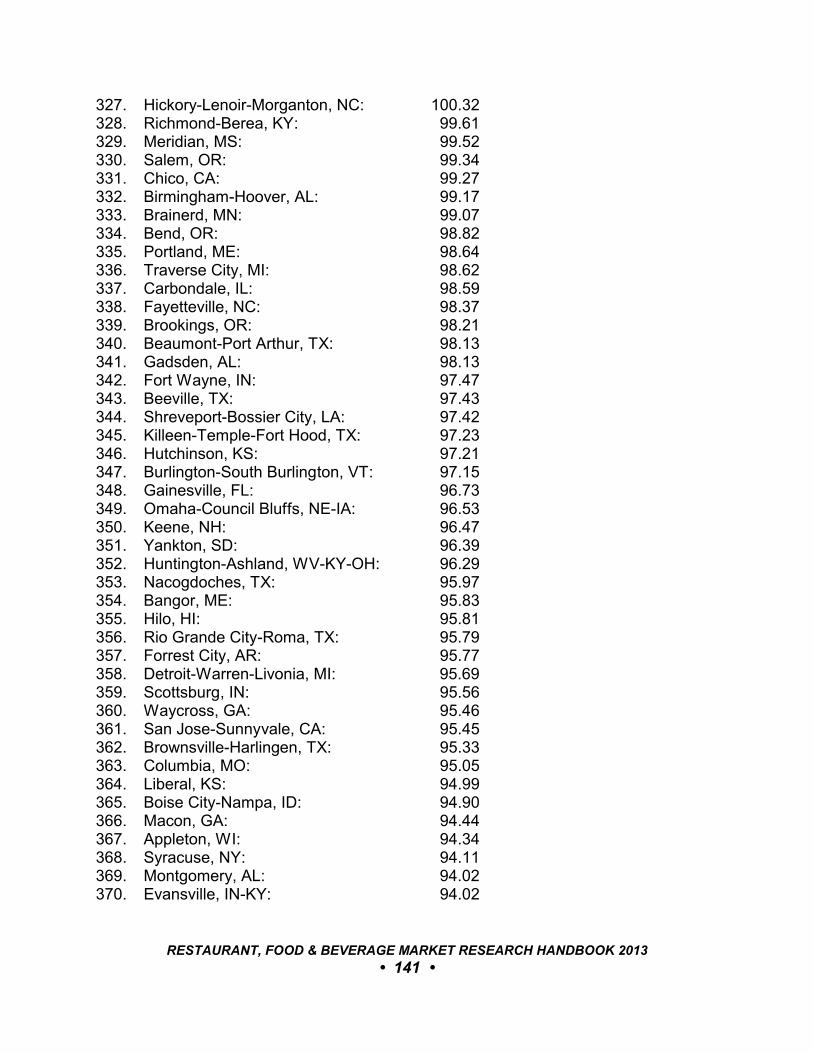
327. Hickory-Lenoir-Morganton, NC: 100.32328. Richmond-Berea, KY: 99.61329. Meridian, MS: 99.52330. Salem, OR: 99.34331. Chico, CA: 99.27332. Birmingham-Hoover, AL: 99.17333. Brainerd, MN: 99.07334. Bend, OR: 98.82335. Portland, ME: 98.64336. Traverse City, MI: 98.62337. Carbondale, IL: 98.59338. Fayetteville, NC: 98.37339. Brookings, OR: 98.21340. Beaumont-Port Arthur, TX: 98.13341. Gadsden, AL: 98.13342. Fort Wayne, IN: 97.47343. Beeville, TX: 97.43344. Shreveport-Bossier City, LA: 97.42345. Killeen-Temple-Fort Hood, TX: 97.23346. Hutchinson, KS: 97.21347. Burlington-South Burlington, VT: 97.15348. Gainesville, FL: 96.73349. Omaha-Council Bluffs, NE-IA: 96.53350. Keene, NH: 96.47351. Yankton, SD: 96.39352. Huntington-Ashland, WV-KY-OH: 96.29353. Nacogdoches, TX: 95.97354. Bangor, ME: 95.83355. Hilo, HI: 95.81356. Rio Grande City-Roma, TX: 95.79357. Forrest City, AR: 95.77358. Detroit-Warren-Livonia, MI: 95.69359. Scottsburg, IN: 95.56360. Waycross, GA: 95.46361. San Jose-Sunnyvale, CA: 95.45362. Brownsville-Harlingen, TX: 95.33363. Columbia, MO: 95.05364. Liberal, KS: 94.99365. Boise City-Nampa, ID: 94.90366. Macon, GA: 94.44367. Appleton, WI: 94.34368. Syracuse, NY: 94.11369. Montgomery, AL: 94.02370. Evansville, IN-KY: 94.02
RESTAURANT, FOOD & BEVERAGE MARKET RESEARCH HANDBOOK 2013
• 141 •
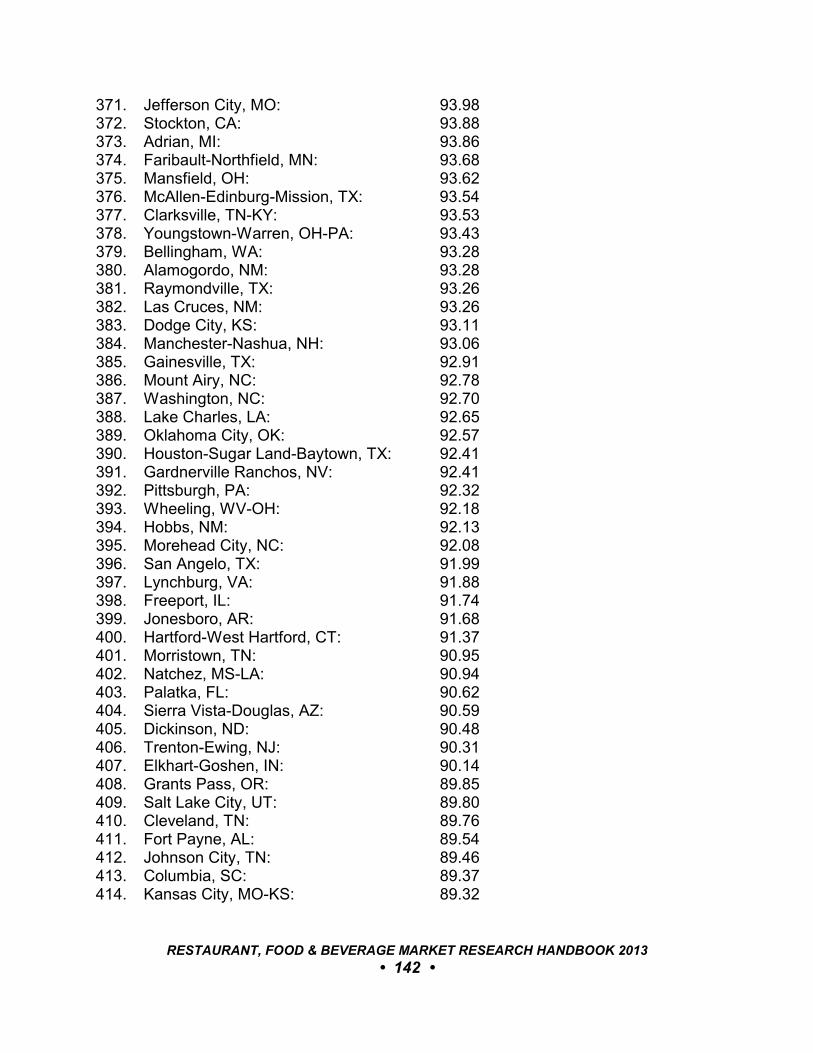
371. Jefferson City, MO: 93.98372. Stockton, CA: 93.88373. Adrian, MI: 93.86374. Faribault-Northfield, MN: 93.68375. Mansfield, OH: 93.62376. McAllen-Edinburg-Mission, TX: 93.54377. Clarksville, TN-KY: 93.53378. Youngstown-Warren, OH-PA: 93.43379. Bellingham, WA: 93.28380. Alamogordo, NM: 93.28381. Raymondville, TX: 93.26382. Las Cruces, NM: 93.26383. Dodge City, KS: 93.11384. Manchester-Nashua, NH: 93.06385. Gainesville, TX: 92.91386. Mount Airy, NC: 92.78387. Washington, NC: 92.70388. Lake Charles, LA: 92.65389. Oklahoma City, OK: 92.57390. Houston-Sugar Land-Baytown, TX: 92.41391. Gardnerville Ranchos, NV: 92.41392. Pittsburgh, PA: 92.32393. Wheeling, WV-OH: 92.18394. Hobbs, NM: 92.13395. Morehead City, NC: 92.08396. San Angelo, TX: 91.99397. Lynchburg, VA: 91.88398. Freeport, IL: 91.74399. Jonesboro, AR: 91.68400. Hartford-West Hartford, CT: 91.37401. Morristown, TN: 90.95402. Natchez, MS-LA: 90.94403. Palatka, FL: 90.62404. Sierra Vista-Douglas, AZ: 90.59405. Dickinson, ND: 90.48406. Trenton-Ewing, NJ: 90.31407. Elkhart-Goshen, IN: 90.14408. Grants Pass, OR: 89.85409. Salt Lake City, UT: 89.80410. Cleveland, TN: 89.76411. Fort Payne, AL: 89.54412. Johnson City, TN: 89.46413. Columbia, SC: 89.37414. Kansas City, MO-KS: 89.32
RESTAURANT, FOOD & BEVERAGE MARKET RESEARCH HANDBOOK 2013
• 142 •
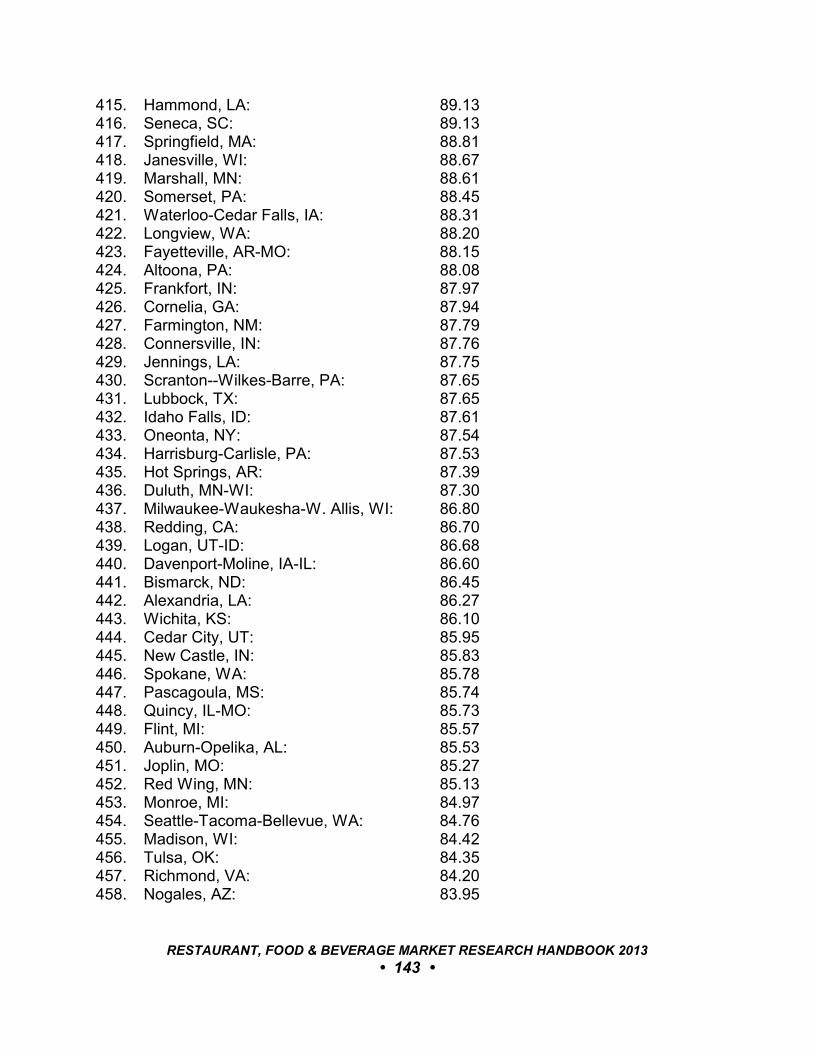
415. Hammond, LA: 89.13416. Seneca, SC: 89.13417. Springfield, MA: 88.81418. Janesville, WI: 88.67419. Marshall, MN: 88.61420. Somerset, PA: 88.45421. Waterloo-Cedar Falls, IA: 88.31422. Longview, WA: 88.20423. Fayetteville, AR-MO: 88.15424. Altoona, PA: 88.08425. Frankfort, IN: 87.97426. Cornelia, GA: 87.94427. Farmington, NM: 87.79428. Connersville, IN: 87.76429. Jennings, LA: 87.75430. Scranton--Wilkes-Barre, PA: 87.65431. Lubbock, TX: 87.65432. Idaho Falls, ID: 87.61433. Oneonta, NY: 87.54434. Harrisburg-Carlisle, PA: 87.53435. Hot Springs, AR: 87.39436. Duluth, MN-WI: 87.30437. Milwaukee-Waukesha-W. Allis, WI: 86.80438. Redding, CA: 86.70439. Logan, UT-ID: 86.68440. Davenport-Moline, IA-IL: 86.60441. Bismarck, ND: 86.45442. Alexandria, LA: 86.27443. Wichita, KS: 86.10444. Cedar City, UT: 85.95445. New Castle, IN: 85.83446. Spokane, WA: 85.78447. Pascagoula, MS: 85.74448. Quincy, IL-MO: 85.73449. Flint, MI: 85.57450. Auburn-Opelika, AL: 85.53451. Joplin, MO: 85.27452. Red Wing, MN: 85.13453. Monroe, MI: 84.97454. Seattle-Tacoma-Bellevue, WA: 84.76455. Madison, WI: 84.42456. Tulsa, OK: 84.35457. Richmond, VA: 84.20458. Nogales, AZ: 83.95
RESTAURANT, FOOD & BEVERAGE MARKET RESEARCH HANDBOOK 2013
• 143 •

459. Pittsfield, MA: 83.64460. Vineland-Millville-Bridgeton, NJ: 83.51461. San Luis Obispo-Paso Robles, CA: 83.33462. Brookings, SD: 83.31463. Fairbanks, AK: 83.26464. Lakeland-Winter Haven, FL: 83.06465. Fremont, NE: 82.48466. Greensburg, IN: 82.27467. Stevens Point, WI: 82.21468. Pierre, SD: 82.19469. Florence, SC: 82.07470. Andrews, TX: 81.98471. Fresno, CA: 81.69472. Cortland, NY: 81.57473. Binghamton, NY: 81.45474. Watertown-Fort Drum, NY: 81.40475. Dyersburg, TN: 81.21476. Bainbridge, GA: 80.75477. Sebastian-Vero Beach, FL: 80.66478. Muskegon-Norton Shores, MI: 80.60479. Uvalde, TX: 80.59480. Glasgow, KY: 80.59481. Ann Arbor, MI: 80.34482. North Platte, NE: 80.26483. Ames, IA: 80.12484. Grand Rapids-Wyoming, MI: 80.12485. Merced, CA: 80.08486. Salisbury, NC: 79.91487. Dublin, GA: 79.90488. Kirksville, MO: 79.86489. Sidney, OH: 79.55490. Laurel, MS: 79.42491. Kennewick-Pasco-Richland, WA: 79.32492. Mount Pleasant, MI: 79.26493. Corvallis, OR: 79.09494. Dothan, AL: 79.00495. Lake City, FL: 78.72496. Iron Mountain, MI-WI: 78.67497. Lawrence, KS: 78.55498. Greenville, MS: 78.42499. Salina, KS: 78.37500. Brenham, TX: 78.35501. Ellensburg, WA: 78.35502. Hagerstown-Martinsburg, MD-WV: 78.32
RESTAURANT, FOOD & BEVERAGE MARKET RESEARCH HANDBOOK 2013
• 144 •
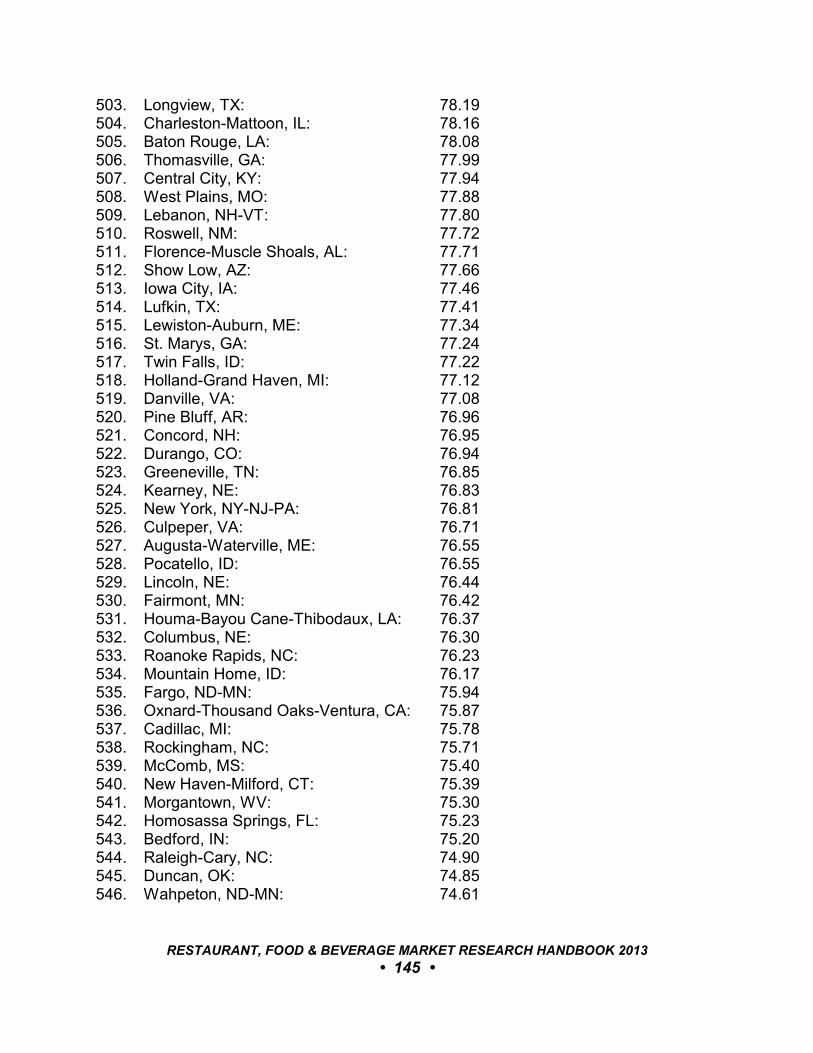
503. Longview, TX: 78.19504. Charleston-Mattoon, IL: 78.16505. Baton Rouge, LA: 78.08506. Thomasville, GA: 77.99507. Central City, KY: 77.94508. West Plains, MO: 77.88509. Lebanon, NH-VT: 77.80510. Roswell, NM: 77.72511. Florence-Muscle Shoals, AL: 77.71512. Show Low, AZ: 77.66513. Iowa City, IA: 77.46514. Lufkin, TX: 77.41515. Lewiston-Auburn, ME: 77.34516. St. Marys, GA: 77.24517. Twin Falls, ID: 77.22518. Holland-Grand Haven, MI: 77.12519. Danville, VA: 77.08520. Pine Bluff, AR: 76.96521. Concord, NH: 76.95522. Durango, CO: 76.94523. Greeneville, TN: 76.85524. Kearney, NE: 76.83525. New York, NY-NJ-PA: 76.81526. Culpeper, VA: 76.71527. Augusta-Waterville, ME: 76.55528. Pocatello, ID: 76.55529. Lincoln, NE: 76.44530. Fairmont, MN: 76.42531. Houma-Bayou Cane-Thibodaux, LA: 76.37532. Columbus, NE: 76.30533. Roanoke Rapids, NC: 76.23534. Mountain Home, ID: 76.17535. Fargo, ND-MN: 75.94536. Oxnard-Thousand Oaks-Ventura, CA: 75.87537. Cadillac, MI: 75.78538. Rockingham, NC: 75.71539. McComb, MS: 75.40540. New Haven-Milford, CT: 75.39541. Morgantown, WV: 75.30542. Homosassa Springs, FL: 75.23543. Bedford, IN: 75.20544. Raleigh-Cary, NC: 74.90545. Duncan, OK: 74.85546. Wahpeton, ND-MN: 74.61
RESTAURANT, FOOD & BEVERAGE MARKET RESEARCH HANDBOOK 2013
• 145 •
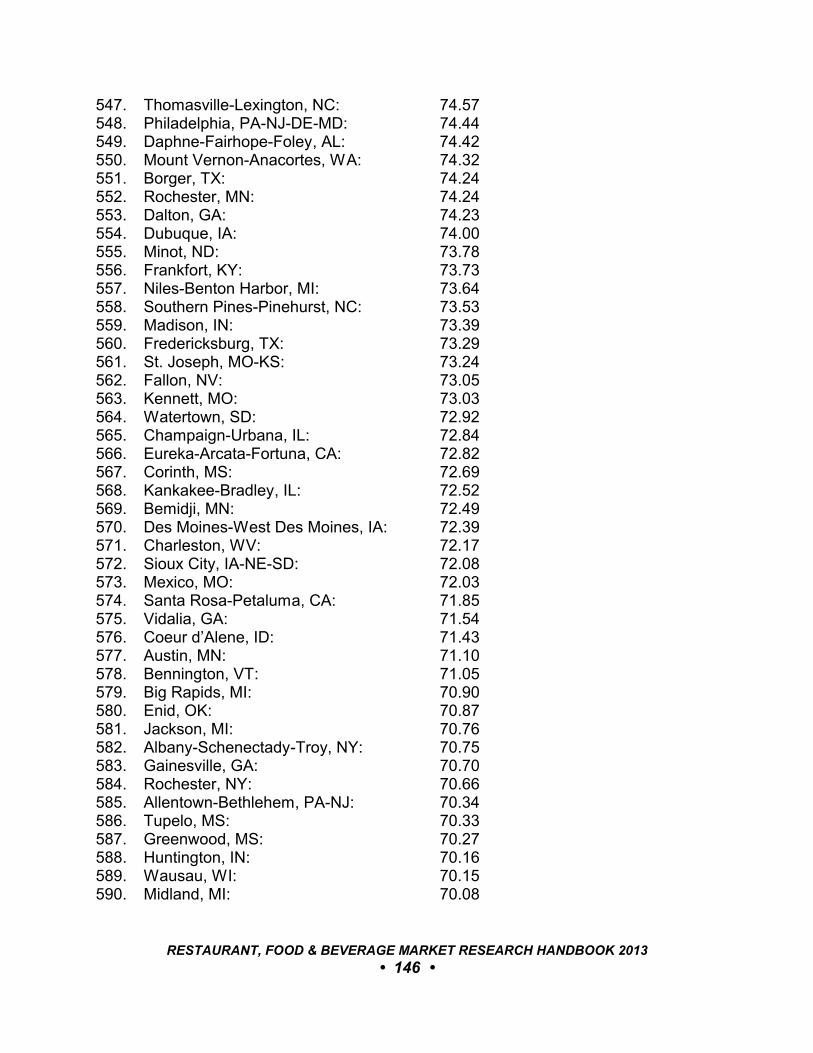
547. Thomasville-Lexington, NC: 74.57548. Philadelphia, PA-NJ-DE-MD: 74.44549. Daphne-Fairhope-Foley, AL: 74.42550. Mount Vernon-Anacortes, WA: 74.32551. Borger, TX: 74.24552. Rochester, MN: 74.24553. Dalton, GA: 74.23554. Dubuque, IA: 74.00555. Minot, ND: 73.78556. Frankfort, KY: 73.73557. Niles-Benton Harbor, MI: 73.64558. Southern Pines-Pinehurst, NC: 73.53559. Madison, IN: 73.39560. Fredericksburg, TX: 73.29561. St. Joseph, MO-KS: 73.24562. Fallon, NV: 73.05563. Kennett, MO: 73.03564. Watertown, SD: 72.92565. Champaign-Urbana, IL: 72.84566. Eureka-Arcata-Fortuna, CA: 72.82567. Corinth, MS: 72.69568. Kankakee-Bradley, IL: 72.52569. Bemidji, MN: 72.49570. Des Moines-West Des Moines, IA: 72.39571. Charleston, WV: 72.17572. Sioux City, IA-NE-SD: 72.08573. Mexico, MO: 72.03574. Santa Rosa-Petaluma, CA: 71.85575. Vidalia, GA: 71.54576. Coeur d’Alene, ID: 71.43577. Austin, MN: 71.10578. Bennington, VT: 71.05579. Big Rapids, MI: 70.90580. Enid, OK: 70.87581. Jackson, MI: 70.76582. Albany-Schenectady-Troy, NY: 70.75583. Gainesville, GA: 70.70584. Rochester, NY: 70.66585. Allentown-Bethlehem, PA-NJ: 70.34586. Tupelo, MS: 70.33587. Greenwood, MS: 70.27588. Huntington, IN: 70.16589. Wausau, WI: 70.15590. Midland, MI: 70.08
RESTAURANT, FOOD & BEVERAGE MARKET RESEARCH HANDBOOK 2013
• 146 •
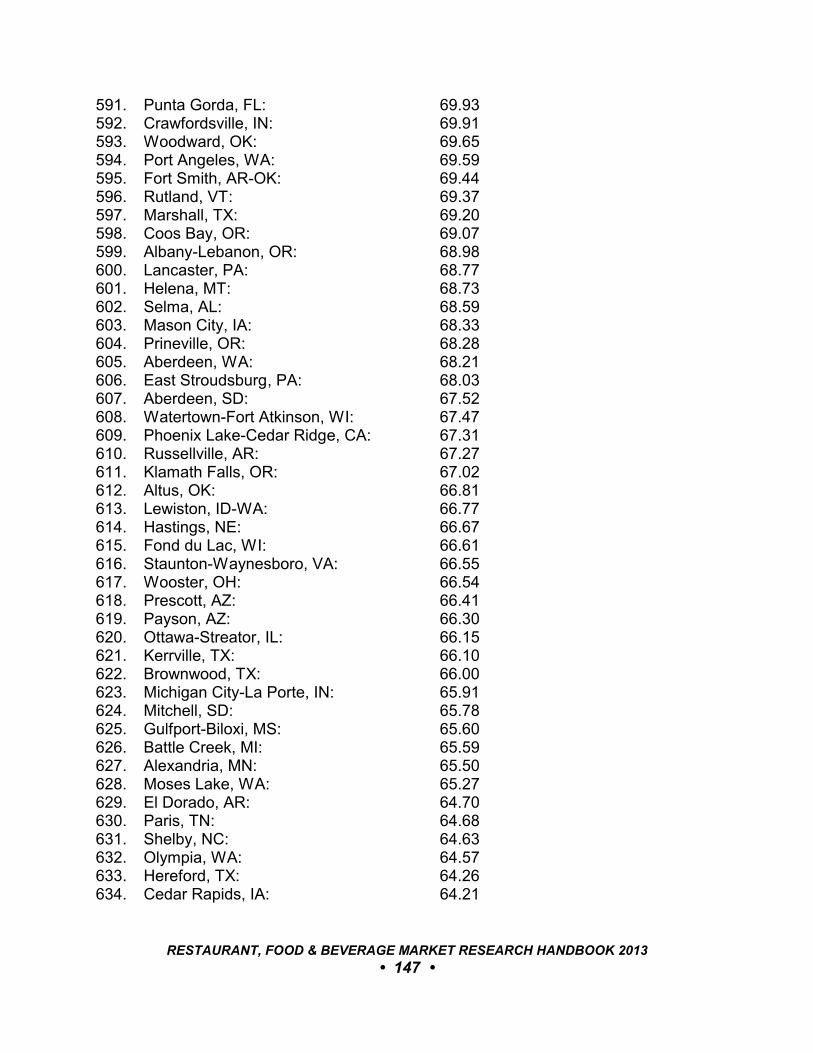
591. Punta Gorda, FL: 69.93592. Crawfordsville, IN: 69.91593. Woodward, OK: 69.65594. Port Angeles, WA: 69.59595. Fort Smith, AR-OK: 69.44596. Rutland, VT: 69.37597. Marshall, TX: 69.20598. Coos Bay, OR: 69.07599. Albany-Lebanon, OR: 68.98600. Lancaster, PA: 68.77601. Helena, MT: 68.73602. Selma, AL: 68.59603. Mason City, IA: 68.33604. Prineville, OR: 68.28605. Aberdeen, WA: 68.21606. East Stroudsburg, PA: 68.03607. Aberdeen, SD: 67.52608. Watertown-Fort Atkinson, WI: 67.47609. Phoenix Lake-Cedar Ridge, CA: 67.31610. Russellville, AR: 67.27611. Klamath Falls, OR: 67.02612. Altus, OK: 66.81613. Lewiston, ID-WA: 66.77614. Hastings, NE: 66.67615. Fond du Lac, WI: 66.61616. Staunton-Waynesboro, VA: 66.55617. Wooster, OH: 66.54618. Prescott, AZ: 66.41619. Payson, AZ: 66.30620. Ottawa-Streator, IL: 66.15621. Kerrville, TX: 66.10622. Brownwood, TX: 66.00623. Michigan City-La Porte, IN: 65.91624. Mitchell, SD: 65.78625. Gulfport-Biloxi, MS: 65.60626. Battle Creek, MI: 65.59627. Alexandria, MN: 65.50628. Moses Lake, WA: 65.27629. El Dorado, AR: 64.70630. Paris, TN: 64.68631. Shelby, NC: 64.63632. Olympia, WA: 64.57633. Hereford, TX: 64.26634. Cedar Rapids, IA: 64.21
RESTAURANT, FOOD & BEVERAGE MARKET RESEARCH HANDBOOK 2013
• 147 •
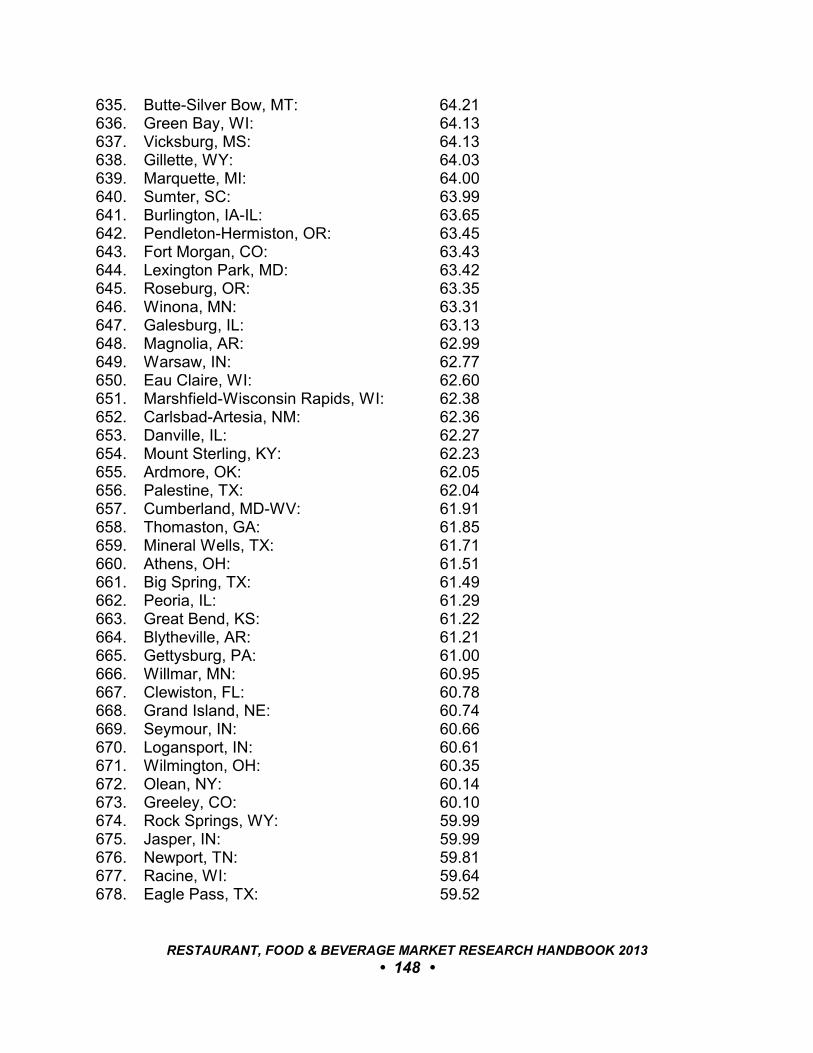
635. Butte-Silver Bow, MT: 64.21636. Green Bay, WI: 64.13637. Vicksburg, MS: 64.13638. Gillette, WY: 64.03639. Marquette, MI: 64.00640. Sumter, SC: 63.99641. Burlington, IA-IL: 63.65642. Pendleton-Hermiston, OR: 63.45643. Fort Morgan, CO: 63.43644. Lexington Park, MD: 63.42645. Roseburg, OR: 63.35646. Winona, MN: 63.31647. Galesburg, IL: 63.13648. Magnolia, AR: 62.99649. Warsaw, IN: 62.77650. Eau Claire, WI: 62.60651. Marshfield-Wisconsin Rapids, WI: 62.38652. Carlsbad-Artesia, NM: 62.36653. Danville, IL: 62.27654. Mount Sterling, KY: 62.23655. Ardmore, OK: 62.05656. Palestine, TX: 62.04657. Cumberland, MD-WV: 61.91658. Thomaston, GA: 61.85659. Mineral Wells, TX: 61.71660. Athens, OH: 61.51661. Big Spring, TX: 61.49662. Peoria, IL: 61.29663. Great Bend, KS: 61.22664. Blytheville, AR: 61.21665. Gettysburg, PA: 61.00666. Willmar, MN: 60.95667. Clewiston, FL: 60.78668. Grand Island, NE: 60.74669. Seymour, IN: 60.66670. Logansport, IN: 60.61671. Wilmington, OH: 60.35672. Olean, NY: 60.14673. Greeley, CO: 60.10674. Rock Springs, WY: 59.99675. Jasper, IN: 59.99676. Newport, TN: 59.81677. Racine, WI: 59.64678. Eagle Pass, TX: 59.52
RESTAURANT, FOOD & BEVERAGE MARKET RESEARCH HANDBOOK 2013
• 148 •
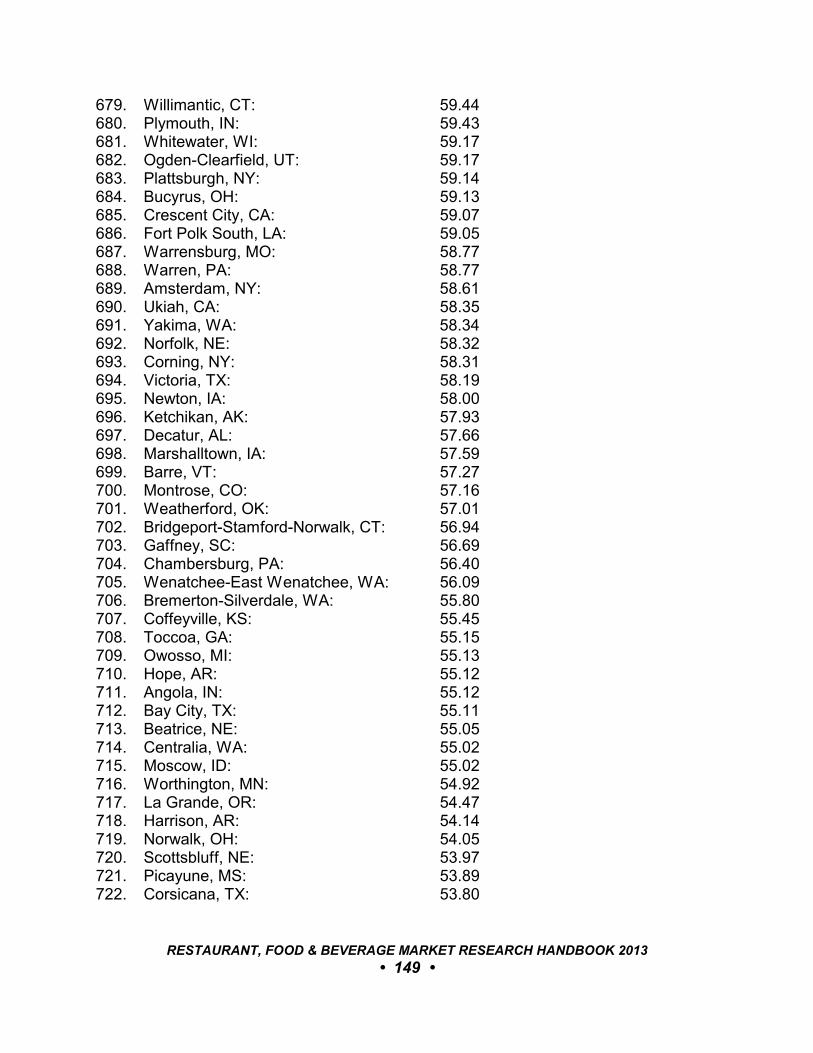
679. Willimantic, CT: 59.44680. Plymouth, IN: 59.43681. Whitewater, WI: 59.17682. Ogden-Clearfield, UT: 59.17683. Plattsburgh, NY: 59.14684. Bucyrus, OH: 59.13685. Crescent City, CA: 59.07686. Fort Polk South, LA: 59.05687. Warrensburg, MO: 58.77688. Warren, PA: 58.77689. Amsterdam, NY: 58.61690. Ukiah, CA: 58.35691. Yakima, WA: 58.34692. Norfolk, NE: 58.32693. Corning, NY: 58.31694. Victoria, TX: 58.19695. Newton, IA: 58.00696. Ketchikan, AK: 57.93697. Decatur, AL: 57.66698. Marshalltown, IA: 57.59699. Barre, VT: 57.27700. Montrose, CO: 57.16701. Weatherford, OK: 57.01702. Bridgeport-Stamford-Norwalk, CT: 56.94703. Gaffney, SC: 56.69704. Chambersburg, PA: 56.40705. Wenatchee-East Wenatchee, WA: 56.09706. Bremerton-Silverdale, WA: 55.80707. Coffeyville, KS: 55.45708. Toccoa, GA: 55.15709. Owosso, MI: 55.13710. Hope, AR: 55.12711. Angola, IN: 55.12712. Bay City, TX: 55.11713. Beatrice, NE: 55.05714. Centralia, WA: 55.02715. Moscow, ID: 55.02716. Worthington, MN: 54.92717. La Grande, OR: 54.47718. Harrison, AR: 54.14719. Norwalk, OH: 54.05720. Scottsbluff, NE: 53.97721. Picayune, MS: 53.89722. Corsicana, TX: 53.80
RESTAURANT, FOOD & BEVERAGE MARKET RESEARCH HANDBOOK 2013
• 149 •
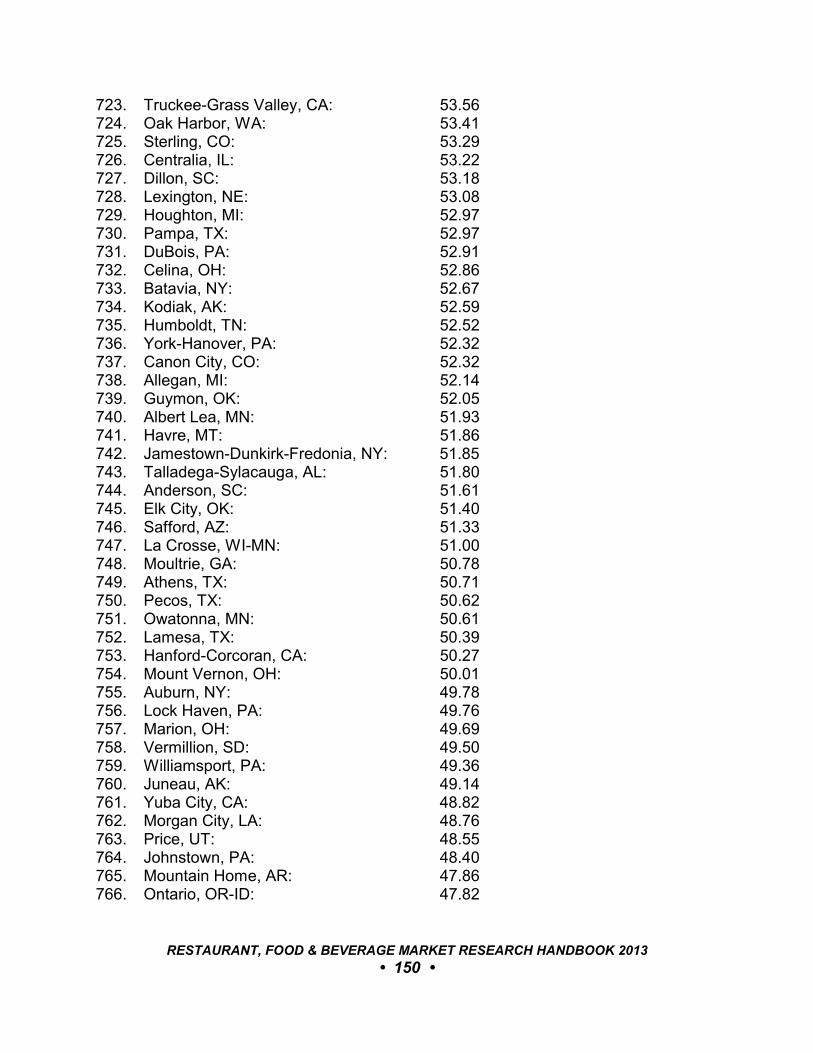
723. Truckee-Grass Valley, CA: 53.56724. Oak Harbor, WA: 53.41725. Sterling, CO: 53.29726. Centralia, IL: 53.22727. Dillon, SC: 53.18728. Lexington, NE: 53.08729. Houghton, MI: 52.97730. Pampa, TX: 52.97731. DuBois, PA: 52.91732. Celina, OH: 52.86733. Batavia, NY: 52.67734. Kodiak, AK: 52.59735. Humboldt, TN: 52.52736. York-Hanover, PA: 52.32737. Canon City, CO: 52.32738. Allegan, MI: 52.14739. Guymon, OK: 52.05740. Albert Lea, MN: 51.93741. Havre, MT: 51.86742. Jamestown-Dunkirk-Fredonia, NY: 51.85743. Talladega-Sylacauga, AL: 51.80744. Anderson, SC: 51.61745. Elk City, OK: 51.40746. Safford, AZ: 51.33747. La Crosse, WI-MN: 51.00748. Moultrie, GA: 50.78749. Athens, TX: 50.71750. Pecos, TX: 50.62751. Owatonna, MN: 50.61752. Lamesa, TX: 50.39753. Hanford-Corcoran, CA: 50.27754. Mount Vernon, OH: 50.01755. Auburn, NY: 49.78756. Lock Haven, PA: 49.76757. Marion, OH: 49.69758. Vermillion, SD: 49.50759. Williamsport, PA: 49.36760. Juneau, AK: 49.14761. Yuba City, CA: 48.82762. Morgan City, LA: 48.76763. Price, UT: 48.55764. Johnstown, PA: 48.40765. Mountain Home, AR: 47.86766. Ontario, OR-ID: 47.82
RESTAURANT, FOOD & BEVERAGE MARKET RESEARCH HANDBOOK 2013
• 150 •
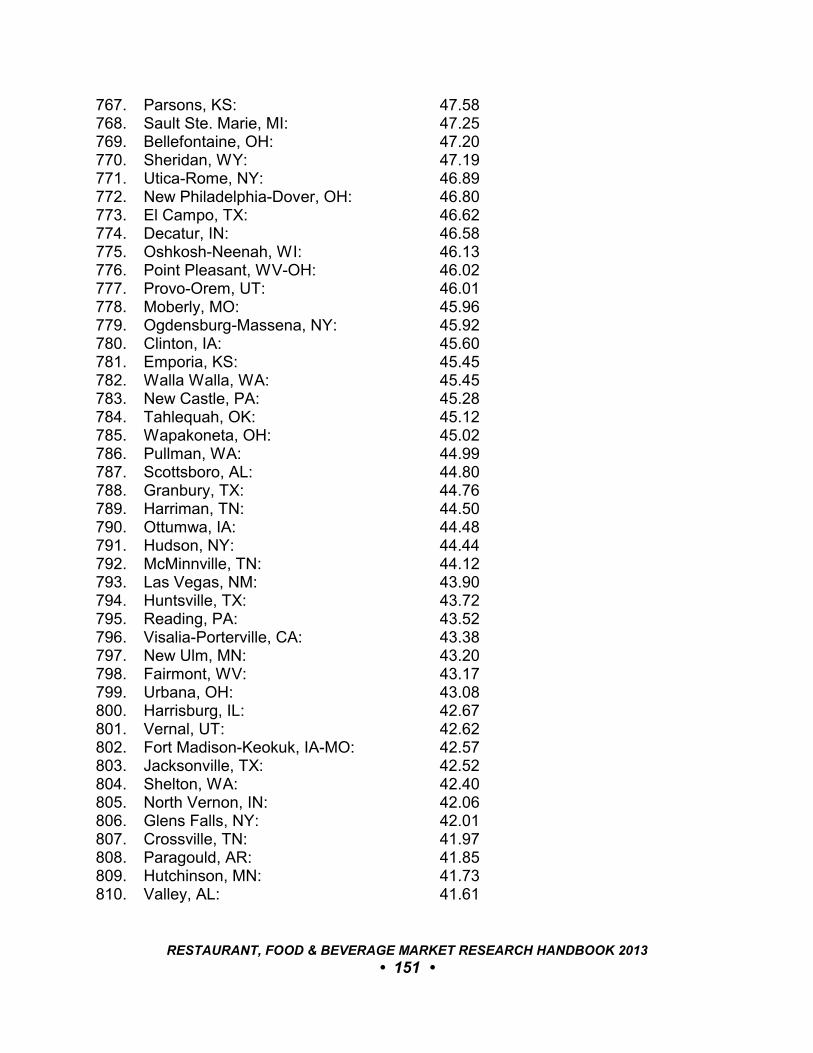
767. Parsons, KS: 47.58768. Sault Ste. Marie, MI: 47.25769. Bellefontaine, OH: 47.20770. Sheridan, WY: 47.19771. Utica-Rome, NY: 46.89772. New Philadelphia-Dover, OH: 46.80773. El Campo, TX: 46.62774. Decatur, IN: 46.58775. Oshkosh-Neenah, WI: 46.13776. Point Pleasant, WV-OH: 46.02777. Provo-Orem, UT: 46.01778. Moberly, MO: 45.96779. Ogdensburg-Massena, NY: 45.92780. Clinton, IA: 45.60781. Emporia, KS: 45.45782. Walla Walla, WA: 45.45783. New Castle, PA: 45.28784. Tahlequah, OK: 45.12785. Wapakoneta, OH: 45.02786. Pullman, WA: 44.99787. Scottsboro, AL: 44.80788. Granbury, TX: 44.76789. Harriman, TN: 44.50790. Ottumwa, IA: 44.48791. Hudson, NY: 44.44792. McMinnville, TN: 44.12793. Las Vegas, NM: 43.90794. Huntsville, TX: 43.72795. Reading, PA: 43.52796. Visalia-Porterville, CA: 43.38797. New Ulm, MN: 43.20798. Fairmont, WV: 43.17799. Urbana, OH: 43.08800. Harrisburg, IL: 42.67801. Vernal, UT: 42.62802. Fort Madison-Keokuk, IA-MO: 42.57803. Jacksonville, TX: 42.52804. Shelton, WA: 42.40805. North Vernon, IN: 42.06806. Glens Falls, NY: 42.01807. Crossville, TN: 41.97808. Paragould, AR: 41.85809. Hutchinson, MN: 41.73810. Valley, AL: 41.61
RESTAURANT, FOOD & BEVERAGE MARKET RESEARCH HANDBOOK 2013
• 151 •
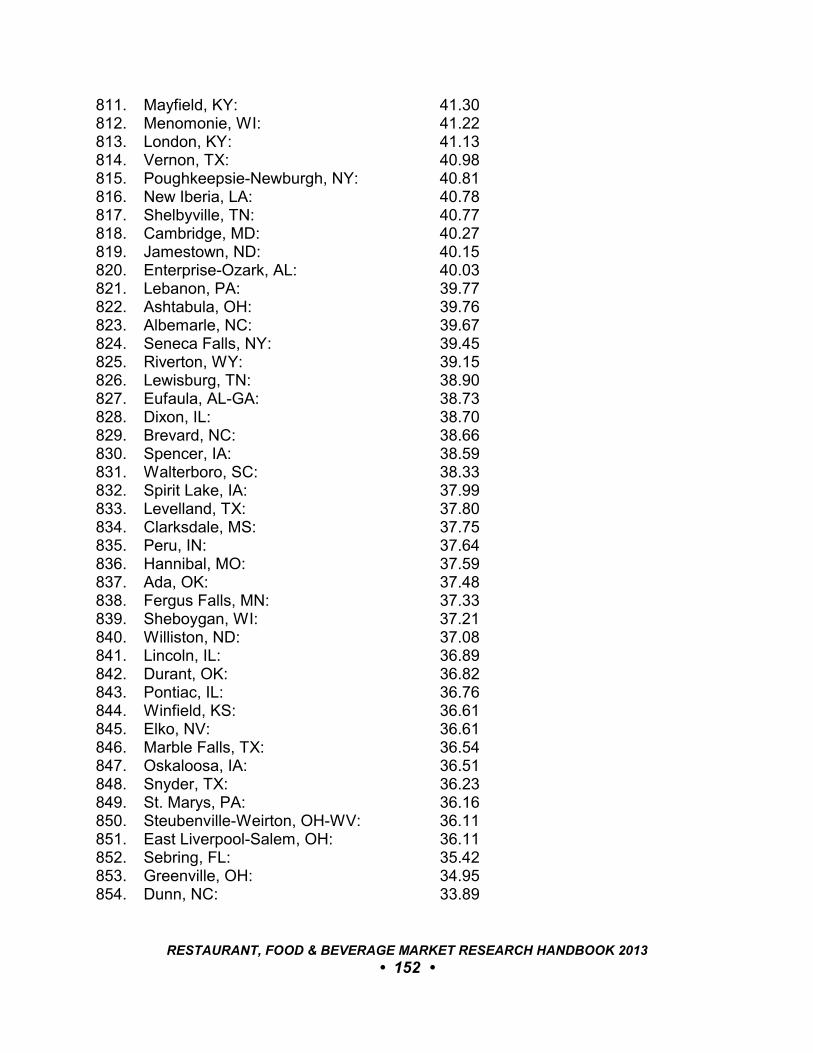
811. Mayfield, KY: 41.30812. Menomonie, WI: 41.22813. London, KY: 41.13814. Vernon, TX: 40.98815. Poughkeepsie-Newburgh, NY: 40.81816. New Iberia, LA: 40.78817. Shelbyville, TN: 40.77818. Cambridge, MD: 40.27819. Jamestown, ND: 40.15820. Enterprise-Ozark, AL: 40.03821. Lebanon, PA: 39.77822. Ashtabula, OH: 39.76823. Albemarle, NC: 39.67824. Seneca Falls, NY: 39.45825. Riverton, WY: 39.15826. Lewisburg, TN: 38.90827. Eufaula, AL-GA: 38.73828. Dixon, IL: 38.70829. Brevard, NC: 38.66830. Spencer, IA: 38.59831. Walterboro, SC: 38.33832. Spirit Lake, IA: 37.99833. Levelland, TX: 37.80834. Clarksdale, MS: 37.75835. Peru, IN: 37.64836. Hannibal, MO: 37.59837. Ada, OK: 37.48838. Fergus Falls, MN: 37.33839. Sheboygan, WI: 37.21840. Williston, ND: 37.08841. Lincoln, IL: 36.89842. Durant, OK: 36.82843. Pontiac, IL: 36.76844. Winfield, KS: 36.61845. Elko, NV: 36.61846. Marble Falls, TX: 36.54847. Oskaloosa, IA: 36.51848. Snyder, TX: 36.23849. St. Marys, PA: 36.16850. Steubenville-Weirton, OH-WV: 36.11851. East Liverpool-Salem, OH: 36.11852. Sebring, FL: 35.42853. Greenville, OH: 34.95854. Dunn, NC: 33.89
RESTAURANT, FOOD & BEVERAGE MARKET RESEARCH HANDBOOK 2013
• 152 •
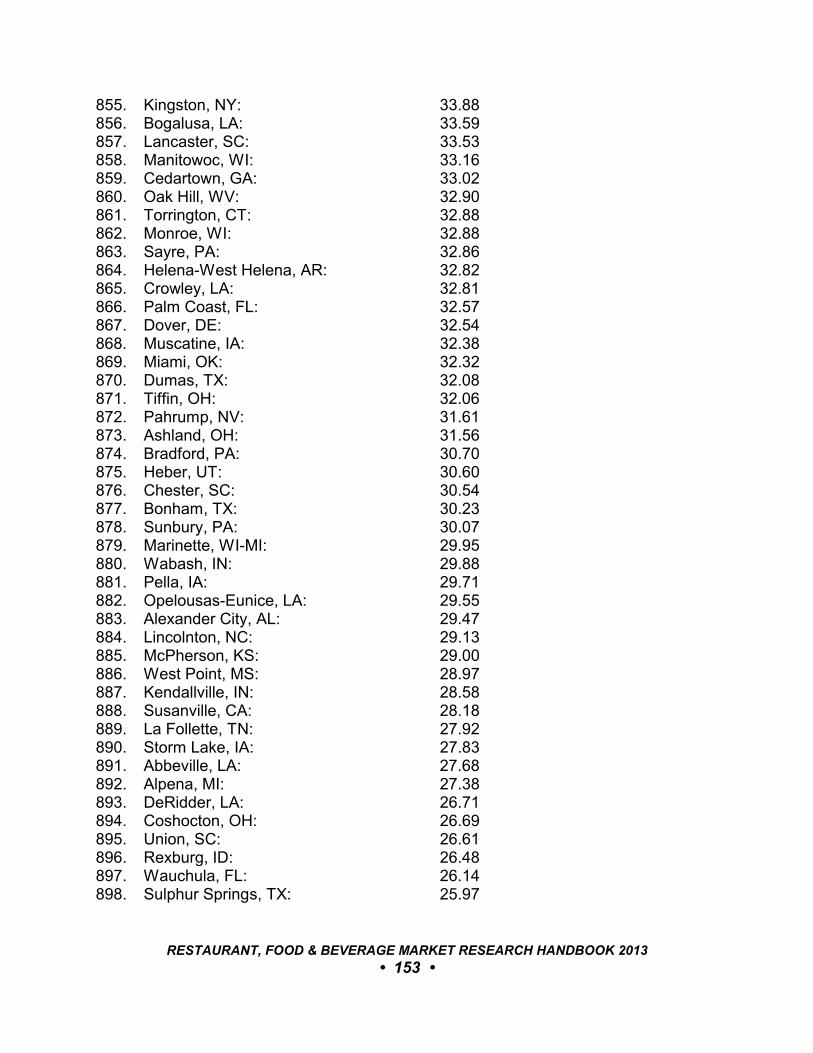
855. Kingston, NY: 33.88856. Bogalusa, LA: 33.59857. Lancaster, SC: 33.53858. Manitowoc, WI: 33.16859. Cedartown, GA: 33.02860. Oak Hill, WV: 32.90861. Torrington, CT: 32.88862. Monroe, WI: 32.88863. Sayre, PA: 32.86864. Helena-West Helena, AR: 32.82865. Crowley, LA: 32.81866. Palm Coast, FL: 32.57867. Dover, DE: 32.54868. Muscatine, IA: 32.38869. Miami, OK: 32.32870. Dumas, TX: 32.08871. Tiffin, OH: 32.06872. Pahrump, NV: 31.61873. Ashland, OH: 31.56874. Bradford, PA: 30.70875. Heber, UT: 30.60876. Chester, SC: 30.54877. Bonham, TX: 30.23878. Sunbury, PA: 30.07879. Marinette, WI-MI: 29.95880. Wabash, IN: 29.88881. Pella, IA: 29.71882. Opelousas-Eunice, LA: 29.55883. Alexander City, AL: 29.47884. Lincolnton, NC: 29.13885. McPherson, KS: 29.00886. West Point, MS: 28.97887. Kendallville, IN: 28.58888. Susanville, CA: 28.18889. La Follette, TN: 27.92890. Storm Lake, IA: 27.83891. Abbeville, LA: 27.68892. Alpena, MI: 27.38893. DeRidder, LA: 26.71894. Coshocton, OH: 26.69895. Union, SC: 26.61896. Rexburg, ID: 26.48897. Wauchula, FL: 26.14898. Sulphur Springs, TX: 25.97
RESTAURANT, FOOD & BEVERAGE MARKET RESEARCH HANDBOOK 2013
• 153 •
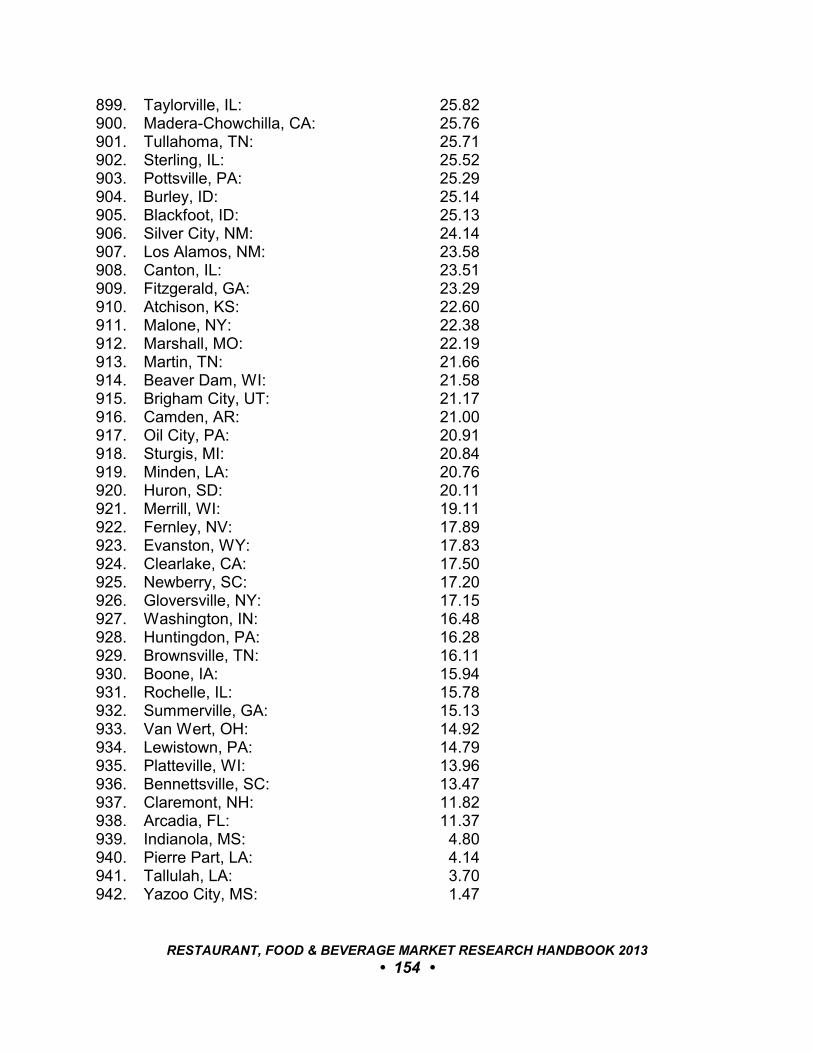
899. Taylorville, IL: 25.82900. Madera-Chowchilla, CA: 25.76901. Tullahoma, TN: 25.71902. Sterling, IL: 25.52903. Pottsville, PA: 25.29904. Burley, ID: 25.14905. Blackfoot, ID: 25.13906. Silver City, NM: 24.14907. Los Alamos, NM: 23.58908. Canton, IL: 23.51909. Fitzgerald, GA: 23.29910. Atchison, KS: 22.60911. Malone, NY: 22.38912. Marshall, MO: 22.19913. Martin, TN: 21.66914. Beaver Dam, WI: 21.58915. Brigham City, UT: 21.17916. Camden, AR: 21.00917. Oil City, PA: 20.91918. Sturgis, MI: 20.84919. Minden, LA: 20.76920. Huron, SD: 20.11921. Merrill, WI: 19.11922. Fernley, NV: 17.89923. Evanston, WY: 17.83924. Clearlake, CA: 17.50925. Newberry, SC: 17.20926. Gloversville, NY: 17.15927. Washington, IN: 16.48928. Huntingdon, PA: 16.28929. Brownsville, TN: 16.11930. Boone, IA: 15.94931. Rochelle, IL: 15.78932. Summerville, GA: 15.13933. Van Wert, OH: 14.92934. Lewistown, PA: 14.79935. Platteville, WI: 13.96936. Bennettsville, SC: 13.47937. Claremont, NH: 11.82938. Arcadia, FL: 11.37939. Indianola, MS: 4.80940. Pierre Part, LA: 4.14941. Tallulah, LA: 3.70942. Yazoo City, MS: 1.47
RESTAURANT, FOOD & BEVERAGE MARKET RESEARCH HANDBOOK 2013
• 154 •

12.3 Market ResourcesThe Nielsen Company, 770 Broadway, New York, NY 10003. (646) 654-5000. (www.nielsen.com)
RESTAURANT, FOOD & BEVERAGE MARKET RESEARCH HANDBOOK 2013
• 155 •
13
TOP MARKETS FOR QSR GROWTH
13.1 Top 40 Markets For Quick-Service Restaurant ExpansionAccording to QSR (January 2013), based on an assessment by The NPD Group
(www.npd.com), the top 40 markets for quick-service restaurant expansion through2016 are as follows:
Projected QSR Traffic Population
Grow th Forecast QSR Units Change
Large Markets• Denver, CO: 11.1% 4,789 6%• Washington, DC: 10.9% 6,292 8%• Charlotte, NC: 9,0% 2,915 9%• Houston, TX: 8.9% 6,508 10%• Orlando-Daytona Beach-Melbourne, FL: 8.0% 3,659 8%• Nashville, TN: 7.6% 2,579 7%• Minneapolis-Saint Paul, MN: 7.2% 3,945 4%• San Diego, CA: 6.4% 3,584 6%• Dallas-Ft. Worth, TX: 5.5% 8,002 6%• Indianapolis, IN: 5.0% 2,940 5%• Miami-Ft. Lauderdale, FL: 4.8% 3,961 1%• Raleigh-Durham, NC: 4.6% 2,748 10%• San Antonio, TX: 4.4% 2,361 12%• Seattle-Tacoma, WA: 4.0% 5,739 7%• Salt Lake City, UT: 3.6% 2,731 8%
Medium Markets• Waco-Temple-Bryan, TX: 21.0% 985 13%• Las Vegas, NV: 17.7% 2,323 12%• Greenville-Spartanburg-Asheville-
Anderson, SC-NC: 13.2% 2,095 7%• Huntsville-Decatur, Florence, AL: 12.5% 878 8%• Austin, TX: 11.8% 2,023 13%• Ft. Myers-Naples, FL: 11.3% 1,145 9%• Tulsa, Ok: 11.2% 1,516 6%• Harlingen-Weslaco-Brownsville-
McAllen, TX: 11.2% 1,011 13%
RESTAURANT, FOOD & BEVERAGE MARKET RESEARCH HANDBOOK 2013
• 156 •
• Buffalo, NY: 10.0% 1,531 1%• Albuquerque-Santa Fe, NM: 9.6% 1,760 8%• Wichita-Hutchinson, KS: 9.6% 1,224 5%• Fresno-Visalia, CA: 9.3% 1,778 8%• Columbus, OH: 9.3% 2,651 7%• Rochester, NY: 8.2% 1,030 4%• Jacksonville-Brunswick, FL-GA: 7.6% 1,831 7%
Small Markets• Yuma-El Centro, AZ-CA: 19.6% 276 10%• Fargo-Valley City, ND: 16.0% 512 6%• Odessa-Midland, TX: 16.0% 413 12%• Medford-Klamath Falls, OR: 15.1% 500 4%• Laredo, TX: 14.7% 229 13%• Helena, MT: 14.4% 70 11%• Wilmington, NC: 14.4% 453 12%• Bakersfield, CA: 13.5% 732 12%• Columbus, GA: 13.4% 566 6%• Palm Springs, CA: 13.2% 441 12%
RESTAURANT, FOOD & BEVERAGE MARKET RESEARCH HANDBOOK 2013
• 157 •

PART IV: MARKET SEGMENTS
RESTAURANT, FOOD & BEVERAGE MARKET RESEARCH HANDBOOK 2013
• 158 •
14
CASUAL-DINING RESTAURANTS
14.1 ProfileCasual-dining restaurants offer full dinners with complete table service and
alcoholic beverages are available at most. Casual-dining restaurants are sometimesreferred to as dinnerhouses.
The NPD Group (www.npd.com) estimates there are approximately 168,000casual-dining restaurants in the United States.
According to 2012 Chain Restaurant Operators, published by Chain Store Guide(www.chainstoreguide.com), there are 35,909 casual-dining chain restaurants in theUnited States.
14.2 OverviewFew consumer business segments were hit harder by the recent economic woes
than casual-dining restaurants. The segment began to recover in 2012. Surveys byDectiva (www.dectiva.com) found consumers spending 41.1% of their dining dollars atcasual-dining restaurants in 2012 compared with 38.7% a year prior. For comparison,spending at limited-service restaurants dropped four percentage points during the sametimeframe.
_________________________________________________________________
“After years of being pummeled by theeconomy, casual-dining operators are shakingoff the hits and starting to win back the tight-fisted consumers who spurred them for lower-priced fast-casual and quick-service options.”
Nation’s Restaurant News, 6/11/12 _________________________________________________________________
RESTAURANT, FOOD & BEVERAGE MARKET RESEARCH HANDBOOK 2013
• 159 •
Casual-dining chains strived to maintain sales throughout the recession withmenu price cuts and a stream of continuous promotions. As the economy improvedand commodity prices rose, some chains increased price points in an effort to improvemargins.
_________________________________________________________________
“Casual-dining chains aim to drive sales withbeverages, gift cards, and healthful menuitems.”
Nation’s Restaurant News, 6/11/12 _________________________________________________________________
Major chains across the casual-dining concept are re-imaging, changing with thetimes, and refocusing on the post-recession consumer. For some, this involves a brandmakeover rather than simply adding new menu items and making cosmetic changes. Among the chains refreshing their brand image is Applebee’s Neighborhood Bar & Grill,which renovated all of its 1,900 locations, with an investment that averaged over$200,000 per location.
_________________________________________________________________
“The industry’s casual-dining segment is knownfor concepts that can be costly to build andcomplicated to run, but they are also known tobe high sales generators.”
Nation’s Restaurant News, 6/25/12 _________________________________________________________________
Some chain locations are beginning to take on local personality, with menu itemssourced from local farms, regional cuisine, and chefs who are being allowed to varyfrom corporate-directed menus with daily features.
RESTAURANT, FOOD & BEVERAGE MARKET RESEARCH HANDBOOK 2013
• 160 •
15
CATERING & BANQUETS
15.1 ProfileThe National Restaurant Association (www.restaurant.org) forecasts social
caterers’ sales at $8.38 billion for 2013, a 5.6% increase over 2012. For comparison,the overall commercial restaurant sector is projected to grow 3.8% in 2013. Includinghotel and on-premise banquets and other types of catering, the segment generates anestimated $15 billion, according to the association.
With a broader definition of the market, Technomic (www.technomic.com) pegsthe catering market at $33.3 billion, with restaurants holding a 69% marketshare,followed by caterers, supermarkets, warehouse clubs, and other retailers.
According to the National Restaurant Association, half of family- and casual-dining operators, two-thirds of fine-dining operators, and 70% of quick-servicerestaurants offer off-premise catering.
There are approximately 53,000 caterers in the United States, excluding hotels,according to Catersource.
15.2 OverviewA survey of the catering industry was recently conducted by the Department of
Food and Beverage Management, School of Hotel Administration, Cornell University,and Catersource. A total of 327 caterers responded to the survey, with 79% reportingthat off-premise catering was their primary business focus. The caterers reportedtypical party size as follows (percentage of survey respondents):• Less than 100: 14%• 100-to-250: 68%• More than 250: 17%
An overwhelming majority of the survey respondents indicated labor issues astheir biggest concern – including the hiring of chefs and kitchen personnel, service staff(both-full and part-time), and sales staff. The operators also cited being concernedabout their ability to continue to grow their businesses amid increased competition.
While the catering market for corporate conventions and events declined duringthe economic downturn, the drop was more than offset by increased demand for in-home catering. A survey by Technomic found that 40% of consumers were increasingtheir entertainment activities at home, and when doing so are just as likely to sourcefood for these occasions from restaurants as from food retailers. This demand has
RESTAURANT, FOOD & BEVERAGE MARKET RESEARCH HANDBOOK 2013
• 161 •
drawn more restaurants into the catering marketplace.Another growing part of the catering business is the restaurant banquet
business, also known as private dining, which has attracted several major chains aswell as multi-concept operators and fine-dining independents. One example isBuckhead Life Group (www.buckheadrestaurants.com), the largest fine-dining operatorin Atlanta, which converted 103 West, one of its 11 restaurants, from fine-dining toprivate dining. The facility can accommodate parties from six to 600 and caters tobusiness meetings and events, bar/bat mitzvahs, engagement parties and showers,rehearsal dinners, and wedding receptions. Fleming’s Prime Steakhouse & Wine Bar(www.flemingssteakhouse.com), a 164-unit chain that is part of the OutbackSteakhouse family, derives upward of 15% of sales from private parties.
Similar to the trend in restaurants, caterers are experiencing increased demandfor healthful items and locally sourced menu items. There is also an increasingdemand for cultural and international items on catering menus.
15.3 Market ResourcesNational Association for Catering & Events, 9891 Broken Land Parkway, Suite 301,Columbia, MD 21046. (410) 290-5410. (www.nace.net)
RESTAURANT, FOOD & BEVERAGE MARKET RESEARCH HANDBOOK 2013
• 162 •
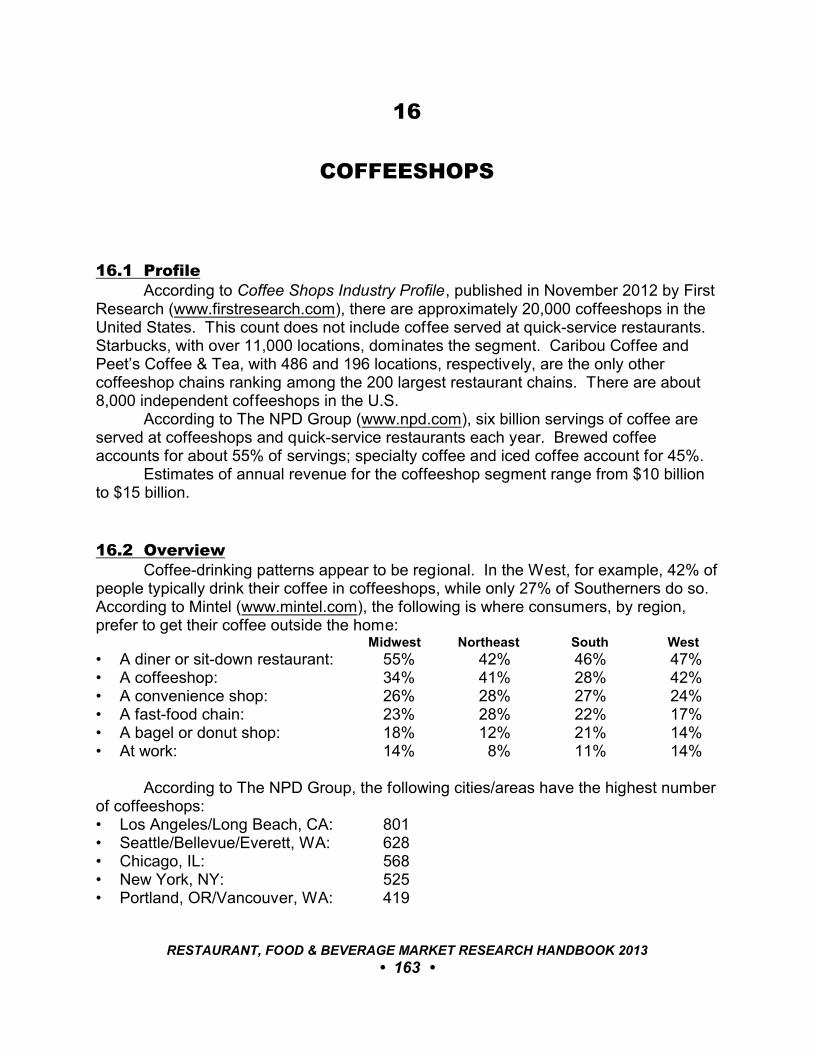
16
COFFEESHOPS
16.1 ProfileAccording to Coffee Shops Industry Profile, published in November 2012 by First
Research (www.firstresearch.com), there are approximately 20,000 coffeeshops in theUnited States. This count does not include coffee served at quick-service restaurants. Starbucks, with over 11,000 locations, dominates the segment. Caribou Coffee andPeet’s Coffee & Tea, with 486 and 196 locations, respectively, are the only othercoffeeshop chains ranking among the 200 largest restaurant chains. There are about8,000 independent coffeeshops in the U.S.
According to The NPD Group (www.npd.com), six billion servings of coffee areserved at coffeeshops and quick-service restaurants each year. Brewed coffeeaccounts for about 55% of servings; specialty coffee and iced coffee account for 45%.
Estimates of annual revenue for the coffeeshop segment range from $10 billionto $15 billion.
16.2 OverviewCoffee-drinking patterns appear to be regional. In the West, for example, 42% of
people typically drink their coffee in coffeeshops, while only 27% of Southerners do so. According to Mintel (www.mintel.com), the following is where consumers, by region,prefer to get their coffee outside the home:
Midwest Northeast South West
• A diner or sit-down restaurant: 55% 42% 46% 47%• A coffeeshop: 34% 41% 28% 42%• A convenience shop: 26% 28% 27% 24%• A fast-food chain: 23% 28% 22% 17%• A bagel or donut shop: 18% 12% 21% 14%• At work: 14% 8% 11% 14%
According to The NPD Group, the following cities/areas have the highest numberof coffeeshops:• Los Angeles/Long Beach, CA: 801• Seattle/Bellevue/Everett, WA: 628• Chicago, IL: 568• New York, NY: 525• Portland, OR/Vancouver, WA: 419
RESTAURANT, FOOD & BEVERAGE MARKET RESEARCH HANDBOOK 2013
• 163 •

A persistent challenge for coffeeshops is to expand business beyond themorning and early afternoon hours. Starbucks locations report 70% of business isbefore 2 p.m. Efforts to increase day-long consumption, which have included coffeeserved at varying temperatures and flavored with a wide range of ingredients, havebeen successful. The NPD Group reported that the number of coffee servings orderedin the afternoon was up 4% for the twelve-month period ending June 2012; orders forspecialty coffees were up 4.6%.
In 2012, Starbucks added beer, wine, and food offerings to select stores in theAtlanta, Chicago, and Southern California markets. The concept was tested in 2011 infive Seattle and one Portland store. The food menu includes flatbreads, small plates,and snacks.
Starbucks plans to open 1,600 U.S. locations f rom 2013 through 2017; 60% willinclude drive thrus.
_________________________________________________________________
“Drive thrus create incremental revenues andprofits compared to traditional stores andrepresent a fast-growing and highly profitableformat for Starbucks, comprising just overone-third of our U.S. company-operated storesbut contributing nearly 45% of our U.S. retailprofit. We are investing in this high-marginstore format with innovations that will elevatethe customer experience of our brand byenhancing drive-thru efficiency and consistencyof service.”
Howard Schultz, Chairman and CEO Stabucks Corp. Portland Business Journal,1/28/13
_________________________________________________________________
In 2012, the second- and third-largest coffeeshop chains were acquired by Joh.A. Benckiser Group. Peet’s Coffee & Tea was acquired in October for $941 million andCaribou Coffee was acquired in December for $340 million. Combined, the two chainsoperate about 700 stores.
RESTAURANT, FOOD & BEVERAGE MARKET RESEARCH HANDBOOK 2013
• 164 •
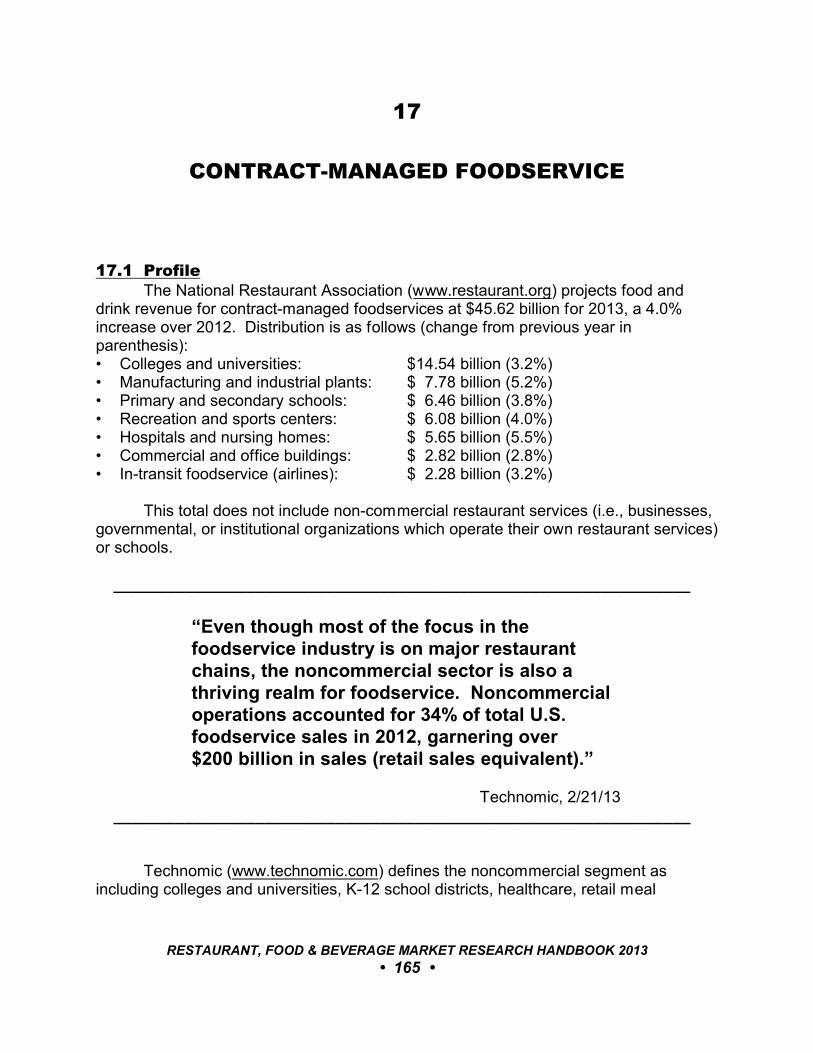
17
CONTRACT-MANAGED FOODSERVICE
17.1 ProfileThe National Restaurant Association (www.restaurant.org) projects food and
drink revenue for contract-managed foodservices at $45.62 billion for 2013, a 4.0%increase over 2012. Distribution is as follows (change from previous year inparenthesis):• Colleges and universities: $14.54 billion (3.2%)• Manufacturing and industrial plants: $ 7.78 billion (5.2%)• Primary and secondary schools: $ 6.46 billion (3.8%)• Recreation and sports centers: $ 6.08 billion (4.0%)• Hospitals and nursing homes: $ 5.65 billion (5.5%)• Commercial and office buildings: $ 2.82 billion (2.8%)• In-transit foodservice (airlines): $ 2.28 billion (3.2%)
This total does not include non-commercial restaurant services (i.e., businesses,governmental, or institutional organizations which operate their own restaurant services)or schools.
_________________________________________________________________
“Even though most of the focus in thefoodservice industry is on major restaurantchains, the noncommercial sector is also athriving realm for foodservice. Noncommercialoperations accounted for 34% of total U.S.foodservice sales in 2012, garnering over $200 billion in sales (retail sales equivalent).”
Technomic, 2/21/13 _________________________________________________________________
Technomic (www.technomic.com) defines the noncommercial segment asincluding colleges and universities, K-12 school districts, healthcare, retail meal
RESTAURANT, FOOD & BEVERAGE MARKET RESEARCH HANDBOOK 2013
• 165 •

solutions, convenience stores, travel centers, lodging/hotels, recreation, travel,business and industry, military, corrections, daycare, group purchasing organizations,and foodservice management firms.
17.2 OverviewFor 2013 Technomic expects the strongest growth in the healthcare (4.5%) and
business & industry (4.0%) subsegments. As a whole, noncommercial foodserviceoperations are forecast to grow 3.7%.
A survey by The NPD Group (www.npd.com) found that 51% of patrons dine atbusiness and industry (B&I) foodservice cafeteria/restaurants primarily because ofconvenience. Just 4% said they visit because they like the restaurant, and only 2%said they visit for a specific menu item.
Some B&I foodservice operators have recently introduced menu innovations thatare changing the image of the segment. Aramark, for example, partnered with CookingLight to menu the magazine’s latest recipes. Another example is RestaurantAssociates, which introduced the rotation of offerings on a five-week cycle to avoiddiner boredom. The company also launched Whole Sum, a themed food station wherediners can enjoy a variety of complete meals containing fewer than 600 calories.
According to Foodservice Director, takeout comprises about 20% of foodserviceoperators’ sales. Grab-and-go is most popular in hospitals (33%), at business andindustrial sites (33%), and at colleges (22%) and least popular in nursing homes/long-term care (8%) and schools (6%).
RESTAURANT, FOOD & BEVERAGE MARKET RESEARCH HANDBOOK 2013
• 166 •
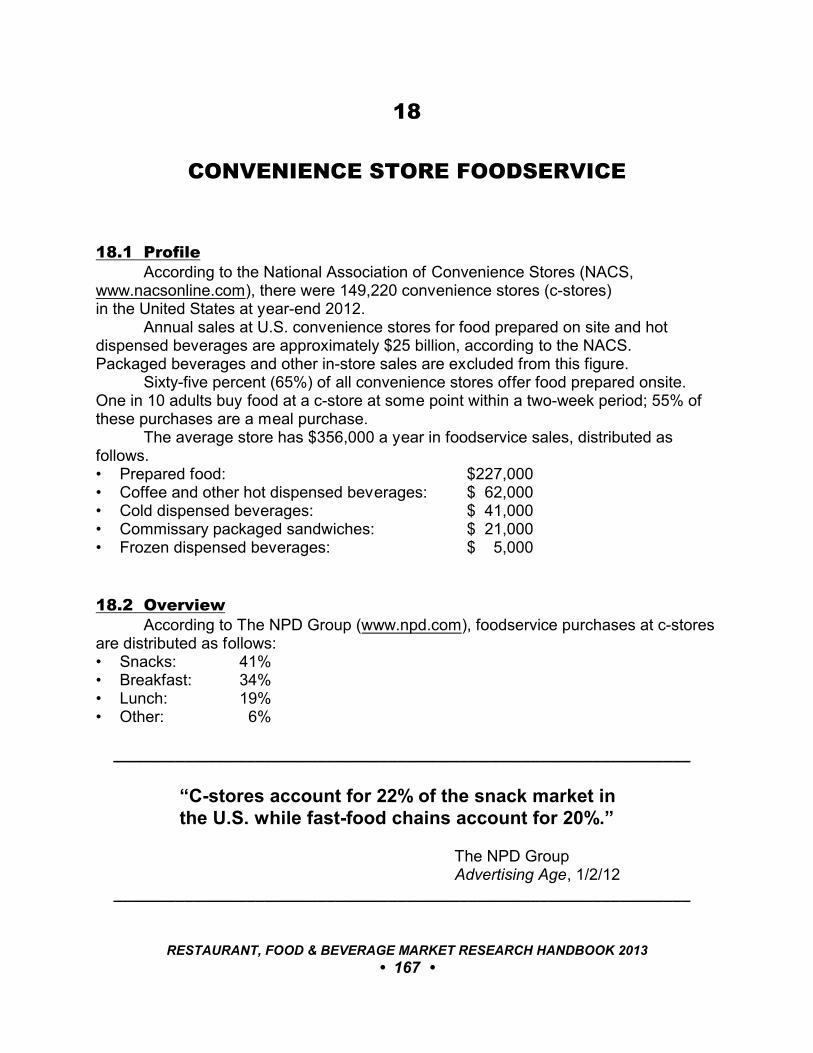
18
CONVENIENCE STORE FOODSERVICE
18.1 ProfileAccording to the National Association of Convenience Stores (NACS,
www.nacsonline.com), there were 149,220 convenience stores (c-stores) in the United States at year-end 2012.
Annual sales at U.S. convenience stores for food prepared on site and hotdispensed beverages are approximately $25 billion, according to the NACS. Packaged beverages and other in-store sales are excluded from this figure.
Sixty-five percent (65%) of all convenience stores offer food prepared onsite. One in 10 adults buy food at a c-store at some point within a two-week period; 55% ofthese purchases are a meal purchase.
The average store has $356,000 a year in foodservice sales, distributed asfollows. • Prepared food: $227,000• Coffee and other hot dispensed beverages: $ 62,000• Cold dispensed beverages: $ 41,000• Commissary packaged sandwiches: $ 21,000• Frozen dispensed beverages: $ 5,000
18.2 OverviewAccording to The NPD Group (www.npd.com), foodservice purchases at c-stores
are distributed as follows:• Snacks: 41%• Breakfast: 34%• Lunch: 19%• Other: 6%
_________________________________________________________________
“C-stores account for 22% of the snack market inthe U.S. while fast-food chains account for 20%.”
The NPD Group Advertising Age, 1/2/12
_________________________________________________________________
RESTAURANT, FOOD & BEVERAGE MARKET RESEARCH HANDBOOK 2013
• 167 •

Market Intelligence Report: Convenience Stores, a November 2012 report byTechnomic (www.technomic.com), provides the following assessment of c-storefoodservice:• Fifty-two percent (52%) of consumers pick up snacks from prepared-food sections
of convenience stores or mini-marts, an increase from 37% who did so in 2010.• Twenty-two percent (22%) of consumers occasionally have breakfast from a c-store
during the week, an increase from 12% who did so in 2010.• Thirteen percent (13%) purchase breakfast from c-stores on the weekend, an
increase from 7% who did so in 2010.• During the week, 17% of consumers say they purchase lunch from a convenience
store. For comparison, 56% purchase lunch from a quick-service restaurant and20% do so from a grocery store.
• While c-stores score well with consumers in terms of convenience, portability, speed of food preparation, and service, the healthfulness of the food is consideredsatisfactory to only 28% of consumers.
• C-store foodservice is projected to grow nominally by 2.5% in 2013 and 2014.
Foodservice carries a gross margin of more than 55% for c-stores, according tothe NACS.
_________________________________________________________________
“As revenues from gasoline and tobaccoproducts fall, foodservice sales are increasinglybecoming convenience stores’ most profitablecategory.”
Technomic, 11/28/12 _________________________________________________________________
An increasing number of high-volume c-stores, such as those located alonginterstate highways, franchise or license an established quick-service brand. Chester’sChicken, Pizza Pro, Quizno’s, and Subway restaurants are frequently co-brand with c-stores.
RESTAURANT, FOOD & BEVERAGE MARKET RESEARCH HANDBOOK 2013
• 168 •
19
FAMILY-DINING RESTAURANTS
19.1 ProfileFamily restaurants aim to appeal to customers of all ages by offering a relaxed
atmosphere, low prices, and menus catering to both children’s and adults’ palates. Most do not serve alcoholic beverages, and those that do generally have limitedselections. Family-dining restaurants are open for all dayparts – breakfast, lunch, anddinner – and many offer late-night hours.
According to Technomic (www.technomic.com), family-style restaurants accountfor $33 billion in annual sales.
Fifteen (15) family-dining chains ranked among the 200 largest U.S. restaurantchains in 2012, according to Nation’s Restaurant News. Their combined sales were$12.86 billion; they operated 8,683 units.
19.2 OverviewTechnomic provides the following assessment of the family-dining segment:
• Sixty-eight percent (68%) of consumers say they would be highly likely to visit afamily-style restaurant when they want an affordable sit-down meal, indicating thatconsumers think these locations may offer a better value proposition than othertypes of full-service restaurants.
• Family-dining patronage is relatively high, with 73% of consumers saying they visit atleast once a month, and 38% doing so once a week or more.
• Reflecting a strong family-friendly ambiance, 68% of consumers say they would belikely or extremely likely to visit a family-dining restaurant when dining with children.
• Fifty-two percent (52%) of consumers say the availability of healthful food atfamily-style restaurants is very important.
• Fifty-one percent (51%) of consumers view family-style restaurants as the mostsuitable choice for breakfast.
• Despite the sluggish economy, appetizer sales at family-dining restaurants havedone relatively well, outpacing salads, desserts, beverages, and soups, andequaling more than half of sandwich sales.
• The vast majority of revenues for family-dining come from on-premise dining.Takeout and catering represent very small shares of sales.
RESTAURANT, FOOD & BEVERAGE MARKET RESEARCH HANDBOOK 2013
• 169 •
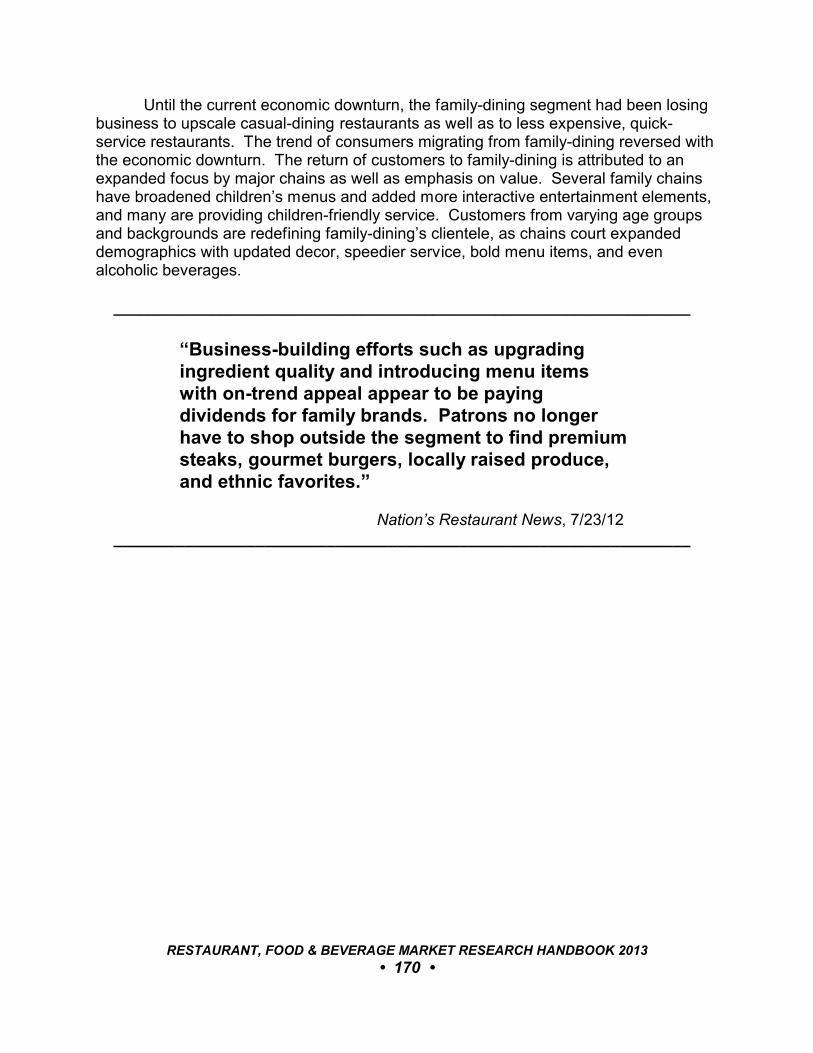
Until the current economic downturn, the family-dining segment had been losingbusiness to upscale casual-dining restaurants as well as to less expensive, quick-service restaurants. The trend of consumers migrating from family-dining reversed withthe economic downturn. The return of customers to family-dining is attributed to anexpanded focus by major chains as well as emphasis on value. Several family chainshave broadened children’s menus and added more interactive entertainment elements,and many are providing children-friendly service. Customers from varying age groupsand backgrounds are redefining family-dining’s clientele, as chains court expandeddemographics with updated decor, speedier service, bold menu items, and evenalcoholic beverages.
_________________________________________________________________
“Business-building efforts such as upgradingingredient quality and introducing menu itemswith on-trend appeal appear to be payingdividends for family brands. Patrons no longerhave to shop outside the segment to find premiumsteaks, gourmet burgers, locally raised produce,and ethnic favorites.”
Nation’s Restaurant News, 7/23/12 _________________________________________________________________
RESTAURANT, FOOD & BEVERAGE MARKET RESEARCH HANDBOOK 2013
• 170 •
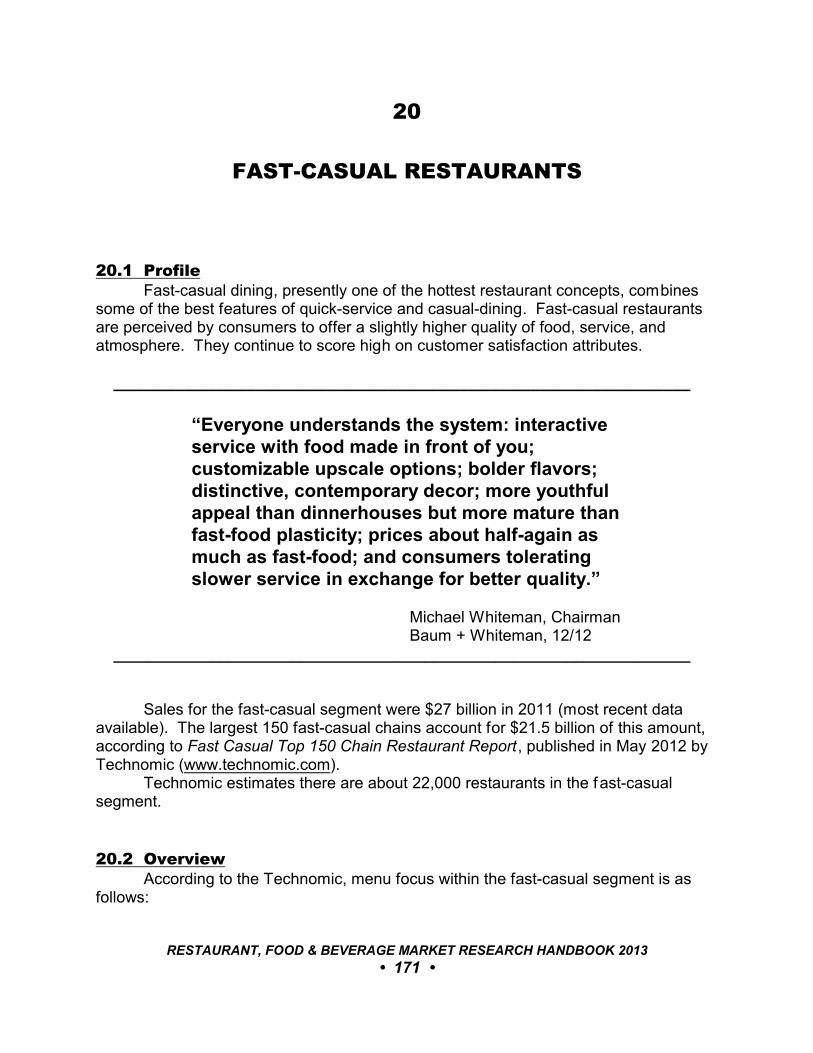
20
FAST-CASUAL RESTAURANTS
20.1 Profile Fast-casual dining, presently one of the hottest restaurant concepts, combinessome of the best features of quick-service and casual-dining. Fast-casual restaurantsare perceived by consumers to offer a slightly higher quality of food, service, andatmosphere. They continue to score high on customer satisfaction attributes.
_________________________________________________________________
“Everyone understands the system: interactiveservice with food made in front of you;customizable upscale options; bolder flavors;distinctive, contemporary decor; more youthfulappeal than dinnerhouses but more mature thanfast-food plasticity; prices about half-again asmuch as fast-food; and consumers toleratingslower service in exchange for better quality.”
Michael Whiteman, Chairman Baum + Whiteman, 12/12
_________________________________________________________________
Sales for the fast-casual segment were $27 billion in 2011 (most recent dataavailable). The largest 150 fast-casual chains account for $21.5 billion of this amount,according to Fast Casual Top 150 Chain Restaurant Report, published in May 2012 byTechnomic (www.technomic.com).
Technomic estimates there are about 22,000 restaurants in the fast-casualsegment.
20.2 OverviewAccording to the Technomic, menu focus within the fast-casual segment is as
follows:
RESTAURANT, FOOD & BEVERAGE MARKET RESEARCH HANDBOOK 2013
• 171 •

• Mexican: 20%• Bakery cafe: 18%• Sandwiches other than burgers: 16%• Hamburger: 11%• Chicken: 9%• Specialty*: 9%• Pizza: 7%• Asian: 6%
* Includes: Barbecue, healthful, Italian, other ethnic, and soup
The NPD Group (www.npd.com) segments fast-casual customers as follows:• Switchers: 40% Go where new items and promotions are; skew to females, younger adults, middle-aged adults, and higher incomes
• Loyals: 38% Visit same brands regardless of special offers; skew
to males and higher incomes
• Lapsed: 14% Seldom go or don’t think about it; skew to older adults
and lower incomes
• Price Sensitive: 8% Go for lowest price/discounts; skew to lower incomes
According to Hudson Riehle, Senior Vice President of Research for the NationalRestaurant Association (www.restaurant.org), the fast-casual segment always doesbetter than the rest of the industry because it’s a hybrid – it combines the convenienceof quick-service with the food offerings of higher-check establishments. Even in arecession, the demand for convenience continues.
An increasing number of fast-casual chains offer beer and wine service, blurringthe line between fast-casual and casual-dining. Alcoholic beverage service appeals tomany value-focused diners who have traded down from full-service venues. It alsohelps drive traffic at dinner, typically a more difficult daypart for many fast-casualchains.
The success of Chipotle Mexican Grill has been a market driver for the entiresegment, spurring many new players into the fast-casual marketplace.
RESTAURANT, FOOD & BEVERAGE MARKET RESEARCH HANDBOOK 2013
• 172 •
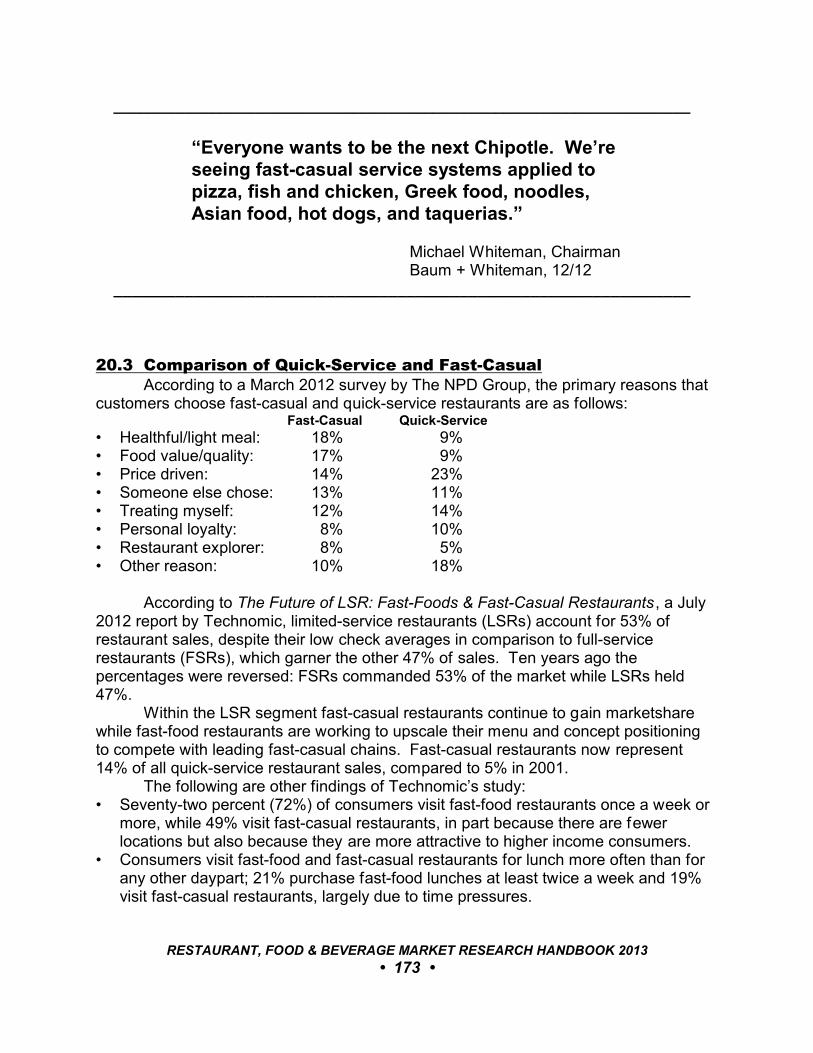
_________________________________________________________________
“Everyone wants to be the next Chipotle. We’reseeing fast-casual service systems applied topizza, fish and chicken, Greek food, noodles,Asian food, hot dogs, and taquerias.”
Michael Whiteman, Chairman Baum + Whiteman, 12/12
_________________________________________________________________
20.3 Comparison of Quick-Service and Fast-CasualAccording to a March 2012 survey by The NPD Group, the primary reasons that
customers choose fast-casual and quick-service restaurants are as follows:Fast-Casual Quick-Service
• Healthful/light meal: 18% 9%• Food value/quality: 17% 9%• Price driven: 14% 23%• Someone else chose: 13% 11%• Treating myself: 12% 14%• Personal loyalty: 8% 10%• Restaurant explorer: 8% 5%• Other reason: 10% 18%
According to The Future of LSR: Fast-Foods & Fast-Casual Restaurants , a July2012 report by Technomic, limited-service restaurants (LSRs) account for 53% ofrestaurant sales, despite their low check averages in comparison to full-servicerestaurants (FSRs), which garner the other 47% of sales. Ten years ago thepercentages were reversed: FSRs commanded 53% of the market while LSRs held47%.
Within the LSR segment fast-casual restaurants continue to gain marketsharewhile fast-food restaurants are working to upscale their menu and concept positioningto compete with leading fast-casual chains. Fast-casual restaurants now represent14% of all quick-service restaurant sales, compared to 5% in 2001.
The following are other findings of Technomic’s study:• Seventy-two percent (72%) of consumers visit fast-food restaurants once a week or
more, while 49% visit fast-casual restaurants, in part because there are fewerlocations but also because they are more attractive to higher income consumers.
• Consumers visit fast-food and fast-casual restaurants for lunch more often than forany other daypart; 21% purchase fast-food lunches at least twice a week and 19%visit fast-casual restaurants, largely due to time pressures.
RESTAURANT, FOOD & BEVERAGE MARKET RESEARCH HANDBOOK 2013
• 173 •
• Breakfast sandwiches have grown by 35% at fast-food restaurants and by 29% atfast-casual chains, showing the strength of breakfast entrèes at LSRs.
• Gluten-free options and the growing importance of better-for-you kids’ mealscontinue to guide better-for-you LSR menu development.
• Street food influences continue. Rustic, handheld street foods with a global spinhave helped LSR menu developers create unique and craveable offerings. Consumers are looking for new flavor supplements for their sophisticated palettes.
Technomic foresees that there will be a blurring of the lines between fast-foodand fast-casual restaurants, with operators in each subsegment tweaking their conceptswith new unit designs and convenient service formats in order to remain competitive.
RESTAURANT, FOOD & BEVERAGE MARKET RESEARCH HANDBOOK 2013
• 174 •
21
FINE-DINING
21.1 ProfileFine-dining restaurants are full-service restaurants with an upscale menu and
extensive beverage offerings. The restaurants generally have a more sophisticateddecor and ambiance, the waitstaff is usually highly trained and often wears more formalattire, and there is often a dress code for patrons. The line between fine-dining andcasual-dining is becoming blurred as fine-dining restaurants have become more casualand many casual-dining restaurants are serving upscale cuisine.
By some estimates, fine-dining restaurants make up approximately 10% of totalU.S. restaurant industry sales.
21.2 OverviewA survey of fine-dining patrons presented in The Changing Face of America’s
Fine Diners, a report by RestaurantRx Consulting (www.restaurantrxconsulting.com),provided the following insight into the segment:• Sixty-nine percent (69%) of those polled said food quality was most important to
them when choosing where to dine. Half (50%) of respondents ranked inconsistentfood quality as their top complaint at fine-dining restaurants, 20% saidinconsistency, as a whole, was their biggest source of dissatisfaction, and 11% saidinconsistency in service was their primary complaint.
• When questioned about value, 52% of respondents said poor value was one of theirtop three complaints; 42% cited high menu prices as a source of dissatisfaction.
• Sixty-three percent (63%) said they prefer simply prepared foods served casuallyrather than richer offerings delivered in a more formal setting; 61% said they wereadventurous in their tastes and liked to experience new and exotic dishes.
• Eighty-one percent (81%) of respondents in the survey said they preferred dining ata one-of-a-kind establishment, versus at an upscale national chain.
Fifty-one percent (51%) of fine-dining operators experienced increased sales in2012, the highest among all full-service segments, according to the National RestaurantAssociation (www.restaurant.org). Fifty-seven percent (57%) anticipate increased salesin 2013.
RESTAURANT, FOOD & BEVERAGE MARKET RESEARCH HANDBOOK 2013
• 175 •
_________________________________________________________________
“Brands that cater to consumers making morethan $100,000 annually – about 20% of U.S.households, according to the U.S. CensusBureau – are doing comparatively well.”
Nation’s Restaurant News, 11/12/12 _________________________________________________________________
No restaurant segment has benefitted more from the uptick in business andleisure travel than fine-dining. Travelers and tourists represent an average of 29% ofsales for fine-dining operators, according to the National Restaurant Association. Americans took 2.04 person-trips in 2012, surpassing the pre-recession mark set in2007, according to the U.S. Travel Association (www.ustravel.org). Traveler spendingalso rebounded to pre-recession levels in 2012. The increase in spending was twicethat of the number of trips, indicating that those who do travel for business and leisureare spending more freely on things such as fine dining.
Still, while visits to fine-dining restaurants increased 4% in 2012, traffic has yet toreturn to pre-recession levels, according to The NPD Group (www.npd.com). Onereason is because affluent consumers are increasingly choosing restaurant optionsother than fine dining.
_________________________________________________________________
“Upscale customers aren’t necessarily lookingfor traditional upscale experiences. They’re alot more focused on bar food, socializing, andthe entertainment aspect, with chefs cookingonsite.”
Bonnie Riggs, Analyst The NPD Group Nation’s Restaurant News, 11/12/12
_________________________________________________________________
A new segment, polished casual, is emerging to satisfy customers wanting fine-dining quality in a less formal environment.
RESTAURANT, FOOD & BEVERAGE MARKET RESEARCH HANDBOOK 2013
• 176 •
_________________________________________________________________
“Fine- and casual-dining meet in the middle tocreate an accessible upscale segment.”
Nation’s Restaurant News, 11/12/12 _________________________________________________________________
RESTAURANT, FOOD & BEVERAGE MARKET RESEARCH HANDBOOK 2013
• 177 •
22
FOOD CONCESSIONS AT AIRPORTS
22.1 ProfileAccording to ARN Fact Book, published by Airport Revenue News
(www.airportrevenuenews.com), annual food and beverage service at the 90 largestU.S. airports is $3.3 billion. Food and beverage spending per enplaning passenger is$5.12.
The following airports have the highest food and beverage sales:• Hartsfield-Jackson Atlanta International Airport: $235.4 million• Chicago O’Hare International Airport: $187.4 million• Los Angeles International Airport: $156.4 million• John F. Kennedy International Airport (New York City): $151.0 million• Denver International Airport: $149.5 million• Dallas-Fort Worth International Airport: $141.5 million• San Francisco International Airport: $124.5 million• Charlotte/Douglas International Airport: $101.7 million• Miami International Airport: $ 99.0 million• Phoenix Sky Harbor International Airport: $ 92.4 million
22.2 OverviewDespite the reduction in air traffic at some of the larger airports, travelers are
spending more at airport restaurants as they become increasingly aware of the gooddining options that are available.
According to Amy Snow, Concessions Manager at Los Angeles InternationalAirport, travelers are spending more per transaction at airport-based restaurants, anindication that they are increasingly choosing upscale dining options.
According to Chain Store Guide (www.chainstoreguide.com), there are 124restaurant companies operating in airports. Among them, the following are the largest:• Anton Airfood Inc. (www.airfood.com)• CA One Services (www.delawarenorth.com)• Concessions International (www.cintl.com)• Delaware North Cos. (www.delawrenorth.com)• HMSHost (www.hmshost.com)• SSP America (www.foodtravelexperts.com)
RESTAURANT, FOOD & BEVERAGE MARKET RESEARCH HANDBOOK 2013
• 178 •
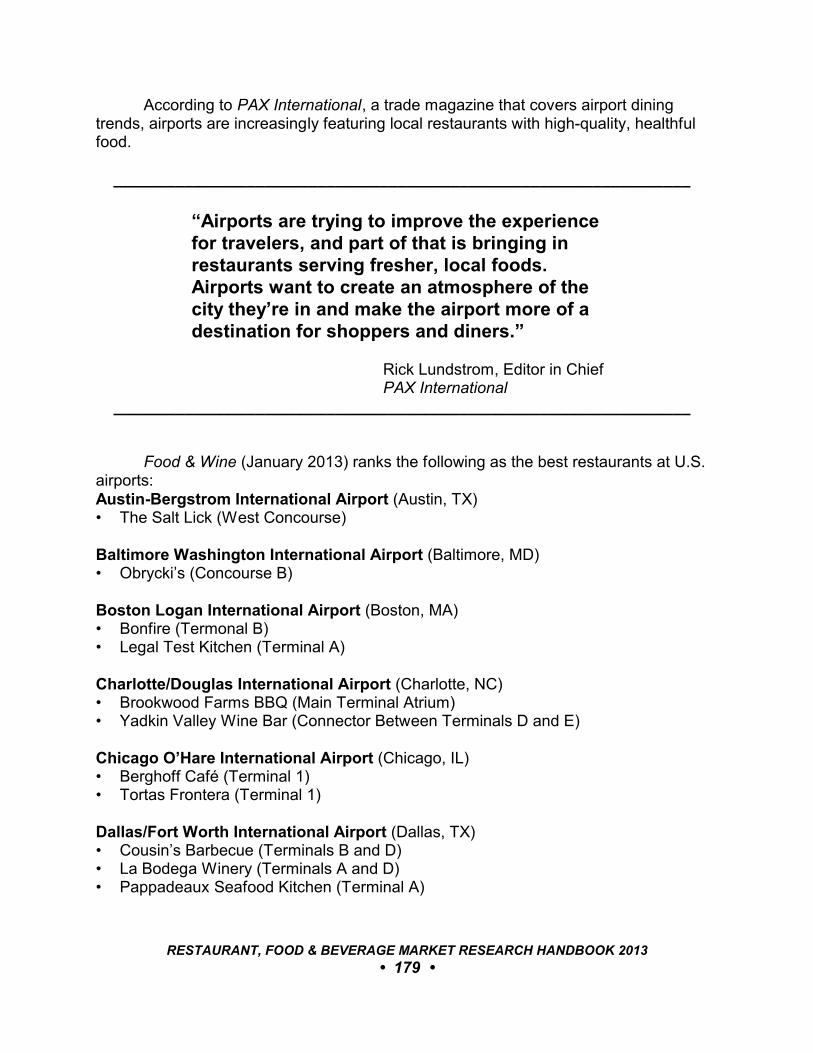
According to PAX International, a trade magazine that covers airport diningtrends, airports are increasingly featuring local restaurants with high-quality, healthfulfood.
_________________________________________________________________
“Airports are trying to improve the experiencefor travelers, and part of that is bringing inrestaurants serving fresher, local foods. Airports want to create an atmosphere of thecity they’re in and make the airport more of adestination for shoppers and diners.”
Rick Lundstrom, Editor in ChiefPAX International
_________________________________________________________________
Food & Wine (January 2013) ranks the following as the best restaurants at U.S.airports:Austin-Bergstrom International Airport (Austin, TX)• The Salt Lick (West Concourse)
Baltimore Washington International Airport (Baltimore, MD)• Obrycki’s (Concourse B)
Boston Logan International Airport (Boston, MA)• Bonfire (Termonal B)• Legal Test Kitchen (Terminal A)
Charlotte/Douglas International Airport (Charlotte, NC)• Brookwood Farms BBQ (Main Terminal Atrium)• Yadkin Valley Wine Bar (Connector Between Terminals D and E)
Chicago O’Hare International Airport (Chicago, IL)• Berghoff Café (Terminal 1)• Tortas Frontera (Terminal 1)
Dallas/Fort Worth International Airport (Dallas, TX)• Cousin’s Barbecue (Terminals B and D)• La Bodega Winery (Terminals A and D)• Pappadeaux Seafood Kitchen (Terminal A)
RESTAURANT, FOOD & BEVERAGE MARKET RESEARCH HANDBOOK 2013
• 179 •

Denver International Airport (Denver, CO)• New Belgium Hub (Concourse B)• Tamales by La Casita (Concourse C)
General Mitchell International Airport (Milwaukee, WI)• Usinger’s (Concourse D)
George Bush Intercontinental Airport (Houston, TX)• Pappadeaux Seafood Kitchen (Terminal E)
Hartsfield-Jackson Atlanta International Airport (Atlanta, GA)• One Flew South (Terminal E)• Paschal’s Restaurant (Concourse A food court; Main Terminal Atrium)
John F. Kennedy International Airport (New York, NY)• Aeronuova (Terminal 5)• Brasserie La Vie (Terminal 5)• Deep Blue (Terminal 5)• Piquillo (Terminal 5)
LaGuardia International Airport (New York, NY)• Custom Burgers by Pat LaFrieda (Terminal D)• Figs (Central Terminal Building; between Concourses B & C)• Prime Tavern (Terminal D)• Tagliare (Terminal D)
Los Angeles International Airport (Los Angeles, CA)• Encounter Restaurant (Theme Building)• La Brea Bakery (Terminals 1, 2 and 7)• Pink’s Hot Dogs (Tom Bradley International Terminal)
Memphis International Airport (Memphis, TN)• Corky’s BBQ (Terminals A and C)
Miami International Airport (Miami, FL)• Beaudevin (Terminal D)• La Carreta (Terminal D)
Minneapolis-St. Paul International Airport (St. Paul, MN)• French Meadow Bakery & Café (Concourse F)• Ike’s Food and Cocktails (The Mall; across from Checkpoint 1)
RESTAURANT, FOOD & BEVERAGE MARKET RESEARCH HANDBOOK 2013
• 180 •
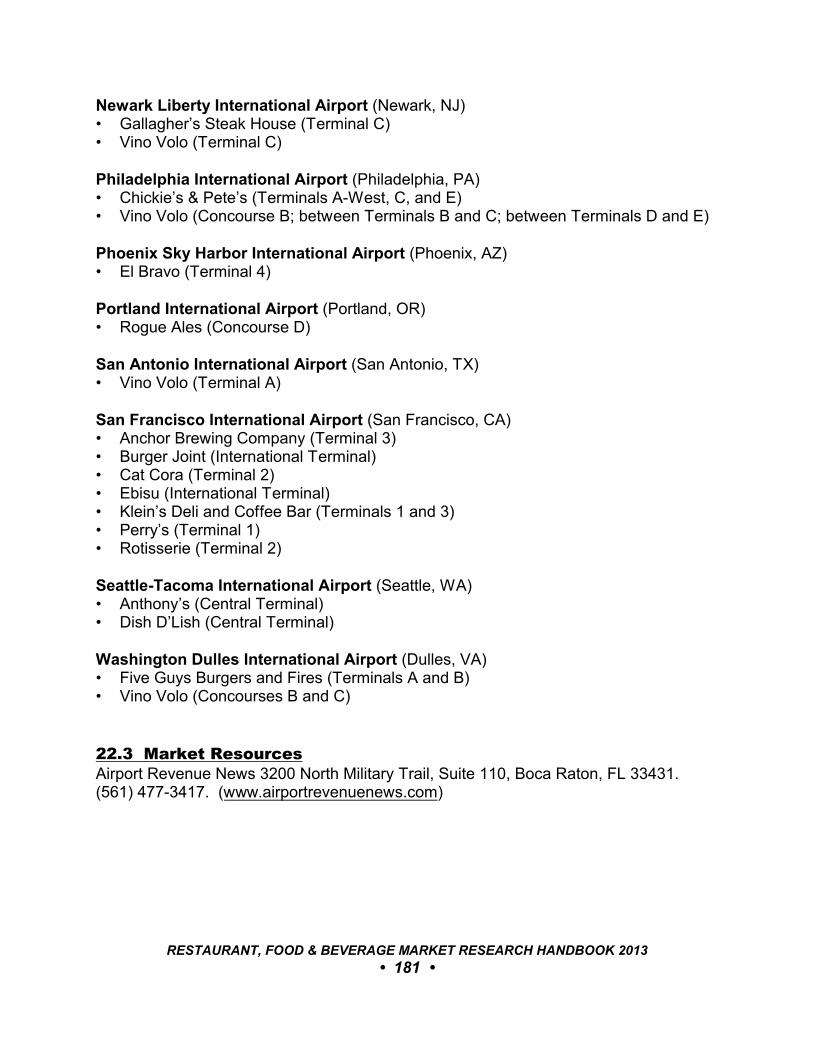
Newark Liberty International Airport (Newark, NJ)• Gallagher’s Steak House (Terminal C)• Vino Volo (Terminal C)
Philadelphia International Airport (Philadelphia, PA)• Chickie’s & Pete’s (Terminals A-West, C, and E)• Vino Volo (Concourse B; between Terminals B and C; between Terminals D and E)
Phoenix Sky Harbor International Airport (Phoenix, AZ)• El Bravo (Terminal 4)
Portland International Airport (Portland, OR)• Rogue Ales (Concourse D)
San Antonio International Airport (San Antonio, TX)• Vino Volo (Terminal A)
San Francisco International Airport (San Francisco, CA)• Anchor Brewing Company (Terminal 3)• Burger Joint (International Terminal)• Cat Cora (Terminal 2)• Ebisu (International Terminal)• Klein’s Deli and Coffee Bar (Terminals 1 and 3)• Perry’s (Terminal 1)• Rotisserie (Terminal 2)
Seattle-Tacoma International Airport (Seattle, WA)• Anthony’s (Central Terminal)• Dish D’Lish (Central Terminal)
Washington Dulles International Airport (Dulles, VA)• Five Guys Burgers and Fires (Terminals A and B)• Vino Volo (Concourses B and C)
22.3 Market ResourcesAirport Revenue News 3200 North Military Trail, Suite 110, Boca Raton, FL 33431.(561) 477-3417. (www.airportrevenuenews.com)
RESTAURANT, FOOD & BEVERAGE MARKET RESEARCH HANDBOOK 2013
• 181 •
23
FOOD CONCESSIONS AT SPORTS VENUES
23.1 Market AssessmentSportsBusiness Journal estimates revenue from on-site game-day concessions,
merchandise, and parking at approximately $11 billion.Of 133 major league facilities, 122 had contracts with independent companies to
operate their general concessions in 2012; 11 had in-house operations, according toSportsBusiness Journal. For premium-seat catering, 123 facilities contracted withoutside suppliers; 8 handled this service in-house.
Premium concessions are probably the most lucrative aspect of sports food-service. The NFL’s suite/club seating market alone yields approximately $2 billionannually, according to the Association of Luxury Suite Directors (www.alsd.com).
According to SportsBusiness Journal’s 2013 Resource Guide & Fact Book, thesports concessions business is distributed by vendor marketshare as follows:
General Premium
• Aramark (www.aramark.com): 26.7% 20.2%• Levy Restaurants (www.levyrestaurants.com): 25.8% 33.9%• Delaware North Sportservice
(www.delawarenorth.com/sportservice-home.aspx): 20.0% 16.1%• Centerplate (www.centerplate.com): 16.7% 12.9%• Legends Hospitality Management (www.legendshm.com): 2.5% 2.4%• Savor (www.savor.com): 2.5% 2.4%• Ovations (www.ocfair.com/ovations/): 1.7% 1.8%• Sodexho (www.sodexhousa.com): 0.8% 0.8%• Others: 3.3% 8.7%
23.2 OverviewFood courts at many professional sports stadiums and arenas have gone
upscale, and many fans look forward to a meal at a game – rather than avoid stadiumfare as in years past. The following are some examples:• At the plaza level of American Airlines Arena in Miami, Bongos Cuban Café, owned
by Gloria and Emilio Estefan, offers a unique blend of authentic Cuban cuisine. • At EverBank Field, home of the Jacksonville Jaguars, Wolfgang Puck Grand Cafe
showcases the eclectic dishes and homemade Austrian classics that made ChefPuck famous.
RESTAURANT, FOOD & BEVERAGE MARKET RESEARCH HANDBOOK 2013
• 182 •

• At Yankee Stadium, NYY Steak, an upscale steakhouse, and Hard Rock Cafe areamong the food options. Celebrity chefs will occasionally make appearances at theballpark's restaurants and help prepare food for fans in premium seating.
• At the Palace of Auburn Hills, home of the Detroit Pistons, the Palace Grille offerselegant dining for up to 250 patrons and includes a lounge area for enjoyingcocktails and refreshments before or after events.
Hot dogs remain a favorite at ball parks. The Hot Dog & Sausage Council(www.hot-dog.org) estimated that 20.5 million hot dogs were consumed in major leaguestadiums during the 2012 season. The top hot dog-eating stadiums are as follows:• Rangers Ballpark (Texas Rangers): 1.6 million• Citizen’s Bank Park (Philadelphia Phillies): 1.5 million• Fenway Park (Boston Red Sox): 1.5 million• Dodger Stadium (Los Angeles Dodgers): 1.4 million
RESTAURANT, FOOD & BEVERAGE MARKET RESEARCH HANDBOOK 2013
• 183 •
24
FOOD TRUCKS
24.1 ProfileA rapidly growing segment in the foodservice marketplace is food trucks, also
referred to as food trailers and food carts. Some trucks are chef-operated and manyoffer unique ethnic cuisine.
The Kruse Company estimates annual food truck sales at $5 billion, an increasefrom virtually zero only five years ago.
The gourmet food truck segment has its roots in Austin, Los Angeles, andPortland, where a few innovative chefs pioneered the concept. The rise of gourmetfood trucks as a dining option has been fueled by features in Food & Wine, ForbesTraveler, The New York Times, and USA Today, among other national periodicals, aswell as local media sources. The concept has spread to most major cities throughoutthe United States.
24.2 OverviewLocal regulation of food trucks varies. In some cities trucks must be tethered to
pods or parked in designated lots. In others, food trucks can freely cruise and set-upalmost anywhere the operators choose.
_________________________________________________________________
“New Orleans, for example, requires mobile foodvendors to change locations after 45 minutes inone spot. Among other restrictions, Chicago’sfood trucks have had to fight to cook onboard,Washington DC’s are technically supposed tovacate once their line of clients clears, LA’s have topark within 200 feet of a bathroom where workerscan wash hands, New York’s got booted fromMidtown, and in cities like Atlanta and Austin,trucks have largely been relegated to group parks.”
The Daily Meal, 11/13/12 _________________________________________________________________
RESTAURANT, FOOD & BEVERAGE MARKET RESEARCH HANDBOOK 2013
• 184 •
Food trucks have developed a cult-like following in some cities, with manydeveloping their huge following via Facebook and Twitter. Reviews on sites such asUrbanSpoon and Yelp have helped fuel interest.
The food truck business model has appealed to operators hesitant to sinkmillions of dollars into a high-concept restaurant. According to The New York Times, anew food truck costs about $125,000; adding specialized kitchen equipment andenhancements can push the cost up to $250,000. This compares favorably to openinga bricks-and-mortar restaurant, where $850,000 to $1.5 million in start-up capital istypically needed to secure a lease, renovate a space, equip a kitchen, and hire a staff.
The growth of the segment in the cities where the concept pioneered suggeststhat food trucks are more than a passing fad. • The first L.A. Street Food Fest was held in downtown Los Angeles in 2010. The 3rd
annual event, held in July 2012, attracted several thousand people who waited inline for up an hour for meals served by 30 food trucks.
• Portland, Oregon, has an estimated 600 carts in operation. Some operators haveapplied for liquor licenses.
• Over 500 food trailers operate in Austin. Most operate from one of more than adozen food trailer parks that have been designated throughout the city and itssuburbs. Most parks are set up with common seating areas and provide power andwater facilities for the trucks.
_________________________________________________________________
“A year ago, editorial pushback on the trendindicated a peak. Instead, it increased twofoldin cities like St. Louis and Boston, while ontested asphalt in Los Angeles and New York, itspresence strengthened. Food trucks are here tostay.”
The Daily Meal, 11/13/12 _________________________________________________________________
Established restaurants are launching food truck operations to expand theirbrand, and mobile chefs are opening casual-dining locations.
In Los Angeles, Roy Choi, the owner-chef of the popular Kogi BBQ truck, hasopened three bricks-and-mortar restaurants: Chego, A-Frame, and Sunny Spot.
Several restaurant chains including Dairy Queen, Gold Star Chili, QdobaMexican Grill, and Sizzler have rolled out food trucks; some are using their vehicles ascatering operations and test kitchens on wheels. Operating their food trucks at local
RESTAURANT, FOOD & BEVERAGE MARKET RESEARCH HANDBOOK 2013
• 185 •
events also builds brand awareness.The food truck trend receives a mixed reception from the established restaurant
community. While some applaud the creativity, many feel that truck-based operatorscompete unfairly with traditional restaurants because of their lower capital investmentand lax regulatory oversight.
RESTAURANT, FOOD & BEVERAGE MARKET RESEARCH HANDBOOK 2013
• 186 •
25
MALL-BASED RESTAURANTS & FOOD COURTS
25.1 ProfileAccording to the International Council of Shopping Centers (ICSC, www.icsc.org),
mall food court sales are $512 per sq. ft., down from a peak of $541 per sq. ft. in 2007but greater than the average revenue of $373 per sq. ft. for all mall tenants. In fact,foodservice is the second most lucrative segment of non-anchor tenants. By categorytype, revenue is $777 per sq. ft. for food court tenants, $497 per sq. ft. for other fast-food vendors, and $446 per sq. ft. for restaurants.
25.2 OverviewAccording to the ICSC, shoppers that visit a mall for less than 30 minutes spend
an average of $54.20, or 44% less than the overall average mall spend of $98.40. Shoppers whose mall visits last 180 minutes or longer spent $205.20 per visit, or 52%more than the average.
Shoppers spend an average of 45 minutes more in the mall if there are foodoptions.
Approximately 7% of shoppers go to malls specifically for food. According toGuy Mercurio, Vice President at Macerich Co., a slate of restaurants at a mall can drawupwards of two million diners a year, many of whom might not visit the mall otherwise.
Food courts and other mall foodservice have changed in recent years. Gone arethe sterile common dining areas that were designed to be easily cleaned andmaintained but without regard for the customer’s experience. Today’s mall food courtsare inviting – some even have fireplaces.
Mall operators have also worked to attract upscale casual-dining restaurants. These restaurants are aimed to complement traditional food court offerings.
One example of the new breed of mall dining is the Dining Deck at Santa MonicaPlace, a 30-year-old mall just blocks from the beach. Full-service restaurants sharespace with a food court that includes local fast-casual chains and a farmers market-likegathering of food purveyors. Live music is played in the evening, and diners can enjoya sunset to the west or view the lights of the city skyline to the east.
At the renovated dining terrace at Century City, in Los Angeles, seating rangesfrom soft couches to counters to tables, with smaller versions designed for kids. Dine-inmeals are served on china with glassware and silverware. The mall experienced closeto double-digit sales increases during the 24-months following the remodel.
RESTAURANT, FOOD & BEVERAGE MARKET RESEARCH HANDBOOK 2013
• 187 •
25.3 Market ResourcesInternational Council of Shopping Centers, 1221 Avenue of the Americas, 41st Floor, New York, NY 10020. (646) 728-3800. (www.icsc.org)
RESTAURANT, FOOD & BEVERAGE MARKET RESEARCH HANDBOOK 2013
• 188 •
26
PIZZA
26.1 ProfileThe pizza industry is a $40 billion-a-year business, according to the National
Association of Pizza Operators (NAPO, www.napo.com), with over 5.5 million pizzassold in the United States in 2012.
According to Pizza Today, published by NAPO, independents control about 46%of the market.
Eleven (11) pizza chains ranked among the 200 largest U.S. restaurant chains in2012, according to Nation’s Restaurant News. Their combined sales were $15.22billion; they operated 23,113 units.
26.2 TrendsAccording to Pizza Consumer Trend Report, an April 2012 report by Technomic
(www.technomic.com), 41% of consumers eat pizza once a week, an increase from26% who did so in 2010.
_________________________________________________________________
“Consumers increasingly view pizza as the‘go-to’ food when they don’t feel likecooking. Pizza consumption has increasedover the past two years as leading playersrevamp menus to include more innovativespecialty pizzas, gourmet ingredients and itemsbeyond pizza that help operators drive traffic.”
Darren Tristano Executive Vice President Technomic, 4/11/12
_________________________________________________________________
RESTAURANT, FOOD & BEVERAGE MARKET RESEARCH HANDBOOK 2013
• 189 •
Technomic identifies the following trends in the pizza restaurant segment:• The latest menu trends call for authenticity, from Neapolitan, Sicilian, and other
regional Italian interpretations, to depth-of-flavor preparations, such ashearth-baked, wood-fired, coal, and brick-oven cooking.
• Combo-meat varieties and calzone-style stuffed pizzas stand out as growth areas atlimited-service restaurants (LSR). At full-service restaurants, there has been slightgrowth in the number of veggie/garden and combo-meat pizzas.
• Chicken’s adaptability contributes to its widespread use as the top listed proteintopping in the full-service segment and third most-frequently listed protein inlimited-service, largely due to barbeque and Buffalo chicken varieties.
• Thirty-seven percent (37%) of consumers order pizza from non-pizza limited-serviceand fast-casual restaurant locations once a month, signaling room for growth forthese concepts and a potential threat for LSR pizza chains.
• Forty-nine percent (49%) of consumers are purchasing pizza from a grocery storeonce a month, making it the second leading foodservice source for pizza, surpassedonly by LSR pizza restaurants (71%).
• All foodservice pizza purchases have increased over the past two years, butcarryout and dine-in pizza occasions have increased the most; 68% of consumersnow order carryout pizza once a month or more, followed by 45% who say theyorder pizza for dine-in.
Online ordering and increased use of mobile devices is changing orderingpatterns for pizza delivery outlets. Online ordering represents 25% of Domino’s sales.
The convenience provided by takeout and delivery remains a major driver in thepizza marketplace. Seventy percent (70%) of Domino’s business is delivery.
Several pizza chains operating in a fast-casual format have recently launched. These include Pie Five Pizza Co. (The Colony, TX), Top That! Pizza (Tulsa, OK), andUncle Maddio’s Pizza (Atlanta, GA). They join established fast-casual chains BrixxWood Fired Pizza, Donatos Pizza, Fazoli’s, Jerry’s Subs & Pizza, RedBrick Pizza,Straw Hat Pizza, The Loop Pizza Grill, and zpizza.
_________________________________________________________________
“Fast-casual pizza is birthing as a category.”
Nation’s Restaurant News, 3/5/12 _________________________________________________________________
Responding to the increased interest in healthful dining, most pizza chains havemade strides to serve more healthful fare by offering salads, vegetarian pizzas, andgluten-free pizzas, among other items.
RESTAURANT, FOOD & BEVERAGE MARKET RESEARCH HANDBOOK 2013
• 190 •
27
QUICK-SERVICE RESTAURANTS
27.1 ProfileAccording to The NPD Group (www.npd.com), traffic at quick-service restaurants
(QSRs) is distributed by meal occasion as follows:• Morning meal: 20%• Lunch: 37%• Supper: 29%• P.M. snack: 14%
Burgers hold a lion’s share of the QSR market. An emphasis on chickensandwiches and wraps, however, is diversifying the QSR menu.
_________________________________________________________________
“The 15 [largest] burger chains generated$67.99 billion in domestic net sales last year,representing 71.5% of the segment’s total.”
Nation’s Restaurant News, 6/25/12 _________________________________________________________________
According to Sandelman & Associates (www.sandelman.com), eat-in diningcomprises 30% of all quick-service occasions. Drive-thru makes up 40%, carryoutaccounts for 23%, and delivery comprises 7%.
27.2 OverviewVisits to quick-service restaurants generally hold up better throughout economic
downturns than any other segment. However, competition from the fast-casualsegment hindered growth during the Great Recession and prolonged recovery.
RESTAURANT, FOOD & BEVERAGE MARKET RESEARCH HANDBOOK 2013
• 191 •
_________________________________________________________________
“They’re chasing the fast-casual segment. That’s exactly what’s going on. We’ve beentracking fast-food for well over 30 years, andduring every period of recession and economicdownturn, fast-food has never experienced thiskind of poor performance for this long a periodof time. In 2009 the sector experienced negativegrowth, then leveled off. It’s not growing, nor isit forecasted to grow.”
Bonnie Riggs, Analyst The NPD Group, 1/23/13
_________________________________________________________________
A comparison of QSRs and fast-casual restaurants is presented in Section 20.3of this handbook.
The following chains experienced the highest net loss in number of units duringthe prior three years (source: The NPD Group):• Quiznos: -1,940• Blimpie: - 343• Starbucks: - 323• KFC: - 223• Domino’s Pizza: - 205• Baskin Robbins: - 203• Dairy Queen: - 183• Arby’s: - 153• Long John Silvers: - 153• Pizza Hut: - 143
Despite the harsh market conditions, the following chains experienced significantunit growth during the period:• Subway: 2,691• Wingstreet: 1,739• Little Caesars: 826• Dunkin’ Donuts: 792• Taco Bell: 259• Papa John’s: 243
RESTAURANT, FOOD & BEVERAGE MARKET RESEARCH HANDBOOK 2013
• 192 •
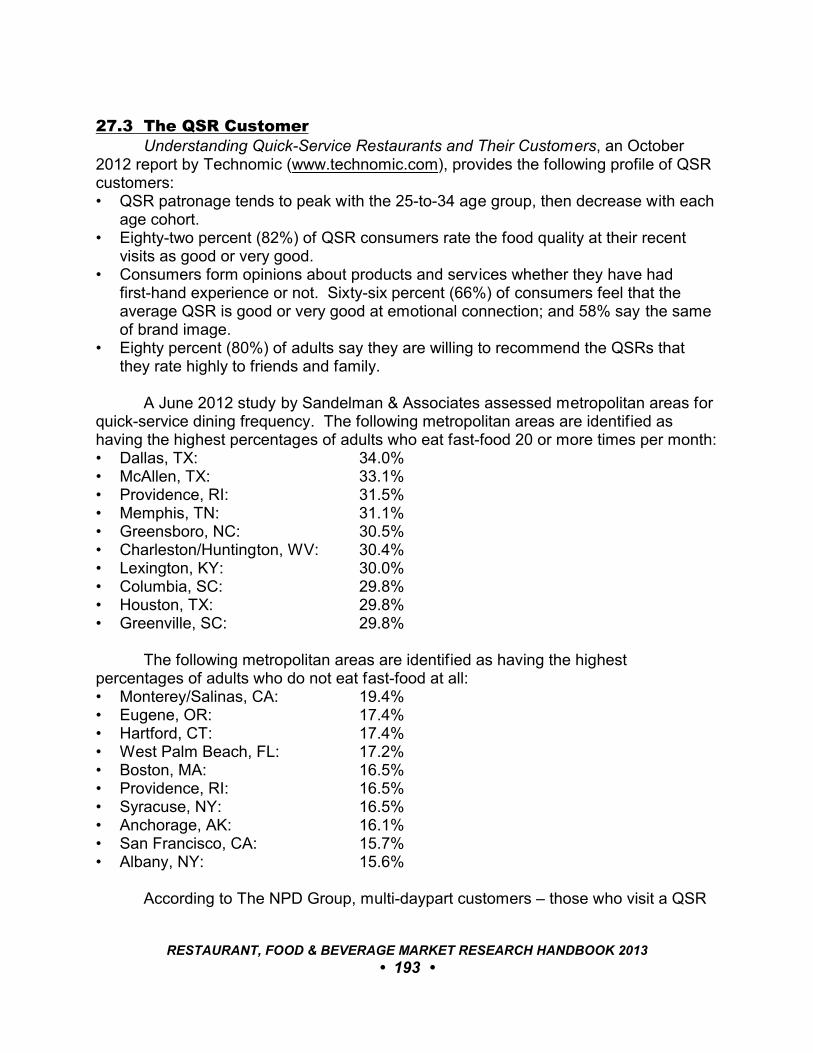
27.3 The QSR CustomerUnderstanding Quick-Service Restaurants and Their Customers, an October
2012 report by Technomic (www.technomic.com), provides the following profile of QSRcustomers:• QSR patronage tends to peak with the 25-to-34 age group, then decrease with each
age cohort.• Eighty-two percent (82%) of QSR consumers rate the food quality at their recent
visits as good or very good.• Consumers form opinions about products and services whether they have had
first-hand experience or not. Sixty-six percent (66%) of consumers feel that theaverage QSR is good or very good at emotional connection; and 58% say the sameof brand image.
• Eighty percent (80%) of adults say they are willing to recommend the QSRs thatthey rate highly to friends and family.
A June 2012 study by Sandelman & Associates assessed metropolitan areas forquick-service dining frequency. The following metropolitan areas are identified ashaving the highest percentages of adults who eat fast-food 20 or more times per month:• Dallas, TX: 34.0%• McAllen, TX: 33.1%• Providence, RI: 31.5%• Memphis, TN: 31.1%• Greensboro, NC: 30.5%• Charleston/Huntington, WV: 30.4%• Lexington, KY: 30.0%• Columbia, SC: 29.8%• Houston, TX: 29.8%• Greenville, SC: 29.8%
The following metropolitan areas are identified as having the highestpercentages of adults who do not eat fast-food at all:• Monterey/Salinas, CA: 19.4%• Eugene, OR: 17.4%• Hartford, CT: 17.4%• West Palm Beach, FL: 17.2%• Boston, MA: 16.5%• Providence, RI: 16.5%• Syracuse, NY: 16.5%• Anchorage, AK: 16.1%• San Francisco, CA: 15.7%• Albany, NY: 15.6%
According to The NPD Group, multi-daypart customers – those who visit a QSR
RESTAURANT, FOOD & BEVERAGE MARKET RESEARCH HANDBOOK 2013
• 193 •
for more than one meal – account for a disproportionately high percentage of sales. While multi-daypart buyers comprise 21% of QSR customers, they account for 35% ofvisits. They visit a QSR 4.6 times monthly, on average, while single-daypart customersaverage 2.2 visits. The following is a distribution of multi-daypart customer traffic(source: The NPD Group):• Lunch and supper: 43%• Morning meal and evening snack: 12%• Morning meal and lunch: 11%• Three or more dayparts: 11%• Lunch and evening snack: 7%• Supper and evening snack: 7%• Morning meal and supper: 5%
RESTAURANT, FOOD & BEVERAGE MARKET RESEARCH HANDBOOK 2013
• 194 •
28
SNACKS
28.1 ProfileSnack eating places include a wide range of venues: bakeries, cupcake shops,
doughnut shops, ice cream shops, juice bars, pastry shops, pretzel stands, smoothiebars, and more.
The National Restaurant Association (www.restaurant.org) forecasts snack shopand nonalcoholic beverage bar sales at $29.06 billion for 2013, a 4.3% increase over2012. Coffeeshops (see Chapter 16) account for almost half of the total.
28.2 OverviewAccording to Snacking Occasion Consumer Trend Report, published in March
2012 by Technomic (www.technomic.com), 48% of consumers say they snack at leasttwice a day, an increase from 25% who did so in 2010. Restaurants are capitalizing onthe growing snacking occasion by offering quick, portable, smaller-portioned, low-pricedfood and drink in a myriad of ways to continue gaining share of snack purchases.
_________________________________________________________________
“Recent consumer research indicates thatsnacking is becoming a larger part ofconsumers’ daily lives. Pressure from thenutritional disclosure legislation has promptedthe foodservice industry to reduce caloriecounts in meals. As a result, Americans arenow more inclined to ‘graze’ throughout theday, seeking snacks that provide fuel betweentraditional meal parts.”
Darren TristanoExecutive Vice PresidentTechnomic, 3/12/12
_________________________________________________________________
RESTAURANT, FOOD & BEVERAGE MARKET RESEARCH HANDBOOK 2013
• 195 •
Restaurants garnered 22% of consumers’ snacking occasions in 2012, anincrease from 17% in 2010, according to Technomic.
The following are other findings of the Technomic study:• Major chains are using late-night hours to promote value-oriented snack items and
bar plates to cater to younger customers who visit more often for late-night snacks.• Thirty-seven percent (37%) of consumers have broadened their definition of
snacks to include more types of foods, beverages, and restaurant fare. • The mini sandwich, slider, or wrap has evolved from a simple snack item to a
downsized gourmet version of signature full-sized offerings.• Sixty-two percent (62%) say that most of the snacks they purchase for
away-from-home consumption are impulse purchases.• Thirty-three percent (33%) of consumers say they are increasingly looking for
more healthful snack options.
_________________________________________________________________
“Habits of around-the-clock eating, the street-food/food-truck craze, consumers’ demand forflexible portions and prices, and operators’need to move beyond price-cutting on coremenu items all combine to make snack fare akey trend. Tapas, mezze, and upscale bar bitesin full-service restaurants are matched byflavorful novelties in limited-service restaurants,from Spicy Chicken McBites at McDonald’s andChicken Littles at KFC to mini corn dogs at Jackin the Box and cheesecake bites at Sonic.”
Technomic, 11/19/12 _________________________________________________________________
28.3 TrendsUntil recently the juice bar category included only a handful of small
independents across the country. Among them are Daily Juice (Austin, TX), DailyKitchen & Wellness Bar (Las Vegas, NV), Earthbar (Los Angeles, CA), Kreation Kafe(Los Angeles, CA), Liquiteria (New York, NY), Moon Juice (Los Angeles, CA), andPuree Artisan Juices (Washington, DC).
RESTAURANT, FOOD & BEVERAGE MARKET RESEARCH HANDBOOK 2013
• 196 •
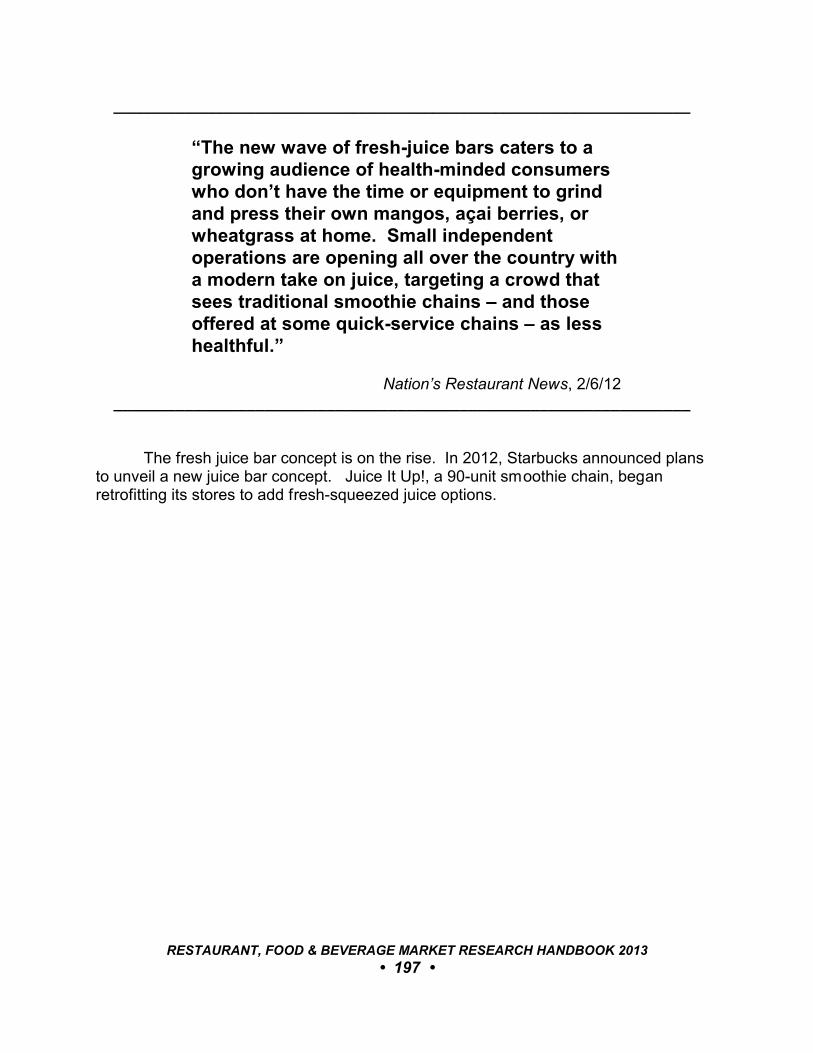
_________________________________________________________________
“The new wave of fresh-juice bars caters to agrowing audience of health-minded consumerswho don’t have the time or equipment to grindand press their own mangos, açai berries, orwheatgrass at home. Small independentoperations are opening all over the country witha modern take on juice, targeting a crowd thatsees traditional smoothie chains – and thoseoffered at some quick-service chains – as lesshealthful.”
Nation’s Restaurant News, 2/6/12 _________________________________________________________________
The fresh juice bar concept is on the rise. In 2012, Starbucks announced plansto unveil a new juice bar concept. Juice It Up!, a 90-unit smoothie chain, beganretrofitting its stores to add fresh-squeezed juice options.
RESTAURANT, FOOD & BEVERAGE MARKET RESEARCH HANDBOOK 2013
• 197 •
29
SUPERMARKET FOODSERVICE
29.1 ProfileAccording to the International Dairy Deli Bakery Association (www.iddba.org),
prepared food sales at U.S. supermarkets are approximately $6 billion annually. Technomic (www.technomic.com) estimates that sales of prepared food in
supermarkets are increasing at about 7% annually.According to The NPD Group (www.npd.com), supermarkets and other retail
outlets (excluding convenience stores and chains located within retail stores) garner 6%of the roughly 62 billion commercial foodservice meals and snacks consumed annually. This amounts to about 3.7 billion meals and snacks purchased for consumption withinsix hours. Distribution is as follows: • Morning meal: 21%• Lunch: 27%• Supper: 17%• Evening/night snack: 35%
Prepared foods from supermarkets are part of the overall market dubbed ‘retailmeal solutions’ (RMS). According to Technomic, retail meal solutions are a $37 billionmarket, which includes $10 billion in beverage sales. The category also includes frozenentrèes as well as prepared foods. Over the past five years RMS growth has beenstrongest within non-supermarket channels, such as supercenters and warehouseclubs.
29.2 OverviewMost supermarkets provide an in-store area where customers can eat prepared
foods. Some stores have taken the concept a step further. The following areexamples:• Many Whole Foods stores feature hot and cold buffet lines, chefs at cooking
stations, and pizza ovens, along with expanded dining areas. The 59,000-square-foot Whole Foods store at the Time Warner Center in New York City has a sleek300-seat dining area. Some Whole Food locations even have live music in thedining area on the weekends.
• Epicure Gourmet Market (Sunny Isles, Florida) has a full-service bar and outdoorpatio with umbrella-shaded tables for customers.
RESTAURANT, FOOD & BEVERAGE MARKET RESEARCH HANDBOOK 2013
• 198 •
• Wegmans stores have a sprawling Market Cafe area where customers have anextensive selection of prepared foods for consumption in an adjacent dining area. Wegmans’ outlet in Providence, Rhode Island, includes The Pub, a table-servicerestaurant and bar.
Other grocery brands operating on-premise full-service restaurants includeBristol Farms, Buehler’s, and Lunds/Byerly’s.
29.3 TrendsAccording to Retailer Meal Solutions Consumer Trend Report, published in
January 2013 by Technomic, 38% of consumers say that they purchase RMS fromtraditional supermarkets each week, a decline from 42% who did so in 2010.
_________________________________________________________________
“At the height of the economic downturn, manyconsumers flocked to supermarkets, massmerchandisers, warehouse clubs and otherretailers, looking for a deal on prepared foods.But now that the economy is recovering fromthe recession ... these consumers may bereversing the patterns they set a couple of yearsago by heading back to restaurants. Forretailers to gain or maintain their share offoodservice dollars, they’ll need to clearly standout from restaurants.”
Darren Tristano Executive Vice President Technomic, 1/29/13
_________________________________________________________________
The following are other findings of the Technomic report:• Among those who purchase RMS at least once a month, 43% do so four or more
times per month.• Opportunities exist for retailers to leverage their customization options to compete
with restaurants; only 38% of consumers say that retail prepared foods allow formore customization than food purchased from a restaurant.
RESTAURANT, FOOD & BEVERAGE MARKET RESEARCH HANDBOOK 2013
• 199 •
• While half of consumers think the quality of prepared foods has greatly improvedsince 2010, 40% say they would like to see more name-brand foods that typicallydenote a higher quality perception.
RESTAURANT, FOOD & BEVERAGE MARKET RESEARCH HANDBOOK 2013
• 200 •

PART V: MARKET LEADERS
RESTAURANT, FOOD & BEVERAGE MARKET RESEARCH HANDBOOK 2013
• 201 •
30
LARGEST BAKERY CAFE CHAINS
30.1 Largest ChainsAccording to Top 25 Bakery Cafe Chains Restaurant Report, by Technomic
(www.technomic.com), the following are the largest bakery cafe chains in the U.S.:• Alonti• Atlanta Bread Company• Au Bon Pain• Bear Rock • Boudin Bakery• Boudin San Francisco• Cafe Carolina and Bakery• Cafe Express• Camille’s Sidewalk Cafe• Champagne French Bakery Cafe• Corner Bakery Cafe• Crispers Fresh Salads and Such• Einstein Bros. Bagels• Europa Café• Frullati Café & Bakery• Jazzman’s Cafe & Bakery• La Madeline Country French Cafe• La Boulanger• Le Pain Quotidien• Panera Bread• Paradise Bakery• Pax Wholesome Foods• Sandella’s Flatbread Cafe• Specialty’s Café & Bakery• Wildflower Bread Company
30.2 Market ResourcesTop 25 Bakery Cafe Chains Restaurant Report, Technomic, Inc., 300 South RiversidePlaza, Suite 1940 South, Chicago, IL 60606. (312) 876-0004. (www.technomic.com)
RESTAURANT, FOOD & BEVERAGE MARKET RESEARCH HANDBOOK 2013
• 202 •

31
LARGEST BURGER CHAINS
31.1 Largest ChainsAccording to Top 75 Limited-Service Burger Chains Restaurant Report,
published by Technomic (www.technomic.com), the following are the largest limited-service burger chains in the U.S.:• A&W All-American Food • Arctic Circle Restaurants • B-BOP’S • b.good • Back Yard Burgers • Bagger Dave’s Legendary Burger Tavern • Baker’s Drive Thru • Beck’s Prime • Better Burger NYC • Blake’s Lotaburger • Blazing Onion Burger Company • Boardwalk Fresh Burgers & Fries • Bobby’s Burger Palace • Burger Hut Burgers • Burger King • Burger Lounge • Burger Street • Burgerville • Canyons Burger Company • Carl’s Jr. • Central Park USA • Checkers Drive-In Restaurants • Cheeseburger Bobby’s • Cheeseburger Charley’s• Culver’s• Elevation Burger • Energy Kitchen • Evos’...Feel Great Fast Food • Farmer Boys • Fatburger • Five Guys Burgers and Fries
RESTAURANT, FOOD & BEVERAGE MARKET RESEARCH HANDBOOK 2013
• 203 •
• Flamers Burgers and Chicken • Foster’s Grille • Freddy’s Frozen Custard & Steakburgers • Fuddruckers • Good Times Burgers & Frozen Custard• Hardee’s • Iceberg Drive Inn • In-N-Out Burger • Jack in the Box • Jack’s • Jake’s Wayback Burgers • Johnnie’s Charcoal Broiler • Johnny’s Lunch • Jollibee • Kidd Valley • Krystal Company • Larkburger • M Burger • Martin’s Restaurants • McDonald’s • Meatheads Burgers & Fries • Mighty Fine Burgers, Fries & Shakes • Mooyah Burgers & Fries • New York Burger Co. • Original Hamburger Stand • Pal’s Sudden Service • Rally’s Hamburgers • Remington Grill • Schoop’s Hamburgers • Shake Shack • Showmars Restaurant • Smashburger • Sonic Drive-Ins • Spangles• The Counter• The Habit Burger Grill • Umami Burger • Village Burger Bar • Ward’s Food Systems • Wendy’s• Whataburger • White Castle • Wild Willy’s Burgers
RESTAURANT, FOOD & BEVERAGE MARKET RESEARCH HANDBOOK 2013
• 204 •
31.2 Market ResourcesTop 75 Limited-Service Burger Chains Restaurant Report, Technomic, Inc., 300 SouthRiverside Plaza, Suite 1940 South, Chicago, IL 60606. (312) 876-0004. (www.technomic.com)
RESTAURANT, FOOD & BEVERAGE MARKET RESEARCH HANDBOOK 2013
• 205 •
32
LARGEST FAMILY-DINING CHAINS
32.1 Largest ChainsThe following are the largest family-dining chains (source: Technomic):
• Bakers Square• Big Boy Restaurants• Bob Evans Restaurants• Carrows• Coco’s Bakery Restaurant• Country Kitchen• Country Market Restaurant & Buffet• Cracker Barrel Old Country Store• Denny’s• Eat’n Park• Elmer’s• First Watch• Friendly’s• Golden Corral Buffet & Grill• Huddle House• IHOP• Luby’s• Marie Callender’s Restaurant & Bakery• Mimi’s Cafe• Old Country Buffet/HomeTown Buffet• The Original Pancake House• Perkins Restaurant & Bakery• Ryan’s• Shari’s Restaurants• Shoney’s• Sizzler• Village Inn• Waffle House
32.2 Market ResourcesTechnomic, Inc., 300 South Riverside Plaza, Suite 1940 South, Chicago, IL 60606. (312) 876-0004. (www.technomic.com)
RESTAURANT, FOOD & BEVERAGE MARKET RESEARCH HANDBOOK 2013
• 206 •
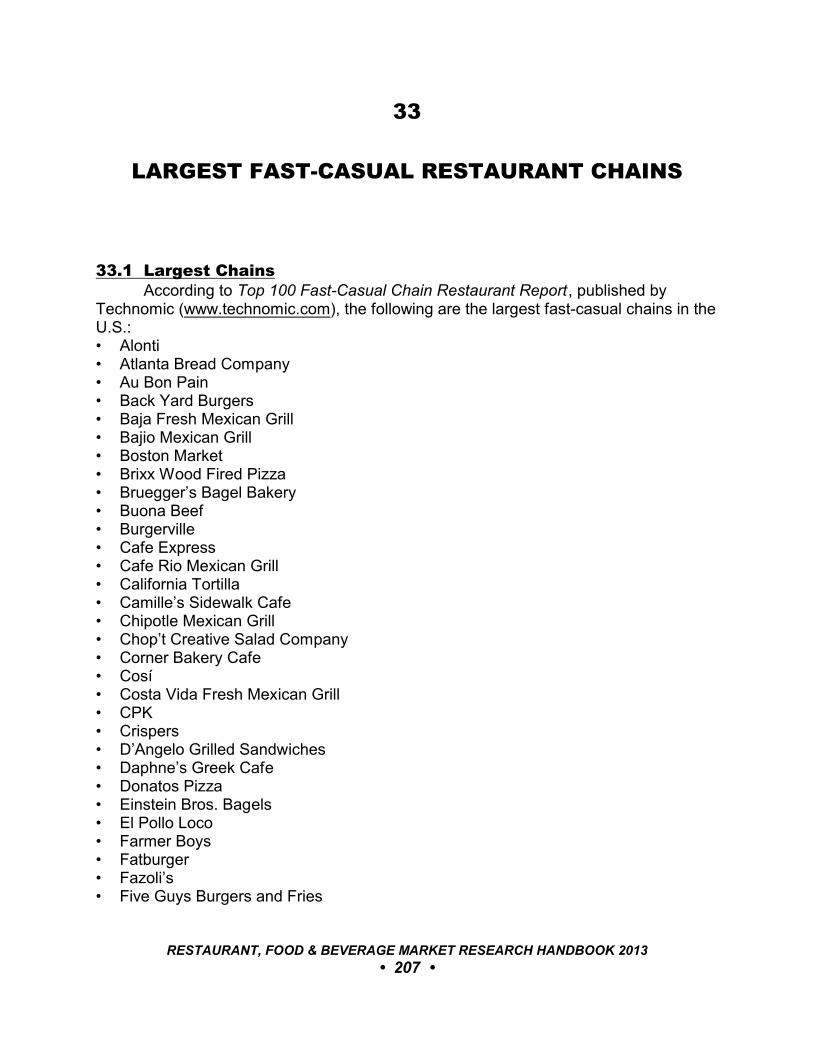
33
LARGEST FAST-CASUAL RESTAURANT CHAINS
33.1 Largest ChainsAccording to Top 100 Fast-Casual Chain Restaurant Report, published by
Technomic (www.technomic.com), the following are the largest fast-casual chains in theU.S.:• Alonti• Atlanta Bread Company• Au Bon Pain• Back Yard Burgers• Baja Fresh Mexican Grill• Bajio Mexican Grill• Boston Market• Brixx Wood Fired Pizza• Bruegger’s Bagel Bakery• Buona Beef• Burgerville• Cafe Express• Cafe Rio Mexican Grill• California Tortilla• Camille’s Sidewalk Cafe• Chipotle Mexican Grill• Chop’t Creative Salad Company• Corner Bakery Cafe• Cosí• Costa Vida Fresh Mexican Grill• CPK• Crispers• D’Angelo Grilled Sandwiches• Daphne’s Greek Cafe• Donatos Pizza• Einstein Bros. Bagels• El Pollo Loco• Farmer Boys• Fatburger• Fazoli’s• Five Guys Burgers and Fries
RESTAURANT, FOOD & BEVERAGE MARKET RESEARCH HANDBOOK 2013
• 207 •
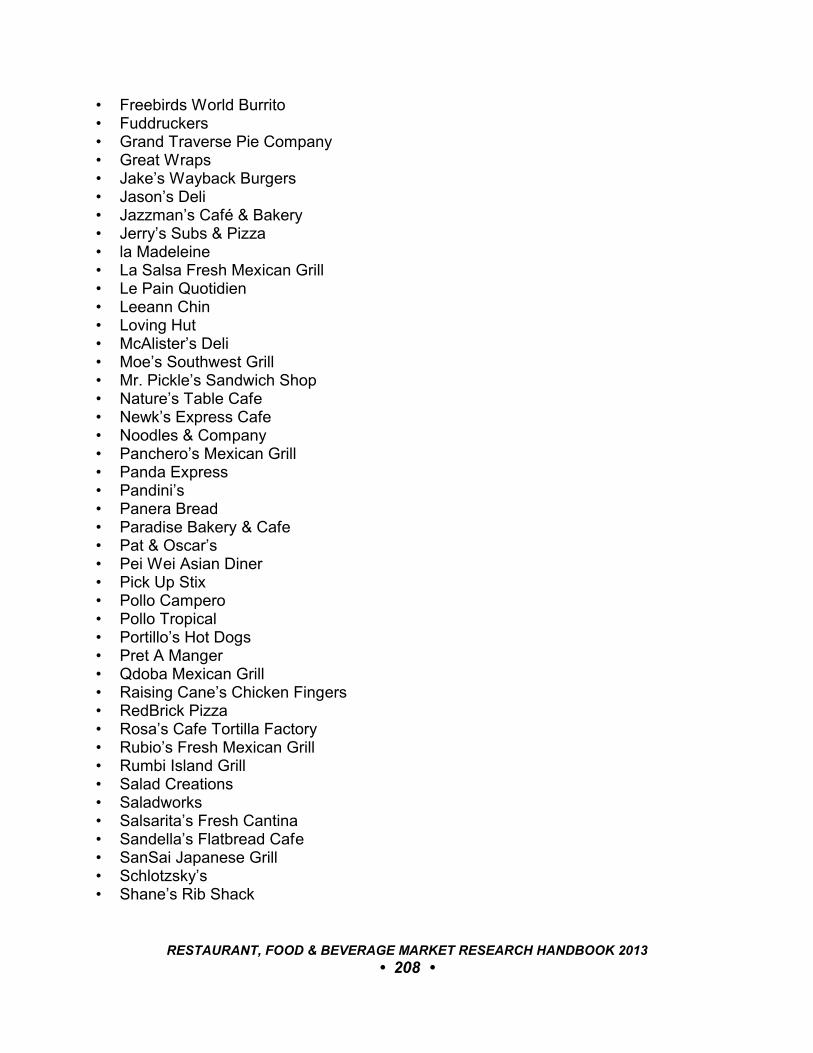
• Freebirds World Burrito• Fuddruckers• Grand Traverse Pie Company• Great Wraps• Jake’s Wayback Burgers• Jason’s Deli• Jazzman’s Café & Bakery• Jerry’s Subs & Pizza• la Madeleine• La Salsa Fresh Mexican Grill• Le Pain Quotidien• Leeann Chin• Loving Hut• McAlister’s Deli• Moe’s Southwest Grill• Mr. Pickle’s Sandwich Shop• Nature’s Table Cafe• Newk’s Express Cafe• Noodles & Company• Panchero’s Mexican Grill• Panda Express• Pandini’s• Panera Bread• Paradise Bakery & Cafe• Pat & Oscar’s• Pei Wei Asian Diner• Pick Up Stix• Pollo Campero• Pollo Tropical• Portillo’s Hot Dogs• Pret A Manger• Qdoba Mexican Grill• Raising Cane’s Chicken Fingers• RedBrick Pizza• Rosa’s Cafe Tortilla Factory• Rubio’s Fresh Mexican Grill• Rumbi Island Grill• Salad Creations• Saladworks• Salsarita’s Fresh Cantina• Sandella’s Flatbread Cafe• SanSai Japanese Grill• Schlotzsky’s• Shane’s Rib Shack
RESTAURANT, FOOD & BEVERAGE MARKET RESEARCH HANDBOOK 2013
• 208 •

• Sharky’s Woodfired Mexican Grill• Showmars Restaurant• Smashburger• Smithfield’s Chicken ‘N Bar-B-Q• Specialty’s Café & Bakery• Spicy Pickle• Straw Hat Pizza• Taco Bueno• Taco Cabana• Taco Del Mar• The Counter• The Habit Burger Grill• The Loop Pizza Grill• Tijuana Flats• Wahoo’s Fish Taco• Which Wich?• Wildflower Bread Company• Wing Zone• Wings To Go• Wingstop• Wolfgang Puck Express• Zaxby’s• Zoës Kitchen• Zoup! Fresh Soup Company• zpizza
33.2 Market ResourcesTop 100 Fast-Casual Chain Restaurant Report, Technomic, Inc., 300 South RiversidePlaza, Suite 1940 South, Chicago, IL 60606. (312) 876-0004. (www.technomic.com)
RESTAURANT, FOOD & BEVERAGE MARKET RESEARCH HANDBOOK 2013
• 209 •
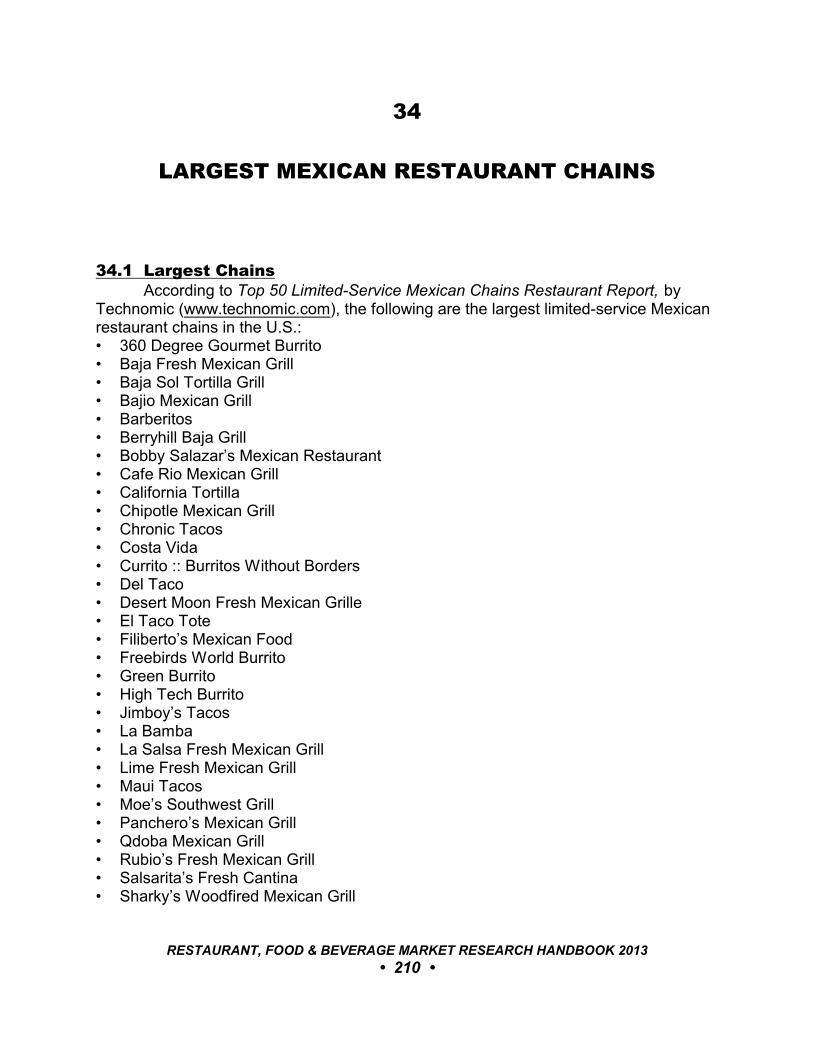
34
LARGEST MEXICAN RESTAURANT CHAINS
34.1 Largest ChainsAccording to Top 50 Limited-Service Mexican Chains Restaurant Report, by
Technomic (www.technomic.com), the following are the largest limited-service Mexicanrestaurant chains in the U.S.:• 360 Degree Gourmet Burrito• Baja Fresh Mexican Grill• Baja Sol Tortilla Grill• Bajio Mexican Grill• Barberitos• Berryhill Baja Grill• Bobby Salazar’s Mexican Restaurant• Cafe Rio Mexican Grill• California Tortilla• Chipotle Mexican Grill• Chronic Tacos• Costa Vida• Currito :: Burritos Without Borders• Del Taco• Desert Moon Fresh Mexican Grille• El Taco Tote• Filiberto’s Mexican Food• Freebirds World Burrito• Green Burrito• High Tech Burrito• Jimboy’s Tacos• La Bamba• La Salsa Fresh Mexican Grill• Lime Fresh Mexican Grill• Maui Tacos• Moe’s Southwest Grill• Panchero’s Mexican Grill• Qdoba Mexican Grill• Rubio’s Fresh Mexican Grill• Salsarita’s Fresh Cantina• Sharky’s Woodfired Mexican Grill
RESTAURANT, FOOD & BEVERAGE MARKET RESEARCH HANDBOOK 2013
• 210 •
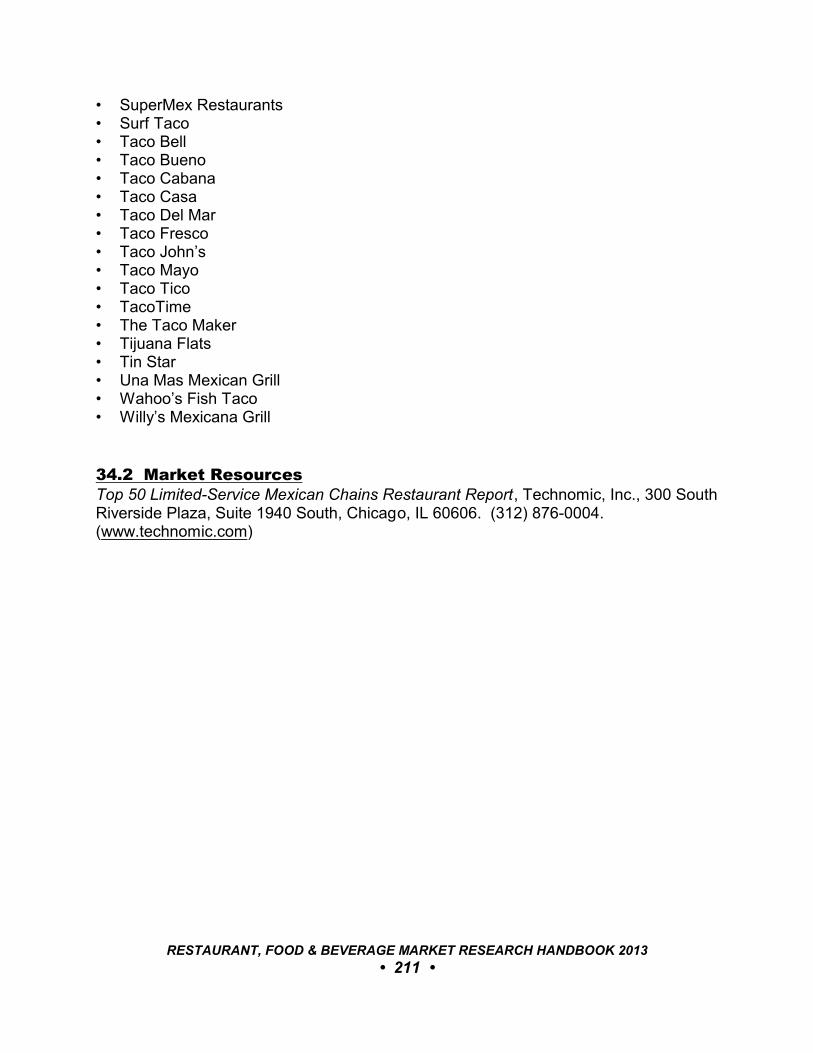
• SuperMex Restaurants• Surf Taco• Taco Bell• Taco Bueno• Taco Cabana• Taco Casa• Taco Del Mar• Taco Fresco• Taco John’s• Taco Mayo• Taco Tico• TacoTime• The Taco Maker• Tijuana Flats• Tin Star• Una Mas Mexican Grill• Wahoo’s Fish Taco• Willy’s Mexicana Grill
34.2 Market ResourcesTop 50 Limited-Service Mexican Chains Restaurant Report, Technomic, Inc., 300 SouthRiverside Plaza, Suite 1940 South, Chicago, IL 60606. (312) 876-0004. (www.technomic.com)
RESTAURANT, FOOD & BEVERAGE MARKET RESEARCH HANDBOOK 2013
• 211 •
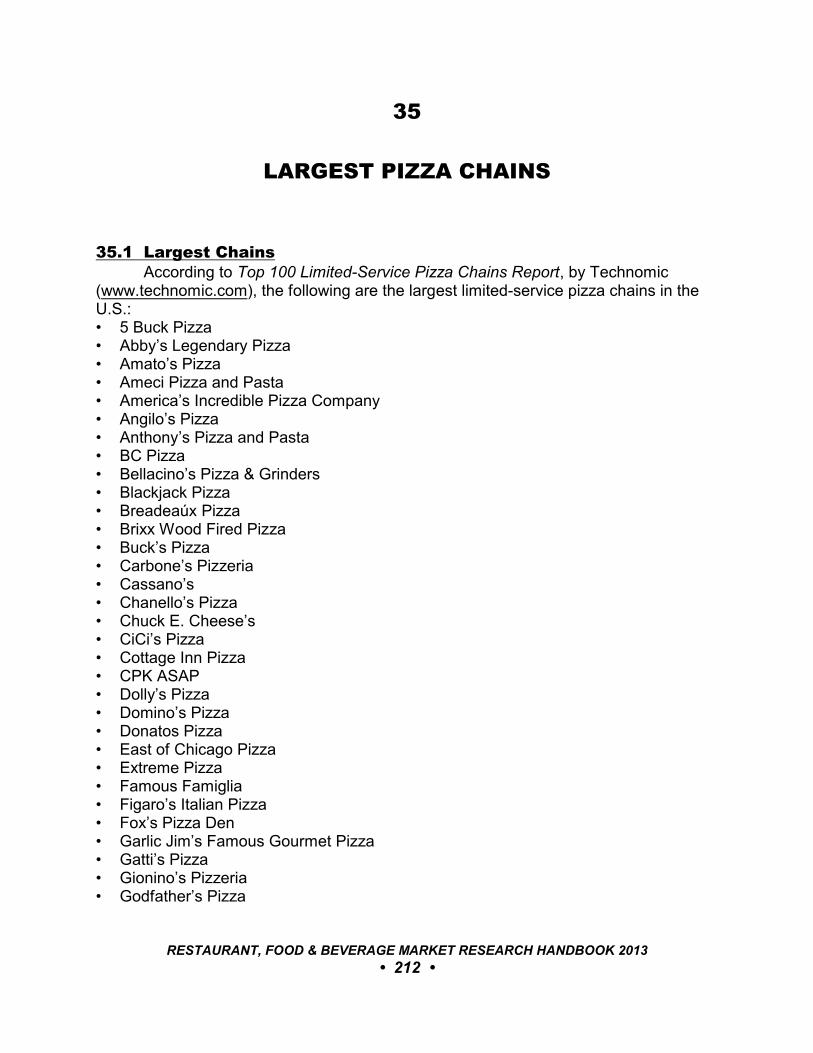
35
LARGEST PIZZA CHAINS
35.1 Largest ChainsAccording to Top 100 Limited-Service Pizza Chains Report, by Technomic
(www.technomic.com), the following are the largest limited-service pizza chains in theU.S.:• 5 Buck Pizza• Abby’s Legendary Pizza• Amato’s Pizza• Ameci Pizza and Pasta• America’s Incredible Pizza Company• Angilo’s Pizza• Anthony’s Pizza and Pasta• BC Pizza• Bellacino’s Pizza & Grinders• Blackjack Pizza• Breadeaúx Pizza• Brixx Wood Fired Pizza• Buck’s Pizza• Carbone’s Pizzeria• Cassano’s• Chanello’s Pizza• Chuck E. Cheese’s• CiCi’s Pizza• Cottage Inn Pizza• CPK ASAP• Dolly’s Pizza• Domino’s Pizza• Donatos Pizza• East of Chicago Pizza• Extreme Pizza• Famous Famiglia• Figaro’s Italian Pizza• Fox’s Pizza Den• Garlic Jim’s Famous Gourmet Pizza• Gatti’s Pizza• Gionino’s Pizzeria• Godfather’s Pizza
RESTAURANT, FOOD & BEVERAGE MARKET RESEARCH HANDBOOK 2013
• 212 •
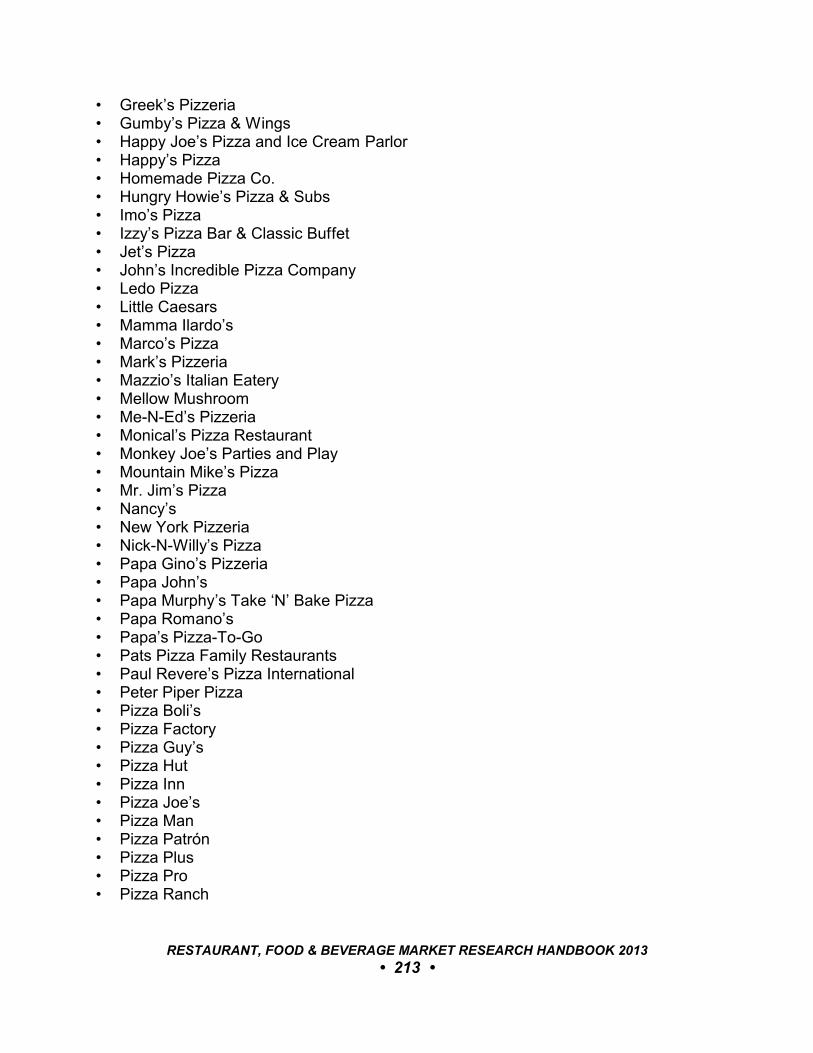
• Greek’s Pizzeria• Gumby’s Pizza & Wings• Happy Joe’s Pizza and Ice Cream Parlor• Happy’s Pizza• Homemade Pizza Co.• Hungry Howie’s Pizza & Subs• Imo’s Pizza• Izzy’s Pizza Bar & Classic Buffet• Jet’s Pizza• John’s Incredible Pizza Company• Ledo Pizza• Little Caesars• Mamma Ilardo’s• Marco’s Pizza• Mark’s Pizzeria• Mazzio’s Italian Eatery• Mellow Mushroom• Me-N-Ed’s Pizzeria• Monical’s Pizza Restaurant• Monkey Joe’s Parties and Play• Mountain Mike’s Pizza• Mr. Jim’s Pizza• Nancy’s• New York Pizzeria• Nick-N-Willy’s Pizza• Papa Gino’s Pizzeria• Papa John’s• Papa Murphy’s Take ‘N’ Bake Pizza• Papa Romano’s• Papa’s Pizza-To-Go• Pats Pizza Family Restaurants• Paul Revere’s Pizza International• Peter Piper Pizza• Pizza Boli’s• Pizza Factory• Pizza Guy’s• Pizza Hut• Pizza Inn• Pizza Joe’s• Pizza Man• Pizza Patrón• Pizza Plus• Pizza Pro• Pizza Ranch
RESTAURANT, FOOD & BEVERAGE MARKET RESEARCH HANDBOOK 2013
• 213 •
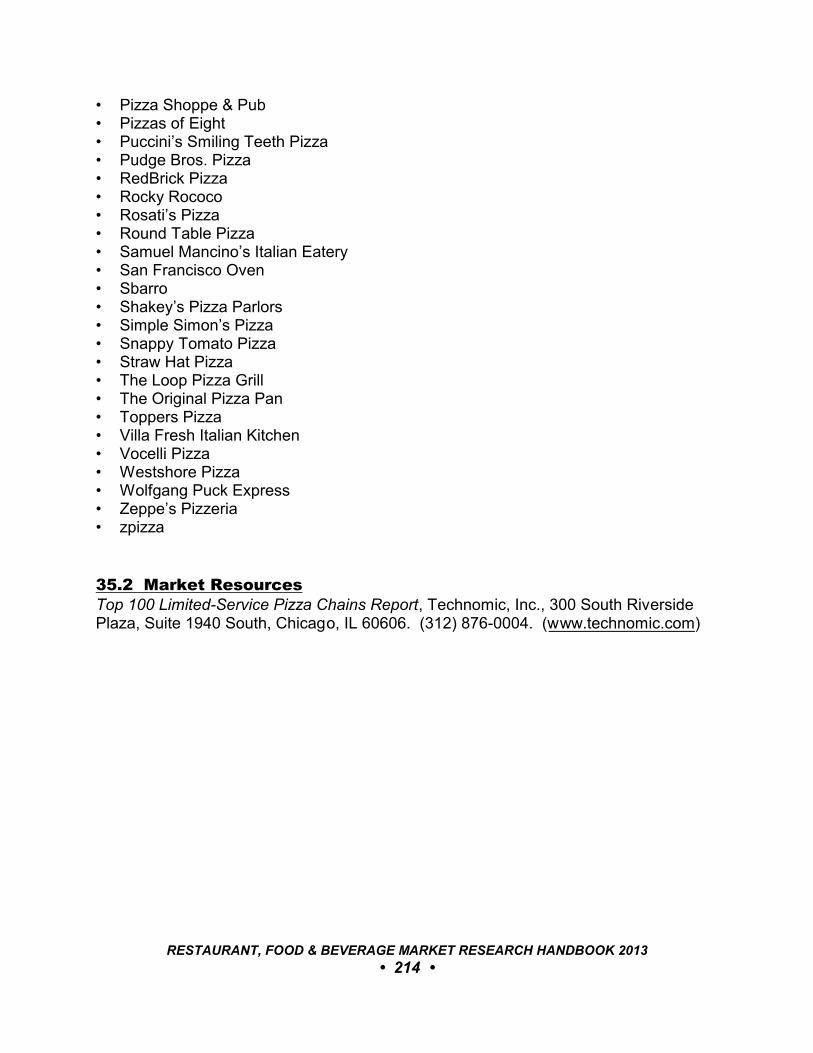
• Pizza Shoppe & Pub• Pizzas of Eight• Puccini’s Smiling Teeth Pizza• Pudge Bros. Pizza• RedBrick Pizza• Rocky Rococo• Rosati’s Pizza• Round Table Pizza• Samuel Mancino’s Italian Eatery• San Francisco Oven• Sbarro• Shakey’s Pizza Parlors• Simple Simon’s Pizza• Snappy Tomato Pizza• Straw Hat Pizza• The Loop Pizza Grill• The Original Pizza Pan• Toppers Pizza• Villa Fresh Italian Kitchen• Vocelli Pizza• Westshore Pizza• Wolfgang Puck Express• Zeppe’s Pizzeria• zpizza
35.2 Market ResourcesTop 100 Limited-Service Pizza Chains Report, Technomic, Inc., 300 South RiversidePlaza, Suite 1940 South, Chicago, IL 60606. (312) 876-0004. (www.technomic.com)
RESTAURANT, FOOD & BEVERAGE MARKET RESEARCH HANDBOOK 2013
• 214 •
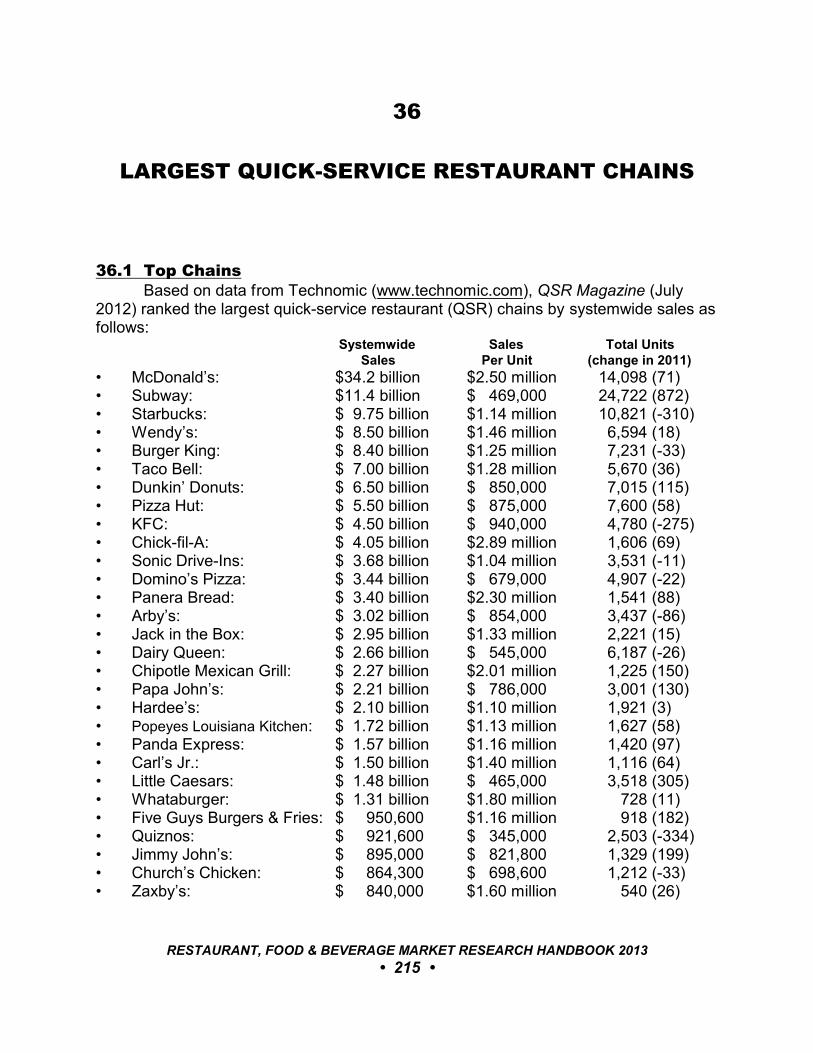
36
LARGEST QUICK-SERVICE RESTAURANT CHAINS
36.1 Top ChainsBased on data from Technomic (www.technomic.com), QSR Magazine (July
2012) ranked the largest quick-service restaurant (QSR) chains by systemwide sales asfollows:
Systemwide Sales Total Units Sales Per Unit (change in 2011)
• McDonald’s: $34.2 billion $2.50 million 14,098 (71)• Subway: $11.4 billion $ 469,000 24,722 (872)• Starbucks: $ 9.75 billion $1.14 million 10,821 (-310)• Wendy’s: $ 8.50 billion $1.46 million 6,594 (18)• Burger King: $ 8.40 billion $1.25 million 7,231 (-33)• Taco Bell: $ 7.00 billion $1.28 million 5,670 (36)• Dunkin’ Donuts: $ 6.50 billion $ 850,000 7,015 (115)• Pizza Hut: $ 5.50 billion $ 875,000 7,600 (58)• KFC: $ 4.50 billion $ 940,000 4,780 (-275)• Chick-fil-A: $ 4.05 billion $2.89 million 1,606 (69)• Sonic Drive-Ins: $ 3.68 billion $1.04 million 3,531 (-11)• Domino’s Pizza: $ 3.44 billion $ 679,000 4,907 (-22)• Panera Bread: $ 3.40 billion $2.30 million 1,541 (88)• Arby’s: $ 3.02 billion $ 854,000 3,437 (-86)• Jack in the Box: $ 2.95 billion $1.33 million 2,221 (15)• Dairy Queen: $ 2.66 billion $ 545,000 6,187 (-26)• Chipotle Mexican Grill: $ 2.27 billion $2.01 million 1,225 (150)• Papa John’s: $ 2.21 billion $ 786,000 3,001 (130)• Hardee’s: $ 2.10 billion $1.10 million 1,921 (3)• Popeyes Louisiana Kitchen: $ 1.72 billion $1.13 million 1,627 (58)• Panda Express: $ 1.57 billion $1.16 million 1,420 (97)• Carl’s Jr.: $ 1.50 billion $1.40 million 1,116 (64)• Little Caesars: $ 1.48 billion $ 465,000 3,518 (305)• Whataburger: $ 1.31 billion $1.80 million 728 (11)• Five Guys Burgers & Fries: $ 950,600 $1.16 million 918 (182)• Quiznos: $ 921,600 $ 345,000 2,503 (-334)• Jimmy John’s: $ 895,000 $ 821,800 1,329 (199)• Church’s Chicken: $ 864,300 $ 698,600 1,212 (-33)• Zaxby’s: $ 840,000 $1.60 million 540 (26)
RESTAURANT, FOOD & BEVERAGE MARKET RESEARCH HANDBOOK 2013
• 215 •

• Steak ‘n Shake: $ 823,900 $1.65 million 491 (4)• Bojangles’: $ 767,400 $1.60 million 506 (21)• Culver’s: $ 747,100 $1.71 million 444 (20)• Papa Murphy’s: $ 695,900 $ 559,500 1,283 (42)• Checkers/Rally’s: $ 669,000 $ 852,000 780 (-18)• Long John Silver’s: $ 635,000 $ 670,000 932 (-32)• White Castle: $ 631,700 $1.25 million 410 (-5)• Del Taco: $ 590,700 $1.10 million 532 (10)• El Pollo Loco: $ 545,000 $1.43 million 394 (-18)• Jason’s Deli: $ 534,100 $2.20 million 233 (12)• Boston Market: $ 532,000 $1.10 million 481 (-10)• Krispy Kreme: $ 531,700 $2.30 million 234 (5)• Qdoba Mexican Grill: $ 528,700 $ 961,000 583 (58)• CiCi’s Pizza: $ 516,000 $ 895,400 573 (-21)• In-N-Out Burger: $ 498,500 $1.93 million 266 (14)• Baskin-Robbins: $ 495,900 $ 200,000 2,457 (-43)• Tim Hortons: $ 473,000 $1.07 million 714 (112)• Einstein Bros. Bagels: $ 439,000 $ 884,000 534 (40)• Captain D’s: $ 433,300 $ 832,000 519 (-12)• Sbarro: $ 420,000 $ 690,000 611 (-70)• Krystal: $ 404,900 $1.12 million 357 (-7)
36.2 Largest QSR Chains By CategoryRanked by systemwide sales, the largest QSR chains are as follows (source:
QSR Magazine):Asian• Panda Express: $ 1.57 billion
Burgers• McDonald’s: $34.2 billion• Wendy’s: $ 8.50 billion• Burger King: $ 8.40 billion• Sonic Drive-In: $ 3.69 billion• Jack in the Box: $ 2.95 billion• Dairy Queen: $ 2.66 billion• Hardee’s: $ 2.10 billion• Carl’s Jr.: $ 1.50 billion• Whataburger: $ 1.31 billion• Five Guys Burgers & Fries: $ 950 million• Steak-N-Shake: $ 824 million• Culver’s: $ 747 million• Checkers/Rally’s: $ 670 million
RESTAURANT, FOOD & BEVERAGE MARKET RESEARCH HANDBOOK 2013
• 216 •
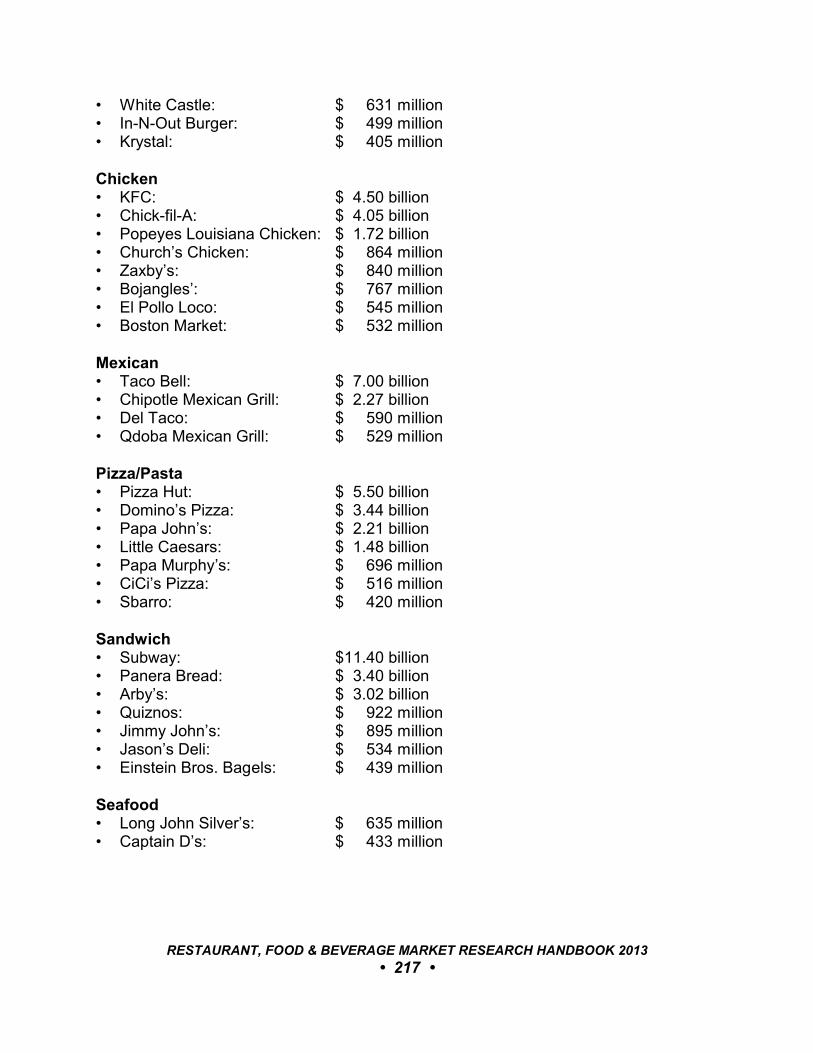
• White Castle: $ 631 million• In-N-Out Burger: $ 499 million• Krystal: $ 405 million
Chicken• KFC: $ 4.50 billion• Chick-fil-A: $ 4.05 billion• Popeyes Louisiana Chicken: $ 1.72 billion• Church’s Chicken: $ 864 million• Zaxby’s: $ 840 million• Bojangles’: $ 767 million• El Pollo Loco: $ 545 million• Boston Market: $ 532 million
Mexican• Taco Bell: $ 7.00 billion• Chipotle Mexican Grill: $ 2.27 billion• Del Taco: $ 590 million• Qdoba Mexican Grill: $ 529 million
Pizza/Pasta• Pizza Hut: $ 5.50 billion• Domino’s Pizza: $ 3.44 billion• Papa John’s: $ 2.21 billion• Little Caesars: $ 1.48 billion• Papa Murphy’s: $ 696 million• CiCi’s Pizza: $ 516 million• Sbarro: $ 420 million
Sandwich• Subway: $11.40 billion• Panera Bread: $ 3.40 billion• Arby’s: $ 3.02 billion• Quiznos: $ 922 million• Jimmy John’s: $ 895 million• Jason’s Deli: $ 534 million• Einstein Bros. Bagels: $ 439 million
Seafood• Long John Silver’s: $ 635 million• Captain D’s: $ 433 million
RESTAURANT, FOOD & BEVERAGE MARKET RESEARCH HANDBOOK 2013
• 217 •

Snack• Starbucks: $ 9.75 billion• Dunkin’ Donuts: $ 6.50 billion• Baskin-Robbins: $ 496 million• Tim Hortons: $ 473 million
RESTAURANT, FOOD & BEVERAGE MARKET RESEARCH HANDBOOK 2013
• 218 •
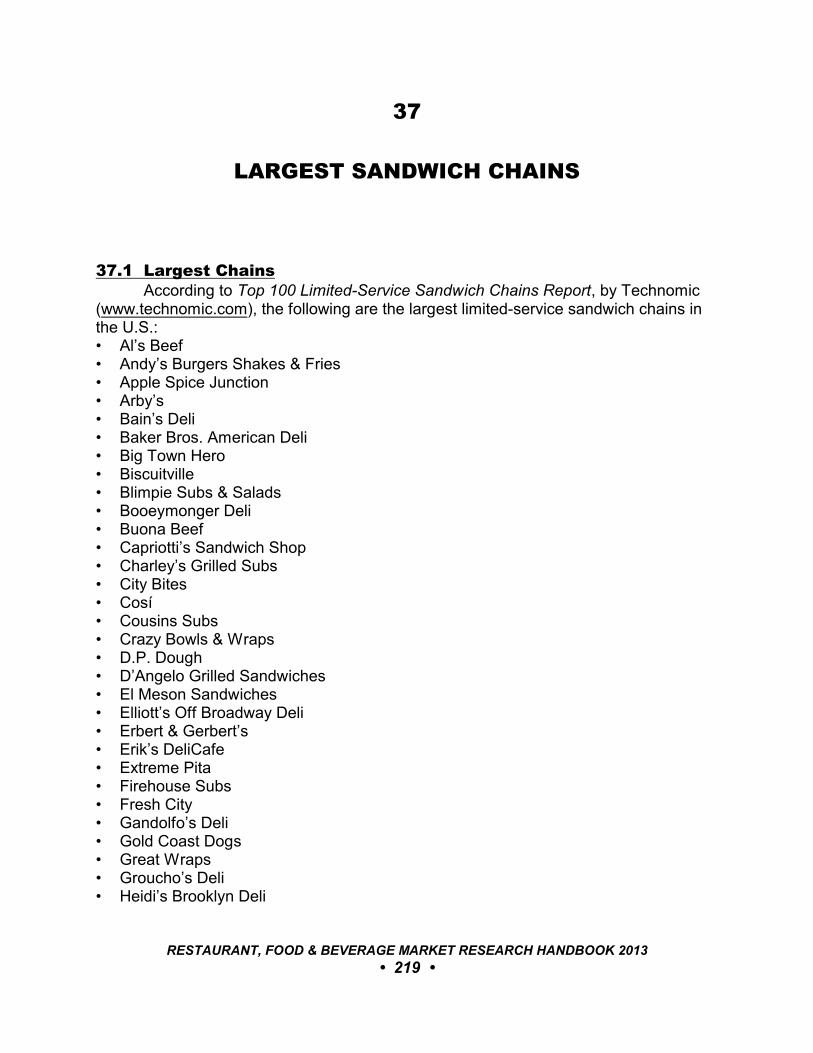
37
LARGEST SANDWICH CHAINS
37.1 Largest ChainsAccording to Top 100 Limited-Service Sandwich Chains Report, by Technomic
(www.technomic.com), the following are the largest limited-service sandwich chains inthe U.S.:• Al’s Beef• Andy’s Burgers Shakes & Fries• Apple Spice Junction• Arby’s• Bain’s Deli• Baker Bros. American Deli• Big Town Hero• Biscuitville• Blimpie Subs & Salads• Booeymonger Deli• Buona Beef• Capriotti’s Sandwich Shop• Charley’s Grilled Subs• City Bites• Cosí• Cousins Subs• Crazy Bowls & Wraps• D.P. Dough• D’Angelo Grilled Sandwiches• El Meson Sandwiches• Elliott’s Off Broadway Deli• Erbert & Gerbert’s• Erik’s DeliCafe• Extreme Pita• Firehouse Subs• Fresh City• Gandolfo’s Deli• Gold Coast Dogs• Great Wraps• Groucho’s Deli• Heidi’s Brooklyn Deli
RESTAURANT, FOOD & BEVERAGE MARKET RESEARCH HANDBOOK 2013
• 219 •

• Hogi Yogi• Hot Dog on a Stick• Jason’s Deli• Jerry’s Subs & Pizza• Jersey Mike’s Subs• Jimmy John’s Gourmet Sandwich Shop• Jody Maroni’s Sausage Kingdom• Jreck Subs• Larry’s Giant Subs• Lenny’s Sub Shop• Lion’s Choice• Maid-Rite• McAlister’s Deli• Miami Subs Grill• Milios Sandwiches• Mr. Goodcents Subs & Pastas• Mr. Hero• Mr. Pickle’s Sandwich Shop• Mr. Pita• Mr. Subb• Mr. Submarine’s• Murphy’s Deli• Nathan’s Famous• Obee’s• Organic To Go• Penn Station East Coast Subs• Pepperjax Grill• Philly Connection• Pita Pit• Planet Sub• Pockets• Port of Subs• Portillo’s Hot Dogs• Potbelly Sandwich Works• Pret A Manger• Quiznos• Rio Wraps Southwestern Grill• Roly Poly• Roy Rogers Restaurants• Runza• Schlotzsky’s• Sheetz• Silver Mine Subs• Smiling Moose Deli
RESTAURANT, FOOD & BEVERAGE MARKET RESEARCH HANDBOOK 2013
• 220 •
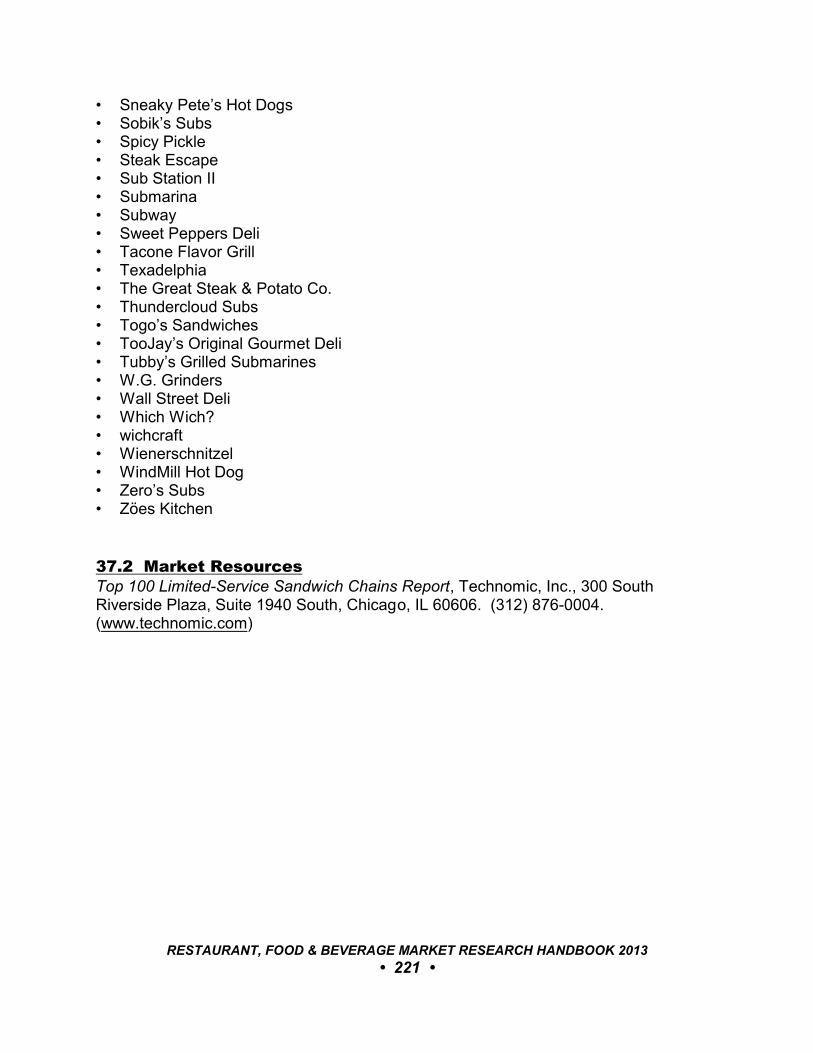
• Sneaky Pete’s Hot Dogs• Sobik’s Subs• Spicy Pickle• Steak Escape• Sub Station II• Submarina• Subway• Sweet Peppers Deli• Tacone Flavor Grill• Texadelphia• The Great Steak & Potato Co.• Thundercloud Subs• Togo’s Sandwiches• TooJay’s Original Gourmet Deli• Tubby’s Grilled Submarines• W.G. Grinders• Wall Street Deli• Which Wich?• wichcraft• Wienerschnitzel• WindMill Hot Dog• Zero’s Subs• Zöes Kitchen
37.2 Market ResourcesTop 100 Limited-Service Sandwich Chains Report, Technomic, Inc., 300 SouthRiverside Plaza, Suite 1940 South, Chicago, IL 60606. (312) 876-0004. (www.technomic.com)
RESTAURANT, FOOD & BEVERAGE MARKET RESEARCH HANDBOOK 2013
• 221 •
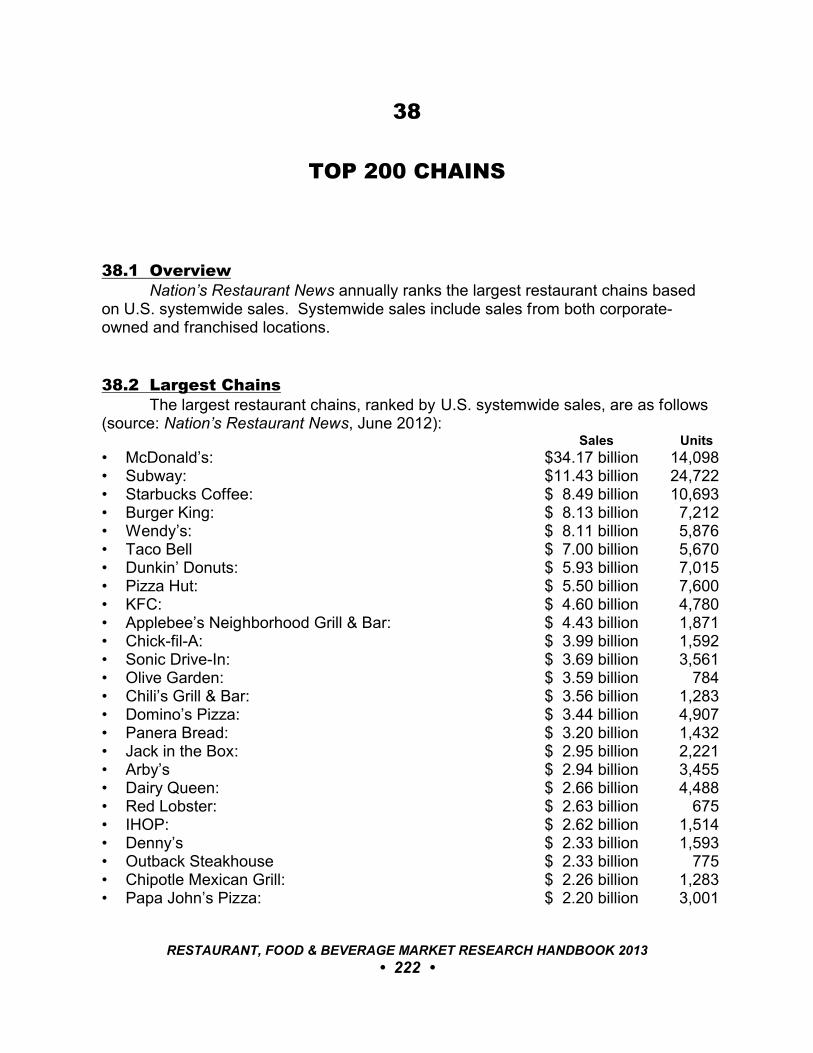
38
TOP 200 CHAINS
38.1 OverviewNation’s Restaurant News annually ranks the largest restaurant chains based
on U.S. systemwide sales. Systemwide sales include sales from both corporate-owned and franchised locations.
38.2 Largest ChainsThe largest restaurant chains, ranked by U.S. systemwide sales, are as follows
(source: Nation’s Restaurant News, June 2012): Sales Units
• McDonald’s: $34.17 billion 14,098• Subway: $11.43 billion 24,722• Starbucks Coffee: $ 8.49 billion 10,693• Burger King: $ 8.13 billion 7,212• Wendy’s: $ 8.11 billion 5,876• Taco Bell $ 7.00 billion 5,670• Dunkin’ Donuts: $ 5.93 billion 7,015• Pizza Hut: $ 5.50 billion 7,600• KFC: $ 4.60 billion 4,780• Applebee’s Neighborhood Grill & Bar: $ 4.43 billion 1,871• Chick-fil-A: $ 3.99 billion 1,592• Sonic Drive-In: $ 3.69 billion 3,561• Olive Garden: $ 3.59 billion 784• Chili’s Grill & Bar: $ 3.56 billion 1,283• Domino’s Pizza: $ 3.44 billion 4,907• Panera Bread: $ 3.20 billion 1,432• Jack in the Box: $ 2.95 billion 2,221• Arby’s $ 2.94 billion 3,455• Dairy Queen: $ 2.66 billion 4,488• Red Lobster: $ 2.63 billion 675• IHOP: $ 2.62 billion 1,514• Denny’s $ 2.33 billion 1,593• Outback Steakhouse $ 2.33 billion 775• Chipotle Mexican Grill: $ 2.26 billion 1,283• Papa John’s Pizza: $ 2.20 billion 3,001
RESTAURANT, FOOD & BEVERAGE MARKET RESEARCH HANDBOOK 2013
• 222 •
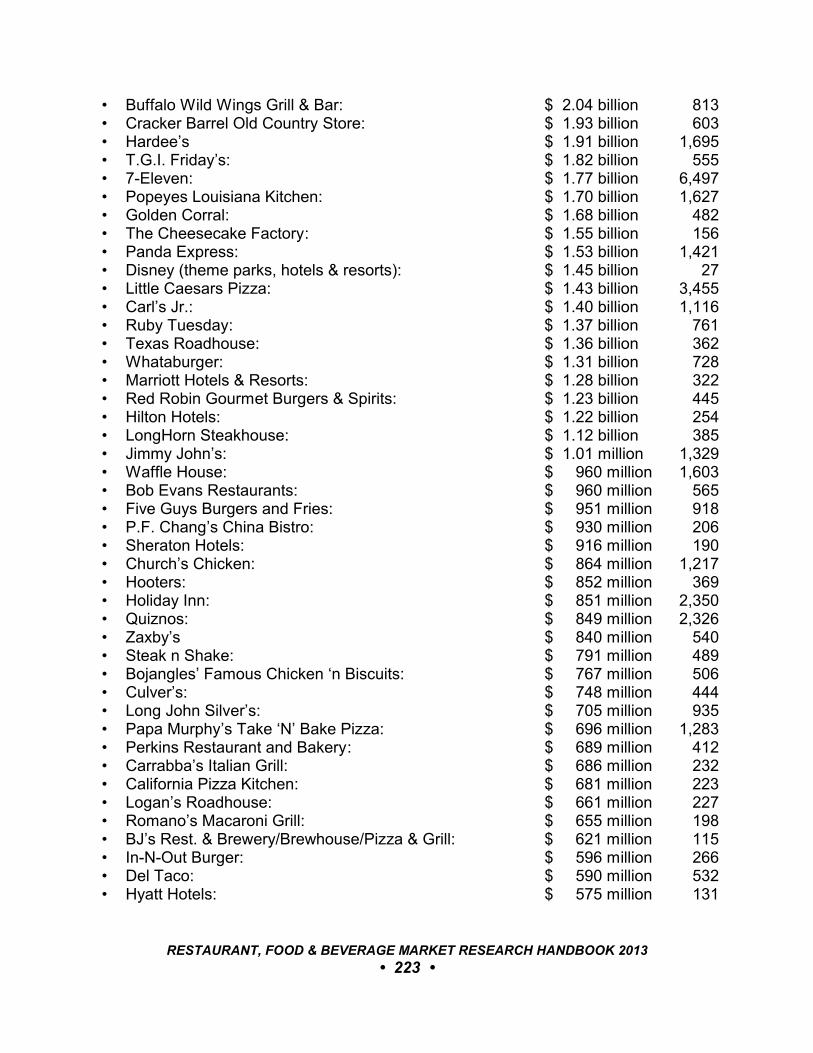
• Buffalo Wild Wings Grill & Bar: $ 2.04 billion 813• Cracker Barrel Old Country Store: $ 1.93 billion 603• Hardee’s $ 1.91 billion 1,695• T.G.I. Friday’s: $ 1.82 billion 555• 7-Eleven: $ 1.77 billion 6,497• Popeyes Louisiana Kitchen: $ 1.70 billion 1,627• Golden Corral: $ 1.68 billion 482• The Cheesecake Factory: $ 1.55 billion 156• Panda Express: $ 1.53 billion 1,421• Disney (theme parks, hotels & resorts): $ 1.45 billion 27• Little Caesars Pizza: $ 1.43 billion 3,455• Carl’s Jr.: $ 1.40 billion 1,116• Ruby Tuesday: $ 1.37 billion 761• Texas Roadhouse: $ 1.36 billion 362• Whataburger: $ 1.31 billion 728• Marriott Hotels & Resorts: $ 1.28 billion 322• Red Robin Gourmet Burgers & Spirits: $ 1.23 billion 445• Hilton Hotels: $ 1.22 billion 254• LongHorn Steakhouse: $ 1.12 billion 385• Jimmy John’s: $ 1.01 million 1,329• Waffle House: $ 960 million 1,603• Bob Evans Restaurants: $ 960 million 565• Five Guys Burgers and Fries: $ 951 million 918• P.F. Chang’s China Bistro: $ 930 million 206• Sheraton Hotels: $ 916 million 190• Church’s Chicken: $ 864 million 1,217• Hooters: $ 852 million 369• Holiday Inn: $ 851 million 2,350• Quiznos: $ 849 million 2,326• Zaxby’s $ 840 million 540• Steak n Shake: $ 791 million 489• Bojangles’ Famous Chicken ‘n Biscuits: $ 767 million 506• Culver’s: $ 748 million 444• Long John Silver’s: $ 705 million 935• Papa Murphy’s Take ‘N’ Bake Pizza: $ 696 million 1,283• Perkins Restaurant and Bakery: $ 689 million 412• Carrabba’s Italian Grill: $ 686 million 232• California Pizza Kitchen: $ 681 million 223• Logan’s Roadhouse: $ 661 million 227• Romano’s Macaroni Grill: $ 655 million 198• BJ’s Rest. & Brewery/Brewhouse/Pizza & Grill: $ 621 million 115• In-N-Out Burger: $ 596 million 266• Del Taco: $ 590 million 532• Hyatt Hotels: $ 575 million 131
RESTAURANT, FOOD & BEVERAGE MARKET RESEARCH HANDBOOK 2013
• 223 •
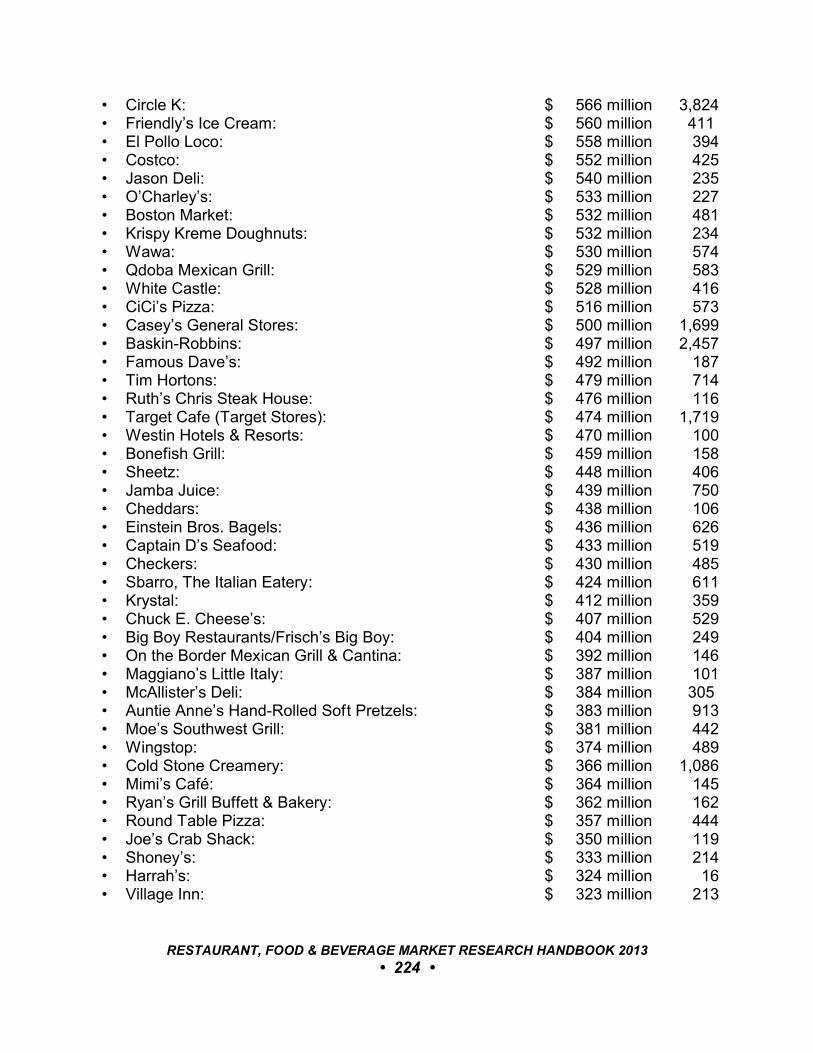
• Circle K: $ 566 million 3,824• Friendly’s Ice Cream: $ 560 million 411• El Pollo Loco: $ 558 million 394• Costco: $ 552 million 425• Jason Deli: $ 540 million 235• O’Charley’s: $ 533 million 227• Boston Market: $ 532 million 481• Krispy Kreme Doughnuts: $ 532 million 234• Wawa: $ 530 million 574• Qdoba Mexican Grill: $ 529 million 583• White Castle: $ 528 million 416• CiCi’s Pizza: $ 516 million 573• Casey’s General Stores: $ 500 million 1,699• Baskin-Robbins: $ 497 million 2,457• Famous Dave’s: $ 492 million 187• Tim Hortons: $ 479 million 714• Ruth’s Chris Steak House: $ 476 million 116• Target Cafe (Target Stores): $ 474 million 1,719• Westin Hotels & Resorts: $ 470 million 100• Bonefish Grill: $ 459 million 158• Sheetz: $ 448 million 406• Jamba Juice: $ 439 million 750• Cheddars: $ 438 million 106• Einstein Bros. Bagels: $ 436 million 626• Captain D’s Seafood: $ 433 million 519• Checkers: $ 430 million 485• Sbarro, The Italian Eatery: $ 424 million 611• Krystal: $ 412 million 359• Chuck E. Cheese’s: $ 407 million 529• Big Boy Restaurants/Frisch’s Big Boy: $ 404 million 249• On the Border Mexican Grill & Cantina: $ 392 million 146• Maggiano’s Little Italy: $ 387 million 101• McAllister’s Deli: $ 384 million 305• Auntie Anne’s Hand-Rolled Soft Pretzels: $ 383 million 913• Moe’s Southwest Grill: $ 381 million 442• Wingstop: $ 374 million 489• Cold Stone Creamery: $ 366 million 1,086• Mimi’s Café: $ 364 million 145• Ryan’s Grill Buffett & Bakery: $ 362 million 162• Round Table Pizza: $ 357 million 444• Joe’s Crab Shack: $ 350 million 119• Shoney’s: $ 333 million 214• Harrah’s: $ 324 million 16• Village Inn: $ 323 million 213
RESTAURANT, FOOD & BEVERAGE MARKET RESEARCH HANDBOOK 2013
• 224 •
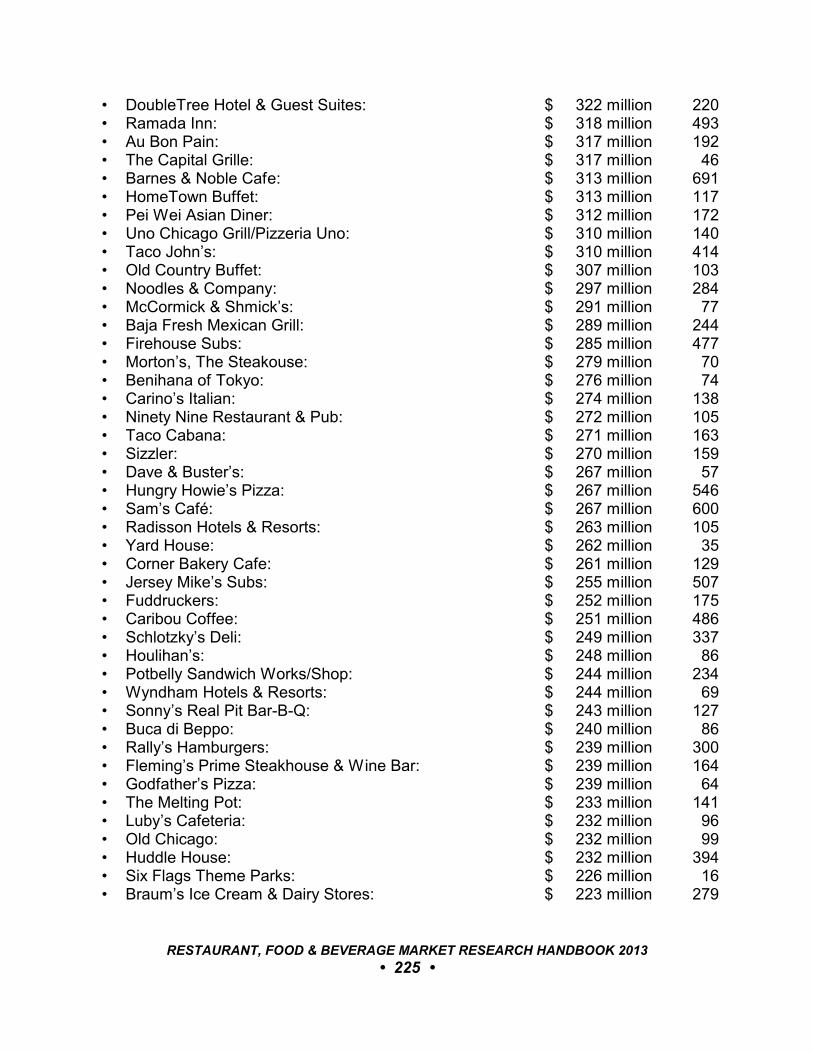
• DoubleTree Hotel & Guest Suites: $ 322 million 220• Ramada Inn: $ 318 million 493• Au Bon Pain: $ 317 million 192• The Capital Grille: $ 317 million 46• Barnes & Noble Cafe: $ 313 million 691• HomeTown Buffet: $ 313 million 117• Pei Wei Asian Diner: $ 312 million 172• Uno Chicago Grill/Pizzeria Uno: $ 310 million 140• Taco John’s: $ 310 million 414• Old Country Buffet: $ 307 million 103• Noodles & Company: $ 297 million 284• McCormick & Shmick’s: $ 291 million 77• Baja Fresh Mexican Grill: $ 289 million 244• Firehouse Subs: $ 285 million 477• Morton’s, The Steakouse: $ 279 million 70• Benihana of Tokyo: $ 276 million 74• Carino’s Italian: $ 274 million 138• Ninety Nine Restaurant & Pub: $ 272 million 105• Taco Cabana: $ 271 million 163• Sizzler: $ 270 million 159• Dave & Buster’s: $ 267 million 57• Hungry Howie’s Pizza: $ 267 million 546• Sam’s Café: $ 267 million 600• Radisson Hotels & Resorts: $ 263 million 105• Yard House: $ 262 million 35• Corner Bakery Cafe: $ 261 million 129• Jersey Mike’s Subs: $ 255 million 507• Fuddruckers: $ 252 million 175• Caribou Coffee: $ 251 million 486• Schlotzky’s Deli: $ 249 million 337• Houlihan’s: $ 248 million 86• Potbelly Sandwich Works/Shop: $ 244 million 234• Wyndham Hotels & Resorts: $ 244 million 69• Sonny’s Real Pit Bar-B-Q: $ 243 million 127• Buca di Beppo: $ 240 million 86• Rally’s Hamburgers: $ 239 million 300• Fleming’s Prime Steakhouse & Wine Bar: $ 239 million 164• Godfather’s Pizza: $ 239 million 64• The Melting Pot: $ 233 million 141• Luby’s Cafeteria: $ 232 million 96• Old Chicago: $ 232 million 99• Huddle House: $ 232 million 394• Six Flags Theme Parks: $ 226 million 16• Braum’s Ice Cream & Dairy Stores: $ 223 million 279
RESTAURANT, FOOD & BEVERAGE MARKET RESEARCH HANDBOOK 2013
• 225 •
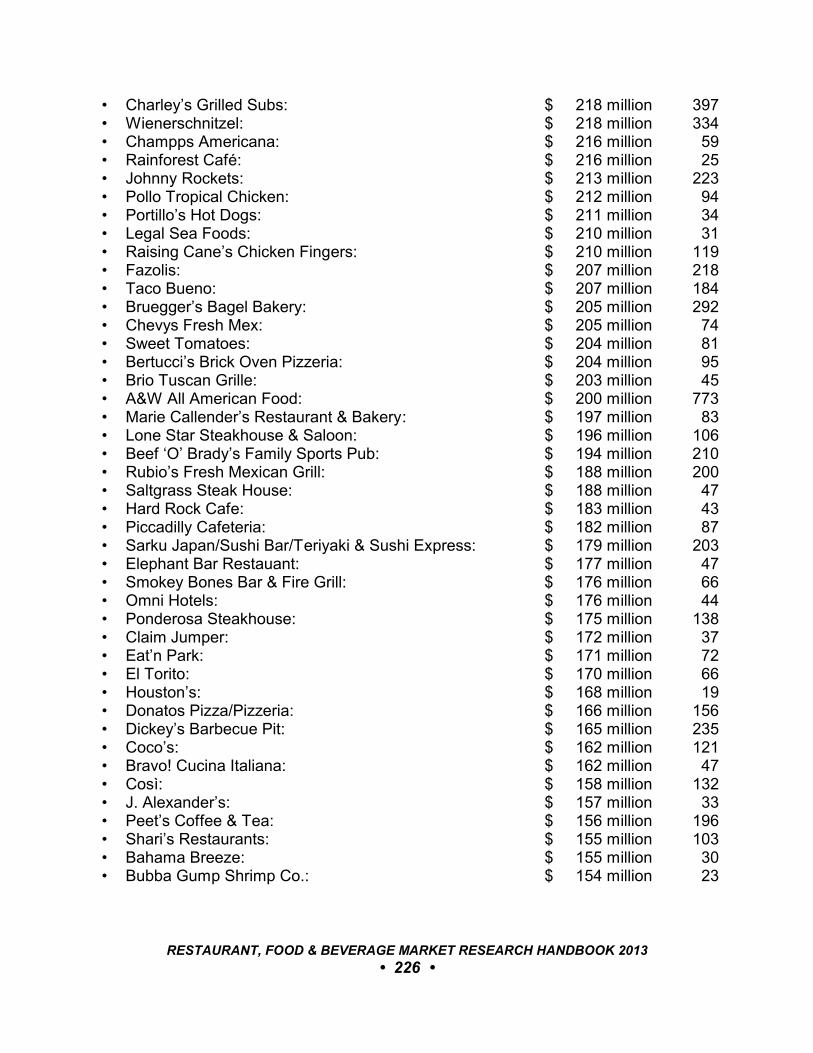
• Charley’s Grilled Subs: $ 218 million 397• Wienerschnitzel: $ 218 million 334• Champps Americana: $ 216 million 59• Rainforest Café: $ 216 million 25• Johnny Rockets: $ 213 million 223• Pollo Tropical Chicken: $ 212 million 94• Portillo’s Hot Dogs: $ 211 million 34• Legal Sea Foods: $ 210 million 31• Raising Cane’s Chicken Fingers: $ 210 million 119• Fazolis: $ 207 million 218• Taco Bueno: $ 207 million 184• Bruegger’s Bagel Bakery: $ 205 million 292• Chevys Fresh Mex: $ 205 million 74• Sweet Tomatoes: $ 204 million 81• Bertucci’s Brick Oven Pizzeria: $ 204 million 95• Brio Tuscan Grille: $ 203 million 45• A&W All American Food: $ 200 million 773• Marie Callender’s Restaurant & Bakery: $ 197 million 83• Lone Star Steakhouse & Saloon: $ 196 million 106• Beef ‘O’ Brady’s Family Sports Pub: $ 194 million 210• Rubio’s Fresh Mexican Grill: $ 188 million 200• Saltgrass Steak House: $ 188 million 47• Hard Rock Cafe: $ 183 million 43• Piccadilly Cafeteria: $ 182 million 87• Sarku Japan/Sushi Bar/Teriyaki & Sushi Express: $ 179 million 203• Elephant Bar Restauant: $ 177 million 47• Smokey Bones Bar & Fire Grill: $ 176 million 66• Omni Hotels: $ 176 million 44• Ponderosa Steakhouse: $ 175 million 138• Claim Jumper: $ 172 million 37• Eat’n Park: $ 171 million 72• El Torito: $ 170 million 66• Houston’s: $ 168 million 19• Donatos Pizza/Pizzeria: $ 166 million 156• Dickey’s Barbecue Pit: $ 165 million 235• Coco’s: $ 162 million 121• Bravo! Cucina Italiana: $ 162 million 47• Così: $ 158 million 132• J. Alexander’s: $ 157 million 33• Peet’s Coffee & Tea: $ 156 million 196• Shari’s Restaurants: $ 155 million 103• Bahama Breeze: $ 155 million 30• Bubba Gump Shrimp Co.: $ 154 million 23
RESTAURANT, FOOD & BEVERAGE MARKET RESEARCH HANDBOOK 2013
• 226 •
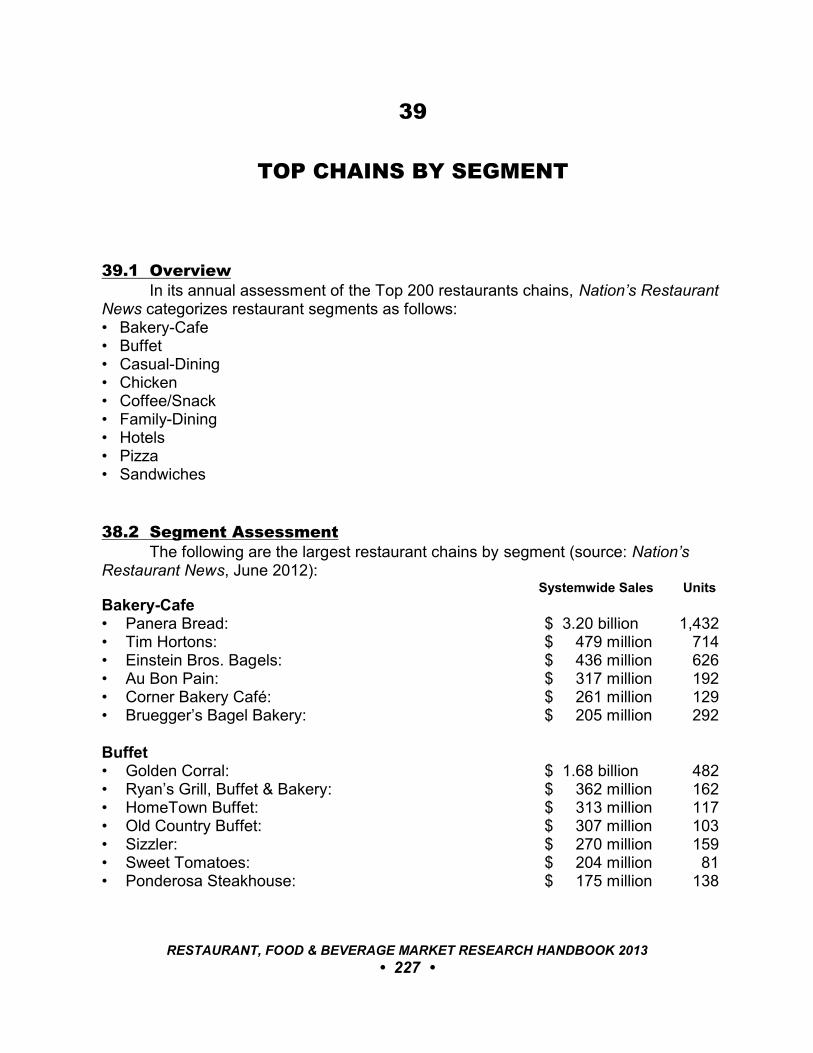
39
TOP CHAINS BY SEGMENT
39.1 OverviewIn its annual assessment of the Top 200 restaurants chains, Nation’s Restaurant
News categorizes restaurant segments as follows:• Bakery-Cafe• Buffet• Casual-Dining• Chicken• Coffee/Snack• Family-Dining• Hotels• Pizza• Sandwiches
38.2 Segment AssessmentThe following are the largest restaurant chains by segment (source: Nation’s
Restaurant News, June 2012):Systemwide Sales Units
Bakery-Cafe• Panera Bread: $ 3.20 billion 1,432• Tim Hortons: $ 479 million 714• Einstein Bros. Bagels: $ 436 million 626• Au Bon Pain: $ 317 million 192• Corner Bakery Café: $ 261 million 129• Bruegger’s Bagel Bakery: $ 205 million 292
Buffet• Golden Corral: $ 1.68 billion 482• Ryan’s Grill, Buffet & Bakery: $ 362 million 162• HomeTown Buffet: $ 313 million 117• Old Country Buffet: $ 307 million 103• Sizzler: $ 270 million 159• Sweet Tomatoes: $ 204 million 81• Ponderosa Steakhouse: $ 175 million 138
RESTAURANT, FOOD & BEVERAGE MARKET RESEARCH HANDBOOK 2013
• 227 •
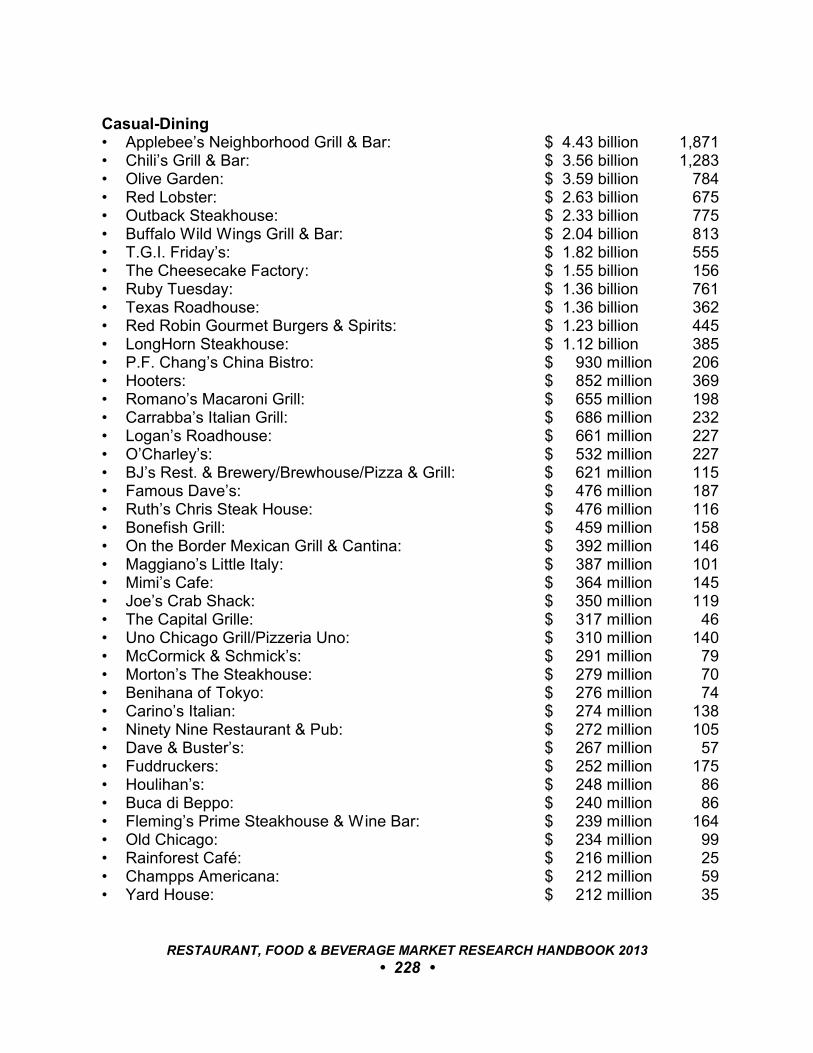
Casual-Dining• Applebee’s Neighborhood Grill & Bar: $ 4.43 billion 1,871• Chili’s Grill & Bar: $ 3.56 billion 1,283• Olive Garden: $ 3.59 billion 784• Red Lobster: $ 2.63 billion 675• Outback Steakhouse: $ 2.33 billion 775• Buffalo Wild Wings Grill & Bar: $ 2.04 billion 813• T.G.I. Friday’s: $ 1.82 billion 555• The Cheesecake Factory: $ 1.55 billion 156• Ruby Tuesday: $ 1.36 billion 761• Texas Roadhouse: $ 1.36 billion 362• Red Robin Gourmet Burgers & Spirits: $ 1.23 billion 445• LongHorn Steakhouse: $ 1.12 billion 385• P.F. Chang’s China Bistro: $ 930 million 206• Hooters: $ 852 million 369• Romano’s Macaroni Grill: $ 655 million 198• Carrabba’s Italian Grill: $ 686 million 232• Logan’s Roadhouse: $ 661 million 227• O’Charley’s: $ 532 million 227• BJ’s Rest. & Brewery/Brewhouse/Pizza & Grill: $ 621 million 115• Famous Dave’s: $ 476 million 187• Ruth’s Chris Steak House: $ 476 million 116• Bonefish Grill: $ 459 million 158• On the Border Mexican Grill & Cantina: $ 392 million 146• Maggiano’s Little Italy: $ 387 million 101• Mimi’s Cafe: $ 364 million 145• Joe’s Crab Shack: $ 350 million 119• The Capital Grille: $ 317 million 46• Uno Chicago Grill/Pizzeria Uno: $ 310 million 140• McCormick & Schmick’s: $ 291 million 79• Morton’s The Steakhouse: $ 279 million 70• Benihana of Tokyo: $ 276 million 74• Carino’s Italian: $ 274 million 138• Ninety Nine Restaurant & Pub: $ 272 million 105• Dave & Buster’s: $ 267 million 57• Fuddruckers: $ 252 million 175• Houlihan’s: $ 248 million 86• Buca di Beppo: $ 240 million 86• Fleming’s Prime Steakhouse & Wine Bar: $ 239 million 164• Old Chicago: $ 234 million 99• Rainforest Café: $ 216 million 25• Champps Americana: $ 212 million 59• Yard House: $ 212 million 35
RESTAURANT, FOOD & BEVERAGE MARKET RESEARCH HANDBOOK 2013
• 228 •

• Legal Sea Foods: $ 210 million 31• Chevy’s Fresh Mex: $ 205 million 74• Lone Star Steakhouse & Saloon: $ 196 million 106• Marie Callender’s Restaurant & Bakery: $ 196 million 83• Beef ‘O’ Brady’s Family Sports Pub: $ 194 million 210• Claim Jumper: $ 172 million 37• El Torito: $ 170 million 66
Chicken• KFC: $ 4.60 billion 4,780• Chick-fil-A: $ 3.99 billion 1,592• Popeyes Louisiana Kitchen: $ 1.60 billion 1,580• Church’s Chicken: $ 864 million 1,217• Zaxby’s $ 840 million 540• Bojangles’ Famous Chicken ‘n Biscuits: $ 767 million 506• El Pollo Loco: $ 552 million 425• Boston Market: $ 532 million 481• Wingstop: $ 374 million 489• Pollo Tropical Chicken on the Grill: $ 211 million 94
Coffee/Snack• Starbucks Coffee: $ 8.49 billion 10,693• Dunkin’ Donuts: $ 5.93 billion 7,015• Krispy Kreme Doughnuts: $ 432 million 234• Baskin-Robbins: $ 497 million 2,457• Jamba Juice: $ 439 million 750• Auntie Anne’s Hand-Rolled Soft Pretzels: $ 383 million 913• Cold Stone Creamery: $ 366 million 1,086• Caribou Coffee: $ 251 million 486
Family-Dining• IHOP: $ 2.62 billion 1,514• Denny’s: $ 2.33 billion 1,593• Cracker Barrel Old Country Store: $ 1.93 billion 603• Bob Evans Restaurants: $ 960 million 565• Waffle House: $ 960 million 1,603• Steak ‘n Shake: $ 791 million 489• Perkins Restaurant and Bakery: $ 689 million 412• Friendly’s Ice Cream: $ 560 million 411• Big Boy Restaurants/Frisch’s Big Boy: $ 404 million 249• Shoney’s: $ 333 million 214• Village Inn: $ 323 million 213• Sonny’s Real Pit Bar-B-Q: $ 243 million 127• Huddle House: $ 232 million 394
RESTAURANT, FOOD & BEVERAGE MARKET RESEARCH HANDBOOK 2013
• 229 •
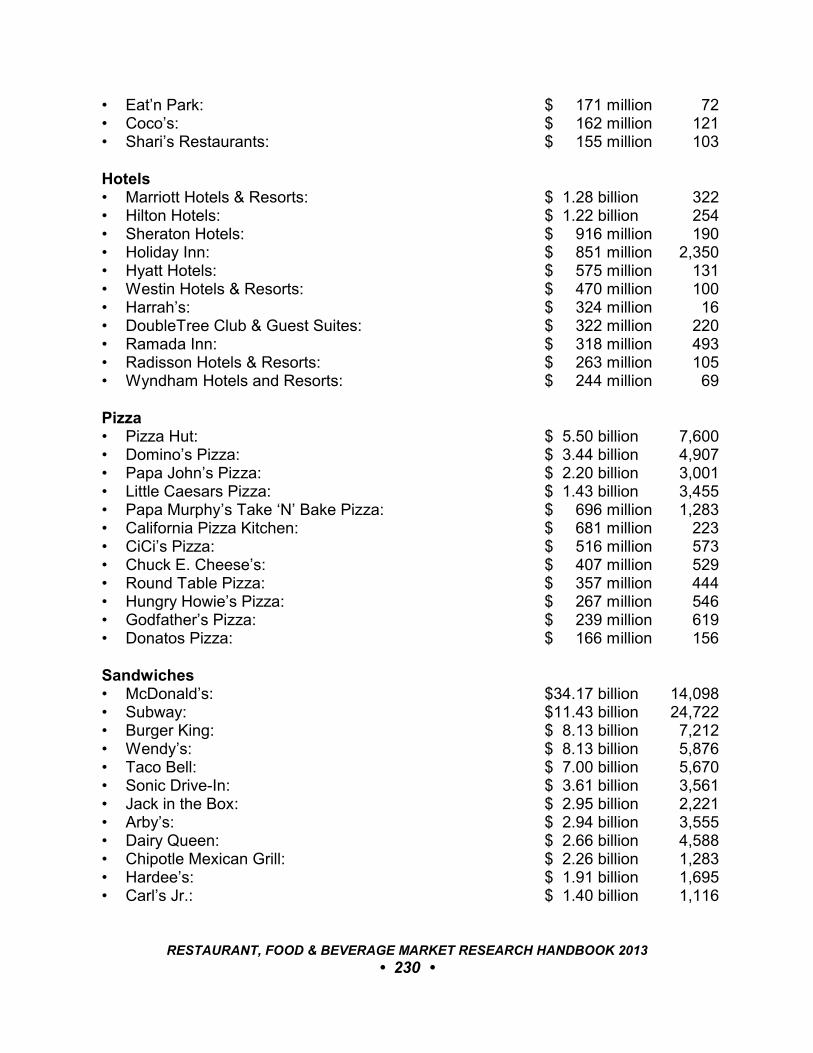
• Eat’n Park: $ 171 million 72• Coco’s: $ 162 million 121• Shari’s Restaurants: $ 155 million 103
Hotels• Marriott Hotels & Resorts: $ 1.28 billion 322• Hilton Hotels: $ 1.22 billion 254• Sheraton Hotels: $ 916 million 190• Holiday Inn: $ 851 million 2,350• Hyatt Hotels: $ 575 million 131• Westin Hotels & Resorts: $ 470 million 100• Harrah’s: $ 324 million 16• DoubleTree Club & Guest Suites: $ 322 million 220• Ramada Inn: $ 318 million 493• Radisson Hotels & Resorts: $ 263 million 105• Wyndham Hotels and Resorts: $ 244 million 69
Pizza• Pizza Hut: $ 5.50 billion 7,600• Domino’s Pizza: $ 3.44 billion 4,907• Papa John’s Pizza: $ 2.20 billion 3,001• Little Caesars Pizza: $ 1.43 billion 3,455• Papa Murphy’s Take ‘N’ Bake Pizza: $ 696 million 1,283• California Pizza Kitchen: $ 681 million 223• CiCi’s Pizza: $ 516 million 573• Chuck E. Cheese’s: $ 407 million 529• Round Table Pizza: $ 357 million 444• Hungry Howie’s Pizza: $ 267 million 546• Godfather’s Pizza: $ 239 million 619• Donatos Pizza: $ 166 million 156
Sandwiches• McDonald’s: $34.17 billion 14,098• Subway: $11.43 billion 24,722• Burger King: $ 8.13 billion 7,212• Wendy’s: $ 8.13 billion 5,876• Taco Bell: $ 7.00 billion 5,670• Sonic Drive-In: $ 3.61 billion 3,561• Jack in the Box: $ 2.95 billion 2,221• Arby’s: $ 2.94 billion 3,555• Dairy Queen: $ 2.66 billion 4,588• Chipotle Mexican Grill: $ 2.26 billion 1,283• Hardee’s: $ 1.91 billion 1,695• Carl’s Jr.: $ 1.40 billion 1,116
RESTAURANT, FOOD & BEVERAGE MARKET RESEARCH HANDBOOK 2013
• 230 •

• Whataburger: $ 1.33 billion 728• Jimmy John’s: $ 1.01 billion 1,329• Five Guys Burgers and Fries: $ 951 million 918• Quiznos: $ 840 million 2,326• Culver’s: $ 748 million 444• In-N-Out Burger: $ 596 million 266• Del Taco: $ 579 million 532• Jason Deli: $ 540 million 235• White Castle: $ 528 million 416• Qdoba Mexican Grill: $ 429 million 583• Checkers: $ 430 million 485• Krystal: $ 411 million 359• McAlister’s Deli: $ 384 million 305• Moe’s Southwest Grill: $ 381 million 442• Taco John’s: $ 310 million 414• Baja Fresh Mexican Grill: $ 289 million 244• Firehouse Subs: $ 285 million 477• Taco Cabana: $ 271 million 163• Jersey Mike’s Subs: $ 255 million 507• Schlotzsky’s Deli: $ 249 million 337• Potbelly Sandwich Works: $ 244 million 234• Rally’s Hamburgers: $ 239 million 300• Braum’s Ice Cream & Dairy Stores: $ 223 million 279• Wienerschnitzel: $ 218 million 334• Johnny Rockets: $ 213 million 223• Taco Bueno: $ 207 million 184• A&W All American Food: $ 200 million 773• Rubio’s Fresh Mexican Grill: $ 188 million 200
RESTAURANT, FOOD & BEVERAGE MARKET RESEARCH HANDBOOK 2013
• 231 •
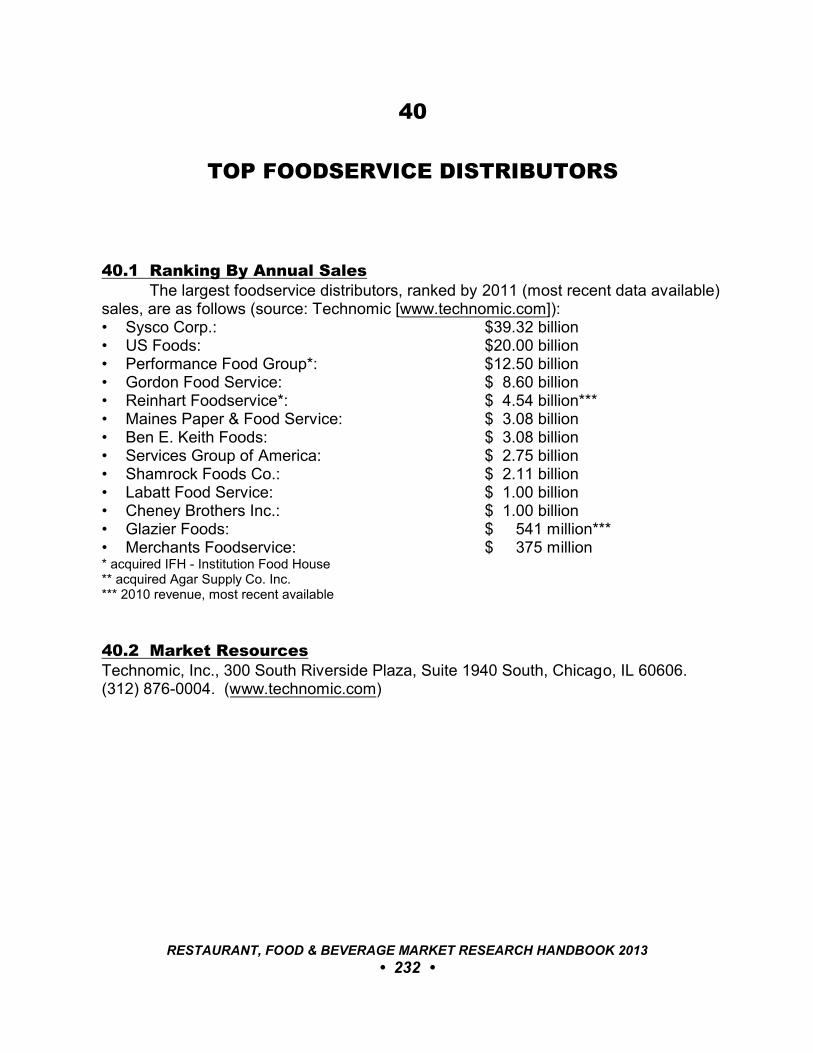
40
TOP FOODSERVICE DISTRIBUTORS
40.1 Ranking By Annual SalesThe largest foodservice distributors, ranked by 2011 (most recent data available)
sales, are as follows (source: Technomic [www.technomic.com]):• Sysco Corp.: $39.32 billion• US Foods: $20.00 billion• Performance Food Group*: $12.50 billion• Gordon Food Service: $ 8.60 billion• Reinhart Foodservice*: $ 4.54 billion***• Maines Paper & Food Service: $ 3.08 billion• Ben E. Keith Foods: $ 3.08 billion• Services Group of America: $ 2.75 billion• Shamrock Foods Co.: $ 2.11 billion• Labatt Food Service: $ 1.00 billion• Cheney Brothers Inc.: $ 1.00 billion• Glazier Foods: $ 541 million***• Merchants Foodservice: $ 375 million* acquired IFH - Institution Food House** acquired Agar Supply Co. Inc.*** 2010 revenue, most recent available
40.2 Market ResourcesTechnomic, Inc., 300 South Riverside Plaza, Suite 1940 South, Chicago, IL 60606. (312) 876-0004. (www.technomic.com)
RESTAURANT, FOOD & BEVERAGE MARKET RESEARCH HANDBOOK 2013
• 232 •
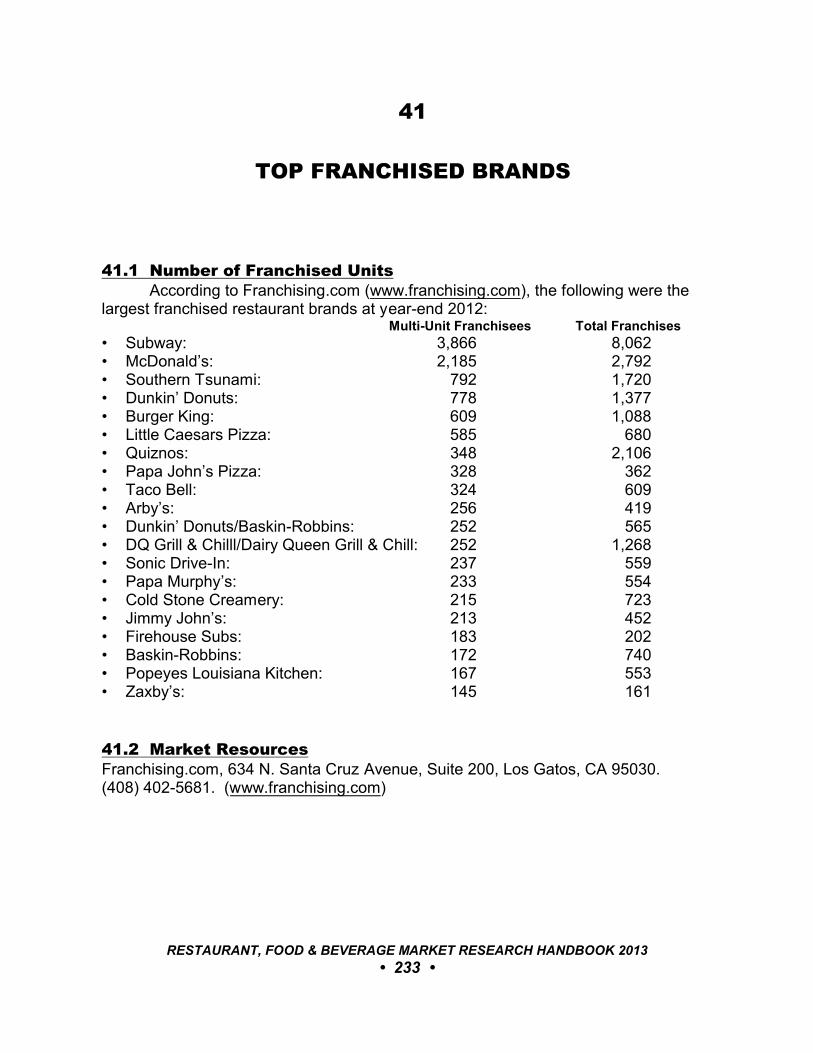
41
TOP FRANCHISED BRANDS
41.1 Number of Franchised UnitsAccording to Franchising.com (www.franchising.com), the following were the
largest franchised restaurant brands at year-end 2012:Multi-Unit Franchisees Total Franchises
• Subway: 3,866 8,062• McDonald’s: 2,185 2,792• Southern Tsunami: 792 1,720• Dunkin’ Donuts: 778 1,377• Burger King: 609 1,088• Little Caesars Pizza: 585 680• Quiznos: 348 2,106• Papa John’s Pizza: 328 362• Taco Bell: 324 609• Arby’s: 256 419• Dunkin’ Donuts/Baskin-Robbins: 252 565• DQ Grill & Chilll/Dairy Queen Grill & Chill: 252 1,268• Sonic Drive-In: 237 559• Papa Murphy’s: 233 554• Cold Stone Creamery: 215 723• Jimmy John’s: 213 452• Firehouse Subs: 183 202• Baskin-Robbins: 172 740• Popeyes Louisiana Kitchen: 167 553• Zaxby’s: 145 161
41.2 Market ResourcesFranchising.com, 634 N. Santa Cruz Avenue, Suite 200, Los Gatos, CA 95030. (408) 402-5681. (www.franchising.com)
RESTAURANT, FOOD & BEVERAGE MARKET RESEARCH HANDBOOK 2013
• 233 •
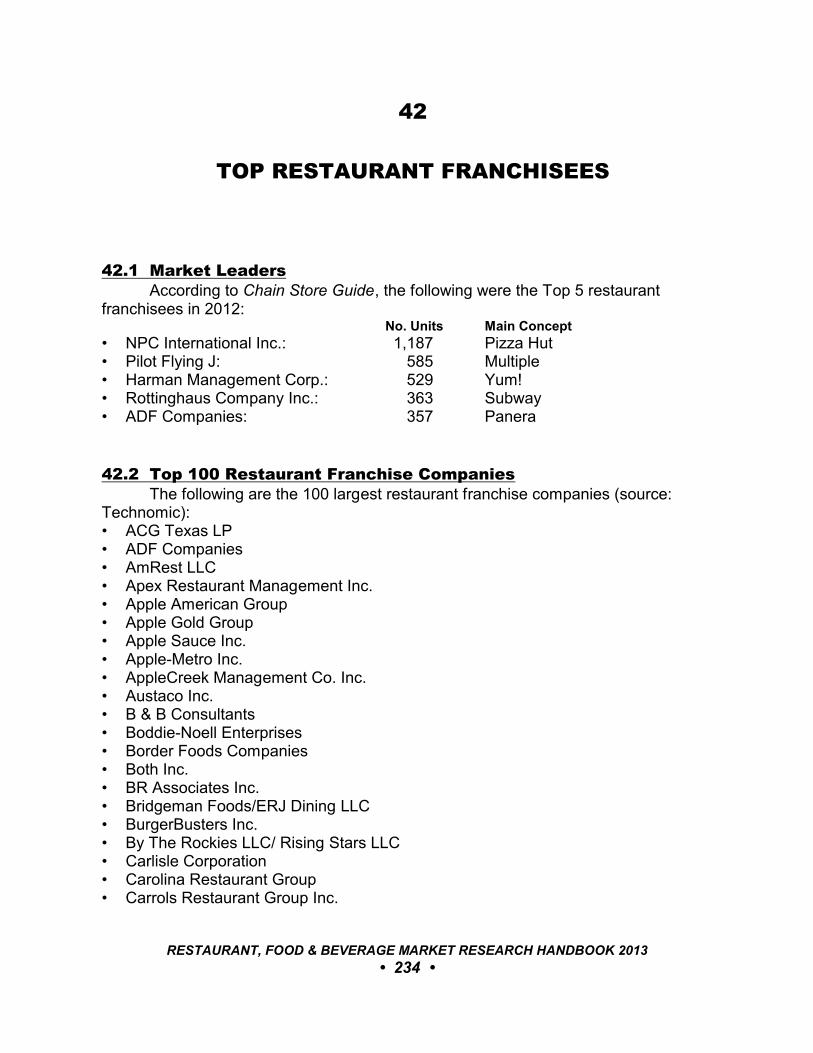
42
TOP RESTAURANT FRANCHISEES
42.1 Market LeadersAccording to Chain Store Guide, the following were the Top 5 restaurant
franchisees in 2012: No. Units Main Concept
• NPC International Inc.: 1,187 Pizza Hut• Pilot Flying J: 585 Multiple• Harman Management Corp.: 529 Yum! • Rottinghaus Company Inc.: 363 Subway• ADF Companies: 357 Panera
42.2 Top 100 Restaurant Franchise CompaniesThe following are the 100 largest restaurant franchise companies (source:
Technomic):• ACG Texas LP• ADF Companies• AmRest LLC• Apex Restaurant Management Inc.• Apple American Group• Apple Gold Group• Apple Sauce Inc.• Apple-Metro Inc.• AppleCreek Management Co. Inc.• Austaco Inc.• B & B Consultants• Boddie-Noell Enterprises• Border Foods Companies• Both Inc.• BR Associates Inc.• Bridgeman Foods/ERJ Dining LLC• BurgerBusters Inc.• By The Rockies LLC/ Rising Stars LLC• Carlisle Corporation• Carolina Restaurant Group• Carrols Restaurant Group Inc.
RESTAURANT, FOOD & BEVERAGE MARKET RESEARCH HANDBOOK 2013
• 234 •
• Caspers Company• Casual Restaurant Concepts• Cedar Enterprises Inc.• CFRA Inc.• CLP Corporation• Concord Hospitality Inc.• Covelli Enterprises• Daland Corporation• DavCo Restaurants Inc.• Desert De Oro Foods Inc.• DL Rogers Corp.• Doherty Enterprises Inc.• Emerald Foods Inc.• Falcon Holdings LLC• Fourteen Foods• Friendly Franchisees Corp.• Frisch’s Restaurants Inc.• Fugate Enterprises• Hamra Management Company• Harman Management Corp.• Heartland Food Corp• Hospitality Restaurant Group Inc.• Interfoods of America Inc.• Jan Companies• JIB Management Inc.• JRN Inc.• Kaizen Group of Companies• Kazi Management VI LLC• Kessler Group Inc.• K-MAC Enterprises• Luihn Food Systems Inc.• McEssy Investment Co.• Metro Corral Partners Inc.• Missoula Mac Inc.• Morgan’s Foods Inc.• MRCO LLC• Muy Brands LLC• Neighborhood Restaurant Group• NPC International Inc.• Pacific Bells Inc.• Pacific Island Restaurants Inc.• Palo Alto Inc.• Paradigm Investment Group• Pennant Foods Corp.
RESTAURANT, FOOD & BEVERAGE MARKET RESEARCH HANDBOOK 2013
• 235 •
• Pepper Dining Inc.• Pilot Flying J• Pizza Properties Inc./QSR Burgers LLC• PJ United Inc.• QK Inc.• Quality Dining Inc.• Quality Restaurant Concepts LLC• REE Inc.• Restaurant Management Co.• RPM Pizza• Scarbrough Management• Sizzling Platter Inc.• Southern Bells Inc.• Southern California Pizza Company• Southern Multifoods Inc.• SSCP Management Inc.• Strang Corporation• Strategic Restaurants Acquisition Corp.• Sun Holdings LLC• Sunshine Restaurant Partners LLC• T-Bird Restaurant Group• T.L. Cannon Companies• Tacala LLC• Tar Heel Capital• The Bistro Group• The Briad Group• The Rose Group• Thomas and King Inc.• Treadwell Enterprises• United States Beef Corp.• V & J Holding Companies Inc.• Valenti Management• Wendy’s of Colorado Springs• Western Reserve Restaurant Management• Wisconsin Hospitality Group
42.3 Market ResourcesTop 400 Restaurant Franchise Company Report, Technomic, Inc., 300 South RiversidePlaza, Suite 1940 South, Chicago, IL 60606. (312) 876-0004. (www.technomic.com)
RESTAURANT, FOOD & BEVERAGE MARKET RESEARCH HANDBOOK 2013
• 236 •
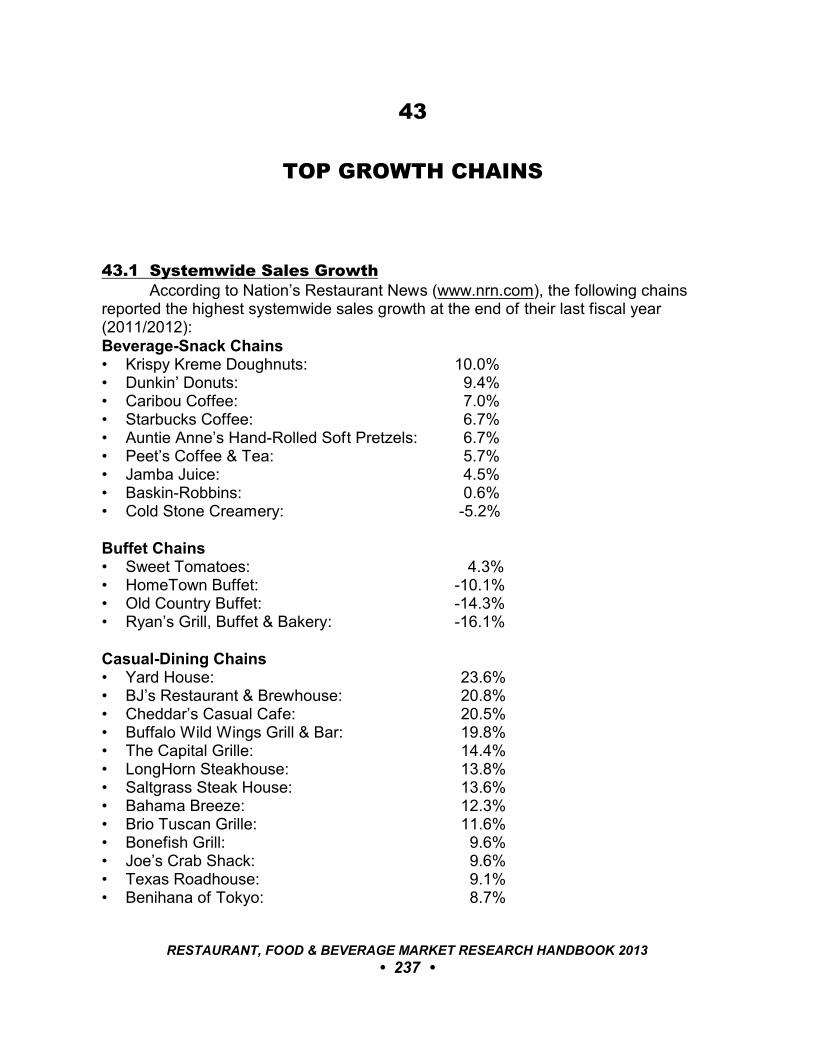
43
TOP GROWTH CHAINS
43.1 Systemwide Sales GrowthAccording to Nation’s Restaurant News (www.nrn.com), the following chains
reported the highest systemwide sales growth at the end of their last fiscal year(2011/2012):Beverage-Snack Chains• Krispy Kreme Doughnuts: 10.0%• Dunkin’ Donuts: 9.4%• Caribou Coffee: 7.0%• Starbucks Coffee: 6.7%• Auntie Anne’s Hand-Rolled Soft Pretzels: 6.7%• Peet’s Coffee & Tea: 5.7%• Jamba Juice: 4.5%• Baskin-Robbins: 0.6%• Cold Stone Creamery: -5.2%
Buffet Chains• Sweet Tomatoes: 4.3%• HomeTown Buffet: -10.1%• Old Country Buffet: -14.3%• Ryan’s Grill, Buffet & Bakery: -16.1%
Casual-Dining Chains• Yard House: 23.6%• BJ’s Restaurant & Brewhouse: 20.8%• Cheddar’s Casual Cafe: 20.5%• Buffalo Wild Wings Grill & Bar: 19.8%• The Capital Grille: 14.4%• LongHorn Steakhouse: 13.8%• Saltgrass Steak House: 13.6%• Bahama Breeze: 12.3%• Brio Tuscan Grille: 11.6%• Bonefish Grill: 9.6%• Joe’s Crab Shack: 9.6%• Texas Roadhouse: 9.1%• Benihana of Tokyo: 8.7%
RESTAURANT, FOOD & BEVERAGE MARKET RESEARCH HANDBOOK 2013
• 237 •
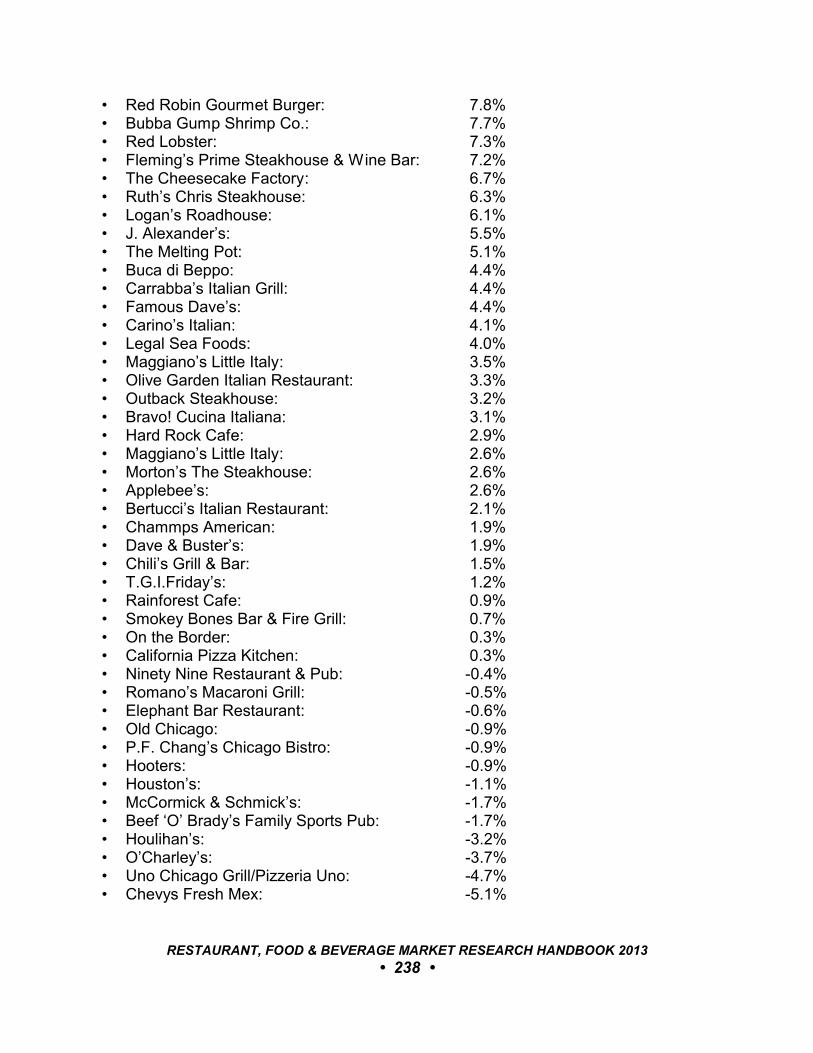
• Red Robin Gourmet Burger: 7.8%• Bubba Gump Shrimp Co.: 7.7%• Red Lobster: 7.3%• Fleming’s Prime Steakhouse & Wine Bar: 7.2%• The Cheesecake Factory: 6.7%• Ruth’s Chris Steakhouse: 6.3%• Logan’s Roadhouse: 6.1%• J. Alexander’s: 5.5%• The Melting Pot: 5.1%• Buca di Beppo: 4.4%• Carrabba’s Italian Grill: 4.4%• Famous Dave’s: 4.4%• Carino’s Italian: 4.1%• Legal Sea Foods: 4.0%• Maggiano’s Little Italy: 3.5%• Olive Garden Italian Restaurant: 3.3%• Outback Steakhouse: 3.2%• Bravo! Cucina Italiana: 3.1%• Hard Rock Cafe: 2.9%• Maggiano’s Little Italy: 2.6% • Morton’s The Steakhouse: 2.6%• Applebee’s: 2.6%• Bertucci’s Italian Restaurant: 2.1%• Chammps American: 1.9%• Dave & Buster’s: 1.9%• Chili’s Grill & Bar: 1.5%• T.G.I.Friday’s: 1.2%• Rainforest Cafe: 0.9%• Smokey Bones Bar & Fire Grill: 0.7%• On the Border: 0.3%• California Pizza Kitchen: 0.3%• Ninety Nine Restaurant & Pub: -0.4%• Romano’s Macaroni Grill: -0.5%• Elephant Bar Restaurant: -0.6%• Old Chicago: -0.9%• P.F. Chang’s Chicago Bistro: -0.9%• Hooters: -0.9%• Houston’s: -1.1%• McCormick & Schmick’s: -1.7%• Beef ‘O’ Brady’s Family Sports Pub: -1.7%• Houlihan’s: -3.2%• O’Charley’s: -3.7%• Uno Chicago Grill/Pizzeria Uno: -4.7%• Chevys Fresh Mex: -5.1%
RESTAURANT, FOOD & BEVERAGE MARKET RESEARCH HANDBOOK 2013
• 238 •
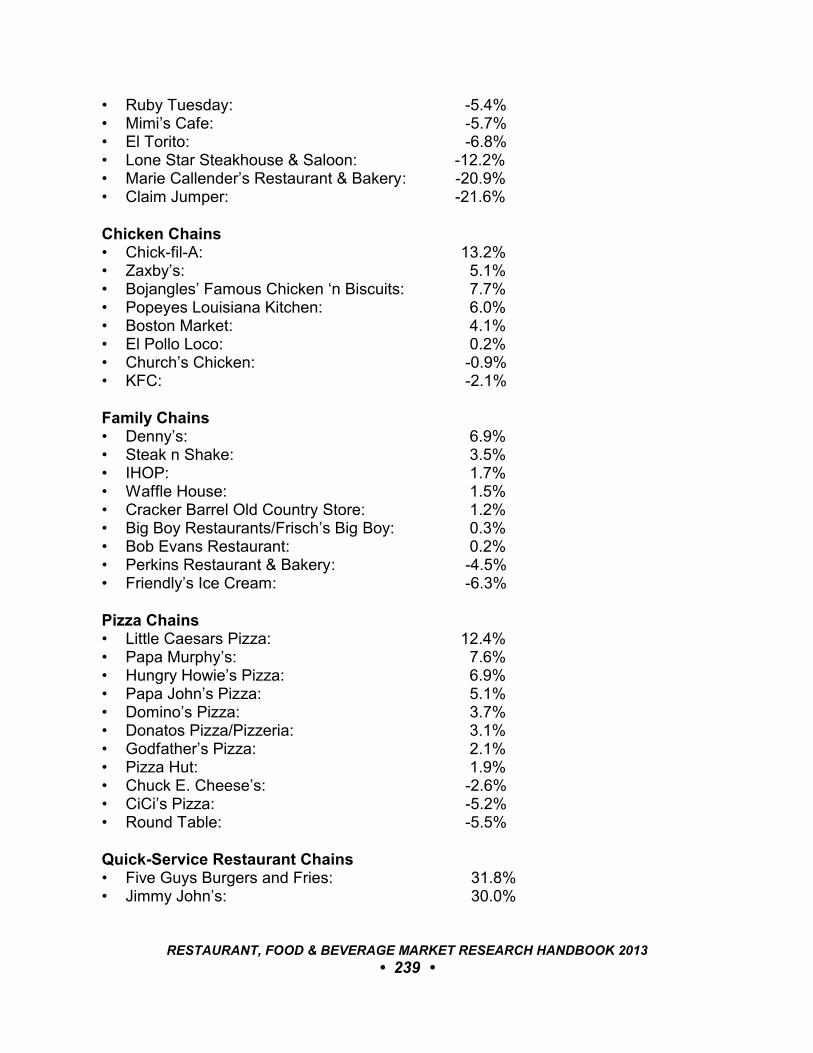
• Ruby Tuesday: -5.4%• Mimi’s Cafe: -5.7%• El Torito: -6.8%• Lone Star Steakhouse & Saloon: -12.2%• Marie Callender’s Restaurant & Bakery: -20.9%• Claim Jumper: -21.6%
Chicken Chains• Chick-fil-A: 13.2%• Zaxby’s: 5.1%• Bojangles’ Famous Chicken ‘n Biscuits: 7.7%• Popeyes Louisiana Kitchen: 6.0%• Boston Market: 4.1%• El Pollo Loco: 0.2%• Church’s Chicken: -0.9%• KFC: -2.1%
Family Chains• Denny’s: 6.9%• Steak n Shake: 3.5%• IHOP: 1.7%• Waffle House: 1.5%• Cracker Barrel Old Country Store: 1.2%• Big Boy Restaurants/Frisch’s Big Boy: 0.3%• Bob Evans Restaurant: 0.2%• Perkins Restaurant & Bakery: -4.5%• Friendly’s Ice Cream: -6.3%
Pizza Chains• Little Caesars Pizza: 12.4%• Papa Murphy’s: 7.6%• Hungry Howie’s Pizza: 6.9%• Papa John’s Pizza: 5.1%• Domino’s Pizza: 3.7%• Donatos Pizza/Pizzeria: 3.1%• Godfather’s Pizza: 2.1%• Pizza Hut: 1.9%• Chuck E. Cheese’s: -2.6%• CiCi’s Pizza: -5.2%• Round Table: -5.5%
Quick-Service Restaurant Chains• Five Guys Burgers and Fries: 31.8%• Jimmy John’s: 30.0%
RESTAURANT, FOOD & BEVERAGE MARKET RESEARCH HANDBOOK 2013
• 239 •
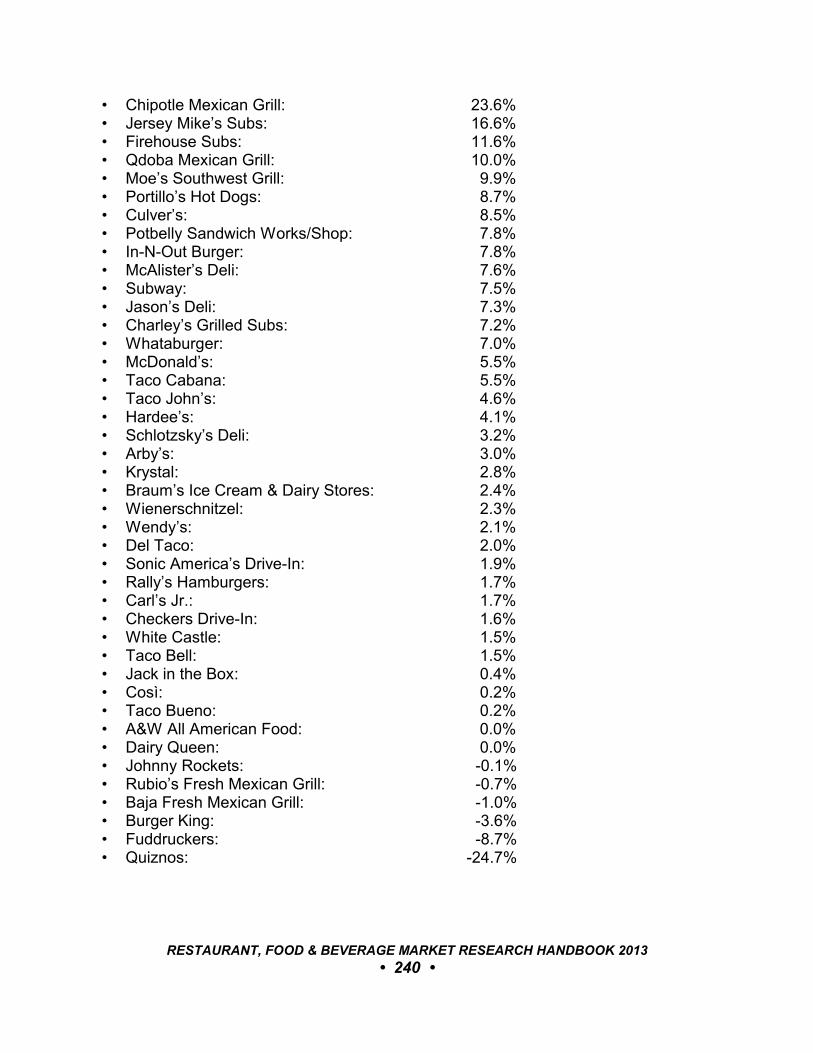
• Chipotle Mexican Grill: 23.6%• Jersey Mike’s Subs: 16.6%• Firehouse Subs: 11.6%• Qdoba Mexican Grill: 10.0%• Moe’s Southwest Grill: 9.9%• Portillo’s Hot Dogs: 8.7%• Culver’s: 8.5%• Potbelly Sandwich Works/Shop: 7.8%• In-N-Out Burger: 7.8%• McAlister’s Deli: 7.6%• Subway: 7.5%• Jason’s Deli: 7.3%• Charley’s Grilled Subs: 7.2%• Whataburger: 7.0%• McDonald’s: 5.5%• Taco Cabana: 5.5%• Taco John’s: 4.6%• Hardee’s: 4.1%• Schlotzsky’s Deli: 3.2%• Arby’s: 3.0%• Krystal: 2.8%• Braum’s Ice Cream & Dairy Stores: 2.4%• Wienerschnitzel: 2.3%• Wendy’s: 2.1%• Del Taco: 2.0%• Sonic America’s Drive-In: 1.9%• Rally’s Hamburgers: 1.7%• Carl’s Jr.: 1.7%• Checkers Drive-In: 1.6%• White Castle: 1.5%• Taco Bell: 1.5%• Jack in the Box: 0.4%• Così: 0.2%• Taco Bueno: 0.2%• A&W All American Food: 0.0%• Dairy Queen: 0.0%• Johnny Rockets: -0.1%• Rubio’s Fresh Mexican Grill: -0.7%• Baja Fresh Mexican Grill: -1.0%• Burger King: -3.6%• Fuddruckers: -8.7%• Quiznos: -24.7%
RESTAURANT, FOOD & BEVERAGE MARKET RESEARCH HANDBOOK 2013
• 240 •

43.2 Market ResourcesNation’s Restaurant News, 1166 Avenue of the Americas, 10th Floor, New York, NY10036. (212) 204-4200. (www.nrn.com)
RESTAURANT, FOOD & BEVERAGE MARKET RESEARCH HANDBOOK 2013
• 241 •

44
TOP INDEPENDENT RESTAURANTS
44.1 Rank By Annual Gross RevenueAccording to Forbes (August 2012), the following independent restaurants have
the highest annual gross revenue:• Bob Chinn’s Crab House (Wheeling, IL): $24.0 million• The Grill On Main (Edgartown, MA): $23.5 million• Sparks Steak House (New York, NY): $23.0 million• Tony’s Restaurant & Catering (Houston, TX): $20.0 million• Athenian Inn (Seattle, WA): $19.2 million• Joe’s Stone Crab (Miami Beach, FL): $19.0 million• Rickey’s Restaurant (Novato, CA): $18.7 million• Bridgewater Grill (Golden, CO): $18.4 million• Elizabeth on 37th (Savannah, GA): $17.4 million• Jeeves & Co. (Scottsburg, IN): $15.9 million
_________________________________________________________________
“The highest grossing restaurant in the U.S. isnot in some swank corner of Manhattan or on aglittery Los Angeles boulevard, but in theunassuming Chicago suburb of Wheeling.”
Forbes, 8/6/12 _________________________________________________________________
RESTAURANT, FOOD & BEVERAGE MARKET RESEARCH HANDBOOK 2013
• 242 •
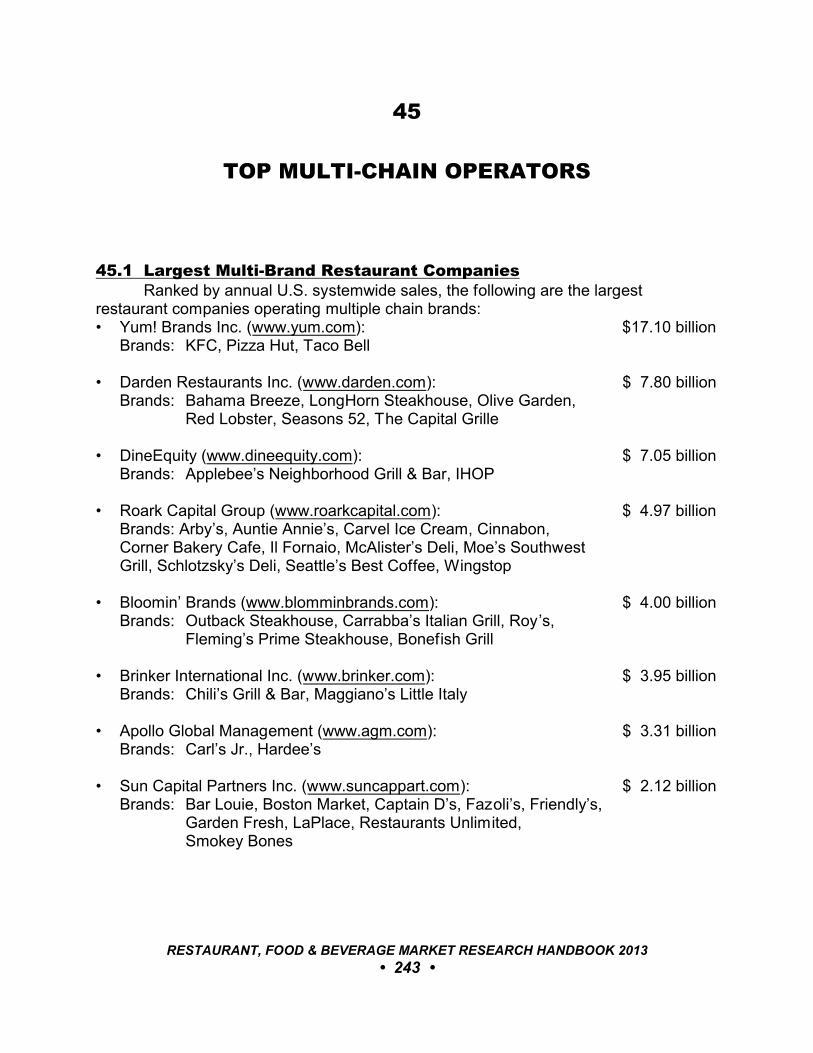
45
TOP MULTI-CHAIN OPERATORS
45.1 Largest Multi-Brand Restaurant CompaniesRanked by annual U.S. systemwide sales, the following are the largest
restaurant companies operating multiple chain brands:• Yum! Brands Inc. (www.yum.com): $17.10 billion
Brands: KFC, Pizza Hut, Taco Bell
• Darden Restaurants Inc. (www.darden.com): $ 7.80 billionBrands: Bahama Breeze, LongHorn Steakhouse, Olive Garden,
Red Lobster, Seasons 52, The Capital Grille
• DineEquity (www.dineequity.com): $ 7.05 billionBrands: Applebee’s Neighborhood Grill & Bar, IHOP
• Roark Capital Group (www.roarkcapital.com): $ 4.97 billionBrands: Arby’s, Auntie Annie’s, Carvel Ice Cream, Cinnabon, Corner Bakery Cafe, Il Fornaio, McAlister’s Deli, Moe’s Southwest Grill, Schlotzsky’s Deli, Seattle’s Best Coffee, Wingstop
• Bloomin’ Brands (www.blomminbrands.com): $ 4.00 billionBrands: Outback Steakhouse, Carrabba’s Italian Grill, Roy’s,
Fleming’s Prime Steakhouse, Bonefish Grill
• Brinker International Inc. (www.brinker.com): $ 3.95 billionBrands: Chili’s Grill & Bar, Maggiano’s Little Italy
• Apollo Global Management (www.agm.com): $ 3.31 billionBrands: Carl’s Jr., Hardee’s
• Sun Capital Partners Inc. (www.suncappart.com): $ 2.12 billionBrands: Bar Louie, Boston Market, Captain D’s, Fazoli’s, Friendly’s,
Garden Fresh, LaPlace, Restaurants Unlimited, Smokey Bones
RESTAURANT, FOOD & BEVERAGE MARKET RESEARCH HANDBOOK 2013
• 243 •
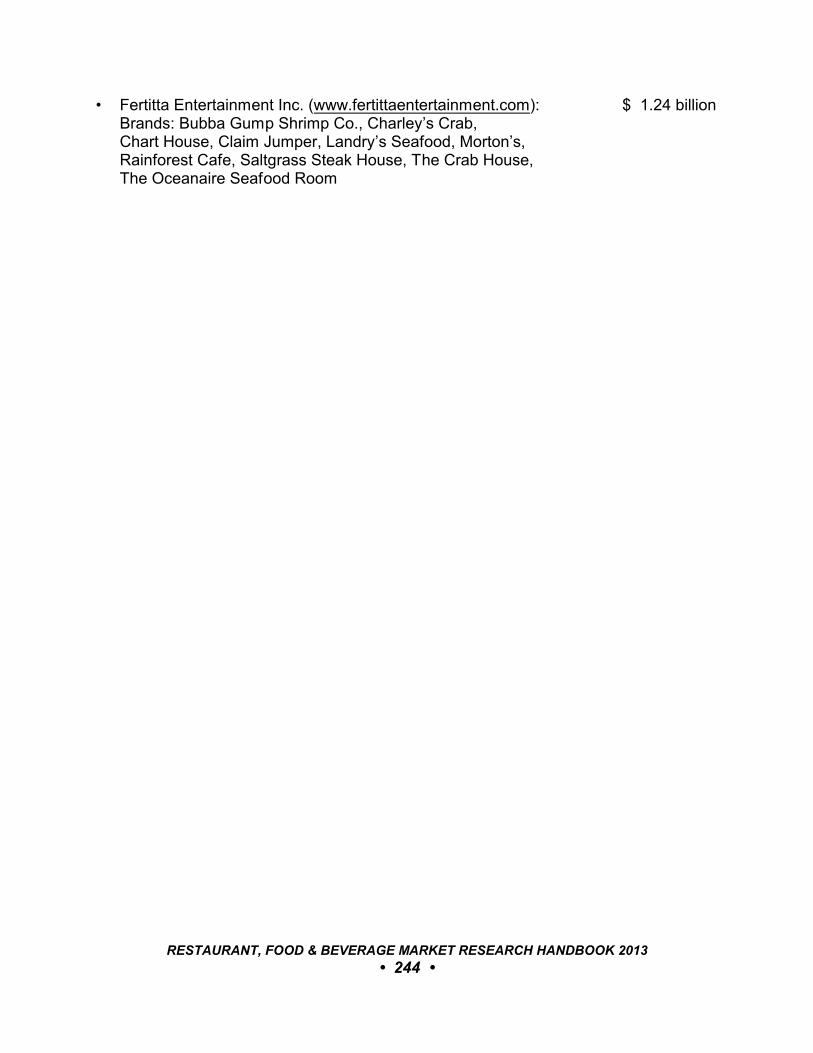
• Fertitta Entertainment Inc. (www.fertittaentertainment.com): $ 1.24 billionBrands: Bubba Gump Shrimp Co., Charley’s Crab,Chart House, Claim Jumper, Landry’s Seafood, Morton’s,Rainforest Cafe, Saltgrass Steak House, The Crab House, The Oceanaire Seafood Room
RESTAURANT, FOOD & BEVERAGE MARKET RESEARCH HANDBOOK 2013
• 244 •
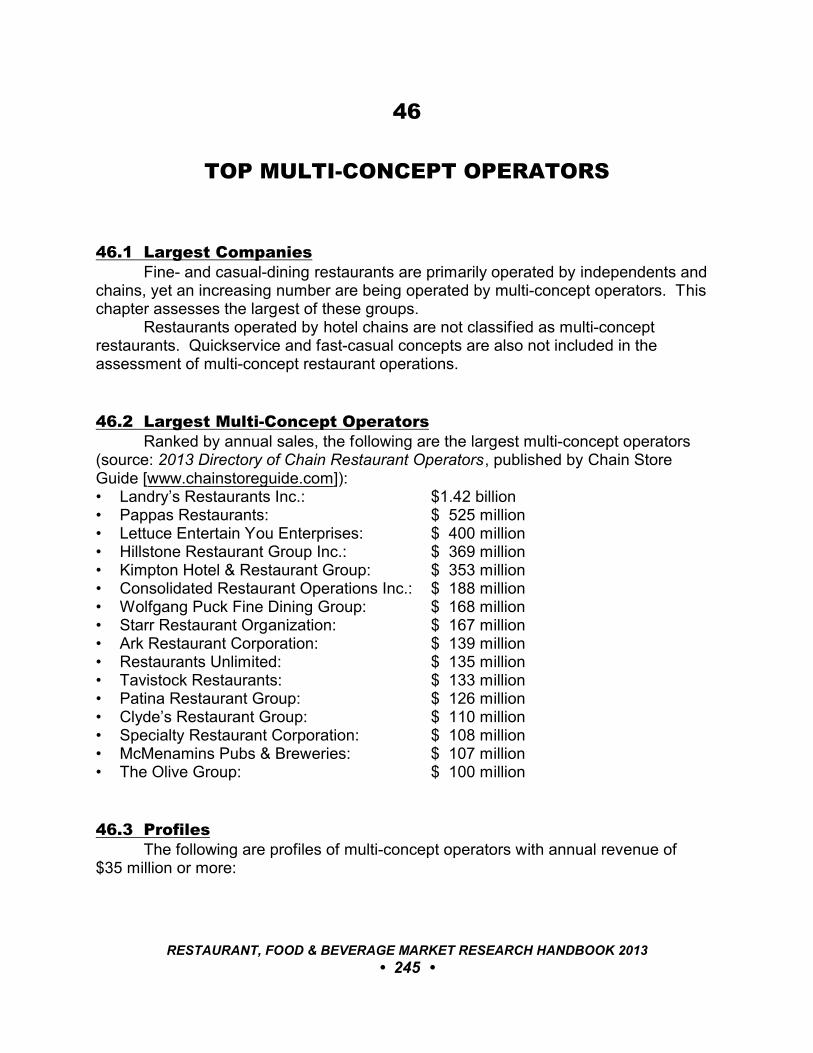
46
TOP MULTI-CONCEPT OPERATORS
46.1 Largest CompaniesFine- and casual-dining restaurants are primarily operated by independents and
chains, yet an increasing number are being operated by multi-concept operators. Thischapter assesses the largest of these groups.
Restaurants operated by hotel chains are not classified as multi-conceptrestaurants. Quickservice and fast-casual concepts are also not included in theassessment of multi-concept restaurant operations.
46.2 Largest Multi-Concept OperatorsRanked by annual sales, the following are the largest multi-concept operators
(source: 2013 Directory of Chain Restaurant Operators, published by Chain StoreGuide [www.chainstoreguide.com]):• Landry’s Restaurants Inc.: $1.42 billion• Pappas Restaurants: $ 525 million• Lettuce Entertain You Enterprises: $ 400 million• Hillstone Restaurant Group Inc.: $ 369 million• Kimpton Hotel & Restaurant Group: $ 353 million• Consolidated Restaurant Operations Inc.: $ 188 million• Wolfgang Puck Fine Dining Group: $ 168 million• Starr Restaurant Organization: $ 167 million• Ark Restaurant Corporation: $ 139 million• Restaurants Unlimited: $ 135 million• Tavistock Restaurants: $ 133 million• Patina Restaurant Group: $ 126 million• Clyde’s Restaurant Group: $ 110 million• Specialty Restaurant Corporation: $ 108 million• McMenamins Pubs & Breweries: $ 107 million• The Olive Group: $ 100 million
46.3 ProfilesThe following are profiles of multi-concept operators with annual revenue of
$35 million or more:
RESTAURANT, FOOD & BEVERAGE MARKET RESEARCH HANDBOOK 2013
• 245 •
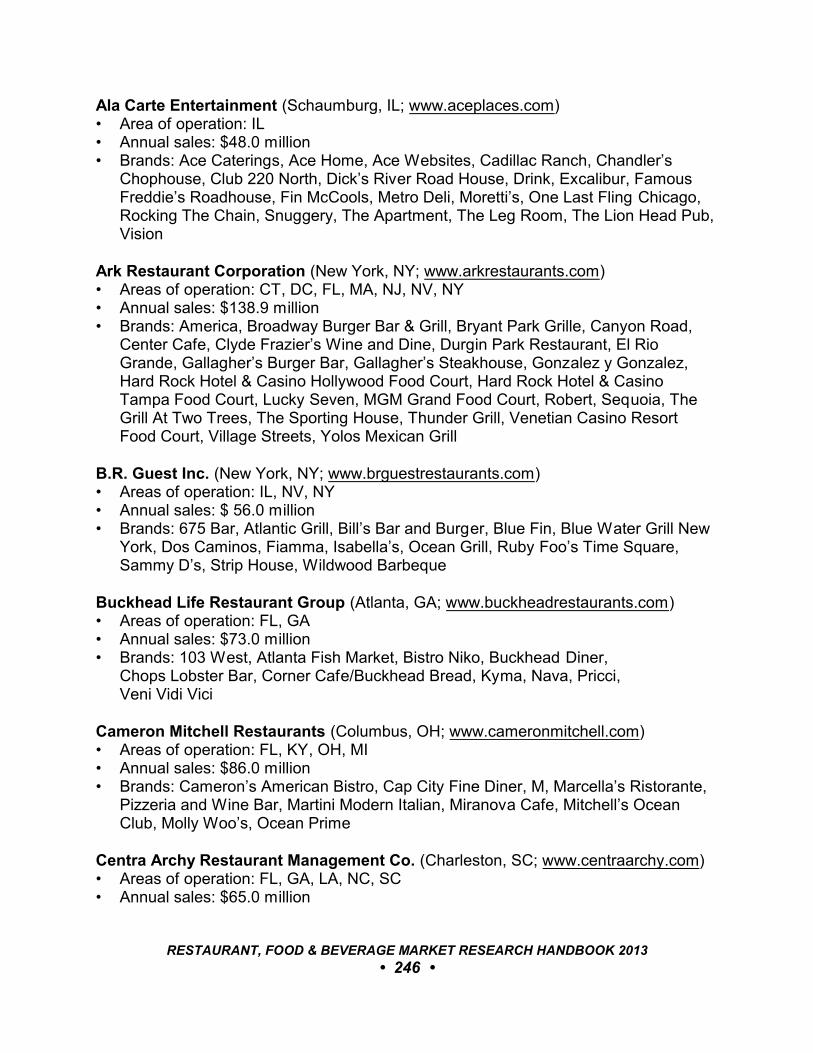
Ala Carte Entertainment (Schaumburg, IL; www.aceplaces.com) • Area of operation: IL• Annual sales: $48.0 million• Brands: Ace Caterings, Ace Home, Ace Websites, Cadillac Ranch, Chandler’s
Chophouse, Club 220 North, Dick’s River Road House, Drink, Excalibur, FamousFreddie’s Roadhouse, Fin McCools, Metro Deli, Moretti’s, One Last Fling Chicago,Rocking The Chain, Snuggery, The Apartment, The Leg Room, The Lion Head Pub,Vision
Ark Restaurant Corporation (New York, NY; www.arkrestaurants.com)• Areas of operation: CT, DC, FL, MA, NJ, NV, NY• Annual sales: $138.9 million• Brands: America, Broadway Burger Bar & Grill, Bryant Park Grille, Canyon Road,
Center Cafe, Clyde Frazier’s Wine and Dine, Durgin Park Restaurant, El RioGrande, Gallagher’s Burger Bar, Gallagher’s Steakhouse, Gonzalez y Gonzalez,Hard Rock Hotel & Casino Hollywood Food Court, Hard Rock Hotel & CasinoTampa Food Court, Lucky Seven, MGM Grand Food Court, Robert, Sequoia, TheGrill At Two Trees, The Sporting House, Thunder Grill, Venetian Casino ResortFood Court, Village Streets, Yolos Mexican Grill
B.R. Guest Inc. (New York, NY; www.brguestrestaurants.com)• Areas of operation: IL, NV, NY• Annual sales: $ 56.0 million• Brands: 675 Bar, Atlantic Grill, Bill’s Bar and Burger, Blue Fin, Blue Water Grill New
York, Dos Caminos, Fiamma, Isabella’s, Ocean Grill, Ruby Foo’s Time Square,Sammy D’s, Strip House, Wildwood Barbeque
Buckhead Life Restaurant Group (Atlanta, GA; www.buckheadrestaurants.com)• Areas of operation: FL, GA• Annual sales: $73.0 million• Brands: 103 West, Atlanta Fish Market, Bistro Niko, Buckhead Diner, Chops Lobster Bar, Corner Cafe/Buckhead Bread, Kyma, Nava, Pricci,
Veni Vidi Vici
Cameron Mitchell Restaurants (Columbus, OH; www.cameronmitchell.com)• Areas of operation: FL, KY, OH, MI• Annual sales: $86.0 million• Brands: Cameron’s American Bistro, Cap City Fine Diner, M, Marcella’s Ristorante,
Pizzeria and Wine Bar, Martini Modern Italian, Miranova Cafe, Mitchell’s OceanClub, Molly Woo’s, Ocean Prime
Centra Archy Restaurant Management Co. (Charleston, SC; www.centraarchy.com)• Areas of operation: FL, GA, LA, NC, SC• Annual sales: $65.0 million
RESTAURANT, FOOD & BEVERAGE MARKET RESEARCH HANDBOOK 2013
• 246 •
• Brands: California Dreaming, Carolina Roadhouse, Chophouse 47, Chophouse NewOrleans, Fiesta Del Burro Loco, Gulfstream Cafe, Joey D’s Oak Room, LenoxSquare Grill, New York Prime, The Tavern at Phipps
Charlie Palmer Group (New York, NY; www.charliepalmer.com)• Areas of operation: CA, DC, NV, NY, TX• Annual sales: $55.0 million• Brands: Astra, Aureole, Briscola, Burritt Room + Tavern, Charlie Palmer @
Bloomingdales, Charlie Palmer On The Joule, Charlie Palmer Steak, District Meats,Dry Creek Kitchen
Clyde’s Restaurant Group (Washington, DC; www.clydes.com)• Areas of operation: DC, MD, VA• Annual sales: $110.0 million• Brands: 1789 Restaurant, Clyde’s, Clyde’s Willow Creek Farm, F. Scott’s, Old Ebbitt
Grill, The Hamilton, The Tomato Palace, The Tombs, Tower Oaks Lodge
Concentrics Restaurants (Atlanta, GA; www.concentricshospitality.com)• Areas of operation: FL, GA• Annual sales: $70.0 million• Brands: Flip, HD1, Lobby at Twelve, LPC, Luma on Park, Murphy’s, ONE Midtown
Kitchen, Parish, Prato, Room at Twelve, Tap, The Spence, Three Sixty, Two UrbanLicks
Consolidated Restaurant Operations Inc. (Dallas, TX; www.croinc.com)• Areas of operation: AL, AR, CO, FL, KY, LA, MO, OK, SC, TN, TX• Annual sales: $188.0 million• Brands: Cantina Laredo, Cool River Cafe Steakhouse & Southwestern Grill,
Double D Ranch, El Chico Cafe, Good Eats Grill, Ill Forks, Lucky’s Cafe, Silver Fox Steakhouse
Copper Cellar Corporation (Knoxville, TN; www.coppercellar.com)• Area of operation: TN• Annual sales: $50.0 million• Brands: Calhoun’s, Cappuccino’s, Cherokee Grill, Chesapeake’s, Copper Cellar,
Cumberland Grill, Smoky Mountain Brewery
Divine Dining Group (Myrtle Beach, SC; www.divinedininggroup.com)• Area of operation: SC• Annual sales: $40.0 million• Brands: Blue Crab, Bovine’s Wood Fired Specialities, Bubba’s Fish Shack, Divine
Fish House, Divine Prime Restaurant, River City Cafe, Ultimate California Pizza,Wahoo’s Raw Bar & Marina
RESTAURANT, FOOD & BEVERAGE MARKET RESEARCH HANDBOOK 2013
• 247 •
Fireman Hospitality Group (New York, NY; www.thefiremangroup.com)• Area of operation: NY• Annual sales: $51.0 million• Brands: Bond 45, Brooklyn Diner Times Square, Brooklyn Diner USA, Cafe
Fiorello’s, Fiorella Pizzeria E Caffe, Redeye Grill, Trattoria dell’Arte
Gibson Restaurant Group (Chicago, IL; www.gibsonssteakhouse.com)• Area of operation: IL• Annual sales: $51.0 million• Brands: Gibsons Bar & Steakhouse, Hugo’s Frog Bar & Fish House, Luxbar,
Quartino Ristorante, Pizzeria Wine Bar
Great American Restaurants(Falls Church, VA; www.greatamericanrestaurants.com)• Area of operation: VA• Annual sales: $56.5 million• Brands: Artie’s, Best Buns Bread, Carlyle, Coastal Flats, Jackson’s, Mike’s
American Grill, Ozzie, Silverado, Sweetwater Tavern
Hal Smith Restaurant Group (Norman, OK; www.eshrg.com)• Areas of operation: AR, AZ, FL, IN, KS, MD, NE, OK, TX, VA• Annual sales: $96.0 million• Brands: Big Tuna, Charleston’s Restaurant, Hefner Grill, Krispy Kreme Doughnuts,
Louie’s Grill and Bar, Mahogany Prime Steak House, Mama Roya, Red RockCanyon Grille, Sauce, Ted’s Café Escondido, The Garage, Toby Keith’s I Love ThisBar & Grill, Upper Crust Wood Fired Pizza
Hillstone Restaurant Group Inc. (Beverly Hills, CA; www.hillstone.com)• Areas of operation: AZ, CA, CO, FL, GA, IL, LA, MA, MD, MO, NJ, NY, TN, TX• Annual sales: $369.0 million• Brands: Bandera, Cherry Creek Grill, East Hampton Grill, Gulfstream, Hillstone,
Houston’s, Los Altos Grill, Palm Beach Grill, R + D Kitchen, Rutherford Grill, SouthBeverly Grill, Woodmont Grill
Kimpton Hotel & Restaurant Group (San Francisco, CA; www.kimptonhotels.com)• Areas of operation: AZ, CA, CO, DC, FL, IL, MA, NY, OR, TX, UT, WA• Annual sales: $353.0 million• Brands: 312 Chicago, 39 Degrees, Alto Rex, Area 31, Atwood Café, B&O Brasserie,
Bambara Cambridge, Bambara Salt Lake City, Bar Rouge, Blue Mermaid Café,BLVD 16, Bookstore Bar & Café, BRABO, Café Pescatore, Central 214, Cobalt,Domaso Trattoria Moderna, Encore, Fifth Floor, Firefly, Grand Café, Harry Denton’sStarlight Room, Heaton’s Reef Bar & Grill, Helix Lounge, Jackson 20, KO Prime,Library Bistro, NIOS, Pacci Ristorante, Panzano, Park Place, Pazzo Bakery & Café,Pazzo Ristorante, Ponzu, Poste Brasserie, Postrio, Puccini & Pinetti, Red Star
RESTAURANT, FOOD & BEVERAGE MARKET RESEARCH HANDBOOK 2013
• 248 •
Tavern & Roast House, Ruby Room, Sable Kitchen & Bar, Sazerac, Scala’s Bistro,Silverleaf Tavern, Six and Lounge Six, Social, South Water Kitchen, Square 1682,Taggia, The Grille, Tulio, Urbana
King’s Seafood Co. (Costa Mesa, CA; www.kingsseafood.com)• Areas of operation: AZ, CA, NV• Annual sales: $50.5 million• Brands: 555 East Prime, Fish Camp, King’s Fish House and King Crab Lounge, Lou
& Mickeys, Ocean Avenue Seafood, Pier Burger, Water Grill
Landry’s Restaurants Inc. (Houston, TX; www.landrysseafood.com)• Areas of operation: AL, AZ, CA, CO, CT, FL, GA, IL, KS, KY, LA, MA, MD, MI, MN,
MO, NJ, NM, NY, OK, OR, PA, SC, TN, TX, VA, WA• Annual sales: $1.42 billion• Brands: Aquarium, Babin’s Seafood House, Beso Steakhouse, Big Fish Seafood
Bistro, Brenner’s Steakhouse, Bubba Gump Shrimp Co., Cadillac Bar Restaurant,Charley’s Crab, Chart House, Claim Jumper, Fish Tales, Fisherman’s Wharf, GandyDancer, Grand Concourse, Grotto, Harlow’s, Jake’s Famous Crawfish, Jake’s Grill,La Griglia, Landry’s Seafood House, M & S Grill, Mai Tai Bar, McCormick &Schmick’s Grille, McCormick’s Fish House & Bar, Meriwether’s, Peohe’s, RainforestCafé, Red Sushi, River Crab, Rusty Pelican, Saltgrass Steak House, SimmsSteakhouse, Spenger’s Fresh Fish Grotto, T-Rex Café, The Boathouse, The CrabHouse, The Flying Dutchman, The Heathman Restaurant & Bar, The OceanaireSeafood Room, Tower of the Americas, Vic & Anthony’s Steakhouse, WilliamDouglas Steakhouse, Willie G’s Seafood & Steak House, Yak & Yeti
Lettuce Entertain You Enterprises (Chicago, IL; www.leye.com)• Areas of operation: AZ, CA, IL, MN, NV, VA• Annual sales: $400.0 million• Brands: Antico Posto, Big Bowl Fresh Chinese and Thai, Bub City, Cafe Ba-Ba-
Reeba!, Community Canteen, Di Pescara, Don & Charlie’s, Eiffel Tower Restaurant,El Segundo Sol Taqueria & Margarita Bar, Everest, foodlife, Frankie’s Scaloppine &Fifth Floor Pizzeria, Hub 51, Joe’s Seafood, Prime Steak, and Stone Crab, L.Woods Tap & Pine Lodge, L20, M Burger, M Street Kitchen, Maggiano’s Little Italy,Mity Nice Grill, Mon Ami Gabi, Nacional 27, Osteria via Stato, Paris Club,Petterino’s, Pizzeria via Stato, R.J. Grunts, Reel Club, RPM Pizza, Saranello’s,Scoozi!, Shaw’s Crab House, Stella Rossa Pizza Bar, Stripburger, The Magic PanCrepe Stand, Tokio Pub, Tru, Tucci Benucch, Twin City Grill, Wildfire, Wow Bao
M Crowd Restaurant Group (Irving, TX; www.mcrowd.com)• Areas of operation: GA, MO, TX• Annual sales: $50.0 million• Brands: Mi Cocina, Taco Diner, The Mercury Grill
RESTAURANT, FOOD & BEVERAGE MARKET RESEARCH HANDBOOK 2013
• 249 •
Mad Anthony’s Inc (Kirkland, WA; www.anthonys.com)• Areas of operation: OR, WA• Annual sales: $51.0 million• Brands: Anthony’s at Cap Sante Boat Haven, Anthony’s at Columbia Point,
Anthony’s at Gig Harbor, Anthony’s at Point Defiance, Anthony’s at Sinclair Inlet,Anthony’s at Spokane Falls, Anthony’s at Squalicum Harbor, Anthony’s at The OldMill District, Anthony’s Beach Café, Anthony’s Bell Street Diner, Anthony’s Fish Bar,Anthony’s Hearthfire Grill, Anthony’s HomePort, Anthony’s Pier 66, Anthony’sSeafood Grill, Anthony’s Woodfire Grill, Chinook’s at Salmon Bay, Des MoinesOyster Bar & Grill, Harbor Lights, Little Chinook’s
McMenamins Pubs & Breweries (Portland, OR; www.mcmenamins.com)• Areas of operation: OR, WA• Annual sales: $106.7 million• Brands: Back Stage Bar, Bagdad Café and Theater, Barley Mill Pub, Black Rabbit
Restaurant, Blue Moon Tavern and Grill, Cornelius Pass Road House and Brewery,Dad Watsons Restaurant and Brewery, East 19th Street Café, Edgefield Manor,Fulton Pub and Brewery, Grand Lodge, Greater Trumps, Greenway Pub, HighStreet Brewery & Pub, Highland Pub and Brewery, Hillsdale Brewery and PublicHouse, Hotel Oregon, Hotel Oregon Pub, John Barleycorn’s Restaurant andBrewery, Kennedy School, Lighthouse Brewpub, Market Street Pub, McMenamins,Mission Theater and Pub, North Bank, Oak Hills Brewpub, Olympic Club, RaleighHills Pub, Ringler’s Annex, Ringlers, Riverwood Pub, Rock Creek Tavern, Six ArmsBrewpub, The Crystal Ballroom, The Ram’s Head, The White Eagle, ThompsonBrewery and Public House
Pappas Restaurants (Houston, TX; www.pappadeaux.com)• Areas of operation: AZ, CO, GA, IL, NM, OH, TX• Annual sales: $525.0 million• Brands: Dot Coffee Shop, Pappadeaux Seafood Kitchen, Pappas B-B-Q, Pappas
Bros. Steakhouse, Pappas Burger, Pappas Seafood House, Pappasito’s Cantina,Ruby’s Diner, Yia Yia Marys Pappas Greek Kitchen
Patina Restaurant Group (New York, NY; www.patinagroup.com)Areas of operation: CA, FL, NV, NY• Annual sales: $126.0 million• Brands: Brasserie, Brasserie 8 ½, C+M at LACA, Café at the Opera, Café Centro,
Café Descanso at Descanso Gardens, Café Pinot, Catal Restaurant & UVA Bar,Concert Hall Café, Cucina & CO, Kendell’s Brasserie, LACMA Café, La Fonda DelSol, Leatherby’s Café Rouge, Lincoln Ristorante, Macy’s Cellar Bar & Grill, MarketCafé, Naples 45, Naples Ristorante & Pizzeria, Nick & Stef’s Steakhouse, NortonSimone Café at Norton Simon Museum, Panevino Ristorante, Patina, PinotBrasserie at the Venetian, Pinot Grill, Pinot Provence, Ray’s and Stark Bar atLACMA, Rock Center Café, Rooftop Grill at Hollywood Bowl, Spotlight Café,
RESTAURANT, FOOD & BEVERAGE MARKET RESEARCH HANDBOOK 2013
• 250 •
Tangata, Taqueria, The Beer Bar, The Grand Tier Restaurant, The Rink, The SeaGrill, Tortilla Jo’s, Tutto Italia, Via Napoli
Restaurants-America (Glenview, IL; www.restaurants-america.com)• Areas of operation: FL, IL, MD, MN, TX, VA• Annual sales: $40.0 million• Brands: Bluepointe Oyster Bar, Boca Chica Tapas & Tequila, Central Standard,
Midtown Kitchen & Bar, Mockingbird Taproom, One North, Park Tavern, Primebar,Red Star Tavern, The Grilroom, Townhouse Restaurant & Wine Bar
Restaurants Unlimited (Seattle, WA; www.r-u-i.com)• Areas of operation: AK, AZ, CA, HI, IN, MN, OH, OR, TX, VA, WA• Annual sales: $135.0 million• Brands: Billy Heartbeats, Clinkerdagger, Cutters Crabhouse, Henry’s Tavern,
Horatio’s, Kincaid’s, Maggie Bluff’s, Manzana, Newport Bay, Palisade, PalominoRestaurant & Bar, Pizzeria Fondi, Portland City Grill, Portland Seafood Co., Ryan’sGrill, Scott’s Bar & Grill, Simon & Seafort’s Saloon & Grill, Skates on the Bay,Stanford’s, Stanley & Seafort’s Steak, Chop & Fish House
Restaurants-America (Glenview, IL; www.restaurants-america.com)• Areas of operation: FL, IL, MD, MN, TX, VA• Annual sales: $40.0 million• Brands: Bluepointe Oyster Bar, Boca Chica Tapas & Tequila, Central Standard,
Midtown Kitchen & Bar, Mockingbird Taproom, One North, Park Tavern, Primebar,Red Star Tavern, The Grillroom, Townhouse Restaurant & Wine Bar
Schwartz Brothers Restaurants (Bellevue, WA; www.schwartzbros.com)• Area of operation: WA• Annual sales: $53.0 million• Brands: Chandler’s Crabhouse, Daniel’s Broiler, Spazzo Italian Grill
Select Restaurants (Cleveland, OH; www.selectrestaurants.com)• Areas of operation: CA, IL, MA, MD, OH, PA• Annual sales: $50.0 million• Parker Restaurant & Bar, Parker’s Lighthouse, Parkers Blue Ash Tavern, Pier W,
Rusty Scupper, Top of the Hub, Winberie’s Restaurant & Bar
Specialty Restaurants Corporation (Anaheim, CA; www.specialtyrestaurants.com)• Areas of operation: CA, CO, FL, NY, OH, TX• Annual sales: $107.5 million• Brands: 100th Bomb Group, 56th Fighter Group, 94th Aero Squadron, Brady’s
Landing, Castaway, Guaymas, HS Lordships, Luminarias, Monterey Hill Steak &Seafood Restaurant, Orange Hill, Rusty Pelican, Shanghai Reds, Sunbird, TheOdyssey, The Proud Bird, The Reef, The River Club Restaurant, Whiskey Joe’s
RESTAURANT, FOOD & BEVERAGE MARKET RESEARCH HANDBOOK 2013
• 251 •
Starr Restaurant Organization (Philadelphia, PA; www.starr-organization.com)• Areas of operation: FL, NJ, NY, PA• Annual sales: $166.6 million• Brands: Alma de Cuba, Barclay Prime, Buddakan, Butcher and Singer, Caffe
Storico, Continental Midtown, El Rey, El Vez, Fette Sau, Frankford Hall, Granite Hillat Philadelphia Museum of Art, Il Pittore, Jones, Le Diplomate, Makoto, Morimoto,Parc, Pizzeria Stella, Pod, Rat’s Restaurant, Route 6, Square Burger, Steak 954,Talula’s Garden, The Continental, The Dandelion Pub
TS Restaurants (Lahaina, HI; www.tsrestaurants.com)• Areas of operation: CA, HI• Annual sales: $96.0 million• Brands: Duke’s, Hula Grill, Jake’s Del Mar, Keoki’s Paradise, Kimo’s, Leilani’s on
the Beach, Sandys Beach Grill, Sunnyside Restaurant & Lodge
Tavistock Restaurants (Emeryville, CA; www.tavistock.com)• Areas of operation: AR, AZ, CA, CT, FL, IN, KS, MA, MD, MN, MO, NH, NJ, OK, PA,
RI, TX• Annual sales: $132.6 million• Brands: Abe & Louie’s, Alcatraz Brewing Co., Atlantic Fish, Blackhawk Grille, Cafe
Del Rey, California Cafe Bar & Grill, Charley’s, Coach Grill, FREEBIRDS WorldBurrito, Joe’s American Bar & Grill, Napa Valley Grille, Sapporo, Zed 451
The Glazier Group (www.theglaziergroup.com)• Areas of operation: FL, NJ, NY• Annual sales: $42.8 million• Brands: Bridgewaters, Michael Jordan’s The Steak House, Strip House
The Olive Group (Charlestown, MA; www.toddenglish.com)• Areas of operation: CT, FL, MA, NV, NY• Annual sales: $100.0 million• Brands: BlueZoo, BonFire, Ca Va Brasserie, English Tap and Beer Gardens, Figs,
Isabell’s CurlyCakes, Kingfish Hall, Olives, Plaza Food Hall, Todd English P.U.B.,Todd English Restaurant, Todd English Tuscany
Tour de France (New York; New York; www.tourdefrancenyc.com)• Area of operation: NY• Annual sales: $48.0 million• Brands: Café D’Alsace, French Roast, L’Express, Le Monde, Maison, Marseille,
Nice Matin, Pigalle
RESTAURANT, FOOD & BEVERAGE MARKET RESEARCH HANDBOOK 2013
• 252 •
Trowbridge Restaurant Group (Bingham Farms, MI; www.mattpreincerg.com)Area of operation: MI• Annual sales: $41.6 million• Brands: Coach Insignia, Deli Unique, Gastronomy, No. VI Chophouse & Lobster
Bar, Northern Lakes Seafood Co., Plaza Deli
Wolfgang Puck Fine Dining Group (Beverly Hills, CA; www.wolfgangpuck.com)• Areas of operation: AZ, CA, CO, DC, FL, GA, HI, IL, IN, KY, MA, MI, NC, NV, NJ,
NY, OH, OK, RI, TX, UT, WA• Annual sales: $167.7 million• Brands: Chinois, CUT, Five Sixty by Wolfgang Puck, Gelson’s Grab and Go, Jai by
Wolfgang Puck, Measure, Postrio Bar & Grill, Puck’s at the MCA, Red/Seven,Spago, Spectra by Wolfgang Puck, Trattoria del Lupo, The Source, Wolfgang PuckAmerican Grille, Wolfgang Puck Bar & Grill, Wolfgang Puck Bistro, Wolfgang PuckBistro, Wolfgang Puck Express, Wolfgang Puck Grand Café, Wolfgang Puck Grille,Wolfgang Puck Kiosk, Wolfgang Puck Pizza / Bar, Wolfgang Puck Pizzeria &Cucina, Wolfgang Puck Steak, WP24 by Wolfgang Puck
RESTAURANT, FOOD & BEVERAGE MARKET RESEARCH HANDBOOK 2013
• 253 •
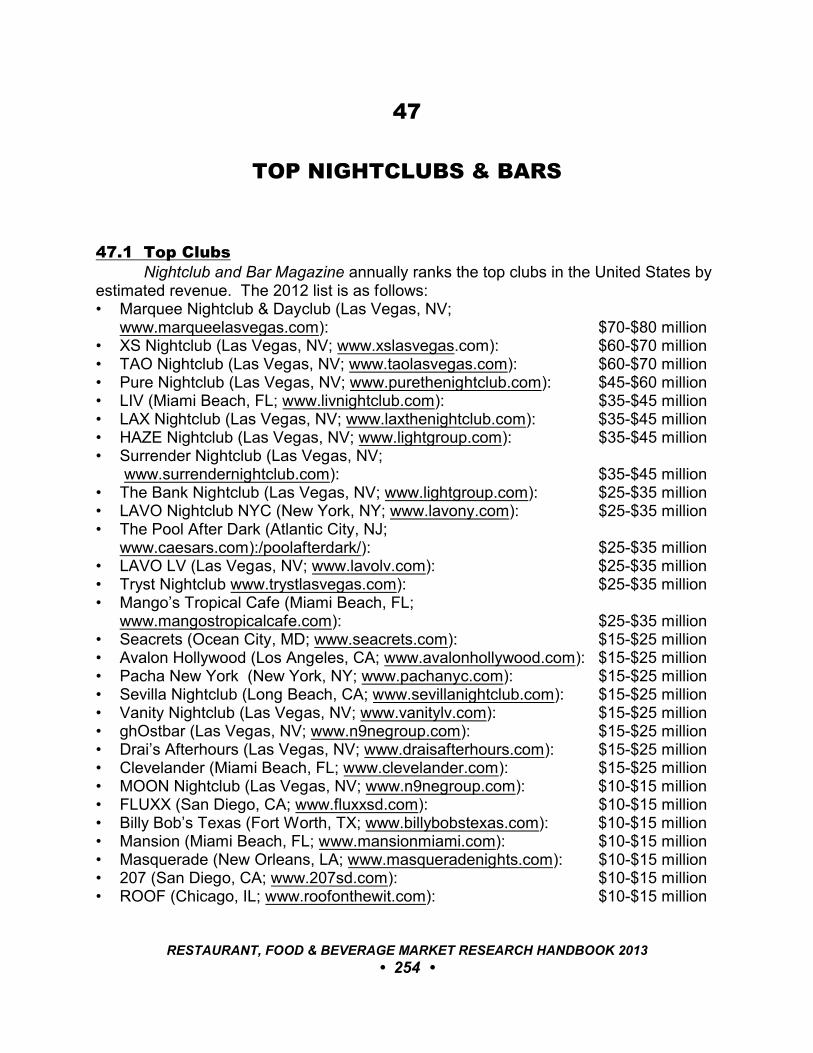
47
TOP NIGHTCLUBS & BARS
47.1 Top ClubsNightclub and Bar Magazine annually ranks the top clubs in the United States by
estimated revenue. The 2012 list is as follows:• Marquee Nightclub & Dayclub (Las Vegas, NV;
www.marqueelasvegas.com): $70-$80 million• XS Nightclub (Las Vegas, NV; www.xslasvegas.com): $60-$70 million• TAO Nightclub (Las Vegas, NV; www.taolasvegas.com): $60-$70 million• Pure Nightclub (Las Vegas, NV; www.purethenightclub.com): $45-$60 million• LIV (Miami Beach, FL; www.livnightclub.com): $35-$45 million• LAX Nightclub (Las Vegas, NV; www.laxthenightclub.com): $35-$45 million• HAZE Nightclub (Las Vegas, NV; www.lightgroup.com): $35-$45 million• Surrender Nightclub (Las Vegas, NV;
www.surrendernightclub.com): $35-$45 million• The Bank Nightclub (Las Vegas, NV; www.lightgroup.com): $25-$35 million• LAVO Nightclub NYC (New York, NY; www.lavony.com): $25-$35 million• The Pool After Dark (Atlantic City, NJ;
www.caesars.com):/poolafterdark/): $25-$35 million• LAVO LV (Las Vegas, NV; www.lavolv.com): $25-$35 million• Tryst Nightclub www.trystlasvegas.com): $25-$35 million• Mango’s Tropical Cafe (Miami Beach, FL;
www.mangostropicalcafe.com): $25-$35 million• Seacrets (Ocean City, MD; www.seacrets.com): $15-$25 million• Avalon Hollywood (Los Angeles, CA; www.avalonhollywood.com): $15-$25 million• Pacha New York (New York, NY; www.pachanyc.com): $15-$25 million• Sevilla Nightclub (Long Beach, CA; www.sevillanightclub.com): $15-$25 million• Vanity Nightclub (Las Vegas, NV; www.vanitylv.com): $15-$25 million• ghOstbar (Las Vegas, NV; www.n9negroup.com): $15-$25 million• Drai’s Afterhours (Las Vegas, NV; www.draisafterhours.com): $15-$25 million• Clevelander (Miami Beach, FL; www.clevelander.com): $15-$25 million• MOON Nightclub (Las Vegas, NV; www.n9negroup.com): $10-$15 million• FLUXX (San Diego, CA; www.fluxxsd.com): $10-$15 million• Billy Bob’s Texas (Fort Worth, TX; www.billybobstexas.com): $10-$15 million• Mansion (Miami Beach, FL; www.mansionmiami.com): $10-$15 million• Masquerade (New Orleans, LA; www.masqueradenights.com): $10-$15 million• 207 (San Diego, CA; www.207sd.com): $10-$15 million• ROOF (Chicago, IL; www.roofonthewit.com): $10-$15 million
RESTAURANT, FOOD & BEVERAGE MARKET RESEARCH HANDBOOK 2013
• 254 •

• The Gold Lounge (Las Vegas, NV; www.lightgroup.com): $10-$15 million• Shrine Asian Kitchen Lounge & Nightclub (Mashantucket, CT;
www.shrinemgmfoxwoods.com): $10-$15 million• SET Nightclub (Miami Beach, FL; www.setmiami.com): $10-$15 million• Stingaree (San Diego, CA; www.stingsandiego.com): $10-$15 million• AJ’s club bimini (Destin, FL; www.ajs-destin.com): $10-$15 million• Playboy Club (Las Vegas, NV; www.n9negroup.com): $10-$15 million• Float (San Diego, CA; www.207sd.com): $10-$15 million• Opera Nightclub (Atlanta, GA; www.operaatlanta.com): $10-$15 million• Drai’s Hollywood (Los Angeles, CA; www.hollywood.drais.net): $10-$15 million• Kilroy’s Sports Bar (Bloomington, IN;
www.kilroys-bloomington.com): $10-$15 million• Vision (Chicago, IL; www.visionnightclub.com): $10-$15 million• Rain Nightclub (Las Vegas, NV; www.n9negroup.com): $10-$15 million• Ivy (San Diego, CA; www.ivyentertainmentsandiego.com): $10-$15 million• P.O.V (Washington, DC; www.pointofviewdc.com): $10-$15 million• 1 Oak NYC (New York, NY; www.1oaknyc.com): $10-$15 million• The Chandelier (Las Vegas, NV;
www.cosmopolitanlasvegas.com): $10-$15 million• Plush (Dallas, TX; www.plushdallas.com): $10-$15 million• Public House (Chicago, IL; www.publichousechicago.com): $10-$15 million• Playhouse Nightclub (Los Angeles, CA;
www.playhousenightclub.com): $10-$15 million• Bar Anticipation (Lake Como, NJ; www.bar-a.com): $10-$15 million• Webster Hall (New York, NY; www.websterhall.com): $10-$15 million• Avenue (New York, NY; www.avenue-newyork.com): $10-$15 million• The Park Lounge (Sacramento, CA; www.theparkdowntown.com): $10-$15 million• Wall (Miami Beach, FL; www.wallmiami.com): $10-$15 million• Sutra OC (Costa Mesa, CA; www.sutraoc.com): $10-$15 million• Altitude Sky Lounge (San Diego, CA;
www.altitudeskylounge.com): $10-$15 million• 1015 Folsom (San Francisco, CA; www.puraclub.com): $10-$15 million• Marquee NY (New York, NY; www.marqueeny.com): $5-$10 million• Studio 54 (Las Vegas, NV; www.mgmgrand.com/nightlife): $5-$10 million• Krave Nightclub (Las Vegas, NV; www.kravelasvegas.com): $5-$10 million• The Highlands Hollywood (Los Angeles, CA;
www.thehighlandshollywood.com): $5-$10 million• tenjune (New York, NY; www.tenjunenyc.com): $5-$10 million• LOVE (Washington, DC; www.lovetheclub.com): $5-$10 million• Ecco Ultra Lounge (Los Angeles, CA; www.eccohollywood.com): $5-$10 million• Space Miami (Miami, FL; www.clubspace.com): $5-$10 million• Passion Nightclub (Hollywood, FL; www.passionnightclub.com): $5-$10 million• Stoney’s Rockin’ Country (Las Vegas, NV;
www.stoneysrockincountry.com): $5-$10 million
RESTAURANT, FOOD & BEVERAGE MARKET RESEARCH HANDBOOK 2013
• 255 •
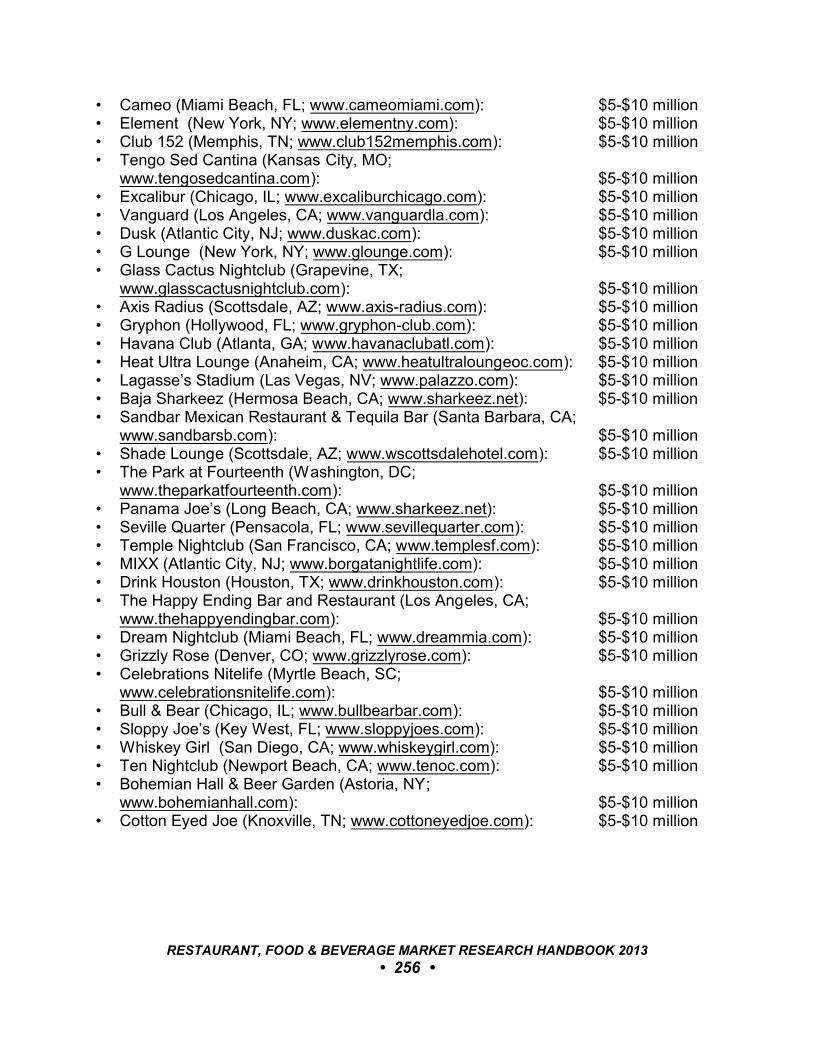
• Cameo (Miami Beach, FL; www.cameomiami.com): $5-$10 million• Element (New York, NY; www.elementny.com): $5-$10 million• Club 152 (Memphis, TN; www.club152memphis.com): $5-$10 million• Tengo Sed Cantina (Kansas City, MO;
www.tengosedcantina.com): $5-$10 million• Excalibur (Chicago, IL; www.excaliburchicago.com): $5-$10 million• Vanguard (Los Angeles, CA; www.vanguardla.com): $5-$10 million• Dusk (Atlantic City, NJ; www.duskac.com): $5-$10 million• G Lounge (New York, NY; www.glounge.com): $5-$10 million• Glass Cactus Nightclub (Grapevine, TX;
www.glasscactusnightclub.com): $5-$10 million• Axis Radius (Scottsdale, AZ; www.axis-radius.com): $5-$10 million• Gryphon (Hollywood, FL; www.gryphon-club.com): $5-$10 million• Havana Club (Atlanta, GA; www.havanaclubatl.com): $5-$10 million• Heat Ultra Lounge (Anaheim, CA; www.heatultraloungeoc.com): $5-$10 million• Lagasse’s Stadium (Las Vegas, NV; www.palazzo.com): $5-$10 million• Baja Sharkeez (Hermosa Beach, CA; www.sharkeez.net): $5-$10 million• Sandbar Mexican Restaurant & Tequila Bar (Santa Barbara, CA;
www.sandbarsb.com): $5-$10 million• Shade Lounge (Scottsdale, AZ; www.wscottsdalehotel.com): $5-$10 million• The Park at Fourteenth (Washington, DC;
www.theparkatfourteenth.com): $5-$10 million• Panama Joe’s (Long Beach, CA; www.sharkeez.net): $5-$10 million• Seville Quarter (Pensacola, FL; www.sevillequarter.com): $5-$10 million• Temple Nightclub (San Francisco, CA; www.templesf.com): $5-$10 million• MIXX (Atlantic City, NJ; www.borgatanightlife.com): $5-$10 million• Drink Houston (Houston, TX; www.drinkhouston.com): $5-$10 million• The Happy Ending Bar and Restaurant (Los Angeles, CA;
www.thehappyendingbar.com): $5-$10 million• Dream Nightclub (Miami Beach, FL; www.dreammia.com): $5-$10 million• Grizzly Rose (Denver, CO; www.grizzlyrose.com): $5-$10 million• Celebrations Nitelife (Myrtle Beach, SC;
www.celebrationsnitelife.com): $5-$10 million• Bull & Bear (Chicago, IL; www.bullbearbar.com): $5-$10 million• Sloppy Joe’s (Key West, FL; www.sloppyjoes.com): $5-$10 million• Whiskey Girl (San Diego, CA; www.whiskeygirl.com): $5-$10 million• Ten Nightclub (Newport Beach, CA; www.tenoc.com): $5-$10 million• Bohemian Hall & Beer Garden (Astoria, NY;
www.bohemianhall.com): $5-$10 million• Cotton Eyed Joe (Knoxville, TN; www.cottoneyedjoe.com): $5-$10 million
RESTAURANT, FOOD & BEVERAGE MARKET RESEARCH HANDBOOK 2013
• 256 •

PART VI: THE CUSTOMER
RESTAURANT, FOOD & BEVERAGE MARKET RESEARCH HANDBOOK 2013
• 257 •
48
CUSTOMER DEMOGRAPHICS
48.1 OverviewWho’s Buying at Restaurants and Carry-outs, published by New Strategist
(www.newstrategist.com), and based on data from the Consumer Spending Survey, bythe Bureau of Labor Statistics (www.bls.gov), provides a demographic assessment offull-service and quick-service restaurant patronage across the breakfast, lunch, anddinner day-parts. Assessment is also made for dining while traveling and spending forsnacks at quick-service restaurants.
Average annual household spending for the eight restaurant occasions andformats are as follows:• Breakfast, full-service restaurants: $ 99.99• Breakfast, quick-service restaurants*: $115.45 • Lunch, full-service restaurants: $294.75• Lunch, quick-service restaurants*: $388.05• Dinner, full-service restaurants: $720.06• Dinner, quick-service restaurants*: $342.18• Dining while traveling: $237.87• Snacks at quick-service restaurants*: $111.01* Quick-service restaurants in this analysis include takeout, delivery, concessions, buffets, and
cafeterias other than those operated by employers and schools.
Sections 48.2 through 48.9, which follow, provide demographic assessments ofthese eight restaurant occasions and formats. Based on this data, assessments forspending by age, household income, household type, race/ethnicity, region, andeducation are presented in sections 48.10 through 48.15, respectively.
48.2 Breakfast at Full-Service RestaurantsThe following is a demographic assessment of consumer spending for breakfast at
full-service restaurants:Age of Householder Index Marketshare $ Per HH
• Under age 25: 58 4% $ 58 • 25-to-34: 84 14% $ 84• 35-to-44: 100 19% $ 100• 45-to-54: 110 23% $ 110• 55-to-64: 124 20% $ 124
RESTAURANT, FOOD & BEVERAGE MARKET RESEARCH HANDBOOK 2013
• 258 •
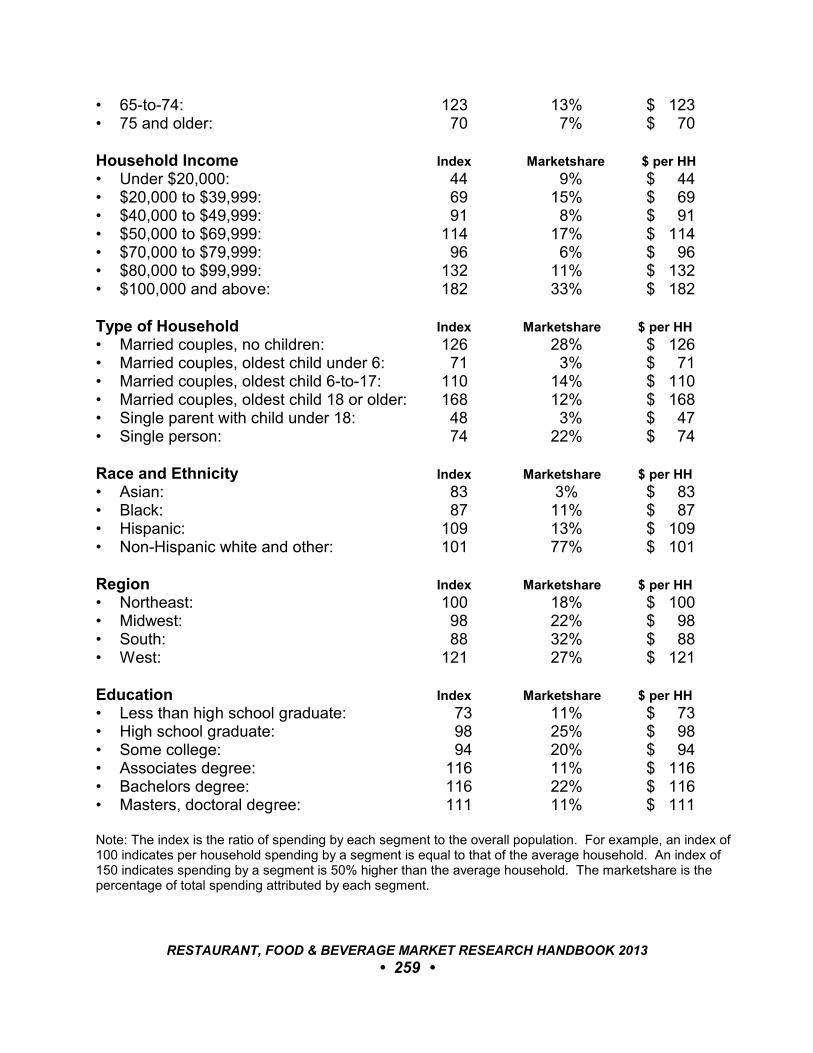
• 65-to-74: 123 13% $ 123• 75 and older: 70 7% $ 70
Household Income Index Marketshare $ per HH
• Under $20,000: 44 9% $ 44• $20,000 to $39,999: 69 15% $ 69• $40,000 to $49,999: 91 8% $ 91• $50,000 to $69,999: 114 17% $ 114• $70,000 to $79,999: 96 6% $ 96• $80,000 to $99,999: 132 11% $ 132• $100,000 and above: 182 33% $ 182
Type of Household Index Marketshare $ per HH
• Married couples, no children: 126 28% $ 126• Married couples, oldest child under 6: 71 3% $ 71• Married couples, oldest child 6-to-17: 110 14% $ 110• Married couples, oldest child 18 or older: 168 12% $ 168• Single parent with child under 18: 48 3% $ 47• Single person: 74 22% $ 74
Race and Ethnicity Index Marketshare $ per HH
• Asian: 83 3% $ 83• Black: 87 11% $ 87• Hispanic: 109 13% $ 109• Non-Hispanic white and other: 101 77% $ 101
Region Index Marketshare $ per HH
• Northeast: 100 18% $ 100• Midwest: 98 22% $ 98• South: 88 32% $ 88• West: 121 27% $ 121
Education Index Marketshare $ per HH
• Less than high school graduate: 73 11% $ 73 • High school graduate: 98 25% $ 98• Some college: 94 20% $ 94• Associates degree: 116 11% $ 116• Bachelors degree: 116 22% $ 116• Masters, doctoral degree: 111 11% $ 111
Note: The index is the ratio of spending by each segment to the overall population. For example, an index of100 indicates per household spending by a segment is equal to that of the average household. An index of150 indicates spending by a segment is 50% higher than the average household. The marketshare is thepercentage of total spending attributed by each segment.
RESTAURANT, FOOD & BEVERAGE MARKET RESEARCH HANDBOOK 2013
• 259 •

_________________________________________________________________
“The biggest spenders on breakfast and brunch atfull-service restaurants are older married couplesenjoying a leisurely meal. Householders ages 55-to-74 spend 23% to 24% more than average on thisitem. Married couples without children at home(many of them empty-nesters) spend 26% morethan average on breakfast and brunch atfull-service restaurants. Couples with adultchildren at home spend 68% more than averageon full-service breakfast, in part because theirhouseholds are larger.”
New Strategist _________________________________________________________________
48.3 Breakfast at Quick-Service RestaurantsThe following is a demographic assessment of consumer spending for breakfast
at quick-service restaurants:Age of Householder Index Marketshare $ per HH
• Under age 25: 69 5% $ 79• 25-to-34: 116 20% $ 134• 35-to-44: 133 25% $ 138• 45-to-54: 122 26% $ 136• 55-to-64: 87 14% $ 84• 65-to-74: 74 8% $ 67• 75 and older: 27 2% $ 30
Household Income Index Marketshare $ per HH
• Under $20,000: 43 9% $ 50• $20,000 to $39,999: 78 17% $ 90• $40,000 to $49,999: 95 9% $ 109• $50,000 to $69,999: 94 14% $ 109• $70,000 to $79,999: 112 7% $ 129• $80,000 to $99,999: 133 11% $ 153• $100,000 and above: 181 32% $ 209
RESTAURANT, FOOD & BEVERAGE MARKET RESEARCH HANDBOOK 2013
• 260 •
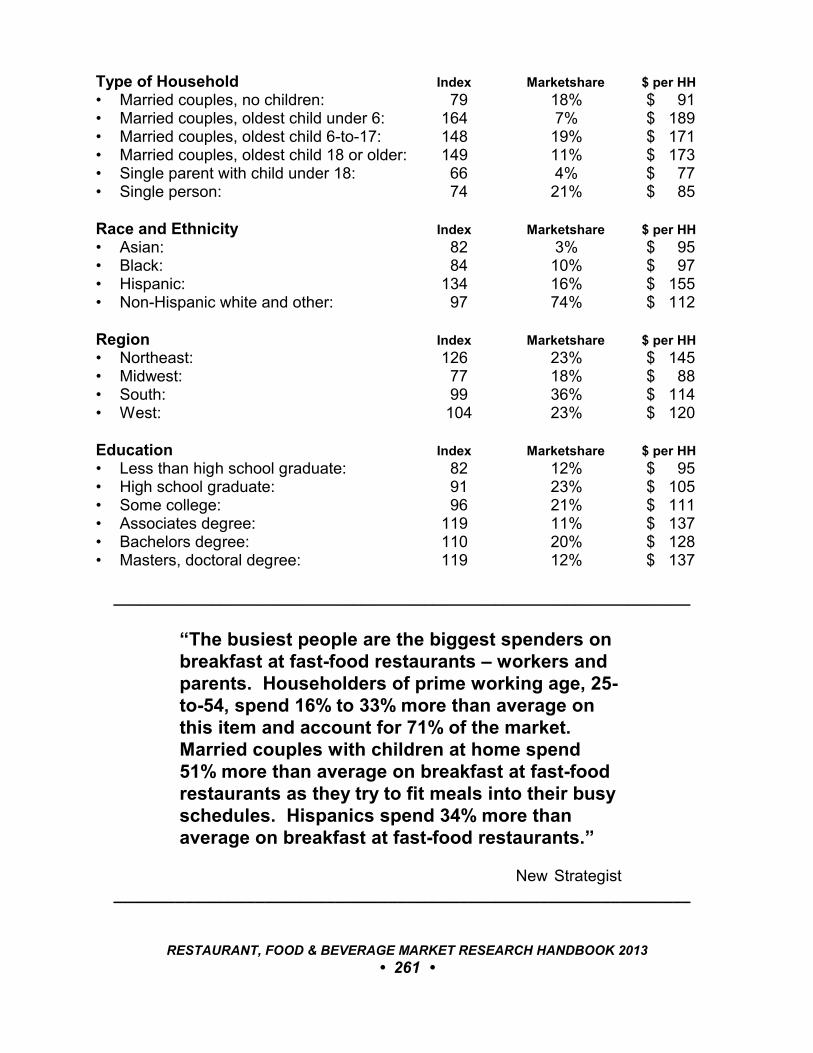
Type of Household Index Marketshare $ per HH
• Married couples, no children: 79 18% $ 91• Married couples, oldest child under 6: 164 7% $ 189• Married couples, oldest child 6-to-17: 148 19% $ 171• Married couples, oldest child 18 or older: 149 11% $ 173• Single parent with child under 18: 66 4% $ 77• Single person: 74 21% $ 85
Race and Ethnicity Index Marketshare $ per HH
• Asian: 82 3% $ 95• Black: 84 10% $ 97• Hispanic: 134 16% $ 155• Non-Hispanic white and other: 97 74% $ 112
Region Index Marketshare $ per HH
• Northeast: 126 23% $ 145• Midwest: 77 18% $ 88• South: 99 36% $ 114• West: 104 23% $ 120
Education Index Marketshare $ per HH
• Less than high school graduate: 82 12% $ 95• High school graduate: 91 23% $ 105• Some college: 96 21% $ 111• Associates degree: 119 11% $ 137• Bachelors degree: 110 20% $ 128• Masters, doctoral degree: 119 12% $ 137
_________________________________________________________________
“The busiest people are the biggest spenders onbreakfast at fast-food restaurants – workers andparents. Householders of prime working age, 25-to-54, spend 16% to 33% more than average onthis item and account for 71% of the market. Married couples with children at home spend51% more than average on breakfast at fast-foodrestaurants as they try to fit meals into their busyschedules. Hispanics spend 34% more thanaverage on breakfast at fast-food restaurants.”
New Strategist _________________________________________________________________
RESTAURANT, FOOD & BEVERAGE MARKET RESEARCH HANDBOOK 2013
• 261 •
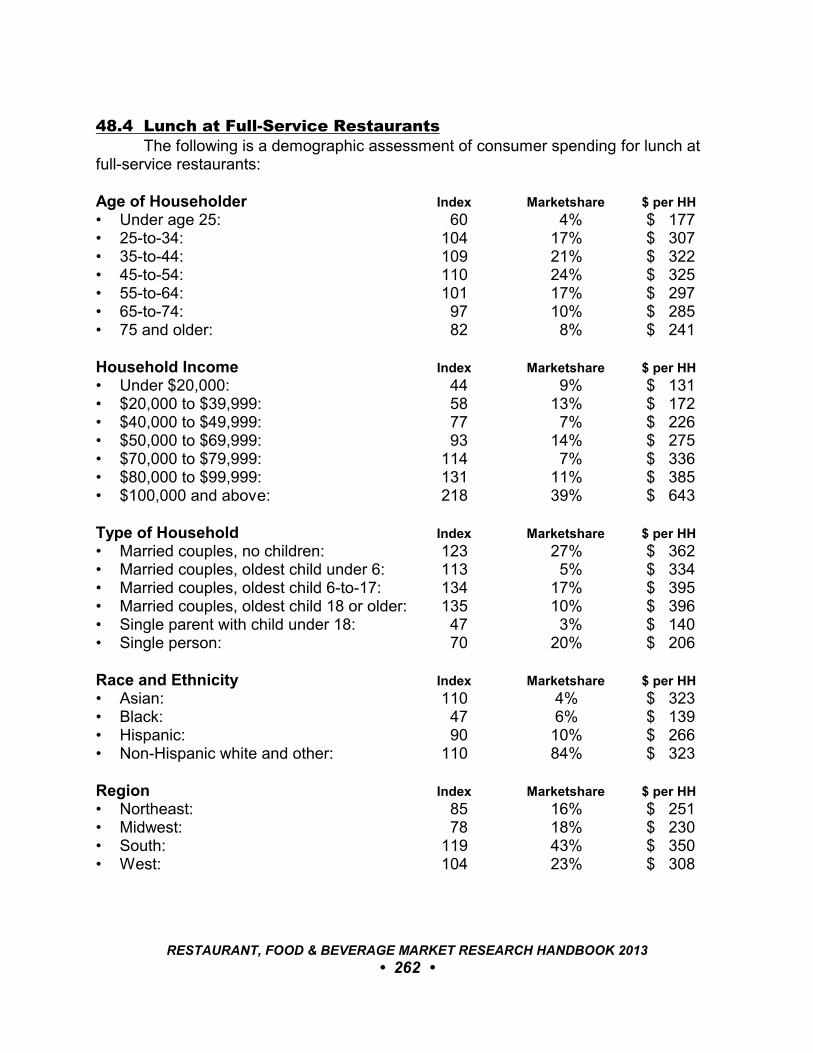
48.4 Lunch at Full-Service RestaurantsThe following is a demographic assessment of consumer spending for lunch at
full-service restaurants:
Age of Householder Index Marketshare $ per HH
• Under age 25: 60 4% $ 177• 25-to-34: 104 17% $ 307• 35-to-44: 109 21% $ 322• 45-to-54: 110 24% $ 325• 55-to-64: 101 17% $ 297• 65-to-74: 97 10% $ 285• 75 and older: 82 8% $ 241
Household Income Index Marketshare $ per HH
• Under $20,000: 44 9% $ 131• $20,000 to $39,999: 58 13% $ 172• $40,000 to $49,999: 77 7% $ 226• $50,000 to $69,999: 93 14% $ 275• $70,000 to $79,999: 114 7% $ 336• $80,000 to $99,999: 131 11% $ 385• $100,000 and above: 218 39% $ 643
Type of Household Index Marketshare $ per HH
• Married couples, no children: 123 27% $ 362• Married couples, oldest child under 6: 113 5% $ 334• Married couples, oldest child 6-to-17: 134 17% $ 395• Married couples, oldest child 18 or older: 135 10% $ 396• Single parent with child under 18: 47 3% $ 140• Single person: 70 20% $ 206
Race and Ethnicity Index Marketshare $ per HH
• Asian: 110 4% $ 323• Black: 47 6% $ 139• Hispanic: 90 10% $ 266• Non-Hispanic white and other: 110 84% $ 323
Region Index Marketshare $ per HH
• Northeast: 85 16% $ 251• Midwest: 78 18% $ 230• South: 119 43% $ 350• West: 104 23% $ 308
RESTAURANT, FOOD & BEVERAGE MARKET RESEARCH HANDBOOK 2013
• 262 •
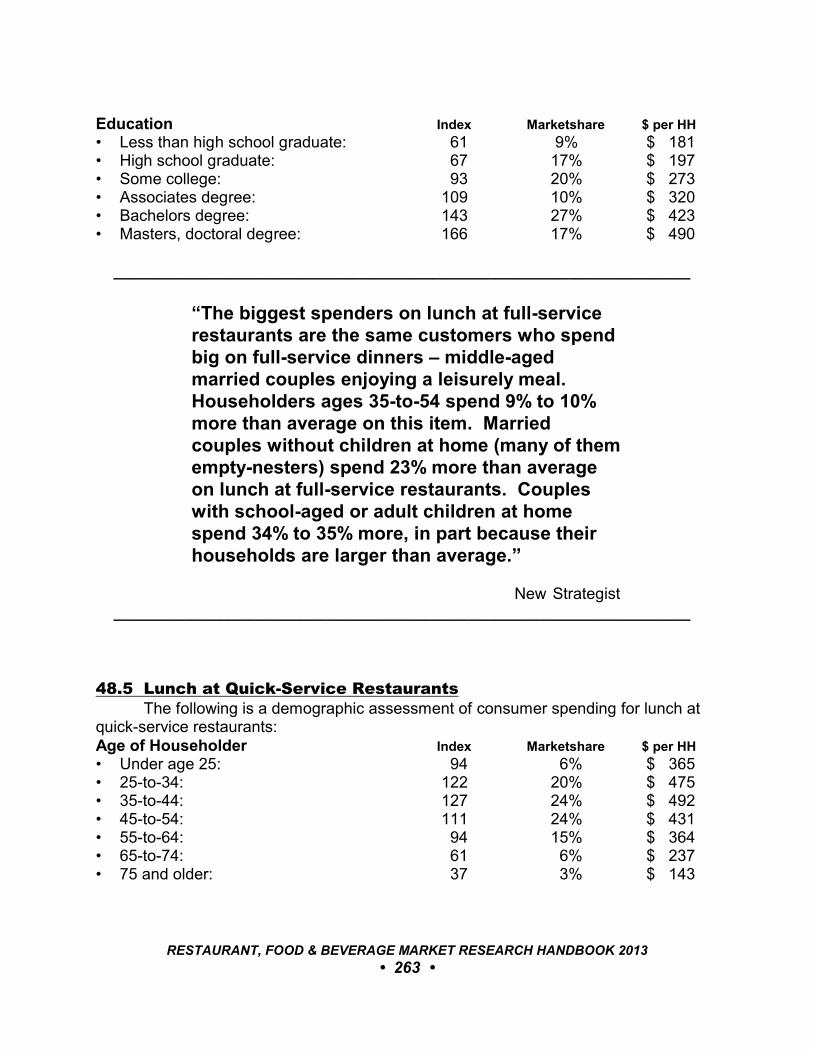
Education Index Marketshare $ per HH
• Less than high school graduate: 61 9% $ 181• High school graduate: 67 17% $ 197• Some college: 93 20% $ 273• Associates degree: 109 10% $ 320• Bachelors degree: 143 27% $ 423• Masters, doctoral degree: 166 17% $ 490
_________________________________________________________________
“The biggest spenders on lunch at full-servicerestaurants are the same customers who spendbig on full-service dinners – middle-agedmarried couples enjoying a leisurely meal. Householders ages 35-to-54 spend 9% to 10%more than average on this item. Marriedcouples without children at home (many of themempty-nesters) spend 23% more than averageon lunch at full-service restaurants. Coupleswith school-aged or adult children at homespend 34% to 35% more, in part because theirhouseholds are larger than average.”
New Strategist _________________________________________________________________
48.5 Lunch at Quick-Service RestaurantsThe following is a demographic assessment of consumer spending for lunch at
quick-service restaurants:Age of Householder Index Marketshare $ per HH
• Under age 25: 94 6% $ 365• 25-to-34: 122 20% $ 475• 35-to-44: 127 24% $ 492• 45-to-54: 111 24% $ 431• 55-to-64: 94 15% $ 364• 65-to-74: 61 6% $ 237 • 75 and older: 37 3% $ 143
RESTAURANT, FOOD & BEVERAGE MARKET RESEARCH HANDBOOK 2013
• 263 •

Household Income Index Marketshare $ per HH
• Under $20,000: 48 10% $ 186• $20,000 to $39,999: 74 16% $ 286• $40,000 to $49,999: 90 8% $ 348• $50,000 to $69,999: 107 16% $ 417• $70,000 to $79,999: 124 7% $ 480• $80,000 to $99,999: 137 11% $ 530• $100,000 and above: 166 30% $ 645
Type of Household Index Marketshare $ per HH
• Married couples, no children: 91 20% $ 355• Married couples, oldest child under 6: 141 6% $ 548• Married couples, oldest child 6-to-17: 140 18% $ 543• Married couples, oldest child 18 or older: 153 11% $ 593• Single parent with child under 18: 90 5% $ 351• Single person: 62 18% $ 240
Race and Ethnicity Index Marketshare $ per HH
• Asian: 124 5% $ 482• Black: 81 10% $ 315• Hispanic: 111 13% $ 429• Non-Hispanic white and other: 101 77% $ 393
Region Index Marketshare $ per HH
• Northeast: 105 20% $ 409• Midwest: 88 20% $ 343• South: 101 37% $ 393• West: 105 24% $ 409
Education Index Marketshare $ per HH
• Less than high school graduate: 79 12% $ 306• High school graduate: 89 23% $ 345• Some college: 99 22% $ 385• Associates degree: 122 11% $ 473• Bachelors degree: 111 21% $ 431• Masters, doctoral degree: 120 12% $ 465
RESTAURANT, FOOD & BEVERAGE MARKET RESEARCH HANDBOOK 2013
• 264 •
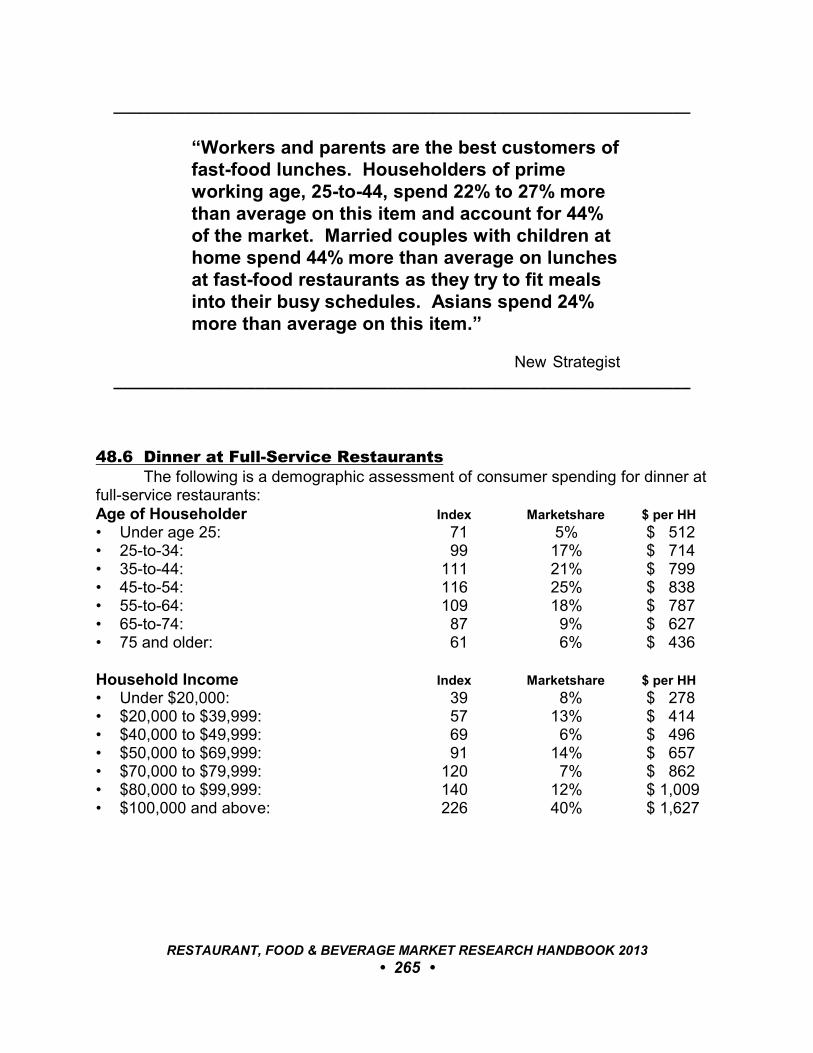
_________________________________________________________________
“Workers and parents are the best customers offast-food lunches. Householders of primeworking age, 25-to-44, spend 22% to 27% morethan average on this item and account for 44%of the market. Married couples with children athome spend 44% more than average on lunchesat fast-food restaurants as they try to fit mealsinto their busy schedules. Asians spend 24%more than average on this item.”
New Strategist _________________________________________________________________
48.6 Dinner at Full-Service RestaurantsThe following is a demographic assessment of consumer spending for dinner at
full-service restaurants:Age of Householder Index Marketshare $ per HH
• Under age 25: 71 5% $ 512• 25-to-34: 99 17% $ 714• 35-to-44: 111 21% $ 799 • 45-to-54: 116 25% $ 838• 55-to-64: 109 18% $ 787• 65-to-74: 87 9% $ 627• 75 and older: 61 6% $ 436
Household Income Index Marketshare $ per HH
• Under $20,000: 39 8% $ 278• $20,000 to $39,999: 57 13% $ 414• $40,000 to $49,999: 69 6% $ 496 • $50,000 to $69,999: 91 14% $ 657• $70,000 to $79,999: 120 7% $ 862• $80,000 to $99,999: 140 12% $ 1,009• $100,000 and above: 226 40% $ 1,627
RESTAURANT, FOOD & BEVERAGE MARKET RESEARCH HANDBOOK 2013
• 265 •
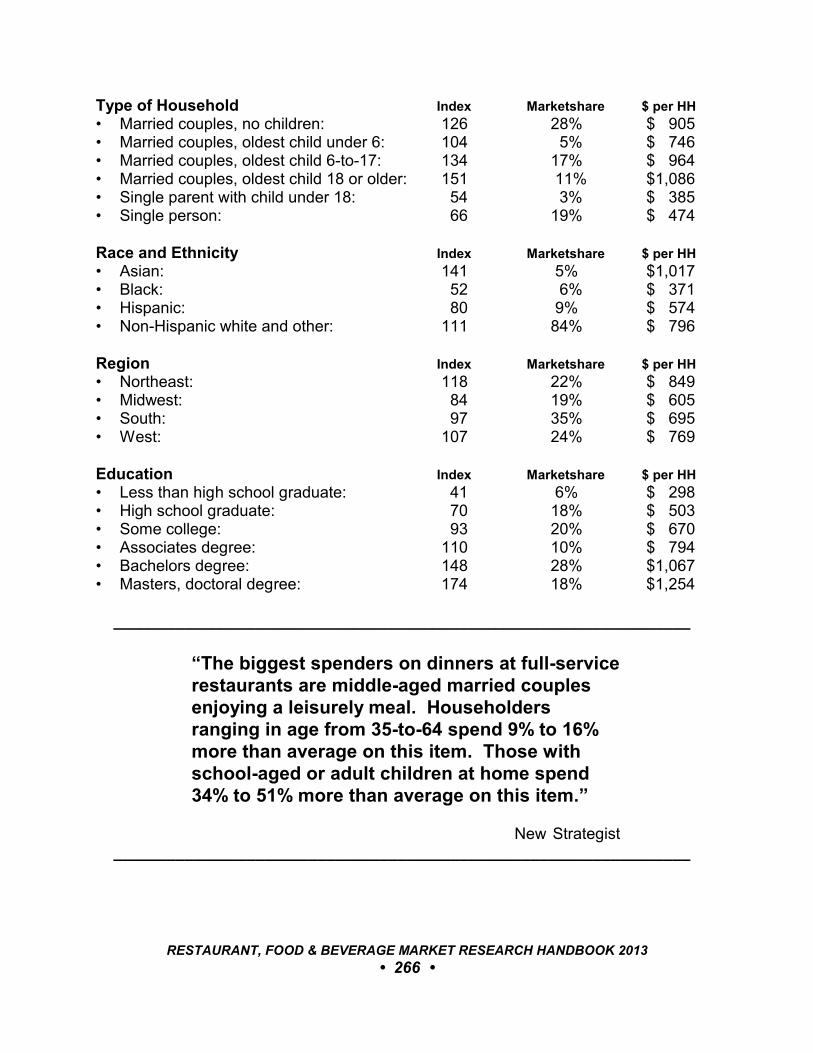
Type of Household Index Marketshare $ per HH
• Married couples, no children: 126 28% $ 905 • Married couples, oldest child under 6: 104 5% $ 746• Married couples, oldest child 6-to-17: 134 17% $ 964• Married couples, oldest child 18 or older: 151 11% $1,086• Single parent with child under 18: 54 3% $ 385• Single person: 66 19% $ 474
Race and Ethnicity Index Marketshare $ per HH
• Asian: 141 5% $1,017• Black: 52 6% $ 371• Hispanic: 80 9% $ 574• Non-Hispanic white and other: 111 84% $ 796
Region Index Marketshare $ per HH
• Northeast: 118 22% $ 849• Midwest: 84 19% $ 605• South: 97 35% $ 695• West: 107 24% $ 769
Education Index Marketshare $ per HH
• Less than high school graduate: 41 6% $ 298• High school graduate: 70 18% $ 503• Some college: 93 20% $ 670• Associates degree: 110 10% $ 794• Bachelors degree: 148 28% $1,067• Masters, doctoral degree: 174 18% $1,254
_________________________________________________________________
“The biggest spenders on dinners at full-servicerestaurants are middle-aged married couplesenjoying a leisurely meal. Householdersranging in age from 35-to-64 spend 9% to 16%more than average on this item. Those withschool-aged or adult children at home spend34% to 51% more than average on this item.”
New Strategist _________________________________________________________________
RESTAURANT, FOOD & BEVERAGE MARKET RESEARCH HANDBOOK 2013
• 266 •
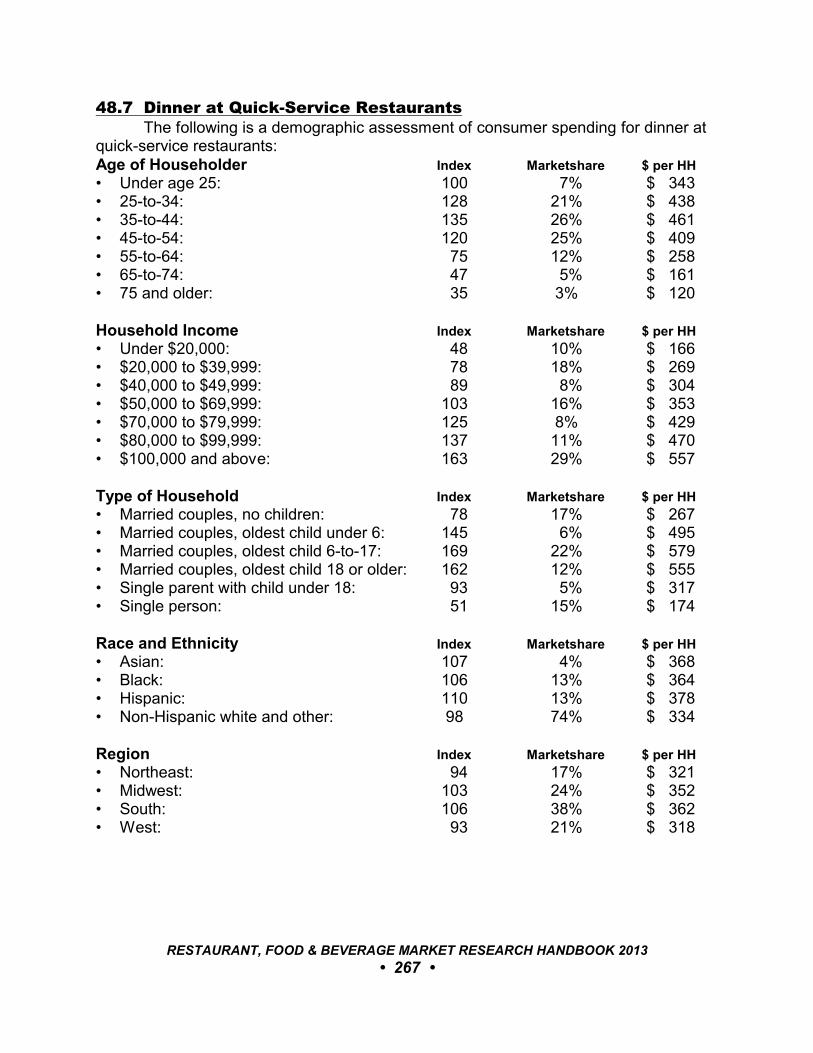
48.7 Dinner at Quick-Service RestaurantsThe following is a demographic assessment of consumer spending for dinner at
quick-service restaurants:Age of Householder Index Marketshare $ per HH
• Under age 25: 100 7% $ 343• 25-to-34: 128 21% $ 438• 35-to-44: 135 26% $ 461• 45-to-54: 120 25% $ 409• 55-to-64: 75 12% $ 258• 65-to-74: 47 5% $ 161• 75 and older: 35 3% $ 120
Household Income Index Marketshare $ per HH
• Under $20,000: 48 10% $ 166• $20,000 to $39,999: 78 18% $ 269• $40,000 to $49,999: 89 8% $ 304• $50,000 to $69,999: 103 16% $ 353• $70,000 to $79,999: 125 8% $ 429• $80,000 to $99,999: 137 11% $ 470• $100,000 and above: 163 29% $ 557
Type of Household Index Marketshare $ per HH
• Married couples, no children: 78 17% $ 267• Married couples, oldest child under 6: 145 6% $ 495• Married couples, oldest child 6-to-17: 169 22% $ 579• Married couples, oldest child 18 or older: 162 12% $ 555• Single parent with child under 18: 93 5% $ 317• Single person: 51 15% $ 174
Race and Ethnicity Index Marketshare $ per HH
• Asian: 107 4% $ 368• Black: 106 13% $ 364• Hispanic: 110 13% $ 378• Non-Hispanic white and other: 98 74% $ 334
Region Index Marketshare $ per HH
• Northeast: 94 17% $ 321• Midwest: 103 24% $ 352• South: 106 38% $ 362• West: 93 21% $ 318
RESTAURANT, FOOD & BEVERAGE MARKET RESEARCH HANDBOOK 2013
• 267 •
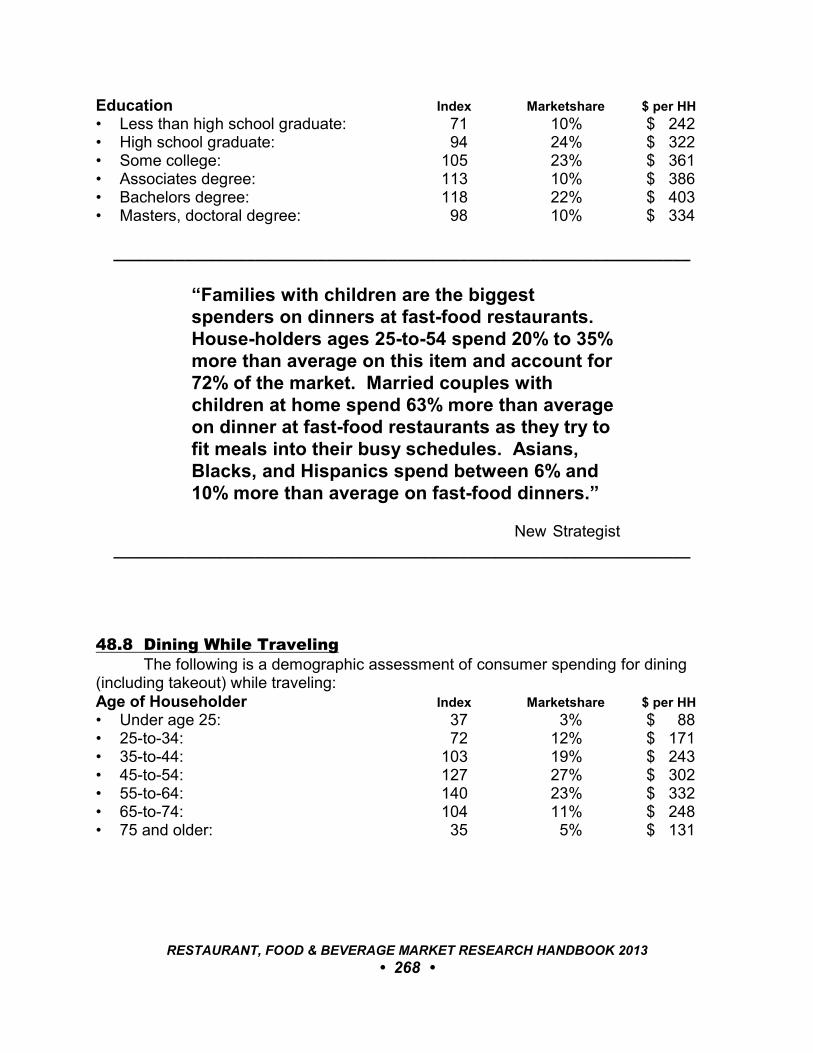
Education Index Marketshare $ per HH
• Less than high school graduate: 71 10% $ 242• High school graduate: 94 24% $ 322• Some college: 105 23% $ 361• Associates degree: 113 10% $ 386• Bachelors degree: 118 22% $ 403• Masters, doctoral degree: 98 10% $ 334
_________________________________________________________________
“Families with children are the biggestspenders on dinners at fast-food restaurants. House-holders ages 25-to-54 spend 20% to 35%more than average on this item and account for72% of the market. Married couples withchildren at home spend 63% more than averageon dinner at fast-food restaurants as they try tofit meals into their busy schedules. Asians,Blacks, and Hispanics spend between 6% and10% more than average on fast-food dinners.”
New Strategist _________________________________________________________________
48.8 Dining While TravelingThe following is a demographic assessment of consumer spending for dining
(including takeout) while traveling:Age of Householder Index Marketshare $ per HH
• Under age 25: 37 3% $ 88• 25-to-34: 72 12% $ 171• 35-to-44: 103 19% $ 243• 45-to-54: 127 27% $ 302• 55-to-64: 140 23% $ 332• 65-to-74: 104 11% $ 248• 75 and older: 35 5% $ 131
RESTAURANT, FOOD & BEVERAGE MARKET RESEARCH HANDBOOK 2013
• 268 •
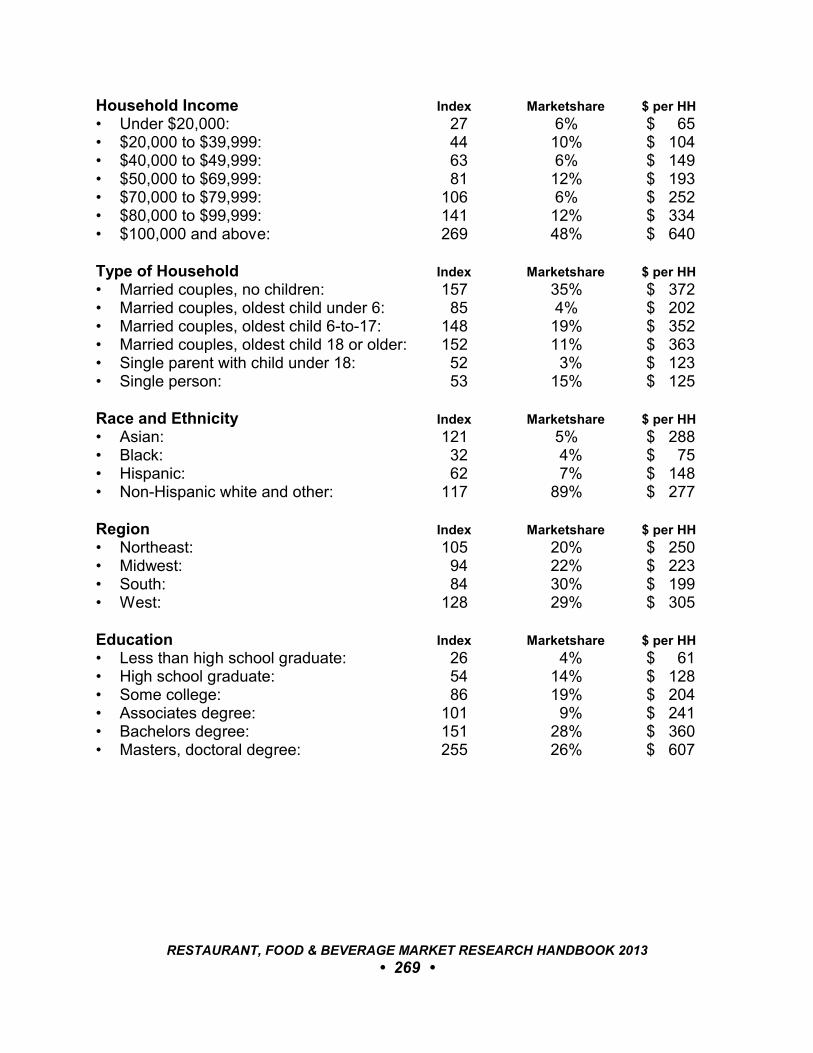
Household Income Index Marketshare $ per HH
• Under $20,000: 27 6% $ 65• $20,000 to $39,999: 44 10% $ 104• $40,000 to $49,999: 63 6% $ 149• $50,000 to $69,999: 81 12% $ 193• $70,000 to $79,999: 106 6% $ 252• $80,000 to $99,999: 141 12% $ 334• $100,000 and above: 269 48% $ 640
Type of Household Index Marketshare $ per HH
• Married couples, no children: 157 35% $ 372• Married couples, oldest child under 6: 85 4% $ 202• Married couples, oldest child 6-to-17: 148 19% $ 352• Married couples, oldest child 18 or older: 152 11% $ 363• Single parent with child under 18: 52 3% $ 123• Single person: 53 15% $ 125
Race and Ethnicity Index Marketshare $ per HH
• Asian: 121 5% $ 288• Black: 32 4% $ 75• Hispanic: 62 7% $ 148• Non-Hispanic white and other: 117 89% $ 277
Region Index Marketshare $ per HH
• Northeast: 105 20% $ 250• Midwest: 94 22% $ 223• South: 84 30% $ 199• West: 128 29% $ 305
Education Index Marketshare $ per HH
• Less than high school graduate: 26 4% $ 61• High school graduate: 54 14% $ 128• Some college: 86 19% $ 204• Associates degree: 101 9% $ 241• Bachelors degree: 151 28% $ 360• Masters, doctoral degree: 255 26% $ 607
RESTAURANT, FOOD & BEVERAGE MARKET RESEARCH HANDBOOK 2013
• 269 •
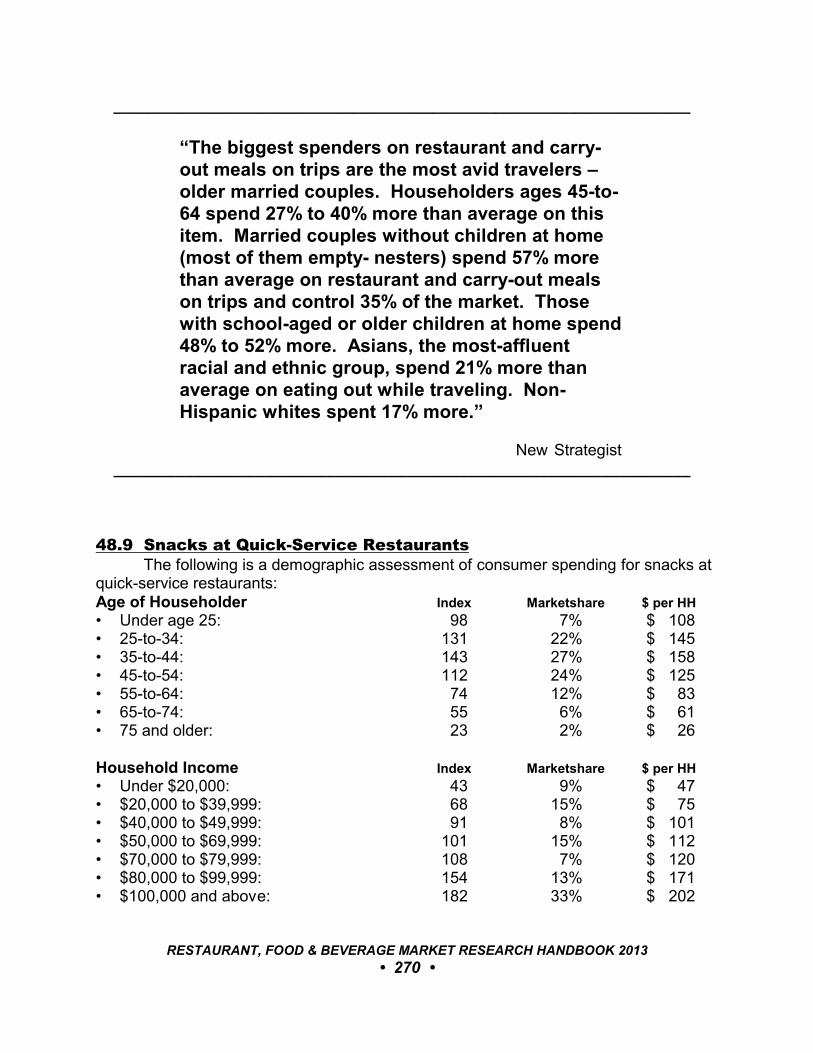
_________________________________________________________________
“The biggest spenders on restaurant and carry-out meals on trips are the most avid travelers –older married couples. Householders ages 45-to-64 spend 27% to 40% more than average on thisitem. Married couples without children at home(most of them empty- nesters) spend 57% morethan average on restaurant and carry-out mealson trips and control 35% of the market. Thosewith school-aged or older children at home spend48% to 52% more. Asians, the most-affluentracial and ethnic group, spend 21% more thanaverage on eating out while traveling. Non-Hispanic whites spent 17% more.”
New Strategist _________________________________________________________________
48.9 Snacks at Quick-Service RestaurantsThe following is a demographic assessment of consumer spending for snacks at
quick-service restaurants:Age of Householder Index Marketshare $ per HH
• Under age 25: 98 7% $ 108• 25-to-34: 131 22% $ 145• 35-to-44: 143 27% $ 158• 45-to-54: 112 24% $ 125• 55-to-64: 74 12% $ 83• 65-to-74: 55 6% $ 61• 75 and older: 23 2% $ 26
Household Income Index Marketshare $ per HH
• Under $20,000: 43 9% $ 47• $20,000 to $39,999: 68 15% $ 75• $40,000 to $49,999: 91 8% $ 101• $50,000 to $69,999: 101 15% $ 112• $70,000 to $79,999: 108 7% $ 120• $80,000 to $99,999: 154 13% $ 171• $100,000 and above: 182 33% $ 202
RESTAURANT, FOOD & BEVERAGE MARKET RESEARCH HANDBOOK 2013
• 270 •

Type of Household Index Marketshare $ per HH
• Married couples, no children: 85 19% $ 94• Married couples, oldest child under 6: 157 7% $ 175• Married couples, oldest child 6-to-17: 182 23% $ 202• Married couples, oldest child 18 or older: 148 11% $ 164• Single parent with child under 18: 87 5% $ 96• Single person: 59 17% $ 65
Race and Ethnicity Index Marketshare $ per HH
• Asian: 80 3% $ 89• Black: 57 7% $ 63• Hispanic: 89 10% $ 99• Non-Hispanic white and other: 108 82% $ 120
Region Index Marketshare $ per HH
• Northeast: 108 20% $ 120• Midwest: 91 21% $ 101• South: 80 29% $ 89• West: 135 30% $ 150
Education Index Marketshare $ per HH
• Less than high school graduate: 55 8% $ 61• High school graduate: 83 21% $ 92• Some college: 101 22% $ 113• Associates degree: 116 11% $ 128• Bachelors degree: 128 24% $ 143• Masters, doctoral degree: 134 14% $ 149
_________________________________________________________________
“Parents are the best customers of snacks fromfast-food restaurants. Householders ages 25-to-44, most with children, spend 31% to 43% morethan the average household on fast-foodsnacks. Married couples with children at homespend two-thirds more than average on thisitem, the figure peaking at 82% above averageamong parents with school-aged children.”
New Strategist _________________________________________________________________
RESTAURANT, FOOD & BEVERAGE MARKET RESEARCH HANDBOOK 2013
• 271 •
48.10 Spending by AgeNot surprisingly, middle-aged consumers spend the most at restaurants because
they have the highest incomes and typically the largest households. Overall, house-holders ages 35-to-54 spend 17% to 21% more than average.
Older consumers, particularly empty-nesters, are far more likely to choose full-service over quick-service restaurants.
Among householders under age 25, fast-food meals claim 60% of the restaurantbudget. The fast-food share declines with age and drops below the full-service share inthe 45-to-54 age group. The need to provide meal options for children is one reason forthis shift in restaurant preference.
Among household types, single parents with children devote the largest share oftheir dining-out spending to quick-service restaurants (49%). In contrast, marriedcouples without children at home (most of them empty-nesters) spend only 30% of theirrestaurant dollars at fast-food establishments.
48.11 Spending by Household IncomeAffluent households spend much more than average at restaurants. House-
holders with incomes of $100,000 or more spend nearly twice the average atrestaurants. While accounting for only 18% of total households, the $100,000-plusincome group accounts for 36% of spending for dining out. These affluent householdsaccount for 48% of spending for dinner at full-service restaurants and 48% of spendingfor restaurant food while traveling.
48.12 Spending by Household TypeMarried couples with school-aged or older children at home spend more eating
out than any other household type – 49% to 51% more than average. Married coupleswithout children at home spend more than average on full-service meals for all dayparts.
48.13 Spending by Race and EthnicityAsian households spend 18% more than the average household on restaurant
meals – more than any other racial or ethnic group. Hispanic households spend 16%less than average; African-American households spend 33% less than average.
48.14 Spending by RegionRestaurant spending is highest in the West and lowest in the Midwest.
Households in the Northeast are the biggest spenders on full-service dinners (14%above average) and quick-service breakfast (26% above average), but spend 15% lessthan average on full-service lunches.
RESTAURANT, FOOD & BEVERAGE MARKET RESEARCH HANDBOOK 2013
• 272 •
48.15 Spending by EducationSpending on eating out rises with education, in part, because educated
householders typically have higher incomes. College graduates spend 39% more thanthe average householder at restaurants, spending 51% to 57% above average on full-service lunches and dinners. College graduates, who comprise 29% of households,account for more than 40% of spending on full-service lunches and dinners.
48.16 Market ResourcesNew Strategist, P.O. Box 242, Ithaca, NY 14851. (800) 848-0842. (www.newstrategist.com)
RESTAURANT, FOOD & BEVERAGE MARKET RESEARCH HANDBOOK 2013
• 273 •
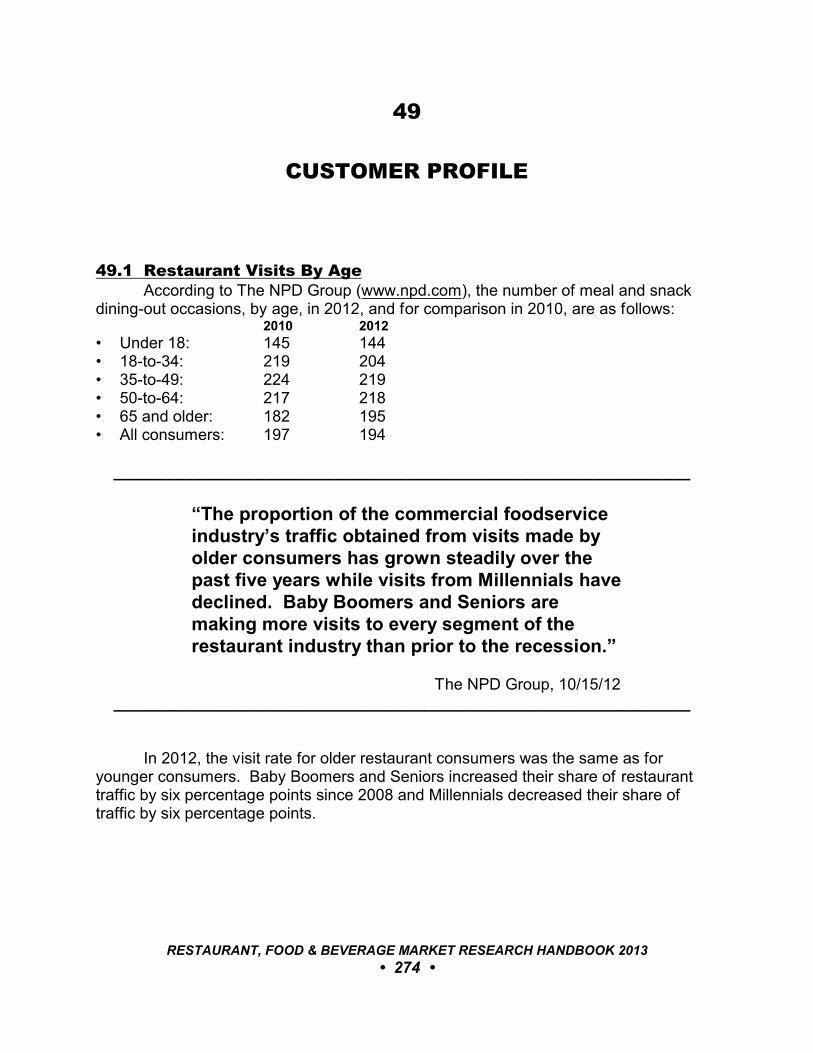
49
CUSTOMER PROFILE
49.1 Restaurant Visits By AgeAccording to The NPD Group (www.npd.com), the number of meal and snack
dining-out occasions, by age, in 2012, and for comparison in 2010, are as follows:2010 2012
• Under 18: 145 144• 18-to-34: 219 204• 35-to-49: 224 219• 50-to-64: 217 218• 65 and older: 182 195• All consumers: 197 194
_________________________________________________________________
“The proportion of the commercial foodserviceindustry’s traffic obtained from visits made byolder consumers has grown steadily over thepast five years while visits from Millennials havedeclined. Baby Boomers and Seniors aremaking more visits to every segment of therestaurant industry than prior to the recession.”
The NPD Group, 10/15/12 _________________________________________________________________
In 2012, the visit rate for older restaurant consumers was the same as foryounger consumers. Baby Boomers and Seniors increased their share of restauranttraffic by six percentage points since 2008 and Millennials decreased their share oftraffic by six percentage points.
RESTAURANT, FOOD & BEVERAGE MARKET RESEARCH HANDBOOK 2013
• 274 •
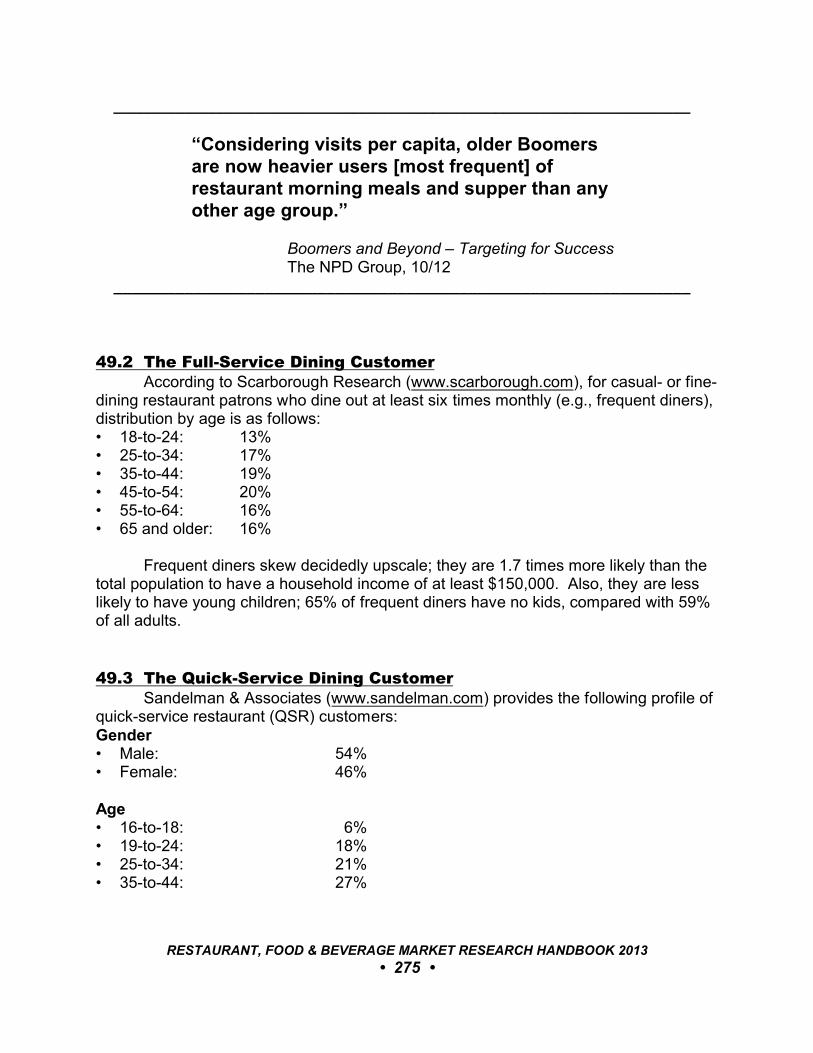
_________________________________________________________________
“Considering visits per capita, older Boomersare now heavier users [most frequent] ofrestaurant morning meals and supper than anyother age group.”
Boomers and Beyond – Targeting for SuccessThe NPD Group, 10/12
_________________________________________________________________
49.2 The Full-Service Dining CustomerAccording to Scarborough Research (www.scarborough.com), for casual- or fine-
dining restaurant patrons who dine out at least six times monthly (e.g., frequent diners),distribution by age is as follows:• 18-to-24: 13%• 25-to-34: 17%• 35-to-44: 19%• 45-to-54: 20%• 55-to-64: 16%• 65 and older: 16%
Frequent diners skew decidedly upscale; they are 1.7 times more likely than thetotal population to have a household income of at least $150,000. Also, they are lesslikely to have young children; 65% of frequent diners have no kids, compared with 59%of all adults.
49.3 The Quick-Service Dining CustomerSandelman & Associates (www.sandelman.com) provides the following profile of
quick-service restaurant (QSR) customers:Gender• Male: 54%• Female: 46%
Age• 16-to-18: 6%• 19-to-24: 18%• 25-to-34: 21%• 35-to-44: 27%
RESTAURANT, FOOD & BEVERAGE MARKET RESEARCH HANDBOOK 2013
• 275 •
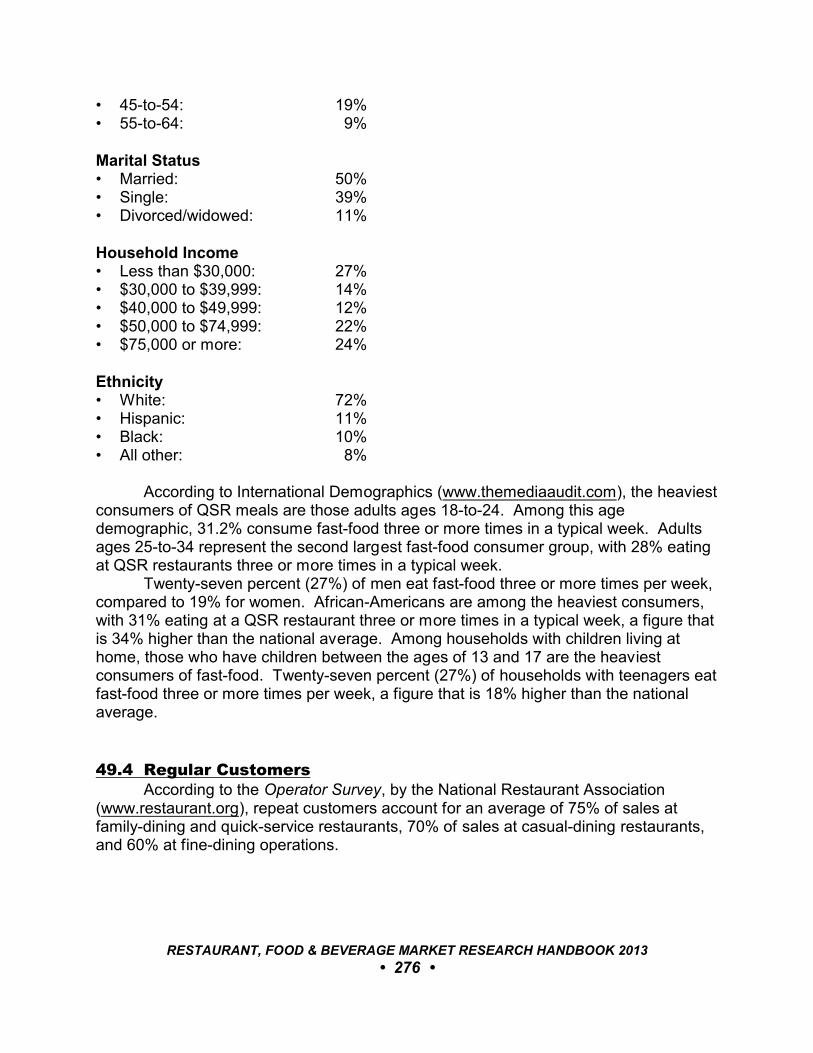
• 45-to-54: 19%• 55-to-64: 9%
Marital Status• Married: 50%• Single: 39%• Divorced/widowed: 11%
Household Income• Less than $30,000: 27%• $30,000 to $39,999: 14%• $40,000 to $49,999: 12%• $50,000 to $74,999: 22%• $75,000 or more: 24%
Ethnicity• White: 72%• Hispanic: 11%• Black: 10%• All other: 8%
According to International Demographics (www.themediaaudit.com), the heaviestconsumers of QSR meals are those adults ages 18-to-24. Among this agedemographic, 31.2% consume fast-food three or more times in a typical week. Adultsages 25-to-34 represent the second largest fast-food consumer group, with 28% eatingat QSR restaurants three or more times in a typical week.
Twenty-seven percent (27%) of men eat fast-food three or more times per week,compared to 19% for women. African-Americans are among the heaviest consumers,with 31% eating at a QSR restaurant three or more times in a typical week, a figure thatis 34% higher than the national average. Among households with children living athome, those who have children between the ages of 13 and 17 are the heaviestconsumers of fast-food. Twenty-seven percent (27%) of households with teenagers eatfast-food three or more times per week, a figure that is 18% higher than the nationalaverage.
49.4 Regular CustomersAccording to the Operator Survey, by the National Restaurant Association
(www.restaurant.org), repeat customers account for an average of 75% of sales atfamily-dining and quick-service restaurants, 70% of sales at casual-dining restaurants,and 60% at fine-dining operations.
RESTAURANT, FOOD & BEVERAGE MARKET RESEARCH HANDBOOK 2013
• 276 •
_________________________________________________________________
“Regulars pay the rent. From a bottom-linestandpoint, they’re critical. You can spend a lotof money on advertising, but if you pay closeattention to keeping your current customershappy, they’ll do a lot of advertising for you andyou’ll spend a lot less money.”
Joan Simon, PrincipalFull Plate Restaurant ConsultingRestaurant Business
_________________________________________________________________
49.5 Families Dining OutAccording to The NPD Group, families dining out with children account for 14
billion meals and snacks sold at restaurants and $70 billion in annual sales. Approximately 35% of restaurant visits are made by parties with kids. Of these
visits, 81% are made to quick-service restaurants, 10% to casual-dining restaurants,and 9% to family-dining restaurants.
49.6 Value-Focused CustomersThe Influence of Income Consumer Trend Report, an October 2012 study by
Technomic (www.technomic.com), reported that for middle-income consumers, lowprices are the most important factor – more so than convenient location, fast service,and order accuracy – when it comes to deciding which limited-service, dine-inrestaurants to patronize.
_________________________________________________________________
“The middle-income group as a wholeexpressed a desire to dine out more often thanthey currently do, which may explain why lowcost is a high priority. Seventy-one percent(71%) of upper-middle consumers said they userestaurants as social venues to catch up withfriends and family.”
Aimee Harvey, Editor Technomic, 10/5/12
_________________________________________________________________
RESTAURANT, FOOD & BEVERAGE MARKET RESEARCH HANDBOOK 2013
• 277 •
An April 2012 report by The NPD Group similarly reported that middle incomeconsumers place emphasis on value in dining but also found that upper incomeconsumers are watching their restaurant spending.
_________________________________________________________________
“A gap has been growing between Americanconsumers who are financially secure and thosewho are not. But the two groups havesomething in common: Both are cutting back ontheir number of restaurant visits. The NPDGroup reveals that adults who are visitingrestaurants less often than last yearincreasingly include both the financiallystrained and the financially comfortable.”
Nation’s Restaurant News, 4/30/12 _________________________________________________________________
The NPD Group found that more than one-half of consumers considerthemselves ‘financially strained.’ Among this group, 54% say they are cutting back ondining out. Twenty-nine percent (29%) of those who consider themselves ‘financiallycomfortable’ say they are cutting back on dining out.
49.7 What Customers WantIn surveys by The NPD Group, customers said the following were what they seek
most from restaurants:Casual-Dining• Tasty food• Good value• No cooking• No clean up• Enjoyable experience• Time with friends and family
RESTAURANT, FOOD & BEVERAGE MARKET RESEARCH HANDBOOK 2013
• 278 •
Quick-Service Restaurants• No cooking• Good value• Speed• Inexpensive meal• Tasty food• Cheap outing
RESTAURANT, FOOD & BEVERAGE MARKET RESEARCH HANDBOOK 2013
• 279 •
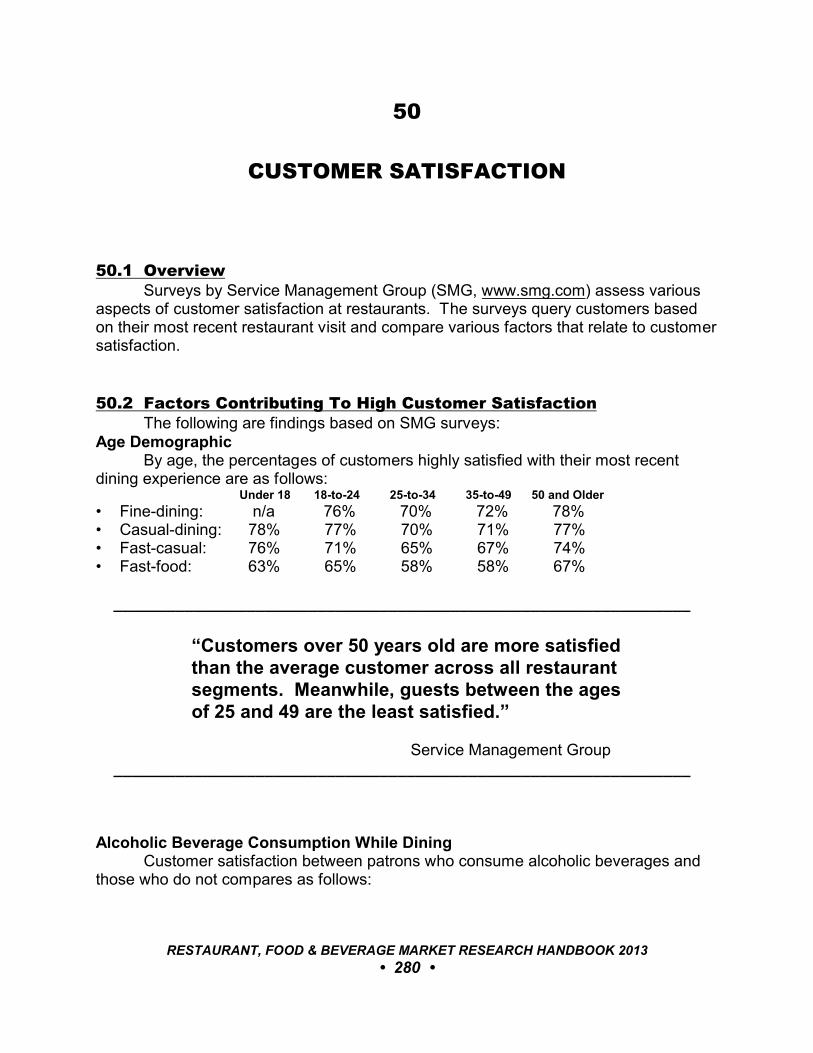
50
CUSTOMER SATISFACTION
50.1 OverviewSurveys by Service Management Group (SMG, www.smg.com) assess various
aspects of customer satisfaction at restaurants. The surveys query customers basedon their most recent restaurant visit and compare various factors that relate to customersatisfaction.
50.2 Factors Contributing To High Customer SatisfactionThe following are findings based on SMG surveys:
Age DemographicBy age, the percentages of customers highly satisfied with their most recent
dining experience are as follows:Under 18 18-to-24 25-to-34 35-to-49 50 and Older
• Fine-dining: n/a 76% 70% 72% 78%• Casual-dining: 78% 77% 70% 71% 77%• Fast-casual: 76% 71% 65% 67% 74%• Fast-food: 63% 65% 58% 58% 67%
_________________________________________________________________
“Customers over 50 years old are more satisfiedthan the average customer across all restaurantsegments. Meanwhile, guests between the agesof 25 and 49 are the least satisfied.”
Service Management Group _________________________________________________________________
Alcoholic Beverage Consumption While DiningCustomer satisfaction between patrons who consume alcoholic beverages and
those who do not compares as follows:
RESTAURANT, FOOD & BEVERAGE MARKET RESEARCH HANDBOOK 2013
• 280 •
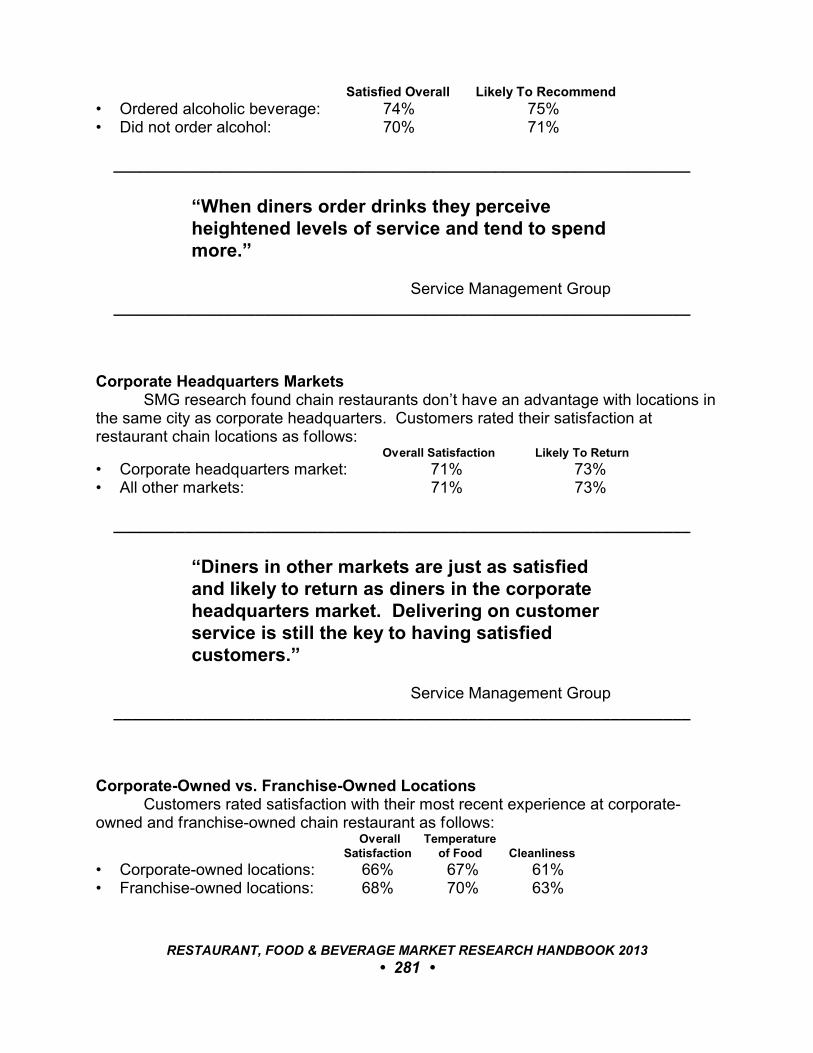
Satisfied Overall Likely To Recommend
• Ordered alcoholic beverage: 74% 75%• Did not order alcohol: 70% 71%
_________________________________________________________________
“When diners order drinks they perceiveheightened levels of service and tend to spendmore.”
Service Management Group _________________________________________________________________
Corporate Headquarters MarketsSMG research found chain restaurants don’t have an advantage with locations in
the same city as corporate headquarters. Customers rated their satisfaction atrestaurant chain locations as follows:
Overall Satisfaction Likely To Return
• Corporate headquarters market: 71% 73%• All other markets: 71% 73%
_________________________________________________________________
“Diners in other markets are just as satisfiedand likely to return as diners in the corporateheadquarters market. Delivering on customerservice is still the key to having satisfiedcustomers.”
Service Management Group _________________________________________________________________
Corporate-Owned vs. Franchise-Owned LocationsCustomers rated satisfaction with their most recent experience at corporate-
owned and franchise-owned chain restaurant as follows: Overall Temperature
Satisfaction of Food Cleanliness
• Corporate-owned locations: 66% 67% 61%• Franchise-owned locations: 68% 70% 63%
RESTAURANT, FOOD & BEVERAGE MARKET RESEARCH HANDBOOK 2013
• 281 •
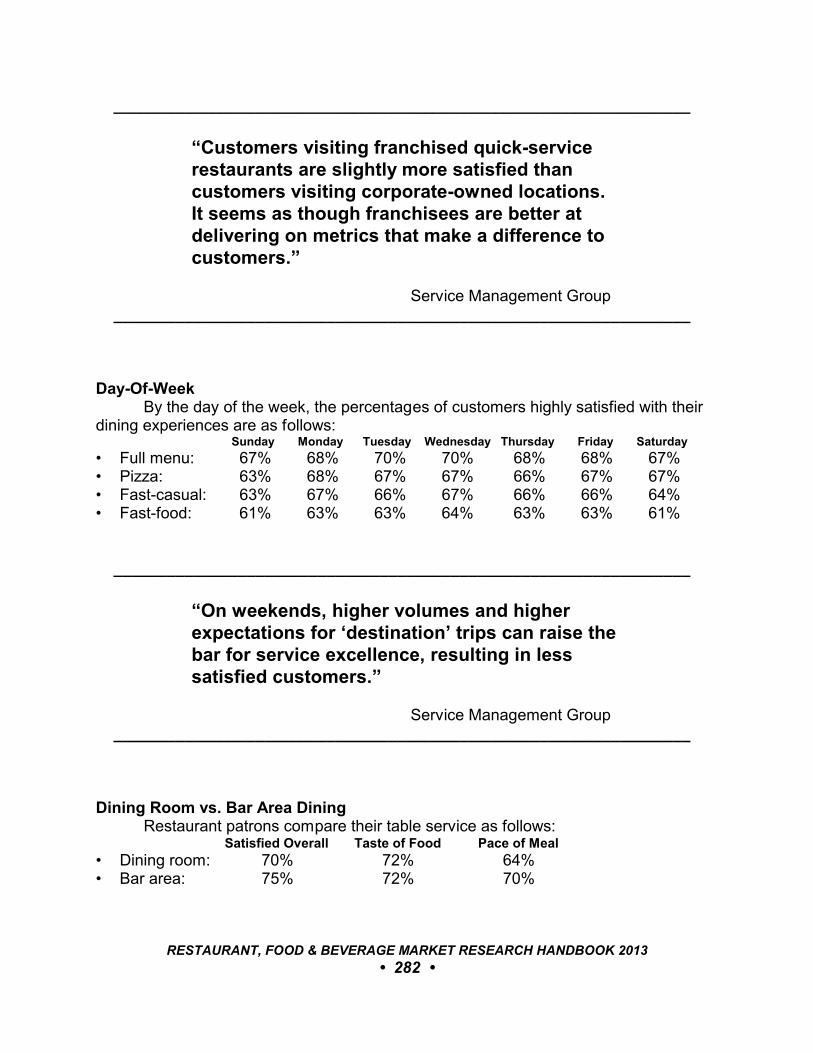
_________________________________________________________________
“Customers visiting franchised quick-servicerestaurants are slightly more satisfied thancustomers visiting corporate-owned locations. It seems as though franchisees are better atdelivering on metrics that make a difference tocustomers.”
Service Management Group _________________________________________________________________
Day-Of-WeekBy the day of the week, the percentages of customers highly satisfied with their
dining experiences are as follows: Sunday Monday Tuesday Wednesday Thursday Friday Saturday
• Full menu: 67% 68% 70% 70% 68% 68% 67%• Pizza: 63% 68% 67% 67% 66% 67% 67%• Fast-casual: 63% 67% 66% 67% 66% 66% 64%• Fast-food: 61% 63% 63% 64% 63% 63% 61%
_________________________________________________________________
“On weekends, higher volumes and higherexpectations for ‘destination’ trips can raise thebar for service excellence, resulting in lesssatisfied customers.”
Service Management Group _________________________________________________________________
Dining Room vs. Bar Area DiningRestaurant patrons compare their table service as follows:
Satisfied Overall Taste of Food Pace of Meal
• Dining room: 70% 72% 64%• Bar area: 75% 72% 70%
RESTAURANT, FOOD & BEVERAGE MARKET RESEARCH HANDBOOK 2013
• 282 •
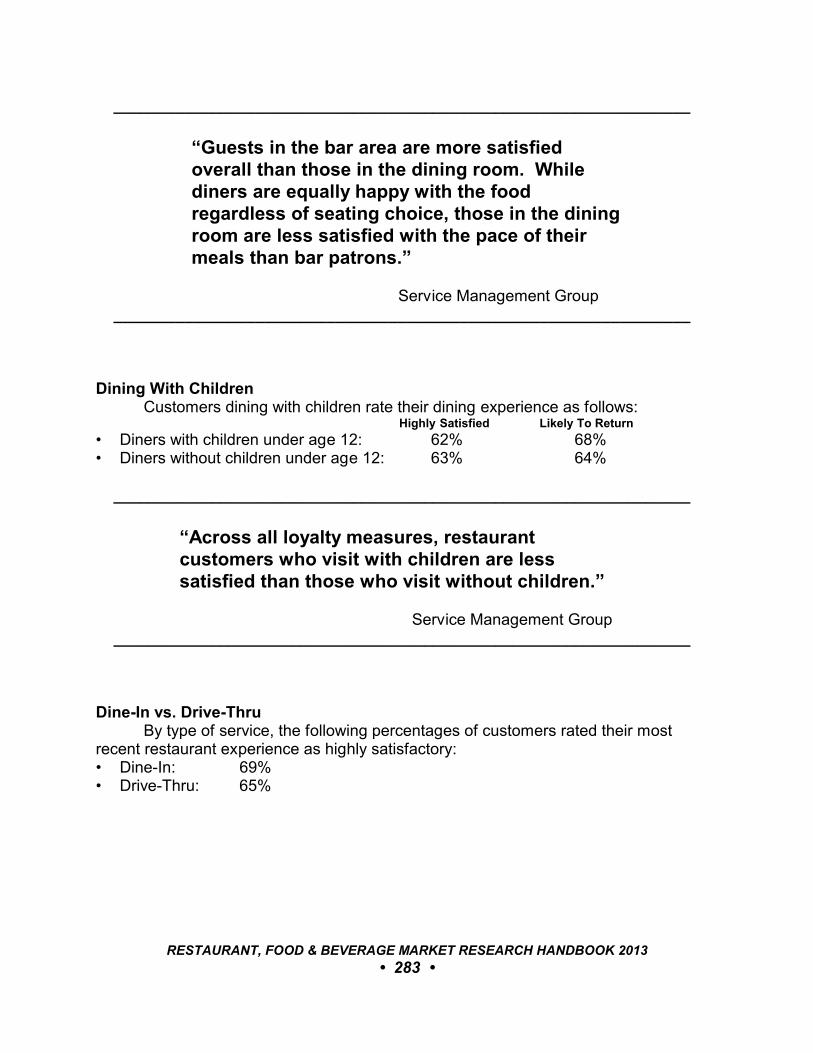
_________________________________________________________________
“Guests in the bar area are more satisfiedoverall than those in the dining room. Whilediners are equally happy with the foodregardless of seating choice, those in the diningroom are less satisfied with the pace of theirmeals than bar patrons.”
Service Management Group _________________________________________________________________
Dining With ChildrenCustomers dining with children rate their dining experience as follows:
Highly Satisfied Likely To Return
• Diners with children under age 12: 62% 68%• Diners without children under age 12: 63% 64%
_________________________________________________________________
“Across all loyalty measures, restaurantcustomers who visit with children are lesssatisfied than those who visit without children.”
Service Management Group _________________________________________________________________
Dine-In vs. Drive-ThruBy type of service, the following percentages of customers rated their most
recent restaurant experience as highly satisfactory:• Dine-In: 69%• Drive-Thru: 65%
RESTAURANT, FOOD & BEVERAGE MARKET RESEARCH HANDBOOK 2013
• 283 •
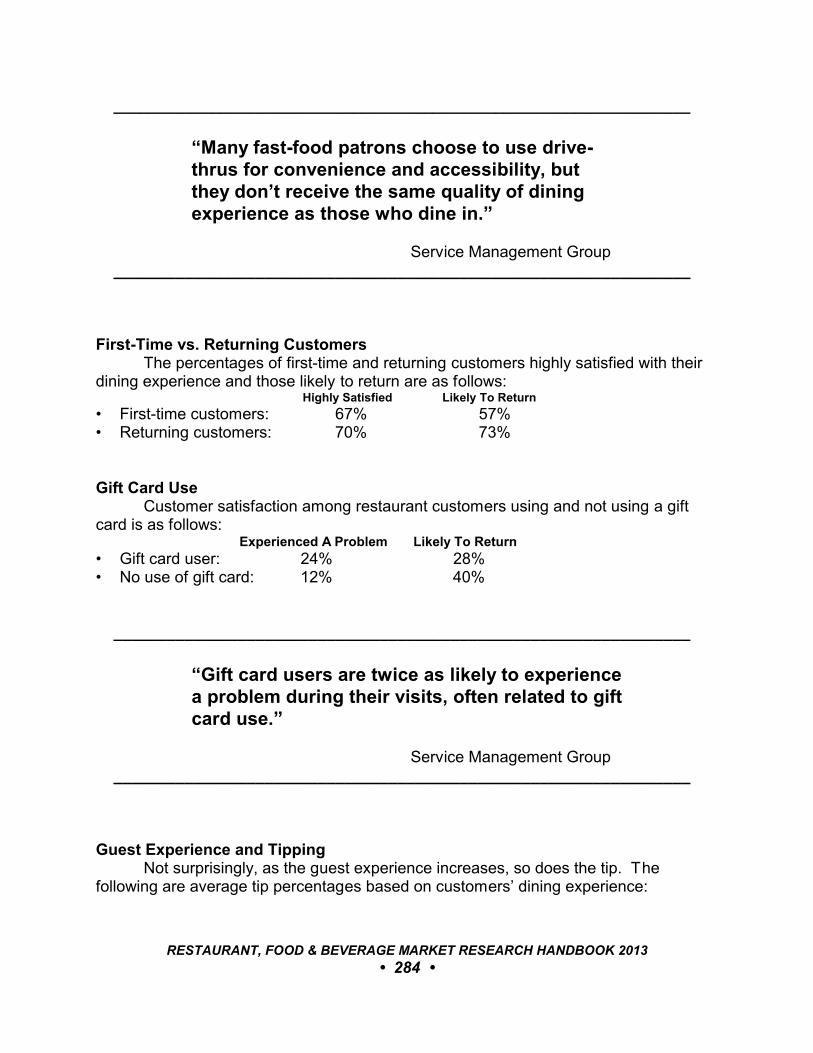
_________________________________________________________________
“Many fast-food patrons choose to use drive-thrus for convenience and accessibility, butthey don’t receive the same quality of diningexperience as those who dine in.”
Service Management Group _________________________________________________________________
First-Time vs. Returning CustomersThe percentages of first-time and returning customers highly satisfied with their
dining experience and those likely to return are as follows: Highly Satisfied Likely To Return
• First-time customers: 67% 57%• Returning customers: 70% 73%
Gift Card UseCustomer satisfaction among restaurant customers using and not using a gift
card is as follows:Experienced A Problem Likely To Return
• Gift card user: 24% 28%• No use of gift card: 12% 40%
_________________________________________________________________
“Gift card users are twice as likely to experiencea problem during their visits, often related to giftcard use.”
Service Management Group _________________________________________________________________
Guest Experience and TippingNot surprisingly, as the guest experience increases, so does the tip. The
following are average tip percentages based on customers’ dining experience:
RESTAURANT, FOOD & BEVERAGE MARKET RESEARCH HANDBOOK 2013
• 284 •

• Highly satisfied: 19.7%• Neutral: 17.3%• Highly dissatisfied: 16.2%
Manager PresenceCustomer satisfaction with and without a manager on duty and active is as
follows: Overall Satisfaction Likely To Return
• Manager visible: 84% 81%• Manager not visible: 65% 55%
_________________________________________________________________
“When a manager interacts with or servescustomers, guests indicate they have a betteroverall experience.”
Service Management Group _________________________________________________________________
Newer vs. Older RestaurantsBased on the age of the restaurant, the following percentages of customers said
they likely would recommend a restaurant:• Restaurant under five years old: 69%• Restaurant 5-to-10 years old: 67%• Restaurant more than 10 years old: 65%
_________________________________________________________________
“Guests visiting restaurants that have beenoperating for fewer than five years are slightlymore likely to recommend the restaurant tofriends. This helps make the case that investingin store updates can help drive customer loyalty.”
Service Management Group _________________________________________________________________
RESTAURANT, FOOD & BEVERAGE MARKET RESEARCH HANDBOOK 2013
• 285 •
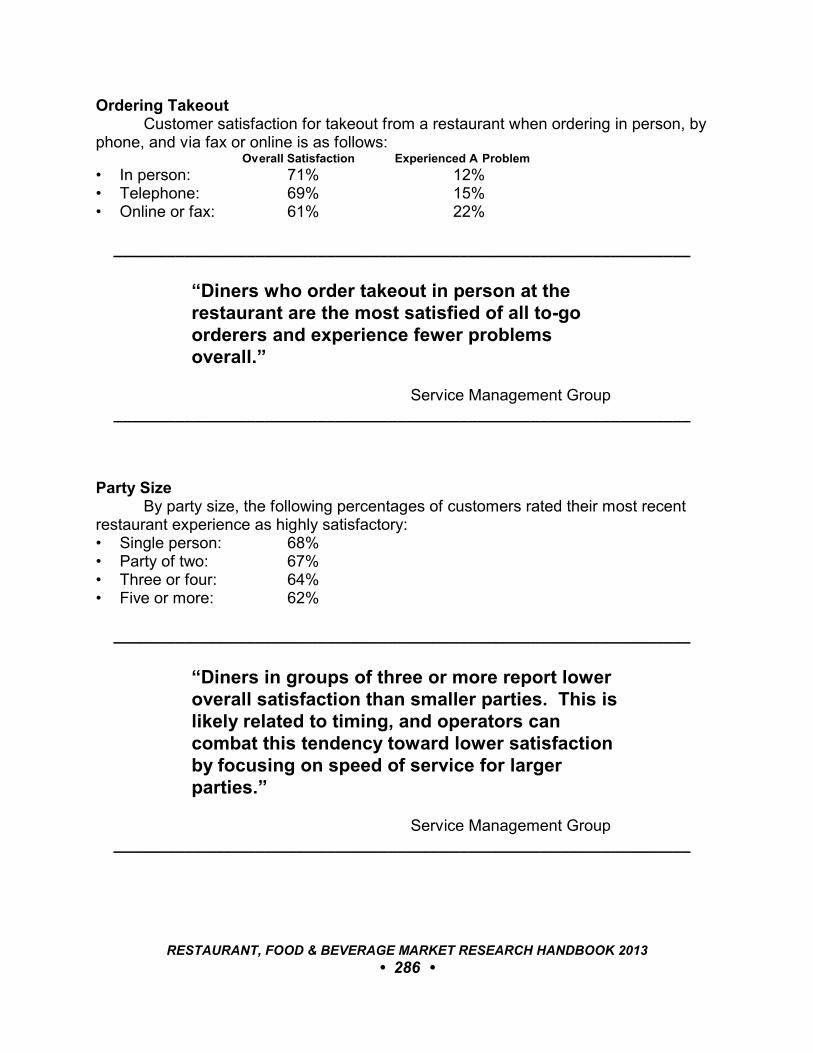
Ordering TakeoutCustomer satisfaction for takeout from a restaurant when ordering in person, by
phone, and via fax or online is as follows: Overall Satisfaction Experienced A Problem
• In person: 71% 12%• Telephone: 69% 15%• Online or fax: 61% 22%
_________________________________________________________________
“Diners who order takeout in person at therestaurant are the most satisfied of all to-goorderers and experience fewer problemsoverall.”
Service Management Group _________________________________________________________________
Party SizeBy party size, the following percentages of customers rated their most recent
restaurant experience as highly satisfactory:• Single person: 68%• Party of two: 67%• Three or four: 64%• Five or more: 62%
_________________________________________________________________
“Diners in groups of three or more report loweroverall satisfaction than smaller parties. This islikely related to timing, and operators cancombat this tendency toward lower satisfactionby focusing on speed of service for largerparties.”
Service Management Group _________________________________________________________________
RESTAURANT, FOOD & BEVERAGE MARKET RESEARCH HANDBOOK 2013
• 286 •
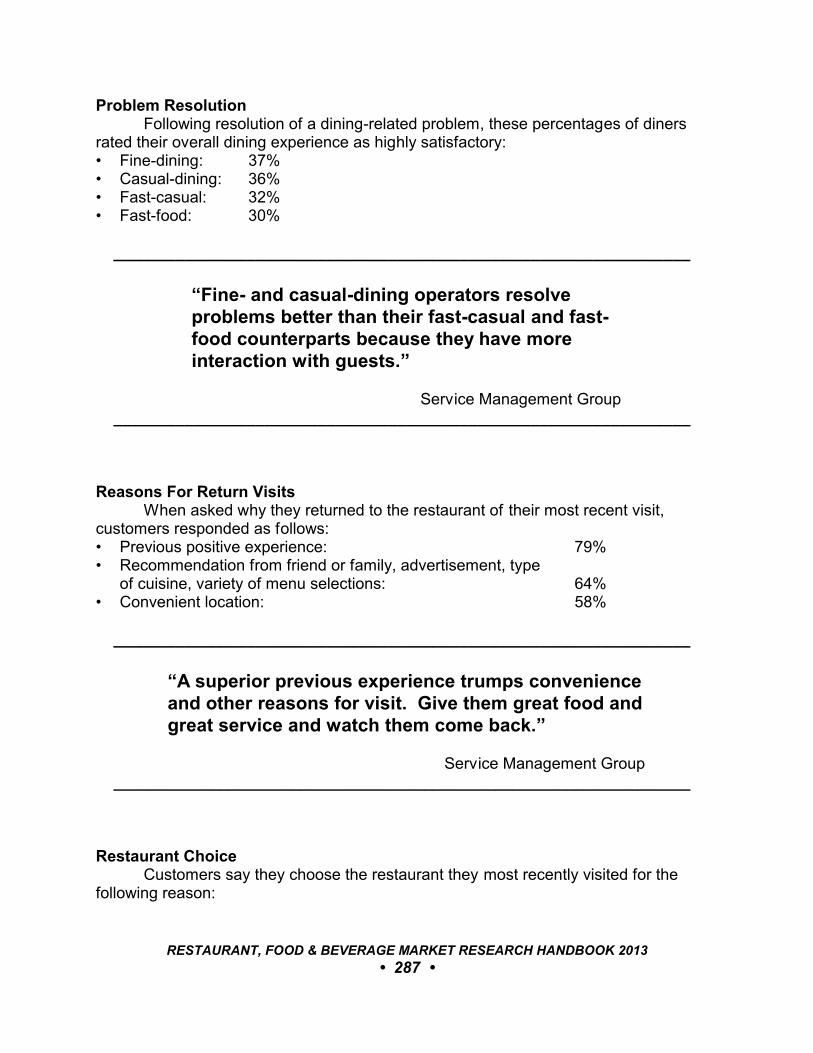
Problem ResolutionFollowing resolution of a dining-related problem, these percentages of diners
rated their overall dining experience as highly satisfactory:• Fine-dining: 37%• Casual-dining: 36%• Fast-casual: 32%• Fast-food: 30%
_________________________________________________________________
“Fine- and casual-dining operators resolveproblems better than their fast-casual and fast-food counterparts because they have moreinteraction with guests.”
Service Management Group _________________________________________________________________
Reasons For Return VisitsWhen asked why they returned to the restaurant of their most recent visit,
customers responded as follows:• Previous positive experience: 79%• Recommendation from friend or family, advertisement, type
of cuisine, variety of menu selections: 64%• Convenient location: 58%
_________________________________________________________________
“A superior previous experience trumps convenienceand other reasons for visit. Give them great food andgreat service and watch them come back.”
Service Management Group _________________________________________________________________
Restaurant ChoiceCustomers say they choose the restaurant they most recently visited for the
following reason:
RESTAURANT, FOOD & BEVERAGE MARKET RESEARCH HANDBOOK 2013
• 287 •
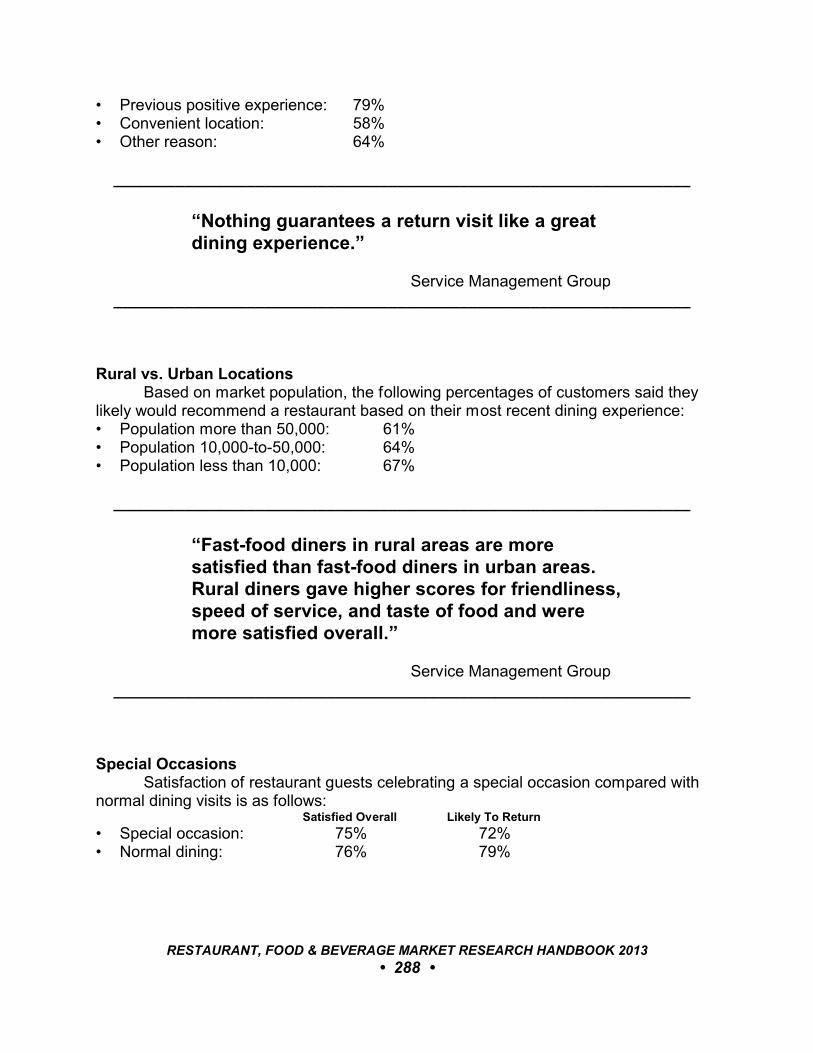
• Previous positive experience: 79%• Convenient location: 58%• Other reason: 64%
_________________________________________________________________
“Nothing guarantees a return visit like a greatdining experience.”
Service Management Group _________________________________________________________________
Rural vs. Urban LocationsBased on market population, the following percentages of customers said they
likely would recommend a restaurant based on their most recent dining experience:• Population more than 50,000: 61%• Population 10,000-to-50,000: 64%• Population less than 10,000: 67%
_________________________________________________________________
“Fast-food diners in rural areas are moresatisfied than fast-food diners in urban areas.Rural diners gave higher scores for friendliness,speed of service, and taste of food and weremore satisfied overall.”
Service Management Group _________________________________________________________________
Special OccasionsSatisfaction of restaurant guests celebrating a special occasion compared with
normal dining visits is as follows: Satisfied Overall Likely To Return
• Special occasion: 75% 72%• Normal dining: 76% 79%
RESTAURANT, FOOD & BEVERAGE MARKET RESEARCH HANDBOOK 2013
• 288 •
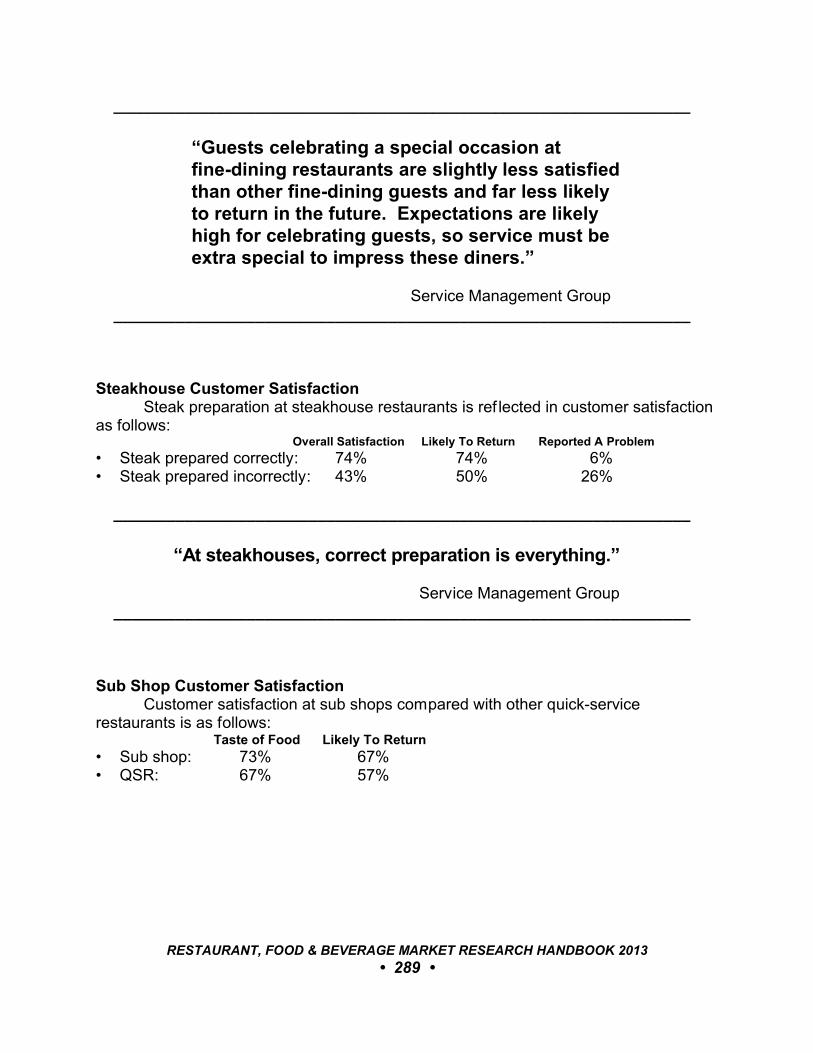
_________________________________________________________________
“Guests celebrating a special occasion atfine-dining restaurants are slightly less satisfiedthan other fine-dining guests and far less likelyto return in the future. Expectations are likelyhigh for celebrating guests, so service must beextra special to impress these diners.”
Service Management Group _________________________________________________________________
Steakhouse Customer SatisfactionSteak preparation at steakhouse restaurants is ref lected in customer satisfaction
as follows: Overall Satisfaction Likely To Return Reported A Problem
• Steak prepared correctly: 74% 74% 6%• Steak prepared incorrectly: 43% 50% 26%
_________________________________________________________________
“At steakhouses, correct preparation is everything.”
Service Management Group _________________________________________________________________
Sub Shop Customer SatisfactionCustomer satisfaction at sub shops compared with other quick-service
restaurants is as follows: Taste of Food Likely To Return
• Sub shop: 73% 67%• QSR: 67% 57%
RESTAURANT, FOOD & BEVERAGE MARKET RESEARCH HANDBOOK 2013
• 289 •
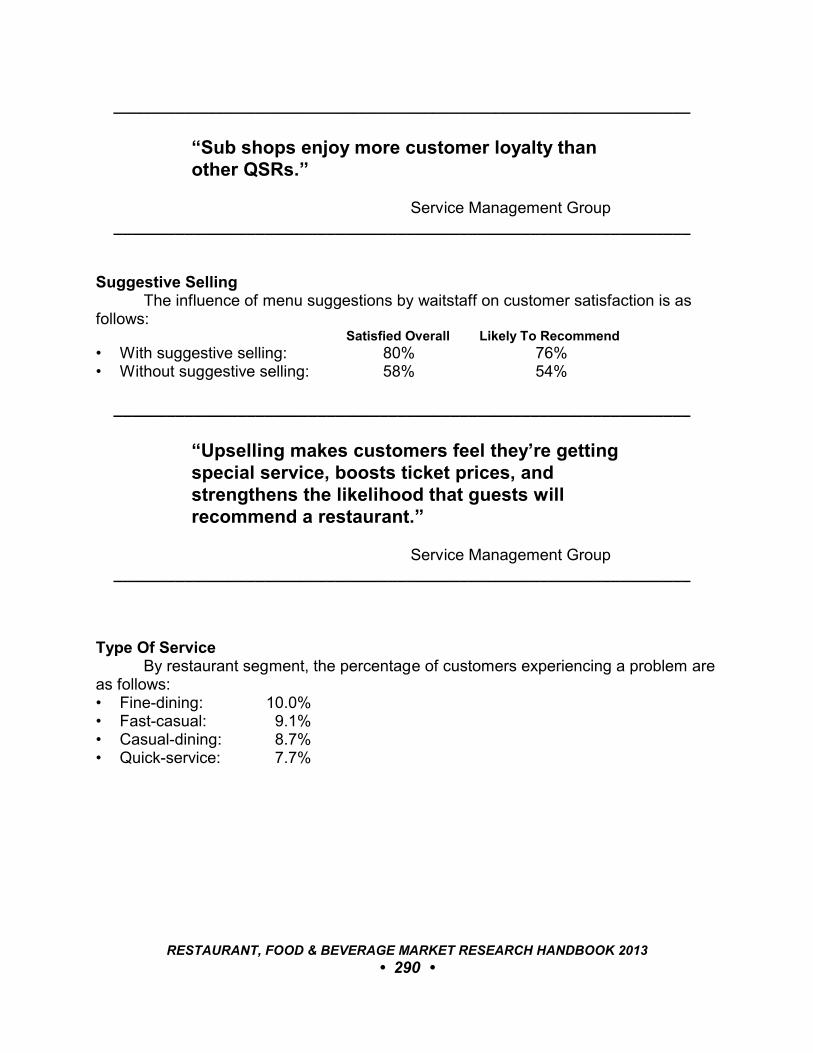
_________________________________________________________________
“Sub shops enjoy more customer loyalty thanother QSRs.”
Service Management Group _________________________________________________________________
Suggestive SellingThe influence of menu suggestions by waitstaff on customer satisfaction is as
follows: Satisfied Overall Likely To Recommend
• With suggestive selling: 80% 76%• Without suggestive selling: 58% 54%
_________________________________________________________________
“Upselling makes customers feel they’re gettingspecial service, boosts ticket prices, andstrengthens the likelihood that guests willrecommend a restaurant.”
Service Management Group _________________________________________________________________
Type Of ServiceBy restaurant segment, the percentage of customers experiencing a problem are
as follows:• Fine-dining: 10.0%• Fast-casual: 9.1%• Casual-dining: 8.7%• Quick-service: 7.7%
RESTAURANT, FOOD & BEVERAGE MARKET RESEARCH HANDBOOK 2013
• 290 •

_________________________________________________________________
“The expectations of fine-dining customers aremuch higher, and raised expectations meancustomers are more likely to perceive problemswith their experience.”
Service Management Group _________________________________________________________________
50.3 Market ResourcesService Management Group, 1737 McGee Street, Kansas City, MO 64108. (800) 764-0439. (www.smg.com)
RESTAURANT, FOOD & BEVERAGE MARKET RESEARCH HANDBOOK 2013
• 291 •
51
HISPANIC-AMERICAN CUSTOMERS
51.1 OverviewCensus 2010 counted 50.5 million Hispanics in the United States, or 16.3% of
the total population. The nation’s Latino population, which was 35.3 million in 2000,grew 43% over the decade. The Hispanic population also accounted for 56% of thenation’s growth from 2000 to 2010.
While some regions of the U.S. have long had a high concentration of Hispanic-Americans, such as Florida and the states bordering Mexico, the influx into other areashas been rapid. In the Pacific Northwest, for instance, the Hispanic populationincreased 71% between the 2000 and 2010 censuses. In such regions, restaurateurshave been scurrying to develop programs that properly cater to the changing populationmix.
The rise of the Hispanic population in the United States has spurred a f ocusamong many restaurateurs on developing menus and promotions that appeal toHispanic-Americans.
51.2 Market AssessmentAccording to Latino Foodservice Trends in the U.S., a report by Packaged Facts
(www.packagedfacts.com), the share of restaurant sales from Hispanic patrons is onthe upswing, with growth of 4.7% in 2011, almost double that of U.S. consumersgenerally.
_________________________________________________________________
“It’s no longer a secret that U.S. Hispanics, whomake some 6 billion restaurant visits and spend$30 billion annually, are critical to the health ofthe restaurant industry.”
Nation’s Restaurant News, 9/17/12 _________________________________________________________________
RESTAURANT, FOOD & BEVERAGE MARKET RESEARCH HANDBOOK 2013
• 292 •

51.3 Hispanic Restaurant PatronageAccording to The NPD Group (www.npd.com), Hispanics traditionally frequent
restaurants more than other ethnic groups. As recently as 2009, Hispanic visits torestaurants outpaced those of Caucasians by 4% and of African-Americans by 6%. The economic downturn affected many Hispanic-Americans and their restaurantpatronage declined. In 2012, Hispanic restaurant visits to restaurants were 44.0 percapita compared to 48.1 per capita for non-Hispanics.
_________________________________________________________________
“This recession has been harder on Hispanicsthan the general population, and that’s reflectedin restaurant patronage. It’s a fragile market.”
Michele Schmal, Analyst The NPD Group Nation’s Restaurant News, 10/17/12
_________________________________________________________________
The pattern of restaurants visits by English-speaking Hispanic-Americans isvirtually the same as that of non-Hispanics. Garcia Research Associates(www.garciaresearch.com) found, however, that dining patterns vary for lessacculturated Hispanic-Americans who speak only or mostly Spanish. The following isthe daytime restaurant traffic distribution among these three groups:
English-Speaking Less Acculturated Non-Hispanics Hispanics Hispanics
• Lunch: 35% 34% 23%• Supper: 33% 32% 24%• Morning meal: 18% 18% 31%• P.M. snack: 15% 15% 22%
_________________________________________________________________
“When it comes to their dining-out behavior,Hispanics tend to use restaurants more often forsnacks than the average consumer, and less oftenthan average for main meals such as dinner.”
Arnie Schwartz, President of Foodservice
The NPD Group, 5/2/11 _________________________________________________________________
RESTAURANT, FOOD & BEVERAGE MARKET RESEARCH HANDBOOK 2013
• 293 •
Hispanics are much more likely to have children with them than non-Hispanics. The following are percentages of restaurant visits by customers having children withthem (source: The NPD Group):• Less acculturated Hispanics: >50%• English-speaking Hispanics: 33%• Non-Hispanics: 29%
_________________________________________________________________
“Food and beverages play a central role in thepreservation of Hispanic culture andreconnection for family; as a result, Hispanicsview mealtime, nutrition, and healthy eatingdifferently than non-Hispanics. Going forseconds, for instance, is encouraged andwelcomed, and conveys that a person ‘eats well’and has a good appetite, which is a symbol ofgood health.”
Terry Soto, PresidentAbout Marketing Solutions, 10/8/12
_________________________________________________________________
51.4 Hispanic Menu PreferencesA panel on “Developing Products for the Hispanic Market” at the May 2012
conference of the Research Chefs Association (www.culinology.com) discussedHispanic-focused menu trends. The following is a summary of comments made byleading chefs:• Hispanics like a lot of flavor in their food and value the presentation on the plate,
according to Fernando Desa, executive chef at Goya Foods.• According to Jonathan Rogan, executive chef of El Pollo Loco, value, flavor, and
perceived healthfulness are the three main pillars of restaurant cuisine that appealto the Hispanic consumer. The Hispanic population is more prone to diabetes thanthe general population, so restaurants need to offer some healthful options.
• Hispanic customers value an authentic restaurant experience. According to MarkMiller, chef and restaurant consultant, “When you look at the Hispanic marketplace,you have to be very careful that you aren’t selling a product without that productbeing designed for their culture, for their social-psycho dynamic, and for their valuesystem.”
RESTAURANT, FOOD & BEVERAGE MARKET RESEARCH HANDBOOK 2013
• 294 •
• Peruvian is poised to be the “next big thing” among Hispanic-American consumers. A fusion of Asian cuisine with a little Spanish cuisine, Peruvian cuisine is verytropical and refreshing with a wide variety of chilies and a lot of freshness with fishpreparations. Elizabeth Johnson-Kossick, chef instructor and Latin cuisine specialistat the Culinary Institute of America’s San Antonio campus, pointed out that Peruvianfood also has a lot of visual freshness and flavor profiles with pepper pastes.
RESTAURANT, FOOD & BEVERAGE MARKET RESEARCH HANDBOOK 2013
• 295 •
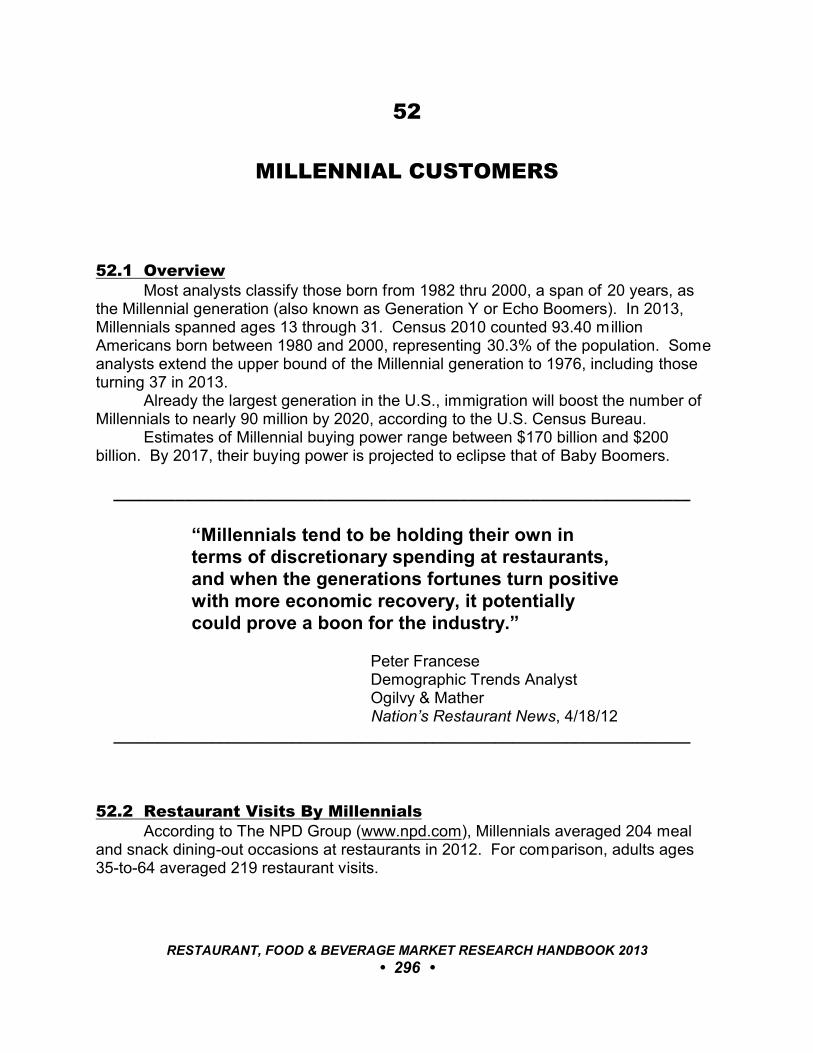
52
MILLENNIAL CUSTOMERS
52.1 OverviewMost analysts classify those born from 1982 thru 2000, a span of 20 years, as
the Millennial generation (also known as Generation Y or Echo Boomers). In 2013,Millennials spanned ages 13 through 31. Census 2010 counted 93.40 millionAmericans born between 1980 and 2000, representing 30.3% of the population. Someanalysts extend the upper bound of the Millennial generation to 1976, including thoseturning 37 in 2013.
Already the largest generation in the U.S., immigration will boost the number ofMillennials to nearly 90 million by 2020, according to the U.S. Census Bureau.
Estimates of Millennial buying power range between $170 billion and $200billion. By 2017, their buying power is projected to eclipse that of Baby Boomers.
_________________________________________________________________
“Millennials tend to be holding their own interms of discretionary spending at restaurants,and when the generations fortunes turn positivewith more economic recovery, it potentiallycould prove a boon for the industry.”
Peter Francese Demographic Trends Analyst Ogilvy & Mather Nation’s Restaurant News, 4/18/12
_________________________________________________________________
52.2 Restaurant Visits By MillennialsAccording to The NPD Group (www.npd.com), Millennials averaged 204 meal
and snack dining-out occasions at restaurants in 2012. For comparison, adults ages35-to-64 averaged 219 restaurant visits.
RESTAURANT, FOOD & BEVERAGE MARKET RESEARCH HANDBOOK 2013
• 296 •
In a June 2012 survey by Service Management Group (SMG, www.smg.com),33% of Millennials said they intended to visit fine-dining restaurants more frequently inthe next 12 months. For comparison, 25% of Generation Xers and 13% of BabyBoomers said so.
Understanding the Foodservice Attitudes & Behaviors of Millennials , a November2012 study by Technomic (www.technomic.com), reported the following characteristicsof Millennial dining at restaurants:• Forty-one percent (41%) of Millennials purchase food away from home at least twice
a week, compared to 38% of Gen Xers and 37% of Baby Boomers.• Forty-eight percent (48%) of Millennials compared to 47% of Gen Xers and 31% of
Baby Boomers strongly agree that they have a diverse social network. Of thoseMillennials, 67% say it makes them more interested in ethnic foods.
• Fifty-nine percent (59%) of Millennials say they look up restaurant menus onlineoften or very often via a computer and 19% do so using a mobile device.
• Twenty percent (20%) of Millennials say that it is important for restaurants to servealcoholic beverages compared to 12% of Gen Xers and 10% of Baby Boomers whosay so.
52.3 Dining PrioritiesThe following are findings of recent market surveys that provide insight into
Millennial dining expectations:• Convenience matters most to Millennial consumers in their dining experience,
according to an April 2012 poll of restaurant market analysts by Nation’s RestaurantNews. Convenience also ranks as the top consideration among Generation Xers;Baby Boomers place the highest priority on restaurant service style. In addition toconvenience, Millennials place emphasis on restaurant atmosphere, brandauthenticity, personal connection with a brand, and service style also rated high inthe poll. (Note: food quality was not a consideration in the dining experience poll;that was considered a given when eating out.)
• In a March 2012 survey by SMG, 42.6% of Millennials said they eat out because ofconvenience and time constraints; 30.4% of consumers overall said so.
_________________________________________________________________
“Compared with older generations, Millennialsare much more likely to eat out because theydon’t have time to prepare a meal at home.”
SMG, 3/12 _________________________________________________________________
RESTAURANT, FOOD & BEVERAGE MARKET RESEARCH HANDBOOK 2013
• 297 •
• According to WD Partners (www.wdpartners.com), Millennials want a socialexperience above all else when visiting a restaurant or bar. For comparison, foodquality is the single most important aspect of the dining experience for BabyBoomers.
• A recent survey by the School of Hospitality at Georgia State University found that45% of Millennials are willing to spend 50¢ more per meal when dining out fororganic menu options’ 30% would pay an additional $1.
52.4 Restaurant Interactions Online and MobileMillennials are more likely than any other generation to follow and interact with
restaurants online.
_________________________________________________________________
“More than half of Millennials surveyed [bySMG], or 52.8%, said they like checking outbrands on social media sites like Facebook andTwitter, while only 36.2% of non-Millennials do. Just over 33% of Millennials said they like abrand more when that brand uses social media,compared with only 17.4% of the oldercomparison group.”
Nation’s Restaurant News, 9/12/11 _________________________________________________________________
Dennis Lombardi, Executive Vice President at WD Partners, suggests that asocial-media strategy is important to attract Millennial customers.
RESTAURANT, FOOD & BEVERAGE MARKET RESEARCH HANDBOOK 2013
• 298 •
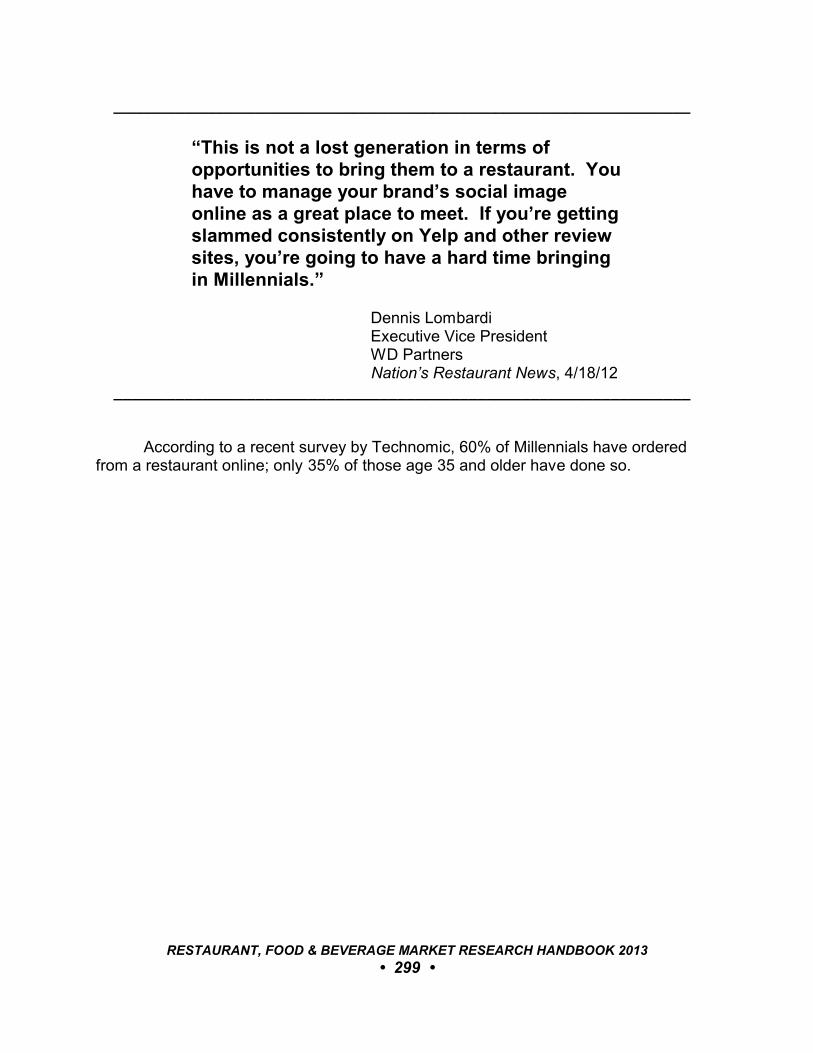
_________________________________________________________________
“This is not a lost generation in terms ofopportunities to bring them to a restaurant. Youhave to manage your brand’s social imageonline as a great place to meet. If you’re gettingslammed consistently on Yelp and other reviewsites, you’re going to have a hard time bringingin Millennials.”
Dennis Lombardi Executive Vice President WD Partners Nation’s Restaurant News, 4/18/12
_________________________________________________________________
According to a recent survey by Technomic, 60% of Millennials have orderedfrom a restaurant online; only 35% of those age 35 and older have done so.
RESTAURANT, FOOD & BEVERAGE MARKET RESEARCH HANDBOOK 2013
• 299 •
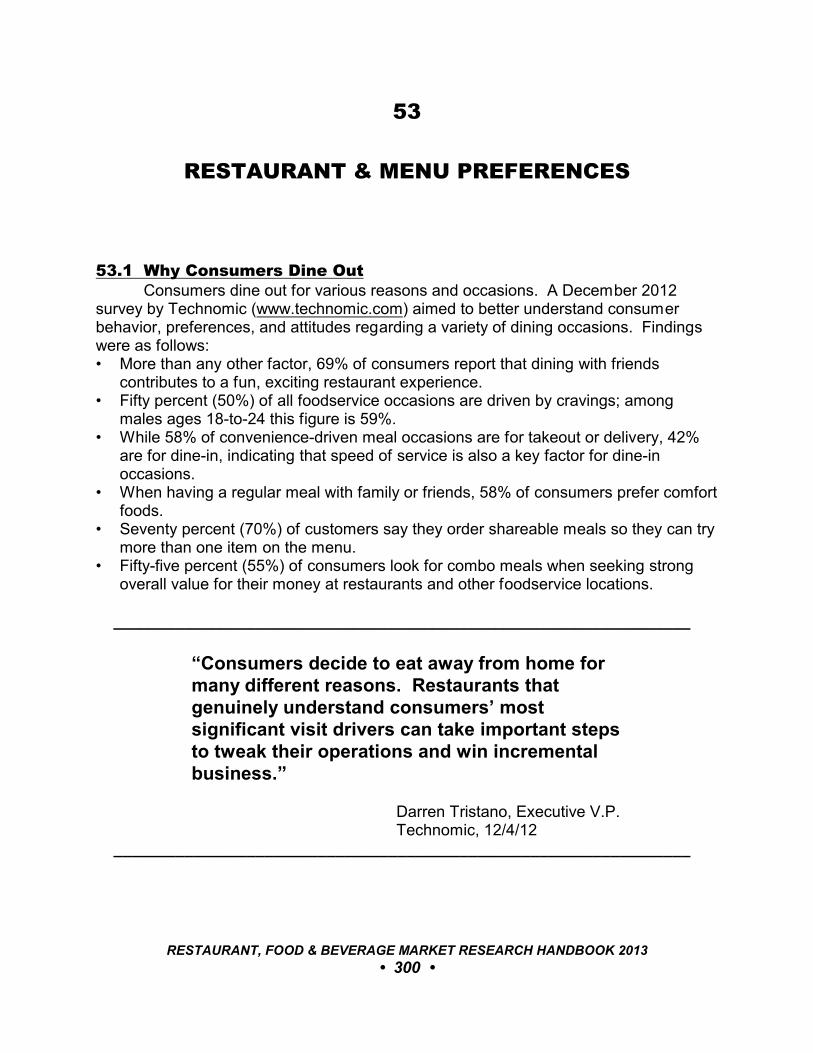
53
RESTAURANT & MENU PREFERENCES
53.1 Why Consumers Dine OutConsumers dine out for various reasons and occasions. A December 2012
survey by Technomic (www.technomic.com) aimed to better understand consumerbehavior, preferences, and attitudes regarding a variety of dining occasions. Findingswere as follows:• More than any other factor, 69% of consumers report that dining with friends
contributes to a fun, exciting restaurant experience.• Fifty percent (50%) of all foodservice occasions are driven by cravings; among
males ages 18-to-24 this figure is 59%.• While 58% of convenience-driven meal occasions are for takeout or delivery, 42%
are for dine-in, indicating that speed of service is also a key factor for dine-inoccasions.
• When having a regular meal with family or friends, 58% of consumers prefer comfortfoods.
• Seventy percent (70%) of customers say they order shareable meals so they can trymore than one item on the menu.
• Fifty-five percent (55%) of consumers look for combo meals when seeking strongoverall value for their money at restaurants and other foodservice locations.
_________________________________________________________________
“Consumers decide to eat away from home formany different reasons. Restaurants thatgenuinely understand consumers’ mostsignificant visit drivers can take important stepsto tweak their operations and win incrementalbusiness.”
Darren Tristano, Executive V.P. Technomic, 12/4/12
_________________________________________________________________
RESTAURANT, FOOD & BEVERAGE MARKET RESEARCH HANDBOOK 2013
• 300 •
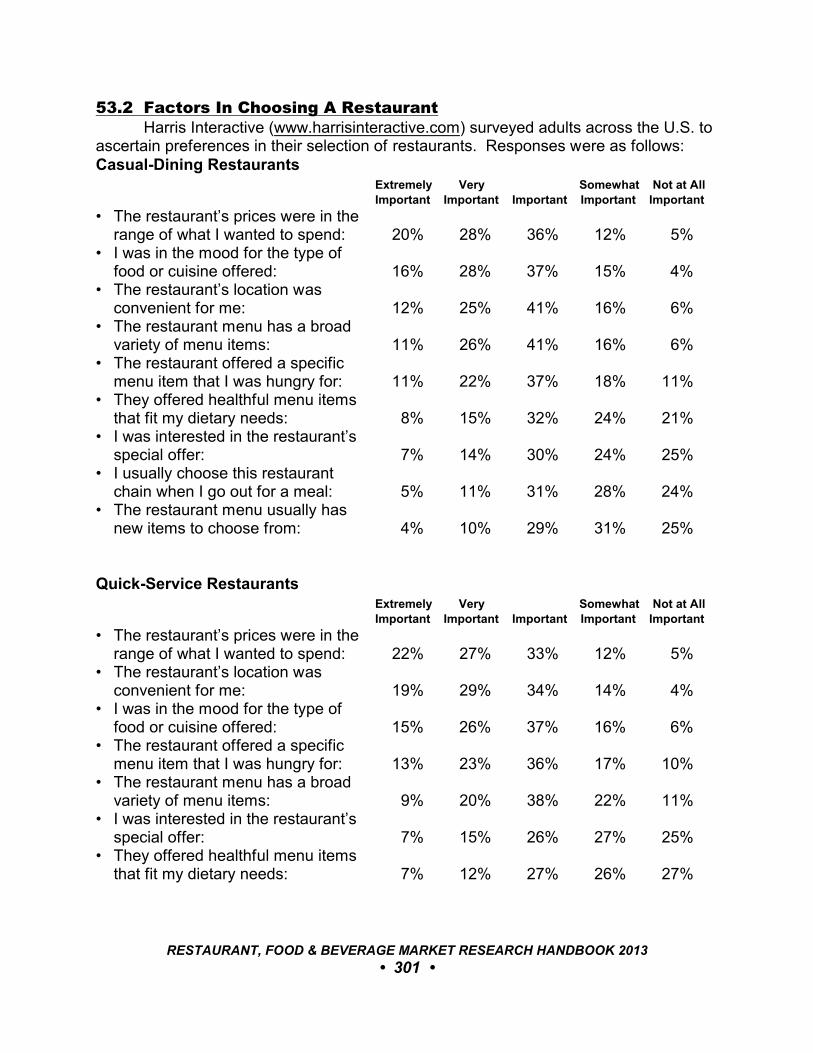
53.2 Factors In Choosing A RestaurantHarris Interactive (www.harrisinteractive.com) surveyed adults across the U.S. to
ascertain preferences in their selection of restaurants. Responses were as follows:Casual-Dining Restaurants
Extremely Very Somewhat Not at All
Important Important Important Important Important
• The restaurant’s prices were in the range of what I wanted to spend: 20% 28% 36% 12% 5%
• I was in the mood for the type offood or cuisine offered: 16% 28% 37% 15% 4%
• The restaurant’s location was convenient for me: 12% 25% 41% 16% 6%
• The restaurant menu has a broad variety of menu items: 11% 26% 41% 16% 6%
• The restaurant offered a specific menu item that I was hungry for: 11% 22% 37% 18% 11%
• They offered healthful menu items that fit my dietary needs: 8% 15% 32% 24% 21%
• I was interested in the restaurant’s special offer: 7% 14% 30% 24% 25%
• I usually choose this restaurantchain when I go out for a meal: 5% 11% 31% 28% 24%
• The restaurant menu usually hasnew items to choose from: 4% 10% 29% 31% 25%
Quick-Service Restaurants Extremely Very Somewhat Not at All
Important Important Important Important Important
• The restaurant’s prices were in the range of what I wanted to spend: 22% 27% 33% 12% 5%
• The restaurant’s location wasconvenient for me: 19% 29% 34% 14% 4%
• I was in the mood for the type offood or cuisine offered: 15% 26% 37% 16% 6%
• The restaurant offered a specificmenu item that I was hungry for: 13% 23% 36% 17% 10%
• The restaurant menu has a broadvariety of menu items: 9% 20% 38% 22% 11%
• I was interested in the restaurant’sspecial offer: 7% 15% 26% 27% 25%
• They offered healthful menu itemsthat fit my dietary needs: 7% 12% 27% 26% 27%
RESTAURANT, FOOD & BEVERAGE MARKET RESEARCH HANDBOOK 2013
• 301 •
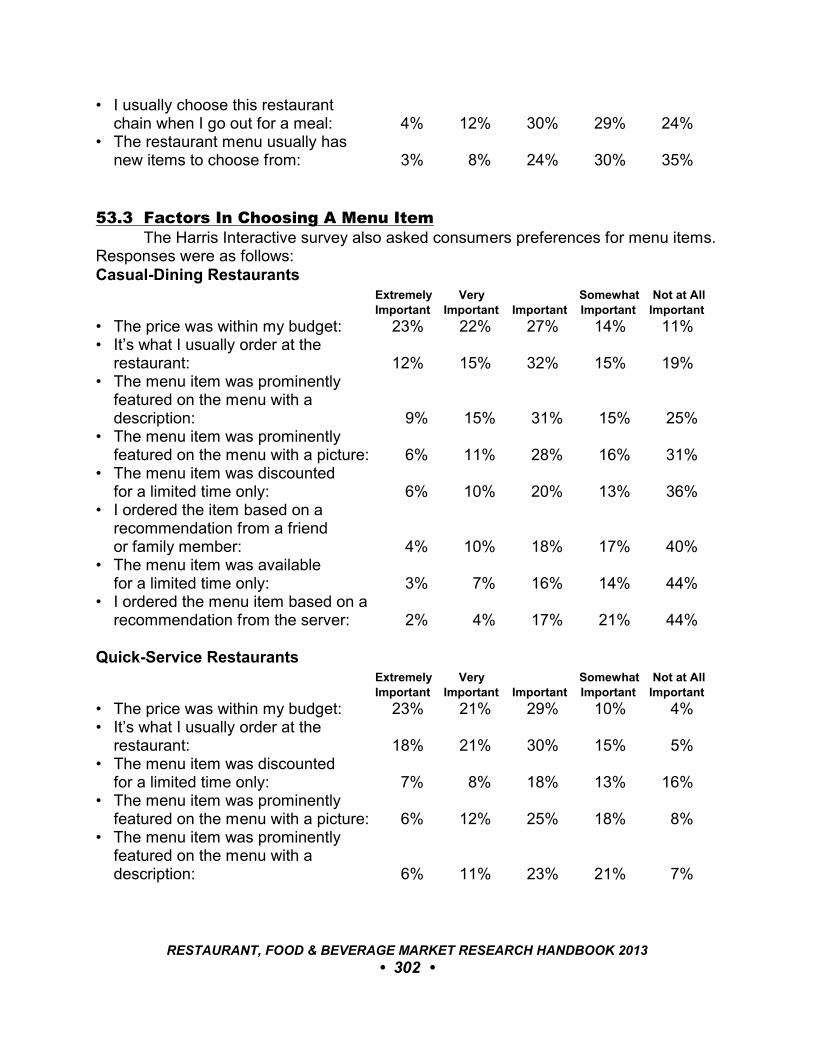
• I usually choose this restaurantchain when I go out for a meal: 4% 12% 30% 29% 24%
• The restaurant menu usually hasnew items to choose from: 3% 8% 24% 30% 35%
53.3 Factors In Choosing A Menu ItemThe Harris Interactive survey also asked consumers preferences for menu items.
Responses were as follows:Casual-Dining Restaurants
Extremely Very Somewhat Not at All
Important Important Important Important Important
• The price was within my budget: 23% 22% 27% 14% 11%• It’s what I usually order at the
restaurant: 12% 15% 32% 15% 19%• The menu item was prominently
featured on the menu with a description: 9% 15% 31% 15% 25%
• The menu item was prominentlyfeatured on the menu with a picture: 6% 11% 28% 16% 31%
• The menu item was discountedfor a limited time only: 6% 10% 20% 13% 36%
• I ordered the item based on arecommendation from a friendor family member: 4% 10% 18% 17% 40%
• The menu item was available for a limited time only: 3% 7% 16% 14% 44%
• I ordered the menu item based on arecommendation from the server: 2% 4% 17% 21% 44%
Quick-Service Restaurants Extremely Very Somewhat Not at All
Important Important Important Important Important
• The price was within my budget: 23% 21% 29% 10% 4%• It’s what I usually order at the
restaurant: 18% 21% 30% 15% 5%• The menu item was discounted
for a limited time only: 7% 8% 18% 13% 16%• The menu item was prominently
featured on the menu with a picture: 6% 12% 25% 18% 8%• The menu item was prominently
featured on the menu with a description: 6% 11% 23% 21% 7%
RESTAURANT, FOOD & BEVERAGE MARKET RESEARCH HANDBOOK 2013
• 302 •
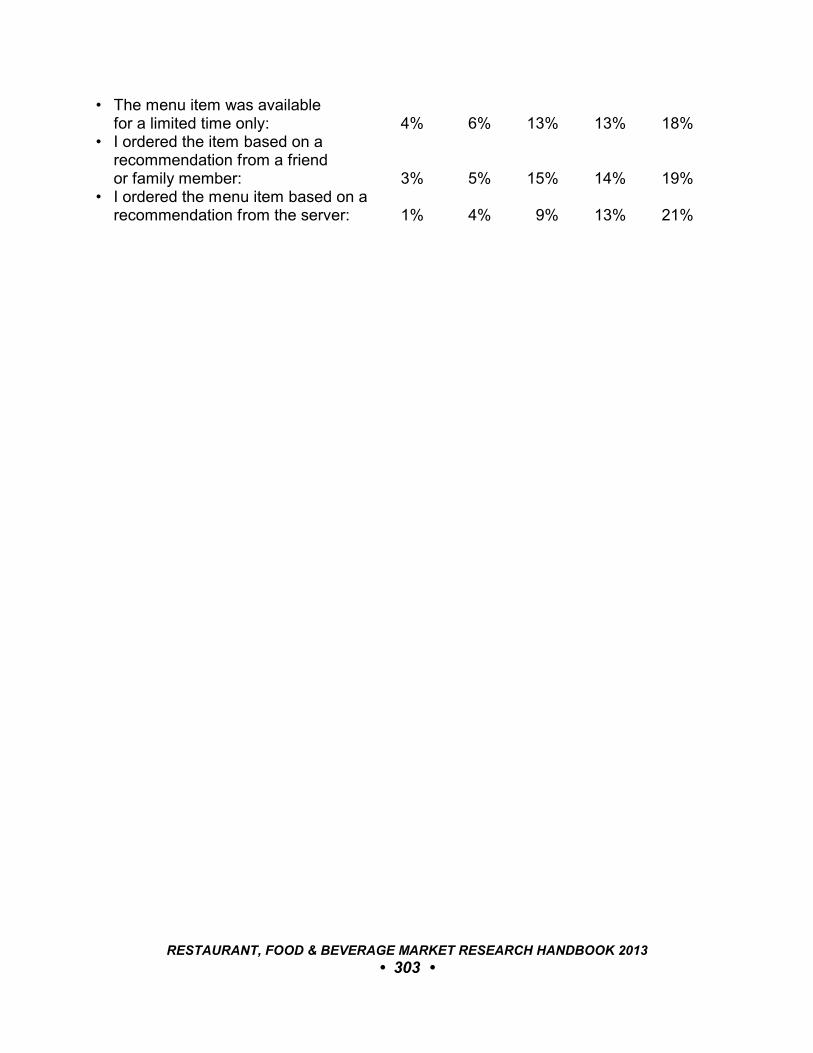
• The menu item was available for a limited time only: 4% 6% 13% 13% 18%
• I ordered the item based on arecommendation from a friendor family member: 3% 5% 15% 14% 19%
• I ordered the menu item based on arecommendation from the server: 1% 4% 9% 13% 21%
RESTAURANT, FOOD & BEVERAGE MARKET RESEARCH HANDBOOK 2013
• 303 •
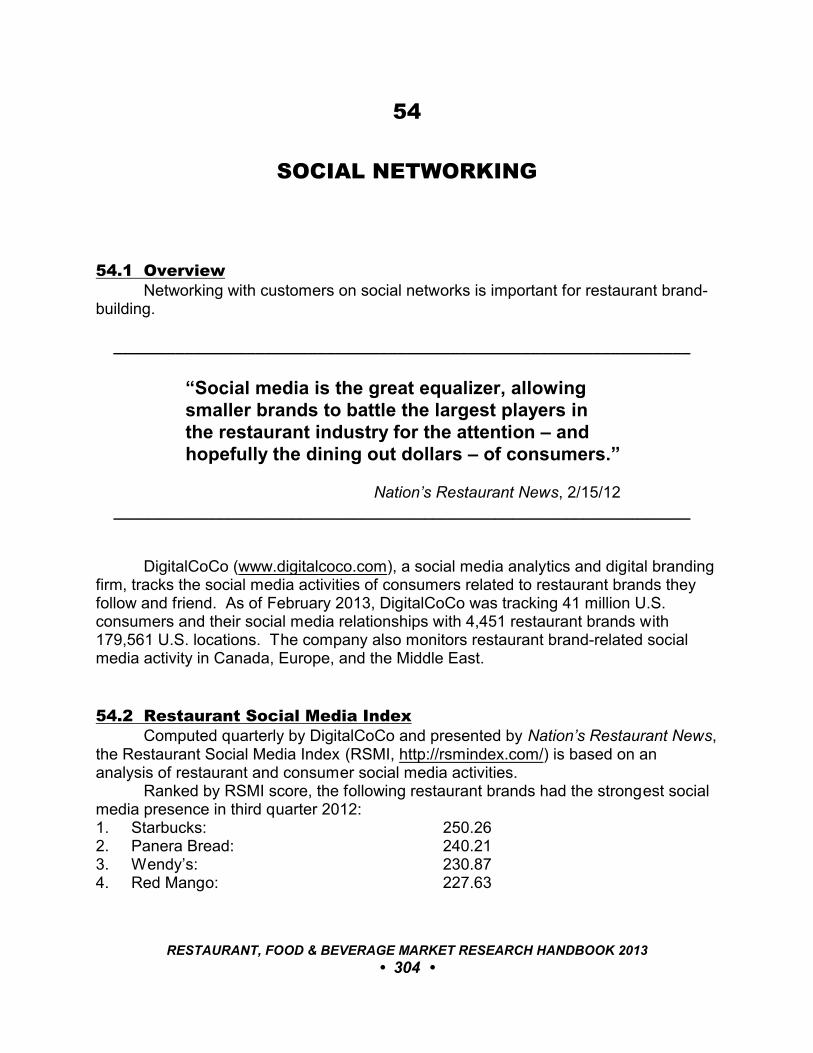
54
SOCIAL NETWORKING
54.1 OverviewNetworking with customers on social networks is important for restaurant brand-
building.
_________________________________________________________________
“Social media is the great equalizer, allowingsmaller brands to battle the largest players in the restaurant industry for the attention – andhopefully the dining out dollars – of consumers.”
Nation’s Restaurant News, 2/15/12 _________________________________________________________________
DigitalCoCo (www.digitalcoco.com), a social media analytics and digital brandingfirm, tracks the social media activities of consumers related to restaurant brands theyfollow and friend. As of February 2013, DigitalCoCo was tracking 41 million U.S.consumers and their social media relationships with 4,451 restaurant brands with179,561 U.S. locations. The company also monitors restaurant brand-related socialmedia activity in Canada, Europe, and the Middle East.
54.2 Restaurant Social Media IndexComputed quarterly by DigitalCoCo and presented by Nation’s Restaurant News,
the Restaurant Social Media Index (RSMI, http://rsmindex.com/) is based on ananalysis of restaurant and consumer social media activities.
Ranked by RSMI score, the following restaurant brands had the strongest socialmedia presence in third quarter 2012:1. Starbucks: 250.262. Panera Bread: 240.21 3. Wendy’s: 230.87 4. Red Mango: 227.63
RESTAURANT, FOOD & BEVERAGE MARKET RESEARCH HANDBOOK 2013
• 304 •
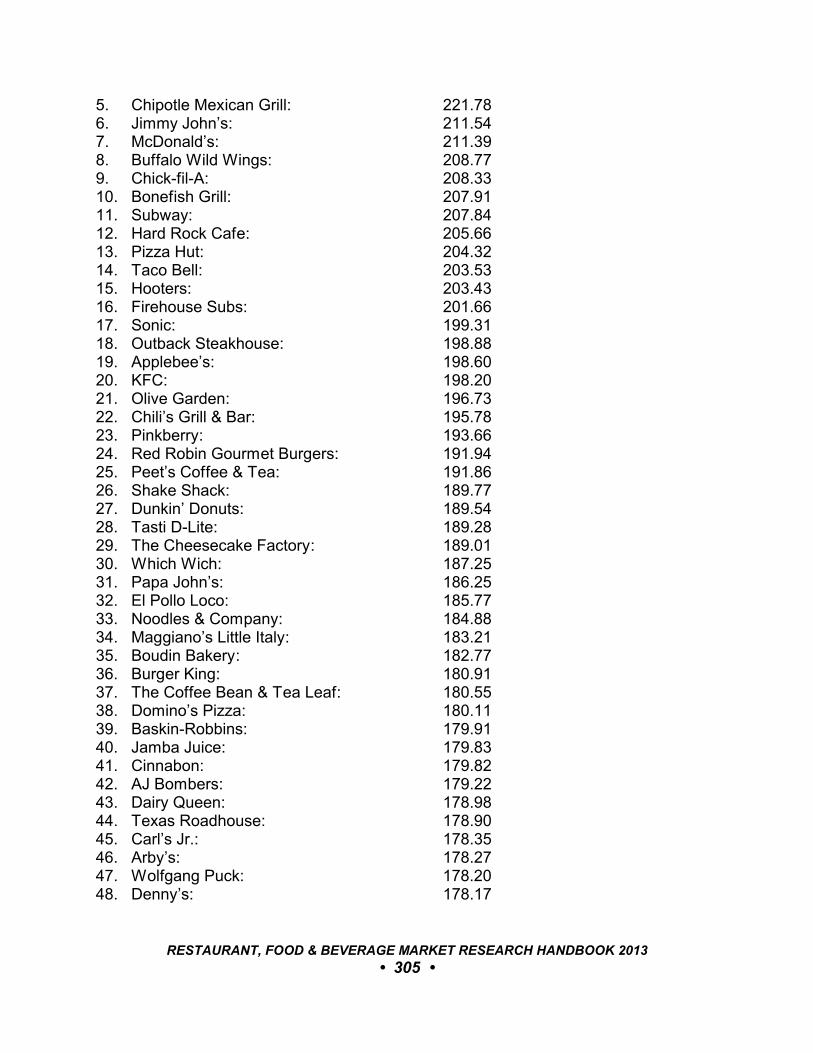
5. Chipotle Mexican Grill: 221.78 6. Jimmy John’s: 211.54 7. McDonald’s: 211.39 8. Buffalo Wild Wings: 208.77 9. Chick-fil-A: 208.33 10. Bonefish Grill: 207.91 11. Subway: 207.84 12. Hard Rock Cafe: 205.6613. Pizza Hut: 204.3214. Taco Bell: 203.53 15. Hooters: 203.4316. Firehouse Subs: 201.66 17. Sonic: 199.3118. Outback Steakhouse: 198.8819. Applebee’s: 198.6020. KFC: 198.2021. Olive Garden: 196.7322. Chili’s Grill & Bar: 195.7823. Pinkberry: 193.6624. Red Robin Gourmet Burgers: 191.9425. Peet’s Coffee & Tea: 191.8626. Shake Shack: 189.7727. Dunkin’ Donuts: 189.5428. Tasti D-Lite: 189.2829. The Cheesecake Factory: 189.0130. Which Wich: 187.2531. Papa John’s: 186.2532. El Pollo Loco: 185.7733. Noodles & Company: 184.8834. Maggiano’s Little Italy: 183.2135. Boudin Bakery: 182.7736. Burger King: 180.9137. The Coffee Bean & Tea Leaf: 180.5538. Domino’s Pizza: 180.1139. Baskin-Robbins: 179.9140. Jamba Juice: 179.8341. Cinnabon: 179.8242. AJ Bombers: 179.2243. Dairy Queen: 178.9844. Texas Roadhouse: 178.9045. Carl’s Jr.: 178.3546. Arby’s: 178.2747. Wolfgang Puck: 178.2048. Denny’s: 178.17
RESTAURANT, FOOD & BEVERAGE MARKET RESEARCH HANDBOOK 2013
• 305 •

49. Wingstop: 177.7150. Sweetgreen: 176.8851. Auntie Anne’s Hand-Rolled Soft Pretzels: 176.0752. Native Foods Cafe: 175.7753. Cold Stone Creamery: 175.5454. Red Lobster: 175.4455. Caribou Coffee: 175.3656. Qdoba Mexican Grill: 173.5857. Buca di Beppo: 173.3258. Pei Wei Asian Diner: 171.3759. Smashburger: 171.3760. Quiznos: 170.9761. Souplantation & Sweet Tomatoes: 170.9762. Popeyes Louisiana Kitchen: 170.8763. Taco John’s: 170.3264. Five Guys Burgers and Fries: 169.8965. Tijuana Flats: 169.7766. P.F. Chang’s China Bistro: 169.5467. Veggie Grill: 168.7668. Johnny Rockets: 168.6469. Dave & Buster’s: 168.3070. Whataburger: 168.2171. Rainforest Cafe: 168.0272. Wow Bao: 167.8173. Twisted Root Burger Co.: 166.9774. Tropical Smoothie Cafe: 166.9775. In-N-Out Burger: 166.9676. Anthony’s Coal Fired Pizza: 166.7577. T.G.I. Friday’s: 166.6778. Chop’t Creative Salad Company: 166.6379. Mellow Mushroom: 166.1980. McAlister’s Deli: 165.8881. Bubba Gump Shrimp Co.: 165.6982. Tender Greens: 165.5483. Uno Chicago Grill: 165.0884. Yard House: 164.8185. Moe’s Southwest Grill: 164.8186. Pizza Fusion: 164.6587. Rubio’s: 164.2188. LYFE Kitchen: 163.9289. Potbelly Sandwich Shop: 163.8090. Hardee’s: 163.7791. Romano’s Macaroni Grill: 163.7092. Twin Peaks: 163.66
RESTAURANT, FOOD & BEVERAGE MARKET RESEARCH HANDBOOK 2013
• 306 •
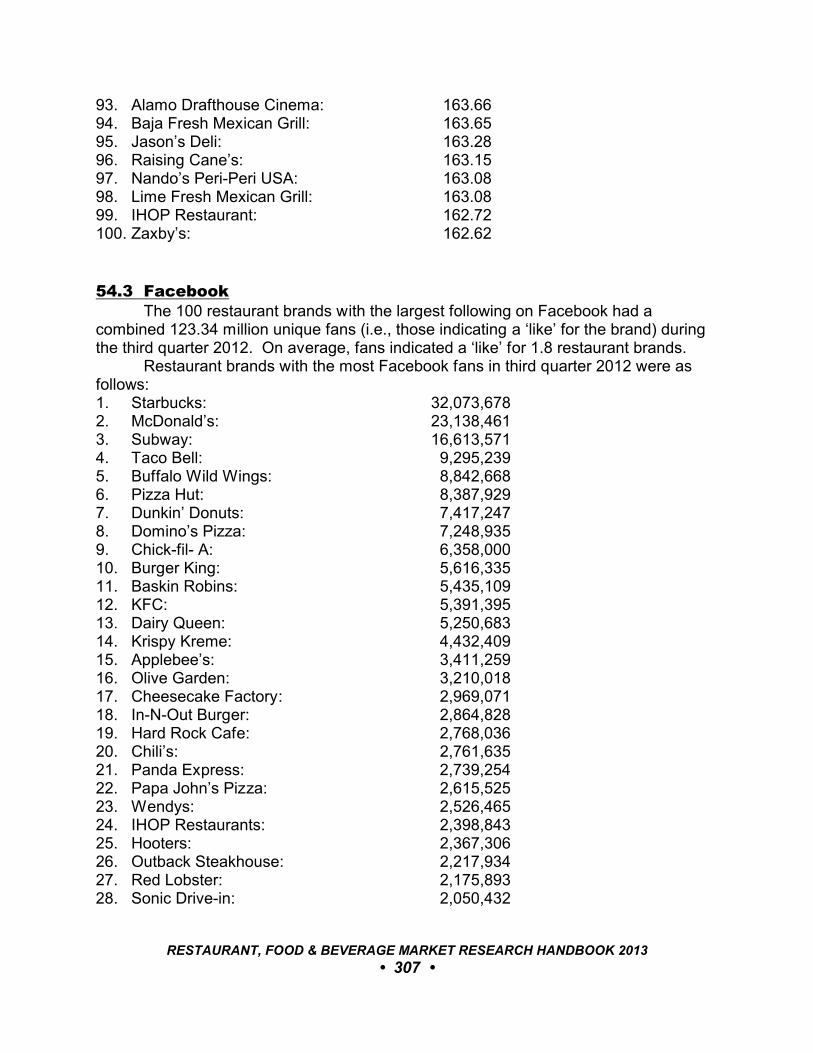
93. Alamo Drafthouse Cinema: 163.6694. Baja Fresh Mexican Grill: 163.6595. Jason’s Deli: 163.2896. Raising Cane’s: 163.1597. Nando’s Peri-Peri USA: 163.0898. Lime Fresh Mexican Grill: 163.0899. IHOP Restaurant: 162.72100. Zaxby’s: 162.62
54.3 FacebookThe 100 restaurant brands with the largest following on Facebook had a
combined 123.34 million unique fans (i.e., those indicating a ‘like’ for the brand) duringthe third quarter 2012. On average, fans indicated a ‘like’ for 1.8 restaurant brands.
Restaurant brands with the most Facebook fans in third quarter 2012 were asfollows:1. Starbucks: 32,073,6782. McDonald’s: 23,138,4613. Subway: 16,613,5714. Taco Bell: 9,295,2395. Buffalo Wild Wings: 8,842,6686. Pizza Hut: 8,387,9297. Dunkin’ Donuts: 7,417,2478. Domino’s Pizza: 7,248,9359. Chick-fil- A: 6,358,00010. Burger King: 5,616,33511. Baskin Robins: 5,435,10912. KFC: 5,391,39513. Dairy Queen: 5,250,68314. Krispy Kreme: 4,432,40915. Applebee’s: 3,411,25916. Olive Garden: 3,210,01817. Cheesecake Factory: 2,969,07118. In-N-Out Burger: 2,864,82819. Hard Rock Cafe: 2,768,03620. Chili’s: 2,761,63521. Panda Express: 2,739,25422. Papa John’s Pizza: 2,615,52523. Wendys: 2,526,46524. IHOP Restaurants: 2,398,84325. Hooters: 2,367,30626. Outback Steakhouse: 2,217,93427. Red Lobster: 2,175,89328. Sonic Drive-in: 2,050,432
RESTAURANT, FOOD & BEVERAGE MARKET RESEARCH HANDBOOK 2013
• 307 •
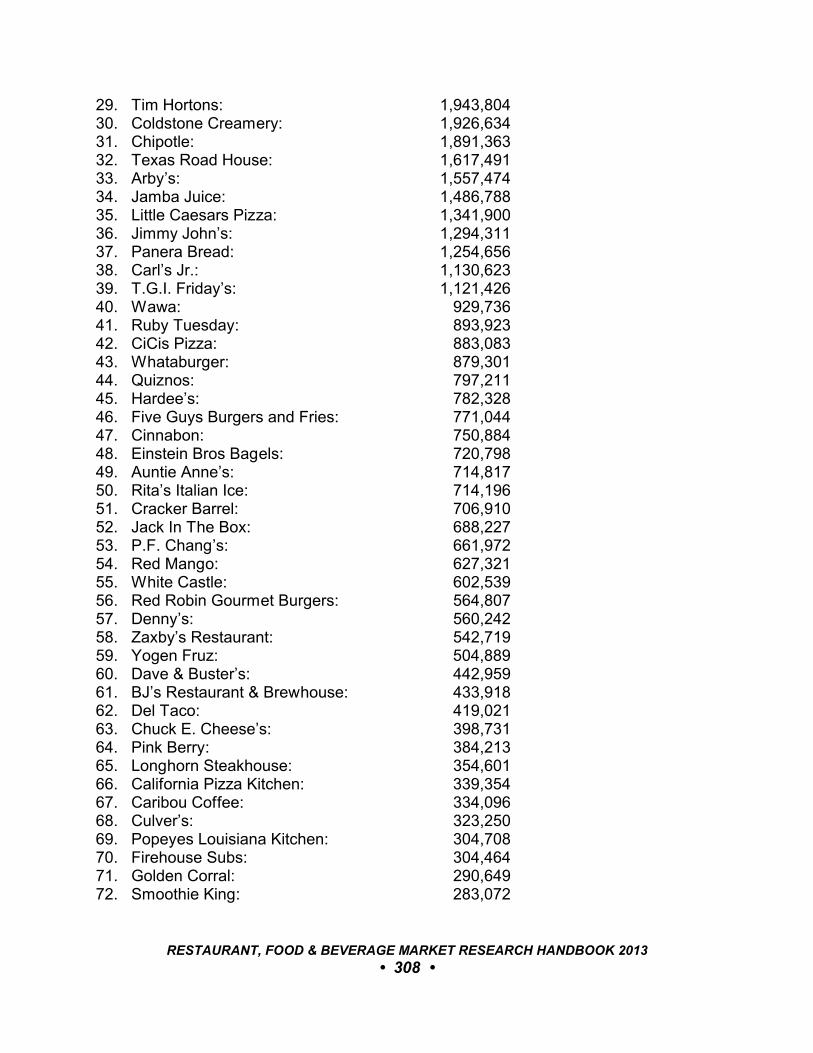
29. Tim Hortons: 1,943,80430. Coldstone Creamery: 1,926,63431. Chipotle: 1,891,36332. Texas Road House: 1,617,49133. Arby’s: 1,557,47434. Jamba Juice: 1,486,78835. Little Caesars Pizza: 1,341,90036. Jimmy John’s: 1,294,31137. Panera Bread: 1,254,65638. Carl’s Jr.: 1,130,62339. T.G.I. Friday’s: 1,121,42640. Wawa: 929,73641. Ruby Tuesday: 893,92342. CiCis Pizza: 883,08343. Whataburger: 879,30144. Quiznos: 797,21145. Hardee’s: 782,32846. Five Guys Burgers and Fries: 771,04447. Cinnabon: 750,88448. Einstein Bros Bagels: 720,79849. Auntie Anne’s: 714,81750. Rita’s Italian Ice: 714,19651. Cracker Barrel: 706,91052. Jack In The Box: 688,22753. P.F. Chang’s: 661,97254. Red Mango: 627,32155. White Castle: 602,53956. Red Robin Gourmet Burgers: 564,80757. Denny’s: 560,24258. Zaxby’s Restaurant: 542,71959. Yogen Fruz: 504,88960. Dave & Buster’s: 442,95961. BJ’s Restaurant & Brewhouse: 433,91862. Del Taco: 419,02163. Chuck E. Cheese’s: 398,73164. Pink Berry: 384,21365. Longhorn Steakhouse: 354,60166. California Pizza Kitchen: 339,35467. Caribou Coffee: 334,09668. Culver’s: 323,25069. Popeyes Louisiana Kitchen: 304,70870. Firehouse Subs: 304,46471. Golden Corral: 290,64972. Smoothie King: 283,072
RESTAURANT, FOOD & BEVERAGE MARKET RESEARCH HANDBOOK 2013
• 308 •
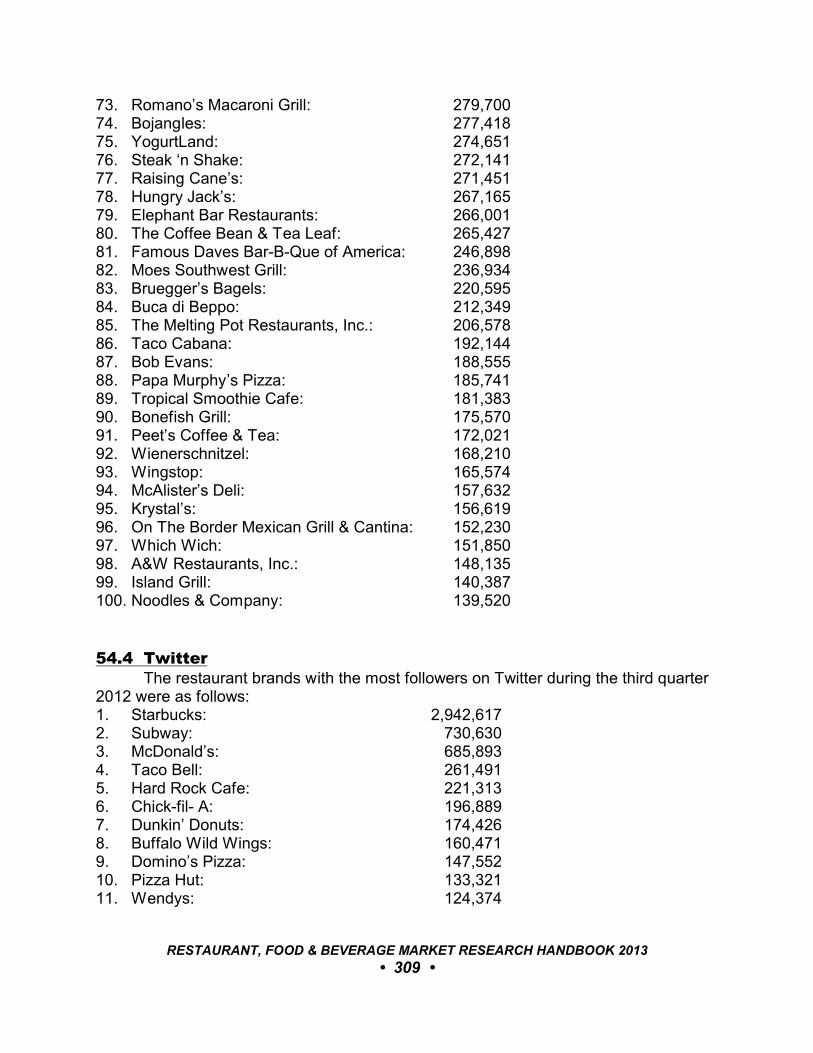
73. Romano’s Macaroni Grill: 279,70074. Bojangles: 277,41875. YogurtLand: 274,65176. Steak ‘n Shake: 272,14177. Raising Cane’s: 271,45178. Hungry Jack’s: 267,16579. Elephant Bar Restaurants: 266,00180. The Coffee Bean & Tea Leaf: 265,42781. Famous Daves Bar-B-Que of America: 246,89882. Moes Southwest Grill: 236,93483. Bruegger’s Bagels: 220,59584. Buca di Beppo: 212,34985. The Melting Pot Restaurants, Inc.: 206,57886. Taco Cabana: 192,14487. Bob Evans: 188,55588. Papa Murphy’s Pizza: 185,74189. Tropical Smoothie Cafe: 181,38390. Bonefish Grill: 175,57091. Peet’s Coffee & Tea: 172,02192. Wienerschnitzel: 168,21093. Wingstop: 165,57494. McAlister’s Deli: 157,63295. Krystal’s: 156,61996. On The Border Mexican Grill & Cantina: 152,23097. Which Wich: 151,85098. A&W Restaurants, Inc.: 148,13599. Island Grill: 140,387100. Noodles & Company: 139,520
54.4 TwitterThe restaurant brands with the most followers on Twitter during the third quarter
2012 were as follows:1. Starbucks: 2,942,6172. Subway: 730,6303. McDonald’s: 685,8934. Taco Bell: 261,4915. Hard Rock Cafe: 221,3136. Chick-fil- A: 196,8897. Dunkin’ Donuts: 174,4268. Buffalo Wild Wings: 160,4719. Domino’s Pizza: 147,55210. Pizza Hut: 133,32111. Wendys: 124,374
RESTAURANT, FOOD & BEVERAGE MARKET RESEARCH HANDBOOK 2013
• 309 •
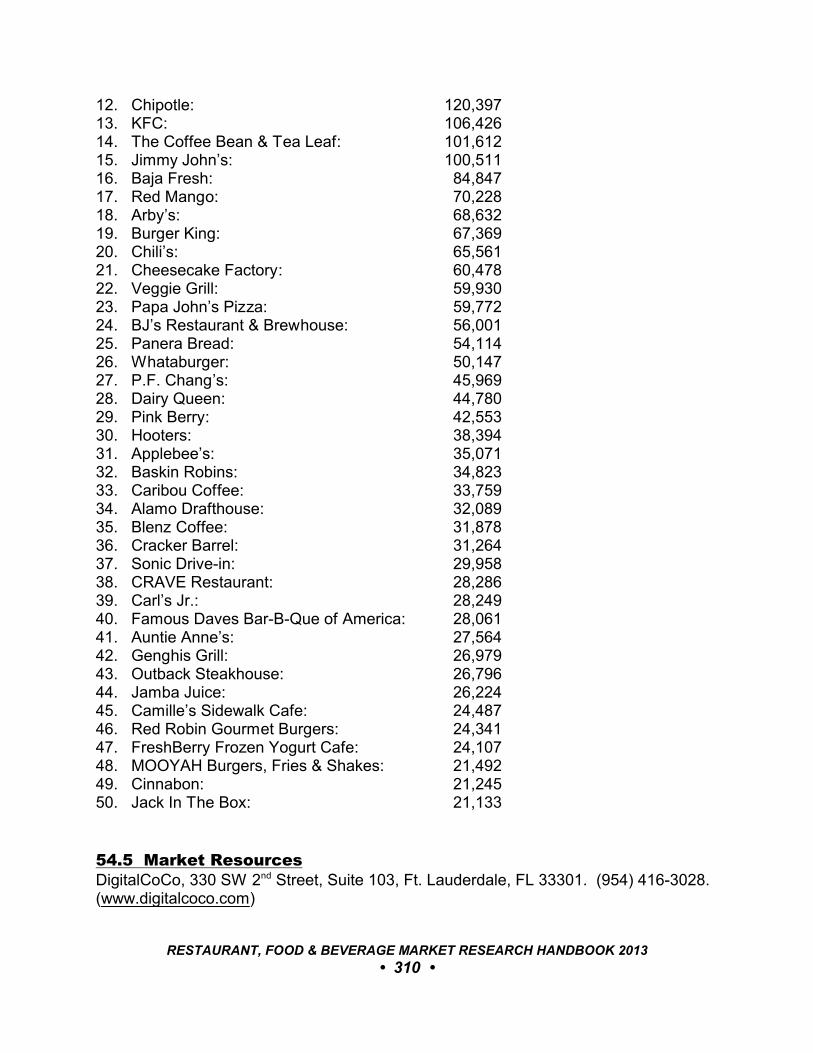
12. Chipotle: 120,39713. KFC: 106,42614. The Coffee Bean & Tea Leaf: 101,61215. Jimmy John’s: 100,51116. Baja Fresh: 84,84717. Red Mango: 70,22818. Arby’s: 68,63219. Burger King: 67,36920. Chili’s: 65,56121. Cheesecake Factory: 60,47822. Veggie Grill: 59,93023. Papa John’s Pizza: 59,77224. BJ’s Restaurant & Brewhouse: 56,00125. Panera Bread: 54,11426. Whataburger: 50,14727. P.F. Chang’s: 45,96928. Dairy Queen: 44,78029. Pink Berry: 42,55330. Hooters: 38,39431. Applebee’s: 35,07132. Baskin Robins: 34,82333. Caribou Coffee: 33,75934. Alamo Drafthouse: 32,08935. Blenz Coffee: 31,87836. Cracker Barrel: 31,26437. Sonic Drive-in: 29,95838. CRAVE Restaurant: 28,28639. Carl’s Jr.: 28,24940. Famous Daves Bar-B-Que of America: 28,06141. Auntie Anne’s: 27,56442. Genghis Grill: 26,97943. Outback Steakhouse: 26,79644. Jamba Juice: 26,22445. Camille’s Sidewalk Cafe: 24,48746. Red Robin Gourmet Burgers: 24,34147. FreshBerry Frozen Yogurt Cafe: 24,10748. MOOYAH Burgers, Fries & Shakes: 21,49249. Cinnabon: 21,24550. Jack In The Box: 21,133
54.5 Market ResourcesDigitalCoCo, 330 SW 2nd Street, Suite 103, Ft. Lauderdale, FL 33301. (954) 416-3028.(www.digitalcoco.com)
RESTAURANT, FOOD & BEVERAGE MARKET RESEARCH HANDBOOK 2013
• 310 •
PART VII: DINING TRENDS & ANALYSES
RESTAURANT, FOOD & BEVERAGE MARKET RESEARCH HANDBOOK 2013
• 311 •

55
BURGERS & SANDWICHES
55.1 OverviewAccording to The NPD Group (www.npd.com), Americans purchase more than
22 million sandwiches, burgers, and wraps each year. Sales of these items increasedthrough the economic downturn.
According to Sandwich Consumer Trend Report, published by Technomic(www.technomic.com), 96% of consumers purchase sandwiches at least once a week; 59% say they eat at least three sandwiches a week.
55.2 HamburgersAccording to Market Intelligence Report: Better Burgers, a 2012 report by
Technomic, the limited-service burger segment is the largest menu segment by revenuein the restaurant industry. McDonald’s accounts for half of the segment’s business.
A growing number of upscale fast-casual burger players, dubbed “better burger”concepts, have penetrated the marketplace. Growing burger chains like BurgerFi,Shake Shack, and Umami Burger, for example, offer expanded choices throughpremium cuts of meat along with specialized toppings, sauces, and other add-ons.
_________________________________________________________________
“Better-burger concepts have a lot going forthem. First, they have the benefit of a basic andbeloved menu focus. Raising the quality of theprotein, bun, toppings and sides has been awinning formula. And a number of celebritychefs have opened concepts that focus onburgers made with premium ingredients,helping to raise their profile.”
Darren Tristano, Executive V.P. Technomic, 8/1/12
_________________________________________________________________
RESTAURANT, FOOD & BEVERAGE MARKET RESEARCH HANDBOOK 2013
• 312 •
Hamburger sales in the quick-service restaurant segment yield more than $65billion annually, according to Technomic, with Americans consuming over 30.5 burgersper capita at restaurants.
According to The NPD Group, more than nine billion hamburgers are sold at U.S.restaurants each year, accounting for about 15% of all restaurant orders. Forty-twopercent (42%) of all sandwiches sold are burgers. Distribution among types of burgersis as follows:• Large cheeseburger: 42%• Regular cheeseburger: 20%• Bacon cheeseburger: 15%• Regular hamburger: 12%• Large hamburger: 11%
According to Datassential (www.datassential.com), 44% of all restaurants – fromquick-service to fine-dining, have some type of burger on their menu. Driven by theincreasing popularity of upscale burgers, casual- and fine-dining restaurants across theU.S. have rolled out artisan burgers and unique pairings. Of all restaurants that offerburgers, 32% are menued with cheddar, 30% with Swiss, and 25% with Americancheese.
The ‘Big Three’ burger chains – McDonald’s, Burger King and Wendy’s –account for nearly 75% of quick-service and fast-casual burger chains sales in the U.S.,according to Technomic.
Tom Ryan, founder and chief concept officer of Smashburger, foresees fast-casual concepts garnering 20% to 30% of the burger market within a few years, withthree or four chains emerging as the leaders in the segment. Because of thedominance of the Big Three, fast-casual chains now garner only 2.6% of burger sales.
In March 2011, Hardee’s and Carl’s Jr., subsidiaries of CKE Restaurants andwith more than 3,000 locations in 42 states, become the first national fast-food chainsto add turkey burgers to their permanent menu. The 500-calorie burger was rolled outwith a marketing tie-in with Men’s Health magazine.
55.3 Hot Dogs & SausagesAccording to data provided by the National Hot Dog & Sausage Council
(www.hot-dog.org), more than 700 million packages of hot dogs were sold at retailstores in 2012, not including Wal-Mart, which does not report sales data. That numberrepresents more than $1.7 billion in retail sales.
Consumers spend more than $4 billion purchasing 1.5 billion pounds of hot dogseach year, according to the council.
During summer – Memorial Day to Labor Day – Americans consume sevenbillion hot dogs. On Independence Day alone, Americans consumed an estimated 150million hot dogs in 2012.
RESTAURANT, FOOD & BEVERAGE MARKET RESEARCH HANDBOOK 2013
• 313 •
According to The Size and Scope of the U.S. Hot Dog Market, published by theNational Hot Dog & Sausage Council, the summer months between Memorial Day andLabor Day continue to make up the ‘hot dog season;’ an average of 38% of the totalnumber of hot dogs sold are during this time. Ten percent (10%) of annual retail salesof hot dogs occur during July, which is designated as National Hot Dog Month.
Hot dogs remain a favorite at baseball parks. The Hot Dog & Sausage Councilestimated that 21.2 million hot dogs were consumed in major league stadiums duringthe 2011 season. More than 2.0 million hot dogs were sold at Shea Stadium, home ofthe New York Mets – the highest number among the 30 major league ball parks.
The following are the top hot dog consuming cities/region (source: National HotDog & Sausage Council):1. Los Angeles, CA2. Corpus Christi and San Antonio, TX3. New York, NY4. Washington, DC and Baltimore, MD5. Chicago, IL6. Dallas, TX7. Houston, TX8. Philadelphia, PA9. South Carolina (statewide)10. Harrisburg and Scranton, PA
Walt Disney World (Orlando, FL) sold six million hot dogs in 2012.Chicago is home to almost 2,000 privately owned hot dog restaurant and
foodservice businesses – from street-side stands to dedicated neighborhood diners. The Varsity (Atlanta, GA) sells an average of 17,000 hot dogs each day, the
most of any restaurant in the world. On football game days at nearby Georgia Tech,the restaurant typically sells 50,000 hot dogs.
Gray’s Papaya, with two locations in New York City, sells an average of 11,000hot dogs daily, making it the most popular hot dog restaurant in the city.
55.4 Other SandwichesOther popular sandwich types include chicken and veggie sandwiches, along
with wraps, tacos, tortillas, burritos, and crepes.According to The NPD Group, consumers eat about four billion chicken sandwich
servings at restaurants annually, or approximately 18% of all sandwiches sold.The number of barbeque sandwiches purchased at restaurants increased 15% in
2011, according to The NPD Group. This was the highest increase among all types ofsandwiches. Approximately 250 million barbeque sandwiches are served each year.
According to Technomic, 57% of adults say they eat at least one deli sandwichevery two months; 47% eat a sub sandwich in the same period.
RESTAURANT, FOOD & BEVERAGE MARKET RESEARCH HANDBOOK 2013
• 314 •
55.5 Market ResourcesNational Hot Dog and Sausage Council, 1150 Connecticut Ave NW, 12th Floor,Washington, DC 20036. (202) 587-4200. (www.hot-dog.org).
RESTAURANT, FOOD & BEVERAGE MARKET RESEARCH HANDBOOK 2013
• 315 •
56
CELEBRITY CHEFS
56.1 Cooking Shows On TelevisionOne Harris Poll (www.harrisinteractive.com) found that 50% of adults watch TV
shows about cooking occasionally or very often. By demographic, those who do so areas follows:Gender• Female: 54%• Male: 46%
Age• 18-to-33: 43%• 34-to-45: 51%• 46-to-64: 55%• 65 and older: 49%
_________________________________________________________________
“In the Food Network era, the phenomenon ofthe celebrity chef has utterly transformed therestaurant industry and, in the process, changedthe very nature of how we eat.”
Time _________________________________________________________________
Exposure from television cooking shows has propelled some noted chefs tocelebrity status.
56.2 Top-Earning ChefsAccording to Forbes (July 2012), the top-earning chefs are as follows:
• Gordon Ramsay: $38 million• Rachael Ray: $25 million• Wolfgang Puck: $20 million
RESTAURANT, FOOD & BEVERAGE MARKET RESEARCH HANDBOOK 2013
• 316 •
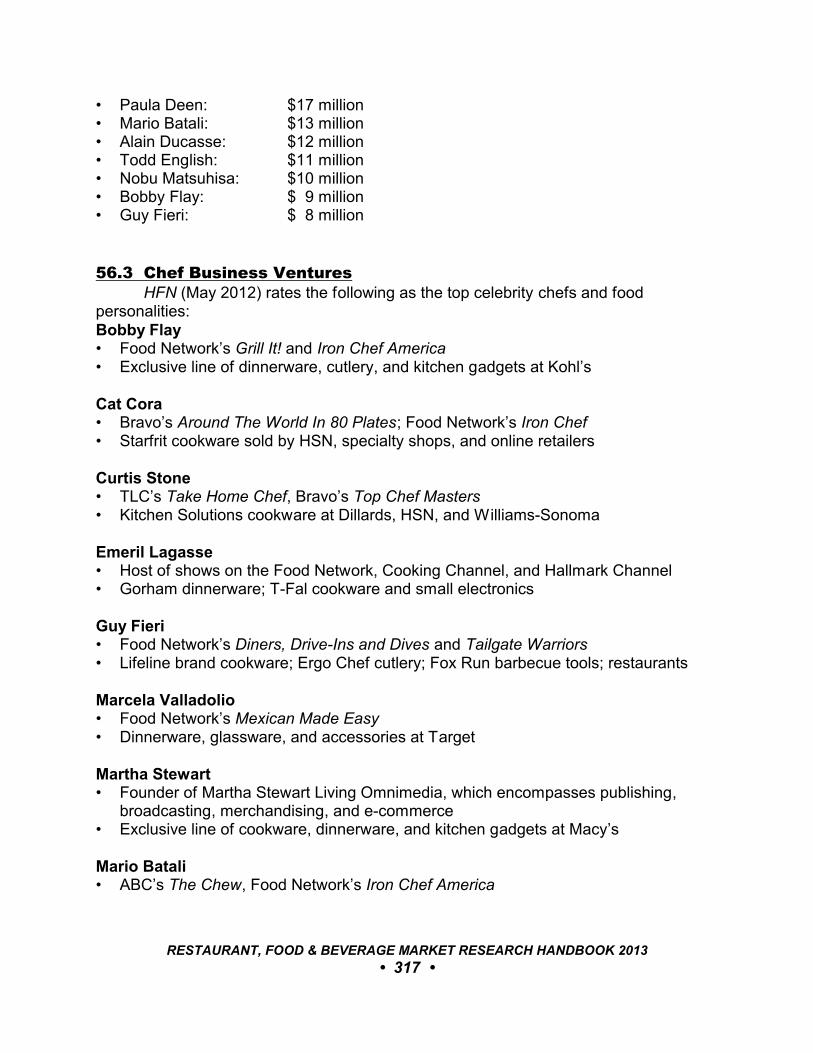
• Paula Deen: $17 million• Mario Batali: $13 million• Alain Ducasse: $12 million• Todd English: $11 million• Nobu Matsuhisa: $10 million• Bobby Flay: $ 9 million• Guy Fieri: $ 8 million
56.3 Chef Business VenturesHFN (May 2012) rates the following as the top celebrity chefs and food
personalities:Bobby Flay• Food Network’s Grill It! and Iron Chef America• Exclusive line of dinnerware, cutlery, and kitchen gadgets at Kohl’s
Cat Cora• Bravo’s Around The World In 80 Plates; Food Network’s Iron Chef• Starfrit cookware sold by HSN, specialty shops, and online retailers
Curtis Stone• TLC’s Take Home Chef, Bravo’s Top Chef Masters• Kitchen Solutions cookware at Dillards, HSN, and Williams-Sonoma
Emeril Lagasse• Host of shows on the Food Network, Cooking Channel, and Hallmark Channel• Gorham dinnerware; T-Fal cookware and small electronics
Guy Fieri• Food Network’s Diners, Drive-Ins and Dives and Tailgate Warriors• Lifeline brand cookware; Ergo Chef cutlery; Fox Run barbecue tools; restaurants
Marcela Valladolio• Food Network’s Mexican Made Easy• Dinnerware, glassware, and accessories at Target
Martha Stewart• Founder of Martha Stewart Living Omnimedia, which encompasses publishing,
broadcasting, merchandising, and e-commerce• Exclusive line of cookware, dinnerware, and kitchen gadgets at Macy’s
Mario Batali• ABC’s The Chew, Food Network’s Iron Chef America
RESTAURANT, FOOD & BEVERAGE MARKET RESEARCH HANDBOOK 2013
• 317 •
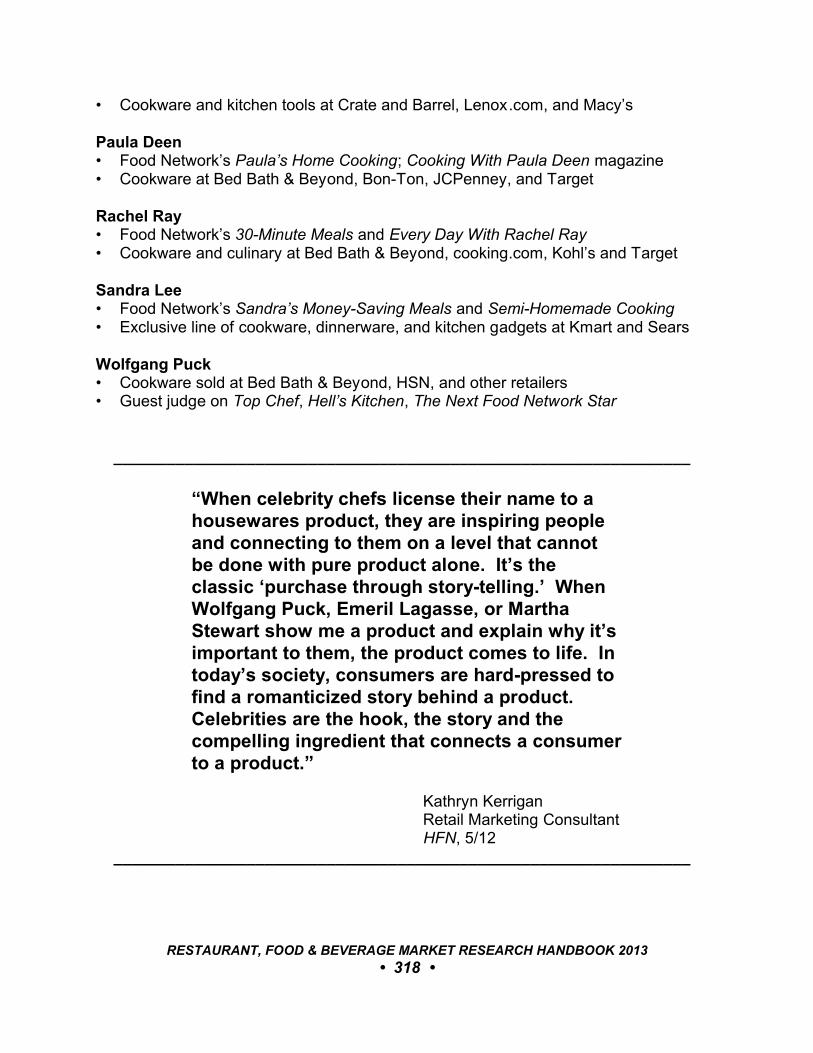
• Cookware and kitchen tools at Crate and Barrel, Lenox.com, and Macy’s
Paula Deen• Food Network’s Paula’s Home Cooking; Cooking With Paula Deen magazine• Cookware at Bed Bath & Beyond, Bon-Ton, JCPenney, and Target
Rachel Ray• Food Network’s 30-Minute Meals and Every Day With Rachel Ray• Cookware and culinary at Bed Bath & Beyond, cooking.com, Kohl’s and Target
Sandra Lee• Food Network’s Sandra’s Money-Saving Meals and Semi-Homemade Cooking• Exclusive line of cookware, dinnerware, and kitchen gadgets at Kmart and Sears
Wolfgang Puck• Cookware sold at Bed Bath & Beyond, HSN, and other retailers• Guest judge on Top Chef, Hell’s Kitchen, The Next Food Network Star
_________________________________________________________________
“When celebrity chefs license their name to ahousewares product, they are inspiring peopleand connecting to them on a level that cannotbe done with pure product alone. It’s theclassic ‘purchase through story-telling.’ WhenWolfgang Puck, Emeril Lagasse, or MarthaStewart show me a product and explain why it’simportant to them, the product comes to life. Intoday’s society, consumers are hard-pressed tofind a romanticized story behind a product. Celebrities are the hook, the story and thecompelling ingredient that connects a consumerto a product.”
Kathryn Kerrigan Retail Marketing Consultant HFN, 5/12
_________________________________________________________________
RESTAURANT, FOOD & BEVERAGE MARKET RESEARCH HANDBOOK 2013
• 318 •

The following are some other examples of hospitality and business ventures ofthese and other renowned chefs:• In addition to co-ownership of restaurants in New York, Las Vegas, Los Angeles,
and Singapore, chef Mario Batali has authored four cookbooks and is aspokesperson for Crocs footwear.
• Anthony Bourdain, formerly executive chef at Brasserie Les Halles in New York City,has authored several books, including best-selling Kitchen Confidential: Adventuresin the Culinary Underbelly, and hosts Parts Unknown on CNN.
• David Chang, chef-owner of Momofuku Noodle Bar and several other restaurants inNew York City, has co-authored a best-selling cookbook and has served as a guestjudge on Top Chef: All Stars.
• Nobu Matsuhisa, famed sushi chef and business partners with Robert De Niro, hasexpanded beyond his celebrated restaurant concepts to include a boutique hotelwith high-end sushi room service to his portfolio.
• Gordon Ramsay, owner of 24 restaurants around the world, hosts the wildly popularHell’s Kitchen as well as Master Chef.
• Ming Tsai, chef-owner of Blue Ginger, has authored four cookbooks, stars on SimplyMing, which is in its eighth season on public television, and has licensed BlueGinger Multi-Grain Brown Rice Chips to Kellogg’s.
56.4 Chef-Inspired Restaurant ConceptsA few chefs have used their celebrity to develop restaurant concepts across the
country. Wolfgang Puck, credited with starting the concept of chef-branding, nowoperates 27 restaurants. Alain Ducasse and Nobu Matsuhisa each operate ov er 20restaurants. Teaming up with Starwood Hotels and Resorts, Jean GeorgesVongerichten plans to open 50 restaurants by 2014.
The following are the largest chef-branded operations (U.S. operations only):Alain Ducasse (www.alain-ducasse.com)• Brands: Adour at The St. Regis Washington, DC, Benoit New York, Mix in Las
Vegas
Emeril’s Homebase (www.emerils.com)• Brands: Burgers and More by Emeril, Delmonico Steakhouse, e2 emeril’s eatery,
e2Go, Emeril’s Chophouse, Emeril’s Delmonico, Emeril’s Italian Table, Emeril’s NewOrleans, Emeril’s New Orleans Fish House, Emeril’s Orlando, Emeril’s TchoupShop, Lagasse’s Stadium, NOLA Restaurant, Table 10
Jean-Georges Management (www.jean-georges.com)• Brands: ABC Kitchen, J&G Grill, J&G Steakhouse, Jean-Georges, Jean-Georges
Steakhouse, JoJo, Kauai Grill, Market, Nougatine at Jean-Georges, Perry St, Prime
RESTAURANT, FOOD & BEVERAGE MARKET RESEARCH HANDBOOK 2013
• 319 •
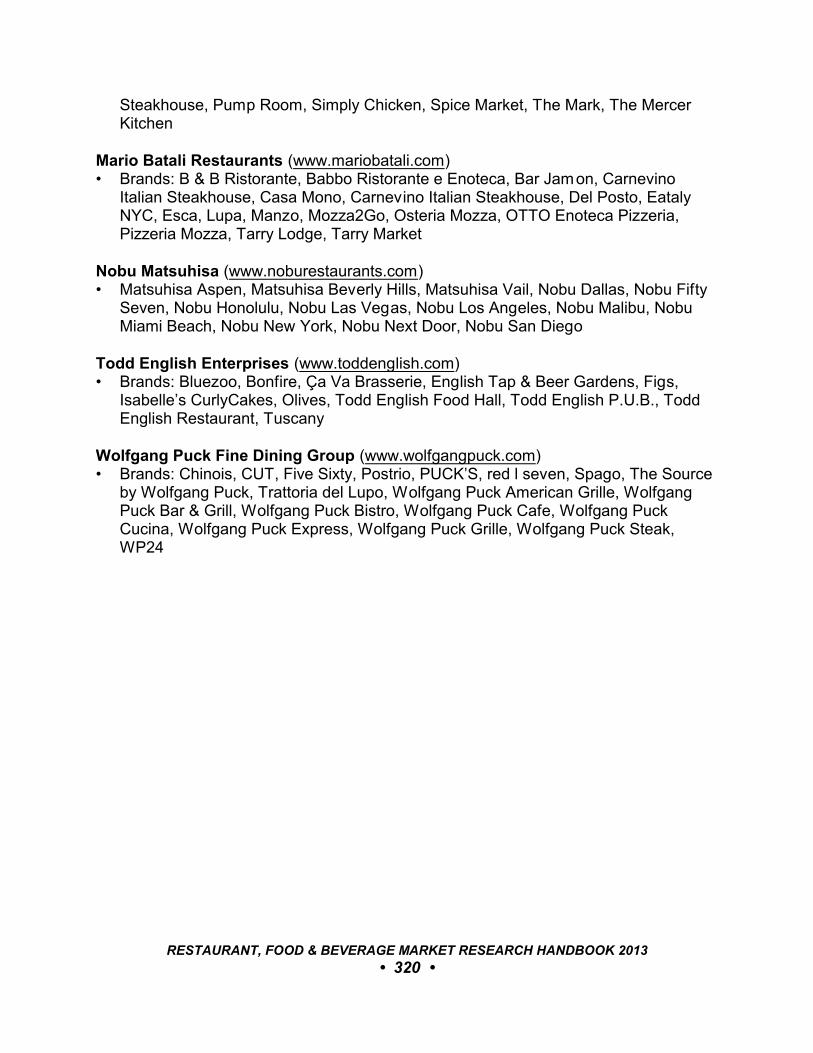
Steakhouse, Pump Room, Simply Chicken, Spice Market, The Mark, The MercerKitchen
Mario Batali Restaurants (www.mariobatali.com)• Brands: B & B Ristorante, Babbo Ristorante e Enoteca, Bar Jamon, Carnevino
Italian Steakhouse, Casa Mono, Carnevino Italian Steakhouse, Del Posto, EatalyNYC, Esca, Lupa, Manzo, Mozza2Go, Osteria Mozza, OTTO Enoteca Pizzeria,Pizzeria Mozza, Tarry Lodge, Tarry Market
Nobu Matsuhisa (www.noburestaurants.com)• Matsuhisa Aspen, Matsuhisa Beverly Hills, Matsuhisa Vail, Nobu Dallas, Nobu Fifty
Seven, Nobu Honolulu, Nobu Las Vegas, Nobu Los Angeles, Nobu Malibu, NobuMiami Beach, Nobu New York, Nobu Next Door, Nobu San Diego
Todd English Enterprises (www.toddenglish.com)• Brands: Bluezoo, Bonfire, Ça Va Brasserie, English Tap & Beer Gardens, Figs,
Isabelle’s CurlyCakes, Olives, Todd English Food Hall, Todd English P.U.B., ToddEnglish Restaurant, Tuscany
Wolfgang Puck Fine Dining Group (www.wolfgangpuck.com)• Brands: Chinois, CUT, Five Sixty, Postrio, PUCK’S, red l seven, Spago, The Source
by Wolfgang Puck, Trattoria del Lupo, Wolfgang Puck American Grille, WolfgangPuck Bar & Grill, Wolfgang Puck Bistro, Wolfgang Puck Cafe, Wolfgang PuckCucina, Wolfgang Puck Express, Wolfgang Puck Grille, Wolfgang Puck Steak,WP24
RESTAURANT, FOOD & BEVERAGE MARKET RESEARCH HANDBOOK 2013
• 320 •
57
CHILDREN’S MEALS
57.1 The Kids LiveWell InitiativeThe National Restaurant Association (www.restaurant.org) launched the Kids
LiveWell initiative in 2011. Nineteen restaurant chains participated in the program’s firstyears, as follows: Au Bon Pain, Bonefish Grill, Burger King, Burgerville, Carrabba’sItalian Grill, Chevys, Chili’s, Corner Bakery Café, Cracker Barrel, Denny’s, El PolloLoco, Friendly’s, IHOP, Joe’s Crab Shack, Outback Steakhouse, Silver Diner, Sizzler,T-Bones Great American Eatery, and zpizza.
At the end of its first year, in July 2012, the Kids LiveWell program boasted morethan 100 participating brands – both chains and independent operators – with morethan 25,000 locations throughout the U.S.
Participating restaurants commit to offering and promoting a variety of menuselections that meet criteria based on leading health organizations’ scientific dietary recommendations, including the USDA Dietary Guidelines. Restaurants must offer afull kids’ meal, including entrèe, side, and beverage, totaling 600 calories or less. Mealsmust contain two or more servings of fruit, vegetables, whole grains, lean protein,and/or low-fat dairy, while restricting unhealthful fats, sugar, and sodium. Also,participating restaurants must provide and promote nutritional information.
57.2 Healthful Kids’ Menus At QSRsAccording to the National Restaurant Association, healthful options in kids’ meals
was the No. 3 trend in the quick-service restaurant (QSR) segment in 2012 and 2013. In 2011 it was the No. 1 trend. Though the interest in healthful meal options forchildren’s fare has reportedly waned, numerous efforts continue to improve thenutritional value of children’s meals.
McDonald’s launched the Happy Meal Choice program in 2004. More recently,McDonald’s added to its kids’ menu a grilled Snack Wrap option that comes with a Fruitn’ Yogurt Parfait with granola and a 16.9-ounce bottle of water. The Happy Meal wasrevised in 2011 to include apple slices and fewer fries.
Subway’s Fresh Fit® meals for kids include a low-fat sandwich, such sides assliced apples and raisins, low-fat milk, yogurt, and juice options, and toy premiumspromoting physical activities.
Burger King introduced Crown Meals for kids in 2011. There are breakfast,hamburger, and chicken tender options, each accompanied by apple juice or fat-free
RESTAURANT, FOOD & BEVERAGE MARKET RESEARCH HANDBOOK 2013
• 321 •
milk and fresh apple slices.Several fast-casual operators, including Tony Roma’s, Olive Garden, and Uno’s
Pizzeria also have revamped their menus.The NPD Group (www.npd.com) found servings of kids’ meals with toys were
down 6% in 2011, from about 1.3 billion servings to 1.2 billion servings.
_________________________________________________________________
“Kids’ meals are losing appeal with both kidsand parents. Dollar menus have given price-conscious parents a powerful incentive tochoose an à la carte burger or fries rather thanpaying for a kids’ meal. In addition, the toysthat come in today’s kids’ meals aren’tcapturing kids’ attention, and children aresimply aging out of the meals earlier as they’rebecoming more technologically savvy.”
Bonnie Riggs, AnalystThe NPD GroupNation Restaurant News, 5/28/12
_________________________________________________________________
Though lures like toys may no longer help to boost sales of kids’ meals, TheNDP Group still sees the renewed focus on menu offerings aimed at childrencontinuing.
57.3 School MealsIn 2011, the U.S. Department of Agriculture published the revised dietary
standards aimed at the approximately 32 million children who eat breakfasts andlunches served at schools. The guidelines are aimed at making meals more nutritious,including increasing the amounts of whole grains, fruits, and vegetables and limiting theamount of sodium, saturated fat, trans fat, and calories per meal.
The School Nutrition Association (www.schoolnutrition.org), a national, non-profitprofessional organization representing 55,000 school nutrition professionals across thecountry, provides the following assessment for cafeteria service at K-12 schools in their2012 Back to School Trends Report:• Cafeterias are serving fruits and vegetables in a variety of ways to appeal to
students’ diverse preferences. In addition to produce offered in the traditionalserving line, over 55% of responding school districts have self-serve salad or
RESTAURANT, FOOD & BEVERAGE MARKET RESEARCH HANDBOOK 2013
• 322 •
produce bars.• More schools are providing convenient grab-and-go options. Nearly 64% of
respondents offer pre-packaged salads, 87% offer whole fruit, and 67% offerpackaged produce, like bags of baby carrots, grapes, and sliced apples thatstudents can eat on the run or toss in their backpacks for later. Many districts arepurchasing produce from local farmers – over 60% of respondents say they willpurchase locally-grown or locally-raised items in the coming school year.
• All respondents are serving whole-grain rich items in their school cafeterias, withnearly every district offering whole-grain breads/rolls/buns. Over 80% of districts areoffering whole-grain pastas, rice, and cereals, and 78% report serving whole-graintortillas, pitas, or flatbreads.
• Schools have also taken steps to make kid favorites into healthy choices. In 42% ofresponding school districts, pizza is the most popular lunch entrèe served, but over92% of districts are serving pizza with a whole-grain rich crust. Districts also reportserving student favorites that are low-sodium, low-fat, and reduced sugar.
• Virtually all respondents (94%) use some method to encourage students to try thesenew menu items, with over 87% employing student taste testing/sampling methods. Districts get students involved in the menu selection process by allowing them totaste test and provide feedback on potential new foods or recipes. Through tastetests, cafeterias gain valuable insight which helps them identify healthy choices thatstudents are interested to eat. And when introducing new menu items, manycafeterias offer students free samples, giving students the chance to taste anunfamiliar food before they commit to selecting that item as part of their meal.
57.4 Market ResourcesSchool Nutrition Association, 120 Waterfront Street, Suite 300, National Harbor, MD20745. (301) 686-3100. (www.schoolnutrition.org)
RESTAURANT, FOOD & BEVERAGE MARKET RESEARCH HANDBOOK 2013
• 323 •

58
CUISINE
58.1 Regional CuisineVirtually every city and state in America has a dish that is its culinary signature.The following are some cuisines and dishes for which states are noted (sources:
USA Today, Go, and various local media sources):• Alabama: Vegetable plate• Alaska: King salmon• Arizona: Chimichanga• Arkansas: Catfish• California: Fresh, seasonal organic vegetables• Colorado: Lamb chops• Connecticut: Whole clam bellies• Delaware: French fries sprinkled with salt and malt vinegar• Florida: Key lime pie, fresh seafood at local fish shacks, Floribbean cuisine• Georgia: Peach cobbler• Hawaii: Grilled mahi-mahi• Idaho: Baked russet potato• Illinois: Corn dogs• Indiana: Perch• Iowa: Grilled pork chops• Kansas: Fried chicken• Kentucky: Corn pudding• Louisiana: Crawfish• Maine: Lobster roll• Maryland: Steamed blue crabs• Massachusetts: New England clam chowder• Michigan: Cherry pies• Minnesota: Walleye• Mississippi: Pecan pie• Missouri: Prime rib• Montana: Rainbow trout• Nebraska: Strip steak• Nevada: All-you-can-eat buffets, celebrity-chef steakhouses• New Hampshire: New England boiled dinner• New Jersey: Diner fare• New Mexico: Enchiladas
RESTAURANT, FOOD & BEVERAGE MARKET RESEARCH HANDBOOK 2013
• 324 •
• New York: Reuben sandwich• North Carolina: Grilled quail• North Dakota: Cinnamon rolls• Ohio: German chocolate cake• Oklahoma: Chicken-fried steak• Oregon: Marionberry cobbler• Pennsylvania: Shoo-fly pie• Rhode Island: Jonnycakes• South Carolina: Shrimp and grits• South Dakota: Buffalo rib-eye steak• Tennessee: Buttermilk biscuits• Texas: Chili con carne; Tex-Mex cuisine• Utah: Brownie chocolate sundae• Vermont: Pancakes and maple syrup• Virginia: Country hams• Washington: Olympia oysters• West Virginia: Ramps (wild onions)• Wisconsin: Grilled bratwurst slathered with brown mustard• Wyoming: Western breakfast
The following are some local specialities (sources: Forbes, Sky Magazine, USAToday, and various local media sources):• Albuquerque, New Mexico: Blue corn enchiladas• Atlanta, Georgia: Pot likker• Boston, Massachusetts: Indian pudding, baked beans, surf & turf tacos, scrod• Buffalo, New York: Buffalo wings• Charleston, South Carolina: Creamy grits• Chicago, Illinois: Italian beef, hot dogs, deep dish pizza• Cincinnati, Ohio: Double-decker sandwich; Cincinnati chili• Dallas, Texas: Barbeque brisket• Kansas City, Missouri: Fried chicken dinner, barbecue• Los Angeles, California: Fish tacos• Louisville, Kentucky: Hot Brown• Memphis, Tennessee: Pork sandwich• Miami, Florida: Stone Crabs, Key Lime pie, Cuban sandwiches• Milwaukee, Wisconsin: Frozen custard• Mobile, Alabama: West Indies salad• Nashville, Tennessee: Ham and red-eye gravy• New Orleans, Louisiana: Oyster loaf, jambalaya, gumbo, crawfish• New York, New York: Pastrami sandwich, pizza, bagels• Philadelphia, Pennsylvania: Cheese steak sandwich• Portland, Oregon: Oyster stew• San Diego, California: Fish tacos• San Francisco, California: Sourdough bread
RESTAURANT, FOOD & BEVERAGE MARKET RESEARCH HANDBOOK 2013
• 325 •
• Seattle, Washington: Salmon• Tampa, Florida: Cubano (Cuban sandwich)• Tucson, Arizona: Chimichanga
According to Nation’s Restaurant News, the following are popular regional flavorprofiles:Midwest• American cheese• Cherry• Corned beef• Italian beef• Italian sausage• Ranch
Northwest• Anchovy• Eggplant• Ginger ale• Iced coffee• Lobster• Mesclun• Parmigiana• Plum tomatoes• Veal• Ziti
South• Catfish• Crawfish• Key lime pie• Pecan• Queso• Sweet tea
West• Avocado• Burrito• Cabbage• Cilantro• Green chile• Latte• Sourdough• Tostada• Zucchini
RESTAURANT, FOOD & BEVERAGE MARKET RESEARCH HANDBOOK 2013
• 326 •
58.2 Ethnic CuisineAccording to Mintel International Group (www.mintel.com), ethnic foods garner
$75 billion annually in the U.S. Italian, Mexican, Chinese, Pan-Asian, and Japanesecuisine were found by Mintel to be the most popular ethnic foods, with 66.6% ofrespondents to a Mintel survey saying authenticity was their top expectation when itcomes to ethnic foods.
A recent survey of consumers by Harris Interactive (www.harrisinteractive.com)asked participants their favorite types of ethnic food. Responses were as follows:• Italian: 28%• Mexican: 24%• Chinese: 22%• Japanese: 7%• Thai: 5%• Indian: 3%• Cajun: 2%• Other: 8%
According to The NPD Group (www.npd.com), the following are the 10 fastest-growing ethnic cuisines listed on restaurant menus:• Cuban• Asian• Shanghai• Tuscan• Mandarin• Mediterranean• Hong Kong• Thai• Japanese• Italian
RESTAURANT, FOOD & BEVERAGE MARKET RESEARCH HANDBOOK 2013
• 327 •
59
CUSTOMER SERVICE
59.1 Ranking Customer PrioritiesThe 2012 National Household Survey, conducted by the National Restaurant
Association (www.restaurant.org), asked adults the attributes most important when theyare choosing a full-service restaurant. Responses were as follows:• Good service: 97%• Enjoyable atmosphere: 93%• Good value: 93%• Favorite items on the menu: 90%• Healthy menu items: 76%• Family- or child-friendly: 68%• Locally souorced food: 64%• Takeout or delivery options: 49%• Food they haven’t tried before: 48%• Organic or environmentally friendly food: 43%
_________________________________________________________________
“Good service still tops the list of restaurantattributes.”
2013 Restaurant Industry Forecast National Restaurant Association, 1/13
_________________________________________________________________
59.2 Customer Service StrategiesJim Sullivan, CEO of Sullivision (www.sullivision.com), suggests the following as
drivers of customer satisfaction at restaurants:• Focus on ROG (return of guest), not ROI. Repeat business is the linchpin of
profitability in any successful foodservice operation.• Make your customers happier by hiring and developing great people. Compete first
for talent, then customers.
RESTAURANT, FOOD & BEVERAGE MARKET RESEARCH HANDBOOK 2013
• 328 •

• When customer service problems recur, look first at the system before you blameyour people.
• Make certain that owners and managers set the right example. Companies do whatthe boss does. When managers walk past a problem, they’ve approved it.
• Sync hiring, training, and marketing to support and exceed guest expectations. Servers must sell all that the kitchen can make and the kitchen must make all thatthe servers can sell.
• Service goals should be budgeted every year along with sales goals.• Have a one-minute post-shift debrief meeting with every team member.
_________________________________________________________________
“In my opinion service is the key deliverablethat distinguishes foodservice from retailoperations. If you buy a laptop at an electronicsstore, you still have a laptop when you gethome, no matter how you were treated by theemployees. But when you go to a restaurant –other than leftovers – what do you have whenyou get home? Memories.”
Jim Sullivan, CEO Sullivision Nation’s Restaurant News, 2/11/13
_________________________________________________________________
59.3 Team ServiceCross-training servers and pairing them up with co-workers has been shown to
result in more effective coverage of tables.
RESTAURANT, FOOD & BEVERAGE MARKET RESEARCH HANDBOOK 2013
• 329 •
_________________________________________________________________
“While the restaurant industry has longadvocated the practice of having one serverinteract exclusively with designated customers,a growing number of casual-dining brands areturning to a team-service model in an effort toboost profitability and heighten the guestexperience.”
Nation’s Restaurant News, 10/1/12 _________________________________________________________________
National chains like Chili’s Grill & Bar, Red Lobster, and Hooters are shif tingaway from the one-server, one-table standard and asking front-of-the-house staffers towork together as a other team.
_________________________________________________________________
“When we first rolled [team service] out we saw adifference of one [percentage] point on the laborline in the P&L, and that was worth $25 million.”
Kelli Valade, Chief Operating Officer Chili’s Grill & Bar Nation’s Restaurant News, 10/1/12
_________________________________________________________________
59.4 Top Restaurants For ServiceWinners of Open Table’s 2012 Diners’ Choice Award for Best Service are
presented in Section 94.3 of this handbook.Zagat (www.zagat.com), a restaurant guidebook and online publisher, released
its 2013 list of the best restaurants for service in February 2013. The list is presented inSection 113.4 of this handbook.
RESTAURANT, FOOD & BEVERAGE MARKET RESEARCH HANDBOOK 2013
• 330 •
60
DAYPARTS
60.1 Daypart Spending and TrafficAccording to Consumer Spending Survey, by the Bureau of Labor Statistics
(www.bls.gov), consumer spending in restaurants by daypart is distributed as follows:• Dinner: 46%• Lunch: 30%• Dining while traveling: 10%• Breakfast: 9%• Snacks: 5%
Distribution of total restaurant traffic, including takeout and delivery, is as follows(sources: The NPD Group [www.npd.com] and Nation’s Restaurant News):• Morning meal: 20%• Lunch: 33%• Dinner: 31%• P.M. snacks: 16%
Assessments of restaurant dining recognize that few people eat the traditionalthree meals each day. Consumers increasingly eat one or two formal meals and snackthroughout the day. This trend is discussed in Chapter 75.
_________________________________________________________________
“The idea of a normal day being breakfast,lunch, and dinner is a myth.”
Ron Paul, PresidentTechnomicUSA Today, 11/22/11
_________________________________________________________________
RESTAURANT, FOOD & BEVERAGE MARKET RESEARCH HANDBOOK 2013
• 331 •
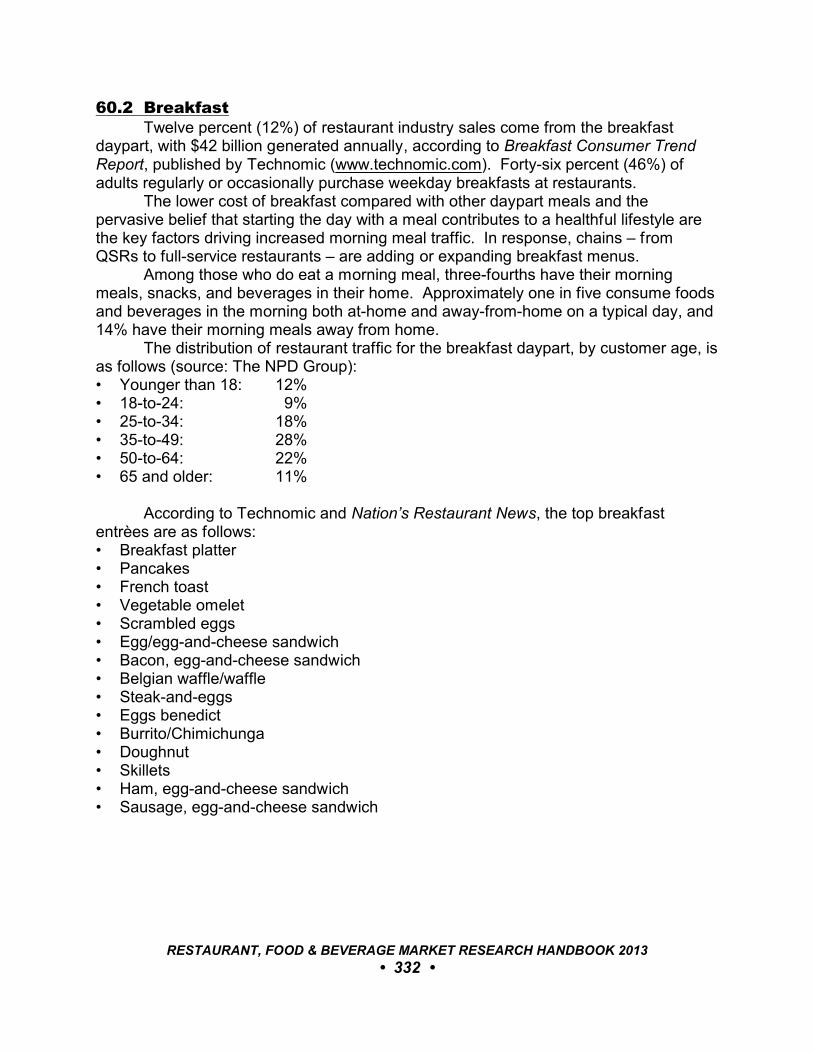
60.2 BreakfastTwelve percent (12%) of restaurant industry sales come from the breakfast
daypart, with $42 billion generated annually, according to Breakfast Consumer TrendReport, published by Technomic (www.technomic.com). Forty-six percent (46%) ofadults regularly or occasionally purchase weekday breakfasts at restaurants.
The lower cost of breakfast compared with other daypart meals and thepervasive belief that starting the day with a meal contributes to a healthful lifestyle arethe key factors driving increased morning meal traffic. In response, chains – fromQSRs to full-service restaurants – are adding or expanding breakfast menus.
Among those who do eat a morning meal, three-fourths have their morningmeals, snacks, and beverages in their home. Approximately one in five consume foodsand beverages in the morning both at-home and away-from-home on a typical day, and14% have their morning meals away from home.
The distribution of restaurant traffic for the breakfast daypart, by customer age, isas follows (source: The NPD Group):• Younger than 18: 12%• 18-to-24: 9%• 25-to-34: 18%• 35-to-49: 28%• 50-to-64: 22%• 65 and older: 11%
According to Technomic and Nation’s Restaurant News, the top breakfastentrèes are as follows:• Breakfast platter• Pancakes• French toast• Vegetable omelet• Scrambled eggs• Egg/egg-and-cheese sandwich• Bacon, egg-and-cheese sandwich• Belgian waffle/waffle• Steak-and-eggs• Eggs benedict• Burrito/Chimichunga• Doughnut• Skillets• Ham, egg-and-cheese sandwich• Sausage, egg-and-cheese sandwich
RESTAURANT, FOOD & BEVERAGE MARKET RESEARCH HANDBOOK 2013
• 332 •
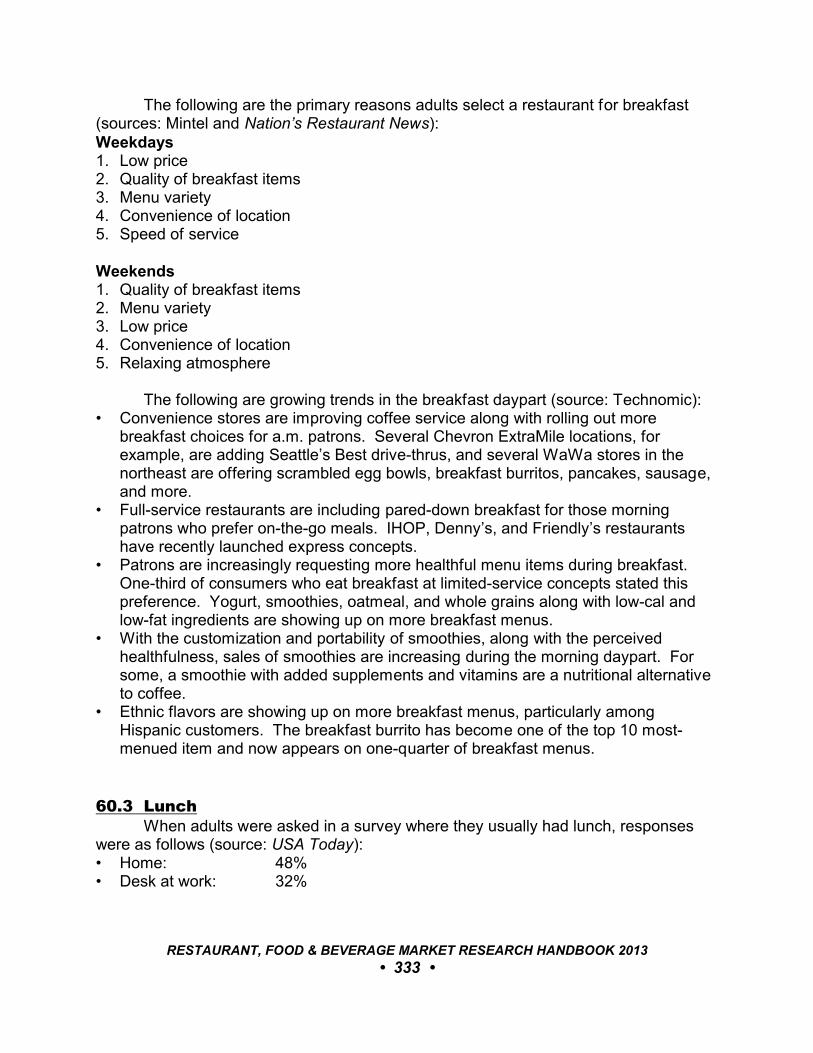
The following are the primary reasons adults select a restaurant for breakfast(sources: Mintel and Nation’s Restaurant News):Weekdays1. Low price2. Quality of breakfast items3. Menu variety4. Convenience of location5. Speed of service
Weekends1. Quality of breakfast items2. Menu variety3. Low price4. Convenience of location5. Relaxing atmosphere
The following are growing trends in the breakfast daypart (source: Technomic):• Convenience stores are improving coffee service along with rolling out more
breakfast choices for a.m. patrons. Several Chevron ExtraMile locations, forexample, are adding Seattle’s Best drive-thrus, and several WaWa stores in thenortheast are offering scrambled egg bowls, breakfast burritos, pancakes, sausage,and more.
• Full-service restaurants are including pared-down breakfast for those morningpatrons who prefer on-the-go meals. IHOP, Denny’s, and Friendly’s restaurantshave recently launched express concepts.
• Patrons are increasingly requesting more healthful menu items during breakfast. One-third of consumers who eat breakfast at limited-service concepts stated thispreference. Yogurt, smoothies, oatmeal, and whole grains along with low-cal andlow-fat ingredients are showing up on more breakfast menus.
• With the customization and portability of smoothies, along with the perceivedhealthfulness, sales of smoothies are increasing during the morning daypart. Forsome, a smoothie with added supplements and vitamins are a nutritional alternativeto coffee.
• Ethnic flavors are showing up on more breakfast menus, particularly amongHispanic customers. The breakfast burrito has become one of the top 10 most-menued item and now appears on one-quarter of breakfast menus.
60.3 LunchWhen adults were asked in a survey where they usually had lunch, responses
were as follows (source: USA Today):• Home: 48%• Desk at work: 32%
RESTAURANT, FOOD & BEVERAGE MARKET RESEARCH HANDBOOK 2013
• 333 •
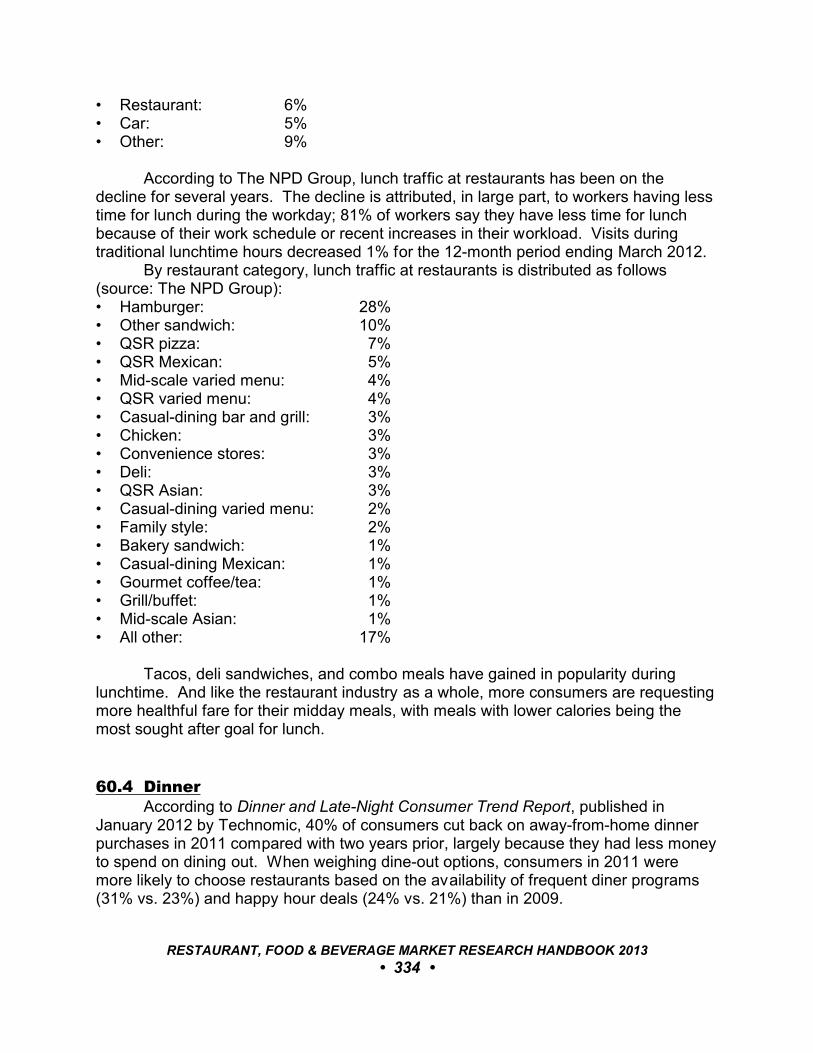
• Restaurant: 6%• Car: 5%• Other: 9%
According to The NPD Group, lunch traffic at restaurants has been on thedecline for several years. The decline is attributed, in large part, to workers having lesstime for lunch during the workday; 81% of workers say they have less time for lunchbecause of their work schedule or recent increases in their workload. Visits duringtraditional lunchtime hours decreased 1% for the 12-month period ending March 2012.
By restaurant category, lunch traffic at restaurants is distributed as follows(source: The NPD Group):• Hamburger: 28%• Other sandwich: 10%• QSR pizza: 7%• QSR Mexican: 5%• Mid-scale varied menu: 4%• QSR varied menu: 4%• Casual-dining bar and grill: 3%• Chicken: 3%• Convenience stores: 3%• Deli: 3%• QSR Asian: 3%• Casual-dining varied menu: 2%• Family style: 2%• Bakery sandwich: 1%• Casual-dining Mexican: 1%• Gourmet coffee/tea: 1%• Grill/buffet: 1%• Mid-scale Asian: 1%• All other: 17%
Tacos, deli sandwiches, and combo meals have gained in popularity duringlunchtime. And like the restaurant industry as a whole, more consumers are requestingmore healthful fare for their midday meals, with meals with lower calories being themost sought after goal for lunch.
60.4 DinnerAccording to Dinner and Late-Night Consumer Trend Report, published in
January 2012 by Technomic, 40% of consumers cut back on away-from-home dinnerpurchases in 2011 compared with two years prior, largely because they had less moneyto spend on dining out. When weighing dine-out options, consumers in 2011 weremore likely to choose restaurants based on the availability of frequent diner programs(31% vs. 23%) and happy hour deals (24% vs. 21%) than in 2009.
RESTAURANT, FOOD & BEVERAGE MARKET RESEARCH HANDBOOK 2013
• 334 •
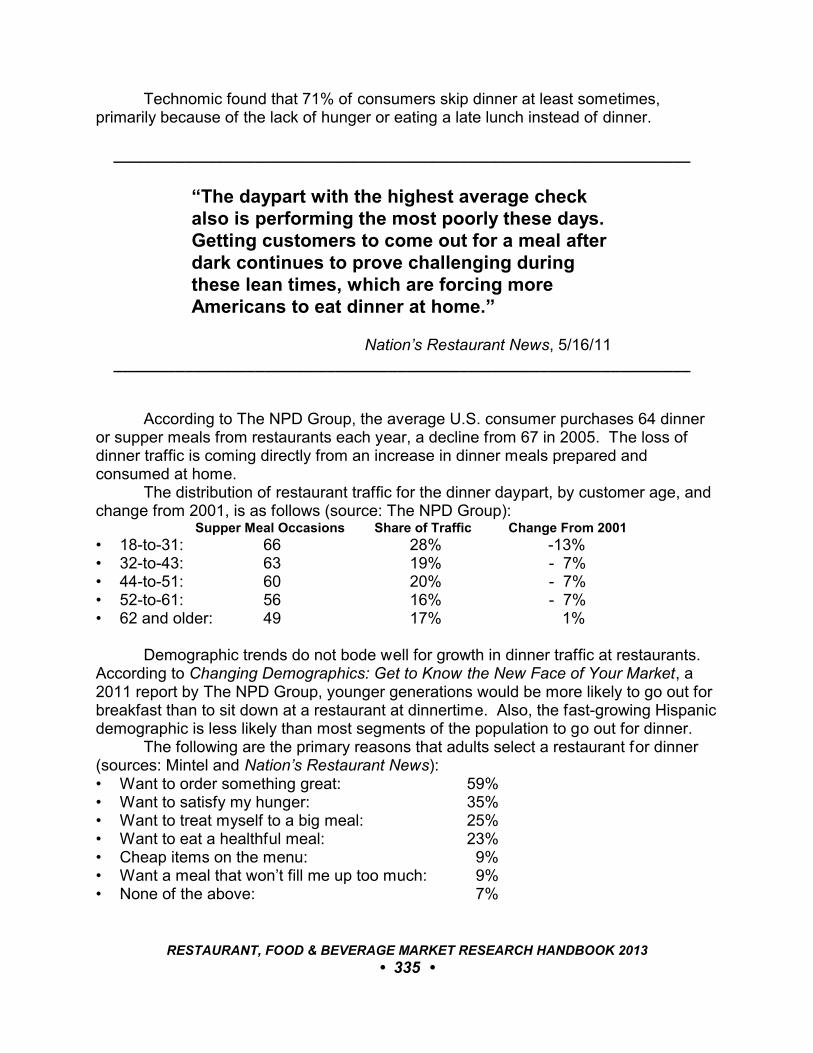
Technomic found that 71% of consumers skip dinner at least sometimes,primarily because of the lack of hunger or eating a late lunch instead of dinner.
_________________________________________________________________
“The daypart with the highest average checkalso is performing the most poorly these days. Getting customers to come out for a meal afterdark continues to prove challenging duringthese lean times, which are forcing moreAmericans to eat dinner at home.”
Nation’s Restaurant News, 5/16/11 _________________________________________________________________
According to The NPD Group, the average U.S. consumer purchases 64 dinneror supper meals from restaurants each year, a decline from 67 in 2005. The loss ofdinner traffic is coming directly from an increase in dinner meals prepared andconsumed at home.
The distribution of restaurant traffic for the dinner daypart, by customer age, andchange from 2001, is as follows (source: The NPD Group):
Supper Meal Occasions Share of Traffic Change From 2001
• 18-to-31: 66 28% -13%• 32-to-43: 63 19% - 7%• 44-to-51: 60 20% - 7%• 52-to-61: 56 16% - 7%• 62 and older: 49 17% 1%
Demographic trends do not bode well for growth in dinner traffic at restaurants. According to Changing Demographics: Get to Know the New Face of Your Market, a2011 report by The NPD Group, younger generations would be more likely to go out forbreakfast than to sit down at a restaurant at dinnertime. Also, the fast-growing Hispanicdemographic is less likely than most segments of the population to go out for dinner.
The following are the primary reasons that adults select a restaurant for dinner(sources: Mintel and Nation’s Restaurant News):• Want to order something great: 59%• Want to satisfy my hunger: 35%• Want to treat myself to a big meal: 25%• Want to eat a healthful meal: 23%• Cheap items on the menu: 9%• Want a meal that won’t fill me up too much: 9%• None of the above: 7%
RESTAURANT, FOOD & BEVERAGE MARKET RESEARCH HANDBOOK 2013
• 335 •
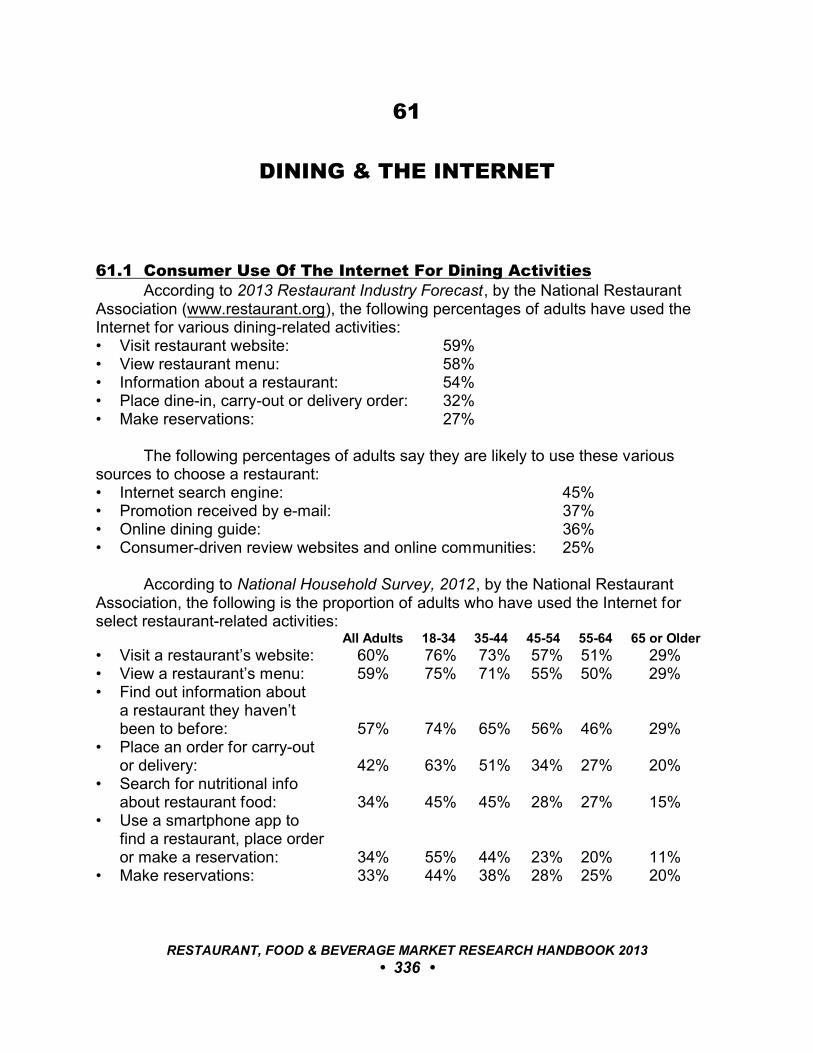
61
DINING & THE INTERNET
61.1 Consumer Use Of The Internet For Dining ActivitiesAccording to 2013 Restaurant Industry Forecast, by the National Restaurant
Association (www.restaurant.org), the following percentages of adults have used theInternet for various dining-related activities:• Visit restaurant website: 59%• View restaurant menu: 58%• Information about a restaurant: 54%• Place dine-in, carry-out or delivery order: 32%• Make reservations: 27%
The following percentages of adults say they are likely to use these varioussources to choose a restaurant:• Internet search engine: 45%• Promotion received by e-mail: 37%• Online dining guide: 36%• Consumer-driven review websites and online communities: 25%
According to National Household Survey, 2012, by the National RestaurantAssociation, the following is the proportion of adults who have used the Internet forselect restaurant-related activities:
All Adults 18-34 35-44 45-54 55-64 65 or Older
• Visit a restaurant’s website: 60% 76% 73% 57% 51% 29% • View a restaurant’s menu: 59% 75% 71% 55% 50% 29%• Find out information about
a restaurant they haven’tbeen to before: 57% 74% 65% 56% 46% 29%
• Place an order for carry-outor delivery: 42% 63% 51% 34% 27% 20%
• Search for nutritional infoabout restaurant food: 34% 45% 45% 28% 27% 15%
• Use a smartphone app tofind a restaurant, place orderor make a reservation: 34% 55% 44% 23% 20% 11%
• Make reservations: 33% 44% 38% 28% 25% 20%
RESTAURANT, FOOD & BEVERAGE MARKET RESEARCH HANDBOOK 2013
• 336 •
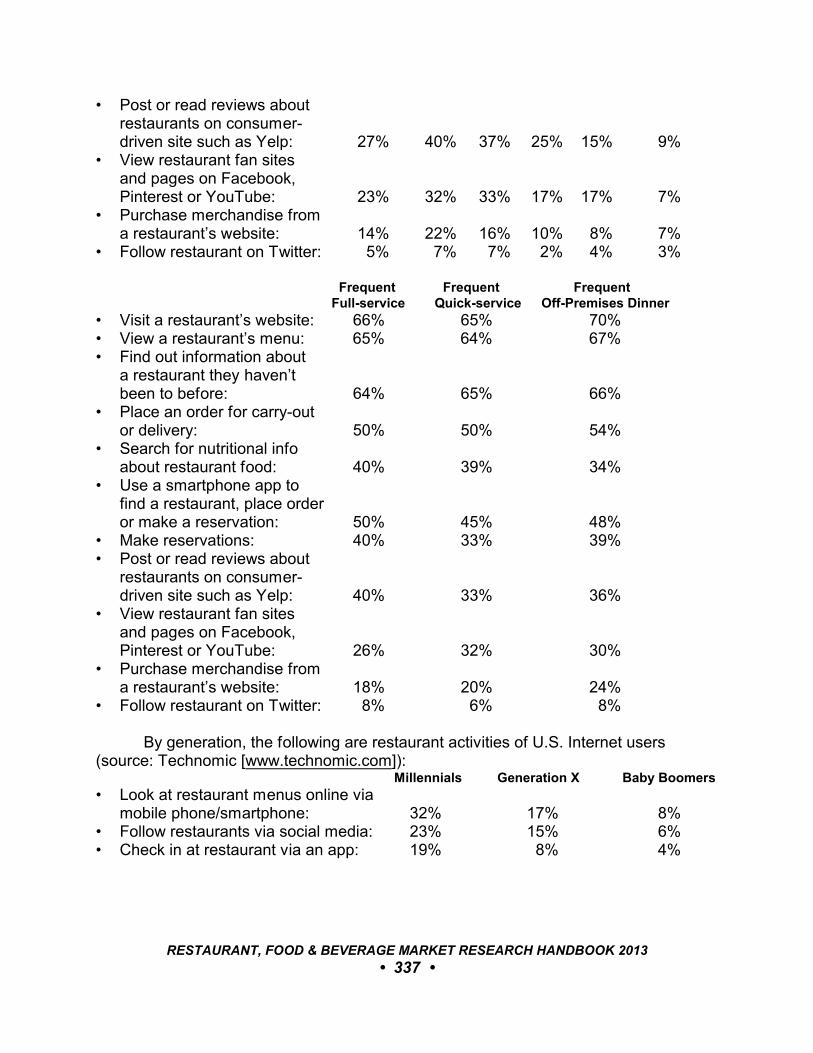
• Post or read reviews aboutrestaurants on consumer-driven site such as Yelp: 27% 40% 37% 25% 15% 9%
• View restaurant fan sitesand pages on Facebook,Pinterest or YouTube: 23% 32% 33% 17% 17% 7%
• Purchase merchandise froma restaurant’s website: 14% 22% 16% 10% 8% 7%
• Follow restaurant on Twitter: 5% 7% 7% 2% 4% 3%
Frequent Frequent Frequent Full-service Quick-service Off-Premises Dinner
• Visit a restaurant’s website: 66% 65% 70% • View a restaurant’s menu: 65% 64% 67%• Find out information about
a restaurant they haven’tbeen to before: 64% 65% 66%
• Place an order for carry-outor delivery: 50% 50% 54%
• Search for nutritional infoabout restaurant food: 40% 39% 34%
• Use a smartphone app tofind a restaurant, place orderor make a reservation: 50% 45% 48%
• Make reservations: 40% 33% 39%• Post or read reviews about
restaurants on consumer-driven site such as Yelp: 40% 33% 36%
• View restaurant fan sitesand pages on Facebook,Pinterest or YouTube: 26% 32% 30%
• Purchase merchandise froma restaurant’s website: 18% 20% 24%
• Follow restaurant on Twitter: 8% 6% 8%
By generation, the following are restaurant activities of U.S. Internet users(source: Technomic [www.technomic.com]):
Millennials Generation X Baby Boomers
• Look at restaurant menus online viamobile phone/smartphone: 32% 17% 8%
• Follow restaurants via social media: 23% 15% 6%• Check in at restaurant via an app: 19% 8% 4%
RESTAURANT, FOOD & BEVERAGE MARKET RESEARCH HANDBOOK 2013
• 337 •
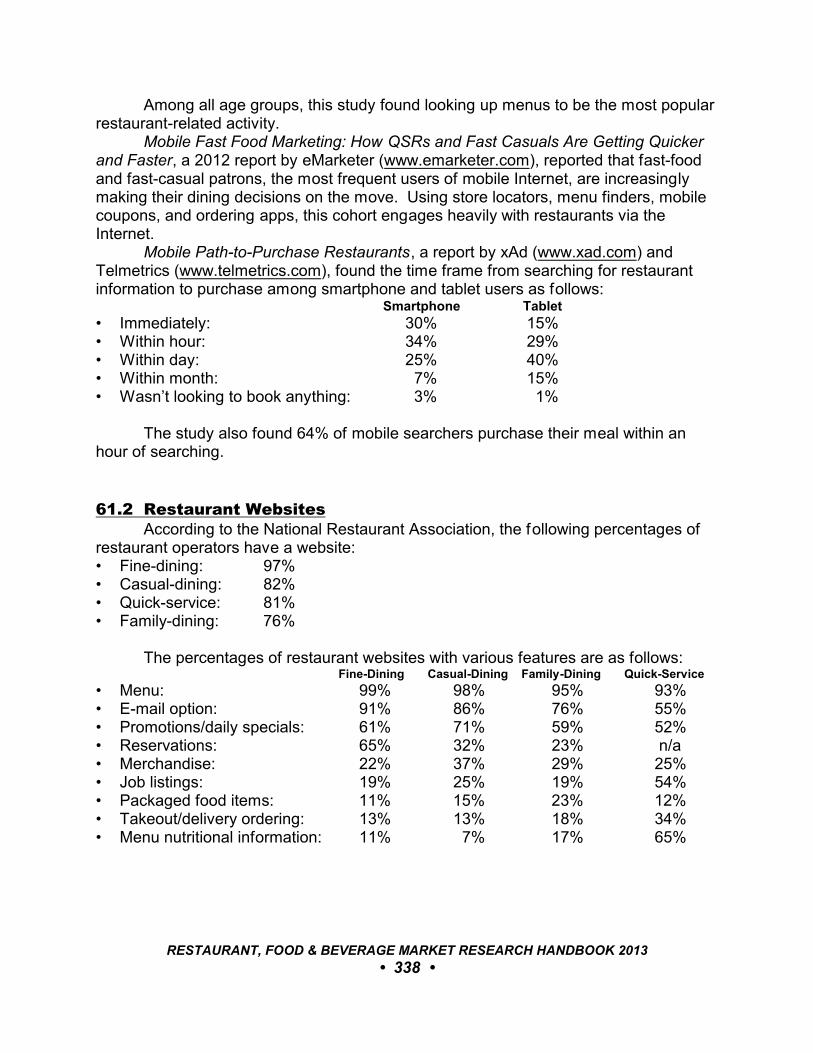
Among all age groups, this study found looking up menus to be the most popularrestaurant-related activity.
Mobile Fast Food Marketing: How QSRs and Fast Casuals Are Getting Quickerand Faster, a 2012 report by eMarketer (www.emarketer.com), reported that fast-foodand fast-casual patrons, the most frequent users of mobile Internet, are increasinglymaking their dining decisions on the move. Using store locators, menu finders, mobilecoupons, and ordering apps, this cohort engages heavily with restaurants via theInternet.
Mobile Path-to-Purchase Restaurants, a report by xAd (www.xad.com) andTelmetrics (www.telmetrics.com), found the time frame from searching for restaurantinformation to purchase among smartphone and tablet users as follows:
Smartphone Tablet
• Immediately: 30% 15%• Within hour: 34% 29%• Within day: 25% 40%• Within month: 7% 15%• Wasn’t looking to book anything: 3% 1%
The study also found 64% of mobile searchers purchase their meal within anhour of searching.
61.2 Restaurant WebsitesAccording to the National Restaurant Association, the following percentages of
restaurant operators have a website:• Fine-dining: 97%• Casual-dining: 82%• Quick-service: 81%• Family-dining: 76%
The percentages of restaurant websites with various features are as follows: Fine-Dining Casual-Dining Family-Dining Quick-Service
• Menu: 99% 98% 95% 93%• E-mail option: 91% 86% 76% 55%• Promotions/daily specials: 61% 71% 59% 52%• Reservations: 65% 32% 23% n/a• Merchandise: 22% 37% 29% 25%• Job listings: 19% 25% 19% 54%• Packaged food items: 11% 15% 23% 12%• Takeout/delivery ordering: 13% 13% 18% 34%• Menu nutritional information: 11% 7% 17% 65%
RESTAURANT, FOOD & BEVERAGE MARKET RESEARCH HANDBOOK 2013
• 338 •
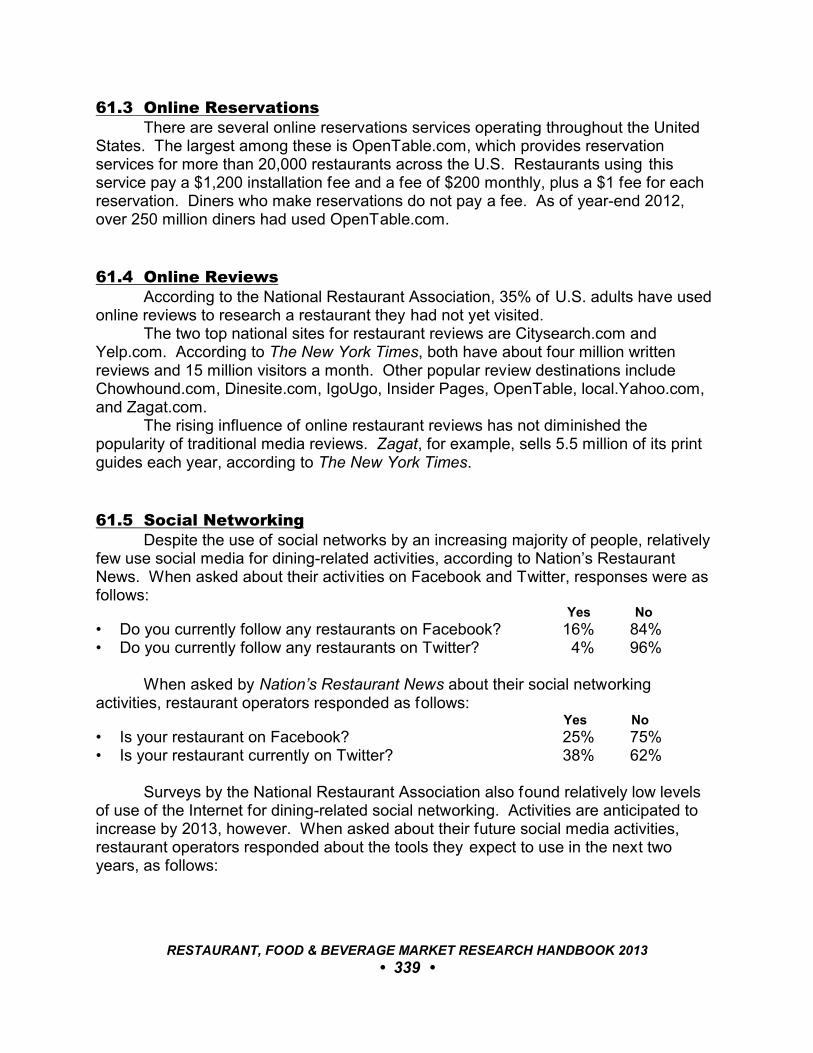
61.3 Online ReservationsThere are several online reservations services operating throughout the United
States. The largest among these is OpenTable.com, which provides reservationservices for more than 20,000 restaurants across the U.S. Restaurants using thisservice pay a $1,200 installation fee and a fee of $200 monthly, plus a $1 fee for eachreservation. Diners who make reservations do not pay a fee. As of year-end 2012,over 250 million diners had used OpenTable.com.
61.4 Online ReviewsAccording to the National Restaurant Association, 35% of U.S. adults have used
online reviews to research a restaurant they had not yet visited. The two top national sites for restaurant reviews are Citysearch.com and
Yelp.com. According to The New York Times, both have about four million writtenreviews and 15 million visitors a month. Other popular review destinations includeChowhound.com, Dinesite.com, IgoUgo, Insider Pages, OpenTable, local.Yahoo.com,and Zagat.com.
The rising influence of online restaurant reviews has not diminished thepopularity of traditional media reviews. Zagat, for example, sells 5.5 million of its printguides each year, according to The New York Times.
61.5 Social NetworkingDespite the use of social networks by an increasing majority of people, relatively
few use social media for dining-related activities, according to Nation’s RestaurantNews. When asked about their activities on Facebook and Twitter, responses were asfollows:
Yes No
• Do you currently follow any restaurants on Facebook? 16% 84%• Do you currently follow any restaurants on Twitter? 4% 96%
When asked by Nation’s Restaurant News about their social networkingactivities, restaurant operators responded as follows:
Yes No
• Is your restaurant on Facebook? 25% 75%• Is your restaurant currently on Twitter? 38% 62%
Surveys by the National Restaurant Association also found relatively low levelsof use of the Internet for dining-related social networking. Activities are anticipated toincrease by 2013, however. When asked about their future social media activities,restaurant operators responded about the tools they expect to use in the next twoyears, as follows:
RESTAURANT, FOOD & BEVERAGE MARKET RESEARCH HANDBOOK 2013
• 339 •

Fine-Dining Casual-Dining Family-Dining Quick-Service
• Facebook: 84% 80% 74% 80%• Online review sites (Yelp, etc.): 70% 62% 61% 56%• Twitter: 63% 60% 51% 69%• Restaurant blog: 62% 44% 45% 51%• Phone apps like Urban Spoon: 54% 47% 37% 47%• YouTube/other video sharing sites: 45% 40% 44% 50%• Text messaging: 36% 46% 38% 64%• Flickr/other photo-sharing sites: 42% 32% 39% 41%
_________________________________________________________________
“Digital marketing is a good way to drive first-time visits. It can be used to shape opinionsabout a brand, then drive repeat business. Social media generates trial.”
Bonnie Riggs, Analyst The NPD Group Nation’s Restaurant News, 2/20/12
_________________________________________________________________
61.6 Online OrderingAccording to a survey by Prof. Sheryl E. Kimes at the School of Hotel
Administration at Cornell University, 48% of adults have ordered meals online, eitherthrough websites, text messaging, or mobile apps. The percentages of those who havedone so are as follows:Gender• Female: 52%• Male: 45%
Age• 18-to-24: 70%• 25-to-34: 78%• 35-to-49: 55%• 50-to-64: 33%• 65 and older: 21%
RESTAURANT, FOOD & BEVERAGE MARKET RESEARCH HANDBOOK 2013
• 340 •
Locale• Urban: 60%• Suburban: 49%• Small town: 36%• Rural: 41%
Cornell University researchers found that 27% of restaurants offering takeout,delivery, or catered meals support online ordering. Among those offering the option,89% said their systems provided incremental business increases, improved service, orboth.
61.7 In-Restaurant Ordering Via TabletA few restaurants are letting dining-room customers place orders using a tablet
computer. One example is California-based Stacked: Food Well Built, which hasplaced iPads on tables at each of its three locations. Diners use the tablet devices tolook at meal options, order, and pay for meals. The devices rest inside metal framesthat sit about 3-inches off the tabletops. Customers ordering burgers select the type ofbun, meat, and toppings on the iPad by clicking and dragging icons. Pizzas and saladsmay also be ordered using the devices.
Restaurants located near Delta Air Lines gates at New York’s John F. Kennedyand LaGuardia airports installed iPads at tables to allow guests to custom-order meals.
Bone’s Restaurant (Atlanta) uses iPads to present its wine list; wine salesincreased 20% during the first six months following introduction of the concept.
RESTAURANT, FOOD & BEVERAGE MARKET RESEARCH HANDBOOK 2013
• 341 •

62
DINING WHILE TRAVELING
62.1 Traveler Dining2012 Restaurant Trends Survey, by the National Restaurant Association
(www.restaurant.org), reports that travelers and tourists represent an average of 29% ofsales for fine-dining operators, approximately 25% of sales for family-dining and casual-dining operators, 19% of sales for quick-service operators, and 15% of sales for fast-casual operators.
According to a survey by Experian Simmons (www.smrb.com), 18% of adults saythat they “try to eat gourmet food whenever they can;” 31% of these consumers“strongly” agree with the statement. Travel provides the opportunity for those who enjoygourmet dining to experience new cuisine.
According to Portrait of Affluent Travelers, a report by Ypartnership(www.mmgyglobal.com), 85% of luxury travelers want dining in new and differentrestaurants as part of their travel experience. This ranked highest among all travelactivities among the affluent, ahead of shopping, gambling, cultural activities,museums, and spas.
62.2 Culinary DestinationsAccording to the U.S. Travel Association (USTA, www.ustravel.org), the top
destinations for food-related travel are as follows:• California• Florida• New York• Texas• North Carolina• Georgia
The top destinations for wine-related travel are as follows:• California• New York• Missouri• North Carolina• Oregon• Pennsylvania
RESTAURANT, FOOD & BEVERAGE MARKET RESEARCH HANDBOOK 2013
• 342 •

62.3 Sampling ToursCombining culinary interests with walking tours, sampling tours have become an
increasingly popular tourist activity in New Orleans, Seattle, and New York, amongother cities.
In the city where Creole cuisine – proclaimed to be the country’s only trueregional cuisine – originated, New Orleans Culinary History Tours(www.noculinarytours.com) offers daily walking tours. Stops on the tour include severalhistoric restaurants, including the two oldest in the city: Antoine’s and Tujague’s,established in 1840 and 1856, respectively.
The concept has also caught on in Seattle. Savor Seattle Tours(www.savorseattletours.com) offers walking tours that stop at select restaurants andfarmers’ booths for demonstrations, informative talks, and tastings at the famed PikePlace Market. Seattle Food Tours (www.seattlefoodtours.com) offers cultural and foodtours of both Pike Place Market and the Belltown neighborhood.
In South Florida, Miami Culinary Tours (www.miamiculinarytours.com) offers theCuba Bonita Tour, with visits to Little Havana and Key Biscayne for a variety of classicCuban dishes and drinks.
In Baltimore, Charm City Food Tours (www.charmcityfoodtours.com) hostsculinary tours of four neighborhoods: Federal Hill, Fells Point, Little Italy/Jonestown, andMount Vernon.
Walking tours focusing on New York City’s diverse ethnic and local cuisine havebecome popular. The following are three of the more popular tours:• Savory Sojourns (www.savorysojourns.com) hosts tours throughout Manhattan that
include visits to the city’s myriad specialty food shops and indoor markets. Thegroup also takes visitors on ethnic food tours through such neighborhoods asChinatown, Little Italy, and Atlantic Avenue, also known as ‘Little Arabia.’
• New York Chocolate Tours (www.sweetwalks.com), hosted by Carmen Botez, editorof an online magazine, charges visitors $70 for a tasting tour of the city’s high-endsweets shops.
• Foods of New York Tours (www.foodsofny.com) offers tours of shops andrestaurants in Chelsea Market, Chinatown, and Greenwich Village. According toThe News & Observer, annual ticket sales total more than 20,000 and areincreasing at about 30% per year.
62.4 Culinary Arts ProgramsBesides their curricula for students seeking careers in the field, several U.S.
cooking schools have programs specially designed for tourists as well as locals wantingto sharpen their culinary skills. One such is Johnson & Wales University(www.jwu.edu), with its Chefs Choice® classes at its Providence, Rhode Island; NorthMiami, Florida; Denver, Colorado; and Charlotte, North Carolina, campuses.
RESTAURANT, FOOD & BEVERAGE MARKET RESEARCH HANDBOOK 2013
• 343 •
Harrah’s Resort in Atlantic City, New Jersey, offers visitors the opportunity tofine-tune cooking skills at The Viking Cooking School. Students prepare gourmetdishes during the classes, which are offered for 90 minutes or three hours.
The Creative Cooking School (www.creativecookingschool.com) in Las Vegas,Nevada, offers four-day classes that teach the techniques of sautéing, stir-frying,roasting, grilling, and pan-frying. Participants learn how to prepare romantic dinners,spruce-up recipe staples, and create dessert treats like chocolate decadence souf flé.
The Culinary Institute of America (www.ciachef.edu) offers two- to five-daysessions at its Hyde Park, New York, campus. The basic program covers stocks,sauces, and sautéing; the pastry course tackles delicacies from buttercreams to crèmeanglaise; and baking courses focus on recipes from sourdough starters to scones. Atthe school’s campus in St. Helena, California, novices can take a variety of food andwine courses.
The following are other prominent cooking schools, all of which offer both chefdemonstrations and hands-on classes:• New Orleans Cooking Experience (New Orleans, LA;
www.neworleanscookingexperience.com)• Relish Culinary Adventure (Healdsburg, CA; www.relishculinary.com)• The French Pastry School (Chicago, IL; www.frenchpastryschool.com)• The Institute of Culinary Education (New York, NY; (www.iceculinary.com)• Woodlands Resort & Inn (Summerville, SC; www.woodlandsinn.com)
Select cruise lines also offer culinary activities. Crystal Cruises, for example,started its guest chef program on world cruises in the early 1990s and has sinceexpanded to more than a dozen itineraries. In addition to the sure-fire appeal of thecooking demonstrations and tastings by celebrated chefs, the line sees it as aneducational tool for its own chefs. Adding a winemaker or sommelier boosts winesales.
62.5 Winery ToursSonoma and Napa Valley, California, particularly the wineries, are primary tourist
destinations, garnering five million visitors annually. Approximately an hour north ofSan Francisco, the heart of California’s $35 billion wine industry offers many touroptions. Along with the opportunity to learn about the art of winemaking, wineries in theregion offer breathtaking views, outdoor music, and other attractions. The following is asampling:• A tour of Gloria Ferrer winery (www.gloriaferrer.com) takes visitors deep into the
caves carved out of the hillside and educates them on the process of sparklingwinemaking. Each summer the winery hosts its Catalan Festival – a two-daycelebration honoring the owners’ Spanish roots.
RESTAURANT, FOOD & BEVERAGE MARKET RESEARCH HANDBOOK 2013
• 344 •
• Gundlach Bundschu (www.gunbun.com) has transformed the winery experience intomuch more. In the spring and summer the winery hosts a myriad of activities thatinclude a Shakespeare festival, movies under the stars, and classical musicconcerts.
• Along with the tasting room for award-winning wines, the Rubicon Estate(www.rubiconestate.com) includes the Centennial Museum, with displays of moviememorabilia including Francis Ford Coppola’s five Oscar statues.
• St. Supery Vineyards and Winery (www.stsupery.com) offers a one-day HarvestAdventure. Groups of up to 12 pick grapes, stomp them with their feet, and tastejuices as they ferment. A blending seminar concludes the experience.
• Viansa Winery & Italian Marketplace (www.viansa.com) includes a 90-acrewaterfowl preserve. In the summer months the winery hosts barbecues and livemusic.
Winery-themed tourism is not exclusive to California; all 50 states have at leastone winery. Most wineries have gift shops and offer wine tasting for visitors. A few aredestinations for business meetings and leisure tourists. Château Élan Winery & Resort(www.chateauelanatlanta.com), 40 minutes north of Atlanta, for example, has aconference center, spa, two championship golf courses, classic French fine-dining, andan Irish pub in addition to winery tours.
In New York state, the Finger Lakes and Long Island areas are prominentviticultural regions. The Hudson Valley, 90 miles north of New York City, is home toBenmarl Winery, in Marlboro, the country’s oldest commercial winery and the oldestcontinuously farmed vineyard, dating to 1772.
Prohibition nearly wiped out Texas’s wine industry, but it re-emerged in the1970s and now offers 163 wineries in four regions. The prime sectors, because of theirclimate and proximity to Austin, are the Texas Hill Country American Viticultural Areaand, within that, the 110-square-mile American Viticultural Area of Fredericksburg. About 30 wineries are located within them – as are many of the state’s best BBQrestaurants.
Fifty-six wineries are spread across Michigan along four wine trails, but most ofthe best grapes are grown near the eastern shore of Lake Michigan and its bays. Topwineries are positioning themselves as small but key players in the Rieslingrenaissance that is taking hold across the country, and nearly one million visitorssampled the offerings in 2012. The most popular wine region, because of its primesetting along Lake Michigan, is the Leelanau Peninsula, home to about 20 wineries, 16 of which have public tasting rooms.
62.6 American Whiskey TrailThe Distilled Spirits Council of the United States has developed the American
Whiskey Trail (www.discus.org/trail) in conjunction with several distillers and historicsites in Virginia, Kentucky, and Tennessee. The trail is a heritage route tracing thehistory of spirits in America, from the colonial era, where whiskey had an important
RESTAURANT, FOOD & BEVERAGE MARKET RESEARCH HANDBOOK 2013
• 345 •
economic and social function in the fabric of the community, to the Whiskey Rebellion,through prohibition, and into modern times.
Participating distillers include Buffalo Trace (Franklin County, KY), George Dickel(Tullahoma, TN), Jack Daniel’s (Lynchburg, TN), Jim Beam Distillery (Clermont, KY),Maker’s Mark (Loretto, KY), Wild Turkey (Lawrenceburg, KY), and Woodford Reserve(Versailles, KY). The gateway to the American Whiskey Trail is George Washington’sDistillery at Historic Mount Vernon.
RESTAURANT, FOOD & BEVERAGE MARKET RESEARCH HANDBOOK 2013
• 346 •
63
DINING WITH ENTERTAINMENT
63.1 OverviewCombining entertainment with dining is not new, yet the popularity of jazz clubs
and other types of restaurants that offer music and entertainment with dining is asstrong as ever. Dinner theaters and comedy clubs also remain popular ‘eatertainment’destinations.
_________________________________________________________________
“As the industry continues to get morecompetitive, entertainment really does becomea differentiating component.”
Hudson Riehle, Sr. V.P. Research National Restaurant Association
_________________________________________________________________
The restaurant and entertainment sectors were among the business segmentshardest hit during the economic downturn. Consumers have experienced ‘frugalityfatigue,’ as Ron Paul, President of Technomic (www.technomic.com), calls thephenomena, and many are resuming their spending at restaurants that offer fun alongwith an enjoyable dining experience.
_________________________________________________________________
“The whole ‘eatertainment’ thing is comingback. It’s back with a slightly older customerthat wants quality cocktails and food.”
Chris Tripoli, President A’La Carte Foodservice Consulting Group Nation’s Restaurant News, 3/21/11
_________________________________________________________________
RESTAURANT, FOOD & BEVERAGE MARKET RESEARCH HANDBOOK 2013
• 347 •
63.2 Live Music and DiningRestaurants featuring all varieties of live music are popular across the country.
Two chains operate music venues with restaurants, as follows:• House of Blues (www.hob.com) is a home for live music and southern-inspired
cuisine in an environment celebrating the African-American cultural contributions ofblues music and folk art. The first location opened in 1992. There are nowclubs/restaurants in Anaheim, Atlantic City, Boston, Chicago, Cleveland, Dallas,Houston, Las Vegas, Myrtle Beach, New Orleans, Orlando, San Diego, and WestHollywood.
• Hard Rock Live (www.hardrock.com) has locations in Hollywood (Florida), Orlando,and Mexico City.
The following are some of the top jazz clubs across the U.S. noted for theircuisine:• Baker’s Keyboard Lounge (Detroit, MI; http://theofficialbakerskeyboardlounge.com)• Birdland (New York, NY; www.birdlandjazz.com)• Blue Note (New York, NY; www.bluenotejazz.com)• Blues Alley (Washington, DC; www.bluesalley.com)• Catalina Bar & Grill (Los Angeles, CA; www.catalinajazzclub.com)• Dakota Jazz Club & Restaurant (Saint Paul, MN; www.dakotacooks.com)• Dimitriou’s Jazz Alley (Seattle, WA; www.jazzalley.com)• Iridium (New York, NY; www.iridiumjazzclub.com)• Snug Harbor Jazz Bistro (New Orleans, LA; www.snugjazz.com)• Tula’s (Seattle, WA; www.tulas.com)• Yoshi’s at Jack London Square (San Francisco, CA; www.yoshis.com)
63.3 Theme RestaurantsTheme restaurants, primarily Hard Rock Cafe and Planet Hollywood, were the
rage of the early 1990s. As with most hot trends, interest shifted and the themerestaurant segment began to fade. Theme restaurants that have survived have doneso by finding their own niche in the market and by placing a priority on their food quality.
Both Hard Rock Cafe and Planet Hollywood have survived by downsizing,changing with the times, and capitalizing on international appeal. And both have usedtheir brand reputation to expand into the casino market.
Hard Rock, founded in 1971, now has 138 locations in 42 countries; only 42 arelocated in the United States. There are four Hard Rock casinos, in Las Vegas, Florida,and Mississippi. The Seminole Tribe of Florida owns the chain.
Planet Hollywood has downsized to five U.S. units – Honolulu, New York City,Niagara Falls, Las Vegas, and Orlando – and 12 international restaurants.
The tropical jungle-themed Rainforest Cafe, developed by Steve Schussler and
RESTAURANT, FOOD & BEVERAGE MARKET RESEARCH HANDBOOK 2013
• 348 •
launched in 1994, was sold to Landry’s Restaurants in 2000. Today, Landry’s operates25 Rainforest Cafes in the United States and nine abroad, with average unit volumes of$8.5 million, according to the company.
Mr. Schussler also developed the vision for the dinosaur-themed T-Rex, inKansas City, and Yak & Yeti, an Asian-theme concept which opened in 2008 inDisney’s Animal Kingdom. Both T-Rex and Yak & Yeti are also owned by Landry’s.
One of the most successful theme restaurant concepts is 32-year-old Chuck E.Cheese’s (www.chuckecheese.com). The child-friendly pizza chain has more than 500locations.
The following are other theme restaurants operating across the United States:• At Harley-Davidson Cafe (Las Vegas, NV; www.harley-davidsoncafe.com), a giant
three-dimensional sculpture of a Harley-Davidson motorcycle is integrated into thestructure to appear as if it is bursting out of the northwest corner of the building. Onthe Las Vegas Strip, where land values are estimated at $13 million an acre, theHarley-Davidson Cafe is the last remaining freestanding restaurant; all others areaffiliated with hotel casinos.
• NASCAR Sports Grill (Hampton, VA and Orlando, FL; www.nascarsportsgrill.com), a gathering place for racing fans, combines memorabilia, a 37-foot media wall with
plasma screens and audio, and dining.• Country music star Toby Keith has three branded Toby Keith’s I Love This Bar &
Grill (www.tobykeithsbar.com) restaurants, which display the singer’s musicmemorabilia and host concerts. Locations are Oklahoma City, Thackerville, andTulsa, Oklahoma.
63.4 Experiential RestaurantsSome restaurants provide an entertainment experience with the meal. The
following are some notable examples:• Dave & Buster’s (www.daveandbusters.com) combines dining with the largest chain
of amusement arcades in the country. The concept was launched in the late 1970sin Little Rock, Arkansas, when two side-by-side establishments, Slick Willy’s Worldof Entertainment and Buster’s Bar & Grill, combined operations. The are now 68locations.
• Dinner in the Sky (www.dinnerinthesky.com) hoists up to 22 guests on a platform 18stories above the ground for dinner. The experience is offered in Las Vegas, NewYork City, and Seminole Casino Coconut Creek (Florida), plus several cities in 31countries.
• The decor of Jekyll & Hyde (New York City, www.jekyllpub.com) includes gargoylesand coffins. The ghoulish entertainment includes live skits, animatronics, andinteractive puppets.
• Medieval Times (www.medievaltimes.com) is a nine-unit chain with restaurants setinside a faux 11th century castle. Guests experience all of the feasting, pagentry,tournament games, and exciting sword fights that characterized the best of life amillennia ago. Locations are in Atlanta, Georgia; Buena Park, California; Dallas
RESTAURANT, FOOD & BEVERAGE MARKET RESEARCH HANDBOOK 2013
• 349 •
Texas; Chicago, Illinois; Hanover, Maryland; Kissimmee, Florida; Lyndhurst, NewJersey; Myrtle Beach, South Carolina, and Toronto, Ontario.
• Dining at Opaque - Dining in the Dark (West Hollywood, CA, www.darkdining.com)is precisely what the name implies. Customers are led into a pitch-black diningroom where they dine on a three-course meal, relying on their other four sensesduring the experience. The waiters are legally blind. Launched in 2005 as aSaturday-only concept, dining expanded to include Friday evenings. Locations haveopened in San Diego, San Francisco, Dallas, and New York.
63.5 Mystery Dinner TheatersThere are approximately 200 mystery dinner theaters across the U.S.; the
Orlando area alone has six. The following are some of the more prominent mysterydinner theaters:• Agatha’s A Taste of Mystery (Atlanta, GA; www.agathas.com)• Bistro Romano Mystery Theatre (Philadelphia, PA; www.bistroromano.com)• Haunted Dinner Theater (Williamsburg, VA; www.haunteddinnertheater.com)• Murder by Chocolate (Houston, TX; www.murderbychocolate.com)• Murder Mystery Train (Lansing, MI and Toledo, OH; www.murdermysterytrain.com)• Mystery Cafe (Boston, MA; www.mysterycafe.com)• Seminole Dinner Mystery Train (Ft. Myers, FL; www.semgulf.com)• Sleuths Mystery Dinner Show (Orlando, FL; www.sleuths.com)• The Dinner Detective (11 locations in California, Colorado, Illinois, and Texas;
www.thedinnerdetective.com)
63.6 Dinner and a MovieAttendance at movie cinemas has been on the decline since 2002, largely
because of increased competition from digital downloads, video on demand, and DVDrent-by-mail; combined with increasingly theater-like home-entertainment technology. Hoping to lure moviegoers back to the cinema, several new ventures put a new spin onthe ‘dinner and a movie’ concept, offering a combination of reserved seating, alcoholicbeverage service, made-to-order dinners, and theaters that include leather seating, allwhile projecting the latest films via state-of-the art digital projection systems. Thefollowing are a few of the operations:• AMC Theatres, the second largest cinema chain in the U.S., operates Fork &
Screen (www.amctheatres.com/buckhead/) in Atlanta.• Cinebarre (www.cinebarre.com), a unit of Regal Cinemas, which opened its first
location in 2007, has locations in Colorado, North Carolina, Oregon, South Carolina,and Washington.
• Movie Tavern (www.movietavern.com) opened its first location in 2007 and has 16locations, in Colorado, Georgia, Kentucky, Ohio, Pennsylvania, Texas, and Virginia.
• At nine of its locations, Muvico (www.muvico.com) offers seating connected to its
RESTAURANT, FOOD & BEVERAGE MARKET RESEARCH HANDBOOK 2013
• 350 •
Premier Bistro & Bars.• Studio Movie Grill (www.studiomoviegrill.com) had 12 locations, in Arizona, Georgia,
Illinois, North Carolina, and Texas.• iPic Theaters, (www.ipictheaters.com) has locations in Arizona, California, Florida,
Illinois, Texas, Washington, and Wisconsin.• Alamo Drafthouse Cinema (www.drafthouse.com) has 10 units and plans to expand
throughout Texas.• Cobb Theatres/Cine Bistro (www.cobbcinebistros.com) has seven locations, in
Colorado, Florida, Georgia, and Virginia.
63.7 SpeakeasiesWhile today’s restaurants and bars work hard to maintain visibility, a handful
strive to keep their locations secret, reminiscent of the speakeasies of the 20's and 30'sthroughout Prohibition. The following are among those with hidden doorways andcoded access:• Alchemy (www.alchemymidtown.com), tucked into an alleyway in the Midtown
neighborhood in Tallahassee, Florida, allows patrons entrance only with areservation and a secret password. Cocktails are crafted using ingredients reflectiveof the speakeasy era.
• In Tampa, a password is needed to gain entrance to Ciro’s Speakeasy(www.cirostampa.com). Staff dress the part, with ladies wearing flapper-stylecocktail dresses and gents donning shirts and ties with rolled-up sleeves andsuspenders.
• In Atlanta, Prohibition (www.prohibitionatl.com) is a swanky club with the feel of a1920s underground speakeasy. Guests ask around at a nearby bar for a secretphone number and step into an antique phone booth to call for entry.
• Prohibited, the bar at Symphony 8 (www.symphony8boston.com), in Boston, isentered via a cast-iron stairway hidden behind a bookshelf. A password, posteddaily on Prohibited’s Facebook page daily, is required for entry.
• In New York City, guests enter PDT [Please Don’t Tell] (www.pdtnyc.com) through aphone booth in Crif Dogs, a hot dog shop.
• In Alexandria, Virginia, the entrance to PX (www.eamonnsdublinchipper.com) ismarked only by a pirate flag and blue light. Reservations may be made only online. Upon arrival, guests knock, a small window in the door opens, and their reservationsare confirmed before entry.
• At Safe House (www.safe-house.com), a spy-themed restaurant and bar inMilwaukee, guests must recite a password for entry. The staff is really into theespionage mission, holding James Bond screenings and talking in spy lingo. International Exports Ltd., on North Front Street, is in fact a craftily contrived ‘front’for the Safe House.
RESTAURANT, FOOD & BEVERAGE MARKET RESEARCH HANDBOOK 2013
• 351 •
63.8 Novel RestaurantsThe following are some other unique concepts in restaurants:
• Encounter Restaurant & Bar (www.encounterlax.com), housed in the flying saucer-shaped building at the center of the Los Angeles International Airport, has a decorlike something out of a sci-fi movie. Cinematic and surreal, the entrance to therestaurant looks extremely 1961 (the year the building opened). Bartendersdispense drinks from cosmic, laser-like taps.
• Firehouse Grill (Evanston, Illinois, www.firehousegrill.net) maintains much of theoriginal interior of the old fire station it replaced.
• Forbes Island (www.forbesisland.com) is a floating restaurant built on a barge inSan Francisco Bay. Patrons access the restaurant by boarding a boat from Pier 39on Fisherman’s Wharf. It took 10 years to obtain permits for the project, whichincludes the only privately built lighthouse in the United States.
• Garage (Seattle, www.garagebilliards.com) is located in a cavernous old auto repairshop. The restaurant includes a billiards hall and bowling alley.
• Hangar One Steakhouse (www.hangaronesteakhouse.com) is perfect for Wichita,which is dubbed the “Air Capital of the World.” Servers dressed like flight attendantsserve aviation-themed menu items in a makeshift airplane hangar.
• Heart Attack Grill (Dallas, Houston, and Las Vegas; www.heartattackgrill.com) takespride in its unhealthy menu with such offerings as a four-patty Quadruple BypassBurger®, French fries deep fried in pure lard, and a milk shake with the “world’shighest butterfat content.” Meals are served by waitresses dressed as nurses. Customers weighing over 350 pounds eat free.
• Locanda Vini e Olii (Brooklyn, New York; www.locandavinieolii.com) is a former drugstore that retained much of the authentic decor, including the service counter, oldcabinets, and medicine bottles.
• Ninjas do the serving at the Japanese concept restaurant Ninja New York(www.ninjanewyork.com).
• Attached to Best Western’s Space Age Lodge, Outer Limits Restaurant (Gila Bend,Arizona; www.bestwesternspaceagelodge.com/html/Restaurant.htm) features aneon-lit rooftop UFO. Inside there is a floor-to-ceiling outer-space theme, along witha menu of American and Mexican fare.
• The decor at Space Aliens Grill & Bar (Bismark, North Dakota;www.spacealiens.com) features a 30-foot-high domed ceiling that displays a view ofouter space. The dining room, bar, and arcade showcase alien sculptures alongwith an extensive menu.
• Evocative of being backstage at a concert, with picnic tables, concert lighting, largescreen TVs, and project screens with a 360-degree speaker system, Rock & Brews(www.rockandbrews.com), co-founded by Gene Simmons of the rock band Kiss andwhich opened its first location in Los Angeles in 2011, has plans to expand thebrand with six additional locations in 2013.
• Located below the Fairmont Hotel in San Francisco, the circa-1945 tropical loungethe Tonga Room (www.tongaroom.com) is a remarkably intact vision of midcenturyTiki culture. The Island Groove Band performs on the lagoon on a moving Gilligan’s
RESTAURANT, FOOD & BEVERAGE MARKET RESEARCH HANDBOOK 2013
• 352 •
Island-esque raft platform, and every half hour there’s an indoor thundershower. The Tonga room serves Pacific Rim cuisine and tropical cocktails served in tikivessels.
• The Cave (www.thecaverestaurantandresort.com), in Richland, Missouri, is thenation’s only restaurant located in an actual cave. The space began as a naturalcave that served as a dance hall in the 1920s.
• Supperclub (www.supperclub.com) is a multisensory experience incorporatingunusual food, music, dancing, and experimental and avant-garde live performances(supperclub performers are often culled from art schools). With U.S. locations inSan Francisco and Los Angeles, the restaurant offers a four-course internationallyinspired meal from chef Nelson German served to diners who lounge fashionably onwhite beds.
• Eat. Drink. Do Laundry. Located in College Station, Texas, patrons at HarveyWashbangers (www.harveywashbangers.com) can enjoy free wi-fi, localmicrobrews, and a bar & grill menu along with the option of doing their laundry ordropping of clothes for dry cleaning.
• Housed in a Chateauesque mansion dating to 1908, the Magic Castle restaurant(www.magiccastle.com) is private club in Hollywood, California, for members of theAcademy for Magic Arts and their guests, offering a menu inspired by the Victorianera.
• Opened in New York in 1993, Lucky Cheng’s (www.luckychengsrestaurant.com),with a location in Las Vegas, offers guests pan-Asian cuisine with a drag show.
RESTAURANT, FOOD & BEVERAGE MARKET RESEARCH HANDBOOK 2013
• 353 •

64
DOG-FRIENDLY RESTAURANTS
64.1 OverviewAccording to the American Pet Products Manufacturers Association (APPMA,
www.appma.org), approximately 45.6 million U.S. households (40% of all households)own a dog.
For most dog owners, their pets are valued as companions and friends. In aHarris Poll (www.harrisinteractive.com), 92% of dog-owners said they consider their petto be a member of the family.
A survey by GfK Roper Public Affairs & Media (www.gfkamerica.com) found 43% of dog owners feed their pet ‘human food,’ and 42% have taken the dog along ona vacation.
_________________________________________________________________
“It wasn’t so very long ago that the phrase ‘adog’s life’ meant sleeping outside, enduring theelements, living with aches, and sitting by thedinner table waiting for a few scraps to land onthe floor. Today’s dog has it much better. Theirmenu reflects every fad in human food – fromlocally sourced organic meat and vegan snacksto gourmet meals bolstered by, say, glucosamineto ward off stiff joints.”
Bloomberg Businessweek _________________________________________________________________
64.2 Dog-friendly RestaurantsLocal health codes generally mandate that pets be restricted from enclosed
restaurants, but many allow dogs in open-air areas. Where permitted, somerestaurants with outdoor seating will allow people dining outside to have their pets.
RESTAURANT, FOOD & BEVERAGE MARKET RESEARCH HANDBOOK 2013
• 354 •
Taking one’s dog to restaurants and other public places isn’t unusual inEuropean countries and in the trendy boutiques and outdoor promenades of coastalcities. Dining with a pet is relatively common in outdoor cafes throughout SouthernCalifornia and Florida. In Miami Beach, for example, virtually all of the dozens ofoutdoor cafes that line Lincoln Road Mall accommodate patrons with their dogs. Morerecently, restaurants in the Northern states have been accommodating guests withdogs.
Dog-friendly patios even appeal to some diners without their pets. Karen Berndt,owner of the Harbor Fish Market & Grille (Baileys Harbor, Wisconsin), says the verypresence of the animals at her upscale restaurant attracts vacationers who havetraveled sans pet. Many request patio seating even when they have left their pets athome.
Some restaurants host special events for dog owners and their pets. Mutt LynchWinery (Healdsburg, California), for instance, hosts private tastings and charityfunctions where the guests often consist of 300 humans and 100 or more dogs. TheSonoma County winery was voted the wine country’s most dog-friendly winery by themonthly newspaper Bay Woof in San Francisco.
Bringfido.com, Dogfriendly.com, and Petfriendlytravel.com provide listings ofrestaurants nationwide that permit guests with dogs.
64.3 Dog MenusProviding a bowl of water and sometimes complimentary treats has been
standard fare for restaurants that accommodate patrons with dogs. Some restaurantshave taken this service a step further, offering a menu for dogs. The following aresome examples:• Art and Soul restaurant on Capitol Hill in Washington, D.C., has a Puppy Patio
Menu that includes a 3-ounce steak ($5) and homemade doggie granola treats ($5).• Harbor Fish Market & Grille (Baileys Harbor, Wisconsin) offers special canine menu
items such as scrambled eggs, chicken breast, and frozen custard ($2.50 to $3.95).• Shake Shack (Miami Beach and New York City) serves The Pooch-ini® –
Shackburger dog biscuits, peanut butter, and vanilla custard – for $3.50.
RESTAURANT, FOOD & BEVERAGE MARKET RESEARCH HANDBOOK 2013
• 355 •

65
FOOD & WINE FESTIVALS
65.1 OverviewMore than 1,000 food festivals are held annually across the United States.
65.2 Prominent Food FestivalsThe largest food festival is the 12-day Taste of Chicago, held annually in June,
and attended by more than 3.6 million people. The 32nd Taste of Chicago (2012)collected more than $12 million in ticket revenue.
The following are other popular food festivals, many of which have annualattendance of 100,000 or more: • A Taste of Colorado (Denver, CO; www.atasteofcolorado.com)• ArtFeast (Santa Fe, NM; www.artfeast.com)• Bite of Seattle (Seattle, WA; www.biteofseattle.com)• Bridge City Gumbo Festival (Bridge City, LA; www.hgaparish.org/gumbofestival)• Charleston Food & Wine Festival (Charleston, SC;
www.charlestonfoodandwine.com)• Culinary Festival (Scottsdale, AZ; www.scottsdalefest.org) • Epcot International Food & Wine Festival (Lake Buena Vista, FL;
https://disneyworld.disney.go.com/events-tours/epcot/epcot-international-food-and-wine-festival/)• Finger Lakes Wine Festival (Watkins Glen, NY; www.flwinefest.com)• Food Network Wine & Food Festival (New York, NY;
www.nycwineandfoodfestival.com)• Hudson Valley Wine & Food Fest (Rhinebeck, NY; www.hudsonvalleywinefest.com)• Minnesota Monthly Food & Wine Experience (Minneapolis, MN;
www.foodwineshow.com)• Mohegan Sun Winefest (Uncasville, CT; www.sunwinefest.com)• National Shrimp Festival (Gulf Shores, AL;
http://alagulfcoastchamber.com/pages/ShrimpFestival)• Pebble Beach Food & Wine (Carmel, CA; www.pbfw.com)• Pensacola Seafood Festival (www.fiestaoffiveflags.org/pensacola-seafood-festival)• RoadKill Cook-Off (Marlinton, WV; http://pccocwv.com/festival.htm)• Sugarland Wine & Food Affair (Houston, TX; www.sugarlandwineandfoodaffair.com)• Taste of Atlanta (Atlanta, GA; www.tasteofatlanta.com)• Taste of Buffalo (Buffalo, NY; www.tasteofbuffalo.com)
RESTAURANT, FOOD & BEVERAGE MARKET RESEARCH HANDBOOK 2013
• 356 •
• Taste of Dallas (Dallas, TX; www.tasteofdallas.org)• Taste of Main (Bellevue, WA; http://tasteofmainbellevue.com)• Taste of Vail (Vail, CO; www.tasteofvail.com)• Taste Washington (Seattle, WA; www.tastewashington.org)• Vintage Ohio (Kirtland, OH; www.visitvintageohio.com)• Vintage Virginia (Centreville, VA; www.vintagevirginia.com)• Wine & Food Experience (New Orleans, LA; www.nowfe.com)• Wine & Food Festival (Dallas, TX; www.dallaswineandfoodfestival.com) • Wine Expo (Boston, MA; www.wine-expos.com/Wine/expo/)• Wine Festival (Nantucket, MA; www.nantucketwinefestival.com) • Winter Wine Festival (Naples, FL; www.napleswinefestival.com) • World Chicken Festival (London, KY; www.chickenfestival.com)• Zinfandel Festival (San Francisco, CA; www.zinfandel.org)
One of the grandest food festivals is three-day The Food & Wine Classic(www.foodandwine.com/classic), held in Aspen, Colorado, which will celebrate its 32nd
year in 2013. Approximately 5,000 participants pay $1,000 or more to sample wine,attend cooking seminars, and rub elbows with celebrity chefs at the event.
The Food Network’s South Beach Wine & Food Festival (www.sobefest.com) isa four-day, star-studded destination event. Tickets may be purchased for the entirefestival or individually for the approximately 60 events. In its 12th year, the 2013 festivalwas held February 21-24. Over 30,000 people attended the main events and another20,000 attended separate, lower cost family-oriented festival events.
Vegfest (www.vegfest.com), a series of annual vegetarian food festivals, are heldin Boston, Detroit, Jacksonville, New York City, Portland, Salt Lake City, San Francisco,Seattle, Washington, D.C., and several other cities.
65.3 Market ResourcesDirectories of food festivals are available online at the following websites:
• www.festivals.com/food_beverage.aspx • www.foodreference.com/html/upcomingfoodevents.html • www.parade.com/food/festivals/index.html
RESTAURANT, FOOD & BEVERAGE MARKET RESEARCH HANDBOOK 2013
• 357 •
66
HOLIDAY DINING
66.1 OverviewAlthough restaurants are an essential part of Americans’ lives throughout the
year, they also serve as a social oasis in times of celebration and special occasions.According to the National Restaurant Association (www.restaurant.org), holiday
dining, rank-ordered based on percentages of Americans dining out, is as follows:• Birthdays: 55%• Mother’s Day: 38%• Valentine’s Day: 32%• Father’s Day: 23%• New Year’s Eve: 17%• Easter: 16%• New Year’s Day: 12%• Thanksgiving: 11%• St. Patrick’s Day: 7%• Christmas Day: 6%• Secretaries’ Day: 6%
According to the National Restaurant Association, table-service restaurantsderive between 4.6% and 6.1% of annual sales from gift cards, most of which are givenas birthday or Christmas gifts.
66.2 BirthdaysBirthdays are the leading single occasion for dining out. According to a National
Restaurant Association survey, 55% of people eat out on their birthday. A spouse’sbirthday is an occasion for dining out for 51% of survey participants. More than 33%eat out for a child’s birthday.
A man is more likely to dine out on his wife’s birthday than a woman is on herhusband’s birthday. Baby Boomers with teenagers under 17 years old are more likelyto dine out to celebrate a child’s birthday than other age groups.
Affluent households with two employed adults and children at home are mostlikely to dine out to celebrate the birthdays of everyone in the household.
RESTAURANT, FOOD & BEVERAGE MARKET RESEARCH HANDBOOK 2013
• 358 •

66.3 Valentine’s DayAccording to the National Restaurant Association, Valentine’s Day is the second
most popular day of the year to dine out, with about 31% of Americans visiting arestaurant for the occasion. By age, the percentages that dine out for Valentine’s Dayare as follows:• 18-to-34: 33%• 35-to-45: 39%• 55 and older: 27%
Spending for the occasion topped $17.6 billion in 2012, with a tab average of$71.99 for an evening out, according to the association.
A survey by Zagat (www.zagat.com) found more couples dining out forValentine’s Day, with 44% reportedly doing so in 2012, with 20% going back to afavorite restaurant for the occasion.
Among those dining out for Valentine’s Day, the following factors are mostimportant in choosing a restaurant:• General favorite: 42%• Romantic atmosphere: 13%• Special menu or promotion: 13%• Picked by companion: 12%• Restaurant they haven’t been to before: 11%
The National Restaurant Association surveyed member restaurants on what typeof promotions they offer around Valentine’s Day. Responses were as follows:• Special menu items: 63%• Prix fixe menu: 45%• Celebratory beverages or desserts: 34%• Flower/candy: 28%• Entertainment/music: 13%
66.4 Mother’s DayAccording to the National Restaurant Association, Mother’s Day is the most
popular formal occasion to dine out. National Restaurant Association research showsthat 38% of Americans dine out on Mother’s Day.
According to the association’s Holiday Dining Survey, dining out on Mother’s Dayis more common among larger households; 44% of adults in households consisting ofthree or more individuals eat a Mother’s Day meal at a restaurant, compared with 24%of one-person households. Respondents under age 25 and those ages 35-to-44 weremore likely than older respondents to dine out on Mother’s Day – 47% and 42%,respectively.
Among those who dine at a restaurant on Mother’s Day, 59% celebrate theoccasion at dinner, 51% at lunch/brunch, and 22% at breakf ast. (The percentages add
RESTAURANT, FOOD & BEVERAGE MARKET RESEARCH HANDBOOK 2013
• 359 •
to more than 100% because many people have more than one restaurant meal onMother’s Day.) In addition, 62% of adults who celebrate Mother’s Day with a specialmeal do so with their spouse, and 62% also do so with their mother or mother-in-law. Sixteen percent (16%) observe the day with their grandmother or spouse’sgrandmother, while 18% share the day with someone else.
66.5 Father’s DayAccording to the National Restaurant Association’s Holiday Dining survey, 23%
of Americans choose to celebrate Father’s Day by dining out, an increase of sixpercentage points from a decade ago.
Larger households consisting of three or more individuals are more likely to dineout on Father’s Day than were smaller households. Twenty-seven percent (27%) ofadults in households with three or more individuals reported eating out on Father’s Day.
Father’s Day is the fourth most popular holiday or occasion to dine out.
66.6 EasterAccording to the National Restaurant Association, 13% of Americans dine out on
Easter Sunday, making this the sixth most popular holiday or occasion to dine out. Individuals ages 65 and older are more likely to dine out on Easter than any other agegroup (18%). Adults ages 35-to-44 are the second most likely to dine out during theEaster holiday (14%), while adults ages 25-to-34 are the least likely (9%). Men aremore likely than women to have an Easter meal at a restaurant (15% and 11%,respectively).
In addition to offering Easter brunches and other meals in their establishments,many restaurants offer takeout options to complement meals eaten at home.
66.7 New Year’s EveApproximately 13% of Americans dine out on New Year’s Eve, and 8% eat at
restaurants on New Year’s day, according to the National Restaurant Association’srecent Holiday Dining Survey.
Individuals between the ages of 18 and 34 are most likely to dine out on bothNew Year’s Eve and New Year’s Day, and males are more likely to do so than females.
66.8 ThanksgivingAccording to The NPD Group (www.npd.com), 51% of adults celebrate
Thanksgiving somewhere other than their own home. Among those who eat at home,about half prepare turkey.
National Restaurant Association research finds that about one in 10 Americanscelebrate Thanksgiving Day by dining out, and 53% use restaurant-prepared takeout
RESTAURANT, FOOD & BEVERAGE MARKET RESEARCH HANDBOOK 2013
• 360 •

items for all or part of their holiday menu.Many restaurants are open on Thanksgiving, and approximately 11% of
Americans typically have their Thanksgiving Day meal at a restaurant. Those living insmaller households and households without children are more likely to dine out onThanksgiving. Males are more likely than females to eat at a restaurant on the holiday. Generally, younger adults are more likely to use restaurant takeout items as part of theirThanksgiving meal at home.
66.9 St. Patrick’s DayPubs and restaurants throughout North America celebrate St. Patrick’s Day.
Savannah and Boston hold the largest celebrations.According to the Savannah Area Convention & Visitors Bureau, 500,000 to
700,000 attend the annual parade, including some international visitors. There are noeconomic impact figures, but it is the busiest time of the year for most downtownretailers, hotels, restaurants, and bars.
Many restaurants on St. Patrick’s Day serve green beer and feature true Irishdishes. To re-create a true Irish pint of stout some pubs install a special pour systemthat improves the creaminess of the pint.
66.10 OktoberfestOktoberfest has evolved into an annual celebration of beer. Despite the event’s
name, most Oktoberfests, including the original in Munich, kick off in September.The following are some noteworthy Oktoberfest celebrations in North America:
• Oktoberfest Zinzinnati, which draws half a million people, is the largest beer festivaloutside of Munich. According to a recent study commissioned by the GreaterCincinnati Chamber of Commerce, Oktoberfest Zinzinnati has direct spending of$20.4 million and an economic impact of $42.2 million.
• Approximately 200,000 revelers annually participate in Tulsa’s Oktoberfest, calledone of the world’s top German food festivals by Bon Appétit magazine.
• A two-month celebration in Helen, Georgia, a Bavarian-themed mountain town witha population of 300, attracts 50,000 devotees of beer and bratwurst.
• The 40-year-old LaCrosse, Wisconsin, Oktoberfest has earned the reputation asone of the best Old World folk festivals in the U.S.
66.11 Super Bowl SundayIf Super Bowl Sunday – a quasi-holiday in America – was ranked among
traditional holidays as an occasion for restaurant patronage, it would rank seventh. Formany bars and restaurants, it is the biggest sales day of the year.
According to the National Restaurant Association, approximately 15% ofAmericans order takeout or delivery from a restaurant for an at-home Super Bowl
RESTAURANT, FOOD & BEVERAGE MARKET RESEARCH HANDBOOK 2013
• 361 •
gathering. For younger adults (ages 18-to-34) the figure increases to 22%. Of thosewho order takeout or delivery, approximately 58% order pizza, 50% order chickenwings, and 20% order subs or sandwiches.
RESTAURANT, FOOD & BEVERAGE MARKET RESEARCH HANDBOOK 2013
• 362 •

67
LATE-NIGHT HOURS
67.1 OverviewSome family-dining chains such as Denny’s, IHOP, Steak ‘n Shake, and Waffle
House have long had late-night service. Several years ago, many quick-servicerestaurants began operating with extended hours. More than 95% of McDonald’srestaurants now have extended hours; several thousand are open 24 hours. Morerecently, many casual-dining chains have been extending operating hours.
_________________________________________________________________
“A growing number of casual-dining concepts arestaying open past the typical 10 p.m. or 11 p.m.close, often keeping the doors and kitchen openuntil midnight or even 2 a.m. Many Applebee’sNeighborhood Grill & Bars expanded their hourslast year, and Red Robin Gourmet Burgers hasadded late-night happy hours over the past fewmonths. Smokey Bones Bar & Fire Grill enhancedits evening offerings nearly a year and a half ago,and profitable operators like the 100-unit BJ’sRestaurants have long offered late-night dining.”
Nation’s Restaurant News, 3/21/11 _________________________________________________________________
67.2 Late-Night Customer DemographicsAccording to Technomic (www.technomic.com), late-night hours appeal to
patrons of various age demographics as follows:• 18-to-24: 66%• 25-to-34: 56%• 35-to-44: 50%
RESTAURANT, FOOD & BEVERAGE MARKET RESEARCH HANDBOOK 2013
• 363 •
• 45-to-54: 48%• 55 and older: 43%
_________________________________________________________________
“[Late-night] customers range from factorythird-shift employees to teenagers coming homefrom parties.”
John Dillon, Vice President Denny’s Nation’s Restaurant News
_________________________________________________________________
67.3 Late-Night OperationsThe following are operational characteristics of some restaurants that maintain
late-night hours:• At Denny’s, servers working from 10 p.m. to 5 a.m. wear jeans and T-shirts instead
of black pants and collared shirts. Alternative music is played during those hours,and a special late-night-only menu is offered. Forty-seven percent (47%) of late-night customers at Denny’s are under age 24; two-thirds are coming from spots likenight clubs or bowling alleys.
• Approximately 80% of Applebee’s 2,000 locations are open until midnight or later;late-night revenue accounts for 13% of sales. Alcoholic beverage sales account for14% of the late-night sales mix. In about 100 markets the brand has introducedClub Applebee’s, offering 2-for-1 specials and theme nights like karaoke night, trivianight, and ‘80s night, and more for a late-night crowd.
_________________________________________________________________
“Staying open later allows us to have more funwith things later at night when the kids are inbed.”
Brian Masilionis, Senior V.P. Applebee’s Advertising Age, 8/6/12
_________________________________________________________________
RESTAURANT, FOOD & BEVERAGE MARKET RESEARCH HANDBOOK 2013
• 364 •
• Smokey Bones Bar & Fire Grill, a 68-unit casual-dining chain, keeps its recentlyremodeled restaurants open until midnight and 2 a.m., depending on the market,and offers a special late-night menu. Bar business makes up half of sales between10 p.m. and 2 a.m., compared with 15% to 18% during lunch and dinner.
• Night Kitchen, in Seattle, Washington, is open only from 6 p.m. until 6 a.m. A fullbreakfast menu is available at all hours; the restaurant has a 50-50 split betweensales of breakfast and dinner fare.
• Boston’s Restaurant & Sports Bar, with 50 locations in the U.S., keeps itsrestaurants open until 2 a.m. in most markets.
_________________________________________________________________
“We’re open late because we’re already payingthose fixed costs. We do a big delivery service,so we definitely pick up late-night deliveriesafter other pizza chains close down. Sincemany of our restaurants are near hotels, we cando in-room delivery service for them or partnerwith them for late-night guests.”
Randy Steinbrenner, Vice PresidentBoston’s Restaurant & Sports BarNation’s Restaurant News, 3/21/11
_________________________________________________________________
RESTAURANT, FOOD & BEVERAGE MARKET RESEARCH HANDBOOK 2013
• 365 •
68
LICENSING
68.1 Market AssessmentAccording to The Licensing Letter, retail sales of restaurant-branded licensed
merchandise in 2012 was $4.29 million, a 3.9% increase over 2011.
68.2 Case Studies
Boston Market• Boston Market terminated its licensing agreement with Heinz in 2012, shifting its
product line to Overhill Farms, which manufactures, distributes, and markets thechain’s line of branded frozen meals. Under the Heinz licensing agreement, sales of30 Boston Market frozen meals in 2010 reached more than $100 million.
California Pizza Kitchen• One of the most prominent brands among restaurant-branded grocery products is
California Pizza Kitchen, whose licensing agreement with Kraft Foods dates to 1998. Annual sales of frozen California Pizza Kitchen products are $160 million, accordingto The Wall Street Journal; licensing royalties are $6.6 million.
Cinnabon• Cinnabon, a brand of Focus Brands, has more than 50 licensed retail products.
Combined annual retail sales are about $400 million.
_________________________________________________________________
“There’s Cinnabon branded bread, cream ofwheat, bagels, a bake mix for muffins, ToasterStrudels, cereal, pancake syrup, nuts, popcorn,and coffee creamer, to name a few.”
Nation’s Restaurant News, 6/25/12 _________________________________________________________________
RESTAURANT, FOOD & BEVERAGE MARKET RESEARCH HANDBOOK 2013
• 366 •
Dunkin’ Donuts’• Dunkin’ Donuts’ licensed coffee, marketed by Smucker’s, has annual retail sales of
approximately $250 million, according to Nation’s Restaurant News. Dunkin’ Donutsalso sells its own retail line of packaged coffee in its stores.
Jamba Juice• Jamba Juice has one of the more ambitious licensing programs. Its licensed
product portfolio includes nine partnerships with products including energy drinks,fruit-flavored coconut water drinks, novelty frozen desserts, and a home smoothiekit. Recently developed products awaiting licensing include energy bars and yogurt. According to James White, CEO of Jamba Juice, the company’s goal is $1 billion inretail sales, or about $500 million at wholesale, for its licensed products. Royaltyrates range from 4% to 7% of wholesale revenue.
_________________________________________________________________
“The goal is to build Jamba Juice into a multi-category health-and-wellness lifestyle brandalong the lines of Kashi or Burt’s Bees.”
Nation’s Restaurant News, 6/25/12 _________________________________________________________________
P.F. Chang’s China Bistro• The chefs at P.F. Chang’s China Bistro created a line of frozen meals licensed by
ConAgra for manufacturing and distribution to supermarkets. The products,launched in 2010, emphasize convenience – dinners for two are promoted as beingskillet-ready in 13 minutes or less. Annual sales are more than $100 million,according to Nation’s Restaurant News.
Starbucks• Starbucks has numerous licensed products, the largest being its Frappuccino chilled
coffee drinks, produced by North American Coffee Partnership, a partnership withPepsiCo. Launched in 1996, annual U.S. retail sales of Frappuccino surpass $1billion. Partnering with Acosta Sales and Marketing (www.acosta.com), Starbuckslaunched the VIA Ready Brew instant coffee line in 2009, with sales reaching $135million during its first year. In 2011, Starbucks ended its licensing agreement withKraft, taking its bagged coffee and tea distribution in-house. Starbucks continued toexpand its lines of licensed products in 2012 with the acquisition of the Teavanaretail tea brand for $620 million and the La Boulange bakery brand for $100 million.
RESTAURANT, FOOD & BEVERAGE MARKET RESEARCH HANDBOOK 2013
• 367 •
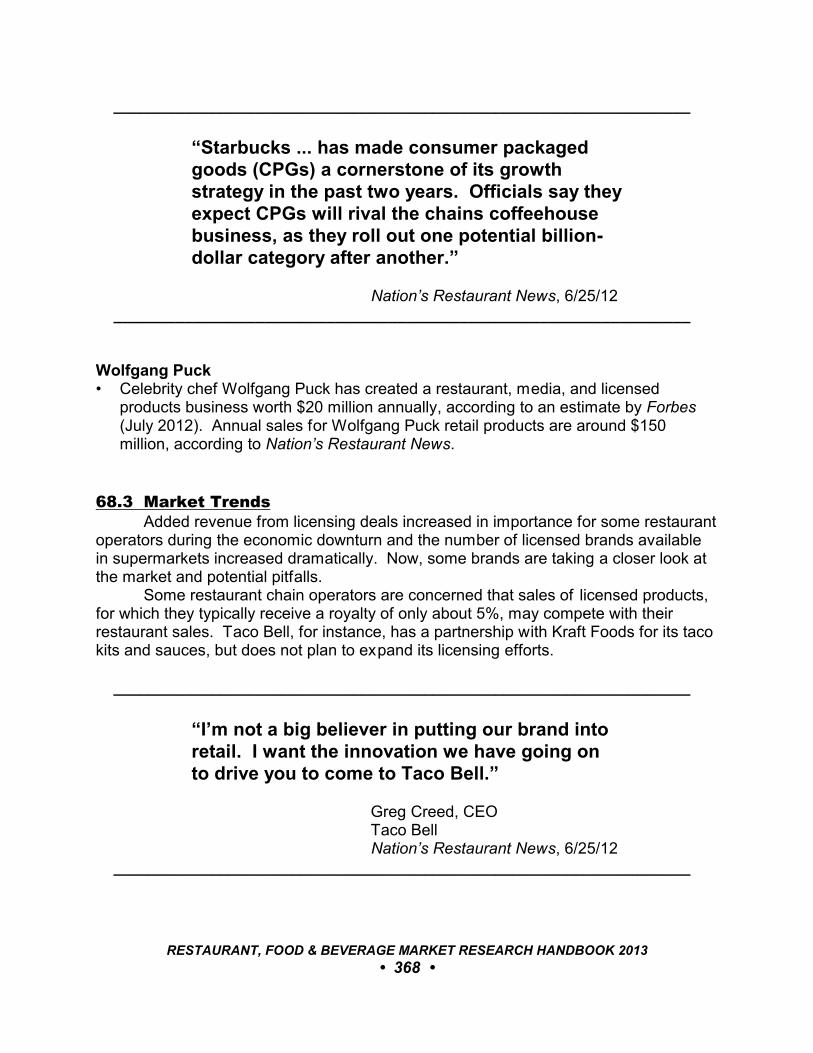
_________________________________________________________________
“Starbucks ... has made consumer packagedgoods (CPGs) a cornerstone of its growthstrategy in the past two years. Officials say theyexpect CPGs will rival the chains coffeehousebusiness, as they roll out one potential billion-dollar category after another.”
Nation’s Restaurant News, 6/25/12 _________________________________________________________________
Wolfgang Puck• Celebrity chef Wolfgang Puck has created a restaurant, media, and licensed
products business worth $20 million annually, according to an estimate by Forbes(July 2012). Annual sales for Wolfgang Puck retail products are around $150million, according to Nation’s Restaurant News.
68.3 Market TrendsAdded revenue from licensing deals increased in importance for some restaurant
operators during the economic downturn and the number of licensed brands availablein supermarkets increased dramatically. Now, some brands are taking a closer look atthe market and potential pitfalls.
Some restaurant chain operators are concerned that sales of licensed products,for which they typically receive a royalty of only about 5%, may compete with theirrestaurant sales. Taco Bell, for instance, has a partnership with Kraft Foods for its tacokits and sauces, but does not plan to expand its licensing efforts.
_________________________________________________________________
“I’m not a big believer in putting our brand intoretail. I want the innovation we have going onto drive you to come to Taco Bell.”
Greg Creed, CEO Taco Bell Nation’s Restaurant News, 6/25/12
_________________________________________________________________
RESTAURANT, FOOD & BEVERAGE MARKET RESEARCH HANDBOOK 2013
• 368 •
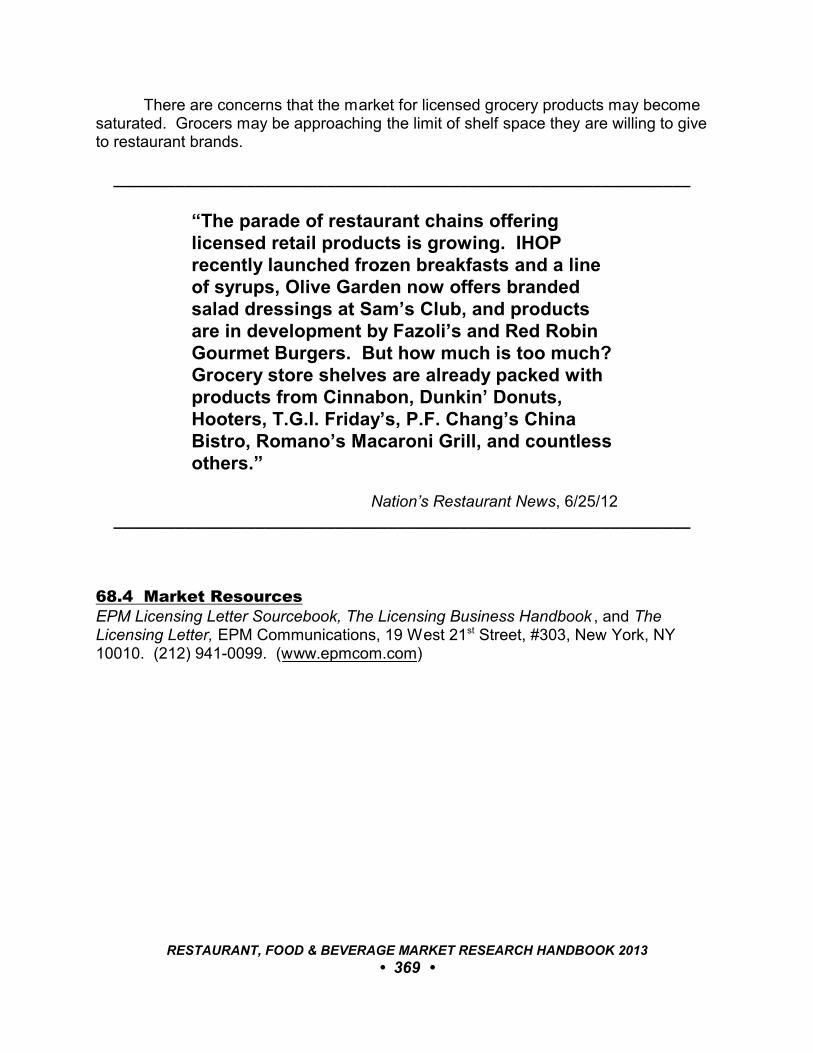
There are concerns that the market for licensed grocery products may becomesaturated. Grocers may be approaching the limit of shelf space they are willing to giveto restaurant brands.
_________________________________________________________________
“The parade of restaurant chains offeringlicensed retail products is growing. IHOPrecently launched frozen breakfasts and a lineof syrups, Olive Garden now offers brandedsalad dressings at Sam’s Club, and productsare in development by Fazoli’s and Red RobinGourmet Burgers. But how much is too much? Grocery store shelves are already packed withproducts from Cinnabon, Dunkin’ Donuts,Hooters, T.G.I. Friday’s, P.F. Chang’s ChinaBistro, Romano’s Macaroni Grill, and countlessothers.”
Nation’s Restaurant News, 6/25/12 _________________________________________________________________
68.4 Market ResourcesEPM Licensing Letter Sourcebook, The Licensing Business Handbook , and TheLicensing Letter, EPM Communications, 19 West 21st Street, #303, New York, NY10010. (212) 941-0099. (www.epmcom.com)
RESTAURANT, FOOD & BEVERAGE MARKET RESEARCH HANDBOOK 2013
• 369 •
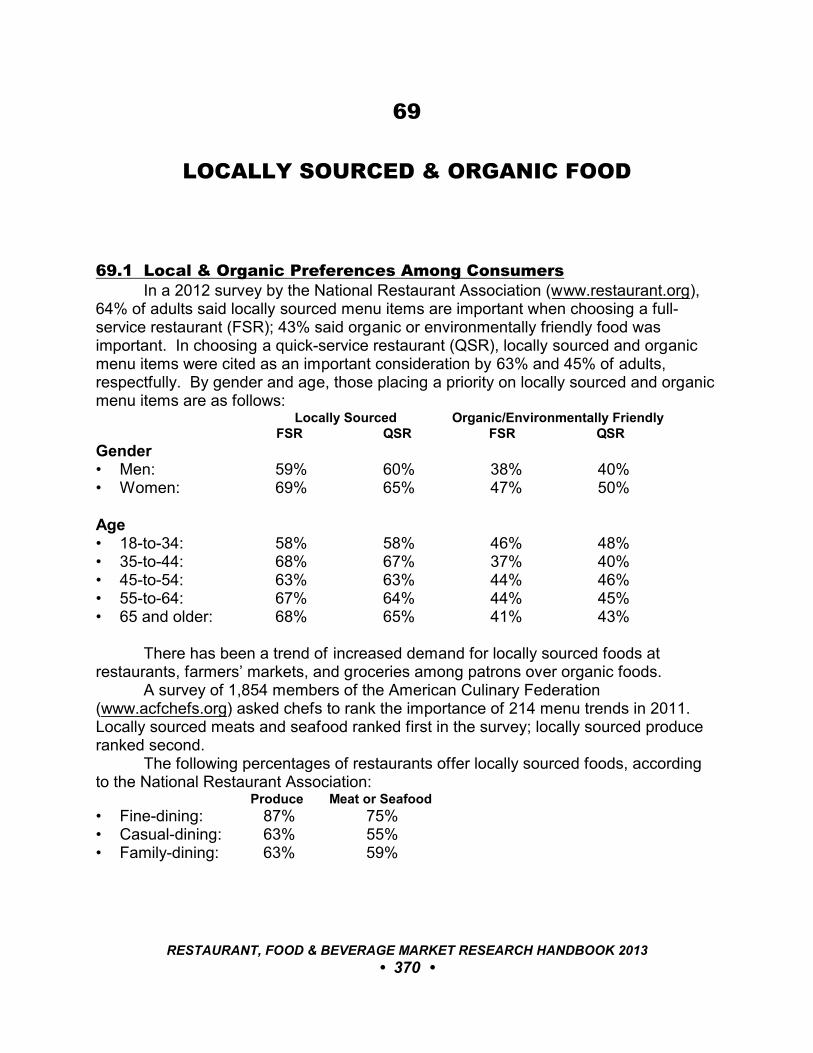
69
LOCALLY SOURCED & ORGANIC FOOD
69.1 Local & Organic Preferences Among ConsumersIn a 2012 survey by the National Restaurant Association (www.restaurant.org),
64% of adults said locally sourced menu items are important when choosing a full-service restaurant (FSR); 43% said organic or environmentally friendly food wasimportant. In choosing a quick-service restaurant (QSR), locally sourced and organicmenu items were cited as an important consideration by 63% and 45% of adults,respectfully. By gender and age, those placing a priority on locally sourced and organicmenu items are as follows:
Locally Sourced Organic/Environmentally Friendly FSR QSR FSR QSR
Gender• Men: 59% 60% 38% 40%• Women: 69% 65% 47% 50%
Age• 18-to-34: 58% 58% 46% 48%• 35-to-44: 68% 67% 37% 40%• 45-to-54: 63% 63% 44% 46%• 55-to-64: 67% 64% 44% 45%• 65 and older: 68% 65% 41% 43%
There has been a trend of increased demand for locally sourced foods atrestaurants, farmers’ markets, and groceries among patrons over organic foods.
A survey of 1,854 members of the American Culinary Federation(www.acfchefs.org) asked chefs to rank the importance of 214 menu trends in 2011. Locally sourced meats and seafood ranked first in the survey; locally sourced produceranked second.
The following percentages of restaurants offer locally sourced foods, accordingto the National Restaurant Association: Produce Meat or Seafood
• Fine-dining: 87% 75%• Casual-dining: 63% 55%• Family-dining: 63% 59%
RESTAURANT, FOOD & BEVERAGE MARKET RESEARCH HANDBOOK 2013
• 370 •
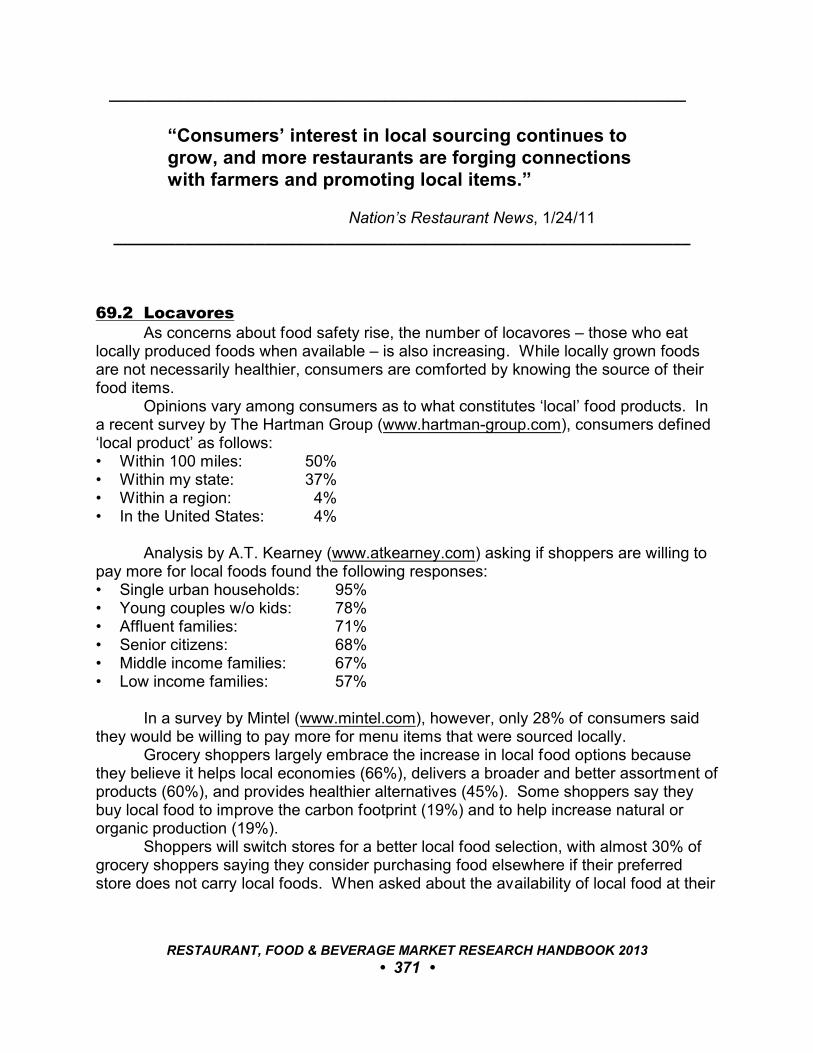
_________________________________________________________________
“Consumers’ interest in local sourcing continues togrow, and more restaurants are forging connectionswith farmers and promoting local items.”
Nation’s Restaurant News, 1/24/11 _________________________________________________________________
69.2 LocavoresAs concerns about food safety rise, the number of locavores – those who eat
locally produced foods when available – is also increasing. While locally grown foodsare not necessarily healthier, consumers are comforted by knowing the source of theirfood items.
Opinions vary among consumers as to what constitutes ‘local’ food products. Ina recent survey by The Hartman Group (www.hartman-group.com), consumers defined‘local product’ as follows:• Within 100 miles: 50%• Within my state: 37%• Within a region: 4%• In the United States: 4%
Analysis by A.T. Kearney (www.atkearney.com) asking if shoppers are willing topay more for local foods found the following responses:• Single urban households: 95%• Young couples w/o kids: 78%• Affluent families: 71%• Senior citizens: 68%• Middle income families: 67%• Low income families: 57%
In a survey by Mintel (www.mintel.com), however, only 28% of consumers saidthey would be willing to pay more for menu items that were sourced locally.
Grocery shoppers largely embrace the increase in local food options becausethey believe it helps local economies (66%), delivers a broader and better assortment ofproducts (60%), and provides healthier alternatives (45%). Some shoppers say theybuy local food to improve the carbon footprint (19%) and to help increase natural ororganic production (19%).
Shoppers will switch stores for a better local food selection, with almost 30% ofgrocery shoppers saying they consider purchasing food elsewhere if their preferredstore does not carry local foods. When asked about the availability of local food at their
RESTAURANT, FOOD & BEVERAGE MARKET RESEARCH HANDBOOK 2013
• 371 •
preferred supermarket, 65% say their supermarket offers at least some kind of locallysourced food. Only 5% indicate they shop for local foods at big-box retailers, 15% atnational supermarkets. Overwhelmingly respondents say their main source for localfood is still the local farmers market and farm stores.
The importance of local food received increased awareness when the first lady,Michelle Obama, emphasized the need for fresh, unprocessed, locally grown food byplanting a vegetable garden on the While House grounds.
69.3 Local Sourcing At Limited-Service RestaurantsWhile local items most frequently are found on fine-dining, upscale casual-
dining, and independent restaurant menus, a few limited-service chains also stand out. Chipotle Mexican Grill, for example, purchases at least 25% of its romaine lettuce,green bell peppers, jalapeños, and onions f rom farms within 200 miles fromrestaurants. The 1,250-restaurant chain purchases over 75 million pounds of naturallyraised and locally processed meats annually.
Several other chains source select local food products for some regionallocations. McDonald’s outlets in Washington State, for instance, purchase all of themilk, 95% of potatoes and fish filets, and 85% of apples from Pacific Northwestsources.
Sysco, the largest foodservice distributor in the U.S., has set up localcrop.com, awebsite that solicits local farmers to make their products available to local restaurants.
Most large restaurant chains find it impractical to source more than a few selectmenu items locally, primarily because local farmers simply cannot provide foodproducts in the quantities required. Uno Chicago Grill, for example, had set up a projectfor a Maine farmer to supply tomatoes to its restaurants in the Northeast; the projectlasted only three weeks because the farmer could not keep up with demand.
Adding hundreds or thousands of small local farmers to the supply chain of amajor restaurant corporation – and subjecting them to the same rigorous safetystandards as current suppliers – would be an impractical task.
_________________________________________________________________
“Operational and logistical challenges, shortgrowing seasons in colder climates, foodhandling safety, supply issues and higher foodcosts are among the obstacles that keep manyrestaurants from implementing local foodsourcing on a large scale.”
Nation’s Restaurant News, 1/24/11 _________________________________________________________________
RESTAURANT, FOOD & BEVERAGE MARKET RESEARCH HANDBOOK 2013
• 372 •
Few diners are aware of the safeguards that protect the food they eat inrestaurant chains. Darden Restaurants, for instance, employs over 50 biologists andpublic health specialists, 17 field plant inspectors, and 20 quality control managers whoreview and certify the food products of the 1,500 suppliers who serve its 1,800restaurants.
69.4 Chef- and Restaurant-owned FarmsSeveral chefs and restaurateurs have acquired farms to supply their restaurants
with fresh produce. Great Performances (www.greatperformances.com), a New YorkCity-based caterer, for example, acquired Katchie Farm, a 60-acre organic farm inKinderhook, New York, with some 29 different varieties of vegetables – from arugula towinter squash – as well as a selection of culinary herbs.
Other restaurants with their own farm operations include 610 Magnolia(Louisville, KY; www.610magnolia.com), Bayard’s (New York, NY; www.bayards.com),Bern’s Steak House (Tampa, FL; www.bernssteakhouse.com), Dahlia Lounge (Seattle, WA; www.tomdouglas.com), Manresa (Los Gatos, CA; www.manresarestaurant.com),and Primo (Rockland, ME; www.primorestaurant.com).
A similar pairing is farms that operate restaurants on site. One such isBlackberry Farm (www.blackberryfarm.com), a 4,200-acre farm in Walland, Tennessee. As well as dining, Blackberry Farm offers 63 guest accommodations, which includethree meals per day of the farm’s celebrated Foothills Cuisine. The following are otherfarm-based restaurants:• 21 Acres (Woodinville, WA; www.21acres.org)• Arrows Restaurant (Ogunquit, ME; www.arrowsrestaurant.com)• Blue Hill at Stone Barns (Pocantico Hills, NY; www.bluehillstonebarns.com)• Celebrity Dairy (Silver City, NC; www.celebritydairy.com)• Everett Family Farms (Soquel, CA; http://everettfamilyfarm.com)• Flow at 14 Acre Farm (Jim Thorpe, PA; www.14acrefarm.com)• Inn at Baldwin Creek (Bristol, VT; www.innatbaldwincreek.com)• Gathering Together Farm (Philomoth, OR; www.gatheringtogetherfarm.com)• Paradise Farms (Homestead, FL; www.paradisefarms.net)• Patowmock Farms (Lovettsville, VA; www.patowmackfarm.com)• Shelburne Farms (Shelburne, VT; www.shelburnefarms.org)• The Loft at TradersPoint Creamery (Indianapolis, IN;
www.traderspointcreamery.com)
Some restaurants partner with local farms to sponsor periodic farm-to-tabledinners where their patrons and food providers can mingle. Eno Terra Restaurant(Kingston, NJ; (www.enoterra.com), Michael’s Genuine Food & Drink (Miami, FL,www.michaelsgenuine.com), and Park Place on Main (Louisville, KY;www.diningonmain.com), among others, have such programs.
RESTAURANT, FOOD & BEVERAGE MARKET RESEARCH HANDBOOK 2013
• 373 •

69.5 Organic MenusWhile the interest in organic foods was first seen in supermarket food purchases,
demand has increasing in the restaurant sector.
_________________________________________________________________
“While the growth in organic purchases isprimarily in the retail category, consumers aredemanding these offerings more when they dineout, and restaurant operators need to meetthese demands.”
Nation’s Restaurant News _________________________________________________________________
Recently launched chains with organic menus include Evos (www.evos.com),FreeFoods NYC (www.freefoodsnyc.com), and Pizza Fusion (www.pizzafusion.com).
RESTAURANT, FOOD & BEVERAGE MARKET RESEARCH HANDBOOK 2013
• 374 •
70
LOYALTY PROGRAMS
70.1 OverviewRepeat business is among a restaurant’s most important assets, and many
restaurateurs are adding or refining frequent-diner programs to draw guests in and keepthem coming back. Restaurant businesses are using discounts, free meals, rewardspoints, and gift cards as they try to attract this repeat business.
70.2 Restaurant ProgramsAccording to the 2012 National Household Survey, by the National Restaurant
Association (www.restaurant.org), roughly one out of four full-service and quick-servicerestaurants offer frequent-diner programs.
Based on survey responses, the following percentages of restaurants reportedtheir programs were more popular in 2012 compared to 2011:• Fast-casual: 61%• Family-dining: 59%• Fine-dining: 53%• Quick-service: 53%• Casual-dining: 46%
70.3 Customer ParticipationOverall, 36% of adults participate in a frequent-diner program at a full-service
restaurant, fast-food place, or coffee shop. Among this group, the types of restaurantswhose programs they participate in are as follows (source: National RestaurantAssociation):• Off-premises/delivery: 51%• Quick-service: 43%• Full-service: 42%
Women are more likely than men to participate (41% versus 31%), and youngadults are more likely than older adults to participate.
70.4 Social Networking With Loyalty CustomersMany restaurants have integrated loyalty programs with their social networking
RESTAURANT, FOOD & BEVERAGE MARKET RESEARCH HANDBOOK 2013
• 375 •
sites. One example is Tasti D-Lite, which linked its TastiRewards loyalty programthrough the point-of-sale system to Facebook, Twitter, and Foursquare. Whenloyalty-club members swipe their TreatCards at the POS, a tweet, a Facebook post,and check-ins on Facebook Places and Foursquare are sent to those customers’friends and followers. The messages contain a coupon for the friends and followers.
Another concept marrying loyalty rewards with social networking is Plink(www.plink.com), which offers users cash as well as Facebook credits and otherrewards from purchases at participating restaurants like Red Robins, Taco Bell, andOutback Steakhouse.
_________________________________________________________________
“If you can get these credits that you wouldhave spent money on anyway, people are goingto jump all over it. It’s a great way to do anotheraspect of loyalty.”
Brian Lee, President Revelation Advertising & Social Media Nation’s Restaurant News, 4/30/12
_________________________________________________________________
An expansion of the of loyalty programs tied to social sites sees loyalty rewardstied to mobile phones and bank cards that are linked to social apps. Paper cards andkeychain fobs are falling away as loyalty programs are adoption these new platforms.
Through such providers as Mocapay, Punchh, Front Flip, and Level Up,customers snap a photo of their receipt or scan a code with a smartphone or simply usetheir linked credit card and rewards are seamlessly registered.
Brands using such virtual platforms glean valuable data on their customers(location, frequency of visits, spending, etc.) which allow them to more narrowly targetdiscounts and rewards and tailor future programs.
RESTAURANT, FOOD & BEVERAGE MARKET RESEARCH HANDBOOK 2013
• 376 •
71
NON-TRADITIONAL RESTAURANT SITES
71.1 Pop-Up RestaurantsPop-up restaurants, generally operated by notable chefs and restaurateurs, are
temporary restaurants that open for brief time periods. They often are set-up inconjunction with festivals. While not a new concept, pop-up restaurants have becometrendy because social media allows patrons to follow the movement of theserestaurants and make online reservations. The following are some examples:• Former contestants from Bravo TV’s Top Chef, cooked two at a time for six days
each at The Top Chef Kitchen, a pop-up restaurant that operated in New York City’sTribeca neighborhood during October and November 2012. Chefs Richard Blais,Jennifer Carroll, Tiffany Derry, Tiffani Faison, Mike Isabella, Edward Lee, AntoniaLofaso, Paul Qui, Grayson Schmitz, and Fabio Viviani participated. The pop-up wasstaged to help kick off the 10th season of the show.
• California chef Gary Menes hosts a pop-up restaurant called Le Comptoir(www.lecomptoirla.com) at various locations in the Los Angeles vicinity.
• Michelle Bernstein (www.chefmichellebernstein.com), a James Beard FoundationAward-winning chef, operated The Kitchen At Orchid in conjunction with ThePleasure Garden, a three-month theatrical pop-up entertainment experience inMiami.
• Sushi Samba (www.sushisampa.com), a popular restaurant in Miami Beach, openedSamba Pop for two weeks in December 2012 in conjunction with Art Basel, thelargest annual arts festival in the U.S.
_________________________________________________________________
“As pop-ups become more popular, their natureis changing, with some operators using them asa launch pad for a more permanent presence.”
David Coffer, ChairmanThe Coffer GroupNation’s Restaurant News, 3/5/12
_________________________________________________________________
RESTAURANT, FOOD & BEVERAGE MARKET RESEARCH HANDBOOK 2013
• 377 •
71.2 Restaurants At Auto DealershipsWhile most auto dealerships only install vending machines in their showrooms, a
few have opened restaurants as a convenience for their customers.The following are example auto dealership restaurants:
• Bistro 33 at Mercedes-Benz of Rocklin (Rocklin, CA; http://edh.bistro33.com)• Dal Toro at Lamborghini (Las Vegas, NV; http://daltoro.com/LasVegas/) • Horseless Carriage Restaurant (North Hills, CA;
www.galpin.com/the-horseless-carriage-restaurant)• Twin Creeks Cafe at Frank Motor Co. (Fort Worth, TX;
www.facebook.com/TwinCreeksCafe)• Vintana Wine + Dine at Lexus Centre of Escondido (Escondido, CA;
www.cohnrestaurants.com/menu-restaurants/vintana-wine-dine/ andwww.lexusescondido.com)
_________________________________________________________________
“It’s been said that car dealership showroomshave indeed started to become one of today’strendy dining sites.”
KNG, 1/26/12 _________________________________________________________________
71.3 Restaurants At Car WashesHaving a restaurant located at a car wash can be convenient for customers. The
following are examples of operators that combine dining and full-service bats at carwashes:• 34th Street Burgers + Deli at the Sparkling Image Car Wash (Bakersfield, CA;
www.sparklingimage.com)• Auto Spa Bistro (Atlanta, GA; www.autospabistro.com)• Car Wash Cafe (Kilmarnock, VA; no website)• Chamois Restaurant/Car Wash (Mattawan, MI;
www.facebook.com/pages/Chamois-RestaurantCar-Wash/102228449836700?sk=wall)• Europa Car Wash & Cafe (Miami, FL; www.europainmiami.com)• Metro Organic Bistro at Karma Car Wash (Miami, FL; www.karmacarwash.com)• The Hub Car Wash & Diner (Colorado Springs, CO; www.thehub.com)
71.4 Restaurants At Museums and Tourist AttractionsMuseums and other tourist attractions are increasingly being paired with upscale
dining to enhance the visitor experience. The following are some of the most
RESTAURANT, FOOD & BEVERAGE MARKET RESEARCH HANDBOOK 2013
• 378 •
recognized (sources: Bloomberg Businessweek, USA Today, and local media sources):• Albert’s at the San Diego Zoo (San Diego, CA;
www.sandiegozoo.org/zoo/dining.html)• Cafe Alcazar at the Lightner Museum (St. Augustine, FL; www.cafe-alcazar.com)• Gertrude’s at the Baltimore Museum of Art (Baltimore, MD;
www.johnshields.com/restaurant/rest/gertrudes.html)• Mr. Rain’s Fun House at the American Visionary Art Museum (Baltimore, MD;
www.mrrainsfunhouse.com)• Museum Restaurant at the Philadelphia Museum of Art (Philadelphia, PA;
(www.philamuseum.org/dining)• The Modern at the Museum of Modern Art (New York, NY; www.themodernnyc.com)• The Restaurant at the J. Paul Getty Museum (Los Angeles, CA;
www.getty.edu/visit/see_do/eat_shop.html)• Zola at the International Spy Museum (Washington, DC;
(www.spymuseum.org/shop/zola.php)
71.5 Restaurants At Parks and Botanical Gardens• Arizona Room (Grand Canyon National Park, AZ;
www.grandcanyonlodges.com/arizona-room-418.html)• Bartolotta’s Lake Park Bistro (Lake Park, Milwaukee; WI; www.lakeparkbistro.com)• Beach Chalet Brewery and Restaurant (Golden Gate Park, San Francisco, CA;
www.beachchalet.com)• Boathouse Forest Park (St. Louis, MO; www.boathouseforestpark.com)• Café Phipps at Phipps Conservatory & Botanical Garden (Pittsburgh, PA;
http://phipps.conservatory.org/visit-phipps/cafe-phipps.aspx)• Garden Room Cafe (Garden of Georgia, Athens, GA;
www.uga.edu/botgarden/cafe.html)• Glass House Cafe at Fairchild Tropical Gardens (Coral Gables, FL;
www.fairchildgarden.org)• Jordan Pond Restaurant (Acadia National Park, ME, www.jordanpond.com)• Lakota Dining Room at Sylvan Lake Resort (Custer State Park, SD;
www.custerresorts.com/sylvan-lake-lodge/)• North Pond (Lincoln Park, Chicago, IL; www.northpondrestaurant.com)• Pineapple Room Restaurant at Cheekwood (Nashville, TN; www.cheekwood.org)• The Ahwahnee (Yosemite National Park, CA;
www.yosemitepark.com/Dining_AhwahneeDiningRoom.aspx)• The Central Park Boat House Restaurant (Central Park, New York, NY;
www.thecentralparkboathouse.com)
71.6 Restaurants At Retail StoresCommon years ago at large department stores, fancy tea rooms and restaurants
are making a comeback among some retailers. High-end stores like Macy’s, Neiman
RESTAURANT, FOOD & BEVERAGE MARKET RESEARCH HANDBOOK 2013
• 379 •
Marcus, and Nordstrom have restaurants. Macy’s offers upscale dining at several of its U.S. locations. To develop its
restaurant offerings, Macy’s put together a team of 16 select chefs, including RickBayless, Cat Cora, Todd English, Marcus Samuelsson, Nancy Silverton, and TakashiYagihashi, each of whom has created an in-store concept restaurant.
_________________________________________________________________
“In the 1900s, many U.S. department stores ranrestaurants and tearooms. Some achievediconic status and continue to serve customerstoday, including Chicago’s Walnut Room at theformer Marshall Field’s flagship (now a Macy’s)and the Zodiac restaurant at a Neiman Marcusstore in Dallas. More recently, Nordstrom,which has offered food for many years, hastested operating a contemporary diner calledSixth & Pine and added espresso bars. Thedepartment store chain currently operatesseven different kinds of in-store restaurants, fora total of more than 200 eateries and coffeebars.”
Bloomberg Businessweek, 12/10/12 _________________________________________________________________
Polo Ralph Lauren operates the clubby looking, 85-seat RL in its Chicago store. Managed by Gibsons Restaurant Group (www.gibsonsrestaurantgroup.com), therestaurant does more than $7 million in annual sales.
Tommy Bahama, operator of more than 80 tropical-theme sportswear stores,also operates 13 full-service Tommy Bahama Tropical Cafe & Emporium restaurants. Restaurants average about $6.5 million in annual sales, and stores with restaurantstypically sell more apparel than those without casual-dining adjuncts.
RESTAURANT, FOOD & BEVERAGE MARKET RESEARCH HANDBOOK 2013
• 380 •

_________________________________________________________________
“Shoppers at the new Tommy Bahama flagshipstore on Manhattan’s Fifth Avenue are be ableto buy one of the brand’s signaturetropical-print shirts before grabbing a drink atthe Marlin Bar, next to the selling floor. Laterthey can head upstairs to order macadamia nut-encrusted snapper at a restaurant perchedabove the retailing space. Adding island-inspired dishes and $12 chauffered sidecarmartinis to the clothing chain’s product mixisn’t a marketing gimmick or loss leader.Tommy Bahama has become a model for otherretailers: Its 13 combination restaurant-storesgenerate two and a half times the sales persquare foot of the apparel chain’s 97 regularlocations worldwide.”
Bloomberg Businessweek, 12/10/12 _________________________________________________________________
Ikea has restaurants in all of its 301 stores worldwide, including its 38 U.S.locations. The multilevel Ikeas have a quick-service restaurant on an upper floor, mostwith as many as 400 seats. Stores also have limited-menu bistros on the ground floornext to a section that sells Swedish packaged foods.
In 2012, JCPenney announced plan to add juice bars and cof fee shops tohundreds of its stores over the next few years.
RESTAURANT, FOOD & BEVERAGE MARKET RESEARCH HANDBOOK 2013
• 381 •
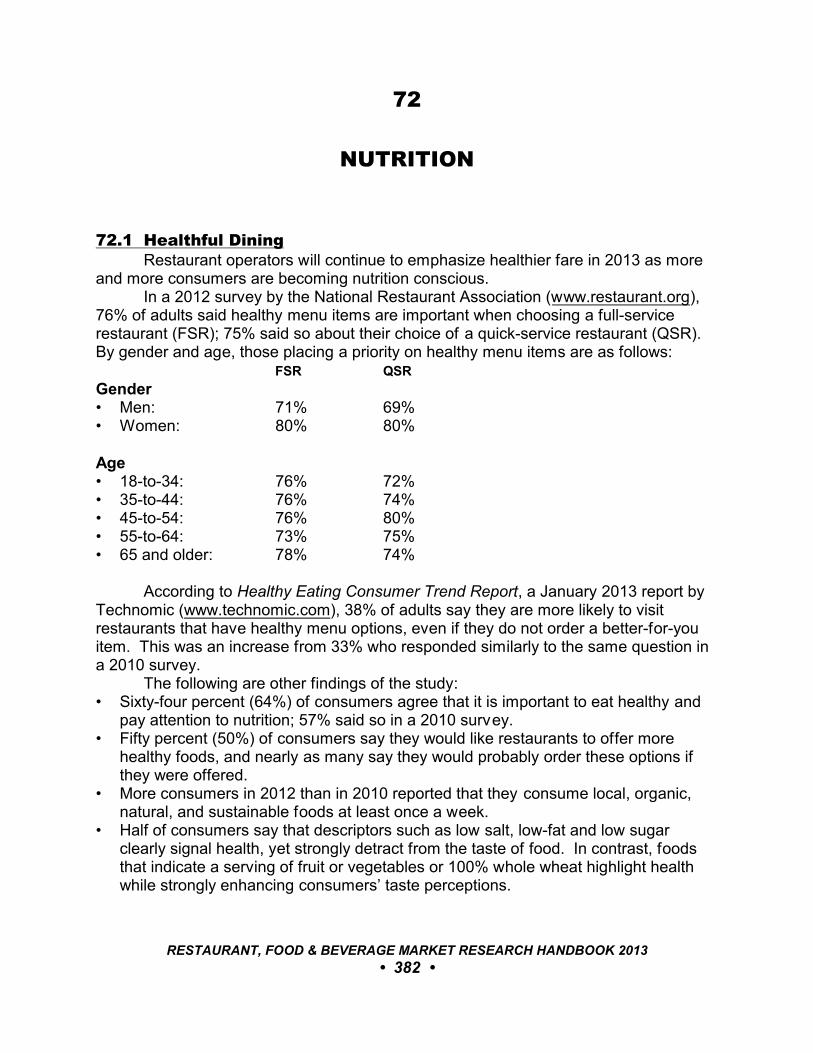
72
NUTRITION
72.1 Healthful DiningRestaurant operators will continue to emphasize healthier fare in 2013 as more
and more consumers are becoming nutrition conscious.In a 2012 survey by the National Restaurant Association (www.restaurant.org),
76% of adults said healthy menu items are important when choosing a full-servicerestaurant (FSR); 75% said so about their choice of a quick-service restaurant (QSR). By gender and age, those placing a priority on healthy menu items are as follows:
FSR QSR
Gender• Men: 71% 69%• Women: 80% 80%
Age• 18-to-34: 76% 72%• 35-to-44: 76% 74%• 45-to-54: 76% 80%• 55-to-64: 73% 75%• 65 and older: 78% 74%
According to Healthy Eating Consumer Trend Report, a January 2013 report byTechnomic (www.technomic.com), 38% of adults say they are more likely to visitrestaurants that have healthy menu options, even if they do not order a better-for-youitem. This was an increase from 33% who responded similarly to the same question ina 2010 survey.
The following are other findings of the study:• Sixty-four percent (64%) of consumers agree that it is important to eat healthy and
pay attention to nutrition; 57% said so in a 2010 survey.• Fifty percent (50%) of consumers say they would like restaurants to offer more
healthy foods, and nearly as many say they would probably order these options ifthey were offered.
• More consumers in 2012 than in 2010 reported that they consume local, organic,natural, and sustainable foods at least once a week.
• Half of consumers say that descriptors such as low salt, low-fat and low sugarclearly signal health, yet strongly detract from the taste of food. In contrast, foodsthat indicate a serving of fruit or vegetables or 100% whole wheat highlight healthwhile strongly enhancing consumers’ taste perceptions.
RESTAURANT, FOOD & BEVERAGE MARKET RESEARCH HANDBOOK 2013
• 382 •
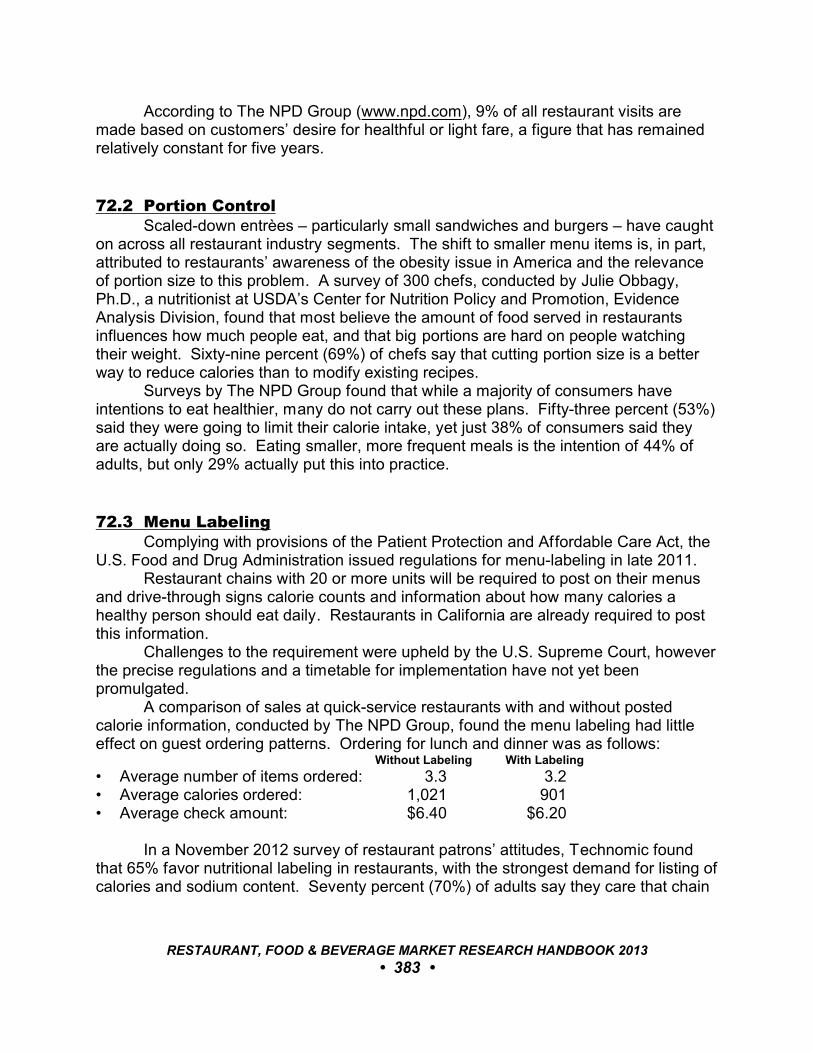
According to The NPD Group (www.npd.com), 9% of all restaurant visits aremade based on customers’ desire for healthful or light fare, a figure that has remainedrelatively constant for five years.
72.2 Portion ControlScaled-down entrèes – particularly small sandwiches and burgers – have caught
on across all restaurant industry segments. The shift to smaller menu items is, in part,attributed to restaurants’ awareness of the obesity issue in America and the relevanceof portion size to this problem. A survey of 300 chefs, conducted by Julie Obbagy,Ph.D., a nutritionist at USDA’s Center for Nutrition Policy and Promotion, EvidenceAnalysis Division, found that most believe the amount of food served in restaurantsinfluences how much people eat, and that big portions are hard on people watchingtheir weight. Sixty-nine percent (69%) of chefs say that cutting portion size is a betterway to reduce calories than to modify existing recipes.
Surveys by The NPD Group found that while a majority of consumers haveintentions to eat healthier, many do not carry out these plans. Fifty-three percent (53%)said they were going to limit their calorie intake, yet just 38% of consumers said theyare actually doing so. Eating smaller, more frequent meals is the intention of 44% ofadults, but only 29% actually put this into practice.
72.3 Menu LabelingComplying with provisions of the Patient Protection and Affordable Care Act, the
U.S. Food and Drug Administration issued regulations for menu-labeling in late 2011. Restaurant chains with 20 or more units will be required to post on their menus
and drive-through signs calorie counts and information about how many calories ahealthy person should eat daily. Restaurants in California are already required to postthis information.
Challenges to the requirement were upheld by the U.S. Supreme Court, howeverthe precise regulations and a timetable for implementation have not yet beenpromulgated.
A comparison of sales at quick-service restaurants with and without postedcalorie information, conducted by The NPD Group, found the menu labeling had littleeffect on guest ordering patterns. Ordering for lunch and dinner was as follows:
Without Labeling With Labeling
• Average number of items ordered: 3.3 3.2• Average calories ordered: 1,021 901• Average check amount: $6.40 $6.20
In a November 2012 survey of restaurant patrons’ attitudes, Technomic foundthat 65% favor nutritional labeling in restaurants, with the strongest demand for listing ofcalories and sodium content. Seventy percent (70%) of adults say they care that chain
RESTAURANT, FOOD & BEVERAGE MARKET RESEARCH HANDBOOK 2013
• 383 •
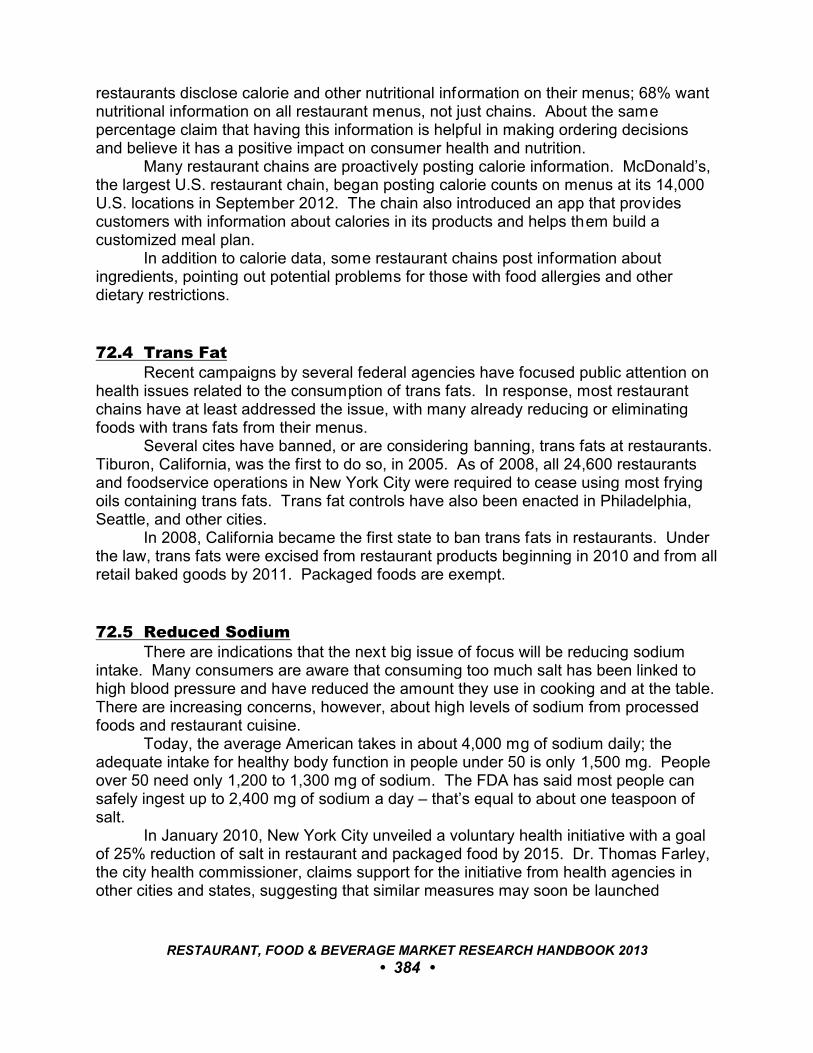
restaurants disclose calorie and other nutritional information on their menus; 68% wantnutritional information on all restaurant menus, not just chains. About the samepercentage claim that having this information is helpful in making ordering decisionsand believe it has a positive impact on consumer health and nutrition.
Many restaurant chains are proactively posting calorie information. McDonald’s,the largest U.S. restaurant chain, began posting calorie counts on menus at its 14,000U.S. locations in September 2012. The chain also introduced an app that providescustomers with information about calories in its products and helps them build acustomized meal plan.
In addition to calorie data, some restaurant chains post information aboutingredients, pointing out potential problems for those with food allergies and otherdietary restrictions.
72.4 Trans FatRecent campaigns by several federal agencies have focused public attention on
health issues related to the consumption of trans fats. In response, most restaurantchains have at least addressed the issue, with many already reducing or eliminatingfoods with trans fats from their menus.
Several cites have banned, or are considering banning, trans fats at restaurants. Tiburon, California, was the first to do so, in 2005. As of 2008, all 24,600 restaurantsand foodservice operations in New York City were required to cease using most fryingoils containing trans fats. Trans fat controls have also been enacted in Philadelphia,Seattle, and other cities.
In 2008, California became the first state to ban trans fats in restaurants. Underthe law, trans fats were excised from restaurant products beginning in 2010 and from allretail baked goods by 2011. Packaged foods are exempt.
72.5 Reduced SodiumThere are indications that the next big issue of focus will be reducing sodium
intake. Many consumers are aware that consuming too much salt has been linked tohigh blood pressure and have reduced the amount they use in cooking and at the table. There are increasing concerns, however, about high levels of sodium from processedfoods and restaurant cuisine.
Today, the average American takes in about 4,000 mg of sodium daily; theadequate intake for healthy body function in people under 50 is only 1,500 mg. Peopleover 50 need only 1,200 to 1,300 mg of sodium. The FDA has said most people cansafely ingest up to 2,400 mg of sodium a day – that’s equal to about one teaspoon ofsalt.
In January 2010, New York City unveiled a voluntary health initiative with a goalof 25% reduction of salt in restaurant and packaged food by 2015. Dr. Thomas Farley,the city health commissioner, claims support for the initiative from health agencies inother cities and states, suggesting that similar measures may soon be launched
RESTAURANT, FOOD & BEVERAGE MARKET RESEARCH HANDBOOK 2013
• 384 •
elsewhere.Many restaurant chains have been proactive in reducing sodium in menu items
before being mandated to do so. Au Bon Pain, Burger King, Denny’s, and Yum!Brands, among others, have launched low-sodium initiatives.
RESTAURANT, FOOD & BEVERAGE MARKET RESEARCH HANDBOOK 2013
• 385 •
73
RESTRICTIVE DIET MENUS
73.1 OverviewMintel (www.mintel.com) estimates that 100 million Americans have a food
intolerance of some type.
73.2 Gluten-Free Menu ItemsAn increasing number of restaurants are responding to people with celiac
disease, an intolerance to gluten. Estimates of the number of Americans with celiacdisease range from three million to 18 million. An estimated 5% of restaurant visits areby guests with gluten issues.
The interest in gluten-free foods goes beyond those with celiac disease. According to Gluten-Free Foods And Beverages In The U.S. , an October 2012 reportby Packaged Facts (www.packagedfacts.com), 18% of U.S. adults look for gluten-freeoptions.
_________________________________________________________________
“Growing consumer suspicion that grain-baseddiets are unhealthy or unnatural – hence therecent popularity of the so-called Paleo diet –have helped boost the gluten-free industry. Andthe perception that gluten-free products arebetter for the body-conscious buyer has alsohelped. Celebrities such as Miley Cyrus havecredited their weight loss to gluten-free eating. But experts have cautioned that such a diet isn’tfor everyone – only those diagnosed with celiacdisease.”
Los Angeles Times, 10/23/12 _________________________________________________________________
RESTAURANT, FOOD & BEVERAGE MARKET RESEARCH HANDBOOK 2013
• 386 •
In a survey by the National Restaurant Association (www.restaurant.org), chefs named gluten-free/food allergy-conscious meals as one of the top 10 trends in both full-service and quick-service restaurants in 2013.
There was a surge in restaurant offerings of gluten-free menu items about twoyears ago. According to Technomic (www.technomic.com), the number of U.S.restaurants with gluten-free menus rose 61% in 2011.
When introducing gluten-free menu items, restaurants must take measures toensure that ingredients in dishes are not contaminated with gluten protein from otheritems being prepared in the same kitchen.
_________________________________________________________________
“It’s not so hard offering gluten-free, but thecontamination issue is the thing to watch for. You can serve hamburger with no bun, but ifyou’re using the same utensil to put ahamburger on a regular bun there’s [gluten]contamination. If you’re making a gluten-freepizza you have to make it in a different place,using different pans. You can’t just pick offcroutons from a salad. It’s more than justsaying we have a gluten-free menu.”
Deborah Ceizler, DirectorCeliac Disease Foundation
_________________________________________________________________
73.3 Kosher CuisineMore than 10 million people eat kosher products annually. According to Michael
Cohen, a consultant and former owner of a kosher pizza business, approximately 50%of people who eat kosher do so because of their Jewish faith, 30% do so for healthreasons, and the other 20% are non-Jewish and eat kosher for other reasons.
Certification agencies called mashgiachs supervise food production andpreparation to ensure that food is kosher. According to Kashrus Magazine, whichtracks kosher certification, there are approximately 1,100 kosher certificationorganizations in the U.S.
Lubicom (www.lubicom.com) estimates the U.S. retail market for Kosher foods at$13 billion.
According to a recent survey by Mintel, among the 21% of American adults whobuy kosher products, 55% say they believe the products to be safer or healthier.
RESTAURANT, FOOD & BEVERAGE MARKET RESEARCH HANDBOOK 2013
• 387 •
Kosher restaurants are mainly concentrated in large cities, especially those witha large Jewish population. One-third of the nation’s Jewish population is withinapproximately 300 miles of New York City.
According to Restaurant Business, there has recently been an increase inopenings of high-end kosher restaurants across the U.S.
In South Florida, kosher-Asian-fusion cuisine has become popular, and anumber of Thai, Japanese, and other Asian chefs have set themselves apart in acompetitive market thanks to Rabbinical supervision and technical advise.
Subway maintains several kosher restaurants in the U.S.
73.4 Halal FoodsMuslims are allowed to eat only Halal foods under Islamic dietary guidelines.
The criteria specify what foods are allowed how the food must be prepared. The foodsaddressed are mostly types of meat/animal tissue.
In assessments of how many Muslims there are in the United States, estimatesrange widely – from 2 million to 7 million or more. An assessment by Pew ResearchCenter (www.pewresearch.org) placed the number at 2.8 million.
Consumers have generally looked to Indian restaurants for Halal menus. Anincreasing number of restaurants in areas with large Arab-American populations arenow offering Halal menu items. Even McDonald’s locations in Dearborn, Michigan, forexample, which has the largest concentration of Arab-Americans in the U.S., offersmeals meeting Islamic dietary standards.
73.5 Vegetarian CuisineA survey by the National Restaurant Association found that 20% of consumers
are likely to look for a restaurant that serves some vegetarian items. According to the Vegetarian Resource Group (www.vrg.org), 3.4% of U.S. adults,
or 7.5 million adults, do not eat meat, poultry, or fish and are considered truevegetarians. Many other people consider themselves vegetarian but may occasionallyconsume meat, poultry, or fish.
There are many forms of vegetarianism: Vegans eat no animals productswhatsoever, including eggs and dairy; lacto-ovo vegetarians avoid meat but consumedairy and egg products; and lacto-vegetarians do not eat meat but consume dairyproducts. People chose not to consume meat for ethical, religious, health, andecological reasons. An estimated two million U.S. adults are vegans.
The Vegetarian Resource Group estimates that 13% of adults are flexitarians,people who subsist primarily on plant-based foods but are not strictly vegetarians.
It is becoming more common to find people whose dietary interests fall outsidetraditional categories like vegetarian, vegan, and omnivore. A recent survey byVegetarian Times found that about 70% of its readers sometimes eat meat. Similarly,about 30% to 40% of the meat-eating population seek out vegetarian meals, at leastoccasionally.
RESTAURANT, FOOD & BEVERAGE MARKET RESEARCH HANDBOOK 2013
• 388 •
According to Gavin Kaysen, a Food & Wine Best New Chef award winner, theincreased popularity of vegetarian cuisine is, in part, due to creative preparationsdeveloped by fine-dining restaurant and resort chefs.
RESTAURANT, FOOD & BEVERAGE MARKET RESEARCH HANDBOOK 2013
• 389 •
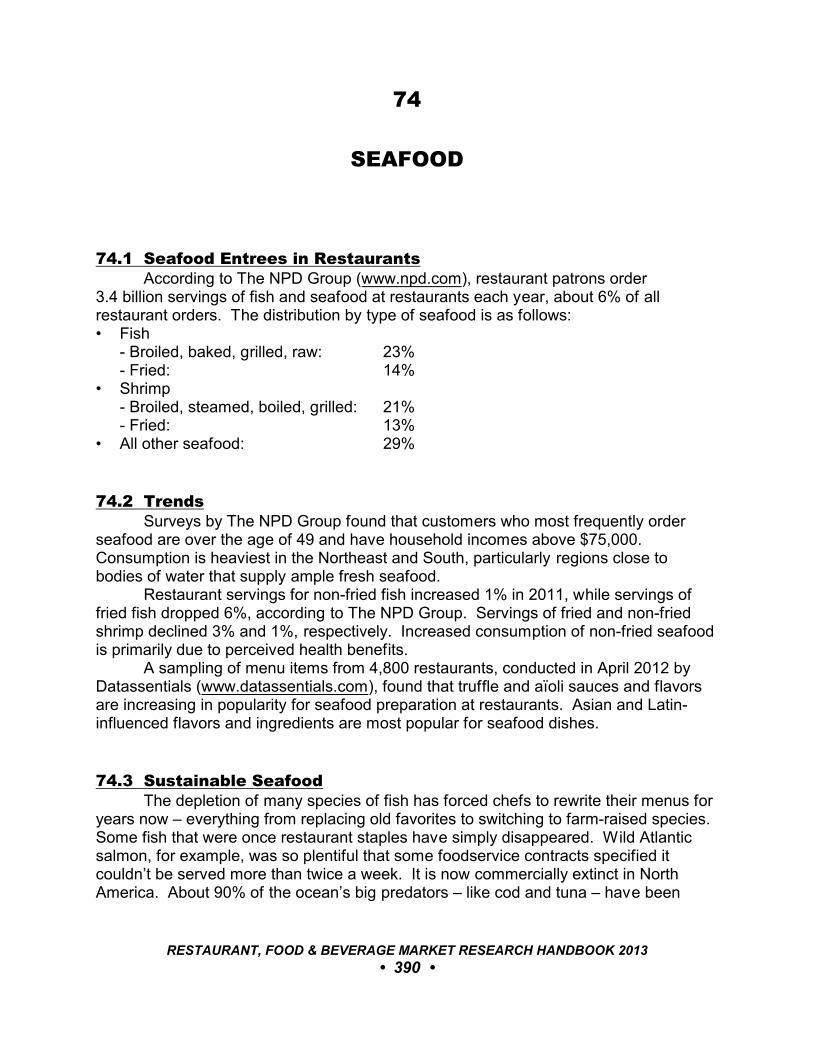
74
SEAFOOD
74.1 Seafood Entrees in RestaurantsAccording to The NPD Group (www.npd.com), restaurant patrons order
3.4 billion servings of fish and seafood at restaurants each year, about 6% of allrestaurant orders. The distribution by type of seafood is as follows:• Fish
- Broiled, baked, grilled, raw: 23%- Fried: 14%
• Shrimp- Broiled, steamed, boiled, grilled: 21%- Fried: 13%
• All other seafood: 29%
74.2 TrendsSurveys by The NPD Group found that customers who most frequently order
seafood are over the age of 49 and have household incomes above $75,000. Consumption is heaviest in the Northeast and South, particularly regions close tobodies of water that supply ample fresh seafood.
Restaurant servings for non-fried fish increased 1% in 2011, while servings offried fish dropped 6%, according to The NPD Group. Servings of fried and non-friedshrimp declined 3% and 1%, respectively. Increased consumption of non-fried seafoodis primarily due to perceived health benefits.
A sampling of menu items from 4,800 restaurants, conducted in April 2012 byDatassentials (www.datassentials.com), found that truffle and aïoli sauces and flavorsare increasing in popularity for seafood preparation at restaurants. Asian and Latin-influenced flavors and ingredients are most popular for seafood dishes.
74.3 Sustainable SeafoodThe depletion of many species of fish has forced chefs to rewrite their menus for
years now – everything from replacing old favorites to switching to farm-raised species. Some fish that were once restaurant staples have simply disappeared. Wild Atlanticsalmon, for example, was so plentiful that some foodservice contracts specified itcouldn’t be served more than twice a week. It is now commercially extinct in NorthAmerica. About 90% of the ocean’s big predators – like cod and tuna – have been
RESTAURANT, FOOD & BEVERAGE MARKET RESEARCH HANDBOOK 2013
• 390 •
extremely over-fished. Increasingly, fish and shrimp farms are filling the shortfall. Chilean sea bass’s rise and fall has been recent. Originally called the
Patagonian toothfish, there was virtually no consumer demand before a marketerrenamed it Chilean sea bass. Sales took off in the early 1990s. Chefs found that it wasreally easy to work with and full of flavor. By the late 1990s, however, fish stocks haddeclined so much that a campaign to protect it, called Take a Pass on Chilean SeaBass, by the National Environmental Trust (www.envirotrust.org), launched in 2002,calling upon restaurants to stop serving it. Today much of what’s sold as Chilean seabass is, in fact, other fish entirely.
According to a study directed by Prof. Boris Worm, Ph.D., at DalhousieUniversity (Halifax, Nova Scotia), 29% of fish and shellfish populations worldwide have‘collapsed.’ Among the species that have collapsed in North American regions: Atlanticsturgeon in Delaware Bay and Chesapeake Bay; Atlantic salmon in MassachusettsBay; Chinook salmon from California to British Columbia, and striped bass from the St.John’s River in the Outer Bay of Fundy. If the declines continue, there could be littlesustainable seafood available by 2048, asserts the report.
Many chefs today are joining groups such as the Seafood Choices Alliance(www.seafoodchoices.org) and Chef’s Collaborative (www.chefscollaborative.org), bothof which work to educate fishers, chefs, and retailers on making responsible purchasingdecisions. Compass Group, the largest foodservice company in the U.S., for example,has a sustainable seafood policy to reduce the use of red-listed species – those thatscientists believe are in most danger of collapse – and, wherever possible, to replacethose products made from a threatened type of fish with sustainable seafood optionscomparable in price and flavor.
One major trend toward sustainable seafood is the use of farm-raised fish. Though catfish, tilapia, salmon, and shrimp have dominated aquaculture for years now,a host of other species are now being farmed, too. Some already have attained thekind of flavor and quality that approaches their wild-caught counterparts, includingoysters, caviar, trout, striped bass, and barramundi. Other farm-raised introductions tothe market include tuna, halibut, snapper, turbot, and cod.
Another approach to sustainability is to offer some fish seasonally. Chefs areavoiding spawning times, for example, to protect juvenile fish.
While necessary, fishing restrictions related to sustainability contribute toshortages. Combined with an aging workforce that is not getting replenished byyounger fishermen and continuing disasters that have impeded Gulf coast fishing inrecent years, demand for quality domestic seafood may soon outpace supply.
RESTAURANT, FOOD & BEVERAGE MARKET RESEARCH HANDBOOK 2013
• 391 •
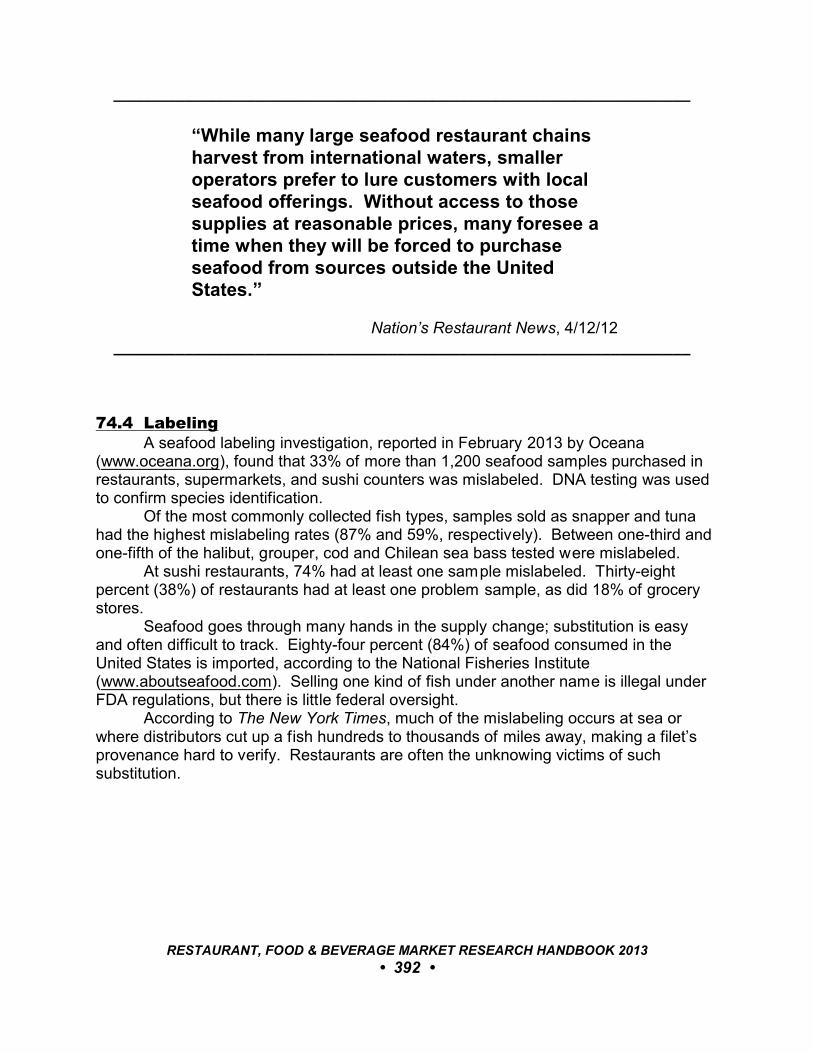
_________________________________________________________________
“While many large seafood restaurant chainsharvest from international waters, smalleroperators prefer to lure customers with localseafood offerings. Without access to thosesupplies at reasonable prices, many foresee atime when they will be forced to purchaseseafood from sources outside the UnitedStates.”
Nation’s Restaurant News, 4/12/12 _________________________________________________________________
74.4 LabelingA seafood labeling investigation, reported in February 2013 by Oceana
(www.oceana.org), found that 33% of more than 1,200 seafood samples purchased inrestaurants, supermarkets, and sushi counters was mislabeled. DNA testing was usedto confirm species identification.
Of the most commonly collected fish types, samples sold as snapper and tunahad the highest mislabeling rates (87% and 59%, respectively). Between one-third andone-fifth of the halibut, grouper, cod and Chilean sea bass tested were mislabeled.
At sushi restaurants, 74% had at least one sample mislabeled. Thirty-eightpercent (38%) of restaurants had at least one problem sample, as did 18% of grocerystores.
Seafood goes through many hands in the supply change; substitution is easyand often difficult to track. Eighty-four percent (84%) of seafood consumed in theUnited States is imported, according to the National Fisheries Institute(www.aboutseafood.com). Selling one kind of fish under another name is illegal underFDA regulations, but there is little federal oversight.
According to The New York Times, much of the mislabeling occurs at sea orwhere distributors cut up a fish hundreds to thousands of miles away, making a filet’sprovenance hard to verify. Restaurants are often the unknowing victims of suchsubstitution.
RESTAURANT, FOOD & BEVERAGE MARKET RESEARCH HANDBOOK 2013
• 392 •

_________________________________________________________________
“Restaurants would be very concerned that ahigh percentage of fish are not what they hadordered. Unless you’re very sophisticated, youmay not be able to tell the difference betweencertain species of fish when you receive them.”
Andrew Moesel, SpokesmanNew York State Restaurant AssociationThe New York Times, 12/11/12
_________________________________________________________________
The Marine Stewardship Council (MSC, www.msc.org) has developed the ChainOf Custody certification program for restaurants. To be certified, restaurants mustrigorously screen suppliers and require that they document all seafood. Suppliers areaudited by a third party inspector to ensure that the seafood purchased is actually whatit is declared to be. DNA testing is also conducted to verify certain species of fish. Alist of certified restaurants in the United States is posted online atwww.msc.org/where-to-buy/dining-out/usa.
RESTAURANT, FOOD & BEVERAGE MARKET RESEARCH HANDBOOK 2013
• 393 •

75
SNACKING
75.1 OverviewFindings from Snacking Occasion Consumer Trend Report, a 2012 report by
Technomic (www.technomic.com), show increased snacking among consumers,compared to 2010. Of the 1,500 respondents in the report’s poll, 48% said they snackat least twice a day, compared to 25% who reported snacking twice daily in 2010.
Snack consumption is distributed by age demographic as follows:• 18-to-24: 28.2%• 25-to-34: 25.5%• 34-to-44: 20.1%• 45-to-54: 16.8%• 55 and older: 9.4%
While candies, chips and other sweet, salty or savory treats are most oftenthought of as typical for snacking, fresh whole foods like fruits are found to be the mostpopular snack food of all. Fresh fruit is the top snack food consumed in the UnitedStates and also the fastest growing, according to Snacking in America, a 2012 report byThe NPD Group (www.npd.com).
Fresh fruits are consumed in 10 more snack occasions a year than chocolate –the second-most popular snack food – and 25 more occasions a year than the third-most popular snack item, potato chips.
_________________________________________________________________
“Among opportunities this trend presents toproducers and produce retailers to market andmerchandise fruit around ... usage can beexpanded with packaging innovation andpromotions for on-the-go activities when it’sleast likely to be consumed.”
Darren Seifer, AnalystThe NPD Group, 1/8/12
_________________________________________________________________
RESTAURANT, FOOD & BEVERAGE MARKET RESEARCH HANDBOOK 2013
• 394 •
In spite of the popularity of fruits as snack food, the snack sector is drivenprimarily by prepared and packaged items.
The study also found more Americans to be consuming less during main mealtimes (i.e., breakfast, lunch, dinner) while increasing between-meal snack occasions. Ultimately consumers are redefining completely what is a snack and when is a snackoccasion.
_________________________________________________________________
“We’ve been talking to our customers a lot aboutsnacks during the last five years because we’veseen consumer behavior change so much. They’ve redefined what a snack is. People usedto think a snack was chips, cookies, or crackers. Now snacks are beverages, mini-meals, or threeitems on a tray.”
Kim Holman Director of MarketingWixonFood Processing, 4/5/12
_________________________________________________________________
75.2 Market AssessmentThe following is a 2012 assessment of snack foods provided by the National
Confectioners Association (www.candyusa.com):• U.S. sweet and snack sales are an $80 billion market.• Sweets and snack foods account for 10% of total grocery store sales.• Thirty percent (30%) of sweet and snack sales are attributed to products that came
out in the last two years (i.e., 2011 and 2012). During that period, 4,600 new sweetand snack food products were introduced.
Of new product launches in 2011, 1,563 new confectionery products debuted,according to Datamonitor’s (www.datamonitor.com) Product Launch Analytics onlinedatabase of new U.S. products SKUs. There were 895 chocolate rollouts, 512 sugarconfectionery (non-chocolate) treats, and 156 gum products.
Other snacks categories saw 3,231 products launched. Cookies accounted for634, nuts and seeds (461), crackers (287), potato chips (382), cereal bars (357), andpopcorn (114). Other savory snacks (pretzels, tortilla chips, puffed snacks, fruit snacks,meat snacks, etc.) totaled 844, and processed snacks (tortilla chips, corn chips, othernon-potato chips) came in at 152.
RESTAURANT, FOOD & BEVERAGE MARKET RESEARCH HANDBOOK 2013
• 395 •
75.3 Snack Food TrendsThe following were the top snack trends in 2012 (source: National Confectioners
Association):Shareable Affordable Sweets• Share Bags (stand up bags) to share with family and friends, and informally gift to
others are becoming more widely available at retail.
Perfect Pairings – Sweet & Salty• There are a variety of new products with the sweet and salty flavor coupling, from
milk chocolate-covered raisins and peanuts to cinnamon sugar popcorn, chocolate-covered pretzels, potato chips and bars.
Flavors Beyond Borders• Snacks with Middle Eastern, Asian, and Mediterranean-inf luenced flavors are
popping up on store shelves. A number of snacks coming to market are based onchickpeas, lentils, and seaweed.
Mango Mania• There is a new generation of tropical fruit flavors, with mango leading the way.
Pairing mango with pineapple, orange, coconut, and strawberry to create newconfectionery flavors is gaining popularity, but tropical fruit is also making its way tothe snack aisle, from freeze dried fruits to mouth-watering salsas.
Packing a Healthy Punch• Healthy snacking continues to gain momentum. Nutritional health bars are the top
growing snack item, according to Symphony IRI (www.symphonyiri.com). Many newsnacks provide a variety of health attributes, whether gluten-free, all natural, madefrom whole grains, or including B vitamins and antioxidants.
RESTAURANT, FOOD & BEVERAGE MARKET RESEARCH HANDBOOK 2013
• 396 •
76
TAKEOUT & DELIVERY
76.1 Market AssessmentAccording to The NPD Group (www.npd.com), the average U.S. consumer
purchases 127 meals annually at restaurants for consumption elsewhere. Forcomparison, the average customer buys 81 meals for consumption in a restaurant.
Restaurant takeout and delivery sales are estimated as follows: Sales Percent of Total Sales
• Quick-service restaurants: $115 billion 70%• Full-service restaurants: $ 20 billion 10%
76.2 Takeout and The American LifestyleIn a 2012 survey by the National Restaurant Association (www.restaurant.org),
33% of adults said purchasing takeout from restaurants is an important part of they waythey live. For frequent restaurant patrons, the percentage is even higher, as follows:• Frequent full-service restaurant (FSR) customers: 44%• Frequent quick-service restaurant (QSR) customers: 48%• Frequent off-premises dinner (OPD) customers: 53%
In the 2012 survey, the percentages of adults who say they are likely to usevarious off-premise options are as follows:
All Frequent Customers Adults FSR QSR OPD
• Delivery from a full-service restaurant: 55% 58% 65% 68%• Delivery from a quick-service restaurant: 52% 54% 61% 68%• Takeout from a full-service restaurant: 51% 53% 59% 69%
76.3 The Takeout and Delivery CustomerAccording to Technomic (www.technomic.com), 57% of consumers purchase
takeout once a week or more. Consumers use takeout and delivery monthly, by agedemographic, as follows (source: Technomic; number of meal occasions):
1 or 2 3 to 9 10 or more
• 18-to-24: 10% 49% 42%• 25-to-34: 26% 47% 27%• 35-to-44: 28% 52% 20%• 45 and older: 29% 52% 19%
RESTAURANT, FOOD & BEVERAGE MARKET RESEARCH HANDBOOK 2013
• 397 •
Consumers’ preferences in takeout and delivery are as follows (source:Technomic; percentage of respondents):• Drive-thru: 49%• Home delivery: 45%• Designated takeout parking spaces: 45%• Dedicated takeout staff: 37%• Online ordering: 35%• Office delivery: 34%• Curbside delivery: 31%
Takeout sales do not appear to significantly cannibalize dining room traffic. Technomic found that 60% of consumers who recently purchased takeout said if theyhad not done so on that occasion, they would most likely have made food at home andnot purchased from a foodservice operator.
76.4 Pizza DeliveryDelivery services are credited as being a significant factor in the growth of major
pizza chains. Seventy percent (70%) of Domino Pizza’s business is delivery; thechain’s annual sales are $3.56 billion. Many small independent pizza restaurants,however, do not offer delivery services.
_________________________________________________________________
“There is a reason that not all pizza placesdeliver: It isn’t easy.”
Tim McIntyre, Vice PresidentDomino’s PizzaUSA Today, 1/17/12
_________________________________________________________________
76.5 Quick-Service Carryout and DeliveryAccording to Sandelman & Associates (www.sandelman.com), drive-thru
accounts for 41% of all fast-food occasions, carryout ordered inside the restaurantcomprises 23%, and delivery comprises 6% for quick-service restaurants (QSRs). Theother 30% are dine-in meals. By daypart, the percentage of customers who usedcarryout services on their last QSR purchase is as follows:• Breakfast: 5%• Lunch: 33%• Dinner: 58%• Snacks: 4%
RESTAURANT, FOOD & BEVERAGE MARKET RESEARCH HANDBOOK 2013
• 398 •
Virtually all quick-service restaurants offer carryout; an increasing number areoffering delivery service.
Burger King has tested home delivery at select locations in Maryland andVirginia. The operators of more than 300 franchised Subway restaurants inWashington, D.C., two McDonald’s locations in New York City, and a San Franciscofranchisee of Johnny Rockets have also tested or offer home delivery service.
76.6 Takeout At Full-Service ChainsAccording to the National Restaurant Association (www.restaurant.org), nine in
10 family- and casual-dining operators and three-fourths of fine-dining operators offertakeout service. Thirty-seven percent (37%) of American adults have used curbsidetakeout from a full-service restaurant. Most full-service restaurants do not offerdelivery. Among those that do, 40% find it to account for an increasing share of sales.
More than half of adults surveyed by the National Restaurant Association saidthey would be likely to use a curbside takeout option if offered by their favorite table-service restaurant. Fifty-eight percent (58%) of adult consumers said they would belikely to order food for delivery from their favorite table-service restaurant if providedwith the option.
A recent survey by Technomic found 54% of respondents had ordered a mealfrom a full-service restaurant for off-premise consumption at least once during thepreceding week; 17% had ordered twice. Nearly one in 10 had used a full-servicerestaurant as their meal source at least three times during the prior seven days.
76.7 Takeout for Offices and ElsewhereAmericans are increasingly eating takeout meals at work. According to The NPD
Group, the average worker purchases 27 meals annually for consumption at theworkplace, a 17% increase from 10 years ago.
Takeout food is not always for consumption at the office or home; over two-thirdsof American consumers, at least occasionally, eat in their car. According to a survey byKelton Research (www.keltonresearch.com), when asked how often they eat in theircar, drivers responded as follows:• At least once a day: 9%• Once or twice a week: 14%• Once a month: 14%• Never: 31%• Other response: 32%
76.8 Takeout PackagingPackaging for takeout is important for environmental considerations as well as to
maintain product integrity. In a survey by the National Restaurant Association, the
RESTAURANT, FOOD & BEVERAGE MARKET RESEARCH HANDBOOK 2013
• 399 •
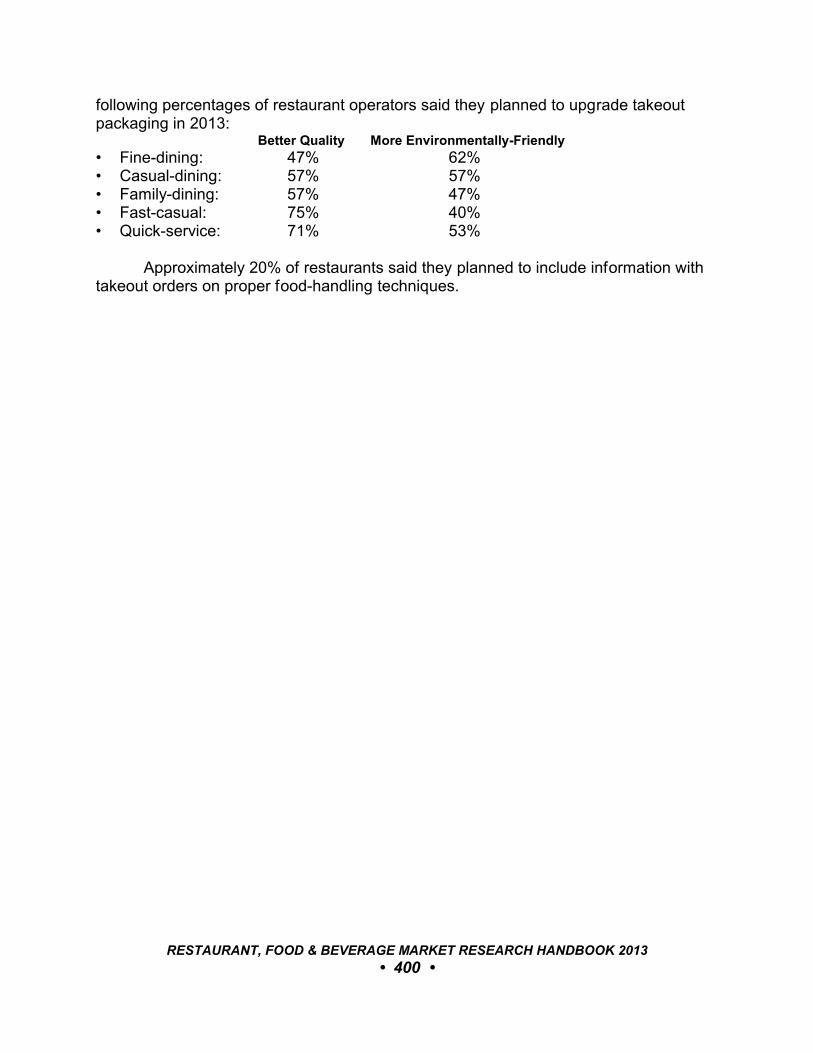
following percentages of restaurant operators said they planned to upgrade takeoutpackaging in 2013:
Better Quality More Environmentally-Friendly
• Fine-dining: 47% 62%• Casual-dining: 57% 57%• Family-dining: 57% 47%• Fast-casual: 75% 40%• Quick-service: 71% 53%
Approximately 20% of restaurants said they planned to include information withtakeout orders on proper food-handling techniques.
RESTAURANT, FOOD & BEVERAGE MARKET RESEARCH HANDBOOK 2013
• 400 •
77
VALUE-FOCUSED DINING
77.1 OverviewMany consumers cut back on their dining out occasions during the economic
downturn. Now, as the economy is recovering, consumers are beginning to dine outmore but many have a new emphasis on value in their restaurant experiences.
_________________________________________________________________
“Budget-conscious consumers continue toexpect the best value for their money. In fact,nine out of 10 operators across all segmentssaid their customers are more value-consciousthan they were two years ago.”
2013 Restaurant Industry Forecast National Restaurant Association, 1/13
_________________________________________________________________
77.2 Trading DownBased on the analysis of more than 250 million checks at full-service restaurants
in 2012, GuestMetrics (www.guestmetrics.com) found that the number of entrèesordered declined by 1.5%, while orders of appetizers and sides grew by 2.8%. Theaverage price of an entrèe was $11.56 in 2012, compared with $5.57 for appetizers andsides, indicating downward pressure on average checks. The number of wine bottlesordered in restaurants and bars dropped 13% between 2011 and 2012; the number ofglasses of wine rose by 4%. Dessert sales rose by 2.3%.
RESTAURANT, FOOD & BEVERAGE MARKET RESEARCH HANDBOOK 2013
• 401 •
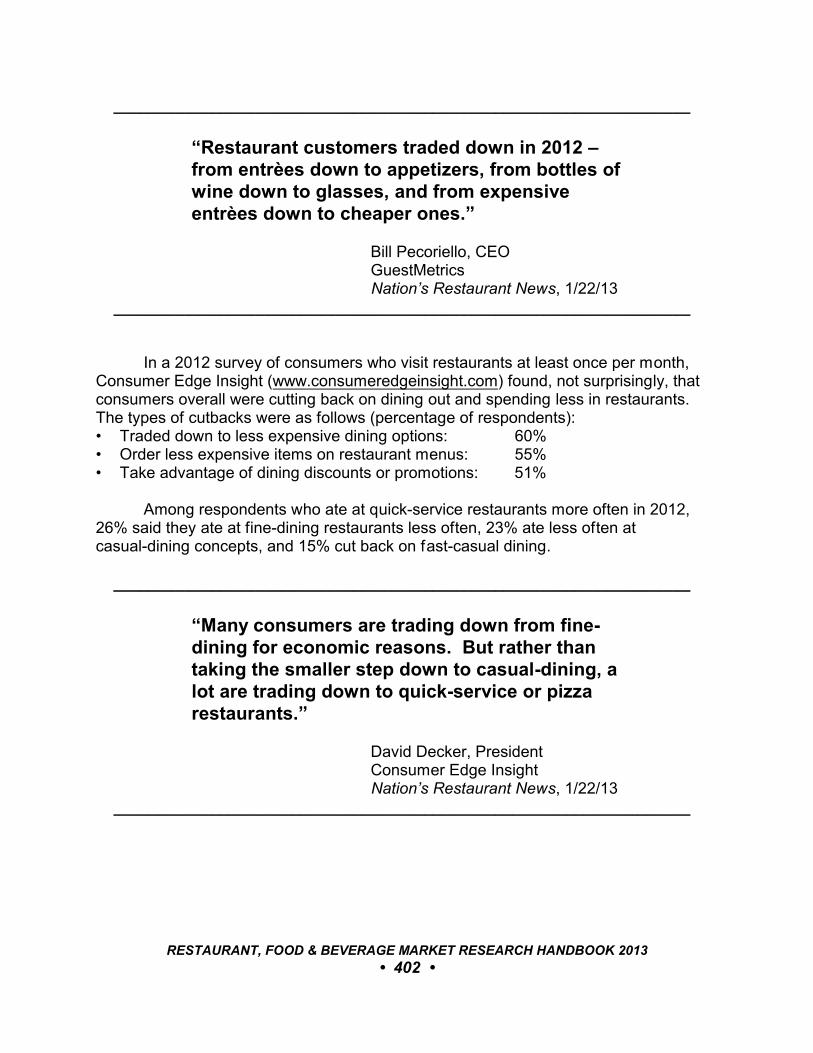
_________________________________________________________________
“Restaurant customers traded down in 2012 –from entrèes down to appetizers, from bottles ofwine down to glasses, and from expensiveentrèes down to cheaper ones.”
Bill Pecoriello, CEO GuestMetrics Nation’s Restaurant News, 1/22/13
_________________________________________________________________
In a 2012 survey of consumers who visit restaurants at least once per month,Consumer Edge Insight (www.consumeredgeinsight.com) found, not surprisingly, thatconsumers overall were cutting back on dining out and spending less in restaurants. The types of cutbacks were as follows (percentage of respondents):• Traded down to less expensive dining options: 60%• Order less expensive items on restaurant menus: 55%• Take advantage of dining discounts or promotions: 51%
Among respondents who ate at quick-service restaurants more often in 2012,26% said they ate at fine-dining restaurants less often, 23% ate less often atcasual-dining concepts, and 15% cut back on fast-casual dining.
_________________________________________________________________
“Many consumers are trading down from fine-dining for economic reasons. But rather thantaking the smaller step down to casual-dining, alot are trading down to quick-service or pizzarestaurants.”
David Decker, President Consumer Edge Insight Nation’s Restaurant News, 1/22/13
_________________________________________________________________
RESTAURANT, FOOD & BEVERAGE MARKET RESEARCH HANDBOOK 2013
• 402 •
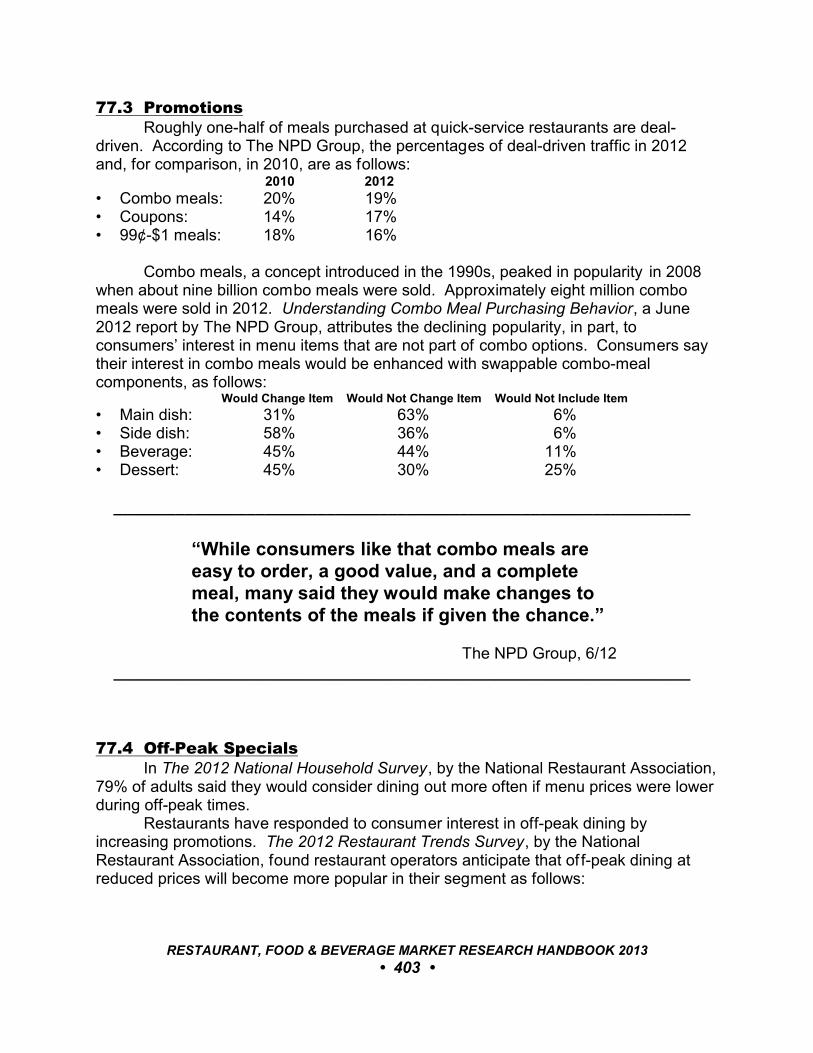
77.3 PromotionsRoughly one-half of meals purchased at quick-service restaurants are deal-
driven. According to The NPD Group, the percentages of deal-driven traffic in 2012and, for comparison, in 2010, are as follows:
2010 2012
• Combo meals: 20% 19%• Coupons: 14% 17%• 99¢-$1 meals: 18% 16%
Combo meals, a concept introduced in the 1990s, peaked in popularity in 2008when about nine billion combo meals were sold. Approximately eight million combomeals were sold in 2012. Understanding Combo Meal Purchasing Behavior, a June2012 report by The NPD Group, attributes the declining popularity, in part, toconsumers’ interest in menu items that are not part of combo options. Consumers saytheir interest in combo meals would be enhanced with swappable combo-mealcomponents, as follows:
Would Change Item Would Not Change Item Would Not Include Item
• Main dish: 31% 63% 6%• Side dish: 58% 36% 6%• Beverage: 45% 44% 11%• Dessert: 45% 30% 25%
_________________________________________________________________
“While consumers like that combo meals areeasy to order, a good value, and a completemeal, many said they would make changes tothe contents of the meals if given the chance.”
The NPD Group, 6/12 _________________________________________________________________
77.4 Off-Peak SpecialsIn The 2012 National Household Survey, by the National Restaurant Association,
79% of adults said they would consider dining out more often if menu prices were lowerduring off-peak times.
Restaurants have responded to consumer interest in off-peak dining byincreasing promotions. The 2012 Restaurant Trends Survey, by the NationalRestaurant Association, found restaurant operators anticipate that of f-peak dining atreduced prices will become more popular in their segment as follows:
RESTAURANT, FOOD & BEVERAGE MARKET RESEARCH HANDBOOK 2013
• 403 •
• Fine-dining: 58%• Casual-dining: 61%• Family-dining: 59%• Fast-casual: 39%• Quick-service: 33%
RESTAURANT, FOOD & BEVERAGE MARKET RESEARCH HANDBOOK 2013
• 404 •
PART VIII: BEVERAGE TRENDS & ANALYSES
RESTAURANT, FOOD & BEVERAGE MARKET RESEARCH HANDBOOK 2013
• 405 •

78
BEVERAGE CONSUMPTION & SPENDING
78.1 Beverage ConsumptionAccording to Beverage Marketing Corporation (www.beveragemarketing.com),
the average person consumes 165.0 gallons of beverages annually. Consumption bybeverage category is as follows:• Carbonated soft drinks: 44.7 gallons• Bottled water: 28.3 gallons• Beer: 20.8 gallons• Milk: 20.4 gallons• Coffee: 18.5 gallons• Fruit beverages: 11.5 gallons• Tea: 10.3 gallons• Sports beverages: 4.0 gallons• Wine: 2.3 gallons• Distilled spirits: 1.5 gallons• Value-added water: 1.5 gallons• Energy drinks: 1.2 gallons
People also consume approximately 25.0 gallons of tap water annually.
78.2 Beverage SpendingConsumers in the U.S. spend more than $300 billion annually on beverage
purchases. This includes alcoholic and nonalcoholic beverages, consumed both on-premise and at home.
According to the Distilled Spirits Council (DISCUS, www.discus.org), alcoholicbeverage supplier gross revenue in 2012 was $62.14 billion, distributed as follows(change from previous year in parenthesis):• Beer: $30.32 billion (3.7%)• Spirits: $21.29 billion (4.6%)• Wine: $10.53 billion (3.3%)
According to The Beverage Information Group (www.beveragenet.net), annualon-premise alcoholic beverage sales are approximately $110 billion.
RESTAURANT, FOOD & BEVERAGE MARKET RESEARCH HANDBOOK 2013
• 406 •
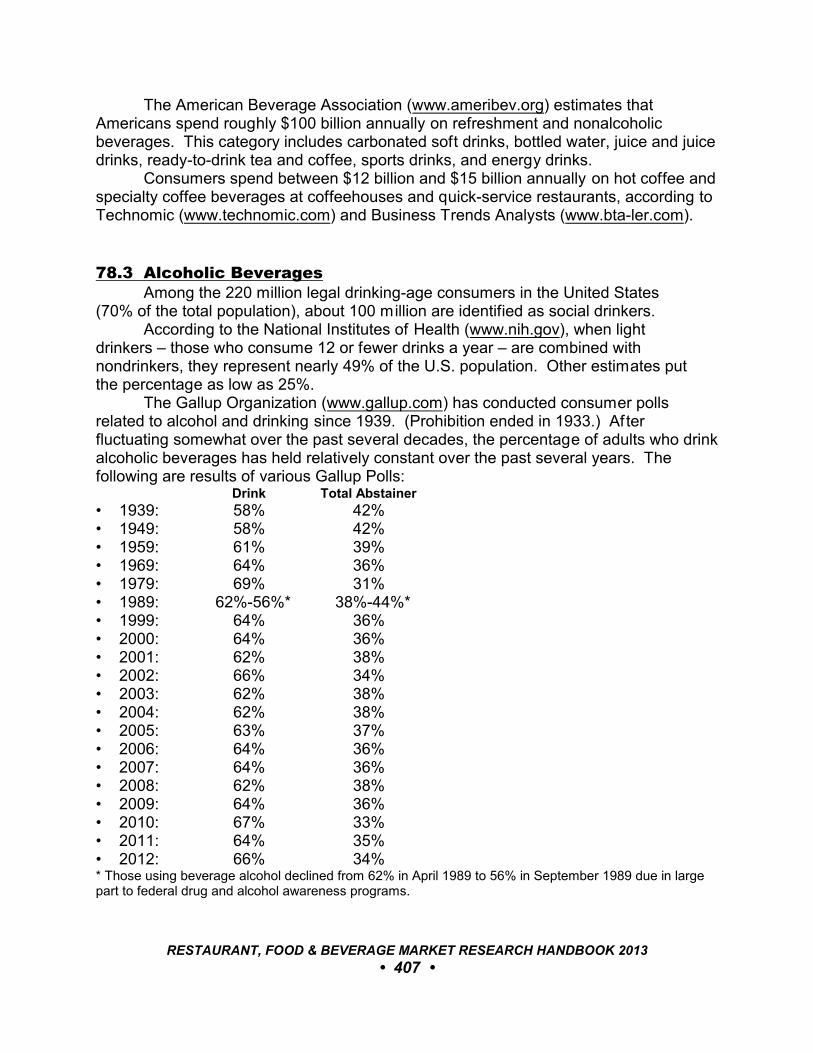
The American Beverage Association (www.ameribev.org) estimates thatAmericans spend roughly $100 billion annually on refreshment and nonalcoholicbeverages. This category includes carbonated soft drinks, bottled water, juice and juicedrinks, ready-to-drink tea and coffee, sports drinks, and energy drinks.
Consumers spend between $12 billion and $15 billion annually on hot coffee andspecialty coffee beverages at coffeehouses and quick-service restaurants, according toTechnomic (www.technomic.com) and Business Trends Analysts (www.bta-ler.com).
78.3 Alcoholic BeveragesAmong the 220 million legal drinking-age consumers in the United States
(70% of the total population), about 100 million are identified as social drinkers. According to the National Institutes of Health (www.nih.gov), when light
drinkers – those who consume 12 or fewer drinks a year – are combined withnondrinkers, they represent nearly 49% of the U.S. population. Other estimates put the percentage as low as 25%.
The Gallup Organization (www.gallup.com) has conducted consumer pollsrelated to alcohol and drinking since 1939. (Prohibition ended in 1933.) Af terfluctuating somewhat over the past several decades, the percentage of adults who drinkalcoholic beverages has held relatively constant over the past several years. Thefollowing are results of various Gallup Polls:
Drink Total Abstainer
• 1939: 58% 42%• 1949: 58% 42%• 1959: 61% 39%• 1969: 64% 36%• 1979: 69% 31%• 1989: 62%-56%* 38%-44%*• 1999: 64% 36%• 2000: 64% 36%• 2001: 62% 38%• 2002: 66% 34%• 2003: 62% 38%• 2004: 62% 38%• 2005: 63% 37%• 2006: 64% 36%• 2007: 64% 36%• 2008: 62% 38%• 2009: 64% 36%• 2010: 67% 33%• 2011: 64% 35%• 2012: 66% 34%* Those using beverage alcohol declined from 62% in April 1989 to 56% in September 1989 due in largepart to federal drug and alcohol awareness programs.
RESTAURANT, FOOD & BEVERAGE MARKET RESEARCH HANDBOOK 2013
• 407 •

Among those who consume alcoholic beverages (2012), the following are thebeverages most frequently consumed (source: Gallup):• Beer: 39%• Wine: 35%• Spirits: 22%
The following is the distribution of those who drink alcoholic beverages by weeklyconsumption (source: Gallup):• Less than one drink: 34%• 1-to-7 drinks: 52%• 8 or more drinks: 12%
Harris Poll (www.harrisinteractive.com) reports consumption of alcoholicbeverages by adults in 2011 (most recent data available) as follows:
At least once At least once Less than once Daily per Week a month a month Never
Gender• Female: 3% 21% 21% 33% 24%• Male: 7% 38% 18% 24% 20%
Age• 21-to-34: 3% 33% 24% 21% 23%• 35-to-46: 3% 30% 20% 32% 18%• 47-to-65: 5% 29% 17% 31% 22%• 66 and older: 11% 26% 18% 29% 27%
All 5% 29% 20% 29% 22%
Those who drink alcoholic beverages at least several times a year drink thefollowing types of beverages (source: Harris Poll):
All Men Women
• Beer: 63% 75% 50%• Domestic wine: 54% 45% 63%• Vodka: 41% 40% 43%• Rum: 34% 34% 35%• Imported wine: 28% 26% 31%• Tequila: 28% 27% 30%• Canadian/Irish/other whiskey: 20% 25% 14%• Champagne: 17% 13% 23%• Cordials and liqueurs: 17% 14% 20%• Bourbon: 15% 23% 6%• Gin: 14% 15% 13%• Scotch: 11% 17% 4%• Cognac: 8% 11% 4%
RESTAURANT, FOOD & BEVERAGE MARKET RESEARCH HANDBOOK 2013
• 408 •
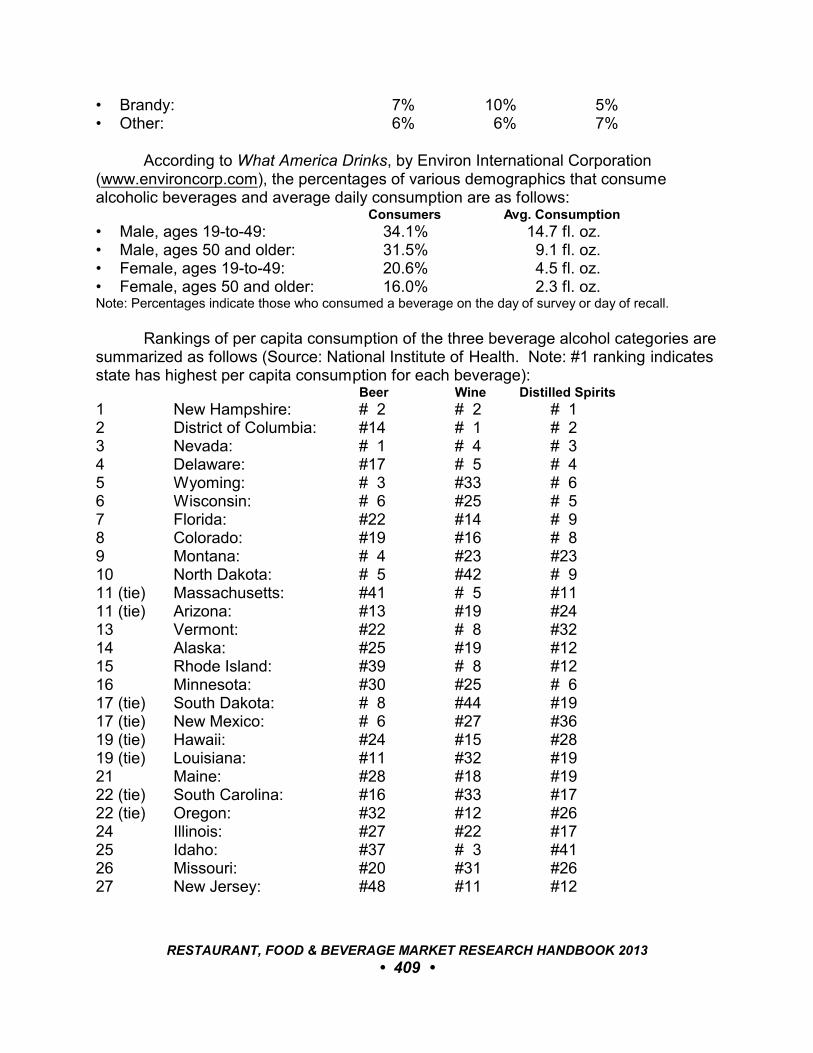
• Brandy: 7% 10% 5%• Other: 6% 6% 7%
According to What America Drinks, by Environ International Corporation(www.environcorp.com), the percentages of various demographics that consumealcoholic beverages and average daily consumption are as follows:
Consumers Avg. Consumption
• Male, ages 19-to-49: 34.1% 14.7 fl. oz.• Male, ages 50 and older: 31.5% 9.1 fl. oz.• Female, ages 19-to-49: 20.6% 4.5 fl. oz.• Female, ages 50 and older: 16.0% 2.3 fl. oz.Note: Percentages indicate those who consumed a beverage on the day of survey or day of recall.
Rankings of per capita consumption of the three beverage alcohol categories aresummarized as follows (Source: National Institute of Health. Note: #1 ranking indicatesstate has highest per capita consumption for each beverage):
Beer Wine Distilled Spirits
1 New Hampshire: # 2 # 2 # 12 District of Columbia: #14 # 1 # 23 Nevada: # 1 # 4 # 34 Delaware: #17 # 5 # 45 Wyoming: # 3 #33 # 66 Wisconsin: # 6 #25 # 57 Florida: #22 #14 # 98 Colorado: #19 #16 # 89 Montana: # 4 #23 #2310 North Dakota: # 5 #42 # 911 (tie) Massachusetts: #41 # 5 #1111 (tie) Arizona: #13 #19 #2413 Vermont: #22 # 8 #3214 Alaska: #25 #19 #1215 Rhode Island: #39 # 8 #1216 Minnesota: #30 #25 # 617 (tie) South Dakota: # 8 #44 #1917 (tie) New Mexico: # 6 #27 #3619 (tie) Hawaii: #24 #15 #2819 (tie) Louisiana: #11 #32 #1921 Maine: #28 #18 #1922 (tie) South Carolina: #16 #33 #1722 (tie) Oregon: #32 #12 #2624 Illinois: #27 #22 #1725 Idaho: #37 # 3 #4126 Missouri: #20 #31 #2627 New Jersey: #48 #11 #12
RESTAURANT, FOOD & BEVERAGE MARKET RESEARCH HANDBOOK 2013
• 409 •
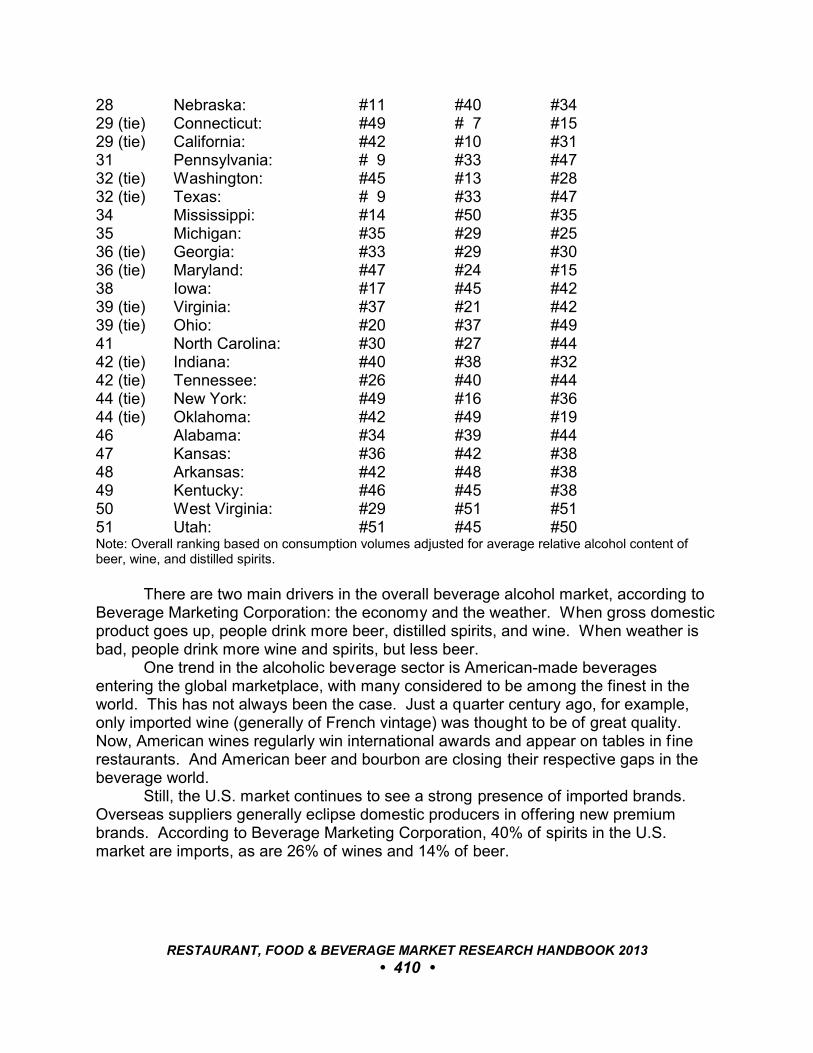
28 Nebraska: #11 #40 #3429 (tie) Connecticut: #49 # 7 #1529 (tie) California: #42 #10 #3131 Pennsylvania: # 9 #33 #4732 (tie) Washington: #45 #13 #2832 (tie) Texas: # 9 #33 #4734 Mississippi: #14 #50 #3535 Michigan: #35 #29 #2536 (tie) Georgia: #33 #29 #3036 (tie) Maryland: #47 #24 #1538 Iowa: #17 #45 #4239 (tie) Virginia: #37 #21 #4239 (tie) Ohio: #20 #37 #4941 North Carolina: #30 #27 #4442 (tie) Indiana: #40 #38 #3242 (tie) Tennessee: #26 #40 #4444 (tie) New York: #49 #16 #3644 (tie) Oklahoma: #42 #49 #1946 Alabama: #34 #39 #4447 Kansas: #36 #42 #3848 Arkansas: #42 #48 #3849 Kentucky: #46 #45 #3850 West Virginia: #29 #51 #5151 Utah: #51 #45 #50Note: Overall ranking based on consumption volumes adjusted for average relative alcohol content ofbeer, wine, and distilled spirits.
There are two main drivers in the overall beverage alcohol market, according toBeverage Marketing Corporation: the economy and the weather. When gross domesticproduct goes up, people drink more beer, distilled spirits, and wine. When weather isbad, people drink more wine and spirits, but less beer.
One trend in the alcoholic beverage sector is American-made beveragesentering the global marketplace, with many considered to be among the finest in theworld. This has not always been the case. Just a quarter century ago, for example,only imported wine (generally of French vintage) was thought to be of great quality. Now, American wines regularly win international awards and appear on tables in finerestaurants. And American beer and bourbon are closing their respective gaps in thebeverage world.
Still, the U.S. market continues to see a strong presence of imported brands. Overseas suppliers generally eclipse domestic producers in offering new premiumbrands. According to Beverage Marketing Corporation, 40% of spirits in the U.S.market are imports, as are 26% of wines and 14% of beer.
RESTAURANT, FOOD & BEVERAGE MARKET RESEARCH HANDBOOK 2013
• 410 •

78.4 Nonalcoholic BeveragesAccording to What America Drinks, the percentages of demographics consuming
various types of nonalcoholic beverages are as follows: CSD Coffee Tea Juice Milk
• Male and female, ages 4-to-8: 45.2% 1.0% 1.4% 37.3% 74.3%• Male, ages 9-to-13: 66.6% 2.4% 2.7% 30.6% 64.8%• Male, ages 14-to-18: 74.7% 3.1% 4.1% 26.5% 55.2%• Male, ages 19-to-49: 58.5% 39.7% 10.7% 22.2% 37.4%• Male, ages 50 and older: 35.1% 71.3% 17.3% 35.5% 45.3%• Female, ages 9-to-13: 60.5% 1.1% 4.8% 30.7% 59.9%• Female, ages 14-to-18: 67.0% 5.0% 5.9% 26.7% 43.5%• Female, ages 19-to-49: 51.0% 38.7% 14.2% 23.4% 32.5%• Female, ages 50 and older: 25.9% 67.9% 22.8% 34.3% 44.7%Notes: Percentages indicate those who consumed a beverage on the day of survey or day of recall. CSD = carbonated soft drinks. Juice includes fruit and vegetable juices but not fruit drinks. Milk includes only plain milk, not flavored milk.
According to Beverage Marketing Corporation, the overall U.S. liquidrefreshment beverage market, which includes all nonalcoholic beverages except tapwater, increased 0.9% in 2011. This followed an increase of 1.3% in 2010 and declinesof 2.8% and 2.1%, respectively, in 2009 and 2008.
RESTAURANT, FOOD & BEVERAGE MARKET RESEARCH HANDBOOK 2013
• 411 •

79
BEER
79.1 Market AssessmentThe Brewers Association (www.beertown.org) estimates U.S. beer sales in 2011
at $96 billion, a 1% decline from a year prior.According to Beverage Marketing Corporation (www.beveragemarketing.com),
U.S. beer consumption has been as follows:• 2007: 206.8 million barrels• 2008: 207.6 million barrels• 2009: 203.1 million barrels• 2010: 201.3 million barrels• 2011: 198.3 million barrelsNote: one case = 2.25 gallons; one barrel = 31.0 gallons (117.3 liters); one barrel = 13.7 cases
_________________________________________________________________
“Between 2007 and 2011, beer volume fell about4.1%. Part of that can, of course, be attributed tothe economic downturn. But with growth returningto the other alcohol segments much sooner, whendoes that explanation stop working?”
Beverage World, 5/12 _________________________________________________________________
Beer supplier gross revenue has been as follows (source: Distilled Spirits Councilof the United States [www.discus.org]; change from previous year in parenthesis):• 2003: $24.8 billion (2.9%)• 2004: $25.6 billion (3.2%)• 2005: $25.6 billion (no change)• 2006: $26.3 billion (2.7%)• 2007: $27.5 billion (4.6%)• 2008: $28.5 billion (3.6%)• 2009: $28.8 billion (1.1%)• 2010: $28.6 billion (-0.7%)• 2011: $30.32 billion (3.7%)
RESTAURANT, FOOD & BEVERAGE MARKET RESEARCH HANDBOOK 2013
• 412 •
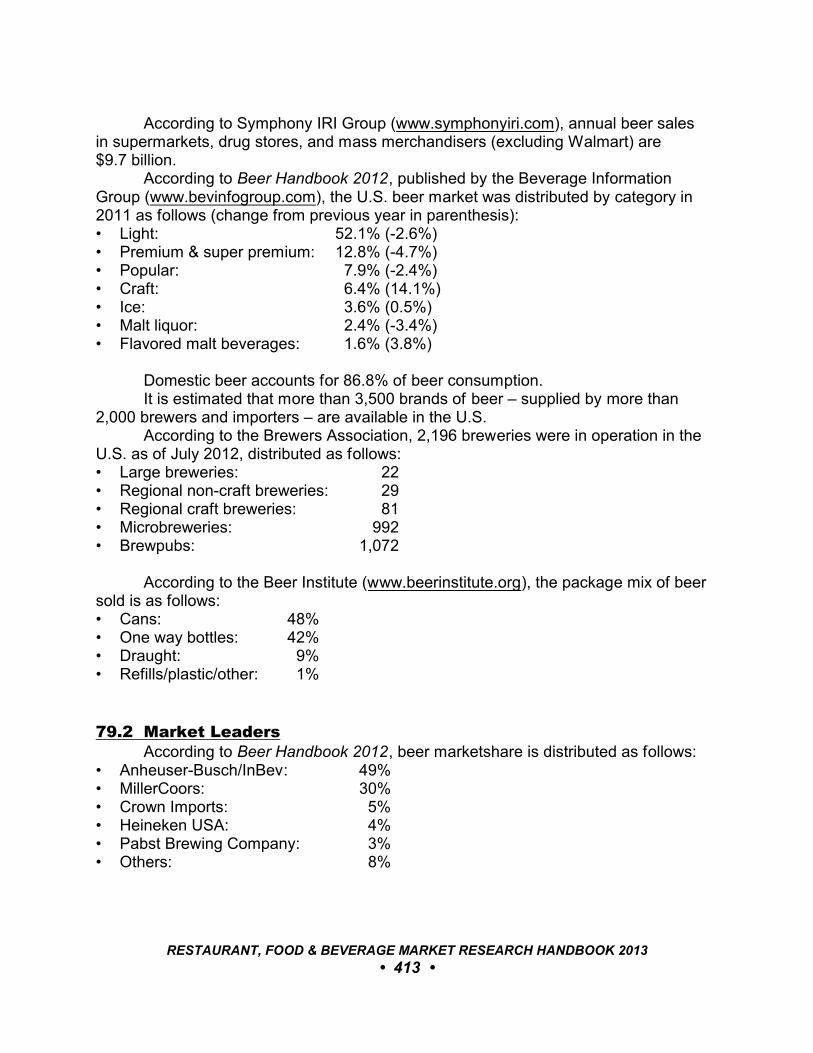
According to Symphony IRI Group (www.symphonyiri.com), annual beer sales in supermarkets, drug stores, and mass merchandisers (excluding Walmart) are $9.7 billion.
According to Beer Handbook 2012, published by the Beverage InformationGroup (www.bevinfogroup.com), the U.S. beer market was distributed by category in2011 as follows (change from previous year in parenthesis):• Light: 52.1% (-2.6%)• Premium & super premium: 12.8% (-4.7%)• Popular: 7.9% (-2.4%)• Craft: 6.4% (14.1%)• Ice: 3.6% (0.5%)• Malt liquor: 2.4% (-3.4%)• Flavored malt beverages: 1.6% (3.8%)
Domestic beer accounts for 86.8% of beer consumption. It is estimated that more than 3,500 brands of beer – supplied by more than
2,000 brewers and importers – are available in the U.S.According to the Brewers Association, 2,196 breweries were in operation in the
U.S. as of July 2012, distributed as follows:• Large breweries: 22• Regional non-craft breweries: 29• Regional craft breweries: 81• Microbreweries: 992• Brewpubs: 1,072
According to the Beer Institute (www.beerinstitute.org), the package mix of beersold is as follows:• Cans: 48%• One way bottles: 42%• Draught: 9%• Refills/plastic/other: 1%
79.2 Market LeadersAccording to Beer Handbook 2012, beer marketshare is distributed as follows:
• Anheuser-Busch/InBev: 49%• MillerCoors: 30%• Crown Imports: 5%• Heineken USA: 4%• Pabst Brewing Company: 3%• Others: 8%
RESTAURANT, FOOD & BEVERAGE MARKET RESEARCH HANDBOOK 2013
• 413 •
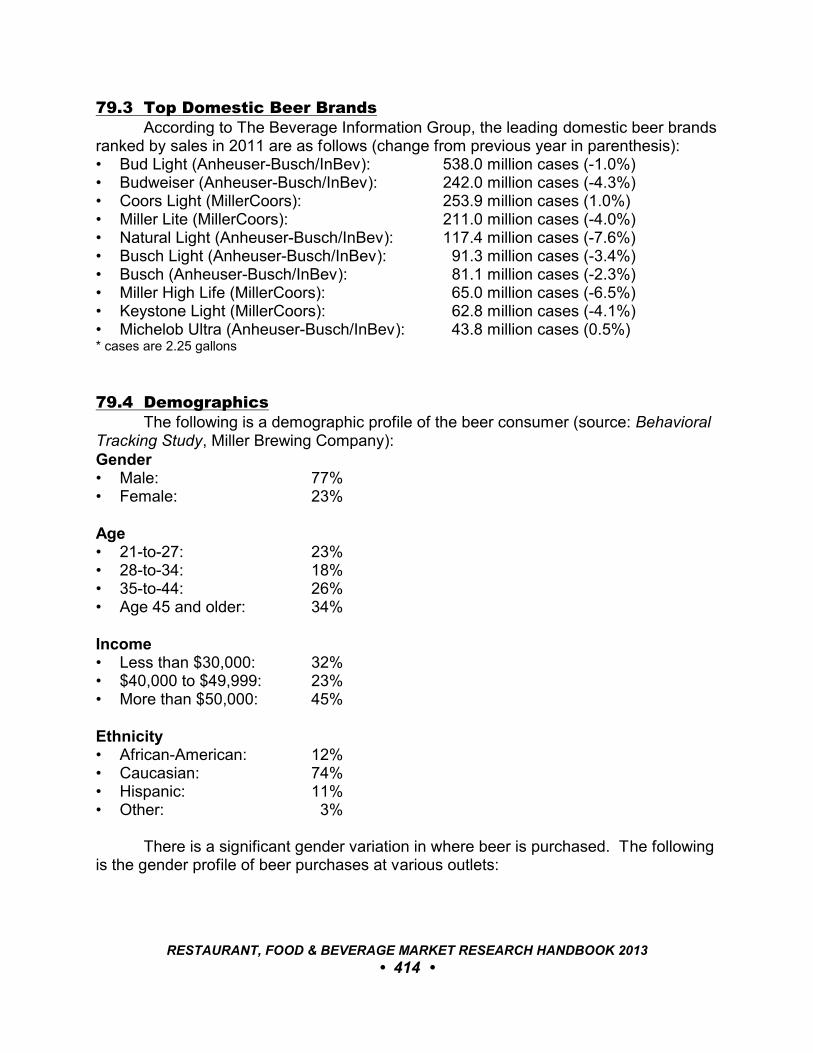
79.3 Top Domestic Beer BrandsAccording to The Beverage Information Group, the leading domestic beer brands
ranked by sales in 2011 are as follows (change from previous year in parenthesis):• Bud Light (Anheuser-Busch/InBev): 538.0 million cases (-1.0%)• Budweiser (Anheuser-Busch/InBev): 242.0 million cases (-4.3%)• Coors Light (MillerCoors): 253.9 million cases (1.0%)• Miller Lite (MillerCoors): 211.0 million cases (-4.0%)• Natural Light (Anheuser-Busch/InBev): 117.4 million cases (-7.6%)• Busch Light (Anheuser-Busch/InBev): 91.3 million cases (-3.4%)• Busch (Anheuser-Busch/InBev): 81.1 million cases (-2.3%)• Miller High Life (MillerCoors): 65.0 million cases (-6.5%)• Keystone Light (MillerCoors): 62.8 million cases (-4.1%)• Michelob Ultra (Anheuser-Busch/InBev): 43.8 million cases (0.5%)* cases are 2.25 gallons
79.4 DemographicsThe following is a demographic profile of the beer consumer (source: Behavioral
Tracking Study, Miller Brewing Company):Gender• Male: 77%• Female: 23%
Age• 21-to-27: 23%• 28-to-34: 18%• 35-to-44: 26%• Age 45 and older: 34%
Income• Less than $30,000: 32%• $40,000 to $49,999: 23%• More than $50,000: 45%
Ethnicity• African-American: 12%• Caucasian: 74%• Hispanic: 11%• Other: 3%
There is a significant gender variation in where beer is purchased. The followingis the gender profile of beer purchases at various outlets:
RESTAURANT, FOOD & BEVERAGE MARKET RESEARCH HANDBOOK 2013
• 414 •
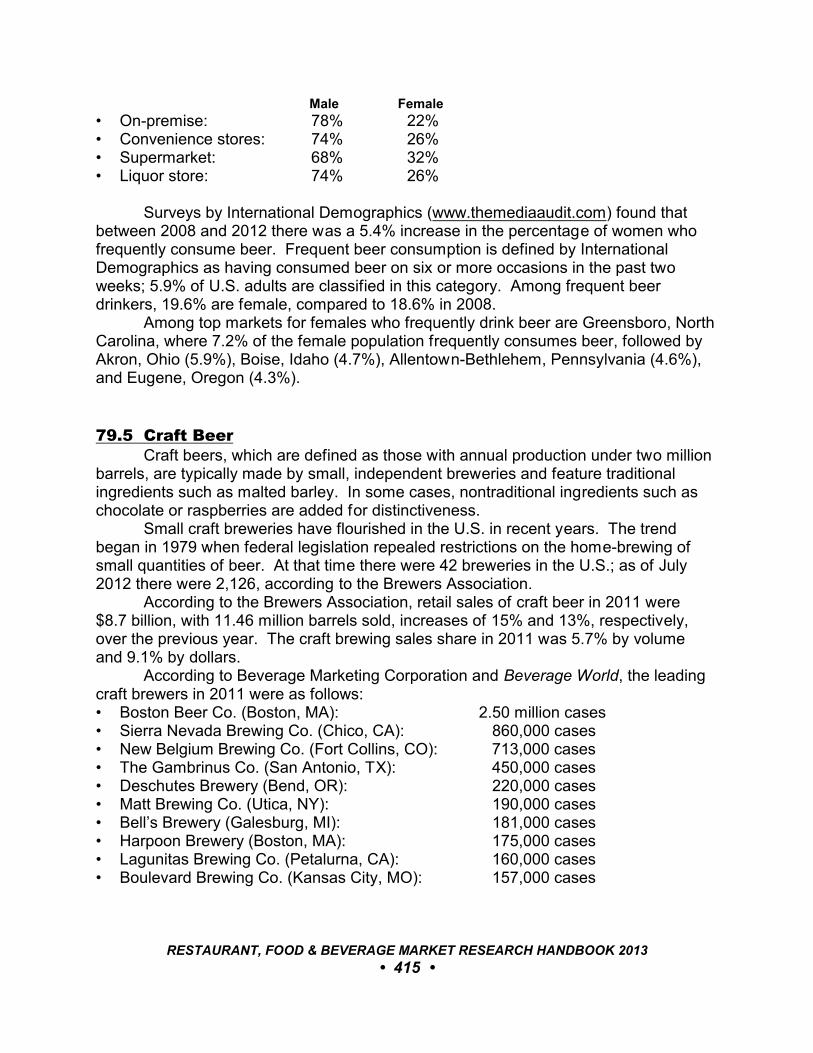
Male Female
• On-premise: 78% 22%• Convenience stores: 74% 26%• Supermarket: 68% 32%• Liquor store: 74% 26%
Surveys by International Demographics (www.themediaaudit.com) found thatbetween 2008 and 2012 there was a 5.4% increase in the percentage of women whofrequently consume beer. Frequent beer consumption is defined by InternationalDemographics as having consumed beer on six or more occasions in the past twoweeks; 5.9% of U.S. adults are classified in this category. Among frequent beerdrinkers, 19.6% are female, compared to 18.6% in 2008.
Among top markets for females who frequently drink beer are Greensboro, NorthCarolina, where 7.2% of the female population frequently consumes beer, followed byAkron, Ohio (5.9%), Boise, Idaho (4.7%), Allentown-Bethlehem, Pennsylvania (4.6%),and Eugene, Oregon (4.3%).
79.5 Craft BeerCraft beers, which are defined as those with annual production under two million
barrels, are typically made by small, independent breweries and feature traditionalingredients such as malted barley. In some cases, nontraditional ingredients such aschocolate or raspberries are added for distinctiveness.
Small craft breweries have flourished in the U.S. in recent years. The trendbegan in 1979 when federal legislation repealed restrictions on the home-brewing ofsmall quantities of beer. At that time there were 42 breweries in the U.S.; as of July2012 there were 2,126, according to the Brewers Association.
According to the Brewers Association, retail sales of craft beer in 2011 were $8.7 billion, with 11.46 million barrels sold, increases of 15% and 13%, respectively,over the previous year. The craft brewing sales share in 2011 was 5.7% by volume and 9.1% by dollars.
According to Beverage Marketing Corporation and Beverage World, the leadingcraft brewers in 2011 were as follows:• Boston Beer Co. (Boston, MA): 2.50 million cases• Sierra Nevada Brewing Co. (Chico, CA): 860,000 cases• New Belgium Brewing Co. (Fort Collins, CO): 713,000 cases• The Gambrinus Co. (San Antonio, TX): 450,000 cases• Deschutes Brewery (Bend, OR): 220,000 cases• Matt Brewing Co. (Utica, NY): 190,000 cases• Bell’s Brewery (Galesburg, MI): 181,000 cases• Harpoon Brewery (Boston, MA): 175,000 cases• Lagunitas Brewing Co. (Petalurna, CA): 160,000 cases• Boulevard Brewing Co. (Kansas City, MO): 157,000 cases
RESTAURANT, FOOD & BEVERAGE MARKET RESEARCH HANDBOOK 2013
• 415 •
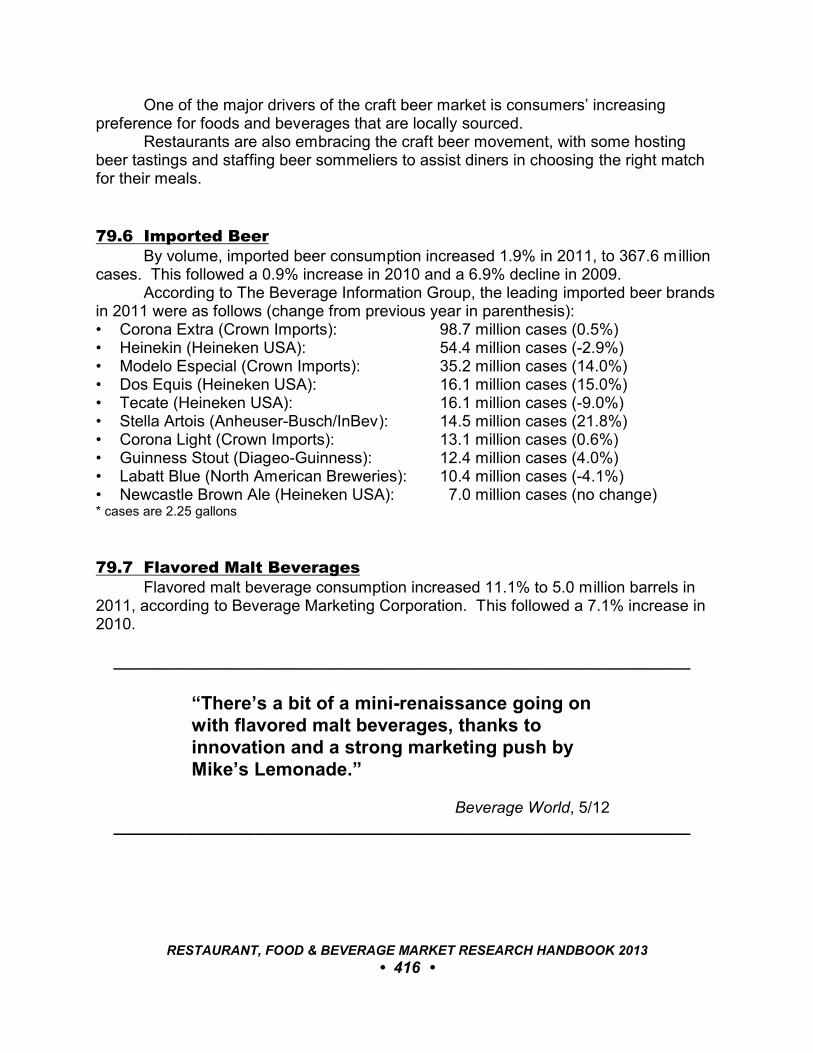
One of the major drivers of the craft beer market is consumers’ increasingpreference for foods and beverages that are locally sourced.
Restaurants are also embracing the craft beer movement, with some hostingbeer tastings and staffing beer sommeliers to assist diners in choosing the right matchfor their meals.
79.6 Imported BeerBy volume, imported beer consumption increased 1.9% in 2011, to 367.6 million
cases. This followed a 0.9% increase in 2010 and a 6.9% decline in 2009.According to The Beverage Information Group, the leading imported beer brands
in 2011 were as follows (change from previous year in parenthesis):• Corona Extra (Crown Imports): 98.7 million cases (0.5%)• Heinekin (Heineken USA): 54.4 million cases (-2.9%)• Modelo Especial (Crown Imports): 35.2 million cases (14.0%)• Dos Equis (Heineken USA): 16.1 million cases (15.0%)• Tecate (Heineken USA): 16.1 million cases (-9.0%)• Stella Artois (Anheuser-Busch/InBev): 14.5 million cases (21.8%)• Corona Light (Crown Imports): 13.1 million cases (0.6%)• Guinness Stout (Diageo-Guinness): 12.4 million cases (4.0%)• Labatt Blue (North American Breweries): 10.4 million cases (-4.1%)• Newcastle Brown Ale (Heineken USA): 7.0 million cases (no change)* cases are 2.25 gallons
79.7 Flavored Malt BeveragesFlavored malt beverage consumption increased 11.1% to 5.0 million barrels in
2011, according to Beverage Marketing Corporation. This followed a 7.1% increase in2010.
_________________________________________________________________
“There’s a bit of a mini-renaissance going onwith flavored malt beverages, thanks toinnovation and a strong marketing push byMike’s Lemonade.”
Beverage World, 5/12 _________________________________________________________________
RESTAURANT, FOOD & BEVERAGE MARKET RESEARCH HANDBOOK 2013
• 416 •
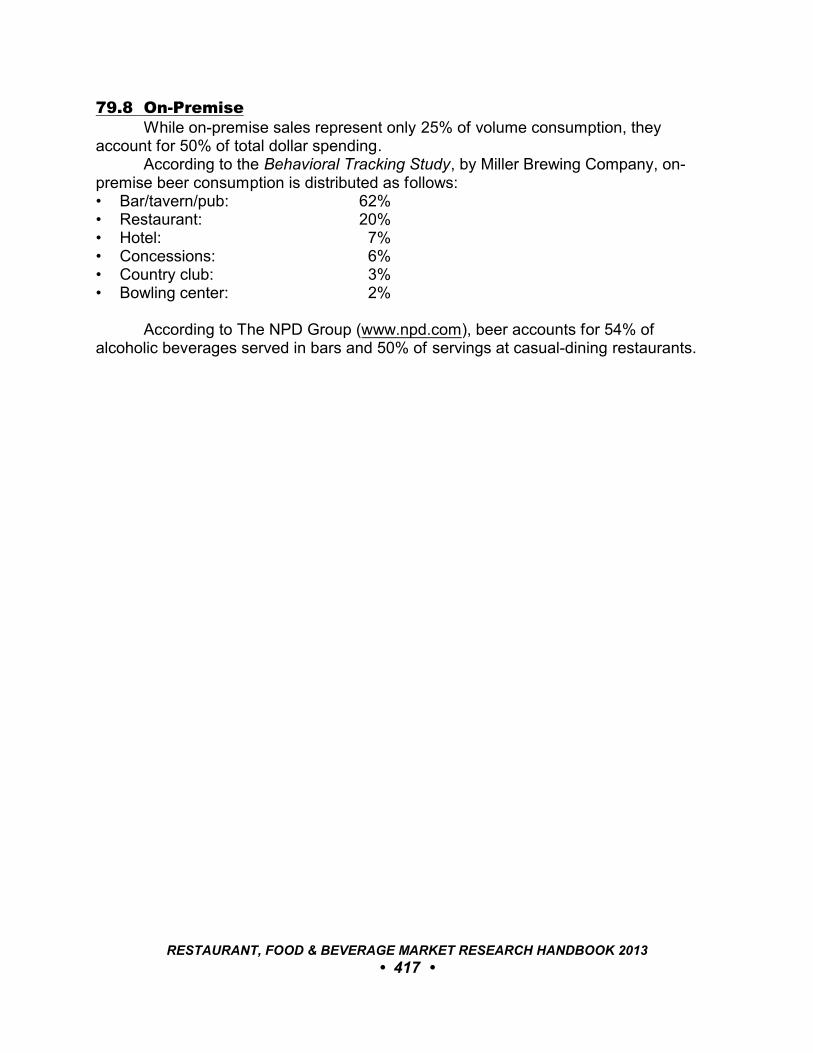
79.8 On-PremiseWhile on-premise sales represent only 25% of volume consumption, they
account for 50% of total dollar spending.According to the Behavioral Tracking Study, by Miller Brewing Company, on-
premise beer consumption is distributed as follows:• Bar/tavern/pub: 62%• Restaurant: 20%• Hotel: 7%• Concessions: 6%• Country club: 3%• Bowling center: 2%
According to The NPD Group (www.npd.com), beer accounts for 54% of alcoholic beverages served in bars and 50% of servings at casual-dining restaurants.
RESTAURANT, FOOD & BEVERAGE MARKET RESEARCH HANDBOOK 2013
• 417 •
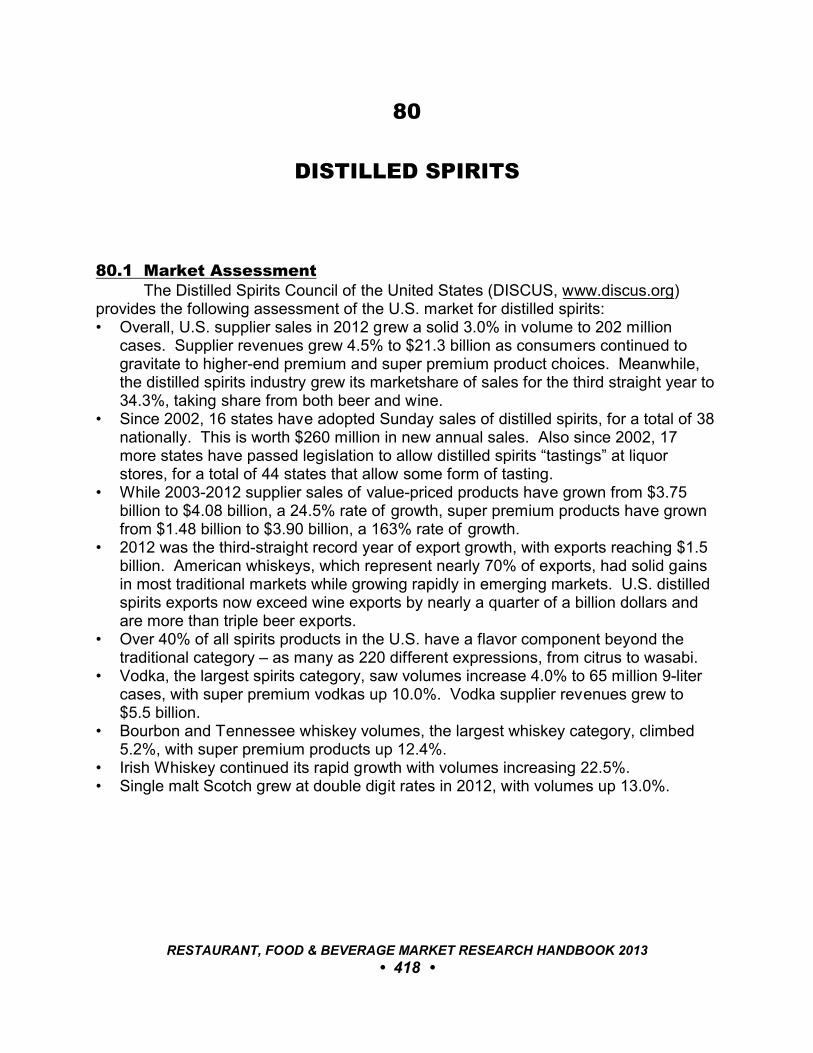
80
DISTILLED SPIRITS
80.1 Market AssessmentThe Distilled Spirits Council of the United States (DISCUS, www.discus.org)
provides the following assessment of the U.S. market for distilled spirits:• Overall, U.S. supplier sales in 2012 grew a solid 3.0% in volume to 202 million
cases. Supplier revenues grew 4.5% to $21.3 billion as consumers continued togravitate to higher-end premium and super premium product choices. Meanwhile,the distilled spirits industry grew its marketshare of sales for the third straight year to34.3%, taking share from both beer and wine.
• Since 2002, 16 states have adopted Sunday sales of distilled spirits, for a total of 38nationally. This is worth $260 million in new annual sales. Also since 2002, 17more states have passed legislation to allow distilled spirits “tastings” at liquorstores, for a total of 44 states that allow some form of tasting.
• While 2003-2012 supplier sales of value-priced products have grown from $3.75billion to $4.08 billion, a 24.5% rate of growth, super premium products have grownfrom $1.48 billion to $3.90 billion, a 163% rate of growth.
• 2012 was the third-straight record year of export growth, with exports reaching $1.5billion. American whiskeys, which represent nearly 70% of exports, had solid gainsin most traditional markets while growing rapidly in emerging markets. U.S. distilledspirits exports now exceed wine exports by nearly a quarter of a billion dollars andare more than triple beer exports.
• Over 40% of all spirits products in the U.S. have a flavor component beyond thetraditional category – as many as 220 different expressions, from citrus to wasabi.
• Vodka, the largest spirits category, saw volumes increase 4.0% to 65 million 9-litercases, with super premium vodkas up 10.0%. Vodka supplier revenues grew to$5.5 billion.
• Bourbon and Tennessee whiskey volumes, the largest whiskey category, climbed5.2%, with super premium products up 12.4%.
• Irish Whiskey continued its rapid growth with volumes increasing 22.5%.• Single malt Scotch grew at double digit rates in 2012, with volumes up 13.0%.
RESTAURANT, FOOD & BEVERAGE MARKET RESEARCH HANDBOOK 2013
• 418 •
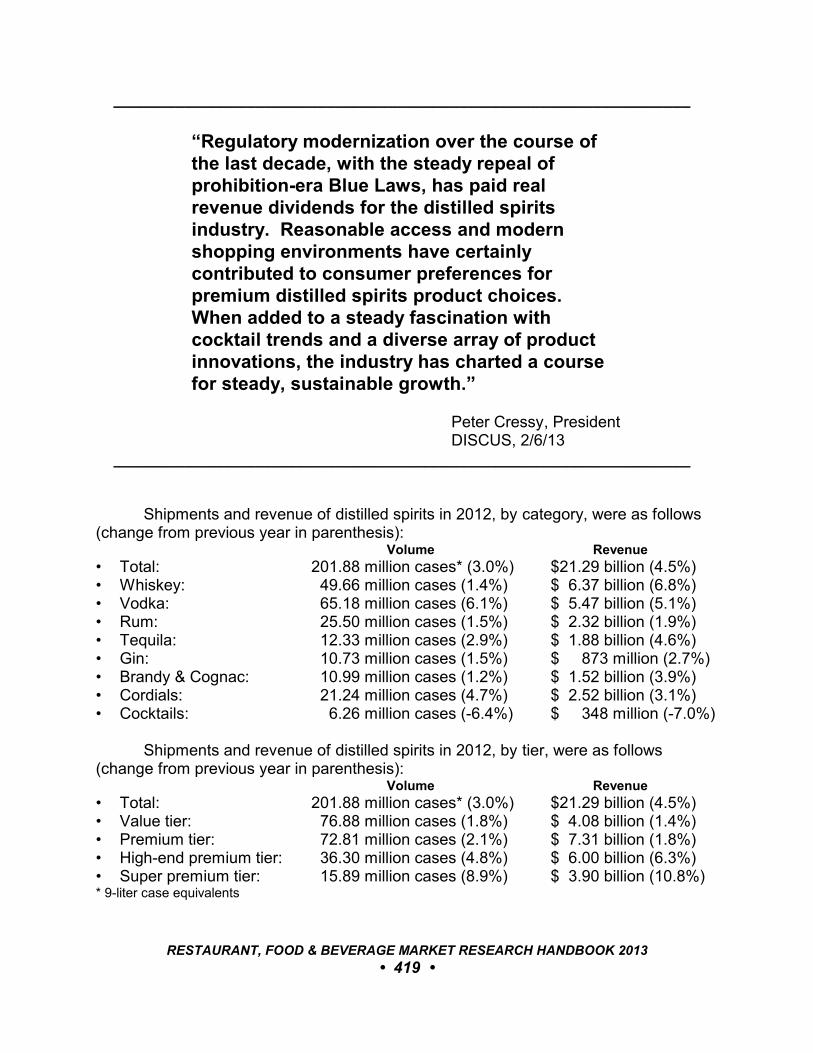
_________________________________________________________________
“Regulatory modernization over the course ofthe last decade, with the steady repeal ofprohibition-era Blue Laws, has paid realrevenue dividends for the distilled spiritsindustry. Reasonable access and modernshopping environments have certainlycontributed to consumer preferences forpremium distilled spirits product choices. When added to a steady fascination withcocktail trends and a diverse array of productinnovations, the industry has charted a coursefor steady, sustainable growth.”
Peter Cressy, President DISCUS, 2/6/13
_________________________________________________________________
Shipments and revenue of distilled spirits in 2012, by category, were as follows(change from previous year in parenthesis):
Volume Revenue
• Total: 201.88 million cases* (3.0%) $21.29 billion (4.5%)• Whiskey: 49.66 million cases (1.4%) $ 6.37 billion (6.8%)• Vodka: 65.18 million cases (6.1%) $ 5.47 billion (5.1%)• Rum: 25.50 million cases (1.5%) $ 2.32 billion (1.9%)• Tequila: 12.33 million cases (2.9%) $ 1.88 billion (4.6%)• Gin: 10.73 million cases (1.5%) $ 873 million (2.7%)• Brandy & Cognac: 10.99 million cases (1.2%) $ 1.52 billion (3.9%)• Cordials: 21.24 million cases (4.7%) $ 2.52 billion (3.1%)• Cocktails: 6.26 million cases (-6.4%) $ 348 million (-7.0%)
Shipments and revenue of distilled spirits in 2012, by tier, were as follows(change from previous year in parenthesis):
Volume Revenue
• Total: 201.88 million cases* (3.0%) $21.29 billion (4.5%)• Value tier: 76.88 million cases (1.8%) $ 4.08 billion (1.4%)• Premium tier: 72.81 million cases (2.1%) $ 7.31 billion (1.8%)• High-end premium tier: 36.30 million cases (4.8%) $ 6.00 billion (6.3%)• Super premium tier: 15.89 million cases (8.9%) $ 3.90 billion (10.8%)* 9-liter case equivalents
RESTAURANT, FOOD & BEVERAGE MARKET RESEARCH HANDBOOK 2013
• 419 •
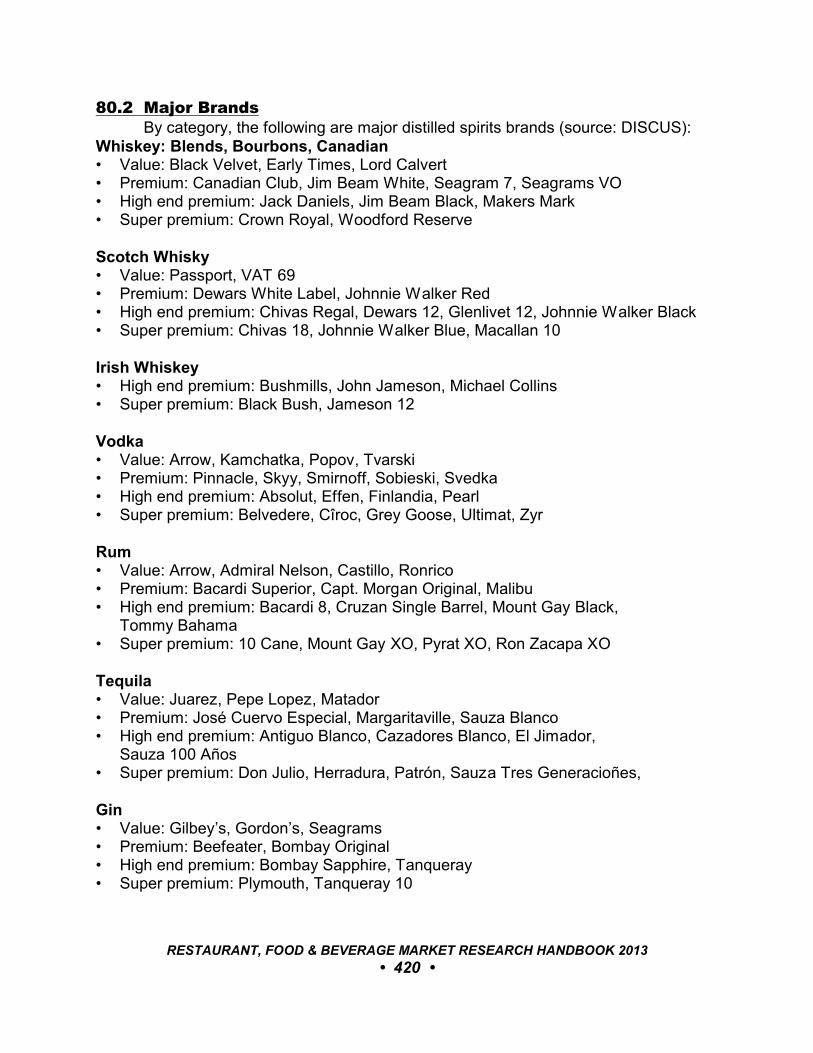
80.2 Major BrandsBy category, the following are major distilled spirits brands (source: DISCUS):
Whiskey: Blends, Bourbons, Canadian• Value: Black Velvet, Early Times, Lord Calvert• Premium: Canadian Club, Jim Beam White, Seagram 7, Seagrams VO• High end premium: Jack Daniels, Jim Beam Black, Makers Mark• Super premium: Crown Royal, Woodford Reserve
Scotch Whisky• Value: Passport, VAT 69• Premium: Dewars White Label, Johnnie Walker Red• High end premium: Chivas Regal, Dewars 12, Glenlivet 12, Johnnie Walker Black• Super premium: Chivas 18, Johnnie Walker Blue, Macallan 10
Irish Whiskey• High end premium: Bushmills, John Jameson, Michael Collins• Super premium: Black Bush, Jameson 12
Vodka• Value: Arrow, Kamchatka, Popov, Tvarski• Premium: Pinnacle, Skyy, Smirnoff, Sobieski, Svedka• High end premium: Absolut, Effen, Finlandia, Pearl• Super premium: Belvedere, Cîroc, Grey Goose, Ultimat, Zyr
Rum• Value: Arrow, Admiral Nelson, Castillo, Ronrico• Premium: Bacardi Superior, Capt. Morgan Original, Malibu• High end premium: Bacardi 8, Cruzan Single Barrel, Mount Gay Black,
Tommy Bahama• Super premium: 10 Cane, Mount Gay XO, Pyrat XO, Ron Zacapa XO
Tequila• Value: Juarez, Pepe Lopez, Matador• Premium: José Cuervo Especial, Margaritaville, Sauza Blanco• High end premium: Antiguo Blanco, Cazadores Blanco, El Jimador,
Sauza 100 Años• Super premium: Don Julio, Herradura, Patrón, Sauza Tres Generacioñes,
Gin• Value: Gilbey’s, Gordon’s, Seagrams• Premium: Beefeater, Bombay Original• High end premium: Bombay Sapphire, Tanqueray• Super premium: Plymouth, Tanqueray 10
RESTAURANT, FOOD & BEVERAGE MARKET RESEARCH HANDBOOK 2013
• 420 •
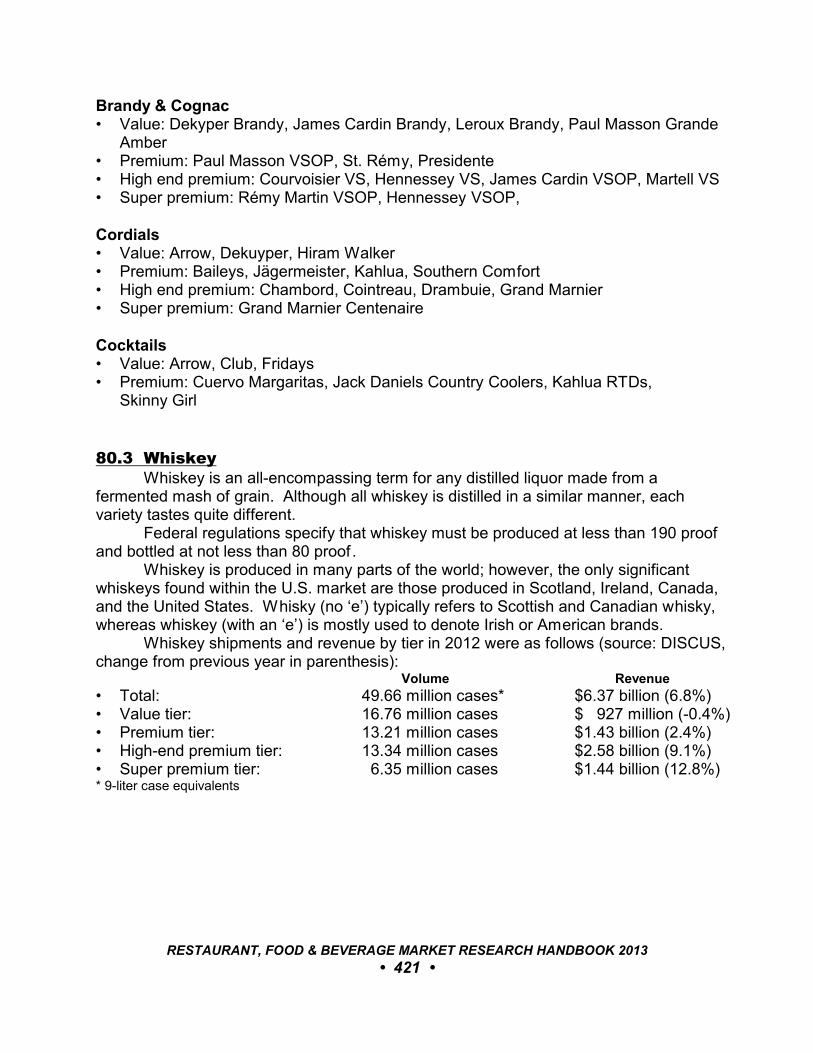
Brandy & Cognac• Value: Dekyper Brandy, James Cardin Brandy, Leroux Brandy, Paul Masson Grande
Amber• Premium: Paul Masson VSOP, St. Rémy, Presidente• High end premium: Courvoisier VS, Hennessey VS, James Cardin VSOP, Martell VS• Super premium: Rémy Martin VSOP, Hennessey VSOP,
Cordials• Value: Arrow, Dekuyper, Hiram Walker• Premium: Baileys, Jägermeister, Kahlua, Southern Comfort• High end premium: Chambord, Cointreau, Drambuie, Grand Marnier• Super premium: Grand Marnier Centenaire
Cocktails• Value: Arrow, Club, Fridays • Premium: Cuervo Margaritas, Jack Daniels Country Coolers, Kahlua RTDs,
Skinny Girl
80.3 WhiskeyWhiskey is an all-encompassing term for any distilled liquor made from a
fermented mash of grain. Although all whiskey is distilled in a similar manner, eachvariety tastes quite different.
Federal regulations specify that whiskey must be produced at less than 190 proofand bottled at not less than 80 proof .
Whiskey is produced in many parts of the world; however, the only significantwhiskeys found within the U.S. market are those produced in Scotland, Ireland, Canada,and the United States. Whisky (no ‘e’) typically refers to Scottish and Canadian whisky,whereas whiskey (with an ‘e’) is mostly used to denote Irish or American brands.
Whiskey shipments and revenue by tier in 2012 were as follows (source: DISCUS,change from previous year in parenthesis):
Volume Revenue
• Total: 49.66 million cases* $6.37 billion (6.8%)• Value tier: 16.76 million cases $ 927 million (-0.4%)• Premium tier: 13.21 million cases $1.43 billion (2.4%)• High-end premium tier: 13.34 million cases $2.58 billion (9.1%)• Super premium tier: 6.35 million cases $1.44 billion (12.8%)* 9-liter case equivalents
RESTAURANT, FOOD & BEVERAGE MARKET RESEARCH HANDBOOK 2013
• 421 •

Shipments and revenue by category in 2012 were as follows: Volume Revenue
• Blended whiskey: 5.86 million cases* (0.3%) $ 327 million (2.9%) • Bourbon & Tennessee: 16.88 million cases (5.2%) $2.22 billion (7.3%)• Canadian: 16.03 million cases (2.1%) $1.60 billion (3.1%)• Scotch - blended: 7.64 million cases (-0.4%) $1.29 billion (3.9%)• Scotch - single malt: 1.59 million cases (13.0%) $ 518 million (16.4%)• Irish: 2.16 million cases (22.5%) $ 415 million (23.7%)* 9-liter case equivalents
The following are the leading brands of American bourbon and whiskey in the U.S.,ranked by number of cases shipped in 2011 (source: Liquor Handbook 2012, published byThe Beverage Information Group [www.beveragenet.net], change from previous year inparenthesis):
American Bourbon and Straight Whiskey• Jack Daniel’s: 4.66 million cases* (0.2%)• Jim Beam: 3.16 million cases (4.3%)• Evan Williams: 1.30 million cases (1.2%)• Makers Mark: 1.04 million cases (13.2%) • Early Times: 570,000 cases (-7.6%)• Wild Turkey: 555,000 cases (0.9%)• Ten High: 450,000 cases (no change)• Old Crow: 435,000 cases (1.4%)• Ancient Age/AAA: 370,000 cases (-1.3%)• Heaven Hill: 290,000 cases (-2.0%)* 9-liter case equivalents
_________________________________________________________________
“Bourbon is American like jazz and baseball –most of the interest is in bourbon.”
Bobby Fitzgerald, OwnerLincoln Whiskey KitchenCheers, 9/12
_________________________________________________________________
Canadian Whisky• Crown Royal: 4.04 million cases* (1.0%)• Black Velvet: 1.89 million cases (5.6%)• Canadian Mist: 1.62 million cases (-6.1%)• Canadian Club: 1.18 million cases (0.8%)
RESTAURANT, FOOD & BEVERAGE MARKET RESEARCH HANDBOOK 2013
• 422 •
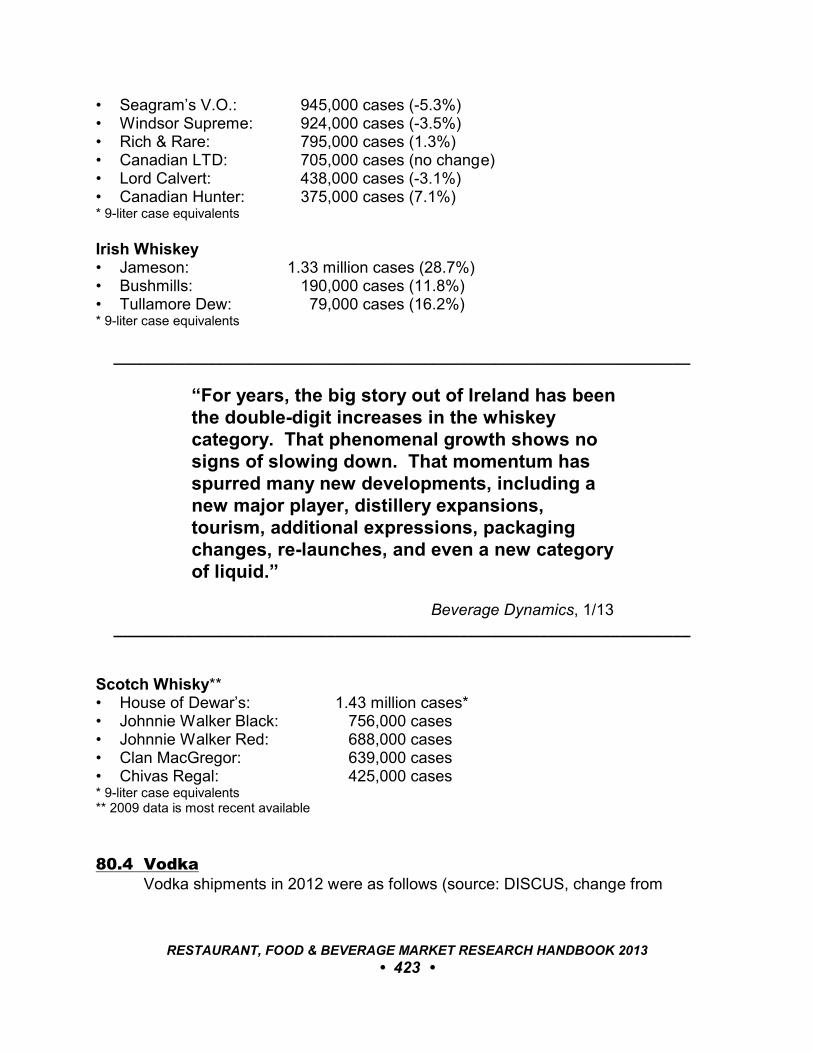
• Seagram’s V.O.: 945,000 cases (-5.3%)• Windsor Supreme: 924,000 cases (-3.5%)• Rich & Rare: 795,000 cases (1.3%)• Canadian LTD: 705,000 cases (no change)• Lord Calvert: 438,000 cases (-3.1%)• Canadian Hunter: 375,000 cases (7.1%)* 9-liter case equivalents
Irish Whiskey• Jameson: 1.33 million cases (28.7%)• Bushmills: 190,000 cases (11.8%)• Tullamore Dew: 79,000 cases (16.2%)* 9-liter case equivalents
_________________________________________________________________
“For years, the big story out of Ireland has beenthe double-digit increases in the whiskeycategory. That phenomenal growth shows nosigns of slowing down. That momentum hasspurred many new developments, including anew major player, distillery expansions,tourism, additional expressions, packagingchanges, re-launches, and even a new categoryof liquid.”
Beverage Dynamics, 1/13 _________________________________________________________________
Scotch Whisky**• House of Dewar’s: 1.43 million cases*• Johnnie Walker Black: 756,000 cases• Johnnie Walker Red: 688,000 cases• Clan MacGregor: 639,000 cases• Chivas Regal: 425,000 cases* 9-liter case equivalents** 2009 data is most recent available
80.4 VodkaVodka shipments in 2012 were as follows (source: DISCUS, change from
RESTAURANT, FOOD & BEVERAGE MARKET RESEARCH HANDBOOK 2013
• 423 •

previous year in parenthesis): Volume Revenue
• Total: 65.18 million cases* (4.0%) $5.47 billion (5.1%)• Value tier: 26.56 million cases (1.7%) $1.08 million (1.4%)• Premium tier: 19.82 million cases (5.7%) $1.51 billion (5.4%)• High-end premium tier: 12.54 million cases (3.5%) $1.60 billion (4.0%)• Super premium tier: 6.26 million cases (10.0%) $1.27 billion (9.5%)* 9-liter case equivalents
The following are the leading brands of vodka in the U.S., ranked by number ofcases shipped in 2011 (source: The Beverage Information Group; change from previousyear in parenthesis):• Smirnoff: 9.66 million cases* (0.6%)• Absolut: 4.56 million cases (-1.2%)• Svedka: 3.69 million cases (12.9%)• Grey Goose: 3.42 million cases (0.6%)• Skyy: 2.74 million cases (1.5%)• Pinnacle: 2.70 million cases (92.9%)• McCormick: 2.20 million cases (-2.8%)• Barton: 1.93 million cases (4.0%)• Ketel One: 1.90 million cases (5.2%)• Skol: 1.80 million cases (7.9%)* 9-liter case equivalents
Vodka continues to be the most popular liquor in the United States, accounting formore than one out of every five bottles of distilled spirits sold. Lacking aroma, taste, andcolor, vodka is distilled at a high proof that extracts all of the congeners, or the naturalcompounds, in the distillate that give the product its taste and aroma. Because vodka ishighly neutral, it is possible to make it from a mash of the cheapest and most readilyavailable raw ingredients. Although traditionally made from potatoes, vodka is nowgenerally produced from cereal grains, including rye, wheat, and barley, but mostly corn.
The market for vodka in the U.S. has been one the hottest among all alcoholicbeverage segments over the past few years. While the entire distilled beveragecategory has increased marketshare among alcoholic beverages, sales of vodka havegrown even faster.
RESTAURANT, FOOD & BEVERAGE MARKET RESEARCH HANDBOOK 2013
• 424 •
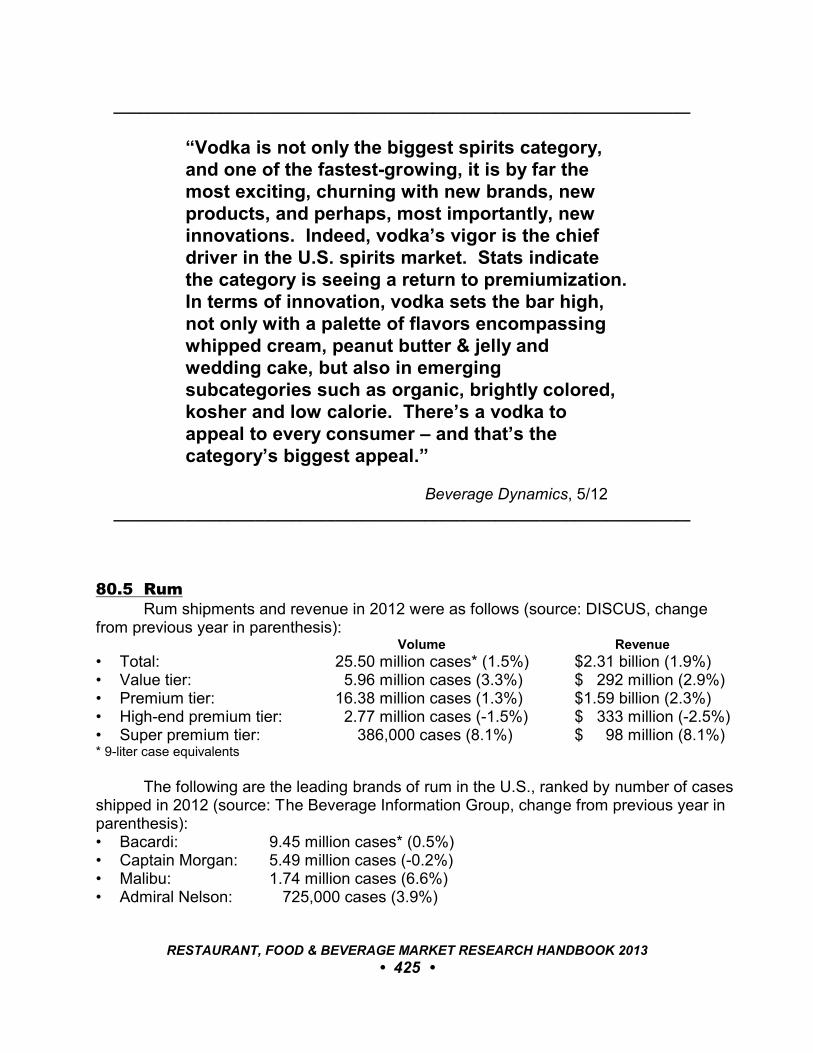
_________________________________________________________________
“Vodka is not only the biggest spirits category,and one of the fastest-growing, it is by far themost exciting, churning with new brands, newproducts, and perhaps, most importantly, newinnovations. Indeed, vodka’s vigor is the chiefdriver in the U.S. spirits market. Stats indicatethe category is seeing a return to premiumization. In terms of innovation, vodka sets the bar high,not only with a palette of flavors encompassingwhipped cream, peanut butter & jelly andwedding cake, but also in emergingsubcategories such as organic, brightly colored,kosher and low calorie. There’s a vodka toappeal to every consumer – and that’s thecategory’s biggest appeal.”
Beverage Dynamics, 5/12 _________________________________________________________________
80.5 RumRum shipments and revenue in 2012 were as follows (source: DISCUS, change
from previous year in parenthesis): Volume Revenue
• Total: 25.50 million cases* (1.5%) $2.31 billion (1.9%)• Value tier: 5.96 million cases (3.3%) $ 292 million (2.9%)• Premium tier: 16.38 million cases (1.3%) $1.59 billion (2.3%)• High-end premium tier: 2.77 million cases (-1.5%) $ 333 million (-2.5%)• Super premium tier: 386,000 cases (8.1%) $ 98 million (8.1%)* 9-liter case equivalents
The following are the leading brands of rum in the U.S., ranked by number of casesshipped in 2012 (source: The Beverage Information Group, change from previous year inparenthesis):• Bacardi: 9.45 million cases* (0.5%)• Captain Morgan: 5.49 million cases (-0.2%)• Malibu: 1.74 million cases (6.6%)• Admiral Nelson: 725,000 cases (3.9%)
RESTAURANT, FOOD & BEVERAGE MARKET RESEARCH HANDBOOK 2013
• 425 •
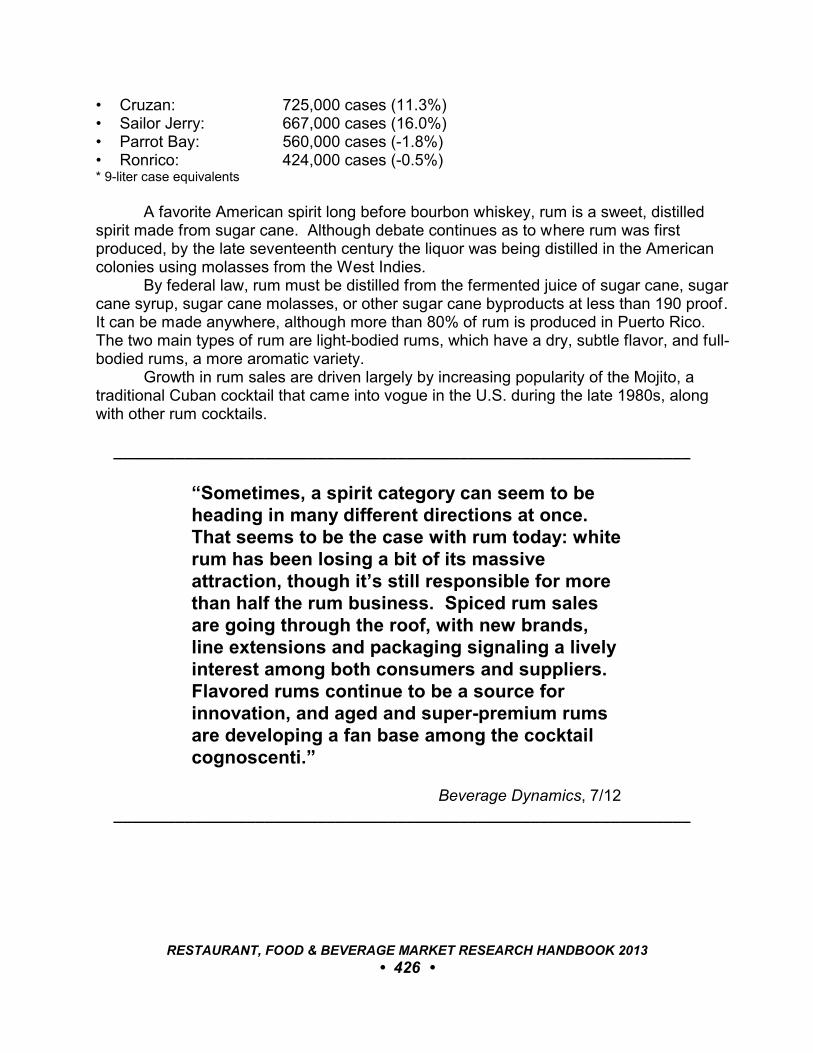
• Cruzan: 725,000 cases (11.3%)• Sailor Jerry: 667,000 cases (16.0%)• Parrot Bay: 560,000 cases (-1.8%)• Ronrico: 424,000 cases (-0.5%)* 9-liter case equivalents
A favorite American spirit long before bourbon whiskey, rum is a sweet, distilledspirit made from sugar cane. Although debate continues as to where rum was firstproduced, by the late seventeenth century the liquor was being distilled in the Americancolonies using molasses from the West Indies.
By federal law, rum must be distilled from the fermented juice of sugar cane, sugarcane syrup, sugar cane molasses, or other sugar cane byproducts at less than 190 proof. It can be made anywhere, although more than 80% of rum is produced in Puerto Rico. The two main types of rum are light-bodied rums, which have a dry, subtle flavor, and full-bodied rums, a more aromatic variety.
Growth in rum sales are driven largely by increasing popularity of the Mojito, atraditional Cuban cocktail that came into vogue in the U.S. during the late 1980s, alongwith other rum cocktails.
_________________________________________________________________
“Sometimes, a spirit category can seem to beheading in many different directions at once. That seems to be the case with rum today: whiterum has been losing a bit of its massiveattraction, though it’s still responsible for morethan half the rum business. Spiced rum salesare going through the roof, with new brands,line extensions and packaging signaling a livelyinterest among both consumers and suppliers. Flavored rums continue to be a source forinnovation, and aged and super-premium rumsare developing a fan base among the cocktailcognoscenti.”
Beverage Dynamics, 7/12 _________________________________________________________________
RESTAURANT, FOOD & BEVERAGE MARKET RESEARCH HANDBOOK 2013
• 426 •
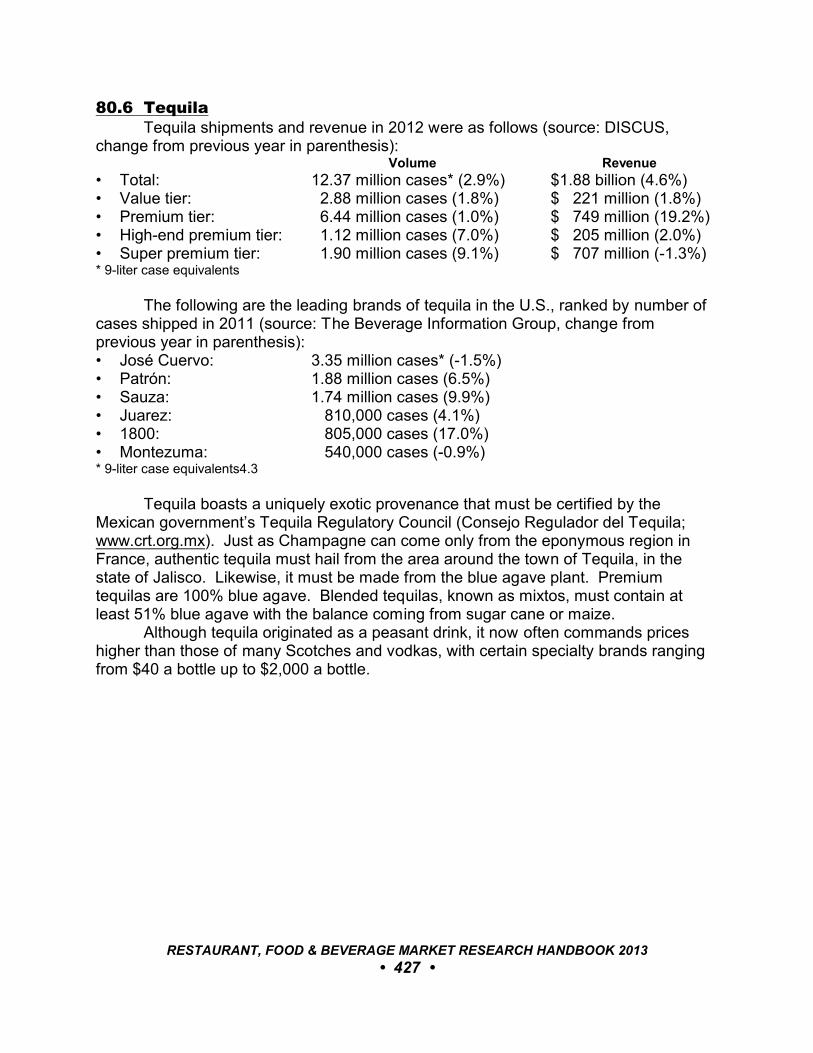
80.6 TequilaTequila shipments and revenue in 2012 were as follows (source: DISCUS,
change from previous year in parenthesis): Volume Revenue
• Total: 12.37 million cases* (2.9%) $1.88 billion (4.6%)• Value tier: 2.88 million cases (1.8%) $ 221 million (1.8%)• Premium tier: 6.44 million cases (1.0%) $ 749 million (19.2%)• High-end premium tier: 1.12 million cases (7.0%) $ 205 million (2.0%)• Super premium tier: 1.90 million cases (9.1%) $ 707 million (-1.3%)* 9-liter case equivalents
The following are the leading brands of tequila in the U.S., ranked by number ofcases shipped in 2011 (source: The Beverage Information Group, change fromprevious year in parenthesis):• José Cuervo: 3.35 million cases* (-1.5%)• Patrón: 1.88 million cases (6.5%)• Sauza: 1.74 million cases (9.9%)• Juarez: 810,000 cases (4.1%)• 1800: 805,000 cases (17.0%)• Montezuma: 540,000 cases (-0.9%)* 9-liter case equivalents4.3
Tequila boasts a uniquely exotic provenance that must be certified by the
Mexican government’s Tequila Regulatory Council (Consejo Regulador del Tequila;www.crt.org.mx). Just as Champagne can come only from the eponymous region inFrance, authentic tequila must hail from the area around the town of Tequila, in thestate of Jalisco. Likewise, it must be made from the blue agave plant. Premiumtequilas are 100% blue agave. Blended tequilas, known as mixtos, must contain atleast 51% blue agave with the balance coming from sugar cane or maize.
Although tequila originated as a peasant drink, it now often commands priceshigher than those of many Scotches and vodkas, with certain specialty brands rangingfrom $40 a bottle up to $2,000 a bottle.
RESTAURANT, FOOD & BEVERAGE MARKET RESEARCH HANDBOOK 2013
• 427 •
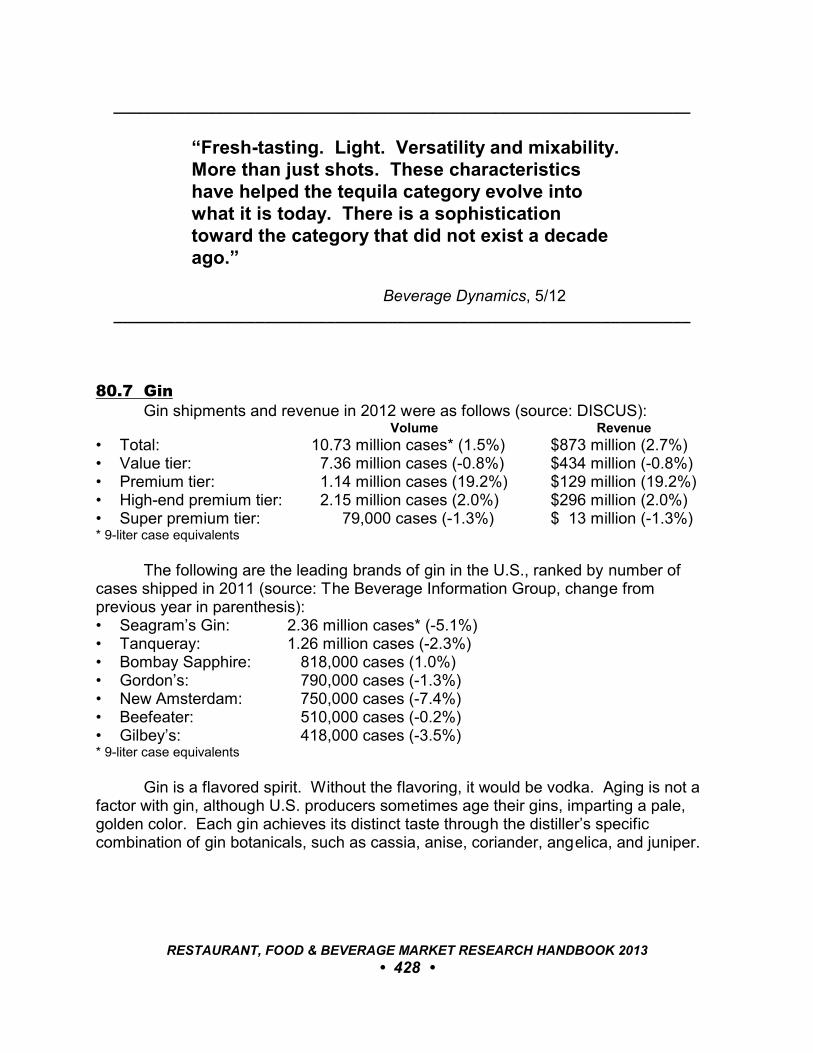
_________________________________________________________________
“Fresh-tasting. Light. Versatility and mixability. More than just shots. These characteristicshave helped the tequila category evolve intowhat it is today. There is a sophisticationtoward the category that did not exist a decadeago.”
Beverage Dynamics, 5/12 _________________________________________________________________
80.7 GinGin shipments and revenue in 2012 were as follows (source: DISCUS):
Volume Revenue
• Total: 10.73 million cases* (1.5%) $873 million (2.7%)• Value tier: 7.36 million cases (-0.8%) $434 million (-0.8%)• Premium tier: 1.14 million cases (19.2%) $129 million (19.2%)• High-end premium tier: 2.15 million cases (2.0%) $296 million (2.0%)• Super premium tier: 79,000 cases (-1.3%) $ 13 million (-1.3%)* 9-liter case equivalents
The following are the leading brands of gin in the U.S., ranked by number ofcases shipped in 2011 (source: The Beverage Information Group, change fromprevious year in parenthesis):• Seagram’s Gin: 2.36 million cases* (-5.1%)• Tanqueray: 1.26 million cases (-2.3%)• Bombay Sapphire: 818,000 cases (1.0%)• Gordon’s: 790,000 cases (-1.3%)• New Amsterdam: 750,000 cases (-7.4%)• Beefeater: 510,000 cases (-0.2%)• Gilbey’s: 418,000 cases (-3.5%)* 9-liter case equivalents
Gin is a flavored spirit. Without the flavoring, it would be vodka. Aging is not afactor with gin, although U.S. producers sometimes age their gins, imparting a pale,golden color. Each gin achieves its distinct taste through the distiller’s specificcombination of gin botanicals, such as cassia, anise, coriander, angelica, and juniper.
RESTAURANT, FOOD & BEVERAGE MARKET RESEARCH HANDBOOK 2013
• 428 •
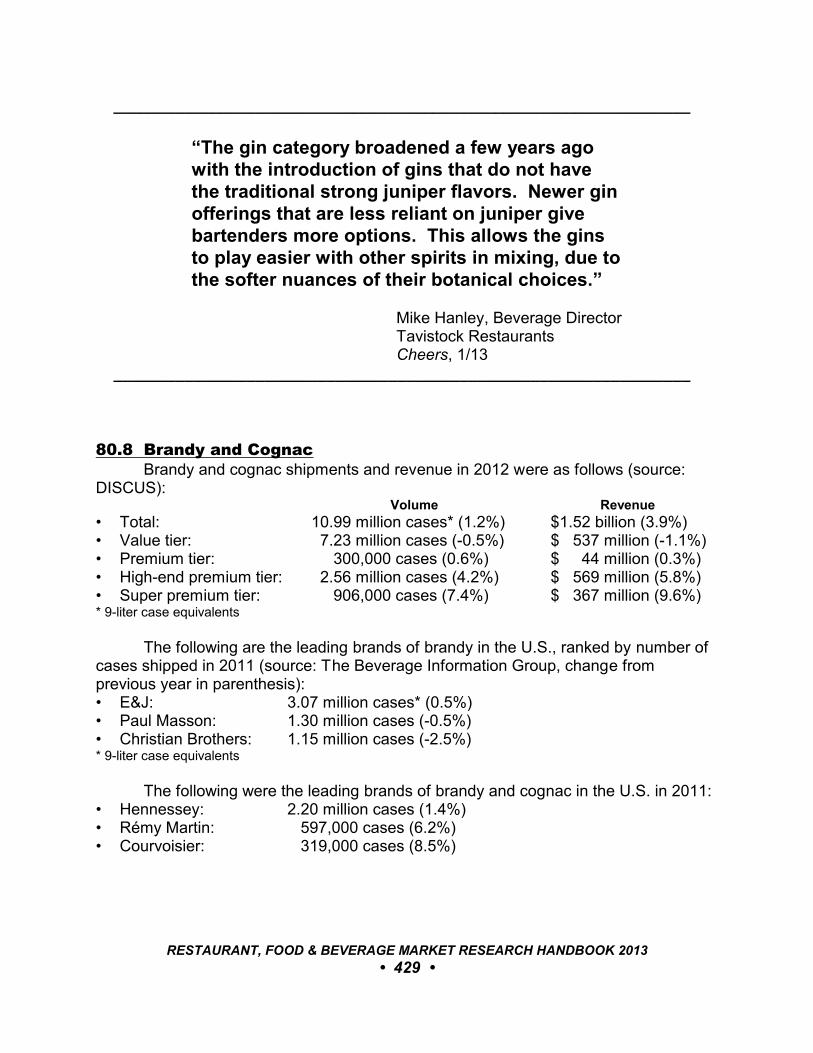
_________________________________________________________________
“The gin category broadened a few years agowith the introduction of gins that do not havethe traditional strong juniper flavors. Newer ginofferings that are less reliant on juniper givebartenders more options. This allows the ginsto play easier with other spirits in mixing, due tothe softer nuances of their botanical choices.”
Mike Hanley, Beverage Director Tavistock Restaurants Cheers, 1/13
_________________________________________________________________
80.8 Brandy and CognacBrandy and cognac shipments and revenue in 2012 were as follows (source:
DISCUS): Volume Revenue
• Total: 10.99 million cases* (1.2%) $1.52 billion (3.9%)• Value tier: 7.23 million cases (-0.5%) $ 537 million (-1.1%)• Premium tier: 300,000 cases (0.6%) $ 44 million (0.3%)• High-end premium tier: 2.56 million cases (4.2%) $ 569 million (5.8%)• Super premium tier: 906,000 cases (7.4%) $ 367 million (9.6%)* 9-liter case equivalents
The following are the leading brands of brandy in the U.S., ranked by number ofcases shipped in 2011 (source: The Beverage Information Group, change fromprevious year in parenthesis):• E&J: 3.07 million cases* (0.5%)• Paul Masson: 1.30 million cases (-0.5%)• Christian Brothers: 1.15 million cases (-2.5%)* 9-liter case equivalents
The following were the leading brands of brandy and cognac in the U.S. in 2011:• Hennessey: 2.20 million cases (1.4%)• Rémy Martin: 597,000 cases (6.2%)• Courvoisier: 319,000 cases (8.5%)
RESTAURANT, FOOD & BEVERAGE MARKET RESEARCH HANDBOOK 2013
• 429 •
Cognac accounts for one-third of all brandy consumed by Americans. By Frenchlaw, supported by the World Trade Organization (www.wto.org), the spirit can originateonly in the town of Cognac and six surrounding viticultural areas.
Because cognac and brandy represent the good life, their market is sometimessuggested as a reflection of the overall economy.
Cognac is increasingly being consumed as a main drink or ingredient in acocktail rather than merely as an after-dinner digestif. Brandy-based cocktails are farfrom new. Patrick Gavin Duffy’s 1934 classic The Official Mixer’s Manual containssome 100 cognac-based cocktails. The current emphasis reflects the increasedpopularity of upscale cocktails.
_________________________________________________________________
“The contrast between brandy and cognactrajectories continues: brandy, the larger of thetwo in volume, dropped 1.5% in 2011.”
Beverage Dynamics, 12/12 _________________________________________________________________
80.9 CordialsCordial shipments and revenue in 2012 were as follows (source: DISCUS,
change from previous year in parenthesis): Volume Revenue
• Total: 21.24 million cases* (4.7%) $2.52 billion (3.1%)• Value tier: 8.08 million cases (9.8%) $ 481 million (9.8%)• Premium tier: 11.14 million cases (0.4%) $1.61 billion (-0.6%)• High-end premium tier: 1.83 million cases (10.7%) $ 421 million (10.9%)• Super premium tier: 11,000 cases (25.9%) $ 4 million (28.4%)* 9-liter case equivalents
The following are the leading brands of cordials and liqueurs in the U.S., rankedby number of cases shipped in 2009 (most recent data available; source: The BeverageInformation Group):• Jägermeister: 2.72 million cases*• DeKuyper: 2.53 million cases• Southern Comfort: 1.37 million cases• Baileys: 1.32 million cases• Kahlua: 1.03 million cases• Hiram Walker Cordials: 918,000 cases• Grand Marnier: 484,000 cases• Hpnotiq: 455,000 cases* 9-liter case equivalents
RESTAURANT, FOOD & BEVERAGE MARKET RESEARCH HANDBOOK 2013
• 430 •
The cordial or liqueur category is the largest and most diverse in terms of thenumber of brands, flavors, and alcohol content. It also is one of the largest in total casesales. Products in this category encompass all flavors and are used as after-dinnerdrinks, aperitifs, components of classic cocktails or popular shooters, or flavorfulenhancements to foods.
Originating in Europe, cordials and liqueurs are alcoholic beverages that areprepared by mixing or compounding various spirits with flavorings. The cordial categoryincludes schnapps, liqueurs, cremes, and brandies.
RESTAURANT, FOOD & BEVERAGE MARKET RESEARCH HANDBOOK 2013
• 431 •
81
WINE
81.1 Market AssessmentWine consumption and gross revenues in the U.S. have been as follows
(sources: Beverage Marketing Corporation [www.beveragemarketing.com] andCanadean [www.canadean.com]; change from previous year in parenthesis):
Consumption Gross Revenues
• 2002: 583.8 million gallons (5.0%) $ 7.0 billion (6.1%)• 2003: 614.1 million gallons (5.2%) $ 7.5 billion (7.1%)• 2004: 637.4 million gallons (3.7%) $ 7.9 billion (5.3%)• 2005: 651.3 million gallons (2.2%) $ 8.3 billion (5.1%)• 2006: 673.4 million gallons (3.4%) $ 8.6 billion (3.5%)• 2007: 700.5 million gallons (4.0%) $ 9.2 billion (7.0%)• 2008: 706.2 million gallons (0.8%) $ 9.4 billion (2.2%)• 2009: 716.8 million gallons (1.5%) $ 9.5 billion (1.1%)• 2010: 732.1 million gallons (2.1%) $ 9.8 billion (3.1%)• 2011: 748.8 million gallons (2.3%) $10.2 billion (4.1%)• 2012: 769.7 million gallons (2.8%) n/a
Distribution of the U.S. table wine market by origin is as follows (source: TheBeverage Information Group [www.beveragenet.net]):• California: 68%• Imported: 26%• Other states: 6%
Among adults, per capita consumption of table wine was 3.08 gallons in 2012.According to London-based International Wine and Spirits Record
(www.iwsp.co.uk), wine consumption in the U.S. is up more that 30% over the pastdecade, elevating the U.S. past Italy as the world’s second-largest consumer of wine. Silicon Valley Bank (www.siliconvalleybank.com) reported consumption reached 3.8 billion bottles in 2010, pushing the U.S. past France as the world’s top wineconsumer. Consumption further increased to 4.0 billion bottles in 2012.
Over 70% of wine purchased for consumption at home is purchased in liquorstores or wine shops, according to The Nielsen Company (www.nielsen.com).
According to Symphony IRI Group (www.symphonyiri.com), annual wine sales insupermarkets, drug stores, and mass merchandisers (excluding Walmart) for the 52-week period ending April 15, 2012 were $6.8 billion.
RESTAURANT, FOOD & BEVERAGE MARKET RESEARCH HANDBOOK 2013
• 432 •
Wine accounts for 12% of alcoholic beverages served in bars and 18% ofservings at casual-dining restaurants, according to The NPD Group (www.npd.com).
81.2 U.S. Wine ExportsIn 2011, U.S. wine exports (90% from California) increased 21.7% in value to
$1.39 billion in winery revenues; this followed a 25.6% increase in 2010. Volumeshipments rose 5.8% to 50.6 million nine-liter cases, according to the U.S. Departmentof Commerce. Wine exports were distributed by country/region as follows:• European Union: $478 million• Canada: $379 million• Hong Kong: $163 million• Japan: $105 million• China: $ 63 million
81.3 Market LeadersAccording to Symphony IRI Group, the following are the top wine brands sold at
supermarkets, drug stores, convenience stores, and mass merchandisers (excludingWalmart), ranked by sales during the 52-week period ending April 15, 2012 (changefrom prior year in parenthesis):• Barefoot: $368.4 million (18.9%)• Sutter Home: $278.7 million (5.5%)• Yellow Tail: $231.1 million (3.2%)• Franzia: $205.6 million (1.9%)• Woodbridge by Robert Mondavi: $198.4 million (6.6%)• Kendall Jackson Vintners: $153.6 million (2.4%)• Gallo Family Vineyards: $129.6 million (13.1%)• Beringer: $121.9 million (-7.7%)• Carlo Rossi: $111.6 million (-4.8%)• Chateau Ste. Michelle: $105.8 million (8.3%)
81.4 Wine Consumer CharacteristicsAccording to 2012 Consumer Tracking Study, conducted for the Wine Market
Council (www.winemarketcouncil.com), among 228 million U.S. adults, 100 million werewine drinkers in 2012. For comparison, 78 million adults were non-drinkers and 50million said they drink only beer or distilled spirits.
Twenty-five percent (25%) of U.S. adults are identified as wine drinkers. Distribution of adults by consumption characteristics is as follows:• Core wine drinker (once per week or more frequently): 25%• Marginal consumer of wine (once every two or three months): 19%
RESTAURANT, FOOD & BEVERAGE MARKET RESEARCH HANDBOOK 2013
• 433 •
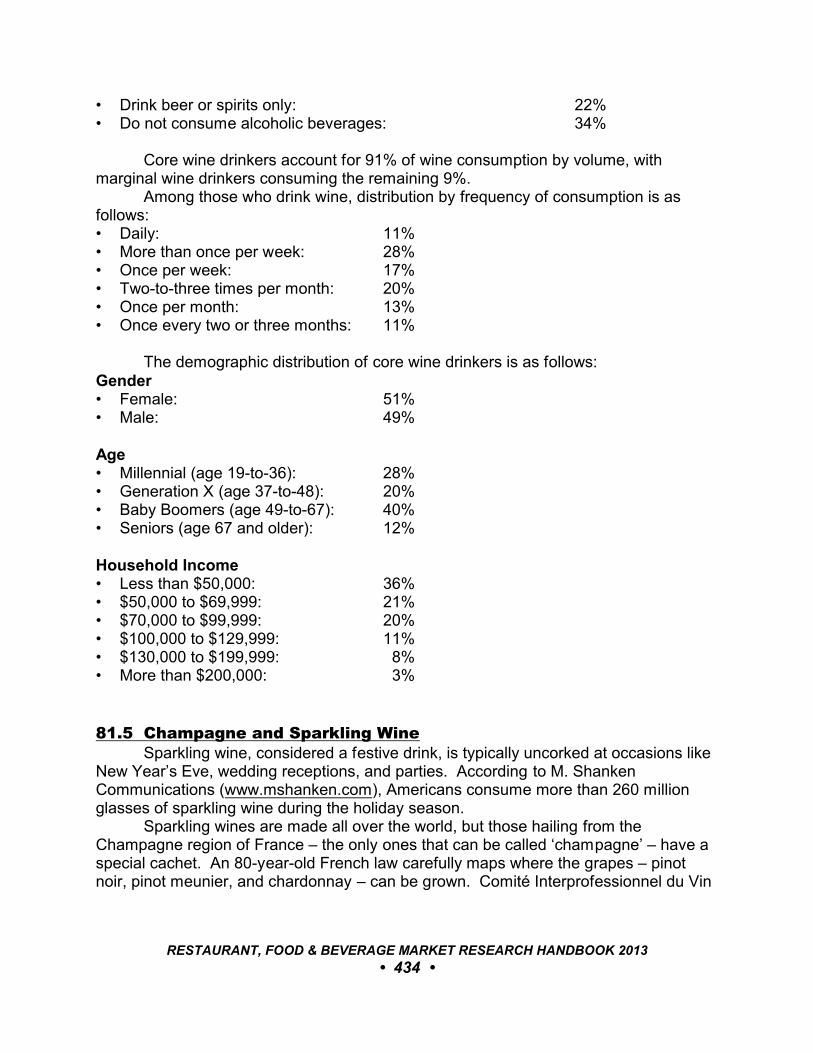
• Drink beer or spirits only: 22%• Do not consume alcoholic beverages: 34%
Core wine drinkers account for 91% of wine consumption by volume, withmarginal wine drinkers consuming the remaining 9%.
Among those who drink wine, distribution by frequency of consumption is asfollows:• Daily: 11%• More than once per week: 28%• Once per week: 17%• Two-to-three times per month: 20%• Once per month: 13%• Once every two or three months: 11%
The demographic distribution of core wine drinkers is as follows:Gender• Female: 51%• Male: 49%
Age• Millennial (age 19-to-36): 28%• Generation X (age 37-to-48): 20%• Baby Boomers (age 49-to-67): 40%• Seniors (age 67 and older): 12%
Household Income• Less than $50,000: 36%• $50,000 to $69,999: 21%• $70,000 to $99,999: 20%• $100,000 to $129,999: 11%• $130,000 to $199,999: 8%• More than $200,000: 3%
81.5 Champagne and Sparkling WineSparkling wine, considered a festive drink, is typically uncorked at occasions like
New Year’s Eve, wedding receptions, and parties. According to M. ShankenCommunications (www.mshanken.com), Americans consume more than 260 millionglasses of sparkling wine during the holiday season.
Sparkling wines are made all over the world, but those hailing from theChampagne region of France – the only ones that can be called ‘champagne’ – have aspecial cachet. An 80-year-old French law carefully maps where the grapes – pinotnoir, pinot meunier, and chardonnay – can be grown. Comité Interprofessionnel du Vin
RESTAURANT, FOOD & BEVERAGE MARKET RESEARCH HANDBOOK 2013
• 434 •

de Champagne (CIVC), the industry’s regulatory body, sets a maximum yield of 10,500kilograms per hectare (4.7 tons per acre) for the annual harvest. Champagne can besold 15 months after harvest; Vintage Champagne and a Champagne Grande Annéemust age at least five years.
According to the Champagne Bureau (www.champagne.us) 16 million bottles ofChampagne were shipped to the U.S. in 2011, a 28% increase f rom the year prior butdown significantly from the peak of 23.2 million bottles shipped in 2006.
Moët & Chandon and Veuve Clicquot, with 600,000 and 400,000 cases,respectively, produced annually, are the leading producers of champagne. These twobrands, which together account for 55% of champagne sold in the U.S. – along withKrug, Ruinart, and Mercier – are owned by the luxury giant LVMH (www.lvmh.com).
Champagne made by independent grower-producers has been quietly gaining afoothold. Many of these small, family-owned vineyards have long supplied the bighouses with grapes: land in Champagne is limited, so big makers rely on the 20,000 orso small farmers across the region for their grapes, which they blend together. About2,000 of these farmers make their own bubbly, the best of which is increasinglyavailable in the United States.
With a steadily increasing demand, winemakers have asked French regulators toredefine or even expand the boundaries of the Champagne region.
Leading U.S. producers of sparkling wine are Andre Champagne Cellars (1.7million), Cook’s (1.3 million), and Korbel Champagne Cellars (1.2 million casesannually).
81.6 OneophilesEnjoyment of wine as a hobby is helping to drive the market. Participation in
wine clubs, winery tours, wine tastings, wine auctions, and wine festivals has becomepopular. For oenophiles, or wine connoisseurs, drinking, learning about, and collectingwine is a cultural and educational experience.
Among core wine drinkers (i.e. those who drink wine at least weekly), 18% are amembers of a wine club; 3% are members of three or more clubs, according to theWine Market Council.
No other beverage, and few consumer products of any type, are prized as aninvestment like wine. In 2011, a 300-bottle collection of Chateau Lafite Rothschild soldat a Christie’s auction for $539,280, a record.
According to Fireman’s Fund (www.firemansfund.com), as many as 10% of thenation’s most affluent households have wine collections worth at least $100,000.
RESTAURANT, FOOD & BEVERAGE MARKET RESEARCH HANDBOOK 2013
• 435 •

82
REFRESHMENT & FUNCTIONAL BEVERAGES
82.1 Carbonated Soft DrinksAccording to Beverage Marketing Corporation (www.beveragemarketing.com),
consumption of carbonated soft drinks (CSD) has been as follows (change fromprevious year in parenthesis):• 2003: 15.3 billion gallons (0.4%)• 2004: 15.4 billion gallons (0.7%)• 2005: 15.3 billion gallons (-0.6%)• 2006: 15.1 billion gallons (-1.1%)• 2007: 14.7 billion gallons (-2.6%)• 2008: 14.2 billion gallons (-3.1%)• 2009: 13.9 billion gallons (-2.3%)• 2010: 13.8 billion gallons (-0.8%)• 2011: 13.6 billion gallons (-1.7%)
_________________________________________________________________
“This marks the seventh consecutive year ofdeclines for the category. Consumers simplywant healthier refreshment. With morebeverages on the shelf each year, carbonatedsoft drinks are losing drinking occasions. Companies need to figure out how to giveconsumers new reasons to pick up CSDs. That’s a tough challenge.”
Michael Bellas, CEO Beverage Marketing Corp. Beverage World, 5/12
_________________________________________________________________
Even with declining consumption, CSDs still account for about 45% of allnonalcoholic beverages (by volume) consumed in the United States, excluding tap
RESTAURANT, FOOD & BEVERAGE MARKET RESEARCH HANDBOOK 2013
• 436 •
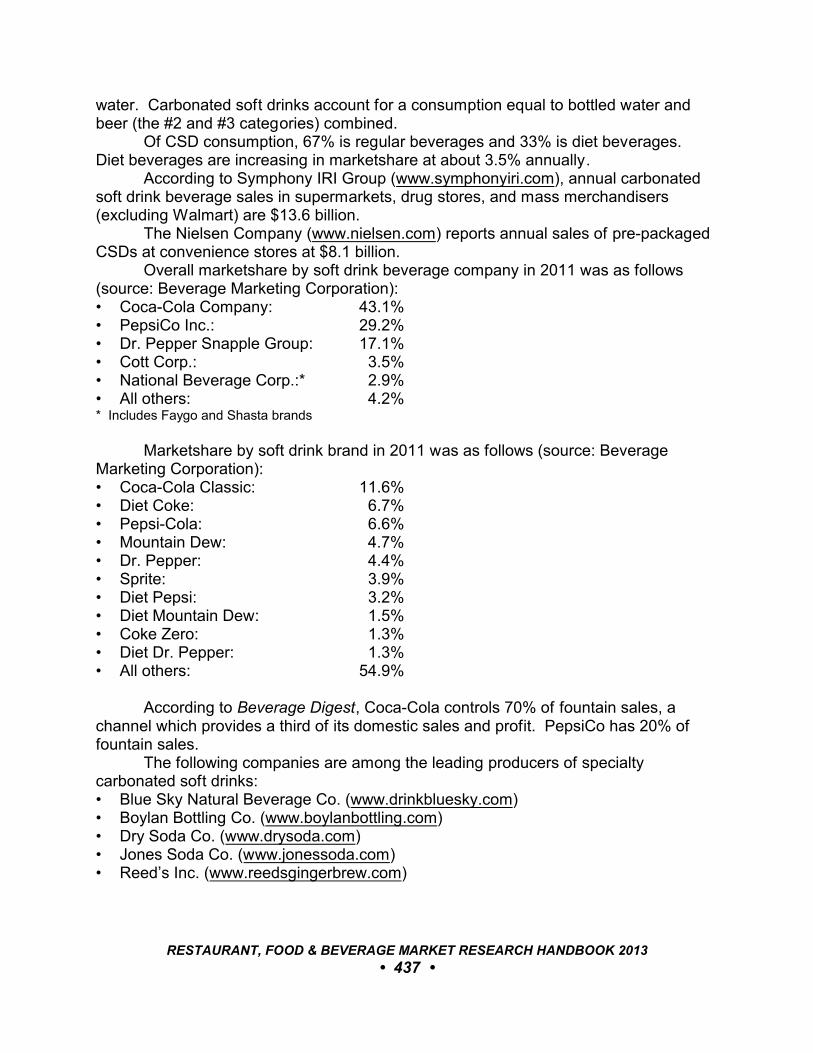
water. Carbonated soft drinks account for a consumption equal to bottled water andbeer (the #2 and #3 categories) combined.
Of CSD consumption, 67% is regular beverages and 33% is diet beverages. Diet beverages are increasing in marketshare at about 3.5% annually.
According to Symphony IRI Group (www.symphonyiri.com), annual carbonatedsoft drink beverage sales in supermarkets, drug stores, and mass merchandisers(excluding Walmart) are $13.6 billion.
The Nielsen Company (www.nielsen.com) reports annual sales of pre-packagedCSDs at convenience stores at $8.1 billion.
Overall marketshare by soft drink beverage company in 2011 was as follows(source: Beverage Marketing Corporation):• Coca-Cola Company: 43.1%• PepsiCo Inc.: 29.2%• Dr. Pepper Snapple Group: 17.1%• Cott Corp.: 3.5%• National Beverage Corp.:* 2.9%• All others: 4.2%* Includes Faygo and Shasta brands
Marketshare by soft drink brand in 2011 was as follows (source: BeverageMarketing Corporation):• Coca-Cola Classic: 11.6%• Diet Coke: 6.7%• Pepsi-Cola: 6.6%• Mountain Dew: 4.7%• Dr. Pepper: 4.4%• Sprite: 3.9%• Diet Pepsi: 3.2%• Diet Mountain Dew: 1.5%• Coke Zero: 1.3%• Diet Dr. Pepper: 1.3%• All others: 54.9%
According to Beverage Digest, Coca-Cola controls 70% of fountain sales, achannel which provides a third of its domestic sales and profit. PepsiCo has 20% offountain sales.
The following companies are among the leading producers of specialtycarbonated soft drinks:• Blue Sky Natural Beverage Co. (www.drinkbluesky.com)• Boylan Bottling Co. (www.boylanbottling.com)• Dry Soda Co. (www.drysoda.com)• Jones Soda Co. (www.jonessoda.com)• Reed’s Inc. (www.reedsgingerbrew.com)
RESTAURANT, FOOD & BEVERAGE MARKET RESEARCH HANDBOOK 2013
• 437 •
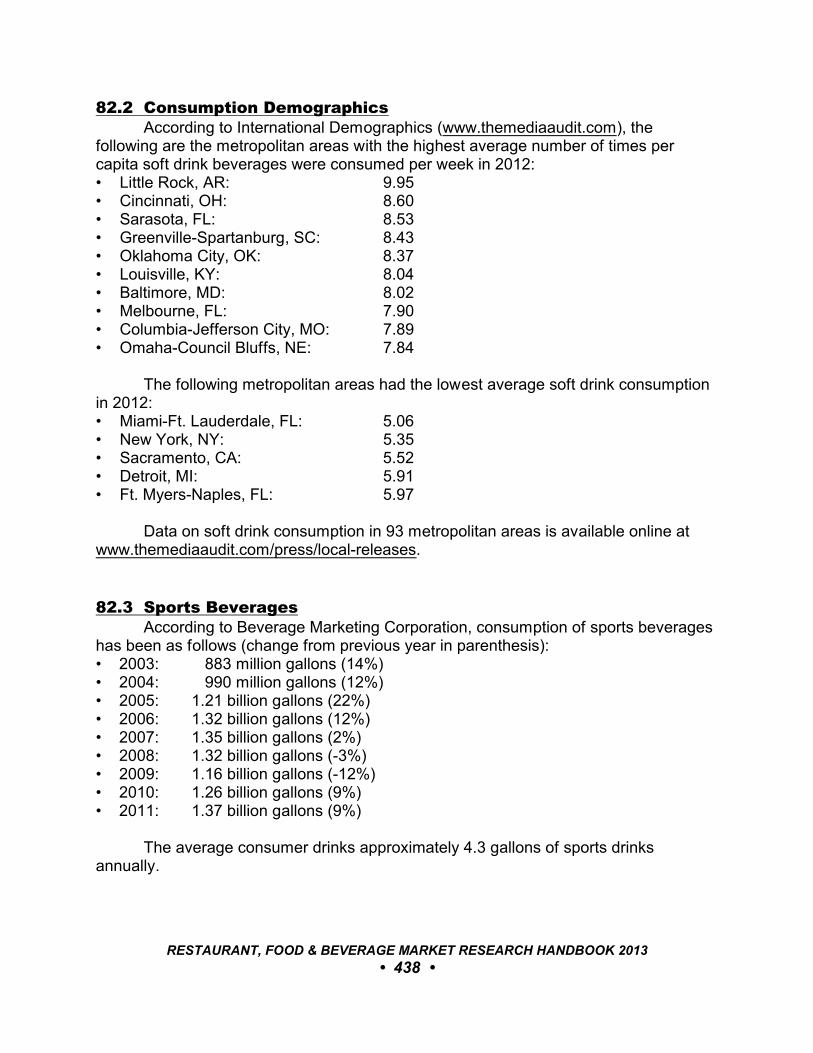
82.2 Consumption DemographicsAccording to International Demographics (www.themediaaudit.com), the
following are the metropolitan areas with the highest average number of times percapita soft drink beverages were consumed per week in 2012:• Little Rock, AR: 9.95• Cincinnati, OH: 8.60• Sarasota, FL: 8.53• Greenville-Spartanburg, SC: 8.43• Oklahoma City, OK: 8.37• Louisville, KY: 8.04• Baltimore, MD: 8.02• Melbourne, FL: 7.90• Columbia-Jefferson City, MO: 7.89• Omaha-Council Bluffs, NE: 7.84
The following metropolitan areas had the lowest average soft drink consumptionin 2012:• Miami-Ft. Lauderdale, FL: 5.06• New York, NY: 5.35• Sacramento, CA: 5.52• Detroit, MI: 5.91• Ft. Myers-Naples, FL: 5.97
Data on soft drink consumption in 93 metropolitan areas is available online atwww.themediaaudit.com/press/local-releases.
82.3 Sports BeveragesAccording to Beverage Marketing Corporation, consumption of sports beverages
has been as follows (change from previous year in parenthesis):• 2003: 883 million gallons (14%)• 2004: 990 million gallons (12%)• 2005: 1.21 billion gallons (22%)• 2006: 1.32 billion gallons (12%)• 2007: 1.35 billion gallons (2%)• 2008: 1.32 billion gallons (-3%)• 2009: 1.16 billion gallons (-12%)• 2010: 1.26 billion gallons (9%)• 2011: 1.37 billion gallons (9%)
The average consumer drinks approximately 4.3 gallons of sports drinksannually.
RESTAURANT, FOOD & BEVERAGE MARKET RESEARCH HANDBOOK 2013
• 438 •
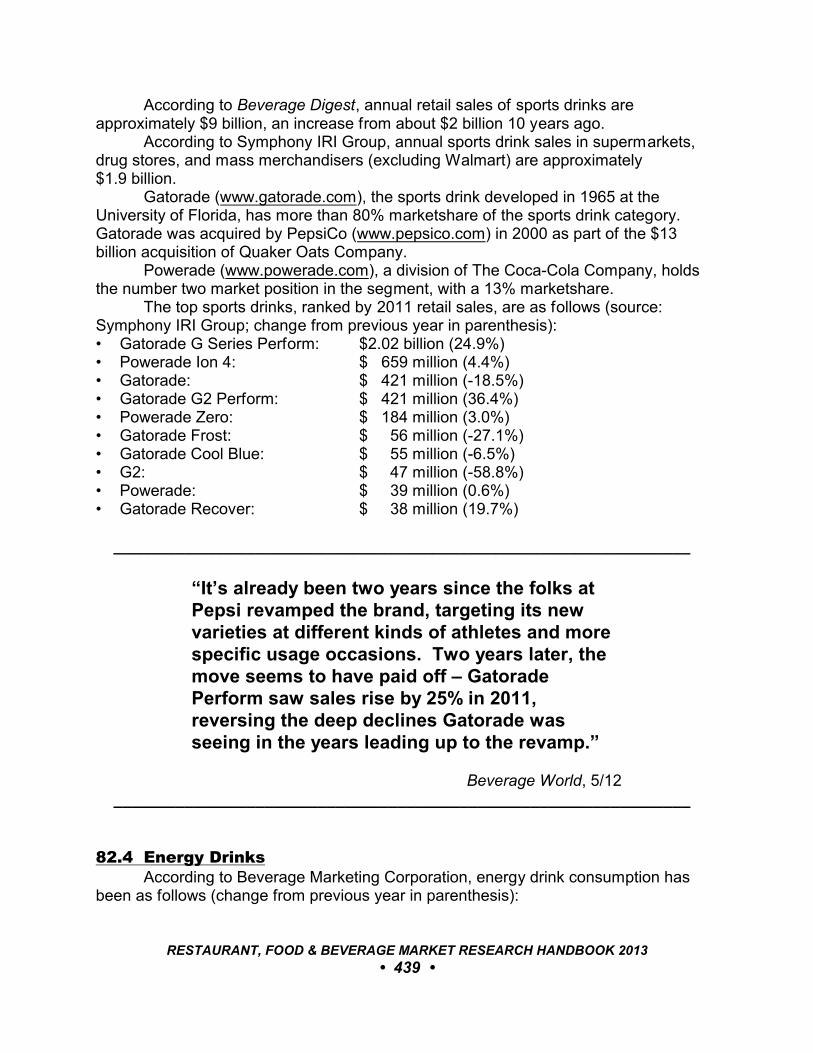
According to Beverage Digest, annual retail sales of sports drinks areapproximately $9 billion, an increase from about $2 billion 10 years ago.
According to Symphony IRI Group, annual sports drink sales in supermarkets,drug stores, and mass merchandisers (excluding Walmart) are approximately $1.9 billion.
Gatorade (www.gatorade.com), the sports drink developed in 1965 at theUniversity of Florida, has more than 80% marketshare of the sports drink category. Gatorade was acquired by PepsiCo (www.pepsico.com) in 2000 as part of the $13billion acquisition of Quaker Oats Company.
Powerade (www.powerade.com), a division of The Coca-Cola Company, holdsthe number two market position in the segment, with a 13% marketshare.
The top sports drinks, ranked by 2011 retail sales, are as follows (source:Symphony IRI Group; change from previous year in parenthesis):• Gatorade G Series Perform: $2.02 billion (24.9%)• Powerade Ion 4: $ 659 million (4.4%)• Gatorade: $ 421 million (-18.5%)• Gatorade G2 Perform: $ 421 million (36.4%)• Powerade Zero: $ 184 million (3.0%)• Gatorade Frost: $ 56 million (-27.1%)• Gatorade Cool Blue: $ 55 million (-6.5%)• G2: $ 47 million (-58.8%)• Powerade: $ 39 million (0.6%)• Gatorade Recover: $ 38 million (19.7%)
_________________________________________________________________
“It’s already been two years since the folks atPepsi revamped the brand, targeting its newvarieties at different kinds of athletes and morespecific usage occasions. Two years later, themove seems to have paid off – GatoradePerform saw sales rise by 25% in 2011,reversing the deep declines Gatorade wasseeing in the years leading up to the revamp.”
Beverage World, 5/12 _________________________________________________________________
82.4 Energy DrinksAccording to Beverage Marketing Corporation, energy drink consumption has
been as follows (change from previous year in parenthesis):
RESTAURANT, FOOD & BEVERAGE MARKET RESEARCH HANDBOOK 2013
• 439 •

• 2003: 60 million gallons (55%)• 2004: 94 million gallons (64%)• 2005: 161 million gallons (79%)• 2006: 243 million gallons (49%)• 2007: 336 million gallons (28%)• 2008: 354 million gallons (9%)• 2009: 354 million gallons (no change)• 2010: 384 million gallons (5%)• 2011: 450 million gallons (18%)
_________________________________________________________________
“What a year, what a year. When all was said anddone, the energy drink category racked up avolume increase of 17.2% in 2011. They’ve hitthat sweet spot with usage occasions all day longand they’ve had some wonderful new productintroductions.”
Gary Hemphill, Managing DirectorBeverage Marketing CorporationBeverage World, 5/12
_________________________________________________________________
According to Symphony IRI Group, annual energy drink sales in supermarkets,drug stores, and mass merchandisers (excluding Walmart) are $1.25 billion.
More than 2,000 energy drink brands are on the market in the U.S., according toBrandweek.
According to Beverage World State of The Industry 2012, market leaders are asfollows (change from previous year in parenthesis):Energy Drinks• Red Bull: $2.60 billion (16%)• Monster Energy: $1.38 billion (23%)• Rockstar: $ 472 million (12%)• NOS: $ 237 million (12%)• Java Monster: $ 197 million (16%)• Monster Mega: $ 196 million (14%)• Amp: $ 142 million (2%)• Rockstar Recovery: $ 138 million (128%)• Monster Rehab: $ 125 million (1,550%)• Full Throttle: $ 97 million (-11%)
RESTAURANT, FOOD & BEVERAGE MARKET RESEARCH HANDBOOK 2013
• 440 •
Energy Shots• 5 Hour Energy: $928 million (17%)• 5 Hour Energy Extra: $ 54 million (483%)• Stacker 26 Hour Power: $ 29 million (-7%)• Worx Energy: $ 13 million (4,554%)
Despite the hip and trendy image associated with energy drinks, only 4% ofenergy drink buyers cited “cool and trendy” as a reason for their energy drink purchasein a recent survey by The NPD Group. NPD found “the need for an energy boost” to bethe number one reason for purchase across all buyer segments. Taste and preferencefor the energy category as the biggest attraction among younger consumers, while olderbuyers cited the need for caffeine, instant energy, and an alternative to coffee. Thirty-six percent (36%) of energy drink buyers reported doing something work-related whenthey made their last energy drink purchase; more than travel, school, meal time, andsporting events combined.
Seventy percent (70%) of energy drink buyers in the NPD survey reportedpurchasing their drinks cold and for immediate consumption. Over one-half of energydrink purchases are unplanned. The convenience channel has reaped the benef its ofthis impulse behavior. Two-thirds of buyers cite a purchase in the convenience retailchannel within the past six months, and 50% report their last purchase in this channelrather than in traditional grocery stores.
82.5 Juice & Fruit DrinksAccording to Beverage Marketing Corporation, annual consumption of fruit
beverages is 3.5 billion gallons, a figure which has been declining about 2% annually inrecent years.
The juices market consists of 100% fruit juice from concentrate, 100% fruit juicenot from concentrate, nectar (30%-to-99% juice), fruit drinks (0-to-29% juice), andvegetable juice. The 100% juice categories account for 68% of the market.
According to Mintel (www.mintel.com), annual consumer spending for juice andfruit beverages is approximately $19 billion, an amount that has remained relativelyconstant in recent years. While sales in supermarkets have declined slightly, spendingon RTD juice drinks at other retail outlets has increased.
According to Beverage World, the annual packaged juice market, by category, isas follows:• Cranberry: $1.11 billion• Apple: $ 828 million• Vegetable other than tomato: $ 818 million• Grape: $ 367 million• Orange: $ 166 million• Tomato: $ 108 million• Prune: $ 101 million
RESTAURANT, FOOD & BEVERAGE MARKET RESEARCH HANDBOOK 2013
• 441 •

• Pineapple: $ 87 million• Grapefruit: $ 58 million
According to Symphony IRI Group, annual juice and fruit drink sales insupermarkets, drug stores, and mass merchandisers (excluding Walmart), by category,are as follows:• Refrigerated juices and drinks: $4.5 billion• Bottled juices: $3.8 billion• Aseptic packaged juices: $ 900 million• Canned juices: $ 500 million• Frozen juices: $ 400 million
According to the Beverage World State of The Industry, RTD juice and smoothiemarket leaders are as follows (change from previous year in parenthesis):Refrigerated Juice and RTD Smoothies• Naked: $104.3 million (18.6%)• Naked Superfood: $ 97.8 million (36.3%)• Bolthouse Farms: $ 56.4 million (50.8%)• Odwalla: $ 32.2 million (11.1%)
Single-Serve Bottled Juice and RTD Smoothies• SoBe: $20.6 million (4.9%)• F’real: $ 5.2 million (15.6%)• V8 Splash Smoothies: $ 4.1 million (-6.7%)
According to Symphony IRI Group, the following are the leading orange juicebrands sold at supermarkets, drug stores, convenience stores, and massmerchandisers (excluding Walmart), ranked by sales during the 52-week period endingApril 15, 2012 (change from prior year in parenthesis):• Tropicana Pure Premium: $835.2 million (-6.5%)• Simply Orange: $502.7 million (3.6%)• Private label: $450.8 million (-4.4%)• Florida’s Natural: $320.5 million (11.0%)• Minute Maid Premium: $241.1 million (-2.4%)• Minute Maid: $ 65.3 million (155.5%)• Minute Maid Premium Kids: $ 26.0 million (5.5%)
The leading brands of bottled fruit drinks during the same period are as follows(source: Symphony IRI Group; change from prior year in parenthesis):• Hawaiian Punch: $185.5 million (1.4%)• V8 Splash: $125.8 million (10.4%)• Tampico: $ 91.7 million (0.3%)• Snapple: $ 74.6 million (17.4%)• Bug Juice: $ 67.2 million (-16.8%)
RESTAURANT, FOOD & BEVERAGE MARKET RESEARCH HANDBOOK 2013
• 442 •
• Tum-E Yummies: $ 66.3 million (40,3%)• Private label: $ 65.5 million (4.2%)• Fuze: $ 60.7 million (934.4%)• Kool-Aid Bursts: $ 55.1 million (1.4%)
While once considered the healthier alternative to carbonated soft drinks, thetrend toward healthier eating has actually led to sagging sales of fruit juice and juicedrinks, with many consumers shying away from the high sugar and high calorie content.
RESTAURANT, FOOD & BEVERAGE MARKET RESEARCH HANDBOOK 2013
• 443 •
83
COFFEE & TEA
83.1 Coffee ConsumptionAmericans consumed approximately 7.0 billion gallons of coffee in 2012.The coffee market consists of three segments:
• Roasted and instant coffee purchased at supermarkets and other retail outlets• Away-from-home consumption of regular and specialty coffee at coffeeshops,
restaurants, and other establishments• Ready-to-drink (RTD) coffee
Seventy-eight percent (78%) of Americans drink coffee – 62% drink it every dayand 73% do so at least weekly – according to National Coffee Drinking Trends 2012, bythe National Coffee Association (NCA, www.ncausa.org). There are more U.S.consumers who drink coffee daily than there are soft drink consumers (51%). Seventy-three percent (73%) of coffee consumed in the U.S. is prepared at home.
The 2012 survey reported that among those ages 18-to-24, daily consumptionjumped from 40% to 50%, and for the 25-to-39 group, 54% to 63%.
Gourmet coffee consumption is on the rise, increasing from 37% of all cups ofcoffee consumed in the U.S. in 2011 to 46% in 2012. In the 2011 survey by NCA, 25%of Americans said they drank a gourmet coffee within the prior 24 hours; in 2012 32%said they did so.
The 2012 survey also found that consumer adoption of the single-cup formatcontinues to expand. Ownership of single-cup brewers increased to 10% from 7% ayear prior, with 36% reportedly owning their single-cup brewer for less than six months.Perception of the quality of coffee from single-cup systems increased, with 25% ratingthe brewers as “excellent” versus 15% who did so in 2011.
According to Ethnicity and Coffee, a September 2012 by the NCA, 74% ofHispanic-Americans drink coffee daily, 12 percentage points ahead of Americans ofother ethnicity. Past-week consumption was 80% compared with 72% for non-Hispanic-Americans.
A positive health perception is driving increased coffee consumption. Responses in surveys by the NCA show that 46% of consumers recognize theinherently positive benefits of drinking coffee, an increase from 36% in 2005.
According to Symphony IRI Group (www.symphonyiri.com), annual coffee salesin supermarkets, drug stores, and mass merchandisers (excluding Walmart) are $4.4billion.
RESTAURANT, FOOD & BEVERAGE MARKET RESEARCH HANDBOOK 2013
• 444 •
83.2 RTD CoffeeAccording to the Beverage World State of The Industry 2012, 60.8 million gallons
of ready-to-drink coffee were consumed in 2011, an 9.4% increase from a year prior.
83.3 CoffeeshopsCoffeeshops are assessed in Chapter 16.
83.4 Tea ConsumptionAmericans consume over 55 billion servings of tea, or over 2.50 billion gallons,
each year.The Sage Group (www.thesagegroup.com) estimated the retail size of the U.S.
tea industry in 2011 at more than $27 billion. A January 2013 estimate by Nation’sRestaurant News placed the market significantly higher, at $40 billion.
According to The 2012 State of the U.S. Tea Industry , by the Tea Association ofthe USA (www.teausa.com), tea imports were 281 million pounds in 2011; wholesaletea sales were $8.2 billion.
_________________________________________________________________
“The U.S. tea industry has fared better thanmost sectors during the past three-to-fouryears. 2011 has seen yet another, albeitmodest, increase in tea imports of just under 1%but still achieving record breaking total teaimports. The dollar value of wholesale tea salesis estimated to be up a modest 5%. Within thetea industry there are segments that are faringbetter than others, with RTD and Specialty Teaon top of the list.”
Joseph P. Simrany, PresidentTea Association of the U.S.A.The 2012 State of the U.S. Tea Industry
_________________________________________________________________
According to the Tea Association of the USA, after water, tea is the most widelyconsumed beverage in the world. Tea can be found in almost 80% of U.S. households. It is the only beverage commonly served hot or iced, anytime, anywhere, for any
RESTAURANT, FOOD & BEVERAGE MARKET RESEARCH HANDBOOK 2013
• 445 •
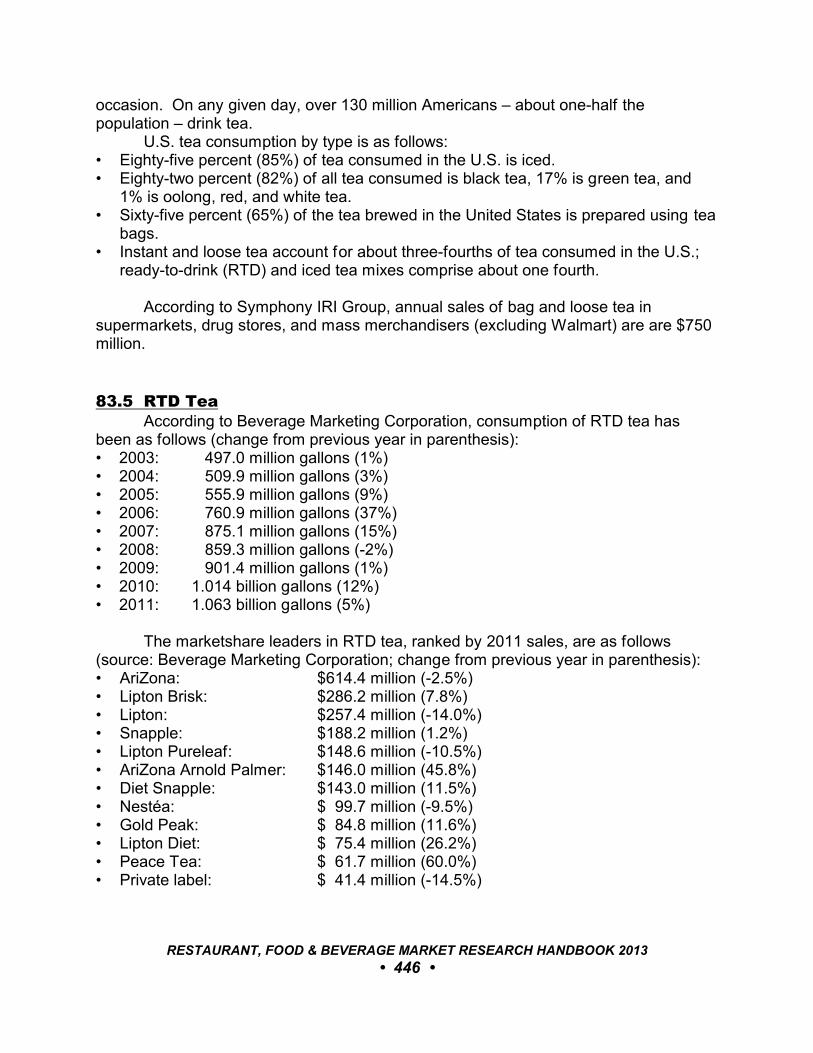
occasion. On any given day, over 130 million Americans – about one-half thepopulation – drink tea.
U.S. tea consumption by type is as follows:• Eighty-five percent (85%) of tea consumed in the U.S. is iced.• Eighty-two percent (82%) of all tea consumed is black tea, 17% is green tea, and
1% is oolong, red, and white tea.• Sixty-five percent (65%) of the tea brewed in the United States is prepared using tea
bags. • Instant and loose tea account for about three-fourths of tea consumed in the U.S.;
ready-to-drink (RTD) and iced tea mixes comprise about one fourth.
According to Symphony IRI Group, annual sales of bag and loose tea insupermarkets, drug stores, and mass merchandisers (excluding Walmart) are are $750million.
83.5 RTD TeaAccording to Beverage Marketing Corporation, consumption of RTD tea has
been as follows (change from previous year in parenthesis):• 2003: 497.0 million gallons (1%)• 2004: 509.9 million gallons (3%)• 2005: 555.9 million gallons (9%)• 2006: 760.9 million gallons (37%)• 2007: 875.1 million gallons (15%)• 2008: 859.3 million gallons (-2%)• 2009: 901.4 million gallons (1%)• 2010: 1.014 billion gallons (12%)• 2011: 1.063 billion gallons (5%)
The marketshare leaders in RTD tea, ranked by 2011 sales, are as follows(source: Beverage Marketing Corporation; change from previous year in parenthesis):• AriZona: $614.4 million (-2.5%)• Lipton Brisk: $286.2 million (7.8%)• Lipton: $257.4 million (-14.0%)• Snapple: $188.2 million (1.2%)• Lipton Pureleaf: $148.6 million (-10.5%)• AriZona Arnold Palmer: $146.0 million (45.8%)• Diet Snapple: $143.0 million (11.5%)• Nestéa: $ 99.7 million (-9.5%)• Gold Peak: $ 84.8 million (11.6%)• Lipton Diet: $ 75.4 million (26.2%)• Peace Tea: $ 61.7 million (60.0%)• Private label: $ 41.4 million (-14.5%)
RESTAURANT, FOOD & BEVERAGE MARKET RESEARCH HANDBOOK 2013
• 446 •

According to Symphony IRI Group, annual RTD tea sales in supermarkets, drugstores, and mass merchandisers (excluding Walmart) are $1.6 billion. Annualconvenience store sales of RTD tea are $1.0 billion, according to The Nielsen Company(www.nielsen.com).
83.6 Tea Stores and Tea BarsThere are only a few dozen tea bars in the United States, excluding coffeeshops
that also have tea on their menu or retail tea stores that also offer limited beverageservice. Argo Tea, with 16 locations in the U.S., is the largest tea bar chain. Forcomparison, there are approximately 20,000 coffeeshops in the U.S. and Starbucksoperates over 11,000 locations.
Given the increasing popularity of tea, the tea bar count could rise dramatically inthe near future. Several companies are rolling out plans for expansion.
In November 2012, Starbucks announced an agreement to acquire the 300-unitTeavana retail tea brand for $620 million. Teavana derives only about 5% of revenuefrom beverage service. With the acquisition, Starbucks plans to turn Teavana into aplace where patrons can enjoy a cup of brewed tea as well as purchase retail teaproducts.
_________________________________________________________________
“[Starbucks CEO] Howard Schultz pledged to‘do for tea what we did for coffee.’ Consideringthat Starbucks was the chain that broughtpremium coffee to the masses, that is goodnews for those who have long promotedpremium tea.”
Nation’s Restaurant News, 1/14/13 _________________________________________________________________
In 2012, The Coffee Bean & Tea Leaf announced plans to add a tea-bar conceptto its 850 coffeeshop units.
Also in 2012, the McAlister Deli chain debuted a prototype restaurant with astand-apart tea bar.
Jamba Juice, which invested in Talbott Tea, a premium tea brand, announcedplans to introduce hot and cold tea to its menu and sell packaged tea at its over-800locations.
Portola Coffee Lab, a Southern California chain, launched Seventh Tea Bar as astandalone concept in early 2013.
RESTAURANT, FOOD & BEVERAGE MARKET RESEARCH HANDBOOK 2013
• 447 •
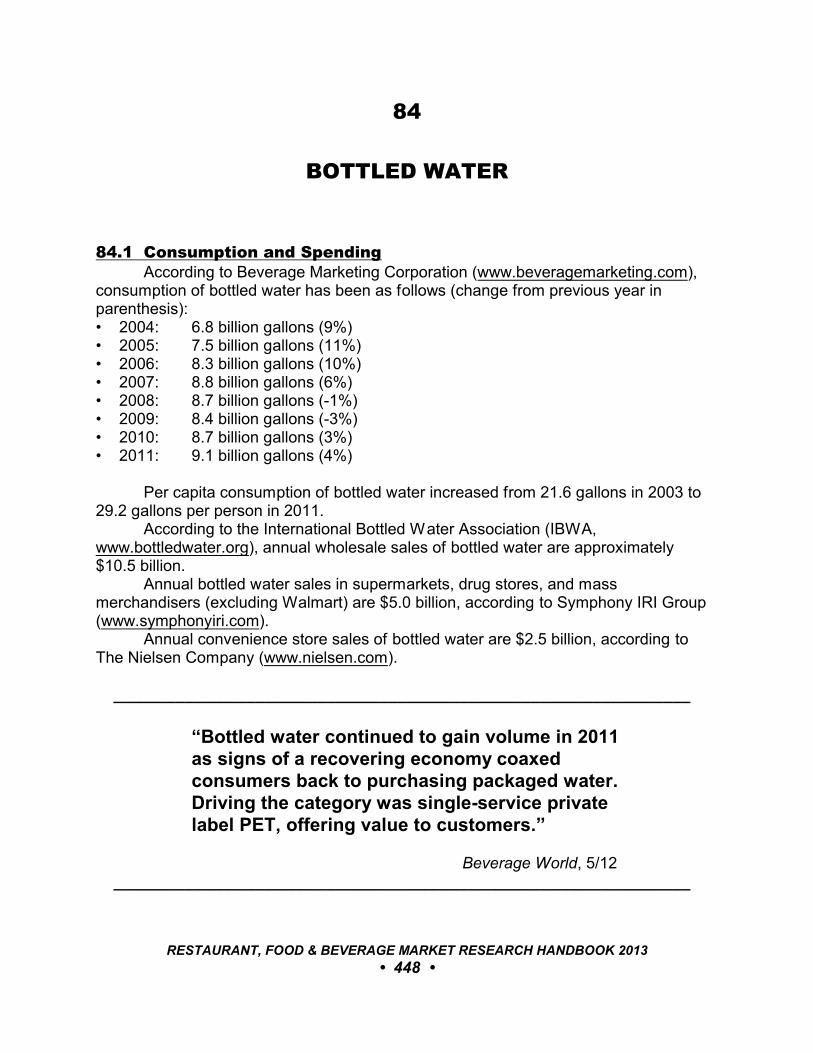
84
BOTTLED WATER
84.1 Consumption and SpendingAccording to Beverage Marketing Corporation (www.beveragemarketing.com),
consumption of bottled water has been as follows (change from previous year inparenthesis):• 2004: 6.8 billion gallons (9%)• 2005: 7.5 billion gallons (11%)• 2006: 8.3 billion gallons (10%)• 2007: 8.8 billion gallons (6%)• 2008: 8.7 billion gallons (-1%)• 2009: 8.4 billion gallons (-3%)• 2010: 8.7 billion gallons (3%)• 2011: 9.1 billion gallons (4%)
Per capita consumption of bottled water increased from 21.6 gallons in 2003 to29.2 gallons per person in 2011.
According to the International Bottled Water Association (IBWA,www.bottledwater.org), annual wholesale sales of bottled water are approximately$10.5 billion.
Annual bottled water sales in supermarkets, drug stores, and massmerchandisers (excluding Walmart) are $5.0 billion, according to Symphony IRI Group(www.symphonyiri.com).
Annual convenience store sales of bottled water are $2.5 billion, according toThe Nielsen Company (www.nielsen.com).
_________________________________________________________________
“Bottled water continued to gain volume in 2011as signs of a recovering economy coaxedconsumers back to purchasing packaged water. Driving the category was single-service privatelabel PET, offering value to customers.”
Beverage World, 5/12 _________________________________________________________________
RESTAURANT, FOOD & BEVERAGE MARKET RESEARCH HANDBOOK 2013
• 448 •
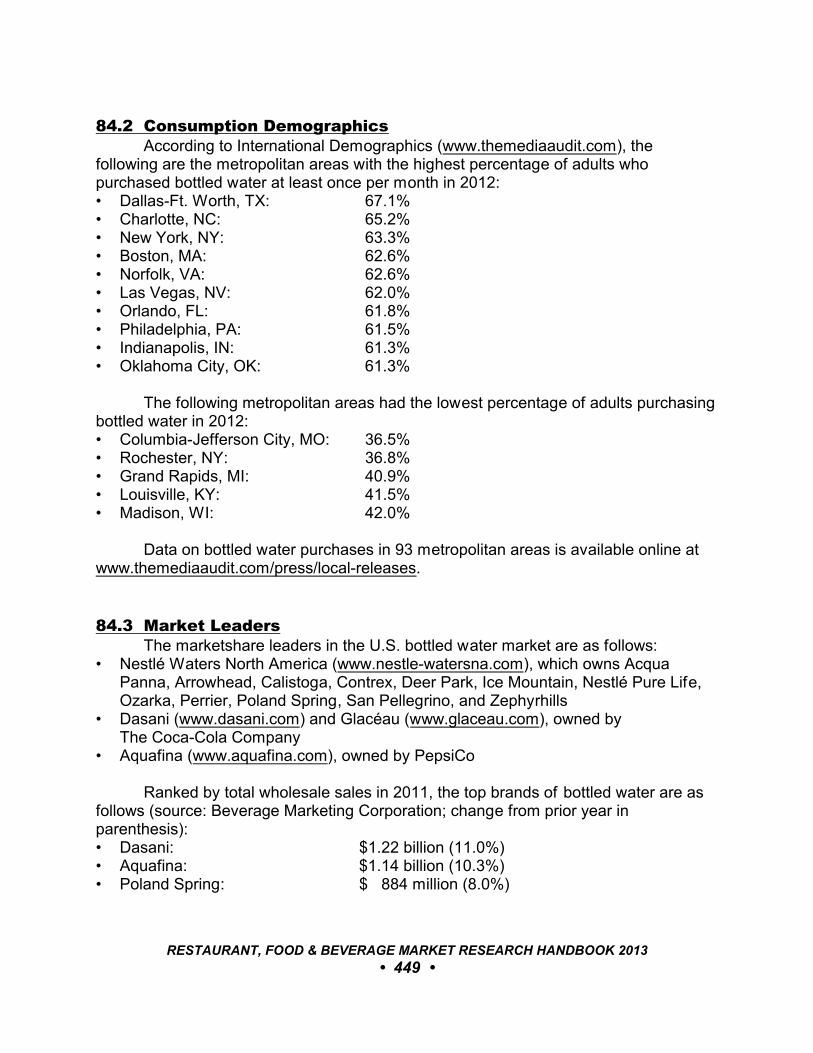
84.2 Consumption DemographicsAccording to International Demographics (www.themediaaudit.com), the
following are the metropolitan areas with the highest percentage of adults whopurchased bottled water at least once per month in 2012:• Dallas-Ft. Worth, TX: 67.1%• Charlotte, NC: 65.2%• New York, NY: 63.3%• Boston, MA: 62.6%• Norfolk, VA: 62.6%• Las Vegas, NV: 62.0%• Orlando, FL: 61.8%• Philadelphia, PA: 61.5%• Indianapolis, IN: 61.3%• Oklahoma City, OK: 61.3%
The following metropolitan areas had the lowest percentage of adults purchasingbottled water in 2012:• Columbia-Jefferson City, MO: 36.5%• Rochester, NY: 36.8%• Grand Rapids, MI: 40.9%• Louisville, KY: 41.5%• Madison, WI: 42.0%
Data on bottled water purchases in 93 metropolitan areas is available online atwww.themediaaudit.com/press/local-releases.
84.3 Market LeadersThe marketshare leaders in the U.S. bottled water market are as follows:
• Nestlé Waters North America (www.nestle-watersna.com), which owns AcquaPanna, Arrowhead, Calistoga, Contrex, Deer Park, Ice Mountain, Nestlé Pure Life,Ozarka, Perrier, Poland Spring, San Pellegrino, and Zephyrhills
• Dasani (www.dasani.com) and Glacéau (www.glaceau.com), owned by The Coca-Cola Company
• Aquafina (www.aquafina.com), owned by PepsiCo
Ranked by total wholesale sales in 2011, the top brands of bottled water are asfollows (source: Beverage Marketing Corporation; change from prior year inparenthesis):• Dasani: $1.22 billion (11.0%)• Aquafina: $1.14 billion (10.3%)• Poland Spring: $ 884 million (8.0%)
RESTAURANT, FOOD & BEVERAGE MARKET RESEARCH HANDBOOK 2013
• 449 •
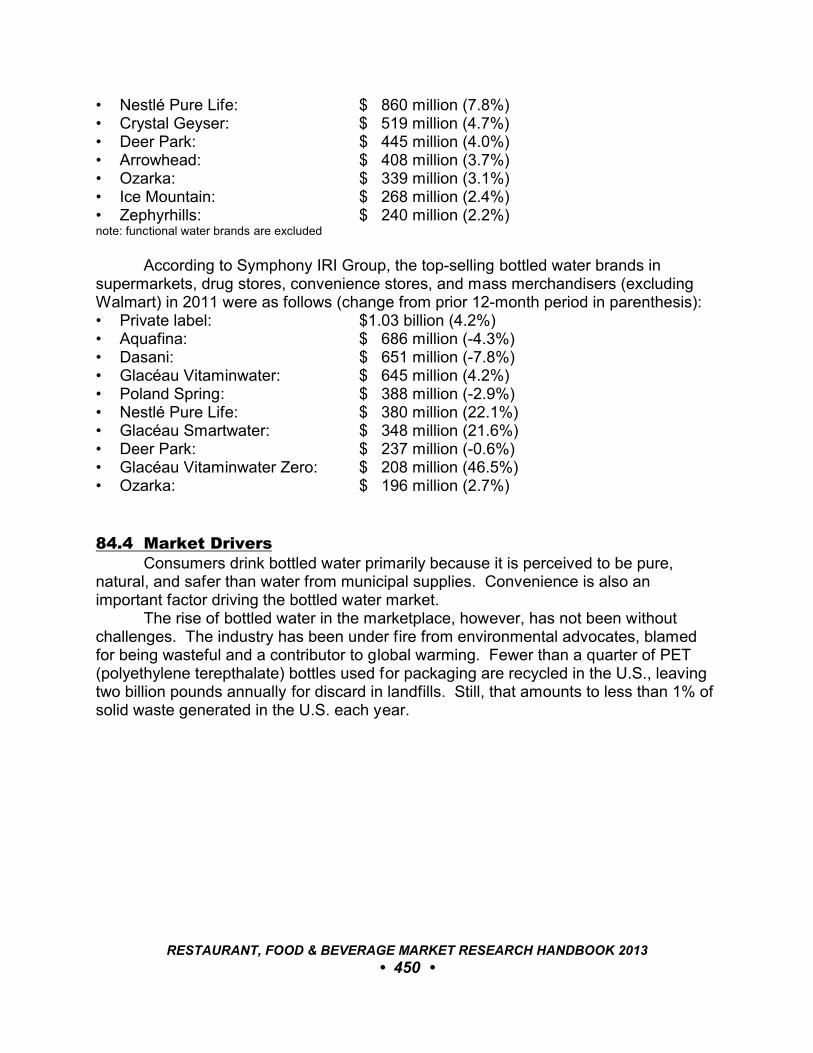
• Nestlé Pure Life: $ 860 million (7.8%)• Crystal Geyser: $ 519 million (4.7%)• Deer Park: $ 445 million (4.0%)• Arrowhead: $ 408 million (3.7%)• Ozarka: $ 339 million (3.1%)• Ice Mountain: $ 268 million (2.4%)• Zephyrhills: $ 240 million (2.2%)note: functional water brands are excluded
According to Symphony IRI Group, the top-selling bottled water brands insupermarkets, drug stores, convenience stores, and mass merchandisers (excludingWalmart) in 2011 were as follows (change from prior 12-month period in parenthesis):• Private label: $1.03 billion (4.2%)• Aquafina: $ 686 million (-4.3%)• Dasani: $ 651 million (-7.8%)• Glacéau Vitaminwater: $ 645 million (4.2%)• Poland Spring: $ 388 million (-2.9%)• Nestlé Pure Life: $ 380 million (22.1%)• Glacéau Smartwater: $ 348 million (21.6%)• Deer Park: $ 237 million (-0.6%)• Glacéau Vitaminwater Zero: $ 208 million (46.5%)• Ozarka: $ 196 million (2.7%)
84.4 Market DriversConsumers drink bottled water primarily because it is perceived to be pure,
natural, and safer than water from municipal supplies. Convenience is also animportant factor driving the bottled water market.
The rise of bottled water in the marketplace, however, has not been withoutchallenges. The industry has been under fire from environmental advocates, blamedfor being wasteful and a contributor to global warming. Fewer than a quarter of PET(polyethylene terepthalate) bottles used for packaging are recycled in the U.S., leavingtwo billion pounds annually for discard in landfills. Still, that amounts to less than 1% ofsolid waste generated in the U.S. each year.
RESTAURANT, FOOD & BEVERAGE MARKET RESEARCH HANDBOOK 2013
• 450 •
85
MILK
85.1 Consumption and Dairy ProductionAccording to the International Dairy Foods Association (IDFA, www.idfa.org),
93% of households purchase milk at least once each year. The percentages ofhouseholds purchasing various types of fluid milk are as follows:• Reduced fat white milk: 56%• Whole white milk: 42%• Fat free white milk: 35%• Low fat white milk: 34%• Flavored milk: 32%
The Economic Research Service of the U.S. Department of Agriculture (USDA, www.usda.gov) reported that total farm milk production in 2012 in the U.S. was 203 billion pounds, a 1.7% increase over the previous year.
The Dairy Farmers of America (www.dfamilk.com), a dairy marketing cooperative owned by 19,500 dairy farmers across the U.S., sells more than 62 billion pounds of milk annually for its members.
85.2 Consumer SpendingAccording to Symphony IRI Group (www.symphonyiri.com), 2011 milk sales in
supermarkets, drug stores, and mass merchandisers (excluding Walmart) were $11.8billion.
According to the National Association of Convenience Stores (NACS,www.nacsonline.com), annual fluid milk sales in convenience stores are $3.1 billion.
Milk consumed through federal school programs represents 5.6% of U.S. fluidmilk sales, according to the USDA.
Annual vending machine sales of milk are approximately $700 million, accordingto Vending Times. Milk is sold in approximately 83,000 machines across the U.S.
85.3 Market DriversAccording to Data Development Worldwide (www.datadw.com), among
consumers who are increasing their consumption of milk, the reasons for drinking moremilk are as follows:
RESTAURANT, FOOD & BEVERAGE MARKET RESEARCH HANDBOOK 2013
• 451 •
• Healthier for myself or child: 32%• Trying to cut back on fats or trying to lose weight: 24%• Like the taste: 14%• Pregnant or nursing a baby: 12%• Good for bones: 7%
RESTAURANT, FOOD & BEVERAGE MARKET RESEARCH HANDBOOK 2013
• 452 •
86
BEVERAGE SERVICE IN RESTAURANTS & BARS
86.1 Market AssessmentAccording to the National Restaurant Association (www.restaurant.org),
beverage sales account for approximately 21% of total revenues in full-servicerestaurants. Total sales at full-service restaurants for 2013 are projected at $208.7billion; beverage sales will account for approximately $43.8 billion. At quick-servicerestaurants, beverages account for approximately 4% of the average customer check. Of the $188.1 billion in projected total sales for 2013, quick-service restaurants areprojected to sell an estimated $7.5 billion in beverages. These figures do not includebeverage sales at bars and taverns or snack bars.
_________________________________________________________________
“Beverages are the most popular items orderedat restaurants in America. Right off the bat, adrink is a very important thing to the market-place. It’s not a hamburger or French fries, notthat those aren’t important, but beveragesrepresent the biggest purchase category.”
Harry Blazer, Vice President The NPD Group
_________________________________________________________________
There are approximately 350,000 on-premise licensed locations serving alcoholicbeverages in the U.S., according to Trade Dimensions (www.tdlinx.com).
According to Technomic (www.technomic.com), sales of spirits, wine, and beer inrestaurants, bars, and other licensed on-premise locations increased 4.9% to $93.7billion in 2011. Adult beverage on-premise volume declined 1.1%.
A 2012 survey by Mintel (www.mintel.com) found that 44% of full-servicerestaurant customers had ordered a cocktail in the prior three months.
RESTAURANT, FOOD & BEVERAGE MARKET RESEARCH HANDBOOK 2013
• 453 •
86.2 Refreshment and Nonalcoholic Beverage Service in RestaurantsAccording to The NPD Group (www.npd.com), restaurants serve approximately
50 billion nonalcoholic drinks annually. (This total does not include coffeeshops orcoffee purchased for takeout.)
The following are the number of servings of nonalcoholic beverages atrestaurants (sources: The NPD Group and Nation’s Restaurant News):• Regular carbonated soft drinks: 12.10 billion• Iced tea: 5.35 billion• Tap water: 4.50 billion• Diet carbonated soft drinks: 4.17 billion• Traditional coffee: 3.50 billion• Bottled water: 2.70 billion• Specialty coffee: 2.40 billion• Non-carbonated soft drinks: 2.00 billion• Juice: 1.90 billion• Milk: 1.50 billion• Shakes/malts/floats: 800 million• Frozen/slushie soft drinks: 770 million• Hot tea: 650 million• Iced coffee: 500 million• Smoothies: 500 million• Hot chocolate: 210 million
The Beverage Consumer Trend Report, published in September 2012 byTechnomic, reported that 71% of adults purchase beverages away from home at leasttwice a week, an increase from 66% who did so in 2010. Specialty coffee increased by10% on limited-service menus between 2010 and 2012, smoothies grew by 8.5%, andspecialty tea listings nearly doubled.
86.3 Alcoholic Beverage Service in Full-Service RestaurantsFull-service restaurants serve approximately 2.5 billion alcoholic beverages
annually, according to The NPD Group. (This total does not include drinks served atbars or concessions.) Thirty-five percent (35%) of full-service restaurant orders in 2012included an alcoholic beverage, a percentage that has been relatively constant forseveral years.
According to Technomic, spending on alcoholic beverages as a percentage ofguest total at some popular casual-dining chain restaurants is as follows:• Dave & Buster’s: 35%• Hard Rock Cafe: 35%• Rock Bottom Brewery: 34%• Champps: 30%• McCormick & Schmick’s: 30%
RESTAURANT, FOOD & BEVERAGE MARKET RESEARCH HANDBOOK 2013
• 454 •
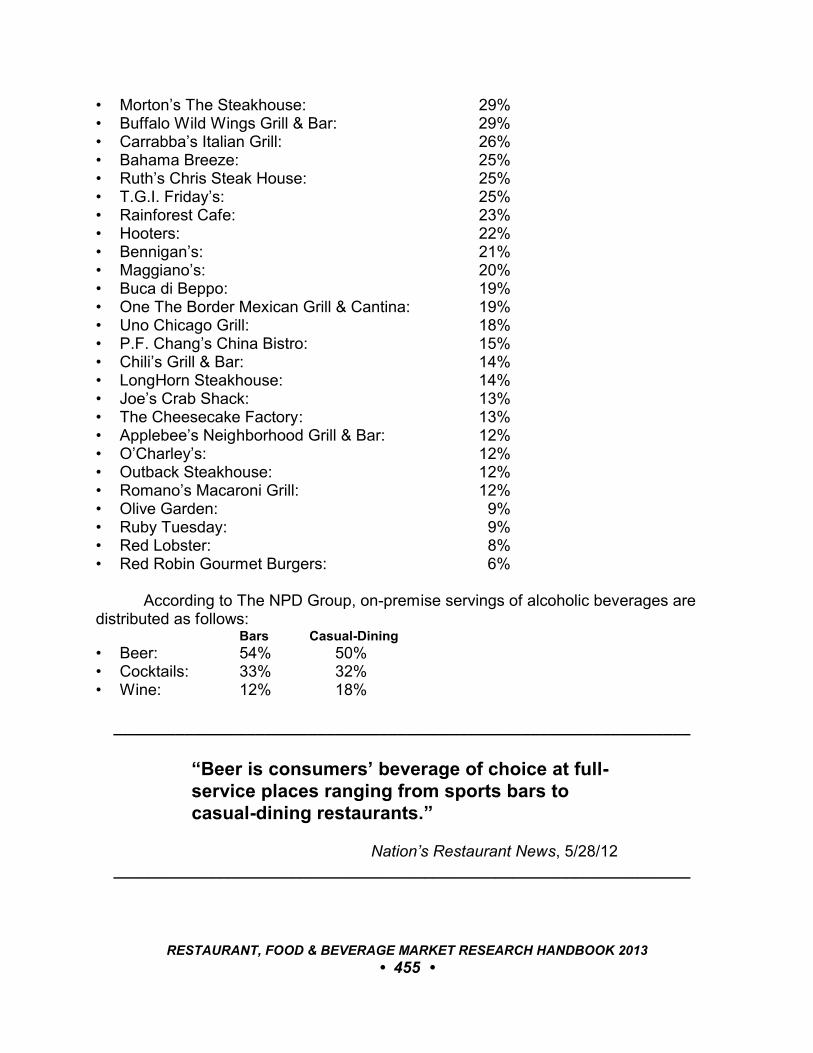
• Morton’s The Steakhouse: 29%• Buffalo Wild Wings Grill & Bar: 29%• Carrabba’s Italian Grill: 26%• Bahama Breeze: 25%• Ruth’s Chris Steak House: 25%• T.G.I. Friday’s: 25%• Rainforest Cafe: 23%• Hooters: 22%• Bennigan’s: 21%• Maggiano’s: 20%• Buca di Beppo: 19%• One The Border Mexican Grill & Cantina: 19%• Uno Chicago Grill: 18%• P.F. Chang’s China Bistro: 15%• Chili’s Grill & Bar: 14%• LongHorn Steakhouse: 14%• Joe’s Crab Shack: 13%• The Cheesecake Factory: 13%• Applebee’s Neighborhood Grill & Bar: 12%• O’Charley’s: 12%• Outback Steakhouse: 12%• Romano’s Macaroni Grill: 12%• Olive Garden: 9%• Ruby Tuesday: 9%• Red Lobster: 8%• Red Robin Gourmet Burgers: 6%
According to The NPD Group, on-premise servings of alcoholic beverages aredistributed as follows:
Bars Casual-Dining
• Beer: 54% 50%• Cocktails: 33% 32%• Wine: 12% 18%
_________________________________________________________________
“Beer is consumers’ beverage of choice at full-service places ranging from sports bars tocasual-dining restaurants.”
Nation’s Restaurant News, 5/28/12 _________________________________________________________________
RESTAURANT, FOOD & BEVERAGE MARKET RESEARCH HANDBOOK 2013
• 455 •
According to The NPD Group, 37% of adults include alcohol with theircasual/fine-dining restaurant dinners from Friday to Sunday; 34% do so when diningbetween Monday and Thursday.
Although weekend lunch is an occasion for beverage alcohol consumption formany, consumption nearly triples between lunch and dinner. An alcoholic beverage isordered at 13% of casual- and fine-dining lunch occasions, whereas an alcoholicbeverage is ordered 36% of the time for a dinner meal.
Beer is generally the preferred drink at lunches that include an alcoholicbeverage; 55% of lunches where beverage alcohol is consumed include beer. Cocktails and wine take the lead at dinnertime; those consuming beer drop to 45% forthat daypart. Happy hour, the hours between 4:00 p.m. and 7:00 p.m., is whenconsumption of beer (58%) is highest, and cocktails during this time are on par withdinnertime consumption (34%). While wine is generally consumed throughout theweek, cocktails are more popular on the weekends.
NPD found that the more alcoholic beverages people drink, the more they spendwhen dining out. The average dining check is about $12.00 without beverage alcohol. With alcohol, the average check amount almost doubles. Despite the fact that differentfoods affect check size (especially when pairing steak with red wine and pasta withwhite wine, for example), the type of wine also affects the average check amount. People tend to have a higher check when they order red wine, a moderate check withwhite wine, and a lower check with blush wine. Also, desserts are ordered more oftenwhen wine is included with a meal.
Several casual-dining chains are revamping their bar offerings to increase sales. One example is Red Robin Gourmet Burgers, which recently launched early- andlate-night happy hours and redesigned menus to highlight alcohol and nonalcoholicbeverages. Alcoholic beverages account for about 6% of Red Robin’s sales; for every1% increase in the alcohol sales mix, the chain sees a $6 million increase in profit.
_________________________________________________________________
“Alcoholic beverages are highly, highly profitable. It’s been such a challenging time for the industry, I think they’re trying to pull out all the stops.”
Bonnie Riggs, Analyst The NPD Group
_________________________________________________________________
According to GuestMetrics (www.guestmetrics.com), a research firm thatanalyzes point-of-sale data, mixed drink sales increased 1.9% in 2012. Mangomargaritas, ginger Mojitos, and similar cocktails with a flavor associated with themdrove the growth in mixed drink sales in 2012. Flavored drinks made up about 26% ofall cocktails sold, but they accounted for 51% of incremental growth in 2012 with a salesgrowth rate of 3.9%. The fastest growing drink flavors were mango, which grew by
RESTAURANT, FOOD & BEVERAGE MARKET RESEARCH HANDBOOK 2013
• 456 •
35%, and tea, which increased by 30%. Ginger and melon flavors each grew by 15%and cucumber was in 10% more cocktails sold.
_________________________________________________________________
“The disparity in growth rates of flavored drinksover non-flavored drinks is evident in the typesof cocktails sold. The largest category share[are] gains experienced by margaritas andMojitos, while at the other end of the spectrum,we see that Cosmopolitans and martinisexperienced the greatest share loss in 2012.”
Peter Reidhead, Vice PresidentGuestMetricsNation’s Restaurant News, 1/9/13
_________________________________________________________________
86.4 Alcoholic Beverage Service In Limited-Service RestaurantsThough alcoholic beverage service at quick-service restaurants (QSRs) in the
U.S. is rare, several chains are beginning to offer beer, wine, and mixed drinks at selectlocations. In 2010, Burger King began offering beer at its Whopper Bar location inMiami Beach. Beer service was also launched at locations in Las Vegas, Memphis,New York City, and Orlando.
Sonic Drive-In introduced beer service at two Florida locations in 2011; beer isserved only on the patio at these restaurants.
White Castle and Burgerville tested beer service at select locations in 2012.
_________________________________________________________________
“Fast feeders such as Burger King and Sonicare dabbling in booze in test markets. Themoves can bring higher check prices, but alsoregulatory headaches. And for big fast-foodchains, selling booze on a large scale won’tdeliver huge margins – at least not at first –since it’s also likely to add upfront costs.”
Advertising Age, 5/21/12 _________________________________________________________________
RESTAURANT, FOOD & BEVERAGE MARKET RESEARCH HANDBOOK 2013
• 457 •
Several fast-casual restaurants chains offer alcoholic beverage service. ChipotleMexican Grill serves beer and margaritas at most of its 1,100 locations. Noodles &Company, a 260-unit chain, sells beer and wine. Moe’s Southwest Grill sells beer andwine at about 40 of its 430 units. Smashburger serves beer at more than 90% of its156 U.S. locations. Freebirds World Burritos, a 90-unit chain, offers beer at all of itslocations and margaritas at some franchised restaurants. While beverage service iswell-received by customers at these fast-casual chains, Technomic estimates that eventhe most successful locations generate only about 5% of sales from alcoholicbeverages.
While generating only modest interest among limited-service patrons, beer andwine service poses several operational challenges.
_________________________________________________________________
“There are plenty of risks. For one, most statesrequire that people who handle or serve alcoholbe at least 18 years old and be supervised bysomeone age 21 or older. This posescomplications for fast feeders that often hireminors. Many states require special alcoholtraining for employees, a potentially costly andtime-consuming endeavor for fast-feedersrelying on part-time help. Further complicatingmatters, local licensing rules make it nearlyimpossible for fast feeders to sell booze insome places.”
Advertising Age, 5/21/12 _________________________________________________________________
86.5 Nonalcoholic CocktailsConsidering that 70% of adults consume alcoholic beverages less than once per
week and 35% are total abstainers, most casual- and fine-dining restaurants areoverlooking a huge opportunity by offering only a limited selection of nonalcoholicbeverages to their patrons.
In a 2012 survey by Technomic, 29% of adults said they like to try new andunique beverages offered at restaurants; 47% of those in the 18-to-24 agedemographic indicated this interest.
RESTAURANT, FOOD & BEVERAGE MARKET RESEARCH HANDBOOK 2013
• 458 •

_________________________________________________________________
“Innovative operators are creating value bycrafting new and unique beverages includingspecialty lemonades, handmade sodas, and‘mocktails’ that are uniquely flavorful, fresh anda better-for-you option.”
Darren Tristano, Executive V.P.Technomic, 9/24/12
_________________________________________________________________
The following are examples of restaurants and bars that have reported successwith more sophisticated non-alcoholic drink options:• Lark Creek Restaurant Group, in Southern California, serves at least three or four
Zero Proof beverages with fresh and creative ingredients at each of its 12 locations.• Obika Mozzarella Bar, with restaurants in Los Angeles and New York City, offers
three, $6, spirit-free options at the top of its cocktail list: The Gingerella, a mix oflemon, pineapple, orange, grenadine and ginger ale; and the California Crisp madewith lemon, lime and pomegranate juice.
• The menu at Island Creek Oyster Bar, in Boston, includes Abstain, a section ofspecialty non-alcoholic cocktails which are updated every two weeks. Ten percent(10%) of patrons order Abstain drinks.
• The three restaurants at Mayflower Park Hotel, in Seattle, have experienced anincrease in sales of nonalcoholic options in the last two years.
• Michael’s Genuine Food and Drink, in Miami, reports a 24% increase in servings ofnonalcoholic cocktails over the past two years.
• Roy’s Hawaiian Fusion Cuisine offers a selection of fresh-ingredient-basednonalcoholic cocktails at each of its 31 locations.
• Havana Central, a Cuban restaurant chain in New York City, makes lemonade toorder, mixing the customers’ choice of fruit purée with the juice of 1½ lemons, agavenectar, and water. The chain sells about 40,000 of the drinks annually at each of itsthree locations; the cost is $5.
• The house-made soda program at Miller Union, in Atlanta, focuses on local productsand natural ingredients. The selection varies depending on what ingredients are athand.
RESTAURANT, FOOD & BEVERAGE MARKET RESEARCH HANDBOOK 2013
• 459 •

_________________________________________________________________
“Basically whatever the pastry chef is using isprobably what I’m going to be using. Recentlythat has meant rhubarb-lemon and cucumber-mint sodas. But I get more experimentalsometimes, such as with a fig-and-balsamic-vinegar soda.”
Stuart White, Mixologist Miller Union Nation’s Restaurant News, 5/28/12
_________________________________________________________________
86.6 Happy HoursWhile the popularity of happy hours declined during the economic downturn,
many bars and restaurants ramped up their after-work offerings in 2012.
_________________________________________________________________
“Happy hours are here again. A growingnumber of casual-dining operators arediscovering that beefed-up happy hours canboost traffic and provide a financial bright spotin their sales mix.”
Nation’s Restaurant News, 4/30/12 _________________________________________________________________
A 2012 survey by Technomic found that customers find the following happy hourspecials most appealing (percentage of respondents indicating option is somewhat orvery appealing):• 50% off any drink: 90%• Two drinks for the price of one: 88%• Line-priced classic cocktails: 73%• Discounted pitchers: 69%• Inexpensive specialty drinks: 68%• Inexpensive bottles of beer: 64%
RESTAURANT, FOOD & BEVERAGE MARKET RESEARCH HANDBOOK 2013
• 460 •
• Inexpensive draft beer: 62%• Discounted glasses of wine: 52%
Given a choice, 58% of men and 55% of women said they prefer happy hour onFriday; Wednesday rated as the second most preferred day for the activity. Whilehappy hours are rarely offered on weekends, Technomic found that 64% ofrespondents said they would patronize a Saturday happy hour if one were offered.
86.7 Beverage-Only Restaurant OccasionsConsumers ordering beverages without food represent an increasing percentage
of restaurant traffic, and the occasions occur throughout the day. The NPD Groupreported that for the 12-month period ending June 2012 total restaurant visits were flatwhereas visits that included both food and beverage declined by 2%.
_________________________________________________________________
“As consumers manage restaurant checks bycutting back on beverages and orderingfood-only at main meals, restaurant chains aredriving incremental beverage-only occasions atother times during the day through theintroduction of new beverages and beveragemarketing efforts.”
The NPD Group, 11/12/12 _________________________________________________________________
Beverage-only foodservice occasions steadily increase during the morning, peakbetween 1:00 p.m. and 3:00 p.m., and then gradually taper off through the lateafternoon and evening hours. Shakes, smoothies, slushy drinks, coffee, and bottledwater are among the beverages more likely to be consumed at a restaurant occasionthat doesn’t include food.
RESTAURANT, FOOD & BEVERAGE MARKET RESEARCH HANDBOOK 2013
• 461 •

PART IX: AWARD WINNERS
RESTAURANT, FOOD & BEVERAGE MARKET RESEARCH HANDBOOK 2013
• 462 •
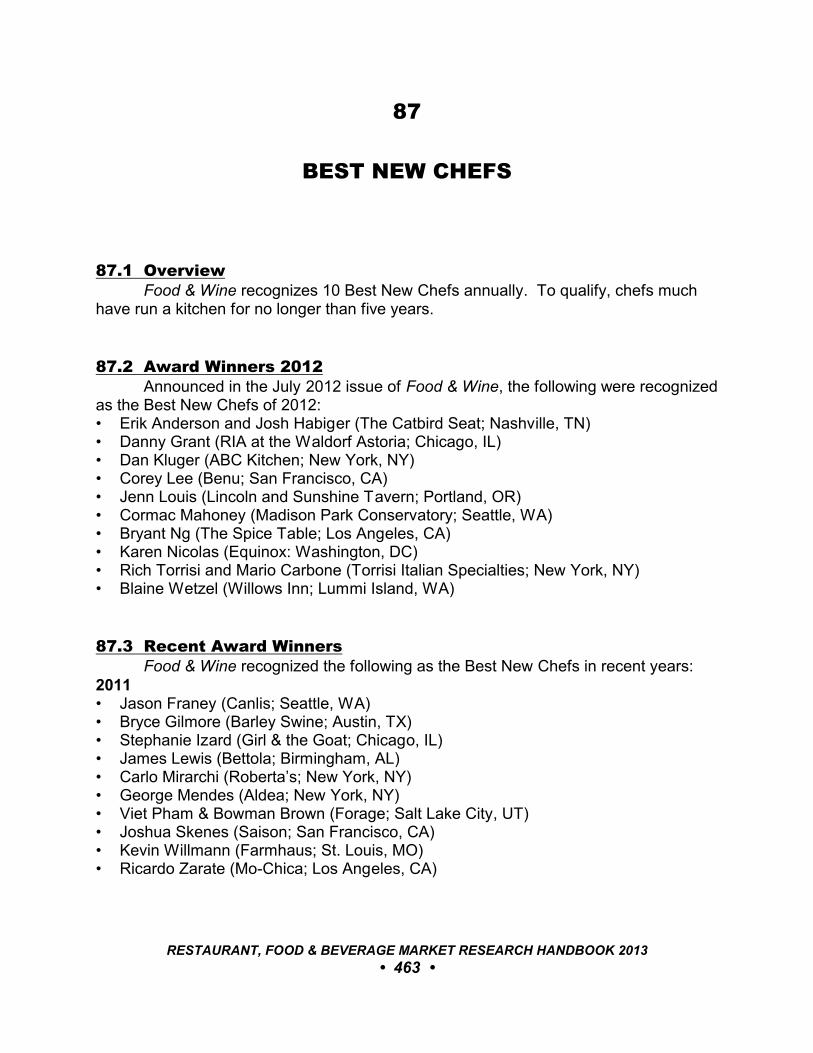
87
BEST NEW CHEFS
87.1 OverviewFood & Wine recognizes 10 Best New Chefs annually. To qualify, chefs much
have run a kitchen for no longer than five years.
87.2 Award Winners 2012Announced in the July 2012 issue of Food & Wine, the following were recognized
as the Best New Chefs of 2012:• Erik Anderson and Josh Habiger (The Catbird Seat; Nashville, TN)• Danny Grant (RIA at the Waldorf Astoria; Chicago, IL)• Dan Kluger (ABC Kitchen; New York, NY)• Corey Lee (Benu; San Francisco, CA)• Jenn Louis (Lincoln and Sunshine Tavern; Portland, OR)• Cormac Mahoney (Madison Park Conservatory; Seattle, WA)• Bryant Ng (The Spice Table; Los Angeles, CA)• Karen Nicolas (Equinox: Washington, DC)• Rich Torrisi and Mario Carbone (Torrisi Italian Specialties; New York, NY)• Blaine Wetzel (Willows Inn; Lummi Island, WA)
87.3 Recent Award WinnersFood & Wine recognized the following as the Best New Chefs in recent years:
2011• Jason Franey (Canlis; Seattle, WA)• Bryce Gilmore (Barley Swine; Austin, TX)• Stephanie Izard (Girl & the Goat; Chicago, IL)• James Lewis (Bettola; Birmingham, AL)• Carlo Mirarchi (Roberta’s; New York, NY)• George Mendes (Aldea; New York, NY)• Viet Pham & Bowman Brown (Forage; Salt Lake City, UT)• Joshua Skenes (Saison; San Francisco, CA)• Kevin Willmann (Farmhaus; St. Louis, MO)• Ricardo Zarate (Mo-Chica; Los Angeles, CA)
RESTAURANT, FOOD & BEVERAGE MARKET RESEARCH HANDBOOK 2013
• 463 •
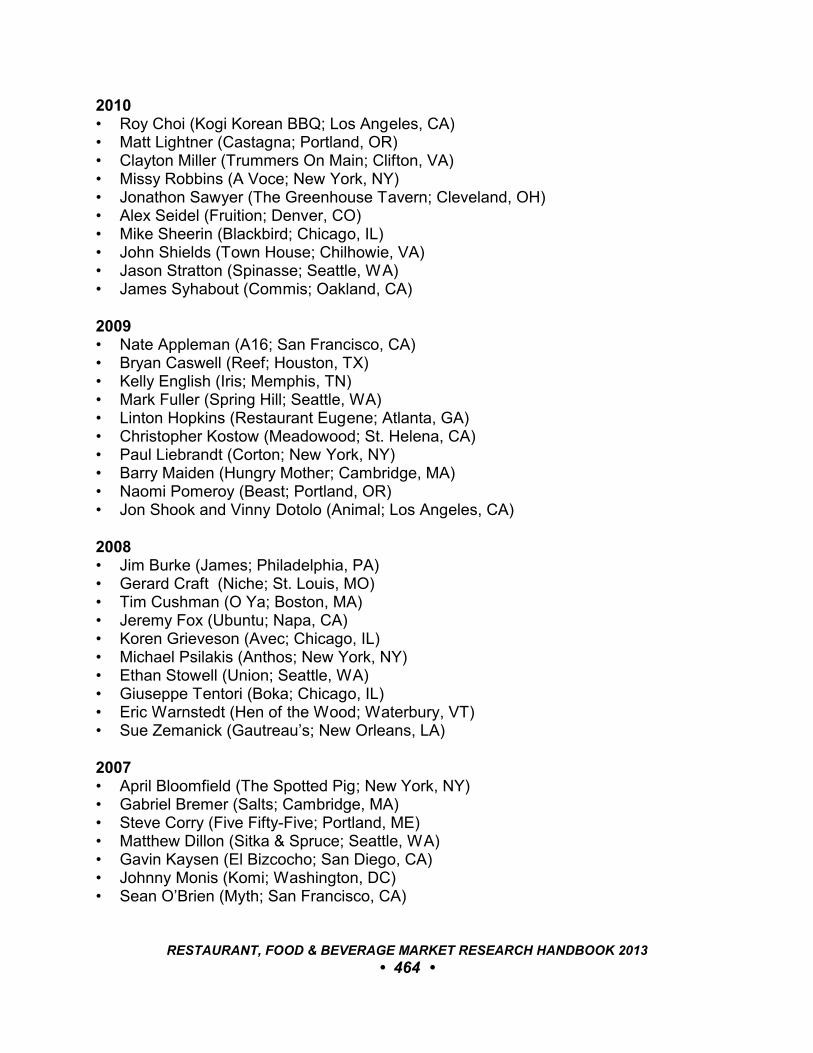
2010• Roy Choi (Kogi Korean BBQ; Los Angeles, CA)• Matt Lightner (Castagna; Portland, OR)• Clayton Miller (Trummers On Main; Clifton, VA)• Missy Robbins (A Voce; New York, NY)• Jonathon Sawyer (The Greenhouse Tavern; Cleveland, OH)• Alex Seidel (Fruition; Denver, CO)• Mike Sheerin (Blackbird; Chicago, IL)• John Shields (Town House; Chilhowie, VA)• Jason Stratton (Spinasse; Seattle, WA)• James Syhabout (Commis; Oakland, CA)
2009• Nate Appleman (A16; San Francisco, CA)• Bryan Caswell (Reef; Houston, TX)• Kelly English (Iris; Memphis, TN)• Mark Fuller (Spring Hill; Seattle, WA)• Linton Hopkins (Restaurant Eugene; Atlanta, GA)• Christopher Kostow (Meadowood; St. Helena, CA)• Paul Liebrandt (Corton; New York, NY)• Barry Maiden (Hungry Mother; Cambridge, MA)• Naomi Pomeroy (Beast; Portland, OR)• Jon Shook and Vinny Dotolo (Animal; Los Angeles, CA)
2008• Jim Burke (James; Philadelphia, PA)• Gerard Craft (Niche; St. Louis, MO)• Tim Cushman (O Ya; Boston, MA)• Jeremy Fox (Ubuntu; Napa, CA)• Koren Grieveson (Avec; Chicago, IL)• Michael Psilakis (Anthos; New York, NY)• Ethan Stowell (Union; Seattle, WA)• Giuseppe Tentori (Boka; Chicago, IL)• Eric Warnstedt (Hen of the Wood; Waterbury, VT)• Sue Zemanick (Gautreau’s; New Orleans, LA)
2007• April Bloomfield (The Spotted Pig; New York, NY)• Gabriel Bremer (Salts; Cambridge, MA)• Steve Corry (Five Fifty-Five; Portland, ME)• Matthew Dillon (Sitka & Spruce; Seattle, WA)• Gavin Kaysen (El Bizcocho; San Diego, CA)• Johnny Monis (Komi; Washington, DC)• Sean O’Brien (Myth; San Francisco, CA)
RESTAURANT, FOOD & BEVERAGE MARKET RESEARCH HANDBOOK 2013
• 464 •
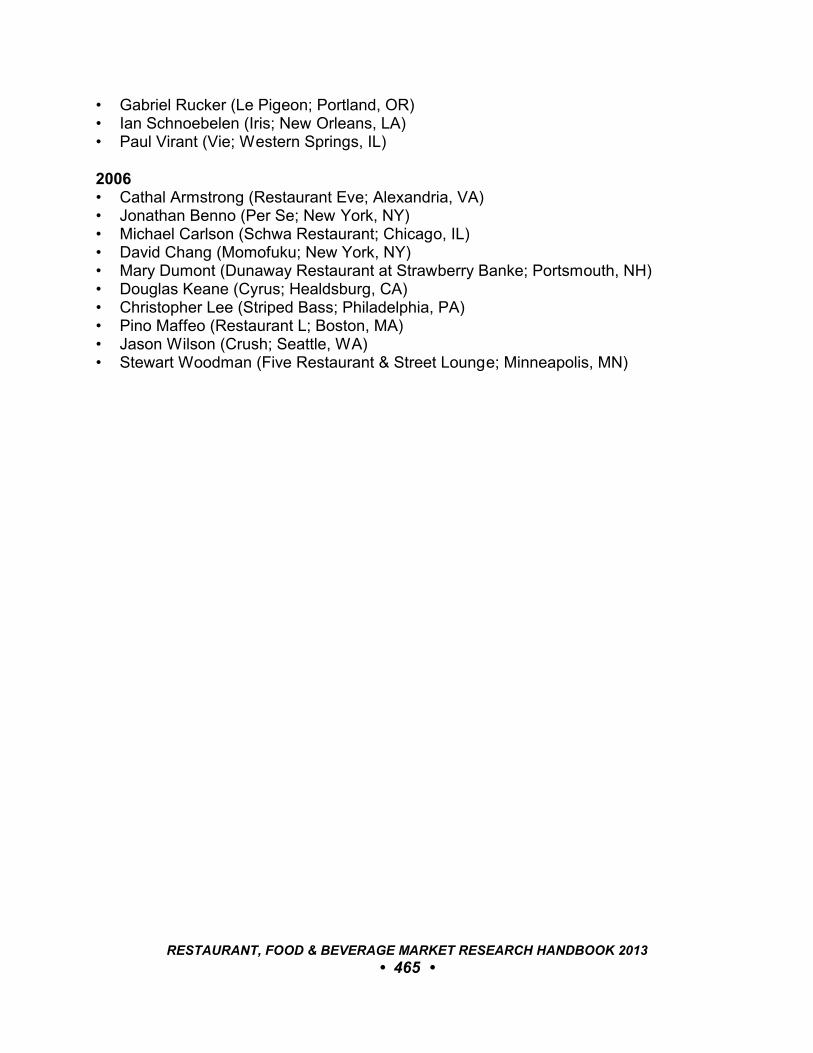
• Gabriel Rucker (Le Pigeon; Portland, OR)• Ian Schnoebelen (Iris; New Orleans, LA)• Paul Virant (Vie; Western Springs, IL)
2006• Cathal Armstrong (Restaurant Eve; Alexandria, VA)• Jonathan Benno (Per Se; New York, NY)• Michael Carlson (Schwa Restaurant; Chicago, IL)• David Chang (Momofuku; New York, NY)• Mary Dumont (Dunaway Restaurant at Strawberry Banke; Portsmouth, NH)• Douglas Keane (Cyrus; Healdsburg, CA)• Christopher Lee (Striped Bass; Philadelphia, PA)• Pino Maffeo (Restaurant L; Boston, MA)• Jason Wilson (Crush; Seattle, WA)• Stewart Woodman (Five Restaurant & Street Lounge; Minneapolis, MN)
RESTAURANT, FOOD & BEVERAGE MARKET RESEARCH HANDBOOK 2013
• 465 •
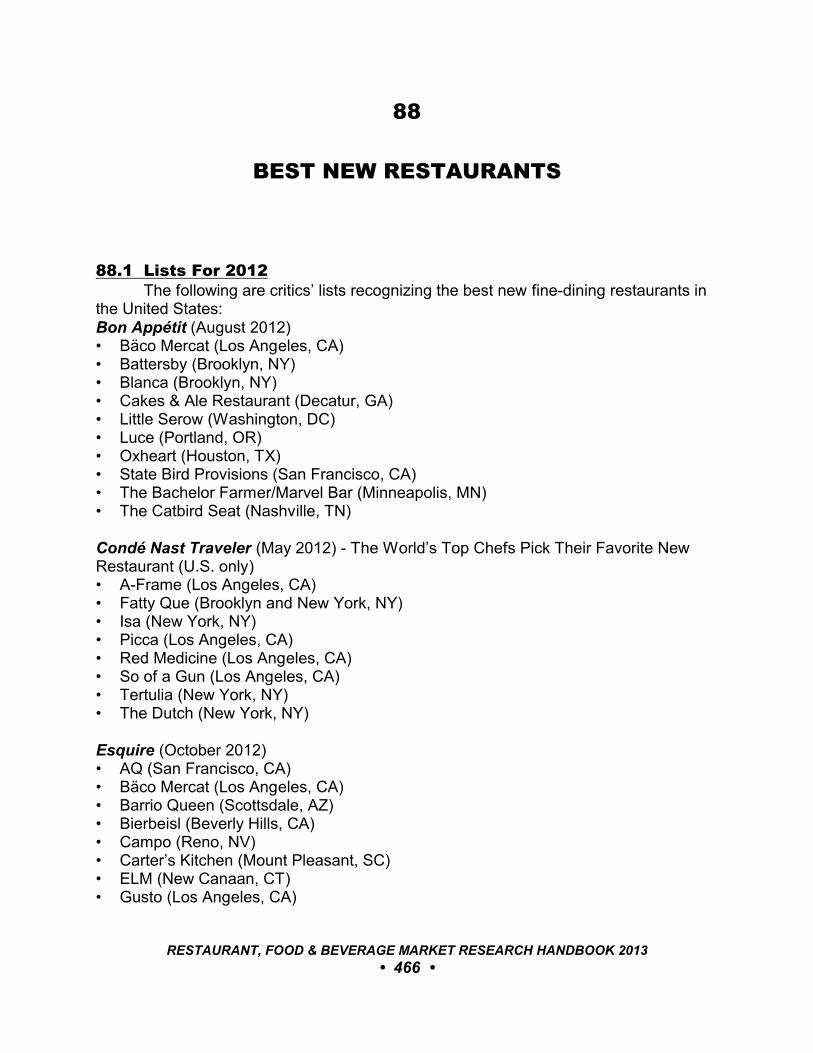
88
BEST NEW RESTAURANTS
88.1 Lists For 2012The following are critics’ lists recognizing the best new fine-dining restaurants in
the United States:Bon Appétit (August 2012)• Bäco Mercat (Los Angeles, CA)• Battersby (Brooklyn, NY)• Blanca (Brooklyn, NY)• Cakes & Ale Restaurant (Decatur, GA)• Little Serow (Washington, DC)• Luce (Portland, OR)• Oxheart (Houston, TX)• State Bird Provisions (San Francisco, CA)• The Bachelor Farmer/Marvel Bar (Minneapolis, MN)• The Catbird Seat (Nashville, TN)
Condé Nast Traveler (May 2012) - The World’s Top Chefs Pick Their Favorite NewRestaurant (U.S. only)• A-Frame (Los Angeles, CA)• Fatty Que (Brooklyn and New York, NY)• Isa (New York, NY)• Picca (Los Angeles, CA)• Red Medicine (Los Angeles, CA)• So of a Gun (Los Angeles, CA)• Tertulia (New York, NY)• The Dutch (New York, NY)
Esquire (October 2012)• AQ (San Francisco, CA)• Bäco Mercat (Los Angeles, CA)• Barrio Queen (Scottsdale, AZ)• Bierbeisl (Beverly Hills, CA)• Campo (Reno, NV)• Carter’s Kitchen (Mount Pleasant, SC)• ELM (New Canaan, CT)• Gusto (Los Angeles, CA)
RESTAURANT, FOOD & BEVERAGE MARKET RESEARCH HANDBOOK 2013
• 466 •
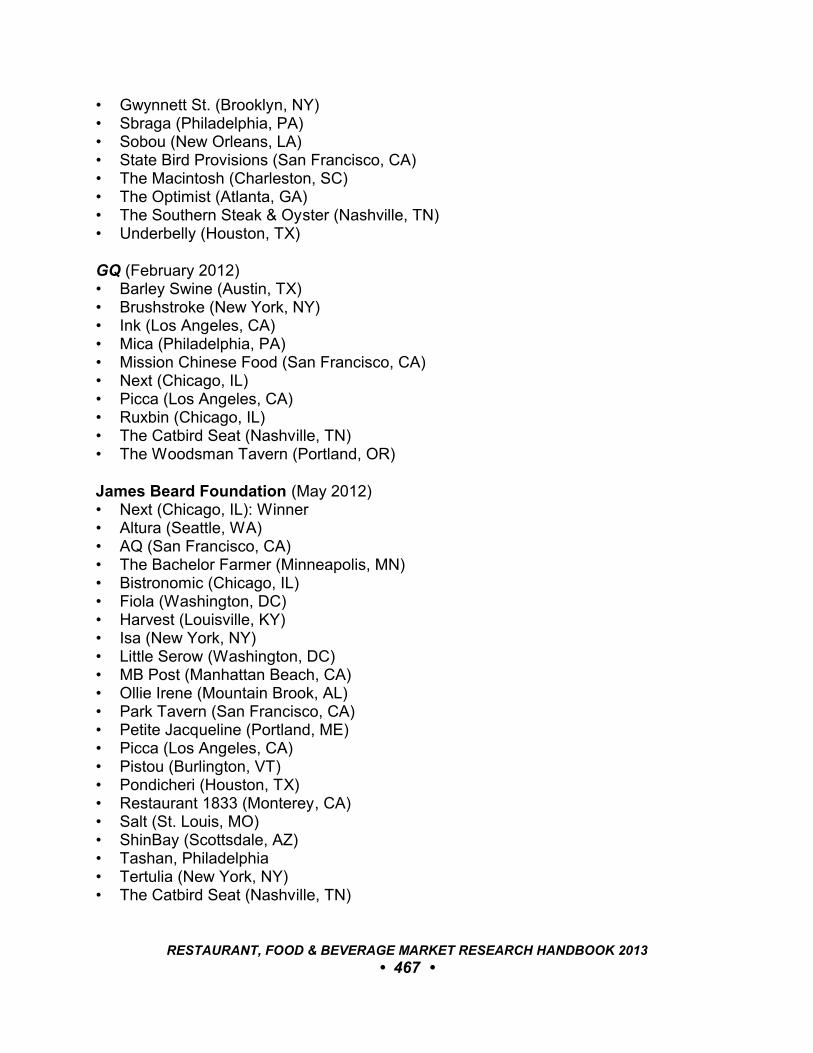
• Gwynnett St. (Brooklyn, NY)• Sbraga (Philadelphia, PA)• Sobou (New Orleans, LA)• State Bird Provisions (San Francisco, CA)• The Macintosh (Charleston, SC)• The Optimist (Atlanta, GA)• The Southern Steak & Oyster (Nashville, TN)• Underbelly (Houston, TX)
GQ (February 2012)• Barley Swine (Austin, TX)• Brushstroke (New York, NY)• Ink (Los Angeles, CA)• Mica (Philadelphia, PA)• Mission Chinese Food (San Francisco, CA)• Next (Chicago, IL)• Picca (Los Angeles, CA)• Ruxbin (Chicago, IL)• The Catbird Seat (Nashville, TN)• The Woodsman Tavern (Portland, OR)
James Beard Foundation (May 2012)• Next (Chicago, IL): Winner• Altura (Seattle, WA)• AQ (San Francisco, CA)• The Bachelor Farmer (Minneapolis, MN)• Bistronomic (Chicago, IL)• Fiola (Washington, DC)• Harvest (Louisville, KY)• Isa (New York, NY)• Little Serow (Washington, DC)• MB Post (Manhattan Beach, CA)• Ollie Irene (Mountain Brook, AL)• Park Tavern (San Francisco, CA)• Petite Jacqueline (Portland, ME)• Picca (Los Angeles, CA)• Pistou (Burlington, VT)• Pondicheri (Houston, TX)• Restaurant 1833 (Monterey, CA)• Salt (St. Louis, MO)• ShinBay (Scottsdale, AZ)• Tashan, Philadelphia• Tertulia (New York, NY)• The Catbird Seat (Nashville, TN)
RESTAURANT, FOOD & BEVERAGE MARKET RESEARCH HANDBOOK 2013
• 467 •

• The Dorrance (Providence, RI)• The Farm and Fisherman (Philadelphia, PA)• The Macintosh (Charleston, SC)• Trade (Boston, MA)• Tremont, (New York, NY)• Yardbird Southern Table & Bar (Miami Beach, FL)• Zeppoli (Collingswood, NJ)
RESTAURANT, FOOD & BEVERAGE MARKET RESEARCH HANDBOOK 2013
• 468 •
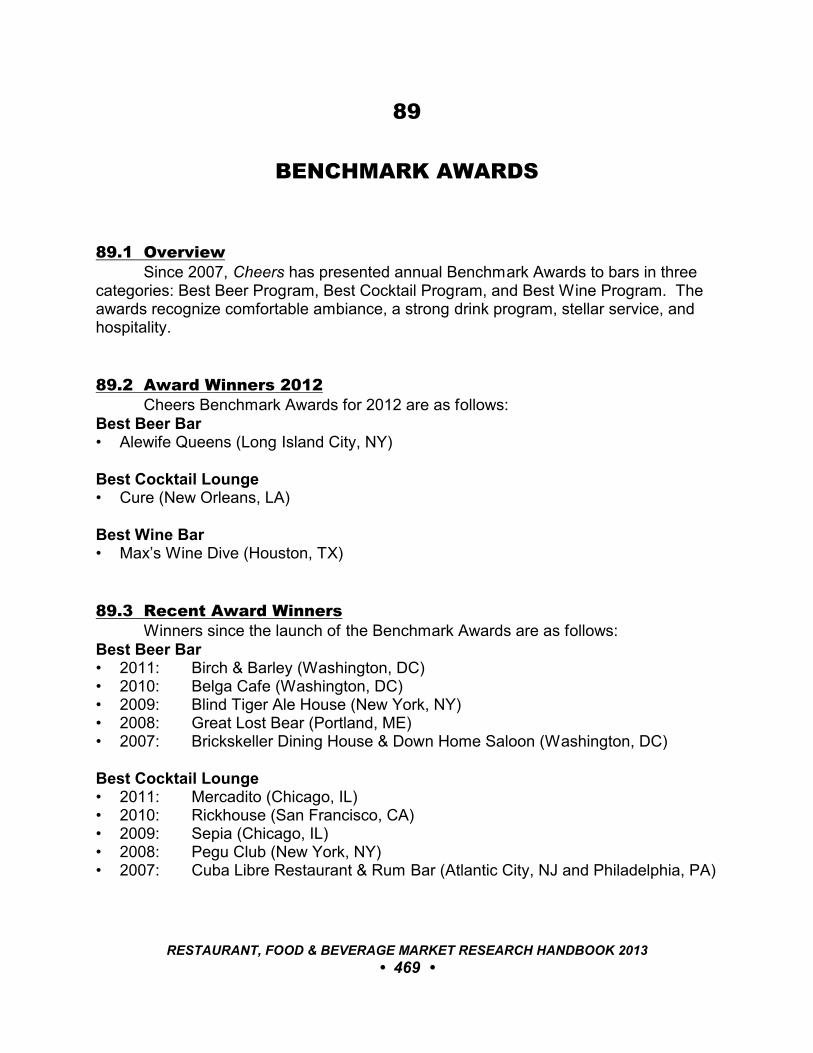
89
BENCHMARK AWARDS
89.1 OverviewSince 2007, Cheers has presented annual Benchmark Awards to bars in three
categories: Best Beer Program, Best Cocktail Program, and Best Wine Program. Theawards recognize comfortable ambiance, a strong drink program, stellar service, andhospitality.
89.2 Award Winners 2012Cheers Benchmark Awards for 2012 are as follows:
Best Beer Bar• Alewife Queens (Long Island City, NY)
Best Cocktail Lounge• Cure (New Orleans, LA)
Best Wine Bar• Max’s Wine Dive (Houston, TX)
89.3 Recent Award WinnersWinners since the launch of the Benchmark Awards are as follows:
Best Beer Bar• 2011: Birch & Barley (Washington, DC)• 2010: Belga Cafe (Washington, DC)• 2009: Blind Tiger Ale House (New York, NY)• 2008: Great Lost Bear (Portland, ME)• 2007: Brickskeller Dining House & Down Home Saloon (Washington, DC)
Best Cocktail Lounge• 2011: Mercadito (Chicago, IL)• 2010: Rickhouse (San Francisco, CA)• 2009: Sepia (Chicago, IL)• 2008: Pegu Club (New York, NY)• 2007: Cuba Libre Restaurant & Rum Bar (Atlantic City, NJ and Philadelphia, PA)
RESTAURANT, FOOD & BEVERAGE MARKET RESEARCH HANDBOOK 2013
• 469 •

Best Wine Bar• 2011: Summit at the Broadmoor (Colorado Springs, CO)• 2010: BOKA Kitchen and Bar (Seattle, WA)• 2009: Ottimista Enoteca-Café, San Francisco, CA)• 2008: Madison & Vine (New York, NY)• 2007: DW’s Restaurant at David Walley’s Resort, Hot Springs & Spa
(Genoa, NV)
RESTAURANT, FOOD & BEVERAGE MARKET RESEARCH HANDBOOK 2013
• 470 •
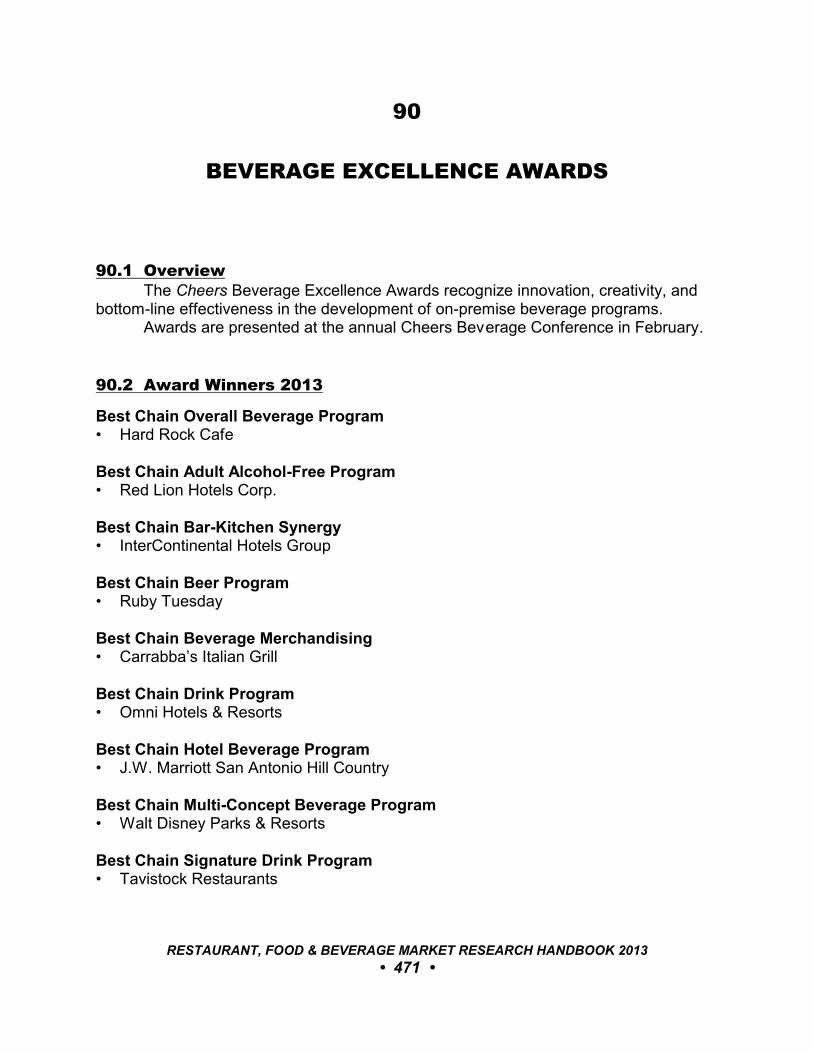
90
BEVERAGE EXCELLENCE AWARDS
90.1 OverviewThe Cheers Beverage Excellence Awards recognize innovation, creativity, and
bottom-line effectiveness in the development of on-premise beverage programs.Awards are presented at the annual Cheers Beverage Conference in February.
90.2 Award Winners 2013
Best Chain Overall Beverage Program• Hard Rock Cafe
Best Chain Adult Alcohol-Free Program• Red Lion Hotels Corp.
Best Chain Bar-Kitchen Synergy• InterContinental Hotels Group
Best Chain Beer Program• Ruby Tuesday
Best Chain Beverage Merchandising• Carrabba’s Italian Grill
Best Chain Drink Program• Omni Hotels & Resorts
Best Chain Hotel Beverage Program • J.W. Marriott San Antonio Hill Country
Best Chain Multi-Concept Beverage Program• Walt Disney Parks & Resorts
Best Chain Signature Drink Program• Tavistock Restaurants
RESTAURANT, FOOD & BEVERAGE MARKET RESEARCH HANDBOOK 2013
• 471 •

Best Chain Spirits Program• Celebrity Cruises
Best Chain Wine Program• Sheraton Hotels & Resorts
Beverage Industry Innovator of the Year• Tippling Brothers
Best Staff Training Program• Marriott International
Raising the Bar Award• Kip Snider, director of beverage: Yard House Restaurants
90.3 Award Winners 2012
Best Chain Overall Beverage Program• P.F. Chang’s China Bistro
Best Chain Beer Program• Rusty Bucket Restaurant & Tavern (Cameron Mitchell Group)
Best Chain Beverage Merchandising• Quaker Steak & Lube
Best Chain Drink Program• Ruby Tuesday
Best Chain Hotel Beverage Program • The Broadmoor
Best Chain Multi-Concept Beverage Program• Walt Disney Parks & Resorts
Best Chain Signature Drink Program• Omni Hotels & Resorts
Best Chain Spirits Program• Fairmont Hotels & Resorts
Best Chain Wine Program• Fleming’s Prime Steakhouse
RESTAURANT, FOOD & BEVERAGE MARKET RESEARCH HANDBOOK 2013
• 472 •
Best Staff Training Program• Rusty Bucket Restaurant & Tavern/Cameron Mitchell
90.4 Award Winners 2011
Best Chain Overall Beverage Program• Bar Louie
Best Chain Adult Alcohol-Free Program• Ruby Tuesday
Best Chain Beer Program• Yard House
Best Chain Beverage Menu• McCormick & Schmick’s Seafood Restaurants
Best Chain Beverage Merchandising• Westin Hotels
Best Chain Drink Program• Ram International
Best Chain Hotel Beverage Program• Royal Caribbean International Best Chain Multi-Concept Beverage Program• The Cheesecake Factory
Best Chain Signature Drink Program• The Phoenician Resort
Best Chain Spirits Program• Ocean Prime Restaurant
Best Chain Wine Program• P.F. Chang’s China Bistro
RESTAURANT, FOOD & BEVERAGE MARKET RESEARCH HANDBOOK 2013
• 473 •

91
CHAIN RESTAURANT CONSUMERS’ CHOICE AWARDS
91.1 OverviewTechnomic (www.technomic.com) presents annual Chain Restaurant
Consumers’ Choice Awards. The inaugural awards, presented in January 2013, were based on surveys
following 80,000 restaurant visits where consumers rated 115 restaurant chains onmore than 60 different attributes.
91.2 Award Winners 2013
Service• Quick-service: Chick-fil-A • Fast-casual: Firehouse Subs• Full-service: Outback Steakhouse
Food & Beverage• Quick-service: Culver’s• Fast-casual: McAlister’s Deli• Full-service: Cracker Barrel Old Country Store
Atmosphere• Quick-service: Caribou Coffee • Fast-casual: Panera Bread Co.• Full-service: LongHorn Steakhouse
Brand Image• Quick-service: Jamba Juice • Fast-casual: Qdoba Mexican Grill • Full-service: Red Robin Gourmet Burgers
91.3 Market ResourcesTechnomic, Inc., 300 South Riverside Plaza, Suite 1940 South, Chicago, IL 60606. (312) 876-0004. (www.technomic.com)
RESTAURANT, FOOD & BEVERAGE MARKET RESEARCH HANDBOOK 2013
• 474 •
92
CONSUMER PICKS
92.1 OverviewSince 2011, WD Partners (www.wdpartners.com) has annually polled consumers
across the U.S. about their attitudes toward restaurant chain brands. Surveyparticipants rate 10 attributes for chains they patronized in the previous six months, asfollows:• Atmosphere• Cleanliness• Cravability• Food quality• Likelihood to recommend• Likelihood to return• Menu variety• Reputation• Service• Value
Overall scores for each brand are a weighted average of the 10 attribute scores. The results of the survey, based on ratings of 171 restaurant chain brands, were
published by Nation’s Restaurant News in August 2012 and presented online athttp://nrn.com/industry-data/consumer-picks. The top ranked brands are summarizedin this chapter.
92.2 Favorites By SegmentThe top five restaurant brands by segment were as follows:
Casual-Dining1. The Cheesecake Factory2. P.F. Chang’s China Bistro3. Bonefish Grill4. Olive Garden5. Carabba’s Italian Grill
RESTAURANT, FOOD & BEVERAGE MARKET RESEARCH HANDBOOK 2013
• 475 •
Limited-Service1. Marble Slab Creamery2. Papa Murphy’s Take ‘N’ Bake3. In-N-Out Burger4. Ben & Jerry’s5. Chick-fil-A
Family-Dining1. Cracker Barrel Old Country Store2. Marie Callender’s3. Bob Evans Restaurants4. The Original Pancake House5. IHOP
92.3 Favorites By DemographicBy demographic, the following brands received the highest overall scores:
Casual-Dining• Women: The Cheesecake Factory• Men: P.F. Chang’s China Bistro• Millenials: Bonefish Grill• Generation X: P.F. Chang’s China Bistro• Baby Boomers: BJ’s Restaurant & Brewhouse• Seniors: The Cheesecake Factory• Income less than $25,000: The Cheesecake Factory• Income $25,000 to $49,999: The Cheesecake Factory• Income $50,000 to $74,999: BJ’s Restaurant & Brewhouse• Income $75,000 to $100,000: Bucca di Beppo• Income higher than $100,000: Mellow Mushroom Pizza Bakers
Limited-Service• Women: Marble Slab Creamery• Men: Potbelly Sandwich Works• Millenials: In-N-Out Burger• Generation X: Marble Slab Creamery• Baby Boomers: Marble Slab Creamery• Seniors: Papa Murphy’s Take ‘N’ Bake Pizza• Income less than $25,000: Souplantation/Sweet Tomatoes• Income $25,000 to $49,999: Marble Slab Creamery• Income $50,000 to $74,999: In-N-Out Burger• Income $75,000 to $100,000: Papa Murphy’s Take ‘N’ Bake Pizza• Income higher than $100,000: Bruster’s Real Ice Cream
RESTAURANT, FOOD & BEVERAGE MARKET RESEARCH HANDBOOK 2013
• 476 •

92.4 Market ResourcesWD Partners, 1201 Dublin Road, Columbus, OH 43215. (614) 221-0840. (www.wdpartners.com)
RESTAURANT, FOOD & BEVERAGE MARKET RESEARCH HANDBOOK 2013
• 477 •
93
CUSTOMER SATISFACTION
93.1 OverviewThe American Customer Satisfaction Index (ACSI, www.theacsi.org) is a national
economic indicator of satisfaction with the quality of products and services available toU.S. household consumers. Established in 1994, the ACSI produces indices ofcustomer satisfaction on a 0-100 scale.
The ACSI is based on about 65,000 interviews conducted annually, with 250 to260 interviews completed per company/agency. Industry sample sizes vary from 750 to10,000, depending on the number of measured companies in each industry.
The ACSI is produced by the Stephen M. Ross Business School at the Universityof Michigan (www.bus.umich.edu), in partnership with the American Society for Quality(www.asq.org) and the international consulting firm CFI Group (www.cfigroup.com). ForeSee Results (www.foreseeresults.com) sponsors the e-commerce and e-businessmeasurements.
93.2 ACSI ScoresThe ACSI scores for restaurant sectors have been as follows:
Full-Service Limited-Service
• 2007: 81 77• 2008: 80 78• 2009: 84 78• 2010: 81 75• 2011: 82 79• 2012: 80 80
93.3 Customer Satisfaction ScoresASCI scores from 2012 surveys and change from 2011 scores for restaurant
chains are as follows:Full-Service Restaurants• Red Lobster: 83 (1.2%)• Outback Steakhouse: 81 (no change)• Olive Garden: 80 (-2.4%)• Appleebee’s: 77 (n/a)
RESTAURANT, FOOD & BEVERAGE MARKET RESEARCH HANDBOOK 2013
• 478 •
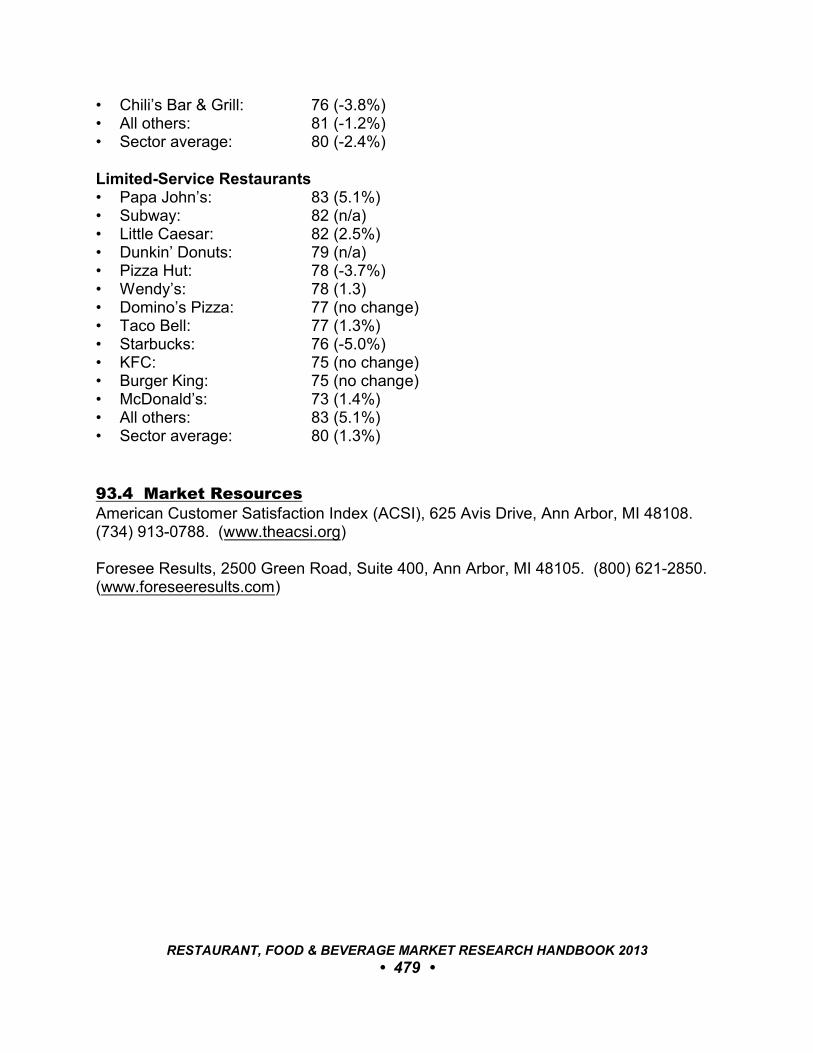
• Chili’s Bar & Grill: 76 (-3.8%)• All others: 81 (-1.2%)• Sector average: 80 (-2.4%)
Limited-Service Restaurants• Papa John’s: 83 (5.1%)• Subway: 82 (n/a)• Little Caesar: 82 (2.5%)• Dunkin’ Donuts: 79 (n/a)• Pizza Hut: 78 (-3.7%)• Wendy’s: 78 (1.3)• Domino’s Pizza: 77 (no change)• Taco Bell: 77 (1.3%)• Starbucks: 76 (-5.0%)• KFC: 75 (no change)• Burger King: 75 (no change)• McDonald’s: 73 (1.4%)• All others: 83 (5.1%)• Sector average: 80 (1.3%)
93.4 Market ResourcesAmerican Customer Satisfaction Index (ACSI), 625 Avis Drive, Ann Arbor, MI 48108. (734) 913-0788. (www.theacsi.org)
Foresee Results, 2500 Green Road, Suite 400, Ann Arbor, MI 48105. (800) 621-2850.(www.foreseeresults.com)
RESTAURANT, FOOD & BEVERAGE MARKET RESEARCH HANDBOOK 2013
• 479 •
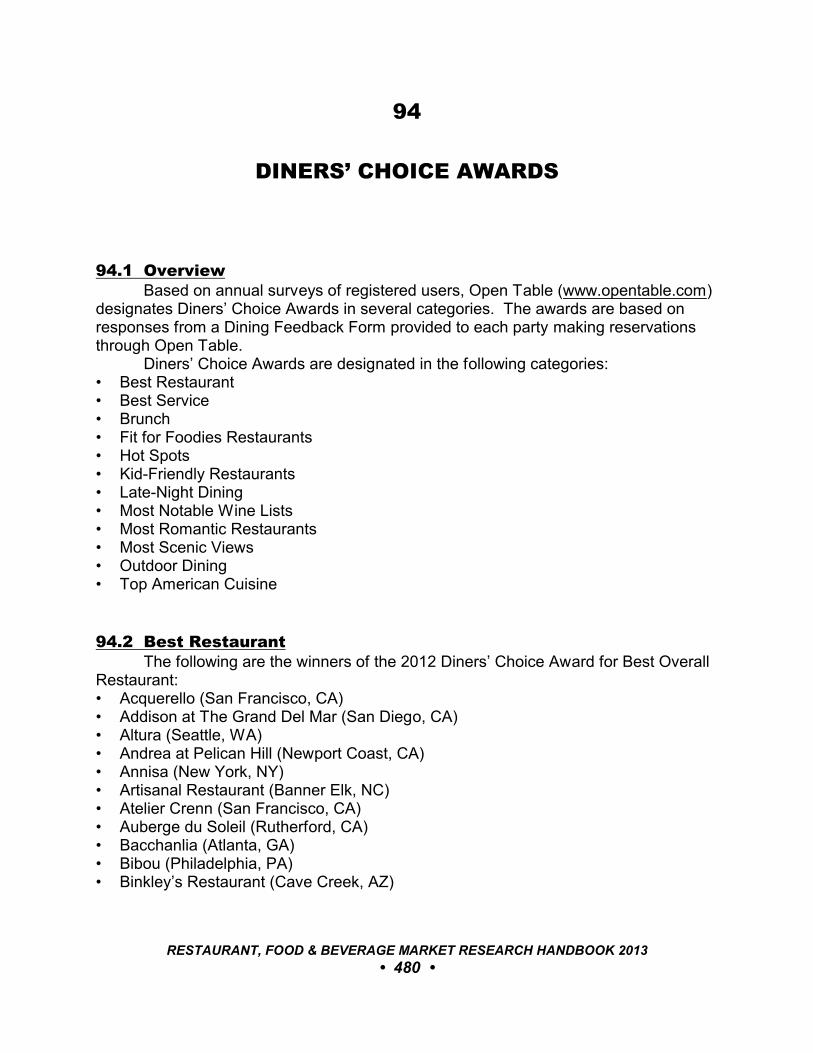
94
DINERS’ CHOICE AWARDS
94.1 OverviewBased on annual surveys of registered users, Open Table (www.opentable.com)
designates Diners’ Choice Awards in several categories. The awards are based onresponses from a Dining Feedback Form provided to each party making reservationsthrough Open Table.
Diners’ Choice Awards are designated in the following categories:• Best Restaurant• Best Service• Brunch• Fit for Foodies Restaurants• Hot Spots • Kid-Friendly Restaurants• Late-Night Dining• Most Notable Wine Lists• Most Romantic Restaurants• Most Scenic Views• Outdoor Dining• Top American Cuisine
94.2 Best RestaurantThe following are the winners of the 2012 Diners’ Choice Award for Best Overall
Restaurant:• Acquerello (San Francisco, CA)• Addison at The Grand Del Mar (San Diego, CA)• Altura (Seattle, WA)• Andrea at Pelican Hill (Newport Coast, CA)• Annisa (New York, NY)• Artisanal Restaurant (Banner Elk, NC)• Atelier Crenn (San Francisco, CA)• Auberge du Soleil (Rutherford, CA)• Bacchanlia (Atlanta, GA)• Bibou (Philadelphia, PA)• Binkley’s Restaurant (Cave Creek, AZ)
RESTAURANT, FOOD & BEVERAGE MARKET RESEARCH HANDBOOK 2013
• 480 •
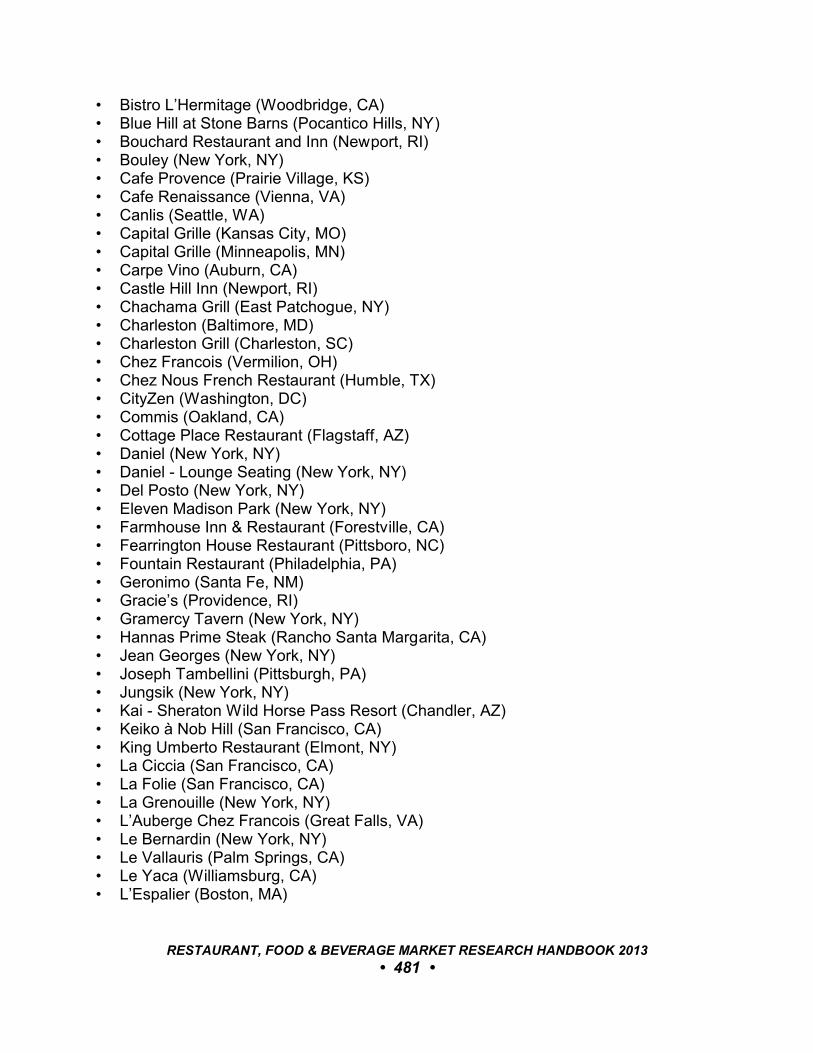
• Bistro L’Hermitage (Woodbridge, CA)• Blue Hill at Stone Barns (Pocantico Hills, NY)• Bouchard Restaurant and Inn (Newport, RI)• Bouley (New York, NY)• Cafe Provence (Prairie Village, KS)• Cafe Renaissance (Vienna, VA)• Canlis (Seattle, WA)• Capital Grille (Kansas City, MO)• Capital Grille (Minneapolis, MN)• Carpe Vino (Auburn, CA)• Castle Hill Inn (Newport, RI)• Chachama Grill (East Patchogue, NY)• Charleston (Baltimore, MD)• Charleston Grill (Charleston, SC)• Chez Francois (Vermilion, OH)• Chez Nous French Restaurant (Humble, TX)• CityZen (Washington, DC)• Commis (Oakland, CA)• Cottage Place Restaurant (Flagstaff, AZ)• Daniel (New York, NY)• Daniel - Lounge Seating (New York, NY)• Del Posto (New York, NY)• Eleven Madison Park (New York, NY)• Farmhouse Inn & Restaurant (Forestville, CA)• Fearrington House Restaurant (Pittsboro, NC)• Fountain Restaurant (Philadelphia, PA)• Geronimo (Santa Fe, NM)• Gracie’s (Providence, RI)• Gramercy Tavern (New York, NY)• Hannas Prime Steak (Rancho Santa Margarita, CA)• Jean Georges (New York, NY)• Joseph Tambellini (Pittsburgh, PA)• Jungsik (New York, NY)• Kai - Sheraton Wild Horse Pass Resort (Chandler, AZ)• Keiko à Nob Hill (San Francisco, CA)• King Umberto Restaurant (Elmont, NY)• La Ciccia (San Francisco, CA)• La Folie (San Francisco, CA)• La Grenouille (New York, NY)• L’Auberge Chez Francois (Great Falls, VA)• Le Bernardin (New York, NY)• Le Vallauris (Palm Springs, CA)• Le Yaca (Williamsburg, CA)• L’Espalier (Boston, MA)
RESTAURANT, FOOD & BEVERAGE MARKET RESEARCH HANDBOOK 2013
• 481 •
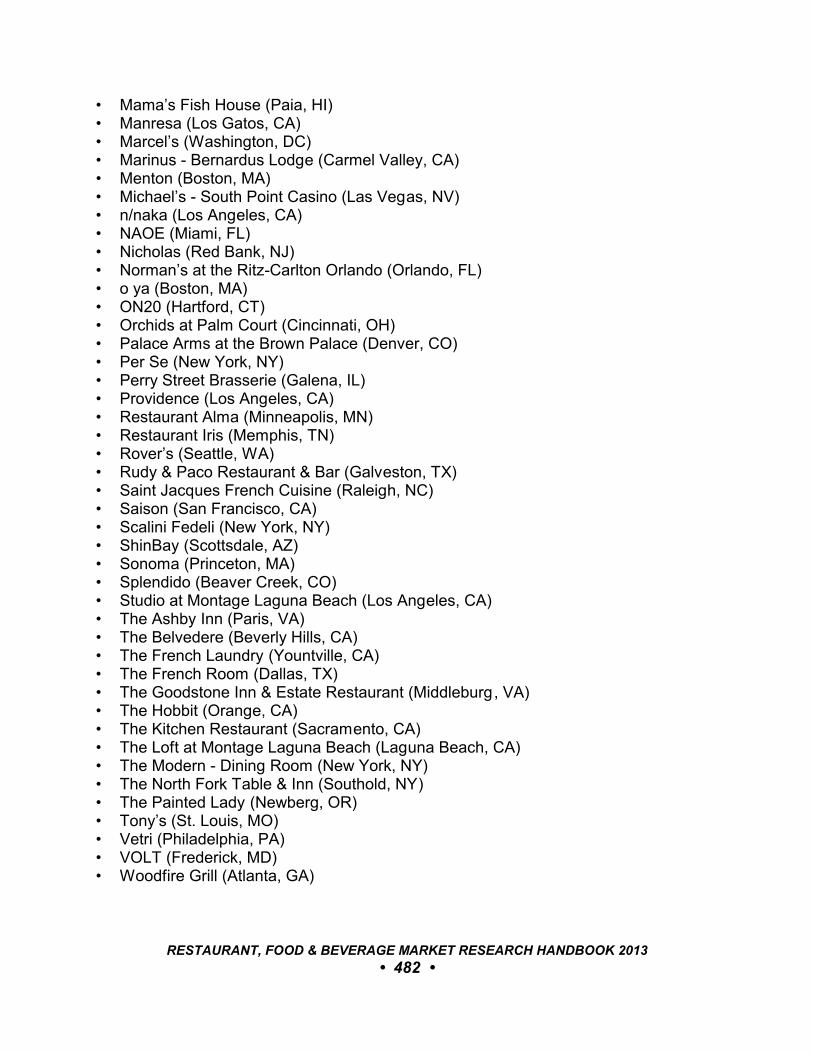
• Mama’s Fish House (Paia, HI)• Manresa (Los Gatos, CA)• Marcel’s (Washington, DC)• Marinus - Bernardus Lodge (Carmel Valley, CA)• Menton (Boston, MA)• Michael’s - South Point Casino (Las Vegas, NV)• n/naka (Los Angeles, CA)• NAOE (Miami, FL)• Nicholas (Red Bank, NJ)• Norman’s at the Ritz-Carlton Orlando (Orlando, FL)• o ya (Boston, MA)• ON20 (Hartford, CT)• Orchids at Palm Court (Cincinnati, OH)• Palace Arms at the Brown Palace (Denver, CO)• Per Se (New York, NY)• Perry Street Brasserie (Galena, IL)• Providence (Los Angeles, CA)• Restaurant Alma (Minneapolis, MN)• Restaurant Iris (Memphis, TN)• Rover’s (Seattle, WA)• Rudy & Paco Restaurant & Bar (Galveston, TX)• Saint Jacques French Cuisine (Raleigh, NC)• Saison (San Francisco, CA)• Scalini Fedeli (New York, NY)• ShinBay (Scottsdale, AZ)• Sonoma (Princeton, MA)• Splendido (Beaver Creek, CO)• Studio at Montage Laguna Beach (Los Angeles, CA)• The Ashby Inn (Paris, VA)• The Belvedere (Beverly Hills, CA)• The French Laundry (Yountville, CA)• The French Room (Dallas, TX)• The Goodstone Inn & Estate Restaurant (Middleburg, VA)• The Hobbit (Orange, CA)• The Kitchen Restaurant (Sacramento, CA)• The Loft at Montage Laguna Beach (Laguna Beach, CA)• The Modern - Dining Room (New York, NY)• The North Fork Table & Inn (Southold, NY)• The Painted Lady (Newberg, OR)• Tony’s (St. Louis, MO)• Vetri (Philadelphia, PA)• VOLT (Frederick, MD)• Woodfire Grill (Atlanta, GA)
RESTAURANT, FOOD & BEVERAGE MARKET RESEARCH HANDBOOK 2013
• 482 •

94.3 Best ServiceThe following are the winners of the 2012 Diners’ Choice Award for Best Service:
• Acqua Restaurant & Wine Bar (White Bear Lake, MN)• Acquerello (San Francisco, CA)• Addison at The Grand Del Mar (San Diego, CA)• Bacchanalia (Atlanta, GA)• Bibou (Philadelphia, PA)• Binkley’s Restaurant (Cave Creek, AZ)• Bistro L’Hermitage (Woodbridge, VA)• Blue Hill at Stone Barns (Pocantico Hills, NY)• Bluestem (Kansas City, MO)• Bones (Atlanta, GA)• Cafe Renaissance (Vienna, VA)• Canlis (Seattle, WA)• Capital Grille - Minneapolis (Minneapolis, MN)• Castagna (Portland, ME)• Chama Gaucha Brazilian Steakhouse (Downers Grove, IL)• Charleston (Baltimore, MD)• Charleston Grill (Charleston, SC)• Chez Francois (Vermilion, OH)• Chez Nous French Restaurant (Humble, TX)• CityZen (Washington, DC)• Congress (Austin, TX)• Corbett’s Fine Dining (Louisville, KY)• Cyrus (Healdsburg, CA)• Daniel (New York, NY)• Daniel - Lounge Seating (New York, NY)• Del Posto (New York, NY)• Dewz (Modesto, CA)• Eleven Madison Park (New York, NY)• Elizabeth on 37th (Savannah, GA)• Farmhouse Inn & Restaurant (Forestville, CA)• Fat Canary (Williamsburg, VA)• Fearrington House Restaurant (Pittsboro, NC)• Fig Tree (Charlotte, NC)• Forage (Salt Lake City, UT)• Fountain Restaurant (Philadelphia, PA)• Frasca Food and Wine (Boulder, CO)• Genoa Restaurant (Portland, OR)• Gordon Ramsay at the London (New York, NY)• Grouse Mountain Grill (Avon, CO)• Halls Chophouse (Charleston, SC)• Hannas Prime Steak (Rancho Santa Margarita, CA)• Herons (Cary, NC)
RESTAURANT, FOOD & BEVERAGE MARKET RESEARCH HANDBOOK 2013
• 483 •
• Highlands Bar & Grill (Birmingham, AL)• joan’s in the Park (Saint Paul, MN)• Kai - Sheraton Wild Horse Pass Resort (Chandler, AZ)• Killen’s Steakhouse (Pearland, TX)• La Belle Vie (Minneapolis, MN)• La Grenouille (New York, NY)• La Mer at Halekulani (Honolulu, HI)• L’Auberge Chez Francois (Great Falls, VA)• Le Bernardin (New York, NY)• Les Nomades (Chicago, IL)• L’Etoile Restaurant (Madison, WI)• Madrona Manor (Healdsburg, CA)• Mahogany Prime Omaha (Omaha, NE)• Marcel’s (Washington, DC)• Menton (Boston, MA)• Michael’s - South Point Casino (Las Vegas, NV)• Mitchell’s Ocean Club - Easton Town Center (Columbus, OH)• Morton’s The Steakhouse - Portland (Portland, OR)• Niche (St. Louis, MO)• Nicholas (Red Bank, NJ)• o ya (Boston, MA)• Opus 9 Steakhouse (Williamsburg, VA)• Orchids at Palm Court - Hilton Cincinnati Netherland Plaza (Cincinnati, OH)• Palace Arms at the Brown Palace (Denver, CO)• Peninsula Grill (Charleston, SC)• Pepper Tree Restaurant (Colorado Springs, CO)• Per Se (New York, NY)• Plume at the Jefferson Hotel (Washington, DC)• Rafain Brazilian Steakhouse (Dallas, TX)• Restaurant Iris (Memphis, TN)• Rover’s (Seattle, WA)• Rudy & Paco Restaurant & Bar (Galveston, TX)• Russell’s Steaks, Chops, and More (Williamsville, NY)• Ruth’s Chris Steak House - Jacksonville (Jacksonville, FL)• Saint Jacques French Cuisine (Raleigh, NC)• Sedgley Place (Greene, ME)• Sonoma (Princeton, MA)• St. John’s Restaurant (Chattanooga, TN)• The Copper Door (Hayesville, NC)• The Dining Room - Biltmore Estate (Asheville, NC)• The French Room (Dallas, TX)• The Grill - The Ritz-Carlton (Naples, FL)• The Hobbit (Orange, CA)• The Kitchen Restaurant (Sacramento, CA)
RESTAURANT, FOOD & BEVERAGE MARKET RESEARCH HANDBOOK 2013
• 484 •
• The Melting Pot - Myrtle Beach (Myrtle Beach, SC)• The Painted Lady (Newberg, OR)• The Restaurant at Meadowood (Saint Helena, CA)• The Steak House at Silver Reef (Ferndale, WA)• Tony’s - St. Louis (St. Louis, MO)• TRU (Chicago, IL)• Uchi (Austin, TX)• Vetri (Philadelphia, PA)• Vic & Anthony’s Steakhouse (Las Vegas, NV)• Vintage Tavern (Suffolk, VA)• White Barn Inn (Kennebunkport Beach, ME)• Woodfire Grill (Atlanta, GA)
94.4 BrunchThe following are the winners of the 2012 Diners’ Choice Award for Best Brunch:
• 56th Fighter Group (East Farmingdale, NY)• 94th Aero Squadron (Miami, FL)• 94th Aero Squadron (San Diego, CA)• 94th Aero Squadron (Van Nuys, CA)• 100th Bomb Group (Cleveland, OH)• Allgauer’s (Lisle, IL)• Ana Beall’s Tea Room (Westfield, NJ)• B Matthews Eatery (Savannah, GA)• Back Bay Bistro (Newport Beach, CA)• Bananas Modern American Diner (Orlando, FL)• Bedford Post - The Barn (Bedford, NY)• Belga Cafe (Washington, DC)• Big Jones (Chicago, IL)• Biltmore Brunch (Coral Gables, FL)• Bixby’s (St. Louis, MO)• BLD (Los Angeles, CA)• Brady’s Landing (Houston, TX)• Broadway Cellars (Chicago, IL)• Brockton Villa (La Jolla, CA)• Buttons Food and Music (Forth Worth, TX)• Cafe Fleuri (Boston, MA)• Cafe Modern (Fort Worth, TX)• Cafe Monte (Charlotte, NC)• Capitol Garage (Sacramento, CA)• Castaway (Burbank, CA)• Chez Zee (Austin, TX)• Cookshop (New York, NY)• Cooperage Inn Restaurant (Baiting Hollow, NY)
RESTAURANT, FOOD & BEVERAGE MARKET RESEARCH HANDBOOK 2013
• 485 •

• Cupping Room Cafe (New York, NY)• Deerfield (Newark, DE)• Einstein’s (Atlanta, GA)• Ellyngton’s at the Brown Palace (Denver, CO)• Essex (New York, NY)• FARMiCia (Philadelphia, PA)• Fearrington Granary (Pittsboro, NC)• Five Points (New York, NY)• Friend of a Farmer (New York, NY)• Garden Court (San Francisco, CA)• Generations Restaurant (Media, PA)• Gertrude’s at the Baltimore Museum of Art (Baltimore, MD)• Grand Concourse (Pittsburgh, PA)• Henry’s Restaurant (New York, NY)• HS Lordships (Berkeley, CA)• Humphreys Restaurant (San Diego, CA)• Hundred Acres (New York, NY)• Ironside (San Francisco, CA)• Jane (New York, NY)• Kelties Restaurant and Catering (Westfield, IN)• La Note Restaurant Provencal (Berkeley, CA)• Lake Elmo Inn (Lake Elmo, MN)• L’Enfant Café & Bar (Washington, DC)• Level One (Washington, DC)• Lucile’s (Fort Worth, TX)• LuLu’s (Richmond, VA)• Luminarias (Monterey Park, CA)• Madhatter (Washington, DC)• Magic Flute (San Francisco, CA)• Masa (Boston, MA)• Mountain View Restaurant at Cheyenne Mountain Resort (Colorado Springs, CO)• Mrs. K’s Toll House (Silver Spring, MD)• Museum Cafe (Oklahoma City, OK)• Norma’s at Le Parker Meridien (New York, NY)• North End Cafe (Louisville, KY)• Odyssey (Granada Hills, CA)• Paradou (New York, NY)• Parks Edge (Atlanta, GA)• Parrot Cage - Washburne Culinary Institute (Chicago, IL)• Pastis (New York, NY)• Peacock Alley (New York, NY)• Peackock Café (Washington, DC)• Plumeria Beach House (Kahala, HI)• Poco (New York, NY)
RESTAURANT, FOOD & BEVERAGE MARKET RESEARCH HANDBOOK 2013
• 486 •
• Pond House Cafe (West Hartford, CT)• Proud Bird (Los Angeles, CA)• Queen Mary Champagne Sunday (Long Beach, CA)• R Gang Eatery (San Diego, CA)• Rosebud (Atlanta, GA)• Salty’s on Alki (Seattle, WA)• Sanfords Restaurant (Astoria, NY)• Sarabeth’s Central Park South (New York, NY)• Sarabeth’s East (New York, NY)• Sarabeth’s TriBeCa (New York, NY)• Sarabeth’s West (New York, NY)• Shanghai Red’s (Marina Del Rey, CA)• South End Buttery (Boston, MA)• Styer’s Garden Cafe (Glen Mills, PA)• Sundy House (Delray Beach, FL)• Tap Room - Hotel Bethlehem (Bethlehem, PA) • TART Restaurant & Farmer’s Daughter Hotel (Los Angeles, CA)• Ted’s Bulletin (Washington, DC)• The Bistro at Childress Vineyards (Lexington, NC)• The Dining Room at Salish Lodge & Spa (Snoqualmie, WA)• The Farm of Beverly Hills (Beverly Hills, CA)• The Front Page (Washington, DC)• The Reef (Long Beach, CA)• The Roycroft Inn (East Aurora, NY)• The Smith (New York, NY)• Tom Hams Lighthouse (San Diego, CA)• Top of the Mark (San Francisco, CA)• Town’s End Restaurant (San Francisco, CA)• Valley Green Inn (Philadelphia, PA)
94.5 Fit For Foodies RestaurantsThe following are the winners of the 2012 Diners’ Choice Award for the top Fit for
Foodies Restaurant:• Abattoir (Atlanta, GA)• Acadia (Chicago, IL)• Ad Hoc (Yountville, CA)• Altura (Seattle, WA)• Annisa (New York, NY)• Atelier Crenn (San Francisco, CA)• Aviary (Portland, OR)• Beast (Portland, OR)• Benu (San Francisco, CA)• Bibou (Philadelphia, PA)
RESTAURANT, FOOD & BEVERAGE MARKET RESEARCH HANDBOOK 2013
• 487 •
• Blackbird (Chicago, IL)• bresca (Portland, ME)• Camino (Oakland, CA)• Canteen (San Francisco, CA)• Cascina Spinasse (Seattle, WA)• Castagna (Portland, OR)• Central Kitchen (San Francisco, CA)• Cochon (New Orleans, LA)• Commis (Oakland, CA)• Commonwealth (San Francisco, CA)• Cotogna (San Francisco, CA)• Craigie on Main (Cambridge, MA)• Cube Cafe and Marketplace (Los Angeles, CA)• Dirt Candy (New York, NY)• East by Northeast (Cambridge, MA)• Ela (Philadelphia, PA)• Eola (Washington, DC)• Farmhouse Inn & Restaurant (Forestville, CA)• FIG (Charleston, SC)• Flour + Water (San Francisco, CA)• Fond (Philadelphia, PA)• Forage (Salt Lake City, UT)• Frances (San Francisco, CA)• Girl & the Goat (Chicago, IL)• Golden Beetle (Seattle, WA)• goosefoot (Chicago, IL)• Graham Elliot (Chicago, IL)• Gruner (Portland, OR)• Gwynnett St (Brooklyn, NY)• Haven (Oakland, CA)• How to Cook A Wolf (Seattle, WA)• Hugo’s Restaurant (Portland, ME)• Hungry Mother (Cambridge, MA)• iNG Restaurant (Chicago, IL)• ink. (Los Angeles, CA)• Kin Shop (New York, NY)• Le Pigeon (Portland, OR)• Little Bird (Portland, OR)• Little Fish (Philadelphia, PA)• Local Mission Eatery (San Francisco, CA)• Lula Cafe (Chicago, IL)• Mezze (Los Angeles, CA)• Miller Union (Atlanta, GA)• Mistral Kitchen (Seattle, WA)
RESTAURANT, FOOD & BEVERAGE MARKET RESEARCH HANDBOOK 2013
• 488 •
• Moto Restaurant (Chicago, IL)• Natural Selection (Portland, OR)• Ned Ludd (Portland, OR)• Nobuo at Teeter House (Phoenix, AZ)• Park Kitchen (Portland, OR)• Piccolo (Minneapolis, MN)• Ping Restaurant (Portland, OR)• Playa (Los Angeles, CA)• Plum (Oakland, CA)• Poppy (Seattle, WA)• Posh (Scottsdale, AZ)• Range (San Francisco, CA)• Red Medicine (Los Angeles, CA)• Restaurant Alma (Minneapolis, MN)• Restaurant Zoe (Seattle, WA)• Russet (Philadelphia, PA)• Rustic Canyon Wine Bar (Santa Monica, CA)• Saffron Restaurant & Lounge (Minneapolis, MN)• Saison (San Francisco, CA)• Sbraga (Philadelphia, PA)• Sons & Daughters (San Francisco, CA)• Soto (New York, NY)• SPOR (San Francisco, CA)• Sprout (Chicago, IL)• Spur Gastropub (Seattle, WA)• Staple & Fancy Mercantile (Seattle, WA)• Susan Feniger’s STREET (Los Angeles, CA)• Tabla Mediterranean Bistro (Portland, OR)• Takashi (Chicago, IL)• Tar & Roses (Santa Monica, CA)• Terra Plata (Seattle, WA)• The Bristol (Chicago, IL)• The Farm and Fisherman (Forestville, CA)• The Publican (Chicago, IL)• The Refinery (Tampa, FL)• The Spence (Atlanta, GA)• The Squeaky Bean (Denver, CO)• The Tasting Kitchen (Venice, CA)• Tilth (Seattle, WA)• Topolobampo (Chicago, IL)• Twelve Restaurant (Denver, CO)• Underbelly (Houston, TX)• Vedge (Philadelphia, PA)• Vernick Food & Drink (Philadelphia, PA)
RESTAURANT, FOOD & BEVERAGE MARKET RESEARCH HANDBOOK 2013
• 489 •
• wd-50 (New York, NY)• Woodfire Grill (Atlanta, GA)• Zahav (Philadelphia, PA)
94.6 Hot SpotsThe 2012 Diners’ Choice Award for top Hot Spot (which recognizes hip
restaurants, celebrity chefs, and avant-garde restaurateurs) are as follows:• 25 Lusk (San Francisco, CA)• Abe & Arthur’s (New York, NY)• Asellina Ristorante (New York, NY)• B.B. King’s Blues Club (Memphis, TN)• Beaumarchais (New York, NY)• Beauty and Essex (New York, NY)• BOA Steakhouse - Sunset (Hollywood, CA)• Bond Street Social (Baltimore, MD)• Broadway by Amar Santana (Laguna Beach, CA)• Buccan (Palm Beach, FL)• Buddakan NY (New York, NY)• Burlap (San Diego, CA)• Campo (Reno, NV)• Catch (New York, NY)• Chino Latino (Minneapolis, MN)• Cleo - SBE (Los Angeles, CA)• CO-OP Food & Drink (New York, NY)• Del Frisco’s Grille - McKinney Ave. (Dallas, TX)• Departure Restaurant and Lounge (Portland, OR)• do Restaurant at the View (Atlanta, GA)• Dragonfly at Hotel ZaZa (Dallas, TX)• Drunken Fish (Kansas City, MO)• Enso Asian Bistro & Sushi Bar (Charlotte, NC)• Fig & Olive - Melrose Place (West Hollywood, CA)• Geisha House - Hollywood (Hollywood, CA)• Gilt Bar (Chicago, IL)• Girl & the Goat (Chicago, IL)• GT Fish and Oyster (Chicago, IL)• HUB 51 (Chicago, IL)• Imperial No. Nine (New York, NY)• ink. (Los Angeles, CA)• Jaleo - The Cosmopolitan of Las Vegas (Las Vegas, NV)• Katana (West Hollywood, CA)• Katsuya - Brentwood - SBE (Brentwood, CA)• Katsuya - Hollywood - SBE (Los Angeles, CA)• Katsuya - LA LIVE (Los Angeles, CA)
RESTAURANT, FOOD & BEVERAGE MARKET RESEARCH HANDBOOK 2013
• 490 •
• Katsuya - SBE (Laguna Beach, CA)• Koi (West Hollywood, CA)• Lavo (Las Vegas, NV)• Lavo - NYC (New York, NY)• Linger (Denver, CO)• Lost Society (Washington, DC)• Lulu California Bistro (Palm Springs, CA)• Manhattan Beach Post (Manhattan Beach, CA)• Marble Lane (New York, NY)• Maude’s liquor bar (Chicago, IL)• Meat Market (Miami Beach, FL)• Mercadito (Chicago, IL)• Mercato di Vetro (West Hollywood, CA)• Mr. Chow - Beverly Hills (Beverly Hills, CA)• Mr. Chow - Miami (Miami Beach, FL)• N9NE Steakhouse Las Vegas (Las Vegas, NV)• Nada (Cincinnati, OH)• Nikko Japanese Restaurant (Charlotte, NC)• Nisen (Woodbury, NY)• Nobu Miami (Miami, FL)• Paris Club (Chicago, IL)• Picca (Los Angeles, CA)• Prato (Winter Park, FL)• Prime Italian (Miami Beach, FL)• Private Social (Dallas, TX)• Pump Room - Public Hotel (Chicago, IL)• Red Ginger at Traverse City (Traverse City, MI)• Red Lantern (Boston, MA)• Red Rooster Harlem (New York, NY)• Rocco’s Tacos and Tequila Bar (West Palm Beach, FL)• ROKA AKOR (Chicago, IL)• Searsucker (San Diego, CA)• Sino Restaurant & Lounge (San Jose, CA)• STK - Los Angeles (West Hollywood, CA)• STK - Miami (Miami, FL)• STK - NYC - Meatpacking (New York, NY)• STK - The Cosmopolitan of Las Vegas (Las Vegas, NV)• Sugarcane raw bar grill (Miami, FL)• Sunda (Chicago, IL)• Sushi Samba dromo (Miami Beach, FL)• Sushi Samba strip (Las Vegas, NV)• Tao (New York, NY)• Tao Restaurant and Nightclub (Las Vegas, NV)• Tavernita (Chicago, IL)
RESTAURANT, FOOD & BEVERAGE MARKET RESEARCH HANDBOOK 2013
• 491 •
• The Bazaar by José Andrés (Los Angeles, CA)• The Darby (New York, NY)• The Hurricane Club (New York, NY)• The Lion (New York, NY)• The Office (Delray Beach, FL)• The Standard Grill (New York, NY)• The Stanton Social (New York, NY)• Toku Modern Asian (Manhasset, NY)• Triniti (Houston, TX)• Trio Restaurant (Palm Springs, CA)• Twist (Atlanta, GA)• TWO Urban Licks (Atlanta, GA)• Uchi (Houston, TX)• Uchiko (Austin, TX)• Virago (Nashville, TN)• Wang’s in the Desert (Palm Springs, CA)• Yardbird Southern Table & Bar (Miami Beach, FL)• YOLO (Ft. Lauderdale, FL)• Zuma Japanese Restaurant (Miami, FL)
94.7 Kid-Friendly RestaurantsThe following are the winners of the 2012 Diners’ Choice Award for most
Kid-Friendly Restaurant:• Aquarium Restaurant (Denver, CO)• Benihana (Encino, CA)• Buca di Beppo (25 locations nationwide)• Burger Joes - Burnesville (Burnsville, MN)• Burger Joes - Calhoun (Minneapolis, MN)• Cafe Pesto - Kawaihae Harbor (Kawaihae, HI)• Carmine’s - 91st Street (New York, NY)• Crown & Crumpet (San Francisco, CA)• Deerfield (Newark, NJ)• F. McLintocks Saloon & Dining House (Pismo Beach, CA)• Genji Japanese Steakhouse (Dublin, OH)• Graziano’s - Chicago (Chicago, IL)• House of Japan - Dublin (Dublin, OH)• House of Japan - Polaris (Polaris, OH)• Kyoto Palace Restaurant (Campbell, CA)• Landmarc at the Time Warner Center (New York, NY)• Margaritaville at Universal Orlando Citywalk (Orlando, FL)• Marleys Island Grille (Hilton Head Island, SC)• Max Brenner - Philadelphia (Philadelphia, PA)• Max Brenner - Union Square (New York, NY)
RESTAURANT, FOOD & BEVERAGE MARKET RESEARCH HANDBOOK 2013
• 492 •
• Mikado at Desert Springs JW Marriott (Palm Desert, CA)• Miyama Japanese Steak House and Sushi Bar (Denver, CO)• Mythos at Universal’s Island of Adventure (Orlando, FL)• NINJA NEW YORK (New York, NY)• Not Your Average Joe’s Acton (Acton, MA)• Not Your Average Joe’s Beverly (Beverly, MA)• Not Your Average Joe’s Landsdowne (Leesburg, VA)• Not Your Average Joe’s Needham (Needham, MA)• Not Your Average Joe’s Norwell (Norwell, MA)• Oceanarium Restaurant (Honolulu, HI)• Pagoda Floating Restaurant (Honolulu, HI)• Paradise Cove Beach Cafe (Malibu, CA)• R J Grunt’s (Chicago, IL)• Rawhide Steakhouse at Wild Horse Pass (Chandler, AZ)• Rizzuto’s Wood-Fired Kitchen & Bar - Westport (Westport, CT)• Rosebud Italian Country House and Pizzeria (Deerfield, IL)• Rye Grill and Bar (Rye, NY)• Sarabeth’s TriBeCa (New York, NY)• Snow City Cafe (Anchorage, AK)• Summer Shack (Boston, MA)• Summer Shack Cambridge (Cambridge, MA)• Summer Shack Dedham (Dedham, MA)• Table 24 (Orinda, CA)• The Brooklyn Diner Times Square (New York, NY)• The Kitchen at Hard Rock Hotel (Orlando, FL)• The Pirate’s House (Savannah, GA)• The Prickly Pear Cantina (Danville, CA)• Virgil’s (New York, NY)• Yankee Pier - Larkspur (Larkspur, CA)
94.8 Late-Night DiningThe following are the 2012 Late-Night Dining Diners’ Choice Award Winners:
• 28 Degrees (Boston, MA)• 77 South (Leanwood, KS)• Adelphia (Deptford, NJ)• Ajna Bar (New York, NY)• Azucar Cuban Cuisine & Cigars (Jersey City, NJ)• B.B. King’s Blues Club (Nashville, TN)• B.B. King’s Blues Club - Las Vegas (Las Vegas, NV)• B.B. King’s Blues Club - Memphis (Memphis, TN)• B.B. King’s Blues Club - Orlando (Orlando, FL)• B.B. King’s Blues Club - West Palm Beach (West Palm Beach, FL)• Bambino Bar & Kitchen (Buffalo, NY)
RESTAURANT, FOOD & BEVERAGE MARKET RESEARCH HANDBOOK 2013
• 493 •
• Bananas Modern American Diner (Orlando, FL)• Bar Cento (Cleveland, OH)• Beauty and Essex (New York, NY)• Birrraporetti’s (Houston, TX)• Biscuits & Blues (San Francisco, CA)• Bistro Francais (Washington, DC)• Bradstreet Craftshouse Restaurant (Minneapolis, MN)• Buttons Food and Music - Addison (Addison, TX)• Buttons Food and Music - Fort Worth (Forth Worth, TX)• Cafe Circa (Atlanta, GA)• Casa di Amore (Las Vegas, NV)• Cavo (Astoria, NY)• Chambers Eat + Drink (San Francisco, CA)• Chapter One: the modern local (Santa Ana, CA)• Chino Latino (Minneapolis, MN)• Copeland’s Cheesecake Bistro (Atlanta, GA)• Crossroads at House of Blues (Houston, TX)• Darryl’s Corner Bar and Kitchen (Boston, MA)• Departure Restaurant and Lounge (Portland, OR)• Dick’s Last Resort (Chicago, IL)• do Restaurant at the View (Atlanta, GA)• Draft (Raleigh, NC)• Eclipse di Luna (Atlanta, GA)• Eclipse di Luna - Park Place (Atlanta, GA)• Eulogy Belgian Tavern (Philadelphia, PA)• Fly Bar & Restaurant (Tampa, FL)• Frank Ski’s Restaurant & Lounge (Atlanta, GA)• Fujimar (Washington, DC)• Gilt Club (Portland, OR)• Globe (San Francisco, CA)• Green Russell (Denver, CO)• Guantanamera (New York, NY)• Gyu-Kaku - Kapiolani (Honolulu, HI)• Gyu-Kaku - Pasadena (Pasadena, CA)• Gyu-Kaku - Torrance (Torrance, CA)• H Street Country Club (Washington, DC)• Hip Kitty Jazz & Fondue (Claremont, CA)• Holstein’s - The Cosmopolitan of Las Vegas (Las Vegas, NV)• Latin Quarter at Universal CityWalk (Orlando, FL)• Loca Luna (Atlanta, GA)• Lola (St. Louis, MO)• Lucky’s Lounge (Boston, MA)• MeZz (Charlotte, NC)• MPD Restaurant (New York, NY)
RESTAURANT, FOOD & BEVERAGE MARKET RESEARCH HANDBOOK 2013
• 494 •
• MUA (Oakland, CA)• Mulberry Project (New York, NY)• Nacional 27 (Chicago, IL)• Negril Village (New York, NY)• Nine Fine Irishmen - New York New York (Las Vegas, NV)• nopa (San Francisco, CA)• Oola (San Francisco, CA)• Patria Restaurant and Mixology Lounge (Rahway, NJ)• Perch LA (Los Angeles, CA)• POP Champagne & Dessert Bar (Pasadena, CA)• Restaurant Aura (Minneapolis, MN)• Rooftop 120 (Glastonbury, CT)• Rum Bar (Philadelphia, PA)• Sanctuaria (St. Louis, MO)• SAX restaurant & lounge (Washington, DC)• Scene Restaurant & Lounge (Huntsville, AL)• Shokudo (Honolulu, HI)• Shout (Atlanta, GA)• Smoke Jazz and Supper Club (New York, NY)• SOB’s - Sounds of Brazil (New York, NY)• Soco (Brooklyn, NY)• Solas (Raleigh, NC)• Starlite (San Diego, CA)• Storm Rhum Bar and Bistro (Asheville, NC)• Strip (Atlanta, GA)• Sub Zero Vodka Bar (St. Louis, MO)• Sugar Factory (Las Vegas, NV)• Suzy Wong’s House of Yum (Nashville, TN)• Taverna Opa - Orlando (Orlando, FL)• The Brown Street Club (Greenville, SC)• The Darby (New York, NY)• The Drawing Room (Chicago, IL)• The Gorbals (Los Angeles, CA)• The Hamilton (Washington, DC)• The Jazz Kitchen (Indianapolis, IN)• The Nest (Indian Wells, CA)• Three Aces (Chicago, IL)• Todd English P.U.B. (Las Vegas, NV)• Tsunami - Panhandle (San Francisco, CA)• Twist (Atlanta, GA)• World Cafe Live at the Queen (Wilmington, DE)
RESTAURANT, FOOD & BEVERAGE MARKET RESEARCH HANDBOOK 2013
• 495 •
94.9 Most Notable Wine ListsThe following are the winners of the 2012 Most Notable Wine List Diners’ Choice
Award:• 20 Brix (Milford, OH)• 360 Bistro (Nashville, TN)• 4 Olives Restaurant (Manhattan, KS)• Acquerello (San Francisco, CA)• Addison at The Grand Del Mar (San Diego, CA)• Aida Bistro & Wine Bar (Columbia, MD)• Andre’s Bouchée Bistro and Wine Bar (Carmel, CA)• Angelina’s Ristorante (Bonita Springs, FL)• Artisanal Restaurant (Banner Elk, NC)• Aureole - Las Vegas (Las Vegas, NV)• Barolo Grill (Denver, CO)• Bin 36 (Chicago, IL)• Bin 38 (San Francisco, CA)• Bistro Blanc (Glenelg, MD)• Block 7 (Houston, TX)• Bonterra (Charlotte, NC)• Bouchon (Santa Barbara, CA)• Buckheads (Richmond, VA)• Canlis (Seattle, CA)• Carpe Vino (Auburn, CA)• Casa D’Angelo (Fort Lauderdale, FL)• ‘Cesca Charleston (Charleston, SC)• Chez Francois (Vermillion, IL)• Cinghiale - Enoteca Wine Bar (Baltimore, MD)• Copia Restaurant and Wine Garden (St. Louis, MO)• Cork Restaurant (Chandler, AZ)• daryl Restaurant (New Brunswick, NJ)• DOC Wine Bar (Lombard, IL)• Domaine Hudson (Wilmington, DE)• Eno Vino Wine Bar and Bistro (Madison, WI)• Enotria (Sacramento, CA)• Fleming’s Prime Steakhouse & Wine Bar (West Hartford, CT)• Flyte World Dining & Wine (Nashville, TN)• Frasca Food and Wine (Boulder, CO)• Grand Cru Wine Bar & Bistro (Arlington, VA)• Grapeseed (Bethesda, MD)• Graziano’s Coral Gable (Coral Gables, FL)• Hampton Street Vineyard (Columbia, SC)• Indulge Bistro & Wine Bar (Highlands Ranch, CO)• Iron Bridge Wine Company - Columbia (Columbia, MD)• Iron Bridge Wine Company - Warrenton (Warrenton, VA)
RESTAURANT, FOOD & BEVERAGE MARKET RESEARCH HANDBOOK 2013
• 496 •
• La Famiglia Ristorante (Philadelphia, PA)• La Sirena (West Palm Beach, FL)• Los Olivos Wine Merchant & Cafe (Los Olivos, CA)• Marche Bacchus (Las Vegas, NV)• Max’s Wine Die (Austin, TX)• Mercy Wine Bar (Dallas, TX)• Metrovino (Portland, OR)• Morrell Wine Bar & Cafe (New York, NY)• Napa & Company (Stamford, CT)• Novita Wine Bar Trattoria (Garden City, NY)• On The Square (Tarboro, NC)• Pairings Bistro (Bel Air, MD)• Porter’s Steakhouse (Collinsville, IL)• Press (Saint Helena, CA)• Proof Restaurant (Washington, DC)• Purple Cafe and Wine Bar (Bellevue, WA)• Purple Cafe and Wine Bar (Kirkland, WA)• Purple Cafe and Wine Bar (Seattle, WA)• Purple Cafe and Wine Bar (Woodinville, WA)• Red Fish Restaurant (Hilton Head Island, SC)• Red Newt Bistro (Hector, NY)• Reserve Grand Rapids (Grand Rapids, MI)• Ristorante Panorama (Philadelphia, PA)• RN74 - Seattle (Seattle, WA)• Robust (Webster Groves, MO)• SeaBlue Restaurant & Wine Bar (North Myrtle Beach, SC)• Sip Restaurant (Issaquah, WA)• Soif Wine Bar Restaurant (Santa Cruz, CA)• Sonoma Grille Pittsburgh (Pittsburgh, PA)• Sonoma Wine Bar & Bistro (Virginia Beach, VA)• Stone Balloon Winehouse (Newark, DE)• Stonehome Wine Bar & Restaurant (Brooklyn, NY)• Tannin Wine Bar and Kitchen (Kansas City, MO)• Tastings Wine Bar and Bistro (Foxboro, MA)• Troquet (Boston, MA)• The 3rd Corner Wine Shop & Bistro (Palm Desert, CA)• The Curious Grape (Arlington, VA)• The Hobbit (Orange, CA)• The Joel Palmer house (Dayton, OR)• The Pluckemin Inn (Bedminster, NJ)• The Refectory Restaurant & Bistro (Columbus, OH)• The Royce at the Langham (Pasadena, CA)• The Tasting Room @ City Centre (Houston, TX)• The Tasting Room Wine & Tapas (St. Augustine, FL)
RESTAURANT, FOOD & BEVERAGE MARKET RESEARCH HANDBOOK 2013
• 497 •
• The Wine Kitchen on the Creek (Frederick, MD)• The Winery Restaurant & Wine Bar (Tustin, CA)• Two 40 South Restauran & Wine Bar (Brea, CA)• Undici (Rumson, NJ)• Upstairs 2 (Los Angeles, CA)• Venice Ristorante & Wine Bar (Denver, CO)• Veritas (New York, NY)• Vertical Wine Bistro (Pasadena, CA)• Vines Grille and Wine bar (Orlando, FL)• Vino Rosina (Baltimore, MD)• Vinology (Ann Arbor, MI)• Whitehouse-Crawford (Walla Walla, WA)• Wine 30 (New York, NY)• Wine Market Bistro (Baltimore, MD)
94.10 Most Romantic RestaurantsThe following are the winners of the 2012 Diners’ Choice Award for Most
Romantic Restaurant:• A Caprice (Tiburon, CA)• Acquerello (San Francisco, CA)• Addison at The Grand Del Mar (San Diego, CA)• Alize at the Top of the Palms Casino Resort (Las Vegas, NV)• Andre’s at the Monte Carlo Resort & Casino (Las Vegas, NV)• Bacaro (New York, NY)• Bertrand at Mister A’s (San Diego, CA)• Bouchard Restaurant and Inn (Newport, RI)• Boulevard Steakhouse (Edmond, OK)• Briarhurst Manor (Manitou Springs, CO)• Brown’s Beach House (Kohala Coast, HI)• Cacharel Restaurant (Arlington, TX)• Cafe Central (El Paso, TX)• Cafe Renaissance (Vienna, VA)• Canlis (Seattle, WA)• Capische (Wailea, HI)• Castle Falls (Oklahoma City, OK)• Chez Francois (Vermillion, OH)• Chez Nous French Restaurant (Humble, TX)• Chez Shea (Seattle, WA)• Club A Steakhouse (New York, NY)• Coach House (Oklahoma City, OK)• Coach Insignia (Detroit, MI)• Craftwood Inn (Manitou Springs, CO)• Different Pointe of View (Phoenix, AZ)
RESTAURANT, FOOD & BEVERAGE MARKET RESEARCH HANDBOOK 2013
• 498 •
• Eagle’s Nest - Hyatt Regency Indianapolis (Indianapolis, IN)• Eiffel Tower (Las Vegas, NV)• Erminia Ristorante (New York, NY)• Fearrington House Restaurant (Pittsboro, NC)• Fleur de Lys (San Francisco, CA)• French 75 Bistro (Laguna Beach, CA)• French Cafe (Omaha, NE)• Geja’s Café (Chicago, IL)• Genoa Restaurant (Portland, OR)• Gibraltar (Miami, FL)• Glasbern Country Inn (Fogelsville, PA)• Il Bistro (Seattle, WA)• Il Cielo Gardens Restaurant & Bar (Beverly Hills, CA)• Il Mulino (Chicago, IL)• La Caille Restaurant (Sandy, UT)• La Cremaillere (Bedford, NY)• La Mer at Halekulani (Honolulu, HI)• Latitudes (Key West, FL)• L’Auberge Restaurant on Oak Creek (Sedona, AZ)• Log Haven (Salt Lake City, UT)• Madrona Manor (Healdsburg, CA)• Michael’s-South Point Casino (Las Vegas, NV)• Michel’s at the Colony Surf (Honolulu, HI)• Mona Lisa Fondue Restaurant (Manitou Springs, CO)• Nana (Dallas, TX)• Nikolai’s Roof (Atlanta, GA)• One if by Land, Two if by Sea (New York, NY)• Pamplemousse Le Restaurant (Las Vegas, NV)• Pepper Tree Restaurant (Colorado Springs, CO)• Plume at the Jefferson Hotel (Washington, DC)• Quiessence Restaurant & Wine Bar (Phoenix, AZ)• Red Fish Grill (Miami, FL)• Restaurant Iris (Memphis, TN)• Ristorante Massimo (Portsmouth, NH)• Riverview Restaurant (Troutdale, OR)• Roof Restaurant (Salt Lake City, UT)• Sarento’s Top of the ‘I’ (Honolulu, HI)• SASSI (Scottsdale, AZ)• Seagar’s Restaurant (Destin, FL)• Second Empire Restaurant and Tavern (Raleigh, NC)• Shadowbrook Restaurant Capitola (Capitola, CA)• Sir Winston’s Aboard The Queen Mary (Long Beach, CA)• Spindletop (Houston, TX)• Stonehouse at San Ysidro Ranch (Santa Barbara, CA)
RESTAURANT, FOOD & BEVERAGE MARKET RESEARCH HANDBOOK 2013
• 499 •
• The Cellar (Fullerton, CA)• The Dining Room - Biltmore Estates (Asheville, NC)• The Elkridge Furnace Inn (Elkridge, MD)• The French Room (Dallas, TX)• The Hungry I (Boston, MA)• The Library Restaurant (Charleston, SC)• The Little Door (Los Angeles, CA)• The Melting Pot (Arlington, TX)• The Melting Pot (Atlanta, GA)• The Melting Pot (Columbus, OH)• The Melting Pot (Dayton, OH)• The Melting Pot (Fairview Park, OH)• The Melting Pot (Greenwood, IN)• The Melting Pot (Indianapolis, IN)• The Melting Pot (Knoxville, TN)• The Melting Pot (Larkspur, CA)• The Melting Pot (Memphis, TN)• The Melting Pot (Myrtle Beach, SC)• The Melting Pot (Richmond, VA)• The Melting Pot (Virginia Beach, VA)• The Melting Pot (University City, MO)• The Old Warsaw (Dallas, TX)• The Refectory Restaurant & Bistro (Columbus, OH)• The Sky Room (Long Beach, CA)• Tidepools (Poipu, HI)• Vernon’s Hidden Valley Steakhouse (Los Ranchos De Albuquerque, NM)• White Barn Inn (Kennebunk Beach, ME)• Yamashiro (Hollywood, CA)• Zenkichi (Brooklyn, NY)
94.11 Most Scenic ViewsThe following are the winners of the 2012 Diners’ Choice Award for restaurant
with the Most Scenic Views:• 42 (White Plains, NY)• A Caprice (Tiburon, CA)• Alchemy Restaurant at Copperwyn Resort (Fountain Hills, AZ)• Alizé at the Top of the Palms Casino Resort (Las Vegas, NV)• Aquarius - Dream Inn (Santa Cruz, CA)• Bali Hai Restaurant (San Diego, CA)• Baxter’s Lakeside Grille (Lake Ozark, MO)• Beach Chalet Brewery & Restaurant (San Francisco, CA)• BeachHouse bar + grill (Kirkland, WA)• Bertrand at Mister A’s (San Diego, CA)
RESTAURANT, FOOD & BEVERAGE MARKET RESEARCH HANDBOOK 2013
• 500 •
• Boat House Waterfront Dining (Tiverton, RI)• Canlis (Seattle, WA)• Cannons Seafood Grill (Dana Point, CA)• Chart House Restaurant - Atlantic City (Atlantic City, NJ)• Chart House Restaurant - Cardiff (Cardiff, CA)• Chart House Restaurant - Dana Point (Dana Point, CA)• Chart House Restaurant - Longboat Key (Longboat Key, FL)• Chart House Restaurant - Malibu (Malibu, CA)• Chart House Restaurant - Portland (Portland, TX)• Chart House Restaurant - Redondo Beach (Redondo Beach, CA)• Chart House Restaurant - Towers of the Americas (San Antonio, TX)• Chart House Restaurant - Weehawken (Weehawken, NJ)• Chelsea’s Chowder House (Long Beach, CA)• Cite (Chicago, IL)• Coach Insignia (Detroit, MI)• Columbia Restaurant (St. Petersburg, FL)• Compass Restaurant - Hyatt Regency Phoenix (Phoenix, AZ)• Crow’s Nest - Hotel Captain Cook (Anchorage, AZ)• Cutters Crabhouse (Seattle, WA)• Different Pointe of View (Phoenix, AZ)• Duke’s Malibu (Malibu, CA)• Eagle’s Nest - Hyatt Regency Indianapolis (Indianapolis, IN)• Edgewood Restaurant (Lake Tahoe, NV)• Fish Hopper (Monterey, CA)• Five Sixty by Wolfgang Puck (Dallas, TX)• Flagstaff House (Boulder, CO)• Fog Harbor Fish House (San Francisco, CA)• Franciscan Crab Restaurant (San Francisco, CA)• Georgetowne Inn (Pittsburg, PA)• Grandviews at the Grand Hyatt San Francisco (San Francisco, CA)• Harbor House (Milwaukee, WI)• High Finance Restaurant - At the top of the Tram (Albuquerque, NM)• Highlawn Pavilion (West Orange, NJ)• Il Fornaio - Coronado (Coronado, CA)• Island Prime (San Diego, CA)• JJ Astor (Duluth, MN)• La Costanera (Montara, CA)• Lynnhaven Fish House (Virginia Beach, VA)• Marina Cafe (Destin, FL)• McCormick & Kuleto’s Seafood Restaurant (San Francisco, CA)• Metropolitan Club (Chicago, IL)• Miramar Beach Restaurant (Half Moon Bay, CA)• Monterey Bay Fish Grotto (Mt. Washington, PA)• Moss Beach Distillery (Half Moon Bay, CA)
RESTAURANT, FOOD & BEVERAGE MARKET RESEARCH HANDBOOK 2013
• 501 •
• Nick and Nino’s Penthouse Steakhouse-Hilton Springfield (Springfield, IL)• Old Oyster Factory (Hilton Head, SC)• Pacific’s Edge Restaurant (Carmel, CA)• Palisade (Seattle, WA)• Peaks Restaurant (Palm Springs, CA)• Portland City Grill (Portland, OR)• Primavista (Cincinnati, OH)• R Lounge at Two Times Square (Manhattan, NY)• Riva’s Crabhouse on Navy Pier (Chicago, IL)• River’s End (Jenner, CA)• Robert (Manhattan, NY)• Rocky Point Restauran (Carmel, CA)• Sandiago’s Mexican Grill (Albuquerque, MN)• Sarento’s Top of the “I” (Honolulu, HI)• Seaglass Restaurant and Lounge (Salisbury, MA)• Seven Glaciers (Anchorage, AK)• Severn Inn (Annapolis, MD)• Signature Room at the 95th (Chicago, IL)• Six Seven Restaurant & Lounge (Seattle, WA)• Skates on the Bay (Berkeley, CA)• SkyCity Restaurant at the Space Needle (Seattle, WA)• Steamers of Pismo (Pismo Beach, CA)• Steiner Ranch Steakhouse (Austin, TX)• Sundial Restaurant at the Westin Peachtree (Atlanta, GA)• Sunnyside (Tahoe City, CA)• Sutro’s at the Cliff House (San Francisco, CA)• The Celestial Steakhouse (Cincinnati, OH)• The Grandview Restaurant and Lounge at The Geneva Inn (Lake Geneva, WI)• The Marine Room (La Jolla, CA)• The Penthouse Restaurant (Santa Monica, CA)• The Restaurant at Alderbrook (Union, WA)• The Restaurant at Patowmack Farm (Lovettsville, VA)• The Spinnaker(Sausalito, CA)• The Sunset (Malibu, CA)• The View Restaurant (New York, NY)• Top of the Hub (Boston, MA)• Top of the Riverfront - Millennium Hotel (St. Louis, MO)• Top of the Tower (New York, NY)• View (Oakdale, NY)• West Restaurant and Lounge (Los Angeles, CA)• WP24 by Wolfgang Puck (Los Angeles, CA)• Yamashiro (Hollywood, CA)
RESTAURANT, FOOD & BEVERAGE MARKET RESEARCH HANDBOOK 2013
• 502 •

94.12 Outdoor DiningThe following are the winners of the 2012 Diners’ Choice Award for Best Outdoor
Dining:• A Fish Called Avalon (Miami Beach, FL)• Adobe Grill @ La Quinta Resort (La Quinta, CA)• Alexander’s (Naples, FL)• BALEENnaples (Naples, FL)• Beachcomber Cafe - Crystal Cove (Newport Coast, CA)• Bimini Boatyard (Fort Lauderdale, FL)• Blue Agave Club (Pleasanton, CA)• Blue Coyote Bar & Grill (Palm Springs, CA)• Blue Dragon Restaurant (Kamuela, HI)• Blue Moon Fish Co. (Fort Lauderdale, FL)• Bridge House Tavern (Chicago, IL)• Brockton Villa (La Jolla, CA)• Brown’s Beach House - The Fairmont Orchid (Kohala Coast, HI)• Cafe Amelie (New Orleans, LA)• Cafe Luna (Naples, FL)• Cafe Malaga (McKinney, TX)• Cafe Pinot (Los Angeles, CA)• Cafe Sambal - Mandarin Oriental Miami (Miami, FL)• Cafe Santorini (Pasadena, CA)• Caffe Riace (Palo Alto, CA)• Campiello (Naples, FL)• Capische (Wailea, HI)• Chart House Restaurant (Ft. Lauderdale, FL)• Chautauqua Dining Hall (Boulder, CO)• Dada (Delray Beach, FL)• Deck 84 (Delray Beach, FL)• Duke’s Beach House Maui (Lahaina, HI)• Edendale (Los Angeles, CA)• El Chorro Lodge (Paradise Alley, AZ)• Ferraro’s Bar e Ristorante Maui (Wallea, HI)• Five Palms Beach Grill (Kihei, HI)• Gannon’s (Wailea, HI)• Gaylord’s at Kilohana (Lihue, HI)• George’s Ocean Terrace (La Jolla, CA)• GG’s Waterfront Bar & Grill (Hollywood, FL)• Gigino at Wagner Park (New York, NY)• Handsome Harry’s Third Street Bistro (Naples, FL)• Hau Tree Lanai (Honolulu, HI)• House of Tricks (Tempe, AZ)• Hula Grill - Kaanapali (Lahaina, HI)• Jackalope Ranch (Indio, CA)
RESTAURANT, FOOD & BEVERAGE MARKET RESEARCH HANDBOOK 2013
• 503 •
• Jake’s (Palm Springs, CA)• Japengo - Maui (Lahina, HI)• JB’s On The Beach (Deerfield Beach, FL)• JRDN Restaurant (San Diego, CA)• Katsuya - Glendale - SBE (Glendale, CA)• La Bottega (New York, NY)• Latitudes (Key West, FL)• Lavender Bistro (La Quinta, CA)• Lon’s at The Hermosa (Paradise Valley, AZ)• Marche Bacchus (Las Vegas, NV)• Martinique Bistro (New Orleans, LA)• Max’s Grille (Boca Raton, FL)• Metro Lafayette (Lafayette, CA)• Milagros (Redwood City, CA)• MiraMare (Naples, FL)• Nick’s Fishmarket Maui (Wailea, HI)• Nine One Five (Key West, FL)• Novo Restaurant (San Luis Obispo, CA)• Oceans 234 (Deerfield Beach, FL)• Olive and June (Austin, TX)• Ophelia’s on the bay (Sarasota, FL)• Ovations at Wolf Trap (Vienna, VA)• Paradise Cove Beach Cafe (Malibu, CA)• Perch LA (Los Angeles, CA)• Pier 23 Cafe (San Francisco, CA)• Pier 45 (Rochester, NY)• Plantation Gardens (Koloa, HI)• Plumeria Beach House (Kahala, HI)• Portico Restaurant(Richmond, VA)• Poseidon (Del Mar, CA)• Purple Palm Restaurant (Palm Springs, CA)• Red Fish Grill (Miami, FL)• Renato’s (Palm Beach, FL)• Restaurant at Sunset Marquis (West Hollywood, CA)• Rocco’s Tacos & Tequila Bar (Boca Raton, FL)• Sam Choy’s Kai Lanai (Kailua-Kona, HI)• Sapphire Laguna (Laguna Beach, CA)• Sheerwater Restaurant at the Hotel Del Coronado (Coronado, CA)• Sonoma Wine Garden (Santa Monica, CA)• Spencer’s Restaurant (Palm Springs, CA)• Splashes at Surf & Sand Resort (Laguna Beach, CA)• Stone Brewing World Bistro & Garden (Escondido, CA)• Sundowners on The Bay (Key Largo, FL)• Sundy House (Delray Beach, FL)
RESTAURANT, FOOD & BEVERAGE MARKET RESEARCH HANDBOOK 2013
• 504 •
• TART Restaurant @ Farmer’s Daughter Hotel (Los Angeles, CA)• The House at Secret Garden (Phoenix, AZ)• The Restaurant at Ponte (Temecula, CA)• The Turtle Club (Naples, FL)• Tommy Bahama’s Restaurant & Bar - Naples (Naples, FL)• Tommy Bahama’s Restaurant & Bar - Palm Desert (Palm Desert, CA)• Tommy Bahama’s Restaurant & Bar - Wailea, Maui (Kihei, HI)• Trio on the Bay (North Bay Village, FL)• Veranda Fireside Lounge & Restaurant (San Diego, CA)• Vic and Angelo’s (Palm Beach Gardens, FL)• Villa Sorriso (Pasadena, CA)• Wilshire (Santa Monica, CA)• Woodshed Smokehouse (Fort Worth, TX)
94.13 Top American CuisineThe following are the winners of the 2012 Diners’ Choice Award for restaurants
in the United States that specialize in American Cuisine:• 1789 Restaurant (Washington, DC)• A Toute Heure (Cranford, NJ)• Abacus (Dallas, TX)• Annie Gunn’s (Chesterfield, MO)• Annisa (New York, NY)• Aria (Atlanta, GA)• Ashley’s Restaurant (Little Rock, AR)• Bartlett Pear Inn (Easton, MD)• Blue Hill (New York, NY)• Blue Hill at Stone Barns (Pocantico Hills, NY)• Bluestem (Kansas City, MO)• Boulevard (San Francisco, CA)• Bouquet Restaurant and Wine Bar (Covington, KY)• Cabernet Grill Texas Wine Country Restaurant (Fredricksburg, TX)• Canoe (Atlanta, GA)• Carpe Diem Restaurant (Charlotte, NC)• Castagna (Portland, OR)• Charleston (Baltimore, MD)• Charleston Grill (Charleston, SC)• Cheever’s Cafe (Oklahoma City, OK)• Chef’s Table at the Edgewater (Winter Garden, FL)• Coldwater Cafe & Catering (Tipp City, OH)• Communal (Provo, UT)• Corbett’s Fine Dining (Louisville, KY)• Corduroy (Washington, DC)• Craft (New York, NY)
RESTAURANT, FOOD & BEVERAGE MARKET RESEARCH HANDBOOK 2013
• 505 •
• Dal Rae (Pico Rivera, CA)• Dante (Tremont, OH)• Devereaux’s (Greenville, SC)• Eleven Madison Park (New York, NY)• Ellerbe Fine Foods (Fort Worth, TX)• Fearing’s (Dallas, TX)• FIG (Charleston, SC)• Flagstaff House (Boulder, CO)• Gramercy Tavern (New York, NY)• Grove (Grand Rapids, MI)• Hamptons (Sumter, SC)• Harry’s Restaurant (Manhattan, KS)• Herons (Cary, NC)• joan’s in the Park (Saint Paul, MN)• John Bentley’s (Redwood City, CA)• K restaurant (Orlando, FL)• Lahaina Grill (Lahaina, HI)• Lilly’s Bistro (Louisville, KY)• LJ’s & The Kat Lounge (Hagerstown, MD)• Lola - A Michael Symon Restaurant (Cleveland, OH)• Manhattan Beach Post (Manhattan Beach, CA)• McEwen’s on Monroe (Memphis, TN)• Mica (Chestnut Hill, PA)• Millwright’s (Simsbury, CT)• Milton’s Cuisine and Cocktails (Milton, GA)• Mokomandy (Sterling, VA)• Mulvaney’s B&L (Sacramento, CA)• Murray’s Restaurant & Cocktail Lounge (Minneapolis, MN)• Nana’s Restaurant (Durham, NC)• Niche (St. Louis, MO)• Orchids at Palm Court (Cincinnati, OH)• Paseo Grill (Oklahoma City, OK)• Patti’s 1880's Settlemen (Grand Rivers, KY)• Peli Peli (Houston, TX)• Peninsula Grill (Charleston, SC)• Per Se (New York, NY)• Restaurant Tallent (Bloomington, IN)• Root Down (Denver, CO)• Saddle Peak Lodge (Calabasas, CA)• Seasons 52 (Phoenix, AZ)• Shoemaker’s Grille (Lynchburg, VA)• Silo Elevated Cuisine 1604 (San Antonio, TX)• Silo Elevated Cuisine - Alamo Heights (San Antonio, TX)• Splendido (Beaver Creek, CO)
RESTAURANT, FOOD & BEVERAGE MARKET RESEARCH HANDBOOK 2013
• 506 •
• St. John’s Meeting Place (Chattanooga, TN)• St. John’s Restaurant (Chattanooga, TN)• Story (Prairie Village, KS)• Sweet Basil (Vail, CO)• Talula’s Garden (Philadelphia, PA)• The American Restaurant (Kansas City, MO)• The Blue Ox (Lynn, MA)• The Cafe at Brookwood (Brookshire, TX)• The Classic Table (Roanoake, TX)• The Dock (Newport Beach, CA)• The Macintosh (Charleston, SC)• The Mill at 2T (Tariffville, CT)• The Orchard Restaurant in Kennett Square (Kennett Square, PA)• The Parson’s Table (Little River, SC)• The Prime Rib (Baltimore, MD)• The Pullman (Glenwood Springs, CO)• The Ranch Restaurant (Anaheim, CA)• The Root Restaurant & Bar (White Lake, MI)• The Schoolhouse at Cannondale (Wilton, CT)• The Tree Room @ Sundance (Sundance, UT)• Tilth (Seattle, WA)• Vernick Food & Drink (Philadelphia, PA)• Vie (Western Springs, IL)• Vintage Tavern (Suffolk, VA)• VOLT (Frederick, MD)• Washington Inn (Cape May, NJ)• White Barn Inn (Kennebunk, ME)• Woodberry Kitchen (Baltimore, MD)
RESTAURANT, FOOD & BEVERAGE MARKET RESEARCH HANDBOOK 2013
• 507 •
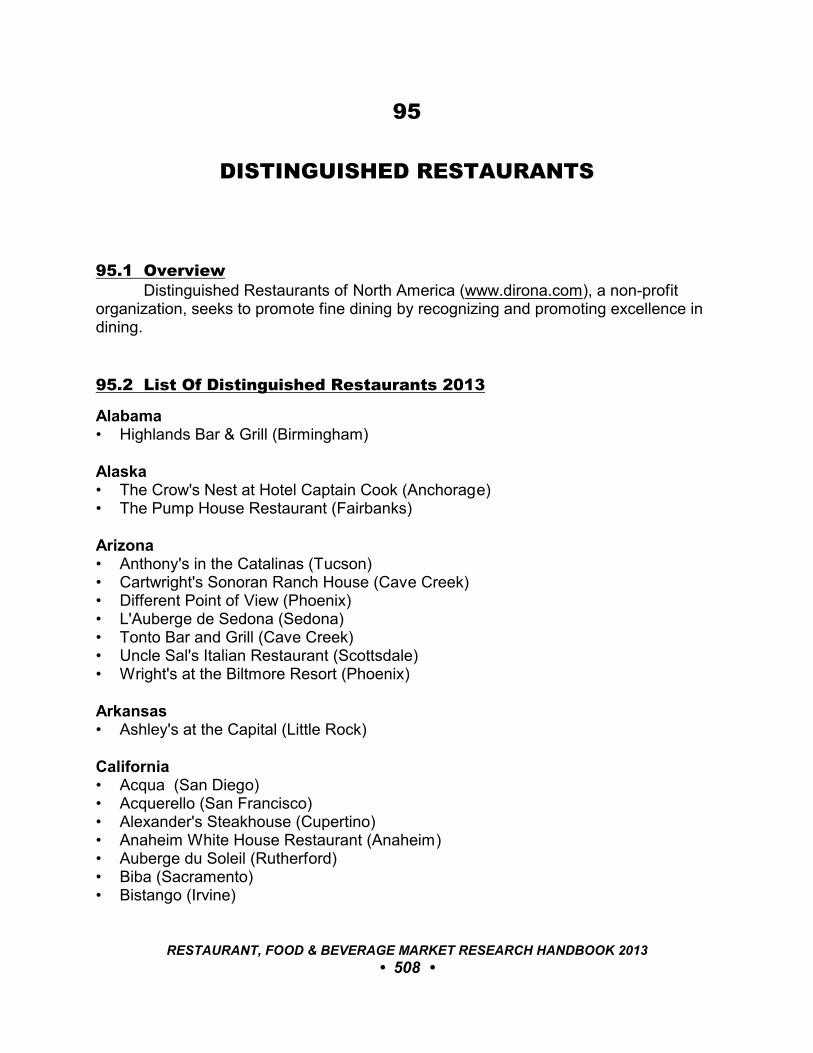
95
DISTINGUISHED RESTAURANTS
95.1 OverviewDistinguished Restaurants of North America (www.dirona.com), a non-profit
organization, seeks to promote fine dining by recognizing and promoting excellence indining.
95.2 List Of Distinguished Restaurants 2013
Alabama• Highlands Bar & Grill (Birmingham)
Alaska• The Crow's Nest at Hotel Captain Cook (Anchorage)• The Pump House Restaurant (Fairbanks)
Arizona• Anthony's in the Catalinas (Tucson)• Cartwright's Sonoran Ranch House (Cave Creek)• Different Point of View (Phoenix)• L'Auberge de Sedona (Sedona)• Tonto Bar and Grill (Cave Creek)• Uncle Sal's Italian Restaurant (Scottsdale)• Wright's at the Biltmore Resort (Phoenix)
Arkansas• Ashley's at the Capital (Little Rock)
California• Acqua (San Diego)• Acquerello (San Francisco)• Alexander's Steakhouse (Cupertino)• Anaheim White House Restaurant (Anaheim)• Auberge du Soleil (Rutherford)• Biba (Sacramento)• Bistango (Irvine)
RESTAURANT, FOOD & BEVERAGE MARKET RESEARCH HANDBOOK 2013
• 508 •
• C2 Steak & Seafood (Brooks)• Domaine Chandon (Yountville)• Donovan's Steak & Chop House (La Jolla)• Duane's Prime Steaks & Seafood (Riverside)• El Bizcocho Winery (San Diego)• Fandango (Pacific Grove)• Farallon (San Francisco)• Fior d'Italia (San Francisco)• First Cabin (Newport Beach)• Five Crowns Restaurant (Corona del Mar)• French Laundry (Yountville)• Gennaro's Ristorante (Glendale)• George's at the Cove (La Jolla)• Grant Grill (San Diego)• Harris' Restaurant (San Francisco)• La Folie (San Francisco)• La Toque Restaurant (Napa)• La Valencia Sky Room (La Jolla)• Lark Creek Inn (Larkspur)• Lawry's The Prime Rib (Beverly Hills)• Le Central Bistro (San Francisco)• Le Papillon (San Jose)• Le Petit Chateau (North Hollywood)• LG's Prime Steak House (Palm Desert)• L'Olivier (San Francisco)• Manhattan Steak & Seafood (Orange)• Mélisse Restaurant (Santa Monica)• Michael's Restaurant (Santa Monica)• Mille Fleurs (Rancho Santa Fe)• Mr. Stox Restaurant (Anaheim)• Musso and Frank Grill (Hollywood)• Mustards Grill (Napa)• Napa Rose (Anaheim)• One Market Restaurant (San Francisco)• Pacifica Seafood Restaurant (Palm Desert)• Pacific's Edge (Carmel)• Paolo's Restaurant (San Jose)• Park Avenue Steaks & Chops (Stanton)• Patina (Los Angeles)• Postrio (San Francisco)• The Cellar (Fullerton)• The French Laundry (Yountville)• The Grill on Hollywood (Hollywood)• The Grill on the Alley (Beverly Hills)
RESTAURANT, FOOD & BEVERAGE MARKET RESEARCH HANDBOOK 2013
• 509 •
• The Hobbit Restaurant (Orange, CA)• The Marine Room (La Jolla)• The Plumed Horse (Saratoga)• The Restaurant at Wente Vineyards (Livermore)• The Sardine Factory (Monterey)• The Sky Room (Long Beach)• The Winery at the District (Tustin)• Tommy Toy's Cuisine Chinoise (San Francisco)• Trader Vic's (Emeryville)• Valentine Restaurant (Santa Monica)• Wally's Desert Turtle (Rancho Mirage)• Water Grill Restaurant (Los Angeles)
Colorado• Beano's Cabin (Avon)• Broker Restaurant (Denver)• Brook's Steakhouse (Greenwood Village)• Charles Court (Colorado Springs)• Flagstaff House (Boulder)• Larkspur Restaurant (Vail)• Left Bank Restaurant (Vail)• Ludwig's (Vail)• Mirabelle Restaurant at Beaver Creek (Avon)• Palace Arms at The Brown Palace Hotel (Denver)• Restaurant Kevin Taylor (Denver)• Strings (Denver)• Syzygy (Aspen)• Terra Bistro (Denver)• The Cliff House Dining Room (Manitou Springs)• The Penrose Room (Colorado Springs)• The Tuscany (Denver)
Connecticut• Bernard's (Ridgefield)• Cavey's Restaurant (Manchester)• Rebeccas (Greenwich)• Restaurant Jean-Louis (Greenwich)
Delaware• Columbus Inn (Wilmington)• The Green Room (Wilmington)
RESTAURANT, FOOD & BEVERAGE MARKET RESEARCH HANDBOOK 2013
• 510 •
District of Columbia• 1789 Restaurant (Washington)• 701 Restaurant (Washington)• Bombay Club (Washington)• Equinox Restaurant (Washington)• i Ricchi (Washington)• Kinkead's An American Brasserie (Washington)• Marcel's (Washington)• Michel Richard Citronelle (Washington)• Smith & Wollensky (Washington)• Taberna Del Alabardero (Washington)• Teatro Goldoni (Washington)• The Caucus Room (Washington)• The Oceanaire Seafood Room (Washington)• The Oval Room (Washington)• The Prime Rib (Washington)
Florida• 30 Degree Blue (Panama City Beach)• 32 East (Delray Beach)• 95 Cordova Restaurant and Cobalt Lounge (St. Augustine)• Armani's at the Grand Hyatt Tampa Bay (Tampa)• Arturo's Ristorante (Boca Raton)• Atlantic's Edge at Cheeca Lodge & Spa (Islamorada)• Bern's Steak House (Tampa)• Bistro AIX (Jacksonville)• Brooks Restaurant (Deerfield Beach)• Cafe Cellini (Palm Beach)• Cafe' Chardonnay (Palm Beach Gardens)• Cafe L'Europe (Palm Beach and Sarasota)• Café Margaux (Cocoa)• Capriccio Ristorante (Pembroke Pines)• Chardonnay Restaurant (Naples)• Charley's Aged Steaks & Market Fresh Fish (Tampa)• Charley's Steak House (Orlando and Kissimmee)• Chef Allen's (Aventura)• Christini's Ristorante Italiano (Orlando)• Columbia Restaurant (Tampa)• Darrel & Oliver's Cafe' Maxx (Pompano Beach)• Donatello (Tampa)• Eduardo de San Angel (Ft. Lauderdale)• Euphemia Haye (Longboat Key)• Finz (Destin)• FishBones (Lake Mary)
RESTAURANT, FOOD & BEVERAGE MARKET RESEARCH HANDBOOK 2013
• 511 •
• Grill Room on Las Olas (Ft. Lauderdale)• Johnnie's Hideaway (Orlando)• Maison & Jardin (Altamonte Springs)• Marina Cafe (Destin)• Michael's on East (Sarasota)• MoonFish (Orlando)• Old Hickory Steakhouse (Kissimmee)• Ristorante Paradiso (Lake Worth)• Ruth's Chris Steak House (Orlando, North Palm Beach, and Winter Park)• Seagar's Prime Steaks & Seafood (Destin)• SideBerns (Tampa)• Smith & Wollensky (Miami Beach)• Square One Restaurant (Key West)• Ta-boo´ Restaurant (Palm Beach)• Tantra Restaurant and Lounge (Miami Beach)• The Black Pearl (Dunedin)• The Boheme (Orlando)• The Colony Dining Room (Longboat Key)• The Flagler Steakhouse (Palm Beach)• The Forge (Miami Beach)• Vito's Chop House (Orlando)
Georgia• Aqua Blue (Norcross)• Aria (Atlanta)• Bone's Restaurant (Atlanta)• Hi Life Restaurant (Norcross)• La Grotta Ristorante Italiano (Atlanta)• Local 11ten Food and Wine (Savannah)• Murphy's (Atlanta)• Nikolai's Roof at The Hilton Atlanta (Atlanta)• Sapphire Grill (Savannah)• South City Kitchen Midtown (Atlanta)• The Olde Pink House Restaurant (Savannah)
Hawaii• Alan Wong's Restaurant (Honolulu)• Bali by the Sea (Honolulu)• Cafe' Portofino (Lihue)• La Mer (Honolulu)• Pahu i'a (Kailua-Kona)
Idaho• Beverly's (Coeur d'Alene)
RESTAURANT, FOOD & BEVERAGE MARKET RESEARCH HANDBOOK 2013
• 512 •

Illinois• Carlucci (Rosemont)• Chicago Chop House (Chicago)• Cite' Elegant Dining (Chicago)• Coco Pazzo (Chicago)• Gene & Georgetti (Chicago)• Gibson's Bar & Steakhouse (Chicago)• Joe's Seafood, Prime Steak & Stone Crab (Chicago)• Lawry's The Prime Rib (Chicago)• Le Titi de Paris (Arlington Heights)• Le Vichyssois (Lakemoor)• Nieto's (Highland Park)• Salpicón (Chicago)• Smith & Wollensky (Chicago)• The Grill on the Alley (Chicago)• Va Pensiero (Evanston)• Vivere (Chicago)
Iowa• 801 Chophouse (Des Moines)• Splash Seafood Bar & Grill (Des Moines)
Kentucky• Equus Restaurant (Louisville)• The Oakroom at the Seelbach Hotel (Louisville)• Vincenzo's Italian Restaurant (Louisville)• Winston's Restaurant (Louisville)
Louisiana• Andrea's Restaurant (Metairie)• Arnaud's Restaurant (New Orleans)• Bayona (New Orleans)• Bistro at Maison de Ville (New Orleans)• Commander's Palace (New Orleans)• Galatoire's Restaurant (New Orleans)• GW Fins (New Orleans)• Lafitte's Landing (Donaldsville and Darrow)• Le Parvenu Restaurant (Kenner)• Mr. B's Bistro (New Orleans)• Ruth's Chris Steak House (Metairie)• Stella! (New Orleans)• Superiors Steakhouse (Shreveport)• The Grill Room at the Windsor Court Hotel (New Orleans)
RESTAURANT, FOOD & BEVERAGE MARKET RESEARCH HANDBOOK 2013
• 513 •

Maine• Clay Hill Farm (York)• The White Barn Inn (Kennebunkport)
Maryland• Antrim 1844 (Taneytown)• Da Mimmo (Baltimore)• Della Notte Ristorante (Baltimore)• Restaurant 213 (Fruitland)• The Milton Inn (Sparks)
Massachusetts• 75 Chestnut (Boston)• Anthony's Pier 4 (Boston)• Bravo (Boston)• Chillingsworth (Brewster)• Dan'l Webster Inn (Sandwich)• Grill 23 & Bar (Boston)• Il Capriccio Restorante e Bar (Waltham)• Òran Mór (Nantucket)• Sonoma Restaurant (Princeton)• The Summer House Restaurant (Siasconset)• Top of the Hub (Boston)
Michigan• Big Rock Chop House (Birmingham)• La Bistecca Italian Grille (Plymouth)• Opus One (Detroit)• Ristorante Café Cortina (Farmington Hills)• Schuler's Restaurant & Pub (Marshall)• The English Inn Restaurant & Pub (Eaton Rapids)• The Lark (West Bloomfield)• The Rattlesnake Club (Detroit)• The Whitney (Detroit)
Minnesota• Lord Fletcher's Old Lake Lodge (Minnetonka)• The St. Paul Grill (Saint Paul)
Mississippi• BR Prime Steakhouse (Biloxi)• Chicago Steakhouse at the Gold Strike Casino Resort (Tunica Resorts)• Fairbanks Steakhouse (Tunica Resorts)
RESTAURANT, FOOD & BEVERAGE MARKET RESEARCH HANDBOOK 2013
• 514 •

• Huntingtons Grille at the Hilton Jackson Hotel (Jackson)• Jack Binion's Steak House (Tunica Resorts)
Missouri• Al's Restaurant (St. Louis)• Annie Gunn's (Chesterfield)• dominic's (St. Louis)• Dominic's Trattoria (St. Louis)• Jasper's (Kansas City)• John Mineo's Italian Restaurant (St. Louis)• Station Grille Restaurant (St. Louis)• Tony's of St. Louis (St. Louis)
Montana• Rainbow Ranch Restaurant (Big Sky)
Nevada• Adele's (Carson City)• Alize at the Top of the Palms (Las Vegas)• Andre's at the Monte Carlo Resort (Las Vegas)• Ferraro's Restaurant (Las Vegas)• Harrah's Steak House (Reno)• La Strada (Reno)• Le Cirque (Las Vegas)• Mimmo Ferraro's Restaurant (Las Vegas)• Mon Ami Gabi (Las Vegas)• Peppermill's White Orchid (Reno)• Picasso (Las Vegas)• Piero's Italian Cuisine (Las Vegas)• Romanza at the Peppermill (Reno)• Roxy (Reno)• Smith & Wollensky (Las Vegas)
New Hampshire• Sugar Hill Inn (Sugar Hill)• The Bedford Village Inn (Bedford)• The Dining Room at Mt. Washington Resort (Bretton Woods)
New Jersey• Highlawn Pavilion at Eagle Rock Reservation (West Orange)• Knife & Fork Inn (Atlantic City)• La Spiaggia (Ship Botton)• L'Allegria Restaurant, Inc. (Madison)• Panico's (New Brunswick)
RESTAURANT, FOOD & BEVERAGE MARKET RESEARCH HANDBOOK 2013
• 515 •

• Peregrine's (Atlantic City)• Ram's Head Inn (Galloway)• Ruth's Chris Steak House (Weehawken)• The Bernard's Inn (Bernardsville)• The Dining Room at the Hilton Short Hills (Short Hills)• The Manor (West Orange)• The Park Steak House (Park Ridge)• The Saddle River Inn (Saddle River)
New Mexico• Geronimo (Santa Fe)• Rancher's Club of New Mexico Albuquerque)
New York• 21 Club (New York)• Alfama (New York)• Aquavit (New York)• Arabelle (New York)• Aureole (New York)• Barbetta (New York)• Bobby Van's (New York)• Bouley (New York)• Caffe' on the Green (Whitestone)• Daniel (New York)• Del Frisco's Double Eagle Steak House (New York)• Friends Lake Inn (Chestertown)• Gallagher's Steak House (New York)• Jack's Oyster House (Albany)• Le Perigord (New York)• Lenox Room (New York)• Maloney & Porcelli (New York)• Michael's (New York)• Nicola's Restaurant (New York)• Nobu (New York)• One if by Land, Two if by Sea (New York)• Park Avenue (New York)• Piccolo Restaurant of Huntington (Huntington)• Picholine (New York)• Salvatore's Italian Gardens (Depew)• Smith & Wollensky (New York)• Sparks Steak House (New York)• Terrace in the Sky (New York)• The American Hotel (Sag Harbor)• The Brewster Inn (Cazenovia)
RESTAURANT, FOOD & BEVERAGE MARKET RESEARCH HANDBOOK 2013
• 516 •
• The Four Seasons (New York)• The Living Room Restaurant at Maidstone Arms Inn (East Hampton)• The Post House (New York)• The River Cafe (Brooklyn)• Tocqueville (New York)• Tribeca Grill (New York)• Union Square Cafe (New York)• Xaviar's at Piermont (Piermont)• Yono's Restaurant (Albany)
North Carolina• Angus Barn (Raleigh)• Bonterra Dining & Wine Room (Charlotte)• Elizabeth's Cafe' & Winery (Duck)• Horizons at Grove Park Inn (Asheville)• Port Land Grill (Wilmington)• Second Empire Restaurant & Tavern (Raleigh)• The Capital Grille (Charlotte)• The Dining Room, Inn on Biltmore Estate (Asheville)• Upstream (Charlotte)
Ohio• Alberini's (Niles)• L'Auberge Restaurant (Dayton)• Ristorante Giovanni's (Beachwood)• The Palace Restaurant (Cincinnati)• The Refectory (Columbus)
Oklahoma• Polo Grill (Tulsa)
Oregon• Genoa (Portland)• Joel Palmer House (Dayton)• RingSide Steakhouse Downtown (Portland)• RingSide Steakhouse Glendoveer (Portland)• The Painted Lady Restaurant (Newberg)
Pennsylvania• Accomac Inn (York)• Bricco (Harrisburg)• Dilworthtown Inn (West Chester)• DiSalvo's Station Restaurant (Latrobe)• Finelli's Italian Villa (Altoona)
RESTAURANT, FOOD & BEVERAGE MARKET RESEARCH HANDBOOK 2013
• 517 •
• Haydn Zug's Restaurant (East Petersburg)• Hyeholde Restaurant (Moon Township)• Isabela on Grandview (Pittsburgh)• Restaurant Mazzi at the Inn of Leola Village (Leola)• Ristorante La Buca (Philadelphia)• Smith & Wollensky (Philadelphia)• TÉ at The Inn at Leola Village (Leola)• The Carlton (Pittsburgh)• The Circular Dining Room at The Hotel Hershey (Hershey)• Vallozzi's Restaurant (Greensburg)
Rhode Island• Bouchard Restaurant & Inn (Newport)• Capriccio (Providence)• Providence Oyster Bar (Providence)• Restaurant Bouchard (Newport)
South Carolina• Charleston Grill (Charleston)• Circa 1886 (Charleston)• Cypress Lowcountry Grille (Charleston)• Grill 225 (Charleston)• Magnolia's (Charleston)• Peninsula Grill (Charleston)• Terra (West Columbia)• The Restaurant at the Willcox (Aiken)
Tennessee• Capriccio Grill (Memphis)• Chez Philippe (Memphis)• Folks Folly Prime Steak House (Memphis)• Old Hickory Steakhouse (Nashville)• Sunset Grill (Nashville)• The Stock-Yard Restaurant (Nashville)• The Troutdale Dining Room (Bristol)
Texas• Abacus Restaurant (Dallas)• Al Biernat's (Dallas)• August E's (Fredericksburg)• Bistro Le Cep (Houston)• Bob's Steak & Chop House (Dallas)• Bohanan's Prime Steaks & Seafood (San Antonio)• Brennan's of Houston (Houston)
RESTAURANT, FOOD & BEVERAGE MARKET RESEARCH HANDBOOK 2013
• 518 •
• Café Pacific (Dallas)• Chez Nous French Restaurant (Humble)• Christopher's World Grille (Bryan)• Del Frisco's Double Eagle Steak House (Dallas)• Fearing's Restaurant at The Ritz Carlton (Dallas)• Fig Tree (San Antonio)• III Forks (Dallas)• Jasper's (Plano)• Jeffrey's Restaurant (Austin)• La Colombe d'Or Hotel & Restaurant (Houston)• Mark's American Cuisine (Houston)• Mesa Street Grill (El Paso)• Nana (Dallas)• Noé Restaurant & Bar (Houston)• Pappas Brothers Steakhouse (Dallas)• Perry's Restaurant (Dallas)• Rough Creek Lodge (Glen Rose)• Ruth's Chris Steak House (Dallas and San Antonio)• Stephan Pyles Restaurant (Dallas)• The Capital Grille (Houston)• The Lonesome Dove Western Bistro (Fort Worth)• The Mansion on Turtle Creek (Dallas)• The Place at Perry's (Dallas)
Utah• Grappa Italian Restaurant (Park City)• Log Haven Restaurant (Salt Lake City)• Painted Pony Restaurant (St. George)• Riverhorse on Main (Park City)
Vermont• Hemingway's (Killington)• The Colonnade (Manchester)• The Hermitage (West Dover)• The Inn at Sawmill Farm (West Dover)
Virginia• Clifton (Charlottesville)• La Bergerie (Alexandria)• L'Auberge Chez Francois (Great Falls)• Lemaire at The Jefferson Hotel (Richmond)• Regency Room (Williamsburg)• River'd Inn (Woodstock)• The Boathouse at Sunday Park (Midlothian)
RESTAURANT, FOOD & BEVERAGE MARKET RESEARCH HANDBOOK 2013
• 519 •
• The Dining Room at Ford's Colony (Williamsburg)• The Inn at Little Washington (Washington)• The Seafare of Williamsburg (Williamsburg)
Washington• Campagne & Cafe Campagne (Seattle)• Metropolitan Grill (Seattle)• Place Pigalle Restaurant & Bar at Pike Place Market (Seattle)• Ray's Boathouse, Cafe' & Catering (Seattle)• Sun Mountain Lodge (Winthrop)• The Georgian (Seattle)• The Herbfarm (Woodinville)• The Steak House at Silver Reef Casino (Ferndale)• Tulalip Bay (Tulalip)
West Virginia• The Greenbrier's Main Dining Room (White Sulphur Springs)
Wisconsin• Bartolotta's Lake Park Bistro (Milwaukee)• Dream Dance (Milwaukee)• Mr. B's - A Bartolotta Steakhouse (Brookfield)• Ristorante Bartolotta (Wauwatosa)• The Immigrant Restaurant at The American Club (Kohler)
Wyoming• The Granary at Spring Creek Ranch (Jackson Hole)
RESTAURANT, FOOD & BEVERAGE MARKET RESEARCH HANDBOOK 2013
• 520 •
96
FAVORITE LIMITED-SERVICE RESTAURANTS
96.1 OverviewA series of surveys conducted in 2012 by Market Force Information
(www.marketforce.com) queried consumers about their favorite restaurants. Thesurveys calculated favorites in six categories based on the total number of votes, thenfactored in the number of locations for each chain to present a more level view of theresults. Rankings of the favorite chains, indexed by restaurant count, are presented inthis chapter.
96.2 Top Chains By Segment
Burger Chains1. Five Guys Burgers and Fires2. In-N-Out Burger3. Fuddruckers4. A&W All-American Food5. Smashburger6. Culver’s7. Steak ‘n Shake8. Whataburger9. Carl’s Jr.10. Wendy’s
Chicken Chains1. Chick-fil-A2. Raising Cane’s3. Boston Market4. El Pollo Loco5. Zaxby’s6. Popeye’s Louisiana Kitchen7. KFC8. Wingstop9. Church’s Chicken
RESTAURANT, FOOD & BEVERAGE MARKET RESEARCH HANDBOOK 2013
• 521 •
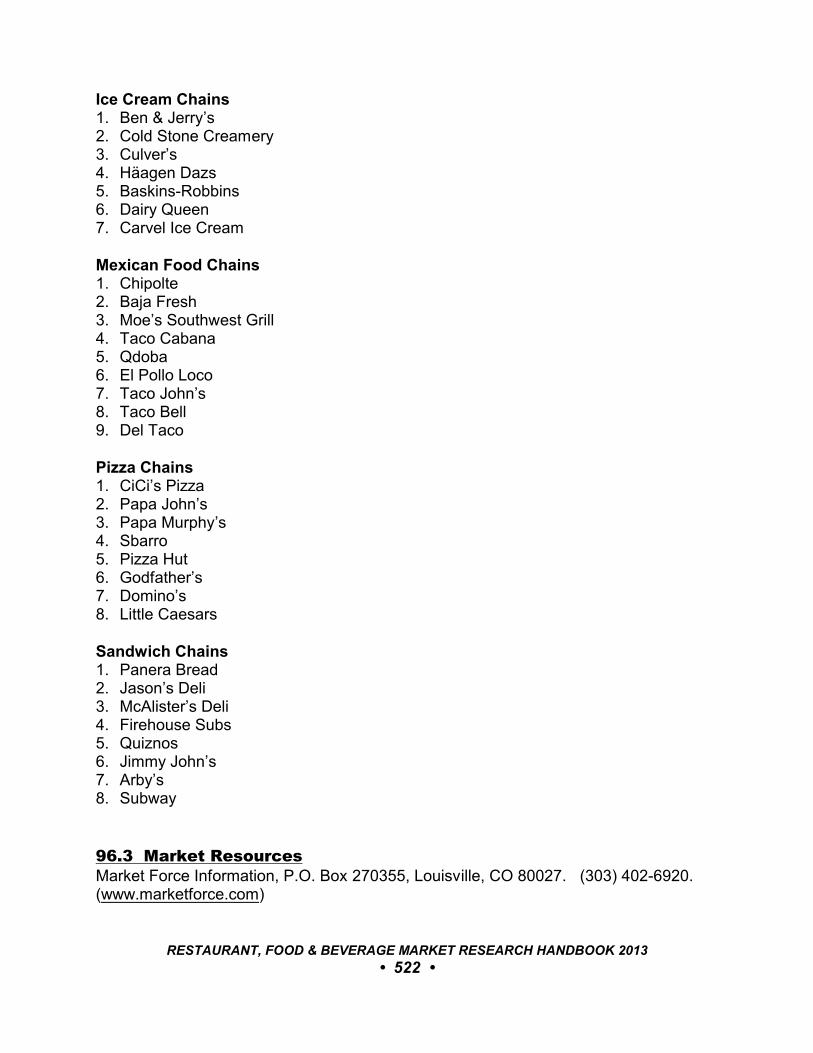
Ice Cream Chains1. Ben & Jerry’s2. Cold Stone Creamery3. Culver’s4. Häagen Dazs5. Baskins-Robbins6. Dairy Queen7. Carvel Ice Cream
Mexican Food Chains1. Chipolte2. Baja Fresh3. Moe’s Southwest Grill4. Taco Cabana5. Qdoba6. El Pollo Loco7. Taco John’s8. Taco Bell9. Del Taco
Pizza Chains1. CiCi’s Pizza2. Papa John’s3. Papa Murphy’s4. Sbarro5. Pizza Hut6. Godfather’s7. Domino’s8. Little Caesars
Sandwich Chains1. Panera Bread2. Jason’s Deli3. McAlister’s Deli4. Firehouse Subs5. Quiznos6. Jimmy John’s7. Arby’s8. Subway
96.3 Market ResourcesMarket Force Information, P.O. Box 270355, Louisville, CO 80027. (303) 402-6920. (www.marketforce.com)
RESTAURANT, FOOD & BEVERAGE MARKET RESEARCH HANDBOOK 2013
• 522 •
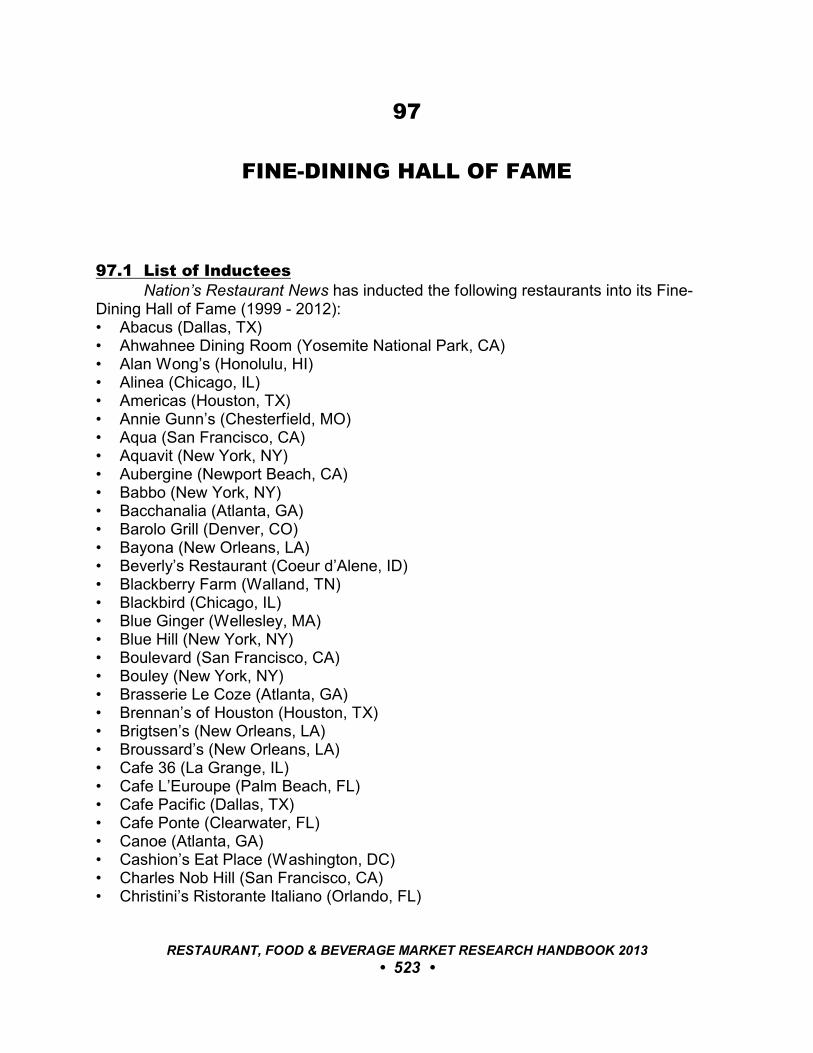
97
FINE-DINING HALL OF FAME
97.1 List of InducteesNation’s Restaurant News has inducted the following restaurants into its Fine-
Dining Hall of Fame (1999 - 2012):• Abacus (Dallas, TX)• Ahwahnee Dining Room (Yosemite National Park, CA)• Alan Wong’s (Honolulu, HI)• Alinea (Chicago, IL)• Americas (Houston, TX)• Annie Gunn’s (Chesterfield, MO)• Aqua (San Francisco, CA)• Aquavit (New York, NY)• Aubergine (Newport Beach, CA)• Babbo (New York, NY)• Bacchanalia (Atlanta, GA)• Barolo Grill (Denver, CO)• Bayona (New Orleans, LA)• Beverly’s Restaurant (Coeur d’Alene, ID)• Blackberry Farm (Walland, TN)• Blackbird (Chicago, IL)• Blue Ginger (Wellesley, MA)• Blue Hill (New York, NY) • Boulevard (San Francisco, CA)• Bouley (New York, NY)• Brasserie Le Coze (Atlanta, GA)• Brennan’s of Houston (Houston, TX)• Brigtsen’s (New Orleans, LA)• Broussard’s (New Orleans, LA)• Cafe 36 (La Grange, IL)• Cafe L’Euroupe (Palm Beach, FL)• Cafe Pacific (Dallas, TX)• Cafe Ponte (Clearwater, FL)• Canoe (Atlanta, GA)• Cashion’s Eat Place (Washington, DC)• Charles Nob Hill (San Francisco, CA)• Christini’s Ristorante Italiano (Orlando, FL)
RESTAURANT, FOOD & BEVERAGE MARKET RESEARCH HANDBOOK 2013
• 523 •
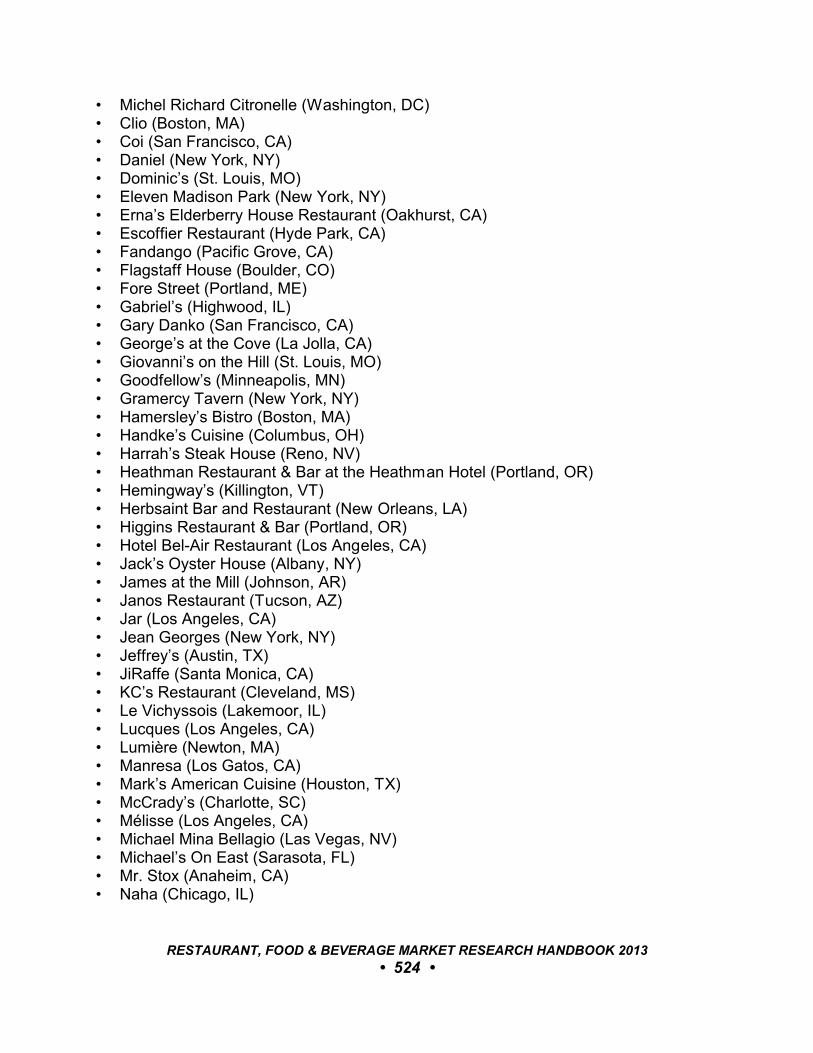
• Michel Richard Citronelle (Washington, DC)• Clio (Boston, MA)• Coi (San Francisco, CA)• Daniel (New York, NY)• Dominic’s (St. Louis, MO)• Eleven Madison Park (New York, NY)• Erna’s Elderberry House Restaurant (Oakhurst, CA)• Escoffier Restaurant (Hyde Park, CA)• Fandango (Pacific Grove, CA)• Flagstaff House (Boulder, CO)• Fore Street (Portland, ME)• Gabriel’s (Highwood, IL)• Gary Danko (San Francisco, CA)• George’s at the Cove (La Jolla, CA)• Giovanni’s on the Hill (St. Louis, MO)• Goodfellow’s (Minneapolis, MN)• Gramercy Tavern (New York, NY)• Hamersley’s Bistro (Boston, MA)• Handke’s Cuisine (Columbus, OH)• Harrah’s Steak House (Reno, NV)• Heathman Restaurant & Bar at the Heathman Hotel (Portland, OR)• Hemingway’s (Killington, VT)• Herbsaint Bar and Restaurant (New Orleans, LA)• Higgins Restaurant & Bar (Portland, OR)• Hotel Bel-Air Restaurant (Los Angeles, CA)• Jack’s Oyster House (Albany, NY)• James at the Mill (Johnson, AR)• Janos Restaurant (Tucson, AZ)• Jar (Los Angeles, CA)• Jean Georges (New York, NY)• Jeffrey’s (Austin, TX)• JiRaffe (Santa Monica, CA)• KC’s Restaurant (Cleveland, MS)• Le Vichyssois (Lakemoor, IL) • Lucques (Los Angeles, CA)• Lumière (Newton, MA)• Manresa (Los Gatos, CA)• Mark’s American Cuisine (Houston, TX)• McCrady’s (Charlotte, SC)• Mélisse (Los Angeles, CA)• Michael Mina Bellagio (Las Vegas, NV)• Michael’s On East (Sarasota, FL)• Mr. Stox (Anaheim, CA)• Naha (Chicago, IL)
RESTAURANT, FOOD & BEVERAGE MARKET RESEARCH HANDBOOK 2013
• 524 •
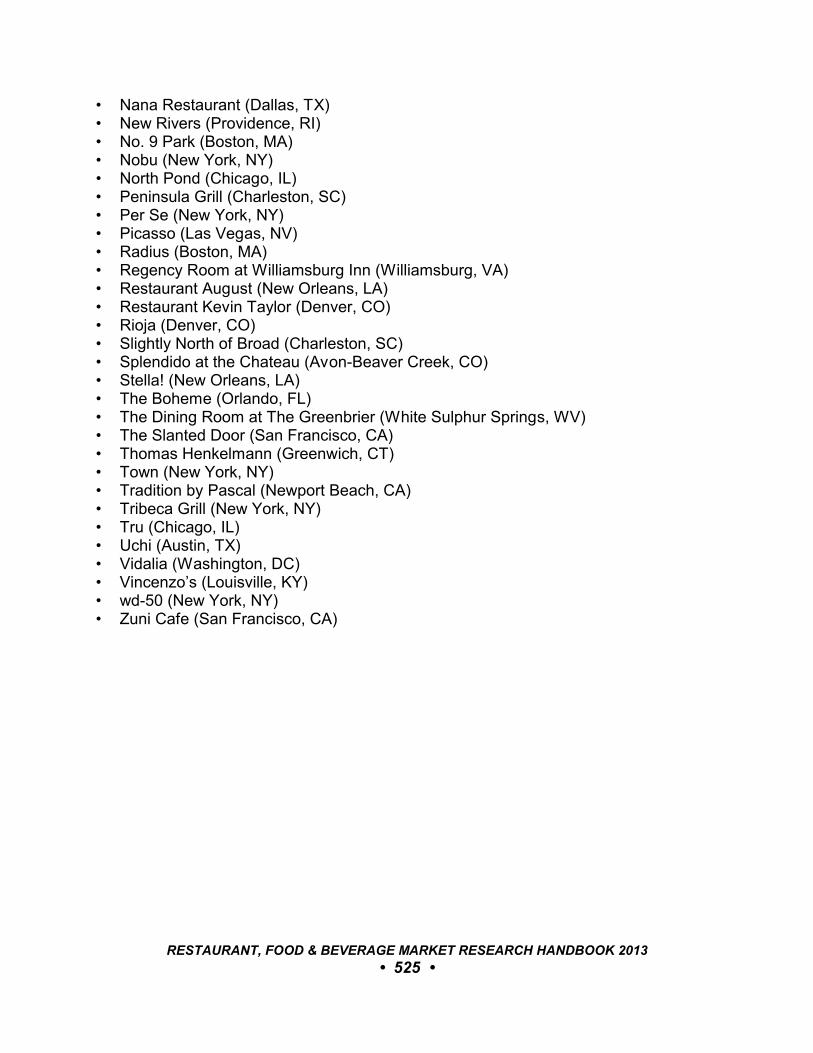
• Nana Restaurant (Dallas, TX)• New Rivers (Providence, RI)• No. 9 Park (Boston, MA) • Nobu (New York, NY)• North Pond (Chicago, IL) • Peninsula Grill (Charleston, SC)• Per Se (New York, NY)• Picasso (Las Vegas, NV)• Radius (Boston, MA) • Regency Room at Williamsburg Inn (Williamsburg, VA)• Restaurant August (New Orleans, LA)• Restaurant Kevin Taylor (Denver, CO)• Rioja (Denver, CO)• Slightly North of Broad (Charleston, SC)• Splendido at the Chateau (Avon-Beaver Creek, CO)• Stella! (New Orleans, LA)• The Boheme (Orlando, FL)• The Dining Room at The Greenbrier (White Sulphur Springs, WV)• The Slanted Door (San Francisco, CA)• Thomas Henkelmann (Greenwich, CT) • Town (New York, NY)• Tradition by Pascal (Newport Beach, CA)• Tribeca Grill (New York, NY)• Tru (Chicago, IL)• Uchi (Austin, TX)• Vidalia (Washington, DC)• Vincenzo’s (Louisville, KY)• wd-50 (New York, NY)• Zuni Cafe (San Francisco, CA)
RESTAURANT, FOOD & BEVERAGE MARKET RESEARCH HANDBOOK 2013
• 525 •
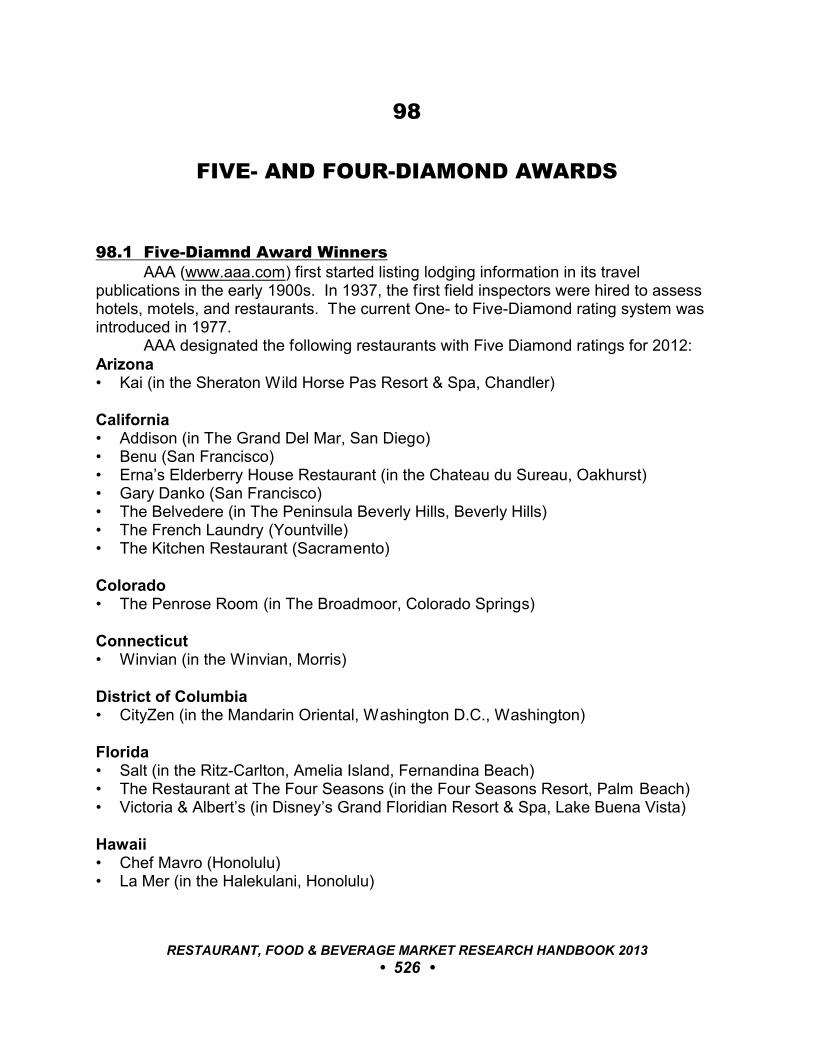
98
FIVE- AND FOUR-DIAMOND AWARDS
98.1 Five-Diamnd Award WinnersAAA (www.aaa.com) first started listing lodging information in its travel
publications in the early 1900s. In 1937, the first field inspectors were hired to assesshotels, motels, and restaurants. The current One- to Five-Diamond rating system wasintroduced in 1977.
AAA designated the following restaurants with Five Diamond ratings for 2012:Arizona• Kai (in the Sheraton Wild Horse Pas Resort & Spa, Chandler)
California• Addison (in The Grand Del Mar, San Diego)• Benu (San Francisco)• Erna’s Elderberry House Restaurant (in the Chateau du Sureau, Oakhurst)• Gary Danko (San Francisco)• The Belvedere (in The Peninsula Beverly Hills, Beverly Hills)• The French Laundry (Yountville)• The Kitchen Restaurant (Sacramento)
Colorado• The Penrose Room (in The Broadmoor, Colorado Springs)
Connecticut• Winvian (in the Winvian, Morris)
District of Columbia• CityZen (in the Mandarin Oriental, Washington D.C., Washington)
Florida• Salt (in the Ritz-Carlton, Amelia Island, Fernandina Beach)• The Restaurant at The Four Seasons (in the Four Seasons Resort, Palm Beach)• Victoria & Albert’s (in Disney’s Grand Floridian Resort & Spa, Lake Buena Vista)
Hawaii• Chef Mavro (Honolulu)• La Mer (in the Halekulani, Honolulu)
RESTAURANT, FOOD & BEVERAGE MARKET RESEARCH HANDBOOK 2013
• 526 •
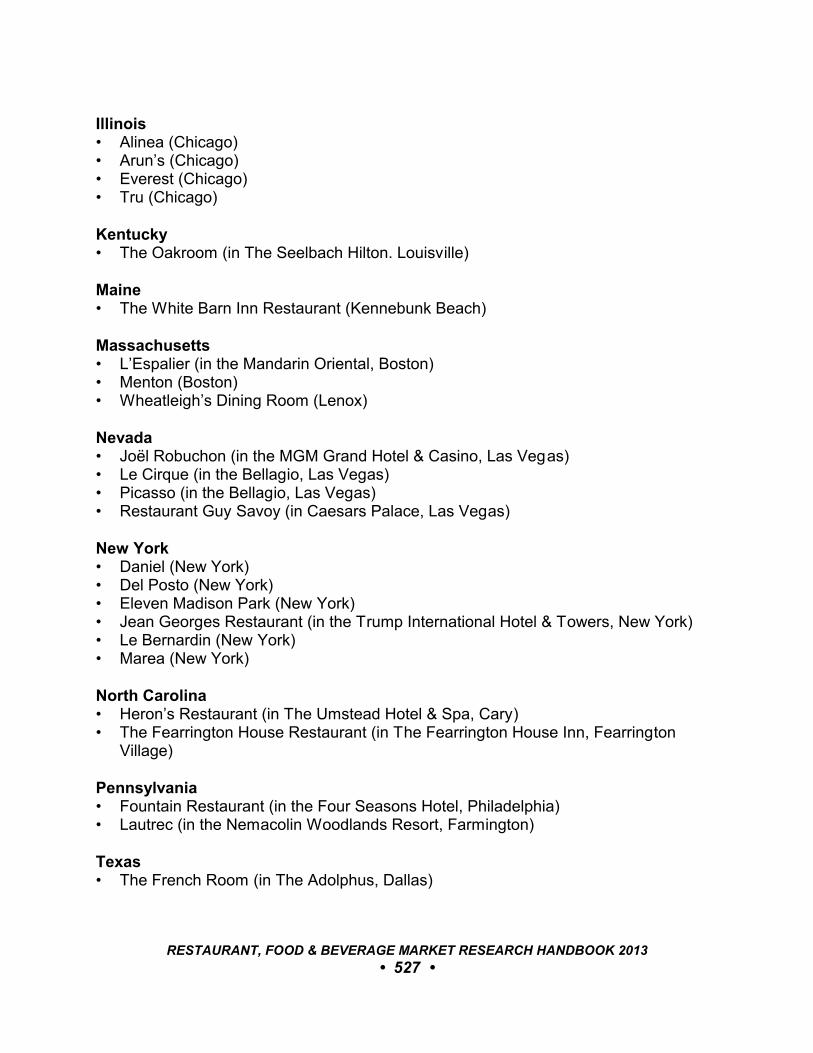
Illinois• Alinea (Chicago)• Arun’s (Chicago)• Everest (Chicago)• Tru (Chicago)
Kentucky• The Oakroom (in The Seelbach Hilton. Louisville)
Maine• The White Barn Inn Restaurant (Kennebunk Beach)
Massachusetts• L’Espalier (in the Mandarin Oriental, Boston)• Menton (Boston)• Wheatleigh’s Dining Room (Lenox)
Nevada• Joël Robuchon (in the MGM Grand Hotel & Casino, Las Vegas)• Le Cirque (in the Bellagio, Las Vegas)• Picasso (in the Bellagio, Las Vegas)• Restaurant Guy Savoy (in Caesars Palace, Las Vegas)
New York• Daniel (New York)• Del Posto (New York)• Eleven Madison Park (New York)• Jean Georges Restaurant (in the Trump International Hotel & Towers, New York)• Le Bernardin (New York)• Marea (New York)
North Carolina• Heron’s Restaurant (in The Umstead Hotel & Spa, Cary)• The Fearrington House Restaurant (in The Fearrington House Inn, Fearrington
Village)
Pennsylvania• Fountain Restaurant (in the Four Seasons Hotel, Philadelphia)• Lautrec (in the Nemacolin Woodlands Resort, Farmington)
Texas• The French Room (in The Adolphus, Dallas)
RESTAURANT, FOOD & BEVERAGE MARKET RESEARCH HANDBOOK 2013
• 527 •
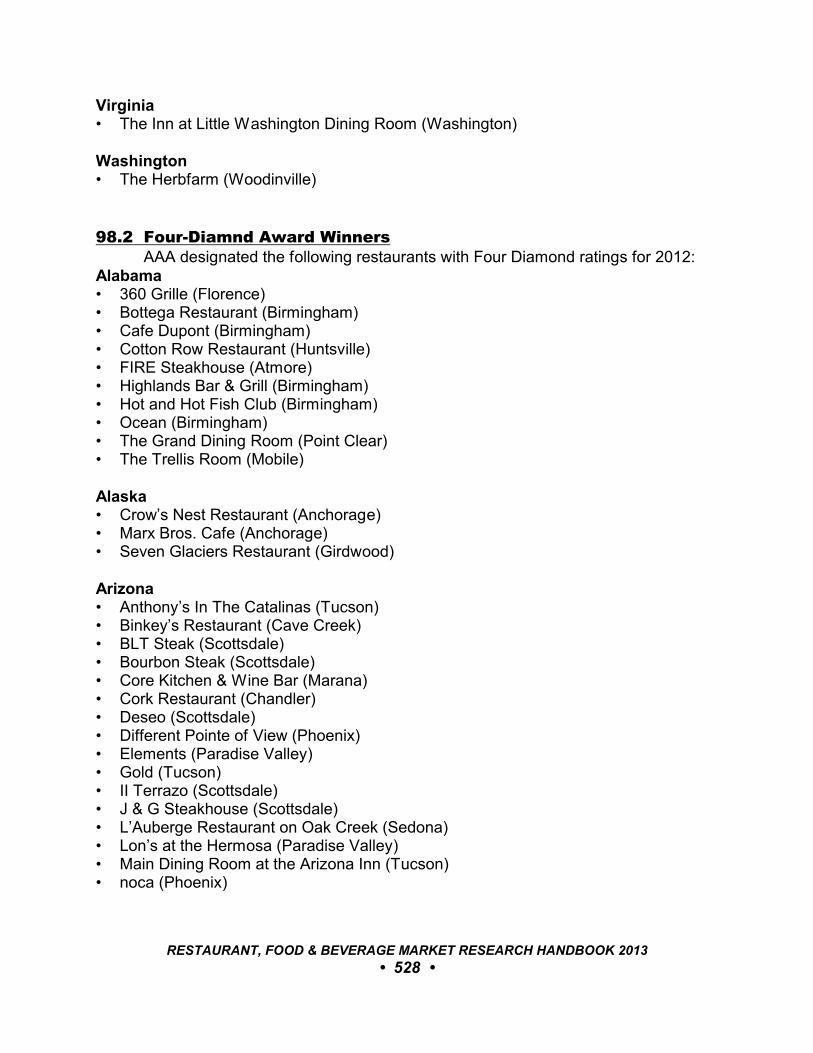
Virginia• The Inn at Little Washington Dining Room (Washington)
Washington• The Herbfarm (Woodinville)
98.2 Four-Diamnd Award WinnersAAA designated the following restaurants with Four Diamond ratings for 2012:
Alabama• 360 Grille (Florence)• Bottega Restaurant (Birmingham)• Cafe Dupont (Birmingham)• Cotton Row Restaurant (Huntsville)• FIRE Steakhouse (Atmore)• Highlands Bar & Grill (Birmingham)• Hot and Hot Fish Club (Birmingham)• Ocean (Birmingham)• The Grand Dining Room (Point Clear)• The Trellis Room (Mobile)
Alaska• Crow’s Nest Restaurant (Anchorage)• Marx Bros. Cafe (Anchorage)• Seven Glaciers Restaurant (Girdwood)
Arizona• Anthony’s In The Catalinas (Tucson)• Binkey’s Restaurant (Cave Creek)• BLT Steak (Scottsdale)• Bourbon Steak (Scottsdale)• Core Kitchen & Wine Bar (Marana)• Cork Restaurant (Chandler)• Deseo (Scottsdale)• Different Pointe of View (Phoenix)• Elements (Paradise Valley)• Gold (Tucson)• II Terrazo (Scottsdale)• J & G Steakhouse (Scottsdale)• L’Auberge Restaurant on Oak Creek (Sedona)• Lon’s at the Hermosa (Paradise Valley)• Main Dining Room at the Arizona Inn (Tucson)• noca (Phoenix)
RESTAURANT, FOOD & BEVERAGE MARKET RESEARCH HANDBOOK 2013
• 528 •
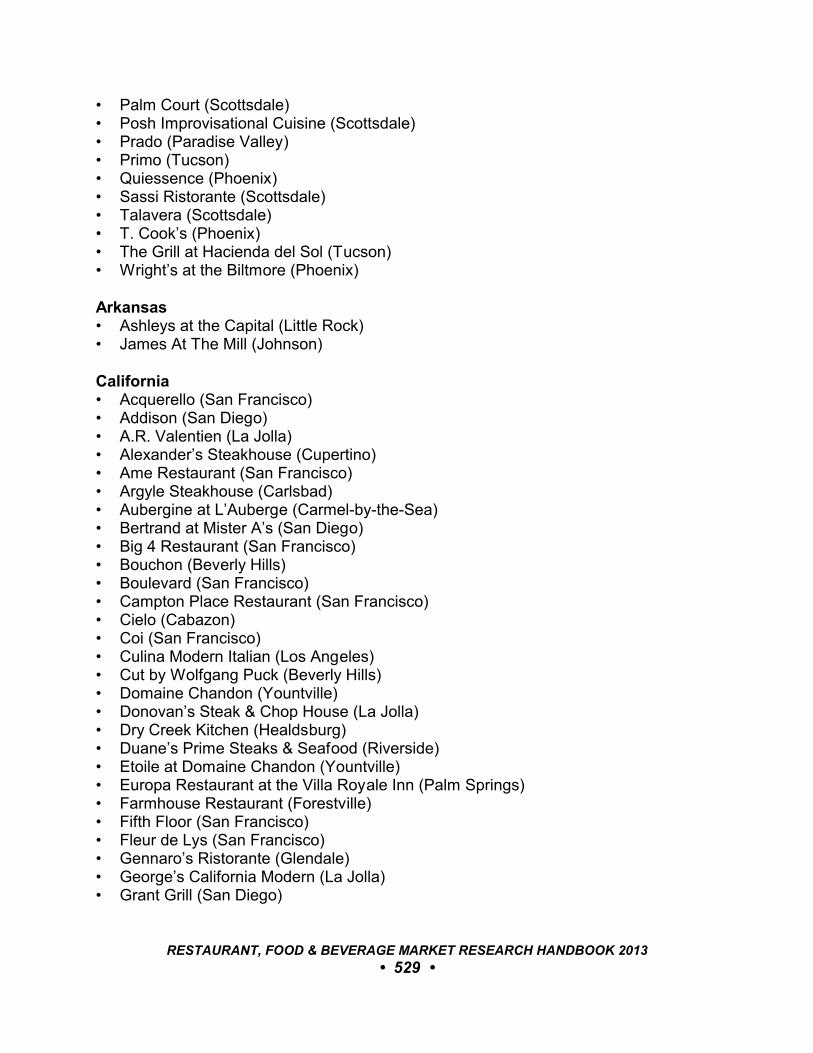
• Palm Court (Scottsdale)• Posh Improvisational Cuisine (Scottsdale)• Prado (Paradise Valley)• Primo (Tucson)• Quiessence (Phoenix)• Sassi Ristorante (Scottsdale)• Talavera (Scottsdale)• T. Cook’s (Phoenix)• The Grill at Hacienda del Sol (Tucson)• Wright’s at the Biltmore (Phoenix)
Arkansas• Ashleys at the Capital (Little Rock)• James At The Mill (Johnson)
California• Acquerello (San Francisco)• Addison (San Diego)• A.R. Valentien (La Jolla)• Alexander’s Steakhouse (Cupertino)• Ame Restaurant (San Francisco)• Argyle Steakhouse (Carlsbad)• Aubergine at L’Auberge (Carmel-by-the-Sea)• Bertrand at Mister A’s (San Diego)• Big 4 Restaurant (San Francisco)• Bouchon (Beverly Hills)• Boulevard (San Francisco)• Campton Place Restaurant (San Francisco)• Cielo (Cabazon)• Coi (San Francisco)• Culina Modern Italian (Los Angeles)• Cut by Wolfgang Puck (Beverly Hills)• Domaine Chandon (Yountville)• Donovan’s Steak & Chop House (La Jolla)• Dry Creek Kitchen (Healdsburg)• Duane’s Prime Steaks & Seafood (Riverside)• Etoile at Domaine Chandon (Yountville)• Europa Restaurant at the Villa Royale Inn (Palm Springs)• Farmhouse Restaurant (Forestville)• Fifth Floor (San Francisco)• Fleur de Lys (San Francisco)• Gennaro’s Ristorante (Glendale)• George’s California Modern (La Jolla)• Grant Grill (San Diego)
RESTAURANT, FOOD & BEVERAGE MARKET RESEARCH HANDBOOK 2013
• 529 •
• Great Oak Steakhouse (Temecula)• Hampton’s (Westlake Village)• High Steaks Steakhouse (Lincoln)• Jardiniere (San Francisco)• jer-ne restaurant (Marina Del Rey)• La Folie (San Francisco)• Le Vallauris (Palm Springs)• Madrona Manor Wine Country Inn & Restaurant (Healdsburg)• Manresa (Los Gatos)• Maravilla (Ojai)• Masa’s (San Francisco)• Melisse (Santa Monica)• Michael Mina (San Francisco)• Mille Fleurs (Rancho Santa Fe)• Murray Circle (Sausalito)• Napa Rose (Anaheim)• Navio (Half Moon Bay)• Pacific’s Edge (Carmel-by-the-Sea)• Palm Terrace Restaurant (Newport Beach)• Parallel 67 (San Francisco)• Patina (Los Angeles)• Quattro Restaurant & Bar (East Palo Alto)• Raya (Dana Point)• Saddle Peak Lodge (Calabasas)• Saison (San Francisco)• Sante (Sonoma)• Sardine Factory (Monterey)• Sirocco (Indian Wells)• Sky Room (La Jolla)• Spago Beverly Hills (Beverly Hills)• Studio (Laguna Beach)• The Ballard Inn Restaurant (Solvang)• The Belvedere (Beverly Hills)• The Blvd (Beverly Hills)• The Californian (Huntington Beach)• The Cellar (Fullerton)• The Duck Club (Monterey)• The Firehouse (Sacramento)• The First Cabin At The Balboa Bay Club & Resort (Newport Beach)• The French Poodle Restaurant (Carmel-by-the-Sea)• The Kitchen Restaurant (Sacramento)• The Plumed Horse (Saratoga)• The Raymond Restaurant (Pasadena)• The Ritz Restaurant and Garden (Newport Beach)
RESTAURANT, FOOD & BEVERAGE MARKET RESEARCH HANDBOOK 2013
• 530 •
• The Sky Room (Long Beach)• The Village Pub (Woodside)• The Willows (Santa Ynez)• Valentino Santa Monica (Santa Monica)• Vivace (Carlsbad)• Wally’s Desert Turtle (Rancho Mirage)
Colorado• Alpenglow Stube (Keystone)• Charles Court (Colorado Springs)• Chefs Club by Food & Wine (Aspen)• Colt & Gray (Denver)• Edge Restaurant & Bar (Denver)• Frasca (Boulder)• Grouse Mountain Grill (Beaver Creek)• Keystone Ranch Restaurant (Keystone)• Mirabelle at Beaver Creek (Beaver Creek)• Mizuna (Denver)• Palace Arms (Denver)• Panzano (Denver)• Restaurant Kelly Liken (Vail)• Restaurant Kevin Taylor (Denver)• Rev Restaurant at Hotel Madeline Telluride (Telluride)• Rioja (Denver)• Spago (Beaver Creek)• Splendido at the Chateau (Beaver Creek)• Summit (Colorado Springs)• Syzygy (Aspen)• The Cliff House Restaurant (Manitou Springs)• The Flagstaff House Restaurant (Boulder)
Connecticut• Craftsteak (Ledyard)• Fresh Salt (Old Saybrook)• Octagon (Groton)• Paragon (Mashantucket)• Rebeccas (Greenwich)• Stonehenge Inn and Restaurant (Ridgefield)• The Mayflower Inn Dining Room (Washington)• Thomas Henkelmann (Greenwich)
Delaware• The Green Room (Wilmington)
RESTAURANT, FOOD & BEVERAGE MARKET RESEARCH HANDBOOK 2013
• 531 •
District of Columbia• adour (Washington)• Bourbon Steak (Washington)• Komi (Washington)• Marcel’s (Washington)• Westend Bistro by Eric Ripert (Washington)
Florida• A Land Remembered (Orlando)• Area 31 (Miami)• Armani’s (Tampa)• Arturo’s Ristorante (Boca Raton)• Atlantic’s Edge (Islamorada)• Atrio (Miami)• Azul (Miami)• Azurea (Atlantic Beach)• Barton G. The Restaurant (Miami Beach)• Bull & Bear Prime Steakhouse (Orlando)• Cafe Boulud (Palm Beach)• Cafe Marquesa (Key West)• Casa Tua (Miami Beach)• Cala Bella (Orlando)• Caretta on the Gulf (Clearwater Beach)• Christini’s Ristorante Italiano (Orlando)• Cioppino (Key Biscayne)• db Bistro Moderne (Miami)• East End Brasserie (Fort Lauderdale)• Fish Out of Water (Santa Rosa Beach)• Gibraltar (Coconut Grove)• Gotham Steak (Miami Beach)• Hakkasan (Miami Beach)• Hollywood Prime (Hollywood)• Hot Tin Roof (Key West)• Il Mulino New York (Sunny Isles Beach)• Ireland’s Steakhouse (Weston)• J & G Grill (Bal Harbour)• Kathy’s Gazebo Cafe (Boca Raton)• Latitudes (Key West)• Lemonia (Naples)• Luma on Park (Winter Park)• Maritana Grille (St. Pete Beach)• Matthew’s Restaurant (Jacksonville)• Michael’s On East (Sarasota)• Michy’s (Miami)
RESTAURANT, FOOD & BEVERAGE MARKET RESEARCH HANDBOOK 2013
• 532 •
• Neomi’s Grill (Sunny Isles Beach)• Norman’s At The Ritz-Carlton (Orlando)• Palme d’Or (Coral Gables)• Paradiso Restaurant (Lake Worth)• Pisces (Key West)• Primo (Orlando)• Rainbow Palace (Fort Lauderdale)• Restaurant Medure (Ponte Vedra Beach)• Red The Steakhouse South Beach (Miami Beach)• Sale e Pepe (Marco Island)• Scarpetta (Miami Beach)• Seagar’s Prime Steaks and Seafood (Destin)• SideBern’s (Tampa)• Sugarcane Raw Bar Grill (Miami)• Tantra (Miami Beach)• The Boheme (Orlando)• The Dining Room at Little Palm Island (Big Pine Key)• The Grill (Naples)• The Restaurant (Palm Beach)• The Restaurant at The Setai (Miami Beach)• The Venetian Room (Lake Buena Vista)• Timo (Sunny Isles Beach)• Todd English’s Bluezoo (Lake Buena Vista)• Via Luna (Fort Lauderdale)
Georgia• Aria (Atlanta)• Atlanta Grill (Atlanta)• Bacchanalia (Atlanta)• BLT Steak (Atlanta)• Canoe (Atlanta)• Georgia’s Bistro (Greensboro)• La Grotta Ravinia Ristorante Italiano (Atlanta)• La Grotta Ristorante Italiano (Atlanta)• Nan Thai Fine Dining (Atlanta)• Nikolai’s Roof (Atlanta)• Park 75 at the Four Seasons (Atlanta)• Restaurant Eugene (Atlanta)
Hawaii• Azul (Kapolei)• Bali Steak & Seafood (Honolulu)• Brown’s Beach House (Kohala Coast)• Hoku’s (Honolulu)
RESTAURANT, FOOD & BEVERAGE MARKET RESEARCH HANDBOOK 2013
• 533 •
• La Mer (Honolulu)• Orchids (Honolulu)• Pahu i’a (Kaupulehu)• Sarento’s on the Beach (Kihei)• Spago (Wailea)• The Banyan Tree (Kapalua)• The Dining Room (Lanai City)
Idaho• Beverly’s (Coeur D’Alene)
Illinois• Blackbird (Chicago)• Boka (Chicago)• Courtright’s Restaurant (Willow Springs)• L2O (Chicago)• Les Nomades (Chicago)• Lockwood Restaurant (Chicago)• mk (Chicago)• moto (Chicago)• NAHA (Chicago)• Next Restaurant (Chicago)• NoMI (Chicago)• Shanghai Terrace (Chicago)• Sixteen (Chicago)• Spiaggia (Chicago)• Tallgrass (Lockport)• Topolobampo (Chicago)• Zealous (Chicago)
Indiana• Joseph Decuis (Roanoke)• LaSalle Grill (South Bend)• Restaurant Tallent (Bloomington)• The Carriage House Dining Room (South Bend)
Kentucky• Corbett’s - An American Place (Louisville)• The English Grill (Louisville)• Vincenzo’s Restaurant (Louisville)• Z’s Oyster Bar & Steakhouse (Louisville)
Louisiana• Commander’s Palace (New Orleans)
RESTAURANT, FOOD & BEVERAGE MARKET RESEARCH HANDBOOK 2013
• 534 •
• Emeril’s (New Orleans)• Emeril’s Delmonico Restaurant & Bar (New Orleans)• Restaurant August (New Orleans)• Restaurant Revolution (New Orleans)• Stella! (New Orleans)• The Grill Room (New Orleans)
Maine• Arrows Restaurant (Ogunquit)• Back Bay Grill (Portland)• Earth (Kennebunkport)• Fore Street (Portland)• Harstone Inn (Camden)• Hugo’s Restaurant (Portland)• Michelle’s Fine Dining (Bar Harbor)• Natalie’s (Camden)• Primo (Rockland)• the Salt Exchange (Portland)
Maryland• Charleston (Baltimore)• Sherwood’s Landing (St. Michaels)• Volt (Frederick)
Massachusetts• Asana (Boston)• Aura (Boston)• Blantyre Main Dining Room (Lenox)• Clio (Boston)• Left Bank (Tyngsboro)• Mamma Maria (Boston)• Market by Jean-Georges (Boston)• Meritage (Boston)• Miel (Boston)• Mooo.... (Boston)• No. 9 Park (Boston)• Pigalle (Boston)• Radius (Boston)• Rialto (Cambridge)• Sibling Rivalry (Boston)• The Cafe (Boston)• The Old Inn on the Green (New Marlborough)• Topper’s (Nantucket)• twenty-eight Atlantic (East Harwich)
RESTAURANT, FOOD & BEVERAGE MARKET RESEARCH HANDBOOK 2013
• 535 •
Michigan• Cafe’ Cortina (Farmington Hills)• Cygnus 27 (Grand Rapids)• Iridescence Restaurant (Detroit)• Rugby Grille (Birmingham)• The Lark (West Bloomfield)
Minnesota• Cosmos (Minneapolis)• La Belle Vie (Minneapolis)• Travail Kitchen and Amusements (Robbinsdale)
Mississippi• BR Prime (Biloxi)• Jia (Biloxi)• Purple Parrot Café (Hattiesburg)• thirty-two (Biloxi)• Tien (Biloxi)
Missouri• Bluestem Restaurant (Kansas City)• Cielo Restaurant (St. Louis)• Giovanni’s on the Hill (St. Louis)• Niche (Clayton)• The American Restaurant at Crown Center (Kansas City)• The Grill (Clayton)• Tony’s (St. Louis)
Nevada• Alizé (Las Vegas)• Andre’s Las Vegas (Las Vegas)• Aureole (Las Vegas)• B & B Ristorante (Las Vegas)• Bartolotta Ristorante di Mare (Las Vegas)• Botero (Las Vegas)Carnevino (Las Vegas)• Ciera Steak & Chop House (Stateline)• Craftsteak (Las Vegas)• CUT by Wolfgang Puck (Las Vegas)• Eiffel Tower Restaurant (Las Vegas)• Jasmine (Las Vegas)• L’Atelier de Joël Robuchon (Las Vegas)• Michael Mina (Las Vegas)• Michael’s Gourmet Room (Las Vegas)
RESTAURANT, FOOD & BEVERAGE MARKET RESEARCH HANDBOOK 2013
• 536 •
• Mix (Las Vegas)• Nobhill (Las Vegas)• Pearl (Las Vegas)• Prime Steakhouse (Las Vegas)• Sage (Las Vegas)• Seablue (Las Vegas)• Sensi (Las Vegas)• Shibuya (Las Vegas)• Stripsteak (Las Vegas)• SW Steakhouse (Las Vegas)• The Country Club - A New American Steakhouse (Las Vegas)• Wing Lei (Las Vegas)
New Hampshire• Bedford Village Inn Restaurant (Bedford)• Mountain View Grand Resort and Spa Main Dining Room (Whitefield)• The Inn at Thorn Hill (Jackson)• The Dining Room at The Omni Bretton Arms Inn (Bretton Woods)• The Dining Room at The Omni Mount Washington Hotel (Bretton Woods)• The Manor Dining Room (Holderness)• Wentworth Dining Room (Jackson)
New Jersey• David Burke Fromagerie (Rumson)• Il Capriccio (Whippany)• Pluckemin Inn (Bedminster)• Rat’s (Hamilton)• Restaurant Nicholas (Red Bank)• Restaurant Serenade (Chatham)• Stage Left (New Brunswick)• The Bernards Inn (Bernardsville)• The Frog and the Peach (New Brunswick)• The Manor (West Orange)
New Mexico• Fuego (Santa Fe)• Geronimo (Santa Fe)• Terra (New Mexico)
New York• A Voce Columbus (New York)• Adour Alain Ducasse at The St. Regis New York (New York)• Ai Fiori (New York)• Aquavit (New York)
RESTAURANT, FOOD & BEVERAGE MARKET RESEARCH HANDBOOK 2013
• 537 •

• Arabelle (New York)• Asiate (New York)• Aureole (New York)• Babbo (New York)• BLT Steak (New York)• Blue Hill (New York)• BondSt (New York)• Bouley (New York)• Brushstroke (New York)• Cafe Boulud (New York)• City Hall (New York)• Colicchio & Sons (New York)• Craft (New York)• David Burke Townhouse (New York)• db Bistro Moderne (New York)• Dovetail (New York)• Gilt (New York)• Gordon Ramsay at The London (New York)• Gotham Bar and Grill (New York)• Gramercy Tavern (New York)• Junoon Restaurant (New York, NY)• La Grenouille (New York)• La Panetiere (Rye)• Le Cirque (New York)• Manzo (New York)• Nobu (New York)• North End Grill (New York)• Oceana (New York)• One If By Land, Two If By Sea (New York)• Picholine (New York)• River Cafe (Brooklyn)• Rogue Tomate (New York)• Scalini Fedili (New York)• Scrimshaw at The Desmond (Colonie)• South Gate (New York)• Taste Albany (Albany)• Telepan (New York)• The Four Seasons (New York)• The Inn at Erlowest (Lake George)• The View Restaurant (Lake Placid)• TOKU Modern Asian (Manhasset)• Wallse Restaurant (New York)• WD-50 (New York)• Wildflowers (Verona)
RESTAURANT, FOOD & BEVERAGE MARKET RESEARCH HANDBOOK 2013
• 538 •
North Carolina• 1895 Grille (Pinehurst)• Bonterra Dining & Wine Room (Charlotte)• Carolina Crossroads Restaurant (Chapel Hill)• Chef and The Farmer (Kinston)• Four Square Restaurant (Durham)• Gamekeeper Restaurant & Bar (Boone)• Horizons (Asheville)• Il Palio Ristorante (Chapel Hill)• Madison’s Restaurant & Wine Bar (Highlands)• McNinch House (Charlotte)• Second Empire Restaurant & Tavern (Raleigh)• The Fairview Dining Room (Durham)• Zebra Restaurant and Fine Catering (Charlotte)
North Dakota• HoDo Restaurant (Fargo)
Ohio• Boca Restaurant (Cincinnati)• Lola (Cleveland)• M (Columbus)• Nicola’s (Cincinnati)• Orchids at Palm Court (Cincinnati)• Ristorante Giovanni’s (Beachwood)• The Celestial Steakhouse (Cincinnati)• The Leopard Restaurant (Aurora)• The Palace Restaurant (Cincinnati)• The Refectory Restaurant & Bistro (Columbus)
Oklahoma• Polo Grill (Tulsa)• The Coach House (Oklahoma City)
Oregon• Noisette Restaurant (Portland)• The Painted Lady (Newberg)
Pennsylvania• 10 Arts Bistro & Lounge by Eric Ripert (Philadelphia)• Aqueous (Farmington)• Barclay Prime (Philadelphia)• Circular Dining Room (Hershey)
RESTAURANT, FOOD & BEVERAGE MARKET RESEARCH HANDBOOK 2013
• 539 •
• Eleven (Pittsburgh)• Lacroix at The Rittenhouse (Philadelphia)• Le Bec-Fin (Philadelphia)• Morimoto (Philadelphia)• Moshulu (Philadelphia)• Patsel’s (Clarks Summit)• Savona (West Conshohocken)• Swann Lounge & Cafe (Philadelphia)• The Commonwealth Room (York)• The French Manor (South Sterling)• The Golden Sheaf (Harrisburg)• The Settlers Inn at Bingham Park (Hawley)• Vetri (Philadelphia)• XIX (Nineteen) Restaurant (Philadelphia)
Rhode Island• Gracies (Providence)• Muse by Jonathan Cartwright (Newport)• Seasons at the Ocean House (Watch Hill)• Spiced Pear Restaurant (Newport)
South Carolina• Charleston Grill (Charleston)• Circa 1886 (Charleston)• Cypress (Charleston)• Divine Prime (Myrtle Beach)• Grill 225 (Charleston)• Hall’s Chophouse (Charleston)• Langdon’s Restaurant and Wine Bar (Mount Pleasant)• Ocean Room (Kiawah Island)• Old Fort Pub (Hilton Head Island)• Palmetto Cafe (Charleston)• Passion 8 Bistro (Fort Mill)• Peninsula Grill (Charleston)• Rick Erwin’s Nantucket Seafood grill (Greenville)• The Dining Room at Abingdon Manor (Latta)• Tristan (Charleston)
Tennessee• Capitol Grille (Nashville)• Chez Philippe (Memphis)• St. John’s Restaurant (Chattanooga)• The Orangery (Knoxville)
RESTAURANT, FOOD & BEVERAGE MARKET RESEARCH HANDBOOK 2013
• 540 •
Texas• Abacus (Dallas)• Antlers Lodge (San Antonio)• Bijoux (Dallas)• Bohanan’s Prime Steak and Seafood (San Antonio)• Bolla at The Stoneleigh Hotel & Spa (Dallas)• Brennan’s of Houston (Houston)• Cafe on the Green (Irving)• Christopher’s World Grille (Bryan)• Citrus (San Antonio)• DaMarco (Houston)• Fearing’s (Dallas)• Fig Tree Restaurant (San Antonio)• Francesca’s at Sunset (San Antonio)• Hill Country Dining Room (Austin)• Hotel St. Germain (Dallas)• Las Canarias Restaurant (San Antonio)• Mark’s American Cuisine (Houston)• Noé Restaurant & Bar (Houston)• Ostra (San Antonio)• Pappas Bros. Steakhouse (Houston)• Pyramid Restaurant & Bar (Dallas)• Quattro (Houston)• Shearn’s Restaurant (Galveston)• Sustenio (San Antonio)• T/X Restaurant (Dallas)• The Driskill Grill (Austin)• The Inn at Dos Brisas (Washington)• The Landmark Restaurant (Dallas)• The Mansion Restaurant at Rosewood Mansion (Dallas)• The Remington Restaurant (Houston)• The Republic (College Station)• The Steakhouse (Galveston)• Tony’s (Houston)• Trio (Austin)• Valentino (Houston)
Utah• Apex Restaurant (Park City)• Blue Boar Restaurant (Midway)• Chef’s Table (Orem)• Forage Restaurant (Salt Lake City)• Goldener Hirsch Restaurant (Park City)• Glitretind (Park City)
RESTAURANT, FOOD & BEVERAGE MARKET RESEARCH HANDBOOK 2013
• 541 •
• Grappa Italian Restaurant (Park City)• J&G Grill at St. Regis (Park City)• La Caille (Sandy)• Log Haven (Salt Lake City)• Riverhorse on Main (Park City)• The Mariposa (Park City)• The Paris Bistro (Salt Lake City)• Tree Room at Sundance Resort (Provo)
Vermont• 275 Main (Warren)• Rabbit Hill Inn Dining Room (Lower Waterford)• Solstice (Stowe)• The Red Rooster (Woodstock)• Windham Hill Restaurant (West Townshend)
Virginia• 2941 Restaurant (Falls Church)• Fat Canary (Williamsburg)• Fossett’s (Keswick)• L’Auberge Chez Francois & Jacques Brasserie (Great Falls)• L’Auberge Provencale (White Post)• Lemaire (Richmond)• Restaurant Eve (Alexandria)• Salacia (Virginia Beach)• Terrapin (Virginia Beach)• The Old Mill Room (Charlottesville)• The Regency Dining Room (Williamsburg)
Washington• Canlis (Seattle)• Masselow’s (Airway Heights)• Rover’s Restaurant (Seattle)• Sun Mountain Lodge Dining Room (Winthrop)• The Dining Room at Salish Lodge & Spa (Snoqualmie)• The Georgian (Seattle)• Tulalip Bay (Marysville)
West Virginia• Bavarian Inn Dining Room (Shepherdstown)
Wisconsin• Sanford Restaurant (Milwaukee)• The Immigrant Restaurant & Winery (Kohler)
RESTAURANT, FOOD & BEVERAGE MARKET RESEARCH HANDBOOK 2013
• 542 •

Wyoming• The Wild Sage (Jackson)• Westbank Grill (Teton Village)
RESTAURANT, FOOD & BEVERAGE MARKET RESEARCH HANDBOOK 2013
• 543 •
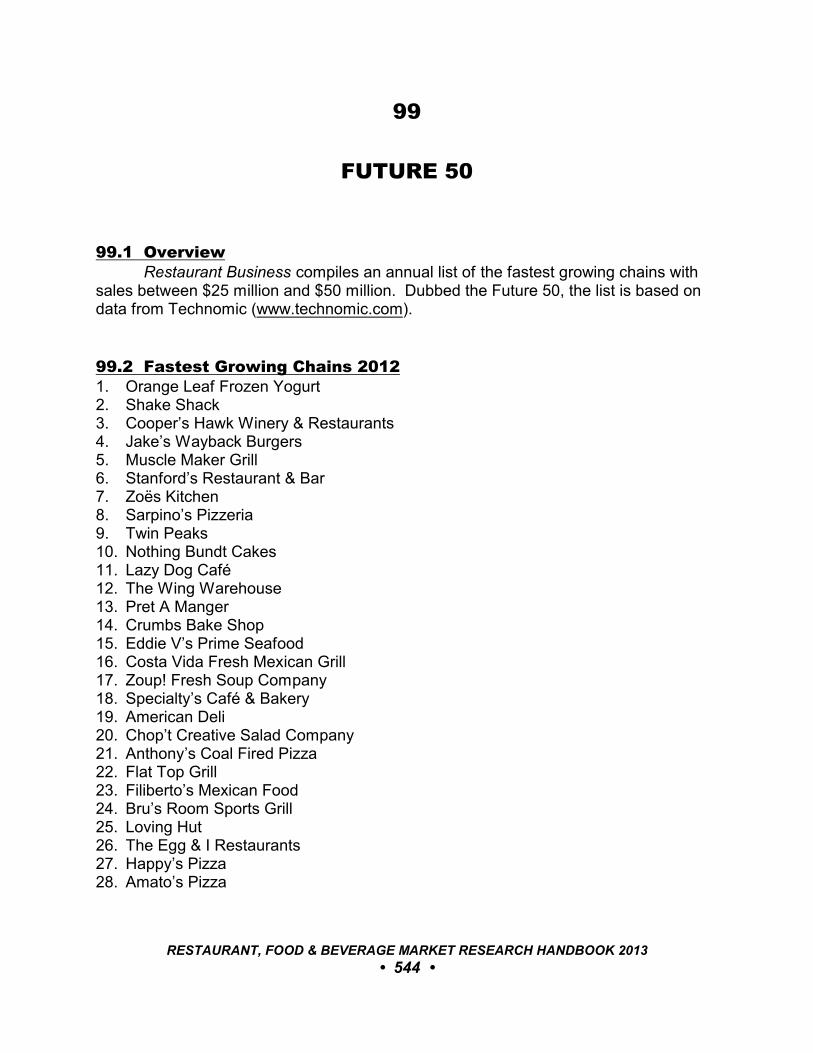
99
FUTURE 50
99.1 OverviewRestaurant Business compiles an annual list of the fastest growing chains with
sales between $25 million and $50 million. Dubbed the Future 50, the list is based ondata from Technomic (www.technomic.com).
99.2 Fastest Growing Chains 20121. Orange Leaf Frozen Yogurt2. Shake Shack3. Cooper’s Hawk Winery & Restaurants4. Jake’s Wayback Burgers5. Muscle Maker Grill6. Stanford’s Restaurant & Bar7. Zoës Kitchen8. Sarpino’s Pizzeria9. Twin Peaks10. Nothing Bundt Cakes11. Lazy Dog Café12. The Wing Warehouse13. Pret A Manger14. Crumbs Bake Shop15. Eddie V’s Prime Seafood16. Costa Vida Fresh Mexican Grill17. Zoup! Fresh Soup Company18. Specialty’s Café & Bakery19. American Deli20. Chop’t Creative Salad Company21. Anthony’s Coal Fired Pizza22. Flat Top Grill23. Filiberto’s Mexican Food24. Bru’s Room Sports Grill25. Loving Hut26. The Egg & I Restaurants27. Happy’s Pizza28. Amato’s Pizza
RESTAURANT, FOOD & BEVERAGE MARKET RESEARCH HANDBOOK 2013
• 544 •
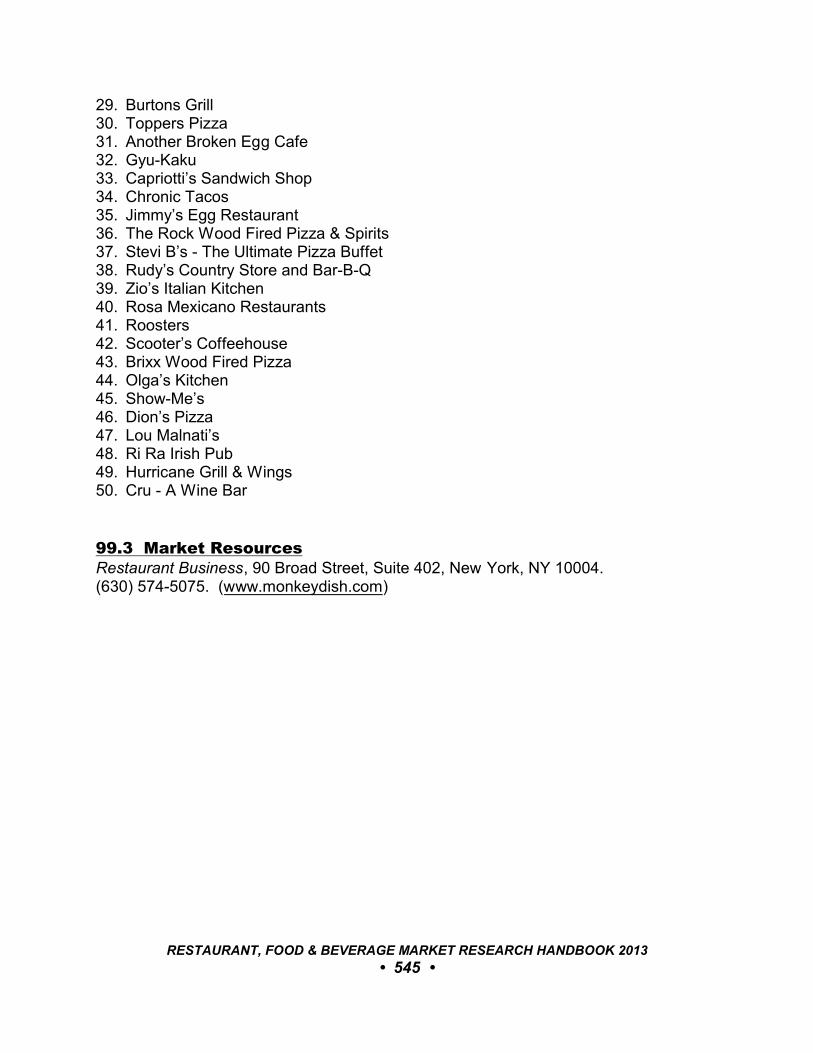
29. Burtons Grill30. Toppers Pizza31. Another Broken Egg Cafe32. Gyu-Kaku33. Capriotti’s Sandwich Shop34. Chronic Tacos35. Jimmy’s Egg Restaurant36. The Rock Wood Fired Pizza & Spirits37. Stevi B’s - The Ultimate Pizza Buffet38. Rudy’s Country Store and Bar-B-Q39. Zio’s Italian Kitchen40. Rosa Mexicano Restaurants41. Roosters42. Scooter’s Coffeehouse43. Brixx Wood Fired Pizza44. Olga’s Kitchen45. Show-Me’s46. Dion’s Pizza47. Lou Malnati’s48. Ri Ra Irish Pub49. Hurricane Grill & Wings50. Cru - A Wine Bar
99.3 Market ResourcesRestaurant Business, 90 Broad Street, Suite 402, New York, NY 10004. (630) 574-5075. (www.monkeydish.com)
RESTAURANT, FOOD & BEVERAGE MARKET RESEARCH HANDBOOK 2013
• 545 •
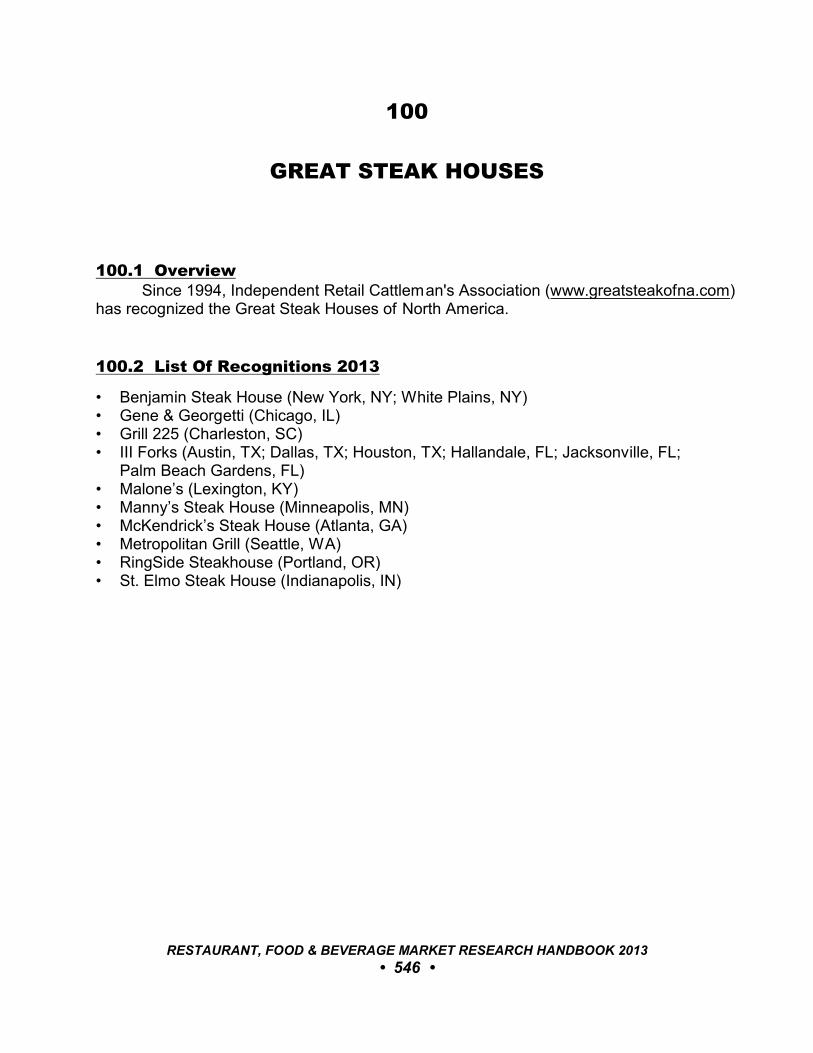
100
GREAT STEAK HOUSES
100.1 Overview Since 1994, Independent Retail Cattleman's Association (www.greatsteakofna.com)
has recognized the Great Steak Houses of North America.
100.2 List Of Recognitions 2013
• Benjamin Steak House (New York, NY; White Plains, NY)• Gene & Georgetti (Chicago, IL)• Grill 225 (Charleston, SC)• III Forks (Austin, TX; Dallas, TX; Houston, TX; Hallandale, FL; Jacksonville, FL;
Palm Beach Gardens, FL)• Malone’s (Lexington, KY)• Manny’s Steak House (Minneapolis, MN)• McKendrick’s Steak House (Atlanta, GA)• Metropolitan Grill (Seattle, WA)• RingSide Steakhouse (Portland, OR)• St. Elmo Steak House (Indianapolis, IN)
RESTAURANT, FOOD & BEVERAGE MARKET RESEARCH HANDBOOK 2013
• 546 •
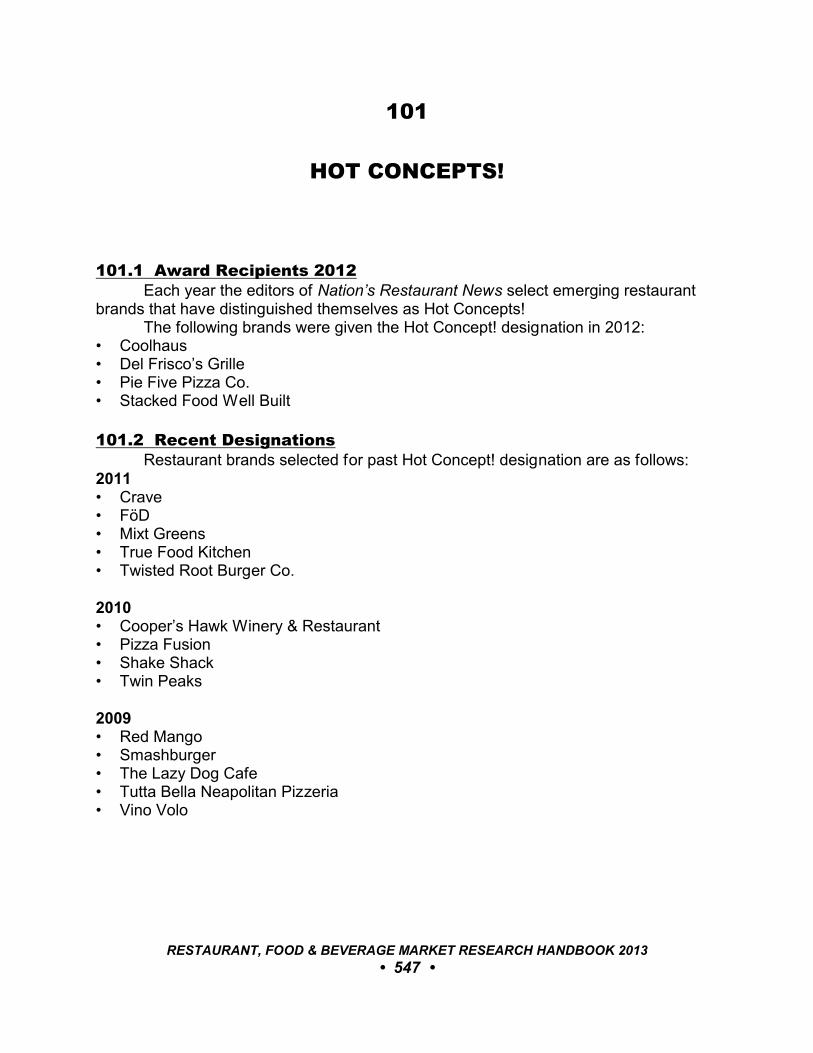
101
HOT CONCEPTS!
101.1 Award Recipients 2012Each year the editors of Nation’s Restaurant News select emerging restaurant
brands that have distinguished themselves as Hot Concepts! The following brands were given the Hot Concept! designation in 2012:
• Coolhaus• Del Frisco’s Grille• Pie Five Pizza Co.• Stacked Food Well Built
101.2 Recent DesignationsRestaurant brands selected for past Hot Concept! designation are as follows:
2011• Crave• FöD• Mixt Greens• True Food Kitchen• Twisted Root Burger Co.
2010• Cooper’s Hawk Winery & Restaurant• Pizza Fusion• Shake Shack• Twin Peaks
2009• Red Mango• Smashburger• The Lazy Dog Cafe• Tutta Bella Neapolitan Pizzeria• Vino Volo
RESTAURANT, FOOD & BEVERAGE MARKET RESEARCH HANDBOOK 2013
• 547 •

2008• Chop’t Creative Salad Company• Jasper’s• Organic To Go• The Counter• Vapiano’s International
2007• Go Roma Italian Kitchen• Granite City Food & Brewery• The Grape• Gyu-Kaku Japanese BBQ• Which Wich?• WingStreet
2006• Cheeseburger in Paradise• Pandini’s• RedBrick Pizza• Seasons 52• Spicy Pickle• Summer Shack
2005• Caffé Ritazza• Cafe Spice• Offerdahl’s Cafe Grill• Redstone American Grill• Sauce Pizza & Wine• Up The Creek Fish Camp & Grill• Zoup! Fresh Soup Company
2004• Crescent City• Fox Sports Grill• Jazzman’s Cafe• Moe’s Southwest Grill• O’Naturals• Thaifoon Taste of Asia
RESTAURANT, FOOD & BEVERAGE MARKET RESEARCH HANDBOOK 2013
• 548 •
2003• Fogo de Chão• Grand Lux Cafe• Pei Wei Asian Diner• Raising Cane’s Chicken Fingers• Smokey Bones BBQ• Ted’s Montana Grill
2002• Brio Tuscan Grille• Fresh City• Genghis Grill• Pallino Pastaria Company• Stonewood Tavern and Grill• Yard House
2001• ESPN Zone• Figs Restaurant• Fire & iCE• Nick & Stef’s• Noodles & Company• Samba Room
2000• Big Bowl• Fleming’s Prime Steakhouse• Fuzio Universal Pasta• House of Bread• Maui Tacos• Naked Fish Restaurants• Nobu• Not Your Average Joe’s
101.3 Market ResourcesNation’s Restaurant News, 249 W. 17th Street, New York, NY 10011. (212) 204-4200.(www.nrn.com)
RESTAURANT, FOOD & BEVERAGE MARKET RESEARCH HANDBOOK 2013
• 549 •
102
JAMES BEARD FOUNDATION AWARDS
102.1 OverviewThe James Beard Foundation Awards (www.jamesbeard.org), often called “The
Oscars of the Food World,” have been presented annually since 1990. A slate ofnominees is presented each March, and more than 600 culinary professionals areinvolved in the voting process. Winners are announced in June. The sections thatfollow list current and recent award winners.
102.2 Award Winners 2012
Outstanding Restaurant• Boulevard (San Francisco, CA)
Best New Restaurant• Next (Chicago, IL)
Outstanding Chef• Daniel Humm (Eleven Madison Park; New York, NY)
Rising Star Chef• Christina Tosi (Momofuku Millk Bar; New York, NY)
Outstanding Pastry Chef• Mindy Segal (Mindy’s HotCholcolate; Chicago, IL)
Best Chef: Great Lakes• Bruce Sherman (North Pond; Chicgao, IL)
Best Chef: Mid-Atlantic• Maricel Presilla (Cucharamama; Hoboken, NJ)
Best Chef: Midwest• Tory Miller (L’Etoile; Madison, WI)
Best Chef: New York City• Michael Anthony (Gramercy Tavern; New York, NY)
RESTAURANT, FOOD & BEVERAGE MARKET RESEARCH HANDBOOK 2013
• 550 •

Best Chef: Northeast• Tim Cushman (O Ya, Boston, MA)
Best Chef: Northwest• Matt Dillon (Sitka & Spruce; Seattle, WA)
Best Chef: Pacific• Matt Molina (Osteria Mozza; Los Angeles, CA)
Best Chef: South• Chris Hastings (Hot and Hot Fish Club; Birmingham, AL)
Best Chef: Southeast• Hugh Acheson (Five and Ten; Athens, GA)• Linton Hopkins (Restaurant Eugene; Atlanta, GA)
Best Chef: Southwest• Paul Qui (Uchiko; Austin, TX)
102.3 Recent Award Winners
Outstanding Restaurant• 2011: Eleven Madison Park (New York, NY)• 2010: Daniel (New York, NY)• 2009: Jean Georges (New York, NY)• 2008: Gramercy Tavern (New York, NY)• 2007: Frontera Grill (Chicago, IL)
Best New Restaurant• 2011: ABC Kitchen (New York, NY)• 2010: Marea (New York, NY)• 2009: Momofuku Ko (New York, NY)• 2008: Central Michel Richard (Washington, DC)• 2007: L’Atelier de Joël Robuchon (Las Vegas, NV)
Outstanding Chef• 2011: José Andrés (minibar; Washington, DC)• 2010: Tom Colicchio (Craft; New York City)• 2009: Dan Barber (Blue Hill; New York, NY)• 2008: Grant Achatz (Alinea; Chicago, IL)• 2007: Michel Richard (Michel Richard Citronelle; Washington, DC)
RESTAURANT, FOOD & BEVERAGE MARKET RESEARCH HANDBOOK 2013
• 551 •

Rising Star Chef• 2011: Gabriel Rucker (Le Pigeon; Portland, OR)• 2010: Timothy Hollingsworth (The French Laundry; Yountville, CA)• 2009: Nate Appleman (A16; San Francisco, CA)• 2008: Gavin Kaysen (Cafe Boulud; New York, NY)• 2007: David Chang (Momofuku Noodle Bar; New York, NY)
Outstanding Pastry Chef• 2011: Angela Pinkerton (Eleven Madison Park; New York, NY)• 2010: Nicole Plue (Redd; Yountville, CA)
102.4 Market ResourcesJames Beard Foundation, 167 West 12th Street, New York, NY 10011. (212) 675-4984.(www.jamesbeard.org)
RESTAURANT, FOOD & BEVERAGE MARKET RESEARCH HANDBOOK 2013
• 552 •
103
MENU MASTERS
103.1 OverviewSelected annually by Nation’s Restaurant News, the Menu Masters Awards
honor companies and individuals that have created the most successful new menudevelopments. This chapter lists current and recent award winners.
103.2 Winners By Category
Best Healthy Innovations• 2012: The Cheesecake Factory: SkinnyLicious Menu• 2011: Subway• 2010: KFC• 2009: Qdoba’s Smart Meals• 2008: University of Connecticut’s Department of Dining Services • 2007: Chartwells• 2006: Williamson Hospitality Services • 2005: T.G.I. Friday’s • 2004: Ruby Tuesday, Inc.• 2003: Applebee’s Neighborhood Grill & Bar• 2002: Ground Round• 2001: Fresh Choice • 2000: Chili’s• 1999: Jamba Juice
Best Limited-Time Offer• 2012: Quaker Steak & Lube: Shake, W rap & Roll!• 2011: Popeyes Louisiana Kitchen• 2010: Red Robin Gourmet Burgers• 2009: Denny’s• 2008: Burger King• 2007: Golden Corral• 2006: Taco Bell • 2005: Panera Bread • 2004: 99 Restaurant & Pub• 2003: Round Table Pizza• 2002: McDonald’s
RESTAURANT, FOOD & BEVERAGE MARKET RESEARCH HANDBOOK 2013
• 553 •
• 2001: T.G.I. Friday’s • 2000: Wyndham Hotels & Resorts• 1999: Wolfgang Puck Cafe• 1998: Cracker Barrel
Best Menu Revamp• 2012: Buffalo Wild Wings: Customize Your Grub• 2011: Old Chicago Pizza & Pasta• 2010: Tropical Smoothie Cafe• 2009: Pizza Hut• 2008: O’Charley’s• 2007: Captain D’s Seafood• 2006: Ruby Tuesday• 2005: Logan’s Roadhouse• 2004: Olive Garden• 2003: Bob Evans• 2002: Claim Jumper• 2001: Bennigan’s • 2000: Denny’s• 1999: Stephen Anderson• 1998: Legal Sea Foods
Best Menu/Line Extension• 2012: Wendy’s: The “W” Cheeseburger• 2011: Shari’s Restaurant & Pies• 2010: Au Bon Pain• 2009: Chick-fil-A• 2008: Red Lobster• 2007: Jack in the Box• 2006: Boston Market• 2005: Uno Chicago Grill• 2004: IHOP• 2003: Schlotzsky’s Deli• 2002: Panera Bread• 2001: Subway Restaurants• 2000: Domino’s Pizza• 1999: Popeye’s Chicken & Biscuits• 1998: California Pizza Kitchen
Best Menu Trendsetter• 2012: Mama Fu’s: Bánh Mi Vietnamese Street Sandwich• 2011: UMass Dining• 2010: Burgerville
RESTAURANT, FOOD & BEVERAGE MARKET RESEARCH HANDBOOK 2013
• 554 •
Best New Menu Item• 2012: Sonic Corp.: Premium Beef Dogs• 2011: Panda Express• 2010: Outback Steakhouse• 2009: Culver’s• 2008: Maggiano’s Little Italy• 2007: Dunkin’ Donuts• 2006: California Pizza Kitchen• 2005: Jack in the Box• 2004: Famous Dave’s• 2003: P.F. Chang’s China Bistro• 2002: The Cheesecake Factory• 2001: Champps• 2000: Bob Evans• 1999: Einstein Bros. Bagels• 1998: Wendy’s International
Chef/Innovator• 2012: Stan Frankenthaler: Vice President, Global Product Innovation and Culinary
for Dunkin’ Brands• 2011: Scott Davis• 2010: Brad Blum• 2009: David Burke• 2008: Paul Carr• 2007: Cliff Pleau• 2006: Dan Coudreaut• 2005: Kurt Hankins• 2004: Oona Settembre• 2003: Robert Okura• 2002: Stephen Anderson• 2001: Johnny Law
Menu Masters Hall of Fame• 2012: Jose Garces: Owner of Garces Restaurant Group (Philadelphia)• 2011: Tom Colicchio• 2010: Jon Luther• 2009: Wolfgang Puck• 2008: Roger Berkowitz• 2007: Burt Cutino• 2006: Chef Emeril Lagasse• 2005: David Overton• 2004: Chef Martin Yan• 2003: Paul Prudhomme• 2002: Jasper White
RESTAURANT, FOOD & BEVERAGE MARKET RESEARCH HANDBOOK 2013
• 555 •
• 2001: Richard Melman• 2000: Jacques Pepin• 1999: Colonel Sanders• 1998: Warren LeRuth
103.3 Market ResourcesNation’s Restaurant News, 249 W. 17th Street, New York, NY 10011. (212) 204-4200.(www.nrn.com)
RESTAURANT, FOOD & BEVERAGE MARKET RESEARCH HANDBOOK 2013
• 556 •
104
MICHELIN 3-STAR RESTAURANTS
104.1 OverviewMichelin published its first guide in 1900 in France. In 2005, The Michelin Guide
expanded to include the U.S., with a guide to New York. Guides for San Francisco andChicago have also been introduced.
Beginning in 1926, Michelin began reviewing and rating restaurants with 1-star,2-star, and 3-star ratings. This chapter presents the 3-star-rated restaurants in theChicago, New York, and San Francisco for 2012.
104.2 Chicago 3-Star Restaurants• Alinea
104.3 New York 3-Star Restaurants• Chef’s Table at Brooklyn Fare (Brooklyn)• Daniel• Eleven Madison Park• Jean Georges• Masa• Per Se
104.4 San Francisco 3-Star Restaurants• The French Laundry (Napa region)• The Restaurant at Meadowood (Napa region)
RESTAURANT, FOOD & BEVERAGE MARKET RESEARCH HANDBOOK 2013
• 557 •

105
MILLENNIALS’ FAVORITE RESTAURANT CHAINS
105.1 OverviewAs part of the May 2012 study Understanding the Foodservice Attitudes and
Behaviors of Millennials, Technomic (www.technomic.com) surveyed Millennials (ages19-to-34) to determine their favorite chain restaurant brands. The survey evaluatedthree attributes, as follows:Food Quality• For Millennials, food quality goes beyond taste and visual appeal, also incorporating
sourcing elements such as grass-fed and free-range into their quality perception.
Social Responsibility• Acting in a socially responsible manner includes the management of operations that
are good for the environment and treating employees well.
Support Of Local Community Activities• Emphasis is placed on support of community organizations and making charitable
contributions.
_________________________________________________________________
“Millennials visit restaurants more frequently thanany other generation. Millennials are unique. They communicate differently, are self-expressive,confident, liberal, upbeat, and open to change. But marketing to them can be a challenge. Thisgroup has a distinct perspective on diningoccasions, placing more value on attributes likesocial responsibility, sustainability, local, andorganic, grass-fed, and hormone-free offerings. They foster emotional connections to brands andtheir loyalty stems beyond experience.”
Darren Tristano, Exec. V.P. Technomic, 5/10/12
_________________________________________________________________
RESTAURANT, FOOD & BEVERAGE MARKET RESEARCH HANDBOOK 2013
• 558 •
105.2 Favorite Restaurant Chains
Food Quality• Quick-service: Jimmy John’s Gourmet Sandwich Shop• Fast-casual: McAlister’s Deli• Family-style: Cracker Barrel Old Country Store• Casual-dining: Red Lobster
Social Responsibility• Quick-service: In-N-Out Burger• Fast-casual: McAlister’s Deli• Family-style: Cracker Barrel Old Country Store• Casual-dining: Logan’s Roadhouse
Support Of Local Community Activities• Quick-service: Chik-fil-A• Fast-casual: Corner Bakery Cafe• Family-style: Bob Evans• Casual-dining: Bonefish Grill
105.3 Market ResourcesTechnomic, Inc., 300 South Riverside Plaza, Suite 1940 South, Chicago, IL 60606. (312) 876-0004. (www.technomic.com)
RESTAURANT, FOOD & BEVERAGE MARKET RESEARCH HANDBOOK 2013
• 559 •
106
RESTAURANT NEIGHBOR AWARD
106.1 Award Winners 2012According to the National Restaurant Association (www.restaurant.org), 90% of
restaurants give back to the local communities which they serve through charitableactivities, each donating time or money to an average of 35 projects annually.
With the Restaurant Neighbor Award, the National Restaurant Association andAmerican Express annually salute restaurateurs who go above and beyond in givingback to their communities. The following are the 2012 award-winning restaurantoperators:National Large Business Winner• Aramark (Philadelphia, PA)
Cornerstone Humanitarian of the Year• Cornerstone Humanitarian: Tammy and Noel Cunningham, Strings Restaurant
(Denver, CO)
The following restaurant operators were also recognized by the NationalRestaurant Association in 2012 for their community-focused contributions:Arizona• Desert Taco/Del Taco (Scottsdale)• Flancer’s (Gilbert)
California• BJ’s Restaurants Inc. (Huntington Beach)• Gala Corp. (Costa Mesa)
Colorado• Geta Asfaw, McDonald’s franchisee (Denver)• S&S Restaurant Group Inc. dba Carmine’s on Penn (Denver)• Tammy and Noel Cunningham, Strings Restaurant (Denver)
Pennsylvania• Aramark (Philadelphia)
RESTAURANT, FOOD & BEVERAGE MARKET RESEARCH HANDBOOK 2013
• 560 •
107
SELECTIONS: BON APPÉTIT
107.1 OverviewBon Appétit magazine regularly compiles various lists of top food and beverages
as well as restaurants and snack shops throughout the U.S. The following are the mostrecent lists:
107.2 Best Restaurant and Snack Shops Sepections
Best Cakes• Alexis Baking Company (Napa, CA)
Menu item: Blum’s Coffee Crunch Cake• Betty Bakery (Brooklyn, NY)
Menu item: Lemon Cake• Crixa (Berkeley, CA)
Menu item: Black Forest Cake• Cordúa restaurants (multiple locations)
Menu item: Churrascos Tres Leches Cake• Ken’s Artisan Bakery (Portland, OR)
Menu item: Canelés• Lady M (New York, NY)
Menu item: Mille Crêpes Cake• Macrina (Seattle, WA)
Menu item: Red Velvet Cake• Miette (San Francisco, CA)
Menu item: Tomboy Cake• Peninsula Grill (Charleston, SC)
Menu item: Coconut Layer Cake• Salty Tart (Minneapolis, MN)
Menu item: White Chocolate Lemon Blueberry Cake
Best Coffeeshops• Abraço (New York, NY)• Four Barrel Coffee (San Francisco, CA)• Kopplin’s Coffee (Saint Paul, MN)• Lamill Coffee (Los Angeles, CA)
RESTAURANT, FOOD & BEVERAGE MARKET RESEARCH HANDBOOK 2013
• 561 •
• Little T American Baker (Portland, OR)• Novo (Denver, CO)• Octane Coffee Bar & Lounge (Atlanta, GA)• Peregrine Espresso (Washington, DC)• Progress Coffee (Austin, TX)• The Coffee Studio (Chicago, GA)
Best Doughnut Shops• Bouchon Bakery (Yountville, CA)• Coffee An’ Donut Shop (Westport, NY)• Dat Donuts (Chicago, IL)• Doughnut Plant (New York, NY)• Dynamo Donuts (San Francisco, CA)• Kane’s Donuts (Saugus, MA)• Mighty-O Donuts (Seattle, WA)• Randy’s Donuts (Inglewood, CA)• Round Rock Donuts (Round Rock, TX)• The Donut Stop (St. Louis, MO)• Voodoo Doughnut (Portland, OR)
Best Destination Diners• Nickel Diner (Los Angeles, CA)
Menu item: Maple-bacon doughnut• Bite Café (Chicago, IL)
Menu item: Breakfast poutine• M. Wells (Long Island City, NY)
Menu item: Foie gras grilled cheese• Crossroads Diner (Dallas, TX)
Menu item: Pickle-juice egg salad sandwich • Citizen’s Band (San Francisco, CA)
Menu item: Braised pork belly and egg• 24 Diner (Austin, TX)
Menu item: Roasted banana and brown sugar milk shake
Best Germanic Restaurants• Gruner (Portland, OR)• Bar Tartine (San Francisco, CA)• Leopold’s (San Francisco, CA)• Frankford Hall (Philadelphia, PA)• Prime Meats (Brooklyn, NY)• Cafe Katja (New York, NY)• Seasonal (New York, NY)
RESTAURANT, FOOD & BEVERAGE MARKET RESEARCH HANDBOOK 2013
• 562 •
Best Lobster Rolls• Red Hook Lobster Pound (Washington, DC)• Blue Plate Oysterette (Santa Monica, CA)• Brick Alley Pub & Restaurant (Newport, RI)• JCT Kitchen & Bar (Atlanta, GA)• Perla Seafood & Oyster Bar (Austin, TX)• Smack Shack Lobster (Minneapolis, MN)
Best New Jewish Delis• Wise Sons Jewish Delicatessen (San Francisco, CA)• Stopsky’s Delicatessen (Mercer Island, WA)• Rye Delicatessen & Bar (Minneapolis, MN)• Mile End Delicatessen (New York, NY)
Best New Sushi Restaurants• Arami (Chicago, IL)• Bamboo Sushi (Portland, OR)• Brushstroke (New York, NY)• Kome Sushi Kitchen (Austin, TX)• Masa Sushi & Robata (Minneapolis, MN)• Miyake (Portland, ME)• Shunji (Los Angeles, CA)• Sushi Kappo Tamua (Seattle, WA)• Tomo (Atlanta, GA)• Uchi (Houston, TX)
Best Restaurants For Celebrity Sightings In Los Angeles• The Tower Bar• Cut• The Bazaar by José Andrés• Madeo• Soho House• Katsuya by Starck Hollywood• Dan Tana’s• Joan’s on Third• The Polo Lounge• Animal
Best Restaurants For Celebrity Sightings In New York• Locando Verde• The Spotted Pig• ABC Kitchen• Spice Market• Bar Pitti
RESTAURANT, FOOD & BEVERAGE MARKET RESEARCH HANDBOOK 2013
• 563 •

• Acme• The Dutch• The Waverly Inn• Marlow & Sons• Super Linda
RESTAURANT, FOOD & BEVERAGE MARKET RESEARCH HANDBOOK 2013
• 564 •
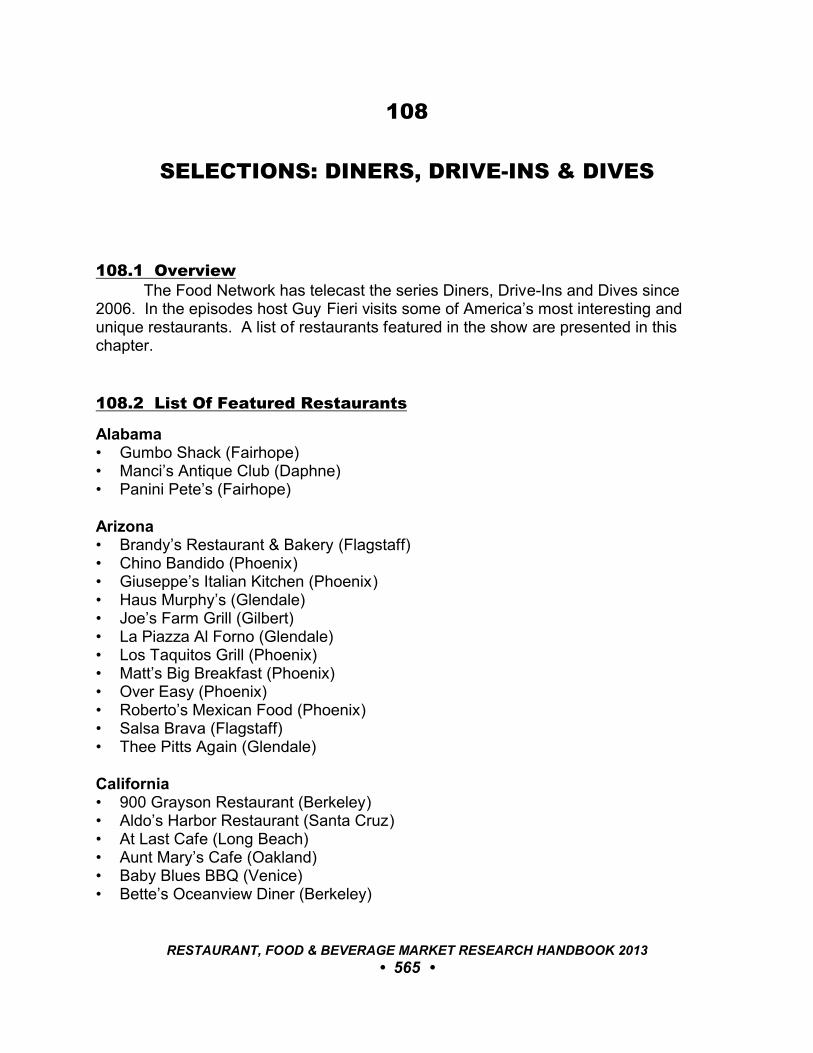
108
SELECTIONS: DINERS, DRIVE-INS & DIVES
108.1 OverviewThe Food Network has telecast the series Diners, Drive-Ins and Dives since
2006. In the episodes host Guy Fieri visits some of America’s most interesting andunique restaurants. A list of restaurants featured in the show are presented in thischapter.
108.2 List Of Featured Restaurants
Alabama• Gumbo Shack (Fairhope)• Manci’s Antique Club (Daphne)• Panini Pete’s (Fairhope)
Arizona• Brandy’s Restaurant & Bakery (Flagstaff)• Chino Bandido (Phoenix)• Giuseppe’s Italian Kitchen (Phoenix)• Haus Murphy’s (Glendale)• Joe’s Farm Grill (Gilbert)• La Piazza Al Forno (Glendale)• Los Taquitos Grill (Phoenix)• Matt’s Big Breakfast (Phoenix)• Over Easy (Phoenix)• Roberto’s Mexican Food (Phoenix)• Salsa Brava (Flagstaff)• Thee Pitts Again (Glendale)
California• 900 Grayson Restaurant (Berkeley)• Aldo’s Harbor Restaurant (Santa Cruz)• At Last Cafe (Long Beach)• Aunt Mary’s Cafe (Oakland)• Baby Blues BBQ (Venice)• Bette’s Oceanview Diner (Berkeley)
RESTAURANT, FOOD & BEVERAGE MARKET RESEARCH HANDBOOK 2013
• 565 •
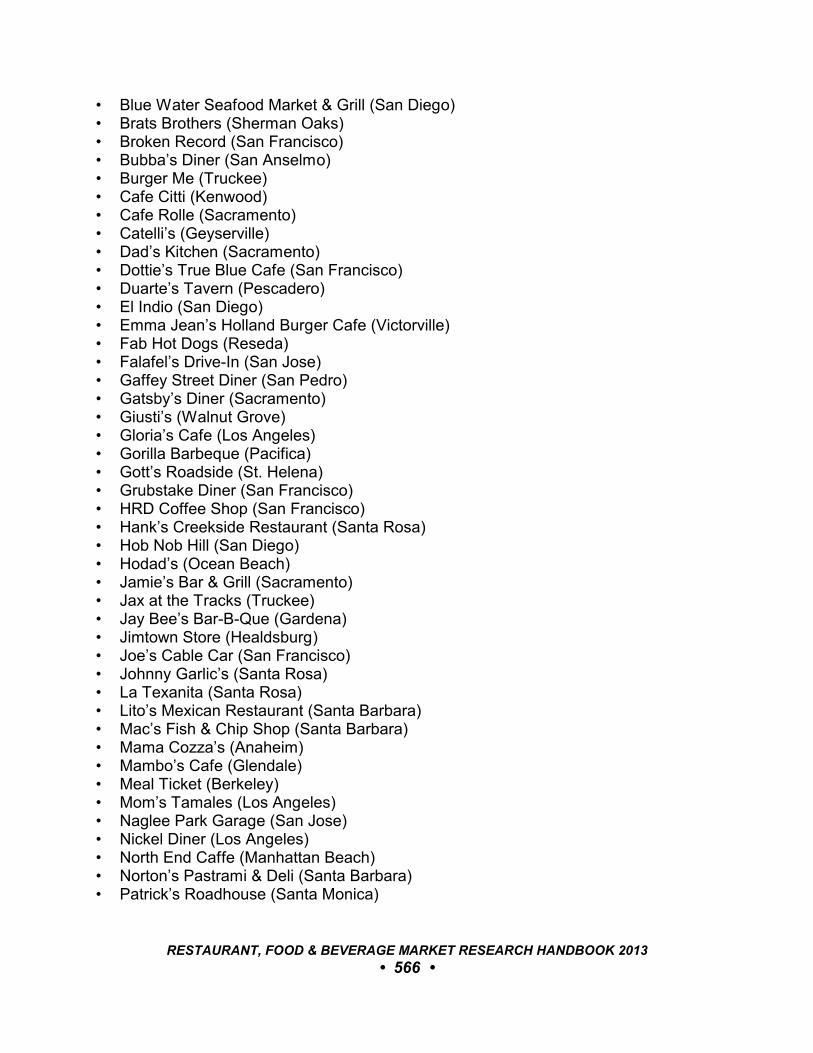
• Blue Water Seafood Market & Grill (San Diego)• Brats Brothers (Sherman Oaks)• Broken Record (San Francisco)• Bubba’s Diner (San Anselmo)• Burger Me (Truckee)• Cafe Citti (Kenwood)• Cafe Rolle (Sacramento)• Catelli’s (Geyserville)• Dad’s Kitchen (Sacramento)• Dottie’s True Blue Cafe (San Francisco)• Duarte’s Tavern (Pescadero)• El Indio (San Diego)• Emma Jean’s Holland Burger Cafe (Victorville)• Fab Hot Dogs (Reseda)• Falafel’s Drive-In (San Jose)• Gaffey Street Diner (San Pedro)• Gatsby’s Diner (Sacramento)• Giusti’s (Walnut Grove)• Gloria’s Cafe (Los Angeles)• Gorilla Barbeque (Pacifica)• Gott’s Roadside (St. Helena)• Grubstake Diner (San Francisco)• HRD Coffee Shop (San Francisco)• Hank’s Creekside Restaurant (Santa Rosa)• Hob Nob Hill (San Diego)• Hodad’s (Ocean Beach)• Jamie’s Bar & Grill (Sacramento)• Jax at the Tracks (Truckee)• Jay Bee’s Bar-B-Que (Gardena)• Jimtown Store (Healdsburg)• Joe’s Cable Car (San Francisco)• Johnny Garlic’s (Santa Rosa)• La Texanita (Santa Rosa)• Lito’s Mexican Restaurant (Santa Barbara)• Mac’s Fish & Chip Shop (Santa Barbara)• Mama Cozza’s (Anaheim)• Mambo’s Cafe (Glendale)• Meal Ticket (Berkeley)• Mom’s Tamales (Los Angeles)• Naglee Park Garage (San Jose)• Nickel Diner (Los Angeles)• North End Caffe (Manhattan Beach)• Norton’s Pastrami & Deli (Santa Barbara)• Patrick’s Roadhouse (Santa Monica)
RESTAURANT, FOOD & BEVERAGE MARKET RESEARCH HANDBOOK 2013
• 566 •

• Paul’s Coffee Shop (Fountain Valley)• Pete’s Breakfast House (Ventura)• Pier 23 Cafe (San Francisco)• Pizzeria Luigi (San Diego)• Polka Restaurant & Catering (Los Angeles)• Putah Creek Cafe (Winters)• Q Restaurant (San Francisco)• Rick & Ann’s Restaurant (Berkeley)• Rocco’s Cafe (San Francisco)• Rudy’s Can’t Fail Cafe (Emeryville)• Russian River Pub (Forestville)• Studio Diner (San Diego)• Ramona Cafe (Ramona)• Santa Cruz Diner (Santa Cruz)• Savoy Cafe & Deli (Santa Barbara)• Schellville Grill (Sonoma)• Schooner or Later (Long Beach)• Sol Food Puerto Rican Cuisine (San Rafael)• Squeeze Inn (Sacramento)• Sunflower Caffe (Sonoma)• Tee Off Bar & Grill (San Francisco)• The Golden Bear (Sacramento)• The Golden State (Los Angeles)• The Kitchen (Oxnard)• The Oinkster (Eagle Rock)• Tioli’s Crazee Burger (San Diego)• Tommy’s Joynt (San Francisco)• W.O.W - Worth Our Weight (Santa Rosa)• Willie Bird’s Restaurant (Santa Rosa)
Colorado• Bang! (Denver)• Foolish Craig’s Cafe (Boulder)• Lauer-Krauts (Brighton)• Sam’s No. 3 (Denver)• Steuben’s Food Service (Denver)• The Bagel Delicatessen & Restaurant (Denver)• The Sink (Boulder)• Tocabe American Indian Eatery (Denver)
Connecticut• Black Duck Cafe (Westport)• Corey’s Catsup and Mustard (Manchester)• Merritt Canteen Inc (Bridgeport)
RESTAURANT, FOOD & BEVERAGE MARKET RESEARCH HANDBOOK 2013
• 567 •
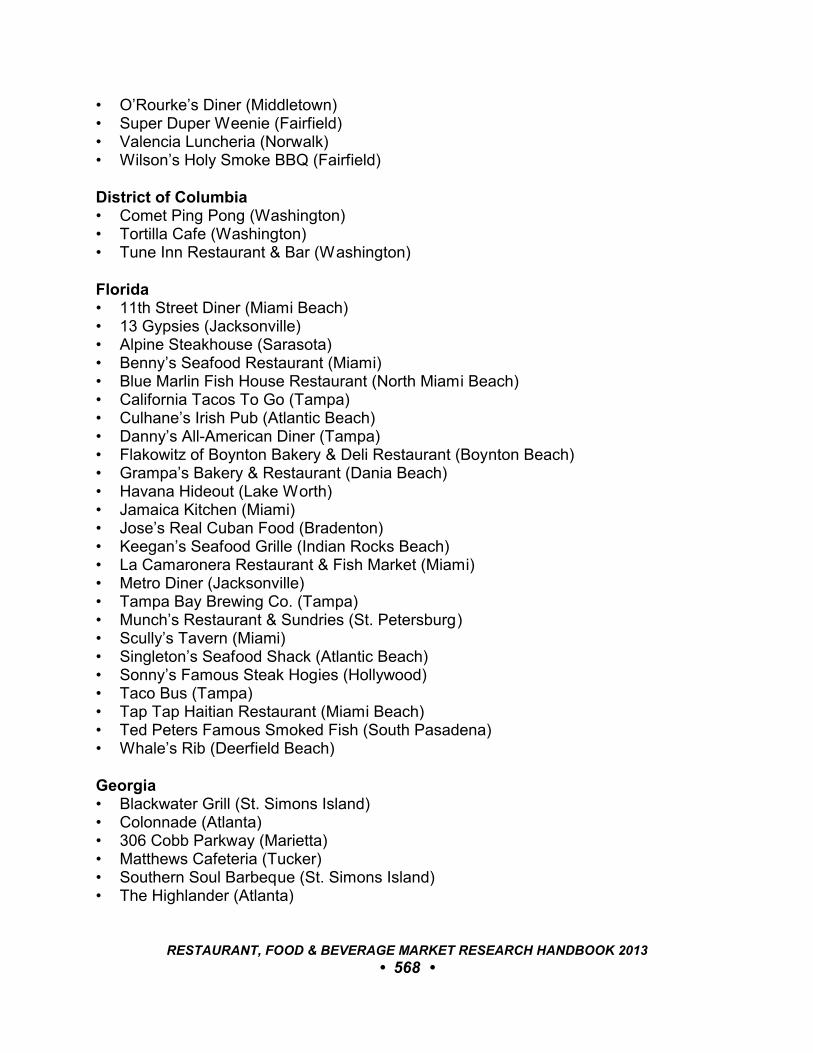
• O’Rourke’s Diner (Middletown)• Super Duper Weenie (Fairfield)• Valencia Luncheria (Norwalk)• Wilson’s Holy Smoke BBQ (Fairfield)
District of Columbia• Comet Ping Pong (Washington)• Tortilla Cafe (Washington)• Tune Inn Restaurant & Bar (Washington)
Florida• 11th Street Diner (Miami Beach)• 13 Gypsies (Jacksonville)• Alpine Steakhouse (Sarasota)• Benny’s Seafood Restaurant (Miami)• Blue Marlin Fish House Restaurant (North Miami Beach)• California Tacos To Go (Tampa)• Culhane’s Irish Pub (Atlantic Beach)• Danny’s All-American Diner (Tampa)• Flakowitz of Boynton Bakery & Deli Restaurant (Boynton Beach)• Grampa’s Bakery & Restaurant (Dania Beach)• Havana Hideout (Lake Worth)• Jamaica Kitchen (Miami)• Jose’s Real Cuban Food (Bradenton)• Keegan’s Seafood Grille (Indian Rocks Beach)• La Camaronera Restaurant & Fish Market (Miami)• Metro Diner (Jacksonville)• Tampa Bay Brewing Co. (Tampa)• Munch’s Restaurant & Sundries (St. Petersburg)• Scully’s Tavern (Miami)• Singleton’s Seafood Shack (Atlantic Beach)• Sonny’s Famous Steak Hogies (Hollywood)• Taco Bus (Tampa)• Tap Tap Haitian Restaurant (Miami Beach)• Ted Peters Famous Smoked Fish (South Pasadena)• Whale’s Rib (Deerfield Beach)
Georgia• Blackwater Grill (St. Simons Island)• Colonnade (Atlanta)• 306 Cobb Parkway (Marietta)• Matthews Cafeteria (Tucker)• Southern Soul Barbeque (St. Simons Island)• The Highlander (Atlanta)
RESTAURANT, FOOD & BEVERAGE MARKET RESEARCH HANDBOOK 2013
• 568 •
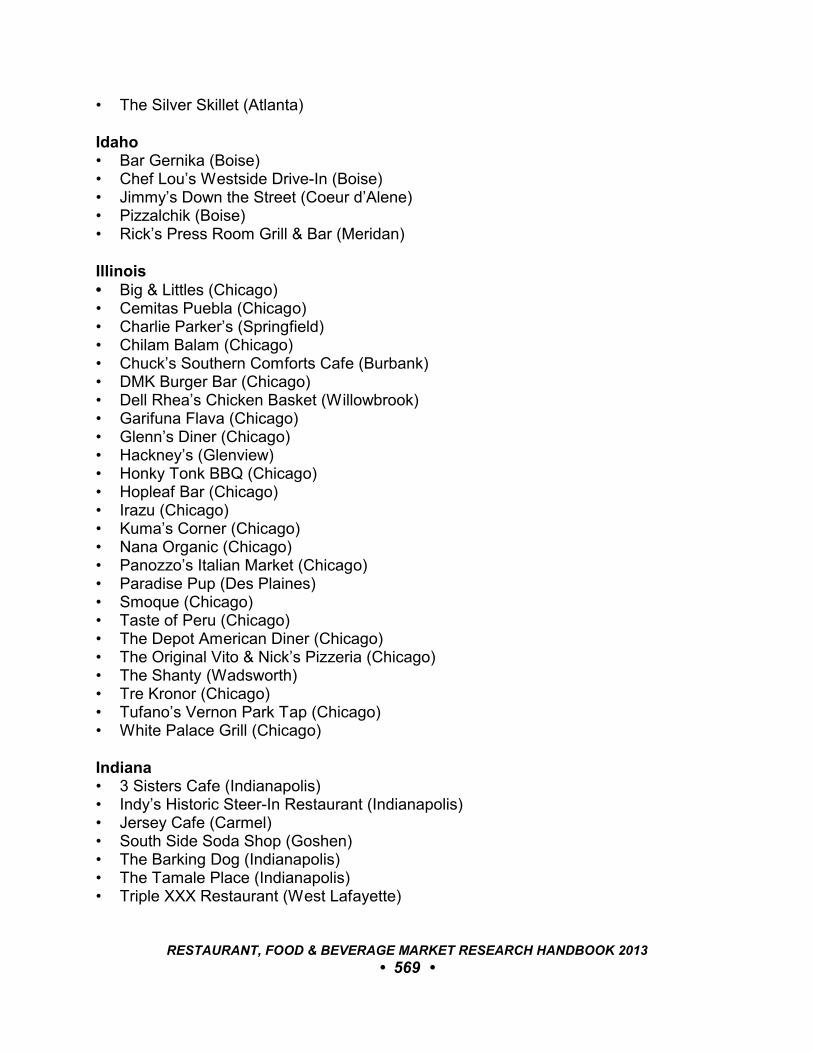
• The Silver Skillet (Atlanta)
Idaho• Bar Gernika (Boise)• Chef Lou’s Westside Drive-In (Boise)• Jimmy’s Down the Street (Coeur d’Alene)• Pizzalchik (Boise)• Rick’s Press Room Grill & Bar (Meridan)
Illinois• Big & Littles (Chicago)• Cemitas Puebla (Chicago)• Charlie Parker’s (Springfield)• Chilam Balam (Chicago)• Chuck’s Southern Comforts Cafe (Burbank)• DMK Burger Bar (Chicago)• Dell Rhea’s Chicken Basket (Willowbrook)• Garifuna Flava (Chicago)• Glenn’s Diner (Chicago)• Hackney’s (Glenview)• Honky Tonk BBQ (Chicago)• Hopleaf Bar (Chicago)• Irazu (Chicago)• Kuma’s Corner (Chicago)• Nana Organic (Chicago)• Panozzo’s Italian Market (Chicago)• Paradise Pup (Des Plaines)• Smoque (Chicago)• Taste of Peru (Chicago)• The Depot American Diner (Chicago)• The Original Vito & Nick’s Pizzeria (Chicago)• The Shanty (Wadsworth)• Tre Kronor (Chicago)• Tufano’s Vernon Park Tap (Chicago)• White Palace Grill (Chicago)
Indiana• 3 Sisters Cafe (Indianapolis)• Indy’s Historic Steer-In Restaurant (Indianapolis)• Jersey Cafe (Carmel)• South Side Soda Shop (Goshen)• The Barking Dog (Indianapolis)• The Tamale Place (Indianapolis)• Triple XXX Restaurant (West Lafayette)
RESTAURANT, FOOD & BEVERAGE MARKET RESEARCH HANDBOOK 2013
• 569 •
• Zest (Indianapolis)• Zydeco’s (Mooresville)
Iowa• Dixie Quick’s (Council Bluffs)
Kansas• BBQ Shack (Paola)• Bobo’s Drive In (Topeka)• Brint’s Diner (Wichita)• Cafe on the Route (Baxter Springs)• Johnny’s Bar-B-Q (Mission)• RJ’s Bob-Be-Que Shack (Mission)• Woodyard Bar-B-Que (Kansas City)
Kentucky• J.J.McBrewster’s (Lexington)• Parkette Drive In (Lexington)• Rick’s White Light Diner (Frankfort)• Smokey Valley Truck Stop (Olive Hill)• Virgil’s Cafe (Bellevue)• Wallace Station (Versailles)
Louisiana• Casamento’s Restaurant (New Orleans)• Joey K’s Restaurant & Bar (New Orleans)• Katie’s Restaurant (New Orleans)• Louie & the Redhead Lady (Mandeville)• Mahony’s Po-Boy Shop (New Orleans)• Parasol’s Bar & Restaurant (New Orleans)• Sammy’s Food Service & Deli (New Orleans)• Surrey’s Cafe (New Orleans)• The Creole Creamery - Uptown (New Orleans)• The Joint (New Orleans)• The Old Coffee Pot Restaurant (New Orleans)• The Rivershack Tavern (Jefferson)
Maine• A1 Diner (Gardiner)• Becky’s Diner (Portland)• Bob’s Clam Hut (Kittery)• Maine Diner (Wells)• Porthole Restaurant (Portland)
RESTAURANT, FOOD & BEVERAGE MARKET RESEARCH HANDBOOK 2013
• 570 •
Maryland• Blue Moon Cafe (Baltimore)• Boulevard Diner (Dundalk)• Brick Oven Pizza (Baltimore)• Broadway Diner (Baltimore)• Chaps Pit Beef (Baltimore)• Di Pasquale’s (Baltimore)• G&A Restaurant (Baltimore)• Galway Bay Irish Pub (Annapolis)• Joe Squared Pizza (Baltimore)• R&R Taqueria (Elkridge)• Sip & Bite Restaurant (Baltimore)• Stoney Creek Inn (Greenland Beach)
Massachusetts• Charlie’s Diner (Spencer)• Greek Corner Restaurant (Cambridge)• Italian Express Pizzeria (Boston)• JT Farnham’s Seafood & Grill (South Essex)• Kelly’s Diner (Somerville)• Mike’s City Diner (Boston)• Morin’s Hometown Bar & Grille (Attleboro)• Mr. Bartley’s Gourmet Burgers (Cambridge)• Rino’s Place (East Boston)• Sam LaGrassa’s (Boston)• The Little Depot Diner (Peabody)
Michigan• Clarkston Union Bar & Kitchen (Village of Clarkston)• Joe’s Gizzard City (Potterville)• Krazy Jim’s Blimpy Burger (Ann Arbor)• Polish Village Cafe (Hamtramck)• Supino Pizzeria (Detroit)• The Fly Trap (Ferndale)• Traffic Jam & Snug (Detroit)• Union Woodshop (Clarkston)
Minnesota• Al’s Breakfast (Minneapolis)• At Sara’s Table Chester Creek Cafe (Duluth)• Broders’ Cucina Italiana (Minneapolis)• Bryant-Lake Bowl (Minneapolis)• Casper & Runyon’s Nook (St. Paul)• Colossal Cafe (Minneapolis)
RESTAURANT, FOOD & BEVERAGE MARKET RESEARCH HANDBOOK 2013
• 571 •
• Donatelli’s (White Bear Lake)• Duluth Grill (Duluth)• Emily’s Lebanese Delicatessen (Minneapolis)• Gordy’s Hi-Hat (Cloquet)• Kramarczuk’s (Minneapolis)• Marla’s Caribbean Cuisine (Minneapolis)• Modern Cafe (Minneapolis)• Northern Waters Smokehaus (Duluth)• Nye’s Polonaise Room (Minneapolis)• Pizzeria Lola (Minneapolis)• Psycho Suzie’s Motor Lounge (Minneapolis)• Q fanatic BBQ (Champlin)• Smack Shack at The 1029 Bar (Minneapolis)• Smalley’s Caribbean Barbeque (Stillwater)• The Blue Door Pub (St. Paul)• The Nook (St. Paul)• The Wienery (Minneapolis)• Victor’s 1959 Cafe (Minneapolis)
Mississippi• Blow Fly Inn (Gulfport)• Darwell’s Cafe (Long Beach)• The Shed Barbecue & Blues Joint (Ocean Springs)
Missouri• Grinders (Kansas City)• Happy Gillis Cafe & Hangout (Kansas City)• Iron Barley (St. Louis)• Smokin’ Guns BBQ (North Kansas City)• Swagger Fine Spirits and Food (Kansas City)• Sweetie Pie’s (St. Louis)• The Brick (Kansas City)• YJ’s Snack Bar (Kansas City)
Nebraska• Amato’s (Omaha)• Big Mama’s Kitchen & Catering (Omaha)• Brewburger’s (Omaha)• California Tacos (Omaha)• Joe Tess Place (Omaha)
Nevada• Bachi Burger (Las Vegas)• Dish Cafe & Catering (Reno)
RESTAURANT, FOOD & BEVERAGE MARKET RESEARCH HANDBOOK 2013
• 572 •
• Forte European Tapas Bar & Bistro (Las Vegas)• Four Kegs Sports Pub (Las Vegas)• Gold ‘N Silver Inn (Reno)• John Mull’s Meats and Road Kill Grill (Las Vegas)• Lola’s - A Louisiana Kitchen (Las Vegas)• Naked City Pizza (Las Vegas)• The Coffee Cup (Boulder City)• UNLV (Las Vegas)
New Hampshire• Red Arrow Diner (Manchester)
New Jersey• 10th Avenue Burrito (Belmar)• Brownstone Diner (Jersey City)• George’s Place (Cape May)• Hightstown Diner (Hightstown)• Jefferson Diner (Lake Hopatcong)• Maui’s Dog House (Wildwood)• Mustache Bill’s (Barnegat Light)• Quahog’s Seafood Shack (Stone Harbor)• Skylark Diner (Edison)• The Ritz Diner (Livingston)• Tick Tock Diner (Clifton)• White Manna Hamburgers (Hackensack)
New Mexico• Backroad Pizza (Santa Fe)• Bert’s Burger Bowl (Santa Fe)• Cecilia’s Cafe (Albuquerque)• Harry’s Roadhouse (Santa Fe)• Monte Carlo Steak House (Albuquerque)• Sophia’s Place (Albuquerque)• Standard Diner (Albuquerque)• Tecolote Cafe (Santa Fe)• Tune-Up Cafe (Santa Fe)• Zia Diner & Angel Food Catering (Santa Fe)
New York• Ben’s Best Deli (Rego Park)• Blackthorn Restaurant and Pub (Buffalo)• Defonte’s Sandwich Shops (Brooklyn and New York City)• Empire Brewing Company (Syracuse)• Eva’s European Sweets (Syracuse)
RESTAURANT, FOOD & BEVERAGE MARKET RESEARCH HANDBOOK 2013
• 573 •
• Eveready Diner (Hyde Park)• Gazala’s Place (New York)• Grover’s Bar & Grill (East Amherst)• Hildebrandt’s (Williston Park)• John’s of 12th Street (New York)• Lake Effect Diner (Buffalo)• MOgridder’s BBQ (Bronx)• Mulberry Cafe (Lackawanna)• Pies ‘N’ Thighs (Brooklyn)• Rincon Criollo (Corona-Queens)• Sage General Store (Long Island City)• Sidecar (Brooklyn)• Sophia Restaurant (Buffalo)• The Pitstop (Merrick)• The Redhead (New York)• The Sparrow Tavern (Astoria)• Tortilleria Nixtamal (Corona)
North Carolina• Bar-B-Q King (Charlotte)• Dish (Charlotte)• Jake’s Good Eats (Charlotte)• Landmark Restaurant Diner (Charlotte)• South 21 Drive-In (Charlotte)• The Black Pelican Oceanfront Restaurant (Kitty Hawk)• The Penguin (Charlotte)
Ohio• Blue Ash Chili Restaurant (Cincinnati)• Geraci’s Restaurant (Cleveland)• Lucky’s Cafe (Cleveland)• Melt Bar & Grilled (Lakewood)• Momocho (Cleveland)• Parkview Niteclub (Cleveland)• Sterle’s Slovenian Country House (Cleveland)• Terry’s Turf Club (Cincinnati)
Oklahoma• Cattlemen’s Steakhouse (Oklahoma City)• Clanton’s Cafe (Vinita)• Eischen’s Bar & Grill (Okarche)• Ingrid’s Kitchen (Oklahoma City)• Leo’s BBQ (Oklahoma City)• Nic’s Grill (Oklahoma City)
RESTAURANT, FOOD & BEVERAGE MARKET RESEARCH HANDBOOK 2013
• 574 •
• The Diner (Norman)• The Rock Cafe (Stroud)
Oregon• Arleta Library Bakery & Cafe (Portland)• Blueplate Lunch Counter & Soda Fountain (Portland)• Bunk Sandwiches (Portland)• Byways Cafe (Portland)• Otto’s Sausage Kitchen & Meat Market (Portland)• Pine State Biscuits (Portland)• Podnah’s Pit Barbecue (Portland)• Pok Pok (Portland)
Pennsylvania• Big Jim’s (Pittsburgh)• Crystal Restaurant (Pittsburgh)• Daddypops (Hatboro)• Dor-Stop Restaurant (Pittsburgh)• Good Dog Bar & Restaurant (Philadelphia)• Honey’s Sit-N-Eat (Philadelphia)• Kelly O’s Diner (Pittsburgh)• Lo Bello’s (Coraopolis)• Memphis Taproom (Philadelphia)• Nadine’s Restaurant (Pittsburgh)• Pineville Tavern (Pineville)• Silk City Diner (Philadelphia)• Starlite Lounge (Blawnox)• The Dining Car & Market (Philadelphia)
Rhode Island• Crazy Burger Cafe & Juice Bar (Narragansett)• Evelyn’s Drive-In (Tiverton)• Louie’s Restaurant (Providence)• The Liberty Elm Diner (Providence)
South Carolina• Fuel Cantina (Charleston)• Harold’s (Gaffney)• Pawleys Front Porch (Columbia)• Perfectly Franks (Summerville)• Tattooed Moose (Charleston)• The Beacon Drive-In (Spartanburg)• The Early Bird Diner (Charleston)• The Farmer’s Shed (Lexington)
RESTAURANT, FOOD & BEVERAGE MARKET RESEARCH HANDBOOK 2013
• 575 •
• The Glass Onion (Charleston)
Tennessee• Alcenia’s (Memphis)• Arnold’s Country Kitchen (Nashville)• Athens Family Restaurant (Nashville)• Bro’s Cajun Cuisine (Nashville)• Cafe Rakka (Hendersonville)• Cozy Corner (Memphis)• Jamaicaway (Nashville)• Leonard’s BBQ (Memphis)• Little Tea Shop (Memphis)• Marlowe’s Ribs (Memphis)• Martin’s Bar-B-Que Joint (Nolensville)• Pizza Palace (Knoxville)• Savarino’s Cucina (Nashville)• Tom’s Bar-B-Q (Memphis)• Uncle Lou’s (Memphis)
Texas• Afrah (Richardson)• Avila’s (Dallas)• Beto’s Comida Latina (San Antonio)• Bob’s Taco Station (Rosenberg)• Bun ‘N’ Barrel (San Antonio)• Cafe Pita (Houston)• Cane Rosso (Dallas)• Casino El Camino (Austin)• Chef Point Cafe (Watauga)• Chop House Burgers (Arlington)• Counter Cafe (Austin)• Dough Pizzeria Napoletana (San Antonio)• El Bohio (San Antonio)• Foreign & Domestic (Austin)• Fred’s Texas Cafe (Fort Worth)• Green Mesquite (Austin)• Hullabaloo Diner (Wellborn)• Jamaica Gates Caribbean Cuisine (Arlington)• Kenny & Ziggy’s (Houston)• Lankford Grocery (Houston)• Louie Mueller BBQ (Taylor)• Luke’s Inside Out (Austin)• Mac & Ernie’s (Tarpley)• Magnolia Cafe (Austin)
RESTAURANT, FOOD & BEVERAGE MARKET RESEARCH HANDBOOK 2013
• 576 •
• Magnolia Pancake Haus (San Antonio)• Maple & Motor (Dallas)• Maria’s Taco Express (Austin)• Louie’s (Dallas)• Moroccan Bites (San Antonio)• Niko Niko’s (Houston)• Noble Pig Sandwiches (Austin)• Monument Cafe (Georgetown)• Pecan Lodge (Dallas)• Pepe’s and Mito’s (Dallas)• Prince Lebanese Grill (Arlington)• Red Lion Pub & Restaurant (Houston)• T-Bone Tom’s Steakhouse (Kemah)• Taco Taco Cafe (San Antonio)• Texas Pride BBQ (Adkins)• The Cove (San Antonio)• Tip Top Cafe (San Antonio)• Twisted Root Burger Co. (Dallas)
Utah• Blue Plate Diner (Salt Lake City)• Burger Bar (Roy)• Lone Star Taqueria (Salt Lake City)• Moochie’s Meatballs & More (Salt Lake City)• Pat’s BBQ (Salt Lake City)• Red Iguana (Salt Lake City)• Ruth’s Diner (Salt Lake City)
Virginia• Beach Pub (Virginia Beach)• Captain Chuck-a-Mucks (Rescue)• Citrus Breakfast & Lunch (Virginia Beach)• Dots Back Inn (Richmond)• Doumar’s (Norfolk)• Flip Flops Grill & Chill (Virginia Beach)• Get Fresh Cafe (Norfolk)• Harvey’s Hot Dogs II (Portsmouth)• La Caraquena (Falls Church)• Leaping Lizards Cafe (Virginia Beach)• Metro 29 Diner (Arlington)• Moseberth’s Fried Chicken (Portsmouth)• Rigoletto Italian Bakery & Cafe (Virginia Beach)• The Village Cafe (Richmond)• Virginia Diner (Wakefield)
RESTAURANT, FOOD & BEVERAGE MARKET RESEARCH HANDBOOK 2013
• 577 •
• Whitner’s BBQ (Virginia Beach)
Washington• Bizzarro Italian Cafe (Seattle)• Bobby’s Hawaiian Style Restaurant (Everett)• Chaps Coffee Co (Spokane)• Crockett’s Public House (Puyallup)• Elk Public House (Spokane)• Fish Tale Brew Pub (Olympia)• Georgia’s Greek Restaurant & Deli (Seattle)• Hills’ Restaurant and Lounge (Spokane)• Mike’s Chili Parlor (Seattle)• Pam’s Kitchen (Seattle)• Picabu Neighborhood Bistro (Spokane)• Slim’s Last Chance Chili Shack & Watering Hole (Seattle)• Southern Kitchen Restaurant (Tacoma)• The Madison Diner (Bainbridge Island)• Voula’s Offshore Cafe (Seattle)• Waddell’s Pub and Grille (Spokane)
West Virginia• Central City Cafe (Huntington)• Hillbilly Hot Dogs (Lesage)
Wisconsin• Anchor Bar (Superior)• Cempazuchi (Milwaukee)• Comet Cafe (Milwaukee)• Franks Diner (Kenosha)
RESTAURANT, FOOD & BEVERAGE MARKET RESEARCH HANDBOOK 2013
• 578 •
109
SELECTIONS: FOOD & WINE
109.1 OverviewFood & Wine magazine regularly compiles various lists of top food and
beverages as well as restaurants and bars throughout the U.S. The following are themost recent lists:
109.2 America’s Best
Best Bars• Anvil Bar & Refuge (Houston, TX)• Arnaud’s French 75 Bar (New Orleans, LA)• Bar Agricole (San Francisco, CA)• Beretta (San Francisco, CA)• Bradstreet Crafthouse (Minneapolis, MN)• Clover Club (New York, NY)• Clyde Common (Portland, OR)• Comstock Saloon (San Francisco, CA)• Copa d’Oro (Santa Monica, CA)• Craft & Commerce (San Diego, CA)• Cure (New Orleans, LA)• Death & Co. (New York, NY)• Distil (Milwaukee, WI)• Downtown Cocktail Room (Las Vegas, NV)• Drink (Boston, MA)• Dutch Kills (New York, NY)• Eleven Madison Park (New York, NY)• Employees Only (New York, NY)• Holeman & Finch Public House (Atlanta, GA)• Island Creek Oyster Bar (Boston, MA)• Jimmy’s (Aspen, CO)• Leon’s Full Service (Decatur, GA)• Little Branch (New York, NY)• Living Room Bar (Miami Beach, FL)• Mayahuel (New York, NY)• Oak at Fourteenth (Boulder, CO)
RESTAURANT, FOOD & BEVERAGE MARKET RESEARCH HANDBOOK 2013
• 579 •
• Parasol Down (Las Vegas, NV)• Pegu Club (New York, NY)• PDT (New York, NY)• PX (Alexandria, VA)• Rivera (Los Angeles, CA)• Rob Roy (Seattle, WA)• Roger Room (West Hollywood, CA)• Sable Kitchen & Bar (Chicago, IL)• Smuggler’s Cove (San Francisco, CA)• Southwark (Philadelphia, PA)• Taste (St. Louis, MO)• Tavern Law (Seattle, WA)• Teardrop Cocktail Lounge (Portland, OR)• The Alembic (San Francisco, CA)• The Drawing Room (Chicago, IL)• The Florida Room (Miami Beach, FL)• The Franklin Mortgage & Investment Co. (Philadelphia, PA)• The Passenger (Washington, DC)• The Patterson House (Nashville, TN)• The Slanted Door (San Francisco, CA)• The Sound Table (Atlanta, GA)• The Tasting Kitchen (Venice, CA)• The Varnish (Los Angeles, CA)• The Violet Hour (Chicago, IL)
Best Beer Bars• Beer Revolution (Oakland, CA)• Blind Tiger Ale House (New York, NY)• Breukelen Bier Merchants (Brooklyn, NY)• Bukowski Tavern (Boston, MA)• Draught House (Austin, TX)• Father’s Office (Los Angeles, CA)• Great Lost Bear (Portland, ME)• Hopleaf (Chicago, IL)• Monk’s Kettle (San Francisco)• Spuyten Duyvil (Brooklyn, NY)• Standard Tap (Philadelphia, PA)• The Bulldog (New Orleans, LA)• The Mitten Bar (Ludington, MI)• Über Tavern (Seattle, WA)• Verdugo (Los Angeles, CA)
RESTAURANT, FOOD & BEVERAGE MARKET RESEARCH HANDBOOK 2013
• 580 •
Best Beer Gardens• Biergarten (San Francisco, CA)• Birreria (New York, NY)• Bohemiam Hall and Beer Garden (Queens, NY)• Der Biergarten (Atlanta, GA)• Drury Beer Garden (Philadelphia, PA)• Easy Tiger (Austin, TX)• Lowry Beer Garden (Denver, CO)• Prost! (Portland, OR)• Sheffield’s (Chicago, IL)• Stone Brewing World Bistro & Gardens (San Diego, CA)• Sweet Cheeks Q (Boston, MA)• The Red Lion Tavern (Los Angeles, CA)• Village Pub & Beer Garden (Nashville, TN)• Zeitgeist (San Francisco, CA)
Best Burgers/Bacon Burgers• B Spot Burgers (Ohio, multiple locations)• BLT Burger (Las Vegas, NV)• Bobby’s Burger Palace (various locations throughout Northeast U.S.)• Chicago Cut Steakhouse (Chicago, IL)• Craigie on Main (Boston, MA)• David Burke Primehouse (Chicago, IL)• Dyer’s Burgers (Memphis, TN)• Farm Burger (Decatur, GA)• Father’s Office (Los Angeles, CA)• Gott’s Roadside (Napa, CA)• Green Street Grill (Boston, MA)• Healdsburg Bar & Grill (Healdsburg, CA)• Holeman & Finch (Atlanta, GA)• In-N-Out Burger (California, multiple locations)• Little Owl (New York, NY)• Louis’s Lunch (New Haven, CT)• Lüke (New Orleans, LA)• Michael’s Genuine Food & Drink (Miami, FL)• Miller’s Bar (Dearborn, MI)• Minetta Tavern (New York, NY)• Palena Café (Washington, DC)• Perini Ranch Steakhouse (Buffalo Gap, TX)• Peter Luger (New York, NY)• Shake Shack (New York, NY and Philadelphia, PA)• Slows Bar BQ (Detroit, MI)• Smoke (Dallas, TX)• Ted’s (Meriden, CT)
RESTAURANT, FOOD & BEVERAGE MARKET RESEARCH HANDBOOK 2013
• 581 •
• The Spotted Pig (New York, NY)• Umamicatessen (Los Angeles, CA)• Wayfare Tavern (San Francisco, CA)• White Manna (Hackensack, NJ)• Zuni Café (San Francisco, CA)
Best Chicken Wings• 17th Street BBQ (Murphysboro, IL and Las Vegas, NV)• Alla Spina (Philadelphia, PA)• Anchor Bar (Buffalo, NY)• Belly Shack (Chicago, IL)• Big Bob Gibson Bar-B-Q (AL and NC)• BonChon (various U.S. locations)• Clio (Boston, MA)• Hopscotch (Oakland, CA)• Lodge Restaurant at Carmel Valley Ranch (Carmel, CA)• Lukshon by Sang Yoon (Culver City, CA)• Mission Chinese Food (San Francisco, CA and New York, NY)• NOLA Restaurant (New Orleans, LA)• Pok Pok (Portland, OR and New York, NY)• Prato (Winter Park, FL)• San Tung (San Francisco, CA)• Roast (Detroit, MI)• Talde (Brooklyn, NY)• The Bazaar by José Andrés (Los Angeles, CA)• The Kettle Black (Brooklyn, NY)• The Parish (Los Angeles, CA)• The Source (Washington, DC)• WingStop (Texas-based chain)• Yusho (Chicago, IL)
Best Doughnuts• Betty Ann Food Shop (Boston, MA)• Britt’s Donuts (Carolina Beach, NC)• Café du Monde (New Orleans, LA)• Clear Flour Bread Bakery (Brookline, MA)• Congdon’s Doughnuts (Wells, ME)• Doughnut Plant (New York, NY)• Dynamo Donuts (San Francisco, CA)• Gourdough’s (Austin, TX)• Peter Pan Donut & Pastry Shop (Brooklyn, NY)• Primo’s Donuts (Los Angeles, CA)
RESTAURANT, FOOD & BEVERAGE MARKET RESEARCH HANDBOOK 2013
• 582 •
• Sublime Doughnuts (Atlanta, GA)• The Doughnut Shop (St. Louis, MO)• The Doughnut Vault (Chicago, IL)• Top Pot Doughnuts (Seattle, WA)• Voodoo Doughnut (Portland, OR)
Best Fried Chicken• Ad Hoc (Napa Valley, CA)• Barbecue Inn (Houston, TX)• Birch & Barley (Washington, DC)• Blue Ribbon Sushi Bar & Grill (Las Vegas, NV)• Bubba’s Cooks Country (Dallas, TX)• Central Michel Richard (Washington, DC)• Crisp (Chicago, IL)• Greenwood’s (Roswell, GA)• Harold’s Chicken Shack (Chicago, IL)• Hattie’s (Saratoga Springs, NY)• Husk (Charleston, SC)• Jestine’s (Charleston, SC)• Jus Cookin’s (Lakewood, CO)• Mama Dip’s Kitchen (Chapel Hill, NC)• Mary Mac’s Tea Room (Atlanta, GA)• Momofuku Noodle Bar (New York, NY)• Perry St. (New York, NY)• Pies-N-Thighs (Brooklyn, NY)• Pine State Biscuits (Portland, OR)• Prince’s Hot Chicken Shack (Nashville, TN)• Roscoe’s House of Chicken and Waffles (Los Angeles, CA)• Simpatica (Portland, OR)• Son of a Gun (Los Angeles, CA)• Supper (Philadelphia, PA)• The Highball (Austin, TX)• Two Sisters Kitchen (Jackson, MS)• Willie Mae’s Scotch House (New Orleans, LA)
Best Grilled Cheese• 24 Diner (Austin, TX)• Artisanal Fromagerie, Bistro and Wine Bar (New York, NY)• Beecher’s Handmade Cheese (Seattle, WA and New York, NY)• Blue Dog Bakery & Café (Louisville, KY)• Big Sur Bakery (Big Sur, CA)• Bouchon Bakery (New York, NY)• Café Mezza (Houston, TX)• Clementine (Los Angeles, CA)
RESTAURANT, FOOD & BEVERAGE MARKET RESEARCH HANDBOOK 2013
• 583 •
• EastBurn (Portland, OR)• Five Guys Burgers and Fries (multiple U.S. locations)• Grahamwich (Chicago, IL)• Grilled Cheese & Co. (Catonsville, MD)• Jaleo (Washington, DC)• Lola (Cleveland, OH)• Milk Truck (New York, NY)• Roxy’s Grilled Cheese (Boston, MA)• South Philadelphia Tap Room (Philadelphia, PA)• Tartine Bakery (San Francisco, CA)• The American Grilled Cheese Kitchen (San Francisco, CA)• The Grilled Cheese Truck (Los Angeles, CA)• The Queens Kickshaw (Queens, NY)
Best Ice Cream Shops• Amy’s Ice Cream (Austin, TX)• Annabelle’s Natural Ice Cream (Portsmouth, NY)• Big Dipper Ice Cream (Missoula, MT)• Bi-Rite Creamery (San Francisco, CA)• Blue Marble (Brooklyn, NY)• Bubbie’s Ice Cream (Honolulu, HI)• Cool Moon Ice Cream (Portland, OR)• Crescent Ridge Dairy Bar (Sharon, MA)• Four Seas Ice Cream (Centerville MA)• Glacé Artisan Ice Cream (Kansas City, MO)• Graeter’s (Ohio, various locations)• Ici Ice Cream (Berkley, CA)• Jeni’s Splendid Ice Creams (Columbus, OH)• Maple View Farm and Dairy (Hillsborough, NC)• Molly Moon Ice Cream (Seattle, WA)• Moomers Homemade Ice Cream (Traverse City, MI)• Mora Iced Creamery (Bainbridge Island, WA)• Mt. Desert Ice Cream (Bar Harbor, ME)• Pumphouse Creamery (Minneapolis, MN)• Sweet Action Ice Cream (Denver, CO)• Sweet Republic (Scottsdale, AZ)• The Creole Creamery (New Orleans, LA)• Three Twins Organic Ice Cream (San Rafael, CA)• Toscanini’s (Cambridge, MA)• Woodside Farm Creamery (Hockessin, DE)
Best Juice Bars• Beverly Hills Juice (Los Angeles, CA)• BluePrintJuice (New York, NY)
RESTAURANT, FOOD & BEVERAGE MARKET RESEARCH HANDBOOK 2013
• 584 •

• Drought (Detroit, MI)• Dtox Juice (Atlanta, GA)• Evolution Fresh (Bellevue, WA)• Juice Land (Austin,TX)• Juice Press (New York, NY)• Juice to You (San Francisco, CA)• jugofresh (Miami, FL)• Kreation Juicery (Santa Monica, CA)• Liquiteria (New York, NY)• Melvin’s Juice Box (New York, NY)• Moon Juice (Venice, CA)• Organic Avenue (New York, NY)• Paleta (Los Angeles, CA and Detroit, MI)• Peeled (Chicago, IL)• Pressed Juicery (various locations, CA)• Sip (Portland, OR)• sweetpress (Washington, DC)• The Gem (Dallas, TX)
Best Places For Pie• Achatz Handmade Pie Co. (Ann Arbor, MI)• First Prize Pies (Brooklyn, NY)• Hill Country Chicken (New York, NY)• HoneyPie (Milwaukee, WI)• Hoosier Mama Pie Company (Chicago, IL)• Mission Pie (San Francisco, CA)• PieLab (Greensboro, AL)• Random Order (Portland, OR)• Scratch (Durham, NC)• Simplethings Sandwich & Pie Shop (Los Angeles, CA)• Sweetie Pies (Napa Valley, CA)• Three Babes Bakeshop (San Francisco, CA)
Best Pizza Places• 2Amys Neapolitan Pizzeria (Washington, DC)• 800 Degrees (Los Angeles, CA)• Al Forno (Providence, RI)• Apizza Scholls (Portland, OR)• Bar Toma (Chicago, IL)• Buddy’s Pizza (Detroit, MI)• Burt’s Place (Chicago, IL)• Casey’s Pizza Truck (San Francisco, CA)• Co. (New York, NY)
RESTAURANT, FOOD & BEVERAGE MARKET RESEARCH HANDBOOK 2013
• 585 •
• Del Popolo (San Francisco, CA)• Di Fara (Brooklyn, NY)• Don Antonio by Starita (New York, NY)• Flour + Water (San Francisco, CA)• Forcella (New York, NY)• Frank Pepe Pizzeria Napoletana (New Haven, CT)• Franny’s (Brooklyn, NY)• Garage Bar (Louisville, KY)• Great Lake (Chicago, IL)• Harry’s Pizzeria (Miami, FL)• Ken’s Artisan Pizza (Portland, OR)• Keste Pizza and Vino (New York, NY)• Lucali (Brooklyn, NY)• Mani Osteria (Ann Arbor, MI)• Motorini (New York, NY)• Nicoletta (New York, NY)• Osteria (Philadelphia, PA)• Oven and Shaker (Portland, OR)• Pastaria (St. Louis, MO)• Paulie Gee’s (Brooklyn, NY)• Pizzaiolo (Oakland, CA)• Pizzeria Bianco (Phoenix, AZ)• Pizzeria Delfina (San Francisco, CA)• Pizzeria Lola (Minneapolis, MN)• Pizzeria Mozza (Los Angeles, CA)• Pizzeria Picco (Larkspur, CA)• Punch Pizza (Saint Paul, MN)• Redd Wood (Yountville, CA)• Ribalta (New York, NY)• Rubirosa (New York, NY)• Santarpio’s Pizza (Boston, MA)• Sottocasa (New York, NY)• Stella Rossa (Santa Monica, CA)• Supino Pizzeria (Detroit, MI)• Tacconelli’s Pizzeria (Philadelphia, PA)• Tarry Lodge (Port Chester, NY)• Totonno’s (Brooklyn, NY)• The Backspace (Austin, TX)• Via Tribunali (New York, NY)
Best Sandwich Shops• Bäco Mercat (Los Angeles, CA)• Be’wiched (Minneapolis, MN)• Bunk (Portland, OR)
RESTAURANT, FOOD & BEVERAGE MARKET RESEARCH HANDBOOK 2013
• 586 •
• Butcher & Bee (Charleston, SC)• Cochon Butcher (New Orleans, LA)• Cutty’s (Brookline, MA)• Fozzie’s Sandwich Emporium (St. Louis, MO)• Fundamental (Los Angeles, CA)• Ink.Sack (Los Angeles, CA)• Neal’s Deli (Carrboro, NC)• No. 7 Sub (New York, NY)• Pane Bianco (Phoenix, AZ)• Parm (New York, NY)• Revival Market (Houston, TX)• Star Provisions (Atlanta, GA)• Wise Sons (San Francisco, CA)• Xoco (Chicago, IL)• Zingerman’s Roadhouse (Ann Arbor, MI)
Best Southern Food• 5 & 10 (Athens, GA)• Bar-B-Que Shop (Memphis, TN)• Big Apple Inn (Jackson, MS)• Burbage’s Grocery (Charleston, SC)• Charlie Teeple’s Seafood (Thunderbolt, GA)• Charlie Vergo’s Rendezvous (Memphis, TN)• Clary’s Café (Savannah, GA)• Cochon (New Orleans, LA)• Cochon Butcher (New Orleans, LA)• Cypress (Charleston, SC)• Elizabeth on 37th (Savannah, GA)• FIG (Charleston, SC)• Herbsaint (New Orleans, LA)• Holeman & Finch Public House (Atlanta, GA)• Hot and Hot Fish Club (Birmingham, AL)• Husk (Charleston, SC)• Interstate Bar-B-Que (Memphis, TN)• Mahony’s Po-Boy Shop (New Orleans, LA)• Marandy’s Soul Food Restaurant (Savannah, GA)• Martha Lou’s Kitchen (Charleston, SC)• McCrady’s (Charleston, SC)• Payne’s Bar-B-Que (Memphis, TN)• Restaurant August (New Orleans, LA)• Restaurant Eugene (Atlanta, GA)• Scott’s Bar-B-Que (Hemingway, SC)• The Barn at Blackberry Farm (Walland, TN)• The Catbird Seat (Nashville, TN)
RESTAURANT, FOOD & BEVERAGE MARKET RESEARCH HANDBOOK 2013
• 587 •
• Willie Mae’s Scotch House (New Orleans, LA)• Yardbird Southern Table & Kitchen (Miami, FL)
RESTAURANT, FOOD & BEVERAGE MARKET RESEARCH HANDBOOK 2013
• 588 •
110
SELECTIONS: GAYOT
110.1 OverviewSince 1969, Gayot (pronounced guy-OH; www.gayot.com) has been a resource
for news and professional reviews on dining, travel, and lifestyle. Annually, Gayot publishes a list of the Top 40 restaurants in the U.S. and Top 10
lists for several restaurant segments. This chapter presents the 2012 selections.
110.2 Top 40 List 2012
• Addison (San Diego, CA)• Alinea (Chicago, IL)• Chef Mavro (Honolulu, HI)• Coi (San Francisco, CA)• Cyrus (Healdsburg, CA)• Daniel (New York, NY)• Eleven Madison Park (New York, NY)• Everest (Chicago, IL)• Frasca Food & Wine (Boulder, CO)• Gary Danko (San Francisco, CA)• Jean Georges (New York, NY)• Joël Robuchon (Las Vegas, NV)• L’Espalier (Boston, MA)• Le Bernardin (New York, NY)• Le Cirque (New York, NY)• Manresa (Los Gatos, CA)• Masa (New York, NY)• Masa’s (San Francisco, CA)• Mélisse (Los Angeles, CA)• Menton (Boston, MA)• Michel Richard Citronelle (Washington, DC)• Patina (Los Angeles, CA)• per Se (New York, NY)• Picasso (Las Vegas, NV)• Providence (Los Angeles, CA)• Restaurant August (New Orleans, LA)
RESTAURANT, FOOD & BEVERAGE MARKET RESEARCH HANDBOOK 2013
• 589 •
• Restaurant Eugene (Atlanta, GA)• Restaurant Guy Savoy (Las Vegas, NV)• Restaurant Nicholas (Red Bank, NJ)• Spago Beverly Hills (Los Angeles, CA)• Studio (Laguna Beach, CA)• The French Laundry (Yountville, CA)• The Herbfarm (Woodinville, WA)• The Inn at Little Washington (Washington, VA)• The Modern (New York, NY)• TRU (Chicago, IL)• Twist by Pierre Gagnaire (Las Vegas, NV)• Urasawa (Los Angeles, CA)• Vetri (Philadelphia, PA)• Vie (Western Springs, IL)
110.3 Top 10 By Segment
Best Barbecue Restaurants• City Market (Luling, TX)• Daisy May’s BBQ USA (New York, NY)• Everett & Jones Barbeque (Oakland, CA)• Fiorella’s Jack Stack Barbecue (Kansas City, MO)• Fox Bros. Bar-B-Q (Atlanta, GA)• Full Moon Bar-B-Que (Hoover, AL)• Montgomery Inn at the Boathouse (Cincinnati, OH)• Smoque BBQ (Chicago, IL)• Urban Bar-B-Cue Company (Rockville, MD)• Zeke’s Smokehouse (Montrose, CA)
Best Burger Restaurants• 25 Degrees (Hollywood, CA)• Billy Goat Tavern & Grill (Chicago, IL)• Bobcat Bite (Santa Fe, NM)• Burger Bar at Mandalay Bay Resort & Casino (Las Vegas, NV)• Burger Joint at Le Parker Meridien (New York, NY)• BurgerMeister (San Francisco, CA)• Carl’s Drive In (Brentwood, MO)• Chip’s Old Fashioned Hamburgers (Dallas, TX)• FLIP burger boutique (Atlanta, GA)• Le Tub (Hollywood, FL)
RESTAURANT, FOOD & BEVERAGE MARKET RESEARCH HANDBOOK 2013
• 590 •
Best Cheap Eats• All Star Sandwich Bar (Cambridge, MA)• The Bee’s Knees Tapas Restaurant & Lounge (Augusta, GA)• Big Star (Chicago, IL)• Burger Tap & Shake (Washington, DC)• Hash House A Go Go (Las Vegas, NV and San Diego, CA)• Ken’s Artisan Pizza (Portland, OR)• Mission Chinese Food (San Francisco, CA)• Pok Pok NY (Brooklyn, NY)• Punk’s (Baltimore, MD)• Slater’s 50/50 (Anaheim Hills, CA)
Best Craft Cocktail Bars• The Aviary (Chicago, IL)• Bar Pleiades at The Surry (New York, NY)• Clock Bar at the The Westin St. Francis (San Francisco, CA)• Columbia Room (Washington, DC)• Cure (New Orleans, LA)• Delmonico Steakhouse at The Venetian (Las Vegas, NV)• Drinkshop at the W Atlanta Downtown (Atlanta, GA)• Ray’s & Stark Bar at the Los Angeles County Museum of Art (Los Angeles, CA)• The Franklin Mortgage & Investment Co. (Philadelphia, PA)• Zig Zag Cafe (Seattle, WA)
Best Heart-Healthy Restaurants• Canyon Ranch Grill at The Palazzo Resort Hotel Casino (Las Vegas, NV)• Community Food & Juice (New York, NY)• Greenleaf Gourmet Chopshop (Beverly Hills, CA)• Greens at Fort Mason (San Francisco, CA)• Green Zebra (Chicago, IL)• Makoto (Bal Harbour, FL)• Natural Selection (Portland, OR)• Spa Cafe at Bacara Resort & Spa (Goleta, CA)• Vedge (Philadelphia, PA)
Best Holiday Dining Restaurants• 701 Restaurant (Washington, DC)• Clio at the Eliot Hotel (Boston, MA)• Fearing’s at The Ritz-Carlton (Dallas, TX)• Fountain Restaurant at the Four Seasons Hotel (Philadelphia, PA)• Georgian Room at The Cloister (Sea Island, GA)
RESTAURANT, FOOD & BEVERAGE MARKET RESEARCH HANDBOOK 2013
• 591 •
• Jean Georges at Trump International Hotel & Tower (New York, NY)• Madera at Rosewood Sand Hill (Menlo Park, CA)• Melissa (Santa Monica, CA)• NoMI Kitchen at the Park Hyatt (Chicago, IL)• Picasso at Bellagio (Las Vegas, NV)
Best Hotel Restaurants• Addison at The Grand Del Mar (San Diego, CA)• Michael Mina at Bellagio (Las Vegas, NV)• Auberge du Soleil (Rutherford, CA)• CityZen at Mandarin Oriental (Washington DC)• Georgian Room at The Cloister (Sea Island, GA)• Jean Georges at Trump International Hotel & Tower (New York, NY)• Joël Robouchon at MGM Grand Hotel & Casino (Las Vegas, NV)• Masa’s at the Executive Hotel Vintage Court (San Francisco, CA)• Michel Richard Citronelle at the Latham Hotel (Washington, DC)• Restaurant Guy Savoy at Caesars Palace (Las Vegas, NV)
Best Ice Cream Shops• Bassetts Ice Cream (Philadelphia, PA)• Black Dog Gelato (Chicago, IL)• Fairfax Scoop (Fairfax, CA)• Four Seas Ice Cream (Centerville, MA)• Graeter’s (Cincinnati, OH)• Il Laboratorio del Gelato (New York, NY)• Mora Iced Creamery (Bainbridge Island, WA)• Morelli’s Gourmet Ice Cream & Desserts (Atlanta, GA)• Scoops (Los Angeles, CA)• Wild About Harry’s (Dallas, TX)
Best Irish Pubs• Doyle’s Cafe (Boston, MA)• Galway Hooker (New York, NY)• The Harp (Cleveland, OH)• The Irish Bank Bar & Restaurant (San Francisco, CA)• The Irish Oak (Chicago, IL)• Kelly’s Irish Times (Washington, DC)• McGillin’s Olde Ale House (Philadelphia, PA)• McGuire’s Irish Pub (Pensacola, FL)• O’Brien’s Irish Pub & Restaurant (Santa Monica, CA)• Rosie McCaffrey’s Irish Pub & Restaurant (Phoenix, AZ)
RESTAURANT, FOOD & BEVERAGE MARKET RESEARCH HANDBOOK 2013
• 592 •
Best Molecular Gastronomy Restaurants• Alinea (Chicago, IL)• AnQi Gourmet Bistro by Crustacean (Costa Mesa, CA)• Atelier Crenn (San Francisco, CA)• Baume (Palo Alto, CA)• Hugo’s (Portland, ME)• Moto (Chicago, IL)• Nine-Ten at the Grande Colonial Hotel (La Jolla, CA)• The Bazaar by Jose Andres (Los Angeles, CA)• The French Laundry (Yountville, CA)• wd-50 (New York, NY)
Best New Restaurants• Bacio (Las Vegas, NV)• Boulud Sud (New York, NY)• Broadway by Amar Santana (Orange County, CA)• ChoLon Modern Asian Bistro (Denver, CO)• El Centro D.F. (Washington, DC)• Graffiato by Mike Isabella (Washington, DC)• Husk (Charleston, SC)• Maison Giraud (Los Angeles, CA)• Next Restaurant (Chicago, IL)• No. 246 Restaurant (Atlanta, GA)• Origen (San Francisco, CA)• Philippe Restaurant + Lounge (Houston, TX)• Ray’s & Stark Bar (Los Angeles, CA)• Scarpetta (Las Vegas, NV)• The Commissary (Dallas, TX)• The Dutch (New York, NY)
Best Outdoor Dining Restaurants• 230 Fifth (New York, NY)• Comme Ca at The Cosmopolitan (Las Vegas, NV)• The Beachcomber at Crystal Cove (Newport Coast, CA)• Area 31 at the Epic Hotel (Miami, FL)• John Ash & Co. (Santa Rosa, CA)• La Mar Cebicheria Peruana (San Francisco, CA)• Rittenhouse Tavern (Philadelphia, PA)• Piccolo Sogno (Chicago, IL)• The Polo Lounge at The Beverly Hills Hotel (Beverly Hills, CA)• Ray’s on the River (Atlanta, GA)
RESTAURANT, FOOD & BEVERAGE MARKET RESEARCH HANDBOOK 2013
• 593 •
Best Penthouse Restaurants• Bertrand at Mister A’s (San Diego, CA)• Coach Insignia (Detroit, MI)• Eiffel Tower at Paris Las Vegas (Las Vegas, NV)• Everest at the Chicago Stock Exchange (Chicago, IL)• L.A. Prime at The Westin Bonaventure Hotel & Suites (Los Angeles, CA)• Nikolai’s Roof at Hilton Atlanta (Atlanta, GA)• Penthouse 808 at Ravel (Long Island City, NY)• The Loft at Montage Laguna Beach (Laguna Beach, CA)• Top of the Hub at Prudential Center (Boston, MA)• XIX Nineteen Restaurant at Park Hyatt Philadelphia at the Bellevue
(Philadelphia, PA)
Best Pizza Restaurants• 2Amys (Washington, DC)• Antico Pizza Napoletana (Atlanta, GA)• Dolce Vita Pizzeria & Enoteca (Houston, TX)• Great Lake Pizza (Chicago, IL)• Keste Pizza & Vino (New York, NY)• Pizzeria Bianco (Phoenix, AZ)• Regina Pizzeria (Boston, MA)• Serious Pie (Seattle, WA)• Stella Rossa Pizza Bar (Santa Monica, CA)• Tony’s Pizza Napoletana (San Francisco, CA)
Best Seafood Restaurants• AQUA by El Gaucho (Seattle, WA)• Bartolotta Ristorante di Mare at Wynn Las Vegas (Las Vegas, NV)• Chef Mavro (Honolulu, HI)• L2O at The Belden-Stratford (Chicago, IL)• Le Bernardin (New York, NY)• Maritana Grille at The Don CeSar (St. Pete Beach, FL)• Providence (Los Angeles, CA)• REEF (Houston, TX)• Splash Restaurant & Bar (Westport, CT)• Waterbar (San Francisco, CA)
Best Sports Bars• Jake’s Dilemma (New York, NY)• Bobby Valentine’s Sports Gallery Cafe (Stamford, CT)• The Burger & Beer Joint (Miami Beach, FL)
RESTAURANT, FOOD & BEVERAGE MARKET RESEARCH HANDBOOK 2013
• 594 •
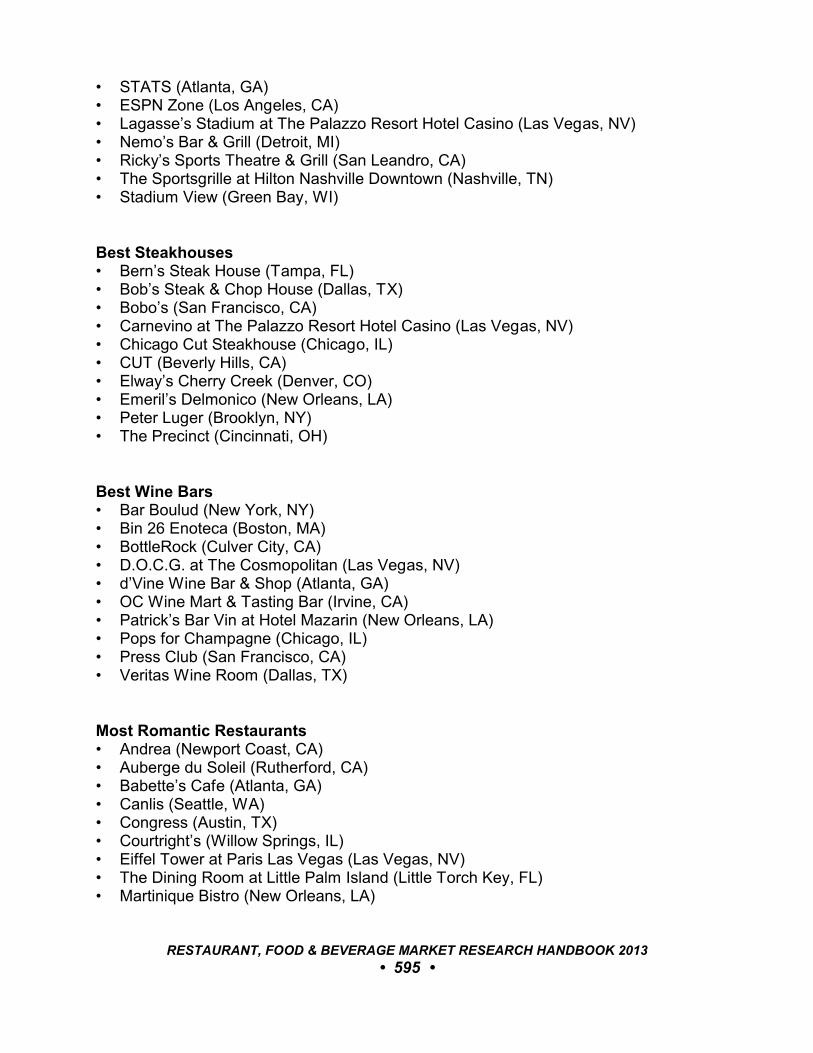
• STATS (Atlanta, GA)• ESPN Zone (Los Angeles, CA)• Lagasse’s Stadium at The Palazzo Resort Hotel Casino (Las Vegas, NV)• Nemo’s Bar & Grill (Detroit, MI)• Ricky’s Sports Theatre & Grill (San Leandro, CA)• The Sportsgrille at Hilton Nashville Downtown (Nashville, TN)• Stadium View (Green Bay, WI)
Best Steakhouses• Bern’s Steak House (Tampa, FL)• Bob’s Steak & Chop House (Dallas, TX)• Bobo’s (San Francisco, CA)• Carnevino at The Palazzo Resort Hotel Casino (Las Vegas, NV)• Chicago Cut Steakhouse (Chicago, IL)• CUT (Beverly Hills, CA)• Elway’s Cherry Creek (Denver, CO)• Emeril’s Delmonico (New Orleans, LA)• Peter Luger (Brooklyn, NY)• The Precinct (Cincinnati, OH)
Best Wine Bars• Bar Boulud (New York, NY)• Bin 26 Enoteca (Boston, MA)• BottleRock (Culver City, CA)• D.O.C.G. at The Cosmopolitan (Las Vegas, NV)• d’Vine Wine Bar & Shop (Atlanta, GA)• OC Wine Mart & Tasting Bar (Irvine, CA)• Patrick’s Bar Vin at Hotel Mazarin (New Orleans, LA)• Pops for Champagne (Chicago, IL)• Press Club (San Francisco, CA)• Veritas Wine Room (Dallas, TX)
Most Romantic Restaurants• Andrea (Newport Coast, CA)• Auberge du Soleil (Rutherford, CA)• Babette’s Cafe (Atlanta, GA)• Canlis (Seattle, WA)• Congress (Austin, TX)• Courtright’s (Willow Springs, IL)• Eiffel Tower at Paris Las Vegas (Las Vegas, NV)• The Dining Room at Little Palm Island (Little Torch Key, FL)• Martinique Bistro (New Orleans, LA)
RESTAURANT, FOOD & BEVERAGE MARKET RESEARCH HANDBOOK 2013
• 595 •
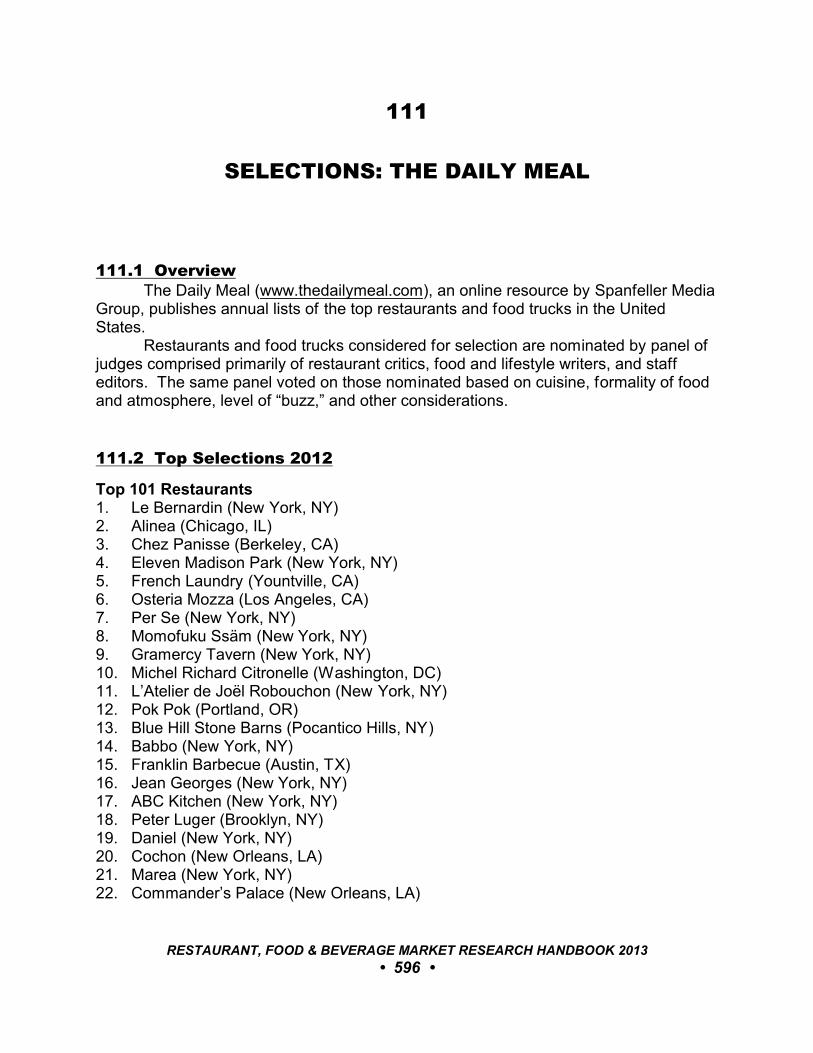
111
SELECTIONS: THE DAILY MEAL
111.1 OverviewThe Daily Meal (www.thedailymeal.com), an online resource by Spanfeller Media
Group, publishes annual lists of the top restaurants and food trucks in the UnitedStates.
Restaurants and food trucks considered for selection are nominated by panel ofjudges comprised primarily of restaurant critics, food and lifestyle writers, and staffeditors. The same panel voted on those nominated based on cuisine, formality of foodand atmosphere, level of “buzz,” and other considerations.
111.2 Top Selections 2012
Top 101 Restaurants1. Le Bernardin (New York, NY)2. Alinea (Chicago, IL)3. Chez Panisse (Berkeley, CA)4. Eleven Madison Park (New York, NY)5. French Laundry (Yountville, CA)6. Osteria Mozza (Los Angeles, CA)7. Per Se (New York, NY)8. Momofuku Ssäm (New York, NY)9. Gramercy Tavern (New York, NY)10. Michel Richard Citronelle (Washington, DC)11. L’Atelier de Joël Robouchon (New York, NY)12. Pok Pok (Portland, OR)13. Blue Hill Stone Barns (Pocantico Hills, NY)14. Babbo (New York, NY)15. Franklin Barbecue (Austin, TX)16. Jean Georges (New York, NY)17. ABC Kitchen (New York, NY)18. Peter Luger (Brooklyn, NY)19. Daniel (New York, NY)20. Cochon (New Orleans, LA)21. Marea (New York, NY)22. Commander’s Palace (New Orleans, LA)
RESTAURANT, FOOD & BEVERAGE MARKET RESEARCH HANDBOOK 2013
• 596 •
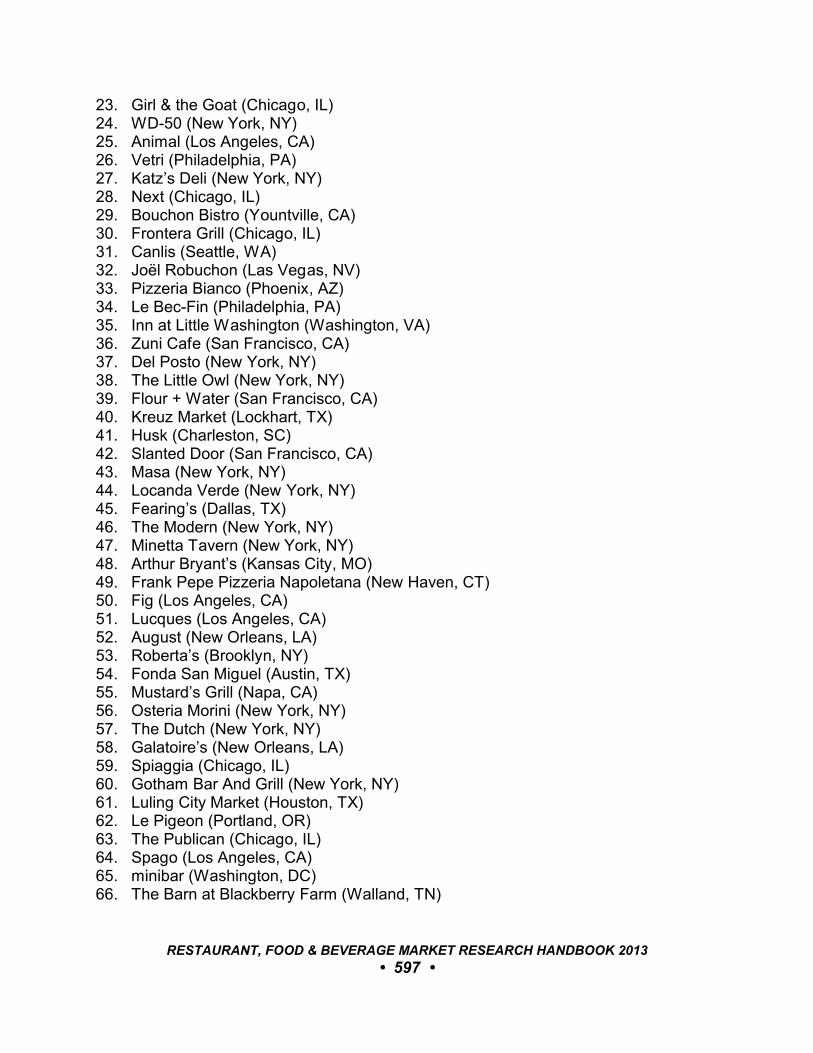
23. Girl & the Goat (Chicago, IL)24. WD-50 (New York, NY)25. Animal (Los Angeles, CA)26. Vetri (Philadelphia, PA)27. Katz’s Deli (New York, NY)28. Next (Chicago, IL)29. Bouchon Bistro (Yountville, CA)30. Frontera Grill (Chicago, IL)31. Canlis (Seattle, WA)32. Joël Robuchon (Las Vegas, NV)33. Pizzeria Bianco (Phoenix, AZ)34. Le Bec-Fin (Philadelphia, PA)35. Inn at Little Washington (Washington, VA)36. Zuni Cafe (San Francisco, CA)37. Del Posto (New York, NY)38. The Little Owl (New York, NY)39. Flour + Water (San Francisco, CA)40. Kreuz Market (Lockhart, TX)41. Husk (Charleston, SC)42. Slanted Door (San Francisco, CA)43. Masa (New York, NY)44. Locanda Verde (New York, NY)45. Fearing’s (Dallas, TX)46. The Modern (New York, NY)47. Minetta Tavern (New York, NY)48. Arthur Bryant’s (Kansas City, MO)49. Frank Pepe Pizzeria Napoletana (New Haven, CT)50. Fig (Los Angeles, CA)51. Lucques (Los Angeles, CA)52. August (New Orleans, LA)53. Roberta’s (Brooklyn, NY)54. Fonda San Miguel (Austin, TX)55. Mustard’s Grill (Napa, CA)56. Osteria Morini (New York, NY)57. The Dutch (New York, NY)58. Galatoire’s (New Orleans, LA)59. Spiaggia (Chicago, IL)60. Gotham Bar And Grill (New York, NY)61. Luling City Market (Houston, TX)62. Le Pigeon (Portland, OR)63. The Publican (Chicago, IL)64. Spago (Los Angeles, CA)65. minibar (Washington, DC)66. The Barn at Blackberry Farm (Walland, TN)
RESTAURANT, FOOD & BEVERAGE MARKET RESEARCH HANDBOOK 2013
• 597 •
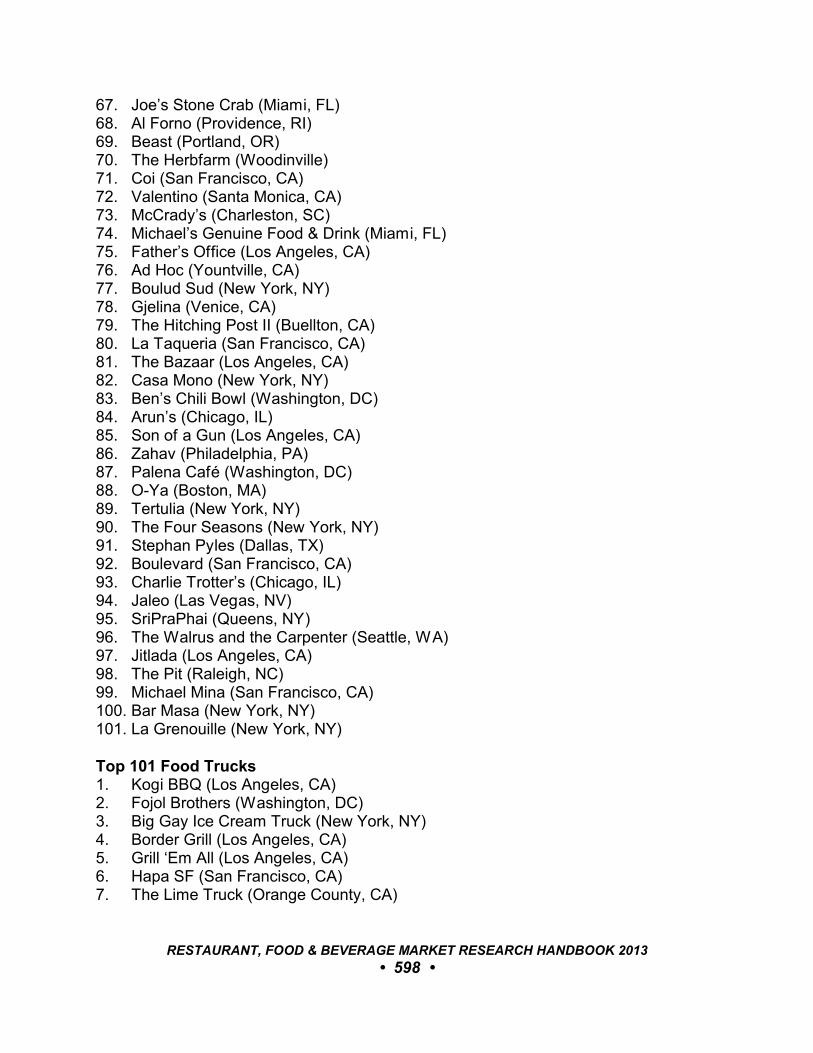
67. Joe’s Stone Crab (Miami, FL)68. Al Forno (Providence, RI)69. Beast (Portland, OR)70. The Herbfarm (Woodinville)71. Coi (San Francisco, CA)72. Valentino (Santa Monica, CA)73. McCrady’s (Charleston, SC)74. Michael’s Genuine Food & Drink (Miami, FL)75. Father’s Office (Los Angeles, CA)76. Ad Hoc (Yountville, CA)77. Boulud Sud (New York, NY)78. Gjelina (Venice, CA)79. The Hitching Post II (Buellton, CA)80. La Taqueria (San Francisco, CA)81. The Bazaar (Los Angeles, CA)82. Casa Mono (New York, NY)83. Ben’s Chili Bowl (Washington, DC)84. Arun’s (Chicago, IL)85. Son of a Gun (Los Angeles, CA)86. Zahav (Philadelphia, PA)87. Palena Café (Washington, DC)88. O-Ya (Boston, MA)89. Tertulia (New York, NY)90. The Four Seasons (New York, NY)91. Stephan Pyles (Dallas, TX)92. Boulevard (San Francisco, CA)93. Charlie Trotter’s (Chicago, IL)94. Jaleo (Las Vegas, NV)95. SriPraPhai (Queens, NY)96. The Walrus and the Carpenter (Seattle, WA)97. Jitlada (Los Angeles, CA)98. The Pit (Raleigh, NC)99. Michael Mina (San Francisco, CA)100. Bar Masa (New York, NY)101. La Grenouille (New York, NY)
Top 101 Food Trucks1. Kogi BBQ (Los Angeles, CA)2. Fojol Brothers (Washington, DC)3. Big Gay Ice Cream Truck (New York, NY)4. Border Grill (Los Angeles, CA)5. Grill ‘Em All (Los Angeles, CA)6. Hapa SF (San Francisco, CA)7. The Lime Truck (Orange County, CA)
RESTAURANT, FOOD & BEVERAGE MARKET RESEARCH HANDBOOK 2013
• 598 •
8. Roxy’s Gourmet Grilled Cheese (Boston, MA)9. The Grilled Cheese Truck (Los Angeles, CA)10. Chef Shack (Minneapolis, MN)11. Red Hook Lobster Pound (New York, NY)12. India Jones Chow Truck (Los Angeles, CA)13. Sam’s ChowderMobile (San Francisco, CA)14. Wafels & Dinges (New York, NY)15. Jogasaki Truck (Los Angeles, CA)16. The Buttermilk Truck (Los Angeles, CA)17. Where Ya At Matt? (Seattle, WA)18. Red Hook Lobster Truck (Washington, DC)19. Fukuburger Truck (Las Vegas, NV)20. The Cinnamon Snail (New York, NY)21. Maximus/Minimus (Seattle, WA)22. Bernie’s Burger Bus (Houston, TX)23. Roli Roti Gourmet Rotisserie (San Francisco, CA)24. Baby’s Badass Burgers (Los Angeles, CA)25. Basil Thyme (Washington, DC)26. Spencer on the Go (San Francisco, CA)27. LudoTruck (Los Angeles, CA)28. Schnitzel & Things (New York, NY)29. Chairman Bao Bun Truck (San Francisco, CA)30. Korilla BBQ (New York, NY)31. Guerrilla Street Food (St. Louis, MO)32. Smack Shack (Minneapolis, MN)33. Lobsta Truck (Los Angeles, CA)34. Staff Meal (Boston, MA)35. Coreanos (Austin, TX)36. Fry Smith (Los Angeles, CA)37. Country Boys/Martinez Taco (New York, NY)38. Food Shark (Marfa, TX)39. Clover Food Truck (Boston, MA)40. Señor Sisig (San Francisco, CA)41. Luke’s Lobster (New York, NY)42. Nom Nom Truck (Los Angeles, CA)43. Komodo Truck (Los Angeles, CA)44. Vizzi Truck (Los Angeles, CA)45. Fivetenburger (Oakland, CA)46. El Camión (Seattle, WA)47. The Grilled Cheeserie (Nashville, TN)48. Crêpes Bonaparte (Los Angeles, CA)49. Pepe Food Truck (Washington, DC)50. Dim Ssäm à gogo by Sakaya Kitchem (Miami, FL)51. Jefe’s Original Fish Taco & Burgers (Miami, FL)
RESTAURANT, FOOD & BEVERAGE MARKET RESEARCH HANDBOOK 2013
• 599 •
52. 5411 Empanadas (Chicago, IL)53. DC Slice (Washington, DC)54. The Mighty Cone (Austin, TX)55. Taim Mobile (New York, NY)56. JapaCurry (San Francisco, CA)57. Biker Jim’s Gourmet Dogs (Denver, CO)58. Oh My Gogi! BBQ (Houston, TX)59. The Big Cheese (Washington, DC)60. Lucky Old Souls (Philadelphia, PA)61. The Southern Mac & Cheese Truck (Chicago, IL)62. Kung Fu Tacos (San Francisco, CA)63. Riffs Fine Street Food (Nashville, TN)64. KoJa Kitchen (San Francisco, CA)65. Rib Whip (San Francisco, CA)66. Diggity Donuts/Little Blue Brunch Truc (Charleston, SC)67. Scratch Truck (Indianapolis, IN)68. The Eatsie Boys (Houston, TX)69. Marination Mobile (Seattle, WA)70. Basic Kneads Pizza (Denver, CO)71. Rancho Bravo Tacos (Seattle, WA)72. The Peached Tortilla (Austin, TX)73. Streetza (Milwaukee, WI)74. Ms. Cheezious Fresh Made Grilled Cheese (Miami, FL)75. Souvlaki GR (New York, NY)76. Liba Falafel Truck (San Francisco, CA)77. Solber Pupusas (New York, NY)78. South Philly Experience (Los Angeles, CA)79. Tasty Kabob (Washington, DC)80. CapMac (Washington, DC)81. El Norteño (San Francisco, CA)82. Tacos El Asadero (Seattle, WA)83. Cha Cha Chow (St. Louis, MO)84. Curbside Cravings (Los Angeles, CA)85. The People’s Pig (Portland, OR)86. Foodie Call (New Orleans, LA)87. Iyanzé aka “The African Truck” (Chicago, IL)88. Seoul Sausage (Los Angeles, CA)89. Empanada Intifada (New Orleans, LA)90. Sushi Fix (Minneapolis, MN)91. Momogoose (Boston, MA)92. Vellee Deli (Minneapolis, MN)93. Hello My Name is BB (Charleston, SC)94. Cucina Zapata (Philadelphia, PA)95. Bloomy’s Roast Beef (Minneapolis, MN)
RESTAURANT, FOOD & BEVERAGE MARKET RESEARCH HANDBOOK 2013
• 600 •
96. Seoul Taco (St. Louis, MO)97. Tokyo Crêpes (Charleston, SC)98. The Slide Ride (Chicago, IL)99. Pot Kettle Blac (Charleston, SC)100. Happy Grillmore (Seattle, WA)101. Ebbett’s Good to Go (San Francisco, CA)
Best Pizza In America 20121. DiFara (Brooklyn, NY)2. Motorino (New York, NY)3. John’s Pizzeria (New York, NY)4. Pizano’s (Chicago, IL)5. Vito & Nick’s (Chicago, IL)6. Joe’s (New York, NY)7. Frank Pepe’s (New Haven, CT)8. Gino’s East (Chicago, IL)9. Co. (New York, NY)10. Fireside Pies (Dallas, TX)11. Monza (Charleston, SC)12. Jumbo Slice Pizza (Washington, DC)13. A16 (San Francisco, CA)14. Reginelli’s (New Orleans, LA)15. Anthony’s Coal Fired Pizza (various locations in Connecticut, Delaware, Florida, New Jersey, New York, Pennsylvania)16. Roppolo’s (Auston, TX)17. Antonio’s Ristorante (Addison, TX)18. Flour + Water (San Francisco, CA)19. Gjelina (Los Angeles, CA)20. Regina Pizzeria (Boston, MA)21. Sally’s Apizza (New Haven, CT)22. Scuola Vecchia (Delray Beach, FL)23. Osteria (Philadelphia, PA)24. DeLorenzo’s (Trenton, NJ)25. Pizzeria Mozza (Los Angeles, CA)26. Pizzeria Bianco (Phoenix, AZ)27. Una Pizza Napoletana (San Francisco, CA)28. Santarpio’s (Boston, MA)28. Al Forno (Providence, RI)29. Great Lake (Chicago, IL)30. Spacca Napoli (Chicago, IL)32. EVO (Charleston, SC)33. 2Amys (Washington, DC)34. Pizaro’s (Houston, TX)35. Papa’s Tomato Pies (Trenton, NJ)
RESTAURANT, FOOD & BEVERAGE MARKET RESEARCH HANDBOOK 2013
• 601 •
111.3 Market ResourcesThe Daily Meal, 156 5th Avenue, Suite 400, New York, NY 10010. (www.thedailymeal.com)
RESTAURANT, FOOD & BEVERAGE MARKET RESEARCH HANDBOOK 2013
• 602 •
112
SELECTIONS: TRAVEL + LEISURE
112.1 OverviewTravel + Leisure magazine regularly compiles various lists of top restaurants
throughout the U.S. The following are the most recent lists:
112.2 Restaurant and Beverage Service Selections
Best BYO Restaurants• Bennachin (New Orleans, LA)• Bonsoirée (Chicago, IL)• Cafe Rossetti’s (Winthrop, MA)• D-Street Noshery (Portland, OR)• Five Islands Lobster (Georgetown, ME)• G’Raj Mahal Café (Austin, TX)• Iggies (Baltimore, MD)• Kaz An Nou (New York, NY)• Lolita (Philadelphia, PA)• Russian Dacha Café (Los Angeles, CA)• Thai X-ing (Washington, DC)• White Tiger Gourmet (Athens, GA)
Best Chinese Restaurants• A Single Pebble (Burlington, VT)• Bo Ling’s (Kansas City, MO)• Chiang’s Gourmet (Seattle, WA)• Chou’s Kitchen (Chandler, AZ)• Chung King (Los Angeles, CA)• Gourmet Dumpling House (Boston, MA)• Han Dynasty (Philadelphia, PA)• Hunan Taste (Catonsville, MD)• Koi Palace (Daly City, CA)• Lao Sze Chuan (Chicago, IL)• Little Village Noodle House (Honolulu, HI)• Mandarin (Salt Lake City, UT)• Mission Chinese Food (New York, NY and San Francisco, CA)
RESTAURANT, FOOD & BEVERAGE MARKET RESEARCH HANDBOOK 2013
• 603 •
• Peter Chang Café (Richmond, VA)• Ping Pang Pong (Las Vegas, NV)• San Tung Restaurant (San Francisco, CA)• Sea Harbour Restaurant (Rosemead, CA)• Shandong (Portland, OR)• Shanghai Restaurant (Houston, TX)• Spicy & Tasty (New York, NY)• Taipei Gourmet (Lexington, MA)• The Source (Washington, DC)• Xi’an Famous Foods (New York, NY)• Yangming Restaurant (Bryn Mawr, PA)
Best Cocktail Bars• Anvil Bar (Houston, TX)• Cure (New Orleans, LA)• Drink (Boston, MA)• Green Russell (Denver, CO)• Smuggler’s Cove (San Francisco, CA)• Teardrop Lounge (Portland, OR)• The Clover Club (Brooklyn, NY)• The Passenger (Washington, DC)• The Violet Hour (Chicago, IL)• Zig Zag Café (Seattle, WA)
Best Comfort Foods• Absolute Bagels (New York, NY)
Menu item: Bagels• Angelini Osteria (Los Angeles, CA)
Menu item: Lasagna• Big Bob Gibson Bar-B-Q (Decatur, AL)
Menu item: Barbecued Chicken• Burt’s Place (Chicago, IL)
Menu item: Deep-Dish Pizza• Dolphin Marina & Restaurant (South Harpswell, ME)
Menu item: Chowder• Doughnut Plant (New York, NY)
Menu item: Donuts• Famous 4th Street Delicatessen (Philadelphia, PA)
Menu item: Chicken Soup• Girl & the Goat (Chicago, IL)
Menu item: French Fries• Highlands Bar & Grill (Birmingham, AL)
Menu item: Baked Grits
RESTAURANT, FOOD & BEVERAGE MARKET RESEARCH HANDBOOK 2013
• 604 •
• Jacques Torres (various locatins, NY and NJ) Menu item: Chocolate Chip Cookies
• Johnsons Corner (Loveland, CO) Menu item: Cinnamon Roll
• Loveless Café (Nashville, TN) Menu item: Biscuits and Gravy
• Meatball Shop (New York, NY) Menu item: Meatballs
• Melt Bar and Grilled (Lakewood, OH) Menu item: Grilled Cheese
• Moonlite Bar-B-Q Inn (Owensboro, KY) Menu item: Ribs
• Prince’s Hot Chicken Shack (Nashville, TN) Menu item: Friend Chicken
• Quinn’s Pub (Seattle, WA) Menu item: Burger
• Salt Grass Steak House (Houston, TX) Menu item: Chicken-Fried Steak
• Sam Choy’s Breakfast, Lunch & Crab (Honolulu, HI) Menu item: Loco Moco
• Sarcone’s Deli (Philadelphia, PA) Menu item: Hoagie
• Slim’s Last Chance (Seattle, WA) Menu item: Chili
• Slow Bar B Q (Detroit, MI) Menu item: Mac ‘n Cheese
• Stanley’s Kitchen and Tap (Chicago, IL) Menu item: Mashed Potatoes
• Susiecakes (Los Angeles, CA) Menu item: Cupcakes
• The Aroma Pie Shop (Whalan, MN) Menu item: Pie
• The Blacksmith (Bend, OR) Menu item: Meatloaf
• The Little Nell (Aspen, CO) Menu item: Hot Chocolate
• The Original Pancake House (Portland, OR) Menu item: Pancakes
• The Red Hot (Tacoma, WA) Menu item: Hot Dog
• Wong (New York, NY) Menu item: Ice Cream
RESTAURANT, FOOD & BEVERAGE MARKET RESEARCH HANDBOOK 2013
• 605 •
Best Donuts• Bob’s Donut & Pastry Shop (San Francisco, CA)• Bomboloni (New York, NY)• Bouchon Bakery (Yountville, CA)• Café Du Monde (New Orleans, LA)• Coffee An’ Donut Shop (Westport, CT)• Doughnut Plant (New York, NY)• Dynamo Donut and Coffee (San Francisco, CA)• Fractured Prune (Ocean City, MD)• Frosty’s Donut & Coffee Shop (Brunswick, ME)• Kane’s Donuts (Saugus, MA)• Mighty-O Donuts (Seattle, WA)• Nicola’s Donuts (Tampa, FL)• Old Fashioned Donuts (Chicago, IL)• Peter Pan Bakery (Brooklyn, NY)• Randy’s Donuts (Los Angeles)• Round Rock Donuts (Round Rock, TX)• Spudnut Shop (Richland, WA)• Stan’s Doughnuts (Westwood Village, CA)• Sublime Doughnuts (Atlanta, GA)• Top Pot Doughnuts (Seattle, WA)• Voodoo Doughnut (Portland, OR)• Walton Donuts (Denver, CO)
Best Fried Chicken• Barbecue Inn (Houston, TX)• Blue Ribbon Sushi Bar and Grill (New York, NY)• Crisp (Chicago, IL)• Hollyhock Hill (Indianapolis, IN)• Max’s Wine Dive (Austin, TX)• Prince’s Hot Chicken Shack (Nashville, TN)• Rack & Soul (New York, NY)• Restaurant Eugene (Atlanta, GA)• Roscoe’s House of Chicken and Waffles (Los Angeles, CA)• Side Street Inn (Honolulu, HI)• Spring Hill (Seattle, WA)
Best French Fries• Al’s French Fry (Burlington, VT)• Amsterdam Bar & Hall (Saint Paul, MN)• Blue Duck Tavern (Washington, DC)• Boise Fry Company (various locations, Idaho)
RESTAURANT, FOOD & BEVERAGE MARKET RESEARCH HANDBOOK 2013
• 606 •
• Bourbon Steak (Miami, FL)• Chego (Los Angeles, CA)• Coreanos (Austin, TX)• Duckfat (Portland, ME)• Flip Burger Boutique (Atlanta, GA)• Gilroy Garlic Fries at AT&T Park (San Francisco, CA)• Green Pig Bistro (Arlington, VA)• Hot Doug’s (Chicago, IL)• Hubcap Grill (Houston, TX)• Jasper’s Corner Tap (San Francisco, CA)• Jonesy’s EatBar (Denver, CO)• La Boca (New Orleans, LA)• Pike Street Fish Fry (Seattle, WA)• Pomme Frites (New York, NY)• Saus (Boston, MA)• Thrasher’s (Ocean City, MD)• The Breslin Bar & Dining Room (New York, NY)• The Green Room (Greenville, SC)• The Original Hot Dog Shop (Pittsburgh, PA)• Violetta (Portland, OR)
Best Italian Restaurants• Acquerello (San Francisco, CA)• Al Forno (Providence, RI)• Assaggio (Seattle, WA)• Bar La Grassa (Minneapolis, MN)• Bartolotta (Las Vegas, NV)• Caffé Mingo (Portland, OR)• Da Marco (Houston, TX)• Del Posto (New York, NY)• Domenica (New Orleans, LA)• Flour + Water (San Francisco, CA)• Frank Pepe Pizzeria Napoletana (New Haven, CT)• Frasca (Boulder, CO)• Harry’s Pizzeria (Miami, FL)• Jasper’s (Kansas City, MO)• L’Amante (Burlington, VT)• Mani Osteria (Ann Arbor, MI)• Marea (New York, NY)• Obelisk (Washington, DC)• Osteria Mozza/Pizzeria Mozza (Los Angeles, CA)• Palena Café (Washington, DC)• Pizzeria Bianco (Phoenix, AZ)
RESTAURANT, FOOD & BEVERAGE MARKET RESEARCH HANDBOOK 2013
• 607 •
• Roberta’s (Brooklyn, NY)• Spiaggia (Chicago, IL)• Terramia Ristorante (Boston, MA)• The Backspace (Austin TX)• Tony’s (St. Louis, MO)• Trattoria Lucca (Charleston, SC)• Tulio (Seattle, WA)• Valentino (Santa Monica, CA)• Vetri (Philadelphia, PA)
Best Pancakes• Hawaiian Style Café (Big Island, HI)• Hominy Grill (Charleston, SC)• Lake Placid Lodge (Lake Placid, NY)• Lula (Chicago, IL)• Prune (New York, NY)• Stanley (New Orleans, LA)• The Downyflake (Nantucket, MA)• The Farmers Diner (Quechee, VT)• The Griddle Café (West Hollywood, CA)• The Original Pancake House (Portland, OR)
Best Places To Drink Tea• Harney & Sons (New York, NY)• Ku Cha House of Tea (Boulder, CO)• Park Hyatt (Washington, DC)• Samovar Tea Lounge (San Francisco, CA)• Seven Cups (Tucson, AZ)• Steven Smith Teamaker (Portland, OR)
Best Seafood Restaurants• Anchor & Hope (San Francisco, CA)• Cantler’s Riverside Inn (Annapolis, MD)• Casamento’s (New Orleans, LA)• Coastal Cold Storage (Petersburg, AK)• Dave’s Carry-Out (Charleston, SC)• DC Coast (Washington, DC)• Dock’s Oyster House (Atlantic City, NJ)• Garcia’s Seafood Grille & Fish Market (Miami, FL)• GT Fish & Oyster (Chicago, IL)• Hogfish Bar & Grill (Stock Island, FL)
RESTAURANT, FOOD & BEVERAGE MARKET RESEARCH HANDBOOK 2013
• 608 •

• Jake’s Famous Crawfish (Portland, OR)• Jax Fish House & Oyster Bar (Denver, CO)• Le Bernardin (New York, NY)• Little Fish BYOB (Philadelphia, PA)• Maison Premiere (Brooklyn, NY)• Mama’s Fish House (Maui, HI)• Marshall Store (Tomales Bay, CA)• Neptune Oyster (Boston, MA)• Red Fish Grill (New Orleans, LA)• Reef (Houston, TX)• RM Seafood (Las Vegas, NV)• Sea Change (Minneapolis, MN)• Shaw’s Fish and Lobster (New Harbor, ME)• Son of a Gun (Los Angeles, CA)• Star Fish Company (Cortez, FL)• Straight Wharf Restaurant (Nantucket, MA)• The Clam Shack (Kennebunkport, ME)• The Optimist (Atlanta, GA)• The Walrus and the Carpenter (Seattle, WA)• Uchi + Uchiko (Austin, TX)• Water Grill (Los Angeles, CA)
Best Wine Bars• 20 Brix (Cincinnati, OH)• Bacchanal (New Orleans, LA)• Bar Covell (Los Angeles, CA)• Barcelona (Atlanta, GA)• Bin No. 18 (Miami, FL)• Caveau Wine Bar (Denver, CO)• D.O.C. Wine Bar (Chicago, IL)• Domacin (Stillwater, MN)• Flight Wine Bar (Rochester, NY)• Grotto Wine Bar (Cleveland, OH)• Kazimierz World Wine Bar (Scottsdale, AZ)• Kir (Portland, OR)• Lelabar (New York, NY)• Max’s Wine Dive (Austin, TX)• Poco Wine Room (Seattle, WA)• Sonoma Wine Bar (Houston, TX)• The Ten Bells (New York, NY)• The Butcher Shop (Boston, MA)• The Hidden Vine (San Francisco, CA)• Tinto (Philadelphia, PA)
RESTAURANT, FOOD & BEVERAGE MARKET RESEARCH HANDBOOK 2013
• 609 •
• Veritas (Washington, DC)• Veritas Wine Room (Dallas, TX)• Vino Italia Tapas (Honolulu, HI)• West End Wine Bar (Chapel Hill, NC)• Zin Wine Bar (Healdsburg, CA)
Coolest Coffeehouses• Arabica Coffee Company (Portland, ME)• Beach Bum Café (Honolulu, HI)• Blue Bottle Coffee (San Francisco, CA)• Busboys and Poets (Washington, DC)• Café Demetrio (Miami, FL)• Café du Monde (New Orleans, LA)• Coava (Portland, OR)• Coffee Slingers (Oklahoma City, OK)• Comet Coffee (Ann Arbor, MI)• Espresso Vivace Roasteria (Seattle, WA)• Four Barrel (San Francisco, CA)• Intelligentsia Coffee & Tea (Chicago, IL)• Kopplin’s Coffee (Saint Paul, MN)• Lamill Coffee Boutique (Los Angeles, CA)• Octane Coffee House & Lounge (Atlanta, GA)• One Shot Coffee (Philadelphia, PA)• Otherlands Coffee Bar (Memphis, TN)• PJ’s Coffee (New Orleans, LA)• Pavement Coffee House (Boston, MA)• Progress Coffee (Austin, TX)• RBC (New York, NY)• Spro (Baltimore, MD)• Stumptown (Portland, OR)• The Roasterie Café (Kansas City, MO)• The Roasting Plant (New York, NY)
RESTAURANT, FOOD & BEVERAGE MARKET RESEARCH HANDBOOK 2013
• 610 •
113
SELECTIONS: ZAGAT
113.1 Best BurgersZagat Survey (www.zagat.com) selected the following as the best restaurants for
a burger:Atlanta, GA• The Vortex
Baltimore, MD• Linwoods (Owings Mills)
Boston, MA• Mr. Bartley’s
Charlotte, NC• Bad Daddy’s Burger Bar
Chicago, IL• Edzo’s Burger Shop (Evanston)
Dallas/Fort Worth, TX• Maple & Motor
Denver, CO• Crave Real Burgers (Castle Rock)
Fort Lauderdale, FL• Le Tub (Hollywood)
Honolulu, HI• Kua ‘Aina Sandwich (North Shore)
Houston, TX• Goode Co. Burgers
RESTAURANT, FOOD & BEVERAGE MARKET RESEARCH HANDBOOK 2013
• 611 •
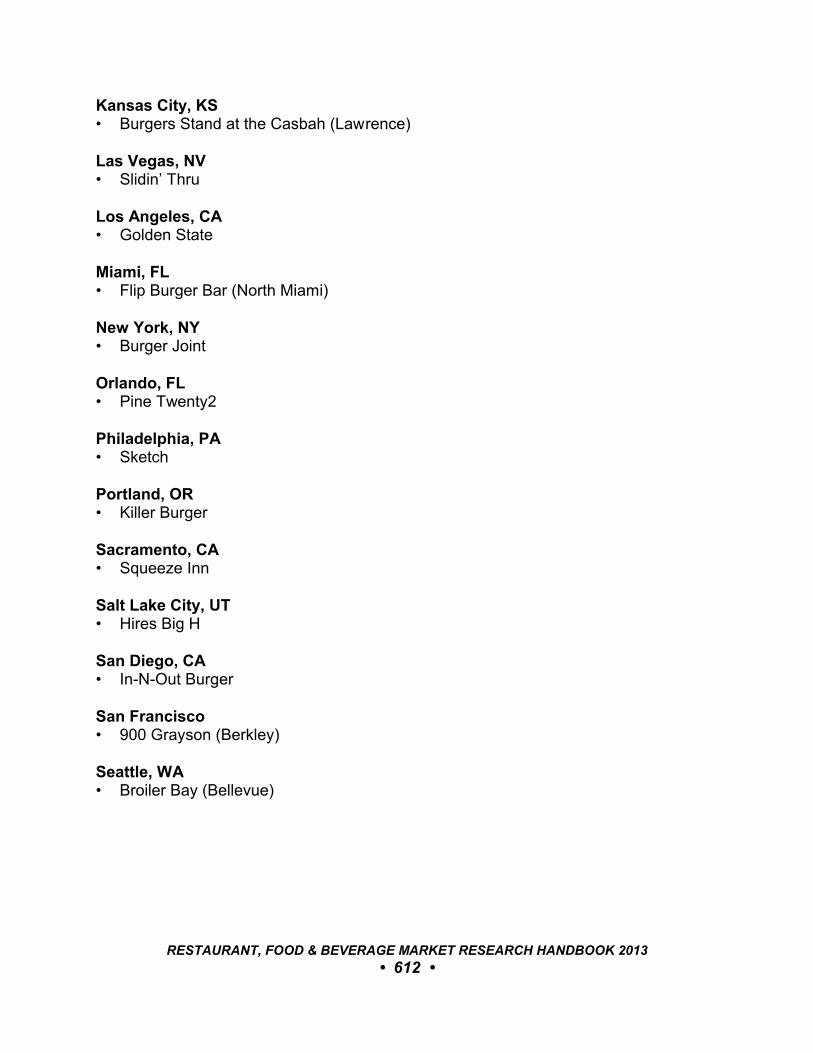
Kansas City, KS• Burgers Stand at the Casbah (Lawrence)
Las Vegas, NV• Slidin’ Thru
Los Angeles, CA• Golden State
Miami, FL• Flip Burger Bar (North Miami)
New York, NY• Burger Joint
Orlando, FL• Pine Twenty2
Philadelphia, PA• Sketch
Portland, OR• Killer Burger
Sacramento, CA• Squeeze Inn
Salt Lake City, UT• Hires Big H
San Diego, CA• In-N-Out Burger
San Francisco• 900 Grayson (Berkley)
Seattle, WA• Broiler Bay (Bellevue)
RESTAURANT, FOOD & BEVERAGE MARKET RESEARCH HANDBOOK 2013
• 612 •
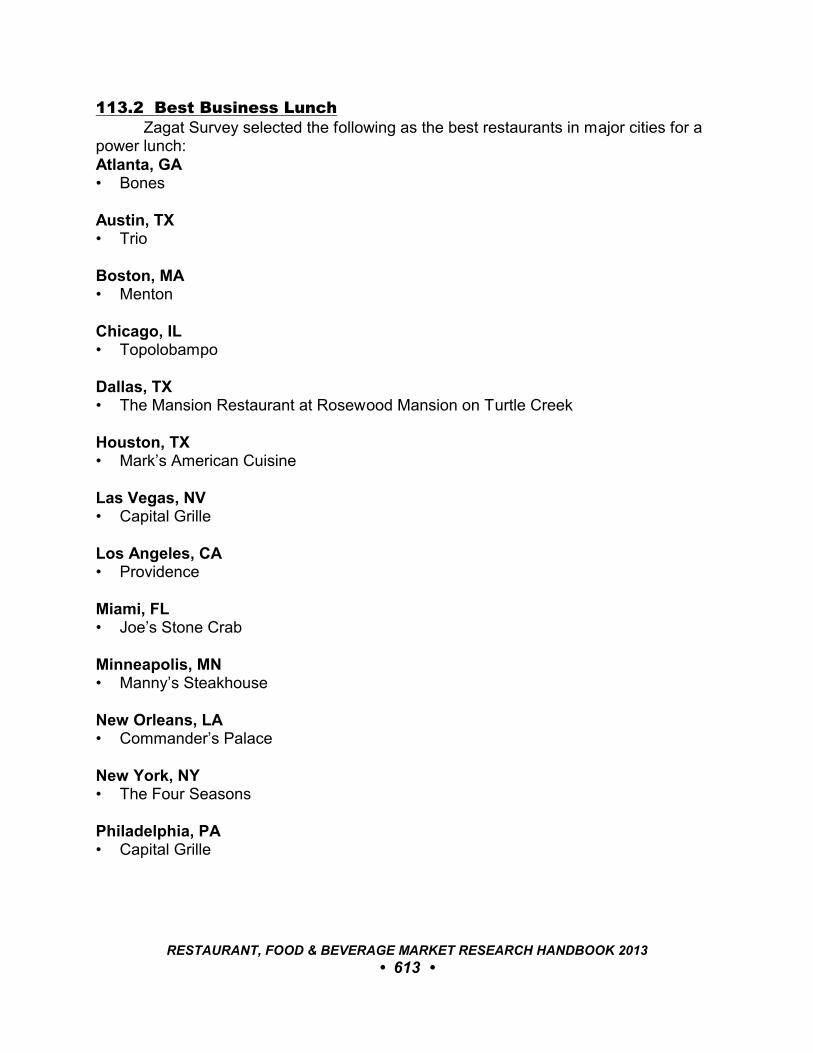
113.2 Best Business LunchZagat Survey selected the following as the best restaurants in major cities for a
power lunch:Atlanta, GA• Bones
Austin, TX• Trio
Boston, MA• Menton
Chicago, IL• Topolobampo
Dallas, TX• The Mansion Restaurant at Rosewood Mansion on Turtle Creek
Houston, TX• Mark’s American Cuisine
Las Vegas, NV• Capital Grille
Los Angeles, CA• Providence
Miami, FL• Joe’s Stone Crab
Minneapolis, MN• Manny’s Steakhouse
New Orleans, LA• Commander’s Palace
New York, NY• The Four Seasons
Philadelphia, PA• Capital Grille
RESTAURANT, FOOD & BEVERAGE MARKET RESEARCH HANDBOOK 2013
• 613 •
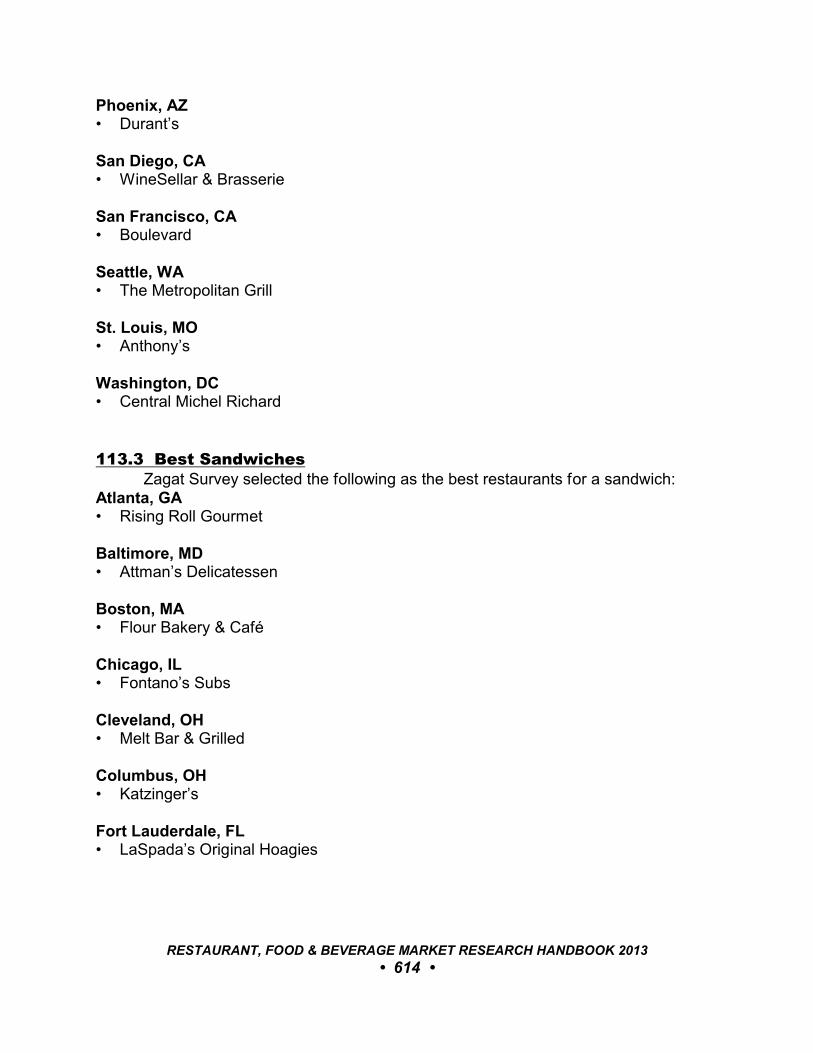
Phoenix, AZ• Durant’s
San Diego, CA• WineSellar & Brasserie
San Francisco, CA• Boulevard
Seattle, WA• The Metropolitan Grill
St. Louis, MO• Anthony’s
Washington, DC• Central Michel Richard
113.3 Best SandwichesZagat Survey selected the following as the best restaurants for a sandwich:
Atlanta, GA• Rising Roll Gourmet
Baltimore, MD• Attman’s Delicatessen
Boston, MA• Flour Bakery & Café
Chicago, IL• Fontano’s Subs
Cleveland, OH• Melt Bar & Grilled
Columbus, OH• Katzinger’s
Fort Lauderdale, FL• LaSpada’s Original Hoagies
RESTAURANT, FOOD & BEVERAGE MARKET RESEARCH HANDBOOK 2013
• 614 •
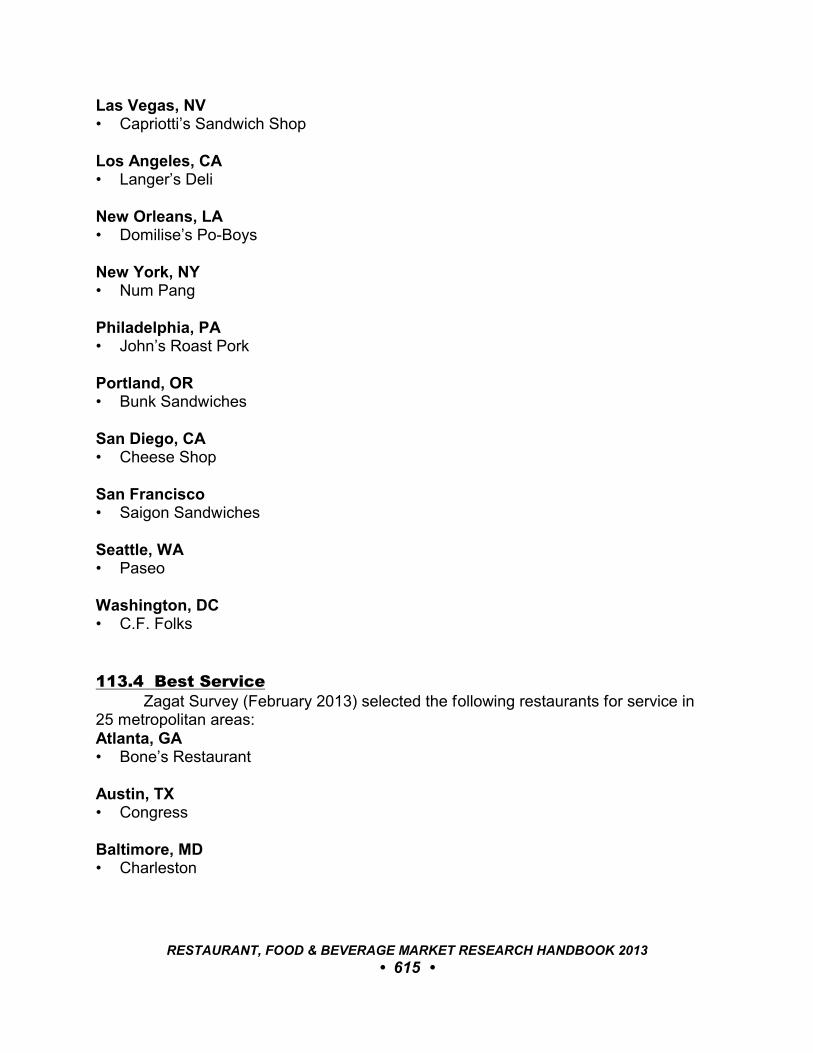
Las Vegas, NV• Capriotti’s Sandwich Shop
Los Angeles, CA• Langer’s Deli
New Orleans, LA• Domilise’s Po-Boys
New York, NY• Num Pang
Philadelphia, PA• John’s Roast Pork
Portland, OR• Bunk Sandwiches
San Diego, CA• Cheese Shop
San Francisco• Saigon Sandwiches
Seattle, WA• Paseo
Washington, DC• C.F. Folks
113.4 Best ServiceZagat Survey (February 2013) selected the following restaurants for service in
25 metropolitan areas:Atlanta, GA• Bone’s Restaurant
Austin, TX• Congress
Baltimore, MD• Charleston
RESTAURANT, FOOD & BEVERAGE MARKET RESEARCH HANDBOOK 2013
• 615 •
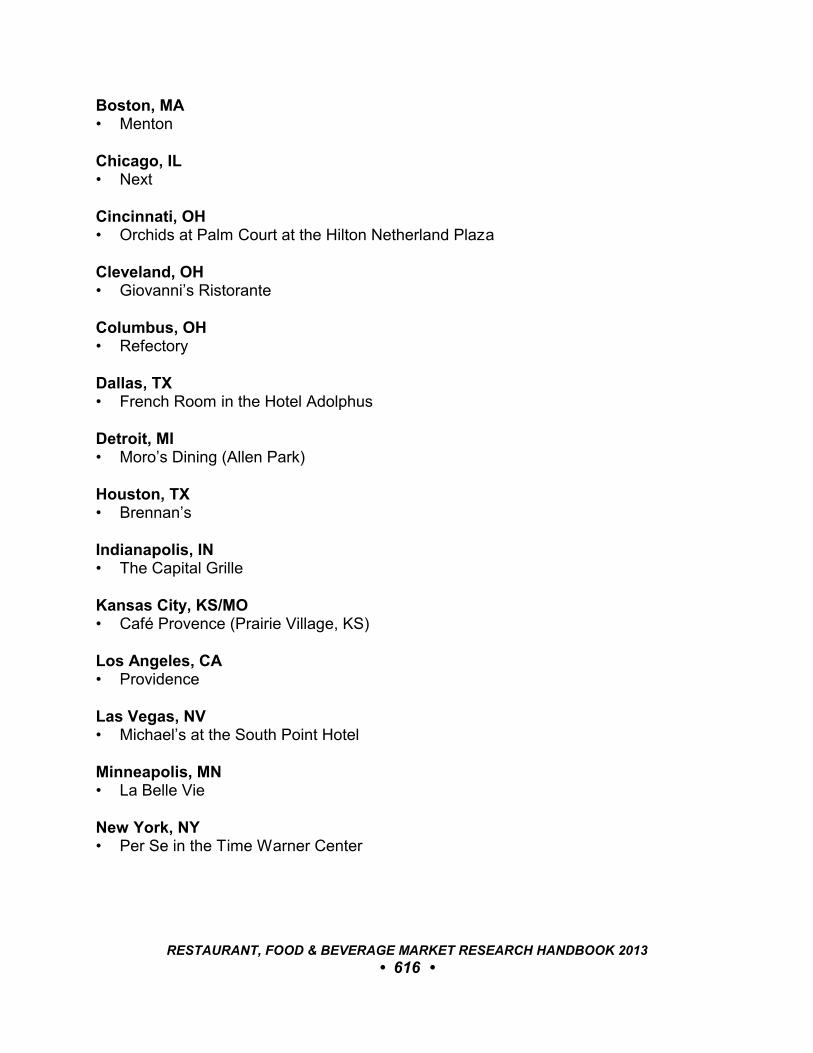
Boston, MA• Menton
Chicago, IL• Next
Cincinnati, OH• Orchids at Palm Court at the Hilton Netherland Plaza
Cleveland, OH• Giovanni’s Ristorante
Columbus, OH• Refectory
Dallas, TX• French Room in the Hotel Adolphus
Detroit, MI• Moro’s Dining (Allen Park)
Houston, TX• Brennan’s
Indianapolis, IN• The Capital Grille
Kansas City, KS/MO• Café Provence (Prairie Village, KS)
Los Angeles, CA• Providence
Las Vegas, NV• Michael’s at the South Point Hotel
Minneapolis, MN• La Belle Vie
New York, NY• Per Se in the Time Warner Center
RESTAURANT, FOOD & BEVERAGE MARKET RESEARCH HANDBOOK 2013
• 616 •
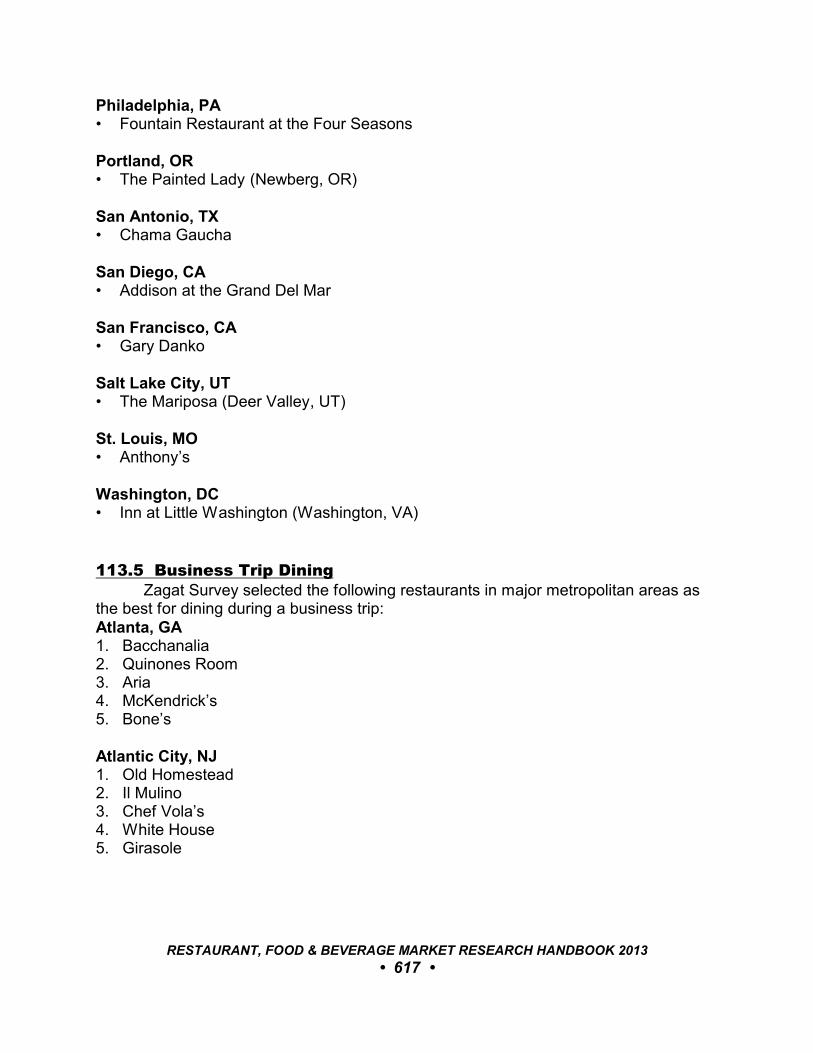
Philadelphia, PA• Fountain Restaurant at the Four Seasons
Portland, OR• The Painted Lady (Newberg, OR)
San Antonio, TX• Chama Gaucha
San Diego, CA• Addison at the Grand Del Mar
San Francisco, CA• Gary Danko
Salt Lake City, UT• The Mariposa (Deer Valley, UT)
St. Louis, MO• Anthony’s
Washington, DC• Inn at Little Washington (Washington, VA)
113.5 Business Trip DiningZagat Survey selected the following restaurants in major metropolitan areas as
the best for dining during a business trip:Atlanta, GA 1. Bacchanalia 2. Quinones Room 3. Aria 4. McKendrick’s 5. Bone’s
Atlantic City, NJ 1. Old Homestead 2. Il Mulino 3. Chef Vola’s 4. White House 5. Girasole
RESTAURANT, FOOD & BEVERAGE MARKET RESEARCH HANDBOOK 2013
• 617 •
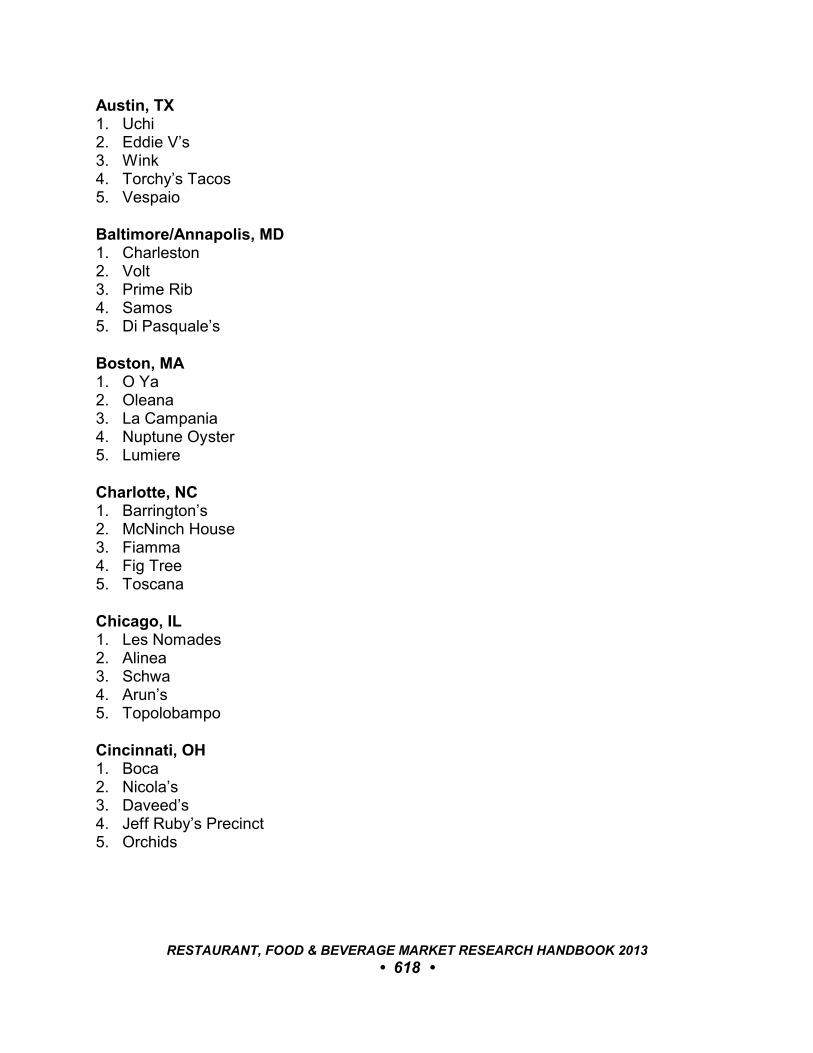
Austin, TX 1. Uchi 2. Eddie V’s 3. Wink 4. Torchy’s Tacos 5. Vespaio
Baltimore/Annapolis, MD 1. Charleston 2. Volt 3. Prime Rib 4. Samos 5. Di Pasquale’s
Boston, MA 1. O Ya 2. Oleana 3. La Campania 4. Nuptune Oyster 5. Lumiere
Charlotte, NC 1. Barrington’s 2. McNinch House 3. Fiamma 4. Fig Tree 5. Toscana
Chicago, IL 1. Les Nomades 2. Alinea 3. Schwa 4. Arun’s 5. Topolobampo
Cincinnati, OH 1. Boca 2. Nicola’s 3. Daveed’s 4. Jeff Ruby’s Precinct 5. Orchids
RESTAURANT, FOOD & BEVERAGE MARKET RESEARCH HANDBOOK 2013
• 618 •
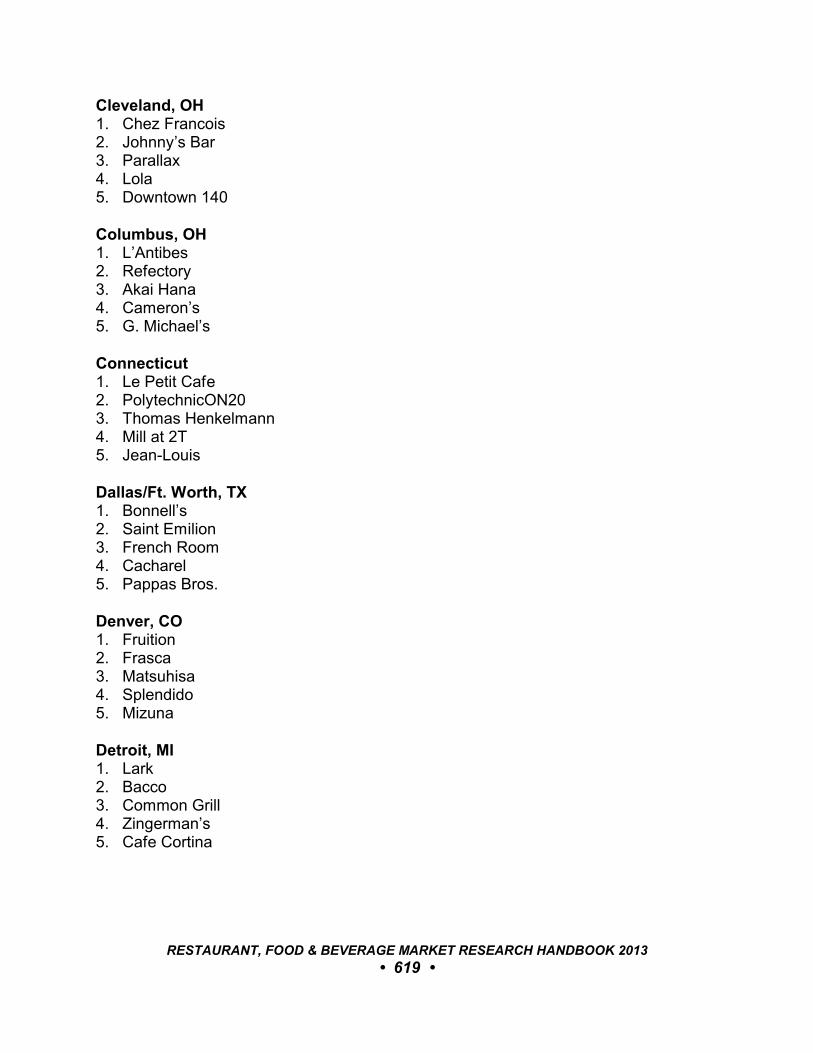
Cleveland, OH 1. Chez Francois 2. Johnny’s Bar 3. Parallax 4. Lola 5. Downtown 140
Columbus, OH 1. L’Antibes 2. Refectory 3. Akai Hana 4. Cameron’s 5. G. Michael’s
Connecticut 1. Le Petit Cafe 2. PolytechnicON20 3. Thomas Henkelmann 4. Mill at 2T 5. Jean-Louis
Dallas/Ft. Worth, TX 1. Bonnell’s 2. Saint Emilion 3. French Room 4. Cacharel 5. Pappas Bros.
Denver, CO 1. Fruition 2. Frasca 3. Matsuhisa 4. Splendido 5. Mizuna
Detroit, MI 1. Lark 2. Bacco 3. Common Grill 4. Zingerman’s 5. Cafe Cortina
RESTAURANT, FOOD & BEVERAGE MARKET RESEARCH HANDBOOK 2013
• 619 •
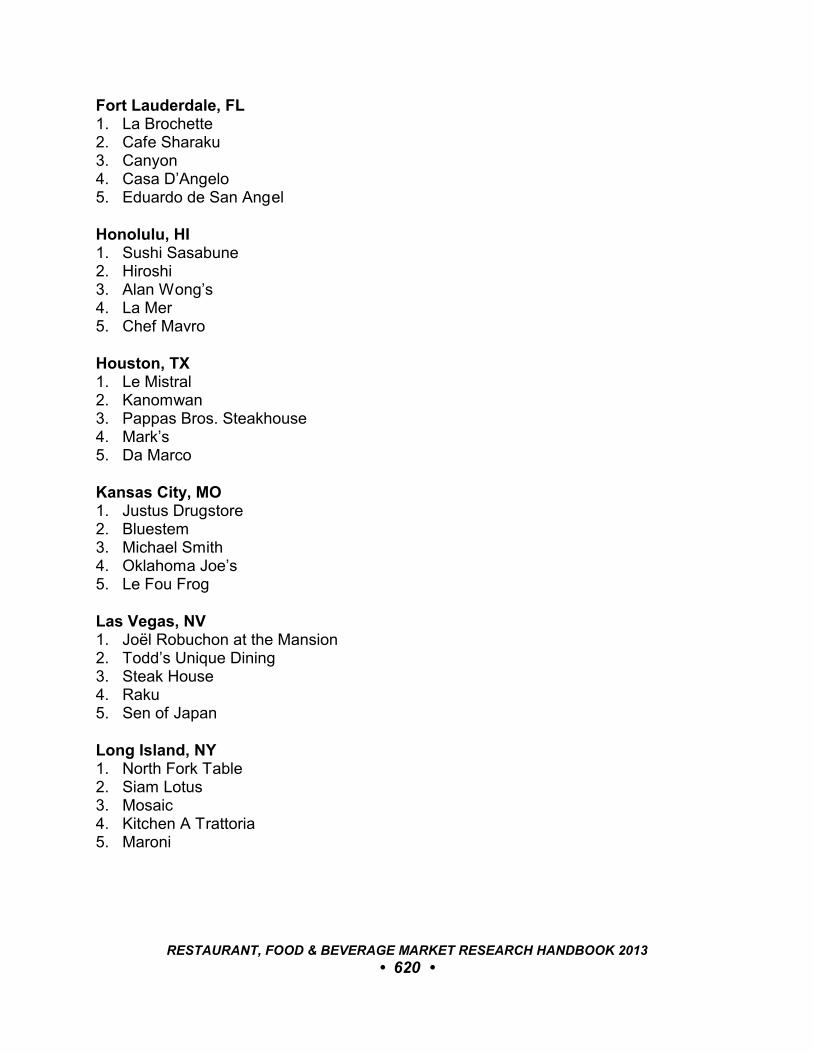
Fort Lauderdale, FL 1. La Brochette 2. Cafe Sharaku 3. Canyon 4. Casa D’Angelo 5. Eduardo de San Angel
Honolulu, HI 1. Sushi Sasabune 2. Hiroshi 3. Alan Wong’s 4. La Mer 5. Chef Mavro
Houston, TX 1. Le Mistral 2. Kanomwan 3. Pappas Bros. Steakhouse4. Mark’s 5. Da Marco
Kansas City, MO 1. Justus Drugstore 2. Bluestem 3. Michael Smith 4. Oklahoma Joe’s 5. Le Fou Frog
Las Vegas, NV 1. Joël Robuchon at the Mansion2. Todd’s Unique Dining 3. Steak House 4. Raku 5. Sen of Japan
Long Island, NY 1. North Fork Table 2. Siam Lotus 3. Mosaic 4. Kitchen A Trattoria 5. Maroni
RESTAURANT, FOOD & BEVERAGE MARKET RESEARCH HANDBOOK 2013
• 620 •
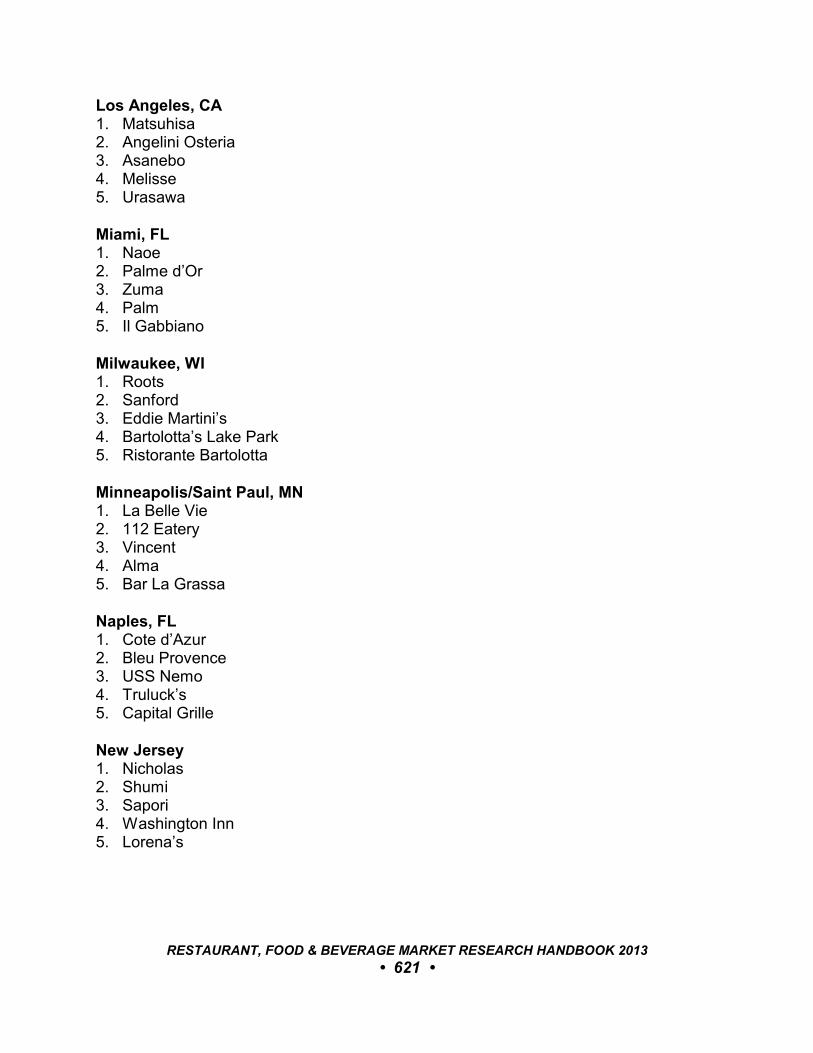
Los Angeles, CA 1. Matsuhisa 2. Angelini Osteria 3. Asanebo 4. Melisse 5. Urasawa
Miami, FL 1. Naoe 2. Palme d’Or 3. Zuma 4. Palm 5. Il Gabbiano
Milwaukee, WI 1. Roots 2. Sanford 3. Eddie Martini’s 4. Bartolotta’s Lake Park 5. Ristorante Bartolotta
Minneapolis/Saint Paul, MN 1. La Belle Vie 2. 112 Eatery 3. Vincent 4. Alma 5. Bar La Grassa
Naples, FL 1. Cote d’Azur 2. Bleu Provence 3. USS Nemo 4. Truluck’s 5. Capital Grille
New Jersey 1. Nicholas 2. Shumi 3. Sapori 4. Washington Inn 5. Lorena’s
RESTAURANT, FOOD & BEVERAGE MARKET RESEARCH HANDBOOK 2013
• 621 •
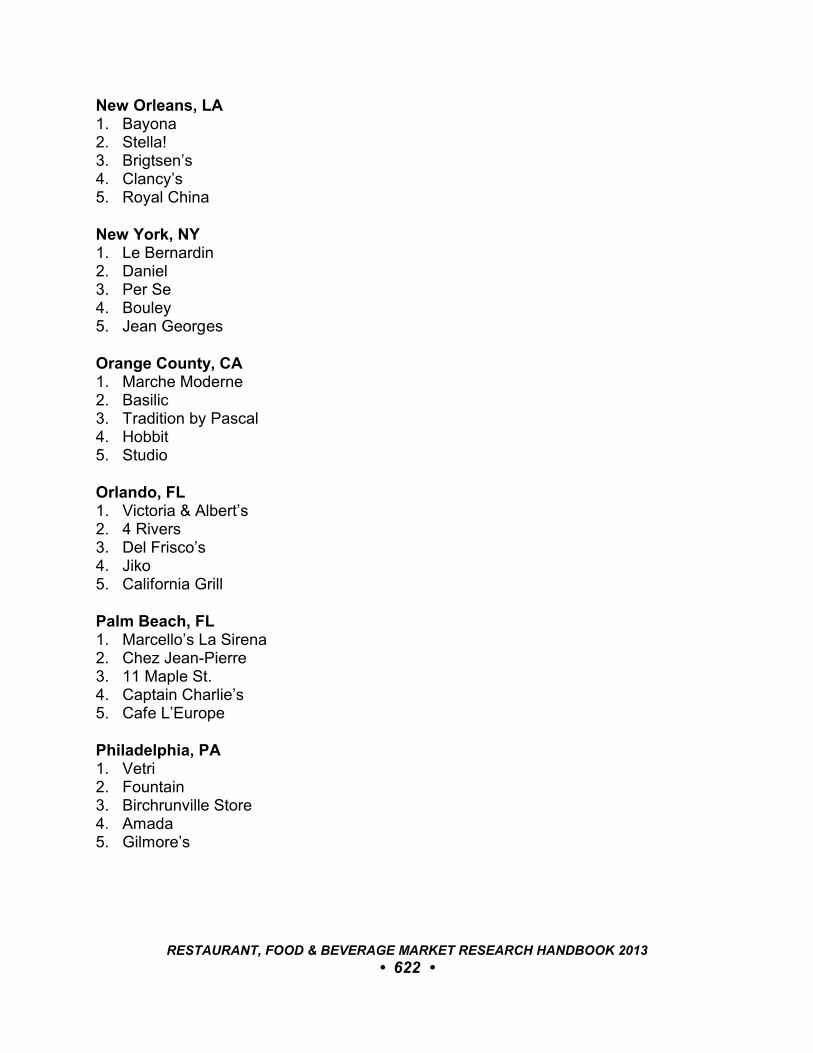
New Orleans, LA1. Bayona 2. Stella! 3. Brigtsen’s 4. Clancy’s 5. Royal China
New York, NY 1. Le Bernardin 2. Daniel 3. Per Se 4. Bouley 5. Jean Georges
Orange County, CA 1. Marche Moderne 2. Basilic 3. Tradition by Pascal 4. Hobbit 5. Studio
Orlando, FL 1. Victoria & Albert’s 2. 4 Rivers 3. Del Frisco’s 4. Jiko 5. California Grill
Palm Beach, FL 1. Marcello’s La Sirena 2. Chez Jean-Pierre 3. 11 Maple St. 4. Captain Charlie’s 5. Cafe L’Europe
Philadelphia, PA 1. Vetri 2. Fountain 3. Birchrunville Store 4. Amada 5. Gilmore’s
RESTAURANT, FOOD & BEVERAGE MARKET RESEARCH HANDBOOK 2013
• 622 •
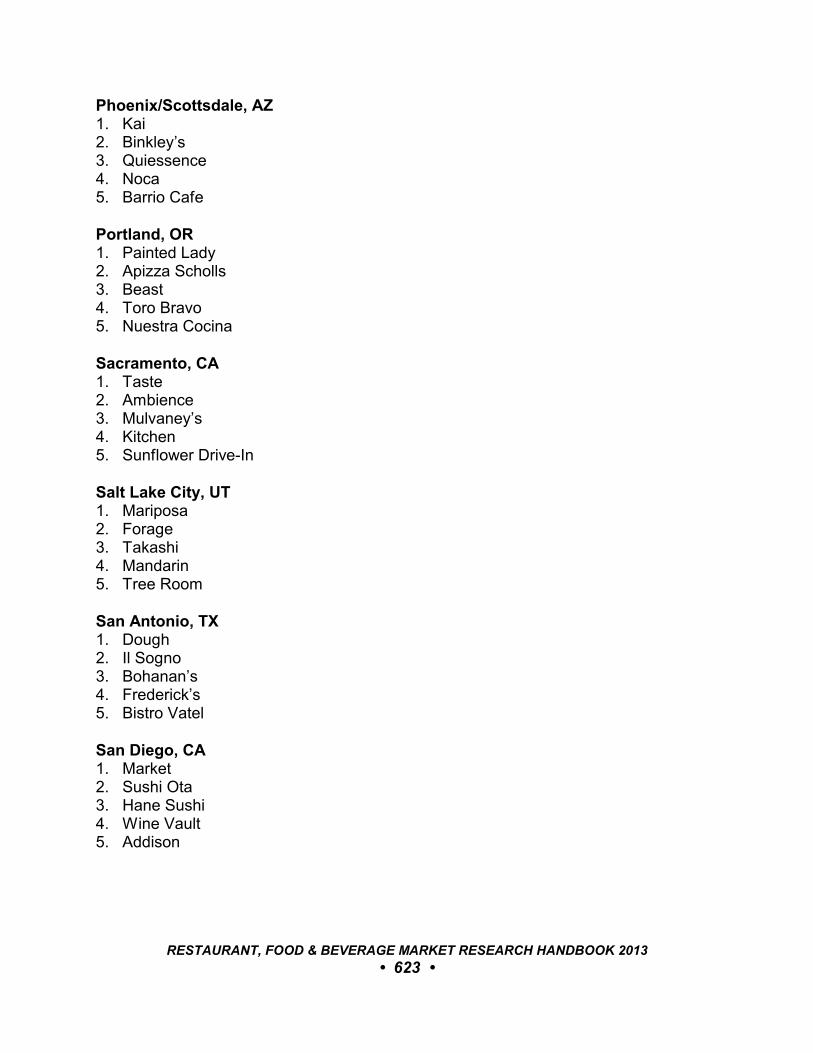
Phoenix/Scottsdale, AZ1. Kai 2. Binkley’s 3. Quiessence 4. Noca 5. Barrio Cafe
Portland, OR 1. Painted Lady 2. Apizza Scholls 3. Beast 4. Toro Bravo 5. Nuestra Cocina
Sacramento, CA 1. Taste 2. Ambience 3. Mulvaney’s 4. Kitchen 5. Sunflower Drive-In
Salt Lake City, UT 1. Mariposa 2. Forage 3. Takashi 4. Mandarin 5. Tree Room
San Antonio, TX 1. Dough 2. Il Sogno 3. Bohanan’s 4. Frederick’s 5. Bistro Vatel
San Diego, CA 1. Market 2. Sushi Ota 3. Hane Sushi 4. Wine Vault 5. Addison
RESTAURANT, FOOD & BEVERAGE MARKET RESEARCH HANDBOOK 2013
• 623 •
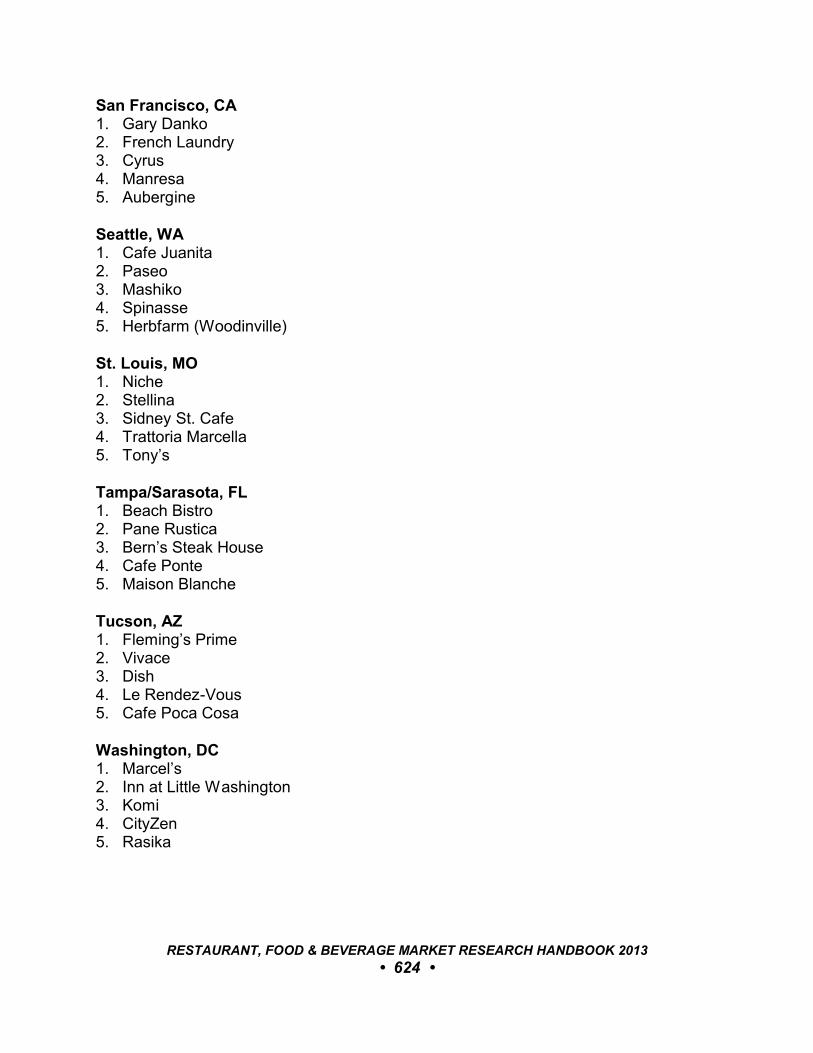
San Francisco, CA 1. Gary Danko 2. French Laundry 3. Cyrus 4. Manresa 5. Aubergine
Seattle, WA 1. Cafe Juanita 2. Paseo 3. Mashiko 4. Spinasse 5. Herbfarm (Woodinville)
St. Louis, MO 1. Niche 2. Stellina 3. Sidney St. Cafe 4. Trattoria Marcella 5. Tony’s
Tampa/Sarasota, FL 1. Beach Bistro 2. Pane Rustica 3. Bern’s Steak House 4. Cafe Ponte 5. Maison Blanche
Tucson, AZ 1. Fleming’s Prime 2. Vivace 3. Dish 4. Le Rendez-Vous 5. Cafe Poca Cosa
Washington, DC 1. Marcel’s 2. Inn at Little Washington 3. Komi 4. CityZen 5. Rasika
RESTAURANT, FOOD & BEVERAGE MARKET RESEARCH HANDBOOK 2013
• 624 •

Westchester/Hudson Valley 1. Sushi Nanase 2. Xaviars at Piermont 3. Il Cenacolo 4. Freelance Cafe 5. Buffet de la Gare
113.6 Hotel RestaurantsZagat Survey selected the following top hotel restaurants in 25 metropolitan
areas:Atlanta, GA• La Grotta Ravinia (Crowne Plaza Ravinia)
Austin, TX• Driskill Grill (Driskill Hotel)
Boston, MA• Clio (Eliot)
Chicago, IL• The Lobby (The Peninsula)
Dallas/ Fort Worth, TX• French Room (The Adolphus)
Denver, CO• Restaurant Kevin Taylor (Hotel Teatro)
Detroit, MI• Saltwater (MGM Grand Casino)
Honolulu, HI• La Mer (Halekulani)
Houston, TX• Quattro (Four Seasons)
Las Vegas, NV• L’Atelier de Jol Robuchon (MGM Grand)
Los Angeles, CA• Saam at the Bazaar by Jos Andrs (SLS at Beverly Hills)
RESTAURANT, FOOD & BEVERAGE MARKET RESEARCH HANDBOOK 2013
• 625 •
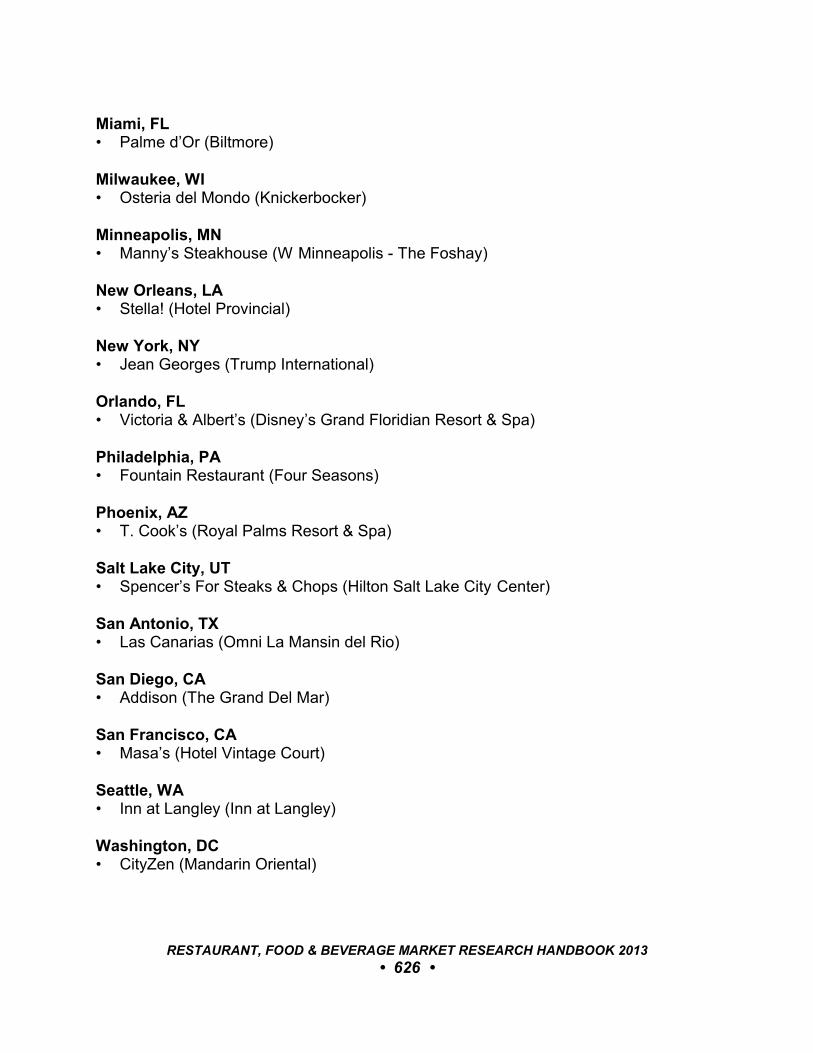
Miami, FL• Palme d’Or (Biltmore)
Milwaukee, WI• Osteria del Mondo (Knickerbocker)
Minneapolis, MN• Manny’s Steakhouse (W Minneapolis - The Foshay)
New Orleans, LA• Stella! (Hotel Provincial)
New York, NY• Jean Georges (Trump International)
Orlando, FL• Victoria & Albert’s (Disney’s Grand Floridian Resort & Spa)
Philadelphia, PA• Fountain Restaurant (Four Seasons)
Phoenix, AZ• T. Cook’s (Royal Palms Resort & Spa)
Salt Lake City, UT• Spencer’s For Steaks & Chops (Hilton Salt Lake City Center)
San Antonio, TX• Las Canarias (Omni La Mansin del Rio)
San Diego, CA• Addison (The Grand Del Mar)
San Francisco, CA• Masa’s (Hotel Vintage Court)
Seattle, WA• Inn at Langley (Inn at Langley)
Washington, DC• CityZen (Mandarin Oriental)
RESTAURANT, FOOD & BEVERAGE MARKET RESEARCH HANDBOOK 2013
• 626 •
113.7 Market ResourcesZagat Survey, 4 Columbus Circle, 3rd Floor, New York, NY 10019. (800) 540-9609.(www.zagat.com)
RESTAURANT, FOOD & BEVERAGE MARKET RESEARCH HANDBOOK 2013
• 627 •

114
STAR DIAMOND AWARD
114.1 OverviewSince 1949, the American Academy of Hospitality Sciences (AAHS) has
recognized restaurants with its Star Diamond Award (www.stardiamondaward.com).
114.2 Five Star Diamond Awards 2013Five Star Diamond designations were given to the following U.S. restaurants:
• ABC Kitchen (New York, NY)• Adour Alain Ducasse (New York, NY)• Bouley (New York, NY)• Anaheim White House Restaurant (Anaheim, CA)• Bryant & Cooper Steakhouse (Roslyn, NY)• Café L’ Europe (Palm Beach, FL)• Cafe Milano (Washington, DC)• Cipollini (Manhasset, NY)• City Hall (New York, NY)• Da Umberto (New York, NY)• David Burke Fromagerie (Rumson, NJ)• David Burke Kitchen (New York, NY)• David Burke Prime (Mashantucket, CT)• David Burke Townhouse (New York, NY)• David Burke’s Primehouse (Chicago, IL)• Empire Steak House (New York, NY)• Fishtail by David Burke (New York, NY)• Garwood Lounge & Piano Bar (Fisher Island, FL)• Gigino Trattoria (New York, NY)• Giumarello’s (Westmont, NJ)• J & G Steakhouse (Washington D.C.)• Jean Georges (New York, NY)• Jungsik (New York, NY)• Le Bernardin (New York, NY)• La Dorada (Coral Gables, FL)• MEGU Midtown (New York, NY)• Mr. K’s (New York, NY)
RESTAURANT, FOOD & BEVERAGE MARKET RESEARCH HANDBOOK 2013
• 628 •
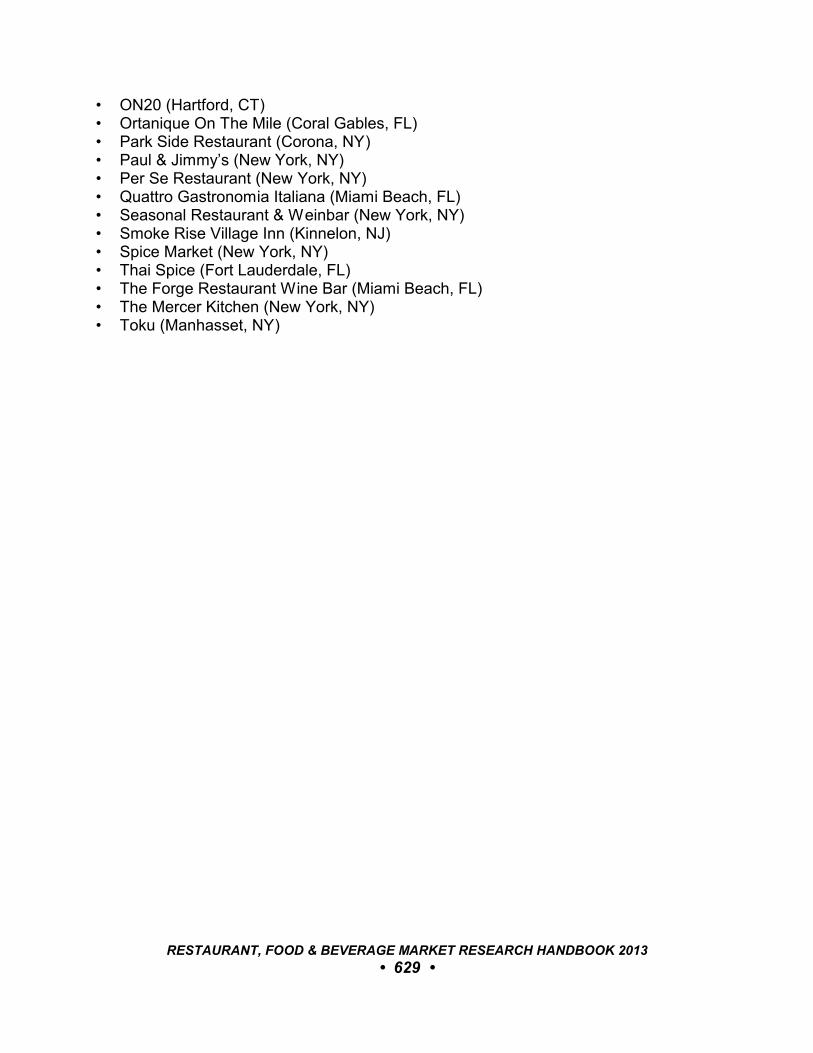
• ON20 (Hartford, CT)• Ortanique On The Mile (Coral Gables, FL)• Park Side Restaurant (Corona, NY)• Paul & Jimmy’s (New York, NY)• Per Se Restaurant (New York, NY)• Quattro Gastronomia Italiana (Miami Beach, FL)• Seasonal Restaurant & Weinbar (New York, NY)• Smoke Rise Village Inn (Kinnelon, NJ)• Spice Market (New York, NY)• Thai Spice (Fort Lauderdale, FL)• The Forge Restaurant Wine Bar (Miami Beach, FL)• The Mercer Kitchen (New York, NY)• Toku (Manhasset, NY)
RESTAURANT, FOOD & BEVERAGE MARKET RESEARCH HANDBOOK 2013
• 629 •
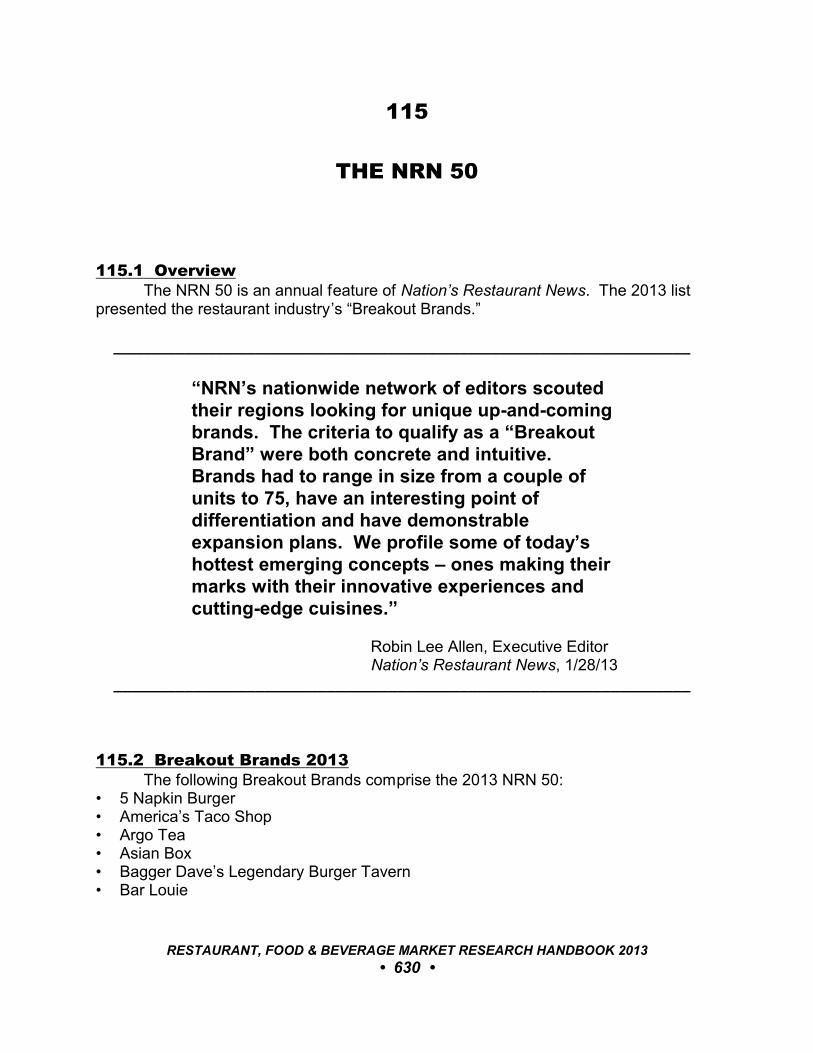
115
THE NRN 50
115.1 OverviewThe NRN 50 is an annual feature of Nation’s Restaurant News. The 2013 list
presented the restaurant industry’s “Breakout Brands.”
_________________________________________________________________
“NRN’s nationwide network of editors scoutedtheir regions looking for unique up-and-comingbrands. The criteria to qualify as a “BreakoutBrand” were both concrete and intuitive. Brands had to range in size from a couple ofunits to 75, have an interesting point ofdifferentiation and have demonstrableexpansion plans. We profile some of today’shottest emerging concepts – ones making theirmarks with their innovative experiences andcutting-edge cuisines.”
Robin Lee Allen, Executive Editor Nation’s Restaurant News, 1/28/13
_________________________________________________________________
115.2 Breakout Brands 2013The following Breakout Brands comprise the 2013 NRN 50:
• 5 Napkin Burger• America’s Taco Shop• Argo Tea• Asian Box• Bagger Dave’s Legendary Burger Tavern• Bar Louie
RESTAURANT, FOOD & BEVERAGE MARKET RESEARCH HANDBOOK 2013
• 630 •
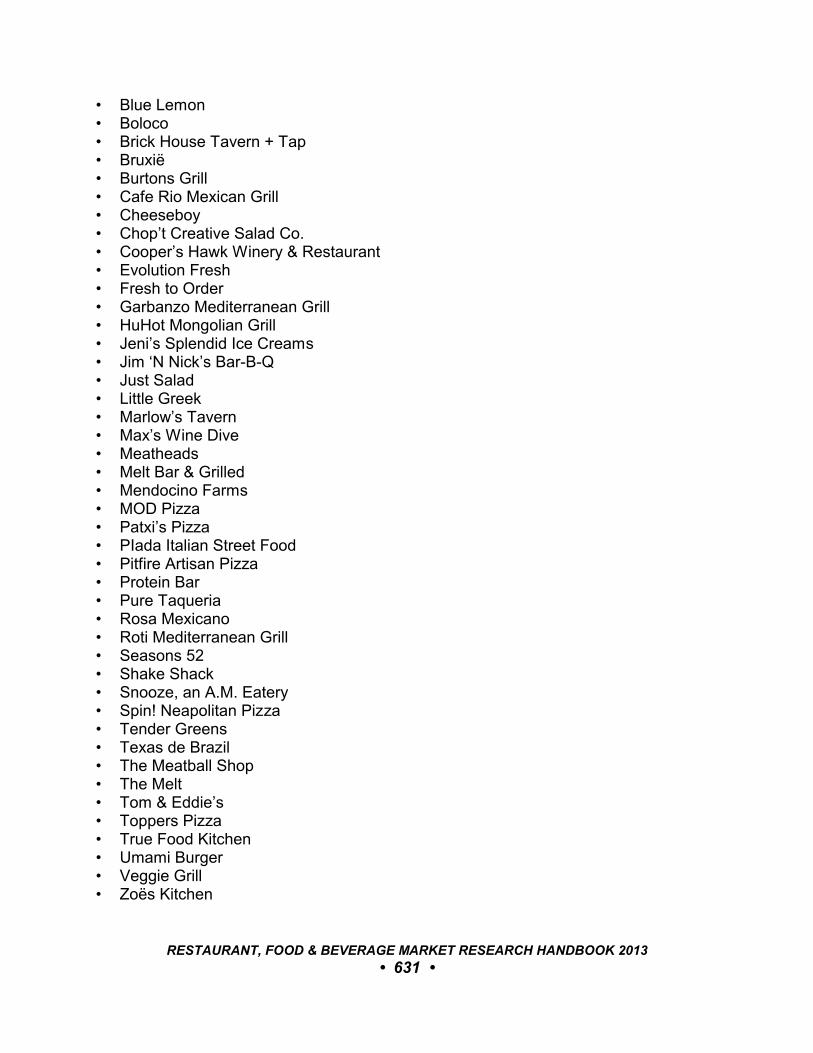
• Blue Lemon• Boloco• Brick House Tavern + Tap• Bruxië• Burtons Grill• Cafe Rio Mexican Grill• Cheeseboy• Chop’t Creative Salad Co.• Cooper’s Hawk Winery & Restaurant• Evolution Fresh• Fresh to Order• Garbanzo Mediterranean Grill• HuHot Mongolian Grill• Jeni’s Splendid Ice Creams• Jim ‘N Nick’s Bar-B-Q• Just Salad• Little Greek• Marlow’s Tavern• Max’s Wine Dive• Meatheads• Melt Bar & Grilled• Mendocino Farms• MOD Pizza• Patxi’s Pizza• PIada Italian Street Food• Pitfire Artisan Pizza• Protein Bar• Pure Taqueria• Rosa Mexicano• Roti Mediterranean Grill• Seasons 52• Shake Shack• Snooze, an A.M. Eatery• Spin! Neapolitan Pizza• Tender Greens• Texas de Brazil• The Meatball Shop• The Melt• Tom & Eddie’s• Toppers Pizza• True Food Kitchen• Umami Burger• Veggie Grill• Zoës Kitchen
RESTAURANT, FOOD & BEVERAGE MARKET RESEARCH HANDBOOK 2013
• 631 •
115.3 Market ResourcesNation’s Restaurant News, 249 W. 17th Street, New York, NY 10011. (212) 204-4200.(www.nrn.com)
RESTAURANT, FOOD & BEVERAGE MARKET RESEARCH HANDBOOK 2013
• 632 •
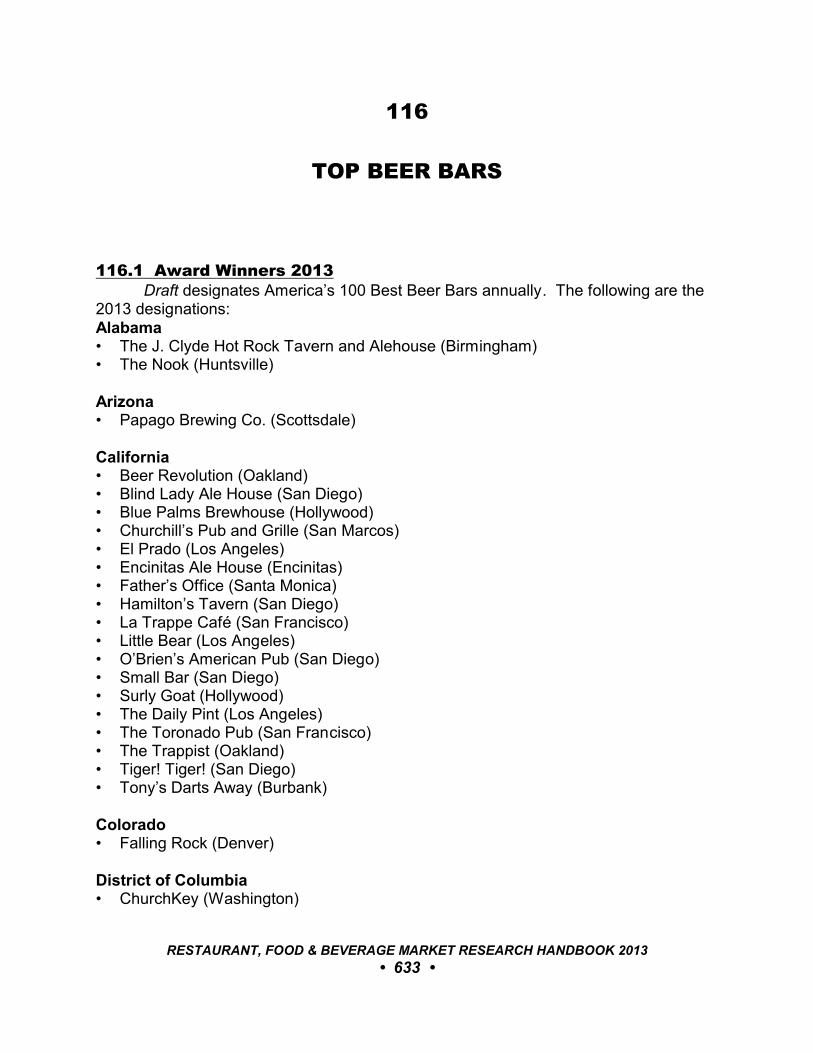
116
TOP BEER BARS
116.1 Award Winners 2013Draft designates America’s 100 Best Beer Bars annually. The following are the
2013 designations:Alabama• The J. Clyde Hot Rock Tavern and Alehouse (Birmingham)• The Nook (Huntsville)
Arizona• Papago Brewing Co. (Scottsdale)
California• Beer Revolution (Oakland)• Blind Lady Ale House (San Diego)• Blue Palms Brewhouse (Hollywood)• Churchill’s Pub and Grille (San Marcos)• El Prado (Los Angeles)• Encinitas Ale House (Encinitas)• Father’s Office (Santa Monica)• Hamilton’s Tavern (San Diego)• La Trappe Café (San Francisco)• Little Bear (Los Angeles)• O’Brien’s American Pub (San Diego)• Small Bar (San Diego)• Surly Goat (Hollywood)• The Daily Pint (Los Angeles)• The Toronado Pub (San Francisco)• The Trappist (Oakland)• Tiger! Tiger! (San Diego)• Tony’s Darts Away (Burbank)
Colorado• Falling Rock (Denver)
District of Columbia• ChurchKey (Washington)
RESTAURANT, FOOD & BEVERAGE MARKET RESEARCH HANDBOOK 2013
• 633 •
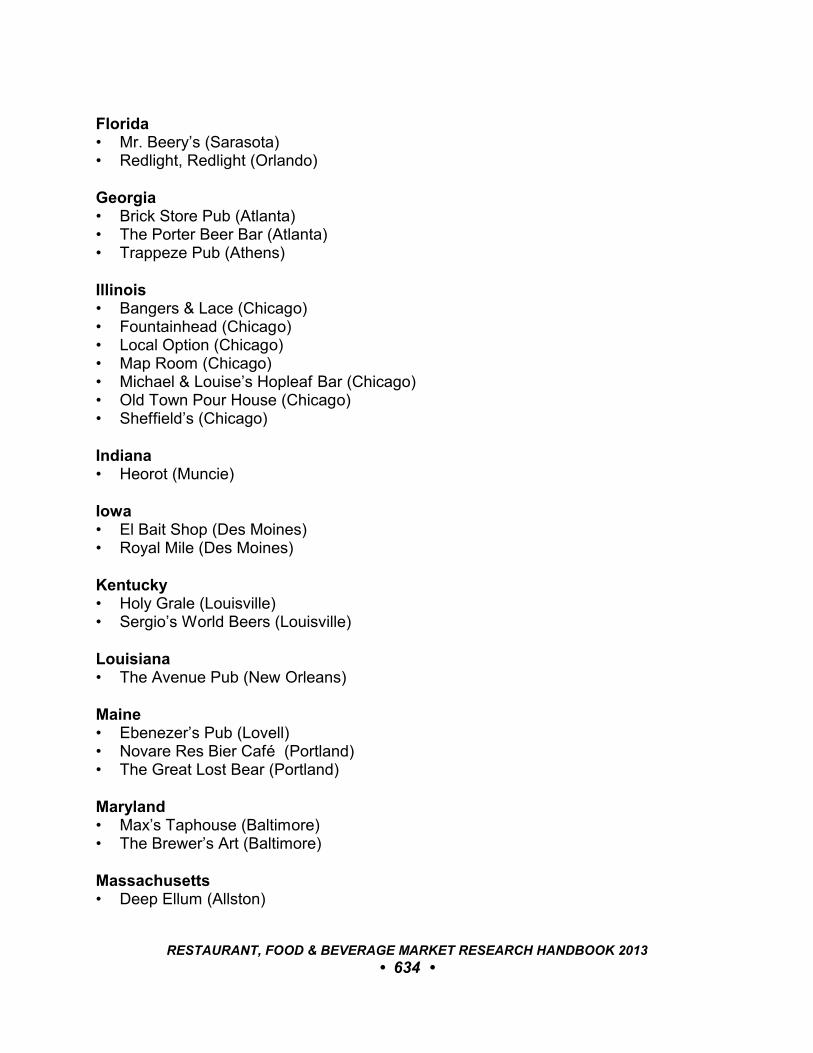
Florida• Mr. Beery’s (Sarasota)• Redlight, Redlight (Orlando)
Georgia• Brick Store Pub (Atlanta)• The Porter Beer Bar (Atlanta)• Trappeze Pub (Athens)
Illinois• Bangers & Lace (Chicago)• Fountainhead (Chicago)• Local Option (Chicago)• Map Room (Chicago)• Michael & Louise’s Hopleaf Bar (Chicago)• Old Town Pour House (Chicago)• Sheffield’s (Chicago)
Indiana• Heorot (Muncie)
Iowa• El Bait Shop (Des Moines)• Royal Mile (Des Moines)
Kentucky• Holy Grale (Louisville)• Sergio’s World Beers (Louisville)
Louisiana• The Avenue Pub (New Orleans)
Maine• Ebenezer’s Pub (Lovell)• Novare Res Bier Café (Portland)• The Great Lost Bear (Portland)
Maryland• Max’s Taphouse (Baltimore)• The Brewer’s Art (Baltimore)
Massachusetts• Deep Ellum (Allston)
RESTAURANT, FOOD & BEVERAGE MARKET RESEARCH HANDBOOK 2013
• 634 •

• The Publick House (Brookline)• Sunset Grill & Tap (Allston)
Michigan• Ashley’s (Ann Arbor)• Clubhouse BFD (Rochester Hills)• Hopcat (Grand Rapids)• The Mitten Bar (Ludington)
Minnesota• Republic (Minneapolis)• The Happy Gnome (Saint Paul)
Missouri• Bridge (St. Louis)• International Tap House (St. Louis)• The Foundry (Kansas City)
Nebraska• Crescent Moon Ale House (Omaha)• Krug Park (Omaha)
New York• Bierkraft (Brooklyn)• Blind Tiger (New York)• Rattle N Hum (New York)• Spuyten Duyvil (Brooklyn)• Top Hops Beer Shop (New York)
North Carolina• Brewmasters Bar & Grill (Raleigh)• Busy Bee Café (Raleigh)• Growlers Pourhouse (Charlotte)• Harrika’s Brew Haus (Swansboro)• Thirsty Monk (Asheville)
Ohio• Buckeye Beer Engine (Lakewood)• La Cave Du Vin (Cleveland)• McNulty’s Bier Markt (Cleveland)
Oklahoma• TapWerks Alehouse & Café (Oklahoma City)
RESTAURANT, FOOD & BEVERAGE MARKET RESEARCH HANDBOOK 2013
• 635 •
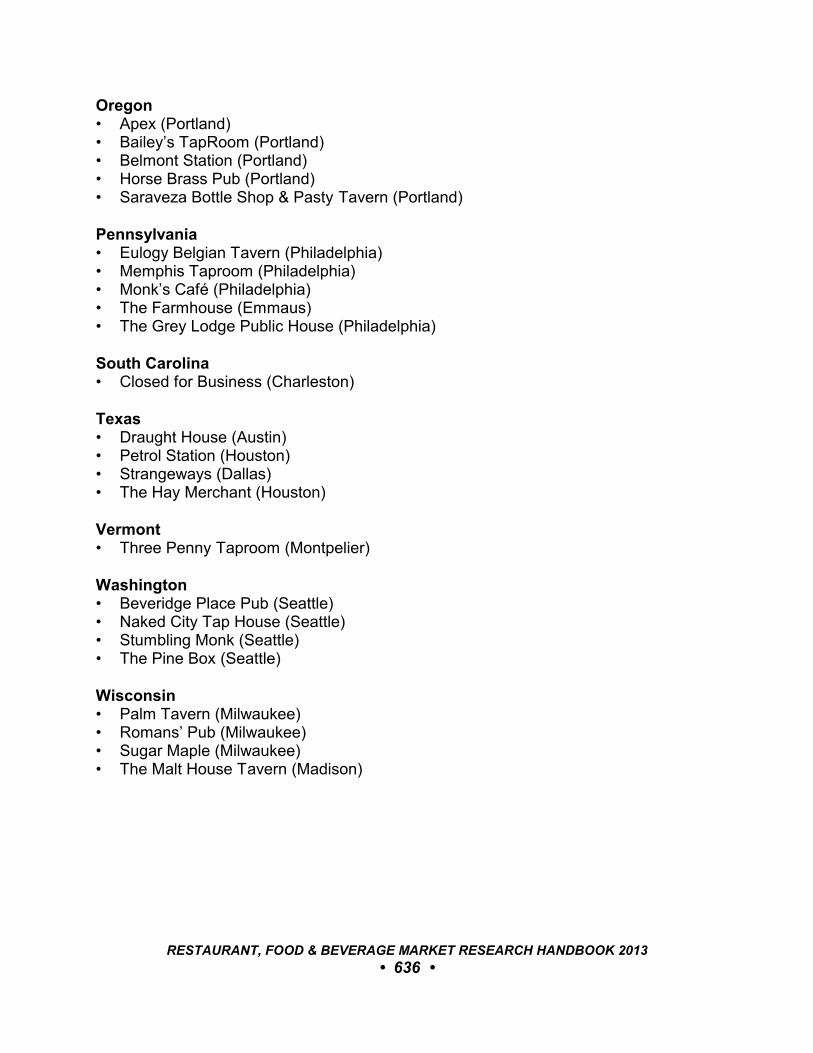
Oregon• Apex (Portland)• Bailey’s TapRoom (Portland)• Belmont Station (Portland)• Horse Brass Pub (Portland)• Saraveza Bottle Shop & Pasty Tavern (Portland)
Pennsylvania• Eulogy Belgian Tavern (Philadelphia)• Memphis Taproom (Philadelphia)• Monk’s Café (Philadelphia)• The Farmhouse (Emmaus)• The Grey Lodge Public House (Philadelphia)
South Carolina• Closed for Business (Charleston)
Texas• Draught House (Austin)• Petrol Station (Houston)• Strangeways (Dallas)• The Hay Merchant (Houston)
Vermont• Three Penny Taproom (Montpelier)
Washington• Beveridge Place Pub (Seattle)• Naked City Tap House (Seattle)• Stumbling Monk (Seattle)• The Pine Box (Seattle)
Wisconsin• Palm Tavern (Milwaukee)• Romans’ Pub (Milwaukee)• Sugar Maple (Milwaukee)• The Malt House Tavern (Madison)
RESTAURANT, FOOD & BEVERAGE MARKET RESEARCH HANDBOOK 2013
• 636 •

117
TOP RESTAURANT BRANDS
117.1 OverviewSince 2003, The EquiTrend® study by Harris Poll (www.harrisinteractive.com)
has rated U.S. restaurant brands based on familiarity, quality, and purchaseconsideration.
117.2 Top Brand Scores 2011The 2011 EquiTrend® study was conducted online among 25,099 U.S.
consumers ages 15 and older. The following were the top ranked U.S. restaurantbrands:Casual-Dining Chains• Panera Bread: 69.7• Longhorn Steakhouse: 65.4• Bonefish Grill: 65.1• Applebee’s: 62.9• IHOP (International House of
Pancakes): 62.6
Quick-Service Chains• Subway: 73.1• Dairy Queen: 69.6• Wendy’s: 68.7• Five Guys Burgers and Fries: 68.3• Chick-fil-A: 66.2• McDonald’s: 64.7• Burger King: 62.8
117.3 Market ResourcesHarris Interactive, 60 Corporate Woods, Rochester, NY 14623. (585) 272-8400. (www.harrisinteractive.com)
RESTAURANT, FOOD & BEVERAGE MARKET RESEARCH HANDBOOK 2013
• 637 •
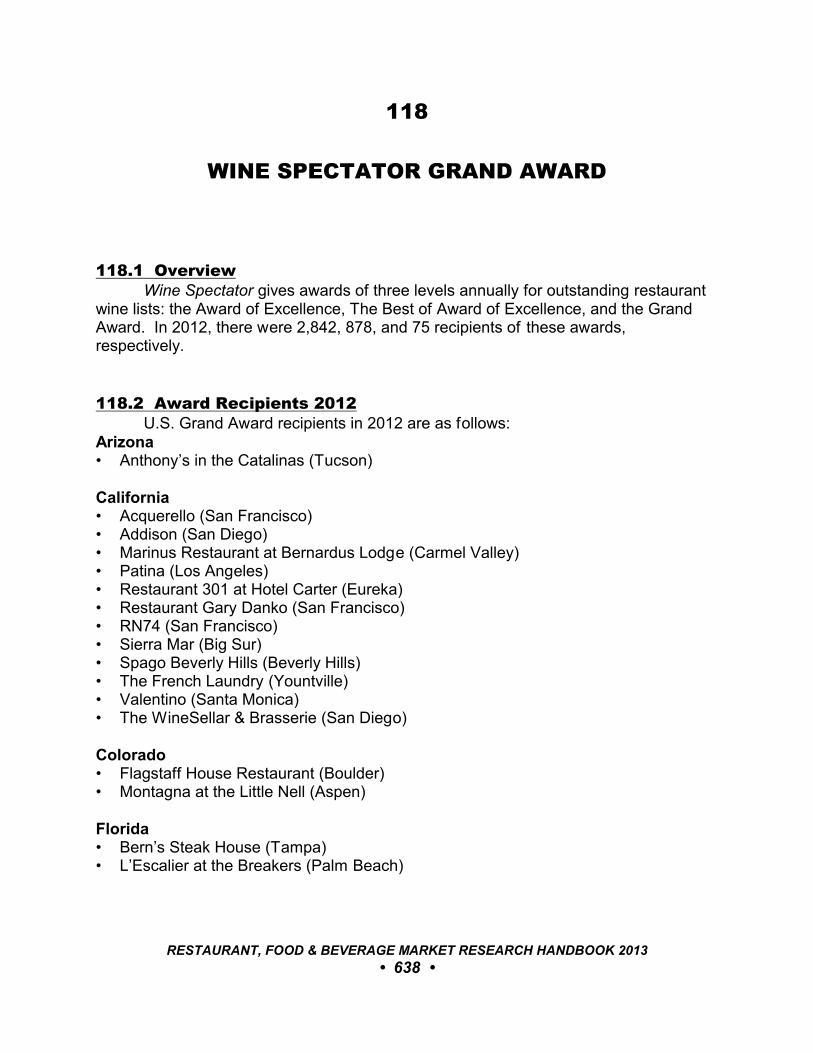
118
WINE SPECTATOR GRAND AWARD
118.1 OverviewWine Spectator gives awards of three levels annually for outstanding restaurant
wine lists: the Award of Excellence, The Best of Award of Excellence, and the GrandAward. In 2012, there were 2,842, 878, and 75 recipients of these awards,respectively.
118.2 Award Recipients 2012U.S. Grand Award recipients in 2012 are as follows:
Arizona• Anthony’s in the Catalinas (Tucson)
California• Acquerello (San Francisco)• Addison (San Diego)• Marinus Restaurant at Bernardus Lodge (Carmel Valley)• Patina (Los Angeles)• Restaurant 301 at Hotel Carter (Eureka)• Restaurant Gary Danko (San Francisco)• RN74 (San Francisco) • Sierra Mar (Big Sur)• Spago Beverly Hills (Beverly Hills)• The French Laundry (Yountville)• Valentino (Santa Monica)• The WineSellar & Brasserie (San Diego)
Colorado• Flagstaff House Restaurant (Boulder)• Montagna at the Little Nell (Aspen)
Florida• Bern’s Steak House (Tampa)• L’Escalier at the Breakers (Palm Beach)
RESTAURANT, FOOD & BEVERAGE MARKET RESEARCH HANDBOOK 2013
• 638 •
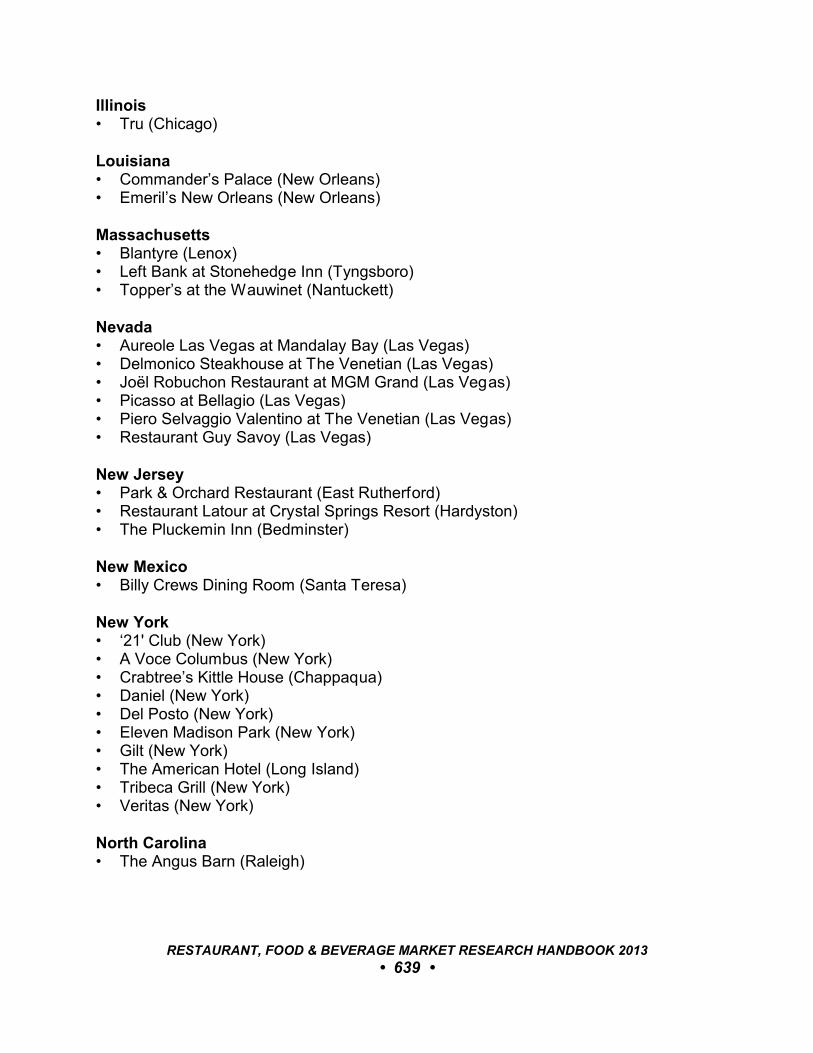
Illinois• Tru (Chicago)
Louisiana• Commander’s Palace (New Orleans)• Emeril’s New Orleans (New Orleans)
Massachusetts• Blantyre (Lenox)• Left Bank at Stonehedge Inn (Tyngsboro)• Topper’s at the Wauwinet (Nantuckett)
Nevada• Aureole Las Vegas at Mandalay Bay (Las Vegas)• Delmonico Steakhouse at The Venetian (Las Vegas)• Joël Robuchon Restaurant at MGM Grand (Las Vegas)• Picasso at Bellagio (Las Vegas)• Piero Selvaggio Valentino at The Venetian (Las Vegas)• Restaurant Guy Savoy (Las Vegas)
New Jersey• Park & Orchard Restaurant (East Rutherford)• Restaurant Latour at Crystal Springs Resort (Hardyston)• The Pluckemin Inn (Bedminster)
New Mexico• Billy Crews Dining Room (Santa Teresa)
New York• ‘21' Club (New York)• A Voce Columbus (New York)• Crabtree’s Kittle House (Chappaqua)• Daniel (New York)• Del Posto (New York)• Eleven Madison Park (New York)• Gilt (New York)• The American Hotel (Long Island)• Tribeca Grill (New York)• Veritas (New York)
North Carolina• The Angus Barn (Raleigh)
RESTAURANT, FOOD & BEVERAGE MARKET RESEARCH HANDBOOK 2013
• 639 •
Tennessee• Blackberry Farm (Walland)
Texas• Pappas Bros. Steakhouse (Dallas)• Pappas Bros. Steakhouse (Houston)
Virginia• The Inn at Little Washington (Washington)
Washington• Canlis Restaurant (Seattle)• Wild Ginger (Seattle)
RESTAURANT, FOOD & BEVERAGE MARKET RESEARCH HANDBOOK 2013
• 640 •
PART X: FOOD & BEVERAGE DESIGNATIONS
RESTAURANT, FOOD & BEVERAGE MARKET RESEARCH HANDBOOK 2013
• 641 •
119
NATIONAL FOOD & BEVERAGE HOLIDAYS
119.1 OverviewThere are hundreds of designations of days, weeks, and months that recognize
a specific food or beverage. Some designations are made by official proclamationwhile others are de facto designations; none have the force of the law. Most officialfood holiday designations are promulgated by the U.S. Chamber of Commerce, tradeassociations, or public relations firms as a promotional vehicle. The President of theUnited States declares about 150 commemorative days each year; proclamation offood days by the President are rare.
The following are lists of national food & beverage designations recognized inthe United States.
119.2 National Food & Beverage Days
January• January 1: Bloody Mary Day• January 1: Apple Gifting Day• January 2: National Cream Puff Day• January 3: Chocolate-Filled Cherry Day• January 4: National Spaghetti Day• January 5: National Whipped Cream Day• January 6: Bean Day• January 6: National Shortbread Day• January 7: National Tempura Day• January 8: English Toffee Day• January 9: National Apricot Day• January 10: Bittersweet Chocolate Day• January 11: Hot Toddy Day• January 11: Milk Day• January 12: Curried Chicken Day• January 13: National Peach Melba Day• January 14: National Hot Pastrami Sandwich Day• January 15: Strawberry Ice Cream Day• January 16: International Hot & Spicy Food Day• January 16: National Fig Newton Day
RESTAURANT, FOOD & BEVERAGE MARKET RESEARCH HANDBOOK 2013
• 642 •
• January 17: Hot-Buttered Rum Day• January 18: Peking Duck Day• January 19: National Popcorn Day• January 20: National Buttercrunch Day• January 20: National Cheese Lover’s Day• January 20: National Coffee Break Day• January 20: National Granola Bar Day• January 21: New England Clam Chowder Day• January 22: National Blonde Brownie Day• January 23: National Pie Day• January 24: National Peanut Butter Day• January 25: National Irish Coffee Day• January 26: National Pistachio Day• January 27: Chocolate Cake Day• January 28: National Blueberry Pancake Day• January 29: National Corn Chip Day• January 30: National Croissant Day• January 31: Brandy Alexander Day
February• February 1: Baked Alaska Day• February 2: Heavenly Hash Day• February 3: Carrot Cake Day• February 4: Homemade Soup Day• February 5: National Chocolate Fondue Day• February 6: National Frozen Yogurt Day• February 7: National Fettuccine Alfredo Day• February 8: National Molasses Bar Day• February 9: National Bagels and Lox Day• February 10: National Cream Cheese Brownie Day• February 11: National Peppermint Patty Day• February 12: National Plum Pudding Day• February 13: National Tortini Day• February 14: National Cream Filled Chocolates Day• February 15: International Gumdrop Day• February 16: National Almond Day• February 17: National Cafe Au Lait Day• February 18: National Crab Stuffed Flounder Day• February 19: National Chocolate Mint Day• February 20: National Cherry Pie Day• February 21: National Sticky Bun Day• February 22: National Margarita Day• February 23: National Banana Bread Day• February 24: National Tortilla Chip Day
RESTAURANT, FOOD & BEVERAGE MARKET RESEARCH HANDBOOK 2013
• 643 •
• February 25 National Chocolate Covered Peanuts Day• February 26: National Pistachio Day• February 27: National Kahlua Day• February 28: National Chocolate Souffle Day
March• March 1: National Peanut Butter Lover’s Day• March 2: National Banana Cream Pie Day• March 3: National Mulled Wine Day• March 4: National Pound Cake Day• March 5: National Cheese Doodle Day• March 6: National Frozen Food Day• March 7: National Crown Roast of Pork Day• March 8: National Peanut Cluster Day• March 9: National Crabmeat Day• March 10: National Blueberry Popover Day• March 11: National Oatmeal-Nut Waffle Day• March 12: National Baked Scallops Day• March 13: National Coconut Torte Day• March 14: National Potato Chip Day• March 15: National Pears Helene Day• March 16: National Artichoke Hearts Day• March 17: National Green Beer Day• March 18: National Lacy Oatmeal Cookie Day• March 19: National Chocolate Carmel Day• March 20: National Ravioli Day• March 21: National French Bread Day• March 22: National Bavarian Crepes Day• March 23: National Chip and Dip Day• March 24: National Chocolate Covered Raisins Day• March 25: National Lobster Newburg Day• March 26: National Nougat Day• March 27: National Spanish Paella Day• March 28: National Black Forest Cake Day• March 28: Something On A Stick Day• March 29: National Lemon Chiffon Cake Day• March 30: Turkey Neck Soup Day• March 31: National Clams on the Half Shell Day• March 31: Oranges and Lemons Day• March 31: Tater Day
April• 1st Monday: Sweet Potato Day• Good Friday: National Hot Cross Bun Day
RESTAURANT, FOOD & BEVERAGE MARKET RESEARCH HANDBOOK 2013
• 644 •
• Easter: National Baked Ham with Pineapple Day• April 1: National Sourdough Bread Day• April 2: National Peanut Butter & Jelly Day• April 3: National Chocolate Moose Day• April 4: Chocolate Milk Powder Day• April 4: National Cordon Bleu Day• April 5: National Caramel Day & Raisin and Spice Bar Day• April 6: Fresh Tomato Day• April 6: National Caramel Popcorn Day• April 7: National Coffee Cake Day• April 8: Milk in Glass Bottles Day• April 8: National Empanada Day• April 9: National Chinese Almond Cookie Day• April 10: Cinnamon Crescent Day• April 11: National Cheese Fondue Day• April 12: National Licorice Day• April 12: Grilled Cheese Sandwich Day• April 13: National Peach Cobbler Day• April 14: National Pecan Day• April 15: Glazed Spiral Ham Day• April 16: National Eggs Benedict Day• April 16: Day of the Mushroom• April 17: National Cheese Ball Day• April 18: National Animal Cracker Day• April 19: Garlic Day• April 19: Amaretto Day• April 20: Pineapple Upside Down Cake Day• April 20: Lima Bean Respect Day• April 21: Chocolate-Covered Cashew Truffle Day• April 22: Jelly Bean Day• April 23: Picnic Day• April 24: Pigs-in-a-Blanket Day• April 25: National Zucchini Bread Day• April 26: National Pretzel Day• April 27: Prime Rib Day• April 28: National Blueberry Pie Day• April 29: National Shrimp Scampi Day• April 30: National Oatmeal Cookie Day• April 30: Raisin Day
May• May 1: National Chocolate Parfait Day• May 2: National Truffles Day• May 3: National Raspberry Tart Day
RESTAURANT, FOOD & BEVERAGE MARKET RESEARCH HANDBOOK 2013
• 645 •

• May 4: National Orange Juice Day• May 4: National Homebrew Day• May 4: National Candied Orange Peel Day• May 5: National Chocolate Custard Day• May 5: Totally Chipotle Day• May 5: National Hoagie Day• May 6: National Crepes Suzette Day• May 6: International No Diet Day• May 6: National Beverage Day• May 7: National Roast Leg of Lamb Day• May 8: National Coconut Cream Pie Day• May 8: National Empanada Day• May 9: National Butterscotch Brownie Day• May 10: National Shrimp Day• May 11: National Mocha Torte Day• May 11: Eat What You Want Day• May 12: National Nutty Fudge Day• May 13: National Apple Pie Day• May 13: National Fruit Cocktail Day• May 14: National Buttermilk Biscuit Day• May 15: National Chocolate Chip Day• May 16: National Coquilles St. Jacques Day• May 17: National Cherry Cobbler Day• May 18: National Cheese Soufflé Day• May 19: National Devil’s Food Cake Day• May 20: National Quiche Lorraine Day• May 20: Pick Strawberries Day• May 21: National Strawberries & Cream Day• May 22: National Vanilla Pudding Day• May 23: National Taffy Day• May 24: National Escargot Day• May 25: National Wine Day• May 25: National Brown Bag it Day• May 26: National Blueberry Cheesecake Day• May 26: National Cherry Dessert Day• May 27: National Grape Popsicle Day• May 28: National Brisket Day• May 28: National Hamburger Day• May 29: National Coq Au Vin Day• May 30: National Mint Julep Day• May 30: National Macaroon Day
RESTAURANT, FOOD & BEVERAGE MARKET RESEARCH HANDBOOK 2013
• 646 •
June• 1st Friday: National Doughnut Day• June 1: National Hazelnut Cake Day• June 2: National Chocolate Macaroon Day• June 3: National Rocky Road Day• June 4: National Frozen Yogurt Day• June 5: National Gingerbread Day• June 6: National Applesauce Cake Day• June 7: National Chocolate Ice Cream Day• June 9: National Strawberry Rhubarb Pie Day• June 10: National Black Cow Day• June 11: National German Chocolate Day• June 12: National Peanut Butter Cookie Day• June 13: National Lobster Day• June 14: National Strawberry Shortcake Day• June 16: National Fudge Day• June 17: National Apple Streudel Day• June 18: National Cherry Tart Day• June 19: National Martini Day• June 20: National Vanilla Milkshake Day• June 21: National Peaches & Cream Day• June 22: National Chocolate Eclair Day• June 23: National Pecan Sandy Day• June 24: National Creamy Pralines Day• June 25: National Strawberry Parfait Day• June 26: National Chocolate Pudding Day• June 27: National Orange Blossom Day• June 28: National Tapioca Day• June 29: National Almond Butter Crunch Day• June 30: National Ice Cream Soda Day
July• 3rd Sunday: Sundae Day• July 1: Creative Ice Cream Flavor Day• July 1: National Gingersnap Day• July 2: National Anisette Day• July 3: National Chocolate Wafer Day• July 3: Eat Beans Day• July 4: National Barbecued Spareribs Day• July 4: Caesar Salad Birthday• July 4: Sidewalk Egg Frying Day• July 5: National Apple Turnover Day• July 5: Graham Cracker Day• July 6: National Fried Chicken Day
RESTAURANT, FOOD & BEVERAGE MARKET RESEARCH HANDBOOK 2013
• 647 •
• July 7: National Strawberry Sundae Day• July 7: Chocolate Day• July 7: Macaroni day• July 7: Ice Cream Cone Day• July 8: National Milk Chocolate with Almonds Day• July 9: National Sugar Cookie Day• July 10: National Piña Colada Day• July 11: National Blueberry Muffin Day• July 11: Vegetarian Food Day• July 12: National Pecan Pie Day• July 12: National Blueberry Muffin Day• July 12: Eat Your Jello Day• July 13: National Ice Cream Day• July 13: National French Fries Day• July 14: National Grand Marnier Day• July 15: National Tapioca Pudding Day• July 15: Gummi Worm Day• July 16: National Corn Fritters Day• July 16: Ice Cream Sundae Day• July 16: Fresh Spinach Day• July 16: National Ice Cream Day• July 17: National Peach Ice Cream Day• July 18: National Caviar Day• July 19: National Daiquiri Day• July 20: National Lollipop Day• July 20: National Ice Cream Soda Day• July 20: Fortune Cookie Day • July 21: National Junk Food Day• July 21: National Creme Brulee Day • July 22: National Penuche Fudge Day• July 22: Maple Syrup Day• July 23: National Vanilla Ice Cream Day• July 23: National Hot Dog Day• July 24: National Tequila Day• July 25: National Hot Fudge Sundae Day• July 26: National Coffee Milkshake Day• July 27: National Scotch Day• July 27: National Cream Brulee Day • July 28: National Milk Chocolate Day• July 29: National Lasagna Day• July 30: National Cheesecake Day• July 31: Cotton Candy Day• July 31: Jump for Jelly Beans Day• July 31: National Raspberry Cake Day
RESTAURANT, FOOD & BEVERAGE MARKET RESEARCH HANDBOOK 2013
• 648 •
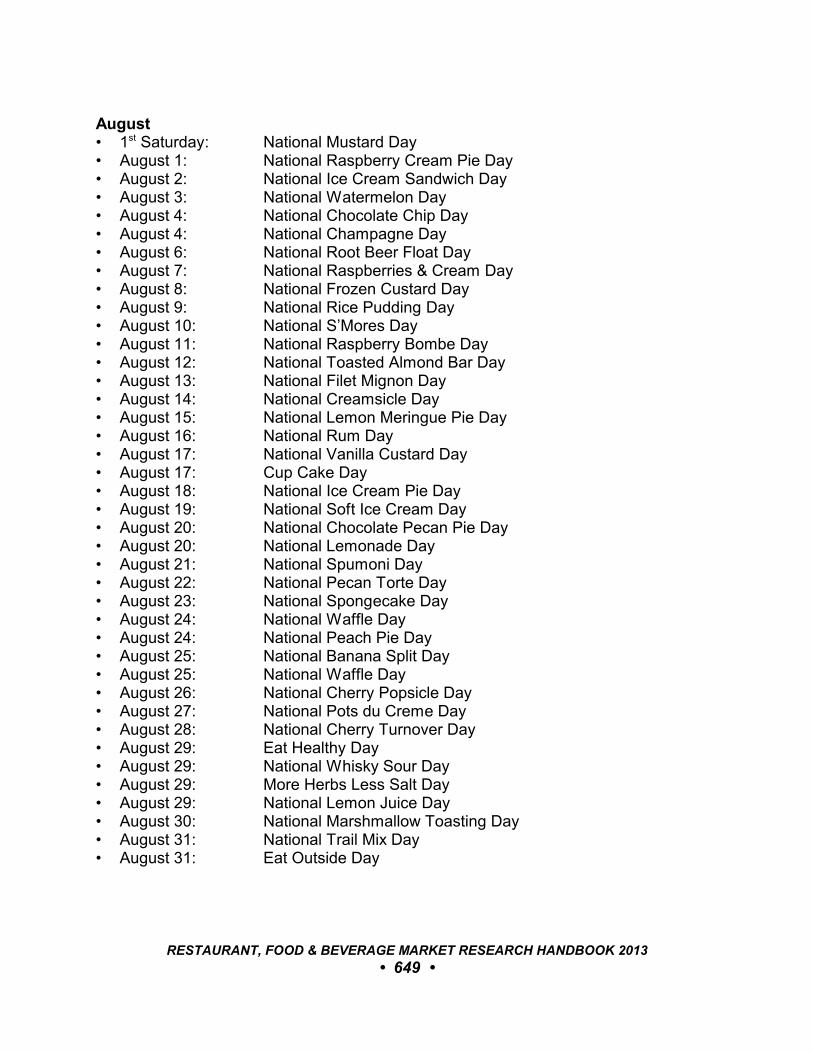
August• 1st Saturday: National Mustard Day• August 1: National Raspberry Cream Pie Day• August 2: National Ice Cream Sandwich Day• August 3: National Watermelon Day• August 4: National Chocolate Chip Day• August 4: National Champagne Day• August 6: National Root Beer Float Day• August 7: National Raspberries & Cream Day• August 8: National Frozen Custard Day• August 9: National Rice Pudding Day• August 10: National S’Mores Day• August 11: National Raspberry Bombe Day• August 12: National Toasted Almond Bar Day• August 13: National Filet Mignon Day• August 14: National Creamsicle Day• August 15: National Lemon Meringue Pie Day• August 16: National Rum Day• August 17: National Vanilla Custard Day• August 17: Cup Cake Day• August 18: National Ice Cream Pie Day• August 19: National Soft Ice Cream Day• August 20: National Chocolate Pecan Pie Day• August 20: National Lemonade Day• August 21: National Spumoni Day• August 22: National Pecan Torte Day• August 23: National Spongecake Day• August 24: National Waffle Day• August 24: National Peach Pie Day• August 25: National Banana Split Day• August 25: National Waffle Day• August 26: National Cherry Popsicle Day• August 27: National Pots du Creme Day• August 28: National Cherry Turnover Day• August 29: Eat Healthy Day• August 29: National Whisky Sour Day• August 29: More Herbs Less Salt Day• August 29: National Lemon Juice Day• August 30: National Marshmallow Toasting Day• August 31: National Trail Mix Day• August 31: Eat Outside Day
RESTAURANT, FOOD & BEVERAGE MARKET RESEARCH HANDBOOK 2013
• 649 •

September• September 1: National Cherry Popover Day• September 2: National Blueberry Popsicle Day• September 3: National Welsh Rarebit Day• September 4: National Macadamia Nut Day• September 4: Eat an Extra Dessert Day• September 5: National Cheese Pizza Day• September 6: National Coffee Ice Cream Day• September 7: National Napoleon Day• September 8: National Date-Nut Bread Day• September 9: National Steak au Poivre Day• September 11: National Hot Cross Bun Day• September 12: National Chocolate Milkshake Day• September 13: National Peanut Day• September 14: National Cream-Filled Donut Day• September 15: National Creme de Menthe Day• September 17: National Apple Dumpling Day• September 19: National Butterscotch Pudding Day• September 20: National Rum Punch Day• September 21: National Pecan Cookie Day• September 22: National White Chocolate Day• September 23: National Chocolate Day• September 24: National Cherries Jubilee Day• September 25: National Crab Newberg Day• September 26: National Pancake Day• September 27: National Chocolate Milk Day• September 27: National Corned Beef Hash Day• September 28: National Strawberry Cream Pie Day• September 29: National Mocha Day• September 30: National Mulled Cider Day
October• 2nd Friday: World Egg Day• October 1: World Vegetarian Day• October 2: National French Fried Scallops Day• October 3: National Carmel Custard Day• October 4: National Taco Day• October 5: National Apple Betty Day• October 6: National Noodle Day• October 7: National Frappe Day• October 8: National Fluffernutter Day• October 9: National Dessert Day• October 10: National Angel Food Cake Day• October 11: National Sausage Pizza Day
RESTAURANT, FOOD & BEVERAGE MARKET RESEARCH HANDBOOK 2013
• 650 •
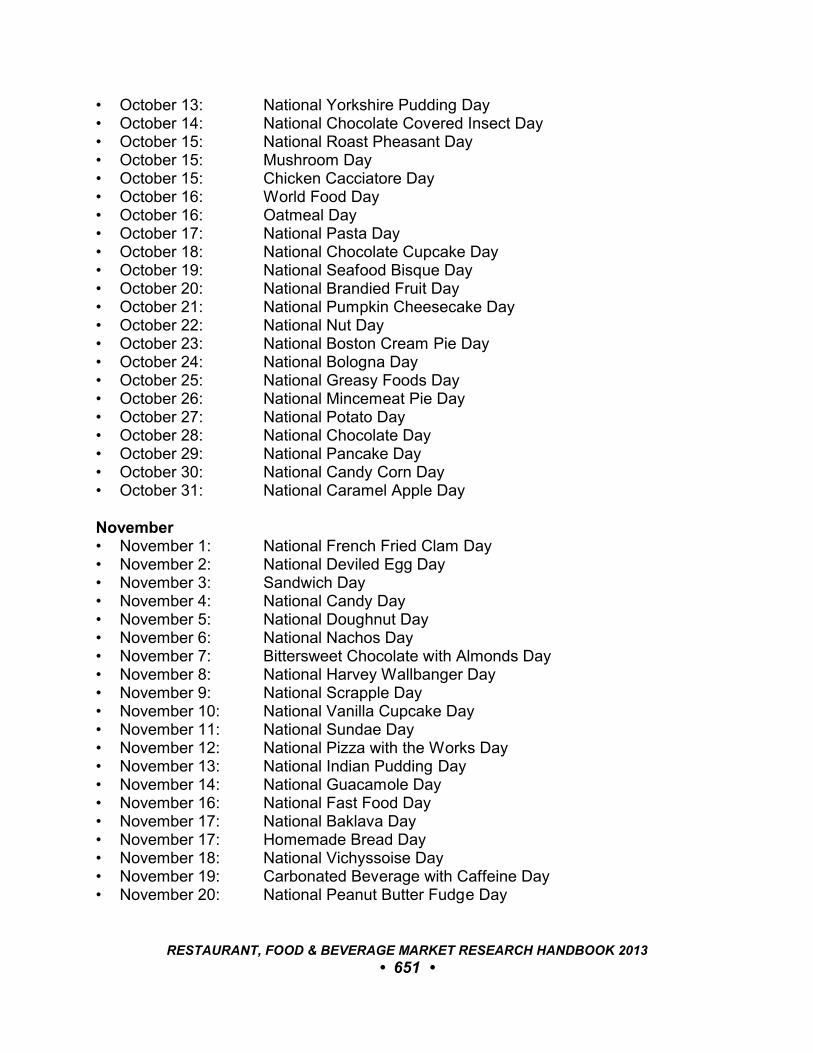
• October 13: National Yorkshire Pudding Day• October 14: National Chocolate Covered Insect Day• October 15: National Roast Pheasant Day• October 15: Mushroom Day• October 15: Chicken Cacciatore Day• October 16: World Food Day• October 16: Oatmeal Day• October 17: National Pasta Day• October 18: National Chocolate Cupcake Day• October 19: National Seafood Bisque Day• October 20: National Brandied Fruit Day• October 21: National Pumpkin Cheesecake Day• October 22: National Nut Day• October 23: National Boston Cream Pie Day• October 24: National Bologna Day• October 25: National Greasy Foods Day• October 26: National Mincemeat Pie Day• October 27: National Potato Day• October 28: National Chocolate Day• October 29: National Pancake Day• October 30: National Candy Corn Day• October 31: National Caramel Apple Day
November• November 1: National French Fried Clam Day• November 2: National Deviled Egg Day• November 3: Sandwich Day• November 4: National Candy Day• November 5: National Doughnut Day• November 6: National Nachos Day• November 7: Bittersweet Chocolate with Almonds Day• November 8: National Harvey Wallbanger Day• November 9: National Scrapple Day• November 10: National Vanilla Cupcake Day• November 11: National Sundae Day• November 12: National Pizza with the Works Day• November 13: National Indian Pudding Day• November 14: National Guacamole Day• November 16: National Fast Food Day• November 17: National Baklava Day• November 17: Homemade Bread Day• November 18: National Vichyssoise Day• November 19: Carbonated Beverage with Caffeine Day• November 20: National Peanut Butter Fudge Day
RESTAURANT, FOOD & BEVERAGE MARKET RESEARCH HANDBOOK 2013
• 651 •
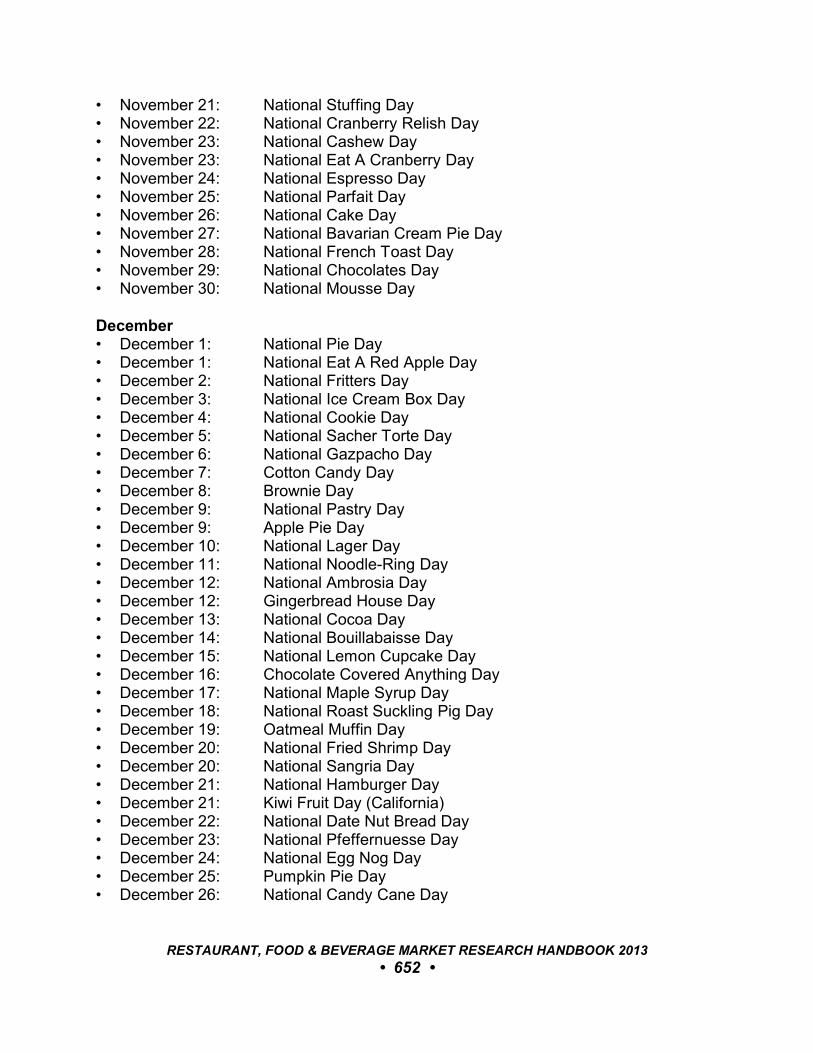
• November 21: National Stuffing Day• November 22: National Cranberry Relish Day• November 23: National Cashew Day• November 23: National Eat A Cranberry Day• November 24: National Espresso Day• November 25: National Parfait Day• November 26: National Cake Day• November 27: National Bavarian Cream Pie Day• November 28: National French Toast Day• November 29: National Chocolates Day• November 30: National Mousse Day
December• December 1: National Pie Day• December 1: National Eat A Red Apple Day• December 2: National Fritters Day• December 3: National Ice Cream Box Day• December 4: National Cookie Day• December 5: National Sacher Torte Day• December 6: National Gazpacho Day• December 7: Cotton Candy Day• December 8: Brownie Day• December 9: National Pastry Day• December 9: Apple Pie Day• December 10: National Lager Day• December 11: National Noodle-Ring Day• December 12: National Ambrosia Day• December 12: Gingerbread House Day• December 13: National Cocoa Day• December 14: National Bouillabaisse Day• December 15: National Lemon Cupcake Day• December 16: Chocolate Covered Anything Day• December 17: National Maple Syrup Day• December 18: National Roast Suckling Pig Day• December 19: Oatmeal Muffin Day• December 20: National Fried Shrimp Day• December 20: National Sangria Day• December 21: National Hamburger Day• December 21: Kiwi Fruit Day (California)• December 22: National Date Nut Bread Day• December 23: National Pfeffernuesse Day• December 24: National Egg Nog Day• December 25: Pumpkin Pie Day• December 26: National Candy Cane Day
RESTAURANT, FOOD & BEVERAGE MARKET RESEARCH HANDBOOK 2013
• 652 •
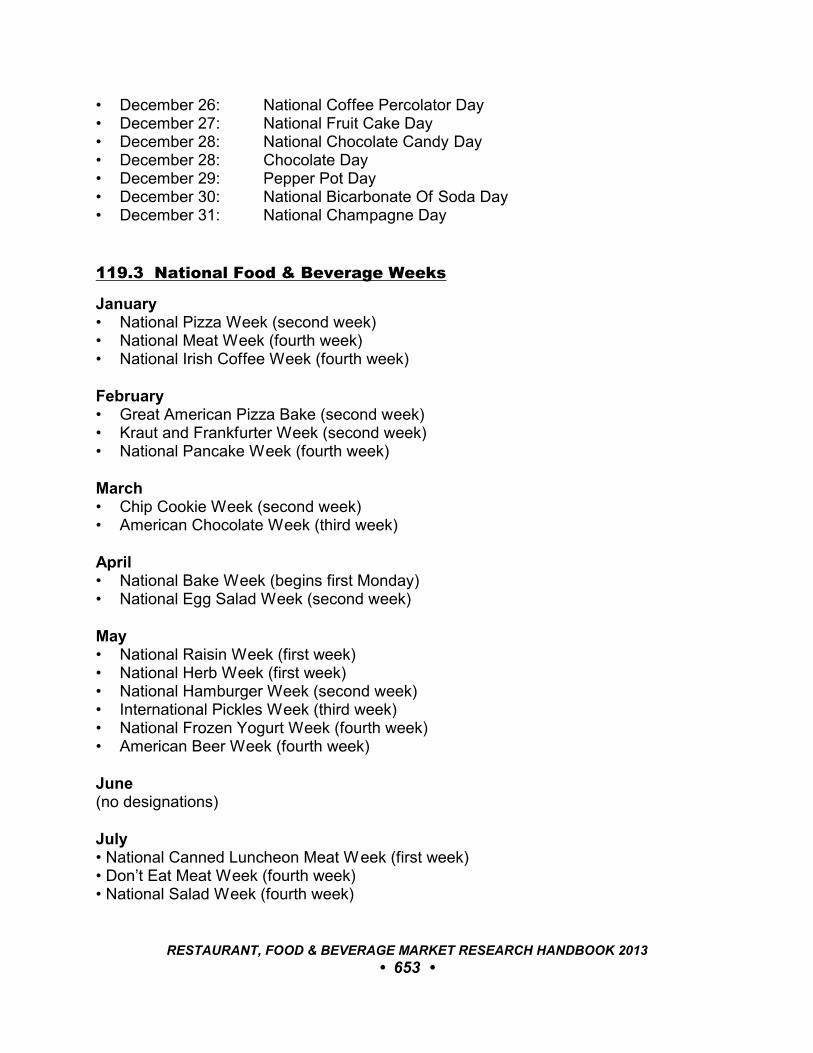
• December 26: National Coffee Percolator Day• December 27: National Fruit Cake Day• December 28: National Chocolate Candy Day• December 28: Chocolate Day• December 29: Pepper Pot Day• December 30: National Bicarbonate Of Soda Day• December 31: National Champagne Day
119.3 National Food & Beverage Weeks
January• National Pizza Week (second week)• National Meat Week (fourth week)• National Irish Coffee Week (fourth week)
February• Great American Pizza Bake (second week)• Kraut and Frankfurter Week (second week)• National Pancake Week (fourth week)
March• Chip Cookie Week (second week)• American Chocolate Week (third week)
April• National Bake Week (begins first Monday)• National Egg Salad Week (second week)
May• National Raisin Week (first week)• National Herb Week (first week)• National Hamburger Week (second week)• International Pickles Week (third week)• National Frozen Yogurt Week (fourth week)• American Beer Week (fourth week)
June(no designations)
July• National Canned Luncheon Meat Week (first week)• Don’t Eat Meat Week (fourth week)• National Salad Week (fourth week)
RESTAURANT, FOOD & BEVERAGE MARKET RESEARCH HANDBOOK 2013
• 653 •
August• National Apple Week (second week)
September• National Waffle Week (second week) • National Biscuit & Gravy Week (second week)• Vegetarian Awareness Week (second week) • National Wild Rice Week (fourth week)
October• National Chili Week (first week)• American Beer Week (second week) • National Food Bank Week (second week)• National School Lunch Week (second week)• National Bulk Foods Week (third week)• National Kraut Sandwich Week (third week)• Pickled Peppers Week (third week)• Chicken Soup for the Soul Week (fourth week)
November• National Fig Week (first week)
December• Cookie Cutter Week (first week) • Lager Beer Week (second week)
119.4 National Food & Beverage Months
January• Bread Machine Baking Month• Fat Free Living Month• National Candy Month• National Egg Month• National Hot Tea Month• National Meat Month• National Oatmeal Month• National Slow Cooking Month• National Soup Month• National Wheat Bread Month• Prune Breakfast Month
RESTAURANT, FOOD & BEVERAGE MARKET RESEARCH HANDBOOK 2013
• 654 •
February• Berry Fresh Month• Canned Food Month• Celebration of Chocolate Month• Great American Pies Month• National Cherry Month• National Fiber Focus Month• National Fondue Month• National Grapefruit Month• National Heart Healthy Month• National Hot Breakfast Month• National Snack Food Month• Potato Lover’s Month• Sweet Potato Month
March• Great American Meatout Month• International Hamburger & Pickle Month • Maple Sugar Month• National Celery Month• National Flour Month• National Frozen Food Month• National Nutrition Month• National Noodle Month• National Peanut Month• National Sauce Month• National Caffeine Awareness Month
April• Fresh Florida Tomato Month• National BLT Sandwich Month• National Garlic Month• National Grilled Cheese Sandwich Month• National Pecan Month• National Soyfoods Month• National Soft Pretzel Month
May• National Asparagus Month• National Barbecue Month• National Chocolate Custard Month• National Egg Month• National Gazpacho Aficionado Month• National Hamburger Month
RESTAURANT, FOOD & BEVERAGE MARKET RESEARCH HANDBOOK 2013
• 655 •
• National Mediterranean Diet Month• National Salad Month• National Salsa Month• National Strawberry Month
June• National Beef Steak Month• National Candy Month• National Dairy Month• National Fresh Fruit and Vegetables Month• National Frozen Yogurt Month• National Iced Tea Month• National Papaya Month• National Seafood Month• National Turkey Lovers Month
July• National Baked Bean Month• National Berries Month• National Bison Month• National Culinary Arts Month• National Grilling Month• National Hot Dog Month• National Ice Cream Month• National Pickle Month• National Picnic Month• National Watermelon Month
August• National Brownies At Brunch Month• National Catfish Month• National Panini Month• National Peach Month• National Sandwich Month
September• California Wine Month• Ethnic Foods Month• National Biscuit Month• National Bourbon Heritage Month• National Breakfast Month• National Chicken Month• National Honey Month• National Ice Cream Sandwich Month
RESTAURANT, FOOD & BEVERAGE MARKET RESEARCH HANDBOOK 2013
• 656 •
• National Mushroom Month• National Organic Harvest Month• National Papaya Month• National Potato Month• National Rice Month• Whole Grains Month
October• Eat Country Ham Month• Fair Trade Month• National Apple Month• National Applejack Month• National Caramel Month• National Chili Month• National Cookie Month• National Dessert Month• National Pasta Month• National Pickled Peppers Month• National Pizza Festival Month• National Popcorn Poppin’ Month• National Pork Month• National Pretzel Month• National Seafood Month• Vegetarian Awareness Month
November• Georgia Pecan Month• Good Nutrition Month• National Peanut Butter Lover’s Month• National Pepper Month• National Pomegranate Month• Raisin Bread Month• Vegan Month
December• National Egg Nog Month• National Fruit Cake Month
RESTAURANT, FOOD & BEVERAGE MARKET RESEARCH HANDBOOK 2013
• 657 •
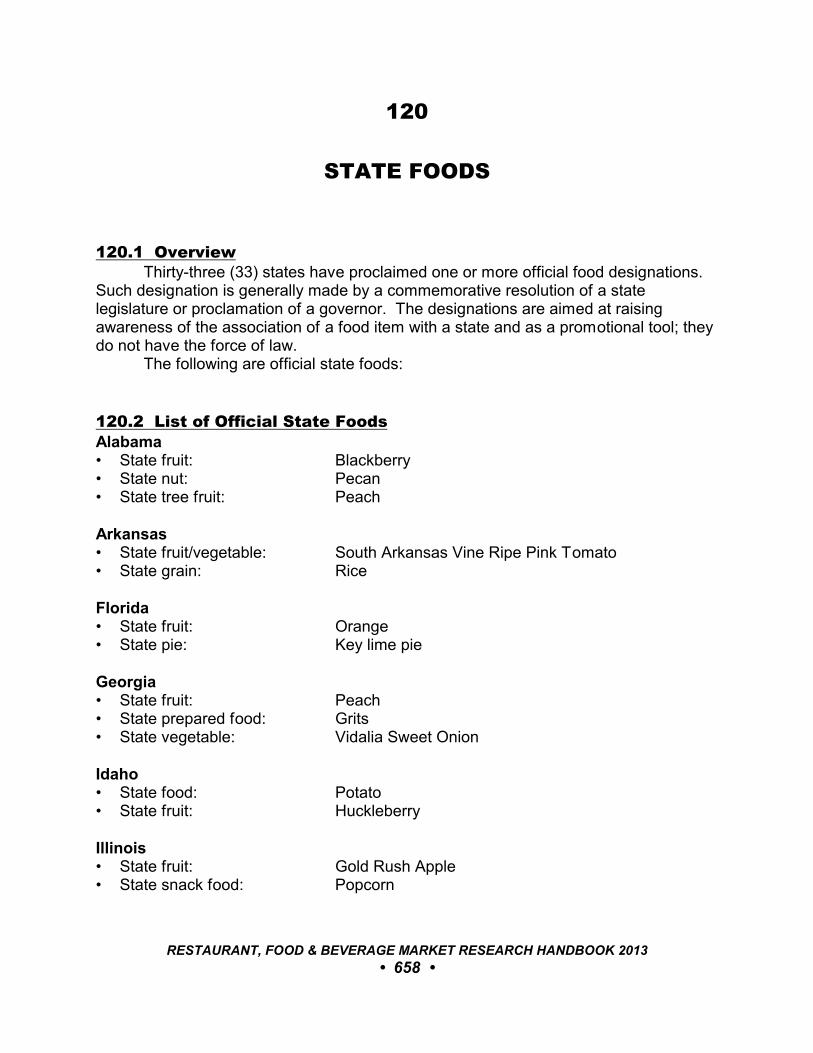
120
STATE FOODS
120.1 OverviewThirty-three (33) states have proclaimed one or more official food designations.
Such designation is generally made by a commemorative resolution of a statelegislature or proclamation of a governor. The designations are aimed at raisingawareness of the association of a food item with a state and as a promotional tool; theydo not have the force of law.
The following are official state foods:
120.2 List of Official State Foods
Alabama• State fruit: Blackberry• State nut: Pecan• State tree fruit: Peach
Arkansas• State fruit/vegetable: South Arkansas Vine Ripe Pink Tomato• State grain: Rice
Florida• State fruit: Orange• State pie: Key lime pie
Georgia• State fruit: Peach • State prepared food: Grits• State vegetable: Vidalia Sweet Onion
Idaho• State food: Potato • State fruit: Huckleberry
Illinois• State fruit: Gold Rush Apple• State snack food: Popcorn
RESTAURANT, FOOD & BEVERAGE MARKET RESEARCH HANDBOOK 2013
• 658 •
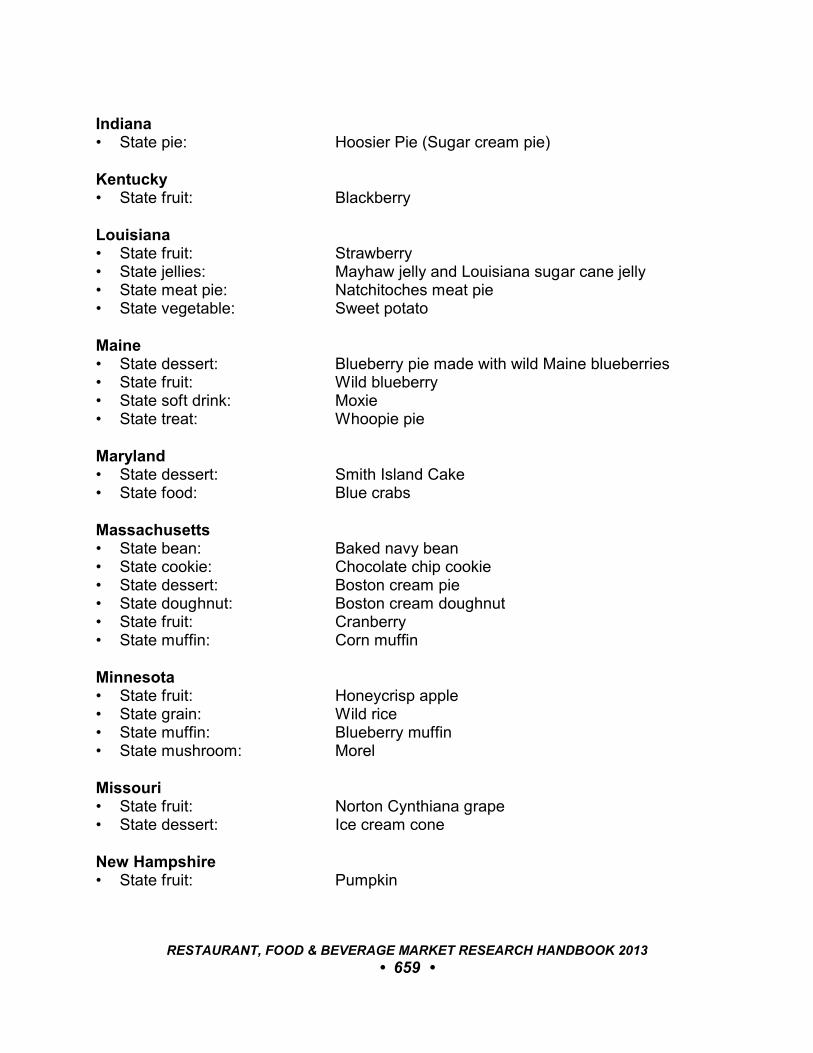
Indiana• State pie: Hoosier Pie (Sugar cream pie)
Kentucky• State fruit: Blackberry
Louisiana• State fruit: Strawberry• State jellies: Mayhaw jelly and Louisiana sugar cane jelly• State meat pie: Natchitoches meat pie• State vegetable: Sweet potato
Maine• State dessert: Blueberry pie made with wild Maine blueberries• State fruit: Wild blueberry• State soft drink: Moxie• State treat: Whoopie pie
Maryland• State dessert: Smith Island Cake• State food: Blue crabs
Massachusetts• State bean: Baked navy bean• State cookie: Chocolate chip cookie• State dessert: Boston cream pie• State doughnut: Boston cream doughnut• State fruit: Cranberry • State muffin: Corn muffin
Minnesota• State fruit: Honeycrisp apple• State grain: Wild rice• State muffin: Blueberry muffin• State mushroom: Morel
Missouri• State fruit: Norton Cynthiana grape • State dessert: Ice cream cone
New Hampshire• State fruit: Pumpkin
RESTAURANT, FOOD & BEVERAGE MARKET RESEARCH HANDBOOK 2013
• 659 •
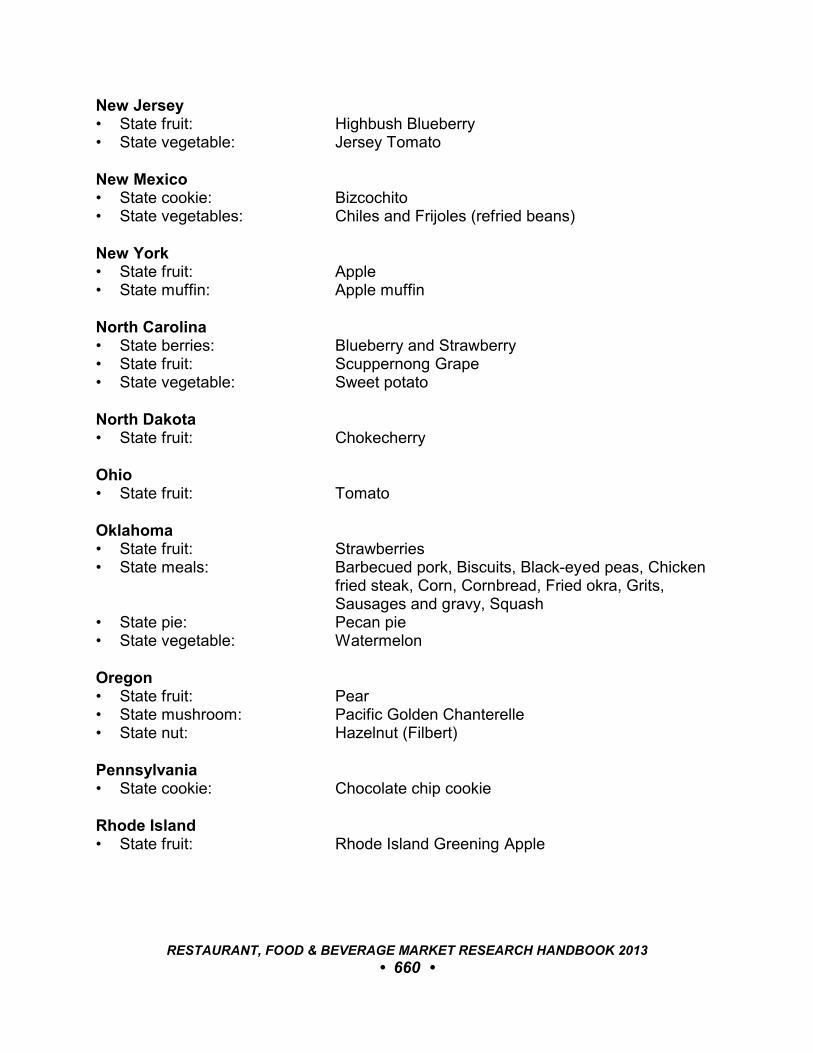
New Jersey• State fruit: Highbush Blueberry• State vegetable: Jersey Tomato
New Mexico• State cookie: Bizcochito• State vegetables: Chiles and Frijoles (refried beans)
New York• State fruit: Apple • State muffin: Apple muffin North Carolina• State berries: Blueberry and Strawberry• State fruit: Scuppernong Grape• State vegetable: Sweet potato
North Dakota• State fruit: Chokecherry
Ohio • State fruit: Tomato
Oklahoma• State fruit: Strawberries• State meals: Barbecued pork, Biscuits, Black-eyed peas, Chicken
fried steak, Corn, Cornbread, Fried okra, Grits,Sausages and gravy, Squash
• State pie: Pecan pie• State vegetable: Watermelon
Oregon• State fruit: Pear• State mushroom: Pacific Golden Chanterelle• State nut: Hazelnut (Filbert)
Pennsylvania• State cookie: Chocolate chip cookie
Rhode Island• State fruit: Rhode Island Greening Apple
RESTAURANT, FOOD & BEVERAGE MARKET RESEARCH HANDBOOK 2013
• 660 •
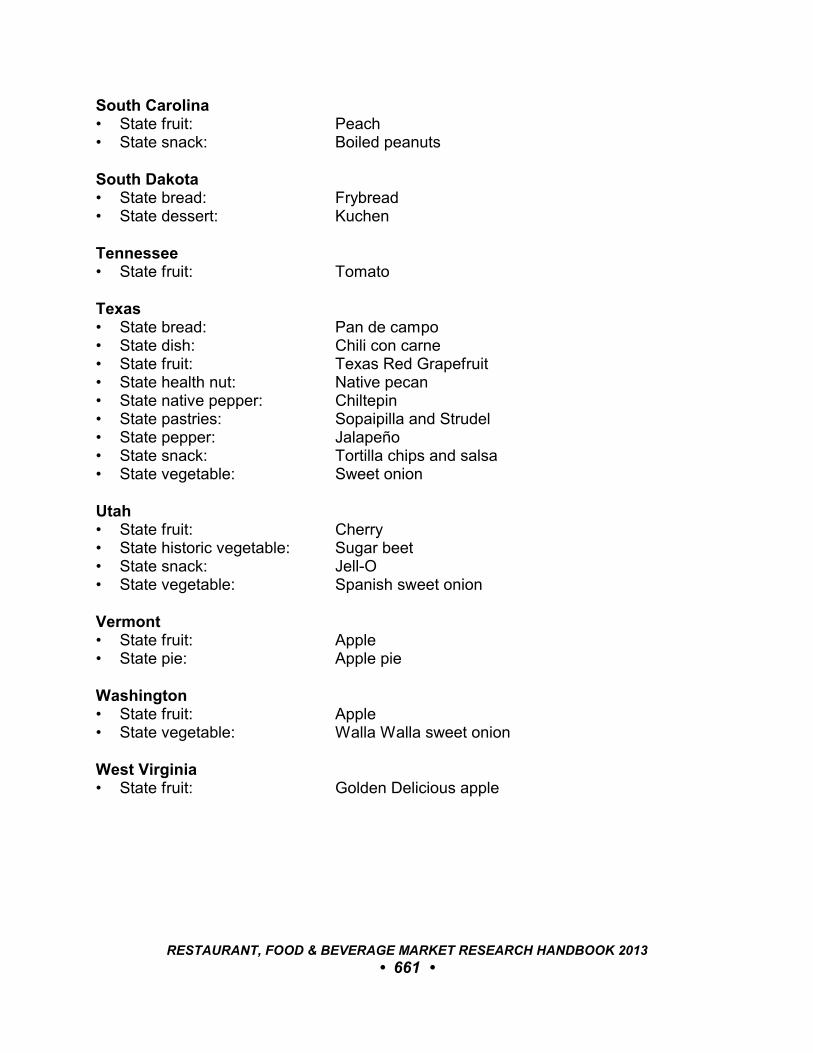
South Carolina• State fruit: Peach• State snack: Boiled peanuts
South Dakota• State bread: Frybread• State dessert: Kuchen
Tennessee• State fruit: Tomato
Texas• State bread: Pan de campo• State dish: Chili con carne• State fruit: Texas Red Grapefruit• State health nut: Native pecan• State native pepper: Chiltepin• State pastries: Sopaipilla and Strudel • State pepper: Jalapeño• State snack: Tortilla chips and salsa • State vegetable: Sweet onion
Utah• State fruit: Cherry• State historic vegetable: Sugar beet• State snack: Jell-O• State vegetable: Spanish sweet onion
Vermont• State fruit: Apple• State pie: Apple pie
Washington• State fruit: Apple• State vegetable: Walla Walla sweet onion
West Virginia• State fruit: Golden Delicious apple
RESTAURANT, FOOD & BEVERAGE MARKET RESEARCH HANDBOOK 2013
• 661 •
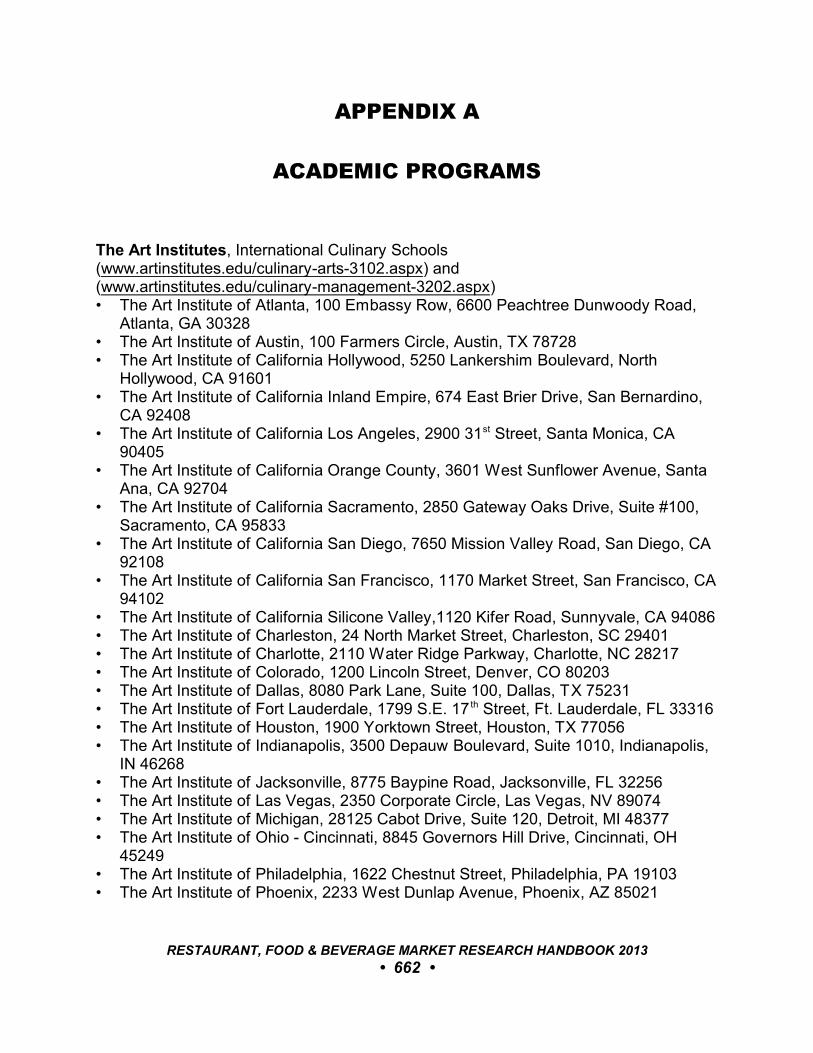
APPENDIX A
ACADEMIC PROGRAMS
The Art Institutes, International Culinary Schools(www.artinstitutes.edu/culinary-arts-3102.aspx) and (www.artinstitutes.edu/culinary-management-3202.aspx)• The Art Institute of Atlanta, 100 Embassy Row, 6600 Peachtree Dunwoody Road,
Atlanta, GA 30328• The Art Institute of Austin, 100 Farmers Circle, Austin, TX 78728• The Art Institute of California Hollywood, 5250 Lankershim Boulevard, North
Hollywood, CA 91601• The Art Institute of California Inland Empire, 674 East Brier Drive, San Bernardino,
CA 92408• The Art Institute of California Los Angeles, 2900 31st Street, Santa Monica, CA
90405• The Art Institute of California Orange County, 3601 West Sunflower Avenue, Santa
Ana, CA 92704• The Art Institute of California Sacramento, 2850 Gateway Oaks Drive, Suite #100,
Sacramento, CA 95833• The Art Institute of California San Diego, 7650 Mission Valley Road, San Diego, CA
92108• The Art Institute of California San Francisco, 1170 Market Street, San Francisco, CA
94102• The Art Institute of California Silicone Valley,1120 Kifer Road, Sunnyvale, CA 94086• The Art Institute of Charleston, 24 North Market Street, Charleston, SC 29401• The Art Institute of Charlotte, 2110 Water Ridge Parkway, Charlotte, NC 28217• The Art Institute of Colorado, 1200 Lincoln Street, Denver, CO 80203• The Art Institute of Dallas, 8080 Park Lane, Suite 100, Dallas, TX 75231• The Art Institute of Fort Lauderdale, 1799 S.E. 17 th Street, Ft. Lauderdale, FL 33316• The Art Institute of Houston, 1900 Yorktown Street, Houston, TX 77056• The Art Institute of Indianapolis, 3500 Depauw Boulevard, Suite 1010, Indianapolis,
IN 46268• The Art Institute of Jacksonville, 8775 Baypine Road, Jacksonville, FL 32256• The Art Institute of Las Vegas, 2350 Corporate Circle, Las Vegas, NV 89074• The Art Institute of Michigan, 28125 Cabot Drive, Suite 120, Detroit, MI 48377• The Art Institute of Ohio - Cincinnati, 8845 Governors Hill Drive, Cincinnati, OH
45249• The Art Institute of Philadelphia, 1622 Chestnut Street, Philadelphia, PA 19103• The Art Institute of Phoenix, 2233 West Dunlap Avenue, Phoenix, AZ 85021
RESTAURANT, FOOD & BEVERAGE MARKET RESEARCH HANDBOOK 2013
• 662 •
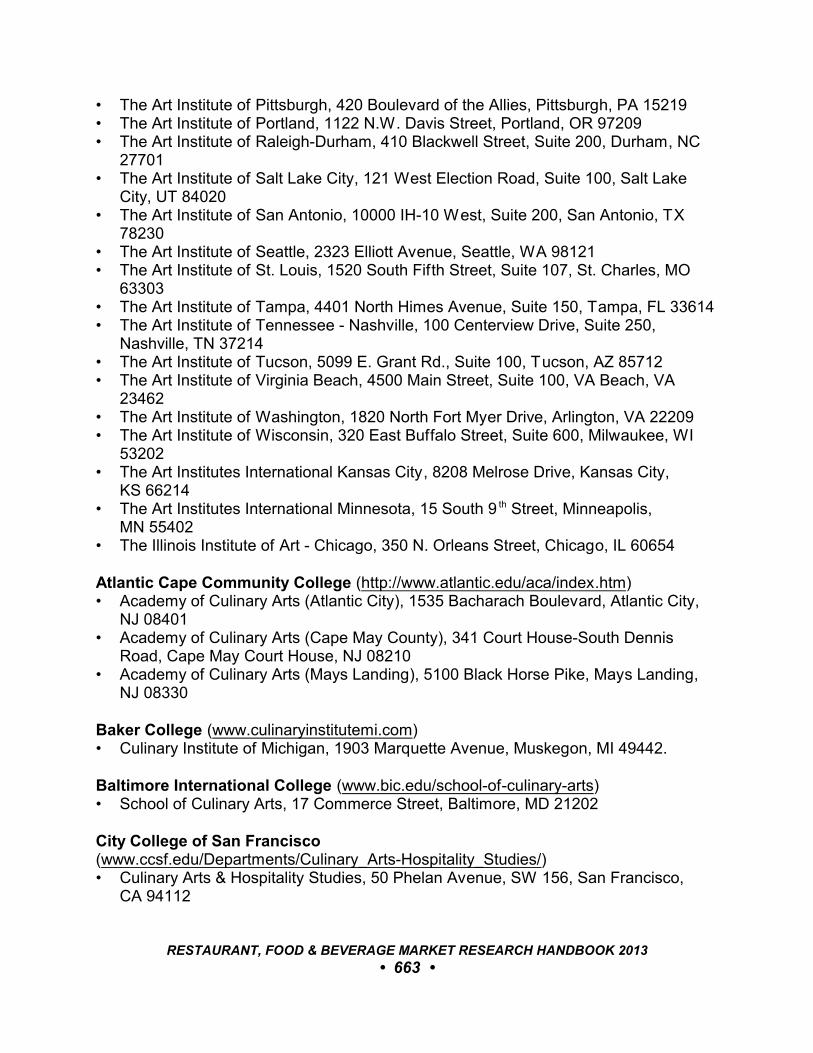
• The Art Institute of Pittsburgh, 420 Boulevard of the Allies, Pittsburgh, PA 15219• The Art Institute of Portland, 1122 N.W. Davis Street, Portland, OR 97209• The Art Institute of Raleigh-Durham, 410 Blackwell Street, Suite 200, Durham, NC
27701• The Art Institute of Salt Lake City, 121 West Election Road, Suite 100, Salt Lake
City, UT 84020• The Art Institute of San Antonio, 10000 IH-10 West, Suite 200, San Antonio, TX
78230• The Art Institute of Seattle, 2323 Elliott Avenue, Seattle, WA 98121• The Art Institute of St. Louis, 1520 South Fifth Street, Suite 107, St. Charles, MO
63303• The Art Institute of Tampa, 4401 North Himes Avenue, Suite 150, Tampa, FL 33614• The Art Institute of Tennessee - Nashville, 100 Centerview Drive, Suite 250,
Nashville, TN 37214• The Art Institute of Tucson, 5099 E. Grant Rd., Suite 100, Tucson, AZ 85712• The Art Institute of Virginia Beach, 4500 Main Street, Suite 100, VA Beach, VA
23462 • The Art Institute of Washington, 1820 North Fort Myer Drive, Arlington, VA 22209• The Art Institute of Wisconsin, 320 East Buffalo Street, Suite 600, Milwaukee, WI
53202• The Art Institutes International Kansas City, 8208 Melrose Drive, Kansas City,
KS 66214• The Art Institutes International Minnesota, 15 South 9 th Street, Minneapolis,
MN 55402• The Illinois Institute of Art - Chicago, 350 N. Orleans Street, Chicago, IL 60654
Atlantic Cape Community College (http://www.atlantic.edu/aca/index.htm)• Academy of Culinary Arts (Atlantic City), 1535 Bacharach Boulevard, Atlantic City,
NJ 08401• Academy of Culinary Arts (Cape May County), 341 Court House-South Dennis
Road, Cape May Court House, NJ 08210• Academy of Culinary Arts (Mays Landing), 5100 Black Horse Pike, Mays Landing,
NJ 08330
Baker College (www.culinaryinstitutemi.com)• Culinary Institute of Michigan, 1903 Marquette Avenue, Muskegon, MI 49442.
Baltimore International College (www.bic.edu/school-of-culinary-arts)• School of Culinary Arts, 17 Commerce Street, Baltimore, MD 21202
City College of San Francisco(www.ccsf.edu/Departments/Culinary_Arts-Hospitality_Studies/)• Culinary Arts & Hospitality Studies, 50 Phelan Avenue, SW 156, San Francisco,
CA 94112
RESTAURANT, FOOD & BEVERAGE MARKET RESEARCH HANDBOOK 2013
• 663 •
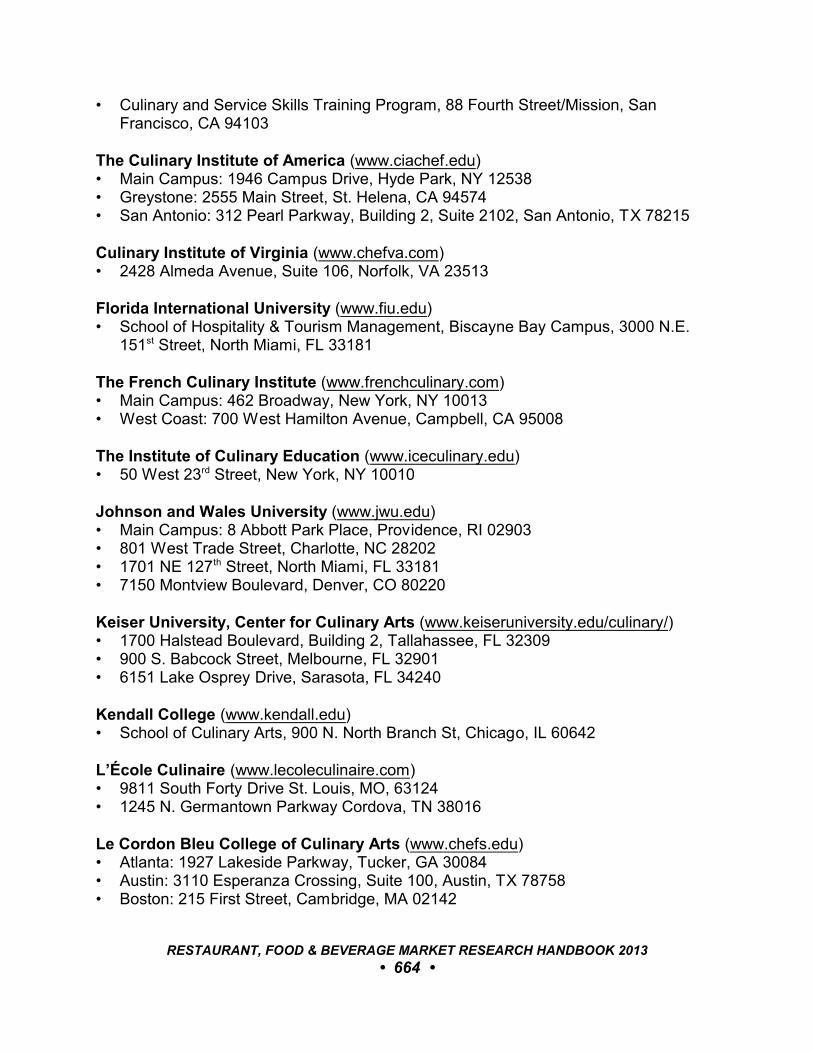
• Culinary and Service Skills Training Program, 88 Fourth Street/Mission, SanFrancisco, CA 94103
The Culinary Institute of America (www.ciachef.edu)• Main Campus: 1946 Campus Drive, Hyde Park, NY 12538• Greystone: 2555 Main Street, St. Helena, CA 94574• San Antonio: 312 Pearl Parkway, Building 2, Suite 2102, San Antonio, TX 78215
Culinary Institute of Virginia (www.chefva.com)• 2428 Almeda Avenue, Suite 106, Norfolk, VA 23513
Florida International University (www.fiu.edu)• School of Hospitality & Tourism Management, Biscayne Bay Campus, 3000 N.E.
151st Street, North Miami, FL 33181
The French Culinary Institute (www.frenchculinary.com)• Main Campus: 462 Broadway, New York, NY 10013• West Coast: 700 West Hamilton Avenue, Campbell, CA 95008
The Institute of Culinary Education (www.iceculinary.edu)• 50 West 23rd Street, New York, NY 10010
Johnson and Wales University (www.jwu.edu)• Main Campus: 8 Abbott Park Place, Providence, RI 02903 • 801 West Trade Street, Charlotte, NC 28202• 1701 NE 127th Street, North Miami, FL 33181 • 7150 Montview Boulevard, Denver, CO 80220
Keiser University, Center for Culinary Arts (www.keiseruniversity.edu/culinary/)• 1700 Halstead Boulevard, Building 2, Tallahassee, FL 32309• 900 S. Babcock Street, Melbourne, FL 32901• 6151 Lake Osprey Drive, Sarasota, FL 34240
Kendall College (www.kendall.edu)• School of Culinary Arts, 900 N. North Branch St, Chicago, IL 60642
L’École Culinaire (www.lecoleculinaire.com)• 9811 South Forty Drive St. Louis, MO, 63124• 1245 N. Germantown Parkway Cordova, TN 38016
Le Cordon Bleu College of Culinary Arts (www.chefs.edu)• Atlanta: 1927 Lakeside Parkway, Tucker, GA 30084• Austin: 3110 Esperanza Crossing, Suite 100, Austin, TX 78758• Boston: 215 First Street, Cambridge, MA 02142
RESTAURANT, FOOD & BEVERAGE MARKET RESEARCH HANDBOOK 2013
• 664 •
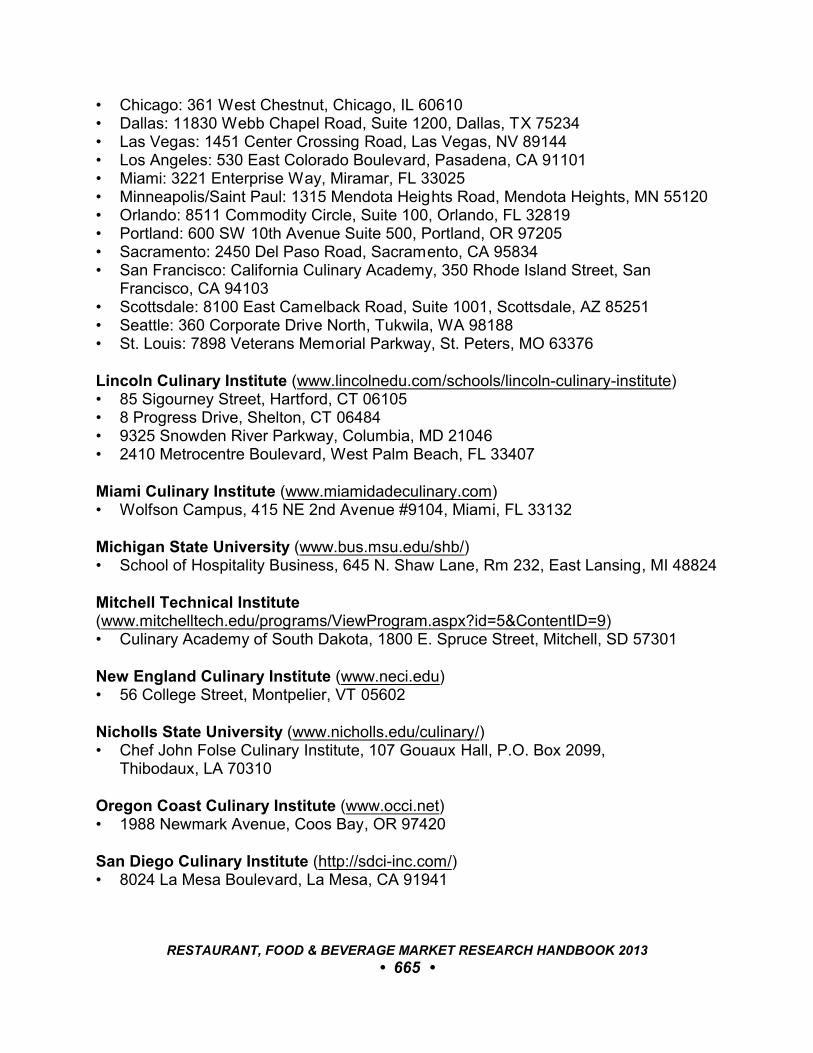
• Chicago: 361 West Chestnut, Chicago, IL 60610• Dallas: 11830 Webb Chapel Road, Suite 1200, Dallas, TX 75234• Las Vegas: 1451 Center Crossing Road, Las Vegas, NV 89144• Los Angeles: 530 East Colorado Boulevard, Pasadena, CA 91101• Miami: 3221 Enterprise Way, Miramar, FL 33025• Minneapolis/Saint Paul: 1315 Mendota Heights Road, Mendota Heights, MN 55120• Orlando: 8511 Commodity Circle, Suite 100, Orlando, FL 32819• Portland: 600 SW 10th Avenue Suite 500, Portland, OR 97205• Sacramento: 2450 Del Paso Road, Sacramento, CA 95834• San Francisco: California Culinary Academy, 350 Rhode Island Street, San
Francisco, CA 94103• Scottsdale: 8100 East Camelback Road, Suite 1001, Scottsdale, AZ 85251• Seattle: 360 Corporate Drive North, Tukwila, WA 98188• St. Louis: 7898 Veterans Memorial Parkway, St. Peters, MO 63376
Lincoln Culinary Institute (www.lincolnedu.com/schools/lincoln-culinary-institute)• 85 Sigourney Street, Hartford, CT 06105• 8 Progress Drive, Shelton, CT 06484• 9325 Snowden River Parkway, Columbia, MD 21046• 2410 Metrocentre Boulevard, West Palm Beach, FL 33407
Miami Culinary Institute (www.miamidadeculinary.com)• Wolfson Campus, 415 NE 2nd Avenue #9104, Miami, FL 33132
Michigan State University (www.bus.msu.edu/shb/)• School of Hospitality Business, 645 N. Shaw Lane, Rm 232, East Lansing, MI 48824
Mitchell Technical Institute(www.mitchelltech.edu/programs/ViewProgram.aspx?id=5&ContentID=9)• Culinary Academy of South Dakota, 1800 E. Spruce Street, Mitchell, SD 57301
New England Culinary Institute (www.neci.edu)• 56 College Street, Montpelier, VT 05602
Nicholls State University (www.nicholls.edu/culinary/)• Chef John Folse Culinary Institute, 107 Gouaux Hall, P.O. Box 2099,
Thibodaux, LA 70310
Oregon Coast Culinary Institute (www.occi.net)• 1988 Newmark Avenue, Coos Bay, OR 97420
San Diego Culinary Institute (http://sdci-inc.com/)• 8024 La Mesa Boulevard, La Mesa, CA 91941
RESTAURANT, FOOD & BEVERAGE MARKET RESEARCH HANDBOOK 2013
• 665 •
Southwest Minnesota State University(www.smsu.edu/academics/programs/culinology/Index.cfm)• Culinology and Hospitality Management, 1501 State Street, Marshall, MN 56258.
Southwestern Oregon Community College(www.socc.edu/academics/pgs/academic-dept/culinary/index.shtml)• 1988 Newmark Avenue, Coos Bay, OR 97420
Stratford University (www.stratford.edu/culinary), Advanced Culinary Arts Program• 210 S. Central Avenue, Baltimore, MD 21202• 836 J. Clyde Morris Boulevard, Newport News, VA 23601 • 14349 Gideon Drive, Woodbridge, VA 22192• 7777 Leesburg Pike, Falls Church, VA 22043• 11104 W. Broad Street, Glen Allen, VA 23060
Sullivan University (www.sullivan.edu/nchs.asp)• National Center For Hospitality Studies, 3101 Bardstown Road, Louisville, KY 40205
SUNY Oneonta (www.oneonta.edu/academics/huec/FSRA3.asp)• Food Service and Restaurant Administration, Department of Human Ecology,
Ravine Parkway, Oneonta, NY 13820.
University of Central Florida (http://hospitality.ucf.edu/)• Rosen College of Hospitality Management, 9907 Universal Boulevard, Orlando,
FL 32819
University of Houston (www.hrm.uh.edu)• Conrad N. Hilton College of Hotel and Restaurant Management, 4800 Calhoun
Road, Houston, TX 77004
University of Nevada, Las Vegas (www.unlv.edu/hotel/cam)• William F. Harrah College of Hotel Administration, Food & Beverage Management
Department, 4505 S. Maryland Parkway, Box 456022, Las Vegas, NV 89154.
University of New Haven (www.cthospitality.us)• Hospitality and Tourism Management, 300 Boston Post Road, West Haven, CT
06516
University of Tennessee (http://culinary.utk.edu/)• The Culinary Institute, 220B Jessie Harris Building, Knoxville, TN 37996
RESTAURANT, FOOD & BEVERAGE MARKET RESEARCH HANDBOOK 2013
• 666 •
Walters State Community College (www.ws.edu/academics/business/culinary-arts)• Department of Hospitality Business, 500 South Davy Crockett Parkway, Morristown,
TN 37813
Walnut Hill College (www.walnuthillcollege.edu)• The Restaurant School at Walnut Hill College, 4207 Walnut Street, Philadelphia,
PA 19104
RESTAURANT, FOOD & BEVERAGE MARKET RESEARCH HANDBOOK 2013
• 667 •
APPENDIX B
ANALYSTS & MARKET CONSULTANTS
Baum + Whiteman, 912 President Street, Brooklyn, NY 11215. (718) 622-0200. (www.baumwhiteman.com)
Beverage Information Group, 17 High Street, 2nd Floor, Norwalk, CT 06851. (203) 855-8499. (www.bevinfogroup.com)
Beverage Marketing Corporation, 850 Third Avenue, New York, NY 10022. (212) 826-1255. (www.beveragemarketing.com)
Black Box Intelligence, 17304 Preston Road, Suite 430, Dallas, TX 75252.(972) 364-0490. (www.blackboxintelligence.com)
Center for Culinary Development, 1255 Battery Street, Suite 100, San Francisco, CA94111. (415) 693-8900. (www.ccdsf.com)
CFI Group, 625 Avis Drive, Ann Arbor, MI 48108. (734) 930-9090. (www.cfigroup.com)
Chain Store Guide, 10117 Princess Palm Drive, Tampa, FL 33610. (813) 627-6800. (www.csgis.com)
Consumer Edge Insight, 1 Landmark Square, 9th Floor, Stamford, CT 06901.(203) 504-8122. (www.consumeredgeinsight.com)
Datassential, 1762 Westwood Boulevard, Suite 250, Los Angeles, CA 90024. (877) 886-3687. (www.datassential.com)
Empathica, 2121 Argentia Road, Suite 200, Mississauga ON L5N 2X4.(905) 542-9001. (www.empathica.com)
Environ International Corporation, 2200 Powell Street, Suite 700, Emeryville, CA 94608. (510) 655-7400. (www.environcorp.com)
Federation of Dining Room Professionals, 1417 Sadler Road, Suite 100,Fernandina Beach, FL 32034. (904) 491-6690. (www.fdrp.com)
RESTAURANT, FOOD & BEVERAGE MARKET RESEARCH HANDBOOK 2013
• 668 •
GfK Knowledge Networks, 2100 Geng Road, Suite 210, Palo Alto, CA 94303.(650) 289-2000. (www.knowledgenetworks.com)
GfK MRI, 75 Ninth Avenue, 5th Floor, New York, NY 10011. (212) 8884-9200. (www.gfkmri.com)
GuestMetrics Inc., 1602 Village Market Boulevard, Leesburg, VA 20175.(703) 297-3400. (www.guestmetrics.com)
Harris Interactive, 60 Corporate Woods, Rochester, NY 14623. (585) 272-8400. (www.harrisinteractive.com)
Information Resources, Inc., 150 North Clinton Street, Chicago, IL 60661. (312) 726-1221. (www.infores.com)
Malcolm M. Knapp Inc., 26 East 91st Street, New York, NY 10128. (212) 289-7782. (www.malcolmknapp.com)
Market Force Information, Post Office Box 270355, Louisville, CO 80027. (303) 402-6920. (www.marketforce.com)
Mintel, 333 W. Wacker Drive Suite 1100, Chicago, IL 60606. (312) 932-0400. (www.mintel.com)
New Strategist, P.O. Box 242, Ithaca, NY 14851. (800) 848-0842. (www.newstrategist.com)
Packaged Facts, 11200 Rockville Pike, Suite 504, Rockville, MD 20852. (240) 747-3095. (www.packagedfacts.com)
Restaurant Marketing Group, 5421 South Helena Street, Centennial, CO 80015. (303) 521-1988. (www.rmktgroup.com)
Restaurant Research LLC, 1 Cricklewood Road, Redding, CT 06896. (203) 938-4703.(www.restaurantresearch.info)
Restaurant RX Consulting, 4767 New Broad Street, Orlando, FL 32814.(407) 517-2789. (www.restaurantrxconsulting.com)
Revenue Management Solutions, 777 South Harbour Island Boulevard, Suite 890,Tampa, FL 33602. (813) 277-0034. (www.revenuemanage.com)
Richard K. Miller & Associates, 4132 Atlanta Highway, Suite 110, Loganville, GA 30052. (888) 928-7562. (www.rkma.com)
RESTAURANT, FOOD & BEVERAGE MARKET RESEARCH HANDBOOK 2013
• 669 •
Sandelman & Associates, 257 La Paloma, Suite 1, San Clemente, CA 92672. (949) 388-5600. (www.sandelman.com)
Scarborough Research, 770 Broadway, New York, NY 10003. (646) 654-8400. (www.scarborough.com)
Service Management Group, 1737 McGee Street, Kansas City, MO 64108. (800) 764-0439. (www.smg.com)
Technomic, Inc., 300 South Riverside Plaza, Suite 1200 South, Chicago, IL 60606. (312) 876-0004. (www.technomic.com)
The Beverage Information Group, 17 High Street, 2nd Floor, Norwalk, CT 06851.(203) 855-8499. (www.bevinfogroup.com)
The Gallup Organization, 901 F Street NW, Washington, DC 20004. (202) 715-3030. (www.gallup.com)
The Hartman Group, 3150 Richards Road, Suite 200, Bellevue, WA 98005. (425) 452-0818. (www.hartman-group.com)
The Kruse Company, 5636 River Oaks Place NW, Atlanta, GA 30327.(404) 256-0770. (no website)
The Media Audit, 10333 Richmond Avenue, Suite 200, Houston, TX 77042. (713) 626-0333. (www.themediaaudit.com)
The NPD Group, 900 West Shore Road, Port Washington, NY 11050. (516) 625-0700. (www.npd.com)
WD Partners, 7007 Discovery Boulevard, Dublin, OH 43017. (614) 634-7000. (www.wdpartners.com)
Zagat Survey LLC, 76 9th Avenue, 4th Floor, New York, NY 10011. (212) 977-6000. (www.zagat.com)
RESTAURANT, FOOD & BEVERAGE MARKET RESEARCH HANDBOOK 2013
• 670 •
APPENDIX C
ASSOCIATIONS
American Beverage Association, 1101 Sixteenth Street NW, Washington, DC 20036. (202) 463-6732. (www.ameribev.org)
Beer Institute, 122 C Street NW, Suite 350, Washington, DC 20001. (202) 737-2337. (www.beerinstitute.org)
Brewers Association, 736 Pearl Street, Boulder, CO 80302. (303) 447-0816. (www.brewersassociation.org)
Distilled Spirits Council of the United States, 1250 Eye Street NW, Suite 400,Washington, DC 20005. (202) 628-3544. (www.discus.org)
Food Marketing Institute, 2345 Crystal Drive, Suite 800, Arlington, VA 22202.(202) 452-8444. (www.fmi.org)
International Bottled Water Association, 1700 Diagonal Road, Suite 650, Alexandria,VA 22314. (703) 683-5213. (www.bottledwater.org)
International Dairy Foods Association, 1250 H Street NW, Suite 900, Washington, DC20005. (202) 737-4332. (www.idfa.org)
National Association of Pizzeria Operators, 908 South 8 th Street, Suite 200, Louisville,KY 40203. (502) 736-9530. (www.napo.com)
National Coffee Association, 45 Broadway, Suite 1140, New York, NY 10006. (212) 766-4007. (www.ncausa.org)
National Council of Chain Restaurants, division of the National Retail Federation, 325 7th Street NW, Suite 1100, Washington, DC 20004. (202) 783-7971. (www.nccr.net)
National Restaurant Association, 2055 L Street NW, Suite 700, Washington, DC 20036. (202) 331-5900. (www.restaurant.org)
RESTAURANT, FOOD & BEVERAGE MARKET RESEARCH HANDBOOK 2013
• 671 •
Organic Trade Association, 28 Vernon Street, Suite 413, Brattleboro, VT 05301. (802)275-3800. (www.ota.com)
Research Chefs Association, 1100 Johnson Ferry Road, Suite 300, Atlanta, GA 30342. (404) 252-3663. (www.culinology.com)
Society of Foodservice Management, 455 South 4 th, Suite 650, Louisville, KY 40202. (502) 574-9931. (www.sfm-online.org)
Specialty Coffee Association of America, 330 Golden Shore, Suite 50, Long Beach, CA90802. (562) 624-4100. (www.scaa.org)
Tea Association of the USA, 362 5th Avenue, Suite 801, New York, NY 10001. (212) 986-9415. (www.teausa.org)
Wine Institute, 425 Market Street, Suite 1000, San Francisco, CA 94105. (415) 512-0151. (www.wineinstitute.org)
RESTAURANT, FOOD & BEVERAGE MARKET RESEARCH HANDBOOK 2013
• 672 •
APPENDIX D
PERIODICALS
Beer Marketer’s Insights, 49 East Maple Avenue, Suffern, NY 10901. (845) 507-0040. (www.beerinsights.com)
Beverage Digest, P.O. Box 621, Bedford Hills, NY 10507. (914) 244-0700. (www.beverage-digest.com)
Beverage Dynamics, 17 High Street, 2nd Floor, Norwalk, CT 06851. (203) 855-8499. (www.beveragenet.net)
Beverage World, 333 Seventh Avenue, 11th Floor, New York, NY 10001. (646) 708-7300. (www.beverageworld.com)
Cheers, 17 High Street, Norwalk, CT 06851. (203) 855-8499. (www.beveragenet.net)
Cornell Hospitality Quarterly, Cornell University, 185 Statler Hall, Ithaca, NY 14853. (607) 255-3025. (http://cqx.sagepub.com/)
Food Arts, M. Shanken Communications, 387 Park Avenue South, New York, NY10016. (212) 684-4224. (www.mshanken.com/foodarts/)
FoodService Director, 90 Broad Street, Suite 402, New York, NY 10004. (630) 574-5075. (www.fsdmag.com)
FSR: Ideas and Insights for Full-Service Restaurants, 4905 Pine Cone Drive, Suite 2,Durham, NC 27727. (919) 945-0713. (www.fsrmagazine.com)
Market Watch, M. Shanken Communications, 387 Park Avenue South, New York, NY10016. (212) 684-4224. (www.mshanken.com/marketwatch/)
Nation’s Restaurant News, 1166 Avenue of the Americas, 10th Floor, New York, NY10036. (212) 204-4200. (www.nrn.com)
Pizza Today, National Association of Pizza Operators, 908 South 8 th Street, Suite 200,Louisville, KY 40203. (502) 736-9500. (www.pizzatoday.com)
RESTAURANT, FOOD & BEVERAGE MARKET RESEARCH HANDBOOK 2013
• 673 •
QSR: The Magazine of Quick Service Restaurant Success, 4905 Pine Cone Drive,Suite 2, Durham, NC 27727. (800) 662-4834. (www.qsrmagazine.com)
Restaurant Business, 90 Broad Street, Suite 402, New York, NY 10004. (630) 574-5075. (www.monkeydish.com)
Restaurant Finance Monitor, 2808 Anthony Lane South, Minneapolis, MN 55418.(612) 767-3200. (www.restfinance.com)
RESTAURANT, FOOD & BEVERAGE MARKET RESEARCH HANDBOOK 2013
• 674 •
APPENDIX E
STATE RESTAURANT ASSOCIATIONS
Alabama• Alabama Restaurant Association, 61B Market Place, Montgomery, AL 36117.
(334) 244-1320. (www.alabamarestaurants.com/index2.cfm)
Alaska• Alaska Cabaret, Hotel, Restaurant & Retailers Association, 1503 W . 31st Avenue,
Suite 202, Anchorage, AK 99503. (907) 274-8133. (www.alaskacharr.com)
Arizona• Arizona Restaurant Association, 4250 N. Drinkwater Boulevard, Suite 350,
Scottsdale, AZ 85251. (602) 307-9134. And 465 W . St. Mary’s Road, Suite 300,Tucson, AZ 85701. (520) 791-9106. (www.azrestaurant.org)
Arkansas• Arkansas Hospitality Association, 603 S. Pulaski Street, Little Rock, AR 72201.
(501) 376-2323. (www.arhospitality.org)
California• California Restaurant Association, 621 Capitol Mall, Suite 2000, Sacramento, CA
95814. (916) 447-5793. (www.calrest.org)
Colorado• Colorado Restaurant Association, 430 E. 7 th Avenue, Denver, CO 80203.
(303) 830-2972. (www.coloradorestaurant.com)
Connecticut• Connecticut Restaurant Association, 38 Hungerford Street, Hartford, CT 06106.
(860) 278-8008. (www.ctrestaurant.org)
Delaware• Delaware Restaurant Association, P.O. Box 8004, Newark, DE 19714.
(302) 738-2545. (www.delawarerestaurant.org)
RESTAURANT, FOOD & BEVERAGE MARKET RESEARCH HANDBOOK 2013
• 675 •
Florida• Florida Restaurant & Lodging Association, 230 South Adams Street, Tallahassee,
FL 32301. (850) 224-2250. (www.frla.org)
Georgia• Georgia Restaurant Association, Piedmont Place, 3520 Piedmont Road, Suite 130,
Atlanta, GA 30305. (404) 467-9000. (www.garestaurants.org)
Hawaii• Hawaii Restaurant Association, 1451 South King Street, Suite 503, Honolulu, HI
96814. (808) 944-9105. (www.restauranthi.com)
Idaho• Idaho Lodging & Restaurant Association, P.O. Box 1822, Boise, ID 83701.
(208) 342-0010. (www.idahohospitality.net)
Illinois• Illinois Restaurant Association, 33 W. Monroe Street, Suite 250, Chicago, IL 60603.
(312) 787-4000. (www.illinoisrestaurants.org)
Indiana• Indiana Restaurant Association, 200 S. Meridian Street, Suite 350, Indianapolis, IN
46225. (317) 673-4211. (www.indianarestaurants.org)
Iowa• Iowa Restaurant Association, 8525 Douglas Avenue, Suite 47, Des Moines, IA
50322. (515) 276-1454. (www.restaurantiowa.com)
Kansas• Kansas Restaurant & Hospitality Association, 3500 N. Rock Road, Building 1300,
Wichita, KS 67226. (316) 267-8383. (www.krha.org)
Kentucky• Kentucky Restaurant Association, 133 Evergreen Road, Suite 201, Louisville, KY
40243. (502) 896-0464. (www.kyra.org)
Louisiana• Louisiana Restaurant Association, 2700 N. Arnoult Road, Metairie, LA 70002.
(504) 454-2277. (www.lra.org)
Maine• Maine Restaurant Association, 45 Melville Street, Suite 2, Augusta, ME 04330.
(207) 623-2178. (www.mainerestaurant.com)
RESTAURANT, FOOD & BEVERAGE MARKET RESEARCH HANDBOOK 2013
• 676 •
Maryland• Restaurant Association of Maryland, 6301 Hillside Court, Columbia, MD 21046.
(410) 290-6800. (www.marylandrestaurants.com)
Massachusetts• Massachusetts Restaurant Association, 333 Turnpike Road, Suite 102,
Southborough, MA 01772. (508) 303-9905. (www.massrestaurantassoc.org)
Michigan• Michigan Restaurant Association, 225 W. Washtenaw Street, Lansing, MI 48933.
(517) 482-5244. (www.michiganrestaurant.org)
Minnesota• Minnesota Restaurant Association, 305 East Roselawn Avenue, Saint Paul, MN
55117. (651) 778-2400. (www.hospitalitymn.org)
Mississippi• Mississippi Hospitality & Restaurant Association, 130 Riverview Drive, Suite C,
Flowood, MS 39232. (601) 420-4210. (www.msra.org)
Missouri• Missouri Restaurant Association, 1810 Craig Road, Suite 225, St. Louis, MO 63146.
(314) 576-2777. (www.morestaurants.org)
Montana• Montana Restaurant Association, 1645 Parkhill Drive, Suite 6, Billings, MT 59102.
(406) 256-1005. (www.mtrestaurant.com)
Nebraska• Nebraska Restaurant Association & Hospitality Education Foundation, 1610 S. 70 th
Street, Suite 101, Lincoln, NE 68506. (402) 488-3999. (www.nebraska-dining.org)
Nevada• Nevada Restaurant Association, 1500 E. Tropicana Avenue, Suite 114-A,
Las Vegas, NV 89119. (702) 878-2313. (www.nvrestaurants.com)
New Hampshire• New Hampshire Lodging & Restaurant Association, 341 Loudon Road., Unit 3, P.O.
Box 1175, Concord, NH 03302. (603) 228-9585. (www.nhlra.com)
New Jersey• New Jersey Restaurant Association, 126 W. State Street, Trenton, NJ 08608.
(609) 599-3316. (www.njra.org)
RESTAURANT, FOOD & BEVERAGE MARKET RESEARCH HANDBOOK 2013
• 677 •
New Mexico• New Mexico Restaurant Association, 9201 Montgomery Boulevard NE, Suite 602,
Albuquerque, NM 87111. (505) 343-9848. (www.nmrestaurants.org)
New York• New York State Restaurant Association, 409 New Karner Road, Suite 202, Albany,
NY 12205. (518) 452-4222. (www.nysra.org)
North Carolina• North Carolina Restaurant and Lodging Association, 6036 Six Forks Road, Raleigh,
NC 27609. (919) 844-0098. (www.ncrla.biz)
North Dakota• North Dakota Hospitality Association, P.O. Box 428, Bismarck, ND 58502.
(701) 223-3313. (www.ndhospitality.com)
Ohio• Ohio Restaurant Association, 1525 Bethel Road, Suite 201, Colum bus, OH 43220.
(614) 442-3535. (www.ohiorestaurant.org)
Oklahoma• Oklahoma Restaurant Association, 3800 N. Portland Avenue, OK City, OK 73112.
(405) 942-8181. (www.okrestaurants.com)
Oregon• Oregon Restaurant and Lodging Association, 8565 SW Salish Lane, Suite 120,
Wilsonville, OR 97070. (503) 682-4422. (www.oregonrla.org)
Pennsylvania• Pennsylvania Restaurant Association, 100 State Street, Harrisburg, PA 17101.
(717) 232-4433. (www.parestaurant.org)
Rhode Island• Rhode Island Hospitality Association, 94 Sabra Street, Cranston, RI 02910.
(401) 223-1120. (www.rihospitality.org)
South Carolina• South Carolina Hospitality Association, P.O. Box 7577, Columbia, SC 29202.
(803) 765-9000. (www.schospitality.org)
South Dakota• South Dakota Retailers Association Restaurant Division, P.O. Box 638,
320 E. Capitol, Pierre, SD 57501. (605) 224-5050. (www.sdra.org)
RESTAURANT, FOOD & BEVERAGE MARKET RESEARCH HANDBOOK 2013
• 678 •
Tennessee• Tennessee Hospitality Association, 475 Craighead Street, Nashville, TN 37204.
(615) 385-9970. (www.tnhospitality.net)
Texas• Texas Restaurant Association, P.O. Box 1429, Austin, TX 78767. (512) 457-4100.
(www.restaurantville.com)
Utah• Utah Restaurant Association, 5645 Waterbury Way, Suite D203, Salt Lake City, UT
84121. (801) 274-7309. (www.utahdineout.com)
Vermont• Vermont Chamber of Commerce, Hospitality Division, P.O. Box 37, Montpelier, VT
05601. (802) 223-3443. (www.vtchamber.com)
Virginia• Virginia Hospitality & Travel Association, 2101 Libbie Avenue, Richmond, VA 23230.
(804) 288-3065. (www.vhta.org)
Washington• Washington Restaurant Association, 510 Plum Street SE, Suite 200, Olympia, WA
98501. (360) 956-7279. (www.wrahome.com)
West Virginia• West Virginia Hospitality and Travel Association, P.O. Box 2391, Charleston, WV
25328. (304) 342-6511. (www.wvhta.com)
Wisconsin• Wisconsin Restaurant Association, 2801 Fish Hatchery Road, Madison, WI 53713.
(608) 270-9950. (www.wirestaurant.org)
Wyoming• Wyoming Lodging & Restaurant Association, P.O. Box 1003, Cheyenne, WY 82003.
(307) 634-8816. (www.wlra.org)
RESTAURANT, FOOD & BEVERAGE MARKET RESEARCH HANDBOOK 2013
• 679 •

REFERENCES
PART I: MARKET OVERVIEW
Chapter 1: Market Summary2013 Restaurant Industry Forecast, National Restaurant Association, January 2013.
Spring 2012 ReCount, The NPD Group, October 2012.
Chapter 2: State-By-State Analysis2013 Restaurant Industry Forecast, National Restaurant Association, January 2013.
Chapter 3: Review of 20132013 Restaurant Industry Forecast, National Restaurant Association, January 2013.
Allen, Robin Lee, “2012 The Year In Review,” Nation’s Restaurant News, December 17,2012.
PART II: TRENDS FOR 2013
Chapter 5: Culinary Trends2013 Restaurant Industry Forecast, National Restaurant Association, January 2013.
Chapter 6: Food & Dining Trends17 Hottest Food and Dining Trends for Restaurants & Hotels, 2013 , Baum + Whiteman,December 2012.
Bonisteel, Sara, “Epicurious Predicts the Top Food Trends of 2013,” November 29,2012.
“Consumers Curate 2013 Food Trends,” Culinary Visions, October 2012.
Flavor Forecast 2013, McCormick & Company, December 2012.
RESTAURANT, FOOD & BEVERAGE MARKET RESEARCH HANDBOOK 2013
• 680 •
“Food and Dining Trends In Restaurants and Hotels For 2013,” Baum + Whiteman,December 2012.
“Food Trend Predictions For 2013,” NutritionPlugged.com, December 9, 2012.
Horovitz, Bruce, “Eating Will Get Smaller In 2013,” USA Today, October 23, 2012.
How Hotel And Restaurant Trends Will Shape A New Reality In 2013, Andrew Freeman & Co., December 2012.
Lempert, Phil, “The Top 10 Food Trend Predictions for 2013,” Supermarket News,December 3, 2012.
“Technomic’s Top 10 Adult Beverage Trends for 2013,” Nightclub and Bar, December 14, 2012.
“What’s Ahead in 2013?” Technomic, November 19, 2012.
PART III: CITY-BY-CITY ANALYSES
Chapter 12: Market Growth PotentialWolff, Matt, “The Restaurant Growth Index 2012,” Restaurant Business, March 31,2012.
Chapter 13: Top Markets For QSR GrowthSmith, Daniel P., “The Growth 40,” QSR Magazine, January 2013.
PART IV: MARKET SEGMENTS
Chapter 14: Casual-Dining RestaurantsBrandau, Mark, “Casual-Dining Chains Return To Systemwide Sales Growth,” Nation’sRestaurant News, July 23, 2012.
Liddle, Alan J., “After Rough Patch, A Few Bright Spots For Full-Service,” Nation’sRestaurant News, June 25, 2012.
Scarpa, James, “Building Momentum: Casual-Dining Chains Aim To Drive Sales,”Nation’s Restaurant News, June 11, 2012, pp 1, 18-20.
RESTAURANT, FOOD & BEVERAGE MARKET RESEARCH HANDBOOK 2013
• 681 •
Chapter 16: CoffeeshopsCoffee Shops Industry Profile, First Research, November 2012.
Culverwell, Wendy, “Starbucks Revs Up For Drive-Thrus,” Portland Business Journal,January 28, 2013.
Saporito, Bill, “Starbucks’ Big Mug,” Time, June 25, 2012.
Thorn, Bret, “The Day-Long Grind,” Nation’s Restaurant News, October 15, 2012.
Chapter 17: Contract-Managed Foodservice“Noncommercial Foodservice Showing Signs Of Growth,” Technomic, February 21,2013.
Chapter 18: Convenience Store Foodservice2012 State of the Industry, National Association of Convenience Stores, June 2012.
“Foodservice Sales Are Increasingly Becoming Convenience Stores’ Most ProfitableCategory,” Technomic, November 28, 2012.
Market Intelligence Report: Convenience Stores, Technomic, November 2012.
Maze, Jonathan, “The Blurring Line Between C-Stores and Restaurants,” RestaurantFinance Monitor, October 3, 2012.
Morrison, Maureen, “Pay Heed, Fast Feeders: C-Stores Out To Eat Your Lunch,”Advertising Age, January 2, 2012.
Chapter 19: Family-Dining RestaurantsLiddle, Alan J., “Family Segment Posts Strong Sales Despite Decline In Total Units,”Nation’s Restaurant News, June 25, 2012, p. 82.
Scarpa, James, “Menu Upgrades Pay Off For Family Chains,” Nation’s RestaurantNews, July 23, 2012, p. 66.
Chapter 20: Fast-Casual RestaurantsBrandau, Mark, “QSR Brands Brace For Growing Threats,” Nation’s Restaurant News,February 20, 2012, pp 1, 18-19.
RESTAURANT, FOOD & BEVERAGE MARKET RESEARCH HANDBOOK 2013
• 682 •
“Differences Are Blurring Between Fast-Food And Fast-Casual Restaurants,”Technomic, July 24, 2012.
Fast Casual Top 150 Chain Restaurant Report, Technomic, May 2012.
Glazer, Fern, “Money Matters,” Nation’s Restaurant News, July 23, 2012.
Sanburn, Josh, “Fast-Casual Nation,” Time, April 23, 2012.
The Future of LSR: Fast-Foods & Fast-Casual Restaurants Consumer Trend Report,Technomic, July 2012.
Chapter 21: Fine DiningThorn, Bret, “A Class Of Its Own,” Nation’s Restaurant News, November 12, 2012.
Chapter 22: Food Concessions At AirportsARN Fact Book, Airport Revenue News, January 2013.
Cruz, Clarissa, “Ultimate Airport Dining Survival Guide: Best Airport Restaurants,” Food& Wine, January 2013.
Chapter 24: Food TrucksBovino, Arthur, “101 Best Food Trucks In America,” The Daily Meal, November 13,2012.
Coffer, David, “Pop-Up Restaurants, Food Trucks Go Global,” Nation’s RestaurantNews, March 5, 2012.
Chapter 26: PizzaCoomes, Steve, “A New Voice For The Pizza Segment,” Nation’s Restaurant News, May 28, 2012, pp 1, 10.
Coomes, Steve, “Overall Pizza Sales Grow Despite Unit Contraction,” Nation’sRestaurant News, July 23, 2012.
Liddle, Alan J.,”Pizza Chains Differentiate Products To Grab Slice Of Sales,” Nation’sRestaurant News, June 25, 2012.
Pizza Consumer Trend Report, Technomic, April 2012.
RESTAURANT, FOOD & BEVERAGE MARKET RESEARCH HANDBOOK 2013
• 683 •
“Pizza Occasions Grow With Key Sales Drivers Including Innovation, Convenience AndVersatility,” Technomic, April 11, 2012.
Ruggless, Ron, “Pizza Chains Get Personal,” Nation’s Restaurant News, March 5,2012, pp 1, 24.
Chapter 27: Quick-Service Restaurants“A Snapshot Of Quick-Service Restaurant Customers,” Technomic, October 1, 2012.
Brandau, Mark, “QSR Brands Brace For Growing Threats,” Nation’s Restaurant News,February 20, 2012, pp 1, 18-19.
“Fast Food Restaurants Go Upscale,” NACS Daily News, January 23, 2013.
Glazer, Fern, “Gauging Growth,” Nation’s Restaurant News, March 19, 2012.
Hellmich, Nanci, “Today’s Adults Eat Less Fast Food,” USA Today, February 21, 2013.
Liddle, Alan, “Burger Players Dominate Sales, Lag In Growth Metrics,” Nation’sRestaurant News, June 25, 2012.
“Top 10 Fast-Food Markets Almost All In South,” Sandelman & Associates, June 28,2012.
Understanding Quick-Service Restaurants and Their Customers, Technomic, October2012.
Chapter 28: SnacksFrumkin, Paul, “Beverage-Snack Builds On Positive Growth Momentum,” Nation’sRestaurant News, July 23, 2012, pp 68-69.
Jennings, Lisa, “Operators Find Opportunity In Juice Bars,” Nation’s Restaurant News,February 6, 2012.
Liddle, Alan J., “Fondness For Quick Bites, Beverages Ring The Registers,” Nation’sRestaurant News, June 25, 2012, p. 72.
“Snacking Is Gaining Further Traction, Becoming A Consumer Lifestyle,” Technomic,March 12, 2012.
Snacking Occasion Consumer Trend Report, Technomic, March 2012.
RESTAURANT, FOOD & BEVERAGE MARKET RESEARCH HANDBOOK 2013
• 684 •
“What’s Ahead in 2013?” Technomic, November 19, 2013.
Chapter 29: Supermarket FoodserviceRetailer Meal Solutions Consumer Trend Report, Technomic, January 2013.
PART V: MARKET LEADERS
Chapter 44: Top Independent RestaurantsPomerantz, Dorothy, “The Old Man And The Sea,” Forbes, August 6, 2012, pp 98-99.
PART VI: THE CUSTOMER
Chapter 49: Customer ProfileAllen, Robin Lee, “Are You On Target?” Nation’s Restaurant News, April 30, 2012.
Boomers and Beyond – Targeting for Success, The NPD Group, January 2013.
“Boomers Increase Restaurant Visits While Millennials Cut Back,” The NPD Group,January 15, 2013.
Dostal, Erin, “Menu Price Matters More To Middle-Income Consumers,” Nation’sRestaurant News, October 5, 2012.
Glazer, Fern, “Over-50 Crowd Ups Restaurant Visits,” Nation’s Restaurant News,October 15, 2012.
Glazer, Fern, “Spending Plans,” Nation’s Restaurant News, April 30, 2012.
The Influence of Income Consumer Trend Report, Technomic, October 2012.
Chapter 50: Customer SatisfactionRuggless, Ron, “Hit or Myth: At Steakhouses, Correct Preparation Is Everything,”Nation’s Restaurant News, July 9, 2012.
Ruggless, Ron, “Hit or Myth: Consumers Find Suggestive Selling Unpalatable,” Nation’sRestaurant News, May 28, 2012.
Ruggless, Ron, “Hit or Myth: Diners Accompanied By Children Are Harder To SatisfyThan Diners Without Them,” Nation’s Restaurant News, March 7, 2011, p. 4.
RESTAURANT, FOOD & BEVERAGE MARKET RESEARCH HANDBOOK 2013
• 685 •
Ruggless, Ron, “Hit or Myth: Diners In Large Parties Are Less Satisfied With TheExperience Than Those In Smaller Groups,” Nation’s Restaurant News, July 11, 2011,p. 4.
Ruggless, Ron, “Hit or Myth: Diners Who Consume Alcoholic Beverages Enjoy TheirMeals More,” Nation’s Restaurant News, September 26, 2011, p. 6.
Ruggless, Ron, “Hit or Myth: Fast-Food Customers Who Use The Drive-Thru Are MoreSatisfied Than Customers Who Dine In,” Nation’s Restaurant News, February 7, 2011,p. 6.
Ruggless, Ron, “Hit or Myth: Gift Cards Help Improve Loyalty,” Nation’s RestaurantNews, January 14, 2013.
Ruggless, Ron, “Hit or Myth: Guests Visiting Older Restaurants Are Harder To Please,”Nation’s Restaurant News, August 8, 2011.
Ruggless, Ron, “Hit or Myth: Managers Matter During The Dining Experience,” Nation’sRestaurant News, April 2, 2012.
Ruggless, Ron, “Hit or Myth: Nothing Beats A Great Customer Experience,” Nation’sRestaurant News, April 12, 2011.
Ruggless, Ron, “Hit or Myth: Online Ordering Improves The Take-Out Experience,”Nation’s Restaurant News, April 30, 2012.
Ruggless, Ron, “Hit or Myth: Quick-Service Customers Report More Issues,” Nation’sRestaurant News, January 9, 2012.
Ruggless, Ron, “Hit or Myth: Restaurant Employees Do A Good Job Of HandlingHoliday Crowds,” Nation’s Restaurant News, December 17, 2012.
Ruggless, Ron, “Hit or Myth: Sub Shops Enjoy More Customer Loyalty Than OtherQSRs,” Nation’s Restaurant News, September 3, 2012.
Chapter 51: Hispanic-American CustomersGlazer, Fern, “Untapped Potential,” Nation’s Restaurant News, September 17, 2012.
Ruggless, Ron, “Cultural Differences, Flavors Key To Attracting Hispanic Consumers,”Nation’s Restaurant News, March 27, 2012.
Seifer, Darren, It’s Mealtime With U.S. Hispanics, The NPD Group, October 2012.
RESTAURANT, FOOD & BEVERAGE MARKET RESEARCH HANDBOOK 2013
• 686 •
Chapter 52: Millennial CustomersBrandau, Mark, “Millennials,” Nation’s Restaurant News, April 30, 2012.
“Restaurants Look To Meet Millennials’ Needs Without Alienating Others,” Technomic,November 6, 2012.
Understanding the Foodservice Attitudes & Behaviors of Millennials , Technomic,November 2012.
Chapter 53: Restaurant & Menu PreferencesMenu Positioning & Occasion Driver Consumer Trend Report, Technomic, December2012.
“Why Eat Out?” Technomic, December 4, 2012.
PART VII: DINING TRENDS & ANALYSES
Chapter 57: Children’s MealsFrumkin, Paul, “Growing Stronger; Restaurants Rethink Healthfulness Of Kids’ MenuItems As Focus On Nutrition Intensifies,” Nation’s Restaurant News, March 19, 2012.
“NPD Report: Interest In Kids’ Meals Wanes,” Nation’s Restaurant News, May 28, 2012.
Sweeney, Dawn, “Kids LiveWell Reflects Commitment To Health,” Nation’s RestaurantNews, July 23, 2012.
Chapter 59: Customer Service2013 Restaurant Industry Forecast, National Restaurant Association, January 2013.
Brandau, Mark, “Operators Take Up Team Service,” Nation’s Restaurant News,October 1, 2012, pp 3, 40.
Jennings, Lisa, “At Your Service,” Nation’s Restaurant News, April 2, 2012, pp 1, 51.
Sullivan, Jim, “Driving Customer Service With Service,” Nation’s Restaurant News,February 11, 2013, pp 28-30.
Chapter 60: DaypartsJennings, Lisa, “Cracking The Code,” Nation’s Restaurant News, April 16, 2012.
RESTAURANT, FOOD & BEVERAGE MARKET RESEARCH HANDBOOK 2013
• 687 •
Thorn, Bret, “Lunch Special,” Nation’s Restaurant News, June 25, 2012.
Chapter 61: Dining & The InternetGlazer, Fern, “The Digital Influence,” Nation’s Restaurant News, February 20, 2012.
“Mobile Accelerates The Fast Food Experience,” eMarketer, December 3, 2012.
Chapter 63: Dining With EntertainmentLetakis, Patricia, “Return Of The Speakeasy,” Florida Travel Life, January/February, p.21.
Chapter 67: Late-Night HoursMorrison, Maureen, “The Hottest New Joint In Town? Head Down To Club Applebee’s,”Advertising Age, August 6, 2012, pp 2, 22.
Chapter 68: LicensingJennings, Lisa, “License To Sell,” Nation’s Restaurant News, June 25, 2012, pp 1, 16-18.
Mayer, Ira, “North American Licensing Up 2.1% At Retail In 2012; Some LicensedCategories Outperform General Market,” The Licensing Letter, February 18, 2013.
Chapter 69: Locally Sourced & Organic FoodRuehle, Jens and James Rushing, “Buying Into The Local Food Movement,” A.T.Kearney, January 2013.
Chapter 70: Loyalty ProgramsBrandau, Mark “Join The Club,” Nation’s Restaurant News, April 30, 2012, p. 88.
Brandau, Mark, “Shifting Loyalties,” Nation’s Restaurant News, March 5, 2012, p. 34.
Chapter 71: Non-Traditional Restaurant SitesCoffer, David, “Pop-Up Restaurants, Food Trucks Go Global,” Nation’s RestaurantNews, March 5, 2012.
RESTAURANT, FOOD & BEVERAGE MARKET RESEARCH HANDBOOK 2013
• 688 •
Genevive, G., “Car Dealership Restaurants – A Rising and Growing Dining Concept,”KNG, January 26, 2012.
Maheshwari, Sapna, “Pick Out A Shirt, Then Pass The Peas,” BloombergBusinessweek, December 10, 2012.
Chapter 72: Nutrition2013 Restaurant Industry Forecast, National Restaurant Association, January 2013.
Brandau, Mark, “Leveraging Healthful Menu Offerings,” Nation’s Restaurant News, May9, 2012.
Healthy Eating Consumer Trend Report, Technomic, January 2013.
Storm, Stephanie, “McDonald’s Menu To Post Calorie Data,” The New York Times,September 12, 2012.
Storm, Stephanie, “U.S. Cuts Estimate Of Sugar Intake,” The New York Times, October26, 2012.
“Strong Consumer Support For Nutritional Disclosure At Restaurants,” Technomic,November 15, 2012.
“The Majority of U.S. Adults Consider Themselves to Be Healthy, But Eating BehaviorsShow Only 20% Classified as Most Healthy Eaters,” The NPD Group, September 4,2012.
“What’s ‘Healthy’ At Restaurants?” Technomic, January 3, 2013.
Chapter 73: Restrictive Diet MenusGluten-Free Foods And Beverages In The U.S. , 4th Edition, Packaged Facts, October2012.
Gluten-Free Foods Report, Mintel, January 2012.
Hsu, Tiffany, “Gluten-Free Food And Drinks Have Become A $4.2 Billion Market,” LosAngeles Times, October 23, 2012.
Jennings, Lisa, “Gluten-Free Efforts Carry Benefits, Risks,” Nation’s Restaurant News,June 11, 2012. Keating, Caitlin, “Fast Food Goes Gluten-Free,” Fortune, January 16, 2012, p. 12.
RESTAURANT, FOOD & BEVERAGE MARKET RESEARCH HANDBOOK 2013
• 689 •
Chapter 74: SeafoodCoomes, Steve, “Troubled Waters,” Nation’s Restaurant News, April 16, 2012.
Moore, Sonya, “Asian, Latin Flavors Hot Trend For Seafood Dishes,” Nation’sRestaurant News, April 12, 2012.
Rosenthal, Elisabeth, “Tests Say Mislabeled Fish Is a Widespread Problem,” The NewYork Times, December 11, 2012.
Weise, Elizabeth, “Flaky Fakes Common In Stores, Restaurants,” USA Today, February21, 2013.
Chapter 75: Snacking“Consumers Eating More Between Traditional Meals,” Nation’s Restaurant News,September 3, 2012, p. 80.
Snacking In America, The NPD Group, November 2012.
Snacking Occasion Consumer Trend Report, Technomic, March 2012.
Toops, Diane “Snacking Occasions On The Rise,” Food Processing, April 5, 2012.
Chapter 76: Takeout & Delivery2013 Restaurant Industry Forecast, National Restaurant Association, January 2013.
Horovitz, Bruce, “Burger King Tries Home Delivery,” USA Today, January 17, 2012.
Takeout and Off-Premise Dining Consumer Trend Report, Technomic, December 2011.
Chapter 77: Value-Focused Dining2013 Restaurant Industry Forecast, National Restaurant Association, January 2013.
Glazer, Fern, “Deal Makers,” Nation’s Restaurant News, November 26, 2012.
Glazer, Fern, “Winning Combinations,” Nation’s Restaurant News, June 25, 2012, pp 104-106.
Jennings, Lisa, “Consumers Trading Down From Fine-Dining To Quick-Service,”Nation’s Restaurant News, September 24, 2012.
RESTAURANT, FOOD & BEVERAGE MARKET RESEARCH HANDBOOK 2013
• 690 •
Thorn, Bret, “Restaurant Customers Traded Down In 2012,” Nation’s Restaurant News,January 22, 2013.
PART VIII: BEVERAGE TRENDS & ANALYSES
Chapter 78: Beverage Consumption & SpendingCoroso, Regina A., “Three In Ten Americans Drink Alcohol At Least Once A Week,”Harris Interactive, April 6, 2011.
Kaplan, Andrew and Jennifer Cirillo, “State-of-the-Industry 2012,” Beverage World, May2012, pp 23-44.
Saad, Lydia, “Majority in U.S. Drink Alcohol, Averaging Four Drinks A Week,” Gallup,August 17, 2012.
Chapter 79: Beer“Beer Consumption Among Females Rises,” fyi, International Demographics, October2012.
Cioletti, Jeff, “Still A Mixed Barrel,” Beverage World, May 2012.
Khermouch, Gerry, “Beer 2012: State-of-the-Industry Report,” Beverage Dynamics,September/October 2012.
Chapter 80: Distilled Spirits“Distilled Spirits Market Share Edges Upward in 2012,” Distilled Spirits Council of theUnited States, February 6, 2013. Lockett, Michelle P., “Mad For Whiskey,” Cheers, September 2012.
Magyarics, Kelly A., “New Spins on Gin,” Cheers, January 2013.
Robertiello, Jack, “Innovation Drives Cognac,” Beverage Dynamics,November/December 2012.
Robertiello, Jack, “Spicing Up Sales,” Beverage Dynamics, July/August 2012.
Rodgers, Monica Kass, “Tequila Time,” Cheers, April 2012.
Strandness, Kate, “Light, Mixable … and Innovating,” Beverage Dynamics,January/February 2013.
RESTAURANT, FOOD & BEVERAGE MARKET RESEARCH HANDBOOK 2013
• 691 •
Strandness, Kate, “Tequila’s New Revolution,” Beverage Dynamics, May/June 2012.
Strenk, Thomas Henry, “A Clear Winner,” Beverage Dynamics, May/June 2012.
Strenk, Thomas Henry, “Gin Blossoms,” Beverage Dynamics, July/August 2012.
Strenk, Thomas Henry, “Irish Spirits Express,” Beverage Dynamics, January/February2013.
Ward, Carol, “Tequila’s High-End Ride,” Market Watch, July/August 2012.
Chapter 82: Refreshment & Functional BeveragesKaplan, Andrew, “On The Rebound,” Beverage World, May 2012.
Kaplan, Andrew and Jennifer Cirillo, “Re-Energized!” Beverage World, May 2012.
Kaplan, Andrew and Jennifer Cirillo, “State-of-the-Industry 2012,” Beverage World, May 2012, pp 23-44.
Chapter 83: Coffee & TeaJennings, Lisa, “Tea Time In America?” Nation’s Restaurant News, January 13, 2013.
Kaplan, Andrew and Jennifer Cirillo, “State-of-the-Industry 2012,” Beverage World, May2012, pp 23-44.
National Coffee Drinking Trends 2012, National Coffee Association, March 2012.
The State of the U.S. Tea Industry, Tea Association of the U.S.A., 2012.
Chapter 84: Bottled WaterKaplan, Andrew and Jennifer Cirillo, “State-of-the-Industry 2012,” Beverage World, May2012, pp 23-44.
Kaplan, Andrew and Jennifer Cirillo, “Health & Wellness Still Top Of Mind,” BeverageWorld, May 2012.
McCoy, Kevin, “Disputes Spring Up On Bottled Water Sources,” USA Today, December14, 2012.
RESTAURANT, FOOD & BEVERAGE MARKET RESEARCH HANDBOOK 2013
• 692 •
Chapter 86: Beverage Service In Restaurants & Bars“Beverage-Only Restaurant Occasions Are Key To Expanding Foodservice BeverageSales,” The NPD Group, September 12, 2012.
“Drink Sales And Volume Tracking Positively At The Bar,” Technomic, November 29,2012.
Glazer, Fern, “Diners Drink Up,” Nation’s Restaurant News, May 26, 2012.
Jennings, Lisa, “Fast-Casual Chains Ramp Up Alcohol Offerings,” Nation’s RestaurantNews, January 17, 2013.
“Lean On Beverages To Increase Restaurant Check Averages,” Technomic, September24, 2012.
Morrison, Maureen and E.J. Schultz, “Beer-At-Burger Chain Fad May Leave Hangover,”Advertising Age, May 21, 2012.
Ruggless, Ron, “Happy Hours Are Here Again,” Nation’s Restaurant News, April 30,2012, pp 1, 46-48.
Thorn, Bret, “Flavored Cocktails Drove 2012 Restaurant Drink Sales,” Nation’sRestaurant News, January 9, 2013.
Thorn, Bret, “Seasonal Sips,” Nation’s Restaurant News, May 28, 2012.
PART IX: AWARD WINNERS
Chapter 107: Selections: Bon AppétitKnowlton, Andrew, “Six of the Best Lobster Rolls Across the U.S.,” Bon Appétit, March2011.
Knowlton, Andrew, “The Foodist’s Favorite Germanic Restaurants Across America,”Bon Appétit, July 12, 2011.
Knowlton, Andrew, “Top 10 Best Boutique Coffee Shops,” Bon Appétit, January 2011.
“Michelle Williams and Jay-Z Ahoy: The 10 Best Restaurants for Celebrity Sightings inNew York,” Bon Appétit, June 6, 2012.
Rothstein, Maryl, “America’s Top 6 Destination Diners and Their Must-Order Dishes,”Bon Appétit, May 24, 2011.
RESTAURANT, FOOD & BEVERAGE MARKET RESEARCH HANDBOOK 2013
• 693 •
Sanders, Rachel, “The Best New Jewish Delis in America,” Bon Appétit, August 22,2012.
“Turn Off That iPhone Flash and Hit the 10 Best Restaurants for Celeb Sightings in LA,”Bon Appétit, June 7, 2012.
Van Buren, Alex, “Not the Baking Type? Here Are 10 Cakes Worth Buying,” BonAppétit, October 10, 2012.
Van Buren, Alex, “The Best New Sushi Restaurants in America,” Bon Appétit, May 15,2012.
Chapter 112: Selections: Travel + LeisureBovino, Arthur, “Best Italian Restaurants in the U.S.,” Travel & Leisure, September2012.
Campbell, Geraldine, “Best Seafood Restaurants in the U.S.,” Travel & Leisure,October 2012.
Curtis, Wayne, “America’s Best Cocktail Bars,” Travel + Leisure, May 2011.
Curtis, Wayne, “America’s Coolest Coffeehouses,” Travel + Leisure, December 2011.
Curtis, Wayne and Aarti Virani, “America’s Best Wine Bars,” Travel + Leisure, March 2012.
Holmes, Catesby, “America’s Best BYO Restaurants,” Travel & Leisure, March 2011.
Kiniry, Laura and Brendan Spiegel, “Best French Fries in the U.S.,” Travel & Leisure,November 2012.
Parham, Kate, “Best Chinese Restaurants In The U.S.,” Travel + Leisure, February 15,2013.
Sachs, Adam, “New York’s Top Restaurants,” Travel & Leisure, July 2012.
Schoenfield, Bruce, “The Traveler’s Guide To Tea,” Travel & Leisure, May 2012.
Sloley, Emma, “America’s Best Comfort Foods,” Travel & Leisure, January 2011.
RESTAURANT, FOOD & BEVERAGE MARKET RESEARCH HANDBOOK 2013
• 694 •
Chapter 113: Selections: ZagatStoller, Gary, “Hey Burger Lovers: Get Your Buns To These Joints,” USA Today,February 19, 2013.
Stoller, Gary, “These Restaurants Take ‘Be Our Guest’ Seriously,” USA Today,February 11, 2013.
Stoller, Gary, “Zagat Picks Power Lunch Hot Spots,” USA Today, May 10, 2011, p. 3B.
Stoller, Kristin, “New Restaurants Spice Up Biz Trips,” USA Today, July 26, 2011, p.3B.
Chapter 115: The NRN 50Allen, Robin Lee, “The NRN 50: Breakout Brands,” Nation’s Restaurant News, January 28, 2013.
RESTAURANT, FOOD & BEVERAGE MARKET RESEARCH HANDBOOK 2013
• 695 •