profiling individual differences in alcoholic beverage ... - mdpi
TRANSCRIPT

foods
Article
Profiling Individual Differences in AlcoholicBeverage Preference and Consumption: New Insightsfrom a Large-Scale Study
Maria Carla Cravero 1 , Monica Laureati 2,*, Sara Spinelli 3,* , Federica Bonello 1 ,Erminio Monteleone 3 , Cristina Proserpio 2 , Maria Rosa Lottero 1, Ella Pagliarini 2 andCaterina Dinnella 3
1 Council for Agricultural Research and Economics (CREA), Research Centre for Viticulture and Enology,via Pietro Micca 35, 14100 Asti, Italy; [email protected] (M.C.C.);[email protected] (F.B.); [email protected] (M.R.L.)
2 Department of Food Environmental and Nutritional Sciences (DeFENS), University of Milan, Via Celoria 2,20133 Milan, Italy; [email protected] (C.P.); [email protected] (E.P.)
3 Department of Agriculture, Food, Environment and Forestry (DAGRI), University of Florence,via Donizetti 6, 50144 Florence, Italy; [email protected] (E.M.); [email protected] (C.D.)
* Correspondence: [email protected] (M.L.); [email protected] (S.S.); Tel.: +39-02-5031-9188 (M.L.);Tel.: +39-05-5275-5519 (S.S.)
Received: 17 July 2020; Accepted: 10 August 2020; Published: 17 August 2020�����������������
Abstract: Alcoholic beverage consumption plays an important role in European culture, and in manycontexts drinking alcohol is socially acceptable and considered part of the diet. Understanding thedeterminants of alcohol preference and consumption is important not only for disease prevention,intervention, and policy management, but also for market segmentation, product development, andoptimization. The aim of the study was to investigate the effect of individual responsiveness to variousoral sensations on self-reported liking and intake of 14 alcoholic and non-alcoholic beverages (includingbeers, wines, spirits, and cocktails) considering gender, age, and oral responsiveness (measuredthrough response to 6-n-propyl-2-thiouracil -PROP, basic tastes, astringency, and pungency) in a largesample of Italian consumers. Data were collected from 2388 respondents (age range 18–60 years;mean age = 37.6, SD = 13.1; 58.2% women). These results indicate that notwithstanding the stronggender difference, with women generally liking and consuming fewer alcoholic beverages than men,liking patterns in the two genders were similar. Three liking patterns for different alcoholic beverageslargely driven by orosensory properties were identified in both genders. “Spirit-lovers” constitutedthe smallest group (12%), consumed alcoholic beverages of any kind (not only spirits) more than theother segments, and were mainly men aged 30–45. “Beer/wine lovers” (44%) were the oldest groupwith no difference by gender. “Mild-drink lovers” (44%) liked alcoholic drinks with intense sweettaste and/or mixers that moderate ethanol perception. They were mainly women, aged 18–29, had alower consumption of alcohol, and a higher orosensory responsiveness than the other two groups.The results also suggest the opportunity to develop personalized recommendations towards specificconsumer segments based not only on socio-demographics but considering also perceptive variables.Finally, our data suggest that increased burning and bitterness from alcohol may act as a sensoryhindrance to alcoholic beverage overconsumption.
Keywords: wine; beer; spirits; cocktails; age; gender; PROP; taste responsiveness;consumer segmentation
Foods 2020, 9, 1131; doi:10.3390/foods9081131 www.mdpi.com/journal/foods
Foods 2020, 9, 1131 2 of 17
1. Introduction
Alcoholic beverage consumption plays an important role in European culture, and in manycontexts drinking alcohol is socially acceptable and considered part of the diet [1]. According todata from the World Health Organization (WHO), Europe is the heaviest drinking area worldwide,consuming about a quarter of total alcohol [2]. The Italian population alcohol consumption per capita(year 2010), expressed in L of pure alcohol, corresponded on average to 9.9 L, 11.9 L for men and 7.2 forwomen, with the highest consumption corresponding to wine (66%), beer (23%), and spirits (11%) [2].
Many factors influence alcohol intake, including genetics, psychological conditions, socialand cultural norms, socio-demographics, and taste responsiveness [3,4]. A better understandingof the determinants of alcoholic beverage preference and consumption is important not only fordisease prevention, intervention, and policy management, but also for market segmentation, productdevelopment, and optimization [4].
The most robust result in research on alcohol behavior is related to the gender gap in thefrequency and amount of alcohol consumed, with men drinking more alcohol and more frequentlythan women [5,6]. Considering age, results are less consistent; however, in general, a trend for youngerpeople to drink alcohol less frequently but in larger amounts and for older people smaller amounts ofalcohol more frequently was reported [2].
Oral responsiveness to taste and mouthfeel sensations has also been shown to influence alcoholconsumption [4]. Alcohol elicits multiple and complex oral sensations spanning from sweetness,bitterness, astringency, and a set of trigeminal sensations such as stinging, tingling, irritation, andburning [7]. Considering the substantial individual variation in sensory perception, oral sensationresponsiveness may reasonably account for differences in alcohol consumption behavior [8].
The association between oral responsiveness and alcohol consumption has been investigatedmainly in relation to health issues including addiction. A number of studies have focused on alcoholconsumption and markers of genetic variation in taste responsiveness, i.e., the ability to taste thebitterness of 6-n-propyl-2-thiouracil (PROP) or phenylthiocarbamide (PTC). In general, findingsindicate that individuals who taste PROP as intensely bitter also taste alcohol as more bitter andmore irritating; these alcohol nociceptive sensations may act as a deterrent to alcohol consumption [9].More specifically, Duffy et al. [10,11] found that PROP non-tasters perceived less intensely bitternessand oral burn from alcohol and were more likely to have greater preference for [11] and consumptionof alcohol [10,11]. Intranuovo and Powers [12] reported that those least able to taste PROP bitternessconsumed a greater number of beers than those who tasted PROP as intensely bitter. Regular consumersof beer were also more likely to be non-tasters of PROP/PTC than low consumers according to findingsby Guinard et al. [13]. This study further found that low consumption of beer was driven by bittertaste disliking. Thibodeau et al. [8] evidenced that regardless of the type of oral sensation, the mostresponsive subjects tended to drink fewer alcoholic beverages. In a large-scale study, Fischer et al. [14]found that consumers of alcoholic beverages perceived salt, sweet, and sour to be significantly lessintense than non-drinkers, but after adjusting for age and gender the relation was significant only forsalt and sweet.
Although a number of studies has been conducted to explore the association between oralperception and alcohol consumption, several limitations of the existing literature have beenhighlighted [4]. In general, almost all studies involved a reduced number of volunteers (≈30–200),who were often selected from a non-representative sample of the population (e.g., convenience sampleof college students) making it difficult to generalize the results. When large-scale studies wereconducted, only a segment of the population was involved (>40 years) [15], a single alcoholic beveragecategory (i.e., wine) was investigated [16] or alcohol consumption was evaluated globally withoutdetailed information regarding the specific beverages [14].
In view of these limitations, the aim of this study was to investigate the effect of individualresponsiveness to various oral sensations (bitterness from PROP and caffeine, sweetness, sourness,saltiness, astringency, and pungency) on preference and consumption of 14 alcoholic and non-alcoholic
Foods 2020, 9, 1131 3 of 17
beverages (including beers, wines, spirits, and cocktails) in a large sample of consumers recruited invarious regions of Italy. Age and gender effects on alcohol preference and consumption were alsoinvestigated since these factors are known to influence both alcohol behavior and taste responsiveness.Finally, we explored and characterized segments of consumers varying in alcoholic preferencesseparated by gender (within-gender approach).
2. Materials and Methods
The present paper is part of the Italian taste (IT) project, a large-scale study aimed atexploring the associations among biological, genetic, physiological, sociocultural, psychological, andpersonality-related factors, describing the dimensions of food liking, preference, behavior, and choice,and their relevance in determining individual differences within a given food culture framework [17].
The IT project started in 2014 within the Italian Sensory Science Society (SISS) involving, on avoluntary basis, 58 SISS members working in 19 sensory laboratories of public and private organizationsacross the country. This study consisted of an online questionnaire session (at home) and a one-on-onetesting in a sensory laboratory across 2 days. Only a selection of these tests will be presented here.For a complete overview of the study and further details on the definition of the procedures, seeMonteleone et al. [17].
2.1. Participants
Data were collected from 2388 subjects (age range 18–60 years; mean age = 37.6, SD = 13.1; 58.2%women). The mean age of men and women was37.8 years (SD = 12.9) and 37.5 years (SD = 13.3),respectively. In order to explore possible age-related differences, respondents were divided inthree age groups: 18–29 years (38.3%), 30–45 years (28.4%), 46–60 years (33.3%). The exclusioncriteria were pregnancy and not being born in Italy. Participants recruitment details are reportedin Monteleone et al. [17]. Briefly, participants were recruited on a national basis by means ofannouncements published on social networks (Facebook), articles published in national newspapers,and in magazines. Furthermore, each research unit recruited subjects locally by means of socialnetworks, mailing lists, pamphlet distribution, and word of mouth.
The study was conducted in agreement with the Italian ethical requirements on research activitiesand personal data protection (D.L. 30.6.03 n. 196). The study protocol was approved by the EthicsCommittee of Trieste University. The respondents gave their written informed consent at the beginningof the test according to the principles of the Declaration of Helsinki.
2.2. Procedure
2.2.1. Assessment of Alcoholic Beverage Consumption and Liking
Prior to the laboratory sessions, respondents completed at home an online questionnaire in orderto collect information about their age, gender, country of birth, and their consumption of alcoholicbeverages, such as beer (“On average, how many glasses/cans of beer do you drink per week?”), wine(“On average, how many glasses of wine do you drink per week?”), liquors/spirits (“On average, how manytimes a week do you consume liquor or spirits?”), aperitifs/cocktails (“On average, how many times a week doyou drink alcoholic beverages as aperitifs, liqueur wines, cocktails?”). Answers were provided as number ofglasses/cans/times of consumed drink. The different phrasing for the different alcoholic beverages wasdue to the fact that in Italy there is not a standard portion (e.g., glass or can) of spirits and cocktails,which can actually be consumed in very different formats. Respondents who declared zero weeklyconsumption of all four types of alcoholic beverages were defined as occasional drinkers (ODs). In fact,they cannot be defined strictly as abstainers or non-drinkers as many of them, while reporting to notconsume alcohol in a limited time frame (in a week), expressed a liking rating for various alcoholicbeverages (see below). Therefore, we assumed they were people that probably were used to drinkalcohol only in special occasions (e.g., celebrations).

Foods 2020, 9, 1131 4 of 17
Moreover, participants were asked to report their liking for 14 alcoholic and non-alcoholic drinks(blonde beer, dark beer, dry spumante, sweet spumante, red wine, white wine, sparkling white wine,limoncello, grappa, liquors, passito wine, whisky, alcoholic and non-alcoholic aperitifs) using a 9-pointhedonic scale [18] anchored at the extremes: 1 = “extremely disliked” and 9 = “extremely liked”, usingas middle point of the scale 5 = “neither liked nor disliked”. These drinks were selected in order tohave a wide representation of the different alcoholic beverages and cocktails most frequently consumedin Italy. If the participant had never tasted the product in question, she/he could choose the answer,“I have never tasted it”, and these were treated as missing values. These respondents will be referredto as “never tasted” along the text.
2.2.2. Assessment of Chemosensory Responsiveness
Responsiveness to Basic Tastes, Astringency, and Pungency
Participants were invited to take part in a tasting session in a sensory laboratory setting and wereasked to rate the intensity of six water solutions representing four basic tastes and the sensations ofastringency and pungency. The intensity of all water solutions was assessed using the generalizedlabeled magnitude scale, gLMS (0–100) [19]. The concentration of the solutions was decided based onpublished psychophysical data [20–22] and preliminary trials conducted with one hundred untrainedsubjects (unpublished data) in order to select solutions equivalent to moderate/strong on a gLMS(sourness: Citric acid 4 g/kg; bitterness: Caffeine 3 g/kg; sweetness: Sucrose 200 g/kg; saltiness:Sodium chloride 15 g/kg; astringency: Potassium aluminum sulfate 0.8 g/kg; pungency: Capsaicin1.5 mg/kg) [17].
Participants were trained in the use of the gLMS consistent with standard procedures [23–25].The gLMS consisted of a 100-unit vertical line with labels placed at no sensation, 0; barely detectable,1.4; weak, 6; moderate, 17; strong, 34.7; very strong, 52.5; and the strongest imaginable sensation ofany kind, 100. Numerical labels were not reported on the scale. Subjects were instructed to think tothe “strongest imaginable sensation” as the most intense sensation they could imagine that involvesremembered/imagined sensations in any sensory modality. This included such varied sensations as thecold of a cube of ice in the mouth, the deafening noise of a plane that is flying low, the strong pain feltwhen shutting a finger in a door. Participants were invited to ask questions about how to use the scale,and a practice trial was given in which they were asked to evaluate the intensity of the most intenselight they have ever experienced using a paper version of the scale.
Respondents evaluated the solutions in individual booths under normal light conditionsand were informed about the sensory quality that they were tasting. Water solutions werepresented simultaneously (10 mL) in 80-mL plastic cups identified with a random three-digit code.The presentation order of the samples was randomized, except for the capsaicin solution, which wasalways presented last to minimize carry-over effects. Participants were instructed to hold the samplein their mouth for 3 s, then expectorate, wait 3 s (5 s in the case of bitterness, astringency, and burning)and evaluate the intensity of the sensation on the gLMS. After each sample, participants rinsed theirmouth with water and waited 60 s before evaluating the following sample. After the capsaicin solution,participants rinsed their mouth with water, had a cracker, and rinsed again with water for at least 180 sbefore proceeding to the following test.
Responsiveness to PROP
In a separate session, participants also rated the intensity of a water solution of6-n-propyl-2-thiouracil (PROP). A supra-threshold 3.2 mM solution was prepared by dissolving0.5447 g/L of PROP (European Pharmacopoeia Reference Standard, Sigma Aldrich, Milano, IT) intodeionized water [26]. Subjects were presented with two identical samples (10 mL) in plastic cups,coded with three-digit numbers [22]. Subjects were instructed to hold each sample (10 mL) in theirmouth for 10 s, then expectorate, wait 20 s, and evaluate the intensity of bitterness using the gLMS [19].
Foods 2020, 9, 1131 5 of 17
Subjects had a 90 s break in order to control for carry-over effect after the first sample evaluation.During the break, subjects rinsed their mouth with water for 30 s, had some plain crackers for 30 s, andfinally rinsed with water for a further 30 s. The average bitterness score was used for each subject.
2.3. Data Analysis
Two-way analyses of variance (ANOVAs) were performed to investigate the effect of age(18–29 years, 30–45 years, 46–60 years), gender (men, women), and their interaction on alcoholicbeverage consumption (beer, wine, liquors/spirits, and aperitif/cocktails) and liking (14 different drinks).When the ANOVAs showed a significant effect (p < 0.05), post-hoc comparisons using the Bonferronitest adjusted for multiple comparison were used.
In order to explore segments of consumers varying in alcoholic beverage preference, a principalcomponent analysis (PCA) was computed on liking data of the 14 beverages. The analysis wasconducted separately for women and men (within-gender approach). Initially, the PCA was performedby removing the ODs as it was believed that these subjects might be less representative of the preferencefor alcoholic beverages. However, the plots that were obtained without ODs were very similar to thoseof the total sample. We assumed that this similarity was due to the fact that, despite having a lowalcohol consumption, ODs still have a well-defined preference for alcoholic beverages. For this reason,we identified liking patterns for different alcoholic beverages including ODs. Data were standardized(i.e., scaled to unit variance) prior to modeling and full cross validation was chosen as validationmethod. Consumers with more than 50% of missing values (n = 57, which corresponded to mostof the “never tasted” subjects) were automatically removed from the analysis. The PCAs were thusrun on a total of 2331 subjects (1353 women and 978 men). Based on loadings coordinates on thefirst two principal components (PC1, PC2), subjects were grouped into three segments, representingliking patterns for different alcoholic beverages (see details in Section 3.3). The three consumer likingsegments were inspected for alcoholic beverage consumption and for chemosensory responsiveness.First, a 2-way ANOVA was run considering age (3 age groups), consumer segments based on liking(three segments), and their interaction as factors. After verifying that the contribution of age wasmarginal and did not provide further information compared to the models considered previously,differences in alcoholic beverage consumption and in chemosensory responsiveness between the threeliking segments were investigated through 1-way ANOVA followed by the Bonferroni post-hoc testconsidering consumer segments based on liking (three segments) as factor. Differences related todrinking behavior, age, and gender among consumer segments were analyzed using a chi-square test.
The SAS/STAT statistical software package version 9.4 (SAS Institute Inc., Cary, NC, USA) and theUnscrambler software version 11.0 (CAMO Software AS, Oslo, Norway) were used for the data analysis.
3. Results
3.1. Alcoholic Beverage Consumption
3.1.1. Age and Gender Differences
On average, mean consumption of beer and wine corresponded to 1.3 and 2.4 glasses perweek, respectively. Spirits/liquors and aperitifs/cocktails were consumed 0.4 and 0.7 times per week,respectively. Four hundred and eighty-nine subjects (20.5% of the total sample) stated a zero weeklyaverage consumption of alcoholic beverages (occasional drinkers, ODs). Among the ODs, 77%were women, whereas similar OD proportions were found across age groups (18–29 years = 31%;30–45 years = 34%; 46–60 years = 35%).
There were strong effects of gender and age on alcoholic beverage consumption (Table 1).
Foods 2020, 9, 1131 6 of 17
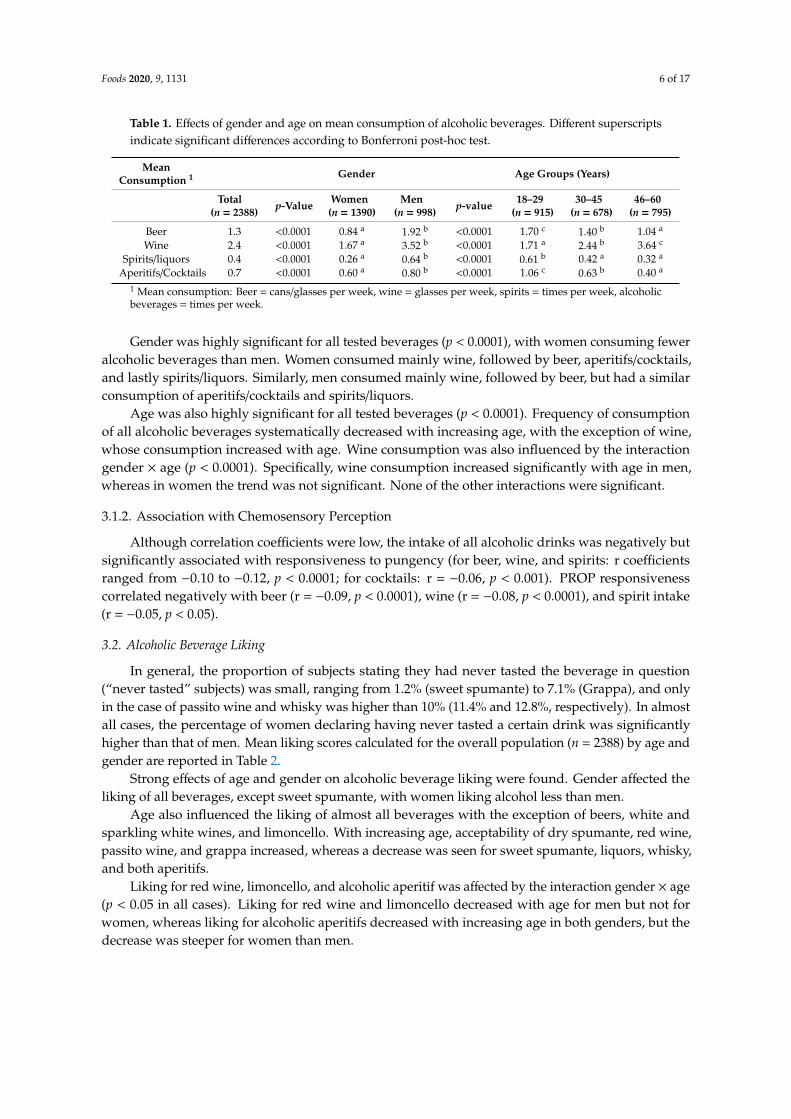
Table 1. Effects of gender and age on mean consumption of alcoholic beverages. Different superscriptsindicate significant differences according to Bonferroni post-hoc test.
MeanConsumption 1 Gender Age Groups (Years)
Total(n = 2388) p-Value Women
(n = 1390)Men
(n = 998) p-value 18–29(n = 915)
30–45(n = 678)
46–60(n = 795)
Beer 1.3 <0.0001 0.84 a 1.92 b <0.0001 1.70 c 1.40 b 1.04 a
Wine 2.4 <0.0001 1.67 a 3.52 b <0.0001 1.71 a 2.44 b 3.64 c
Spirits/liquors 0.4 <0.0001 0.26 a 0.64 b <0.0001 0.61 b 0.42 a 0.32 a
Aperitifs/Cocktails 0.7 <0.0001 0.60 a 0.80 b <0.0001 1.06 c 0.63 b 0.40 a
1 Mean consumption: Beer = cans/glasses per week, wine = glasses per week, spirits = times per week, alcoholicbeverages = times per week.
Gender was highly significant for all tested beverages (p < 0.0001), with women consuming feweralcoholic beverages than men. Women consumed mainly wine, followed by beer, aperitifs/cocktails,and lastly spirits/liquors. Similarly, men consumed mainly wine, followed by beer, but had a similarconsumption of aperitifs/cocktails and spirits/liquors.
Age was also highly significant for all tested beverages (p < 0.0001). Frequency of consumptionof all alcoholic beverages systematically decreased with increasing age, with the exception of wine,whose consumption increased with age. Wine consumption was also influenced by the interactiongender × age (p < 0.0001). Specifically, wine consumption increased significantly with age in men,whereas in women the trend was not significant. None of the other interactions were significant.
3.1.2. Association with Chemosensory Perception
Although correlation coefficients were low, the intake of all alcoholic drinks was negatively butsignificantly associated with responsiveness to pungency (for beer, wine, and spirits: r coefficientsranged from −0.10 to −0.12, p < 0.0001; for cocktails: r = −0.06, p < 0.001). PROP responsivenesscorrelated negatively with beer (r = −0.09, p < 0.0001), wine (r = −0.08, p < 0.0001), and spirit intake(r = −0.05, p < 0.05).
3.2. Alcoholic Beverage Liking
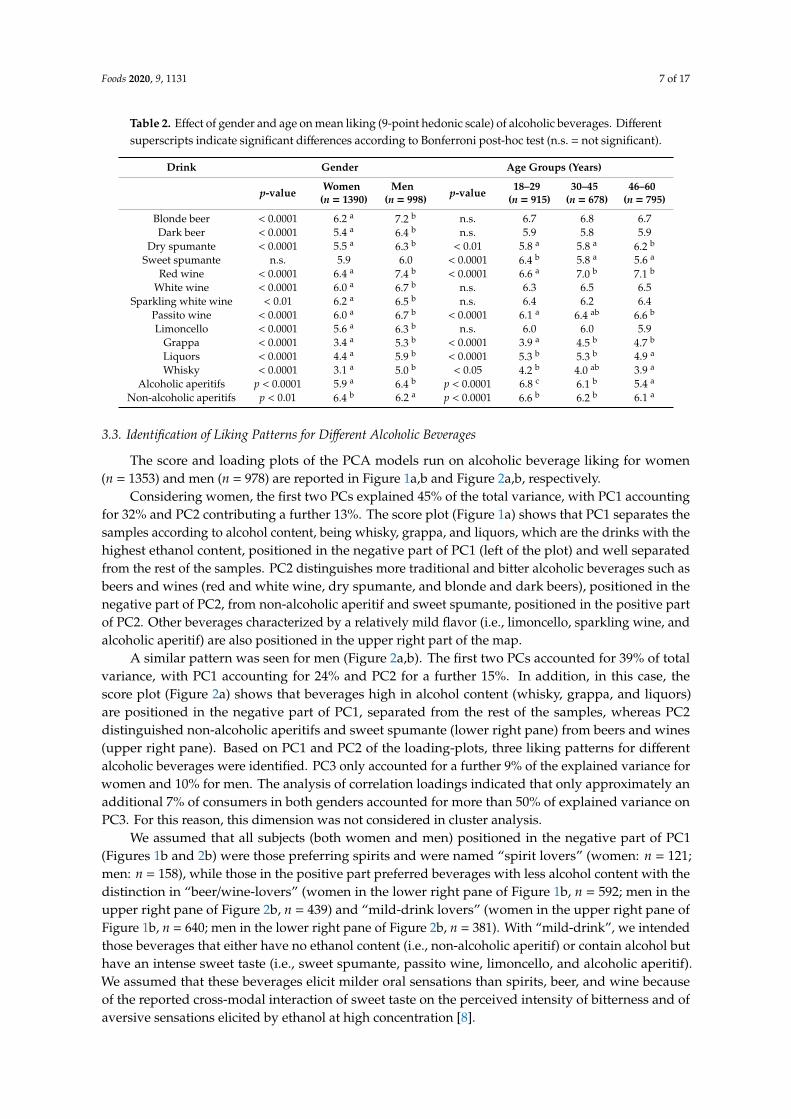
In general, the proportion of subjects stating they had never tasted the beverage in question(“never tasted” subjects) was small, ranging from 1.2% (sweet spumante) to 7.1% (Grappa), and onlyin the case of passito wine and whisky was higher than 10% (11.4% and 12.8%, respectively). In almostall cases, the percentage of women declaring having never tasted a certain drink was significantlyhigher than that of men. Mean liking scores calculated for the overall population (n = 2388) by age andgender are reported in Table 2.
Strong effects of age and gender on alcoholic beverage liking were found. Gender affected theliking of all beverages, except sweet spumante, with women liking alcohol less than men.
Age also influenced the liking of almost all beverages with the exception of beers, white andsparkling white wines, and limoncello. With increasing age, acceptability of dry spumante, red wine,passito wine, and grappa increased, whereas a decrease was seen for sweet spumante, liquors, whisky,and both aperitifs.
Liking for red wine, limoncello, and alcoholic aperitif was affected by the interaction gender × age(p < 0.05 in all cases). Liking for red wine and limoncello decreased with age for men but not forwomen, whereas liking for alcoholic aperitifs decreased with increasing age in both genders, but thedecrease was steeper for women than men.
Foods 2020, 9, 1131 7 of 17
Table 2. Effect of gender and age on mean liking (9-point hedonic scale) of alcoholic beverages. Differentsuperscripts indicate significant differences according to Bonferroni post-hoc test (n.s. = not significant).
Drink Gender Age Groups (Years)
p-value Women(n = 1390)
Men(n = 998) p-value 18–29
(n = 915)30–45
(n = 678)46–60
(n = 795)
Blonde beer < 0.0001 6.2 a 7.2 b n.s. 6.7 6.8 6.7Dark beer < 0.0001 5.4 a 6.4 b n.s. 5.9 5.8 5.9
Dry spumante < 0.0001 5.5 a 6.3 b < 0.01 5.8 a 5.8 a 6.2 b
Sweet spumante n.s. 5.9 6.0 < 0.0001 6.4 b 5.8 a 5.6 a
Red wine < 0.0001 6.4 a 7.4 b < 0.0001 6.6 a 7.0 b 7.1 b
White wine < 0.0001 6.0 a 6.7 b n.s. 6.3 6.5 6.5Sparkling white wine < 0.01 6.2 a 6.5 b n.s. 6.4 6.2 6.4
Passito wine < 0.0001 6.0 a 6.7 b < 0.0001 6.1 a 6.4 ab 6.6 b
Limoncello < 0.0001 5.6 a 6.3 b n.s. 6.0 6.0 5.9Grappa < 0.0001 3.4 a 5.3 b < 0.0001 3.9 a 4.5 b 4.7 b
Liquors < 0.0001 4.4 a 5.9 b < 0.0001 5.3 b 5.3 b 4.9 a
Whisky < 0.0001 3.1 a 5.0 b < 0.05 4.2 b 4.0 ab 3.9 a
Alcoholic aperitifs p < 0.0001 5.9 a 6.4 b p < 0.0001 6.8 c 6.1 b 5.4 a
Non-alcoholic aperitifs p < 0.01 6.4 b 6.2 a p < 0.0001 6.6 b 6.2 b 6.1 a
3.3. Identification of Liking Patterns for Different Alcoholic Beverages
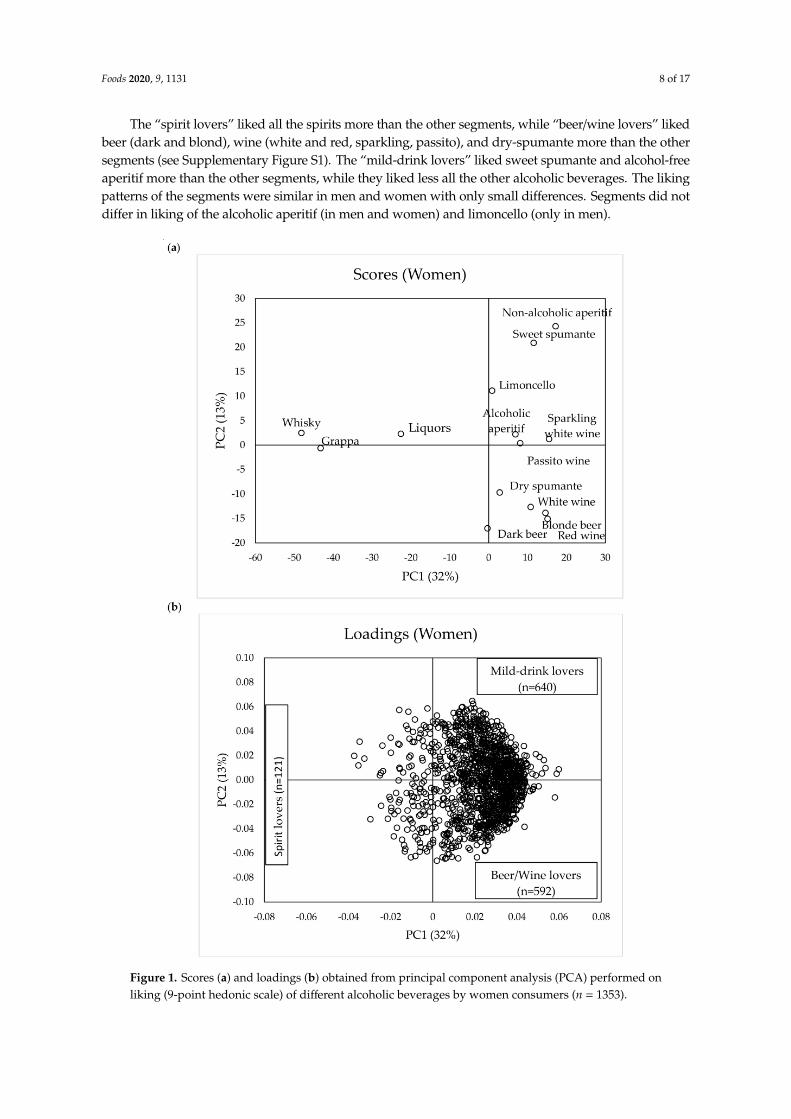
The score and loading plots of the PCA models run on alcoholic beverage liking for women(n = 1353) and men (n = 978) are reported in Figure 1a,b and Figure 2a,b, respectively.
Considering women, the first two PCs explained 45% of the total variance, with PC1 accountingfor 32% and PC2 contributing a further 13%. The score plot (Figure 1a) shows that PC1 separates thesamples according to alcohol content, being whisky, grappa, and liquors, which are the drinks with thehighest ethanol content, positioned in the negative part of PC1 (left of the plot) and well separatedfrom the rest of the samples. PC2 distinguishes more traditional and bitter alcoholic beverages such asbeers and wines (red and white wine, dry spumante, and blonde and dark beers), positioned in thenegative part of PC2, from non-alcoholic aperitif and sweet spumante, positioned in the positive partof PC2. Other beverages characterized by a relatively mild flavor (i.e., limoncello, sparkling wine, andalcoholic aperitif) are also positioned in the upper right part of the map.
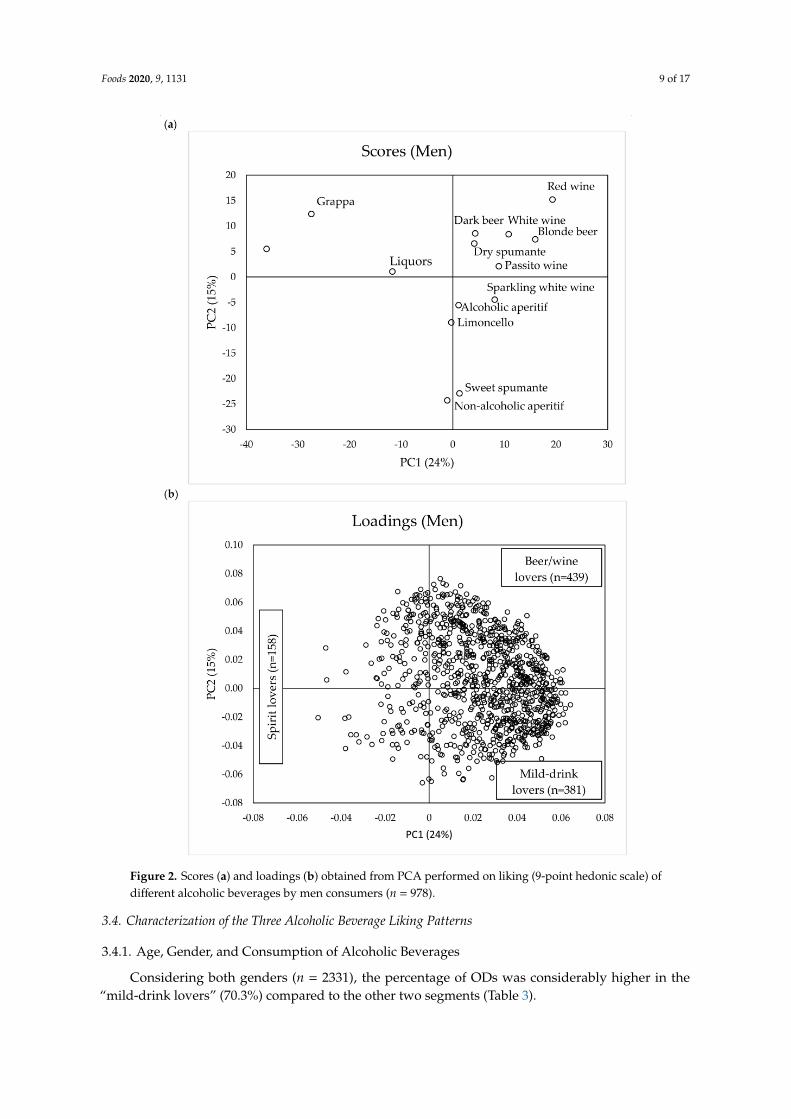
A similar pattern was seen for men (Figure 2a,b). The first two PCs accounted for 39% of totalvariance, with PC1 accounting for 24% and PC2 for a further 15%. In addition, in this case, thescore plot (Figure 2a) shows that beverages high in alcohol content (whisky, grappa, and liquors)are positioned in the negative part of PC1, separated from the rest of the samples, whereas PC2distinguished non-alcoholic aperitifs and sweet spumante (lower right pane) from beers and wines(upper right pane). Based on PC1 and PC2 of the loading-plots, three liking patterns for differentalcoholic beverages were identified. PC3 only accounted for a further 9% of the explained variance forwomen and 10% for men. The analysis of correlation loadings indicated that only approximately anadditional 7% of consumers in both genders accounted for more than 50% of explained variance onPC3. For this reason, this dimension was not considered in cluster analysis.
We assumed that all subjects (both women and men) positioned in the negative part of PC1(Figures 1b and 2b) were those preferring spirits and were named “spirit lovers” (women: n = 121;men: n = 158), while those in the positive part preferred beverages with less alcohol content with thedistinction in “beer/wine-lovers” (women in the lower right pane of Figure 1b, n = 592; men in theupper right pane of Figure 2b, n = 439) and “mild-drink lovers” (women in the upper right pane ofFigure 1b, n = 640; men in the lower right pane of Figure 2b, n = 381). With “mild-drink”, we intendedthose beverages that either have no ethanol content (i.e., non-alcoholic aperitif) or contain alcohol buthave an intense sweet taste (i.e., sweet spumante, passito wine, limoncello, and alcoholic aperitif).We assumed that these beverages elicit milder oral sensations than spirits, beer, and wine becauseof the reported cross-modal interaction of sweet taste on the perceived intensity of bitterness and ofaversive sensations elicited by ethanol at high concentration [8].
Foods 2020, 9, 1131 8 of 17
The “spirit lovers” liked all the spirits more than the other segments, while “beer/wine lovers” likedbeer (dark and blond), wine (white and red, sparkling, passito), and dry-spumante more than the othersegments (see Supplementary Figure S1). The “mild-drink lovers” liked sweet spumante and alcohol-freeaperitif more than the other segments, while they liked less all the other alcoholic beverages. The likingpatterns of the segments were similar in men and women with only small differences. Segments did notdiffer in liking of the alcoholic aperitif (in men and women) and limoncello (only in men).
Figure 1. Scores (a) and loadings (b) obtained from principal component analysis (PCA) performed onliking (9-point hedonic scale) of different alcoholic beverages by women consumers (n = 1353).
Foods 2020, 9, 1131 9 of 17
Figure 2. Scores (a) and loadings (b) obtained from PCA performed on liking (9-point hedonic scale) ofdifferent alcoholic beverages by men consumers (n = 978).
3.4. Characterization of the Three Alcoholic Beverage Liking Patterns
3.4.1. Age, Gender, and Consumption of Alcoholic Beverages
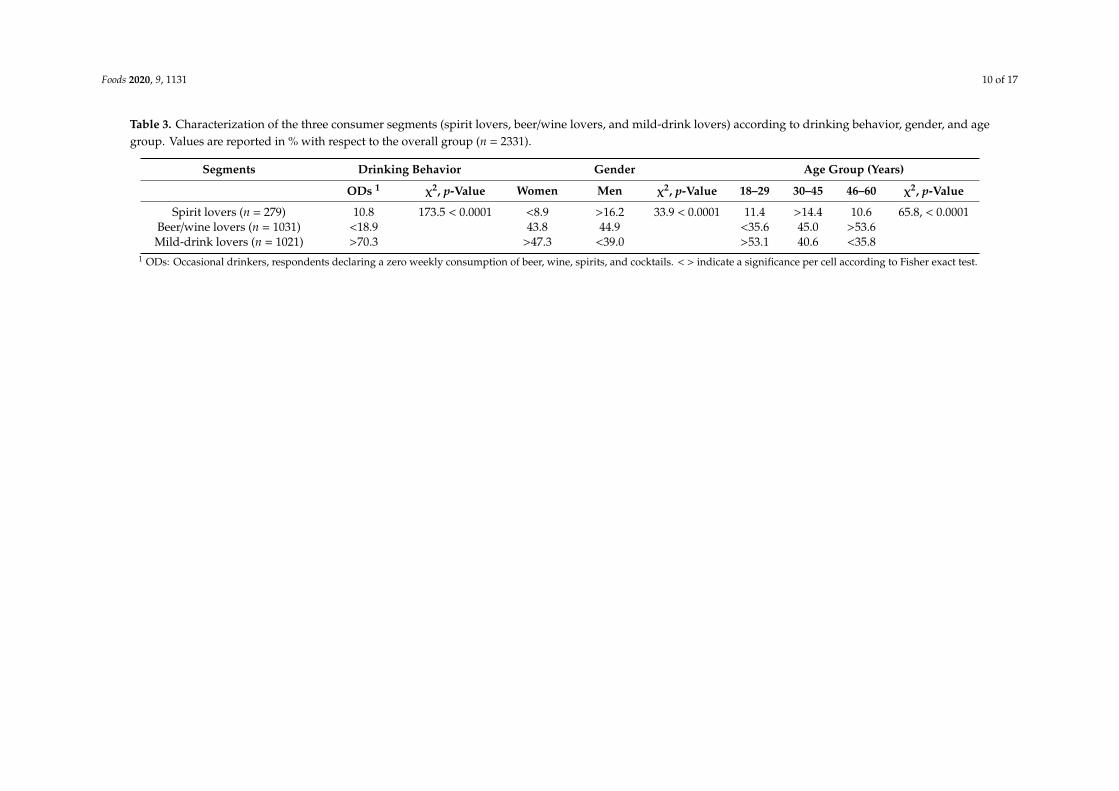
Considering both genders (n = 2331), the percentage of ODs was considerably higher in the“mild-drink lovers” (70.3%) compared to the other two segments (Table 3).
Foods 2020, 9, 1131 10 of 17
Table 3. Characterization of the three consumer segments (spirit lovers, beer/wine lovers, and mild-drink lovers) according to drinking behavior, gender, and agegroup. Values are reported in % with respect to the overall group (n = 2331).
Segments Drinking Behavior Gender Age Group (Years)
ODs 1 χ2, p-Value Women Men χ2, p-Value 18–29 30–45 46–60 χ2, p-Value
Spirit lovers (n = 279) 10.8 173.5 < 0.0001 <8.9 >16.2 33.9 < 0.0001 11.4 >14.4 10.6 65.8, < 0.0001Beer/wine lovers (n = 1031) <18.9 43.8 44.9 <35.6 45.0 >53.6Mild-drink lovers (n = 1021) >70.3 >47.3 <39.0 >53.1 40.6 <35.8
1 ODs: Occasional drinkers, respondents declaring a zero weekly consumption of beer, wine, spirits, and cocktails. < > indicate a significance per cell according to Fisher exact test.
Foods 2020, 9, 1131 11 of 17
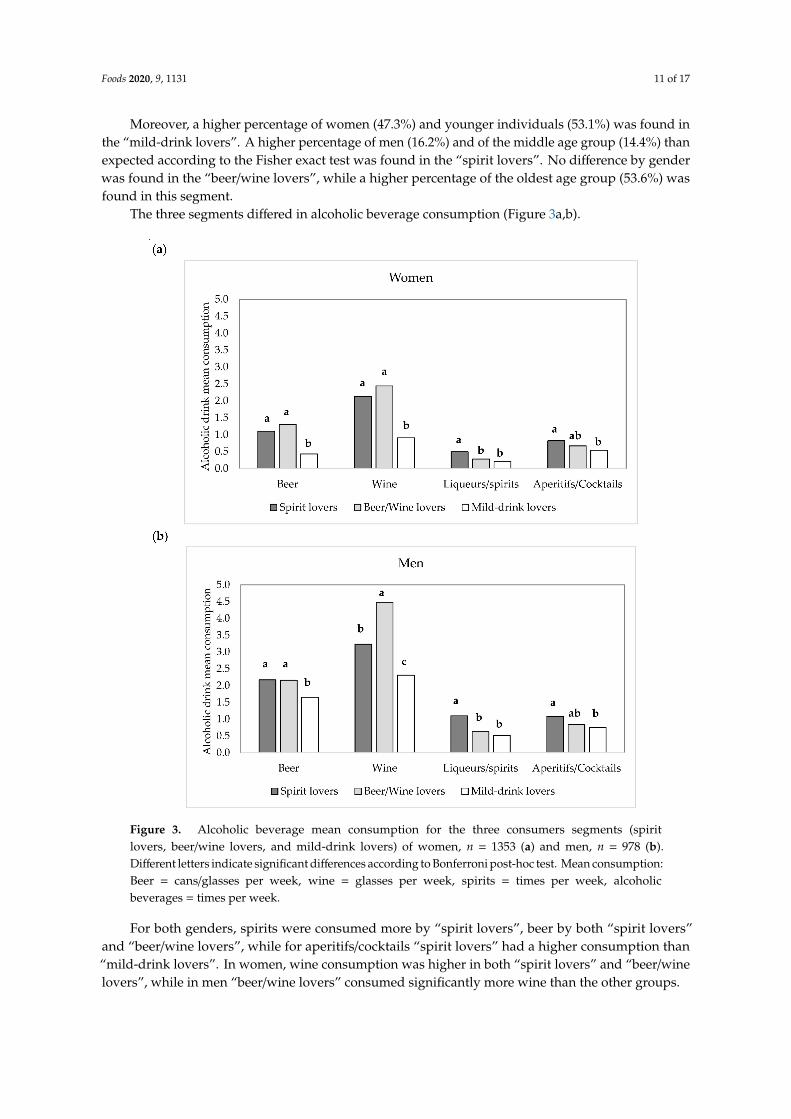
Moreover, a higher percentage of women (47.3%) and younger individuals (53.1%) was found inthe “mild-drink lovers”. A higher percentage of men (16.2%) and of the middle age group (14.4%) thanexpected according to the Fisher exact test was found in the “spirit lovers”. No difference by genderwas found in the “beer/wine lovers”, while a higher percentage of the oldest age group (53.6%) wasfound in this segment.
The three segments differed in alcoholic beverage consumption (Figure 3a,b).
Figure 3. Alcoholic beverage mean consumption for the three consumers segments (spiritlovers, beer/wine lovers, and mild-drink lovers) of women, n = 1353 (a) and men, n = 978 (b).Different letters indicate significant differences according to Bonferroni post-hoc test. Mean consumption:Beer = cans/glasses per week, wine = glasses per week, spirits = times per week, alcoholicbeverages = times per week.
For both genders, spirits were consumed more by “spirit lovers”, beer by both “spirit lovers”and “beer/wine lovers”, while for aperitifs/cocktails “spirit lovers” had a higher consumption than“mild-drink lovers”. In women, wine consumption was higher in both “spirit lovers” and “beer/winelovers”, while in men “beer/wine lovers” consumed significantly more wine than the other groups.
Foods 2020, 9, 1131 12 of 17
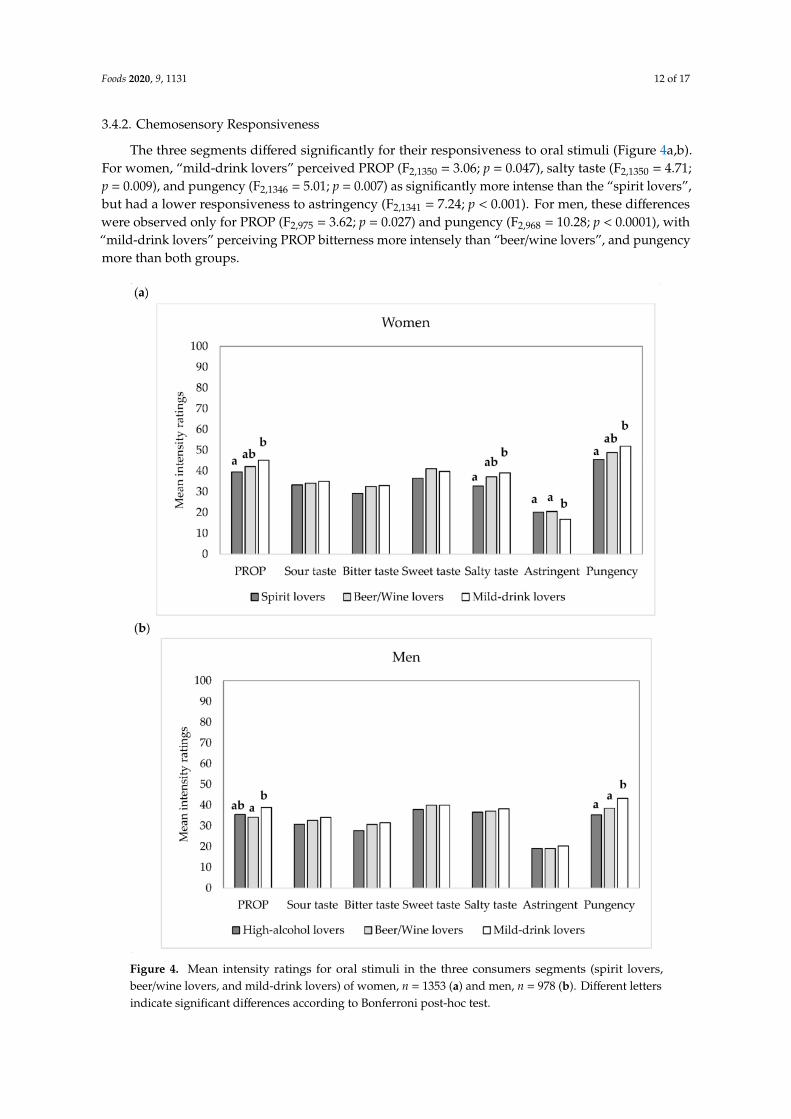
3.4.2. Chemosensory Responsiveness
The three segments differed significantly for their responsiveness to oral stimuli (Figure 4a,b).For women, “mild-drink lovers” perceived PROP (F2,1350 = 3.06; p = 0.047), salty taste (F2,1350 = 4.71;p = 0.009), and pungency (F2,1346 = 5.01; p = 0.007) as significantly more intense than the “spirit lovers”,but had a lower responsiveness to astringency (F2,1341 = 7.24; p < 0.001). For men, these differenceswere observed only for PROP (F2,975 = 3.62; p = 0.027) and pungency (F2,968 = 10.28; p < 0.0001), with“mild-drink lovers” perceiving PROP bitterness more intensely than “beer/wine lovers”, and pungencymore than both groups.
Figure 4. Mean intensity ratings for oral stimuli in the three consumers segments (spirit lovers,beer/wine lovers, and mild-drink lovers) of women, n = 1353 (a) and men, n = 978 (b). Different lettersindicate significant differences according to Bonferroni post-hoc test.

Foods 2020, 9, 1131 13 of 17
4. Discussion
The present study, conducted on a large and representative sample of the Italian population,confirmed that demographic variables such as gender and age greatly influence both the preferenceand consumption of most of the alcoholic beverages considered, and that chemosensory perceptionmay play an important role in modulating alcohol behavior.
Occasional drinkers, defined as those declaring a zero weekly consumption of beer, wine,spirits/liquors, and cocktails, represented up to 20% of the population sample. This group consistedmainly of women, with no difference according to age.
For both genders, the higher consumption of alcohol corresponded to wine and beer, while spiritsand cocktails were less consumed. These results are in line with previous research and WHO datareporting wine as the most popular alcoholic drink in Italy [27], followed by beer and spirits [2].This outcome was expected since Italy is known to be a country dominating global wine production andtrade and is also considered an important reference for wine consumption linked to gastronomy [28].
In our population sample, women liked and consumed fewer alcoholic beverages thanmen. In general, women consumed wine and beer 2 times and spirits 2.5 times less than men.Although evidence for convergence has been observed [5], the gender gap in alcohol consumption is acommon finding in several countries [2,29] and it is partially explained by different drinking norms setfor men [30] and by the more aversive physiological effects alcohol may have on women [31].
We observed that alcoholic beverage consumption decreased with aging, with the exceptionof wine, for which a systematic increase was seen. It should be highlighted that in many contexts,drinking alcohol is socially acceptable, in particular, moderate wine consumption is considered partof well-known dietary patterns such as the Mediterranean diet [32]. Therefore, the older populationmight be more inclined to choose wine instead of other alcoholic beverages. Another reason for thehigher wine consumption in the older group might be that alcohol consumption is strongly linked tosocial factors. In agreement with this assumption, sweet spumante, liquors, whisky, and both aperitifswere highly liked by young people, while red wine, passito wine, dry spumante, and grappa weremore appreciated with increasing age. Interestingly, in Italy, the consumption of these latter drinks ismainly associated with meals (i.e., wine) or forms part of a ritual (e.g., grappa and after dinner fortifiedwines such as passito), while the drinks preferred by young people are often consumed outdoors, in theevening, during the weekend, and in more social settings (e.g., discos and dance clubs) [33]. Therefore,the different liking patterns observed in the present study may reflect a difference between generationsin alcoholic beverage conceptualisation: older people associate alcohol with relaxation and may link itsconsumption more to a symbolic ritual, e.g., having a drink to demarcate the end of a working day [34],while young consumers may perceive alcohol more as a way to socialize and get out of routine [33].
The adoption of a within-gender approach [35] allowed pointing out some similarities betweenthe two genders. In fact, while women liked and consumed fewer alcoholic beverages than men, whenanalyzed separately, similar liking patterns between genders were found. These three distinct likingpatterns were largely driven by the orosensory properties of the beverages. Only a small percentageof the population sample liked spirits (“spirit lovers”), while most of the consumers liked alcoholicbeverages with a lower alcohol content. Among these, two clusters have been identified, one preferringbeers and wines (“beer/wine lovers”), which are notoriously characterized by sharp orosensoryproperties such as bitterness, sourness, and astringency [4], and one preferring non-alcoholic drinksand alcoholic drinks with intense sweet taste and/or mixers that moderate the perception of ethanol(“mild-drink lovers”) [8]. However, gender, as well as age group distribution, were considerablydifferent within the three consumers’ segments. “Mild-drink lovers” were more likely to be womenand young, “spirit lovers” were mainly men aged 30–45, while “beer/wine lovers” were the oldestgroup with no significant difference by gender. The three clusters differed in the consumption ofalcoholic drinks and in the response to oral sensations. “Mild-drink lovers” had the highest proportionof ODs, a lower consumption of all alcoholic beverages, especially beer and wine, and were moresensitive to PROP and pungency. “Mild-drink lovers” women were also more and less sensitive to salty
Foods 2020, 9, 1131 14 of 17
taste and astringency, respectively. Interestingly, there are similarities between our study and anotherone conducted on a large sample of American wine consumers. Although the study was performedconsidering different wine styles and not a variety of alcoholic beverages, Pickering et al. [16] identifieda cluster of “sweet wine likers” who were mainly women, young, consumed less wine, and had ahigher PROP responsiveness, as we found for “mild-drink lovers”. This convergence of findings isinteresting and indicates that the characteristics of alcoholic beverages consumers may extend beyonda single cultural context and a specific beverage category. Our findings are also in line with previousresearch, indicating that most responsive subjects tend to drink less [8,14] and that increased perceptionof PROP bitterness associates with higher perception of saltiness [36,37], pungency [38–41], and greaterirritation from ethanol [39,42] in water solutions, as well as with more intense perceived bitterness inalcoholic beverages [43]. In the present study, we did not measure responsiveness to irritation fromethanol but from capsaicin (pungency). Capsaicin perception is mediated by the TRPV1 ion channel,a nociceptor associated with the perception of burning, whose response is elicited and potentiatedby ethanol [44,45]. Recent evidence has shown that individuals who consume beer, wine, and spiritsless frequently perceive greater bitterness and burning/tingling from ethanol [7]; thus, the higherperception of these aversive sensations might be one potential reason for the disliking and lowerconsumption of alcoholic beverages [4]. The causality of the association between oral responsivenessand alcohol consumption is still not well understood. The intensity with which drinkers perceivetaste could potentially affect their alcoholic beverage choices and drinking habits; conversely, alcoholconsumption may impair taste sensitivity [15].
An unexpected finding was the reduced responsiveness to astringency by women “mild-drinklovers”. We would have expected, rather, that this group had an increased perception of astringencythat may act as hindrance to the consumption of beverages, mainly wine and beer, rich in compoundseliciting this mouthfeel sensation. In fact, Thibodeau et al. [8] recently reported that individuals mostresponsive to sourness and astringency drank less alcohol. Astringency is an oral sensation difficultto detect and recognize [46,47], probably even more in subjects that usually do not drink alcoholicbeverages characterized by this sensation. The perception of other sensations such as sweetness,sourness, and bitterness from caffeine did not differ between the consumer segments. These findingssuggest that innately pleasant sensations (i.e., sweetness), and stimuli that are not elicited by ethanol(i.e., sourness) may have little influence on alcohol consumption behaviors, while the null result forbitterness responsiveness may be due to the use of caffeine, which activates different bitter receptors(TAS2R7, TAS2R10, TAS2R14, TAS2R43, and TAS2R46) [48] compared to ethanol (TAS2R13 andTAS2R38) [44]. In this context, Roura et al. [49] reported that the intensity of different bitter compoundsis associated if they elicit the same TAS2R receptors. It should also be considered that several factorsare involved in the preference and consumption of alcoholic beverages; therefore, it is reasonable thatthe perceptual dimension plays only part of the role. As a final remark, however, although differencesin perception between the consumer groups were generally modest and not always significant, theywere observed for almost all oral sensations and for both genders, suggesting a robust effect.
Further factors may affect liking and consumption of alcoholic beverages that were not consideredin this study, related to the persons such as personality traits as sensitivity to reward [50] and sensationseeking [51], but also related to the product such as emotions and context [52]. Taken together, thesefactors may contribute to a deeper understanding of individual differences in liking and consumptionof alcoholic beverages.
5. Conclusions
Large scale studies are important to confirm or refute trends observed in smaller lab-basedstudies. In this context, our findings confirmed and expanded the existing knowledge on the interplaybetween age, gender, chemosensory responsiveness, and alcohol consumption. We confirmed theimportance of gender and age in alcoholic beverage liking and intake. Notwithstanding the largegender-related differences, three distinct liking patterns for different alcoholic beverages were identified
Foods 2020, 9, 1131 15 of 17
in a similar way in men and women, reflecting plausible market segments: One small segment isoriented toward spirits, one toward beer/wine, and one toward drinks with mild sensory properties.Finally, we confirmed that preference and consumption of alcoholic beverages may be modulated bychemosensory responsiveness. People with higher response to oral sensations (mainly PROP bitternessand burning sensation) may experience the aversive sensations more strongly, leading to lower likingand, thus, consumption of alcohol. The systematic study of the interplay between chemosensoryperception and alcohol consumption is rather new. Further studies are encouraged to better understandthe causality of this association.
Supplementary Materials: The following are available online at http://www.mdpi.com/2304-8158/9/8/1131/s1.Figure S1: Mean liking scores for spirits, beers/wine and cocktails provided by the three consumers clusters(Spirit lovers, Beer/Wine lovers and Mild-drink lovers) by gender.
Author Contributions: Conceptualization, M.L., C.D., S.S., M.C.C., F.B.; methodology, M.L., S.S., C.D., E.P.; formalanalysis, M.C.C., F.B., M.L., C.P., S.S., C.D.; investigation, M.C.C., F.B., M.R.L., M.L., C.P., S.S., C.D.; resources,E.M., E.P., M.C.C.; data curation, S.S.; writing—Original draft preparation, M.L., M.C.C., C.D., C.P. F.B., S.S.;writing—Review and editing, M.C.C., M.L., S.S., F.B., C.D., C.P., E.P., E.M., M.R.L.; visualization, M.L., C.P.;supervision, C.D., S.S.; project administration, E.M.; funding acquisition, E.M., M.L. All authors have read andagreed to the published version of the manuscript.
Funding: This research received funding by the University of Milan Piano di sostegno alla ricerca 2018.
Acknowledgments: This work is part of the Italian Taste project, a conjoint study of the Italian Sensory ScienceSociety (SISS). The authors are grateful to all volunteers for participating in this study and to all the SISS membersthat participated in the collection of the data.
Conflicts of Interest: The authors declare no conflict of interest.
References
1. Silva, A.P.; Jager, G.; Van Zyl, H.; Voss, H.P.; Pintado, M.; Hogg, T.; De Graaf, C. Cheers, proost, saúde:Cultural, contextual and psychological factors of wine and beer consumption in Portugal and in theNetherlands. Crit. Rev. Food Sci. Nutr. 2017, 57, 1340–1349. [CrossRef] [PubMed]
2. World Health Organization. Global Status Report on Alcohol and Health 2018; WHO: Geneva, Switzerland, 2018.3. Nolen-Hoeksema, S. Gender differences in risk factors and consequences for alcohol use and problems.
Clin. Psychol. Rev. 2004, 24, 981–1010. [CrossRef] [PubMed]4. Thibodeau, M.; Pickering, G.J. The role of taste in alcohol preference, consumption and risk behavior. Crit. Rev.
Food Sci. Nutr. 2019, 59, 676–692. [CrossRef] [PubMed]5. Bratberg, G.H.; Wilsnack, S.J.; Wilsnack, R.; Haugland, S.H.; Krokstad, S.; Sund, E.R.; Bjørngaard, J.H. Gender
differences and gender convergence in alcohol use over the past three decades (1984–2008), The HUNT Study,Norway. BMC Public Health 2016, 16, 723. [CrossRef]
6. Mäkelä, P.; Gmel, G.; Grittner, U.; Kuendig, H.; Kuntsche, S.; Bloomfield, K.; Room, R. Drinking patterns andtheir gender differences in Europe. Alcohol Alcohol. 2006, 41 (Suppl. 1), i8–i18. [CrossRef]
7. Nolden, A.A.; Hayes, J.E. Perceptual qualities of ethanol depend on concentration, and variation in thesepercepts associates with drinking frequency. Chemosens. Percept. 2015, 8, 149–157. [CrossRef]
8. Thibodeau, M.; Bajec, M.R.; Pickering, G.J. Orosensory responsiveness and alcohol behaviour. Physiol. Behav.2017, 177, 91–98. [CrossRef]
9. Bachmanov, A.A.; Kiefer, S.W.; Molina, J.C.; Tordoff, M.G.; Duffy, V.B.; Bartoshuk, L.M.; Mennella, J.A.Chemosensory factors influencing alcohol perception, preferences, and consumption. Alcohol. Clin. Exp. Res.2003, 27, 220–231. [CrossRef]
10. Duffy, V.B.; Davidson, A.C.; Kidd, J.R.; Kidd, K.K.; Speed, W.C.; Pakstis, A.J.; Reed, D.R.; Snyder, D.J.;Bartoshuk, L.M. Bitter receptor gene (TAS2R38), 6-n-propylthiouracil (PROP) bitterness and alcohol intake.Alcohol. Clin. Exp. Res. 2004, 28, 1629–1637. [CrossRef]
11. Duffy, V.B.; Peterson, J.M.; Bartoshuk, L.M. Associations between taste genetics, oral sensations and alcoholintake. Physiol. Behav. 2004, 82, 435–445. [CrossRef]
12. Intranuovo, L.R.; Powers, A.S. The perceived bitterness of beer and 6-n-propylthiouracil (PROP) sensitivity.Ann. N. Y. Acad. Sci. 1998, 855, 813–815. [CrossRef] [PubMed]
Foods 2020, 9, 1131 16 of 17
13. Guinard, J.-X.; Zoumas-Morse, C.; Dietz, J.; Goldberg, S.; Holz, M.; Heck, E.; Amoros, A. Does consumption ofbeer, alcohol, and bitter substances affect bitterness perception? Physiol. Behav. 1996, 59, 625–631. [CrossRef]
14. Fischer, M.E.; Cruickshanks, K.J.; Schubert, C.R.; Pinto, A.; Klein, B.E.K.; Klein, R.; Nieto, F.J.; Pankow, J.S.;Huang, G.-H.; Snyder, D.J. Taste intensity in the Beaver Dam offspring study. Laryngoscope 2013, 123,1399–1404. [CrossRef] [PubMed]
15. Ng, G.I.; Chen, C.M.; Graubard, B.I.; Hoffman, H.J.; Breslow, R.A. Alcohol and taste intensity.Chemosens. Percept. 2019, 12, 90–99. [CrossRef]
16. Pickering, G.J.; Jain, A.K.; Bezawada, R. Segmentation and drivers of wine liking and consumption in USwine consumers. Int. J. Wine Res. 2014, 6, 9–19. [CrossRef]
17. Monteleone, E.; Spinelli, S.; Dinnella, C.; Endrizzi, I.; Laureati, M.; Pagliarini, E.; Tesini, F. Exploringinfluences on food choice in a large population sample: The Italian Taste project. Food Qual. Prefer. 2017, 59,123–140. [CrossRef]
18. Peryam, D.R.; Pilgrim, F.J. Hedonic scale method of measuring food preferences. Food Technol. 1957, 11, 9–14.19. Bartoshuk, L.M.; Duffy, V.B.; Green, B.G.; Hoffman, H.J.; Ko, C.-W.; Lucchina, L.A.; Marks, L.E.; Snyder, D.J.;
Weiffenbach, J.M. Valid across-group comparisons with labeled scales: The gLMS versus magnitude matching.Physiol. Behav. 2004, 82, 109–114. [CrossRef]
20. Feeney, E.L.; Hayes, J.E. Regional differences in suprathreshold intensity for bitter and umami stimuli.Chemosens. Percept. 2014, 7, 147–157. [CrossRef]
21. Hayes, J.E.; Sullivan, B.S.; Duffy, V.B. Explaining variability in sodium intake through oral sensory phenotype,salt sensation and liking. Physiol. Behav. 2010, 100, 369–380. [CrossRef]
22. Masi, C.; Dinnella, C.; Monteleone, E.; Prescott, J. The impact of individual variations in taste sensitivity oncoffee perceptions and preferences. Physiol. Behav. 2015, 138, 219–226. [CrossRef] [PubMed]
23. Bartoshuk, L.M. Comparing sensory experiences across individuals: Recent psychophysical advancesilluminate genetic variation in taste perception. Chem. Senses 2000, 25, 447–460. [CrossRef] [PubMed]
24. Green, B.G.; Dalton, P.; Cowart, B.; Shaffer, G.; Rankin, K.; Higgins, J. Evaluating the “Labeled MagnitudeScale” for measuring sensations of taste and smell. Chem. Senses 1996, 21, 323–334. [CrossRef] [PubMed]
25. Green, B.G.; Shaffer, G.S.; Gilmore, M.M. Derivation and evaluation of a semantic scale of oral sensationmagnitude with apparent ratio properties. Chem. Senses 1993, 18, 683–702. [CrossRef]
26. Prescott, J.; Soo, J.; Campbell, H.; Roberts, C. Responses of PROP taster groups to variations in sensoryqualities within foods and beverages. Physiol. Behav. 2004, 82, 459–469. [CrossRef]
27. Sluik, D.; Jankovic, N.; O’Doherty, M.G.; Geelen, A.; Schöttker, B.; Rolandsson, O.; Jong, J.C.K.-D.; Ferrières, J.;Bamia, C.; Fransen, H.P.; et al. Alcoholic Beverage Preference and Dietary Habits in Elderly across Europe:Analyses within the Consortium on Health and Ageing: Network of Cohorts in Europe and the UnitedStates (CHANCES) Project. PLoS ONE 2016, 11, e0161603. [CrossRef]
28. Rodríguez-Donate, M.C.; Romero-Rodríguez, M.E.; Cano-Fernández, V.J.; Guirao-Pérez, G. Analysis ofheterogeneity in the preferences of wine consumption. Wine Econ. Policy 2019, 8, 69–80. [CrossRef]
29. Wilsnack, S.C.; Wilsnack, R.W.; Kantor, L.W. Focus on women and the costs of alcohol use. Alcohol Res. Health2014, 35, 219–228.
30. Chapman, N.G.; Nanney, M.; Lellock, S.J.; Mikles-Schluterman, J. Bottling gender: Accomplishing genderthrough craft beer consumption. Food Cult. Soc. 2018, 21, 296–313. [CrossRef]
31. Thomasson, H.R. Gender differences in alcohol metabolism. In Recent Developments in Alcoholism; Springer:Boston, MA, USA, 2002; pp. 163–179.
32. Predieri, S.; Sinesio, F.; Monteleone, E.; Spinelli, S.; Cianciabella, M.; Daniele, G.M.; Dinnella, C.; Gasperi, F.;Endrizzi, I.; Torri, L.; et al. Gender, Age, Geographical Area, Food Neophobia and Their Relationships withthe Adherence to the Mediterranean Diet: New Insights from a Large Population Cross-Sectional Study.Nutrients 2020, 12, 1778. [CrossRef]
33. Marinelli, N.; Fabbrizzi, S.; Alampi Sottini, V.; Sacchelli, S.; Bernetti, I.; Menghini, S. Generation Y, wine andalcohol. A semantic differential approach to consumption analysis in Tuscany. Appetite 2014, 75, 117–127.[CrossRef] [PubMed]
34. Bastian, S.E.P.; Danner, L.; Niimi, J.; Ristic, R.; Johnson, T.E. Alcoholic beverages in context. In Context:The Effects of Environment on Product Design and Evaluation; Meiselman, H.L., Ed.; Woodhead Publishing:Cambridge, UK, 2019; pp. 605–630.
Foods 2020, 9, 1131 17 of 17
35. Spinelli, S.; Dinnella, C.; Tesini, F.; Bendini, A.; Braghieri, A.; Proserpio, C.; Torri, L.; Miele, N.A.; Aprea, E.;Mazzaglia, A.; et al. Gender Differences in Fat-Rich Meat Choice: Influence of Personality and Attitudes.Nutrients 2020, 12, 1374. [CrossRef] [PubMed]
36. Bajec, M.R.; Pickering, G.J. Thermal taste, PROP responsiveness, and perception of oral sensations.Physiol. Behav. 2008, 95, 581–590. [CrossRef] [PubMed]
37. Fischer, M.E.; Cruickshanks, K.J.; Pankow, J.S.; Pankratz, N.; Schubert, C.R.; Huang, G.-H.; Klein, B.E.K.;Klein, R.; Pinto, A. The associations between 6-n-propylthiouracil (PROP) intensity and taste intensitiesdiffer by TAS2R38 haplotype. J. Nutr. Nutr. 2014, 7, 143–152. [CrossRef]
38. Karrer, T.; Bartoshuk, L. Capsaicin desensitization and recovery on the human tongue. Physiol. Behav. 1991,49, 757–764. [CrossRef]
39. Prescott, J.; Swain-Campbell, N. Responses to repeated oral irritation by capsaicin, cinnamaldehyde andethanol in prop tasters and nontasters. Chem. Senses 2000, 25, 239–246. [CrossRef]
40. Tepper, B.J.; Nurse, R.J. Fat perception is related to PROP taster status. Physiol. Behav. 1997, 61,949–954. [CrossRef]
41. Spinelli, S.; De Toffoli, A.; Dinnella, C.; Laureati, M.; Pagliarini, E.; Bendini, A.; Braghieri, A.; Gallina, T.;Sinesio, F.; Torri, L.; et al. Personality traits and gender influence liking and choice of food pungency.Food Qual. Prefer. 2018, 66, 113–126. [CrossRef]
42. Bartoshuk, L.; Conner, E.; Grubin, D.; Karrer, T.; Kochenbach, K.; Palcso, M.; Snow, D.; Pelchat, M.;Danowski, S. Prop supertasters and the perception of ethyl alcohol. Fifteenth Annual Meeting of theAssociation for Chemoreception Sciences (AChemS XV). Chem. Senses 1993, 18, 526–527. [CrossRef]
43. Pickering, G.J.; Simukova, K.; DiBattista, D. Intensity of taste and astringency sensations elicited by red winesis associated with sensitivity to PROP (6-n-propylthiouracil). Food Qual. Prefer. 2004, 15, 147–154. [CrossRef]
44. Allen, A.L.; McGeary, J.E.; Hayes, J.E. Polymorphisms in TRPV1 and TAS2Rs associate with sensations fromsampled ethanol. Alcohol Clin. Exp. Res. 2014, 38, 2550–2560. [CrossRef] [PubMed]
45. Trevisani, M.; Smart, D.; Gunthorpe, M.J.; Tognetto, M.; Barbieri, M.; Campi, B.; Amadesi, S.; Gray, J.;Jerman, J.C.; Brough, S.J.; et al. Ethanol elicits and potentiates nociceptor responses via the vanilloidreceptor-1. Nat. Neurosci. 2002, 5, 546–551. [CrossRef] [PubMed]
46. Bajec, M.R.; Pickering, G.J. Astringency: Mechanisms and perception. Crit. Rev. Food Sci. Nutr. 2008, 48,858–875. [CrossRef] [PubMed]
47. Ma, W.; Guo, A.; Zhang, Y.; Wang, H.; Liu, Y.; Li, H. A review on astringency and bitterness perception oftannins in wine. Trends Food Sci. Technol. 2014, 40, 6–19. [CrossRef]
48. Meyerhof, W.; Batram, C.; Kuhn, C.; Brockhoff, A.; Chudoba, E.; Bufe, B.; Appendino, G.; Behrens, M. Themolecular receptive ranges of human TAS2R bitter taste receptors. Chem. Senses 2010, 35, 157–170. [CrossRef]
49. Roura, E.; Aldayyani, A.; Thavaraj, P.; Prakash, S.; Greenway, D.; Thomas, W.G.; Meyerhof, W.; Roudnitzky, N.;Foster, S.R. Variability in human bitter taste sensitivity to chemically diverse compounds can be accountedfor by differential TAS2R activation. Chem. Senses 2015, 40, 427–435. [CrossRef]
50. Tapper, K.; Baker, L.; Jiga-Boy, G.; Haddock, G.; Maio, G. Sensitivity to reward and punishment: Associationswith diet, alcohol consumption, and smoking. Pers. Ind. Diff. 2015, 72, 79–84. [CrossRef]
51. Terasaki, M.; Imada, S. Sensation seeking and food preferences. Pers. Ind. Diff. 1988, 1, 87–93. [CrossRef]52. Pierguidi, L.; Spinelli, S.; Dinnella, C.; Prescott, J.; Monteleone, E. Liking patterns moderate the relationship
between sensory, emotional and context appropriateness profiles: Evidences from a Global Profile study onalcoholic cocktails. Food Qual. Prefer. 2020, 83, 103904. [CrossRef]
© 2020 by the authors. Licensee MDPI, Basel, Switzerland. This article is an open accessarticle distributed under the terms and conditions of the Creative Commons Attribution(CC BY) license (http://creativecommons.org/licenses/by/4.0/).