developing a food and beverage corporate sustainability
TRANSCRIPT

�����������������
Citation: Bui, T.-D.; Aminah, H.;
Wang, C.-H.; Tseng, M.-L.;
Iranmanesh, M.; Lim, M.K.
Developing a Food and Beverage
Corporate Sustainability
Performance Structure in Indonesia:
Enhancing the Leadership Role and
Tenet Value from an Ethical
Perspective. Sustainability 2022, 14,
3658. https://doi.org/10.3390/
su14063658
Academic Editor: Donato Morea
Received: 19 January 2022
Accepted: 12 March 2022
Published: 21 March 2022
Publisher’s Note: MDPI stays neutral
with regard to jurisdictional claims in
published maps and institutional affil-
iations.
Copyright: © 2022 by the authors.
Licensee MDPI, Basel, Switzerland.
This article is an open access article
distributed under the terms and
conditions of the Creative Commons
Attribution (CC BY) license (https://
creativecommons.org/licenses/by/
4.0/).
sustainability
Article
Developing a Food and Beverage Corporate SustainabilityPerformance Structure in Indonesia: Enhancing the LeadershipRole and Tenet Value from an Ethical PerspectiveTat-Dat Bui 1,2 , Hania Aminah 2,3 , Ching-Hsin Wang 1,4,* , Ming-Lang Tseng 1,5,* , Mohammad Iranmanesh 6
and Ming K. Lim 7
1 Institute of Innovation and Circular Economy, Asia University, Taichung 413305, Taiwan;[email protected]
2 Department of Business Administration, Asia Management College, Asia University,Taichung 413305, Taiwan; [email protected]
3 Department of Management, Faculty of Economics, Universitas Negeri Jakarta, Jakarta 13220, Indonesia4 Department of Leisure Industry Management, National Chin-Yi University of Technology,
Taichung 41170, Taiwan5 Department of Medical Research, China Medical University Hospital, China Medical University,
Taichung 40402, Taiwan6 School of Business and Law, Edith Cowan University, Joondalup, WA 6027, Australia;
[email protected] Adam Smith Business School, University of Glasgow, Glasgow G12 8QQ, UK; [email protected]* Correspondence: [email protected] (C.-H.W.); [email protected] (M.-L.T.)
Abstract: The food and beverage industry is the second largest contributor to Indonesia’s economy;however, most industry firms significantly, and negatively, impact ecological and economic per-formance, and corporate sustainability performance is considered an area that can be significantlyimproved. This study aims to measure the causal interrelationships among the hierarchical attributes,as well as the decisive attributes that force successful corporate sustainability. Further, there arealso other factors that have a negative impact, such as poor social justice and firms’ responsibili-ties and identities. Hence, emphasizing the ethics role to ensure a better sustainable performancein addition to focusing on the traditional triple-bottom-line is needed. A hybrid method is used.The fuzzy Delphi method develops a valid theoretical structure. The fuzzy decision-making trialand evaluation laboratory addresses the causal effect among the attributes. The fuzzy Kano modelis used to determine the decisive attributes that enhance corporate sustainability performance inpractice. The results show that a leadership role, tenet values, human potential development, andenvironmental impacts are the causative aspects, and the role of ethical issues is confirmed thoughits influence on the leadership role and tenet value aspects. This study contributes to the corporatesustainability performance literature by offering new theoretical angles as a hierarchical structureand elaborating the causal linkages among the attributes. Practical guidelines are provided to theIndonesian food and beverage industry, thus helping to archive reference data on firm performanceand competitive advantage.
Keywords: corporate sustainability performance; firm ethics; tenet value; leadership role; fuzzydecision-making trial and evaluation laboratory; fuzzy Kano model
1. Introduction
The Indonesian food and beverage (F&B) industry provides the second largest contributionto the country’s economic growth and the largest contribution to its export performance of13.73 billion US dollars in the first quarter of 2020 [1,2]. Moreover, the industry is included ingovernment policies that have made the increase in performance and productivity a top priority.Thus, the F&B industry has an influence on improving the country’s economic performance.
Sustainability 2022, 14, 3658. https://doi.org/10.3390/su14063658 https://www.mdpi.com/journal/sustainability

Sustainability 2022, 14, 3658 2 of 24
However, most of the corporations in the industry significantly contribute to the creation ofenvironmental impacts, for instance, air pollution, ground soil contamination, and garbagedisposal, that affect not only the ecological system but also the overall performance of theeconomy [3–7]. There are also other factors, such as poor performance in social justice, firmresponsibility, and identity, that can have a negative impact, including a social impact [8,9].According to Zhan et al. [10], the protection of the environment and the development ofsustainability performance should be the main basis by which corporations lessen the negativeeffect they have on the environment as well as on society. Hence, it is important for corporationsto maintain stability, continue protection and improve sustainability performance, especiallyfor F&B products in Indonesia, the products most needed by customers. Therefore, as partof sustainability performance, corporate sustainability performance (CSP) is considered aninstrument to improve performance.
Further, regarding CSP, in the context of performance improvement, the concept is definedas a balancing of the social, environmental, and economical performance perspectives, which arealso regarded as triple-bottom-line (TBL) pillars of sustainability [3,11,12]. However, other aca-demics of different disciplines, such as engineering and environmental science, have proposed arelation between CSP and sustaining ability concepts and vital resources [13–15]. As a result, itis necessary to gain a better understanding of other factors than can influence CSP, for instance,political instability, governance, and corporate culture [16]. Nevertheless, the ethical perspectiveshould also be addressed by corporations when managing their sustainable development activ-ities because ethics impact firm performance; for instance, the greatest contribution in termsof energy and ecological protection is firm efficiency [17,18]. Complex and uncertainty-relatedproblems and the lack of ethical roles are also other factors. Blome et al. [19] emphasize thatfirm ethics is the degree of the foundation of the firm; for instance, the role of rewards, ethicalleadership, codes of ethics, and the anticipated adherence to power in guiding the applicationof sustainable actions were investigated. Jin et al. [20] posited ethical tenets as distinct themesthat were ultimately incorporated into an overarching theme of ethics. Moreover, ethical tenetsshould be included to enhance corporate sustainability [21]. As a result, it is crucial to change theparadigms, and it is necessary for F&B firms to formulate ethical guidelines to improve financialand nonfinancial corporate efficiency as well as to develop sustainable performance in an ethicalform [22,23]. Hence, to improve sustainability performance in shifting to a better direction interms of solving critical problems, optimal firm ethics are needed. This study intends to identifythe role of firms’ ethics in the context of the TBL in improving CSP.
Prior studies have identified various attributes that influence firms’ CSP, creatinga complex structural interrelationship among the attributes that has not been fully ad-dressed [20,24,25]. This identified a need for this study to integrate these attributes intoa valid theoretical structure and to clarify the causal interrelationships among them toprovide a critical direction for future implementations [26]. Furthermore, the amount ofqualitative and quantitative data and the pervasive occurrence of the latest externalitiesemerging from many sources also generate a high level of complexity and uncertainty in afirm’s operational context. CSP is frustrated by the undesirable effects of uncertainty, whichcannot be completely dispatched by stakeholders and decisionmakers [7,16,27]. Utilizingboth qualitative and quantitative approaches, this study applies the fuzzy Delphi method(FDM), the fuzzy decision-making trial and evaluation laboratory (FDEMATEL), and afuzzy Kano model (FKM) to measure the causal interrelationships and linkages among thehierarchical properties and to define the guiding and reliant factors in corporate sustain-ability success in terms of their degree of impact on one another. Qualitative informationcollected from expert linguistic judgments is translated into quantitative data using thefuzzy approach. In particular, the FDM is employed to acquire valid hierarchical attributesproposed from the literature [28]. Then, FDEMATEL is chosen to address the multiplexcausal interrelationships among attributes [29]. Finally, the FKM is used to identify im-provement attributes for CSP practices by defining the decisive level of attributes andcategorizing the attributes into distinct gatherings [30]. From the above discussions, thefollowing are the research questions to be addressed:

Sustainability 2022, 14, 3658 3 of 24
What is the valid theoretical structure of CSP?What are the causal interrelationships among ethics attributes and other CSP attributes?What are the decisive attributes for archiving the CSP practices in the Indonesian
F&B industry?This study contributes to the CSP reference research by offering new theoretical
standpoints for the literature, such as a hierarchical structure as well as the cause-and-effect interactions among CSP attributes. Practical guidelines are provided through theidentification of decisive attributes from detailed empirical results in the Indonesian F&Bindustry, thus helping to document data on firm performance and competitive advantages.
This study is organized as follows. Section 2 conducts a literature review of therelevant reference research and the proposed methodologies and measures. Section 3outlines the method employed in this paper, and Section 4 presents the study’s findings.The theoretical and managerial implications are discussed in Section 5. Finally, Section 6discusses the conclusion, limitations, and future studies.
2. Literature Review
This section includes a review of the literature on corporate sustainability performance,corporate ethics, the proposed hybrid method and the proposed measured attributes.
2.1. Corporate Sustainability Performance
CSP is one of the foundations for understanding sustainable development in a cor-poration. The concept is defined as corporate and stakeholder actions that contribute toestablishing a sustainable balance in the TBL perspectives and their interrelationshipsin a sustainable business operation [3,7,31]. Moreover, CSP is explained as a corporateoperation aimed at achieving sustainability equilibrium, which includes a TBL focus aimedat applying processes to corporations and their stakeholders [10,26]. Saunila et al. [32]claimed that CSP requires a careful balance of the needs of people with environmental andeconomic well-being. Saunila et al. [32] argued that economic sustainability should focuson items’ monetary benefits, considering the monetary value of ecological consequences.Even though the concept is well known, assessing CSP through the framework of the TBLis needed. According to Agrawal & Singh [11], the TBL is important in the sustainability ofcorporations, where sustainability can have an impact on increasing profits, reducing waste,and providing satisfaction to customers. Emphasizing the fundamental requirements foreffective sustainability performance management, such as a TBL structure for measuringand assessing sustainability performance, is important to effectively manage CSP.
However, it is challenging to attain a consistent and objective corporate sustainabil-ity assessment. Moreover, theories clearly indicate loose compromises among the TBLframework, with the goal of ensuring that corporate sustainability performance provideswin–win opportunities for corporations [7,9,13]. This requires a more detailed explanationof a corporation’s performance related to its sustainability measures. Pislaru et al. [25]argued that by incorporating new variables, such as environmental security, social welfare,human rights, and corporate ethics, the philosophy of sustainable culture development hasgradually altered the conventional corporate managerial method of optimizing shareholdervalue. For a critical approach to meet societal demands, Martínez et al. [27] proposed thatfirms adopt a culture administration comprising ethics. Better corporations can rely ona founding on ethical bases to operate ethically. To achieve CSP, with the addition of thefirm ethics perspective, corporate performance is argued to be further improved. However,neither the typical TBL framework nor the cultural philosophy’s auxiliary resolutions havewholly incorporated ethics [15]. There are still few studies that discuss firm ethics to assistin CSP and decision-making processes in improving corporate performance and achievingsustainable development objectives [12,14].

Sustainability 2022, 14, 3658 4 of 24
2.2. Firm Ethical Perspective Associated with Corporate Sustainability Performance
Firm ethics is an essential corporate element that strongly affects business perfor-mance [17,19,23]. For instance, Wahab [33] described firm ethics as the implementation of astructured value of ethics and a declaration of ethical principles. Houqe et al. [34] definedfirm ethics as behavior that is consistent with the ideals of the community or society towhich a person belongs. Supported by Stahl et al. [35], ethics is a part of the ideals andnorms that cannot be excluded because ethics also reflect norms. Indeed, the applicationof ethics within the firm provides benefits that also improve corporate performance bothfinancially and nonfinancially [3,4,34]. The concept is a foundation enabling the firm toachieve its goals in line with the values held by the corporation and the stakeholders. Va-lente et al. [15] argued that firm ethics affect corporate performance and risk management.Martínez et al. [27] claimed that firms conventionally attend to a number of high-profileethical predicaments in technological segments, considering their actions as part of a long-term economic strategy. However, many businesses sometimes face ethical scrutiny, oftenbecause of circumstances beyond their control. Ethics incorporation is hard to achieve dueto its complexity such that firms seldom employ an ethical foundation when launching astructural values hierarchy.
Keeping ethical and sustainable business criteria in mind is important [17,20,36].Machado et al. [37] emphasized that corporations with an implemented commerce frame-work must be transparent and ethical to ensure long-term growth without manipulatinghuman esteem. Kumar et al. [17] suggested that firms in the new business environmentof sustainable development must utilize ethics and technology for sustainable benefitextension. This means that businesses should use ethics in their operations and that doingso has a strong long-term value. Tseng et al. [3] showed that social image, corporate culture,and stakeholder management improved CSP activities and that these activities neededsupport from top management and from manager attitudes and behaviors. According toGuarnieri & Trojan [38], firms should consider ethical concerns in addition to TBL perspec-tives while optimizing the corporate operations for long-term development. Jin et al. [20]posited that honesty, accountability, trust, inclusion of steps for change, debatable policies,and adherence to individual ethics are all ethical tenets. Kumar et al. [17] and Sulej [39]stated that leadership roles serve as models for ethical business conduct and are importantfor corporate sustainability. However, in archiving CSP activities, straightforward firmethics instruction is still missing. Therefore, this study is critical for enlarging sustainabledevelopment studies by incorporating these characteristics into a more holistic CSP concept.
2.3. Proposed Hybrid Method
Previous research has used several methodologies for analyzing CSP; they adoptedsurvey-based approaches, quantitative methods, and traditional statistical methods. Wi-jethilake [40] used structural equation modeling to explore the intermediating of sustainabil-ity control models between CSP and a functioning sustainability strategy. Aksoy et al. [12]used probit and logit models to investigate the high level of CSP enablers within nonfinan-cial firms. However, only a few studies have paid attention to complexity among existingCSP attributes [25,26]. This study employs hybrid methods of FDM, FDEMATEL and FKMto approach CSP. The FDM and FDEMATEL are used to validate the structure accordinglyto assess causal interrelationships among the attributes [7,28]. In particular, Tseng et al. [7]proposed the FDM to eliminate the uncertainty of expert judgment and to conduct surveysfollowing guidelines for expert opinions. Each expert has some degree of ambiguity abouta specific variable, frequently referred to as an “ambiguous area”. The FDM is used toaddress this ‘ambiguous area’, assuring a satisfactory analytical outcome. Meanwhile,Tsai et al. [29] used FDEMATEL as a foundation to criticize the attributes’ causal interre-lationships and categorize the components into two cause and effect quadrants based ontheir relationship.
However, the decisive level of the attributes can remain unsolved [41]. This studyfurther employs the FKM to categorize the approach into distinct decisive collections.

Sustainability 2022, 14, 3658 5 of 24
Shokouhyar et al. [30] stated that fuzzy kano is a model for determining the function ofvarious quality components and is called a two-dimensional consistency model, which hasbeen demonstrated to be a highly successful instrument. Jain & Singh [41] claimed thatthe technique allowed respondents to express their views in percentages by utilizing twofactors, namely, functional and dysfunctional factors. Hence, this study applied FKM tounderstand the experts’ needs in the context of CSP based on functional and dysfunctionalcomponents. Moreover, the fuzzy kano approach enables a corporation to obtain a morecomplete and accurate representation of the true voice of the experts. Therefore, based on itsprominence and active implementation demonstrated in the literature, FDM, FDEMATELand FKM would be an appropriate strategy for our research to address CSP in this study.
2.4. Proposed Attributes
CSP attributes have been proposed from the current literature, including 9 aspects and35 criteria derived from 4 perspective, which are listed in Table 1.
Based on the social perspective (P1), previous studies have proposed that socialidentity (A1) refers to the part of individual or group perception that derives from theindividuals’ knowledge about the corporation and that consists of corporate reputation,legal compliance, organizational culture, and communication [8,26,42] relates to the stake-holders’ general perception of the corporation [43] Legal compliance (C2) indicates a criticalfeature in the process of ecological assessment, defining the contextual factors and en-hancing the organizations’ legitimacy [44] suggested that the organizational culture (C3)is related to sustainable assumptions, attitudes, ethical behavior, beliefs, knowledge, andvalue. Meanwhile, communication (C4) denotes the concept that removes the risk ofachieving the firm’s strategic objectives and makes them more manageable [26]. Humandevelopment (A2) is related to the support for the development of human potential toenable the use of skills to achieve the objectives of CS and comprises green employment,talent attraction and retention, decision-making participation, construction of position-ing ability, and an eco-friendly reward system [31]. Green recruitment (C5) is related tothe recruitment procedure designed to increase the shared environmental responsibilityamong employees in an organization. Talent attraction and retention (C6) is critical forCSP because sustainable development necessitates innovative efforts, and competent andcontented employees contribute to innovation development [31]. To initiate and createdecisions related to sustainability, participative decision-making (C7) is important to makeemployees feel empowered [26]. Skill building orientation (C8) should also be embraced bycorporations to improve the competences required for achieving sustainability with theiremployees through routine training [31]. Last, through an eco-friendly reward system (C9),corporations can embed sustainable development goals into their performance assessmentstructure to assess employee performance [42].
From the environmental perspective (P2), environmental impact (A3) refers to theto CSP impacts linked to cost-effectiveness and increased competitiveness by the reduc-tion of toxic emissions and through recycled materials, renewable energy, eco-friendlyproducts/services and energy consumption [45]. This proposed aspect, including toxicemissions (C10) related to the cumulative direct and indirect toxic pollution that must alsobe reduced and recycled materials (C11), refers to the recycled material volume increase.Renewable energy (C12) represents the enlarged renewable energy consumption rate inthe corporation. Eco-friendly products/services (C13) refer to the improved developmentof eco-friendly products/services [45]. Therefore, energy consumption (C14) promoteseconomic expansion and enhances the environment [46]. Employee environmental satisfac-tion (A4) denotes the correlation between a person’s life experience and a specific criterionpertaining to the individual environmental awareness and consisting of environmentalproblems, attention to the environment, the state of the environment, and environmentalinitiatives [47]. The environmental problems (C15) are the most critical environmentalissues that need to be addressed, also suggesting that attention to the environment (C16)is the extent to which the employer pays satisfactory attention to the environment. The

Sustainability 2022, 14, 3658 6 of 24
state of the environment (C17) refers to the employees’ satisfaction with their environment,and environmental initiatives (C18) are based on the corporate policy that focuses on theenvironment. Meanwhile, individual environmental performance (A5) is the result of totalindividual actions comprising initiatives related to voluntary issues and projects [47,48].Voluntarily issues (C19) refer to the employees’ voluntary involvement in the actionsdealing with environmental issues [48]. Voluntary projects (C20) refer to the employees’volunteering for corporate environmental projects, activities, and events [47].
From the economic perspective (P3), the investment benefit (A6) is a measure ofmarket share, return on assets, return on equity, return on investment, and return onsales that reflect the corporation’s internal efficiency [45]. Market share (C21) refers to thegrowth of corporate market share relative to that of competitors [46]. Return on equity(C22) is measured as the ratio of net profits to owners equity and is used to evaluatethe corporation’s success by paying dividends to shareholders equal to the amount ofequity available to the corporation [25]. Moreover, the return on assets (C23) refers to thenet ratio of profits to operating assets; it calculates a corporation’s efficiency in using itsassets to generate potential economic benefits [25]. Meanwhile, the return on sales (C24)is used to determine the profitability of a corporation’s product or service [24]. Returnon investment (C25) is utilized to determine the effectiveness of a corporation’s assetinvestments based on the gains realized after deducting capital costs [25]. On the otherhand, firm economic performance (A7) is an impact and denotes the firm’s contribution tothe economy as indicated by its quality management system, infrastructure investment,and reduced cost [40]. The quality management system (C26) focuses on integrating aquality management system culture, such as ISO 15000, total quality management, andan environmental management system [31]. Infrastructure investment (C27) relates tothe development and impact of infrastructure investments. Reduced cost (C28) refers toreduced production costs for the same amount of output [40].
From the firm ethics perspective (P4), tenet values (A8) comprise specific ethical tenets,including honesty, transparency, and trust [20]. Honesty (C29) refers to anything that should bereported to consumers or the general public [20]. Transparency (C30) is related to the truth [20],and trust (C31) denotes that corporation will do well if they are trusted [20]. Meanwhile,leadership role (A9) refers to the role model of a leader and is reflected in a caring for ethics,being a model of ethical behavior, and in having an ethical direction [17,19]. A care for ethics(C32) refers to the employer regularly showing a concern about ethics [17]. A model of ethicalbehavior (C33) refers to actions on the part of organizations and their constituents comprisingthe ethical model for members of the organization [49]. Ethical behavior (C34) refers to ethicaldecision-making and establishing a standard for how followers should respond to ethicaldilemmas [50]. Meanwhile, ethical direction (C35) refers to the norm in the organization [17].
Table 1. Proposed measures.
Perspective Aspects Criteria Description Literature Review
P1Social perspective
A1 Socialidentity
C1 Corporatereputation
Corporate reputation is the existingstakeholder perception of the firm in terms
of CSP.
[26,43,44,48]
C2 Legal compliance
Legal compliance is the difficulty ofacquiring an overview of myriad
industry-specific social and environmentalregulations prior to launching activities
C3 Organizationculture
The organizational culture is related to thesustainable beliefs, values and learning of
a corporate, which are embodied inarranging the materials and presenting the
behavior of its stakeholders.
C4 Communication
Beyond the organizational culture,transparency and communication reducescomplexity, makes fulfilling the corporate’s
strategic objectives manageable.

Sustainability 2022, 14, 3658 7 of 24
Table 1. Cont.
Perspective Aspects Criteria Description Literature Review
A2Human
potentialdevelopment
C5 Greenrecruitment
Corporate should have a policy ofintegrating sustainability criteria into therecruitment process to accelerate shared
environmental commitment among peoplewithin the corporate.
C6 Talent attractionand retention
Recruiting and nurturing talentedemployees is vital for corporate
pursuing sustainability.
C7 Participativedecision making
Creating an environment of participativedecision making so that subordinates feelempowered to initiate and make decision
related to sustainability.
C8 Skill buildingorientation
Corporate should manage and develop theskills necessary to pursue sustainability
among people within it throughconducting regular training.
C9 Eco-friendlyreward system
Corporate should integrate sustainabledevelopment goals with the performance
measurement system to evaluate theperformance of employees.
P2Environmental
perspective
A3 Environmentalimpact
C10 Toxic emissionThe corporate seeks to reduce toxic
emissions that are directly orindirectly affected.
[45–48,51,52]
C11 Recycledmaterials
The corporate has started usingrecycled materials.
C12 Renewableenergy
The corporate increase their consumptionof renewable energy.
C13 Eco-friendlyproduct/service
Increasing number of environmentallyfriendly products or services
being developed.
C14 Energyconsumption
Total reduction of direct and indirectenergy consumption.
A4Employee en-vironmentalsatisfaction
C15 Environmentalproblems
The development program has addressedthe most important
environmental problems.
C16 Attention to theenvironment
The satisfaction of the amount of attentiongiven to the environment to the employer.
C17 State of theenvironment
The satisfaction of the state of theenvironment in the office.
C18 Environmentalinitiatives
The information of the corporate’senvironmental initiatives to the employees.
A5Individual en-vironmentalperformance
C19 Voluntarily issueVoluntarily carry out environmental
actions and initiatives in the dailywork activities.
C20 Voluntarilyproject
Voluntarily for projects, endeavours orevents that address environmental issues
in the corporate.
P3Economic
perspectiveA6
Investmentbenefit
C21 Market shareThe growth in the corporate’s market share
relative to competitors during the lastthree years has been.
[24,25,40,45]
C22 Return on equity
return on equity (ROE) is calculated as aratio between net income and own equity
and it is used to assess the corporate’sperformance by paying dividends to the
shareholders proportional to the amount ofequity that has been made available to
the corporate.

Sustainability 2022, 14, 3658 8 of 24
Table 1. Cont.
Perspective Aspects Criteria Description Literature Review
C23 Return on assets
is calculated as a ratio between theoperating income and operating assets,measures the corporate’s efficiency in
using its assets on order to obtain futureeconomic benefits.
C24 Return on salesDescribes the corporate’s operationalefficiency and is computed as a ratiobetween gross margin and total sales.
C25 Return oninvestment
Measure the efficiency of the investmentsin the assets of the corporate, based on the
gains that are obtained taking intoconsideration the costs of capital.
A7Economy’s
firmperformance
C26Quality
managementsystems
Corporate adopting a culture of qualitymanagement systems, including Total
Quality Management (TQM), ISO 14000and environmental management
system (EMS).
C27 Infrastructureinvestment
Development and impact of infrastructureinvestments of the corporate.
C28 Reduced costs Reduced costs of inputs for same level ofoutputs of the production.
P4Governanceperspective
A8 Tenet value
C29 HonestyCustomers and the stakeholders have the
right to be provided withcorporate-related information.
[19,20,49,50]
C30 Transparency The important thing in the firm ethics istransparency and honesty.
C31 Trust The corporate that carries out good ethicsis a corporate that can be trusted.
A9 Leadershiprole
C32 Care for ethics Senior managers regularly show that theycare about ethics.
C33 Model of ethicalbehavior Senior managers model ethical behavior.
C34 Ethical behavior Ethical behavior is the norm inthe corporate.
C35 Ethical direction Senior managers guide decision making inan ethical direction.
3. Method
This part is separated into two parts. The first covers the F&B industry in Indonesiaand the necessity to enhance its performance to achieve CSP. The second section discussesthe methods that are used in this study.
3.1. Industrial Background
In Indonesia, the F&B industry has performed positively throughout 2020 and emergedas one of Indonesia’s most resilient growth industries and as a top priority for the govern-ment [1,53]. Moreover, the export value of the F&B industry in the first quarter of 2020reached 99 million USD. However, the issue of sustainability is the main issue currentlyfaced by this industry. The Proper Secretariat of the MOEF (Ministry of the Environmentand Forestry of Indonesia) stated that this polemic led 20 corporations to suffer from beingunable to operate; also, in 2019, they introduced a ranking in which nearly 305 firms wereranked as being negligent in environmental and social sustainability. The negative effects ofhazardous and toxic soil pollution, such as hexavalent chromium, mercury, arsenic, barium,copper, plum, nickel and zinc, has a harmful effect on the environment and can causepollution and contamination. Meanwhile, beverage waste suffers degradation that causesmethane gas in soil [2,54]. This has an impact on decreasing corporate performance and

Sustainability 2022, 14, 3658 9 of 24
represents a threat to a firm’s sustainability in the future. The TBL concept in conductingbusiness was envisaged as a response to the problems that have occurred. However, CSP isstill not performing effectively and requires further investigation to play a strong role in anapproach in addition to the TBL concept approach.
On the other hand, many firms are facing environmental, social, and economicalchallenges from their stakeholders. Stakeholder pressure explains the power and capacityof stakeholders to influence an organization to make a decision [55]. Moreover, firms haveproblems in terms of a compatible life cycle, lack of policy enforcement, determination ofsustainable farmland and high-cost investments. On policy issues, policy-makers avoidplanning activities, and because of plan additions from the public, the policy-makingprocess might be a lengthy procedure. Hence, approaches other than the TBL conceptare needed; emphasizing the role of ethics, including tenet values and leadership roles,is needed to ensure a better future for sustainability. However, the government and F&Bfirms in Indonesia still pay little attention to ethics roles. Therefore, this study providesbenefits to F&B industry practitioners that will enable them to improve their CSP and toproceed with their business operations through focusing on ethics roles. Because of theeconomic, social, and environmental impacts on the industry, the decision of this industryto support the study structure is important [31].
3.2. Data Collection
This study engages 53 experts for the measurement process, as shown in Appendix A.All respondents are employees from various firms in the F&B industry in Indonesia. Thequestionnaire of this study was developed in 2021 and distributed to 60 respondents. Therespondents completed a questionnaire that was distributed through email. In the F&Bindustry, there are also various divisions to support the company’s business goals. Thesedivisions generally consist of two main and supporting areas, each of which has a differentrole. The characteristics of each division in each company are generally the same, and theonly difference is the name of the division. The targets of the respondents in this studywere the managerial and supervisory levels, as well as the top level, namely, directors anddeputy directors. In composition, on average, almost more than 50% of respondents areat the supervisory level, while the manager and general manager levels comprise morethan 30% and the remainder are at the director and deputy director levels. For the years ofservice in the company, more than 50% of the respondents have an average work experienceof over five years. This can be explained by the fact that the average age of the respondentsis more than 30 years, with work experience of more than 5 years. The education levelof the respondents was strong: 62% were undergraduate graduates, 11% were master’sgraduates, and the rest, approximately 26%, were diploma graduates. Meanwhile, 53%of respondents were in supervisory positions, and only 6% were in general manager anddeputy director positions.
3.3. Fuzzy Delphi Method
The FDM originated as fuzzy set theory combined with the Delphi technique and aimedto deal with the specialist source barrier and to improve survey accuracy (Ishikawa et al., 1993).The Delphi methodology was used to eliminate criteria that were not important from the originalcollection of CSP data, and fuzzy set theory was utilized to resolve the unpredictability arisingfrom the experts’ viewpoints. In this study, the individual criterion’s relevance as a linguisticvariable was assessed by experts to verify the proposed attributes based on specialist linguisticsources, providing thus an effective assessment procedure, for example, a reduction in surveytime and expenses, while necessitating a large sample of respondents [56].

Sustainability 2022, 14, 3658 10 of 24
Considering that the commission has n experts, the analytical method begins withexpert x being requested to assess the critical degree of attribute y as
d =(axy; bxy; cxy
), x = 1, 2, 3, . . . , z; y
= 1, 2, 3, . . . , z, as dy is the weight o f y presented as py
=(ay; by; cy
)with ay = min
(axy), by =
(n∏1
bxy
) 1n
, and cy
= max(cxy)
Next, the specialist’s linguistic sources are interpreted into triangular fuzzy numbers,as shown in Table 2.
Table 2. The transformations of linguistic terms for FDM.
Linguistic Terms (Performance/Importance) Corresponding Triangular Fuzzy Numbers
Extreme (0.75, 1.0, 1.0)Demonstrated (0.5, 0.75, 1.0)
Strong (0.25, 0.5, 0.75)Moderate (0, 0.25, 0.5)
Equal (0, 0, 0.25)
The convex combination values are obtained using a ε cut as:
uy = ay − ε(cy − by
),py = xy − ε
(by − εay
),b = 1, 2, 3, . . . , m (1)
where ε = [0, 1] denoting whether the experts’ opinions are optimistic or pessimistic.ε = 0.5 denotes a common opinion.
The fuzzy evaluation is transformed into precise numbers Hy as follows:
Hy =∫ (
uy, py)= σ
[uy + (1− σ)py
](2)
where σ indicates the expert’s positive balancing assessment.
Afterward, the threshold is attained as T =
(m∑
y=1Hy
)/m to polish the valid attributes
from the initial set.If Hy ≥ T, attribute b is valid. If not, it is removed.
3.4. Fuzzy DEMATEL
The causal interrelationships among the CSP aspects are acquired using FDEMATEL.Expert judgment involves making decisions in the face of uncertainty; additionally, FDE-MATEL is used to deal with the vagueness inherent in expert judgments and to assist indecision-making [26]. It is particularly advantageous and effective for envisioning thestructure by using causal matrices and/or charts for the purpose of analyzing and studyingcomplex decision-making. FDEMATEL uses fuzzy rules to convert qualitative data intofuzzy quantitative data. The fuzzy membership functions ek
ij =(
ek1ij, ek
2ij, ek3ij
)are used to
calculate the weighted total values.An attribute set Q = {q1, q2, q3, · · · , qn} of mathematical relations are postulated, and
specific pairwise comparisons are utilized to produce them. Using linguistic scales rangingfrom VL (very little influence) to VHI (very great influence), the study determined crispvalues for TFNs, as shown in Table 3. Suppose that there are k experts in the evaluatingassessment and ek
ij represent the fuzzy weight of the ith attribute’s influence on the jth
attribute as assessed by expert kth.

Sustainability 2022, 14, 3658 11 of 24
Table 3. TFNs linguistic scale.
Scale Linguistic Variable Corresponding Triangular Fuzzy Number (TFNs)
VL Very low influence (0.0, 0.1, 0.3)L Low influence (0.1, 0.3, 0.5)M Moderate influence (0.3, 0.5, 0.7)H High influence (0.5, 0.7, 0.9)
VH Very high influence (0.7, 0.9, 1.0)
The fuzzy numbers are abridged using:
Q =(
qek1ij , qek
2ij, qek3ij
)=
(
ek1ij −min ek
1ij
)∆
,
(ek
2ij −min ek2ij
)∆
,
(ek
3ij −min ek3ij
)∆
(3)
where ∆ = maxek3ij −mine
The left (l) and right (r) normalized values are computed using
(lnij, rn
ij
)=
(qek2ij(
1 + qek2ij − qek
1ij
) ,qek
3ij(1 + qek
3ij − qek2ij
) (4)
The normalized crisp values (nc) are determined using:
nckij =
[lkij
(1− lk
ij
)+(
rkij)
2]
(1− lk
ij + rkij
) (5)
The synthetic crisp values are gathered from each perceptiveness of the k expert using:
ekij =
(nc1
ij + nc2ij + nc3
ij + · · ·+ nc3ij
)k
(6)
The n × n initial matrix of direct relation (IM) is developed in pairwise comparisonform, in which ek
ij denotes the influence level of attribute i on attribute j as IM =[ek
ij
]n×n
.
The normalized direct relation matrix (U) is generated as
U = τ ⊗ IMτ = 1
max1≤i≤k∑k
j=1 ekij
(7)
The interrelationship matrix (W) is then attained using:
W = U(I −U)−1, (8)
where W is[wij]
n×n i, j = 1, 2, · · · n.The driving power (ϑ) and dependence power (µ)values are assimilated from the row and column total values of the interrelationshipmatrix using:
ϑ =
[n
∑i−1
wij
]n×n
= [wi]n×1 (9)
µ =
[n
∑j−1
wij
]n×n
=[wj]
1×nv (10)
Therefore, the attributes are positioned into the cause-and-effect diagram by deriving[(ϑ + µ), (ϑ − µ)], which in turn form the horizontal and vertical vectors. On the one hand,

Sustainability 2022, 14, 3658 12 of 24
(ϑ + µ) signifies the attributes’ importance. The attribute with the higher (ϑ + µ) valueis more important among the set. On the other hand, the attributes are categorized intocause-and-effect groups based on their (ϑ − µ) values. If (ϑ − µ) values are positive, theattribute is assigned to the cause group; otherwise, it is assigned to the effect group.
3.5. Fuzzy Kano Model
The FKM aims to organize and features a matrix based on five distinct levels (shownin Figure 1) [31].
Sustainability 2022, 14, x FOR PEER REVIEW 13 of 25
Criteria 𝒊 Dysfunctional
Pleasant Expect No Different Okay Dislike
Functional
Like - A A A O Expect R I I I M Neutral R I I I M Accept R I I I M Dislike R R R R -
The Kano model questionnaire allows respondents to more completely present thoughts and solutions to often encountered problems and fit them within a human think-ing model; even minor feelings or ideas are communicated to service providers via the questionnaire. As a result, Kano’s model and subsequent quality attribute categorization will be both comparative and real. Fuzzy context is employed to reduce the uncertainty and roughness of the responses. The method provides high flexibility for respondents to show their authentic opinions. If the respondents are asked to give multiple answers on a fuzzy basis, the data will be closer to their original perception. Five distinct responses are suggested. The respondents may respond to questions by marking multiple responses with quantitative values within the interval of 0 to 100%. All attributes are designed with a single pair of functional-dysfunctional queries. The questionnaire was validated through interviews with researchers and experts. When the expert did not have a precise judgment in one single choice, percentages showing their response for multiple choices were used, such as 60% and 40% for a functionality. Table 5 shows a sample outcome for a specific expert.
Table 5. The fuzzy kano’s questionnaire.
How Do You Feel When the Good Corporate Is Having or Not Having a Good
Ethics?
FKM Questionnaire It Is
Pleasant (%) It Is Expected to Be Like That (%)
No Different (%)
It Is Okay for Me (%)
I Do Not Like That (%)
Respondent I Functional 60 40
Dysfunctional 10 30 60
High performance
Dysfunctional Functional
Low performance
Indifferent
One-dimensional
Attractive
Must-be
Reverse
Figure 1. Kano Model. Figure 1. Kano Model.
Must-be (M): includes the required attributes that a firm must have to maintain itsnormal operational procedures, and a failure to meet these requirements intensely increaseslow performance.
One-dimensional (O): includes the attributes such that if these attributes are fulfilled,the firm’s performance is enhanced; otherwise, low performance occurs. These attributesare the expectation standard to improve the firm’s operational procedures.
Attractive (A): includes attributes that deliver outstanding performance once fulfilledbut do not cause low performance when not achieved. These attributes are not ordinarilypredictable and are often undeclared due to unexpected performance delight.
Indifferent (I): includes attributes bringing neither high nor low performance tothe firm.
Reverse (R): includes attributes bringing high performance level but then resulting inlow performance and denoting that decision-makers are not alike.
The Kano model may be used to gauge the total perceived respondent evaluationof the study subject. For the decision-making, the evaluation is based on functional anddysfunctional dimensions of the responses [41]. Figure 1 depicts the connection betweenthe respondents’ evaluation and the functional presence of quality features in variousKano classes. For each attribute, the Kano Model employs a survey that includes a pairof dysfunctional and functional questions. Functional inquiries represent circumstancesin which the questioned attribute is appropriately delivered. In contrast, dysfunctionalqueries identify situations in which the performance of the chosen attribute is inadequate.Using the Fuzzy Kano questionnaire, five distinct reactions are possible for the proposedattribute. Then, the Kano evaluation table is shown in Table 4.

Sustainability 2022, 14, 3658 13 of 24
Table 4. Fuzzy Kano model evaluation table.
Criteria iDysfunctional
Pleasant Expect No Different Okay Dislike
Functional
Like - A A A OExpect R I I I MNeutral R I I I MAccept R I I I MDislike R R R R -
The Kano model questionnaire allows respondents to more completely present thoughtsand solutions to often encountered problems and fit them within a human thinking model;even minor feelings or ideas are communicated to service providers via the questionnaire.As a result, Kano’s model and subsequent quality attribute categorization will be bothcomparative and real. Fuzzy context is employed to reduce the uncertainty and roughnessof the responses. The method provides high flexibility for respondents to show their au-thentic opinions. If the respondents are asked to give multiple answers on a fuzzy basis, thedata will be closer to their original perception. Five distinct responses are suggested. Therespondents may respond to questions by marking multiple responses with quantitativevalues within the interval of 0 to 100%. All attributes are designed with a single pair offunctional-dysfunctional queries. The questionnaire was validated through interviews withresearchers and experts. When the expert did not have a precise judgment in one singlechoice, percentages showing their response for multiple choices were used, such as 60%and 40% for a functionality. Table 5 shows a sample outcome for a specific expert.
Table 5. The fuzzy kano’s questionnaire.
How Do You Feel When theGood Corporate Is Having or Not
Having a Good Ethics?
FKM Questionnaire
It Is Pleasant(%)
It Is Expected toBe Like That (%)
No Different(%)
It Is Okay forMe (%)
I Do Not LikeThat (%)
Respondent I Functional 60 40Dysfunctional 10 30 60
Then, the functional (F) and dysfunctional (D) matrices are created for the purpose ofrecording the respondents’ replies. The matrix S, with a dimension of [5 × 5] is obtained bymultiplying the transpose of matrix F by matrix D. For example:
F =
0.60.4000
D = [0, 0, 0.1, 0.3, 0.6] (11)
Then S[5×5] is calculated by combining F[5×1] and D[1×5].The fuzzy Kano Model isformed as:
S5×5 = F5×1 × D1×5 =
a11 a12 a13 a14 a15a21 a22 a23 a24 a25a31 a32 a33 a34 a35a41 a42 a43 a44 a45a51 a52 a53 a54 a55
(12)

Sustainability 2022, 14, 3658 14 of 24
For example:0 0 0.1 0.3 0.6
S5×5 =
0.60.4000
0 0 0.6 0.18 0.360 0 0.4 0.12 0.240 0 0 0 00 0 0 0 00 0 0 0 0
Then, the membership value was calculated as shown below:
(M) = a25 + a35 + a45(O) = a15
(A) = a12 + a13 + a14(I) = a22 + a23 + a24 + a32 + a34 + a42 + a43 + a44
(R) = a21 + a31 + a41 + a51 + a52 + a54
(13)
Each attribute’s membership degree is compared to the Kano assessment chart, andthe membership degree T is obtained.
T =
0.24 0.36 0.24 0.16 0
A O M I R
0 1 0 0 0
(14)
The membership degrees frequency for every attribute are summarized. Thus, at-tributes are classified into the formerly stated five categories.
4. Results
This section discusses the results and discussion of the FDM, DEMATEL and Kanoanalysis used in this study.
4.1. Fuzzy Delphi Method Results
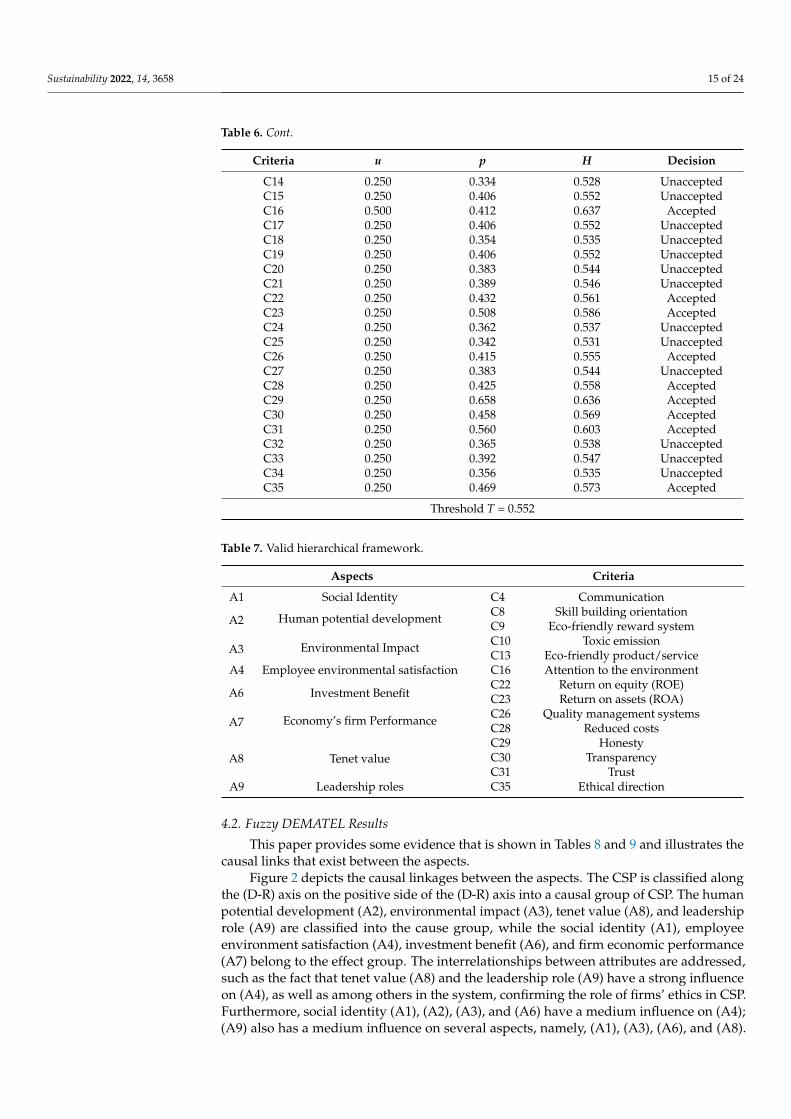
Thirty-five criteria shown in Table 1 for the CSP criteria were submitted for FDManalysis. The acceptability threshold was determined, T = 0.552, using Equations (1) and (2).The FDM findings, which include the weights assigned to the criterion and their associatedthresholds, are shown in Table 6. The criteria with a defuzzied weight less than the value ofthe threshold are eliminated. Once all the criteria belonging to an aspect are eliminated, thataspect is also removed. Table 7 shows the eight accepted aspects, and fourteen acceptedcriteria remain as validated structures for the next stage of the evaluation.
Table 6. FDM—CSP Screening Out.
Criteria u p H Decision
C1 0.250 0.345 0.532 UnacceptedC2 0.250 0.395 0.548 UnacceptedC3 0.250 0.260 0.503 UnacceptedC4 0.250 0.409 0.553 AcceptedC5 0.250 0.298 0.516 UnacceptedC6 0.250 0.286 0.512 UnacceptedC7 0.250 0.371 0.540 UnacceptedC8 0.250 0.409 0.553 AcceptedC9 0.250 0.415 0.555 Accepted
C10 0.250 0.443 0.564 AcceptedC11 0.250 0.374 0.541 UnacceptedC12 0.250 0.356 0.535 UnacceptedC13 0.250 0.415 0.555 Accepted
Sustainability 2022, 14, 3658 15 of 24
Table 6. Cont.
Criteria u p H Decision
C14 0.250 0.334 0.528 UnacceptedC15 0.250 0.406 0.552 UnacceptedC16 0.500 0.412 0.637 AcceptedC17 0.250 0.406 0.552 UnacceptedC18 0.250 0.354 0.535 UnacceptedC19 0.250 0.406 0.552 UnacceptedC20 0.250 0.383 0.544 UnacceptedC21 0.250 0.389 0.546 UnacceptedC22 0.250 0.432 0.561 AcceptedC23 0.250 0.508 0.586 AcceptedC24 0.250 0.362 0.537 UnacceptedC25 0.250 0.342 0.531 UnacceptedC26 0.250 0.415 0.555 AcceptedC27 0.250 0.383 0.544 UnacceptedC28 0.250 0.425 0.558 AcceptedC29 0.250 0.658 0.636 AcceptedC30 0.250 0.458 0.569 AcceptedC31 0.250 0.560 0.603 AcceptedC32 0.250 0.365 0.538 UnacceptedC33 0.250 0.392 0.547 UnacceptedC34 0.250 0.356 0.535 UnacceptedC35 0.250 0.469 0.573 Accepted
Threshold T = 0.552
Table 7. Valid hierarchical framework.
Aspects Criteria
A1 Social Identity C4 Communication
A2 Human potential development C8 Skill building orientationC9 Eco-friendly reward system
A3 Environmental Impact C10 Toxic emissionC13 Eco-friendly product/service
A4 Employee environmental satisfaction C16 Attention to the environment
A6 Investment BenefitC22 Return on equity (ROE)C23 Return on assets (ROA)
A7 Economy’s firm Performance C26 Quality management systemsC28 Reduced costs
A8 Tenet valueC29 HonestyC30 TransparencyC31 Trust
A9 Leadership roles C35 Ethical direction
4.2. Fuzzy DEMATEL Results
This paper provides some evidence that is shown in Tables 8 and 9 and illustrates thecausal links that exist between the aspects.
Figure 2 depicts the causal linkages between the aspects. The CSP is classified alongthe (D-R) axis on the positive side of the (D-R) axis into a causal group of CSP. The humanpotential development (A2), environmental impact (A3), tenet value (A8), and leadershiprole (A9) are classified into the cause group, while the social identity (A1), employeeenvironment satisfaction (A4), investment benefit (A6), and firm economic performance(A7) belong to the effect group. The interrelationships between attributes are addressed,such as the fact that tenet value (A8) and the leadership role (A9) have a strong influenceon (A4), as well as among others in the system, confirming the role of firms’ ethics in CSP.Furthermore, social identity (A1), (A2), (A3), and (A6) have a medium influence on (A4);(A9) also has a medium influence on several aspects, namely, (A1), (A3), (A6), and (A8).

Sustainability 2022, 14, 3658 16 of 24
There is a causal interrelation between (A9) and (A3), a medium influence of (A9) with(A3), and a weak relationship of (A3) with (A9). Meanwhile, a weak relationship betweenaspects is found as follows: (A3) with (A9), (A7) with (A4), (A8) with (A1), (A3), (A6),(A7), and (A9), and (A9) with (A2) and (A7). However, the reverse interaction also showsinterinfluences among the SCP aspects in (A3) and (A8) to (A9).
Table 8. Matrix of total interrelationships.
A1 A2 A3 A4 A6 A7 A8 A9 ϑ
A1 4.150 3.962 4.066 4.267 4.040 4.037 4.067 4.058 32.648A2 4.073 4.008 4.052 4.224 4.033 3.983 4.008 4.044 32.426A3 4.093 3.994 4.158 4.271 4.071 4.031 4.072 4.081 32.773A4 4.046 3.914 4.033 4.276 4.018 3.989 4.039 4.038 32.353A6 4.059 3.917 4.021 4.191 4.075 3.965 4.014 4.019 32.261A7 3.914 3.792 3.934 4.096 3.928 3.938 3.889 3.900 31.392A8 4.155 4.044 4.141 4.330 4.126 4.085 4.189 4.136 33.205A9 4.209 4.092 4.197 4.385 4.183 4.147 4.182 4.255 33.650
µ 32.699 31.725 32.602 34.041 32.474 32.175 32.460 32.531
Table 9. The driving and dependence power.
ϑ µ ϑ+µ ϑ−µ
A1 32.648 32.699 65.347 (0.051)A2 32.426 31.725 64.150 0.701A3 32.773 32.602 65.376 0.171A4 32.353 34.041 66.394 (1.688)A6 32.261 32.474 64.735 (0.214)A7 31.392 32.175 63.567 (0.783)A8 33.205 32.460 65.665 0.745A9 33.650 32.531 66.181 1.119
Sustainability 2022, 14, x FOR PEER REVIEW 18 of 25
• Social Identity—A1 • Human Potential Development—A2 • Environmental Impact—A3 • Employee Environmental Satisfaction—A4 • Investment Benefit—A6 • Economy’s Firm Performance—A7 • Tenets Value—A8 • Leadership Role—A9
Figure 2. Causal interrelationships figure among the aspects.
4.3. Fuzzy Kano Result Shown in Table 10, the frequency data of all CSP criteria is grouped into fuzzy Kano
categories based on the level the executives. The criteria are categorized into 4 groups. The indifferent group includes communication criteria (C4), skill building orientation (C8), at-tention to the environment (C16), and return on assets (C23). The must-be criteria con-sisted of toxic emission (C10), transparency (C30), and trust (C31). The criteria of honesty (C29), ethical direction (C35), and eco-friendly product/service (C13) are assigned to the one-dimensional group. Finally, the attractive group comprises an eco-friendly reward system (C9), return on equity criteria (C22), quality management systems (C26), and re-duced cost (C28), which are considered the decisive criteria for successful performance.
Table 10. Fuzzy Kano result.
Criteria A O M I R Distribution C4 Communication 9 14 10 20 0 Indifferent C8 Skill building orientation 3 3 20 27 0 Indifferent C9 Eco-friendly reward system 27 0 1 26 0 Attractive
C10 Toxic emission 1 3 41 8 0 Must Be C13 Eco-friendly product/service 11 22 9 11 0 One-dimensional
A1
A2
A3
A4
A6
A7
A8
A9
A1
A2
A3
A4
A6
A7
A8
A9
A1
A2
A3
A4
A6
A7
A8A9
Weak
Medium
Strong
Figure 2. Causal interrelationships figure among the aspects.

Sustainability 2022, 14, 3658 17 of 24
4.3. Fuzzy Kano Result
Shown in Table 10, the frequency data of all CSP criteria is grouped into fuzzy Kanocategories based on the level the executives. The criteria are categorized into 4 groups.The indifferent group includes communication criteria (C4), skill building orientation(C8), attention to the environment (C16), and return on assets (C23). The must-be criteriaconsisted of toxic emission (C10), transparency (C30), and trust (C31). The criteria ofhonesty (C29), ethical direction (C35), and eco-friendly product/service (C13) are assignedto the one-dimensional group. Finally, the attractive group comprises an eco-friendlyreward system (C9), return on equity criteria (C22), quality management systems (C26), andreduced cost (C28), which are considered the decisive criteria for successful performance.
Table 10. Fuzzy Kano result.
Criteria A O M I R Distribution
C4 Communication 9 14 10 20 0 IndifferentC8 Skill building orientation 3 3 20 27 0 IndifferentC9 Eco-friendly reward system 27 0 1 26 0 Attractive
C10 Toxic emission 1 3 41 8 0 Must BeC13 Eco-friendly product/service 11 22 9 11 0 One-dimensionalC16 Attention to the environment 4 1 8 40 0 IndifferentC22 Return on equity 41 2 1 10 0 AttractiveC23 Return on assets 9 0 1 43 0 IndifferentC26 Quality management systems 29 4 8 12 0 AttractiveC28 Reduced costs 27 20 2 5 0 AttractiveC29 Honesty 2 50 0 1 0 One-dimensionalC30 Transparency 10 2 33 8 0 Must BeC31 Trust 6 3 32 13 0 Must BeC35 Ethical direction 18 21 9 7 0 One-dimensional
5. Implications5.1. Theoretical Implications
Identifying the cause-and-effect interrelationships of CSP is the objective of this study.CSP is influenced by the leadership role, tenet values, human potential development, andenvironmental impacts.
The results show that the leadership role has the highest importance and is a strongcause and influence for employee environmental satisfaction, as well as for other aspects,such as social identity and the firm’s economic performance. Leadership plays an importantrole in improving CSP, helps a firm to implement an ethical structure, and even becomes thebasis and foundation through which a firm achieves its performance goals [15,27,39]. Theethical structure includes a leadership role, which is an important role for managers to playto provide an example and direction in accordance with the ethical standards that must becarried out [17,36]. The results reveal that it has a strong influence on social identity andinvestment benefits. By implementing and applying leadership roles within the corporation,firms provide stakeholders a deeper understanding, especially workers, encouraging themto improve their reputation and corporate culture as a CSP improvement [8]. In addition,regarding investment benefits, for which improved performance is highly linked to thefirm’s internal efficiency as measured by financial outcomes, leadership can directly increaseCSP [25]. Therefore, the leadership role improves CSP in F&B firms.
Another aspect is represented by tenet values, which have a strong influence withinthe system, especially on employee environmental satisfaction, and comprise honesty,transparency, and trust in CSP [20]. By adopting ethical tenets within a sustainable andtransparent business model instead of relying on people principles, corporations ensurelong-term growth [37]. The aspect is important for corporations to ensure their growth,especially the adoption of firm ethics to reduce several risks in the long term to ensure thatfirms are managed properly [15]. These risks are related to TBL issues, and by reducing the

Sustainability 2022, 14, 3658 18 of 24
risks, tenet value can help firms improve their performance. As is well known, sustainableperformance is a benchmark for firms and becomes a structure for evaluating them, pro-viding win–win solutions for companies. Ethical tenet values have been confirmed to helpfirms take the steps to change debatable policies and to preserve individual ethics [20,33].As a result, the corporate’s objectives will be achieved by implementing firm ethics [27].Therefore, corporate performance can be improved by applying an ethical structure.
Additionally, the human potential development supports consistency in improvingCSP through increasing stakeholder satisfaction by emphasizing eco-friendly systems [31].A system that is environmentally friendly to stakeholders can help achieve performanceimprovements and sustainable development goals within the corporation [10]. Socialidentity encourages individuals and groups to understand aspects related to corporatereputation, corporate culture, and communication [8,26,42]. This can be the result ofa strong push from human potential development in increasing knowledge and skills.Likewise, regarding firm’s economic performance, human development can increase thecorporation’s financial performance in both tangible and nontangible areas, for instance,infrastructure investment and cost reduction [9,40].
Environmental impact also affects CSP in improving firm performance related to costeffectiveness and increasing competitiveness through the reduction of toxic emissions, therecycling of materials, the use of renewable energy, and the consumption of energy [45].Thus, the results reveal that the influence of the environmental impact on employee environ-mental satisfaction is significant. Because the corporation’s attention to its influence on theenvironment provides satisfaction to its stakeholders, especially to its workers, employeesdevelop a high awareness of the environment by caring for the environment, taking theinitiative on environmental issues, and voluntarily becoming involved in projects relatedto environmental issues in companies [47]. Thus, the environmental impact on the firmprovides environment-related satisfaction to its employees, which therefore improves CSP.
5.2. Practical Implications
This study provides necessary implications for business managers in the F&B industryto improve practical CSP. The findings demonstrate that firm ethics have an interrela-tionship among the attributes and strongly improve corporate performance in terms offinancial and nonfinancial benefits to the F&B industry in Indonesia. Moreover, managersare encouraged to adopt and acknowledge firm ethics as an implementation approachthat significantly improves CSP. In improving its performance, the F&B industry facesvarious challenges, especially the negative impacts of its production operations, such as airpollution, ground soil contamination, and garbage disposal, and other challenges in thearea of social justice, social responsibility, and social identity. These challenges are a criticalproblem in improving sustainability performance. However, the most important thing isthat firms need to manage their sustainable development activities along with a firm ethicsapproach because this approach is remarkably effective and efficient in terms of protectingsociety and the ecology, increasing efficiency, and enhancing the corporate reputation byapplying CSP. Moreover, an approach based on attributes is an innovative one in the F&Bindustry, since F&B firms are often mainly concerned with environmental issues. Thisstudy identified decisive innovative attributes that provide practical implications for CSPin the F&B in Indonesia. The criteria are classified into the attractive category, which bringsoutstanding performance, and comprise an eco-friendly reward system, return on equity,quality management system, and reduced costs.
The eco-friendly reward system is an essential system for corporates to improveCSP by increasing employee motivation. With an eco-friendly reward system, employees’motivation and trust increase, and the corporations’ image is more valuable and betterthan those of their competitors because it fits the firm’s goals. The form of reward givenconsists of direct financial, indirect financial and nonfinancial rewards, which are related tothe implementation of environmentally friendly activities by the employees. However, thisis also a challenge for the Indonesian F&B industry in carrying out its activities because

Sustainability 2022, 14, 3658 19 of 24
these criteria relate to a reward system that is constructed by the corporation and that alsoimproves individual performance. Therefore, along with implementing an eco-friendlyreward system for employees, firms should have high motivation to always work in anenvironmentally friendly manner, such as preparing work documents in digital formto reduce waste, plastic and paper and saving electrical energy by limiting the use ofenergy-inefficient electronic equipment. Thus, CSP effectively and efficiently increasesstakeholder satisfaction.
Financial performance is a way to assess the efficiency of the corporation’s manage-ment’s financial performance to see how far a corporation has improved through correctlyusing financial implementation rules and has a large role in improving corporate perfor-mance. Therefore, another major attractive criterion that must be considered and is anindustry concern in improving CSP is the return on equity, which is related to the efficientuse of share capital by corporations. The return on equity is critical for shareholders andpotential investors to improve corporate performance. It is crucial for firms to scrutinizethe return on equity to improve the welfare of shareholders and to increase the firm’s stockpurchase based on the size of the firm’s profitability, which also increases CSP. The higherthe return on equity is, the more effective and efficient the firm’s management, the higherthe firm’s performance, and the higher the profit generated by the firm.
A quality management system, an assertive integrated system designed by the corpora-tion, consists of a total quality management and environmental management system, whichcan be a corporate culture system to improve CSP. Applying the principles and processesof the quality management system properly enhances customer satisfaction, F&B producthealth and safety, firm transparency, and risk response and reduces investigation time. Thecriterion is a management standard quality system that is internationally recognized bythe industry to improve corporate performance. International trade in the F&B industryrequires firms to be concerned about product quality, F&B safety, and traceability both inthe production process and throughout the production chain. The quality managementsystem process designed by the corporation should include designing policies for F&Bsafety, establishing communication procedures with internal and external stakeholders,developing strategies to provide adequate resources, and evaluating the performanceof the quality system. Thus, F&B firms should apply the process starting from the pro-curement of raw materials and the processing of raw materials to product distributionto consumers. To improve the quality management system, firms should also includeprinciples, such as customer focus, leadership within the company, a multistakeholderengagement, process approach, continuous improvement, evidence-based decision-making,and relationship management.
The next criterion that is also critical to increase CSP is reduced costs. Various effortshave been made by corporations to optimize cost efficiency, but cost reduction is the mostessential for corporations in the F&B industry, as it focuses on the process of eliminatingwaste and improving business processes to reduce the overhead or cost of goods sold andimpacts corporate performance. This cost reduction strategy refers to effective principlesand methods to improve operating efficiency. Therefore, reduced costs affect operationsand production processes by making them more efficient and increase profits. Due toreduced production costs, corporations can refocus their budgeted resources on expandingoperations or expanding to new markets, with a focus on research and development. Thiscan support the strategic alignment of objectives and innovation, increase market share andoptimally achieve CSP. In addition, to increase profits without having a negative impact onproduct quality, it is important for corporations to cut costs that do not provide businessbenefits. Cost reduction implementation by firms can be achieved through automation,productivity improvement, outsourcing, waste elimination, quality control, improvement ofthe reliability of systems, improvement in equipment, and improvement in processes. Thus,efficiency carried out by reducing costs will optimally increase corporate performance.

Sustainability 2022, 14, 3658 20 of 24
6. Conclusions
This study measures the causal interrelationships and linkages among the hierarchicalproperties and defines the guiding and reliant forces in corporate sustainability success.CSP is critical for improving the long-term success of the firm. It is also essential inovercoming the many issues originating from the industry processes. The Indonesian foodand beverage industry provide the second largest contribution to a country’s economicgrowth. However, most of the corporations in the industry significantly contribute to thenegative impact that affects not only the ecological system but also the overall performanceof the economy. According to past studies, TBL has been identified as a fundamentalstructure utilized for sustainability applications in a variety of industries. However, inthis study, a different discipline, firm ethics, is proposed as a relation between CSP andsustaining ability to gain a better understanding of and to enhance CSP. This study proposes9 aspects and 35 criteria derived from 4 perspectives from the current literature, includingthe TBL and firm ethics. Both qualitative and quantitative approaches are utilized. Due tothe high complexity and uncertainty of CSP, the FDM, FDEMATEL, and FKM are applied
The findings of this study highlighted significantly that firm ethics could be a referenceand a solution for the issues related to enhancing corporate sustainability performance.The results indicate that among the factors in the cause group, tenet values and a lead-ership role have a strong influence in improving CSP. Therefore, having and practicingethics in the corporation will significantly improve corporate sustainability performance.The decisive criteria, i.e., an eco-friendly reward system, the return on equity, a qualitymanagement system, and reduced costs are identified as firm attributes that can be appliedand implemented to enhance CSP in the F&B industry in Indonesia.
This study contributes to the literature by presenting novel information and guide-lines on corporate transformation to achieve sustainable performance by defining criticalattributes for CSP as well as the decisive criteria for industrial success. New theoreticalstandpoints for the literature are provided through a hierarchical structure as well as ananalysis of the cause-and-effect interactions among the CSP attributes. The findings wouldsupport decisionmakers who are attempting to improve their corporate performance inthe long term. Practical guidelines are provided through the identification of decisiveattributes derived from detailed empirical results in the Indonesian F&B industry. As alsoexemplified by leadership roles, the application of firm ethics can significantly improvecorporate performance as a direction guiding the implementation of practices in managingsustainable development activities in responding to complex and uncertainty problems,thus helping to achieve firm performance and competitive advantages in sustainability.
This study has several limitations. The attribute set of this study may not be com-prehensive, and future studies are recommended to add more attributes to the structuresince each of these factors might be additional possible drivers of CSP. Measurement errorsmay exist due to experts’ subjective judgments, which could not be generalized, and futurestudies can increase the survey sample size to avoid this problem. Additionally, this studyonly examines one industry, the F&B industry in Indonesia. Analyzing another industry inanother region or country may provide further specification.
Author Contributions: T.-D.B. Conceptualization; original draft Writing; review & editing; H.A.original draft writing; C.-H.W. Conceptualization; Resources; review and editing; M.-L.T. Conceptual-ization; Resources; review and editing; M.I. Conceptualization; Resources; review and editing; M.K.L.original draft writing. All authors have read and agreed to the published version of the manuscript.
Funding: Funded by Ministry of Science & Technology Taiwan Grant number: 110-2221-E-468-010.
Institutional Review Board Statement: Not available.
Informed Consent Statement: Not available.
Data Availability Statement: Not available.
Conflicts of Interest: The authors declare no conflict of interest.

Sustainability 2022, 14, 3658 21 of 24
Appendix A
Table A1. Respondent Information.
No Occupation Level of Education Years of Expertise Organization Type(Academia/Practices)
1 Manager of Branch Process Development andQuality Control Bachelor 10 years Practices
2 Manager of Factory Bachelor 12 years Practices3 Supervisor of Production Diploma 8 years Practices4 General Manager of Production Master 9 years Practices5 Manager of Quality Control Bachelor 4 years Practices6 Supervisor of Finished Good Diploma 7 years Practices7 Supervisor of General Affairs Bachelor 6 years Practices8 Manager of Finance and Accounting Bachelor 10 years Practices9 Supervisor of Sales Area Bachelor 8 years Practices10 Deputy Director of Buyer and Logistics Master 21 years Practices11 Director of Consumer Branded Product Master 26 years Practices12 Deputy Director of Manufacturing Master 17 years Practices13 Manager of IT Operation and Infrastructure Bachelor 8 years Practices14 Director of Operation Master 27 years Practices15 General Manager of Buyer and Logistics Bachelor 7 years Practices16 Supervisor of Operation Bachelor 4 years Practices17 Manager of Store Diploma 10 years Practices18 Supervisor of Operation Bachelor 5 years Practices19 Manager of Beverage Bachelor 9 years Practices20 Supervisor of Production Diploma 7 years Practices21 Supervisor of Purchasing and Logistics Bachelor 5 years Practices22 Supervisor of Fresh Product Diploma 5 years Practices23 Deputy Director Marketing and Sales Bachelor 25 years Practices24 Director of Corporate Function Bachelor 28 years Practices25 Manager of Store Bachelor 8 years Practices26 General Manager of Buyer and Logistics Diploma 7 years Practices27 Director of Quality Control Master 22 years Practices28 Manager of Factory Bachelor 10 years Practices29 Supervisor of Finished Good Bachelor 8 years Practices30 Supervisor of Groceries Product Diploma 11 years Practices31 Supervisor of Meat and Poultry Bachelor 7 years Practices32 Supervisor of Diary and Daily Diploma 6 years Practices33 Manager of Human Capital Bachelor 9 years Practices34 Supervisor of Breakfast Drink Diploma 3 years Practices35 Manager of Quality Control Raw Material Bachelor 9 years Practices36 Supervisor of Import Fruit Bachelor 8 years Practices37 Manager of Branch Personal Bachelor 16 years Practices38 Supervisor of Breakfast Food Bachelor 5 years Practices39 Supervisor of Liquid Milk Diploma 8 years Practices40 Supervisor of Sales and Marketing Bachelor 4 years Practices41 Supervisor of Administration and Wages Bachelor 9 years Practices42 Manager of Perishable Bachelor 14 years Practices43 Manager of Non-food Diploma 9 years Practices44 Supervisor of Human Capital Diploma 3 years Practices
45 Supervisor of Production Planning and InventoryControl Bachelor 5 years Practices
46 Supervisor of Quality Control Process Bachelor 5 years Practices47 Manager of General Merchandising Bachelor 10 years Practices48 Supervisor of Local Fruit Bachelor 9 years Practices

Sustainability 2022, 14, 3658 22 of 24
Table A1. Cont.
No Occupation Level of Education Years of Expertise Organization Type(Academia/Practices)
49 Supervisor of Frozen Food Bachelor 5 years Practices50 Supervisor of Snacks Bachelor 5 years Practices51 Supervisor of Fresh Milk Diploma 10 years Practices52 Supervisor of General Affair and Service Diploma 4 years Practices53 Supervisor of Manufacturing Bachelor 5 years Practices
References1. Kemenperin. Pembangunan Industri Tahun 2020. Available online: https://kemenperin.go.id/tanyajawab/detail.php?id=47549
(accessed on 29 April 2021).2. Widaningrum, D.L.; Surjandari, I.; Sudiana, D. Discovering spatial patterns of fast-food restaurants in Jakarta, Indonesia. J. Ind.
Prod. Eng. 2020, 37, 403–421. [CrossRef]3. Tseng, M.L.; Lim, M.K.; Wu, K.J. Corporate sustainability performance improvement using an interrelationship hierarchical
model approach. Bus. Strategy Environ. 2018, 27, 1334–1346. [CrossRef]4. Orazalin, N. Corporate governance and corporate social responsibility (CSR) disclosure in an emerging economy: Evidence from
commercial banks of Kazakhstan. Corp. Gov. 2019, 19, 490–507. [CrossRef]5. Schrobback, P.; Meath, C. Corporate sustainability governance: Insight from the Australian and New Zealand port industry.
J. Clean. Prod. 2020, 255, 120280. [CrossRef]6. Kücükgül, E.; Cerin, P.; Liu, Y. Enhancing the value of corporate sustainability: An approach for aligning multiple SDGs guides
on reporting. J. Clean. Prod. 2022, 333, 130005. [CrossRef]7. Tseng, M.L.; Lim, M.K.; Ali, M.H.; Christianti, G.; Juladacha, P. Assessing the sustainable food system in Thailand under
uncertainties: Governance, distribution and storage drive technological innovation. J. Ind. Prod. Eng. 2021, 39, 1–18. [CrossRef]8. Singh, K.; Misra, M. Linking Corporate Social Responsibility (CSR) and Organizational Performance: The moderating effect of
corporate reputation. Eur. Res. Manag. Bus. Econ. 2021, 27, 100139. [CrossRef]9. Torkayesh, A.E.; Ecer, F.; Pamucar, D. Comparative assessment of social sustainability performance: Integrated data-driven
weighting system and CoCoSo model. Sustain. Cities Soc. 2021, 71, 102975. [CrossRef]10. Zhan, Y.; Chung, L.; Lim, M.K.; Ye, F.; Kumar, A.; Tan, K.H. The impact of sustainability on supplier selection: A behavioural
study. Int. J. Prod. Econ. 2021, 236, 108118. [CrossRef]11. Agrawal, S.; Singh, R.K. Analyzing disposition decisions for sustainable reverse logistics: Triple Bottom Line approach. Resour.
Conserv. Recycl. 2019, 150, 104448. [CrossRef]12. Aksoy, M.; Yilmaz, M.K.; Tatoglu, E.; Basar, M. Antecedents of corporate sustainability performance in Turkey: The effects of
ownership structure and board attributes on non-financial companies. J. Clean. Prod. 2020, 276, 124284. [CrossRef]13. Nikolaou, I.E.; Tsalis, T.A.; Evangelinos, K.I. A framework to measure corporate sustainability performance: A strong
sustainability-based view of firm. Sustain. Prod. Consum. 2019, 18, 1–18. [CrossRef]14. Guo, Y.; Wang, L.; Yang, Q. Do corporate environmental ethics influence firms’ green practice? The mediating role of green
innovation and the moderating role of personal ties. J. Clean. Prod. 2020, 266, 122054. [CrossRef]15. Valente, M.; Sá, C.; Soares, N.; Sousa, S. Exploring the consistency of ethical perceptions by business and economics higher
education students: Looking from academia towards the corporate world. Int. J. Manag. Educ. 2021, 19, 100499. [CrossRef]16. Jia, J.; Li, Z. Does external uncertainty matter in corporate sustainability performance? J. Corp. Financ. 2020, 65, 101743. [CrossRef]17. Kumar, R.; Singh, R.K.; Dwivedi, Y.K. Application of industry 4.0 technologies in SMEs for ethical and sustainable operations:
Analysis of challenges. J. Clean. Prod. 2020, 275, 124063. [CrossRef]18. Kumar, S.; Chen, J.; Del, M.; El-kassar, A. Technological Forecasting & Social Change Environmental ethics, environmental
performance, and competitive advantage: Role of environmental training. Technol. Forecast. Soc. Chang. 2019, 146, 203–211.19. Blome, C.; Foerstl, K.; Schleper, M.C. Antecedents of green supplier championing and greenwashing: An empirical study on
leadership and ethical incentives. J. Clean. Prod. 2017, 152, 339–350. [CrossRef]20. Jin, Y.; Austin, L.; Eaddy, L.S.; Spector, S.; Reber, B.; Espina, C. How financial crisis history informs ethical corporate communica-
tion: Insights from corporate communication leaders. Public Relat. Rev. 2018, 44, 574–584. [CrossRef]21. Barnard, S.; Elliott, M. The 10-tenets of adaptive management and sustainability: An holistic framework for understanding and
managing the socio-ecological system. Environ. Sci. Policy 2015, 51, 181–191. [CrossRef]22. Santos, R.A.; dos Méxas, M.P.; Meiriño, M.J.; Sampaio, M.C.; Costa, H.G. Criteria for assessing a sustainable hotel business.
J. Clean. Prod. 2020, 262, 121347. [CrossRef]23. Vitolla, F.; Raimo, N.; Rubino, M.; Garegnani, G.M. Do cultural differences impact ethical issues? Exploring the relationship
between national culture and quality of code of ethics. J. Int. Manag. 2021, 27, 100823. [CrossRef]24. Rahman, D.; Kabir, M.; Oliver, B. Does exposure to product market competition influence insider trading profitability? J. Corp.
Financ. 2021, 66, 101792. [CrossRef]

Sustainability 2022, 14, 3658 23 of 24
25. Pislaru, M.; Herghiligiu, I.V.; Robu, I.B. Corporate sustainable performance assessment based on fuzzy logic. J. Clean. Prod. 2019,223, 998–1013. [CrossRef]
26. Tseng, M.L.; Wu, K.J.; Ma, L.; Kuo, T.C.; Sai, F. A hierarchical framework for assessing corporate sustainability performance usinga hybrid fuzzy synthetic method-DEMATEL. Technol. Forecast. Soc. Chang. 2019, 144, 524–533. [CrossRef]
27. Martínez, C.; Skeet, A.G.; Sasia, P.M. Managing organizational ethics: How ethics becomes pervasive within organizations. Bus.Horiz. 2021, 64, 83–92. [CrossRef] [PubMed]
28. Bui, T.D.; Tsai, F.M.; Tseng, M.L.; Tan, R.R.; Yu, K.D.S.; Lim, M.K. Sustainable supply chain management towards disruption andorganizational ambidexterity: A data driven analysis. Sustain. Prod. Consum. 2021, 26, 373–410. [CrossRef]
29. Tsai, J.F.; Wang, C.P.; Lin, M.H.; Huang, S.W. Analysis of key factors for supplier selection in taiwan’s thin-film transistorliquid-crystal displays industry. Mathematics 2021, 9, 396. [CrossRef]
30. Shokouhyar, S.; Shokoohyar, S.; Safari, S. Research on the influence of after-sales service quality factors on customer satisfaction.J. Retail. Consum. Serv. 2020, 56, 102139. [CrossRef]
31. Islam, M.S.; Tseng, M.L.; Karia, N. Assessment of corporate culture in sustainability performance using a hierarchical frameworkand interdependence relations. J. Clean. Prod. 2019, 217, 676–690. [CrossRef]
32. Saunila, M.; Nasiri, M.; Ukko, J.; Rantala, T. Smart technologies and corporate sustainability: The mediation effect of corporatesustainability strategy. Comput. Ind. 2019, 108, 178–185. [CrossRef]
33. Wahab, M. Is an unsustainability environmentally unethical? Ethics orientation, environmental sustainability engagement andperformance. J. Clean. Prod. 2021, 294, 126240. [CrossRef]
34. Houqe, M.N.; van Zijl, T.; Dunstan, K.; Karim, A.K.M.W. Corporate ethics and auditor choice–international evidence. Res. Account.Regul. 2015, 27, 57–65. [CrossRef]
35. Stahl, B.C.; Chatfield, K.; Ten Holter, C.; Brem, A. Ethics in corporate research and development: Can responsible research andinnovation approaches aid sustainability? J. Clean. Prod. 2019, 239, 118044. [CrossRef]
36. Kumar, S.; Mehany, M.S.H.M. Developing a Sustainability and Resilience Monitoring Scheme for Infrastructure Projects UsingSustainable Development Goals (SDGs). In Proceedings of the Construction Research Congress, Arlington, VA, USA, 9–12March 2022.
37. Machado, C.G.; Winroth, M.P.; Ribeiro Da Silva, E.H.D. Sustainable manufacturing in Industry 4.0: An emerging research agenda.Int. J. Prod. Res. 2020, 58, 1462–1484. [CrossRef]
38. Guarnieri, P.; Trojan, F. Resources, Conservation & Recycling Decision making on supplier selection based on social, ethical, andenvironmental criteria: A study in the textile industry. Resour. Conserv. Recycl. 2019, 141, 347–361.
39. Sulej, K.P. Environmental strategies and human resource development consistency: Research in the manufacturing industry.J. Clean. Prod. 2022, 330, 129538. [CrossRef]
40. Wijethilake, C. Proactive sustainability strategy and corporate sustainability performance: The mediating effect of sustainabilitycontrol systems. J. Environ. Manag. 2017, 196, 569–582. [CrossRef]
41. Jain, N.; Singh, A.R. Sustainable supplier selection under must-be criteria through Fuzzy inference system. J. Clean. Prod. 2020,248, 119275. [CrossRef]
42. Ko, K.C.; Nie, J.; Ran, R.; Gu, Y. Corporate social responsibility, social identity, and innovation performance in China. Pac. BasinFinanc. J. 2020, 63, 101415. [CrossRef]
43. Wolter, J.S.; Donavan, D.T.; Giebelhausen, M. The corporate reputation and consumer-company identification link as a sensemak-ing process: A cross-level interaction analysis. J. Bus. Res. 2021, 132, 289–300. [CrossRef]
44. Mazzi, A.; Spagnolo, M.; Toniolo, S. External communication on legal compliance by Italian waste treatment companies. J. Clean.Prod. 2020, 255, 120325. [CrossRef]
45. Úbeda-García, M.; Claver-Cortés, E.; Marco-Lajara, B.; Zaragoza-Sáez, P. Corporate social responsibility and firm performance inthe hotel industry. The mediating role of green human resource management and environmental outcomes. J. Bus. Res. 2021, 123,57–69. [CrossRef]
46. Khan, I.; Hou, F.; Zakari, A.; Konadu, V. The dynamic links among energy transitions, energy consumption, and sustainableeconomic growth: A novel framework for IEA countries. Energy 2021, 222, 119935. [CrossRef]
47. Paillé, P.; Valéau, P.; Renwick, D.W. Leveraging green human resource practices to achieve environmental sustainability. J. Clean.Prod. 2020, 260, 121137. [CrossRef]
48. Ismail, N.B.; Alcouffe, S.; Galy, N.; Ceulemans, K. The impact of international sustainability initiatives on Life Cycle Assessmentvoluntary disclosures: The case of France’s CAC40 listed companies. J. Clean. Prod. 2021, 282, 124456. [CrossRef]
49. George, F. Human Resource Management Review Ethical person-environment fit: An integrative definition, key findings, and acall for future research. Hum. Resour. Manag. Rev. 2021, 32, 100840.
50. Schwepker, C.H.; Dimitriou, C.K. International Journal of Hospitality Management Using ethical leadership to reduce job stressand improve performance quality in the hospitality industry. Int. J. Hosp. Manag. 2021, 94, 102860. [CrossRef]
51. Guerci, M.; Carollo, L. A paradox view on green human resource management: Insights from the Italian context. Int. J. Hum.Resour. Manag. 2016, 27, 212–238. [CrossRef]
52. Walls, J.L.; Berrone, P.; Phan, P.H. Corporate Governance And Environmental Performance: Is There Really A Link? Strateg.Manag. J. 2012, 33, 885–913. [CrossRef]

Sustainability 2022, 14, 3658 24 of 24
53. Deloitte. Deloitte Indonesia Business and Industry Updates. 2020. Available online: https://www2.deloitte.com/id/en/pages/about-deloitte/articles/business-and-industry-updates.html (accessed on 30 April 2021).
54. Widya, C.; Andianti, R.; Pragesari, N.N. Lingkungan Hidup Indonesia 2019. 2019. Available online: https://www.bps.go.id/publication/2019/12/13/e11bfc8ff8392e5e13a8cff3/statistik-lingkungan-hidup-indonesia-2019.html (accessed on 30 April 2021).
55. Shahzad, M.; Qu, Y.; Zafar, A.U.; Ding, X.; Rehman, S.U. Translating stakeholders’ pressure into environmental practices—Themediating role of knowledge management. J. Clean. Prod. 2020, 275, 124163. [CrossRef]
56. Bui, T.D.; Tsai, F.M.; Tseng, M.L.; Wu, K.J.; Chiu, A.S. Effective municipal solid waste management capability under uncertaintyin Vietnam: Utilizing economic efficiency and technology to foster social mobilization and environmental integrity. J. Clean. Prod.2020, 259, 120981. [CrossRef]