csa companion 2021 - s&p global corporate sustainability
TRANSCRIPT

CSA Companion 2021 Corporate Sustainability Assessment
Table of Contents Introd uction .................................................................................................................................................................................. 5
What is the purpose of this document? ........................................................................................................................... 5 How should you use this document?................................................................................................................................ 5 General Guidance .............................................................................................................................................................. 5 Media & Stakeholder A nalysis.......................................................................................................................................... 6 Assessment focus ............................................................................................................................................................. 7
Company Information .................................................................................................................................................................. 8 Question-Specific Guidance & Definitions ...................................................................................................................... 8 Data Requirements ........................................................................................................................................................... 8
Economic Dimension ................................................................................................................................................................... 9 Corporate Governance ...................................................................................................................................................... 9
Board Structure........................................................................................................................................................ 9 Board Diversity Policy ............................................................................................................................................ 12 Board Gender Diversity .......................................................................................................................................... 13 Board Effectiveness ............................................................................................................................................... 14 Board Average Tenure............................................................................................................................................ 16 Board Industry Experience .................................................................................................................................... 17 CEO Compensation – Success Metrics ................................................................................................................ 18 CEO Compensation – Long-Term Performance Alignment................................................................................. 19 Management Ownership ....................................................................................................................................... 21 Management Ownership Requirements............................................................................................................... 22 Government Ownership ......................................................................................................................................... 23 Family Owners hip................................................................................................................................................... 25 Dual Class Shares .................................................................................................................................................. 26 CEO-to-Employee Pay Ratio.................................................................................................................................. 27
Materiality........................................................................................................................................................................ 29 Material Issues ....................................................................................................................................................... 29 Materiality Disclosure............................................................................................................................................ 32
Risk & Crisis Management.............................................................................................................................................. 33 Risk Governance..................................................................................................................................................... 33 Emerging Risks ....................................................................................................................................................... 35 Risk Culture ............................................................................................................................................................ 37
Codes of Business Conduct ............................................................................................................................................ 38 Codes of Conduct ................................................................................................................................................... 38 Codes of Conduct: Coverage.................................................................................................................................. 39 Corruption & Bribery .............................................................................................................................................. 41 Code of Conduct: Systems/Procedures ................................................................................................................ 42 Anti-Competitive Practices ................................................................................................................................... 43 Corruption & Bribery Cases ................................................................................................................................... 44 Reporting on Breaches .......................................................................................................................................... 45
Customer Relationship Management ............................................................................................................................ 46 Customer Satisfaction Measurement .................................................................................................................. 46
Policy Influence................................................................................................................................................................ 49 Contributions & Other Spending ........................................................................................................................... 49 Largest Contributions & Expenditures ................................................................................................................. 52
Supply Chain M anagement............................................................................................................................................. 54
3 / 174
Introduction - What is the purpose of this document?
Supplier Code of Conduct ...................................................................................................................................... 54 Critical Supplier Identification .............................................................................................................................. 55 Supply Chain Risk Exposure.................................................................................................................................. 56 Supplier Risk Management Measures ................................................................................................................. 58 ESG Integration in SCM Strategy .......................................................................................................................... 59 Supply Chain Transparency & Reporting.............................................................................................................. 61
Tax Strategy ..................................................................................................................................................................... 63 Tax Strategy and Governance................................................................................................................................ 63 Tax Reporting.......................................................................................................................................................... 65 Effective Tax rate.................................................................................................................................................... 67
Information Sec urity/Cybersecurity & System Availability .......................................................................................... 72 IT Security/Cybersecurity Governance ................................................................................................................. 72 IT Security/ Cybersecurity Meas ures .................................................................................................................... 74 IT Security/ Cybersecurity Process & Infrastructure ........................................................................................... 75
Environmental Dimension ......................................................................................................................................................... 78 Environmental Reporting ................................................................................................................................................ 78
Environmental Reporting- Coverage .................................................................................................................... 78 Environmental Reporting- Assurance .................................................................................................................. 80
Environmental Policy & M anagement System .............................................................................................................. 81 Coverage of E nvironmental Management P olicy ................................................................................................. 81 EMS: Certification/ Audit/ Verification ................................................................................................................. 83
Operational Eco-Efficiency ............................................................................................................................................. 84 Direct Greenhouse Gas Emissions (Scope 1) ....................................................................................................... 85 Indirect Greenhouse Gas Emissions (Scope 2) .................................................................................................... 87 Energy Cons umption.............................................................................................................................................. 89 Water Consumption ............................................................................................................................................... 92 Waste Disposal....................................................................................................................................................... 95
Climate Strategy .............................................................................................................................................................. 97 Climate Risk M anagement .................................................................................................................................... 97 Climate-Related M anagement Incentives ........................................................................................................... 98 Climate Change Strategy ....................................................................................................................................... 99 Financial Risks of Climate Change ..................................................................................................................... 100 Financial Opportunities Arising from Clim ate Change ...................................................................................... 102 Climate Risk Assessment- P hysical Risks ......................................................................................................... 104 Climate Risk Assessment- Transition Risks ...................................................................................................... 106 Physical Climate Risk Adaptation ....................................................................................................................... 108 Climate-Related Targets ..................................................................................................................................... 110 Scope 3 GHG Emissions....................................................................................................................................... 112
Social Dimension ...................................................................................................................................................................... 114 Social Reporting ............................................................................................................................................................ 114
Social Reporting- Coverage ................................................................................................................................. 114 Social Reporting- Assurance............................................................................................................................... 116
Labor Practice Indicators .............................................................................................................................................. 117 Discrimination & Harassment............................................................................................................................. 117 Workforce Breakdown: Gender ........................................................................................................................... 120 Workforce Breakdown: Race/ Ethnicity & Nationality....................................................................................... 123 Workforce Breakdown: Other Minorities ............................................................................................................ 126 Gender Pay Indicators .......................................................................................................................................... 128 Freedom of Association ....................................................................................................................................... 130
Human Rights ................................................................................................................................................................ 131
4 / 174
Introduction - What is the purpose of this document?
Human Rights Commitment ................................................................................................................................ 131 Human Rights Due Diligence Process ................................................................................................................ 133 Human Rights Assessment ................................................................................................................................. 135 Human Rights Mitigation & Remediation........................................................................................................... 137
Human Capital Development........................................................................................................................................ 139 Training & Development Inputs ........................................................................................................................... 139 Employee Development P rograms ...................................................................................................................... 141 Human Capital Return on Investment ................................................................................................................ 143
Talent Attraction & Retention ....................................................................................................................................... 144 Hiring 144 People A nalytics ................................................................................................................................................... 146 Strategic Workforce Planning ............................................................................................................................. 148 Type of Individual Performance Appraisal ......................................................................................................... 150 Long-Term Incentives for Employees ................................................................................................................. 151 Employee Turnover Rate...................................................................................................................................... 153 Trend of Em ployee Engagement ......................................................................................................................... 155
Corporate Citizenship & Phi lanthropy.......................................................................................................................... 158 Corporate Citizenship Strategy ........................................................................................................................... 158 Type of Phi lanthropic Activities ........................................................................................................................... 160 Philanthropic Contributions ................................................................................................................................ 162
GRI Mapping – Index ................................................................................................................................................................ 164 GRI M apping - Economic Dimension............................................................................................................................ 164 GRI M apping - E nvironmental Dimension.................................................................................................................... 168 GRI M apping - Social Dimension .................................................................................................................................. 172
Disclaimer ................................................................................................................................................................................. 174

5 / 174
Introduction - What is the purpose of this document?
Introduction What is the purpose of this document?
We believe it is vital that we are transparent about our Corporate Sustainability Assessment (CSA) process, the methodology and rationale behind the questions we ask, our expectations in terms of information and data, and how the information you provide is used to calculate the S&P Global ESG Score used to notably select constituents of the Dow Jones Sustainability Indices (DJSI). To this end, this document provides companies filling in our CSA questionnaire with information on the general questions we ask of companies in all (or many) industries. Our aim is to clarify not just the questions’ rationale and intent, but also to provide extra details on the structure of our questions, the definitions we use, and guidance on what types of answers are expected and acceptable for each question. We intend to update this document over time to reflect changes to the CSA and to cover more cross-industry questions (questions applicable to a majority but not all industries). We are also sharing the approach by which responses are assessed, what we call the “Assessment Focus.” We provide an overview of links between the CSA and the GRI (Global Reporting Initiative) Standards at the end of this document to help reduce the effort companies need to put in to fill in the questionnaire by better understanding where common metrics or definitions are used. Please
refer to the final section of this document to view the complete table. Please note we do not guarantee the accuracy of all references to GRI Standards, nor can we guarantee that all references in this document reflect ongoing changes to the GRI Standards framework. It is important to note that this document provides supplementary guidance on how to answer the questions; it should not be used on its own to fill out the questionnaire. For presentation purposes, there may be some discrepancies between this document and the online CSA questionnaire, and the questionnaire visible via the portal should always be considered the master document in terms of the Question Layout, and data or information requested. This document should be used as a complement to the online questionnaire and is in no way intended to replace it. The CSA Companion serves as an additional source of information for companies participating in the CSA and for those that wish to understand the approach to completing the questionnaire. The CSA companion simply serves as additional information – the illustrative examples do not serve as guarantees for a higher S&P Global ESG Score or improved results in the CSA.
How should you use this document?For each covered question, this document provides the assessment focus, the question rationale, details of the question layout and specific guidance on how to answer. The question-specific guidance & definitions sections define the terms we use and provide details on how to interpret and answer each question. They also specify the question’s alignment with the GRI or other standards and framework, and whether internal or public documents will be necessary to answer the question, in full or in part. For the purpose of the CSA, the term “public references” refers to documents, reports, websites, or other online content found in the public domain. This information must be available to all stakeholders and valid at the time of the review of the CSA by us. The Question Layout sections contain key information about each question’s structure but do not include standard responses such as “Not known” or “Not applicable,” which are options for all questions. • The radio button item in the Question Layout sections
of this document indicate that a single answer can be selected. A single answer may be followed by a number of multiple-choice items.
• The checkbox item in the Question Layout sections of
this document indicates that multiple answers can be selected.
IMPORTANT NOTE: The CSA applies 61 industry specific questionnaires. Up to 50% of the CSA questions in an industry questionnaire apply only to a cross section of industries or are sometimes even specific to that single industry. These questions are likely not covered in this document. As of 2021 we provide two CSA versions: a Full CSA containing on average 100 questions per industry and a Core CSA, targeted at medium-size companies, that covers on average 70 questions. Whether a question that is contained in this document applies to your company is determined by your Industry and the applicable CSA (Full or Core). The full set of criteria and questions applicable to a company is visible in the company’s questionnaire section of the CSA portal.
General Guidance Criterion Weights
The Corporate Sustainability Assessment (CSA) is a holistic assessment, but the structure and weighting of each criterion depends on its financial materiality in a given industry. To aid companies’ preparation for the CSA, we share the weights for the different aspects of the assessment on our website under CSA Methodology. These weight schemes are also clearly visible on the
Company Benchmarking Scorecard which all participating companies receive in September.
Answering Questions This section provides general guidance on how to complete the Corporate Sustainability Assessment, our
6 / 174
Introduction - Media & Stakeholder Analysis
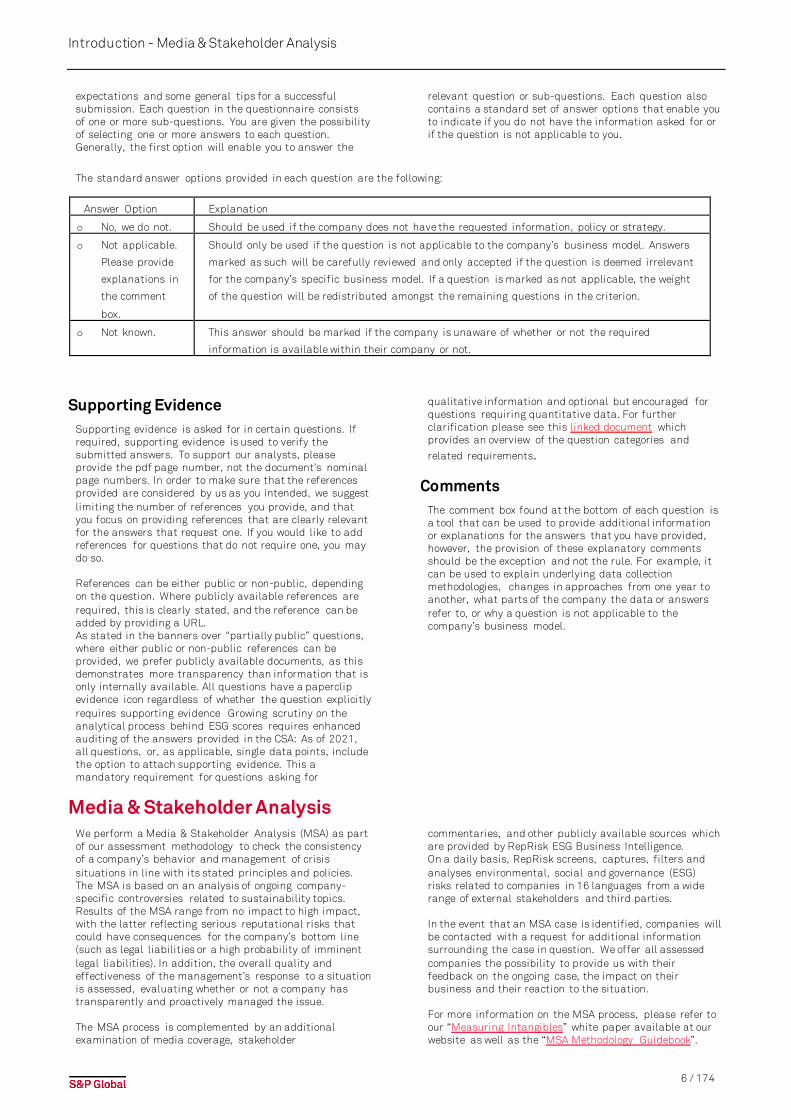
expectations and some general tips for a successful submission. Each question in the questionnaire consists of one or more sub-questions. You are given the possibility of selecting one or more answers to each question. Generally, the first option will enable you to answer the
relevant question or sub-questions. Each question also contains a standard set of answer options that enable you to indicate if you do not have the information asked for or if the question is not applicable to you.
The standard answer options provided in each question are the following:
Answer Option Explanation
o No, we do not. Should be used if the company does not have the requested information, policy or strategy.
o Not applicable.
Please provide
explanations in
the comment
box.
Should only be used if the question is not applicable to the company’s business model. Answers
marked as such will be carefully reviewed and only accepted if the question is deemed irrelevant
for the company’s specific business model. If a question is marked as not applicable, the weight
of the question will be redistributed amongst the remaining questions in the criterion.
o Not known. This answer should be marked if the company is unaware of whether or not the required
information is available within their company or not.
Supporting Evidence Supporting evidence is asked for in certain questions. If required, supporting evidence is used to verify the submitted answers. To support our analysts, please provide the pdf page number, not the document’s nominal page numbers. In order to make sure that the references provided are considered by us as you intended, we suggest limiting the number of references you provide, and that you focus on providing references that are clearly relevant for the answers that request one. If you would like to add references for questions that do not require one, you may do so. References can be either public or non-public, depending on the question. Where publicly available references are required, this is clearly stated, and the reference can be added by providing a URL. As stated in the banners over “partially public” questions, where either public or non-public references can be provided, we prefer publicly available documents, as this demonstrates more transparency than information that is only internally available. All questions have a paperclip evidence icon regardless of whether the question explicitly requires supporting evidence Growing scrutiny on the analytical process behind ESG scores requires enhanced auditing of the answers provided in the CSA: As of 2021, all questions, or, as applicable, single data points, include the option to attach supporting evidence. This a mandatory requirement for questions asking for
qualitative information and optional but encouraged for questions requiring quantitative data. For further clarification please see this linked document which provides an overview of the question categories and
related requirements.
Comments The comment box found at the bottom of each question is a tool that can be used to provide additional information or explanations for the answers that you have provided, however, the provision of these explanatory comments should be the exception and not the rule. For example, it can be used to explain underlying data collection methodologies, changes in approaches from one year to another, what parts of the company the data or answers refer to, or why a question is not applicable to the company’s business model.
Media & Stakeholder Analysis We perform a Media & Stakeholder Analysis (MSA) as part of our assessment methodology to check the consistency of a company’s behavior and management of crisis situations in line with its stated principles and policies. The MSA is based on an analysis of ongoing company-specific controversies related to sustainability topics. Results of the MSA range from no impact to high impact, with the latter reflecting serious reputational risks that could have consequences for the company’s bottom line (such as legal liabilities or a high probability of imminent legal liabilities). In addition, the overall quality and effectiveness of the management’s response to a situation is assessed, evaluating whether or not a company has transparently and proactively managed the issue. The MSA process is complemented by an additional examination of media coverage, stakeholder
commentaries, and other publicly available sources which are provided by RepRisk ESG Business Intelligence. On a daily basis, RepRisk screens, captures, filters and analyses environmental, social and governance (ESG) risks related to companies in 16 languages from a wide range of external stakeholders and third parties. In the event that an MSA case is identified, companies will be contacted with a request for additional information surrounding the case in question. We offer all assessed companies the possibility to provide us with their feedback on the ongoing case, the impact on their business and their reaction to the situation. For more information on the MSA process, please refer to our “Measuring Intangibles” white paper available at our website as well as the “MSA Methodology Guidebook”.
7 / 174
-
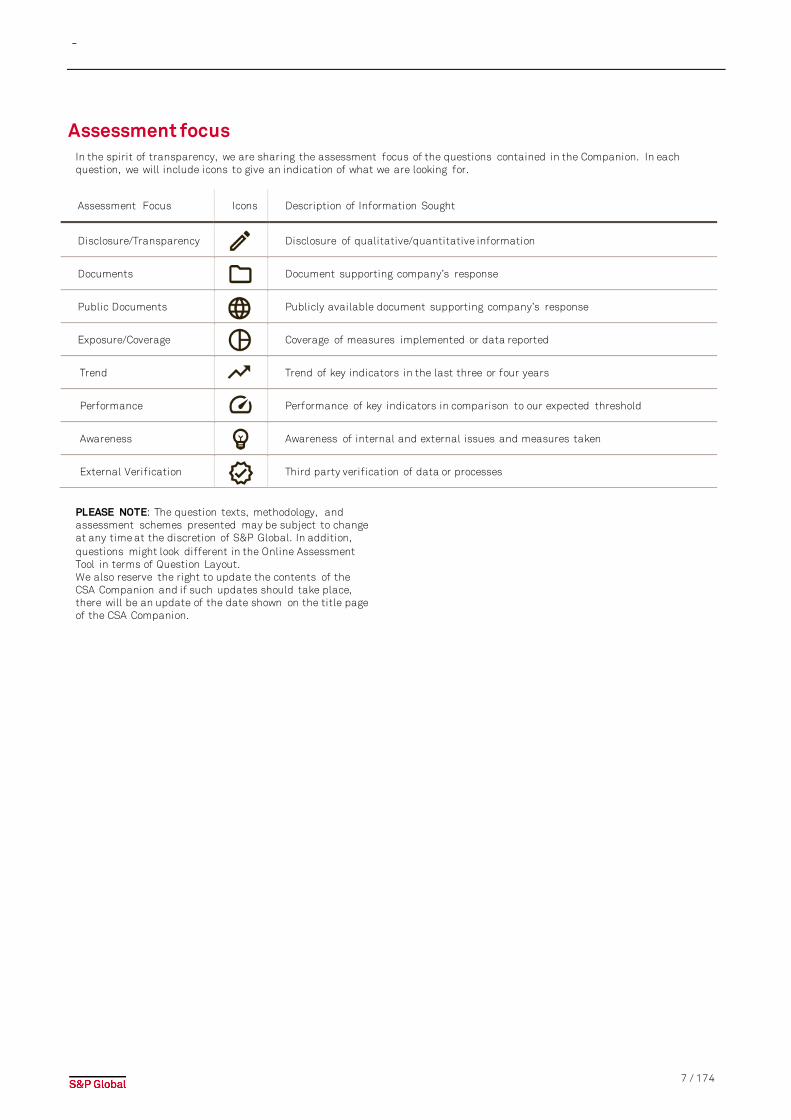
Assessment focus In the spirit of transparency, we are sharing the assessment focus of the questions contained in the Companion. In each question, we will include icons to give an indication of what we are looking for.
Assessment Focus Icons Description of Information Sought
Disclosure/Transparency
Disclosure of qualitative/quantitative information
Documents
Document supporting company’s response
Public Documents
Publicly available document supporting company’s response
Exposure/Coverage
Coverage of measures implemented or data reported
Trend
Trend of key indicators in the last three or four years
Performance
Performance of key indicators in comparison to our expected threshold
Awareness
Awareness of internal and external issues and measures taken
External Verification
Third party verification of data or processes
PLEASE NOTE: The question texts, methodology, and assessment schemes presented may be subject to change at any time at the discretion of S&P Global. In addition, questions might look different in the Online Assessment Tool in terms of Question Layout. We also reserve the right to update the contents of the CSA Companion and if such updates should take place, there will be an update of the date shown on the title page of the CSA Companion.

8 / 174
Company Information -
Company Information Question-Specific Guidance &
Definitions The information asked in this question is required by us to normalize quantitative data provided in other questions and criteria (e.g. Operational Eco-Efficiency). Company data reported here may also be used to normalize other reported data in the questionnaire or may be used by us for research purposes. • Revenues: Please provide the revenues in your
reporting currency, and indicate which currency you have used in the comment box. Please provide constant currency (foreign exchange adjusted) revenues if possible, as they eliminate the effect of fluctuations in foreign exchange rates and are thus a better indicator of business performance. However, reported revenues are also accepted.
• Total Employees: The number of people employed on a full time and part-time basis by the company, calculated as: Total Employees = Full Time Employees + 0.5 * Part Time Employees. If you calculate your total number of employees differently, please describe your method in the comment box.
Data Requirements • Please provide information for all parts of this
question and ensure that the figures provided are consistent over four years as well as consistent with the figures (e.g. emissions) provided in the other questions.
• Reporting currency: currency selected will be used throughout the questionnaire for consistency purposes, and will automatically be selected for questions asking for monetary data.
• Unless otherwise specified, all monetary values should be reported in their absolute values.
• If available for your industry, please select the appropriate normalization factor to be used for normalizing data reported in "Operational Eco-Efficiency".
9 / 174
Economic Dimension - Corporate Governance
Economic Dimension Corporate Governance
Corporate governance systems ensure that a company is managed in the interests of shareholders (including minority shareholders). On the one hand this includes checks and balances that enable the Board of Directors to have appropriate control and oversight responsibilities. Empirical evidence suggests that over a period of 5 years, the difference in return on equity between well-governed and badly-governed companies can be as much as 56% (source: GMI 2007). On the other hand, management incentives have to be set in such a way that management interests are aligned with shareholders' interests. Our questions focus on board structure, composition of
the board and related committees, board effectiveness and measures to ensure alignment with shareholders' long-term interests, which include transparency and the structure of executive remuneration as well as share ownership requirements. We ask that most information reported is publicly available and verifiable. Provided information should always be as up-to-date as possible, reflecting the current governance structure and processes of the company. For questions marked as requiring public information, information not verifiable in the public domain will not be accepted.
Board Structure Public: this question requires publicly available information.
Assessment Focus
Question Rationale
An effective board of directors, properly constituted, is the linchpin of good corporate governance. Boards are responsible for managerial performance, meeting the corporation's stated objectives, compliance with applicable laws and regulations, and protecting shareholder rights and interests. To assess the quality of a board’s structure, we focus on its composition, its
proportion of independent members, and its overall size, as empirical studies show that oversized boards are counter-productive to firm performance. We also assess to what extent companies have made explicit statements about their definitions of, and requirements with respect to the independence of board members.
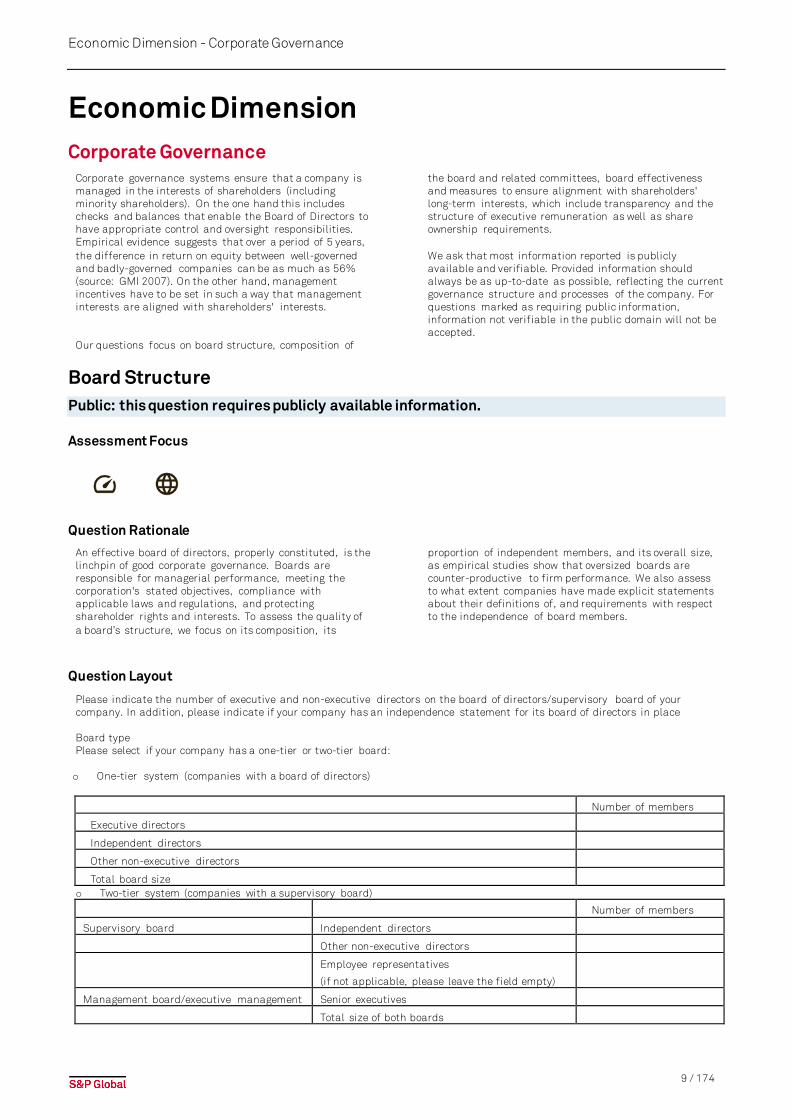
Question Layout
Please indicate the number of executive and non-executive directors on the board of directors/supervisory board of your company. In addition, please indicate if your company has an independence statement for its board of directors in place Board type Please select if your company has a one-tier or two-tier board: o One-tier system (companies with a board of directors)
Number of members
Executive directors
Independent directors
Other non-executive directors
Total board size o Two-tier system (companies with a supervisory board)
Number of members
Supervisory board Independent directors
Other non-executive directors
Employee representatives
(if not applicable, please leave the field empty)
Management board/executive management Senior executives
Total size of both boards
10 / 174
Economic Dimension - Corporate Governance
Question Layout (continued)
Board Independence Statement
Please indicate if your company has an independence statement for the board of directors in place. Please provide a supporting public reference:
o Yes, we have a publicly available independencestatement. Please indicate below what thestatement includes and provide a public reference:
� An explicit definition of what determines that a board member is independent. Please specify:
� A target share of independent directors on the board. Please specify:
o We do not have a public independence statementfor the board of directors
Question-Specific Guidance & Definitions
Types of Boards: Companies can choose between one- and two-tier systems when answering the question. The descriptions below will help you identify which of these structures your company has in place.
One-tier systems have a single board consisting of executive, non-executive and independent directors. It is possible that such boards only consist of independent directors or a combination of executive and independent directors. Most countries use a one-tier system.
Two-tier systems have an executive board and a supervisory board, which is composed of non-executive or independent members and – in certain countries – employee representatives. Countries that commonly use two-tier systems include Austria, Denmark, Finland, France, Germany, Hungary, Norway, and The Netherlands. Sweden is an exception and should be classified as one-tier despite the presence of employee representatives on the board, employee representatives on such boards should be counted as non-executives.
Types of Directors: We outline definitions of possible types of directors below. These definitions should be used to classify board members.
Executive directors are employees and are usually senior managers of the company. Executive directors are employees of the company, and are in an executive function (e.g. CEO, CFO, etc.).
Independent directors are non-executive directors that are independent by meeting at least 4 of the 9 criteria listed (of which at least 2 of the first 3 criteria) listed below:
1. The director must not have been employed by thecompany in an executive capacity within the last five years.
2. The director must not accept or have a “FamilyMember who accepts any payments from thecompany or any parent or subsidiary of thecompany in excess of $60,000 during the currentfiscal year or any of the past three fiscal years”,other than those permitted by SEC Rule 4200Definitions.
3. The director must not be a “Family Member of anindividual who is, or during the past three years wasemployed by the company or by any parent orsubsidiary of the company as an executive officer.”
4. The director must not be (and must not be affiliatedwith a company that is) an adviser or consultant tothe company or a member of the company’s seniormanagement.
5. The director must not be affiliated with a significantcustomer or supplier of the company.
6. The director must have no personal servicescontract(s) with the company or a member of thecompany’s senior management.
7. The director must not be affiliated with a not-for-profit entity that receives significant contributionsfrom the company.
8. The director must not have been a partner oremployee of the company’s outside auditor duringthe past three years.
9. The director must not have any other conflict ofinterest that the board itself determines to meanthey cannot be considered independent.
Other non-executive directors are directors that are not executives but also do not qualify as independent as defined above. They are all other members of the board not already accounted in the executive and independent categories. They might be employed by the organization.
Data Requirements:
• The type of board, the breakdown between thedifferent types of directors, and the total board sizemust be filled out.
• If the definition of independence at the companydiffers from our definition given above, please adjustthe number of independent directors in line with ourdefinition and provide a comment in the commentbox.
• In the question part “Board IndependenceStatement”, we also expect the statement to meet atleast 4 out of 9 criteria of which at least 2 of the first3 have to be met. If this is not the case, then pleaseindicate so.
• In the question part “Board Independence Statement”we do allow you to refer to an established national orstock exchange Corporate Governance Code as longas this also meets our definition of independence.
• All data in this question is expected to be publiclyavailable. However, we will double check yourcomments to see if the definition of independencediffers from ours.
Public Disclosure Requirements: • Board structure (it must be determinable whether
board members are executive directors, employeerepresentatives, non-executive directors orindependent directors)
• Publicly available independence statement• Public reporting on the definition of independence
used (i.e. if it is in-line with local or internationalstandards corresponding to the definition used by us)
• Public reporting on the target share of independentdirectors on the board
References
• GRI Standards 102-22 & 405-1 are relevant for this question.
11 / 174
Economic Dimension - Corporate Governance
Non-Executive Chairperson/Lead Director
Public: this question requires publicly available information.
Assessment Focus
Question Rationale
International consensus favors the separation of the roles of chairperson and CEO. If the board of directors opts to appoint one person fulfilling both roles, it has to build in the necessary checks and balances to avoid a potential
abuse of power. Companies headed by a joint chairperson/CEO are expected to explain their reasons for this structure, have appointed a “lead independent director,” and should provide a statement about the lead director’s responsibilities.
Question Layout
Is the board of directors or the supervisory board headed by a non-executive and independent chairperson and/or an independent lead director? [Choose the option that best reflects the company’s governance structure]
o Chairperson is non-executiv e and independent. Please specify for how many years this approach has been adoptedo Role of CEO and chairperson is split and former CEO/chairper son (presently in a non-executi ve position) is now
chairperson o Role of CEO and chairperson is split and chairperson is non-executiv e but not independento Role of CEO and chairperson is split and former CEO/chairper son is now chairperson, but independent lead director is
appointed Please indicate the name of the lead director o Role of chairperson and CEO is joint, but independent lead director is appointed.
Please indicate the name of the lead director o Role of chairperson and CEO is joint or chairperson is an executive director
Question-Specific Guidance & Definitions
If the company has an independent chairperson, the number of calendar years this approach has been in place should be indicated in the box following the first statement.
The independent lead director role exists to provide leadership to the board in those instances in which the joint roles of Chairperson and CEO could potentially be in conflict. Fundamentally, the role exists to ensure that the board operates independently of management and that directors have independent leadership at the board level. If the company has chosen either of the two options indicating that it has an independent lead director, the name of this director should be provided in the comment box.
Independent directors are non-executive directors that are independent by meeting at least 4 of the 9 criteria listed (of which at least 2 of the first 3 criteria) listed below:
1. The director must not have been employed by thecompany in an executive capacity within the last five years.
2. The director must not accept or have a “FamilyMember who accepts any payments from thecompany or any parent or subsidiary of thecompany in excess of $60,000 during the currentfiscal year or any of the past three fiscal years”,other than those permitted by SEC Rule 4200
Definitions.
3. The director must not be a “Family Member of anindividual who is, or during the past three yearswas employed by the company or by any parent orsubsidiary of the company as an executive officer.”
4. The director must not be (and must not beaffiliated with a company that is) an adviser or consultant to the company or a member of thecompany’s senior management.
5. The director must not be affiliated with asignificant customer or supplier of the company.
6. The director must have no personal servicescontract(s) with the company or a member of thecompany’s senior management.
7. The director must not be affiliated with a not-for-profit entity that receives significant contributionsfrom the company.
8. The director must not have been a partner or employee of the company’s outside auditor duringthe past three years.
9. The director must not have any other conflict ofinterest that the board itself determines to meanthey cannot be considered independent.
12 / 174
Economic Dimension - Corporate Governance
Board Diversity Policy Public: this question requires publicly available information.
Assessment Focus
Question Rationale
Corporate boards are tasked with monitoring companies’ management teams on behalf of those companies’ shareholders and other stakeholders. Boards are the direct representatives of these stakeholders and form one of the most important components of corporate governance. It is therefore important that the board members selected have the right experience and skills, are sufficiently independent, and act in the best interests of all stakeholders.
Diversity adds value to the board, through differences in perspective and experience. Diverse boards will be able to assess problems from a broader point of view and are more likely to take into account the best interests of all stakeholders.
Furthermore, studies have shown a positive correlation between gender diversity on boards and companies’ financial performance. It can also be important for board members to have a broad and complementary range of skills, although boards’ needs can differ across individual companies and industries depending on the existing and required skills of board members and the available pool of qualified board members when electing new board members.
Question Layout
Does your company have a formal, publicly available board diversity policy that clearly requires diversity factors such as gender, race, ethnicity, country of origin, nationality or cultural background in the board nomination process? Please indicate where this information is available in your public reporting or corporate website.
o Yes, our policy is publicly available and specifically includes the following:� Gender � Race or Ethnicity � Nationality, country of origin or cultural background
o No, we do not have a publicly available diversity policy.
Question-Specific Guidance & Definitions
Local corporate governance codes: Certain local corporate governance codes include guidance on diversity criteria. This can be accepted in this question if both of the following criteria apply:
• The company publicly states in its annual report thatit adheres with the local corporate governance codewithout exception OR clearly states what thoseexceptions are and that they do not include thediversity factors specifically ticked in the question,and
• The local corporate governance code clearly indicatesthat the specific criteria ticked in the response areconsidered for the board nomination process.
Race: In the absence of any internationally agreed definition, race is most often statistically characterized in terms of phenotype and appearance (e.g. skin colors), or with regard to ancestry. This should not be understood as an attempt to trace the definition of race to biological, anthropological or genetic factors but rather to (somewhat artificially) distinguish it from the concept of ethnicity. (OECD, 2018)
Ethnicity: Describes a shared culture: the practices, values, and beliefs that characterize those belonging to a community. This multidimensional concept acts as an umbrella term encompassing language, religion traditions and other (United Nations, 2017). A number of related concepts, including ancestry, citizenship and nationality, may overlap with ethnicity. However, ethnicity is not the same as nationality or citizenship, nor it is a measure of biology or genes. (OECD, 2018)
Nationality: A person's country of origin or citizenship.
References
• GRI Standards 102-24 & 405-1 are relevant for this question.
13 / 174
Economic Dimension - Corporate Governance
Board Gender Diversity Public: this question requires publicly available information.
Assessment Focus
Question Rationale
We assess whether the board reflects the diversity of the workforce and marketplace, thereby ensuring that a variety of viewpoints are heard and factored into corporate decision-making. A commitment to diversity at all levels can help companies attract employees, create goodwill with consumers, and compete better in the diverse global marketplace, which in turn benefits long-
term shareholder value. Gender diversity has been an important topic of discussion in recent years, and various academic studies have shown a positive correlation between gender diversity and corporate performance, for example in terms of corporate governance (Adams and Ferreira, 2009) and innovation (Deszö and Ross, 2012).
Question Layout
Please indicate the number of women on your company's board of directors/supervisory board and specify where this information is available in your public reporting or corporate website. If your company has a one-tier board structure, this figure includes: female executive directors, non-executive directors and independent directors. If your company has a two-tier board structure, this figure ONLY includes female independent directors and non-executive directors (this means that senior executives and employee representatives should not be included).
Question-Specific Guidance & Definitions
Employee representatives and senior executives should not be included in the total number of women for two-tier boards as they are not considered in the calculation of the total size of the supervisory board.
Employee representatives should be included in the total number of women on the board for one-tier boards containing employee representatives (e.g. for Swedish companies). If there are no women on the board of directors or supervisory board, you should write 0 in the answer to this question.
References
• The study “Corporate Governance, Board Diversity, and Firm Value” (October 2001) examined Fortune 1000 firms and found a significant positive relationship between the fraction of women or minorities on the board and firm value.
• GRI Standards 102-4 & 102-22 & 405-1 are relevant for this question.
14 / 174
Economic Dimension - Corporate Governance
Board Effectiveness Public: this question requires publicly available information.
Assessment Focus
Question Rationale
An effective board of directors is vital for good corporate governance. Several studies have found that companies with specific procedures and practices designed to ensure the accountability of their board and a close alignment with shareholders’ interests perform better than those that do not. We use the parameters in this question as a proxy for the overall effectiveness of the board. In addition to meeting attendance, the number of external directorships board members hold, and performance assessment, we ask for information on how board
members are elected, as the frequency of election and structure of the process can affect the accountability of board members: When board members are elected individually and on an annual basis, shareholders are able to vote them off if they are concerned with their performance. If shareholders can frequently express their confidence in or concerns about board members, the board as a whole becomes more accountable.
Question Layout
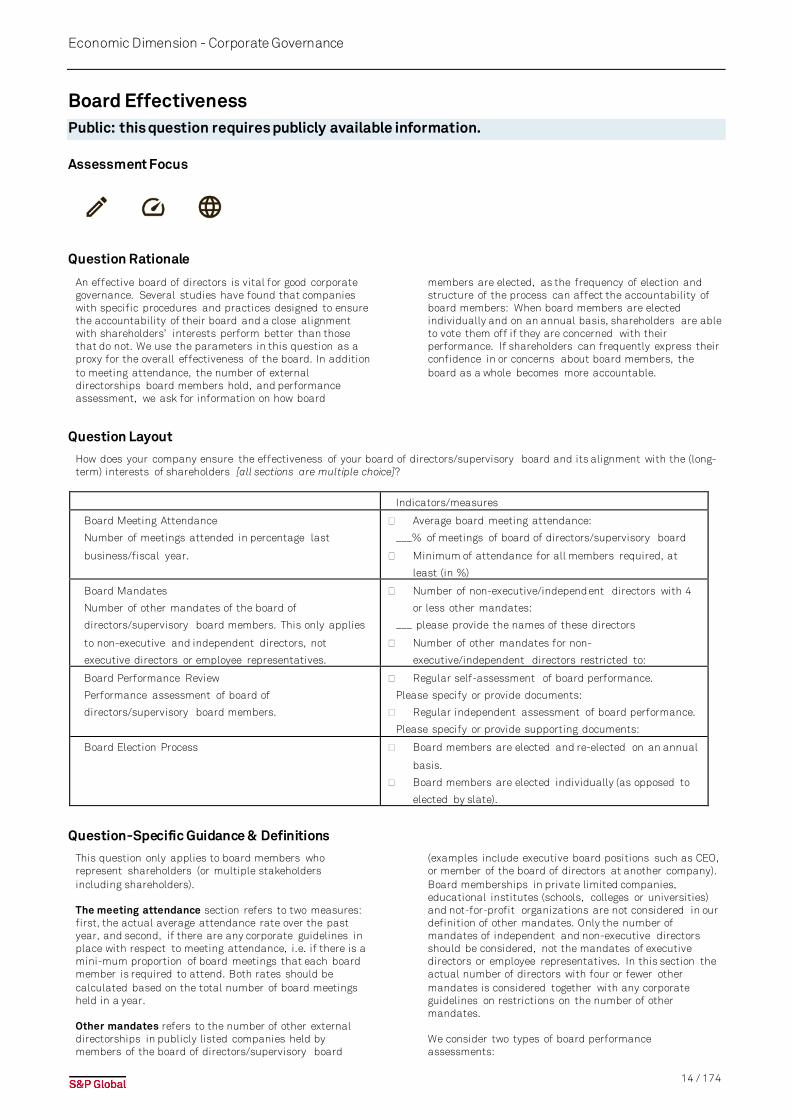
How does your company ensure the effectiveness of your board of directors/supervisory board and its alignment with the (long-term) interests of shareholders [all sections are multiple choice]?
Indicators/measures
Board Meeting Attendance
Number of meetings attended in percentage last
business/fiscal year.
� Average board meeting attendance:
___% of meetings of board of directors/supervisory board
� Minimum of attendance for all members required, at
least (in %)
Board Mandates
Number of other mandates of the board of
directors/supervisory board members. This only applies
to non-executive and independent directors, not
executive directors or employee representatives.
� Number of non-executive/independ ent directors with 4
or less other mandates:
___ please provide the names of these directors
� Number of other mandates for non-
executive/independent directors restricted to:
Board Performance Review
Performance assessment of board of
directors/supervisory board members.
� Regular self-assessment of board performance.
Please specify or provide documents:
� Regular independent assessment of board performance.
Please specify or provide supporting documents:
Board Election Process � Board members are elected and re-elected on an annual
basis.
� Board members are elected individually (as opposed to
elected by slate).
Question-Specific Guidance & Definitions
This question only applies to board members who represent shareholders (or multiple stakeholders including shareholders).
The meeting attendance section refers to two measures: first, the actual average attendance rate over the past year, and second, if there are any corporate guidelines in place with respect to meeting attendance, i.e. if there is a minimum proportion of board meetings that each board member is required to attend. Both rates should be calculated based on the total number of board meetings held in a year.
Other mandates refers to the number of other external directorships in publicly listed companies held by members of the board of directors/supervisory board
(examples include executive board positions such as CEO, or member of the board of directors at another company). Board memberships in private limited companies, educational institutes (schools, colleges or universities) and not-for-profit organizations are not considered in our definition of other mandates. Only the number of mandates of independent and non-executive directors should be considered, not the mandates of executive directors or employee representatives. In this section the actual number of directors with four or fewer other mandates is considered together with any corporate guidelines on restrictions on the number of other mandates.
We consider two types of board performance assessments:
15 / 174
Economic Dimension - Corporate Governance
(1) self-assessments of the board’s performance, meaningthat the board members themselves are allowed tosystematically evaluate their performance; and(2) independent assessments of the board’s performance,meaning that an independent third party evaluates the performance of the board. Such assessments are considered regular if the company clearly shows that there are guidelines to perform them at set intervals (such as annually or every second year). Assessments are also considered regular if the company is carrying them out for the first time but with the explicit intention of conducting them regularly. It is considered best practice to carry out both types of assessments on a regular basis, although not necessarily annually.
Annual election of board members refers to a procedure whereby each board member has to be re-elected at each annual general meeting for shareholders (as opposed to when a member is elected for multiple years).
Individual election of board members refers to a procedure whereby each member is elected on an
individual basis (as opposed to members being elected by slate).
References
• Corporate Accountability Report "Does CorporateGovernance Matter to Investment Returns?” by Jay W.Eisenhofer, Gregg S. Leving, ISSN 1542-9563
• McKinsey Strategy & Corporate Finance "Toward aValue-Creating Board" by Conor Kehoe, Frithjof Lund,and Nina Spielmann
16 / 174
Economic Dimension - Corporate Governance
Board Average Tenure Public: this question requires publicly available information.
Assessment Focus
Question Rationale
Corporate boards are tasked with monitoring companies’ management teams on behalf of those companies’ shareholders and other stakeholders. Boards are the direct representatives of these stakeholders and form one of the most important components of corporate governance. It is therefore important that the board members selected have the right experience and skills, are sufficiently independent, and act in the best interests
of all stakeholders. Board tenure reflects retention and continuity on one hand, and refreshment of skills and perspectives, and independence on the other.
Research strongly supports the assertion that optimal board tenure is in the 7 to 12-year range, and that firm value declines as average tenure deviates therefrom.
Question Layout
Please indicate the average tenure of board members on your company’s board of directors/supervisory board in years. If your company has a one-tier board structure, this figure includes all members (executive directors, non-executive directors and independent directors). If your company has a two-tier board structure, this figure ONLY includes independent directors and non-executive directors (e.g. exclude employee representatives). Please indicate where this information is available in your public reporting or corporate website.
o Average tenure of board members in years:______
Question Specific Guidance & Definitions
Tenure: the number of years a member has served on the board of directors.
For two-tier boards: Employee representatives and senior executives should not be included in the calculation for two-tier boards, as they are not considered in the calculation of the total size of the supervisory board.
For one-tier boards: All board members should be reported, including executive, independent and non-executive members.
Public disclosure requirements: Average board tenure and/or individual tenure of each member of the board of directors.
Mergers and Acquisitions: If the company is a spin-off or merger, tenure from the previous company is counted.
References
• Sterling Huang. Board Tenure and Firm Performance.INSEAD Business School. May 2013.
• Canavan, et al. Board tenure: How long is too long?Directors & Boards. 2004.
17 / 174
Economic Dimension - Corporate Governance
Board Industry Experience Public: this question requires publicly available information.
Assessment Focus
Question Rationale
Corporate boards are tasked with monitoring companies’ management teams on behalf of those companies’ shareholders and other stakeholders. Boards are the direct representatives of these stakeholders and form one of the most important components of corporate governance. It is therefore important that the board
members selected have the right experience and skills, are sufficiently independent, and act in the best interests of all stakeholders. This question focuses on industry and audit experience, two of the most important skill sets for setting strategy and effectively monitoring and evaluating management’s performance.
Question Layout
Please indicate the number of board members with relevant work experience in your company's sector according to GICS Level 1 sector classification (excluding executive members and employee representatives) and list the directors’ names. Please indicate where this information is available in your public reporting or corporate website.
Number of independent or non-executive members with industry experience (e.g. excludes
executives):
Please list the independent or non-executive directors included in the above count:
Question Specific Guidance & Definitions
Board Industry Experience: The member must have practical work experience in the industry (based on GICS 1 classification below). This experience can be acquired either by way of functions in management, academia, consulting or research. 'Practical work experience' in the industry refers to experience attained in employee or executive roles. Having been on another company's board in the same industry does not qualify as relevant experience
GICS Level 1 sectors: • Energy• Materials • Industrials • Consumer Discretionary• Consumer Staples • Healthcare • Financials • Information Technology• Communication Services • Utilities • Real Estate
Executives and Employee Representatives: Board members who are executives or elected as employee representatives are not included.
Data Requirements
Two-tier board structures: this question should only include the supervisory board and not the management board.
Public disclosure requirements: Number of independent or non-executive members of the board of directors with industry experience and/or public disclosure of the industry experience of each individual board member.
For companies in the FBN, TCD and IDD industries: if your company has very diversified operations or significant investments into businesses in industries other than the one used for the purpose of this assessment, board experience from another relevant industry can be accepted if an explanation is provided, clearly indicating the other GICS sector and how it relates to the company.
18 / 174
Economic Dimension - Corporate Governance
CEO Compensation – Success Metrics Public: This question requires publicly available information.
Assessment Focus
Question Rationale
Use of financial metrics to evaluate management performance have become ubiquitous as the benefits of aligning incentives with company performance have been established. Our research shows that use of revenue, operating profit, and EPS are common practice. Differentiation is now only observed in a few aspects,
including use of return metrics (capital efficiency) and relative metrics which compare the company to peers. In this question, we aim to find out which corporate performance indicators are used to determine CEO variable compensation. Please include only metrics applied to the CEO.
Question Layout
Does your company have predefined financial returns and/or relative financial metrics relevant for Chief Executive Officer’s variable compensation? Please indicate where this information is available in your public reporting or corporate website.
o Yes, our company has pre-defined financial returns and/or relative financial metrics relevant for Chief ExecutiveOfficer’s variable compensation? Please provide supporting evidence.
Reference link_______
� Financial Returns (e.g. return on assets, return on equity, return on invested capital, etc.). Please list all metrics used for this category:
� Relative Financial Metrics (e.g. comparison to peers using metrics such as total shareholder return, Tobin’s Q, growth, etc.). Please list all metrics used for this category:
Question-Specific Guidance & Definitions
Success metrics for variable CEO compensation: part of this question, any corporate performance indicators that are used to determine the CEO's variable compensation should be indicated. Please only include metrics that apply to the CEO's compensation, not metrics that are selectively used for other senior executives or specialist senior managers at a lower level (such as CFO or COO).
Financial metrics: Financial Returns refer to capital efficiency (capital is the source of funds, debt, equity, etc.). Therefore, Financial Returns always use an Income Statement profit metric (e.g. EBIT, income, operating income) divided by a Balance Sheet metric (e.g., Assets (entire balance sheet), Equity, Total Capital (debt plus equity), Invested Capital. We do not accept revenue growth, net profit after taxes, earnings per share and dividends per share. Acceptable financial metrics include: Return on Assets, Return on Equity, Return on Invested Capital.
Data Requirements
Please only include metrics that apply to the CEO's compensation, not metrics that are selectively used for other senior executives or specialist senior managers at a lower level (such as CFO or COO).
References:
• GRI Standard 102-35 is relevant for this question.
19 / 174
Economic Dimension - Corporate Governance
CEO Compensation – Long-Term Performance Alignment Public: This question requires publicly available information.
Assessment Focus
Question Rationale
Both financial and non-financial metrics are becoming increasingly important in determining variable compensation for executive management and more specifically the CEO. In this question, we assess time vesting and performance periods that are used for determining the CEO’s variable compensation. A longer vesting period ensures that the interests of management and the long-term interest of shareholders are better aligned. Additionally, we assess if the short-term bonus is deferred in shares.
Economic alignment of management with the long-term performance of the company is an essential component of executive compensation. This alignment can be achieved
in several ways, including deferral of short-term compensation, time vesting and long term performance periods. Alignment with long term performance is particularly important during periods of short CEO tenure, as the risk of short-termism increases. For example, in 2009, CEO’s of S&P 500 companies held their position for an average of just 7.2 yrs. This has subsequently increased to 10.8 years in 2015 as the economy recovered and turnover declined, but the risk of a reversion remains. (Matteo Tonello, The Conference Board, Inc., 2016). A longer vesting period ensures that the interests of management and the long-term interest of shareholders are better aligned.
Question Layout
Does your company have the following compensation structures in place to align with long-term performance? Please indicate where this information is available in your public reporting or corporate website.
o Yes, our company has guidelines on deferred bonus, time vesting, performance period and time vesting for CEO’s variablecompensation.
Deferral of Bonus for Short-term CEO Compensation Is a portion of the CEO’s short-term incentive deferred in the form shares?
Please indicate the percentage of the short-term bonus deferred in in the form of shares: _______ %
Performance Period for Variable CEO Compensation What is the longest performance period applied to evaluate variable compensation (based on predefined targets, either relative or absolute), covered in your executive compensation plan? Is there a clawback policy in place? Please note that compensation that only is time vested is not considered as performance-based compensation in this part of the question.
Please indicate the longest performance period covered by your executive compensation plan: _______ years.
� We have a clawback provision in place. Please specify: _______
Time Vesting for Variable CEO Compensation Please indicate the longest time vesting period for variable CEO compensation: _______ years.
Question-Specific Guidance & Definitions
Deferred shares: refer to the percentage of the short-term bonus paid out in deferred shares instead of cash. The company can choose to pay-out the annual short-term bonus in deferred shares to the CEO and other executive directors which is seen as a best practice.
Deferred bonus compensation is an arrangement in which a portion of an employee's income is paid out at a later date after which the income was earned during a set performance period.
Performance period: This refers to a performance-based pay-out structure of variable compensation for the cur-rent period x which is dependent on achieving targets in the following periods (x+1, x+2, x+3, etc.). Please note that option- and stock-based compensation for which the
number of options or stocks rewarded is not dependent on future performance do not count as performance vesting but are considered as time vesting. Example: “The actual number of shares that may become earned and payable under the awards will generally range from 0% to 200% of the target number of units based on achievement of the specified goals over a two-year period."
A clawback provision is a policy that allows a company to recover performance-based compensation for some period of time after compensation awards are granted. Clawback provisions may apply to short and/or long-term awards. The circumstances and conduct that would trigger clawback provisions include, but are not limited to, restatement of financial results, errors in financial

20 / 174
Economic Dimension - Corporate Governance
information reported, misconduct by the employee directly, or misconduct by any other employee that results in incorrect financial reporting.
Time vesting refers to time-based pay-out structures of variable compensation for the current period x over the coming years (x+1, x+2, x+3, etc.). The amount of future pay-out is independent of the coming year's performance. If all long-term incentives are based on future performance, the same figure should be given for the longest performance period and the longest time vesting period.
We accept the total number: the sum of the vesting period and the required holding period.
Data Requirements
In this question, we assess the time vesting and performance periods as well as whether the company has a clawback provision in place. In addition, we asses if the short-term bonus is deferred in shares.
The question applies to CEO compensation only.
References
• GRI Standard 102-35 is relevant for this question.
21 / 174
Economic Dimension - Corporate Governance
Management Ownership Partially public: additional credit will be granted for relevant publicly available evidence.
Assessment Focus
Question Rationale
As corporate governance systems aim to ensure that a company is managed in the interests of its shareholders, in this question we assess whether the company’s CEO and other executives have stock ownership.
Academic research suggests that stock ownership by senior management is positively correlated to financial performance.
Question Layout
Do your company’s CEO and other executive committee members hold company shares? Please note that the shares included in the calculation should not be hedged or the personal financial risk of holding the shares otherwise removed. Please also indicate where this information is available in your public reporting or corporate website.
o Yes, company CEO and other executive officers hold company shares:
Reference link_______
Position Name(s) Multiple of base salary
Chief Executive Officer
Average across other executive committee
members owning shares
Question-Specific Guidance & Definitions
Economic interest in shares held: the shares included in the calculation should not be hedged or the personal financial risk of holding the shares otherwise removed.
Data Requirements
The question assesses if the CEO and/or other executive managers have stock ownership of the company.
Public disclosure requirements Shareholdings of the Chief Executive Officer and at least two other executive officers.
References
• Academic research (e.g. Bhagat and Bolton 2008)shows that stock ownership of senior management ispositively related to future operating profit.
Other research includes: • Core & Larcker (2000). Performances consequences
of mandatory increases in executive stock ownership.• Gugler, Mueller, & Yurtoglu (2008). The Effects of
Ownership Concentration and Identity on InvestmentPerformance: An International Comparison
22 / 174
Economic Dimension - Corporate Governance
Management Ownership Requirements Public: this question requires publicly available information.
Assessment Focus
Question Rationale
As corporate governance systems aim to ensure that a company is managed in the interests of its shareholders, in this question we assess whether there are stock ownership guidelines in place for the company’s CEO and other executives.
Academic research (e.g. Bhagat and Bolton 2008) suggests that stock ownership by senior management is positively correlated to future operating profit.
Question Layout
Does your company have specific stock ownership requirements for the CEO and other members of your executive committee? Please indicate where this information is available in your public reporting or corporate website.
o Yes, there are specific requirements in place. Please indicate at which levels this exist and indicate the share ownershiprequirements as a multiple of the annual base salary.
Reference Link______
� The CEO has to build up a share ownership of ______ times the annual base salary. � Other members of the executive committee besides the CEO have to build up a share ownership of ______ times the
annual base salary.
Data Requirements
The question assesses if there are explicit requirements indicating that the CEO and/or other executive managers are required to build up share ownership equivalent to a specific multiple of their annual base salary.
Public disclosure requirements: Share ownership requirements for the Chief Executive Officer and for all other company executives.
References
• Academic research (e.g. Bhagat and Bolton 2008)shows that stock ownership of senior management ispositively related to future operating profit.
Others: • Core & Larcker (2000), Performances consequences
of mandatory increases in executive stock ownership.• Gugler, Mueller, & Yurtoglu (2008), The Effects of
Ownership Concentration and Identity on InvestmentPerformance: An International Comparison
23 / 174
Economic Dimension - Corporate Governance
Government Ownership Public: This question requires publicly available information.
Assessment Focus
Question Rationale
As corporate governance systems aim to ensure that a company is managed in the interests of its shareholders, in this question we assess if a government has voting rights of more than 5% and has golden shares at the
company. Academic research (e.g. Goldeng et. al., 2008 or Chen et. al., 2017) suggests that companies without government ownership perform better than companies with government ownership.
Question Layout
Please indicate whether individual governmental institutions own a total of 5% or more of the voting rights of your company and if Yes, whether golden shares exist for them. Government ownership of 5% or less of the voting rights need to be reported. Please also indicate where this information is available in your public reporting or corporate website.
Reference link_______
Government Ownership Do governmental institutions own a total of 5% or more of the voting rights of your company?
o Yes, individual governmental institutions have more than 5% of the voting rights.
Please provide the total percentage of government ownership (sum of % of individual governmental institutions owning more than 5% of voting rights):_______ %
Please provide details for the government ownership (e.g. calculation, members, organizations, etc. if available):
Golden Shares for Governmental Institutions Does your company have golden shares for governmental institutions?
o Yes, our company has golden shares for governmental institutions.o No, our company doesn’t have any golden shares for governmental institutions.
o No governmental institutions own more than 5% of the voting rights. Please provide publicly available evidence of the company share ownership structure.
Question-Specific Guidance & Definitions
Government Ownership: For the definition of government institutions and ownership, we adopt the Organization for Economic Co-operation and Development (OECD) definition (2005): “Enterprises where the state has significant control through full, majority, or significant minority ownership. In this definition we include state owned enterprises (SOEs) which are owned by the central or federal government, as well as SOEs owned by regional and local governments.” This definition includes: Government pension funds, state asset management funds, development banks (federal and local) and sovereign wealth funds.
Golden Shares for Governments: A type of share that gives its shareholder veto power over changes to the company's charter. A golden share holds special voting rights, giving its holder the ability to block another shareholder from taking more than a ratio of ordinary shares.
Data Requirements
Total % of government voting rights and government golden shares. Government ownership requirements:
Holding companies that own stakes higher than 5% in other companies, and in turn are majority owned by a government or governmental institutions should be reported in this question. For example, a holding company (Company A) is 70% government owned. Company A owns 40% of the voting rights in Company B. Company B should report 40% government ownership in this question.
Public disclosure requirements: • Total percentage of government ownership (sum of %
of individual governmental institutions owning morethan 5% of voting rights) or disclosure of all individualgovernmental institutions owning more than 5% ofvoting rights.
• Golden shares for governmental institutions (only ifthe corresponding option is marked).
References
• Chen, Ghoul, Guedhami, & Wang (2017), Do state andforeign ownership affect investment efficiency?Evidence from privatizations.
• Goldeng, Grünfeld, & Benito (2008), The Performance Differential between Private and State OwnedEnterprises: The Roles of Ownership, Managementand Market Structure.

24 / 174
Economic Dimension - Corporate Governance
25 / 174
Economic Dimension - Corporate Governance
Family Ownership Public: This question requires publicly available information.
Assessment Focus
Question Rationale
As corporate governance systems aim to ensure that a company is managed in the interests of its shareholders, in this question we assess if one or several individuals of the (founder) families are ultimate owners and have at least 5% of the voting rights.
Academic research (e.g. Eugster & Isakov, 2016 or Corstjens, Peyer & Van der Hey-den, 2006) suggests that family ownership is positively correlated to future operating profit.
Question Layout
Please indicate whether (founding) family members, personally or through other companies or organizations, individually have more than 5% of the voting rights of your company. Please also indicate where this information is available in your public reporting or corporate website.
o Yes, (founding) family members individually own more than 5% of the voting rights. Total % of voting rights of the company: _______% Reference link_______ Please provide details for the family ownership (e.g. calculation, members, organizations, etc. if available):
o No, (founding) family members individually do not have more than 5% of the voting rights.
Question-Specific Guidance & Definitions
Significant family ownership: At least one of the founding family members, personally or through other companies or organizations, must own more than 5% of the voting rights of your company. If no individual owns more than 5%, we do not consider it significant family ownership. Founding family: The founding family can be one or several individuals or family members. They might have not necessarily set up the company independently. In case a family acquires an existing company and transforms it into a new company, this second family can be considered the 'founding family'(e.g. if a company has been acquired, re-named and re-branded). Public disclosure requirements: • Total percentage of family ownership (sum of % of
individual (founding) family members owning more than 5% of voting rights) or disclosure of all
• individual (founding) family members owning more than 5% of voting rights.
Data Requirements
We are looking for founding family ownership, in order to assess whether descendants of the founding families are current owners with significant voting rights. Total % of voting rights of founding family members,
personally or through companies/organizations to be reported: • if one of the family members owns more than 5%, the
respondent shall report the total of all family members’ holdings. e.g. add the person(s) with individual ownership of over 5% of the voting rights plus those who individually own less than 5% of voting rights. Please report the total even if there is no pooling agreement in place.
• if the family owns more than 5% of the company through a holding company, the family must own at least 50% of the holding company that in turn holds shares of the company.
• if none of the family members individually own more than 5% of the company's voting rights, please mark "No, (founding) family members individually do not have more than 5% of the voting rights."
• If any of the founding members or their families still hold more than 5%, this should be reported.
• if the company was not founded by a family, please mark 'Not Applicable'
References
• Credit Suisse (2017), The CS Family 1000 • Eugster & Isakov (2016), Founding family ownership,
stock market performance and agency problems. • Corstjens, Peyer & Van der Heyden (2006),
Performance of Family Firms: Evidence from US and European firms and investors.
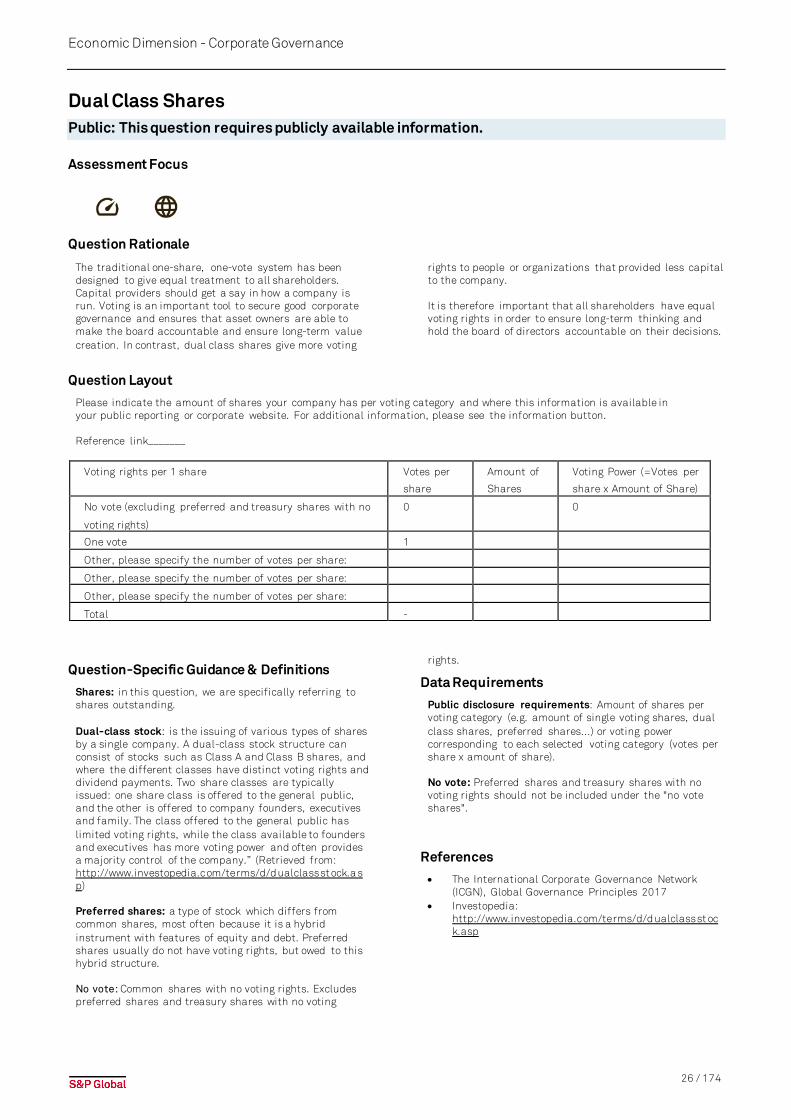
26 / 174
Economic Dimension - Corporate Governance
Dual Class Shares Public: This question requires publicly available information.
Assessment Focus
Question Rationale
The traditional one-share, one-vote system has been designed to give equal treatment to all shareholders. Capital providers should get a say in how a company is run. Voting is an important tool to secure good corporate governance and ensures that asset owners are able to make the board accountable and ensure long-term value creation. In contrast, dual class shares give more voting
rights to people or organizations that provided less capital to the company. It is therefore important that all shareholders have equal voting rights in order to ensure long-term thinking and hold the board of directors accountable on their decisions.
Question Layout
Please indicate the amount of shares your company has per voting category and where this information is available in your public reporting or corporate website. For additional information, please see the information button. Reference link_______
Voting rights per 1 share Votes per
share
Amount of
Shares
Voting Power (=Votes per
share x Amount of Share)
No vote (excluding preferred and treasury shares with no
voting rights)
0 0
One vote 1
Other, please specify the number of votes per share:
Other, please specify the number of votes per share:
Other, please specify the number of votes per share:
Total -
Question-Specific Guidance & Definitions
Shares: in this question, we are specifically referring to shares outstanding. Dual-class stock: is the issuing of various types of shares by a single company. A dual-class stock structure can consist of stocks such as Class A and Class B shares, and where the different classes have distinct voting rights and dividend payments. Two share classes are typically issued: one share class is offered to the general public, and the other is offered to company founders, executives and family. The class offered to the general public has limited voting rights, while the class available to founders and executives has more voting power and often provides a majority control of the company.” (Retrieved from: http://www.investopedia.com/terms/d/d ualclassst ock.a sp) Preferred shares: a type of stock which differs from common shares, most often because it is a hybrid instrument with features of equity and debt. Preferred shares usually do not have voting rights, but owed to this hybrid structure. No vote: Common shares with no voting rights. Excludes preferred shares and treasury shares with no voting
rights.
Data Requirements
Public disclosure requirements: Amount of shares per voting category (e.g. amount of single voting shares, dual class shares, preferred shares...) or voting power corresponding to each selected voting category (votes per share x amount of share). No vote: Preferred shares and treasury shares with no voting rights should not be included under the "no vote shares".
References
• The International Corporate Governance Network (ICGN), Global Governance Principles 2017
• Investopedia: http://www.investopedia.com/terms/d/d ualclassst ock.asp
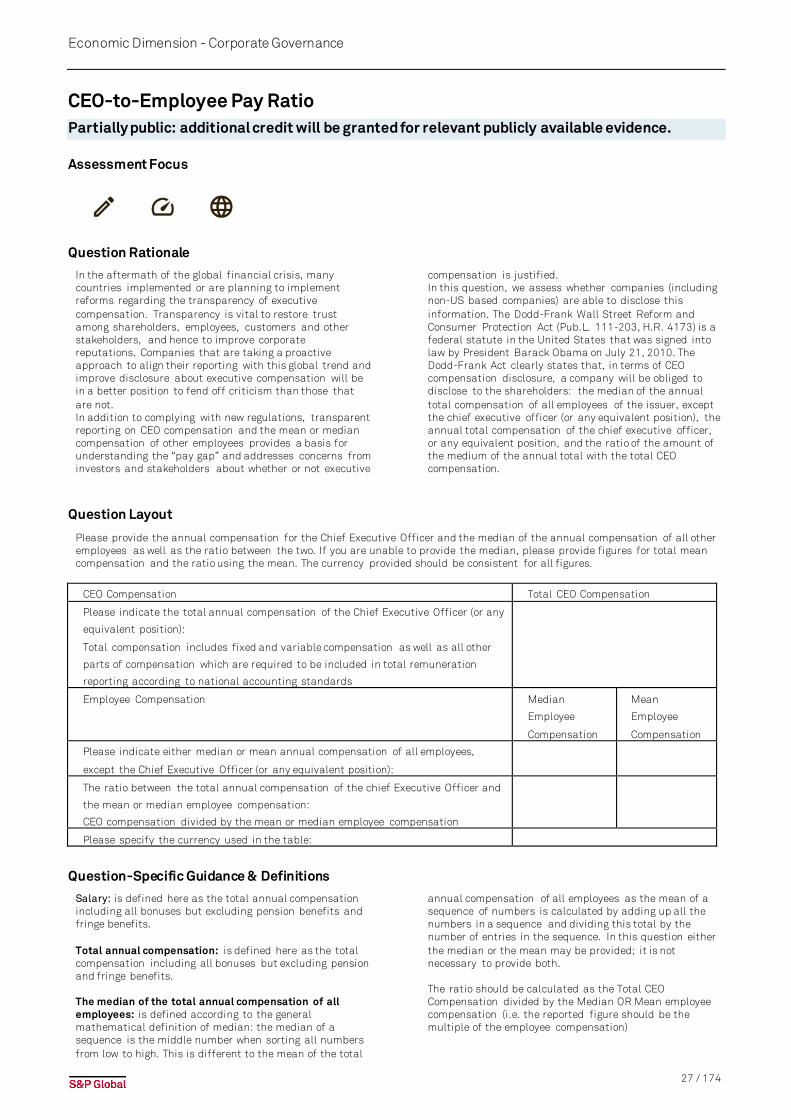
27 / 174
Economic Dimension - Corporate Governance
CEO-to-Employee Pay Ratio Partially public: additional credit will be granted for relevant publicly available evidence.
Assessment Focus
Question Rationale
In the aftermath of the global financial crisis, many countries implemented or are planning to implement reforms regarding the transparency of executive compensation. Transparency is vital to restore trust among shareholders, employees, customers and other stakeholders, and hence to improve corporate reputations. Companies that are taking a proactive approach to align their reporting with this global trend and improve disclosure about executive compensation will be in a better position to fend off criticism than those that are not. In addition to complying with new regulations, transparent reporting on CEO compensation and the mean or median compensation of other employees provides a basis for understanding the “pay gap” and addresses concerns from investors and stakeholders about whether or not executive
compensation is justified. In this question, we assess whether companies (including non-US based companies) are able to disclose this information. The Dodd-Frank Wall Street Reform and Consumer Protection Act (Pub.L. 111-203, H.R. 4173) is a federal statute in the United States that was signed into law by President Barack Obama on July 21, 2010. The Dodd-Frank Act clearly states that, in terms of CEO compensation disclosure, a company will be obliged to disclose to the shareholders: the median of the annual total compensation of all employees of the issuer, except the chief executive officer (or any equivalent position), the annual total compensation of the chief executive officer, or any equivalent position, and the ratio of the amount of the medium of the annual total with the total CEO compensation.
Question Layout
Please provide the annual compensation for the Chief Executive Officer and the median of the annual compensation of all other employees as well as the ratio between the two. If you are unable to provide the median, please provide figures for total mean compensation and the ratio using the mean. The currency provided should be consistent for all figures.
CEO Compensation Total CEO Compensation
Please indicate the total annual compensation of the Chief Executive Officer (or any
equivalent position):
Total compensation includes fixed and variable compensation as well as all other
parts of compensation which are required to be included in total remuneration
reporting according to national accounting standards
Employee Compensation Median
Employee
Compensation
Mean
Employee
Compensation
Please indicate either median or mean annual compensation of all employees,
except the Chief Executive Officer (or any equivalent position):
The ratio between the total annual compensation of the chief Executive Officer and
the mean or median employee compensation:
CEO compensation divided by the mean or median employee compensation
Please specify the currency used in the table:
Question-Specific Guidance & Definitions
Salary: is defined here as the total annual compensation including all bonuses but excluding pension benefits and fringe benefits. Total annual compensation: is defined here as the total compensation including all bonuses but excluding pension and fringe benefits. The median of the total annual compensation of all employees: is defined according to the general mathematical definition of median: the median of a sequence is the middle number when sorting all numbers from low to high. This is different to the mean of the total
annual compensation of all employees as the mean of a sequence of numbers is calculated by adding up all the numbers in a sequence and dividing this total by the number of entries in the sequence. In this question either the median or the mean may be provided; it is not necessary to provide both. The ratio should be calculated as the Total CEO Compensation divided by the Median OR Mean employee compensation (i.e. the reported figure should be the multiple of the employee compensation)
28 / 174
Economic Dimension - Corporate Governance
Data Requirements
While we expect the figure to cover the entirety of a company’s global operations, for this question, companies may make cost-of-living adjustments to the compensation of employees residing in a jurisdiction different from that of the CEO, provided that these adjustments are applied to all such employees included in the calculation, and that these adjustments are explained in the company comment section, and the raw, unadjusted data is also provided in the company comment section.
Disclosure requirements for partially public question: Additional credit will be granted for relevant publicly available evidence covering one of the following aspects of this question:
• Annual compensation of Chief Executive Officer andmedian (mean) annual compensation of all employeesexcept the Chief Executive Officer (or any equivalent position)
• Ratio between the total annual compensation of theChief Executive Officer and the median (mean)employee compensation
References
• The Dodd–Frank Wall Street Reform and ConsumerProtection Act (Pub.L. 111-203, H.R. 4173), www.gpo.gov/fdsys/pkg/BI LLS-111hr4173enr/pdf/BILLS-111hr4173enr.pdf (p. 529)
• GRI Standard 102-38 is relevant for this question.
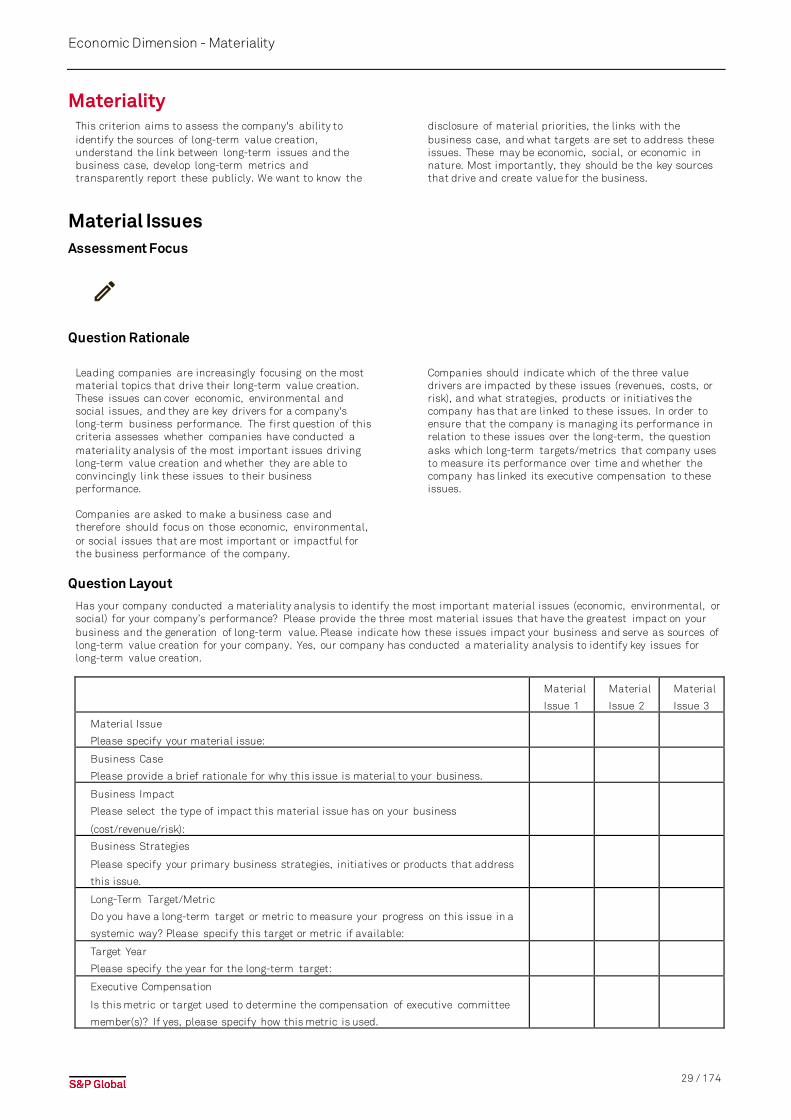
29 / 174
Economic Dimension - Materiality
Materiality This criterion aims to assess the company's ability to identify the sources of long-term value creation, understand the link between long-term issues and the business case, develop long-term metrics and transparently report these publicly. We want to know the
disclosure of material priorities, the links with the business case, and what targets are set to address these issues. These may be economic, social, or economic in nature. Most importantly, they should be the key sources that drive and create value for the business.
Material Issues Assessment Focus
Question Rationale
Leading companies are increasingly focusing on the most material topics that drive their long-term value creation. These issues can cover economic, environmental and social issues, and they are key drivers for a company's long-term business performance. The first question of this criteria assesses whether companies have conducted a materiality analysis of the most important issues driving long-term value creation and whether they are able to convincingly link these issues to their business performance. Companies are asked to make a business case and therefore should focus on those economic, environmental, or social issues that are most important or impactful for the business performance of the company.
Companies should indicate which of the three value drivers are impacted by these issues (revenues, costs, or risk), and what strategies, products or initiatives the company has that are linked to these issues. In order to ensure that the company is managing its performance in relation to these issues over the long-term, the question asks which long-term targets/metrics that company uses to measure its performance over time and whether the company has linked its executive compensation to these issues.
Question Layout
Has your company conducted a materiality analysis to identify the most important material issues (economic, environmental, or social) for your company’s performance? Please provide the three most material issues that have the greatest impact on your business and the generation of long-term value. Please indicate how these issues impact your business and serve as sources of long-term value creation for your company. Yes, our company has conducted a materiality analysis to identify key issues for long-term value creation.
Material
Issue 1
Material
Issue 2
Material
Issue 3
Material Issue
Please specify your material issue:
Business Case
Please provide a brief rationale for why this issue is material to your business.
Business Impact
Please select the type of impact this material issue has on your business
(cost/revenue/risk):
Business Strategies
Please specify your primary business strategies, initiatives or products that address
this issue.
Long-Term Target/Metric
Do you have a long-term target or metric to measure your progress on this issue in a
systemic way? Please specify this target or metric if available:
Target Year
Please specify the year for the long-term target:
Executive Compensation
Is this metric or target used to determine the compensation of executive committee
member(s)? If yes, please specify how this metric is used.

30 / 174
Economic Dimension - Materiality
31 / 174
Economic Dimension - Materiality
Question-Specific Guidance & Definitions
Material Issue: A material issue is a sustainability factor that can have a present or future impact on the company’s value drivers, competitive position, and therefore on long-term shareholder value creation.
Materiality Assessment: A materiality assessment is an approach to identify critical economic, environmental and social issues which have a significant impact on the company's business performance.
Materiality Assessment Frequency: We expect companies to conduct a materiality assessment at least every 5 years and to report the results in at least one of the two most recent Annual or Sustainability reports.
Data Requirements
We expect companies to have conducted a materiality analysis and identified the three most material economic, environmental or social issues driving long-term value creation which should be clearly defined.
Material Issue
Our expectation: Companies have conducted a materiality analysis and identified the most important issues driving long-term performance. Companies clearly define the three most material economic, environmental or social issues driving long-term value creation. The following would be unacceptable: Purely financial metrics/issues (net profit, cash flow, earnings per share, product sales), Operational business metrics/issues (e.g. market expansion, efficient use of capital, operational excellence), General issues without a description of the specific sub-issues that might impact the company’s performance (e.g. macroeconomic conditions, long-term shareholder value). Please note that companies that do not provide an acceptable material issue do not receive points for any of the sub-questions related to that material issue.
The business case should explain how the material issue is affecting your business and industry and how it is impacting your company’s bottom line, its stakeholders, and its license to operate. The business case may relate to reducing or avoiding risks or seizing new business opportunities.
Our expectation: The business case should contain the following information: A clear link between the material issue and the business case. A clear explanation of why the issue is material to the company’s performance in terms of cost/revenue/risk (e.g. cost savings, revenue generation, operational risks with direct impact on financial performance).The following would be deemed unacceptable: The Business case does not link the material issue to the company’s performance in terms of costs, revenues or risks. The business case is describing the material issue and its importance for society / the environment but does not provide information on why the issue is relevant to the company’s performance (e.g. impact of global warming on society).
The business impact must be selected from the dropdown list provided. Companies can indicate whether the material issue is most closely linked with costs, revenues or risk management. Examples of cost-related issues
include the cost of raw materials, production costs, fines or litigation. Revenue-related issues include matters related to, for example, product innovation, competitiveness or market expansion. Risk-related issues include threats to a company’s license to operate, litigation risk, non-compliance, and reputational risk.
Business strategies include the tools, processes and plans that companies use to address the material issues referred to. These could include mitigation plans, product and service strategies, or internal and external initiatives.
Our expectations: The company provides a clear explanation of the strategies, initiatives, or products or services through which it addresses the material issue. The following would be deemed unacceptable: Strategies, initiatives, or products or services that do not directly address the material issue. Strategies that are not clearly described (e.g. human resources-oriented management). Description of the current situation without providing the strategies or products to address this situation. Provision of a target instead of a strategy, initiative or product (e.g. zero fatalities or injuries).
Long-term targets should be targets to be achieved in over three years. They may include targets that were set in the past (not in the most recent fiscal year), but the timeframe should be clear. For example, a target set in 2014 would be acceptable if it is clear that the time horizon extends beyond three years from now or from when they were set. Targets should be specific and measurable.
Our expectations: The metric or long-term target is linked to the material issue. The metric or long-term target and how it is being used are clearly described. The time horizon of the long-term target should be at least three years. Indicating the current reporting year as target year is acceptable if: If the company’s long-term target is by necessity, ongoing, (such as zero fatalities) please indicate the current year as target year and explain in the company comment section. The current reporting year (e.g. 2019) corresponds to the long-term target’s finishing year. The following would be unacceptable: Targets/metrics are not linked to the material issue. Vague targets or targets whose progress cannot be measured (e.g. ensure a good working environment, reduce workplace accidents). Targets are short-term (less than 3 years).
The target year should specifically relate to the reported target and should be reported as a single fiscal year, not a time range.
The question also assesses whether specific material issues are linked to executive compensation. It should be clear that the link is to senior executives and not just line managers or topic experts. For example, it should be clear that targets for environmental issues apply to senior management and not only environmental managers at the operational level with responsibility for this area.
References
• GRI Standards 102-15, 102-47, 103-1 are relevantfor this question.
32 / 174
Economic Dimension - Materiality
Materiality Disclosure Public: this question requires publicly available information.
Assessment Focus
Question Rationale
Disclosing material sustainability issues to stakeholders is a key component of a company’s communication. Discussing the process and approach for identifying material issues provides context to a company’s reporting and enables stakeholders to understand how a company sets its priorities. The process for identifying these issues should include external stakeholders and be well-
documented, and material issues should be clearly defined and prioritized. Furthermore, companies should set targets for the material issues and consistently report on the progress towards achieving the targets aimed at dealing with these issues.
Question Layout
Do you publicly disclose details of your materiality analysis, including information on how you conduct the materiality analysis process and your progress towards your targets or metrics?
o Yes, we publicly disclose this information. Please indicate the information you report on and indicate where this isavailable in your public reporting.
� We publicly disclose our materiality analysis, including the most material issues and a description of our process. Please attach supporting evidence.
� We publicly report on our progress towards our targets or metrics for material issues. Please attach supporting evidence.
Question-Specific Guidance & Definitions
Materiality: Any factor that can have a present or future impact on value creation and therefore the financial performance of the company over time. These could be economic, environmental, or social in nature.
Materiality analysis and material issues may be reported on in any of the company’s communication channels, such as its annual report, sustainability report, company website or other public communication. We no longer differentiate between where this information is reported, as long as it is publicly available.
References
GRI Standards 102-15, 102-47, 103-1 are relevant for this question.

33 / 174
Economic Dimension - Risk & Crisis Management
Risk & Crisis Management Effective risk and crisis management is vital for a company’s long-term financial planning and organizational flexibility. Since the financial crisis, it has gained particular importance. Companies need to implement internal control processes to comply with existing regulations and proactively develop control mechanisms. Our questions focus on risk governance, emerging risks, and the incentives, training and empowering employees in order to develop an effective risk culture. Additionally, we perform a real-time check to assess the system with our internal MSA (Media and Stakeholder Analysis).
Only general or almost general questions are covered in this section. There might be additional industry-specific questions related to Risk & Crisis Management in the questionnaire, and certain questions listed below might not apply to your company.
Risk Governance Assessment Focus
Question Rationale
For a company’s risk management procedures to be effective, risk awareness, concern and management have to stem from the company’s senior management and board of directors. While overall responsibility for risk management lies with the board of directors, it is the senior management team’s duty to translate the strategic
direction set by the board into appropriate policies and procedures and to put in place an effective approach to execute and implement those policies. To ensure that the policies are consistent with the risk tolerance of the company’s shareholders, they should be approved by the board.
Question Layout
Please indicate which people, departments and committees are responsible and accountable for enterprise risk management in terms of risk appetite & tolerance as well as risk monitoring & reporting. Please also indicate the expertise and training applicable to non-executive directors as well as the corporate structure of risk management functions.
Please
indicate
name and
position
Reporting line:
please
indicate who
the person or
committee
reports to
Highest ranking
person with
dedicated risk
management
responsibility on
an operational
level (not CEO)
Highest ranking
person with
responsibility for
monitoring and
auditing risk
management
performance on
an operational
level (not CEO)
� Number of non-executive members on board of directors/supervisory board with expertise in (enterprise) risk management. Please specify number of non-executive directors:
� Regular education for non-executive directors ensured. Please specify:
� The risk management function is structurally independent of the company’s business lines. Please specify:________

34 / 174
Economic Dimension - Risk & Crisis Management
Question-Specific Guidance & Definitions
Under highest responsible person or committee: The name and position of the person or body with the respective responsibilities should be indicated. Examples of responsible people or committees include Chief Risk Officer, Risk Committee, Internal Audit and Chief Compliance Officer.
Under reporting line: The whole reporting line from the responsible people or committee up to the executive managers or board of directors should be provided.
Risk appetite can be defined as “the amount and type of risk that an organization is willing to take in order to meet its strategic objectives”. Organizations will have different risk appetites depending on their industry, culture and objectives. A range of appetites exists for different risks and these may change over time. While risk appetite is about the pursuit of risk, risk tolerance is about what an organization can deal with. Companies should enter here the name of the highest-ranking individual or body in the organization that is responsible for determining the appropriate risk level of the organization. In most cases this would be the Chief Risk officer or the highest-ranking committee responsible for risk management in the company.
Risk monitoring and reporting are needed to ensure policies are carried out and processes are executed in accordance with management’s stated performance goals and risk tolerances. Here the name of the highest-ranking individual or committee responsible for monitoring risk should be provided. This could be Internal Audit or any comparable function independently ensuring that corporate practices are consistent with the company’s risk strategy and policies.
For the option on expertise in (enterprise) risk management for non-executive directors, it is not
expected that a large number of board members could have such experience. However, it is considered beneficial to have at least some members on the board with risk management experience. In many non-financial industries this could be someone who has worked in operational risk management. It could also include someone with a finance background who has worked in financial risk assessment. Experience on a risk-related board committee alone is not acceptable; rather, the focus is on professional experience that relates to risk management.
Regular education relates to risk-specific education and training provided to non-executive directors, to ensure that they are informed about the latest-risk management practices and are equipped to assess the various forms of risks.
Regular refers to education or training that occurs consistently belong to the company’s scheduled training mechanisms for board members.
Structural independence means that the organization’s risk function is independent of other business functions, departments or divisions, and serves as a means to address risks throughout the entire organization and not just within a specific department. Structural independence enables the objective monitoring and control of various risks in the best interests of the entire organization and without the potential of a conflict of interests arising from other business priorities.
References
• GRI Standard 102-19 & 102-20 & 102-29 & 102-30are relevant for this question.
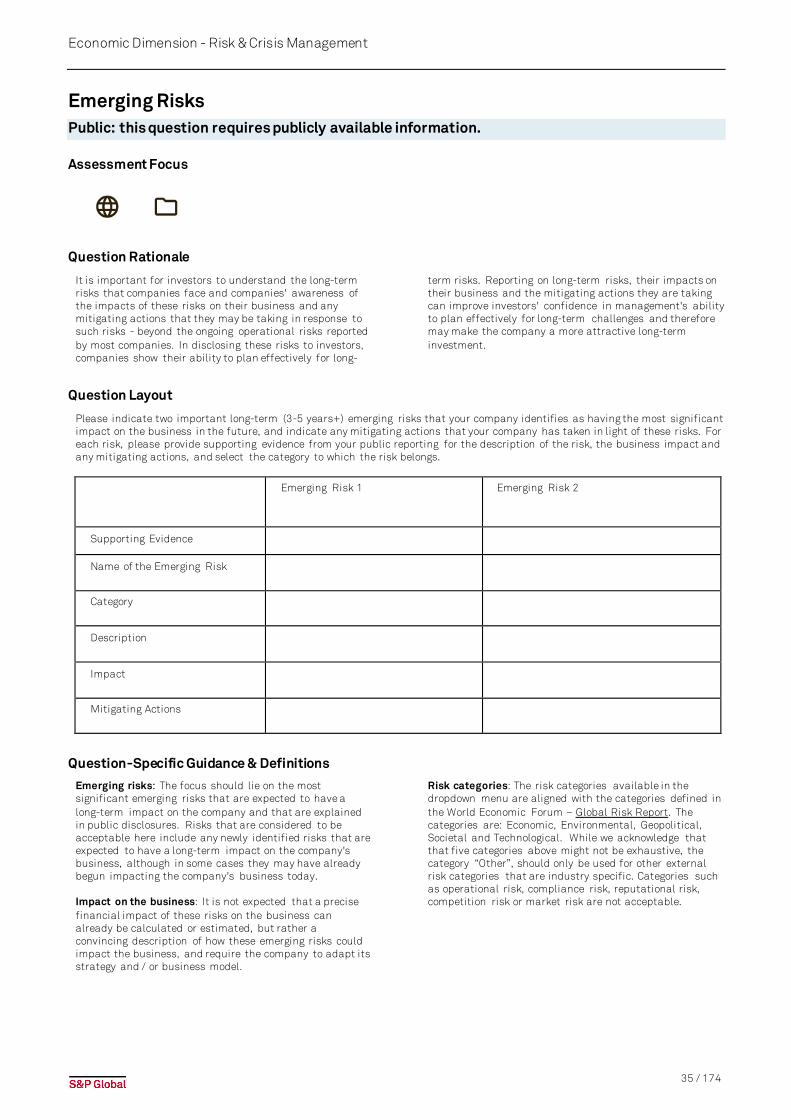
35 / 174
Economic Dimension - Risk & Crisis Management
Emerging Risks Public: this question requires publicly available information.
Assessment Focus
Question Rationale
It is important for investors to understand the long-term risks that companies face and companies' awareness of the impacts of these risks on their business and any mitigating actions that they may be taking in response to such risks - beyond the ongoing operational risks reported by most companies. In disclosing these risks to investors, companies show their ability to plan effectively for long-
term risks. Reporting on long-term risks, their impacts on their business and the mitigating actions they are taking can improve investors' confidence in management's ability to plan effectively for long-term challenges and therefore may make the company a more attractive long-term investment.
Question Layout
Please indicate two important long-term (3-5 years+) emerging risks that your company identifies as having the most significant impact on the business in the future, and indicate any mitigating actions that your company has taken in light of these risks. For each risk, please provide supporting evidence from your public reporting for the description of the risk, the business impact and any mitigating actions, and select the category to which the risk belongs.
Emerging Risk 1 Emerging Risk 2
Supporting Evidence
Name of the Emerging Risk
Category
Description
Impact
Mitigating Actions
Question-Specific Guidance & Definitions
Emerging risks: The focus should lie on the most significant emerging risks that are expected to have a long-term impact on the company and that are explained in public disclosures. Risks that are considered to be acceptable here include any newly identified risks that are expected to have a long-term impact on the company's business, although in some cases they may have already begun impacting the company's business today. Impact on the business: It is not expected that a precise financial impact of these risks on the business can already be calculated or estimated, but rather a convincing description of how these emerging risks could impact the business, and require the company to adapt its strategy and / or business model.
Risk categories: The risk categories available in the dropdown menu are aligned with the categories defined in the World Economic Forum – Global Risk Report. The categories are: Economic, Environmental, Geopolitical, Societal and Technological. While we acknowledge that that five categories above might not be exhaustive, the category “Other”, should only be used for other external risk categories that are industry specific. Categories such as operational risk, compliance risk, reputational risk, competition risk or market risk are not acceptable.
36 / 174
Economic Dimension - Risk & Crisis Management
Data Requirements
This question requires supporting evidence from the public domain. Because the disclosure of long-term emerging risks (beyond operational risks commonly reported by companies or required by regulators) is so important for long-term investors, the risks provided in this question should correspond to risks that are disclosed publicly (e.g. annual report, sustainability report, integrated report, company publications, corporate website, risk reports,...). Additional specifications related to the description of the risk, the business impact and mitigating actions not available in the public domain will not be considered. An emerging risk needs to fulfil the six below requirements in order to be accepted: • The risk is new, emerging or significantly increasing
in importance. • The potential impact of the risk is long-term, i.e. the
risk is unlikely to have a significant impact on the company for at least three to five years, but potentially may have begun to have consequences for the company today.
• The potential impact of the risk is significant, i.e. it
has the potential to affect a large part of the company’s operations and may require the company to adapt its strategy and/or business model.
• The risk is an external risk, i.e. it arises from events outside the company and are beyond its influence or control. Sources of these risks include natural, geopolitical or macroeconomic factors, but exclude operational, reputational or market risks.
• The risk and its impact on the company are specific. For example, long-term risks like macroeconomic developments should be described in the context of the business environment that the company operates in (i.e. the specific regulations or laws that may be introduced) and the impact on the company should be specific (i.e. not simply the description of the overall impact on the industry).
• The risk and its impact are publicly disclosed. The mitigating actions have to be reported together with the risk and its impact, as a response to the risk. on the industry).
References
World Economic Forum – Global Risk Report
37 / 174
Economic Dimension - Risk & Crisis Management
Risk Culture Assessment Focus
Question Rationale
While an effective structure for risk management is essential, events since the credit crisis as well as several high-profile disasters such as the Macondo oil spill have demonstrated the need for strong risk culture throughout the organization to ensure that the importance of risk is understood by all employees. This question is designed to assess if companies are implementing an effective risk culture across their business.
Question Layout
What strategies does your company pursue in order to promote and enhance an effective risk culture throughout the organization? Please indicate the relevant options below and specify where prompted [multiple options can be indicated].
o Financial incentives that incorporate risk management metrics; please specify the incentives and metrics. � For senior executives; please specify: � For line managers; please specify:
o Focused training throughout the organization on risk management principles, please specify: o Inclusion of risk management criteria in the HR review process for employee evaluations o Measures enabling individual employees to proactively identify and report potential risks throughout the
organization; please specify: o Measures enabling continuous improvement in risk management practices through the involvement of
employees in a structured feedback process; please specify: o Incorporating risk criteria in the product development or approval process o Other means of measuring or innovating for an effective risk culture; please specify:
Question-Specific Guidance & Definitions
Risk management metrics refers to any risk management measures that may be part of an individual’s performance review, or any goal linked to reducing risk that affects compensation, including measures to reduce occupational health and safety incidents or environmental risks. Risk management in the HR review process can include any element of risk performance (including avoidance of risks) that is included in the review of employee performance. Measures for reporting risks should be more than whistle-blowing mechanisms. Rather, these should be procedures that enable employees to report potential incidents that could occur, based on their experience. This can in turn be used in order to improve risk management and monitoring.
Other means of measuring or innovating for an effective risk culture: this option is looking for other means of innovating for an effective risk culture. Examples include interactive platforms in the intranet to spread the use of risk management best practices, innovation hubs related to risk management or culture, competition or award to reward innovating ideas in the area of risk management or risk culture. This option is not looking at risk management plans and processes, or examples of risk prevention measures such as health and safety plans, description of ERM processes, or how the risk management processes are structured within the company.

38 / 174
Economic Dimension - Codes of Business Conduct
Codes of Business Conduct Economic crime is consistently harmful to a company's intangible assets (e.g. negative impact on the company's reputation, on staff morale and on business relationships). Internal controls appear to be inefficient when looking at how economic crimes are actually discovered, suggesting that internal systems are often co-opted, circumvented or overridden.
Companies active in countries with weak anti-corruption laws are exposed to additional reputational and legal
risks. Evidence of corrupt practices can result in exclusion from contracts financed by institutions that blacklist suppliers of bribes (e.g. World Bank's list of debarred firms), potentially impacting future earnings as well as higher risk premiums for debt or equity.
The key focus of the criterion is on the Codes of Conduct, their implementation and the transparent reporting on breaches, as well as the occurrence of corruption & bribery cases and anti-competitive practices.
Codes of Conduct Public: this question requires publicly available information.
Assessment Focus
Question Rationale
Codes of Conduct are corporate documents outlining a company's values, principles and guidelines in a variety of areas. Ideally, codes combine aspirations and detailed standards on how to put them into practice, guiding the way the company conducts its business activities.
Codes of Conduct are voluntary but often seen as an important part of company culture, reputation and compliance. With this question, we assess the existence and scope of a company's Code of Conduct.
Question Layout
Which of the following aspects are covered by your codes of conduct at a group level (including subsidiaries)? Please indicate where this information is available in your public reporting or corporate website.
o Yes, our group-wide codes of conduct are publicly available and specifically include the following:
� Corruption and bribery � Discrimination � Confidentiality of information � Conflicts of interest � Antitrust/anti-competitive practices � Money-laundering and/or insider trading/dealing � Environment, health and safety � Whistleblowing
Question-Specific Guidance & Definitions
Please be aware that Codes of Conduct can come in different formats and have different names (e.g. internal rules, company's credo, compliance codes, ethics codes, codes of practice, charters).
References
• GRI Standards 102-16 & 102-17 are relevant for this question.
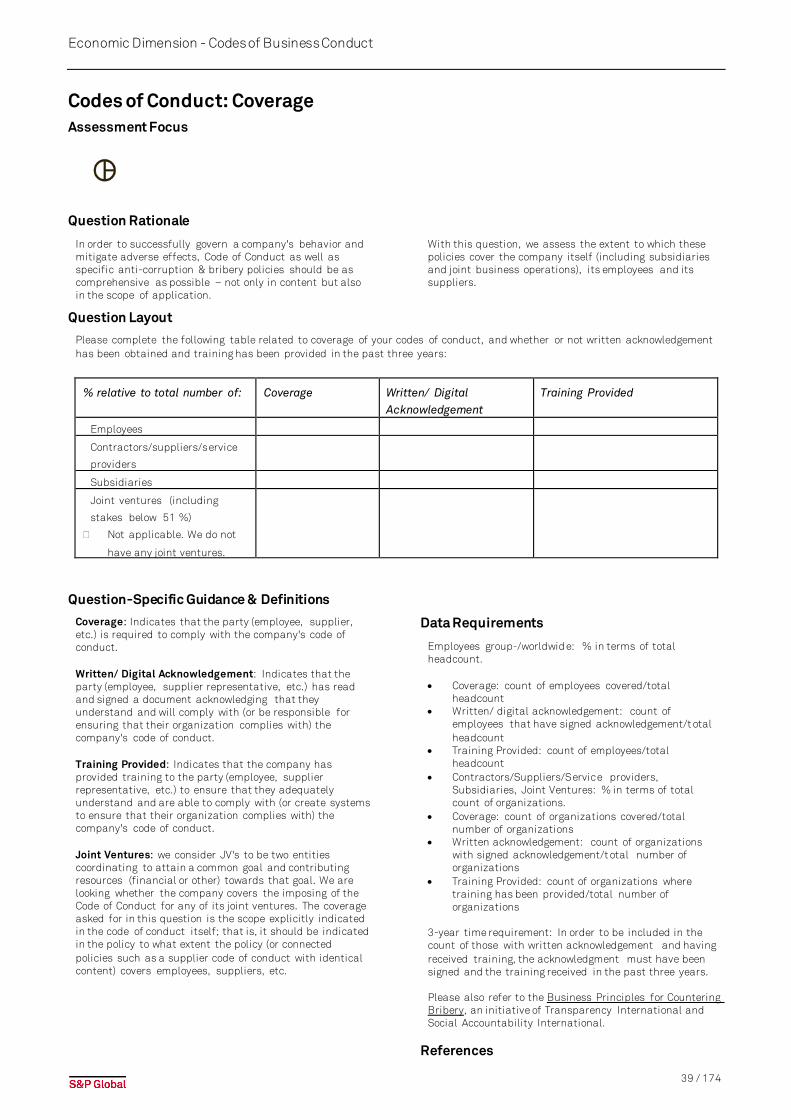
39 / 174
Economic Dimension - Codes of Business Conduct
Codes of Conduct: Coverage Assessment Focus
Question Rationale
In order to successfully govern a company's behavior and mitigate adverse effects, Code of Conduct as well as specific anti-corruption & bribery policies should be as comprehensive as possible – not only in content but also in the scope of application.
With this question, we assess the extent to which these policies cover the company itself (including subsidiaries and joint business operations), its employees and its suppliers.
Question Layout
Please complete the following table related to coverage of your codes of conduct, and whether or not written acknowledgement has been obtained and training has been provided in the past three years:
% relative to total number of: Coverage Written/ Digital Acknowledgement
Training Provided
Employees
Contractors/suppliers/service
providers
Subsidiaries
Joint ventures (including
stakes below 51 %)
� Not applicable. We do not
have any joint ventures.
Question-Specific Guidance & Definitions
Coverage: Indicates that the party (employee, supplier, etc.) is required to comply with the company's code of conduct. Written/ Digital Acknowledgement: Indicates that the party (employee, supplier representative, etc.) has read and signed a document acknowledging that they understand and will comply with (or be responsible for ensuring that their organization complies with) the company's code of conduct. Training Provided: Indicates that the company has provided training to the party (employee, supplier representative, etc.) to ensure that they adequately understand and are able to comply with (or create systems to ensure that their organization complies with) the company's code of conduct. Joint Ventures: we consider JV's to be two entities coordinating to attain a common goal and contributing resources (financial or other) towards that goal. We are looking whether the company covers the imposing of the Code of Conduct for any of its joint ventures. The coverage asked for in this question is the scope explicitly indicated in the code of conduct itself; that is, it should be indicated in the policy to what extent the policy (or connected policies such as a supplier code of conduct with identical content) covers employees, suppliers, etc.
Data Requirements
Employees group-/worldwid e: % in terms of total headcount. • Coverage: count of employees covered/total
headcount • Written/ digital acknowledgement: count of
employees that have signed acknowledgement/t otal headcount
• Training Provided: count of employees/total headcount
• Contractors/Suppliers/Service providers, Subsidiaries, Joint Ventures: % in terms of total count of organizations.
• Coverage: count of organizations covered/total number of organizations
• Written acknowledgement: count of organizations with signed acknowledgement/t otal number of organizations
• Training Provided: count of organizations where training has been provided/total number of organizations
3-year time requirement: In order to be included in the count of those with written acknowledgement and having received training, the acknowledgment must have been signed and the training received in the past three years. Please also refer to the Business Principles for Countering Bribery, an initiative of Transparency International and Social Accountability International.
References

40 / 174
Economic Dimension - Codes of Business Conduct
• GRI Standard 205-2 are relevant for this question

41 / 174
Economic Dimension - Codes of Business Conduct
Corruption & Bribery Public: this question requires publicly available information.
Assessment Focus
Question Rationale
Corruption and bribery are economic crimes that are consistently harmful to a company’s intangible assets (such as its reputation, staff morale, or business relationships). Companies doing business in countries with weak anti-corruption and bribery laws are exposed to additional reputational and legal risks.
Evidence of corrupt practices can result in a company's exclusion from contracts financed by institutions that blacklist bribe suppliers (for example, the World Bank's list of debarred firms), potentially affecting the company's future earnings. Due to the additional types of risk that
corruption introduces, it creates uncertain consequences for investors, and therefore increases the risk premium a company must pay for debt or equity. This question assesses the anti-corruption and bribery policy a company has in place to complement legal requirements (or to compensate for the lack of such requirements in certain countries). Because political and charitable contributions can be used as subterfuge for bribery, they should be explicitly covered by the anti-corruption policy and should be publicly disclosed.
Question Layout
Which of the following aspects are covered by your anti-corruption and bribery policy at a group level (including subsidiaries)? Please indicate where this information is available in your public reporting or corporate website. Please also ensure that the marked options are both covered by your company's policy and are clearly disclosed in the attached public documents.
o Yes, our group-wide anti-corruption and bribery policy is publicly available and specifically includes the following:
� Bribes in any form (including kickbacks) on any portion of contract payments or soft dollar practices � Direct or indirect political contributions
o Political contributions publicly disclosed. Please attach supporting evidence and/or provide a web link:� Charitable contributions and sponsorship
o Charitable contributions and sponsorship publicly disclosed. Please indicate web address:
Question-Specific Guidance & Definitions
Kickback: A kickback refers to a share of misappropriated funds paid by one organization to another in a case of corrupt bidding. This can occur in a business context or in any other situation in which people are entrusted to spend funds that do not belong to them. In this context, a company would win a contract in a public bidding process even though the quote it provides exceeds the market price or best offer. For the benefit of having won the contract, the provider of the service then pays a kickback (for example, the difference between the overvalued and the actual market price, or part of this difference) to the buyer.
Soft dollar: The term soft dollar is used in the finance industry and refers to in-kind payments made by a money manager (a fund, investor, etc.) to its service providers. Instead of paying the service providers with cash (i.e. hard dollars), the investor pays in-kind (i.e. with soft dollars) by passing on business to its service providers.
Political contributions and charitable donations: This question specifically considers contributions and donations that act as a means of bribery and corruption, and this needs to be explicitly addressed in the attached policies. In the context of this question, disclosure on details of contributions and donations is only considered for topics that are specifically covered in the relevant policy. Other aspects related to political contributions and charitable donations that are not linked to bribery or
corruption are addressed in other parts of the questionnaire.
Data Requirements
This question requires supporting evidence from the public domain. The information provided has to be included in your public reporting (e.g. annual report, sustainability report, integrated report, company publications etc.) or corporate website. Please ensure that the marked options are both covered by your company's policy and are clearly disclosed in the attached documents.
References
• OECD Convention on Combating Bribery of ForeignPublic Officials in International BusinessTransactions, 1997
• United Nations Convention Against Corruption, 2003• Business Principles for Countering Bribery, 2009 (by
Transparency International, second edition) • GRI Standard 102-16 is relevant for this question.

42 / 174
Economic Dimension - Codes of Business Conduct
Code of Conduct: Systems/Procedures Assessment Focus
Question Rationale
As with every strategy or goal, a code of conduct is only as good as the extent to which it is complied with. A company therefore needs to have proper systems and procedures in place to ensure its code of conduct is implemented and
assure its employees, creditors, business partners, shareholders and other stakeholders that internal systems will not be co-opted, circumvented or overridden.
Question Layout
What mechanisms are in place to ensure effective implementation of your company’s codes of conduct (e.g. compliance system) [multiple options can be indicated]?
� Responsibilities, accountabilities and reporting lines are systemically defined in all divisions and group companies � Dedicated help desks, focal points, ombudsman, hotlines � Compliance linked to employee remuneration � Employee performance appraisal systems integrate compliance/codes of conduct � Disciplinary action in the event of breaches, e.g. warnings, dismissal, zero-tolerance policy � Compliance system is certified/audited/verified by third party; please specify: _________
Question-Specific Guidance & Definitions
Third-party verification: For the certification/audit/verification of the compliance system, only independent third parties are accepted. Internal audit is not considered an independent third party. A third-party review must cover the company's codes of conduct and compliance systems for enforcing these codes, including tracking and reporting of breaches. Third-party assurance on other financial data or sustainability reporting is not accepted here.
References
• GRI Standards 102-16 & 102-17 are relevant for this question.
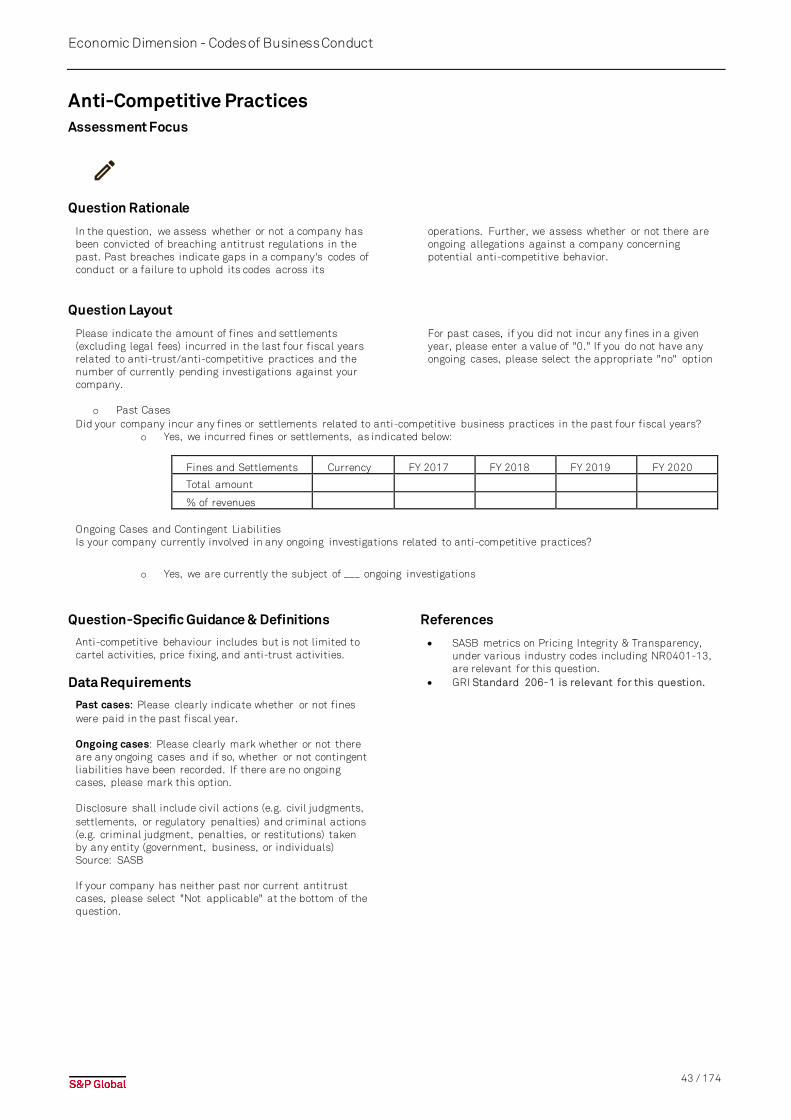
43 / 174
Economic Dimension - Codes of Business Conduct
Anti-Competitive Practices Assessment Focus
Question Rationale
In the question, we assess whether or not a company has been convicted of breaching antitrust regulations in the past. Past breaches indicate gaps in a company's codes of conduct or a failure to uphold its codes across its
operations. Further, we assess whether or not there are ongoing allegations against a company concerning potential anti-competitive behavior.
Question Layout
Please indicate the amount of fines and settlements (excluding legal fees) incurred in the last four fiscal years related to anti-trust/anti-competitive practices and the number of currently pending investigations against your company.
For past cases, if you did not incur any fines in a given year, please enter a value of "0." If you do not have any ongoing cases, please select the appropriate "no" option
o Past CasesDid your company incur any fines or settlements related to anti-competitive business practices in the past four fiscal years?
o Yes, we incurred fines or settlements, as indicated below:
Fines and Settlements Currency FY 2017 FY 2018 FY 2019 FY 2020
Total amount
% of revenues
Ongoing Cases and Contingent Liabilities Is your company currently involved in any ongoing investigations related to anti-competitive practices?
o Yes, we are currently the subject of ___ ongoing investigations
Question-Specific Guidance & Definitions
Anti-competitive behaviour includes but is not limited to cartel activities, price fixing, and anti-trust activities.
Data Requirements
Past cases: Please clearly indicate whether or not fines were paid in the past fiscal year.
Ongoing cases: Please clearly mark whether or not there are any ongoing cases and if so, whether or not contingent liabilities have been recorded. If there are no ongoing cases, please mark this option.
Disclosure shall include civil actions (e.g. civil judgments, settlements, or regulatory penalties) and criminal actions (e.g. criminal judgment, penalties, or restitutions) taken by any entity (government, business, or individuals) Source: SASB
If your company has neither past nor current antitrust cases, please select "Not applicable" at the bottom of the question.
References
• SASB metrics on Pricing Integrity & Transparency,under various industry codes including NR0401-13,are relevant for this question.
• GRI Standard 206-1 is relevant for this question.
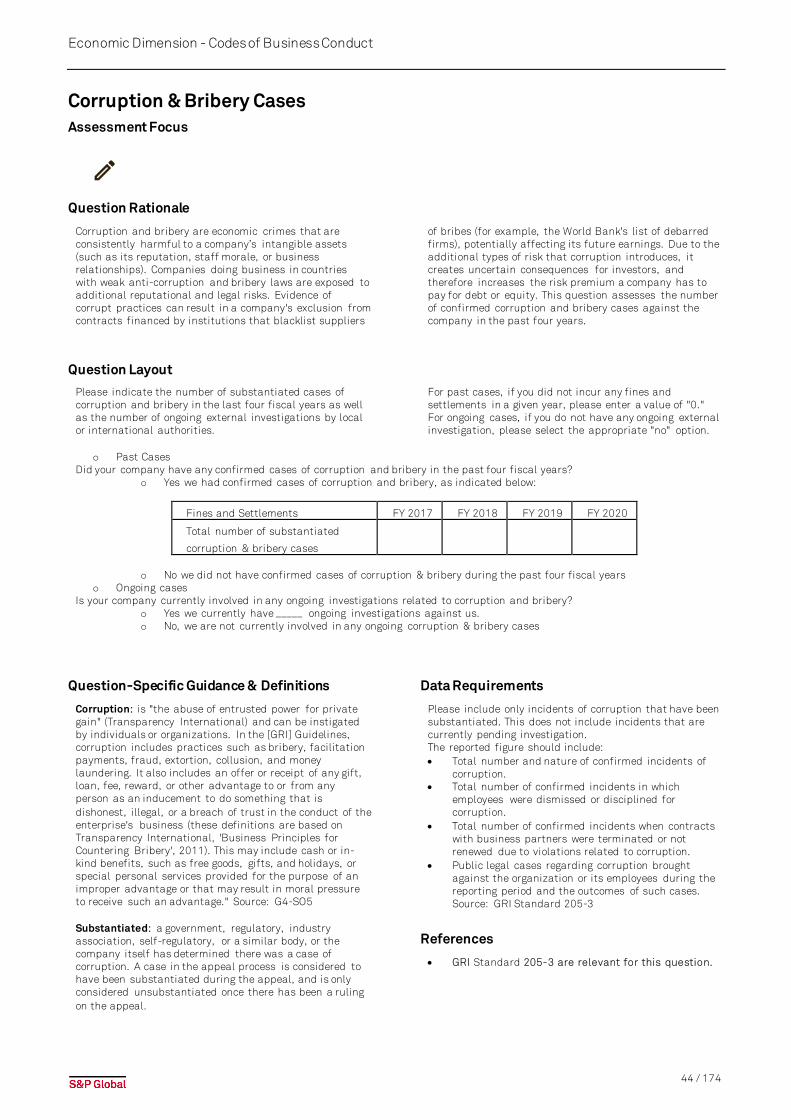
44 / 174
Economic Dimension - Codes of Business Conduct
Corruption & Bribery Cases Assessment Focus
Question Rationale
Corruption and bribery are economic crimes that are consistently harmful to a company’s intangible assets (such as its reputation, staff morale, or business relationships). Companies doing business in countries with weak anti-corruption and bribery laws are exposed to additional reputational and legal risks. Evidence of corrupt practices can result in a company's exclusion from contracts financed by institutions that blacklist suppliers
of bribes (for example, the World Bank's list of debarred firms), potentially affecting its future earnings. Due to the additional types of risk that corruption introduces, it creates uncertain consequences for investors, and therefore increases the risk premium a company has to pay for debt or equity. This question assesses the number of confirmed corruption and bribery cases against the company in the past four years.
Question Layout
Please indicate the number of substantiated cases of corruption and bribery in the last four fiscal years as well as the number of ongoing external investigations by local or international authorities.
For past cases, if you did not incur any fines and settlements in a given year, please enter a value of "0." For ongoing cases, if you do not have any ongoing external investigation, please select the appropriate "no" option.
o Past Cases Did your company have any confirmed cases of corruption and bribery in the past four fiscal years?
o Yes we had confirmed cases of corruption and bribery, as indicated below:
Fines and Settlements FY 2017 FY 2018 FY 2019 FY 2020
Total number of substantiated
corruption & bribery cases
o No we did not have confirmed cases of corruption & bribery during the past four fiscal years o Ongoing cases
Is your company currently involved in any ongoing investigations related to corruption and bribery? o Yes we currently have _____ ongoing investigations against us.o No, we are not currently involved in any ongoing corruption & bribery cases
Question-Specific Guidance & Definitions
Corruption: is "the abuse of entrusted power for private gain" (Transparency International) and can be instigated by individuals or organizations. In the [GRI] Guidelines, corruption includes practices such as bribery, facilitation payments, fraud, extortion, collusion, and money laundering. It also includes an offer or receipt of any gift, loan, fee, reward, or other advantage to or from any person as an inducement to do something that is dishonest, illegal, or a breach of trust in the conduct of the enterprise's business (these definitions are based on Transparency International, 'Business Principles for Countering Bribery', 2011). This may include cash or in-kind benefits, such as free goods, gifts, and holidays, or special personal services provided for the purpose of an improper advantage or that may result in moral pressure to receive such an advantage." Source: G4-SO5
Substantiated: a government, regulatory, industry association, self-regulatory, or a similar body, or the company itself has determined there was a case of corruption. A case in the appeal process is considered to have been substantiated during the appeal, and is only considered unsubstantiated once there has been a ruling on the appeal.
Data Requirements
Please include only incidents of corruption that have been substantiated. This does not include incidents that are currently pending investigation. The reported figure should include: • Total number and nature of confirmed incidents of
corruption.• Total number of confirmed incidents in which
employees were dismissed or disciplined forcorruption.
• Total number of confirmed incidents when contractswith business partners were terminated or not renewed due to violations related to corruption.
• Public legal cases regarding corruption broughtagainst the organization or its employees during thereporting period and the outcomes of such cases.Source: GRI Standard 205-3
References
• GRI Standard 205-3 are relevant for this question.
45 / 174
Economic Dimension - Codes of Business Conduct
Reporting on Breaches Public: this question requires publicly available information.
Assessment Focus
Question Rationale
Organizations are increasingly expected by the marketplace, international norms, and stakeholders to demonstrate their adherence to integrity, governance, and good business practices. Reporting to authorities is mandatory in many countries but our questions are looking for evidence of transparent corporate reporting to
all stakeholders. This question assesses the transparency a company shows in relation to breaches of its codes of conduct or anti-corruption & bribery policies towards its stakeholders, both for the occurrence of incidents as well as the company's response.
Question Layout
Does your company publicly report on breaches (e.g. number of breaches, cases, etc.) against your codes of conduct/ethics? Please specify where this information is available in your public reporting or corporate website.
o Yes, we publicly report on breaches to our codes of conduct.o We publicly report that no breaches have occurred during the most recent reporting cycle
Question-Specific Guidance & Definitions
Both the disclosure of code of conduct breaches and the comprehensiveness of the disclosure are assessed. When assessing the comprehensiveness of the disclosure, aspects such as the number of cases, the types and categories of cases, and the consequences of the breaches are considered. Filings to authorities that are not publicly available to all stakeholders will not be considered here.
If there were no code of conduct breaches, the second option "We publicly report that no breaches have occurred during the most recent reporting cycle" should be chosen. The absence of breaches needs to be publicly disclosed for the purpose of this question and an indication of where this is publicly reported should be given. A comment indicating that no breaches occurred and that reporting would have been available in the event of such breaches occurring is not sufficient for this question.
Data Requirements
Please note that if your company did not have any code of conduct breaches, please tick “Yes, please refer to the reference(s) provided:” and indicate where this is publicly reported.
References
• OECD Convention on Combating Bribery of ForeignPublic Officials in International BusinessTransactions, 1997
• United Nations Convention Against Corruption, 2003• Business Principles for Countering Bribery, 2009 (by
Transparency International, second edition)
• GRI Standards 102-17 & 205-3 are relevant for thisquestion.
46 / 174
Economic Dimension - Customer Relationship Management
Customer Relationship Management Strong relationships with customers lead to increased customer loyalty. Harvard Business School research revealed that a 5% increase in retention can result in a profit increase of up to 75%, depending on the industry. The value of retaining customers makes perfect business sense when one considers that a consumer retained for life is more cost effective, requires less service, provides more business and contributes to new customer acquisition by offering positive referrals. Additionally, customer relationship management tools provide important data which allows the company to target relevant customer groups, develop specific products, and ensure that it has all relevant information to strengthen customer relationships. Online presence and channels have reshaped customer relationships: companies need to be present on several platforms to reach out to customers, and for some sectors today it is strategic development to develop strong online capabilities. In some industries,
customer data privacy and safety risks have emerged and companies need to ensure strong policies to avoid increasing costs of breaches and negative reputational impact. The key focus of the criterion is on the tools a company has implemented or is using to manage customers, online strategy, sales and distribution channels, customer satisfaction and customer protection.
Please note: Only general or almost general questions are covered in this section. There might be additional industry-specific questions related to Customer Relationship Management in the questionnaire, and certain questions listed below might not apply to your company.
Customer Satisfaction Measurement Partially public: additional credit will be granted for relevant publicly available evidence.
Assessment Focus
Question Rationale
Research from Harvard Business School has shown that a 5% increase in retention can result in a bottom-line profit increase of up to 75%, depending on the industry. The dramatic economic power of customer retention is revealed when viewing customers in terms of lifetime value (LTV). The value of retaining customers makes perfect business sense when one considers that a
consumer retained for life is more cost effective, requires less service, provides more business and contributes to new customer acquisition by offering positive referrals. Companies in consumer-facing industries (B2C) should therefore monitor customer satisfaction and report the results of satisfaction surveys targeting consumers (i.e. end users) of their products/services.
Question Layout
Does your company monitor and set quantitative targets to improve satisfaction and are targets and results communicated externally? Please attach documents and indicate the coverage for the data provided. Please refer to the information button for additional clarifications. For each row in the table, it is mandatory that the values provided are in the same unit.
o We measure satisfaction with the unit "% of satisfied respondents out of total number of respondents to the survey."
Please complete the table below and attach supporting evidence.
o Please tick this option if your supporting evidence is available in the public domain
Satisfaction Measurement Unit FY2017 FY2018 FY2019 FY2020 What was your
target for FY 2020
Satisfied respondents % of satisfied
respondents out
of total number of
respondents to
the survey
Data coverage: % of
customers/consumers
surveyed (both
respondents and non-
respondents) out of total
number of
percentage of:
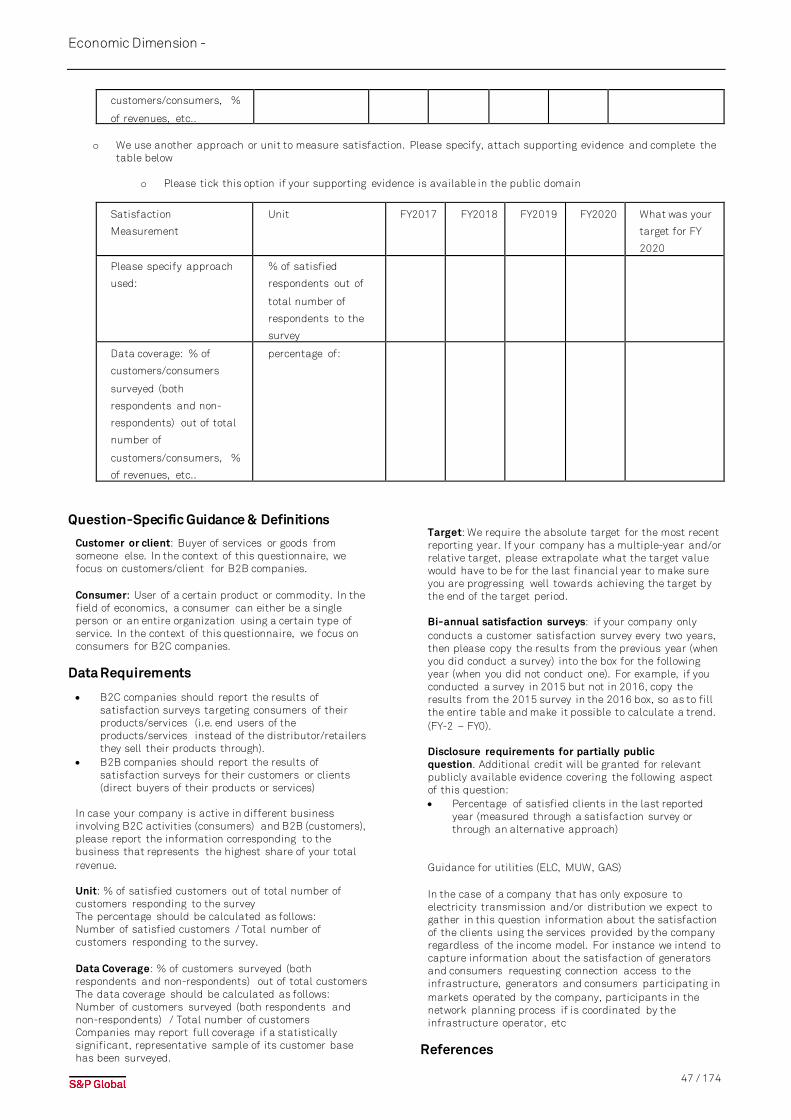
47 / 174
Economic Dimension -
customers/consumers, %
of revenues, etc..
o We use another approach or unit to measure satisfaction. Please specify, attach supporting evidence and complete the table below
o Please tick this option if your supporting evidence is available in the public domain
Satisfaction
Measurement
Unit FY2017 FY2018 FY2019 FY2020 What was your
target for FY
2020
Please specify approach
used:
% of satisfied
respondents out of
total number of
respondents to the
survey
Data coverage: % of
customers/consumers
surveyed (both
respondents and non-
respondents) out of total
number of
customers/consumers, %
of revenues, etc..
percentage of:
Question-Specific Guidance & Definitions
Customer or client: Buyer of services or goods from someone else. In the context of this questionnaire, we focus on customers/client for B2B companies. Consumer: User of a certain product or commodity. In the field of economics, a consumer can either be a single person or an entire organization using a certain type of service. In the context of this questionnaire, we focus on consumers for B2C companies.
Data Requirements
• B2C companies should report the results of satisfaction surveys targeting consumers of their products/services (i.e. end users of the products/services instead of the distributor/retailers they sell their products through).
• B2B companies should report the results of satisfaction surveys for their customers or clients (direct buyers of their products or services)
In case your company is active in different business involving B2C activities (consumers) and B2B (customers), please report the information corresponding to the business that represents the highest share of your total revenue. Unit: % of satisfied customers out of total number of customers responding to the survey The percentage should be calculated as follows: Number of satisfied customers / Total number of customers responding to the survey. Data Coverage: % of customers surveyed (both respondents and non-respondents) out of total customers The data coverage should be calculated as follows: Number of customers surveyed (both respondents and non-respondents) / Total number of customers Companies may report full coverage if a statistically significant, representative sample of its customer base has been surveyed.
Target: We require the absolute target for the most recent reporting year. If your company has a multiple-year and/or relative target, please extrapolate what the target value would have to be for the last financial year to make sure you are progressing well towards achieving the target by the end of the target period. Bi-annual satisfaction surveys: if your company only conducts a customer satisfaction survey every two years, then please copy the results from the previous year (when you did conduct a survey) into the box for the following year (when you did not conduct one). For example, if you conducted a survey in 2015 but not in 2016, copy the results from the 2015 survey in the 2016 box, so as to fill the entire table and make it possible to calculate a trend. (FY-2 – FY0). Disclosure requirements for partially public question. Additional credit will be granted for relevant publicly available evidence covering the following aspect of this question: • Percentage of satisfied clients in the last reported
year (measured through a satisfaction survey or through an alternative approach)
Guidance for utilities (ELC, MUW, GAS) In the case of a company that has only exposure to electricity transmission and/or distribution we expect to gather in this question information about the satisfaction of the clients using the services provided by the company regardless of the income model. For instance we intend to capture information about the satisfaction of generators and consumers requesting connection access to the infrastructure, generators and consumers participating in markets operated by the company, participants in the network planning process if is coordinated by the infrastructure operator, etc
References

48 / 174
Economic Dimension -
• GRI Standard 102-43 & 102-44 are relevant for this question.
49 / 174
Economic Dimension - Policy Influence
Policy Influence Although companies legitimately represent themselves in legislative, political and public discourse, excessive contributions to political campaigns, lobbying expenditures and contributions to trade associations and other tax-exempt groups may damage companies’ reputations and creates risks of corruption. In this
criterion, we evaluate the amount of money companies are allocating to organizations whose primary role is to create or influence public policy, legislation and regulations. We also ask for the largest contributions to such groups, and we assess the public disclosure on these two aspects.
Contributions & Other Spending Partially public: additional credit will be granted for relevant publicly available evidence.
Assessment Focus
Question Rationale
Although companies legitimately represent themselves in legislative, political and public discourse, excessive contributions to political campaigns, lobbying expenditures and contributions to trade associations and other tax-exempt groups may damage companies’ reputations and creates risks of corruption. In this
criterion, we evaluate the amount of money companies are allocating to organizations whose primary role is to create or influence public policy, legislation and regulations. We also ask for the largest contributions to such groups, and we assess the public disclosure on these two aspects.
.
Question Layout
Please indicate your annual total monetary contributions to and spending for political campaigns, political organizations, lobbyists or lobbying organizations, trade associations and other tax-exempt groups, as defined in the Info Text. If this information is publicly reported, please provide supporting evidence or indicate the weblink below. PAC contributions by employees should not be included. Please also indicate if these figures are provided in your public reporting.
o We are able to itemize the figures. If you have not made any contributions for one or more items, please enter 0 and
indicate if this information is available in your public reporting: Reference Link_____________
Contributions to: Currency FY 2017 FY 2018 FY 2019 FY 2020
Lobbying, interest
representation or similar
Local, regional or national
political
campaigns/candidates
Trade associations or tax-
exempt groups (e.g., think
tanks)
Other (spending related to
ballot measures, referendums,
etc.)
Total contributions and other
spending
Data coverage (% of
denominator)
Percentage
of: ______
__________
o We can only report the total spending figures. Please indicate the items included in your total spending figures. If an item is not included, please select "not included". If you have not made any contributions for a specific category, please select "No contribution." Please also indicate if these figures are provided in your public reporting.
Reference Link____________
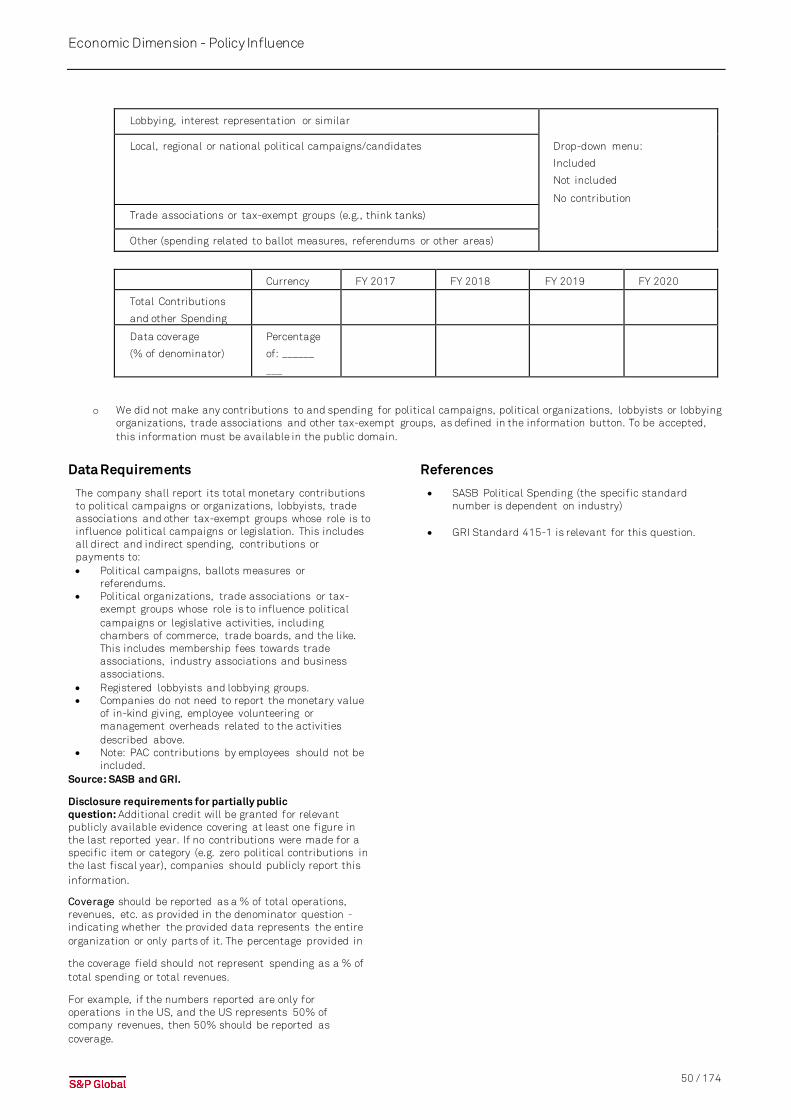
50 / 174
Economic Dimension - Policy Influence
Lobbying, interest representation or similar
Local, regional or national political campaigns/candidates Drop-down menu:
Included
Not included
No contribution
Trade associations or tax-exempt groups (e.g., think tanks)
Other (spending related to ballot measures, referendums or other areas)
Currency FY 2017 FY 2018 FY 2019 FY 2020
Total Contributions
and other Spending
Data coverage
(% of denominator)
Percentage
of: ______
___
o We did not make any contributions to and spending for political campaigns, political organizations, lobbyists or lobbying organizations, trade associations and other tax-exempt groups, as defined in the information button. To be accepted, this information must be available in the public domain.
Data Requirements
The company shall report its total monetary contributions to political campaigns or organizations, lobbyists, trade associations and other tax-exempt groups whose role is to influence political campaigns or legislation. This includes all direct and indirect spending, contributions or payments to: • Political campaigns, ballots measures or
referendums. • Political organizations, trade associations or tax-
exempt groups whose role is to influence political campaigns or legislative activities, including chambers of commerce, trade boards, and the like. This includes membership fees towards trade associations, industry associations and business associations.
• Registered lobbyists and lobbying groups. • Companies do not need to report the monetary value
of in-kind giving, employee volunteering or management overheads related to the activities described above.
• Note: PAC contributions by employees should not be included.
Source: SASB and GRI.
Disclosure requirements for partially public question: Additional credit will be granted for relevant publicly available evidence covering at least one figure in the last reported year. If no contributions were made for a specific item or category (e.g. zero political contributions in the last fiscal year), companies should publicly report this information.
Coverage should be reported as a % of total operations, revenues, etc. as provided in the denominator question - indicating whether the provided data represents the entire organization or only parts of it. The percentage provided in
the coverage field should not represent spending as a % of total spending or total revenues.
For example, if the numbers reported are only for operations in the US, and the US represents 50% of company revenues, then 50% should be reported as coverage.
References
• SASB Political Spending (the specific standard number is dependent on industry)
• GRI Standard 415-1 is relevant for this question.

51 / 174
Economic Dimension - Policy Influence
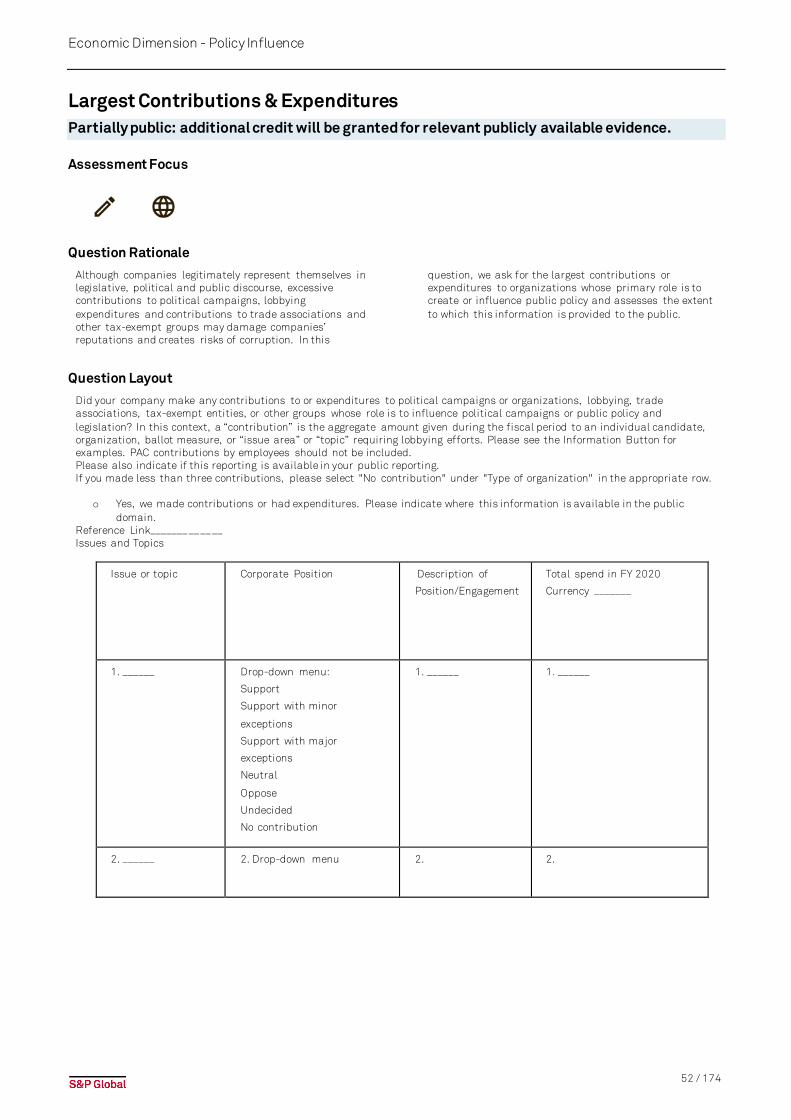
52 / 174
Economic Dimension - Policy Influence
Largest Contributions & Expenditures Partially public: additional credit will be granted for relevant publicly available evidence.
Assessment Focus
Question Rationale
Although companies legitimately represent themselves in legislative, political and public discourse, excessive contributions to political campaigns, lobbying expenditures and contributions to trade associations and other tax-exempt groups may damage companies’ reputations and creates risks of corruption. In this
question, we ask for the largest contributions or expenditures to organizations whose primary role is to create or influence public policy and assesses the extent to which this information is provided to the public.
Question Layout
Did your company make any contributions to or expenditures to political campaigns or organizations, lobbying, trade associations, tax-exempt entities, or other groups whose role is to influence political campaigns or public policy and legislation? In this context, a “contribution” is the aggregate amount given during the fiscal period to an individual candidate, organization, ballot measure, or “issue area” or “topic” requiring lobbying efforts. Please see the Information Button for examples. PAC contributions by employees should not be included. Please also indicate if this reporting is available in your public reporting. If you made less than three contributions, please select "No contribution" under "Type of organization" in the appropriate row.
o Yes, we made contributions or had expenditures. Please indicate where this information is available in the public domain.
Reference Link_____________ Issues and Topics
Issue or topic Corporate Position Description of
Position/Engagement
Total spend in FY 2020
Currency _______
1. ______ Drop-down menu:
Support
Support with minor
exceptions
Support with major
exceptions
Neutral
Oppose
Undecided
No contribution
1. ______ 1. ______
2. ______ 2. Drop-down menu 2. 2.
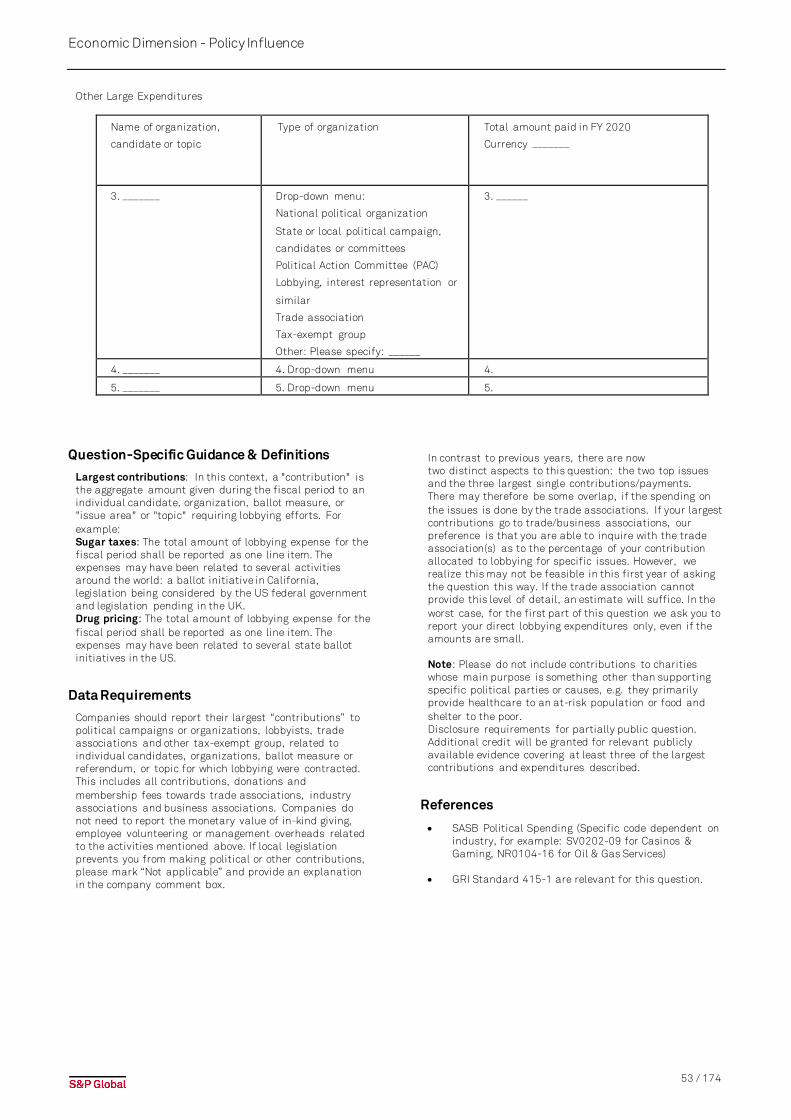
53 / 174
Economic Dimension - Policy Influence
Other Large Expenditures
Name of organization,
candidate or topic
Type of organization Total amount paid in FY 2020
Currency _______
3. _______ Drop-down menu:
National political organization
State or local political campaign,
candidates or committees
Political Action Committee (PAC)
Lobbying, interest representation or
similar
Trade association
Tax-exempt group
Other: Please specify: ______
3. ______
4. _______ 4. Drop-down menu 4.
5. _______ 5. Drop-down menu 5.
Question-Specific Guidance & Definitions
Largest contributions: In this context, a "contribution" is the aggregate amount given during the fiscal period to an individual candidate, organization, ballot measure, or "issue area" or "topic" requiring lobbying efforts. For example: Sugar taxes: The total amount of lobbying expense for the fiscal period shall be reported as one line item. The expenses may have been related to several activities around the world: a ballot initiative in California, legislation being considered by the US federal government and legislation pending in the UK. Drug pricing: The total amount of lobbying expense for the fiscal period shall be reported as one line item. The expenses may have been related to several state ballot initiatives in the US.
Data Requirements
Companies should report their largest “contributions” to political campaigns or organizations, lobbyists, trade associations and other tax-exempt group, related to individual candidates, organizations, ballot measure or referendum, or topic for which lobbying were contracted. This includes all contributions, donations and membership fees towards trade associations, industry associations and business associations. Companies do not need to report the monetary value of in-kind giving, employee volunteering or management overheads related to the activities mentioned above. If local legislation prevents you from making political or other contributions, please mark “Not applicable” and provide an explanation in the company comment box.
In contrast to previous years, there are now two distinct aspects to this question: the two top issues and the three largest single contributions/payments. There may therefore be some overlap, if the spending on the issues is done by the trade associations. If your largest contributions go to trade/business associations, our preference is that you are able to inquire with the trade association(s) as to the percentage of your contribution allocated to lobbying for specific issues. However, we realize this may not be feasible in this first year of asking the question this way. If the trade association cannot provide this level of detail, an estimate will suffice. In the worst case, for the first part of this question we ask you to report your direct lobbying expenditures only, even if the amounts are small. Note: Please do not include contributions to charities whose main purpose is something other than supporting specific political parties or causes, e.g. they primarily provide healthcare to an at-risk population or food and shelter to the poor. Disclosure requirements for partially public question. Additional credit will be granted for relevant publicly available evidence covering at least three of the largest contributions and expenditures described.
References
• SASB Political Spending (Specific code dependent on industry, for example: SV0202-09 for Casinos & Gaming, NR0104-16 for Oil & Gas Services)
• GRI Standard 415-1 are relevant for this question.
54 / 174
Economic Dimension - Supply Chain Management
Supply Chain Management In an increasingly globalized world, when a company outsources its production, services or business processes, it also outsources corporate responsibilities and reputational risks. This means that companies need to find new strategies to manage the associated risks and opportunities which differ from the traditional risk and opportunity management with the company's production or services in-house. In addition, the company is confronted with the need to minimize costs and time of delivery to satisfy suppliers' demand and increase profitability without negatively impacting product quality or incurring high environmental or social costs. Investors increasingly see the importance of supply chain risk management and the negative consequences if it is not
managed effectively. This criterion aims to identify companies with lower supply chain risk profiles, either through supply chain characteristics or through appropriate management of existing risks. In addition, we seek to identify companies that are using sustainable supply chain management as an opportunity to improve their long-term financial performance. Please note: Only general or almost general (applying to at least 50 industries) questions are covered in this section. There might be additional industry-specific questions related to supply chain management in the questionnaire, and some questions below might not apply to your company.
Supplier Code of Conduct Public: this question requires publicly available information.
Assessment Focus
Question Rationale
Companies not only outsource production, services and business processes but responsibilities, risks and opportunities as well. On one hand, outsourcing generally tends to increase a company's flexibility, but on the other hand, supply chain risks might become less apparent, new dependencies may arise, and the identification, monitoring and management of risks and opportunities in the supply chain may become more difficult.
A general supplier code of conduct summarizes and represents the basic commitments a company requires from its suppliers. It also serves as a first information source for prospective suppliers. With this question, we assess if your company has a supplier code of conduct, if it is public, and what issues it covers.
Question Layout
Does your company have a Supplier Code of Conduct and is it publicly available? Please provide a weblink and indicate which of the listed issues are covered in the Code and applied to all operations across all countries. o Yes, our company has a Supplier Code of Conduct and it is publicly available. The Code covers the following issues:
� Environmental standards for the suppliers' processes, products or services � Child labor � Fundamental human rights (e.g. labor, freedom of association, ILO convention s) � working hours, lay-off practices, remuneration) � Occupational health and safety � Business ethics (e.g. corruption, anti-competitiv e practices) � Our suppliers should have a sustainable procurement policy in place for their own suppliers � Other, please specify: ______________
Question-Specific Guidance & Definitions
A supplier code of conduct describes the principles, values, standards, or rules of behaviour that guide the decisions, procedures and systems of the supplier in a way that (a) contributes to the welfare of its key stakeholders, and (b) respects the rights of all constituents affected by its operations. It usually includes at least the following components: • Labor practice and standards: This includes
safeguards against child labor, non-discrimination, health and safety, working conditions, working hours, compensation, right to association, freely chosen employment.
• Environmental policy This comprises of product and materials use and technology of transport system.
• Ethics Establishing anti-corruption measures, and adhering to fair business practices in winning business, employees, and in managing partner relationships (e.g. ‘upstream’ in the supply chain)
References
For the definition of the supplier code of conduct see also the International Federation of Accountants.
55 / 174
Economic Dimension - Supply Chain Management
Critical Supplier Identification Assessment Focus
Question Rationale
Companies not only outsource production, services and business processes but responsibilities, risks and opportunities as well. On one hand, outsourcing generally tends to increase a company's flexibility, but on the other hand, supply chain risks might become less apparent, new dependencies may arise, and the identification, monitoring and management of risks and opportunities in the supply chain may become more difficult.
An important first step in supply chain management is to try to understand supply chain risks and dependencies from a general, economic point of view. Once a company has identified its critical suppliers, it can focus its supply chain monitoring and risk management efforts on those suppliers with the potential to cause problems. Therefore, this question seeks to understand to what extent companies are able to identify their critical suppliers.
Question Layout
Does your company identify critical suppliers? o Yes, our company identifies critical suppliers
Definition of critical suppliers Please indicate which of the following elements are considered in your definition of critical suppliers and attach supporting evidence describing the process of identifying critical suppliers:
� High-volum e suppliers or similar � Critical component suppliers or similar � Non-substit utabl e suppliers or similar � Other, please specify:
Critical tier 1 and non-tier 1 suppliers Please indicate how many critical tier 1 and critical non-tier 1 suppliers you have identified. If you did not identify any suppliers in one of the categories, please provide an explanation in the comment box at the end of the question.
Type of supplier Absolute number of suppliers Share of total procurement spent (%)
Total tier 1 suppliers
Critical tier 1 suppliers
Critical non-tier 1 suppliers
Question-Specific Guidance & Definitions
Critical suppliers are defined by us as suppliers whose goods or services have a significant impact on the competitive advantage, market success or survival of the company. Critical suppliers include high-volume suppliers, suppliers of critical components and non-substitutable suppliers.
Critical non-tier 1 suppliers: refers to suppliers that are considered critical (see definition above), and provide their products and services to the supplier at the next level in the chain (tier-2 suppliers and higher)
Tier 1 suppliers: refers to suppliers that directly supply goods or services to the company
Tier 2 and lower: provide their products and services to the supplier at the next level in the chain (E.g. Tier-2 supplies to Tier-1)
Data Requirements
Companies in RTS Retailing industry are to report on all suppliers, not solely its private label/own brands' suppliers. They should report in terms of percentage (%) of total suppliers.
References
• GRI Standards 102-9, 414-2, 409-1, 408-1, 407-1,308-2 are relevant for this question.

56 / 174
Economic Dimension - Supply Chain Management
Supply Chain Risk Exposure Assessment Focus
Question Rationale
Companies not only outsource production, services and business processes but responsibilities, risks and opportunities as well. On one hand, outsourcing generally tends to increase a company's flexibility, but on the other hand, supply chain risks might become less apparent, new dependencies may arise, and the identification, monitoring and management of risks and opportunities in the supply chain may become more difficult.
This question seeks to assess if companies have a systematic approach to identifying and defining potential sustainability risks in their supply chain. Companies able to properly identify high risk suppliers will also be better positioned to prioritize their risk management measures and proactively detect issues connected to suppliers’ ESG performance.
Question Layout
Does your company have a formalized process in place to identify potential sustainability risks in the supply chain? o Yes, we have a formalized process in place.
Formal risk identification process Please provide a brief description of your company's sustainability risk identification process. Explain, for instance, how your company identifies suppliers with potentially higher sustainability risks, or describe the higher risks which are typically found or expected to be found, or how these potential risks are linked to your overall supply chain management strategy. Please attach supporting evidence showing this process.
Sustainability risk assessment scope and targets Please indicate the scope of the sustainability risk assessments performed for tier 1 and critical non-tier 1 suppliers. Site visits, questionnaires, external sustainability agencies, stakeholder information, external databases, news watches, etc., are all acceptable types of assessments in this part of the question. If a supplier has been assessed multiple times in the last three years, it should only be counted once. Please also indicate if you have a target in place and by what year that target should be achieved.
Type of supplier Number of suppliers assessed in
the last 3 years % of suppliers in that category
assessed in the last 3 years Description of
Target
Tier 1 suppliers Please provide a
description of your
target:
Target Year: Critical non-tier 1
suppliers Please provide a
description of your
target:
Target Year: Definition of “sustainability high-risk” Please provide the definition or the description that your company uses for "sustainability high-risk." Share of sustainability high-risk suppliers Please indicate the current share of your company's total number of tier 1 suppliers (both critical and non-critical) as well as the share of your non-tier 1 suppliers for which you have identified a high level of sustainability risk in the table below. If you have not identified any suppliers as being high sustainability risk, please report "0" in the relevant fields. This information will be used in the proceeding question "Risk Management Measures"
Type of supplier Number of suppliers
classified as high-
risk
Percentage of total suppliers in that category classified as high-risk
(based on total number of suppliers in that category provided in
"Awareness" question). The values should not exceed 100%. Total tier 1 suppliers
Critical non-tier 1
suppliers
57 / 174
Economic Dimension - Supply Chain Management
Question-Specific Guidance & Definitions
Critical suppliers: They are defined as suppliers whose goods, materials, services (including intellectual property (IP)/patents) have a significant impact on the competitive advantage, market success or survival of the company. Critical suppliers include high-volume suppliers, suppliers of critical components and non-substitutable suppliers.
Tier 1 suppliers refers to suppliers that directly supply goods or services to the company.
Tier 2 and lower provide their products and services to the supplier at the next higher level in the chain (E.g. Tier-2 supplies to Tier-1)
Number of suppliers assessed in the last 3 years refers to the total number of the suppliers assessed in the last three years (Year 1 + Year 2 + Year 3)
Percentage of suppliers assessed in the last 3 years refers to the number of suppliers assessed in the last three years divided by the total absolute number of suppliers in the current year (as provided in the awareness question)
High-risk supplier is defined as those suppliers that have a high probability of causing an adverse impact on the organization due to social, environmental and/or economic misconduct. The definition of high-risk supplier must contain a set of relevant criteria used for the classification, the rationale for such criteria and the risk level identification process.
References
• GRI Standards 308-2, 414-2, 409-1, 408-1 & 407-1 are relevant for this question.
58 / 174
Economic Dimension - Supply Chain Management
Supplier Risk Management Measures Assessment Focus
Question Rationale
Companies not only outsource production, services and business processes but responsibilities, risks and opportunities as well. On one hand, outsourcing generally tends to increase a company's flexibility, but on the other hand, supply chain risks might become less apparent, new dependencies may arise, and the identification,
monitoring and management of risks and opportunities in the supply chain may become more difficult.
This question seeks to assess if companies have a systematic approach to monitoring sustainability risks in their supply chain.
Question Layout
Please indicate which measures your company has taken in order to manage sustainability risks amongst your critical suppliers (tier 1 and non-tier 1) and your high sustainability risk suppliers. Please indicate the scope and attach supporting evidence or specify where requested.
o Our company measures sustainability risks in the supply chain on an ongoing basis
Ongoing sustainability monitoring: Please indicate the standard frequency of a more comprehensive assessment of your suppliers and attach supporting evidence (for example a process describing the system that tracks assessments' frequency). By "more comprehensive," we mean an assessment including at least a company visit either by your company's own personnel or by external third parties, for instance sustainability agencies. Please note that the percentage of suppliers assessed at least once every three years should NOT include the companies assessed annually. Please also note that it is possible that there is some overlap between critical suppliers and suppliers with high sustainability risk.
Type of supplier Percentage assessed
annually
Percentage assessed at least once
every 3 years
Critical suppliers (tier 1 and non-tier 1)
Suppliers with high sustainability risk
Corrective action plans for suppliers Please attach a sample as supporting document and indicate the percentage of assessed or audited suppliers for which corrective action plans have been developed. Further, please indicate what percentage of suppliers with a corrective action plan has improved their ESG performance since the action plan was launched.
Measure Percentage
% of current suppliers with high sustainability risk (following the definition in the question "Risk
Exposure") where gaps have been identified that have corrective action plans
% of current suppliers with corrective action plans that have improved their ESG performance within 12
months of the plan's launch
Question-Specific Guidance & Definitions
Critical suppliers are defined by us as suppliers whose goods or services have a significant impact on the competitive advantage, market success or survival of the company. Critical suppliers include high-volume suppliers, suppliers of critical components and non-substitutable suppliers.
Tier 1 suppliers refers to suppliers that directly supply goods or services to the company.
Tier 2 and lower provide their products and services to the supplier at the next higher level in the chain (E.g. Tier-2 supplies to Tier-1)
References
• GRI Standards 308-2, 409-1, 408-1 & 407-1 are relevant for this question.
59 / 174
Economic Dimension - Supply Chain Management
ESG Integration in SCM Strategy Assessment Focus
Question Rationale
Companies not only outsource production, services and business processes but responsibilities, risks and opportunities as well. On one hand, outsourcing generally tends to increase a company's flexibility, but on the other hand, supply chain risks might become less apparent, new dependencies may arise, and the identification, monitoring and management of risks and opportunities in the supply chain may become more difficult.
The ability to systematically integrate sustainability objectives into the overall supply chain strategy shows a strategic dedication to making the supply chain more sustainable which will give the company a better position when it comes to leveraging opportunities and mitigating risks arising in the supply chain. This question aims to assess the extent to which sustainability is integrated into the supply chain strategy and how this is implemented into the business activities such as supplier selection.
Question Layout
Please indicate the main priorities of your company's general supply chain management strategy as well as the environmental, social and governance (ESG) objectives that have been identified in your company. Further, please indicate how ESG factors are integrated in your supplier selection decisions.
o General supply chain strategy Please provide a brief description of the top five priorities of your company's general supply chain management strategy and attach supporting evidence. Please note that this should refer to the general approach that the company is taking in order to manage the supply chain with regards to aspects such as cost, time, quality and continuity of supply and not to a sustainable sourcing or a sustainable supply chain strategy. Integration of ESG objectives: Please indicate which formalized environmental, social and governance (ESG) objectives have been identified for your supply chain management strategy. Further, indicate how these are connected to the overall supply chain strategy by providing supporting evidence. Please note that in this section you can refer to a sustainable sourcing strategy or a sustainable supply chain strategy as well as to objectives relating to ESG factors already integrated in the strategy above.
Type of supplier Description of ESG
objective Link to overall supply chain strategy
Key ESG
Objective 1
Key ESG
Objective 2
Integration of ESG factors into supplier selection Please complete the table below, indicating how ESG factors impact your supplier selection and retention process. Please attach supporting evidence and provide a brief description on the scale and approach for the minimum threshold for either new suppliers, existing suppliers or both.
Please indicate if the threshold is for
new suppliers, existing suppliers or
both:
Minimum quantitative/qualitative threshold required
(i.e. certified management systems in place, requiring to replicate own standards
down the supply chain, minimum score at ESG assessment, etc.):
Does your company use a % (weight) of ESG in the overall assessment of suppliers (compared to other factors such as price, quality and delivery time), as a tool to ensure integration of sustainability into supplier selection and retention decisions? If so, please provide an estimate of the average weight across supplier categories: _______ and indicate for which supplier categories this weight factor is being applied: _____
60 / 174
Economic Dimension - Supply Chain Management
Question-Specific Guidance & Definitions
In the first section we refer to the General Supply Chain Management Strategy, which does not refer to specific sustainability or ESG aspects but rather to the overall strategy and directives that guide sourcing and buyer decisions. In the second section we request information on ESG objectives and how they link to the overall strategy, and here you can refer to sustainability aspects of the general strategy if such objectives exist or to a separate sustainable sourcing strategy or similar. Our main aim is to see whether there might be conflicting requirements; for example, a general strategy focused on price and short lead times, and a sustainable sourcing policy that seeks to minimize air transport.
The percentage weight allocated to ESG factors in supplier selection refers to a practice in which sustainability or ESG criteria are considered an integral part of supplier selection, together with other factors such as price, quality and delivery time. It should be clear that such criteria are consistently applied across the product group for which this is indicated.
Tier 1 suppliers refer to suppliers that directly supply goods or services to the company
References
• GRI Standards 308-1 & 414-1 are relevant for thisquestion
61 / 174
Economic Dimension - Supply Chain Management
Supply Chain Transparency & Reporting Public: this question requires publicly available information.
Assessment Focus
Question Rationale
Companies not only outsource production, services and business processes but responsibilities, risks and opportunities as well. Outsourcing generally tends to increase a company's flexibility, but supply chain risks might become less apparent, new dependencies may arise, and the identification, monitoring and management of risks and opportunities in the supply chain may become more difficult.
To ensure credibility and trust amongst investors as well as other stakeholders, it is crucial that companies transparently report on processes as well as results connected to their supply chains. This question seeks to assess the extent to which companies are publicly reporting on aspects regarding supplier risk and performance.
Question Layout
Which aspects of your supply chain management approach does your company publicly report on (on a consolidated basis)? o We publicly report our supply chain management approach Supply chain management approach transparency Please attach supporting evidence and/or website where the information can be found in the public domain.
� Supply chain spend analysis (containing basic spend analysis information such as: number of suppliers, category, spend value and geographi cal spread)
� Supply chain awareness (identification of critical suppliers) � Supply chain risk assessment and corrective actions (e.g. supplier sustainability assessment) � ESG integration in supply chain management strategy (e.g. minimum thresholds or alignment of overall supply
chain management strategy with ESG objectives) Reporting Quantitative KPIs and targets Please indicate below the extent to which your company reports on supply chain management sustainability key performance indicators (KPIs) in the public domain and provide the targets linked to these indicators. The Annual Report, Sustainability Report and corporate website are considered to be relevant public communication sources. If available, please select KPIs with at least three years of history, well-defined targets and clear reporting on progress towards these targets.
Type of
supplier Please specify the KPI and attach the public
reference together with the page number where
the supply chain indicator is publicly reported:
Please specify the target that is linked to the KPI and attach
the public reference together with the page number where
the target of the supply indicator is publicly reported: KPI 1
KPI 2
KPI 3
Question-Specific Guidance & Definitions
This question aims to assess the transparency of the company’s supply chain reporting. Therefore, all the information presented here must be available in the public domain, and preferably referenced through a web link. Spend analysis refers to a full assessment of the supply chain, including information on each supplier. A typical spend analysis would include number of suppliers, category type, spend value and geographic spread. Please bear in mind that this analysis refers to the structure of the supply chain as a whole and does not specifically focus on environmental, social and governance (ESG) assessments of the supply chain. Disclosure of risk awareness refers to disclosures around the definition and identification of critical tier-1 and non-
tier 1 suppliers. Disclosure of risk assessment and corrective actions refers to measures taken to identify and mitigate identified risks, such as the approach to supplier assessments, monitoring and corrective action plans. Examples of KPIs relating to supply chain management include (but are not limited to) percentage of assessed suppliers, percentage of audited suppliers, KPIs related to the outcome of capacity-building activities, percentage of suppliers with contract clauses, percentage of suppliers with ISO14001 (or similar), percentage of procurement spent with preferred suppliers (according to sustainability criteria), number of suppliers rejected for sustainability reasons, scope 3 missions, suppliers' water use, percentage of procurement staffed trained on sustainability aspects. For each KPI reported, we also

62 / 174
Economic Dimension -
request details of targets and progress made towards meeting those targets.
Data Requirements
• The KPI must be quantitative and disclosed in the public domain
• Each KPI should have a target
• Each target should have a target year • Progress on the target should be publicly disclosed
63 / 174
Economic Dimension - Tax Strategy
Tax Strategy Tax competition between tax territories (countries or regions within countries) has left room for companies to optimize their tax spending. While tax optimization has a positive impact on profitability and hence company value, a too-aggressive tax strategy might not be sustainable in the mid- to long-term and adds some risk to long-term profits. First, there is a reputational risk because of increased public and regulatory scrutiny which could result in lower brand value. Second, the relationship with
the host country may be negatively impacted. This could result in approval delays or rejection of expansion projects or, in the worst cases, companies risk losing their license to operate. Third, earnings might be impacted if the tax authorities decide to change tax regulation which leads to direct financial risks. Finally, economic development risk arises if governments receive inadequate tax receipts for funding local infrastructure or education.
Tax Strategy and Governance Assessment Focus
Question Rationale
Tax avoidance strategies are usually set up in a legally sound way. Therefore, general statements about a company’s intention to comply with all tax laws and regulations in its countries of operation are not sufficient. Every company should be able to give a coherent justification of their approach to key tax issues such as the use of tax minimization techniques in line with their approach to other CSR issues. The adoption of a formal tax policy serves to guide company practices and provide investors, regulators and
other external stakeholders with an idea of the company’s tax risk profile, against which practices and disclosures can be compared. An effective policy should be overseen by the board of directors, created in conjunction with relevant senior management, and regularly reviewed to ensure emerging risks are addressed. This question seeks to determine if there is a group-wide tax policy or strategy available in the public domain that addresses sensitive or high-risk tax issues in a clear and sustainable way.
Question Layout
Does your company have a publicly available and group-wide tax policy, strategy or principles in place which indicate your approach towards taxation?
o Yes, we have a publicly available, group-wide tax policy covering the following elements. Please provide the relevant web link:
o A commitment to compliance with the spirit as well as the letter of the tax laws and regulations in the countries in which the company operates
o A commitment not to transfer value created to low tax jurisdictions o A commitment not to use tax structures without commercial substance o A commitment to undertake transfer pricing using the arm’s length principle o A commitment not to use secrecy jurisdictions or so-called "tax havens” for tax avoidance o An approval process of the tax policy by the board of directors
o No, we do not have a publicly available group-wide tax policy. o Not applicable. Please provide explanations in the comment box below. o Not known
Question-Specific Guidance & Definitions
Tax avoidance: Tax avoidance is an abuse of the tax system, a deliberate attempt to get out of an obligation to pay tax by entering into a set of artificial financial arrangements which have little or no commercial purpose other than the reduction of a tax bill. Tax avoidance is unethical in that it seeks to undermine tax law and public policy and it is frequently found to be unlawful. Tax avoidance can be within the letter, but not the spirit, of the law. (Source: TaxWatch) The spirit of the tax laws: This refers to the intention of the policy maker who wrote the respective law. The letter of the law: This refers to the literal interpretation of the law only. Low tax jurisdiction: For the purpose of this question, low
tax jurisdiction refers to any jurisdiction with significantly lower tax rates than other jurisdictions in which the company operates. The arm’s length principle: This valuation principle is commonly applied to commercial and financial transactions between related companies. It says that transactions should be valued as if they had been carried out between unrelated parties, each acting in their own best interest. Tax havens: (Offshore) countries or jurisdictions offering little or no tax liability. Tax havens may only share limited or no financial information with foreign tax authorities and may not require businesses to operate out their country to receive tax benefits. The board of directors: For the purpose of this question, this can refer to the board of directors, its sub-

64 / 174
Economic Dimension - Tax Strategy
committees, or a single named director. The tax policy must be approved or signed by the respective board representative(s), and /or clearly state their involvement in the creation of the tax policy. General statements regarding the responsibilities of the board of directors or regular reporting to the board are not enough.
Data Requirements
While many companies have group-wide tax accounting
policies with clearly defined roles and responsibilities within the organization in place, we specifically look for taxation policies that address issues such as responsible taxation, transparency, transfer pricing, etc., going beyond minimum legal tax disclosure requirements.
References
GRI Standard 207-1, 207-2 are relevant for this question.
65 / 174
Economic Dimension - Tax Strategy
Tax Reporting Public: this question requires publicly available information.
Assessment Focus
Question Rationale
Leading companies have realized that public reporting on their revenues, operating profits and tax on a country-by-country basis helps build trust in their corporation and complements the reporting on their broader economic contribution. In combination with key information about the names and tax residence of all constituent entities, the main activities by tax jurisdiction as well as the average number of employees help investors better understand a company’s tax profile and potential exposure to tax risks. If tax payments differ from the expected rates in a given jurisdiction, pro-active
companies can steer and facilitate the discussion about their tax contributions with all their stakeholders by explaining the reasons behind the difference in their reporting. In this question, we aim to identify to what extent companies report key information about their tax contributions in all tax jurisdictions where the entities included in their organization’s audited consolidated financial statements are resident for tax purposes.
Question Layout
Does your company publicly report on key business, financial and tax information for each tax jurisdiction where the entities included in your organization’s audited consolidated financial statements are resident for tax purposes? Please indicate where this information is available in your public reporting.
o Yes, we publicly report on the following for each tax jurisdiction in which we operate: o Names of all the resident entities o Primary activities o Number of employees o Revenue o Profit (Loss) before tax o Income tax accrued (current year) o Income tax paid
o No, we do not report on tax related metrics on a tax jurisdiction basis. o Not applicable. Please provide explanations in the comment box below. o Not known
Question-Specific Guidance & Definitions
A constituent entity is a separate business unit, or subsidiary, of a multi-national enterprise group that is included in the consolidated group for financial reporting purposes. This includes a permanent establishment if a separate income statement is prepared for regulatory, financial, internal management or tax purposes. A description of the primary activities by jurisdiction can be in the form of a short statement regarding the nature of the trade in the respective location (e.g. Sales, Marketing or Distribution, Manufacturing or Production, Purchasing or Procurement, R&D, Holding or Managing Intellectual Property, etc.). Revenues: All revenues, (extraordinary) gains and income, or other inflows shown in the financial statement prepared in accordance with the applicable accounting rules relating to profit and loss, such as the income statement or profit and loss statement, should be reported as revenues. Profit (Loss) before tax: Also referred to as pre-tax profit (loss), pre-tax income or earnings before tax (EBT). We also accept operating profit, earnings before interest and
tax (EBIT). Income Tax Accrued (Current year) is the amount of accrued current tax expense recorded on taxable profits or losses for the reporting fiscal year of all constituent entities resident for tax purposes in the relevant tax jurisdiction irrespective of whether or not the tax has been paid (E.g. Based on a preliminary tax assessment). The current tax expense only reflects operations in the current year and does not include deferred taxes or provisions for uncertain tax liabilities. However, for the purpose of this question, country-by country reporting on income tax expense, corporate income tax or current tax provisions is also accepted. Income Tax Paid (on Cash Basis) is the amount of corporate income taxes actually paid during the reporting fiscal year, which should thus include not only advanced payments fulfilling the relevant fiscal year’s tax obligation but also payments fulfilling the previous year(s)’ tax obligation (E.g. payment of the unpaid balance of corporate income tax accrued in relation to the previous year(s), including payments related to reassessments of previous years), regardless of whether those taxes have been paid under protest. Consolidated taxes paid that include other items such as value added tax, social
66 / 174
Economic Dimension - Tax Strategy
security taxes, regional or industry-specific taxes are not accepted. The amount of Income Tax Accrued (Current Year) and Income Tax Paid (on Cash Basis) should be reported independently. The Number of Employees should reflect the average number of FTEs (full-time equivalents) during the reporting fiscal year, or a similar number, provided that it is applied consistently across the jurisdictions. Reasonable rounding is permissible, if it does not materially distort the relative distribution of employees across tax jurisdictions.
Data Requirements
Please note: The tax data disclosed should fully reconcile with the corresponding information in the consolidated income statement. To receive credit for comprehensive country-by-country reporting, we expect the countries reported on to cover at least 90% of the respective financial metric. This means that in order to receive credit for all boxes, we expect distinct disclosure for each of the metrics below, disclosing at least 90% of the respective consolidated total values in the income statement:
• Revenues • Profit (loss) before tax • Income tax accrued (current year)
• Income tax paid (cash basis) In case at least 90% of the respective metric (e.g. revenues) comes from one country (e.g. “domestic”), the remaining amount of the respective metric has to be summarized as "Other", "Foreign", "International" or similar. The disclosed metrics must fully reconcile with the corresponding figures in the consolidated income statement. If there is more than one constituent entity in a jurisdiction, the numbers can be reported on an aggregate basis at a jurisdictional level. Accordingly, data should be reported on an aggregated basis, regardless of whether the transactions occurred cross-border or within the jurisdiction, or between related parties or unrelated parties. If possible, however, companies should report consolidated figures if consolidated data can be reported for each jurisdiction. Companies should state clearly if the data is reported on an aggregated or consolidated basis. To receive credit for public reporting on the names of constituent entities, the primary activities and the number of employees, companies are expected to clearly state that the information includes all constituent entities of the organization.
References
GRI Standard 207-4 is relevant for this question. OECD / G20: Base Erosion and Profit Shifting – Action 13
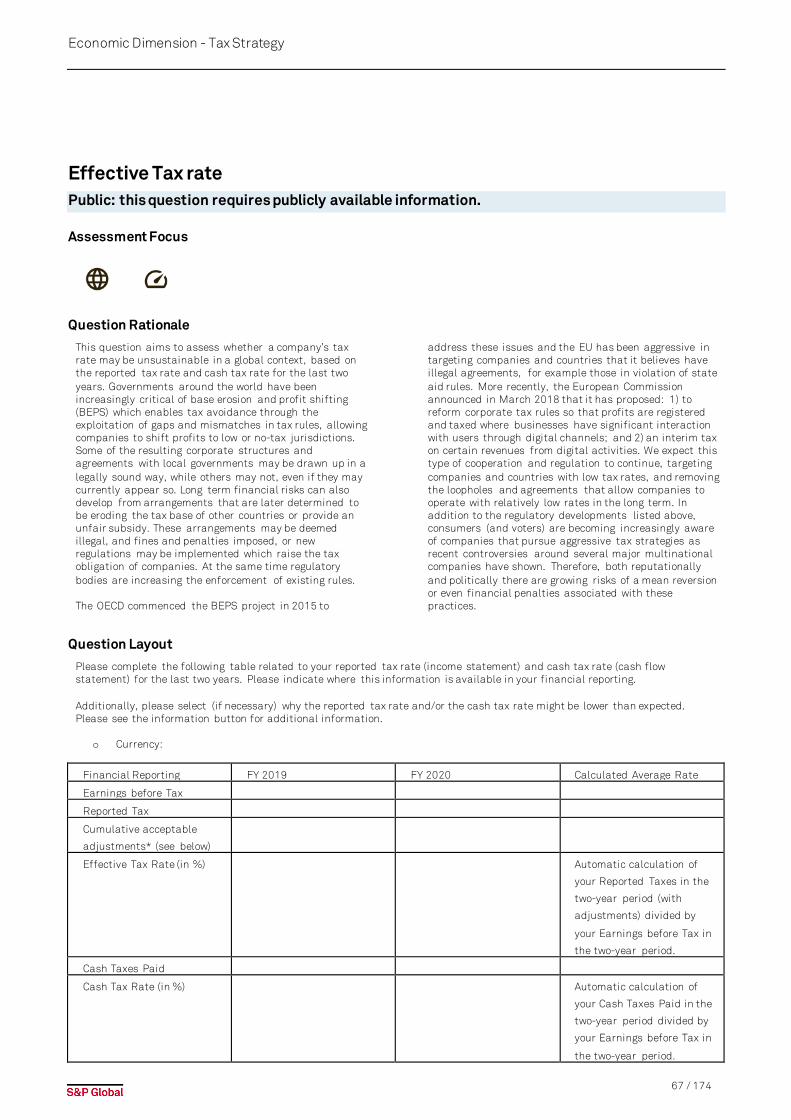
67 / 174
Economic Dimension - Tax Strategy
Effective Tax rate Public: this question requires publicly available information.
Assessment Focus
Question Rationale
This question aims to assess whether a company’s tax rate may be unsustainable in a global context, based on the reported tax rate and cash tax rate for the last two years. Governments around the world have been increasingly critical of base erosion and profit shifting (BEPS) which enables tax avoidance through the exploitation of gaps and mismatches in tax rules, allowing companies to shift profits to low or no-tax jurisdictions. Some of the resulting corporate structures and agreements with local governments may be drawn up in a legally sound way, while others may not, even if they may currently appear so. Long term financial risks can also develop from arrangements that are later determined to be eroding the tax base of other countries or provide an unfair subsidy. These arrangements may be deemed illegal, and fines and penalties imposed, or new regulations may be implemented which raise the tax obligation of companies. At the same time regulatory bodies are increasing the enforcement of existing rules. The OECD commenced the BEPS project in 2015 to
address these issues and the EU has been aggressive in targeting companies and countries that it believes have illegal agreements, for example those in violation of state aid rules. More recently, the European Commission announced in March 2018 that it has proposed: 1) to reform corporate tax rules so that profits are registered and taxed where businesses have significant interaction with users through digital channels; and 2) an interim tax on certain revenues from digital activities. We expect this type of cooperation and regulation to continue, targeting companies and countries with low tax rates, and removing the loopholes and agreements that allow companies to operate with relatively low rates in the long term. In addition to the regulatory developments listed above, consumers (and voters) are becoming increasingly aware of companies that pursue aggressive tax strategies as recent controversies around several major multinational companies have shown. Therefore, both reputationally and politically there are growing risks of a mean reversion or even financial penalties associated with these practices.
Question Layout
Please complete the following table related to your reported tax rate (income statement) and cash tax rate (cash flow statement) for the last two years. Please indicate where this information is available in your financial reporting. Additionally, please select (if necessary) why the reported tax rate and/or the cash tax rate might be lower than expected. Please see the information button for additional information.
o Currency:
Financial Reporting FY 2019 FY 2020 Calculated Average Rate
Earnings before Tax
Reported Tax
Cumulative acceptable
adjustments* (see below)
Effective Tax Rate (in %) Automatic calculation of
your Reported Taxes in the
two-year period (with
adjustments) divided by
your Earnings before Tax in
the two-year period.
Cash Taxes Paid
Cash Tax Rate (in %) Automatic calculation of
your Cash Taxes Paid in the
two-year period divided by
your Earnings before Tax in
the two-year period.
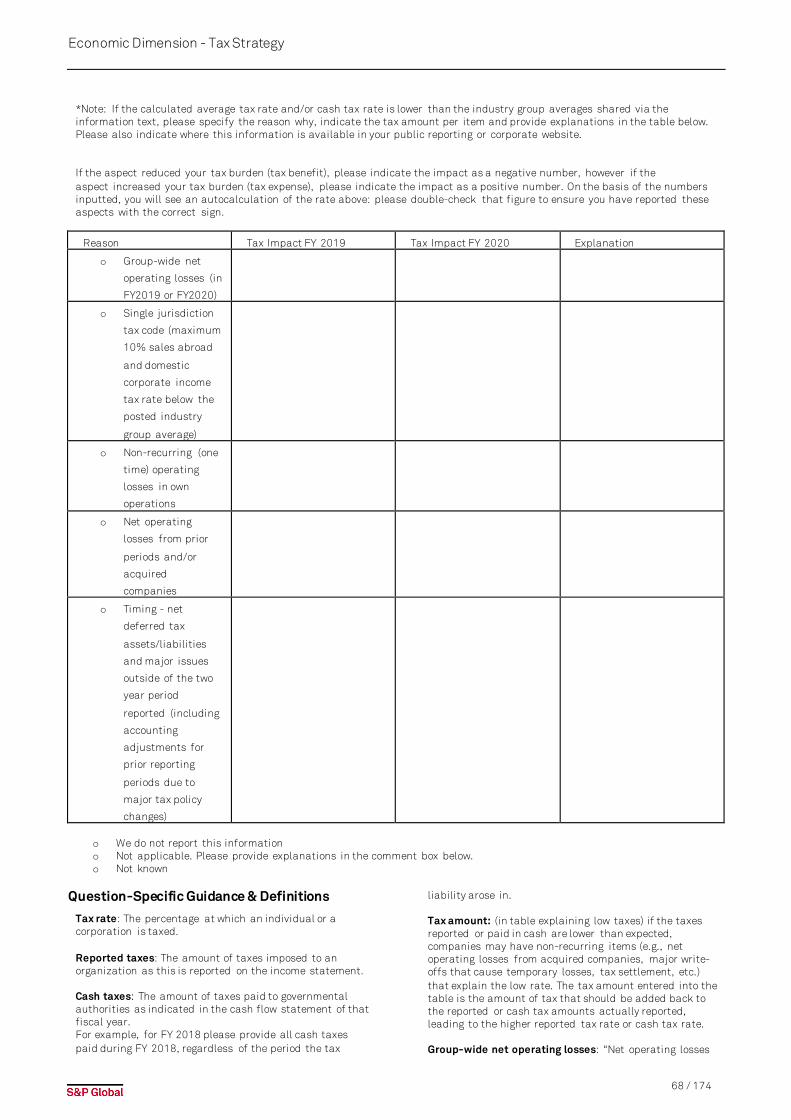
68 / 174
Economic Dimension - Tax Strategy
*Note: If the calculated average tax rate and/or cash tax rate is lower than the industry group averages shared via the information text, please specify the reason why, indicate the tax amount per item and provide explanations in the table below. Please also indicate where this information is available in your public reporting or corporate website. If the aspect reduced your tax burden (tax benefit), please indicate the impact as a negative number, however if the aspect increased your tax burden (tax expense), please indicate the impact as a positive number. On the basis of the numbers inputted, you will see an autocalculation of the rate above: please double-check that figure to ensure you have reported these aspects with the correct sign.
Reason Tax Impact FY 2019 Tax Impact FY 2020 Explanation
o Group-wide net
operating losses (in
FY2019 or FY2020)
o Single jurisdiction
tax code (maximum
10% sales abroad
and domestic
corporate income
tax rate below the
posted industry
group average)
o Non-recurring (one
time) operating
losses in own
operations
o Net operating
losses from prior
periods and/or
acquired
companies
o Timing - net
deferred tax
assets/liabilities
and major issues
outside of the two
year period
reported (including
accounting
adjustments for
prior reporting
periods due to
major tax policy
changes)
o We do not report this information o Not applicable. Please provide explanations in the comment box below. o Not known
Question-Specific Guidance & Definitions
Tax rate: The percentage at which an individual or a corporation is taxed. Reported taxes: The amount of taxes imposed to an organization as this is reported on the income statement. Cash taxes: The amount of taxes paid to governmental authorities as indicated in the cash flow statement of that fiscal year. For example, for FY 2018 please provide all cash taxes paid during FY 2018, regardless of the period the tax
liability arose in. Tax amount: (in table explaining low taxes) if the taxes reported or paid in cash are lower than expected, companies may have non-recurring items (e.g., net operating losses from acquired companies, major write-offs that cause temporary losses, tax settlement, etc.) that explain the low rate. The tax amount entered into the table is the amount of tax that should be added back to the reported or cash tax amounts actually reported, leading to the higher reported tax rate or cash tax rate. Group-wide net operating losses: “Net operating losses
69 / 174
Economic Dimension - Tax Strategy
(NOL) are a tax credit created when a company's expenses exceed its revenues, generating negative taxable income as computed for tax purposes. NOL can be used to offset positive taxable income, reducing cash taxes payable. NOL can be carried back 2 years to recover past taxes paid, and forward 20 years to offset taxable income in future periods. After 20 years, any remaining NOL expire and are no longer available for use. NOL carried forward are recorded on the balance sheet as deferred tax assets (DTA).” Source: Macabacus In the case a company has group-wide losses, there is no associated amount, since there is no income. Non-recurring (one-time) losses in own operations: Non-recurring (one-time) losses are irregular or infrequent losses (e.g., write-off of a large investment, large settlement or fine) that would offset ongoing income generated. Net operating losses from acquired companies: This option refers to “taxable acquisitions in which the acquired net assets are stepped-up for tax purposes, the target's net operating losses (NOL) may generally be used immediately by the acquirer to offset the gain on the actual or deemed asset sale.” Source: Macabacus Single jurisdiction tax code: (e.g. low domestic rate and maximum 10% sales abroad) Certain countries (e.g. Ireland) have a low tax rate for companies. Therefore, certain countries will have a lower tax rate than the average in the industry. If your company has more than 90% of sales domestically, this option can be ticked. Timing – Issues outside of the two years period: This option refers to an event that happened outside of the two years and was carried forward to the two last fiscal years. This could be losses from a company's own operations as described above, or due to a tax deal reached with the government. The net change in valuation allowance can be accepted as timing issue, provided the specific effect is clearly described in the public reporting.
Data Requirements
Earnings before Tax (EBT) may also be known as Operating Income before Tax or Profit before Tax and is often a unique line item on the income statement. Two years of data are required. To get a sense of whether your company's "calculated average tax rate and/or cash tax rate is lower than it might be expected by a stakeholder," please review the Average Effective Tax Rate & Cash Tax Rate for each of the 24
GICS® Industry Groups, on page 60 of the CSA Companion. In order to establish these industry group-specific thresholds, we've updated our original, Bloomberg-based research on the basis of the data we collected via the 2018 Corporate Sustainability Assessment. We took each company's average effective tax rate, and cash tax rate, respectively, and averaged over all the rates reported for that industry group worldwide. Public disclosure requirements: Public disclosure of the following items for the last two fiscal years:
• Earnings before tax • Reported taxes • Reported tax rate • Cash taxes paid • Cash tax rate
As stated in the question text: completion of the second table of the question is not required, however, if it is completed, we expect supporting evidence in the public domain. If any of the following items have been selected, then these should be reported publicly, as well as the corresponding tax impact (if relevant for the selected option):
• Group-wide net operating losses • Non-recurring (one time) operating losses in own
operations • Net operating losses from acquired companies • Single jurisdiction tax code (e.g. low domestic rate
and maximum 10% sales abroad) • Timing - issues outside of the two year period
reported
References
• Average Effective Tax Rate & Cash Tax Rate for each of the 24 GICS® Industry Groups, please see the CSA Companion, page 60
• Organization for Economic Co-operation and Development (OECD) framework “Base Erosion and Profit Shifting (BEPS)"
• Fair Tax, retrieved from: https://fairtaxmark.net/wp-content/uploads/2014/01/How-Compani es-Avoid-Tax.pdf
• Macabacus: http://macabacus.com/taxes/net-operating-loss
•
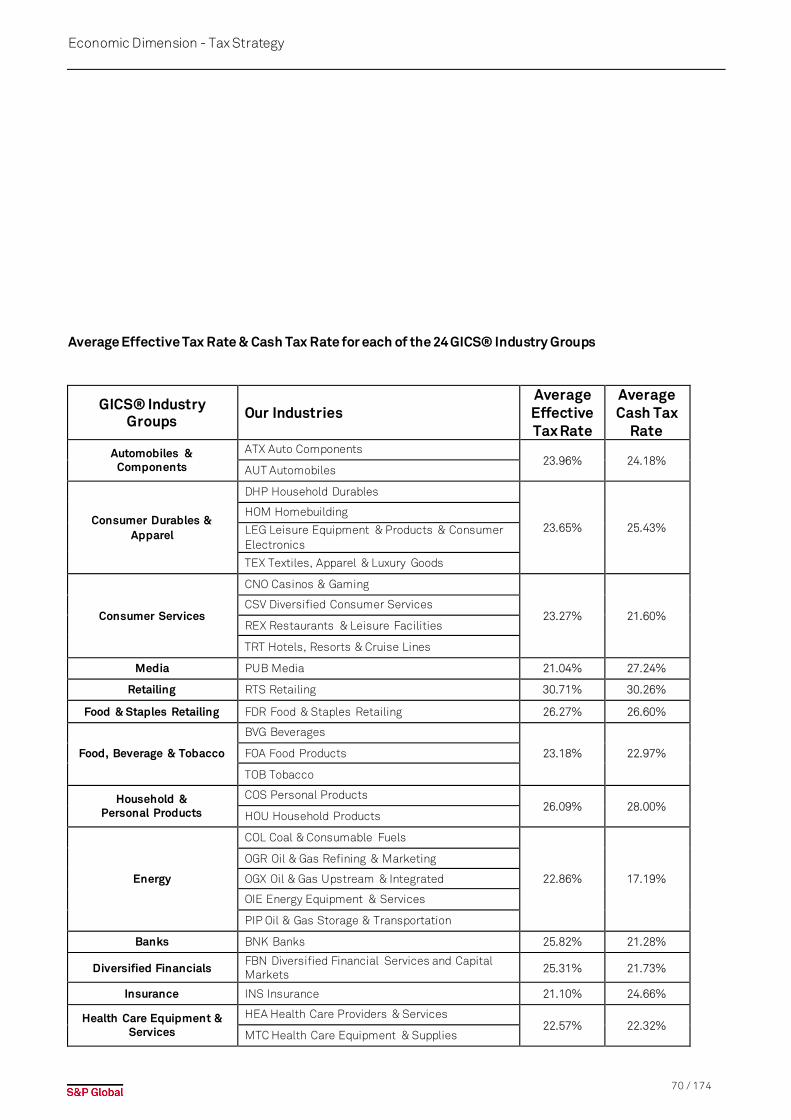
70 / 174
Economic Dimension - Tax Strategy
Average Effective Tax Rate & Cash Tax Rate for each of the 24 GICS® Industry Groups
GICS® Industry Groups Our Industries
Average Effective Tax Rate
Average Cash Tax
Rate Automobiles &
Components
ATX Auto Components 23.96% 24.18%
AUT Automobiles
Consumer Durables & Apparel
DHP Household Durables
23.65% 25.43% HOM Homebuilding
LEG Leisure Equipment & Products & Consumer Electronics
TEX Textiles, Apparel & Luxury Goods
Consumer Services
CNO Casinos & Gaming
23.27% 21.60% CSV Diversified Consumer Services
REX Restaurants & Leisure Facilities
TRT Hotels, Resorts & Cruise Lines
Media PUB Media 21.04% 27.24%
Retailing RTS Retailing 30.71% 30.26%
Food & Staples Retailing FDR Food & Staples Retailing 26.27% 26.60%
Food, Beverage & Tobacco
BVG Beverages
23.18% 22.97% FOA Food Products
TOB Tobacco
Household & Personal Products
COS Personal Products 26.09% 28.00%
HOU Household Products
Energy
COL Coal & Consumable Fuels
22.86% 17.19%
OGR Oil & Gas Refining & Marketing
OGX Oil & Gas Upstream & Integrated
OIE Energy Equipment & Services
PIP Oil & Gas Storage & Transportation
Banks BNK Banks 25.82% 21.28%
Diversified Financials FBN Diversified Financial Services and Capital Markets 25.31% 21.73%
Insurance INS Insurance 21.10% 24.66%
Health Care Equipment & Services
HEA Health Care Providers & Services 22.57% 22.32%
MTC Health Care Equipment & Supplies
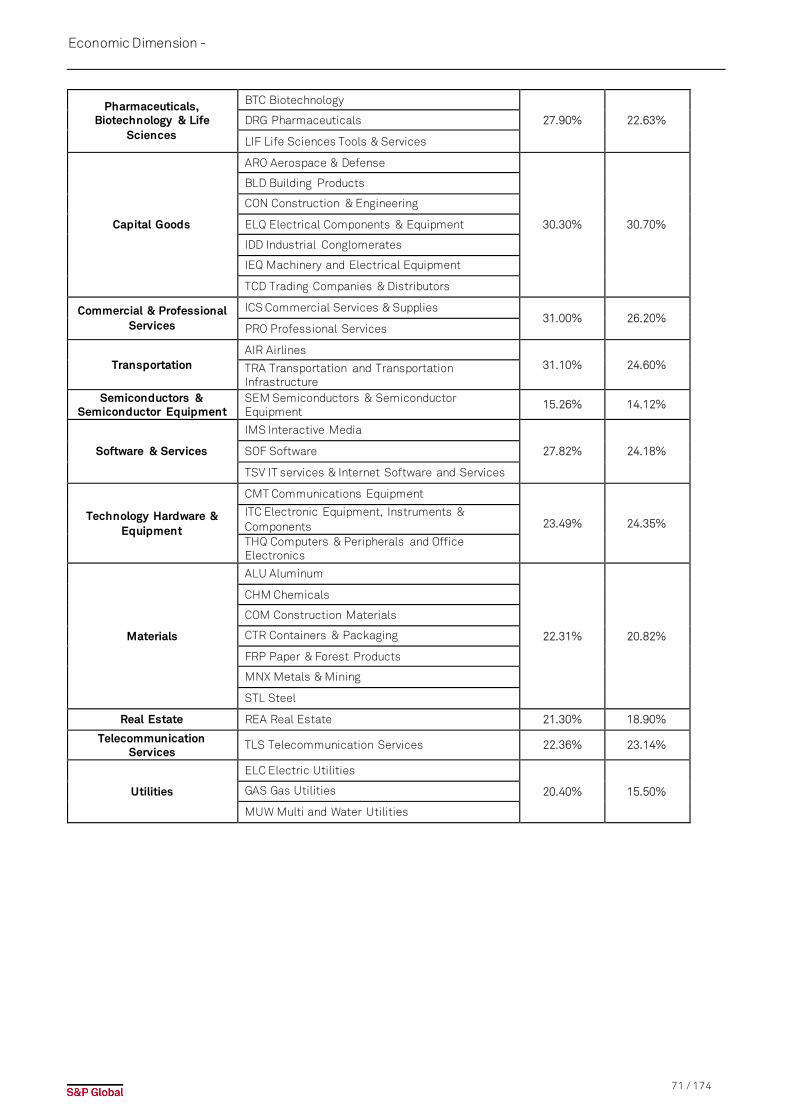
71 / 174
Economic Dimension -
Pharmaceuticals, Biotechnology & Life
Sciences
BTC Biotechnology
27.90% 22.63% DRG Pharmaceuticals
LIF Life Sciences Tools & Services
Capital Goods
ARO Aerospace & Defense
30.30% 30.70%
BLD Building Products
CON Construction & Engineering
ELQ Electrical Components & Equipment
IDD Industrial Conglomerates
IEQ Machinery and Electrical Equipment
TCD Trading Companies & Distributors
Commercial & Professional Services
ICS Commercial Services & Supplies 31.00% 26.20%
PRO Professional Services
Transportation AIR Airlines
31.10% 24.60% TRA Transportation and Transportation Infrastructure
Semiconductors & Semiconductor Equipment
SEM Semiconductors & Semiconductor Equipment
15.26% 14.12%
Software & Services
IMS Interactive Media
27.82% 24.18% SOF Software
TSV IT services & Internet Software and Services
Technology Hardware & Equipment
CMT Communications Equipment
23.49% 24.35% ITC Electronic Equipment, Instruments & Components THQ Computers & Peripherals and Office Electronics
Materials
ALU Aluminum
22.31% 20.82%
CHM Chemicals
COM Construction Materials
CTR Containers & Packaging
FRP Paper & Forest Products
MNX Metals & Mining
STL Steel
Real Estate REA Real Estate 21.30% 18.90%
Telecommunication Services
TLS Telecommunication Services 22.36% 23.14%
Utilities
ELC Electric Utilities
20.40% 15.50% GAS Gas Utilities
MUW Multi and Water Utilities

72 / 174
Economic Dimension -
Information Security/Cybersecurity & System Availability Due to the current trend of digitization, including but not limited to cloud computing, online marketplaces and payments etc., it is crucial that access to network, IT systems and data is assured at all times. As a result, lower than agreed upon system performance or service disruptions can result in higher costs and reputational risk for companies. The main risks stem from technical failure, human error, malicious attacks, weather events, natural disasters or terrorist attacks. Managing such risks, including contingency plans, is crucial to ensuring business continuity. The criterion focuses on how well companies are prepared to prevent IT system failures and major information security/cybersecurity incidents and if they can react appropriately in case of such events. It also evaluates whether companies have experienced IT infrastructure / information security /cybersecurity incidents in the past and if there was material financial impact.
Over the past decade, the number of information security breaches has been growing exponentially. The many incidents and their related costs have shown that information security/cybersecurity has become a financially material issue which has to be managed diligently to protect corporate value. The costs of cybercrime are manifold and can impact the company in different ways. Internal costs are operational costs and relate to dealing with the cybercrime and incidence prevention. External costs include the consequences of the cyber-attack such as the loss or theft of sensitive information, operations' disruption, fines and penalties, infrastructure damage or revenue losses due to loss of customers. The criterion focuses on how well companies are prepared to prevent major information security/cybersecurity incidents and if they can react appropriately in case of an attack. It also evaluates whether companies have experienced information security/cybersecurity incidents in the past and what the financial consequences were.
IT Security/Cybersecurity Governance Partially public: additional credit will be granted for relevant publicly available evidence.
Assessment Focus
Question Rationale
Due to the current trend of digitization, including but not limited to cloud computing, online marketplaces and payments etc., it is crucial that access to network, IT systems and data is assured at all times. As a result, lower than agreed upon system performance or service disruptions can result in higher costs and reputational risk for companies. The main risks stem from technical failure, human error, malicious attacks, weather events, natural disasters or terrorist attacks. Managing such risks, including contingency plans, is crucial to ensuring business continuity. Over the past decade, the number of information security breaches has grown exponentially with some attacks
reaching unprecedented scale and the cyber threat landscape continues to grow and evolve, abusing existing and new technologies and exploiting vulnerable users. These incidents and the related costs have shown that information security/cybersecurity has become a financially material issue which must be diligently managed to protect corporate value. The costs of cyberattack are manifold and can impact the company in different ways. Internal costs are operational costs and relate to dealing with cybercrime and incidence prevention. External costs include the consequences of the cyber-attack such as the loss or theft of sensitive information, operations' disruption, fines and penalties, infrastructure damage or revenue losses due to loss of
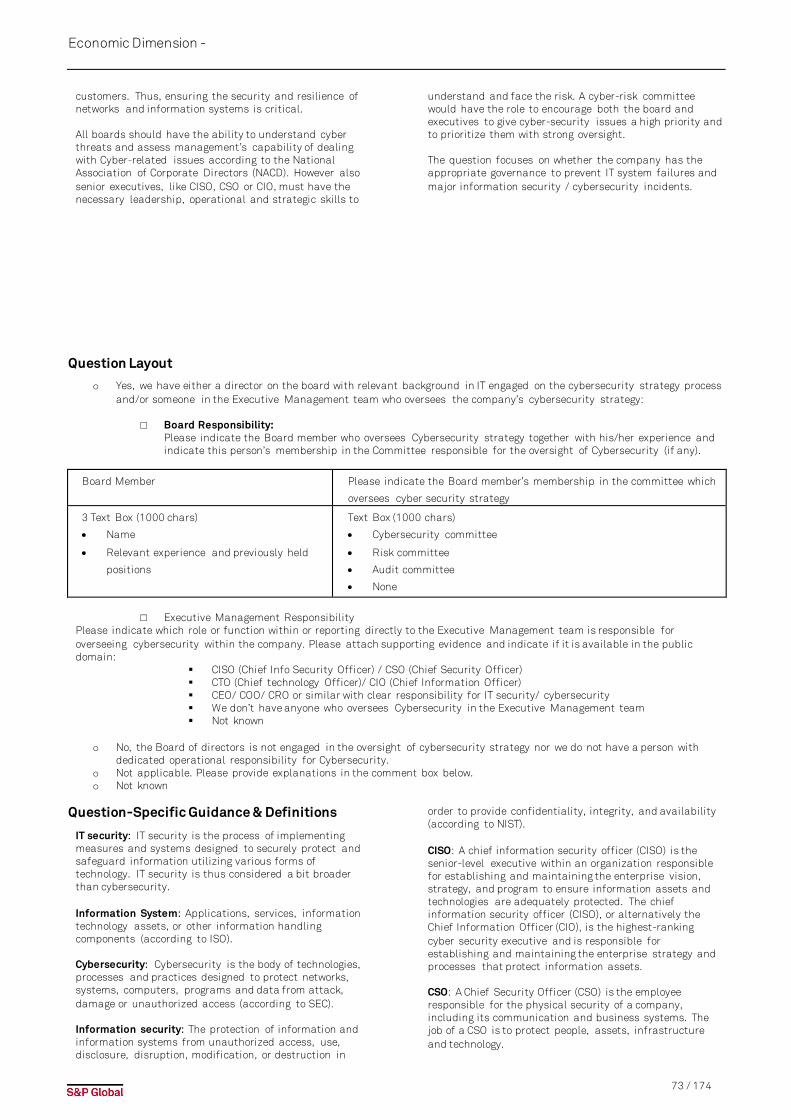
73 / 174
Economic Dimension -
customers. Thus, ensuring the security and resilience of networks and information systems is critical. All boards should have the ability to understand cyber threats and assess management’s capability of dealing with Cyber-related issues according to the National Association of Corporate Directors (NACD). However also senior executives, like CISO, CSO or CIO, must have the necessary leadership, operational and strategic skills to
understand and face the risk. A cyber-risk committee would have the role to encourage both the board and executives to give cyber-security issues a high priority and to prioritize them with strong oversight. The question focuses on whether the company has the appropriate governance to prevent IT system failures and major information security / cybersecurity incidents.
Question Layout
o Yes, we have either a director on the board with relevant background in IT engaged on the cybersecurity strategy process and/or someone in the Executive Management team who oversees the company’s cybersecurity strategy:
□ Board Responsibility:
Please indicate the Board member who oversees Cybersecurity strategy together with his/her experience and indicate this person’s membership in the Committee responsible for the oversight of Cybersecurity (if any).
Board Member Please indicate the Board member’s membership in the committee which
oversees cyber security strategy
3 Text Box (1000 chars)
• Name
• Relevant experience and previously held
positions
Text Box (1000 chars)
• Cybersecurity committee
• Risk committee
• Audit committee
• None
□ Executive Management Responsibility
Please indicate which role or function within or reporting directly to the Executive Management team is responsible for overseeing cybersecurity within the company. Please attach supporting evidence and indicate if it is available in the public domain:
CISO (Chief Info Security Officer) / CSO (Chief Security Officer) CTO (Chief technology Officer)/ CIO (Chief Information Officer) CEO/ COO/ CRO or similar with clear responsibility for IT security/ cybersecurity We don’t have anyone who oversees Cybersecurity in the Executive Management team Not known
o No, the Board of directors is not engaged in the oversight of cybersecurity strategy nor we do not have a person with
dedicated operational responsibility for Cybersecurity. o Not applicable. Please provide explanations in the comment box below. o Not known
Question-Specific Guidance & Definitions
IT security: IT security is the process of implementing measures and systems designed to securely protect and safeguard information utilizing various forms of technology. IT security is thus considered a bit broader than cybersecurity. Information System: Applications, services, information technology assets, or other information handling components (according to ISO). Cybersecurity: Cybersecurity is the body of technologies, processes and practices designed to protect networks, systems, computers, programs and data from attack, damage or unauthorized access (according to SEC). Information security: The protection of information and information systems from unauthorized access, use, disclosure, disruption, modification, or destruction in
order to provide confidentiality, integrity, and availability (according to NIST). CISO: A chief information security officer (CISO) is the senior-level executive within an organization responsible for establishing and maintaining the enterprise vision, strategy, and program to ensure information assets and technologies are adequately protected. The chief information security officer (CISO), or alternatively the Chief Information Officer (CIO), is the highest-ranking cyber security executive and is responsible for establishing and maintaining the enterprise strategy and processes that protect information assets. CSO: A Chief Security Officer (CSO) is the employee responsible for the physical security of a company, including its communication and business systems. The job of a CSO is to protect people, assets, infrastructure and technology.
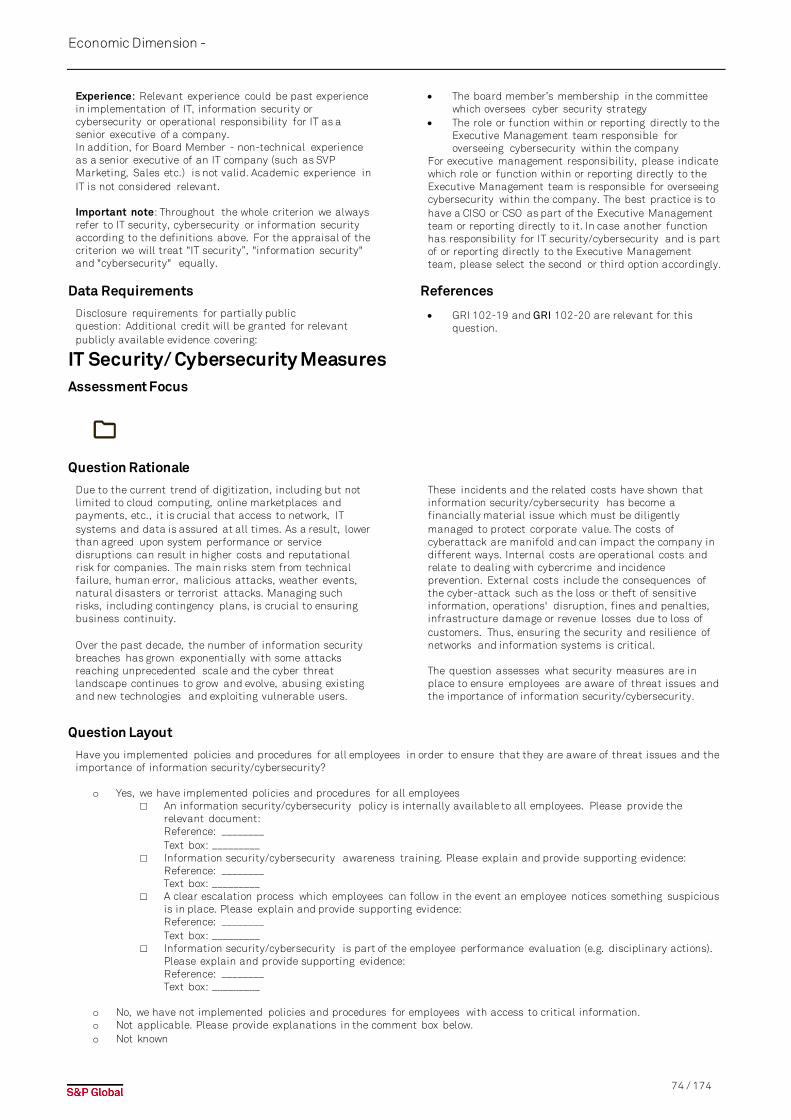
74 / 174
Economic Dimension -
Experience: Relevant experience could be past experience in implementation of IT, information security or cybersecurity or operational responsibility for IT as a senior executive of a company. In addition, for Board Member - non-technical experience as a senior executive of an IT company (such as SVP Marketing, Sales etc.) is not valid. Academic experience in IT is not considered relevant. Important note: Throughout the whole criterion we always refer to IT security, cybersecurity or information security according to the definitions above. For the appraisal of the criterion we will treat “IT security”, "information security" and "cybersecurity" equally.
Data Requirements
Disclosure requirements for partially public question: Additional credit will be granted for relevant publicly available evidence covering:
• The board member’s membership in the committee which oversees cyber security strategy
• The role or function within or reporting directly to the Executive Management team responsible for overseeing cybersecurity within the company
For executive management responsibility, please indicate which role or function within or reporting directly to the Executive Management team is responsible for overseeing cybersecurity within the company. The best practice is to have a CISO or CSO as part of the Executive Management team or reporting directly to it. In case another function has responsibility for IT security/cybersecurity and is part of or reporting directly to the Executive Management team, please select the second or third option accordingly.
References
• GRI 102-19 and GRI 102-20 are relevant for this question.
IT Security/ Cybersecurity Measures Assessment Focus
Question Rationale
Due to the current trend of digitization, including but not limited to cloud computing, online marketplaces and payments, etc., it is crucial that access to network, IT systems and data is assured at all times. As a result, lower than agreed upon system performance or service disruptions can result in higher costs and reputational risk for companies. The main risks stem from technical failure, human error, malicious attacks, weather events, natural disasters or terrorist attacks. Managing such risks, including contingency plans, is crucial to ensuring business continuity. Over the past decade, the number of information security breaches has grown exponentially with some attacks reaching unprecedented scale and the cyber threat landscape continues to grow and evolve, abusing existing and new technologies and exploiting vulnerable users.
These incidents and the related costs have shown that information security/cybersecurity has become a financially material issue which must be diligently managed to protect corporate value. The costs of cyberattack are manifold and can impact the company in different ways. Internal costs are operational costs and relate to dealing with cybercrime and incidence prevention. External costs include the consequences of the cyber-attack such as the loss or theft of sensitive information, operations' disruption, fines and penalties, infrastructure damage or revenue losses due to loss of customers. Thus, ensuring the security and resilience of networks and information systems is critical. The question assesses what security measures are in place to ensure employees are aware of threat issues and the importance of information security/cybersecurity.
Question Layout
Have you implemented policies and procedures for all employees in order to ensure that they are aware of threat issues and the importance of information security/cybersecurity?
o Yes, we have implemented policies and procedures for all employees □ An information security/cybersecurity policy is internally available to all employees. Please provide the
relevant document: Reference: ________ Text box: _________
□ Information security/cybersecurity awareness training. Please explain and provide supporting evidence: Reference: ________ Text box: _________
□ A clear escalation process which employees can follow in the event an employee notices something suspicious is in place. Please explain and provide supporting evidence: Reference: ________ Text box: _________
□ Information security/cybersecurity is part of the employee performance evaluation (e.g. disciplinary actions). Please explain and provide supporting evidence: Reference: ________ Text box: _________
o No, we have not implemented policies and procedures for employees with access to critical information. o Not applicable. Please provide explanations in the comment box below. o Not known

75 / 174
Economic Dimension -
Question-Specific Guidance & Definitions
IT security: IT security is the process of implementing measures and systems designed to securely protect and safeguard information utilizing various forms of technology. IT security is thus considered a bit broader than cybersecurity. Information System: Applications, services, information technology assets, or other information handling components (according to ISO). Cybersecurity: Cybersecurity is the body of technologies, processes and practices designed to protect networks, systems, computers, programs and data from attack, damage or unauthorized access (according to SEC).
Information security: The protection of information and information systems from unauthorized access, use, disclosure, disruption, modification, or destruction in order to provide confidentiality, integrity, and availability (according to NIST). Important note: Throughout the whole criterion we always refer to IT security, cybersecurity or information security according to the definitions above. For the appraisal of the criterion we will treat “IT security”, "information security" and "cybersecurity" equally.
References • GRI 102-20 is relevant for this question.
IT Security/ Cybersecurity Process & Infrastructure Assessment Focus
Question Rationale
Due to the current trend of digitization, including but not limited to cloud computing, online marketplaces and payments, etc., it is crucial that access to network, IT systems and data is assured at all times. As a result, lower than agreed upon system performance or service disruptions can result in higher costs and reputational risk for companies. The main risks stem from technical failure, human error, malicious attacks, weather events, natural disasters or terrorist attacks. Managing such risks, including contingency plans, is crucial to ensuring business continuity. Over the past decade, the number of information security breaches has grown exponentially with some attacks reaching unprecedented scale and the cyber threat landscape continues to grow and evolve, abusing existing and new technologies and exploiting vulnerable users. These incidents and the related costs have shown that
information security/cybersecurity has become a financially material issue which must be diligently managed to protect corporate value. The costs of cyberattack are manifold and can impact the company in different ways. Internal costs are operational costs and relate to dealing with cybercrime and incidence prevention. External costs include the consequences of the cyber-attack such as the loss or theft of sensitive information, operations' disruption, fines and penalties, infrastructure damage or revenue losses due to loss of customers. Thus, ensuring the security and resilience of networks and information systems is critical. The question focuses on how well companies are prepared to prevent major IT infrastructure and information security/cybersecurity incidents and if they can react appropriately in the event of such events.
Question Layout
o Incident response Do you have business continuity / contingency plans and incident response procedures in place and how often do you test them? Please provide supporting evidence.
o Yes, and we test them at least semi-annually
o Yes, and we test them at least annually o Yes, but frequency is not specified o No, we do not have such plans and
procedures in place Certification Is your IT infrastructure and information security management system certified to ISO 27001, NIST or similar?
o Yes, the following percentage of our IT infrastructure has been certified: _______
o No, our IT infrastructure has not been certified.
External verification and Vulnerability Analysis Please indicate if there are other additional procedures implemented to assure the security of the IT infrastructure / information security management systems.
o Our IT infrastructure and information security management systems have been audited by external auditors in the last fiscal year. Please provide letter of opinion from the external auditor.
o We conduct third-party vulnerability analysis including simulated hacker attacks. Please provide supporting evidence
o We do not have processes and infrastructure in
place to prevent and/or respond to cyberattacks. o Not applicable. Please provide explanations in the
comment box below. o Not known

76 / 174
Economic Dimension -
77 / 174
Economic Dimension -
Question-Specific Guidance & Definitions
IT security: IT security is the process of implementing measures and systems designed to securely protect and safeguard information utilizing various forms of technology. IT security is thus considered a bit broader than cybersecurity. Information System: Applications, services, information technology assets, or other information handling components (Source: ISO). Cybersecurity: Cybersecurity is the body of technologies, processes and practices designed to protect networks, systems, computers, programs and data from attack, damage or unauthorized access (Source: SEC). Information security: The protection of information and information systems from unauthorized access, use, disclosure, disruption, modification, or destruction in order to provide confidentiality, integrity, and availability (Source: NIST). Vulnerability Analysis (aka Vulnerability Assessment aka VA): A vulnerability analysis is the process of defining, identifying, classifying and prioritizing vulnerabilities in computer systems, applications and network infrastructures and providing the organization doing the assessment with the necessary knowledge, awareness and risk background to understand the threats to its environment and react appropriately (Source: ISACA) Important note: Throughout the whole criterion we always refer to IT security, cybersecurity or information security according to the definitions above. For the appraisal of the criterion, we will treat “IT security”, "information security" and "cybersecurity" equally.
Data Requirements
Vulnerability analysis: We expect to see evidence that a vulnerability analysis was conducted and that this analysis included simulated hacker attacks. The analysis and testing should be performed by a third party with appropriate certification. Please note: Non-IT companies can also calculate the percentage of certified IT infrastructure based on the percentage of certified IT products by external vendors.
References
External management standards and frameworks include but are not limited to: • ISO/IEC 27001:2013 – Information technology –
Security techniques – Information security management systems – Requirements
• “Framework for Improving Critical Infrastructure
Cybersecurity, Version 1.0,” February 12, 2014, National Institute of Standards and Technology (NIST)

78 / 174
Environmental Dimension - Environmental Reporting
Environmental DimensionEnvironmental Reporting
Environmental performance is becoming a material issue in all industries. Maintaining transparency through appropriate reporting, and monitoring it at the board level, increases stakeholders' and customers' trust and positively influences the company's reputation and brand equity. While disclosure levels are increasing, quality of
reporting varies significantly. Our questions focus on the relevance, scope and timeliness of the information contained in environmental reports, as well as external quality guarantees based on internationally acknowledged reporting standards.
Environmental Reporting- Coverage Public: this question requires publicly available information.
Assessment Focus
Question Rationale
The quality and availability of the information in the public domain gives an indication of the company’s proficiency in environmental reporting. The greater the scope of the information it discloses, the more it is representative of its
business activities as a whole, and the more likely it is to be used by investors as it will provide a more accurate picture of the overall environmental impacts of the company’s business activities.
Question Layout
Does your company publicly report on quantitative environmental indicators? If yes, please indicate where the coverage of these indicators is clearly indicated in your public reporting.
o Yes, we publicly report on environmental indicators. Please select the coverage of the company's publicly available environmental indicators from the dropdown list below (select ONLY if the coverage is the same for all environmental indicators your company reports on):
Dropdown menu: <25 Please indicate the weblink and the page number where the coverage for all environmental indicators is indicated (in the public domain):
o We report on environmental indicators, but only provide coverage for some environmental data/indicators in our public reporting. Please specify for the three environmental indicators where you have the highest available coverage (select ONLY if you report coverage for individual indicators but not for the full report):
Environmental Indicator,
please specify:
Coverage of Indicator (% of
revenues or business
operations)
Please indicate the weblink and page number
where the coverage for the environmental
indicator is publicly reported:
o We report on environmental indicators, but do not clearly indicate the coverage of the data in our public reporting o We do not report on environmental indicators. o Not applicable. Please provide explanations in the comment box below. o Not known
79 / 174
Environmental Dimension -
Question-Specific Guidance & Definitions
Reporting coverage: Refers to the boundary or the range of entities (e.g. subsidiaries, joint ventures, sub-contractors, etc.) whose performance is presented by the report. Ideally, the company reports on its entities for which it has management control and/or over 50% ownership – that would be considered 100%.
Data Requirements
• "Data" and "indicators" refer to quantitative metricsor KPIs that cover environmental topics
• The first option should only be used if it is publicly stated that the coverage is the same for allenvironmental data reported on, or if it is explicitlystated that the coverage applies to the full report.
• If the coverage varies between different indicators, the three with the highest available coverage andtheir respective coverage should be indicated underthe second option.
• In both cases, the coverage must be publicly availableand please refer to where in the public domain thisinformation can be found.
References • GRI Standards 102-45 & 102-46 are relevant for this
question.

80 / 174
Environmental Dimension -
Environmental Reporting- Assurance Public: this question requires publicly available information.
Assessment Focus
Question Rationale
As with financial data, assurance of environmental data enables a greater level of reliability and therefore a greater likelihood that this data will be used by investors
in their analysis and investment decisions. Transparency around the assurance process and the data assured also increase stakeholder trust in the published information.
Question Layout
Please indicate below what type of external assurance your company has received in relation to your company's environmental reporting. Please attach supporting evidence indicating where the assurance statement is available in the public domain.
o The assurance statement is an "External Audit" or "External Assurance" produced by assurance specialists (e.g. accountants, certification bodies, specialist consultancies).
o The assurance statement contains a "declaration of independence" which specifies that the assurance provider has no conflict of interest in relation to providing the assurance of environmental data for the company which has been assured.
o The assurance statement is based on a recognized international or national standard (e.g. AA1000AS, ISAE 3000).
o The scope of the assurance statement is clearly indicated in the assurance statement. If the assurance statement only covers some KPIs (but not all) it is clearly indicated which data/KPIs disclosed in the report have been assured (e.g. each KPI assured is marked with an "assurance" symbol/flag).
o The assurance statement contains a conclusion, i.e. either "reasonable assurance" or "limited assurance"
o We do not have any external assurance on our environmental reporting.
o Not applicable. Please provide explanations in the comment box below.
o Not known
Question-Specific Guidance & Definitions Assurance specialists: Include accountants, certification bodies, specialist consultancies. It does not include independent advisory board, stakeholder panel, or high-level individual (e.g. Environmental Minister). The declaration of independence: An explicit statement of independence from the auditor confirming that there is no other commercial link to the company’s operations or business that could result in a conflict of interest. Recognized international or national standard: It refers to assurance standards and not reporting standards (such as GRI guidelines). Examples of these assurance standards are AA1000AS and ISAE 3000, but regional or local standards are also acceptable if they are clearly specified and are comparable to international standards. Examples include: • Standard DR03422 (Australia /New Zealand) • Assurance Engagements of Sustainability Reports
(Germany) • Environmental Report Assurance Services Guidelines
by the JICPA (Japan) • FAR auditing standard RevR6 (Sweden) • Standard 3810 Assurance Engagements related to
Sustainability Reports (the Netherlands)
• AT-C Section 105 and 210 (United States/ Canada)
Scope of assurance: If the scope of assurance covers some (but not all) environmental indicators, these need to be clearly marked in the relevant sections of the report. If the assurance statement covers all data items in the report, this also needs to be explicitly stated. Conclusion/Level of assurance: This refers to the conclusion of the assurance process which is according to the level of assurance i.e. to limited/moderate or reasonable assurance. The level of assurance indicates the extent and depth of the work the assurance provider undertakes in relation to sustainability disclosures. Most assurance providers offer two levels: ‘reasonable’ assurance (i.e. high but still involving some risk of inappropriate conclusion) or ‘limited’ assurance (i.e. moderate) (GRI, 2013). References • GRI Standard 102-56 is relevant for this question.
81 / 174
Environmental Dimension - Environmental Policy & Management System
Environmental Policy & Management System Environmental Management System (EMS) refers to the management of an organization's environmental programs in a comprehensive, systematic, planned and documented manner. It includes the organizational structure, planning and resources to develop them, and the procedure for the implementation and management of the company's policy on environmental resource management. Companies that have adopted an EMS as a management tool are more likely to improve their environmental performance in a cost-effective way and to reduce the risk of incurring fines
or penalties for not complying with environmental legislation. Please note: Only general or almost general questions are covered in this section. There might be additional industry-specific questions related to Environmental Policy & Management System in the questionnaire, and certain questions listed below might not apply to your company.
Coverage of Environmental Management Policy Public: this question requires publicly available information.
Assessment Focus
Question Rationale
Corporate environmental guidelines are an important indicator of a company’s commitment to measure and reduce the environmental impact of its operations. Companies that have adopted corporate environmental guidelines as a management tool are more likely to
improve their environmental performance in a structured and systematic way. Our question identifies the existence, scope, and public availability of such environmental requirements/guidelines.
Question Layout
Is your company's environmental management policy publicly available? If so, please indicate which of the following options are covered by your policy and indicate and provide supporting evidence of where this is clearly stated in the public domain. All chosen options should be clearly defined in the publicly available policy (i.e. formal policies and not different sections of a report or case study).
o Yes, our environmental management policy is publicly available and includes the following items:
o Production operations and business facilities
o Products and services
o Distribution and logistics
o Management of waste
o Suppliers, service providers and contractors
o Other key business partners (e.g. non-managed operations, joint venture partners, licensees, outsourcing partners, etc.)
o Due-diligence, mergers and acquisitions
o Other, please specify
o No, we do not have an environmental policy publicly available
o Not applicable. Please provide explanations in the comment box below.
o Not known
Question-Specific Guidance & Definitions
New projects: All new initiatives taken on by your company and may include new facilities as well as other types of new areas for your company.

82 / 174
Environmental Dimension -

83 / 174
Environmental Dimension -
EMS: Certification/ Audit/ Verification Assessment Focus
Question Rationale
A verified/ audited EMS reflects a company's internal and external commitment towards the monitoring of environmental data. Further, the verification process can facilitate improvements to a company's EMS, improving efficiency and coverage. Our question on audit verification
focuses on identifying whether the company has implemented, verified and certified its environmental management system so as to ensure the credibility of the procedures and systems in place.
Question Layout
Please indicate how your Environmental Management System (EMS) is certified / audited / verified and indicate the coverage of this verification for the selected standard. Please note that the total coverage for all three alternatives should not exceed 100% - to avoid double-counting, for the parts of your operations with multiple certifications/types of verification, only mark one of the three options: indicating the coverage of international standards first, followed by third-party verification and then internal verification. Coverage should be relative to global operations and not only a single subsidiary, region or site. Please also note that the requested verification only pertains to your Environmental Management System(s), not to your environmental data or reporting.
o Our Environmental Management System (EMS) is certified / audited / verified. Please indicate what the coverage figures below are based on (e.g. % of group-wide operations, group-wide revenues, group-wide production sites, total employees, etc.):
Certification / Audit / Verification Description Coverage (%)
Our EMS is verified through
international standards (e.g. ISO 14001,
JIS Q 14001, EMAS certification)
Please specify and attach relevant
examples of certification documents:
Third party certification /audit
/ verification by specialized companies
Please specify and attach relevant
examples of verification documents:
Internal certification /audit /
verification by company's own
specialists from headquarters
Please specify and attach relevant
examples of verification documents:
Total (should not exceed 100%)
o Not certified / audited / verified. o Not applicable. Please provide explanations in the comment box below. o Not known
Data Requirements
Please note that the total coverage for all three alternatives should not exceed 100 % - to avoid double-counting, for the parts of your operations with multiple certifications/types of verification, only mark one of the three options: indicating the coverage of international standards first, followed by third-party verification and
then internal verification. Coverage should be relative to global operations and not only a single subsidiary, region or site. Please also note that verification only pertains to your Environmental Management Systems, not the verification of environmental data or reporting.
84 / 174
Environmental Dimension - Operational Eco-Efficiency
Operational Eco-Efficiency Reducing the overall environmental footprint of companies in both the manufacturing and service industries is crucial, as the risks of financial and reputational costs linked to environmental litigation are increasing. Producing more with less material is essential for many industries affected by the increasing scarcity of natural resources. For all industries, minimizing the consumption of natural resources and waste-generating activities can reduce costs and, in some cases, lead to new business opportunities. The key focus of this criterion is on the inputs and outputs of business operations. It assesses trends in the consumption of natural resources and the production of waste products specific to each industry. Only the five general questions applicable to all industries are covered in this chapter. Additional industry-specific questions exist to capture environmental indicators specific to different industries. We assess the relative improvement of a company’s operational eco-efficiency over time by normalizing absolute environmental data (such as greenhouse gas emissions) relative to a denominator value that can vary according to the industry. Some examples of denominators used include revenues, production volume, square meters, and FTEs. Although absolute emission or waste production figures may increase over time as a company grows or becomes more profitable, we expect that the relative efficiency of the company should improve over time. The section on Denominators does not cover all variations of the questions, but is used to illustrate the purpose of the question. Please note that for industry-specific denominators the guidance in the questionnaire should be followed whenever it differs from the general description in this document. The following guidance applies to all environmental performance data: Environmental performance data should cover the activities of the entire company, should be consolidated in the same way as in financial reporting, and must refer to the same financial year and be aligned with the figures reported in the denominator question. If the figures provided do not cover the entire company, the coverage fields should be used to adjust the percentage of the company represented by the provided data. The coverage should be in line with the denominator provided (i.e. revenues, FTEs, production volume, etc.) Environmental performance data should only cover direct emissions and resource use; that is, resources used and
emissions caused by the company and its consolidated activities. Emissions and resources used by suppliers and customers should be excluded. In particular, environmental data of group companies should follow the following rules: • Only the questions applicable to all or most
industries are covered in this chapter. Additional industry-specific questions exist to capture environmental indicators specific to different industries. dated at-equity must not be considered
• Environmental data of companies that are consolidated proportionally must be considered according to the proportion at which they are consolidated financially
• Environmental data of companies that are fully consolidated must be fully considered irrespective of the proportion to which they belong to the group
• Environmental data should refer to the specific company structure of each particular year. There should be no pro-forma backward consolidation of the current company structure
• Environmental data of companies that have been sold or no longer consolidated should be excluded from environmental data as of the reporting period from which the company was no longer consolidated
• Environmental data of companies that have been bought should only be included as of the reporting period from which the company was consolidated financially for the first time
• Where environmental data do not cover all consolidated activities of the company, the scope (coverage) should be indicated, together with the environmental data that are known
• For indicators for which a company has no emissions or does not use any resources, you should fill in 0
• Where the reported environmental data deviate from these definitions you are asked to explain in what way the data provided differ from the definitions
• If a company publicly reports on long-term but not annual targets, an annual target can be estimated based on internal targets or a linear interpolation
• The data must be provided in the unit indicated in the question. If the company tracks an indicator in a different unit, the unit converter must be used to convert the data into the required unit.
Please note: Only general or almost general questions are covered in this section. There might be additional industry-specific questions related to Operational Eco-Efficiency in the questionnaire, and certain questions listed below might not apply to your company.
85 / 174
Environmental Dimension - Operational Eco-Efficiency
Direct Greenhouse Gas Emissions (Scope 1) Partially public: additional credit will be granted for relevant publicly available evidence.
Assessment Focus
Question Rationale
Producing more with less material is essential for many industries affected by the increasing scarcity of natural resources. Operational Eco-Efficiency can enhance companies’ competitiveness through reduced costs and environmental liabilities. It can also mean companies are better prepared for future environmental regulations.
The key focus is on the inputs and outputs of business operations, and the assessment of trends in the consumption of natural resources and the production of environmental waste products specific to each industry.
Question Layout
Please provide your company's total direct greenhouse gas emissions (DGHG SCOPE 1) for the part of your company's operations for which you have a reliable and auditable data acquisition and aggregation system. Please refer to the information button for additional clarifications. For each row in the table, it is mandatory that the values provided are in the same unit. Also, please ensure that you have correctly filled in the Company Information section at the beginning of the questionnaire, and that the coverage in the table below is related to the denominator relevant for your company as indicated in that section.
Direct GHG (Scope 1) Unit FY
2017
FY
2018
FY
2019
FY
2020
What was your
target for FY
2020?
Total direct GHG emissions (Scope
1)
metric tons
of CO2
equivalents
Data coverage (as % of
denominator)
percentage of:
Public Reporting
o Our data is publicl y availabl e. Please provid e supp or ti n g eviden ce or web link. Third-Party Verification
o Our data has been third-p ar t y verified in the most recen t financial year repor t ed. Please provid e supp or ti n g eviden ce.
Data Consistency
o We report publicly on this information, but the data in the table above differ from our publicly reported figures. Please provide an explanation for this difference in the comment box: ___
o We have a temporary coverage reduction or target challenge due to corporate actions. Please briefly explain if a merger, acquisition, divestment, etc. has temporarily caused a reduction in your ability to report optimal coverage or caused your target to appear abnormal: ___
o We are not able to report this information in absolute terms; the information provided in the table above is normalized data. For the purpose of this question, please always provide absolute figures if available.
o We only report on combined Scope 1 & Scope 2 emissions. Please provide the combined figures in the table above and mark “Not Applicable” in the next question (EP – Indirect Greenhouse Gas Emissions (Scope 2)).
Question-Specific Guidance & Definitions
GHG scope 1: Greenhouse gas emissions (GHGs) refers to emissions of the six main GHGs that are covered by the Kyoto Protocol. These gases are outlined below. Each GHG has a different capacity to cause global warming, depending on its radiative properties, its molecular weight and its lifespan in the atmosphere. Greenhouse gases covered by the Kyoto Protocol: • Carbon Dioxide - CO2: Emitted from the burning of
fossil fuels, carbon dioxide accounted for some 86 percent of the UK’s human induced GHG emissions in 2003.
• Methane - CH4: Emitted mainly from agriculture,
waste disposal, leakage from the gas distribution system and coal mining, methane contributed to over 6 per cent of UK anthropogenic GHG emissions in 2003.
• Nitrous Oxide - N2O: The main anthropogenic sources of nitrous oxide emissions are agriculture, transport, industrial processes, and coal combustion. Nitrous oxide accounted for approx. 6 percent of UK GHG emissions in 2003.
• Hydrofluorocarbons - HFCs, Perfluorocarbons - PFCs and Sulphur Hexafluoride - SF6: Collectively known as “F-gases”, these are emitted mainly from air conditioning and refrigeration and industrial
86 / 174
Environmental Dimension - Operational Eco-Efficiency
processes. • Offsetting: Only emissions from renewable resources
where the emitter can be reasonably confident that greenhouse gas emissions will be naturally offset or neutralized do not need to be reported (Example: wood burning when a company can be reasonably confident that forests will be reforested). Greenhouse gas emissions that have been offset this way need not be reported. This does not include greenhouse gas emissions for which companies are required to be in the possession of CO2 permits. These emissions need to be reported.
Data Requirements
Specific data requirements for Greenhouse gas emissions: • Greenhouse gas emissions should be reported as
metric tons of CO2-equivalents. • Data on greenhouse gas emissions should only
include CO2 and all other greenhouse gas emissions. • All greenhouse gas emissions emitted directly by the
company should be reported. • Offsetting: Only emissions from renewable resources
where the emitter can be reasonably confident that greenhouse gas emissions will be naturally offset or neutralized do not need to be reported (Example: wood-burning when a company can be reasonably confident that forests will be reforested). Greenhouse gas emissions that have been offset this way need not be reported. This does not include greenhouse gas emissions for which companies are required to be in the possession of CO2 permits. These emissions need to be reported.
• Greenhouse gas emissions of owned and/or managed fleet must be included.
• Greenhouse gas emissions due to commuting of employees should not be included.
• Greenhouse gas emissions of business travel other than by owned and/or operated fleet should not be included.
Disclosure requirements for partially public question. Additional credit will be granted for relevant publicly available evidence covering the following aspect of this question: Direct Greenhouse Gas Emissions (Scope 1) figure for at least the most recent reported year. Third-party verification: For third-party verification, we expect that data in the most recent year reported has been third-party verified and that relevant documentation is attached showing this verification. Internal audits or verification will not be considered. Data consistency • If the environmental performance data reported in
the questionnaire do not correspond to the publicly reported figures, the corresponding option should be marked and the discrepancy should be explained. This option should not be indicated if the information is not publicly reported at all
• If there is a temporary reduction in coverage due to a corporation action, the corresponding box should be marked and the reduction should be explained
• If it is not possible to report the figures in absolute terms, the data should be reported in relative terms and the corresponding box should be ticked. Please note that information should always be reported in absolute terms if possible, even if it deviates from public reporting. If relative figures are indicated, this need to be done for ALL environmental performance figures and the denominator should be set to 1
• If GHG emissions are only reported and tracked as combined Scope 1 and Scope 2 emissions, the
combined figures should be indicated in this question, the corresponding box should be ticked and the following question, EP – Indirect Greenhouse Gas Emissions (Scope 2), should be marked as Not Applicable.
General data requirements: Environmental performance data should cover the activities of the entire company with the same consolidation as used in financial reporting and must refer to the financial year (e.g., 01/01 to 31/12 for both financial and environmental data) and be aligned with the figures reported in the Company Information section Target: We require the absolute target for the most recent reporting year. If your company has a multiple year and/or relative target, please extrapolate what the target value would have to be for the last financial year to make sure you are progressing well towards achieving the target by the end of the target period. As a consequence, environmental performance data should only cover the direct emissions/resource use, i.e., resource use/emissions caused by the company and its consolidated activities. Emissions and resource use of suppliers and customers should be excluded. In particular, environmental data of group companies should follow the following rules: • Environmental data of companies that are
consolidated at-equity must not be considered. • Environmental data of companies that are
consolidated proportionally must be considered to the proportion at which they are consolidated financially.
• Environmental data of companies that are fully consolidated must be fully considered irrespective of the proportion to which they belong to the group.
• Environmental data should refer to the specific company structure of each particular year. There should be no pro-forma backward consolidation of the current company structure.
• Environmental data of companies that are sold or no longer consolidated should be excluded from environmental data as of the reporting period in which the company has not been consolidated any more.
• Environmental data of companies that have been bought should only be included as of the reporting period in which the company is consolidated financially for the first time.
• Where environmental data does not cover all consolidated activities of the company, the coverage should be indicated together with the environmental data that is known.
• Indicators where a company has no emissions/resource use, 0 should be filled.
• Where the reported environmental data deviates from these definitions you are asked to explain in what way the data provided differs from the definitions.
• If a company publicly reports on long-term but not annual targets, an annual target has to be estimated based on internal target setting or a linear distribution.
• The data must be provided in the unit indicated in the question. If the company is tracking the specific indicator in a different unit, the unit converter must be used to convert the data into the preferred unit.
• Please ensure that the " Company Information section has been correctly filled in, and that the coverage in the table below is based on the same denominator.
References

87 / 174
Environmental Dimension - Operational Eco-Efficiency
• GRI Standard 305-1 is relevant for this question.
Indirect Greenhouse Gas Emissions (Scope 2) Partially public: additional credit will be granted for relevant publicly available evidence.
Assessment Focus
Question Rationale
Producing more with less material is essential for many industries affected by the growing scarcity of natural resources. Operational Eco-Efficiency enhances competitiveness in terms of cost reductions and reduces environmental liabilities. It also enables companies to be better prepared for future environmental regulations.
The key focus is on inputs and outputs of business operations and the assessment of trends in the consumption of natural resources and the production of environmental waste products specific to each industry.
Question Layout
Please provide your company's indirect greenhouse gas emissions from energy purchased (purchased and consumed, i.e. without energy trading) (IGHG SCOPE 2) for the part of your company's operations for which you have a reliable and auditable data acquisition and aggregation system. Please refer to the information button for additional clarifications. For each row in the table, it is mandatory that the values provided are in the same unit. Also, please ensure that you have correctly filled in the Company Information section at the beginning of the questionnaire, and that the coverage in the table below is related to the denominator relevant for your company as indicated in that section.
IGHG Scope 2 Unit FY
2017
FY
2018
FY
2019
FY
2020
What was your
target for FY
2020?
Indirect greenhouse gas emissions
from energy purchased and consumed
(scope 2)
metric tons
of CO2
equivalents
Data coverage (as % of denominator) percentage
of:
Public Reporting
o Our data is publicl y availabl e. Please provid e supp or ti n g eviden ce or web link. Third-Party Verification
o Our data has been third-p ar t y verified in the most recen t financial year repor t ed. Please provid e supp or ti n g eviden ce.
Data Consistency
o We report publicly on this information, but the data in the table above differ from our publicly reported figures. Please provide an explanation for this difference in the comment box: ___
o We have a temporary coverage reduction or target challenge due to corporate actions. Please briefly explain if a merger, acquisition, divestment, etc. has temporarily caused a reduction in your ability to report optimal coverage or caused your target to appear abnormal: ___
o We are not able to report this information in absolute terms; the information provided in the table above is normalized data. For the purpose of this question, please always provide absolute figures if available.
o We measure our indirect greenhouse gas emissions according to the location-based method instead of the market-based method (see the information button for further details).
Question-Specific Guidance & Definitions
GHG scope 2 Indirect impacts- energy use: Many companies report on the GHG emissions incurred in the generation of the electricity they consume and for service companies these indirect emissions can be more
important than their direct environmental impacts. There are also some ways that companies can mitigate these emissions, for example by paying a renewable tariff or improving energy efficiency.

88 / 174
Environmental Dimension - Operational Eco-Efficiency
Data Requirements
Specific Data Requirement for Indirect Greenhouse Gas Emissions (Scope 2): Greenhouse gas emissions should be reported as metric tons of CO2-equivalents. Data on greenhouse gas emissions should include CO2 and all other greenhouse gas emissions weighted according to greenhouse gas potential. Measuring Scope 2 emissions is recommended to be performed according to the market-based method of the Greenhouse Gas Protocol. However, the location-based method is equally accepted. (cf. Greenhouse Gas Protocol Scope 2 Guidance, January 2015) • Location-based method: reflects the average
emissions intensity of grids on which energy consumption occurs (using mostly grid-average emission factor data).
• Market-based method: reflects emissions from electricity that companies have purposefully chosen (or their lack of choice). It derives emission factors from contractual instruments, which include any type of contract between two parties for the sale and purchase of energy bundled with attributes about the energy generation, or for unbundled attribute claims.
Third-party verification: For third-party verification, we expect that data in the most recent year reported has been third-party verified and that relevant documentation is attached showing this verification. Internal audits or verification will not be considered. Data consistency • If the environmental performance data reported in
the questionnaire do not correspond to the publicly reported figures, the corresponding option should be marked and the discrepancy should be explained. This option should not be indicated if the information is not publicly reported at all.
• If there is a temporary reduction in coverage due to a corporation action, the corresponding box should be marked and the reduction should be explained
• If it is not possible to report the figures in absolute terms, the data should be reported in relative terms and the corresponding box should be ticked. Please note that information should always be reported in absolute terms if possible, even if it deviates from public reporting. If relative figures are indicated, this need to be done for ALL environmental performance figures and the denominator should be set to 1
• If GHG emissions are only reported and tracked as combined Scope 1 and Scope 2 emissions, the combined figures should be indicated in the previous question (EP- Direct Greenhouse Gas Emissions (Scope 1), the corresponding box should be ticked and this question, should be marked as Not Applicable.
• If the market-based method for accounting for indirect GHG emissions has not been used, figures based on the location-based method should be indicated and the corresponding box should be ticked.
General data requirements: Environmental performance data should cover the activities of the entire company with the same consolidation as used in financial reporting and must refer to the financial year (e.g., 01/01 to 31/12 for both financial and environmental data) and be aligned with the figures reported in the Company Information section
Target: We require the absolute target for the most recent reporting year. If your company has a multiple year and/or relative target, please extrapolate what the target value would have to be for the last financial year to make sure you are progressing well towards achieving the target by the end of the target period. As a consequence, environmental performance data should only cover the indirect emissions/resource use, i.e., resource use/emissions caused by the company and its consolidated activities. Emissions and resource use of suppliers and customers should be excluded. In particular, environmental data of group companies should follow the following rules: • Environmental data of companies that are
consolidated at-equity must not be considered. • Environmental data of companies that are
consolidated proportionally must be considered to the proportion at which they are consolidated financially.
• Environmental data of companies that are fully consolidated must be fully considered irrespective of the proportion to which they belong to the group.
• Environmental data of business travel other than by owned and/or operated fleet should not be included unless specifically asked for.
• Environmental data should refer to the specific company structure of each particular year. There should be no pro-forma backward consolidation of the current company structure.
• Environmental data of companies that are sold or no longer consolidated should be excluded from environmental data as of the reporting period in which the company has not been consolidated any more.
• Environmental data of companies that have been bought should only be included as of the reporting period in which the company is consolidated financially for the first time.
• Where environmental data does not cover all consolidated activities of the company, the scope should be indicated together with the environmental data that is known.
• Indicators where a company has no emissions/resource use, 0 should be filled.
• Where the reported environmental data deviates from these definitions you are asked to explain in what way the data provided differs from the definitions.
• If a company publicly reports on long-term but not annual targets, an annual target has to be estimated based on internal target setting or a linear distribution.
• The data must be provided in the unit indicated in the question. If the company is tracking the specific indicator in a different unit, the unit converter must be used to convert the data into the preferred unit.
• Please ensure that the Company Information section has been correctly filled in, and that the coverage in the table below is based on the same denominator.
Disclosure requirements for partially public question: Additional credit will be granted for relevant publicly available evidence covering the following aspect of this question: • Indirect Greenhouse Gas Emissions (Scope 2) figure
for at least the most recent reported year.
References
• GRI Standard 305-2 is relevant for this question.
89 / 174
Environmental Dimension - Operational Eco-Efficiency
Energy Consumption Partially public: additional credit will be granted for relevant publicly available evidence
Assessment Focus
Question Rationale
Producing more with less material is essential for many industries affected by the growing natural resource scarcity. Operational Eco-Efficiency enhances competitiveness in terms of cost reductions and reduced environmental liabilities. It also enables companies to be better prepared for future environmental regulations. The key focus is on inputs and outputs of business
operations and assessing trends in natural resource consumption and environmental waste production specific to each industry. In this question we are aiming to find out the total energy consumption Please list renewable energies separately and specify the type of renewable energy in the text box.
Question Layout
Please complete the following table about total energy consumption. For each row in the table, it is mandatory that the values provided are in the same unit. Please see the Information Button for definitions of the cost options. Also, please ensure that you have correctly filled in the Company Information section at the beginning of the questionnaire, and that the coverage in the table below is related to the denominator relevant for your company as indicated in that section.
Total energy consumption Unit FY 2017 FY 2018 FY 2019 FY 2020 What was your
target for FY
2020?
A. Non-renewable fuels (nuclear
fuels, coal, oil, natural gas, etc.)
purchased and consumed
MWh
B. Non-renewable electricity
purchased
MWh
C. Steam/heating/cooling and
other energy (non-renewable)
purchased
MWh
D. Total renewable energy (wind,
solar, biomass, hydroelectric,
geothermal, etc.) purchased or
generated.
Please specify_______
MWh
E. Total non-renewable energy
(electricity and heating &
cooling) sold
MWh
Total non-renewable energy
consumption (A+B+C-E)
MWh
Total costs of energy
consumption
Currency:
Data coverage (as % of
denominator)
Percentag
e of
90 / 174
Environmental Dimension - Operational Eco-Efficiency
Public Reporting o Our data is publicly available. Please provide supporting evidence or web link.
Third-Party Verification
o Our data has been third-party verified in the most recent financial year reported. Please provide supporting evidence. Data Consistency
o We report publicly on this information, but the data in the table above differ from our publicly reported figures. Please provide an explanation for this difference in the comment box: ___
o We have a temporary coverage reduction or target challenge due to corporate actions. Please briefly explain if a merger, acquisition, divestment, etc. has temporarily caused a reduction in your ability to report optimal coverage or caused your target to appear abnormal: ___
o We are not able to report this information in absolute terms; the information provided in the table above is normalized data. For the purpose of this question, please always provide absolute figures if available.
Question-Specific Guidance & Definitions
Non-renewable fuels: This includes transport fuels and fuels for electricity generation such as nuclear fuels, coal, oil, natural gas, etc. Non-renewable electricity purchased: This excludes self-generated electricity. Steam/heating/cooling and other energy purchased (only non-renewable energy): If there is no explicit mention of renewables, assume non-renewable energy. Exclude self-generated steam/heating/cooling from fuels listed in A. Total renewable energy (wind, solar, biomass, hydroelectric, geothermal, etc.) purchased or generated: Includes both purchased and self-generated energy. Total non-renewable energy sold (electricity, heating & cooling): Primarily for electric utilities, for most other companies this will be "Not applicable" Total non-renewable energy consumption: Sum of (A + B + C) minus E Total cost of energy consumption: (see below) • Energy costs include electricity, direct purchases, fuel for owned-energy production, other fuel, etc., plus depreciation of owned-energy projects, minus related income (e.g. generated by waste sold for energy production, energy sold from owned-energy facilities, etc.). It does not include total capital investment or maintenance costs. In the table, the methodology for total costs of energy consumption can be selected from three options: • 1) total cost of energy purchased • 2) total cost of energy purchased, minus income generated (e.g. by waste sold for energy production, energy sold from owned-energy facilities, etc.) • 3) total cost of energy purchased plus depreciation of owned-energy projects, minus income generated • Please pay attention to the correct conversion of units! See also: https://www.iea.org/rep orts/unit-conv erter-and-glossary#unit-converter
• NB: we only score total non-renewable energy consumption, so if you don’t have all data available it is ok to only provide data for Total non-renewable energy consumption
Data Requirements
Third-party verification: For third-party verification, we expect that data in the most recent year reported has been third-party verified and that relevant documentation is attached showing this verification. Internal audits or verification will not be considered. Data consistency
• If the environmental performance data reported in the questionnaire do not correspond to the publicly reported figures, the corresponding option should be marked and the discrepancy should be explained. This option should not be indicated if the information is not publicly reported at all
• If there is a temporary reduction in coverage due to, for example, a major acquisition, the corresponding box should be marked and the reduction should be explained
• If it is not possible to report the figures in absolute terms, the data should be reported in relative terms and the corresponding box should be ticked. Please note that information should always be reported in absolute terms if possible, even if it deviates from public reporting. If relative figures are provided, this need to be done for ALL environmental performance figures and the denominator should be set to 1.
General data requirements: Environmental performance data should cover the activities of the entire company with the same consolidation as used in financial reporting and must refer to the financial year (e.g., 01/01 to 31/12 for both financial and environmental data) and be aligned with the figures reported in the Company Information section.
Target: We require the absolute target for the most recent reporting year. If your company has a multiple year and/or relative target, please extrapolate what the target value would have to be for the last financial year to make sure you are progressing well towards achieving the target by the end of the target period.
In particular, environmental data of group companies should follow the following rules: • Environmental data of companies that are
consolidated at-equity must not be considered. • Environmental data of companies that are
consolidated proportionally must be considered to the proportion at which they are consolidated financially.
• Environmental data of companies that are fully consolidated must be fully considered irrespective of the proportion to which they belong to the group.
• Environmental data of business travel other than by owned and/or operated fleet should not be included unless specifically asked for.
• Environmental data should refer to the specific company structure of each particular year. There should be no pro-forma backward consolidation of the current company structure.
• Environmental data of companies that are sold or no longer consolidated should be excluded from environmental data as of the reporting period in
91 / 174
Environmental Dimension - Operational Eco-Efficiency
which the company has not been consolidated any more.
• Environmental data of companies that have beenbought should only be included as of the reportingperiod in which the company is consolidatedfinancially for the first time.
• Where environmental data does not cover all consolidated activities of the company, the scopeshould be indicated together with the environmentaldata that is known
• Where the reported environmental data deviates fromthese definitions you are asked to explain in what waythe data provided differs from the definitions.
• If a company publicly reports on long-term but notannual targets, an annual target has to be estimatedbased on internal target setting or a lineardistribution.
• The data must be provided in the unit indicated in the question. If the company is tracking the specificindicator in a different unit, the unit converter must
be used to convert the data into the preferred unit. • Please ensure that the Company Information section
has been correctly filled in, and that the coverage inthe table below is based on the same denominator.
Disclosure requirements for partially public question Additional credit will be granted for relevant publicly available evidence covering the following aspect of this question: • Total non-renewable energy consumption for at least
the most recent reported year.
References
• GRI Standards 302-1 & 302-2 are relevant for thisquestion.
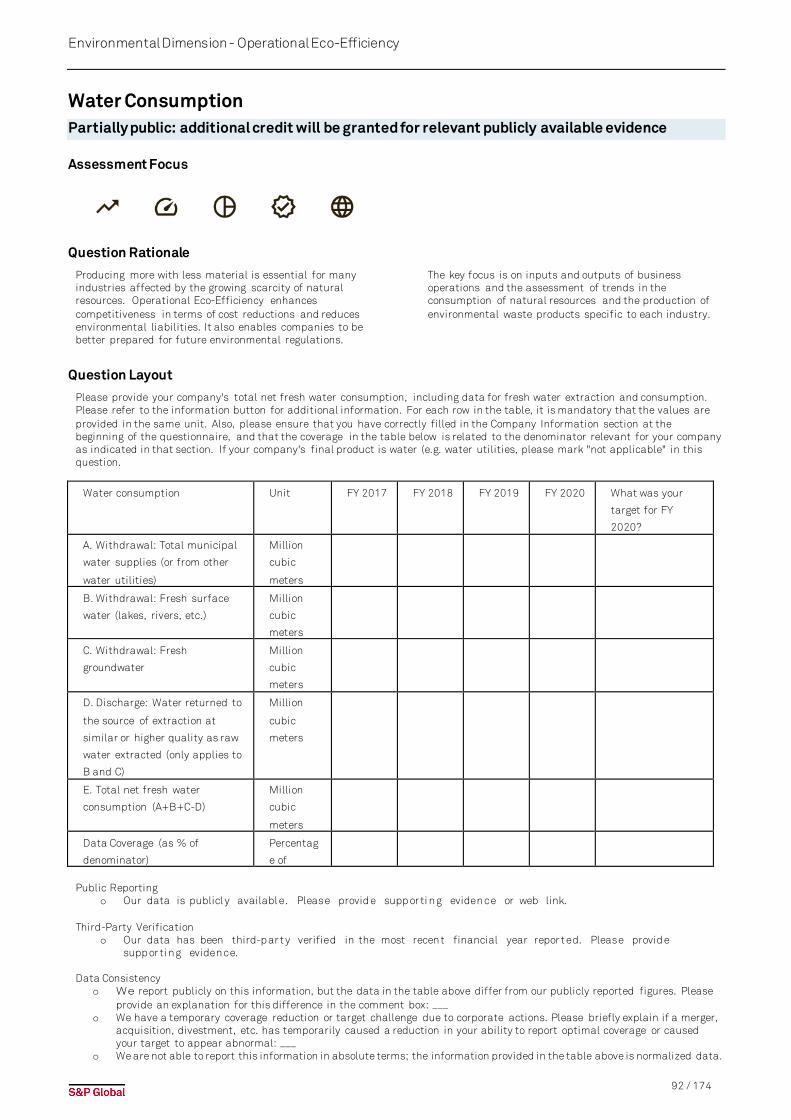
92 / 174
Environmental Dimension - Operational Eco-Efficiency
Water Consumption Partially public: additional credit will be granted for relevant publicly available evidence
Assessment Focus
Question Rationale
Producing more with less material is essential for many industries affected by the growing scarcity of natural resources. Operational Eco-Efficiency enhances competitiveness in terms of cost reductions and reduces environmental liabilities. It also enables companies to be better prepared for future environmental regulations.
The key focus is on inputs and outputs of business operations and the assessment of trends in the consumption of natural resources and the production of environmental waste products specific to each industry.
Question Layout
Please provide your company's total net fresh water consumption, including data for fresh water extraction and consumption. Please refer to the information button for additional information. For each row in the table, it is mandatory that the values are provided in the same unit. Also, please ensure that you have correctly filled in the Company Information section at the beginning of the questionnaire, and that the coverage in the table below is related to the denominator relevant for your company as indicated in that section. If your company's final product is water (e.g. water utilities, please mark "not applicable" in this question.
Water consumption Unit FY 2017 FY 2018 FY 2019 FY 2020 What was your
target for FY
2020?
A. Withdrawal: Total municipal
water supplies (or from other
water utilities)
Million
cubic
meters
B. Withdrawal: Fresh surface
water (lakes, rivers, etc.)
Million
cubic
meters
C. Withdrawal: Fresh
groundwater
Million
cubic
meters
D. Discharge: Water returned to
the source of extraction at
similar or higher quality as raw
water extracted (only applies to
B and C)
Million
cubic
meters
E. Total net fresh water
consumption (A+B+C-D)
Million
cubic
meters
Data Coverage (as % of
denominator)
Percentag
e of
Public Reporting
o Our data is publicl y availabl e. Please provid e supp or ti n g eviden ce or web link. Third-Party Verification
o Our data has been third-p ar t y verified in the most recen t financial year repor t ed. Please provid e supp or ti n g eviden ce.
Data Consistency
o We report publicly on this information, but the data in the table above differ from our publicly reported figures. Please provide an explanation for this difference in the comment box: ___
o We have a temporary coverage reduction or target challenge due to corporate actions. Please briefly explain if a merger, acquisition, divestment, etc. has temporarily caused a reduction in your ability to report optimal coverage or caused your target to appear abnormal: ___
o We are not able to report this information in absolute terms; the information provided in the table above is normalized data.
93 / 174
Environmental Dimension - Operational Eco-Efficiency
For the purpose of this question, please always provide absolute figures if available.
Question-Specific Guidance & Definitions
Total net fresh water consumption (E): = Municipal water (A) + Fresh surface water (B) + Fresh ground water (C) - Water returned to the source of extraction at similar or higher quality as raw water extracted (D). Please do not include salt or brackish water into the reported figures. Rainwater collected and waste water should not be reported. Only water used for cooling and returned to the source at equal or higher quality should be reported under item D. Total municipal water supplies: All water supplied directly by the municipality and/or other public or private water utilities. Fresh surface water (lakes, rivers, etc.): It includes water from wetlands, rivers, lakes. Do not include sea water. Fresh ground water: Fresh water from below the surface. Do not include brackish ground water Water quality: To define the levels of water quality, we consider the quality categorization of the Minerals Council of Australia (MCA) as a good approach to be followed: Category 1: Water is of a high quality and may require minimal and inexpensive treatment (for example water disinfection and pond settlement of solids) to raise the quality to appropriate drinking water standards. Category 2: Water is of a medium quality with individual constituents encompassing a wide range of values. It would require moderate level of treatment such as disinfection, neutralization, removal of solids and chemicals to meet appropriate drinking water standards. Category 3: Water is of a low quality with individual constituents encompassing high values of total dissolved solids, elevated levels of dissolved metals or extreme levels of pH. It would require significant treatment to remove dissolved solids and metals, neutralize and disinfect to meet appropriate drinking water standards.
Data Requirements
Disclosure requirements for partially public question. Additional credit will be granted for relevant publicly available evidence covering the following aspect of this question: • Total net fresh water consumption for at least the
most recent reported year. Third-party verification: For third-party verification, we expect that data in the most recent year reported has been third-party verified and that relevant documentation is attached showing this verification. Internal audits or verification will not be considered. Data consistency • If the environmental performance data reported in
the questionnaire do not correspond to the publicly reported figures, the corresponding option should be marked and the discrepancy should be explained. This option should not be indicated if the information is not publicly reported at all.
• If there is a temporary reduction in coverage due to, for example, a major acquisition, the corresponding box should be marked and the reduction should be explained.
• If it is not possible to report the figures in absolute terms, the data should be reported in relative terms and the corresponding box should be ticked. Please note that information should always be reported in absolute terms if possible, even if it deviates from public reporting. If relative figures are indicated, this need to be done for ALL environmental performance
figures and the denominator should be set to 1. General data requirements Environmental performance data should cover the activities of the entire company with the same consolidation as used in financial reporting and must refer to the financial year (e.g., 01/01 to 31/12 for both financial and environmental data) and be aligned with the figures reported in the Company Information section Target: We require the absolute target for the most recent reporting year. If your company has a multiple year and/or relative target, please extrapolate what the target value would have to be for the last financial year to make sure you are progressing well towards achieving the target by the end of the target period. In particular, environmental data of group companies should follow the following rules: • Environmental data of companies that are
consolidated at-equity must not be considered. • Environmental data of companies that are
consolidated proportionally must be considered to the proportion at which they are consolidated financially.
• Environmental data of companies that are fully consolidated must be fully considered irrespective of the proportion to which they belong to the group.
• Environmental data of business travel other than by owned and/or operated fleet should not be included unless specifically asked for.
• Environmental data should refer to the specific company structure of each particular year. There should be no pro-forma backward consolidation of the current company structure.
• Environmental data of companies that are sold or no longer consolidated should be excluded from environmental data as of the reporting period in which the company has not been consolidated anymore.
• Environmental data of companies that have been bought should only be included as of the reporting period in which the company is consolidated financially for the first time.
• Where environmental data does not cover all consolidated activities of the company, the scope should be indicated together with the environmental data that is known.
• Where the reported environmental data deviates from these definitions you are asked to explain in what way the data provided differs from the definitions.
• If a company publicly reports on long-term but not annual targets, an annual target has to be estimated based on internal target setting or a linear distribution.
• The data must be provided in the unit indicated in the question. If the company is tracking the specific indicator in a different unit, the unit converter must be used to convert the data into the preferred unit.
• Please ensure that the Company Information section has been correctly filled in, and that the coverage in the table below is based on the same denominator.
References
GRI Standard 303-3 and 303-4 are relevant for this question. Minerals Council of Australia (MCA), Water Accounting Framework for the Minerals Industry, User 410 Guide, v 1.3, 2014. https://minerals.org.au/sites/default/fil es/WAF _UserGuide_v1.3_(Jan_2014).pdf

94 / 174
Environmental Dimension - Operational Eco-Efficiency

95 / 174
Environmental Dimension - Operational Eco-Efficiency
Waste Disposal Partially public: additional credit will be granted for relevant publicly available evidence.
Assessment Focus
Question Rationale
Producing more with less material is essential for many industries affected by the growing scarcity of natural resources. Operational Eco-Efficiency enhances competitiveness in terms of cost reductions and reduces environmental liabilities. It also enables companies to be better prepared for future environmental regulations.
The key focus is on inputs and outputs of business operations and the assessment of trends in the consumption of natural resources and the production of environmental waste products specific to each industry.
Question Layout
Please indicate the total waste that your company disposes of (i.e. that is not reused or recycled, repurposed, or sent for energy recovery) for the part of your company’s operations for which you have a reliable and auditable data acquisition and aggregation system. Disposed waste includes waste that is sent to landfill or incinerated without energy recovery. Total volumes include waste that is disposed of both onsite and offsite. Please refer to the information button for additional clarifications. For each row in the table, it is mandatory that the values provided are in the same unit. Please also ensure that the “Denominator” question in this criterion has been correctly filled in, and that the coverage in the table below is based on the same denominator.
Waste generation Unit FY
2017
FY
2018
FY
2019
FY
2020
What was your
target for FY
2020?
a. Total waste generated metric tonnes
b. Total waste used/recycled/sold metric tonnes
TOTAL WASTE DISPOSED (A - B) metric tonnes
Data coverage (as % of
denominator)
percentage of:
Public Reporting
o Our data is publicl y availabl e. Please provid e supp or ti n g eviden ce or web link. Third-Party Verification
o Our data has been third-p ar t y verified in the most recen t financial year repor t ed. Please provid e supp or ti n g eviden ce.
Data Consistency
o We report publicly on this information, but the data in the table above differ from our publicly reported figures. Please provide an explanation for this difference in the comment box: ___
o We have a temporary coverage reduction or target challenge due to corporate actions. Please briefly explain if a merger, acquisition, divestment, etc. has temporarily caused a reduction in your ability to report optimal coverage or caused your target to appear abnormal: ___
o We are not able to report this information in absolute terms; the information provided in the table above is normalized data. For the purpose of this question, please always provide absolute figures if available.
Question-Specific Guidance & Definitions
Total waste generated: Waste may be generated during the extraction and processing of raw materials, during product manufacturing, during the consumption of final products, and during any other human activity. For the purposes of this question, we are interested only in solid waste. Total waste used/recycled/sold: Generated waste which has been reused, recycled or sold for instance for energy
recovery purposed. Total waste disposed: It is defined as waste that is landfilled, subject to deep well injection or incinerated without energy recovery (either on-site and off-site). It is waste generated minus waste used/recycled/sold.
96 / 174
Environmental Dimension - Operational Eco-Efficiency
Data Requirements
Specific data requirement for Waste Waste should be reported in dry metric tonnes of waste. Waste disposed should include materials landfilled, subject to deep well injection or incinerated without energy recovery (both on-site and off-site). Materials that are sent offsite for beneficial use (such as for recycling, re-purposing, or energy recovery) should be reported in this question separately. Waste from extraordinary activities should not be considered. The definition of what is considered to be extraordinary should be consistent with financial reporting. Example: we would not expect a pharmaceutical company building its new headquarters to report the resulting construction waste. Disclosure requirements for partially public question. Additional credit will be granted for relevant publicly available evidence covering the following aspect of this question: Total waste disposed figure for at least the most recent reported year. Third-party verification: For third-party verification, we expect that data in the most recent year reported has been third-party verified and that relevant documentation is attached showing this verification. Internal audits or verification will not be considered. Data consistency • If the environmental performance data reported in
the questionnaire do not correspond to the publicly reported figures, the corresponding option should be marked and the discrepancy should be explained. This option should not be indicated if the information is not publicly reported at all.
• If there is a temporary reduction in coverage due to, for example, a major acquisition, the corresponding box should be marked and the reduction should be explained.
• If it is not possible to report the figures in absolute terms, the data should be reported in relative terms and the corresponding box should be ticked. Please note that information should always be reported in absolute terms if possible, even if it deviates from public reporting. If relative figures are indicated, this need to be done for ALL environmental performance figures and the denominator should be set to 1
• If the data reported are not consistent with the definition provided above, the data should be provided in the table, the option should be marked, and an explanation of how it differs should be provided in the comment box.
General data requirements • For companies who have the EP - Hazardous Waste
or EP - Mineral Waste questions in their questionnaire, please do not report this infor-mation here but rather, report that data sepa-rately in those
questions. If you do not have those questions in your industry questionnaire, please include hazardous and mineral waste data here.
• For companies who have the EP - Ash and Gypsum Waste question in their questionnaire, ash and gypsum waste data should be tracked in both EP - Waste and EP - Ash and Gypsum Waste questions.
• Environmental performance data should cover the activities of the entire company with the same consolidation as used in financial reporting and must refer to the financial year (e.g., 01/01 to 31/12 for both financial and environmental data) and be aligned with the figures reported in the Company Information section question.
In particular, environmental data of group companies should follow the following rules • Environmental data of companies that are
consolidated at-equity must not be considered. • Environmental data of companies that are
consolidated proportionally must be considered to the proportion at which they are consolidated financially.
• Environmental data of companies that are fully consolidated must be fully considered irrespective of the proportion to which they belong to the group.
• Environmental data of business travel other than by owned and/or operated fleet should not be included unless specifically asked for.
• Environmental data should refer to the specific company structure of each particular year. There should be no pro-forma backward consolidation of the current company structure.
• Environmental data of companies that are sold or no longer consolidated should be excluded from environmental data as of the reporting period in which the company has not been consolidated any more.
• Environmental data of companies that have been bought should only be included as of the reporting period in which the company is consolidated financially for the first time.
• Where environmental data does not cover all consolidated activities of the company, the scope should be indicated together with the environmental data that is known.
• Where the reported environmental data deviates from these definitions you are asked to explain in what way the data provided differs from the definitions.
• If a company publicly reports on long-term but not annual targets, an annual target has to be estimated based on internal target setting or a linear distribution.
• Please ensure that the Company Information section has been correctly filled in, and that the coverage in the table below is based on the same denominator.
References
• Directive 2008/98/EC of the European Parliament and of the Council (Waste Framework Directive)
• GRI Standard 306-2 is relevant for this question.

97 / 174
Environmental Dimension - Climate Strategy
Climate Strategy Most industries are likely to be impacted by climate change, albeit to a varying degree; consequently, they face a need to design strategies commensurate to the scale of the challenge for their industry. While most focus on the risks associated with a changing climate, some seek to identify and seize the business opportunities linked to this global challenge. Most of the questions in this criterion have been developed in alignment with the CDP methodology as part of a collaboration between us and CDP (https://www.cdproject.net). Additionally, some questions in this criterion are aligned with the Task Force on Climate-related Financial Disclosure (TCFD, https://www.fsb-tcfd.or g/), which published in 2017 a set of recommendations for voluntary and consistent climate-related financial risk disclosures in mainstream reporting. While the developed disclosure
recommendations are voluntary, investors demand for companies to report in line with TCFD is growing exponentially and governments are starting to move toward requiring TCFD disclosures through regulation. Finally, the EU action plan on sustainable finance and its EU Taxonomy Regulation on the establishment of a framework to facilitate sustainable investment have also been considered in the further development of this criterion. (Regulation (EU) 2020/852). Please note: Only general or almost general questions are covered in this section (applying to at least 46 industries). There might be additional industry-specific questions related to Climate Strategy in the questionnaire, and certain questions listed below might not apply to your company.
Climate Risk Management Public: this question requires publicly available information.
Assessment Focus
Question Rationale
This question focuses on whether a company applies the TCFD framework in the management of climate-related risks and opportunities. Demand for climate-related disclosure from investors has increased significantly since the release of the TCFD recommendations in 2017. In addition, public sector leaders have also noted the importance of transparency on climate-related issues within financial markets. Climate-related risk is increasingly the subject of new reporting requirements,
such as the European Non-financial Reporting Directive 2014/95/EU, which embeds regulatory guidance based on the TCFD recommendations. Many national governments and public sector organizations formally support the TCFD and some have started to issue regulation making TCFD disclosure mandatory. Delay in applying the TCFD framework can not only result in not meeting investors’ needs but also in compliance costs.
Question Layout
Does your organization apply the TCFD framework in the management of climate-related risks and opportunities? Please indicate where this information is available in your public reporting.
o Yes, we fully integrate the TCFD framework in our risk management. o We are in the process of integrating the TCFD framework in our risk management. Please indicate the timeframe by
when you plan to fully integrate the TCFD framework: o No, we do not apply the TCFD framework in our risk management. Please explain the reason. o Not applicable. Please provide explanations in the comment box below. o Not known
Data Requirements
This question requires public evidence. Please indicate where in your public reporting you report information about applying the TCFD framework.
References
• TCFD (2017) Final Report: Recommendations of the Task Force on Climate-related Financial Disclosures https://www.fsb-tcfd.org/publication s/final-recommendations-report/
98 / 174
Environmental Dimension - Climate Strategy
Climate-Related Management Incentives Assessment Focus
Question Rationale
This question aims to capture how rewards are associated with the management of climate change issues, including attainment of targets.
This ensures that climate-related ambitions and goals are embedded throughout the company and that management is held accountable for the achievement of these goals.
Question Layout
Do you provide incentives for the management of climate change issues, including the attainment of targets? o Yes. Please provide further details on the climate change-related incentives provided, starting from the highest management
level.
Who is entitled to benefit from this incentive? Type of incentives Incentivized KPIs
Drop-down menu:
Chief Executive Officer (CEO)
Other Named Executives Officers
Business Unit Managers
Employees
Other, please specify _____
Drop-down menu:
Monetary
Recognition (non-monetary)
Other
Drop-down menu:
Emissions reduction
Energy reduction
Efficiency project
Purchasing
Supply chain engagement
Other, please specify_____
2. 2. 2.
3. 3. 3.
o No, we do not provide incentives for the management of climate change issues. o Not applicable. Please provide explanations in the comment box below. o Not known.
Question Specific Guidance & Definitions
Incentives: Please note that incentives can be positive (i.e. giving access to something) or negative (preventing access to something). Examples of incentive types include: • Monetary: a bonus or some form of financial
remuneration. • Recognition (non-monetary): employee award (e.g.
employee of the year) or career progression scheme, but not tied directly to any form of financial remuneration.
• Other non-monetary rewards: including increased holiday allowances, special assignment, etc.
Data Requirements
If several types of incentives are used in your company, please select the incentive that is most commonly employed and include the fact that your company also uses other incentives in the comment box. Each employee group should only be selected once. When you select an incentive for a certain employee group, it is not necessary for all employees in this group to be entitled to benefit from this incentive. For example, you can select the category "Business Unit Managers" even if only one manager is entitled to the incentive.
References
• This question refers to CDP question C1.3a and TCFD recommendation Metrics and Targets (a).
• The questions in this criterion have been developed in
alignment with the CDP (www.cdp.net).
99 / 174
Environmental Dimension - Climate Strategy
Climate Change Strategy Assessment Focus
Question Rationale
This question focuses on the processes and strategies that organizations use to structure their approach to climate change. Companies should select the option that
best describes their risk management procedures with regards to climate change risks and opportunities.
Question Layout
How are your organizations’ processes for identifying, assessing, and managing climate-related issues integrated into your overall risk management? Please attach supporting evidence.
o Integrated into multi-disciplinary company-wide risk management processes, i.e. a documented process where climate
change risks and opportunities are integrated into the company’s centralized enterprise risk management program covering all types/sources of risks and opportunities.
Reference Link____________ o A specific climate change risk management process, i.e. a documented process which considers climate change risks
and opportunities separate from other business risks and opportunities. Reference Link____________
o There are no documented processes for assessing and managing risk and opportunities from climate change. o Not applicable. Please provide explanations in the comment box below. o Not known
Data Requirements
If you have more than one procedure in place in your organization, please select the one that is most commonly employed. Please note that the CDP submission is not considered as a relevant supporting document in this question.
References
• This question refers to CDP question C2.2. • The questions in this criterion have been developed in
alignment with the CDP (https://www.cdp.net).
100 / 174
Environmental Dimension - Climate Strategy
Financial Risks of Climate Change Assessment Focus
Question Rationale
With this question we aim to find out if companies have identified the risks where there is the potential for
substantive changes in business operations, revenue or expenditure to arise.
Question Layout
Have you identified any climate change risks (current or future) that have potential to generate a substantive change in your business operations, revenue or expenditures?
o Yes, we have identified climate change-related risks with potential impact. Please estimate the financial impact for the most significant risk from each category and provide supporting evidence:
Risks driven by changes in regulation: Currency:
o Brief description of the most significant risk and methods used to manage this risk:
o Estimated financial implications of the risk before taking action: Average estimated time frame (in number of years) for financial implications of this risk:
o Estimated costs of these actions: Risks driven by change in physical climate parameters or other climate-change related developments Currency:
o Brief description of the most significant risk and methods used to manage this risk:
o Estimated financial implications of the risk before taking action: Average estimated time frame (in number of years) for financial implications of this risk:
o Estimated costs of these actions:
o We have conducted an analysis of our climate change risk, but our company is not exposed to climate change risks that have the potential to generate a substantive change in business operations, revenue, or expenditure. Please specify:
o We have not conducted an analysis related to climate change risks. o Not applicable. Please provide explanations in the comment box below. o Not known
Question Specific Guidance & Definitions
Climate change risks: can include, but are not limited to: • Currently being experienced or expected to arise in
the future • Already managed and therefore not expected to
generate negative residual impacts (e.g. because of an insurance policy)
• Newly identified • Risks which cannot be managed • Well understood or with high levels of uncertainty
with regard to the likelihood of the risk materializing and the extent to which it will impact the business
Regulatory risks: arise from current and/or expected city, state, regional, national or global governmental policy related to climate change. Risks include, but are not limited to, the imposition of emissions limits, energy efficiency standards and carbon trading schemes.
Physical risks: may arise from dramatic extreme weather events or subtle changes in weather patterns. Other climate-related risks: include, but are not limited to: reputation, changing consumer behavior, induced changes in human and cultural environments, fluctuating socio-economic conditions and increasing humanitarian demands. Under financial implications: you are asked to provide quantitative estimates of the inherent financial impacts of the risks before taking into consideration any controls you may have in place to mitigate the impacts. An example would be the cost of destruction of facilities from extreme weather before taking into consideration how much insurance coverage you have. It is acknowledged that these will be estimates.
101 / 174
Environmental Dimension - Climate Strategy
The methods: you are using or plan to use to manage the risk could include diversification of product/service offering, research and development in new product lines or lobbying of decision makers. In all cases please identify how this action has affected (or is expected to affect) the likelihood and/or magnitude of the risk (i.e. the residual risk) and over what timeframe the risk is expected to or has been reduced. The costs associated: with the management actions you have described can be annual or capital costs. Where there is no additional cost for action, please explicitly state this is the case. Where the cost is integrated into existing budgets, please provide some estimate of the scale of those costs. Timeframe: the timeframe refers to the time when you expect the risks are likely to materialize. It is acknowledged that risks further into the future are likely to have a higher degree of uncertainty associated with them. For companies submitting to CDP: in this question we ask you to indicate the estimated timeframe in years, using an integer. In the CDP questionnaire the time frame is defined as time ranges: Current; 1-5 years; 6-10 years; >10; to convert these ranges to an integer please use the following conversion table: • Current = 0 • 1-5 years = 3 • 6-10 years = 8 • >10 = 10
Data Requirements
Please describe and provide figures concerning the most significant risk from each category (i.e. the risk which has the most potential to generate a substantive change in your business operations, revenue or expenditure). Please provide quantification of climate change risks for those parts of the business where such analysis has been conducted. If this assessment does not cover all business operations, please provide data for those measured areas only and provide an explanation of which areas are covered in the comment box.
References
This question refers to CDP question 2.3a and TCFD recommendation Strategy (b). GRI Standard 201 -2 is relevant for this question. The questions in this criterion have been developed in alignment with the CDP (https://www.cdp.net).
102 / 174
Environmental Dimension - Climate Strategy
Financial Opportunities Arising from Climate Change Assessment Focus
Question Rationale
When a company faces risks associated with climate change (reported in previous question) it is possible that they may also experience opportunities. Both arise from changes in the operating environment for a company and as some changes can represent additional costs, others
(or even the same changes represent opportunities to exploit new markets or products. This question aims to find out if companies have identified climate change related opportunities that have the potential to generate positive change in their business operations, revenue generation and expenditure.
Question Layout
Have you identified any climate change-related opportunities (current or future) that have the potential to generate a substantive positive change in your business operations, revenue, expenditure (i.e. opportunities driven by changes in regulation, physical, or other climate change-related developments)?
o Yes, we have identified climate change-related opportunities. Please briefly describe the most significant opportunity resulting from climate change on your business operations, revenue growth, or expenditures and provide supporting evidence:
Currency:
o Please estimate the annual financial positive implications of this opportunity: Estimated time frame (in number of years) for positive financial implications of this opportunity:
o Please estimate the current annual costs associated with developing this opportunity:
o We do not consider climate change related opportunities (current or future) to be relevant to our business, please explain why:
o We have not conducted an analysis of our climate change opportunities. o Not applicable. Please provide explanations in the comment box below. o Not known
Question Specific Guidance & Definitions
Climate Change Opportunities: can include, but are not limited to:
• Currently being experienced or expected to arise in the future
• Being managed or newly identified • Well understood or with high levels of uncertainty
with regard to the likelihood of the opportunity materializing and the extent to which it will impact the business
Opportunities can be related to any of the following categories:
Regulation: on climate change related issues may present opportunities for your organization if it is better suited than its competitors to meet those regulations, or more able to help others to do so. Possible scenarios would include a company whose products already meet anticipated standards designed to curb emissions, those whose products will enable its customers to meet mandatory requirements or those companies who provide services assisting others in meeting regulatory requirements. Regulation may also create new markets such as emission trading markets leading to new opportunities.
Physical changes: related to climate change may present opportunities in a variety of ways. Reduced sea ice may allow access to new areas for vessels. Changing temperature and rainfall may extend growing seasons for farmers. Alternatively, your organization may have goods and services that enable others to adapt to physical changes.
Other climate-related opportunities: include those posed by changes in consumer attitude or improved standing due to your organization’s stance or action on climate change.
The financial implications: of the opportunity should be expressed quantitatively. It is acknowledged that these will be estimates and where possible the assumptions made in arriving at a financial impact figure should be stated in the comment box.
The costs associated: with developing the opportunities refer to the cost arising from the actions needed to exploit the opportunity and maximize its potential realization. Where there is no cost for action, please explicitly state this in the comment box, and in this case insert “0” to the text box provided.
Timeframe: – the timeframe refers to the time when you expect the opportunities to materialize. It is acknowledged that opportunities further into the future are likely to have a higher degree of uncertainty associated with them.
For companies submitting to CDP: in this question we ask you to indicate the estimated timeframe in years, using an integer. In CDP questionnaire the time frame is defined as time ranges: Current; 1-5 years; 6-10 years; >10; to convert these ranges to an integer please use the following conversion table:
• Current = 0 • 1-5 years = 3 • 6-10 years = 8 • >10 = 10

103 / 174
Environmental Dimension - Climate Strategy
Data Requirements
Please describe and provide figures concerning the most significant opportunity identified.
References
This question refers to CDP question 2.4a and TCFD recommendation Strategy (b). GRI Standard 201 -2 is relevant for this question. The questions in this criterion have been developed in alignment with the CDP (https://www.cdp.net).
104 / 174
Environmental Dimension - Climate Strategy
Climate Risk Assessment- Physical Risks Partially public: additional credit will be granted for relevant publicly available evidence.
Assessment Focus
Question Rationale
Today, nearly all organizations are affected by climate change-related risks. However, the most significant effects of climate change are likely to emerge over the medium to longer term, while the precise timing and magnitude of these impacts remain uncertain. This uncertainty represents a challenge for organizations and investors to understand the potential effects of climate change on their businesses, strategies, and financial performance. To appropriately incorporate these potential impacts in their planning processes, organizations need to consider how such risks and opportunities may evolve and what the potential implications may be under different conditions. One way to do this is through using climate-related scenario analysis.
This question is aligned with the TCFD recommendations, which include a recommended disclosure on the resilience of the organization’s strategy, taking into consideration different climate-related scenarios, including a 2°C or lower scenario. This question is also aligned with the European Non-financial Reporting Directive 2014/95/EU, which demands that when reporting on their climate-related risks and opportunities, companies consider their whole value chain. Indeed, risks of negative impacts on an organization and risks of negative impacts on the climate may arise from companies’ own operations and may also occur throughout the value chain, both upstream in the supply chain and downstream.
Question Layout
Has your company assessed physical risks related to climate change?
o Yes, we have completed an assessment of material physical climate risks for our company. This has the following characteristics. Please select any that apply regarding your assessment, provide supporting evidence and indicate where this is available in your public reporting.
Methodology We publicly report on our scenario analysis
o We use qualitative climate-related scenario analysis o We use quantitative climate-related scenario analysis o We use qualitative and quantitative climate-related scenario analysis o We do not use climate-related scenario analysis
If your organization uses climate-related scenarios for physical risks, please select any that apply:
o RCP 2.6 o RCP 4.5 o RCP 6 o RCP 8.5 o Other (please specify):
Scope and focus of assessment We publicly report on the scope and focus of the assessment
o The scope of our assessment includes our own operations Please select the type(s) of assessment that apply:
o Context-specific assessment of the physical impacts of climate change for each asset (covering majority of assets)
o General level assessment on the physical impacts of climate change o Assessment consistent with the expected lifetime of the assets or activities
o The scope of our assessment includes our upstream operations o The scope of our assessment includes our downstream operations and clients
o We have not completed a climate-related risk assessment for physical risks. o Not applicable. We do not consider our company’s assets or operations to be exposed to physical climate risks. Please
provide explanations in the comment box below. o Not known
105 / 174
Environmental Dimension - Climate Strategy
Question Specific Guidance & Definitions
Risk Assessment: Systematic process for an organization to evaluate potential risks that may impact its assets and operations.
Scenario Analysis: Process for identifying and assessing a potential range of outcomes of future events under conditions of uncertainty. In the case of climate change, for example, scenarios allow an organization to explore and develop an understanding of how the physical and transition risks of climate change may impact its businesses, strategies, and financial performance over time.
(TCFD (2017), Recommendations of the Task Force on Climate-related Financial Disclosures)
Physical risks: Risks associated with physical impacts from climate change that could affect carbon assets and operating companies. These impacts may include “acute” physical damage from variations in weather patterns (such as severe storms, floods, and droughts) and “chronic” impacts such as sea level rise, and desertification.
(TCDF (2017), Technical Supplement: The Use of Scenario Analysis in Disclosure of Climate-related Risks and Opportunities)
Context specific: Adaptation responds to physical climate risks that are mostly location and context specific. Due to this nature, organizations can best assess climate related risks and mitigate them based on a context specific plan. For example, there are in principle several engineering and non-engineering options available to a coastal city to respond to the risk resulting from increased sea level. Responses will vary according to where the city is located, its size, the institutional and financial capacity of the city administration to deal with climate risk, the technical and engineering expertise available, the priority of the city, the perception of the citizens, and other factors.
(EU Technical Expert Group, Taxonomy Report, Technical Annex)
Value Chain: Terminology used to describe the upstream and downstream life cycle of a product, process, or service, including material sourcing, production, consumption, and disposal/recycling.
Upstream activities include operations that relate to the initial stages of producing a good or service, e.g. material sourcing, material processing, supplier activities.
Downstream activities include operations that relate to processing the materials into a finished product and delivering it to the end user (e.g. transportation, distribution and consumption).
(TCFD (2017), Technical Supplement: The Use of Scenario Analysis in Disclosure of Climate-related Risks and Opportunities)
Data Requirements
Please include in your response all the scenarios based on which you assess the physical risks related to climate change.
In line with the TCFD recommended disclosure, two scenarios are required for full scoring, one of which has to be a 2°C or lower scenario.
If your company conducts a scenario analysis and uses another method, please describe the three following elements:
• Parameters used (e.g. discount rate, GDP, other macro-economic variables etc.)
• Assumptions made (e.g. assumptions related to policy changes, technology development/deploym ent, energy mix, price of key commodities or inputs, geographical tailoring of transitional and physical impacts, and timing of potential impacts)
• Description of the different scenarios with time horizons set
Additional credit will be granted for public disclosure of:
• At least one climate related scenario • The focus and scope of the climate risk assessment
References
• TCFD (2017) Final Report: Recommendations of the Task Force on Climate-related Financial Disclosures https://www.fsb-tcfd.org/publication s/final-recommendations-report/
• TCFD (2017), Technical Supplement: The Use of
Scenario Analysis in Disclosure of Climate-related Risks and Opportunities https://www.fsb-tcfd.org/publications/final-technical-supplem ent/
• CDP (2017), CDP Technical Note on Scenario Analysis
– Conducting and disclosing scenario analysis • EU, Technical Expert Group (TEG)(2020) Technical
Annex on technical screening criteria for economic activities that can make a substantial contribution to climate change mitigation or adaptation. https://ec.europa.eu/info/sit es/inf o/files/busin ess_economy_euro/banking_and_finance/d ocument s/200309-sustainable-finance-teg-final-r ep ort-tax on omy-annexes_en.pdf
• European Commission, Guidelines on reporting
climate-related information https://ec.europa.eu/finance/d ocs/p olicy/190618-climate-related-information-rep ortin g-guidelines_en.pdf
This question refers to CDP questions C3.1a and C3.1d and TCFD recommendation Strategy (a), (b), and (c)
106 / 174
Environmental Dimension - Climate Strategy
Climate Risk Assessment- Transition Risks Partially public: additional credit will be granted for relevant publicly available evidence.
Assessment Focus
Question Rationale
Today, nearly all organizations are affected by climate change-related risks. However, the most significant effects of climate change are likely to emerge over the medium to longer-term, while the precise timing and magnitude of these impacts remain uncertain. This uncertainty represents a challenge for organizations and investors to understand the potential effects of climate change on their businesses, strategies, and financial performance. To appropriately incorporate these potential impacts in their planning processes, organizations need to consider how such risks and opportunities may evolve and what the potential implications may be under different conditions. One way to do this is by using climate-related scenario analysis.
This question is aligned with the TCFD recommendations, which include a recommended disclosure on the resilience of the organization’s strategy, taking into consideration different climate-related scenarios, including a 2°C or lower scenario. This question is also aligned with the European Non-financial Reporting Directive 2014/95/EU, which demands that when reporting on their climate-related risks and opportunities, companies consider their whole value chain. Indeed, risks of negative impacts on an organization and risks of negative impacts on the climate may arise from companies’ own operations and may also occur throughout the value chain, both upstream in the supply chain and downstream.
Question Layout
Has your company assessed transition risks related to climate change?
o Yes, we have completed an assessment of material transition climate risks for our company. This has the following characteristics. Please select any that apply regarding your assessment, provide supporting evidence and indicate where this is available in your public reporting.
Methodology We publicly report on our scenario analysis
o We use qualitative climate-related scenario analysis o We use quantitative climate-related scenario analysis o We use qualitative and quantitative climate-related scenario analysis o We do not use climate-related scenario analysis
If your organization uses climate-related scenarios for transition risks, please select any that apply:
o IEA 2DS o IEA B2DS o IAE 450 o Greenpeace o DDPP o IEA Sustainable Development Scenario o IEA NPS o IEA CPS o IRENA o Nationally determined contributions (NDCs) o BNEF NEO o MESSAGE-GLOBIOM o REMIND o Other (please specify):
Scope and focus of assessment We publicly report on the scope and focus of the assessment
o The scope of our assessment includes our own operations Please select the type(s) of assessment that apply:
o Assessment of transition risk based on potential scenarios for legislation, technological development or market conditions General level assessment on the physical impacts of climate change
o Assessment consistent with the expected lifetime of the assets or activities o The scope of our assessment includes our upstream operations o The scope of our assessment includes our downstream operations and clients
o We have not completed a climate-related risk assessment for transition risks. o Not applicable. We do not consider our company’s assets or operations to be exposed to transition climate risks. Please
provide explanations in the comment box below. o Not known
107 / 174
Environmental Dimension - Climate Strategy
Question Specific Guidance & Definitions
Risk Assessment: Systematic process for an organization to evaluate potential risks that may impact its assets and operations.
Scenario Analysis: Process for identifying and assessing a potential range of outcomes of future events under conditions of uncertainty. In the case of climate change, for example, scenarios allow an organization to explore and develop an understanding of how the physical and transition risks of climate change may impact its businesses, strategies, and financial performance over time.
(TCFD (2017), Recommendations of the Task Force on Climate-related Financial Disclosures)
Transition risk: Transitioning to a lower-carbon economy may entail extensive policy, legal, technology, and market changes to address mitigation and adaptation requirements related to climate change. Depending on the nature, speed, and focus of these changes, transition risks may pose varying levels of financial and reputational risk to organizations. Transition risks can be divided into four categories: policy and regulatory risks; technological risk; market risk; and reputational risk.
• Policy, regulation and legal risks include implementing carbon-pricing mechanisms to reduce GHG emissions, shifting energy use toward lower-emission sources, and adopting energy-efficiency solutions. The risk associated with and financial impact of policy changes depend on the nature and timing of the policy change. Another important risk is litigation risk, which can occur as a result of litigation by for example property owners, municipalities, states, insurers, shareholders, and public interest organizations.
• Technological risks result from technological improvements or innovations that support the transition to a lower-carbon, energy-efficient economy. For example, the development and use of emerging technologies such as renewable energy, battery storage, energy efficiency, and carbon capture and storage will affect the competitiveness of certain organizations, their production and distribution costs, and ultimately the demand for their products and services from end-users.
• Market risks can impact the company in various ways. One of the major ways is through shifts in supply and demand for certain commodities, products, and services.
• Reputational risks may arise from changing customer or community perceptions of an organization’s contribution to or detraction from the transition to a lower-carbon economy.
(TCFD (2017), Technical Supplement: The Use of Scenario Analysis in Disclosure of Climate-related Risks and Opportunities)
Value Chain: Terminology used to describe the upstream and downstream life cycle of a product, process, or service, including material sourcing, production, consumption, and disposal/recycling.
Upstream activities include operations that relate to the initial stages of producing a good or service, e.g. material sourcing, material processing, supplier activities.
Downstream activities include operations that relate to processing the materials into a finished product and delivering it to the end-user (e.g. transportation, distribution, and consumption).
(TCFD (2017), Technical Supplement: The Use of Scenario Analysis in Disclosure of Climate-related Risks and Opportunities)
Data Requirements
Please include in your response all the scenarios based on which you assess the transition risks related to climate change.
In line with the TCFD recommended disclosure, two scenarios are required for full scoring, one of which has to be a 2°C or lower scenario.
If your company conducts a scenario analysis and uses another method, please describe the three following elements:
• Parameters used (e.g. discount rate, GDP, other macro-economic variables, etc.)
• Assumptions made (e.g. assumptions related to policy changes, technology development/deploym ent, energy mix, price of key commodities or inputs, geographical tailoring of transitional and physical impacts, and timing of potential impacts)
• Description of the different scenarios with time horizons set
Additional credit will be granted for public disclosure of:
• At least one climate-related scenario • The focus and scope of the climate risk assessment
References
• TCFD (2017) Final Report: Recommendations of the Task Force on Climate-related Financial Disclosures https://www.fsb-tcfd.org/publication s/final-recommendations-report/
• TCFD (2017), Technical Supplement: The Use of
Scenario Analysis in Disclosure of Climate-related Risks and Opportunities https://www.fsb-tcfd.org/publications/final-technical-supplem ent/
• CDP (2017), CDP Technical Note on Scenario Analysis
– Conducting and disclosing scenario analysis • EU, Technical Expert Group (TEG)(2020) Technical
Annex on technical screening criteria for economic activities that can make a substantial contribution to climate change mitigation or adaptation. https://ec.europa.eu/info/sit es/inf o/files/busin ess_economy_euro/banking_and_finance/d ocument s/200309-sustainable-finance-teg-final-r ep ort-tax on omy-annexes_en.pdf
• European Commission, Guidelines on reporting
climate-related information https://ec.europa.eu/finance/d ocs/p olicy/190618-climate-related-information-rep ortin g-guidelines_en.pdf
This question refers to CDP questions C3.1a and C3.1d and TCFD recommendation Strategy (a), (b), and (c)
108 / 174
Environmental Dimension - Climate Strategy
Physical Climate Risk Adaptation Partially public: additional credit will be granted for relevant publicly available evidence.
Assessment Focus
Question Rationale
The climate risk assessment of physical and transition risks builds the basis for companies to plan adaptation and mitigation measures in response to those risks. Adaptation and mitigation measures are ideally planned so that context specific factors are considered for all relevant assets and operations, since climate-related hazards are location and context specific.
This question focuses specifically on adaptation measures for physical risks. Climate change adaptation can be understood as anticipating the adverse effects of climate change and taking appropriate action to prevent or minimize the damage they can cause. It includes business opportunities such as new technologies to use scarce water resources more efficiently, or the building of new flood defences.
Climate change mitigation and adaptation is a central part of the EU taxonomy for sustainable activities. The information on risk assessment of physical impacts is required for evaluating compliance with the EU Taxonomy Do No Significant Harm criteria on climate change adaptation. The EU taxonomy demands that an activity integrates physical and non-physical measures aimed at reducing all material risks that have been identified through a climate risk assessment. For existing activities, the implementation of those physical and non-physical measures may be phased and executed over a period of time of up to five years. For new activities, implementation of these measures must be met at the time of design and construction. (EU Technical Expert Group, Taxonomy Report, Technical Annex).
Question Layout
Based on your climate risk assessment, has your company set up a plan to adapt to the identified physical climate risks? Please provide supporting evidence and indicate where this is available in the public domain.
o We publicly report on our plan to adapt to physical risks
o Yes, we have a context-specific plan to adapt to physical climate risks o The risk assessment and plan to adapt to physical climate risks cover the following share of our existing
operations (Percentage of total revenues): The plan includes a target to implement relevant adaptation measures within the following timeline for existing operations:
o Less than 5 years o 5 to 10 years o More than 10 years
o The risk assessment and plan to adapt to physical climate risks cover the following share of our new operations (Percentage of new operations):
o We have no new asset planned.
o Yes, we have an overall plan to adapt to potential physical climate risks. The plan includes a target to implement relevant adaptation measures within the following timeline:
o Less than 5 years o 5 to 10 years o More than 10 years
o No, we have no existing plan to adapt to physical climate risks. o Not applicable. We do not consider our company’s assets or operations to be exposed to physical climate risks. Please
provide explanations in the comment box below. o Not known
Question Specific Guidance & Definitions
Adaptation: Anticipating the adverse effects of climate change and taking appropriate action to prevent or minimize the damage they can cause or taking advantage of opportunities that may arise.
Context specific: Adaptation responds to physical climate risks that are mostly location and context specific. Due to this nature, organizations can best assess climate related risks and mitigate them based on a context specific plan. For example, there are in principle several engineering and non-engineering options available to a coastal city to respond to the risk resulting from increased sea level. Responses will vary according to where the city is located, its size, the institutional
and financial capacity of the city administration to deal with climate risk, the technical and engineering expertise available, the priority of the city, the perception of the citizens, and other factors. The adaptation responses will benefit the city that adopts them and possibly the systems that depend or interact with the city.
A context specific plan integrates physical and non-physical measures aimed at reducing - to the extent possible and on a best effort basis - all material risks that have been identified through a climate risk assessment. (EU Technical Expert Group, Taxonomy Report, Technical Annex)

109 / 174
Environmental Dimension - Climate Strategy
New operations: refers to assets planned, under construction or put in use after the current reporting cycle (i.e. after 2020 for the 2021 CSA).
Data Requirements
If your company has performed a climate risk assessment for physical risks and no material physical risks were identified, please select “not applicable” to this question.
References
• TCFD (2017) Final Report: Recommendations of the Task Force on Climate-related Financial Disclosures https://www.fsb-tcfd.org/publication s/final-recommendations-report/
• EU, Technical Expert Group (TEG)(2020) Technical
Annex on technical screening criteria for economic
activities that can make a substantial contribution to climate change mitigation or adaptation. https://ec.europa.eu/info/sit es/inf o/files/busin ess_economy_euro/banking_and_finance/d ocument s/200309-sustainable-finance-teg-final-r ep ort-tax on omy-annexes_en.pdf
• European Commission, Guidelines on reporting
climate-related information https://ec.europa.eu/finance/d ocs/p olicy/190618-climate-related-information-rep ortin g-guidelines_en.pdf
This question refers to TCFD recommendation Strategy (b) and the EU Taxonomy Regulation, criterion A1.1 Screening criteria for ‘adapted activities’.
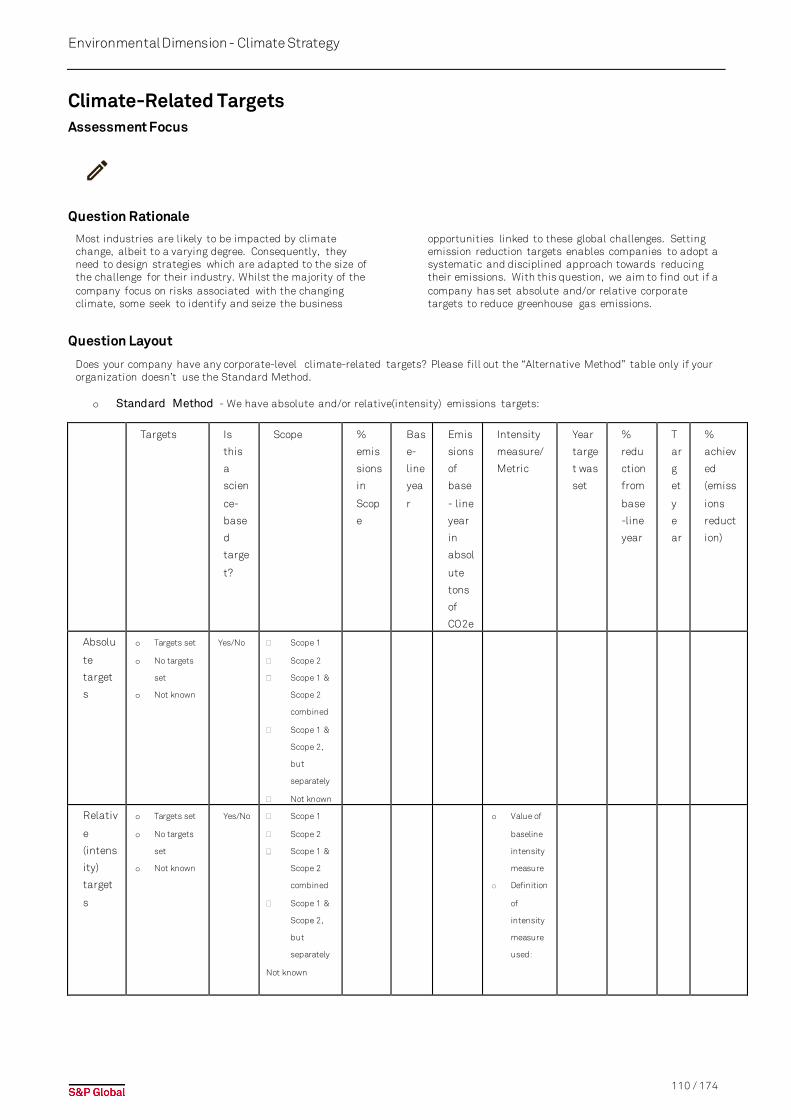
110 / 174
Environmental Dimension - Climate Strategy
Climate-Related Targets Assessment Focus
Question Rationale
Most industries are likely to be impacted by climate change, albeit to a varying degree. Consequently, they need to design strategies which are adapted to the size of the challenge for their industry. Whilst the majority of the company focus on risks associated with the changing climate, some seek to identify and seize the business
opportunities linked to these global challenges. Setting emission reduction targets enables companies to adopt a systematic and disciplined approach towards reducing their emissions. With this question, we aim to find out if a company has set absolute and/or relative corporate targets to reduce greenhouse gas emissions.
Question Layout
Does your company have any corporate-level climate-related targets? Please fill out the “Alternative Method” table only if your organization doesn’t use the Standard Method.
o Standard Method - We have absolute and/or relative(intensity) emissions targets:
Targets Is
this
a
scien
ce-
base
d
targe
t?
Scope %
emis
sions
in
Scop
e
Bas
e-
line
yea
r
Emis
sions
of
base
- line
year
in
absol
ute
tons
of
CO2e
Intensity
measure/
Metric
Year
targe
t was
set
%
redu
ction
from
base
-line
year
T
ar
g
et
y
e
ar
%
achiev
ed
(emiss
ions
reduct
ion)
Absolu
te
target
s
o Targets set
o No targets
set
o Not known
Yes/No � Scope 1
� Scope 2
� Scope 1 &
Scope 2
combined
� Scope 1 &
Scope 2,
but
separately
� Not known
Relativ
e
(intens
ity)
target
s
o Targets set
o No targets
set
o Not known
Yes/No � Scope 1
� Scope 2
� Scope 1 &
Scope 2
combined
� Scope 1 &
Scope 2,
but
separately
Not known
o Value of
baseline
intensity
measure
o Definition
of
intensity
measure
used:
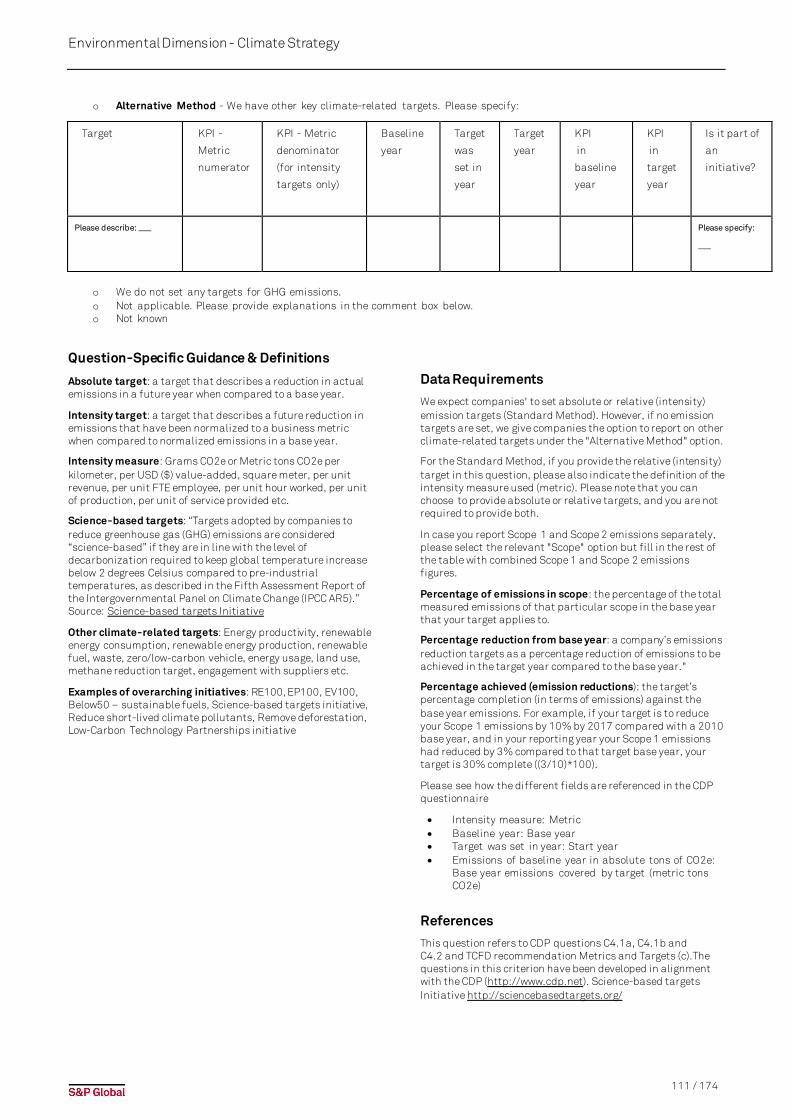
111 / 174
Environmental Dimension - Climate Strategy
o Alternative Method - We have other key climate-related targets. Please specify:
Target KPI -
Metric
numerator
KPI - Metric
denominator
(for intensity
targets only)
Baseline
year
Target
was
set in
year
Target
year
KPI
in
baseline
year
KPI
in
target
year
Is it part of
an
initiative?
Please describe: ___ Please specify:
___
o We do not set any targets for GHG emissions. o Not applicable. Please provide explanations in the comment box below. o Not known
Question-Specific Guidance & Definitions
Absolute target: a target that describes a reduction in actual emissions in a future year when compared to a base year.
Intensity target: a target that describes a future reduction in emissions that have been normalized to a business metric when compared to normalized emissions in a base year.
Intensity measure: Grams CO2e or Metric tons CO2e per kilometer, per USD ($) value-added, square meter, per unit revenue, per unit FTE employee, per unit hour worked, per unit of production, per unit of service provided etc.
Science-based targets: “Targets adopted by companies to reduce greenhouse gas (GHG) emissions are considered “science-based” if they are in line with the level of decarbonization required to keep global temperature increase below 2 degrees Celsius compared to pre-industrial temperatures, as described in the Fifth Assessment Report of the Intergovernmental Panel on Climate Change (IPCC AR5).” Source: Science-based targets Initiative
Other climate-related targets: Energy productivity, renewable energy consumption, renewable energy production, renewable fuel, waste, zero/low-carbon vehicle, energy usage, land use, methane reduction target, engagement with suppliers etc.
Examples of overarching initiatives: RE100, EP100, EV100, Below50 – sustainable fuels, Science-based targets initiative, Reduce short-lived climate pollutants, Remove deforestation, Low-Carbon Technology Partnerships initiative
Data Requirements
We expect companies' to set absolute or relative (intensity) emission targets (Standard Method). However, if no emission targets are set, we give companies the option to report on other climate-related targets under the "Alternative Method" option.
For the Standard Method, if you provide the relative (intensity) target in this question, please also indicate the definition of the intensity measure used (metric). Please note that you can choose to provide absolute or relative targets, and you are not required to provide both.
In case you report Scope 1 and Scope 2 emissions separately, please select the relevant "Scope" option but fill in the rest of the table with combined Scope 1 and Scope 2 emissions figures.
Percentage of emissions in scope: the percentage of the total measured emissions of that particular scope in the base year that your target applies to.
Percentage reduction from base year: a company’s emissions reduction targets as a percentage reduction of emissions to be achieved in the target year compared to the base year."
Percentage achieved (emission reductions): the target’s percentage completion (in terms of emissions) against the base year emissions. For example, if your target is to reduce your Scope 1 emissions by 10% by 2017 compared with a 2010 base year, and in your reporting year your Scope 1 emissions had reduced by 3% compared to that target base year, your target is 30% complete ((3/10)*100).
Please see how the different fields are referenced in the CDP questionnaire
• Intensity measure: Metric • Baseline year: Base year • Target was set in year: Start year • Emissions of baseline year in absolute tons of CO2e:
Base year emissions covered by target (metric tons CO2e)
References
This question refers to CDP questions C4.1a, C4.1b and C4.2 and TCFD recommendation Metrics and Targets (c).The questions in this criterion have been developed in alignment with the CDP (http://www.cdp.net). Science-based targets Initiative http://sciencebasedtargets.org/
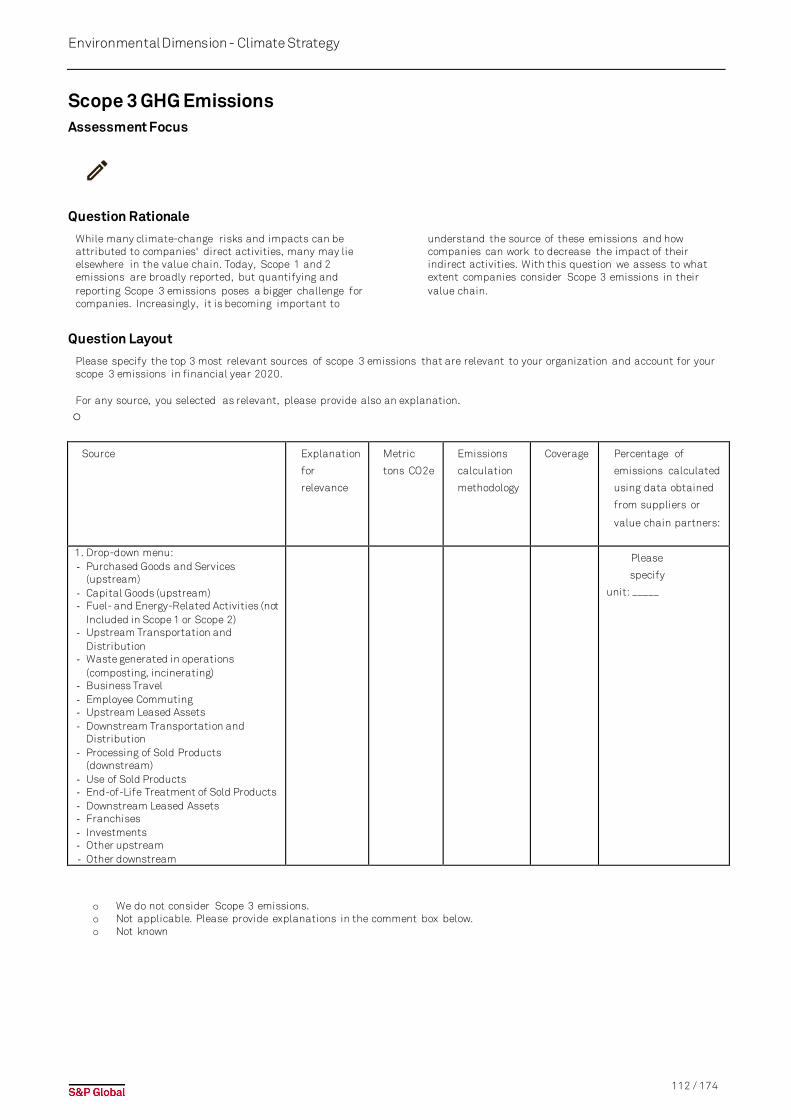
112 / 174
Environmental Dimension - Climate Strategy
Scope 3 GHG Emissions Assessment Focus
Question Rationale
While many climate-change risks and impacts can be attributed to companies' direct activities, many may lie elsewhere in the value chain. Today, Scope 1 and 2 emissions are broadly reported, but quantifying and reporting Scope 3 emissions poses a bigger challenge for companies. Increasingly, it is becoming important to
understand the source of these emissions and how companies can work to decrease the impact of their indirect activities. With this question we assess to what extent companies consider Scope 3 emissions in their value chain.
Question Layout
Please specify the top 3 most relevant sources of scope 3 emissions that are relevant to your organization and account for your scope 3 emissions in financial year 2020. For any source, you selected as relevant, please provide also an explanation.
o
Source Explanation
for
relevance
Metric
tons CO2e
Emissions
calculation
methodology
Coverage
Percentage of
emissions calculated
using data obtained
from suppliers or
value chain partners:
1. Drop-down menu: - Purchased Goods and Services
(upstream) - Capital Goods (upstream) - Fuel- and Energy-Related Activities (not
Included in Scope 1 or Scope 2) - Upstream Transportation and
Distribution - Waste generated in operations
(composting, incinerating) - Business Travel - Employee Commuting - Upstream Leased Assets - Downstream Transportation and
Distribution - Processing of Sold Products
(downstream) - Use of Sold Products - End-of-Life Treatment of Sold Products - Downstream Leased Assets - Franchises - Investments - Other upstream - Other downstream
Please
specify
unit: _____
o We do not consider Scope 3 emissions. o Not applicable. Please provide explanations in the comment box below. o Not known
113 / 174
- Climate Strategy
Question-Specific Guidance & Definitions
Relevance: This refers to one of the five principles of the GHG Protocol’s Corporate Value Chain Accounting and Reporting Standard, which states that the scope 3 inventory should be based on the assumption that it ensures the GHG inventory appropriately reflects the GHG emissions of the company and serves users’ decision-making needs– both within and beyond the company. Companies should use the principle of relevance when determining whether to exclude activities from the inventory boundary. Companies should also use the principle of relevance as a guide when selecting data sources. According to the GHG Protocol, companies may use two types of data to calculate scope 3 emissions: primary and secondary data. Primary data: includes data provided by suppliers or others that directly relates to specific activities in the reporting company’s value chain. Primary activity data may be obtained through meter readings, purchase records, utility bills, engineering models, direct monitoring, mass balance, stoichiometry, or other methods for obtaining data from specific activities in the company’s value chain. Secondary data: includes industry average data (e.g., from published databases, government statistics, literature reviews, and industry associations), financial data, proxy data, and other generic data. In specific cases, companies may use specific data from one activity in the value chain to estimate emissions for another activity in the value chain. This type of data (i.e., proxy data) is considered secondary data, since it is not specific to the activity for which emissions are being calculated. Source: GHG Protocol
Data Requirements
For this question, our expectations are aligned with the guidelines of the GHG Protocol Corporate Value Chain (Scope 3) Accounting and Reporting Standard. That means that we expect companies to account for all scope 3 emissions and disclose and justify any exclusions (Completeness Principle of the GHG Protocol Scope 3 Standard). Explanation for relevance: please provide details regarding how you have reached the conclusion that the source is relevant to your organization. Relevance should be determined with reference to the GHG Protocol Scope 3 Standard. Emissions calculation methodology: please provide a short description of the types and sources of data used to calculate emissions (e.g. activity data, emission factors and GWP values), along with a description of the methodologies, assumptions and allocation methods used to calculate emissions. Percentage of emissions calculated using data obtained from suppliers or value chain partners: please provide the percentage of emissions calculated using primary data.
References
This question refers to CDP question C6.5 and TCFD recommendation Metrics and Targets (b). This criterion has been developed in alignment with the CDP (https://www.cdp.net/). This question contains categories of Scope 3 emissions and definitions of the Greenhouse Gas Protocol’s Corporate Value Chain (Scope 3) Accounting and Reporting Standard, published in September 2011. GRI Standard 305-3 is relevant for this question.
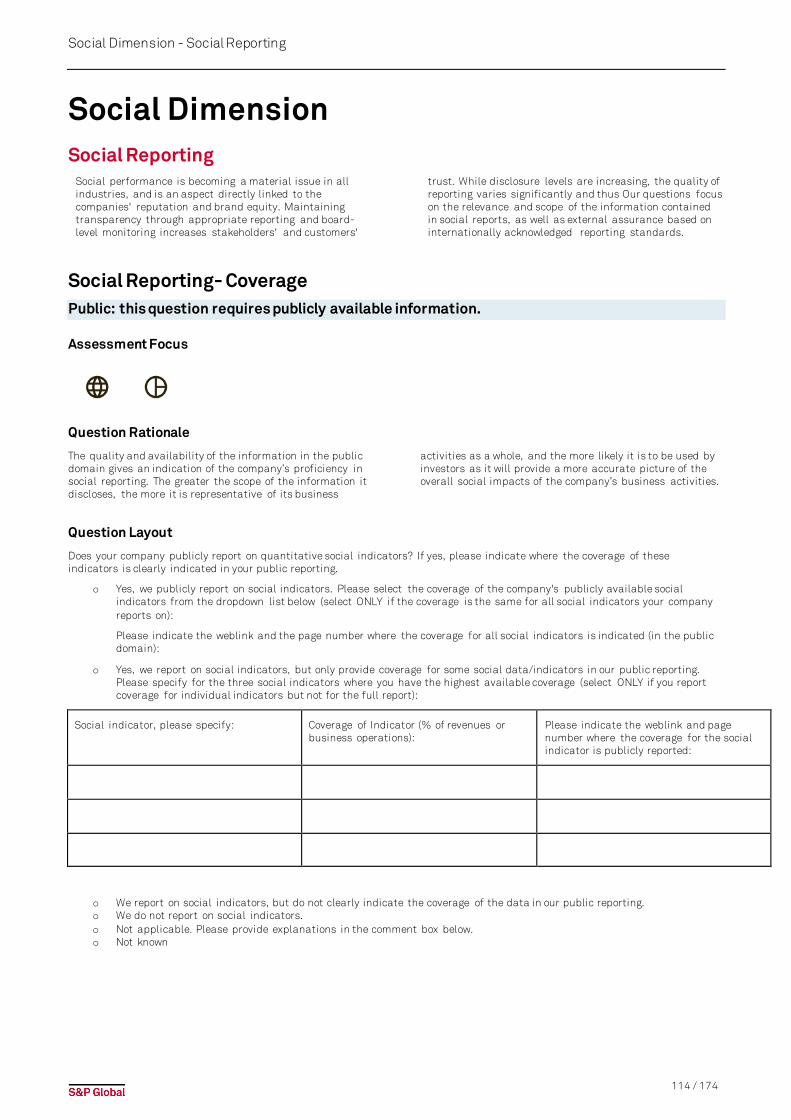
114 / 174
Social Dimension - Social Reporting
Social Dimension Social Reporting
Social performance is becoming a material issue in all industries, and is an aspect directly linked to the companies' reputation and brand equity. Maintaining transparency through appropriate reporting and board-level monitoring increases stakeholders' and customers'
trust. While disclosure levels are increasing, the quality of reporting varies significantly and thus Our questions focus on the relevance and scope of the information contained in social reports, as well as external assurance based on internationally acknowledged reporting standards.
Social Reporting- Coverage Public: this question requires publicly available information.
Assessment Focus
Question Rationale
The quality and availability of the information in the public domain gives an indication of the company’s proficiency in social reporting. The greater the scope of the information it discloses, the more it is representative of its business
activities as a whole, and the more likely it is to be used by investors as it will provide a more accurate picture of the overall social impacts of the company’s business activities.
Question Layout
Does your company publicly report on quantitative social indicators? If yes, please indicate where the coverage of these indicators is clearly indicated in your public reporting.
o Yes, we publicly report on social indicators. Please select the coverage of the company's publicly available social indicators from the dropdown list below (select ONLY if the coverage is the same for all social indicators your company reports on):
Please indicate the weblink and the page number where the coverage for all social indicators is indicated (in the public domain):
o Yes, we report on social indicators, but only provide coverage for some social data/indicators in our public reporting. Please specify for the three social indicators where you have the highest available coverage (select ONLY if you report coverage for individual indicators but not for the full report):
Social indicator, please specify: Coverage of Indicator (% of revenues or business operations):
Please indicate the weblink and page number where the coverage for the social indicator is publicly reported:
o We report on social indicators, but do not clearly indicate the coverage of the data in our public reporting. o We do not report on social indicators. o Not applicable. Please provide explanations in the comment box below. o Not known
115 / 174
Social Dimension -
Question-Specific Definitions & Guidance
Reporting coverage refers to the boundary or the range of entities (e.g. subsidiaries, joint ventures, sub-contractors, etc.) whose performance is presented by the report. Ideally the company reports on its entities for which it has management control and/or over 50% ownership – that would be considered 100%.
Social indicators: refer to quantitative indicators / KPIs covering KPIs covering human capital, labor indicators, human rights issues, occupational health and safety and other indicators covered under the "Social Dimension". Supply chain indicators are acceptable if they clearly focus on social issues.
Data Requirements
o The first option should only be used if it is publiclystated that the coverage is the same for all social data reported on, or if it is explicitly stated thatthe coverage applies to the full report.
o If the coverage varies between differentindicators, the three with the highest availablecoverage and their respective coverage should beindicated under the second option.
o In both cases, the coverage must be publiclyavailable and please refer to where in the publicdomain this information can be found.
References
• GRI Standards 102-45 & 102-46 are relevant for thisquestion.
116 / 174
Social Dimension -
Social Reporting- Assurance Public: this question requires publicly available information.
Assessment Focus
Question Rationale
As with financial data, assurance of social data ensures that it is more reliable and makes it more likely that investors will use these data in their analysis and
investment decisions. Transparency about the assurance process and the data assured also increase stakeholders’ trust in published information.
Question Layout
Please indicate below what type of external assurance your company has received in relation to your company's social reporting. Please attach supporting evidence, indicating where the assurance statement is available in the public domain.
o Yes
o The assurance statement is an "External Audit" or "External Assurance" produced by assurance specialists (e.g. accountants, certification bodies, specialist consultancies)
o The assurance statement contains a "declaration of independence" which specifies that the assurance provider has no conflict of interest in relation to providing the assurance of social data for the company which has been assured
o The assurance statement is based on a recognized international or national standard (e.g. AA1000AS, ISAE 3000)
o The scope of the assurance is clearly indicated in the assurance statement. If the assurance statement only covers some KPIs (but not all) it is clearly indicated which data / KPIs disclosed in the report have been assured (e.g. each KPI assured is marked with an "assurance" symbol / flag).
o The assurance statement contains a conclusion, i.e. either "reasonable assurance" or "limited assurance"
o We do not have any external assurance on our social reporting. o Not applicable. Please provide explanations in the comment box below. o Not known
Question-Specific Definitions & Guidance
Assurance specialists: Include accountants, certification bodies, and specialist consultancies. The term does not include independent advisory boards, stakeholder panels, or high-level individuals.
The declaration of independence: An explicit statement of independence from the auditor confirming that there is no other commercial link to the company’s operations or business that could result in a conflict of interest.
Recognized international or national standard: Refers to assurance standards and not reporting standards (such as GRI guidelines). Examples of these assurance standards are AA1000AS and ISAE 3000, but regional or local standards are also acceptable if they are clearly specified and are comparable to international standards.
Examples include:
• Standard DR03422 (Australia /New Zealand) • Assurance Engagements of Sustainability Reports
(Germany) • Environmental Report Assurance Services Guidelines
by the JICPA (Japan) • FAR auditing standard RevR6 (Sweden) • Standard 3810 Assurance Engagements related to
Sustainability Reports (the Netherlands) • AT-C Section 105 and 210 (United States/
Canada)
Scope of assurance: If the scope of assurance covers some (but not all) social indicators, these need to be clearly marked in the relevant sections of the report. If the assurance statement covers all data items in the report, this also needs to be explicitly stated.
Conclusion/Level of assurance: This refers to the conclusion of the assurance process which is according to the level of assurance i.e. to limited/moderate or reasonable assurance. The level of assurance indicates the extent and depth of the work the assurance provider undertakes in relation to sustainability disclosures. Most assurance providers offer two levels: ‘reasonable’ assurance (i.e. high but still involving some risk of inappropriate conclusion) or ‘limited’ assurance (i.e. moderate) (GRI, 2013).
Social indicators: refer to quantitative indicators / KPIs covering KPIs covering human capital, labor indicators, human rights issues, occupational health and safety and other indicators covered under the "Social Dimension". Supply chain indicators are acceptable if they clearly focus on social issues.
References
• GRI Standard 102-56 is relevant to this question.
117 / 174
Social Dimension - Labor Practice Indicators
Labor Practice Indicators Employees represent one of a company's most important assets. Maintaining good relations with employees is essential for the success of businesses' operations, particularly in industries characterized by organized labor. Beyond providing a safe and healthy working environment, companies should support fair treatment practices such as guaranteeing diversity, ensuring equal remuneration and supporting freedom of association. In accordance with international standards on labor and human rights,
companies are increasingly expected to adhere to and apply these standards equally across all operations within the organization. Furthermore, growing customer awareness leads to higher expectations from companies in their role as global corporate citizens and their ability to drive sustainable business practices forward. The key focus of the criterion is on gender diversity in management, equal remuneration, and freedom of association.
Discrimination & Harassment Public: this question requires publicly available information.
Assessment Focus
Question Rationale
The purpose of this question is to evaluate the quality of the company’s non-discrimination and anti-harassment policy. According to the International Labor Organization (ILO), discrimination based on the mentioned identity markers is a violation of human and labor rights. Furthermore, diverse companies with strong non-
discriminatory practices have been proven to perform better in terms of innovation, efficiency, productivity, employee engagement and talent attraction and retention, thus making anti-discrimination practices a key strategic topic for companies.
Question Layout
Does your company have a public group-wide non-discrimination and anti-harassment policy and what are the measures in place to effectively deal with discrimination and harassment in the workplace?
o Our policy and measures include the following:
o Explicit statement prohibiting harassment: o Sexual harassment o Non-sexual harassment
o Zero tolerance policy for discrimination o Trainings for all employees on discrimination and harassment in the workplace o Defined escalation process for reporting incidents o Corrective or disciplinary action taken in case of discriminatory behavior or harassment o We disclose the number of incidents of discrimination and harassment reviewed in the last fiscal year:
o We do not have a group-wide non-discrimination and anti-harassment policy and we do not have such measures in
place. o Not applicable. Please provide explanations in the comment box below. o Not known
Question-Specific Definitions & Guidance
Discrimination: Discrimination is defined as the act and the result of treating people unequally by imposing unequal burdens or denying benefits, instead of treating each person fairly on the basis of individual merit. Discrimination can also include harassment. Harassment: Harassment is defined as a course of comments or actions that are unwelcome, or should reasonably be known to be unwelcome, to the person towards whom they are addressed. Non-sexual harassment includes but is not exclusive to mobbing and bullying, while sexual harassment includes a sexual component. Zero tolerance: Zero-tolerance policies against harass-ment and discrimination dictate that any allegations are taken seriously and handled confidentially and sympa-theticcally. If allegations are confirmed, remedial action,
disciplinary action, dismissal, or legal action will be taken. Defined escalation process: System consisting of specific procedures, roles and rules for receiving complaints and providing remedy. Grievance mechanisms are also accepted here. It should be specifically specified in the company's public domain that the reporting of discrimination and harassment incidents are to be reported through the defined escalation process. Corrective action: Corrective action is a process of communicating with the employee and taking active measures to improve unacceptable behavior. Disciplinary action: A disciplinary action is a reprimand or corrective action in response to employee misconduct, rule violation, or poor performance. Depending on the severity of the case, a disciplinary action can take
118 / 174
Social Dimension - Labor Practice Indicators
different forms, including: a verbal warning, a written warning, a poor performance review or evaluation, a reduction in rank or pay and termination. Number of incidents of discrimination and harassment: Incidents of harassment or discrimination on grounds of race, color, sex, religion, political opinion, national extraction, or social origin as defined by the ILO, or other relevant forms of discrimination involving internal and/or external stakeholders across operations in the reporting period.
Data Requirements
This question requires publicly available information. We expect companies to have a statement explicitly prohibiting both sexual and non-sexual harassment. We expect the company's policies and measures to be explicitly relevant to discrimination and harassment. A simple mention of discrimination in the Codes of Conduct is not considered as sufficient. If discrimination and harassment are included in trainings, escalations processes and disciplinary actions together with other breaches of the Codes of Conduct, it should be mentioned that each aspect also covers discrimination and harassment specifically.
References
• ILO: Convention no. 111 • ILO: Business, Discrimination and Equality
• GRI 406: Non-discrimination

119 / 174
Social Dimension - Labor Practice Indicators

120 / 174
Social Dimension - Labor Practice Indicators
Workforce Breakdown: Gender Partially public: additional credit will be granted for relevant publicly available evidence.
Assessment Focus
Question Rationale
We assess various Labor KPIs of an organization to determine not only the quality, but also the transparency of its reporting on diversity issues. Gender diversity can improve a company’s performance as it increases the likelihood of bringing people with different types of knowledge, views and perspectives together. This diversity results in better innovative and problem-solving skills, improves talent attraction and retention, increases employee engagement and results in higher efficiency. Several initiatives have already been taken by shareholders and governments to increase the share of women in the workforce and in leadership positions.
Companies who are early adopters of inclusive hiring and retention practices will therefore benefit from positive recognition and lower compliance costs in the future. This question specifically assesses workforce gender diversity by asking about the proportion of women at different levels of responsibility. We expect companies to also commit to gender balance across the talent pipeline by setting targets for the levels of representation where they face the greatest challenges. This question looks at the companies' ability to disclose this data, as well as its performance compared to its industry peers and its ability to retain women talent.
Question Layout
Does your company monitor the following indicators regarding workforce gender diversity? If so, please complete the table. Please provide the coverage reported on as a percentage of FTEs and attach supporting public evidence where indicated if available. Please also indicate whether you have set a public target for women representation. We expect companies to have set at least one public target for one representation level in order to meet our requirements for the targets. We do not expect companies to have targets for each level of representation.
o Yes, we monitor the following indicators: Please select the coverage of the data reported on as a % of FTEs:
Diversity Indicator Percentage (0 - 100 %) Public Target
Share of women in total workforce (as
% of total workforce)
Public reporting available: Target year:
Public reporting:
Share of women in all management
positions, including junior, middle and
senior management (as % of total
management positions)
Public reporting available: Target year:
Public reporting:
Share of women in junior management
positions, i.e. first level of
management (as % of total junior
management positions)
Public reporting available: Target year:
Public reporting:
Share of women in top management
positions, i.e. maximum two levels
away from the CEO or comparable
positions (as % of total top
management positions)
Public reporting available: Target year:
Public reporting:
Share of women in management
positions in revenue-generating
functions (e.g. sales) as % of all such
managers (i.e. excluding support
functions such as HR, IT, Legal, etc.)
Public reporting available: Target year:
Public reporting:
Share of women in STEM-related
positions (as % of total STEM
positions)
Public reporting available: Target year:
Public reporting:
o No, we do not monitor the gender breakdown of our workforce. o Not applicable. Please provide explanations in the comment box below. o Not known
121 / 174
Social Dimension - Labor Practice Indicators
Question-Specific Definitions & Guidance
The definitions provided below are guidelines that should be followed as closely as possible. If a different definition is used, this should be explained accordingly and a consistent definition should be used in any other questions that may require information about organizational structures. Gender identity: Each person’s deeply felt internal and individual experience of gender, which may or may not correspond to the sex assigned at birth, including the personal sense of the body (which may involve, if freely chosen, modification of bodily appearance or function by medical, surgical or other means) and other expressions of gender, including dress, speech and mannerisms. (European Institute for Gender Equality). In this question, we refer to employees who self-identify as women, i.e. who consider their gender identity to be woman. Management positions: This refers to all levels of management, including junior, middle and senior level management. Junior management positions: refer to first-line managers, junior managers and the lowest level of management within a company’s management hierarchy. These individuals are typically responsible for directing and executing the day-to-day operational objectives of organizations, conveying the directions of higher level officials and managers to subordinate personnel. Middle management positions: refer to managers who head specific departments (such as accounting, marketing, production) or business units, or who serve as project managers in flat organizations. Middle managers are responsible for implementing the top management's policies and plans and typically have two management levels below them. Top management positions: refer to management positions with a reporting line at most two levels away from the CEO. They include individuals who plan, direct, and formulate policies, set strategy, and provide the overall direction of enterprises/organizations for the development and delivery of products or services, within the parameters approved by boards of directors or other governing bodies. Revenue-generating functions: refer to line management roles in departments such as sales, or that contribute directly to the output of products or services. It excludes support functions such as HR, IT, Legal. May also be referred to as roles that have P&L responsibility. STEM: Science, technology, engineering and mathematics. STEM workers use their knowledge of science, technology, engineering or mathematics in their daily responsibilities. To be classified as a STEM employee, the employee should have a STEM-related qualification and make use of these skills in their operational position. Positions include, but are not limited to, the following: Computer programmer, web developer, statistician, logistician, engineer, physicist, scientist. Coverage: The coverage corresponds to the scope of the data reported on. For example, if a company only reports on its employees in one country, and these employees represent X% of the total workforce, then the company should select the bracket which includes this X%. Please
us a consistent coverage for all of the indicators. Data Requirements
Disclosure requirements for partially public question. Additional credit will be granted for relevant publicly available evidence covering each of the following aspects of this question:
• Women in the total workforce • Women in all management positions • Women in junior management positions • Women in senior management positions • Women in revenue-generating positions • Women in STEM-related positions
We expect companies to have set at least one public target for one representation level in order to meet our requirements for the targets. We do not expect companies to have public targets for each level of representation, but only for one level. This target needs to be publicly available or will not be considered as relevant in the scoring of this question.
References
• The gender equality questions were developed in collaboration with EDGE, leveraging its robust research on gender equality. EDGE is the leading global assessment methodology and business certification standard for gender equality. It measures where organizations stand in terms of gender balance across their pipeline, pay equity, effectiveness of policies and practices to ensure equitable career flows as well as inclusiveness of their culture. Launched at the World Economic Forum in 2011, EDGE has been designed to help companies not only create an optimal workplace for women and men, but also benefit from it. EDGE stands for Economic Dividends for Gender Equality and is distinguished by its rigor and focus on business impact. EDGE Certification’s diverse customer base consists of 200 large organizations in 44 countries across five continents, representing 29 different industries and employing globally more than 2.4 million employees.
• GRI Standards 102-8 & 405 -1 • ILO convention No. 111

122 / 174
Social Dimension - Labor Practice Indicators
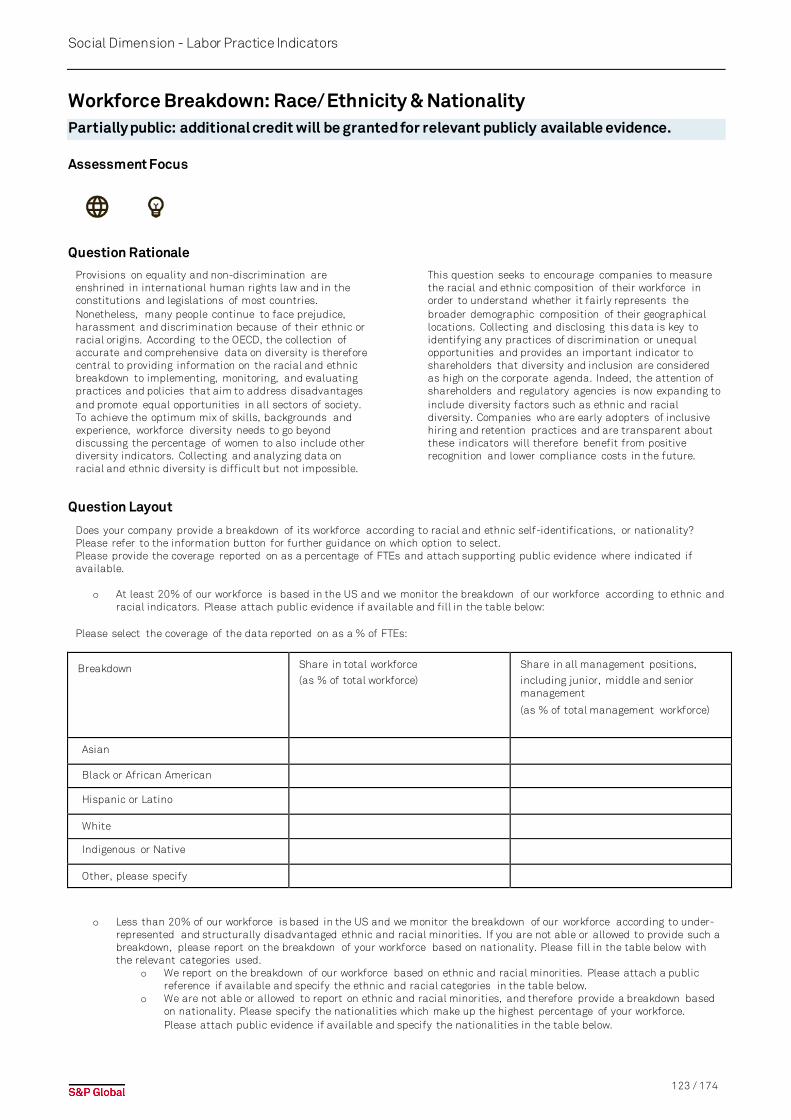
123 / 174
Social Dimension - Labor Practice Indicators
Workforce Breakdown: Race/ Ethnicity & Nationality Partially public: additional credit will be granted for relevant publicly available evidence.
Assessment Focus
Question Rationale
Provisions on equality and non-discrimination are enshrined in international human rights law and in the constitutions and legislations of most countries. Nonetheless, many people continue to face prejudice, harassment and discrimination because of their ethnic or racial origins. According to the OECD, the collection of accurate and comprehensive data on diversity is therefore central to providing information on the racial and ethnic breakdown to implementing, monitoring, and evaluating practices and policies that aim to address disadvantages and promote equal opportunities in all sectors of society. To achieve the optimum mix of skills, backgrounds and experience, workforce diversity needs to go beyond discussing the percentage of women to also include other diversity indicators. Collecting and analyzing data on racial and ethnic diversity is difficult but not impossible.
This question seeks to encourage companies to measure the racial and ethnic composition of their workforce in order to understand whether it fairly represents the broader demographic composition of their geographical locations. Collecting and disclosing this data is key to identifying any practices of discrimination or unequal opportunities and provides an important indicator to shareholders that diversity and inclusion are considered as high on the corporate agenda. Indeed, the attention of shareholders and regulatory agencies is now expanding to include diversity factors such as ethnic and racial diversity. Companies who are early adopters of inclusive hiring and retention practices and are transparent about these indicators will therefore benefit from positive recognition and lower compliance costs in the future.
Question Layout
Does your company provide a breakdown of its workforce according to racial and ethnic self-identifications, or nationality? Please refer to the information button for further guidance on which option to select. Please provide the coverage reported on as a percentage of FTEs and attach supporting public evidence where indicated if available.
o At least 20% of our workforce is based in the US and we monitor the breakdown of our workforce according to ethnic and racial indicators. Please attach public evidence if available and fill in the table below:
Please select the coverage of the data reported on as a % of FTEs:
Breakdown Share in total workforce
(as % of total workforce)
Share in all management positions,
including junior, middle and senior management
(as % of total management workforce)
Asian
Black or African American
Hispanic or Latino
White
Indigenous or Native
Other, please specify
o Less than 20% of our workforce is based in the US and we monitor the breakdown of our workforce according to under-represented and structurally disadvantaged ethnic and racial minorities. If you are not able or allowed to provide such a breakdown, please report on the breakdown of your workforce based on nationality. Please fill in the table below with the relevant categories used.
o We report on the breakdown of our workforce based on ethnic and racial minorities. Please attach a public reference if available and specify the ethnic and racial categories in the table below.
o We are not able or allowed to report on ethnic and racial minorities, and therefore provide a breakdown based on nationality. Please specify the nationalities which make up the highest percentage of your workforce. Please attach public evidence if available and specify the nationalities in the table below.
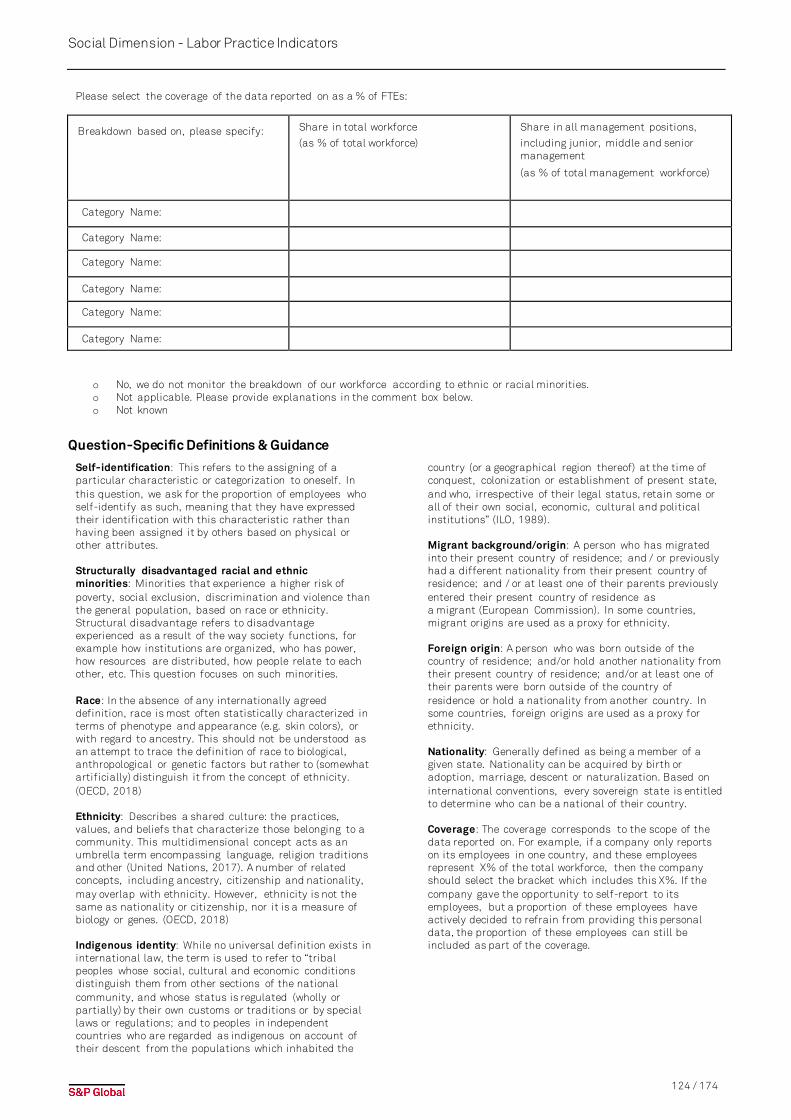
124 / 174
Social Dimension - Labor Practice Indicators
Please select the coverage of the data reported on as a % of FTEs:
Breakdown based on, please specify: Share in total workforce
(as % of total workforce)
Share in all management positions,
including junior, middle and senior management
(as % of total management workforce)
Category Name:
Category Name:
Category Name:
Category Name:
Category Name:
Category Name:
o No, we do not monitor the breakdown of our workforce according to ethnic or racial minorities. o Not applicable. Please provide explanations in the comment box below. o Not known
Question-Specific Definitions & Guidance
Self-identification: This refers to the assigning of a particular characteristic or categorization to oneself. In this question, we ask for the proportion of employees who self-identify as such, meaning that they have expressed their identification with this characteristic rather than having been assigned it by others based on physical or other attributes. Structurally disadvantaged racial and ethnic minorities: Minorities that experience a higher risk of poverty, social exclusion, discrimination and violence than the general population, based on race or ethnicity. Structural disadvantage refers to disadvantage experienced as a result of the way society functions, for example how institutions are organized, who has power, how resources are distributed, how people relate to each other, etc. This question focuses on such minorities. Race: In the absence of any internationally agreed definition, race is most often statistically characterized in terms of phenotype and appearance (e.g. skin colors), or with regard to ancestry. This should not be understood as an attempt to trace the definition of race to biological, anthropological or genetic factors but rather to (somewhat artificially) distinguish it from the concept of ethnicity. (OECD, 2018) Ethnicity: Describes a shared culture: the practices, values, and beliefs that characterize those belonging to a community. This multidimensional concept acts as an umbrella term encompassing language, religion traditions and other (United Nations, 2017). A number of related concepts, including ancestry, citizenship and nationality, may overlap with ethnicity. However, ethnicity is not the same as nationality or citizenship, nor it is a measure of biology or genes. (OECD, 2018) Indigenous identity: While no universal definition exists in international law, the term is used to refer to “tribal peoples whose social, cultural and economic conditions distinguish them from other sections of the national community, and whose status is regulated (wholly or partially) by their own customs or traditions or by special laws or regulations; and to peoples in independent countries who are regarded as indigenous on account of their descent from the populations which inhabited the
country (or a geographical region thereof) at the time of conquest, colonization or establishment of present state, and who, irrespective of their legal status, retain some or all of their own social, economic, cultural and political institutions” (ILO, 1989). Migrant background/origin: A person who has migrated into their present country of residence; and / or previously had a different nationality from their present country of residence; and / or at least one of their parents previously entered their present country of residence as a migrant (European Commission). In some countries, migrant origins are used as a proxy for ethnicity. Foreign origin: A person who was born outside of the country of residence; and/or hold another nationality from their present country of residence; and/or at least one of their parents were born outside of the country of residence or hold a nationality from another country. In some countries, foreign origins are used as a proxy for ethnicity. Nationality: Generally defined as being a member of a given state. Nationality can be acquired by birth or adoption, marriage, descent or naturalization. Based on international conventions, every sovereign state is entitled to determine who can be a national of their country. Coverage: The coverage corresponds to the scope of the data reported on. For example, if a company only reports on its employees in one country, and these employees represent X% of the total workforce, then the company should select the bracket which includes this X%. If the company gave the opportunity to self-report to its employees, but a proportion of these employees have actively decided to refrain from providing this personal data, the proportion of these employees can still be included as part of the coverage.
125 / 174
Social Dimension - Labor Practice Indicators
Data Requirements
In Europe, according to the Article 9 of the GDPR, it is prohibited to process personal data revealing racial or ethnic origin, except if the data subject has given explicit consent to the processing of those personal data, provided this is not prohibited by national law. Other exemptions exist, such as reasons of substantial public interest which might include statistical research purposes for equality of opportunity and treatment. However, if as a result, your company does not collect racial or ethnic data, please report on the nationalities which make up the highest percentage of your employees, providing the name of each nationality in each “category name” text box. Not Applicable will not be accepted, as we expect companies to report on the breakdown of nationalities. We expect companies to report on at least three different categories (racial or ethnic categories, or nationalities) in order to score full points for this question. The coverage provides an indication of the scope of the data reported on but is not considered in the scoring of this question as we recognize that the data is complex to consolidate at the global level. Disclosure requirements for partially public question: Additional credit will be granted for relevant publicly available evidence covering at least one level of responsibility for at least three minority groups. If your company has more than 20% of its workforce in the US, then we require you to select the first option and report according to the categories defined in the table. We expect public disclosure on at least three categories. If more than 20% of your workforce is in the US, but you also have employees in other parts of the world, please select
the coverage bracket which covers your employees in the US. You will not be penalized for not reporting on the full coverage of your FTEs as we recognize that the data is complex to consolidate at the global level. If your company has less than 20% of its workforce in the US, please select the second option and fill in the table according to the relevant categories for the highest share of your workforce. We expect public disclosure on at least three categories. Please select the coverage bracket which covers the scope of employees you are reporting on. You will not be penalized for not reporting on the full coverage of your FTEs as we recognize that the data is complex to consolidate at the global level. If your company has less than 20% of its workforce in the US and you are unable or not allowed to report on ethnic and racial indicators, please select the second option and report on the nationalities which make up the highest share of your workforce. Please note that this is not the preferred option as nationality is an imperfect proxy for the diversity indicator assessed in this question. We do not accept disclosure on the geographical spread of the workforce, here we refer to the nationalities of the employees rather than their geographical location. We expect disclosure on at least three different nationalities.
References
• GRI 405-1 • ILO convention No. 111 • GDPR Article 9
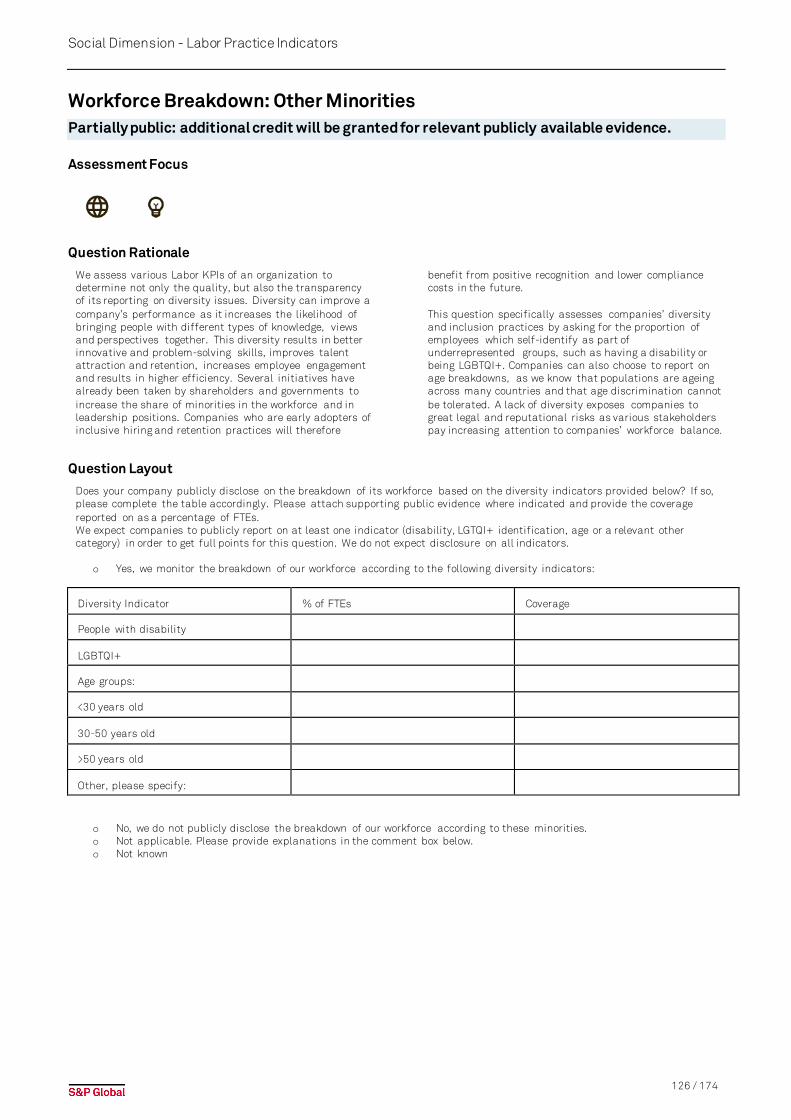
126 / 174
Social Dimension - Labor Practice Indicators
Workforce Breakdown: Other Minorities Partially public: additional credit will be granted for relevant publicly available evidence.
Assessment Focus
Question Rationale
We assess various Labor KPIs of an organization to determine not only the quality, but also the transparency of its reporting on diversity issues. Diversity can improve a company’s performance as it increases the likelihood of bringing people with different types of knowledge, views and perspectives together. This diversity results in better innovative and problem-solving skills, improves talent attraction and retention, increases employee engagement and results in higher efficiency. Several initiatives have already been taken by shareholders and governments to increase the share of minorities in the workforce and in leadership positions. Companies who are early adopters of inclusive hiring and retention practices will therefore
benefit from positive recognition and lower compliance costs in the future. This question specifically assesses companies’ diversity and inclusion practices by asking for the proportion of employees which self-identify as part of underrepresented groups, such as having a disability or being LGBTQI+. Companies can also choose to report on age breakdowns, as we know that populations are ageing across many countries and that age discrimination cannot be tolerated. A lack of diversity exposes companies to great legal and reputational risks as various stakeholders pay increasing attention to companies’ workforce balance.
Question Layout
Does your company publicly disclose on the breakdown of its workforce based on the diversity indicators provided below? If so, please complete the table accordingly. Please attach supporting public evidence where indicated and provide the coverage reported on as a percentage of FTEs. We expect companies to publicly report on at least one indicator (disability, LGTQI+ identification, age or a relevant other category) in order to get full points for this question. We do not expect disclosure on all indicators.
o Yes, we monitor the breakdown of our workforce according to the following diversity indicators:
Diversity Indicator % of FTEs Coverage
People with disability
LGBTQI+
Age groups:
<30 years old
30-50 years old
>50 years old
Other, please specify:
o No, we do not publicly disclose the breakdown of our workforce according to these minorities. o Not applicable. Please provide explanations in the comment box below. o Not known
127 / 174
Social Dimension - Labor Practice Indicators
Question-Specific Definitions & Guidance
Self-identification: This refers to the assigning of a particular characteristic or categorization to oneself. In this question, if reporting on disability or LBTQI+, we ask for the proportion of employees who self-identify as such, meaning that they have expressed their identification with this characteristic rather than having been assigned it by others based on physical or other judgements. LGBTQI+: Lesbian, gay, bisexual, transgender, queer or/and intersex. Rather than being an exhaustive list, this term refers to people who self-identify as having sexual orientations and/or gender expressions which are non-hegemonic and/or non-binary. People with disability: People who have long-term physical, mental, intellectual or sensory impairments which in interaction with various barriers may hinder their full and effective participation in society on an equal basis with others. A disability can be visible or non-visible or a combination of both. Other: Based on cultural and social contexts, other diversity indicators might be more relevant to a company’s workforce. This includes for example veterans or former prisoners. Coverage: The coverage corresponds to the scope of the data reported on. For example, if a company only reports on its employees in one country, and these employees represent X% of the total workforce, then the company should select the bracket which includes this X%. If the company gave the opportunity to self-report to its employees, but a proportion of these employees have actively decided to refrain from providing this personal data, the proportion of these employees can still be included as part of the coverage.
Data Requirements
Disclosure requirements for public question: We require all the data provided to be available in the public domain. We do not expect companies to tick all options in order to score full points for this question. We expect public reporting on at least one diversity indicator: disability, LGBTQI+ identification, age groups or a relevant other category. Regarding the coverage, we recognize that not all types of data can be collected in all parts of the world. Please select the coverage bracket which covers the employees you are reporting on. You will not be penalized for not reporting on the full coverage of your FTEs as we recognize that the data is complex to consolidate at the global level. According to the Article 9 of the GDPR, the processing of data concerning health or data concerning a natural person’s sex life or sexual orientation is prohibited, except if the data subject has given explicit consent to the processing of this personal data, provided this is not prohibited by national law. Other exemptions exist, such as reasons of substantial public interest which might include statistical research purposes for equality of opportunity and treatment. However, if as a result, your company does not collect data regarding disability or LGBTQI+ identification, please report on the distribution of your workforce according to ages groups. You will not be penalized for only providing age data. However, the option "Not applicable" will not be accepted as in that case, we expect disclosure on age groups.
References
• GRI 405-1 • ILO convention No. 111 • GDPR Article 9

128 / 174
Social Dimension - Labor Practice Indicators
Gender Pay Indicators Partially public: additional credit will be granted for relevant publicly available evidence.
Assessment Focus
Question Rationale
This question assesses the company’s pay practices by evaluating the results of its gender pay assessments. An increasing number of countries are adopting regulations which require companies to conduct such pay assessments and to disclose the results, making this topic
of high strategic importance. Furthermore, unequal remuneration and gender pay gaps pose a threat to the company’s ability to attract and to retain women talent, lowers employee engagement and can lead to reputationally damaging controversies.
Question Layout
Does your company monitor and disclose the results of your gender pay gap or equal pay assessment? If your company conducts both, please select the option with the highest coverage.
o We monitor and disclose the results of our equal pay analysis. If this information (or the ratios) is publicly reported, please provide the relevant URL.
Currency: Please provide the coverage reported on (as a % of FTEs):
Employee Level Average Women Salary Average Men Salary
Executive level (base salary only)
Executive level (base salary + other cash
incentives)
Management level (base salary only)
Management level (base salary + other cash
incentives)
Non-management level
o Our equal pay assessment is third-party verified. Please provide supporting evidence:
o We monitor and disclose the results of our gender pay gap analysis. If this information is publicly reported, please
provide the relevant URL. Please provide the coverage reported on (as a % of FTEs):
Indicator Difference between men and women employees (%)
Mean gender pay gap
Median gender pay gap
Mean bonus gap
Median bonus gap
o Our gender pay gap assessment is third-party verified. Please provide supporting evidence:
o We conduct gender pay assessments but do not disclose the results. Please provide supporting qualitative evidence: o We do not conduct gender pay assessments. o Not applicable. Please provide explanations in the comment box below. o Not known
129 / 174
Social Dimension - Labor Practice Indicators
Question-Specific Guidance & Definitions
Executive level: Employees who have an executive function and play a strategic role within an organization. They hold senior positions and impact company-wide decisions. Executives usually report directly to the CEO.
Management level: All management-level positions from first-line/junior managers up to top/senior managers with a reporting line 2 levels or less from the CEO, but excluding executive-level positions. Managerial functions are those that involve planning, policy making, strategizing, leading and controlling. Non-management level: Employees in charge of executionary functions, such as production and administrative positions. These employees have limited or no managerial role. Other cash incentives: These are monetary incentives paid on top of the employee’s regular salary to reward employees for job performance or longevity. These incentives have an explicit monetary value and can include rewards such as bonuses and stock options. Equal pay: Equal pay compares the salary of men and women who have the same or equivalent positions to assess whether they are paid the same for equal work. Gender pay gap: The gender pay gap is the difference in average gross hourly earnings between women and men – it therefore assesses the difference in pay at the aggregated level. Calculated this way, the gender pay gap does not take into account all the different factors that may play a role, for example education, hours worked, type of job, career breaks or part-time work. However, it reflects the work that women do and their position in the company hierarchy, therefore also providing an indicator on equality of opportunities to develop one’s career and access higher-paid positions. Mean gender pay gap: The difference between the mean hourly rate of pay of male full-pay relevant employees and that of female full-pay relevant employees. Median gender pay gap: The difference between the median hourly rate of pay of male full-pay relevant employees and that of female full-pay relevant employees. Mean bonus gap: The difference between the mean bonus pay paid to male relevant employees and that paid to female relevant employees. Median bonus gap: The difference between the median bonus pay paid to male relevant employees and that paid to female relevant employees. Coverage: Please select the coverage range on which you are reporting. For example, if you are reporting on your employees in country ABC, and these employees make up 80% of your total workforce, please select the coverage range “>75%”.
Data Requirements
Disclosure requirements for partially public question: Additional credit will be granted for relevant publicly available evidence disclosing the metrics requested either for equal remuneration or for the gender pay gap. If your company conducts both equal pay and gender pay gap assessments, please select the option for which you have data for the highest proportion of your employees.
References
International standards: ILO convention No. 111 & GRI 405-2. The gender equality questions were developed in collaboration with EDGE, leveraging its robust research on gender equality. EDGE is the leading global assessment methodology and business certification standard for gender equality. It measures where organizations stand in terms of gender balance across their pipeline, pay equity, effectiveness of policies and practices to ensure equitable career flows as well as inclusiveness of their culture. Launched at the World Economic Forum in 2011, EDGE has been designed to help companies not only create an optimal workplace for women and men, but also benefit from it. EDGE stands for Economic Dividends for Gender Equality and is distinguished by its rigor and focus on business impact. EDGE Certification’s diverse customer base consists of 200 large organizations in 44 countries across five continents, representing 29 different industries and employing globally more than 2.4 million employees. The study “Do Firms Respond to Gender Pay Gap Transparency?” (January 2019) examined the effect of pay transparency on the gender pay gap and firm outcomes by examining a 2006 policy change in Denmark that required firms to provide gender dis-aggregated wage statistics. Using detailed data and a differences-in-differences statistical approach, Bennedsen et al found that the law indeed reduced the gender pay gap .
130 / 174
Social Dimension - Labor Practice Indicators
Freedom of Association Public: this question requires publicly available information.
Assessment Focus
Question Rationale
We assess various Labor KPIs at an organization to determine the quality and transparency of its reporting. In line with ILO Convention No. 87 and No. 98, this question
assesses if your company allows employees to join an independent trade union.
Question Layout
What percent of your total number of employees are represented by an independent trade union or covered by collective bargaining agreements? Please indicate where this is available in your public reporting. Please note: employees who are eligible but are not actually covered by collective bargaining agreements should be excluded from the count.
o
% of employees represented by an independent trade
union or covered by collective bargaining agreements: Link to public reporting
o We do not track freedom of association metrics. o Not applicable. Please provide explanations in the comment box below. o Not known
Question Specific Guidance & Definitions
Collective bargaining agreements: Written legal contracts between an employer and a union representing the employees. These agreements can be at the sector, national, regional, organizational, or workplace level.
An independent trade union: A trade union which is not under the control of an employer or group of employers or of one or more employers' associations, and is free from interference by an employer or any such group or association
Data Requirements
Percentage of employees covered by collective bargaining agreements Employees who are eligible but are not actually covered by collective bargaining agreements should be excluded from the count.
References
• GRI Standards 102-41 & 407-1 are relevant for this question.
131 / 174
Social Dimension - Human Rights
Human Rights The questions in this criterion aim to assess whether or not companies are meeting the implementation
requirements of the UN guiding principles for business and human rights.
Human Rights Commitment Public: this question requires publicly available information.
Assessment Focus
Question Rationale
The purpose of this question is to identify companies that have an active commitment to respect human rights in their business relationships in line with the UN guiding principles or another internationally accepted standard. The policy needs to be company-specific with a company-wide commitment and not just for a single site, business unit, or project. Following the most recent international developments in the field of corporate non-financial disclosures, we want to know not only the coverage of businesses human rights policies but what are the specific human rights issues considered within them and whether they highlight
particular human rights for attention, whether the commitment is limited to a particular set of rights, encompasses all internationally recognized human rights, or encompasses all internationally recognized human rights but highlights some as needing particular attention according to the context in which the company operates. This input will reinforce the understanding of a company’s approach to human rights, building increased trust with different stakeholders and demonstrating international good business practice.
Question Layout
Do you have a publicly available, company-specific policy in place for your commitment to respect human rights in accordance with the UN Guiding Principles on Business and Human Rights or other internationally accepted standards? Please indicate where this information is available in your public reporting or corporate website.
o Yes. We have a publicly available policy for our commitments to human rights. The policy covers the following:
o A statement of commitment to respect human rights in accordance with internationally accepted standards o A statement of commitment to prevent/respect at least:
o human trafficking o forced labor o Child labor o Freedom of association o The right to collective bargaining o Equal remuneration o Discrimination o Other rights:
The policy also covers the following:
o Requirements for our own operations (employees, direct activities, products or services) o Requirements for our suppliers o Requirements for our partners
o No, we do not have a human rights policy. o Not applicable. Please provide explanations in the comment box below. o Not known
Question-Specific Guidance & Definitions
Respecting human rights:
• Avoid causing or contributing to adverse human rights impacts through their own activities, and address such impacts when they occur
• Seek to prevent or mitigate adverse human rights impacts that are directly linked to their operations, products or services by their business relationships, even if they have not contributed to those impacts.
Suppliers: Include brokers, consultants, contractors, distributors, franchisees or licensees, home workers, independent contractors, manufacturers, primary producers, sub-contractors and wholesalers.
Partners: Include agents, lobbyists and other intermediaries, joint venture and consortia partners, governments, customers, clients, local communities.
132 / 174
Social Dimension - Human Rights
Human trafficking: The recruitment, transport, transfer, harboring or receipt of a person by such means as threat or use of force or other forms of coercion, abduction, fraud or deception for the purpose of exploitation.
Forced labor: Forced labor can be understood as work that is performed involuntarily and under the menace of any penalty. It refers to situations in which persons are coerced to work through the use of violence or intimidation, or by more subtle means such as manipulated debt, retention of identity papers or threats of denunciation to immigration authorities.
Child labor: Work that deprives children of their childhood, their potential and their dignity, and that is harmful to physical and mental development. It refers to work that:
• is mentally, physically, socially or morally dangerous and harmful to children; and/or
• interferes with their schooling by: depriving them of the opportunity to attend school; obliging them to leave school prematurely; or requiring them to attempt to combine school attendance with excessively long and heavy work.
Freedom of association: The right of workers and employers to form and join organizations of their own choosing
Right to collective bargaining: The right of workers to bargain freely with employers is an essential element in freedom of association. Collective bargaining is a voluntary process through which employers and workers discuss and negotiate their relations, in particular terms and conditions of work.
Equal remuneration: This means principle of equal remuneration for men and women workers for work of equal value.
Right to non-discrimination: The principle of non-discrimination seeks “to guarantee that human rights are exercised without discrimination of any kind based on race, color, sex, language, religion, political or other opinion, national or social origin, property, birth or other status such as disability, age, marital and family status, sexual orientation and gender identity, health status, place of residence, economic and social situation.
Data Requirements
This question requires supporting evidence from the public domain. The information provided has to be included in your public reporting (e.g. annual report, sustainability report, integrated report, company publications etc.) or corporate website.
Only referring to or being a signatory to external entities such as the UN Global Compact (UNGC) or International Labour Organization (ILO) is not sufficient for the statement of commitment. A letter from your company to the UNGC is also not sufficient. We require a company-specific statement of commitment.
References
• Office of the High Commissioner for Human Rights: http://www.ohchr.org/Document s/Pub lications/GuidingPrinciplesBusinessHR_EN.pdf
• Business & Human Rights Resource Center: https://www.business-humanrights. or g/en/big-issues/un-guiding-principles-on -busin ess-human -rights/
• UN Global Compact guide to developing a policy: https://www.unglobalcompact.org/d ocs/issues_doc/human_rights/Resour ces/HR _Policy _Guide_2nd_Edition.pdf
133 / 174
Social Dimension - Human Rights
Human Rights Due Diligence Process Public: this question requires publicly available information.
Assessment Focus
Question Rationale
The purpose of this question is to assess whether your company has a due diligence process to proactively and systematically identify potential human rights impacts and where they could occur. Here we ask about the scope of your due diligence risk identification process, whether it covers only your own operations or also your value chain and other activities, and whether you perform a human rights due diligence process before entering into new business relationships (mergers, acquisitions, joint ventures...). We also focus on the type of issues you’ve specifically addressed when carrying out the due diligence process and what type of vulnerable groups you’ve clearly considered throughout the
process. A passive approach such as a whistle blowing or confidential reporting system is not sufficient for this question.
There is an increasing number of studies addressing the link between good corporate performance, human rights and financial returns. For example, some studies indicate that businesses that properly address human rights issues are likely to have a more productive and more profitable workforce and avoid costly risks. (Baglayan, Basak & Landau, Ingrid & McVey, Marisa & Wodajo, Kebene. Good Business: The Economic Case for Protecting Human Rights, 2018)
Question Layout
Has your company developed a due diligence process to proactively identify and assess potential impacts and risks relating to respecting human rights?
o Yes, and our process covers the following. Please provide supporting evidence of a risk mapping or other form of assessment to identify areas of potential risk:
o Risk identification in our own operations o Risk identification in our value chain or other activities related to our business o Risk identification in new business relations (mergers, acquisitions, joint ventures...) o We do a systematic periodic review of the risk mapping of potential issues
Please indicate the issues and vulnerable groups covered in your due diligence risk identification process. Please attach public supporting evidence for all of the aspects covered. Actual or potential human rights issues covered: Check all that apply and provide relevant evidence for each issue covered. We expect at least four issues to be covered.
o human trafficking o forced labor o Child labor o Freedom of association o The right to collective bargaining o Equal remuneration o Discrimination o Others, please specify:
Groups at risk of human rights issues covered: Check all that apply and provide evidence for each group covered. We expect at least four groups to be covered.
o Own employees o Women o Children o Indigenous people o Migrant workers o Third-party contracted labor o Local communities o Others, please specify:
o We are developing a process, but we have not yet conducted any assessments. Please provide information indicating the
status and expected completion date. o No, we do not have a process. o Not applicable. Please provide an explanation in the comment box below. o Not known
134 / 174
Social Dimension - Human Rights
Question-Specific Guidance & Definitions
Adverse human rights impact: An “adverse human rights impact” occurs when an action removes or reduces the ability of an individual to enjoy his or her human rights. Human rights risks: The risks that a company's operations/activities/products pose to people's fundamental human rights. Human rights due diligence: Understood as the process through which enterprises can identify, prevent, mitigate and account for how they address their actual and potential adverse impacts as an integral part of business decision-making and risk management systems. Due diligence can be included within broader enterprise risk management systems, provided that it goes beyond simply identifying and managing material risks to the enterprise itself, to include the risks of adverse impacts related with human rights.
Data Requirements
Supporting documentation should be recent, provide a clear description of the due diligence process, indicate the coverage of business activities and demonstrate that it is an ongoing activity. The information should be available in the public domain. The information provided has to be included in your public reporting (e.g. annual report, sustainability report, integrated report, company publications etc) or corporate website. For the actual or potential human rights issues covered, we expect evidence that at least four issues are covered by the due diligence risk identification process. Similarly, for the groups at risk of human rights issues, we expect at least four groups to be covered in the process. We do not expect all issues and all groups to be covered. The outcomes of conducting the risk identification process should be provided in the following “Human Rights Assessment” question. A passive approach such as a whistleblowing or confidential reporting system is not sufficient for this question.
References
• UN Guiding Principles on Business & Human Rights: http://www.ohchr.org/D ocum ents/Publicati ons/GuidingPrinciplesBusinessHR_EN.pdf
• OECD Guidelines for Multinational Enterprises, Chapter IV. http://www.oecd.or g/daf/inv/mn e/48004323.pdf
• OECD Due Diligence Guidance for Responsible Business Conduct. https://www.oecd.org/inv estm ent/du e-diligence-guidance-for -r esp onsibl e-busin ess-conduct.htm
• GRI Standard 412 is relevant for this question. • UN Guiding Principles on Business and Human Rights
Reporting Framework, mainly sections B1 & B2 https://www.ungprep orting. org/wp -content/uploads/UNGPRep ortingFramework_with guidance2017.pdf
135 / 174
Social Dimension - Human Rights
Human Rights Assessment Assessment Focus
Question Rationale
The purpose of this question is to assess the extent your company is proactively identifying where risks are and managing them. The process should consider the country contexts in which the organisation operates, the potential and actual human rights impacts resulting from the
organisation’s activities, and the relationships connected to those activities. (source: https://www.unglobalcompact.or g/d ocs/n ews_events/8.1/human_rights_translated.pdf)
Question Layout
Has your company conducted an assessment of potential human rights issues across your business activities in the past three years?
o Yes. We have proactively conducted an assessment of potential human rights issues in the last 3 years. Please complete the table below related to the portion of activities assessed, the portion of activities where risks have been identified, and the portion of activities with mitigation actions taken. If any of the business categories are not material to your company, select "Not relevant" and provide an explanation.
If an entity has been assessed multiple times in the last three years, it should only be counted once.
Category
A. % of total
assessed in last
3 years
B. % of total assessed (column
A) where risks have been
identified
C. % of risk (column B) with
mitigation actions taken
o Own Operations (including Joint
Ventures where the company has
management control)
Please select the basis for reporting
(denominator): as a % of:
o Not relevant
o Contractors and Tier I Suppliers
(as a % of contractors or Tier I
Suppliers)
o Not relevant
o Joint Ventures (including stakes
above 10%) (as a % of joint
ventures)
o Not applicable. We do not have
any joint ventures at stakes above
10%.
o No, we have not conducted a human rights assessment in the last three years. o Not applicable. Please provide an explanation in the comment box below. o Not known
Question-Specific Guidance & Definitions
Own Operations: Includes direct activities, own employees, own sites, own products/services Contractors and Tier 1 Suppliers: Include brokers, consultants, contractors, distributors, franchisees or licensees, home workers, independent contractors, manufacturers, primary producers, sub-contractors and wholesalers. Joint ventures (including stakes above 10%): all joint ventures not included in Own Operations as defined above.
Percentage of suppliers assessed in the last 3 years: This refers to the number of entities across the different categories of business activities that have been assessed in the last three years, divided by the total absolute number of entities within the different categories of business activities in the current year. If an entity has been assessed multiple times in the last three years, it should only be counted once.

136 / 174
Social Dimension - Human Rights
Data Requirements
Supporting documentation should be recent, and provide a clear description of the assessment status for the past 3 years. For information on their own operations, companies may choose the basis for reporting from the following options: % of FTEs, % of revenues, % of clients, % of investment portfolio, % of sites or % of products. For information on contractors and Tier I suppliers, the basis for reporting should be the % of contractors and Tier I suppliers. For information on joint ventures, the basis for reporting should be the % of joint ventures.
References
• GRI Standards 411-1 & 412-1 are relevant for this question.
• Office of the High Commissioner for Human Rights: http://www.ohchr.org/Document s/Pub lications/GuidingPrinciplesBusinessHR_EN.pdf
• Business & Human Rights Resource Center: https://www.business-humanrights.org/en/big-issu es/u n-guiding-principles-on-business-human-rights/
• UNGP Reporting Framework, specially section C3: https://www.ungpreportin g.or g/wp -content/uploads/UNGPRep ortingFramework_with guidance2017.pdf
137 / 174
Social Dimension - Human Rights
Human Rights Mitigation & Remediation Public: this question requires publicly available information.
Assessment Focus
Question Rationale
The purpose of this question is to know through concrete examples, what the reporting company has done during the reporting period to reduce the likelihood of negative impacts related to each human rights risk and what actions has it taken when the impact has already happened.
In assessing human rights impacts, companies will have search for both actual and potential adverse impacts. Potential impacts should be prevented or mitigated through the horizontal integration of findings across the business enterprise, while actual impacts—those that have already occurred – should be a subject for remediation.
Question Layout
Does your company publicly disclose on the following measures?
o Yes, our company publicly reports on our human rights commitments. The following are publicly available:
o Processes implemented to mitigate human rights risks:
o The number of sites with mitigation plans:
o The type of remediation actions taken:
o No, we do not publicly report about mitigation and remediation actions o Not applicable. Please provide an explanation in the comment box below. o Not known
Question-Specific Guidance & Definitions
Mitigation actions: The mitigation of a negative human rights impact refers to actions taken to reduce the extent of the impact. The mitigation of a human rights risk refers to actions taken to reduce the likelihood that a potential negative impact will occur. Remediation actions: They are here understood as processes that apply when the company has caused or contributed to a negative human rights impact (an actual violation has already happened) and through which it is able to help ensure that the people who were impacted receive an effective remedy. The remediating action aims to restore individuals or groups that have been harmed by a business’s activities to the situation they would have been in had the impact not occurred. Where this is not possible, it can involve compensation or other forms of remedy that try to make amends for the harm caused. These outcomes may take a range of forms such as apologies, restitution, rehabilitation, financial or non-financial compensation, and punitive sanctions (whether criminal or administrative, such as fines), as well as the prevention of harm through, for example, injunctions or guarantees of non-repetition. This should not be confused with ‘remediation’ in the context of social audits, where the concept includes and typically focuses on – forward-looking actions to prevent a non-compliance from recurring.
Data Requirements Information should be specifically related to human rights issues, general information on ESG or sustainability would not be accepted unless it concretely states the specific human rights topics considered within a more general approach.
We require supporting evidence to be available in the public domain.
Note: For the number of sites with mitigation plans, information on the general number of mitigation plans or number of mitigation plans for operations/business units/business operations/products/investment portfolio/clients will also be accepted.
For remediation actions, in case the company has been involved directly or indirectly in a human rights impact, information should be provided on the type of remediation actions taken. The information should always be linked with an existing impact or violation. In case the company has not caused nor contributed to any human rights violation, this should be stated in the public domain. In this case, the option can be ticked as no remediating actions would be expected.
Note for companies in BNK, FBN, INS: Number of sites: The number of sites can be interpreted as the number of portfolios, client relationships or products with mitigation actions in place.
Mitigation actions: The following types of mitigation actions could also be considered when they specifically refer to human rights in case of indirect involvement in a potential adverse human rights impact:
138 / 174
Social Dimension - Human Rights
• specific human rights requirements in investment mandates or clear human rights conditions precedent to investments,
• due diligence requirements with respect to investee companies,
• use of leverage in case of investee company breach of covenants,
• exclusions (maintaining a no-go list) of high-risk companies or companies that are in breach/violation of human rights principles,
• active engagement with investee, • divestment decisions.
Remediation actions: As for remediation actions, companies within the BNK, FBN and INS would frequently be only indirectly linked with the adverse impact. In those cases, where the company has not contributed to the impact, but it is still directly linked to the harm through its business relationships, information about the efforts to persuade the investee company / business relationship to remediate the harm and about its participation in dialogue or mediation processes regarding the remediation of the adverse impact is expected. Also, information about co-operation with judicial and non-judicial mechanisms would be expected for companies
involved in judicial or non-judicial proceedings related with human rights issues. Besides, an entity acknowledging the harm suffered and demonstrating efforts to improve its processes to ensure that similar adverse impacts will not reoccur is as well acceptable.
In addition, information on direct mitigation and remediation actions are expected when the company has directly caused or may have caused an adverse human rights impact.
References
• GRI Standards 411-1 & 412-1 are relevant for this question.
• UNGP Reporting Framework, specially section C4 and C6
https://www.ungpreportin g.org/wp -content/uploads/UNGPRep ortingFramework_with guidance2017.pdf • Doing business with respect for human rights, A
guidance tool for companies, 2nd edition, 2016, Shift, Global Compact Network Netherlands, Oxfam.
https://www.businessr esp ecthumanri ghts. org/ima ge/2016/10/24/business_respect_human_ri ghts_full.pdf
139 / 174
Social Dimension - Human Capital Development
Human Capital Development Human capital can make up a significant part of a company's intangible assets and for many industries, human capital development is one of the most financially material sustainability factors. Considering the drivers in technological disruption and innovation, demographic shifts, and societal developments, companies need to
focus on developing their human capital and make sure that their employees have the necessary skill set needed to perform well and execute the business strategy. To address the skills gap challenge, companies must carefully consider their investments in training, upskilling and reskilling their workforce.
Training & Development Inputs Assessment Focus
Question Rationale
To address the skills gap challenge and remain competitive in attracting and retaining talents, companies must carefully assess their investments in training, upskilling and reskilling their workforce. Training & development can lead to positive outcomes such as reduced turnover, reduced external hiring costs and a
more engaged and committed workforce. This question assesses whether companies are leveraging their current workforce capabilities by investing in their training & development, and whether these investments are made fairly across the entire employee base.
Question Layout
Please fill out the following table for the related training & development data for the last fiscal year and attach supporting evidence of where this information is reported.
o Please indicate the percentage of global FTEs the data in the table below represents:
Data breakdown We break down the data for either of the KPIs above based on the following categories. Please select any that apply and attach supporting evidence:
o Age group o Gender o Management level (e.g. junior/low level, middle, senior/top level management) o Race, ethnicity, nationality, country of origin, cultural background o Type of training
o We do not track these metrics related to employee training and development. o Not applicable. Please provide explanations in the comment box below. o Not known
Question-Specific Guidance & Definitions
FTEs: Full-Time Equivalents is the number of working hours that represents one full-time employee during a fixed time period, such as one month or one year. The concept is used to convert the hours worked by several part-time employees into the hours worked by full-time employees. Average hours of training and development per FTE: it refers to the total number of hours of training and development provided in the last fiscal year divided by the total number of FTEs.
Average amount spent on training and development per FTE: it refers to the total amount spent on training and development in the last fiscal year divided by the total number of FTEs. This figure should not include ‘learning and development’ team operational cost like this team’s employee salaries. By type of training: Here different types of training may include but are not limited to “on-the-job” training, coaching, mentorship, leadership trainings, compliance trainings, cultural diversity training, IT training, OHS
FY 2020
Average hours per FTE of training and development
o This data is publicly available. Please provide supporting evidence or web
link:
Average amount spent per FTE on training and development.
o This data is publicly available. Please provide supporting evidence or web
link:
140 / 174
Social Dimension - Human Capital Development
training etc.
Data Requirements
• Companies with less than 100 employees (e.g. investment offices and vehicles, funds, holding companies, etc.) should mark this question Not Applicable.
Disclosure Requirements • Additional credit will be granted for relevant publicly
available evidence covering the following aspect of this question:
• Average hours of training spent per FTE and/or
• Average amount spent per FTE on training and development programs
• Difference in coverage of the different KPIs: this question asks for two different KPIs. In case the reporting coverage of this KPIs is different e.g. a company can provide data for “Average hours of training spent per FTE” for 70% of their FTEs but only 30% of their FTEs for “Average amount spent per FTE”, then for reasons on consistency they should provide data for both KPIs for 30% of their FTEs.
• Difference between publicly and privately available data: Companies should report information as it is publicly reported. That means that in case a company publicly reports for “Average hours of training and development per FTE” for 50% of the FTEs but they could answer the question with more information that it is only privately available (e.g. for 100% of FTEs) then they should fill out the question only based on the information that it is publicly reported and hence verifiable, in this case they should report data and coverage for 50%.
Data breakdown • Companies can provide data breakdown for either of
the two KPIs asked, i.e. “Average hours of training spent per FTE” and/or Average amount spent per FTE on training and development programs
• We don’t expect companies to break down the data by all the categories mentioned in the question, but full points for this section will be granted for having a breakdown for at least 2 categories. The purpose of this section is to assess whether companies are able to track these KPIs in a way that allow them to evaluate and reassure fair treatment of all employees.
• In Europe, according to the Article 9 of the GDPR, it is prohibited to process personal data revealing racial or ethnic origin, except if the data subject has given explicit consent to the processing of those personal data, provided this is not prohibited by national law. Other exemptions exist, such as reasons of substantial public interest which might include statistical research purposes for equality of opportunity and treatment. We therefore expect companies to report on only two different categories, in order to not penalize companies that do not report data breakdown on race.
• For this section, companies can attach either private or public evidence and we expect to see the specific data broken down by these categories e.g. “ x% “Average hours of training spent per FTE” for junior employees, y% for mid-level managers and z% for senior managers
References
• GRI Standard 404-1 is relevant for this question.
141 / 174
Social Dimension - Human Capital Development
Employee Development Programs Assessment Focus
Question Rationale
One of the challenges companies face is to fully understand the positive business and financial effects of investing in employees and whether the investments they are making are having the desired impact on their people and their organizations. This question measures how and to what degree companies can measure the benefits to their business of their investments in human capital by describing two examples of employee development
programs, demonstrating their benefits to the business and asking whether companies are able to quantify these benefits. For investors, understanding whether companies are maximizing the benefits of their investments into people can be key to understanding how efficiently capital is deployed across the organization and how companies are making forward looking, strategic investments in their people.
Question Layout
Please provide two examples of employee development programs in your company that have been developed to upgrade and improve employee skills. Please fill out the fields of the table and provide supporting evidence. For further clarifications on the information asked below, please consult the information text.
o
Program 1 Program 2
Name & Description of the program
Description of program
objective/business benefits
Quantitative impact of business
benefits (monetary or non-monetary)
% of FTEs participating in the program
Supporting Evidence
o We do not offer any employee development program. o Not applicable. Please provide explanations in the comment box below. o Not known
Question-Specific Guidance & Definitions
Employee development programs: it refers to programs that have been developed to enhance or improve your employees’ skills. They can be functional, leadership, on the job-trainings such as leadership or management development programs, young talent development programs, sales training for sales executives, green or black belt certifications, project management training etc. This does not cover programs providing employees with the basic skills they need to carry out their daily work or to help them reach certain minimum requirements, such as mandatory compliance training, annual recertification programs, basic OHS or workplace security training, board training for new board members, training programs that are necessary to bring new employees up to a minimum standard in order to fulfil their job requirements, graduate/ trainee or apprenticeship programs. Name & Description of the program: companies are expected to provide specific example of programs and explain how they can provide business benefit. General reference to the existing of a Learning Academy or Institute or purchase of LinkedIn Learning license is not sufficient
Description of program objective/business benefits: it refers to the benefits that the company derives as a result of providing the training, not the benefits for the employee
undertaking the training. Of course, programs may result in benefits to both the company and the employees. This should not be a description of the employee development program but rather an explanation of how the program aids the company’s overall performance or helps it meet its strategic targets. Quantitative impact of business benefits: they refer to either monetary or non-monetary metrics that a company uses to track and measure the impacts of its development programs. These metrics should be directly linked to the employee development program described in terms of a measurable outcome as a relevant indicator of more effective business performance. Examples include but are not limited to quantitative information showing changes in employee engagement, employee turnover, efficiency, productivity, revenue generation cost savings, sales, internal employee promotions, employee retention etc. (i.e. specific statements of x% increase in employee engagement, x% decrease in employee turnover etc.) This does not refer to the number of trainees/ participants or any qualitative description of the beforementioned metrics (i.e. statements like “increased number of trainees”, “increase in employee engagement” etc.) FTEs: Full-Time Equivalents is the number of working hours that represents one full-time employee during a fixed time period, such as one month or one year. The

142 / 174
Social Dimension - Human Capital Development
concept is used to convert the hours worked by several part-time employees into the hours worked by full-time employees. Percentage of FTEs participating in the program: it refers to percentage of FTEs actively participating/ made use of the program, not the number of people that are eligible or have access to the program, out of the total amount of FTEs in the latest reporting year.
Data Requirements
• Companies with less than 100 employees (e.g. investment offices and vehicles, funds, holding companies, etc.) should mark this question Not Applicable.
• Companies should select the programs they will report on based on their strategic importance. Companies should select programs which they can sufficiently demonstrate their business impact than select the programs that have simply higher employee coverage; “% of FTEs participating in the program” field is appraised only on disclosure and therefore greater values of employee coverage will not necessarily lead to a better scoring performance for this question.
• Quantitative impact of business benefits: The quantitative impact reported should be linked to the program’s business benefit described in the previous field and not unrelated.
• Supporting Evidence: Please share a document and indicate the relevant page where the selected programs are described. At least the Program “Name & Description of the program” information should be verifiable in this document
References
• GRI Standard 404-2 is relevant for this question.
143 / 174
Social Dimension -
Human Capital Return on Investment Assessment Focus
Question Rationale
The Human Capital Return on Investment provides a means of measuring your company’s profitability in relation to total employee costs. It is derived by removing non-employee costs from overall operating costs and deriving the resulting operating profitability.
This metric provides a view into the degree to which economic value is derived looking at profitability solely in relation to human capital costs.
Question Layout
Please indicate the following information on a standard Human Capital Return on Investment metric, serving as a global measure of the return on your Human Capital programs. Please provide supporting evidence.
FY
2017
FY
2018
FY
2019
FY
2020
a) Total Revenue, as specified in the "Denominator" question
Currency:
b) Total Operating Expenses, please specify currency:
c) Total employee-related expenses (salaries + benefits), please specify
currency:
Resulting HC ROI (a - (b-c))/c
Total FTEs, as specified in the "Denominator" question
o We do not track any of the above metrics. o Not applicable. Please provide explanations in the comment box below. o Not known
Question-Specific Guidance & Definitions
Total Revenue: it refers to the amount your company has received in revenues before any deductions are made. Total operating expenses: it refers to all the expenses your company has from its operations. It should be in line with accepted financial accounting and reporting standards including everything a company will have defined in their income statement. Total employee-related expenses (salaries + benefits): this includes training and development programs, pensions, hiring, etc., as it covers all costs directly related to employees.
Data Requirements
• Companies with less than 100 employees (e.g. investment offices and vehicles, funds, holding companies, etc.) should mark this question Not Applicable.
• By subtracting Total Operating Expenses (b) less Total employee-related expenses (salaries + benefits) (c) from Total Revenue (a), your company’s profitability prior to human capital costs are calculated. Dividing this figure by Total employee-related expenses (salaries + benefits) (c) then leads to the ratio that examines your company’s level of profitability in relation to the total human capital expenses.
References
• GRI Standard 201-1 is relevant for this question.
144 / 174
Social Dimension -
Talent Attraction & Retention Successful Talent Attraction & Retention management enables companies to maintain their competitive advantage and to execute their corporate strategies. Companies should develop and implement an appropriate and well-balanced compensation framework for all employee categories, adopting compensation plans that incorporate both fixed and variable components.
Furthermore, the variable compensation should be balanced with respect to time horizon on all employee levels. Our questions assess whether the company has a comprehensive approach and system to reward employees across all categories on the basis of company-wide and individual performance metrics.
Hiring Assessment Focus
Question Rationale
Employees are one of the most important intangible assets for companies. The ability to attract qualified and talented employees, as well as retain and nurture internal talents is pivotal for corporate success. Companies focused on attracting the best talents should not forget about their internal talents who have grown with the company, understand the organization, its mission and
culture. Companies need to build organized internal career mobility processes to retain talents and reduce external hiring costs. This question asks for the number of new employee hires, the percentages of positions filled by internal candidates, the hiring cost, and data breakdown by age, gender, race/ethnicity and management level.
Question Layout
Please indicate the total number of new employee hire rates and the percentage of open positions filled by internal candidates. Please also report the average hiring cost/FTE for the last fiscal year. Please note: The average hiring cost/FTE should specifically relate to the number of employees hired last year, not average cost for all employees.
o
FY 2017 FY 2018 FY 2019 FY 2020
Total number of new employee
hires
o This data is publicly
available. Please
provide supporting
evidence or web link:
Percentage of open positions
filled by internal candidates
(internal hires)
o This data is publicly
available. Please
provide supporting
evidence or web link:
Average hiring cost/FTE
Currency:
Data breakdown We break down the new employee hires and/or internal hires data based on the following categories. Please provide supporting evidence:
o Age group o Gender o Management level (e.g. junior/low level, middle, senior/top level management) o Race, ethnicity, nationality, country of origin or cultural background
o We do not report this information o Not applicable. Please provide explanations in the comment box below.
145 / 174
Social Dimension - Talent Attraction & Retention
o Not Known Question-Specific Guidance & Definitions
FTEs: Full-Time Equivalents is the number of working hours that represents one full-time employee during a fixed time period, such as one month or one year. The concept is used to convert the hours worked by several part-time employees into the hours worked by full-time employees. Total number of new employee hires: refers to the number of new full-time employees (FTEs) hired in the reporting year. It should not include internal candidates i.e. existing employees that have been hired in different positions or internally promoted. Percentage of open positions filled by internal candidates (or internal hires or promotions): refers to the total number of open positions filled by a company’s own employees divided by the total number of vacancies in the company in the reporting year. This metric provides a mean of determining the effectiveness of human capital development by providing employees with the skills required for promotion, and it also demonstrates how proactive organizations are in providing their employees with new challenges for growth and development throughout their careers. Average hiring cost/FTE: refers to the average cost of hiring a new full-time employee (FTE) in the reporting year. This figure should be calculated based on the costs of hiring all new FTEs in the reporting period and not based on the costs of hiring FTEs who were already at the company before the last fiscal year started. The average hiring cost includes internal and external recruiting cost e.g. recruiter salaries, interviews, agency fees, advertising, job fairs, travel and relocation costs.
Data Requirements
• Companies with fewer than 100 employees (e.g. investment offices and vehicles, funds, holding companies, etc.) should mark this question Not Applicable.
Disclosure requirements: Additional credit will be granted for relevant publicly available evidence covering the following aspect of this question, for at least the most recent reported year.
• Total number of new employee hires • Percentage of open positions filled by internal
candidates (internal hires) Data breakdown:
• We don’t expect companies to break down the data by all the categories mentioned in the question, but full points will be granted for this section for having a breakdown for at least 2 categories. The purpose of this section is to assess whether companies are able to track these metrics in a way to be able to evaluate and reassure fair treatment of all employees.
• In Europe, according to the Article 9 of the GDPR, it is prohibited to process personal data revealing racial or ethnic origin, except if the data subject has given explicit consent to the processing of those personal data, provided this is not prohibited by national law. Other exemptions exist, such as reasons of substantial public interest which might include statistical research purposes for equality of opportunity and treatment. We therefore expect companies to report on only two different categories, in order to not penalize companies that do not report data breakdown on race.
• For this section, companies can attach either private or public evidence and we expect to see the specific quantitative data broken down by these categories
References
• GRI Standard 401-1 is relevant for this question.

146 / 174
Social Dimension - Talent Attraction & Retention
People Analytics Assessment Focus
Question Rationale
People Analytics (also known as HR or Talent analytics) refers to the application of advanced analytics and use of large data sets in human capital management. Using the knowledge gained through analysis of human capital related data can help companies identify current risks and opportunities and make better informed decisions to improve talent management and eventually business performance. The main cases for which companies have started using analytics are employee performance measurement and workforce planning. Companies are also applying data to identify skills gaps, evaluate recruiting channels, screen candidates and assess talent
supply and demand etc. Asking about the use of People Analytics, i.e. collection and analysis of HR related data in order to draw insights (e.g. solving existing problems or capitalizing on new opportunities) doesn't suggest the dehumanization of the employer-employee relationship. On the contrary, it is proven that evaluating data that companies are already collecting might be useful to further improve employee experience, better inform employee training and development efforts, promote fair treatment of employees and eliminate bias.
Question Layout
Does your company use any People Analytics (PA) in any of the following analysis? If yes, please select any practice that apply and provide a supporting evidence indicating the page number where the relevant information can be found and a comment in the reference field with a short description of how People Analytics is applied in your case. Please note that companies are not expected to make use of PA in all the following analysis. For further clarifications, please consult the information text.
o Yes. Please select any relevant analysis that apply:
o Measuring employee performance o Strategic workforce planning o Identifying current workforce skills gaps o Recruiting & hiring (e.g. evaluating recruiting channels, screening of candidates, assessing talent
supply/demand) o Identifying flight risks to improve retention o Competitive intelligence o Organizational network analysis
o No, our company does not use People Analytics. o Not applicable. Please provide explanations in the comment box below. o Not known
Question-Specific Guidance & Definitions
People analytics: it is also known as HR, Talent or workforce analytics. It is the practice of collecting and analyzing Human Resources and organizational data through the application of statistics and other data interpretation techniques. The aim of this method is to transform this data into actionable insights that improve the company’s systems, processes and strategies in order to achieve sustainable business success. Strategic workforce planning: it is the long-term planning aiming at “the strategic alignment of an organization’s human capital with its business direction. It is a methodical process of analyzing the current workforce, determining future workforce needs, identifying the gap between the present and the future, and implementing solutions so the organization can accomplish its mission, goals, and objectives.” (Minnesota Management and Budget cited, HR Society 2013, p.3). Types of Workforce planning:
• Strategic planning: long-range planning, usually covering a 3 to 5-year forecast period, aligned to business needs and outcomes. It focuses on
identifying the workforce implications, current, transition and future of business strategic objectives and includes scenario planning.
• Operational planning: mid-range planning, usually covering the next 12 to 18 months. It should align with the timeframe of the business planning cycle. It is the process and systems applied to gathering, analyzing and reporting on workforce planning strategy.
• Tactical or short-range planning: it takes place once a year and is usually part of budgeting
Identify current workforce skill gaps: this practice should be considered as a part of the Strategic Workforce Planning (SWP) process. Some companies may identify current workforce skill gaps for operational reasons or for short-term planning, e.g. they may evaluate that they are currently more in need of employees with a specific programming knowledge and decide to open two positions in a specific year, without necessarily taking into consideration the more long-term planning and strategic direction.
147 / 174
Social Dimension - Talent Attraction & Retention
Recruiting & hiring (e.g. evaluating recruiting channels, screening of candidates, assessing talent supply/demand): examples may include but are not limited to engaging assessments identifying successful candidates, use of external databases to evaluate talent pool, screening of internal databases to identify internal employees with relevant skills etc. Identifying flight risks to improve retention: this refers to the process of identification of disengaged or dissatisfied employees with their current compensation, job or career prospects that may look elsewhere for new opportunities. These employees are deemed as high-risk employees to quit. Competitive intelligence: Competitive Intelligence (CI) is the systematic collection and analysis of information from multiple sources, often used in marketing, product, and sales departments in order to understand a company’s competitive landscape. In the Human Resource field, CI is used in developing human capital strategies, identifying related threats and opportunities and advancing organization’s talent retention and acquisition efforts from industry information, company research, organizational charts, employee information, labor market information, and overall trends. Organizational network analysis: Also known as Relational Analytics, Organizational Network Analysis (ONA) is a method for studying information flow, interaction and socio-technical networks within an organization. This technique creates statistical and graphical models of people, tasks, groups, knowledge and resources of organizational systems. It is based on social network theory and more specifically, dynamic network analysis. ONA is a growing trend in the field of People Analytics, especially around the concept of understanding diversity and inclusion, innovation, as well as employee performance and motivation.
Data Requirements
• Companies with fewer than 100 employees (e.g. investment offices and vehicles, funds, holding companies, etc.) should mark this question Not Applicable.
• Companies are not expected to make use of PA for all the type of analysis listed in the question. One option is sufficient to achieve maximum score in this question, if the supporting evidence and short description comment meet our requirements.
• It is possible that a company uses People Analytics for different cases that correspond to more than one of the options available. Please select all that apply, provide relevant supporting evidence and a short description.
• The analysis shared in this question do not need to apply to the whole company, it can also apply to a local/regional/segm ent/bu siness unit.
• In this question, it is not required to share the actual data of your analysis but rather the analytical process that has been followed. The analysis can be qualitative, quantitative, predictive or perspective. For example, this question doesn’t ask whether your company is measuring employee performance but rather whether any software, systems, real-time monitoring or other tools are used to collect and analyze this data in order to better evaluate employee performance.
• People Analytics tools can be internally and/or externally developed (e.g. LinkedIn) but they should have an internal focus i.e. aiming to improve the company’s systems, processes and strategies in order to achieve better talent management.
• Companies are not expected to have high-tech systems or platforms in place in order to conduct HR data analysis, use of simple tools (e.g. Excel) is also sufficient if they serve companies’ analytical purposes.
Supporting evidence:
• It can be either private or public documentation. • Any type of supporting evidence that can
demonstrate the type of analysis conducted is acceptable (e.g. screenshots of online systems, documents of application procedures, documentation of a successful application case, comprehensive comments).
• General statements that a company uses People Analytics are not acceptable.
• Evidence of the outcome of the analysis is welcome but not necessary. This information is necessary in the Strategic Workforce Planning question.
• Simple tracking of HR data and sharing of data sheets is not sufficient. This question doesn’t seek evidence of simple data collection, but it focuses on understanding what type of data analysis has been conducted in order to identify issues or key areas of improvement in talent management.
References
• Global Talent Trends, 2020, LinkedIn Talent Solutions.
• Minnesota Management and Budget cited, The Complete Guide to Workforce Planning. In HR Society, 2013, p.3
• https://en.wikipedia.org/wi ki/Organizati onal_n et work_analysis
• People Analytics Grows Up: Healthy New Focus On Productivity". Josh Bersin.
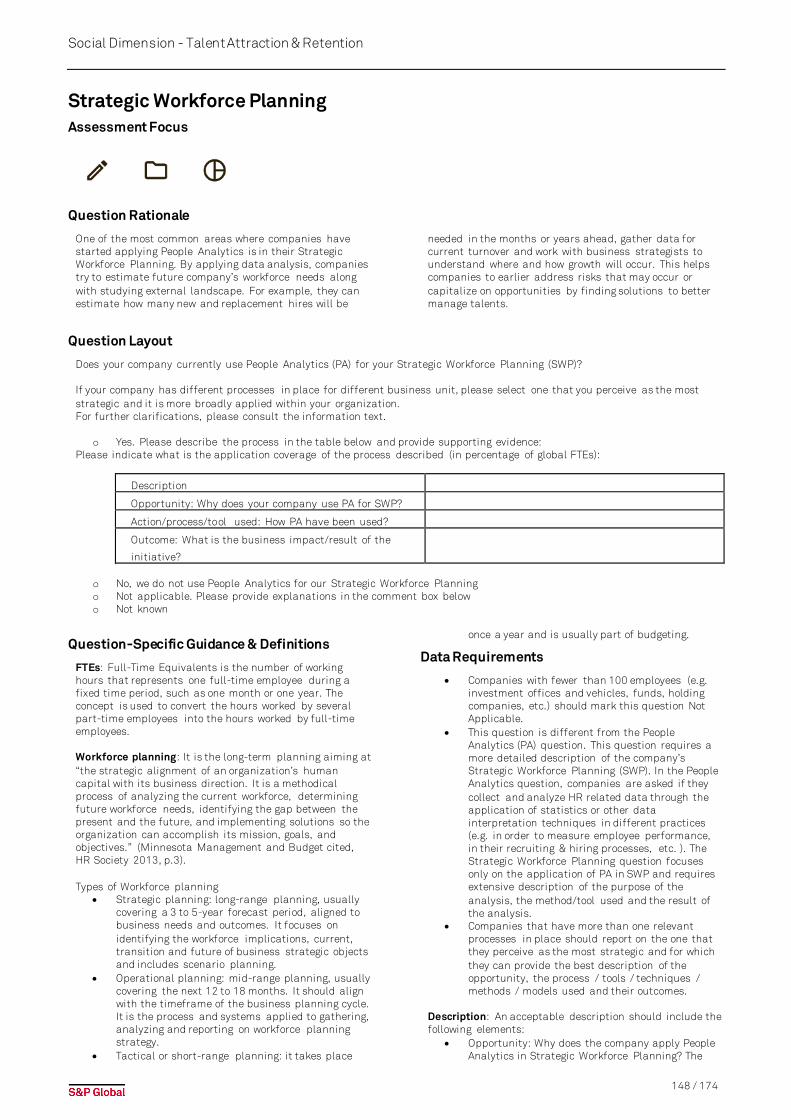
148 / 174
Social Dimension - Talent Attraction & Retention
Strategic Workforce Planning Assessment Focus
Question Rationale
One of the most common areas where companies have started applying People Analytics is in their Strategic Workforce Planning. By applying data analysis, companies try to estimate future company’s workforce needs along with studying external landscape. For example, they can estimate how many new and replacement hires will be
needed in the months or years ahead, gather data for current turnover and work with business strategists to understand where and how growth will occur. This helps companies to earlier address risks that may occur or capitalize on opportunities by finding solutions to better manage talents.
Question Layout
Does your company currently use People Analytics (PA) for your Strategic Workforce Planning (SWP)? If your company has different processes in place for different business unit, please select one that you perceive as the most strategic and it is more broadly applied within your organization. For further clarifications, please consult the information text.
o Yes. Please describe the process in the table below and provide supporting evidence: Please indicate what is the application coverage of the process described (in percentage of global FTEs):
Description
Opportunity: Why does your company use PA for SWP?
Action/process/tool used: How PA have been used?
Outcome: What is the business impact/result of the
initiative?
o No, we do not use People Analytics for our Strategic Workforce Planning o Not applicable. Please provide explanations in the comment box below o Not known
Question-Specific Guidance & Definitions
FTEs: Full-Time Equivalents is the number of working hours that represents one full-time employee during a fixed time period, such as one month or one year. The concept is used to convert the hours worked by several part-time employees into the hours worked by full-time employees. Workforce planning: It is the long-term planning aiming at “the strategic alignment of an organization’s human capital with its business direction. It is a methodical process of analyzing the current workforce, determining future workforce needs, identifying the gap between the present and the future, and implementing solutions so the organization can accomplish its mission, goals, and objectives.” (Minnesota Management and Budget cited, HR Society 2013, p.3). Types of Workforce planning
• Strategic planning: long-range planning, usually covering a 3 to 5-year forecast period, aligned to business needs and outcomes. It focuses on identifying the workforce implications, current, transition and future of business strategic objects and includes scenario planning.
• Operational planning: mid-range planning, usually covering the next 12 to 18 months. It should align with the timeframe of the business planning cycle. It is the process and systems applied to gathering, analyzing and reporting on workforce planning strategy.
• Tactical or short-range planning: it takes place
once a year and is usually part of budgeting.
Data Requirements
• Companies with fewer than 100 employees (e.g. investment offices and vehicles, funds, holding companies, etc.) should mark this question Not Applicable.
• This question is different from the People Analytics (PA) question. This question requires a more detailed description of the company’s Strategic Workforce Planning (SWP). In the People Analytics question, companies are asked if they collect and analyze HR related data through the application of statistics or other data interpretation techniques in different practices (e.g. in order to measure employee performance, in their recruiting & hiring processes, etc. ). The Strategic Workforce Planning question focuses only on the application of PA in SWP and requires extensive description of the purpose of the analysis, the method/tool used and the result of the analysis.
• Companies that have more than one relevant processes in place should report on the one that they perceive as the most strategic and for which they can provide the best description of the opportunity, the process / tools / techniques / methods / models used and their outcomes.
Description: An acceptable description should include the following elements:
• Opportunity: Why does the company apply People Analytics in Strategic Workforce Planning? The

149 / 174
Social Dimension - Talent Attraction & Retention
aim of the activity or the purpose the company is seeking to address with such analysis should be described. For example, a company may be investing in analytics in order to combat high voluntary employee turnover.
• Action: How People Analytics have been used? Description of process / tools / techniques / methods / models being used to collect and use the necessary data and the type of data that is used. For example, a company builds and rolls out dashboards of data on headcounts, employee engagement, compensation or a company develops predicting models to analyze the data already collected.
• Outcome: What is the business impact/result of the initiative? For example, a company is able to develop models to effectively predict employees with high flight risk, modify its strategy and thereby lower voluntary employee turnover.
Supporting Evidence: please provide supporting documentation (private or public) that will help better support the description of your PA application in SWP. Any type of supporting evidence that can demonstrate the type of analysis conducted is acceptable (e.g. screenshots of online systems, documents of application procedures, documentation of a successful application case,
comprehensive comments etc.).
References
• Minnesota Management and Budget cited, The Complete Guide to Workforce Planning. In. HR Society, 2013, p.3
• Strategic Workforce Planning: Developing Optimized Talent Strategies for Future Growth, Ross Sparkman, cited, Global Talent Trends, 2020, LinkedIn Talent Solutions.
• Sloan, Julie. The Workforce Planning Imperative JSM, 2010, cited, Wikipedia

150 / 174
Social Dimension - Talent Attraction & Retention
Type of Individual Performance Appraisal Assessment Focus
Question Rationale
In this question, we assess the various tools that companies use to measure individuals’ performance and
to what extent these tools are applied throughout the organization.
Question Layout
Please indicate the type and employee coverage of the individual performance appraisals used for individual performance-related compensation.
Type of Performance Appraisal % of all employees
Management by objectives: systematic use of agreed measurable targets by line superior
Multidimensional performance appraisal (e.g. 360 degree feedback)
Formal comparative ranking of employees within one employee categories
Question-Specific Guidance & Definitions
Please note that multiple options might be valid for some employees, so the sum of all options doesn't need to add up to 100%. Management by objectives: refers to a process in which employees have pre-defined and measurable goals that are set on at least a yearly basis together with their line manager and systematically followed up on. Multidimensional performance appraisal: refers to a system in which the employee’s performance is formally evaluated not just by their direct line manager, but also by their peers, direct reports, and other employees, providing what is referred to as a “360 degree” view of the employee’s performance. A formal comparative ranking: refers to a system in which employees are systematically graded relative to their peers in the same group (for example within the team performing a particular function).
Data Requirements
• Companies with less than 100 employees (e.g. investment offices and vehicles, funds, holding companies, etc.) should mark this question Not Applicable.
References
• GRI Standard 404-3 is relevant for this question.

151 / 174
Social Dimension - Talent Attraction & Retention
Long-Term Incentives for Employees Assessment Focus
Question Rationale
Long-term incentive programs can be essential for companies to retain well-qualified employees over time. Such programs serve to orient key decisions throughout the organization around longer-term goals and strategic objectives, giving companies a greater likelihood of success over time.
This question assesses the long-term incentive programs the company has in place, the timeframe for which performance incentives are paid out, the extent to which these programs apply to employees across the organization, and the extent to which they are associated with sustainability principles.
Question Layout
Does your company provide long-term incentives for employees below the senior management level? Long-term incentive programs are programs tied to an employee's performance. The performance can be measured during one or multiple years. These incentive programs do not include employee benefits (please see the information button definitions for more information). Please note: senior management includes employees that are at most two management levels from the CEO (or equivalent). Below senior management level refers to all employees that are more than two management levels away from the CEO. If your company uses a different definition for "below senior management level" please provide the definition in your answer. Long-term incentives for the executive management and/or senior management are not accepted in this question.
o
Please describe the following aspects
(both):
1) the type of long-term incentive
program (e.g. stock options, restricted
stock units, cash incentives, etc.);
2) the type of employees below the
senior management level the program
applies to:
Our long-term
incentives for
employees below
the senior
management level
are on average paid
out after:
Please report the
percentage of
your workforce
below senior
management
level (max. two
levels from the
CEO) that this
program applies
to:
Do the long-term
incentives include
targets associated
with sustainability
performance? Please
explain in the
comment box below:
o 2 years
o 3 years
o Longer than 3
years
% of our
employees
o No, we do not offer long-term incentive programs for employees below the senior management level. o Not applicable. Please provide explanations in the comment box below. o Not known
Question-Specific Guidance & Definitions
Long-term incentives: Any form of variable compensation that is paid out over a time period longer than one year. This can include deferred cash bonuses, stock options and restricted stock units. Pension contributions should not be included as these are not considered to be bonus programs or variable compensation. If your company uses different pay out time periods for different employee categories, please use a weighted average of the pay-out time periods for your long-term incentive programs. Sustainability performance: It can relate to any sustainability goals set your company, whether they are related to environmental issues, social issues such as occupational health and safety, or any other sustainability issue defined as material by your company. Senior management level refers to employees that are within two levels of the CEO as a maximum. “Employees below senior management” thus refers to all employees that are below the "senior management level". Please note that the definition of "senior management level" is up to
the company as we allow the company to choose the best definition according to its business plan and company structure. If your definition differs from our definition due to your business model, please explain this in the question.

152 / 174
Social Dimension - Talent Attraction & Retention
Data Requirements
Companies with less than 100 employees (e.g. investment offices and vehicles, funds, holding companies, etc.) should mark this question Not Applicable. Average time period for performance the average pay-out time period on which these incentive programs are based. If different pay-out time periods are used for different employee categories, please use a weighted average of the pay-out time periods for long-term incentive programs that exist. Percentage of your workforce below senior management level (max. two levels from the CEO) refers to the percentage of employees that are not considered senior management that are part of the long-term incentives program. For example, if your company has 100 employees, 10 are senior management (a maximum of two level from the CEO in the organizational structure) and 10 employees below senior management are part of the long-term incentives program, then 11% (=10/90*100) of employees below senior management level are covered in the program. Long-term incentives for executive management and/or senior management are not accepted
in this question.
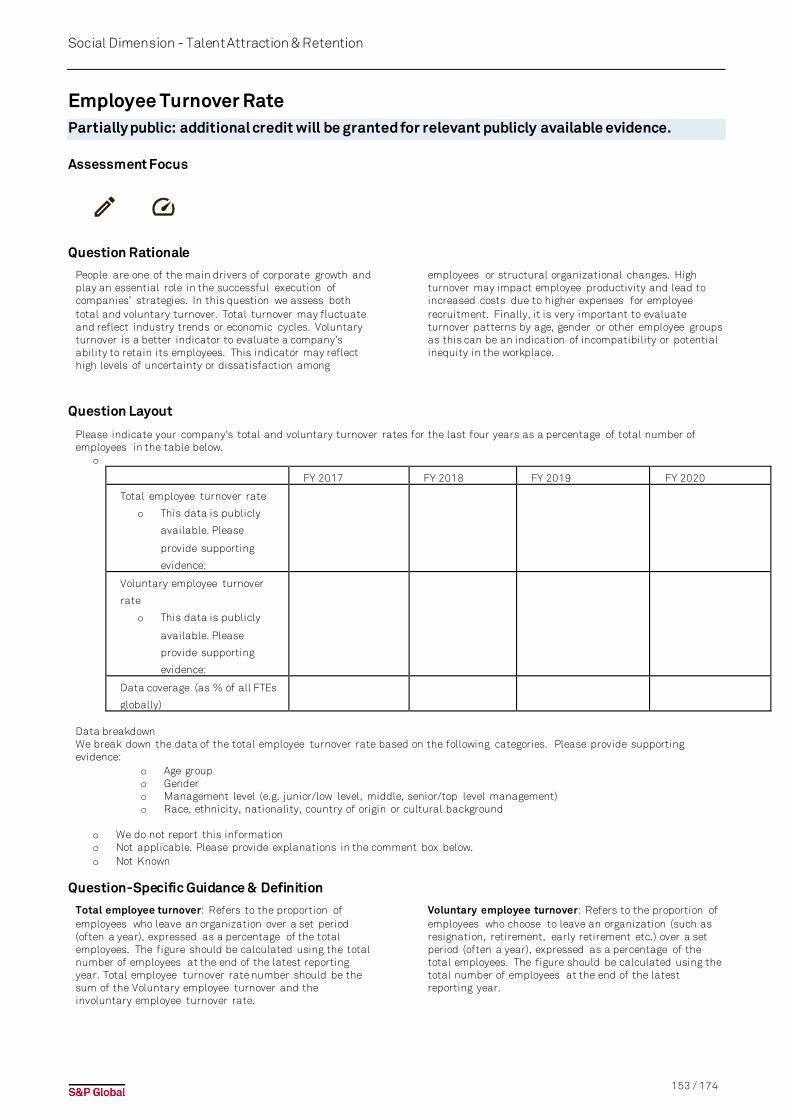
153 / 174
Social Dimension - Talent Attraction & Retention
Employee Turnover Rate Partially public: additional credit will be granted for relevant publicly available evidence.
Assessment Focus
Question Rationale
People are one of the main drivers of corporate growth and play an essential role in the successful execution of companies’ strategies. In this question we assess both total and voluntary turnover. Total turnover may fluctuate and reflect industry trends or economic cycles. Voluntary turnover is a better indicator to evaluate a company’s ability to retain its employees. This indicator may reflect high levels of uncertainty or dissatisfaction among
employees or structural organizational changes. High turnover may impact employee productivity and lead to increased costs due to higher expenses for employee recruitment. Finally, it is very important to evaluate turnover patterns by age, gender or other employee groups as this can be an indication of incompatibility or potential inequity in the workplace.
Question Layout
Please indicate your company's total and voluntary turnover rates for the last four years as a percentage of total number of employees in the table below.
o
FY 2017 FY 2018 FY 2019 FY 2020
Total employee turnover rate
o This data is publicly
available. Please
provide supporting
evidence:
Voluntary employee turnover
rate
o This data is publicly
available. Please
provide supporting
evidence:
Data coverage (as % of all FTEs
globally)
Data breakdown We break down the data of the total employee turnover rate based on the following categories. Please provide supporting evidence:
o Age group o Gender o Management level (e.g. junior/low level, middle, senior/top level management) o Race, ethnicity, nationality, country of origin or cultural background
o We do not report this information o Not applicable. Please provide explanations in the comment box below. o Not Known
Question-Specific Guidance & Definition
Total employee turnover: Refers to the proportion of employees who leave an organization over a set period (often a year), expressed as a percentage of the total employees. The figure should be calculated using the total number of employees at the end of the latest reporting year. Total employee turnover rate number should be the sum of the Voluntary employee turnover and the involuntary employee turnover rate.
Voluntary employee turnover: Refers to the proportion of employees who choose to leave an organization (such as resignation, retirement, early retirement etc.) over a set period (often a year), expressed as a percentage of the total employees. The figure should be calculated using the total number of employees at the end of the latest reporting year.
154 / 174
Social Dimension - Talent Attraction & Retention
Data Requirements
Companies with fewer than 100 employees (e.g. investment offices and vehicles, funds, holding companies, etc.) should mark this question Not Applicable.
• If the company doesn’t have a lot of FTEs because they outsource all their activities to contractors, then contractors are to be considered employees and the question will be applicable.
• If the company's definition for the turnover rates does not match our definition, then mark 'Not Applicable' for this question
Disclosure requirements: Additional credit will be granted for relevant publicly available evidence covering the following aspects of this question, for at least the most recent reported year.
• Total employee turnover rate • Voluntary employee turnover rate
Data Breakdown:
• We don’t expect companies to break down the data by all the categories mentioned in the question, but full points will be granted for this section for having a breakdown for at least 2 categories. The purpose of this section is to assess whether companies are able to track these metrics in a way to be able to evaluate and ensure fair treatment of all employees.
• In Europe, according to the Article 9 of the GDPR, it is prohibited to process personal data revealing racial or ethnic origin, except if the data subject has given explicit consent to the processing of those personal data, provided this is not prohibited by national law. Other exemptions exist, such as reasons of substantial public interest which might include statistical research purposes for equality of opportunity and treatment. We therefore expect companies to report on only two different categories, in order to not penalize companies that do not report data breakdown on race.
• For this section, companies can attach either private or public evidence and we expect to see the specific quantitative data broken down by these categories
References
• GRI Standard 401-1 is relevant for this question .
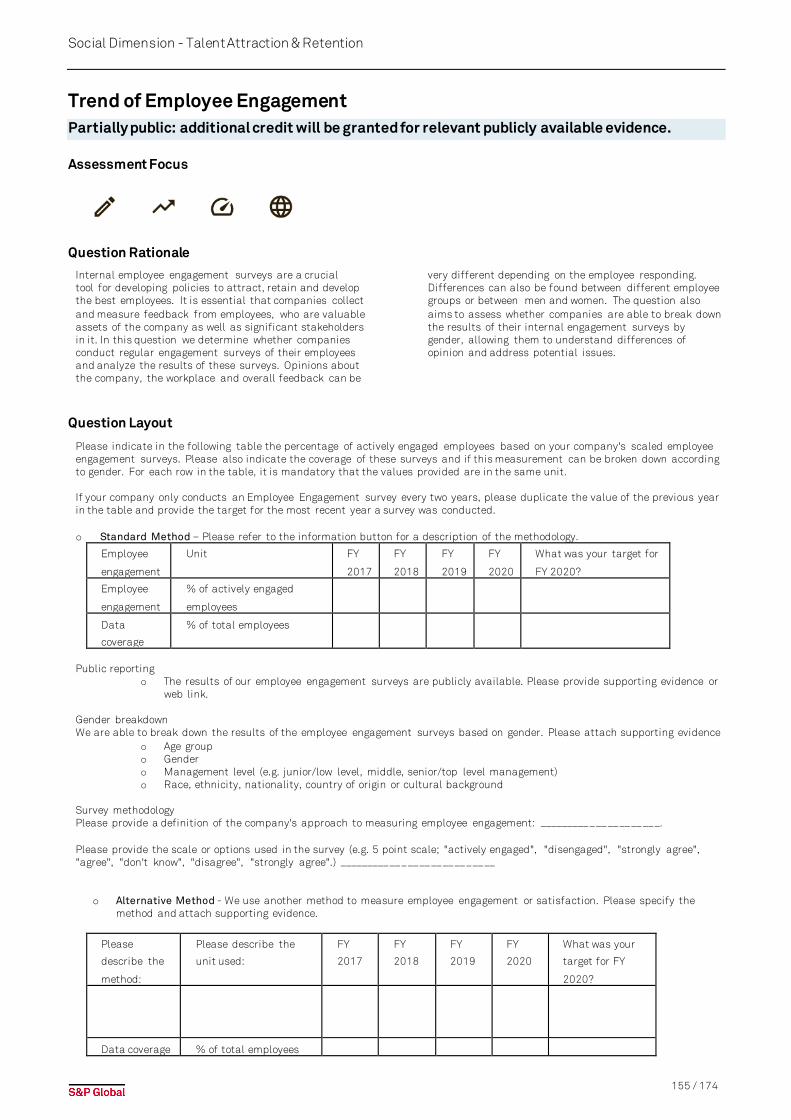
155 / 174
Social Dimension - Talent Attraction & Retention
Trend of Employee Engagement Partially public: additional credit will be granted for relevant publicly available evidence.
Assessment Focus
Question Rationale
Internal employee engagement surveys are a crucial tool for developing policies to attract, retain and develop the best employees. It is essential that companies collect and measure feedback from employees, who are valuable assets of the company as well as significant stakeholders in it. In this question we determine whether companies conduct regular engagement surveys of their employees and analyze the results of these surveys. Opinions about the company, the workplace and overall feedback can be
very different depending on the employee responding. Differences can also be found between different employee groups or between men and women. The question also aims to assess whether companies are able to break down the results of their internal engagement surveys by gender, allowing them to understand differences of opinion and address potential issues.
Question Layout
Please indicate in the following table the percentage of actively engaged employees based on your company's scaled employee engagement surveys. Please also indicate the coverage of these surveys and if this measurement can be broken down according to gender. For each row in the table, it is mandatory that the values provided are in the same unit. If your company only conducts an Employee Engagement survey every two years, please duplicate the value of the previous year in the table and provide the target for the most recent year a survey was conducted. o Standard Method – Please refer to the information button for a description of the methodology.
Employee
engagement
Unit FY
2017
FY
2018
FY
2019
FY
2020
What was your target for
FY 2020?
Employee
engagement
% of actively engaged
employees
Data
coverage
% of total employees
Public reporting
o The results of our employee engagement surveys are publicly available. Please provide supporting evidence or web link.
Gender breakdown We are able to break down the results of the employee engagement surveys based on gender. Please attach supporting evidence
o Age group o Gender o Management level (e.g. junior/low level, middle, senior/top level management) o Race, ethnicity, nationality, country of origin or cultural background
Survey methodology Please provide a definition of the company's approach to measuring employee engagement: _____________________. Please provide the scale or options used in the survey (e.g. 5 point scale; "actively engaged", "disengaged", "strongly agree", "agree", "don't know", "disagree", "strongly agree".) ___________________________
o Alternative Method - We use another method to measure employee engagement or satisfaction. Please specify the method and attach supporting evidence.
Please
describe the
method:
Please describe the
unit used:
FY
2017
FY
2018
FY
2019
FY
2020
What was your
target for FY
2020?
Data coverage % of total employees
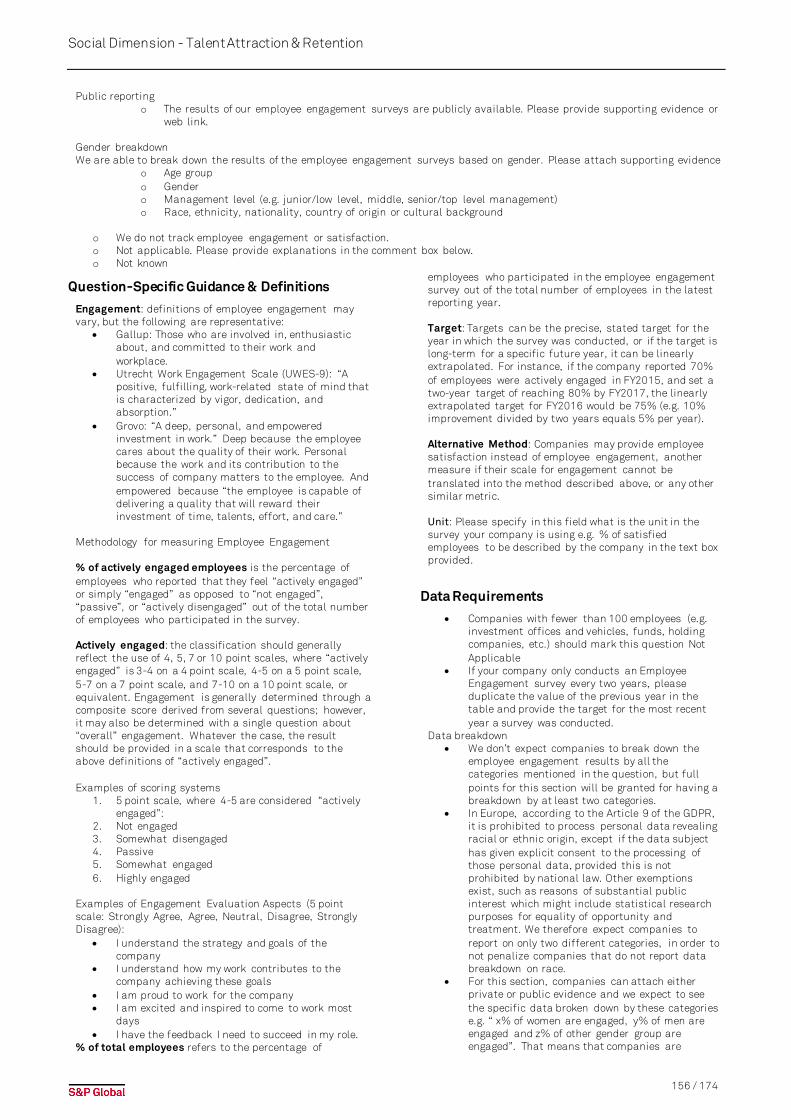
156 / 174
Social Dimension - Talent Attraction & Retention
Public reporting o The results of our employee engagement surveys are publicly available. Please provide supporting evidence or
web link. Gender breakdown We are able to break down the results of the employee engagement surveys based on gender. Please attach supporting evidence
o Age group o Gender o Management level (e.g. junior/low level, middle, senior/top level management) o Race, ethnicity, nationality, country of origin or cultural background
o We do not track employee engagement or satisfaction. o Not applicable. Please provide explanations in the comment box below. o Not known
Question-Specific Guidance & Definitions
Engagement: definitions of employee engagement may vary, but the following are representative:
• Gallup: Those who are involved in, enthusiastic about, and committed to their work and workplace.
• Utrecht Work Engagement Scale (UWES-9): “A positive, fulfilling, work-related state of mind that is characterized by vigor, dedication, and absorption.”
• Grovo: “A deep, personal, and empowered investment in work.” Deep because the employee cares about the quality of their work. Personal because the work and its contribution to the success of company matters to the employee. And empowered because “the employee is capable of delivering a quality that will reward their investment of time, talents, effort, and care.”
Methodology for measuring Employee Engagement % of actively engaged employees is the percentage of employees who reported that they feel “actively engaged” or simply “engaged” as opposed to “not engaged”, “passive”, or “actively disengaged” out of the total number of employees who participated in the survey. Actively engaged: the classification should generally reflect the use of 4, 5, 7 or 10 point scales, where “actively engaged” is 3-4 on a 4 point scale, 4-5 on a 5 point scale, 5-7 on a 7 point scale, and 7-10 on a 10 point scale, or equivalent. Engagement is generally determined through a composite score derived from several questions; however, it may also be determined with a single question about “overall” engagement. Whatever the case, the result should be provided in a scale that corresponds to the above definitions of “actively engaged”. Examples of scoring systems
1. 5 point scale, where 4-5 are considered “actively engaged”:
2. Not engaged 3. Somewhat disengaged 4. Passive 5. Somewhat engaged 6. Highly engaged
Examples of Engagement Evaluation Aspects (5 point scale: Strongly Agree, Agree, Neutral, Disagree, Strongly Disagree):
• I understand the strategy and goals of the company
• I understand how my work contributes to the company achieving these goals
• I am proud to work for the company • I am excited and inspired to come to work most
days • I have the feedback I need to succeed in my role.
% of total employees refers to the percentage of
employees who participated in the employee engagement survey out of the total number of employees in the latest reporting year. Target: Targets can be the precise, stated target for the year in which the survey was conducted, or if the target is long-term for a specific future year, it can be linearly extrapolated. For instance, if the company reported 70% of employees were actively engaged in FY2015, and set a two-year target of reaching 80% by FY2017, the linearly extrapolated target for FY2016 would be 75% (e.g. 10% improvement divided by two years equals 5% per year). Alternative Method: Companies may provide employee satisfaction instead of employee engagement, another measure if their scale for engagement cannot be translated into the method described above, or any other similar metric. Unit: Please specify in this field what is the unit in the survey your company is using e.g. % of satisfied employees to be described by the company in the text box provided.
Data Requirements
• Companies with fewer than 100 employees (e.g. investment offices and vehicles, funds, holding companies, etc.) should mark this question Not Applicable
• If your company only conducts an Employee Engagement survey every two years, please duplicate the value of the previous year in the table and provide the target for the most recent year a survey was conducted.
Data breakdown • We don’t expect companies to break down the
employee engagement results by all the categories mentioned in the question, but full points for this section will be granted for having a breakdown by at least two categories.
• In Europe, according to the Article 9 of the GDPR, it is prohibited to process personal data revealing racial or ethnic origin, except if the data subject has given explicit consent to the processing of those personal data, provided this is not prohibited by national law. Other exemptions exist, such as reasons of substantial public interest which might include statistical research purposes for equality of opportunity and treatment. We therefore expect companies to report on only two different categories, in order to not penalize companies that do not report data breakdown on race.
• For this section, companies can attach either private or public evidence and we expect to see the specific data broken down by these categories e.g. “ x% of women are engaged, y% of men are engaged and z% of other gender group are engaged”. That means that companies are

157 / 174
Social Dimension - Talent Attraction & Retention
expected to provide quantitative figures and not simple evidence that for example the employee’s gender was asked in the employee engagement survey.
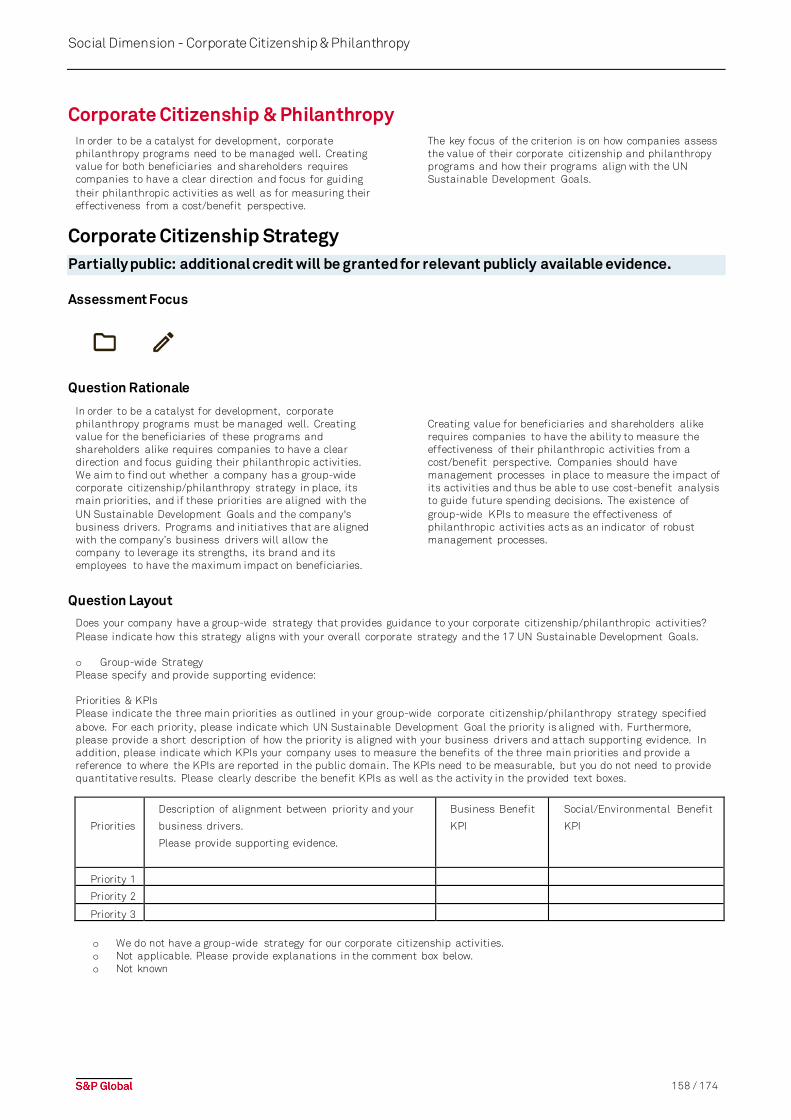
158 / 174
Social Dimension - Corporate Citizenship & Philanthropy
Corporate Citizenship & Philanthropy In order to be a catalyst for development, corporate philanthropy programs need to be managed well. Creating value for both beneficiaries and shareholders requires companies to have a clear direction and focus for guiding their philanthropic activities as well as for measuring their effectiveness from a cost/benefit perspective.
The key focus of the criterion is on how companies assess the value of their corporate citizenship and philanthropy programs and how their programs align with the UN Sustainable Development Goals.
Corporate Citizenship Strategy Partially public: additional credit will be granted for relevant publicly available evidence.
Assessment Focus
Question Rationale
In order to be a catalyst for development, corporate philanthropy programs must be managed well. Creating value for the beneficiaries of these programs and shareholders alike requires companies to have a clear direction and focus guiding their philanthropic activities. We aim to find out whether a company has a group-wide corporate citizenship/philanthropy strategy in place, its main priorities, and if these priorities are aligned with the UN Sustainable Development Goals and the company's business drivers. Programs and initiatives that are aligned with the company’s business drivers will allow the company to leverage its strengths, its brand and its employees to have the maximum impact on beneficiaries.
Creating value for beneficiaries and shareholders alike requires companies to have the ability to measure the effectiveness of their philanthropic activities from a cost/benefit perspective. Companies should have management processes in place to measure the impact of its activities and thus be able to use cost-benefit analysis to guide future spending decisions. The existence of group-wide KPIs to measure the effectiveness of philanthropic activities acts as an indicator of robust management processes.
Question Layout
Does your company have a group-wide strategy that provides guidance to your corporate citizenship/philanthropic activities? Please indicate how this strategy aligns with your overall corporate strategy and the 17 UN Sustainable Development Goals. o Group-wide Strategy Please specify and provide supporting evidence: Priorities & KPIs Please indicate the three main priorities as outlined in your group-wide corporate citizenship/philanthropy strategy specified above. For each priority, please indicate which UN Sustainable Development Goal the priority is aligned with. Furthermore, please provide a short description of how the priority is aligned with your business drivers and attach supporting evidence. In addition, please indicate which KPIs your company uses to measure the benefits of the three main priorities and provide a reference to where the KPIs are reported in the public domain. The KPIs need to be measurable, but you do not need to provide quantitative results. Please clearly describe the benefit KPIs as well as the activity in the provided text boxes.
Priorities
Description of alignment between priority and your
business drivers.
Please provide supporting evidence.
Business Benefit
KPI
Social/Environmental Benefit
KPI
Priority 1
Priority 2
Priority 3
o We do not have a group-wide strategy for our corporate citizenship activities. o Not applicable. Please provide explanations in the comment box below. o Not known
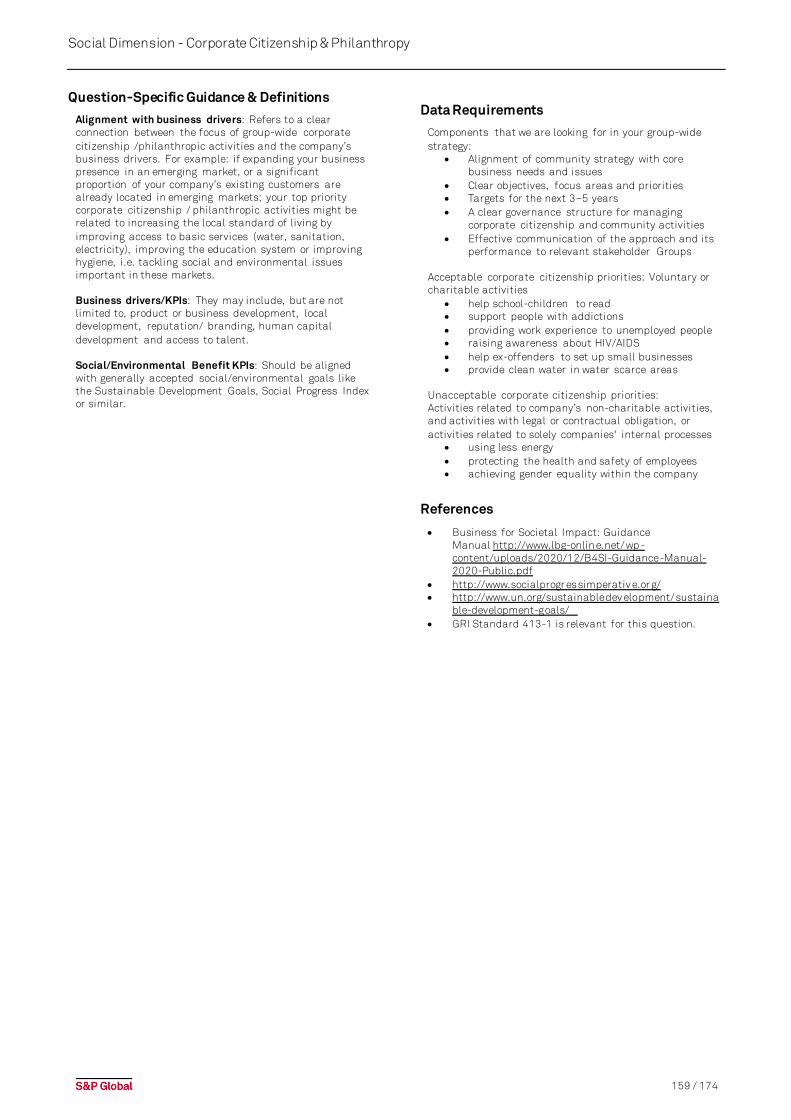
159 / 174
Social Dimension - Corporate Citizenship & Philanthropy
Question-Specific Guidance & Definitions
Alignment with business drivers: Refers to a clear connection between the focus of group-wide corporate citizenship /philanthropic activities and the company’s business drivers. For example: if expanding your business presence in an emerging market, or a significant proportion of your company’s existing customers are already located in emerging markets; your top priority corporate citizenship / philanthropic activities might be related to increasing the local standard of living by improving access to basic services (water, sanitation, electricity), improving the education system or improving hygiene, i.e. tackling social and environmental issues important in these markets. Business drivers/KPIs: They may include, but are not limited to, product or business development, local development, reputation/ branding, human capital development and access to talent. Social/Environmental Benefit KPIs: Should be aligned with generally accepted social/environmental goals like the Sustainable Development Goals, Social Progress Index or similar.
Data Requirements
Components that we are looking for in your group-wide strategy:
• Alignment of community strategy with core business needs and issues
• Clear objectives, focus areas and priorities • Targets for the next 3–5 years • A clear governance structure for managing
corporate citizenship and community activities • Effective communication of the approach and its
performance to relevant stakeholder Groups Acceptable corporate citizenship priorities: Voluntary or charitable activities
• help school-children to read • support people with addictions • providing work experience to unemployed people • raising awareness about HIV/AIDS • help ex-offenders to set up small businesses • provide clean water in water scarce areas
Unacceptable corporate citizenship priorities: Activities related to company’s non-charitable activities, and activities with legal or contractual obligation, or activities related to solely companies' internal processes
• using less energy • protecting the health and safety of employees • achieving gender equality within the company
References
• Business for Societal Impact: Guidance Manual http://www.lbg-onlin e.net/wp -content/uploads/2020/12/B4SI-Guidance-Manual-2020-Public.pdf
• http://www.socialprogr essimperativ e.or g/ • http://www.un.org/sustainabledev elopment/sustaina
ble-development-goals/ • GRI Standard 413-1 is relevant for this question.
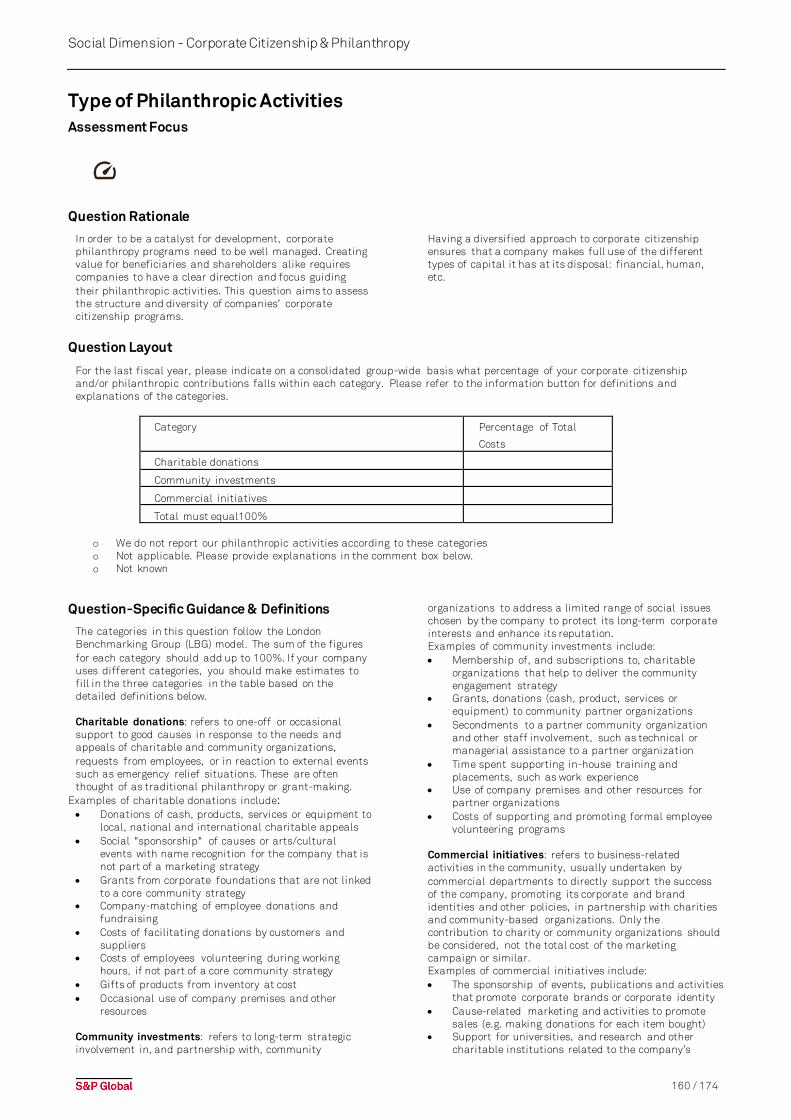
160 / 174
Social Dimension - Corporate Citizenship & Philanthropy
Type of Philanthropic Activities Assessment Focus
Question Rationale
In order to be a catalyst for development, corporate philanthropy programs need to be well managed. Creating value for beneficiaries and shareholders alike requires companies to have a clear direction and focus guiding their philanthropic activities. This question aims to assess the structure and diversity of companies’ corporate citizenship programs.
Having a diversified approach to corporate citizenship ensures that a company makes full use of the different types of capital it has at its disposal: financial, human, etc.
Question Layout
For the last fiscal year, please indicate on a consolidated group-wide basis what percentage of your corporate citizenship and/or philanthropic contributions falls within each category. Please refer to the information button for definitions and explanations of the categories.
Category Percentage of Total
Costs
Charitable donations
Community investments
Commercial initiatives
Total must equal100%
o We do not report our philanthropic activities according to these categories o Not applicable. Please provide explanations in the comment box below. o Not known
Question-Specific Guidance & Definitions
The categories in this question follow the London Benchmarking Group (LBG) model. The sum of the figures for each category should add up to 100%. If your company uses different categories, you should make estimates to fill in the three categories in the table based on the detailed definitions below. Charitable donations: refers to one-off or occasional support to good causes in response to the needs and appeals of charitable and community organizations, requests from employees, or in reaction to external events such as emergency relief situations. These are often thought of as traditional philanthropy or grant-making.
Examples of charitable donations include: • Donations of cash, products, services or equipment to
local, national and international charitable appeals • Social "sponsorship" of causes or arts/cultural
events with name recognition for the company that is not part of a marketing strategy
• Grants from corporate foundations that are not linked to a core community strategy
• Company-matching of employee donations and fundraising
• Costs of facilitating donations by customers and suppliers
• Costs of employees volunteering during working hours, if not part of a core community strategy
• Gifts of products from inventory at cost • Occasional use of company premises and other
resources Community investments: refers to long-term strategic involvement in, and partnership with, community
organizations to address a limited range of social issues chosen by the company to protect its long-term corporate interests and enhance its reputation. Examples of community investments include: • Membership of, and subscriptions to, charitable
organizations that help to deliver the community engagement strategy
• Grants, donations (cash, product, services or equipment) to community partner organizations
• Secondments to a partner community organization and other staff involvement, such as technical or managerial assistance to a partner organization
• Time spent supporting in-house training and placements, such as work experience
• Use of company premises and other resources for partner organizations
• Costs of supporting and promoting formal employee volunteering programs
Commercial initiatives: refers to business-related activities in the community, usually undertaken by commercial departments to directly support the success of the company, promoting its corporate and brand identities and other policies, in partnership with charities and community-based organizations. Only the contribution to charity or community organizations should be considered, not the total cost of the marketing campaign or similar. Examples of commercial initiatives include: • The sponsorship of events, publications and activities
that promote corporate brands or corporate identity • Cause-related marketing and activities to promote
sales (e.g. making donations for each item bought) • Support for universities, and research and other
charitable institutions related to the company’s

161 / 174
Social Dimension - Corporate Citizenship & Philanthropy
business or aiming to improve the image of the brand or perception of the company
• Exceptional one-off gifts of property and other assets
References
• Business for Societal Impact: Guidance Manual: http://www.lbg-online.net /wp -content/uploads/2020/12/B4SI-Guidance-Manual-
2020-Public.pdf • GRI Standard 201-1 is relevant for this question.
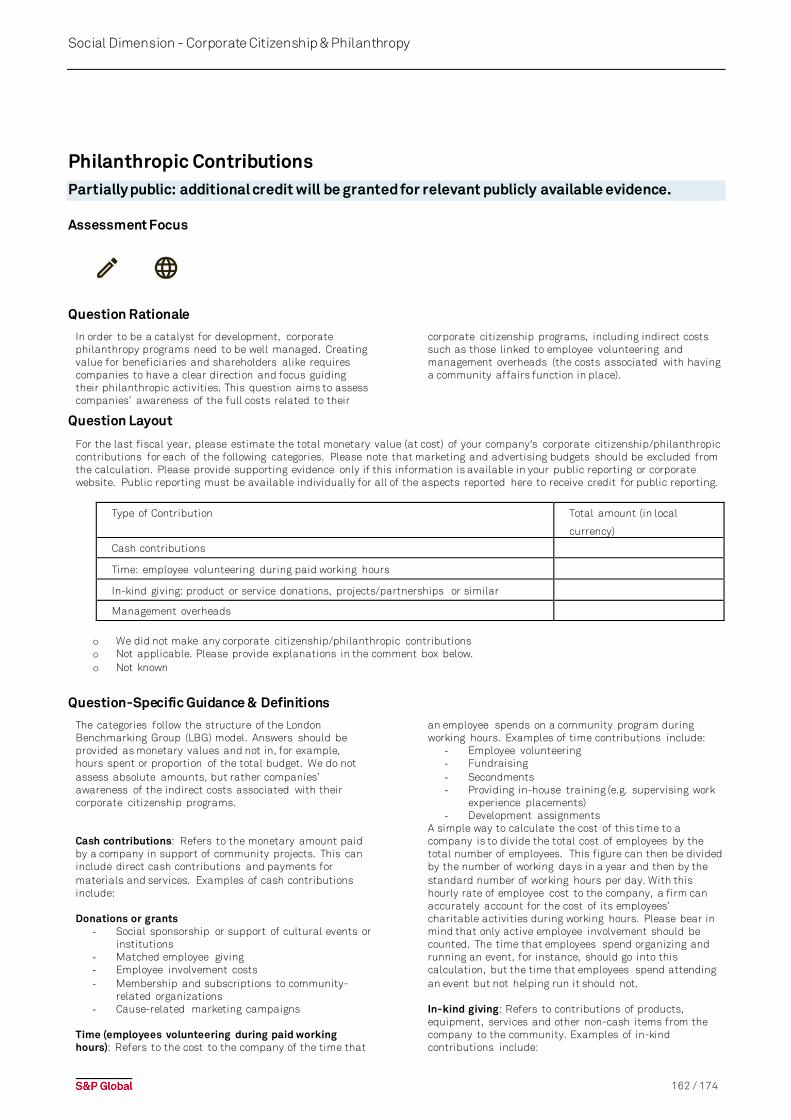
162 / 174
Social Dimension - Corporate Citizenship & Philanthropy
Philanthropic Contributions Partially public: additional credit will be granted for relevant publicly available evidence.
Assessment Focus
Question Rationale
In order to be a catalyst for development, corporate philanthropy programs need to be well managed. Creating value for beneficiaries and shareholders alike requires companies to have a clear direction and focus guiding their philanthropic activities. This question aims to assess companies’ awareness of the full costs related to their
corporate citizenship programs, including indirect costs such as those linked to employee volunteering and management overheads (the costs associated with having a community affairs function in place).
Question Layout
For the last fiscal year, please estimate the total monetary value (at cost) of your company's corporate citizenship/philanthropic contributions for each of the following categories. Please note that marketing and advertising budgets should be excluded from the calculation. Please provide supporting evidence only if this information is available in your public reporting or corporate website. Public reporting must be available individually for all of the aspects reported here to receive credit for public reporting.
Type of Contribution Total amount (in local
currency)
Cash contributions
Time: employee volunteering during paid working hours
In-kind giving: product or service donations, projects/partnerships or similar
Management overheads
o We did not make any corporate citizenship/philanthropic contributions o Not applicable. Please provide explanations in the comment box below. o Not known
Question-Specific Guidance & Definitions
The categories follow the structure of the London Benchmarking Group (LBG) model. Answers should be provided as monetary values and not in, for example, hours spent or proportion of the total budget. We do not assess absolute amounts, but rather companies’ awareness of the indirect costs associated with their corporate citizenship programs. Cash contributions: Refers to the monetary amount paid by a company in support of community projects. This can include direct cash contributions and payments for materials and services. Examples of cash contributions include: Donations or grants
- Social sponsorship or support of cultural events or institutions
- Matched employee giving - Employee involvement costs - Membership and subscriptions to community-
related organizations - Cause-related marketing campaigns
Time (employees volunteering during paid working hours): Refers to the cost to the company of the time that
an employee spends on a community program during working hours. Examples of time contributions include:
- Employee volunteering - Fundraising - Secondments - Providing in-house training (e.g. supervising work
experience placements) - Development assignments
A simple way to calculate the cost of this time to a company is to divide the total cost of employees by the total number of employees. This figure can then be divided by the number of working days in a year and then by the standard number of working hours per day. With this hourly rate of employee cost to the company, a firm can accurately account for the cost of its employees’ charitable activities during working hours. Please bear in mind that only active employee involvement should be counted. The time that employees spend organizing and running an event, for instance, should go into this calculation, but the time that employees spend attending an event but not helping run it should not. In-kind giving: Refers to contributions of products, equipment, services and other non-cash items from the company to the community. Examples of in-kind contributions include:
163 / 174
Social Dimension - Corporate Citizenship & Philanthropy
• Donations of products (such as for prizes at community events)
• Contributions of used office equipment or furniture
• Use of company premises • Provision of free advertising space in a publication
or on a TV channel or website to a community organization at no cost
• Provision of pro bono legal, accounting or other professional services
In-kind contributions should be valued based on what it has cost the company to provide them, not on what the beneficiary would have had to pay to attain these goods or services at market prices. Management costs (overheads): Refers to the costs associated with having in place a community affairs function; for example, providing salaries and benefits to community affairs staff, and paying for their overheads and costs related to research and communications. Examples of overhead costs include:
• Salaries, pension, national insurance, benefits & recruitment costs of communities affairs staff
• Running costs & overheads: phone & faxes, computer equipment, travel, business overheads, not just for individual projects
• Paying for external professional advice to better manage a program
• Communicating the community program to relevant audiences
• Research into issues and possible projects Please assess overhead costs based on overall program coordination and communication, not by individual projects. (Time spent on one-off projects should be counted under time contributions, as described above.) If
managing community programs is only one part of an employee’s job, the cost of that employee should be apportioned accordingly.
Data Requirements
Disclosure requirements for partially public question. Additional credit will be granted for relevant publicly available evidence covering all of the following aspects of this question: Total monetary value (at cost) of your company's corporate citizenship/philanthropic contributions for each of the following categories:
• Cash contributions • Time: employee volunteering during paid working
hours • In-kind giving: product or services donations,
projects/partnerships or similar • Management overheads
Public reporting must be available individually for all of the aspects reported here to receive credit for public reporting. Reporting of a total or overall figure is not sufficient to receive credit for public reporting.
References
• Business for Societal Impact: Guidance Manual: http://www.lbg-online.net /wp -content/uploads/2020/12/B4SI-Guidance-Manual-2020-Public.pdf
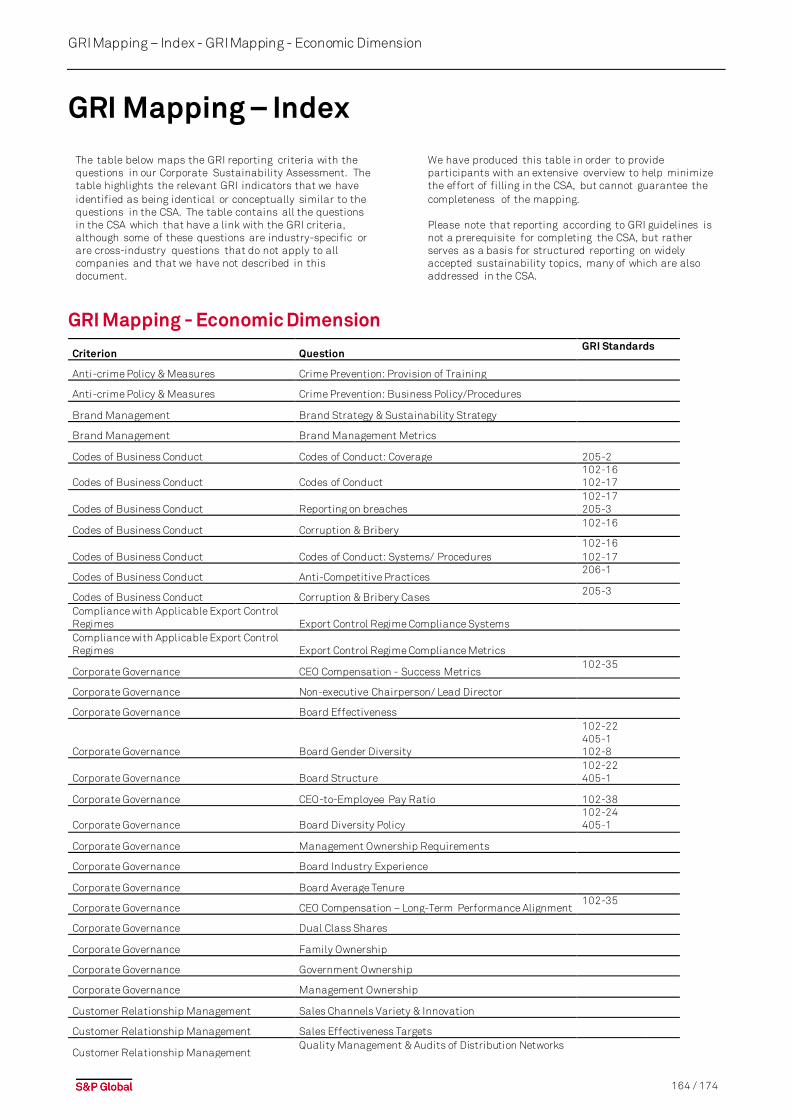
164 / 174
GRI Mapping – Index - GRI Mapping - Economic Dimension
GRI Mapping – Index The table below maps the GRI reporting criteria with the questions in our Corporate Sustainability Assessment. The table highlights the relevant GRI indicators that we have identified as being identical or conceptually similar to the questions in the CSA. The table contains all the questions in the CSA which that have a link with the GRI criteria, although some of these questions are industry-specific or are cross-industry questions that do not apply to all companies and that we have not described in this document.
We have produced this table in order to provide participants with an extensive overview to help minimize the effort of filling in the CSA, but cannot guarantee the completeness of the mapping. Please note that reporting according to GRI guidelines is not a prerequisite for completing the CSA, but rather serves as a basis for structured reporting on widely accepted sustainability topics, many of which are also addressed in the CSA.
GRI Mapping - Economic Dimension
Criterion Question GRI Standards
Anti-crime Policy & Measures Crime Prevention: Provision of Training
Anti-crime Policy & Measures Crime Prevention: Business Policy/Procedures
Brand Management Brand Strategy & Sustainability Strategy
Brand Management Brand Management Metrics
Codes of Business Conduct Codes of Conduct: Coverage 205-2
Codes of Business Conduct Codes of Conduct 102-16 102-17
Codes of Business Conduct Reporting on breaches 102-17 205-3
Codes of Business Conduct Corruption & Bribery 102-16
Codes of Business Conduct Codes of Conduct: Systems/ Procedures 102-16 102-17
Codes of Business Conduct Anti-Competitive Practices 206-1
Codes of Business Conduct Corruption & Bribery Cases 205-3
Compliance with Applicable Export Control Regimes Export Control Regime Compliance Systems
Compliance with Applicable Export Control Regimes Export Control Regime Compliance Metrics
Corporate Governance CEO Compensation - Success Metrics 102-35
Corporate Governance Non-executive Chairperson/ Lead Director
Corporate Governance Board Effectiveness
Corporate Governance Board Gender Diversity
102-22 405-1 102-8
Corporate Governance Board Structure 102-22 405-1
Corporate Governance CEO-to-Employee Pay Ratio 102-38
Corporate Governance Board Diversity Policy 102-24 405-1
Corporate Governance Management Ownership Requirements
Corporate Governance Board Industry Experience
Corporate Governance Board Average Tenure
Corporate Governance CEO Compensation – Long-Term Performance Alignment 102-35
Corporate Governance Dual Class Shares
Corporate Governance Family Ownership
Corporate Governance Government Ownership
Corporate Governance Management Ownership
Customer Relationship Management Sales Channels Variety & Innovation
Customer Relationship Management Sales Effectiveness Targets
Customer Relationship Management Quality Management & Audits of Distribution Networks
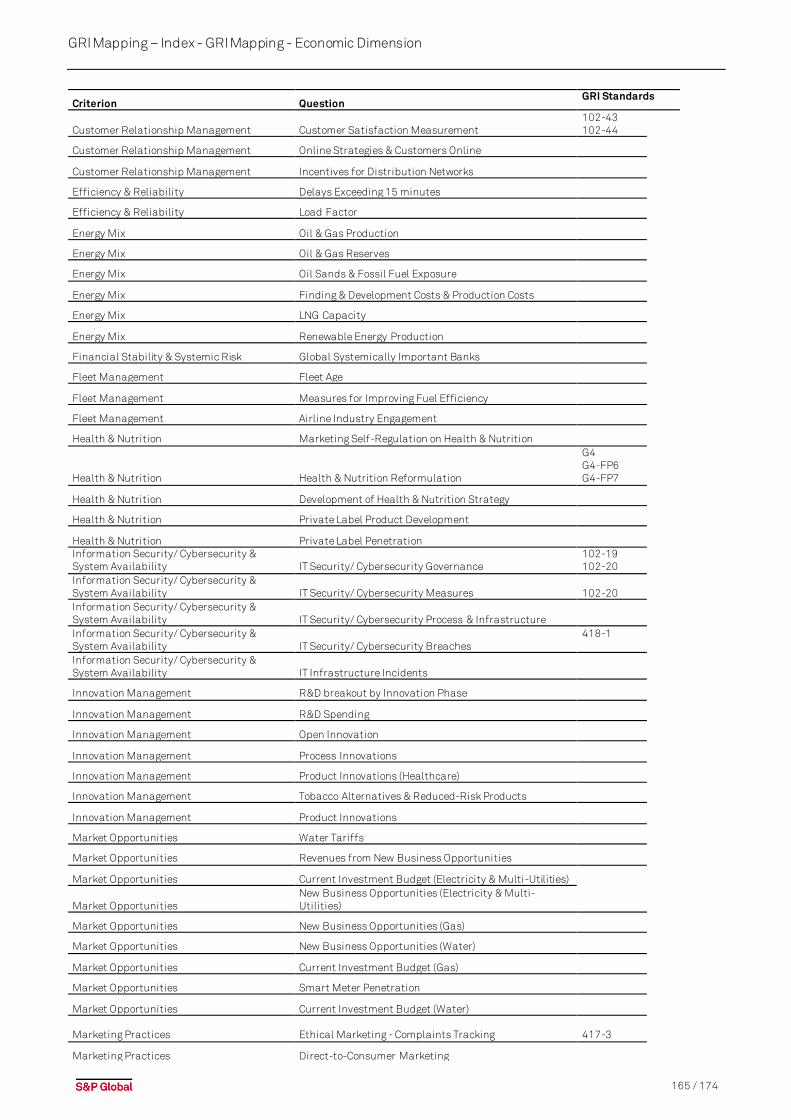
165 / 174
GRI Mapping – Index - GRI Mapping - Economic Dimension
Criterion Question GRI Standards
Customer Relationship Management Customer Satisfaction Measurement 102-43 102-44
Customer Relationship Management Online Strategies & Customers Online
Customer Relationship Management Incentives for Distribution Networks
Efficiency & Reliability Delays Exceeding 15 minutes
Efficiency & Reliability Load Factor
Energy Mix Oil & Gas Production
Energy Mix Oil & Gas Reserves
Energy Mix Oil Sands & Fossil Fuel Exposure
Energy Mix Finding & Development Costs & Production Costs
Energy Mix LNG Capacity
Energy Mix Renewable Energy Production
Financial Stability & Systemic Risk Global Systemically Important Banks
Fleet Management Fleet Age
Fleet Management Measures for Improving Fuel Efficiency
Fleet Management Airline Industry Engagement
Health & Nutrition Marketing Self-Regulation on Health & Nutrition
Health & Nutrition Health & Nutrition Reformulation
G4 G4-FP6 G4-FP7
Health & Nutrition Development of Health & Nutrition Strategy
Health & Nutrition Private Label Product Development
Health & Nutrition Private Label Penetration
Information Security/ Cybersecurity & System Availability IT Security/ Cybersecurity Governance
102-19 102-20
Information Security/ Cybersecurity & System Availability IT Security/ Cybersecurity Measures
102-20
Information Security/ Cybersecurity & System Availability IT Security/ Cybersecurity Process & Infrastructure
Information Security/ Cybersecurity & System Availability IT Security/ Cybersecurity Breaches
418-1
Information Security/ Cybersecurity & System Availability IT Infrastructure Incidents
Innovation Management R&D breakout by Innovation Phase
Innovation Management R&D Spending
Innovation Management Open Innovation
Innovation Management Process Innovations
Innovation Management Product Innovations (Healthcare)
Innovation Management Tobacco Alternatives & Reduced-Risk Products
Innovation Management Product Innovations
Market Opportunities Water Tariffs
Market Opportunities Revenues from New Business Opportunities
Market Opportunities Current Investment Budget (Electricity & Multi-Utilities)
Market Opportunities New Business Opportunities (Electricity & Multi-Utilities)
Market Opportunities New Business Opportunities (Gas)
Market Opportunities New Business Opportunities (Water)
Market Opportunities Current Investment Budget (Gas)
Market Opportunities Smart Meter Penetration
Market Opportunities Current Investment Budget (Water)
Marketing Practices
Ethical Marketing - Complaints Tracking
417-3
Marketing Practices Direct-to-Consumer Marketing
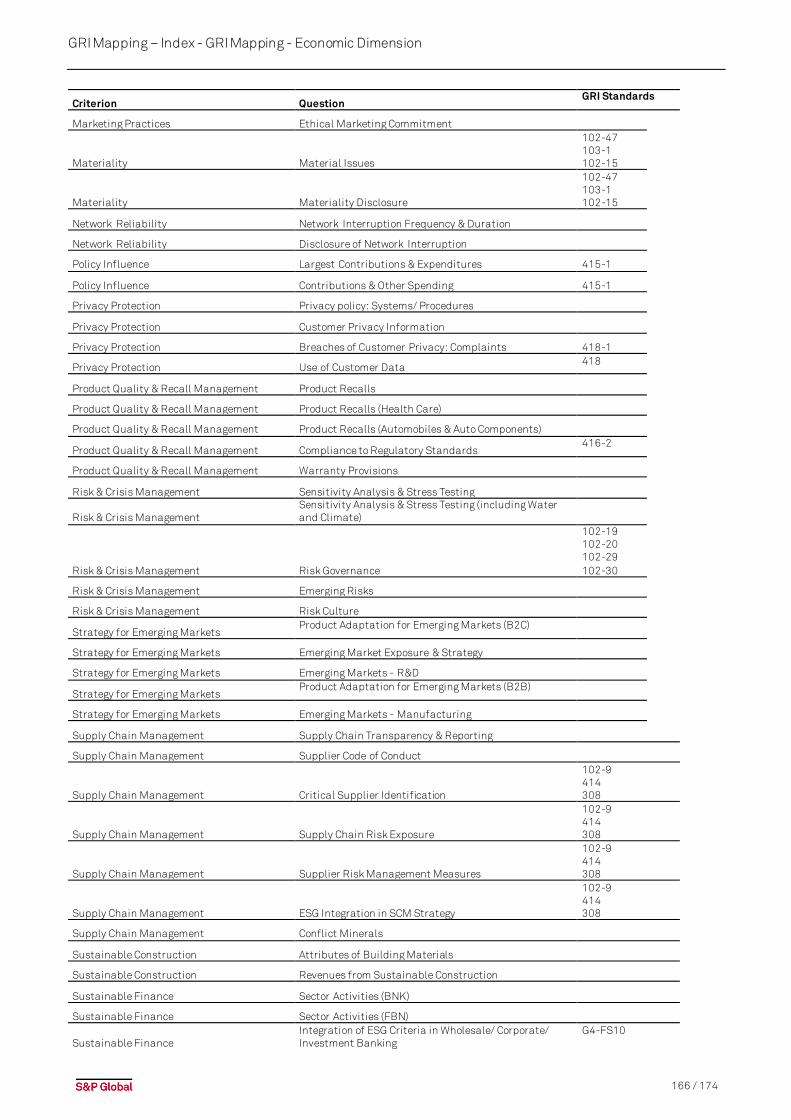
166 / 174
GRI Mapping – Index - GRI Mapping - Economic Dimension
Criterion Question GRI Standards
Marketing Practices Ethical Marketing Commitment
Materiality Material Issues
102-47 103-1 102-15
Materiality Materiality Disclosure
102-47 103-1 102-15
Network Reliability Network Interruption Frequency & Duration
Network Reliability Disclosure of Network Interruption
Policy Influence Largest Contributions & Expenditures 415-1
Policy Influence Contributions & Other Spending 415-1
Privacy Protection Privacy policy: Systems/ Procedures
Privacy Protection Customer Privacy Information
Privacy Protection Breaches of Customer Privacy: Complaints 418-1
Privacy Protection Use of Customer Data 418
Product Quality & Recall Management Product Recalls
Product Quality & Recall Management Product Recalls (Health Care)
Product Quality & Recall Management Product Recalls (Automobiles & Auto Components)
Product Quality & Recall Management Compliance to Regulatory Standards 416-2
Product Quality & Recall Management Warranty Provisions
Risk & Crisis Management Sensitivity Analysis & Stress Testing
Risk & Crisis Management Sensitivity Analysis & Stress Testing (including Water and Climate)
Risk & Crisis Management Risk Governance
102-19 102-20 102-29 102-30
Risk & Crisis Management Emerging Risks
Risk & Crisis Management Risk Culture
Strategy for Emerging Markets Product Adaptation for Emerging Markets (B2C)
Strategy for Emerging Markets Emerging Market Exposure & Strategy
Strategy for Emerging Markets Emerging Markets - R&D
Strategy for Emerging Markets Product Adaptation for Emerging Markets (B2B)
Strategy for Emerging Markets Emerging Markets - Manufacturing
Supply Chain Management Supply Chain Transparency & Reporting
Supply Chain Management Supplier Code of Conduct
Supply Chain Management Critical Supplier Identification
102-9 414 308
Supply Chain Management
Supply Chain Risk Exposure
102-9 414 308
Supply Chain Management Supplier Risk Management Measures
102-9 414 308
Supply Chain Management ESG Integration in SCM Strategy
102-9 414 308
Supply Chain Management Conflict Minerals
Sustainable Construction Attributes of Building Materials
Sustainable Construction Revenues from Sustainable Construction
Sustainable Finance Sector Activities (BNK)
Sustainable Finance Sector Activities (FBN)
Sustainable Finance Integration of ESG Criteria in Wholesale/ Corporate/ Investment Banking
G4-FS10
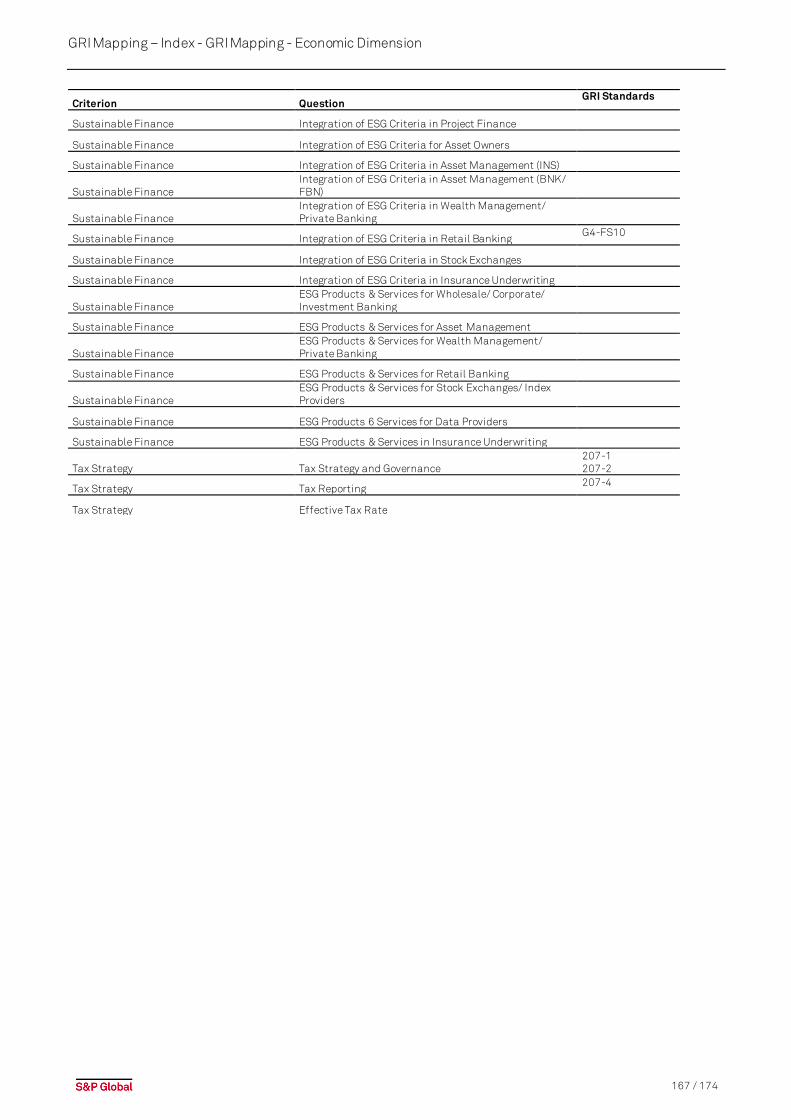
167 / 174
GRI Mapping – Index - GRI Mapping - Economic Dimension
Criterion Question GRI Standards
Sustainable Finance Integration of ESG Criteria in Project Finance
Sustainable Finance Integration of ESG Criteria for Asset Owners
Sustainable Finance Integration of ESG Criteria in Asset Management (INS)
Sustainable Finance Integration of ESG Criteria in Asset Management (BNK/ FBN)
Sustainable Finance Integration of ESG Criteria in Wealth Management/ Private Banking
Sustainable Finance Integration of ESG Criteria in Retail Banking G4-FS10
Sustainable Finance Integration of ESG Criteria in Stock Exchanges
Sustainable Finance Integration of ESG Criteria in Insurance Underwriting
Sustainable Finance ESG Products & Services for Wholesale/ Corporate/ Investment Banking
Sustainable Finance ESG Products & Services for Asset Management
Sustainable Finance ESG Products & Services for Wealth Management/ Private Banking
Sustainable Finance ESG Products & Services for Retail Banking
Sustainable Finance ESG Products & Services for Stock Exchanges/ Index Providers
Sustainable Finance ESG Products 6 Services for Data Providers
Sustainable Finance ESG Products & Services in Insurance Underwriting
Tax Strategy Tax Strategy and Governance 207-1 207-2
Tax Strategy Tax Reporting 207-4
Tax Strategy Effective Tax Rate
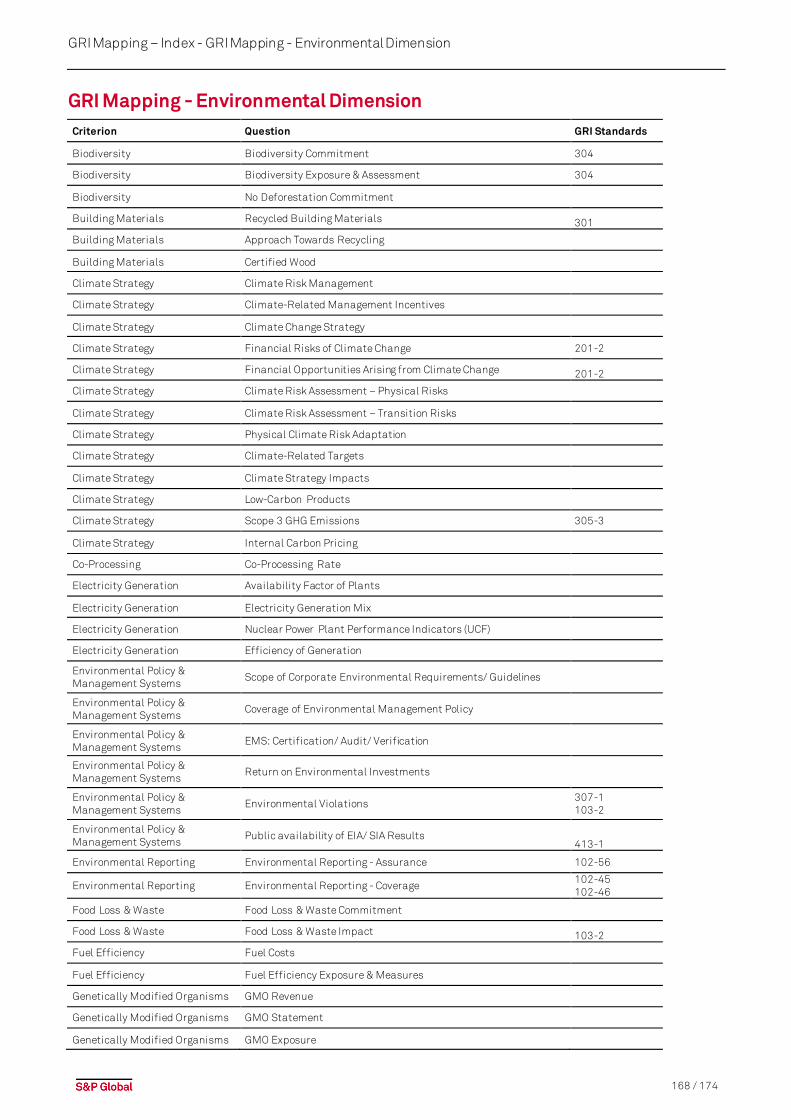
168 / 174
GRI Mapping – Index - GRI Mapping - Environmental Dimension
GRI Mapping - Environmental Dimension Criterion Question GRI Standards
Biodiversity Biodiversity Commitment 304
Biodiversity Biodiversity Exposure & Assessment 304
Biodiversity No Deforestation Commitment
Building Materials Recycled Building Materials 301
Building Materials Approach Towards Recycling Building Materials Certified Wood Climate Strategy Climate Risk Management Climate Strategy Climate-Related Management Incentives Climate Strategy Climate Change Strategy Climate Strategy Financial Risks of Climate Change 201-2 Climate Strategy Financial Opportunities Arising from Climate Change 201-2
Climate Strategy Climate Risk Assessment – Physical Risks
Climate Strategy Climate Risk Assessment – Transition Risks
Climate Strategy Physical Climate Risk Adaptation
Climate Strategy Climate-Related Targets
Climate Strategy Climate Strategy Impacts
Climate Strategy Low-Carbon Products
Climate Strategy Scope 3 GHG Emissions 305-3
Climate Strategy Internal Carbon Pricing
Co-Processing Co-Processing Rate Electricity Generation Availability Factor of Plants Electricity Generation Electricity Generation Mix Electricity Generation Nuclear Power Plant Performance Indicators (UCF) Electricity Generation Efficiency of Generation Environmental Policy & Management Systems
Scope of Corporate Environmental Requirements/ Guidelines Environmental Policy & Management Systems
Coverage of Environmental Management Policy Environmental Policy & Management Systems
EMS: Certification/ Audit/ Verification Environmental Policy & Management Systems
Return on Environmental Investments
Environmental Policy & Management Systems
Environmental Violations 307-1 103-2
Environmental Policy & Management Systems
Public availability of EIA/ SIA Results 413-1
Environmental Reporting Environmental Reporting - Assurance 102-56
Environmental Reporting Environmental Reporting - Coverage 102-45 102-46
Food Loss & Waste Food Loss & Waste Commitment Food Loss & Waste Food Loss & Waste Impact 103-2
Fuel Efficiency Fuel Costs Fuel Efficiency Fuel Efficiency Exposure & Measures Genetically Modified Organisms GMO Revenue Genetically Modified Organisms GMO Statement Genetically Modified Organisms GMO Exposure
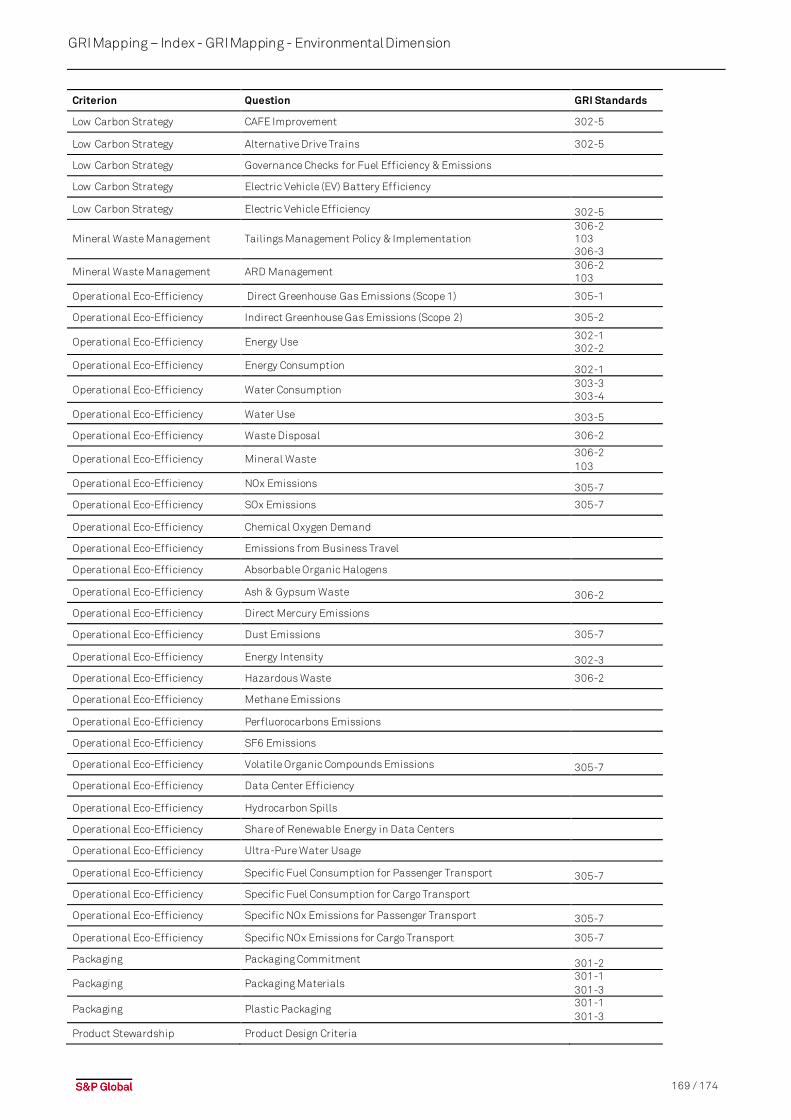
169 / 174
GRI Mapping – Index - GRI Mapping - Environmental Dimension
Criterion Question GRI Standards
Low Carbon Strategy CAFE Improvement 302-5
Low Carbon Strategy Alternative Drive Trains 302-5
Low Carbon Strategy Governance Checks for Fuel Efficiency & Emissions Low Carbon Strategy Electric Vehicle (EV) Battery Efficiency Low Carbon Strategy Electric Vehicle Efficiency 302-5
Mineral Waste Management Tailings Management Policy & Implementation 306-2 103 306-3
Mineral Waste Management ARD Management 306-2 103
Operational Eco-Efficiency Direct Greenhouse Gas Emissions (Scope 1) 305-1
Operational Eco-Efficiency Indirect Greenhouse Gas Emissions (Scope 2) 305-2
Operational Eco-Efficiency Energy Use 302-1 302-2
Operational Eco-Efficiency Energy Consumption 302-1
Operational Eco-Efficiency Water Consumption 303-3 303-4
Operational Eco-Efficiency Water Use 303-5 Operational Eco-Efficiency Waste Disposal 306-2
Operational Eco-Efficiency Mineral Waste 306-2 103
Operational Eco-Efficiency NOx Emissions 305-7 Operational Eco-Efficiency SOx Emissions 305-7
Operational Eco-Efficiency Chemical Oxygen Demand
Operational Eco-Efficiency Emissions from Business Travel
Operational Eco-Efficiency Absorbable Organic Halogens
Operational Eco-Efficiency Ash & Gypsum Waste 306-2 Operational Eco-Efficiency Direct Mercury Emissions
Operational Eco-Efficiency Dust Emissions 305-7
Operational Eco-Efficiency Energy Intensity 302-3 Operational Eco-Efficiency Hazardous Waste 306-2
Operational Eco-Efficiency Methane Emissions
Operational Eco-Efficiency Perfluorocarbons Emissions Operational Eco-Efficiency SF6 Emissions
Operational Eco-Efficiency Volatile Organic Compounds Emissions 305-7 Operational Eco-Efficiency Data Center Efficiency
Operational Eco-Efficiency Hydrocarbon Spills
Operational Eco-Efficiency Share of Renewable Energy in Data Centers Operational Eco-Efficiency Ultra-Pure Water Usage
Operational Eco-Efficiency Specific Fuel Consumption for Passenger Transport 305-7 Operational Eco-Efficiency Specific Fuel Consumption for Cargo Transport Operational Eco-Efficiency Specific NOx Emissions for Passenger Transport 305-7 Operational Eco-Efficiency Specific NOx Emissions for Cargo Transport 305-7
Packaging Packaging Commitment 301-2 Packaging Packaging Materials
301-1 301-3
Packaging Plastic Packaging 301-1 301-3
Product Stewardship Product Design Criteria
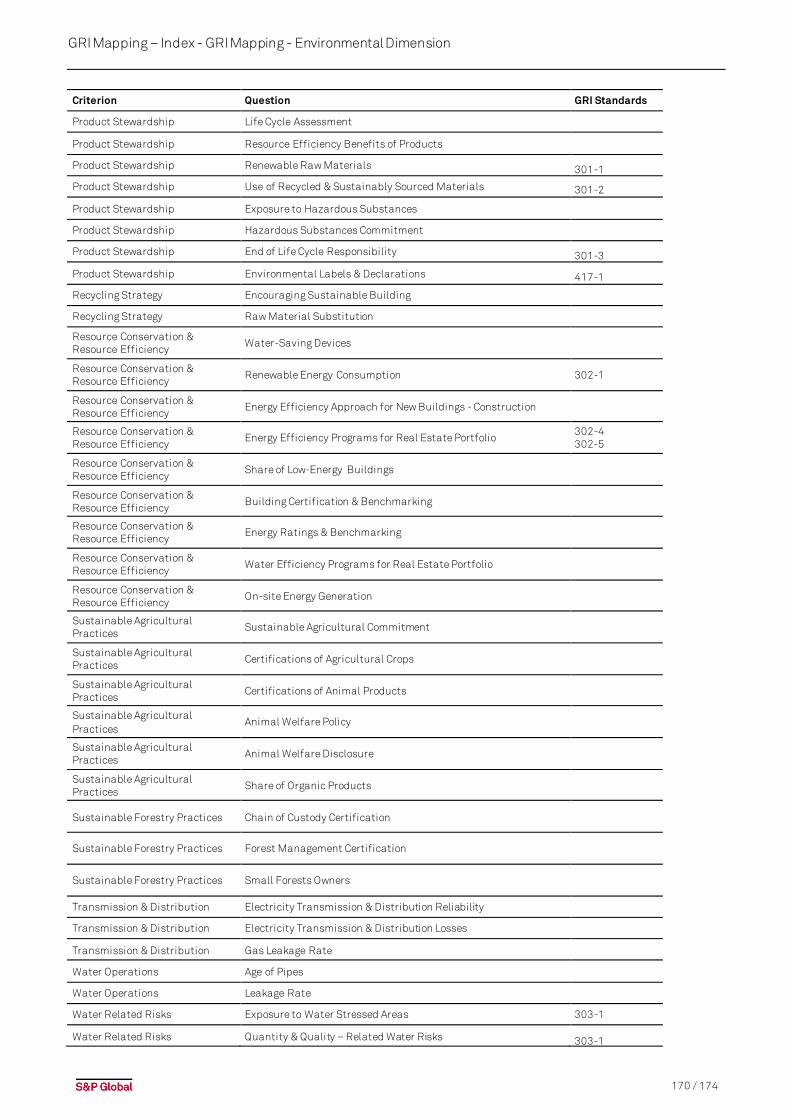
170 / 174
GRI Mapping – Index - GRI Mapping - Environmental Dimension
Criterion Question GRI Standards
Product Stewardship Life Cycle Assessment
Product Stewardship Resource Efficiency Benefits of Products Product Stewardship Renewable Raw Materials 301-1
Product Stewardship Use of Recycled & Sustainably Sourced Materials 301-2 Product Stewardship Exposure to Hazardous Substances
Product Stewardship Hazardous Substances Commitment
Product Stewardship End of Life Cycle Responsibility 301-3 Product Stewardship Environmental Labels & Declarations 417-1
Recycling Strategy Encouraging Sustainable Building Recycling Strategy Raw Material Substitution Resource Conservation & Resource Efficiency
Water-Saving Devices Resource Conservation & Resource Efficiency
Renewable Energy Consumption 302-1
Resource Conservation & Resource Efficiency
Energy Efficiency Approach for New Buildings - Construction Resource Conservation & Resource Efficiency
Energy Efficiency Programs for Real Estate Portfolio 302-4 302-5
Resource Conservation & Resource Efficiency
Share of Low-Energy Buildings Resource Conservation & Resource Efficiency
Building Certification & Benchmarking Resource Conservation & Resource Efficiency
Energy Ratings & Benchmarking Resource Conservation & Resource Efficiency
Water Efficiency Programs for Real Estate Portfolio Resource Conservation & Resource Efficiency
On-site Energy Generation Sustainable Agricultural Practices
Sustainable Agricultural Commitment Sustainable Agricultural Practices
Certifications of Agricultural Crops Sustainable Agricultural Practices
Certifications of Animal Products Sustainable Agricultural Practices
Animal Welfare Policy Sustainable Agricultural Practices
Animal Welfare Disclosure Sustainable Agricultural Practices
Share of Organic Products
Sustainable Forestry Practices Chain of Custody Certification
Sustainable Forestry Practices Forest Management Certification
Sustainable Forestry Practices Small Forests Owners Transmission & Distribution Electricity Transmission & Distribution Reliability Transmission & Distribution Electricity Transmission & Distribution Losses Transmission & Distribution Gas Leakage Rate Water Operations Age of Pipes Water Operations Leakage Rate Water Related Risks Exposure to Water Stressed Areas 303-1
Water Related Risks Quantity & Quality – Related Water Risks 303-1

171 / 174
GRI Mapping – Index - GRI Mapping - Environmental Dimension
Criterion Question GRI Standards
Water Related Risks Water-Related Regulatory Changes & Pricing Structure 303-1 Water Related Risks Water-Related Stakeholder Conflicts 303-1 Water Related Risks Exposure of Suppliers to Water Risks 303-1 Water Related Risks Water Risks Management of Suppliers 303-1 Water Related Risks Business Impacts of Water Related Incidents
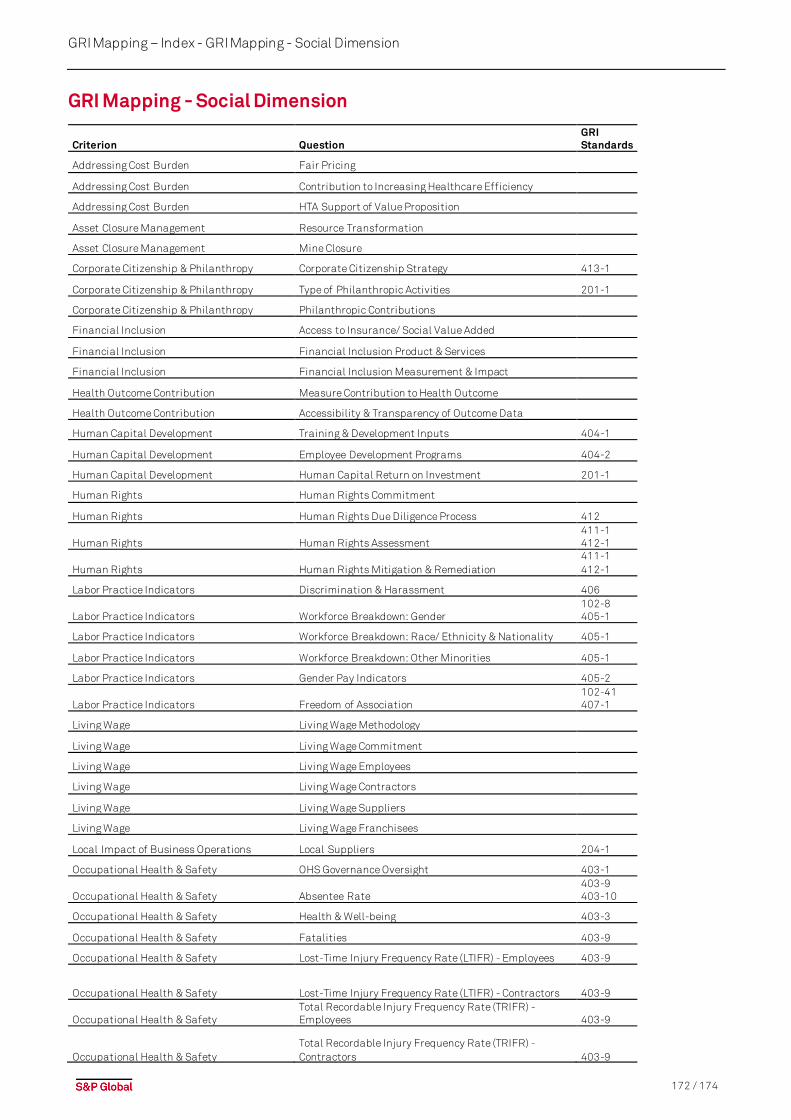
172 / 174
GRI Mapping – Index - GRI Mapping - Social Dimension
GRI Mapping - Social Dimension
Criterion Question GRI Standards
Addressing Cost Burden Fair Pricing
Addressing Cost Burden Contribution to Increasing Healthcare Efficiency
Addressing Cost Burden HTA Support of Value Proposition
Asset Closure Management Resource Transformation
Asset Closure Management Mine Closure
Corporate Citizenship & Philanthropy Corporate Citizenship Strategy 413-1
Corporate Citizenship & Philanthropy Type of Philanthropic Activities 201-1
Corporate Citizenship & Philanthropy Philanthropic Contributions
Financial Inclusion Access to Insurance/ Social Value Added
Financial Inclusion Financial Inclusion Product & Services
Financial Inclusion Financial Inclusion Measurement & Impact
Health Outcome Contribution Measure Contribution to Health Outcome
Health Outcome Contribution Accessibility & Transparency of Outcome Data
Human Capital Development Training & Development Inputs 404-1
Human Capital Development Employee Development Programs 404-2
Human Capital Development Human Capital Return on Investment 201-1
Human Rights Human Rights Commitment
Human Rights Human Rights Due Diligence Process 412
Human Rights Human Rights Assessment 411-1 412-1
Human Rights Human Rights Mitigation & Remediation 411-1 412-1
Labor Practice Indicators Discrimination & Harassment 406
Labor Practice Indicators Workforce Breakdown: Gender 102-8 405-1
Labor Practice Indicators Workforce Breakdown: Race/ Ethnicity & Nationality 405-1
Labor Practice Indicators Workforce Breakdown: Other Minorities 405-1
Labor Practice Indicators Gender Pay Indicators 405-2
Labor Practice Indicators Freedom of Association 102-41 407-1
Living Wage Living Wage Methodology
Living Wage Living Wage Commitment
Living Wage Living Wage Employees
Living Wage Living Wage Contractors
Living Wage Living Wage Suppliers
Living Wage Living Wage Franchisees
Local Impact of Business Operations Local Suppliers 204-1
Occupational Health & Safety OHS Governance Oversight 403-1
Occupational Health & Safety Absentee Rate 403-9 403-10
Occupational Health & Safety Health & Well-being 403-3
Occupational Health & Safety Fatalities 403-9
Occupational Health & Safety Lost-Time Injury Frequency Rate (LTIFR) - Employees 403-9
Occupational Health & Safety Lost-Time Injury Frequency Rate (LTIFR) - Contractors 403-9
Occupational Health & Safety Total Recordable Injury Frequency Rate (TRIFR) - Employees 403-9
Occupational Health & Safety Total Recordable Injury Frequency Rate (TRIFR) - Contractors 403-9
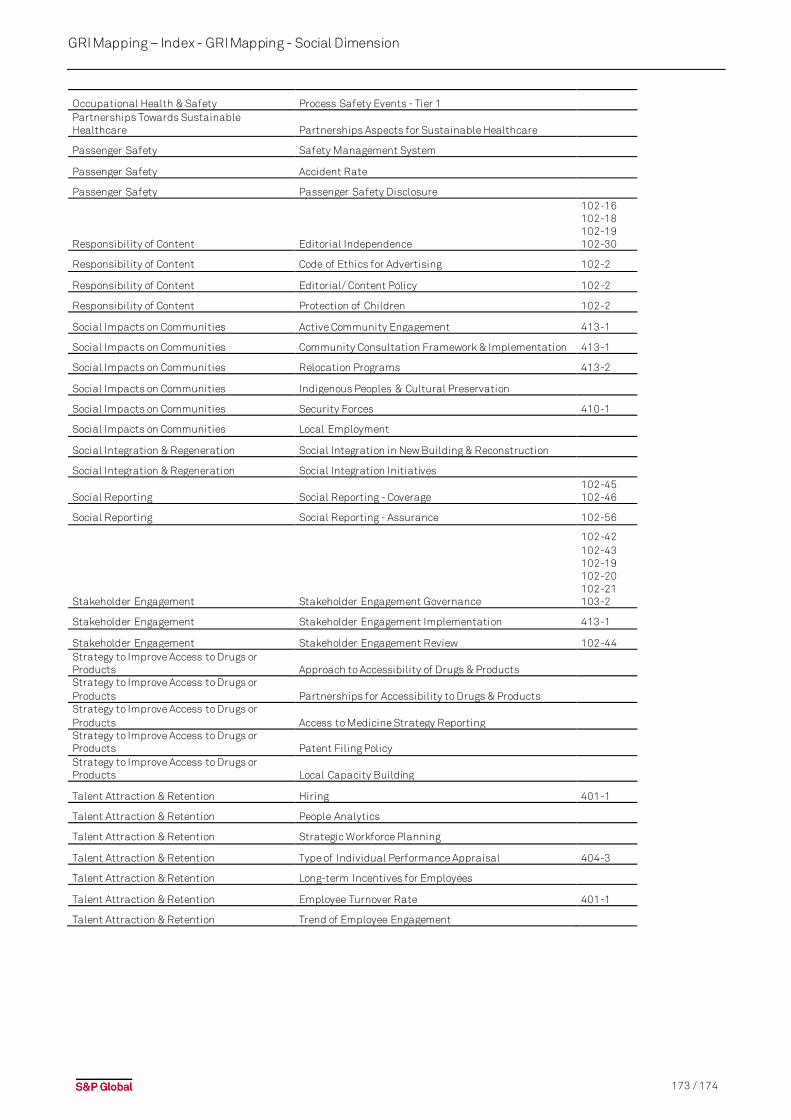
173 / 174
GRI Mapping – Index - GRI Mapping - Social Dimension
Occupational Health & Safety Process Safety Events - Tier 1 Partnerships Towards Sustainable Healthcare Partnerships Aspects for Sustainable Healthcare
Passenger Safety Safety Management System
Passenger Safety Accident Rate
Passenger Safety Passenger Safety Disclosure
Responsibility of Content Editorial Independence
102-16 102-18 102-19 102-30
Responsibility of Content Code of Ethics for Advertising 102-2
Responsibility of Content Editorial/ Content Policy 102-2
Responsibility of Content Protection of Children 102-2
Social Impacts on Communities Active Community Engagement 413-1
Social Impacts on Communities Community Consultation Framework & Implementation 413-1
Social Impacts on Communities Relocation Programs 413-2
Social Impacts on Communities Indigenous Peoples & Cultural Preservation
Social Impacts on Communities Security Forces 410-1
Social Impacts on Communities Local Employment
Social Integration & Regeneration Social Integration in New Building & Reconstruction
Social Integration & Regeneration Social Integration Initiatives
Social Reporting Social Reporting - Coverage 102-45 102-46
Social Reporting Social Reporting - Assurance 102-56
Stakeholder Engagement Stakeholder Engagement Governance
102-42 102-43 102-19 102-20 102-21 103-2
Stakeholder Engagement Stakeholder Engagement Implementation 413-1
Stakeholder Engagement Stakeholder Engagement Review 102-44 Strategy to Improve Access to Drugs or Products Approach to Accessibility of Drugs & Products Strategy to Improve Access to Drugs or Products Partnerships for Accessibility to Drugs & Products Strategy to Improve Access to Drugs or Products Access to Medicine Strategy Reporting Strategy to Improve Access to Drugs or Products Patent Filing Policy Strategy to Improve Access to Drugs or Products Local Capacity Building
Talent Attraction & Retention Hiring 401-1
Talent Attraction & Retention People Analytics
Talent Attraction & Retention Strategic Workforce Planning
Talent Attraction & Retention Type of Individual Performance Appraisal 404-3
Talent Attraction & Retention Long-term Incentives for Employees
Talent Attraction & Retention Employee Turnover Rate 401-1
Talent Attraction & Retention Trend of Employee Engagement

174 / 174
Disclaimer - GRI Mapping - Social Dimension
Disclaimer Unless otherwise noted, all information, data and other material, including ratings or scores (all such information, “Content”) contained in this publication and other reports, materials, or websites of S&P Global Inc. and/or its affiliates is the exclusive property of S&P Global (Switzerland) SA, a subsidiary of S&P Global Inc., and/or its relevant affiliates (individually and collectively “S&P”) and their third party licensors and may not be copied or reproduced in any form except with the prior written permission of S&P. The Content shall not be used for any unlawful or unauthorized purposes. This publication is derived from sources believed to be accurate and reliable, but it is each reader’s responsibility to evaluate the accuracy, completeness and usefulness of any opinions, statements or other Content contained in this publication. The Content and any other material and information in this publication are provided “as is” and without warranties of any kind, either expressed or implied. S&P Global (Switzerland) SA, a subsidiary of S&P Global Inc., and/or its relevant affiliates and their third party licensors disclaim all warranties, expressed or implied, including, but not limited to, implied warranties of merchantability and fitness for a particular purpose. S&P (and any third-party providers, as well as their directors, officers, shareholders, employees or agents) does not guarantee the accuracy, adequacy, completeness, timeliness or availability of any Content and are not responsible for any errors or omissions (negligent or otherwise), regardless of the cause, or for the results obtained from the use of such Content. In no event shall S&P (and any third-party providers, as well as their directors, officers, shareholders, employees or agents) be liable for any direct, indirect, special, incidental, and/or consequential damages, costs, expenses, legal fees, or losses (including, without limitation, lost income or lost profit and opportunity costs) in connection with any use of the Content (including, without limitation, any opinions or other information expressly or implicitly contained in this publication). Any opinions and views in this publication reflect the current judgment of the authors and may change without notice. Further, any opinions and views expressed by CSA participants do not reflect the policies or positions of S&P or any other person, organization or company. The Content contained in this publication is distributed with the understanding that the authors, publishers and distributors are not rendering legal, accounting or other professional advice or opinions on specific facts or matters and accordingly assume no liability whatsoever in connection with its use. The Content contained in this publication constitutes neither a solicitation, nor a recommendation, nor an offer to buy or sell investment instruments or others services, or to engage in any other kind of transaction, and such information is not directed to persons in any jurisdiction where the provision of such Content would run counter to local laws and regulations. S&P keeps certain activities of its business units separate from each other in order to preserve the independence and objectivity of their respective activities. As a result, certain business units of S&P may have information that is not available to other S&P business units. S&P has established policies and procedures to maintain the confidentiality of certain non-public information received in connection with each analytical process. For information provided as part of the CSA questionnaire refer to our “Use of Information and Confidentiality Policy” https://portal.csa.spglobal.com/su rvey/d ocument s/Use_of _Informati on_Poli cy.pdf and for personal information provided to S&P refer to S&P Global’s Privacy Policy: https://www.spglobal.com/en/privacy/privacy -p olicy -en glish . Copyright© 2021 S&P Global Inc. All rights reserved. S&P is a registered trademark of Standard & Poor’s Financial Services LLC (“S&P”). DOW JONES, DJSI and Dow Jones Sustainability are registered trademarks of Dow Jones Trademark Holdings LLC (“Dow Jones”). These trademarks together with others have been licensed to S&P Dow Jones Indices LLC. Redistribution or reproduction in whole or in part are prohibited without written permission of S&P Dow Jones Indices LLC.
S&P Global Switzerland SA Josefstrasse 218 - 8005 Zurich - Switzerland - Phone +41 44 529 17 60 – [email protected] – www.spglobal.com/esg/csa