methodology in soil-k research - international potash institute
TRANSCRIPT

......
....
n
VK
-tv %'i -21,
M%
.................
..............
......... -------
.....
SO
......
...
P-rL
rl.. .......
...
FLnjj
4A-A
IZ
S i. .....
......
EE
)50
-z y'.-k X:-,
. ...... . . ........%
K
.........
.....
"073 56! KiOO x
I-F
A,.
P"

Methodology in Soil-K Research
International Potash Institute
Methodology in Soil-K Research
UProceedings of the 20th Colloquium of the InternationalPotash Institute held in Baden bei Wien 1987

© All rights held by International Potash InstituteCH-3048 Worblaufen-Bern/Switzerland
Layout : Mario Pellegrini, BernComposition: METROSATZ, Worblaufen-BernPrinting : Lang-Druck, Liebefeld-Bern
Contents
Opening Session
N. Cello Welcome address 7
Session No. 1 Mineralogy of Soil-K
G. Pedo Current aspects of the mineralogy of claysand soils 11
D. Tessier Identification of clays - Data from investi-gations with strongly hydrated systems 45
H. Tributh Development of K containing mineralsduring weathering and suitable methods fortheir determination 65
Lelia Arcan Scanning electron microscopy and micro-probe techniques for soil-K characterization 85
L G. Wood X-ray and neutron diffraction 109
H. Laudelout Co-ordinator's Report on Session No. 1 133
Session No. 2 K Release and K Fixation
K. W. T. Goulding Potassium fixation and release 137
A. Bar, A. Banin and Y Chen Adsorption and exchange of K in multi-ionic soil systems as affected by mineralogy 155
Siobhan Staunton and PH. Nye The surface mobility of exchangeablecations in soil 171
I. Novozamsky and Critical evaluation of soil testing methodsV.J.G. Houba for K 177
P. Villemin Translation of laboratory K-data into K fer-tilizer recommendations 199
A. van Diest Co-ordinator's Report on Session No. 2 211
Session No. 3 Potassium Dynamics in the Rhizosphere
R.O. Kuchenbuch Potassium dynamics in the rhizosphere andpotassium availability 215
H.M. Helal and Methods of sampling and investigation ofD. Sauerbeck rhizosphere soil 235
3
B. Jaillard Techniques for studying the ionic environ-ment at the soil/root interface 247
M. van Noordwijk Methods for quantification of root distribu-tion pattern and root dynamics in the field 263
G. Trolidenier Rhizosphere organisms - Potassium inter-actions with emphasis on methodology 283
U Kafkafi Co-ordinator's Report on Session No. 3 299
Session No. 4 Field Studies on Potassium AvailabilityT Harrach, B. Keil and The influence of soil structure on rooting,Th. Vorderbriigge nutrient uptake and yield formation 303R. Lichitfuss and H. Grimme Field methods for the evaluation of soil fac-
tors affecting potassium response 321B. Bar- Yosef Effect of soil-water status as affected by irri-
gation on potassium transport in soils 339PH. T Beckett Spatial variability of soil K-status 357A. Kdchl Interpretation of long-term experiments
with K manuring 3811.1. Neeteson, W.P. Wadman Assessment of optimum application ratesofand P.A.L Ehlert fertilizer K on the basis of response curves 395H. Behringer Co-ordinator's Report on Session No. 4 403
Closing SessionP. Gruber Methodology of potash fertilizer recom-
mendations 409
0. Steineck The need for potassium in relation to sup-plies of major plant nutrients 423
4
Chairman of the 20th PI-Colloquium
Prof. Dr. 0. Steineck, Director, Institute of CropHusbandry and Plant Breeding, AgriculturalUniversity, Vienna/Austria; member of theScientific Board of the International PotashInstitute
Opening Session
5

Welcome address
Dr. N. Celio, Former President of the Confederation of Switzerland; Presidentof the International Potash Institute
Ladies and gentlemen, distinguished guests,
I extend to you on behalf of the Board of the International Potash Institutea hearty welcome to this 20th Colloquium in the charming atmosphere ofBaden bei Wien.
As the official languages of the Colloquium are English and German youwill perhaps allow me to pronounce this welcome also in the language ofShakespeare, which I do in the knowledge that our interpreters will be wellable to make good any errors in my pronounciation. I am confident that twoworking days with a third day set aside for the technical excursion will be spentin the congenial atmosphere of an international family gathering and that thiswill help us to clarify some of the fundamental problems of methodology inpotassium research.
We are indeed fortunate that our Austrian friends, led by Professor OttoSteineck, member of our Scientific Board and President of this Colloquium,invited us to hold this meeting in Austria where we last met in a Congress 30years ago. This country's fundamental research into agricultural problems hasfor long occupied a leading position in Europe. Austria and the Austrian peoplehave for centuries exercised a magnetic power on account of their prominencein the fields of art, science and technology. This country was the centre of thegreat Austro-Hungarian Empire with its many different peoples. Now muchsmaller in area, Austria and her capital city have lost none of their importanceas a bridge between East and West Europe; on the contrary, it seems that thisrole has become even more important and indeed indispensable.
The choice of venue, on the advice of Professor Steineck, fell on Baden beiWien and there were several reasons for this. The subject of the colloquiumembraces fundamental problems which will tax your intellectual concentration.It is possible to concentrate only in a quiet and restful atmosphere and thisis certainly to be found here; Baden bei Wien offers a creative atmosphere forscientific discussion.
We also thought that Vienna with its pulsating life and many cultural attrac-tions is already well-known to many of you, or, if not, this is an omission thatwill sooner or later be corrected, while the essentially Austrian small town ofBaden offers attractions which are no longer easy to find.
The topic of this 20th Colloquium ((Methodology in Soil K Research> isof worldwide importance. On this occasion we are not confined within thelimits of a particular climatic zone or type of agriculture. Scientific research
7

into the problems of soil potassium is being persued worldwide but there areplenty of uncertainties as to the most efficient methods. The InternationalPotash Institute is not concerned with the current methodological strife butrather hopes, as the programme demonstrates, to clarify fundamental princi-ples.
Thanks to the wide contacts of the members of the Scientific Board it hasbeen possible to find truly authoritative and internationally recognised contri-butors to deal with the interlocking problems of our theme. We are indeed grate-ful to our speakers.
A main aim of the Scientific Board is that the Colloquium proceedings willbe a reference source for all engaged in the relevant fields of study.
One further point: we originally intended to restrict attendance at this specia-lised meeting to 70 or 80 specialists. This we failed to achieve. Although theColloquium received minimum publicity, we find ourselves welcoming today138 participants from 24 countries. We have no regrets - "Nothing is here fortears, nothing to wail or knock the breast .
And so to work. I wish you all a fruitful Colloquium!
8
Chairman of the 1st Session
Prof Dr. H. Laudelout, Dept. of Soil Science,Catholic University of Louvain-la-Neuve/Belgium; member of the Scientific Board of theInternational Potash Institute
1st Session
Mineralogy of Soil-K
9
Current Aspects of the Mineralogyof Clays and Soils
G. Pedro, Soil Science Station, INRA, Versailles/France *
Summary
The aim of this paper is to present the new look of soil mineralogy, and especially soil claymineralogy, so as somewhat to redefine the relationships between the mineral constituentsof the soil and potassium.
The standard method for characterising separated soil minerals is reviewed. Despite re-cent improvements in the study of structure and polycrystallinity, this has its limitations.Current problems are then discussed under:- Mineralogical characterisation of undisturbed soil samples in the dry state: optical andelectron micromorpholgy in association with X-ray diffraction and electron probe micro-analysis.- Mineralogical characterisation of undisturbed hydrated soil samples: the significance ofelectron-microscopy (SEM and HRTEM) and of small angle scattering (SAS).
The results of current research concerning the different levels of organisation (structure,texture and plasmic fabric) are then presented as they relate to the chief characteristic claysof soils.
D~nominations des M~thodologies/ Names of Methods(see also paper by Tessier, page 45)
Diffraction des rayons X = X-ray diffraction (XRD)Diffraction interparticulaire = Interparticle diffractionDiffusion aux petits angles = Small angle scattering (SAS)Microscopic dlectronique A balayage = Scanning electron microscopy (SEM)Microscopic 6lectronique htransmission = Transmission electron microscopy
(TEM)Microscopie 6lectronique ihaute r6solution = High resolution transm. elect.
microscopy (HRTEM)Microscopic 6lectroniqueanalytique A balayage = Scanning transmission electron
microscopy (STEM)
• Dr. G. Pedro, Soil Science Laboratory, INRA, Route de Saint-Cyr, F-78000
Versailles/France
11
Spectroscopie infrarouge = Infrared spectroscopy (IR)R6sonance paramagn6tique61ectronique (RPE) = Electron spin resonance (ESR)R6sonance magn6tique nucl6aire(RMN) = Nuclear magnetic resonance (NMR)Spectrom~tre it dispersion d'6nergie = Energy dispersive spectrometer
(EDS)Spectrom~tre A dispersion delongueur d'onde = Wavelength dispersive spectrometer
(WDS)Spectroscopie d'absorption optique = Optical absorption spectroscopySpectroscopie d'absorption desrayons X = X-Ray absorption spectroscopy
EXAFS: Extended X-ray absorptionfine structure.
1. Introduction
Soils are dominated by the mineral components (some 90% by weight and 45% byvolume) and it is certain that improved understanding of the minerals must lead toimproved understanding of soil properties. Soil mineralogy remains a fundamen-tal part of soil science; soil potassium relationships must be approached from thestandpoint of mineralogy. This is not an easy field of study because soil is a specialkind of material.- First, the soil is an unconsolidated system, a <'divided solid; it is not just made
up of different mineral species, but each species identified occurs as a great num-ber of particles of varying size, often extremely small (<0.1 [im). Actually, it is apopulation. Illustrative of this point is that 1 cm3 clay plasma contains from 200- 400 X 10' particles.
- Second, it is a hydrated solid, water normally being adsorbed to the solid phase.This adsorbed water, which corresponds to water of crystallisation or subjectedto surface tension (0 < li.), should be considered an integral part of the solid con-stituents, and is therefore concerned in the characterisation of soil minerals. Thisis true to the extent that Millot[1964]defined the clays as <the most typical rep-resentatives of the hydrosphere silicates .
- Finally, it is an organo-mineralsystem - a medium where there are interactionsbetween organic compounds and mineral units.
All this means that soil mineralogy cannot be understood just by simple applica-tion of the methods of classical mineralogy but that soils occupy a special position.However, ideas and methodology in the study of soil minerals have made greatprogress in recent years.
Discussion will fall under the following headings:- the use of classical mineralogy,
12

- a review of progress in the study of soil minerals after extraction and separation,- recent in situ studies (undisturbed moist samples),- finally, some applications and perspectives concerning present knowledge.
2. Review of classical methods in mineralogy
The classical approach is concerned only with the characteristics of the mineralsthemselves quite independent of other considerations (location, distribution, envi-ronment ...). Since the soil is made up from an arrangement of crystalline mineralelements of variable size, it is necessary to obtain reasonably homogeneous (typeand dimensions) samples to work on which; they can be sorted first on size (par-ticle size separation) and then on other properties, e.g. density (heavy minerals).
Two main groups can be distinguished:a) Large particles (macro-crystals) which can be examined in the same way as indi-
vidual crystals (individually and in isolation).b) Small particles (micro-crystals) in the study of which the heterogeneity and po-
lycrystallinity of samples must be taken into account.
2.1. Study of macro-crystals relies on familiar methods
Such as: the study of crystal form (geometric crystallography), optical properties,chemical composition. These can be observed with the naked eye (macroscopic),or by binocular magnifier (sub-macroscopic); use of the polarising microscope onthin sections which renders the minerals transparent (Sorby[1845); normal chem-ical analysis.
Such a procedure is usually enough to describe the mineral; but it can be taken astage further by more detailed work using X-ray diffraction on individual crystalsto indicate the atomic structure. Precise identification is possible using referencetables.
2.2. The characterisation of samples made up from small particles is amuch more delicate matter
This is the usual situation with the clay fraction. Here we are dealing with samplesof mixed mineral composition (several mineral species in association) and whichare always polycrystalline (numerous crystals within a given species).
Up to 1930 the problem was virtually insoluble. The optical microscope had in-sufficient resolution to yield useful information. Chemical composition reflectedonly the average.
Progress became possible first with X-rays and then with the electron micro-scope.
13
The favoured method uses the powder method of Debye-Scherrer - diffractionof monochromatic X-ray by polycrystalline samples. The diffraction is characteris-tic of the nature of the substance and in particular of its atomic structure (applica-tion of Bragg's law).
Measuring the X-ray diffraction pattern the peaks (001) and (hkl) gives informa-tion on the crystalline constituents of the powder.
The method has played a major role in the study of soil clays (0' 2 [pm), whichhave been shown to be phyllosilicates made up of layers 7, 10 or 14 A thick, withfixed or variable inter-layer spacing. However it is limited because the individualclay particles cannot be cseen' in isolation and it does not indicate the diversity ofparticles within the same species. The morphological study of small particles had toawait the availability of transmission electron microscopy (TEM) (Beutelspacherand van derMarel[1968) used with the electron microprobe to obtain informationon the chemical composition of isolated small particles.
All this opened the way for a standard methodology for study of microcrystal-line elements of the soil and it is worth recalling the main lines which have been fol-lowed and their limitations.
2.3. Value and limitations of the standard method for characterisingthe constituents of the clay fraction of soils
Here we refer to the application of X-ray diffraction to air-dried soil samples, eitherpre-treated or not, and, in some cases, to the same samples impregnated with poly-alcohols and/or dried at high temperature (300-5000 C).
The method is valued for its simplicity in use and for the results it gives. It de-scribed the main types of clay minerals (cf. the international nomenclature AIPEA[Table 1]). Main points can be summarised:
- the data obtained result from the X-ray properties and relate to the elementarystructural units of the layers and interlamellar space of which the degree of ex-pansion is given by the equidistance (001). It throws no light on the structure oflarger particles such as crystallite.
- It can only distinguish the main groups (chlorite, vermiculite, smectite); it rarelydefines the mineral species.
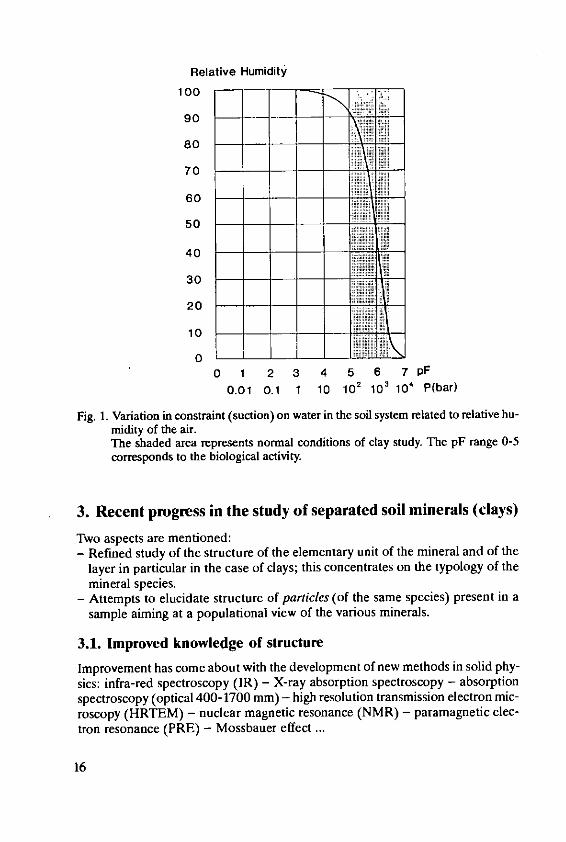
- Because the minerals examined in this way are anhydrous or only weakly hydra-ted(Figure 1), the data are not applicable to real soil conditions. For the non-ex-panding minerals (kaolinite, illite ...) this is of little consequence, but in others(vermiculite, smectite) it is.
- finally, this approach is global, reflecting only the average of a large number ofcrystals, and so gives a mean value both as regards geometry (spacing, type ofstacking, degree of organisation ...) and chemistry (composition).
All properties except the thickness of the structural units, i.e. those relating tostacking, are difficult of access though they can be understood in macrocrystals
14
(polytypes) '. Because of this, ideas about interstratification deriving from the su-perposition of different layers (interstratification) or about crystallinity (as in illitesKubler, 11966, 1968]) can only be approximate.
To conclude, the standard method has been of great service in relation to thesmall mineral particles, but being relatively easy in use and having acquired reputa-tion and some prestige, it has resulted in a picture which is both simplistic and in-complete and which distorts the true facts. It has led to a very restrictive picture ofthe mineralogy of soil constituents:- It is an essentially typological approach based on characteristics of the mineral
species without taking account of questions of form, arrangements and associa-tions within the whole system;
- It is a concept based exclusively on crystallography, that is ,mean characterisa-tion of the layers present in the sample (interlamellar spacing and crystal-chemi-cal constitution).This was the state of affairs for fifty years or so. It is only since 1975, thanks to theavailability of new apparatus and new methods that there has been development,at least in some research laboratories. There have been two main avenues ofprogress:
- the first, further study of separated minerals, refining previous work;- the second entirely different approach attempted to study the constituents in situ
in the natural environment.
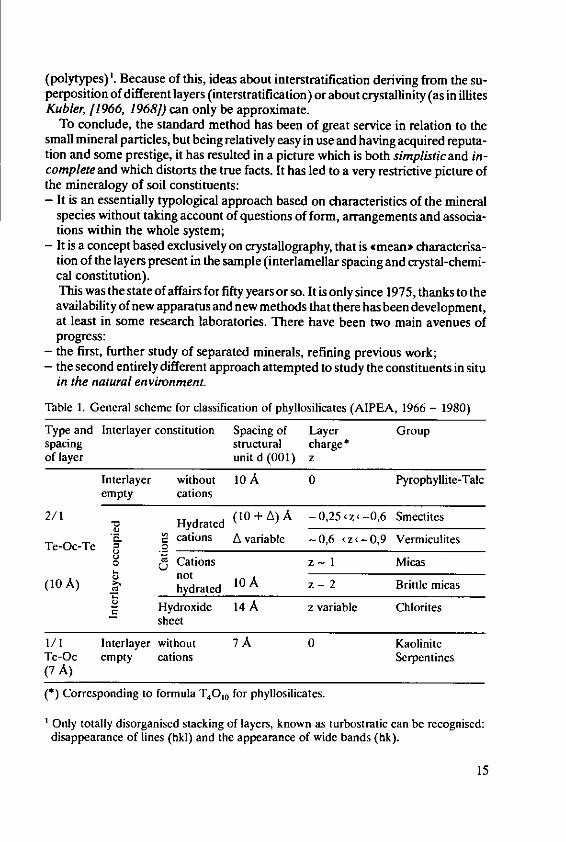
Table I. General scheme for classification of phyllosilicates (AIPEA, 1966 - 1980)
Type and Interlayer constitution Spacing of Layer Groupspacing structural charge*of layer unit d (001) z
Interlayer without 10 A 0 Pyrophyllite-Talcempty cations
2/1 Hydrated (10 + A) A -0,25cz<-0,6 Smectites
" cations A variable -0,6 <z<-0,9 VermiculitesTe-Oc-Te 0 ._._0 Cations z - I Micas(1oA not m
(1A) hydrated 10A z- 2 Brittle micas
Hydroxide 14 A z variable Chloritessheet
1/1 Interlayer without 7 A 0 KaoliniteTe-Oc empty cations Serpentines(7 A)
(*) Corresponding to formula T40 0 for phyllosilicates.
Only totally disorganised stacking of layers, known as turbostratic can be recognised:disappearance of lines (hkl) and the appearance of wide bands (hk).
15
Relative Humidity
100 7T90 -
-
80
70
60
50 -
40
30
20
10
0
0 1 2 3 4 5 6 7 pF
0.01 0.1 1 10 102 103 104 P(bar)
Fig. 1. Variation in constraint (suction) on water in the soil system related to relative hu-midity of the air.The shaded area represents normal conditions of clay study. The pF range 0-5corresponds to the biological activity.
3. Recent progress in the study of separated soil minerals (clays)
Two aspects are mentioned:- Refined study of the structure of the elementary unit of the mineral and of the
layer in particular in the case of clays; this concentrates on the typology of themineral species.
- Attempts to elucidate structure of particles (of the same species) present in asample aiming at a populational view of the various minerals.
3.1. Improved knowledge of structure
Improvement has come about with the development of new methods in solid phy-sics: infra-red spectroscopy (IR) - X-ray absorption spectroscopy - absorptionspectroscopy (optical 400-1700 mm) - high resolution transmission electron mic-roscopy (HRTEM) - nuclear magnetic resonance (NMR) - paramagnetic elec-tron resonance (PRE) - Mossbauer effect ...
16
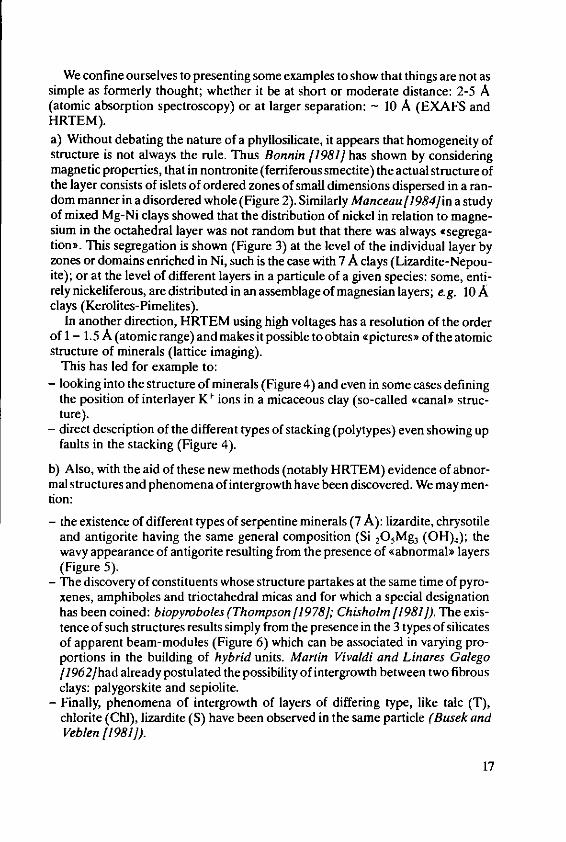
We confine ourselves to presenting some examples to show that things are not assimple as formerly thought; whether it be at short or moderate distance: 2-5 A(atomic absorption spectroscopy) or at larger separation: - 10 A (EXAFS andHRTEM).a) Without debating the nature of a phyllosilicate, it appears that homogeneity ofstructure is not always the rule. Thus Bonnin [1981] has shown by consideringmagnetic properties, that in nontronite (ferriferous smectite) the actual structure ofthe layer consists of islets of ordered zones of small dimensions dispersed in a ran-dom manner in a disordered whole (Figure 2). Similarly Manceau[1984]in a studyof mixed Mg-Ni clays showed that the distribution of nickel in relation to magne-sium in the octahedral layer was not random but that there was always csegrega-tion'. This segregation is shown (Figure 3) at the level of the individual layer byzones or domains enriched in Ni, such is the case with 7 A clays (Lizardite-Nepou-ite); or at the level of different layers in a particule of a given species: some, enti-rely nickeliferous, are distributed in an assemblage of magnesian layers; e.g. 10 Aclays (Kerolites-Pimelites).
In another direction, HRTEM using high voltages has a resolution of the orderof 1 - 1.5 A (atomic range) and makes it possible to obtain opictures> of the atomicstructure of minerals (lattice imaging).
This has led for example to:- looking into the structure of minerals (Figure 4) and even in some cases defining
the position of interlayer K' ions in a micaceous clay (so-called '<canal" struc-ture).
- direct description of the different types of stacking (polytypes) even showing upfaults in the stacking (Figure 4).
b) Also, with the aid of these new methods (notably HRTEM) evidence of abnor-mal structures and phenomena of intergrowth have been discovered. We may men-tion:
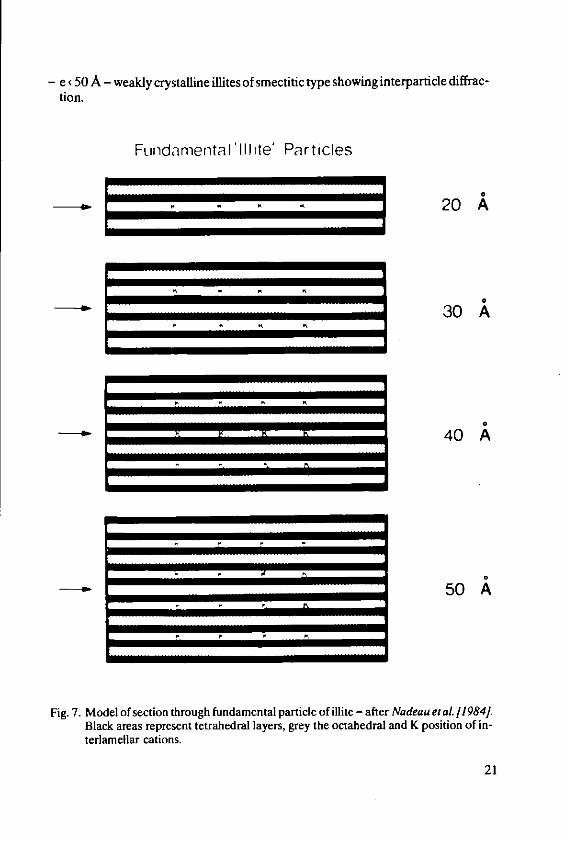
- the existence of different types of serpentine minerals (7 A): lizardite, chrysotileand antigorite having the same general composition (Si 20 5Mg3 (OH),); thewavy appearance of antigorite resulting from the presence of "abnormal> layers(Figure 5).
- The discovery of constituents whose structure partakes at the same time of pyro-xenes, amphiboles and trioctahedral micas and for which a special designationhas been coined: biopyroboles (Thompson f1978]; Chisholm [1981]). The exis-tence of such structures results simply from the presence in the 3 types of silicatesof apparent beam-modules (Figure 6) which can be associated in varying pro-portions in the building of hybrid units. Martin Vivaldi and Linares Galegof1962]had already postulated the possibility of intergrowth between two fibrousclays: palygorskite and sepiolite.
- Finally, phenomena of intergrowth of layers of differing type, like talc (T),chlorite (Chi), lizardite (S) have been observed in the same particle (Busek andVeblen /1981]).
17
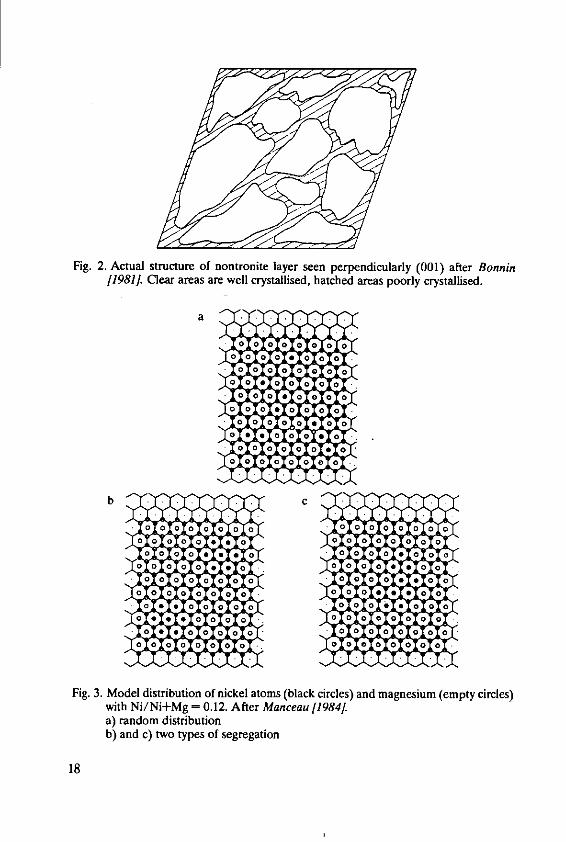
Fig. 2. Actual structure of nontronite layer seen perpendicularly (001) after Bonnin11981]. Clear areas are well crystallised, hatched areas poorly crystallised.
a
00 0 a0 0 00
0 00 0 0 0 00
*00 0 00 0 00
*00 00 0 0 -00 00000 0
* 00a00000 0 0 000.. 0 0
with 00000+ - 0.12. 000 aneu[181
Fig 3.aMdl distributionfnceatm(bakcrlsanmgeiu(mpyice)
b) and c) two types of segregation
18
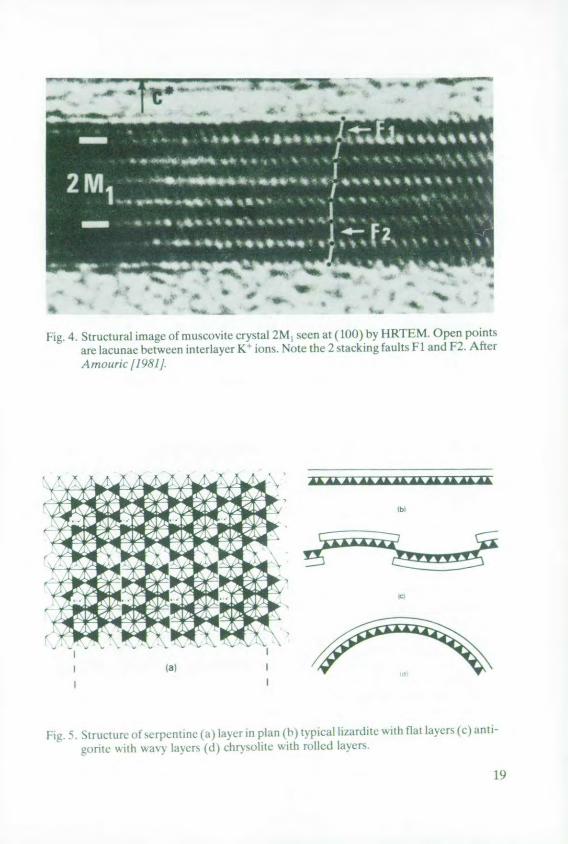
Fig. 4. Structural image of muscovite crystal 2M, seen at (100) by HRTEM. Open points
are lacunae between interlayer K' ions. Note the 2 stacking faults FI and F2. After
A mouri / 1981].
* StructUrC O> soC pctitC At lxcr in plan (b) tpical [izardiIC with flatl]aycts (c) anti-
contc ,ith way, layr' (d) chry.%,slie wIth iollcd laycr,
19

mica Amphi bole Pyroxene
(a) (b) (c)Fig h Hearn-modules of biopvroboles Scen in section Arter Ihonpson /1978/
3.2. Improvement in recognition of polcrxstallinitN
[eh s ud\ vf entitics larger ilhan the laxcr became possible wilh the introduction ofelectron iiicroscoiy pv hich could I tsh e n) Ihem up in) dispersed sanple,. We mention155 as'pects:- I he scarch foir the existence of an elementaux particle charactcristic of each type
f <clay (electron microscopy):- Smudv of the chemical homogeneity of the arious parlicles constituent ill the
saMc Mineral species (electrn micutidiffaction and election probe).St) Io tar as concerns the former, attempts have been milde to idenlify tie elemet?-
1,ry paricle ol a riL in ne tirals (priary partile (Meti)g aor Oberin/I971/)'illamental pamtle ( adearm ci al /19841). According to this concept, each clwkoo ldihe maidc tip by face tl-face aggreganitin of these lementar partices
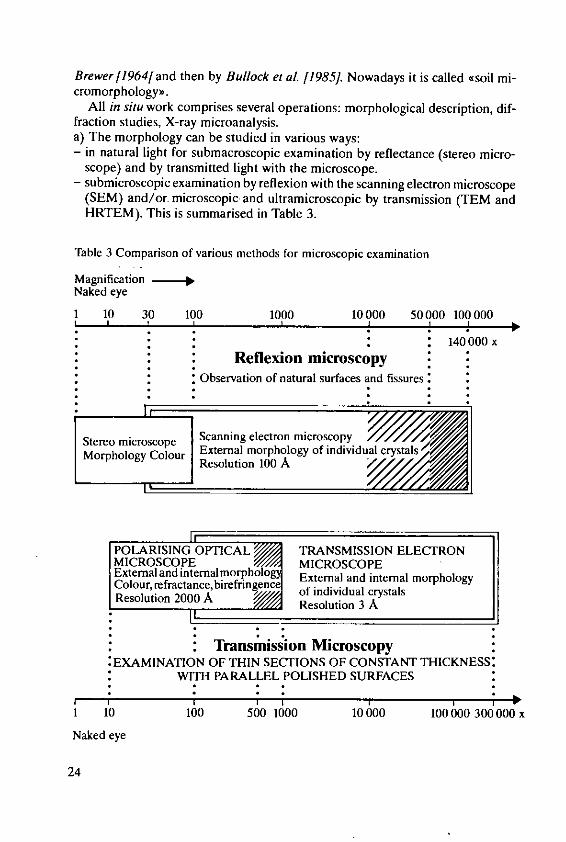
Also. whetn the particle, are- vcry small ( 51i A) the indication of X-Iav difeacTioll actIlly restl from disordered slacking of particles (interparticlC difflaction:\adeae a 119,4, t9N85): the width ofc hcrent diffusion then being grcatcr than
the thickness of the particle.Ihis accorling to a\deadu, the ileites aret disliticushCd l)ithe thickness o tlheir
fu1ati110tNl patIricles (V1eule 7) oil which basis they can be divided ino to olz1 lup;:- e sI A cll crvstallhsed illites Nhoing ittraparticle diffraction:
20
- e c 50 A - weakly crystalline illites of smectitic type showing interparticle diffrac-tion.
Fundamental'Illite' Particles
--,,. _ __ _20 A
___30
40A
-- A ___ ___ _50 A* - N I
Fig. 7. Model of section through fundamental particle of illite - after Nadeau et aL 119841.Black areas represent tetrahedral layers, grey the octahedral and K position of in-terlamellar cations.
21

Table 2. Distribution of cations among tetrahedral and octahedral sheets and K amount(on the basis of 22 negative valencies) for particles of 4 minerals taken for exam-ple, i.e. glauconite, stevensite, nontronite, illite
Tetrahedra / Octahedra /Si AI(tetr.) Al total Al(oct.) Fe3+ Mg K
Odin glauconite6 3.65 0.35 0.54 0.19 1.40 0.31 0.85
20 3.70 0.30 0.655 0.355 1.17 0.485 0.7223 3.69 0.31 0.72 0.41 1.12 0.485 0.6926 3.88 0.12 0.93 0.81 0.75 0.43 0.5229 3.55 0.45 0.57 0.12 1.485 0.40 0.7939 3.80 0.20 0.655 0.455 1.24 0.20 0.67
lbel Ghassoul stevensite4 3.945 0.055 0.15 0.095 0.09 2.70 0.07
15 3.83 0.17 0.35 0.18 0.08 2.63 0.1116 3.95 0.05 0.78 0.73 0.30 1.40 0.1518 3.97 0.03 0.32 0.29 0.01 2.51 0.0925 3.92 0.08 0.10 0.02 0.06 2.89 0.0333 3.92 0.08 0.62 0.54 0.17 1.93 0.0843 4.00 - 0.20 0.20 0.03 2.55 0.06
Galapagos nontronite1 3.865 0.135 0.29 0.155 1.46 0.47 0.292 3.995 0.005 0.17 0.165 1.47 0.26 0.533 3.84 0.16 0.16 - 1.70 0.23 0.665 3.88 0.12 0.16 - 1.67 0.17 0.667 3.92 0.08 0.35 0.27 1.23 0.44 0.678 3.95 0.05 0.51 0.46 1.31 0.21 0.31
-16 3.65 0.35 0.35 - 1.43 0.76 0.5829 3.86 0.14 0.22 0.07 1.48 0.64 0.16
Trias illite from the Pyrnees3 3.13 0.87 2.55 1.68 0.18 0.40 0.447 3.17 0.83 1.70 0.87 0.315 1.31 0.60
12 3.13 0.87 2.27 1.40 0.24 0.77 0.4114 3.215 0.785 2.515 1.73 0.10 0.34 0.5827 2.995 0.005 2.32 2.315 0.28 0.69 0.80530 2.94 0.06 2.08 2.02 0.31 1.21 0.6333 2.855 1.145 2.235 1.09 0.35 1.05 0.7053 2.89 0.11 2.12 2.01 0.49 1.055 0.47
The value of this kind of approach is in having shown the need to introduce para-meters relating to the dimensions of the crystalline entities in describing fine mine-rals (not confined to the layer). Its value is limited as it is confined to measure-
22

ments on samples obtained by vigorous dispersion and it is not known whether thissimply separates the original units or whether it also results in artificial fragmenta-tion. In any case, we are here dealing with conditions very different from those inthe natural soil.
b) The second aspect concerns the chemical homogeneity of clay crystals (02 [im). Here we can cite the work of Duplay 11982, 1984]on chemical analysis byelectron microprobe of 15 - 20 particles of pure clay. These analyses showed thateach .species* is made up of a population of particles of different chemical compo-sition (Table 2); thus classical analytical methods give only a mean of dispersedpoint values.
Two general conclusions can be drawn:- At least in the case of typical clay particles the concept of species should become
one of a population.- Secondly, most of the time there is continuous variation in chemical composition
between extreme values. Because of this, it appears as though the various layersof a 2: 1 clay make up a continuum of variable composition like a solid solution.
Such results are most instructive in that they call for reconsideration of resultswhich have been accepted up to now. Nevertheless they result from work on claysuspensions which do not necessarily correspond to conditions in the soil. Henceit has been essential to initiate mineralogical studies of undisturbed and undis-persed soil materials.
4. Present status of the knowledge of soil minerals; importanceof the (ecological)) approach to mineralogy
The great progress made in this area over the past ten years has been made possibleby being able to make studies of mineralogy directly on natural soil samples. Thisgoes beyond the usual methods using separated minerals and takes into account theenvironment of the mineral, its degree of hydratation, its situation, and its relation-ships with its neighbours. Work has been done both on air-dried materials and onhydrated samples, i.e. in their field state of hydratation or hydrated to varyingdegree.
4.1. Mineralogical characterisation of undisturbed dry soil samples.
4.1.1. MethodologyProgress became possible when the advantages of impregnating the soil with syn-thetic resins were realised for the preparation of thin sections for microscopic exa-mination of soil samples ... Following the early work of Delage and Lagatu19041,Kubiena[1938]developed this research before the war and it was carried further by
23
Brewer [1964] and then by Bullock et aL [1985]. Nowadays it is called csoil mi-cromorphology .
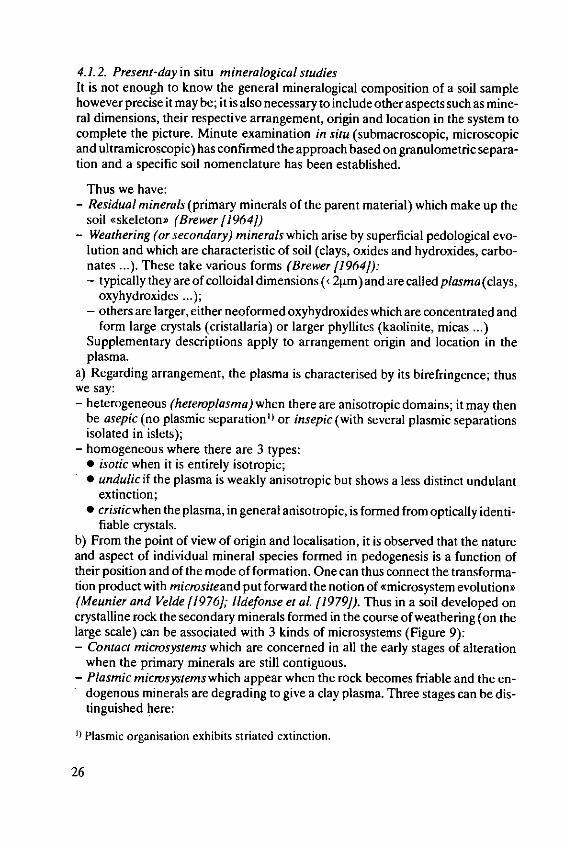
All in situ work comprises several operations: morphological description, dif-fraction studies, X-ray microanalysis.a) The morphology can be studied in various ways:- in natural light for submacroscopic examination by reflectance (stereo micro-
scope) and by transmitted light with the microscope.- submicroscopic examination by reflexion with the scanning electron microscope
(SEM) and/or. microscopic and ultramicroscopic by transmission (TEM andHRTEM). This is summarised in Table 3.
Table 3 Comparison of various methods for microscopic examination
Magnification --Naked eye
1 10 30 100 1000 10000 50 000 100 000I II I I I
140 000 xReflexion microscopy
Observation of natural surfaces and fissures
Stereo microscope Scanning electron microscopyMorpoloy CoourExternal morphology of individual cfrystlMopo gl C orResolution 100 A /w
POLARISING OPTICAL SECITRANSMISSION ELECTRONMICROSCOPE V011//" MICROSCOPEE x e n la di e n l m r h gExternal and internal m orphology
." WITH PARALLEL POLISHED SURFACES
Coor Ierctne brfinjelc Is I I
1 R0 100 50 1000 100 100000 300000 x
Naked eye
24

b) In using X-ray diffraction (XRD) to study fine minerals in situ, two procedureshave been used: direct diffraction on thin sections (Wilson and Clarke f1978),which is difficult; diffraction on small samples taken from thin sections (Meunierand Velde[1982], Beaufort et al. [1983]). The latter involves very small amounts ofmaterial (10-' - 10-2 mg) tedious to prepare, using micro-sampling apparatus(Pmust [1983/) (Figure 8), and diffraction analysis along with a proportional de-tector or preferably a linear detector (Pmust 11986]).
c) Micro-analysis can be achieved easily with the electron microprobe [ 19491. Thisanalyses the X-ray spectrum emitted by the sample under a beam of electrons usingenergy dispersive spectrometer (EDS) or wavelength dispersive spectrometer(WDS). The volume of the sample analysed is of the order of several ltm 3. The lo-calisation of the zone examined has been improved with the introduction of scan-ning transmission electron microscopy (STEM) along with the X-ray spectrometer(e.g. Rautureau and Steinberg [1985]); in effect this is nano-analysis.
*ICfOMANIR.T1EUA
Cm
Fig. 8. Apparatus for taking thin sections. After Pmust 119831.
25
4.1.2. Present-day in situ mineralogical studiesIt is not enough to know the general mineralogical composition of a soil samplehowever precise it may be; it is also necessary to include other aspects such as mine-ral dimensions, their respective arrangement, origin and location in the system tocomplete the picture. Minute examination in situ (submacroscopic, microscopicand ultramicroscopic) has confirmed the approach based on granulometric separa-tion and a specific soil nomenclature has been established.
Thus we have:- Residual minerals (primary minerals of the parent material) which make up the
soil <skeletono (Brewer [1964])- Weathering (or secondary) minerals which arise by superficial pedological evo-
lution and which are characteristic of soil (clays, oxides and hydroxides, carbo-nates ...). These take various forms (Brewer [1964]):- typically they are of colloidal dimensions ( 2[am) and are called plasma (clays,
oxyhydroxides ...);- others are larger, either neoformed oxyhydroxides which are concentrated and
form large crystals (cristallaria) or larger phyllites (kaolinite, micas ...)Supplementary descriptions apply to arrangement origin and location in theplasma.
a) Regarding arrangement, the plasma is characterised by its birefringence; thuswe say:- heterogeneous (heteroplasma) when there are anisotropic domains; it may then
be asepic (no plasmic separation') or insepic (with several plasmic separationsisolated in islets);
- homogeneous where there are 3 types:* isotic when it is entirely isotropic;* undulic if the plasma is weakly anisotropic but shows a less distinct undulant
extinction;* cristicwhen the plasma, in general anisotropic, is formed from optically identi-
fiable crystals.b) From the point of view of origin and localisation, it is observed that the natureand aspect of individual mineral species formed in pedogenesis is a function oftheir position and of the mode of formation. One can thus connect the transforma-tion product with micrositeand put forward the notion of gmicrosystem evolution'(Meunier and Velde [1976]; Ildefonse et al [1979]). Thus in a soil developed oncrystalline rock the secondary minerals formed in the course of weathering (on thelarge scale) can be associated with 3 kinds of microsystems (Figure 9):- Contact microsystems which are concerned in all the early stages of alteration
when the primary minerals are still contiguous.- Plasmic microsystems which appear when the rock becomes friable and the en-
dogenous minerals are degrading to give a clay plasma. Three stages can be dis-tinguished here:
Plasmic organisation exhibits striated extinction.
26
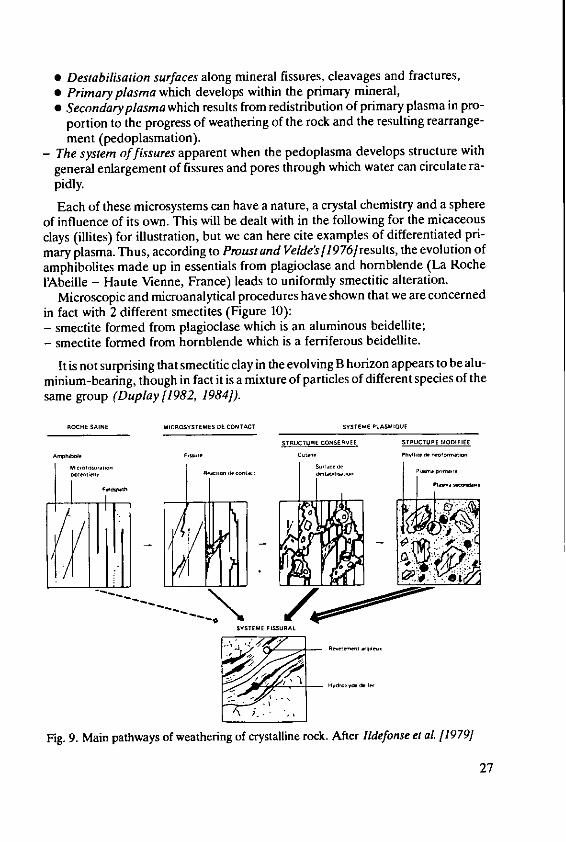
* Destabilisation surfaces along mineral fissures, cleavages and fractures,* Primary plasma which develops within the primary mineral,* Secondaryplasma which results from redistribution of primary plasma in pro-
portion to the progress of weathering of the rock and the resulting rearrange-ment (pedoplasmation).
- The system of fissures apparent when the pedoplasma develops structure withgeneral enlargement of fissures and pores through which water can circulate ra-pidly.
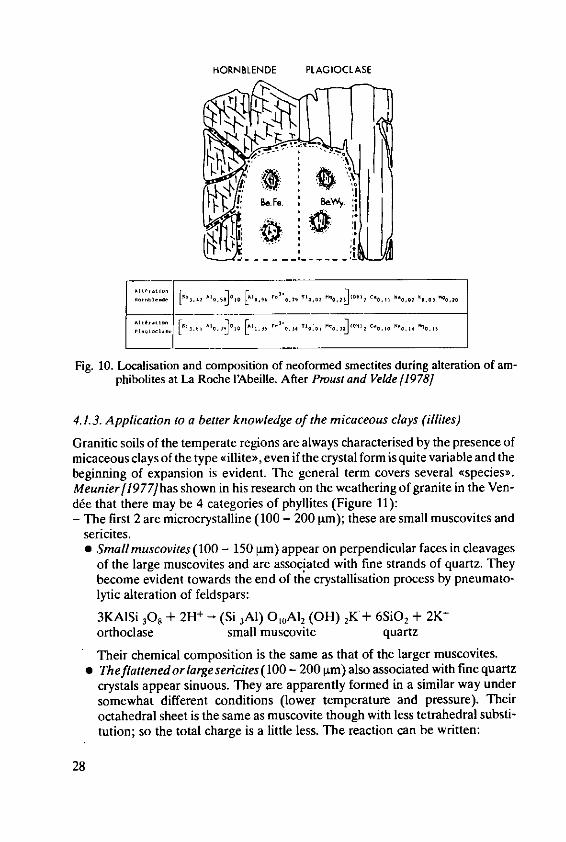
Each of these microsystems can have a nature, a crystal chemistry and a sphereof influence of its own. This will be dealt with in the following for the micaceousclays (illites) for illustration, but we can here cite examples of differentiated pri-mary plasma. Thus, according to Proust and Velde's [1976 results, the evolution of
amphibolites made up in essentials from plagioclase and hornblende (La RocheI'Abeille - Haute Vienne, France) leads to uniformly smectitic alteration.
Microscopic and microanalytical procedures have shown that we are concernedin fact with 2 different smectites (Figure 10):- smectite formed from plagioclase which is an aluminous beidellite;- smectite formed from hornblende which is a ferriferous beidellite.
It is not surprising that smectitic clay in the evolving B horizon appears to be alu-minium-bearing, though in fact it is a mixture of particles of different species of thesame group (Duplay 11982, 1984]).
ROCHE SAINE MICROSYSTEMES DE CONTACT SYSTEME PLASNA.hUE
STRUCTURE CONSERVEE STRUCTURE MODIFIES
AImwh,~ER ru.uce C lm PhyIIhe O t~l
S.,,.~,
SY'STEME FIMURAL
Fig. 9. Main pathways of weathering of crystalline rock. After Ildefonse et al 11979J
27
HORNBLENDE PLAGIOCLASE
ii'
Fig. 10. Localisation and composition of neoformed smectites during alteration of am-phibolites at La Roche l'Abeille. After Proust and Velde (1978]
4.1.3. Application to a better knowledge of the micaceous clays (illites)
Granitic soils of the temperate regions are always characterised by the presence ofmicaceous clays of the type 'illiteD, even if the crystal form is quite variable and thebeginning of expansion is evident. The general term covers several €species".Meunier[1977] has shown in his research on the weathering of granite in the Ven-d6e that there may be 4 categories of phyllites (Figure 11):- The first 2 are microcrystalline (100 - 200 lm); these are small muscovites and
sericites.* Small muscovites (100 - 150 tm) appear on perpendicular faces in cleavages
of the large muscovites and are associated with fine strands of quartz. Theybecome evident towards the end of the crystallisation process by pneumato-lytic alteration of feldspars:
3KAISi ,0s + 2H + - (Si 3A1) O0A12 (OH) 2K+ 6SiO 2 + 2K+
orthoclase small muscovite quartz
Their chemical composition is the same as that of the larger muscovites.* Theflattened or large sericites (100- 200 m) also associated with fine quartz
crystals appear sinuous. They are apparently formed in a similar way undersomewhat different conditions (lower temperature and pressure). Theiroctahedral sheet is the same as muscovite though with less tetrahedral substi-tution; so the total charge is a little less. The reaction can be written:
28
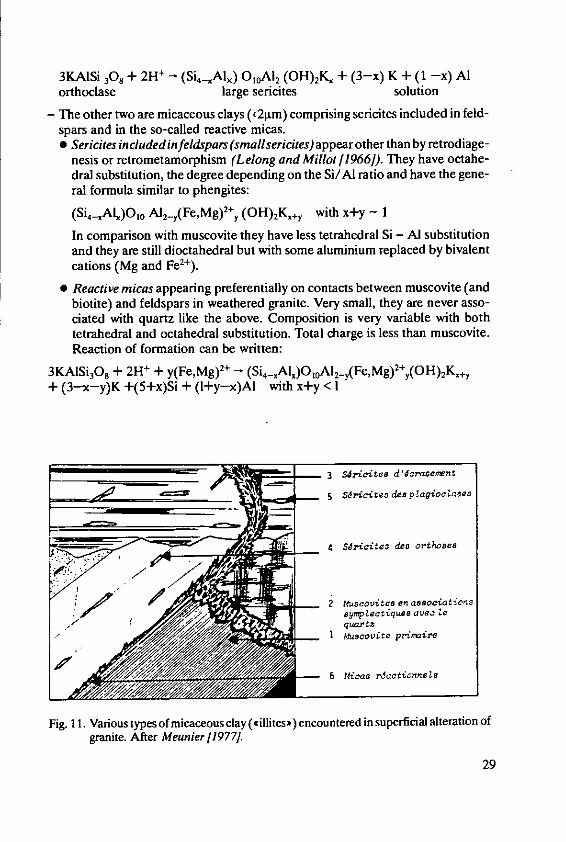
3KAISi 308 + 2H + - (Si 4 ,,Alx) O,0 A12 (OH) 2K4 + (3-x) K + (1 -x) Alorthoclase large sericites solution
- The other two are micaceous clays (<2im) comprising sericites included in feld-spars and in the so-called reactive micas.* Sericites includedinfeldspars (smallsericites) appear other than by retrodiage-
nesis or retrometamorphism (Lelong and Millot [1966]). They have octahe-dral substitution, the degree depending on the Si/Al ratio and have the gene-ral formula similar to phengites:
(Si 4_A)O 0 Al 2 y(Fe,Mg)2+y (OH)2 K,+y with x+y - 1
In comparison with muscovite they have less tetrahedral Si - Al substitutionand they are still dioctahedral but with some aluminium replaced by bivalentcations (Mg and Fe2").
* Reactive micas appearing preferentially on contacts between muscovite (andbiotite) and feldspars in weathered granite. Very small, they are never asso-ciated with quartz like the above. Composition is very variable with bothtetrahedral and octahedral substitution. Total charge is less than muscovite.Reaction of formation can be written:
3KAISi 30 8 + 2H' + y(Fe,Mg)' + - (Si 4 _-Alj)OIOAl 2_Y(Fe,Mg) 2+Y(OH) 2Kx+y+ (3-x-y)K +(5+x)Si + (l+y-x)AI with x+y < I
_____________________3 Srieite, d'dcrasenent
__5 S drcites des p!agiocta se
4 SUlicite3 des orthoses
2 Mslcovitjs enassocatO'cos
synZectiqua aveC Le
qua1tz-_ I MfusCOt)te prirf
6 Micas rlactionneleo
Fig. 11. Various types of micaceous clay (.illites') encountered in superficial alteration of
granite. After Meunier f1977].
29
4.2. Mineralogy of natural soils (undisturbed and moist)
In general all soils are hydrated and even if the degree of hydration varies muchwith environmental conditions, it is always higher than in air-dried soil. This matteris of great current interest, especially in the case of the clay (<21m) and fine clay( 0.1pm).
To enable the work to be done 3 things are required:1. To know how to stabilise a sample in the existing state of hydration prior to con-trolled drying.2. To know how to impregnate the fixed samples for preparation of ultrathin sec-tions (ultramicrotome).3. To be able to measure interparticular spacing up to 500nm, the hydrated parti-cles being more widely separated than in dry samples.I and 2 will suffice for a particular, local, very precise but qualitative study usingelectron microscopy. 3 is indispensable for quantitative work and requires the useof X ray small angle scattering (SAS).
Brief complementary information on preparation and electron microscopeexamination follows, more detail is to be found elsewhere (Tessier, p. 45)but it isnecessary to mention the SAS method here.
4.2.1. Preparation of moist samples.
A recent account has been given by Tessier [1985. In general two methods areused:- freezing-lyophilisation: Samples are rapidly frozen to prevent the movement of
water and formation of ice crystals; Freon 22 cooled in liquid nitrogen is used.During lyophilisation temperature is kept at -400C and this can be done withinthe electron microscope using the Cryoscan procedure of Jeol (Tessier and Ber-rier [1979]).
- Substitution method: Methanol is the usual solvent which is replaced by liquidCO2 which in turn is eliminated either by the critical point method for examina-tion by SEM or by Spurr's resin to prepare thin sections by ultra microtome forexamination by transmission (TEM and HRTEM) (Tessier [1984]).
4.2.2. Use of electron microscopy
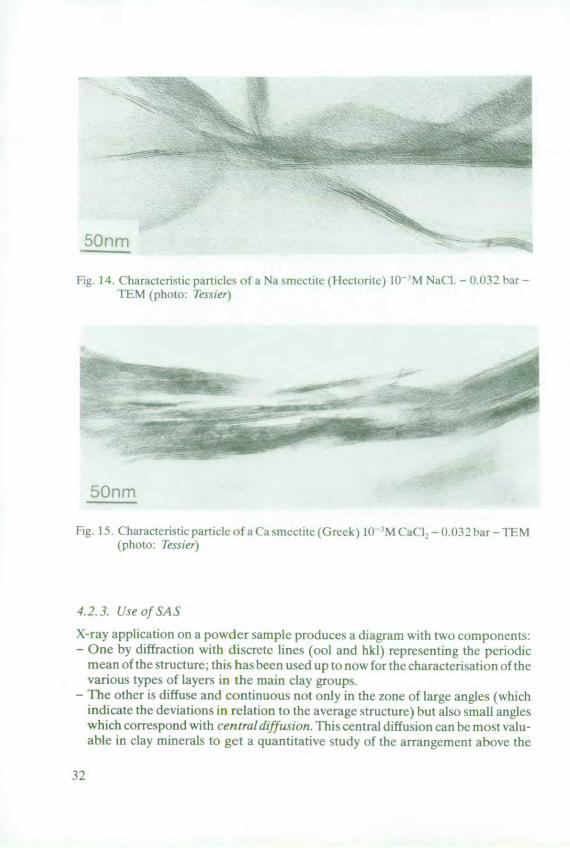
There are two aspects:- Using SEM it is possible to see the micro-structural arrangement of the plasmas
in situ, which cannot be done with the optical microscope. This enables one to gobeyond the particle (or to describe it in the lateral sense) and to obtain data on thespatial arrangement of units; this can be done for different hydric and geochemi-cal situations (an example for the smectite network is given in figures 12 and 13).
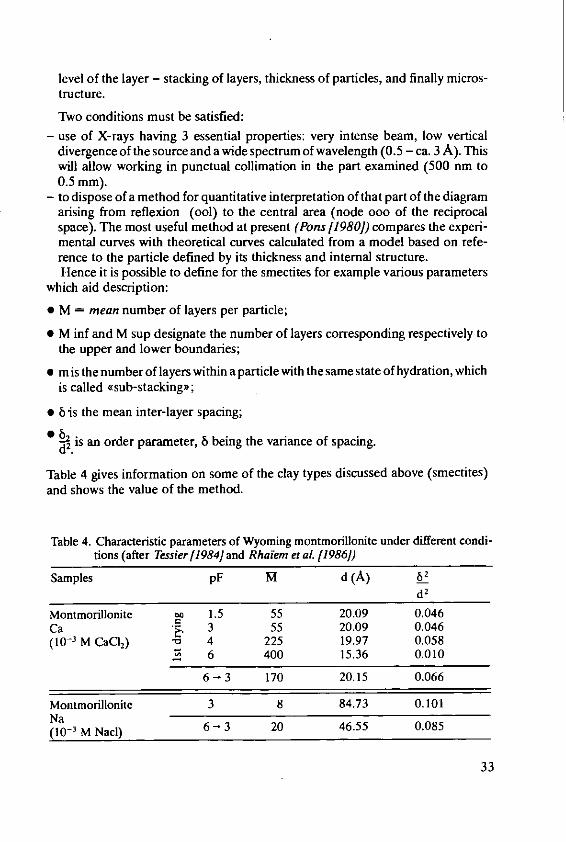
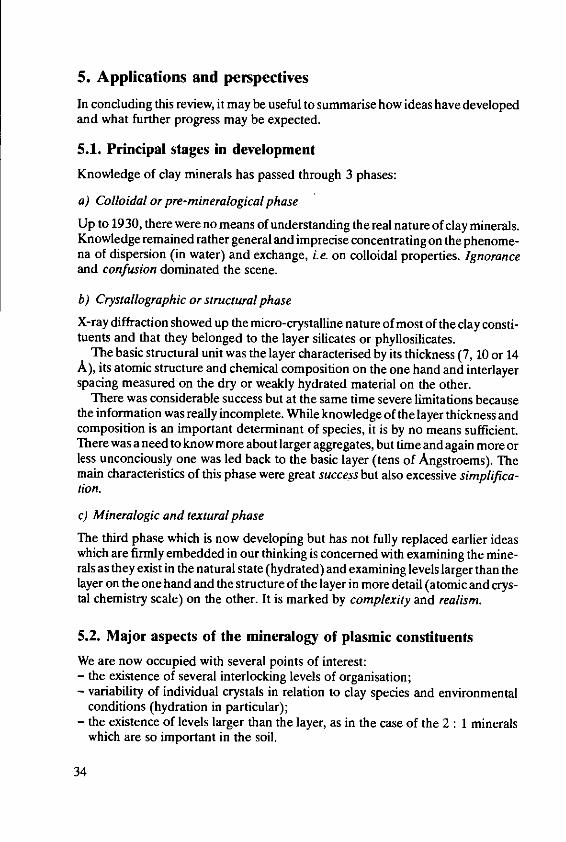
- Using TEM one can visualise the particles in detail and even count the number oflayers (by HRTEM) in the individual crystals (Figures 14 and 15). These resultscan be compared with those by SAS.
30
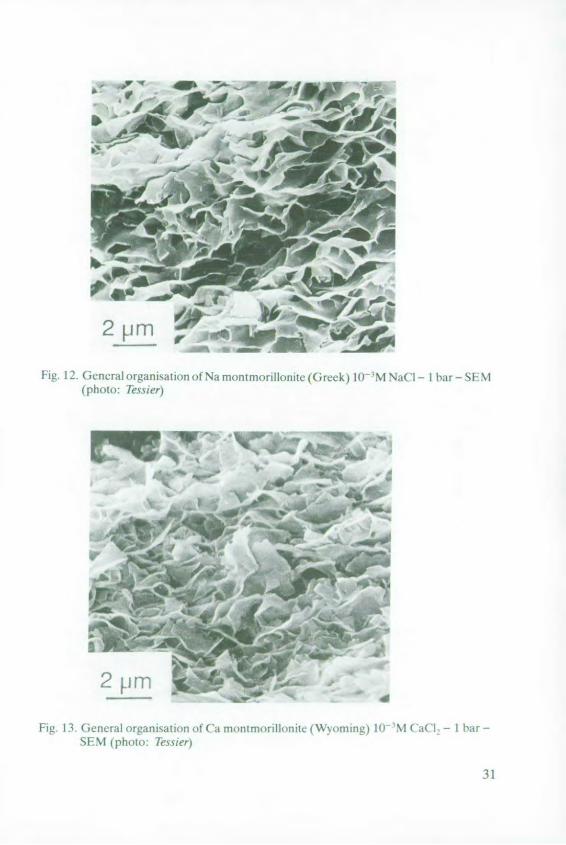
V
FiI 12. GenewraP)dl lraI lIOn of Na mon tnor Illmt (( ck)1 M Naf I - 1 hbar - SF;MN(phot~o: lsoier)
2 Pm
Fig. 13. (iencral or~anisatin of (a montmorilIanitc (GiWoninz) IM NI Ca -I [r- IAr-
SMNI (photo: lesier)
31
50nm
I g 14. Characteristic particles o a Na smctc (ectorttc.) 10 1M Na( 1. - O1M32 bar -FEM (photo: lesier)
50nm
Fig, 15. Characteristicparticeofa(Casmectite (Greek) I) 'M (aC'I -0.032bai -IFM(photo: Te dier)
4.2.3. Use of SA S
X-ray application on a powder sample produces a diagram with two components:- One by diffraction with discrete lines (ool and hkl) representing the periodic
mean of the structure this has been used up to now for the characterisation of thevarious types of layers in the main clay groups.
- The other is diffuse and continuous not only in the zone of large angles (whichindicate the deviations in relation to the average structure) but also small angleswhich correspond with centraldiffusion. This central diffusion can be most valu-able in clay minerals to get a quantitative study of the arrangement above the
32
level of the layer - stacking of layers, thickness of particles, and finally micros-tructure.
Two conditions must be satisfied:
- use of X-rays having 3 essential properties: very intense beam, low verticaldivergence of the source and a wide spectrum of wavelength (0.5 - ca. 3 A). Thiswill allow working in punctual collimation in the part examined (500 rim to0.5 mm).
- to dispose of a method for quantitative interpretation of that part of the diagramarising from reflexion (ool) to the central area (node ooo of the reciprocalspace). The most useful method at present (Pons [1980]) compares the experi-mental curves with theoretical curves calculated from a model based on refe-rence to the particle defined by its thickness and internal structure.Hence it is possible to define for the smectites for example various parameters
which aid description:
* M = mean number of layers per particle;
* M inf and M sup designate the number of layers corresponding respectively tothe upper and lower boundaries;
* m is the number of layers within a particle with the same state of hydration, whichis called .sub-stacking";
* 8Mis the mean inter-layer spacing;
d2.is an order parameter, 6 being the variance of spacing.
Table 4 gives information on some of the clay types discussed above (smectites)and shows the value of the method.
Table 4. Characteristic parameters of Wyoming montmorillonite under different condi-tions (after Tessier [1984J and Rhafem et at. 119861)
Samples pF M d (A) 68d2
Montmorillonite o 1.5 55 20.09 0.046Ca 3 55 20.09 0.046(10-3 M CaCI2 ) 4 225 19.97 0.058
6 400 15.36 0.010
6 - 3 170 20.15 0.066
Montmorillonite 3 8 84.73 0.101Na(10- 1 M Nacl) 6 - 3 20 46.55 0.085
33
5. Applications and perspectives
In concluding this review, it may be useful to summarise how ideas have developedand what further progress may be expected.
5.1. Principal stages in development
Knowledge of clay minerals has passed through 3 phases:
a) Colloidal or pre-mineralogical phase
Up to 1930, there were no means of understanding the real nature of clay minerals.Knowledge remained rather general and imprecise concentrating on the phenome-na of dispersion (in water) and exchange, i.e. on colloidal properties. Ignoranceand confusion dominated the scene.
b) Crystallographic or structural phase
X-ray diffraction showed up the micro-crystalline nature of most of the clay consti-tuents and that they belonged to the layer silicates or phyllosilicates.
The basic structural unit was the layer characterised by its thickness (7, 10 or 14A), its atomic structure and chemical composition on the one hand and interlayerspacing measured on the dry or weakly hydrated material on the other.
There was considerable success but at the same time severe limitations becausethe information was really incomplete. While knowledge of the layer thickness andcomposition is an important determinant of species, it is by no means sufficient.There was a need to know more about larger aggregates, but time and again more orless unconciously one was led back to the basic layer (tens of Angstroems). Themain characteristics of this phase were great success but also excessive simplifica-tion.
c) Mineralogic and textural phase
The third phase which is now developing but has not fully replaced earlier ideaswhich are firmly embedded in our thinking is concerned with examining the mine-rals as they exist in the natural state (hydrated) and examining levels larger than thelayer on the one hand and the structure of the layer in more detail (atomic and crys-tal chemistry scale) on the other. It is marked by complexity and realism.
5.2. Major aspects of the mineralogy of plasmic constituents
We are now occupied with several points of interest:- the existence of several interlocking levels of organisation;- variability of individual crystals in relation to clay species and environmental
conditions (hydration in particular);- the existence of levels larger than the layer, as in the case of the 2 : 1 minerals
which are so important in the soil.
34
a) Knowledge of a clay mineral sample implies knowledge of individual crystalcomponents at 3 levels:- individual elementarystructureat the level of the layer (nature and crystal-chem-
ical composition) or better, of the structural unit (layer + interlayer);- as to texture - constitution, dimension and morphology of individual hydrated
crystals;- the mutual arrangement of individuals, i.e. the plasmicfabric.
This involves not only characterising the solid portion (anhydrous) but at thesame time taking account of water which to a substantial degree is found in themicropores (0 < hlim) of the system.
Grosso-modo this can be diveded into 3:- interlayer water (when present) for the structural level;- intra-particle for the textural level;- inter-particle for the plasmic fabric.
The first form of water is organised water which has always been considered out-side the structural units. The two other forms, bound water but not organised,should also be taken into account because of the important influence they have ontexture and disposition of individual crystals.
All this is of value no matter what the clay constituent. But when one wishes totreat things in more detail, one is compelled to define the clay type in advance.b) Variability of crystalline individuals in the main typesThe 3 clays encountered in soils are:- Kaolinites (layer 7 A, neutral, interlayer space empty)- Illites (layer 10 A charge z>0.6, interlayers occupied by non-exchangeable K)- Smectites (layer 10 A, charge z < 0.45, interlayers occupied by hydrated and ex-
changeable cations).According to the present state of knowledge, these clays are organised as inFigure 16:- Kaolinites: layers are stacked in limited numbers to give a fixed mono-crystalline
entity whose size depends upon origin (texture). These are elementary crystal-lites which are then arranged face-to-face to form larger aggregates.
- Illites: stacking is analogous to kaoinites. There is a supplementary level of orga-nisation which is a fixed polycrystalline lens shaped unit. This is a micro-domainformed by a stable coupling of several crystallites. Here, the micro-domain is thefundamental crystalline individual.
- Smectite: in this case the problem is quite different. Four levels can be defined:1) the elementary layer (structural unit);2) ordered stacking of several layers corresponding to 4crystallite* (sub-stacking [Pons, 1980J);3) superposed overlapping of some of these crystallites yielding a quasi-crystal (Aylmore and Quirk [19 71]) (Figure 17)4) spatial arrangement of these quasi-crystals to give a 3-dimensionalnetwork which confers a sponge-like character (Figures 12 and 13).
35
The latter 3 are not constant for a given smectite because their existence andconstitution depend much on environmental conditions and it is thus difficult toconceive of a single typical individual.
K (St. Austell ) crislolhlekoolinite
(Provins)
2.O.6 tlie Microdomain a
2<06 Smectite Quosicrystol
. oorn f
119831 aa
b
Fig. 17. Diagram of quasi-crystal of smectite in section (a) and surface (b). After Tessier[1984].
36
c) Conclusions
First in this field, some points can be presented:- Knowledge of the individual layer is by itself quite insufficient to conveniently
characterise a clay mineral and to deduce its properties.- Hence it is necessary to take account in future of the higher levels of organisation
and particularly to take note of the crystalline individual corresponding, in com-mon parlance, to the (particle).
- From this point of view, things are not uniform to the extent that it is rather an idlefancy to wish to define a characteristic particle for each individual clay. As wehave seen, the situation with regard to the 3 mineral types is the following:
1) If water molecules cannot enter into the interlayer space (kaolinite and illite) thenotion of the particle has a particular meaning. Structure and texture are then con-stant and can be defined. Only arrangement can vary with the environmental con-ditions. The particle is mono-crystalline for kaolinite and polycrystalline (micro-domain) for illites (Table 5 and Figure 16).
Table 5. Levels of organisation of 3 main clays
Levels of organisation Kaolinites Illites Smectites
Sructure (1) Structural unit Structural unit Structural unit(layer+interlayer)
( monocrystalline Crystallite Crystallite CrystalliteT entity (11) (Sub-stacking)
polycrystalline - Microdomain QuasicrystalL entity (Ill)
Plasmic fabric (IV) - Network
2) If the clays can hold water in the interlayer space the particle concept strictly no
longer applies. There may be levels like substacking or quasicrystal but these arenot fixed characteristics of the species because they are subject to continuous varia-
tion according to the types of exchangeable cations, the water status of the system
and its hydric history. In other words, if the atomic structure is constant and the 3
dimensional network a characteristic state, the intermediate level (texture) is morevariable. This is important because we now know that the physico-hydric propert-ies of the plasmic phase depend in the first place on its texture. But, what about theother less well-defined 2:1 constituents?
3) Problems of 2:1 clay minerals: A recent study by Tessier and Pedro [1985] has
shown that the different 2:1 clay minerals with 0 ( Z < 1 (Table 6, page 40) can be
divided into 3 categories (Figures 18 and 19):
- The first category has charge z c 0.45 and consists of true smectites where all in-
terlayer cations are exchangeable and in which the degree of hydration is inverse-
37
ly proportional to layer charge. These have all the structural and textural chardc-teristics indicated above for smectites.
- The second category is defined by a charge z > 0.6. These are illites in which mostof the interlayer cations are not exchangeable (100% for z = 1, 70% for z = 0.6).These minerals, always weakly hydrated, have all the structural and texturalcharacteristics of illites and occur notably as micro-domains.
- The third group have intermediate charge (0.45cz'0.6). These are very commonin soil and react to XRD like smectites though their interlayer cations are not allexchangeable (70 - 100%). Intraparticle hydration is weak and texture quite in-dividual. From this point of view (Figure 20) while they appear as quasicrystals,
Cation exchange capacity Cation exchange capacity
B. (meq.cm-3) (meq. g,)
7 000 .2.50
- 2.0075%,.--
4 1 1.50L SR_"-- 50-
N 4-3 G ' "C -- -
.
H BF B
-Li - " 16,5% -0.50
0,3 ,4 0.s 0,6 0 ,7 0,8 0,9 o
Layer charge (z)
Fig. 18. Exchange capacity related to layer-charge for the 2 :1 clays of Table 6. Diagonallines indicate percentage of cations exchangeable. After Tessier and Pedro [1985]
38

they are in fact heterogeneous with smectitic units passing continuously to illiticmicrodomains, the ratio depending on layer charge with consequent effects onwater characteristics.
Finally, the study of clay minerals has now assumed a new look which takes ac-count of the nature of the layer structure but at the same time goes beyond that inattempting to characterise higher levels of organisation (texture and plasmic fab-ric). This approach will dominate the subject; it is only in thus that all the characte-ristics - physicochemical, physicohydric and rheological of such evolving mineralswill be explained. The future will surely see strong development of research inthis field.
Water ratio (0) Water content ( W)
H45- \
Na 2/1 clays,10-3 M No. 540. 1 St drying, 0.032 x 05Pa
BF
w30 w
10G\
20
L \SR
I0 C
N
Li G So
0,3 0,4 0,5 0,6 0,7 0,8 0,9 1,0
Layer charge (z)
Fig. 19. Variation in watercontent in 2: 1 clays(Table 6) related to layer-charge for ident-ical conditions (10- 3M Na C and pF 1.5 [0.032 bar]). After Tessier and Pedro[1985]
39
Table 6. Cation formulae of the 2:1 clay minerals studied.
Sample and symbol Formula
Hectorite (H)Hector, California Cao.15(Mg2.71Li. 29)(Si4)
Smectite (BF)Belle Fouche,South Dakota Cao.15 Ko.03(All.55Fe3o. 7Fe2+o.0 Mg0.29)(Si3.90Alo. 1)
Smectite (W)Wyoming Cao. 17Ko.o(Al1 .53Fe3+o.18 M&. 26Tio.01 )(Si 3.96Al 4).,)
Smectite (G)Greece Cao.18Nao.03(All.55Fe3+ 0.Fe+ 0 Mgo.3Ti0 .02)(Si3.92Alo.o8)
Smectite (L)Lorena Cao.22Ko.0(Al1s 4Fe3 +o.2Fe+o.02Mgo.23)(Si 3. 2Al. Is)
Smectite (SR)Santa Rita,New Mexico CaO.25Ko.oi(AI 4 8Fe3+o ojMgo.4 5)(Si 3.97Ao.02)
Smectite (B)B6thonvilliers Ca0.23Kl I Nao.0 I (Al.3 2Fe 3+o.39Mgo.23)(Si3 .8 2Al.t 1 8)
Smectite (C)Cameron, Arizona Cao.20 Ko.21(Alj. 36Fe3+0.42Fe2+%02Mgo. 15)(Si 3 70Al 0)
Illite (Li)Lichres Cao.14K0 .35(All.4sFe3+o.33Mg.23)(Si3.47Al0.53 )
fllite (LP)Le Puy Cao.07Ko.66(Alt.2.Fe3+o.32Fe2+o.02Mgo.38Tio.0)(Sia.48Alo.52)
Glauconite (CO)Cormes Cao.08Ko.68Nao.03(mlo.45Fe3+t.14Fe2+04Mg.3s)(Si3.63Al37 )
40
I C'
50nm a
10 A56
5Onm b
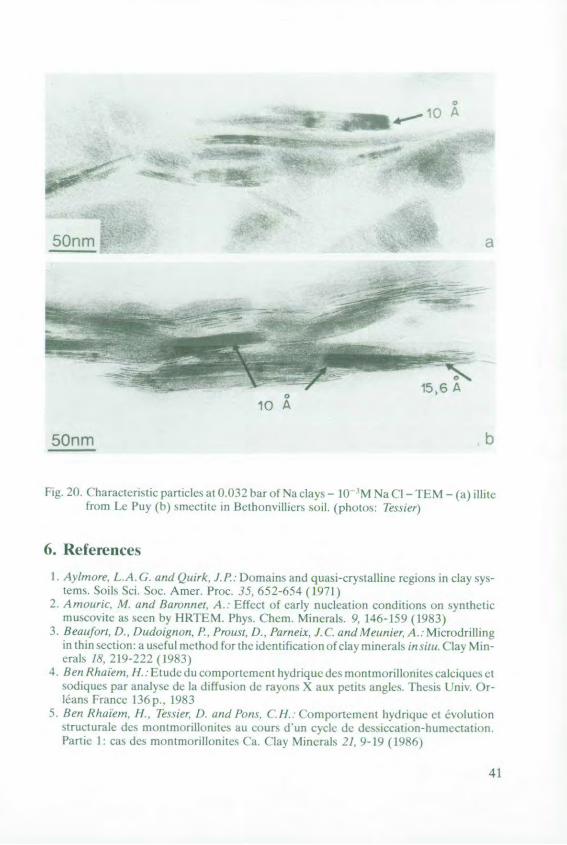
I-ig 20. ( haracterstic particles at {t032 bar ol Nacla ,- 10 'M Na (I " -IM - (a) lutcIrom Ic Puy (b) mcctele in Bethonilliers soi. (photos: ]kssr)
6. References1. Ay/nore, l A CL and Quirk, l. [)omains and quasi-crystallinc rcgions in clay sys-
tems. Soils Sci, Soc. Amer. Proc. 35, 652-654 (1971)2. Anmutric, W. and Bamnnet, A.. Fffcct of early nucleation conditions on svnihetic
muscovItc as seen by tRFN-M. Phy,. Chem. Mincrals, 9, 146-159 ( 1983)3. Beaulort, D., Dudoignon, P, Proust, D., Parneix, J. (. and Meunwr A.: Microdrilling
in thin secth I: a usCfUl method [or tie dent ification of clay, minerals in itu, ('la Mi-crals IN, 219-222 ( 1983)
4. Ben Rhwem1. L : tude d I coimp ortement hyd riq tic des montnoril lonites calciques ctsodiques par analysc dc la diffusion de ra/eons X aUX petits angles I hesis I, niv Or-]ians -rancc 136p., 1983
5. Ben Rhatem, 11. 7isir. 1). and I'ons, (I1: (Omp)FIrCIment hydrnq iL cI el eOL1IitMl
strucurale tie, mont mrllon ites au cours diun clte de ssiccat P n -hteetat iPartic I : cas des montmorinllontes ( a. Clay Minerals 21, 9- 19 (1 986j
41
o liureidva4 h e, I I a i c r 1 h pl at / ti A llas tt c ccitrKpr Ct 1 ts,0c~pt.j. eirJ33 p., 1968;Bonm, /. . () lp (.t.,; i:Tc'ti . HII /eid le'erat, . Intacrvstalnc distibntiOn Of f e'
In (jot-field nonionite: a sflItoscopiC stud). Phis, (hem. Mmi 2. 55 4 ( 1)84)s Brewer, R: [abric and Mincrail A nasis ol Soi, ,J Wilcv and So tns, New York, 470 p.
? B/lo A. P., edormqE V. \, ri,,s, A. Sloopt. ( and irrina, 12 1 landbook to soilthin secto u &scriptton 1.'p n Research publitatnons (U , 19 85
It BumtA, PR and I/b/en. 1) R. Dctecs In mnrals as obsered with high Ic.olttiontranmission ccot mircrsCopy. Bull Mineral 104, 249-260 (1981)
1I ( hI oln, . h : Pvrobole structure rvpc, Man 44, 205-2 If, ( 1981I l)elage.e, and L.auaul.It, S or ]a ctnstitUtsion dkIt ret carable, (Comptc rcndu Acad
Sciences Pais, 109, p. 1043- 1044 (1904)13 0la), : Petpulatutns tic monoparticulcs d'argiles. Analyse chirmniue par microsonde
eleclonique. Ihesis Poiticrs II 10p-. 198214 Dupl J A mJ ssshiique'sponctuellesdeargies Science'(icol Boll, Strasboturg,
.7, 4, 307-312 (1984)1 ldetonse Ph. ProuNst, D., lhtunier4 4. and Veld, B. Role des phdnomenes tIc d&stab-
tlisation-recristallisaion sueccessii dans laliranion des roches cristallines au c tiesmicrosystcnics chiiniques. Science do Sol n 2 et 3: Altdration des rochcs>s , 239-257
1979)1I, Knbiena, 14.L. icropedolog, ( ollegiaic PIcss. Ames, lowa. 243 p. 193817 Kubler, B ICs argiles, indicalcurs tic rmdtamorphismc. Rev. Inst. Fr. Petrole, 19
1093- 1112 (1964)18 Kubletr B, La cristallinite tie Filitc ci Its /ones tout it fail superieurc du mdtamor-
phimc. In, (Coloque str les Etagc'I Tctoniucs A ki Bacon nidre. Neuchastcl, Suisse,105-122, 1966
19) Lehong F and Miln G.. Sur Sniongine des mindraux micacvs des alterations lateri-tiques. Diagenese regrssivc. Minraux en transit. Bull Serv Carte (icol. At, Lorr, 11).3-4, 271-287 (1966)
20. :lanreau <,.: Localisation du nickel dans les phyllosilicates Application aax mincraisde Nituvelle ('aiddonic. Thesis. Universitd Paris VII, 101 p., 1984
21 anceau, A and (alas, ( : Heterogeneous distribution of nickel in hydrou, silicaesnrom New-Caledonia ore deposits Am, Miner. 70, 549-558 (1985)
22. 1larrin ivahli, J.L. and Ltnare, Gonzalez, J.: A randon intergrowth of sepiolite andattapulgite. ('lays ('lay Miner. 9, 592-602 (1962)
23, Mering, .J. and Oberlin. G-The smcctics In: The Electron-Optical investigation of(lays, Mineralogical Society, I ondon. 135- 145. 1971
24. Menier, A.. Les micanismes de l'altIralion des graniteset c c tole des niicrosvstien:S.Ilsis ini m Poeitcrs. 28p.. MemoircSoc. (idotl I 19810. n 40. 8Op.- 1977
25 Weanie. A. and l 'de. B. Mineta! reactions at grain contacts in earl stagesofgranite"cathcring. ('lay Miii I 235-244) ( 1976)
26 Weller, A. and ide, B X-ray diffraction of orienced clays in small quantities (0 Itug). ('lay Miner. 17. 250-262 (1982)
27 Slilt ( : (eolgic des argiles. Masso rd.. Paris. 499 p., 196428. Vadean, Ph. Rilson, M., .Mc Hanv, IV,. and lait, I.M.: Interpaiticlc diffraction: a
new concept for interstrairtied clays. (lay Miner. 19, 757-769 (1984)29 \,reaa. Ph.: Ihc physical dimension , of fundamental cla particles. (lay Minerals
20 499-514 (1985)
42

30. Pedro, G. and Tessier, D.: Importance de Ia prise en compte des parambtres texturauxdans la caract&isation des argiles. Proc. Euroclay, Prague, 417-428 (1985)
31. Pons, C.H.: Mise en 6vidence des relations entre la texture et ]a structure dans les sys-t mes eau-smectites par diffusion aux petits angles du rayonnement X synchrotron.Thesis Univ. Orleans, France, 115 p., 1980
32. Proust, D.: M6canismes de l'alt6ration supergbne des roches basiques. Etude desar~nes d'orthoamphibolite du Limousin et de glaucophanite de 'ile de Groix (Morbi-ban), Thesis Poitiers, 197 p., 1983
33. Proust, . and Velde, B.: Beidellite crystallization from plagioclase and amphiboleprecursors. Clay Minerals 13, 2, 199-209 (1978)
34. Rassineux, F, Beaufort, D., Merceron, T., Bouchet, A andMeunier, A.: Use for a linearlocalization detector in earth sciences: X-Ray diffraction on small material quantities,X-Ray diffraction on petrographic thin section, Clays and Clay Minerals (in press)(1987)
35. Rautureau, M. andSteinberg, M.: D6termination de ja composition et de l'homog6n6-it6 des phyllosilicates par microscopie dlectronique analytique h balayage (S.T.E.M.)J. Microsc. Spectrosc. Electron. 10, 181-192 (1985)
36. Tessier, D.: Hydratation, gonflement et structuration des mat(riaux argileux au coursde la dessiccation et de la r6humectation. Thesis Paris, INRA Versailles, 361 p., 1984
37. Tessier, D.: Etude de ]a microstructure d'6chantillons de sols. Validit6 et limite destechniques de ddshydratation disponibles. R6union Internationale de microscopic dessols, Paris, 23-30, 1987
38. Tessier, D. and Berrier, .: Utilisation de ]a microscopie e1ectronique k balayage dans1'6tude des sols. Observation de sols humides soumis i diff(rents pF. Science du Sol 1,67-82 (1979)
39. Tessier, D. andPedo, G.: Characterization of 2/1 claysin soils. Importance of the claytexture. Int. Clay Conference Denver (USA), 1985
40. Thompson, J.B.: Biopyriboles and polysomatic series. American Min. 63, 239-249(1978)
41. Wilson, M.J. and Clark, D.R.: X-ray identification of clay materials in thin sectionsi.Sed. Petrol. 48, 656-660 (1978)
43
Identification of Clays - Data fromInvestigations with Strongly HydratedSystems
D. Tessier, Station of Soil Science, I.N.R.A. Versailles/France*
Summary
In conventional studies, clays are identified in strongly dehydrated samples (equilibratedat relative humidities < 90%). Under such conditions, their organisation is often very dif-ferent from that in the natural soil. Clays can also be examined and identified in the rangeof biological activity (suction pressures < 16 bar). For this purpose, the behaviour of clayshas been investigated under controlled matric and osmotic potential. Scanning and trans-mission electron microscopy and X-ray small angle scattering were used to characteriseclay - water systems at various water content levels. It was then possible to identify claysnot just by reference to properties of the interlayer space but also by description of the par-ticles as they are found in well hydrated systems.
It was shown that, in the range of high moisture content, the interlayer hydration andparticle characteristics of potassium smectites were comparable with those of sodiumsmectites. In this case, identification rests upon study of all states of hydration which is notpossible with the classical methods (interlayer spacing < 2 layers of water).
1. Introduction
It is well-known that soil texture, clay content and type of clay mineral play a directpart in determining many soil properties including the dynamics of ions, especiallypotassium (Qu6mener [1986]). Qurmener underlines the importance of climaticfactors and cultural history and the need to study soils against the background ofthe energetic relationship of soil water. Work has shown that good water relationsand, in particular, biological activity, in the soil require relatively low levels of soilwater tension. The limit for the availability of water to plants is defined as the waterretained at a suction pressure above 16 bar. This is the result of capillary andosmotic forces between clay surfaces and these forces are due to the presence ofions near the charged surfaces. This is also the range within which the clay constitu-ents of the soil greatly influence structure in all its aspects.
* Dr. D. Tessier, Station de Science du Sol, INRA, Route de St. Cyr, F-78000 Versailles/
France
45
Most mineralogical, crystallographic and physico-chemical work on clay min-erals has been done on relatively dry samples (water activity, a < 0.90) i.e. muchdrier than needed for biological activity (aw > 0.988) [Pddro, this colloquium].
Most of the work has been limited to the study of the clay layer and inter-layercharacteristics. This has taken no account of arrangements on a more microscopiclevel than the elementary units. While not ignoring the importance of the layer andinterlayer, the characterisation of soil clays should also be concerned with thelarger aggregates and their associations with the pore space.
In this paper which discusses the methods used and results obtained in the studyof well hydrated clays, the accent is on the properties and microstructure of potas-sium clays.
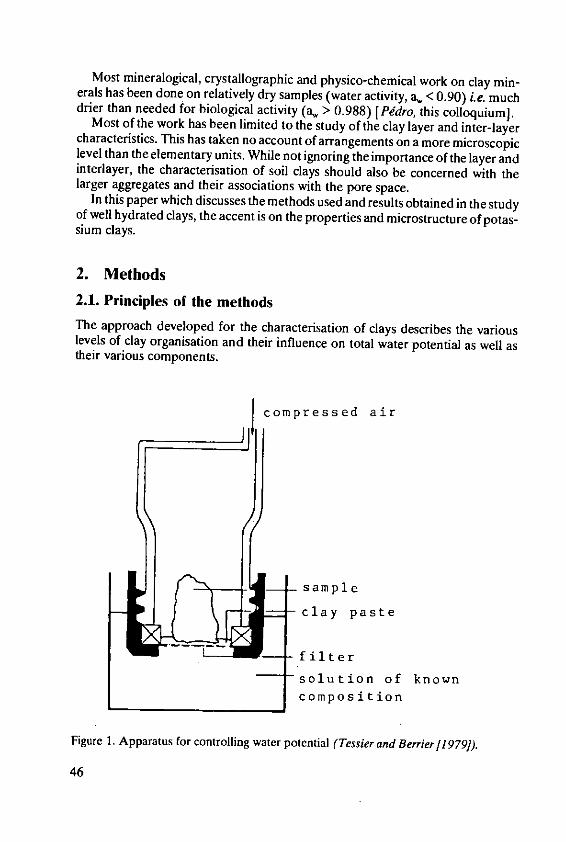
2. Methods
2.1. Principles of the methodsThe approach developed for the characterisation of clays describes the variouslevels of clay organisation and their influence on total water potential as well astheir various components.
compressed air
sample
clay paste
filter
solution of knowncomposition
Figure 1. Apparatus for controlling water potential (Tessier and Berrier/f979]).
46

All precise work on clayey material, (hydration mechanism, mineralogicalstudy) should be done on samples in which the exchangeable ions are accuratelyknown. The method consists in particular in the elimination of excess salts from theinterstitial solution during ion exchange so that clays can be studied at virtually nulosmotic potential. In well hydrated clays, as in many natural conditions, salt con-centration of the solution directly affects the level of flocculation and consequentlythe microstructure of the soil and its structural stability (Aytmore and Quirk[1962J; Tessier [1984]).
To control the matric and osmotic components of water potential, we have usedthe method described by Tessier and Berrier 11979] (Figure 1). This permits firstfixing the suction pressure, i. e. the matric component (in the general sense) ofwater potential and secondly equilibrating the sample at a pre-determined salt con-centration. The procedure can be used in both wetting and drying to obtain desorp-tion and adsorption isotherms of water. Table 1 gives for various values of theseparameters the equivalence between different methods of presenting the data,maximum pore size, according to Laplace's Law, and the change in water activity bylowering the temperature.
Tabel 1. Levels of energy and ways of expressing various states of water in the soil in rela-tion to the external pressure applied and the maximum size of the correspondingpores.
Gas pressure pF Chemical Water Decrease in Maximumapplied (bar) potential of activity temperature size of the
the water °C pores filledJ. kg- ' with water
(V±m)
0.010 1 - 1 0.999993 1500.100 2 - 10 0.999927 151 3 - 100 0.99927 1.510 4 - 1000 0.9927 0.1515.8 4.2 - 1580 0.9888 - 1.1 0.009100 5 - 10000 0.927 - 10 0.015500 5.7 -50000 0.6951000 6 - 100000 0.484 -90 0.0015
Heated to #7 - 0 - -
105 0C
2.2. Methods
Understanding of well hydrated clay systems in fact assumes the possibility ofdescribing the solid phase and water sites over the range 1 Angstr6m to macros-copic (e.g. several cm). Samples prepared at a know water potential are investi-gated by electron microscopy (SEM, TEM) and X ray small angle scattering(SAS).
47

2.2.1 Sample preparation
Only electron microscopy has sufficient resolution to enable study of the structureof clays. In this work it is not a matter of describing material whose particles havebeen separated by preliminary treatment (or which have been dried as in the classi-cal methods). The freeze drying method and substitution of the interstitial solutionby solvents have been used to preserve the microstructure as far as possible.
- For scanning electron microscopy (SEM) our microscope is equipped withmeans to observe small samples (4 1 mm) at low temperature (- 100 deg- C)severely frozen in freon which is cooled by liquid nitrogen (Tessier etal. 11979]).
- For transmission electron microscopy (TEM), the interstitial solution isreplaced by methanol, then by propylene oxide and finally by Spurr's [1969]resin. After hardening, thin (500 A) sections are prepared (Tessier[] 984]). Thereplacement of water by solvents does not usually disturb the general arrange-ment of particles. When there is change in the interlayer spacing, this can beinterpreted by reference to the properties of the solvent used (Tessier [1987]).
2.2.2 X-ray examination (SAS)
X-ray examination of clays is generally confined to the layer and interlayer. Inter-pretation of spectra is often essentially qualitative as it consists solely of identifyingthe position and intensity of the pick 001. The work is generally done on stronglydehydrated samples (k < 0.9). Because of this, the particles of the material are invery close contact. This does not give information on well hydrated particlesbecause in the course of drying, many interparticular spaces become analogous tointerlayer spaces in the dry state (Ben Rhaiem et al. [1986]). Further, well hydratedsystems require a different approach to the X-ray patterns if it is wished to charac-terise the whole of the clay-water system. This involves the whole of the X-rayspectrum, i.e. the zone of central scattering as well as Bragg's diffraction.
2.2.2.1 The method in principle
The method used for quantitative interpretation of X-ray diagrams comparesexperimental curves with theoretical curves calculated from an appropriate model(Pons etal. [1981, 1982]; Saez -A unon etal. [1983]). The models take into accountthe whole of the spectrum (central scattering and pick 001) because there is nodiscontinuity of intensity which allows the treatment of the central part of thediagram (small angle scattering) independently of the 001 peak. The model satis-fying such conditions is based on the notion of particle and its internal order (Fi-gure 2):
- a particle is defined first of all by the total number of layers M- internal particle structure depends on the degree of ordering of layers. It is well
ordered when the interlayer distances are homogeneous (e.g. 7.14, 10, 15.6etc.); it is not when the interlayer distance is irregular (e.g. 10, 15.6 and 50 A)
48
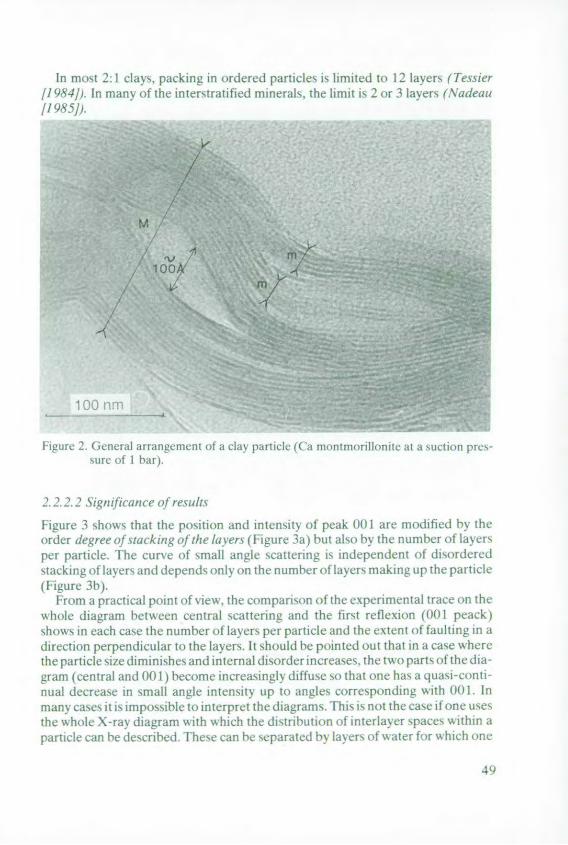
In most 2:1 clays, packing in ordered particles is limited to 12 layers (Tessier/1 9841. In many of the interstratified minerals, the limit is 2 or 3 lavers (Aadeau[1985]j.
A f
100 1) 11
Figure 2. ( ieneral arrangement of a clay particle (Ca mo morilloni Ic at a suction 1rc,-sure ot 1 bar).
2.2.2• 2 Significanc eofresults
Figure 3 shows that the position and intensity of peak 001 are modified by theorder degree ofiacking of the layers (Figure 3a) but also by the number of layer,per particle. The curvse of small angle scaltering is independent of disordered,tacking ol layers and depends only on the number (if lavers making up the particle(Figure 3b).
From a practical point of view, the comparison of the experimental trace on thewhole diagram between central scattering and the first reflexion (001 peack)shows in each case the number of layers per particle and the extent of faulting in adirection perpendicular to the layers. It should be pointed out that in a case wherethe particle size diminishes and internal disorder increases, the tw o parts of the dia-gram (central and 001) become increasingl, diffuse so that one has a quasi-conti-nual decrease in small angle intensity up to angles corresponding with )0 j. Inmany cases it is impossible to interpret the diagrams. This is not the case if one use,the whole X-ray diagram w ith which the distribution of interlayer spaces within aparticle can be described. These can be separated by layers of w ater for which nc
49
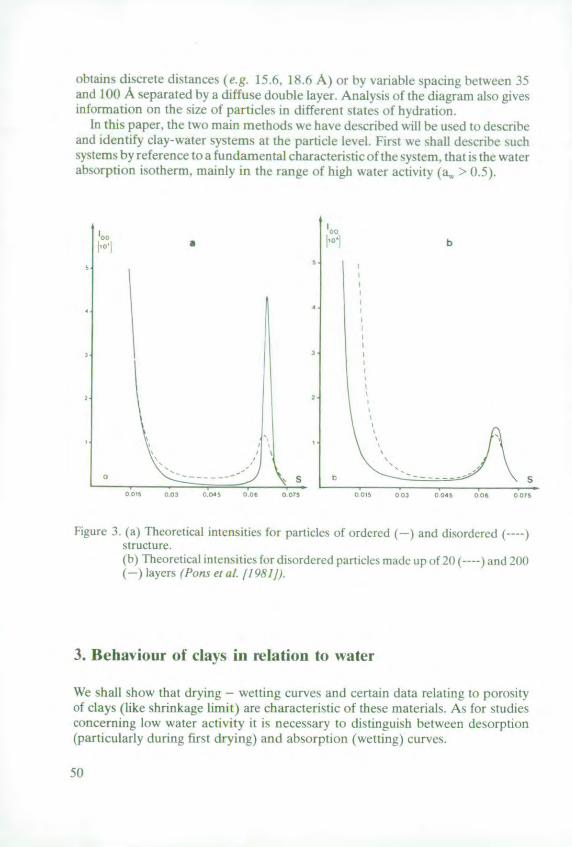
obtains discrete distances (e.g. 15,6, 18.6 A) or by variable spacing between 35and 100 A separated by a diffuse double layer. Analysis of the diagram also givesinformation on the size of particles in different states of hydration.
In this paper, the two main methods we have described will be used to describeand identify clay-water systems at the particle level. First we shall describe suchsystems by reference to a fundamental characteristic of the system. that is the waterabsorption isotherm, mainly in the range of high water activity (a., > 0.5).
01) b
xl S
Figure 3 (a) Theoretical intensities for particles of ordered (-) and disordered (----)structure.(b) Theoretical intensities for disorder ed paricles made Lip of 20) (-) and 200(-) Iayers (Pans et a/, /1 98l,
3. Behaviour of clays in relation to water
We shall show that drying - wetting curves and certain data relating to porosityof clays (like shrinkage limit) are characteristic of these materials. As lor studiesconcerning low water activity it is necessary to distinguish between desorption(particularly during first drying) and absorption (wetting) curves.
50

3.1. Initial drying curves
To describe behaviour of a clay it is necessary to take into account a number of fac-tors affecting this behaviour. Here, we refer to layer charge deficit, type of compen-sating cation and water potential.
3.1.1 Effect of layer charge
Layer charge distinguishes between the main types of 2: 1 minerals in soils i.e. illitesand smectites. Starting with different 2:1 clays whose layer charge (z) variesbetween 0.29 and 0.92 we have prepared gels or pastes in a 10- 1 NaCI M solution.At a suction pressure of 0.032 bar (Figure 4) the results show a more or less steadyevolution of water ratio. (9) i.e. of the volume of water in relation to the volume ofsolid as the charge deficit increases (ISSS1 976]; Tessier and Pedro 1987]). Onecan say that for clays with charge < 0.6, i.e. smectites, the value for S decreasesstrongly as the overall charge deficit increases. In contrast, for illites (z > 0.6) thevalues of S varies or decreases slightly. These results agree with those of Foster[1955], Dufey and Banin [1979. They show that clays belonging to the samegeneral group (smectites, illites) have very different hydration properties on themacro scale which are themselves characteristic of the layer charge under the expe-rimental conditions applying.
H45 *\
40
BF\
30 *%
.2\
3:20
L \SR
10 C
*Li
03 0.4 0.5 0.6 0.7 o,8 0.9 i.o Layer charge (z)
Figure 4. Water content of 2:1 Na-clays, 10- M NaCl related to layercharge at 0.032 bar.
51

3.1.2 Role of the exchangeable cations
The four most common cations in soil are: Na+, K+, Mg2+ and Ca2+. The results ofFigure 5 were obtained With Bethonvilliers (France) smectite saturated in turn withthese 4 cations in a 10- 3 M chloride solution. In the range of suction pressure < 0.1bar, water content decreases in the order Na > K > Mg > Ca. In constrast at 1000bar (aw = 0.5) water contents are in the order Ca > Mg > Na > K.
Water ratio (a)Water content
20(W) 7,5
155
I0
5,
I I I0.010 0.10 1.0 10 100 1000
P (bar)
Figure 5. Water content of Bethonvilliers Na, K, Mg and Ca smectites - first drying.
This shows that in the range of low suction pressure where there is biologicalactivity, Na and K smectites show similar isotherms and this distinguishes themfrom Mg and, more so, from Ca smectites. Results at high suction pressure (aw =0.5) confirm previous reports (Monneyetal. 11952]; GlaeserandMering[1954];Suquet [1968]).
In contrast, with model illites (layer charge - 0.75) and kaolinites, it is virtuallyimpossible to find evidence of difference in behaviour according to nature of thecation at low suction pressure. This shows that at high water activity it is the smec-tites and interstratified clays (i.e. with a major part of their compensating cationsexchangeable) which show varied macroscopic hydration and as a consequence,have varied both swelling and structure.
52
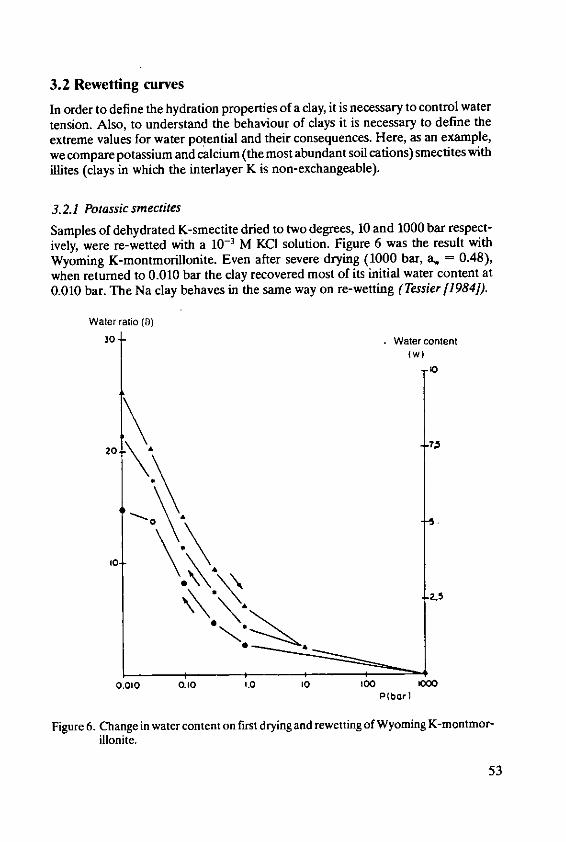
3.2 Rewetting curves
In order to define the hydration properties of a clay, it is necessary to control watertension. Also, to understand the behaviour of clays it is necessary to define theextreme values for water potential and their consequences. Here, as an example,we compare potassium and calcium (the most abundant soil cations) smectites withillites (clays in which the interlayer K is non-exchangeable).
3.2.1 Potassic smectites
Samples of dehydrated K-smectite dried to two degrees, 10 and 1000 bar respect-ively, were re-wetted with a 10- M KCI solution. Figure 6 was the result withWyoming K-montmorillonite. Even after severe drying (1000 bar, a = 0.48),when returned to 0.010 bar the clay recovered most of its initial water content at0.010 bar. The Na clay behaves in the same way on re-wetting (Tessier [1984]).
Water ratio (o)
30 . Water content(W)
10
20,
.2.5
0.010 0.10 1.0 10 0o 00P(bor)
Figure 6. Change in water content on first drying and rewetting of Wyoming K-montmor-
illonite.
53
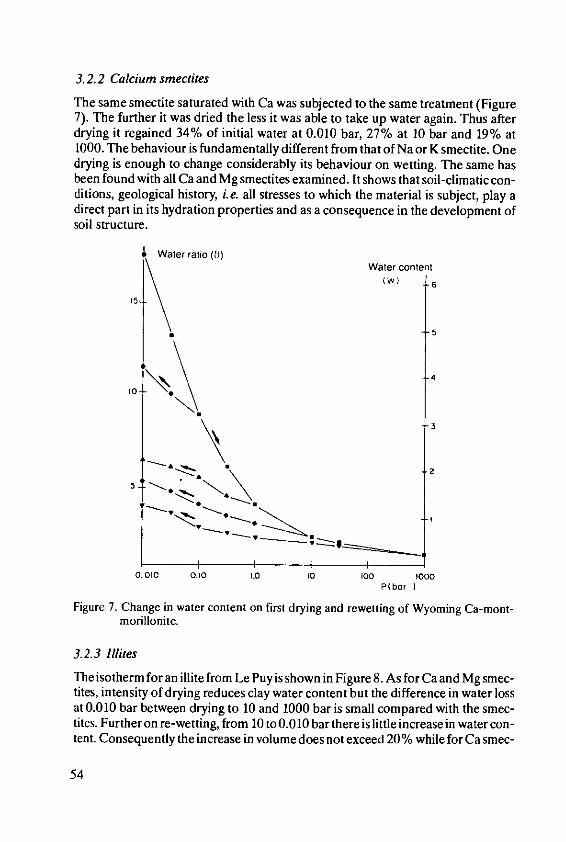
3.2.2 Calcium smectites
The same smectite saturated with Ca was subjected to the same treatment (Figure7). The further it was dried the less it was able to take up water again. Thus afterdrying it regained 34% of initial water at 0.010 bar, 27% at 10 bar and 19% at1000. The behaviour is fundamentally different from that of Na or K smectite. Onedrying is enough to change considerably its behaviour on wetting. The same hasbeen found with all Ca and Mg smectites examined. It shows that soil-climatic con-ditions, geological history, i.e. all stresses to which the material is subject, play adirect part in its hydration properties and as a consequence in the development ofsoil structure.
water ratio (t))Water content
( 6
5 155
4
0.010 0.10 1.0 to 10 1000
P(bor
Figure 7. Change in water content on first drying and rewetting of Wyoming Ca-mont-morillonite.
3.2.3 Mites
The isotherm for an illite from Le Puy is shown in Figure 8. As for Caand Mg smec-ftes, intensity of drying reduces clay water content but the difference in water lossat 0.010 bar between drying to 10 and 1000 bar is small compared with the smec-tires. Further on re-wetting, from 10 to 0.010 bar there is little increase in water con-tent. Consequently the increase in volume does not exceed 20% while for Ca smec-
54

tite it can exceed 150% (Tessierfl984]). This behaviour is characteristic of kaoli-nites and highly charged illites whatever the exchangeable cations (Na, K, Mg, Ca).
In thus appears that to analyse the hydration properties of clay-water systems, itis necessary to be aware of their nature and also of their energetic history. With claymaterials it is not a case of classical hysteresis, as for a mass of rigid grains. Thewhole of the water potential curve depends especially on the maximum stressessuffered by the materials through their history (Croney and Coleman 11954]; Tes-sier [1984]). This must be taken into account in laboratory work.
Water ratio (8)
Water content4- (W)
3i,0
2-2 • A
0.5
I I I I0.010 0.10 t.0 10 100 100
PI bar)
Figure 8. Change in water content on first drying and rewetting of K-illite from Le Puy.
4. Development of clay organisation
As we have seen, the curves relating water potential and water content are charac-teristic of clays. In proceeding to characterise the organisation of clay water sys-
tems in the range Angstrom to submacroscopic, we shall show how knowledge ofthe microstructure of such systems aids in better identification. We shall also seehow it is possible to describe the mechanism of hydration and swelling of clays insoil.
55
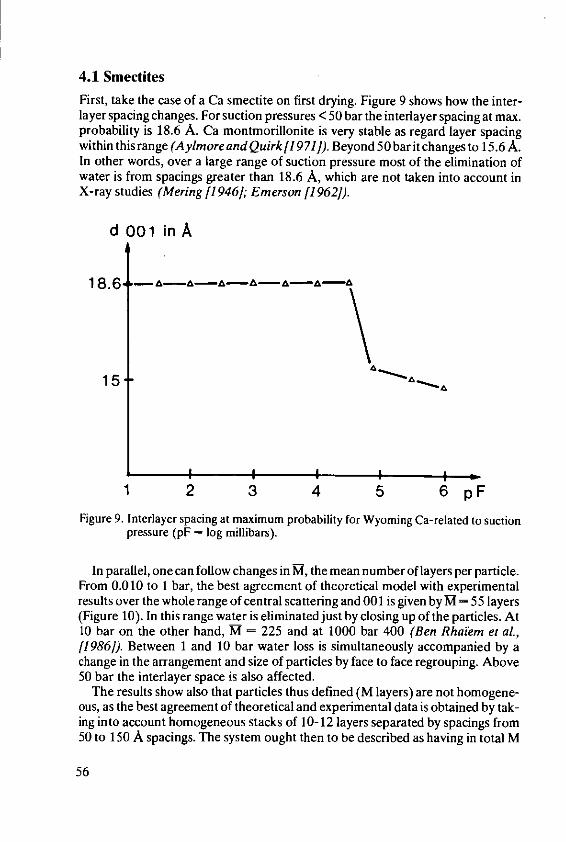
4.1 Smectites
First, take the case of a Ca smectite on first drying. Figure 9 shows how the inter-layer spacing changes. For suction pressures < 50 bar the interlayer spacing at max.probability is 18.6 A. Ca montmorillonite is very stable as regard layer spacingwithin this range (A ylmore andQuirkf [971]). Beyond 50 barit changes to 15.6 A.In other words, over a large range of suction pressure most of the elimination ofwater is from spacings greater than 18.6 A, which are not taken into account inX-ray studies (Mering [1946]; Emerson [1962]).
d 001 in A
1 8.6 ,- -A a-, a A
15" ' A
I I I I I -m
1 2 3 4 5 6 pFFigure 9. Interlayer spacing at maximum probability for Wyoming Ca-related to suction
pressure (pF log millibars).
In parallel, one can follow changes in M, the mean number of layers per particle.From 0.0 10 to 1 bar, the best agreement of theoretical model with experimentalresults over the whole range of central scattering and 001 is given by M = 55 layers(Figure 10). In this range water is eliminated just by closing up of the particles. At10 bar on the other hand, M = 225 and at 1000 bar 400 (Ben Rhaiem et aL,[1986]). Between 1 and 10 bar water loss is simultaneously accompanied by achange in the arrangement and size of particles by face to face regrouping. Above50 bar the interlayer space is also affected.
The results show also that particles thus defined (M layers) are not homogene-ous, as the best agreement of theoretical and experimental data is obtained by tak-ing into account homogeneous stacks of 10-12 layers separated by spacings from50 to 150 A spacings. The system ought then to be described as having in total M
56
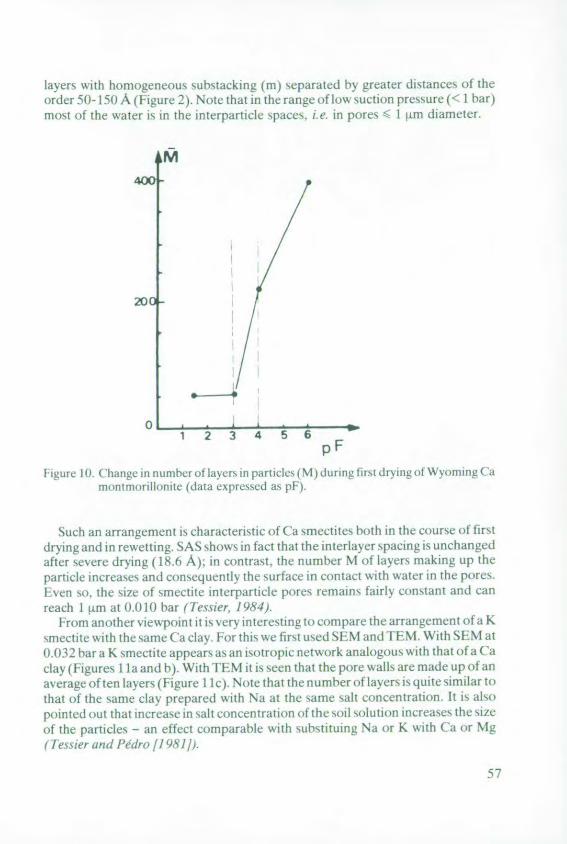
layers with homogeneous substacking (m) separated by greater distances of theorder 50- 150 A (Figure 2). Note that in the range of low suction pressure (< I bar)most of the water is in the interparticle spaces, i.e. in pores < I lin diameter.
tM
01 2 3 4 56
pF
Iigaure n. n umbe ot layers n particles (M) during first drying of Wyoming (amiontiorillonite (data expressed as pF).
Such an arrangement is characteristic of (a smectites both in the course of firstdrying and in rewetting. SAS shows in fact that the interlayer spacing is unchangedafter severe drying ( 18.6 A): in contrast, the number M of layers making up theparticle increases and consequently the surface in contact with water in the pores.Even so. the size of smectite interparticle pores remains fairly constant and canreach I i.m at 0.010 bar (lessier, 1984).
From another viewpoint it is very interesting to com pare the arrangement of a Ksnectite "ith the same Ca clay. For this we first used SEM andI FM. With S EM at0.032 bar a K smectite appears as an isotropic network analogous with that of a Caclay (Figures 1 la and b). With IEM it is seen that the pore walls are made up of anaverage of ten layers (Figure II c). Note that the number of layers is quite similar tothat of the same clay prepared with Na at the same salt concentration. It is alsopointed out that increase in salt concentration of the soil solutiom increases the sizeof the particles - an effect comparable with substitutug Na or K with Ca or Mg(fessier and Pdro [1981/).
57

V I N
-,
fIgLlre 11. ( cknral arrancrn e Ie of Wyornng nontmo ri lonitc O. (132 bar (a) ( a cla> S|-M(b) K cla SM (c) K clay TEM
58
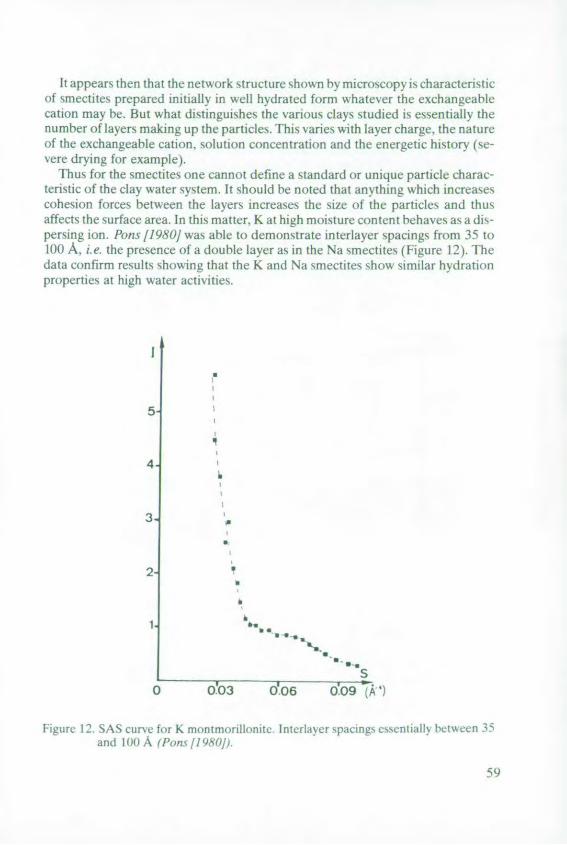
It appears then that the network structure shown by microscopy is characteristicof smectites prepared initially in well hydrated form whatever the exchangeablecation may be. But what distinguishes the various clays studied is essentially thenumber of layers making up the particles. This varies with layer charge, the natureof the exchangeable cation, solution concentration and the energetic history (se-vere drying for example).
Thus for the smectites one cannot define a standard or unique particle charac-teristic of the clay water system. It should be noted that anything which increasescohesion forces between the layers increases the size of the particles and thusaffects the surface area. In this matter. K at high moisture content behaves as a dis-persing ion. Pons /1980] was able to demonstrate interlayer spacings from 35 to100 A. i.e. the presence of a double laver as in the Na smectites (Figure 12). Thedata confirm results showing that the K and Na smectites show similar hydrationproperties at high water activities.
S
5
4
3.5
2-
b
SS%-
S
0 003 o06 do 9(A
Figuro 12. SAS curvc for K montmrnorillonitc Ihniriayer spatngs cssenjtal betwci 35and 100 A 1(Pott 11980/)
59
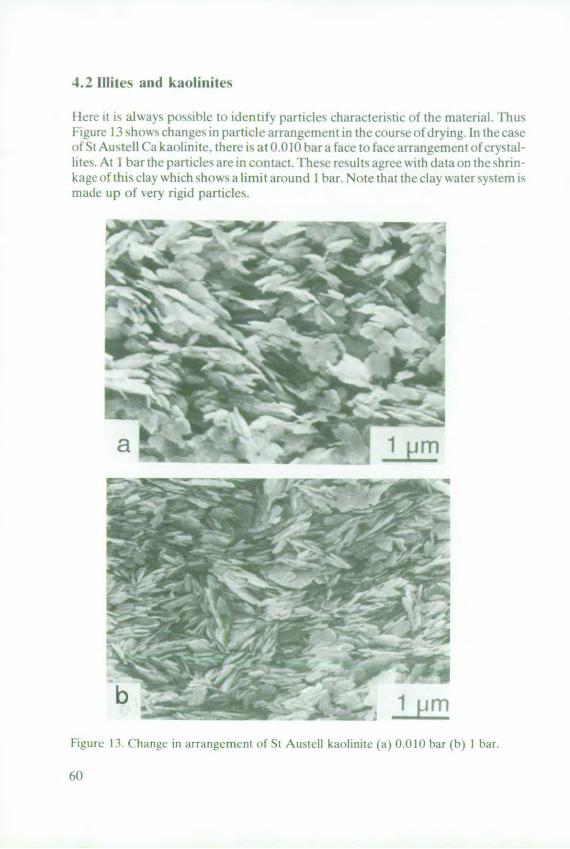
4.2 Illites and kaolinites
[Here it is always possihle to identify particles characteristic of the material. I husFigure 13 shoiws changes in particle arrangement in the course of drying. In the caseof St Austell (a kaolinite. there is at 0(0 bar a face to face arrangement of crystal-lites. At I bar the particles are in contact These results agree with data on the shrin-kage of this clay which shows a limit around I bar. Note that the clay water system ismade up of very rigid particles.
Figure 13. Change in arrangenic nt of St Austcl I kaol inite (a) 0.010 bar (b) I bal.
60
In this case the value of the void ratio at the shrinkage limit (minimum porosity)is still large, as e = 1.1 (Tessier[1984]). Analogous behaviour is seen in illites. Incontrast for a smectite, whatever the exchangeable cation, the minimum value of ereaches 0.35. Thus there is a direct relation between the nature of the interlayerspace and the shrinkage limit of clays. In effect, for the illites and kaolinites the par-ticles can be considered almost not to be deformed on shrinking. In iWlites, non-exchangeable K in the hexagonal cavities assures the rigidity of the particles. Thedrying process only results in rearrangement at the interparticular level leading tovariations in volume and to a macroscopic structure. In contrast, for the clays with alarge number of interlayer spaces with hydrated exchangeable cations, the particlesare flexible and the layers can slide on the a b plane and thus adjust themselves(Suquet [1968]; de la Calle 119771). There is complete reorganisation of the claywith variation in water content which can affect all levels of arrangement resultingto cracking and shearing. At the lowest energy levels, there is a considerable changein structure of the system. This change in structure can be provoked by differentfactors, of which the two main are solution concentration and suction pressure. Theformer directly affects flocculation.
5. Conclusion
We have shown that clays should be described over a much larger energy rangethan has been usual and especially for values of aw > 0.98. In this range, potassiumclays show hydration behaviour similar to sodium clays. The sodium and potas-sium smectites at low suctions are much more hydrated than the same Ca and Mgclays which distinguishes the illites sensu stricto and kaolinites. The interstratifiedminerals generally show behaviour intermediate between these two extremes.Thus it is now possible to identify a clay by its hydration behaviour at low suctionpressure, but this must be done under perfect control of solution concentration, i.e.osmotic pressure.
Once continuity has been established between the structural unit (layer) and themacroscopic arrangement of clays it becomes possible to distingish the main claytypes by arrangement of the particles. One can then demonstrate the specific roleof physico-chemical factors in the characteristics of the system under study.Results obtained by various techniques (SEM, TEM, SAS) are coherent.
In summary, the results demonstrate that it is not possible to describe the pro-perties of clays, especially when well hydrated, and consequently swelling andstructure merely on the basis of classical mineralogy. It is necessary to take intoaccount the geochemical environment and also energetic history i.e. climatic ormechanical constraints. On such a basis one can develop an overall strategy for thestudy of soil calys and thus establish a tie-up with their physical and physico-chem-ical properties.
61
6. References
1. Aylmore, L.A. G. and Quirk, J. P.: The structural status of clay systems. Clays and clayMinerals, 9, 104-130 (1962)
2. A ylmore, L.A. G. and Quirk, J. P.: Domains and quasi-crystalline regions in clay sys-tems. Soils Sci. Soc. Amer. Proc. 35, 652-654 (1971)
3. Ben Rhaiem, H.: Etude du comportement hydrique des montmorillonites calciques etsodiques par analyse de Ia diffusion de rayons X aux petits angles. Thesis Univ.Orleans France 136 p., 1983
4. Ben Rhaiem, H., Tessier, D. et Pons, C.H.: Comportement hydrique et evolutionstructurale des montmorillonites au cours d'un cycle de dessiccation-humectation.Partie I: cas des montmorillonites Ca. Clay Minerals 21, 9-19 (1986)
5. Calle (de 1a), C.: Structure des vermiculites, facteurs conditionnant les mouvementsdes feuillets. Thesis Univ. Paris VI. 133 p, 1987
6. Dufey, J.E. and Banin, A.: Particle shape and size of two sodium-calcium montmoril-lonite clays. Soil Sci. Soc. Am. J. 43, 782-785 (1979)
7. Emerson, W. W.: The swelling of Ca-montmorillonite due to water absorption. 2-wa-ter up take in the liquid phase. J. Soil Science, 13, 40-45 (1963)
8. Foster. The relation between composition and swelling in disperse systems. Clays andclay Minerals 3, 296-316 (1958)
9. Glaeser, R. andMering, J.: Isotherms d'hydratation des montmorillonites bi-ioniquesNa-Ca. Clay Miner. Bull. 2, 188-193 (1984)
10. J.S.S.S.: Soil physics terminology. Int. Soil Sc. Soc. Bull. 48, 16-22 (1976)11. Mering, J.: On the hydration of montmorillonite. Trans. Farad. Soc., 42, 205-219
(1946)12. Mooney, R. W., Keenan, A. C. and Wood, L.A.: Adsorption of water vapor by mont-
morillonite. II. Effect of exchangeable ions and lattice swelling as measured by X-raydiffraction. J. Amer. Chem. Soc. 74, 1371-1374 (1952)
13. Nadeau, P.H.: The physical dimensions of fundamental clay particles. Clay Minerals,20, 499-514 (1985)
14. Norrish, K.: The swelling of montmorillonite. Discuss. Farady Soc., 18, 120-134(1954)
15. Pons, C.H.: Mise en 6vidence des relations entre la texture et la structure dans les sys-times eau-smectites par diffusion aux petits angles du rayonnement X synchrotron.Thesis Univ. Orl6ans, France, 115 p., 1980
16. Pons, CH., Rousseaux, F. and Tchoubar, D.: Utilisation du rayonnement synchro-tron en diffusion aux petits angles pour 1'6tude du gonflement des smectites. I. Etudedu syst~me auu-montmorillonite-Na en fonction de la temp6rature. Clay Minerals,16, 23-42 (1981)
17. Pon, C.H., Tessier, D., Ben Rhaiem, H. and Tchoubar, D.: A comparison betweenX-ray studies and electron microscopy observations of smectite fabric. In: Proc. Int.Clay Conf. Bologna, Pavia, 1981, H. van Qiphen and F. Veniale, Eds., Elsevier,Amsterdam, 165-186, 1982
18. Qudmener, J.: Important factors in potassium balance sheets, 13" Congr. Int. PotashInstitute, 33-63 (1986)
19. Saez-Aunon, J., Porns, C.H., Iglesias, J.E. and Raussell-Colom, J.A.: Etude du gon-flement des vermiculites ornithine en solution saline par analyse de ia diffusion desrayons X aux petits angles. M6thode d'interpritation et recherche des param~tresd'ordre. J. Appl. Crystallogr. 16, 439-448 (1983)
62

20. Spurr, A.R.: A low-viscosity epoxy resin embedding medium for electron micros-copy. Ultrastructure Research 26, 31-43 (1969)
21. Suquet, H.: Propri6t6s de gonflement et structure de la saponite. Comparaison avec lavermiculite. Thesis Univ. Paris VI, 269 p., 1968
22. Tessier, D.: Etude de la microstructure d'6chantillons de sols. Validit6 et limite destechniques de d6shydratation disponibles. Proc. Int. Meeting Soil Micromorphology,Paris, 23-30, 1987
23. Tessier, D. and Berrier, J.: Utilisation de la microscopie 61ectronique A balayage dansl'etude des sols. Observation de sols humides soumis iidiff6rents pF. Science du Sol. 1,67-82 (1979)
24. Tessier, D. and Ptdro, G.: Electron microscopy of Na-smectite. Role of layer charge,salt concentration and suction parameters. in Proc. Int. Clay Conf. Bologna, Pavia,1981. H. van Olphen and F. Veniale, eds., Elsevier, Amsterdam, 165-176, 1982
25. Tessier, D. and Pedro, G.: Characterization of 2:1 clays in soils. Importance of theclay texture. Proc. Int. Clay Conf. Denver, 1987
63

Development of K containing Mineralsduring Weathering and SuitableMethods for their Determination
H. Tributh, Institute of Soil Science, Justus-Liebig-University Giessen/Fed. Rep.of Germany*
Summary
The development of clay minerals includes the processes of formation, transformation,and decomposition of clay minerals in soils.
The clay formation in soils of temperate climate is mainly a result of mica weathering inthe silt and sand fractions. Transformation means alteration of minerals which leads toexpansion of K containing clay minerals for which a decrease in layer charge and potas-ium release are the most important requirements.
Clay decomposition is a consequence of soils becoming increasingly poor in bases andtheir additional pollution with acidic substances from the environment.
An analysis of individual stages of development is only possible after dividing the claycomponent into subfractions.
The X-ray methods, the determination of the layer charge by the n-alkylammoniummethod, and the contraction behaviour after KCI treatment are means of determining thestages of clay mineral development. As long-term K fertilizing proves, K shortgage bothdecreased yields and accelerates clay mineral transformation. Liming benefits the deve-lopment of clay minerals because sufficient base saturation prevents clay decomposition.Methodological aspects are described.
1. Introduction
Knowledge of alterations of K containing layer-silicates and of K exchange hasbeen derived mainly from model substances or clays from deposits summarised byTributh 11976].
It is much more difficult to detect transformation processes due to weathering innatural soil clay fractions than it is to carry out an experimental simulation. Exactanalysis of the mineralogical composition of the subfractions of clays is possibleonly by extended fractionation by centrifuges.
* Dr. H. Tributh, Institute of Soil Science, Justus-Liebig-Universitat Giessen, Wiesen-
strasse 3-5, D-6300 Giessen/Fed. Rep. of Germany.
65
There are already reports existing on the advantages of more detailed determi-nation of mineral constituents and their properties by extended fractionation inclay mineralogical experiments (Tributh [1967, 1970, 1971]). My own examin-ations on clay subfractions with those carried out in close cooperation with Leh-nardt [1974] and Hilger-Alexandrou [1976] indicated that clay mineral develop-ment is influenced by the soil environment, i.e. according to the degree of baseimpoverishment differing cend productsD are detected.
Among the identification procedures by X-ray diffractometry the contractionbehaviour after K treatment has proved to be best suited for the differenciation oftransformation stages of soil clays. In cooperation with Lagaly/Kiel the close con-nection between decrease in layer charge and contraction behaviour could berevealed by the alkylammonium exchange (Tributh [1976]).
2. Stages of clay mineral development caused by weathering
The extent of clay mineral development is mainly determined by the intensity ofweathering and, especially, by the pH shift to the acidic medium. (Figure 1).Scheffer et al. [1966] discovered that the coarse particles of the clay fraction arenearly exclusively produced by a cryoclastic clay formation (mechanical weather-ing), whereas the chemical weathering mainly produces clay fractions < 0.2 ipm.
Clay formation in loess soils is fundamentally characterized by weathering ofmicas in the silt and sand fraction which first leads to reduction in particle size with-out much change in mineral logical properties. As soon as the mica particles fallbelow the 2 pm boundary they belong to the clay fraction and are then called illites.According to F6lster et al [1963] approximately 95 % of the clay minerals of oursoils are produced by wheathering of micas. The (second) possibility of clay min-eral genesis often mentioned (Scheffer/Schachtschabel[1 976]), clay mineral gen-esis by new formation from silicate degradation products, is certainly of subordi-nate significance for soils in Central Europe. Since the soil represents an open sys-tem, the conditions of environment and concentration required for the new forma-tion of three-layer minerals are not fulfilled, whereas, under certain conditions,formation of halloysites and kaolinites may also occur in our climatic zone.
The transformation of mica-type clay minerals begins at a particle size of < 0.2jun and proceeds from expansion at the edges to a layer distance of 1.8 nm (Trib-uth /1976]). The basic requirement for this alteration is potassium release andreduction in layer charge. The fact that this process runs pararell to the particle sizereduction is shown by X-ray diagrams of different clay fractions of a Ukrainechernozem (Figure 2).
The air-dried Ca samples show the smooth transition into fully expandable min-erals with decreasing particle size more cxlearly than glycerol treatments.
66
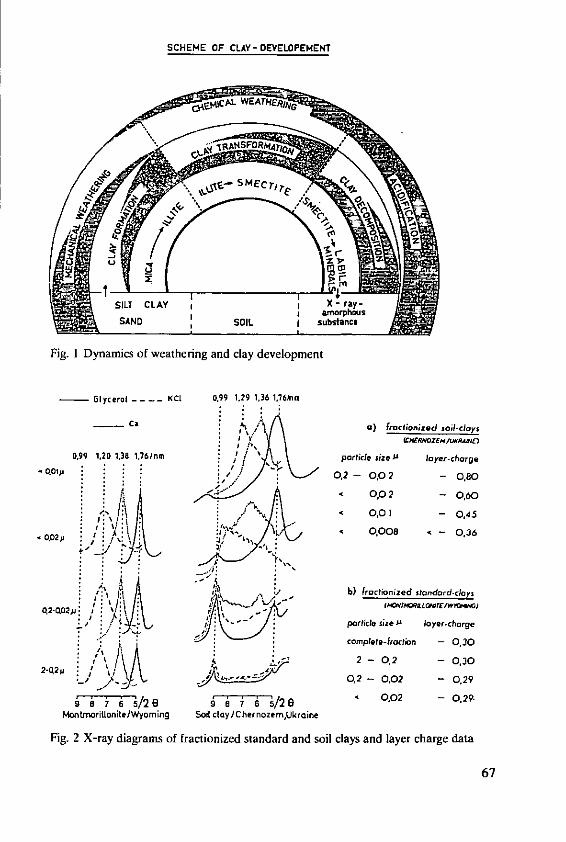
SCHEME OF CLAY- DEVELOPEMENT
- lyerl -- K I 0,9 12 .617 I
SILT CLAY X - ray-~arorphous
Fig. I Dynamics Of weathering and clay development
-2 Glycerol . . . . KCI 0.99 1.29 1.36010-6m0
Ii- _a , ;
6 f) raci n;ze d s dacl ys
0.99 1,20 1.38 1.761rm particle size P layer-charge
• 0,0,complele0. -lrc.0 - 0.3o
S0,0 2 -0,60
Il%
0,2, 0,02 - 0,45
9765/26 ''6 /0,02 - 0,36
Montmritloite/Womb) Soc6.re tord/oernaemUkaiys
Fig.2 X-ay iagrms o frctioizdstadardandroil claysz A la yer charge t
:corplete-roc6on - 7 0,304 2 -0,2 -03
• _ ,C,_t. p 0,2 - 0,02 - 0,29
4 /2 tl 9 8 ' 76F- 5/21) 0,02 - 0.29.MontinorJffonitelWyomning Soil clay / C her nozem,Uk r ine
Fig. 2 X-ray diagrams of fractionized Standard and soil clays and layer charge data
67

The qualitative differences are very clearly shown by contraction tests with KCI.While the smectites (1.76 nm) in the fraction 0.2-0.02 pLm nearly totally contract to0.99 nm, only some of the minerals of the fraction < 0.02 pm are able to contract.The minerals of the fraction < 0.01 tm only contract to 1.26 nm, and thus react likethe montmorillonites from deposits in Wyoming which reveal approximately thesame layer distance in all subfractions. The fact that the tendency to contraction islargely parallel to the layer charge is confirmed by the layer charge data. These datawere obtained from the subfractions of the Ukraine chernozem in cooperationwith Lagaly/Kiel. Only the fraction < 0.008 pm (without figure) of the soil clayalmost reaches with < 0.36 the layer charge of the standard Wyoming montmoril-lonite.
For the development of smectite it is essential that the environment does notchange. As long as calcium and magnesium ions are available to replace thereleased potassium, the transformation of illite leads to smectite which remainsstable up to extremely small grain sizes.
The clay decomposition of three-layer minerals starts with an extreme expan-sion beyond 0.2 nm. The coherence of the layers decreases to such an extent thatresistence to the expansive power of the glycerol (in the soil: water) is lost, and theinterlayer spaces expand to infinity.
The state of qlability" is the first and also the only visible phase of clay decompo-sition. As soon as the layers are totally independent of each other, the (001) reflexdisappears and the diagram exhibits a pronounced continuous increase of intensityto small angles (Figure 3).
- Glycerol ------- KC Ca
1,1Onm 1,0 nm 176nm 1,0nm 1.76nmI, i\I I,
I I I
o) ' I /bb
: t + i\j
I' \
M.. i.. 0... 2ro
Fig. 3 Examples of stabile and labile minerals of clay fractions < 0.06 [Lm
68
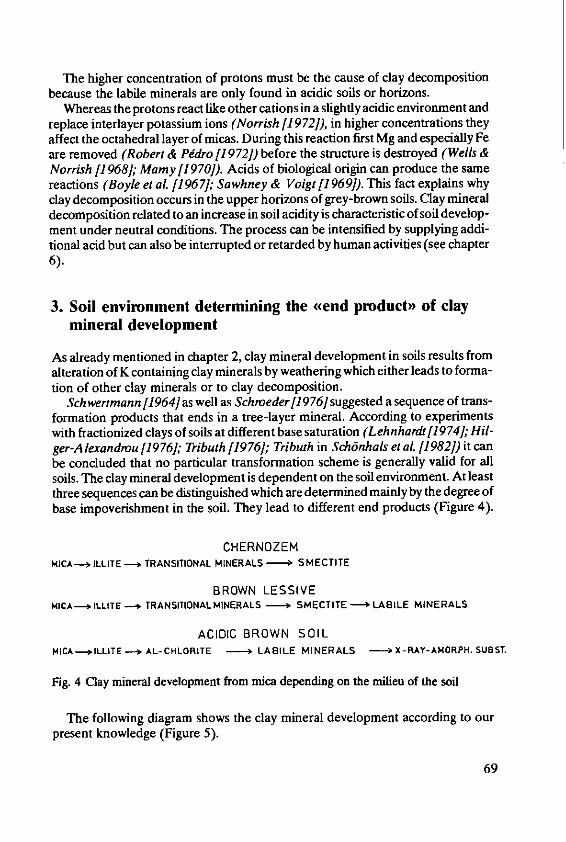
The higher concentration of protons must be the cause of clay decompositionbecause the labile minerals are only found in acidic soils or horizons.
Whereas the protons react like other cations in a slightly acidic environment andreplace interlayer potassium ions (Norrish [1972]), in higher concentrations theyaffect the octahedral layer of micas. During this reaction first Mg and especially Feare removed (Robert & Ptdro [1972]) before the structure is destroyed (Wells &Norrish [1968]; Mamy 11970]). Acids of biological origin can produce the samereactions (Boyle et al. [1967]; Sawhney & Voigt 11969]). This fact explains whyclay decomposition occurs in the upper horizons of grey-brown soils. Clay mineraldecomposition related to an increase in soil acidity is characteristic of soil develop-ment under neutral conditions. The process can be intensified by supplying addi-tional acid but can also be interrupted or retarded by human activities (see chapter6).
3. Soil environment determining the ((end product) of claymineral development
As already mentioned in chapter 2, clay mineral development in soils results fromalteration of K containing clay minerals by weathering which either leads to forma-tion of other clay minerals or to clay decomposition.
Sch wertmann [1964] as well as Schroeder[l976] suggested a sequence of trans-formation products that ends in a tree-layer mineral. According to experimentswith fractionized clays of soils at different base saturation (Lehnhardt[1974]; Hil-ger-Alexandrou [1976]; Tributh 11976]; Tributh in SchOnhals et al. [1982]) it canbe concluded that no particular transformation scheme is generally valid for allsoils. The clay mineral development is dependent on the soil environment. At leastthree sequences can be distinguished which are determined mainly by the degree ofbase impoverishment in the soil. They lead to different end products (Figure 4).
CHERNOZEMMICA-. ILLITE - TRANSITIONAL MINERALS I S MECTITE
BROWN LESSIVEMICA-*ILLITE T--. RANSITIONALMINERALS - SMECTITE- 3LABILE MINERALS
ACIDIC BROWN SOILMICA-. ILLITE-> AL-CHLORITE --- LABILE MINERALS .-- X-RAY-AMORPH. SUBST.
Fig. 4 Clay mineral development from mica depending on the milieu of the soil
The following diagram shows the clay mineral development according to ourpresent knowledge (Figure 5).
69
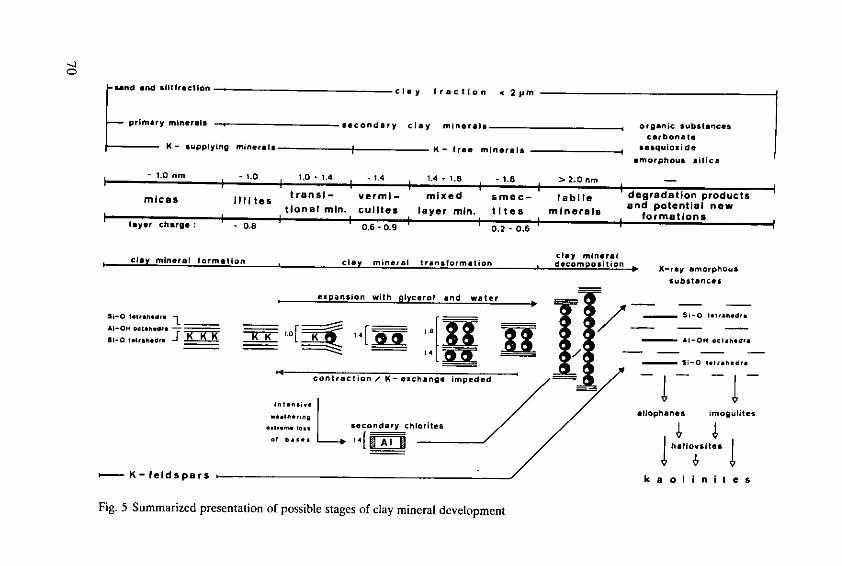
-.4
sand and alltfractlon clay fraction < 2ym
primary minerals secondary clay minerals organic substancescarbonate
K - supplying minerals K - free minerals squio.idamorphous silica
-1.0 nm -1.0 1.0-1.4 -1.4 1.4-1.8 -1.8 > 2.0nn, -
micas Jifftes transi- verml- mixed smec- labile degradation products
tional min. cultes layer rin. tites minerals and potential newlayer charge O 06- 02formations
.Clay ineal ormtio cly mclay mineral
clay mineraf formation clay mineral transformation decomposition X-ray amorphou s
substances
expansion with glycerol and water -
51-0 etraadra _______ -~- 2 S-o th~l.dra
AuO Th.hl z4 -SI-C .Ilhdl. K I O1 At-Oloclaih dla
SSi-C ..... dracontraclion / K- exchange impeded
w........ allophanes imogulites.1- secondary chlorites01 buSs$ 1 hafiovsite/
- K-feldspars k a o I i n i t e s
Fig. 5 Summarized presentation of possible stages of clay mineral development

First of all, the boundary of the different grain sizes is marked out by the delimi-nation of the clay fraction < 2 pm from the silt and sand fractions. In the next lineprimary and secondary clay minerals are distinguished. The clay fraction not onlycontains silicate clay minerals but also organic substances, sesquioxides, carbo-nates and amorphous silica.
A further division reveals that minerals act as K suppliers.According to their significance, mica-type clay minerals are in the centre of the
table. The sequence of the minerals was determined by the basal spacings (dvalues) after glycerol treatment. The initial product of the outline of the develop-ment is mica which transforms to illite by passing the < 2 pm boundary. The onlydifference between illite and mica is that illite has a lower K content which is indi-cated by leaving out one of the symbolic K letters. Barshad[1948], Newmann &Brown /1966] as well as Robert 11971] have shown that the first phase of potas-sium removal can start without any strong lattice alteration. The transition statesbetween illite, vermiculite and smectite comprise transition minerals, mixed layerminerals and labile minerals.
As the schematic outlines illustrate, the ,transition minerals (1.0-1.4 nm) areillites expanded at the edges, as proved by Graf v. Reichenbach andRichj 968]byscanning electron micrographs of pure micas. The layers of the transitional miner-als are held together by the potassium in the centre at a layer distance of about 1.0nm.
The sphere opening the layers at the edge in the schematic outline stands sym-bolically for glycerol as intercalacting solvent in the laboratory. In the soil the sameeffect is produced by water molecules. The term <mixed-layer mineralso symboli-cally represents the existence of various layer distances.
As shown in the outline, layer distances of 1.4 nm and 1.8 nm may occur inpackets of layers, but often mica-like layers with d-values of 1.0 nm are included(Norrish [1972]).
The term 4labile mineralsD was proposed on the basis of observations after gly-cerol treatment. As described in Figure 3, labile minerals represent the first visiblephase of clay decomposition.
The degradation products of minerals can be found at the end of the line. In thiscase they consists of X-ray amorphous substances that are not necessarily withoutstructure. Furthermore, the section contains possible new formations. The spheri-cal allophanes are not exactly delimited as they are considered as degradation,transformation, or formation products by different authors. The arrows pointingdown indicate that allophanes as well as imogulites can be formed from silicatedegradation products and that they then possibly represent the preliminary stagefor the formation of halloysites and kaolinites.
The single minerals or their symbolic equivalents are not connected by arrows toindicate that ordering according to expansibility does not necessarily signify thesequence of clay mineral development. It may serve as an example that vermicu-lites (= 1.4 nm) cannot be detected in most of the loess soils (Lehnhardt [1974],Tributh [1970], Tributh in Schilnhals et al. [1982]).
71
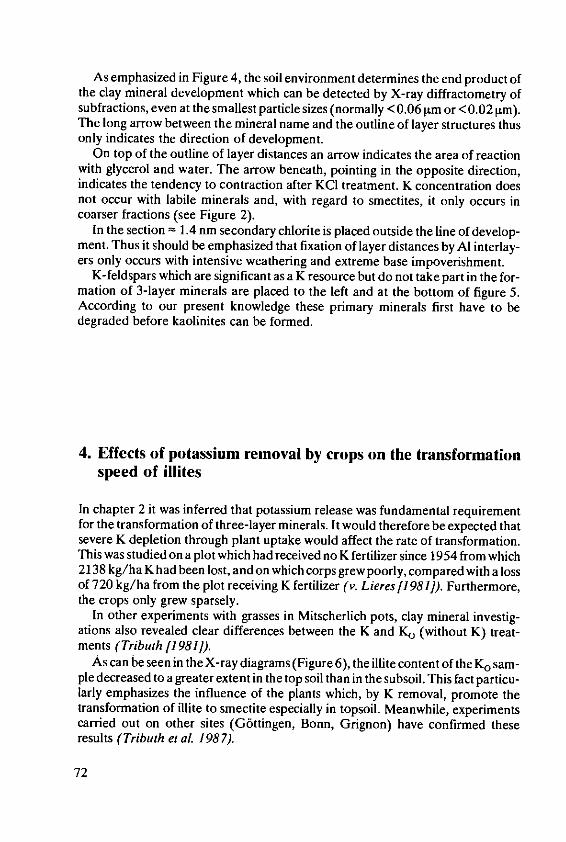
As emphasized in Figure 4, the soil environment determines the end product ofthe clay mineral development which can be detected by X-ray diffractometry ofsubfractions, even at the smallest particle sizes (normally <0.06 [m or < 0.02 lin).The long arrow between the mineral name and the outline of layer structures thusonly indicates the direction of development.
On top of the outline of layer distances an arrow indicates the area of reactionwith glycerol and water. The arrow beneath, pointing in the opposite direction,indicates the tendency to contraction after KCI treatment. K concentration doesnot occur with labile minerals and, with regard to smectites, it only occurs incoarser fractions (see Figure 2).
In the section - 1.4 nm secondary chlorite is placed outside the line of develop-ment. Thus it should be emphasized that fixation of layer distances by Al interlay-ers only occurs with intensive weathering and extreme base impoverishment.
K-feldspars which are significant as a K resource but do not take part in the for-mation of 3-layer minerals are placed to the left and at the bottom of figure 5.According to our present knowledge these primary minerals first have to bedegraded before kaolinites can be formed.
4. Effects of potassium removal by crops on the transformationspeed of illites
In chapter 2 it was inferred that potassium release was fundamental requirementfor the transformation of three-layer minerals. It would therefore be expected thatsevere K depletion through plant uptake would affect the rate of transformation.This was studied on a plot which had received no K fertilizer since 1954 from which2138 kg/ha K had been lost, and on which corps grew poorly, compared with a lossof 720 kg/ha from the plot receiving K fertilizer (v. Lieres [1 981). Furthermore,the crops only grew sparsely.
In other experiments with grasses in Mitscherlich pots, clay mineral investig-ations also revealed clear differences between the K and Ko (without K) treat-ments (Tributh [19811).
As can be seen in the X-ray diagrams (Figure 6), the illite content of the K. sam-ple decreased to a greater extent in the top soil than in the subsoil. This fact particu-larly emphasizes the influence of the plants which, by K removal, promote thetransformation of illite to smectite especially in topsoil. Meanwhile, experimentscarried out on other sites (G6ttingen, Bonn, Grignon) have confirmed theseresults (Tributh et al. 1987).
72
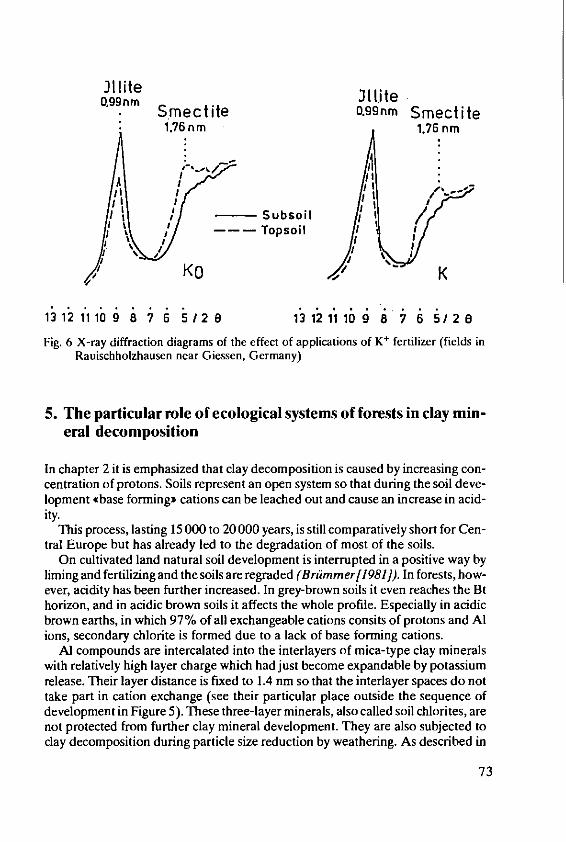
J1ilite0.99nm 3 1 lite
Smectite .9§nm Smectite1.76 n m 1.76 nm
I /,
Subsoil
, I ---- Topsoil
/ 'Ir
SKO K
131211109 8 7 6 5/2 8 1 3121110 9 8 7 6 5/26
Fig. 6 X-ray diffraction diagrams of the effect of applications of K+ fertilizer (fields inRauischholzhausen near Giessen, Germany)
5. The particular role of ecological systems of forests in clay min-eral decomposition
In chapter 2 it is emphasized that clay decomposition is caused by increasing con-centration of protons. Soils represent an open system so that during the soil deve-lopment cbase formingp cations can be leached out and cause an increase in acid-ity.
This process, lasting 15 000 to 20 000 years, is still comparatively short for Cen-tral Europe but has already led to the degradation of most of the soils.
On cultivated land natural soil development is interrupted in a positive way byliming and fertilizing and the soils are regraded (Briimmer[1981). In forests, how-ever, acidity has been further increased. In grey-brown soils it even reaches the Bthorizon, and in acidic brown soils it affects the whole profile. Especially in acidicbrown earths, in which 97% of all exchangeable cations consits of protons and Alions, secondary chlorite is formed due to a lack of base forming cations.
Al compounds are intercalated into the interlayers of mica-type clay mineralswith relatively high layer charge which had just become expandable by potassiumrelease. Their layer distance is fixed to 1.4 nm so that the interlayer spaces do nottake part in cation exchange (see their particular place outside the sequence ofdevelopment in Figure 5). These three-layer minerals, also called soil chlorites, arenot protected from further clay mineral development. They are also subjected toclay decomposition during particle size reduction by weathering. As described in
73
chapter 6, they can also be remobilized by liming. Advanced processes of podsoli-zation, however, have to be assessed differently. Favoured by several generations ofconiferous forests, they have even led to a destruction of kaolinite which is nor-mally rather stable in an acidic environment. -
Another disadvantageous ecological property beside the formation of organicacids is the special acid supply of coniferous forests. These forests filter SO 2 and itssolution products from the air to a higher degree than deciduous forests and deliverthem to the soil as sulphurous and sulphuric acid. The amount of acid (in equiva-lents) can be three times greater than that under a beech forest (Ulrich [1980a]). pHvalues measured in soils under beech forest also indicate that the soil so-called Cal-kaline fertilization by leaf fall is not sufficient effectively to stop the increase inacidity (Runge & Wieners [1984]).
Unfortunately, the advanced degree of clay decomposition described for theecological systems of forests also holds for many tropical soils which have experi-enced long-lasting and intensive weathering.
6. The influence of fertilization on clay mineral development
As shown in the gsummarizing representation in Figure 5, the weathering of pri-mary minerals is the basic requirement for the release of nutrients for plants and theformation of secondary clay minerals. However, the rate of clay mineral transfor-mation and decomposition can be influenced by fertilizing.
In this context it is an interesting fact that, in spite of the increased transforma-tion of illites (Figure 6) in the field without K-fertilizing (chapter 4), the release ofK was not sufficient for normal plant growth, and yield decreased. In this relation achange of the experimental procedure can be of interest. A deficiency field that hadbeen tested for ten years was fertilized with farmyard manure for a further twelveyears. Not only did the plants at once achieve higher yields, but eight years after thefirst supply of manure a positive balance was gained and this improved significantlyin the following four years. The changes could also be detected by X-ray techniqueswhich revealed a decrease in illite transformation.
The K ions which re-entered the interlayer space following potassium fertiliza-tion do increase the stock of soil nutrients because, though with greater difficulty,they can be exchanged. Although contractions occur at certain layer charges (seeFigure 2) and the basal spacings are comparable with those of illites (1.0 nm), thisprocess should not be described as gfixation or gillitization" because the Krelease produces mica-type minerals by weathering and results in irreversibletransformations in the silicate layer which is accompanied by an expansion of theb-axis. Therefore, the original structure of illite cannot be restored when K is againsupplied (Burns & White /1963]; Ellis & Morland [1959]; Newmann [1970b];Brown & Newmann 11970]).
74
While K shortage merely accelerates the transformation speed of illites, Cashortage also changes the environmental conditions (decrease of pH) which leadsto clay decomposition.
Secondary chlorite (see Figure 5) which is often found under forests can be re-mobilized by cultivation, in particular by liming (Niederbudde & Schwertmann11980]). In strongly acidic soils it must be taken into account that the soil is not onlypoor in nutrients but its capacity for nutrient storage is blocked (secondary chlor-ite), or the layer silicates have been transformed into labile minerals or X-ray amor-phous substances with very low storage capacity. Thus, nutrients supplied by ferti-lizing do not increase the plant available stock but are mainly leached out and alsoincrease water pollution.
In contrast to the interlayer spaces blocked by Al, labile minerals or X-ray amor-phous substances as weathering products cannot be transformed into intact three-layer minerals by liming.
Useful fertilizing, however, may positively influence the clay mineral develop-ment that is still in process and may prevent further clay decomposition.
7. Methodical aspects
7.1 Winning of clay subfractions
As already mentioned in the introduction, it is difficult to detect transformationprocesses that are due to weathering by analysing natural clay fractions of soils. Anessential requirement for such an analysis is extended clay fractionation (Tributh/1970]) in which clay subfractions are separated by centrifuge for further analyticalinvestigations (X-ray, CEC).
The pre-treatment and preparation of analytical samples is described in greatdetail by Tributh & Lagaly[1986a]. Therefore, only the significance of dialysis asan important requirement for optimal dispersion should be emphasized. Theextended particle size analysis which has been developed as a routine procedure(Tributh [1972]), provides diagnostic criteria for the estimation of the quantitativeextent of clay mineral development (Tributh in Plass et at /1977]; Tributh inSchbnhalsetal[1982]; Tributh etal[1986]). It is recommended to use five clay sub-fractions. Details on the methods can be found in Tributh & LagalyfJ986b].
7.2 X-ray detection of transformation stages in K containing clay min-erals
Generally, the expansibility of clay minerals is tested by treatment of the clay sam-ples with glycerol or ethylene-glycol. As indicated by the outline of basal spacings(Figure 5), different stages of expansibility can be distinguished. A disadvantage ofthe glycerol test, however, is that it does not determine exact layer charges for it
75
functions according to the principle <yes or no,. Smectites of different soil claysubfractions expand to the same basal spacing of 1.76 nm, although the layercharges can be very different (see Figure 2).
The qualitative changes of the minerals which take place with decreasing parti-cle size, however, become visible by the contraction behaviour. A comparison ofthe X-ray diagrams gained after KCI treatment with the layer charges of the claysubfractions shows a clear relationship. No exact layer charge values can beobtained from the contraction test but ranges of layer charges can be distinguished.
1. Complete concentration = higher layer chargebasal spacing = 1.0 nm (0.6-0.8)
2. Incomplete contraction = medium layer chargebasal spacing - 1.0 nm but (0.4-0.6)slightly asymmetricup to 1.6 nm
3. Slight contraction = low layer chargebasal spacing lies between (< 0.4)1.2 nm and 1.3 nm as inmontmorillonites of deposits
A rough classification like the above may be significant both for the estimation ofK fixation and for useful fertilization. Therefore, the KCI contraction test will bedescribed in some detail:First, 100 ml clay suspension samples are taken from a clay suspension obtained bypretreatment of the soil (removal of carbonates, iron oxides and humus materials)(Tributh & Lagaly [1986a]) and precipitated with CaCI2. The sample is centri-fuged and the solution decanted. The Ca treatment is repeated three times with 1 NCaCI2. Then the sample is washed once with distilled H20. About a third of thesample is transferred into another centrifuge tube for the KCI treatment. Theremaining two thirds of the Ca sample are used for X-ray determination, with orwithout glycerol treatment.
The sample in the centrifuge tube is dispersed in 50 ml 0.1 N KCI solution andagain centrifuged. After decanting the clear (!) solution, the KCI treatment isrepeated three times. Then the sample is washed once with distilled H20 anddecanted only when the solution is clear after prolonged centrifuging. Finally, thesample is X-rayed after three to four days of air drying.
Robert [1972] described the concentration test with KCI as a method whichmakes it possible to differentiate between <realD montmorillonites and smectitesformed by transformation in the soil. However, the contraction test was carried outby him in a slightly different way (drying of the K-clay up to 110 0C and subsequentglycerol treatment) than by Schwertmann & Politz [1961].
76
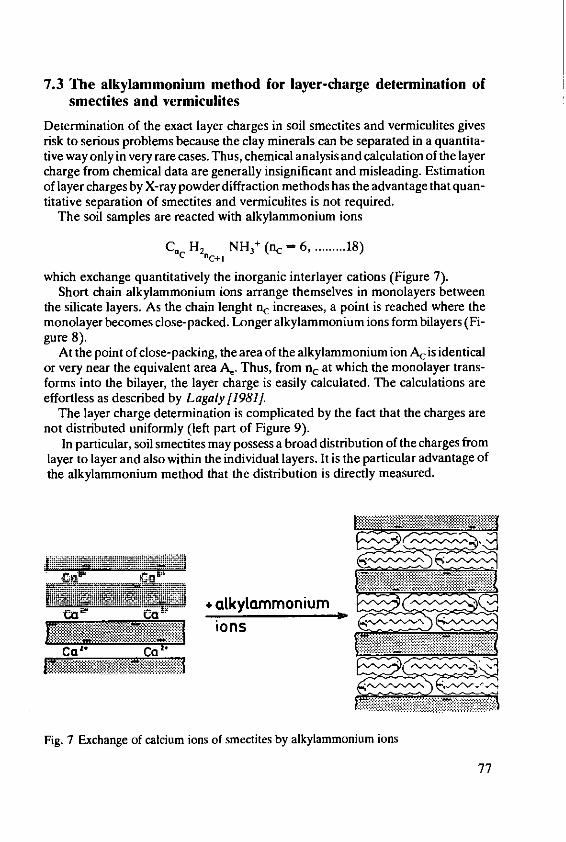
7.3 The alkylammonium method for layer-charge determination ofsmectites and vermiculites
Determination of the exact layer charges in soil smectites and vermiculites givesrisk to serious problems because the clay minerals can be separated in a quantita-tive way only in very rare cases. Thus, chemical analysis and calculation of the layercharge from chemical data are generally insignificant and misleading. Estimationof layer charges by X-ray powder diffraction methods has the advantage that quan-titative separation of smectites and vermiculites is not required.
The soil samples are reacted with alkylammonium ions
C.c H2,c+1 NH3+ (nc = 6 ......... 18)
which exchange quantitatively the inorganic interlayer cations (Figure 7).Short chain alkylammonium ions arrange themselves in monolayers between
the silicate layers. As the chain lenght nc increases, a point is reached where themonolayer becomes close-packed. Longer alkylammonium ions form bilayers (Fi-gure 8).
At the point of close-packing, the area of the alkylammonium ion A c is identicalor very near the equivalent area A,. Thus, from nc at which the monolayer trans-forms into the bilayer, the layer charge is easily calculated. The calculations areeffortless as described by Lagaly [1981].
The layer charge determination is complicated by the fact that the charges arenot distributed uniformly (left part of Figure 9).
In particular, soil smectites may possess a broad distribution of the charges fromlayer to layer and also within the individual layers. It is the particular advantage ofthe alkylammonium method that the distribution is directly measured.
E- N'
:": ca.,:+:.olkylammonium
ionsCa' Ca
Fig. 7 Exchange of calcium ions of smectites by alkylammonium ions
77
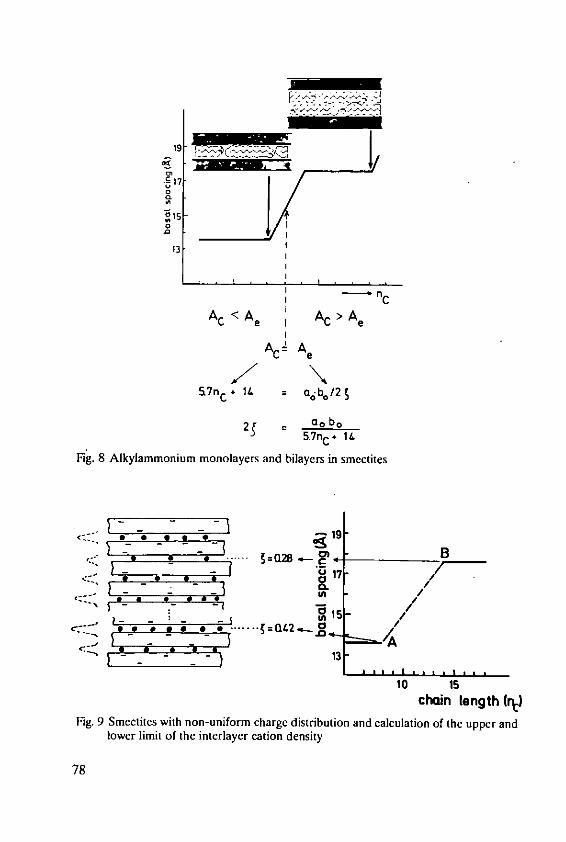
19- T M F
1~ 7
'3
ncAc <A i AC > A
AC! A
57 nlc 14 a~b0 /2S
2 o ab.
Fig. 8 Alkylamnionium monolayers and bilayers; in smectites
W -19
7.IA
I - -I
nC
A =R A e p a aA e.
10 15
chain length (tFig. 9 Smectites with non-uniform charge distribution and calculation of the upper and
lower limit of the interlayer cation density
78
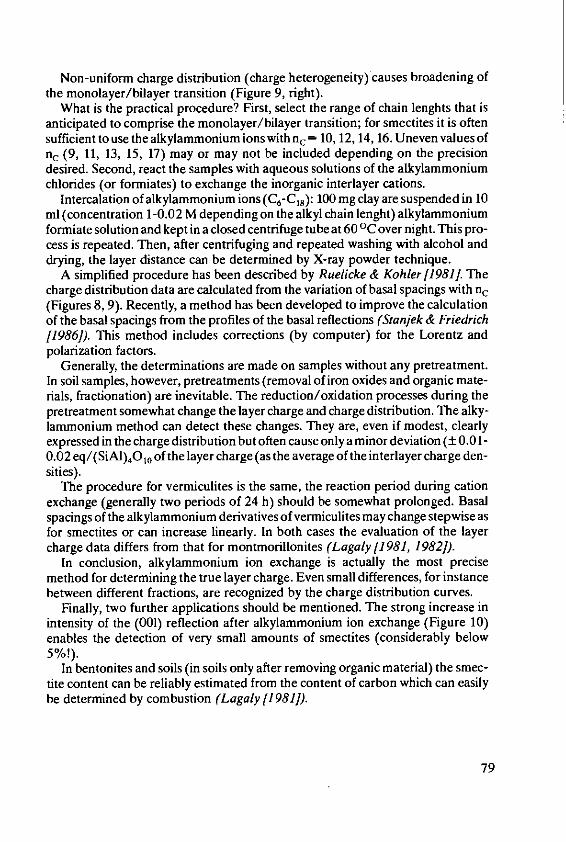
Non-uniform charge distribution (charge heterogeneity) causes broadening ofthe monolayer/bilayer transition (Figure 9, right).
What is the practical procedure? First, select the range of chain lenghts that isanticipated to comprise the monolayer/bilayer transition; for smectites it is oftensufficient to use the alkylammonium ions with nc= 10, 12,14, 16. Uneven values ofnc (9, 11, 13, 15, 17) may or may not be included depending on the precisiondesired. Second, react the samples with aqueous solutions of the alkylammoniumchlorides (or formiates) to exchange the inorganic interlayer cations.
Intercalation of alkylammonium ions (C6-C 8 ): 100 mg clay are suspended in 10ml (concentration 1-0.02 M depending on the alkyl chain lenght) alkylammoniumformiate solution and kept in a closed centrifuge tube at 60 °C over night. This pro-cess is repeated. Then, after centrifuging and repeated washing with alcohol anddrying, the layer distance can be determined by X-ray powder technique.
A simplified procedure has been described by Ruelicke & Kohler [1981]. Thecharge distribution data are calculated from the variation of basal spacings with nc(Figures 8, 9). Recently, a method has been developed to improve the calculationof the basal spacings from the profiles of the basal reflections (Stanjek & Friedrich11986]). This method includes corrections (by computer) for the Lorentz andpolarization factors.
Generally, the determinations are made on samples without any pretreatment.In soil samples, however, pretreatments (removal of iron oxides and organic mate-rials, fractionation) are inevitable. The reduction/oxidation processes during thepretreatment somewhat change the layer charge and charge distribution. The alky-lammonium method can detect these changes. They are, even if modest, clearlyexpressed in the charge distribution but often cause only a minor deviation (± 0.0 1-0.02 eq/(SiAl)4 O10 of the layer charge (as the average of the interlayer charge den-sities).
The procedure for vermiculites is the same, the reaction period during cationexchange (generally two periods of 24 h) should be somewhat prolonged. Basalspacings of the alkylammonium derivatives of vermiculites may change stepwise asfor smectites or can increase linearly. In both cases the evaluation of the layercharge data differs from that for montmorillonites (Lagaly /1 981, 1982]).
In conclusion, alkylammonium ion exchange is actually the most precisemethod for determining the true layer charge. Even small differences, for instancebetween different fractions, are recognized by the charge distribution curves.
Finally, two further applications should be mentioned. The strong increase inintensity of the (001) reflection after alkylammonium ion exchange (Figure 10)enables the detection of very small amounts of smectites (considerably below5%!).
In bentonites and soils (in soils only after removing organic material) the smec-tite content can be reliably estimated from the content of carbon which can easilybe determined by combustion (Lagaly /1981]).
79
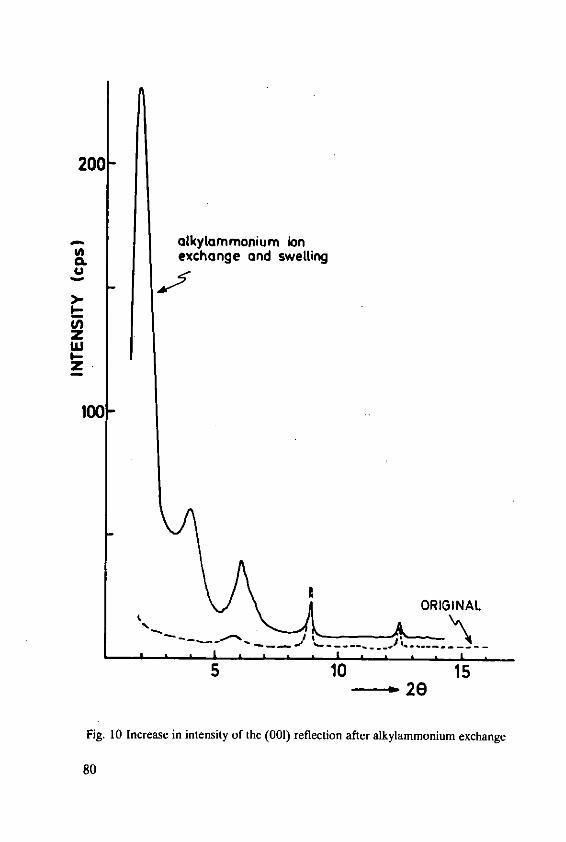
200
alkytommonium iona exchange and swelling
U
z
z
100-
ORIGINAL
5 10 15-a20
Fig. 10 Increase in intensity of the (001) reflection after alkylammonium exchange
80
8. References
1. Barshad, J.: Vermiculite and its relation to biotite. Amer. Min. 33, 655-678 (1948)2. Boyle, J.R., Voigt, G.K. & Sawhney, B.L.: Biotite flakes: Alteration by chemical and
biological treatment. Science 155, 193-195 (1967)3. Brown, G. & Newmann, A. C.D.: Cation exchange properties of micas. 111. Releaseof
potassium sorbed by potassium-depleted micas. Clay Minerals 8, 273-278 (1970)4. Briimmer, G.: Einfluss des Menschen auf den Stoffhaushalt der BOden. Schriften-
reihe des Agrarwissenschaftlichen Fachbereichs der Universitdt Kiel 62, 191-202(1981)
5. Burns, A.. & White, J.L.: The effect of potassium removal on the b-dimension ofmuscovite and dioctahedral soil micas. Proc. Int. Clay Congr. Stockholm, 9-16(1963)
6. Ellis, B. G. & Mortland, M.M.: Rate of potassium release from fixed and native forms.Soil Sci. Soc. Am. Proc. 23, 451-453 (1959)
7. F4lster, H., Meyer, B. & Kalk, E.: Parabraunerden aus primAr carbonathaltigemWiirm-Loss in Niedersachsen. II. Profilbilanz der zweiten Folge bodengenetischerTeilprozesse: Tonbildung, Tonverlagerung, Gefflgeverdichtung, Tonumwandlung.Z. Pflanzenerndihr., Dfingung, Bodenkunde 100, 1-12 (1962)
8. Hilger-Alexandrou, St: Der Tonmineralbestand der Lockerbraunerden des Vogels-berges, ein Beitrag zu ihrer Genese. Dissertation, Giessen, 1976
9. Lagaly, G.: Characterization of clays by organic compounds. Clay. Min. 16, 1-21(1981)
10. Lagaly, G.: Silicate. Ullmann's Encyklopidie der technischen Chemie, 4. Auflage,Bd. 21, Verlag Chemie, Weinheim, 365-376, 1982
11. Lehnhardt, F.: Em Beitrag zur Genese und Systematik polnischer L6ssb6den (Lub-liner Hiigelland), Dissertation, Giessen, 1974
12. Lieres, A.-L.v.: Untersuchungen zur Kalium-Nachlieferung aufgrund von Feld-Dauerversuchen, Gcfissversuchen und chemischen Untersuchungen. DissertationGiessen, 1981
13. Mamy, J.: Extraction of interlayer K from phlogopite. Specific effects of cations. Roleof Na and H concentrations in extraction solution. Clays and Clay Minerals 18, 157-163 (1970)
14. Newman, A. CD.: Cation exchange properties of micas. I. Clay Minerals 8, 267-272(1970b)
15. Newman, A.C.D. & Brown, G.: Chemical changes during the alteration of micas.Clay Minerals 6, 297-309 (1966)
16. Niederbudde, E.A. & Schwertmann, U.: Clay Mineralogy of Soils. Geol. Jb. 039,99-114, Hannover (1980)
17. Norrish, K.: Factors in the weathering of mica to vermiculite. Proc. Int. Clay Conf.Madrid (1972)
18. Plass, W., Poetsch, Th., Tributh, H. & Zakosek, H.: Zur Entstehung eines Smonica-Profils in Rheinessen. Z. Pflanzenemihr., Bodenkunde. 140, 317-328 (1977)
19. Reichenbach, H. Graf v. & Rich, C.J.: Preparation of dioctahedral vermiculites frommuscovite and subsequent exchange properties. IXth Int. Congr. Soil. Sci. Adelaide,1, 709-719 (1968)
20. Robert, M.: Etude experimentale de l'6volution des micas (biotites), 1. Les aspects duprocessus de vermiculitisation. Ann. Agron. 22, 1, 43-93 (1971)
81
21. Robert, M.: The experimental transformation of mica toward smectite. Relativeimportance of total charge and tetrahedral substitution. Clays and Clay Min. (1972)
22. Robert, M. & Pedro, G.: An experimental evaluation of the effect of pH and concen-tration of salt solution in altering trioctahedral micas. Proc. Int. Clay Conf. Madrid433-447 (1972)
23. Ruehlicke, G. & Kohler, E.E.: A simplified procedure for determining layer chargeby the n-alkylammonium method. Clay Minerals 16, 305-307 (198 1)
24. Runge, M. & Wieners, G.: Aluminiumformen in Pseudogleyen unter Laub- und Na-delwald. Z. Pflanzernihr. Bodenkunde 147, 159-170 (1984)
25. Sawhney, B.L. & Voigt, G.K.: Chemical and biological weathering in vermiculitefrom Transvaal. Soil Sci. Soc. Am. Proc. 23, 625-629 (1969)
26. Scheffer, F., Meyer, B. & Gebhardt, H.: Pedochemische und kryoklastische Ver-lehmung (Tonbildung) in B6den aus kalkreichen Lockersedimenten (Beispiel Lbss).Z. Pfl. D. B., 114, 77-89 (1966)
27. Scheffer, F. & Schachtschabel, P.: Lehrbuch der Bodenkunde. Ferdinand Enke Ver-lag, Stuttgart, 1976
28. Schdnhals, E., Mavrocordat, G., Tributh, H., Chrita, C., Zanelli, S. & Mekedinti, V.:Pedogenische Untersuchungen an Tschernosemen und Parabraunerden der Donau-Ebene Rum.niens und des n6rdlichen Oberrheintieflands (Vorderpfilzer Tiefland).Giessener Abhandl. z. Agrar- und Wirtschaftsforschung des europiischen Ostens.Bd. 115, 157 S., Giessen (1982)
29: Schroeder, D.: Structure and Weathering of Potassium containing Minerals. Proc.1lth Congr. Int. Potash Institute 1978, Bern, Switzerland, 43-63 (1979)
30. Schwertmann, U.: Neuere Ergebnisse auf dem Gebiet der Tonmineralogie von B6-den. Landw. Forschung, Sonderheft 18, 33-42 (1964)
31. Schwertmann, U. & Politz, U.: Die Tonminerale in einigen Marschen und ihr Ver-halten gegendber Kalium. Z. Pflanzenemhrung, Diingung, Bodenkunde 95, 209-227 (1961)
32. Stanjek, B. & Friedrich, C.: The determination of layer charge by cure-fitting ofLorentz- and polarization- corrected X-ray diagrams. Clay Minerals 21, 183-190(1986)
33. Tributh, H.: Die Bedeutung der erweiterten Tonfraktionierung f/ur die genaucreKennzeichnung des Mineralbestandes und seiner Eigenschaften. Dissertation, Gies-sen, 1967
34. Tributh, H.: Die Bedeutung der erweiterten Tonfraktionierung ffir die genauereKennzeichnung des Mineralbestandes und seiner Eigenschaften. Z. Pflanzenernihr.,Bodenkunde 126, 117-134 (1970)
35. Tributh, H.: Die tonmineralogische Zusammensetzung eines *Gew6hnlichenTschernosems, bei Novo-Moskovsk/Ukraine. Giessener Abhandl. z. Agrar- undWirtschaftsforschung des europAischen Ostens Bd. 56, 27-45 (1971)
36. Tributh, H.: Bedeutung und Methode der erweiterten Korngr6ssenanalyse. Mit-teilgn. Dtsch. Bodenkundl. Gesellsch. 15, 11-17 (1972)
37. Tributh, H.: Die Umwandlung von Dreischichtmineralien in Bdden aus Lss. Mit-teilgn, Dtsch. Bodenkundl. Gesellsch. 18, 413-418 (1974)
38. Tributh, H.: Die Umwandlung der glimmerartigen Schichtsilikate zu aufweitbarenDreischicht-Tonmineralien. Z. Pflanzenernihr., Bodenkunde 1, 7-25, (1976)
39. Tributh, H.: Erste Ergebnisse fiber die Reduzierung der lllitgehalte durch Kalium-entzug der Pflanzen. Mitteilgn. Dtsch. Bodenkundl. Gesellsch. 32, 827-834 (1981)
82
40. Tributlh, 1H., Breburda, J., Tequ, C., Merlescu, Er. & A varvarei, J.: Tonmineralo-gische, granulometrische und chemische Untersuchungen an B6den der .Obcineleder Bukovina' (Ost-Karpaten) von RumAnien unter besonderer Berficksichtigungihrer Genese. Giessener Abhandl. z. Agrar- und Wirtschaftsforschg. des europA-ischen Ostens, Bd. 140, 15-45 (1986)
41. Tributh, H. & Lagaly, G.: Aufbereitung und Identifizierung von Boden- und Lager-stAttentonen. 1. Aufbereitung der Proben im Labor. GIT Fachz. Lab. 30, 524-529(1986a)
42. Tributh, H. & Lagaly, G.: Aufbereitung und Identifizierung von Boden- und Lager-stAttentonen. I. Kongr6ssenanalyse und Gewinnung von Tonsubfraktionen. GITFachz. Lab. 30, 771-776 (1986b)
43. Tributh, H., Boguslawski, E. v., Lieres, A. -L., Steffens, D. & Mengel, K.: Effect ofpotassium removal by crop on transformation of illite clay minerals (will be printed in'Soil Science', 1987)
44. Ulrich, B.: Die WAlder in Mitteleuropa: Messergebnisse ihrer Umweltbelastung,Theorie ihrer Gefdhrdung, Prognose ihrer Entwicklung. Allg. Forst-Zeitschr. 44,(1980a)
45. Wells, C.B. & Norrish, K.: Accelerated rates of release of interlayer potassium frommicas. Trans. 9th Int. Congr. Soil Sci. 11, 683-694 (1968)
83
Scanning Electron Microscopy andMicroprobe Techniques forSoil-K Characterization
Lelia Arcan, SEM Laboratory, The Volcani Center, Bet Dagan/Israel
Summary
Scanning Electron Microscopy (SEM) and Energy Dispersive Spectrometry (EDS) pro-vide, as a system, a powerfull tool for direct investigation of soil structure and composition.
Soil characteristic fabrics were obtained, reflecting correlations between soil composi-tion, exchangeable complex and the electrolyte content in pore water. SEM micrographsof soils after rain simulation experiments, present at the very surface of fractured samples,a clean silt grain layer due to the clay dispersion and to the downward movement into a clayaccumulating twashed in' zone. The thickness of the silt and of the .washed in' layers arereflecting the size fraction content and soil sodicity.
Due to the fact that lack of homogeneity and surface roughness are strong disturbingparameters in X-ray microanalysis, specific methodology for potassium evaluation wasrecommended: (i) characterizing the active part of the soil matrix using oriented films ofintermediate thickness on carbon support, (ii) using standards having mass absorptioncoeficients for potassium K a line close to the analysed sample, (iii) optimizing workingparameters e.g. electron energies at low values and take off angles related to the topogra-phic effect.
1. Introduction
Both Scanning Electron Microscopy (SEM) and Energy Dispersive Spectrometry(EDS) were applied in soil analysis as independent techniques from the verybeginning of their development. Blaske [196 9], Gillot [1969], Bohor & Hughes
119711, presented scanning electron micrographs and emphasized the possibilityof the SEM technique to bring direct information on soil fabric by continuouslyvarying the examined specimen area from the optical microscopic range of magni-fication up to a few sq. grm. In his work on clay minerals Tovey[1 971] emphasized
Lelia Arcan, SEM Laboratory, ARO, The Volcani Center, Bet Dagan, 50250 Israel
85
the oriented character of a clay structure, and presented an optical technique forquantifying the topographic information obtained from scanning electron micro-graphs. Particle size and shape were correlated to the diffusion path of exchange-able cations and structural imperfections were attributed to an increase in inter-layer penetration of the exchangeable cations (Wells & Norrish [1 968], von Reich-enbach 11976]). More recently, Tovey & Socolov [1981] published a review ofquantitative SEM methods for soil fabric analysis.
The electron microprobe X-ray analyzer was used in its early stages as an inde-pendent tool in soil investigation. One of the first works using this instrument wasreported by Rausell-Collom et at. [1965], in which point-by-point analysis of cal-cium and potassium illustrated the replacement of potassium by calcium at theedge of a mica flake in an artificial weathering experiment.
Recent works use the Analytical Electron Microscope (A EM) as a tool for ele-mental and structural characterization of clay minerals by applying thin film tech-niques. Anandetal. [1985] in experiments on the influence of microenvironmenton K feldspar found a consistent correlation between the composition and thestructure.
The capacity of a soil to supply potassium to plants is dependent upon the Kcontent and the rate of its release by the primary minerals as well as upon the quant-ity and the type of clay minerals. SEM/EDS use appropriate preparation tech-niques (freeze drying, critical point drying) to minimize artifacts due to the dryingprocess. In processes, such as ion diffusion in soil, where effects of pore size andtheir distribution are important factors, these techniques could bring support toconventional experiments, thus supplying simultaneous and rapid information ontexture and composition at the microscopic level.
It is well accepted that rough surfaces introduce errors in elemental quantifica-tion by EDS analysis (Smallet aL [1979]). On the other hand every step in samplepreparation introduces some artifacts, making it impossible to look for the mobilepotassium content in its original location.
The aims of this paper are: (i) to analyze the potassium detectability by EDS insoil systems, (ii) to present basic SEM/EDS abilities to investigate films of finefractions for semiquantitative evaluation and (iii) to characterize soil matrix struc-ture e.g. relationships between the adsorption complex and the morphological pat-tern.
2. Soil structure analysis
2.1 Preparation methods
In preparing representative soil samples for SEM observations, the main difficultyarises from the necessity of removing the water from the soil sample (the analysis isperformed in vacuum) without destroying the original texture. For soils with lowmoisture content, the procedure is quite straitforward. Tovey & Wong [1973] re-
86
viewed six techniques used for fluid removal from soil samples: oven drying, airdrying, controlled humidity drying, substitution drying, freeze drying, and critical-point drying. For sensitive soils, with high moisture content, the last two techniquesare needed; it is well-accepted that artifacts are generated by dehydration, regard-less of the way the drying is performed.
For textural studies in our laboratory, an alternate solution has been adopted tominimize these artifacts. For loess soils with low moisture content, the first step is tocover a trimmed sample of 1 sq. cm and 2-3 mm thick - with a carbon layer in orderto secure mechanically the surface particles. After fracturing and attaching theexposed surface to the SEM stub, the less bonded particles are removed by a peel-ing procedure. The samples are double-coated with carbon and gold before obser-vation in the microscope. For soils with high moisture content,the sample is freezedried and in order to assure fast cooling, its size must be limited to a few cubic mil-limeters.
For qualitative EDS analysis, the fractured surfaces are observed after applyingcarbon masks to limit the exposed area and to minimize the charging and topogra-phic effect. Semiquantitative analyses are carried out on oriented films on a frac-tion of soil less than 2 pm, using standards of similar roughness.
2.2 SEM - Structural analysis capabilities
The large depth of focus, the resolution down to 100 A and the capability to obtainstereo pictures, made the scanning electron microscope from the very begining ofits existence a suitable technique for soil fabric studies.
Lohnes & Demirel [1978], made a thorough review of the research on clay andclay soil fabric using SEM and pointed out a good correlation between the struc-ture and the tests that characterize their mechanical behaviour.
Two problems, sample preparation, as already mentioned, and quantitativeassessment of soil fabric remain the main limitations of this technique. Tovey &Socolov 11981], while acknowledging difficulties, succeeded in quantifying SEMmethods for the evaluation of soil fabric, for oriented samples.
In an effort to explain weathering processes, both techniques - SEM-EDS andAEM - facilitate the observation on diagenetic transformation in minerals. Exper-imental extraction of interlayer K in biotite was directly visualized in SEM. VonReichenbach 119761 presented SEM evidence that potassium dissolve in micaminerals at the exchange fronts, penetrating into the particle as the weatheringproceeds. The biotite unit, after releasing K ions, presents wavy areas around thecontour; as a consequence of diminishing strength between the layers, expansiontakes place, promoting further physical weathering; finally the unit is fractured insmall particles.
The active role of the different components of soil concerning K availability tothe plant is well known (Bray[1954J, van Diest[1978]). K diffuses through the soilby way of both, water-filled soil pores and water films surrounding soil particles.
87
Two important influences on K mobility in a soil-water system, amongst other fac-tors, are the adsorbed phase and the free electrolytes in pore water. These two fac-tors, usually measured by independent methods, may be simultaneouslyapproached by SEM/EDS as they reflect relationships, between the chemical andthe mineralogical components in the soil-water system.
Ali & Turner [1982] presented SEM micrographs showing the stages in thedevelopment of authigenic K-feldspar, in which intrastratal dissolution wasresponsible for providing the interstitial environment with the necessary potas-sium, aluminium, and silicon ions. Using EDS, for preliminary and semiquantitiveanalysis, in conjunction with electron probe for mineral identification and chemi-cal analysis they presented the diagenetic sequence: illite - quartz - K feldspar -illite - kaolinite.
Bryan & Williams [1982] comparing the X-ray diffraction data with EDS analy-sis, found that bulk chemistry using X-ray spectra indicates large variations inoxide evaluation of up to 15% standard deviation for K20, due to the uneven dis-tribution of the analyzed particles. When size-fractioned samples were analyzed,higher accuracy was obtained making this technique a valuable complement to thestructural information provided by X-ray diffractometry.
Lanier & Jones [1979] using SEM under laboratory consolidation conditionsfound a series of correlations between the development of grain aggregates andwater salinity in kaolinite clay. Kaolinite particles flocculating in the fresh waterpresent large aggregates in which individual grains link face-to-face. Increasing sal-inity enhances the development of multiple kaolinite grain aggregates.
Chen et al. [1976] studied freeze-dried specimens, and presented SEM micro-graphs showing different fabrics for montmorillonite with calcium and sodium inthe adsorption complex. When calcium was present in the complex, large irregularaggregates characterized these structures. When calcium was exchanged bysodium, an arrangement with large thin units with small distances between themand small pores was obtained.
The character of adsorbed water around the clay particles has been extensivelyinvestigated (e.g. Martin [1960]) and the correlation with the cation mobility in soilwater systems has been established. For potassium mobility in soil, the possibilityof observing structural modification as a response to changes in adsorption phase,presents practical significance. Natural soil with low as a well as high water content,in undisturbed structure, analysed by SEM/EDS, provides experimental datacorrelating mobility with the presence of specific components and their structure.
2.3 Structural factors as influenced by exchangeable cations.
The important role of exchangeable cations/electrolyte concentration in K mobil-ity is well accepted. Estimating the transformation in soil fabric by SEM analysis,when the soil water system changes as a result of variation in cation exchange com-plex, may offer very usefull qualitative information.
88
In our Ihoratorv (Gal et ai 19S4/1) significant structural modifications werefound in two types of soil with different exchangeable cation ratios, when low elec-trolytes in pore water were supplied.
Fractured samples of Netanya sandy loam soil, with 26",, montmorillonite in thel I", clay fraction, shows, after rain simulation with distilled water, different struc-tures for two levels of exchangeable sodium percentages (ESP)-1.0. and 11.6. InFigure Ia a sample with low FSP shows, at low magnification, large aggregates ran-domly oriented. Sand grains co ered with a thin film of clay are seen throughout theprofile. Figure Ib (magnification of the center of Figure la). shows randomlyoriented clay aggregates. At higher magnification (Figure Ic), stereo pictures pres-ent a strong orientation of the clay particles. For the same soil, with higher sodiumconcentration in the exchangeable complex FSP L116, the top first layer containsmany cleaned grains ( Figure 2). suggesting some dispersion process of the clay par-ticles, stripping of the thin film of clay from the coarser sand grains, and a downw-ard movement of the small clay particles during the rain simulation.
In the same experimental conditions, but with a Golan clay with a 65% fractionless than 2 rm (mainly montmorillonite and kaolinite) the effect caused by thepresence of different exchangeable cations was even more definite. In Figures 3and 4, the characteristic structuresof the clay soil (with ESP 1.6 and 10.3) present anaked-silt-grains layer on the top of the "washed-iny layer after rain simulationwith distilled water. The thickness of the silt layer (50ptm at low sodicity and about250itm at high sodicity) and the density of the Awashed-in> layer increase with anincrease in soil sodicity, creating a well-developed crust. Characteristic to the'washed-im> layer with high ESP are macrovoids lined with compact clay (Figure5).
These structural observations are in good agreement with the infiltration ratedata of Agassi /1981] and Kazran /1983] obtained on the same soils. In theirexperiments, usinga rain simulator and distilled water, they found that the infiltra-tion rate (mm h) factor was more sensitive to a certain exchangeable cations-elec-trolyte concentration in soil-water system. than to the permeability of the underly-ing soil.
In an effort to obtain a correlation between the structures and tie FI)S analysisin clay mineral,, oriented films on carbon supports were analyzed after being air-dried. Figure 6 shows less than a 2 tim fraction of clay soil for two different FSP's.In Figure 6a, on a soil sample micrograph with lSP 1.1) one may distinguish at lowmagnification large aggregates with pores between them, randomly disposed.When calcium is present in the exchangeable com plex, a thin and strong orientedwater film keeps the particles tight in a compact arrangement. The compact char-acter of the aggregates is seen at a higher magnification in Fieurc6b. It Figure6c atFSP 11. the clay particles are organized in a more isotropic structure with face-edge contacts heiss ecn them. At higher magnification in Figure 6d, microporosityof this clay can be observed. suggesting the presence f sodium in the exchangeablecomplex, In this case, a thicker, less oriented water layer arTOund the clay particles isresponsible for the fac-edge air angement.
89
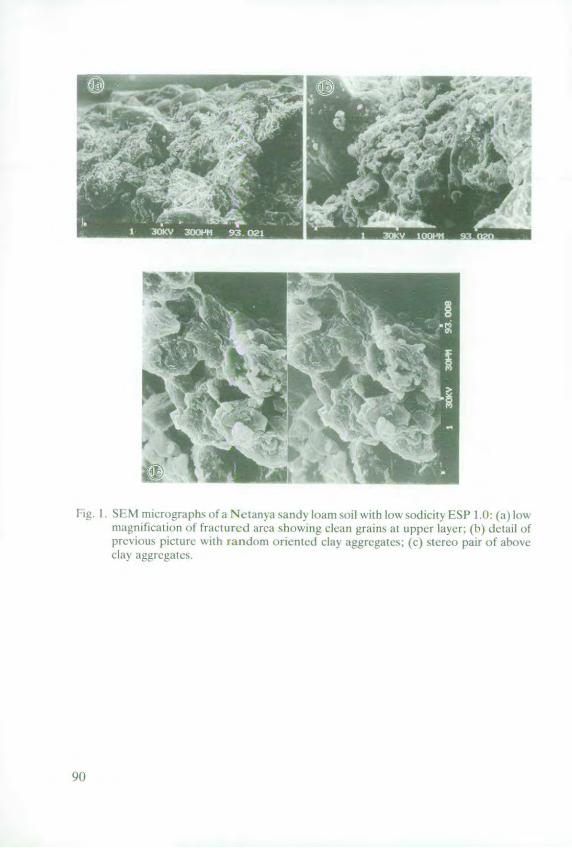
4k2
I I SI \ micr .gr aphs t a Nctaiya sand% loam soil with Io sodicity EFSP LO: la) IowmILgnification o tracrcd arca showing clean grains at upper kaVC: (b) dCtail ofprcviou , pict rc wtih randiom oriented clax aggrcgates: (c) stereo pair of aboveclay aggrecalsc.
9)

Fig 2. Stereo pair of compacted area of naked grains on soil sui ace after being uhn ittedto rain simulation with distilled waler (bar I00 im).
91

IiQ. 3. SFM microtmph 4 a fractured sample mn (,olax cla 5,)11 v ith [SI' I sho1m1ng thediplaccnmcnt I mall clay particlk.
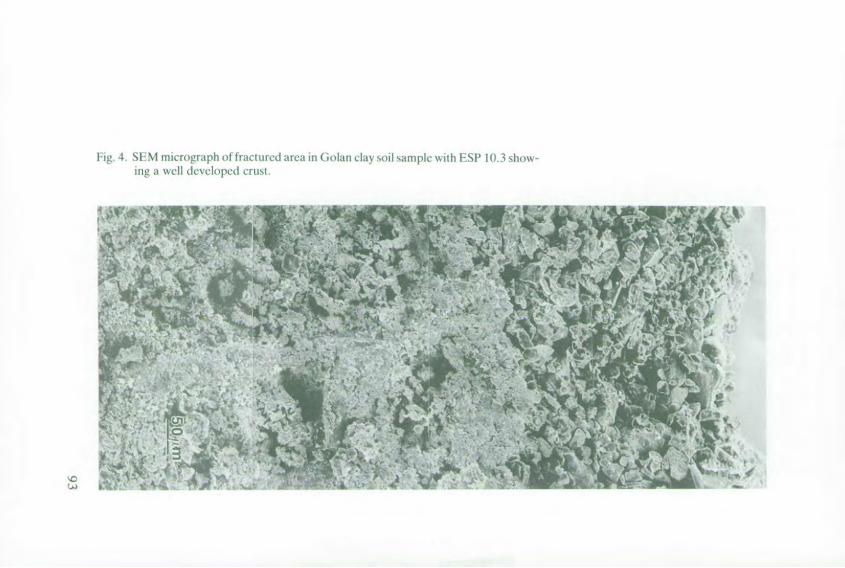
Ih 4. S FIM micro)graph of Iracitucd area in Golan clay soil sample wih SP 10.3 show-Mig a1 "clH developed crusI.
uA!A

ES 103 a-0)i )
944
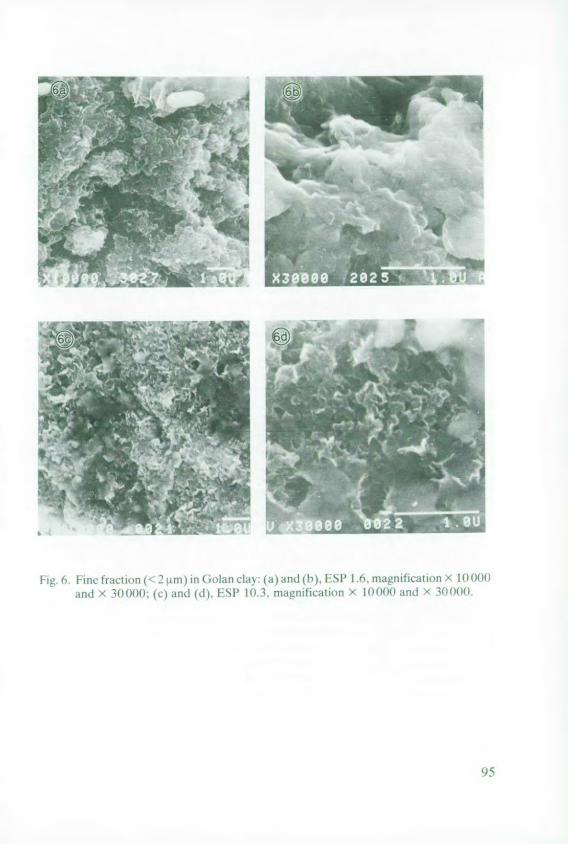
~ , f inc f raction (< 2 tn ) in G olhn clay: (a) and (h). [ Si I6. m agnification x II1( 00
and x 30000: (c) and (Id). tP1 1(.3, magnificatiom x 1000( and x 300()
95
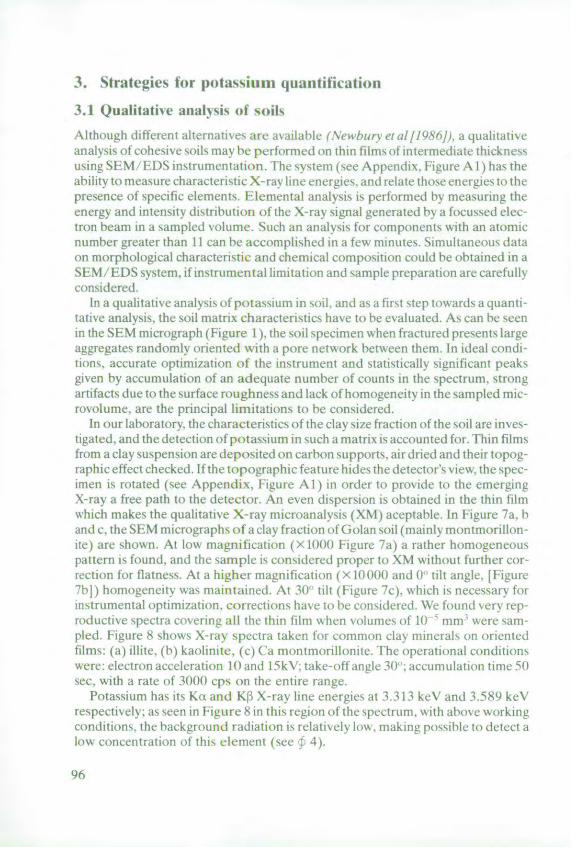
3. Strategies for potassium quantification
3.1 Qualitative analysis of soils
Although different alternatiPe, are avaii able ( Neibury ei atI I GM9O, a qualitatiecanalysis of cohesive soIs rnay be performed on thin I ns of in termediate thicknessusing SEM l F)S instrumentation, lhe sYstem (see Appendix, Figure A I ) has theability to measure characteristic X- -ax line energie-, and relate those energies to thepresence of specific elements, Elemental analysis is performed by measuring theenergy and intensity distribution of the X-ray signal generated by a focussed elec-tron beam in a sampled volume. Such an analysis for components with an atomicnumber greater than I I can he accomplished in a few minute>. Simultaneous dataon morphological characteristic and chemical composition could be obtained in aSliM/ liDS system, if instrumental limitation and sample preparation are carefullyconsidered.
In a qualitative anaiysis of potassiu m in soil, and as a ftrst step tows ards a quantitative analysis, the soil matrix characteristics have to be exaluated. As can be seenin the SETM micrograph (Figure I ). the soil specimen when fractured presents largeaggregates randomly oriented vith a pore network between them. In ideal condi-lions, accurate optimization of the instrunment and statistically significant peaksgiven by accumulation of an adequate number of Counts ill the spectrum, strongartifacts due to the surface roughness and lack of homogeneity in the sampled mic-rovolume, are the principal limitations to be considered.
In our laboratory, the characteristics of the clay size fraction of the soil are inves-tigated, and the detection of potassium in such a matrix is accounted for. Fhin filmsfrom a clay suspension are deposited on carbon supports. air dried and their topog-raphic effect checked. If the topographic feature hides the detector's view, the spec-imen is rotated (see Appendix, Figure A I ) in order to provide to the emergingX-ray a free path to tle detector. An even dispersion is obtained in the thin filmwhich makes the qualitativ e X-ray microanalysis (XM) aceptable. In Figure 7 a. band c, the SliM micrographs of a clay fraction of Golan soil (mnainly monmori ilon -ite) arc shown. At low magnification (X 1000 Figure 7a) a lather honmogencouspattern is found, and the sample is considered proper to XM without further cor-rection for flatness. At a higher magnification ( x 1000 and 0 tilt angle. [ Figure7bj) hiomogeneity was maintained. At 30 tilt (I igure 7c). which is necessary forinstrumental optimization, coIrections hae to hc conidcecd. ,e found very lep-roductive spectra co,,ern all the thin film when vollmes, if i0 t nInC were sarl-pled. Figure 8 shows X- ray pectra taken for commn clay in niesab, or oientedfilms: (at illite, (b) kaolinite, (c) (a rnontmorillonitc, The operational comlitionswere: electron acceleration 10 and l5kV take-off angle 30 : accumUlation lime 50sec, with a rate of 3000 cps on the entire range.
Potassium has its Kcc and K3 X-ay line energies at 3.313 keV and 3.589 keVrespectively: as seen in Figure 8 in this region of the speCt rum, with aboxe workingconditions, the background radiation is relatively low, inaking possible to detect aiow concentration of this element (sec 4),
96
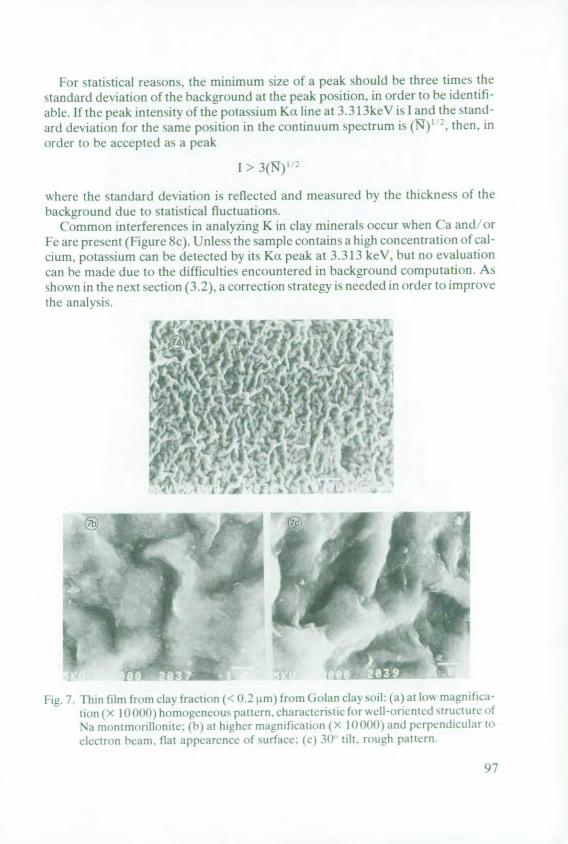
For statistical reasons, the minimum size of a peak should he three times thestandard deviation of the background at the peak position, in order to be identiti-able. If the peak intensity of the potassium Kit line at 3.313keV is I and the stand-ard dev iation for the same position in the continuum spectrum is (N) , then, inorder to be accepted as a peak
[>3(N)
where the standard deviation is reflected and measured by the thickness of thebackground due to statistical fluctuations.
(ommon interferences in analyzing K in clay minerals occur when Ca and orFe are present (Figure 8c). Ujnless the sample contains a high concentration of cal-ctum. potassium can be detected by its Kt peak at 3.313 keV, but no evaluationcan be made due to the difficulties encountered in background computation. Asshown in the next section (3.2). a correction strategy is needed in order to improvethe analsis.
lie 7. tIn ilm trom clay fraction (< 0.2 am) from Golan clay soil (a) at liw mainiha-liont ( :s 1(0)0) homoecaus patten, characteristc for sel l-oricnted structure at
Na nonim iorillanite: (h) at higher rnlgnihc.i (X too ]( and perpendicular
lecIrIon IKan., f]lt appcarencc at surtacc: te) 30 ih. roaugh palttin.
97
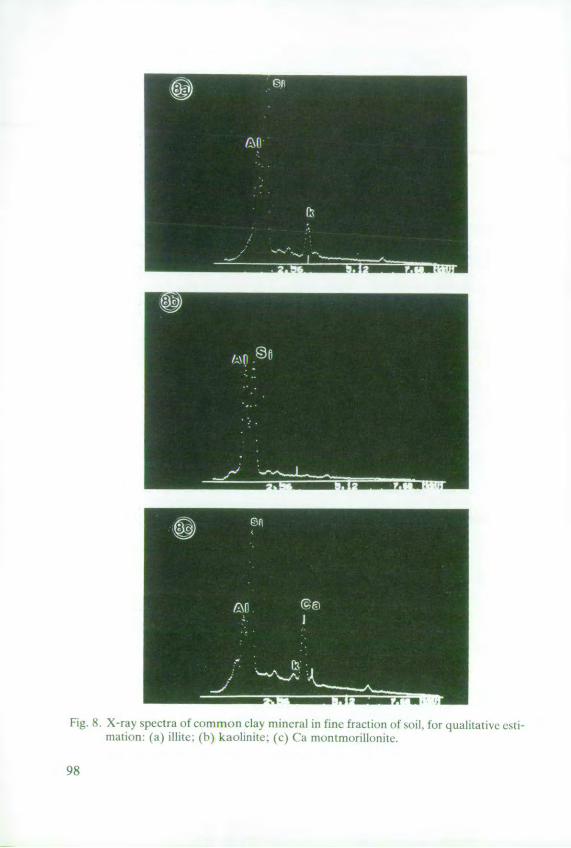
Fig. 8. X-raN spectra of common clav mineral iii fine fraction o so.il, for quaitative esli-
milalion: (a) illne: (1h) kaolinitc: (c) ('a montmiorillonitc.
98
3.2 Towards a quantitatiie analysis
Weight fraction of an element in a compound sample can be estimated by measur-ing the relative intensity (unknown specimen versus standard) of its characteristicpeak in the X-ray spectrum. The correlation is not a straightforward one; itdepends on both material and the instrumental conditions.
For soil specimens when potassium has to be evaluated by X-ray microanalysis,the main difficulties are related to the sample homogeneity and to its similarity tothe standard.
Ziebold & Ogilvie /19641 developed an empirical approach, using calibrationcurves (mass fraction versus corrected relative intensity) for specimens of a knowncomposition. A set of equations for all the components is needed, and the con-stants must be determined experimentally. The empirical approach technique istime-consuming, and sometimes impossible for certain multi-component speci-mens.
In our laboratory. for X-ray microanalysis of potassium in the clay fraction ofsoil, an alternative technique is used. If1a well-oriented film can be obtained, themass fraction may be expressed in a first approximation by the ratio:
where ( and C. are mass ra clions of the sample, and of the standard. respect ively; and 1,and I,. arc the measured intensities of the X-ray line of the element in the sampleand in the standard, respectively.
According to Castaing/1951, the above approximation is valid if the sampleand the standard interact similarly with the electron beam and can be used for aninitial estimation of composition. In Table 1, estimation of the potassium contentgiven by Eq. (1) is carried out for the three principal components present in theclay fraction of the soil. The second column presents the measured intensities I,of the Ku line for potassium at 3.313 keV, after background subtraction. Incolumns 3 to 6, C, is presented as being calculated from Eq. (1 ) using standards KI.KCIL KNO;. and biotite. Values C, very close to the actual concentrations were ob-tained when the mass absorption coefficient (jt/0) and the flatness of the sample(Figure 9a) and of the standard (Figure 9b) were close enough.
For an accurate X-ray microanalysis, ZAF corrections (see Appendix) arerecommended to compensate the different behaviour in electron matrix interac-tion; they are reflected in peak intensities in the sample and in the standard. Thecorrection equation has a general form (Goldstein et al [19811):
C (ZAF) k (2)
vhcrc hc "etght traction ( (it the ana]/Cd elemet i correlLted to k (the relatic
nuensn ratio neasurcd xpertmn tal 1), using threC C onCctin factor'. Z, A and F. inttc Cotputanon ifdel
99
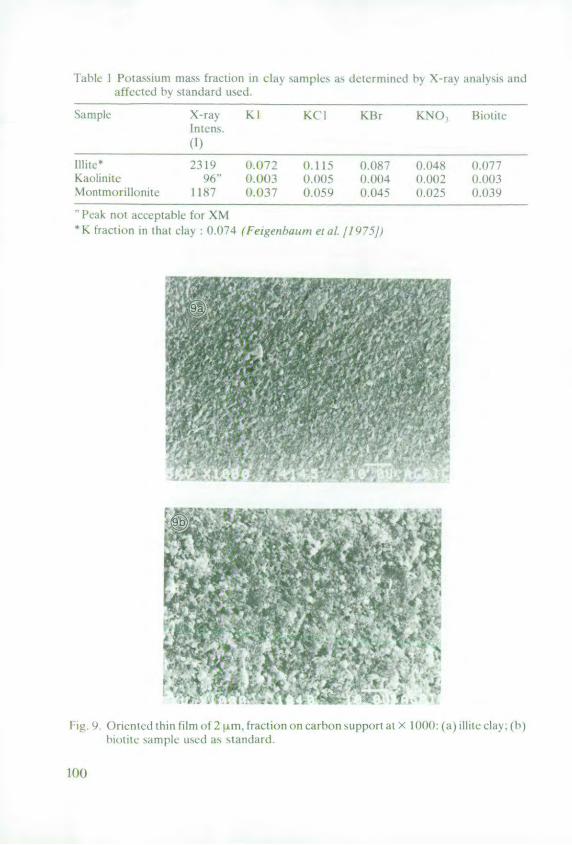
LINc I Ptqajltu nlls Iraliton il cial samncs a, tlCTfllulHne 1lw X fa% andlv<i, rA
affcclicd lv, sandlld ucd.
Sanlpk X-ra% K I K(I KBr KNO Hiolic
l]hitc* 231,) 1)72 0I 15 0,8? (1,048 (07?Kwiolililtc " t( (14 05 0.0)04 (14)4)2 0.0)3Montrnorillonitc 1187 0037 0(059 )1)45 (.025 (..039
ICdk nol icccplabc for XMK framcion in tiat clax l).1)74 (!i /wwn eit. '19751)
F:ig.) Oricntcd thin filmot l2 %i, fraction on carbon support aX Ix 100: (a) I(hic cla%: 1 1')1 wutitc sat(plt ucr v> siandarci
From these three factors, Ai the absorption correction factor, provides animportant contribution by compensating the different responses of the sample andthe standard, so that the electron beam action is corrected to:
Ai = f(x)./f(x) (3)
The absorption function f(x)1 for the standard, and f(x) for the sample expressthe attenuation of the generated X-ray photons, due to absorption, emerging fromthe sample surface to the detector. The X-ray attenuation depends on the instru-mental conditions (operating and geometric) and on the material properties (ab-sorption coeffients pI/Q, mean atomic number Z, and mean atomic weight A). Ifthe sample and the standard have similar characteristics, the two absorption func-tions are almost equal and the A value is close to the unit.
Calculation of the absorption correction using Philibert's[1963] expression forthe absorption function f(x), gives:
1/f(x)i = (l+xjoj)ll+(N/(l+hj)xjoj (4)
where, for h i = 1.2Aj/Zjfor the element i, (4a)
x i = (I/Q)icsc * (4b)
oi = (4.5X10)/(Eo 6-Ec1 6) (4c)
h = ICAh and (p/a) - ECi(P-/)i 1 (4d)
where (R/Lp/j - mass absorption coefficients for the X-ray line of element i in theelement j, in the sample or the standard.
- X-ray emergence angle
Eo - operating voltage
E, - critical excitation voltage
7; - atomic number of element j
_A_. - atomic weight of element j
In the Eqs. (4) to (4d) the index i refers to potassium and j to all the componentsincluding i in the sample or standard.
Figure 10 shows the effect of the electron energy (accelerating voltage E.) andof the take-off angle (the angle between emergencing X-ray path and the detectordirection) on the absorption coefficient factor computed from Eqs. (3) and (4), foran illite matrix. The absorption correction increases (in absolute values) with theincrease in acceleration voltage and the decrease in take-off angle. The efficiencyfor the X-ray generation by electron interaction with the specimen, has a maximumvalue E/E, that ranges between 3 and 5, where E is the electron energy, and E, isthe energy of the appropriate ionization level of the atom. From this statement, aswell as from our experiments, a maximum efficiency is obtained for the potassium
101

excitation condition at E. = 10 kv. The take-off angle is harder to optimize in astandard SEM/EDS system due to instrumental limitations, but stage improve-ments and manipulations could be helpful. The resulting low correction factor forpotassium in soil components (Figure 10), (1% at 300 take-off angle) makes theapproximation contained in (1) a valid semiquantitative analysis, if a proper stand-ard is considered.
1.21
1.20
1.19
1.18
1.17
1.16
1.151.14
1.131.12
1.111.10
U 1.05 -
1.07 -
1.06 -1.05 -
1.04 -
1.03
1.02 -
1.011.00 -
5 10 15 20 25 30
Eo accelerotion volage (V)0 15. 25 0 52*
Fig. 10. Absorption correction factor for potassium Ka X-ray line in illite clay.
Figure 11 presents the absorption correction factor computed for the potassiumKo X-ray line in soil components (take-off angle 25'), as a function of accelerationvoltages. Relatively low correction values are needed (between 2 and 4%) at aworking voltage of 10 kV for the major components in soil. For this reason, semi-quantitative evaluation of potassium in such matrices could be carried out withoutabsorption corrections.
The low energy needed when operating the EDS for potassium XM, makes itpossible to use inorganic salts as standards; they present the advantages of havingtheir absorption function f(x) close to those of the soil sample, and the correspond-ing Ai = f(x),,/f(x) ratio close to the unit. In Figure 12, a comparison between dif-ferent standards shows values close to the unit for absorption correction factors inclay matrix, when standards with similar absorption mass coefficients are consid-ered. These results are in good agreement with the results obtained by X-ray mea-surements (Table 1 and 2). The biotite standard has p/p = 363 very close to p/p =364.38 for illite.
102
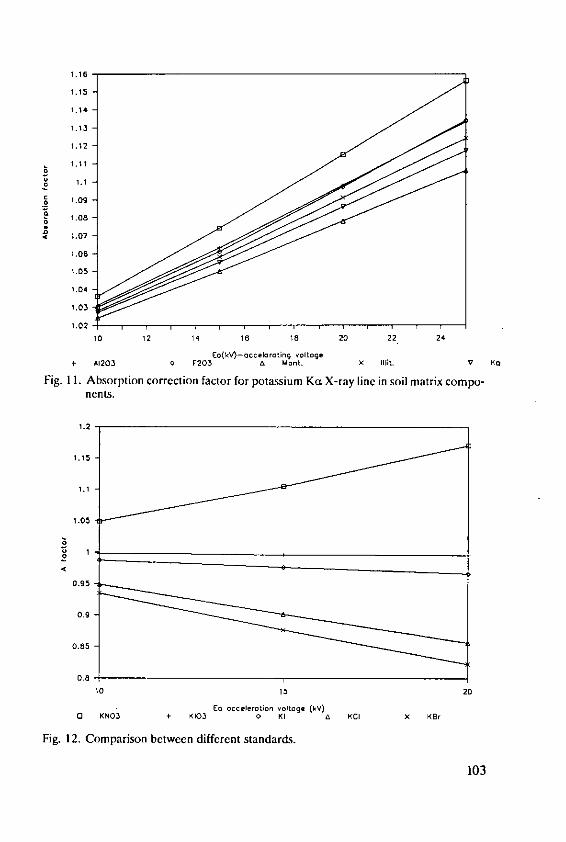
1.16
1.15
1.14
1.13
1.02
1.11
04
o 1.1
o 1.08
1.07
0 01.05
1.04
1.04
1.02
10 12 14 16 18 20 22 24
Eo(kV)-ocelaroting voltoge
+ A1203 0 F203 A Mont. X Ilit. V K,
Fig. 11. Absorption correction factor for potassium Ka X-ray line in soil matrix compo-nents.
1.2 -
1.15
1.1
1.05 "
" I
0.95 -
0.9
0.85 -
0.8
10 15 20
Eo accelerotion voltage (kV)0 KNO3 + K103 0 KI a KCI X KBr
Fig. 12. Comparison between different standards.
103
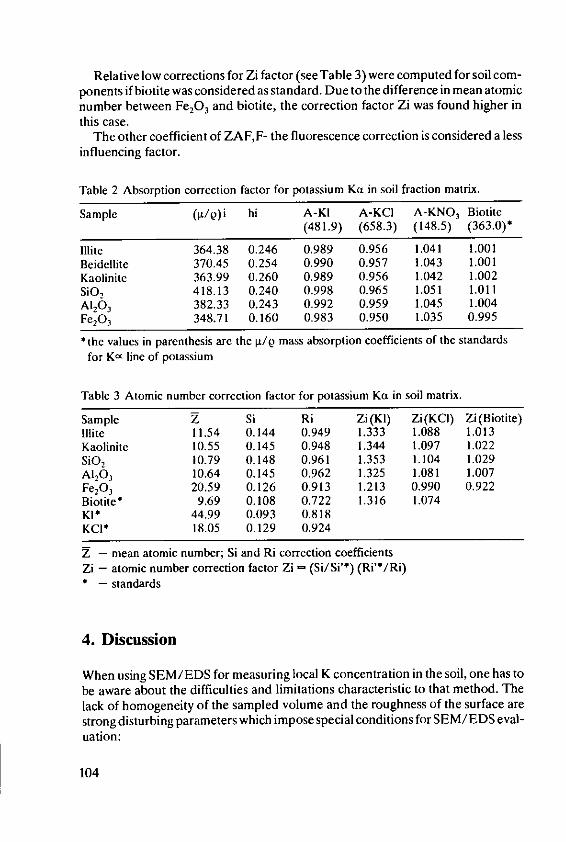
Relative low corrections for Zi factor (see Table 3) were computed for soil com-ponents if biotite was considered as standard. Due to the difference in mean atomicnumber between Fe20 3 and biotite, the correction factor Zi was found higher inthis case.
The other coefficient of ZAF,F- the fluorescence correction is considered a lessinfluencing factor.
Table 2 Absorption correction factor for potassium Ka in soil fraction matrix.
Sample ([/,)i hi A-KI A-KCI A-KNO 3 Biotite(481.9) (658.3) (148.5) (363.0)*
llite 364.38 0.246 0.989 0.956 1.041 1.001Beidellite 370.45 0.254 0.990 0.957 1.043 1.001Kaolinite 363.99 0.260 0.989 0.956 1.042 1.002SiO, 418.13 0.240 0.998 0.965 1.051 1.011AI,6 3 382.33 0.243 0.992 0.959 1.045 1.004Fe20 3 348.71 0.160 0.983 0.950 1.035 0.995
* the values in parenthesis are the LI/p mass absorption coefficients of the standards
for K- line of potassium
Table 3 Atomic number correction factor for potassium KoL in soil matrix.
Sample Z Si Ri Zi (KI) Zi(KCI) Zi (Biotite)Illite 11.54 0.144 0.949 1.333 1.088 1.013Kaolinite 10.55 0.145 0.948 1.344 1.097 1.022SiO 2 10.79 0.148 0.961 1.353 1.104 1.029A1201 10.64 0.145 0.962 1.325 1.081 1.007Fe2O3 20.59 0.126 0.913 1.213 0.990 0.922Biotite' 9.69 0.108 0.722 1.316 1.074Kl* 44.99 0.093 0.818KCI* 18.05 0.129 0.924
Z - mean atomic number; Si and Ri correction coefficientsZi - atomic number correction factor Zi - (Si/Si'*) (Ri'*/Ri)* - standards
4. Discussion
When using SEM/EDS for measuring local K concentration in the soil, one has tobe aware about the difficulties and limitations characteristic to that method. Thelack of homogeneity of the sampled volume and the roughness of the surface arestrong disturbing parameters which impose special conditions for SEM/EDS eval-uation:
104
- optimize working parameters e.g. electron energies at low values and high take-off angles related to the topographic effect.
- restrict this techniques to well defined systems like oriented films of intermediatethickness on low electron absorbing media (e.g. carbon support)
- use of standards having values of mass absorption coefficients for potassium Kctline, very close to the analysed sample.
For an illite sample, results show good reproductibility and acceptable concord-ance with the actual concentration in potassium, when biotite is considered asstandard. In fact, in this ideal case, the conventional ZAF correction is not neces-sary. Using the actual concentration of the sample and the standard to calculate thecorrection factors, the values for A (absorption correction factor) were close tounity in the actual working conditions. In this case a higher level of sophistication inquantitative analysis is not even needed.
An important concern of the analyst is to ascertain the MDM (minimum detect-able mass fraction), when using a SEM/EDS system. The intricacy of the problemlies in the fact that MDM is a function of several parameters concerning both, thespecimen characteristics and the instrumental conditions. WittryfI 980] expressesthe detection limit as a function of Ip/lb the ratio of X-ray intensities measured atthe peak intensity lp and the corresponding background lb position. In this contextthe background is assumed to be the same in the sample and in the standard. A verystrong dependence of the concentration limit on Ip/Ib ratio results. Diagrams ofthe typical dectability limits in EDS analyses (Levin 11986]), place potassium,when in a matrix with low absorption coefficients, in a convenient position: underfavorable working conditions, detectable concentration limits could reach 0.1-0.3%.
No matter how important all the above limitations and working conditionsappear when SEM or EDS are separatly applied in soil analysis, their simultaneoususe, offers very significant advantages: the system is able to relate detector orienta-tion to topography, to evaluate surface structural similarities of specimen andstandard in the specific EDS sampled microvolume and mainly to provide manycorrelating data between structure and specific components.
Appendix: Definitions and Notations
Energy-dispersive X-ray spectrometer. In a scanning electron microscope a speci-men is irradiated by a finely focused electron beam, which may be static or swept ina raster across the surface of the specimen. When the electron beam impinge on aspecimen surface the incident electrons lose their energy in electron-specimeninteractions and sygnals containing information abouth the specimen could becapture by various detectors. If the X-ray signal from the sample passes through aberyllium window into a cooled lithium-drifted silicon detector and is processed in
105

order to provide characteristic material photon energy, the system is called energy-dispersive spectroscopy EDS (see Figure Al)
ZAFtechnique uses a theoretical approach in order to introduce three matrixeffect corrections.
Zi - atomic number correction factor compensates for the amount of incidentelectrons which are not involved in X-ray generation, due to backscattering andretardation processes. From fundamental consideration (Heinrich 19811) this fac-tor adjust the differences between the mean atomic number in the spectrum and inthe standard.
Ai - absorption correction factor compensate the absorption of X-ray of themeasured element by the other elements in the matrix.
Fi - the fluorescence correction is required when parasitic fluorescence appearsdue to the fact that the characteristic X-ray energies of the elements j are sufficientto excite X-ray secondarily from element i.
LiquidNitrogenReservoir Si(Li) L_ _J
DetectorI Eletron
I suplA/D Converter ]
I CRT]
Multichannet __Display
Analyzer Printer/
Plotter
Computerr
Fig. A t (Appendix). Bloc diagram of EDS system (adapted after Levin 19861); e-speci-men tilt, q,-take-off angle.
106
Symbols
K - potassium
Ka, K3, - X-ray line energies
ESP - Exchangeable sodium percentage
Z = Z C, 7 - average atomic number
-= C, A - average atomic weightx i - absorption parameter = (pL/a) cscip
5. References
1. Agassi, M., Shainberg, L and Morin, J.: Effect of electrolyte concentration and soilsodicity on the infiltration rate and crust formation. Soil Sci. Soc. Am. J. 45, 848-851(1981)
2. Ali, A.D. and Turner, P.: Authigenic K-feldspar in the Bromsgrove sandstone forma-tion (triassic) of central England. Journal of Sedimentary Petrology 52, 1, 187-197(1982)
3. Anand, R.R., Gilkes, R.J., Armitage, T.M. and Hillyer, J. W.: Feldspar weathering inlateritic saprolite. Clays and clay minerals 33, 1, 31-43 (1985)
4. Blaske, R.: 3-D Interpretation of clay fabrics by SEM. BEDO 2, 9, 275-2 (1969)5. Bohor, B.F. and Hughes, R.E.: SEM study of clays and clay minerals. Clays and clay
minerals 19, (1), 49-54 (1971)6. Bray, R.H.: A nutrient mobility concept of soil-plant relationships. Soil Sci. 78, 9-22
(1954)7. Bryant, R. and Williams, D.: Mineralogical analysis of suspended cohesive sediment
using analytical electron microscope. J. of sedim. petrology 52, 1, 299-306 (1982)8. Castaing, R.: Ph. D. thesis, University of Paris, 19519. Chen, Y., Banin, A. andSchnitzer, M.: Use of scanning electron microscope forstruc-
tural studies on soils and soil components. Scanning Electron Microscopy 111, 425-432 (1976)
10. van Diest, A.: Factors affecting the availability of potassium in soils. Proc. I l "Congr.Int. Potash Institute, 75-97 (1978)
11. Feigenbaum, Sala and Shainberg, L: Dissolution of illite - a possible mechanism ofpotassium release. Soil Sci. Soc. Am. Proc. 39, 985-990 (1975)
12. Gal, M., Arcan, L., Shainberg, L and Keren, R.: Effect of exchangeable sodium andphosphogypsum on crust structure - Scanning electron microscope observations. SoilSci. Soc. of Am. J. 48, 4, 872-878 (1984)
13. Gillot, J.E.: Study of the fabric of fine-graine sediments with the SEM. J. Sediment.Petrol. 39, 90-105 (1969)
14. Goldstein, J.I, Newbury, D.E., Echlin, P., Joy, D.C., Fiori, C. and Lifshin, E.:Scanning Electron Microscopy and X-ray Microanalysis. Plenum Press, New York,1981
107
15. Gooley, R.: Electron probe microanalysis in Gcosciences. Scanning Electron Micros-copy 1,493-502 (1981)
16. Heinrich, K.F.J.: Electron Beam X-Ray Microanalysis. Van Nostrand ReinholdComp. New York, 1981
17. Kazman, Z., Shainberg, L and Gal, M.: Effect of low levels of exchangeable Na andapplied phosphogypsum on the infiltration rate of various soils. Soil Sci. 135, 184-192(1983)
18. Lanier, W.P. and Jones, D.L.: Scanning electron microscopy study of the texturalrelationships of kaolinite clay floculated in increasingly saline solutions. ScanningElectron Microscopy 1, 525-529 (1979)
19. Levin, E.R.: Principles of X-ray spectroscopy. Scanning Electron Microscopy 1,65-76 (1986)
20. Lohnes, R.A. and Demirel, T: SEM applications in soil mechanics. Scanning Elec-tron Microscopy 1, 643-654 (1978)
21. Lynn, W. C. and Grossmann: Observation of certain soil fabric with the SEM. Soil Sci.Soc. Amer., Proc. 34, 645-648 (1970)
22. Newbury, D.E., Joy, D.C., Echlin, P., Fiori, CE. and Goldstein, J.L: AdvancedScanning Electron Microscopy and X-ray Microanalysis. Plenum Press New York,1986
23. Philibert, J.: Proc. 3,d Int. Symp. X-ray Optics and X-ray Microanalysis, StanfordUniversity, eds. Pattee, H.H., Cosslett, V.E. and Engstromm, A., Academic Press,New York 379, (1963)
24. Rausell-Colom, J.A., Sweatman, TR., Wells, CR. and Norrish, K.: Studies in theartificial weathering of mica. In: Experimental Pedology, Proc. Univ. Nottingham,I1tI Easter Sch. Agric. Sci. 40-72 (1965)
25. von Reichenbach, H. G.: Neubildung von Tonmineralien in Boden; in Jasmund: Ton-mineralogie. Bericht fOber ein DFG-Schwerpunktprogramm, Bad Godesberg, 62-91,(1976)
26. Sawhney, B.L.: Electron microprobe analysis. In: Methods of Soil Analysis, Part 1.Physical and Mineralogical Methods-Agronomy Monograph no. 9, 271-279 (1986)
27. Small, J.A., Heinrich, K.F.J., Newbury, D.E. and Myklebust, R.L.: Progress in thedevelopment of the peak-to-background method for the quantitative analysis of thesingle particles with the electron probe. Scanning Electron Microscopy 11, 807-816(1979)
28. Torrence Martin, R.: In: Clays and Clay Minerals, 9 th Conf. 28 (1960)29. Tovey, N.K.: Soil structure analysis using optical technique on SE micrographs.
IITRI-SEM 4, 49-56 (1971)30. Tovey, N.K. andSocolov: Quantitative SEM methods for soil fabric analysis. Scann-
ing Electron Microscopy 1, 537 (1981)31. Tovey, N.K. and Wong, K. Y.: In: Proc. Int. Symp. on Soil Structure, Swedish Geo-
technical Society, Stockholm, Sweden, 59, (1973)32. Ziebold, TO. and Ogilvie, R.E.: Anal. Chem. 36, 322 (1964)33. Wells, CB. andNorrish, K.: Accelerated rates of release of interlayer potassium from
mica. Int. Congr. Soil Sci., Trans. 9 1h (Adelaide Aust) 2, 683-694 (1968)34. Witry, D.B.: In: European Congress on Electron Microscopy, Leiden 3, 14, 1980
108
X-ray and Neutron Diffraction
1. G. Wood, Rothamsted Experimental Station, Harpenden, Herts/United King-dom*
Summary
X-ray and neutron diffraction are important methods for the identification, quantitativeanalysis and study of the potassium-bearing layer silicate clay minerals found in soil. Thebasic principles of the structural chemistry of these compounds are described and recentadvances in experimental facilities reviewed. Methods for examining both micaceous andinterstratified minerals are discussed, with particular emphasis on the fundamental princi-ples of the diffraction process. Diffraction patterns from these materials can be extremelycomplex and great care must be taken in their interpretation if meaningful results are to beobtained.
1. Introduction
In this paper I shall review briefly the structures of some of the potassium bearingminerals found in soil and the techniques currently available for their investigationby X-ray and neutron diffraction. Potassium occurs in the micaceous 2:1 layersilicate clay minerals and also in one of the components often present in <mixed-layerD> or .interstratifled& clay minerals. It is on these layer silicates that I shall con-centrate in this paper. Other important potassium-bearing minerals include thealkali feldspars (sanidine, orthoclase, microcline, etc) and the zeolites (phillipsite,heulandite-clinoptilolite, etc). These are the subjects of comprehensive reviewsby Smith [1974] and Sand & Mumpton [19781. Feldspars, which are often foundas accessory minerals in soil (especially in the coarser size fractions), are geologi-cally very important minerals and have an extensive literature. Zeolites arematerials of great industrial importance, to the extent that there is ajournal, vZeo-lites', solely devoted to their study.
Research in soil mineralogy must be directed towards two objectives. Firstly, weneed to obtain a better understanding of the structures and chemical and physicalproperties of the minerals present. For example, it is apparent that the methods offormation and indeed even the structures of the so-called interstratified mineralsare not at present well understood. This type of material is common in soil clays andmay also have considerable importance in petroleum exploration (see e. g. Jeans
* L G. Wood PhD, Senior Scientific Officer, Soils Division, Rothamsted Experimental
Station, Harpenden, Herts AL5 2JQ/United Kingdom
109

11982]; Eberl [1984]; Stoessell and Ferrell[1986]). Such fundamental work oftenrequires investigation of rather idealised, qmuseumv, samples. However, study ofthese well-characterised materials is essential if meaningful results are to beobtained. Secondly, we must learn how to apply knowledge gained from these welldefined systems to the more disordered materials found in soils. Here our ability todescribe the system is usually severely limited by its ill-defined nature. A widerange of structurally similar «minerals which may, however, have very differentphysical properties, can be produced by chemical substitution. In these circum-stances merely identifying the different phases can be difficult and, as will be shownbelow, with the techniques currently available analysis on even a semi-quantitativebasis may be almost impossible.
The remaining sections of this paper are intended as a guide, for non-specialists,to the basic principles of the interpretation of diffraction patterns from disorderedmaterials and to the advanced experimental facilities which are likely to becomewidely available in the next few years. Small-angle scattering methods, which canbe of great value in studies of the structural arrangements (texture) of hydratedclays on a larger scale (up to- 5000A) will not be discussed as they are described insome detail in other papers in this volume (Pddro [198 7]; Tessier [1987]).
2. Structures of micaceous and interstratifled minerals
A short review of the structures of the phyllosilicate clay minerals is given byBrown [1984]. More eitensive treatments of this topic may be found in the mono-graphs edited by Greenland and Hayes [1978], Brindley and Brown [1980] andNewman /1987. Bailey [1984] has also recently edited a major review devotedentirely to micas.
The structures of the phyllosilicate layer minerals are in essence quite simple.They consist of stacks of aluminosilicate layers, either superimposed directly oneach other or separated by interlayer material. The layers may be of two types,either 1: 1 (containing 1 tetrahedral and 1 octahedral sheet) or 2:1 (containing 2tetrahedral and 1 octahedral sheet). The tetrahedral sheets are formed by corner-linking (Si/AI)O4 tetrahedra into an infinite network of hexagonal rings. Theoctahedral sheets are formed by placing cations (e. g. Al, Mg, Fe, etc) in the 6-foldcoordinate sites found between two close-packed layers of anions. In the 1:1 min-erals one of these close-packed anion layers is formed from the apical oxygenatoms of the tetrahedral sheet, together with additional anions (usually OH or F)placed at the centre of the hexagonal rings to complete the close packing. In the 2:1minerals both close packed layers of anions are of this type. Further divisions maybe made, on the basis of the site occupancies of the cations in the octahedral sheet,into dioctahedral and trioctahedral subgroups. Different polytypes (or polyty-poids) are formed by different layer stacking arrangements and further divisionsinto mineral species may be made on the basis of chemical composition.
In detail the structures are more complex than this simple scheme suggests. Thetetrahedral sheets, for example, are usually distorted by rotation of the tetrahedra
110

so as to be dimensionally compatible with the octahedral sheet. By means of these,and other, distortions 1:1 and 2:1 layers with a wide range of chemical compositioncan be formed, and this allows the layers to have a range of net electrical charge. Forexample, replacement of Si by Al in the tetrahedral sheet and of trivalent by diva-lent cations in the octahedral sheet leads to an increasingly negative layer charge.The true (as distinct from brittle) micas have a net layer charge of 1 per O0(OH) 2formula unit. This charge is balanced by large monovalent cations, usually potas-sium, which lie in the hexagonal cavities at the base of the tetradrahedral sheets andserve to key one 2:1 layer to the next. Their large size results in the increased basalspacing (- 10A) from that found in minerals without interlayer cations such as pyr-ophyllite and talc (9.2-9.4A; Rayner and Brown 11964]; Rayner and Brown11973]). In the idealised structure the potassium ion is coordinated by 12 anions,but usually structural distortions result in 6 near and 6 more distant neighbours.The primary coordination of the potassium is therefore either octahedral or ditri-gonal-pyramidal, depending on the polytype. Structures with octahedral coordi-nation appear to be more common and would seem to be energetically morefavourable. Structural formulae of some mica group minerals are given in Table 1(after Brown /1984]).
Table I Structural formulae of some mica group minerals including clay micas
cations anions
interlayer octahedral tetrahedral
trioctahedralphlogopite K Mg 3 (SiAl) Oio(OH)2biotite K (MgFe 2+)3 (Si3AI) Olo(OH)2
dioctahedralmuscovite K Al, (SiAI) Oln(OH)2paragonite K Al, (SiAI) Olo(OH)2phengite K (Al.5Mg 0.5) (Si3 A 5) O(OH)2celadonite K (Al Fe3+)l (Mg Fe2+), Si4 O1o(OH)2gauconite i 5 ( 3+R +
( R .4 R 6 ) ( S 3.75A 0.25 ) O 1 ( O H )2laite K., (R 1.65RS.35) (Si,.55A1045) 0 10(OH)2
The micaceous material found in soil clays is often referred to as tillite". SrododiandEberl[ 1984] consider that a more specific nomenclature is now needed. Theydefine cillitic material * as ca general petrological term for the approximately 10Acomponent of the clay-size fraction synonymous with the term ,illitev as used byGrim et a. [193 7]f. lflite itself is defined to be .non-expanding, dioctahedral,aluminous, potassium mica-like material which occurs in the clay size ('4 urm) frac-tionb. It should be noted that features such as the potassium content and polytype,which may be very difficult to determine, are not specified in this definition. The
111
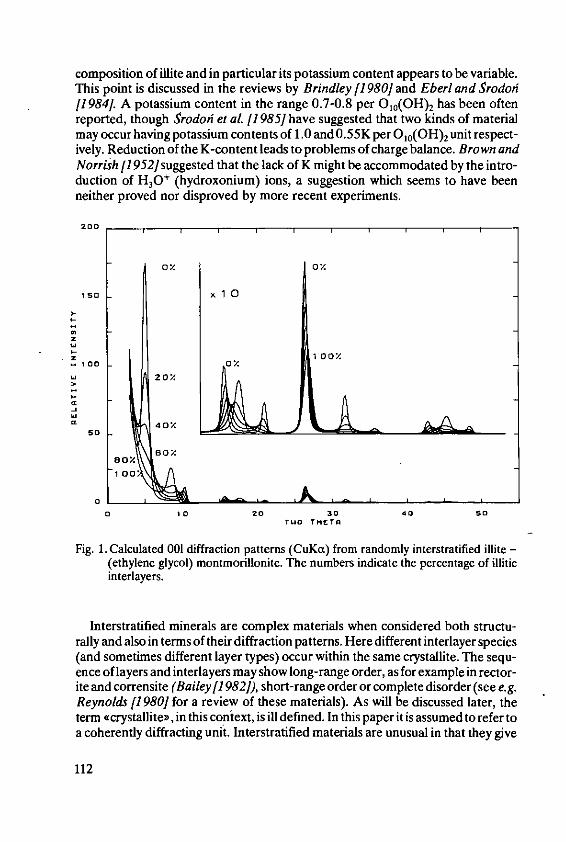
composition of illite and in particular its potassium content appears to be variable.This point is discussed in the reviews by Brindley [1980] and Eberl and Srodohi[1984]. A potassium content in the range 0.7-0.8 per 0 0(OH)2 has been oftenreported, though Srodof et al [1985] have suggested that two kinds of materialmay occur having potassium contents of 1.0 and 0.55K per 0 10(OH) 2 unit respect-ively. Reduction of the K-content leads to problems of charge balance. Brown andNorrish 11952] suggested that the lack of K might be accommodated by the intro-duction of H30+ (hydroxonium) ions, a suggestion which seems to have beenneither proved nor disproved by more recent experiments.
200
0X OA
ISO xl0
0z
15 1 0 0Y
.-. tOI O0Y
LOJ 20%
500
80%
100.
0 t0 20 30 40 50TWO THETA
Fig. 1. Calculated 001 diffraction patterns (CuKa) from randomly interstratified illite -(ethylene glycol) montmorillonite. The numbers indicate the percentage of illiticinterlayers.
Interstratified minerals are complex materials when considered both structu-rally and also in terms of their diffraction patterns. Here different interlayer species(and sometimes different layer types) occur within the same crystallite. The sequ-ence of layers and interlayers may show long-range order, as for example in rector-ite and corrensite (Bailey[i 982]), short-range order or complete disorder (see e.g.Reynolds [1980] for a review of these materials). As will be discussed later, theterm .crystallitev, in this context, is ill defined. In this paper it is assumed to refer toa coherently diffracting unit. Interstratified materials are unusual in that they give
112
diffraction patterns whose cBragg reflections are not rational orders of an inter-planar spacing. Figure 1 shows an example of this, giving the calculated patternsfrom randomly interstratified illite-smectite of different compositions. Illite-smec-tite is probably the most common and important of the interstratified materials, atleast among soil clays. It consists of 2:1 alumino-silicate layers with interlayers thatmay be either illitic (i. e. non-expandable and containing potassium ions) or smec-titic (i. e. expandable interlayers containing solvated cations). Further details ofthe structure of this material will be discussed below.
3. Advances in experimental facilities
The facilities for X-ray and neutron diffraction available to soil mineralogists haveimproved greatly over the last few years, with new radiation sources and detectorsand increased automation and computing power. Many of these advances, whichare reviewed briefly below, are too recent to have had much impact to date, but itseems certain that the next 10 years will see dramatic changes in the way which dif-fraction patterns are measured and interpreted.
3.1 New radiation sources
A number of dedicated Synchrotron Radiation Sources now exist (e. g. SynchrotronRadiation Source (SRS), Daresbury U.K.; National Synchrotron LightSource (NSLS), Brookhaven, U.S.A.) as well as institutes allowing .parasiticp useof high-energy physics facilities. Synchrotron sources provide very intense, paral-lel, plane-polarised beams of X-rays with a continuous spread of wavelengths fromabout 0.2A upwards. They are thus effectively 'white' sources which are suitableboth for diffraction experiments and also for other techniques giving structuralinformation such as EXA FS (Extended X-ray Absorption Fine Structure). A gen-eral review of synchrotron radiation has been published by The Royal Society ofChemistry[1986. Although it appears to have found little or no application in claymineralogy so far, there are a number of groups working on applications of syn-chrotron radiation to powder diffraction. Its main advantages in this field wouldseem to be:
1. low-resolution patterns can be obtained in energy-dispersive mode very rapidly(less than 1 second per pattern) - see e.g. Buras, Gerward, Glazer, Hidaka andStaun Olsen [1979].
2. very high resolution angle-dispersive patterns can be obtained (Hastings,Thomlinson and Cox [1984]).
3. short wavelength X-rays are available (X 4 0.2 A) which can penetrate largesamples
4. novel experiments utilising X-ray anomalous scattering are possible over a com-plete range of wavelength (Georgopoulos and Cohen [1985]).
113
It is possibly the last that is of most interest to soil mineralogists (Wood Nichollsand Brown [1986]).
Neutron sources have shown similar advances. As well as conventional steady-state reactors (e.g. Institut von Laue-Langevin (ILL). Grenoble), very intensepulsed sources are now available (e.g. ISIS, Rutherford-Appleton Laboratory,U.K.). These are particularly suitable for time-of-flight (energy-dispersive) pow-der diffraction. For example, the high resolution powder diffractometer (HRPD)at ISIS will, when operating at full power, allow patterns to be collected with a reso-lution approximately four times better than that of most conventional diffractome-ters (e.g. DIA at ILL, Grenoble) in about 60 minutes.
3.2 New detectors
Recently, several novel X-ray powder diffractometers have been developed usingposition-sensitive detectors (W61fel [1983]; Shishiguchi, Minato and Hashizume11986]). These detectors are essentially elongated proportional counters coupledwith a delay line so as to enable a reading of position as well as X-ray intensity to beobtained. One example of such an instrument, which is commercially available, isdecribed by Wdfel[1983]. This detector measures simultaneously over an angularrange of 450 in 20 and allows diffraction patterns to be measured in typically 3-5mins. Although the resolution of such instruments is, at present, not as good as thatof a conventional parafocussing powder diffractometer it is more than adequatefor most applications in soil mineralogy.
3.3 Automation
Recent advances in electronics have produced major changes in X-ray diffrac-tometer control systems. All modem powder diffractometers, even if of conven-tional (e.g. Bragg-Brentano parafocussing) design, are now driven by stepping-motors and have digital output. Older instruments can usually be upgraded atmodest cost. The ready availability of step-scanned digital output, rather than ana-logue output to a chart, allows much more advanced methods of data analysis, suchas least-squares profile refinement (see e.g. Brown and Wood[ 985] for an appli-cation of this method in soil mineralogy) to be used routinely.
3.4 Computing
Advances in computing have been even more dramatic than those in instrumenta-tion. The last five years has seen an enormous increase in the speed and power ofmicrocomputers. For example, a workstation rated at > 1 Mips (million instruc-tions per second), with 4 Mbyte memory and high-resolution graphics currentlycosts less than £10 000 in the U.K. A machine of this power can perform complexanalyses of diffraction patterns very rapidly. It seems likely that the next few years
114

will see the development of interactive expert systems. for use in clay mineralogy(a crude example of such a system is provided by the search/match programs cur-rently used to identify materials from powder diffraction patterns using the JCPDS(Joint Commission on Powder Diffraction Standards) data-base; see e.g.Schreiner, SurdukowskiandJenkinsl1982). 'Real-time' methods, in which thefuture course of an experiment can be influenced by on-line analysis of the dataalready collected are also likely to become of increasing importance.
4. Qualitative and quantitative estimation of micaceousmaterials
X-ray diffraction is one of the most widely used techniques for identification andquantitative analysis of clay minerals. It has advantages over electron microscopyfor this purpose in that, as a greater volume of material is examined, an analysismore representative of the bulk sample may be obtained. It should be remem-bered, however, that in conventional laboratory powder diffractometry the X-rayswill penetrate into the sample by only a few tens of microns and thus surface effectsmay be important. Neutron diffraction (and possibly also synchrotron radiation)can examine much larger volumes of material because of the lower beam attenua-tion, but the limited availability and high cost of neutron diffraction facilities atpresent preclude their use for routine analyses. In this section I shall concentratemainly on the difficulties involved in X-ray analysis of soil clays with particular ref-erence to the analysis of micaceous phases. Many of the problems outlined belowhave no immediately obvious solution. This discussion, therefore, presents a rathercautious view of the subject but one which it may be salutary to consider.
4.1 Experimental arrangementsAt present almost all X-ray diffraction studies of clays are made using diffractome-ters based on Bragg-Brentano parafocussing reflection geometry. These instru-ments are mechanically robust and produce high count-rates but it should beremembered that in other respects reflection geometry is not the most suitablearrangement when accurate measurements at small values of 20 are required.Detailed aspects of experimental technique are discussed by, for example, Klugand A lexanderfl 974] and Brown and Brindley [1980] and will not be consideredfurther here. One comment which should be made, however, concerns the instru-mental resolution employed. Generally the receiving slits provided with theseinstruments are finer than is necessary for soil mineralogical studies. For example,in the Rothamsted X-ray laboratory, using Philips PW050 cvertical, powdergoniometers, it has been found that a 0.6 mm (- 0.20 20) receiving slit can be usedto advantage and that the diffracted beam Soller slits can often also be removed,
115
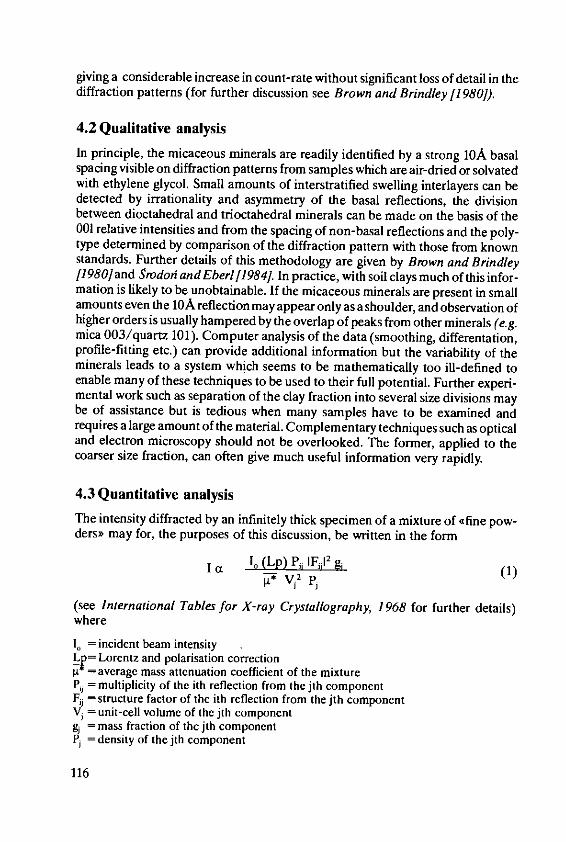
giving a considerable increase in count-rate without significant loss of detail in thediffraction patterns (for further discussion see Brown and Brindley [1980]).
4.2 Qualitative analysisIn principle, the micaceous minerals are readily identified by a strong 10A basalspacing visible on diffraction patterns from samples which are air-dried or solvatedwith ethylene glycol. Small amounts of interstratified swelling interlayers can bedetected by irrationality and asymmetry of the basal reflections, the divisionbetween dioctahedral and trioctahedral minerals can be made on the basis of the001 relative intensities and from the spacing of non-basal reflections and the poly-type determined by comparison of the diffraction pattern with those from knownstandards. Further details of this methodology are given by Brown and Brindleyf19801 and Srodorf and Eberl[1984]. In practice, with soil clays much of this infor-mation is likely to be unobtainable. If the micaceous minerals are present in smallamounts even the 10A reflection may appear only as a shoulder, and observation ofhigher orders is usually hampered by the overlap of peaks from other minerals (e.g.mica 003/quartz 101). Computer analysis of the data (smoothing, differentation,profile-fitting etc.) can provide additional information but the variability of theminerals leads to a system which seems to be mathematically too ill-defined toenable many of these techniques to be used to their full potential. Further experi-mental work such as separation of the clay fraction into several size divisions maybe of assistance but is tedious when many samples have to be examined andrequires a large amount of the material. Complementary techniques such as opticaland electron microscopy should not be overlooked. The former, applied to thecoarser size fraction, can often give much useful information very rapidly.
4.3 Quantitative analysisThe intensity diffracted by an infinitely thick specimen of a mixture of qfine pow-ders> may for, the purposes of this discussion, be written in the form
Ia I o (Lp) Pi IFi 12 g(
ii V'2 P,
(see International Tables for X-ray Crystallography, 1968 for further details)where
Io= incident beam intensityL p= Lorentz and polarisation correctionV= average mass attenuation coefficient of the mixtureP= multiplicity of the ith reflection from the jth componentFij = structure factor of the ith reflection from the jth componentVj = unit-cell volume of the jth componentgi = mass fraction of the jth componentPj = density of the jth component
116
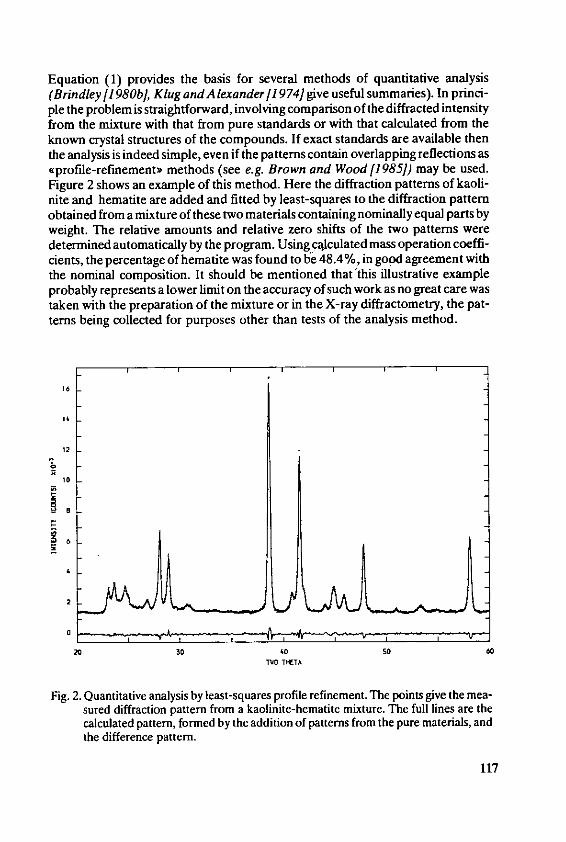
Equation (1) provides the basis for several methods of quantitative analysis(Brindley [1980b], Klug and Alexander [1974] give useful summaries). In princi-ple the problem is straightforward, involving comparison of the diffracted intensityfrom the mixture with that from pure standards or with that calculated from theknown crystal structures of the compounds. If exact standards are available thenthe analysis is indeed simple, even if the patterns contain overlapping reflections as
'profile-refinement' methods (see e.g. Brown and Wood [1985]) may be used.Figure 2 shows an example of this method. Here the diffraction patterns of kaoli-nite and hematite are added and fitted by least-squares to the diffraction patternobtained from a mixture of these two materials containing nominally equal parts byweight. The relative amounts and relative zero shifts of the two patterns weredetermined automatically by the program. Using calculated mass operation coeffi-cients, the percentage of hematite was found to be 48.4%, in good agreement withthe nominal composition. It should be mentioned that'this illustrative exampleprobably represents a lower limit on the accuracy of such work as no great care wastaken with the preparation of the mixture or in the X-ray diffractometry, the pat-terns being collected for purposes other than tests of the analysis method.
16
12
10
2
M 30 40 so WTNO TtTA
Fig. 2. Quantitative analysis by least-squares profile refinement. The points give the mea-sured diffraction pattern from a kaolinite-hematite mixture. The full lines are thecalculated pattern, formed by the addition of patterns from the pure materials, andthe difference pattern.
117
Unfortunately, in real soil clay analyses the process is much less straightforward.Methods such as that described above depend on the availability of either observedor calculated "standard patterns which are representative of the minerals in thatparticular soil. It is not clear at present how these might be obtained. One possibi-lity is to use patterns from a restricted range of standards which are then modifiedby computer to match more closely those in the material being examined, and somesuccess with this type of method has been achieved recently for the admittedlyrather more simple case of the estimation of iron oxides (Brown and Wood[1985]).It is generally considered, however, that, at present, only semi-quantitative analysisof soil clays is possible. The methods usually adopted (see e.g. Bullock and Love-land [1974]) involve putting equation (1) into the form
1I 0w g (2)
where wi is a weighting factor valid for a particular reflection (usually of index 001)from a particular mineral. Integrated areas of peaks from the different minerals areobtained from the diffraction pattern and converted to relative mass fractions via(2). These are then normalised to 100% to give the composition of the clay. Eventhis simplified scheme suffers from a number of theoretical and practical draw-backs such as:
1. What structural model should be used to calculate wj?2. What Lorentz-polarisation factor should be applied?3. What background correction should be used?4. What percentage of the clay fraction may be assumed to be crystalline?
The importance of points (1) and (2) can be seen by reference to Table 2, where ahypothetical binary mixture of a 1:1 kaolinitic and a 2:1 micaceous mineral is con-sidered. It can be seen that the relative weighting factor varies by a factor of 7.4depending on the assumptions made. In compiling Table 2 no attempt was made touse structures which gave extreme values and other sources of variation such as thechoice of atomic scattering factors could also have been included. Thus we mayconclude, for example, that a diffraction pattern containing 10A and 7.2A peaksof equal intensity could be interpreted to indicate compositions ranging from 35 %mica: 65 % kaolin to 80% mica: 20% kaolin, a situation which is clearly unsatisfac-tory. In general it appears that, for analyses based on the 10A mica reflection, fai-lure to recognise the trioctahedral nature of a mica such as biotite can result in itsconcentration in the soil clay being over-estimated by a factor which can be as largeas 5.
A final comment concerns the occurrence of iamorphousv material. Soil claysfrequently show much low angle scattering. It is tempting to attribute this to instru-mental obackgroundb, but it is more likely to be a real effect since it is not foundwhen specimens of pure minerals are examined. The most probable explanation isthat it arises from "amorphous> material, possibly single alumino-silicate layers. Itthus seems likely that procedures such as that described above for the estimation of
118
soil-clay compositions will overestimate the amounts of crystalline> clay mineralsrelative to the total amount of matter in the sample.
Table 2 Semi-quantitative analysis of clays from basal reflections
2M, Muscovite' (002) IM Biotite 2 (001) Dickite' (002)
1Fl 63 80 102V (A') 932.6 492.8 659.5P (g CM- 3) 2.84 3.05 2.60
IF12 X 103 1.61 8.64 9.20vc2 P
20 CoKot° 10.30 10.26 14.36Lp (Random 61.3 61.81 31.3Powder)
4
Lp (Single Crystal)5 5.50 5.53 3.91
wren (Random 0.34 1.85 1.0Powder)w,,, (Single Crystal) 0.25 1.32 1.0
1. Ga ven [1971]2. Takeda and Ross (1975]3. Newnham (1961]4. =(1 + cos220)/2 sin20 sin05. =(1 + cos 220/2 sin20
5. Analysis of interstratified minerals
5.1 Fundamental principles of diffraction by disordered systems
lnterstratified minerals are among the most difficult materials to analyse byX-ray diffraction. Their <crystals - it is even doubtful whether such a word is trulyapplicable - are usually very small, perhaps less than 100A thick, and can poten-tially exhibit almost all other known forms of disorder (stacking faults, strain,chemical substitution etc.). In these circumstances many of the assumptions nor-mally used in X-ray crystal structure analysis fail and it is therefore essential thatmineralogists working in this field have a clear understanding of the conceptsinvolved and of their limitations. The purpose of this section is to illustrate some ofthese concepts using a set of calculated 1-dimensional diffraction patterns. This isanalogous, in the case of interstratified minerals, to analysis of the basal (001) ref-lections to determine the interlayer stacking sequence. There are a number ofexcellent monographs on diffraction from disordered materials. Woolfson [1970]gives a good account of basic diffraction theory, which is also covered in more detailby, for example, James[1962]and Warren [1969]. The small monograph by Wilson
119
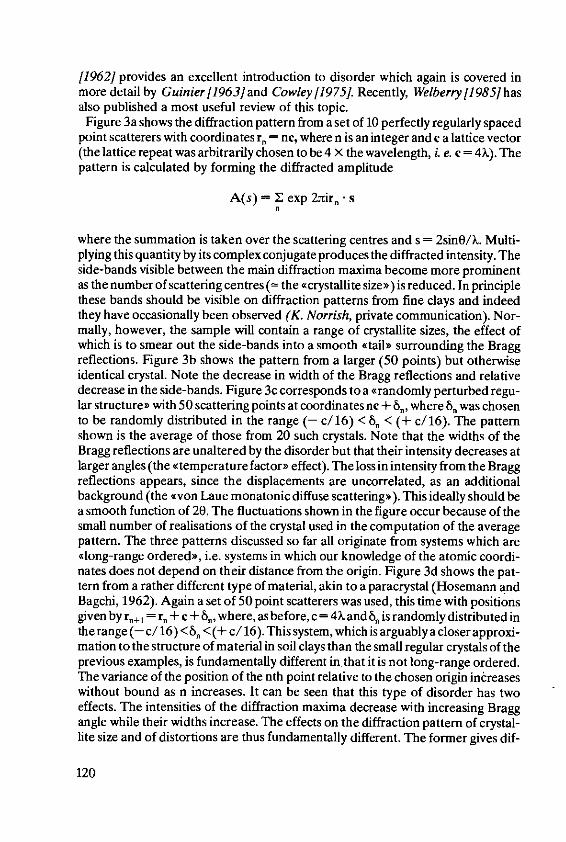
[1962] provides an excellent introduction to disorder which again is covered inmore detail by Guinier[1963]and Cowley[1975]. Recently, Welberry[1985]hasalso published a most useful review of this topic.
Figure 3a shows the diffraction pattern from a set of 10 perfectly regularly spacedpoint scatterers with coordinates r. = ne, where n is an integer and c a lattice vector(the lattice repeat was arbitrarily chosen to be 4 X the wavelength, i. e. c = 4k). Thepattern is calculated by forming the diffracted amplitude
A(s) = Z exp 2;tir n • s
where the summation is taken over the scattering centres and s = 2sin0/. Multi-plying this quantity by its complex conjugate produces the diffracted intensity. Theside-bands visible between the main diffraction maxima become more prominentas the number of scattering centres (= the "crystallite sizeD) is reduced. In principlethese bands should be visible on diffraction patterns from fine clays and indeedthey have occasionally been observed (K. Norrish, private communication). Nor-mally, however, the sample will contain a range of crystallite sizes, the effect ofwhich is to smear out the side-bands into a smooth qtailD surrounding the Braggreflections. Figure 3b shows the pattern from a larger (50 points) but otherwiseidentical crystal. Note the decrease in width of the Bragg reflections and relativedecrease in the side-bands. Figure 3c corresponds to a "randomly perturbed regu-lar structure with 50 scattering points at coordinates nc + 6., where 6. was chosento be randomly distributed in the range (- c/16) < 6, < (+ c/16). The patternshown is the average of those from 20 such crystals. Note that the widths of theBragg reflections are unaltered by the disorder but that their intensity decreases atlarger angles (the ctemperature factor effect). The loss in intensity from the Braggreflections appears, since the displacements are uncorrelated, as an additionalbackground (the 'von Laue monatonic diffuse scattering ). This ideally should bea smooth function of 20. The fluctuations shown in the figure occur because of thesmall number of realisations of the crystal used in the computation of the averagepattern. The three patterns discussed so far all originate from systems which areclong-range ordered , i.e. systems in which our knowledge of the atomic coordi-nates does not depend on their distance from the origin. Figure 3d shows the pat-tern from a rather different type of material, akin to a paracrystal (Hosemann andBagchi, 1962). Again a set of 50 point scatterers was used, this time with positionsgiven by r,,, = r, + c + 6, where, as before, c = 4X and 6n is randomly distributed inthe range (- c/ 16) < 6n < (+ c/ 16). This system, which is arguably a closer approxi-mation to the structure of material in soil clays than the small regular crystals of theprevious examples, is fundamentally different in that it is not long-range ordered.The variance of the position of the nth point relative to the chosen origin increaseswithout bound as n increases. It can be seen that this type of disorder has twoeffects. The intensities of the diffraction maxima decrease with increasing Braggangle while their widths increase. The effects on the diffraction pattern of crystal-lite size and of distortions are thus fundamentally different. The former gives dif-
120
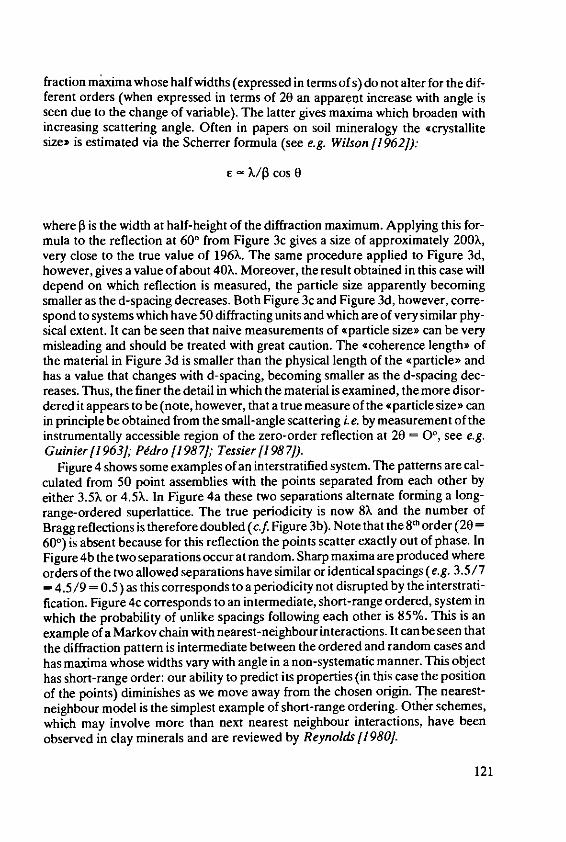
fraction maxima whose half widths (expressed in terms of s) do not alter for the dif-ferent orders (when expressed in terms of 20 an apparent increase with angle isseen due to the change of variable). The latter gives maxima which broaden withincreasing scattering angle. Often in papers on soil mineralogy the "crystallitesize* is estimated via the Scherrer formula (see e.g. Wilson [1962]):
E - X/3 cos 0
where [3 is the width at half-height of the diffraction maximum. Applying this for-mula to the reflection at 600 from Figure 3c gives a size of approximately 200X,very close to the true value of 196X. The same procedure applied to Figure 3d,however, gives a value of about 40X,. Moreover, the result obtained in this case willdepend on which reflection is measured, the particle size apparently becomingsmaller as the d-spacing decreases. Both Figure 3c and Figure 3d, however, corre-spond to systems which have 50 diffracting units and which are of very similar phy-sical extent. It can be seen that naive measurements of oparticle sizeD can be verymisleading and should be treated with great caution. The ccoherence length ofthe material in Figure 3d is smaller than the physical length of the ,particle> andhas a value that changes with d-spacing, becoming smaller as the d-spacing dec-reases. Thus, the finer the detail in which the material is examined, the more disor-dered it appears to be (note, however, that a true measure of the "particle size canin principle be obtained from the small-angle scattering i. e. by measurement of theinstrumentally accessible region of the zero-order reflection at 20 = 00, see e.g.Guinier [1963]; Ptdro [1987]; Tessier [1987]).
Figure 4 shows some examples of an interstratified system. The patterns are cal-culated from 50 point assemblies with the points separated from each other byeither 3.5X or 4.5X. In Figure 4a these two separations alternate forming a long-range-ordered superlattice. The true periodicity is now 8X and the number ofBragg reflections is therefore doubled (c.f. Figure 3b). Note that the 8 b order (20 =600) is absent because for this reflection the points scatter exactly out of phase. InFigure 4b the two separations occur at random. Sharp maxima are produced whereorders of the two allowed separations have similar or identical spacings (e.g. 3.5/7= 4.5/9 = 0.5) as this corresponds to a periodicity not disrupted by the interstrati-fication. Figure 4c corresponds to an intermediate, short-range ordered, system inwhich the probability of unlike spacings following each other is 85%. This is anexample of a Markov chain with nearest-neighbour interactions. It can be seen thatthe diffraction pattern is intermediate between the ordered and random cases andhas maxima whose widths vary with angle in a non-systematic manner. This objecthas short-range order: our ability to predict its properties (in this case the positionof the points) diminishes as we move away from the chosen origin. The nearest-neighbour model is the simplest example of short-range ordering. Other schemes,which may involve more than next nearest neighbour interactions, have beenobserved in clay minerals and are reviewed by Reynolds [1980].
121
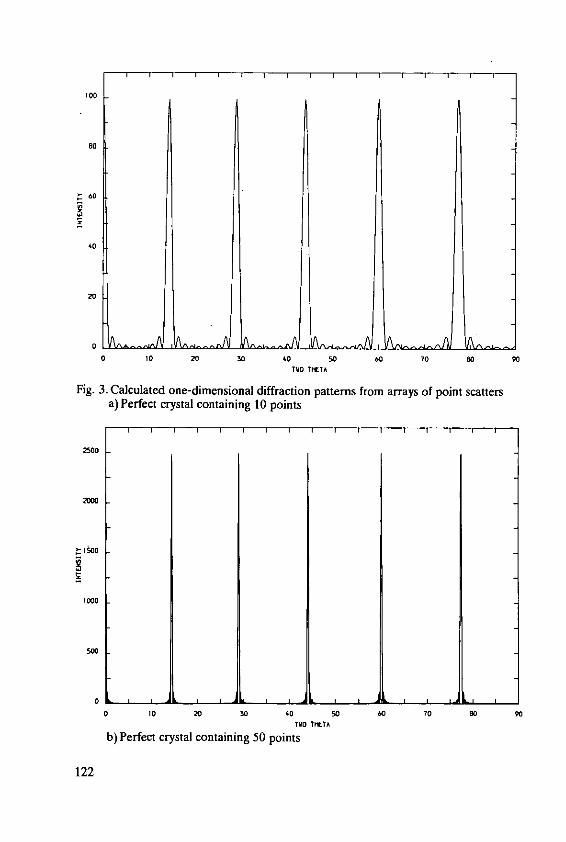
100
80
60
40
20
0 10 20 SO 40 SO 60 70 SO 90TWO TKTA
Fig. 3. Calculated one-dimensional diffraction patterns from arrays of point scattersa) Perfect crystal containing 10 points
25OO
0 10 20 30 40 50 60 70 S0 90TWO TlTA
b)Perfect crystal containing 50 points
122
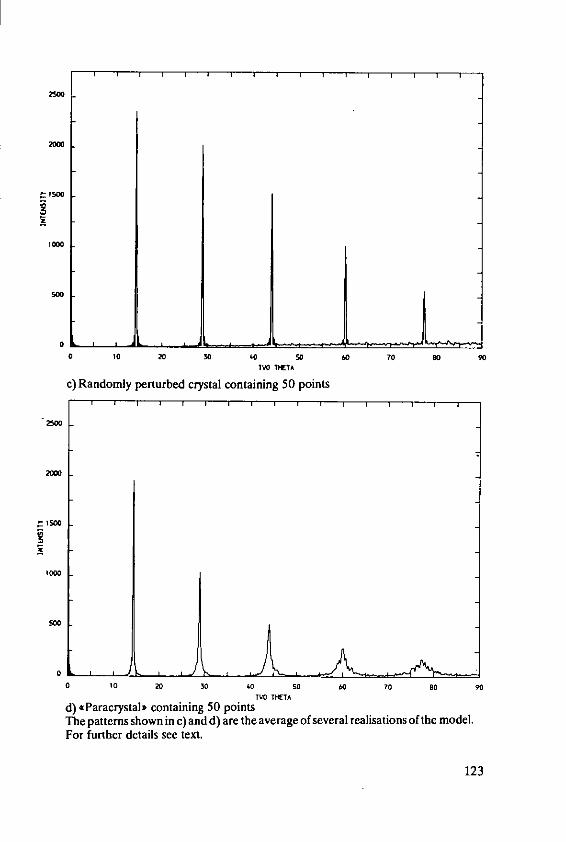
2000
O
0 10 20 30 '0 50 60 70 SO 90IWO TcTA
c) Randomly perturbed crystal containing 50 points
2S00
00
5 0
Ix0
0 '0 20 30 40 50 60 70 80 90TUO T PtTA
d) .Paracrystal' containing 50 pointsThe patterns shown in c) and d) are the average of several realisations of the model.For further details see text.
123
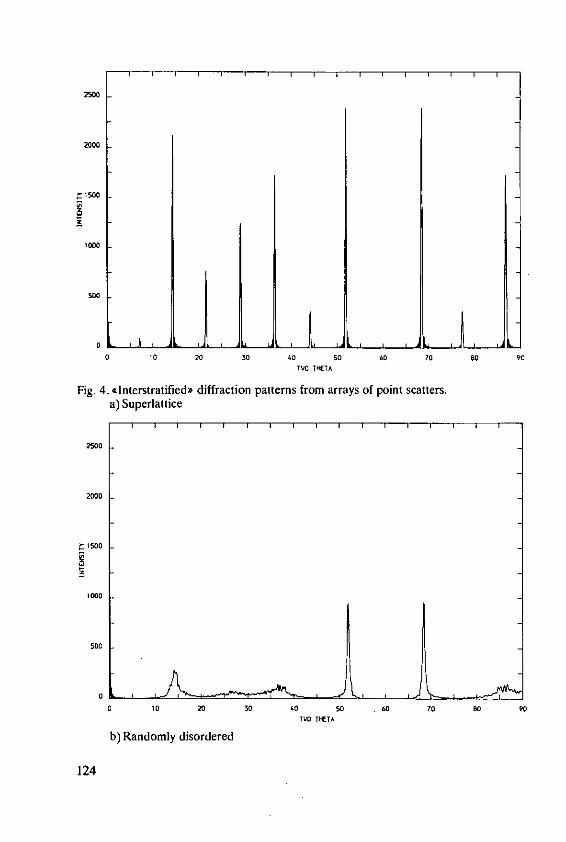
2500
2000
500
0 10 20 30 40 50 60 70 s0 90TUC THtTA
Fig. 4. cInterstratified" diffraction patterns from arrays of point scatters.a) Superlattice
2500
2000
$500
500
0 10 20 30 40 50 60 70 N0 90TWO TM*TA
b) Randomly disordered
124
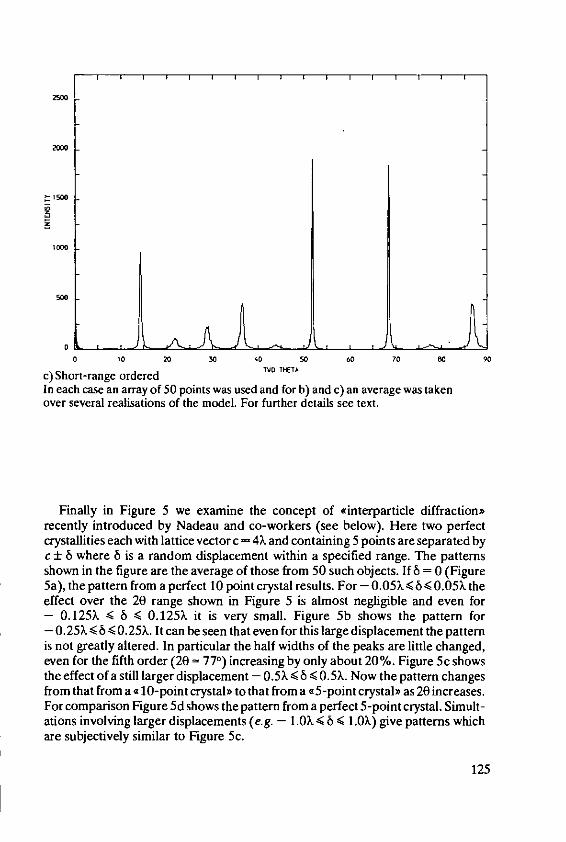
2500
2000
'-1500
000
00 10 20 40 SO 60 70 W 90
c) Short-range ordered TO TK^
In each case an array of 50 points was used and for b) and c) an average was takenover several realisations of the model. For further details see text.
Finally in Figure 5 we examine the concept of ainterparticle diffraction"recently introduced by Nadeau and co-workers (see below). Here two perfectcrystallities each with lattice vector c = 4X and containing 5 points are separated byc ± 6 where 6 is a random displacement within a specified range. The patternsshown in the figure are the average of those from 50 such objects. IfS = 0 (Figure5a), the pattern from a perfect 10 point crystal results. For - 0.05k 4 6 0.05. theeffect over the 20 range shown in Figure 5 is almost negligible and even for- 0.125X < 8 4 0.125k it is very small. Figure 5b shows the pattern for- 0.25k< 6 0.25k. It can be seen that even for this large displacement the patternis not greatly altered. In particular the half widths of the peaks are little changed,even for the fifth order (20 = 770) increasing by only about 20%. Figure 5c showsthe effect of a still larger displacement - 0.5k 48 4 0.5X. Now the pattern changesfrom that from a . 10-point crystalD to that from a C5-point crystal" as 20 increases.For comparison Figure Sd shows the pattern from a perfect 5-point crystal. Simult-ations involving larger displacements (e.g. - 1.0X 4 1.OX) give patterns whichare subjectively similar to Figure 5c.
125
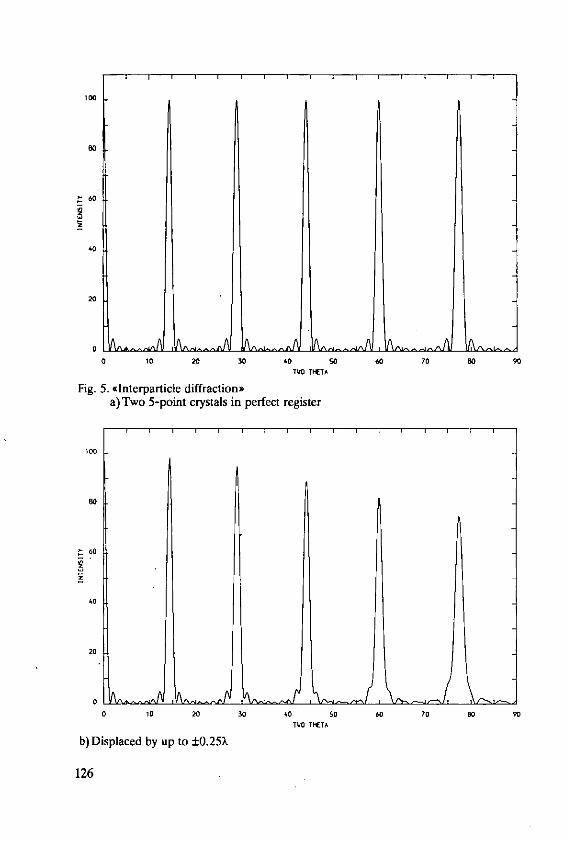
TO
60
40
20
0 ... P A .... AN ..... A L .... A L -.... A ..
O 10 20 30 40 50 60 70 0 90TWO TSTA
Fig. 5. t Interparticle diffraction,a) Two 5-point crystals in perfect register
60
40
20
0 10 20 30 40 50 60 70 N 90
TWO TKtTA
b)Displaced by up to ±0.25X
126
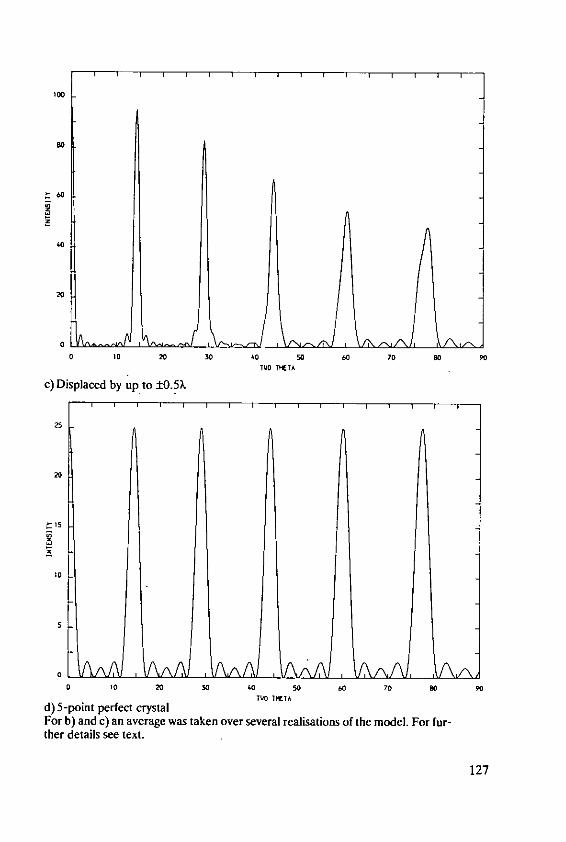
100
00
60
40
o o 20 30 40 50 60 70 W0 901V TtTA
c) Displaced by up to ±0.5%
25
15
10
0 10 20 30 40 S( 60 70 W0 90TO hWITA
d) 5-point perfect crystalFor b) and c) an average was taken over several realisations of the model. For fur-ther details see text.
127
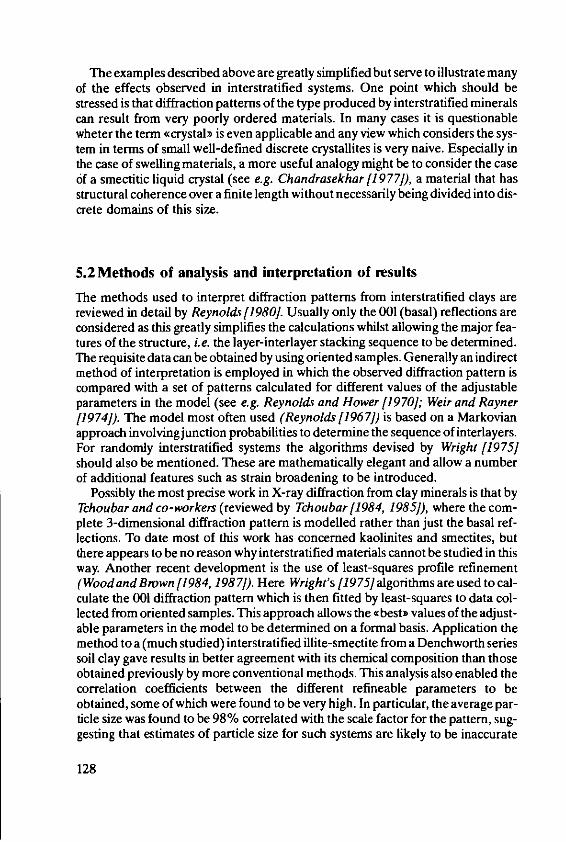
The examples described above are greatly simplified but serve to illustrate manyof the effects observed in interstratified systems. One point which should bestressed is that diffraction patterns of the type produced by interstratified mineralscan result from very poorly ordered materials. In many cases it is questionablewheter the term "crystal' is even applicable and any view which considers the sys-tem in terms of small well-defined discrete crystallites is very naive. Especially inthe case of swelling materials, a more useful analogy might be to consider the case6f a smectitic liquid crystal (see e.g. Chandrasekhar [1977]), a material that hasstructural coherence over a finite length without necessarily being divided into dis-crete domains of this size.
5.2 Methods of analysis and interpretation of results
The methods used to interpret diffraction patterns from interstratified clays arereviewed in detail by Reynolds [1980]. Usually only the 001 (basal) reflections areconsidered as this greatly simplifies the calculations whilst allowing the major fea-tures of the structure, i.e. the layer-interlayer stacking sequence to be determined.The requisite data can be obtained by using oriented samples. Generally an indirectmethod of interpretation is employed in which the observed diffraction pattern iscompared with a set of patterns calculated for different values of the adjustableparameters in the model (see e.g. Reynolds and Hower [1970]; Weir and Rayner[1974]). The model most often used (Reynolds /1967]) is based on a Markovianapproach involving junction probabilities to determine the sequence of interlayers.For randomly interstratified systems the algorithms devised by Wright [1975]should also be mentioned. These are mathematically elegant and allow a numberof additional features such as strain broadening to be introduced.
Possibly the most precise work in X-ray diffraction from clay minerals is that byTchoubar and co-workers (reviewed by Tchoubar [1984, 1985]), where the com-plete 3-dimensional diffraction pattern is modelled rather than just the basal ref-lections. To date most of this work has concerned kaolinites and smectites, butthere appears to be no reason why interstratified materials cannot be studied in thisway. Another recent development is the use of least-squares profile refinement(WoodandBrown [1984, 1987]). Here Wright's [1975] algorithms are used to cal-culate the 001 diffraction pattern which is then fitted by least-squares to data col-lected from oriented samples. This approach allows the "best' values of the adjust-able parameters in the model to be determined on a formal basis. Application themethod to a (much studied) interstratified illite-smectite from a Denchworth seriessoil clay gave results in better agreement with its chemical composition than thoseobtained previously by more conventional methods. This analysis also enabled thecorrelation coefficients between the different refineable parameters to beobtained, some of which were found to be very high. In particular, the average par-ticle size was found to be 98% correlated with the scale factor for the pattern, sug-gesting that estimates of particle size for such systems are likely to be inaccurate
128
(see above). In these circumstances it may be very advantageous to place the dataexperimentally on an absolute scale (Pons et al. [1980]).
Both of the methods reviewed in the previous paragraph require "pure) speci-mens. Techniques more easily applicable to samples containing a mixture of miner-als have been described by Srodofi [1980, 1981, 1984], who has produced a set ofnomograms for the estimation of mineral composition from measurements of a fewkey reflections. These essentially provide an alternative, rapid, means of applyingReynold's model, since they are based on calculations made using the method ofReynolds and Hower 11970j. Even this approach, however, may not always beapplicable to soil clays as it requires accurate determination of the positions ofsome of the higher-order peaks which may well be too weak and diffuse to allowthis. Other, more approximate, methods are also not without pitfalls. If randominterstratification is assumed it might be thought that the percentage of swellinginterlayers could be determined by comparison of the strong first-order reflectionwith the traces shown in Figure 1. Unfortunately, there are serious difficulties inthis. For example, considering the smectitic rich end of the composition range, it isfound that the position of this reflection does not shift greatly as the amount of illiticinterlayers increases but instead decreases in intensity. Thus even if this peak posi-tion could be determined accurately (which is itself a non-trivial process) it isunlikely to provide a reliable estimate of composition. An analysis on the basis ofintensity would require a diffraction pattern from which the background intensityhad been subtracted. Failure to consider this will result in an overestimate of thepercentage of illitic interlayers.
Finally, it is pertinent to make a few further comments on the interpretation ofthe results from diffraction experiments on interstratified systems. In the precedingsection it was shown that the diffraction patterns observed from clay minerals couldbe produced by very poorly ordered systems, to the extent that it is questionablewhether terms such as "crystalb are really applicable. The different types of disor-der can, in principle, be distinguished from each other by, for example, the behav-iour of the halfwidths of the peaks with 20, but in a real case it may be difficult toseparate the effects of size, strain, stacking faults etc. Much of the previous work oninterstratified minerals has neglected strain broadening in favour of size broaden-ing, probably solely for resons of convenience in computer programming. Moreprecise studies of both micas and swelling materials have indicated that both theseterms are important (Kodama, Gatineau and Mring [1971]; Ben Brahim et al.[1983]; Wood and Brown [19871). When examining the results obtained fromX-ray diffraction it must always be remembered that the values of the parameters,and indeed even the parameters themselves, will reflect the model used to interpretthe data. The model most often used in work on interstratified minerals is the Mar-kov chain, junction probability, approach of e.g. Reynolds and Hower 1970]. Al-though this seems to explain successfully many of the features found in diffractionpatterns it is only an approximation (a point well appreciated by its originalauthors) and it should not be inferred that the formation of the mineral thereforenecessarily proceeds via a similar stepwise process. Other types of simulation,Monte-Carlo methods, Ising models etc., are also applicable and may attract more
129
attention in the future (see e.g. Ziman [1979]; Welberry [1985]; Plancon et el.[1983]; Bethke and A ltaner [1986]).
Even within the confines of a single model the results may be viewed in differentways. For example, Reynolds [1980] considers the case of a binary system (A, B)containing less than 50% of species A and in which the probability of A succeedingA is zero. Reynolds refers to this as the c<perfectly ordered case involving nearestneighbours. However, since A must always be followed by B, it is possible todefine a new cspecies C = (AB) and this system then becomes a random mixtureof C and B. Both of these models give identical diffraction patterns and cannot bedistinguished experimentally. The problem (if indeed it is a problem) can beresolved only if some preference is expressed for the v<fundamental units'.Recently, Nadeau and co-workers (Nadeau et al. [1 984a, b, c, 1985]) have pro-posed that interstratified minerals have as their q<fundamental particlesh thin illiticcrystals. This work has done much to stimulate discussion, especially with regard todiagenetic transformations but its true significance has yet to be demonstrated(A hn and Peacor [1986]; Sawhey and Reynolds [1985]; Mackinnon [198 7]).
6. References
l.A hn, J. H. and Peacor, D. R.: Clays Clay Miner. 34, 180-186 (1986)2. Bailey, S. W.: Clay Minerals 17, 243-248 (1982)3. Bailey, S. W.: Micas. In: S. W. Bailey (ed.) Reviews in Mineralogy Vol. 13. Min. Soc.
Amer., 19844. Ben Brahim, J., Armagan, N., Besson, G. and Tchoubar, C: J. Appl. Cryst. 16, 264-
269 (1983)5. Bethke, C. M. and Altaner, S. P.: Clays Clay Miner. 34, 136-145 (1986)6. Brindley, G. W.: Order-Disorder in Clay Mineral Structures. In: G. W. Brindley and
G. Brown (eds.) Crystal Structures of Clay Minerals and their X-ray Identification.Min. Soc. Lend., 1980a
7. Brindley, G. W.: Quantitative X-ray Mineral Analysis of Clays. In: G. W. Brindley(ed.) Crystal Structures of Clay Minerals and their X-ray Identification. Min. Soc.Lond. 1980b
8. Brindley, G. W. and Brown, G.: Crystal Structures of Clay Minerals and their X-rayIdentification. In: G. W. Brindley and G. Brown (eds.) Min. Soc. Lend., 1980
9. Brown, G.: Phil. Trans. Roy. Soc. Lond. A311, 211-240 (1984)10. Brown, G.andBrindley, G. W.: X-ray Diffraction Procedures for Clay Mineral Ident-
ification. In: G. W. Brindley and G. Brown (eds.) Crystal Structures of Clay Mineralsand their X-ray Identification. Min. Soc. Lend., 1980
11. Brown, G. and Norrish, K.: Min. Mag. 29, 929-932 (1952)12. Brown, G. and Wood, 1. G.: Clay Minerals 20, 15-27 (1985)13. Bullock, P. and Loveland, P. J.: Mineralogical Analyses. In: B. W. Avery and C. L.
Bascomb (eds.) Soil Survey Laboratory Methods, Soil Surv. Tech. Monog. No. 6,Harpenden (1974)
130
14. Buras, B., Gerward, L., Glazer, A.M., Hidaka, M. and Staun Olsen, J.:J. Appl. Cryst.12, 531-536 (1979)
15. Chandrasekhar, S.: Liquid Crystals. Cambridge: University Press, 197716. Cowley, J. M.: Diffraction Physics. N. Holland, (Elsevier) Amsterdam, 197517. Eberl, D. D.: Phil. Trans. Roy. Soc. Lond. A311, 241-257 (1984)18. Georgopoulus, P. and Cohen, J. B.: J. Catal. 92, 211-215 (1985)19. Greenland, D. J. and Hayes, M.H.B.: The Chemistry of Soil Constituents. In: D. J.
Greenland and M.H.B. Hayes (eds.) Wiley, Chichester, 197120. Grim, R.E., Bray, R.H. and Bradley, W.F.: Am. Miner. 22, 813-829 (1937)"21. Guinier, A.: X-ray Diffraction in Crystals, Imperfect Crystals, and Amorphous Bod-
ies. Freeman, San Francisco, 196322. Gfiven, N.: Zeit. Krist. 134, 196-212 (1971)23. Hastings, J. R., Thomlinson, W. and Cox, D.E.: J. Appl. Cryst. 17, 85-95 (1984)24. Hosemann, R. and Bagchi, S. N.: Direct Analysis of Diffraction by Matter. North Hol-
land, Amsterdam, 196225. International TablesforX-ray Crystallography: Vol. HII. Birmingham: Kynoch Press
(Present Distributor D. Riedel, Dordrecht), 196826. James, R. W.: The Optical Principles of the Diffraction of X-rays (The Crystalline
State Vol. 2.). Bell, London, 196227. Jeans, C. V.: Clay Minerals 17, 3-4 (1982)28. Klug, H.P. and Alexander, L. E.: X-ray Diffraction Procedures for Polycrystalline
and Amorphous Materials. Wiley, New York, 197429. Kodama, H., Gatineau, L. and M6ring, J.: Clays Clay Miner. 19, 405-413 (1971)30. Mackinnon, LD.R.: Clays Clay Miner 35, 74-76 (1987)31. Nadeau, P. H., Tait, J. M., McHardy, W. J. and Wilson, M. J.: Clay Minerals 19,67-76
(1984a)32. Nadeau, P. H., Wilson, M. ., McHardy, W. J. and Tait, J. M.: Clay Minerals 19, 757-
769 (1984b)33. Nadeau, P. H., Wilson, M. J., McHardy, W. J. and Tait, J. M.: Science 225,923-925
(1984c)34. Nadeau, P. H., Wilson, M. J., McHardy, W. J. and Tait, J. M.: Min. Mag. 49,393-400
(1985)35. Newman, A.C.D. The Chemistry of Clays and Clay Minerals. In: A.C.D. Newman
(ed.) Longmans, London, 198736. Pedro, G.: Proc. 20th Colloq. Int. Potash Inst. Bern pp. 11 (1987)37. Newnham, R. E.: Min. Mag. 32, 683-704 (1961)38. Plancon, A., Drits, V. A., Sakharov, B. A., Gilan, Z. L and Ben Brahim, J.:J. Appl.
Cryst. 16, 62-69 (1983)39. Pons, C. H., Ben Brahim, J., Yiicel, A., Tchoubar, D. and Tchoubar, C: Clay Miner-
als 15, 111-120 (1980)40. Rayner, J. H. and Brown, G.: Clays Clay Miner. 13, 73-84 (1984)41. Rayner, J. H. and Brown, G.: Clays Clay Miner. 21, 103-114 (1973)42. Reynolds, R. C.: Am. Miner. 52, 661-672 (1967)43. Reynolds, R. C.: Interstratified Clay Minerals. In: G. W. Brindleyand G. Brown(eds.)
Crystal Structures of Clay Minerals and their X-ray Identification. Min. Soc. Lond.,1980
44. Reynolds, R. C and Hower, J.: Clays Clay Miner. 18, 25-36 (1970)45. Royal Society of Chemistry: Synchrotron Radiation. Chemistry in Britain. 22, 803-
852 (1986)
131
46. Sand, L. B. and Mumpton, F. A.: Natural Zeolites; Occurrence, Properties and Use.In: L. R. Sand and F. A. Mumpton (eds.) Pergamon Press, Oxford, 1978
47. Sawhney, B.L. and Reynolds, R. C.: Clays Clay Miner 33, 559 (1985)48. Schreiner, W. N., Surdukowski, C. and Jenkins, R.: J. Appl. Cryst. 15, 513-523
(1982)49. Shishiguchi, S., Minato, L and Hashizume, H.: J. Appl. Cryst. 19, 420-426 (1986)50. Smith, J. V.: Feldspar Minerals. Vol. 1, Crystal Structure and Physical Properties;
Vol. 2, Chemical and Textural Properties. Springer-Verlag, Berlin, 197451. Srodoi, J.: Clays Clay Miner. 28, 401-411 (1980)52. Srodoti, J.: Clays Clay Miner. 16, 297-304 (1981)53. Srodoi, J.: Clays Clay Miner. 32, 337-349 (1984)54. Srodofi, J. and Eberl, D. D.: Illite. In: S. W. Bailey (ed.) Reviews in Mineralogy 13,
Min. Soc. Amer. (1984).55. rodori, J., Morgan, D. J., Eslinger, E. V., Eberl, D. D. and Karlinger, M. R.: Clays
Clay Miner. 34, 368-378 (1986)56. Stoessell, R. K. and Ferrell, R. E.: Clays Clay Miner. 34, 113-114 (1986)57. Takeda, H. and Ross, M.: Am. Miner. 60, 1030-1040 (1975)58. Tessier, D.: Proc. 20th Colloq. Int. Potash Inst. Bern pp. 45 (1987)59. Tchoubar, C.: Phil. Trans. Roy. Soc. Lond. A311, 259-269 (1984)60. Tchoubar, C: Miner. Petrogr. Acta 29-A, 35-54 (1985)61. Warren, B. E.: X-ray Diffraction. Addison-Wesley, Reading, Massachnsetts, 196962. Weir, A. H. and Rayner, J. H.: Clay Minerals 10, 173-187 (1974)63. Welberry, T. R.: Rep. Prog. Phys. 48, 1543-1593 (1985)64. Wilson, A.J.C: X-ray Optics. Methuen, London, 196265. Wdlfel, E.R.: J. Appl. Cryst. 16, 341-348 (1983)66. Wood, L G. and Brown, G.: Acta Cryst. A40, C253 (1984)67. Wood, L G. and Brown, G.: Submitted to J. Appl. Cryst. (1987)68. Wood, L G., Nicholls, L. and Brown, G.: J. Appl. Cryst. 19, 364-371 (1986)69. Woolfson, M. M.: An Introduction to X-ray Crystallography. Cambridge: University
Press, 197070. Wright, A. C: Clays Clay Miner. 23, 278-288 (1975)71. Ziman, J. M.: Models of Disorder, the theoretical physics of homogeneously disor-
dered systems. Cambridge: University Press, 1979
132
Coordinator's report on the1st working session
H. Laudelout, Soil Science Dept., University of Louvain, Louvain-la-Neuve,Belgium; member of the Scientific Board of the International Potash Institute
The general feeling might have been that the subjects treated during the firstsession were far removed from the day-to-day preoccupations of the averageagronomist. This impression was dispelled by the lecture delivered by Dr. Pedro(Versailles). He described the changes in the approach of the soil scientist tothe study of clay mineralogy from the early colloid chemistry of clays consi-dered as amorphous substances through what may be termed the classical ap-proach consisting in X-ray or I. R. studies of highly purified mineralogical claysamples. The present day approach is characterized by the use of more andmore sophisticated physical techniques on the one hand and, on the other hand,by the study of natural soil samples in undisturbed field conditions. Thisimplies that mineralogical clay studies are now carried out at «their naturalwater content> and no longer on perfectly dessicated soil samples with oneor two layers of water. The advantages of this approach are obvious: first ofall direct measurement of important properties relating to the surface chemistryof clay minerals becomes possible; secondly the architecture of the natural poresystems becomes directly visible. The concepts of «domains> and «quasi-crystallinity ) which had been used rather loosely in the past, are now firmlyestablished.
Classical methods such as the well known soil water retention curve maybe combined with modern observation techniques as demonstrated by Tessier.The interest of this communication lies in the fact that the fabric of the porousmaterial is examined at <biological water contents) i. e. at water contents whichare normally found in the soil. At these water contents the interlayer spacingsbecome much larger than 2 layers of water and important processes such aselectrolyte exclusion or surface diffusion of ions are considerably modified.
The conclusion presented by Tessier that understanding the properties ofclays requires that their geochemical environment and their energetic historybe taken into account is illustrated in more detail by the presentation of Tributhon the formation, transformation and decomposition of clay minerals. Itshould be emphasized that a process which he describes and which has beenreferred to recently as «cationic denudation) has assumed tremendous impor-tance over the last few years. The reason for this interest is twofold: the impactof acid precipitation on soil and vegetation in industrial countries is wellknown. On the other hand, in many countries of the humid tropics, especially
133
at high elevation, this terminal stage of cationic denudation has reached a pointwhere the productivity of the soil has sunk to a very low level due to aluminiumtoxicity. In many countries, no economic correction of this situation is possible.It must be recognized that the easy correction of soil acidity in industrial coun-tries by the use of marl, lime, basic slag, etc. has led to neglect the study ofthe correction of soil acidity by way of a minimum input technology. To whatextent complexation by organic substances, magnesium and potassium fertili-zation can alleviate this situation remains a pressing object of study.
The use of highly sophisticated techniques was described by Arcan andWood. Rather than go into a summary of their presentations, which were muchcondensed anyway, I think that it would be fitting to emphasize two incidentalcomments made by the two speakers. As mentioned by Arcan, sophisticatedhardware will only do what it is told to do and not what we expect it to do.It is also noteworthy that for the first time in a potash colloquium, the phrase«expert systems was mentioned. It was mentioned here in the rather restrictedcontext of data acquisition and treatment. It seems obvious that in the nottoo distant future, accumulated knowledge will be organized in expert systemsfrom which the practical agronomist, making full use of his own expertise andof the possibility of the machine, will arrive at an optimalised prediction ofthe economic return from potash manuring.
134
Chairman of the 2nd Session
Prof. Dr. A. van Diest, Dept. of Soil Science andPlant Nutrition, Agricultural University ofWageningen/The Netherlands; member of theScientific Board of the International PotashInstitute
2nd Session
K Release and K Fixation
135
Potassium Fixation and Release
K. W T Goulding, Rothamsted Experimental Station, Harpenden, Herts/ UnitedKingdom*
Summary
The fixation and release of potassium in soil are part of a dynamic, reversible process con-trolled primarily by the type and particle size of the primary and secondary minerals pres-ent. The process is also affected by soil structure, soil pH and liming, manuring, tempera-ture, wetting and drying and freezing and thawing, and the action of plant roots. Potassiumexchangeable to a solution of an ammonium salt is the most widely used estimate of plantavailable K. Non-exchangeable K is usually determined, if at all, by the historical methodsof exhaustive cropping in pots or by extraction with acids. Electroultrafiltration is used bysome organizations to produce a multi-element extract. There has been some success inmodelling K availability and uptake to field crops. Potassium fixation is generally mea-sured against K exchangeable to ammonium, magnesium or rubidium salts, but acids andion exchange resins have been shown to extract fixed K.
At present, the routine determination of K fixation and release seems likely to continueto be made by simple and inexpensive procedures involving extractions with ammoniumsalts or acids. More sophisticated methods, which provide data on all categories of soil K,appear destined to remain the favoured tool of some scientists, and to be used only forresearch purposes. Progress is most likely to come from the application of models whichtake into account the amount and especially the rate of release of exchangeable and non-exchangeable K, soil structure and heterogeneity, the movement of nutrients through thesoil, root distribution, morphology and uptake, and climate.
1. Introduction
Potassium release from soils is often viewed as <good> because it replenishesexchangeable K used by crops, but potassium fixation <bad> because it makesadded K unavailable to the plant: Kittrick[1966jstated that K fixation in vermicu-lite involved irreversible interlayer contraction; Acquaye et at [1967Jfound that91% of K added to soil containing vermiculite and interstratified vermiculite/micawas fixed; Doll & Lucas f1973]reported that 92% of the K applied to a sandy clayloam soil in Michigan was fixed, and that tomato production was increased byapplications of up to 1600 kg K/ha. While K fixation is certainly a problem in theshort term, I believe that in the long term it should be viewed as a benefit to agricul-
Dr. K. W. T Goulding, Senior Scientific Officer, Soils and Plant Nutrition Department,
Rothamsted Experimental Station, Harpenden, Hens. AL5 2J0/United Kingdom
137
ture. Only very few soils lose K to drainage by leaching; instead the K is held by thesoil, but not in a way that makes it completely unavailable; it can be released slowly(Johnston [1986]). This can be very important in meeting crop needs and, in mostcases, cannot be compensated for by fresh K.
The subject of potassium fixation and the availability of residual K was reviewedby Beckettf1970]. More recent considerations of both K fixation and release havebeen made by Mengel & Kirkby /1982] and Martin & Sparks [1985], and Qud-mener [1986] gave an extremely useful review of all aspects of soil K.
Whilst this paper reviews mainly current methodology it also considers brieflythe processes involved in K release and fixation because without this it is difficult toproperly assess the methods discussed.
2. Processes of K release and fixation
2.1 Minerals involved in K release and fixationPotassium release and fixation in soils is chiefly a function of the amounts andtypes of primary and secondary minerals present and their particle size, particu-larly in the clay fraction, and of the activity of K in solution around these minerals(Feigenbaum [1986]). Those minerals which determine whether K is released orfixed have been reviewed by Rich 11972].
Those which release K are:
(i) primary minerals - biotite and muscovite mica, and the feldspars orthoclaseand microcline;
(ii) secondary minerals - hydrous mica (illite), and interstratified minerals con-taining these, and the zeolites phillipsite and clinoptilolite.
Potassium fixation was first noted by Dyer[1894]. It occurs in those secondaryminerals which have expanded, or partially expanded interlayers: vermiculite,hydrous mica (illite), and smectite, and has also been reported in glauconite, bei-dellite, nontronite and amorphous materials. Sparks & Huang [1985] suggestedthat hydrous micas fix K under wet or dry conditions, but montmorillonites onlyafter drying.
Some have found evidence for K fixation by allophanes (Schuffelen & van derMarel[1955]; Barber[1979]; Yamada & Shoji[1982]) but this cannot be by inter-layer contraction. Martini & Suarez [1977]attributed it to changes in crystallinityand hydration, especially when the clay was subject to wetting and drying (seebelow).
A further possible method of (fixation> is the formation of insoluble K com-pounds especially aluminosilicates. This was found to be relatively unimportantcompared with fixation in 2:1 layer silicates in some recent work by Shaviv et al.[19851.
138
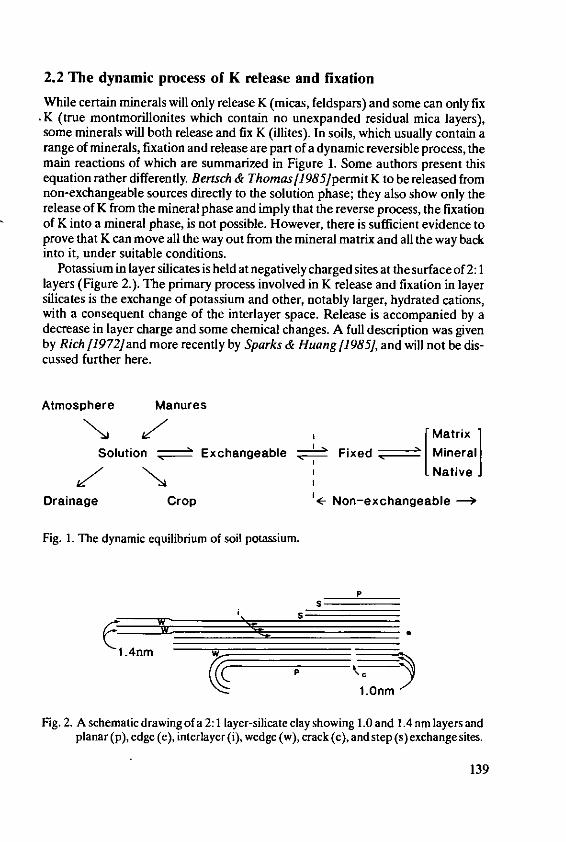
2.2 The dynamic process of K release and fixation
While certain minerals will only release K (micas, feldspars) and some can only fixK (true montmorillonites which contain no unexpanded residual mica layers),some minerals will both release and fix K (illites). In soils, which usually contain arange of minerals, fixation and release are part of a dynamic reversible process, themain reactions of which are summarized in Figure 1. Some authors present thisequation rather differently. Bertsch & Thomas [1985]permit K to be released fromnon-exchangeable sources directly to the solution phase; they also show only therelease of K from the mineral phase and imply that the reverse process, the fixationof K into a mineral phase, is not possible. However, there is sufficient evidence toprove that K can move all the way out from the mineral matrix and all the way backinto it, under suitable conditions.
Potassium in layer silicates is held at negatively charged sites at the surface of 2:1layers (Figure 2.). The primary process involved in K release and fixation in layersilicates is the exchange of potassium and other, notably larger, hydrated cations,with a consequent change of the interlayer space. Release is accompanied by adecrease in layer charge and some chemical changes. A full description was givenby Rich 11972] and more recently by Sparks & Huang [1985, and will not be dis-cussed further here.
Atmosphere Manures
t Xf _ [MatrixISolution . Exchangeable ' Fixed z Minerall
V t Native]
Drainage Crop i<- Non-exchangeable
Fig. 1. The dynamic equilibrium of soil potassium.
PK s
1.4nm
I1.Onm
Fig. 2. A schematic drawing of a 2:1 layer-silicate clay showing 1.0 and 1.4 nm layers andplanar (p), edge (e), interlayer (i), wedge (w), crack (c), and step (s) exchange sites.
139
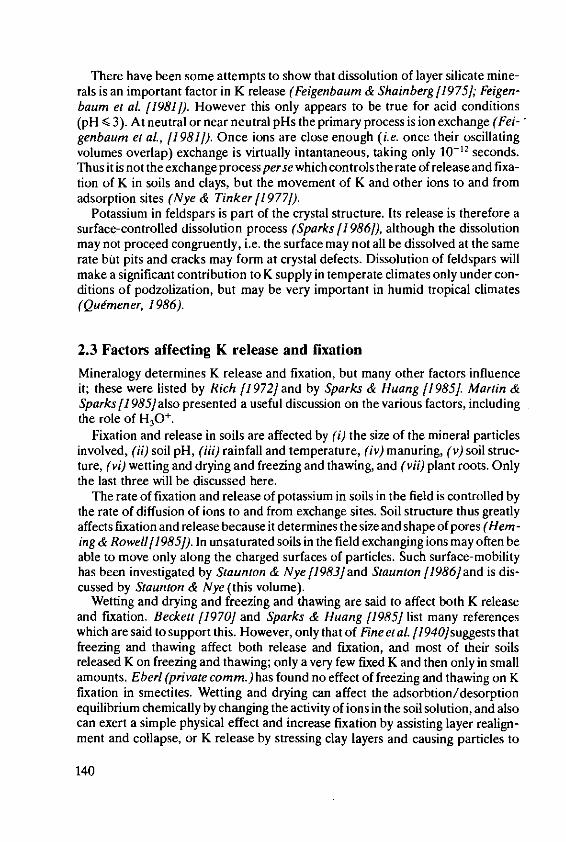
There have been some attempts to show that dissolution of layer silicate mine-rals is an important factor in K release (Feigenbaum & Shainberg [1975]; Feigen-baum et at 11981]). However this only appears to be true for acid conditions(pH < 3). At neutral or near neutral pHs the primary process is ion exchange (Fei-genbaum et at, [1981]). Once ions are close enough (i.e. once their oscillatingvolumes overlap) exchange is virtually intantaneous, taking only 10-2 seconds.Thus it is not the exchange process perse which controls the rate of release and fixa-tion of K in soils and clays, but the movement of K and other ions to and fromadsorption sites (Nye & Tinker/1977]).
Potassium in feldspars is part of the crystal structure. Its release is therefore asurface-controlled dissolution process (Sparks [l 986]), although the dissolutionmay not proceed congruently, i.e. the surface may not all be dissolved at the samerate but pits and cracks may form at crystal defects. Dissolution of feldspars willmake a significant contribution to K supply in temperate climates only under con-ditions of podzolization, but may be very important in humid tropical climates(Qutmener, 1986).
2.3 Factors affecting K release and fixation
Mineralogy determines K release and fixation, but many other factors influenceit; these were listed by Rich 11972] and by Sparks & Huang [1985]. Martin &Sparks[1 985]also presented a useful discussion on the various factors, includingthe role of H 30.
Fixation and release in soils are affected by (i) the size of the mineral particlesinvolved, (ii) soil pH, (iii) rainfall and temperature, (iv) manuring, (v) soil struc-ture, (vi) wetting and drying and freezing and thawing, and (vii) plant roots. Onlythe last three will be discussed here.
The rate of fixation and release of potassium in soils in the field is controlled bythe rate of diffusion of ions to and from exchange sites. Soil structure thus greatlyaffects fixation and release because it determines the size and shape of pores (Hem -ing & Rowell[1985]). In unsaturated soils in the field exchanging ions may often beable to move only along the charged surfaces of particles. Such surface-mobilityhas been investigated by Staunton & Nye[ 1983]and Staunton [1986]and is dis-cussed by Staunton & Nye (this volume).
Wetting and drying and freezing and thawing are said to affect both K releaseand fixation. Beckett [1970] and Sparks & Huang [1985] list many referenceswhich are said to support this. However, only that of Fine etal. [1940]suggests thatfreezing and thawing affect both release and fixation, and most of their soilsreleased K on freezing and thawing; only a very few fixed K and then only in smallamounts. Eberl (private comm.) has found no effect of freezing and thawing on Kfixation in smectites. Wetting and drying can affect the adsorbtion/desorptionequilibrium chemically by changing the activity of ions in the soil solution, and alsocan exert a simple physical effect and increase fixation by assisting layer realign-ment and collapse, or K release by stressing clay layers and causing particles to
140
break. Freezing changes the structure of liquid water, increasing its volume. It canthus increase interlayer space and make the movement of K and other ions easier,facilitating K release, but any contraction on thawing is only to the former spacing.It thus seems unlikely that thawing would increase the ability of soils to fix K.
It was thought that plant roots excreted H+ and thus always increased K release.Nye [1986] and others have now shown that roots excrete both H+ and HCO 3depending on the balance of anions and cations taken up (Rdmheld[1986]), buteither way plant roots have a profound effect on the availability of K. Steffens11986]emphasized that K uptake depends on root distribution and characteristics.Barber[1985]quotes Kuchenbuch as finding that roots acquired K from only 14%of the soil volume, and Beringer[1985]says that as little as 3% of the soil may beavailable to plant roots. If the K used by the plant comes from such a small soilvolume then much non-exchangeable K must become available to the plant fromthe soil around roots. However, recent studies (Barraclough 1987a])suggest thatthe diffusive flow of K may often be sufficient to meet the needs of a winter wheatcrop yielding 10 t/ha of grain.
3. Methods used to study K release
The equilibrium shown in Figure 1 separates soil potassium into exchangeable andnon-exchangeable fractions. This clear separation owes more to what has beenmeasured in the laboratory than to the true situation in the field. However, becausemethods of analysing soil K are most conveniently split into those for exchangeableand non-exchangeable K, this tradition will be followed here. A list of methodsused to measure these fractions is in Table 1, compiled from Grimme & Ndmeth[19791, McLean & Watson [1985] and Sparks & Huang [1985].
Table 1. Methods for measuring soil K (after Martin & Sparks[1 985]; McLean & Watson
11985]; Nbmeth & Grimme [1979])
K Fraction Method
Solution Batch equilibration or column leaching with waterExtraction by pressure membrane or centrifugation(which extract K in the soil solution)Activity ratios
Exchangeable Batch equilibration or leaching with dilute solutions of salts(especially NH4
+) and acids (citric, nitric)ElectroultrafiltrationSilver thioureaMehlich 1 (HCI + H2SO4 ) and 2 (acetic acid, ammoniumfluoride, ammonium chloride, HCI)Ammonium bicarbonate + DTPABray 1
141
Table I contd.
K Fraction Method
Exchangeable Exchange isotherms and other equilibrium data(contd.) Potassium potentials
Calcium acetate lactate (CAL-K)Double lactate (DL-K)
Non-exchangeable Exhaustive croppingLeaching with dilute acids and saltsBoiling with dilute acidsBoiling with concentrated acidsRepeated extractions with NaTPBRepeated extractions with oxalic acidRepeated extractions with Ca or H resinsSodium cobaltinitriteHot MgCI2ElectroultrafiltrationElectrodialysis
Mineral Selective dissolution with Na-pyrosulphate fusion
Total HF digestion
Multi-fraction Q/I curvesEUFSequential extraction by resinsBoiling HNO3
3.1 Exchangeable K
Methods used to measure exchangeable or plant available K have usually involvedsimple extractant techniques. Perhaps the earliest was that of von Liebig [1872],followed by Dyer 11894] who used 1% citric acid believing that roots exuded anextract with approximately this acidity; many subsequent methods have also triedto mimic the action of plant roots. Solutions of ammonium salts are probably themost widely used extractants now, followed by calcium and barium salts, but thelist is almost endless. Those values obtained with different ammonium salts arevery closely related, and correlate well with all salt extracts (Johnston [1986]), andit does seem that a simple extraction with an ammonium salt, most commonly am-monium acetate, gives a very useful indication of that K which is immediatelyavailable to a crop. The use of ammonium acetate may diminish, however, with thewider availability of instrumental techniques in which the acetate ion interfereswith detection.
Because plants take up K from the soil solution, many of the methods used mea-sure the concentration or activity of K in solution, either alone or in combinationwith other ions present. Exchange isotherms and all the associated parametershave proved useful in assisting our fundamental understanding of exchange pro-
142
cesses in the soil but they have been of little use in practical predictions of K availa-bility. Woodruff[19551 and then Arnold[1962]were perhaps the first to suggest theuse of a free energy parameter to assess K availability, but many others followed(see Goulding [1983]). The most recent work along these lines at Rothamsted hasbeen the calculation of critical potassium potentials by Page & Talibudeen[1982a,lb. There seems little likelihood of any such method being put into practicefor advisory purposes. One of the main hindrances to applying ion exchange datato predicting K availability has been the concentration of exchange studies on bi-nary (two-ion) systems. This was necessitated by the complexity of the calculationsfor exchanges involving more than two ions. However, studies of ternary (3 ion)systems have recently been made and data used to construct models of more realis-tic soil systems (Nir et al. 11986]; Shaviv & Jury 11986]; Sposito 11986]). Suchmodels offer a real step forward in K advisory work.
Q/I curves have enjoyed a little more success than exchange isotherms and arestill applied today to assess K availability (Nair & Grimme[1979]; Sparks & Lieb-hardt [1981]; Evangelou et al. [1986]). As well as providing a measure of availableK they show how this fraction is buffered by the soil. However, opinions are dividedon their usefulness for practical purposes. Sparks & Huang [1985] reported theeffectiveness of the various Q/I parameters for determining K availability, andshowed how they changed with cropping, liming, etc. By contrast, Bertsch & Tho-mas[1985]thought that Q/1 curves were not truly representative of K relations in agiven soil because they changed with cropping, and anyway were too expensive foreveryday soil testing.
3.2 Non-exchangeable potassium
There is no agreed standard method for assesssing K reserves, and very few meth-ods are available to farmers for routine determination of reserve K. In the U.K.,Fisons (now Norsk Hydo) began offering a service in 1977 (see Sutton & Blake[1977]) but the method has never been published.
Martin & Sparks [1985]give a comprehensive list and discussion of 16 methodsused to measure non-exchangeable K. Similar, but slightly less comprehensivereviews were made by Doll& Lucas[1973]and McLean & Watson [19851. It is notpossible in this paper to mention every method used, let alone every variant of eachmethod. Instead the most widely used and/or useful methods, will be discussedbriefly in relation to their advantages and disadvantages.
3.2.1. Historical
Of the early methods, those which are still used today are exhaustive cropping inpot experiments and strong acid extractants.
Pot experiments. Any experiment which involves taking samples of field soils,growing a crop on the soil to exhaustion (sometimes with one or more resowings)
143
and measuring the K taken up by the crop with time gives information on K avail-ability, with steps or breaks in the release curve being related to changes in source.One of the most important requirements of laboratory analyses of any nutrient,however, is a standard technique. The standard methods of pot culture (Chami-nade, Stanford de Ment and Neubauer) were reviewed by Quemener [19791.Pot techniques are immediately attractive because one might expect a directsimple relationship between K uptake by plants in pots and in the field. Unfor-tunately there are very large differences between plants growing in the fieldand in pots, whether in growth chambers, glasshouses, or even in open air. Themain factors which contribute to the difference are: (i) weather and the very largeeffect climate has on all aspects of plant growth; (ii) plant root distribution andmorphology - plants in pots explore most of the soil, but plants in fields exploreonly a small part of the soil volume; Beringer[1985]suggested that as little as 3% ofthe soil in the field may be used by a crop, Johnston & Mitchell [1974] that oneyears' cropping in the glasshouse was equivalent to 12 in the field, and Moberg &Nelson [1983jfound that several years exhaustive cropping in pots was the equiva-lent of 60 years cropping in the field; (iii) soil heterogeneity - the soil used in a potexperiment will have been thoroughly mixed to ensure that it is homogeneous;soil in the field is far from being homogeneous, as Beckett(this volume) explained.In spite of this, many still use pot experiments to calibrate laboratory methods with-out attempting to properly relate what they measure to what happens in the field(Binet et al. [19841; Graley [1981]; Ghorayshi & Lotse [1986]).
Strong acids andother extractants cannot be said to mimic plant uptake, but theyare much quicker and more convenient than pot experiments. Because of this theyare widely used to measure non-exchangeable K. The boiling nitric acid methods ofHaylock [1956]and McLean [1961]which measure Available, Step, and Constantrate K are the most widely used (e.g. Jia Xian & Jackson [1985]; AI-Kanani et al.11984]; Sailakshmiswari et al. 11985]). Hsu et al. [1979Jfound boiling nitric acid tobe a good predictor of K availability to plants in pots in the latter stages of growthwhen, presumably, non-exchangeable K was being taken up. However, Singh et al11983] found little correlation between any of the parameters measured by strongacids and winter wheat grown in the field, and Doll & Lucas /1973], reviewingmethods recommended for soil K analysis, describe strong acids as useful forresearch purposes but not for practical advisory work.
3.2.2. More recent methods
Electroultrafiltration (EUF) was developed by Ndmeth [1982]. Water is percolatedthrough a soil while the soil is subjected to an electric field which is increased step-wise; the temperature is also varied. The K collected in several solution extracts isanalysed and plotted against time. Certain fractions have been shown to correlatewith K availability as measured in the field and laboratory. Opinions on its useful-ness differ. Many have reported very good correlations of EUF parameterswith crop data (Plant & Soil, 1985, 83), others (e.g. Sinclair [19821) have found
144
little advantage over conventional methods. The reluctance to accept it seems to bebecause: (i) EUF rarely removes as much K as simple extractants such as ammo-nium accetate, so how can it truly predict the release of K reserves? and (ii) EUFequipment is complex and relatively expensive compared to that normally used forestimating soil K. However, EUF has been suggested to predict not just K availabil-ity, but also that of other macro and micro nutrients (see Nemeth [1985]). It hastherefore been adopted by certain organizations which require a multi-elementanalysis, and in this context may well have its place. In these situations it may be lessexpensive than a traditional soil test laboratory.
Sodium tetraphenylboon, NaTPB, is a precipitant which has been extensivelyused in work with clays and soils (Qudmener[1979,1986]). The amounts extractedcorrelate well with K released in pot experiments, but they are sometimes ratherless. Qudmener[1979]remarks on the high cost of the salt and suggests that this isperhaps the main reason for its lack of application in advisory work. A method forits use in the routine determination of K reserves has recently been proposed byJackson [1985] and is in use in New Zealand, but like so many other methods itseems destined to remain the favoured tool of some scientists, used primarily forresearch purposes.
Ion exchange resins have been used for many years to extract soil K and otherions (see Qutmener [1979]). Early work used only single extractions and resultswere found to be little better than those with simple salts (A rnold1l9581; Haagsma& Miller [1963]). More recently multiple extractions of the same soil sample withresins have been used to build up K release curves (Talibudeen etal. 11978]; Havlin& Westfall 11985]). Such curves seperate the three main categories of soil K -exchangeable, fixed, and mineral matrix or native - and reflect soil clay contentand mineralogy, and manuring and cropping history. They are the same in form andmagnitude to those of cumulative uptake curves obtained by growing ryegrass inpots in the glasshouse, and quantities calculated from them have been found to cor-relate well with the uptake of K by a range of field-grown crops (Goulding[1984]).Used with strong acid extractions, a complete picture of soil K content and releasecan be obtained which includes all fractions of soil K. Recently Goulding andLoveland [1986] suggested that such data could be used to provide backgrounddata and perhaps map soil K preserves. However, because of the complexity andlong duration of extractions needed to prepare release curves, ion exchange resinsare likely to remain a research tool. Several research groups have also been model-ling K release curves obtained from resin exchange studies (Talibudeen et al.11978]; Havlin et al. [1985]; Sparks & Huang[1985]). These may provide a meansof predicting K availability.
3.3 Modelling K release
Recently there have been an increasing number of attempts to use models to pre-dict K availability and uptake. Early models examined nutrient movement to, anduptake by single roots or plants (see Nye & Tinker [1977]), but models have
145
recently been applied to predicting K (and P) uptake by plants in pots and in thefield. The model of Jungk & Claasen [1986]includes nutrient uptake characteris-tics, root and root hair length, exchangeable and non-exchangeable K, diffusioncoefficients, and concentration gradients. It fitted data on K depletion from soiland uptake by maize in pots very well. The authors suggested that it could be usedto understand and quantify processes and interactions in the soil-root system.
Silberbush & Barber's [I 984model predicted well the K uptake of five cultivarsof field-grown soybeans (which exhibited a range of uptake characteristics) on tworather similar silty loam soils. The model accommodates nutrient concentrationand buffer power, diffusion rates, root length and root growth rates, and nutrientinflux rates. More recent tests (Barraclough, 198 7b) with field-grown winter wheatwere very unsatisfactory, however, with the model overpredicting K uptake by 4times and underpredicting P uptake by 20 times.
4. Methods used to study K fixation
Rather less work has been done on K fixation than on K release. This is not reallysurprising as the area of soils subject to serious K fixation problems is fairly small,especially in the developed countries. Addiscott & Talibudeen [1969] listed themore important methods used to measure K fixation; that most widely used was tomeasure K fixed relative to amrnmonium exchange in both clays and soils, either keptmoist or after drying:
Fixed K = (Initial Exchangeable K + Added K) - Exchangeable K after fixation
Van Diest [1979] thought that NH4 might not be the best exchanging cationbecause, being the same size as K+, it might be fixed, thus trapping some K anderroneously increasing the measured fixation capacity.
Other methods involved extracting fixed K from the soil with acids or exchang-ing it with various ions (e.g. Beauchamp[1982]), and some also used x-ray diffrac-tion studies to examine the change in clay structure on absorbing K and thus toestimate K fixation (e.g. Mortland & Gieseking [1951]).
Qutmener 11979] listed the methods used currently to measure fixation. The'most popular is still to measure the amount of potassium remaining exchangeableto ammonium ions following the addition of K to the soil. Van ddr Marers method11954f, widely used in France, involves measuring the K exchangeable to magne-sium rather than ammonium because ammonium ions are thought to replace somefixed K, the opposite of van Diest's criticism.
More recently Qutmener[1986summarized work done at SCPA to relate fixa-tion capacity (as measured by van der Marefs method) to various properties ofsome European soils. Previously he had made the point (Qudmener [19791) thatalthough a lot of work has been done to measure fixed K and the process of fixation,little has been done to devise a systematic method of analysis. This is urgently
146
required. Van Diest 11979] pointed out the difficulty of extrapolating laboratorymeasurements to predict field behaviour, and in particular, that K which is found tobe fixed in the laboratory may well be readily available to a crop in the field.
4.1 Recent developments in measuring K fixation
Ross & Cline [19841 measured the fixation of K in Canadian soils conventionallyagainst NH4 exchange and compared this with the vermiculite content of the soils.They also measured the fixation of K' and NH4 in a vermiculitic soil in the fieldfollowing 6 years of slurry application (Ross et al [19851). Measuring Rb fixationcapacity (by adding 0.1 M RbCI, drying, washing with M NH 4CI, and digestingwith HNO 3-HCIO-HF to determine fixed Rb) before and after slurry applicationshowed that large amounts of K and NH 4 had been fixed, and x-ray diffractionstudies showed that much of the vermiculitic mineral in the soil had been changedinto a mica-like mineral; a form of reverse weathering.
Shaviv et al. 1985]measured K fixation against exchange with Ba, K fixed beingcalculated as either the decrease in CEC or the difference between initial Solution+ Exchangeable K + Added K, and final Solution + Exchangeable K; a reason-able agreement was found between the methods with an r2 of 0.88.
Yamada & Shoji [1982] used an electron microprobe to measure the K contentof fresh and aged (i.e. from soil) volcanic glasses and found that these had fixedsome K during agricultural use.
At Rothamsted, K release curves coupled with extraction by strong acid (20%HCI - constant boiling HCI) have been used to follow the long term balance of K ina number of soils. These two methods together provide estimates of exchangeableand non-exchangeable K, and separate the latter into fixed and mineral K. Usingsoil samples taken periodically from the long-term experiments at Saxmundhamand the Rothamsted and Woburn Reference Plots it has been possible to see inwhich fractions the accumulated K is fixed, and from which fractions K is released.A qualitative balance and, in some cases a quantitative balance has been achieved.We have also attempted to assess K fixation by measuring changes in total K levelson the Classical experiments. However even on these very long term plots, only onthose plots which have received very large amounts of K can a difference in total Kbe seen which is outside the standard error of the method (Johnston, [1986]).
5. The usefulness of methods of measuring K fixation andrelease
Novozamsky & Houba (this volume) critically evaluated soil test methods. Beloware listed some important factors relating to the usefulness of methods of measu-ring K fixation and release, both for research and advisory purposes.
147
5.1 ResearchThe research scientist is seeking information on the amount and rate of release ofvarious fractions of soil K which will enable him to understand the behaviour ofK in soil and relate it to various soil properties; he may or may not be interestedin relating these to K availability to crops. Those methods which provide the bestmeans of relating K release and fixation to soil properties are ion exchange resinsand NaTPB. Strong acid extractions are of some use, especially in combinationwith the detailed release curves obtained from resins and NaTPB. Q/I curves fallbetween the practical and research methods, being too complex for routine testingand not quite sensitive enough to soil changes for research purposes. EUF doesgive quite a lot of information but, as Ndmeth [1985] admits, it will not <replacethe highly informative K desorption curves, in particular not in basic research'.
5.2 Advisory purposes
Beringer[1985]reviewed the usefulness of all analyses for soil K. He preferred sim-ple methods involving extractants, although suggested that ion exchange resins(cation and anion) and EUF were useful in providing information on more thanone nutrient at a time.
For purely advisory purposes balance sheets, as discussed at length at the 13 h IPICongress in 1986, present the simplest and most useful means of assessing soil K inthe field. Regular monitoring of soil K using only ammonium acetate as an extract-ant, linked with analyses of crop yield and nutrient content, shows optimum levelsof soil K and whether this is increasing or decreasing. From this one can develop amanuring policy to maintain soils at an optimum K level (optimum in terms ofeither crop yield or the best economic return) and which will increase, maintain, ordecrease soil K reserves.
Field experiments on major soil types enable the potassium characteristics ofsoils to be determined and incorporated in advice given to those farming such soils.Alternatively, or simultaneously, laboratory methods which estimate the release/fixation of K would be useful to classify and map soil K reserves, providing goodbackground data.
6. Comparing laboratory data with field data
This was discussed in detail by Villemin (this volume). Some points are pertinent tothis paper.
Doll & Lucas [1973] listed some of the information an advisor needs to provideadequate instruction to the farmer and grower: (i) yield goals, (U) crop require-ments, (iii) root uptake ability, (iv) nutrient intensity related to that of other cations
148
and the strength of adsorption of K, (v) the fixation/release properties of both thesurface and subsoil, (vi) the time of year at which the soil sample(s) were taken andthe way in which they were prepared for analysis. Measures of soil K availabilityform a rather small part of this. They concluded that there was no substitute forfield trials.
But what is the main aim of the farmer: is it to increase yield at all costs, or is it toobtain the best economic yield. Beringer[1985]was of the opinion that both short-and long-term fertilizer experiments were required in which soil tests can be relatedto growth of crops in the field. Short-term experiments are important because theyallow many soil types and climatic conditions to be compared. Long-term experi-ments smooth out the vagaries of climate and show when nutrient reserves arelikely to limit yield.
In this context the work of the All India Soil Test - Crop Response CorrelationScheme, summarized by Goswami & Singh /1979] should be mentioned. Thisscheme was designed to improve the advice given to farmers and to allow them tomake best use of the high yielding crop varieties that were becoming available whenthe scheme started in the yearly 1970s. Field experiments were carried out onselected important soil types. Soil test values were related to yield through multiplecorrelation and regression equations. Targetted yields were then set for each soiland critical limits for nutrient levels obtained. GoswamiandSinghwere well awareof the shortcomings of such a simple scheme, but it is commendable for its simplic-ity and clarity of purpose. These authors also noted the need to understand theeffects of soil structure, water availability, root development and properties whengiving advice on nutrient requirements.
7. Summary and conclusions
Many methods have been used to measure K release and fixation. A set of agreedstandard methods would be a great step forward, but admittedly will be very diffi-cult to achieve. The published proceedings of this conference may help towardsthat goal.
There are quite clearly methods which are useful for research purposes andmethods which are useful for advisory work. There are few methods which can doboth jobs. Methods for research must be precise and repeatable, and in particularprovide information on all fractions of soil K. Methods for advisory work need tobe simple and inexpensive and above all to be related to crop behaviour in the field.In this context we still need both short and long-term field experiments to calibrateour laboratory methods.
Cooke & Gething [1978] pointed out the need for laboratory methods whichmeasured the rate of K release to crops, and Bertsch & Thomas[1985]recently rei-terated this need to link kinetic with equilibrium measurements in studies of K
149
availability. They suggested that EUF field strength may provide this link, and ionexchange resins may also provide an answer to this problem.
To make further progress, we need to take into account the perhaps dominatingeffects of soil heterogeneity and structure, root distribution and morphology, andclimate. There have been few attempts to include the effects of wetting and dryingand freezing and thawing on K release from field soils. Because the amount of Kreleased by a few wetting and drying cycles is much greater than that which isreleased by those same soils when kept constantly moist, laboratory methodsshould aim to assess the magnitude of these effects in relation to the need of thecrop for K during the growing season.
With regard to roots, most soil analyses are made on the surface 20 cm or less ofsoil, although subsoil K analyses are currently routine in the Delaware coastal planeof the United States. Beringer[1985]and Haak [1981]have presented data to showthat up to 50% of the K taken up by a crop may come from the subsoil, andMcEwen & Johnston [1984] showed that subsoiling can increase K uptake byimproving root distribution. Kuhlmann et al. 11985] proposed a method for esti-mating root uptake of K from the subsoil using Rb labelling, but a suitable routinetechnique has yet to be established. It is also apparent from root studies that plantroots often explore very little of the soil available to them, perhaps sometimes lessthan 10%. This small volume will be stressed much more in providing enough K forthe crop than would the whole soil. The magnitude of such effects will differbetween crops; Steffens [1986jprovided evidence of greater weathering of illite tosmectite under grass than under clover and annual crops will generally exploit lessof the soil than perennial crops. Equally it will be necessary to take into account dif-fusive flow of K to roots and how this varies with different soil parameters.
We therefore need a more complete understanding of the volume and distribu-tion of roots of the main arable crops, which, together with their uptake characteris-tics and data on soil K release could be combined in a model which would coverevery aspect of soil K availability.
8. References
1. Acquaye, D. K., MacLean, A. J. & Rice, H. M.: Potential and capacity of potassium insome representative soils of Ghana. Soil Sci. 103, 79-89 (1967)
2. Addiscon, T. M. & Talibudeen, 0.: The buffering capacity of potassium reserves insoils. Potash Rev. Subj. 4, 451h suite (1969)
3. AI-Kanani, T, MacKenzie, A. F. & Ross, G. J.: Potassium status of some Quebecsoils: K released by nitric acid and sodium tetra-phenylboron as related to particle sizeand mineralogy. Can. J. Soil Sci. 64. 99-106 (1984)
4. Arnold, P. W.: Potassium uptake by cation-exchange resins from soils and minerals.Nature 182, 1594-1595 (1958)
5. Arnold, P. W.: The potassium status of some English soils considered as a problem ofenergy relationships. Proc. Fert. Soc. No. 72, 25-43 (1962)
150
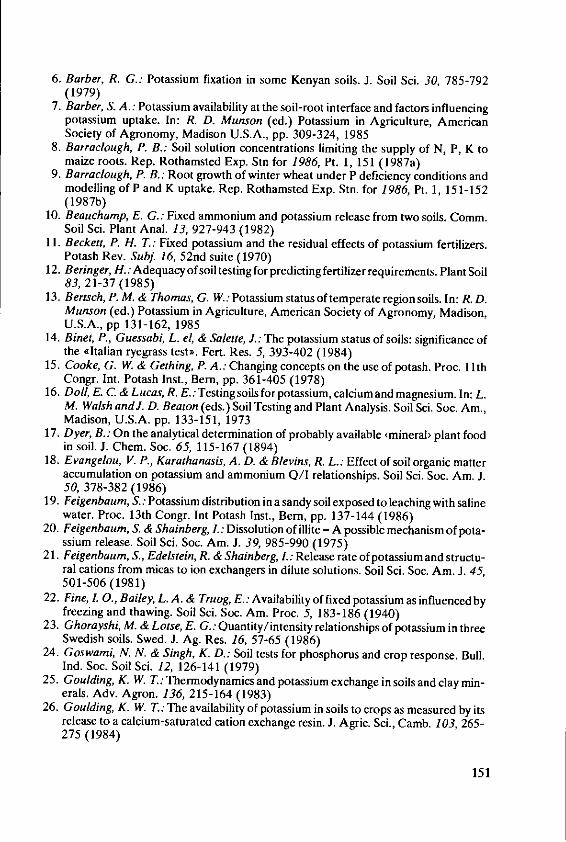
6. Barber, R. G.: Potassium fixation in some Kenyan soils. J. Soil Sci. 30, 785-792(1979)
7. Barber, S. A.: Potassium availability at the soil-root interface and factors influencingpotassium uptake. In: R. D. Munson (ed.) Potassium in Agriculture, AmericanSociety of Agronomy, Madison U.S.A., pp. 309-324, 1985
8. Barraclough, P. B.: Soil solution concentrations limiting the supply of N, P, K tomaize roots. Rep. Rothamsted Exp. Stn for 1986, Pt. 1, 151 (1987a)
9. Barraclough, P. B.: Root growth of winter wheat under P deficiency conditions andmodelling of P and K uptake. Rep. Rothamsted Exp. Stn. for 1986, Pt. 1, 151-152(1987b)
10. Beauchamp, E. G.: Fixed ammonium and potassium release from two soils. Comm.Soil Sci. Plant Anal. 13, 927-943 (1982)
11. Beckett, P. H. T.: Fixed potassium and the residual effects of potassium fertilizers.Potash Rev. Subj. 16, 52nd suite (1970)
12. Beringer, H.: Adequacy of soil testing for predicting fertilizer requirements. Plant Soil83, 21-37 (1985)
13. Bertsch, P. M. & Thomas, G. W.: Potassium status of temperate region soils. In: R. D.Munson (ed.) Potassium in Agriculture, American Society of Agronomy, Madison,U.S.A., pp 131-162, 1985
14. Binet, P., Guessabi, L. el, & Salette, J.: The potassium status of soils: significance ofthe talian ryegrass testD. Fert. Res. 5, 393-402 (1984)
15. Cooke, G. W. & Gething, P. A.: Changing concepts on the use of potash. Proc. 11 thCongr. Int. Potash Inst., Bern, pp. 361-405 (1978)
16. Doll, E. C. &Lucas, R. E.: Testing soils for potassium, calcium and magnesium. In: L.M. Walsh andJ. D. Beaton (eds.) Soil Testing and Plant Analysis. Soil Sci. Soc. Am.,Madison, U.S.A. pp. 133-151, 1973
17. Dyer, B.: On the analytical determination of probably available <mineral> plant foodin soil. J. Chem. Soc. 65, 115-167 (1894)
18. Evangelou, V. P., Karathanasis, A. D. & Blevins, R. L.: Effect of soil organic matteraccumulation on potassium and ammonium Q/I relationships. Soil Sci. Soc. Am. J.50, 378-382 (1986)
19. Feigenbaum, S.: Potassium distribution in a sandy soil exposed to leaching with salinewater. Proc. 13th Congr. lnt Potash Inst., Bern, pp. 137-144 (1986)
20. Feigenbaum, S. & Shainberg, L: Dissolution of illite - A possible mechanism of pota-ssium release. Soil Sci. Soc. Am. J. 39, 985-990 (1975)
21. Feigenbaum, S., Edelstein, B. & Shainberg, L: Release rate of potassium and structu-ral cations from micas to ion exchangers in dilute solutions. Soil Sci. Soc. Am. J. 45,501-506 (1981)
22. Fine, L 0., Bailey, L. A. & Truog, E.: Availability of fixed potassium as influenced byfreezing and thawing. Soil Sci. Soc. Am. Proc. 5, 183-186 (1940)
23. Ghorayshi, M. & Lotse, E. G.: Quantity/intensity relationships of potassium in threeSwedish soils. Swed. J. Ag. Res. 16, 57-65 (1986)
24. Goswami, N. N. & Singh, K. D.: Soil tests for phosphorus and crop response. Bull.Ind. Soc. Soil Sci. 12, 126-141 (1979)
25. Goulding, K. W. T.: Thermodynamics and potassium exchange in soils and clay min-erals. Adv. Agron. 136, 215-164 (1983)
26. Goulding, K. W. T.: The availability of potassium in soils to crops as measured by itsrelease to a calcium-saturated cation exchange resin. J. Agric. Sci., Camb. 103, 265-275 (1984)
151
27. Goulding, K. W. T. & Loveland, P. J.: The classification and mapping of potassiumreserves in soils of England and Wales. J. Soil Sci. 37, 555-565 (1986)
28. Graley, A. M.: Assessing the availability of potassium in soils. Aust. J. Exp. Agric.Anim. Husb. 21 543-548 (1981)
29. Grimme, H. & Nemeth, K.: The evaluation of soil K status by means of soil testing.Proc. I1th Congr. Int. Potash Inst., Bern, pp. 99-108 (1978)
30. Haagsma, T & Miller, M. H.: The release of non-exchangeable soil potassium tocation-exchange resins as influenced by temperature, moisture and exchanging ion.Soil Sci. Soc. Am. Proc. 27, 153-156 (1963)
31. Haak, E.: Nutrient uptake from subsoil by cereals. Proc. 16th Colloq. Int. Potash Inst.Bern, pp. 87-94 (1981)
32. Havlin, J. L. & Westfall, D. G.: Potassium release kinetics and plant response in cal-careous soils. Soil Sci. Soc. Am. J. 49, 366-370 (1985)
33. Haylock, 0. F.: A method for estimating the availability of non-exchangeable pota-ssium. Trans. 6th Int. Congr. Soil Sci. 11, 1,403-408 (1956)
34. Heming, S. . & Rowell, D. L.: Soil structure and potassium supply. 1. The release ofpotassium from soil aggregates to Ca-resin. J. Soil Sci. 36, 45-60 (1985)
35. Hsu, W. W., Liebhardt, W. C, Comoir, L. & Spolgaric, W.: Potassium release by someDelaware soils. Comm. Soil Sci. Plant Anal. 10, 1037-1056 (1979)
36. Jackson, B. L.: A modified sodium tetraphenylboron method for the routine determi-nation of reserve potassium status of soil. NZ J. Exp. Ag. 13, 253-262 (1985)
37. Jia Xian, L. & Jackson, M. L.: Potassium release on drying of soil samples from a var-iety of weathering regimes and clay minerals in China. Geoderma 35, 197-208 (1985)
38. Johnston, A. E.: Potassium fertilization to maintain a K balance under various farm-ing systems. Proc. 13th Congr. Int. Potash Inst., Bern, pp. 177-204 (1986)
39. Johnston, A. E. & Mitchell, 1. D. D.: The behaviour of K remaining in soils from theAgdell experiment at Rothamsted, the results of intensive cropping in pot experi-ments and their relation to soil analysis and the results of field experiments. Rep.Rothamsted Exp. Stn for 1973, Pt 2, 74-97 (1974)
40. Jungk, A. & Claasen, N.: Availability of phosphate and potassium as the result ofinteractions between root and soil in the rhizosphere. Z. Pflanz. Bod. 149, 411-427(1986)
41. Kittrick, J. A.: Forces involved in ion fixation by vermiculite. Soil Sci. Soc. Am. Proc.30, 801-803 (1966)
42. Kuchenbuch, R.: Die Bedeutung von lonenaustauschprozessen im WurzelnahenBoden fur die Pflanzenverfiigbarkeit von Kalium. PhD thesis, Georg-August Uni-versity, Gottingen, FRG, 1983
43. Kuhlmann, H., Claasen, N. & Wehrmann, J.: A method for determining K-uptakefrom subsoil by plants. Plant Soil 83, 449-452 (1985)
44. von Liebig, J.: Soil statistics and soil analysis. Z. landw. Ver. (Abstract in: J. Chem.Soc. (Abstr.) 25, 318 and 837 (1872))
45. MacLean, A. J.: Potassium-supplying power of some Canadian soils. Can. J. Soil Sci.41, 196-206 (1961)
46. Martin, H. W. & Sparks, D. L.: On the behaviour of nonexchangeable potassium insoils. Comm. Soil Sci. Plant Anal. 16, 133-162 (1985)
47. Martini, J. A. & Suarez, A.: Potassium supplying and fixing capacity of some CostaRican Latosols and Andosols determined by successive cropping, extractions andincubations. Soil Sci. 123, 37-47 (1977)
152
48. McEwen, J. & Johnston, A. E.: Factors affecting the production and composition ofmixed grass/clover swards containing modem high-yielding clovers. Proc. 18th Col-loq. Int. Potash Inst., Bern pp. 41-45 (1984)
49. McLean, E. 0. & Watson, M. E.: Soil measurements of plant-available potassium. In:R. D. Munson (ed.) Potassium in Agriculture, Madison, U.S.A., pp. 277-308, 1985
50. Mengel, K. & Kirkby, E. A.: Principles of Plant Nutrition (2nd edition), Int. PotashInst., Bern, 1982
51. Moberg, J. P. & Nielsen, J. D.: Mineralogical changes in soils used for K-depletionexperiments for some years in pots and in the field. Acta Agric. Scand. 33, 21-27(1983)
52. Mortland, M. M. & Gieseking, J. E.: Influence of the silicate ion on potassium fixa-tion. Soil Sci. 71, 381-385 (1951)
53. Nair, P. K. R. & Grimme, H.: Q/l relations and electroulhrafiltration of soils as mea-sures of potassium availability to plants. Z. Pflanz. Bod. 142, 87-94 (1979)
54. Nemeth, K.: Electro-ultrafiltration of aqueous soil suspension with simultaneouslyvarying temperature and voltage. Plant Soil 64, 7-23 (1982)
55. Nemeth, K.: Recent advances in EUF research (1980-1983). Plant Soil 83, 1-19(1985)
56. Nir, S., Hirsch, D., Navrot, . & Banin, A.: Specific adsorption of lithium, sodium,potassium, and strontium to montmorillonite: Observations and predictions. Soil Sci.Soc. Am. J. 50, 40-45 (1986)
57. Nye, P. H.: Acid-base changes in the rhizosphere. Adv. Plant Nutr. 2, 129-153(1986)
58. Nye, P. H. & Tinker, P. B.: Solute movement in the soil-root system. Studies in Ecol-ogy, Vol. 4, Blackwell, Oxford
59. Page, M. B. & Talibudeen, 0.: Critical potassium potentials for crops. 1. The effect ofsoil type on the growth of ryegrass and creeping red fescue. J. Soil Sci. 33, 329-347(1982a)
60. Page, M. B. & Talibudeen, 0.: Critical potassium potentials for crops. 2. Potentialsfor wheat, maize, peas, beans and sugar beet in early growth on a sandy loam. J. SoilSci. 33, 771-778 (1982b)
61. Qudmener, .: The measurement of soil potassium, IPI Res. Top. No. 4 Int. PotashInst., Bern, 1979
62. Qutmener, J.: Important factors in potassium balance sheets. Proc. 13th Congr. Int.Potash Inst., Bern, pp. 33-63 (1986)
63. Rich, C. L: Potassium in soil minerals. Proc. 9th Colloq. Int. Potash Inst., Bern, pp.15-31 (1972)
64. Rdmheld, V.: pH changes in the rhizosphere of various crop plants, in relation to thesupply of plant nutrients. Pot. Rev. Subj. 6, 55th suite (1986)
65. Ross, G. J. & Cline, R. A.: Potassium exchange characteristics in relation to mineral-ogical properties and potassium uptake by grapes of selected soils in the Niagara pen-insula of southern Ontario. Can. J. Soil Sci. 64, 87-98 (1984)
66. Ross, G. J., Phillips, P. A. & Culley, J. L.: Transformation of vermiculite to pedogenicmica by fixation of potassium and ammonium in a six-year field manure applicationexperiment. Can. J. Soil Sci. 65, 599-603 (1985)
67. Sailakshmiswari, Y., Rao, A. S. & Pillai, R. N.: An assessment of potassium releasecharacteristics of some deltaic alluvial soils. J. Pot. Res. 1, 109-116 (1985)
68. Schuffelen, A. C. & van der Maret, H. W.: Potassium fixation in soils. In: PotassiumSymposium, 1955, Int. Potash Inst., Bern, pp. 157-201 (1955)
153
69. Shaviv, A. & Jury, W. A.: Exchange, fixation, and precipitation of cations duringleaching of soils amended with manure: 2. Model simulation. Soil Sci. 141, 298-304(1986)
70. Sha viv, A., Moshin, M., Pratt, P.F. & Mattigod, S. V.: Potassium fixation characteris-tics of five southern California soils. Soil Sci. Soc. Am. J. 49, 1105-1109 (1985)
71. Silberbush, M. & Barber, S. A.: Phosphorous and potassium uptake of field-grownsoybean cultivars predicted by a simulation model. Soil Sci. Soc. Am. J. 48, 592-596(1984)
72. Sinclair, A. H.: A comparison of EUFand Q/I measurements of soil K with its uptakeby ryegrass in Scottish soils. Plant soil 64, 85-94 (1982)
73. Singh, K. D., Goulding, K. W. T. & Sinclair, A. H.: Assessment of potassium in soils.Comm. Soil Sci. Plant Anal. 14, 1015-1033 (1983)
74. Sparks, D. L.: Potassium release from interlayers. Proc. 13th Congr. Int. Potash Inst.,Bern, pp. 83-95 (1986)
75. Sparks, D. L. & Huang, P. M.: Physical chemistry of soil potassium. In: R. D. Munson(ed.). Potassium in Agriculture, Amer. Soc. Agron., Madison, U.S.A., pp. 201-276,1985
76. Sparks, D. L. & Liebhardt, W. C.: Effect of long-term lime and potassium applic-ations on quantity-intensity (Q/1) relationships in sandy soil. Soil Sci. Soc. Am. J. 45,786-790 (1981)
77. Sposito, G.: Chemical models of inorganic pollutants in soils. CRC Crit. Rev. Envir.Contr. 15, 1-24 (1986)
78. Staunton, S.: The self-diffusion of sodium in soil: factors affecting the surface mobil-ity. J. Soil Sci. 37, 373-377 (1986)
79. Staunton, S. & Nye, P.: The self-diffusion of sodium in a naturally aggregated soil. J.Soil Sci. 34, 263-269 (1983)
80. Steffens, D.: Root system and potassium exploitation. Proc. 13th Congr. Int. PotashInst., Bern, pp. 9 7 - 10 8 (1986)
81. Sutton, C. D. & Blake, J. A. C.: Reserve potash analysis - the background to a newFisons service. Agtec Summer 1977, 4-6 (1977)
82. Talibudeen, 0., Beasley, J. D., Lane, P. & Rajendran, N.: Assessment of soil pota-ssium reserves available to plant roots. J. Soil Sci. 29, 207-218 (1978)
83. Van Diest, A.: Factors affecting the availability of potassium in soils. Proc. 1lthCongr. Int. Potash Inst., Bern, pp.7 5 -97 (1978)
84. Van der Marel, H. W.: Potassium fixation in Dutch soils: Mineralogical analyses. SoilSci. 78, 163-179 (1954)
85. Woodruff, C M.: The energies of replacement of calcium by potassium in soils. SoilSci. Soc. Am. Proc. 19, 167-171 (1955)
86. Yamada, I. & Shoji, S.: Retention of potassium by volcanic glasses of the topsoils ofandosols in Tohoku, Japan. Soil Sci. 133, 208-212 (1982)
154
Adsorption and Exchange of K inMulti-Ionic Soil Systems as Affectedby Mineralogy
A. Bar, A. Banin and Y Chen, The Seagram CenterforSoiland WaterSciences, TheFaculty of Agriculture, The Hebrew University, Rehovotlsrael
Summary
The adsorption characteristics of potassium in soils that received high applications ofK-fertilizers in greenhouses were studied. By comparison to control soils that did not re-ceive such high applications of fertilizers and by detailed potassium-calcium exchange iso-therms, it was shown that both in the multi-ionic greenhouse soils and the binary Ca-K ex-change in the soils, a pronounced decrease in adsorption affinity towards potassium is ob-served above a certain exchangeable potassium content. This content was defined as the,Preferential Adsorption Capacity for Potassium' (PACP), and was found to correlatestrongly and linearly to the content of illite in the clay fraction of the soils. The contributionof mica-type minerals in the coarser fractions of the soil to the PACP was apparentlysmaller than that of illite in the clay fraction. Furthermore, montmorillonite, a major min-eral in these soils did not affect profoundly the adsorption at low potassium contents.Reassessment of data from several previous studies of potassium adsorption in arid lands,including those reported by the Riverside Salinity Laboratory in the U.S.A., reveals that asimilar abrupt change in the affinity towards potassium is present. It is recommended thatit will be considered as an additional characterization parameter of potassium exchange insoils.
1. Introduction and backgroundSince the pioneering work of the U.S. Salinity Laboratory in Riverside on the ad-sorption relationships of cations in arid-zone soils it is tacitly assumed that the ad-sorption function of potassium in such soils (as that of sodium) is linear if presentedas the exchangeable potassium ratio (EPR = EP/(CEC-EP)) vs. the potassiumadsorption ratio (PAR), apparently showing a constant Gapon exchange coeffi-cient KK.
Although in the early 1960's it was shown by several European researchers (VanSchouwenburg & Schuffelen [1963]; Bolt et al. [1963]) that the adsorption affinityof potassium, as measured by a Gapon-type coefficient in illitic soils, decreasessteeply as the exchangeable potassium content increases, the use of the linear EPR-
• A. Bar, Prof. A. Banin and Assoc. Prof. Y. Chen, The Seagram Center for Soiland Water Sciences, The Hebrew University, P.O.B. 12, Rehovot/Israel
155
PAR relationship has continued, especially in the arid-zones that were traditionallyinfluenced by the q Riverside approach, to soil and water management. Partial jus-tification for the linearity assumption may have been found in the fact that thedominant clay mineral in many arid-zone soils is smectite-montmorillonite, forwhich potassium has been found to behave similar to sodium and have low affinitythroughout the isotherm, when exchanged with divalent cations (Banin [1968]).
Adsorption of potassium onto minerals from the illite and mica groups is mecha-nistically different from that onto minerals from the smectite or kaolinite groups. Inillitic clay, potassium ions may bind to planar surface sites, to edge sites, and to in-terlattice sites. The specific adsorption of the potassium ions on the edge and inter-lattice sites is due to a combination of electrostatic and crystal stability consider-ations due to the fitting of K into the hexagonal openings between the base oxygenof the tetrahedral layer (Bolt eal[1963]; Van Schouwenburg & Schuffelen [1963]).This gives rise to relatively high preference for potassium over divalent ions whichis not predicted from electrostatic considerations. The "wedge zones in dioctahe-dral vermiculites were also suggested as having preferential adsorption capacity forpotassium (Dolcater et al[1968]; Carson & Dixon [1972]). Unlike the above min-erals, ion exchange of potassium on montmorillonite is similar to that of othermonovalent ions and is primarily controlled by the electrostatic parameters of val-ency ratio and ionic size (Banin [1968]). The exchange sites are on the planar sur-faces and on the edges of the mineral layers. The edge sites of the montmorillonitelayers are not specifically favored for potassium, thus their bonding energy for po-tassium is not particularly high. The slight changes in the adsorption preference ofK vs. Ca throughout the isotherm were found by Banin [1968] as connected tochanges in the packing and arrangement of the clay tactoids during the saturationof the mineral with potassium. It should be pointed out, however, that throughoutthe isotherm, calcium was preferred comparative to potassium and only relativechanges in the degree of preference of the K ions were observed.
In many studies, exchange isotherms of K-Ca on various minerals or soil clayfractions, are presented. Since the exchange sites have different bonding energiesfor potassium, it was found that Gapon constants (KG) would not have the samevalue along the isotherm, especially in minerals from the illitic group. In pure illiteKK values were found to decrease during the saturation of the mineral with potas-sium from an extreme value > 2000 to a final value of about 2 (Schwertmann/1962]; Bolt et al[1 963]). In most of the studies with montmorillonite minerals, KKvalues ((1/mol) 1/2) were found to vary between 1 and 4 (Dolcater et al [1968];Schuffelen [1972]; Knibbe and Thomas[ 972]). Somewhat higher K values werepresented in otherworks: Krishnamoorthy and Overstreet[ 950]4.00-4.76; Ban-in 11968]4.12; Carson and Dixon [1972] 3.03-11.11; Jensen [1973] 3.57-5.16.The high values, generally observed at low levels of adsorbed potassium, were at-tributed to residual impurities of illite. In kaolinite, a decrease in the values of KGwas also found during its saturation with potassium (Sch wertmann [1962]; Jensen11963]).
Selectivity for potassium as measured by the Gapon constant in soils is influ-enced by the assemblage of soil minerals. In soil clay fractions which contain main-
156
ly illite, Iq varied between 40 and 2, generally decreasing with increasing satura-tion with potassium (Bolt [1963]; Van Schouwenburg & Schuffelen [1963]; Rich11964]; Carson and Dixon 11972]; Knibbe & Thomas [1972]; Schuffelen 11972]).In montmorilonite-rich clay fractions which contain also illite, vermiculite or kaol-inite, relatively high values of KK were found at low exchangeable potassium per-centages (EPP): 5.90 at EPP = 10% (Deist & Talibudeen [1976]), and 8.11 at EPP= 2% (Kishk & EI-Sheemy 11974]). Again, the assumption was that the illite orkaolinite minerals contributed to the increase of Iq values in spite of their beingsecondary minerals in the clay fraction.
We have found in a detailed study that the EPR/PAR relationship in severalgreenhouse soils from Israel receiving high applications of potassium fertilizers iscomposed of two linear segments. High preference for potassium, under realisticconditions of multi-ionic exchange in soils at low adsorbed potassium percentages,contributes to what may be defined as PreferentialAdsorption Capacity for Pota-ssium (PA CP) which is linearly correlated to the illite content in the soil. These rel-ations are of importance because former research (Chen etalf1983])has suggestedthat high EPR values may be deleterious to the physical properties of soils in green-houses cultivated for long periods of time.
Reevaluation of published data shows that such a preferential capacity, amount-ing to 3 to 10 percent of the cation exchange capacity of the soil, is characteristic inmany arid-zone soils, and should be considered when potassium state and availa-bility is evaluated.
2. Materials and methods
Greenhouse soilsSoils from eight greenhouse sites from the Lachish and Rehovot districts in Israelwere studied. Greenhouse and control samples were taken from inside the green-houses and from a virgin soil outside the greenhouses, respectively. In the case oftransported greenhouse soils, the control samples were taken from the site of ori-ginal sampling. Cation Exchange Capacity (CEC) and adsorbed cation composi-tion were determined after displacement with IN sodium acetate and IN ammo-nium acetate, respectively (U.S. Salinity Laboratory Staff[1954]). The potassiumadsorption ratio (PAR) was calculated as:
PAR - CK
2
where C is the concentration in solution (me/i), of the respective ions.Gapon's constant for potassium exchange in the soil (KK) was calculated as:
G (2)where EPR is the exchangeable potassium ratio (EPR = qK/(qca + qM%)) and where q is theconcentration of the exchangeable cation (me/100 g soil).
157
The dimensions of KG in eq. 2 are (1/mmol)" 2 , and it is converted to (1/mol)" 2
by multiplication by 100OO = 31.6.
Potassium-calcium exchange isotherms
Exchange isotherms of potassium with calcium were determined for five soils, var-ying in texture and representing the common soils in greenhouses throughout Is-rael.
The upper horizon (0-25 cm) of each soil was sampled. The samples were air-dried, crushed and sieved through a 2 mm sieve. Chemical and physical propertiesof the soils were determined as follows: cation exchange capacity and adsorbedcation species as described with the greenhouse soils; particle size analysis by thehydrometer method (Van der Wolt [1966]); organic matter by a wet-combustionmethod (Black et al[1965]); CaCO3 content by the calcimeter method (Black et al[1965]). The mineralogical composition of the clay fraction was determined usingmethods described by Gal et al /1974].
Exchange isotherms were determined using a double-analysis technique afterequilibrating the soil in suspension with a solution at a given K/Ca ratio and a con-stant total electrolyte concentration (Deist & Talibudeen [1967]; Tucker 11967];Banin [1968]; Knibbe and Thomas[1972]; Carson andDixon /1972]; Schalscha etal1975]). Changes were measured in the soluble phase every three days when theexternal solution was replaced, and in the adsorbed phase after equilibrium wasreached. Using this technique, it was possible to measure exchange reactions at aconstant total electrolyte concentration and to characterize the complete (XK =
0-1.0) range of the equivalent ionic fraction of exchangeable potassium.The equilibration dialysis was performed as follows: A stock suspension at a
concentration of 2% soil in distilled water was prepared for each soil. The suspen-sion was shaken 10 hrs and then aliquots of 150 ml were taken into dialysis bags,and immersed in an excess of the appropriate solution at 270 C. Nine equilibratingsolutions were used, in 4 replicates each. The total electrolyte concentration wasconstant at 20 me/1. The PAR values were calculated so that a desirable EPP valuecan be achieved according to the following equation (U.S. Salinity LaboratoryStaff [1954]).
P 1.036 EPP - 3.6PAR-0.1051 (100 - EPP) (3)
The concentrations of the salts were calculated from the following equation:
c. + cca = 20 (4)
PAR CK (5)
Desired EPP, calculated PAR and composition of the solutions used are listed inTable 1. The dialysis bags were shaken gently and the equilibrating solutions were
158

renewed every 2-3 days. After 15 days, when changes in ionic concentration in so-lution were minimal, the soil suspensions were centrifuged. Potassium and calciumconcentrations were determined in the supernatant solution and, after displace-ment, in the soil sediment.
Table 1. Desired EPP, calculated PAR and K+ and Cal + concentrations in theequilibrating solutions.
Solution Desired EPP Calculated K+ concentration Ca 2+ concentrationNo. % PAR (me/i) (me/I)
1 5 0.16 0.50 19.502 10 0.72 2.14 17.863 15 1.34 3.82 16.184 20 2.04 5.50 14.505 30 3.74 8.85 11.156 40 6.00 12.00 8.007 60 13.93 17.02 2.988 80 37.72 19.47 0.539 100 20.00 0.00
From the analytical data, the equivalent ionic fraction in solution, X, and ad-sorbed in the soil, X, and the selectivity coefficient, KKa, were calculated by usingthe following equations:
XK - cK/(Ce. + CK); Xca = Cca/(Cca + cK) (6)
XK = qK/(qca + qK); ca = qca'(qca + qK) (7)
and
K XK2 X (8)Ka Xc. XK'
3. Results and discussion
The greenhouse soils
It was generally found that values of PAR, EPP and ESP + EPP (data not shown)were higher in the greenhouse samples than in the control samples from the samesite. However, the Gapon constants found in the greenhouse samples were lowerthan in control samples. The conclusion of the survey was that intensive fertiliza-tion, in both local and transported greenhouse soils, had led to enrichment of ex-changeable potassium. Particularly large eirichment percentages of exchangeablepotassium were recorded, in greenhouse samples relative to control samples, insandy soils.
159
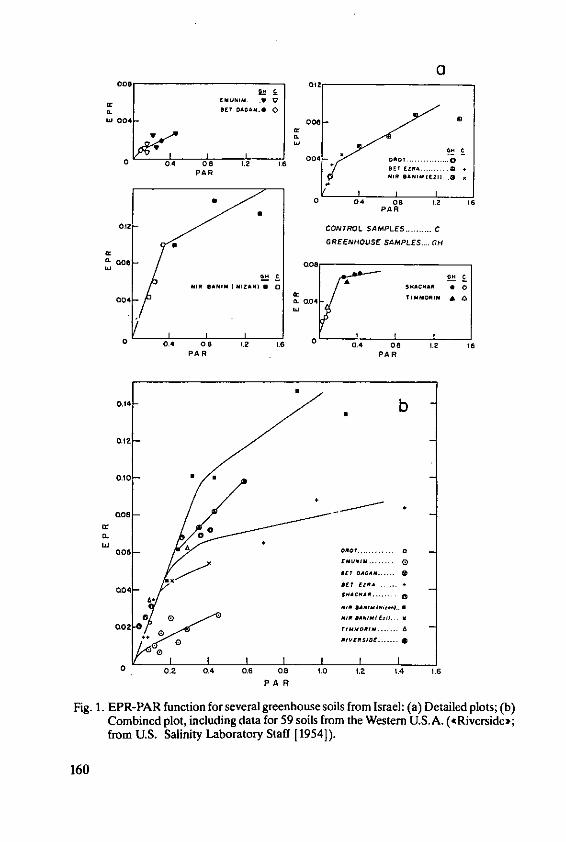
aEUNI ...... V
0. CI£ OAGAM..* 0
A.004-O
ONC
I, 004 004 !
0 04 0 1.2 - 6 00'T.OPARGr .NIB CANItZII...0
•0 04 00 .2 IS
PAR
012- CONTROL SAMPLES ......... CGREENHOUSE SAMPLES G H
0.
000 O0N
2A- A
j04
IK IZANIM004- A. 004 TIMNiORIMA
0O4 0.0 1.2 0 0.4 0. .2 16PAR PAR
0.14- b
0.12
0.10
00o_ ....... AN.S ........
NIP GA N ..il...N
. E . . . . . . .. .... . .
0 0 4 - * s:E IE Z l ... ... .
002 .t M ,t ....... a
0II I I I I I0 0.2 04 0.6 08 1.0 1.2 1.4 1.6
PAR
Fig. 1. EPR-PAR function for several greenhouse soils from Israel: (a) Detailed plots; (b)Combined plot, including data for 59 soils from the Western U.S.A. (eRiverside,;from U.S. Salinity Laboratory Staff [1954]).
160
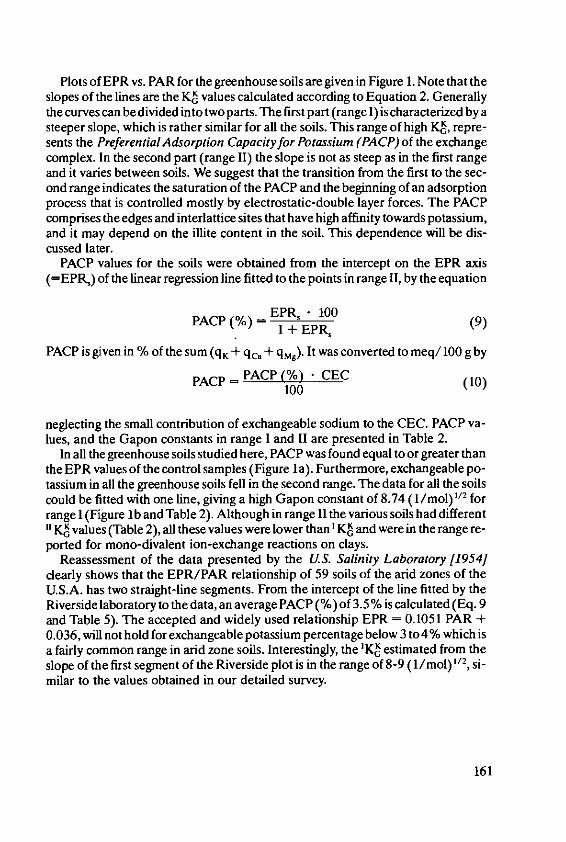
Plots of EPR vs. PAR for the greenhouse soils are given in Figure 1. Note that theslopes of the lines are the KA values calculated according to Equation 2. Generallythe curves can be divided into two parts. The first part (range 1) is characterized by asteeper slope, which is rather similar for all the soils. This range of high K, repre-sents the Preferential Adsorption Capacity for Potassium (PA CP) of the exchangecomplex. In the second part (range II) the slope is not as steep as in the first rangeand it varies between soils. We suggest that the transition from the first to the sec-ond range indicates the saturation of the PACP and the beginning of an adsorptionprocess that is controlled mostly by electrostatic-double layer forces. The PACPcomprises the edges and interlattice sites that have high affinity towards potassium,and it may depend on the illite content in the soil. This dependence will be dis-cussed later.
PACP values for the soils were obtained from the intercept on the EPR axis(=EPRo) of the linear regression line fitted to the points in range 11, by the equation
PACP(%) EPR -100 (9)1 +EPR,
PACP is given in % of the sum (q. + qc. + qMg)" It was converted to meq/ 100 g by
PACP = PACP (%) • CEC (10)100
neglecting the small contribution of exchangeable sodium to the CEC. PACP va-lues, and the Gapon constants in range I and II are presented in Table 2.
In all the greenhouse soils studied here, PACP was found equal to or greater thanthe EPR values of the control samples (Figure la). Furthermore, exchangeable po-tassium in all the greenhouse soils fell in the second range. The data for all the soilscould be fitted with one line, giving a high Gapon constant of 8.74 (1/mol) 2 forrange I (Figure lb and Table 2). Although in range l1 the various soils had different"K values (Table 2), all these values were lower than I KK and were in the range re-ported for mono-divalent ion-exchange reactions on clays.
Reassessment of the data presented by the U.S. Salinity Laboratory [1954]clearly shows that the EPR/PAR relationship of 59 soils of the arid zones of theU.S.A. has two straight-line segments. From the intercept of the line fitted by theRiverside laboratory to the data, an average PACP (%) of 3.5% is calculated (Eq. 9and Table 5). The accepted and widely used relationship EPR = 0.1051 PAR +0.036, will not hold for exchangeable potassium percentage below 3 to4% which isa fairly common range in arid zone soils. Interestingly, the 'KK estimated from theslope of the first segment of the Riverside plot is in the range of 8-9 (1/mol) 112, si-milar to the values obtained in our detailed survey.
161
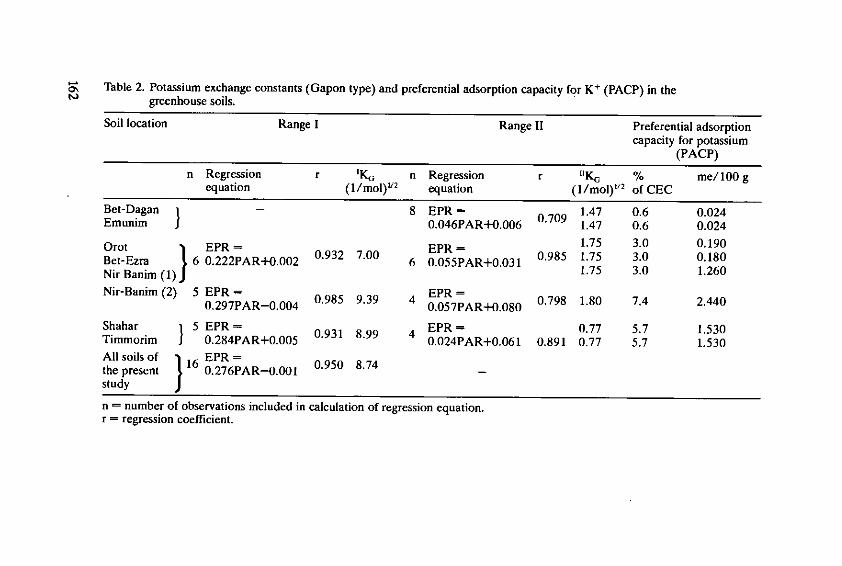
Table 2. Potassium exchange constants (Gapon type) and preferential adsorption capacity for K + (PACP) in theto greenhouse soils.
Soil location Range I Range II Preferential adsorptioncapacity for potassium
(PACP)
n Regression r IKG n Regression r "KG % me/100 gequation (1/mol) /2 equation (1/mol) 2 of CEC
Bet-Dagan 1 8 EPR 147 0.6 0.024Emunim J 0.046PAR+0.006 0.709 1.47 0.6 0.024
Orot EPR 0 EPR - 1.75 3.0 0.190Bet-Ezra 6 0.222PAR+0.002 0.932 7.00 6 0.055PAR+0.031 0985 1.75 3.0 0.180
Nir Banim (1) 1.75 3.0 1.260
Nir-Banim (2) 5 EPR = EPR -0.297PAR-0.004 0.985 939 4 0.057PAR+0.080 0.798 1.80 7.4 2.440
Shahar 1 5 EPR EPR = 0.77 5.7 1.530Timmorim 0.284PAR+0.005 0.931 8.99 0.24PAR+0.061 0.891 0.77 5.7 1.530All soils of 116 EPR =the present 0.276PAR-0.001 0.950 8.74
study
n = number of observations included in calculation of regression equation.r = regression coefficient.
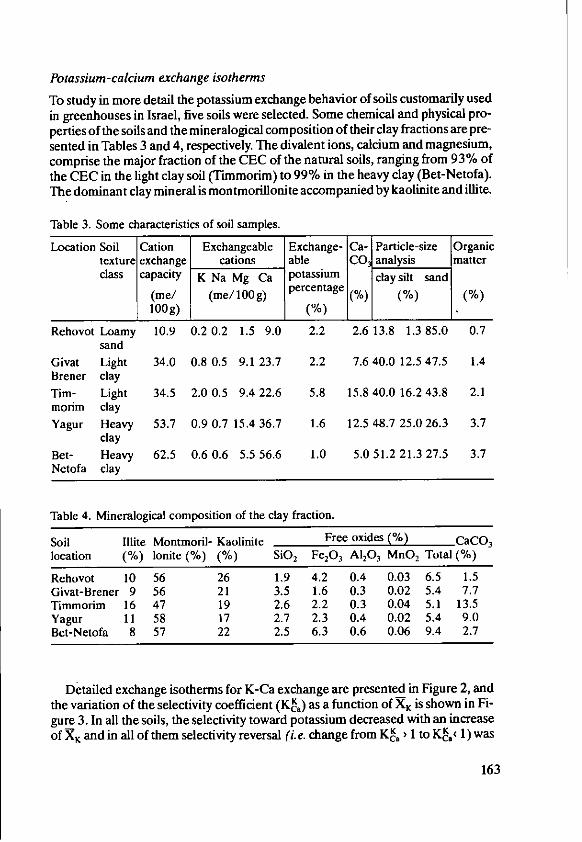
Potassium -calcium exchange isotherms
To study in more detail the potassium exchange behavior of soils customarily usedin greenhouses in Israel, five soils were selected. Some chemical and physical pro-perties of the soils and the mineralogical composition of their clay fractions are pre-sented in Tables 3 and 4, respectively. The divalent ions, calcium and magnesium,comprise the major fraction of the CEC of the natural soils, ranging from 93% ofthe CEC in the light clay soil (Timmorim) to 99% in the heavy clay (Bet-Netofa).The dominant clay mineral is montmorillonite accompanied by kaolinite and illite.
Table 3. Some characteristics of soil samples.
Location Soil Cation Exchangeable Exchange- Ca- Particle-size Organictexture exchange cations able CO, analysis matterclass capacity K Na Mg Ca Potass"um clay silt sand
(me/ (me/100g) percentage (%) (%) (%)100g) (%)
Rehovot Loamy 10.9 0.2 0.2 1.5 9.0 2.2 2.6 13.8 1.3 85.0 0.7sand
Givat Light 34.0 0.8 0.5 9.1 23.7 2.2 7.6 40.0 12.5 47.5 1.4Brener clayTim- Light 34.5 2.0 0.5 9.4 22.6 5.8 15.8 40.0 16.2 43.8 2.1morim clayYagur Heavy 53.7 0.9 0.7 15.4 36.7 1.6 12.5 48.7 25.0 26.3 3.7
clayBet- Heavy 62.5 0.6 0.6 5.5 56.6 1.0 5.0 51.2 21.3 27.5 3.7Netofa clay
Table 4. Mineralogical composition of the clay fraction.
Soil Illite Montmoril- Kaolinite Free oxides (%) CaCOlocation (%) lonite (%) (%) SiO 2 Fe2O3 A1203 MnO2 Total (%)
Rehovot 10 56 26 1.9 4.2 0.4 0.03 6.5 1.5Givat-Brener 9 56 21 3.5 1.6 0.3 0.02 5.4 7.7Timmorim 16 47 19 2.6 2.2 0.3 0.04 5.1 13.5Yagur 11 58 17 2.7 2.3 0.4 0.02 5.4 9.0Bet-Netofa 8 57 22 2.5 6.3 0.6 0.06 9.4 2.7
Detailed exchange isotherms for K-Ca exchange are presented in Figure 2, andthe variation of the selectivity coefficient (Kt,) as a function of XK is shown in Fi-gure 3. In all the soils, the selectivity toward potassium decreased with an increaseof XK and in all of them selectivity reversal (i.e. change from KK > 1 to K K 1) was
163

i.0 I I I I
REHOVOT
0,8-
0.6
0.4
Ix-02
w 0
G80
IL
0
0
0,4
0.2
0 I
0 0. 2 0+4 0.6 0.8 0 0.2 0,4 Q6 08 1.0EQUIVALENT IONIC FRACTION OF K -IN SOLUTION X,
Fig. 2. Potassium-calcium exchange isotherms of five soils at 270 C and constant totalelectrolyte concentration of 20 me/L.
164
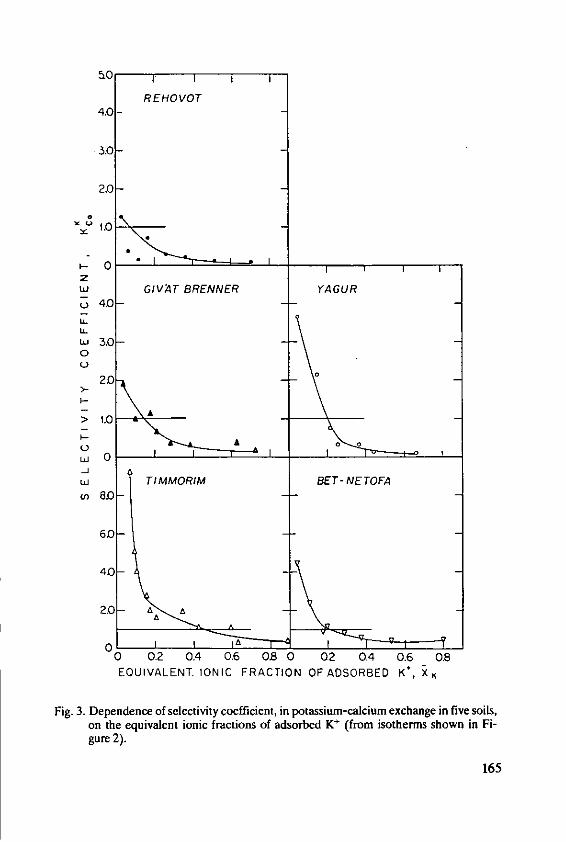
t1O I I I
REHOVOT4.0-
3.0
2.0
-- 0 Iz
GIVAT BRENNER YAGURo 4.0U-L 3.0-0
2.0
I-
> 1.0
Aa a
0TIPMMORIM BET-NE TOFA
8.0- -
60
40
2.0 A A
0 I0 0.2 0A 0.6 O 0 02 0.4 0.6 0.8EQUIVALENT. IONIC FRACTION OF ADSORBED K, K
Fig. 3. Dependence of selectivity coefficient, in potassium-calcium exchange in five soils,on the equivalent ionic fractions of adsorbed K+ (from isotherms shown in Fi-gure 2).
165
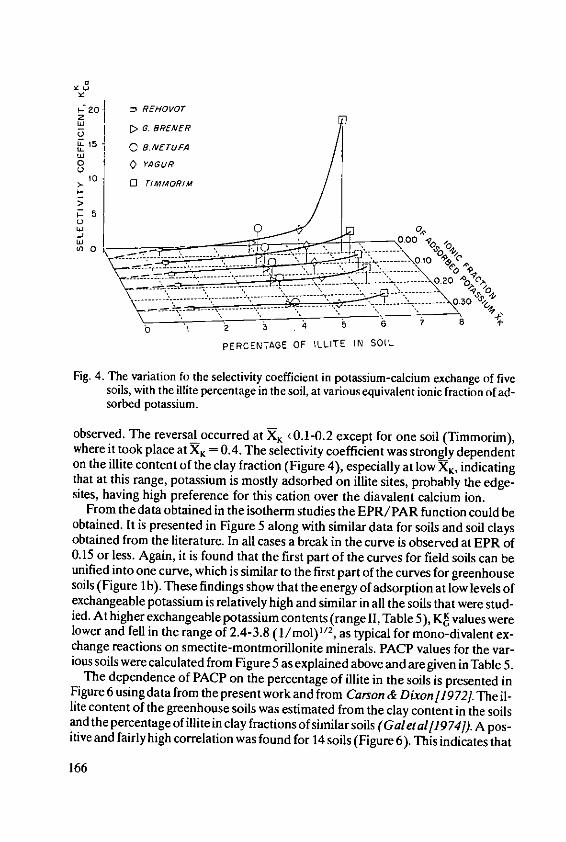
S20, n REHOVOr
to -
0..E E
0.0 ,
pERCENTAGE OF ILLITE IN SOIL
Fig. 4. The variation fo the selectivity coefficient in potassium-calcium exchange of fivesoils, with the illite percentage in the soil, at various equivalent ionic fraction of ad-sorbed potassium.
observed. The reversal occurred at 4X '0.1-0.2 except for one soil (Timmorim),where it took place at XK 0.4. The selectivity coefficient was strongly dependent
on the illite content of the clay fraction (Figure 4), especially at low XK, indicatingthat at this range, potassium is mostly adsorbed on illite sites, probably the edge-sites, having high preference for this cation over the diavalent calcium ton.
From the data obtained in the isotherm studies the FPR/PAR function could beobtained. It is presented in Figure 5 along with similar data for soils and soil claysobtained from the literature. In all cases a break in the curve is observed at EPR of0.15 or less. Again, it is found that the first part of the curves for field soils can beunified into one curve, which is similar to the first part of the curves for greenhousesoils (Figure 1ib). These findings show that the energy of adsorption at low levels ofexchangeable potassium is relatively high and similar in all the soils that were stud-ied. At higher exchangeable potassium contents (range 1I, Table5), Kf values werelower and fell in the range of 2.4-3.8 (1/mol)" 2, as typical for mono-divalent ex-change reactions on smectite-montmorillonite minerals. PACP values for the var-ious soils were calculated from Figure 5 as explained above and are given in Table n.
The depenence of PACP on the percentage of illite in the soils is presented inFigure 6 using data from the present work and from Carson & Dixon 1972. The il-lite content of the greenhouse soils was estimated from the clay content in the soilsand the percentage of illite in clay fractions of similar soils (Galtfl974]). A pos-itive and fairly high correlation was found for 14 soils (Figure 6). This indicates that
166
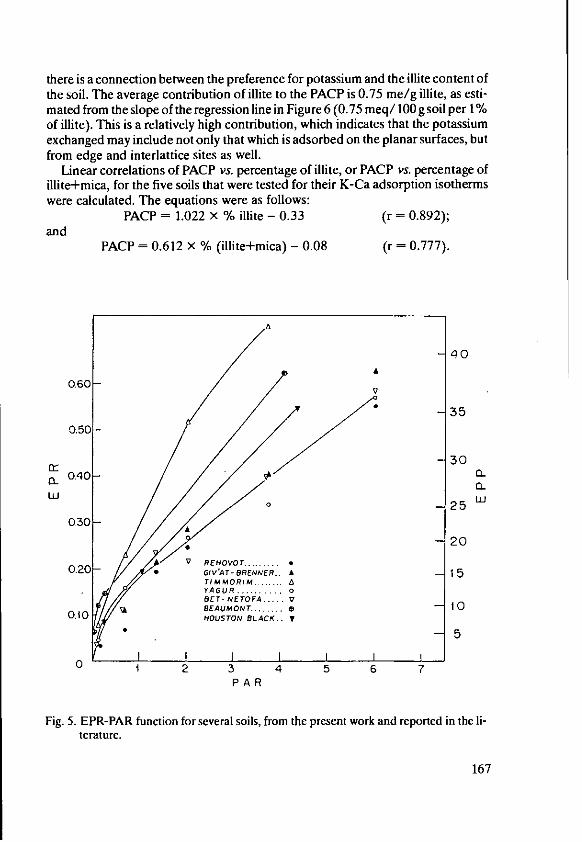
there is a connection between the preference for potassium and the illite content ofthe soil. The average contribution of illite to the PACP is 0.75 me/g illite, as esti-mated from the slope of the regression line in Figure 6 (0.75 meq/ 100 g soil per 1%of illite). This is a relatively high contribution, which indicates that the potassiumexchanged may include not only that which is adsorbed on the planar surfaces, butfrom edge and interlattice sites as well.
Linear correlations of PACP vs. percentage of illite, or PACP vs. percentage ofillite+mica, for the five soils that were tested for their K-Ca adsorption isothermswere calculated. The equations were as follows:
PACP = 1.022 x % illite - 0.33 (r = 0.892);and
PACP = 0.612 x % (illite+mica) - 0.08 (r = 0.777).
40AA
0.60-
-350.50
- 300.40 IL CL
Li 0 25
0.3000
-20V REHOVOT .........
0.20* GIV'AT-BRENNER. A - 15TIMMORIM ........YAGUR .......... oBET-NETOFA .... V
0.1 BEAUMONT ...... a 10,10 HOUSTON BLACK..
5
0 2 3 4 5 6 7PAR
Fig. 5. EPR-PAR function for several soils, from the present work and reported in the li-terature.
167
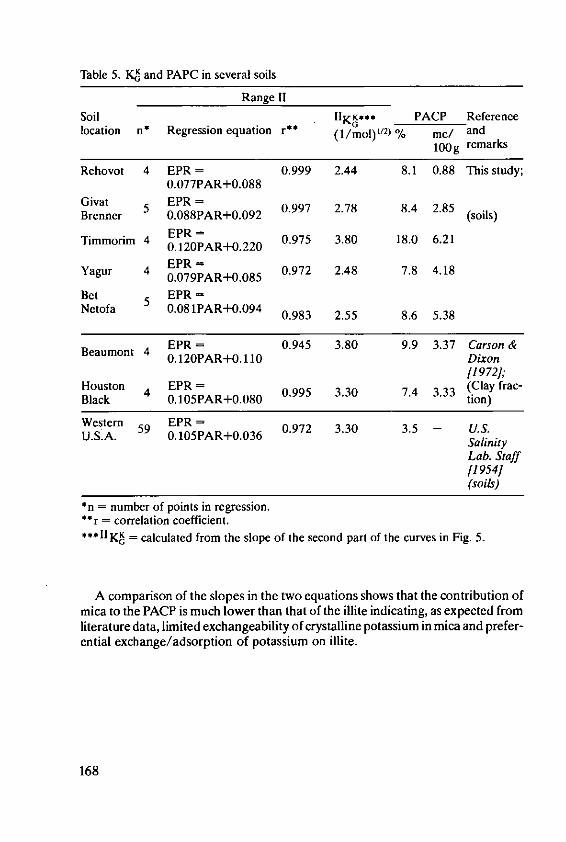
Table 5. K and PAPC in several soils
Range 11
Soil IIKK*** PACP Referencelocation n* Regression equation r** (1/mol) 2 % me and
lOOg remarks
Rehovot 4 EPR = 0.999 2.44 8.1 0.88 This study;0.077PAR+0.088
Givat EPR =Gvt 5 ER=0.997 2.78 8.4 2.85Brenner 0.088PAR+0.092 (soils)
Timmorim 4 EPR = 0.975 3.80 18.0 6.210.120PAR+0.220
Yagur ~ EPR --Yagur 4 0.79PAR+0.085 0.972 2.48 7.8 4.18
Bet EPR =Netofa 0.081PAR+0.094 0.983 2.55 8.6 5.38
Beaumont 4 EPR = 0.945 3.80 9.9 3.37 Carson &0.120PAR+0.110 Dixon
[1972];Houston 4 EPR = 0.995 3.30 7.4 3.33 (Clay frac-Black 0.105PAR+0.080 tion)
Western EPR =0972 3.30 3.5 - U.S.U.S.A. 0.105PAR+0.036 Salinity
Lab. Staff[1954](soils)
*n = number of points in regression.**r = correlation coefficient.
***IlKK = calculated from the slope of the second part of the curves in Fig. 5.
A comparison of the slopes in the two equations shows that the contribution ofmica to the PACP is much lower than that of the illite indicating, as expected fromliterature data, limited exchangeability of crystalline potassium in mica and prefer-ential exchange/adsorption of potassium on illite.
168
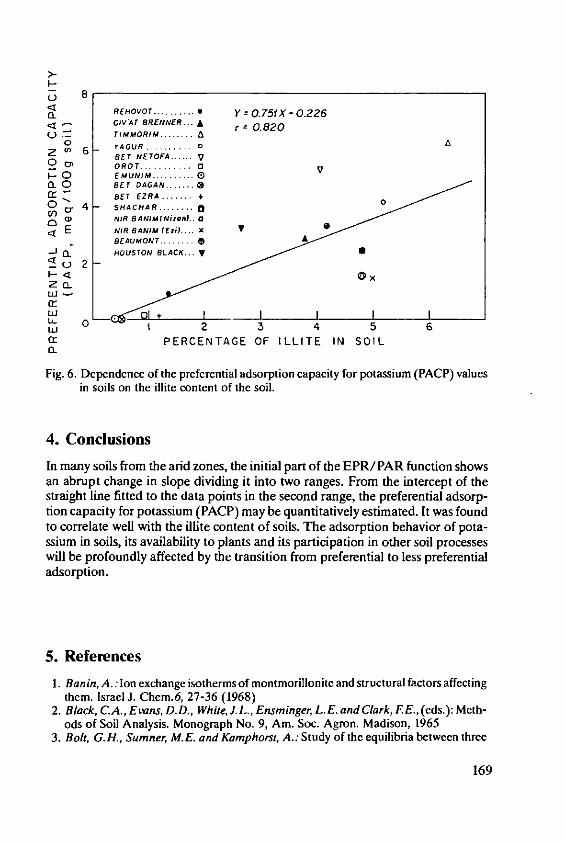
- S 8< REHOVOT .......... • -07 t .2
a ~ oo. Y 0.751 X -0.226< GI'AT BRENNER... A r = 0.820o t TIMMORO 4....... A0 YAGUR .... . .. o
6 BET NETOFA ...... V7RT...
.0 EMUNIM. .......... (D
a 0 BET CAGAN ....... 0E
BAN>M(>iOfJ..
BEAUMONT . A +a HOUSTON BLACK,..
--u 2I-E T R
w 3 4 5 6
Q: PERCENTAGE OF ILLITE IN SOIL
Fig. 6. Dependence of the preferential adsorption capacity for potassium (PACP) valuesin soils on the illite content of the soil.
4. Conclusions
In many soils from the arid zones, the initial part of the EPR/PAR function showsan abrupt change in slope dividing it into two ranges. From the intercept of thestraight line fitted to the data points in the second range, the preferential adsorp-tion capacity for potassium (PACT') may be quantitatively estimated. It was foundto correlate well with the illite content of soils. The adsorption behavior of pota-ssium in soils, its availability to plants and its participation in other soil processeswill be profoundly affected by the transition from preferential to less preferentialadsorption.
5. References1. Banin, A.: Ion exchange isotherms of montmorillonite and structural factors affecting
them. Israel J. Che..6, 27-36 (1968)2. Black, C.A., Evans, D.D., White, J.L., Ensminger, L.E. and Clark,FEE., (eds.): Meth-
ods of Soil Analysis. Monograph No. 9, Am. Soc. Agron. Madison, 19653. Bolt, G.H., Sumner, M.E. and Kamphors, A.: Study of the equilibria between three
169

4. Carson, C D. and Dixon J.B.: Potassium selectivity in certain montmorillonitic soilclays. Soil Sci. Soc. Am. Proc. 36, 838-843 (1972)
5. Chen, Y, Banin A. and Borochovitch A.: Effect of potassium on soil structure in rela-tion to hydraulic conductivity. Geoderma 30, 135-147 (1983)
6. DeistJ. and Talibudeen 0.: Ion exchange in soils from the ion pairs K-Ca, K-Rb andK-Na. J. Soil Sci. 18, 125-137 (1967)
7. Dolcater, D.L., Lotse, E.G., Syers, J.K. and Jackson, M.L.:Cation exchange selectiv-ity of some clay-sized minerals and soil materials. Soil Sci. Soc. Am. Proc. 32,795-798(1968)
8. Gal, M., Ravikovitch, S. andAmiel, A.: Clay mineral distribution and origin in thesoil types of Israel. J. Soil Sci. 25, 79-89 (1974)
9. Jensen, H. E.: K-Ca exchange equilibria on a montmorillonite and a kaolinite clay. !. Atest on the Argersinger thermodynamic approach. Agrochimica 17, 181-190 (1973)
10. Kishk, EM. and El-Sheemy, H.M.: Potassium selectivity of clays as effected by thestate of oxidation of their crystal structure. Clays Clay Miner. 22, 41-47 (1974)
11. Knibbe, W. G.J. and Thomas, G. W.: K-Ca exchange coefficients in clay fraction ofsome vertisols. Soil Sci. Soc. Am. Proc. 36, 568-572 (1972)
12. Krishnamoorty, C. and Overstreet, R.: An experimental evaluation of ion exchangerelationships. Soil Sci. 69, 41-53 (1958)
13. Rich, C.I.: Effect of cation size and pH on potassium exchange in Nason soil. Soil Sci.98, 100-106 (1964)
14. Schalscha, E.B., Pratt, PE andDeAndrade, L.:Potassium-calcium exchange equilib-ria in volcanic-ash soils. Soil Sci. Soc. Am. Proc. 39, 1069-1071 (1975)
15. Schuffelen, A. C.: The cation exchange system of the soil. In: Potassium in Soil. Proc.9th Coll. Int. Potash Inst. Landshut, Germany. pp. 75-88, 1972
16. Sch wertmann, U.: Die selektive Kationensorption der Tonfraktion ciniger Bden ausSedimenten. Ztschr. Pflanzenernihr. Dbng. Bodenkunde 96, 9-25 (1962)
17. Tucker, B.M.: The solubility of potassium from soil illites. IV. Rates of reaction and ex-change constants. Aust. J. Soil Res. 5, 191-201 (1967)
18. U S. Salinity Laboratory Staff: Diagnosis and Improvement of Saline and Alkali Soils.USDA Handbook No. 60 (1954)
19. Van der Wolt, H. V H.: Improved tables and a simplified procedure for soil particle sizeanalysis by hydrometer method. South Afr. Agr. Sci. J. 9, 911-916 (1966)
20. Van Schouwenburg, J. Ch. and Schuffelen A. C.: Potassium exchange behaviour of anillite. Neth. J. Agric. 11, 13-22 (1963)
170
The Surface Mobility of ExchangeableCations in Soil.
S. Staunton and P.H. Nye, Soil Science Laboratory, Department of Plant Sciences,University of Oxford/United Kingdom*
Summary
It is well established that in pure clays exchangeable cations are mobile and make animportant contribution to the total diffusive flux through clay pastes. On the other hand insoils the evidence has been that diffusion occurs very largely through the soil solution; theexchangeable cations contributing little. Using an accurate pulse labelling method fordetermining self-diffusion coefficients, we have recently obtained evidence in a variety ofsoils that exchangeable cations may have considerable mobility. This means that estimatesof the diffusion coefficients of these cations in such soils need to be increased.
The understanding we now have of the movement of nutrients towards roots, awayfrom fertilizers, and down a profile, has emphasized the need for us to know theirdiffusion coefficients. Unfortunately, the diffusion coefficient of an ion, such aspotassium, in a soil varies greatly with the nature of the exchange complex, itsdegree of saturation by the cation, the cation concentration in the soil solution, andthe water content of the soil. Further, in passing from the bulk of the soil to the sur-face of the root, for example, the concentration of the potassium ion in the soilsolution can change greatly, and correspondingly its diffusion coefficient willchange. To attempt to determine the diffusion coefficient experimentally over thiswide range of conditions for a given soil is a considerable and skilled task. It istherefore essential if diffusion coefficients are to be used in dynamic nutrientmodels that we have a ready means of predicting their values from easily measuredsoil properties.
The diffusion coefficient is defined by the equation
dCF = -D - (1)dx
where F is the solute flux, x is distance in the direction of diffusion and C is the con-centration of diffusible cation in the whole soil. The total flux can be conveniently
* Dr. S. Staunton and P.H. Nye, Dept. of Plant Sciences, University of Oxford, Agricultu-ral Science Building, Parks Road, Oxford OX] 3PF/United Kingdom
171
divided into two components. One depends only on the movement of ions throughthe soil solution
dCLFL = -DL 0 fd. - (2)
whereD, is the diffusion coefficient of the ion in free solution0 is the soil moisture contentft. is an impendance factor that accounts for the tortuosity of the diffusion
pathway, and the influence of the solid on the viscosity of the solutionnear changed surfaces
C, is the concentration of the ion in the soil solution.
The other component, Fs, involves the mobility of the exchangeable ions on thesolid surfaces in the direction of diffusion.It is convenient to define a surface phase impedance factor by the equation
Fs = -1 dC. fs 5ds (3)dx:
where ( is the dry density of the soil (wt of solid/unit vol whole soil)C. is the exchangeable cation content (equiv. cation/unit wt of solid)fs is equivalent to fl, it not only depends on the geometric tortuosity of the
sorbed cation, but also contains the effect of the solid on the mobility of theexchangeable cations. We know that movement of exchangeable ions solely via asurface phase pathway is slight since diffusion of ions through dry soil is very slow.Hence fs also allows for the cooperation between liquid and solid pathways. It islikely that within a given system there will be a range of mobilities of sorbed cations,depending on the nature of their bonding with the surface. fs may thus be thoughtof as a measure of the average mobility of exchangeable cations, relative to theirmobility in free solution.
Now F = F, + Fs (4)
Substituting equations (1), (2), (3), in (4)
dC dC, .f (dCsD =D 0 fL - + 1D (5)
dx dx dx
D = DL 0 fL d'L + DL Q fsdC
The main purpose of this paper is to discuss the component fs.
172
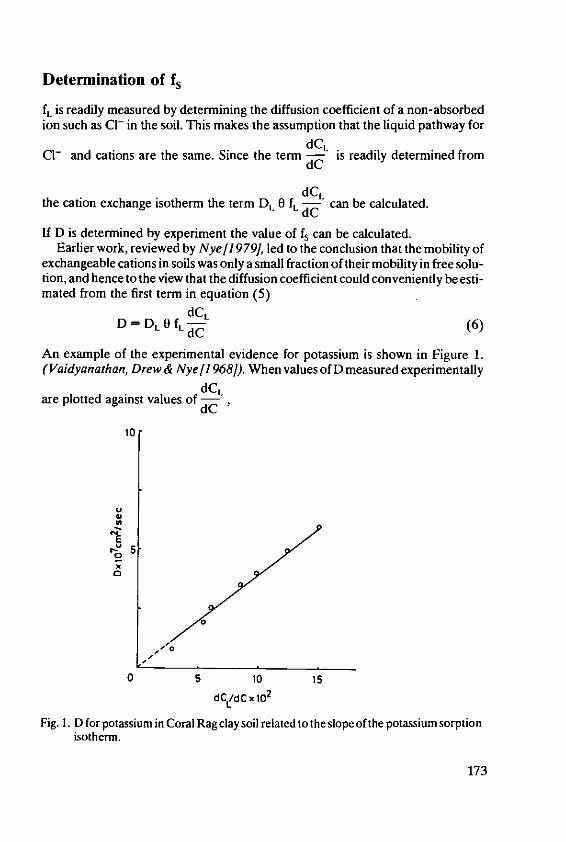
Determination of fs
fL is readily measured by determining the diffusion coefficient of a non-absorbedion such as C- in the soil. This makes the assumption that the liquid pathway for
C- and cations are the same. Since the term CL is readily determined fromdC
dC,the cation exchange isotherm the term DL 0 IL -, can be calculated.
If D is determined by experiment the value of fs can be calculated.Earlier work, reviewed by Nye[1 9791, led to the conclusion that the mobility of
exchangeable cations in soils was only a small fraction of their mobility in free solu-tion, and hence to the view that the diffusion coefficient could conveniently be esti-mated from the first term in equation (5)
D - DL 0L dC L (6)dC
An example of the experimental evidence for potassium is shown in Figure 1.(Vaidyanathan, Drew & Nye[19681). When values of D measured experimentally
are plotted against values of dC,
10
r5
0
0 5 10 15
dCLdCx 102
Fig. 1. D for potassium in Coral Rag clay soil related to the slope of the potassium sorptionisotherm.
173
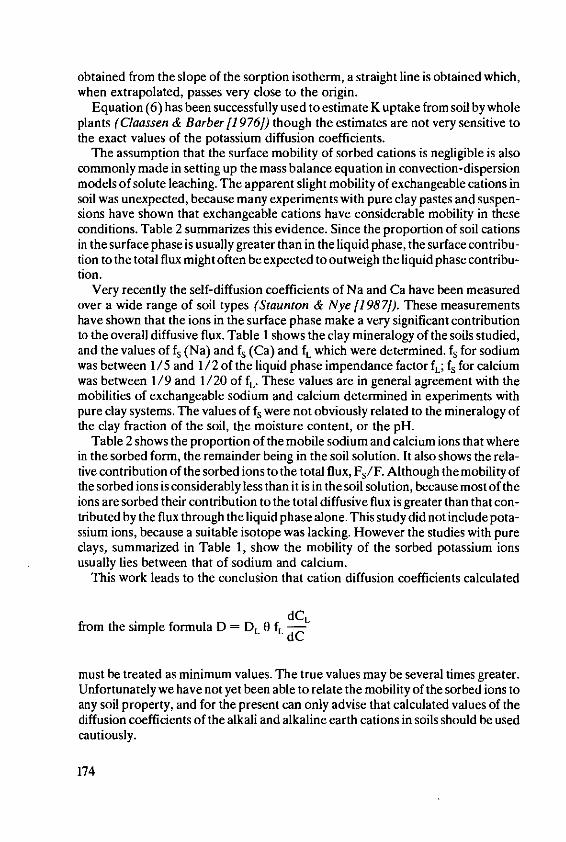
obtained from the slope of the sorption isotherm, a straight line is obtained which,when extrapolated, passes very close to the origin.
Equation (6) has been successfully used to estimate K uptake from soil by wholeplants (Claassen & Barber 11976]) though the estimates are not very sensitive tothe exact values of the potassium diffusion coefficients.
The assumption that the surface mobility of sorbed cations is negligible is alsocommonly made in setting up the mass balance equation in convection-dispersionmodels of solute leaching. The apparent slight mobility of exchangeable cations insoil was unexpected, because many experiments with pure clay pastes and suspen-sions have shown that exchangeable cations have considerable mobility in theseconditions. Table 2 summarizes this evidence. Since the proportion of soil cationsin the surface phase is usually greater than in the liquid phase, the surface contribu-tion to the total flux might often be expected to outweigh the liquid phase contribu-tion.
Very recently the self-diffusion coefficients of Na and Ca have been measuredover a wide range of soil types (Staunton & Nye [1987]). These measurementshave shown that the ions in the surface phase make a very significant contributionto the overall diffusive flux. Table 1 shows the clay mineralogy of the soils studied,and the values of fs (Na) and f. (Ca) and fL which were determined. fs for sodiumwas between 1/5 and 1/2 of the liquid phase impendance factor IE; f, for calciumwas between 1/9 and 1/20 of f,.. These values are in general agreement with themobilities of exchangeable sodium and calcium determined in experiments withpure clay systems. The values of fs were not obviously related to the mineralogy ofthe clay fraction of the soil, the moisture content, or the pH.
Table 2 shows the proportion of the mobile sodium and calcium ions that wherein the sorbed form, the remainder being in the soil solution. It also shows the rela-tive contribution of the sorbed ions to the total flux, Fs/F. Although the mobility ofthe sorbed ions is considerably less than it is in the soil solution, because most of theions are sorbed their contribution to the total diffusive flux is greater than that con-tributed by the flux through the liquid phase alone. This study did not include pota-ssium ions, because a suitable isotope was lacking. However the studies with pureclays, summarized in Table 1, show the mobility of the sorbed potassium ionsusually lies between that of sodium and calcium.
This work leads to the conclusion that cation diffusion coefficients calculated
from the simple formula D = D, 0 , CdC
must be treated as minimum values. The true values may be several times greater.Unfortunately we have not yet been able to relate the mobility of the sorbed ions toany soil property, and for the present can only advise that calculated values of thediffusion coefficients of the alkali and alkaline earth cations in soils should be usedcautiously.
174
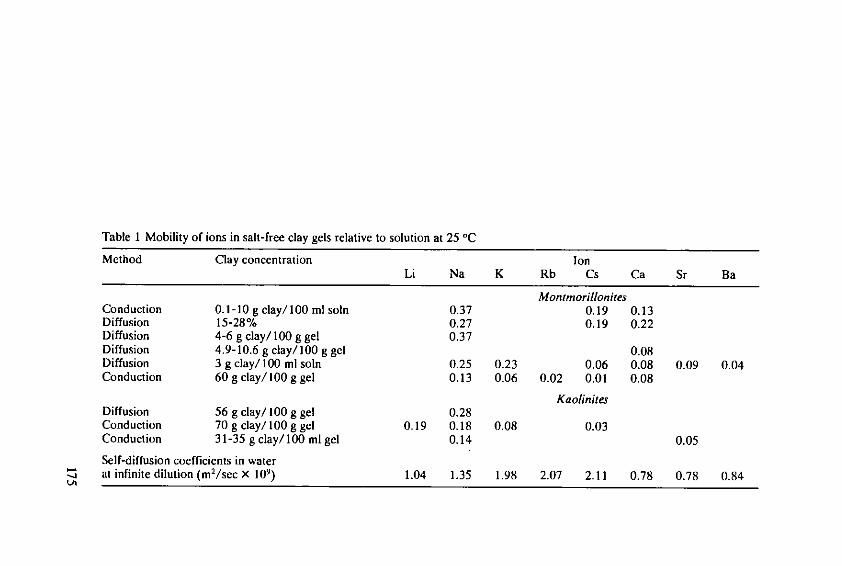
Table 1 Mobility of ions in salt-free clay gels relative to solution at 25 0C
Method Clay concentration IonLi Na K Rb Cs Ca Sr Ba
MontmorillonitesConduction 0.1-10 g clay/100 ml soln 0.37 0.19 0.13Diffusion 15-28% 0.27 0.19 0.22Diffusion 4-6 g clay/100 g gel 0.37Diffusion 4.9-10.6 g clay/100 g gel 0.08Diffusion 3 g clay/100 ml soln 0.25 0.23 0.06 0.08 0.09 0.04Conduction 60 g clay/100 g gel 0.13 0.06 0.02 0.01 0.08
KaolinitesDiffusion 56 g clay/100 g gel 0.28Conduction 70 g clay/100 g gel 0.19 0.18 0.08 0.03Conduction 31-35 g clay/100 ml gel 0.14 0.05
Self-diffusion coefficients in water- at infinite dilution (m2/sec X 109) 1.04 1.35 1.98 2.07 2.11 0.78 0.78 0.84
Table 2 Clay mineralogy and the surface phase impedance factors
Soil Clay mineralogy f. (Na) f. (Ca) 0 IL
Banbury Micaceous, veryferruginous 0.044 0.011 0.28 0.23
Batcombe Complex vermiculitecomponents 0.105 0.016 0.29 0.24
Denchworth Montmorillonite 0.095 0.026 0.39 0.25Tedburn Micaceous 0.129 0.020 0.46 0.24Teigngrace Kaolinite 0.189 0.041 0.38 0.36
Table 3 The proportion of sorbed sodium and calcium ions, and their relative contributionto the total flux.
Sodium CalciumQS/C Fs/F QS/C Fs/F
Banbury 0.911 0.66 0.995 0.90Batombe 0.690 0.49 0.965 0.64Denchworth 0.850 0.68 0.993 0.94Tedbun 0.836 0.73 0.996 0.96Teigngrace 0.758 0.66 0.989 0.91
References
1. Claassen, N. and Barber, S.A.: Simulation model for nutrient uptake from soil by agrowing plant root system. Agronomy Journal 68, 961 (1976)
2. Nye, P. H.: Diffusion of ions and uncharged solutes in soils and soil clays. Advances inAgronomy 31, 225-272 (1979)
3. Staunton, S. and Nye, P.H.: The contribution of sorbed sodium and calcium to theself-diffusion of these cations in soils with different clay mineralogies. Journal of SoilScience (in press) (1987)
4. Vaidyanathan, L. V., Drew, M. C and Nye, P. H.: The measurement and mechanismsof ion diffusion in soils. IV. The concentration dependence of diffusion coefficients ofpotassium in soils at a range of moisture levels and a method for the estimation of thedifferential diffusion coefficient at any concentration. Journal of Soil Science 19, 94-107 (1968)
176

Critical Evaluation of Soil TestingMethods for K.
L Novozamsky and VJ. G. Houba, Department of Soil Science and Plant Nutri-tion, Wageningen Agricultural University, Wageningen, Netherlands*.
Summary
Various methods and approaches for determining available soil potassium are discussedand compared. It is concluded that a theoretical model describing K behaviour in soil is notyet applicable in practical soil testing, and that extraction methods supplying informationon exchangeable K are useful in soil testing only when the values obtained are correctedwith the use of soil parameters affecting exchange reactions in soils.
A 0.01 M CaCI2 extraction procedure was tentatively compared with more establishedextraction procedures ( 0.1 M HCI and Electro-Ultrafiltration). Since different fractionsof soil potassium are extracted with the three methods, different correction parameters areneeded for estimating available K. With the use of such correction factors, all three meth-ods appear equally useful. Preference for anyone of them can therefore be based on econ-omic factors, such as ease and speed of operation and costs involved.
1. Introduction
A wide range of soil extractants has been used, and is still being used, for the assess-ment of that portion of soil K which is o availableD to plants. Probably most wides-pread is the use of neutral I M NH 4Ac solution. Other extractants frequently usedare Bray solution, NaNO3, NH4NO3, CaC 2, NaHCO 3, buffered or unbufferedNH 4 -oxalate, Ca or NH 4-lactate, double acid (HCI-H 2SO4), Morgan's extract(NaOAc-HOAc), dilute H2SO4 (Truog), 0.1 M HCI + 0.2 M oxalic acid, NaTPB(Na-tetraphenylborate) in various concentrations, hot HNO3 , etc.
Our laboratory organises a world-wide sample exchange programme for plantmaterial. Knowing that several member laboratories are also involved in soil analy-sis, we have asked by means of a questionnaire which methods are used for thedetermination of available potassium. The methods reported are listed in Table 1.It is clear that even for the same extracting solution rather different extraction con-ditions are being used.
* Dr. L Novozamskyand Dr. Ir. V.J.G. Houba, Dept. of Soil Science and Plant Nutrition,Agricultural University, De Dreijen 3, NL-6703 BC Wageningen/The Netherlands.
177
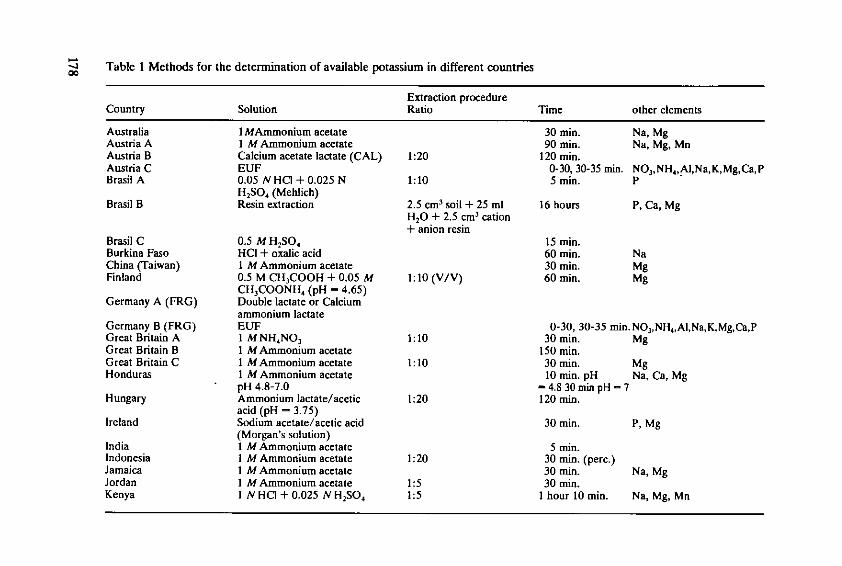
Table 1 Methods for the determination of available potassium in different countries00
Extraction procedureCountry Solution Ratio Time other elements
Australia 1 MAmmonium acetate 30 min. Na, MgAustria A 1 M Ammonium acetate 90 win. Na, Mg, MnAustria B Calcium acetate lactate (CAL) 1:20 120 min.Austria C EUIF 0-30, 30-35 min. NO 3,NH4,AI,Na,K,Mg,Ca,PBrasil A 0.05 NHCI + 0.025 N 1:10 5 min. P
H2SO4 (Mehlich)Brasil B Resin extraction 2.5 cm3 soil + 25 ml 16 hours P, Ca, Mg
H20 + 2.5 cm3 cation+ anion resin
Brasil C 0.5 MH 2SO4 15 min.Burkina Faso HCI + oxalic acid 60 min. NaChina (Taiwan) I M Ammonium acetate 30 min. MgFinland 0.5 M CH3COOH +-- 0.05 M 1:10 (V/V) 60 min. Mg
CH3COONH4 (pH - 4.65)Germany A (FRG) Double lactate or Calcium
ammonium lactateGermany B (FRG) EUF 0-30, 30-35 min. NO,,NH4,AI,Na,K,Mg,Ca,PGreat Britain A 1 MNH4NO, 1:10 30 min. MgGreat Britain B 1 M Ammonium acetate 150 min.Great Britain C I M Ammonium acetate 1:10 30 min. MgHonduras I M Ammonium acetate 10 min. pH Na, Ca, Mg
pH 4.8-7.0 - 4.8 30 miin pH = 7Hungary Ammonium lactate/acetic 1:20 120 win.
acid (pH = 3.75)Ireland Sodium acetate/acetic acid 30 win. P, Mg
(Morgan's solution)India I M Ammonium acetate 5 min.Indonesia I M Ammonium acetate 1:20 30 min. (perc.)Jamaica I M Ammonium acetate 30 win. Na, MgJordan I M Ammonium acetate 1:5 30 min.Kenya I N HCI + 0.025 N H2SO 1:5 1 hour 10 win. Na, Mg, Mn
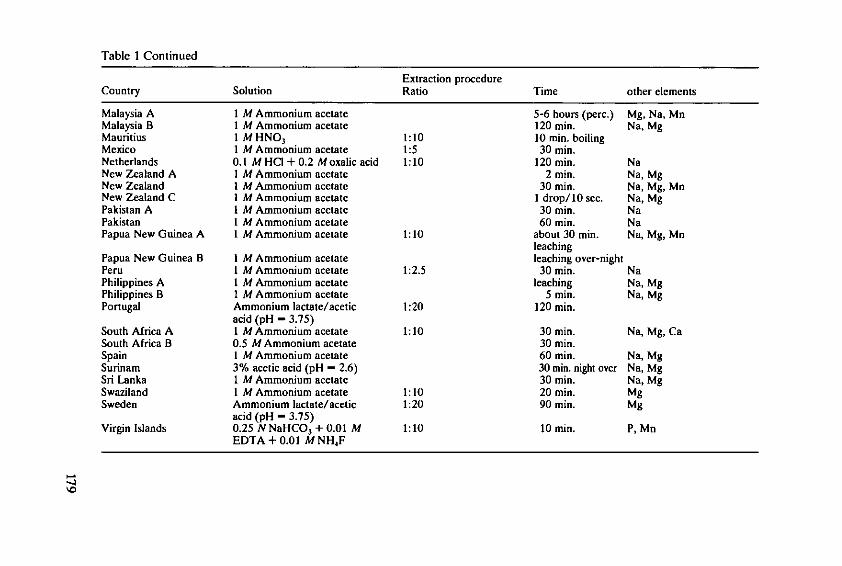
Table 1 Continued
Extraction procedureCountry Solution Ratio Time other elements
Malaysia A I M Ammonium acetate 5-6 hours (perc.) Mg, Na, MnMalaysia B I M Ammonium acetate 120 min. Na, MgMauritius I MHNO 3 1:10 10 min. boilingMexico I M Ammonium acetate 1:5 30 min.Netherlands 0.1 M HC1 + 0.2 Moxalic acid 1:10 120 min. NaNew Zealand A 1 M Ammonium acetate 2 min. Na, MgNew Zealand IM Ammonium acetate 30 min. Na, Mg, MnNew Zealand C I M Ammonium acetate 1 drop/10 sec. Na, MgPakistan A I M Ammonium acetate 30 min. NaPakistan I M Ammonium acetate 60 min. NaPapua New Guinea A I M Ammonium acetate 1:10 about 30 min. Na, Mg, Mn
leachingPapua New Guinea B I M Ammonium acetate leaching over-nightPeru 1 M Ammonium acetate 1:2.5 30 min. NaPhilippines A I M Ammonium acetate leaching Na, MgPhilippines B I M Ammonium acetate 5 min. Na, MgPortugal Ammonium lactate/acetic 1:20 120 min.
acid (pH - 3.75)South Africa A 1 M Ammonium acetate 1:10 30 min. Na, Mg, CaSouth Africa B 0.5 M Ammonium acetate 30 min.Spain I M Ammonium acetate 60 min. Na, MgSurinam 3% acetic acid (pH - 2.6) 30 min. night over Na, MgSri Lanka I M Ammonium acetate 30 min. Na, MgSwaziland I M Ammonium acetate 1:10 20 min. MgSweden Ammonium lactate/acetic 1:20 90 min. Mg
acid (pH - 3.75)Virgin Islands 0.25 N NaHCO 3 + 0.01 M 1:10 10 min. P, Mn
EDTA + 0.01 M NH 4F
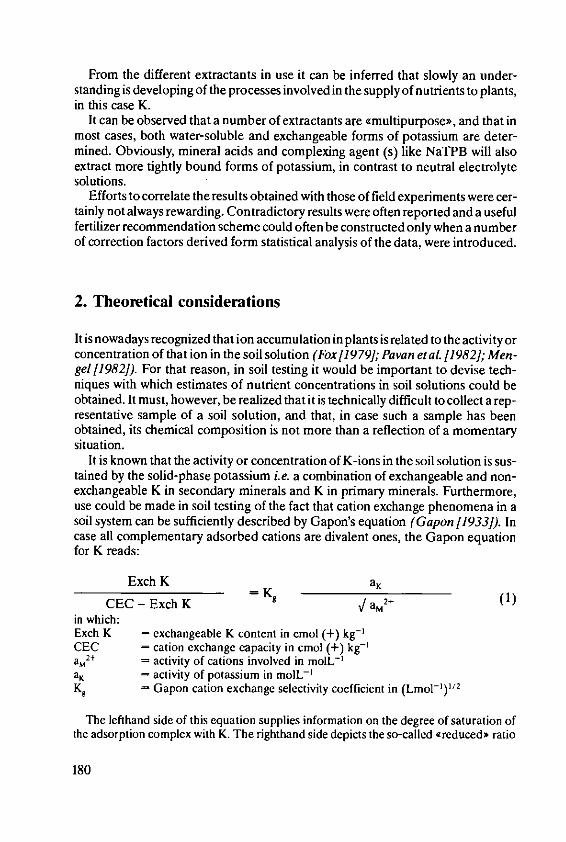
From the different extractants in use it can be inferred that slowly an under-standing is developing of the processes involved in the supply of nutrients to plants,in this case K.
It can be observed that a number of extractants are ,multipurposeo, and that inmost cases, both water-soluble and exchangeable forms of potassium are deter-mined. Obviously, mineral acids and complexing agent (s) like NaTPB will alsoextract more tightly bound forms of potassium, in contrast to neutral electrolytesolutions.
Efforts to correlate the results obtained with those of field experiments were cer-tainly not always rewarding. Contradictory results were often reported and a usefulfertilizer recommendation scheme could often be constructed only when a numberof correction factors derived form statistical analysis of the data, were introduced.
2. Theoretical considerations
It is nowadays recognized that ion accumulation in plants is related to the activity orconcentration of that ion in the soil solution (Fox[ 1979]; Pavan et aL [1982]; Men-gel[1982). For that reason, in soil testing it would be important to devise tech-niques with which estimates of nutrient concentrations in soil solutions could beobtained. It must, however, be realized that it is technically difficult to collect a rep-resentative sample of a soil solution, and that, in case such a sample has beenobtained, its chemical composition is not more than a reflection of a momentarysituation.
It is known that the activity or concentration of K-ions in the soil solution is sus-tained by the solid-phase potassium i.e. a combination of exchangeable and non-exchangeable K in secondary minerals and K in primary minerals. Furthermore,use could be made in soil testing of the fact that cation exchange phenomena in asoil system can be sufficiently described by Gapon's equation (Gapon /1933]). Incase all complementary adsorbed cations are divalent ones, the Gapon equationfor K reads:
Exch K a ,
CEC - Exch K =Kg /aM (1)in which:Exch K = exchangeable K content in cmol (+) kg- 'CEC = cation exchange capacity in cmol (+) kg- 'a,2+ = activity of cations involved in molL - 'aK = activity of potassium in molL- 'Kg = Gapon cation exchange selectivity coefficient in (Lmol-')" /2
The lefthand side of this equation supplies information on the degree of saturation ofthe adsorption complex with K. The righthand side depicts the so-called creducedo ratio
180
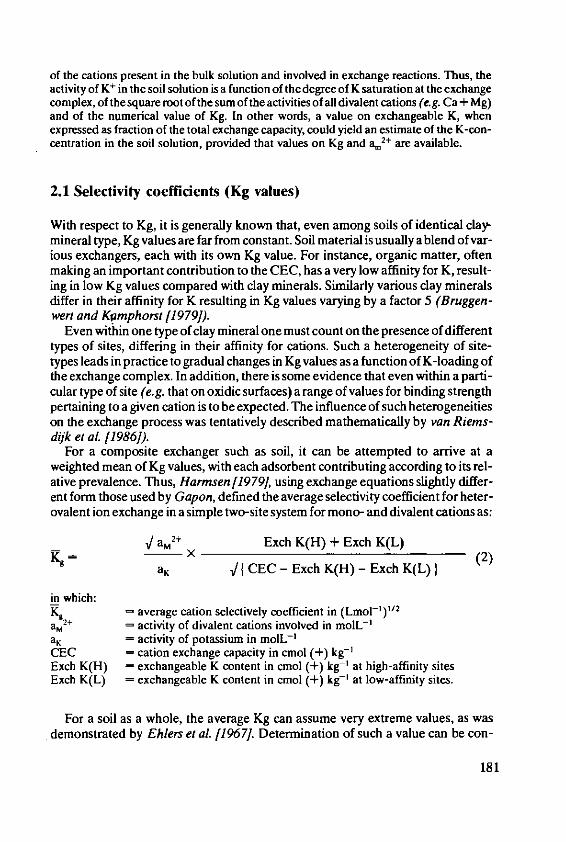
of the cations present in the bulk solution and involved in exchange reactions. Thus, theactivity of K+ in the soil solution is a function of the degree of K saturation at the exchangecomplex, of the square root of the sum of the activities of all divalent cations (e.g. Ca + Mg)and of the numerical value of Kg. In other words, a value on exchangeable K, whenexpressed as fraction of the total exchange capacity, could yield an estimate of the K-con-centration in the soil solution, provided that values on Kg and a.' + are available.
2.1 Selectivity coefficients (Kg values)
With respect to Kg, it is generally known that, even among soils of identical clay-mineral type, Kg values are far from constant. Soil material is usually a blend of var-ious exchangers, each with its own Kg value. For instance, organic matter, oftenmaking an important contribution to the CEC, has a very low affinity for K, result-ing in low Kg values compared with clay minerals. Similarly various clay mineralsdiffer in their affinity for K resulting in Kg values varying by a factor 5 (Bruggen-wert and K.mphorst /1979]).
Even within one type of clay mineral one must count on the presence of differenttypes of sites, differing in their affinity for cations. Such a heterogeneity of site-types leads in practice to gradual changes in Kg values as a function of K-loading ofthe exchange complex. In addition, there is some evidence that even within a parti-cular type of site (e.g. that on oxidic surfaces) a range of values for binding strengthpertaining to a given cation is to be expected. The influence of such heterogeneitieson the exchange process was tentatively described mathematically by van Riems-dijk et al. [1986]).
For a composite exchanger such as soil, it can be attempted to arrive at aweighted mean of Kg values, with each adsorbent contributing according to its rel-ative prevalence. Thus, Harmsen [1979], using exchange equations slightly differ-ent form those used by Gapon, defined the average selectivity coefficient for heter-ovalent ion exchange in a simple two-site system for mono- and divalent cations as:
t a, 2+ Exch K(H) + Exch K(L)Kg X (2)
aK CEC - Exch K(H) - Exch K(L) }
in which:K, - average cation selectively coefficient in (Lmol-')"'
a, 2+ = activity of divalent cations involved in molL- 'a, = activity of potassium in molL- 'CEC = cation exchange capacity in cmol (+) kg -'Exch K(H) = exchangeable K content in cmol (+) kg-' at high-affinity sitesExch K(L) = exchangeable K content in cmol (+) kg- ' at low-affinity sites.
For a soil as a whole, the average Kg can assume very extreme values, as wasdemonstrated by Ehlers et al [1967]. Determination of such a value can be con-
181
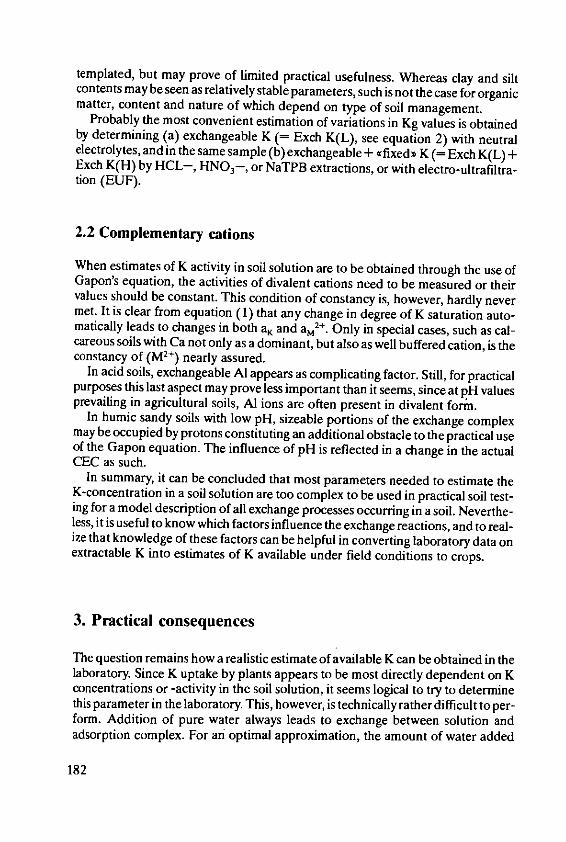
templated, but may prove of limited practical usefulness. Whereas clay and siltcontents may be seen as relatively stable parameters, such is not the case for organicmatter, content and nature of which depend on type of soil management.
Probably the most convenient estimation of variations in Kg values is obtainedby determining (a) exchangeable K (= Exch K(L), see equation 2) with neutralelectrolytes, and in the same sample (b) exchangeable + cfixed> K (= Exch K(L) +Exch K(H) by HCL-, HNO 3-, or NaTPB extractions, or with electro-ultrafiltra-tion (EUF).
2.2 Complementary cations
When estimates of K activity in soil solution are to be obtained through the use ofGapon's equation, the activities of divalent cations need to be measured or theirvalues should be constant. This condition of constancy is, however, hardly nevermet. It is clear from equation (1) that any change in degree of K saturation auto-matically leads to changes in both aK and a,' +. Only in special cases, such as cal-careous soils with Ca not only as a dominant, but also as well buffered cation, is theconstancy of (M2 ) nearly assured.
In acid soils, exchangeable Al appears as complicating factor. Still, for practicalpurposes this last aspect may prove less important than it seems, since at pH valuesprevailing in agricultural soils, Al ions are often present in divalent form.
In humic sandy soils with low pH, sizeable portions of the exchange complexmay be occupied by protons constituting an additional obstacle to the practical useof the Gapon equation. The influence of pH is reflected in a change in the actualCEC as such.
In summary, it can be concluded that most parameters needed to estimate theK-concentration in a soil solution are too complex to be used in practical soil test-ing for a model description of all exchange processes occurring in a soil. Neverthe-less, it is useful to know which factors influence the exchange reactions, and to real-ize that knowledge of these factors can be helpful in converting laboratory data onextractable K into estimates of K available under field conditions to crops.
3. Practical consequences
The question remains how a realistic estimate of available K can be obtained in thelaboratory. Since K uptake by plants appears to be most directly dependent on Kconcentrations or -activity in the soil solution, it seems logical to try to determinethis parameter in the laboratory. This, however, is technically rather difficult to per-form. Addition of pure water always leads to exchange between solution andadsorption complex. For an optimal approximation, the amount of water added
182

should be kept to a minimum. In this line of thinking, a potentiometric determina-tion of K directly in the soil paste, similar to pH measurement, comes to mind. Toour knowledge, such an approach has never been made, probably because of itsanalytical complexicity.
Rather close to determining the concentration of K in the soil solution stands theoriginal EUF technique (Ndmeth [1980]), in which 7 different fractions are distin-guished. The first fraction is supposed to represent the soil solution potassium. Weanalysed a number of soils for solution K with the EUF method and compared theresults with those obtained in a procedure involving an addition of water in a ratio1:2.5 (w:v) soil to solution. The values found were generally very low and no parti-cular differences were found between the values obtained with these two methods,which makes it clear that even the EUF extraction does not give a true picture ofsoil solution potassium.
The empirical determination of the so-called intensity parameter, being thevalue of the activity ratio of cations in the soil solution as defined in equation (1),has been tried by several authors. This approach, together with that of the so-calledQ/1 curves which combines information on intensity parameter with that on buf-fering capacity of soils was reviewed by Goulding 11983]. The laboratory proce-dure for determining activity ratios (A&) and/or 0/I curves is very cumbersomeand the relevance of the results to nutrient uptake is not convincing. Examinationof equation (1) reveals that determination of the fractional saturation of theexchange capacity by potassium yields a parameter which is related to the above-mentioned activity ratio. The laboratory determinations of exchangeable potas-sium and of the CEC are easily performed. Because of variations in K, values, asdiscussed above, the relevance of such a parameter to nutrient uptake should the-oretically be worse than that of activity ratio solely.
4. Proposed methods
Because of cost aspects, easy-to-perform extraction procedures with which the lar-gest possible number of nutrients can be determined are looked for in practice. Insuch extracts usually only the easily exchangeable forms of potassium are present.Considering the above discussion, it is our opinion that such extraction procedureswould be adequate for all practical purposes involving fertilizer recommendations,provided the values obtained are considered together with other soil parametersdirectly or indirectly relevant to the exchange properties of soils, such as pH, clay(type and content) and organic matter. In such an approach, the effects of var-iations in CEC and Kg are empirically taken into account.
The procedure used for making fertilizer recommendations in the Netherlandscan serve as an example of such an approach, except that due to historical develop-ments only two elements (Na and K) are determined in the extract obtained. Therelation between quantities extracted in a laboratory procedure and quantities
183
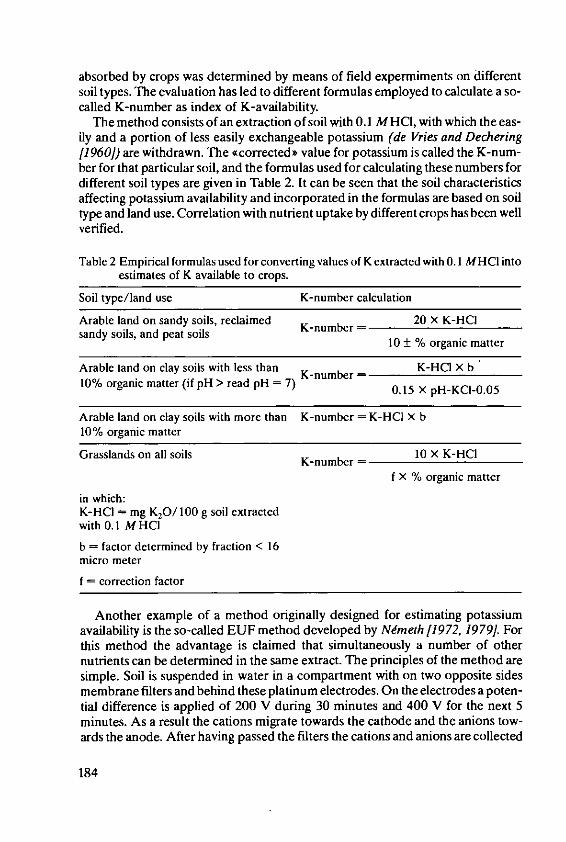
absorbed by crops was determined by means of field expermiments on differentsoil types. The evaluation has led to different formulas employed to calculate a so-called K-number as index of K-availability.
The method consists of an extraction of soil with 0.1 M HCI, with which the eas-ily and a portion of less easily exchangeable potassium (de Vries and Dechering11960]) are withdrawn. The corrected value for potassium is called the K-num-ber for that particular soil, and the formulas used for calculating these numbers fordifferent soil types are given in Table 2. It can be seen that the soil characteristicsaffecting potassium availability and incorporated in the formulas are based on soiltype and land use. Correlation with nutrient uptake by different crops has been wellverified.
Table 2 Empirical formulas used for converting values of K extracted with 0.1 MHCI into
estimates of K available to crops.
Soil type/land use K-number calculation
Arabic land on sandy soils, reclaimed K-number = 20 X K-HCIsandy soils, and peat soils 10 ± % organic matter
Arable land on clay soils with less than K-number - K-HO X b10% organic matter (if pH > read pH = 7) 0.15 X pH-KCI-0.05
Amble land on clay soils with more than K-number = K-HCI X b
10% organic matter
Grasslands on all soils K-number = 10 × K-HCI
f X % organic matter
in which:K-HCI - mg K20/100 g soil extractedwith 0.1 MHCI
b = factor determined by fraction < 16micro meter
I = correction factor
Another example of a method originally designed for estimating potassiumavailability is the so-called EUF method developed by Nemeth [1972, 1979]. Forthis method the advantage is claimed that simultaneously a number of othernutrients can be determined in the same extract. The principles of the method aresimple. Soil is suspended in water in a compartment with on two opposite sidesmembrane filters and behind these platinum electrodes. On the electrodes a poten-tial difference is applied of 200 V during 30 minutes and 400 V for the next 5minutes. As a result the cations migrate towards the cathode and the anions tow-ards the anode. After having passed the filters the cations and anions are collected
184
and measured. In the case of potassium the first fraction (200 V; 0-30 min.; 20 'C)is said to represent the easily exchangeable and water soluble potassium; the sec-ond fraction (400 V; 30-35 min.; 80 'C) contains (part of) the more difficultlyexchangeable K. Here again the analytical values are not used as such but are in factcorrected by taking into account the ratio of the second and first fraction, and thesum of extractable Ca and Mg (Wiklicky andNdmeth [198D]). The ratio of K andCa + Mg in the two fractions supplies information on the mean selectivity coeffi-cient as well as on the cation exchange capacity.
In our laboratory we have applied a very simple extraction with 0.01 M CaC12(Houba et al [1986]). This extracting solution differs slightly in concentrationfrom the one used originally by Schachtschabel[1954]for the determination of Mg,Ba, Sr, K and pH. We preferred 0.01 Mas concentration because it is widely usedfor determining pH (Page et al 11982]; Woodruff, [1961]) and for the determina-tion of N-availability indices (Fox andPiekielek, [19781a and b; Stanford, [1968];Stanford and Smith, 11971, 1976]; Stanford and DeMar, [1969, 1970]).
5. Comparison of the proposed methods
For a comparison, 84 soil samples were collected at 21 locations (4 sites per loca-tion). Roughly half of the soils were sandy soils and the other half clay soils (Table3). For as broad a comparison as possible, not only potassium, but also othernutrients determined in the cuniversal" extraction procedures (EUF and 0.01 MCaCI2) were considered (Table 4).
The results obtained with the various extraction procedures are presented inTables 5, 6 and 7.
5.1 Potassium
A comparison of data on K extracted with 0.01 M CaCI2 and 0.1 M HCI shows thatthe degree of correlation depends on soil type, with clearly different resultsobtained for sandy soils and for clay soils. Such a divergence is to be expected, as0.1 M HCI also extracts portions of the difficultly exchangeable and primary-min-eral K from clay soils. The relations are shown in Figure 1 for all analytical values athand. The relation between the sets of data obtained with the two methods is verygood for sandy soils, whereas the values for clay soils are much more scattered.Hence, it is reasonable to assume that in clay soils the readily exchangeable potas-sium is extracted with both methods but that, depending on type and amount ofclay minerals, varying portions of more tightly bound K, as extracted by HCI, areresponsible for both scattering and higher values.
185
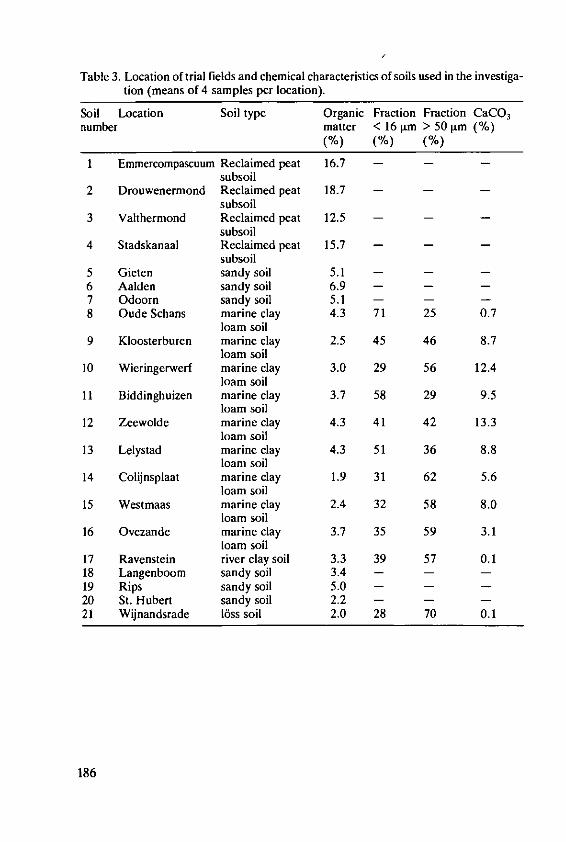
Table 3. Location of trial fields and chemical characteristics of soils used in the investiga-tion (means of 4 samples per location).
Soil Location Soil type Organic Fraction Fraction CaCOnumber matter < 16 [im > 50 lim (%)
(%) (%) (%)
1 Emmercompascuum Reclaimed peat 16.7 - - isubsoil
2 Drouwenermond Reclaimed peat 18.7 - - -
subsoil3 Valthermond Reclaimed peat 12.5 - - -
subsoil4 Stadskanaal Reclaimed peat 15.7 - - -
subsoil5 Gieten sandy soil 5.1 - - -
6 Aalden sandy soil 6.9 - - -
7 Odoorn sandy soil 5.1 - - -
8 Oude Schans marine clay 4.3 71 25 0.7loam soil
9 Kloosterburen marine clay 2.5 45 46 8.7loam soil
10 Wieringerwerf marine clay 3.0 29 56 12.4loam soil
I I Biddinghuizen marine clay 3.7 58 29 9.5loam soil
12 Zeewolde marine clay 4.3 41 42 13.3loam soil
13 Lelystad marine clay 4.3 51 36 8.8loam soil
14 Colijnsplaat marine clay 1.9 31 62 5.6loam soil
15 Westmaas marine clay 2.4 32 58 8.0loam soil
16 Ovezande marine clay 3.7 35 59 3.1loam soil
17 Ravenstein river clay soil 3.3 39 57 0.118 Langenboom sandy soil 3.4 - - -19 Rips sandy soil 5.0 - - -
20 St. Hubert sandy soil 2.2 - - -21 Wijnandsrade 16ss soil 2.0 28 70 0.1
186
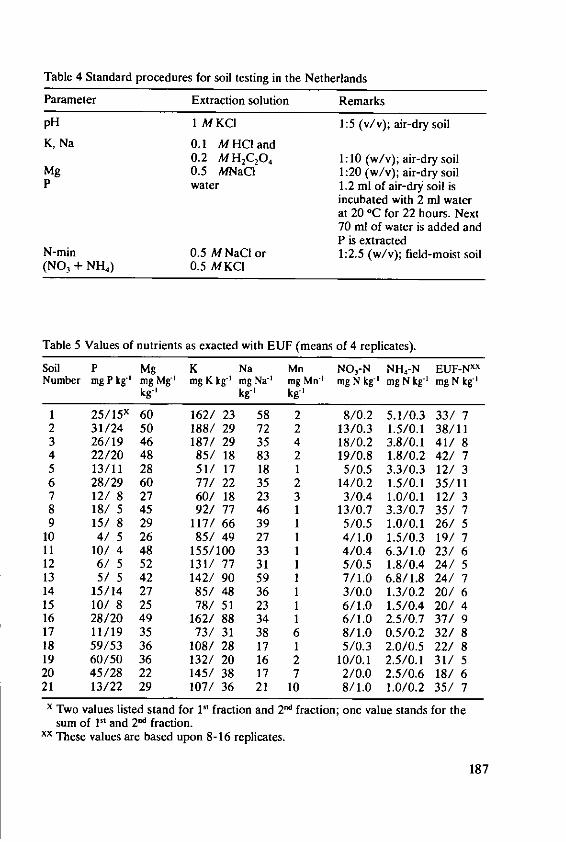
Table 4 Standard procedures for soil testing in the Netherlands
Parameter Extraction solution Remarks
pH 1 MKCI 1:5 (v/v); air-dry soil
K, Na 0.1 MHCl and0.2 MHC 204 1:10 (w/v); air-dry soil
Mg 0.5 MNaCI 1:20 (w/v); air-dry soilP water 1.2 ml of air-dry soil is
incubated with 2 ml waterat 20 °C for 22 hours. Next70 ml of water is added andP is extracted
N-min 0.5 M NaCl or 1:2.5 (w/v); field-moist soil(NO 3 + NH4 ) 0.5 MKCI
Table 5 Values of nutrients as exacted with EUF (means of 4 replicates).
Soil P Mg K Na Mn NO 3-N NH 4-N EUF-NxxNumber mg P kg' l mg Mg' mg K kg-' mg Na-' mg Mn' mg N kg-' mg N kg- mg N kg'
kg-I kg- kg-I
I 25 / 15 x 60 162/ 23 58 2 8/0.2 5.1/0.3 33/ 72 31/24 50 188/ 29 72 2 13/0.3 1.5/0.1 38/113 26/19 46 187/ 29 35 4 18/0.2 3.8/0.1 41/ 84 22/20 48 85/ 18 83 2 19/0.8 1.8/0.2 42/ 75 13/11 28 51/ 17 18 1 5/0.5 3.3/0.3 12/ 36 28/29 60 77/ 22 35 2 14/0.2 1.5/0.1 35/117 12/ 8 27 60/ 18 23 3 3/0.4 1.0/0.1 12/ 38 18/ 5 45 92/ 77 46 1 13/0.7 3.3/0.7 35/ 79 15/ 8 29 117/ 66 39 1 5/0.5 1.0/0.1 26/ 5
10 4/ 5 26 85/ 49 27 1 4/1.0 1.5/0.3 19/ 711 10/ 4 48 155/100 33 1 4/0.4 6.3/1.0 23/ 612 6/ 5 52 131/ 77 31 1 5/0.5 1.8/0.4 24/ 513 5/ 5 42 142/ 90 59 1 7/1.0 6.8/1.8 24/ 714 15/14 27 85/ 48 36 1 3/0.0 1.3/0.2 20/ 615 10/ 8 25 78/ 51 23 1 6/1.0 1.5/0.4 20/ 416 28/20 49 162/ 88 34 1 6/1.0 2.5/0.7 37/ 917 11/19 35 73/ 31 38 6 8/1.0 0.5/0.2 32/ 818 59/53 36 108/ 28 17 1 5/0.3 2.0/0.5 22/ 819 60/50 36 132/ 20 16 2 10/0.1 2.5/0.1 31/ 520 45/28 22 145/ 38 17 7 2/0.0 2.5/0.6 18/ 621 13/22 29 107/ 36 21 10 8/1.0 1.0/0.2 35/ 7x Two values listed stand for 11" fraction and 2 nd fraction; one value stands for the
sum of IV and 2 ad fraction.xx These values are based upon 8-16 replicates.
187
Table 6 Values of pH and nutrients as extracted with standard procedures in use in the- Netherlands
Soil pH K-HCI Mg-NaCI P.
Number I MKCI mg K kg' mg Mg kg' mg P20 51' mg P kg-'
1 5.2 143 171 49 262 5.1 164 166 64 343 4.8 166 94 46 194 5.3 95 139 46 265 5.4 58 65 25 96 5.2 92 94 52 217 5.1 75 42 22 88 7.1 247 195 31 139 7.4 251 86 25 10
10 7.5 145 39 19 811 7.3 326 170 30 1212 7.4 247 146 20 813 7.3 309 120 21 814 7.4 141 65 23 915 7.4 145 48 18 716 7.4 247 118 53 2117 6.6 98 121 37 1418 6.2 129 48 116 3919 5.5 125 54 112 4020 6.7 141 39 89 3221 6.8 112 69 46 17
It is claimed that the EUF-procedure can distinguish between readily exchange-able and tightly bound potassium fractions. This could mean that K in the first frac-tion obtained with EUF is closely related to K extracted with 0.01 MCaCI 2 and thatK in the combined first and second EUF fractions is comparable to K extractedwith HCI, independent of soil type. That this is really the case, can be seen from theanalytical results (Figures 2 and 3).
It is clear that CaC12 extracts only easily exchangeable K (Exch K(L), see equa-tion (2)). Hence, this method provides less information necessary for the evalua-tion of available K than the other two methods discussed. Information on ExchK(H) can be obtained by either taking into account soil type or, still better, bydetermining Exch K(H) which value is little dependent on soil management andtherefore needs to be determined only once. CEC could be determined directly, orcould be estimated from values of pH, clay content and/or organic-matter content.
188

Table 7 pH values and quantities of nutrients as extracted with a 0.01 M CaCI2 solution(means of 4 replicates)
Soil P Mg K Na Mn NO,-N NH4-N Soluble Total NorganicN
NumberpH mgP mgMg mglK mgNa mgMn mgN mgN mgN mgNkg-' kg- t kg - ' kg- ' kg - ' kg - ' kg- ' kg - ' kg-
1 5.0 10.0 145 133 46 8.7 8.4 12.4 16 362 5.1 9.0 125 135 58 8.2 14.9 9.2 21 453 4.8 7.1 88 147 24 15.2 18.2 12.1 11 414 5.2 5.8 125 77 76 6.4 24.3 12.4 16 525 5.5 0.5 60 41 8 3.8 4.0 6.2 5 156 5.2 4.0 93 61 22 4.3 13.0 7.4 11 317 5.3 0.8 53 50 11 7.0 3.3 5.5 4 138 7.4 0.8 127 69 34 0.6 12.5 4.7 10 289 7.4 0.9 70 86 27 0.6 5.0 5.2 8 18
10 7.3 0.6 37 81 17 0.9 3.1 5.2 7 1511 7.4 0.7 126 122 21 0.6 3.5 5.3 11 1912 7.6 0.6 110 107 17 0.7 4.6 6.1 11 2213 7.3 0.5 95 127 44 0.5 7.4 5.9 7 2114 7.2 0.9 55 60 20 0.5 3.3 2.9 5 1115 7.3 0.4 40 65 12 0.7 5.4 4.8 10 2016 7.4 2.5 87 113 19 0.4 7.2 4.0 12 2317 6.6 1.2 109 44 27 5.6 8.4 4.9 12 2518 6.0 13.3 51 88 6 1.8 5.7 5.6 11 2319 5.5 9.9 59 110 7 5.1 15.0 6.6 7 2920 6.5 8.0 41 101 4 3.2 2.5 4.7 7 1421 6.7 1.9 67 107 10 5.2 6.9 5.8 5 18
5.2 Sodium
Sodium was determined with the CaC 2 and EUF procedures only. As expected,the relation between the results obtained with the two procedures is very close,meaning that in both methods solely the readily exchangeable Na is extracted.From the values listed in the Tables 5 and 7 the following relation was calculated;
Na-CaC12 = 1.0 X Na-EUF - 12 (r = 0.993).
The relatively large negative intercept is due to Na contamination of glasscuvettes and filters of the EUF apparatus. The blank values, for which no correc-tions were made, accounted for the intercept value.
189
K-HCI (mg K kg1)
400 /0
00°0300o0
0
000250 0 00 0 00
050 0 00
2 0 00
200
0 0
15Q 0~e 0 0 D 00
07 cI "In n sandy soils n=40 r=0950
100 g 0 n K-Cot) 2 =091 ,,K-IItI-1,05
0 O
h"
{ f
1 3, _ o C la y s o ils , 44 . r = 0 67 6
50 13 K-CQ1 2 :031 . K-HCI 21,58
0 F
0 20 40 60 80 100 120 140 160 180 200 220K-CoI 2 (mg Kkg -1)
Fig. 1. Relation between extractable K with 0.1 MHCI (K-HCI) and 0.01 MCaCl2 (K-CaC]2 ).
K-EUF W"fmrcion (mg K kg-1)
250
200 0
non)
150 p0 005 n0o o o s a n d y s o i ls
100 (D o 0 oclao y soils
o 0 On oo n:84 r: 0932
50 K- CoCI, =077 K-EUF (1I fraction) . 1.6
00 20 40 60 80 100 120 140 160 180 200 220K-CoCI 2( mg K kg- )
Fig. 2. Relation between extractable K with EUF-P' fraction and 0.01 M CaCI2 (K-CaCl,).
190
K-HCI (rag K kg1
350"
0
300o 0
00250" 000 00
00
0
200" cZo sandy soils
150- o clay soils
0 0 n=84 r=0853
o/R 9 K-HG 1 i. K-EUF 1". 2' fcion - 19100- 0 o
50- /
50 100 150 200 250 300K- EUF ISt and 2 fraction (mg K kg- )
Fig. 3. Relation between extractable K with 0. 1 MHCI (K-Ha) and EUF-1" and 2nd frac-tion.
5.3 Magnesium
From the Tables 6 and 7 it can be seen that up to about 100 mg Mg per kg of air-drysoil almost equal amounts of Mg were extracted with 0.5 M NaCl (standard Dutchprocedure) and 0.01 M CaCI2. Above this value, CaCl2 extraction yielded lowervalues due to incomplete exchange. It is to be expected that the location of thisboundary value depends on the total CEC of the soil and on the percentage Ca sat-uration of the adsorption complex. Since for fertilizer advisory purposes on arableland only values up to about 50 mgkg-I Mg are of interest, the exchanging powerof0.01 MCaCI2 as used here is sufficient. Since Mg contents of the soils under investi-gation proved to be rather high, an additional series of 7 sandy soils with Mgcontents in the range of 10 to 40 mg kg- ', was analysed with the two methods. Theregression analysis of all results up to 100 mg kg- ' (extracted with NaCI) showedthatMg-CaC12 = 0.91 X Mg-NaCI + 2 (r = 0.976).
It is clear that both procedures are equally useful in predicting Mg-availability insoil.
191
The values obtained with EUF-extraction were consistently lower than those
obtained with NaCI. Regression analysis showed that:
Mg-EUF = 0.2 X Mg-NaCl + 21 (r = 0.770).
The rather poor relation between EUF- and NaCI values may be ascribed toanalytical difficulties encountered with the EUF-extraction method. During theEUF-extraction, magnesium hydroxides are formed on the cathode. This precipit-ate only partly dissolves in the corresponding filtrate, resulting in low values for Mgmeasured in the filtrate.
5.4 Phosphorus
Normally the P, value used for fertilizer recommendation in the Netherlands isexpressed in mg P20 5 per litre of air-dry soil. For the sake of comparison, however,all results for the different extraction procedures are given here in mg P per kg air-dry soil. P, was determined according to the Dutch procedure (Table 4). Thereafterthe density of the dry soil was determined and the values converted (Table 6).
Extractions with both water and 0.01 M CaCl 2 solution can roughly be consid-ered as yielding intensity parameters. However, the use of 0.01 M CaCI2 solutionleading to a pH lowering in the equilibrium suspension and the introduction of Caions into the system influence the solubility of Ca phosphates. Accordingly, whenthe absolute amounts of P extracted with the two procedures are compared, we findless P with 0.01 M CaCl2 than with water extraction. Since the processes leading tothe establishment of equilibria in CaCl2-extracts are different for calcareous andnon-calcareous soils, separate comparisons were made for these two groups ofsoils.
In Figures 4 and 5 the relations between the amounts extracted with 0.01 MCaCl2 and with water are displayed for all available values. In both cases acceptablecorrelations were found. The somewhat higher variability for the non-calcareoussoils is probably caused by the higher organic matter content of certain soils, intro-ducing additional uncertainties during the conversion from volume to weight forthe water extraction data.
With the EUF method two successive extractions were performed: first 30minutes at 20 °C, followed by 5 minutes at 80 °C. The first-fraction values and theratios of 1" and 2nd-fraction values are, together with other parameters, used forfertilizer recommendation purposes (Wiklicky and Ndmeth [1981).
In Figure 6 the summed values are shown in relation to the values found forwater-extractable phosphorus. A reasonably linear correlation between the twosets of data was found. From the regression relation it further follows that with EUFabout 2.4 times more phosphorus is extracted than with water. In both methods theextraction ratio is comparable so that the values expressed per kg of soil should notdiffer too much.
192

The regression analysis pertaining to the first fraction of EUF leads to:
P-EUF (11 fraction) = 1.2 X P, - 2.5 r = 0.912 (n = 84).
It follows that roughly equal amounts are extracted with both methods, indicat-ing that with these methods similar intensity parameters are obtained. If we take thesecond fraction of P-EUJF separately, the same conclusion can obviously be drawn,on the basis of the following equation:
P-EUF ( 2nd fraction) = 1.1 X P, - 1.5 r = 0.862 (n = 84).
It appears that EUF-extractable P is just double the quantity obtained as intens-ity parameter. Thus, little additional information is obtained with an extendedextraction procedure at 80 OC.
P, (mg P kg-)30-
calcareous soils
20-00
0//0 00
0 C
10 cZ n=37
r= 0.956/ P-CaCl2 = 0.14 " P -0.52
P- CC C[2 (mg P kg1 )Fig. 4. Relation between extractable P with water (P,) and 0.01 MCaCI2 (P-CaC 2) in cal-
careous soils.
193
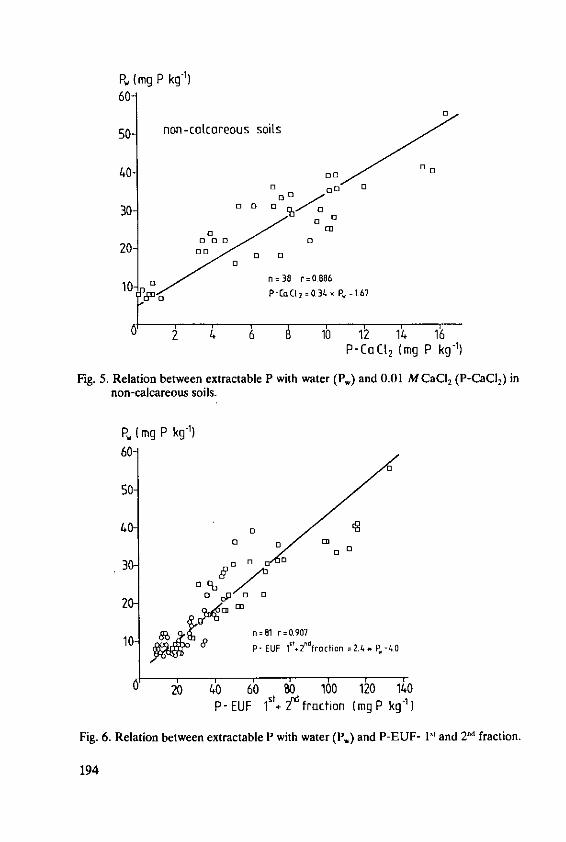
P (mg P kgI )
60-n
50- non-cocareous soits
40 " 00
00 0
30- 0 0
200
AD n=38 r=O08610 Pr P-CI2 =0 34 x P,-167
0 2 4 6 8 1 1 14 16P-CoC 2 (Mg P kg - )
Fig. 5. Relation between extractable P with water (P.) and 0.01 MCaCl2 (P-CaC] 2) innon-calcareous soils.
P (mg P kg- 1)
60
50-
~0 01 0300
20-/ 0 n-81 r=0.907
10- P P" EUF 1".2"fr;hon =2.4. P-40
0 2 40 60 &b 16o 1"014oP- EUF 1St, 26 froction (mg P kg -1)
Fig. 6. Relation between extractable P with water (P,) and P-EUF- 1 t and 2nd fraction.
194

3.5 Nitrogen
The current fertilizer advisory scheme used in the Netherlands is based on levels ofinorganic N forms extractable from fresh soil material sampled to a depth of about1 meter. Such deviating sampling conditions make a comparison of resultsobtained with the various methods rather meaningless.
Next to the inorganic ions NO 3 and NH4+, an additional mobile organic-N
fraction is extracted with the EUF procedure, which fraction is claimed to make anadditional contribution to a proper assessment of N-availability in soils (Ndmeth,[1985]).
A comparison of the EUF-total N values of the first fraction with those of totalsoluble N in 0.01 M CaC12 extracts (Tables 5 and 7) leads to the following relation:
Total-N (CaCI2) = 0.99 X EUF-total N (11t fraction) -2.5 (r = 0.82).
The conclusion can be drawn that virtually identical fractions of soil nitrogen,i.e. N0 3-N and soluble organic N are determined with both methods. This conclu-sion is further supported by a comparison of the N0 3 -values only:
N0 3-N (CaC12) = 1.1 X N0 3-N (EUF) -1 (r = 0.96).
It should be pointed out that the EUF values are poorly reproducible. The valuesof the total EUF-N shown in Table5 are the means of 8-16 replicates, for which thecoefficient of variation varied from 8 to 63%. Especially in clay soils the variabilitywas large. The corresponding coefficients of variation in the CaC12-procedure var-ied from 4 to 25% based upon 4 replicates.
The quantity of nitrogen recovered in the second EUF fraction was not consid-ered here, as if falls within the experimental error range and therefore supplies noadditional information. One of the causes of excessive variability encountered withthe EUF-method could be contamination occurring in filters, and furthermoreanalytical uncertainties in the determination of soluble organic N. The contamina-tion was avoided in the CaC12-procedure by centrifugation. Such a contaminationwas probably also the reason behind an absence of correlation between NH,-Nvalues found with the two methods, contrary to the expectation based upon thegood correlation found in the cases of potassium and sodium.
6. Conclusions
1. In our opinion, theoretical models intended to describe the behaviour of K in amulti-variate exchanger system, such as a soil, cannot yet serve as useful tools formaking K-fertilizer recommendations.
195
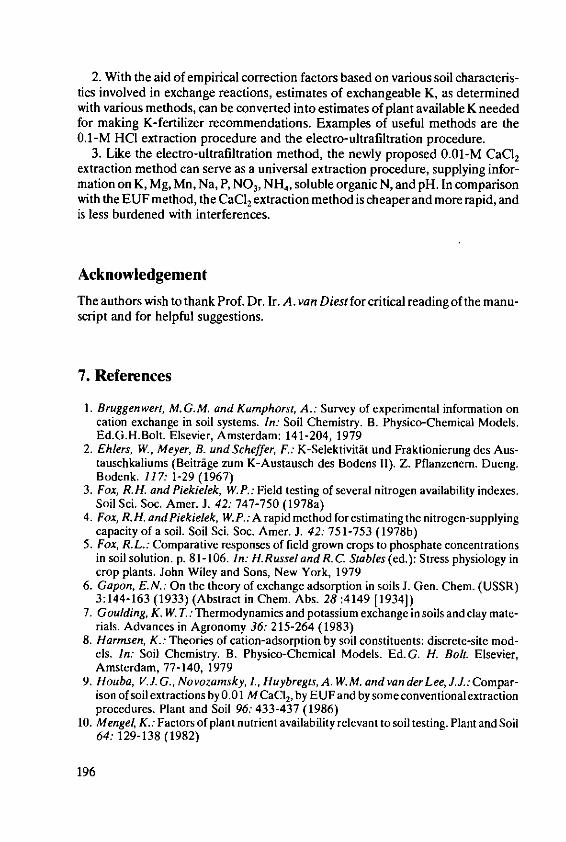
2. With the aid of empirical correction factors based on various soil characteris-tics involved in exchange reactions, estimates of exchangeable K, as determinedwith various methods, can be converted into estimates of plant available K neededfor making K-fertilizer recommendations. Examples of useful methods are the0.1-M HCI extraction procedure and the electro-ultrafiltration procedure.
3. Like the electro-ultrafiltration method, the newly proposed 0.01-M CaCI2extraction method can serve as a universal extraction procedure, supplying infor-mation on K, Mg, Mn, Na, P, NO 3, NH 4 , soluble organic N, and pH. In comparisonwith the EUF method, the CaC12 extraction method is cheaper and more rapid, andis less burdened with interferences.
AcknowledgementThe authors wish to thank Prof. Dr. Ir. A. van Diest for critical reading of the manu-script and for helpful suggestions.
7. References
I. Bruggen wert, M. G. M. and Kamphorst, A.: Survey of experimental information oncation exchange in soil systems. In: Soil Chemistry. B. Physico-Chemical Models.Ed.G.H.Bolt. Elsevier, Amsterdam: 141-204, 1979
2. Ehlers, W., Meyer, B. und Scheffer, F.: K-SelektivitAt und Fraktionierung des Aus-tauschkaliums (Beitrige zum K-Austausch des Bodens II). Z. Pflanzenern. Dueng.Bodenk. 117: 1-29 (1967)
3. Fox, R.H. and Piekielek, W.P.: Field testing of several nitrogen availability indexes.Soil Sci. Soc. Amer. J. 42: 747-750 (1978a)
4. Fox, R.H. and Piekielek, W.P.: A rapid method for estimating the nitrogen-supplyingcapacity of a soil. Soil Sci. Soc. Amer. J. 42: 751-753 (1978b)
5. Fox, R.L.: Comparative responses of field grown crops to phosphate concentrationsin soil solution. p. 81-106. In: H.Russel and R. C Stables (ed.): Stress physiology incrop plants. John Wiley and Sons, New York, 1979
6. Gapon, E.N.: On the theory of exchange adsorption in soils J. Gen. Chem. (USSR)3:144-163 (1933) (Abstract in Chem. Abs. 28:4149 [1934])
7. Goulding, K. W. T.: Thermodynamics and potassium exchange in soils and clay mate-rials. Advances in Agronomy 36: 215-264 (1983)
8. Harmsen, K.: Theories of cation-adsorption by soil constituents: discrete-site mod-els. In: Soil Chemistry. B. Physico-Chemical Models. Ed. G. H. Bolt. Elsevier,Amsterdam, 77-140, 1979
9. Houba, V.J. G., Novozamsky, L, Huybregts, A. W.M. and van der Lee, J.J.: Compar-ison of soil extractions by 0.01 M CaC 2, by EUF and by some conventional extractionprocedures. Plant and Soil 96: 433-437 (1986)
10. Mengel, K.: Factors of plant nutrient availability relevant to soil testing. Plant and Soil64: 129-138 (1982)
196

11. Nemeth, K.: Bodenuntersuchung mittels Elektro-Ultrafiltration (EUF) mit mehrfachvarierter Spannung. Landw. Forsch. Sonderh. 27/11 184-196 (1972)
12. Ndmeth, K.: The availability of nutrients in the soil as determined by Electro-Ultrafil-tration (EUF). Adv. Agron. 31: 155-188 (1979)
13. Nemeth, K.: Electro-Ultrafiltration with varying voltage and temperature during theextraction process. Proc. of the Int. Symp. on the Application of Electro-Ultrafiltra-tion in the Agricultural Production. Budapest, Hungary, 17-57, 1980
14. Nemeth, K.: Recent advances in EUF research (1980-1983). Plant and Soil 83:1-19(1985)
15. Page, A.L., Miller, R.H. andKeeney, D.R. (editors): Methods of SoilAnalysis. Part 2:Chemical and microbiological properties. Second Edition. Amer. Soc. of Agron. Inc.Madison, Wisconsin U.S.A., 1982
16. Pavan, M.A., Bingham, F. T. and Pratt, P.F.: Toxicity of aluminum to coffee in Ulti-sols and Oxisols amended with CaCO, MgCO3 and CaSO,• 2H2O. Soil Sci. Soc.Amer. J. 46:1201-1207 (1982)
17. Riemsdik, W.H. van, Bolt, G.H., Koopal, L.K. and Blaakmeer, J.: Electrolyteadsorption on heterogeneous surfaces: Adsorption Models. J.Colloid Interface Sci.109: 219-228 (1986)
18. Schachtschabel, P. von: Das pflanzenverffigbare Magnesium des Bodens und seineBestimmung. Z. Pflanzenern. Dueng. Bodenk. 67: 9-23 (1954)
19. Smith, S. andStanford, G: Evaluation of a chemical index of soil nitrogen availabil-ity. Soil Sci. 111:228-232 (1971)
20. Stanford, G.: Extractable organic nitrogen and nitrogen mineralization in soils. SoilSci. 106: 345-351 (1968)
21. Stanford, G. and DeMar, W. H.: Extraction of soil organic nitrogen by autoclaving inwater I. The NaOH-distillable fraction as an index of soil nitrogen availability. Soil Sci.107: 203-205 (1969)
22. Stanford, G. and DeMar, W. H.: Extraction of soil organic nitrogen by autoclaving inwater II. Diffusible ammonia, an index of soil nitrogen availability. Soil Sci. 109: 190-196 (1970)
23. Stanford, G. andSmith, 3J.: Estimating potentially mineralizable soil nitrogen from achemical index of soil nitrogen availability. Soil Sci. 122: 71-76 (1976)
24. Vries, 0. deand Dechering, F.J.A.: Grondonderzoek. Uitgeverij Ceres. Meppel. TheNetherlands, 1960
25. Wiklicky, L. und Nemeth, K.: Dfingungsoptimierung mittels EUF-Bodenuntersu-chung bei der Zuckerrilbe. Zuckerind. 106: 982-988 (1981)
26. Woodruff, CM.: Brome cresol purple as an indicator of soil pH. Soil Sci. 91: 272.(1961)
197
Translation of Laboratory K-Data intoK Fertilizer Recommendations
P. Villemin. Research Centre, S.C.P.A., Aspach-le-Bas/France*
Summary
Following a review of present methods for interpreting soil analysis, the methods now usedat the Aspach Research Centre are explained. While exchangeable K does not fullydescribe the K supplying power of a soil, the inclusion of modifying factors reduces uncer-tainty in the relation between soil potential as indicated by response to K fertilizer and soilanalysis results. Such factors are estimates of those forms of potassium which are notexchangeable but which contribute to the nutrition of plants. Fertilizer advice so derived isthen described as well as the consequences of such a philosophy for field experimentation.
1. Introduction
Though the effects of fertilizer nutrients were discovered over a century ago thefirst attempts, in Anglo-Saxon countries [20, 31] or in France [3, 241 alike, atrational fertilizer advice were not made until the period 1940-1960.
This paper is limited to potassium and by reference to recent reviews discussesquestions of the interpretation of soil analysis with reference to three points of cur-rent interest:
- K saturation of the cation exchange capacity,- the desired level of K,- Compensation for crop removals.
Each of these will be considered individually and in combination with one or boththe others 113, 16, 17, 20, 29].- K saturation of the CEC is very widely used for diagnostic purposes. It is basedon the concept of an ideal soil in which the cations are present in ideal proportions.One serious defect of this approach is that it has to be significantly modified in rela-tion to soil type, in particular as between calcareous and non-calcareous soils.- Definition of a desirable soil K level originated in van der Paauw's 133] workconfirmed by Barbier [4, 32]. They stressed the concept of residual value which
* Dr. P Villemin, Centre de Recherches SCPA, Aspach-le-Bas, F-68700 Cemay/ France
199

was indicated in interaction between newly applied fertilizer and the effect of soilenrichment by historical dressings.
"On a soil well provided with a nutrient (e.g. phosphorus orpotassium) moderate dressings of a fertilizer will produceresults superior to those given by much more generous dress-ings on a soil without residues.
- The careful replacement of K removed in crops is based on the idea that avoid-ance of running down the soil reserve of a nutrient will ensure that it will function asa reserve buffer throughout the growing period.
The SCPA has integrated these three ideas in a general concept of rational ferti-lization which uses soil analysis with regional information pertaining to the site, soiltype and cropping objectives.
2. A basis for interpretation
Description of the nutrient supplying power of the soil is based on one or moreanalytical determinations. Necessary basic data are provided:
- first by field experimentation investigating response curves,- second, by soil analysis: for potassium, exchangeable K content, % saturation
of the CEC, clay content etc.
2.1 Expression of results
Soil K levels are plotted against indices of K response 124, 30] (Figure 1). Theresponse index is given by:
Yield at Kx - Yield at K.'R =Yield at K .
This is easily translated into economic terms.It is best only to include in the figure positive or nil responses on the assumption
that negative responses are not caused by depressive effects of the nutrient undertest but by negative interaction, e.g. too little N fertilizer or deficiency in Mg orsome other nutrient.
2.2 Reduction of data
In order to eliminate some of the variability it is advisable to set up soil K classeswithin which the frequency of response FR (ratio of responsive situations to thetotal) can be calculated (Figure 1). FR is then plotted as ordinate against the mid-
200
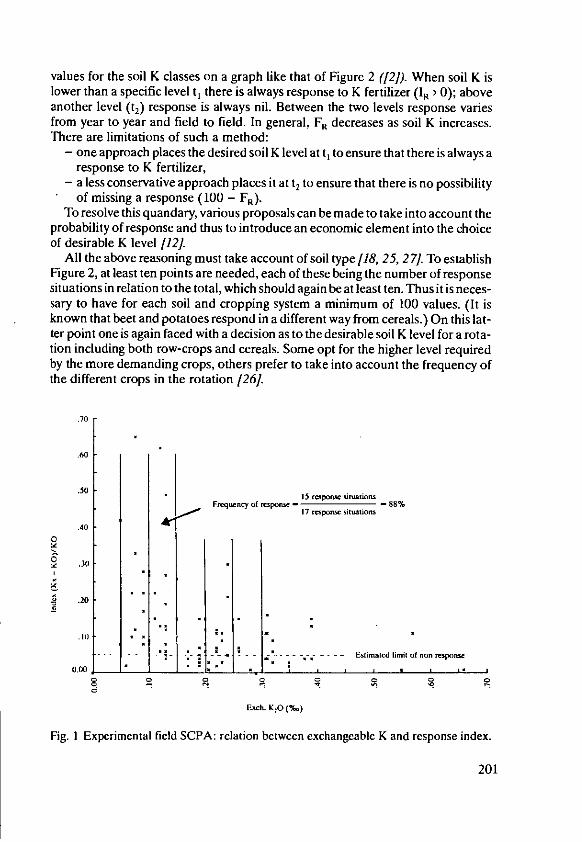
values for the soil K classes on a graph like that of Figure 2 (12]). When soil K islower than a specific level t, there is always response to K fertilizer (R ) 0); aboveanother level (t2) response is always nil. Between the two levels response variesfrom year to year and field to field. In general, FR decreases as soil K increases.There are limitations of such a method:
- one approach places the desired soil K level at t, to ensure that there is always aresponse to K fertilizer,
- a less conservative approach places it at t2 to ensure that there is no possibilityof missing a response (100 - FR).
To resolve this quandary, various proposals can be made to take into account theprobability of response and thus to introduce an economic element into the choiceof desirable K level 112].
All the above reasoning must take account of soil type 118, 25, 27]. To establishFigure 2, at least ten points are needed, each of these being the number of responsesituations in relation to the total, which should again be at least ten. Thus it is neces-sary to have for each soil and cropping system a minimum of 100 values. (It isknown that beet and potatoes respond in a different way from cereals.) On this lat-ter point one is again faced with a decision as to the desirable soil K level for a rota-tion including both row-crops and cereals. Some opt for the higher level requiredby the more demanding crops, others prefer to take into account the frequency ofthe different crops in the rotation [26].
.70
.50 • 15 response situationsFrequency of respons - 88%J 17 response situations
.400
.30
, .20
.. ..-- - - - -- - - - - - - - Estinatcd limit of non respose0.00 ___________________I __________ I_____ i
Exch. KO (%s)
Fig. I Experimental field SCPA: relation between exchangeable K and response index.
201
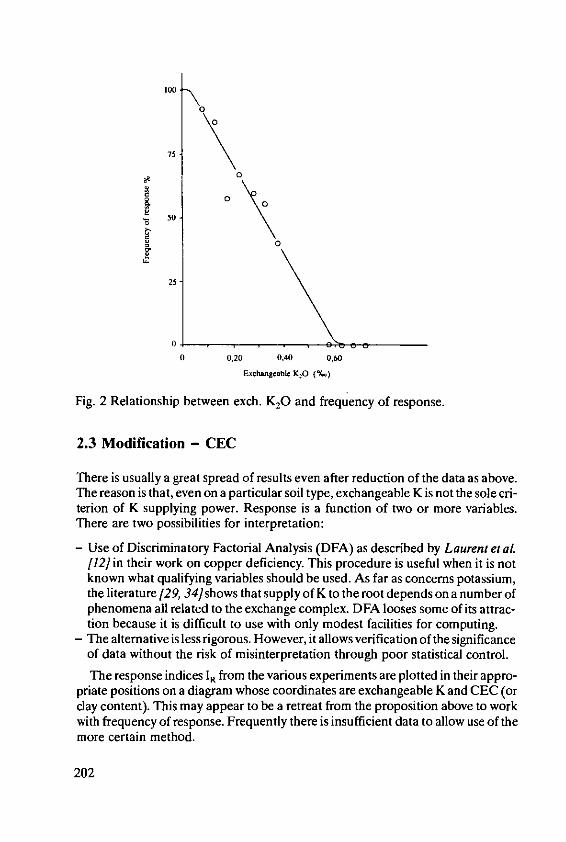
100 _0
75
e 0
25
0
0 0,20 0,40 0,60
Exchangcabic K.O (%)
Fig. 2 Relationship between exch. K20 and frequency of response.
2.3 Modification - CEC
There is usually a great spread of results even after reduction of the data as above.The reason is that, even on a particular soil type, exchangeable K is not the sole cri-terion of K supplying power. Response is a function of two or more variables.There are two possibilities for interpretation:
- Use of Discriminatory Factorial Analysis (DFA) as described by Laurent e al.[12] in their work on copper deficiency. This procedure is useful when it is notknown what qualifying variables should be used. As far as concerns potassium,the literature [29, 34] shows that supply of K to the root depends on a number ofphenomena all related to the exchange complex. DFA looses some of its attrac-tion because it is difficult to use with only modest facilities for computing.
- The alternative is less rigorous. However, it allows verification of the significanceof data without the risk of misinterpretation through poor statistical control.
The response indices 1R from the various experiments are plotted in their appro-priate positions on a diagram whose coordinates are exchangeable K and CEC (orclay content). This may appear to be a retreat from the proposition above to workwith frequency of response. Frequently there is insufficient data to allow use of themore certain method.
202
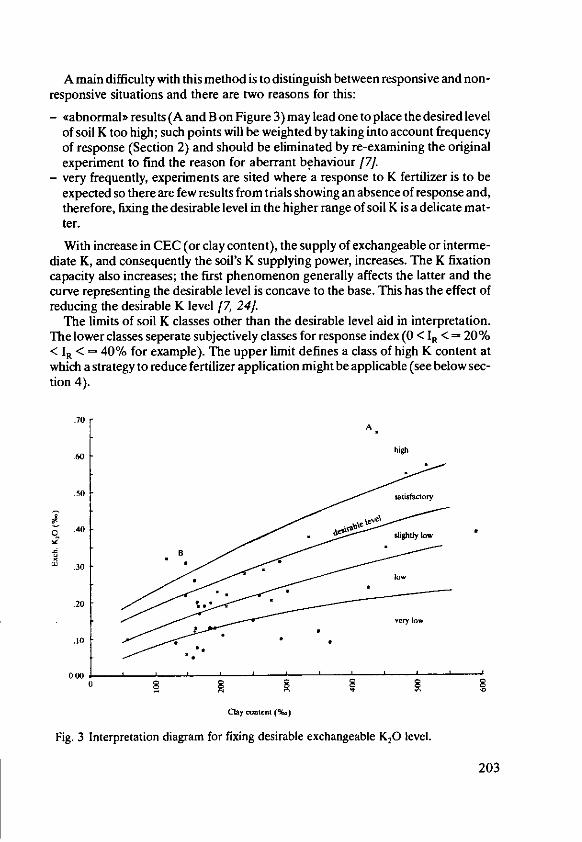
A main difficulty with this method is to distinguish between responsive and non-responsive situations and there are two reasons for this:
- 4abnormal, results (A and B on Figure 3) may lead one to place the desired levelof soil K too high; such points will be weighted by taking into account frequencyof response (Section 2) and should be eliminated by re-examining the originalexperiment to find the reason for aberrant behaviour [7].
- very frequently, experiments are sited where a response to K fertilizer is to beexpected so there are few results from trials showing an absence of response and,therefore, fixing the desirable level in the higher range of soil K is a delicate mat-ter.
With increase in CEC (or clay content), the supply of exchangeable or interme-diate K, and consequently the soil's K supplying power, increases. The K fixationcapacity also increases; the first phenomenon generally affects the latter and thecurve representing the desirable level is concave to the base. This has the effect ofreducing the desirable K level [7, 241.
The limits of soil K classes other than the desirable level aid in interpretation.The lower classes seperate subjectively classes for response index (0 < IR < = 20%< IR < = 40% for example). The upper limit defines a class of high K content atwhich a strategy to reduce fertilizer application might be applicable (see below sec-tion 4).
.70A
60 high
.50
.40
In 30
.20
¥ 1
loww
0
Clay contcnt (%*)
Fig. 3 Interpretation diagram for fixing desirable exchangeable K20 level.
203
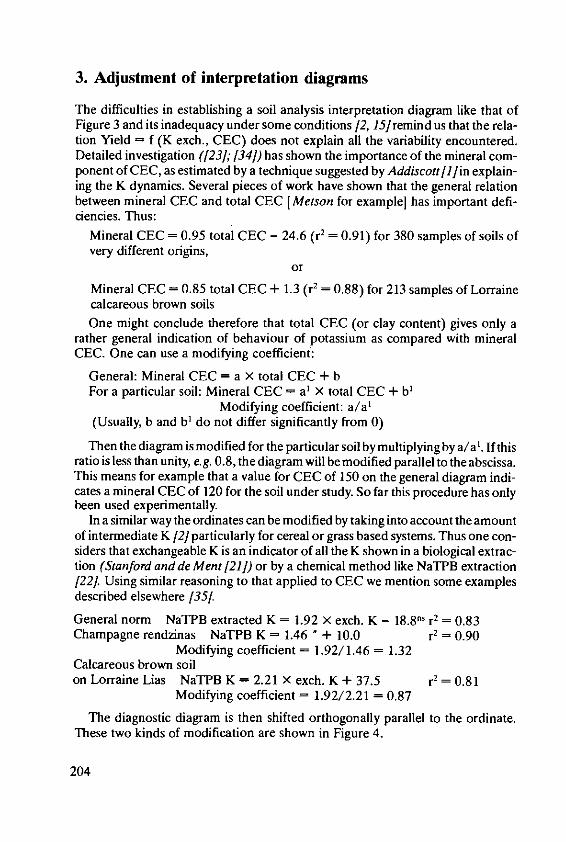
3. Adjustment of interpretation diagrams
The difficulties in establishing a soil analysis interpretation diagram like that ofFigure 3 and its inadequacy under some conditions 12, 15] remind us that the rela-tion Yield = f (K exch., CEC) does not explain all the variability encountered.Detailed investigation (123]; 134]) has shown the importance of the mineral com-ponent of CEC, as estimated by a technique suggested by Addiscott[i]in explain-ing the K dynamics. Several pieces of work have shown that the general relationbetween mineral CEC and total CEC [ Metson for example] has important defi-ciencies. Thus:
Mineral CEC = 0.95 total CEC - 24.6 (r' = 0.91) for 380 samples of soils ofvery different origins,
or
Mineral CEC = 0.85 total CEC + 1.3 (r2 = 0.88) for 213 samples of Lorraine
calcareous brown soilsOne might conclude therefore that total CEC (or clay content) gives only a
rather general indication of behaviour of potassium as compared with mineralCEC. One can use a modifying coefficient:
General: Mineral CEC = a X total CEC + bFor a particular soil: Mineral CEC = a' X total CEC + b'
Modifying coefficient: a/a'(Usually, b and b1 do not differ significantly from 0)
Then the diagram is modified for the particular soil by multiplying by a/a'. If thisratio is less than unity, e.g. 0.8, the diagram will be modified parallel to the abscissa.This means for example that a value for CEC of 150 on the general diagram indi-cates a mineral CEC of 120 for the soil under study. So far this procedure has onlybeen used experimentally.
In a similar way the ordinates can be modified by taking into account the amountof intermediate K [2] particularly for cereal or grass based systems. Thus one con-siders that exchangeable K is an indicator of all the K shown in a biological extrac-tion (Stanford and de Mert [21]) or by a chemical method like NaTPB extraction[221. Using similar reasoning to that applied to CEC we mention some examplesdescribed elsewhere [351.
General norm NaTPB extracted K = 1.92 X exch. K - 18.8 n' r2 = 0.83
Champagne rendzinas NaTPB K = 1.46 ' + 10.0 r2 = 0.90Modifying coefficient = 1.92/1.46 = 1.32
Calcareous brown soilon Lorraine Lias NaTPB K = 2.21 X exch. K + 37.5 r2 = 0.81
Modifying coefficient = 1.92/2.21 = 0.87
The diagnostic diagram is then shifted orthogonally parallel to the ordinate.These two kinds of modification are shown in Figure 4.
204
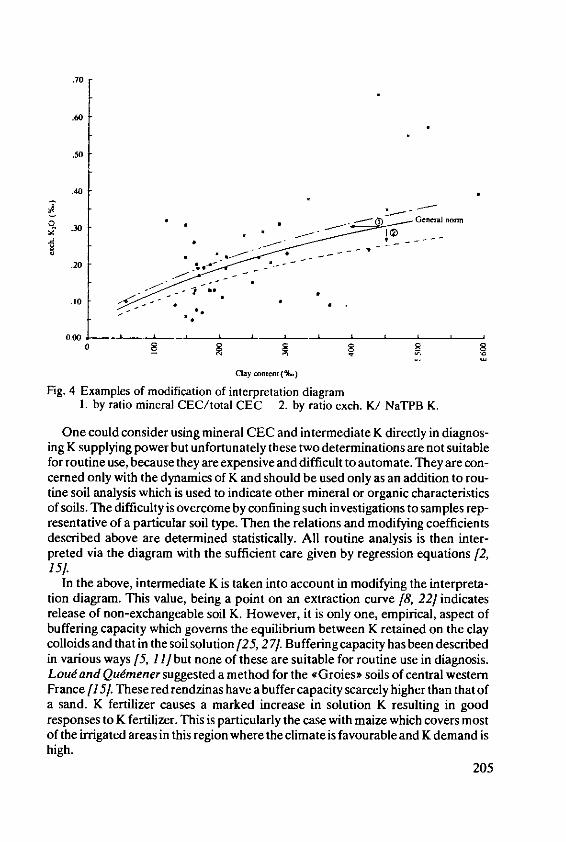
.70
.60
.50
.40
.10
0 F
Clay conientl(%.)
Fig. 4 Examples of modification of interpretation diagram1. by ratio mineral CEC/total CEC 2. by ratio exch. K/ NaTPB K.
One could consider using mineral CEC and intermediate K directly in diagnos-ing K supplying power but unfortunately these two determinations are not suitablefor routine use, because they are expensive and difficult to automate. They are con-cerned only with the dynamics of K and should be used only as an addition to rou-tine soil analysis which is used to indicate other mineral or organic characteristicsof soils. The difficulty is overcome by confining such investigations to samples rep-resentative of a particular soil type. Then the relations and modifying coefficientsdescribed above are determined statistically. All routine analysis is then inter-preted via the diagram with the sufficient care given by regression equations [2,1S].
In the above, intermediate K is taken into account in modifying the interpreta-tion diagram. This value, being a point on an extraction curve [8, 22] indicatesrelease of non-exchangeable soil K. However, it is only one, empirical, aspect ofbuffering capacity which governs the equilibrium between K retained on the claycolloids and that in the soil solution [25, 27]. Buffering capacity has been describedin various ways [5, 11] but none of these are suitable for routine use in diagnosis.Loud and Qudmener suggested a method for the vG roies soils of central westernFrance /151. These red rendzinas have a buffer capacity scarcely higher than that ofa sand. K fertilizer causes a marked increase in solution K resulting in goodresponses to K fertilizer. This is particularly the case with maize which covers mostof the irrigated areas in this region where the climate is favourable and K demand ishigh.
205
4. Fertilizer advice
This has been described in detail elsewhere [7, 9, 35] and only the main points arementioned here.
When soil K is above the critical level it should receive fertilizer to replace thevarious losses: removal in crop, fixation and leaching:
- Crop removal: this is the product of estimated K content, on a regional basis, withthe target yield in the light of local potential and technical competence of thefarmer.
- Leaching: this is measured for each soil by lysimeter studies or estimated fromthe granulometric composition. It depends greatly on rainfall distribution and ismodified on a regional basis.
- Fixation: Pot studies at Aspach have shown that in the course of a cycle wherethe balance (fertilizer applied - crop removal) is zero, the balance indicated byexchangeable K is negative [23]. In other words, that part of fertilizer K fixed isnot re-utilised by the crop within its growth period; the plant uses preferentiallythe exchangeable portion and the rest is accounted for as intermediate K. In cal-culating fertilizer need it is necessary to take this into account; it is expressed as apercentage. Fixation at these levels of soil K often varies between 10 and 20% ofmaximum uptake by the plant. Precise estimation is made in pot trials or throughfield experiments on different soil types.
In the special case where the indicated soil K level is high, fixation is negligibleand K fertilizer application can be reduced by 30%, i.e. omitting K fertilizer forone year in three.
When soil K is below the desired level, corrective measures are called for. Cor-rective requirement is calculated as follows:
Corrective dressing = Difference between soil K determined anddesirable levelXmass of soil in which the application will bedilutedxFixation coefficient
The soil mass depends on soil type and rooting depth and is approximates toplough depth.
The fixation coefficient defines the supplementary fertilizer needed to obtainthe desired enrichment, taking into account fixation. For potassium at least this isgenerally proportional to the rate applied and is expressed as a percentage thereof.For example a soil fixing 35% retains 35% of applied K in the intermediate form,65 % remaining exchangeable [23, 28].
206
5. Consequences for experimentation
The use of norms such as we have described for the interpretation of soil analysisdefines the necessary experimental approach. Here we shall only present an outlineof the relation between experimentation and regional enquiry.
Before deciding to embark on a long term experiment it is necessary to definethe objective in terms of soil and cultural system. The enquiry should follow thecourse outlined:
- Examination of the bank of soil analytical data for the region. If this is insuffi-cient, analysis of sufficient soil samples to represent the region.
- Description of data (statistical basis, histograms ....) from which the 'modal> soilcan be described. This will serve as a reference for the detailed studies which fol-low and can be used to identify the soil type [34, 36].
- Investigation in detail of K dynamics in representative soil samples: intermedi-ate K, K fixation, mineral CEC, 0/I curves, diffusion ...
- Statistical determination of regression equations to estimate elements of Kdynamics mentioned above from routine analyses.
At this stage of the work it is possible:
- To place the soil with regard to the general interpretation of soil analysis and socalculate the required modifications as described above (section 3).
- To define one or more sites representative of the soil type for experimentation.Field experiments investigate crop response to applied nutrients at different
levels of soil enrichment and/or response to increasing rates of K fertilizer.There are two ways of going about things. One approach is to set up, by applying
differential K dressings, different levels of soil K and to compare crop response toincreasing dressings of K on the variously enriched soils. This will indicate the criti-cal level of soil K and will measure the value of residual K in the soil. The other, is toproceed directly to investigation in detail of crop response. If the experiment runsover a lengthy period, there will be a cumulative effect of K dressings applied topreceding crops. Account should be kept of the K balance and this with annual soilanalysis will also indicate the level of soil K which should be aimed for.
Details of the methods used are available elsewhere [6, 19, 27] and an up-to-date summary is in course of preparation, so they will not be discussed here. Sufficeit to say that all factors should be controlled in such a way that the aim of the experi-ment will be realisable. Among other things it is important that:- N fertilizer should be sufficiently high and soil magnesium at an adequate level,
N × K and Mg X K interactions being considerable.- There should be sufficient replication to allow proper statistical treatment.
207

6. Conclusion
Rational fertilizer use is one of the essential requirements for the improvement of
crop productivity. Too high rates increase costs and may result in nutrient disequi-
librium to the detriment of yield. Too low rates makes it impossible to realise the
full potential of the soil - cultural technique - crop combination.Methods of interpreting existing methods of soil analysis as indicating soil fertil-
ity have been discussed. The current philosophy of the Aspach Research Centre is
based on identifying a desirable level of exchangeable K in relation to cation
exchange capacity (or clay content) at a degree of saturation of the CEC. The
resulting advice allows for replacement of crop removals plus a correction to bring
the soil to the desired K level.Further efforts must be made in the future to continue or develop experimenta-
tion to verify the effect of the numerous factors which influence the interpretation
of soil analysis.
7. References
1. Addiscott, T.M.: A note on resolving soil cation exchange capacity into C mineralh and.organic* fractions. J. Agric. Sci. Camb. 75, 365-367 (1970)
2. Balland, D. and Qunener, J.: Comment mettre au point des normes d'interpreta-tion? Exemple du Sud-Ouest. Forum Fertilisation, Atelier 2, Comifer, 1982
3. Barbier, G.: Lois d'action des 6l6ments fertilisants. Techniques Agricoles 1, Fasc.1200 (1960)
4. Barbier, G. and Trocmd, S.: La fumure potassique. Bulletin des CETA, Etude no 580,Avril (1962)
5. Becken, K.: Ca exchange equilibria in soils. Specific adsorption sites for K. Soil Sci. 97(6) 367-383 (1964)
6. Bureau d'EtudeStatistiques ITCF: L'6laboration d'un protocole d'essai. Propositiond'un plan-type et quelques commentaires. Boigneville 91720 Maisse
7. Calvet, G. and Villemin, P.: Interpr6tation des analyses de terre IPAS. Centre deRecherches SCPA. Aspach Ic Bas F-68700 Cernay, 1986
8. Colin, R.: Comparaison entre sels de sodium et m6thodes biologiques pour 'estima-tion de formes de potassium en sols cultiv~s. These pr~sent6e la Facult6 des Sciencesde I'Universit6 de Nancy 1, 1972
9. Collin, D., Villemin., Qudnener, J. and Bornard, J.C. Interprdtation personnalis6ed'analyses de sols (IPAS) par Viddotex. Convention Information SICOB, 20 Septem-bre, 1985
10. Cope, . T. and Evans, C.E.: Soil Testing. Advances in Soil Science, Vol. 1 (1985)11. Goulding, K. W. T.: Thermodynamics and K exchange in soils and clay minerals. Adv-
ances in Agronomy 34, 215-264 (1983)12. Laurent, F., Taureau, J.C., Thevenet, G. and Bregeon, F.: M~thodotogie pour un
diagnostic des situations carencdes en cuivre. Perspectives Agricoles n" 11, F~vrier(1986)
208

13. Liebhardt, W.C.: The basic cation saturation ratio concept and lime and potassiumrecommendations on Delaware's coastal plan soils. Soil Sci. Soc. of Am. Journal 45,n0 3 (1981)
14. L ou, A.: Interaction du potassium avec d'autres facteurs de croissance. SCPA, Dos-sier K20 n0 15, Octobre (1979)
15. Loutf, A. and Qudmener, J.: Le potassium en terre de Groies. Brochure SCPA, 198216. McLean, E. 0. and Carbonell, M. D.: Calcium, magnesium and potassium saturation
ratios in two soils and their effects upon yields and nutrient contents of german milletand alfalfa. Soil Sci. Soc. Amer. Proc. 36 (1972)
17. McLean, E. 0., Harwig, R. C., Eckert, D.J. and Triplett, G. B.: Basic cation saturationratios as a basis for fertilizing and liming agronomic crops. II. Field studies. AgronomyJournal 75, July-August (1983)
18. Marot, J.M., Villemin, P., Dufey, J.E. and Qutmener, J.: Dynamique du potassium etproprietes ptdologiques des terres agricoles du Luxembourg Beige. Revue de l'Agri-culture Vol. 37, no 6, Nov. D6c. p. 1443 (Belgique) (1984)
19. Minist&re de 'Agriculture: Les essais de fertilisation de longue durde. Leur place dansla relance de l'agronomie. Mars, 1985
20. Olson, R.A., Frank, K.D., Grabouski, P.H. and Rehm, G. W.: Economic and agron-omic impacts of varied philosophies of soil testing. Agronomy Journal 74, May-June(1982)
21. Qutmener, J. and Rolland, D.: Application de ]a technique de Stanford et de Ment il'extraction du potassium des sols. Ann. Agron. 21 (6), 819-844 (1970)
22. Qudmener, J.: The use of reagents containing sodium Tetraphenylboron for theextraction of soil potassium: applications to the study of fertility problems. Proc. 10 th
Congr. Int. Potash Inst. Budapest (1974)23. Qudmener, J.: Analyse du potassium dans les sols. Dossier K20 SCPA - Centre de
Recherches d'Aspach le Bas F-68700 Cemay, 1976; 1978, en anglais: The measure-ment of soil potassium I.P.I. Res. Top. n0 4, 48 pp. (1978)
24. Quc'mener, J.: Le conseil de fumure potassique tir6 de l'analyse de sol A la SCPA. Dos-sier K2O n0 6, Novembre (1976)
25. Quimener, J.: Les 6tats du potassium dans le sol et consequences sur l'alimentationdes plantes. C.R. Acad. Agri. de France n° 11 pp. 1377-1392 (1984)
26. Qudmener, J., Bornard, J.C and Villemin, P.: Informatique et regionalisation ducommentaire d'analyse de sol. C.R. Acad. Agri. de France, 71, no 4, pp. 403-412,Seance du 6 Mars (1985)
27. Querener, J.: Compl6mentarit6 de l'exptrimentation et des 6tudes de la dynamiquedu potassium pour ]a r6gionalisation du commentaire d'analyse de sol. C.R. Ac. Agr.France, 71, n0 4, pp. 389-401, S6ance du 6 Mars (1985)
28. Qutmener, J.: A paraitre - La fixation du potassium. 1. Sa mesure par la m6thode vander Marel; relations avec diffdrentes caracteristiques des sols
29. Qutmener, J.: Important factors in potassium balance sheets. 13t1 Congr. Int. PotashInstitute, Reims 25-28 Aoit (1986)
30. Robert, B., Cate, J.R. and Larry A., Nelson: A simple statistical procedure for parti-tioning soil test correlation data into two classes. Soil Sci. Amer. Proc., 35 pp. 658-660 (1971)
31. Roger H., Bray: Soil-plant relations: 1. The quantative relation for exchangeablepotassium to crop yields and to crop response to potash additions. Soil Science 58(1944)
209

32. Trocmd, S. and Barbier, G.: Influence du 'vieuxn et du .jeune potassium sur lateneur en sucre des betteraves. 8 th Congr. Int. Potash Inst., Bern (1966)
33. van der Paauw, F.: Evaluation of methodsof soil testingbyfield experiments. Ass. Int.Sci. Sol. Dublin, 1952
34. Villemin, P. and Qudmener, J.: Dynamique du potassium et fertilisation potassiquedes terres de craies. 1. Dynamique du potassium. c Dossiers Agronomique d'Aspach leBas, n0 1 (1986)
35. Villemin, P., Qudmener, J., Bornard, J. C. and Collin, D.: IPAS - Logiciel d'interpr6-tation personnalis6e des analyses de sols. Annales de Gembloux, 92, 1-12 (Belgique)(1986)
36. Villemin, P.: Classification automatique des formations superficielles en vue de I'm-terpr6tation de I'analyse de terre. A paraitre dans les Dossiers Agronomiquesd'Aspach le Bas (1987)
210

Coordinator's report on the2nd working session
A. van Diest, Dept. of Soil Science and Plant Nutrition, Agricultural Univer-sity, Wageningen/Netherlands; member of the Scientific Board of the Inter-national Potash Institute
The topic of the second session aK release and Kfixation> has importantimplications for practical agriculture. It is clear that for their direct K require-ments plants depend on the K that can be readily released by the soil. Goulding,however, rightfully claimed that in the long run plants also benefit from thefact that many soils are capable of retaining K that was applied to them andwas not absorbed by the first crop grown after application.
In fact, it should not be forgotten that the boundary line we draw betweenexchangeable and non-exchangeable portions of soil K is an arbitrary and artifi-cial one, and that during one growing season crops often manage to withdrawfrom soils quantities of K which are several times larger than the quantity ofK originally present in so-called exchangeable or available form.
Goulding pointed out that in practical agriculture we are faced with thedilemma that many laboratory techniques capable of describing and predictingthe behaviour of K in soils are too cumbersome and too expensive for practicaluse. In their survey of methods in use for determining available K, Novozamskyand Houba could only list simple extraction methods, none of which can shedany light on the behavior of K in soil.
Staunton in her paper made it clear that for a proper evaluation of the rateof supply of K to plant roots not only diffusion through soil solution, but alsodiffusion along exchange sites will have to be taken into account. When soilsdiffer in the ease with which such diffusion processes can take place, one mustrealize that simple laboratory extraction procedures will never be able toaccount for such differences.
In many West European countries the study of K-behaviour in soil may besimplified by the circumstance that only one type of clay mineral is involved.In their contribution to this Colloquium, Bar and co-workers pointed out thatthe adsorption characteristics of soils may be far more complex when morethan one type of clay mineral is present.
Another important issue is the choice between a one-nutrient and a multi-nutrient extracting agent. Both systems are in use and both have their advan-tages and disadvantages. Villemin's contribution is an example of a system inwhich only potassium is under investigation. When every nutrient has its ownextracting agent, soil testing can become so expensive that farmers may show
211
a reluctance to regularly submit samples for testing. In order to avoid suchan unsatisfactory situation, I think that multi-nutrient extracting agents willbecome more important in the near future.
Also with the use of such multi-nutrient extractants, the disadvantage re-mains that the multitude of soil characteristics affecting the availability of Kin soil cannot be properly evaluated in a laboratory extraction procedure. Forfurther progress in this field I can visualize a system in which a farmer placesa number of strips of cation- and anion exchangers in his soil and, after a certainperiod of contact between soil and exchangers, recovers the strips and submitsthese to a soil-testing laboratory for analysis. After recharging, the strips couldbe returned to the farmer for repeated use. In such a procedure, the time-consuming collecting and handling of soil can be avoided. The quantities ofnutrients collected on the exchangers are a function of more soil characteristicsthan can be evaluated in laboratory extractions of soil material, and can there-fore serve as better estimates of nutrient availability than those obtained withthe conventional soil-testing procedures.
Even with such a more natural system of nutrient withdrawal, a number offactors influencing the behaviour of soil K will be overlooked. For instance,the effects that root systems have on the availability of nutrients will not befully evaluated, and weather conditions during the growing season may differfrom those in the extraction period.
Nevertheless, I expect that in the near future progress will be made in therealm of more natural techniques employed to withdraw from a soil those frac-tions of nutrients which under field conditions make a contribution to thenutrition of our crops. In that way, the gap may be breached between knowledgecompiled by mineralogists and the analytical ease and efficiency required byagronomists. It is in my opinion the task of agronomists to devise rapid andsimple extraction methods that still allow full use to be made of knowledgeacquired by mineralogists on the behaviour of K and other minerals in theirnatural habitat, namely the undisturbed soil exposed to regular climatic fluctu-ations.
212
Chairman of the 3rd Session
Prof. Dr. U Kafkafi, Field Crops Department,Faculty of Agriculture, The Hebrew Universityof Jerusalem, Rehovot/Israel; member of theScientific Board of the International PotashInstitute
3rd Session
Potassium Dynamics in theRhizosphere
213
Potassium Dynamics in theRhizosphere and PotassiumAvailability
R. 0. Kuchenbuch, Institute of Agricultural Chemistry, Goettingen/Fed. Rep. ofGermany*
Summary
Diffusion is the main process supplying K to the root. Methods for study of K concentra-tion distribution near the root are briefly described. The extent of K depletion can be influ-enced by factors which affect diffusivity and results show that:
Plants use both exchangeable and non-exchangeable K. Non-exchangeable K is takenup from within 1-2 mm of the root surface while exchangeable and non-exchangeable Kis desorbed and transported further. Fertilization of salts not containing potassiumand/or proton excretion influence availability of both, exchangeable and non-exchangeable K.
K fertilization increases K availability because:(1) Concentration gradients steepen and K flux towards the root increases;(2) Spatial access for K is increased due to higher mobility in soil.
Transport of K to the root is facilitated as soil water content increases.
The plant itself is an important factor in K availability.
1. Introduction
It is often postulated that soil nutrient content is the main factor limiting potassiumavailability. Soil tests based on mainly K concentration are used as indicators of fer-tility level in soil. It is trivial but often ignored that there are three prerequisites fornutrient uptake:
(i) the soil must contain nutrients,(ii) roots have to be in the soil to take up the nutrients,(iii) nutrients must be mobile to reach the root surface.
*New address: Dr. R. 0. Kuchenbuch, Agricultural Research Station BASF AG,P.O. Box 220, D-6703 Limburgerhof, Fed. Rep. of Germany
215
It is well established that only a small fraction of soil K, if any, can come into contactwith the root surface without being transported via soil water to the root. Hence,transport mechanisms are involved in supplying K, e.g. mass flow and diffusion asshown by Barber [1962].
Mass flow, induced by water transpiration by the plant causes transport of K ionsin soil water towards the root surface. Accordingly the amount of K supplied to theplant depends on flow rate of soil water and solution K concentration. Barber[1962] calculated for soils collected in the USA that mass flow could contributefrom 5 to 200 percent of the amount of K taken up by the plant. If mass flow resultsin a higher rate of transport than the plant can take up, nutrient accumulates at theroot surface. If transport through the soil is not sufficient to meet the plant's needs,soil solution concentration at the root surface is reduced. This causes a net diffusiveflux towards the concentration sink, that is the root surface. The flux rate is depend-ent on the size of the diffusion coefficient of potassium in soil and the gradientbetween solution concentration at the root surface and the surrounding soil.Nutrient flux towards the plant root can thus be expressed mathematically as thesum of mass flow and diffusion (equation 1).
For most of the German soils we studied diffusion was the main process of Ksupply to the plant because of low soil solution concentration relative to plantabsorption. Consequently soil solution is depleted during the course of time of Kuptake, being buffered at the same time against this change in concentration bydesorption of K from the solid phase. Schematically this process is shown on thelefthand side of Figure 1. If concentration distribution perpendicular to the rootwere measured at intervals the result would be a graph as given on the right side ofFigure 1. The amount of nutrient absorbed by the plant root thus is given by twoparameters:
(i) degree of depletion at the root surface which is the result of the interaction ofroot K absorption and potassium flow towards the root, and
(ii) the extension of the depletion zone.
How far the depleted soil zone extends from the root surface depends on the sizeof the effective diffusion coefficient (equation 2) and thereby the amount of soilthat feeds a unit of root surface area. The effective diffusion coefficient is given bymultiplication of the diffusion coefficient in water (specific for each element) withfactors that modify flow of K through soil as compared to pure water (equation 3).
dcF=D, - +vc (1)
dr
x 2 jt (2)
D, = D, 0 f/b (3)
F = nutrient flux towards the root surface; De = effective diffusion coefficient; dc/dr =
concentration gradient: change in concentration of the nutrient, dc, with distance from
216

root surface, dr; v = water flux; c, = concentration of soil solution; t = time; D, = diffusioncoefficient in water; 0 = volumetric water content; f = tortuosity (impedance) factor; b =relation between change in concentration of diffusible ions, dc, and change in concentra-tion of ions in solution, dc1.
root 4age
0 0 00
oo
0 O00000
0 4. .
0
a
4
c: 20%00 00 O0
2 0OOO O0 00
4
,Soildistance from the root
Fig. I Schematic representation of the process of nutrient uptake from the soil by diffu-sion controlled process and resulting concentration distribution around roots (afterClaassen, unpublished)
217
This shows that to understand K availability in the soil-root-system one has tomeasure potassium concentration distribution in the vicinity of roots. Such mea-surements allow quantification of degree of depletion and extension of the deple-tion zone in the vicinity of roots. Bulk soil measurements are only satisfactory if (i)mobility is high compared to uptake, and hence no or only small concentration gra-dients are developed; this may be the case in highly fertilized soils with a low bufferpower, and/or (ii) when plant roots are so close together that the soil between themis depleted almost uniformly, which may be the case in pot experiments or undercereal crops.
The aim of this paper is
- to introduce and briefly discuss methods that are used in rhizosphere research tomeasure and calculate potassium concentration distribution close to the rootsurface,and
- to show factors and their significance for K availability.
2. Methods to study K concentration distribution near roots
Several methods with their advantages and disadvantages are described.
2.1 Analysis of soil adhering to rootsThis method tries to separate soil adhering to roots or root hairs form the bulk soil.Usually plants are grown in pots with finely soil. After the experiment roots withadhering soil are carefully separated from the bulk soil. The soil is then carefullywashed from the roots or the roots are shaken gently to loosen the soil. This methodwas used by Starkey [931], Riley and Barber[I96 9, 1970], Hoffmann and Barber11971], Sinha andSingh[1976]andHendriksandJungk[l981]). Elements studiedwere calcium, magnesium, sodium, phosphate, and potassium.
Advantage of the method: (i) no additional equipment needed, (ii) fast anduncomplicated analyses of soil material possible (iii) comparison of rhizosphereand non-rhizosphere soil possible in pot and field experiments with standard soiltest procedures.
Drawbacks of the method: (i) restricted to finely sieved soil, preferably with highsand content, (ii) no well defined cylinder of soil around roots, especially on coarsetextured soils and plants with short root hairs, (iii) problems associated with rootaxes in rhizosphere soil that contain high concentrations of the nutrient underinvestigation and may cause experimental and analytical error, (iv) differencesbetween rhizosphere and non-rhizosphere soil have to be pronounced to be con-sistent.
In summary this method gives qualitative information about changes in concen-tration close to the root.
218
2.2 Autoradiography
In this method soil is mixed with an active isotope of the element to be studied. Aroot growing into this soil will take up the isotope. If the soil is exposed to a x-rayfilm, regions with high activity will result in a higher film density (blackening) thanregions where the plants did take up some of the isotope and where consequentlythe film density is lower. Concentration distribution perpendicular to the root ismeasured densitometrically from this autoradiography. The method was used instudies on potassium mobility in soil by Bhat and Nye[1973], Claassen, Hendriksand Jungk [1981], Claassen and Jungk [1982]. For potassium rubidium was usedas a tracer, except in the work of Claassen el al [1982].
Prerequisites of the method: (i) root sections to be measured have to be at thesoil surface, (ii) radioisotope has to be homogeneously mixed with the soil, (iii)optimum activity necessary for autoradiograph with high resolution. The nuclidehas to be of low energy for high resolution of the autoradiograph and half life has tobe long enough to carry out the experiment.
Advantages of the method: (i) undisturbed measurements of soil-root system,(ii) time course measurements possible on same root section, (iii) two tracers withdifferent half life can be used simultaneously to investigate interaction.
oCrossfire, is a problem generally associated with autoradiography. Emissionof radiation in all possible directions causes the image of the emitter to be largerthan the emitter himself. Hence, film density is not a correct measure for activity.The problem becomes critical where there are big differences in activities, e.g.where a root has a much higher activity than the surrounding soil, or vice versa. Inthis case film density may be very much different from activity. Hence, densitomet-ic measurements have to be corrected for crossfire if film density is not propor-
tional to activity. One way to do this is described by Claassen, Hendriks andJungk[1981]. Soil containing the isotope is separated from inactive PVC material. Thefilm density on the inactive side of the system being caused by crossfire from theactive side is measured. With distance from the border between the two compart-ments film density declines. Using a mathematical procedure suggested by Pas-sioura [1972] coefficients can be calculated to convert film density values intoactivity values. This procedure depends on a laborious empirical approximation(Claassen etal [1981]). If one wants to convert activity distribution of an autoradi-ogram into concentration values this can be done by a procedure described by FriedandDean [1952] or Broadbent[1970]. Isotopically exchangeable potassium has tobe calculated (for details see Claassen andJungk[1 982]); if the relation of activityto isotopically exchangeable K is constant, concentration can readily be calculatedfrom the activity. However, this relation in many cases is not constant. In this caseisotopic dilution studies can be conducted (Claassen and Jungk [1982]). Theintention is to calculate the relation between 43K activity and isotopicallyexchangeable K for different levels of K depletion. To do this soil containing theisotope is diluted successively with a solution similar to the soil solution, but devoidof K. Isotopically exchangeable potassium can be calculated for each desorptionstep. This gives information about the dynamics of potassium as the soil solution is
219
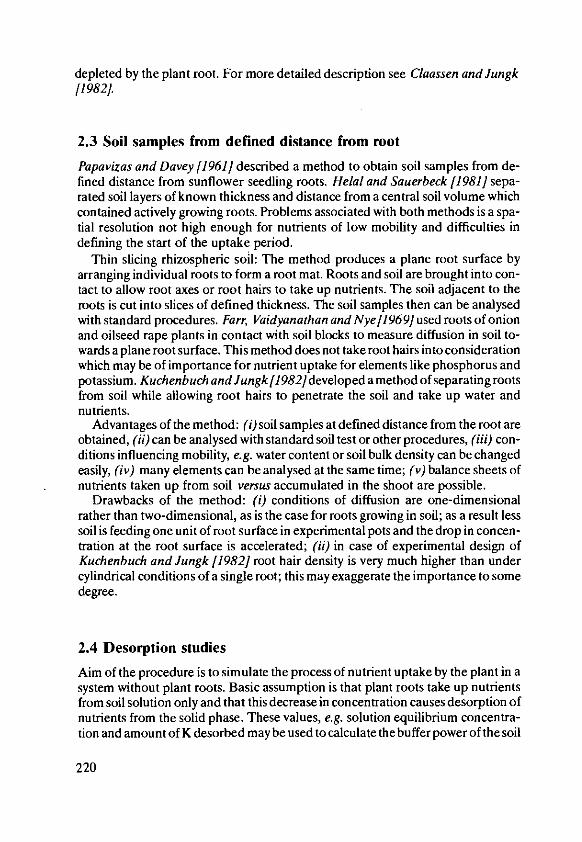
depleted by the plant root. For more detailed description see Claassen andJungk[1982].
2.3 Soil samples from defined distance from root
Papavizas and Davey [1961] described a method to obtain soil samples from de-fined distance from sunflower seedling roots. Hetal and Sauerbeck [1981] sepa-rated soil layers of known thickness and distance from a central soil volume whichcontained actively growing roots. Problems associated with both methods is a spa-tial resolution not high enough for nutrients of low mobility and difficulties indefining the start of the uptake period.
Thin slicing rhizospheric soil: The method produces a plane root surface byarranging individual roots to form a root mat. Roots and soil are brought into con-tact to allow root axes or root hairs to take up nutrients. The soil adjacent to theroots is cut into slices of defined thickness. The soil samples then can be analysedwith standard procedures. Farr, Vaidyanathan and Nye[1969] used roots of onionand oilseed rape plants in contact with soil blocks to measure diffusion in soil to-wards a plane root surface. This method does not take root hairs into considerationwhich may be of importance for nutrient uptake for elements like phosphorus andpotassium. Kuchenbuch andJungk[1982]developed a method of separating rootsfrom soil while allowing root hairs to penetrate the soil and take up water andnutrients.
Advantages of the method: (i) soil samples at defined distance from the root areobtained, (ii) can be analysed with standard soil test or other procedures, (iii) con-ditions influencing mobility, e.g. water content or soil bulk density can be changedeasily, (iv) many elements can be analysed at the same time; (v) balance sheets ofnutrients taken up from soil versus accumulated in the shoot are possible.
Drawbacks of the method: (i) conditions of diffusion are one-dimensionalrather than two-dimensional, as is the case for roots growing in soil; as a result lesssoil is feeding one unit of root surface in experimental pots and the drop in concen-tration at the root surface is accelerated; (ii) in case of experimental design ofKuchenbuch and Jungk 11982] root hair density is very much higher than undercylindrical conditions of a single root; this may exaggerate the importance to somedegree.
2.4 Desorption studies
Aim of the procedure is to simulate the process of nutrient uptake by the plant in asystem without plant roots. Basic assumption is that plant roots take up nutrientsfrom soil solution only and that this decrease in concentration causes desorption ofnutrients from the solid phase. These values, e.g. solution equilibrium concentra-tion and amount of K desorbed may be used to calculate the buffer power of the soil
220
(equation 3), or can be used to calculate isotopically exchangeable potassiun(FriedandDean [1952]; Broadbent[1970]). Usually soil samples are diluted in lowconcentration salt solution, thus initiating a new process of equilibration betweenexchange sites of minerals and solution (Claassen and Jungk [1982]).
2.5 Modelling potassium transport to the root and uptake into theplant
Mechanistic mathematical models that account for the processes involved innutrient flow through the soil towards the root and uptake into the plant have beendeveloped on the basis of work by Nye andMarriott[1969]). The models describediffusion and mass flow mathematically and combine these processes with nutrientuptake calculated with Michaelis-Menten kinetics. Several authors extended thisbasic approach to calculate uptake of a growing root system by changing boundaryconditions and/or mathematical procedures (Claassen and Barber 11976]; Cush-man 11979]; Barber and Cushman 11981]; Cushman [1984], Syring, ClaassenandJungk[1986]). The models have been tested for validity of mathematical solu-tion (Cushman [1979]) and for agreement of calculated results with measureduptake. Verification of the model predictions as summarized by Barber[1984]andshown by Claassen etal. [1986]and Kuchenbuch, Claassen andJungk[1986b]in-dicate that the basic approach is realistic and the main processes of nutrient uptakefrom soil are represented in the model.
Advantages of the method: (i) after verification of the model the individual pro-cesses that led to the result can be investigated; a sensitivity analysis showing theeffect of change of one parameter on the overall result can be conducted as in sensi-tivity analyses carried out by Silberbush and Barber [1983]; (ii) if model predic-tions do not agree with reality, research on the cause of this result may lead to newworking hypotheses and consequently to new understanding of the soil-plant-system; mechanistic models are thus valuable research tools at the moment.
Problems of this approach: since some parameters required by the model are notvery well known at the moment, assumptions often are necessary; these assump-tions may influence the result as much as measured data that go into it. One mustavoid believing the assumptions giving good agreement of calculated withobserved results to be identical with - or better than - results obtained from anexperiment. Even though the mathematics of the models are quite complex and anaccidental verification of the model seems to be very unlikely - there is no substi-tute for experimental evidence for the assumptions.
Barraclough t1986] calculated the concentration gradients around roots thatare necessary to allow uptake rates measured in the field. His calculations are basedon the steady state model of Baldwin, Nye and Tinker[1973] that accounts for rootcompetition and needs input data that are similar to the model of Claassen et aL11976].
221
3. Potassium depletion of the rhizosphere soil
3.1 Potassium availability in the rhizosphere
Plants take up potassium from soil solution only. This process usually decreases soilsolution concentration and potassium is desorbed from the solid phase. Figure 2shows the concentration distribution of potassium, 4 K, measured with autoradi-ography after 1.5 days of uptake on e Herrenhausen soil (Claassen and Jungk[1982]).
0 0 0
o o o
1000
0200 C
00 2 exch. KC)o (Kuchenbuch et o, 19B2)
" 300 43uKa) (Claossen et al, 1982)E
400
-C-)
x 500C
0)c 600U
700
0123456789distance from root. mm
Fig. 2 Potassium concentration distribution in the vicinity of plant roots measured withdifferent methods
222
The graph shows that at about 6 mm from the root surface concentration isidentical with initial soil level. Closer to the root concentration decreases, most ofthe change occurs within 2 mm from the root surface. Total change in concentra-tion is approx. 700 lpmol K/100 gsoil, whereas initial concentration of exchange-able potassium was 374 p[mol/ 100 g soil. The authors conclude from this that non-exchangeable potassium is released as a result of potassium uptake by the plant.The same soil was used in a study by Kuchenbuch andJungk [1982]; the concen-tration distribution of exchangeable K as measured with the method of thin slicingrhizospheric soil is given in Figure 2. A comparison of the two graphs shows thatthe extension of the depletion profile as measured with the two methods is thesame, as well as the concentration distribution from 6 to 3 mm. Closer to the rootautoradiography shows stronger depletion of the soil than exchangeable potas-sium. The difference in amount of K extracted with the two methods can be inter-preted as amount of potassium from non-exchangeable sources that was taken upby, the plant. Almost all of the uptake from non-exchangeable K sources occurswithin 2 mm from the root surface. Similar results are given by Kuchenbuch[1984. Obviously spatial access to non-exchangeable potassium is restricted to a
Zsoil layer very close to the root only, but within this region large amounts of non-exchangeable K are chemically available.
3.2 Influence of exchange processes on potassium availability
So that potassium can be desorbed from exchangeable or non-exchangeablesources into soil solution ion exchange is necessary. Since calcium in arable Euro-pean soils is the dominant ion it will balance most of the exchange. However, if asalt is added to the soil, the cation will exchange potassium from the soil particleinto soil solution, thus reducing K buffer power. Figure 3 shows an example of theresult of NaCI fertilization on concentration distribution of exchangeable potas-sium in the vicinity of roots. As would be expected the extension of the depletionzone increased, increasing the soil volume feeding the root. Degree of depletion atthe root surface is not changed. Hence, potassium availability is not only depend-ent on K content of the soil but may be influenced by factors that usually are notconsidered in fertilizer experiments, e.g. exchange processes.
It has been shown that plants are able to use non-exchangeable K in the vicinityof roots where potassium concentration is low (Figure 2). Generally all ions areable to desorb non-exchangeable potassium, however, there are differences in effi-cacy. Very effective are protons, having a small ion radius and being able to pen-etrate into interlayer spaces of illites more readily than other ions (Rich /1964];Rich and Black [1964]). Acidification of a silt loam soil in a system without plantroots resulted in an increase in concentration of exchangeable potassium and in soilsolution concentration, and consequently in a higher diffusion coefficient (Table 1,after Kuchenbuch [1983]). Adding lime reversed some of the proton effect. Table Ithus shows that protonation of the soil that does not change soil pH very much, e.g.
223
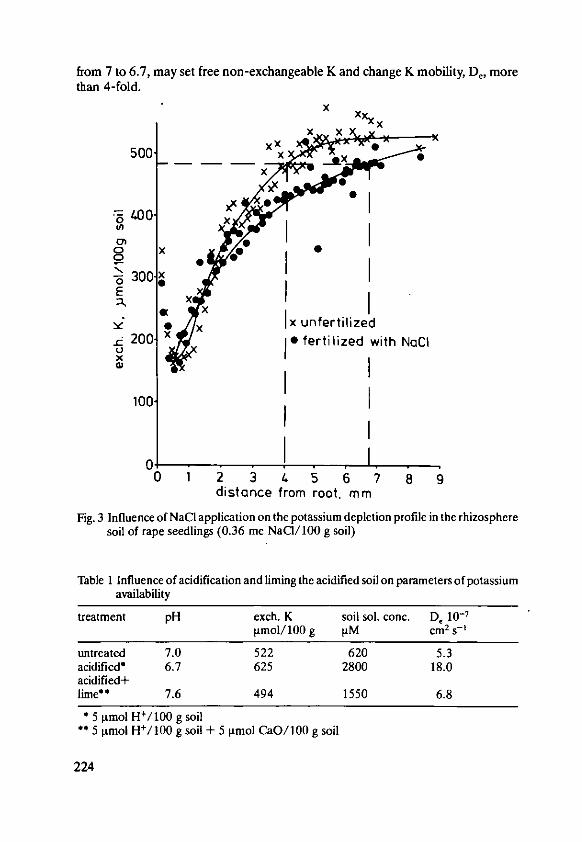
from 7 to 6.7, may set free non-exchangeable K and change K mobility, De, morethan 4-fold.
x
XX x500x x Wx •I
500
0 40So
,,
- 300 XE 0
.X Ix unfertilized.200 x fertilized with NaClx
100
2 3 4 5 6 7 8 9distance from root. mm
Fig. 3 Influence of NaCI application on the potassium depletion profile in the rhizospheresoil of rape seedlings (0.36 me NaCI/100 g soil)
Table 1 Influence of acidification and liming the acidified soil on parameters of potassiumavailability
treatment pH exch. K soil sol. conc. D, 10- 7
[imol/100 g [IM cm 2 s- 1
untreated 7.0 522 620 5.3acidified* 6.7 625 2800 18.0acidified+lime** 7.6 494 1550 6.8
5 imol H+/100 g soil5 lmol H+/100 g soil + 5 itmol CaO/100 g soil
224

It is difficult, however, to interpret the changes of exchangeable K, soil solutionconcentrations and effective diffusion coefficient in terms of potassium uptake bythe plant. The reason is that the measurements represent an equilibrium situation,whereas the plant root disturbs the equilibrium and initiates changes during thecourse of time. Hence, the conclusions from Table I have to be considered qualita-tively rather than quantitatively. A sensitivity analysis of potassium uptake carriedout by Claassen 11986], however, indicates that under conditions of low root den-sity (cm root/cm3 of soil) the concentration of soil solution largely determinespotassium uptake by the plant. Soil solution concentration was influenced morethan exchangeable K when the soil was acidified, and hence an increased potas-sium uptake would be expected.
It is well known that plant roots can change the pH of the surrounding soil andinfluence availability of macro- and micronutrients (Miller, Mamarial and Blair[1970]; RileyandBarber[19 71]; Smiley[1974]). To investigate the change of pH inthe vicinity of roots Kuchenbuch /1983] measured pH in soil samples at a knowndistance from the roots. The results are given in Figure 4, showing that oilseed rapeplants decrease pH from 7 to 6.3, about the change that was used in Table 2 to showthe effect of protonation of the soil on potassium availability. We conclude fromTable I and Figure 4 that excretion of protones may be a factor in the availability ofnon-exchangeable K. This thesis is supported by the fact that the soil layer that isacidified extends about as far into the soil as the layer that contributes most of thenon-exchangeable K as can be seen from Figure 2.
Table 2 summarizes the effect of liming an acid soil on potassium uptake fromexchangeable and non-exchangeable sources (Kuchenbuch [1983]). The experi-ment was carried out with the method of thin slicing rhizospheric soil, and a bal-ance sheet was calculated from data for K uptake as measured by plant analysis vs.exchangeable potassium being lost from the soil. Liming increased pH consider-ably, at the same time reduction in exchangeable potassium was observed. Similarresults were reported by Mehlich [1943] and Thomas and Coleman 119591.Nemeth and Grimme 11972] attribute the decrease of exchangeable K to anincrease of selective sorptive sites within the minerals due to a reduced blocking ofK-selective sites by aluminium compounds.
Table 2 Effect of liming on pH, exchangeable K and potassium uptake by oilseed rapeplants (soil 'Hoyal, IS; plants 4 days old)
(1) (2)treatment pH exch. K K uptake exch. K+ nonexch. K+"
[tmol/100 g pimol/pot lost from taken upsoil, kmol/potvimol/pot
unlimed 4.8 360 33.7 8.9 24.8limed 7.5 330 22.1 6.8 15.3+ calculated from depletion profiles I: difference between (1) and (2)
225
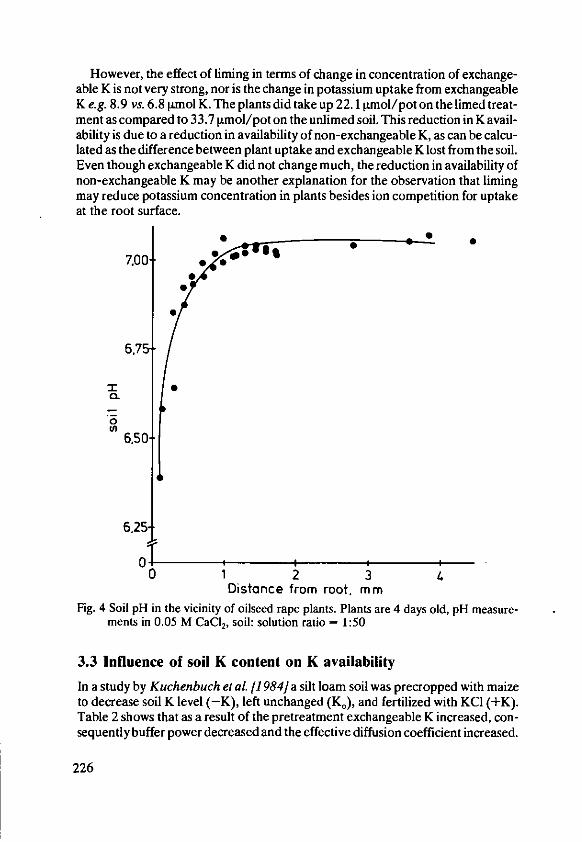
However, the effect of liming in terms of change in concentration of exchange-able K is not very strong, nor is the change in potassium uptake from exchangeableK e.g. 8.9 vs. 6.8 pLmol K. The plants did take up 22.1 plmol/pot on the limed treat-ment as compared to 33.7 imol/pot on the unlimed soil. This reduction in K avail-ability is due to a reduction in availability of non-exchangeable K, as can be calcu-lated as the difference between plant uptake and exchangeable K lost from the soil.Even though exchangeable K did not change much, the reduction in availability ofnon-exchangeable K may be another explanation for the observation that limingmay reduce potassium concentration in plants besides ion competition for uptakeat the root surface.
7.00"
6,75
o.
0U)
6,251
0 1 2 3 4.
Distance from root. mm
Fig. 4 Soil pH in the vicinity of oilseed rape plants. Plants are 4 days old, pH measure-ments in 0.05 M CaC 2, soil: solution ratio = 1:50
3.3 Influence of soil K content on K availability
In a study by Kuchenbuch et al [1984] a silt loam soil was precropped with maizeto decrease soil K level (-K), left unchanged (K.), and fertilized with KCI (+K).Table 2 shows that as a result of the pretreatment exchangeable K increased, con-sequently buffer power decreased and the effective diffusion coefficient increased.
226
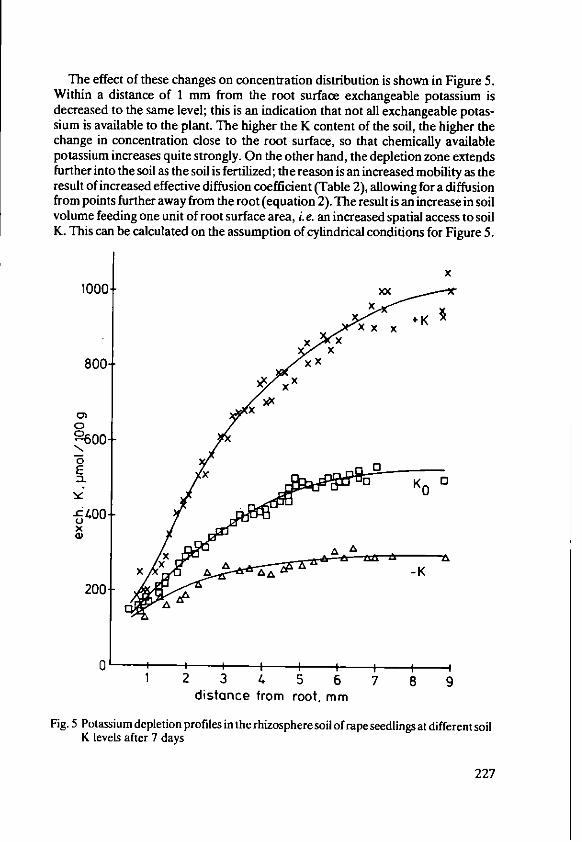
The effect of these changes on concentration distribution is shown in Figure 5.Within a distance of 1 mm from the root surface exchangeable potassium isdecreased to the same level; this is an indication that not all exchangeable potas-sium is available to the plant. The higher the K content of the soil, the higher thechange in concentration close to the root surface, so that chemically availablepotassium increases quite strongly. On the other hand, the depletion zone extendsfurther into the soil as the soil is fertilized; the reason is an increased mobility as theresult of increased effective diffusion coefficient (Table 2), allowing for a diffusionfrom points further away from the root (equation 2). The result is an increase in soilvolume feeding one unit of root surface area, i. e. an increased spatial access to soilK. This can be calculated on the assumption of cylindrical conditions for Figure 5.
x1000 x<
x x x
800- xx
C-600-
:X K00E
200
0I I I I I I I I I1 2 3 /. 5 6 7 8 9
distance from root, mm
Fig. 5 Potassium depletion profiles in the rhizosphere soil of rape seedlings at different soilK levels after 7 days
227
The results are given in Table 3. As the extension of the depletion zone increasesfrom 4.6 mm to 6.3 mm, the soil volume feeding I cm of root doubles from 0.66 to1.24 cm3 .
Table 3 Influence of soil K content on soil parameters of potassium availability (Rape 7days old)
soil exch. K b+ .D, 10- 1 depletion zonekLmol/100 g cm2 s- 1 extension volume++ avail. K++
mm cm- 3/cm pmoles/cm
- K 295 24.5 1.2 4.6 0.66 0.42K. 517 9.0 5.3 5.3 0.88 1.32
+ K 1365 2.6 27.0 6.3 1.24 9.10
ktmol K/cm 3 soil
+ units for b, buffer power, are
itmol K/cm3 soil solution++ calculated from I -dimensional depletion profiles of Figure 5 under the assumption
of cylindrical conditions for 1 cm of root
The combined effect of increased soil volume and stronger depletion within thisvolume results in an increase in available K for one cm of root from 0.42 to 9.10lmoles K. We conclude from these results that fertilization acts in two ways: itincreases the soil volume that feeds one unit of root, e.g. increases the spatial accessfor soil K, and it increases chemically available K, allowing for a stronger depletionof K at the root surface. Both factors result in an increase of K availability that ishigher than exchangeable K would indicate.
Extension of the depletion zone has been found to be a factor of K availabilitybecause it limits the soil volume feeding a root segment. However, this is true only ifno inter-root competition for potassium takes place. If the depletion zone extendsfurther into the soil than the half distance between neighboring roots, the depletionzones will overlap. As a result, soil volume will be restricted by the distancebetween the roots, and the amount of available nutrients will be strongly deter-mined by the second factor of availability, this is amount of chemically available K.If one compares the extension of the depletion zone on the low K soil in Figure 5,which is 4.6 mm, with half distances between roots that have been measured in thefield, one must conclude that with root densities of 3 or greater (half distances< 4 mm) almost all the soil will feed the root under a cereal crop with root densitiesfrom 5 to 15 cm/cm3 for the topsoil layers (Barraclough and Leigh [19841) and alarge portion of the topsoil soil layers at root densities from 1 to 4, as reported forfield grown maize by Mengel and Barber [1976] and Kuchenbuch and Barber11987].
228
3.4 Influence of soil water content on K availability
Equation 3 shows that mobility of soil K, e.g. the diffusion coefficient, is deter-mined by volumetric water content and its interdependence with the tortuosity fac-tor. This has been shown by Rowell, Martin and Nye 119761, Barraclough andTinker[1 981], and Kuchenbuch et alt [1986a]. The effect of soil water content onpotassium uptake, plant growth, and potassium uptake rate has been measured(Mackay and Barber [1986]). Results of Kuchenbuch et al [1 986b] show thatpotassium uptake rate is dependent on potassium mobility in soil, that is the pro-duct of 0 and f. The higher the soil water content, 0, the higher the impedancefactor, f, the higher the diffusion coefficient (equation 3). The higher the diffusioncoefficient the higher the flow rate towards the root (equation 1), and conse-quently the potassium uptake rate. However, these conclusions are qualitativeonly. At the moment they cannot be quantified experimentally. Hence, mathemat-icai models are used to describe the whole process, and these models are used afterverification to get an overall picture of the processes and to investigate the import-ance of the factors involved.
Figure 6 depicts results of mathematical modelling of the influence of soil watercontent on soil solution concentration distribution around roots and the potassiumuptake rate in the course of time (Kuchenbuch et al. [1 986b]). For the dry soil with0 = 0.09 soil solution concentration at the root surface drops to a value close to 0within 7 days. Accordingly potassium uptake rate which is dependent on soil solu-tion concentration also drops as quite rapidly from the start of the experiment. Ifsoil water content is at a higher value no steep concentration gradients can beobserved close to the root surface; concentration decreases in steps of the same sizeup to day 10, being higher at this than in the dry soil after 4 days. Consequentlypotassium uptake rate remains almost at maximum from day 0 to 10 of the experi-ment. We conclude from these calculations that water content of the soil modifiespotassium availability appreciably; at low water content transport to the root maylimit potassium uptake rate earlier than at high water content. The degree of influ-ence depends on initial soil K content; we expect plants on a soil deficient of potas-sium to react much more strongly to changes in soil water content than on high Ksoils. Indications for the strong influence of soil water content on potassium uptakeand yield of different crops are given by Paauw[1 958, Barber[ 959], and Mengeland Braunsch weig [1972].
At the half distance between two neighboring roots, ca. 3 urn from the root sur-face in the examples of Figure 6, the soil is totally depleted of K in case of highwater content, whereas there is some potassium left in the dry soil. However, thetotal soil volume is depleted of K even under dry conditions, showing that mobilityof potassium is not a very important factor determining potassium uptake on thissoil.
229

Q=Q09C3/ 3S= 0,09 cm1 cm 3
daya 1 b
E 0.6-7
E 2.E 1
0,4- 13 0
3 16 -SLC19 S 1
-0 0,2- P
0a
o 0O0 13 0i L t lb 1 1'6 1bdistance from the root(mm) time (days)
O = 0,36 cm3 Icm3
C day 3 d
en
E 0.6
E EU 2
C 7o. ..
00.CA '0.2- -, - -10 -
,---160 • 19 00 1 2 3 01 47 10 1316 19distance from the root(mm) time (days)
Fig. 6 Potassium depletion in the vicinity of onion roots and K uptake rate as a function oftime of uptake at two moisture levels of the soil (Soederhof silt loam)
230
4. Conclusions
The data presented here support the view that potassium is transported towards theroot mainly by diffusion. Depletion zones in the vicinity of roots measured by dif-ferent methods (Figure 2) are a strong indication. Decrease of K concentration atthe root surface (in soil solution, exchangeable or non-exchangeable) and exten-sion of the depletion zone may be considered as the two parameters that determinethe amount of K that is available to a root segment. These parameters are influen-ced by exchange processes between solid and liquid phase, and transport in soilwater towards the root. Transport depends on buffer power, volumetric watercontent, and the tortuosity factor of the soil. Potassium flux rate into the root inaddition depends on the size of the concentration gradient of K in the rhizospheresoil, being a result of plant nutrient uptake. Hence the plant itself becomes animportant factor of nutrient availability - there is no available nutrient in soil un-less the plant root disturbs the equilibrium in soil and induces the flux of nutrientstowards the root. The amount of nutrient that may become available depends onspatial access, a soil factor, and degree of rooting, i.e. root density, a plant factorthat modifies availability of nutrients and has not been considered in this paper.
However, under conditions of low K mobility in soil root density has been shownto be positively related to potassium uptake and yield of corn (Kuchenbuch andBarber[1987]). As a result of these interactions a single factor of nutrient availabil-ity - nutrient content of the soil, nutrient mobility, and rooting intensity - cannotbe expected to be an accurate indication for soil fertility under all the different eco-logical conditions of farming.
More research is needed for a better understanding of the interactions betweenplant and soil in order to isolate and quantify the important parameters to describesoil fertility; the ultimate goal of rhizosphere research could be a better under-standing of the whole system and development of a mechanistic model that has ahigh predictive value for potassium availability in the field.
Acknowledgements
The author wants to express his thanks to Dr. N. Claassen, Inst. f. Agrikulturche-mie, Univ. of Goettingen, for the discussion of the paragraph on autoradiography.
231
5. References
1. Barber, S.A.: Relation of fertilizer placement to nutrient uptake and crop yield. IIEffects of row potassium, potassium soil level, and precipitation. Agron. J. 51,97-99(1959)
2. Barber, S.A.: A diffusion and mass flow concept of soil nutrient availability. Soil Sci.93, 39-49 (1962)
3. Barber, S.A.: Soil Nutrient Bioavailability, a Mechanistic Approach. John Wiley andSons Inc., New York, 1984
4. Barber, S.A. and Cushman, J.H.: Nitrogen uptake model for agronomic crops. In:Modeling waste water renovation-land treatment, p. 382-409. Ed. J.K. Iskandar.John Wiley Interscience, New York, 1981
5. Barraclough, P.B.: Nutrient fluxes in the rhizosphere of field crops. Satellite Sympo-sium XIII Congress of Int. Soc. Soil Sci., 13.-20.08.1986, Hamburg
6. Barraclough, P.B. and Tinker, P.B.: The determination of ionic diffusion coefficientsin field soils. 1. Diffusion coefficients in sieved soils in relation to water and bulk dens-ity. J. Soil Sci. 32, 225-236 (1981)
7. Barraclough, P.B. and Leigh, R.A.: The growth and activity of winter wheat roots inthe field: The effect of sowing date and soil type on root growth of high yielding crops.J. agric. Sci., Cambridge 103, 59-74 (1984)
8. Bhat, K. K.S. andNye, P. H.: Diffusion of phosphate to the plant roots in soil. 1. Quan-titative autoradiography of the depletion zone. Plant and Soil 38, 161-175 (1973)
9. Broadbent, F.E.: Variables affecting A values as a mesure of soil nitrogen availability.Soil Sci. 110, 19-23 (1970)
10. Claassen, N. and Barber, S.A.: Simulation model for nutrient uptake from soil by agrowing plant root system. Agron. J. 68, 961-964 (1976)
11. Claassen, N. andJungk, A.:KaliumdynamikimwurzelnahenBodeninBeziehungzurKaliumaufnahme von Maispflanzen. Z. Pflanzernihr. Bodenk. 145,513-525 (1982)
12. Claassen, N., Hendriks, L. and Jungk, A.: Erfassung der Mineralstoffverteilung imwurzelnahen Boden durch Autoradiographie. Z. Pflanzenerndhr. Bodenk. 144, 306-316 (1981)
13. Claassen, N.: Potassium availability: assessment of the significance of soil parametersby mathematical modelling. Transactions XIII. Congress of the International Societyof Soil Science, Vol. II1, p. 706-707 (1986)
14. Claassen, N., Syring, K.M. and Jungk, A.: Verification of a mathematical model bysimulating potassium uptake from soil. Plant and Soil 95, 209-220 (1986)
15. Cushman, J.H.: An analytical solution to solute transport near root surfaces for lowinitial concentration. I. Equation development. Soil Sci. Soc. Am. J. 43, 1078-1090(1979)
16. Cushman, J.IH.: Nutrient transport inside and outside the root rhizosphere: General-ized model. Soil Sci. 138, 164-179 (1984)
17. Farr, E., Vaidyanathan, L. V. and Nye, P.H.: Measurement of ionic concentrationgradients in soil near roots. Soil Sci. 107, 385-391 (1969)
18. Fried, M. and Dean, L.A.: A concept concerning the measurement of available soilnutrients. Soil Sci. 73, 263-271 (1952)
19. Helal, H.M. andSauerbeck, D.: Ein Verfahren zurTrennung von Bodenzonen unter-schiedlicher Wurzelndhe. Z. Pflanzenerndhr. Bodenk. 144, 524-527 (1981)
232
20. Hendriks, L. and Jungk, A.: Erfassung der Mineralstoffverteilung in WurzelnAhedurch getrennte Analyse von Rhizo- und Restboden. Z. PflanzenernAhr. Bodenk.144, 276-282 (1981)
21. Hoffmann, W.E. andBarber, S.A.: Phosphorus uptakebywheat (Triticumaestivum)as influenced by ion accumulation in the rhizocylinder. Soil Sci. 112, 256-262 (1971)
22. Kuchenbuch, R. and Jungk, A.: A method for determining concentration profiles atthe soil root interface by thin slicing rhizospheric soil. Plant and Soil 68, 391-394(1982)
23. Kuchenbuch, R.: Die Bedeutung von lonenaustauschprozessen im wurzelnahen Bo-den fur die Pflanzenverfiigbarkeit von Kalium. Diss. Univ. G6ttingen, 1983
24. Kuchenbuch, R. and Jungk, A.: Wirkung der Kaliumdiingung auf die Kaliumverfiig-barkeit in der Rhizosphdre von Raps. Z. Pflanzenenihr. Bodenk. 147, 435-448(1984)
25. Kuchenbuch, R., Claassen, N. andJungk, A.: Potassium availability in relation to soilmoisture. I. Effect of soil moisture on potassium diffusion, root growth and potassiumuptake of onion plants. Plant and Soil 95, 221-231 (1986a)
26. Kuchenbuch, R., Claassen, N. andJungk, A.: Potassium availability in relation to soilmoisture. II. Calculations by means of a mathematical simulation model. Plant andSoil 95, 233-243 (1986b)
27. Kuchenbuch, R. and Barber, S.A.: Yearly variation of root distribution with depth inrelation to nutrient uptake and corn yield. In: Communications Soil Science PlantNutrition, in press (1987)
28. Mackay, A.D. and Barber, S.A.: Soil moisture effects of potassium uptake by corn.Agron. J. 77, 524-527 (1985)
29. Mehlich, A.: Base saturation and pH in relation to liming and nutrient conservation ofsoil. Soil Sci. Soc. Amer. Proc. 7, 353-354 (1943)
30. Mengel, K. and Braunschweig, L.: The effect of soil moisture upon the availability ofpotassium and its influence on the growth of young maize plants (Zea mays, L.). SoilSci. 114, 142-148 (1972)
31. Miller, M.H., Mamarial, CP. and Blair, G.J.: Ammonium effects on phosphorusabsorption through pH changes and phosphorus precipitation at the soil root inter-face. Agron. J. 62, 524-527 (1970)
32. Ntmeth, K. and Grimme, H.: Effect of soil pH on the relationship between K-concen-tration in the saturation extract and K saturation of soils. Soil Sci. 114, 349-353(1974)
33. Nye, P.H. and Marriott, H.C.: A theoretical study of the distribution of substancesaround roots resulting from simultaneous diffusion and mass flow. Plant and Soil 30,459-472 (1969)
34. Papavizas, G.C. and Davey, CB.: Extent and nature of the rhizosphere of lupinus.Plant and Soil 14, 215-236 (1961)
35. Paauw, F. van der: Relations between potash requirements of crops and meteorologi-cal conditions. Plant and Soil 9, 254-268 (1958)
36. Rich, C.J.: Effect of cation size and pH on potassium exchange in Nason soil. Soil Sci.98, 100-106 (1964)
37. Rich, C. and Black, W.R.: Potassium exchange as affected by cation size, pH andmineral structure. Soil Sci. 97, 384-390 (1964)
38. Riley, D. and Barber, S.A.: Bicarbonate accumulation and pH-changes at the soy-bean (Glycine max.) root-soil-interface. Soil Sci. Soc. Amer. Proc. 33, 905-908(1969)
233
39. Riley, D. and Barber, S.A.: Salt accumulation at the soybean (Glycine max.) (1.)Merr.) root-soil-interface. Soil Sci. Soc. Amer. Proc. 34, 154-155 (1970)
40. Riley, D. and Barber, S.A.: Effect of ammonium and nitrate fertilization on phospho-rus uptake as related to root induced pH change at the root-soil interface. Soil Sci. Soe.Amer. Proc. 35, 301-306 (1971)
41. Rowell, D.L., Martin, H. W. and Nye, P.H.: The measurements and mechanisms ofion diffusion in soils. 111 The effect of moisture content and soil solution concentrationon the self diffusion of ions in soil. J. Soil Soc. 18, 204-222 (1976)
42. Sinha, B.K. and Singh, N. T.: Salt distribution around roots of wheat under differenttranspiration rates. Plant and Soil 44, 141-147 (1976)
43. Smiley, R. W.: Rhizosphere pH as influenced by plants, soils and fertilizers. Soil Sci.Soc. Amer. Proc. 38, 795-799 (1974)
44. Starkey, R. L.: Some influences on the development of higher plants upon microor-ganisms in the soil: IV influence on the proximity to roots on abundance and activity ofmicroorganisms. Soil Sci. 32, 367-393 (1931)
45. Thomas, G. W. and Coleman, N. T.: A chromatographic approach to the leaching offertilizer salts in soil. Soil Sci. Soc. Amer. Proc. 23, 113-116 (1959)
234
Methods of Sampling andInvestigation of Rhizosphere Soil
H.M. Helal and D. Sauerbeck, Institute of Plant Nutrition and Soil Science,Federal Research Center of Agriculture, Braunschweig-Vblkenrode (FAL)/Fed. Rep. of Germany*
Summary
The rhizosphere is an area of intensive interactions between plant roots and soil. Theseinteractions are of considerable significance for the nutrient availability to the roots. How-ever, limited progress has been so far achieved towards clarifying and quantification of thenutrient dynamics in the rhizosphere. This is mainly attributed to the lack of appropriatemethods. One of the most serious problems which retarded research progress in this field isthe difficulty of separating and sampling the actual rhizosphere soil for analysis. This papergives a comparative evaluation of various methods with special reference to the techniquesdeveloped by the authors.
1. Introduction: Root-microbe-soil interactions
Root influences on soil were already known to both soil microbiologists and agri-cultural chemists during the last century. Sprengelfor instance described the archi-tecture and functions of plant roots as early as 1839. He already considered selec-tive nutrient uptake in connection with root exudations and plant allelopathy,pointing out that plants can prepare part of their food by releasing acids which dis-solve otherwise insoluble mineral substances. Later on Dyer[1894] attributed this'feeding power* of plant roots to the acidity of the root sap while Czapeck [1896]confirmed that the carbonic acid excreted by roots makes available plant nutrientsin the soil. Hiltner in 1904 coined the term qrhizosphere to denote the sphere ofinfluence of roots and referred to both its phytopathological and nutritional signif-icance. However, progress towards further clarifying the processes governingnutrient availability in the rhizosphere was rather slow during the subsequentdecades, mainly due to the lack of appropriate methods for sampling and analysisof the rhizosphere soil. As an alternative concept agricultural chemists devotedmuch effort to developing extractants for the .available' fraction of plantnutrients.
* Dr. H.M. Helaland Prof. Dr. D. Sauerbeck, lnstitut fiir Pflanzenernfhrung und Boden-kunde, FAL, Bundesallee 50, D-3300 Braunschweig/Fed. Rep. of Germany
235
The introduction of the concept of o nutrient mobility by Bray [1954] revivedinterest in clarifying factors which govern the transport of nutrients to the root andestablish nutrient gradients at the root-soil interface (e.g. Barber [1962], Nyef1966], Passioura [1966]). Along with these efforts, new techniques were deve-loped or adopted from other research fields which made possible further progressin rhizosphere research in recent years. The rhizosphere now turned out to be afield of highly complex root-microbe-soil interactions. These are primarily attri-buted to three types of activity of the growing root:
1. fluctuating withdrawal of water and solutes,2. physical stress on adjacent soil aggregates and3. release of organic materials.
These primary processes initiate a series of secondary interactions (Helal andSauerbeck [1984, 1986a, 1987]) of considerable ecological and plant nutritionalsignificance. Understanding these interactions is a basic requirement for furtherdevelopment and refining of methods in rhizosphere research. Therefore a briefdiscussion of important rhizosphere processes is given below through which refer-ence to relevant methods and related problems will be made. It should be men-tioned here, however, that comprehensive treatment or citation is impossiblewithin the scope of this paper.
2. Water and solute gradients
The transport of water from the soil solution through the plants to the atmosphereis governed by the water potential gradient at both interfaces (Slatyer[196 71). De-pending on the rate of water uptake by the plant relative to the water flow in soil tothe root surface, the roots may strongly reduce the water potential of rhizospheresoil (Dunham and Nye [1973]). Consequently both rhizosphere and root waterpotential show periodic variations related to the change in transpiration rate (Hucket al [1970]). Fluctuation of the rhizosphere water content affects in a complexway microbial activity, stability of soil organic matter and soil aggregates (Agarwaleat l[19711, Harris etal[1966], Reidand Goss[1982), as well as binding, diffusionand mass flow transport of nutrients to the root surface (Nye and Tinker[1977]).
Working with sieved soil in model systems under controlled conditions andnear-constant soil water content enables detection of changes in solute concen-trations in the rhizosphere. By the application of refined autoradiographic meth-ods, for instance, nutrient concentration gradients have often been demonstrated(Bhat and Nye [1973], Claassen et al [1981]). It should be mentioned, however,that root turnover investigations (Sauerbeck and Johnen [19771, Steen [19841,HelalandSauerbeck [1986a]) indicated a highly dynamic system involving simul-taneous breakdown of old and initiation of new roots. Accordingly, the active root-soil interface is continuously changing with limited possibility for the buildup ofconcentration gradients.
236
3. Physical root-soil interaction
Plant roots surrounded by a rigid medium can develop a considerable hydrostaticpressure (Pfeffer 11893]). This enables the growing root to displace soil particlesfrom its path ( Whitely and Dexter [1984]). Consequently, the magnitude of physi-cal interaction between roots and soil will depend on the resistance of the soil to dis-placement and deformation (Sprengel [18391). However, soil penetration resist-ance is a complex function of several soil properties including particle size distribu-tion, aggregate stability and the characteristics of the void system in the soil (Barleyand Greacen [1967]). Root observations (Rogers [1939], Huck and Taylor [1982],Wang et at[1986]) show that roots tend to follow the way of least resistance andtherefore grow preferencially along preexisting cavities (e.g. earthworm routes andchannels of decaying roots) which are wider than their own diameter. Conse-quently roots under field conditions have only partial soil contact. Optical investi-gation of undisturbed soil-root interfaces (Altemailler[1987], AltemiillerandHaag[1983], Lundand Beals[1965]) confirm this view and demonstrate the difficulty ofestimating the magnitude of the absorbing root surface. Considering the entire rootsurface as absorbing area, as usually assumed in root modelling (Barber [1984],Cushman 11984]) is an obvious oversimplification of the situation.
In the absence of channels the root may be forced to displace the soil under pres-sure and therefore crush some soil aggregates (Helal and Sauerbeck[1986b]). Anysuch change in aggregation or density of rhizosphere soil is expected to modify aseries of related processes such as soil-root contact and supply of nutrients to theroot surface (Phillips and Brown 11965], Parish [1971]).
4. Exudation and turnover of roots
Plant roots release a great variety of substances into the soil. This includes leakageof diffusible compounds, active secretion of high molecular weight substances aswell as lysis of sloughed cells and drying tissue (Rovira and Davey [1974]). A con-siderable part of our knowledge on root exudates came from simplified work withplants grown in sterile nutrient solution. This led to an underestimation of carbonrelease and the related root influences on soil for some time. It is known now thatboth microorganisms (Vancura et al[1977]) and the physical interaction with thesoil (Barber and Gunn /1974]) have a considerable effect on the exudation andturnover of roots. A quantification of the carbon flow in the rhizosphere ofplants growing in soil became possible only through the introduction of methodsfor homogeneous labelling of plants with 4C (Figure 1). The most important fea-ture of these methods is a gas-tight separation between shoot and root spheres inorder to maintain a constant specific activity of the 14C0 2 supplied continuously tothe shoots. The technique was originally developed to produce "C-labelled plantmaterial for humus research (Sauerbeck andJohnen [1971]). It was then soon real-
237
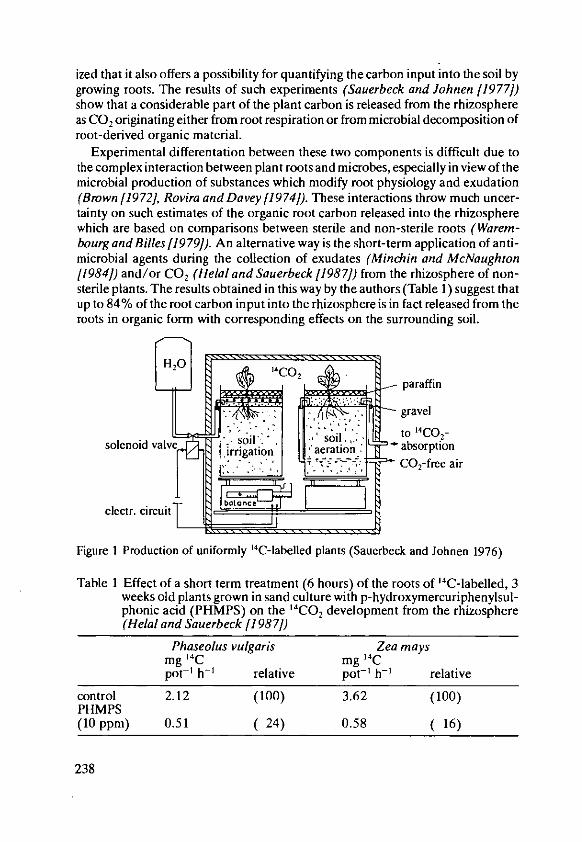
ized that it also offers a possibility for quantifying the carbon input into the soil bygrowing roots. The results of such experiments (Sauerbeck and Johnen /1977])show that a considerable part of the plant carbon is released from the rhizosphereas CO 2 originating either from root respiration or from microbial decomposition ofroot-derived organic material.
Experimental differentation between these two components is difficult due tothe complex interaction between plant roots and microbes, especially in view of themicrobial production of substances which modify root physiology and exudation(Brown [19721, Rovira and Davey [1974]). These interactions throw much uncer-tainty on such estimates of the organic root carbon released into the rhizospherewhich are based on comparisons between sterile and non-sterile roots (Warem-bourg and Billes[1979]). An alternative way is the short-term application of anti-microbial agents during the collection of exudates (Minchin and McNaughton11984]) and/or CO2 (Helal and Sauerbeck 11987]) from the rhizosphere of non-sterile plants. The results obtained in this way by the authors (Table 1) suggest thatup to 84% of the root carbon input into the rhizosphere is in fact released from theroots in organic form with corresponding effects on the surrounding soil.
paraffin
gravel,tol CO,_solenoid valve 1 solbsilpto0
irrigation aeration: absorptionC0 2-free air
electr. circuit
Figure 1 Production of uniformly '4C-labelled plants (Sauerbeck and Johnen 1976)
Table I Effect of a short term treatment (6 hours) of the roots of '4C-labelled, 3weeks old plants grown in sand culture with p-hydroxymercuriphenylsul-phonic acid (PHMPS) on the 4C0 2 development from the rhizosphere(Hetal and Sauerbeck [1987])
Phaseolus vulgaris Zea maysmg 14C mg 14Cpot' h-I relative pot' h-1 relative
control 2.12 (100) 3.62 (100)PHMPS(10 ppm) 0.51 (24) 0.58 (16)
238

5. Nutrient availability in the rhizosphere
Root exudates affect plant nutrient availability directly by modifying the solubility,sorption and diffusion of nutrient elements (Nagarajah et at [19701, Jayman andSivasubramaniam [1975], Kepert et al [1979], Gardner et al [1983], Morel et al11986]). In addition, extracellular root enzymes play a role in rhizosphere nutrientmetabolism (Chang andBandurski[1964, McLachlan and Marco [1982]). How-ever, soluble exudates constitute only a minor fraction of root carbon released intothe rhizosphere (Rovira and Davey [1974]). Furthermore, due to the considerablemicrobial activity in the rhizosphere, soluble exudates are only of low persistence.Their accumulation to concentrations necessary for a significant chemical interac-tion with the soil seems to be limited. The role of the root carbon in rhizospherenutrient turnover should therefore be sought in its function as a source of energy,carbon and nutrients for the rhizosphere microbial population.
In addition to the development of techniques for homogeneous '4C-labelling ofplants and the differentiation between microbial and root respiration, the introduc-tion of methods for the determination of the soil microbial biomass (Jenkinson andPowlson [1976]) opened new ways for a quantitative treatment of carbon andenergy flows in the rhizosphere. An example of the results obtained by combinedapplication of these techniques is presented in Table 2. These results show thatabout 20% of the whole photosynthetic carbon was released by the growing rootsin the soil, which confirms earlier findings of Sauerbeck and Johnen 1977]. Fur-thermore, these results demonstrate the utilization of root-derived carbon by therhizosphere microbial biomass.
Table 2 The 14C-balance of 30 d old maize plants.14CO 2 (35 uCi/g C) was supplied continuously to the shoots from day 7-30
14C-distribution on day 30mg/pot %
shoot 1692 57root 712 24root respiration and decomposition 484 16.3rhizosphere microbial biomass 48 1.6organic metabolites 33 1.1
sum 2969 100
6. Problems of sampling rhizosphere soil
Considerable efforts have been devoted in recent years to developing techniquesfor sampling the rhizosphere soil. This would offer new possibilities for investigat-ing root-microbial interactions related to rhizosphere nutrient turnover. However,most methods still suffer from technical or conceptual insufficiencies.
A classical, widely applied method for sampling involves careful removal of theroots from the soil after adjusting the soil moisture to a suitable level (40-50%
239
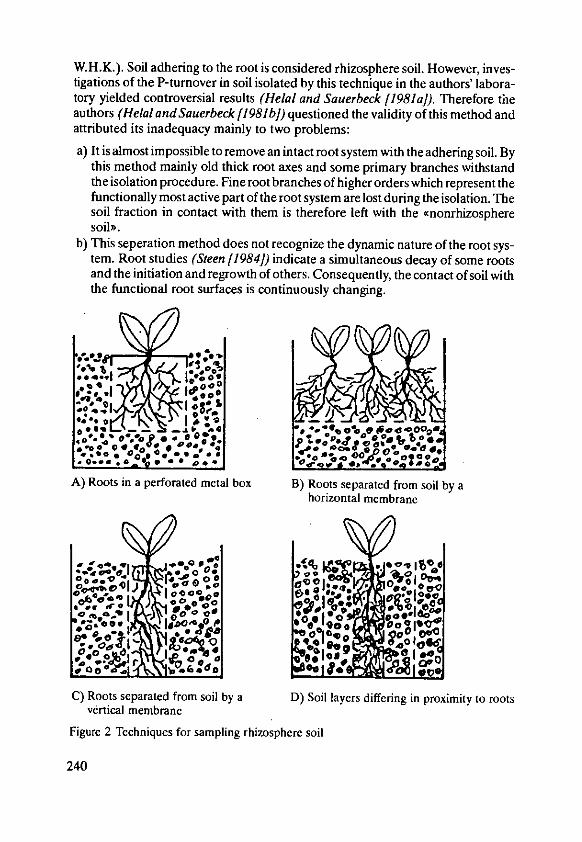
W.H.K.). Soil adhering to the root is considered rhizosphere soil. However, inves-tigations of the P-turnover in soil isolated by this technique in the authors' labora-tory yielded controversial results (Helal and Sauerbeck [1981a]). Therefore theauthors (HelalandSauerbeck [1981b]) questioned the validity of this method andattributed its inadequacy mainly to two problems:
a) It is almost impossible to remove an intact root system with the adhering soil. Bythis method mainly old thick root axes and some primary branches withstandthe isolation procedure. Fine root branches of higher orders which represent thefunctionally most active part of the root system are lost during the isolation. Thesoil fraction in contact with them is therefore left with the ,nonrhizospheresoilD.
b) This seperation method does not recognize the dynamic nature of the root sys-tem. Root studies (Steen [1984]) indicate a simultaneous decay of some rootsand the initiation and regrowth of others. Consequently, the contact of soil withthe functional root surfaces is continuously changing.
0,,S,. - -- - .,,0 I"0 to q o 0_, *+o .Oda* ,
.0.--. 4O a¢ IO ! :I I II :
A) Roots in a perforated metal box B) Roots separated from soil by ahorizontal membrane
. c a 0 _
vertieve memran
ee.c I 0or
IiWoao .0. o 0! 90
C) Roots separated from soil by a D) Soil layers differing in proximity to rootsvertical membrane
Figure 2 Techniques for sampling rhizosphere soil
240
'hie idea of restricting root penetration by using a water permeable harrier andcomparing soil modification on both sides seemed to offer a solution to these prob-lems. ftarmsen and Iager/]9 63/ used a technique (Figure 2A) by which the lom,wA ere restricted to a chamber made from a nickel sheet perforated with holes 60 umin diameter and considered the whole chamber as rhizosphere. However, it is clearthat the soil directly outside the box, receiving diffusible exudates and metabolitesthrough its pores must be by definition also considered as rhizosphere.
The model used by Kuchenbuch andJungk [1982/in ob es a horizontal separa-tion between roots and soil by a mesh screen (Figure 2B), leaving the whole rootsystem outside the soil. A similar situation i, encoutered in the techniques used by,/n3wn and /aq /1984/ and by AleLaughlin and A/ton /1987] who confined theroots inside a membrane (tigure 2C). It is evident that methods avoiding a regularsoil-root contact take insufficient account of the already mentioned physical root-soil interactions, which have a significant bearing on both root turmer and rootinfluences on the soil. Boerm anid Tien /1()79/ used a system of concentric cxlin-ders made of nylon netting and confined the root system to the central core. e ihislatter model acconts for physical root-soil interactions and makes possible thepreparation of rhizosphere soil in a reproducible way. The main problem with thissystem, howkever, is the difficulty of preparing regular cylinders from nylon gauzeand the breakthrough of roots at their jtints. Ta void these ditffcuties the aulthor,developed another technique (F igure 3) described belo,.
Appendix
7. Rhizosphere processes as a function of root proxiinit
The main feature of this technique is dis iding the soil by stainess steel mesh fabric,in to vertical planar layers ( Figure 3). 4 such mesh fabrics are held in position by rec-tangular rods of plexiglass which are fixed wkith screws to the plexiglass side wallsThis altows adjusing he di stance between the i nd iN iaal mesh labrics acrsos thewhole dest ed length. The whole set- up is placed on a sand layer (5mm) inside asuitable plastic container. This saud layer sein es ti isupply ,ater and at a later stageadditional nutrients. The unit is then filled with soid and tie central layer plantedwith two seeds. Root gri )th is thus restricted i nhis central layer Only root hairscan penetrate to the adjacent (intermediate) I ayer. but nes.er reach the outer soillayer. In this wax the three laver', reflect dil terent intensities of toot influences.
Work i th ,e'eral plant species ha, sh usn that the pore diatneter should notexceed 3t0-41 am in irder to present rioot from penetrating. but the open area otthe mesh ifabric should not be less than 20", since othcrwise water and solitnetransport to the oots max be impeded
241

N X)<-applicaion -
silicone rublbr
-> C O-free air ( blid to ahsorbent
frubber washer 4(
rI r contai n er I
soil Usand
Figure3 Arrangement for studying itenover processes in soil /ones of diffeTcn proxi imto roots:I ) root zone. 2) intermedialc zone. 3) outer loneDimensions = see text
A practical advantage of this system is that its dimensions may be %aried to suitthe desired duration of the experiment. This can he achieved by varying the area ofthe mesh fabrics and the distance between them. For short term experiments, thefollowing dimensions are recommended:
- side area 90X 105mm- thickness of central layer 20ram- thickness of half layers at both sides i0mm
A unit of these dimensions holds about 420g soil, i. i ( 140g i each laver. Whenadequately fertilized, this is sufficient to maintain 2 plants for 3-4 weeks.
[he three soil layers which are separated by this technique in order to be com-pared by analysis represent a reproducible gradient of root influences. A basicrequirement for the validity of conclusions drawn from such comparisons is undis-turbed transport of water and solutes across the layers. Disturbance may occureither through shrinkage of soil by drying or due to the tendency of the roots togrow at the interlace. This phenomenon is strengthened by soil compaction. It is
242

therefore recommended to adjust the soil density to 1.1 to 1.2 g/cm3 and the watercontent to 70% of the W.H.C.
The authors combined this technique with "C-labelling and microbial biomassdetermination in order to trace and study the turnover of plant derived carbon insoil zones of different proximity to the plant roots. Homogeneous labelling theplants with 14C is achieved by long term (at least 2 weeks) application of 14CO 2 ofconstant specific activity (usually 35 pCi/g C) to the shoots. This requires a gastight separation between shoots and roots. For this purpose, a rubber washer isfixed between the lid and the lip of the container. The plant shoots pass throughopenings drilled into the container lid and are sealed with silicone rubber. A circu-lating air stream carries the "CO 2 to absorbing flasks containing 3% NaOH. Thetotal amount of C thus collected from the rhizosphere during the growth period isthe sum of two components, namely root respiration and microbial root decompo-sition.
At the end of the growth period the shoots are cut, the individual soil layers sepa-rated by unscrewing the frame and the roots carefully removed from the centralzone. Root damage during this separation can be kept small by adjusting the soilmoisture content before harvest to about 50% of the water holding capacity. Mic-roscopic examination helps in removing any visible root fragments. The "C-con-tent in soil and plant samples is determined by liquid scintillation counting after drycombustion of the sample in a Woesthoff Carmograph. To measure plant derivedcarbon which is incorporated into the microbial biomass, soil samples are analysedby the chloroform fumigation technique of Jenkinson and Powlson 11976$.
An example of results obtained by the authors (HelalandSauerbeck[1986a]) ispresented in Table 3. It shows that the root carbon remaining in the rhizosphere ismainly (60%) bound in microbial cells. This suggests a prevailing contribution ofyoung easily decomposible root tissues to rhizosphere turnover. Furthermore thedata in Table 3 indicate a considerable migration of labelled root carbon. 29% ofthe plant-derived "C in soil was found outside the immediate root zone. Similarly20% of the microbial biomass "C in soil was located outside this central zone. Thismeans that root-derived carbon is transported to a considerable distance awayfrom the roots and available there for microbial utilization.
Table 3 Distribution of plant-derived labelled carbon in soil zones differing in proximityto roots of 30 d old maize plants
total 14C microbial 14Cmg/pot relative mg/pot relative
root zone 57.6 71) 38.3 80)intermediatezone 14.3 18) 6.2 13)outer zone 9.1 1I) 3.5 7)
sum 81.0 (100) 48.0 (100)relative (100) (60)
243
The important conclusion which can be drawn from this work is that the rhizos-phere area is not restricted to the immediate root-soil interface but involves a muchlarger soil volume. Helal and Sauerbeck [1986a] suggested using the detection ofroot-derived carbon in the soil as an indicator for estimating the actual size of therhizosphere.
8. References
1. Agrawal, A.S., Singh, B. R. andKanehiro, Y: Soil nitrogen and carbon mineralizationas affected by drying-rewetting cycles. Soil Sci. Soc. Am. Proc. 35, 96-100 (197 1)
2. Altemiller, H.-J.: Fluorescent light microscopy of soil-root interactions. XIi. Congr.Int. Soc. Soil Sci. 4, 1546-1547 (1986)
3. Alhemiller, H. -J. and Haag, Th.: Mikroskopische Untersuchungen an Maiswurzelnim ungest6rten Bodenverband. Kali-Briefe 16, 349-363 (1983)
4. Barber, S.A.: A diffusion and massflow concept of soil nutrient availability. Soil Sci.93, 39-49 (1962)
5. Barber, S.A.: Soil nutrient bioavailability. A mechanistic approach. Wiley-lntersci-ence, New York, 1984
6. Barber, D.A. and Gunn, K.B.: The effect of mechanical forces on the exudation oforganic substances by the roots of cereal plants grown under sterile conditions. NewPhytol. 73, 39-45 (1974)
7. Barley, K.P. and Greacen, E.L.: Mechanical resistance as a soil factor influencing thegrowth of roots and underground shoots. Adv. Agron. 19, 1-43 (1967)
8. Bhat, K.K.S. and Nye, P.H.: Diffusion of phosphate to plant roots in soil. 1. Quantita-tive autoradiography of the depletion zone. Plant Soil 38, 161-175 (1973)
9. Boero, G. and Thien, S.: Phosphatase activity and phosphorous availability in the rhi-zosphere of corn. In: The soil root interface. Ed. by J.L. Harley and R.S. Russell, pp.231-242. Academic Press, London, 1979
10. Bray, R. H.: A nutrient mobility concept of soil-plant relationships. Soil Sci. 78, 9-22(1954)
11. Brown, M.E.: Plant growth substances produced by microorganisms of soil and rhi-zosphere. J. Appl. Bact. 35, 443-451 (1972)
12. Brown, D.A. and Haq, A.: A porous membrane-root culture technique for growingplants under controlled soil conditions. Soil Sci. Soc. Am. J. 48, 692-695 (1984)
13. Chang, C. W. and Bandurski, R.S.: Exocellular enzymes of corn roots. Plant Physiol.39, 60-64 (1964)
14. Claassen, N., Hendriks, L. and Jungk, A.: Erfassung der Mineralstoffverteilung imwurzelnahen Boden dutch Autoradiographie. Z. Pflanzenerndhr. Bodenk. 144,306-316 (1981)
15. Cushman, J.H.: Nutrient transport inside and outside the root rhizosphere: general-ized model. Soil Sci. 138, 164-171 (1984)
16. Czapek, F.: Zur Lehre von den Wurzelausscheidungen. Jahrb. wiss. Bot. 29, 321-390(1896)
17. Dunham, R.J. andNye, P. H.: The influence of soil water content on the uptake of ionsby roots. 1. Soil watergradients neara plane of onion roots. J. Appl. Ecol. 10, 585-598(1973)
244
18. Dyer, B.: On the analytical determination of probably available tmineral, plant foodin soil. J. Chem. Soc. 65, 115-167 (1894)
19. Gardner, W.K., Barber, D.A. and Parbery, D. G.: The acquisition of phosphorous byLupinus albus L. Ill. The probable mechanism by which phosphorous movement inthe soil/root interface is enhanced. Plant Soil 70, 107-124 (1983)
20. Harmsen, G. W. and Jager, G.: Determination of the quantity of carbon and nitrogenin the rhizosphere of young plants. In: Soil organisms. Ed. by J. Doeksen and J. vander Drift, pp. 245-25 1., North Holland, Amsterdam, 1963
21. Harris, R.F., Chesters, G. and A lien, O.N.: Dynamics of soil aggregation. Adv.Agron. 18, 107-169 (1966)
22. Hela, H.M. and Sauerbeck, D.: Phosphatumsetzungen im Wurzelraum von Pflan-zen. Mitteilgn. Dtsch. Bodenkundl. Gesellsch. 32, 295-304 (1981a)
23. Helal, H.M. and Sauerbeck, D.: Ein Verfabren zur Trennung von Bodenzonenunterschiedlicher Wurzelnfhe. Z. Pflanzenern-ihr. Bodenk. 144, 524-527 (1981b)
24. Helal, H.M. and Sauerbeck, D.: Method for studying turnover processes in soil layersof different proximity to roots. Soil Biol. Biochem. 15, 223-225 (1983)
25. Helal, N. M. and Sauerbeck, D.: Influence of plant roots on carbon and phosphorousmetabolism in soil. Plant Soil 76, 175-182 (1984)
26. Helal, H.M. and Sauerbeck, D.: Effect of plant roots on carbon metabolism of soilmicrobial biomass. Z. PflanzenernAhr. Bodenk. 149, 181-188 (1986a)
27. Helal, H.M. andSauerbeck, D.: Influence of plant roots on the stability of soil organicmatter and of soil aggregates. XIII. Congr. Int. Soc. Soil. Sci. 3, 776-777 (1986b)
28. Helal, H.M. andSauerbeck, D.: Effect of antimicrobial agents on CO 2. developmentin the rhizosphere of nonsterile plants (in preparation).
29. Hilner, L.: Uber neucre Erfahrungen und Probleme auf dem Gebiete der Bodenbak-teriologie unter besonderer BerUcksichtigung der Griindfingung und Brache.Arbeitcn d. Dt. Landw.-Gesellsch. Berlin 98, 59-78 (1904)
30. Huck, M. G., Klepper, B. and Taylor, H. M.: Diurnal variations in root diameter. PlantPhysiol. 45, 529-530 (1970)
31. Huck, M. G. and Taylor, H.M.: The rhizotron as a tool for root research. Adv. Agron.35, 1-35 (1982)
32. Jayman, T. and Sivasubramaniam, S.: Release of bound iron and aluminium fromsoils by the root exudates of tea plants. J. Sci. Food Agric. 26, 1895-1898 (1975)
33. Jenkinson, D.S. and Powlson, D.S.: The effect of biocidal treatments on metabolismin soil. V. A method for measuring soil biomass. Soil Biol. Biochem. 8, 209-213(1976)
34. Kepert, D. G., Robson, A.D. and Posner, A.M.: The effect of organic root products onthe availability of phosphorous to plants. In: The soil-root interface. Ed. by J.L. Har-ley and R.S. Russell, pp. 115-125. Academic Press, London, 1979
35. Kuchenbuch, R. and Jungk, A.: A method for determining concentration profiles atthe soil-root interface by thin slicing rhizospheric soil. Plant Soil 68, 391-394 (1982)
36. Lund, Z.F. and Beals, H. 0.: A technique for making thin sections of soil with roots inplace. Soil Sci. Soc. Am. Proc. 29, 633-634 (1965)
37. McLachlan, K.D. and DeMarco, D.G.: Acid phosphate activity of intact roots andphosphorous nutrition in plants. Il1. Its relation to phosphorous garnering by wheatand a comparison with leaf activity as a measure of P-status. Aust. J. Agric. Res. 33, 1-11(1982)
38. McLaughlin, M.J. andAlston, A. M.: Transformation and movement of P in the rhi-zosphere. Plant Soil 97, 391-399 (1987)
245
39. Minchin, P.E. and McNaughton, G.S.: Exudation of recently fixed carbon by non-sterile roots. J. Exptl. Bot. 35, 74-82 (1984)
40. Morel, J.L., Mench, M. and Guckert, A.: Measurement of Pb, Cu, and Cd bindingwith mucilage exudates from maize (Zea mays L.) roots. Biol. Fertil. Soils 2, 29-34(1986)
41. Nagarajah, S., Posner, A.M. and Quirk, J.P.: Competitive adsorption of phosphatewith polygalacturonate and other organic anions on kaolinite and oxide surfaces.Nature 228, 83-85 (1970)
42. Nye, P.H.: The effect of nutrient intensity and buffering power of a soil and theabsorbing power, size and root hairs of a root on nutrient absorption by diffusion.Plant Soil 25, 81-105 (1966)
43. Nye, P.H. and Tinker, P.B.: Solute movement in the soil-root system. BlackwellScientific Publications, Oxford, 1977
44. Parish, D.H.: Effects of compaction on nutrient supply to plants. In: Compaction ofagricultural soils. Ed. by K.K. Barnes. ASAE, Michigan, 1977
45. Passioura, J. B.: A mathematical model for the uptake of ions from the soil solution.Plant Soil 18, 225-238 (1963)
46. Pfeffer, W.: Druck und Arbeitsleistung durch wachsende Pflanzen. Abhandlungender Kniglich S~ichsichen Gesellschaft der Wissenschaften 33, 235-474 (1893)
47. Phillips, R.E. and Brown, D.A.: Ion diffusion. Ill. The effect of soil compaction onself diffusion of Rubidium-86 and Strontium-89. Soil Sci. Soc. Am. Proc. 29, 657-661 (1965)
48. Reid, J. B. and Gross, M.J.: Interaction between soil drying due to plant water use anddecreases in aggregate stability caused by maize roots. J. Soil Sci. 33, 47-53 (1982)
49. Rogers, W.S.: Apple growth in relation to root stock, soil, seasonal and climatic fac-tors. J. Pomol. 17, 99-130 (1939)
50. Rovira, A.D. and Davey, C.B.: Biology of the rhizosphere. In: The plant root and itsenvironment. Ed. by E. W. Carson, pp. 153-204. Univ. Virginia Press, Charlottes-ville, 1974
51. Sauerbeck, D. and Johnen, B.: Ein vollstAndiges Klein-Phytotron zur Herstellung14C-markierter Pflanzen. Agrochimica 16, 62-76 (1971)
52. Sauerbeck, D. and Johnen, B.: Root formation and decomposition during plantgrowth. Soil Organic Matter Studies, 141-148. IAEA, Wien, 1977
53. Slayter, R.O.: Plant water relationships. Academic Press, London, 196754. Sprengel, C.: Die Lehre vom Diinger. Leipzig, 183955. Steen, E.: Variation of root growth in a grass ley studied with a mesh bag technique.
Swedish J. Agric. Res. 14, 93-97 (1984)56. Vancura, V., Rikryl, P., Kalachoval, Z. and Wurst, M.: Some quantitative aspects of
root exudation. Soil organisms as components of ecosystems, Ecol. Bull. (Stockholm)'25, 381-386 (1977)
57. Wang, J., Hesketh, J.D. and Wooley, J. T: Preexisting channels and soybean rootingpatterns. Soil Sci. 141, 432-437 (1986)
58. Warembourg, F.R. and Billes, G.: Estimating carbon transfer in the rhizosphere. In:The soil-root interface. Ed. by J.L. Harley and R.S. Russel, pp. 183-197. AcademicPress, London, 1979
59. Whiteley, G.M. andDexter, A.R.: Displacement of soil aggregates by elongating rootsand emerging shoots of crop plants. Plant Soil 77, 131-140 (1984)
246
Techniques for Studying the IonicEnvironment at the Soil/RootInterface
B. Jaillard, Dept. Soil Science, INRA, Montpellier/France*
Summary
The study of the ionic medium in the near rhizosphere encounters a problem of the solidphase which prevents access at the study site. This difficulty originates from the diversity ofstudy techniques used and developed in this field: dye indicator and derivative techniques,the techniques of microprobing and of soil labelling, micromorphology and electronicmicroanalysis. It seems that a particular effort should be made, on the one hand, in thedevelopment and the utilisation of glass ion-sensitive microeletrodes which permit thedirect measurement of ion activity in solution, on the other hand, in the utilisation of mi-cromorphology and associated techniques which permit the study of the near rhizospherein undisturbed soil.
1. Introduction
The absorption of mineral ions by the roots is accompanied by the exsorption ofacid or basic equivalents, inducing strong pH and ionic gradients around the roots(Nye[198]). This physiological process produces some important physico-chemi-cal modifications in the near rhizosphere such as the displacement of ionic equili-brium on the soil exchange complex (Kauffman and Bouldin (1967]; Farr et aL11969]; Kuchenbuch and Jungk [1982]), the reduction of metallic oxides andhydroxides (Marschner et aL [1982]), the mobilization of insoluble elements(Aguilarand van Diest[1981]; Grinstedetal. [19821; HedleyetaL [1982]), even thealteration of soil mineral constitutents (Spyridakis et aL [1967]; Malquori et aL(1975]; Jaillard [1984]). Yet, if the various effects of the roots on the medium aretoday well known, their influence on the soil mineral phase are clearly less wellknown, because of the complexity of the reactions which take place, and technicaland methodological difficulties encountered in the study of the ionic medium in thenear rhizosphere.
* Dr. B. Jaillard, Science de Sol, INRA - ENSA, 9 place Viala F- 34060 Montpel-lier/France
247
The problems are a result of the small dimension of relevant volumes, and of thedynamic aspect of the processes which take place, but especially of the presence ofa structured solid phase which prevents access at the study site. Different methodsand associated techniques have been developed and adapted to resolve this diffi-culty. Some, like micromorphology and electronic microanalysis, permit directaccess in the undisturbed soil. But they are destructive. Others, like labelling andmicroprobing, are still often experimental. For, if they permit taking the solid phaseinto account, they are efficient only in disturbed soils. Finally, it is equally possi-ble to dispose of the problem by eliminating the solid phase and by substituting forit a gel substrate which is more easily manipulated.
In this paper, we present the actual technics best adapted to an approach on anartificial medium, on disturbed soil or on undisturbed soil. In particular, we willinsist on their respective advantages and disadvantages, and on the type of infor-mation that they permit us to obtain.
2. Study Techniques on an Artificial Medium
2.1 The pH indicator technique
Plant culture on an artificial gel substrate is a modification of culture on a nutrientsolution. In effect, an agar-agar support is nothing but another stabilised solution, asolid-solution whose composition can easily be changed like a nutritive solution.From this principle, it becomes possible to examine the root activity along the rootusing an adequate indicator. This enabled, Wiesenseeletal /1979]to propose theuse of a dye indicator to reveal the variations of pH induced by the roots. The tech-nique consists of embedding the roots of a plantlet in a film of agar-agar gel, inwhich has been incorporated a pH dye indicator (Figure Ia). Acidification zonesare shown up by first raising the pH of the solid-solution to a value above that of thecolor change, alkalinization zones by reducing it.
Indicators that can be used are few because they must respond to several condi-tions. The indicator must not be lethal, nor toxic, for the roots, and it must not betoo strongly absorbed. Its color change must take place within the range of soil pH,that is around neutrality. Finally, the color change must be sufficiently clear to beobserved. But the color change range can be relatively large, a continuous variationof color favors the quantification of pH change induced (Pilet et a. [1983]; Verseland Mayor [1985]). Consequently, only three dye indicators are at present used:bromocresol green (Haussling et at [1985]), which changes the color at pH 4.5(yellow-blue), bromocresol purple (Wiesenseel et at [1979]), the most commonlyused indicator which changes color around pH 5.6 (yellow-purple), and phenol red(O'Neil and Scott [1983]), which has a color change near pH 7.5 (yellow-red).
This technique has several advantages which explain its success. It is simple touse and is cheap. The revelation is fast, in the order of a few minutes to an hourdepending on the conditions. Above all, it permits in a single operation the visuali-
248

sation of the functionning if the whole root system ot a plantlet, Furthermore, itdistinguishes the vartation in function of the dIfferent roots ol the same plantlet.[loecr. except into the weak color change of the indicator, this technique i, notquantitatic. Morcovei. the agar film is asphvxiating and so it is not adapted tolong-liked cultures.
Since its intrioduction, the p1l indicator technique has been improed andadapted to the study of the %ariations induced by the ioots in the soil. I ike a photo-sensitivc film, the colored agar film is laid (n a flat surface ol soil along which rheroots are grown. 'Iwo processes are used: either the film is formed directly on thesoil surface at 35-40 C (Figure lb), or films prefabricated in the laboratory areplaced on the surface (Figure 1 c) tfamsling ei t /1985/) The second process, isintercstinc because the film can he taken oIA after revelation and the plate ei inplace again. So it becKomie, possihlb to observe change in root activity, of the sameplant with time, These improem&ents allow in situ study if the near rhizosphere oflarge plant, such as trees,.
b
Ie. Impr)%cmcnt ( Pl I IpHnditnor tcchnia uc j li rf vl, 0If a platite t ,c turdt&dcd,in a hilm It dyte a ra .hich i, laid, i a pTILt, ( t) A 1,i sUrfacL oa 'ild, l ntl at I M chf)mts arc cro. s1 ,rnhcddi. wkith a dyie tI. ) A prefallbrtcated film" 1 put (Intl
Hlt sturtfcet of I.[
249
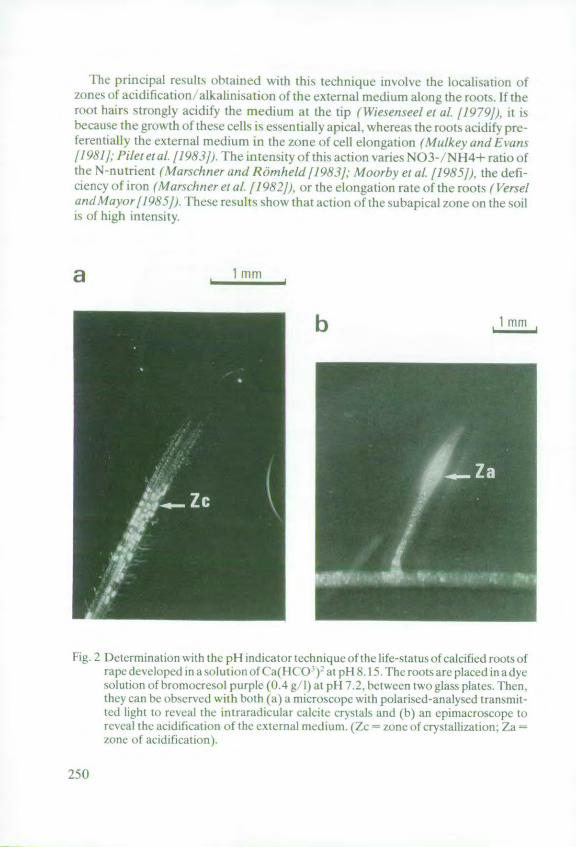
Ihe principal results obtained with this technique involve the Iicalisation ofzones of acidification, alkalinisat ion of the external medium along the roots. If theroot hairs strongly acidify the medium at the tip (Wiesenseel et aL /1079/), It isbecauise the growth of these cells is essentially apical, whereas the roots acidify pre-ferentiafly the external medium in the zone of cell elongation (MulkeyandEvans/1981/: ilerea! T/1983/). The intensity of this action varies N03-/NH4+ ratio ofthe N-nutrient (Marschner and Rdmhed 11983]: Moorbv et al. /1985j), the defi-cicncy of iron (N! arsehner et a/ 982/) or the elongation rate of the roots ( Vrseland Mavor/Q85). ' hese results show that action of the subapical zone on tile soilis of high iniensity.
a , 1 mm,.
6 , ,Inmd
Fig, 2 l)etermination with the p1 I indicator technique of the lite-status of calcified roots ofrape developed in a solun on of Caf(l('O) at pH 8.15. Fhe roots arc placed in a dyesolution of bromocresol purple (0.4 g /1 at pH 7.2, between two glass plates. Then.they can be observed with both (a) a microscope with polarised-analysed transmit-ted light to reveal the inraradicular calcite crystals and (b) an epimacroscopc toreveal the acidification o the external medium. (Zc - /one of crystallization Zazone of acidification).
250
In a contrary sense, this root property can be used to establish the life-status ofroots. Thus we have utilisated the dye indicator technique to examine rape rootswhich contain calcite crystals after one day of culture in alkaline calcic solution (Fi-gure 2a) (Jaillard and Davidian [unpublished data]). The roots are placed in analkaline dye solution between two glass plates. The color change of the pH indica-tor is observed, and the presence of calcite crystals in the roots is verified under themicroscope. The rapid change of color of bromocresol purple in the crystallizationzone which corresponds to the elongation zone (Figure 2b) shows that the calcifiedcells are alive. In these conditions the absorption of calcium is accompanied by itsaccumulation and crystallization as calcite in the cells of the elongation zone.
2.2 Derivative techniques
The root reducing activity can also be shown through reactions which accompanythe color change. Thus, Ambler et at [1971] used an oxidation-reduction reactionbetween a chelate of Fe III, (FeEDTA), and a chelatant of Fe II, which produced acolored complex. In the presence of both reagents, a red coloration appeared as aresult of the fall in redox potential of the solution. Similarly, for manganese, a deco-loration of the solution is observed when the manganese oxide, which is brown, isreduced. Following this principle, Marschner et al. [1982] incorporated the rea-gents into an agar film. Like the pH indicator technique, the position along theroots of the zones of reducing activity is shown by the colour changes of the sub-strate. The time of revelation is in the order of one hour for iron, and of one day formanganese under Fe-deficient conditions.
Beyond the results obtained, this work is especially interesting because of theprinciple which uses a chemical reaction and a phase change process. In effect,since the agar solid-solution plays no physico-chemical role, except an augmenta-tion of buffer-capacity of the medium, it is possible not only to incorporate into itother chemical reagents, but also mineral particles. Moreover, if it is convenient toreveal and to observe the studied phenomena by a simple color change, other ana-lysis techniques could be used: secondary chemical reactions, autoradiography,electronic microanalysis, fluorescence or polarized light. Though limited by itsprinciple, excessively reductionist, this technique should be susceptible to newdevelopments, especially with regard to the introduction of a mineral suspensioninto the agar film.
3. Study techniques in disturbed soil
Most studies on the solid phase have been on disturbed soil. Among the techniquesused, two permit access to the near rhizosphere of a single root: microprobing andsoil labelling.
251
3.1 Microprobing
This paper is limited to ion-sensitive electrodes the utilisation of which has becomegeneralized in chemistry and in biology. At present, there are specific electrodes formost ions exchanged between soil and root: H+, K , Na+, NH4+, Ca2 for thecations, and Cl-, N03- (and HC03- with platinum electrode) for the anions. Theelectrodes permit direct and continuous measurement of the activity of the ions insolution. Their time of response is short, generally less than one minute. However,many applications require probes of a small dimension. Therefore, a special efforthas been made in the direction of miniaturisation. Actually, the dimensions of com-mercial microelectrodes are in the order of one millimeter. This is not the lowerlimit. To measure the pH and the specific activities of plant and animal cells, elec-trophysiologists have built microelectrodes in which the diameter of the sensitivetip does not exceed one micrometer (Thomas[1978]). If the term microelectrode isappropriate for micrometric probes, then the term minielectrode might well beappropriate for millimetric probes.
Miniaturisation causes fragility of the tip, both at the sensitive membrane andthe probe tip itself, this limits their application in soil science. Moreover, the use ofelectrodes in the soil poses a problem of contact between the soil solution and theion-sensitive part of the probe. This problem becomes more difficult as soil mois-ture is decreased. These constraints induced Schaller and Fischer [1981], thenHaussling et al. [1985] to fabricate antimony minielectrodes. Built into reinforcedPasteur pipettes of 0.9 to 0.5 mm diameter, these probes have the advantage ofbeing sufficiently strong to support, without damage, the mechanical constraintsimposed by the presence of a solid phase. Haussling et al [1985] even introducedthem into compacted soils. Since they are less selective than the glass membraneelectrodes (Quehenberger [1977]; Schaller and Fischer /1981]) they have bettercontact with the soil solution, and consequently they are better suited to the studyof the soil solution.
Schaller and Fischer [1985]and Schaller[1987] inserted them in a special expe-rimental device in which there are about ten electrodes. But with this method, it isnecessary to orient the root growth toward the probes. The problem is resolved bypromoting the growth of the roots along the side wall of the sample by inclining theculture device. They show that the different pH profiles in the near rhizosphere aresimilar to the theoretical profile calculated by Nye [1981] and depend mainly onthe buffer-power of the soil. The extension of the pH rhizosphere is inverselyrelated to the buffer-power of the soil. A better relation is obtained with short termbuffering, measured 5 minutes after the addition of HCI, a notion which includes akinetic aspect in the reaction processes of the mineral phase.
In fact, despite these techniques being potentially among the most interesting,the microprobes are little used in the study of the ionic medium in the near rhizo-sphere. It seems that a particular effort should be made in this direction, becausethe techniques of microprobing are at present the only ones that permit a determina-tion of specific ion activities in the near rhizosphere solution during its function-
252
ing. They should take into account both the diffusive and the kinetic aspects whichare important as soon as there are chemical reactions with the soil.
3.2 The technique of soil labelling
A second method consists in introducing into the soil a specific label, most com-monly a radioactive element (Walker and Barber [1961]. This method is solelyexperimental. Autoradiography shows the distribution of the radioactive label,either by exposing a sensitive film, or by direct analysis with a microintegrator or amicrodensitometer. The technique is specific for the element introduced, andinterference is unlikely. The natural background noise is negligible and the sensiti-vity of this technique depends at once on the texture of the soil used, which must bevery fine, and on the initial homogenity of the label distribution. These conditionsare general for all microanalytical techniques, like electronic microanalysis (seebelow). Claassen et at [1981]show that the resolution is better with radioelementswhich emit radiation of low energy.
The realisation of a flat surface poses a problem. This can be achieved by the sidewall of a culture pot. The advantage of this method is to permit the study of the evo-lution of the depletion profile along the roots (Figure 3a). This method, alreadymentioned under the techniques of pH indicator and of microprobing, is the mostfrequently used because it is the most convenient, but it favours some undesirableside-effects: first, the reduction by a half of the soil volume exploited by the roots,second, the preferential growth of root hairs along the sample wall, and finally, thecreation of an anisotrophy of transfer properties of the medium. These edge-effectsare removed by the culture device used by Farr et at. [1969] and Kuchenbuch andJungk [1982] (Figure 3b). But this does not permit to study the rhizosphere of asingle root. The flat surface can be made on a consolidated sample (Sanders[1971]), but embedding could possibly induce a secondary redistribution of theelement under study. Kraus eat [1987]propose consolidating the sample by quickfreezing, which can then be sawn. Advantageously, consolidation makes the possi-ble the study of a transverse section of the near rhizosphere (Figure 3c).
Unlike the techniques of dye indicating and of microprobing, autoradiographydoes not inform us directly about the ionic composition of the soil solution. It givesan image of the distribution of the fixed elements in the near rhizosphere. The con-centrations are calculated from the absorption isotherms, assuming that we are atequilibrium. Moreover, unlike the techniques previously described, which give aninstantaneous image of the ionic environment of the root, autoradiography revealsthe cumulative root action on the diffusion of elements over a period.
Autoradiography has been used with most nutrient elements. In particular, it hasshown that a soluble element which is not absorbed by the root as a sulfate is accu-mulated at the root surface (Barber eat [1963]). This phenomenon is well knownin the soil in the case of gypsum and lime. The artificial introduction of the radioele-ment permits selective labelling of certain reactive sites, for example the soilexchange complex. Using this property, Jungk et at 11982] showed that the deple-
253
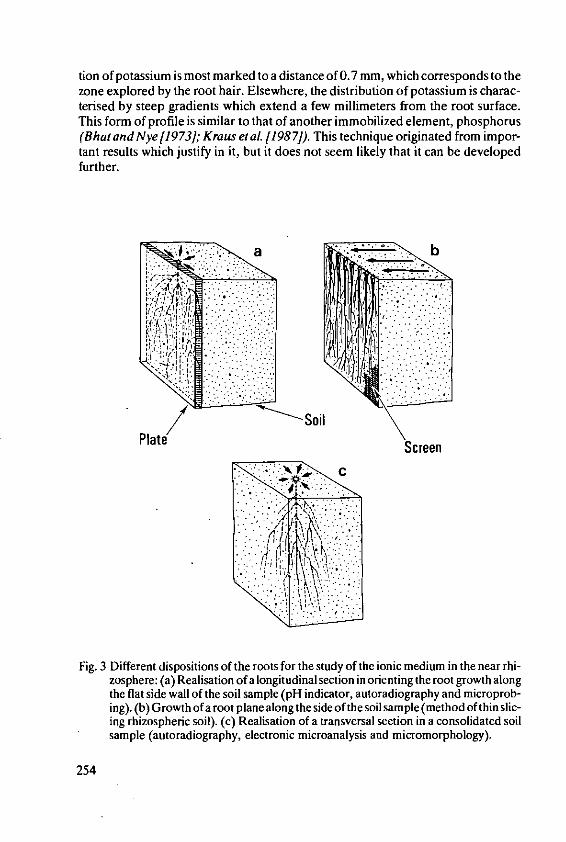
tion of potassium is most marked to a distance of 0.7 mm, which corresponds to thezone explored by the root hair. Elsewhere, the distribution of potassium is charac-terised by steep gradients which extend a few millimeters from the root surface.This form of profile is similar to that of another immobilized element, phosphorus(Bhat andNye 11973]; Kraus et at 11987]). This technique originated from impor-tant results which justify in it, but it does not seem likely that it can be developedfurther.
'a :-'.- b
' ' S oil "r e
th lat d ao he si aplSc ndctr atrdoreey ndMCpr
ing). (b) Growth of a root plane along the side of the soil sample (method of thin slic-ing rhizospheric soil). (e) Realisation of a transversal section in a consolidated soilsample (autoradiography, electronic microanalysis and mieromorphology).
254
4. Study techniques in undisturbed soil:
A third group of methods for study of the ionic medium in the near rhizosphereincludes micromorphology and electronic microanalysis. These permit the obser-vation of undisturbed soil samples taken from the field, and further, they allow thestudy of modifications induced by the roots in nature. Developed by solid physicsand used in soil science (Bullok et at 11985), they rely on the observation of po-lished surfaces and thin sections of soil samples under various light conditions. Thesoil samples are consolidated by embedding in synthetic resins, sawn and then po-lished. There are several methods of observation: optical microscope with naturalor polarised transmitted light, with reflected or fluorescent emitted light. Thechoice depends on the type of information that one hopes to obtain. Actually. thesetechniques are extended by scanning or transmission electronic microscopy.
Micromorphology is most often associated with electronic microanalysis(Wieder and Yaahhn /19741; Qureshi et a! /1978/). the development of which islinked with the electronic microscope. In effect, a sample bombarded by an elec-iron beam emits various signals of which certain can be transformed into a threedimensional image, while others can be used for analysis (Maurice et al/1978]).lhe spatial resolution of electron microprobes is in the order of a cubic micrometer.
That is the best spatial resolution among the analytical techniques that we haveexposed. Multipurpose. these methods have found numerous applications in soilscience, in fields as different as mineralogy, soil physics, soil biology and study ofthe rhizosphere (Lund [1965/; foster et a! 119831: iippkotter et at 1986]).
Micromorphology on soil thin sections provides much information on the struc-ture and organisation of the near rhizosphere resulting from the ionic processeswhich take place. Phenomena such as the reorientation of clays in the near rhizo-sphere can beclearly observed with polarised-analysed light (Figure 4). The natureand distribution of the minerals can be determined both by observation underpolarised light and microanalysis. T hus. the first ionic accumulation or depletionphenomena in the near rhizosphere have been identified by observation on crudesamples (Harley and Lindner /1945]; Greenland /1979/), then soil thin sections(Callic et al. 1983/; Jaillard 1985/). Figure 5 shows a rhizostructure which ischaracterised by the segregation of soluble and insoluble fractions of soil. Thisrhizostructure is developed in a calcareous marl, density 1.55 to 1.80 g/cml andlime content 0.76 gg. Observation on soil thin section by polarised-analysed lightreveals a well marked ring of calcite alteration. In this zone of depletion, the clay ,are oriented parallel to the rot axis. Flectron probe microanalytical study permit,the quantification of clement concentrations. The profiles of calcium (IFigure 6a)and of phosphorus (data not presented) confirm the depletion of these elementsin contact with the root, in zones only 1501 to 250 urn in width. In this case. the highbuffer capacity ol lime considerably reduces the extcnsion of the rhi/osphere.(orlverscly. alunminm (Figure 6b) and potassium (data not presented) accumu-late in the near rhizosphcrc. Both profiles are equally infoirmative because theoreflect the distribution of the ootl clay fraction. From thi' tact. alunnium and
25 5
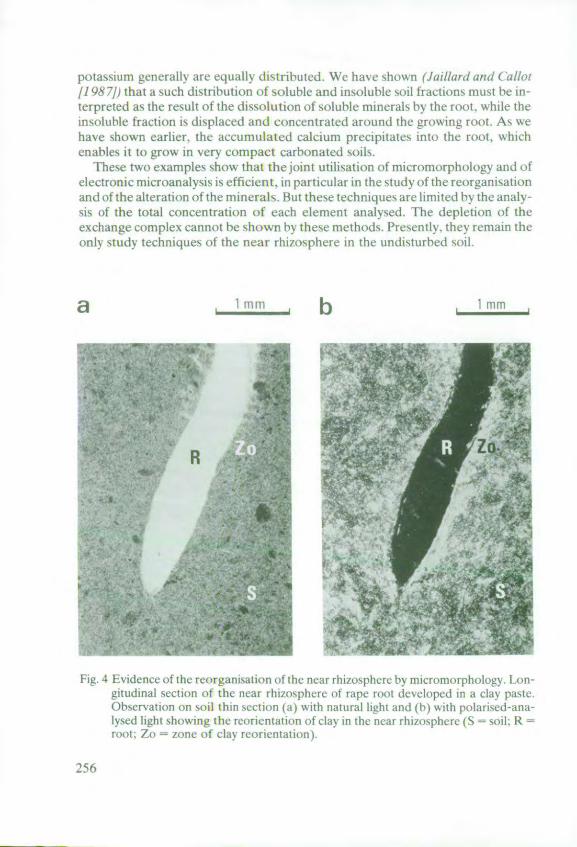
potassium generally are equally distributed. We have shown (Jaillard and (allot11987/) that a such distribution of soluble and insoluble soil fractions must be in-terpreted as the result of the dissolution of soluble minerals by the root, while theinsoluble fraction is displaced and concentrated around the growing root. As wehave shown earlier, the accumulated calcium precipitates into the root. whichenables it to grow in very compact carbonated soils.
These two examples show that the joint utilisation of micromorphology and ofelectronic microanalysis is efficient, in particular in the study of the reorganisationand of the alteration of the minerals. But these techniques are limited by the analv-sis of the total concentration otf each element analysed. The depletion of theexchange complex cannot be shown by these methods. Presently, they remain theonly study techniques of the near rhizosphere in the undisturbed soil.
a 1n11 b Trup
Fig. 4 Evidence of the reorganisation of the ncat rhizosphere by micromorphologv. Lon-gitudinal section of the near rhizosphere of rape riiot developed in a clay paste.Observation on soil thin section (a) with natural light and (b) with polarised-ana-lysed light showing the reorientation of clay in the near rhizsphcre (S =soil: -m:t; Zo = zone of clay reorientation).
256
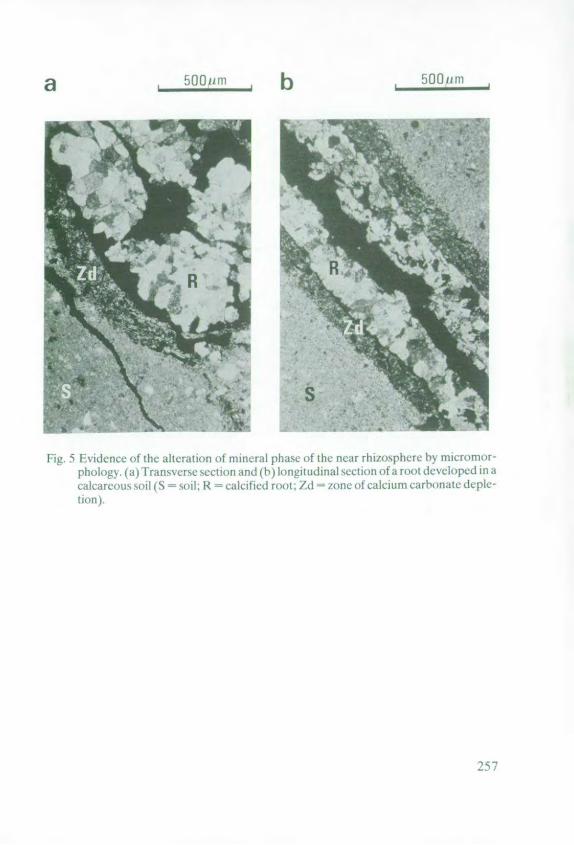
a , 500im b 5001m
i,N
BN
ig,5 Evidence of the alteration of mineral phase of the near rhizospherc by micromor-
phologx. (a)lramsvcrse section and (b) longitudinal section of a root deceloped in acalcareous soil (S =oiL R calcified otl Zd /A-- zOtIC calcium carbonratc dcple-tioi).
257
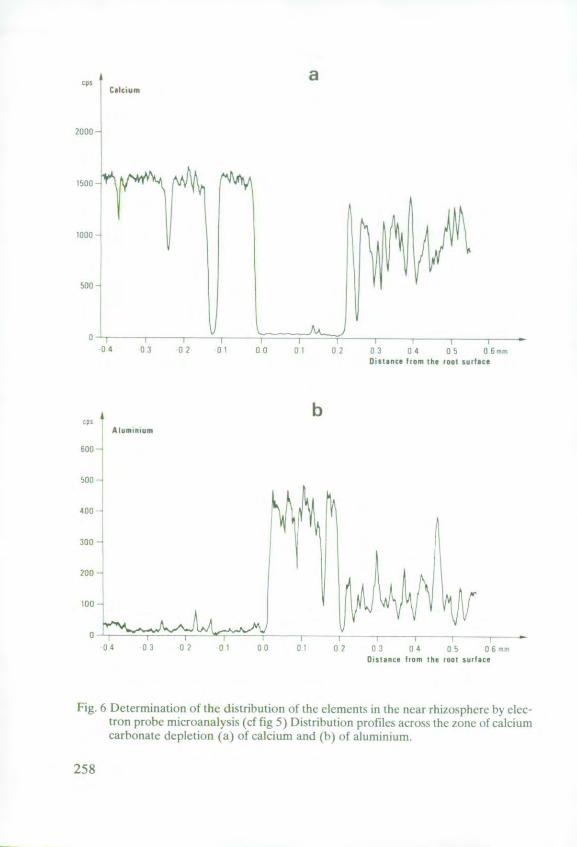
4a
I~uI
Q J.O 9? '1 94 a b Ot
4000
Dlst~nte from he icon surface
A i bC5
200 --- '
Th . ...... T7,
Distance from the root surface
Fig. 6 l elermination of[ the distribution ot the elements in the near rhizosphere by elec-tron probe microanalysis (cf fig 5)1 )isrribution profile:s across the Zone t,$ calciumcarbonate depletion (a) of calcium and (5) of aluminium.
258
5. Conclusion
In discussing techniques for study of the ionic medium in the near rhizosphere, wehave tried to show how the effect of the solid phase on root action and the effect ofroot activity on the soil mineral phase can be taken into account. Both the specifi-city and the complementarity of each of the methods used has been underlined.
While methods using an artificial medium enable one to show the effect of theroot on the medium, their application is limited to the acidifying and the reducingactivity of the roots. Labelling techniques and microprobing are well adapted tostudies on disturbed soils. Microprobing methods should be developed, for theseare the only techniques that permit direct determination of the activity of ions insolution, as well as the composition of the air in the near rhizosphere. However,they are poorly adapted to the study of undisturbed soil.
On the other hand, although not able to approach the functionning of the soil-root system, the techniques of micromorphology and of electronic microanalysisrecord the effect of root activity on the reorganisation and the alteration of differentmineral constituents of soil. They can be used equally well in disturbed and undis-turbed soils. Moreover, they permit study of the near rhizosphere of roots growingunder difficult conditions, e.g. in the deep horizons of the soil. These techniquescould be more frequently employed in this field.
6. References
1. A guilar, A. and van Diest, A.: Rock-phosphate mobilization induced by the alkalineuptake pattern of legumes utilizing symbiotically fixed nitrogen. Plant and Soil, 61,27-42 (1981)
2. Ambler, I.E., Brown, J. C. and Gauch, H. G. Sites of iron reduction in soybean plants.Agron. J., 63, 95-98 (1971)
3. Barber, S.A., Walker, J.M. and Vasey, E.H.: In: Solute movement in the soil-root sys-tem, ed. Nye, P.H. and Tinker, P.B., 342 p., 1977
4. Bhat, K. K.S. and Nye, P.H.: Diffusion of phosphate to plant roots in soil: . Quantita-tive autoradiography of the depletion zone. Plant and Soil 38, 161-175 (1973)
5. Bullock, P., Fedoroff, N., Jongerius, A., Stoops, G., Tursina, T. and Babel, U.:Hand-book for soil thin section description. Waine Res. Public. Ed., 152 p. 1985
6. Callot, G., Chamayou, H., Maertens, C. and Salsac, L.: Les interactions sol/racine:incidence sur la nutrition minrrale. INRA, Paris, 360 p., 1983
7. Claassen, N., Hendricks, L. and Jungk, A.: Erfassung der Mineralstoffverteilung imwurzelnahen Boden durch Autoradiographie Z. Pflanzenem.hr. Bodenk. 114, 306-316(1981)
8. Farr, E., Vaidyanathan, L. V. and Nye, P.H.: Measurement of ionic concentrationgradients in soil near roots. Soil Sci. 107, 385-391 (1969)
9. Foster, R. C., Roviera, A. D. and Cock, T. W.: Ultrastructure of the root-soil interface.Amer. Phytopath Soc. Ed., 157 p, 1983
259
10. Greenland, D.: The physics and chemistry of the soil-root interface some commentsp. 83-98,, in The Soil-Root Interface, ed. Harley, J.L. and Russel, P.S., AcademicPress, London, 1979
11. Grinsted, M., Hedley, M., White, R.E. and Nye, P.H.: Plant-induced changes inthe rhizosphere of rape (Brassica napus var. emerald) seedlings: 1. pH change and theincrease in P concentration in the soil solution. New Phytol., 91, 19-29 (1982)
12. Harley, C.P. and Lindner, R. C.: Observed responses of apple and pear trees to someirrigation waters of north central Washington. Proc. Amer. Soc. Hort. Sci., 46,35-44(1945)
13. Haussling, M., Leisen, E., Marschner, H. andRdmheld, V.: An improved method fornon-destructive measurement of the pH at the root-soil interface (rhizosphere). J.Plant Physiol., 117, 371-375 (1985)
14. Hedley, M.J., Nye, P.H. and White, R. E.: Plant-induced changes in the rhizosphere ofrape (Brassica napus var emerald) seedlings: 11. Origin of the pH change. New Phytol91, 31-44 (1982)
15. Hendricks, L., Claassen, N. and Jungk, A.: Phosphatverarmung des wurzelnahenBodens und Phosphataufnahme von Mais und Raps Z. Pflanzenernahr. Bodenk. 144,486-499 (1981)
16. Jaillard, B.: Mise en evidence de la n6og6n~se de sables calcaires sous l'influence desracines: incidence sur la granulom6trie du sol. Agronomie 4, 91-100 (1984)
17. Jaillard, B.: Activit6 racinaire et rhizostructures en milieu carbonat6. Pedologie.XXXV, 3, 297-313 (1985)
18. Jaillard, B. and Callot, G. Action des racines sur la stgr6gation minfralogique desconstituants, du sol. C.R. Congr. Int. Micromorphologie Sols, ed. N. Fedoroff, L.M.Bresson and M.-A. Courty, A.F.E.S., Plaisir, 371-375, 1987
19. Jungk, A., Claassen, N. and Kuchenbuch, R.: Potassium depletion of the soil-rootinterface to soil parameters and root properties. C.R. 9e Inter. Coll. Plant Nutrition,vol. 1, 250-255 (1982)
20. Kauffman, M.D. and Bouldin D.R.: Relationship of exchangeable and non-exchangeable potassium in soil adjacent to cation-exchange resins and plant roots.Soil Sci. 104, 145-150 (1967)
21. Kraus, M., Fusseder, A. and Beck, E.: In situ-determination of the phosphate-gra-dient around a root by radioautography of frozen soil sections. Plant and Soil. 97,407-418 (1987)
22. Kuchenbuch, R. and Jungk, A.: A method for determining profiles at the soil-rootinterface by thin slicing rhizospheric soil. Plant and Soil. 68, 391-394 (1982)
23. Lund, Z.F.: A technique for making thin sections of soil without roots in place. SoilSci. Soc. Am. Proc. 29, 633-635 (1965)
24. Malquori, A., Ristori, G. and Vidrich, V.: L'alt6ration biologique des silicates depotassium: I. Biotite. Potash Review. Subject 3, 1-7 (1975)
25. Marschner, H., Rtimheld, V. and Ossenberg-Neuhaus, H.: Rapid method for measu-ring changes in pH and reducing processes along roots of intact plants. Z. Pflanzen-physiol. 105, 407-416 (1982)
26. Marschner, H. andR6mheld, V.: In vivo Measurement of root-induced pH changes atthe soil-root interface: effect of plant species and nitrogen source. Z. Pflanzenphysiol.111, 241-251 (1983)
27. Maurice, F., MOny, L. and Tixier, R.: Microanalyse et microscopie 6lectronique 4 ba-layage. Ed. de Physique. Orsay. 534 p., 1978
260
28. Moorby, H., Nye, P.H. and White, R.E.: The influence of nitrate nutrition on Hefflux by young rape plants (Brassica napus cv. emerald). Plant and Soil. 84,403-415(1985)
29. Mulkey, TJ. and Evans, M. L.: Geotropism in corn roots: evidence for its mediationby differential acid efflux. Science. 212, 70-71 (1981)
30. Nye, P.H.: Changes of pH across the rhizosphere induced by roots. Plant and Soil. 6 1,7-26 (1981)
31. O'Neill, R.A. and Scott, T.K.: Proton flux and elongation in primary roots of barley(Hordeum vulgare L.). Plant Physiol. 73, 199-201 (1983)
32. Pilet, P.-E., Versel, 1.-M. and Mayor, G.: Growth distribution and surface pH pat-terns along maize roots. Planta. 158, 398-402 (1983)
33. Quehenberger, P.: The influence of carbon dioxide, bicarbonate and other buffers onthe potential of antimony microelectrodes. Pflugers Arch. ges. Physiol. 368, 141-147(1977)
34. Qureshi, R.H., Jenkins, D.A. andDavis, R.L: Electron probe microanalytical studiesof phosphorus distribution within soil fabric. Soil Sci. Soc. Am. J. 42,698-703 (1978)
35. Sanders, F.E. T.: The effect of root and soil properties on nutrient uptake by compe-ting roots. PhD. Thesis. Oxford University, 1971
36. Schaller, G. and Fischer, W.R.: Die Verwendung von Antimon-Elektroden zur pH-Messung im Boden. Z. PflanzenerAhr. Bodenk. 144, 197-204 (1981)
37. Schaller, G. and Fischer, W.R.: pH-Anderungen in der Rhizosph.re von Mais- undErdnusswurzeln. Z. Pflanzenerniihr. Bodenk. 148, 306-320 (1985)
38. Schaller, G.: pH changes in the rhizosphere in relation to the p1-buffering of soils.Plant and Soil. 97, 444-449 (1987)
39. Spyridakis, D. E., Chesters, G. and Wilde, S.A.: Kaolinization of biotite as a result ofconiferous and deciduous seedling growth. Soil Sci. Soc. Am. Proc. 31, 203-210(1982)
40. Thomas, R.C.: Ion-sensitive intracellular microelectrodes: how to make and usethem. Acad. Pres. London. 110 p., 1978
41. Tippkotter, R., Ritz, K. and Darbyshire, J. F.: The preparation of soil thin sections forbiological studies. J. of Soil Sci. 37, 681-690 (1986)
42. Versel, J. -M. and Mayor, G.: Gradients in maize roots: local elongation and pH.Planta 164 96-100 (1985)
43. Walker, J.M. andBarber, S.A.: Ion uptakeby livingplant roots. Science 133,881-882(1961)
44. Wieder, M. and Yaalon, D.H.: Effect of matrix composition on carbonate nodulecrystallization. Geoderma 11, 95-121 (1974)
45. Wiesenseel, M.H., Dorn, A. and Jaffe, F.J.: Natural H+ currents traverse growingroots and root hairs of barley (Hordeum vulgare L.). Plant Physiol. 64, 512-518(1979)
261
Methods for Quantification of RootDistribution Pattern and RootDynamics in the Field
M. van Noordwijk, Institute for Soil Fertility, Haren/The Netherlands*
Summary
For a functional evaluation of root systems in the field, two aspects deserve special interestand require separate methods for their study:
A. Spatial root distribution: heterogeneity of local root density in relation to plantingpattern, soil structure, and heterogeneity of nutrient supply. Recently such heterogeneitieshave become the subject of research as such and are no longer treated as merely a nuisancein establishing effects of experimental treatments on average root densities. On a detailedlevel the degree of actual soil-root contact has become of interest.
B. Root dynamics in time: root growth and decay in the field can hardly be studied bydestructive means, due to the large spatial heterogeneities. They have to be quantified byrepeated observations of the same roots, under conditions which approach field condi-tions as much as possible.
For both types of information additions to and improvements of classical techniques aregiven: relations between basic root parameters, sampling schemes, quantification of rootanisotropy, quantification of pattern in root distribution, quantification of soil-root con-tact and the mini-rhizotron technique for quantifying root dynamics.
1. Introduction
As the root system in its size, distribution and dynamical pattern forms an import-ant link between plant and soil, the current trend of devising more efficient fertili-sation techniques requires thorough knowledge of roots (Van Noordwijk & De Wil-ligen [1986]). Classical techniques for excavation and study of roots have beendescribed extensively (Schuurman & Goedewaagen [1971]; B6hm [1978]); in thispaper new additions to the methods will be discussed.
Root studies in the field usually have one of the following three objectives:- study of overall root pattern as indicator of soil conditions,- quantification of roots for an interpretation of the relative availability of water
and nutrients in various soil layers throughout the season, and- quantification of input of organic matter through the root system to the soil eco-
system.
* Dr. M. van Noordwik, Instituut voor Bodemvruchtbaarheid, P.O. Box 30003, NL-9750 P.A. Haren/The Netherlands
263
Here we will concentrate on the last two, quantitative objectives. Root researchin the past mainly quantified root dry weight, which is still of interest for the thirdresearch objective. For the second objective, root length and root surface area aremore interesting parameters. We will first consider the relations between theseroot parameters.
2. Relations between basic root parameters
2.1 Geometry of roots
Generally roots can be assumed to be cylindrical in shape, i.e. increase of diameteralong the length of a root and deviations from a circular shape in cross section arenegligible. For such a cylinder simple relationships exist between length, surfacearea and volume:
Vr = x" R ,2 " Lr = Ar• R,/2 [cm3] (1)
where:V, = root volume [cm 3]Ar = root surface area [cm 2]L, root length [cm]R,, = root radius [cm]
Root volume is related to root fresh weight via the specific weight and root por-osity; root dry weight is related to root fresh weight via the dry matter content:
Dr = Mdr*F,= Mdr - (-P,) • Sr• Vr [g] (2)
where:D = root dry weight [g]F, = root fresh weight [g]Mr = dry matter content of rootsP, = air filled root porosity as fraction of V,S, specific weight of root tissue without air filled pores[g cmr 3]
A root system consists of a set of partly interconnected cylinders of variouslengths and diameters. The relationships between root system values of basicdimensions such as length, surface area and volume are similar to those for singleroots, except for the definition of the average root radius. If the root system consistsof n classes of roots, each with root radius Ro (i) and root length per class L, (i), wemay define two types of average root radius, a linear average P.o and a quadraticaverage Po:
n nP. = (E Lr (i) • R(i))/' Lr (i) [CM] (3)
i=l il
264
E L, (i) • R. (i) 2 /ZL, (i) [cm] (4)i=l i=l
For the root system as a whole we find:
n nVrp =I Z V(i)=T • ' L, (i)=x • , 2 Lp [cm 31 (5)
i --l- i ----
n nA, =YA, (i)= 2 - E • L,(i)= 2 x • • LP [cm 2l (6)
i=I i-I
and consequently
VP =A1 • (A, / I)2 " P,,/2 [cm 3] (7)
The term R,/,, has been neglected by several authors when relating rootvolume to root length via average root diameters. This term reflects the variation inroot diameters in the root system, being 1.0 for homogeneous root systems and >1for heterogeneous root systems. If root porosity and dry matter content vary inde-pendently from root diameter, equation (2) holds for the root system, using (linear)average values for all parameters. Combining (2) and (7) we find for the specificroot surface area, Arp/Dp:
Arp/Dp = 1/(Md.r. (1-Pr)" S,• (fo/2) • (f,,/R,)2) [cm 2/gJ (8)
For the specific root length, L,P/D,, we find:
Arp/Dp = 11(31- Mdr. (1-P')- S,' (K% " (fo/%)2) [cm/gj (9)
Figure 1 shows commonly found values for the Arp/Drp and Lrp/Drp ratio, asinfluenced by the parameters of equations (8) and (9). A plant apparently has fourpossibilities to obtain a larger surface area per unit dry weight: a low average rootradius, a low dry matter content, a high root porosity and a homogeneous root sys-tem (in terms of root radius). The parameter S, will not deviate much from 1.0.
Equation (9) shows that tire average root radius alone does not give sufficientinformation to estimate the ratio of root length and root dry weight. Moreover, thecondition used for deriving equation (9) that root porosity and dry matter contentvary independently of root diameter will not usually be fulfilled. Root length anddry weight have to be measured on individual (sub)samples to get reliable results.
Specific root length for various crops and situations usually is in the range 100-300m/g, for roots with an average root diameter of 0.2-0.3mm.
265
specific root specific rootsurface area lepngthm 2/ m/g0.2
A 300 B0.1 100
0.07-30
004b10
a 025 1.0 d
b 005 1.0001 c 005 1.1
0.05 1.2 1I I II I I I
01 0.3 0.5 0.7 10 0.1 0.3 0.5 0.7 1.0mm root radius RO
Fig. 1 Ratio of root dry weight and root surface area (A) or root length (B) as function ofaverage root diameter (equations [8J and [9]); parameters used MdT = 0.075, P, =0.05 or 0.25, S, = 1.0; the lines for P, = 0.25 can also be interpreted as Mdl = 0.059,P, 0.05.
2.2 Methods
Usually root length and diameters are determined on subsamples, using dry weightas a reference for calculating total root length and surface area. Root length is mea-sured on a grid by counting root-line intersections following Tennant [1975,choosing the grid size in such a way that about 400 intersections are found per sub-sample (this reduces the experimental error to less than 5%). Root diameter ismeasured on 20-30 randomly chosen roots per subsample. For calculations ofaverage root diameter data of a number of subsamples have to be pooled, depend-ing on the coefficient of variation; for a c.v. of 0.3, 40 readings are required toreduce this experimental error to less than 10%, for a c.v. of 0.5 100 readings andfor a c.v. of 0.7 200 readings, in practice the c.v. of root diameters in root samplesexcluding tap and main roots is found somewhere in this range. By measuring rootdiameter at every 10th intersection of a root system with a line grid, both types ofaverage root radius defined in (3) and (4) can be calculated:
no -R/n (10)i=ln
I R0 (i)2/n = var(R) + P 2 (11)n=l
266
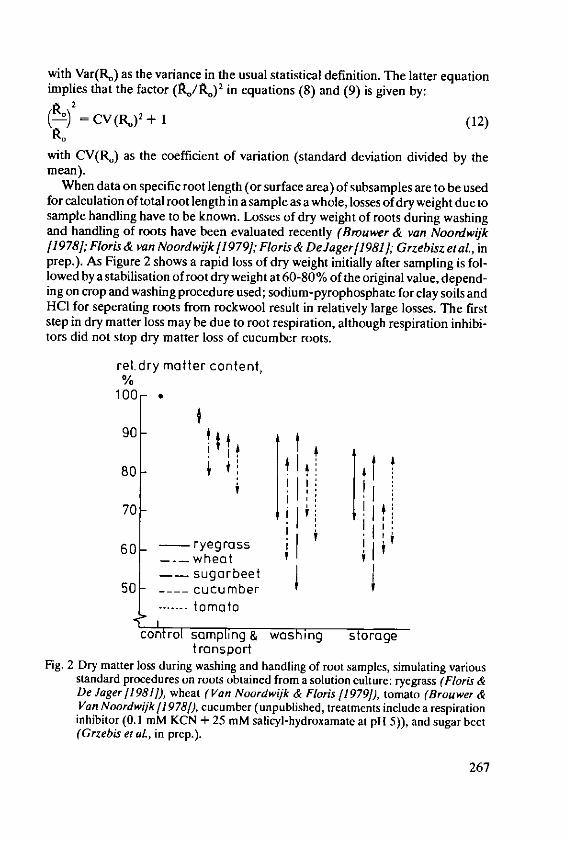
with Var(R,) as the variance in the usual statistical definition. The latter equationimplies that the factor (k 0/&) 2 in equations (8) and (9) is given by:
ft2('-) = CV(R) 2 + 1 (12)
(12with CV(Ro) as the coefficient of variation (standard deviation divided by themean).
When data on specific root length (or surface area) of subsamples are to be usedfor calculation of total root length in a sample as a whole, losses of dry weight due tosample handling have to be known. Losses of dry weight of roots during washingand handling of roots have been evaluated recently (Brouwer & van Noordwijk11978]; Floris & van Noordwijk [1979]; Floris & DeJager[1981]; Grzebisz etal, inprep.). As Figure 2 shows a rapid loss of dry weight initially after sampling is fol-lowed by a stabilisation of root dry weight at 60-80 % of the original value, depend-ing on crop and washing procedure used; sodium-pyrophosphate for clay soils andHCI for seperating roots from rockwool result in relatively large losses. The firststep in dry matter loss may be due to root respiration, although respiration inhibi-tors did not stop dry matter loss of cucumber roots.
rel. dry matter content,
100-
90- I$
80 - $" f70 I
60- -ryegrass l'-0--- wheat I
50 -sugarbeetSO- .. cucumber
------- tomato
con tro[ sampling & washing storagetransport
Fig. 2 Dry matter loss during washing and handling of root samples, simulating variousstandard procedures on roots obtained from a solution culture: ryegrass (Floris &De Jager 1981]D, wheat (Van Noordwijk & Floris [1979]), tomato (Brouwer &Van Noordwijkf [9781), cucumber (unpublished, treatments include a respirationinhibitor (0.1 mM KCN + 25 mM salicyl-hydroxamate at pH 5)), and sugar beet(Grzebis et al, in prep.).
267
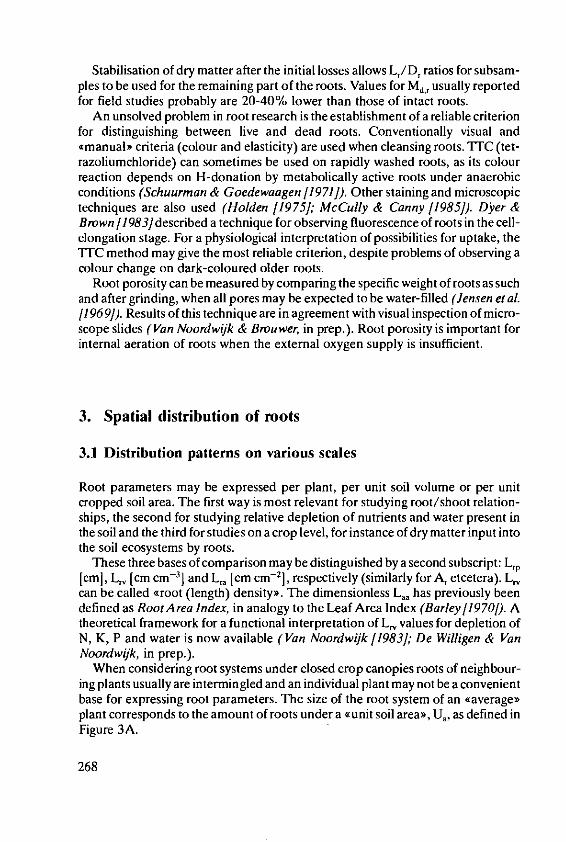
Stabilisation of dry matter after the initial losses allows Lr/D, ratios for subsam-pies to be used for the remaining part of the roots. Values for Md., usually reportedfor field studies probably are 20-40% lower than those of intact roots.
An unsolved problem in root research is the establishment of a reliable criterionfor distinguishing between live and dead roots. Conventionally visual and*manual criteria (colour and elasticity) are used when cleansing roots. TTC (tet-razoliumchloride) can sometimes be used on rapidly washed roots, as its colourreaction depends on H-donation by metabolically active roots under anaerobicconditions (Schuurman & Goedewaagen /1971]). Other staining and microscopictechniques are also used (Holden 11975]; McCully & Canny [1985]). Dyer &Brown [1983] described a technique for observing fluorescence of roots in the cell-elongation stage. For a physiological interpretation of possibilities for uptake, theTTC method may give the most reliable criterion, despite problems of observing acolour change on dark-coloured older roots.
Root porosity can be measured by comparing the specific weight of roots as suchand after grinding, when all pores may be expected to be water-filled (Jensen el al.11969]). Results of this technique are in agreement with visual inspection of micro-scope slides (Van Noordwijk & Brouwer, in prep.). Root porosity is important forinternal aeration of roots when the external oxygen supply is insufficient.
3. Spatial distribution of roots
3.1 Distribution patterns on various scales
Root parameters may be expressed per plant, per unit soil volume or per unitcropped soil area. The first way is most relevant for studying root/shoot relation-ships, the second for studying relative depletion of nutrients and water present inthe soil and the third for studies on a crop level, for instance of dry matter input intothe soil ecosystems by roots.
These three bases of comparison may be distinguished by a second subscript: Lrp[cmj, L, [cm cm -31 and L. [cm cm-], respectively (similarly for A, etcetera). L,can be called "root (length) density'. The dimensionless La has previously beendefined as RootArea Index, in analogy to the Leaf Area Index (Barley[1970). Atheoretical framework for a functional interpretation of L, values for depletion ofN, K, P and water is now available (Van Noordwijk [1983]; De Willigen & VanNoordwijk, in prep.).
When considering root systems under closed crop canopies roots of neighbour-ing plants usually are intermingled and an individual plant may not be a convenientbase for expressing root parameters. The size of the root system of an "average'plant corresponds to the amount of roots under a "unit soil area>, U., as defined inFigure 3A.
268
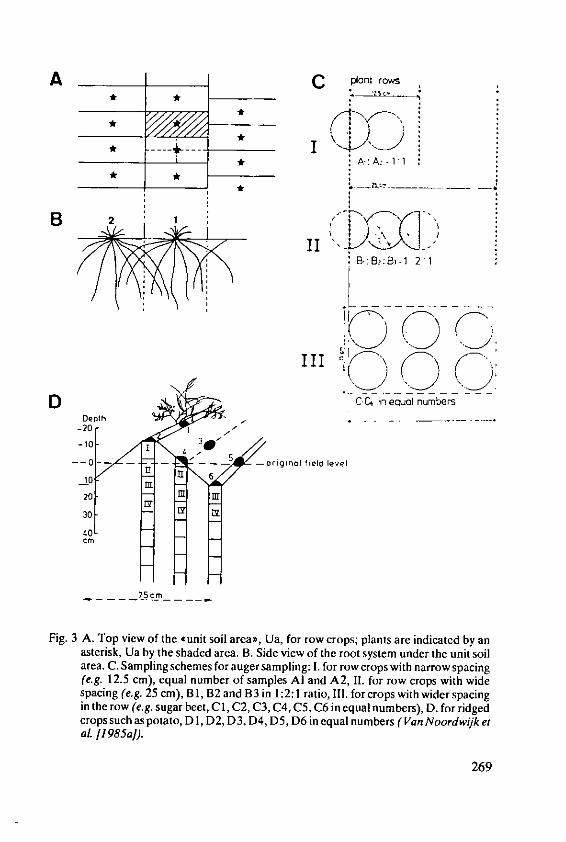
A laC pnt rows
B- B, ,-*_ __ ......L.....- .... *IA A 1
B F'I 1
II - - -
D hC CC in equal numbersDepth . _
-20 1
-10-4- 5---- ,-- "-- - original field level
10 ~ 6
20 M flu
30
cm
75cm
Fig. 3 A. Top view of the .unit soil area", Ua, for row crops; plants are indicated by anasterisk, Ua by the shaded area. B. Side view of the root system under the unit soilarea. C. Sampling schemes for augersampling: 1. for row crops with narrow spacing(e.g. 12.5 cm), equal number of samples Al and A2, 11. for row crops with widespacing (e.g. 25 cr), B1, B2 and B3 in 1:2:1 ratio, 1Il. forcrops with widerspacingin the row (e.g. sugar beet, Cl, C2, C3, C4, C5, C6 in equal numbers), D. for ridgedcrops such as potato, Dl, D2, D3, D4, D5, D6 in equal numbers (Van Noordwijk etat [1985al).
269
The unit soil area equals the reciprocal of plant density. Figure 3B shows that itmay be expected that an equal number of roots of the central plant will be foundoutside the unit soil area, as roots of neighbouring plants enter this volume of soil.Relationships between the various bases of comparison are simple, e.g.
L = Lrp/Ua [cm cm-J (13)
Zr
Lr = " L,,(h) dh [cm cm -2 ] (14)
where h = depth and Z, = depth of rooted zone.
The unit soil area may be divided into four quarters of equal size, which form thesmallest representative area of the field, except for different exposure of the soilsurface to the sun.
Root density parameters vary in both vertical and horizontal direction. Part ofthis variation may be correlated with depth h or with radial distance r to the plant.Lv (h, r, t) gives the average root length per unit volume of soil at depth h, at radialdistance r from the plant and at time t.
Especially in the top layers of the soil a considerable part of the variation can beattributed to radial distance to the plant, r; this fact has practical consequences forsampling schemes. Depending on the adequacy of the Lrv (h, r) description used, acertain amount of variation around this average value will remain, which can bedescribed as <'pattern> in the root distribution (chapter 3.4)
3.2 Washed root samples
A careful consideration of sampling schemes to cover the unit soil area (Figure 3 C)may help to describe Lr (h, r) and may avoid the considerable bias in root weightwhich is inherent to the conventional scheme for row crops. The coefficient of var-iation in root weight in auger samples was found to be relatively constant with avalue of 30-50% for different sampling occasions and depths (Van Noordwijk etal.[1985a]). Such a variation necessitates a large number of replicates, e.g. at least 10to recognize 35% differences between two means and 25 for 20% differences,respectively.
Roots can be washed free from soil using samples either obtained by a soil auger(easily replicated, small samples) or obtained as soil monoliths, usually washed onpinboards (showing the complete shape of a root system). A monolith samplerwhich minimizes damage to experimental plots has been described by Floris & VanNoordwijk [1984]. Washed roots have to be separated from debris and dead rootsby hand, which still is the rate-limiting step in root research.
For measuring mycorrhizal hyphae and root hairs root samples have to bewashed with greater care than otherwise. Small samples of soil are used from which
270
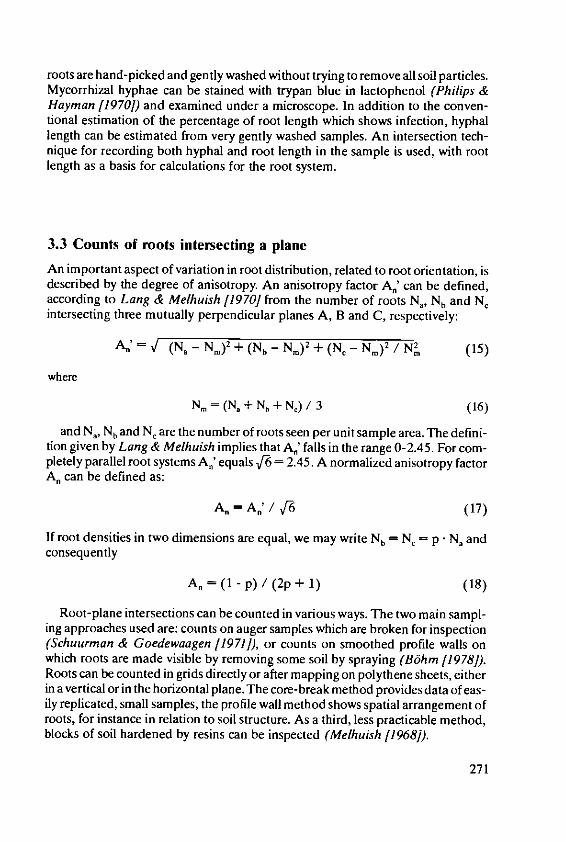
roots are hand-picked and gently washed without trying to remove all soil particles.Mycorrhizal hyphae can be stained with trypan blue in lactophenol (Philips &Hayman [1970]) and examined under a microscope. In addition to the conven-tional estimation of the percentage of root length which shows infection, hyphallength can be estimated from very gently washed samples. An intersection tech-nique for recording both hyphal and root length in the sample is used, with rootlength as a basis for calculations for the root system.
3.3 Counts of roots intersecting a plane
An important aspect of variation in root distribution, related to root orientation, isdescribed by the degree of anisotropy. An anisotropy factor A.' can be defined,according to Lang & Melhuish [1970] from the number of roots Na, N, and NCintersecting three mutually perpendicular planes A, B and C, respectively:
A.' (Na - Nm) 2 + (Nb - Nm) 2 + (Nc - Nm) 2 / N2 (15)
where
Nm=(NB+Nb+N,)/3 (16)
andN,, Nhand N, are the number of roots seen per unit sample area. The defini-tion given by Lang & Melhuish implies that A0 ' falls in the range 0-2.45. For com-pletely parallel root systems A0 ' equals [6 = 2.45. A normalized anisotropy factorA. can be defined as:
A 0 = A.' / v16 (17)
If root densities in two dimensions are equal, we may write Nb = N, = p - N. andconsequently
A. = (I -p) / (2p + 1) (18)
Root-plane intersections can be counted in various ways. The two main sampl-ing approaches used are: counts on auger samples which are broken for inspection(Schuurman & Goedewaagen 11971]), or counts on smoothed profile walls onwhich roots are made visible by removing some soil by spraying (Bbhm [1978]).Roots can be counted in grids directly or after mapping on polythene sheets, eitherin a vertical or in the horizontal plane. The core-break method provides data of eas-ily replicated, small samples, the profile wall method shows spatial arrangement ofroots, for instance in relation to soil structure. As a third, less practicable method,blocks of soil hardened by resins can be inspected (Melhuish [1968]).
271
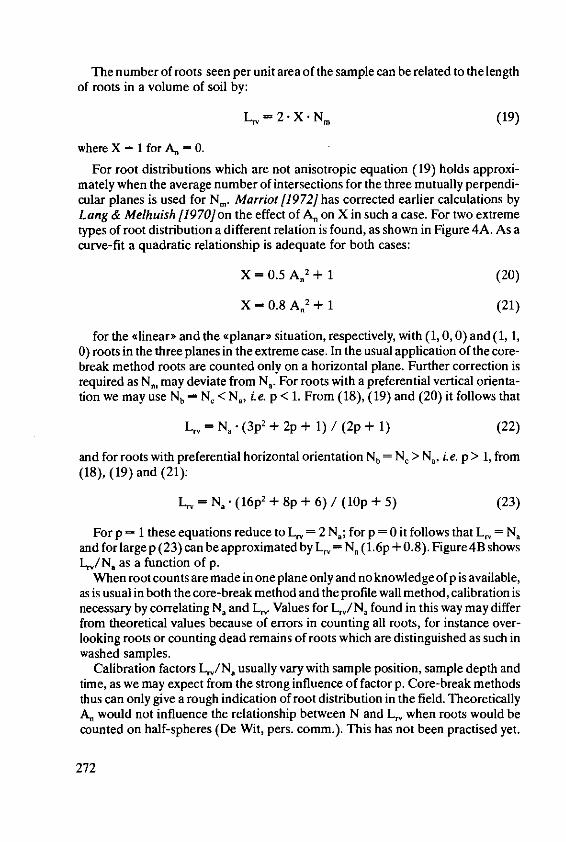
The number of roots seen per unit area of the sample can be related to the length
of roots in a volume of soil by:
L, = 2. X. N. (19)
where X - 1 for A = 0.
For root distributions which are not anisotropic equation (19) holds approxi-mately when the average number of intersections for the three mutually perpendi-cular planes is used for N.. Marriot [19 72] has corrected earlier calculations byLang & Melhuish [1970] on the effect of A. on X in such a case. For two extremetypes of root distribution a different relation is found, as shown in Figure 4A. As acurve-fit a quadratic relationship is adequate for both cases:
X = 0.5 A, 2 + 1 (20)
X= 0.8 A,2 + 1 (21)
for the <inear and the <planar' situation, respectively, with (1, 0, 0) and (1, 1,0) roots in the three planes in the extreme case. In the usual application of the core-break method roots are counted only on a horizontal plane. Further correction isrequired as N, may deviate from Na. For roots with a preferential vertical orienta-tion we may use Nb = N, < Na, i.e. p < 1. From (18), (19) and (20) it follows that
Lrv = N. a(3p + 2p + 1) / (2p + 1) (22)
and for roots with preferential horizontal orientation Nb = N, > Na, i.e. p > 1, from(18), (19) and (21):
L, = N. 0 (16p 2 + 8p + 6) / (10p + 5) (23)
For p = 1 these equations reduce to L, = 2 Na; for p = 0 it follows that L, = Naand for large p (23) can be approximated by Lr, = Na (1.6 p + 0.8). Figure 4B showsLt/Na as a function of p.
When root counts are made in one plane only and no knowledge of p is available,as is usual in both the core-break method and the profile wall method, calibration isnecessary by correlating N. and L. Values for LIN. found in this way may differfrom theoretical values because of errors in counting all roots, for instance over-looking roots or counting dead remains of roots which are distinguished as such inwashed samples.
Calibration factors L,/Na usually vary with sample position, sample depth andtime, as we may expect from the strong influence of factor p. Core-break methodsthus can only give a rough indication of root distribution in the field. TheoreticallyA would not influence the relationship between N and L, when roots would becounted on half-spheres (De Wit, pers. comm.). This has not been practised yet.
272
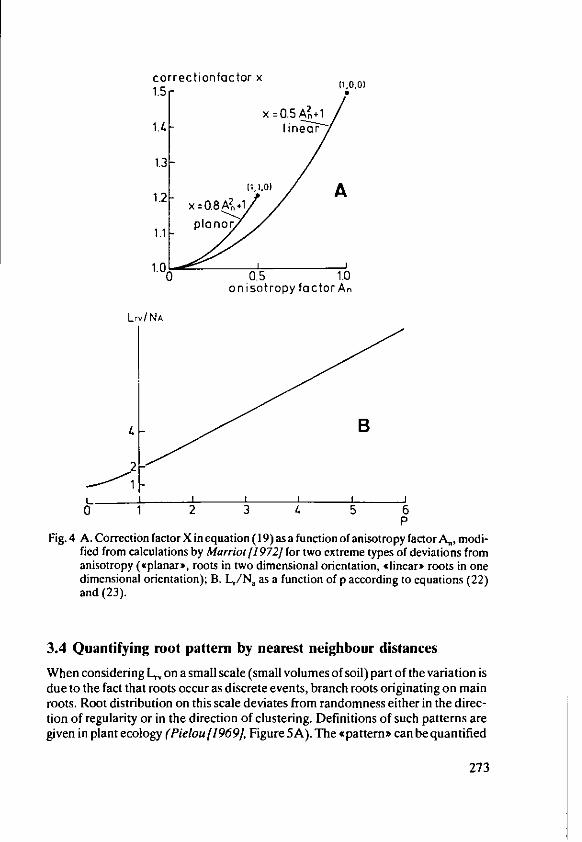
correctionfactor x1.5 (1,0,Ot
x =0.5A 211.4 linear
1.3 X/
1.2 x=0.8 II.O) A
1.1 planar
1.0 0.5 1.0
onisotropy factor A
Lr4INA
2-
L I I I I I
0 I 2 3 . 5 6P
Fig. 4 A. Correction factor X in equation (19) as a function of anisotropy factor A., modi-fied from calculations by Marriot [1972] for two extreme types of deviations fromanisotropy (.planar*, roots in two dimensional orientation, 'linear' roots in onedimensional orientation); B. L,/Na as a function of p according to equations (22)and (23).
3.4 Quantifying root pattern by nearest neighbour distances
When considering Lr, on a small scale (small volumes of soil) part of the variation isdue to the fact that roots occur as discrete events, branch roots originating on mainroots. Root distribution on this scale deviates from randomness either in the direc-tion of regularity or in the direction of clustering. Definitions of such patterns aregiven in plant ecology (Pielou[1969, Figure 5A). The ,pattern' can be quantified
273
by measuring "nearest neighbour distances', i.e. by classifying all soil according tothe distance to the nearest root (Figures 5B and 5C). Root distribution pattern canbe influenced by soil factors (e.g. structure) as well as plant factors (e.g. branch-ing).
* LA A A
regular random clustered
B C
I. / . .\ .
/-, .', .).
', . A.•-
I - - - - - - - - - - -
'I7
* , ' \I.
legend:o-o, cm 152c=05- 1-I EM .2C771- 0-o , EM. Z...,3.
r an doam regular
Fig:. 5 A. Three basic types of spatial distribution: regular, random and contiguous (clus-tered); B. Division of area to nearest roots (Dirichlet tesselation); C. Classificationof area on a root map according to the distance to the nearest root; D. Situationaround an (average root), for a regular and random root distribution.
274
On the basis of a comparison of point-root and root-root distances (Figure 6A),statistical tests of randomness are possible (Diggle 11983]).
The description of nearest neighbour distances on root maps is not only a tech-nique for tests of randomness, it may also provide insight into the frequency distrib-ution of real diffusion distances involved in nutrient and water depletion by a rootsystem. In the three-dimensional reality, however, diffusion distances will be shor-ter than in our two-dimensional maps. The difference may be quantified asfollows.
For the two-dimensional maps the frequency distribution of point-root dis-tances in case of random distribution of roots, can be derived from a Poisson dis-tribution as (Pielou [1969]; Marriot [1972]:
P [6 < D 21= 1 - exp (- D 22 ) (24)
where:D 2 = two-dimensional distance6 = distance of a point on the map to the nearest root?, = number of roots per circle of unit radius.
For randomly oriented roots equation (19) shows:
L -2 = X/3r (25)
For three-dimensional distances of points to randomly oriented and spacedlines Ogston (1958) and Barley (1970) derived that:
P [6 < D31 = 1 - xL Ro2 - exp (-xL, (D32 + 4/3. wV. D3') (26)
where:D3 = three-dimensional distanceV = number of root tips per unit root length
The second term in equation (26) is a correction for the volume occupied by theroots, which normally is negligible. As Figure 6B shows, p in equation (26) is ofconsiderable importance. Its role follows from the possibilities of end-point con-tact for a half sphere around the root tip, added to the tangential contact for cylin-ders around the root.
For = Owe may compare equation (26) to equation (24) and relate D 2 to D 3 :
D3 = D2 / V-2 = 0.71 • D2 (27)
This result strictly depends on random orientation of the roots with regard to theplane in which two-dimensional distances are measured. If D2 is measured in aplane perpendicular to a parallel root system D3 will equal D2. In no case will D3 belarger than D 2 measured in any plane.
275

cumulative frequency100%
'iustered r-* iregular:/ root-root,/ root-root
/ regular: i//point-root I / r no :
Point- root,rootroot
! // /,/ *""' lustered:
0two.dimensional distance to nearest root
cumulative frequency
100
90
L_05
80 ;, ,
70-.,1
60
50 02---.--- 0.6 02
Sto eares roo
=11.
0 02 04 06 018 10 1,2 14 cmthree-dimensional distance
to nearest root
Fig. 6 A. Cumulative frequency of two-dimensional nearest neighbour distances for ran-dom points to roots (p - r) and roots to roots (r - r) for the three types of distribu-tion shown in figure 5A; B. Cumulative frequency of three-dimensional distancesof random points in the soil to the nearest root, for three root length densities andforthree values of cp, the number of root tips per unit root length, accordingto equa-tion (26).
276
Deviations from the regular root pattern usually assumed in theoretical models,have a considerable effect on relative depletion potential of a root system, espe-cially for nutrients of lower mobility in the soil such as potassium and phosphate(De Willigen & Van Noordwijk [1987]).
3.5 Soil-root contact
Uptake of water and nutrients can only take place by direct contact between a rootand the solid + water phase of the soil (De Willigen /1984]). The complement ofsoil-root contact is formed by root-air contact; for roots of low porosity the degreeof root-air contact is important for aeration (De Willigen & Van Noordwijk[1984]). Root-soil contact can be quantified from thin sections of the soil, as usedin soil micro-morphology, but no method for routine analysis is available as yet.
Root-soil contact will vary along the length of a single root and for a root systema frequency distribution of % contact has to be known.
For establishment of soil-root contact and for a direct role in uptake processes,root hairs can be relevant. The average length of root hairs Lh [cm], average radiusRh [cm] and root hair density per cm of root H,, [cm-1j may be necessary todescribe root hairs in detail.
In some cases a o<root hair cylinder,> of radius R + L, is a useful concept.
4. Root dynamics
4.1 Dynamics of fine roots
A root may be expected to increase linearly in length of its main axis and exponen-tially when all branch roots are considered. When considering the increase of .rootdepth> in time linear functions will be adequate, while exponential functions maybe required for describing root length density as a function of depth.
The root system of a plant is in a dynamic balance between root growth and rootdecay or root death. The total length of a root system is mainly determined by thelength of fine branch roots. These fine branch roots may die after some time, whilethe main axis on which they are formed survives, at least to carry on its transportfunction.
Comparable to definitions for populations, a birth rate, death rate and averagelife expectancy can be defined for fine roots. If the potential for water or nutrientuptake is considered to be age-dependent, cohorts of roots of the same age can bedescribed.
277
4.2 Sequential root observations of root dynamics
When destructive methods are used for frequent observations, the heterogeneity ofroot distribution leads to very high coefficients of variation for the estimates ofrelatively small differences in total root density between two observation dates.Several authors have neglected this variation and have attributed every positivedifference between estimated root density at time T + 1 and that at time T to rootgrowth, and every negative value to root decay. Especially for frequent samplingprogrammes true root dynamics can be vastly overestimated by this technique(Singh et at. [1984]). Another problem of this method is that simultaneous rootgrowth and decay in the same soil layer - if it would occur - cannot be measured.
As alternatives for frequent destructive measurements, various techniques existto observe root growth and decay on individual roots; such techniques suffer fromthe problem that the observations can only be made under non-natural conditions.Large-scale rhizotrons (Huck & Taylor[1982]) are expensive and observations arelimited to one soil type or artificially filled soil columns. As a less expensive andmore flexible alternative the .mini-rhizotron" technique is now available forrecording root growth along a glass or lexane wall under field conditions (Sander &Brown [1978]; Vos & Groenwold[1983]; Van Noordwijk et al. f1985b). If obser-vation tubes are introduced into the soil at sowing or planting time, root develop-ment and root decay can be observed for the whole growing period under condi-tions of little disturbance. Calibration of root lengths seen on the rhizotron wall (byevaluating photographic negatives on a grid for counting intersections) to L,, fromwashed samples gives variable results (unpublished results, J. Vos, pers. comm.),necessitating calibration with washed samples if information on the exact root dis-tribution is required.
By visual inspection of a series of photographs from the same mini-rhizotron atthe same depth in soil, the length of new roots on each observation date can bequantified as well as the length of the roots which have disappeared since the previ-ous observation. As root decay and root death may be gradual processes a visualcriterion for presence or absence has to be set and observations preferably have tobe made by one person. At any time t in the growing season the following equationsholds:
R(t) = CTR(t) - CDR(t) (28)
where:R(t) = standing root intensity in the observation plane at time t [cm cm- 2
CTR(t) = cumulative total of roots observed till time t [cm cm-2 ]
CDR(t) = cumulative total of roots decayed till time t [cm cm- 2
For annual roots CTR(t) is equal to CNR(t), the cumulative total of new rootsobserved till time t. By the end of the growing season at t - e we obtain data forCNR(e), CTR(e), CDR(e) and R(e). From these data we can define two ratioswhich may summarize the root dynamics during the growing season as a whole:
278
TRL = CDR(e) / CTR(e) (29)and:
RRR = CNR(e) / R(e) (30)
where:
TRL = turnover of root length during a growing seasonRRR = root replacement ratio during a growing season j-J.
The latter quantity is especially relevant for perennial crops as it gives informa-tion on the average longevity of individual roots. If RRR = I we may conclude thatthe average longevity of a root is I year, provided that R(e) is constant from year toyear. The frequency distribution of individual root longevities cannot be estimatedthis way.
To avoid the comparatively large voids between the standard lexane rhizotronwall and the soil (Van Noordwijk etat[1985bJ) we also use metal frames in which aninflatable rubber tube (made from a motorcycle inner tyre) can be introduced andkept under constant pressure. The pressure used is such that roots grow unimpededbetween the tube and the soil. At regular intervals the observation equipment (fi-bre-optics plus camera) are inserted in the lexane tubes and in the metal frame (af-ter removing the deflated tyre) for photographing roots at every depth in the soil.For each photograph total root intensity is measured with the line-intersect methodwith due correction for the magnification factor. Individual roots are compared onsubsequent photographs with a counting grid as overlay in exactly the same posi-tion by checking each intersection between a root and a line. In this way the lengthof new roots since the previous observation and the length of roots which had dis-appeared can be measured.
In future computer-aided image analysis may reduce the large amount of timeinvolved now.
If the criterion of visibility used in analysing photographs is similar to that usedin cleaning washed root samples, the results obtained can be used for estimating netroot production for a whole growing season based on destructive sampling with anauger, monolith or pinboard method on one date and a series of photographscovering the whole growing season. Net root production over one growing seasoncan be estimated from:
NRP = DRP(m) X CDL X CTR(e) / R(m) (31)
where:
NRP - net root production over the whole growing season [kg/hajDRP(m) = root dry weight per unit soil area at the time of maximum standing
root mass [kg/ha]CSS = correction factor for the sampling scheme used [-JCDL = correction factor for losses of dry weight in sampling and washing
procedures j-j
279
CTR(e) / R(m) = cumulative total of roots seen per growing season (cm cm- 2) dividedby root intensity (cm cm -2 ) at the time of the DRP(m) sampling [-].
The correction factor CSS equals 1.0 if an appropriate sampling scheme is used.For data obtained by other schemes correction factors can sometimes be estimated(Van Noordwijk et al[ 985a]). The correction factor CDL can be estimated fromseperate experiments (Figure 3). If relative root dynamics are different for variouslayers in the soil a correction may be required as the ratio between root intensityseen per cm2 of observation wall and root length density measured in washed sam-ples is not necessarily constant for crops, seasons and soil layers. A point of con-cern is whether or not estimates of root turnover are based on unbiased samples asregards root diameter, as we may expect that fine branch roots have a different(probably higher) turnover than thicker main roots.
5. Conclusion
A recent trend in root research is to try to understand root functions on a moredetailed level by studying the synchronisation of root activity and the presence ofmobile soil resources and the <synlocalisation> of active roots, micro-sites of oxy-gen supply, less mobile nutrient sources and soil organisms. To solve such researchproblems, root research using methods as outlined here, has to be coordinated withsmall-scale studies of soil chemistry, soil physics and soil biology.
6. References
I. Barley, K.P.: The configuration of the root system in relation to nutrient uptake. Adv.Agron. 22, 159-201 (1970)
2. B6hrn, W.: Methods of studying root systems. Springer-Verlag, Berlin, 188pp, 19793. Brouwer, G. and van Noordwijk, M.: Het met zoutzuur vrijspoelen van wortels uit
steenwol en het effect daarvan op het wortelgewicht [With an English summary:Separation of roots from rockwool by means of washing with HCI and the effectthereof on root weight]. Inst. Bodemvruchtbaarheid, Rapp. 4-78, 11 pp (1978)
4. De Willigen, P. and van Noordwijk, M.: Mathematical models on diffusion of oxygento and within plant roots, with special emphasis on effects of soil-root contact. I. Deri-vation of the models. II. Applications. Plant Soil 77, 215-231, 233-241 (1984)
5. De Willigen, P.: Some theoretical aspects of the influence of soil-root contact onuptake and transport of nutrients and water. In: J. Bouma and P.A.C. Raats, (cds.):Proc. ISSS symposium on water and solute movement in heavy clay soils. Wage-ningen, ILRI, pp. 268-275, 1984
6. De Willigen, P. and van Noordwijk, M.: Uptake potential of non-regularly distributedroots. Proc. Xth Colloq. Plant Nutrition, Beltsville, in press.
7. Diggle, P.J.: Statistical analysis of spatial point pattern. Academic Press, London etc.,148 pp, 1983
280
8. Dyer, D.J. and Brown, D.A.: Relationship of fluorescent intensity to ion uptake andelongation of soybean roots. Plant Soil 72, 127-134 (1983)
9. Floris, J. andde Jager, A.: Een schatting van het van Engels raaigras (Loliumperenne)door bemonsteren, bewaren en spoelen [With an English summary: An estimation ofdry-matter loss and changes in the diameter of roots of perennial ryegrass (Loliumperenne) due to sampling, storage and washing) Inst. Bodemvruchtbaarheid, Rapp.1-81, 18 pp (1981)
10. Floris, J. and van Noordwijk, M.: Improved methods for the extraction of soil samplesfor root research. Plant Soil 77, 369-372 (1984)
11. Holden, J.: Use of nuclear staining to assess rates of cell death in cortices of cerealroots. Soil Biol. Biochem. 77, 333-334 (1975)
12. Huck, M. G. and Taylor, H.M.: The rhizotron as a tool for root research. Adv. Agron.35, 1-35 (1982)
13. Jensen, CR., Luxmoore, R.J., Gundy, S.D. and Stolzy, L.H.: Root air space mea-surements by a pycnometer method. Agron. J. 61, 474-475 (1969)
14. McCully, M.E. and Canny, M.J.: Localisation of translocated 14C in roots and rootexudates of fieldgrown maize. Physiol. Plant. 65, 380-392 (1985)
15. Lang, A. R. G. and Methuish, F.M.: Lenghts and diameters of plant roots in non-ran-dom populations by analysis of plane surfaces. Biometrics 26, 421-431 (1970)
16. Marriot, F. H. C.: Buffon's problem for non-random distribution. Biometrics 28,621-624 (1972)
17. Ogston: Trans. Faraday Soc. 54, 1754-1757 (1958)18. Philips, J.M. and Hayman, D.S.: Improved procedure for clearing roots and staining
parasitic and vesicular arbuscular mycorrhizal fungi for rapid assessment of infection.Trans. Br. Mycol. Soc. 55, 158-161 (1970)
19. Pielou, E.C.: An introduction to mathematical ecology. Wiley, New York, 286 pp,1969
20. Sanders, J.L. and Brown, D.A.: A new fiber optic technique for measuring rootgrowth of soybeans under field conditions. Agron. J. 70, 1073-107 6 (1978)
21. Schuurman, J.J. and Goedewaagen, M.A.J.: Methods for the examination of roots.2nd ed. Pudoc, Wageningen, 86 pp. 1971
22. Singh, J.S.: Bias and random errors in estimates of net root production: a simulationapproach. Ecology 65, 1760-1764 (1984)
23. Tennant, D.: A test of a modified line intersect method of estimating root length. J.Ecol. 63, 995-1001 (1975)
24. Van Noordwik, M. and Floris, J.: Loss of dry weight during washing and storage ofroot samples. Plant Soil 53, 239-243 (1979)
25. Van Noordwijk, M.: Functional interpretation of root densities in the field fornutrient and water uptake. In: Wurzeldkologie und ihre Nutzanwendung. Int. Symp.Gumpenstein, 1982, pp. 207-226, 1983
26. Van Noordwijk, M., Floris, J. and de Jager, A.: Sampling schemes for estimating rootdensity distribution in cropped fields. Neth. J. Agric. Sci. 33, 241-262 (1985a)
27. Van Noordwijk, M., de Jager, A. and Floris, J.: A new dimension to observations inminirhizotrons: a stereoscopic view on root photographs. Plant Soil 86, 447-453(1985b)
28. Van Noordwijk, M. andde Willigen, P.: Quantitative root ecology as element of soilfertility theory. Neth. J. Agric. Sci. 34, 273-282 (1986)
29. Vos, J. and Groenwold, J.: Estimation of root densities by observation tubes andendoscope. Plant Soil 74, 295-300 (1986)
281
Rhizosphere Organisms - PotassiumInteractions with Emphasis onMethodology
G. Tolldenier, Agricultural Research Station Biintehof, Hannover/Fed. Rep. ofGermany*
Summary
There are multiple interrelationships between the rhizosphere microflora and plant nutri-tion involving inter alia the potassium nutritional status of plants and potassium availabil-ity. To elucidate some of these interactions plants have to be grown under axenic condi-tions. Exclusion of microorganisms is important e.g. for distinguishing between the activ-ity of roots sensu stricto and their microbial associates as well as for collecting rootexudates. The methods for axenic cultures of plants are briefly outlined. The selected sub-strate is a major problem in growth studies of sterile and nonsterile plants, as sterilization ofsoil either by heat or by y-irradiation produces toxic compounds. Experiments have to berestricted to more or less artificial media like nutrient solution or sand. Using nutrientsolution culture it was found that the K nutritional status influences microbial activity onroots via its effect on plant metabolism and root exudation. Low K supply increases thequantity of readily decomposable organic compounds released from roots.
Enumeration of microorganisms is done either directly by microscopical counting orindirectly by plate counting involving incubation on nutrient media. Both techniquesshowed increasing numbers of bacteria with decreasing K supply, indicating that K availa-bility is not a limiting factor for microbial growth in the rhizosphere. Moreover, rhizos-phere bacteria seem to compete successfully with plants for potassium.
Potassium nutrition affects the quantity and quality of low molecular compounds inroots and root exudates, and the composition of the rhizosphere microflora and microbialtransformations in the root vicinity. Denitrification in general and certain processes in therhizosphere of rice like those associated with iron toxicity and N2 fixation are discussedwith a brief description of the methods applied.
Weathering mediated by free living rhizosphere organisms and mycorrhizal fungi isanother line of research. The results indicate that potassium release from minerals is insuf-ficient to support optimal growth of crops.
Attempts to enhance K availability by inoculation of seeds with .silicate, bacteria arementioned. A recent review is sceptical about the significance of these inoculants.
Dr. G. Trolldenier, Landw. Forschungsanstalt Buntehof, Biinteweg 8, D-3000 Han-nover 71/Fed. Rep. of Germany.
283
1. Introduction
Since the discovery of greater abundance of microorganisms around roots com-pared to bulk soil, a number of scientists have been interested in the question: carerhizosphere organisms opportunists, scavenging simply the waste products fromroots, are they bandits being detrimental to the plants, or even benefactors havingbeneficial effects on plant growth and health?' (Brown[1975]). Hiltner who intro-duced the term vrhizosphere>> as early as 1904 suggested that avon der Zusam-mensetzung der Bodenflora in der Rhizosphdre die Erndhrung der Pflanzen nichtun wesentlich abhdngt (the nutrition of plants certainly depends upon the compo-sition of the soil flora in the rhizosphere). Observing the dense bacterial flora on theroot surface, he noted that gcertain bacteria do not only form a cover but even pen-etrate into the upper cell layers of the roots and - analogous to the ectotrophicmycorrhiza - form a bacteriorrhizaD. He tried to estimate bacterial numbers permm 2 of root surface.
The term .bacteriorrhiza did not succeed, and others are used nowadays tocharacterize the different habitats in the root-soil interface. Today the rhizospheresensu stricto is also called the outer rhizosphere, while the rhizoplane is identicalwith the root surface (Clark [1949]) and the endo- or inner rhizosphere describesthe cortex (Dommergues [1978]). In older root regions the cortical layer is oftendensely colonized by saprophytic microorganisms. The different zones cannot bestrictly seperated from each other, but are interrelated and overlapping. Theincrease in microbial numbers and activities as well as the greater abundance ofrepresentatives of the micro- and mesofauna due to the root environment is calledthe rhizosphere effect (Katznelson [1946]). Many workers have shown that themicrobial population of the rhizosphere differs both quantitatively and qualitat-ively from that in the soil remote from the roots.
2. Abundance of microorganisms on roots as affected by plantnutrition and environmental factors
Many techniques have been applied to quantify the rhizosphere effect.
2.1 Plate count technique
Detailed descriptions are available (e.g. Kaunat [1965]; Parkinson et al. [1971]).Sampled parts of a root system are gently shaken to remove loosely attached soil. Adistinct amount of roots with adhering soil, representing the rhizosphere soil sam-ple, is placed in bottles with sterile water or a dispersing solution of 0.2% Na-pyro-phosphate and shaken for a certain time (30 min) in order to detach microorgan-isms from soil particles and roots and to disintegrate bacterial microcolonies. Thesoil suspension is serially diluted in water and aliquots (0.1 or 1 ml) of the appropri-ate final dilution are mixed in Petri dishes with a molten agar medium according to
284
the traditional plate count technique after Koch. Based on the number of microbialcolonies grown after incubation the number of propagules or cell forming units pergram of soil can be calculated. Numerous modifications of the plate count tech-nique have been described. Limitations of the procedure and difficulties in com-paring R/S ratios (number of rhizosphere organisms divided by number of nonrhi-zosphere organisms) are discussed by Rovira andDavey[1974]and Curl and True-love [1986].
Among the nutrient media simple, low-concentrated nutrient broth solidifiedby agar (Trolldenier[1971a]) has been confirmed as giving the highest number ofttotal' bacteria (van Vuurde and Lange [1978]).
To separate microorganisms of the outer rhizosphere from those of the rhizo-plane and inner rhizosphere, the roots with adhering soil are gently shaken in water,placed in another flask, and then shaken with glass beads (L ouwand Webly[195 9])or macerated shortly in a blender (Kannelson [1961]; Trolldenier and von Rhein -baben [1981a]). Root washings were also used to isolate fungi from roots (Harleyand Waid[l955]; Parkinson et al. [1963]). Specific groups of bacteria like nitrifiers,denitrifiers or nitrogen fixers are counted by using the most-probable-numberprocedure (e.g. Tolldenier [1971b]) discussed by Alexander [1982].
The root zone represents a microbial gradient in which microbial activitydecreases with increasing distance from the roots. The decline of numbers in thecounts of bacteria, streptomyces and fungi with increasing distance from the rootswas shown by Papavizas andDavy[1961] using a multiple-tube device for sampl-ing 3 mm cores from the root surface up to 22 mm apart. The steepest decline ofnumbers was found in the first 3 mm from the root surface.
A newer concept of understanding the dynamics of root colonization is thestudy of the generation or doubling time of bacteria on roots. Large differenceswere found between species of Pseudomonas (Rovira [1979]). The doubling timeof an organism in colonizing the rhizosphere is e.g. an important parameter in esti-mating its efficiency as an inoculant.
2.2 Direct microscope techniques
These techniques have been used for studying the distribution of microorganismson roots as well as for calculating R/S ratios. Classical contact slides after Cho-lodny /1930] and Rossi [1936] may be used for examination of microorganismscolonizing root hairs. Fluorescence microscopy has proved to be highly suitable inobserving the colonization of root hairs attached to contact slides and of thin sec-tions of the root surface (Trolldenier[1965a, b]). With a slide incubation chamberPolonenko and Mayfield[] 979] were able to study microbial colonization of livingroots. Direct observation revealed root tips to be nearly devoid of microorganisms,while older parts are often densely colonized (Rovira [1956]). The rate of rootcolonization seems to depend on environmental conditions. It was demonstratedby transmission electron microscopy that - in contrast to well aerated roots - themucilage of the root caps of roots suffering from oxygen deficiency is already
285

colonized by many bacteria and that on older root parts the cortex is heavilyinvaded by microorganisms (Trolldenier and Hecht-Buchholz [1985]; Figure 1).
The most extensive study of the rhizosphere by electron microscopy has beenpublished by Foster et al. [19831.
When bacteria are counted by the indirect plate count technique and by directmicroscopy in the rhizosphere and in the bulk soil, characteristic differencesbetween both zones become manifest. Soil plate counts as compared with micros-copic counts yield considerably lower numbers in the non rhizosphere soil (1-4%)than in the rhizosphere soil (11-51%) (Table 1). This discrepancy indicates quali-tative differences in the bacterial population of the two zones. Obviously roots sti-mulate zymogeneous organisms - those relying on easily decomposable sub-stances and growing on cultural media - while in the non rhizosphere soil auto-chthonous organisms (Winogradsky [1925]), having more complex nutrientrequirements, predominate. From the increase of zymogeneous organisms in thepresence of plant roots it may be deduced that the greater availability of easilydecomposable compounds is the actual cause of the rhizosphere effect. The growthof bacteria with simple nutrient requirements in the rhizosphere is furtherenhanced by low potassium nutrition (Table 2) for the reasons discussed in the nextsection.
Table I Bacterial numbers (10 • g-') in the rhizosphere of different plants and in nonrhi-zosphere soil obtained by fluorescence microscopy and plate count (Trolldenier11967])
Age of Nonrhizosphere Rhizosphere soil ofplants soil Triticum sativum Vicia faba(Weeks) Micro- Plate Micro- R/S Plate R/S Micro- R/S Plate R/S
scopy scopy ratio ratio scopy ratio ratio
5 483.3 10.8 1.145.7 2.4 153.8 14.2 556.8 1.2 60.0 5.67 324.6 I3.4 684.6 2.1 221.5 16.5 300.7 0.9 154.6 11.5
10 681.6 7.8 922.9 1.4 172.6 22.1 853.9 1.3 262.6 33.7
Table 2 Total bacteria on roots estimated by plate counts and relative proportions of bac-teria having different nutritional requirements in relation to potassium applica-tion to wheat (Trolldenier/1971c])
Plant nutrient Total bacteria Bacterial incidence (o)ratio K2O:N 109 . g1 root(N 1) dry matter Group I Group II Group Ill
requiringGlucose Glucose + Pepton
amino acids
0.5 32.6 69.0 20.5 10.51 27.8 42.9 26.0 31.12 20.9 46.9 17.5 35.63 21.2 26.6 15.2 58.2
286
Fig I Outer root cortex of the lateral root Zone of a vheat root grown in unaeratednutrient solution showing abundant microbial colonization in the rhizoplane. Thecortex cells have been invaded by bacteria (b) TrolIdenier and liechi-Bachho/z/1 (984]1
3. Methods of growing plants in axenic culture
Organic matcria released from roots is rapidly metabolized by microorgani sm, sasindicated bv the higher rootrespiration of noinsterIle roots compared with sterileroot s (lloUlenier/I972j). T herefore it is necessary to exclude microbial comami-nation when studying tihe nature of root exudates. Limitations in adapting theresults obtained w ith plants grown in axeni culture to nalural conditions have beendiscussed by 'inker/1941. IT is furthermore necessary to exclude microorganismsin the control treatment when the effect of rhizosphere microflora on plant grow this examined. IHence, axenic plant culture starts wilh seed sterilization.
A variety of procedures has been applied, often including treatment of seed,Sit h stodium hypochlorite solution. We obtained reliable results b shaking the
seeds for 30 i11in. in 3()" hvdrogien peroxide solution fol ed by the usual wash-
287
inc with sterile wIater. nlike s mre ither ster ilizing agen Is. hydrogen peroxide doesnot affect germination. B ermation on nutrient aga seeds still contaminatedcanl be identified and discarded. Definitely sterile seedlings are transtered to flasksotr tubes conlaining sterile nutrient mineral solution as described elsewhere'Irridenier /172/; figure 2). Selected methods of glro ing plants under axenic
conditions have recently been compiled by ( utl and Iruelove /O?986/Detailed analysis has been made only from watersoluble nonvolatile root
exudates (Rovira eat 119741). Data on the effect tf plant ntri tion and other fac-tors on root exudation are very limited (Hale and Moore 1I197Q)Q. With regard topotassium it was demonstrated with CO, treated bush beans that plants IoNN in Kreleased more labeled organic substances pet unit root weight than plants whichhad been supplied with higher rates of potassium I Tlldener [1972/}. In a moredetailed study with maize grown at different K levels increased release of sugars.organic acids and amino acids per gram of root dry matter was found at P iw K sup-ply (Kraf~iczyk et A /1984/; Table 3).
Table 3 )rganic compounds (ing g root dry matter) found in sterile nutrient solutions
itl different K levels after 23 days of maize growth (Kralfbzyk ei al /1 9841)
T reat ment Sugars Organic acids Amino acids
K, 7.68 15.87 0.1 7aK, 4.73a' 3.42a .13abK- 539a 4.72a 0. lb
In a column, means not followed by a common letter are significa ntlv different atthe 5<- level
The higher root exudation at insufficient K supply may be associated with accu-mulation of soluble carbohydrates and amino acids in the plant due to impairedsynthesis of starch, cellulose and proteins.
The comparative uptake of nutrients by sterile and nonsterile plants has rarely
been studied because of methodological difficulties. In an experiment with redclt ver, uptake and translocation of 'Rb as a tracer tnr potassiunt and (of a wascompared by 7olldenier and Marckworoh /10 62/in sterile and nmnsterile plantsgrown in nutrient solution. Shoots and roots of sititie plants had higher con tents ofRh and (a while total translocation into the shoots was similar. lhe lower concen-trationt of Rb in the tops ol nonsterile plants was probaby a dilution due to tnorerapid growth in the presence of iicroorganisms. In contiast, ill/auaon and WtJones 1972/ found higher Rb accumulations in nonsterile grown plants,. heysuggested that the specific incciu uin emnploved is of great importance -his is con-comitant with earlier findings by 14eihe and Dly//denier /19031. The attempts tostudy plant-rhizosphere organism interreactions in soil failed so far. because toxiccompounds. inter alia ethylene, are produced during sterilizalion by heat and u-,-radiation (it ira andt Bowen /10/66; Rtira and bcn/etl / I 72/i
288
Fig. 2 Axcnic nutrient solution culture of bush beans. The flask is connected with a "aterreservoir. (Trolldenier /1 972a//
4. Change of nutrient availability by rhizosphere organisms
4.1 Mineralization and immobilization
A major function of microorganisms is mineralization of organic residues thus sup-plying plants with essential nutrients. Soil respiration was found t) be a generalindicator of microbial activity.
Due to the contribution of roots and microorganisms respiration is higher in therhizosphere than in the soil remote from roots. Stillef1938] was probably the first tonotice that nonsterile roots have higher respiration than sterile root,. Using a War-burg respirometer foolldenier11972] fund that roots of bush beans colonized bymicroorganisms consumed more than twice as uch oxygcn as sterile control
289
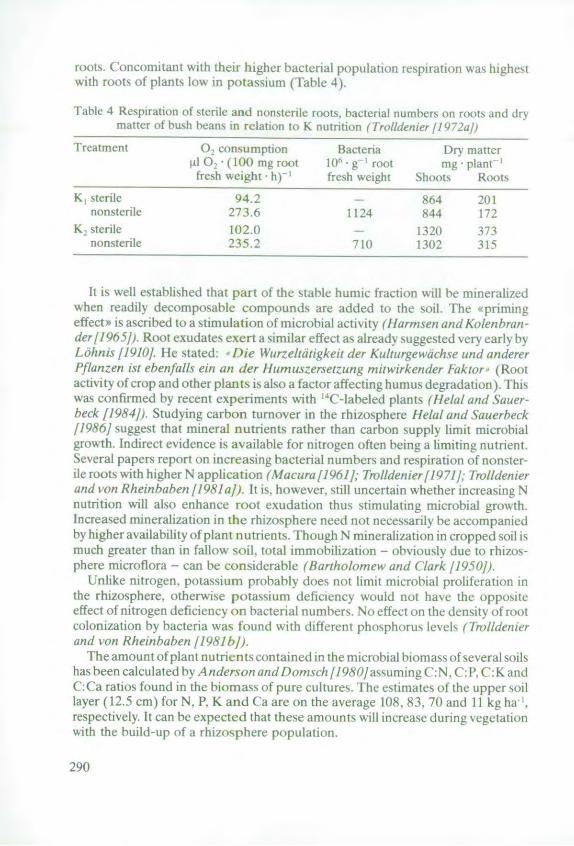
roots. Concomitant with their higher bacterial population respiration was highestwith roots of plants low in potassium (Table 4).
Fable 4 Respiration of sterile and nonsterile roots, bacterial numbers on roots and drymatter of bush beans in relation to K nutrition ( 7oli/denier 1I 72,a/)
lreatment 0. consumption Bacteria Dry mattertil C: ( 100 mg root 16 - g I root rag plantfresh weight , h) fresh weight Shoots Roots
K, sterile 94.2 - 864 20 1nonsterile 273.6 1124 844 172
K, sterile 102.0 1320 373nonsterile 235,2 710 1302 315
It is well established that part of the stable humic fiaction will be mineralizedwhen readily decomposable compounds are added to the soil. The «<primingeffect is ascribed to a stimulation of microbial activity (Harmsen and Kolenbran-der/1965fJ. Root exudates exert a similar effect as already suggested very early byLohnis 11910/. He stated: - Die Wurzeltdtigkeit der Kulturgewdche und andererPflanzen ist ebenfalls em an 4er Humuszersetzung mitwirkender Faktor (Rootactivity of crop and other plants is also a factor affecting humus degradation). Thiswas confirmed by recent experiments with 14(-labeled plants (Helal and Sauer-beck [1984]). Studying carbon turnover in the rhizosphere Ie/al and Sauerbeck/1986/ suggest that mineral nutrients rather than carbon supply limit microbialgrowth. Indirect evidence is available for nitrogen often being a limiting nutrient.Several papers report on increasing bacterial numbers and respiration of nonster-ile roots with higher N application (Macura/1961]; Trolldenier/1971/; "ndl/denierand von Rheinbaben /1981a]). It is, however, still uncertain whether increasing Nnutrition will also enhance root exudation thus stimulating microbial growth.Increased mineralization in the rhizosphere need not necessarily be accompaniedby higher availability of plant nutrients. Though N mineralization in cropped soil ismuch greater than in fallow soil, total immobilization - obviously due to rhizos-phere microflora - can be considerable (Bartholomew and Clark /1950/),
Unlike nitrogen, potassium probably does not limit microbial proliferation inthe rhizosphere, otherwise potassium deficiency would not have the oppositeeffect of nitrogen deficiency on bacterial numbers. No effect on the density of rootcolonization by bacteria was found with different phosphorus levels (ho//denietand von Rheinbaben /1981b/).
The amount of plant nutrients contained in the microbial biomass of several soilshas been calculated by Anderson and DIomch /190jassuming C:N. C: P. C: K andC:Ca ratios found in the biornass of pure cultures. The estimates of the upper soillayer (12.5 cm) for N, P, K and Ca are on the average 108, 83.70 and I1 kg ha .respectively. It can be expected that these amounts will increase during vegetationwith the build-up of a rhizosphere population.
290

4.2 Microbial weathering
The participation of plant roots in association with their rhizosphere inhabitants insoil genesis is well documented. A recent review by Robert and Berthelin /1986/describes degradation and transformation of primary and secondary minerals, for-mation of deposits and synthesis of minerals. First observations were made byDuggeli/1930/concerning the solubilization of carbonate rocks by pure cultures ofmicroorganisms. The soluhilizing action of plant roots can easily be demonstratedby allowing roots to grow along a polished marble plate. After removal of the rootsthe course of root growth can be followed by the etched traces they have left(Tm/)ldenier/1971/; Figure 3).
A powerful tool for examining the weathering process is scanning electron mic-roscopy. A n interesting approach to study the effect of vegetation is to bury porousbags with minerals in the root zoneo f the plants and to analyse the loss of elements(Robert and Berthelin 11986]. Table 5 shows that, under spruce, weathering pro-ceeds more rapidly than under other forest trees. T"he transformation of mica intovermiculite is promoted when K is absorbed from the solution by fungi, wherebythe K equilibrium is shifted ( Weed e a/ [19691). Uptake of K by roots may have asimilar effect. An important role in biological weathering is ascribed to organicacids and chelating agents like siderophores. Both are also produced by roots andmicroorganisms, In the literature, cited by Robert and Berthelin /1986, it isreported that nutrient deficiency in culture media supports the formation of thesecompounds.
Sa
<1
Iig, 3 Marble plate sho %ing crchcd traces of root growsth. !Trolldenier /1 971afl
291

One may speculate that the greater exudation of organic acids and the stimula-tion of bacterial growth in the case of K deficiency may help the plant to overcomeits stress situation. Indeed, it has been shown by Berthelin and Leyal[1982] that therhizosphere microflora and to some degree VA mycorrhiza are able to improve Kuptake from biotite and plant growth. However, the solubilizing action is obviouslynot sufficient to meet the requirements of normally growing plants (Table 6).
Table 5 Effect of different forest plants on the weathering of a mica (biotite) buried for 4years in the A, horizon (Sadio 11982], after Robert and Berthelin 11986])
Plant K20 Fe2O3 MgO A1203% loss
Picea 35 32 10 8Vaccinium 19 7 7 7Abies 26 1 1 0Fagus 22 2 3 0Festuca 5 4 3 4
Table 6 Effect of the rhizosphere microflora of maize and VA mycorrhiza on cationuptake, K being supplied as biotite, Ca as Ca(NO3 )2 , and Mg as MgSO 4 (Ber-thelin and Leyal [1982])
Treatment Shoots K Ca Mgmg mg • plant - '
Sterile 456 ± 180 1.5+0.1 1.8 ±0.3 2.1 ±0.8Rhizosphere 979 ± 46 2.6 ± 0.1 4.8 ± 0.6 4.9 ± 0.3
microfloraVA mycrorhiza 1050± 60 1.9±0.1 3.2±0.3 3.4±0.2VA mycorrhiza 1170 ± 334 2.8 ± 0.5 3.7 ± 0.8 4.8 ± 1.2+ rhizosphere
5. Effect of mycorrhiza on K nutrition of plants
Brief mention of mycorrhiza should be made because of its significance in mediat-ing nutrient uptake by plants. An excellent publication is available on "Methodsand principles of mycorrhizal researcho (Schenck 11982]). However, the majorityof publications in this field concerns phosphorus nutrition and only a few deal withthe effect on potassium uptake.
With ectomycorrhiza of trees Hatch [1937] has already shown improved N, Pand K uptake by mycorrhizal plants as compared with plants without their micro-symbionts. Further references to the beneficial role of ectomycorrhiza in improvingK uptake are given by Harley [1969] and Edmonds et al. [19761.
The stimulatory effects of symbiosis on plant growth or yield level generally dec-rease with higher K nutritional status of the plant. This also applies to VA mycor-rhiza of herbaceous plants.
292

Little is known about VA mycorrhiza effects on K uptake (Powell[1975]). Re-sults of Smith etat [1981]indicate that mycorrhizal infection can improve K nutri-tion of Trifolium subterraneum when internal K concentrations are low. Theauthors conclude that increased K uptake may be an indirect result of improved Pnutrition and Yost and Fox [1982] come to a similar conclusion. Slightly higher Kconcentrations in VA mycorrhizal plants compared to non-mycorrhizal plantswere also found by Sieverding [1983].
6. Bacterial fertilizers to improve K availability
Efforts to improve plant nutrition and growth by seed bacterization are countless.So called silicate bacteria were recommended and used for seed inoculation as ameans of increasing potassium nutrition in plants. Citing earlier literature SaberandEl-Sherif[1975a, b]studied the effect of silicate-dissolving bacteria on potas-sium uptake by Sorghum helepensis (Sudangrass). Unfortunately no accounts aregiven either of exchangeable K contents of the used soils or of the K nutritional sta-tus of the plants. In soil with Nile silt addition K uptake was higher than in soilmixed with sand. In the soil mixed with Nile silt inoculation did not improve Kuptake, whereas in the sand/soil mixture seed inoculation with silicate bacteria, anunidentified Bacillus strain, increased K uptake by about 20% independent of thecalcium content of the soils. Whether the inoculant itself supplied additional potas-sium is questionable. Saber and EI-Sherif [1975a] deal with the enumerationprocedure for silicate-solubilizing bacteria in detail.
In a critical review Mishustin et al 11981] stated that calthough potassium isreleased from silicates by microorganisms, the process is not active enough forcomplete provision of the plants with this element. The positive effect of treatmentof seeds with silicate bacteria is determined largely by the biologically active sub-stances that they producev. Analogous conclusions have often been drawn toexplain effects after inoculation of nitrogen-fixing and P-solubilizing bacteria.
7. Microbial processes as influenced by K nutrition of plants
This aspect has been reviewed earlier (Tmlldenier [1981]). Several processes arealtered in magnitude by variations in potassium nutrition of plants. In K deficiencythe increased root exudation accompanied by accelerated microbial proliferationand respiration may lead to oxygen depletion in the rhizosphere thus favouringdenitrification specifically (Trolldenier 11981]; von Rheinbaben and Trolldenier11983]). Denitrification is furthermore supported nonspecifically by longer pres-ervation of higher soil moisture due to more restricted growth of K deficient plants.The relation between K deficiency and iron toxicity in rice plants seems also to belinked with more rapid 02 depletion in the rhizosphere and the decrease of oxidiz-ing power of rice roots (Trolldenier/1977]).
293
In a long term experiment with rice we found appropriate K nutrition to enhanceassociative nitrogen fixation. At moderate mineral nitrogen fertilization about onequarter of plant nitrogen was derived from N2 fixation (Totldenier [1986]). Possi-ble mechanisms involved are: more rapid uptake of soil-N due to better plantgrowth (thus minimizing the repression of nitrogenase), greater availability oforganic acids which are sources of carbon for important nitrogen fixers, and provi-sion of suitable redox conditions around the roots.
7. References
1. Alexander, M.: Most probable number method for microbial populations. In: Meth-ods of soil analysis. Part 2, pp. 815-820. Page, A.L. (Ed.) Amer. Soc. Agron., Mad-ison Wisconsin, 1982
2. Anderson, J.P.E. and Domsch, K.H.: Quantities of plant nutrients in the microbialbiomass of selected soils. Soil Sci. 130, 211-216 (1980)
3. Bartholomew, W. V. and Clark, F.E.: Nitrogen transformations in soil in relation tothe rhizosphere microflora. Trans. 4th Intern. Soil Sci. Congr., Amsterdam 2, 112-113 (1950)
4. Berthelin, J. andLeyval, C.: Abilityof symbiotic and non-symbiotic rhizospheric mic-roflora of maize (Zea mays) to weather micas and to promote plant growth and plantnutrition. Pl. Soil 68, 369-377 (1982)
5. Brown, M. E.: Rhizosphere micro-organisms - opportunists, bandits or benefactors.In: Soil microbiology, pp. 21-38. Walker, N. (Ed.) Butterworths, London - Boston,1975
6. Cholodny, N.: Ober eine neue Methode zur Untersuchung der Bodenmikroflora.Arch. Mikrobiol. 1, 620-652 (1930)
7. Clark, F.E.: Soil microorganisms and plant roots. Adv. Agron. 1, 241-288 (1949)8. Curl, E.A. and Truelove, B.: The rhizosphere. Springer Verlag, Berlin-Heidelberg-
New York-Tokyo, 19869. Dommergues, Y.R.: The plant-microorganism system. In: Interactions between non-
pathogenic soil micro-organisms and plants. pp. 1-37. Dommergues, Y.R. andKrupa,S. V. (Eds.) Elsevier, Amsterdam-Oxford-New York, 1978
10. Diggeli, M.: Die Mitwirkung von Bakterien bei der Gesteinsverwitterung. Verb.Schweizer. Naturforsch. Ges. 111, 307 (1930)
11. Edmonds, A.S., Wilson, J.M. and Harley, J.L.: Factors affecting potassium uptakeand loss by beech mycorrhiza. New Phytologist 76, 307-315 (1976)
12. Foster, R.C., Rovira, A.D. and Cook, T. W.: Ultrastructure of the root-soil interface.Amer. Phytopathol. Soc., St. Paul, Minnesota, 1983
13. Hale, M.G. and Moore, L.D.: Factors affecting root exudation. 11. 1970-1978. Adv.Agron. 31, 93-124 (1979)
14. Harley, J.L.: Biology of mycorrhiza. Hill, London, 196915. Harmsen, G. W. and Kolenbrander, G.J.: Soil inorganic nitrogen. In: Bartolomew,
W. V. and Clark, F.E., (Eds.) Soil nitrogen. pp. 43-92. Amer. Soc. Agron. Madison,Wisconsin, 1965
294
16. Hatch, A.B.: The physical basis of mycotrophy in the genus Pinus. Black Rock ForestBull. 6 (1937)
17. Helal, H.M. and Sauerbeck, D.R.: Influence of plant roots on C and P metabolism insoil. Pl. Soil 76, 175-182 (1984)
18. Helal, H.M. and Sauerbeck, D.R.: Effect of plant roots on carbon metabolism of soilbiomass. Zeitschr. Pflanzenem. Bodenk. 149, 181-188 (1986)
19. Hilner, L.: Ober neuere Erfahrungen und Problemeauf dem Gebiete der Bodenbak-teriologie unter besonderer Berficksichtigung der Grfindfingung und Brache. Arb.Dtsch. Landwirtschafts-Gesellsch. 98, 59-78 (1904)
20. Katznelson, H.: The rhizosphere effect of mangels on certain groups of micro-organ-isms. Soil Sci. 62, 343-354 (1946)
21. Kaunat, H.: Methoden der Rhizosphdrenforschung. Zentrbl. Bakteriol. II. Abt. 119,158-165 (1965)
22. Kraffczyk, L, Trolldenier, G. andBeringer, H.: Soluble root exudates of maize: influ-ence of potassium supply and rhizosphere microorganisms. Soil Biol. Biochem. 16,315-322 (1984)
23. Lhnis, F.: Handbuch der landwirtschaftlichen Bakteriologie. Gebr. Borntraeger,Berlin, 1910
24. Louw, H.A. and Webley, D.M.: The bacteriology of root region of the oat plant grownunder controlled pot culture conditions. J. Appl. Bacteriol. 22, 216-226 (1959)
25. Macura, J.: Bacterial flora of the root surface of wheat grown in nutrient solutions def-icient in nitrogen and phosphorus. Folia Microbiol. 6, 279-281 (1961)
26. Mishustin, E.N., Smirnova, G.A. andLokhmacheva, R.A.: The decomposition of sil-icates by microorganisms and the use of tsilicate, bacteria as bacterial fertilizers. Biol-ogy Bull. 8, 400-409 (1981)
27. Papa vizas, G.C. and Davey, C.B.: Extent and nature of the rhizosphere of Lupinus.Pl. Soil 14, 215-236 (1961)
28. Parkinson, D., Gray, T.R. G. and Williams, S. T.: Methods for studying the ecology ofsoil micro-organisms. IBP Handbook No 19, Blackwell, Oxford-Edinburgh, 1971
29. Parkinson, D., Taylor, G.S. and Pearson, R.: Studies on fungi in the root region. 1.The development of fungi on young roots. PI. Soil 19, 332-349 (1963)
30. Polenko, D.R. andMayfield, C.J.: A direct observation technique for studies on rhi-zosplane and rhizosphere colonization. Pl. Soil 51, 405-420 (1979)
31. Powell, CL.: Potassium uptake by endotrophic mycorrhizas. In: Endomycorrhizas,pp. 460-468. Mosse, B. and Sanders, F. (Eds.) Academic Press, London-New York,1975
32. Rheinbaben von W. and Trolldenier, G.: Influence of mineral nutrition on denitrifica-tion on plants in nutrient solution culture. Zeitschr. Pflanzenern. Bodenk. 146, 180-187 (1983)
33. Robert, M. and Berthelin, J.: Role of biological and biochemical factors in soil mineralweathering. In: Interactions of soil minerals with natural organics and microbes. pp.453-495. Huang, P.M. andSchnitzer, M. (Eds.) Soil Sci. Soc. Amer. Madison, Wis-consin, 1986
34. Rossi, G.: Direct microscopic and bacteriological examination of the soil. Soil Sci. 41,53-66 (1936)
35. Rovira, A.D.: Plant root excretions in relation to the rhizosphere effect. 1. The natureof root exudate from oats and peas. PI. Soil 7, 178-194 (1956)
295
36. Rovira, A.D.: Biology of the soil-root interface. In: Harley, J.L. and Scott Russell,R.S. (Eds.) The soil-root interface. pp. 145-160. Academic Press, London-NewYork, 1979
37. Rovira, A.D. and Bowen, G. D.: The effects of microorganisms upon plant growth. II.Detoxication of heat-sterilized soils by fungi and bacteria. Pl. Soil 25, 129-142(1966)
38. Rovira, A.D. and Davey, CB.: Biology of the rhizosphere. In: Carson, E. W. (Ed.)The plant root and its environment. pp. 153-204. Univ. Virginia Press, Charlottes-ville, 1974
39. Rovira, A.D., Foster, R.C. and Martin, J.K.: Note on terminology: Origin, nature andnomenclature of the organic materials in the rhizosphere. In: Harley, J.L. and ScottRussell, R.S. (Eds.) The soil-root interface. pp. 1-4. Academic Press, London-NewYork, 1979
40. Rovira, A.D. and Vendrell, M.: Ethylene in sterilized soil: Its significance in studies ofinteractions between microorganisms and plants. Soil Biol. Biochem. 4,63-69(1972)
41. Saber, M.S. M. and EI-Sherif, A. F.: Studies on microbial fertilizers. 1. Effect of silicatedissolving bacteria on the potassium uptake by Sorghum helepensis from calcareoussoils. Zeitschr. Pflanzenern. Bodenk. 138, 173-179 (1975a)
42. Saber, M.S.M. and El-Sherif, A.F: Studies on microbial fertilizers. Ill. Effect ofphosphate and silicate dissolving bacteria on the uptake of phosphorus and potassiumfrom calcareous soils by Sorghum helepensis. Zeitschr. Pflanzenern. Bodenk. 138,613-619 (1975b)
43. Schenck, N.C. (Ed.): Methods and principles of mycorrhizal research. Amer. Phy-topathol. Soc., St.. Paul, Minnesota, 1982
44. Sieverding, E.: Influence of soil water regimes on VA mycorrhiza 11. Effect of soiltemperature and water regime on growth, nutrient uptake, and water utilization ofEupatorium odoratum L. Zeitschr. Acker- Pflanzenb. 152, 56-67 (1983)
45. Smith, S.E., Smith, F.A. and Nicholas, D.J.D.: Effects of endomycorrhizal infectionon phosphate and cation uptake by Trifolium subterraneum. P1. Soil. 63, 57-64(1981)
46. Stille, B.: Untersuchungen Ober die Bedeutung der Rhizosphire. Arch. Mikrobiol. 9,477-485 (1938)
47. Tinker, P.B.: The role of microorganisms in mediating and facilitating the uptake ofplant nutrients from soil. Pl. Soil 76, 77-91 (1984)
48. Trolldenier, G.: Fluorescenzmikroskopische Untersuchung der Rhizosphire. Land-wirtsch. Forsch. 19. Sonderh. 1-7 (1965)
49. Trolldenier, G.: Vergleich zwischen fluoreszenzmikroskopischer Direktz~ihlung,Plattengussverfahren und Membranfiltermethode bei Rhizosphrenuntersuchungen.In: Progress in soil biology. pp. 59-71 Graff, 0. and Satchell, J.E. (Eds.) Vieweg u.Sohn, Braunschweig, 1967
50. Trolldenier, G.: Bodenbiologie - Die Bodenorganismen im Haushalt der Natur. Kos-mos Franckh, Stuttgart, 197 la
51. Trolldenier, G.: Einfluss der Stickstoff- und Kaliumernihrung von Weizen und derSauerstoffversorgung der Wurzeln auf Bakterienzahl, Wurzelatmung und Denitrifi-kation in der RhizosphAre. Zentralbl. Bakteriol. 11. Abt. 126, 130-141 (1971b)
52. Trolldenier, G.: Einfluss der Kalium- und Stickstofferni.hrung von Weizen auf dieBakterienbesiedlung der Rhizosphdre. Landwirtsch. Forsch. 26/11. Sonderh. 37-46(1971c)
296
53. Trolldenier, G.: L'influence de ]a nutrition potassique de haricots nains (Phaseolusvulgaris var. nanus) sur l'exudation de substances organiques marqures au 1
4C, lenombre de bacteries rhizosphiriques et la respiration des racines. Rev. Ecol. Biol. Sol9, 595-603 (1972a)
54. Trolldenier, G.: Fluorszenzmikroskopische Z~hlung von Bodenbakterien. I. Histo-rischer Uberblick und Beschreibung eines Verfahrens zur Zahlung von Bodenbakter-ien in Trockenpriparaten nach FArbung mit Acridinorange. Zentralbl. Bakteriol. II.Abt. 127, 25-40 (1972b)
55. Trolldenier, G.: Mineral nutrition and reduction processes in the rhizosphere of rice.Pl. Soil 47, 193-202 (1977)
56. Trolldenier, G.: Influence of plant nutrition on microbial activity in the rhizosphere.In: Agricultural yield potentials in continental climates. pp. 137-146. Intern. PotashInst. (Ed.), 1981
57. Trolldenier, G.: Nitrogen fixation in the rhizosphere of rice as affected by waterregime and plant nutrition. Trans. 13th. Intern. Soil Sci. Congr. Hamburg 2, 648-649(1986)
58. Trolldenier, G. andHecht-Buchholz, C: Effect of aeration status of nutrient solutionon microorganisms, mucilage and ultrastructure of wheat roots. Pl. Soil, 80, 381-390(1984)
59. Trolldenier, G. and Marckwordt, U.: Untersuchungen iber den Einfluss der Boden-mikroorganismen auf die Rubidium- und Calciumaufnahme in Nihrlbsung wachsen-der Pflanzen. Arch. Mikrobiol. 43, 148-151 (1962)
60. Trolldenier, G. and von Rheinbaben, W.: Root respiration and bacterial populationof roots. 1. Effect on nitrogen source, potassium nutrition and aeration of roots.Zeitschr. Pflanzenern. Bodenk. 144, 366-377 (1981 a)
61. Trolldenier, G. and von Rheinbaben, W.: Root respiration and bacterial populationof roots. 11. Effect of nutrient deficiency. Zeitschr. Pflanzenern. Bodenk. 144, 378-384 (1981b)
62. Vuurde, van J. W.L. and de Lange, A.: The rhizosphere microflora of wheat grownunder controlled conditions. 1I. Influence of the stageof growth of the plant, soil fertil-ity and leaf treatment with urea on the rhizosphere soil microflora. Pl. Soil 50, 461 -472 (1978)
63. Weed, S. B., Davey, C. B. and Cook, M. G.: Weathering of mica by fungi. Soil Sci. Soc.Amer. Proc. 33, 702-706 (1969)
64. Wele, E. and Troldenier, G.: Einfluss von Mikrofloren verschiedener B6den undvon Bakterienreinkulturen auf das Pflanzenwachstum. Arch. Mikrobiol. 47, 42-56(1963)
65. Williamson, F.A. and Wyn Jones, R. G.: The influence of soil microorganisms ongrowth of cereal seedlings and on potassium uptake. Soil Biol. Biochem. 5, 569-575(1973)
66. Winogradsky, S.N.: (1925) cited after Winogradsky, S.N.: Mikrobiologie du sol;probl~mes et m.thodes, Masson et Cie, Paris, 1949
67. Yost, R.S. andFox, R.L.: Influence of mycorrhizae on the mineral contents of cowpeaand soybean grown in an oxisol. Agron. J. 74, 475-481 (1982)
297
Coordinator's report on the3rd working session
U. Kafkafi, Field Crops Research Dept., Faculty of Agriculture, Hebrew Univer-sity of Jerusalem, Rehovot/lsrael; member of the Scientific Board of the Inter-national Potash Institute
Physical and biological methodology of the behaviour of nutrients andmicrobial activity near the root surface were discussed.
Calculations and actual measurements of K concentration at various dis-tances from an active absorbing root surface were presented elegantly byKuchenbuch. He showed that the distribution profile of K in proximity of anabsorbing root surface depends on two kinds of parameters: Soil parameterslike initial K concentration, buffer capacity of the soil, moisture content. Plantparameter: the ability of the root to extract K.
According to his calculations the plant is extracting in the root hair regionK ions that are not exchangeable by ammonium acetate extraction. Twoproblems need further studies: 1) the development of an independent methodto measure the uptake efficiency of the root (Km - Michaelis-Manten constant).2) A more reliable determination of the amount of K taken up from the inter-layer positions.
Jaillard has reviewed the method employed in studying the chemical changesinduced by the living root on the immediate soil environment. To study rootexcretions during growth, the agar with dissolved pH-indicator method is used.It is possible by that method to monitor the active regions of the root thatare releasing acid or basic substances to the growth medium.
Using the polarized light microscope at the end of the growing stage onecan monitor the cumulative effects of the root on the soil around it. It wasdemonstrated by the use of the Electron Dispersive System that the growingroot compresses the clay around the root and reorients it. Calcium carbonatewas also demonstrated to concentrate around the root.
Van Noordwijk has discussed the amount of labour involved in root studyunder actual field conditions. He emphasized the dynamic nature of the rootsystem. There is a dynamic balance between root growth and root decay.
To observe actual root growth in the field, the use of fiber optics with a videocamera enables the research worker to observe actual growth and decay of asingle root, as well as the changes in the root density around the lucid tubesinserted in the field. There are tremendous variations in the method used tostudy root density in the field which is an indicator of the early stage of thisscientific field. The complex reactions near the growing root need a joint effort
299
from several disciplines to synchronize the reactions around the root under fieldconditions.
Helal and Trolldenier have dealt with the methods to study the biologicalactivity around the root.
A new root cage to study the rhizosphere was presented by Helal. It allowsa better and more accurate sampling of biological activity at predetermineddistances from the root surface. He has found that up to 20% of the photo-synthetic carbon is released from the root to the soil. If this method provesaccurate it is expected that it will spread to other disciplines of plant research.
Trolldenier has surveyed the methods used to study the activity of bacteriaaround the root. He demonstrated that the C/N ratio, as affected by N applica-tion and the levels of available K have an influence on the number and composi-tion of the bacteria in the rhizosphere. The lower the K level the higher theroot excretions, hinting to the possibility that the root membrane integrity isdamaged in the case of deficient K in the soil.
300
Chairman of the 4th Session
Prof. Dr. H. Beringer, Director, Bfintehof Agri-cultural Research Station, Hannover/Fed.Republic of Germany
4th Session
Field Studies on PotassiumAvailability
301
The Influence of Soil Structure onRooting, Nutrient Uptake and YieldFormation
T Harrach, B. Keil and Th. Vorderbrigge, Soil Science and Soil ConservationInstitute, Justus-Liebig-University, Giessen/Fed. Rep. of Germany*
Summary
Water supply to the plant, soil aeration and through-rooting are important aspects of soilstructure. Together with particle size distribution packing density (degree of soil compac-tion) is a decisive factor. Bulk density alone is not a good indicator of this; particle size dis-tribution must also be taken into account. Measurement of compaction by penetrometer isnot altogether reliable because resistance to penetration depends not alone on packingdensity reliability but on water content, particle size distribution and other soil properties.
After stoniness, root penetration is hindered or limited mostly by soil aeration or dry-ing out of the soil. Resistance to penetration often gives only indirect information of thereasons for differences in root exploration.
The yield potential of a soil is determined by its rooting capacity - especially in thesubsoil - and by the supply of plant available water in the root-room.
Root penetration and available water capacity of the soil are of decisive importancefor nutrient uptake. Under present-day conditions in central Europe, soil structure is amore important factor in determining crop yield and stability of yield than is nutrient sup-ply.
1. Soil structure
Investigation of soil chemical factors (nutrient supply, pH) which affect plantgrowth is well-developed but the investigation of soil physical factors (soil water,soil aeration) is not so well developed. Causes of yield differences are nowadaysless likely to be found in nutrient supply and are more likely attributable to soilstructure.
* Prof. Dr. T Harrach, B. Keiland T Vorderbrfigge, Institut ftir Bodenkunde und Boden-erhaltung, Wiesenstrasse 3-5, D-6300 Giessen/Fed. Rep. of Germany
303
By soil structure, we understand the spatial arrangement of solid componentsand the resulting system of pores. Pore arrangement is largely determined by text-ure. Inter-particle spaces are designated primary pores. Secondary pores areformed in the development of the structural units (peds) (by frost, biological activ-ity, cultivations etc.).
The most important structural properties are:
- Pore volume- Pore size distribution- Continuity of macro pores- Stability of soil structure.
These can be investigated by physical methods (Hartge[1971]; Hartge[1978];Hillel[1982]) and, quite reliably, by field methods (Bodenkundliche Kartieranlei-tung [1982]; Harrach [19841). More detailed and very important information onstructural units can be obtained using microscopy (micromorphology, morphome-try) (Altemiiller [1974]; Maier-Kiihne [1986]).
Table 1 summarises important functions and soil physical parameters of thestructural units.
Table 1. Functions of soil structure and decisive physical properties of soils
Storage of plant available waterAvailable water capacity (A.W.C.) of individual soil layersA.W.C. of soil penetrated by rootsA.W.C. of effective root-room
Hydraulic conductivitySaturated permeabilityUnsaturated permeability
AerationAir capacityPermeability to airDiffusion rate of oxygenRedox potential
Thermal regimeHeat capacityThermal conductivity
ConsistenceShear strengthAggregate stabilityPlasticity
Root penetrationSoil strength (shear strength, resistance to penetration)AerationChemical factors (pH, toxic material)
304
2. Packing density of soils and compaction
The structural units can undergo change. The plough-layer of arable soils is alteredby natural processes and by cultivations through periodical loosening and compac-tion. There may also be compaction below the depth of cultivation - plough pan -and this is only rectified very slowly, if at all, by natural means. Further, there maybe compaction of geological or pedogenic origin in the deeper layers.
Soil compaction is variously defined by soil scientists. From the point of viewof crop production we mean such compact arrangement of crumbs, so closepack-ing of the solid soil material that through-rooting and yield potential are adverselyaffected.
With change in packing density, properties and functions of the structuralunits alter. Increasing density results in:
- Reduction in pore volume,- Increase in bulk density (solid material per unit volume),- Change in pore size distribution (large decrease in macro and slight increase in
fine pores),- Decrease in satured hydraulic conductivity and permeability to air,- Increase in mechanical strength (e.g. resistance to penetration).
Figure 1 after Dumbeck and Harrach [1985] gives an example of pore size dis-tribution in a loess soil. Pore size distribution in the surface layer is shown for differ-ent packing densities and the correlation between density and pore size range isgiven. The regression lines are so arranged that their separation indicates changefrom the original pore size distribution. In the loosest packing, density is less than1.35 g/cm3 and the pore volume over 50% (vol/vol). In the closest, the corre-sponding values were 1.50g/cm3 and less than 44%. Pores < 3 pm equivalentdiameter increased with increasing compaction, pores > 3 pLm decreased sharply.This value for the transition point does not apply to all soils. Dumbeck [1986],working with a range of soils, found a definite decrease in pores as a result of com-paction; this was mainly in the 3 plm size but also to some extent in those of 10, 30 oreven 50 pm equivalent diameter. Particle size distribution played a part in this[ibid p. 191].
All the above named structural parameters from pore volume to resistance topenetration are relevant in describing compaction. These parameters depend notonly on packing density but also on other soil properties - mainly texture, organicmatter content...
Thus, for instance, bulk density, a relatively easily measured parameter, canonly be used as a measure of packing density in comparing closely similar soils.Soils richer in clay at the same packing density have lower bulk density (Table 2).Content of heavy minerals and organic matter content also affect density. Forcomparison of soils of different clay content, the so-called effective packing dens-ity (Bodenk. Kartieranleitung [1982]) can be used:
Effective packing density = Bulk density + 0.009. clay content
305
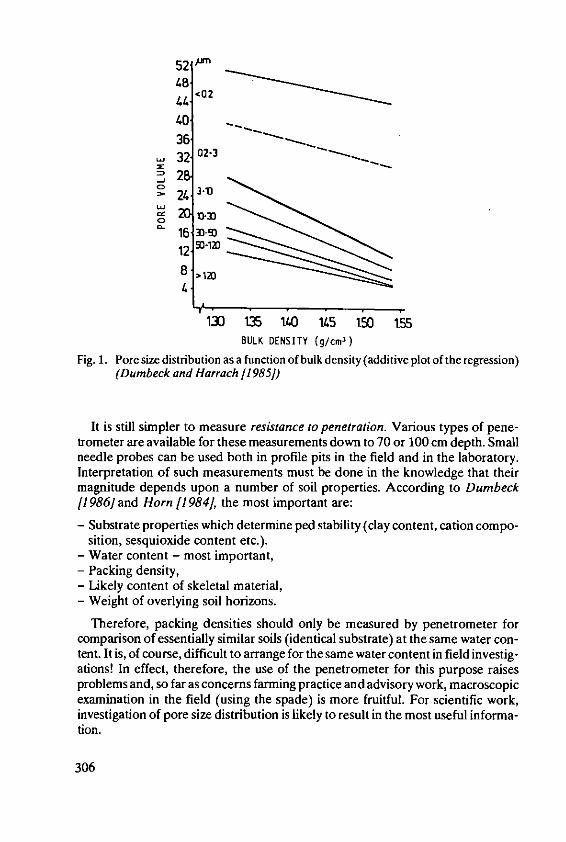
52 ""
48
40 -
3632 02-32B
24 310
16 3-SO
12 5-120
8 'IM4
130 t 140 145 1.50 1.55BULK DENSITY (g/cmr)
Fig. 1. Pore size distribution as a function of bulk density (additive plot of the regression)(Dumbeck and Harrach [19851)
It is still simpler to measure resistance to penetration. Various types of pene-trometer are available for these measurements down to 70 or 100 cm depth. Smallneedle probes can be used both in profile pits in the field and in the laboratory.Interpretation of such measurements must be done in the knowledge that theirmagnitude depends upon a number of soil properties. According to Dumbeck[1986] and Horn [1984], the most important are:
- Substrate properties which determine ped stability (clay content, cation compo-sition, sesquioxide content etc.).
- Water content - most important,- Packing density,- Likely content of skeletal material,- Weight of overlying soil horizons.
Therefore, packing densities should only be measured by penetrometer forcomparison of essentially similar soils (identical substrate) at the same water con-tent. It is, of course, difficult to arrange for the same water content in field investig-ations! In effect, therefore, the use of the penetrometer for this purpose raisesproblems and, so far as concerns farming practice and advisory work, macroscopicexamination in the field (using the spade) is more fruitful. For scientific work,investigation of pore size distribution is likely to result in the most useful informa-tion.
306
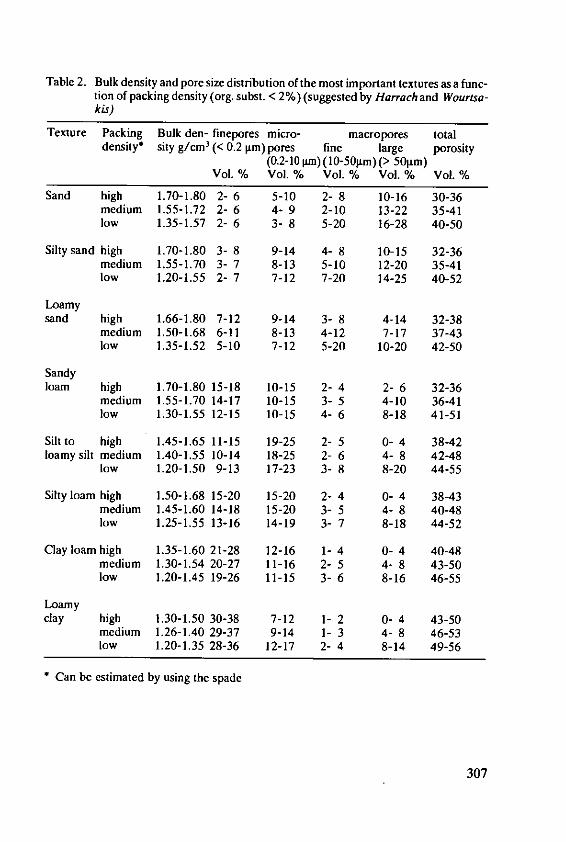
Table 2. Bulk density and pore size distribution of the most important textures as a func-tion of packing density (org. subst. < 2%) (suggested by Harrach and Wourtsa-kis)
Texture Packing Bulk den- finepores micro- macropores totaldensity* sity g/cm3 (< 0.2 tim) pores fine large porosity
(0.2-10 mun) (10-501im) (> 50pm)Vol. % Vol. % Vol. % Vol. % Vol. %
Sand high 1.70-1.80 2- 6 5-10 2- 8 10-16 30-36medium 1.55-1.72 2- 6 4- 9 2-10 13-22 35-41low 1.35-1.57 2- 6 3- 8 5-20 16-28 40-50
Silty sand high 1.70-1.80 3- 8 9-14 4- 8 10-15 32-36medium 1.55-1.70 3- 7 8-13 5-10 12-20 35-41low 1.20-1.55 2- 7 7-12 7-20 14-25 40-52
Loamysand high 1.66-1.80 7-12 9-14 3- 8 4-14 32-38
medium 1.50-1.68 6-11 8-13 4-12 7-17 37-43low 1.35-1.52 5-10 7-12 5-20 10-20 42-50
Sandyloam high 1.70-1.80 15-18 10-15 2- 4 2- 6 32-36
medium 1.55-1.70 14-17 10-15 3- 5 4-10 36-41low 1.30-1.55 12-15 10-15 4- 6 8-18 41-51
Silt to high 1.45-1.65 11-15 19-25 2- 5 0- 4 38-42loamy silt medium 1.40-1.55 10-14 18-25 2- 6 4- 8 42-48
low 1.20-1.50 9-13 17-23 3- 8 8-20 44-55
Silty loam high 1.50-1.68 15-20 15-20 2- 4 0- 4 38-43medium 1.45-1.60 14-18 15-20 3- 5 4- 8 40-48low 1.25-1.55 13-16 14-19 3- 7 8-18 44-52
Clay loam high 1.35-1.60 21-28 12-16 1- 4 0- 4 40-48medium 1.30-1.54 20-27 11-16 2- 5 4- 8 43-50low 1.20-1.45 19-26 11-15 3- 6 8-16 46-55
Loamyclay high 1.30-1.50 30-38 7-12 1- 2 0- 4 43-50
medium 1.26-1.40 29-37 9-14 1- 3 4- 8 46-53low 1.20-1.35 28-36 12-17 2- 4 8-14 49-56
* Can be estimated by using the spade
307
3. Through rooting of soils
Taylor and Klepper's [1978] survey of the literature lists 24 factors which influenceroot growth, saying that this list is still incomplete. After soil chemical factors theylist those connected with soil structure (soil strength, permeability to air, watercontent and temperature). These factors will be examined in turn.
In discussing structure the various requirements of different plants will be kept inmind. For example Lehfeldt [1986] says that plough pan is not so serious a con-straint for spring rape as it is for winter wheat. Spring barley is even more sensitive.In considering effects of structure in practical terms the discussion should be basedon the most demanding crops (sugar beet or barley).
3.1. Resistance to penetration
The root system can explore only a part of the soil. Large pores (> 10 4m) are abso-lutely necessary for root hairs and roots. By exerting pressure, the roots shift soilparticles and so can further penetrate the cavity space, provided the mechanicalresistance of the soil does not prevent it.
There is a copious literature on the effects of mechanical resistance on rootgrowth and the intensity of through-rooting. The main aim of this work has been toestablish limiting values for through-rooting. Three principal methods can be dis-tinguished.
- Measurement of the radial or axial pressure exerted by the root,- Measurement of the pressure which brings about reduction in root growth, by
applying external pressure.- Measurement of root growth in relation to the soil's resistance to penetration.
Axial and radial root pressure have been found to be in the range 0.3-2.6 MPa(Misra etal[I 978]; Whitley[l 981]) (see also Table 3). The plant's requirements inrelation to packing density can be found by making such measurements on seedl-ing roots.
Root growth can be reduced by up to 50% by a soil pressure of 20 KPa. In someplants a reduction of 20% results under certain conditions from a pressure of 50KPa (A bdallah el al /1969]; Taylor and Ratcliff [1969]; Russel [1977]).
Values measured by penetrometer for the restriction of root growth lie some-where between 0.8 and 5.0 MPa (Cannel [1977]; Goodeham [1977]) or some-times higher (see Figure 2). According to Ehler's [1983] literature survey criticalvalues for prevention of root growth are between 2.0 and 2.5 MPa. However, infield experiments, he found values between 3.6 and 5.1 MPa.
Critical values measured by penetrometer are sometimes much higher thanthose derived from model experiments measuring maximum radial and axial rootpressures. The reason for this discrepancy is that the roots can grow around barri-ers in the soil (Bandara and Fritton /1986]) and, to a large extent, because of earth-
308
worm activity and the presence of old root-channels in compacted zones (Ehlers etal [1983]). Further, constrictions in pores can be penetrated by slimming of theroots (Altenitiller and Haag [1983]). Such possibilities are not apparent to thepenetrometer.
A further cause of discrepancy is methodological. A critical analysis by Gooder-ham [1977] pointed out that different workers used different types of probe andoften worked with only one soil type or plant species. Further the role of gas perm-eability was often insufficiently taken into account. Not least it must be pointed outthat resistance to penetration is much affected by soil water content. On account ofthese difficulties, the use of penetrometers to determine critical values is perhaps oflimited value.
Table 3. Maximum axial and radial root growth pressures available from the publishedliterature (from MISRA et al. 1978)
Authors and year Plant species Axial/ No. of Mean Range ofof publication used radial obser- pressure values
pressure vations (kPa) (kPa)
Pfefferf1893] Faba vulgaris axial 6 1082 704-1936Gill and Bolt119551 Faba vulgaris radial 6 509 390- 611
Zea mays axial 4 1451 953-2494Zea mays radial 1 659 -I'icia sativa axial 2 1080 826-1333
Taylor and Ratliff11969] Pisum sativum axial 63 1300 600-2600
(cv. Brunswick)Gossypiumhirsutim axial 64 940 600-1600(cv. Coker 413-68)Arachis hypogaea axial 71 1150 500-2000(cv. VirginiaBunch)
Eavisetalfl969 Pisumsativum axial 290 1150 700-1600(cv. Alaska)Gossypiumhirsutum axial 242 888 400-1300(cv. Coker413-68)
Agarwal andPriharf1975] Cicerarietinum axial 10 450 120 (SE)
Zea mays axial 10 1090 187 (SE)
a SE indicates standard errors of the mean
309

In compact sandy soils, it is recognised that it is not gas permeability butmechanical resistance of the soil that limits root growth. The same holds for com-pacted layers (e.g. humic layers, hardpan, limonite). In such cases mechanicalresistance of the soil must be taken into account. But, more usually, it is not enoughto base conclusions as to gas per permeability merely on penetrometer readings.Better methods are needed.
0
0 0l
00 --- dl.
00
200
., 0 ' S 2 O i 1 S S 6o 0 *' o
MECHANICAL RESIST51ANCE BAR
Fig. 2. Effect of resistance on root growth rate for three soils (Gooderham 11977])
3.2. Soil atmosphere
Soil air capacity is important. This is related to the proportion of air-permeablepores at field capacity, i. e. 2- 3 days after copious watering. Air capacity means theminimum of air filled pores in the soil in critical times following heavy rain (e.g. inthe spring). In well drained soils at field capacity, depending on the unsaturatedhydraulic conductivity of the whole profile, macro pores > 10 lim or > 30 l.m or >50 [Lm equivalent diameter are available for penetration by air (Hartge [l1978] p.212).
The oft-quoted limiting value for optimum gas exchange of 10% air filled pores(Grable [1971]) is viewed as being over-simplified by Hamblin [1985]. PLA[cited by Hamblin] found adequate 0 2 diffusion when macro pores (> 30 lum)amounted to 8% so that root penetration was not hindered. Ehlers [1983] arrivedby calculation at values of 6 and 11% (vol) according to continuity of macro pores.Czeratzki [1972] calculated a figure of 3 vol. %.
310
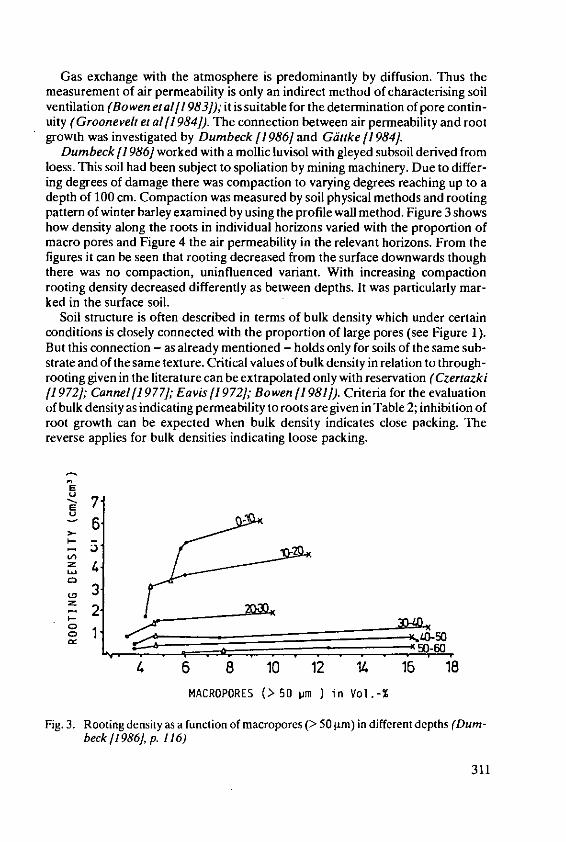
Gas exchange with the atmosphere is predominantly by diffusion. Thus themeasurement of air permeability is only an indirect method of characterising soilventilation (Bowen etal[I 983]); it is suitable for the determination of pore contin-uity (Groonevelt et al[I 984]). The connection between air permeability and rootgrowth was investigated by Dumbeck /1986] and Gdke [19841.
Dumbeck /1986] worked with a mollic luvisol with gleyed subsoil derived fromloess. This soil had been subject to spoliation by mining machinery. Due to differ-ing degrees of damage there was compaction to varying degrees reaching up to adepth of 100 cm. Compaction was measured by soil physical methods and rootingpattern of winter barley examined by using the profile wall method. Figure 3 showshow density along the roots in individual horizons varied with the proportion ofmacro pores and Figure 4 the air permeability in the relevant horizons. From thefigures it can be seen that rooting decreased from the surface downwards thoughthere was no compaction, uninfluenced variant. With increasing compactionrooting density decreased differently as between depths. It was particularly mar-ked in the surface soil.
Soil structure is often described in terms of bulk density which under certainconditions is closely connected with the proportion of large pores (see Figure 1).But this connection - as already mentioned - holds only for soils of the same sub-strate and of the same texture. Critical values of bulk density in relation to through-rooting given in the literature can be extrapolated only with reservation (Czertazki[19 72]; Cannel [1977]; Eavis [1972]; Bowen [1981]). Criteria for the evaluationof bulk density as indicating permeability to roots are given in Table 2; inhibition ofroot growth can be expected when bulk density indicates close packing. Thereverse applies for bulk densities indicating loose packing.
EE 7
5
5066
MACROPORES (> 50 pm ) in Vol.-%
Fig. 3. Rooting density as afunction of macroporcs (>50 Lm) indifferent depths (Dum-beck [1986], p. 116)
311
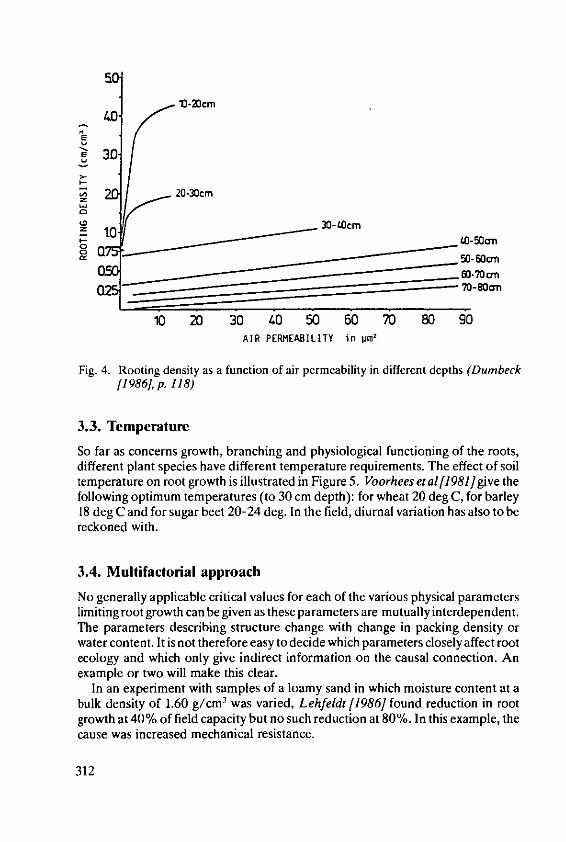
so
13-20cm
3D
220-0cm
~30-4Ocrn-10
0 05-6Ocm _._.._._ . ___..._.___60.?0 o-
Q25'-"-....._ ._ 080c n
10 20 30 40 50 60 70 80 90AIR PERMEABILITIY in pm2
Fig. 4. Rooting density as a function of air permeability in different depths (Dumbeck[1986], p . 118)
3.3. Temperature
So far as concerns growth, branching and physiological functioning of the roots,different plant species have different temperature requirements. The effect of soiltemperature on root growth is illustrated in Figure 5. Voorhees et al[1 981] give thefollowing optimum temperatures (to 30 cm depth): for wheat 20 deg C, for barley18 deg C and for sugar beet 20-24 deg. In the field, diurnal variation has also to bereckoned with.
3.4. Multifactorial approach
No generally applicable critical values for each of the various physical parameterslimiting root growth can be given as these parameters are mutually interdependent.The parameters describing structure change with change in packing density orwater content. It is not therefore easy to decide which parameters closely affect rootecology and which only give indirect information on the causal connection. Anexample or two will make this clear.
In an experiment with samples of a loamy sand in which moisture content at abulk density of 1.60 g/cml was varied, Lehfeldt [1986] found reduction in rootgrowth at 40 % of field capacity but no such reduction at 80%. In this example, thecause was increased mechanical resistance.
312

1.0
• 0.8
0.600
0.4
I-, 0.2
00 5 10 15 20 25 30 35 40
ROOT ENVIRONMENT TEMPERATURE, 'C
Fig. 5. Relative root dry weight as a function of temperature (generalized from data byBrouwer [1962). (cited by Voorhees et al 1981D
7.
a''
4 - x"
Aeraion nd me ch c
-ni°
.10 4%
3 impt.do,+ *.1eC1
00
0
10 00 1000 10.000 l00,00
-Motric potential (cm al a vlT)
Fig. 6. Summary of role of mechanical impedance, aeration and moisture stress on peaseedling root elongation in a sandy loam held at different matric potentials andbulk densities (Eavis 11972], p. 621)
313
Figure 6 after Eavis[1972]shows how root growth was influenced by permeabil-ity to air, mechanical resistance and lack of water when packing density and watercontent were both varied.
Lehfeldt et al[ 1986] found a reduction in root growth in tiped sandy loam at alower bulk density (1.70 g/cm3 ) than in unaltered soil (1.77 g/cm3 ). In this case,the cause was destruction of pore continuity in the sieved soil.
4. Effect of root development on yield
The yield potential of a site depends on a number of factors. These may or may notbe subject to modification by cultural treatment. Nutrient supply can be correctedby fertilizer; structure of the surface layer can be improved by appropriate cultiva-tion. But root penetration in the subsoil can at best be only slightly improved. Evenmore difficult to contend with are unfavourable climatic or weather conditions.Temperature and rainfall affect atmospheric humidity. According to Renger andStrebel[1980] there is a close connection between yield and the ratio transpira-tion/relative humidity deficit. The less the deficit the more effectively is water usedby the plant and the higher the yield.
Kneib and Schroeder[]984] found in Schleswig Holstein that variation in cerealyield was due among other things to changes in relative humidity (sum of meanvalues for May and June). According to them, a decrease of 1 mm Hg is associatedwith a yield increase by about 5% of the maximum.
Those yield-limiting environmental factors which cannot be altered or compen-sated by feasible cultural means determine the value and potential yield of a site.Site potential can be defined as the average potential of the site at an economicallyjustifiable level of input.
The yield potential of a soil is determined by its capacity for through-rooting -especially into the subsoil, and upon the availability of water in the rooting zone.
The effect of root penetration on yield has been discussed by Brown and Scott[1984], Canarache [1984], Dumbeck [1986] and Gattke and Rex [19841. Figure 7shows the significance of rooting into the subsoil for sugar beet yield (Dumbeck[1986]). The results stem from an experiment with 5 cultivation treatments whichproduced contrasting compaction of the surface soil. These resulted in differentialpenetration of the subsoil and were closely correlated with yield.
Rex and Harrach [1984]did experiments with different cereals in four localities.At each place two or three different soils were compared under the same manage-ment. A deep loamy soil from loess was compared with a poorly drained, physio-logically stagnant soil. Figure 8 shows yield in relation to total root-lenght in thesubsoil. The comparisons are between identical crops and identical cultivation. Inall four cases the same tendency is seen: the more intensively the subsoil is exploredby roots, the higher is the yield. On sites where rooting in the subsoil was weak,rooting was more intensive in the topsoil. Consequently, there was negative corre-lation between intensity of topsoil and yield (Rex [1984]).
314

y=2929+tlSr959x
80 r=0992
27070 t
~60 FRLa OSR
50 FR/P/
4.0
005 0 S oo 0.25ROOTING DENSITY (cm roots/cm 3 soil)
Fig. 7. Correlation between yield of sugarbeet and average rooting density in the subsoil(30-100 cm) of an Eutric Fluvisol (Dumbeck [1986], p. 50)
12
11
--
.4-)
S9.
11'0
ROOTLENGTH in subsoil (km/m2)Fig. 8. Correlation between total yield of winter wheat respectively oats and the root
length (km/m 2) in the subsoil (30-100 cm) (Rex[1984], p. 184)
315
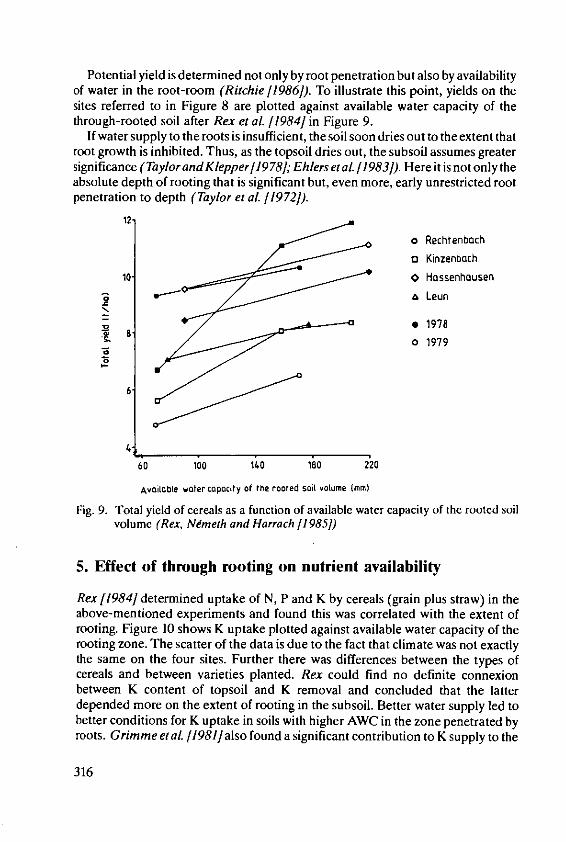
Potential yield is determined not only by root penetration but also by availabilityof water in the root-room (Ritchie 11986]). To illustrate this point, yields on thesites referred to in Figure 8 are plotted against available water capacity of thethrough-rooted soil after Rex et al. [1984] in Figure 9.
If water supply to the roots is insufficient, the soil soon dries out to the extent thatroot growth is inhibited. Thus, as the topsoil dries out, the subsoil assumes greatersignificance (Taylor and Klepper[ [978]; Ehlers etal. /1983]). Here it is not only theabsolute depth of rooting that is significant but, even more, early unrestricted rootpenetration to depth (Taylor et al. /1972]).
12
* Rechtenbach
* Kinzenbach10 0 Hassenhausen
& Leun
32 1978o 1979
6
4
60 100 140 l0 220
Availabte water capacity of the rooted soil votume (mM)
Fig. 9. Total yield of cereals as a function of available water capacity of the rooted soilvolume (Rex, Nmneth and Harrach [1985])
5. Effect of through rooting on nutrient availability
Rex [1984] determined uptake of N, P and K by cereals (grain plus straw) in theabove-mentioned experiments and found this was correlated with the extent ofrooting. Figure 10 shows K uptake plotted against available water capacity of therooting zone. The scatter of the data is due to the fact that climate was not exactlythe same on the four sites. Further there was differences between the types ofcereals and between varieties planted. Rex could find no definite connexionbetween K content of topsoil and K removal and concluded that the latterdepended more on the extent of rooting in the subsoil. Better water supply led tobetter conditions for K uptake in soils with higher AWC in the zone penetrated byroots. Grimme el al /1981]also found a significant contribution to K supply to the
316
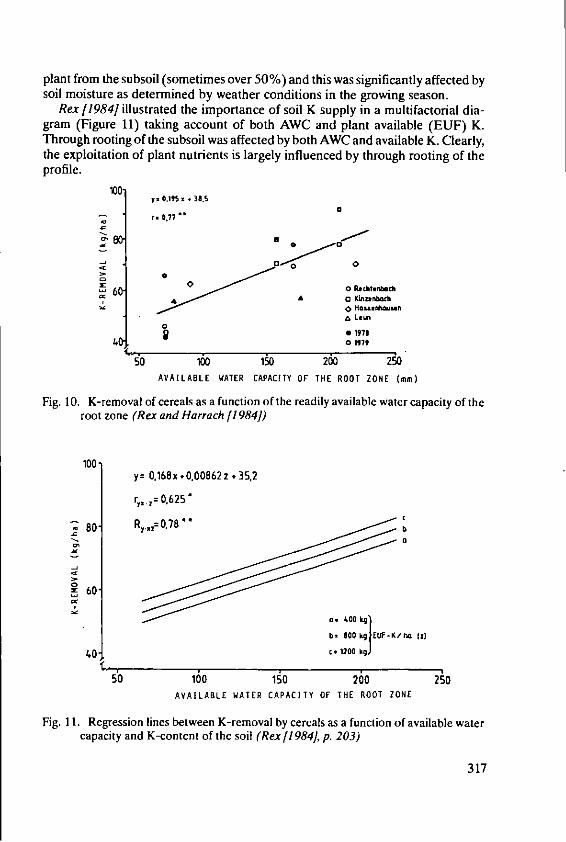
plant from the subsoil (sometimes over 50%) and this was significantly affected bysoil moisture as determined by weather conditions in the growing season.
Rex 11984] illustrated the importance of soil K supply in a multifactorial dia-gram (Figure 11) taking account of both AWC and plant available (EUF) K.Through rooting of the subsoil was affected by both AWC and available K. Clearly,the exploitation of plant nutrients is largely influenced by through rooting of theprofile.
100 y0,195 33.S
00
6 ,0 Rnrodt.
: 0 Kcnmrhaaan
4 0 1979
50 100 150 200 2M0AVAILABLE WATER CAPACITY OF THE ROOT ZONE (mm)
Fig. 10. K-removal of cereals as a function of the readily available water capacity of theroot zone (Rex and Harrach [1984])
100y= 0.168 x . 0,00862 z * 35,2
r 0,0625'
80BO R,.,=0.7 b
S60
b- 100 kg EUF-K/ 1r)
40 c.1200 kg
so 160 150 200 250AVAILABLE WATER CAPACITY OF THE ROOT ZONE
Fig. 11. Regression lines between K-removal by cereals as a function of available watercapacity and K-content of the soil (Rex [ 98 4, p. 203)
317

6. References
1. A bdallah, A.M., Hettiaratchi, D.R.P. and Reece, A. R.: The mechanics of root growthin granular media. J. agric. Engng. Res. 14 (3), 236-248 (1969)
2. A temitiler, H.J: Mikroskopieder Bdden mit Hilfe von Diinnschliffcn. In: Handbuchder Mikroskopie in der Technik H. Freund (Ed.), Bd. 4, Teil 2, 309-367, 1974
3. Altemiiller, H.J. andfHaag, Th.: Mikroskopische Untersuchungen an Maiswurzeln imungest6rten Bodenverband. Kali Briefe 16, 349-363 (1983)
4. Arbeitsgruppe Bodenkunde: Bodenkundliche Kartieranleitung. Schweizerische Ver-lagsbuchhandlung. Stuttgart, 1982
5. Bandara, B. W. and Fritton, D.D.: Directive response of corn roots to physical varri-ers. Plant and Soil 96, 359-368 (1986)
6. Bowen, H.D.: Allevating mechanical impendance. In: "Modifying the root environ-ment to reduce crop stressD. G. F. Arkin and H. M. Taylor (Eds.) ASAE MonographNr. 4 Michigan (1981)
7. Bowen, -. D., Ayers, P. and Salyani, M.: Air permeability as an aeration criterion.ASAE - Paper 83-1551, (1983)
8. Brown, D.A. and Scott, H.D.: Dependance of crop growth and yield on root develop-ment and activity. In: ,Roots, nutrient and water influx, and plant growth". S.A.Barber and D.R. Boulding (Eds.). ASA Special Publication Nr. 49, Madison USA,1984
9. Canarache, A.: Einfluss der Bodenverdichtung auf die Produktivitit der AckerbddenRumfniens. In: cErh6hung der Wasserausnutzung im Boden durch die Pfianze zurSteigerung und Stabilisierung der Ertrfge in der Pflanzenproduktion,. (Proc. Congr.Academy Agric. Sci. GDR 231, 41-48) Berlin (1985)
10. Cannel, R.Q.: Soil aeration and compaction in relation to root growth and soilmanagement. In: gApplied Biology" Vol. 11, 1-86 T.H. Coaker (Ed.). AcademicPress London, 1977
11. Czeratzki, W.: Die Anspriiche der Pflanzcn and den physikalischen Bodenzustand.Landbauforschung Vdlkenrode 22, 29-36 (1972)
12. Dumbeck, G. and Harrach, T.: Porenumverteilung bei Bodenverdichtungen. Mit-teilgn. Dtsch. Bodenkundl. Gesellsch. 43/1, 213-218 (1985)
13. Dumbeck, G.: Bodenphysikalische und funktionelle Aspekte der Packungsdichtevon B6den. Dissertation Giessen, 1986
14. Eavis, B. W.: Soil physical conditions affecting seedling root growth. Plant and Soil36, 613-622 (1972)
15. Ehlers, W.: Auswirkungen der Bodenbelastung mit schwerem Gerdt und der Boden-bearbeitung auf das Bodengcfigc und das Pflanzenwachstum. Kali-Briefe 16, 499-516(1983)
16. Ehlers, W., Kdpke, U., Hesse, F. and B6hm, W.: Penetration resistance and rootgrowth of oats in tilled and untilled loess soil. Soil and Tillage Res. 3, 216-275 (1983)
17. Gdtke, Cl. R.: Zur Wirkung unterschiedlicher bodenphysikalischer Einflussgr6ssenauf die Wurzelausbreitung und die pflanzliche Stoffproduktion. In: cGrundlagen undVerfahren der rationellen Bodenbearbeitung und Erschliessung des Unterbodens ffrdie PflanzenD. Proc. Congr. Academy Agric. Sci. GDR 227,177-183 Berlin (1984)
18. Gooderham, P. T.: Some aspects of soil compaction, root growth and crop yield.Agric. Prog. 52, 33-44 (1977)
318
19. Grable, A.R.: Effects of compaction on content and transmission of air in soils. In:*Compaction of Agric. Soils ASAE Monograph pp. 154-164 (1971)
20. Grimme, H., Strebel, 0., Renger, M. andFleige, H.: Die potentielle K-Anlieferung andie Pflanzenwurzeln durch Diffusion. Mitteilgn. Dtsch. Bodenkundi. Gesellschaft 32,367-374 (1981)
21. Groonevelt, P.H., Kay, B.D. and Grant, CD.: Physical assessment of a soil withrespect to rooting potential. Geoderma 34, 101-114 (1984)
22. Hamblin, A.P.: The influence of soil structure on water movement, crop root growthand water uptake. In: 4Advances in agronomy, 38, 95-158. N. C Brady(Ed.), 1985
23. Harrach, T.: Lockerungsbediirftige B6den cinfach und sicher erkennen! In: g Boden-fruchtbarkeit in Gefahr? - Neuzeitliche Bodennutzung und nachhaltige Ertrags-fdhigkeit*. Arbeiten der DLG 179, 114-121. DLG-Verlag Frankfurt am Main(1984)
24. Hartge, K. H.: Die physikalische Untersuchung von Bden. F. Enke (Ed.), Stuttgart,1972
25. Hartge, K.H.: Einfiihrung in die Bodenphysik. F. Enke(Ed.), Stuttgart, 197826. Hillel, D.: Introduction to Soil Physics. Academic Press, New York, 198227. Horn, R.: Die Vorhersage des Eindringwiderstandes von Bbden anhand von multi-
plen Regressionsanalysen. Z. Kulturtechn. Flurbereinigung 25, 377-380 (1984)28. Kneib, W. and Schr6der, D.: Die Bewertungder Pedofunktion cPflanzliche Produk-
tion, in Schleswig-Holstein. Z. Pflanzenernihrung und Bodenkunde 147, 425-434(1984)
29. Lehfeldt, J.: Durchwurzelung des Unterbodens von Morinenstandorten in Ab-hingigkeit von Verdichtungsgrad der Krumenbasis und der Pflanzenart. Arch.Acker- und Pflanzenbau Bodenk. 30, 549-556, Berlin (1986)
30. Lehfeldt, J., Kullmann, A. and Bober, M.: Wirksamkeit kontinuierlicher Vertikal-poren in Bodensubstraten der Morinenstandorte. Arch. Acker- und PflanzenbauBodenk. 30, 539-547, Berlin (1986)
31. Maier-Kahne, H.M.: Morphometrische Methoden fir die Bodenmikromorphologie.Dissertation, Stuttgart-Hohenheim, 1986
32. Misra, R.K., Dexter, A.R. andAlston, A. M.: Maximum axial and radial growth pres-sure of plant roots. Plant and Soil 95, 315-326 (1986)
33. Renger, M. and Strebel, 0.: Wasserverbrauch und Ertrag von Pflanzenbestfnden.Kali-Briefe 15, 135-143 (1980)
34. Rex, M.: Der Einfluss der Durchwurzelbarkeit des Bodens auf Ertrag nnd den Nihr-stoffentzug von Getreide. Giessener Bodenkundliche Abhandlungen, 1984
35. Rex, M. and Harrach, T.: Die Bedeutung der Unterbodenbeschaffenheit fur die Er-tragsbildung von Getreide. Feldversuche auf verschiedenen Bodentypen mit vari-ierter N.hrstoffversorgung. Landw. Forsch., Sonderheft 40, 384-394 (1984)
36. Rex, M., Ntmeth, K. andHarrach, T.:The EUF-N content of arable soils as an indica-tor of their yield potential. Plant and Soil 83, 117-125 (1985)
37. Ritchie, J. T.: Soil Water and Plant Productivity. XIII. Congress of 1SSS in Hamburg,Trans. Vol. /, 13-28 (1986)
38. Russel, R.S.: Plant root systems. Mc Graw - Hill Comp. London UK, 197739. Taylor, H.M. and Ratliff, L.F.: Root elongation rates of cotton and peanuts as a func-
tion of soil strength and soil water content. Soil Sci. 108, 113-119 (1969)40. Taylor, H.M., Huck, M. G. andKlepper, B.: Root development in relation to soil phy-
sical conditions. In: "Optimizing the soil physical environment toward greater cropyields*. D. Hillel (Ed.), 1972
319

41. Taylor, H. M. and Klepper, B.: The role of rooting characteristics in the supply waterto plants. Advances in agronomy 30, 99-108 (1978)
42. Voorhees, W.B., Allmaras, R.R. and Johnson, CI. E.: Alleviatingtemperature stress.In: .Modifying the root environment to reduce crop stress . G.F. Arkin and H.M.Taylor (Eds.), ASAE Monograph Nr. 4 Michigan (1981)
43. Whiteley, G.M., Utono, W.H. and Dexter, D.R.: A comparison of penetrometerpressures and the pressures exerted by roots. Plant and Soil 61, 351-364 (1981)
320
Field Methods for the Evaluation ofSoil Factors Affecting PotassiumResponse
R. Lichtfuss and H. Grimme, Biintehof Agricultural Research Station, HannoverFed. Rep. of Germany*
Summary
Apart from water soluble K content in the soil K availability and total K content dependon a number of soil properties and site factors which can readily be assessed directly in thefield with simple methods and without the use of expensive equipment. They allow theestimation of parent material, soil texture, humus content, cation exchange capacity,structural type, pH value, bulk density, root depth, and available water capacity.
The recorded soil properties result in the designation of a soil type. Different soiltypes of a whole landscape together form a soil association which can be shown in asoil map. Respective maps can be provided showing the distribution of soil propertieswith regard to K response.
Permanent field installations like soil solution samplers, tensiometers or even weatherstations allow a continuous monitoring of soil nutrient status and climatic site parameters.
1. Introduction
The effect of the potassium on crop growth, especially with regard to the optimiza-tion of yield and quality depends on a number of environmental factors. Besidesthe main soil properties, both climatic conditions and management practices, suchas rate and time of fertilizer application affect K response (Figure 1). As the skillsand the objectives of the farmers vary, their decisions also vary, so that the influenceof farm management practices on K response is difficult to assess. Climatic and soilfactors, on the contrary, can often be assessed in qualitative and semi-quantitativeterms by using relatively simple field methods. Because of the paramount import-ance of the soil in agricultural production systems quantification of relevant soilproperties (Figure 2) is of primary interest in land suitability evaluation.
* Dr. R. Lichtfuss and Dr. H. Grimme, Biintehof Agricultural Research Station, Binte-weg 8, D-3000 Hannover Fed. Rep. of Germany
321
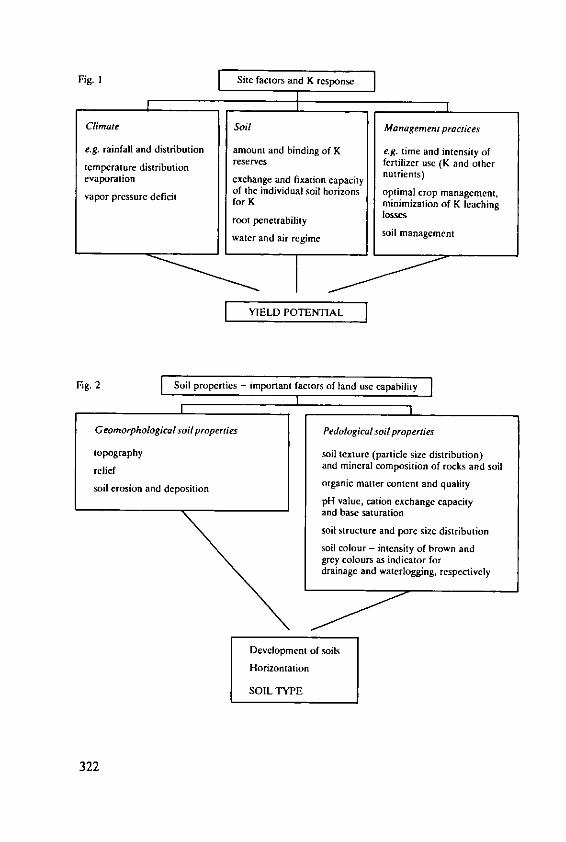
Fig. I Site factors and K response
Climate soil Managenent practices
e.g. rainfall and distribution amount and binding of K e.g. time and intensity of
temperature distribution reserves fertilizer use (K and other
evaporation exchange and fixation capacity nutrients)of the individual soil horizons optimal crop management,vapor pressure deficit for K minimization of K leaching
root penetrability losss
water and air regime soil management
YIELDPOTETIAL
Fig. 2 Soil properties - important factors of land use capabilityI
Geomorphological soil properties Pedological soil properties
topography soil texture (particle size distribution)relief and mineral composition of rocks and soil
soil erosion and deposition organic matter content and qualitypH value, cation exchange capacityand base saturationsoil structure and pore size distribution
soil colour - intensity of brown andgrey colours as indicator fordrainage and waterlogging, respectively
Development of soils
Horizontation
SOIL TYPE
322
2. Field methods for the identification and assessment of soilcharacteristics as related to K behaviour in soils
2.1 Preliminary studiesBefore attempting soil and site description, valuable information can be gatheredfrom the study of topographic, geological and soil maps of the area under consider-ation. These maps may be obtained from the geological survey agencies. Geologi-cal maps provide information on the parent material and therewith often on themineralogy and the K reserves of the soils. Topographic maps allow conclusions tobe drawn on past or present erosion processes and erosion hazards. The consulta-tion of soil maps and - if available - of aerial maps should be a matter of course inthe preparatory stage of field work.
Good farmers keep records (Schlagkarteien) of crop yields and inputs on eachfield. These data give information on the variability of past crop yields in relation tolocal weather conditions, fertilizer inputs and phytosanitary measures. The changeof soil K status with time as related to crop yield and fertilizer rates gives someinsight into the behaviour of K in the soil. The farmer should also be interviewedbefore starting field studies because nobody knows his fields better than he doeswith respect to yield potential and the year to year variability in yield and also withrespect to the effect of soil and crop management on crop performance.
2.2 Simple tests in the field
Simple tests can be made in the field which aid survey work for mapping of soiltypes and ecological features. Some of these tests are also a convenient source ofinformation on the effect of potassium on plant growth.
Choice, presentation and interpretation of the field methods are based on hand-books and other publications by Schumann [1975], Scheffer & Schachtschabel[1982], Schlichting & Blume 1966], Blume & Lamp [1985], Schoeder 119841,B6hm [19761 Fiedler [1973], Hodgson 1978], Clarke [1961j, Rengerf1971] andAG Bodenkunde [1982.
Identification of parent rock and its mineralogical composition
When the rocks from which the soils are formed by pedogenic processes are consid-ered together with climatic factors, conclusions may often be drawn on possiblechronosequences of soil types. Moreover, a rough classification of the rock materialas the source of K in the soil can already give some information with regard to Krelease and K fixation (Table 1). The ability of rocks to supply K depends on theircontents of K bearing minerals like K feldspars, phyllosilicates and clay minerals,e.g. mica schist > granite > quartzite. It also depends on the texture of the parentrock and hence on the reactive surface of the minerals. At comparable contents of
323
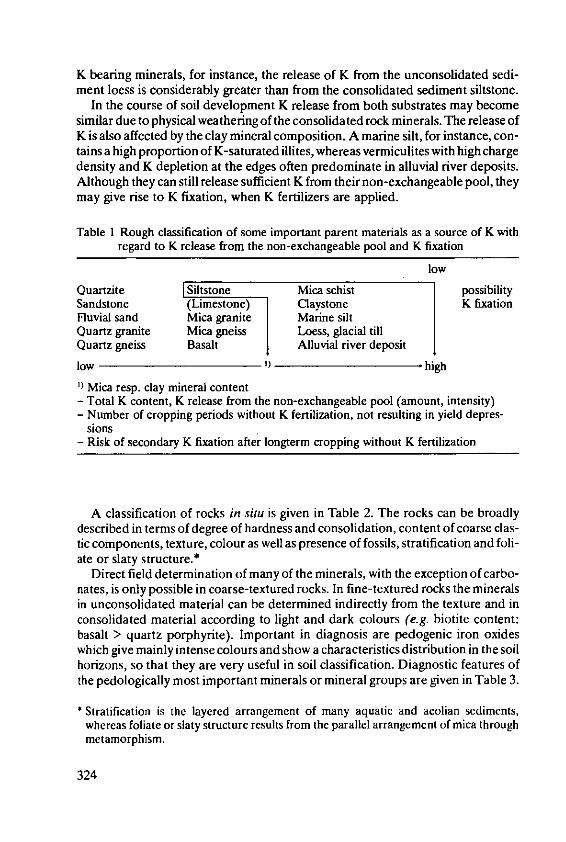
K bearing minerals, for instance, the release of K from the unconsolidated sedi-ment loess is considerably greater than from the consolidated sediment siltstone.
In the course of soil development K release from both substrates may becomesimilar due to physical weathering of the consolidated rock minerals. The release ofK is also affected by the clay mineral composition. A marine silt, for instance, con-tains a high proportion of K-saturated illites, whereas vermiculites with high chargedensity and K depletion at the edges often predominate in alluvial river deposits.Although they can still release sufficient K from their non-exchangeable pool, theymay give rise to K fixation, when K fertilizers are applied.
Table 1 Rough classification of some important parent materials as a source of K with
regard to K release from the non-exchangeable pool and K fixation
low
Quartzite Siltstone Mica schist possibilitySandstone (Limestone) Claystone K fixationFluvial sand Mica granitle Marine siltQuartz granite Mica gneiss Loess, glacial tillQuartz gneiss Basalt Alluvial river deposit
low 1) high
Mica resp. clay mineral content- Total K content, K release from the non-exchangeable pool (amount, intensity)- Number of cropping periods without K fertilization, not resulting in yield depres-
sions- Risk of secondary K fixation after longterm cropping without K fertilization
A classification of rocks in situ is given in Table 2. The rocks can be broadlydescribed in terms of degree of hardness and consolidation, content of coarse clas-tic components, texture, colour as well as presence of fossils, stratification and foli-ate or slaty structure.*
Direct field determination of many of the minerals, with the exception of carbo-nates, is only possible in coarse-textured rocks. In fine-textured rocks the mineralsin unconsolidated material can be determined indirectly from the texture and inconsolidated material according to light and dark colours (e.g. biotite content:basalt > quartz porphyrite). Important in diagnosis are pedogenic iron oxideswhich give mainly intense colours and show a characteristics distribution in the soilhorizons, so that they are very useful in soil classification. Diagnostic features ofthe pedologically most important minerals or mineral groups are given in Table 3.
* Stratification is the layered arrangement of many aquatic and aeolian sediments,whereas foliate or slaty structure results from the parallel arrangement of mica throughmetamorphism.
324
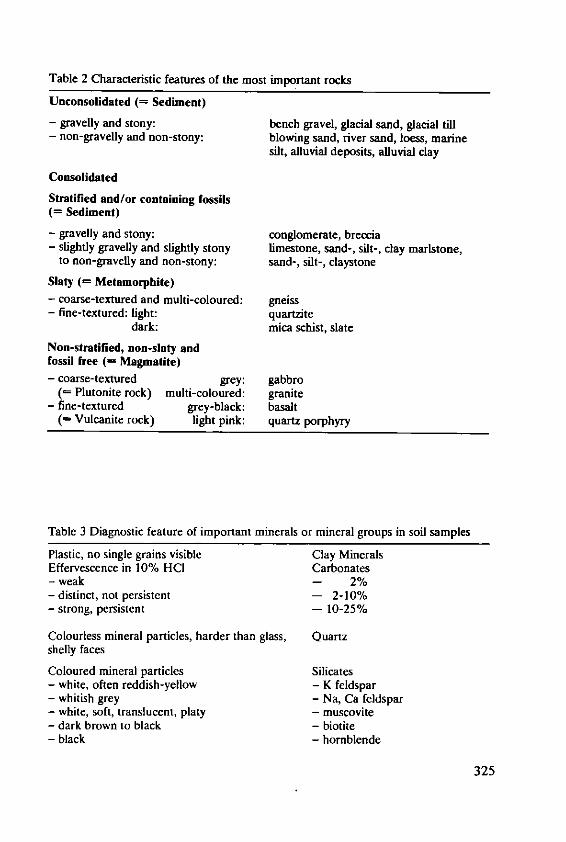
Table 2 Characteristic features of the most important rocks
Unconsolidated (= Sediment)
- gravelly and stony: bench gravel, glacial sand, glacial till- non-gravelly and non-stony: blowing sand, river sand, loess, marine
silt, alluvial deposits, alluvial clay
Consolidated
Stratified and/or containing fossils(= Sediment)
- gravelly and stony: conglomerate, breccia- slightly gravelly and slightly stony limestone, sand-, silt-, clay marlstone,
to non-gravelly and non-stony: sand-, silt-, claystone
Slaty (= Metamorphite)
- coarse-textured and multi-coloured: gneiss- fine-textured: light: quartzite
dark: mica schist, slate
Non-stratified, non-slaty andfossil free (- Magmatite)- coarse-textured grey: gabbro
(- Plutonite rock) multi-coloured: granite- fine-textured grey-black: basalt
(- Vulcanite rock) light pink: quartz porphyry
Table 3 Diagnostic feature of important minerals or mineral groups in soil samples
Plastic, no single grains visible Clay MineralsEffervescence in 10% HCI Carbonates- weak - 2%- distinct, not persistent - 2-10%- strong, persistent - 10-25%
Colourless mineral particles, harder than glass, Quartzshelly faces
Coloured mineral particles Silicates- white, often reddish-yellow - K feldspar- whitish grey - Na, Ca feldspar- white, soft, translucent, platy - muscovite- dark brown to black - biotite- black - hornblende
325
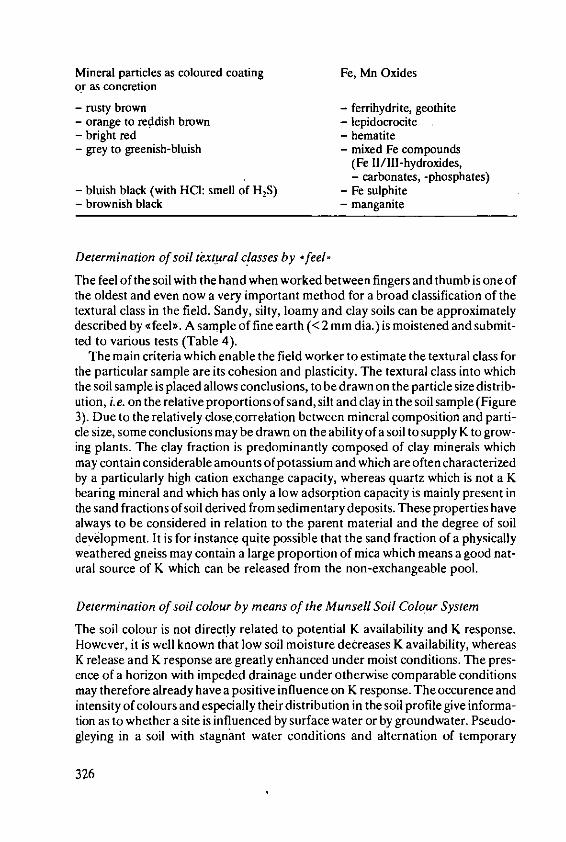
Mineral particles as coloured coating Fe, Mn Oxidesor as concretion
- rusty brown - ferrihydrite, geothite- orange to reddish brown - lepidocrocite- bright red - hematite- grey to greenish-bluish - mixed Fe compounds
(Fe Il/ll-hydroxides,- carbonates, -phosphates)
- bluish black (with HCI: smell of H2S) - Fe sulphite- brownish black - manganite
Determination of soil textural classes by -feel-
The feel of the soil with the hand when worked between fingers and thumb is one ofthe oldest and even now a very important method for a broad classification of thetextural class in the field. Sandy, silty, loamy and clay soils can be approximatelydescribed by cfee,. A sample of fine earth (< 2 mm dia.) is moistened and submit-ted to various tests (Table 4).
The main criteria which enable the field worker to estimate the textural class forthe particular sample are its cohesion and plasticity. The textural class into whichthe soil sample is placed allows conclusions, to be drawn on the particle size distrib-ution, i.e. on the relative proportions of sand, silt and clay in the soil sample (Figure3). Due to the relatively close.correlation between mineral composition and parti-cle size, some conclusions may be drawn on the ability of a soil to supply K to grow-ing plants. The clay fraction is predominantly composed of clay minerals whichmay contain considerable amounts of potassium and which are often characterizedby a particularly high cation exchange capacity, whereas quartz which is not a Kbearing mineral and which has only a low adsorption capacity is mainly present inthe sand fractions of soil derived from sedimentary deposits. These properties havealways to be considered in relation to the parent material and the degree of soildevelopment. It is for instance quite possible that the sand fraction of a physicallyweathered gneiss may contain a large proportion of mica which means a good nat-ural source of K which can be released from the non-exchangeable pool.
Determination of soil colour by means of the Munsell Soil Colour System
The soil colour is not directly related to potential K availability and K response.However, it is well known that low soil moisture decreases K availability, whereasK release and K response are greatly enhanced under moist conditions. The pres-ence of a horizon with impeded drainage under otherwise comparable conditionsmay therefore already have a positive influence on K response. The occurence andintensity of colours and especially their distribution in the soil profile give informa-tion as to whether a site is influenced by surface water or by groundwater. Pseudo-gleying in a soil with stagnant water conditions and alternation of temporary
326
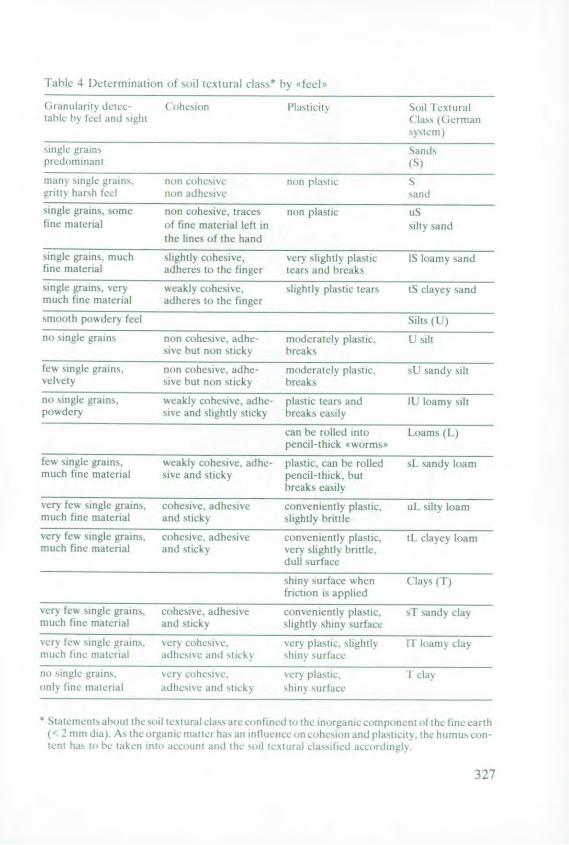
filel 4 [.)ctermmi ton toi l xttral clasi, I, feel>
(iranolaitsl dctc¢ ( ,hcsion lliiit Soil *l tsrraltable >s L cl Int 'tauht ( Thas I( r
alusut steusingle or ittn, SantA
pni. dIII] nlIS}
cnis h,th 1"I rim achasIe 'and
single grains. some non cohesive, traces non plastic uSfine material of tine matcrial left in silt sand
the lines of the hand
single grains, much slightly cohesive. ,sry slightly plastic IS Ilaumy sandfine material adheres to the finger tears and breaks
singale grains, cry wcakly cohesive, sight lv plastic tears tS cayc a sndmuch fine material adheres to the finger
sn'ooth powdery feel Sill (.
no single grains non cohesive, adhc- moderately plaslic. 1. siltsiw hut non sticky breaks
few single igrains, ion cohesive, adhe- noderaely plastic. sl sand, siltvelvcty vice but non sticky breaks
no single grains, weakly cohesc.e adhe- plastic teals and It loan) siltpoidery soe and slightly sticky breaks ejailt
can be rolled into Loams I Ipencil-tlhick t ss orrnt,
fe,, single gratns weakly coshesive, adhe- plastic, call be rolled sI sandy iammuch fine material SiNC and sticky pencil-thick. but
breaks easily
very few single grains, cohesive, adhesive conveniently plastic, l si hI loammuch line material and sticky slightly brittle
very fc single grains, cohcsive, adhesive conveniently plasnc. t. clayey loanmuch fine material and sticky %crv sliuhly brittle,
'il surface
shin1y surface whetn Clays (I)Irteton is applied
vet-v fcs" sin 'lc grans, cihecve adhesive Crilnven intly plastic <I sandy clasmuch fine materi'al and sticky slightly shins surface
setsless~ stiate citos. sers cishesise. 'cry plastic. slirhila fI1 hrsmv dlmooch 1, " in d,: iria , ,rl o1lyl 11v lrist I tcksslt '~rlrsrush fillk malc~llJl idt .. 1: ,I t, ;l ] '*t, k, 'U [ ,l~ Ik
rio mt emlgh gritnt> a'ohcsive, sea> plasm> [ cliv
olly tito ntisnil tdhas'e and stcky sbiny s unlcrec
* t• .titt i[clc ~ lb tl ti> u t sti-ivtl} class ar cr:'tliris'a t th llt~aca ri c*r nr ll t q hI ti a l1> 101 dal \s il thcor' tj ,[AtA r los crttll t i tell c.l-ur cl a sh i vans tlhtsct. ltriu ni c"ir
'I ha, lt 1ocin !4e I tIT*turaI c sIIih-ed crcqe la.iti Is
327
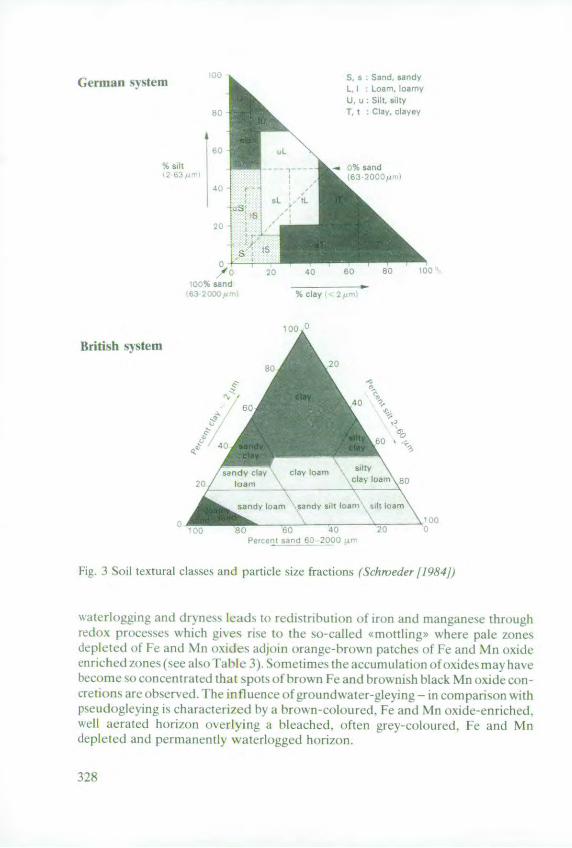
Germl system S ,l s 5andy• ~ L Le o.,,'
UJ u Silt. slt~y
Ct lay, ciava>
il
4, sr % A
British s, tem
0
lo. M cay' loam ,
I g. 3 Soil textural classes and particle size fractions (Schw~eder [198;411
alllggllgand dri[liv' lead, lto te'ditribtionl of iron and nianganese throutgh
FCdo)X proccsse, vdich gives ric¢ to fthe so-called ,mottling,, where pale zonesdepleted )I IFe arid Mil oxides ' adjoin orange Lcbrown patches of I c and IMn oxideo lri lc d/o~lles ( NC.ealso I abe . (n11.tiles
, the aic(.ullHai ion tof oxides lmap haxc
becotnle so conicen trald that s|po[ of brown I canld brownish b'lack IN~lroxide-con-
crovi)ns aie o)bserxed. I'he mlluince ot ) d" ;ter-Lleyin - in cotilarisoll itlIpseutoleyimg) ,cha~ractecrild ab)t)n-colot redI. Fc andMn oxidle-enrichecd.N Cll aerated horiztn okerlying a bleached. otffen grey-cohotrcd, Fec and NMn
deplted and permianently waterlogged horizon,
328
For objective and reproducible description of the soil colour a moist soil frag-ment is compared with the Munsell Soil Colour Chart. According to the system ofnotation each colour may be considered as a resultant of three variables: hue indi-cating its relationship to the spectral colours yellow, red or blue; value indicating itslightness or darkness, and chroma indicating the strength or departure from a neu-tral colour of the same value. The area covered by contrasting colours (mottles,bands, veins) and by the matrix colour is estimated and thus permits conclusions onintensity and duration of the processes that have led to the colour differentation.
Soil colour as indicator of soil organic matter content
In soils the colours of oxides are often masked by coloured humic substances. Dueto its fundamental role in soil fertility and its function as cation exchanger, soilhumus influences potassium response. For this reason the estimation of humuscontent from soil colour could be useful. Up to a certain level and depending on soiltexture the organic matter content correlates with the extent of black and white andthus the colour value read from Munsell Charts. Practical experience has shownthat the values given in Table 5 can be readily used for humus content estimates.
Table 5 Estimation of humus content (%) according to Value (Munsell) and soil textural
class
Colour Value (Munsell) Sand Loam, Clay
light grey 7 < 0.2grey 6 < 0.2 0.2-0.6
5 0.2-0.4 0.2-0.9dark grey 4.5 0.4-0.7 0.9-1.2
4 0.7-1.5 1.2-4black grey 3.5 1.5-3 4 - 6grey 3 3 -5 6 - 8
2.5 5 9 8 -12black 2 >9 > 12
Determination of pH value and estimation of cation exchange capacity andexchangeable cations
For measurement of pH directly in the field, distilled water is added to the soil sam-ple at a soil: water ratio of 1:2.5. After stirring the suspension is left to stand for 10minutes. The pH value is determined in the supernatant soil solution with indicatorpaper or portable pH meter. Subsequently KCI is added with a spatula by repea-tedly stirring the suspension. Then it is allowed to stand for another 10 minutes andthe pH value in the solution is recorded again. The difference between the actual(H2 0) and the effective (KCI) pH value depends on the acid species present in thesoil. The commonly used pH ratings are given in Table 6.
329
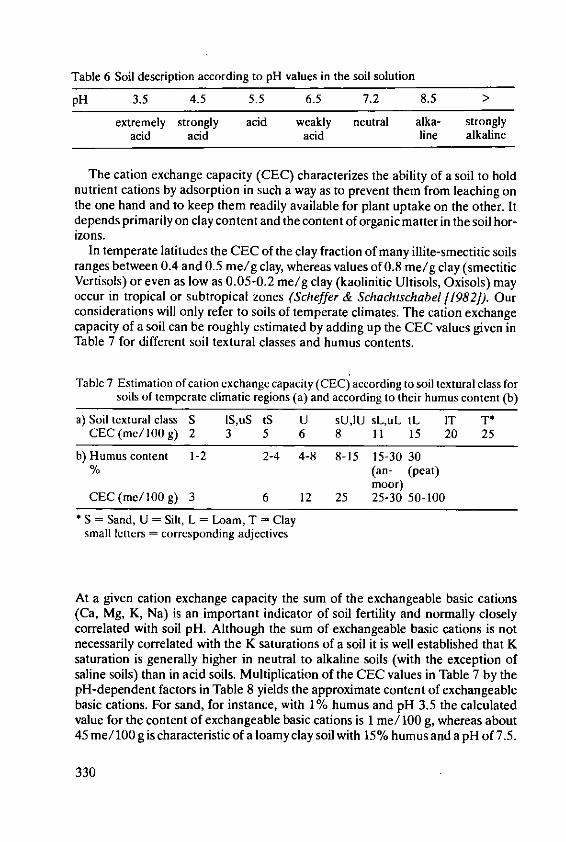
Table 6 Soil description according to pH values in the soil solution
pH 3.5 4.5 5.5 6.5 7.2 8.5 >
extremely strongly acid weakly neutral alka- stronglyacid acid acid line alkaline
The cation exchange capacity (CEC) characterizes the ability of a soil to holdnutrient cations by adsorption in such a way as to prevent them from leaching onthe one hand and to keep them readily available for plant uptake on the other. Itdepends primarily on clay content and the content of organic matter in the soil hor-izons.
In temperate latitudes the CEC of the clay fraction of many illite-smectitic soilsranges between 0.4 and 0.5 me/g clay, whereas values of 0.8 me/g clay (smectiticVertisols) or even as low as 0.05-0.2 me/g clay (kaolinitic Ultisols, Oxisols) mayoccur in tropical or subtropical zones (Scheffer & Schachtschabel [1982]). Ourconsiderations will only refer to soils of temperate climates. The cation exchangecapacity of a soil can be roughly estimated by adding up the CEC values given inTable 7 for different soil textural classes and humus contents.
Table 7 Estimation of cation exchange capacity (CEC) according to soil textural class forsoils of temperate climatic regions (a) and according to their humus content (b)
a) Soil textural class S IS,uS tS U sU,IU sL,uL tL IT T*CEC (me/100 g) 2 3 5 6 8 11 15 20 25
b) Humus content 1-2 2-4 4-8 8-15 15-30 30% (an- (peat)
moor)CEC (me/100 g) 3 6 12 25 25-30 50-100
* S = Sand, U = Silt, L = Loam, T = Claysmall letters = corresponding adjectives
At a given cation exchange capacity the sum of the exchangeable basic cations(Ca, Mg, K, Na) is an important indicator of soil fertility and normally closelycorrelated with soil pH. Although the sum of exchangeable basic cations is notnecessarily correlated with the K saturations of a soil it is well established that Ksaturation is generally higher in neutral to alkaline soils (with the exception ofsaline soils) than in acid soils. Multiplication of the CEC values in Table 7 by thepH-dependent factors in Table 8 yields the approximate content of exchangeablebasic cations. For sand, for instance, with 1% humus and pH 3.5 the calculatedvalue for the content of exchangeable basic cations is 1 me/ 100 g, whereas about45 me/100 g is characteristic of a loamy clay soil with 15% humus and a pH of 7.5.
330

Table 8 pH-dependent factors for the calculation of the sum of exchangeable cations
pH <3 4 5 6 7>Factor 0.1 0.2 0.5 0.7 0.9 1.0
Soil structure and bulk density
The spatial arrangement of the soil particles and the degree of aggregation - thesoil structure - is an important factor determining soil fertility. The structure is pri-marily related to pore size distribution and hence soil moisture retention and soilaeration as well as root penetration. Soil water and soil air regime in relation topotassium response have been described earlier in the text. As plants take up con-siderable amounts of water and nutrients from the subsoil, the effect of soil struc-ture in the subsoil on rooting depth and rooting pattern is also of great significancein nutrient availability and crop response (Figure 4).
m 1 m I m Irm
Single grain Masive Crumb Polyhedral
10cm I0 cm 1ocm
Prismatic Columnar Platy
Fig. 4 Forms of spatial arrangement of solid particles (structural types) (Schroeder[1984])
The single grain type of structure is found in sandy soils and in silty soils low inclay and organic matter. In such soils the individual mineral particles are not com-bined into stable units or aggregates. In the massive type, which is unfavourable forroot growth, the mineral particles are densely packed and cemented together byclay, carbonates and/or Al/Fe-oxides. This type is found, for instance, in com-pacted glacial till or in the iron pan of podsols. The optimal substrate for plantgrowth is characterized by a crumb structure in which the particles are aglomeratedby organic matter and cementing agents resulting in round porous aggregates.Earth worm casts belong to this group. A narrow C/N ratio of organic matter aswell as high Ca saturation on the exchange complex encourage formation and sta-bility of crumb structure.
331

Clay and loam soils with low humus content or quality and low pH, or rather lowCa saturation are characterized by their high capacity for swelling and shrinkagewhen subjected to repeated cycles of wetting and drying. This may result in differ-ent forms of structured aggregates. These aggregates are often so densely com-pacted that their interior resembles the massive state and is resistent to penetrationby roots. The polyhedral structure is characterized by weakly porous aggregates ofdifferent size with many surfaces and sharp edges. Increasing intensity of swellingand shrinkage with vertical cleavage gives rise to prismatic configuration (vertical> horizontal). Under the influence of high Na saturation the sharp edges becomerounded due to peripheral dispersion resulting in a columnar structure. Plates areformed by swelling and shrinkage with cleavage in the horizontal plane (horizontal> vertical) as occurs in mechanically stressed soil horizons, e.g. in the plough panarea.
Many structural types are not only recognized visually, but also by their qbulkdensityD (volume weight). As the bulk density correlates with the soil consistence,field estimates can be made by a «penetrability test in which the reactions to forcedelivered by hand are assessed (Table 9).
Table 9 Field estimates of bulk density with penetrability test by applying force with a pin
on the profile wall
Penetrability Bulk density (g/cm') Constitution
Pin will enter easily and neatly, 1.0 very loosesoil disintegrates and crumblesPin will enter neatly when 1.2 looseapplying slight force
About half of the pin will enter 1.4 moderately compact
Pin will only enter a little 1.6 compact
Pin will not enter at well 1.8 very compact
Rough estimates of bulk density can also be obtained by assessing the reactionsto augering. If the auger can be pushed easily into the soil by hand bulk density is <1.2 g/cm3 . At a bulk density of about 1.4 g/cm3 a hammer has to be used. Eachblow would drive the auger 5-10 crn into the soil.
The stability of massive and aggredated structural forms can be determined inthe field by means of the "swivel testx. To make the test the sample considering ofsoil crushed to 2-5 mm is placed in a porcelain dish and well wetted so that waterstands on the surface. Then the mixture is swirled for about half a minute. Thestructural stability is described according to criteria given in Table 10.
332
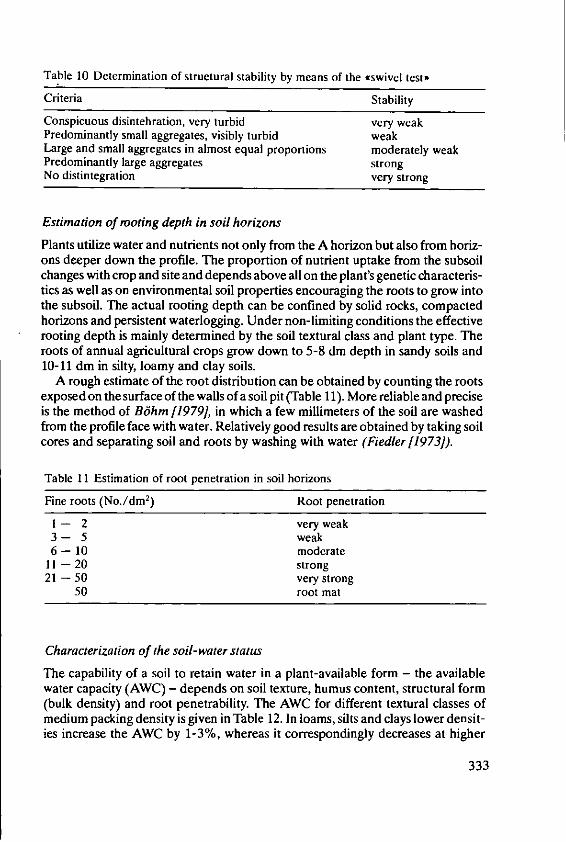
Table 10 Determination of structural stability by means of the .swivel test)
Criteria Stability
Conspicuous disintehration, very turbid very weakPredominantly small aggregates, visibly turbid weakLarge and small aggregates in almost equal proportions moderately weakPredominantly large aggregates strongNo distintegration very strong
Estimation of rooting depth in soil horizons
Plants utilize water and nutrients not only from the A horizon but also from horiz-ons deeper down the profile. The proportion of nutrient uptake from the subsoilchanges with crop and site and depends above all on the plant's genetic characteris-tics as well as on environmental soil properties encouraging the roots to grow intothe subsoil. The actual rooting depth can be confined by solid rocks, compactedhorizons and persistent waterlogging. Under non-limiting conditions the effectiverooting depth is mainly determined by the soil textural class and plant type. Theroots of annual agricultural crops grow down to 5-8 dm depth in sandy soils and10-11 dm in silty, loamy and clay soils.
A rough estimate of the root distribution can be obtained by counting the rootsexposed on the surface of the walls of a soil pit (Table 11). More reliable and preciseis the method of Bthm [1979], in which a few millimeters of the soil are washedfrom the profile face with water. Relatively good results are obtained by taking soilcores and separating soil and roots by washing with water (Fiedler [1973).
Table 11 Estimation of root penetration in soil horizons
Fine roots (No./dm2 ) Root penetration
I - 2 very weak3- 5 weak6 - 10 moderate
11 - 20 strong21 -50 very strong
50 root mat
Characterization of the soil- water status
The capability of a soil to retain water in a plant-available form - the availablewater capacity (AWC) - depends on soil texture, humus content, structural form(bulk density) and root penetrability. The AWC for different textural classes ofmedium packing density is given in Table 12. In loams, silts and clays lower densit-ies increase the AWC by 1-3%, whereas it correspondingly decreases at higher
333
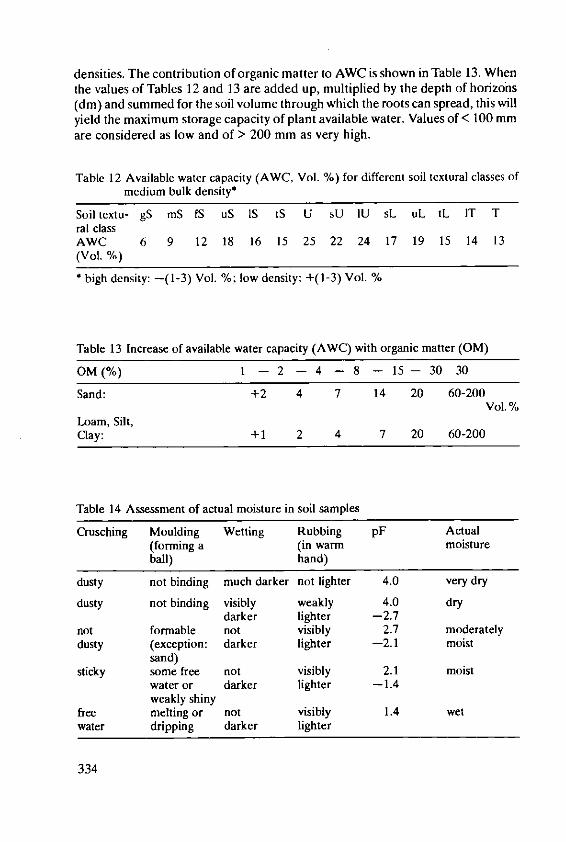
densities. The contribution of organic matter to AWC is shown in Table 13. Whenthe values of Tables 12 and 13 are added up, multiplied by the depth of horizons(dm) and summed for the soil volume through which the roots can spread, this willyield the maximum storage capacity of plant available water. Values of < 100 mmare considered as low and of > 200 mm as very high.
Table 12 Available water capacity (AWC, Vol. %) for different soil textural classes ofmedium bulk density*
Soil textu- gS mS fS uS IS tS U sU IU sL uL tL IT Tral classAWC 6 9 12 18 16 15 25 22 24 17 19 15 14 13(Vol. %)
* high density: -(1-3) Vol. %; low density: +(1-3) Vol. %
Table 13 Increase of available water capacity (AWC) with organic matter (OM)
OM(%) 1 - 2 - 4 - 8 - 15 - 30 30
Sand: +2 4 7 14 20 60-200Vol. %
Loam, Silt,Clay: +1 2 4 7 20 60-200
Table 14 Assessment of actual moisture in soil samples
Crusching Moulding Wetting Rubbing pF Actual(forming a (in warm moistureball) hand)
dusty not binding much darker not lighter 4.0 very dry
dusty not binding visibly weakly 4.0 drydarker lighter -2.7
not formable not visibly 2.7 moderatelydusty (exception: darker lighter -2.1 moist
sand)sticky some free not visibly 2.1 moist
water or darker lighter -1.4weakly shiny
free melting or not visibly 1.4 wetwater dripping darker lighter
334
The presence of a water table can play an important role as a source of water toplants during longer dry periods. The capillary rise of water from the water table tothe rooting zone depends on pore size distribution - and hence on particle size - onthe prevailing water potential and on the distance of the water table from the maxi-mum depth of the rooting zone.
At a water potential corresponding to 50% of AWC and 1 m distance of therooting zone from the water table, the amount of water that becomes accessible tothe roots by capillary rise is e.g. 2-3 mm/day in a loamy silt (e.g. loess) and < 0.2mm/day in a sandy soil or clay.
When comparing different localities and also in planning irrigation schemes ithas proved expedient to observe the changes of water potential in the soil andhence soil moisture status during the period of vegetation. An assessment of actualmoisture, i.e. the degree of saturation with water, can be made in the field by study-ing the changes in consistence and colour when the soil samples are wetted or dried(Table 14).
Description and classification of soils and soil associations
The visible and measurable characteristics of the different soil layers recorded inthe field allow a horizontal differentation of the soil profile according to a formalsystem of soil horizon designations. In natural, uncultivated soils the sequence ofhorizons from top to bottom is: a litter layer (L) an organic horizon (0), a surfacemineral horizon with humified organic matter (A), an eluvial (E or Ae) horizonand an illuvial (B), and the parent material or the C horizon. The system includes afurther G horizon which occurs in hydromorphic soils under the influence ofgroundwater. Through cultivation L and 0 horizons are mixed with the underlyingmineral (A) horizons. For a more detailed description and in order to take accountof special features subscripts and affixes are added to the main symbols (Schroeder[1984]).
The symbols attached to each horizon and the vertical extent of each horizondescribe the present stage of soil development. This description which should be asprecise as possible makes possible conclusions on the history of the soil under con-sideration, on the predominant past soil formation processes and on the ensuingpresent soil properties. All this results then in the designation of a soil type.
The soils in a landscape are seldom homogeneous. Even if they have the sameparent material and constant macroclimatic factors, different soil types may occurin association. Soil maps show the regional distribution of soils in a landscape orsoilscape (Figure 5). The extent of lateral heterogeneity i.e. the variability of soiltypes and hence also the criteria of soil fertility per unit area, varies with geomor-phological type of landscape, e.g. Mittelgebirge > Morinenlandschaft >Ldsslandschaft (low mountain range > morainal landscape > loess landscape). Thetype of relief influences the extent and rate of lateral translocation processes andthereby generates a characteristic distribution pattern of soil types in a landscape.The lenght of a topographic sequence from hill top to valley floor determines the
335
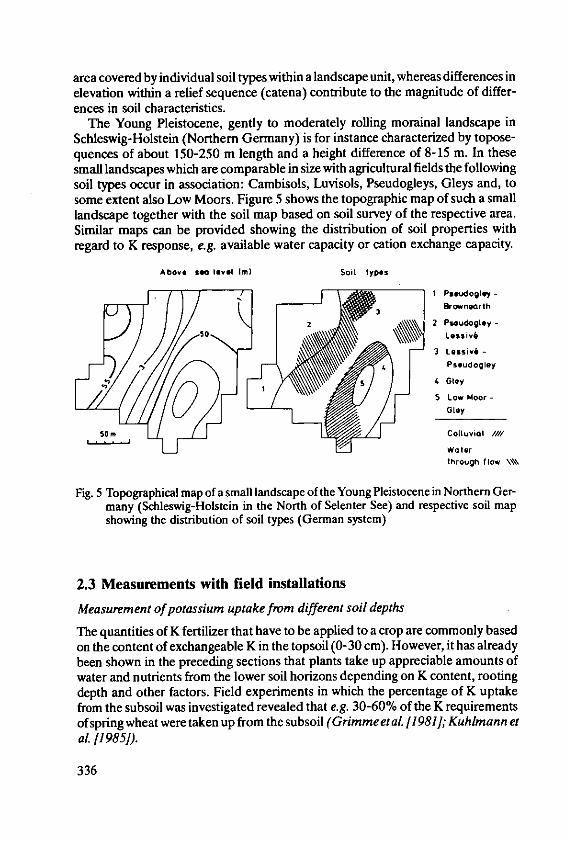
area covered by individual soil types within a landscape unit, whereas differences inelevation within a relief sequence (catena) contribute to the magnitude of differ-ences in soil characteristics.
The Young Pleistocene, gently to moderately rolling morainal landscape inSchleswig-Holstein (Northern Germany) is for instance characterized by topose-quences of about 150-250 m length and a height difference of 8-15 m. In thesesmall landscapes which are comparable in size with agricultural fields the followingsoil types occur in association: Cambisols, Luvisols, Pseudogleys, Gleys and, tosome extent also Low Moors. Figure 5 shows the topographic map of such a smalllandscape together with the soil map based on soil survey of the respective area.Similar maps can be provided showing the distribution of soil properties withregard to K response, e.g. available water capacity or cation exchange capacity.
Abowe so t.v*l I.) Soi[ types
I Pseodogley -
3 Browngarth
2 Pwudogty -
3 Lessiv6 -~Pseudogley
S Low Moor-
Gley
so. Colluvigot///
water
through flow \\\\
Fig. 5 Topographical map of a small landscape of the Young Pleistocene in Northern Ger-many (Schleswig-Holstein in the North of Selenter See) and respective soil mapshowing the distribution of soil types (German system)
2.3 Measurements with field installations
Measurement of potassium uptake from different soil depths
The quantities of K fertilizer that have to be applied to a crop are commonly basedon the content of exchangeable K in the topsoil (0-30 cm). However, it has alreadybeen shown in the preceding sections that plants take up appreciable amounts ofwater and nutrients from the lower soil horizons depending on K content, rootingdepth and other factors. Field experiments in which the percentage of K uptakefrom the subsoil was investigated revealed that e.g. 30-60% of the K requirementsof spring wheat were taken up from the subsoil (Grimme et al [1981]; Kuhlmann eta. 11985]).
336
Moreover, Fleige et al. [1983] were able to show that by far the greatest propor-tion of potassium - 90% - is transported to the plant roots by diffusion rather thanmass flow. In the experiment (see Strebel et al. [1980] for details) the soil solutionwas sampled at 17 depths of a Luvisol (Udalf) by means of suction probes withsmall porous cups made of sintered Ni powder. At the same time soil water contentand soil water suction were determined as a function of soil depth by means of aneutron probe and tensiometers, respectively. In a neighbouring profile the relationbetween water potential and hydraulic conductivity was determined. These dataallow to quantify the contribution of the different horizons to nutrient supply andof diffusion to total nutrient flux.
Another method of determining the potassium uptake from the subsoil - the Rbtracer technique - is described by Kuhlmann etal. [1985. The plants are pregrownin pots containing topsoil (0-30 cm) fertilized with small amounts of non-radioac-tive Rb as a tracer for K. Thus uptake from the subsoil can be distinguished fromthat from the topsoil. Two weeks after germination the bottoms of some pots areremoved and the bottomless pots are sunk into the topsoil of a field allowing theroots to grow into the undisturbed and unlabelled subsoil. The K/Rb ratio in plantsgrowing with or without contact to the subsoil enables the calculation of K uptakefrom the subsoil.
Automatic measurements of climatic-dependent site parameters
The importance of water for optimal plant growth and in particular the role playedby water in K response has been pointed out in various parts of this paper. Espe-cially, in highly intensive agricultural production systems water as a plant nutrientseems to become increasingly a yield limiting factor. Besides the soil factors influ-encing the water relationships, climatic factors, not only the macro-climate but alsoregional climatic influences, and presumably even relief-dependent microclimaticcriteria, play an important role.
In recent years fully automatic monitoring systems have been developed whichcan be installed in the field in order to record microclimatic data and transmit themdirectly to a central computer (e.g. A RAX, Automatic Reporting Weather Sys-tem). These observations include:
- air and soil temperature - wind speed and direction- relative air humidity - snow conditions- atmospheric pressure - soil pH- amount of rain - soil moisture- solar radiation
A comprehensive description of land with respect to land-use capability and cropproductivity must include monitoring and evaluation of those continually chang-ing environmental parameters as listed above. This is an essential prerequisite foroptimal crop management and control of irrigation, crop protection, fertilizationand tillage operations.
337
3. References
1. AG Bodenkunde: Bodenkundliche Kartieranleitung. 3. Aufl. Verlag Schweizerbart.Stuttgart, 1982
2. Blume, H.P. and Lamp, J.: Anleitung zur Ansprache von B6den im GelAnde. Dept.Plant Nutrition & Soil Science, University Kiel, 1985
3. B6hm, W.: Methods of studying root systems. Ecological Studies, Vol. 33, SpringerVerlag, Berlin (1979)
4. Clarke, G.R.: Study of the soil in the field. Oxford University Press, 19615. Fiedler, H.J.: Methoden der Bodenanalyse, Bd. 1: Fiedler, H.J. and Schmiedel, H.:
Feldmethoden. Verlag TH. Steinkopff, Dresden, 19736. Fleige, H., Grimme, H., Renger, M. and Strebel, 0.: Zur Erfassung der Nfihrstoffan-
lieferung durch Diffusion im effektiven Wurzelraum. Mitt. Dtsch. Bodenkdl. Ge-sellsch. 38, 381-386 (1983)
7. Grimme, H., Strebel, 0., Renger, M. and Fleige, H.: Die potentielle K-Anlieferung andie Pflanzenwurzeln durch Diffusion. Mitt. Dtsch. Bodenkdl. Gesellsch. 32,367-374(1981)
8. Hodgson, AM.: Soil sampling and soil description. Clarendon Press. Oxford, 19789. Kuhlmann, H., Claassen, N. and Wehrmann, J.: A method fordetermining the K-up-
take from subsoil by plants. Plant and Soil 83, 449-452 (1985)10. Renger, M.: Die Ennittlung der Porengr6ssenverteilung aus der Kbrnung, dem
Gehalt an organischer Substanz und der Lagerungsdichte. Z. PflanzenemAhr. Boden-kde., 130, 53-67 (1971)
11. Scheffer, F. andSchachtschabel, P.: Lehrbuch der Bodenkunde. 11. Neubearb. Aufl.,Verlag F. Enke, Stuttgart, 1982
12. Schlichting, E. and Blume, H.P.: Bodenkundliches Praktikum, Verlag Parey, Ham-burg und Berlin, 1966
13. Schroeder, D.: Soils. Facts and concepts. Int. Potash Institute, Bern, 198414. Schumann, W.: Steine und Mineralien. Bbichergilde Gutenberg, Frankfurt/M.,
Wien, Zfirich, 197515. Strebel, 0., Grimme, H., Renger, M. and Fleige, H.: A field study with nitrogen- 15 of
soil and fertilzer nitrate uptake and of water withdrawn by spring wheat. Soil Science130, 205-210 (1980)
338

Effect of Soil-Water Status as Affectedby Irrigation on Potassium Transportin Soils
B. Bar-Yosef, Agricultural Research Organization, Bet Dagan/Israel*
Summary
Effects of varying soil-water content on K distribution and transport in soil were analysed,and the factors limiting K availability to plants are discussed. Restricted soil-root volumesrequire continuous monitoring of K concentration in the soil solution (CK). Ceramic vac-uum cups inserted in a sandy soil at deptht of 20 and 40 cm below a tomato crop providedacceptable CK values that could be used to improve K fertilization of the crop during thegrowing period.
1. Introduction
The introduction of sophisticated irrigation and fertilization systems to arid zonesall over the world poses new questions regarding the effect of irrigation and waterstatus in soils on nutrient transport and availability to plants. The objective of thepresent work was to analyse effects of soil water content and K application via thewater on K movement in soils, and to discuss factors which may limit K uptake byplants. Since K concentration in the soil solution and water content in the soildetermine K absorption by plants, means of monitoring these factors under fieldconditions are described, and data for a specific study case are presented.
* Dr. B. Bar-Yosef, Agricultural Research Organization, Bet Dagan 50250, Israel
339
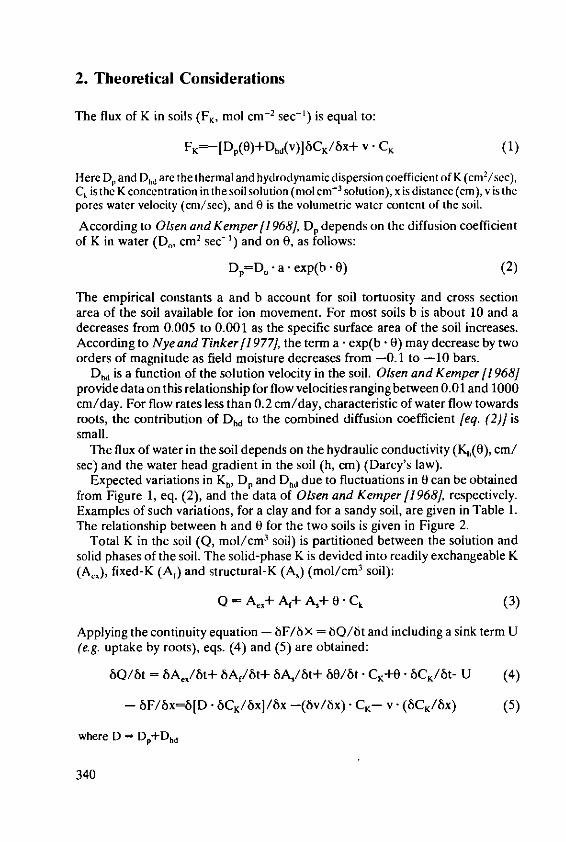
2. Theoretical Considerations
The flux of K in soils (F., mol cm- 2 sec- ') is equal to:
FK=-[DP(A)+Dhd(V)J6CK/bX+ V. CK (1)
HereDp and Dhd are the thermal and hydrodynamic dispersion coefficient of K (cm2/scc),C, is the K concentration in the soil solution (mol cm - 3 solution), xis distance (cm), v is thepores water velocity (cm/sec), and 0 is the volumetric water content of the soil.
According to Olsen and Kemper [1968], Dp depends on the diffusion coefficientof K in water (D., cm' sec - ') and on 0, as follows:
D,=D o - a exp(b • 0) (2)
The empirical constants a and b account for soil tortuosity and cross sectionarea of the soil available for ion movement. For most soils b is about 10 and adecreases from 0.005 to 0.001 as the specific surface area of the soil increases.According to Nye and Tinker 11977], the term a" exp(b - 0) may decrease by twoorders of magnitude as field moisture decreases from -0.1 to -10 bars.
Dd is a function of the solution velocity in the soil. Olsen and Kemper [1968]provide data on this relationship for flow velocities ranging between 0.01 and 1000cm/day. For flow rates less than 0.2 cm/day, characteristic of water flow towardsroots, the contribution of Dhd to the combined diffusion coefficient [eq. (2)] issmall.
The flux of water in the soil depends on the hydraulic conductivity (K,(O), cm/sec) and the water head gradient in the soil (h, cm) (Darcy's law).
Expected variations in K., DP and Dhd due to fluctuations in 0 can be obtainedfrom Figure 1, eq. (2), and the data of Olsen and Kemperf1968], respectively.Examples of such variations, for a clay and for a sandy soil, are given in Table 1.The relationship between h and 0 for the two soils is given in Figure 2.
Total K in the soil (Q, mol/cm3 soil) is partitioned between the solution andsolid phases of the soil. The solid-phase K is devided into readily exchangeable K(Ax), fixed-K (Af) and structural-K (A1) (mol/cm3 soil):
O = A, + A, A,+ 0 'Ck (3)
Applying the continuity equation - bF/6x = 6Q/6t and including a sink term U(e.g. uptake by roots), eqs. (4) and (5) are obtained:
60/8t = iAe/6t+ bAf/bt+ 6A,/6t+ 60/6t •CK+0" 6Cl/t- U (4)
- 6F/bx=8[D -6CK/6XJ/6X -(6v/x) - C K - - (6 CK/ 6 x) (5)
where D - DP+Dhd
340
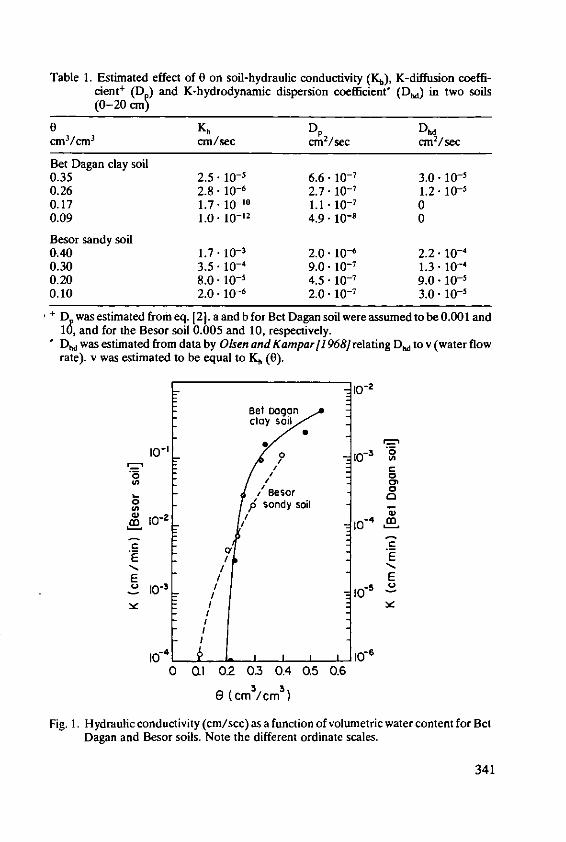
Table 1. Estimated effect of 0 on soil-hydraulic conductivity (K,), K-diffusion coeffi-cient + (D) and K-hydrodynamic dispersion coefficient' (DM) in two soils(0-20 cm)
0 K, Dp D,cm/cm3 cm/sec cm 2/sec cm2/sec
Bet Dagan clay soil0.35 2.5 10-' 6.6- 10- 1 3.0-10 - 10.26 2.8- 10-6 2.7- 10-' 1.2 10-10.17 1.7 10-10 1.1 10- 00.09 1.0 10-12 4.9 10-8 0
Besor sandy soil0.40 1.7* 10- 2.0* 10-6 2.2 - 100 .3 0 3 .5 " 1 0 - 4 9 .0 " 1 0 - 1 .3 " 1 0 - 4
0.20 8.0 10-5 4.5 10- 7 9.0 10-'0.10 2.0 10-6 2.0 10-7 3.0 10-
+ D was estimated from eq. [2j. a and b for Bet Dagan soil were assumed to be 0.001 and
16, and for the Besor soil 0.005 and 10, respectively.D,, was estimated from data by Olsen and Kamparl 968] relating D. to v (water flowrate). v was estimated to be equal to K, (0).
10-2
Bet flagonclay soil
e, Dog
10 1 0 o-3 "0
,Besr
0
NBesor
E / E/
0 Q
10-2 -4 M I -/ - 1
E E
0 .1 0.2 03 0.4 0.5 0.6
6 (cm3/cm )
Fig. 1. Hydraulic conductivity (cm/sc) as a function of volumetric water content for BetDagan and Besor soils. Note the different ordinate scales.
341
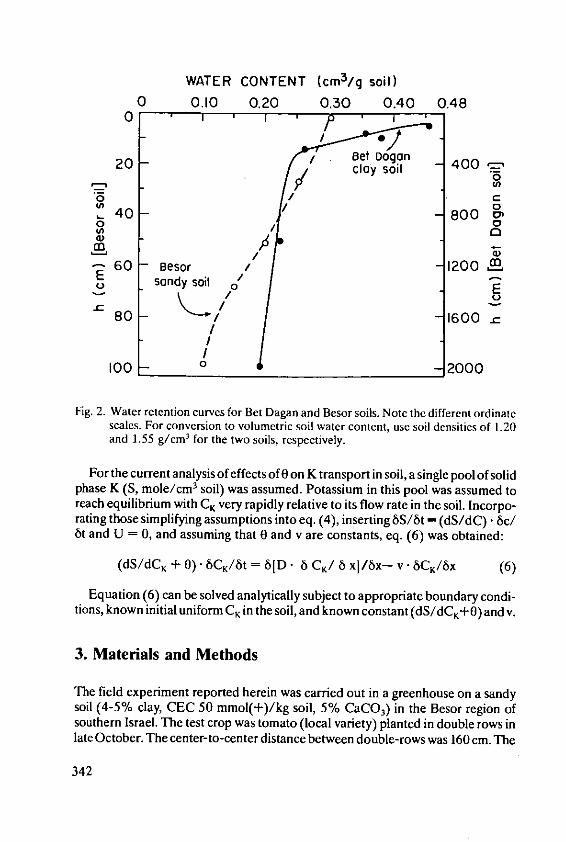
WATER CONTENT (cm3/g soil)
0 0.10 0.20 0.30 0.40 0.480I I ' p .' I ----
20 Beoe Dgan1 scy Soil 400
40 800g0 /
600
//460 Besor /1200 SO
o sandy soil 0
8 0 I1600 ./I
100 0 ._2000
Fig. 2. Water retention curves for Bet Dagan and Besor soils. Note the different ordinatescales. For conversion to volumetric soil water content, use soil densities of 1.20and 1.55 g/cm3 for the two soils, respectively.
For the current analysis of effects of 0 on K transport in soil, a single pool of solidphase K (S, mole/cm3 soil) was assumed. Potassium in this pool was assumed toreach equilibrium with CK very rapidly relative to its flow rate in the soil. Incorpo-rating those simplifying assumptions into eq. (4), inserting 6S/bt = (dS/dC) • bc/6t and U = 0, and assuming that 0 and v are constants, eq. (6) was obtained:
(dS/dCK + 0) • 6CK/6t = 6[D. 6 CK/ x/6xV- v SCK/bx (6)
Equation (6) can be solved analytically subject to appropriate boundary condi-tions, known initial uniform CK in the soil, and known constant (dS/dCK+6) and v.
3. Materials and Methods
The field experiment reported herein was carried out in a greenhouse on a sandysoil (4-5% clay, CEC 50 mmol(+)/kg soil, 5% CaCO 3) in the Besor region ofsouthern Israel. The test crop was tomato (local variety) planted in double rows inlate October. The center-to-center distance between double-rows was 160 cm. The
342
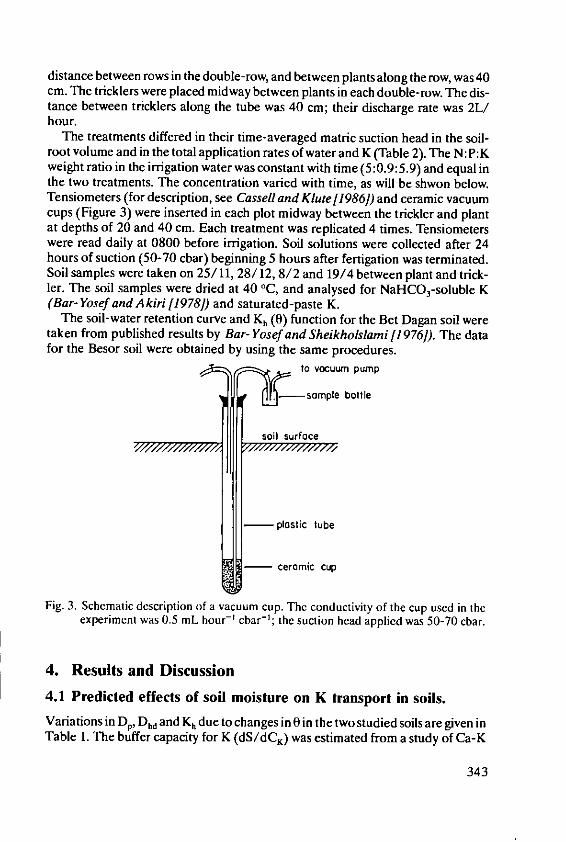
distance between rows in the double-row, and between plants along the row, was 40cm. The tricklers were placed midway between plants in each double-row. The dis-tance between tricklers along the tube was 40 cm; their discharge rate was 2L/hour.
The treatments differed in their time-averaged matric suction head in the soil-root volume and in the total application rates of water and K (Table 2). The N: P:Kweight ratio in the irrigation water was constant with time (5:0.9:5.9) and equal inthe two treatments. The concentration varied with time, as will be shwon below.Tensiometers (for description, see Cassell and Klute[1986]) and ceramic vacuumcups (Figure 3) were inserted in each plot midway between the trickier and plantat depths of 20 and 40 cm. Each treatment was replicated 4 times. Tensiometerswere read daily at 0800 before irrigation. Soil solutions were collected after 24hours of suction (50-70 cbar) beginning 5 hours after fertigation was terminated.Soil samples were taken on 25/11, 28/12, 8/2 and 19/4 between plant and trick-ler. The soil samples were dried at 40 0C, and analysed for NaHCO 3-soluble K(Bar- Yosef and Akiri [1978]) and saturated-paste K.
The soil-water retention curve and Kh (0) function for the Bet Dagan soil weretaken from published results by Bar- Yosef and Sheikholslami [1976]). The datafor the Besor soil were obtained by using the same procedures.
to vacuum pump
-Xsample battle
soil surface
-- plastic tube
- ceramic cup
Fig. 3. Schematic description of a vacuum cup. The conductivity of the cup used in theexperiment was 0.5 mL hour' cbar-'; the suction head applied was 50-70 cbar.
4. Results and Discussion
4.1 Predicted effects of soil moisture on K transport in soils.
Variations in Dp, Dhd and K. due to changes in 0 in the two studied soils are given inTable 1. The buffer capacity for K (dS/dCK) was estimated from a study of Ca-K
343
exchange in the two soils (Feigenbaum and Levi, unpublished data). Due to a limecontent of 10 and 5% in the Bet Dagan and Besor soils, respectively, Ca concentra-tion in the solution phase (Cca) of both soils was nearly constant despite the addi-tion of K or Ca to the system. Under such conditions, AK in the Gapon equation (7)can be partially differentiated with respect to CK to yield eq. (8):
Ak/Ac. = G CK' CC -" 2 (7)
6AK/6CK = Aca G" CC. 1/ 2 (8)
Here G is the Gapon constant of the soil and Cc. is a constant. When the cationexchange capacity (CEC) of the soil consists mainly of AK and Ac., and assumingthat Ac. >> AK, Ac. in [8] may be replaced by CEC. To use the same terminologyas in (6), S = AK.
Study case a: K application via the water on top of the soil.The boundary and initial conditions for this case are given in eqs (9), (10) and
(11) (van Genuchten and Wierenga [1986]):
CK(XO) = Co (9)
[-D(CK/bx)+ V' CKJ..- v Cin (10)
(6CK/6X) (ot) = 0 (11)
The solution of (6), (9), (10) and (11) is (van Genuchten and Wierenga 11986]):
[CK (x,t)-Co]/[C-Co] = 0.5" eric I (R x-v t)/[2' (D R t)1/2 ]}+[V 2 - t/(3.14 •D R)J"/ 2 - exp[ - (R x-v' t)2/(4 - D" R t)]
-0.5- [1+v x/D+v2 t/(D" R)j • exp(v • x/D). erfc[ (R x+v- t)
/2" (D" R't)'/ ' ]
Here eric and exp are the complimentary error function and exponent, respect-ively.
Results of CK(x,t) for various values of 0 in the soil are presented for Bet Daganand Besor soils in Figure 4 and 5, respectively. The distribution in Bet Dagan soilafter 20 days of continuous K application via the water under assumed constantfield capacity conditions is described by line 2 (Figure 4). The cumulative amountof water supplied at the prescribed v (inset table) was 43.2 cm, far more than thedepth to which K moved (- 8 cm). The restricted movement is due to the large buf-fer capacity (R = dS/dCK+O) of the system for K. When decreasing R tenfold, the
CK profile is far more extended than in line 2, even though t was only 5 days. Whendecreasing 0 to 75% of field capacity (0 = 0.26, line 5), v and D were estimated to
decrease 9- and 2.5-fold, respectively (Table 1). This resulted in a very meaningful
344

reduction in the CK profile. The reduction stemmed mainly from the decrease in v,since when maintaining v as in line 2 and varying only D, the concentration profile(line 6) was similar to that of line 2. In addition to its effect on convection, v alsodetermines the amount of K added to the soil via the water. When increasing tunder the conditions of run 5, such as to accommodate the same volume of solutionas in case 2, a steeper K-profile was obtained, and the ion moved deeper into thesoil than in line 2 (line 7). The steeper curve stemmed from the enhanced disper-sion which took place for 180 days, as compared with 20 days in run 2. The pene-tration depth (19 cm) agrees with the diffusion distance estimated from the equa-tion x=(2. • D. T)112, where D and t are as in run 7.
In order to add equal total K quantities at =field capacity and at 0=0.26, it ispossible to increase K concentration in the water in the lower-U case. According tothe current assumptions, this will not increase the depth of K penetration into thesoil, which will still be < 4 cm. However, CK in the upper 4 cm will increase, and itwill equal the CK values obtained in case 2.
Similar effects of 0 on CK distribution in the soil were obtained in the sandyBesor soil (Figure 5). Due to the greater v and D and smaller R relative to BetDagan soil, K movement into this soil was much faster and K in the reference lineNo 1 reached a depth of- 20 cm in 1.2 hours. The expected diffusion distance inthis case is less than 2 cm.
When reducing v five fold, corresponding to a decrease in 0 from 85% of soil-water saturation (0=0.40) to 0=0.30, and assuming that D was unchanged (line 2),a pronounced reduction in K transport occured, with no K found below 9 cm.When taking into account the expected decrease in D (from 0.00022 to 0.00013cm 2/sec) as well (line 3), a C/Cin distribution not much different from line 2 wasobtained. When extending the K application period to 5.8 hours to account for thereduced v and thus supply the same total K rate as in run 1 (run 8), a small differ-ence in the C/Cin distribution relative to case I was obtained.
A further decline in 0 to 0.20 v/v causes v and D to decrease to 8.X 10-s cm/secand 9.X 10-1 cm2/sec, respectively. In this case K did not move below a depth of 4cm (line 4). When increasing t to 25.5 hours to account for the reduced K applica-tion (line 9), K moved down to a depth > 25 cm, and the distribution with depthdiffered, due to the extended dispersion period, from those of either runs 1 or 8.The effect of a ten-fold smaller R (- 0.043) at 0 = 0.20 on the C distribution is pre-sented in line 6. This may represent conditions where the buffer capacity factorconsists mainly of 0 (dS/dCK- 0).
Table 2. Irrigation treatments in the field experiment (four replicates).
Treatments4 5
Planned suction head (cbar) 25 8Total water applied (mm) 297 468Days between irrigations 4-6 1-2
345

C/Gin
0 0.2 0.4 0.6 0.8 1.0
Is I 'd 2
l
2 - a" -,
4---
6- I4
8-10
•
8
0
9 Bet Dogan Soil
Io2
I Parametert
114 Symbol Rt v D t
-2 0 13 2.5x10 5 ix0 - 5 20 0.35
4 A 1.3 .1 5 .
16 5 U 13 2.8xi0- 6 1.2xlO- 5 20 0.26
6 A . 2.5x10 -5 20
7 0 2.8xi0-6 180
18tv - cm/sec; D = cm2 sec 1;
R - (dSldc+6); t - days;
20 e - cm3 /cm 3 (f.c - 0.35%)
Fig. 4. Reduced K concentration in the soil solution (C/Ci., Cm, being the concentration ofK in the inflowing solution) as a function of soil depth under various conditions inthe soil. Parameters and times used for the presented lines are given in the insetTable. Calculation according to cq (12). Bet Dagan clay soil.
346

C/Cin
0 0.2 0.4 0.6 0.8 1.00
2-44
I0-16- V
18-
E14
18 Besor soil
20- Prtr
Syabo1 R D 0
22 1 0 0.43 1.7x10- 3
2.2x10- 1.2 0.402 0 1 3.5x10
- 1
3 V 1.3.10-' D.30
24-4 0 8.0,10-5 9.N10- 5 0.20
6 2 0.043
$ A 0.43 3.5x10"
' 1.3xIO" 5.8
26 9 & .0x10"5
9.0x10- 5
25.5 0.20
*v cm/sc; 0 .- 2*1¢
R - (4S/dc*"; c-hours.
28J Ik3
Fig. 5. As in Figure 4, only for the sandy Besor soil.
347
When evaluating the results in study case a, it should be noted that valuesdenoted to v due to variations in 0 were subject to the assumption that a steadystate, unit water-head gradient existed in the soil profile at each 0. Under such con-ditions, v - Kb(O)/O, and Kh can be estimated for the given 0 from Figure 1. Since vthus estimated is very arbitrary, its effect on CK distribution should be consideredon its own merit, not necessarily in conjunction with variations in 0.
In the Bet Dagan soil, which represents a matrix of high K-retention and relat-ively slow v (< 2.5- 10- 1 cm/sec), the maximal K penetration into the soil (d, cm)can be estimated by d=(2 - D . t) 1 2. A straight line connecting the points C/Cin =1 and x=d gives a reasonable estimate of the CK/Cin distribution in the soil aftertime t.
In soils with a lower buffer capacity and faster v (e.g the Besot soil), the contrib-ution of convection to K distribution is appreciably greater than the combinedeffect of thermal diffusion and mechanical dispersion.
Study case b: K depletion by a planar sink.The boundary condition at the absorbing plane is:
[D" (8
CK/tiX)+ V" CKdx.O=a - Cdlx- 0 (13)
The boundary condition at x- > - and the initial condition are the same as in (11)and (9), respectively. The solution of (6) subject to (9), (11) and (12) was given byNye 1966]."
CK/CCo = 1-0.5 (erfc[ (x+v t/R)/2 • (D . t)'/ 2]+ [(a-v/a] •
exp(-v • x/R" D) ' erfc[ (x-v • t/R)/2 "(D• t)1/21}
+0.5 . f[(2 - a-v)/a] • exp[(ca-v) • (x+a • t/R)/(R • D)]"
erfc[(x+(2 a a-v) • t/R)/(2 • (D' t)112)1) (14)
Water uptake is assumed to create a steady water flow (v, cm/sec) towards thesink. The flux of K uptake depends on CK at the plane surface and on a (cm/sec).The value used for a was adopted from Drew et a. [1969]. The K-depletion linesfor the Bet Dagan clay soil are presented in Figure 6. At field capacity, v was given avalue of 1.2X 10- 6 cm/sec, which is well accepted for water movement towardsroots (Olsen and Kemper 11968]). D was denoted a value of 1.3X 10' cm 2/sec.The difference between the current D and that of Figure 4 stems from the smallerDhd in this case, due to the reduced v. Curve 1 represents K distribution at fieldcapacity. At 75% field capacity, both D and v declined (inset Figure 6),'and theresult (line 3) is a steeper curve, a 15-20% smaller uptake with time, and 25%decrease in CK at the sink surface relative to line 1. The reduced K-depletion as soildrying continues is shown for 0 = 50% and 25% of the water content at fieldcapacity (lines 5 and 7, respectively). A similar trend with varying 0 was obtainedin the sandy Besor soil (data not presented).
348
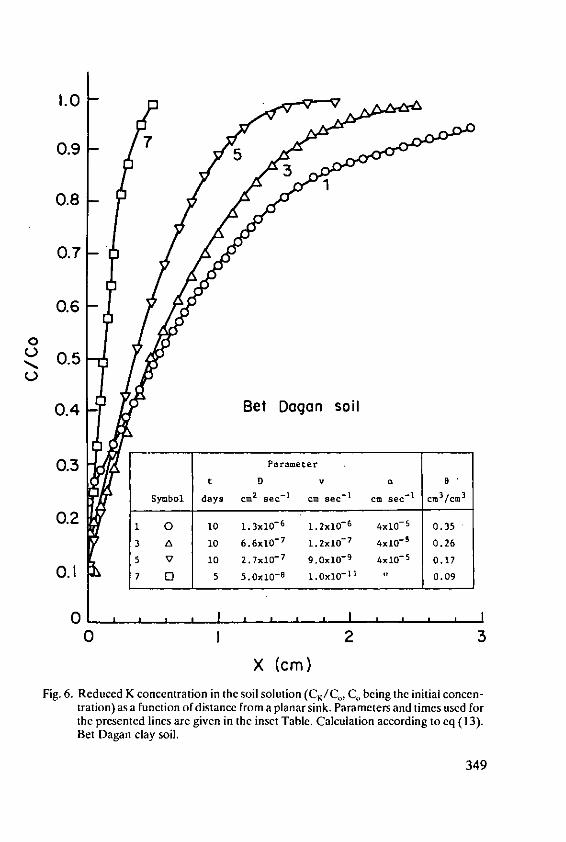
100.9 7
0.8
0.7-
0.6 -
0
U 0.5
0.
0.4 - Bet Dugan soil
0.3 Parameter
t D v a 0
Symbol days C.2
Sec-1
Cm Sec-1
cm sec- I
cm3/cm
3
0.2 1 0 10 1.3xlO- 6 1.2xlO- 6 4xl0 5 0.35
3 A 10 6.6xI1- 7 1.2xO -7 4xl - 0.26
5 7 10 2.7x10- 7 9.0x10⁻⁹ 4xlO- 5 0.17
0.1 7 0 5 5.0xlO- B 1.OxlO-11 0.09
0 1 , _ I
0 2 3
X (cm)Fig. 6. Reduced K concentration in the soil solution (CR/C,, C,, being the initial concen-
tration) as a function of distance from a planar sink. Parameters and times used forthe presented lines are given in the inset Table. Calculation according to eq (13).Bet Dagan clay soil.
349
4.2 Effect of irrigation regime on K application to field crops.
Irrigation rate and frequency determine root growth and distribution in the soil(Bar- Yosef et a1[19801; Bar- Yosef and Sagiv[1985]). Under sufficient water sup-ply, but high irrigation frequency (1 to 3 irrigations/day), the soil-root volume oftomato plants growing in the Besor soil was found to be approximately 1080 m3/ha(or about 40 L/plant) (Bar- Yosef and Sagiv [1985]). At the time of peak K con-sumption rate, the crop used 0.33 mg K [kg soil]-lh - 1. The potential rate of Ktransition from exchange sites in the soil to the soil solution was estimated in a batchexperiment to be about 0.8 mg K [kg soil]-lh -' (Bar- Yosef and Sagiv [1985]).Since under field conditions the K solubilization rate is expected to be appreciablyslower than under batch conditions, the rate of K replenishment in the soil-solutionmay limit K uptake rate by plants even if exchangeable K in the soil is sufficientlylarge. To avoid such a possibility, K must be added via the water at critical growthstages. This is unlikely to be required at a larger soil-root volume per plant.
Bar- Yosef and Sagiv [1985] showed that a bi-daily trickle-irrigated sweet corncrop grown in a loess soils needs a CK of about 0.08 mM at the root surface duringthe main growth season in order to sustain the required rate of K uptake by theplants. Consider an irrigation solution with K concentration of 1.5 mM, which isoften used under field conditions. The data in Figure 4, line 2 (Bet Dagan soil),indicate that if applied on top of the soil, a CK of 0.08 mM, or more will be obtainedin the upper 7 cm soil layer after 20 days of continuous fertigation. Since v = 2.5 X10- s cm/sec, the accumulated water rate is 43 cm water, which is about the annualirrigation rate of sweetcorn in Israel. It is envisioned, therefor, that in Bet Dagansoil the control of CK below 10-15 cm by means of K fertigation is practicallyimpossible. In the sandy Besor soil, under conditions of high soil moisture (Figure5, line 1), CK = 0.08 mM or greater is obtainable after 1.2 hours at a depth of 20 cm.In this soil, care must be taken to avoid K leaching below root depth.
4.3 Monitoring soil-water and K concentration in the soil solution.
Soil water is being monitored under field conditions in order to ensure optimalwater supply to plant roots. Tensiometers (if monitoring soil-water matric poten-tial) or neutron probe access tubes (if monitoring volumetric soil-water content)are inserted into the soil within the expected soil root volume. Irrigation follows apre-scheduled program intented to replenish water uptake by plants as predictedfrom environmental conditions, or to maintain a predetermined soil-water matricpotential at a given point in the soil. Tensiometer or neutron probe readings arecompared with values desired in the soil. If measured and pre-defined values devi-ate by more than a permitted range, irrigation rate, scheduling or both are modi-fied, until the required level in the soil-root volume is maintained. Under trickleirrigation, the recommended soil-water matric potential should be between -8 and-15 and between -10 and -30 centibar in sandy and clay soils, respectively. Such
350
ranges involve variations in 0 (estimated from the soil-water retention curve, e.g.Figure 2) that were shown above substantially to affect K transport in soils.
The ionic composition of soil solutions is monitored to avoid extreme fluctu-ations in nutrient concentrations that may limit their uptake by plants. Soil sampl-ing and saturated-paste extract analysis has the disadvantage of disrupting the realsolution-to-soil ratio prevailing in the field, and the labor involved in sampling thesoil and extracting it. Vacuum cups inserted in the soil allow collection of in situ soilsolution, which is ready for chemical analysis. The convenient operation and lowprice of the vacuum cup system made it very popular with farmers. The most com-monly used vacuum cup, which is constructed of porous ceramics (Rhoades andOster11986]), was used in the present study (Figure 3). The composition of the col-lected solution depends on the specific ion retention characteristics of the ceramicmaterial and the soil volume around the suction cup from which the soil solution isbeing depleted. This depends on the suction applied and on the hydraulic conduc-tivity of the soil.
Meirietal[1985]compared CK results obtained in vacuum cups and in saturatedpaste extracts. The results, obtained in the Besor soil in field plots which received 3levels of K via the water, are summarised in Figure 7. Data points obtained at agiven sampling date are corrolated better than the points of all the 4 sampling datespooled together (Y = 0.493 X + 0.118, R = 0.70). The slope of the linear correla-tion is not surprising, since the soil-water content in the field was approximately50% of the water content of the soil at saturation. The low correlation coefficientreflects a large sampling variability, which is due mainly to temporal effects. Theresults do not indicate any consistent problem in determining C, by means of a cer-amic vacuum cup and definitely encourage further research to establish this factwith other, different soils.
Potassium concentration in the soil solution in the field experiment described inTable 2 was determined by means of ceramic vacuum cups. The soil-water matricpotential during the growing season in the reported treatments is presented inFigure 8. To obtain an average potential of -25 centibars in the upper 40-cm soillayer (treatment 4), fluctuations between -9 and -40 cbar cannot be avoided. Theextreme values characterise the soil a few hours after irrigation stopped, and justbefore irrigation started, respectively. The time interval between irrigations was4-5 days. In terms of 0, the observed fluctuations correspond to variations between0.20 and 0.06 cm 3/cm 3 . In treatment 5, irrigation was applied daily in order tomaintain a nearly constant water head in the 0-40-cm soil layer (between -6 and-10 cbars). The accumulated irrigation required to obtain this low tension was 468mm, as compared with 300 mm applied in treatment 4.
The results of the vacuum cup-C as a function of time are described in Figure 9and 10. In treatment 5 (-8 cbar) C. in the 20-cm-deep cup increased almost line-arly with time from 0.6 to 10 mM K. In the 40-cm-deep cup, only a slight increasein CK (1.5 to 2.3 mM) was observed with time. The NaHCO 3-extractable K in thesoil (0,) increased in the 0-10-cm soil layer until Feb 8, but subsequently declined.This is contrary to the vacuum cup-CK values which continued to increase. QK in
351

the 30-40-cm soil layer also decreased beyond Feb 8, but its absolute value was fivefold smaller than in the 0-10-cm soil layer. A decline in K extractability byNaHCO 3 in various soils after a contact time of 50 to 100 days in the soil wasreported by Bar-Yosef andAkiri [19781. We deduce therefore that the CUP-CKresults are correct.
2 Symbol Sompling2 I
E
4 / y:.493X+0.118/ R=o.70
U)
D
0 2
VACUUM CUP-K ImM)
Fig. 7. Saturated paste-K vs vacuum cup-k (0-40 cm soil layer) in a field experiment inthe sandy Besot soil. Soils were sampled 4 times at intervals of 1 month. The num-bers and bars on the abscissa give the range of K concentration in the irrigationwater in the 3 studied treatments.
. Symbol Depth Icm)
0 207. 0 40 Tr. 4- 6
n /
0440
~0 /
LW I I I
0 1 1
o I I 2 1 I
1.11 30.11 31.12 31.1.82 28.2 31.3
DATEFig. 8. Tensiometer readings during the growing season of glasshouse tomato plants
(Besor soil). Treatments are described in Table 2.
352
Tr. 5 1. 0.0(8 centibor) / *.
10 /_ 9.0
9
8 // .NOHCO 3 cup0
7 0-10C. 20 C.mE aY 6 7.0 Y
I
D 5S3C0-ater--
3- a.-6 -NFON-- CO,-Cup
2 .-- 5.04Ocm
Starting - - Mainhorvtsg horvest
0 1_ 4.01.11 3011 31.12 31.1.82 28.2 31.3 30.4
DATE
Fig. 9. Potassium concentration in the soil solution (mM) obtained by a vacuum cup, andNaHCO3-extractable K in the soil ([lmol/g) as a function of time during the grow-ing season of glasshouse tomatoes. Besor sandy soil. Data given for two soil layers.Also presented is the K-concentration in the water during the growing season.Treatment 5.
Similar behaviour was observed in treatment 4 (Figure 10) but there the absoluteCK and OK values at 20 cm were lower than in treatment 5. The smaller concentra-tion stemmed from the fact that total K applied in treatment 4 was 422 kg/ha, ascompared with 693 kg/ha in treatment 5. In treatment 4, CK at a depth of 40 cmexceeded, most of the time, CK at 20 cm; in treatment 5 the opposite occurred. Thedifference could be explained if K uptake occurred mainly from the upper 20 cmsoil layer. In this case, the smaller K quantity applied to treatment 4 could not pro-vide the large increase in C. observed in treatment 5.
353
II
Tr. 40 (25 centibar)
7
8 . 0-10cmE
8
0
z6
5 -
4 1 I I I I I1.11 30.11 31.12 "31..82 28.2 31.3 19.4 30.4
DATE
5CK-water
3-
01.11 30.11 31.12 31.1.82 28.2 31.3 30.4
DATE
Fig. 10. As in Figure 9, only for treatment 4.
The concentration of K in the irrigation water is depicted in the same Figures: Itwas raised from 3.1 to 4.2 mM when K consumption rate by tomato plants reachedits peak, and was reduced to 2.1 when the consumption rate was smaller, namely,towards the end of the fruit picking period. In treatment 5, CK in the soil solution ata depth of 20 cm equaled CK in the irrigation water 2 weeks after harvesting began,and surpassed it later on due to application rates that exceeded consumption by theplants. In treatment 4, CK in the soil solution during the peak uptake period wasappreciably below the input concentration. It equaled the inflowing K concentra-tion only towards the end of the growing period.
354
The differences in soil-CK between treatments 5 and 4 were reflected in %K inthe plant dry matter, determined on Feb. 8:4.1 and 3.3 in the canopy, and 5.7 and4.5 in the fruits, respectively. The elevated %K did not result in higher fruit yield orimproved fruit quality.
Monitoring CK indicated that under limited water supply (treatment 4) K-up-take occurred mainly from the upper 20 cm soil layer. It also showed that K-fertili-zation beyond mid-March in treatment 5 could have been saved.
The slow increase in CK with time at a depth of 40 cm in treatments 4 and 5 (Fi-gures 9, 10) qualitatively agrees with the calculated results presented in Figure 5, ifthe inflowing solution volume is corrected for the uptake by plants. Constraints inestimating temporal water and K consumption by the tomato crop, and the fact thattrickle irrigation rather than one dimensional water application was used, do notallow a quantitative comparison between the model computations and the fieldexperiment results.
5. References
I. Bar-Yosef, B. andSheikhoislami, M.R.: Distribution of water and ions in soils irri-gated and fertilized from a trickle source. Soil Sci. Soc. Am. J. 40, 575-582 (1976)
2. Bar- Yosef, B. and Akiri, B.: Sodium bicarbonate extraction to estimate nitrogen,phosphorus and potassium availability in soils. Soil Sci. Soc. Am. J. 42, 319-323(1978)
3. Bar- Yosef, B., Stammers, Claire and Sagiv, B.: Growth of trickle-irrigated tomato asrelated to rooting volume and uptake of N and water. Agron. J. 72, 815-822 (1980)
4. Bar- Yosef, B. andSagiv, B.: Potassium supply to field crops grown under drip irriga-tion and fertilization. Proc. Potassium Symp. L. 1985, Pretoria, South Africa. pp.185-188, 1985
5. Brester, E., McNeal, B.L. and Carter, D.L.: Saline and sodic soils. Springer-Verlag,New-York, 1982
6. Cassell, D.K. and Klute, A.: Water potential: Tensiometry. In: A. Klute (ed): Meth-ods of soil analysis. Part 1. pp. 563-596. Series in Agron. No 9. Am. Soc. of Agron.Madison, WI, USA (1986)
7. Drew, M. C, Nye, P.H. and Vaidyanathan, L. V.:The supply of nutrient ions by diffu-sion to plant roots in soil. 1. Absorption of potassium by cylindrical roots of onion andleek. Plant Soil 30, 252-270 (1969)
8. Meiri, A., Feigenbaum, Sala and Sagiv, B.: Potassium fertilization of brackish-waterirrigated-potatoes. Report submitted to the Dead Sea Works, Israel, 1986. Hebrew
9. Nye, P. H. Changes in the concentration of nutrients in the soil near planar absorbingsurfaces when simultaneous diffusion and mass flow occur. Trans. Comm. II & IV. Int.Soc. Soil Sci. (Aberdeen) 317-327 (1966)
10. Nye, P.H. and Tinker, P. B.: Solute movement in the soil-root system. Blackwell, Lon-don, 1977
355

11. Olsen, S.R. andKemper, W.D.: Movement of nutrients to plant roots. Adv. Agron 20,91-151 (1968)
12. Rhoades, J. D. and Oster, J. D.: Solute content. In: A. Klute (ed): Methods of soil anal-ysis, Part 1. pp. 563-596. Series in Agron. No. 9. Am. Soc. Agron. Madison WI,(1986)
13. van Genuchten, M. Th. and Wierenga, P.J.: Solute dispersion coefficients and retar-dation factors. In: A. Klute(ed): Methods of soil analysis, Part 1. pp. 1025-1054. Seriein Agron. No 9. Am. Soc. Agron. Madison, WI (1986)
356

Spatial Variability of Soil K-status
P.H. T Beckett, Soil Science Laboratory, University of Oxford/United Kingdom*
Summary
This paper briefly reviews the short-, medium- and long-term elements of soil K-status. Itthen discusses the processes that contribute to the long-, medium- and short-range com-ponents of the spatial variability of soil K-status. In some cases temporal variability mayequal or exceed spatial variability: this may confuse measurements of the latter.
It reviews published measurements of the variability of soil K-status. These demon-strate that the distribution of variability is usually not random. The non-random distribu-tion of long-range variability in K status may be crudely described in term of soil classes ormap units; these will still include the short- and medium-range components of the totalvariability, which may form a substantial part. Semi-variograms describe the spatialdependance of soil variability better, provided they cover all scales of variability. Even so,it may be useful to reduce the contribution of very short-range variability (cnoise.) bybulking several soil samples from within an area round each sampling site.
It comments on methods for measuring spatial variability, emphasizing that measures ofshort- or medium-range variability must be distributed over the whole area of interest.
Potassium status
Several soil properties, operating in different time scales, control the potassium sta-tus of a soil.
Labile K.
The immediate availability of K to plant roots is determined by the K-concentra-tion or the K-activity of the soil solution, according to whether it is the number ofions or their free energy that control the rate-determining stage of K-uptake. Bothof these fluctuate with adventitious changes in the thickness of the diffuse doublelayers round exchange surfaces in the soil. Activity ratios (AR), such as
aK/. Fa or aK/ ac,+Mg
* Dr. P. H. T. Becketi, Soil Science Laboratory, University of Oxford, AgriculturalScience Building, Parks Road, Oxford OXI 3PF/United Kingdom
357
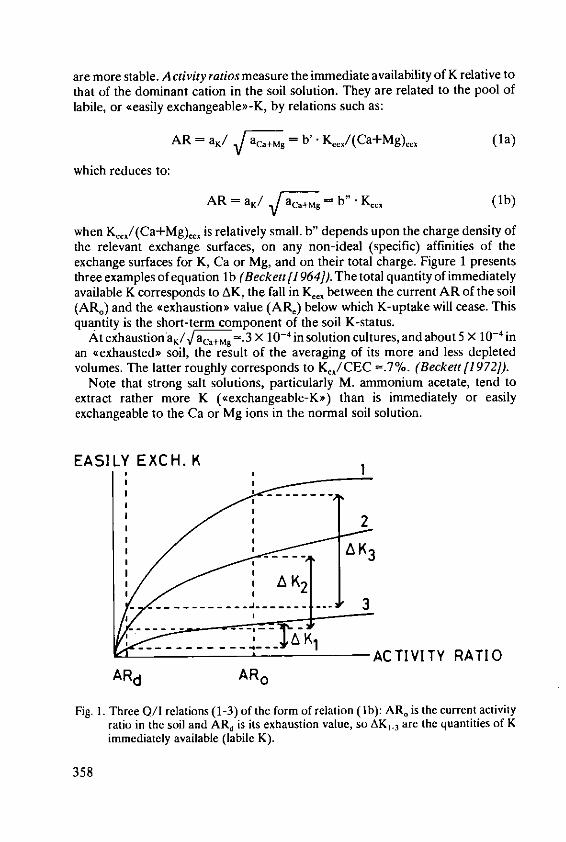
are more stable. Activity ratios measure the immediate availability of K relative tothat of the dominant cation in the soil solution. They are related to the pool oflabile, or 4easily exchangeable>-K, by relations such as:
AR = a/ ac.+Mg - b'. K,,,/(Ca+Mg).. (la)
which reduces to:
AR = aK/ ac.+mg - b" • K, . (lb)
when Kec,/(Ca+Mg),,, is relatively small. b" depends upon the charge density ofthe relevant exchange surfaces, on any non-ideal (specific) affinities of theexchange surfaces for K, Ca or Mg, and on their total charge. Figure 1 presentsthree examples of equation lb (Beckett[1 964]). The total quantity of immediatelyavailable K corresponds to AK, the fall in K,,, between the current AR of the soil(AR.) and the eexhaustion, value (ARe) below which K-uptake will cease. Thisquantity is the short-term component of the soil K-status.
At exhaustion aK/aca+8-. 3 X 10⁻⁴ in solution cultures, and about 5 X 10- 4 inan .exhaustedp soil, the result of the averaging of its more and less depletedvolumes. The latter roughly corresponds to Kex/CEC -.7%. (Beckett fl 972]).
Note that strong salt solutions, particularly M. ammonium acetate, tend toextract rather more K ( exchangeable-K) than is immediately or easilyexchangeable to the Ca or Mg ions in the normal soil solution.
EASILY EXCH. K I
' -ACTIVITY RATIOARd ARo
Fig. 1. Three Q/I relations (1-3) of the form of relation (lb): AR, is the current activityratio in the soil and ARd is its exhaustion value, so AK. 3 are the quantities of Kimmediately available (labile K).
358
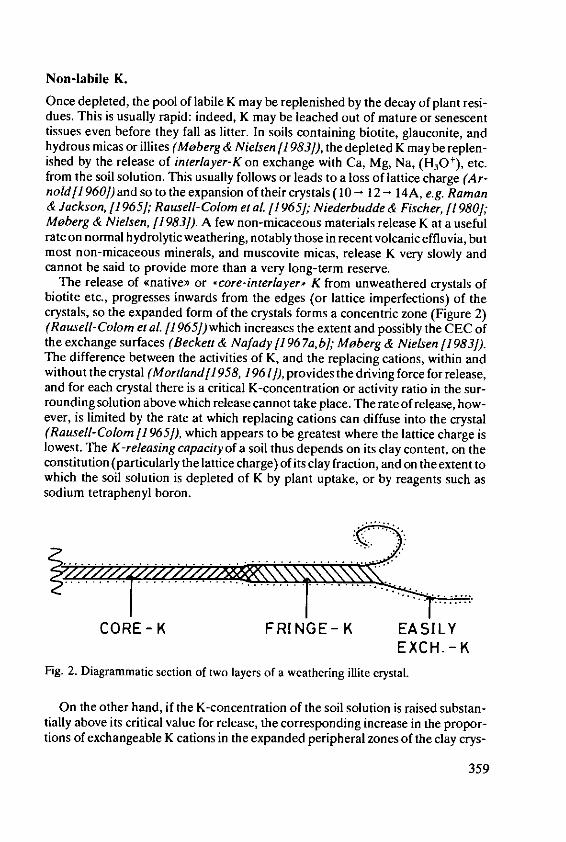
Non-labile K.
Once depleted, the pool of labile K may be replenished by the decay of plant resi-dues. This is usually rapid: indeed, K may be leached out of mature or senescenttissues even before they fall as litter. In soils containing biotite, glauconite, andhydrous micas or illites (Moberg & Nielsen [1983]), the depleted K may be replen-ished by the release of interlayer-K on exchange with Ca, Mg, Na, (H3O+), etc.from the soil solution. This usually follows or leads to a loss of lattice charge (Ar-nold/1 960]) and so to the expansion of their crystals (10 - 12- 14A, e.g. Raman& Jackson, /1965]; Rausell-Colom et al. [1965]; Niederbudde & Fischer, /1980];Moberg & Nielsen, [1983]). A few non-micaceous materials release K at a usefulrate on normal hydrolytic weathering, notably those in recent volcanic effluvia, butmost non-micaceous minerals, and muscovite micas, release K very slowly andcannot be said to provide more than a very long-term reserve.
The release of qnative or core-interlayer' K from unweathered crystals ofbiotite etc., progresses inwards from the edges (or lattice imperfections) of thecrystals, so the expanded form of the crystals forms a concentric zone (Figure 2)(Rausell-Colom et al. 11965]) which increases the extent and possibly the CEC ofthe exchange surfaces (Beckett & Nafady 1196 7a,b]; Moberg & Nielsen [1983]).The difference between the activities of K, and the replacing cations, within andwithout the crystal (Mortland[1958, 1961]), provides the driving force for release,and for each crystal there is a critical K-concentration or activity ratio in the sur-rounding solution above which release cannot take place. The rate of release, how-ever, is limited by the rate at which replacing cations can diffuse into the crystal(Rausell-Colom /1965]), which appears to be greatest where the lattice charge islowest. The K-releasing capacity of a soil thus depends on its clay content, on theconstitution (particularly the lattice charge) of its clay fraction, and on the extent towhich the soil solution is depleted of K by plant uptake, or by reagents such assodium tetraphenyl boron.
CORE-K FRINGE- K EASILYEXCH. - K
Fig. 2. Diagrammatic section of two layers of a weathering illite crystal.
On the other hand, if the K-concentration of the soil solution is raised substan-tially above its critical value for release, the corresponding increase in the propor-tions of exchangeable K cations in the expanded peripheral zones of the clay crys-
359

tals may collapse them (14 - 12- 10A). It is unlikely that the arrangement of the,efixed> K cations, with the Ca and Mg and water molecules entrapped with them(Beckett & Nafady [1 96 7a]), will be well-ordered, so it is commonly observed that.fixed" K is more readily released than "native, K. More significantly, it wouldseem that repeated depletion and replenishment of soil K may lead to a substantialperipheral zone of 'fringe-interlayer-K' whose extent and rate of K-release ref-lect the balance of gains and losses of K over a long while. Indeed, many workershave shown that not only is the K-releasing capacity of illite soils increased by along history of K-fertilization, and thus depends on the magnitude of the pool offringe-K (Figure 2), or vice versa (Beckett & Nafady 1969]; Beckett & Clement119 73]), but their CEC or the extent of their exchange surfaces may have beendecreased by repeated K-fixation, or vice versa. These are the medium to long-term components of soil K status.
Under sustained K-depletion (Figure 3) such soils first release their exchange-able-K, then a further and finite quantity of K at a lower but still significant rate(presumably fringe-K) (Reitemeier et al [1947]; Barrow [1966]; Beckett &Nafady[1967a]; Waddy & Vimpany[1970]). After this, further K release is at amuch slower but more or less constant rate, presumably from core-K or from anintermediate zone between the fringe and core zones.
-J
-IME
Fig. 3. Cumulative K-release with time from three soils, to illustrate the three stages.
In a rested soil, not recently depleted nor replenished with K, K'x/CEC isroughly proportional to the release rate of fringe K (Smith & Matthews [1957];Arnold[1960]): in an exhausted soil the constant, depleted value of K,,/CECappears to depend on the release rate of K from the core or intermediate zones(Tabatabai & Hanway[1 969]). The total-K % of the clay fraction of an illitic soilmay provide a measure of its K-release capacity, but less so or not at all for vermi-culite, smectite or kaolinite clays.
Various attempts have been made to measure these pools of interlayer-K, ortheir rates of release. For example, Haylock (1956) and Netson (1956, 1968) ex-
360

hausted soil or clay samples with successive aliquots of boiling M HNO 3. After 5-6extractions the rate of release became more or less constant (K,) and was assumedto measure the potential release of core-K: the extra K-release during the first 3-4extractions (jstep Ko) comprised exchangeable- and fringe-K and measured themedium-term K reserve. The latter corresponded fairly closely to the resin-Kextracted over 20 hours by a cation exchange resin at 80 'C (Waddy & Vimpany11970]).
In addition the many empirical extractant solutions, such as citric acid, lactic/lactate, acetic acid, ammonium nitrate, sodium bicarbonate, etc., attempt to pro-vide rough estimates of the combined short- and medium-term K reserves of a soil.
Components of variability in soil K status
The total K of sites in a soil-less landscape is determined by the composition oftheir rocks (e.g. igneous rocks contain about 2%, shales 2%, sandstones 1%, lime-stones 0.3%, (Bowen /1966]). The total K of young soils reflects their parent rocksalso. In these early stages of soil development K-release depends as much on whichminerals are present as on their total K; it also depends on the prevailing soil tem-perature, the intensity of biological activity, and on the soil being moist. As thesoils develop and deepen, the total K in their upper horizons falls off; the least resi-stant, high-release minerals weathering more rapidly. In releasing K their mica andillite fractions lose charge and expand, which increases their CEC. Seasonal chan-ges in topsoil K (e.g. Childs & Jencks[196 7]; Briggs, 1974; Martel& Zizka[1978];Weaver& Forcella [1979]; Mollitor at /1980]; Gibson [1986f) build up fringe Kwithin the weathered edges of illitic crystals. Their organic matter contentincreases, too. Thus, throughout the early and middle stages of soil development(which comprise most of the soils of Europe) the short-and medium-term K-reser-ves of a soil tend to increase as its long-term reserves decrease, both in proportionto the geomorphic age of the site and/or the degree of pedological development inthe profile. Soil K-status in different landscapes on the same parent rock should ref-lect their relative ages or relief; in landscapes of the same age soil K-status shouldreflect the proportions of weatherable minerals in their parents rocks.
So in all but the oldest landscapes the patterns of parent rocks provide the maincomponent of the long-range spatial variability of soil K-status. Long-range gra-dients in climatic factors that affect soil development may create long-range trendsin K-status. Thus a sequence of soil profiles, on comparable sites and on compar-able Drift parent materials, along an 813 km transect from Illinois to Nebraska(over which rainfall falls from 99 to 69 cm) showed a steady increase in the total Kcontent of the < 0.001 mm clay fraction of the B horizon, and a decrease in thedepth to the horizon of maximum clay content (Wells & Riecken [1937]).
Within one landscape on one parent rock, the older soils will tend to occur onthe flatter sites, and vice versa. So, ideally, the K-status of different sites in a land-scape should reflect their gradient or their relative physiographic age (Campbell11973]). Similarly, the K-status of different parts of multicyclic landscapes should
361
reflect the relative durations of the different cycles (Campbell1975]). To someextent potassium may become concentrated in the lower parts of the landscapethat receive local drainage. However, temporary excesses of labile K tend to beretained in the fringe-zones of illitic clays, so it is unlikely that K will be as concen-trated in this way as, for example, Ca or Fe. Local geomorphic contrasts such asthese contribute to the medium-range variability of soil K-status. Recurrent localalternations of natural erosion and stability as in the landscape examined by Web-ster and Butler[ 976], or the operation of short-range geomorphic processes suchas sheet-wash, wind erosion, or solifluction, may impose relatively short-rangevariability too.
Super-imposition of secondary or transported soil parent materials may imposefurther trends in K-status, or juxtapose materials of different origin or differentdegrees of weathering. Thus, the very fine sand fraction of a thin loess cover in S.W.Saskatchewan decreases and the silt fractions increase with distance from itssource, while the proportion of mica in the very fine sand and coarse silt increaseswith distance, but decreases in the fine silt fraction. The qtotalD K and presumablyK-status, follows the trend in the mica (Souster et al. [1977]). Similarly the thick-ness of a loess deposit from the Wabash river decreases with distance while thequartz/feldspar ratio of the medium silt fraction rises (Caldwell & White [1956]).Some processes, such as water transport, may accelerate weathering to producedeposits of reduced K-status: others, such as glacial or frost action, or wind blast-ing, may expose fresh facets of weathering minerals. So transported parent materi-als may superimpose short-to long-range patterns of variation in K-status.
Drees & Wilding (1973) found that the variability of total K (within the fine siltor coarse silt fractions) in corresponding horizons of profiles within 4 in2 , varieswith parent material, in the order loess < till < glacial outwash: Mollitor et al.(1980) found that the K-variability within small areas of flood plain forest wasgreater on channel or accretion deposits than on overbank flood deposits: Courtinet al (1983) found that variability in available K increased in the order alluvial <moraine < glaciofluvial deposits.
Many of the patterns derived from the distribution of parent rocks, or the trans-port of their weathering products, become muted in old landscapes, which areusually dominated by profiles of deep weathering and by concave-upwards washslopes (pediplains). In extreme cases the soil reserves of weatherable minerals, andof 2:1 clays, may be almost exhausted, and with them the long- and medium-termK-reserves of the soil. If so, the soil K-status may come to depend wholly on theshort-term reserves of the standing vegetation and the soil organic matter. Indeed,this may also be the case even in young soils forming on quartzitic or weakly arkosicsandstones, which may give rise to highly developed soils even in young land-scapes.
Horizonation within soil profiles usually increases with age and we may expectto find higher proportions of expanded clays, and lower proportions of easilyweatherable minerals in the topsoil than the subsoil. Since the topsoil is also thezone of greatest annual fluctuations in K-status, there will probably be more
362

fringe-K in the topsoil than in the subsoil, and proportionately less core-K until, inreally old soils, the whole K-reserve lies in the organic components of the litter andtopsoil.
The prolonged weathering and mass-wasting necessary to produce old land-scapes commonly results in isostatic uplift. The resulting changes in regional baselevels lead to successive cycles of rejuvenation by dissection, which in their turnlead to successive cycles of soil development, and impose strong, long- to medium-range, patterns of K-status (and other soil properties) in the soils of old and stablecontinents.
Superimposed on the patterns of K-status that derive from patterns of parentrock and patterns of landscape development, and from the geomorphologic pro-cesses that have formed the landscape, there will be patterns imposed by contrastsin natural vegetation, according to whether the main species are monocotyledonsor dicotyledons (this contrast is particularly important for K), are annual or peren-nial, have long or short growing seasons, or have shallow or deep root systems, etc.In some cases, near ecological tension zones, vegetation contrasts may lead to dif-ferent paths of soil development (e.g. to podzols or brown earths in WesternEurope, or to Black or Grey Wooded soils in Alberta); in other cases contrasts innatural vegetation introduce differences in degree. Within one vegetation type thecycles of tree fall and recolonisation in natural woodland, or of fires in grassland,introduce local patterns of shorter range. Similarly, different crops (tree or herb,with high or low K requirements, with high or low recycling of K in residues, withdeep or shallow roots, receiving high or low K-fertilisation), or different crop ro-tations, or, indeed, adjacent farmers practising more or less intensive managementin the same environment, will affect the rates of K-release. They will particularlyaffect the magnitude and the critical activity ratio of the fringe-zone. All these con-trasts introduce medium-or short-range variability.
Within the elements of the patterns of K-status due to different types of naturalvegetation, or different crops, there will be finer contrasts, attributable to treethrow and decaying timber, animal burrows, the concentration of canopy drip andlitter round trees (with bark concentrated near the trunk, and leaves further away)(e.g. Zinke [1962]; Grieve [1977]), or to row crops, ridge and furrow, drainage ordeep ploughing, accelerated sheet-wash or splash erosion, etc. Some soil pro-cesses, such as solonisation, may also introduce short-range patterns of K-status.The spotty distribution of dung or urine patches (e.g. During & Mountier[1967a,b]), and the tendency of some varieties of sheep to congregate and to leaveconcentrations of faeces will also have a marked effect on the variability of K-status(e.g. Hilder & Mottershead[1963]). These contrasts are unlikely to be the result ofstock ingesting soil with their feed. Though sheep faeces may contain up to 30-60% soil under some circumstances (Headley & Drew[1970]), their feed usuallycontains more K than the soil, so the ingested soil does not increase their excretionof K.
Over even shorter ranges, soil cracks or worm burrows may create K-contrasts,and at finer scales contrasts between the interior and the faces of blocky and granu-
363
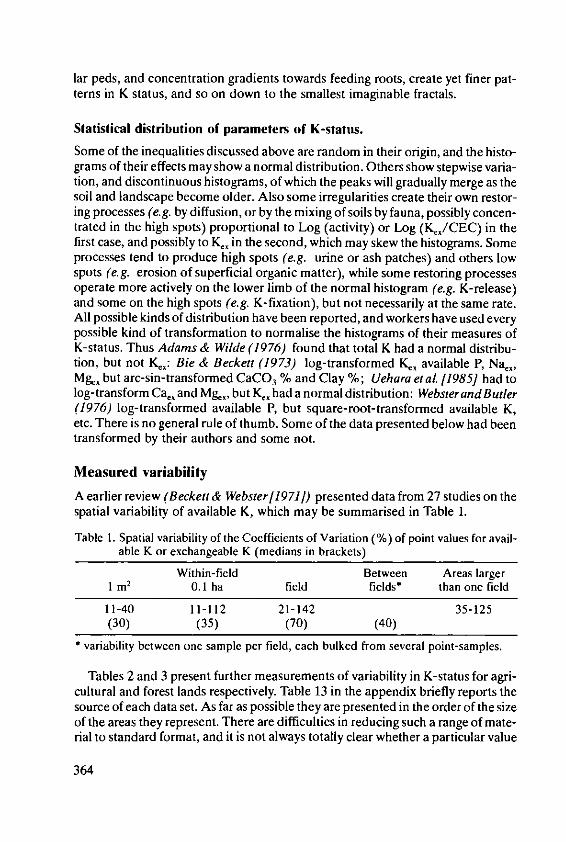
lar peds, and concentration gradients towards feeding roots, create yet finer pat-terns in K status, and so on down to the smallest imaginable fractals.
Statistical distribution of parameters of K-status.
Some of the inequalities discussed above are random in their origin, and the histo-grams of their effects may show a normal distribution. Others show stepwise varia-tion, and discontinuous histograms, of which the peaks will gradually merge as thesoil and landscape become older. Also some irregularities create their own restor-ing processes (e.g. by diffusion, or by the mixing of soils by fauna, possibly concen-trated in the high spots) proportional to Log (activity) or Log (Kx/CEC) in thefirst case, and possibly to K,, in the second, which may skew the histograms. Someprocesses tend to produce high spots (e.g. urine or ash patches) and others lowspots (e.g. erosion of superficial organic matter), while some restoring processesoperate more actively on the lower limb of the normal histogram (e.g. K-release)and some on the high spots (e.g. K-fixation), but not necessarily at the same rate.All possible kinds of distribution have been reported, and workers have used everypossible kind of transformation to normalise the histograms of their measures ofK-status. Thus Adams & Wilde (1976) found that total K had a normal distribu-tion, but not K,: Bie & Beckett (1973) log-transformed K,, available P, Nan,Mg, but arc-sin-transformed CaCO3 % and Clay %; Uehara et al. [1985] had tolog-transform Cae, and M&,, but K. had a normal distribution: Websterand Butler(1976) log-transformed available P, but square-root-transformed available K,etc. There is no general rule of thumb. Some of the data presented below had beentransformed by their authors and some not.
Measured variability
A earlier review (Beckett & Webster[1971]) presented data from 27 studies on thespatial variability of available K, which may be summarised in Table 1.
Table 1. Spatial variability of the Coefficients of Variation (%) of point values for avail-able K or exchangeable K (medians in brackets)
Within-field Between Areas largerI m2 0.1 ha field fields' than one field
11-40 11-112 21-142 35-125(30) (35) (70) (40)
* variability between one sample per field, each bulked from several point-samples.
Tables 2 and 3 present further measurements of variability in K-status for agri-cultural and forest lands respectively. Table 13 in the appendix briefly reports thesource of each data set. As far as possible they are presented in the order of the sizeof the areas they represent. There are difficulties in reducing such a range of mate-rial to standard format, and it is not always totally clear whether a particular value
364
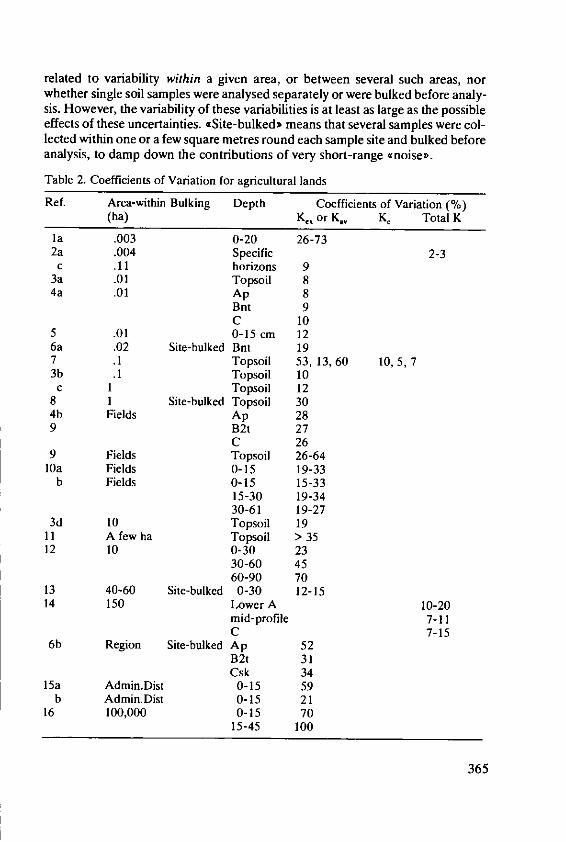
related to variability within a given area, or between several such areas, norwhether single soil samples were analysed separately or were bulked before analy-sis. However, the variability of these variabilities is at least as large as the possibleeffects of these uncertainties. .Site-bulked means that several samples were col-lected within one or a few square metres round each sample site and bulked beforeanalysis, to damp down the contributions of very short-range ,noise>.
Table 2. Coefficients of Variation for agricultural lands
Ref. Area-within Bulking Depth Coefficients of Variation (%)(ha) K, or K., K Total K
la .003 0-20 26-732a .004 Specific 2-3c .11 horizons 9
3a .01 Topsoil 84a .01 Ap 8
Bnt 9C 10
5 .01 0-15 cm 126a .02 Site-bulked Bnt 197 .1 Topsoil 53, 13,60 10,5,73b .1 Topsoil 10c 1 Topsoil 12
8 1 Site-bulked Topsoil 304b Fields Ap 289 B2t 27
C 269 Fields Topsoil 26-6410a Fields 0-15 19-33
b Fields 0-15 15-3315-30 19-3430-61 19-27
3d to Topsoil 1911 A few ha Topsoil > 3512 10 0-30 23
30-60 4560-90 70
13 40-60 Site-bulked 0-30 12-1514 150 Lower A 10-20
mid-profile 7-11C 7-15
6b Region Site-bulked Ap 52B2t 31Csk 34
15a Admin.Dist 0-15 59b Admin.Dist 0-15 21
16 100,000 0-15 7015-45 100
365

Table 3. Coefficients of Variation for forest lands
Ref. Area-within Bulking Depth (cm) Coefficients of Variation (%)(ha) Solution K K,, or Kay Total K
16 .00 Forest floor 3017a .01 Site-bulked F & H 11-30
0-20(min. soil) 20-41
b .01 Site-bulked F & H 210-20(min. soil) 19
18 .03 Site-bulked LF 25H 35
19 .04 5 18150 39
20 .02-.09 Bulked 0-8 22roundeach tree 8-15 22
B 2121 .08 A2 41
B 4122 .09 L 14
F 36H 54
23 .1 Base of Ah 31-4517b .25 Site-bulked F& H 21
0-20(min. soil) 22
c .5 F&H 250-20(min. soil) 23
d I F&H 320-20(min. soil) 23
24a .8-3.3 Site-bulked 0-30 43 Low fertility(min. soil)
55 High fertilityb Region Plot-bulked 0-30 14 Low fertility
(min. soil)35 High fertility
It would appear that forest sites, and particularly the forest floor, show moreshort-range variability than most agricultural sites. Many workers have reportedthat the variability of soil properties, particularly of the nutrient elements, isincreased by tillage, fertilization or grazing. Hemingway [1955] reports that thewithin-field CV for available K is raised from about 30% to about 70% by cultiva-
366
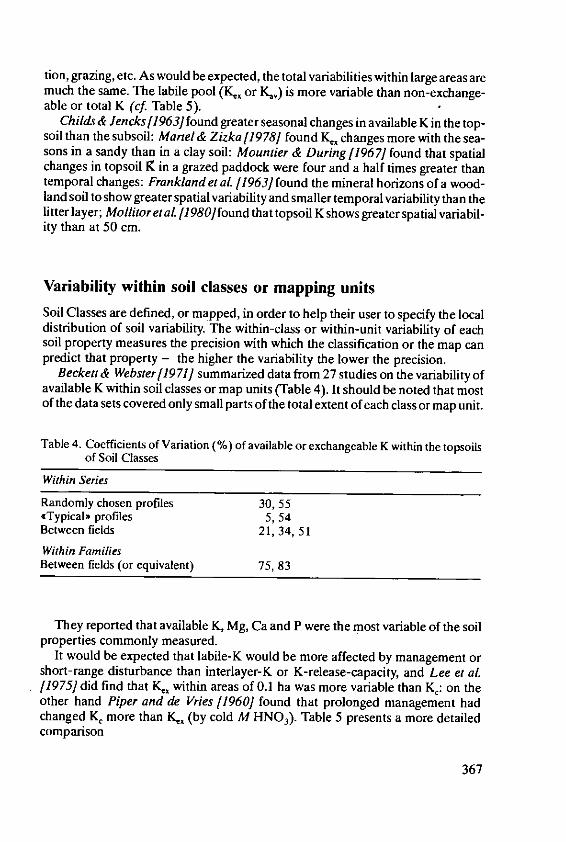
tion, grazing, etc. As would be expected, the total variabilities within large areas aremuch the same. The labile pool (K,, or Ks,) is more variable than non-exchange-able or total K (cf. Table 5).
Childs & Jencks[1963]found greater seasonal changes in available K in the top-soil than the subsoil: Martel & Zizka [1978] found K. changes more with the sea-sons in a sandy than in a clay soil: Mountier & During [1967] found that spatialchanges in topsoil 1Z in a grazed paddock were four and a half times greater thantemporal changes: Frankland et al. [1963] found the mineral horizons of a wood-land soil to show greater spatial variability and smaller temporal variability than thelitter layer; Mollitor et al. [1980 found that topsoil K shows greater spatial variabil-ity than at 50 cm.
Variability within soil classes or mapping unitsSoil Classes are defined, or mapped, in order to help their user to specify the localdistribution of soil variability. The within-class or within-unit variability of eachsoil property measures the precision with which the classification or the map canpredict that property - the higher the variability the lower the precision.
Beckett & Webster[1971] summarized data from 27 studies on the variability ofavailable K within soil classes or map units (Table 4). It should be noted that mostof the data sets covered only small parts of the total extent of each class or map unit.
Table 4. Coefficients of Variation (%) of available or exchangeable K within the topsoils
of Soil Classes
Within Series
Randomly chosen profiles 30, 55*Typical, profiles 5, 54Between fields 21, 34, 51
Within FamiliesBetween fields (or equivalent) 75, 83
They reported that available K, Mg, Ca and P were the most variable of the soilproperties commonly measured.
It would be expected that labile-K would be more affected by management orshort-range disturbance than interlayer-K or K-release-capacity, and Lee et al.11975] did find that K,, within areas of 0.1 ha was more variable than K,: on theother hand Piper and de Vries [1960] found that prolonged management hadchanged K, more than K,, (by cold M HNO 3). Table 5 presents a more detailedcomparison
367

Table 5. Coefficients of Variation (%) of various components of soil K-status
Within soil types Between soil types(a) (b) (a) (b)
Water-soluble K 72 - 13 -
Exchangeable K 39 52 94 206Available K (acid Na-acetate) 51 34 105 140HNO3-soluble K 35 - 64 -
K-uptake by exhaustive cropping(i) Neubauer test - 35 - 172(ii) Glasshouse trial - 36 - 285
(a) Bishop, Maclean et al [1954J- 9 fields on each of 10 soil types.(b) Maclean etal. /1957]- 6 fields on each of 5 soil types.
Subsequently Adams & Wilde [1976] examined the whole extent of the West-mere silt loam as mapped in New Zealand at 1:31680. Their measures related tothe whole map unit, and therefore did not reject the 20% of cimpurities (wrongsoil class) present. On this basis they found (Table 6):
Table 6. Coefficients of Variation (%) within Westmere silt loam map unit
Depth (cm) Kex Total K
0-10 66 1010-20 80 1120-30 106 1230-40 117 1340-60 117 1370-90 181 15
They also plotted the K profiles (K-value against depth) for exchangeable K andtotal K at the 32 sites and measured how many of them lay within the envelopesdefined by ± 10%, ± 25%, ± 50% of the mean profiles for exchangeable and to-tal K respectively (Table 7):
Table 7. Variability of K-profiles within Westmere silt loam map unit
± 10% ± 25% ±50%
Kex 0 0 9K total 17 31 32
(compare Mg, 1 15 27Ca.. 0 12 30Ca total 9 26 31)
368

Tables 6 and 7 both illustrate the high variability of labile K.
Later Gibson et al1]983] re-measured the variability of areas within the samemap unit, and specifically S2 the variance between profile means, and S1 thevariance between different depths within a profile, and found what is presentedin Table 8:
Table 8. Components of the short range variability of Westmere silt loam map unit
0.1 ha 10 ha Whole map unit
Kx, I(, K,. K., Ke. K o.S' 0.6 0.06 0.8 0.1 0.7 0.1S2 0.3 0.07 0.5 0.1 0.4 0.05
They were forced to conclude that the 10 ha area had included a rather discre-pant part which may have weighed rather more heavily within thelO ha samplearea than it might have within the mapping unit as a whole.
Cipra et al. [1972], on the other hand, measured the local variability of theK-status of the Richfield silt loam map unit within seven widely separate fields,one in each of seven counties in S.W. Kansas. They found (Table 9):
Table 9. % of total variation in different subdivisions of Richfield silt loam
Ap B2t C
Between fields within 7 counties 34 59 80Between 25 m2 plots within fields 48 25 12Within 25 m2 plots 15 12 7
Clearly much of the topsoil variability is of short-range, whereas most of the sub-soil variability is of long range.
Ike & Clutter [1968] examined 123 sample plots of 800 M2 in the Blue Ridgemountains (U.S.A.) and found that their Coefficients of Variation were:
A2 BBetween all plots 49% 50%Between plots within series 41% 41%
In this case the soil classification has described only 10% or so of the total bet-ween-plot variability. The within-plot variance varied between 1/4-3/4 of thetotal between-plot variance.
For an area on the Tablelands of New South Wales, Webster and Butler [1976]compared the efficacy of three soil classifications, and a 1:25 000 soil map, at
369
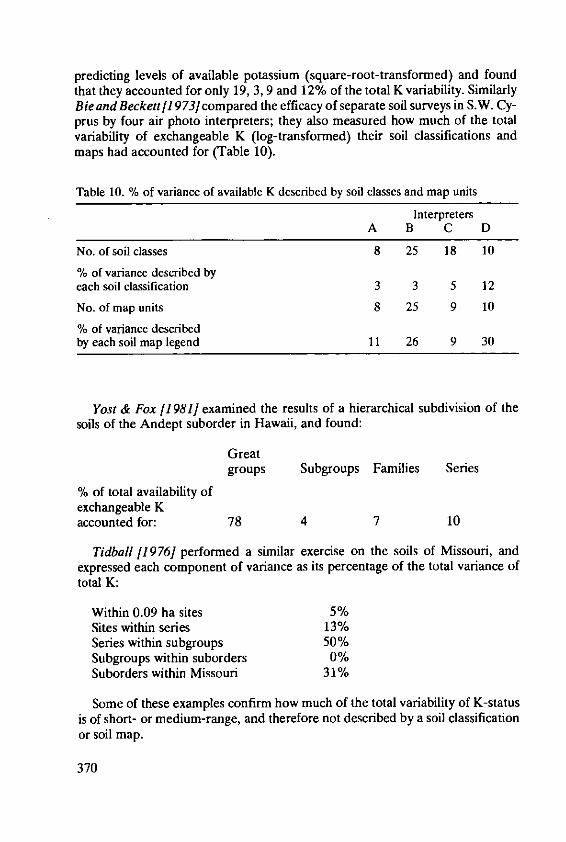
predicting levels of available potassium (square-root-transformed) and foundthat they accounted for only 19, 3, 9 and 12% of the total K variability. SimilarlyBie and Beckett [1 973] compared the efficacy of separate soil surveys in S.W. Cy-prus by four air photo interpreters; they also measured how much of the totalvariability of exchangeable K (log-transformed) their soil classifications andmaps had accounted for (Table 10).
Table 10. % of variance of available K described by soil classes and map unitsInterpreters
A B C D
No. of soil classes 8 25 18 10
% of variance described byeach soil classification 3 3 5 12
No. of map units 8 25 9 10
% of variance describedby each soil map legend 11 26 9 30
Yost & Fox [1981] examined the results of a hierarchical subdivision of thesoils of the Andept suborder in Hawaii, and found:
Greatgroups Subgroups Families Series
% of total availability ofexchangeable Kaccounted for: 78 4 7 10
Tidball [19761 performed a similar exercise on the soils of Missouri, andexpressed each component of variance as its percentage of the total variance oftotal K:
Within 0.09 ha sites 5%Sites within series 13%Series within subgroups 50%Subgroups within suborders 0%Suborders within Missouri 31%
Some of these examples confirm how much of the total variability of K-statusis of short- or medium-range, and therefore not described by a soil classificationor soil map.
370

Part of the variability may be the result of long cultivation which superimposesnew patterns on the patterns originally imposed by geology and pedogenesis.Thus in the Oxford area, Ogunkunle[1979] estimated exchangeable K and Mg,and available P, in six topsoil samples (each bulked from six sub-samples fromwithin 1 in2) from each of an average of five fields (each chosen to contain onlyone soil series) within each of 13 farms. He found (Table 11):
Table 11. Coefficients of Variation of topsoil properties
Mg.x K . Av.P
Between different serieswithin one farm 248 152 34.8
Between different farmswithin one series 35.2 125 230
Between fields within oneseries within one farm - 32.3 -
Residual- between siteswithin one field 28 31.2 51.2
There is a clear gradation between topsoil-Mg which, until recently, farmershave not attempted to change, and soil-P which they have been modifying fromthe Neolithic period. Potassium lies in the middle: in this range of clay, limestoneand sand soils inter-farm differences due to varying levels of fertilizer andbought-in fodder nearly match the effects of different series.
Spatial dependance of the variability of soil K-status
The simplest predictor of the value of the K-status within an area is the mean va-lue for the area. This assumes that its variability is randomly distributed, which isuncommon. Soil classes are defined and mapped in order to describe some of thenon-random components of soil variability, mainly those of longer range. It is as-sumed that class or map-unit means provide better local predictors than themean for the whole area. The preceding section shows that this is not always thecase, particularly if there remain significantly non-random variations within themap unit, as in the Westmere map unit (cf. Gibson et al [1983]).
However these are crude ways of describing soil variability, since Figure 4 (af-ter Beckett and Webster [1971]) and Tables 2 and 3 above, clearly show thatthough the scale of variability tends to increase with the size of the area sampled,often a substantial fraction of it is of very short range.
371

A semi-variogram plots the average of the variance between the values of a soilproperty at two points at a specified distance apart, for a number of such spacings(lag distance): it describes spatial variability more sensitively. It is related to thecorrelogran which plots the correlation between the two sets of values againstthe distance between them, and to the corresponding graph of the variance withinsample plots against the areas of the plots (Figure 4).
(CV) x 1o- 4
20-
1.5
0
1 10 100 1000 JAREA (m)Fig. 4. Variance of available K within areas of varied size - each line represents one set of
data - plotted against f-ie: replotted from Beckett & Webster [1971].
Each of the components of variability discussed above (pp 6-11) may be de-scribed by a simple semi-variogram (Figure 5 [a]). The sill height represents itsfull effect: the range is the distance beyond which its contribution to soil variabil-ity does not increase further-every pair of sites includes the full effect: a nuggetvariance appears when there is substantial short range variability within the mini-num lag distance. This is not necessarily described by extrapolating the semi-var-iogram to zero. Figure 5(b) illustrates separate semi-variograms for three compo-nents of variability of different range and magnitude - these two aspects are notnecessarily correlated. When added they produce the less simple semi-variogram(1 + 2 + 3) that would be measured in the field. As drawn, its points of inflexionreveal the ranges of components 2 and 3. Strictly perhaps, the semi-variogramshould be presented as in Figure 5(c) without surmises about its form below theshortest lag distance. In principle X might be reduced by taking N samples in anarea of L 2 round each sampling site, and bulking them for a single analysis. Thiswould reduce the within-site variance by a factor of 1/N if the the values of theproperty to be measured were normally distributed within each sample, andwould raise the lag axis by X (1 - 1/N ), or proportionately less if the area sam-pled were less than L2.
372
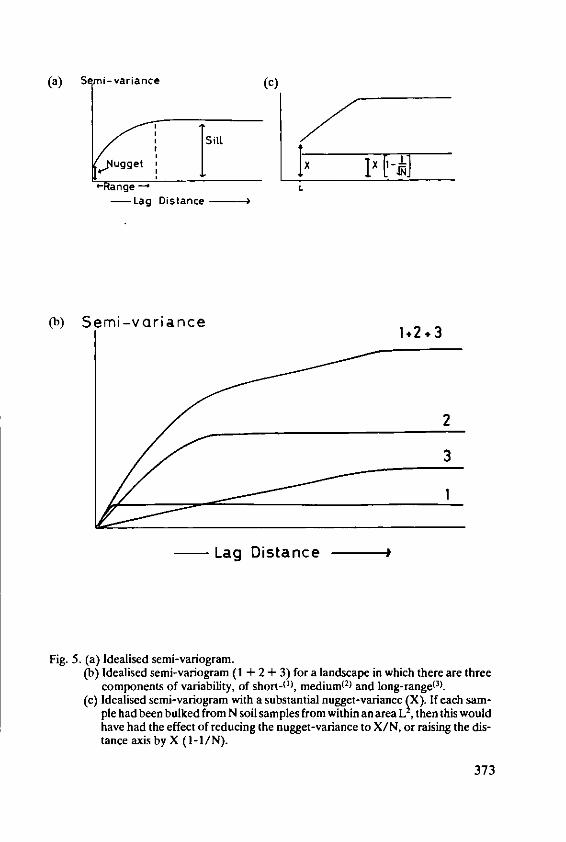
(a) Se i-variance (C)
(,ugget 1Ix I -
-Range -- " L
- Lag Distance
(b) Semi-varianceI+2.3
3
1
- Lag Distance 4
Fig. 5. (a) Idealised semi-variogram.(b) Idealised semi-variogram (1 + 2 + 3) for a landscape in which there are three
components of variability, of short-0), mediumP2) and long-range (3).
(c) Idealised semi-variogram with a substantial nugget-variance SX). If each sam-ple had been bulked from N soil samples from within an area L , then this wouldhave had the effect of reducing the nugget-variance to X/N, or raising the dis-tance axis by X (I-I/N).
373
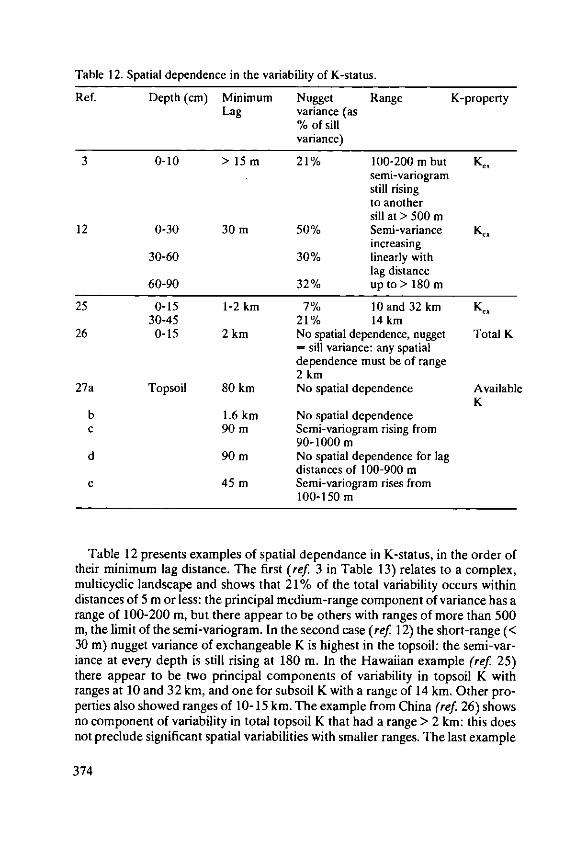
Table 12. Spatial dependence in the variability of K-status.
Ref. Depth (cm) Minimum Nugget Range K-propertyLag variance (as
% of sillvariance)
3 0-10 > 15 m 21% 100-200 m but Kesemi-variogramstill risingto anothersill at > 500 m
12 0-30 30 m 50% Semi-variance Kexincreasing
30-60 30% linearly withlag distance
60-90 32% up to> 180 m
25 0-15 1-2 km 7% 10 and 32 km K0,30-45 21% 14 km
26 0-15 2 km No spatial dependence, nugget Total K= sill variance: any spatialdependence must be of range2 km
27a Topsoil 80 km No spatial dependence AvailableK
b 1.6 km No spatial dependencec 90 m Semi-variogram rising from
90-1000 md 90 m No spatial dependence for lag
distances of 100-900 me 45 m Semi-variogram rises from
100-150 m
Table 12 presents examples of spatial dependance in K-status, in the order oftheir minimum lag distance. The first (ref. 3 in Table 13) relates to a complex,multicyclic landscape and shows that 21% of the total variability occurs withindistances of 5 m or less: the principal medium-range component of variance has arange of 100-200 m, but there appear to be others with ranges of more than 500m, the limit of the semi-variogram. In the second case (ref. 12) the short-range (<30 m) nugget variance of exchangeable K is highest in the topsoil: the semi-var-iance at every depth is still rising at 180 m. In the Hawaiian example (ref. 25)there appear to be two principal components of variability in topsoil K withranges at 10 and 32 kin, and one for subsoil K with a range of 14 km. Other pro-perties also showed ranges of 10-15 km. The example from China (ref. 26) showsno component of variability in total topsoil K that had a range > 2 km: this doesnot preclude significant spatial variabilities with smaller ranges. The last example
374

(ref. 27) includes several fragmentary semi-variograms from transects of 180 mto 1450 km in Central Australia, with minimum lag distances of 45 m to 80 km.As can be seen there is no spatial structure in the variability of available K forranges greater than 80 km along a N-S traverse on the Stuart Highway, nor forranges greater than 1.6 km across a pediment plain. There were marked structu-res with ranges from V/ km to more than 1 km across the pattern of a dissectedlaterite peneplain, and with ranges of 100 m or so across gilgai, but no structurewith ranges of more than 90 m across an area of patterned vegetation with a re-current frequency of the order of 100 m.
These examples emphasize the importance of sampling for both short-and long-range variability. The question of bulking samples to damp down short-range var-iability should be seriously considered in any project where short-range variabilityis of limited interest because management practices will bury it in a mean value.
Measurement of soil variability
Corresponding to the above there are three levels of approach:(i) An overall mean and variance for the whole area of interest, based upon
uniformly distributed (systematic or stratified random) sample sites.(ii) Stratification of variability by means of mapped soil classes (simple map
units), or by iso-lines of the values of K-properties. These are likely to be more use-ful for describing variability in the non-labile than in the labile forms of K. Stratifi-cation into fine divisions is likely to produce map units for which the ,Ia"rea is com-parable to the range of the corresponding semi-variogram (iii) which will be moreuseful. A less fine stratification might provide a useful basis for within-stratumsemi-variograms, and obviate the need to measure long-range components of vari-ability.
(iii) Semi-variograms of K-properties, for the whole area, or within broad strata(ii) defined on soil, geology or other environmental factors.
For all three of these it may be useful and reduce sampling effort if the basic mea-surement is based upon a bulked sample, fully representing a specified area roundeach sample site. To sample even 30m2 round each site (a circle of 3 m radius)would filter out much short range noise, and there are not many kinds of landmanagement that take account of variations within such small areas.
If the short- and medium-range variability in a large area can only be measuredin sample areas, then the sample areas must be fairly distributed over the wholearea - one set of nested plots is rarely adequate. In the case of a semi-variogram, aregular grid of sites at a spacing of say /6 of the mean width of the area or stratum tobe sampled, provides a range of long distances up to half the width (which shouldbe the limit). Satellite sites in random orientations to half of these, at set distancesdown to the minimum lag distances required, should provide a sufficient range ofshorter spacings.
375
APPENDIX
Table 13 Sources of data for Tables 2, 3 and 12.
1. UK, Dune grassland: available K by cresin-bagp procedure. Gibson 11986]
2. USA, Ohio: Farmland a) total K in siltfractions of corresponding horizons in sixprofiles round one pit. Drees & Wilding 1973]
b) Wilding & Drees /1978]3. Australia, NSW: 400 ha. pasture on Table-
lands: 111 sites on 180 m. grid with added*twin) sites at spacings of 5,18 & 56 m: semi-variogram for lag distances 5-500 m. Valuessquare-root transformed. Webster & Butler /1976]
4. USA, Kansas: fields unutilised and unirrigated Cipra et al [1972]5. Canada, Alberta: rotation crops. Briggs[1974]6. W. Canada: solonetzic soils. Carter & Pearson 1985]7. New Zealand: one field on each of three soil
types; pasture. Lee et al. [1975]8. Canada, Quebec: rotation crops. Martel & Zizka /1978]9. Finland Jokinen et al [1983]
10. Canada, Alberta: 3 widely separated fieldsunder rotation cropping. Cameron et al. [1971]
11. USA, Ohio. Wilding & Drees [1978, 1983]12. W. Germany: CaCl2 - extractable K on
30 X 30 an grid, with lag-distances 30-180 m. Dahiya et al [1985]13. N.W. USA; central-pivot irrigation area. Dow et aL [1980]14. UK, Oxon: selected areas of clay soils. Bascomb & Jarvis[1976]15. India, Tamil Nadu a) Alluvial landscape
b) Lateritic landscape Mosi et al. [1975]16. N.W. USA; Douglas fir forest. Grier & McColl[1971]17. UK, Scotland: Sitka spruce forest a) was
measured over a wider range of forest than b) Blyth & McLeod[1978]18. W. Canada: three forest types. Quesnel & Lavkulich [1980]19. N E USA: floodplain forest. Mollitor et al 11980]20. S E USA: 9 year Loblolly pine plantation
on former cotton fields. Metz et al [1966]21. S E USA: Blue ridge forest. Ike & Clutter/1968]22. S E USA: Red pine plantation. Hort et al. 11969]23. UK: Mixed oak woodland, values show that
spatial variation changes with season. Grieve et al. [1984]24. W Canada. Douglas fir: Low (L) and High
(H) fertility plots: *plot-bulked' means thatall the samples within plots of .5-3.3 ha werebulked before analysis. Courtin et al. /1983]
25. Hawaii, 80 sites at 1-2 km intervals, along transectsmore or less perpendicular to the coast, samplesbulked over .3ha, values log-transformed. Yost et al (1982]
376
26. China, Zhangwu county: 102 profiles in3635 km 2 ; semi-variogram calculated for lagdistances 2-50 km. Xu & Webster[f984]
27. Central Australia, natural vegetation, allsamples bulked within 25 m2 areas round eachsite.a) Along 1450 km of the Stuart Highway, sampled
at 80 kin intervals.b) Along 58 km across pediments of Hammersley
range, sampled at 1.6 km intervals.c) 900 m transects perpendicular to drainage in a
strongly dissected landscape, sampled at 90 mintervals.
d) 550 m across striped vegetation pattern, sampledat 90 intervals.
e) 180 m across gilgai area, sampled at 45 m inter-vals Beckett & Bie f1976]
References
1. Adams, J.A. & Wilde, R.H.: Variability within a soil mapping unit mapped at the soiltype level in the Wanganui District. N.Z. J. agric. Res. 19, 435-442 (1976)
2. Arnold, . W: Nature and mode of weathering of soil-potassium reserves. J. Sci. Fd.Agric. 11, 285-292 (1960)
3. Barrow, N.J.: Nutrient potential and capacity. 11. Relationship between potassiumpotential and buffering capacity and the supply of potassium to plants. Aust. J. agric.Res. 17, 849-861 (1966)
4. Bascomb, C.L. & Jarvis, M.G.: Variability in three areas of the Denchworth Soil MapUnit. I. Purity of the map unit and property variability within it. J. Soil Sci. 27,420-437(1976)
5. Beckett, P.H. T: Studies on soil potassium. 11. The timmediate* 0/I relations of labilepotassium in the soil. J. Soil Sci. 15, 9-23 (1964)
6. Becken, P.H.T.: Critical cation activity ratios. Adv. in Agron. 24, 379-412 (1972)7. Beckett, P.H. T & Bie, S. W.: Reconnaissance for soil survey. II. Pre-survey estimates
of the intricacy of the soil pattern. I Soil Sci. 27, 101-110 (1976)8. Beckett, P.H. T & Nafady, M.H.AM.: Studies on soil potassium. V. The effect of K-fixa-
tion and release on the form of the K: (Ca+Mg) exchange isotherm. J. Soil Sci. 18,244-262 (1967a)
9. Beckett, P.H.T and Nafady, M.H.M.: Effect of K-release and fixation on the ion-exchange properties of illite. Soil Sci. 103, 410-416 (1967b)
10. Beckett, PH. T & Nafady, M.H. M.: The effect of prolonged cropping on the exchangesurfaces of the clays of Broadbalk field. J. Soil Sci. 20, 1-10 (1969)
11. Beckett, PH.T & Clement, CR.: K-activity rations and the uptake of potassium byryegrass in the field. . Soil Sci. 24, 82-93. (1973)
12. Beckett, PH. T & Webster, R.: Soil variability: a review. Soils and Fertil. 34, 1-15.(1971)
13. Bie, S.W & Beckett, P H. : Comparison of four independent soil surveys by air-photo interpretation, Paphos area (Cyprus). Photogrammetria 29, 189-202 (1973)
377
14. Bishop, R.F, Maclean, A.J. & Lutwick, L. E.: Fertility studies on soil types and potas-sium supply and requirement as shown by greenhouse studies and fertility tests. Can.J. Agric. Sci. 34, 374-384. (1954)
15. Blyth, J.E & Macleod, D.A. : The significance of soil variability for forest soil studies inN.E. Scotland. J. Soil Sci. 29, 419-430. (1978)
16. Bowen, H.J.M.: Trace Elements in Biochemistry. Academic Press, London and NewYork 1966
17. Briggs, K. G.: Soil sampling and soil uniformity for N, P and K in a small plot area.Can. J. Soil Sci. 54, 115-117 (1974)
18. Caldwell, R.E. & White, J.L.: A study of the origin and distribution of loess in S. Indi-ana. Soil Sci. Soc. Am. Proc. 20, 258-263 (1956)
19. Cameron, D.R., Nyborg, M., Toogood, J.A. & Lavesk, Y.D.H.: Accuracy of fieldsampling for soil tests. Can. J. Soil Sci. 51, 165-175 (1971)
20. Campbell, LB.: Pattern of variation in steepland soils: variation on a singleslope. N.Z.J. Sci. 16, 413-435 (1973)
21. Campbell, L B.: Pattern of variation in steepland soils: soil differences in complex to-pography. N.Z. J. Sci. 18, 53-66 (1975)
22. Carter, M.R. and Pearson J.R.: General and spatial variability of solonetzic soils inNorth Central Alberta. Can. J. Soil Sci. 65, 157-167 (1985)
23. Childs, ED. & Jencks, E.M.: Effect of time and depth of sampling upon soil testresults. Agronomy Journal 59, 537-540 (1967)
24. Cipra, J.E., Bidwell, 0. W., Whitney, D.A. & Feyerherm, A.M.: Variations with dis-tance in selected fertility measurements of pedons of a Western Kansas Udoll. Soil Sci.Soc. Am. Proc. 36, 111-115 (1972)
25. Courtin, P., Fellow, M.C. & Klinka, K.: Lateral variability in some properties of dis-turbed forest soils in South Western British Columbia. Can. J. Soil Sci. 63, 529-539(1983)
26. Dahiya, I.S., Anlaup, R., Kersebaum, K.C. & Richter, J.: Spatial variability of somenutrient constituents of an Alfisol from loess. Il.Geostatistical Analysis. Zeit. Pflanze-nernihr. Bodenk. 148, 268-277 (1985)
27. Dow,A.L, Russel, T.S. & Cline, T.A.: Soil test variability in sandy soils undertwocen-tre-pivot irrigation systems. College of Agriculture Research Centre, WashingtonState University (1980)
28. Drees, L.R. & Wilding, L.P.: Elemental variability within a sampling unit. Soil Sci.Soc. Am. Proc. 37, 82-87 (1973)
29. During, C. & Mountier, N.S.: Sources of error in advisory soil tests. Ill. Spatial var-iance. N.Z. J. Agric. Sci. 10, 134-138 (1967)
30. Frankland, J. C., Ovington, J.D. & Macrae, C.: Spatialand seasonal variationsin soil,litter and ground vegetation in some Lake District woodlands. J. Ecol. 51, 97-112(1963)
31. Gibson, D.J.: Spatial and temporal heterogeneity in soil nutrient supply measuredusing in situ ion-exchange resin bags. Pl. and Soil 96, 445-450 (1986)
32. Gibson, A.R., Giltrap, D.J., Lee, R. & Wilde, R.H.: Soil variability in Westmere siltloam in relation to size of sampling area. 1. Chemical variability. N.Z. J. Sci. 26, 99-109 (1983)
33. Grier, C. C. & Mccoll, J. G.: Forest floor characteristics within a small plot in Douglasfir in Western Washington. Soil Sci. Soc. Am. Proc. 35, 988-991 (1971)
34. Grieve, L C.: Some relationships between vegetation patterns and soil variability inthe Forest of Dean, U.K. J. Biogeography 4, 193-199 (1977)
378
35. Grieve, LC., Foster, L D.L. & Carter, A.D.: Spatial and temporal variations in con-centrations of three ions in solutions extracted from a woodland soil. Catena 11, 305-312. (1984)
36. Hart, J.B., Leaf, A.L. & Stutzbach, S.J: Variations in potassium available to treeswithin an outwash soil. Soil Sci. Soc. Am. Proc. 33, 950-954 (1969)
37. Healey, W.B. & Drew, K.R.: Ingestion of soil by hoggets grazing swedes. N.Z.J. agric.Res. 13, 940-944 (1970)
38. Haylock, O.F.: A method of estimating the availability of non-exchangeable pota-ssium. Trans. 6th Int. Congr. Soil Sci. 2, 403-408 (1956)
39. Hemingway, R.G.: Soil-sampling errors and advisory analyses. J. agr. Sci. (Camb)46, 1-8 (1955)
40. Hilder, E.J. & Mottershead, B.E.: The redistribution of plant nutrients through graz-ing sheep. Aust. J. Sci. 26, 88-89 (1963)
41. Ike, A.F. & Clutter, J.L.: The variability of forest soils of the Georgia Blue Ridgemountains. Soil Sci. Soc. Am. Proc. 32, 284-288 (1968)
42. Jokinen, R.: Variability of topsoil properties at the southern coast of Finland and thenumber of soil samples needed for the estimation of soil properties. J. Sci. Agric. Soc.of Finland 55, 109-117 (1983)
43. Lee, R., Bailey, J.M., Northern, R.D., Barker, P.R. & Gibson, E.J.: Variations insome chemical and physical properties of three related soil types: Dannevirke siltloam, Kiwiten silt loam, and Morton silt loam. N.Z. J. agr. Res. 18, 29-36 (1975)
44. Maclean, A.A, Doyle, J.1. & Hamlyn, F. G.: Fertility studies on some New Brunswicksoils. 2. Soil potassium supply as shown by chemical and greenhouse tests. Can. J. SoilSci. 37, 29-33 (1957)
45. Martel, Y.A. & Zizka, J.: ['effect du temps de l'echantillonage et de l'heterogeneitede champ sur les analyses de fertilit6 du soil. Can. J. Soil Sci. 58, 511-520 (1978)
46. Metson, A.J: The long-term potassium-supplying power of New Zealand soils.Trans. 9th Int. Congr. Soil Sci. 2, 621-630. (1968)
47. Metson, A.J., Arbuckle, R.H. & Saunders, M.L.: The potassium-supplying powerofNew Zealand soils as determined by a modified normal-nitric method. Trans. 6th Int.Congr. Soil Sci. 2, 619-627 (1956)
48. Metz, L.J., Wells, CG. & Swindet, B. F: Sampling soil and foliage in a pine platation.Soil Sci. Soc. Am. Proc. 30, 397-399. (1966)
49. Moberg, J.P. & Nielsen, J.D.: Mineralogical changes in soils used for potasium-deple-tion experiments for some years in pots and in the field. Act. agric. Scand. 33, 21-27.(1983)
50. Mollitor, A. V., Leaf, A.L. & Morris, L.A.: Forest soil variability on North Easternflood plains. Soil Sci. Soc. Am. J. 44, 617-620 (1980)
51. Mortland, M.M.: Kinetics of potassium release from biotite. Soil Sci. Soc. Am. Proc.22, 503-508 (1958)
52. Mortland, M.M.: The dynamic character of potassium release and fixation. Soil Sci.91, 11-13 (1961)
53. Mosi, R.D., Soundarajan, S.K. & Lakshiminaraianan, S.: Summary of soil testvalues of major soil series of Thanjavur District. J. Indian Soc. Soil Sci. 23, 371-379(1975)
54. Mountier, N.S. and During, C: Sources of error in advisory soil tests. IV. Discussionof total variance. N.Z. J. agr. Res. 10, 139-142 (1967)
55. Niederbudde, E.A. & Fischer, W.R.: Clay mineral transformations in soils as influ-enced by potassium release from biotite. Soil Sci. 130, 225-231 (1980)
379
56. Ogunkunle, A. 0.: The optimisation of classifications for soil survey. D. Phil. thesis,Oxford (1979)
57. Piper, C.S. & de Vries, M.P. :The availability of potassium in someTasmanian soils. 11.Exhaustive cropping in relation to potassium reserves in the soil. Aust. J. agric. Res.11, 739-804 (1960)
58. Quesnel, H.J. & Lavkulich, L.M.: Nutrient variability of forest floors near PortHardy, British Columbia, Canada. Can. J. Soil Sci. 60, 565-573 (1980)
59. Raman, K. V. & Jackson, M.L.: Mica surface morphology changes during weather-ing. Soil Sci. Soc. Am. Proc. Am. Proc. 29, 29-32 (1965)
60. Rausell-Colom, J.A., Sweatman, T.R., Wells, C.B. & Norrish, K.: pp.4 0 -72 in: Ex-perimental Pedology eds. E.G. Hallsworth, D. V. Crawford, Butterworth, London,(1965)
61. Reitemeier, R.F., Holmes, R.S., Brown, L C., Klipp, L. W. & Parks, R. Q.: Release ofnon-exchangeable potassium by greenhouse, Neubauer, and laboratory methods.Soil Sci. Soc. Am. Proc. 12, 158-162 (1947)
62. Smith, J.A. & Matthews, B. C: Release of potassium by 18 Ontario soils during con-tinuous cropping in the greenhouse. Can. J. Soil Sci. 37, 1-10 (1957)
63. Souster, W.E., St. Arnaud, R.J. St. & Huang, P.M.: Variation in physical propertiesand mineral composition of thin loess deposits in the Swift Current area of Sas-katchewn. Soil Sci. Soc. Am. J. 41, 594-601 (1977)
64. Tabatabai, M.A. & Hanway, J.J.: Potassium supplying power of Iowa soils at their.minimal" levels of exchangeable potassium. Soil Sci Soc Am. Proc. 33, 105-109(1969)
65. Tidball, R.R.: Chemical variation of soils in Missouri associated with selected levels ofthe soil classification system. U.S. Geological Survey Professional Paper 954-B.U.S.Govt. Printing Office, Washington D.C., (1976)
66. Uehara G., Trangmar, B.B. & Yost, R.S.: Spatial variability of soil properties pp.61-92 in Soil Spatial Variability., ed. D.R. Nielsen, J. Bouma, Pudoc, Wageningen,(1985)
67. Waddy, J.A. & Vimpany, LA.: Estimation of non-exchangeable potassium in soilsusing a cation-exchange resin. J. Sci. Fd. Agric. 21, 113-115 (1970)
68. Weaver, T. & Forcella F.: Seasonal variation in soil nutrients undersix Rocky Moun-tain vegetation types. Soil Sci. Soc. Am. J. 43, 589-593 (1979)
69. Webster, R. & Butler, B.E.: Soil classification and survey studies at Ginninderra.Aust. J. Soil Res. 14, 1-24. (1976)
70. Wells, K.L. & Riecken, F.F.: Regional distribution of potassium in the B horizon clayof some Prairie loess soils of the Midwest. Soil Sci. Soc. Am. Proc. 33, 582-587 (1969)
71. Wilding, L.P. & Drees, L. R.: Spatial variability: a pedologists view point. pp. 1- 12 inDiversity of soils in the Tropics. Spec. Publ. No.34 Soil Sci. Amer. (1978)
72. Wilding, L.P. & Drees, L.R.: Spatial variability and pedology. pp. 83-117 in Pedog-enesis and Soil Taxonomy. 1. Concepts and Interactions. ed. L.P. Wilding, N.E.Smeck, G.F. Hall. Developments in Soil Science I A. Elsevier, Amsterdam (1983)
73. Xu, J. & Webster, R.: A geostatistical study of topsoil properties in Zhangwu county,China. Catena 11, 13-26 (1984)
74. Yost, R.S. & Fox, R.L.: Partitioning variation in soil chemical properties of someAndepts using Soil Taxonomy. Soil Sci. Soc. Am. J. 45, 373-377 (1981)
75. Yost, R.S., Uehara, G. & Fox, R.L.:Geostatisticalanalysisofsoilchemicalpropertiesof large land areas. I. Semi-variograms. Soil. Sci. Soc. Am. J. 46, 1028-1032 (1982)
76. ZinkeP.J.: The pattern of influence of individual forest trees on soil properties. Ecol-ogy 43, 130-133. (1962)
380
Interpretation of Long-TermExperiments with K Manuring
A. Kbchl, Institute for Agricultural Chemistry, Vienna/Austria*
Summary
Results from 3 long-term (30 year) experiments are presented and discussed leading to thefollowing conclusions:
1. Conventional soil analysis of surface soil (CAL, BaC 2, H20, EUF) does not fully ref-lect the effect of long term differential K fertilizer treatment. Taking into account text-ure, K fixation and supply of K from subsoil brings about improvement. Correction ofCAL K for % K of the sum of basic cations improves interpretation.
2. So far as dressings for individual crops are concerned, conventional methods are help-ful but not predicting requirements for ameliorative dressings.
3. Limitations of conventional determinations on topsoil are made clear by the fact that onnil K plots, change in CAL K accounts for only 0.1-3 % of crop uptake and on high K(300 kg/ha/yr) plots for only 2-12% of the excess of K application over removal.Obviously non-exchangeable and subsoil K is important.
4. Needs in terms of both K dressing and soil K content contrast as between rootcrops andcereals. Economically optimum results with cereals are obtained at CAL K values from6-12 mg K20/100 g soil and K fertilizer rates from 0-110 kg/ha K20. For rootcrops therelevant values are 6-19 mg/ 100 g and 160-290 kg/ha/yr K2O. Sugar content of beetand dough elasticity of wheat are positively correlated with soil-K content. Starch con-tent of potatoes is slightly decreased by K supply, but this is compensated by highertuber-yield.
5. Economically optimum K dressings increase crops up to 60% (cereals) and 90%(roots) of the maximum yield responses by K. They produce net yield increases (ferti-lizer cost already deducted) of 5.5 t beets, 2.4 t potatoes and 0.1 t cereals/ha/yr.
1. Introduction
The general improvement in soil fertility of our agricultural land - especially arableland - means that today it is very difficult to find sites for experiments to confirmthe correctness of K fertilizer recommendations and to establish norms for soil Kcontent, ranging from deficiency to excess of K supply. This is because crops obtain
* Dip[. Ing. A. Kdchl, Leiter der Abtlg. ftir Pflanzenernfhrnng, Landwirtschaftlich-che-mische Bundesanstalt, Trunnerstr. 1, A-1020 Wien/Austria
381
their K needs increasingly from reserve sources, either natural or resulting from res-idues accumulated from previous fertilizer treatment and only partially utilisefreshly applied K. K uptake is confined to the soil within a short distance from theroot surface to which non-exchangeable K makes a significant contribution (Cla-assen andJungk [1982]) and this principal fact reduces utilization of fertilizer K inthe bulk soil in the season following applications. From this it follows that gener-ally, and especially on high K soils, full economic evaluation and differentiationbetween past and present K-fertilizer application is not possible. Unutilised resi-dues which compensate for removal from soil sources or increase soil reserveswould not be taken into account.
These difficulties can be overcome only in long-term experiments preferably onsoils which have previously received little fertilizer. This allows the taking intoaccount of the value of fertilizer residues accumulated in the soil and their properevaluation. Long-term experiments have a subsidiary advantage in that they takeinto account seasonal variations in yields.
This paper discusses results from long duration (30 years) trials of K manuringas they indicate how soil K status of different soils is affected by level of fertiliza-tion, how crop yield and quality are affected by this and how the results can be usedto indicate the K fertilizer amounts and soil K levels which are needed for optimumcrop production. Finally it mentions results from survey experiments designed toimprove the interpretation of soil analysis.
2. Materials and methods
The experiments are sited in three contrasting areas of Lower Austria and were laiddown by Reichard in 1956. Data relating to the experimental sites are given inTable 1.
The sites contrast not only as regards altitude and rainfall but also as regards soiltype, parent material and texture. The Rottenhaus soil is especially compact andheavy (silt + clay 97%). These contrasts results - as well be shown - in great differ-ences in response to K fertilizations.
Rates of potash applied at Fuchsenbigl and Rottenhaus were 0, 150 and 300 kg/ha/yr K20 and at Zwettl 0, 50, 100, 150 on account of the high K content of parentmaterial at the latter site. NP dressings were adequate, especially the rate ofnitrogen was adjusted to crop and yield potential every year. Only data from the2nd and 3rd ten year cycles are discussed because there were changes in fertilizertreatment in the early years and in 1965/66 the DL method of extraction wasreplaced by CAL (Schiller[I96 9]) so that soil analysis data since then are not com-parable with the early years. By taking the shorter period the evaluation is based onvarieties with similar yield potential.
The other series of experiments, mentioned briefly in section 3.6, covered a widerange of sites varying in K status (8-52 mg K20/100 g) and soil criteria (type, text-ure, organic matter content etc.) in Lower Austria and the northern Burgenland.Rates of potash applied were per annum: 0, 75, 150, 300 kg/ha K20 and the aim
382
was to calibrate soil-examination methodology (Krchl[1979]). 6 years' results aretaken into consideration.The methods compared in long duration trials and discussed in this paper were asfollows:
CAL Ca-acetate (0.05 m) Ca-lactate (0.05 m) method of Schiller [1969]EUF Electro-ultrafiltration of Ncmeth 119791BaCI, BaCI, (0.2 m) - triethanolamine solution of Mehlich pH 7.5, 1:20, lhH 20 Extraction with water; 1:20, lhK (fix) K fixation. KCI (120 mg/100 g soil) addition and exchange with 1 N
NH 4Ac; 2 X I h. Parallel determination of CAL K.
Table 1. Characteristics of experimental sites
Site Fuchsenbigl Rottenhaus Zwettl
m.a.s.I. 150 290 550Annual rainfall mm 541 836 740Mean annual tempe-rature (deg C) 9.1 8.5 6.8Parent material Loess Silt SilicateSoil type Chemozem Brown earth Brown earthTexture Sandy loam Silty loam Sandy loampH CaCI2 7.5 6.5 6.0CaCO3 % 15 0 0Organic matter % 2.1 2.9 1.9CEC me/100 g 25.4 28.0 11.6Sand/silt/clay (%) 40/42/18 3/67/30 48/36/16
3. Results and discussion
3.1 K content of long-term plots as related to K fertilizer rate andduration
The value of soil analysis for advisory purposes depends upon how well it reflectsnutrient content of the soil and previous fertilizer treatment. Hence long termexperiments in which the history is accurately recorded are of particular value inassessing the value of different methods. This is especially true for the CALextracted K since this was investigated regularly over the full experimentationperiod.
All methods show differences in K supplying power between the experimentalsites. This holds to some extent for the control (K.) plots as would be expected butalso for the K content under fertilizer treatments. Differences in K removal due todifferent crop successions do not explain these differences. Rottenhaus is distin-guished from the other sites by its low K status as indicated by CAL or water
383
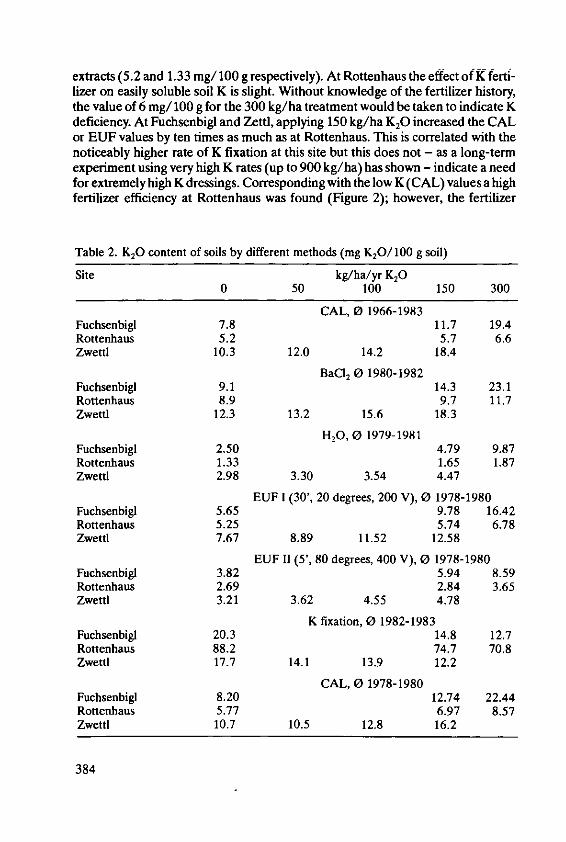
extracts (5.2 and 1.33 mg/100 g respectively). At Rottenhaus the effect of K ferti-lizer on easily soluble soil K is slight. Without knowledge of the fertilizer history,the value of 6 mg/100 g for the 300 kg/ha treatment would be taken to indicate Kdeficiency. At Fuchsenbigl and Zettl, applying 150 kg/ha K20 increased the CALor EUF values by ten times as much as at Rottenhaus. This is correlated with thenoticeably higher rate of K fixation at this site but this does not - as a long-termexperiment using very high K rates (up to 900 kg/ha) has shown - indicate a needfor extremely high K dressings. Corresponding with the low K (CAL) values a highfertilizer efficiency at Rottenhaus was found (Figure 2); however, the fertilizer
Table 2. K20 content of soils by different methods (mg K2 0/100 £ soil)
Site kg/ha/yr K200 50 100 150 300
CAL, 0 1966-1983Fuchsenbigl 7.8 11.7 19.4Rottenhaus 5.2 5.7 6.6Zwettl 10.3 12.0 14.2 18.4
BaC 2 0 1980-1982Fuchsenbigl 9.1 14.3 23.1Rottenhaus 8.9 9.7 11.7Zwettl 12.3 13.2 15.6 18.3
H2O, 0 1979-1981Fuchsenbigl 2.50 4.79 9.87Rottenhaus 1.33 1.65 1.87Zwettl 2.98 3.30 3.54 4.47
EUF 1 (30', 20 degrees, 200 V), 0 1978-1980Fuchsenbigl 5.65 9.78 16.42Rottenhaus 5.25 5.74 6.78Zwettl 7.67 8.89 11.52 12.58
EUF I1 (5', 80 degrees, 400 V), 0 1978-1980Fuchsenbigl 3.82 5.94 8.59Rottenhaus 2.69 2.84 3.65Zwettl 3.21 3.62 4.55 4.78
K fixation, 0 1982-1983Fuchsenbigl 20.3 14.8 12.7Rottenhaus 88.2 74.7 70.8Zwettl 17.7 14.1 13.9 12.2
CAL, 0 1978-1980Fuchsenbigl 8.20 12.74 22.44Rottenhaus 5.77 6.97 8.57Zwettl 10.7 10.5 12.8 16.2
384
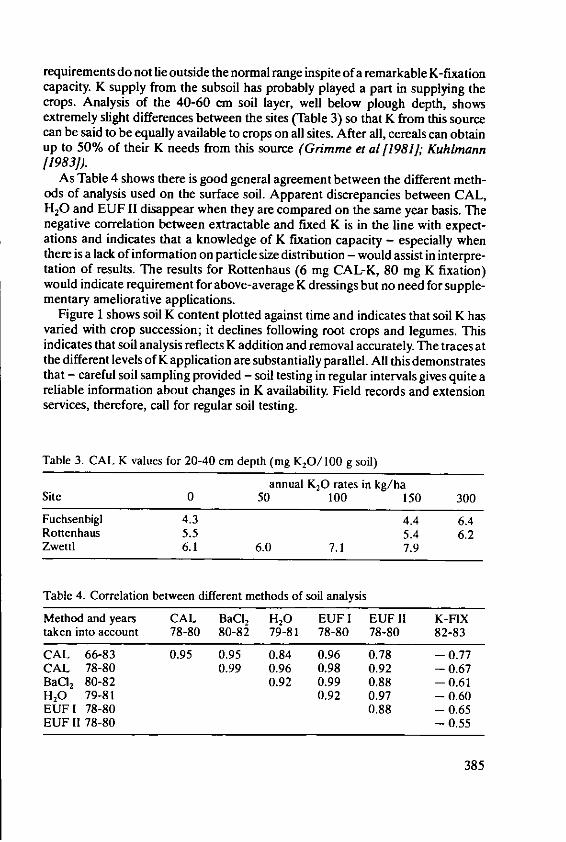
requirements do not lie outside the normal range inspite of a remarkable K-fixationcapacity. K supply from the subsoil has probably played a part in supplying thecrops. Analysis of the 40-60 cm soil layer, well below plough depth, showsextremely slight differences between the sites (Table 3) so that K from this sourcecan be said to be equally available to crops on all sites. After all, cereals can obtainup to 50% of their K needs from this source (Grimme et al 11981]; Kuhlmann119831).
As Table 4 shows there is good general agreement between the different meth-ods of analysis used on the surface soil. Apparent discrepancies between CAL,H20 and EUF II disappear when they are compared on the same year basis. Thenegative correlation between extractable and fixed K is in the line with expect-ations and indicates that a knowledge of K fixation capacity - especially whenthere is a lack of information on particle size distribution - would assist in interpre-tation of results. The results for Rottenhaus (6 mg CAL-K, 80 mg K fixation)would indicate requirement for above-average K dressings but no need for supple-mentary ameliorative applications.
Figure 1 shows soil K content plotted against time and indicates that soil K hasvaried with crop succession; it declines following root crops and legumes. Thisindicates that soil analysis reflects K addition and removal accurately. The traces atthe different levels of K application are substantially parallel. All this demonstratesthat - careful soil sampling provided - soil testing in regular intervals gives quite areliable information about changes in K availability. Field records and extensionservices, therefore, call for regular soil testing.
Table 3. CAL K values for 20-40 cm depth (mg K20/100 g soil)
annual K2O rates in kg/haSite 0 50 100 150 300
Fuchsenbig 4.3 4.4 6.4Rottenhaus 5.5 5.4 6.2Zwettl 6.1 6.0 7.1 7.9
Table 4. Correlation between different methods of soil analysis
Method and years CAL BaCl2 H20 EUF I EUF I1 K-FIXtaken into account 78-80 80-82 79-81 78-80 78-80 82-83
CAL 66-83 0.95 0.95 0.84 0.96 0.78 -0.77CAL 78-80 0.99 0.96 0.98 0.92 - 0.67BaCI 2 80-82 0.92 0.99 0.88 -0.61H20 79-81 0.92 0.97 -0.60EUF 1 78-80 0.88 - 0.65EUF 11 78-80 - 0.55
385
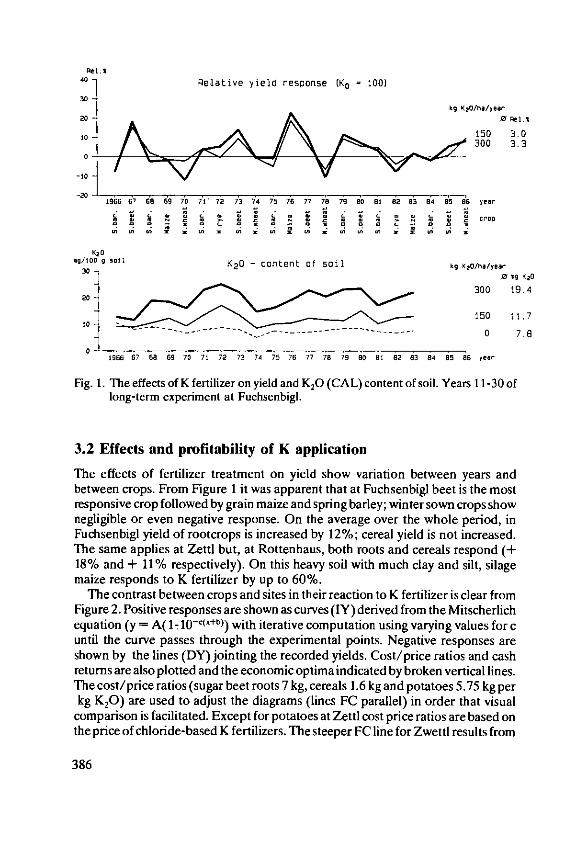
40 felative yield response ( O = ,00)
30k9 K20/na/Year
20 -0 ReI.%
10150 3.0300 3.3
10-
01966 0 68 69 70 71' 72 73 74 75 70 77 78 79 80 81 82 83 84 85 86 .ear
20
0 150 11.7
10 ...... .. ... .. ... .. .. . 0 7 .8
0 1966 67 68 69 70 71 72 73 74 75 76 77 78 79 80 81 82 83 84 85 86 year
Fig. 1. The effects of K fertilizer on yield and K2O (CAL) content of soil. Years 11-30 oflong-term experiment at Fuchsenbigl.
3.2 Effects and profitability of K application
The effects of fertilizer treatment on yield show variation between years andbetween crops. From Figure l it was apparent that at Fuchsenbigl beet is the mostresponsive crop followed by grain maize and spring barley; winter sown crops shownegligible or even negative response. On the average over the whole period, inFuchsenbigl yield of rootcrops is increased by 12%; cereal yield is not increased.The same applies at Zettl but, at Rottenhaus, both roots and cereals respond (+18% and + 11% respectively). On this heavy soil with much clay and silt, silagemaize responds to K fertilizer by up to 60%.
The contrast between crops and sites in their reaction to K fertilizer is clear fromFigure 2. Positive responses are shown as curves (IY) derived from the Mitscherlichequation (y = A( 17 lo-c(x+b)) with iterative computation using varying values for cuntil the curve passes through the experimental points. Negative responses areshown by the lines (DY) jointing the recorded yields. Cost/price ratios and cashreturns are also plotted and the economic optima indicated by broken vertical lines.The cost/price ratios (sugar beet roots 7 kg, cereals 1.6 kg and potatoes 5.75 kg perkg K20) are used to adjust the diagrams (lines FC parallel) in order that visual
comparison is facilitated. Except for potatoes at Zettl cost price ratios are based onthe price of chloride-based K fertilizers. The steeper FC line for Zwettl results from
386
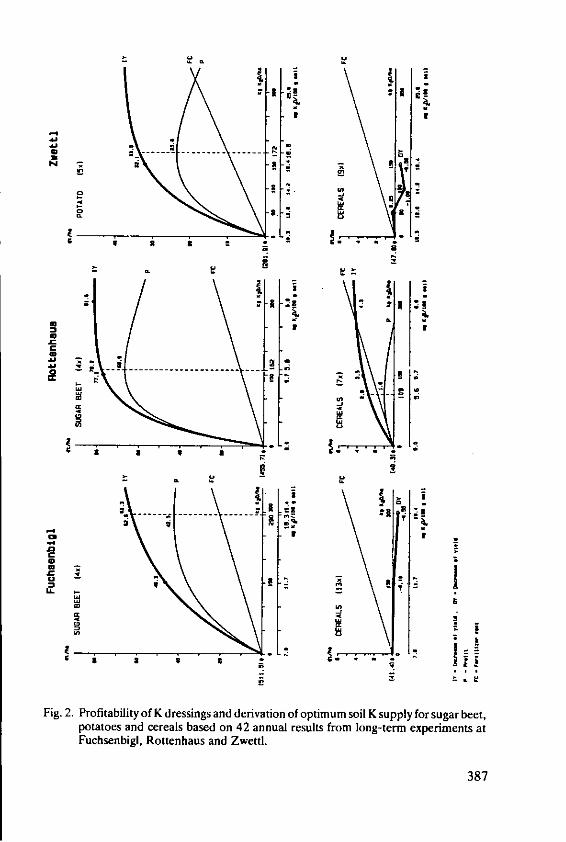
•t I
.
.41
.4 --
0 2
0 -.
Fi 02-rftblty° rsig n 2.r.ai. a!°tmmsi upl ~ ua et
Fuhsnb* Rotnau an -wettl.
ii 387
the substitution for chloride by the more expensive sulphate of potash or sulphate-of-potash-magnesia.
Both curves for gross return (IY) and net return (P) show that the return from Kfertilizer is much higher for root crops than for cereals (nil or negative except atRottenhaus).
Maximum and economically optimum yield responses and K rates correspond-ing with the latter are listed in Table 5. For beet the economically optimumincreases are 6.26 and 7.82 t/ha roots and for potatoes 3.35 t/ha tubers; these arefrom 4-14 % below maximum responses. Cereals responded only at Rottenhauswith economically optimum response of 0.28 t/ha (max. response 0.48). Afterdeduction of cost of fertilizer, the profit remaining amounts to 4.2 or 6.7 t/ha beet,2.4 t/ha potatoes and 0.10 t/ha grain (Rottenhaus) per ha perannum. K fertilizer isat least ten times more profitable on beet than on cereals.
Table 5. Economic results of K manuring (42 annual yields on long-term experiments)
Crop Site Yield increase (dt/ha) Optimum Cost of fert. Marginmaximum optimum rate kg/ha dt/ha/crop dt/ha/crop
K20
Sugar beet Fuchsenb. 73.1 62.6 290 20.3 42.3Sugar beet Rottenh. 81.8 78.2 162 11.3 66.9Potatoes Zwettl 38.3 33.5 172 9.9 23.6Cereals Fuchsenb. - - - - -
Cereals Rottenh. 4.8 2.8 109 1.8 1.0Cereals Zwettl - - -
3.3 Optimum soil K levels
The soil K(CAL) values and optimum K dressings for attainment of optimal yieldare shown in Figure 2 at the base of the vertical line and are supplemented withresults of the other soil testing methods in Table 6. Rooterops, according to site,require 160-290 kg/ha K20 and cereals 0-110 for highest economic return. Theserates lead to the optimum only if K residues in the soil are taken into account. As the
data show, rootcrops at Fuchsenbigl and Zwettl must have access to 18-19 mgK20/ 100 g soil (in addition to the indicated fertilizer rates) if optimum yields are tobe obtained. On the other hand, 8-10 mg suffices for cereals. Spring cereals, whoseK requirement is generally higher (Figure 3), require at Zwettl 12 mg plus 30 kg/haK 20 fertilizer, at Rottenhaus 6 mg/100 g suffices together with the optimal ferti-
lizer rate given in Table 6 for both crop groups besides of the optimal dressings.
388

FUCHSENBIGL ROTTENHAUS C%" (0) ZNETTL12 12 - " --- (ix 12
-(2A(
4 4 4
S0 x)
- (x) 4 \4\
-BK-a -a- -8 - - " -''
- 43.;;(2d1
0 150 300 0 150 300 0 50 100 150kg K2 0/ha/year
Fig. 3. Variation in effects of K on cereal yield with site and crop.
Table 6. K2O rates and optimum soil K values for economically optimum production
Opt. Opt. soil K (mg/100 g KO )Crop Site K20 CAL EUF I EUF II EUFI+II H2O BaCG2
kg/ha
Sugar beet Fuchsenb. 290 18 16 8 24 9 23Sugar beet Rottenh. 162 6 6 3 9 2 10Potatoes Zwettl 172 19 14 5 19 5 23Cereals Fuchsenb. 0 8 6 4 10 3 8Cereals Rottenh. 109 6 6 3 9 2 10Cereals Zwettl 0 10 8 3 11 3 17
3.4 Optimum K supply and crop qualityLong term experiments offer a good basis for assessment of effects of fertilizers onquality. Table 7 shows that K fertilizer increases sugar yield more than it increasesroot yield. Improvement in sugar formation is always accompanied by increase inK and Na uptake to the detriment of extractability. Even so, the refined sugar yieldis still increased slightly more than root yield (+ 15% against + 14%).
On the other hand, in potatoes, starch content slightly decreased with K supply(Table 8). While starch yield increases up to 150 kg/ha K20, the slight increase forthe last increment of potash indicates that it is safer to underestimate than to over-estimate the economically optimum K rate.
389
So far as concerns winter wheat at Fuchsenbigl, 8 mg soil K is enough for opti-mum yield. If quality wheat is grown, dough elasticity increases significantly if Ndressings above 100 kg/ha are accompanied by potash. 75 kg/ha K20 is the appro-priate rate.
Table 7. Effect of long-term K manuring on root and sugar yield (7 year summary).Fuchsenbigl and Rottenhaus
YieldK20 Roots Sugar Refined sugarkg/ha dt/ha Rel.% dt/ha Rel.% dt/ha Rei.%
0 485 100 88.4 100 80.3 100150 544 112 101.1 114 91.0 113300 551 114 104.0 118 92.7 115
Table 8. Effect of long-term K dressings on yield and quality of potatoes (4 year sum-mary). Zwettl
kg/ha Tuber yield Starch content (%) Starch yieldK20 dt/ha Rel. % % Rel. % dt/ha Rel. %
0 298.4 100 16.18 100 48.2 10050 310.0 104 16.13 99.7 49.8 103
100 326.3 109 15.94 98.5 51.7 107150 330.9 111 15.91 98.3 52.4 109
3.5 Change in K content of topsoil in relation to K balance
Changes in CAL K contents of topsoil are listed in Table 9 together with K applic-ations and removals in crops. K20 removals from the nil K plots at Fuchsenbigl(CAL K 8 mg K20) and Rottenhaus (CAL K 5 mg) were respectively 127 and 136kg/ha/yr K20. Of these amounts 97% originated from non-exchangeable sourcesor from the subsoil at Fuchsenbigl and 99% at Rottenhaus. The equilibriumbetween CAL content and other K fractions on the control plots reflects the abilityof the natural soil to supply K.
At the other extreme, 300 kg/ha/yr K20, most of the excess of K applied overuptake has gone into increasing the non-exchangeable and subsoil K. Only 12% ofthe K balance is accounted for in CAL K at Fuchsenbigl and only 2% at Rotten-haus.
390
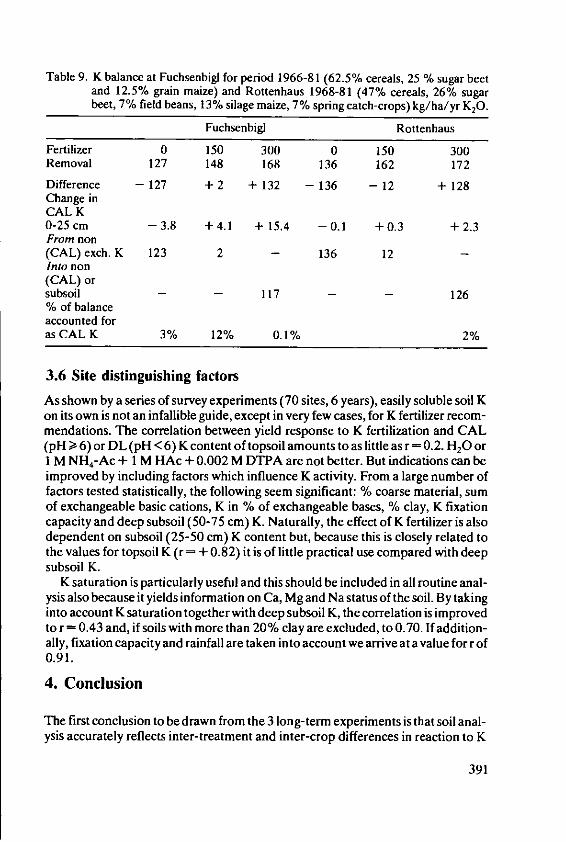
Table 9. K balance at Fuchsenbigl for period 1966-81 (62.5% cereals, 25 % sugar beetand 12.5% grain maize) and Rottenhaus 1968-81 (47% cereals, 26% sugarbeet, 7% field beans, 13% silage maize, 7% spring catch-crops) kg/ha/yr K20.
Fuchsenbigl Rottenhaus
Fertilizer 0 150 300 0 150 300Removal 127 148 168 136 162 172
Difference - 127 + 2 + 132 - 136 - 12 + 128Change inCAL K0-25 cm -3.8 +4.1 + 15.4 -0.1 +0.3 +2.3From non(CAL) exch. K 123 2 - 136 12 -Into non(CAL) orsubsoil - - 117 - - 126% of balanceaccounted foras CAL K 3% 12% 0.1% 2%
3.6 Site distinguishing factors
As shown by a series of survey experiments (70 sites, 6 years), easily soluble soil Kon its own is not an infallible guide, except in very few cases, for K fertilizer recom-mendations. The correlation between yield response to K fertilization and CAL(pH > 6) or DL (pH < 6) K content of topsoil amounts to as little as r = 0.2. H20 or1 M NH 4-Ac + 1 M HAc + 0.002 M DTPA are not better. But indications can beimproved by including factors which influence K activity. From a large number offactors tested statistically, the following seem significant: % coarse material, sumof exchangeable basic cations, K in % of exchangeable bases, % clay, K fixationcapacity and deep subsoil (50-75 cm) K. Naturally, the effect of K fertilizer is alsodependent on subsoil (25-50 cm) K content but, because this is closely related tothe values for topsoil K (r = + 0.82) it is of little practical use compared with deepsubsoil K.
K saturation is particularly useful and this should be included in all routine anal-ysis also because it yields information on Ca, Mg and Na status of the soil. By takinginto account K saturation together with deep subsoil K, the correlation is improvedto r = 0.43 and, if soils with more than 20% clay are excluded, to 0.70. If addition-ally, fixation capacity and rainfall are taken into account we arrive at a value for r of0.91.
4. Conclusion
The first conclusion to be drawn from the 3 long-term experiments is that soil anal-ysis accurately reflects inter-treatment and inter-crop differences in reaction to K
391
fertilizer on one site. However, the effects of differential K application over 3decades has resulted in great differences between sites as regards change in easilysoluble K content of topsoil which indicates that this criterion on its own is oflimited use. Without knowledge of other soil factors there is no guidance as to whatdressings may be needed to build up soil fertility or at best only with considerablereserve (e.g. restriction of additional dressings to the economic optimum).According to the results of the 3 long-term trials the EUF method gives no betterguidance (high correlation between methods, no evident difference in EUF I -EUF II ratio between sites). Interpretation is improved by taking into account siteproperties and further soil data - texture, K in deep subsoil (below 40 cm) and Kfixation. Such information is obtained relatively cheaply since the analyses do notor not frequently have to be repeated. The indication from the 70 survey experi-ments is that furthermore the proportion of K in exchangeable bases is useful.If, for the sake of simplicity, soil investigation is limited to determination of K con-tent of the topsoil, this is an adequate guide to fertilizer rates, provided no amountsabove the optimal ones are applied and differences between crops are taken intoaccount. Within the range of soil K indicated for cereals (6-12 mg/ 100 g K20) opt-imum K dressings range from 0-110 kg/ha K20 (higher values and rates for springbarley, lower for winter-sown crops). Quality wheats should receive 75 kg/ha K20.Above 12 mg the results of the long-term experiments indicate that K dressingscould be reduced. The survey experiments gave somewhat different indications:even within the range 15-28 mg/100 g CAL K20, 75 kg/ha K20 gave economicreturns from spring barley.
Economic evaluation of the results has shown that for rootcrops, 6-19 mg CALK20/100 g and 162-290 kg/ha/yr should suffice. Somewhat lower dressings aresuggested for potatoes because of the reduction in starch content, though if ratesare cut too far, there is a danger of blue spot or after-cooking-blackening especiallyon high clay soils (Marschner and Krauss f1980]). The positive effects of K ferti-lizer on % sugar in beet and yield of refined sugar are to be noted. Dressings tosugar beet could be in the lower range if there were no irrigation in the dry area(Fuchsenbigl) (K5chl [1985]).
The marked difference in K requirement between rootcrops and cereals is con-firmed by Heimes [1971], and Kuhlmann and Wehrmann [1984] while Mengel[1974Jciting results from Harrach and Ndmeth gives requirements of sugar beet at1.3 me K/I soil solution and 0.7 for winter wheat. Bucher et al/I 981] place winterwheat in the same category as the above, less K responsive than spring barley or -as in a 26 year experiment (Mraczek f1979]) - as unresponsive as winter rye.
These differences are not due only to the lesser K removal by cereals but to themore intensive rooting of monocotyledons (Fink [1969]) which are able to extractlarge quantities of non-exchangeable K Claasen and Jungk [1982]; Kuchenbuchand Jungk [1984]; Kuchenbuch and Claasen 11985]). Utilisation of deep subsoil Kis particularly important in dry regions. Transfer of K between exchangeable andnon-exchangeable forms is responsible for the constant soil K values and for thesubstantially annual uptakes (127-136 kg/ha/yr K20) for the control plots.
392
5. References
1. Bucher, R., Diez, Th. and Bihler, E.: Ergebnisse zweier langjdhriger Kalidfingungs-versuche im nordbayerischen L6ssgebiet. Landw. Forsch., Sonderheft 38, 162-177(1981)
2. Claassen, N. & Jungk, A.: Kaliumdynamik im wurzelnahen Boden in Beziehung zurKaliumaufnahme von Maispflanzen. Z. fiir Pflanzenernihr. u. Bodenk. 145, 513-525(1982)
3. Fink, A.: Pflanzenemi.hrung in Stichworten. Verlag Ferdinand Hirt (1969)4. Grimme, H., Strebel, 0., Renger, M. & Fleige, H.: Die potentielle K-Anlieferung an
die Pflanzenwurzeln durch Diffusion. Mittl. Dt. Bodenk. Ges. 32, (1981)5. Heimes, K.H.: Phosphat- und Kalidiingungsversuche. Diss. Bonn, 19716. K6chl, A.: Erste Ergebnisse einer Feldversuchsreihe zur Eichung der Bodenunter-
suchungsmethodik. Die Bodenkultur, 30, 333-351 (1979)7. Kochi, A.: Untersuchungen fiber den optimierten Phosphat- und Kalieinsatz zur
Zuckerriibe. Proc. 4 8th Congr. Int. Institute Sugar Beet Research, Brussels, 43-57(1985)
8. Kuchenbuch, R. & Jungk, A.: Wirkung der Kaliumdflngung auf die Kaliumverffag-barkeit in der RhizosphAre von Raps. Z. f. Pflanzenernfhrung und Bodenk., 147,435-448 (1984)
9. Kuchenbuch, R. & Claassen, N.: Kalium-Verf6gbarkeit und Kalium-Dynamik in derRhizosphfire. Kali-Briefe, 17, 407-418 (1985)
10. Kuhlmann, H.: Beurteilung der Kaliumversorgung von L6ssb6den durch Diingungs-versuche, Boden- und Pflanzenanalysen. Dissertation Hannover, 1983
11. Kuhlmann, H. & Wehrmann. .: Prifung verschicdener Methoden der Bodenanalyseauf ihre Eignung zur Ermittlung des K-Diingerbedarfs auf Ldssboden. Z. Pflanze-nernAhr. Bodenk. 147, 334-348 (1984)
12. Marschner, H. & Krauss, A.: Beziehung zwischen Kaliumgchalt und Qualitiit vonKartoffeln. Der Kartoffelbau 31. Jg. (2) (1980)
13. Mengel, K.: Die Faktoren der Kaliverffigbarkeit und deren Bedeutung ftir dieErtragsbildung. Landw. Forsch., Sonderh. 31, 45-58 (1974)
14. Mraczek, M.: Einfluss von langj~ihrigen Dfingungsmassnahmen und derWitterung imRahmen cines sechsschifigigen Fruchtfolge-Diingungsversuches. Die Bodenkultur,30, 234-255 (1979)
15. N~meth, K.: The availability of nutrients in the soil as determined by electro-ultrafil-tration (EUF). Advances in Agronomy, 31, 155-188 (1979)
16. Schiller, H.: Die CAL-Methode, cine neue Methode zur Bestimmung des pflanzen-verfigbaren Phosphates in B6den. Z. Pflanzenernflhr. u. Bodenkunde, 123, 48-63,(1969)
393
Assessment of Optimum ApplicationRates of Fertilizer K on the Basis ofResponse Curves
J.J. Neeteson, W.P Wadman and PA.. Ehlert, Institute for Soil Fertility, Haren/The Netherlands*
Summary
K-response curves of 39 K-fertilizer trials with potato are described by a quadratic and amodified exponential equation. In all experiments the modified exponential equation wasbetter when the residual sum of squares (RSS) was taken as a measure of the degree of fit.The economically optimum application rates of fertilizer K, which were calculated on thebasis of the modified exponential equation, covered the entire range of fertilizer-K 20levels tested, viz., 0-400 kg ha- '. The confidence intervals (p > 95%) for the optimumK-application rates were frequently very wide. In 18 trials the confidence interval coveredthe entire range of tested fertilizer levels. Although the calculations were done to demon-strate the method and not to make fertilizer recommendations, the implication is thatcare should be exercised in using optimum application rates of fertilizer K for makingfertilizer recommendations.
1. Introduction
Fertilizer recommendations are usually based on results of field trials in which cropresponse to various rates of fertilizer application is determined. The responsecurve then provides the relationship between amount of fertilizer and crop yieldfor each trial. From this curve the economically optimum application rate of ferti-lizer, i.e. the minimum amount of fertilizer needed for maximum financial yield,can be derived. Then, fertilizer recommendations can be made by correlating theoptimum application rates of fertilizer in the various trials with one or more fieldcharacteristics, for instance the amount of plant-available nutrient already presentin the soil.
In the Netherlands numerous fertilizer trials have been conducted to establishthe relationship between the amount of a plant-available nutrient in the soil and theoptimum applicatin rate of fertilizer. Although it was seldom stated explicitly,interpretations of the experimental results were based on hand-drawn curves
* Ir. J.J. Neeteson, Ir. W.P. Wadman and Ir. P.A.L Ehlert, Institute for Soil Fertility, P.O.Box 30003, 9750 RA Haren/The Netherlands
395
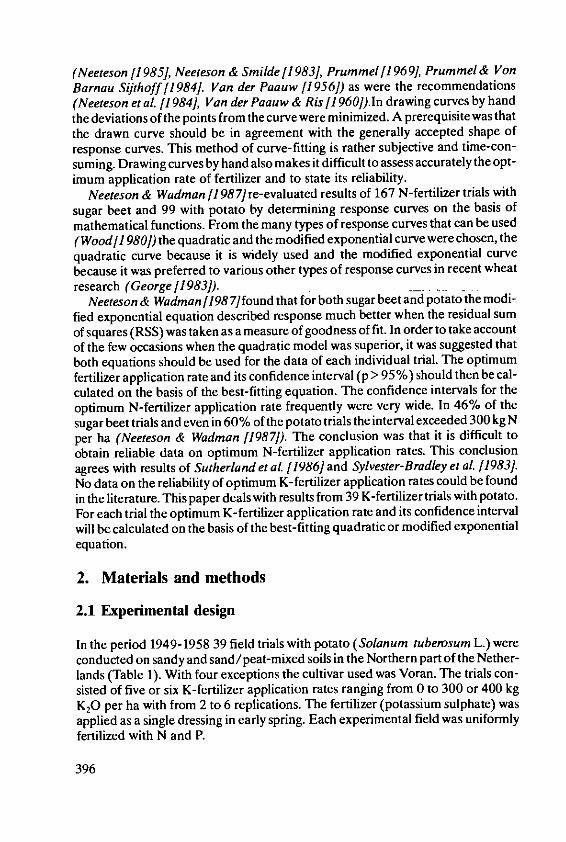
(Neeteson [1985], Neeteson & Smilde [1983], Prummel [1969], Prummel & VonBarnau Sijthoff [1984]. Van der Paauw [1956]) as were the recommendations(Neeteson et al. [1984], Van der Paauw & Ris [1 960J).In drawing curves by handthe deviations of the points from the curve were minimized. A prerequisite was thatthe drawn curve should be in agreement with the generally accepted shape ofresponse curves. This method of curve-fitting is rather subjective and time-con-suming. Drawing curves by hand also makes it difficult to assess accurately the opt-imum application rate of fertilizer and to state its reliability.
Neeteson & Wadman [1987] re-evaluated results of 167 N-fertilizer trials withsugar beet and 99 with potato by determining response curves on the basis ofmathematical functions. From the many types of response curves that can be used(Wood[ 980]) the quadratic and the modified exponential curve were chosen, thequadratic curve because it is widely used and the modified exponential curvebecause it was preferred to various other types of response curves in recent wheatresearch (George [1983]).
Neeteson & Wadman11987]found that for both sugar beet and potato the modi-fied exponential equation described response much better when the residual sum
of squares (RSS) was taken as a measure of goodness of fit. In order to take accountof the few occasions when the quadratic model was superior, it was suggested thatboth equations should be used for the data of each individual trial. The optimumfertilizer application rate and its confidence interval (p > 95 %) should then be cal-culated on the basis of the best-fitting equation. The confidence intervals for theoptimum N-fertilizer application rate frequently were very wide. In 46% of thesugar beet trials and even in 60% of the potato trials the interval exceeded 300 kg Nper ha (Neeteson & Wadman [1987]). The conclusion was that it is difficult toobtain reliable data on optimum N-fertilizer application rates. This conclusionagrees with results of Sutherland et al [1986] and Sylvester-Bradley et al [19831.No data on the reliability of optimum K-fertilizer application rates could be foundin the literature. This paper deals with results from 39 K-fertilizer trials with potato.For each trial the optimum K-fertilizer application rate and its confidence intervalwill be calculated on the basis of the best-fitting quadratic or modified exponentialequation.
2. Materials and methods
2.1 Experimental design
In the period 1949-1958 39 field trials with potato (Solanum tuberosum L.) wereconducted on sandy and sand/peat-mixed soils in the Northern part of the Nether-lands (Table 1). With four exceptions the cultivar used was Voran. The trials con-sisted of five or six K-fertilizer application rates ranging from 0 to 300 or 400 kgK20 per ha with from 2 to 6 replications. The fertilizer (potassium sulphate) wasapplied as a single dressing in early spring. Each experimental field was uniformlyfertilized with N and P.
396
Table 1. Distribution of the trials over the years.
Year Trial number
1949 11951 21954 3- 51955 6-321956 33 - 381958 39
2.2 Determination of optimum application rate of fertilizer K
Response curves are described by both quadratic and exponential equations.The quadratic response curve has the form
Y=b.+ b, K+b 2 K2 (1)
whereY is yield in t ha-', K is applied fertilizer in kg K20 per ha, and b., b, and b2 are coeffi-
dents which are calculated by linear regression analysis.
The economically optimum application of fertilizer K, K0 P, is calculated by
Kop = (P-b,) / 2 b2 (2)
whereP equals the ratio of the cost of 1 kg fertilizer K2O to the price of I ton crop yield.
The modified exponential response curve has the form
Y = b. + b, K + b2 eaK (3)
whereY, K, b0, b, and b2 are the same parameters as those in equation (1) and a is a constant
which was set equal to one of nine predetermined values to avoid non-linear regressionanalysis. (Neeteson & Wadman [1 9871).
For each value of a the response curve was calculated. The response curve whichyielded the lowest residual sum of squares (RSS) was considered to be the curve ofbest fit. The exponential curve was termed cmodified' because of the addition of alinear term (b, k) to allow for decreasing yields at fertilizer levels in excess of thelevel for maximum yield (Wood/I 980]). From equation (3) it can be derived thatthe economically optimum application of fertilizer K, K0 , is
K =p = In [(P-b,) / a b2] / a (4)
397
whereP represents the same as in equation (2).
Details about the response curves and the calculation of the confidence limits
(p > 9 5 %) are given in another paper (Neeteson & Wadman [1987]).
3. Results
3.1 Optimum application rate of fertilizer K
In all trials the residual sum of squares (RSS) was lower when the modified expon-ential equation was used. Next, the optimum K-fertilizer application rate was cal-culated for each trial on the basis of the modified exponential equation. In doing sothe monetary ratio of fertilizer cost to crop value, P in equation (4), was fixed at0.006 (a monetary ratio of 0.006 means for instance that the cost of 1 kg fertilizerK2 0 is DFL (Dutch guilders) 0.90 and the price of 1 tonne (industrial) tubers isDFL 150.00). These values are currently valid in the Netherlands (PAGV [19861).Figure 1 shows the frequency distribution of the optima as determined with themodified exponential curve. The optima of 17 trials fell outside the range of testedlevels of fertilizer K. These trials were omitted because the optima were derivedafter extrapolation, which may considerably decrease reliability. The remaining 22trials showed optima which covered the entire range of fertilizer-K levels tested (Fi-gure 1).
trials,
20
0- 51- 101- 151- 201- 251- 301- 351-
50 100 150 200 250 300 350 400
optimum application rote offertilizer K20, kg ha- 1
Fig. I Optimum application rate of fertilizer K for potato. Only those optima are shownwhich lay within the range of applied fertilizer K20: 0-400 kg ha- .Number of trials= 22.
398

3.2 Confidence interval for optimum application rate of fertilizer K
For each calculated optimum application rate of fertilizer K, including the optimawhich fell outside the range of tested fertilizer levels, the confidence interval (p >95%) was determined to distinguish between the degrees of reliability of theoptima obtained. In Figure 2 only that part of the confidence intervals is indicatedwhich lay within the range of applied fertilizer K, viz., 0-400 kg K20 per ha. Forexample, for trial 11, 264-400 kg K20 per ha is indicated because the calculatedconfidence limits for the optimum application rate were 264 (lower limit) and 626kg K20 per ha (upper limit). Figure 2 shows that the confidence intervals of theoptima were generally very wide. In 18 trials the confidence interval covered thewhole range of tested fertilizer levels.
confidence interval ofoptimum application roteof fertilizer K20, kg ha-'400
300
200
100
01 0 20 30 39
trial numberFig. 2 Confidence interval (black bars) for the optimum application rate of fertilizer K for
potato. See Table I for trial numbers. Only those parts of the confidence intervalsare shown which lay within the range of applied fertilizer K20: 0-400 kg ha-'. Num-ber of trials = 39.
399
4. Discussion
4.1 Optimum application rate of fertilizer K
In. agreement with previous work to describe N-response (Neeteson & Wadman
[1987]) it was found that the modified exponential equation described K-response
better than the quadratic equation. To describe response of wheat to N-fertilizer,
however, Dilz et al [1985] found that the quadratic equation was superior to an
exponential equation, but they used an exponential equation without including a
linear term that would allow for decreasing yields at fertilizer levels in excess of the
level for maximum yield.In this paper the optimum application rate of fertilizer K was calculated on the
basis of the modified exponential equation, because for all experimental data this
equation described K-response better than the quadratic equation. The calculated
optimum application rates of fertilizer K (Figure 1) could lead to the wrong conclu-
sionconcerning the amount of fertilizer K the potato crop generally requires, as the
results of 17 trials were omitted because the optima fell outside the range of tested
levels of fertilizer K. In seven of these trials the optimum was much higher than 400
kg K20 per ha. In three of them, however, the optimum was likely to be less than
zero, whereas in the remaining seven trials the optimum could not be calculated
because the curves were concave. The large number of trials which yielded an opti-
mum outside the range of tested levels of fertilizer K is probably due to the fact that
the range of tested K-fertilizer levels was too narrow and/or that too few replic-
ations or fertilizer levels were included.
4.2 Confidence interval for optimum application rate of fertilizer K
The confidence interval for the calculated optimum application rate of fertilizer K
was generally very wide'(Figure 2). The magnitude of the confidence interval
depends on the magnitude of the RSS and on the shape of the curve, i. e. on the sig-
nificance of (P-b1) and b2 in equations (2) and (4). Confidence intervals for opti-
mum fertilizer application rates are wide when the RSS is as is the case with hetero-
geneous fields. Confidence intervals are also wide when the curves are flat and do
not decline significantly beyond their maximum, which often occurs with pota-
ssium sulphate response curves. The reliability of an optimum also depends on the
place of the optimum within the range of fertilizer levels tested. When the optimum
lies in the middle of the range, it is likely to be more reliable.
A point that deserves attention is the low yield level which was obtained in the
K-fertilizer trials: on average maximum yield was about 35 t tubers per ha. This is
probably due to a lower standard of crop protection and to the low productivity of
the cultivars used: the trials were conducted in the late 1940s and in the 1950s.
400
Moreover, it is likely that too little fertilizer N was applied in the K-fertilizer trials:on average 128 kg N per ha. This is about half the amount which is currentlyapplied. Perhaps too little fertilizer P was applied as well: on average 110 kg P20 5per ha. The old data were used because results of recent trials on sandy soils withfive or more application rates of potassium sulfate were not available.
It can be expected that response curves of recent K-fertilizer trials are less flatthan those of old trials due to a higher standard of crop protection and to sufficientapplication of other nutrients. It is therefore quite possible that in recent trials theconfidence intervals of the optimum application rates of fertilizer K are narrowerthan those shown here (Figure 2). However, we expect that they still are ratherwide. In recent trials the reliability of optimum N-fertilizer application rates waspoor (Neeteson & Wadman[1987). There is no reason to expect that the reliabilityof optimum application rates of K fertilizer will be higher than that of N fertilizer.
Another point that deserves attention is that most trials were conducted in oneyear (1955; see Table 1), so that practical implications of the results presented can-not be derived.
The use of old data, which were obtained for the most part in one year, does notpermit making fertilizer recommendations. However, in this paper it was intendedonly to show the method of calculation, which can be done with old data.
5. Conclusions
1. K-fertilizer response curves of potato can be described better by a modifiedexponential equation than by a quadratic equation.
2. The confidence interval for the optimum application rate of K-fertilizer forpotato of individual one-year trials can be very wide. The implication is that careshould be exercised in using optimum application rates of fertilizer K for makingfertilizer recommendations.
401

6. References
1. Dilz, K., Van Brakel, G.D. and Richards, LR.: Effects of uneven fertiliser spreadingon crop yield and quality. Proc. No. 240, The Fertiliser Society of London, London(1985)
2. George, B.J.: Design and interpretation of nitrogen response experiments. In: Thenitrogen requirement of cereals. RB 385, Min. Agric. Food Fish., London, pp. 133-149 (1983)
3. Neeteson, J.J: Effectiveness of the assessment of nitrogen fertilizer requirement forpotatoes on the basis of soil mineral nitrogen. In: Neeteson, J.J. and Dilz, K. (eds.)Assessment of nitrogen fertilizer requirement. Inst. Soil Fert., Haren (Gn), pp. 15-24,1985
4. Neeteson, J.J. and Smilde, K. W.: Correlative methods of estimating the optimumnitrogen fertilizer rate for sugar beet asbased on soil mineral nitrogen at the end of thewinter period. Proc. Symp. Nitrogen and Sugar Beet, IIRB, Brussels, pp. 409-421,1983
5. Neeteson, J.J. and Wadman, W.P.: Assessment of economically optimum applicationrates of fertilizer N on the basis of response curves. Fert. Res. 12, 37-52 (1987)
6. Neeteson, J.J., Wifnen, G. and Zandt, P.A.: Nieuwe stikstofbemestingsadviezen vooraardappelen. Bedrijfsontwikkeling 15, 331-333 (1984)
7. PA G V: Kwantitatieve informatie. Publ. No. 33. PAGV, Lelystad (1986)8. Prummel, J.: Kaligebrek en late kalibemesting bij aardappelen op zandgrond en dal-
grond in samenhang met chemisch gewasonderzoek. Versl. Landbk. Onderz. 733(1969)
9. Prummel, . and Von Barnau Sijthoff, P.A.: Optimum phosphate and potassiumlevels in potato tops. Fed. Res. 5, 203-211 (1984)
10. Sutherland, R.A., Wright, C C., Verstraeten, L.M.J. and Greenwood, D.J.: The defi-ciency of the ,economic optimum' application for evaluating models which predictcrop yield response to nitrogen fertilizer. Fert. Res. 10, 251-262 (1986)
11. Sylvester-Bradley, R., Dampney, P.M.R. and Murray, A. W.A.: The response ofwheat to nitrogen. In: The nitrogen requirement of cereals. RB 385, Min. Agric. FoodFish., London, pp. 151-174 (1983)
12. Van der Paauw, F.: Calibration of soil test methods for the determination of phos-phate and potash status. Plant Soil VIIi, 105-125 (1956)
13. Van der Paauw, F. and Ris, .: Een niuw kaligetal voor bouwland op zand- en dal-grond. Landbouwvoorl. 17, 719-725 (1960)
14. Wood, J.: The mathematical expression of crop response to inputs. In: Physiologicalaspects of crop productivity. Proc. 15
th Col. Int. Potash Inst., Bern, pp. 263-271
(1980)
402
Coordinator's report on the4th working session
H. Beringer, Bfintehof Agricultural Research Station, Hannover/Fed. Rep. ofGermany
In spite of comprehensive and detailed scientific knowledge about the occur-rence of potassium in soils and its availability (transport) to the root, the farmerand advisor are facing tremendous difficulties, when they have to synthesizethe mosaic stones of knowledge into reliable K fertilizer recommendationsaccounting for both, the economical and ecological aspects. The dimensionsof the complex relationships in soils and plants and of their interactions arenearly undefinable. Large- and small-scale pedogenesis, soil texture and soilstructure, rainfall (irrigation) pattern, etc., all these are parameters contributingto nutrient availability in the soil and thus affecting fertilizer recommendationfor cropping systems of different species and yield potentials.
It is therefore important to develop simple field methods which the advisorand farmer can use for improving fertilizer application and efficiency. In hisreview paper on the <Influence of soil structure on rooting, nutrient uptakeand yield formation Harrach has rigthly stressed the point that in modernagriculture with its high-yielding varieties and improved husbandry techniquespriority in research must be given to soil structure and soil moisture availabilityrather than to further amendments of chemical soil analysis. Root elongationis inhibited by mechanical impedance, reduced gas exchange and decreasingsoil moisture availability. Nevertheless, these three parameters can occur in suchcombinations as to allow a more or less good root elongation. Deep rootingis a prerequisite for high yields. Only this guarantees a satisfactory and uniformwater supply of the crop during the growing season or, in other words, contrib-utes to a sufficiently great available water capacity.
The determination of bulk density is a convenient indicator of soil structure.But it has its limitations in so far as it does not really reflect packing densityand soil compaction which determine the mechanical impedance to rootgrowth. Penetrometers must therefore be used in addition, although readingsby penetrometers are also dependent on other soil factors, of which the soilwater content seems to be the most important one. The simplest way of diagnos-ing the soil structure appears to be the use of a flat, square-ended spade toobtain undisturbed samples of the uppermost soil layer (spade diagnosis afterGorbing).
It has always been the obligation of science to deduce the general principlefrom observed effects of single factors or their interactions. These endeavours
403

can be achieved in two ways: by an empirical agronomic approach (Ktch,Neeteson) and/or by simulation models characterizing soil parameters whichare important for root development and nutrient availability (Beckett, BarYosef).
From a series of long-term experiments in Austria Kochl, for instance, con-cluded that lower levels of exchangeable K would have sufficed for optimumplant productivity in an alluvial soil than those required in a sandy soil, thereason being the higher K buffering capacity in soils with higher clay content.But in spite of the higher K reserves in clay soils, actual K availability mayquickly become critical, so that both root crops and cereals responded to Kfertilizer. On the other hand, sandy loams require higher levels of exchangeableK/100 g soil and this quantity must be supplemented by K fertilizer to rootcrops, but not to cereals, although for good baking quality of wheat K fertilizerwas found to be beneficial.
There is no doubt that the definition of site-specific fertilizer recommenda-tions require long-term experiments. Sensu strictu, however, such recommenda-tions are only valid for the particular site where the long-term experiment hadbeen conducted. This was demonstrated by Neeteson et al. who statisticallyevaluated about 40 annual K fertilizer trials with potato in the period 1949-58.In these trials the confidence intervals for the prediction of optimum K applica-tion rates were frequently very wide, ranging between 0-400 kg K20/ha. Apartfrom the fact that correlations between fertilizer rates and yield response mustbecome less close when the yield plateau is reached, one of the most importantreasons for poor K fertilizer/yield relationships seems to be the enormous large-and small-range spatial variability of soils and plant-available K (Beckett. Evenif the soils are grouped together according to families, groups and soil series,the coefficients of variation for exchangeable K can range between 30-200%.Such wide ranges cast some doubts on concepts attempting to improve K fer-tilizer efficiency by chemical analysis of extrapolations from «benchmarksoils>. As long as soil porosity and soil moisture regimes are not taken intoaccount, reliability of K fertilizer recommendations will be inadequate. Thiswas demonstrated by Bar-Yosefwho simulated the transport of K in a clay anda sand in dependence on hydraulic conductivity as well as on quantity and dura-tion of irrigation. Though not generally applicable, such simulation modelsbased on monitoring nutrient concentrations in the soil solution will definitelylead to a better adjustment of nutrients in the irrigation water with the nutrientdemand of the crop.
For productivity evaluation of a field the advisor has to start from two basicrequirements. Firstly, he needs information from the farmer about yield poten-tial, climatic conditions and soil tillage practices at the farm. Secondly, he needsa manual of field techniques for the evaluation of a soil profile with regardto texture, soil moisture regime, redox potential, pH, compaction, root penetra-tion, etc. Such guidelines were given by Lichtfuss and Grimme who also recom-mended the use of geological, soil and climatic maps in order to improve the
404

interpretation of soil test data. This approach should be followed more closelythan it has been done up to now.
In conclusion, progress in the improvement of fertilization recommendationscan be expected from more detailed inyestigations but also in particular fromconsidering the soil as an integral part of a landscape.
405

Chairman of the Closing SessionProf. Dr. 0. Steineck, Director, Institute of CropHusbandry and Plant Breeding, AgriculturalUniversity, Vienna/Austria; member of theScientific Board of the International PotashInstitute
Closing Session
407
Methodology of Potash Fertilizer
Recommendations
P. Gruber, Austrian Fertilizer Advisory Bureau, Vienna/Austria*
Summary
Fertilizer advice is only of use to the farmer when it gives results. Advice is based on experi-ments and only long-term work can give reliable information. Short-term investigationcan give misleading results. Survey results should be checked by experiment.
Nutrient removals, soil K content and leaf analysis are all valuable. The use of net Kremoval (K in marketed produce) is less subject to error in establishing the K balance thangross K uptake. Especially when soil K content is high chemical soil analysis must be sup-ported by analysis of other factors and modified in the light of site factors and crop charac-teristics. The latter are more important than the development of new extraction tech-niques.
Fertilizer advice aims to achieve maximum economic return which is obtained whenmarginal cost of K application and marginal yield increase are in balance. This involvesconsideration of the whole response curve and of the ratio between produce price and fer-tilizer cost. The return from K fertilizer is to be found not only in crop yield but also in thebuild-up of soil fertility.
Potash fertilizer can be applied: to meet the needs of individual crops or for the rotationas a whole. On high K soils it may be preferable to apply K only to the K demanding crops.For deep-rooted long-term crops it is advisable to use a heavy dressing before establish-ment.
Introduction
Like other fertilizers, potash usage must satisfy several requirements simultane-ously. It should increase crop yield, improve crop quality, give the farmer a betterincome, maintain, or better improve, soil fertility and should not pollute the envi-ronment. Fertilizer advice to the farmer aims to satisfy these conditions. This dis-cussion is based on work by the Austrian Fertilizer Advisory Service (OeDB) 118].
A practical and reliable method of obtaining information on crop potashrequirements is the field experiment. This gives reliable information for a particu-lar site but results can be extrapolated to other conditions only to a very limitedextent. Since it is impossible to carry out an experiment on every field, there mustbe recourse to other methods - K uptake by the crop, soil and plant analysis - ifsound advice is to be given over a wide field.
* Dr. R Gruber. Osterreichische Dhingerberatungsstelle, Auenbruggergasse 2, A-1030
Vienna/Austria
409
Potassium uptake
Uptake is the product of two variables: yield and K concentration in the plant. Bothare variable, hence data for K removal show great variation. K concentration in theplant is by no means constant; it may decrease as yield increases while, if the K sup-ply is above the optimum, there may be luxury consumption. Further, supply ofother nutrients, especially nitrogen, greatly affects K uptake. The plant can onlymake efficient use of nitrogen when K supply is sufficient [8, 26, 27]; the potassiumnitrogen interaction is most important.
Approximate values for K uptake can be obtained from tables which give Kuptakes for the various crops in relation to yield. Tables giving both K removal inharvested produce (grain, tubers, roots) and in crop residues (straw, leaves) areespecially useful /21, 22]. For the purpose of striking a potash balance we may useeither ,gross uptake' (K in whole crop) or cnet removal" (K in marketed pro-duce). Naturally, much information on removals has been accumulated 115, 19,24].
Because the K content of the straw at the fully ripe stage is only a half of that atthe time of maximum crop development [3], K removals at harvest do not correctlyindicate the total K requirement of the crop.
Because of the great variation in K uptake, it is usual to present data simply forlow, medium, high and very high yield levels though this has no strict statisticalbasis.
Soil K content
The plant obtains its potassium needs from both soil and fertilizer. Soil K content isthus important. Methods of soil analysis used up to now all aim to imitate the plantroot and to measure potentially plant available K. The value of soil analysis canonly be checked by investigating the connection between soil K value and yieldresponse to K fertilizer. The lower soil K content, the more likely there will beresponse to K fertilizer. As a result of generous fertilizer treatment in the past,response to K fertilizer is nowadays slight and it has become more difficult to cor-relate the results of field experiments with soil analysis. Absence of response to Kindicates an abundant supply.
The value of soil analysis can be improved by considering also K saturation ofthe CEC, i.e. the ratio of K to other cations, rather than just the absolute value forexchangeable K.
Soil analysis is most valuable in the low range where there is a much closer corre-lation with K response than is the case at higher levels [4]. In the higher range it isnecessary to consider other factors which affect growth and so adjust values for mgK20/ 100 g soil. Such factors are:
- Analytically determined soil factors like clay content, organic matter status, pH,clay mineral composition, content of other nutrients, biological activity,
410
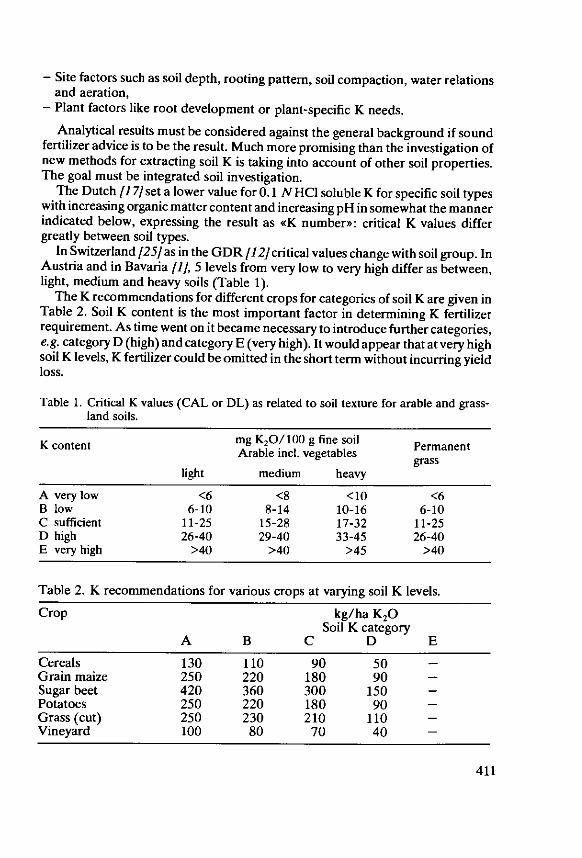
- Site factors such as soil depth, rooting pattern, soil compaction, water relationsand aeration,
- Plant factors like root development or plant-specific K needs.
Analytical results must be considered against the general background if soundfertilizer advice is to be the result. Much more promising than the investigation ofnew methods for extracting soil K is taking into account of other soil properties.The goal must be integrated soil investigation.
The Dutch [17] set a lower value for 0.1 N HCI soluble K for specific soil typeswith increasing organic matter content and increasing pH in somewhat the mannerindicated below, expressing the result as oK number>: critical K values differgreatly between soil types.
In Switzerland [25] as in the GDR [12] critical values change with soil group. InAustria and in Bavaria [1], 5 levels from very low to very high differ as between,light, medium and heavy soils (Table 1).
The K recommendations for different crops for categories of soil K are given inTable 2. Soil K content is the most important factor in determining K fertilizerrequirement. As time went on it became necessary to introduce further categories,e.g. category D (high) and category E (very high). It would appear that at very highsoil K levels, K fertilizer could be omitted in the short term without incurring yieldloss.
Table 1. Critical K values (CAL or DL) as related to soil texture for arable and grass-land soils.
K content mg K2 0/100 g fine soil PermanentArable incl. vegetables gass
light medium heavy
A very low <6 <8 <10 <6B low 6-10 8-14 10-16 6-10C sufficient 11-25 15-28 17-32 11-25D high 26-40 29-40 33-45 26-40E very high >40 >40 >45 >40
Table 2. K recommendations for various crops at varying soil K levels.
Crop kg/ha K20Soil K category
A B C D E
Cereals 130 110 90 50 -Grain maize 250 220 180 90 -Sugar beet 420 360 300 150 -Potatoes 250 220 180 90 -Grass (cut) 250 230 210 110 -Vineyard 100 80 70 40 -
411
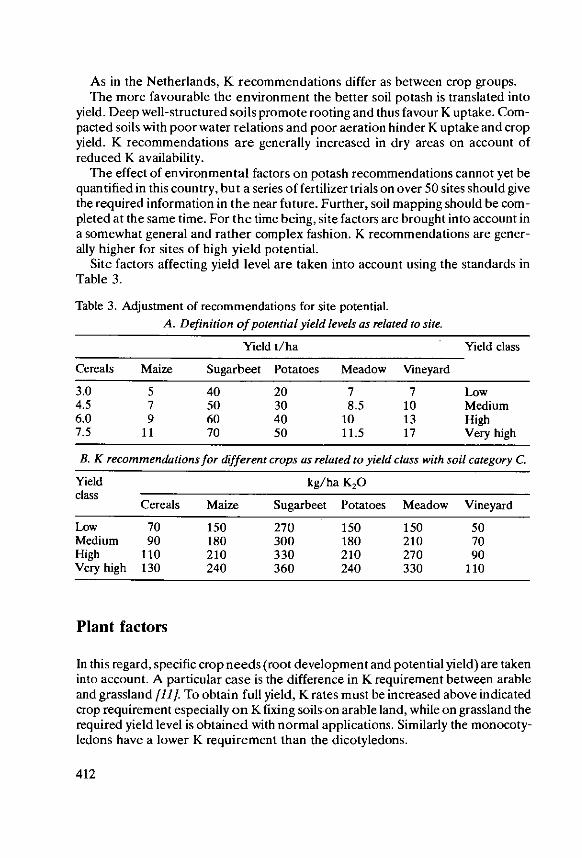
As in the Netherlands, K recommendations differ as between crop groups.The more favourable the environment the better soil potash is translated into
yield. Deep well-structured soils promote rooting and thus favour K uptake. Com-pacted soils with poor water relations and poor aeration hinder K uptake and cropyield. K recommendations are generally increased in dry areas on account ofreduced K availability.
The effect of environmental factors on potash recommendations cannot yet bequantified in this country, but a series of fertilizer trials on over 50 sites should givethe required information in the near future. Further, soil mapping should be com-pleted at the same time. For the time being, site factors are brought into account ina somewhat general and rather complex fashion. K recommendations are gener-ally higher for sites of high yield potential.
Site factors affecting yield level are taken into account using the standards inTable 3.
Table 3. Adjustment of recommendations for site potential.A. Definition of potential yield levels as related to site.
Yield t/ha Yield class
Cereals Maize Sugarbeet Potatoes Meadow Vineyard
3.0 5 40 20 7 7 Low4.5 7 50 30 8.5 10 Medium6.0 9 60 40 10 13 High7.5 11 70 50 11.5 17 Very high
B. K recommendations for different crops as related to yield class with soil category C.
Yield kg/ha K20class
Cereals Maize Sugarbeet Potatoes Meadow Vineyard
Low 70 150 270 150 150 50Medium 90 180 300 180 210 70High 110 210 330 210 270 90Very high 130 240 360 240 330 110
Plant factors
In this regard, specific crop needs (root development and potential yield) are takeninto account. A particular case is the difference in K requirement between arableand grassland [11. To obtain full yield, K rates must be increased above indicatedcrop requirement especially on K fixing soils on arable land, while on grassland therequired yield level is obtained with normal applications. Similarly the monocoty-ledons have a lower K requirement than the dicotyledons.
412
Leaf analysis..
Leaf analysis with due attention to position and timing of sampling can be used inplace of or as an adjunct to soil analysis /2,201. This is applicable especially for Kwhere there have been good correlations between plant K content and response toK fertilizer. The value of leaf analysis lies in the following order for different cropgroups: forest trees > fruit trees > vineyard > grassland > arable. An advantage ofleaf analysis is that it shows up the effects of antagonisms on the plant. Used in con-nection with soil analysis it can be a valuable indicator of fertilizer needs.
With cereals, the connection between K content of the plant and increasedgrowth in response to K fertilizer is marked [14] and plant analysis can better ref-lect the K supply of a site than soil analysis. The critical value is 2 to 2.2% K20 indry matter over the period from shooting to full ear emergence [16]. On lightsoils leaf analysis is particularly useful soil analysis is a better indicator on heaviersoils /23]. Our own experiments [9] with N applied at 0, 100 and 200 kg/ha tograssland showed a better correlation of yield with plant K content than with soilanalysis (Table 4).
Table 4. Correlation between yield of grass and plant K content or soil K content atdiffering N levels.
rNO NIO N200
Soil K (CAL) 1970-1973 0.42 0.58 0.59K content of grass 1971 0.18 0.66 0.81K content of grass 1972 0.81 0.81 0.81
Fertilizer experiments
Experiments with increasing rates of potash should also include variable nitrogentreatments in order to yield full information. We cannot here recapitulate theresults of numberless potash fertilizer experiments. We emphasise that theseexperiments should be of sufficient duration if the information obtained is to bereliable. The use of results from experiments of short duration has led to mistakenfertilizer advice. Farming is a long-term occupation (over generations); the experi-mental approach should be similarly long term.
Referring to Table 5, on the basis of the first year's results alone K, would havebeen recommended only at 200 kg/ha N. On the basis of the first two years, K alsoincreased yield at the lower rates of N but K manuring would hardly have been pro-fitable at NO. It was only in the longer term that the true value of K fertilizerbecame apparent. Shortterm potash experiments can give misleading information113].
413
When the soil K content is already high, it is quite usual for there to be little or noeffect of K fertilizer in the early years. In such cases, the investigator has to exercisesome patience in awaiting the effects of run-down in soil K. One of the fewpublished results of long-term investigation was given at the 11th IPI Congress inBern [6]and is shown in Figure 1. In this experiment with vines, the effect of K ferti-lizer became apparent only from the 6th year.
Table 5. Yield increase (K,, 0-K.) in kg dry matter per kg K20 at increasing N levelson grassland-Giesshiibl
"Periocd NO N 100 N200
1st Year -2.9 -1.2 +3.4Year 1- 2 +5.3 +1.5 +9.3Year I- 5 +10.3 +7.2 +17.1Year 1-10 +11.4 +11.8 +24.9Year 1-15 . +12.0 +12.7 +27.9
191130
120
10
90
lo60
50 NR
30
20
10
0 _ _1955 56 57 58 59 60 61 62 63 6. 65 66 67
Fig. 1. Effect of potassium on vines at Targon [6]•
414
Surveys
These are practical, but cannot give sufficiently full information. They can onlygive indications, and apparent findings need to be confirmed in proper experi-ments.
Crop price / potash price ratios
The K response curve relating yield to rate of K is only half the story. The farmer ismore concerned about the economic return and for this the ratio between value ofcrop increase and cost of fertilizer needed to produce that increase must be takeninto account. The ratio unit price of wheat to unit price of potash in Austria haschanged as follows:
1960 0.731970 0.901980 1.391985 1.47
In terms of wheat grain, the cost of potash to the farmer is twice as much as it wasin 1960. Such facts must be taken into account in giving fertilizer advise.
Economic targets
Early advisory effort emphasised the effect on yield without due regard to the costof treatment. In the simplest terms, the highest return per unit of fertilizer isobtained in the lower range of yield and at modest rate of fertilizer, but the aim offertilization is to achieve maximum profit which is attained at the point on theresponse curve where marginal fertilizer cost is balanced by the marginal value ofyield increase 19]. If marginal cost exceeds marginal return there is a loss unlesscredit is given for effects on soil fertility (residual effects on following crops). Thisapart, the identification of maximum profitability should be a simple matter 1101.In practice, however, this is not so simple because crop yield and fertilizer responseare subject to considerable uncertainty showing variation with soil conditions,weather, crop and crop variety.
The response curves illustrated in Figure 2 show that as fertilizer rate increases(X) response (y) decreases. The optimum fertilizer rate depends upon the price/cost ratio. If this is 0.75 we need a yield increase of 112.5 kg grain to cover the costof 150 kg K20; if it is 1.5, we need 225 kg grain. In this theoretical example, theeconomically optimum K rate decreases from about 135 to 110 kg/ha K20.
415

Yield increaseill grain/hna
10 -Economic
7,
6
5.
4
3
2 Price/cost ratio
1 ......... ....... ....... . . . . .. o ,
30 60 90 120 150 180 kg K20/ha
Fig. 2. Relation between optimum K fertilizer rate and price/cost ratio.
Potash balance
Striking a balance between potash application and potash removal is helpful.When soil potash is abundant, maintenance of the K balance may be the onlyguide. It is usually desirable to confirm or complete the indications from the bal-ance by soil analysis. Either gross or net balance can be used.
Gross Net
Total K removal Removal in grain, tubers, roots+ Leaching + Leaching- K from weathering - K from weathering- K in residues
= Total fall in K - Total fall in K
416
Using the net balance involves less work and is less subject to error as the returnin crop residues, estimation of which is subject to error, does not have to beincluded. Even the net balance is subject to error because leaching at about 10-30kg/ha/yr and mineralisation are not precisely known.
The dressing needed to maintain a desirable level of soil K may be less than Kremoval on high K soils. In contrast, on low K soils and where there is a tendency toleaching or fixation it will be considerably higher. K recommendations could bebased solely on the K balance if soil conditions and their effects on K dynamicscould be ignored.
Potash fertilization - investment in soil fertility
Applying K fertilizer at a rate above the economic optimum is not futile becausethe result is an increase in soil fertility. It is an investment and should be valued assuch. Even if the invested K does not bring an immediate increase in yield a returnin the future is to be expected.
The increase in potash price between 1960 and 1985 (Table 6) means thatexpenditure to bring about an increase in soil K stock in 1960 has yielded a return ofabout 4%. The effect of potash fertilization in Austria on soil K status is indicatedby the results of routine soil testing (Table 7).
Since the start of soil testing, the proportion of soil insufficiently supplied with K(A+B) has declined from 70 to 34%.
Table 6. Change in cost of potash fertilizer in Austria.
Cost of potash RelativeS/kg KO
1960 1.85 1001970 2.17 1171980 3.61 1951985 4.83 261
Table 7. Change in soil K status as indicated by routine soil testing.
No of tests % in K content classA B C D E
1953/54-1971/72 1859731 32 38 30 - -1978/79-1985/86 579496 8 26 42 17 7
417
Fertilization system
Recommendations for specific crops are to be found in many books and these arevaluable though one is not compelled to follow them to the letter. Alternative poli-cies are to apply to each individual crop its own requirement or to treat the rotationas a whole. In the latter case, the requirements of the individual crops are totalledover the rotation and the average annual requirement is applied each year regard-less of crop. This requires that the potassium status should be reasonably uniformover the whole area and that each part of the arable area should carry substantiallythe same succession of crops. Manuring the rotation offers some economy in costand labour and it is easier to calculate the return of nutrient in organic manures andcrop residues. Rotational manuring can be related to the whole farm or to a part ofit.
When soil K status is high or very high, it is permissible to apply the total potashrequirement to the potash-demanding crops, relying on residues to supply theneeds of the cereals which themeselves receive none. The requirement for cereals isadded to the calculated needs of the potash-demanding crops. It remains to men-tion supplementary fertilisation for deep-rooted and long-term crops where, onestablishment, ploughing in to depth more than the average annual requirement offertilizer should be considered.
Cost of investigation
The costs of experimental and advisory work have to be set against the gain to beexpected from good advice. This is decisive in the decision to establish a researchand advisory service. As soil fertility increases the return by way of crop increasedecreases and then the research and advisory costs loom proportionally greater.
The client
An important point in fertilizer advisory work is of a psychlogical nature. Advicegiven must be definite. The best advice is useless if the farmer finds it unacceptable.It must be clear and easy to follow. Advice may be affected by the socioeconomicstatus of the farmer. For hobby farms and rented farms and farms without securityof tenure, economic return on the current crop is the prime consideration while forthose who can be more assured of the future, the building up of soil K statusassumes greater importance.
418
Aspects other than yield
Though it is difficult to quantify, the effect of potash on crop quality may dictateupward or downward revision of the recommendation. If winter-hardiness andstanding power are in question, increased potash dressings may be a corrective.
The advice given must take account of the K content of farm manures and cropresidues, and this has the same value as fertilizer K J5j.
While fertilizer advice is only a help to the farmer in taking decisions, by Aus-trian law it must be based on the latest scientific information. The advisory organi-sation is responsible for the correctness of its advice. This is a considerable respon-sability.
Making advice effective
Advice is only effective when its recommendations are correctly followed. Theremust be mutual trust between the farmer and his advisor if results are to be fruitful[7]. Computerisation can assist with information and accounting support but thiscannot replace scientific knowledge though it can support it. It is noticeable thatmany farmers are particularly impressed by a computerised service.
Along with other factors, the carrying out of over 3 million soil analyses and thephosphate and potash recommendations resulting therefrom has made Austriaover 100% self-sufficient in food. This is impressive economic progress achievedwhich is however not reflected in the level of farm income. This and notably thelarge inter-regional differences in soil K status, are sufficient reasons for furtherimprovement in methods of fertilizer advice. There is a demand for further scien-tific investigation and advice.
References
I. Bayerische Hauptversuchsanstaltfiir Landwirtschaft, Freising-Weihenstephan: DieDiingung von Acker- und Griinland nach Ergebnissen der Bodenuntersuchung, 4.berarbeitete Auflage, 1984
2. Bergmann, W. and Bergmann, E.: Bedarfsgerechter und effektiver Dfingeminelein-satz im intensiven Obst-, Gemaise- und Zicrpflanzenbau durch Kontrolle der Ndhr-stoffversorgung der Pflanzen. Erfurt, 1984
3. Blasi, S.: Stroheinackerung und Kalirficklieferung. Der land- u. forstw. Betrieb, Heft3, 34-35 (1977)
4. Boguslawski v., E.: Die pflanzcnphysiologischen und ackerbaulichen Grundlagender Dangerbedarfsermittlung. Ldw. Forschung 31/1, 270-289 (1974)
419
5. Burgdorf, W. and Beringer, H.: Nachweis von Kalium aus Ernterackstfinden durchBodenuntersuchung und Pflanzenanalyse. Ldw. Forschung, Kongressband 1984,653-661 (1984)
6. Drouineau, G.:Potassium Effects inLong-Term Experiments. Proc. 11thCongr.Int.Potash Institute, Bern (1978)
7. Friichtenicht, K., Hoffmann, G. G.and Vetter, H.:DingenwirrichtigimHinblickaufBodenfruchtbarkeit, Ertrag und Gewinn. Ldw. Forschung, Sonderhcft 35, 152-168(1978)
8. Gruber, P.: Ein Beitrag zur KIrung der Wirkung der Pflanzennihrstoffe Stickstoffund Kalium auf Grflnland. Die Bodenkultur 30, 352-376 (1979)
9. Gruber, P.: Dfingung aus dkonomischer Sicht. Der F6rderungsdienst 27, 104-107(1979)
10. Gurmer, 0.: Diingungsintensitit aus einzelbetrieblicher und agrarwirtschaftlichcrSicht. Die Bodenkultur 31, 313-324 (1980)
11. Gutser, R., Vollrath, H. and Kahbauch, W.: Wirkung einer K- und Na-Dfingung zueiner Dreischnittwiese auf K-fixierendem Boden. Das wirtschaftseigene Futter 24,221-238 (1978)
12. Kerschberger, M., Richter, D. and Witter, B.: Neue Versorgungsstufen far die P-, K-,Mg-Gehalte und den pH-Wert des Bodens auf Acker- und Gruinland. Feldwirtschaft27, 366-368 (1986)
13. Kick, H. and Poletschny, H.: Kaliumhaushalt und Ertragsleistung bei einem langjdh-rigen Kaliformenversuch. Ldw. Forschung 31/1L Sonderheft, 59-68, Kongressband(1974)
14. Knauer, N.: Uber die Brauchbarkeit der Pflanzenanalyse zur Ermittlung der P- undK-Versorgung des Bodens. Landw. Forschung 16, 116-129 (1963)
15. K6chl, A.: Zusammenstellung von Ergebnissen fiber den NPK-Entzug durch Fruchtund Restpflanze, Februar 1986. Briefl. Mitt.
16. K6hnlein, J. and Knauer, N.: Uber die Verwendung der Pflanzenanalyse zur Ermitt-lung des Kalibediirfnisses von Ackerb6den. Zeitschrift for Pflanzenerniihrung, Dan-gung und Bodenkunde 86 (131), 36-49 (1959)
17. Ministerie van Landbouw en Visserij: Adviesbasis voor bemesting van Landbouw-gronden, Sept. 1984, Wageningen
18. Osterreichische Diingerberatungsstelle: Bodenuntersuchung und Dfingung, 2. Auf-lage, 1986
19. Primost, E.: Nihrstoffentzug und N.hrstoffverhAltnis als Grundlage fir die Bemes-sung der Dflngung. Zeitschrift far Acker- und Pflanzenbau 142, 54-65 (1976)
20. Ruckenbauer, W. andAmann, H.: Oberlegungen zur Blattanalyse im Weinbau. Ein-gereicht zur Ver6ffentlichung in .Mitteilungen Klosterneuburg.
21. Ruhr-Stickstoff Aktiengesellschaft Bochum: Faustzahlen far Landwirtschaft undGartenbau
22. Ruppert, W.: Nihrstoffentzugs- und Bedarfswerte fOr betriebswirtschaftliche Kal-kulationen von Ackerfriichten, Grdinland, Feldgemfise und Dauerkulturen. Bayeri-sche Landesanstalt fOr Betriebswirtschaft und Agrarstruktur Mfinchen, April, 1985
23. Schsifer, P.: Vergleichende Betrachtungen von Pflanzen- und Bodenanalysen im Ge-treidebau hinsichtlich ihrer Treffsicherheit zur Voraussage von Kaliwirkungen auf dieErtragsbildung. Die Bodenkultur 28, 340-365 (1977)
24. Schechtner, G.: Kaliddingung des Griinlandes in Abhingigkeit von den Standortver-hilnissen und Bodenuntersuchungsergebnissen. Vervielfiltigtes Vortragsmanus-kript der Bundesanstalt fOr alpenlindische Landwirtschaft in Gumpenstein, 1985
420

25. Sch weizerische Vereinigung Betriebsberatung Landwirtschaft: Dingungsrichtlinienfir den Acker- und Futterbau. SVBL-Dokument Nr. 387-391 (1972)
26. Steineck, 0.: Untersuchungen mit der Wechsell6sungskutur Ober spezifische Wir-kungen der N~hrstoffe Stickstoff und Kali auf das Pflanzenwachstum. Die Bodenkul-tur 13, Ausgabe A, 249-267 (1963)
27. Steineck, 0. and Haeder, H. E.: The Effect of Potassium on Growth and Yield Com-ponents of Plants. Proc. 11 th Congr. Int. Potash Institute Bern, 165-187 (1978)
421
Closing Remarks
The Need for Potassium in Relationto Supplies of Major Plant Nutrients
0. Steineck, Institute for Plant Husbandry and Plant Breeding, Agricultural Uni-versity, Vienna/Austria; member of the Scientific Board of the InternationalPotash Institute
Fertilizer usage has contributed much to the increase in crop yield in recent years.However, we have now arrived in the industrialised countries in a situation of agri-cultural surpluses and some governments are thinking in terms of lower yield andrestricted fertilizer consumption. In such a situation, it is more than ever importantfor the farmer to control fertilizer usage in such a way as to maintain profitability.
Papers presented at the colloquium have discussed matters against the back-ground of this general problem. It is more than ever important to understand thefunction of potassium in building crop yield and to appreciate the importance ofcorrect quantitative relationsiips between potassium and the other major andminor nutrient elements. We are concerned with the qharmonicD inter-relationshipbetween the major nutrients. In achieving this aim we need to be able to define thedesirable nutrient status of the soil and to take steps to achieve and maintain such acondition.
Experimental techniques are required which will accurately determine thenutrient inter-relationships which are needed to achieve optimum crop yield andquality. In this connection solution culture is a useful technique. An experimentcompared nutrient uptake and yield formation using six nutrient solutions thecompositions of which are compared in Table 1. These solutions show extremevariation as regards both nutrient ratio and total concentration.
Yields and nutrient uptake by tomatoes were measured in both static (concen-tration reducing throughout growth) and flowing (nutrient concentration keptconstant) solution culture (Kopetz and Steineck /1962]; Steineck [1962]). Theresults are shown in Figure 1 for yield and Figure 2 for nutrient uptake (Bergauer11976]).
423
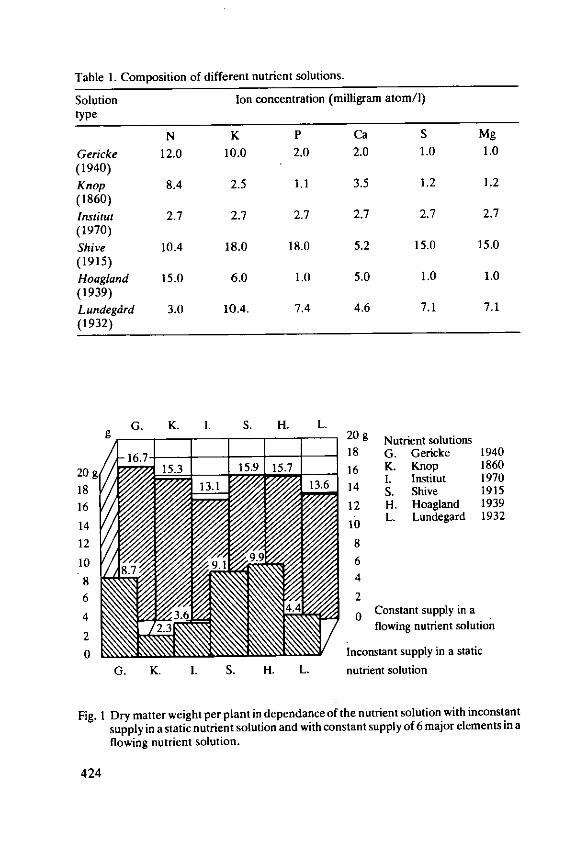
Table 1. Composition of different nutrient solutions.
Solution Ion concentration (milligram atom/I)type
N K P Ca S Mg
Gericke 12.0 10.0 2.0 2.0 1.0 1.0(1940)
Knop 8.4 2.5 1.1 3.5 1.2 1.2(1860)
Institut 2.7 2.7 2.7 2.7 2.7 2.7
(1970)
Shire 10.4 18.0 18.0 5.2 15.0 15.0(1915)
Hoagland 15.0 6.0 1.0 5.0 1.0 1.0
(1939)Lundegdrd 3.0 10.4. 7.4 4.6 7.1 7.1(1932)
G. K. I. S. H. L.9 20 g Nutrient solutions
16.7 18 G. Gericke 1940
20g 15.3 15.9 15.7 16 K. Knop 186018 1. Institut 197018 14 S. Shive 191516 12 H. Hoagland 19391410 L. Lundegard 1932
11012
10
8 4
6 24 30 Constant supply in a
2. flowing nutrient solution2
0 inconstant supply in a static
G. K. 1. S. H. L. nutrient solution
Fig. 1 Dry matter weight per plant in dependance of the nutrient solution with inconstantsupply in a static nutrient solution and with constant supply of 6 major elements in aflowing nutrient solution.
424
In static culture, when the solution concentrations decrease as a result of plantuptake, there are great differences in total dry matter yield between the differentsolutions. The Gericke, Shire and Hoaglandsolutions give good results. It appearsthat these three are of suitable composition to supply the plant's needs over anextended period whereas the other three are not. In the case of Shive's solution thisseems more a result of relatively high concentration rather than of ionic balance.The Gericke and Hoagland solutions produce a high yield with a relatively lowtotal nutrient concentration but the Knop, - Institut, and Lundegdird solutions donot, because they are not of the appropriate nutrient ratio. Indeed there were symp-toms of potassium deficiency in plants grown on Knop 's solution which is too lowin K.
In contrast, in flowing solution culture, there is relatively little difference in drymatter yield between the six tested solutions and the nutrient ratio seems to be ofminor importance. This indicates that when nutrients are supplied in excess of theplant's requirements over a period, nutrient uptake is an expression of the plant'sactual requirements. Excess over the plant requirement remains in the solution.There is an extreme difference in nutrient ratio between Gericke's and Shive's solu-tions but the yield is substantially the same under either treatment.
Translating this into conditions as they are in the soil, it would appear that, asabundant supplies of each major nutrient are present, the ratio between nutrientions is scarcely of significance. It is also clear that when ratios between nitrogen,potassium, phosphorus, calcium, sulphur and magnesium vary greatly, as countlessexamples of soil analysis show them to do, so long as the amount of each nutrient isabove a threshold value indicating sufficiency, yield will be unaffected by fertilizertreatment.
The objective for today and the future for any given set of conditions must beaccurately to determine fertilizer needs from both physiological and economicstandpoints. In this connectioni the question arises as to what is the best way to pro-ceed. At the Institute we have used flowing solution culture in which the nutrientsare held constant at a 1: 1: 1:1:1:1 ionic ratio and at 3 strenghts: 0.1, 0.8 and 2.7 mgatom/l. The assumption is that the three major nutrients are present in sufficientquantity and the same availability and that then nutrient uptake is an expression ofthe plant's selectivity in uptake.
It follows that a first experiment should demonstrate the required inter-nutrientratio and, having this knowledge we can refine the method in a further experimentin which the nutrients are offered in this ratio. From such an experiment we obtainthe results illustrated in Figure 2. Here, the results from the series with the nutrientsin equal concentration (dotted line) are compared with those from the series wherenutrients are supplied in accordance with indications from the former. In the for-mer series, uptake is in the order N somewhat greater than K and both these ele-ments very much greater than those of the rest with Ca and S appreciably higherthan P and Mg. Increasing the solution concentration by a factor of 3 increases theuptake only of N and K.
425

milligram atom %
milligram atom % milligram atom %350- "----' -350
3Concentraion 300300-25
250N I Ca -M-Cocnrtn 200200 "--- -15
150 - ,"--- "10
too 10
5o 50502-
Concentration3N K Ca S P Mg Concentration 2
Concentration I
Fig. 2 Nutrient content in dry matter of a tomato leaf in milligram atom %. Dotted line =
offer in equal ion concentrations. Straight line = offer in relation to uptake.
In the second series, uptakes of N and K are increased while those of Ca, S, P andMg are reduced (solid lines). Furthermore, higher yields were obtained in thisexperiment, indicating the importance of nutrient ratio. Similar experiments weredone with other crops such as potato, sugar beet and cereals, and from the results,harmonic' internutrient ratios can be determined.
Further precision can be obtained by considering nutrient concentrations inindividual plant parts and the results for tomato are illustrated in Figure 3. The stemcontains much N and K in the ratio 1: 1; content of the other elements is small. Thefruit has a much higher N content relative to K and content of the other elements isminimal. The root shows a much wider N:K ratio and its content of Ca, S, Mg and Pis much higher than in the shoot. Concentrations of all elements except P are high-est in the leaf.
As the site of synthesis, the leaf is the most important organ and it is reasonableto assume that leaf analysis would be the best indicator of the desirable nutrientratio for yield formation. Table 2 translates the findings in terms of milligram atompercent into practical fertilizer terms.In practical terms, the required nutrient ratio is 1:2.2:0.5 (N:K 20:P 2O5 )
So far as fertilization is concerned we should aim at soil conditions which willensure a constant supply of nutrients in the desired ratio. This also makes economicsense since the crop will only take up elements in the quantities which it needs foroptimum yield.
426

Table 2. Indicated nutrient ratio for tomato.
Content in leaf dry matter nitrogen phosphate potash
milligram atom % 259 25 167ratio 1 0.097 0.640mg element 3626 775 6513ratio 1 0.21 1.74mg oxide 3626 1775 7849ratio 1 0.490 2.164
The aim of this colloquium has been to find research methods which will indicatehow to determine the crop's demand for potassium in relation to the other majornutrients on physiological grounds in order to optimise economic return and pro-tection of the environment.
milligram atom %250
milligram atom % milligram atom %
250 250
200- -- -- 200
150 -- 150
100100
50- -50
0 0K C Leaf
C S M'RootP Stem
Fig. 3 Content of 6 major nutrients in the dry matter of stem, fruit, root and leaf of tomatoin milligram atom %.
427

References
1. Bergauer, Ch.: Untersuchungen mit Stch- und Wechsell6sungskulturen fiber die Wir-kung des Nfihrstoffverhiltnisses verschiedener Nahrl6sungen auf das Wachstum derTomate (Solanum lycopersicum L.), Master Thesis, Univ. f. Bodenkultur Wien, 1976
2. Gericke, W.F.: The complete guide to soilless gardening Ninth Printing PUTMAN,London 1949
3. Kopetz, L.M. andSteineck, 0.: Zur Frage der Untersuchung von Nahrstoffwirkungen.Die Bodenkultur 13, 145-162, 1962
4. Schropp, W.: Methodenbuch Bd. VIIL Der Vegetationsversuch. 1. Methodik derWasserkultur der h6heren Pflanzen. Verlag Neumann, Radebeul und Berlin 1951
5. Steineck, 0.: Untersuchungen mit der Wechselldsungskultur fiber spezifische Wir-kungen der Nfhrstoffe N u. K auf das Pflanzenwachstum. Die Bodenkultur 13, 249-267, 1962
6. Steineck, 0.:The Relation Between Potassium and Nitrogen in the Production of PlantMaterial. Proc. 10th Congr. Int. Potash Institute, Bern, 189-196 (1974).
428