eci syst em s - international potash institute
TRANSCRIPT
PITASSIUM IN4ECI SYST EM SBid"eche I FIuxes i
Catian n gr'o- analFretSstems

Potassium in EcosystemsBiogeochemical Fluxes of Cations in Agro- and Forest- Systems
23rd Colloquium of the International Potash Institute
Prague, CzechoslovakiaOctober 12-16, 1992
Potassium in Ecosystems
Biogeochemical Fluxes of Cations inAgro- and Forest- Systems
International Potash Institute, CH-4001 Basel / SwitzerlandP.O. Box 1609Phone: (41) 61 261 29 22/24 Telefax: (41) 61 261 29 25

O All rights held by: International Potash InstituteP.O. Box 1609CH-4001 Basel/SwitzerlandPhone: (41) 61 261 29 22/24 Telefax: (41) 61 261 29 25
Printing: Imprimerie Brinkmann, Mulhouse/France
Proceedings of the 23rd Colloquium of the International Potash Institute
CONTENTS
Opening Session page
Wyss, E. W elcome address .............................................. I I
Petr, J. Czech agricultural education-presentsituation, changes and trends ........................ 17
Session 1 K in the Pedosphere
Robert, M. K-fluxes in soils in relation to parent materialand pedogenesis in tropical, temperate andarid clim ates ............................ ........................ 25
Wilson, M.J K-bearing minerals and their K-release ratein different climates ...................................... 45
Fardeau, J.C., Poss, R. Effect of potassium fertilization on K-cyclingand Saragoni, H. in different agrosystems .................................... 59
Baier, . Fertilizer recommendations as determined bychemical and physical parameters of soil andby K requirement of crops ............................ 79
Spiess, E. and Potassium in animal manure and plantBesson, J.M residues: Efficiency and losses ...................... 91Mengel, K. Coordinator's report on session 1 .................... 103
Session 2 K in the Hydrosphere
Hagedorn, H. Size of minimal catchment area for drinkingwater as influenced by climate andpopulation size ................................................ 107
Nativ, R. Potassium in natural groundwater systems ...... 117
Johnston, A.E. and K concentrations in surface and groundwaterGoulding, K. W. T. and the loss of K in relation to land use ........... 135
Dvot6k, J. oncomposition of mineral waters inCzechoslovakia with special referenceto K concentration ........................................... 159
5
Sne, M. Composition of deep-well water andhydroponics .................................................... 167
Laudelout, H. Coordinator's report on session 2 .................... 183
Session 3 K in the Food Chain
Anke, M, Losch, E., Potassium in human nutrition ......................... 187Muller, M., Kramer, K.,Glei, L and Bugdol, K.Rechkemmer, G. Absorption and secretion of K in the
gastrointestinal tract ....................................... 205Zemkov, H. Physiology and pharmacology of K channels... 221Kecskemiti, V. Therapeutic implications of alterations in
endogenous K concentrations for organfunctions ........................................................ 235
Grossklaus, R. K concentration in beverages as a guidancefor K threshold levels in drinking water .......... 251
Vez, A. Coordinator's report on session 3 .................... 263
Session 4 K Requirements in Different Land Use SystemsVanek, V. and The role of K in the amelioration andBalik, J. sustainability of ecosystems ............................ 269Munson, R.D. 'Potassium in ecosystems, with emphasis
on the U .S ...................................................... 279Bonneau, M. Need of K fertilizers in tropical and temperate
forests ............................................................ 309Kaupenjohann, M K requirements of fast-growing tropical treeand Zech, W plantations ..................................................... 325Pagliai, M. Losses of potassium through runoff erosion
and slash-and-burn agriculture ....................... 345Muller, J C. K concentrations in municipal and agroindustrial
effluents: data needed for good fertilizationpractice .......................................................... 363
Avnimelech, Y., Replacement of Na in home and industrialBazelet, M. and uses by K : importance and possibilities ......... 377Weber, B.Van Diest, A. Coordinator's report on session 4 .................... 383
6

POSTERS
1. Derivation of K-fertilizer recommendation
Vostal, I and Potassium balance in Czech agriculture ............... 387Tiustos, P.
Karpinets, T. W Estimation of K fixation and release in soil bytwo consecutive methods ..................................... 391
Schneider, A. and Importance of texture and CEC in K fertilizationVillem in, P. advice .................................................................. 395
Orlovius, K. and Geographical Information System (GIS) as a toolAndres, E. for site-oriented fertilizer recommendations ......... 399Richter, D. and Methods for the derivation of K-availabilityKerschberger, M indices in arable soils .................. 401Loch, J. and Effect of potassium sulphate on the yield andPetho, F. quality of vegetables ........................................... 407
Sarvari, M. Effect of K fertilizer on yield of maize on meadowso ils ..................................................................... 4 11
Nikolova, M Regional K-status of soils in Bulgaria andK-fertilizer recommendations to mostim portant crops ................................................... 415
Fotyma, M., Interaction of soil-K and fertilizer-K on crop yieldCzuba, R. and in long-term field experiments in Poland ............. 419Gosek, S.
Bogaci, R. and Hypothetical potassium balance sheet for total areaBorlan, Z. under principal arable crops in Romania 1990 ..... 423
Gorbanov, S., Potassium balance in a crop rotation experimentM atev, Y. and over 18 years..................................................... 429Tomov, T.
Van Diest, A, Towards unity and clarity in European soilH orakova, H . and testing .................................................................. 433Houba, V.JG.
2. Ecological aspects of potassium use
Uebel, E. and Effects of K- and Mg- fertilizers in forests onChrzon, S. soils previously used for agriculture ..................... 439
Papulov, L. Non-traditional use of potash salts ....................... 4437

Prokoshev, V. Rational use of K fertilizers in Central Russia ...... 445Kading, H., K balance and K fertilization in extensiveSchalitz, G. and grassland utilisation on peat soils ........................ 449Behrendt, A.
Beringer, H. Coordinator's report on poster session .................. 453

Opening Session
Welcome Address
Mr. E. Wyss, President of the International Potash Institute, Basel,Switzerland
Ladies and Gentlemen,
I warmly welcome you all in Prague to the 23rd IPI-Colloquium.In particular, I have the pleasure to be here in the company of Prof. Jiri
Petr, Rector of the University of Agriculture Prague (it is a little bit strangeto me to bid welcome to him in his premises) and to bid welcome to :
- Mr VANEK Vaclav, Prof. Dipl. Ing. Dr., Dean of Agronomical Faculty,University of Agriculture, Prague-Suchdol;
- Mr. LEDVINKA Martin, Dipl. Ing., Head of Unico-Agric, University ofAgriculture, Prague-Suchdol;
- Mr. KUBAT Jaromir, Dipl. Ing. Dr., Director of Research Institute forCrop Production, Prague-Ruzyne;- Mr. BALER Jan, Doc. Dipl. Ing. DrSc., Head of Plant NutritionDiagnostics, Research Institute for Crop Production, Prague-Ruzyne; andcoworkers;- Mr. LABOUNEK Stanislav, Dipl. Ing., Chairman of the Board ofDirectors, Agrobanka Praha Ltd, Prague;-Mr ECKERT Martin, Dipl. Ing., Chairman of the Cooperative Farm VelkdPrilepy; and coworkers.
Then I would like to thank all those, whose efforts have made it possiblefor all of us to meet today. The organization and coordination of an eventsuch as this, which brings together people from various walks of life,scientists from Universities, Governments, Industry and even simple bankerslike me is a tremendous task.
It gives me great satisfaction to report that we have received 160registrations for this Colloquium. This is a reflection of the widespreadinterest which many people are showing in the topic which will bediscussing during our meeting.
II
To start, let me give you just a few - for us foreigners - interesting figuresabout the Czechoslovakian Federal Republic:- the rate of unemployed people was 3.8% in 1991Compare this to Western Europe!- The state budget is roughly balanced. Few states in Western Europe canmake this claim, if any !
Czechoslovakia is reckoned to be among the most developed industrialnations of Europe. There is no doubt, that this country will fight hard tokeep or even improve its rank among the industrialized nations and we aresure, it will succeed.But nevertheless, the Agricultural sector is also very important.
The total surface area of the Czechoslovakian Federal Republic is 12.7million hectares. Farming land represents roughly 50%. This is equal to 0.4hectare per inhabitant versus 0.25 hectare in the European Community.From this comparison, you can gather the importance that the Agriculturalindustry has in this country.
Some of you have attended earlier IPI-manisfestations and are familiarwith our International Potash Institute. For all the others, let me say a fewwords about IPI.
This institute was founded in 1952 by the French and German producersof Potash : that Colloquium is an excellent opportunity to celebrate the 40thanniversary of the foundation of IP. Its headquarters then were in Berne,Switzerland, and moved to Basel only a few months ago.
Today, all the producers in Europe and the Near East are Members of theInstitute and united by a common aim : to encourage agricultural researchwith regard to Potassium and to promote the application of Potash in theworld. IPI is not concerned with sales, but- in the frame of balancedfertilization- with the aim of improving food production as well asmaintaining soil fertility.
The most important task of research is to assure reliable advice based onsound scientific results.
How do we approach this task ? We collect and evaluate the results ofresearch and then try to disseminate them in the best interest of everybodyinvolved.
Scientific Colloquia serve this purpose best. Today, we open the 23rd IThe list of the Colloquia IPI has organized in different parts of the world islong. Each one deals with a specific item of Potassium-research, which is of
12
relevance to Science and Agriculture as today's topic "Potassium inEcosystems".
Here, the latest findings are presented by internationally recognizedScientists who are generally recommended by the members of IP's Scientific
Board, in which 12 countries are represented. After being discussed, all
papers presented will be printed in the proceedings, which will contain, so to
say "the latest state of art" about that important topic, which is presently a
major concern for scientists, agronomists, environmentalists, farmers andalso for the Potash producers themselves.
In addition, there are also other Scientific Meetings all over the worldorganized by our Regional Coordinators. International Congresses and
Colloquia organized by IPI have been attended by more than 7000 Scientists,mainly from Europe.
The economic difficulties the countries of Eastern Europe are facinghave forced Governments to temporarily reduce budgets allocated to
research purposes. And this, at the very moment, where many new private
farmers must obtain knowledge in various aspects of farming and, of course,in the correct use of fertilizers.
Support here can't come an "Ivory Tower" in Basel without being in
touch with the practical problems in the different countries. We thereforehave Regional Coordinators in various parts of the world. A Regional 1I-Coordinator for Eastern Europe was nominated in order to combineknowledge and experience and to transfer those into production techniques.
We all know that this is a process which will be long. In life, big eventsonly happen rarely; but then they have to be followed by a lot of small steps.We are here to help in the making of these small steps; if we can accomplish
this, our goal has been achieved.
For its 40 years of life, IPl has either published or contributed to morethan 700.000 copies of publications in the form of books, booklets or leafletsaimed at informing a wide range of people involved in fertilization. The best
known of these publications is certainly the POTASH REVIEW, dispatched
to more than 5.000 adressees worldwide, and which is aimed at informingscientists about the latest research-works carried out in the world and
devoted to K. But many other publications have been issued, for instance thewell known IPI's Bulletins and IP's Research Topics dealing with precisesubjects such as K recommendations for major crops or the behaviour of K
under various soil and climatic conditions.
13
Since these documents are published in English, the RegionalCoordinators of IPI, in cooperation with local scientists, translate some ofthem in several languages, updated with regional data. For yourinformation, such a work is presently implemented by the RegionalCoordinator of Eastern Europe, Dr. Ernst Andres.
And now, why are we in Prague today ? To this, we have two very clearanswers. It is not only because the "Golden Town" is one of the mostbeautiful and famous cities of Europe.
But first, in Prague of 1992, this scientific gathering is of specialimportance since so much has changed in Central and Eastern Europe.Science and farming must find new directions in the frame of a marketoriented economy. And secondly:
The reduction on the use of Potassium in Central Europe gives cause forconcern : in 1987/88, the consumption of K20 was 2'632'000 t, while in1991, only 1'675'000 t were used, and in 1992 even less.
To a certain extent, common concerns are presently raised in Westernand in Central Europe:- Fundamental environmental changes are occurring which together withgreater consumer interest in health require our full attention.- A balance between productivity and adequate profitability has to beachieved by cutting costs rather than by increasing production.
Going through our program, you will see that we adress those twosubjects in such a way as to deliver objective arguments aimed at clarifyingthe debate.When Dr. Klaus, then Minister of Finance, was in Switzerland, he said : "Idon't pay hard currencies for soft advice !"
We can assure you, our speakers will not give soft, but very valuableadvice and not against hard currency, but almost for free.(I don't think you expected Prof. Petr and me to follow the program. Italloted us one hour to speak about general matters. We thought, it was muchwiser to shorten our speeches and to give some more time to the much morequalified people to adress you).
I am sure that the many highly qualified speakers who will share theirknowledge and experience with you in the coming days, will not only bringyou the most recent developments in the newer uses of Potassium, but alsobroaden your knowledge of existing applications.
I hope you have an enjoyable time and that the Meeting provesrewarding not only in scientific and technical matters, but also that
14

enhancing personal relationships and private meetings will lead to a betterunderstanding and better contacts on a European and International level,which will last long after this Conference is over.I herewith open the 23rd PI-Colloquium.
Thank you!
15
Czech Agricultural Education - Present Situation,Changes and Trends
Prof. J. Peir, Rector of the University of Agriculture, Prague-Suchdol,Czechoslovakia
IntroductionCzech agricultural higher education has been going through a process of
transformation since the return of freedom and democracy in November1989; this process identifies the problems that had accumulated during thelong years of communist dictatorship and suggests solutions to them.Education, however, is closely linked with the development problems of thewhole of society and its economy. In general nowadays, priority is given tothe transformation of the planned command economy into a free marketsystem, the establishment of a rational functioning market mechanism. Atthe same time, restitution of property rights is taking place with privateproperty that was confiscated many years ago. All these changes, and manyothers (e.g. the development of international contacts) are manifest in thechanging behaviour of business entities and individuals. The newly definedeconomic policy of Czechoslovakia gives priority to rapid transition of oureconomy towards an efficient and smooth economic development. Theachievement of these tasks, however, requires a revival of all marketfunctions and also the changes in the structure of national economy inaddition to fundamental changes in economic tools. Structural changes havea considerable impact in agriculture, a sector which formerly received heavysupport from the state budget. The restrictive financial policy introducedafter 1990 resulted in a radical reduction of subsidies in agriculture.Subsidized prices of food that had lost this support resulted in a substantialchange in the consumer demand for food products and to a quite differentorder of priorities. Simultaneously, the process of transformation started tochange fanning cooperatives and state farms into businesses and companiesin private ownership.
A consequence of the changes briefly outlined above has been a shift inthe interests of students and demands for graduates from agricultural schoolsof higher learning (namely from technical and technological courses). This
17

demands changes in the whole system of agricultural higher education,embracing curricula, organization, personel policy and equipment.
Czech agricultural higher education started in 1789 and so has atradition of more than 200 years. The teaching of agricultural sciences in the19th century was included in the study programme of the Czech TechnicalCollege; from 1906 it was an independant course in agriculture anddeveloped further in 1918 (when the Czechoslovak Republic was founded)into a College of Agricultural and Forestry Engineering. In 1920 anotherCollege of Agriculture was founded in Brno (Moravia).
In 1952, agricultural studies were separated from the system of technicalcolleges and independent universities of agriculture were established inPrague, Brno and Bratislava; these schools of higher learning had their ownspecialised departments.
Agricultural sciences are currently taught at the following schools : theUniversity of Agriculture in Prague with four faculties: agronomy,economics, forestry and engineering; the University of Agriculture at Brnowith four departments: agronomy, horticulture, economics and forestry; theCollege of Agriculture of the South Bohemian University at CeskeBudejovice.
Development after the Communist take-over in 1948
Forty years of the communist regime in Czechoslovakia (1948-89) had anegative effect on the whole system of agricultural higher education in theCzech lands. The chief defects of agricultural education at that time were :
1. University authorities were completely subordinated to the bodies ofthe Communist Party and this led to uninformed and subjective interferencein the decisions on university matters.
2. Compulsory administrative unification of the curricula and of staffstructure; narrow specialization and a single (uniform) system oforganization of all schools of higher agricultural education.
3. Suppression of creative non-conformist approach to any problem bothin education and in research.
4. Priority of the so-called Marx-Leninist approach in all sciences (notonly in social sciences).
5. Limitation or elimination of certain fields of science and subjects inthe curricula at the University of Agriculture (especially in the first 5-10years after 1948 and then again after 1968: e.g. genetics, other philosophies
18
except marxism, economic theories, psychology, sociology, cybernetics,marketing, etc.).
6. Application of secondary-school methods of teaching (low incentivesand independence of students).
7. Reduction of the role of the universities as centers of scientificresearch by artificially separating research from education and by creatingresearch institutes outside the school.
8. Limiting the flow of scientific information from advanced Westerncountries, with little or no opportunity to travel to these countries.
9. Application of non-objective criteria in the selection of students andteachers (class approach).
These negative features with interference by state and party authoritieswere not characteristic of agricultural universities alone but were common inall schools of higher learning.
Changes since 1989
The return of democratic principles following November 1989 hasaffected the whole situation at agricultural schools of higher learning inPrague and Brno. Freedom of speech, fundamental to a democratic system,has opened a forum for wide discussion of current problems and the possibletrends in future development. The students were a dynamic element in thedeep social changes in society and education at this stage; they put forwardthe problems that they thought should be tackled at agricultural universitiesand initiated discussions in this direction. The main attention was focusedon the curriculum and liberalization of staff structure, on the possibility ofchoice and combination of subjects, on teaching methods, on personalproblems, on student participation in university management, on problemsof equipment and finance, etc. Some of the problems were resolvedimmediately, others required some time for their solution.Fundamental changes have taken place in the following points:
1. A new Universities Act has been approved by Parliament and this hasincreased autonomy of universities and faculties.
2. New autonomous academic bodies were established, with a high levelof independence in decision-making (Academic Senates of the Universityand of faculties).
3. After many years, academic officials were once again elected by theacademic community in free elections.
19
4. Lectures in Marx-Leninist philosophy as a compulsory theoreticalfoundation for all sciences and subjects (namely for philosophy, sociologyand general economy) were discontinued and substituted by correspondingdisciplines and the up-to-date knowledge and world standards.
5. Subjects included in the curricula and time devoted to them and wholecourse programmes have been changed. This applies particularly to thosethat were closely linked with the command economy (agriculturaleconomics, organization and management, information systems, bookkeeping, etc.)
6. New subjects corresponding with the needs and requirements ofmarket economy (economic theories, management, marketing, finance andbusiness problems) have been gradually introduced and more attention isnow paid to some other subjects (law, foreign languages).
7. Personal contacts with agricultural universities, with educational andresearch institutions in advanced countries have increased considerably andthere is a greater possibility of incorporating our school into EC sponsoredinternational programmes.
8. Competition between individual types of schools of higher learninghas increased.
9. Positions for professors and associate professors have been filled byopen competition in order to replace those whose knowledge and teachingwas not consistent with changing conditions.
10. There are improved possibilities for obtaining funds from domesticsources and international grants and funds are also available from theUniversity's own economic activities.
11. A new concept of the development of the University of Agriculturehas been worked out and approved by the academic bodies.
12. Some faculties apply the credit system of grading and evaluation.13. The Faculty of Forestry was re-established and it is now focused
especially on ecology and landscape engineering.14. Narrowly specialized courses were discontinued and the students are
now offered more choice within the courses with regard to their futurecarreers.
Approach to problem solution
Following the end of the communist regime, staff of the University ofAgriculture in Prague have concentrated on the innovation of systems andcurriculum contents which will match European or, rather, world standards.
20
Some changes were suggested by our own experience and considerations,others were based on know-how from abroad.
The University of Agriculture considered it important to profit fromexperience of the well known schools of higher learning abroad. In 1991, incooperation with the Agricultural University in Wageningen, we started acomplex evaluation of the University of Agriculture in Prague using themethodology applied in the evaluation of Dutch universities. The first stagein this evaluation is now complete and the whole will be completed in 1993.The WAU Evaluation Commission, headed by Rector Magnificus Prof. dr.H. van der Plas, has much appreciated the reports and material submitted bythe University of Agriculture in Prague and the effort made and resultsachieved in establishing contacts with foreigh universities and the projects ofinternational and supranational institutions (such as the EC Programmes,U.S. Government sponsored programs, etc.).
The preliminary evaluation comments favourably upon the positivechanges at the university, namely changes in the curricula, the use of foreignliterature and the very high standard of diploma works, theses anddissertations, etc. Among the positive results is also the method ofevaluation of lecturers and research workers based on the approved systemof point scale and also the system of placements for practical experience forstudents as well as the new study programmes.
The evaluators also had some criticisms, such as the unclear long-termstrategy in agricultural education, or duplication and insufficientcoordination in the teaching programmes. They also mentioned theexcessive work load on the teaching staff caused by oral examinations whichcould be substituted by written examinations. A continuing low proficiencyin foreign languages is a problem since it is essential for the development ofinternational cooperation.
This external evaluation of the University of Agriculture in Prague isconsidered to be an important tool for improvement in the standard ofhigher agricultural education. Contacts with partners abroad and comparingmethods and results in education and research will open the way toachieving European standards. A number of cooperation agreements havebeen signed during the past three years with European and AmericanUniversities and some teachers, scientists and students could usescholarships and grants offered by the partner universities. Several activitiesare financed through the EC programmes (e.g. Tempus).
Important cooperation was started in 1990-91 with Iowa State Universitywho had won grants from US Aid in Washington to finance a series of
21

seminars and courses at agricultural universities in Prague, Brno and Nitraaimed at sharing knowledge and experience in the fields of economics,management and marketing.
The University of Agriculture in Prague has agreements of cooperationwith more than 50 agricultural universities all over the world and also activecontacts with important international organizations (UNESCO, FAO,OECD, etc.).
In 1992 the University of Agriculture in Prague organized a 6-weeksummer study course for students from Ohio State University as part of theirstudy program. These courses were successful and they should continue in1993 even for other American universities (Iowa). These activitiesdemonstrate the efforts of our agricultural universities to become integratedin wider cooperation with European and American universities.
OECS expert groups and experts from other organizations (e.g. CitizensDemocracy Corps, World Bank, etc.) contributed in 1991-92 with reportsand analyses that provided agricultural universities with methodologicalapproaches to the solution of some of the recent problems of these schools.
As mentioned above, schools of agricultural higher education wereinformed about the conclusions and recommendations of the OECDCommission of Experts for Education, as submitted at the beginning of1992. These recommendations were accepted as important suggestionsleading towards the improvement of the system of higher education and itscontentual, organizational, personal and economic position.
22
Chairman of the Session 1
Prof. Dr. K. Mengel, Institute of PlantNutrition, Justus Liebig University,Giessen, Germany, member of the ScientificBoard of the International Potash Institute
Session 1
K in the Pedosphere
23

K-Fluxes in. Soils in Relation to Parent Material andPedogenesis in Tropical, Temperate and AridClimates
Robert, M., Station de Science du Sol, Institut National de la RechercheAgronomique, 78026 Versailles, France
Summary
The topic concerns K dynamics in the pedosphcre and a general view isgiven of the different K pools or compartments and of the main fluxesbetween these compartments. Among the compartments, the K in themineral compartment has been most investigated: it constitutes the mainreserve and the main buffer in the pedosphere. Two main fluxes are presentindependently of the use of fertilizers. The first vertical through leaching,the other horizontal towards the root. Various pedological situations areconsidered. In tropical soils the vertical flux (plus erosion loss) can bedominant; supply of K to the root depends on the presence of 2:1 clayminerals or organic matter. In temperate regions, fluxes between thedifferent K sites which can be distinguished in the mineral compartment arethe main factors which determine plant nutrition. In arid and semi-aridsoils, K fixation can be very high but the chief limiting factor is water massflow. Because our knowledge is incomplete, there are difficulties inpredicting the K flux coming from the mineral pool and the way in whichsoils differing on the bases of soil or land classification will behave.
1. Introduction
Parent material, climatic conditions and living organisms are consideredas the main factors of soil formation but they are also essential parameters todetermine physical and chemical functioning of soil. This is specially truefor K dynamics in soils. In such dynamics, primary and secondary mineralsdepend on both parent rock and pedogenesis and represent the main Ksupplies; climatic conditions (general and local) and natural vegetation ortype of crop are responsible for the main fluxes. The different compartments
25
of the general K cycle are first defined, then the modalities of the cycle willbe described in more precise pedological conditions.
2. General aspects of K dynamics in the pedosphere
K Mineral reserve
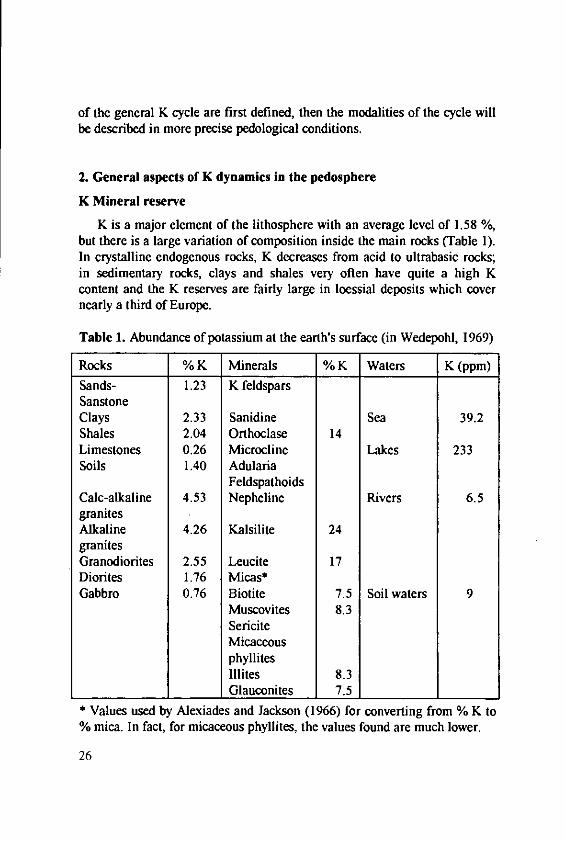
K is a major element of the lithosphere with an average level of 1.58 %,but there is a large variation of composition inside the main rocks (Table 1).In crystalline endogenous rocks, K decreases from acid to ultrabasic rocks;in sedimentary rocks, clays and shales very often have quite a high Kcontent and the K reserves are fairly large in loessial deposits which covernearly a third of Europe.
Table 1. Abundance of potassium at the earth's surface (in Wedepohl, 1969)
Rocks % K Minerals % K Waters K (ppm)Sands- 1.23 K feldsparsSanstoneClays 2.33 Sanidine Sea 39.2Shales 2.04 Orthoclase 14Limestones 0.26 Microcline Lakes 233Soils 1.40 Adularia
FeldspathoidsCalc-alkaline 4.53 Nepheline Rivers 6.5granitesAlkaline 4.26 Kalsilite 24granitesGranodiorites 2.55 Leucite 17Diorites 1.76 Micas*Gabbro 0.76 Biotite 7.5 Soil waters 9
Muscovites 8.3SericiteMicaceousphylliteslllites 8.3Glauconites 7.5
* Values used by Alexiades and Jackson (1966) for converting from % K to% mica. In fact, for micaceous phyllites, the values found are much lower.
26
PEDOSPHERE BIOSPHERE - PLANTS
FeldapMs Feldspao ids Micas and micaccous days veetaionsanidine nephTeline dioctahedral trioctahedral release bymicodine leucit emuscovite dile biolite mineralization
S orthose sencte glauconite phiogopte
Destruction or by H and E rag iffso digffusionby hydroysis comxan aRunoff
Soil Solution I (Oro=sin)
4 TeachrngVernioj ltesSmEaitesHYROSHERInterstiatsfied (ornic YDROSPHERE
minerals mW
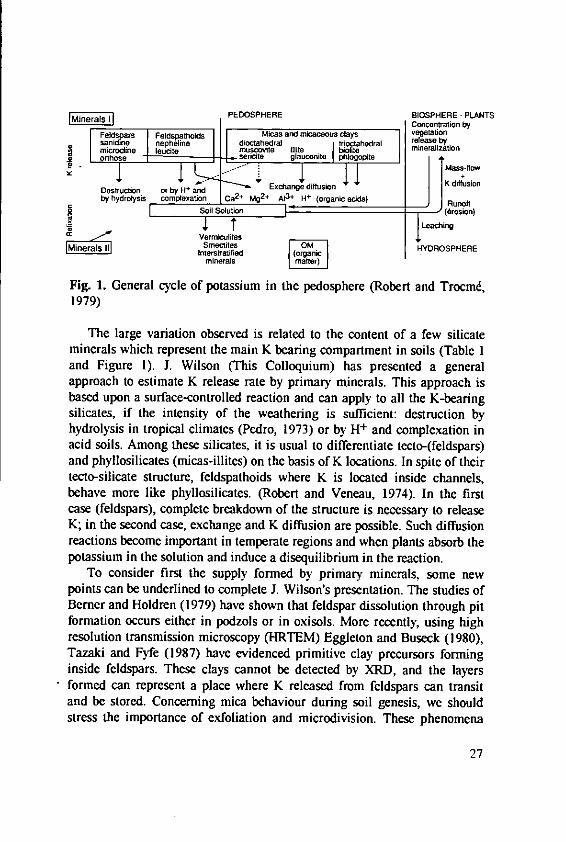
Fig. 1. General cycle of potassium in the pedosphere (Robert and Trocm6,1979)
The large variation observed is related to the content of a few silicateminerals which represent the main K bearing compartment in soils (Table Iand Figure 1). J. Wilson (This Colloquium) has presented a generalapproach to estimate K release rate by primary minerals. This approach isbased upon a surface-controlled reaction and can apply to all the K-bearingsilicates, if the intensity of the weathering is sufficient: destruction byhydrolysis in tropical climates (Pedro, 1973) or by H+ and complexation inacid soils. Among these silicates, it is usual to differentiate tecto-(feldspars)and phyllosilicates (micas-illites) on the basis of K locations. In spite of theirtecto-silicate structure, feldspathoids where K is located inside channels,behave more like phyllosilicates. (Robert and Veneau, 1974). In the firstcase (feldspars), complete breakdown of the structure is necessary to releaseK; in the second case, exchange and K diffusion are possible. Such diffusionreactions become important in temperate regions and when plants absorb thepotassium in the solution and induce a disequilibrium in the reaction.
To consider first the supply formed by primary minerals, some newpoints can be underlined to complete J. Wilson's presentation. The studies ofBerner and Holdren (1979) have shown that feldspar dissolution through pitformation occurs either in podzols or in oxisols. More recently, using highresolution transmission microscopy (HRTEM) Eggleton and Buseck (1980),Tazaki and Fyfe (1987) have evidenced primitive clay precursors forminginside feldspars. These clays cannot be detected by XRD, and the layersformed can represent a place where K released from feldspars can transitand be stored. Concerning mica behaviour during soil genesis, we shouldstress the importance of exfoliation and microdivision. These phenomena
27
are important in crystalline or sedimentary silty rocks and they lead to anincrease in both external surface area and available potassium. Such 10 A0
minerals can be identified fairly well in the clay fraction and they should bedistinguished from sedimentary illites (Robert et al., 1991).
Concerning K-release and fixation by secondary clay minerals, new ideashave been put forward. For example, the Nadeau (1984) theory whichfocused on the existence of fundamental particles and on the importance ofinterparticular spacings, can be of major importance in soils, (Robert et al.1991). Robert and Tessier, (1992) insist on the small dimensions of the soilparticles both in the number of layers per particle and lateral extension. Sothe sites available for K are perhaps more diverse than the classicalinterlattice, edge, and planar. During K release or fixation (for exampleduring wetting and drying cycles) particles can be associated or dissociatedalong the a-b plane. (Andreoli, 1989). In such a dynamic process, planar andinterlattice sites would be interchangeable with some reorganisation of theditrigonal cavities. Similarly redox phenomena in ferric smectite (nontronite)produce the same textural (increase or decrease of the number of layers) andstructural (change in stacking order bidimensional ± tridimensional)modifications (Stucki and Tesssier, 1991).
Infrared spectroscopy in the past enabled a refined characterisation of thedifferent K sites in 2:1 phyllosilicates. It has also made it possible to clearlydifferentiate trioctahedral from dioctahedral environments (Vedder, 1964).This distinction fits with the Bassett (1960) hypothesis which explains thehighest K release from trioctahedral mica. More recently, it was possible touse far infrared spectra of micas in order to make the same distinction(Laperche and Prost, 1991). In illite smectite series, the distinction of threebands at 105, 95 and 85 cm-1 could correspond to different K locations(Harsh et al., 1992).
X Ray diffraction studies (Sakharov et al., 1990) which provide betterknowledge of the structure, also made it possible to distinguish between thehexagonal cavity (micas or illite of 1 M or 2 M polytype) and the ditrigonalcavity which exists in the I Md illite or glauconite, or in K smectitesubjected to wetting and drying cycles.
If we synthesise all these new results obtained by HRTEM, X-raydiffraction and far infrared spectroscopy, we can identify several K sites oneither primary or secondary 2:1 clay minerals, which have to be compared tothe 6 types of cation exchange sites identified by the enthalpies of Ca-Kexchange (Goulding, 1983). The important point is that it appears as acontinuum of different K sites which can all occur within the same soil, with
28
the possibility of transition from site to site. Weathering, but also eventsoccurring during normal soil functioning such as changes in hydricbehaviour or redox conditions, can induce both textural and structuralmodifications with direct repercussions on K fixation or release from or tothese sites.
To establish relationships between such data and soil functioning or evenagricultural practices would be important but difficult because plant rootdevelopment is also affected. So irrigation or no tillage may favour Kdiffusion by increasing the soil moisture but the decrease in rootdevelopment and increasing reduction phenomenon can also affect Kavailability.
K organic pool
In this paper the focus is on the "mineral K pool" because it representsthe main and more complex source of K. The organic K pool consists eitherof fresh organic matter (plant or microorganism residues) cells or of humicand fulvic substances where K is adsorbed on the carboxylic or phenolicgroups. As K does not form an organic complex and the selectivity oforganic matter (OM) is higher for others cations, K release will be easyeither by exchange reaction, leaching or OM mineralisation. Nevertheless,in some cases (tropical soils, podzolic soils) this OM pool represents arelatively large storage.
K in solution, K leaching, and K in the plant
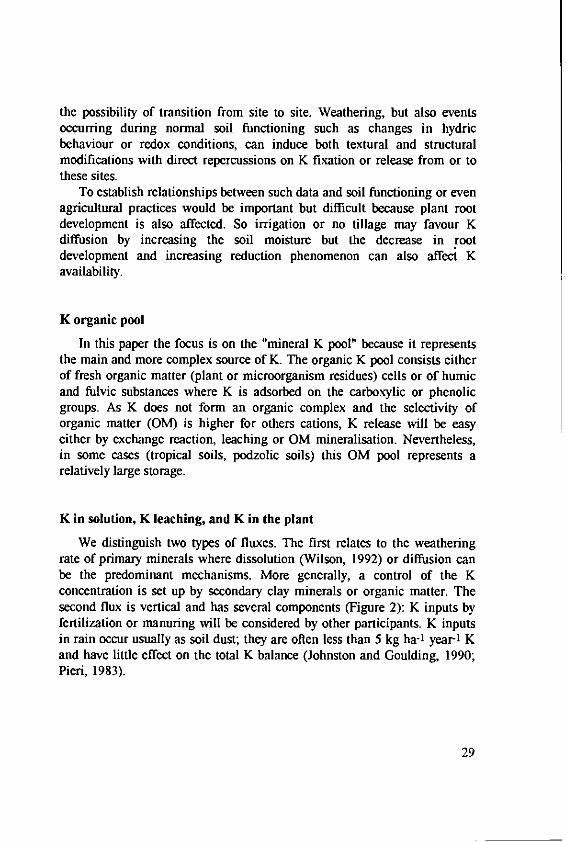
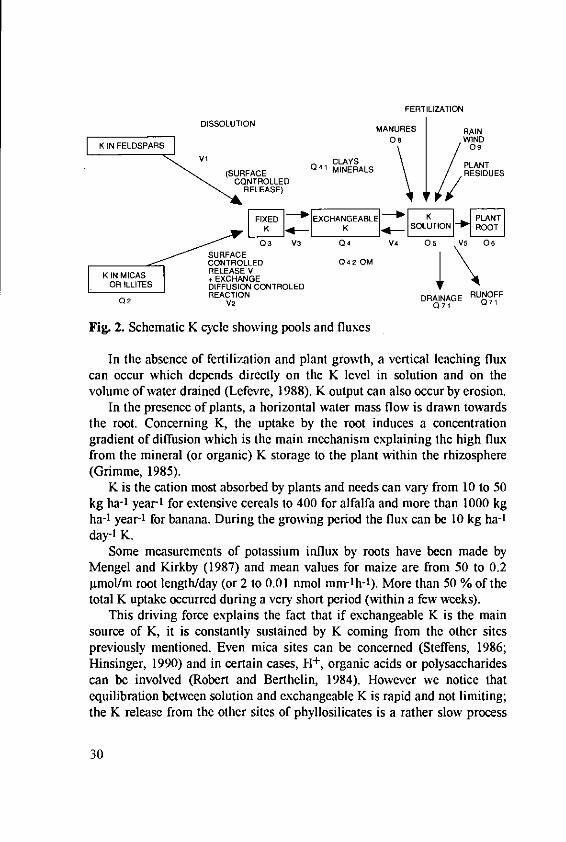
We distinguish two types of fluxes. The first relates to the weatheringrate of primary minerals where dissolution (Wilson, 1992) or diffusion canbe the predominant mechanisms. More generally, a control of the Kconcentration is set up by secondary clay minerals or organic matter. Thesecond flux is vertical and has several components (Figure 2): K inputs byfertilization or manuring will be considered by other participants. K inputsin rain occur usually as soil dust; they are often less than 5 kg ha-1 year- Kand have little effect on the total K balance (Johnston and Goulding, 1990;Pieri, 1983).
29
FERTILIZATION
DISLUINMANURES I RAININ FELDSPARS OWIND
09V' CLAYS PLANT
(SURFACE 041 MINERALS RESIDUESCONTROLLEDRELEASE)
FIXE] NGABLEK E
SURFACECONTROLLED 042 OM
KIN MICAS RELEASE XCHANGEOR LLITES DIFFUSION CONTROLED
02 REACTION DRAINAGE RUNOFFV2Q71 071
Fig. 2. Schematic K cycle showing pools and fluxes
In the absence of fertilization and plant growth, a vertical leaching fluxcan occur which depends directly on the K level in solution and on thevolume of water drained (Lefevre, 1988). K output can also occur by erosion.
In the presence of plants, a horizontal water mass flow is drawn towardsthe root. Concerning K, the uptake by the root induces a concentrationgradient of diffusion which is the main mechanism explaining the high fluxfrom the mineral (or organic) K storage to the plant within the rhizosphere(Grimme, 1985).
K is the cation most absorbed by plants and needs can vary from 10 to 50kg ha-' year 1 for extensive cereals to 400 for alfalfa and more than 1000 kgha-1 year- for banana. During the growing period the flux can be 10 kg ha-1
day-' K.Some measurements of potassium influx by roots have been made by
Mengel and Kirkby (1987) and mean values for maize are from 50 to 0.2gmol/m root length/day (or 2 to 0.01 nmol mm-lh-1). More than 50 % of thetotal K uptake occurred during a very short period (within a few weeks).
This driving force explains the fact that if exchangeable K is the mainsource of K, it is constantly sustained by K coming from the other sitespreviously mentioned. Even mica sites can be concerned (Steffens, 1986;Hinsinger, 1990) and in certain cases, H+, organic acids or polysaccharidescan be involved (Robert and Berthelin, 1984). However we notice thatequilibration between solution and exchangeable K is rapid and not limiting;the K release from the other sites of phyllosilicates is a rather slow process
30
which cannot meet the intense K requirement of the plant (Grimme, 1985).Experiments carried out with isotopic tracers demonstrate both the existenceof fluxes between the different pools or the different sites, and the timedependence of the different types of K release (Fardeau el al., 1992) (ThisColloquium).
A schematic K cycle is presented in Figure 2. In order to speak of flux,we need both the amount of the pools (Q) and the K release or fixation inrelation with time (i.e. speed = V). The mineral compartment is the mostcomplex and it includes several interconnected pools. Several analyticaldeterminations provide information on the composition of the K mineralcompartment: sodium tetmphenylborate extraction gives a better idea aboutthe available reserve, and the determination of the buffer capacity by Q/1isotherm (Quemener, 1986) provides information on the dynamic reaction ofthe different mineral pools. However considering the great diversity of soilconditions quantitative data are difficult to provide; therefore onlyqualitative data as Q and V will be given for the different types of soils.
3. Examples of more specific K dynamics in soils
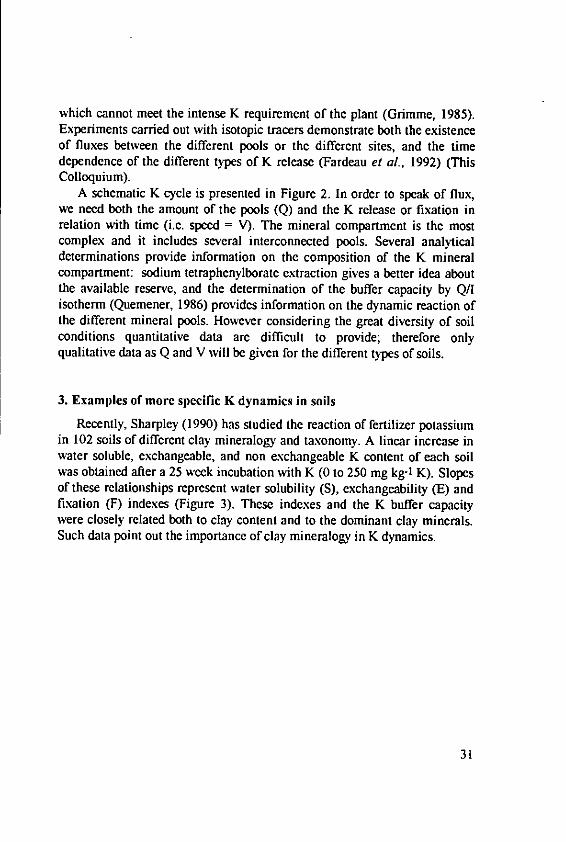
Recently, Sharpley (1990) has studied the reaction of fertilizer potassiumin 102 soils of different clay mineralogy and taxonomy. A linear increase inwater soluble, exchangeable, and non exchangeable K content of each soilwas obtained after a 25 week incubation with K (0 to 250 mg kg-1 K). Slopesof these relationships represent water solubility (S), exchangeability (E) andfixation (F) indexes (Figure 3). These indexes and the K buffer capacitywere closely related both to clay content and to the dominant clay minerals.Such data point out the importance of clay mineralogy in K dynamics.
31
.4
Z02
020C,34 0 OOZ.o'08o0 .
04. 00090Xr7-7Q
4- .,. . r0.0OW7+0.03 *7
001 OAT-- . 0oo,=Xi
CLA COTET 20 v0 L02 4
CLAY CONTENT W
Soils inhthehumidotropic
Y.233* .45' X
0I.,
32-
kk.
5300
I.0
CLAY CONTENT(S
Fig. 3. Relationships between K exchangeability index (E), K fixation index(F) and K buffer capacity and clay content for the kaolinitic, mixed, andsmectitic: soils (Sharpley, 1990)
Soils in the humid tropics
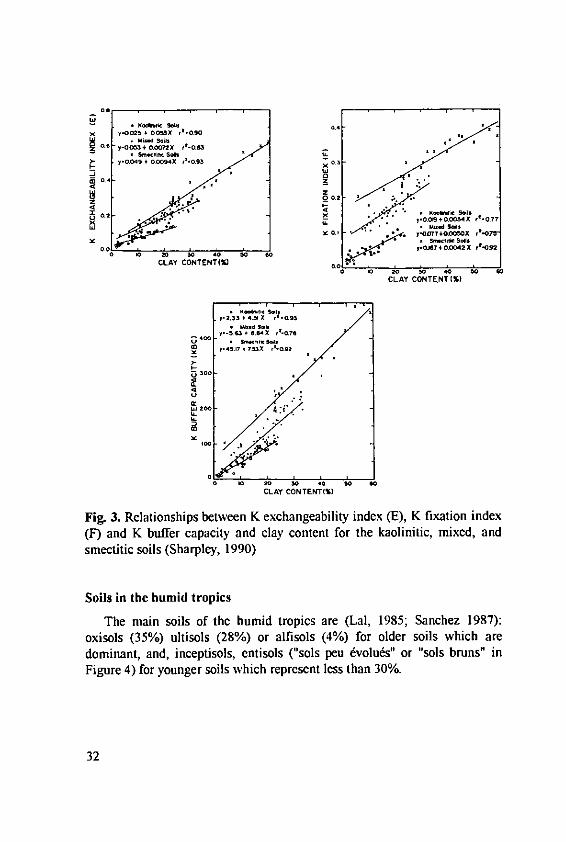
The main soils of the humid tropics are (Lal, 1985; Sanchez 1987):oxisols (35%) ultisols (28%) or alfisols (4%) for older soils which aredominant, and, inceptisols, enitisols ("sols pen dvoluds" or "sols bruns" inFigure 4) for younger soils which represent less than 30%.
32
Clay type
Immature or Ferralic F[ ]erraiiti Ferralitic soilstropica I araferraliti
G recent Cambisols soils Ferasols-tropical Ferralitic oxisolssoils Andosols
1:1 Ferrisols-Ultisols
Ferrugineoustropical soils
Eutrophicbrown soils
2:1
LithomorphicVertisols
P e100 Degree ofPrescence of primary mineral reserve alteration (% of primary
minerals altered)
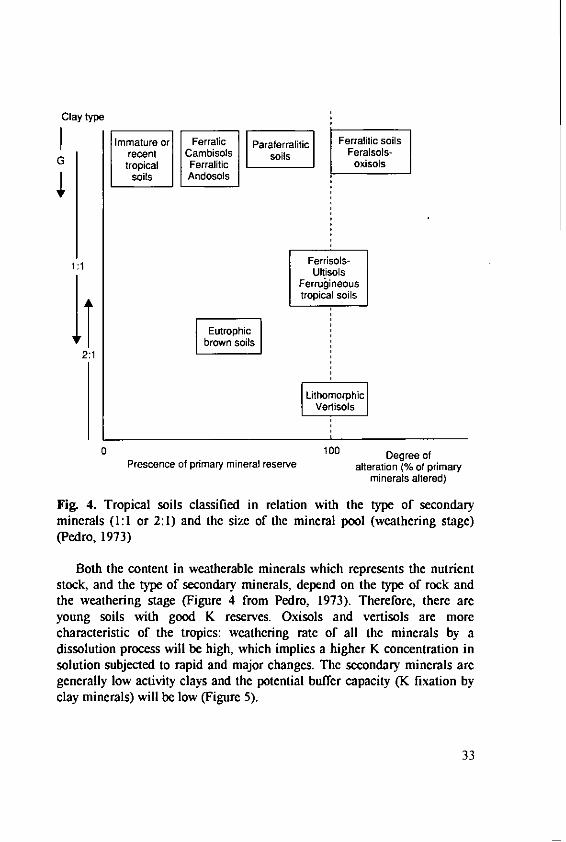
Fig. 4. Tropical soils classified in relation with the type of secondaryminerals (1:1 or 2:1) and the size of the mineral pool (weathering stage)(Pedro, 1973)
Both the content in weatherable minerals which represents the nutrientstock, and the type of secondary minerals, depend on the type of rock andthe weathering stage (Figure 4 from Pedro, 1973). Therefore, there areyoung soils with good K reserves. Oxisols and vertisols are morecharacteristic of the tropics: weathering rate of all the minerals by adissolution process will be high, which implies a higher K concentration insolution subjected to rapid and major changes. The secondary minerals aregenerally low activity clays and the potential buffer capacity (K fixation byclay minerals) will be low (Figure 5).
33
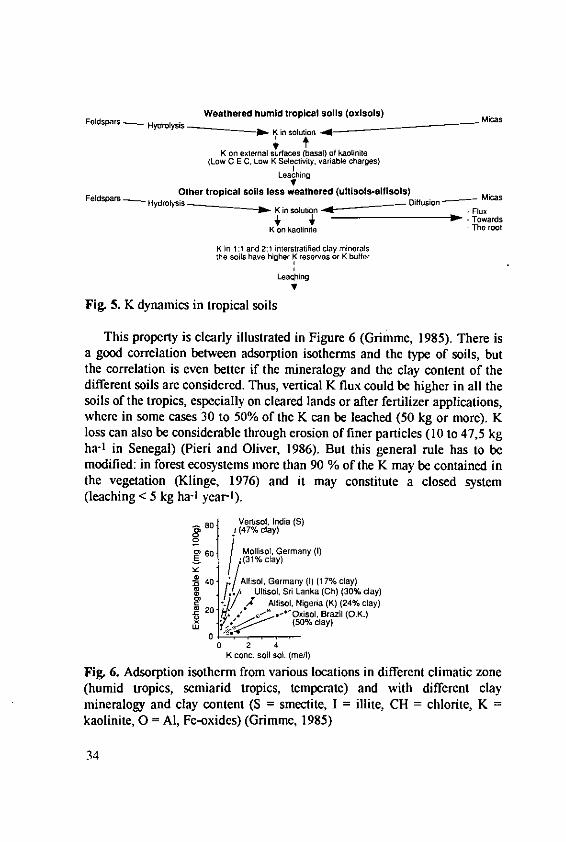
Weathered humid tropical soils (oxisols) MicsFeldspars Hydrolysis K in solution
K on external surfaces (basal) of kaolinite(Low C E C, Low K Selectivity, variable charges)
LeachingV
Other tropical soils less weathered (ultlsols-alfisols)Feldspars Hydrolysis - K in solution n - Flux
S 4 - TowardsK on kaolinite The root
K in 1:1 and 2:1 interstralified clay mineralsthe soils have higher K reserves or K buffer
Leaching
Fig. 5. K dynamics in tropical soils
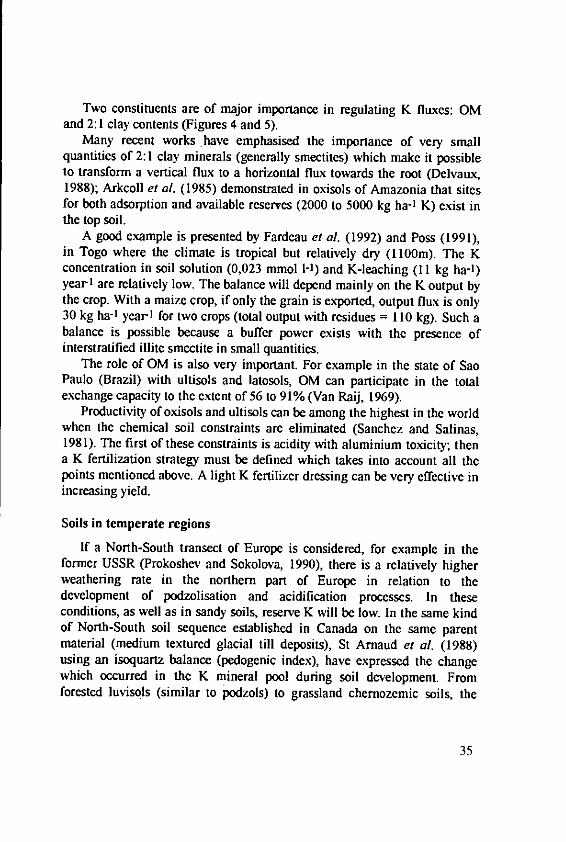
This property is clearly illustrated in Figure 6 (Grimme, 1985). There isa good correlation between adsorption isotherms and the type of soils, butthe correlation is even better if the mineralogy and the clay content of thedifferent soils are considered. Thus, vertical K flux could be higher in all thesoils of the tropics, especially on cleared lands or after fertilizer applications,where in some cases 30 to 50% of the K can be leached (50 kg or more). Kloss can also be considerable through erosion of finer particles (10 to 47,5 kgha-1 in Senegal) (Pieri and Oliver, 1986). But this general rule has to bemodified: in forest ecosystems more than 90 % of the K may be contained inthe vegetation (Klinge, 1976) and it may constitute a closed system(leaching < 5 kg ha-' yearl).
so Verisol, India (S)1 (47% clay)
S60 / MollisoT. Germany (I)g. (31% clay)
40 Alfisol, Germany (I) (17% clay)Ullisol. Sri Lanka (Ch) (30% clay)/' Allisol. Nigeria (K) (24% clay)
20 x-0 .*"Oxisol, Brazil (O.K.)
x (50% clay)US 0
0 2 4K coc. soil sol. (me/I)
Fig. 6. Adsorption isotherm from various locations in different climatic zone(humid tropics, semiarid tropics, temperate) and with different claymineralogy and clay content (S = smectite, I = illite, CH = chlorite, K =kaolinite, 0 = Al, Fe-oxides) (Grimme, 1985)
34
Two constituents are of major importance in regulating K fluxes: OMand 2:1 clay contents (Figures 4 and 5).
Many recent works have emphasised the importance of very smallquantities of 2:1 clay minerals (generally smectites) which make it possibleto transform a vertical flux to a horizontal flux towards the root (Delvaux,1988); Arkcoll et at. (1985) demonstrated in oxisols of Amazonia that sitesfor both adsorption and available reserves (2000 to 5000 kg ha-1 K) exist inthe top soil.
A good example is presented by Fardeau et al. (1992) and Poss (1991),in Togo where the climate is tropical but relatively dry (1100m). The Kconcentration in soil solution (0,023 mmol 1-1) and K-leaching (11 kg ha-')yearl are relatively low. The balance will depend mainly on the K output bythe crop. With a maize crop, if only the grain is exported, output flux is only30 kg ha-I yearl for two crops (total output with residues = 110 kg). Such abalance is possible because a buffer power exists with the presence ofinterstratified illite smectite in small quantities.
The role of OM is also very important. For example in the state of SaoPaulo (Brazil) with ultisols and latosols, OM can participate in the totalexchange capacity to the extent of 56 to 91% (Van Raij, 1969).
Productivity of oxisols and ultisols can be among the highest in the worldwhen the chemical soil constraints are eliminated (Sanchez and Salinas,1981). The first of these constraints is acidity with aluminium toxicity; thena K fertilization strategy must be defined which takes into account all thepoints mentioned above. A light K fertilizer dressing can be very effective inincreasing yield.
Soils in temperate regions
If a North-South transect of Europe is considered, for example in theformer USSR (Prokoshev and Sokolova, 1990), there is a relatively higherweathering rate in the northern part of Europe in relation to thedevelopment of podzolisation and acidification processes. In theseconditions, as well as in sandy soils, reserve K will be low. In the same kindof North-South soil sequence established in Canada on the same parentmaterial (medium textured glacial till deposits), St Arnaud et ai. (1988)using an isoquartz balance (pedogenic index), have expressed the changewhich occurred in the K mineral pool during soil development. Fromforested luvisols (similar to podzols) to grassland chernozemic soils, the
35
total K20 loss varies from 12 % to 2 %. The K feldspars are weathered (by adissolution process) to a greater extent than the micas. The cation exchangecapacity values of the luvisols are low in the surface horizon (loss of OMand clay by leaching); in the chernozem the higher value is related to boththe clay and OM contents.
If podzolic soils are first considered, some nuance can be introducedconcerning the K cycle under forest vegetation: in the Vosges where theannual balance is well known (Mohamed et al., 1992), input is low (2 - 5 kgha-'), output by leaching ranges from 6 to 10 kg and the whole cycleconcerns 30 kg ha- 1 K in a closed internal cycle between trees and soil. Suchquantities have to be referred to the value of the mineral pools which arerespectively 380 kg for exchangeable K and 200 to 300 tons for total K. Thesandy podzols of the Landes (France) where high yields of maize areproduced represent a specific example. These soils have a very low amountof clay, and OM represents the main source of exchangeable K. The annualrate of fertilization (50 kg ha-1 K) is far less than crop requirement becausestover is returned to the soil; K output by leaching (20 to 30 kg) is quiteimportant (Lubet et Juste, 1985; Juste et al, 1982).
Speaking again of young soils with high K reserves, wheat is still grownin the Great Plains Region of the US without any K fertilizer input for abouta century. In the corn belt, only a little K fertilizer is needed even withmaize, if the stover is returned to the soil. The balance is as follows: 14 kg Kapplied, 20 kg removed with the grain, 15 kg lost due to leaching; theremaining 21 kg is held in exchangeable and non exchangeable forms. Sucha balance is due to the great fertility of the soils which are rich in 2:1 clayminerals (illite + smectite). Recent experiments by Robertson et al. (1992)with barley in South Alberta (Canada) have shown that K fertilization cangive the maximum yield either with high initial K application (250 kg ha-'K) or, even better, by annual application of 25 kg ha-1. These are goodexamples of low input fertilization but it should also be noted that lowtemperatures are a major constraint for yield.
36
REPARTIION DES SCLS LSIE N EUROPE
Cj lt
C C A
uo <"4
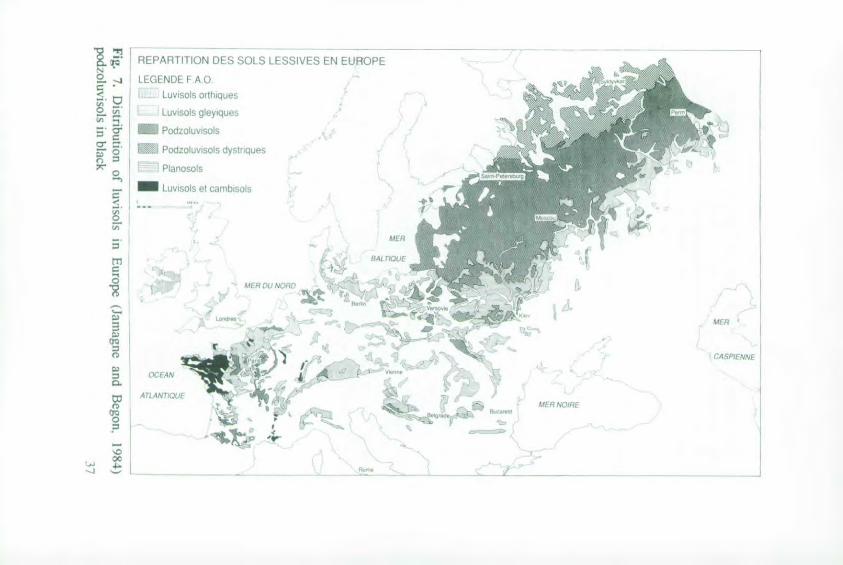
The situation is somewhait similar in the temperate regions of lropex here the most represcntative situation is that of the "sols bruns lessivs" orof the lwuisols developed ol silty acolian material (Figure 7) (Jamagne andBegon. 1984) On such parent material all the soils are characterised b*Nlarge primar reserves and a relatively high amount of 2:1 clay minerals
hich contribute to K flux regulation (Sha rple", 1990)lit such soils, recent studies (Robert et at. 1988) have made it possible to
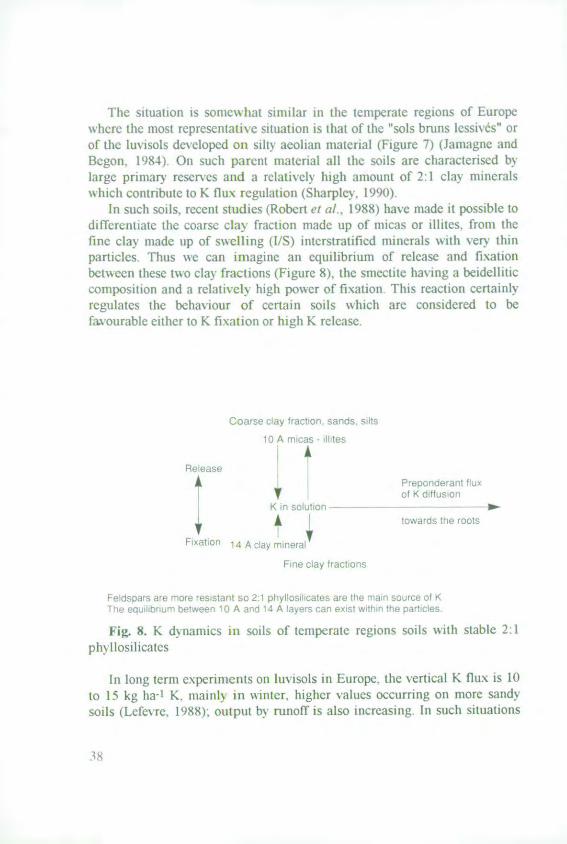
differcntiate the coarse clay fraction made up of micas or illites, from thefine clay made up of swelling (L/S) interstratified minerals wNith very thinparticles. Thus we can imagine an equilibrium of release and fixationbetwcen these two clay fractions (Figure 8), the smectite hav ing a beidelliticcomposition and a relatively high poNer of fiation This reaction certainlxregulates the behaviour of certain soils which are considered to bela ourable either to K fixation or high K release.
Co3ce iy uctt S :S -
1(A P] S 03 r e
~ol K diflusio i1 1 A
A vd 0 oos
F+dsoa> 8( f/ rie P a t SO p1 y 0oi (: {tf~ ! r i~c
Fig. 8. K d , nanics lin soils of temperate regons soils xith stable 2:1ph losilicates
In long tern experiments on luvisols in Europe, the vertical K flux is 10to 15 kg ha-1 K. mainly in wnter, higher values occurring on more sandysoils (Lefcvrc. 1988): output by runoff is also increasing. In such situations
<N
horizontal fluxes towards the roots are dominant and the K reserve in theclay fraction (2 to 3% K20) is very large. The limiting rate will be therelease of non-exchangeable K, especially during the very short growingperiod and for K demanding crops. Until now K fertilization has beenrelatively high in order to obtain maximum yield and applications greatlyexceed removal (Hebert, 1984). But this position is certainly being revisedand for this better prediction tools are needed.
Soils in arid and semi-arid regions
The effect of K, on water use efficiency is well known through itsinfluence on turgor pressure and stomatal regulation and it has therefore aspecific importance in arid regions where water is the main limitation forcrops.
In these areas the main soils are mollisols, inceptisols and vertisols,where the content in primary minerals is high and secondary minerals oftenconsist of smectite. Bouabid et ai. (1991) in a study of 44 soils of Moroccohave demonstrated for vermiculitic and smectitic soil clays thepredominance of tetrahedral charges and a correlative high K-fixationpotential.
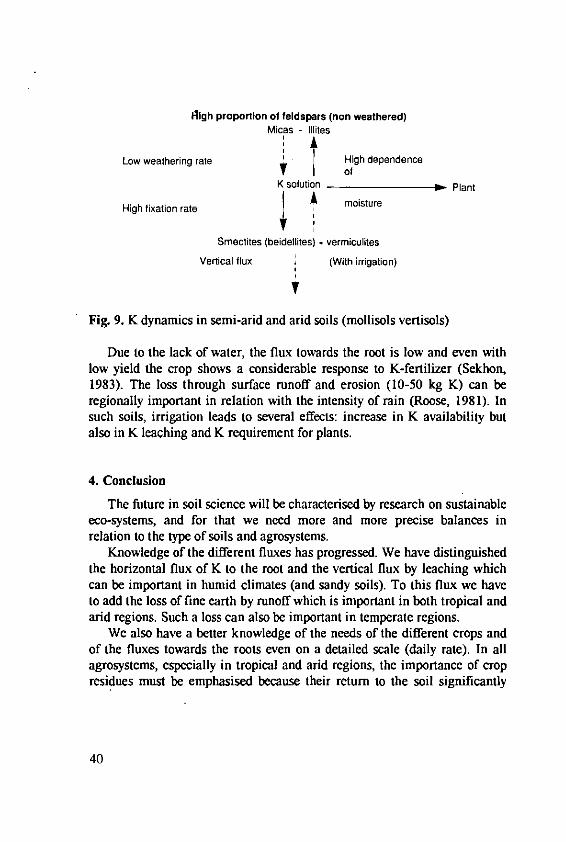
In the Hodna region (Algeria) soils are mainly petrocalcic, gypsum orsaline-rich soils (Daoud and Moktar, 1985). These soils are rich in total K(0.53 to 3% K) but have quite a high K proportion which is ratherunavailable (not extracted by Na tetraphenyl borate). Accordingly K insolution and K fluxes depend on release by primary minerals, which isrelatively low, and fixation by secondary minerals, which is relatively high(Figure 9).
39
-ligh proportion of feldspars (non weathered)Micas - Illites
Low weathering rate t4 High dependenceY i ofK solution Plant
High fixation rate 1 moisture
Smectites (beidellites) + vermiculites
Vertical flux (With irrigation)
Fig. 9. K dynamics in semi-arid and arid soils (mollisols vertisols)
Due to the lack of water, the flux towards the root is low and even withlow yield the crop shows a considerable response to K-fertilizer (Sekhon,1983). The loss through surface runoff and erosion (10-50 kg K) can beregionally important in relation with the intensity of rain (Roose, 1981). Insuch soils, irrigation leads to several effects: increase in K availability butalso in K leaching and K requirement for plants.
4. Conclusion
The future in soil science will be characterised by research on sustainableeco-systems, and for that we need more and more precise balances inrelation to the type of soils and agrosystems.
Knowledge of the different fluxes has progressed. We have distinguishedthe horizontal flux of K to the root and the vertical flux by leaching whichcan be important in humid climates (and sandy soils). To this flux we haveto add the loss of fine earth by runoff which is important in both tropical andarid regions. Such a loss can also be important in temperate regions.
We also have a better knowledge of the needs of the different crops andof the fluxes towards the roots even on a detailed scale (daily rate). In allagrosystems, especially in tropical and arid regions, the importance of cropresidues must be emphasised because their return to the soil significantly
40
decreases the K output. K in organic manures is also an important input fluxwhich has to be considered (Spiess and Besson, 1992) (This Colloquium).
It appears that the part of the K-balance about which relatively less isknown is the participation of the mineral reserve. We have seen that thiscompartment is very complex with the occurrence of several K sites ofdifferent availability. We need to know the various reactions and fluxeswithin this compartment in order to better adapt analytical procedures andmethods of prediction. This mineral compartment shows the greatervariations in relation to different soil types. Some attempts have been madein temperate regions to classify and map the potassium reserves in soils andtheir availability (Goulding and Loveland, 1986). Such data can permit theestablishment of a better relationship between the need of the crop and thenutrient supplying power of the soil. It is even more important to makesimilar studies in arid and tropical regions. In this last case, we have seenthat a small amount of 2:1 phyllosilicates has a considerable importance notonly for the level of K-reserves but also for the buffer power whichdetermines the fluxes.
Therefore, improved mineralogical determinations should be included inthe new fertility capability classifications (Sanchez et al., 1982) because, inthe case of K, they can be a base for low input.technology though this onlyallows submaximal crop yields.
5. References
Andreoli, C.: Evolution des phyllosilicates 2:1 en fonction de la dynamiquedu potassium. Th~se Universitd Paris VI (1989)
Arkcoll, D.B., Goulding K.W.T. and Hughes J.C.: Traces of 2:1 layer-silicate clays in oxisols from Brazil, and their significance for potassiumnutrition. J. of Soil Sci., 36, 123-128 (1985)
Bassett, W.A.: Role of hydroxyl orientation in mica alteration. Bull. Geol.Soc. Amer. 71, 449-456 (1960)
Berner, R.A. and Holdren G.R.: Mechanisms of feldspar weathering IIobservations of feldspars from soils. Geochim. Cosmochim. Acta 43,1173-1186 (1979)
Bouabid, R., Badraoui M. and Bloom P.R.: Potassium fixation and chargecharacteristics of soil clays. Soil Sci. Soc Am J 55, 1493-1498 (1991)
Daoud, V. and Moktar A.: Le r6gime du potassium dans quelques types desol du Hodna, Algdrie. Revue de la Potasse 6, 1-7 (1985)
41
Delvaux, B.: Constituants et propridtds de surface des sols ddrivds depyroclastes basaltiques du Cameroun Occidental. Approche g6ndtique deleur fertilitd. Thdse Univ. Catholique de Louvain Belgique (1988)
Diest, A. van: Characteristics of Nutrient Cycling and Nutrient BalanceSheets in Low Imput and High. Input Agriculture. Proc. 18th IPICongress, Gardone-Riviera, Italy (1984)
Eggleton, R.A. and Buseck P.R.: High resolution electron microscopy offeldspar weathering. Clays Clay Miner. 28, 173-178 (1980)
Goulding, K.W.T. and Loveland P.J.: The classification and mapping ofpotassium reserves in soils of England and Wales. J. Soil Sci. 37, 555-565 (1986)
Goulding, K.W.T.: Thermodynamics and potassium exchange in soils andClay Minerals. Adv. in Agron. 36, 215-263 (1983)
Grimme, H.: The dynamics of potassium in the soil/plant system. IPI Proc.19th IPI Congress, Bangkok, Thailand, 127-154 (1985)
Harsh, J., Laperche, V. and Prost, R.: Far infrared assignment in illitessmectites and interstratifxed illites/smectites (in preparation 1992)
Hebert, J.: Levels of fertilizer input in soil nutrient status in EuropeanAgriculture. Proc. 18th IPI Congress, Gardone, Italy 249-272 (1984)
Hinsinger, Ph.: Action des racines sur la libdration du potassium etI'altdration de mindraux silicatds, incidences agronomiques. These ENSAMontpellier (1990)
Jamagne, M. and Begon J.C.: Les sols lessivds de la zone tempdrde, apportde la pddologie franqaise. Un livre Jubilaire AFES 55-76 (1984)
Johnston, A.E. and Goulding K.W.T.: The use of plant and soil analyses topredict the potassium supplying capacity of soil. Proc. IPI Congress,Soligorsk, USSR, 177-203 (1990)
Juste, C., Tauzin, J., Dureau, P., Courpron, C.: Exportation des dldmentsfertilisants par lessivage en sol sableux des Landes de Gascogne. Rdsultatsde huit anndes d'observations en cases lysimdtriques. Agron. 2, 91-98(1982)
Klinge, H.: Bilanzierung von Hauptnahrstoffen im Okosytem tropischerRegenwald, Manaos, Vorlaufige Daten. Biogeographica 7, 59-77 (1976)
Lal, R.: Soil Surface management in the tropics for intensive land use andhigh sustained production. Adv. in Soil Sci. 5, 1-109 (1986)
Laperche, V. and Prost R.: Assignment of the far-infrared absorption bandsof K in micas. Clays Clay Miner. 39, 281-289 (1991)
42
Lefbvre, G.: Lessivage du potassium. In: phosphore et potassium dans lesrelations sol-plante: consdquences pour la fertilisation, L. Gachon (ed)INRA Paris, 53-78 (1988)
Lubet, E. et Juste, C.: Cindtique de la production de matire s~che et deprdlevement d'61ements nutritifs par une culture irrigude de mais A hauteproductivitt de rendement. Agron. 5, 239-250 (1985)
Mengel, K. and Kirkby, E.: Principles of plant nutrition 4th ed. UPI (1987)Mohamed, D., Ranger J., Dambrine E., Bonneau N.: The current function of
the declining spruce ecosystem assessed by the mass balance technique.Forest ecol. and management 1992 (in press)
Mutscher, H.: Relationship between Mineralogy of soil and assessment ofpotassium availability. Proc. 19th 1PI Congress, Bangkok, Thailand,155-165 (1985)
Nadeau, P.H., Wilson M.J., McHardy W.J. and Tait J.M.: InterstratifiedClays as fundamental particles. Science 225, 923-925 (1984)
Pedro, G.: La pddogdntse sous les tropiques humides et la dynamique dupotassium. Proc. 10th IPI Congress, Abidjan, Ivory Coast. 23-43 (1973)
Pieri, C. and Oliver R.: Assessment of K losses in tropical cropping systemsof francophone Africa and Madagascar. Proc. 17th IPI Congress, Reims,France, 73-92 (1986)
Pieri, C.: Nutrient balances in mainfed farming systems in arid and semi-arid regions. Proc. 17th IPI Congress, Rabat, Morocco. 181-209 (1983)
Poss, I: Transferts de leau et des 6l6ments mindraux dans les terres deBarre du Togo. Consdquences Agronomiques. These Universit6 Paris VI(1991)
Prokoshev, V.V. and Sokolova T.A.: Soil properties and potassiumbehaviour. Proc. 22nd IPI Congress, Soligorsk, USSR, 99-131 (1990)
Qudmener, J.: Important factors in potassium balance sheets. Proc. 13th IPICongress, Reims, France, 41-72 (1986)
Robert, M. and Berthelin J.: Role of biological and biochemical factors insoil mineral weathering. In: interactions of soil minerals with naturalorganics and microbes. SSSA spec. Pub. 17, 453-495 (1984)
Robert, M. and Tessier D.: Incipient weathering : some new concepts onweathering, clay formation and organization. 71- 106 in Weathering,Soils and Paleosols, IP Martini and W. Chesworth (ed.) Elsevier (1992)
Robert, M. and Trocmd, S.: Le Potassium. In: P6dologie 2 constituants etpropri6tds du sol. M. Bonneau et B. Souchier (ed) Masson Paris (1979)
43

Robert, M. and Veneau G.: An experimental evaluation of the effects of pHand concentration of salt solutions on the alteration of Leucite at lowtemperature. Geoderma 11, 209-219 (1974)
Robert, M., Guyot J. et Hervio M.: Mindralogie des sols et dynamique dupotassium. In: phosphore et potassium dans les relations sol-plante :consdluences sur la fertilisation L. Gachon (ed) INRA Paris 13-31(1988)
Robert, M., Hardy M. and Elsass F.: crystallochemistry, properties andorganization of soil clays derived from major sedimentary rocks inFrance. Clay Min. 26, 409420 (1991)
Robertson, J.A., Malhi S.S., Penney D.C., Kryzanowski L.: Relativeeffectiveness of initial versus annual applications of K fertilizer forbarley. Conf. Environmental Soil Science. Edmonton Canada (1992)
Roose, E.: Dynamique actuelle des sols ferrallitiques et ferrugineux tropicauxd'Afrique Occidentale. These Doc. SC 587 p. Univ. Orleans (1980)
Sanchez, P.A. and Salinas J.G.: Low-input technology for managing oxisolsand ultisols in tropical America. Adv. in Agron., 279407 (1981).
Sanchez, P.A.: Management of acid soils in the humid tropics of LatinAmerica. 63-107 in Management of acid tropical soils for sustainableagriculture. Proc. 2 IBSRAM, Bangkok, Thailand, (1987)
Sanchez, P.A., Couto W. and Buol S.W.: The fertility capability soilclassification system : Interpretation, Applicability and Modification.Geoderma 27, 283-309 (1982)
Sekhon, G.S.: Potassium dynamics in the soils of semi arid and arid areas.Proc. 17th IPC Congress, Rabat, Maroc, 153-162 (1983)
Sharpley, A.N.: Reaction of fertilizer potassium in soils of differentmineralogy. Soil Sci. 149, 44-51 (1990)
St. Arnaud, R.J., Stewart J.W.B. and Fressard E.: Application of the"Pedogenic Index" to soil fertility studies, Saskatchevan. Geoderma 43,21-32 (1988)
Steffens, D.: Root system and Potassium exploitation. Proc. 13th IPICongress, Reims, France, 107-118 (1986)
Stucki, J.W. and Tessier D.: Effect of iron oxidation state on the texture andstructural order of Na-Nontronite gels. Clays Clay Miner., 39, 137-143(1991)
Tazaki, K. and Fyfe W.S. Primitive clay precursors formed on feldspar. CanJ. Earth Sc. 24, 506-527 (1987)
Vedder, W.: Correlations between infrared spectrum and chemicalcomposition of mica. Am. Min. 49, 736-768 (1964)
44
K-Bearing Minerals and their K-Release Rates inDifferent Climates
Wilson, MJ., Macaulay Land Use Research Institute, Craigiebuckler,Aberdeen, AB9 2QJ, United Kingdom
Summary
The major K-bearing minerals in soils include framework silicates (K-feldspars and leucite) and layer silicates (biotite, muscovite, phlogopite,illitic minerals and glauconite). There is little comprehensive informationavailable on K-release rates of these individual minerals under fieldconditions and until recently it has not been possible to extrapolate fromlaboratory-determined weathering rates. However, recent work fromScandinavia in the environmental field marks a significant advance in thatcalculated mineral weathering rates have been correlated with field ratesdetermined by a variety of methods to within ±8%. The experimental ratesfor K-bearing minerals are assessed in the light of what is perceived to bethe relative order of susceptibility to weathering from soil mineralogicalstudies. In addition, as these rates increase with temperature and with wettedsurface area the likely effects of climate can also be assessed.
Introduction
The kinetic reactions of K in soils have been conceptualized as occurringbetween different phases representing different K pools described asmineral, non-exchangeable, exchangeable or soluble. But the nature of thesepools can be problematical (Scott and Smith, 1987). Thus, mineral K may bedescribed as including the native K in minerals such as muscovite and Kfeldspar, but has also been considered to include K which has been fixedfollowing its addition to the soil (Sharpley, 1989). However, Scott and Smith(1987) demonstrate clearly that native K in unweathered biotite and fixed Kin degraded biotite show marked differences in their rate of exchange tosodium and hence cannot be regarded as equivalent forms. Again, accordingto Sparks (1987) fixed K can be equated with non-exchangeable K which isdescribed as being held between the tetrahedral layers of 2:1 layer silicates
45
and not bonded into crystal structures of minerals as is mineral K. ButMemon et al (1988) attribute to finely divided feldspars the potential torelease non-exchangeable (fixed) K as well as 2:1 clay minerals.
In view of these problems of definition, it would seem logical indiscussing the release rates from K-bearing minerals to deal with all Kwhich occurs as structural cations in minerals that have been inherited intothe soil from the original parent material. In this paper the emphasis will befirstly upon surface reactions, where K is released at a rate similar to that ofother structural cations, so that the release of interlayer K from layersilicates can be brought more clearly into context.
K-Bearing Minerals
K-bearing minerals in soils generally belong either to the framework orlayer silicates, although in each of these groups there are a number ofmineral varieties which may respond to weathering in different ways. Theframework silicates include K-feldspar and the feldspathoid mineral leucite.Orthoclase feldspar and microcline are the most common forms of Kfeldspar and both occur extensively in soils derived from acid igneous andmetamorphic rocks, particularly granites and granitic gneisses, eitherdirectly or indirectly. Sanidine is a K-feldspar associated with soils derivedfrom volcanic parent material, as does the feldspathoid leucite. An importantstructural feature of feldspars so far as weathering is concerned is theirability to enter into an intimate lamellar intergrowth with other feldspars ofa different chemical composition, sometimes on an exceedingly fine scale.The most common such intergrowth is perthite, where Na-rich lamellae areassociated with the K-feldspar host, but so-called anti-perthites are alsopossible where K-rich lamellac occur in a dominant Na-rich host.
There are many different varieties of layer silicate minerals whichcontain structural K. Muscovite, phlogopite and biotite representingaluminous, magnesian and ferromagnesian compositions respectively maybe thought of as the primary layer silicates insofar as they occur as primarycomponents of igneous rocks. Muscovite and biotite are often commonconstituents of soils derived from granite, granitic gneiss or schist parentmaterials. Biotite may also occur in soils derived from intermediate andmore basic igneous rocks, whereas phlogopite is most often associated withultrabasic parent materials. Fine-grained secondary layer-silicates includesericite, an aluminous mica generally formed by late-stage alteration of K-
46
feldspar, and phengite which is also an aluminous mica but with a somewhat
higher magnesium and iron content and which is often found in fine-grainedmetamorphic rocks. Glauconite has a higher content of iron and magnesiumand is formed as an early diagenetic mineral in marine sediments. Illite is afine-grained hydrous mica-like mineral and again is most often formedduring diagenesis, but following sediment burial. The many different typesof interstratified illite-smectites generally represent intermediate phasesduring the diagenetic conversion of smectite to illite (Eberl, 1984; Wilsonand Nadeau, 1985). All these fine-grained layer silicates may be directlyinherited into the soil from their original parent materials and should be
regarded as K-bearing minerals.
Relative Rates of K-Release from K-bearing Minerals
This can be judged in a general way from the distribution of the mineralsin weathering profiles and from observations of grain surfaces and
associated weathering products. With regard to the common K-feldspars,generally microcline is more stable in weathering profiles than orthoclasefeldspar (Huang, 1989). This is consistent with the overall order of stabilityof rock forming minerals to weathering (Goldich, 1938) whereby thoseminerals which crystallize at higher temperatures in the discontinuousreaction series are generally less stable than the minerals formed at lower
temperatures. Microcline is usually formed at lower temperatures thanorthoclase. Structural considerations may also be important. Thus,
orthoclase has a more disordered structure than microcline in terms of thedistribution of Al and Si ions, and usually contains more Na-rich perthiticintergrowths. The interface between the K- and Na-rich components of aperthite is characterized by a slight structural mismatch (Smith, 1974) and is
therefore a zone of higher surface energy. Selective attack of perthiticintergrowths in K-feldspar has been documented by controlled etchingexperiments (Wilson and McHardy, 1980). Little is known of the relativestability of sanidine, although SEM observations on grains separated fromsome Italian Andosols show that the mineral is virtually unaffected by
weathering. In contrast, leucite occurring in the same soils is deeplycorroded and clearly much more vulnerable to weathering (Violante and
Wilson, 1983).
47

Weathering and release of K from layer silicate minerals has been ablysummarized by Fanning et at (1989). It has long been recognized that biotite(and phlogopite) weather much more rapidly than muscovite.. Biotitevermiculitizes and loses structural K even in cold climates. Thus, in someyouthful (<3000 years) skeletal soils developed from quartz mica schist onthe recently deglaciated Signy Island in Maritime Antarctica it was foundthat in the 75-150 pm fraction biotite had weathered to hydrobiotite therebylosing 50% of its structural K (Wilson and Nadeau, 1985). In acidic soilsbiotite may lose its structural integrity and weather out towards the surface(Farmer et al., 1985). In contrast, muscovite weathers exceedingly slowly.An indirect recognition of this is that the oxic horizon, the diagnostichorizon of the highly weathered Oxisols in the U.S. System of SoilTaxonomy, has been redefined by the Soil Survey Staff (1987) to permit it toinclude up to 10% weatherable minerals in the sand fraction, includingmuscovite by inference (Fanning et al., 1989).
The relative rate of K release from the fine grained dioctahedral micasdepends upon their exact nature. Comminuted muscovitic mica might wellbe expected to be resistant to weathering, but the evidence suggests thatillitic micas behave differently. For example, in the Alfisols (Udalfs) incentral USA, illites evidently lose their K during pedogenesis and transformto a variety of mixed layer and intergrade minerals (Jackson et al., 1952;Fanning and Jackson, 1965). These illites have in large part been inheritedinto the soil from Cretaceous sediments and were ultimately formed by thediagenetic conversion from smectite. Similarly, the fine grainedmetamorphic micas may weather to smectitic (Churchman, 1980) orvermiculitic products (Bain et al., 1990(a)) in Spodosols. Glauconite (andceladonite) are generally considered to be somewhat more suceptible toweathering than illite because of their higher iron and magnesium contents.Release of K may lead to the formation of Fe-rich smectite (Robert, 1973).
The relative rates of K release from such studies are assessed in Table 1.Biotite and possibly leucite are considered to be the minerals which releaseK most rapidly in soils. K-feldspars and muscovite mica release K mostslowly and the other minerals discussed fall into an intermediate category.
48
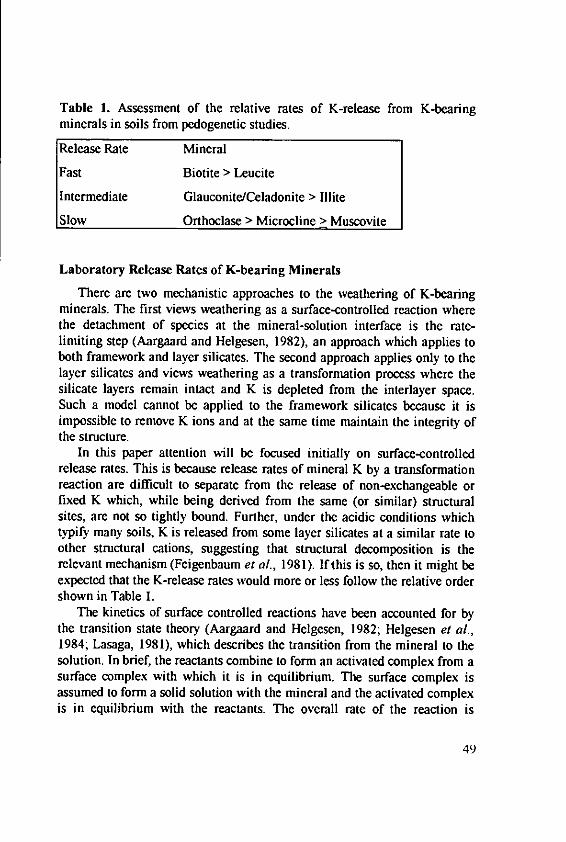
Table 1. Assessment of the relative rates of K-release from K-bearing
minerals in soils from pedogenetic studies.
Release Rate Mineral
Fast Biotite > Leucite
Intermediate Glauconite/Celadonite > Illite
Slow Orthoclase > Microcline > Muscovite
Laboratory Release Rates of K-bearing Minerals
There are two mechanistic approaches to the weathering of K-bearingminerals. The first views weathering as a surface-controlled reaction wherethe detachment of species at the mineral-solution interface is the rate-limiting step (Aargaard and Helgesen, 1982), an approach which applies toboth framework and layer silicates. The second approach applies only to thelayer silicates and views weathering as a transformation process where thesilicate layers remain intact and K is depleted from the interlayer space.Such a model cannot be applied to the framework silicates because it isimpossible to remove K ions and at the same time maintain the integrity ofthe structure.
In this paper attention will be focused initially on surface-controlledrelease rates. This is because release rates of mineral K by a transformationreaction are difficult to separate from the release of non-exchangeable orfixed K which, while being derived from the same (or similar) structuralsites, are not so tightly bound. Further, under the acidic conditions whichtypify many soils, K is released from some layer silicates at a similar rate toother structural cations, suggesting that structural decomposition is therelevant mechanism (Feigenbaum et al., 1981). If this is so, then it might beexpected that the K-release rates would more or less follow the relative ordershown in Table 1.
The kinetics of surface controlled reactions have been accounted for bythe transition state theory (Aargaard and Helgesen, 1982; Helgesen et al.,1984; Lasaga, 1981), which describes the transition from the mineral to thesolution. In brief, the reactants combine to form an activated complex from asurface complex with which it is in equilibrium. The surface complex isassumed to form a solid solution with the mineral and the activated complexis in equilibrium with the reactants. The overall rate of the reaction is
49
controlled by the decomposition of the activated complex and is proportionalto its concentration and, in turn, to the products of the reactants.
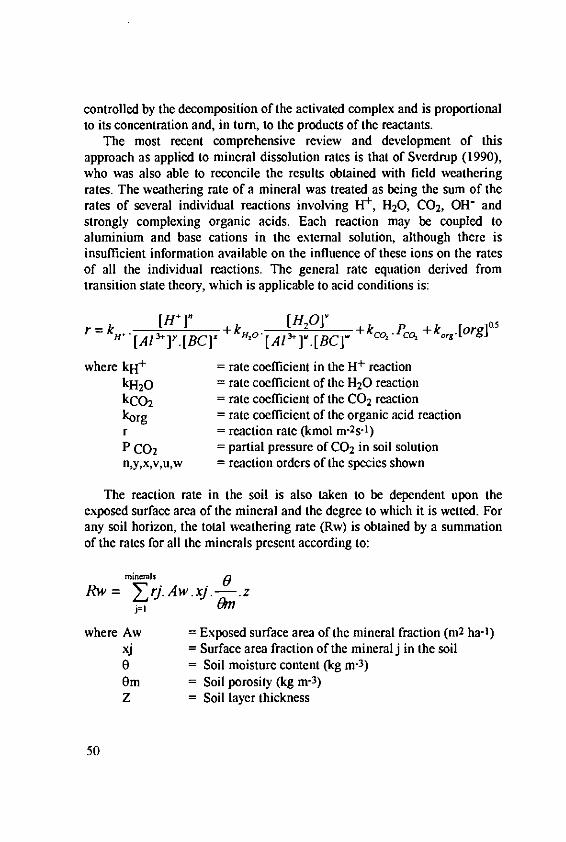
The most recent comprehensive review and development of thisapproach as applied to mineral dissolution rates is that of Sverdrup (1990),who was also able to reconcile the results obtained with field weatheringrates. The weathering rate of a mineral was treated as being the sum of therates of several individual reactions involving H+, H20, C02, OH- andstrongly complexing organic acids. Each reaction may be coupled toaluminium and base cations in the external solution, although there isinsufficient information available on the influence of these ions on the ratesof all the individual reactions. The general rate equation derived fromtransition state theory, which is applicable to acid conditions is:
r = kH. [/-H " + __[_0] +kco.Pco, +k.,,.[org]O.
[AIfl]Y.[BC]x 'O[Al3 ]u.[BC]w
where kH+ = rate coefficient in the H+ reactionkH20 = rate coefficient of the H20 reactionkco 2 = rate coefficient of the CO 2 reactionkorg = rate coefficient of the organic acid reactionr = reaction rate (kmol m-2s-1)P CO2 = partial pressure of CO2 in soil solutionn,y,x,v,u,w = reaction orders of the species shown
The reaction rate in the soil is also taken to be dependent upon theexposed surface area of the mineral and the degree to which it is wetted. Forany soil horizon, the total weathering rate (Rw) is obtained by a summationof the rates for all the minerals present according to:
minerls
Rw= Zrj.Aw.xj.-.zj=I an
where Aw = Exposed surface area of the mineral fraction (m2 ha-')xj = Surface area fraction of the mineral j in the soil0 = Soil moisture content (kg M-3 )
Om = Soil porosity (kg M-3)Z = Soil layer thickness
50
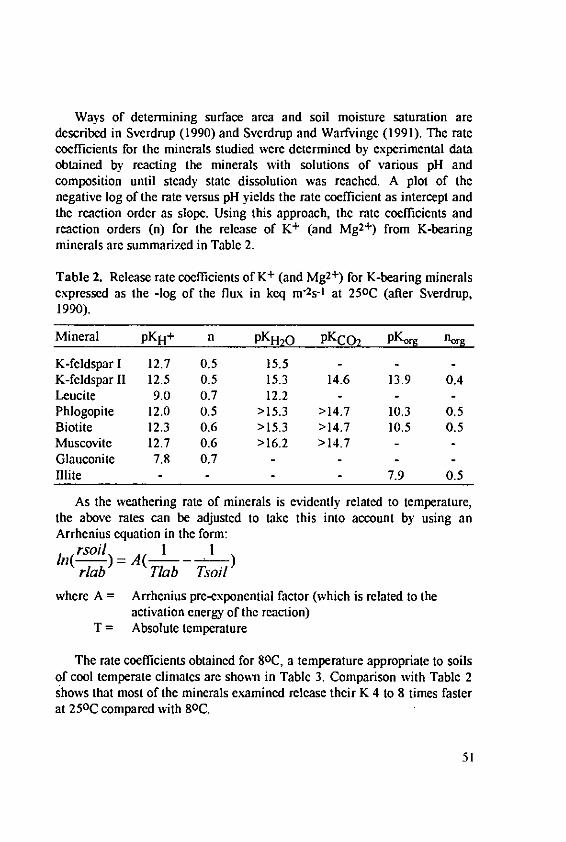
Ways of determining surface area and soil moisture saturation aredescribed in Sverdrup (1990) and Sverdrup and Warfvinge (1991). The ratecoefficients for the minerals studied were determined by experimental dataobtained by reacting the minerals with solutions of various pH andcomposition until steady state dissolution was reached. A plot of thenegative log of the rate versus pH yields the rate coefficient as intercept andthe reaction order as slope. Using this approach, the rate coefficients andreaction orders (n) for the release of K+ (and Mg2+) from K-bearingminerals are summarized in Table 2.
Table 2. Release rate coefficients of K+ (and Mg2+ ) for K-bearing mineralsexpressed as the -log of the flux in keq m-2s-I at 250C (after Sverdrup,1990).
Mineral pKHq+ n PKH20 PKCo 2 pKorg norg
K-feldspar I 12.7 0.5 15.5 - - -
K-feldspar II 12.5 0.5 15.3 14.6 13.9 0.4Leucite 9.0 0.7 12.2 - - -
Phlogopite 12.0 0.5 >15.3 >14.7 10.3 0.5Biotite 12.3 0.6 >15.3 >14.7 10.5 0.5Muscovite 12.7 0.6 >16.2 >14.7 - -
Glauconite 7.8 0.7 - - - -
Illite - 7.9 0.5
As the weathering rate of minerals is evidently related to temperature,the above rates can be adjusted to take this into account by using anArrhenius equation in the form:
rsoil 1bI( )=A( - )
rab Tab Tso)
where A = Arrhenius pre-exponential factor (which is related to theactivation energy of the reaction)
T = Absolute temperature
The rate coefficients obtained for 8oC, a temperature appropriate to soilsof cool temperate climates are shown in Table 3. Comparison with Table 2shows that most of the minerals examined release their K 4 to 8 times fasterat 250C compared with 80C.
51
Table 3. Release rate coefficients of K+ (and Mg 2+) for K-bearing minerals
expressed as the -log of the flux in keqm- 2s-1 at 5OC (after Sverdrup, 1990).
Mineral pKH+ n PKH20 PKCo 2 pKorg n.,
K-feldspar 1 13.4 0.5 16.2 - - -
K-feldspar 1I 13.2 0.5 16.0 15.8 14.2 0.4Leucite 10.4 0.7 13.0 - - -
Phlogopite 12.6 0.5 >16.1 >15.0 10.6 0.5Biotite 13.1 0.6 >16.1 >15.0 10.8 0.5Muscovite 13.5 0.6 17.0 - 14.6-15.1 - -
Glauconite 8.7 0.7 - - -
Illite - - 8.6 0.5
Release Rates for K of K-Bearing Minerals in Soils
Field weathering rates can be determined in both the long- and short-term. Long-term weathering rates can be calculated from soil profiles bycomparing the chemical/mineralogical composition of each horizon withthat of the C horizon which is taken to represent the unweathered parentmaterial. The method requires that the soil is developed upon uniformparent material, that the age of soil is known and that a suitable inertelement/mineral can be used as a reference. Short-term weathering ratesmay be calculated from input/output budgets of catchments. More recently, amethod based on the difference between the Sr isotope ratio of the depositionand that of the parent material has been used to determine the weatheringrate of soil minerals (Jacks, 1990). There are problems with each of thesemethods, particularly when applied to individual minerals. Thus, long termweathering rates most often are expressed in overall chemical terms becauseof the difficulty in quantifying soil mineralogy. The catchment budgetmethod cannot readily be applied to individual minerals and encountersdifficulties with K in particular which is usually held and cycled within thebiomass. Therefore, K release rates tend to be greatly underestimated wheninferences are made on the basis of catchment water analysis. Again, the Srisotope method is best suited for determining the weathering rates ofminerals rich in Ca, an element for which Sr is a suitable surrogate.
Nevertheless, Sverdrup and Warfvinge (1991) have succeeded in
reconciling field weathering rates from various sites in Europe and North
52
America with weathering rates calculated from the PROFILE model(Sverdrnp et at., 1990). This model uses experimentally-derived mineralreaction rates with adjustments for wetted surface area and temperature asdescribed above. It was found that correlation between calculated weatheringrates and field determined weathering rates was excellent, within ±8%.Table 4 shows weathering rates for feldspar and mica minerals, mostlydetermined from chemical analysis of historical soil profiles where thepreponderance of K was associated with a single mineral species.
Table 4. K-release rates from feldspar and mica minerals expressed as -logof K flux (keq m-2s-t ).
Location Mineral Rate Reference
GArdsjon (Sweden) Microcline 12.5-11.6 Olsson et al. (1955)Mharcaidh (Scotland) K-feldspar 12.8-11.7 Bain et al. (1990b)Kelly (Scotland) Fine Muscovite 13.2-12.2 Bain et al. (1990b)Chon (Scotland) Fine Muscovite 13.8-11.2 Bain et al. (1990b)Soiling (Germany) K-feldspar 12.5-11.9 F61ster (1985)Soiling (Germany) Mica 12.8-12.2 F61ster (1985)Coweeta (USA) Biotite 12.2 Velbel (1986)
The rates compare reasonably well with those determined by Sverdrupfor reactions with the H+ ion at 80C. Most of the sites are in NorthernEurope and have a mean annual temperature approaching this value. For aclimate with a mean annual temperature of 250C these rates would beincreased by between 3 to 15 times (Sverdrup and Warfvinge, 1991).
Discussion and Conclusions
The question arises as to whether these K release rates, which areexceedingly low, truly represent K-release rates from soil minerals. Onepoint of difficulty is in reconciling the relative order of weathering asassessed from soil mineralogical studies (Table 1) with the order that may bedetermined from the experimental approach (for the H ion reaction, forexample, which is likely to be most important) as seen in Tables 2 and 3.There is agreement that microcline, orthoclase feldspar and muscovitewould be the slowest weathering minerals. However, the experimental ratecoefficients would seem to indicate, although the data are fragmentary, that
53
illite and glauconite would release K at a faster rate than biotite orphlogopite, which would generally be contrary to the interpretations arisingfrom mineralogical studies of soil profiles. It should be noted though that iforganic acid weathering is dominant, as it may be in podzolic soils, then theweathering rate of the trioctahedral micas increases by two orders ofmagnitude. However, the major point is that natural weathering of layersilicates is likely to encompass the combined effects of both surface-controlled and transformation processes. In many soils it would seem thatthe transformation mechanism plays a dominant role in K release, at leastfor the trioctahedral micas, as the frequently observed natural conversion ofbiotite to vermiculite demonstrates. The transformation reaction is quitedifferent to the surface-controlled reactions discussed above. Here, the rateof release of structural K is a diffusion-controlled process which ischaracterized by a linear relationship between the K released and the squareroot of time (Rausefl-Colon el al. (1964). The driving force of the diffusionis the difference in concentration between newly released K and the externalsolution K (Martin and Sparks, 1985). The external solution may thereforereach a critical K concentration at which point the release of structural Keffectively stops. The critical concentration varies according to the particularmica mineral and is much lower for dioctahedral micas than fortrioctahedral micas (Table 5).
Table 5. Critical solution K concentrations for layer silicates at 25 0 C withIM NaCI as replacement solution (after Scott and Smith, 1966; Newman,1969)
Mineral Conditions Critical K level (mgl-1)
Phlogopite 10-20 pm (IM NaCI) 23Biotite 10-20 pm (IM NaCI) IIMuscovite 10-20 .am (IM NaCI + 0.01M EDTA) 0.1Illite <2 pm (IM NaC1 +0.01M EDTA) IGlauconite <50 pm (IM NaCI with pH 4.5-5.50) 0.6
The rather high critical solution K levels for biotite and phlogopite,which would be well in excess of what is found in most soil solutions,probably accounts for the marked susceptibility to weathering of theseminerals and underlines the predominant role of transformation versussurface-controlled reactions. For the dioctahedral micas, the opposite couldbe the case although further work would be required to substantiate thispoint.
54

References
Aargaard, P. and Helgesen, H: Thermodynamic and kinetic constraints onreaction rates among minerals in aqueous solution: 1. Theoreticalconsiderations. Am. . Sci. 282, 237-285 (1982)
Bain, D.C., Mellor, A. and Wilson, M.J: Nature and origin of an aluminousvermiculitic weathering product in acid soils from upland catchments inScotland. Clay Miner. 25, 467-476 (1990a)
Bain, D-C., Mellor, A., Wilson, M.J. and Duthie, D.M.L: Weathering inScottish and Norwegian catchments in The Surface Waters AcidificationProgramme (edited by B.. Mason) Cambridge University Press pp. 223-236 (1990b)
Churchman, G.J: Clay minerals formed from micas and chlorites in someNew Zealand soils. Clay Miner. 15, 59-76 (1980)
Eberl, D.D: Clay mineral formation and transformation in rocks and soils inClay Minerals: Their Structure, Behaviour and Use. Proceedings of aRoyal Society Discussion Meeting pp. 21-37 (1984)
Fanning, D.S. and Jackson, M.L: Clay mineral weathering in southernWisconsin soils developed in loess and shale-derived till. Clays ClayMiner. 13, 175-101 (1965)
Fanning, D.S., Keramidas, V.Z. and EI-Desoky, M: Micas. Chapter 12 inMinerals in Soil Environments (Edited by J.B. Dixon and S.B. Weed).Published by Soil Science Society of America pp. 551-634 (1989)
Farmer, V.C., McHardy, W.J., Robertson, L., Walker, A. and Wilson, M.J:Micromorphology and sub-microscopy of allophane and imogolite in apodzol Bs horizon: evidence for translocation and origin. Jour. Soil Sci.36, 87-96 (1985)
Feigenbaum, S., Edelstein, R. and Shainberg, 1: Release rate of potassiumand structural cations from micas to ion exchangers in dilute solutions.Soil Sci. Soc. Am. J. 39, 985-990 (1981)
Fblster, H: Proton consumption rates in Holocene and present-dayweathering of acid forest soils in The Chemistry of Weathering (editedby J.I. Drever) D. Reidel Publishing Co. pp. 197-210 (1985)
Goldich, S.S: A study of rock weathering. J. Geol. 46, 17-58 (1938)Helgesen, H., Murphy, W.M. and Aargaard, P: Thermodynamics and kinetic
constraints on reaction rates among minerals and aqueous solutions: 11.Rate constants, effective surface area and hydrolysis of feldspar.Geochim. Cosmochim. Acta 48, 2405-2432 (1984)
55
Huang, P.M: Feldspars Olivines, Pyroxenes and Amphiboles in Mineral inSoil Environments (edited by J.B. Dixon and S.B. Weed) Published bySoil Science Society of American pp. 975-1050 (1989)
Jacks, G: Mineral weathering studies in Scandinavia in The Surface WatersAcidification Programme (edited by B.J. Mason) Published byCambridge University Press pp. 215-222 (1990)
Jackson, M.L., Huang, Y., Corey, R.B., Evans, E.J. and van den Heuvel,P.C: Weathering of clay size minerals in soils and sediments. II.Chemical weathering of layer silicates. Soil Sci. Soc. Am. Proc. 16, 3-6(1952)
Lasaga, A: Transition State theory. In Kinetics of geochemical processes(edited by A. Lasaga and RI. Kirkpatrick) Published by MineralogicalSociety of America pp. 135-170 (1981)
Martin, H.W. and Sparks, DL: On the behaviour of non-exchangeablepotassium in soils. Commun. Soil Sci. Plant Anal. 16, 133-162 -1985)
Memon, Y.M., Fergus, I.F., Hughes, J.D. and Page, D.W: Utilization ofnon-exchangeable soil potassium in relation to soil type, plant speciesand stage of growth. Aust. J. Soil Res. 26, 489496 (1988)
Newman, A.C.D: Cation exchange properties of micas. I. The relationbetween mica composition and K-exchange in solutions of different pH.J. Soil Sci. 20, 357-373 (1969)
Olsson, B., Hallbacken, L., Johanansson, S., Melkerud, P.A., Nilsson, 1. andNilsson, T: The Lake Gardsjdn area - physicogeographical and biologicalfeatures. Published by the Swedish Natural Science Research Council,Stockholm, Sweden. Chapter 37, pp. 10-38 (1985)
Rausell-Colon, J.A., Sweatman, T.R., Wells, C.B. and Norrish, K: Studiesin the artificial weathering of mica in Experimental Pedology. Publishedby Butterworths, London. pp. 40-72 (1964)
Robert, M: The experimental transformation of mica toward smectite:relative importance of total charge and tetrahedral charge. Clays ClayMiner. 21, 167-174 (1973)
Scott, AD. and Smith, S.J: Susceptibility of interlayer potassium in micas toexchange with sodium. Clays Clay Miner. 14, 69-81 (1966)
Scott, A.D. and Smith, S.J: Sources, Amounts and Forms of Alkali Elementsin Soils. Adv. Soil Sci. 6, 101-147 (1987)
Sharpley, A.N: Relationship between soil potassium forms and mineralogy.Soil Sci. Soc. Am. J. 52, 1023-1028 (1989)
Smith, J.V: Feldspar Minerals Vol. 1 Crystal Structure and PhysicalProperties. Published by Springer Verlag, New York (1974)
56
Sparks, D.L: Potassium Dynamics in Soils. Adv. Soil Sci. 6, 1-63 (1987)Soil Survey Staff: Keys to Soil Taxonomy Soil Management Support Service
Techn. Monogr. 6. Dept. of Agronomy Cornell University, Ithaca, NewYork (1987)
Sverdrup, H.U: The Kinetics of Base Cation Release due to ChemicalWeathering. Lund University Press (1990)
Sverdrup, H.U., de Vries W. and Henriksen, A: Mapping Critical Loads.Environmental Report 1990-98 (1990)
Sverdrup, H.U. and Warfvinge, P: Calculating field weathering rates using amechanistic geochemical model PROFILE. Proc. Int. EnvironmentalGeochemistry Conference, Uppsala, Sweden, 1-19 (1991)
Velbel, M.A: The mathematical basis for determining rates of geochemicaland geomorphic processes in small forested watersheds by mass balance:Examples and implications in Rates of Chemical Weathering of Rocksand Minerals (edited by J.M. Coleman and D.P. Dethner). Published byAcademic Press pp. 439451 (1986)
Violante P. and Wilson M.J: Mineralogy of some Italian Andosols withspecial reference to the origin of the clay fraction. Geoderma 29, 157-174(1983)
Wilson, M.J. and McHardy, W.J: Experimental of a microcline perthite andimplications regarding natural weathering. J. Microsc. 120, 291-302(1980)
Wilson, M.J. and Nadeau, PH: Interstratified clay minerals and weatheringprocesses in The Chemistry of Weathering (edited by J.1. Drever)Published by D. Reidel and Co. pp. 97-118 (1985)
57
Effect of Potassium Fertilization on K-Cycling inDifferent Agrosystems
Fardeau, J-C.+ Poss, R.' and Saragoni, H.+
± DPVE, CE Cadarache, 13108 Saint-Paul-Lez-Durance, France
++ ORSTOM UR 2B c/o DPVE, CE Cadarache, 13108 Saint-Paul-Lez-Durance, France
-+CIRAD/1RAT, BP 5035, 34 032 Montpellier Cedex, France
Summary
K cycles in agricultural systems are described by classifying soil K intofive pools (Figure 1) : [1] K in plants, [2] available soil K, [3] unavailablesoil K, [4] K in fertilizers and [5] K in harvests. It has been proved, usingthe isotopic exchange kinetic method applied to K+ ions between the soiland its solution, that potassium accessible to plants is not confined to onehomogeneous pool. Accessible K is a pluricompartimental system in whichK ions move to the solution instantaneously or in times between 0 and theinfinite. Thus the usual partitioning between available and non available soilK appears unjustified. It is shown that concentration of K ions in the soilsolution can be used, in place of activity ratio, as intensity factor tocharacterize soil K availability. Examples of K cycles with maize undervarious conditions of production are discussed : soil, climate, K fertilizationand sociological conditions, all influence K cycles. The main lack ofknowledge encountered in predicting K cycles in differing ecosystemsremains the difficulty to determine potential rates of K transfer from soils orsoil-fertilizer systems to the soil solution and from the soil solution to theplant roots. These matters call for further research.
Introduction
This colloquium is devoted to "K in ecosystems". An ecosystem has beendefined as "a functional system which includes one community of livingorganisms and their environment" (Soukatchev, 1954). So, the frontiers ofan ecosystem are defined by the chosen community of living organisms.Therefore, this paper mainly deals with potassium that can be taken up by
59
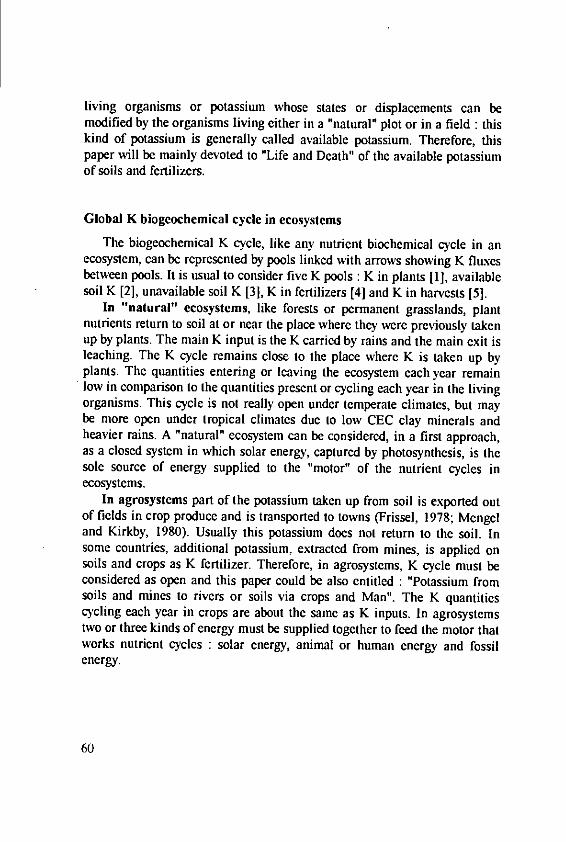
living organisms or potassium whose states or displacements can bemodified by the organisms living either in a "natural" plot or in a field : thiskind of potassium is generally called available potassium. Therefore, thispaper will be mainly devoted to "Life and Death" of the available potassiumof soils and fertilizers.
Global K biogeochemical cycle in ecosystemsThe biogeochemical K cycle, like any nutrient biochemical cycle in an
ecosystem, can be represented by pools linked with arrows showing K fluxesbetween pools. It is usual to consider five K pools : K in plants [1], availablesoil K [2], unavailable soil K [31, K in fertilizers [4] and K in harvests [5].
In "natural" ecosystems, like forests or permanent grasslands, plantnutrients return to soil at or near the place where they were previously takenup by plants. The main K input is the K carried by rains and the main exit isleaching. The K cycle remains close to the place where K is taken up byplants. The quantities entering or leaving the ecosystem each year remainlow in comparison to the quantities present or cycling each year in the livingorganisms. This cycle is not really open under temperate climates, but maybe more open under tropical climates due to low CEC clay minerals andheavier rains. A "natural" ecosystem can be considered, in a first approach,as a closed system in which solar energy, captured by photosynthesis, is thesole source of energy supplied to the "motor" of the nutrient cycles inecosystems.
In agrosystems part of the potassium taken up from soil is exported outof fields in crop produce and is transported to towns (Frissel, 1978; Mengeland Kirkby, 1980). Usually this potassium does not return to the soil. Insome countries, additional potassium, extracted from mines, is applied onsoils and crops as K fertilizer. Therefore, in agrosystems, K cycle must beconsidered as open and this paper could be also entitled : "Potassium fromsoils and mines to rivers or soils via crops and Man". The K quantitiescycling each year in crops are about the same as K inputs. In agrosystemstwo or three kinds of energy must be supplied together to feed the motor thatworks nutrient cycles : solar energy, animal or human energy and fossilenergy.
60
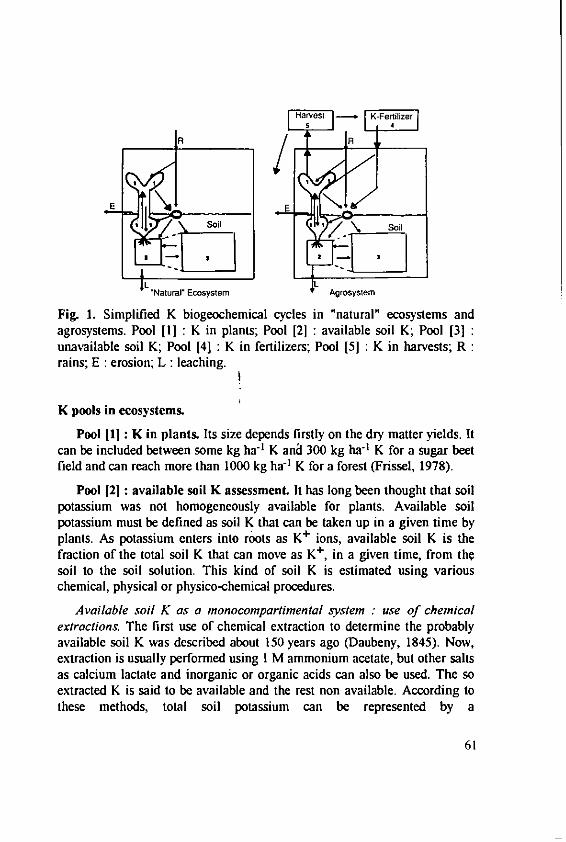
Ha"Ntrl -A Kerniizer5 4
InI
EK
Naturr Ecoyste Agrosysiem
Fig. 1. Simplified K biogeochemical cycles in "natural" ecosystems andagrosystems. Pool [1] : K in plants; Pool [2] : available soil K; Pool [3]unavailable soil K; Pool [4] : K in fertilizers; Pool [5J : K in harvests; Rrains; E : erosion; L : leaching.
K pools in ecosystems.
Pool ill : K in plants. Its size depends firstly on the dry matter yields. Itcan be included between some kg ha-l K ana 300 kg ha-' K for a sugar beetfield and can reach more than 1000 kg ha-' K for a forest (Frissel, 1978).
Pool [21 : available soil K assessment. It has long been thought that soilpotassium was not homogeneously available for plants. Available soilpotassium must be defined as soil K that can be taken up in a given time byplants. As potassium enters into roots as K+ ions, available soil K is thefraction of the total soil K that can move as K+ , in a given time, from thesoil to the soil solution. This kind of soil K is estimated using variouschemical, physical or physico-chemical procedures.
Available soil K as a monocompartimental system : use of chemicalextractions. The first use of chemical extraction to determine the probablyavailable soil K was described about 150 years ago (Daubeny, 1845). Now,extraction is usually performed using I M ammonium acetate, but other saltsas calcium lactate and inorganic or organic acids can also be used. The soextracted K is said to be available and the rest non available. According tothese methods, total soil potassium can be represented by a
61
bicompartimental model where available K appears as a compartment inwhich the availability of each K ion seems to be independent of time.
Available soil K as a pluricompartimental system : use of chemical orphysical determinations. Some workers have thought that all the available Kcould not be uniformly accessible to plants. They have proposed dividingextractable K in three (Sharpley, 1990) or four compartments (Sharpley,1989). These compartments can be determined using sequential extractionseither with chemical reagents such as TBPNa (Quemener, 1978) or byphysical procedures like electro-ultrafiltration (Nemeth, 1985). But physicalcompartmental analysis can also be achieved without extraction usingspectrometric methods like far infra red (Prost and Laperche, 1990) or solid-state NMR (Lambert et al, 1992). In these procedures, K availability issupposed to depend on the chemical or physical bindings between K and soilparticles but to remain independent of time.
Available soil K as a pluricompartimental system : use of isotopicexchange kinetic procedures. Isoionic exchange of ions, carried out withisotopes, is one of the best methods to perform compartmental analysis(Sheppard, 1962). This is possible with 42K + or 43K+; 43K+ is the mostappropriate for this use because it can be produced carrier-free and its half-life is twice as long as that of 42K. An isotopic exchange occurs between43K+ ions applied in a soil-solution system and K+ ions located on the solidphase of the soil. This isotopic exchange is time dependent (Tendille et at,1956; Sumner and Bolt, 1962; Fardeau et al., 1977; Fardeau et al, 1979;Diatta et Fardeau, 1979). The mathematical function characterizing theisotopic exchange kinetic of K+ ions in all soil-solution systems is
(rt/R)/qK = [(rl/R)/qK ] t-n [1],
where R is the quantity of radioactivity applied to the soil-solutionmixture at time t=0, rt the radioactivity remaining in solution after t minutesof isotopic exchange, r1 that remaining after 1 minute, n an empiricalparameter generally lower than 0.2 and qK the K quantity observed in thesolution during the isotopic exchange. The quantity of K, isotopicallyexchangeable at a given time t, is calculated using the following equation:
EKiet = (R/rt) qK -> EKiet = EKiel tn [2].
The conclusion about isotopically exchangeable soil potassium wassimilar to that about isotopically exchangeable soil phosphate (Fardeau et
62
al., 1991; Fardeau and Frossard, 1992) : isotopically exchangeable K is apluricompartimental mamellary system (Sheppard, 1962).
Relation between K + isotopically exchangeable during the first minuteand exchangeable K + determined with NH4-Ac. The quantity,EKiei = qK(R/rl), of K isotopically exchangeable during the first minute ofisotopic exchange is slightly higher (about 10 %) than the quantity ofexchangeable K extracted from soil with IM NH 4-Ac (Tendille et al., 1956;Fardeau et al, 1979; Poss et al., 1991). Therefore K extraction with1 M NH4-Ac can be considered a good method to determine the most labileK.
Relation between isotopically exchangeable and available soil K. Bycarrying out simultaneously pot experiments using 40K+ and isotopicexchange kinetics using 43K+, it has been shown that plant roots take uppotassium only from isotopically exchangeable potassium (Fardeau et al.,1979). It was concluded that the available soil potassium is the isotopicallyexchangeable soil potassium : available soil K is then apluricompartimental mamellary system that can be described using the sameparameters as those used to describe isotopically exchangeable K, i.e. : CK,rl/R and n. A central compartment contains a quantity of K+ ions of thesame order of magnitude as the quantity EKiel = qK(RIrl); the ions itcontains can move from soil to the solution in less time than 30 seconds;therefore they can be considered directly accessible to plant roots. The othermobile ions observed with isotopic exchange have been classified into fourcompartments based on the time required to move towards the soil solution.The first compartment contains ions which can be released to the solutionbetween 1 minute and 1 day; this period is about the same as the activeuptake period for a given zone of a root hair (Barber, 1968; Barber, 1984).The second compartment contains ions which can move to the solutionbetween I day and 3 months, this period corresponding to the activity of arooting system. The third compartment contains ions which can be releasedinto the solution between 3 months and one year. The fourth compartmentcontains ions able to leave the solid phase of the soil in more than one year.The quantities contained in each compartment were determined usingequation [2]. So, when using the isotopic analytical procedure, available Kappears time depending, as it actually is.
Availability of soil potassium. As for phosphate, availability of potassiumdepends, at least, on three factors : intensity factor, (1), quantity factor, (Q)
63
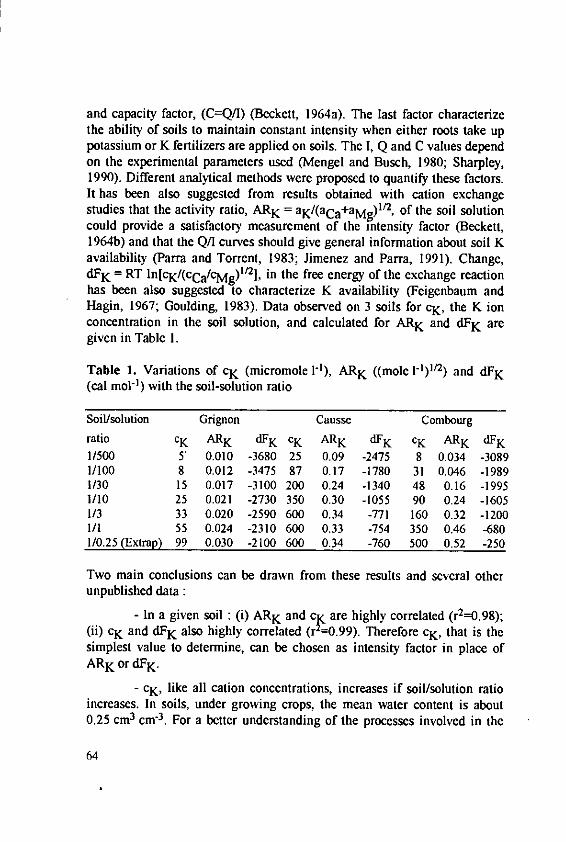
and capacity factor, (C=Q/I) (Beckett, 1964a). The last factor characterizethe ability of soils to maintain constant intensity when either roots take uppotassium or K fertilizers are applied on soils. The I, Q and C values dependon the experimental parameters used (Mengel and Busch, 1980; Sharpley,1990). Different analytical methods were proposed to quantify these factors.It has been also suggested from results obtained with cation exchangestudies that the activity ratio, ARK = aK/(aCa+aMg) 1I 2, of the soil solutioncould provide a satisfactory measurement of the intensity factor (Beckett,1964b) and that the Q/I curves should give general information about soil Kavailability (Parra and Torrent, 1983; Jimenez and Parra, 1991). Change,dFK = RT ln[cK/(CCa/cMg)92 , in the free energy of the exchange reactionhas been also suggested to characterize K availability (Feigenbaum andHagin, 1967; Goulding, 1983). Data observed on 3 soils for cK, the K ionconcentration in the soil solution, and calculated for ARK and dFK aregiven in Table 1.
Table 1. Variations of cK (micromole 1-'), ARK ((mole [I)Il2) and dFK(cal mol-) with the soil-solution ratio
Soil/solution Grignon Causse Combourgratio cK ARK dFK cK ARK dFK cK ARK dFK11500 5" 0.010 -3680 25 0.09 -2475 8 0.034 -30891/100 8 0.012 -3475 87 0.17 -1780 31 0.046 -19891/30 15 0.017 -3100 200 0.24 -1340 48 0.16 -19951/10 25 0.021 -2730 350 0.30 -1055 90 0.24 -16051/3 33 0.020 -2590 600 0.34 -771 160 0.32 -12001/1 55 0.024 -2310 600 0.33 -754 350 0.46 -6801/0.25 (Extrap) 99 0.030 -2100 600 0.34 -760 500 0.52 -250
Two main conclusions can be drawn from these results and several otherunpublished data :
- In a given soil : (i) ARK and C are highly correlated (r2=0.98);(ii) cK and dFK also highly correlated (r =0.99). Therefore C, that is the
simplest value to determine, can be chosen as intensity factor in place ofARK or dFK.
- cK, like all cation concentrations, increases if soil/solution ratioincreases. In soils, under growing crops, the mean water content is about0.25 cm3 cm"3. For a better understanding of the processes involved in the
64
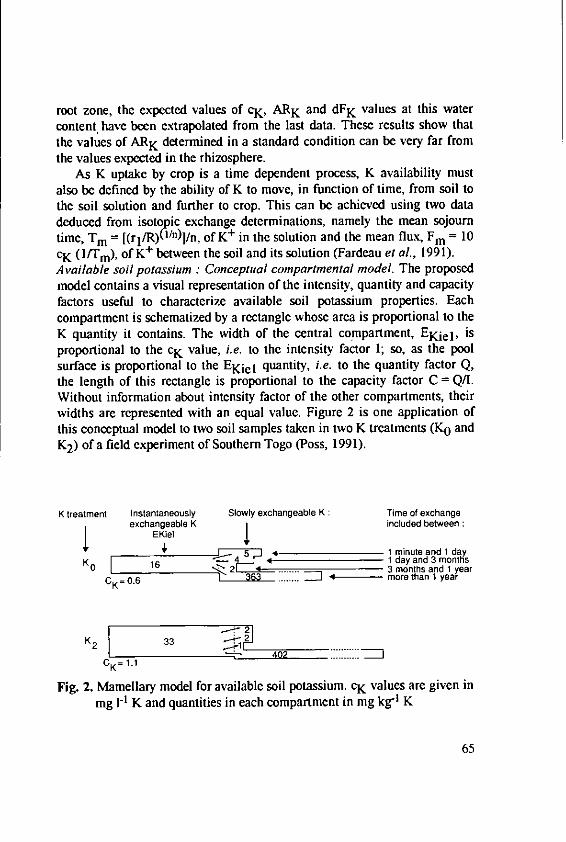
root zone, the expected values of C1 , ARK and dFK values at this watercontent have been extrapolated from the last data. These results show thatthe values of ARK determined in a standard condition can be very far fromthe values expected in the rhizosphere.
As K uptake by crop is a time dependent process, K availability mustalso be defined by the ability of K to move, in function of time, from soil tothe soil solution and further to crop. This can be achieved using two datadeduced from isotopic exchange determinations, namely the mean sojourntime, Tm = [(rl/R)(1/n)I/n, of K+ in the solution and the mean flux, Fm = 10cK ( 1/Tm), of K+ between the soil and its solution (Fardeau et al., 1991).Available soil potassium : Conceptual compartmental model. The proposedmodel contains a visual representation of the intensity, quantity and capacityfactors useful to characterize available soil potassium properties. Eachcompartment is schematized by a rectangle whose area is proportional to theK quantity it contains. The width of the central compartment, EKiel, isproportional to the cK value, i.e. to the intensity factor 1; so, as the poolsurface is proportional to the EKiel quantity, i.e. to the quantity factor Q,the length of this rectangle is proportional to the capacity factor C = Q/I.Without information about intensity factor of the other compartments, theirwidths are represented with an equal value. Figure 2 is one application ofthis conceptual model to two soil samples taken in two K treatments (KO andK2 ) of a field experiment of Southern Togo (Poss, 1991).
K treatment Instantaneously Slowly exchangeable K Time of exchangeexchangeable K included between:
EKiel I1 5 1 minuteand 1 day
1 day and 3 monthsKO 16 ..... 3 months and 1 yearCK= 0.6 363 ....... more than 1 year
K2 33 .-402 -2
GK= 1.1
Fig. 2. Mamellary model for available soil potassium. cK values are given inmg 1-1 K and quantities in each compartment in mg kg "1 K
65
Results show that, in this soil, K fertilization higher than K output (i)increased significantly the compartment EKicl; (ii) did not modifysignificantly the amounts of K in compartments leaving solid phase between1 minute and one year but increased significantly the compartment of verylow mobility, information that can be interpreted, for agronomic purpose, asa fixation (Poss et al., 1991); (iii) did not modify significantly the capacityfactor, i.e. the buffer power of the soil for K ions. This last observation isgeneral.
Pool [3] : unavailable soil K. This pool contains the total soil K minusthe pool of available K. But as shown by the isotopic exchange kineticanalysis, available K depends on the chosen period. Therefore it can be saidthat there are no frontiers between "available" and "unavailable" soilpotassium.
Pool [41 : K in fertilizers. This pool appears in agrosystems. Its sizewhich greatly depends on economic conditions is included between 0 kg ha 1
K and 400 kg ha-1 K just after application on field.
Pool [51 : K in harvests. In many crops this K pool can be much smallerthan pool [1] : K in crops. This is clear for orchards where the major part ofK remains in wood. But this is also true for many other crops. For example,with maize, K in straw can be three times higher than K in grain (Poss,1991) and this factor greatly depends on the ability of soil to feed the crops.The transfers between pools [1] and [5] has to be known with accuracy toestablish K balances in a cropping system.
K fluxes between K pools
The prediction of the potential fluxes between each pool is the maindifficulty encountered in describing K biogeochemical cycle in an ecosystem(Gachon, 1988). K cycling studies, like any nutrient cycling study, couldbenefit from experiments with isotopic tracers. 42K and 43K have sometimesbeen used; but their half-lives, 12.4 hours and 22 hours respectively, are tooshort for agronomic trials. There are three other natural isotopes, 39K, 40Kand 41K; but their isotopic ratio analyses are difficult and expensive. So,86Rb, or 134CS and 137Cs have sometimes been used as substitutes for Kisotopes (Haunold, 1989). These isotopic tracers should not be used assubstitutes for K : they compete with K either for exchange sites in soils or
66

during their uptake by roots (Oien et at., 1959; Fried and Heald, 1960;Claasen and Jungk, 1982).
K outputs of the soil layer in the rooting zone. Uptake by roots,leaching and soil erosion contribute to decrease the total K content of theupper soil layers. K uptake by plants is generally the main exit for K.
K uptake by plants. The roots are the main entry for potassium intoplants. If no K fertilizer is applied, 100 % of the potassium taken up by rootscome from the available soil potassium. When K fertilizer is applied,potassium can be taken up by roots from two nutritive sources: the availablesoil potassium and K in fertilizer. The quantity of K derived from each Ksource is determined using two experimental designs. In the indirect butgeneral design, the quantity of K taken up by a crop with K fertilizer minusthe quantity of K taken up by a crop without K fertilizer is compared withthe K quantity applied as fertilizer. The major assumption of thiscomparison is that the quantity of potassium derived from the soil does notdepend on the quantity of K applied as fertilizer. In the direct method, 40K-labelled fertilizers are required. Due to analytical difficulties and cost of the40K, only three papers report data on the true value of the percentageutilization of K from fertilizers. The values obtained were between 10 and30 % (Slutskaya et al., 1980; Medvedva et al., 1983) and between 6 % and12 % (Fardeau et al., 1984). Due to the fact that the quantities of K appliedwere slightly higher (about 1.5 times) than the quantities of K taken up bycrops, the K derived from fertilizer (Kdfl) in crop was between 10 % and45 %. So 94 % to about 70 % of the K applied a given year remain in soilafter the first crop. These react with soil components and are distributedbetween the various compartments of soil K. As a consequence, availablesoil potassium is, with or without K fertilizers, the main source of potassiumfor plants.
A mean value for cK is about 2 mg I3 K. When growing crops evaporateI I water containing about 2 mg K, the dry matter yield increases of about3 g containing about 30 mg K. So mass-flow can only explain100(2/30) = 7 % of the total K uptake : 93 % of the K taken up during acropping season must be desorbd from the solid phase of the soil (Nye andTinker, 1977). But desorption can arise if, and only if there is a water filmbetween soil particles and root hair.
In all circumstances, quantity and availability of soil K decrease eachtime that K is taken up by crops. In pot experiments (Hinsinger, 1990;Daklia, 1991; Badraoui el al., 1992) or under very intensive cropping
67

conditions (Blanchet et Bose, 1962; Beckett and Nafady, 1969) or undercontinuous cropping without K fertilization (Bose, 1988; Poss, 1991), Kquantities taken up during a given period can be higher than heteroionic orisoionic exchangeable K quantities measured at the beginning of cropping.Similar results were often explained by the assumption that roots of somecrops can take up non exchangeable K (Bosc, 1988). In fact, they showedthat slowly exchangeable K+, identified by isotopic exchange method, turnsinto fast exchangeable K during the cropping period and, so, can participatein the K nutrition of crops (Poss, 1991). This process, sometimes associatedwith clay transformations (Hinsinger, 1990), has been also observed withsoil microorganism activity (Berthelin, 1983).
K leaching. K leaching occurs in soils whenever there is drainage. Thequantities leached depend on numerous factors like dry matter yield and itsK content, amounts of K applied or water drained; they ranged between afew kg ha-1 year' K and more than 50 kg ha-1 year' K (Warren andJohnston, 1962; Quemener, 1978; Lef'evre, 1988). Under special cropsreceiving very high dressings (600 kg ha-1 year 1 K), leaching can reach upto 450 kg ha-1 year 1 K (Pieri and Oliver, 1986).
K inputs in agrosystems. Rains, fertilizers and crop residues are themain entries of K in agrosystems. K in rain falls on soils mainly as particles.K fertilizers are generally applied as water soluble salts and K in cropresidues is mainly in the ionic form but is included in plant cells.
K applied as fertilizer enters pools [1], [2] and [3] and is sometimesleached. The distribution between these four pools depends on K quantityapplied, quantity and mobility of available soil K, crop needs and the type ofclay in each soils. Entry in compartment [31 has been called "fixation"(Way, 1850; Volk, 1938; Attoe, 1946). The pait of K applied which is"fixed" in a given soil depends on the method used to determine fixation(Van der Marel, 1959). The processes involved in fixation remain indiscussion (Gaultier et Mamy, 1988; Poss, 1991).
K contained in crop residues returned to soils becomes available whencrop residues are broken down by microorganisms. The efficiency of this Kappears of the same order as that of K in fertilizers. Two assumptions canexplain this observation : (i) K in crop residues is, for a time which dependson pedoclimatical conditions, protected from reactions with clay particles;(ii) the K content in dry matter of crop residues is about 0.5 % to I %whereas K concentration in the soil solution is about 2 mg 1-1 K. In fact K incrop residues appears more like K fertilizer than the available soil K.
68
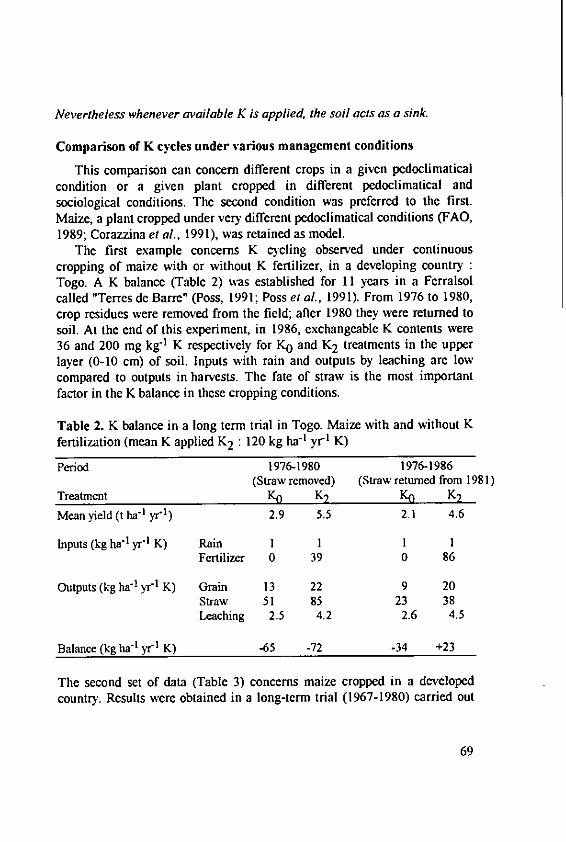
Nevertheless whenever available K is applied, the soil acts as a sink.
Comparison of K cycles under various management conditions
This comparison can concern different crops in a given pedoclimaticalcondition or a given plant cropped in different pedoclimatical andsociological conditions. The second condition was preferred to the first.Maize, a plant cropped under very different pedoclimatical conditions (FAO,1989; Corazzina et al., 1991), was retained as model.
The first example concerns K cycling observed under continuouscropping of maize with or without K fertilizer, in a developing country :Togo. A K balance (Table 2) was established for 11 years in a Ferralsolcalled "Terres de Barre" (Poss, 1991; Poss et al., 1991). From 1976 to 1980,crop residues were removed from the field; after 1980 they were returned tosoil. At the end of this experiment, in 1986, exchangeable K contents were36 and 200 mg kg" K respectively for K0 and K2 treatments in the upperlayer (0-10 cm) of soil. Inputs with rain and outputs by leaching are lowcompared to outputs in harvests. The fate of straw is the most importantfactor in the K balance in these cropping conditions.
Table 2. K balance in a long term trial in Togo. Maize with and without Kfertilization (mean K applied K2 : 120 kg ha-l yrI K)
Period 1976-1980 1976-1986(Straw removed) (Straw returned from 1981)
Treatment K0 K2 K6 K2
Mean yield (t ha' 1 yr"1) 2.9 5.5 2.1 4.6
Inputs (kg ha' 1 yr'1 K) Rain I I I IFertilizer 0 39 0 86
Outputs (kg ha'1 yr' 1 K) Grain 13 22 9 20Straw 51 85 23 38Leaching 2.5 4.2 2.6 4.5
Balance (kg ha' 1 yr' 1 K) -65 -72 -34 +23
The second set of data (Table 3) concerns maize cropped in a developedcountry. Results were obtained in a long-term trial (1967-1980) carried out
69
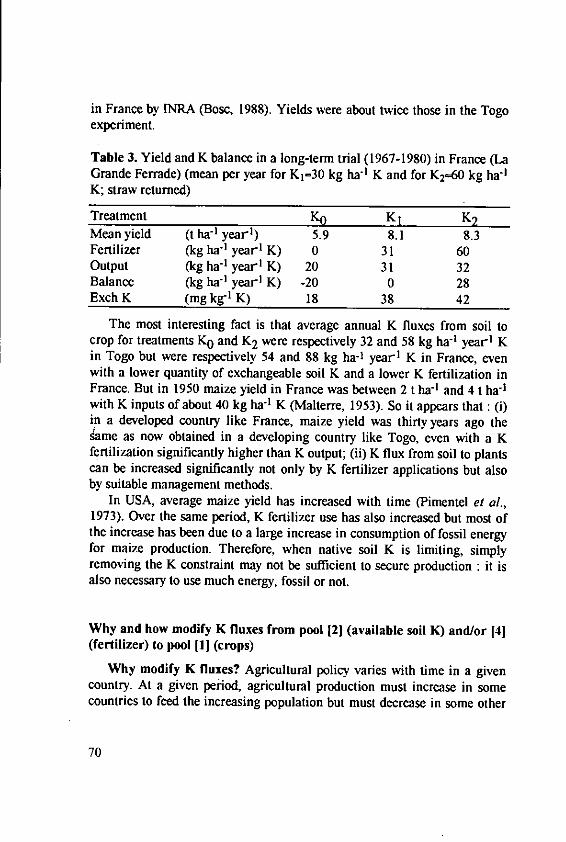
in France by INRA (Bosc, 1988). Yields were about twice those in the Togoexperiment.
Table 3. Yield and K balance in a long-term trial (1967-1980) in France (LaGrande Ferrade) (mean per year for KI-30 kg ha"1 K and for K2-60 kg ha-1K; straw returned)
Treatment KO KI K2Mean yield (t ha-' year-1) 5.9 8.1 8.3Fertilizer (kg ha"1 year 1 K) 0 31 60Output (kg ha- I year,1 K) 20 31 32Balance (kg ha-1 year l K) -20 0 28Exch K (mg kg- IK) 18 38 42
The most interesting fact is that average annual K fluxes from soil tocrop for treatments KO and K2 were respectively 32 and 58 kg ha-1 year 1 Kin Togo but were respectively 54 and 88 kg ha-1 year 1 K in France, evenwith a lower quantity of exchangeable soil K and a lower K fertilization inFrance. But in 1950 maize yield in France was between 2 t ha-' and 4 t ha-1with K inputs of about 40 kg ha-1 K (Malterre, 1953). So it appears that : (i)in a developed country like France, maize yield was thirty years ago thesame as now obtained in a developing country like Togo, even with a Kfertilization significantly higher than K output; (ii) K flux from soil to plantscan be increased significantly not only by K fertilizer applications but alsoby suitable management methods.
In USA, average maize yield has increased with time (Pimentel et al.,1973). Over the same period, K fertilizer use has also increased but most ofthe increase has been due to a large increase in consumption of fossil energyfor maize production. Therefore, when native soil K is limiting, simplyremoving the K constraint may not be sufficient to secure production : it isalso necessary to use much energy, fossil or not.
Why and how modify K fluxes from pool 121 (available soil K) and/or 14](fertilizer) to pool [11 (crops)
Why modify K fluxes? Agricultural policy varies with time in a givencountry. At a given period, agricultural production must increase in somecountries to feed the increasing population but must decrease in some other
70
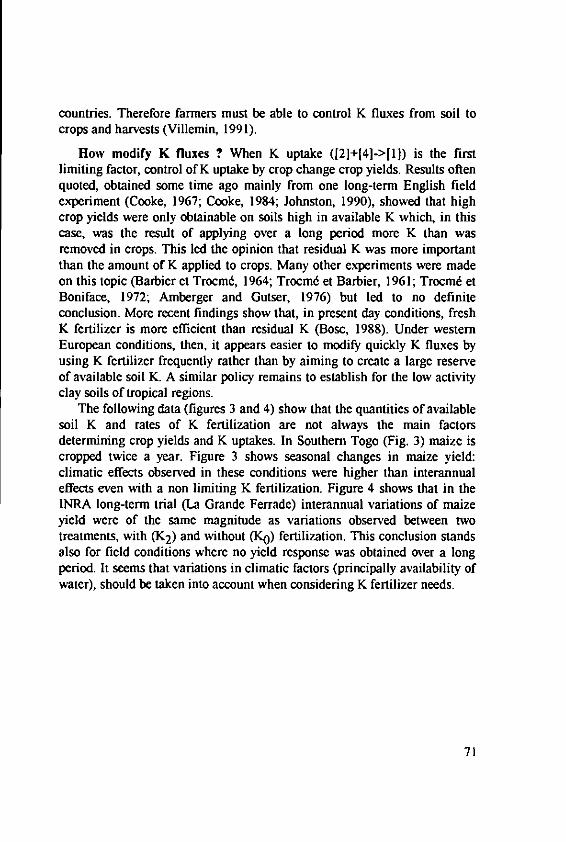
countries. Therefore farmers must be able to control K fluxes from soil tocrops and harvests (Villemin, 1991).
How modify K fluxes ? When K uptake ([2]+[4]->[l]) is the firstlimiting factor, control of K uptake by crop change crop yields. Results oftenquoted, obtained some time ago mainly from one long-term English fieldexperiment (Cooke, 1967; Cooke, 1984; Johnston, 1990), showed that highcrop yields were only obtainable on soils high in available K which, in thiscase, was the result of applying over a long period more K than wasremoved in crops. This led the opinion that residual K was more importantthan the amount of K applied to crops. Many other experiments were madeon this topic (Barbier et Trocmd, 1964; Trocmd et Barbier, 1961; Trocm etBoniface, 1972; Amberger and Gutser, 1976) but led to no definiteconclusion. More recent findings show that, in present day conditions, freshK fertilizer is more efficient than residual K (Bose, 1988). Under westernEuropean conditions, then, it appears easier to modify quickly K fluxes byusing K fertilizer frequently rather than by aiming to create a large reserveof available soil K. A similar policy remains to establish for the low activityclay soils of tropical regions.
The following data (figures 3 and 4) show that the quantities of availablesoil K and rates of K fertilization are not always the main factorsdetermining crop yields and K uptakes. In Southern Togo (Fig. 3) maize iscropped twice a year. Figure 3 shows seasonal changes in maize yield:climatic effects observed in these conditions were higher than interannualeffects even with a non limiting K fertilization. Figure 4 shows that in theINRA long-term trial (La Grande Ferrade) interannual variations of maizeyield were of the same magnitude as variations observed between twotreatments, with (K2 ) and without (K0) fertilization. This conclusion standsalso for field conditions where no yield response was obtained over a longperiod. It seems that variations in climatic factors (principally availability ofwater), should be taken into account when considering K fertilizer needs.
71
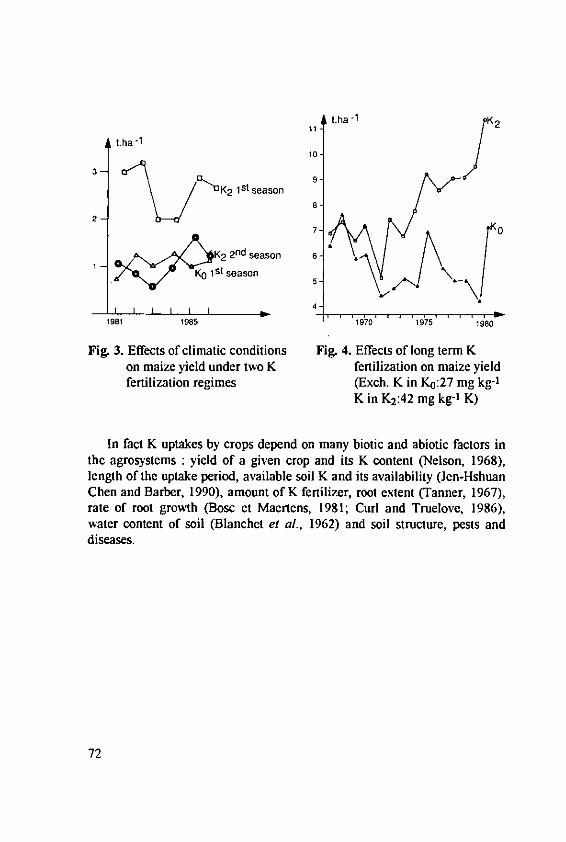
tha -1 K2
tha -110-
K2 1st season
8-
2-
7-
K2 2 nd season 6/I -- St season
4- II =* *
1981 1985 1970 1975 1980
Fig. 3. Effects of climatic conditions Fig. 4. Effects of long term Kon maize yield under two K fertilization on maize yieldfertilization regimes (Exch. K in Ko:27 mg kg-I
K in K2 :42 mg kg-' K)
In fact K uptakes by crops depend on many biotic and abiotic factors inthe agrosystems : yield of a given crop and its K content (Nelson, 1968),length of the uptake period, available soil K and its availability (Jen-HshuanChen and Barber, 1990), amount of K fertilizer, root extent (Tanner, 1967),rate of root growth (Bosc et Maertens, 1981; Curl and Truelove, 1986),water content of soil (Blanchet et al., 1962) and soil structure, pests anddiseases.
72
Conclusions and needs for the future
Sustainability of the Human life on our earth (Lubchenco et at., 1991)depends on sustainable agriculture. So far as potassium does not pollute
soils, crops or waters, its use as a fertilizer can be discussed only on purely
economic grounds depending, for a part, on technical knowledges about the
K biogeochemical cycles. If K is not return to soil, K soil fertility declines;
sustainability depends upon its return (Van der Pol, 1990; Poss, 1991). In
comparison with "natural" ecosystems the most important change to the K
cycle observed in agrosystems is due to the fate of crops residues which is
greater than the effect of K fertilization. It was thought formerly that
increase in the K flux from soil to crop could be achieved only by increasing
available soil K and it was recommended to apply more K than was actually
needed by the crops. Recent experiments in developed country have shown
that under modem management : (i) residual effects are lower than expected
and that immediate effects of fresh K fertilizer were greater than predicted;
(ii) K flux can be increased without increasing available soil K.
Consequently, and because leaching of K is generally low compared with
crop uptake, average K applications can be of the same magnitude than K
outputs.Research needs on the K biogeochemical cycle depend on agricultural
policy of each country. Formerly, the universal goal was to increase crop
production. This is still the aim in many developing countries : K fluxes
from soils to crops must increase quickly to increase crop production.
Elsewhere, as in Western Europe, overall K fluxes should be decreased
quickly; but it is still open to discussion whether it would be decreased in
every field or whether there should be a steep decrease in some with a
continuous increase in others. It appears that in all countries it is more
important to predict K flux than to determine quantity of available soil K.
All routine soil analyses give information on quantity but no information on
potential flux. We need to perfect analytical methods for measuring potential
flux of K ions from soil to soil solution and to classify the mechanisms that
control, in all major types of agricultural systems, the transfer of K from soil
solution to crops.
73
ReferencesAmberger, A. and Gutser, R. : Effect of long-term potassium fertilisation
and potassium dynamics of a brown earth (Weihenstephan). An. Agro.,27, 5-6, 643-658 (1976)
Attoe, O.J. : Potassium fixation and release in soils occurring under moistand dry conditions. Soil Sci. Soc. Am. Proc., 12, 145-149 (1946)Badraoui, M., Bloom P.R. and Delmaki A. : Mobilization of nonexchangeable K by rye-grass in five Moroccan soils with and withoutmica. Plant and Soil. 140, 55-63 (1992)
Barber, S.A. : Mechanism of potassium absorption by plants. In : The role ofpotassium in Agriculture. V.J. Kilmer, S.E. Younts and N.C Brady (eds).ASA. Madison, WI. pp. 293-309 (1968)
Barber, S.A. : Soil nutrient bioavailability. A mechanistic approach. JohnWiley, New-York (1984)
Barbier, G. et Trocmd, S. : Rble compard des engrais et des rdservesnutritives du sol dans Ia production des rdcoltes. Zeitschrift ffir Pflanzen,Dungiing, Bodenkunde, 109, 2, 113-120 (1964)
Beckett, P.H.T. : Studies on soil potassium. I Confirmation of the ratio law:measurement of the potassium potential. J. of Soil Sci., 15, 1, 1-8(1964a)
Beckett, P.H.T. : Studies on soil potassium. II. : The "immediate" Q/Irelations of labile potassium in soil. J. of Soil Sci., 15, 1, 9-23 (1964b)Beckett, P.H.T.and Nafady, M.H.M. : The effect of prolonged cropping on
the exchange surfaces of the clays of Broadbalk field. J. of Soil Sci., 20,1-10 (1969)
Berthelin, J. : Microbial weathering processes. In : Microbial geochemistry.Krumber WE (ed), Blackwell Scientific Publishing, Oxford, pp 223-263(1983)
Blanchet, R. et Bosc, M. : Bilan de potassium et alimentation potassique desplantes en prdsence de rdtrogradations et de lib&ations d'ions K+ nontchangeables. Ann. Agro., 18, 601-621 (1967)
Blanchet, R., Studer, RK et Chaumont, C. : Quclques aspects des interactionsentre l'alimentation potassique ct l'alimentation hydrique des plantes.Ann. Agro., 13 (2), 93-110 (1962)
Bosc, M. : Enseignements fournis par les essais de longue durde sur lafumure phosphatde et potassique. 3. Essais sur la fumure potassique. In:Phosphore et Potassium "dans les relations sol-plante: Consdquencespour la fertilisation L. Gachon (ed), INRA, Paris, pp 403-467 (1988)
74
Bose, M. et Maertens, C. : Re de l'acroissement du systtme racinaire dansl'absorption de divers dtats du potassium du sol. Agrochimica, 25 (1), 1-8(1981)
Claasen, N. and Jngk, A. : Kaliumdynamik im wurzelnahen Boden inBeziehung zur Kaliumaufnahme von Maispflanzen. Z. Pflanzenernahr.Bodenk., 145, 513-525 (1982)
Cooke, G.W. : The control of soil fertility. Crosby Lockwood & Sons,London, (1967)
Cooke, G.W. : Phosphorus and potassium problems in plant production, andhow to solve them. In: Fight against hunger through improved plantnutrition. Proceedings of the 9th world Fertilizer Congress. E. Welte andJ. Szabolcs (eds) CIEC Vienna, Vol 1, pp 197-220 (1984)
Corazzina, E., Gething P.A. and Mazzali, E. : Fertilizing for high .yield.Maize. IPI, Bern, (1991)
Curl, E.A. and Truelove, B. : The rhizosphere. Springer-Verlag, Berlin,(1986)
Daklia, N. : Libdration-fixation du potassium dans les sols cultivds du Nordde la France. These Universit6 de Paris VI, (1991)
Daubeny, D. : On the distinction between the dormant and active ingredientsof the soil. J. R. Agric. SOc. England, 7, 237-245 (1845)
Diatta, S. et Fardeau, I.C. : Etude au moyen de 33po 43 " et 42K+ de raction
des amendements organiques sur la rdgtntration des sols rougestropicaux du Sdndgal. In Colloque IAEA SM 235/37 301-312 (1979)
F.A.O. : Engrais et production alimentaire. FAO, Rome, (1989)Fardeau, J.C. and Frossard, E. : Physical and chemical processes of
phosphorus transformations in soil of semi-arid west-Africa withparticular reference to available soil and fertilizer phosphorus. InPhosphorus cycles in terrestrial and aquatic ecosystems Tiessen H. andFrossard (eds) Saskatchewan Institute of Pedology pp 108-128 (1992)
Fardeau, J.C, Jappe, J. et Quemener, J. : Ddtermination du coefficientd'utilisation du potassium d'un engrais potassique : emploi du 40K.Agronomie 4 (7), 663-669 (1984)
Fardeau, J.C., Chabouis, C. et Hdtier, J.M. Mdthode des cin6tiques dedilution isotopique des ions P0 4
3- et K+ application A l'analyse desmodifications de fertilitd dans les essais de tr~s longue durte. Science duSol, 2, 111-122 (1977)
Fardeau, J.C., Hdtier, J.M. et Jappd, J. : Potassium assimilable du solidentification au pool des ions isotopiquement 6ehangeables. C. R. Acad.Sci., Paris, 288, 1039-1042 (1979)
75
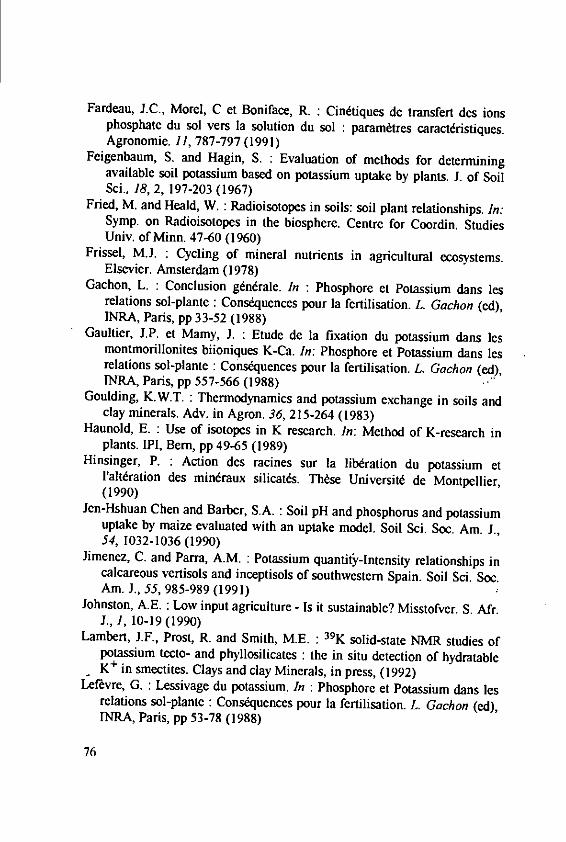
Fardeau, J.C., Morel, C et Boniface, R. : Cindliques de transfert des ionsphosphate du sol vets la solution du sol : param~tres caractdristiques.Agronomie. 11, 787-797 (1991)
Feigenbaum, S. and Hagin, S. : Evaluation of methods for determiningavailable soil potassium based on potassium uptake by plants. J. of SoilSci., 18, 2, 197-203 (1967)
Fried, M. and Heald, W. : Radioisotopes in soils: soil plant relationships. In:Symp. on Radioisotopes in the biosphere. Centre for Coordin. StudiesUniv. of Minn. 47-60 (1960)
Frissel, M.J. : Cycling of mineral nutrients in agricultural ecosystems.Elsevier. Amsterdam (1978)
Gachon, L. : Conclusion gtndrale. In : Phosphore et Potassium dans lesrelations sol-plante : Consdquences pour la fertilisation. L. Gachon (ed),INRA, Paris, pp 33-52 (1988)
Gaultier, J.P. et Mamy, J. : Etude de la fixation du potassium dans lesmontmorillonites biioniques K-Ca. In: Phosphore et Potassium dans lesrelations sol-plante : Constquences pour la fertilisation. L. Gachon (ed),INRA, Paris, pp 557-566 (1988)
Goulding, K.W.T. : Thermodynamics and potassium exchange in soils andclay minerals. Adv. in Agron. 36, 215-264 (1983)
Haunold, E. : Use of isotopes in K research. In: Method of K-research inplants. IPI, Bern, pp 49-65 (1989)
Hinsinger, P. : Action des racines sur la libdration du potassium etl'alt6ration des mindraux silicat6s. Th6se Universitd de Montpellier,(1990)
Jen-Hshuan Chen and Barber, S.A. : Soil pH and phosphorus and potassiumuptake by maize evaluated with an uptake model. Soil Sci. Soc. Am. J.,54, 1032-1036 (1990)
Jimenez, C. and Parra, A.M. : Potassium quantity-Intensity relationships incalcareous vertisols and inceptisols of southwestern Spain. Soil Sci. Soc.Am. J., 55, 985-989 (1991)
Johnston, A.E. : Low input agriculture - Is it sustainable? Misstofver. S. Mr.J., 1, 10-19 (1990)
Lambert, J.F., Prost, R. and Smith, M.E. : 39K solid-state NMR studies ofpotassium tecto- and phyllosilicates : the in situ detection of hydratableK+ in smectites. Clays and clay Minerals, in press, (1992)
I efevre, G. : Lessivage du potassium. In : Phosphore et Potassium dans lesrelations sol-plante : Constquences pour la fertilisation. L. Gachon (ed),INRA, Paris, pp 53-78 (1988)
76
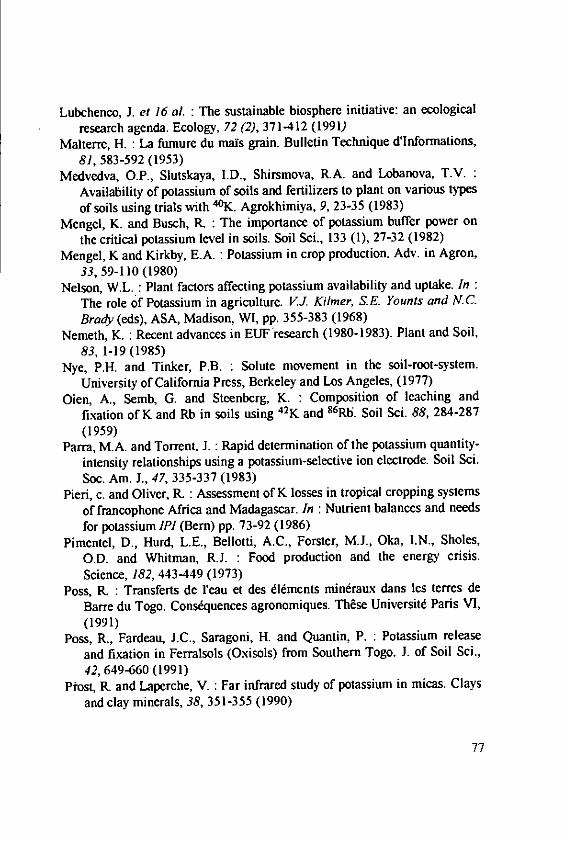
Lubchenco, J. et 16 al. : The sustainable biosphere initiative: an ecologicalresearch agenda. Ecology, 72 (2), 371-412 (1991)
Malterre, H. : La fumnure du mats grain. Bulletin Technique d'Informations,81, 583-592 (1953)
Medvedva, O.P., Slutskaya, I.D., Shirsmova, R.A. and Lobanova, T.V.
Availability of potassium of soils and fertilizers to plant on various types
of soils using trials with 40K. Agrokhimiya, 9, 23-35 (1983)Mengel, K. and Busch, R. : The importance of potassium buffer power on
the critical potassium level in soils. Soil Sci., 133 (1), 27-32 (1982)
Mengel, K and Kirkby, E.A. : Potassium in crop production. Adv. in Agron,33, 59-110 (1980)
Nelson, W.L. : Plant factors affecting potassium availability and uptake. In
The role of Potassium in agriculture. V.J. Kilmer, S.E. Younts and NC.
Brady (eds), ASA, Madison, WI, pp. 355-383 (1968)Nemeth, K. : Recent advances in EUF research (1980-1983). Plant and Soil,
83, 1-19 (1985)Nye, P.H. and Tinker, P.B. : Solute movement in the soil-root-system.
University of California Press, Berkeley and Los Angeles, (1977)
Oien, A., Semb, G. and Steenberg, K. : Composition of leaching and
fixation of K and Rb in soils using 42K and 86R5. Soil Sci. 88, 284-287(1959)
Parra, M.A. and Torrent, J. : Rapid determination of the potassium quantity-
intensity relationships using a potassium-selective ion electrode. Soil Sci.
Soc. Am. J., 47, 335-337 (1983)Pieri, c. and Oliver, R. : Assessment of K losses in tropical cropping systems
of francophone Africa and Madagascar. In : Nutrient balances and needs
for potassium IPI (Bern) pp. 73-92 (1986)Pimentel, D., Hurd, L.E., Bellotti, A.C., Forster, M., Oka, I.N., Sholes,
O.D. and Whitman, R.J. : Food production and the energy crisis.
Science, 182, 443-449 (1973)Poss, R. : Transferts de reau et des 616ments mindraux dans les terres de
Bane du Togo. Consdquences agronomiques. These Universitd Paris VI,(1991)
Poss, R., Fardeau, J.C., Saragoni, H. and Quantin, P. : Potassium release
and fixation in Ferralsols (Oxisols) from Southern Togo. J. of Soil Sci.,42, 649-660 (1991)
Prost, R. and Laperche, V. : Far infrared study of potassium in micas. Clays
and clay minerals, 38, 351-355 (1990)
77
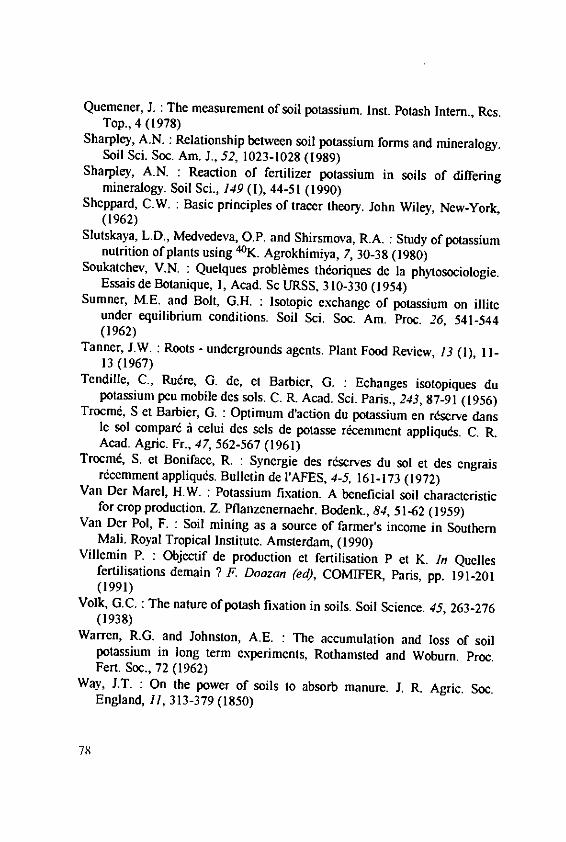
Quemener, J. : The measurement of soil potassium. Inst. Potash Intern., Res.Top., 4 (1978)
Sharpley, A.N. : Relationship between soil potassium forms and mineralogy.Soil Sci. Soc. Am. J., 52, 1023-1028 (1989)
Sharpley, A.N. : Reaction of fertilizer potassium in soils of differingmineralogy. Soil Sci., 149 (1), 44-51 (1990)
Sheppard, C.W. : Basic principles of tracer theory. John Wiley, New-York,(1962)
Slutskaya, L.D., Medvedeva, O.P. and Shirsmova, R.A. : Study of potassiumnutrition of plants using 40K. Agrokhimiya, 7, 30-38 (1980)
Soukatchev, V.N. : Quelques problkmes thdoriques de la phytosociologie.Essais de Botanique, 1, Acad. Sc URSS, 310-330 (1954)
Sumner, M.E. and Bolt, G.H. : Isotopic exchange of potassium on illiteunder equilibrium conditions. Soil Sci. Soc. Am. Proc. 26, 541-544(1962)
Tanner, J.W. : Roots - undergrounds agents. Plant Food Review, 13 (1), 11-13 (1967)
Tendille, C., Ru6re, G. de, et Barbier, G. : Echanges isotopiques dupotassium peu mobile des sols. C. R. Acad. Sci. Paris., 243, 87-91 (1956)
Trocm, S et Barbier, G. : Optimum d'action du potassium en rdserve dansle sol compar6 A celui des sels de potasse rtcemment appliquds. C. R.Acad. Agric. Fr., 47, 562-567 (1961)
Trocm6, S. et Boniface, R. : Synergie des r6serves du sol et des engraisrdcemment appliquds. Bulletin de IAFES, 4-5, 161-173 (1972)
Van Der Marel, H.W. : Potassium fixation. A beneficial soil characteristicfor crop production. Z. Pflanzenernaehr. Bodenk., 84, 51-62 (1959)
Van Der Pol, F. : Soil mining as a source of farmer's income in SouthernMali. Royal Tropical Institute. Amsterdam, (1990)
Villemin P. : Objectif de production et fertilisation P et K. In Quellesfertilisations demain ? F. Doazan (ed), COMIFER, Paris, pp. 191-201(1991)
Volk, G.C. : The nature of potash fixation in soils. Soil Science. 45, 263-276(1938)
Warren, R.G. and Johnston, A.E. : The accumulation and loss of soilpotassium in long term experiments, Rothamsted and Woburn. Proc.Fert. Soc., 72 (1962)
Way, J.T. : On the power of soils to absorb manure. J. R. Agric. Soc.England, 11, 313-379 (1850)
78
Fertilizer Recommendations as Determined by
Chemical and Physical Parameters of Soil and by K
Requirement of Crops
Baier, J., Research Institute for Crop Production, Prague - Ruzyn6,
Czechoslovakia
Summary
Crop yields and soil fertility in Czechoslovakia have greatly improved
over the past 30 years due to intensive fertilizer usage. Research has
concentrated on crop requirements, nutrient balance, soil properties and
plant analysis, resulting in an improvement in fertilizer efficiency. Nutrient
uptake is a prime criterion for K fertilization but this varies with
environmental and genetic factors as confirmed by long-term experiments
since 1957. Interactions with other cations are important and can lead to
imbalance in nutrient uptake with undesirable effects on crop performance.
It is difficult to determine the optimum soil K level and joint use of other
methods to describe the behaviour of soil potassium is discussed. The
present methods for deriving K fertilizer recommendations are described.
1. Introduction
Scientific fertilizer usage is based on the knowledge that crops require
specific amounts of available nutrients in order to express their full yield
potential. Thus crop production depends largely on fertilization and it is
impossible to produce high yields of good quality without using fertilizers.
A prime purpose of fertilization is to replace nutrients removed from the soil
in harvested crops.In our country, as in others with progressive farming, crop yields are
high (Table 1) and it is not now a question as to whether or not to use
fertilizer but, rather, as to what methods of application are economically and
environmentally sound.Average nutrient uptake by crops in the Czech Republic are as follows
(Vostal, 1992):N 121 kg ha-1 , P205 47 kg ha-1 , K20 113 kg ha-1 and MgO 21 kg ha-1 .
Average fertilizer usage (1986 - 1990) was:
N 95, P205 65, K20 63 and MgO 7 kg ha-1 .
79
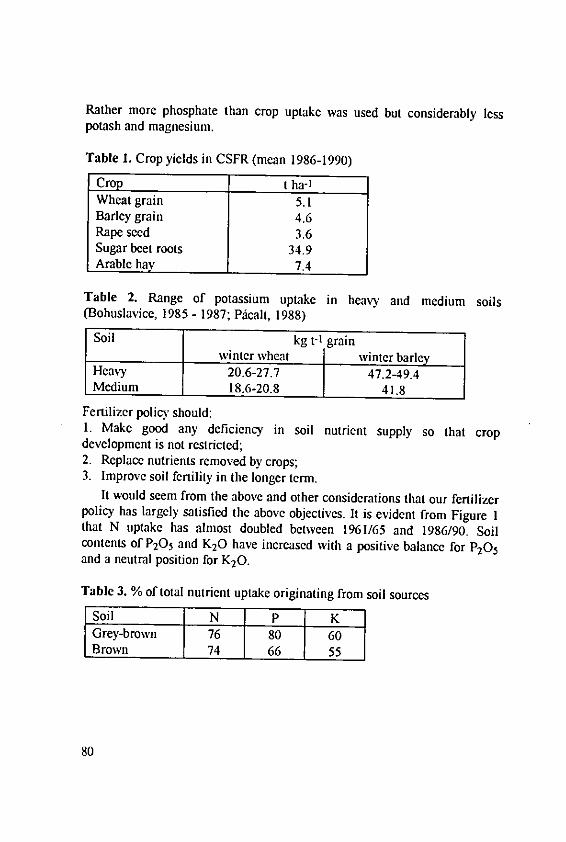
Rather more phosphate than crop uptake was used but considerably lesspotash and magnesium.
Table 1. Crop yields in CSFR (mean 1986-1990)
Crop t ha-1
Wheat grain 5.1Barley grain 4.6Rape seed 3.6Sugar beet roots 34.9Arable hay 7.4
Table 2. Range of potassium uptake in heavy and medium soils(Bohuslavice, 1985- 1987; Picalt, 1988)
Soil kg t-1] grainwinter wheat winter barley
Heavy 20.6-27.7 47.2-49.4Medium 18.6-20.8 41.8
Fertilizer policy should:1. Make good any deficiency in soil nutrient supply so that cropdevelopment is not restricted;2. Replace nutrients removed by crops;3. Improve soil fertility in the longer term.
It would seem from the above and other considerations that our fertilizerpolicy has largely satisfied the above objectives. It is evident from Figure Ithat N uptake has almost doubled between 1961/65 and 1986/90. Soilcontents of P20 5 and K20 have increased with a positive balance for P20 5and a neutral position for K20.
Table 3. % of total nutrient uptake originating from soil sources
Soil I N I P KGrey-brown 76 80 60Brown 74 66 55
80
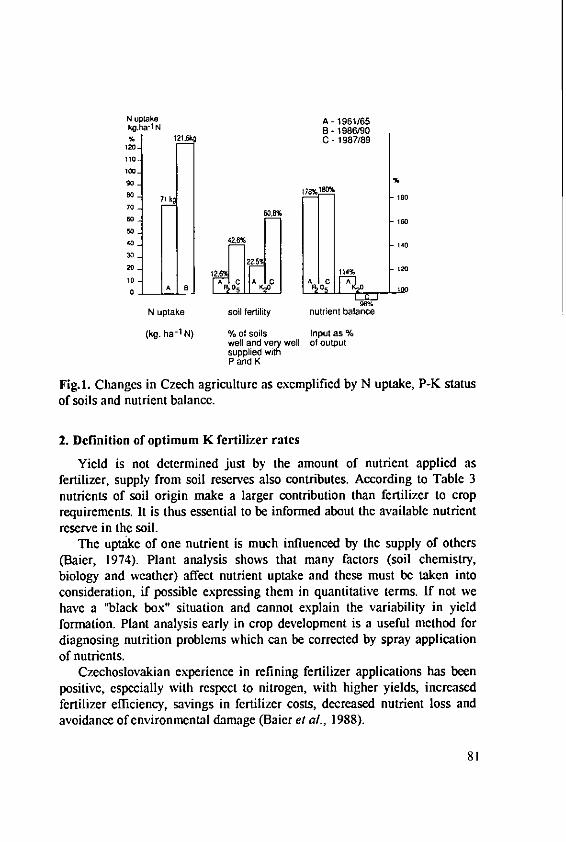
N uptake A - 1961/65kg.ha-l N B - 198690% 121,6kg C - 1987/89
120
110-
t0090
1808 0 le- 1 e71 kg
70_90 60,8%
50
40 426% 140
3020 _ 114% 120
1 AC
96%
N uptake soil fertility nutrient balance
(kg. ha-1 N) % of soils Input as %
well and very well of outputsupplied withP and K
Fig.1. Changes in Czech agriculture as exemplified by N uptake, P-K statusof soils and nutrient balance.
2. Definition of optimum K fertilizer rates
Yield is not determined just by the amount of nutrient applied asfertilizer, supply from soil reserves also contributes. According to Table 3nutrients of soil origin make a larger contribution than fertilizer to croprequirements. It is thus essential to be informed about the available nutrientreserve in the soil.
The uptake of one nutrient is much influenced by the supply of others(Baier, 1974). Plant analysis shows that many factors (soil chemistry,biology and weather) affect nutrient uptake and these must be taken intoconsideration, if possible expressing them in quantitative terms. If not wehave a "black box" situation and cannot explain the variability in yieldformation. Plant analysis early in crop development is a useful method fordiagnosing nutrition problems which can be corrected by spray applicationof nutrients.
Czechoslovakian experience in refining fertilizer applications has beenpositive, especially with respect to nitrogen, with higher yields, increasedfertilizer efficiency, savings in fertilizer costs, decreased nutrient loss andavoidance of environmental damage (Baier et at., 1988).
81
2.1. Crop demands for potassium
Potassium uptakes are normally stated in terms of long-term averagecrop and by-product yields, or, more conveniently in terms of uptake per unityield of produce. These vary over time, with variety and management butmainly, of course, with yield level.
Cereals have a relatively low K requirement. Modern wheat varietiesrequire 18% less K than the old and modern malting barleys some 40% less.This is mainly due to the lower straw to grain ratio of the modern andhigher yielding varieties. This leads to the somewhat strange conclusion thatcrop demand expressed per unit grain yield is lower at higher yield levels;the following data refer to winter barley.
t ha-1 grain kg t-i KO straw/grain<4 19.7 1.30
4.1 -5 18.3 0.935.1-6 17.2 0.66
> 6 15.4 0.70
Experiments at Bohuslavice nad Metuji showed that K consumption bywinter wheat, spring and winter barley (and also by sugar beet) was reducedas the proportion of grain (or roots) to total biomass increased (Figure 2).
Trials on soils of differing texture at Bohuslavice showed higher Kuptakes on heavy soils by both winter wheat and winter barley (Table 2).
2.2. Influence of growing conditions
In making fertilizer recommendations it is impossible to take intoaccount annual (mainly weather) variation. As shown in Figure 3, potassiumuptake was sometimes inadequate for high yield and/or the amount of Kleached from straw varied. Correlation between K uptake and yield can beexpected only when potassium is the limiting nutrient in accordance withthe law of the minimum.
82
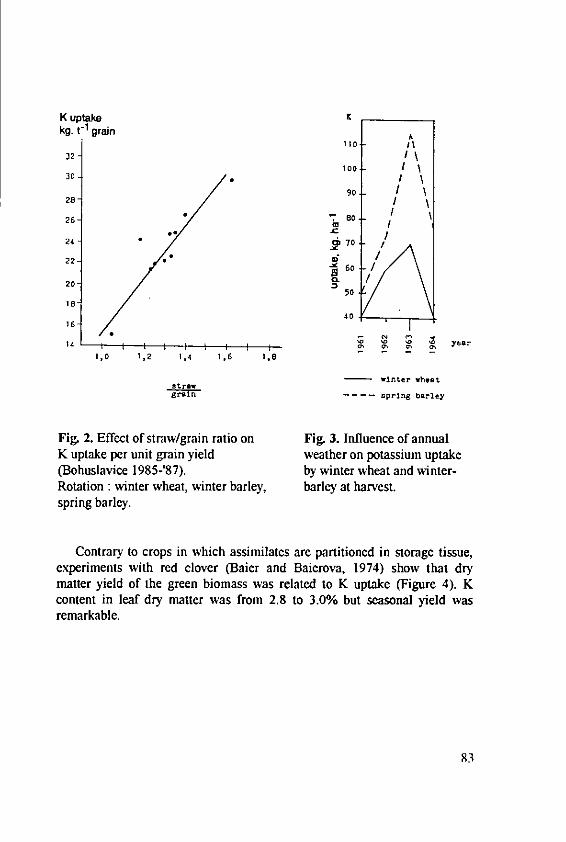
K uptake xkg. t-1 grain A
130 Il
32
10030 * \
90 I \28/
26- 7 80
24 - 070
22- "i 6~60 /20- 0.
50I8-
40
'4 Iyear
I,0 1,2 1,4 1,6 18
-- winter vheatstraw
... - - spring barley
Fig. 2. Effect of straw/grain ratio on Fig. 3. Influence of annualK uptake per unit grain yield weather on potassium uptake(Bohuslavice 1985-'87). by winter wheat and winter-Rotation : winter wheat, winter barley, barley at harvest.spring barley.
Contrary to crops in which assimilates are partitioned in storage tissue,experiments with red clover (Baier and Baierova, 1974) show that drymatter yield of the green biomass was related to K uptake (Figure 4). Kcontent in leaf dry matter was from 2.8 to 3.0% but seasonal yield wasremarkable.
83
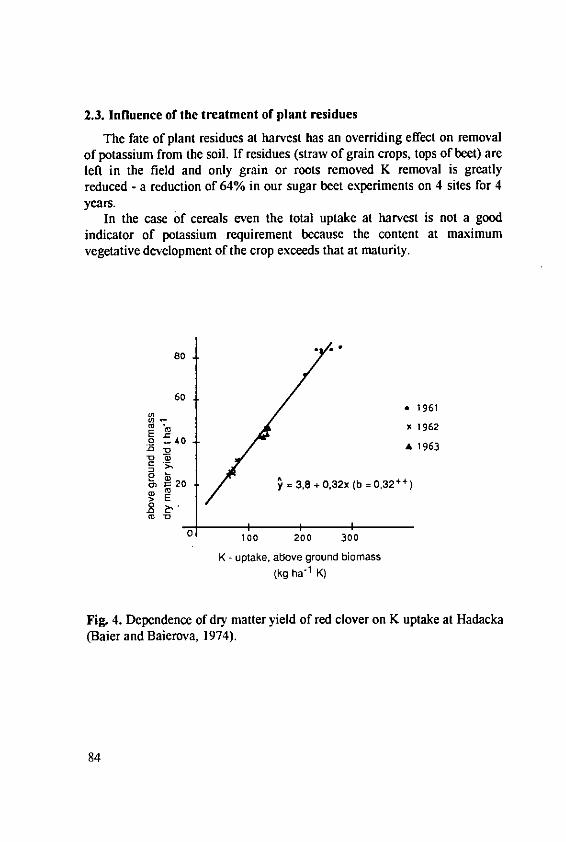
2.3. Influence of the treatment of plant residues
The fate of plant residues at harvest has an overriding effect on removalof potassium from the soil. If residues (straw of grain crops, tops of beet) areleft in the field and only grain or roots removed K removal is greatlyreduced - a reduction of 64% in our sugar beet experiments on 4 sites for 4years.
In the case of cereals even the total uptake at harvest is not a goodindicator of potassium requirement because the content at maximumvegetative development of the crop exceeds that at maturity.
so
60a 1961
( ' 1962o .40O A 1963
020y = 3,8 + 0,32x (b = 0.32 + + )
0
I I IO 100 200 300
K - uptake, above ground biomass
(kg ha"1 K)
Fig. 4. Dependence of dry matter yield of red clover on K uptake at Hadacka(Baier and Baierova, 1974).
84

2.4. Importance of balanced nutrition
We have also to take into account the possibility of antagonistic effects ifpotassium supply is excessive. The contribution to K supply from farmmanures is variable and often unknown. It is difficult to correct deficienciesduring the growth of the crop and to take into account changes in Kbondings in the soil.
All these difficulties make for problems in forecasting K requirementand suggest that it is useful to rely on calculation of the potassium balance.
3. Modification of K fertilizer recommendations by research
It seems that in Czechoslovakia in the past oversimplified and too rigidopinions have resulted in some soils being over-generously fertilized withpotassium and that the consequent high K levels in soils have led to theoccurrence of magnesium deficiency. Using average values for potassiumuptake can be misleading since uptake varies between years and according tosoil conditions. Therefore there is a need for careful monitoring underdifferent conditions and this should include monitoring of other nutrients tocheck on inter-nutrient balances.
No doubt average values will still be widely used in the future but ourresearch shows that as compared with guidelines used in the eighties, thereis now a decreased potassium fertilizer requirement (5-20%) for cereals andgrain maize and the same applies to other crops: potatoes (13%), red clover(18%), oilseed rape (30%) and silage maize (4%). On the other hand sugarand fodder beet and sunflower require more K fertilizer than thoughtpreviously.
3.1. The influence of potassium in soils
Since fertilizer and soil potassium both contribute to the supply of K tothe crop it is necessary to know, in order to forecast fertilizer need, howmuch potassium the soil can supply. We (Baier and BystrA, 1975), like otherworkers, have investigated the effect of the level of available K in the soil oncrop yield and the level which, in the absence of K fertilizer, will supportmaximum crop yield. As shown in Figure 5, the response curve is parabolic,yield increasing up to a maximum and declining slightly if this level isexceeded. The probable explanation is that at very high levels of K, other
85
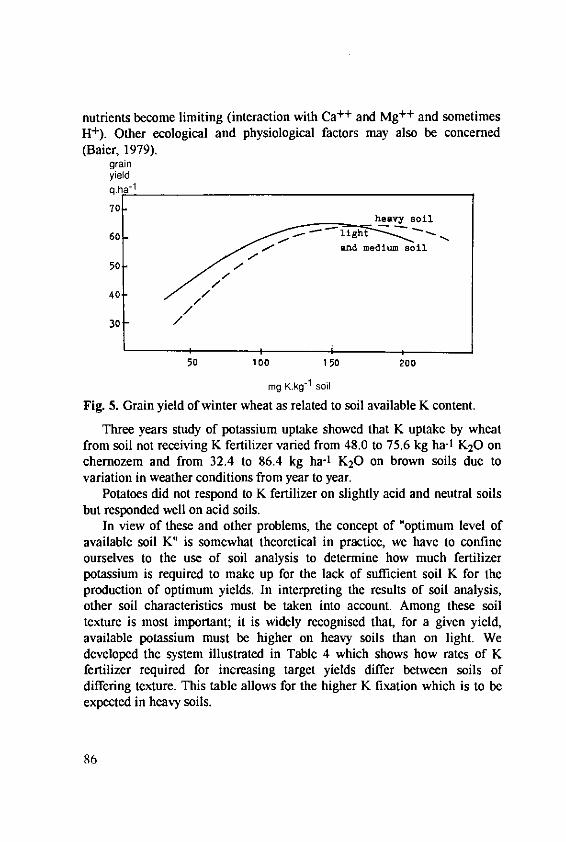
nutrients become limiting (interaction with Ca+ + and Mg ++ and sometimes1+). Other ecological and physiological factors may also be concerned(Baier, 1979).
grainyieldq.ha
- 1
70heavy soil
60 - lightand medium soil
50 -
40 . //
30 /
50 100 150 200
mg K.kg- 1 soil
Fig. 5. Grain yield of winter wheat as related to soil available K content.
Three years study of potassium uptake showed that K uptake by wheatfrom soil not receiving K fertilizer varied from 48.0 to 75.6 kg ha-1 K20 onchernozem and from 32.4 to 86.4 kg ha-' K20 on brown soils due tovariation in weather conditions from year to year.
Potatoes did not respond to K fertilizer on slightly acid and neutral soilsbut responded well on acid soils.
In view of these and other problems, the concept of "optimum level ofavailable soil K" is somewhat theoretical in practice, we have to confineourselves to the use of soil analysis to determine how much fertilizerpotassium is required to make up for the lack of sufficient soil K for theproduction of optimum yields. In interpreting the results of soil analysis,other soil characteristics must be taken into account. Among these soiltexture is most important; it is widely recognised that, for a given yield,available potassium must be higher on heavy soils than on light. Wedeveloped the system illustrated in Table 4 which shows how rates of Kfertilizer required for increasing target yields differ between soils ofdiffering texture. This table allows for the higher K fixation which is to beexpected in heavy soils.
86
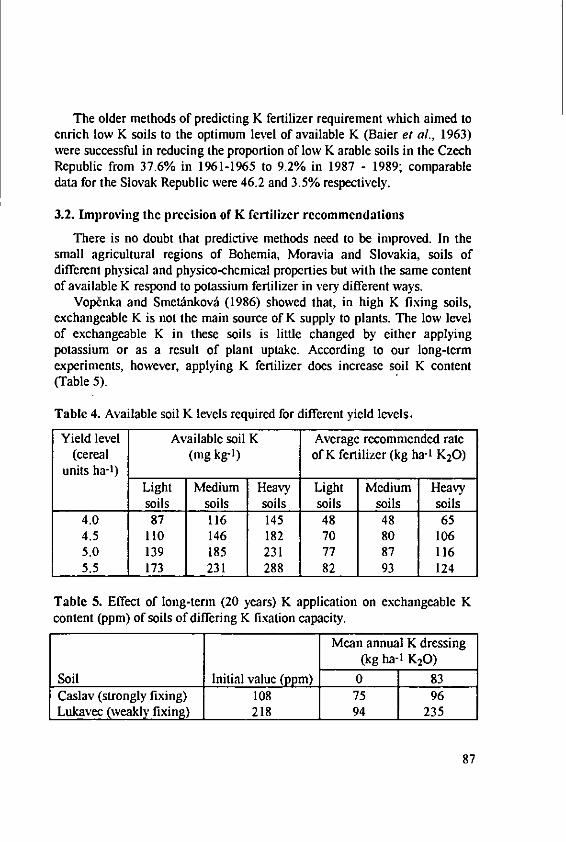
The older methods of predicting K fertilizer requirement which aimed toenrich low K soils to the optimum level of available K (Baler et al., 1963)were successful in reducing the proportion of low K arable soils in the CzechRepublic from 37.6% in 1961-1965 to 9.2% in 1987 - 1989; comparabledata for the Slovak Republic were 46.2 and 3.5% respectively.
3.2. Improving the precision of K fertilizer recommendations
There is no doubt that predictive methods need to be improved. In thesmall agricultural regions of Bohemia, Moravia and Slovakia, soils ofdifferent physical and physico-chemical properties but with the same contentof available K respond to potassium fertilizer in very different ways.
Vop~nka and SmetAnkov (1986) showed that, in high K fixing soils,exchangeable K is not the main source of K supply to plants. The low levelof exchangeable K in these soils is little changed by either applyingpotassium or as a result of plant uptake. According to our long-termexperiments, however, applying K fertilizer does increase soil K content(Table 5).
Table 4. Available soil K levels required for different yield levels.
Yield level Available soil K Average recommended rate(cereal (mg kg-1) of K fertilizer (kg ha-1 K20)
units ha-1)Light Medium Heavy Light Medium Heavysoils soils soils soils soils soils
4.0 87 116 145 48 48 654.5 110 146 182 70 80 1065.0 139 185 231 77 87 1165.5 173 231 288 82 93 124
Table 5. Effect of long-term (20 years) K application on exchangeable Kcontent (ppm) of soils of differing K fixation capacity.
Mean annual K dressing(kg ha-1 K20)
Soil Initial value (ppm) 0 83Caslav (strongly fixing) 108 75 96Lukavec (weakly fixing) 218 94 23
87
VopZnka (1989) considers that using particle size distribution alone tomodulate K availability is not sufficient and that two categories of soilpotassium should be measured : exchangeable plus water soluble and mobilepotassium reserve. HudcovA (1991), based on study of quantity-intensityrelationships, agrees. If the K reserve is high (> 1200 mg kg-' K) the rate ofK fertilizer should be decreased by one step.
Without doubt there are methods capable of characterising the K regimein different soils more precisely but, because they are tedious and expensive,they are little used in practice. An approach similar to that of Andres (1991)using a network of monitoring field experiments is an attractive possibilityfor improving on the present system for determining fertilizer requirements.
At the present time the "Complex Methodology of Plant Nutrition"(Neuberg et al., 1990) is recommended nationwide for determining basicannual application of potassium for a crop rotation. This is based on soil Kcategory including reserves and soil type and allows for K applied in organicmanures. It recommends suspending K fertilization for three years ifexchangeable K exceeds 290, 350 and 460 mg kg-1 on light, medium andheavy soils respectively.
Under this system, potassium fertilizer is applied to cover totalrequirement for a two or three year period and rates are adjusted for climaticregion, soil texture and soil K level. Application at such infrequent intervalsis not recommended for light sandy soils, soils with pH below 5.0 or soilswith very low K reserves which should receive K fertilizer every year.
For soils with medium K content it is recommended that K fixationcapacity should be measured by the Reichenbach-Schroeder method. Someagricultural laboratories use the CEC method for specifying balancedapplication of potassium, magnesium and calcium (Matula, 1984).
References
Andres, E.: Personal communication (1991).Baier, J. et al.: Basic rules for fertilizing recommendation plans in
production regions. UVTIZ Prague (1963).Baier, J.: Principles of basic relations of mineral plant nutrition. DrSc
Thesis, 283 pp. Prague (1974).Baier, J: The effect of ecological factors on nutrient uptake. UVTIZ Prague,
84 pp. (1979).
88
Baier, J.: Plant nutrition in fertilizing system. MZVz CSR, 216 pp. Prague(1982).
Baier, J. and BystrA, L.: The relation between the reserve of availablepotassium in soil and maximum winter wheat yields. RostlinnA itrobaPrague. 21, 779-785 (1975).
Baier, J., SmetfnkovA, M. and BaierovA, V.: Diagnostics of plant nutrition.MZVz CSR, 284 pp. Prague (1988).
Baier, I. and BaierovA, V.: Nutrient uptake and utilization for yieldproduction in red clover. RostlinnA v-roba Prague. 20, 345-355 (1974).
HudcovA, 0.: The influence of fertilizing on regime factors of soilpotassium. RostlinnA v~roba Prague. 37, 473-479 (1991).
Matula, J.: Cation exchange capacity of soil and its utilization for fertilizing.Agrochdmia 24, 11, 333-337 (1984).
Neuberg, J. et al.: Complex methodology of plant nutrition. UVTIZ Prague.327 pp. (1990).
PAcalt, J.: Factors lowering nutrient consumption for unit production in farmand experimental conditions. Archives VURV, Bohuslavice (1988).
Vop6nka, L. and SmetAnkovA, M.: A relationship between potassium uptakeby barley and changes in the soil potassium content during the vegetationperiod. RostlinnA vroba Prague. 32, 493-502 (1986).
Vop~nka, L.: Detailed determination of potassium fertilization from data onnon-exchangeable potassium in soil. RostlinnA vroba Prague. 35, 595-602 (1989).
VostAl, J.: Personal communication (1992).
89

Potassium in Animal Manure and Plant ResiduesEfficiency and Losses
Spiess, E. and Besson, J.-AM, Swiss Federal Research Station forAgricultural Chemistry and Hygiene of Environment, 3097 Liebefeld-Berne,Switzerland
Summary
Animal manure and plant residues are organic fertilizers which cover agreat part of the nutrient requirements of the crops. This is demonstrated bythe potassium cycle of the Swiss agriculture. As the cycle is not closed, thenutrients exported (animal products, vegetable produce, losses) have to bereplaced by mineral fertilizers and imported feedstuffs. In animal husbandry,potassium exports via milk and meat are minimal due to the relatively lowutilization of minerals in animal nutrition.
For an optimal use of fertilizers their quantity, nutrient content andefficiency have to be known. The amount of farmyard manure applied isdifficult to determine. The nutrient content of different manures and plantresidues varies much. In the long term, potassium in animal manure is aseffective as mineral potassium. Certainly, the short-time efficiency is oftenlower in comparison with mineral fertilizer, but the residual effect is better.The plant availability of potassium in straw and other plant residues in sometrials was lower than that of fertilizer K. Losses of K by leaching are only ofimportance on sandy and organic soils.
1. Introduction
Animal manures and plant residues are organic fertilizers, which areproduced on the farm and do not have to be purchased. For their optimaluse, farmers have to know their quantity, nutrient content and efficiency.Less knowledge on these parameters exists for animal manures and plantresidues than for mineral fertilizers, where the quantity applied is easy tocalculate, the content is indicated on the bag and the efficiency is morepredictable.
91
2. Potassium cycle and losses
The importance of animal manures and plant residues for plant nutritioncan be demonstrated by the example of the potassium cycle for the Swissagriculture (Figure 1). The most important nutrient path leads from plantproduction via forage to animal husbandry and from there via manure backto plant production. Nutrients enter the cycle via imported feedstuffs andmineral fertilizers. They replace the amount of nutrients exported from thesystem in animal products (milk, meat etc.), plant produce (wheat, potatoesetc.), leaching, surface run-off and other losses. In Switzerland, only a smallamount of potassium is imported in feedstuffs. An equivalent amount of Kleaves the farms in the form of agricultural products. Three subcycles are ofimportance : animal products as milk and whey are used for feeding calvesand fattening pigs; large amounts of nutrients are contained in harvest losses(e.g. losses during hay or silage making, grazing losses), in feeding lossesand in plant residues (straw, beet tops etc.). The nutrients in these subcyclesdo not leave agriculture. The potassium losses by leaching and surface run-off and the accumulation in the soil are not given in detail in figure 1 due tolack of precise data. They correspond to the parameter "balance".
The amount of potassium exported in animal products is quite low incomparison with the amount of K in the manure. In Switzerland, dairy cattleare fed mainly with roughage and the consumption of concentrate is low.About 75% of the milk is produced with basic forage (Menzi and Gantner,1987). Mineral substances are very inefficiently used by the animal,especially potassium which is always in excess. Only a small amount of thepotassium ingested is contained in milk and meat, while the greatest part isexcreted in dung and urine. Foi dairy cows, the percentage in milk is onlybetween 5 and 15% while the remaining 85-95% are excreted (Fluckiger etal, 1989). The potassium cycle for cattle production, therefore, is nearlyclosed (Figure 2). An excess of 10 kg K per ha is exported in the milk incomparison with the concentrate importation. This amount has to bereplaced with fertilizer.
In Switzerland, the exportation of potassium from agriculture withmarketed produce is low (Figure 1) because the surface used for thecultivation of vegetable produce amounts to less than 20% of the agriculturalarea. Furthermore, yield and K content of most crops are low in comparisonwith grassland (Table 1).
92
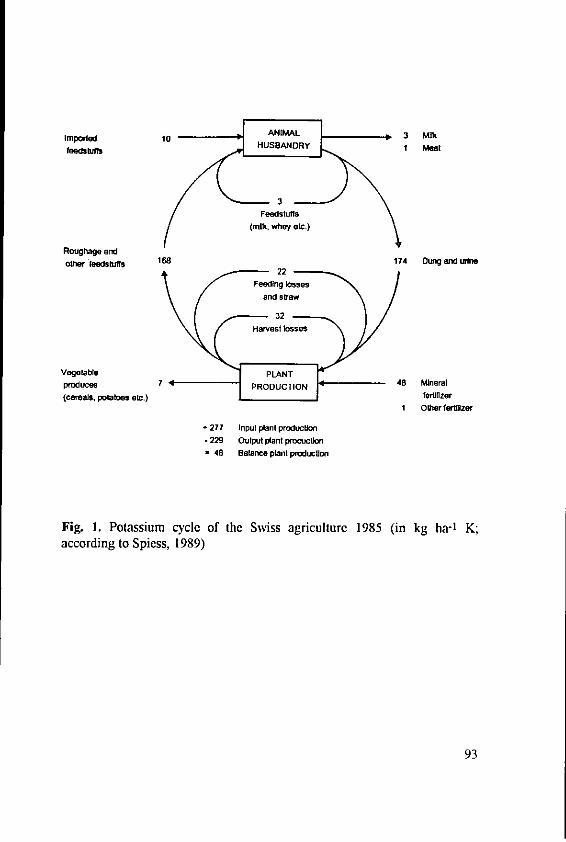
0ANIMAL 3 Mlkteed t HUSBANDRY I Meat
feeedstuffs
(milk, whey etc.)
Roughage andoter teedstuffs 168 174 Dung and urne
Feeding losses
and straw
32
Harvest less"
Vegetable PLANTproduces 7 PRODUCION Mneral(cereals, potatoes etc.) friiflzer
1 Other fertilizer
- 277 Input plant production- 229 Output plant procucilon
= 48 Balance plant producion
Fig. 1. Potassium cycle of the Swiss agriculture 1985 (in kg ha-' K;according to Spiess, 1989)
93
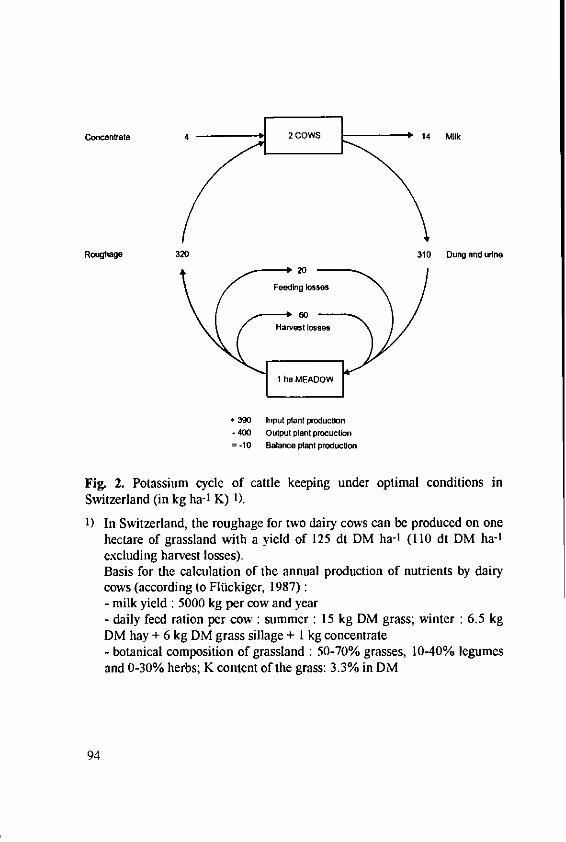
~~ 2tt /COWS
Roughage 320 310 Dung and une
Switzerlanddin (ioksh- 1 K)s)
Hauest e ses
1 eMEADO
-390 Input plant production- 400 Output plant prouctlon
=B-10 Balance plant production
Fig. 2. Potassium cycle of cattle keeping under optimal conditions inSwitzerland (in kg ha-1 K) s).
1) In Switzerland, the roughage for two dairy cows can be produced on onehectare of grassland with a yield of 125 dt DM ha- 4 (110 dt DM ha-l
excluding harvest losses).Basis for the calculation of the annual production of nutrients by dairycows (according to Flaickiger, 1987) :- milk yield : 5000 kg per cow and year- daily feed ration per cow : summer : 15 kg DM grass; winter : 6.5 kgDM hay + 6 kg DM grass sillage + I kg concentrate- botanical composition of grassland : 50-70% grasses, 10-40% legumes
and 0-30% herbs; K content of the grass: 3.3% in DM
94
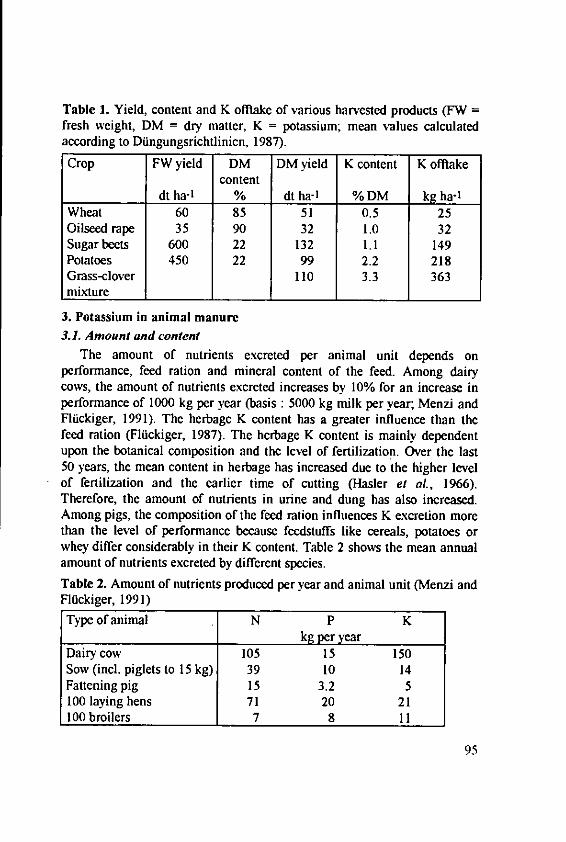
Table 1. Yield, content and K offiake of various harvested products (FW =fresh weight, DM = dry matter, K = potassium; mean values calculatedaccording to Diingungsrichtlinien, 1987).
Crop FW yield DM DM yield K content K offlakecontent
dt ha-1 % dt ha-I % DM kg ha-IWheat 60 85 51 0.5 25Oilseed rape 35 90 32 1.0 32Sugar beets 600 22 132 1.1 149Potatoes 450 22 99 2.2 218Grass-clover 110 3.3 363mixture
3. Potassium in animal manure3.1. Amount and content
The amount of nutrients excreted per animal unit depends onperformance, feed ration and mineral content of the feed. Among dairycows, the amount of nutrients excreted increases by 10% for an increase inperformance of 1000 kg per year (basis : 5000 kg milk per year; Menzi andFloickiger, 1991). The herbage K content has a greater influence than thefeed ration (Fltickiger, 1987). The herbage K content is mainly dependentupon the botanical composition and the level of fertilization. Over the last50 years, the mean content in herbage has increased due to the higher levelof fertilization and the earlier time of cutting (Hasler et aL, 1966).Therefore, the amount of nutrients in urine and dung has also increased.Among pigs, the composition of the feed ration influences K excretion morethan the level of performance because feedstuffs like cereals, potatoes orwhey differ considerably in their K content. Table 2 shows the mean annualamount of nutrients excreted by different species.Table 2. Amount of nutrients produced per year and animal unit (Menzi andFlflckiger, 1991)Type of animal N P K
kg per yearDairy cow 105 15 150Sow (mc. piglets to 15 kg) 39 10 14Fattening pig 15 3.2 5100 laying hens 71 20 21100 broilers 7 8 11
95
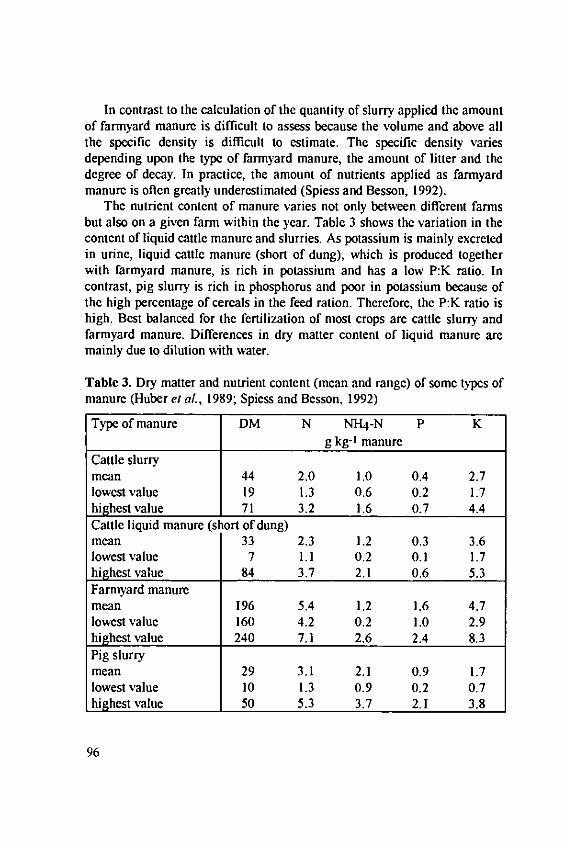
In contrast to the calculation of the quantity of slurry applied the amountof farmyard manure is difficult to assess because the volume and above allthe specific density is difficult to estimate. The specific density variesdepending upon the type of farmyard manure, the amount of litter and thedegree of decay. In practice, the amount of nutrients applied as farmyardmanure is often greatly underestimated (Spiess and Besson, 1992).
The nutrient content of manure varies not only between different farmsbut also on a given farm within the year. Table 3 shows the variation in thecontent of liquid cattle manure and slurries. As potassium is mainly excretedin urine, liquid cattle manure (short of dung), which is produced togetherwith farmyard manure, is rich in potassium and has a low P:K ratio. Incontrast, pig slurry is rich in phosphorus and poor in potassium because ofthe high percentage of cereals in the feed ration. Therefore, the P:K ratio ishigh. Best balanced for the fertilization of most crops are cattle slurry andfarmyard manure. Differences in dry matter content of liquid manure aremainly due to dilution with water.
Table 3. Dry matter and nutrient content (mean and range) of some types ofmanure (Huber et aL, 1989; Spiess and Besson, 1992)
Type of manure DM N NH4-N P Kg kg-' manure
Cattle slurrymean 44 2.0 1.0 0.4 2.7lowest value 19 1.3 0.6 0.2 1.7highest value 71 3.2 1.6 0.7 4.4Cattle liquid manure (short of dung)mean 33 2.3 1.2 0.3 3.6lowest value 7 1.1 0.2 0.1 1.7highest value 84 3.7 2.1 0.6 5.3Farmyard manuremean 196 5.4 1.2 1.6 4.7lowest value 160 4.2 0.2 1.0 2.9highest value 240 7.1 2.6 2.4 8.3Pig slurrymean 29 3.1 2.1 0.9 1.7lowest value 10 1.3 0.9 0.2 0.7highest value 50 5.3 3.7 2.1 3.8
96
3.2. Storage losses
Whereas no potassium can escape from watertight slurry pits and animalhouses, up to a third of the potassium is leached during storage of farmyardmanure (Kdhnlein and Vetter, 1953; Gisiger, 1962; Besson, 1991). Since thedrainage water of farmyard manure normally flows into the slurry pit, thenutrients contained in it are not lost but the already high K content of liquidmanure (short of dung) is further increased and the P:K-ratio of farmyardmanure increases due to loss of potassium. When farmyard manure iscomposted on the field, some nutrients (K, N, Mg etc.) may be leached outor accumulated in great amounts in the soil (Berner, 1990).
3.3. Efficiency
The efficiency of nutrients in manure is difficult to assess as liquidmanure and farmyard manure are "multinutrient fertilizers". Therefore, anincrease in yield is not only due to potassium but a response to manynutrients. Nitrogen certainly has the greatest influence on the yield. Buteven when the ammonium nitrogen is volatilized by intensive aerationbefore a trial, manure still contains organic nitrogen, phosphorus and otherplant nutrients.
Potassium in slurry is inorganically bound and 83-90% of it is soluble inwater (Amberger et aL, 1984). For this reason, the efficiency is in generalthe same as for mineral fertilizer (Voss, 1981). Buchner and Sturm (1980)write that the phosphorus and potassium efficiency both of manure andmineral fertilizer are considered equal.
In a pot trial with Lolium perenne (Amberger el aL, 1984), fertilizationwith cattle, pig or poultry slurry gave yields as good as mineral fertilizers. Inthe first four cuts, plants took up less potassium from slurry, but insubsequent cuts the residual effect of slurry was better than that of potassiumchloride. In pot and field trials short-term K efficiency of manure is oftenlow, but long-term trials suggest potassium of manure and mineral fertilizerto be equal (Smith and van Dijk, 1987).
Potassium leaching is generally low (< 10 kg K per ha and year). Onsandy or organic soils with a low adsorption capacity, however, more K maybe leached out, mainly when great amounts of slurry are spread in autumn orwinter (Mengel, 1982; Steffens and Vetter, 1985; Smith and van Dijk,1987).
97
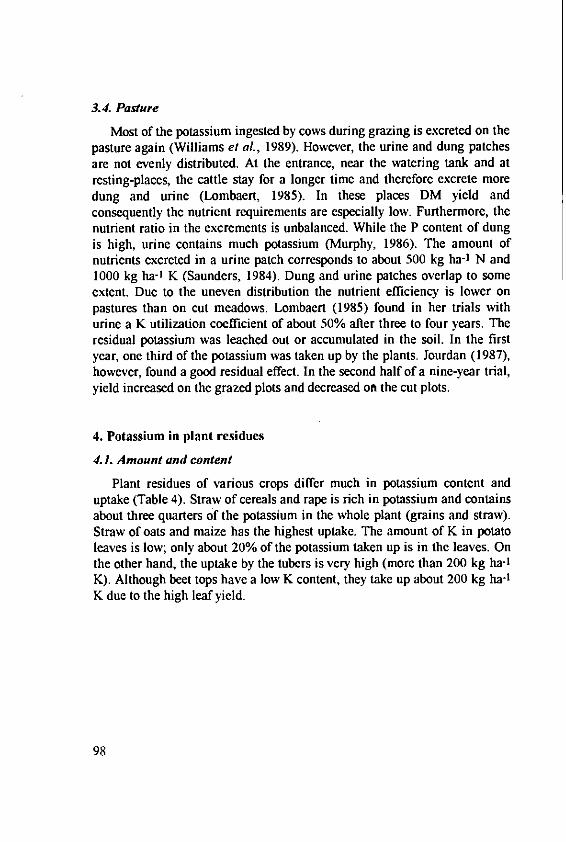
3.4. Pasture
Most of the potassium ingested by cows during grazing is excreted on thepasture again (Williams et al, 1989). However, the urine and dung patchesare not evenly distributed. At the entrance, near the watering tank and atresting-places, the cattle stay for a longer time and therefore excrete moredung and urine (Lombaert, 1985). In these places DM yield andconsequently the nutrient requirements are especially low. Furthermore, thenutrient ratio in the excrements is unbalanced. While the P content of dungis high, urine contains much potassium (Murphy, 1986). The amount ofnutrients excreted in a urine patch corresponds to about 500 kg ha-1 N and1000 kg ha-1 K (Saunders, 1984). Dung and urine patches overlap to someextent. Due to the uneven distribution the nutrient efficiency is lower onpastures than on cut meadows. Lombaert (1985) found in her trials withurine a K utilization coefficient of about 50% after three to four years. Theresidual potassium was leached out or accumulated in the soil. In the firstyear, one third of the potassium was taken up by the plants. Jourdan (1987),however, found a good residual effect. In the second half of a nine-year trial,yield increased on the grazed plots and decreased on the cut plots.
4. Potassium in plant residues
4.1. Amount and content
Plant residues of various crops differ much in potassium content anduptake (Table 4). Straw of cereals and rape is rich in potassium and containsabout three quarters of the potassium in the whole plant (grains and straw).Straw of oats and maize has the highest uptake. The amount of K in potatoleaves is low; only about 20% of the potassium taken up is in the leaves. Onthe other hand, the uptake by the tubers is very high (more than 200 kg ha-IK). Although beet tops have a low K content, they take up about 200 kg ha-'K due to the high leaf yield.
98
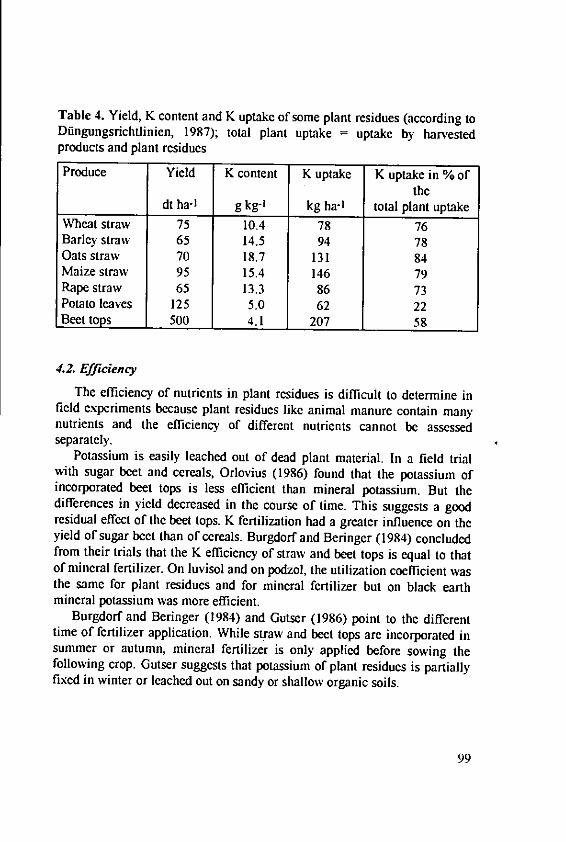
Table 4. Yield, K content and K uptake of some plant residues (according toDiingungsrichtlinien, 1987); total plant uptake = uptake by harvestedproducts and plant residues
Produce Yield K content K uptake K uptake in % ofthe
dt ha-I g kg-' kg ha-I total plant uptakeWheat straw 75 10.4 78 76Barley straw 65 14.5 94 78Oats straw 70 18.7 131 84Maize straw 95 15.4 146 79Rape straw 65 13.3 86 73Potato leaves 125 5.0 62 22Beet tops 500 4.1 207 58
4.2. Efficiency
The efficiency of nutrients in plant residues is difficult to determine infield experiments because plant residues like animal manure contain manynutrients and the efficiency of different nutrients cannot be assessedseparately.
Potassium is easily leached out of dead plant material. In a field trialwith sugar beet and cereals, Orlovius (1986) found that the potassium ofincorporated beet tops is less efficient than mineral potassium. But thedifferences in yield decreased in the course of time. This suggests a goodresidual effect of the beet tops. K fertilization had a greater influence on theyield of sugar beet than of cereals. Burgdorf and Beringer (1984) concludedfrom their trials that the K efficiency of straw and beet tops is equal to thatof mineral fertilizer. On luvisol and on podzol, the utilization coefficient wasthe same for plant residues and for mineral fertilizer but on black earthmineral potassium was more efficient.
Burgdorf and Beringer (1984) and Gutser (1986) point to the differenttime of fertilizer application. While straw and beet tops are incorporated insummer or autumn, mineral fertilizer is only applied before sowing thefollowing crop. Gutser suggests that potassium of plant residues is partiallyfixed in winter or leached out on sandy or shallow organic soils.
99
5. Conclusions
The short-time efficiency of potassium in animal manure and plantresidues often is not as good as for mineral fertilizer. In the long-term,however, the utilization coefficient is the same as for mineral fertilizer, ifthe organic fertilizers are applied within the growing season and in amountsnot exceeding the crop requirements. For optimal fertilization, the amount ofnutrients applied has to be known. For that, farmers should record theapplication rate of manure as precisely as possible and determine thenutrient content by means of standard values or analysis.
6. References
Amberger, A., Wiinsch, A. and Gutser, R. : Kaliumwirkung verschiedenerGlillen. Z. Pflanzenernlihr. Bodenk. 147, 125-130 (1984)
Bemer, A. : Einfluss von Kompostmieten auf die Umwelt. Landw. Schweiz3, 95-99 (1990)
Besson, J.-M. : Le compostage des fumiers. In: L'Azote en question.Colloque de l'Association pour la promotion industrie agriculture(APRIA) A Paris (29-30janvier 1991). Ed. APRIA, 93-106 (1991)
Buchner, A. and Sturm, H. : Gezielter dongen. DLG-Verlag, Frankfurt amMain (1980)
Burgdorf, W. and Beringer, H. : Nachweis von Kalium ausErnterickstAnden durch Bodenuntersuchung und Pflanzenanalyse.Landw. Forschung 37 (Kongressband 1984), 653-661
Dflngungsrichtlinien fir den Acker- und Futterbau. Eds. : U. Walther, J.-P.Ryser, R. Flisch and A. Siegenthaler. LandwirtschaftlicheBeratungszentrale, Lindau (1987)
Fliickiger, E. : Nihrstoffanfall in den Hofdflngern - eine Modellrechnung.Landw. Jb. Schweiz /01, 285-311 (1987)
Fluckiger, E., Besson, J.-M. and Jans, F. : Anfall an Kot und Ham vonHochleistungskiihen. Schweiz. Landw. Forschung 28, 175-189 (1989)
Gisiger, L. : Vom Anfall der Mistgille, ihrem Gehalt und Wert. Mitt.Schweiz. Landw. 10, 150-156 (1962)
Gutser, R. : Evaluation of Potassium from Plant Residues in ArableCropping Systems. In : Nutrient Balances and the Need for Potassium.Proc. 13th 1PI-Congress, Reims, France, 25-28 August 1986.International Potash Institute, Berne-Worblaufen, 233-241 (1986)
100
Hasler, A., Schleiniger, J. and Schnetzer, H.L. : Beitrag zur Kenntnis desMagnesiumgehaltes schweizerischen Wiesenfutters. Schweiz. Landw.Forschung 5, 375-392 (1966)
Huber, R., Menzi, H., Besson, J.-M., Roulet, M. and Flackiger, E. : GrosseUnterschiede im Gehalt von Schweinegiillen. Die Grine 117 (24), 12-16(1989)
Jourdan, 0. : Utilization of potassium excreted by grazing cattle. In : van derMeer, H.G., Unwin, R.J., van Dijk, T.A. and Ennik, G.C. (Eds.). AnimalManure on Grassland and Fodder Crops. Fertilizer or Waste ? MartinusNijhoff Publishers, Dordrecht, 355-356 (1987)
Kdhnlein, J. and Vetter, H. : Die Stalldangerrotte bei steigenderStroheinstreu. Z. Pflanzenernlhr., Dang., Bodenk. 63, 119-141 (1953)
Lombaert, V. : Les animaux an piturage : de mauvais 6pandeurs d'engrais.Cultivar No. 187 (1985)
Mengel, K. : Faktoren und VorgAnge, die den Kaliumbedarf derKulturpflanzen bedingen. Kali-Briefe, Fachgebiet 16, 90. Folge (1982)
Menzi, H. and Gantner, U. : Entwicklung der Milchleistung aus demGrundfitter im schweizerischen Tal- und Berggebiet zwischen 1966 und1985. Schweiz. Landw. Forschung 26, 209-221 (1987)
Menzi, H. and Flockiger, E. : Neue Richtwerte fbr Hofdfinger : AktuellerStand und Konsequenzen. In: Tierhaltung und Njhrstoflkreislauf aufdem landwirtschafllichen Betrieb. SVIAL-Weiterbildungskurs, Bern(16.-17.4.1991)
Murphy, W.E. : Nutrient Cycling in Different Pasture Systems. In : NutrientBalances and the Need for Potassium. Proc. 13th IPI-Congress, Reims,France, 25-28 August 1986. International Potash Institute, Berne-Worblaufen, 227-232 (1986)
Orlovius, K. : Mehrj~hrige Feldversuchsergebnisse zur Bewertung vonKalium aus Ernterilckstanden unter verschiedenen Standortbedingungen.Landw. Forschung 30 (3), 189-197 (1986)
Saunders, W.M.H. : Minerals composition of soil and pasture from areas ofgrazed paddocks, affected and unaffected by dung and urine. NewZealand J. Agric. Res. 27, 405-412 (1984)
Smith, K.A. and van Dijk, T.A. : Utilisation of phosphorus and potassiumfrom animal manures on grassland and forage crops. In : van der Meer,H.G., Unwin, R.J., Dijk, T.A. and Ennik, G.C. (Eds.). Animal Manureon Grassland and Fodder Crops. Fertilizer or Waste ? Martinus NijhoffPublishers, Dordrecht, 87-102 (1987)
101
Spiess, E. : Schatzung der schweizerischen Nflhrstoflbilanz fur 1985.Schriflenreihe der FAC Liebefeld Nr. 4, Liebefeld-Bem (1989)
Spiess, E. and Besson, J.-M. : Hofdiingereinsatz in der SchweizErhebungen und Umfrage auf Landwirtschaftsbetrieben. Schriftenreiheder FAC Liebefeld Nr. 12, Liebefeld-Bern (1992)
Steffens, G. and Vetter, H. : Mittelfristige Nahrstofbilanz undNAhrstoffausnutzung bei Giilleduingung. Kali-Briefe (Bfintehof) 17 (6),441460 (1985)
Voss, W. : Wie sind die GfillenAhrstoffe zu bewerten ? DLG-Mitteilungen96(21), 1150-1151 (1981)
Williams, P.H., Gregg, P.E.H. and Hedley, M.J. : Fate of potassium in dairycow urine applied to intact soil cores. New Zealand J. Agric. Res. 33,151-158 (1990)
102
Coordinator's Report on Session I
Mengel, K., Institute of Plant Nutrition, Justus Liebig University, Giessen,Germany
The basic sources of K+ are K- bearing minerals, mainly frameworksilicates and layer silicates. In these minerals K is a structural element andmay be released by weathering. As M.J. Wilson showed in his presentationthe forces with which these minerals bind K+ differ and hence also therelease rates for K+ . Generally the release rates from mica are higher thanthose from feldspars. Potassium release rates can be described by equationswhich may form the basis for modelling K+ release and may allow aprediction as to how much K+ is provided to plants in a given period. Suchmodels require a precise knowledge of the type and concentration of K-bearing minerals in the soil. In this context it should be kept in mind thatnot only soil minerals but also plant roots are directly involved in the releaseK+ of minerals.
Potassium release from K minerals is considered under agronomic andecological aspects. The former is of importance for crop nutrition, the lattermeans a gradual dissolution of soil minerals and hence also of soil fertility.This process of mineral degradation can be delayed or even blocked by Kfertilizer application.
M. Robert in his leading paper gave a broad view on K+ reactions insoils, K+ fluxes and equilibrium conditions integrating in his concept theplant root as a strong sink for K+ . He emphasized the importance ofintensity, quantity, and buffer power for K+ as main basic parameters forsoil K+ availability and he showed an example of how the K+ buffer powerdiffers for various soil types. The buffer power denoted on the ordinate of thegraph not only represents the so called exchangeable K+ but also non-exchangeable K+ since both fractions are involved in buffering the K+concentration of the soil solution. There is no clear cut difference betweenthe exchangeable and non-exchangeable soil K+ as was emphasized by J.C.Fardeau et al. in their presentation. Following the concept of K+ concentrationin the soil solution (intensity) and the K+ buffer power (plot of theexchangeable + non-exchangeable K+ on the K+ concentration in the soilsolution) one comes up with the conclusion that the level of available K+ foran optimum K+ nutrition should be the higher the larger the K+ buffer
103
power of a soil. This was exactly shown by the posters of Richter andKerschberger, Villemin and Schneider, and Van Diest.
For the farmer the theoretical considerations of K+ availability are of lessinterest than the available soil K+ level at which he obtains the optimumyield. This may depend on various factors as was stressed by J. Baier in hispaper based on his long-term field experiments. For further improving theprediction of K fertilizer rates based on whatsoever soil test, calibriationfield experiments are required for the individual soil types, sites and crops,similar to the trials described by Margarita Nikolova in her poster where itcan be seen that the response to K fertilizer depended on soil types and alsomuch on crop species. An analogous finding was presented by the poster ofOrlovius and Andres. It is assumed that rooting and growth rate of cropspecies have an impact on the optimum level of available soil K+, the formerdecreasing, the latter enhancing it. Therefore K fertilizer application shouldtarget on the crop species of a rotation which gives the highest response to Kfertilizer. This species needs the highest level of available soil K+. Tomaintain an optimum level of available soil K+ not only mineral fertilizershould be considered but also the potassium which is present in plantresidues, slurries and farmyard manure, a problem which was treated in thepresentation of Spiess.
104
Chairman of the Session 2
Prof. H. Laudelout Universit6 Catholiquede Louvain, Centre de RecherchesForestibes, Route de Ia Fagne 34, 6460Chimay, Belgique; member of the ScientificBoard of the International Potash Institute
Session 2
K in the Hydrosphere
105
Size of Minimal Catchment Area for DrinkingWater as Influenced by Climate and Population Size
Hagedorn, H., Geographisches Institut, Universitit Wiirzburg, Am Hubland,D-8700 Wiirzburg, Germany
Summary
Hydrological concepts for the assessment and evaluation of variousparameters of a catchment area are described. Out of the numerous methodsfor the determination of precipitation and runoff the unit hydrograph isdiscussed. Reference is made to the importance of the water balance for thesupply with drinking and process water, which can be positive or negative,depending on the climatic regime. It is explained that the water supply formany urban regions can no longer be obtained from their immediatevicinity. Some regions are at the hydrological and ecological limits of theirwater supply possibilities, so that continued urban growth will have to cometo an end.
Importance of pure drinking water
In a discussion on the foundations of the Roman Empire it was pointedout that the Romans not only put much emphasis on their excellent roadsystem but equally so on the purity of their drinking water. The reduction ofdiseases in their settlements was regarded as a major element of Romansuccess. In a most impressive way long aqueducts transported drinkingwater to Roman settlements, even when they were located along rivers witha good water supply. A case in point is the towns along the middle Rheinvalley that were supplied with drinking water from the Eifel Mts.
This example from history shows the importance of a good water supplyfor a population. It makes clear that the mere presence of water is notenough, but that it has to have certain properties in order to be used asdrinking or process water. Water quality largely depends on the nature of thewatersheds and on their hydrological characteristics. The latter are open toscientific analysis, whereas problems of water supply are greatly dependenton economic, sociological and technical factors. Studies in the field of watereconomics is a rapidly growing discipline.
107
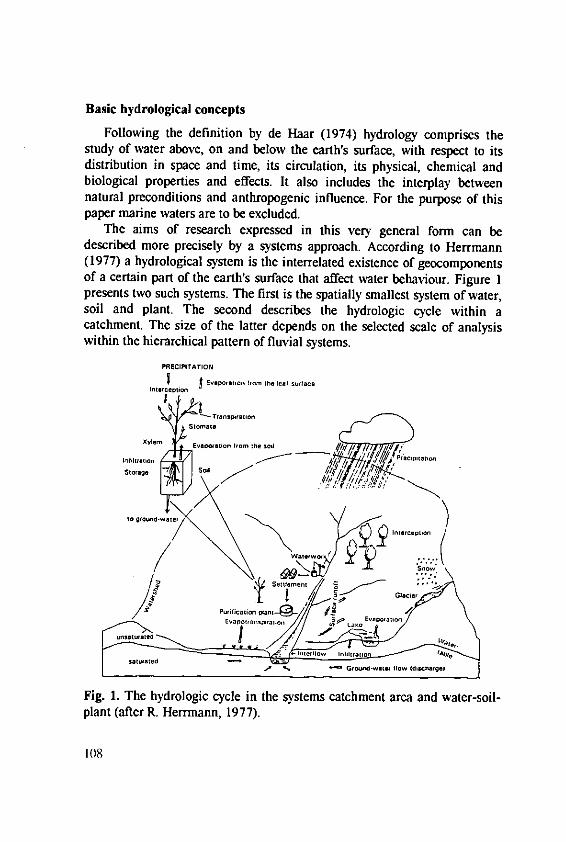
Basic hydrological concepts
Following the definition by de Haar (1974) hydrology comprises thestudy of water above, on and below the earth's surface, with respect to itsdistribution in space and time, its circulation, its physical, chemical andbiological properties and effects. It also includes the interplay betweennatural preconditions and anthropogenic influence. For the purpose of thispaper marine waters are to be excluded.
The aims of research expressed in this very general form can bedescribed more precisely by a systems approach. According to Herrmann(1977) a hydrological system is the interrelated existence of geocomponentsof a certain part of the earth's surface that affect water behaviour. Figure 1presents two such systems. The first is the spatially smallest system of water,soil and plant. The second describes the hydrologic cycle within acatchment. The size of the latter depends on the selected scale of analysiswithin the hierarchical pattern of fluvial systems.
PRECIPITATION
ian . IeWha, I Eveo,aon . - the .r at
stomata
otall
togrotmd-.ali Ww
Snow,
E_ A. .o Ey p..h ,u satrated "ncrn
It Inm tu, W t 1 o w di I ft~ el
Fig. 1. The hydrologic cycle in the systems catchment area and water-soil-plant (after R. Herrmann, 1977).
108
For the present discussion the hydrologic cycle of a given catchment isthe more important one as it is the prime supplier of drinking and processwater. A catchment is separated from others by its watershed. Where thesubsurface and the superficial watersheds coincide, the catchment isidentical with the precipitation area. Where the subterranean catchment areais larger, water from an adjacent precipitation area will be transferred to it.Part of the precipitation will leave the catchment as runoff; another part willinfiltrate; and part of that will be stored as a ground-water reserve fordifferent lengths of time. Runoff has a superficial and a subsurfacecomponent; averaged over a longer period of time runoff is the differencebetween precipitation and evaporation. For shorter periods several factorsaffect the relationship between precipitation and runoff. These are bedrock,weathering debris, soil, vegetation, and land use, as well as landforms.
It is one of the major tasks of hydrology to determine the characteristicsof a catchment with respect to the factors just mentioned, and to analysetheir interrelationship. Another set of factors influencing a catchment'swater balance comprises the spatial and temporal variation of precipitation.In order to understand how the water in a catchment will react anunderstanding of the precipitation characteristics listed below is called for:
1. the pattern of dry periods between precipitation events;2. the identification of the onset of a new, individual precipitation event;3. the duration pattern of precipitation events;4. the temporal pattern of amounts of precipitation of a certain duration;5. the spatial pattern of precipitation (Herrmann, 1977).Models based on random processes are necessary to. determine these
properties as precipitation events are place and time dependent. Knowledgeof all the catchment characteristics mentioned is necessary for determiningand understanding superficial runoff and ground-water renewal.This is not the time to discuss the methods employed today for calculatingrunoff curves etc.; they are mathematical and physical models suitable forboth qualitative and quantitative description. All models rest on empiricalfoundations that limit their application. Except for some very generalstatements each catchment has to be calculated individually.
The unit hydrograph method
There is only one method, which should be mentioned here. It is the unithydrograph method, a procedure to derive the hydrograph of runoff due to
109

any amounts of effective or excess rainfall. This method was first presentedby Sherman (1932).
The unit hydrograph is the hydrograph of surface runoff on a given basindue to an effective rain falling for a unit of time, after the definition given bySherman (1949). Groundwater runoff has to be excluded. The unit of timemay be one day or less. The term "effective rain" means rain producingsurface runoff. The unit hydrograph method takes cognizance of thefollowing facts, among others, that from a given basin the observedhydrograph of runoff due to a given period of rainfall reflects all thecombined physical characteristics of the drainage basin, includinginfiltration, surface detention and storage. It has further been found that,within close approximate limits, the ordinates of a unit hydrograph areproportional to the total volume of surface runoff from such unit time rains,irrespective of the amount of such unit rainfalls. The time duration of thehydrograph of surface runoff, due to an effective rain in a unit of time, ispractically a constant. The distribution of runoff, represented by the ratios ofvolume of runoff during a particular unit of time to the total runoff, is aconstant for all unit hydrographs of runoff derived from the same basin. Thisholds true for all storms on the basin, without regard to their intensity(Sherman, 1949).
Herrmann (1977) criticizes the unit hydrograph method because the unithydrograph can be derived for one basin only. He points out that it is ablack-box model, a model which transforms an input (effective rain) into anoutput (runoff), every time in the same way without taking into accountphysical laws. Figure 2 shows the compilation of a unit hydrograph afterHerrmann (1977). The example of the unit hydrograph method is given hereto explain the variety and difficulties of methods which can be used fordescribing the hydrologic situation in a catchment area.
I a till)
Fig. 2. Compilation of an Unit Hydrograph (UH).
I10
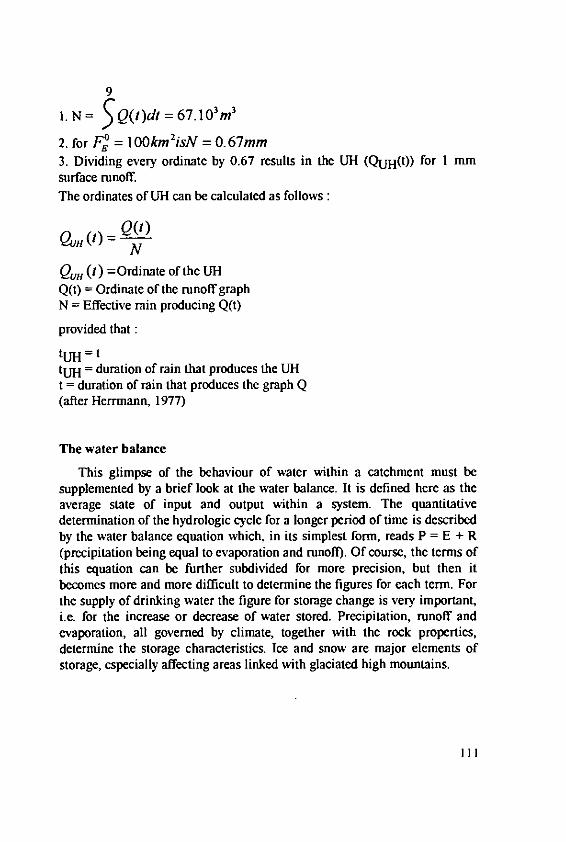
9
l. N = 5Q(t)d =67.13M
2. for F. = lO0km2isN = 0.67mm3. Dividing every ordinate by 0.67 results in the UH (QuH(t)) for I mmsurface runoff.The ordinates of UH can be calculated as follows:
Q(t)N
Qu. (t) =Ordinate of the UHQ(t) = Ordinate of the runoff graphN = Effective rain producing Q(t)
provided that:
tuH = ttUH = duration of rain that produces the UHt = duration of rain that produces the graph Q(after Herrmann, 1977)
The water balance
This glimpse of the behaviour of water within a catchment must besupplemented by a brief look at the water balance. It is defined here as theaverage state of input and output within a system. The quantitativedetermination of the hydrologic cycle for a longer period of time is describedby the water balance equation which, in its simplest form, reads P = E + R(precipitation being equal to evaporation and runoff). Of course, the terms ofthis equation can be further subdivided for more precision, but then itbecomes more and more difficult to determine the figures for each term. Forthe supply of drinking water the figure for storage change is very important,i.e. for the increase or decrease of water stored. Precipitation, runoff andevaporation, all governed by climate, together with the rock properties,determine the storage characteristics. Ice and snow are major elements ofstorage, especially affecting areas linked with glaciated high mountains.
111
Within the humid regions the water balance is always positive. The partof it that is used for human consumption is relatively small and, in general,is available in sufficient quantity in the humid regions. Regional problems ofwater supply may occur, however, in highly populated areas, as at present inthe Frankfurt area. The principal problem there is not to get water at all, butto produce enough good quality drinking water. Regions with an aridclimate, where evaporation exceeds precipitation, have the double problemof both insufficient water supply in general and of good drinking water atthat. They either have to rely on water transferred from humid areas, as e.g.in southern California, or they have to exploit groundwater reservesaccumulated during pluvial periods of the recent geological past. Wherevergroundwater recharge is less than groundwater extraction a catastrophe ispre-programmed. Libya is a good (or really, bad) example. Populationconcentration along the Mediterranean coast has caused over-exploitation ofthe wells where marine brackish water is about to replace fresh water. Toalleviate the problem groundwater from the desert is being pumped to thecoast at enormous costs. It is fossil water, however, coming from an areawhere the present rate of recharge is practically nil. The water import to thecoast, therefore, can only postpone the catastrophe for a few decades at best.
The water situation of the big stream oases along the Nile, Euphrates andIndus river is rapidly worsening. More intensive use of water along theupper reaches reduces the amount of water available downstream in regionswith enormous population growthly thus increasing water demand. Thewidening gap between declining water supply and growing population isabout to create a very explosive situation.
Climatic regimes and the water balanceThe water balance of a wet region is mentioned above. The influence of a
climatic regime on the water balance can be expressed by the watersurpluses and deficiencies. The main types of climatic regimes and the waterbalance will be given in a short survey after Strahler (1954).
We observe a vast water surplus in the wet equatorial climate. It rains thewhole year and the potential evapotranspiration shows only a small annualvariation; no water deficiency occurs.
112
In a tropical desert regime the potential evapotranspiration greatlyexceeds rainfall, a large water deficiency prevails.
The potential evapotranspiration graph of the tropical wet-dry climate inlower latitudes follows a cycle with high values in the dry season of lower-sun and lower values during the rains of the high-sun period. The watersurplus of the rainy season can exceed the deficiency of the dry period; itdepends on the duration of each period.
In the Mediterranean (dry summer, subtropical) a large summerdeficiency results from the fact that the summer rate of potentialevapotranspiration coincides with the summer precipitation minimum.
Continentality of climatic regime is expressed by a summer maximum ofprecipitation coinciding with a summer maximum of potentialevapotranspiration. Normally there is no water deficiency in this climaticregime.
Each type of climate has its own characteristic annual water balancewhich should be well known for planning the water supply and the water usefor all purposes.
Water supply of large urban areas
In planning the water supply for urban areas the parameters referred toin the chapter on hydrology have to be taken into consideration. They are thebasis for the master plans for water management that also have to considerthe economic and population structure of the area. The basis of all planning,however, is the water balance, the relationship between water supply andwater needs. The use of process water has equally to be included in thecalculation, especially in view of the rising thermal pollution of rivers bypower plants. The principal problem certainly is to ensure that water qualityremains sufficiently high. Water quality depends on the naturalcharacteristics of the extraction area modified by anthropogenic pollution.
113
The non-watery contents of groundwater that originate from the rocks ofthe respective catchment area almost completely occur in solution. Table 1lists the average composition of rocks. Concentration of minerals in thegroundwater depends on the geochemical mobility of the elements in a givenchemical environment. Solubility further depends on their ion potentials(Matthess, 1973). Categories have been established for both parameters.With respect to ion potential, K (potassium), for instance, belongs to thecategory of elements that stay in true solution up to high pH values. Withrespect to geochemical mobility, however, potassium belongs to category III,indicating that it is not especially mobile.
The chemical behaviour of surface water partly depends on thecharacteristics of the groundwater that seeps into the surface water. As waterfrom superficial runoff is likely to carry less dissolved material thangroundwater, water derived from a mixture of both will be less mineralized.Most rivers, unfortunately, carry a high load of waste water masking theoriginal chemical composition. Detailed knowledge of riverwatercomposition is mandatory where it is going to be used in infiltration wellsfor artificial groundwater recharge.
In most highly urbanized areas of the world water supply can no longerbe secured from the immediate vicinity. It has to be piped in sometimes overlong distances from areas with a large water supply that has not yet beennegatively affected by man. In the Federal Republic of Germany, forinstance, the coastal city of Bremen and other northern German cities gettheir water from the reservoirs of the Harz Mts. Stuttgart, in southwesternGermany, gets its water from Lake Constance, and the Ruhr IndustrialRegion is supplied from the reservoirs of the Sauerland. By pooling waterfrom different sources waters of different natural chemistry can be mixed forimproving water quality. Problems may occur where the land surroundinglarge reservoirs is used more and more for recreation, increasing the dangersof pollution and reduction of water quality. These will become particularlyapparent in drought years up to the point of causing shortages of goodquality water.
114

Table 1. Mineral components of groundwater - Average composition ofrocks (after Horn and Adams, 1966 and Hem*, 1970) and sea water (afterTurekian, 1969) in mg kg-'.
Magmatite Resistate Hydrolysate Precipitate Evaporite Sea water(Sandstones) (Clays) (Linstmones)
Si 285000 359000 260000 33900 386 2.9A 79500 32100 80100 8970 29 0.001Fe 42200 18600 38800 8190 265 0.0034Ca 36200 22400 22500 272000 11100 411Na 28100 3870 4850 393 310000 10800K 25700 13200 24900 2390 4280 392Mg 17600 8100 16400 45300 3070 1290P 1100 539 733 281 0.088Mn 937 392 575 842 4.4 0.0004F 715 220 560 112 24 1.3Ba 595 193 250 30.1 173 0.021S 410 945 1850 4550 26800 904Sr 368 28.2 290 617 234 8.1C 320* 13800* 15300- 113500* 28.5Cl 305 15 170 305 525000 19400Cr 198 120 423 7.08 10.6 0.0002Rb 166 197 243 46.0 0.12V 149 20.3 101 12.6 0.3 0.0019Cu 97.4 15.4 44.7 4.44 2 0.0009Ni 93.8 2.57 29.4 12.8 1.4 0.0066Zn 80 16.3 130 15.6 0.6 0.005N 46* 600* 16.17Li 32-2 15 46.2 5.16 30.0 0.17Co 23 0.328 8.06 0.123 1.6 0.00039Ga 18.5 5.87 22.8 2.69 0.00003Pb 15.6 13.5 80 16.5 0.9 0.00003Th 11.4 3.94 13.1 2.01 0.2 0.00000CB 7.5 90 194 16 1.2 4.45Cs 4.3 2.15 6.2 0.771 0.0003Be 3.65 0.258 2.13 0.175 0.00000CU 2.75 1.01 4,49 2.2 0.2 0.0033Sn 2.49 0.115 4.12 0.166 0.00081Br 2.37 1.0 4.3 6.6 33 67.3As 1.75 1.0 9.0 1.75 0.0026W 1.42 1.56 1.92 0.561 <0.000001Ge 1.39 0.881 1.32 0.363 0.00006Mo 1.25 0.50 4.25 0.75 1.5 0.011 0.45 3.75 4.4 1.59 1 0.064Hg 0.32 0.057 0.272 0.0456 0.00015Cd 0.19 0.019 0.183 0.0476 0.00011Ag 0.15 0.122 0.271 0.189 0.00028Se 0.05 0.525 0.60 0.315 0.2 0.00009Au 0.00 0.004 0.003 0.0017 0.000011
(after Matthess, 1973)
115
7. Conclusions
The increasing urbanization of the earth goes hand in hand with themodification of the drainage systems by surface sealing, decrease ofvegetated area and changes of land use for agricultural and gardening use.There is an apparent trend towards accelerated runoff and decreasingstorage. Another trend is that urban water supplies are becoming moredifficult and costly. Natural storage is clearly declining where water isderived from glaciers, due to the climatically induced retreat of mountainglaciers.
In the drought-prone regions of the subtropics and the drier margins ofthe tropics the destruction of natural vegetation by agriculture and animalproduction has a negative effect on surface runoff and groundwaterrecharge. This progressively leads to the reduction of available water to theextent that the natural oscillations of precipitation and ground-waterrecharge can no longer be buffered.
The increasing scarcity of water for urban areas will consequently lead toa reduction in urban growth. Away from the cities it is the uncheckedpopulation growth in many parts of the world that creates increasinglysevere problems of water supply.
8. References
Herrmann, R. : Einftihrung in die Hydrologic - Teubner, Stuttgart (1977)Keller, R. : Gewasser und Wasserhaushalt des Festlandes - Aude & Spenner,
Berlin (1961)Matthess, G. : Die Beschaffenheit des Grundwassers. Lchrbuch der
Hydrologic. Bd. 2. Gebrfider Borntr~ger, Berlin, Stuttgart (1973)Sherman, L.K. : The Unit Hydrograph Method - In: O.E. Mcinzer (ed):
Hydrology. Dover Publications, New York (1949)Strahler, A.N. : Introduction to Physical Geography - John Wiley, New
York, London, Sidney (1954)
116
Potassium in Natural Groundwater Systems
Nativ, R.. The Seagram Center for Soil and Water Sciences, HebrewUniversity of Jerusalem, P.O. Box 12, Rehovot 76100, Israel
1. Introduction
The basic information about the chemistry of potassium in water isdeficient. Many of the existing chemical analyses of water do not includepotassium determinations. Some of the old wet-chemical methods forpotassium required considerable analytical skill; consequently, the accuracyof some of the earlier published values for potassium concentrationsobtained using these methods appears to be questionable.
Research aimed at attaining a better understanding of the chemicalbehavior of potassium in natural aqueous systems is still needed (Hem,1985). In this article, the abundance of potassium in the lithosphere and inthe various components of the hydrological cycle are reviewed, and thecontrols on its concentrations are discussed.
2. Abundance of potassium in rocks
The lithosphere contains 2.6% potassium, the seventh most abundantelement. Primary potassium-containing minerals are the K-feldspars (16%)and the K-micas (5.2%). Secondary minerals include illite and transitional-clay minerals (Schroeder, 1978).
2.1. Potassium in igneous and metamorphic rocks
Igneous rocks generally contain 0 to 5% of K20 and 0 to 7% of Na 2O. Afew volcanic rocks from continental areas are extremely rich in potassiumup to 12.66% (Wyomingite, from Leucite Hills, Wyoming) (Brownlow,1979). Table I presents the chemical composition of some common igneousrocks.
117
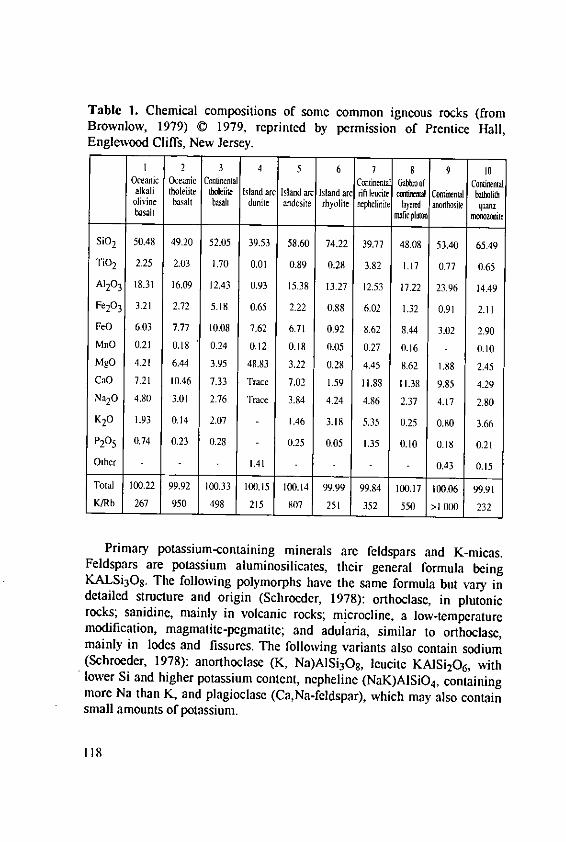
Table 1. Chemical compositions of some common igneous rocks (fromBrownlow, 1979) D 1979, reprinted by permission of Prentice Hall,Englewood Cliffs, New Jersey.
1 2 3 4 5 6 7 8 9 10Oceanic Oceanic Continental Continental Gabbrof Continentalalkali tholeiite tholeijie Islandarc Islandarr Islandarc rftleucite cantintd Catinental baflhlitholivine basalt basalt dunite andesie rhyolite nephelinite layered anohosite qaaz
basalt mafic plmw razcnitle
SiO, 50.48 49.20 52.05 39.53 58.60 74.22 39.77 48.08 53.40 65.49
TiC 2 2.25 2.03 1.70 0.01 0.89 0.28 3.82 1.17 0.77 0.65
A120 3 18.31 16.09 12.43 0.93 15.38 13.27 12.53 17.22 23.96 14.49
Fe20 3 3.21 2.72 5.18 0.65 2.22 0.88 6.02 1.32 0.91 2.11
FeO 6.03 7.77 10.08 7.62 6.71 0.92 8.62 8.44 3.02 2.90MnO 0.21 0.18 0.24 0.12 0.18 0.05 0.27 0.16 - 0.10MgO 4.21 6.44 3.95 48.83 3.22 0.28 4.45 8.62 1.88 2.45CaO 7.21 10.46 7.33 Trace 7.02 1.59 11.88 11.38 9.85 4.29Na20 4.80 3.01 2.76 Trace 3.84 4.24 4.86 2.37 4.17 2.80K20 1.93 0.14 2.07 1.46 3.18 5.35 0.25 0.80 3.66
P205 0.74 0.23 0.28 - 0.25 0.05 1.35 0.10 0.18 0.21
Other - - - 1.41 - - 0.43 0.15
Total 100.22 99.92 100.33 100.15 100.14 99.99 99.84 100.17 100.06 99.91K/Rb 267 950 498 215 807 251 352 550 >1 010 232
Primary potassium-containing minerals are fcldspars and K-micas.Feldspars are potassium aluminosilicates, their general formula beingKALSi 308. The following polymorphs have the same formula but vary indetailed structure and origin (Schroeder, 1978): orthoclase, in plutonicrocks; sanidine, mainly in volcanic rocks; microcline, a low-temperaturemodification, magmatite-pegmatite; and adularia, similar to orthoclase,mainly in lodes and fissures. The following variants also contain sodium(Schroeder, 1978): anorthoclase (K, Na)AISi3 0, leucite KAISi20 6, withlower Si and higher potassium content, nepheline (NaK)AISiO 4, containingmore Na than K, and plagioclase (Ca,Na-feldspar), which may also containsmall amounts of potassium.
118
K-micas are like feldspar, potassium aluminosilicates, but theircomposition is more complex (Schroeder, 1978). Along with the Siterahedra, they contain Al octahedra with varying substitutions of the centralions. According to chemical composition, color, and origin, the followingmicas can be distinguished (Schroeder, 1978): MuscoviteKAI2(AISi 3)OIo(OH)2, bright colored plates derived from magmatites andpegmatites; sericite like muscovite but finer grained, mainly frommetamorphic origin; biotite K(Mg,Fe) 3(AlSi3 )O10(OH)2 dark plates, frommagmatites, pegmatites, and metamorphites; lepidolite and zinnwaldite withadditional lithium in the octahedra.
Igneous and metamorphic rocks can be classified according to the overallalkali/aluminum ratio. According to this classification, Shand (1951)proposed the following four groups :1. Peraluminous, for which molecular A120 3 > Na 20+K 20+CaO (e.g.,muscovite KAI3Si 3Oo(OH) 2 and andalusite AI2SiO5 );2. Metaluminous, for which molecular A120 3 > Na 20+K 20 but<Na 20+K 20+CaO (e.g., biotite K(Mg,Fe) 3AISi3Ojo(OH) 2 and hornblendeNaCa 2 (Mg,Fe,AI) 5(Si,AI)80 22(OH)2);
3. Subaluminous, for which molecular A120 3 = Na 20 + K2 0 (e.g., olivine(Mg,Fe)2Si0 4 and hypersthene (Mg,Fe)Si0 3); and4. Peralkaline, for which molecular A120 3 < Na2 0 +K20 (e.g., aegirineNaFeSi 20 6 and riebeckite Na2Fe3Fe2 SigO22(0H)2 ).
2.2. Potassium in sedimentary rocks
Common potassium-containing minerals in sedimentary rocks includeorthoclase, microcline, plagioclase, muscovite, biotite, and illite (Table 2)
(Brownlow, 1979). In the United States observed variations in potassiumconcentration range from 0.08 to 0.66% in sandstone, from 0.03 to 0.07% inshale, and from 0.004 to 0.006% in carbonate rocks (range of means)(Brownlow, 1979). Carbonate rocks have high values of CaO and low valuesof K20 and Na20. The presence of K20 is a result of silicate impurities.Shale and sandstone are low in Na 20 and CaO and high in K2 0 because ofdetrital feldspar, authigenic feldspar, detrital muscovite, illite, authigenicglauconite, or potassium adsorbed by clay minerals (Brownlow, 1979).
Complete evaporation of seawater results in the precipitation of a variety
of minerals of which polyhalite (K2Ca 2Mg(S04)4*2H 20), kainite(KMg(SO4)CI*3H 20), and carnallite (KMgCI3.o6H20) contain potassium.
119

These salts are the last minerals to precipitate from an extremelyconcentrated brine (5% of the original water volume).
3. Weathering of potassium-containing minerals
Busenberg and Clemency (1976) studied the dissolution kinetics offeldspars over long periods of time and at 250 and 1 atmosphere CO2 partialpressure. They found that cations (K, Na, Ca) and silicic acid are releasedinto solution in four different stages. A short (-1 min) initial stage involvesthe exchange of surface cations for hydrogen ions from solution. This isfollowed by a process in which large amounts of cations, includingpotassium, at exterior sites are rapidly liberated into the solution. This stagemay last -1.5 h for K-feldspars. As a result of the second stage, feldspargrains begin to be armored with a coating of material, which may be similarin composition to kaolinite or illite. Further potassium will be released onlyfrom internal sites after breaking of the stable AI-O and Si-O bonds,involving the destruction of the Si-rich protective shell. Thus, the third stageoccurs at a different rate from that of the second stage and isTable 2. Compositions of the major minerals of common sedimentary rocks(Brownlow, 1979). © 1979, reprinted by permission of Prentice Hall,Englewood Cliffs, New Jersey.
Mineral CompositionQuartz SiO 2Orthoclase KAISi 308Microcline KAlSi 3O8Plagioclase NaAISi3O8-CaAl2Si2O8
Muscovite KA13Si3Olo(OH) 2
Biotite K(Mg, Fe)3AlSi 3Olo(OH)2Kaolinite AI4Si4Ojo(OH)8Montmorillonite (Al, Mg, Fe)4(AI, Si) 80 20(OH)4*nH 20Illite Ko. 2AI 4(A1, Si)80 20(OH)4Chlorite (Mg, Fe, AI)3(AI, Si)4010(OH) 2.(Mg, AI) 3(OH)6
Calcite CaCO3Aragonite CaCO 3
Dolomite CaMg(C0 3)2
120
controlled by the rate at which material can diffuse through the surface
coating. Hydrogen ions diffuse into the feldspar, and cations plus silicic acid
diffuse outward. According to Busenberg and Clemency (1976), this third
stage lasts -19 d. After this, a steady-state equilibrium is reached in which
the surface layer has a constant composition. Further diffusion then occurs at
a slower rate than that of the third stage. The rate of this final stage ranges
from 3.2 x XIO-17 to 2.5 x 10⁻¹⁵ mole/cm2/s.
Factors enhancing the above-mentioned processes include the presence
of sodium, irregularities of the crystal lattice, small particle size (larger
surface area), high temperature, pH, humidity, and migration of the
weathering products. The humid tropics provide the most favorable
conditions for feldspar weathering, whereas in temperate climate only a little
takes place.The weathering of a granite gneiss also demonstrates this sequence of
phases (Brownlow, 1979). Since aluminum tends to stay at the weathering
site in the form of clay minerals, the stages of weathering can be represented
by the increasing percentage of A120 3 in the weathering products (Figure 1).
Following a short increase, as weathering progresses K20 eventually shows
a rapid decrease. Plagioclase and biotite break down rapidly. K-feldspar is
more resistant. The difference in the stabilities of the two feldspars is the
reason why K20 in Figure 1 drops off after Na 2O and CaO.Goldich (1938) pointed out that the major minerals of igneous rocks tend
to have a susceptibility to weathering that is the reverse of their order of
crystallization (Table 3). Elements removed most quickly from a weathering
site are sodium, calcium, and magnesium. Potassium is generally less
mobile, followed by silica and then iron and aluminum.The stability relations of the clay minerals, K-feldspars, and gibbsite can
be calculated using equilibrium constants of reactions. Figure 2 indicates the
relationships among these minerals. When there is increasing activity of
dissolved silica, kaolinite is more stable than gibbsite. Increasing activities
for potassium along with increasing pH make illite and K-feldspar stable
relative to kaolinite.
121
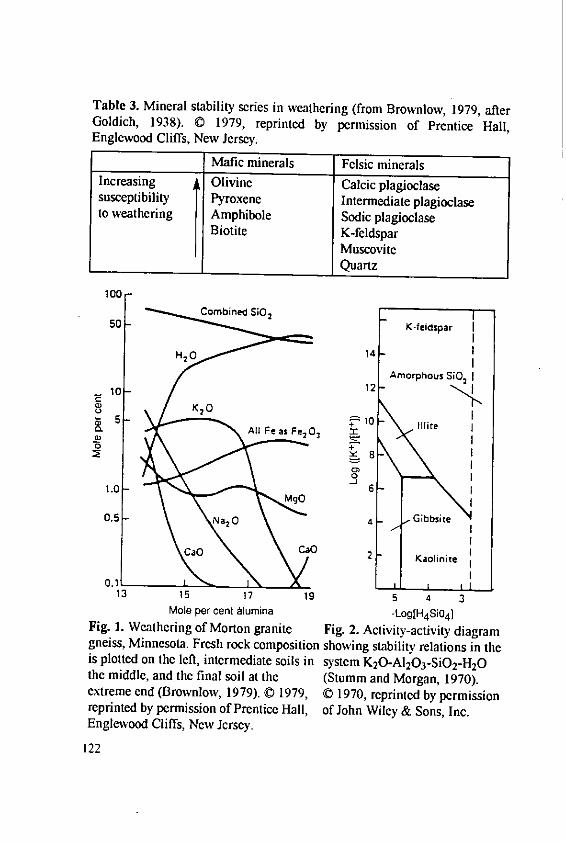
Table 3. Mineral stability series in weathering (from Brownlow, 1979, afterGoldich, 1938). C 1979, reprinted by permission of Prentice Hall,Englewood Cliffs, New Jersey.
Mafic minerals Felsic mineralsIncreasing F Olivine Calcic plagioclasesusceptibility Pyroxene Intermediate plagioclaseto weathering Amphibole Sodic plagioclase
Biotite K-feldsparMuscovite
Quartz
100Combined SiO2
50 K-feldspar I
H'( 14Amorphous SiO, I
10 12
5 5 10 flliteaAlFe as FeO XA
C)'
0)5 +
0
1.0 68
0.5 Na4 bbsie
0aO 2 Kaolinite
13 15 17 19 5 4 3Mole per cent Alumina -Log[H4Si04]
Fig. 1. Weathering of Morton granite Fig. 2. Activity-activity diagramgneiss, Minnesota. Fresh rock composition showing stability relations in theis plotted on the left, intermediate soils in system K20-A120 3-SiO 2-H20the middle, and the final soil at the (Stumm and Morgan, 1970).extreme end (Brownlow, 1979). C 1979, C 1970, reprinted by permissionreprinted by permission of Prentice Hall, of John Wiley & Sons, Inc.Englewood Cliffs, New Jersey.
122
4. Potassium in the hydrological cycle: Concentrations and controllingmechanism
As shown in Tables 1 and 3, potassium is slightly less common than
sodium in igneous rocks but more abundant in all the sedimentary rocks. In
the ocean, the concentration of potassium, though substantial (390 mg L-1),
is far less than that of sodium (10,500) (Hem, 1985). The figures point out
the very different behavior of these two alkali metals in natural systems.
Sodium tends to remain in solution rather persistently once it has been
liberated from silicate-mineral structure. Potassium is liberated with greater
difficulty from silicate minerals and exhibits a stronger tendency to be
reincorporated into solid weathering products, especially certain clay
minerals. Consequently, in most natural waters, the concentration of
sodium generally exceeds that of potassium (Hem, 1985).
4.1. Potassium in seawater
Reactions between low-temperature seawater and marine sediments and
basalts commonly result in reduced concentrations of potassium in the
overlying seawater column. Increased seawater temperature, however,results in the significant release of potassium to the ocean (Drever, 1988).
Measurements of the composition of interstitial waters in marine
sediments suggest the formation of authigenic potassium minerals in
marine sediments is taking place. Results published by Sayles (1979)
indicate that interstitial waters in the top I m of sediments are
systematically depleted in potassium and magnesium and enriched in
calcium, sodium, and bicarbonate. Sayles (1979) concluded that potassium
and magnesium are being taken up by solid phases in the sediment from the
overlying water. Sayles' best estimates of the diffusional fluxes calculated
from the concentration gradients in the interstitial waters are shown in
Table 4.
123
Table 4. Diffusional fluxes across the sediment-water interface based on thecomposition of interstitial water in sediments* (from Drever, 1988, afterSayles, 1979).
Flux(1014g yr-1) Percentage of river input
Ion A B A BNa+ -0.6 -1.0 -30 -48Mg 2+ 0.8 1.3 60 94Ca 2+ -1.9 -2.5 -40 -52K+ 0.6 0.8 84 105HCO3 -4.6 -5.7 -24 -29
The two sets of values result from two different ways of extrapolating thegradients in interstitial water composition to the sediment-water interface.Positive numbers indicate a flux into the sediment.
Marine basalts exposed to ordinary seawater at low temperature undergoalteration that results in the uptake of potassium from the ocean water bythe basalt and loss of calcium, silica, and usually magnesium from thebasalt. The observation of extensive low-temperature alteration in basaltsdrilled by the Deep Sea Drilling Project suggests that low-temperaturealteration of basalts could be the major process by which potassium isremoved from the ocean. Local areas of altered basalt have been foundwhere the K20 content is as high as 6% (Donnely and Francheteau, 1977).If such areas were common, they would represent an important removal sitefor potassium in seawater.
In addition to low-temperature alterations of basalts, high-temperaturereactions are known to occur at the spreading centers of sea floors.Information about these reactions comes from (1) laboratory experiments inwhich basalt was heated with seawater (Bischoff and Dickson, 1975; Mottland Holland, 1978); (2) direct sampling of submarine hot springs at theGalapagos spreading center and the East Pacific Rise (Corliss et al., 1979;Edmond et aL, 1979; von Damm et al., 1985); and (3) geothermal water onthe Teykjanes Peninsula of Iceland, which originates from interactionbetween hot basalt and seawater (Tomasson and Kristmannsdottir, 1972).During these reactions, potassium, calcium, silica, iron, and other transitionmetals are commonly released from the basalt to the sea. Calculations
124
indicate that high-temperature alteration of basalt may contribute about asmuch potassium to the ocean as the river input does (Drever, 1988).
4.2. Potassium in precipitation
Potassium concentrations in open precipitation in various geographicallocations and climates range from 0.1 to 4 mg L-1. Handa (1975) reported aconcentration range of 0.1 to 2.3 mg L-1 in the monsoon-affected area of
Calcutta and Bankipur, India. A mean value of 0.1 mg L-1 was reported in
the humid eastern United States in Carolina and Virginia (Gamble and
Fisher, 1966). At higher elevation (1950 m) and cold, humid climate in
southeastern France, Durand el a. (1992) reported a mean potassiumconcentration of 0.23 mg L-1 (K:Na ratio of 0.36). They reported increased
concentrations (0.43 mg L-1) for spring storm events that were affected bysuspended Saharan dust. Potassium concentrations in snow cores from the
Cascade/Sierra Nevada Mountains at sites above 1,600 m in elevationvaried from a maximum of 0.3 mg L-1 to 0.01 with a mean of 0.019 mg L-1
(Taylor, 1987). Feth et at. (1964) reported similar values (0.3 mg L-1) in
snow samples from Sierra Nevada. However, higher concentrations,ranging from <1 to 4 mg L-' were reported by Angino et al. (1964) in
Antarctic ice. Potassium measurements in the arid Negev desert, Israel,
resulted in a greater range of concentrations of 0.2 to 2.5 mg L- 1 (mean
value was 0.8 mg L-1, and K:Na ratio was 0.07) (Nativ and Mazor, 1987;Nativ et al., 1983), presumably because of the large amount of dust in the
atmosphere preceding some of the sampled rain events.Analyses of throughfall (or under the canopy) indicated that forest
canopies are biologically active substrates on which airshed-watershedinteractions take place. Consequently, throughfall may change its
concentration as a result of canopy interactions. It was observed (Puckett,1987) that the canopy acts as a sink for nitrogen and as a source of
potassium, among other ions such as calcium and magnesium. In a study in
northern Virginia, Puckett (1987) demonstrated that the net flux of
potassium in throughfall in a deciduous forest was an order of magnitudehigher than in the open precipitation. Coniferous throughfall was about
fivefold concentrated in potassium than open precipitation (Table 5). Anindication of similar results was observed in the Walker Branch, in the
Valley and Ridge province, in east Tennessee. Throughfall concentrationsrange from 0.24 to 1.82 mg L-1 (Wilson et al., 1991), but the K:Na ratio
125
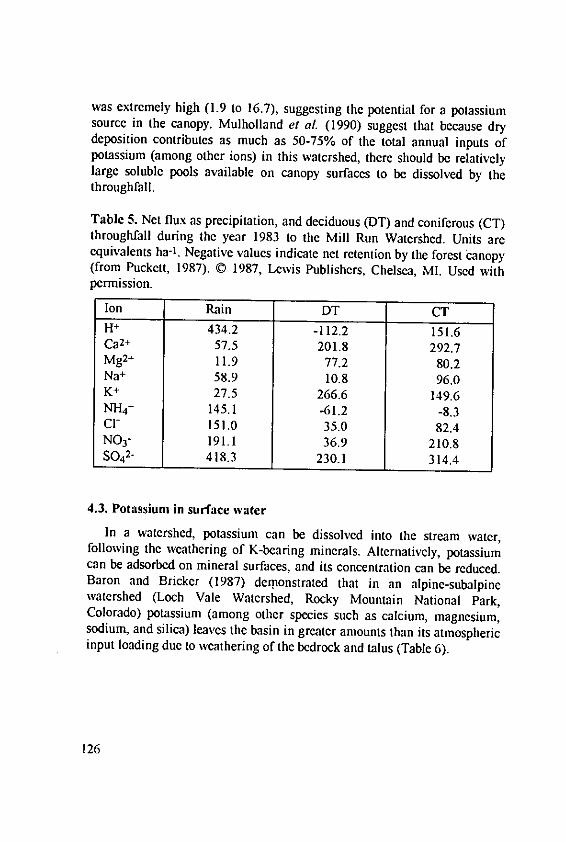
was extremely high (1.9 to 16.7), suggesting the potential for a potassiumsource in the canopy. Mulholland el aL (1990) suggest that because drydeposition contributes as much as 50-75% of the total annual inputs ofpotassium (among other ions) in this watershed, there should be relativelylarge soluble pools available on canopy surfaces to be dissolved by thethroughfall.
Table 5. Net flux as precipitation, and deciduous (DT) and coniferous (CT)throughfall during the year 1983 to the Mill Run Watershed. Units areequivalents ha-1. Negative values indicate net retention by the forest canopy(from Puckett, 1987). © 1987, Lewis Publishers, Chelsea, MI. Used withpermission.
Ion Rain DT CTH 434.2 -112.2 151.6Ca 2+ 57.5 201.8 292.7Mg 2+ 11.9 77.2 80.2Na + 58.9 10.8 96.0K+ 27.5 266.6 149.6NH4+ 145.1 -61.2 -8.3CI- 151.0 35.0 82.4NO3- 191.1 36.9 210.8S042" 418.3 230.1 314.4
4.3. Potassium in surface water
In a watershed, potassium can be dissolved into the stream water,following the weathering of K-bearing minerals. Alternatively, potassiumcan be adsorbed on mineral surfaces, and its concentration can be reduced.Baron and Bricker (1987) demonstrated that in an alpine-subalpinewatershed (Loch Vale Watershed, Rocky Mountain National Park,Colorado) potassium (among other species such as calcium, magnesium,sodium, and silica) leaves the basin in greater amounts than its atmosphericinput loading due to weathering of the bedrock and talus (Table 6).
126
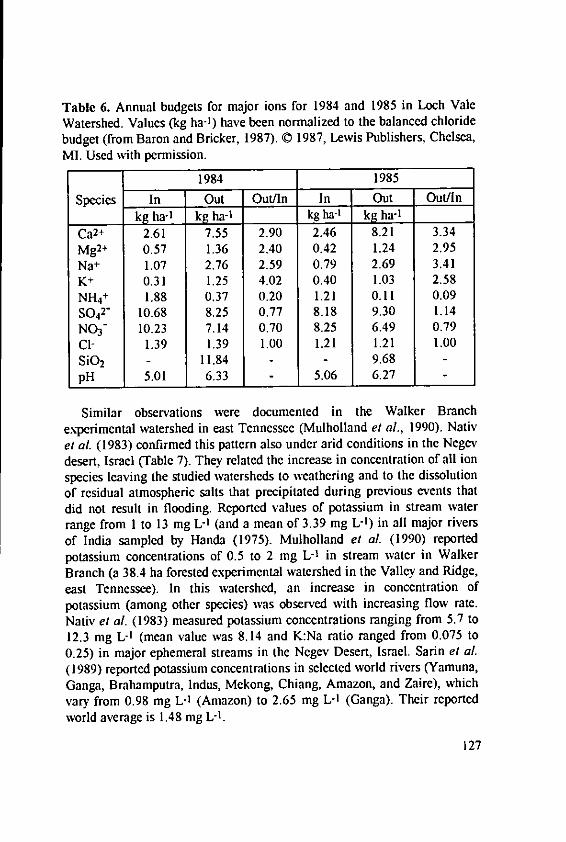
Table 6. Annual budgets for major ions for 1984 and 1985 in Loch ValeWatershed. Values (kg ha-1) have been normalized to the balanced chloridebudget (from Baron and Bricker, 1987). 0 1987, Lewis Publishers, Chelsea,MI. Used with permission.
1984 1985
Species In Out Out/In In Out Out/In
kg ha-1 kg ha-1 kg ha-' kg ha-I
Ca2+ 2.61 7.55 2.90 2.46 8.21 3.34Mg2+ 0.57 1.36 2.40 0.42 1.24 2.95Na 1.07 2.76 2.59 0.79 2.69 3.41K 0.31 1.25 4.02 0.40 1.03 2.58NH4 + 1.88 0.37 0.20 1.21 0.11 0.09S0 42- 10.68 8.25 0.77 8.18 9.30 1.14N03- 10.23 7.14 0.70 8.25 6.49 0.79Cl- 1.39 1.39 1.00 1.21 1.21 1.00SiO 2 - 11.84 - 9.68 -
pH 5.01 6.33 5.06 6.27 -
Similar observations were documented in the Walker Branchexperimental watershed in east Tennessee (Mulholland et a/., 1990). Nativet aL (1983) confirmed this pattern also under arid conditions in the Negevdesert, Israel (Table 7). They related the increase in concentration of all ionspecies leaving the studied watersheds to weathering and to the dissolutionof residual atmospheric salts that precipitated during previous events thatdid not result in flooding. Reported values of potassium in stream waterrange from I to 13 mg L- (and a mean of 3.39 mg L-) in all major riversof India sampled by Handa (1975). Mulholland et aL (1990) reportedpotassium concentrations of 0.5 to 2 mg L-I in stream water in WalkerBranch (a 38.4 ha forested experimental watershed in the Valley and Ridge,east Tennessee). In this watershed, an increase in concentration ofpotassium (among other species) was observed with increasing flow rate.Nativ et a/. (1983) measured potassium concentrations ranging from 5.7 to
12.3 mg L-1 (mean value was 8.14 and K:Na ratio ranged from 0.075 to0.25) in major ephemeral streams in the Negev Desert, Israel. Sarin el al(1989) reported potassium concentrations in selected world rivers (Yamuna,Ganga, Brahamputra, Indus, Mekong, Chiang, Amazon, and Zaire), whichvary from 0.98 mg L-1 (Amazon) to 2.65 mg L- (Ganga). Their reportedworld average is 1.48 mg L-I.
127
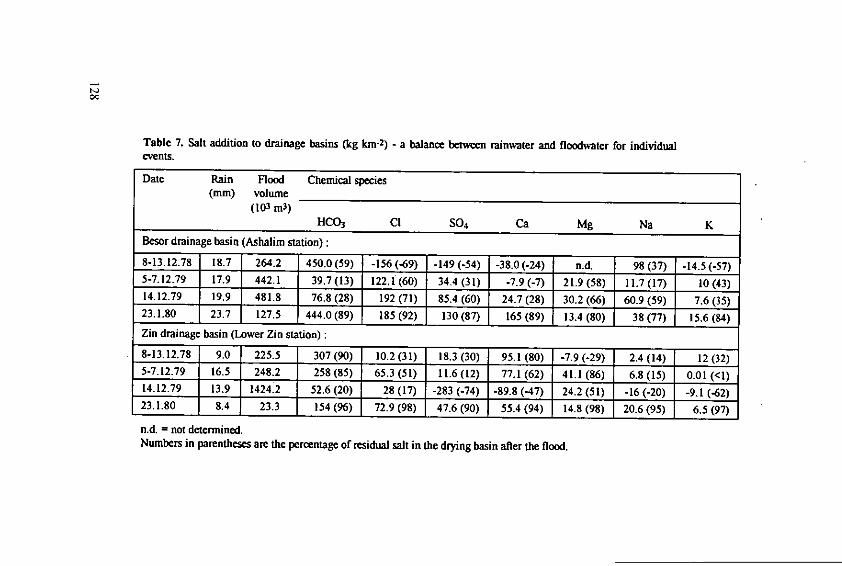
00
Table 7. Salt addition to drainage basins (kg kin-2) - a balance between rainwater and floodwater for individualevents.
Date Rain Flood Chemical species(mm) volume
(103 mn3)HCO3 CI SO 4 Ca Mg Na K
Besor drainage basin (Ashalim station):
8-13.12.78 18.7 264.2 450.0(59) -156(-69) -149(-54) -38.0(-24) n.d. 98(37) -14.5(-57)5-7.12.79 17.9 442.1 39.7(13) 122.1 (60) 34.4 (31) -7.9 (-7) 21.9(58) 11.7 (17) 10(43)14.12.79 19.9 481.8 76.8 (28) 192 (71) 85.4 (60) 24.7 (28) 30.2 (66) 60.9 (59) 7.6 (35)
23.1.80 23.7 127.5 444.0(89) 185 (92) 130 (87) 165 (89) 13.4 (80) 38(77) 15.6 (84)Zin drainage basin (Lower Zin station):
8-13.12.78 9.0 225.5 307 (90) 10.2 (31) 18.3 (30) 95.1 (80) -7.9 (-29) 2.4 (14) 12(32)5-7.12.79 16.5 248.2 258 (85) 65.3 (1) 11.6 (12) 77.1 (62) 41.1 (86) 6.8 (15) 0.01 (<1)14.12.79 13.9 1424.2 52.6 (20) 28 (17) -283 (-74) -89.8 (-47) 24.2 (51) -16 (-20) -9. 1 (-62)23.1.80 8.4 23.3 154 (96) 72.9 (98) 47.6 (90) 55:4 (94) 14.8 (98) 20.6 (95) 6.5 (97)
n.d. = not determined.Numbers in parentheses are the percentage of residual salt in the drying basin after the flood.
Potassium in groundwaterIn dilute natural groundwaters in which the sum of sodium and
potassium is <10 mg L-1, it is not unusual for potassium concentrations toequal or even exceed the sodium concentration. In most freshwater aquifers,however, if the sodium concentration substantially exceeds 10 mg L-1, thepotassium concentration commonly is half or a tenth that of sodium (Hem,1985). Potassium does not form any salts, except at very high concentrations,and calculations such as those of Garrels and Mackenzie (1967) and Hardieand Eugster (1970) predict that potassium should, like sodium, simply buildup in solution during weathering and evaporation. In practice, however,potassium is almost always found to be depleted relative to sodium (Drever,1988). Concentrations of potassium more than a few tens of milligrams perliter are unusual except in water having a high dissolved solidsconcentration or in water from hot springs. In these cases, potassiumconcentrations may be high, but the K:Na ratios are still low (Hem, 1985).
Potassium concentrations in groundwater are commonly low partlybecause of the high degree of stability of potassium-bearing alumino-silicateminerals. Consequently, unaltered K-feldspar grains can be found in manysandstones. However, an even more important reason is the effect ofexchange reactions on potassium removal from solution. The preference ofclay and most other natural ion exchanger for potassium over sodiumprovides a ready explanation of why Na:K ratios in natural groundwater aremuch larger than 1, although potassium is only slightly less abundant thansodium in igneous rocks. Much of the evidence cited to support thismechanism is data showing progressive change in water chemistry alongthe direction of groundwater flow. Chapelle and Knobel (1983) were able todemonstrate in the Aquia aquifer, southern Maryland, that along the flowpath, the chemical evolution of the groundwater is mirrored by the chemicalmodification of the exchanging medium (glauconite). As shown in Figure 3,an increase of dissolved sodium coincides with the increase of exchangeablesodium on the glauconite. Similarly, the increase of dissolved potassium at-20 miles downgradient coincides with the increase of exchangeablepotassium on the glauconite. The coincidence between increases ofdissolved species and the increased availability of these species on exchangesites is consistent with the hypothesis that glauconite composition has beenaltered by cation exchange reactions. The order at which the cations areremoved from solution (Ca, Mg, K, and Na) along the flow path agreesexactly with the order predicted by the stability of the cations on exchangesites and provides additional evidence for this interpretation.
129
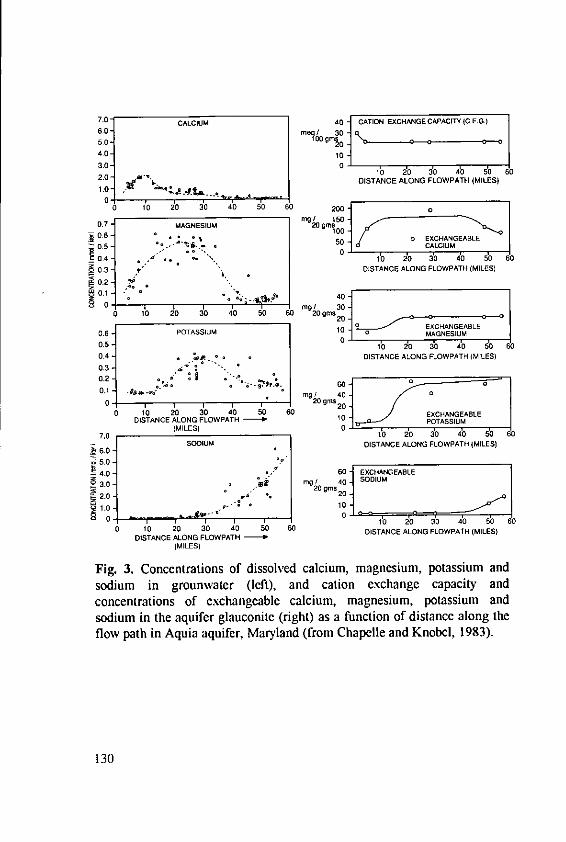
7.0- =CALCIUM 40 4 CATION EXCHANGE CAPACITY (CEG.)m10 . l 30-I_____________
5.0-4 10 104.0 ,o -I I__ _ _ _ _ _ _ _ _ _
3G0 0 I
2.0 , ID 20 30 40 50 60
."3 .- DISTANCE ALONG FLOWPATH (MILES)
O 10 20 30 40 50 60 20001.O,o., 0 EXCHANGEABLE0.7- MAGNESIUM 20 gin'0't 06- 0 * EXCHANGEALE
05. CALCUM
_ 04 . , 2 40 50 60
0.3 , " DISTANCE ALONG FLOWPATH (MILES}
02
0 a19/ 30
0 10 20 30 40 50 60 20901520] A.L:
0l6 POTASSIUM l1 0MANSU
0.5o 10 so 6o os
0.4 . DISTANCE ALONG FLOWPATH (MILES)
03 .
m g, / 4 0 0
0 ,o 20 3'0 40 0 6 0 ECAGBL
DISTANCE ALONG FLOWPATH -1 10 XCHANEABLE
(MILES) 0 O TASSIUM
70 Io20 3'o 4 50 6E
i60- SODIUM DISTANCE ALONG FLOWPATH (MILES)
4.0-60 EXCHANGEABLE
Fi 3.0 C og/ 40 SODIUM!23.0 - .. 20in
1.0 - 1.0 " °
0 1 1 Aw I I - 1'0 o 0 '0O Ea '0 2 0 3 0 0 5 0 O D S A N C E A L O G L O W A T H ( M L E S )DISTANCE ALONG FLOWPATHI
(MILES)
Fig. 3. Concentrations of dissolved calcium, magnesium, potassium and
sodium in grounwater (left), and cation exchange capacity andconcentrations of exchangeable calcium, magnesium, potassium andsodium in the aquifer glauconite (right) as a function of distance along the
flow path in Aquia aquifer, Maryland (from Chapelle and Knobel, 1983).
130
Cation exchange is enhanced in the presence of saline water (Eugsterand Jones, 1979; Drever, 1988), and the depleted ratio of K:CI in salinewater was used to identify connate water in sedimentary rocks (Bath andEdmunds, 1981). In a coastal aquifer, Oregon, the low K:CI ratiocharacterized the freshwater-seawater interface and was presumably causedby the formation of authigenic K-feldspar (Magaritz and Luzier, 1985).
Some of the potassium, however, is also removed from water by theconversion of clays, for example montmorillonite into illite and chlorite. Inthese clays, potassium is incorporated in a special way into their structures.In illite, potassium ions are incorporated in spaces between crystal layers,where they cannot be removed by further ion-exchange reactions (Hem,1985).
Eugster and Jones (1979) showed in their study in Lake Magadi region,the East African Rift Valley, that the removal of potassium took place onlywhen the water was flowing underground (and not in a lake, for example)and argued that the removal process for potassium was sorption oncryptocrystalline surfaces or ion exchange.
In an injection test designed to simulate the migration of major ions inthe sandy Borden aquifer, Canada, Dance and Reardon (1983) demonstratedthe strong attenuation of potassium near the injection site, as opposed tosodium which appeared to be transported at nearly the same rate as chloride.Ceazan et at. (1989) obtained similar results in a glacial outwash aquifer insouthern Cape Cod, Massachusetts, suggesting that even in the near absenceof clay (<0.1%), cation exchange is an important attenuation mechanism forpotassium.
5. Summary
The abundance and forms of potassium in igneous and sedimentaryrocks were reviewed and the weathering processes and rates of potassium-containing minerals was discussed. Although potassium is almost equallyabundant as sodium in rocks and minerals, it is preferentially lost inaqueous phases. Typical concentrations of potassium in the variouscomponents of the hydrological cycle are presented. Potassiumconcentrations are depleted relative to sodium in seawater, precipitation,surface water and groundwater because it is liberated with greater difficultyfrom minerals and exhibits a stronger tendency to be reincorporated intosolid weathering products.
131

6. References
Angino, E. R., Armitage, K. B., and Tosh, J. E.: Ionic content of Antarctic
ice samples. Polar Rec. 12, 507-509 (1964)Baron, J., and Bricker, 0. P.: Hydrological and chemical flux in Loch Vale
Watershed, Rocky Mountain National Park. In: Chemical Quality of
Water and the Hydrologic Cycle, eds. Averett R. C. and McKnight. D.
M., Lewis Publishers, Chelsea, Michigan, 141-155 (1987)Bath, A. H., and Edmunds, W. M.: Identification of connate water in
interstitial solution of chalk sediments. Geochim. et Cosmochim. Acta45, 1449-1461 (1981)
Bischoff, J., and Dickson, F. W.: Seawater-basalt interaction at 20000 C and
500 bars; implication for origin of sea-floor heavy-metal deposits and
regulation of seawater chemistry. Earth Planet. Sci. Lett. 25, 385-397(1975)
Browniow, A. H.: Geochemistry. Prentice Hall, Inc., Englewood Cliffs, NewJersey, (1979)
Busenberg, E., and Clemency, C. V.: The dissolution kinetics of feldspars at
250 C and 1 atrm. CO 2 partial pressure. Geochim. et Cosmochim. Acta
40, 41-49 (1976)Ceazan, M. L., Thruman, E. M., and Smith, R. L.: Retardation of
ammonium and potassium transport through a contaminated sand andgravel aquifer: The role of cation exchange. Environ. Sci. Technol. 23,
1402-1408 (1989)Chapelle, F. H., and Knobel, L. L.: Aqueous geochemistry and the
exchangeable cation composition of glauconite in the Aquia aquifer,Maryland. Ground Water 21, 343-352 (1983).
Corliss, J. B., Dymond, J., Gordon, L. I., Edmond, J. M., von Herzen, R. P.,
Ballard, R. D., Green, K., Williams, D., Bainbridge, A., Crane, K., van
Andel, T. H. : Submarine thermal springs on the Galapagos Rift.
Science 203, 1073-1083 (1979)Dance, J. T., and Reardon, E. J.: Migration of contaminants in groundwater
at a landfill: A case study. 5. Cation migration in the dispersion test. J.Hydrol. 63, 109-130 (1983)
Donnely, T. W., and Francheteau, J.: Mid-ocean ridge in the Cretaceous.Geotimes 22, 21-23 (1977)
Drever, J. T: The Geochemistry of Natural Waters, Prentice Hall,Englewood, New Jersey, (1988)
132
Durand, P., Neal, C., and Lelong, F.: Anthropogenic and naturalcontributions to the rainfall chemistry of a mountainous area in theCevebbes National Park (Mont Lozere, southern France). J. Hydrol. 130,71-85 (1992)
Edmond, J. M., Measures, C., McDuff, R. E., Chan, L. H., Collier, R., andGrant, B.: Ridge crest hydrothermal activity and the balances of themajor and minor elements in the ocean: The Galapagos data. EarthPlane Sci. Lett. 46, 1-18 (1979)
Eugster, H. P., and Jones, B. F.: Behavior of major solutes during closed-basin brine evolution. Am. J. Sci. 279, 609-631 (1979)
Feth, J., Robertson, C. E., and Polzer, W. L.: Sources of mineralconstituents in water from granitic rocks, Sierra Nevada, California andNevada. U.S. Geol. Surv. Water-Supp. Pap. 1535-1:1-70 (1964)
Gamble, A. W., and Fisher, D. W.: Chemical composition of rainfall in E.North Carolina and S. E. Virginia. U.S. Geol. Surv. Water-Supp. Pap.1535-K:1-41 (1966)
Garrels, R. M., and Mackenzie, F. T.: Origin of the chemical composition ofsome springs and lakes. In: Equilibrium Concept in Natural WaterSystem. Am. Chem. Soc. Adv. Chem. Ser. 67, 222-242 (1967)
Goldich, S. S.: A study in rock weathering. J. Geol. 46, 17-58 (1938)Handa, B. K.: Occurrence and distribution of potassium ions in natural
waters in India. J. Hydrol. 26, 267-276 (1975)Hardie, L. A., and Eugster, H. P.: The evolution of close-basin brines.
Mineral. Soc. Am. Spec. Publ. 3, 273-290 (1970)Hem, J. D.: Study and interpretation of the chemical characteristics of
natural water, U.S. Geological Survey Water Supp. Pap. 2254, 104-105(1985)
Magaritz, M., and Luzier, J. E.: Water-rock interactions and seawater-freshwater mixing effects in the coastal dunes aquifer, Coos Bay,Oregon. Geochim. et Cosmochim. Acta 49, 2515-2525 (1985)
Mottl, M., and Holland, H. D.: Chemical exchange during hydrothermalalteration of basalt by seawater: I. Experimental results for major andminor components of seawater. Geochim. Cosmochim. Acta. 42, 1103-1116 (1978)
Mulholland, P. J., Wilson, G. V., and Jardin, P. M.: Hydrogeochemicalresponse of a forested watershed to storms: Effects of preferential flowalong shallow and deep pathways. Water Resourc. Res. 26, 3021-3036(1990)
133
Nativ, R., Issar, A., and Rutledge, J.: Chemistry of rainwater and floodwaterin the Negev Desert, Israel. J. Hydrol. 62, 201-233 (1983)
Nativ, R., and Mazor, E.: Rain events in an arid environment - Theirdistribution and ionic and isotopic composition patterns; MakhteshRamon Basin, Israel. J. Hydrol. 89, 205-237 (1987)
Puckett, L. J.: The influence of forest canopies on the chemical quality ofwater and the hydrological cycle. In: Chemical Quality of Water and theHydrologic Cycle, eds. Averett R. C., and McKnight., D. M., LewisPublishers, Chelsea, Michigan, 4-22 (1987)
Sarin, M. M., Krishnaswami, S., Dilli, K., Somayajulu, B. L. K., andMoore, W. S.: Major ion chemistry of the Ganga-Brahmaputra Riversystem: Weathering processes and fluxes to the Bay of Bengal. Geochim.ct Cosmochim. Acta 53, 997-1009 (1989)
Saylcs, F. L.: The composition and diagenesis of interstitial solutions, I.Fluxes across the seawater-sediment interface in the Atlantic Ocean.Geochim. Cosmochim. Acta 43, 527-545 (1979)
Schroeder, D.: Structure and weathering of potassium containing minerals.In: Potassium Research - Review and Trends, Proceeding of the 11thCongress of the International Potash Institute, 43-63 (1978)
Shand, S. J.: Eruptive Rocks. John Wiley & Sons, New York, (1951)Stumm, W., and Morgan, J. J.: Aquatic Chemistry. John Wiley & Sons,
New York, (1970)Taylor, E. H.: Analytical methodology for the measurement of the chemical
composition of snow cores from the Cascade/Siera Nevada MountainRange. In: Chemical Quality of Water and the Hydrologic Cycle, eds.Averett, R. C., and McKnight., D. M., Lewis Publishers, Chelsea,Michigan, 56-69 (1987)
Tomasson, J., and Kristmannsdottir, H.: High temperature alterationminerals and thermal brines, Reykjanes, Iceland, Contrib. Mineral.Petrol. 36, 123-134 (1972)
von Damm, K. L., Edmond, J. M., Grant, B., Measures, C. I., Walden, B.,and Weiss, R. F.: Chemistry of submarine hydrothermal solutions at21'N, East Pacific Rise. Geochim. Cosmochim. Acta 49, 2197-2220(1985)
Wilson, G. V., Jardin, P. M., Luxmoore, R. J., Zelanzny, L. W., Todd, D.E., and Lietzke, D. A.: Hydrochemical processes controlling subsurfacetransport from an upper subcatchment of Walker Branch Watershedduring storm events. 2. Solute transport processes. J. Hydrol. 123, 317-336 (1991)
134
Potassium Concentrations in Surface andGroundwaters and the Loss of Potassium in Relationto Land Use
Johnston, A.E and Goulding, K.IV.T., Soil Science Department, AFRCInstitute of Arable Crops Research, Rothamsted Experimental Station,Harpenden, Herts., AL5 2JQ, United Kingdom
Summary
Losses of potassium (K) from the rooting zone of soils are a financialloss to the farmer and the magnitude of such losses is important if it affectsthe quality of water intended for human consumption. Across a wide rangeof rainfalls, farming systems, surface soils and underlying geological stratain the UK there is little dramatic change in the range of K concentrations indrainage from either agricultural soils or soils under other land use systems.In upland areas, with less intensive farming and often greater rainfalls, theupper value for the range of K concentrations rarely exceeded 3 mg K I-1.Even in areas of intensive arable production, usually associated with lowerrainfalls and smaller quantities of through drainage, water taken from riversonly occasionally had K concentrations approaching 10 mg I-1. Frommeasured losses of K in lysimeters the relationship, K leached (kg ha-l) =0.012 x drainage + 0.089 (r2 = 0.75) was found. It suggests that for each 100mm through drainage about 1 kg K ha-I would be lost.
Potassium in the soil solution is at risk to loss by leaching but its rapidtransfer to exchangeable and non exchangeable categories of soil Kminimises this risk. Almost all sites capable of holding exchangeable andnon exchangeable K would have to be saturated before there was serious riskof large amounts of K being leached from soil. To predict such losses amodel (KLEACH) has been constructed to predict the retention of K by I cmhorizons in soil and thus the risk of K eventually passing out of the soil tostreams or aquifers.
Whilst there is little evidence that K in drinking water is detrimental tohuman health, the maximum admissible concentration of K in drinkingwater in the EECs Drinking Water Directive is unlikely to be exceeded inmost cases. This situation is unlikely to change because most soils have a
135
great capacity to retain K and the amount of KCI used as fertilizer ischanging little. Increasing levels of chloride in drinking water are associatedwith ever increasing amounts of chloride in atmospheric deposition notincreasing use of potassium fertilizers.
1. Introduction
Much of the water used for human consumption is taken either fromrivers and lakes (surface water) or from deeper strata (aquifers) often manymetres below the surface. At least within the European Community, thereare quality standards for water intended for human consumption. Forpotassium, the Drinking Water Directive (80fl78 EEC) imposes a maximumadmissible concentration (MAC) of 12 mg K 1-1 with a guide level of 10 mg1-1.
The chemical composition of water leaving surface soils depends oncomplex interactions which may or may not reach equilibrium as the waterpasses through air, soil, subsoil and if appropriate, deeper strata. Rainabsorbs impurities introduced into the atmosphere by pollution. It thenpercolates at different rates through top soils of different texture which willhave been enriched to varying degrees with soluble salts added to enhancecrop growth. It then passes through subsoils with widely ranging chemicaland physical properties before being discharged to streams and rivers or,where the lower strata are permeable, into aquifers. This paper discussesfactors affecting the concentration of K in water mainly from agriculturalsoils.
2. Sites and soils
Much of the recent data given here is from five research stations in SouthEastern England together with survey data collected from water supplyorganisations in England and Wales. The research stations together withtheir soil type and average annual rainfall are as follows. Rothamsted, siltyclay loam, 700 mm; Woburn, sandy loam but some light-textured soilsoverlying Oxford clay, 600 mm; Saxmundham, calcareous sandy clay loam,600 mm; Broom's Barn, soils developed in glacial drift range from sandyloams to clay loams, 500 mm; Brimstone Farm, clay with more than 93%clay plus silt, 680 mm.
Only at Saxmundham and Brimstone would artificial drainage beconsidered necessary because the subsoils are only slowly permeable. A new
136
system of clay pipe drains at 0.8 m depth with pebble (stone) backfill toplough layer was installed at Saxmundham in October 1972 to replace anolder system which did not cover all the experimental site. Water was ledinto the backfill and pipe drains through mole channels made in the soil at0.6 m depth and 2.7 m spacing using a mole-plough. This consisted of arigid vertical tine with an enlarged bullet-shaped expander, about 10 cmdiameter, at the base of the tine. At Brimstone Farm large, hydrologicallyseparated plots were established in 1978 to study the interaction ofcultivation, minimum v ploughing, and mole and tile drainage y none, onrates of water loss from soil. Surface runoff, interflow, at the junction of theAp and subsoil horizons, and drainflow on the drained plots, can all beintercepted, collected and measured. The silty clay loams at Rothamsted donot require under drainage, the water passing through clay subsoils ofvarying depth into the chalk strata below. However, Lawes and Gilbertinstalled horseshoe and sole drains, an early form of clay pipe drain onBroadbalk, in 1849 at about 0.7 m depth to aid removal of surface water.There was no pebble backfill. Sandy nams at Woburn and Broom's Barn arefree draining, but on parts of both farms surface soils of this texture overlayslowly permeable subsoils and to speed the removal of surplus water fromthe surface, pipe drains have been installed. Those at Woburn are withoutbackfill.
At all five research stations mainly amble crops are grown and they aregenerously manured especially with P and K to ensure that these nutrientsdo not limit growth.
3. The K cycle in agricultural soils
A simplified potassium cycle for agricultural soils recognises variouscategories or pools of soil K (Figure 1). Their precise definition is lessimportant than the realisation that K can transfer in both directions betweencategories. Plant roots take up K+ from the soil solution and this pool ofreadily available K can be maintained by adding soluble K fertilizers, K-richorganic manures or by transfer from the readily soluble pool as shown inFigure 1. The term readily soluble K is used here because this is the Kextracted by various reagents used world-wide to estimate the availability ofK to crops. All methods of analysis will include the water soluble fraction.When 1 M ammonium acetate or I M ammonium nitrate are used the Kextracted is called exchangeable K because K+ held on cation exchange sites
137
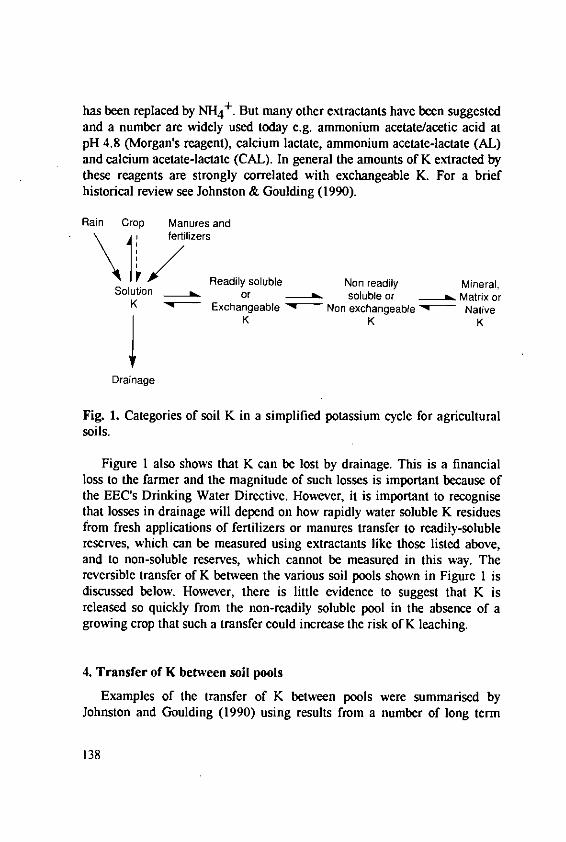
has been replaced by NH4 +. But many other extractants have been suggestedand a number are widely used today e.g. ammonium acetate/acetic acid atpH 4.8 (Morgan's reagent), calcium lactate, ammonium acetate-lactate (AL)and calcium acetate-lactate (CAL). In general the amounts of K extracted bythese reagents are strongly correlated with exchangeable K. For a briefhistorical review see Johnston & Goulding (1990).
Rain Crop Manures andfertilizers
1 VReadily soluble Non readily Mineral,Solution k or . soluble or J Matrix or
K Exchangeable W Non exchangeable NativeK K K
Drainage
Fig. 1. Categories of soil K in a simplified potassium cycle for agriculturalsoils.
Figure 1 also shows that K can be lost by drainage. This is a financialloss to the farmer and the magnitude of such losses is important because ofthe EEC's Drinking Water Directive. However, it is important to recognisethat losses in drainage will depend on how rapidly water soluble K residuesfrom fresh applications of fertilizers or manures transfer to readily-solublereserves, which can be measured using extractants like those listed above,and to non-soluble reserves, which cannot be measured in this way. Thereversible transfer of K between the various soil pools shown in Figure 1 isdiscussed below. However, there is little evidence to suggest that K isreleased so quickly from the non-readily soluble pool in the absence of agrowing crop that such a transfer could increase the risk of K leaching.
4. Transfer of K between soil pools
Examples of the transfer of K between pools were summarised byJohnston and Goulding (1990) using results from a number of long term
138
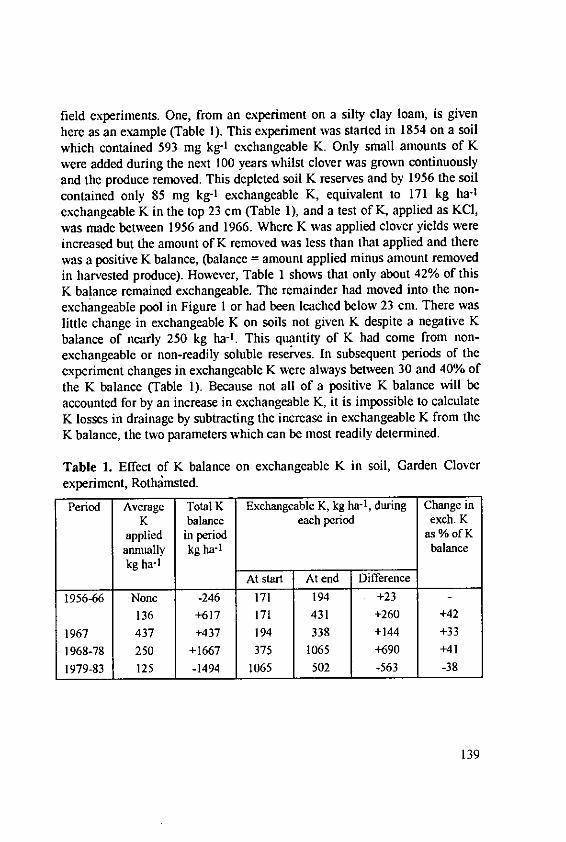
field experiments. One, from an experiment on a silty clay loam, is givenhere as an example (Table 1). This experiment was started in 1854 on a soilwhich contained 593 mg kg-1 exchangeable K. Only small amounts of K
were added during the next 100 years whilst clover was grown continuouslyand the produce removed. This depleted soil K reserves and by 1956 the soilcontained only 85 mg kg-' exchangeable K, equivalent to 171 kg ha-I
exchangeable K in the top 23 cm (Table 1), and a test of K, applied as KCI,was made between 1956 and 1966. Where K was applied clover yields wereincreased but the amount of K removed was less than that applied and therewas a positive K balance, (balance = amount applied minus amount removedin harvested produce). However, Table I shows that only about 42% of thisK balance remained exchangeable. The remainder had moved into the non-exchangeable pool in Figure 1 or had been leached below 23 cm. There waslittle change in exchangeable K on soils not given K despite a negative K
balance of nearly 250 kg ha-'. This quantity of K had come from non-exchangeable or non-readily soluble reserves. In subsequent periods of theexperiment changes in exchangeable K were always between 30 and 40% ofthe K balance (Table 1). Because not all of a positive K balance will be
accounted for by an increase in exchangeable K, it is impossible to calculateK losses in drainage by subtracting the increase in exchangeable K from theK balance, the two parameters which can be most readily determined.
Table 1. Effect of K balance on exchangeable K in soil, Garden Clover
experiment, Rothdmsted.
Period Average Total K Exchangeable K, kg ha- 1, during Change inK balance each period exch. K
applied in period as % ofKannually kg ha- 1 balancekg ha- 1
At start At end Difference
1956-66 None -246 171 194 +23
136 +617 171 431 +260 +42
1967 437 +437 194 338 +144 +33
1968-78 250 +1667 375 1065 +690 +41
1979-83 125 -1494 1065 502 -563 -38
139
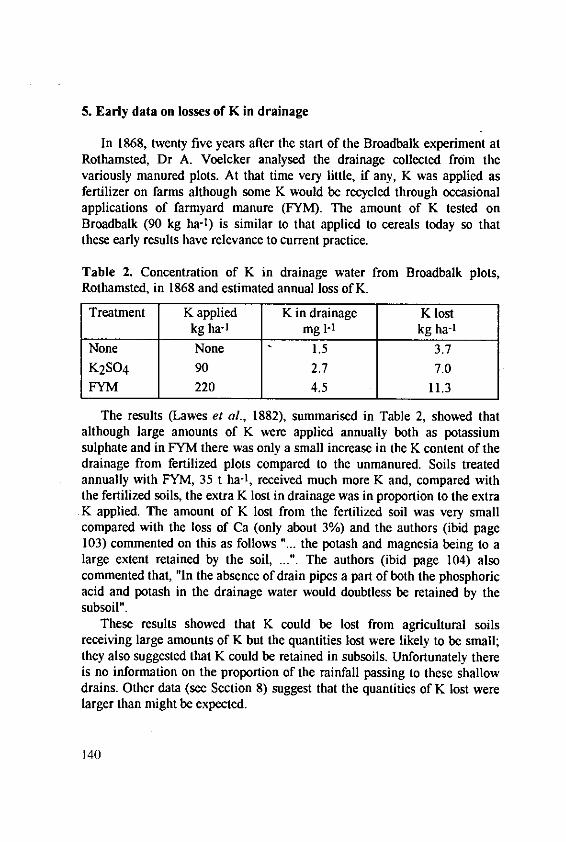
5. Early data on losses of K in drainage
In 1868, twenty five years after the start of the Broadbalk experiment atRothamsted, Dr A. Voclcker analysed the drainage collected from thevariously manured plots. At that time very little, if any, K was applied asfertilizer on farms although some K would be recycled through occasionalapplications of farmyard manure (FYM). The amount of K tested onBroadbalk (90 kg ha-I) is similar to that applied to cereals today so thatthese early results have relevance to current practice.
Table 2. Concentration of K in drainage water from Broadbalk plots,Rothamsted, in 1868 and estimated annual loss of K.
Treatment K applied K in drainage K lostkg ha-1 mg 1-1 kg ha-1
None None 1.5 3.7K2SO4 90 2.7 7.0FYM 220 4.5 11.3
The results (Lawes et al., 1882), summarised in Table 2, showed thatalthough large amounts of K were applied annually both as potassiumsulphate and in FYM there was only a small increase in the K content of thedrainage from fertilized plots compared to the unmanured. Soils treatedannually with FYM, 35 t ha-l , received much more K and, compared withthe fertilized soils, the extra K lost in drainage was in proportion to the extraK applied. The amount of K lost from the fertilized soil was very smallcompared with the loss of Ca (only about 3%) and the authors (ibid page103) commented on this as follows "... the potash and magnesia being to alarge extent retained by the soil, ...". The authors (ibid page 104) alsocommented that, "In the absence of drain pipes a part of both the phosphoricacid and potash in the drainage water would doubtless be retained by thesubsoil".
These results showed that K could be lost from agricultural soilsreceiving large amounts of K but the quantities lost were likely to be small;they also suggested that K could be retained in subsoils. Unfortunately thereis no information on the proportion of the rainfall passing to these shallowdrains. Other data (see Section 8) suggest that the quantities of K lost werelarger than might be expected.
140
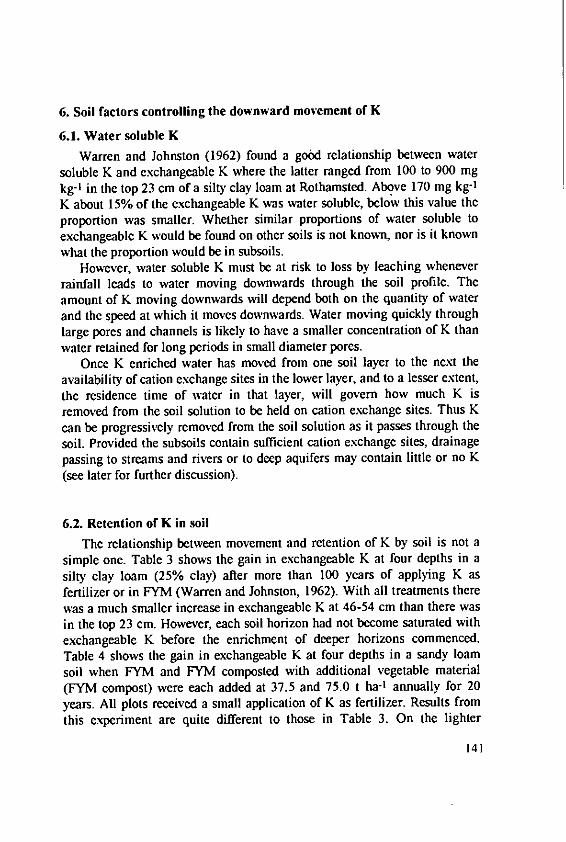
6. Soil factors controlling the downward movement of K
6.1. Water soluble K
Warren and Johnston (1962) found a good relationship between watersoluble K and exchangeable K where the latter ranged from 100 to 900 mgkg-' in the top 23 cm of a silty clay loam at Rothamsted. Above 170 mg kg-1
K about 15% of the exchangeable K was water soluble, below this value theproportion was smaller. Whether similar proportions of water soluble toexchangeable K would be found on other soils is not known, nor is it knownwhat the proportion would be in subsoils.
However, water soluble K must be at risk to loss by leaching wheneverrainfall leads to water moving downwards through the soil profile. Theamount of K moving downwards will depend both on the quantity of waterand the speed at which it moves downwards. Water moving quickly throughlarge pores and channels is likely to have a smaller concentration of K thanwater retained for long periods in small diameter pores.
Once K enriched water has moved from one soil layer to the next theavailability of cation exchange sites in the lower layer, and to a lesser extent,the residence time of water in that layer, will govern how much K isremoved from the soil solution to be held on cation exchange sites. Thus Kcan be progressively removed from the soil solution as it passes through thesoil. Provided the subsoils contain sufficient cation exchange sites, drainagepassing to streams and rivers or to deep aquifers may contain little or no K(see later for further discussion).
6.2. Retention of K in soil
The relationship between movement and retention of K by soil is not asimple one. Table 3 shows the gain in exchangeable K at four depths in asilty clay loam (25% clay) after more than 100 years of applying K asfertilizer or in FYM (Warren and Johnston, 1962). With all treatments therewas a much smaller increase in exchangeable K at 46-54 cm than there wasin the top 23 cm. However, each soil horizon had not become saturated withexchangeable K before the enrichment of deeper horizons commenced.Table 4 shows the gain in exchangeable K at four depths in a sandy loamsoil when FYM and FYM composted with additional vegetable material(FYM compost) were each added at 37.5 and 75.0 t ha-I annually for 20years. All plots received a small application of K as fertilizer. Results fromthis experiment are quite different to those in Table 3. On the lighter
141
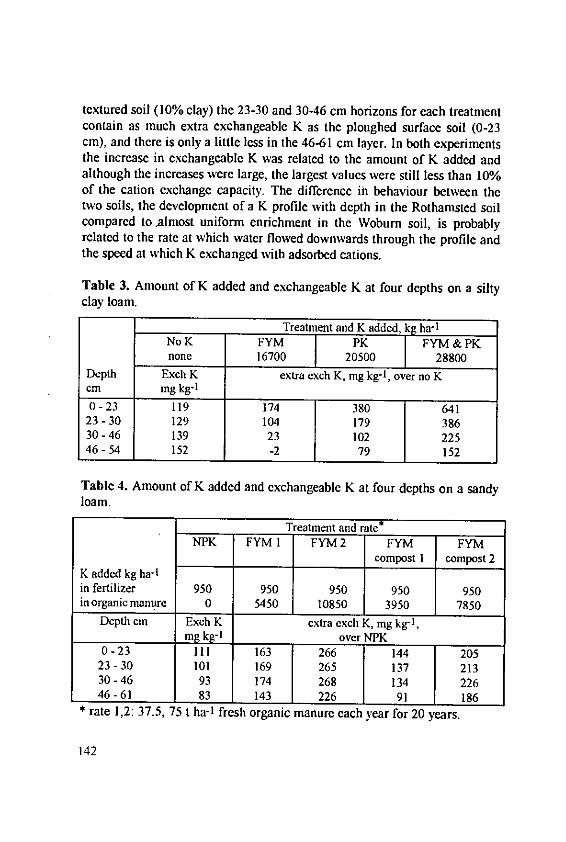
textured soil (10% clay) the 23-30 and 30-46 cm horizons for each treatmentcontain as much extra exchangeable K as the ploughed surface soil (0-23cm), and there is only a little less in the 46-61 cm layer. In both experimentsthe increase in exchangeable K was related to the amount of K added andalthough the increases were large, the largest values were still less than 10%of the cation exchange capacity. The difference in behaviour between thetwo soils, the development of a K profile with depth in the Rothamsted soilcompared to .almost uniform enrichment in the Woburn soil, is probablyrelated to the rate at which water flowed downwards through the profile andthe speed at which K exchanged with adsorbed cations.
Table 3. Amount of K added and exchangeable K at four depths on a siltyclay loam.
Treatment and K added, kg ha-No K FYM PK FYM & PKnone 16700 20500 28800
Depth Exch K extra exch K, mg kg- 1, over no Kcm mg kg-1
0-23 119 174 380 64123-30 129 104 179 38630-46 139 23 102 22546-54 152 -2 79 152
Table 4. Amount of K added and exchangeable K at four depths on a sandyloam.
Treatment and rateNPK FYM I FYM 2 FYM FYM
compost I compost 2K added kg ha-Iin fertilizer 950 950 950 950 950in organic manure 0 5450 10850 3950 7850
Depth cm Exch K extra exch K, mg kg- 1,mng kg-I over NPK
0-23 ill 163 266 144 20523-30 101 169 265 137 21330-46 93 174 268 134 22646-61 83 143 226 91 186
* rate 1,2: 37.5, 75 t ha-I fresh organic manure each year for 20 years.
142
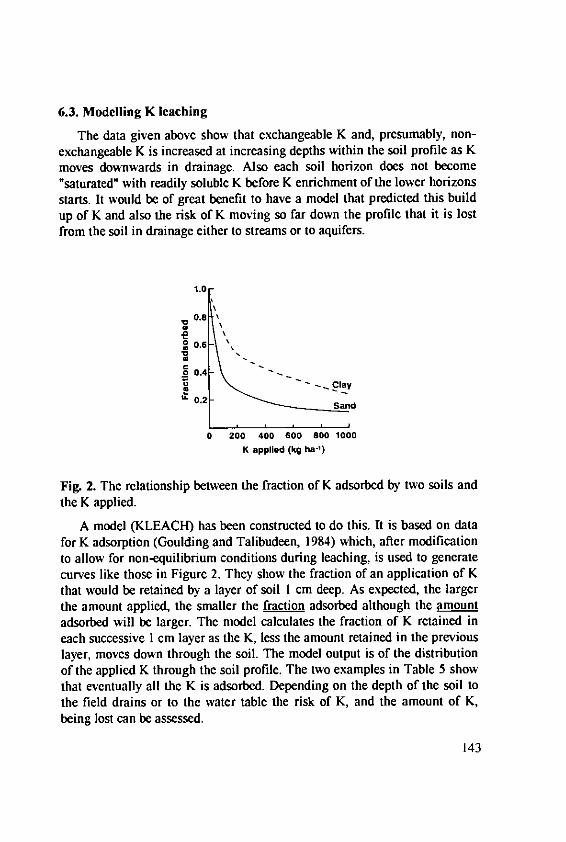
6.3. Modelling K leaching
The data given above show that exchangeable K and, presumably, non-exchangeable K is increased at increasing depths within the soil profile as Kmoves downwards in drainage. Also each soil horizon does not become"saturated" with readily soluble K before K enrichment of the lower horizonsstarts. It would be of great benefit to have a model that predicted this buildup of K and also the risk of K moving so far down the profile that it is lostfrom the soil in drainage either to streams or to aquifers.
1.0
0.8
0.6
0.4-- Clay
0.2S0.2 Sand
0 200 400 600 800 1000
K applied (kg ha- 1)
Fig. 2. The relationship between the fraction of K adsorbed by two soils andthe K applied.
A model (KLEACH) has been constructed to do this. It is based on datafor K adsorption (Goulding and Talibudeen, 1984) which, after modificationto allow for non-equilibrium conditions during leaching, is used to generatecurves like those in Figure 2. They show the fraction of an application of Kthat would be retained by a layer of soil 1 cm deep. As expected, the largerthe amount applied, the smaller the fraction adsorbed although the amountadsorbed will be larger. The model calculates the fraction of K retained ineach successive 1 cm layer as the K, less the amount retained in the previouslayer, moves down through the soil. The model output is of the distributionof the applied K through the soil profile. The two examples in Table 5 showthat eventually all the K is adsorbed. Depending on the depth of the soil tothe field drains or to the water table the risk of K, and the amount of K,being lost can be assessed.
143
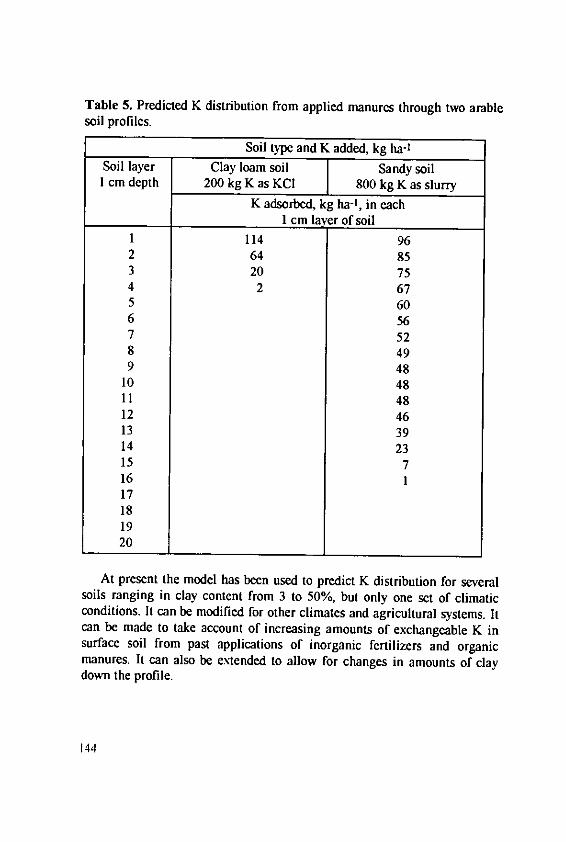
Table 5. Predicted K distribution from applied manures through two arablesoil profiles.
Soil type and K added, kg ha-Soil layer Clay loam soil Sandy soil
1 cm depth 200 kg K as KCI 800 kg K as slurryK adsorbed, kg ha-1, in each
1 cm layer of soil
1 114 962 64 853 20 754 2 675 606 567 528 499 4810 4811 4812 4613 3914 2315 716 117181920
At present the model has been used to predict K distribution for severalsoils ranging in clay content from 3 to 50%, but only one set of climaticconditions. It can be modified for other climates and agricultural systems. Itcan be made to take account of increasing amounts of exchangeable K insurface soil from past applications of inorganic fertilizers and organicmanures. It can also be extended to allow for changes in amounts of claydown the profile.
144

7. K in rainfall
Table 6 shows the mean K concentration and range in rainfall collectedat Rothamsted, Woburn and Saxmundham during the years 1969-73 and atRothamsted, Woburn and Broom's Barn during 1986-91 together with theamount of K added to soil each year. The K concentrations were similar atall four sites, the average ranged from 0.22 to 0.72 mg 1-1 and only smallamounts of K, 1.4 to 4.5 kg ha-I, were added to soil in rainfall. Theseamounts are within the range 1.1 to 9.6 kg ha-1 K reported by Low andArmitage (1970) for sites in England, Germany, Sweden and Australia.They recorded one very large value, 39.3 kg ha-1 K, for a site in SouthAfrica but no explanation was offered.
Table 6. Mean annual concentration and content of K in rainfall at fourexperimental stations in South Eastern England.
Site Annual Concentration mg 1-1 K K addedrainfall mean range to soil
mm kg ha-I
Rothamsted 1969-73 619 0.72 0.1 -3.8 4.51986-91 682 0.22 0.2-0.4 1.5
Woburn 1969-73 548 0.39 < 0. 1 - 1.0 2.11986-91 625 0.23 0.1 -0.5 1.4
Saxmundham 1969-73 574 0.55 < 0.1 - 2.4 3.2Broom's Barn 1986-91 574 0.25 0.1 -0.4 1.4
8. K in drainage water from experimental soils
8.1. The effect of soil pH on losses of K
One consistent effect, noted in published work where comparisons weremade, was that the addition of CaCO3 to soil, liming, caused a decrease inleaching losses of K (see Munson and Nelson, 1963 and references therein).Johnston (1988) summarised data from laboratory experiments made onsoils from long-term experiments at Rothamsted which had very similar claycontents and mineralogies but different pHs, range 5 to 8, and differentlevels of exchangeable K, range 80 to 940 mg kg-1, as a result of pasttreatments over many years. In the laboratory increasing amounts of K were
added to the soils which were put through a 12-week cycle of alternate wet
145
and dry periods each lasting one week. For each soil the proportion of theadded K which remained exchangeable was independent of the amount of Kadded and about 15% of the exchangeable K was water soluble. However, alarger proportion of the added K remained exchangeable in the acid soils,pH 5 to 6, than in the neutral soils, pH 7 to 8. Therefore more of the Kadded to the acid soil was water soluble and at risk to leaching down theprofile.
Soils of similar mineralogy are likely to have a smaller CEC when acidthan when alkaline, thus acid soils can hold less exchangeable K. Also,Ca2+ ions occupy a larger proportion of the CEC in neutral than in acidsoils and K+ can more readily replace Ca2+ than A13+ or H+ ions. Thusagain, more K will be retained as exchangeable K in alkaline soils.
8.2. K in drainage from lysimetersFor all their limitations lysimeters still offer an acceptable, often the
only, practical way of measuring losses of plant nutrients from soil.In 1919, 0.0004 ha monolith lysimeters 1 m deep were set up at
Craibstone at the North of Scotland College of Agriculture (Hendrick andWelsh, 1927). The soil, light textured and granitic, contained 1.25% Kmuch of which was in feldspars which had undergone little weathering.From 1921 the three lysimeters were either unmanured or received FYMwith N and P fertilizers with and without limestone. These treatments wereapplied only to turnips, the first crop in the six-course rotation : turnips,oats, grass hay, grass cut, grass cut and oats grown between 1921 and 1926.The amount of K applied was 170 kg ha-1 in 30 t ha-1 FYM. Average annualrainfall was 870 mm and annual through drainage of 470 mm differed littlebetween lysimeters. On average, the drainage from the three lysimeterscontained almost identical concentrations of K, average 2.5 mg 1-1, range 2.2to 2.9. Thus the amounts of K lost each year were nearly the same 9.8, 9.2and 8.6 kg ha-1 from the unmanured, manured without lime and manuredwith lime treatments respectively. Least K was lost in the first year when theK was applied because there was least through drainage.
In 1951 monolith lysimeters, 88 cm deep, were set up at ICI's JealottsHill Research Station in Southern England (Low and Armitage, 1970). Thetop 23 cm of soil was a sandy loam with 160 mg kg-' exchangeable K. Below23 cm the subsoil was a coarse sand. The lysimeters were either without acrop (fallowed) or grew grass or clover. Before sowing the seeds in July
146
1951 all the lysimeters received the equivalent of 280 kg ha-I K. Initially theleachate was analysed mainly for mineral nitrogen but for three years 1953-55 other cations and anions were measured. The average annual loss of Kwas 4.7, 1.9 and 2.0 kg ha-I from the fallow, grass and clover lysimetersrespectively. The volume of leachate from the fallow lysimeter was almostdouble that from the cropped lysimeters, thus the concentration of K in allthe leachates was similar and independent of cropping. The amounts of Klost were much less than the 10 kg ha-1 K deposited in the 650 mm ofrainfall, even on the lysimeter without a crop. Surprised by the small lossesof K in the leachate and concerned that much K might have been lost in the17 months between the application of K fertilizer and the commencement ofmeasurements, the authors determined the K fixation capacity of the top 15cm of soil in the laboratory. They added the equivalent of 305 kg ha-1 K, asK2HPO4, to the soil and then left it to equilibrate for either three hours ornine days before leaching the soil slowly with the equivalent of 500 mm ofrain. After only three hours equilibration only about 6% of the added K wasin the leachate whilst after nine days the amount was less than 1% of thatadded. Thus it is unlikely that there had been large losses of K from thelysimeters before measurements were started and the small losses recordedare representative of what would happen on a field scale even on lighttextured soils.
8.3. The relationship between drainage and losses of K
Most quantitative data on losses of K from soil are from lysimeterstudies. From some of the data in the literature and some given here, it waspossible to construct the relationship between drainage and K losses in Fig.3. The data are from North America and Europe between 1920 and 1990.The lysimeters were mostly monolith lysimeters ranging in depth up to 1 m.The soils varied from sands to clays; some were cropped, some fallowed;some were given K, others not. The period of measurement varied from oneto ten years but only data for whole years were used here and where possibleaverages of a group of years were taken.
Across this wide range of soils, climates, cropping and manuring, Kleached, in kg ha-1, and drainage, in mm, were related:
K leached = 0.012 x drainage + 0.089 (r2 = 0.75, p <0.001)
147
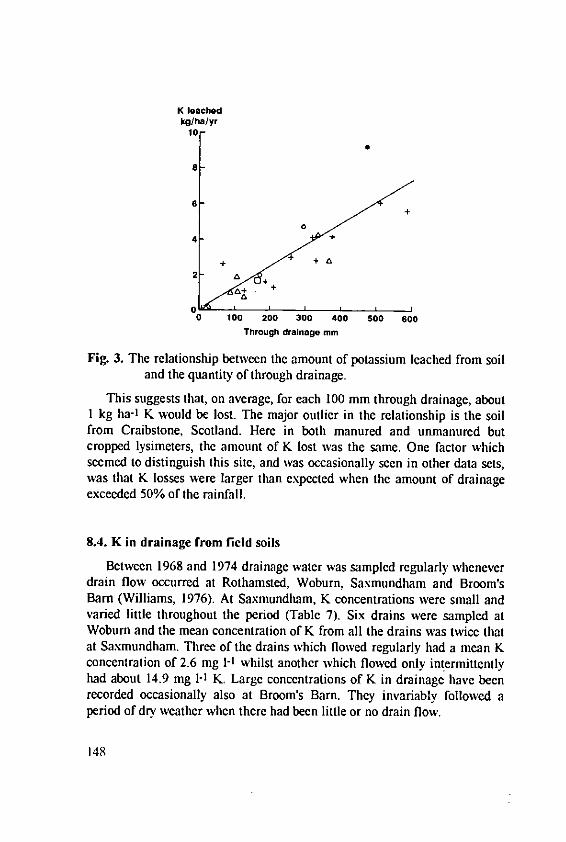
K leachedkg/ha/yr
10
00
4-
+
0 L eI .. +
0 100 200 300 400 500 600Through drainage mm
Fig. 3. The relationship between the amount of potassium leached from soiland the quantity of through drainage.
This suggests that, on average, for each 100 mm through drainage, about1 kg ha-1 K would be lost. The major outlier in the relationship is the soilfrom Craibstone, Scotland. Here in both manured and unmanured butcropped lysimeters, the amount of K lost was the same. One factor whichseemed to distinguish this site, and was occasionally seen in other data sets,was that K losses were larger than expected when the amount of drainageexceeded 50% of the rainfall.
8.4. K in drainage from field soils
Between 1968 and 1974 drainage water was sampled regularly wheneverdrain flow occurred at Rothamsted, Woburn, Saxmundham and Broom'sBarn (Williams, 1976). At Saxmundham, K concentrations were small andvaried little throughout the period (Table 7). Six drains were sampled atWoburn and the mean concentration of K from all the drains was twice thatat Saxmundham. Three of the drains which flowed regularly had a mean Kconcentration of 2.6 mg 1-I whilst another which flowed only intermittentlyhad about 14.9 mg 1-1 K, Large concentrations of K in drainage have beenrecorded occasionally also at Broom's Barn. They invariably followed aperiod of dry weather when there had been little or no drain flow.
148
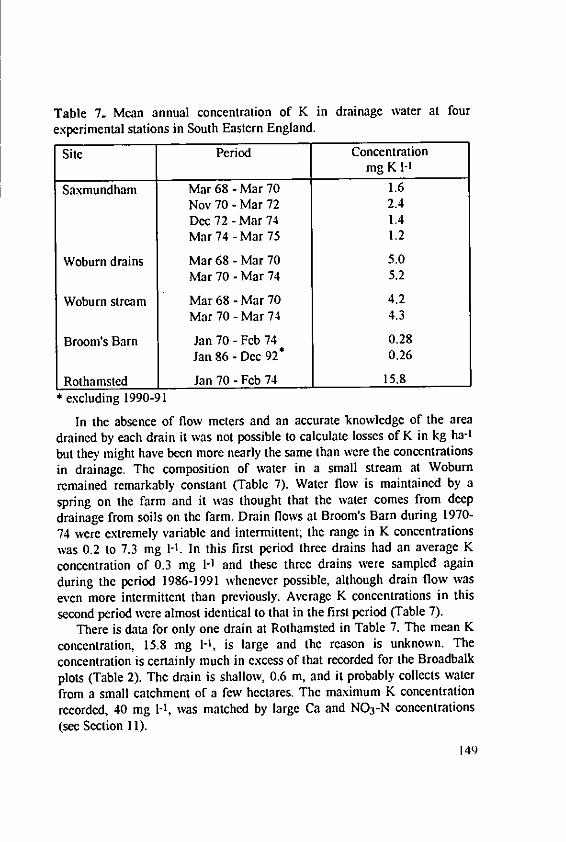
Table 7. Mean annual concentration of K in drainage water at fourexperimental stations in South Eastern England.
Site Period Concentrationmg K 1-l
Saxmundham Mar 68 - Mar 70 1.6Nov 70 - Mar 72 2.4Dec 72 - Mar 74 1.4Mar 74 - Mar 75 1.2
Woburn drains Mar 68 - Mar 70 5.0Mar 70 - Mar 74 5.2
Woburn stream Mar 68 - Mar 70 4.2Mar 70 - Mar 74 4.3
Broom's Barn Jan 70 - Feb 74 0.28Jan 86 - Dec 92* 0.26
Rothamsted Jan 70 - Feb 74 15.8* excluding 1990-91
In the absence of flow meters and an accurate knowledge of the areadrained by each drain it was not possible to calculate losses of K in kg ha-t
but they might have been more nearly the same than were the concentrations
in drainage. The composition of water in a small stream at Woburnremained remarkably constant (Table 7). Water flow is maintained by a
spring on the farm and it was thought that the water comes from deep
drainage from soils on the farm. Drain flows at Broom's Barn during 1970-
74 were extremely variable and intermittent; the range in K concentrationswas 0.2 to 7.3 mg 1-I. In this first period three drains had an average K
concentration of 0.3 mg 1-I and these three drains were sampled againduring the period 1986-1991 whenever possible, although drain flow was
even more intermittent than previously. Average K concentrations in this
second period were almost identical to that in the first period (Table 7).There is data for only one drain at Rothamsted in Table 7. The mean K
concentration, 15.8 mg 1-1, is large and the reason is unknown. The
concentration is certainly much in excess of that recorded for the Broadbalkplots (Table 2). The drain is shallow, 0.6 m, and it probably collects water
from a small catchment of a few hectares. The maximum K concentration
recorded, 40 mg 1-1, was matched by large Ca and N0 3 -N concentrations(see Section 11).
149
The concentration of K in drainage at Brimstone Farm under wellfertilized arable crops has only been measured throughout one drainageseason, 1979/80 (Harris et al, 1984), largely because the concentrations of Kin drainage were very small, range 0.5 to 3.5 mg 1-1. On drained plots, i.e.those with clay pipe drains with pebble back fill into which mole channelsdischarged, 1.18 kg ha-I K was lost in water draining from depth. There wasmuch less K, 0.49 kg ha-1, in the smaller volumes of water removed assurface run off and interflow. On undrained plots most of the excess watermoved laterally through the soil as surface runoff and interflow and theseremoved 0.50 and 0.87 kg ha-t K respectively. Thus the total loss of K fromboth treatments was small and similar, 1.67 and 1.37 kg ha-1 from drainedand undrained soils. In practice all three types of drainage would dischargeto streams and rivers. However, the method or speed at which the drainagereached the stream had little effect on the amount of K lost.
9. K in boreholes on experimental farms
Boreholes into the underlying aquifers exist at Rothamsted, Broom'sBarn and Woburn. It is assumed that the local hydrology causes acontinuous flow of water out of and into the borehole. Certainly the waterlevel varies appreciably throughout a 12 month period. They have beensampled as dipwells regularly each month for some years. The exception isthe Rothamsted Farm borehole where the sample is taken by pumping outabout 20 1 of water on each sampling occasion.
The Rothamsted Farm borehole is deep (99 m); it goes into the chalk at13 m and the depth to the water is 35 m. It is used to extract water forirrigating experimental crops. The mean K concentration and range haschanged little between two periods 1968-74 and 1986-91 (Table 8). As partof a study of the movement of nitrate into aquifers, two shallower borcholeswere drilled into the chalk in the late 1970s. That at Knott Wood goes intochalk at 1 m and the water is at 15 m. It is situated under deciduouswoodland on sloping ground. Water from this shallow borehole had Kconcentrations remarkably similar to those in the much deeper Farmborehole about 500 m away.
150
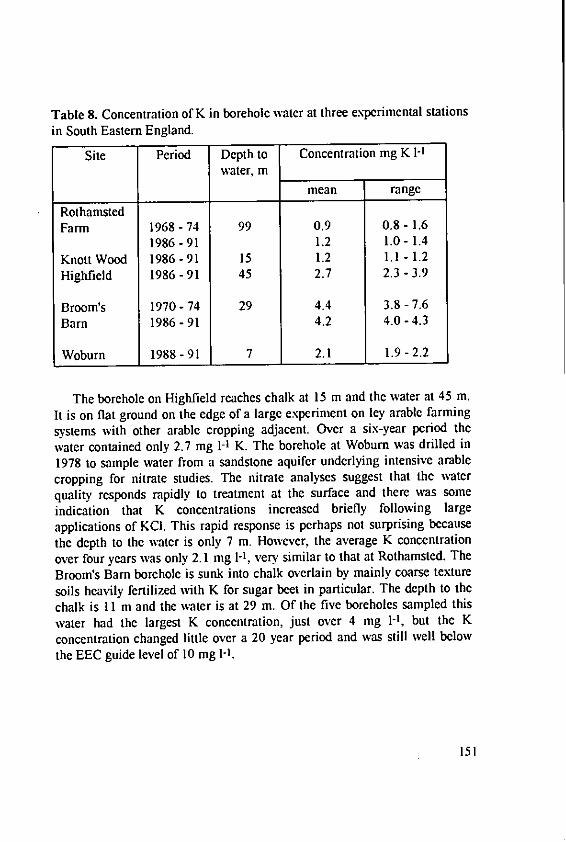
Table 8. Concentration of K in borehole water at three experimental stations
in South Eastern England.
Site Period Depth to Concentration mg K I-water, m
mean range
RothamstedFarm 1968-74 99 0.9 0.8-1.6
1986-91 1.2 1.0- 1.4
Knott Wood 1986-91 15 1.2 1.1 -1.2Highfield 1986 - 91 45 2.7 2.3 - 3.9
Broom's 1970-74 29 4.4 3.8 -7.6
Barn 1986-91 4.2 4.0-4.3
Woburn 1988-91 7 2.1 1.9-2.2
The borehole on Highfield reaches chalk at 15 m and the water at 45 m.
It is on flat ground on the edge of a large experiment on ley amble farming
systems with other arable cropping adjacent. Over a six-year period the
water contained only 2.7 mg 1-1 K. The borehole at Woburn was drilled in
1978 to sample water from a sandstone aquifer underlying intensive amble
cropping for nitrate studies. The nitrate analyses suggest that the water
quality responds rapidly to treatment at the surface and there was some
indication that K concentrations increased briefly following large
applications of KCI. This rapid response is perhaps not surprising because
the depth to the water is only 7 in. However, the average K concentration
over four years was only 2.1 mg 1-1, very similar to that at Rothamsted. The
Broom's Barn borehole is sunk into chalk overlain by mainly coarse texture
soils heavily fertilized with K for sugar beet in particular. The depth to the
chalk is 11 m and the water is at 29 m. Of the five boreholes sampled this
water had the largest K concentration, just over 4 mg 1-1, but the K
concentration changed little over a 20 year period and was still well below
the EEC guide level of 10 mg 1-1.
151
10. K in water, the regional picture in England and Wales
During the period 1968-74, Williams (1976) analysed the water suppliedto the laboratories at Rothamsted and Woburn by their respective watersupply companies. At Rothamsted the water was blended from three deepboreholes in the chalk and 98 samples averaged 1.3 mg 1-1 K (range 0.9 to4.8). At Woburn the 70 m deep borehole is in a sandstone aquifer and 67samples averaged 3.4 mg 1-1 K (range 2.4 to 6.4).
By 1987 the Potash Development Association in Britain was concernedabout the Maximum Admissible Concentration (MAC) for K in watersupplied for human consumption under the EC Drinking Water Directive.At that time water supply was the responsibility of Regional WaterAuthorities. Each Authority was asked to supply what information it couldon the concentration of K in potable water. All were able to supply data withvarying degrees of detail and in different formats, usually for years around1986, and the information is discussed briefly here by courtesy of JD.Hollies (personal communication).
None of the Authorities saw a problem either then or in the foreseeablefuture to supply water below the MAC limit. One Authority pointed out thatlarger than normal levels of K can indicate pollution, for example byleachate from land-fill sites, which usually leads to more detailedinvestigation, especially for possible organic and inorganic pollutants andmicrobial contamination.
There were some interesting similarities and differences within the datawhich relate not only to the agriculture of the region but also to estimates ofthe mean excess winter rainfall which can result in either surface run off orthrough drainage. Excess winter rainfall can be put into three bands, lessthan 150 mm, 150 to 250 mm, and more than 250 mm, and the WaterAuthorities grouped by having most of their catchments in one of the threebands.
Regions with predominantly more than 250 mm excess winter rainfallinclude Wales, the North West, South West and Wessex. Welsh Water gettheir supply from 260 sources which can be grouped as : upland surfacewater mainly derived from streams and reservoirs draining peaty orafforested catchments with K concentrations which ranged from 0.2 to 2.5mg 1I; lowland surface water mainly taken from the middle and lowerreaches of rivers contained 2.0 to 7.5 mg l-1 K, and similar concentrations,2.5 to 9.5 mg 1"H, were found in groundwaters derived mainly from aquifersin limestone or stony gravel at shallow depths. Like Welsh Water, North
152
West Water also derives its supplies from upland reservoirs, lowland rivers
and boreholes. It also noted that upland reservoirs directly fed by streams
had the lowest K levels. Averaged over all supplies, concentrations ranged
from 0.5 to 6.0 mg 1-I K. In both regions water which could be draining
from agricultural land into lowland rivers and shallow aquifers had a larger
K concentration than that from upland areas. Welsh Water noted that K
concentrations showed seasonal variation but this may relate to the volume
of water flowing into the reservoirs or streams at any one time. Similarly,South West Water supplying Devon and Cornwall, which are mainly
livestock areas, recorded an average of 1.5 mg I-1 K (range 0.4 to 5.0) over
two years and 52 sources.Northumbrian Water in the North East of England has about half the
area with 150 - 250 mm excess winter rainfall and the rest over 250 mm. It
covers an area with mainly low input agriculture and forestry. Data for 23
water supply sources gave a mean of 1.6 mg 1-1 K (range 0.6 to 3.7). There
was one value of 15 mg 1-I K out of 12 observations at one site (see Section
11). On the other hand Southern Water with more than half the area with
more than 250 mm but mainly arable agriculture, reported K concentrationsusually below 3 mg 1-1 and with maximum values of 6 mg I-1.
Yorkshire Water, Anglia and Thames have about two thirds of their
areas with 150 - 250 mm excess winter rainfall. Yorkshire with the
remaining third over 250 mm covers an area of variable geology and
farming and includes some large industrial conurbations. It divides its
region into zones. The Pennine area with low input stock rearing had K
concentrations ranging from 0.5 to 2.0 mg 1-1 and this range was very
similar to that (I to 2 mg 1-1) in the East of the region where water is taken
from chalk boreholes but where the agriculture includes the intensively
farmed Vales of York and Pickering. Water supplied from sandstoneboreholes in the south east of the region, in an area of arable cropping, and
that in the north of the region, the Northern Springs, with more mixed
farming, both had K concentrations in the range I to 3 mg 1-1. By contrast,Anglian Water has the other third of its area with less than 150 mm excess
winter rainfall and it covers the eastern counties of England with the largest
concentration of arable agriculture. Recorded K concentrations were
normally between I and 6 mg 1-1; thus the largest values in the range are
greater than those in the Yorkshire region. Anglia also has one or two
geologically old underground waters with up to 14 mg 1-1 K. They consider
that these levels are naturally occurring and the Authority has been granted
derogations under the EEC Drinking Water Directive. It is interesting that
153
some other spring waters derived from underground sources also have largerK concentrations than those found in surface waters. It should also be notedthat Welsh Water reported that groundwaters derived from limestoneaquifers had the largest concentrations of K in their region although thesewere still below the MAC.
Severn Trent Water in the central midlands and Wessex Water in theBristol region together with Somerset and Dorset are both in areas of mixedarable and animal husbandry. Wessex Water, with the majority of its regionwith more than 250 mm excess winter rainfall, has 130 different sources ofsupply and K concentrations range from < 1 to 10.6 mg 1-1. Severn Trent,with most of its region with 150 to 250 mm, has 259 sources which supplied1704 million litres a day with K concentrations ranging from < I to 5 mg 1-1and a further 20 sources which supplied 315 M I day-' with 5 to 10 mg 1-1 K.Thus the range of K concentrations appears to be little affected by thequantity of excess winter rainfall.
It is interesting to compare the range of K concentrations in UK drinkingwaters with those in bottled mineral waters. Nine bottled waters, availablewidely in the UK, declared the K concentration on the label. These valuesranged from 0.3 to 5.7 mg l- K (mean 2.2 mg 1-1).
11. Large concentrations of K in drainage
Attention has been drawn to the large concentration of K in one of theRothamsted drains, most probably due to pollution, and in one source ofsupply on one occasion in data from Northumbrian Water (Section 10).
Van Schreven (1970) also reported very large losses of K in drainageduring 1962-66 from the Eastern Flevoland polder which emerged from thewater in 1957. Rainfall averaged 854 mm each year and added about 7 kgha-1 K. On average 162 kg ha-1 K (range 105 to 226) was lost each year indrainage from the polder; the concentration of K was not given. These lossesare very much larger than others given in this paper. The large annualrainfall, the shallow depth of soil above the water table and the very recentcommencement of drainage probably all contributed to the large loss of K.Smaller losses, 54 kg ha-1 K, were reported in 1963-64 for the North easternpolder (emerged from the water in 1942), so the age of the polder wasprobably important. Unfortunately the amounts of Na lost were not given,neither was the ratio of Na to K in the drainage or in nearby sea water,which might have allowed the K losses to be related to the drainage of waterwhich previously saturated the soil. The soil was described as very heavy
154
with the clay fraction containing about 80% illite and initially much
exchangeable K. It is difficult to see why the true exchangeable K content
should have fallen on drainage but as pointed out previously "exchangeable.K" as measured analytically will include water soluble K held in the soil
matrix. This water soluble K may have been a large proportion of the initial
exchangeable K and would have been lost on drainage. It is also possible
that the oxidation of organic matter decreased the CEC which would have
released K, and that the disintegration of clay minerals on drying after many
years of immersion in water released fixed K.It is almost certain that these exceptionally large losses of K were not
related to the use of fertilizers or manures because the amounts of N lost
were very much smaller, about 15 kg ha-1 N each year, from both polders.
This was only about 10% of the K lost from the Eastern Flevoland polder.
It would be helpful in future if authors reporting larger than anticipated
K losses from soils, or water supplies or drainage with large concentrations
of K, could attempt to offer an explanation. If this is not done then those
responsible for framing legislation do not know whether to ignore the values
as aberrant or take them into serious consideration when deciding on
limiting values.
12. Conclusions
The reason for setting a maximum admissible concentration of 12 mg 1-I
K in the EEC Drinking Water Directive is not known to the authors of this
paper. If organisations supplying water for human consumption can use K
concentrations as an easily measured indicator of possible contamination of
sources of water supply then this is good but within a Directive the choice of
any MAC should be soundly based.At present water supply organisations in England and Wales foresee
little difficulty in supplying water. with less than 12 mg 1-1 K. Across a wide
range of rainfalls, farming systems, surface soils and underlying geological
strata in the UK there is little dramatic change in the range of K
concentrations in drainage from either agricultural soils or soils under other
land use systems. In upland areas with less intensive farming and often
greater rainfalls, the upper value for the range of K concentrations rarely
exceeded 3 mg 1-1 K. Even in areas of intensive arable production, usually
associated with lower rainfalls and smaller quantities of through drainage,water taken from the middle or lower reaches of rivers and from boreholes
155
only occasionally had K concentrations approaching 10 mg 1-1. It is unlikelythat this situation will change appreciably in the foreseeable future. Onepossible cause for increased losses of K in drainage could be that sitescapable of holding exchangeable and non-exchangeable K in both topsoilsand subsoils become saturated. This seems very unlikely except on the verylightest textured soils. On such soils good farm practice applies K annuallyin amounts sufficient to match crop requirement.
Current awareness of increasing levels of chloride in water must not belinked to the use of KCI fertilizers which has changed little in recent years.Goulding et al (1986) showed that chloride deposited in rain increasedthrough the 1970s and 1980s in some areas and has continued to increase inrecent years.
The use of K fertilizers is increasing only very slowly and, with presentrates of use, the national K balance is very small. Church and Skinner(1986) calculated K balances for England and Wales in 1982 for winterwheat, spring barley, oilseed rape and potatoes. For all four crops the Kbalance was positive based on average national yields and % K in dry matterand data from the Survey of Fertilizer Practice on the average amounts of Kapplied to each crop. However the balance was small; for winter wheat, 4 kgha-1 K, for spring barley 21 kg ha-1 and for oilseed rape 12 kg ha-'. It wasmuch larger for potatoes, 69 kg ha-1, but because potatoes are not grownfrequently and often only on the lighter textured soils then the effect on theoverall national K balance for arable rotations is likely to be small.Incorporating straw into soil,because of the ban on straw burning, will makelittle difference to the national K balance for cereals because much of the Kin the straw was returned to the soil in the ash and this was allowed for inthese calculations.
With only a very small positive K balance for agriculture in England andWales and little change likely during the coming years, with many soilshaving a large capacity to retain both exchangeable and non-exchangeableK, there seems little prospect that the concentration of K in drainage fromagricultural land will increase to levels which could cause problems forwater supply organisations to meet the maximum admissible concentrationof K, 12 mg 1-1, imposed by the EEC Drinking Water Directive.
156
References
Church, B.M. and Skinner, R.J. (1986) : The pH and nutrient status of
agricultural soils in England and Wales 1969-83. Journal ofAgricultural
Science, Cambridge, 107, 21-28.
Goulding, K.W.T., Poulton, P.R., Thomas, V.H. and Williams, R.J.B.
(1986): Atmospheric deposition at Rothamsted, Saxmundham and
Woburn experimental stations, England 1969-1984. Water, Air and Soil
Pollution 29, 2749.Goulding, K.W.T. and Talibudeen, 0. (1984) : Thermodynamics of K-Ca
exchange in soils. I Effects of potassium and organic matter residues in
soils from the Broadbalk and Saxmundham RI experiments. Journal of
Soil Science 35, 397-408.Harris, G.L., Goss, M.J., Dowdell, R.J., Howse, K.R. and Morgan, P. (1984):
A study of mole drainage with simplified cultivation for autumn sown
crops on a clay soil. 2. Soil Water regimes, water balances and nutrient
losses in drainage water, 1978-80. Journal of Agricultural Science,
Cambridge 102, 561-581.Hendrick, J. and Welsh, H.D. (1927) : The substances removed by drainage
from a Scottish soil. First International Congress of Soil Science,
Washington D.C. Proceedings of Comnission 2, 358-366.
Johnston, A.E. (1988) : Potassium fertilization to maintain a K-balance
under various farming systems. In : Nutrient balances and the need for
potassium. 13th Congress International Potash Institute, Bern 199-226.
Johnston, A.E. and Goulding, K.W.T. (1990) : The use of plant and soil
analysis to predict the potassium supplying capacity of soil. Proceedings
of 22nd Colloquium International Potash Institute, Bern, 177-204.
Lawes, J.B., Gilbert, J.H. and Warington, R. (1882) : On the amount and
composition of the rain and drainage water collected at Rothamsted.
Journal of the Royal Agricultural Society, 18, 1-24.
Low, A.J. and Armitage, E.R. (1970) : The composition of the leachate
through cropped and uncropped soils in lysimeters compared with that of
the rain. Plant and Soil 33, 393411.Munson, R.D. and Nelson, W.L. (1963) : Movement of applied potassium in
soil. Journal ofAgricultural and Food Chemistry 11, 193-201.
Warren, R.G. and Johnston, A.E. (1962) : Barnfield. Rothamsted
Experimental Station Report for 1961, 228-247.
157
Williams, R.J.B. (1976) : The chemical composition of rain, land drainage,and borehole water from Rothamsted, Broom's Barn, Saxmundham andWoburn Experimental Stations. In : Agriculture and Water Quality.Technical Bulletin 32, Ministry of Agriculture, Fisheries and Food,London, HMSO, 174-220.
Van Schrcven, D.A. (1970) : Leaching losses of nitrogen and potassium inpolders reclaimed from Lake Ijssel. Plant and Soil 33, 629-643.
158
Ion Composition of Mineral Waters inCzechoslovakia with Special Reference to KConcentration
Dvoik, J., Institute of Balneology, RuskA 22, Frantigkovy LAzn6,
Czechoslovakia
Summary
Mineral waters in Czechoslovakia contain from 5 to 141 mg 1-1 K+.
Their ion composition depends not only on the parent geological material
but also on additional factors like contents of dissolved CO 2 and H2SO 4,
temperature and rate of evaporation.
Introduction
The following discussion refers to Table 1, giving details of waters
originating from the sites shown in Figure 1.2.64% Na and 2.40% K by weight occur in the earth's crust; the Na:K
ratio by weight is 1.1 and the ionic ratio 1.87.More sodium than potassium derived from the weathering of minerals
has been carried away in river waters as a result of the differing mobilities
of the ions in solution and differential adsorption by clay minerals (analyses
17a and b in the table).Thus we find in soils only 0.63% Na and 1.36% K with the Na:K ratio
by weight 0.46 and ionic ratio 0.79.As a result of preferential adsorption of K+ by sediments, sea water
contains 10561 mg 1-1 Na+ and 380 mg 1- 1 K+ or 459.2 meq 1-1 Na + and
9.72 meq 1-1 K+, the ionic ration being 47.2 (Analysis 18).
Waters from mineral springs
In the formation of mineral waters by the action of water on rocks, there
are marked interactions between the following factors :
a) CO 2 of postvolcanic origin (sites 1-9 and 11-12);
b) free H2 SO 4 derived from oxidation of pyrites (sites 15, 16);
159

c) elevated temperature (sites 1, 10);d) frequently part of the water concerned in determining the final ioniccomposition is of relict origin which to a varying extent is altered andconcentrated through evaporation (sites 1, 2, 11, 12, 13, 14 and to someextent 8 and 10). At sites 15 and 16 (bitter water containing MgSO4)recent evaporation is a factor.All these factors raise water solubility. Often only one factor may be
concerned but frequently they operate in combination, as indicated in thelast column of the table.
A distinct lithogenic water chemistry is concerned in CO 2 saturatedwaters of the Kaiserwald mountains, the Tepler uplands of western Bohemia(sites 3, 6, 7) and in the centre of the Ore mountains (sites 4, 5). Here lowconcentration mineral waters (1-2 g 1-1 TDS) occur with K+ contents usually5-20 mg 1-1 and Na+:K + ratio around 5 to 14. The rocks of these sites aremetamorphic (gneiss, mica-schist and phyllite) with a high K content(gneiss 2.75% Na and 2.29% K with the ionic ratio Na+:K + 2.04; micaschist and phyllite 1.80% Na and 2.72% K, Na:K ionic ratio 1.12).
From the above it is clear that the effect of CO2 in the water is todissolve more sodium than potassium. A comparison may be made withwater from the river Labe in the Bohemian massif for the year 1892 (17a inthe table) before the water had been affected by human activity as applies tothe later analysis in the year 1976 (17b). These representative data for riverwaters shows the ionic ratio Na+:K + to be only 3.8 with contents 4.4 and 9.7mg 1-I for K+ and Na+ respectively.
Granites of the Bohemian massif contain on the average 2.63% Na and3.74% K (Na+:K + = 1.20). There is no true mineral water originating fromthe granite. At Karlovy Vary (site 1) and on the metamorphic rocks andtertiary sediments in Frantiskovy Lazne (site 2a, b, c) relict evaporation lakewaters are much involved and, because of this, the K+ contents are higher at37, 97 and 136 mg 1I respectively but the Na+:K + ratio at 30 to 86 is finallyshifted strongly in favour of Na+.
The waters from chalky marlstone (sites 8 and 9) have K+ contents of56 to 66 mg 1-1 with Na+:K + ratio 9-15.
The hot springs of Teplice v Cechach (site 10) on metamorphic rocksalso with chalky marlstone contain 10 mg 1-1 K+ (Na+:K + ratio=3 1). On thesame rocks with fossil water (site 11) the CO 2 water contains 93 mg 1-1 K+
(Na+:K + ratio similar at 33).
160
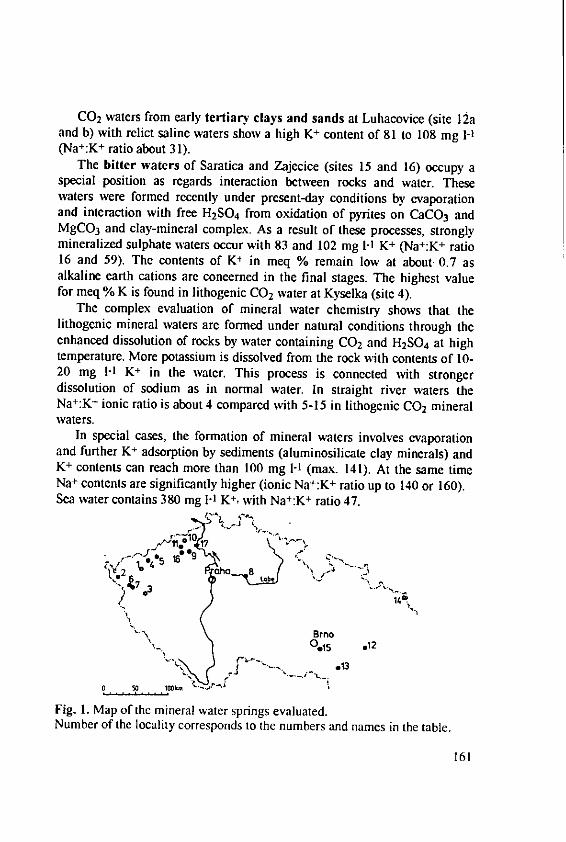
CO 2 waters from early tertiary' clays and sands at Luhacovice (site 12aand b) with relict saline waters show a high K+ content of 81 to 108 mg 1-1(Na+:K + ratio about 31).
The bitter waters of Saratica and Zajecice (sites 15 and 16) occupy aspecial position as regards interaction between rocks and water. Thesewaters were formed recently under present-day conditions by evaporationand interaction with free H2 SO 4 from oxidation of pyrites on CaCO3 andMgCO3 and clay-mineral complex. As a result of these processes, stronglymineralized sulphate waters occur with 83 and 102 mg 1-1 K + (Na+:K + ratio16 and 59). The contents of K+ in meq % remain low at about 0.7 asalkaline earth cations are concerned in the final stages. The highest valuefor meq % K is found in lithogenic CO 2 water at Kyselka (site 4).
The complex evaluation of mineral water chemistry shows that thelithogenic mineral waters are formed under natural conditions through theenhanced dissolution of rocks by water containing CO 2 and H 2 SO 4 at hightemperature. More potassium is dissolved from the rock with contents of 10-20 mg 1-1 K + in the water. This process is connected with strongerdissolution of sodium as in normal water. In straight river waters theNa+:K + ionic ratio is about 4 compared with 5-15 in lithogenic CO 2 mineralwaters.
In special cases, the formation of mineral waters involves evaporationand further K+ adsorption by sediments (aluminosilicatc clay minerals) andK + contents can reach more than 100 mg l-1 (max. 141). At the same timeNa+ contents are significantly higher (ionic Na+:K + ratio up to 140 or 160).Sea water contains 380 ng 1-1 K +, with Na+:K + ratio 47.
Jtj11 .* 17
.t"\ " Brno0.1O5 12
13
Fig. I. Map of the mineral water springs evaluated.Number of the locality corresponds to the numbers and names in the table.
161
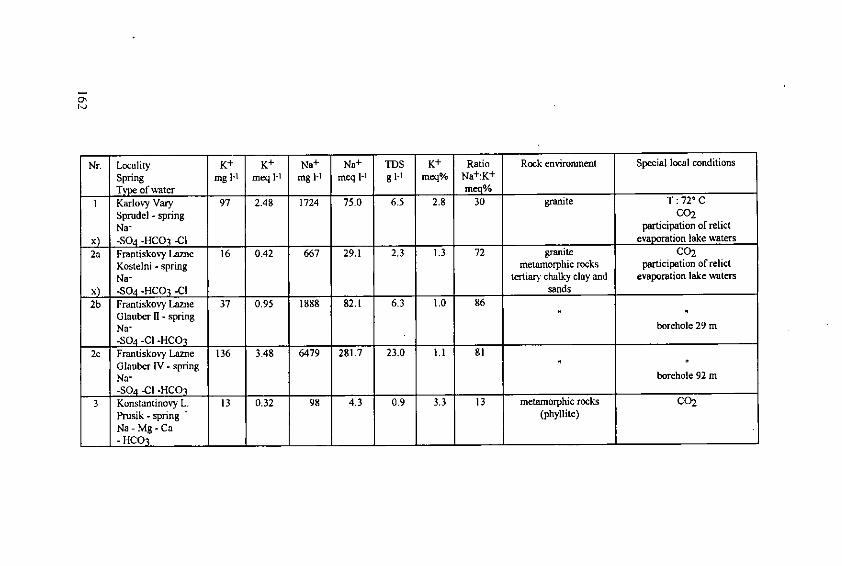
Nr. Locality K+ K+ Na+ Na + TDS K+ Ratio Rock enviroment Special local conditionsSpring mg 1-1 meq 1-1 mg I-I meq 1-1 g 1- meq% Na+:K +
Type of ater meq%I Karlovy Vary 97 2.48 1724 75.0 6.5 2.8 30 granite T: 72 C
Sprudel - spring C0 2Na- participation of relict
x) -SO 4 -HCOg -CI evaporation lake waters
2a Frantiskovy Lazne 16 0.42 667 29.1 2.3 1.3 72 granite CO2Kostelni - spring metamorphic rocks participation of relict
Na- tertiaiy chalky clay and evaporation lake watersx) -S0 4 -HCO 3 -C1 sands2b Frantiskovy Lazne 37 0.95 1888 82.1 6.3 1.0 86
Glauber II - springNa- borehole 29 an
-SO4 -CI -HCO 32c Frantiskovy Lazne 136 3.48 6479 281.7 23.0 1.1 81
Glauber IV - springNa- borehole 92 m-SO 4 -Cl -HCO 3
3 Konstantinovy L. 13 0.32 98 4.3 0.9 3.3 13 metamorphic rocks C02Prsik - spring (phyllite)Na - Mg - Ca- HCO3
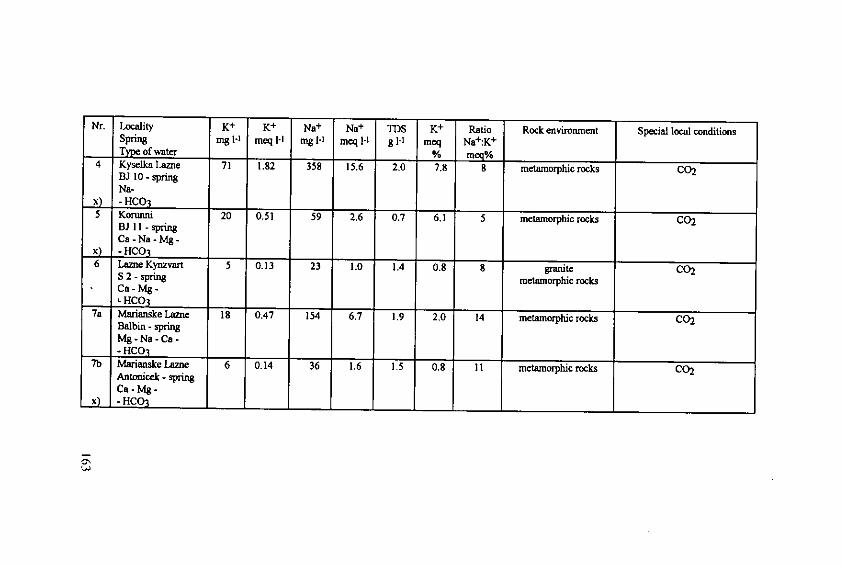
Nr. Locality K+ K+ Na+ Na+ TDS K+ Ratio Rock environment Special local conditionsSpring togl- mq11 mg 1-1 meq 1-1 I g1-1 meq Na+:K+
Type of water - I I % meq%4 Kyselka Lazne 71 1.82 358 15.6 2.0 7.8 8 metamorphic rocks C02
BJ 10 -springNa-
l - HCO 35 Kormni 20 0.51 59 2.6 0.7 6.1 5 metamorphic rocks CO2
BJ II - springCa - Na - Mg -
x) - HCOI6 Lane Kynzvamt 5 0.13 23 1.0 1.4 0.8 8 granite CO2S 2 - spring metamorphic rocks
Ca- Mg-HCOI
7a Marianske Lazne 18 0.47 154 6.7 1.9 2.0 14 metamorphic rocks CO 2Balbin - springMg - Na - Ca -- HCOg
7b Marianske Lazne 6 0.14 36 1.6 1.5 0.8 11 metamorphic rocks CO2Antonicek - springCa - Mg -
x) -HCO 3

Nr. Locality K+ K+ Na+ Na+ TDS K+ Ratio Rock environment Special local conditions
Spring mg l-1 meq -I mg I-1 meq I-I g 1-1 meq Na+:K+
Type of water % mec%
8 Podebrady Lazne 66 1.68 567 24.6 3.4 3.7 15 cretaceous C02
BJ I I - spring chalky claystone
Na - Ca -x) - HCO 3 -CI9a Brvany 61 1.57 333 14.5 2.5 4.7 9 cretaeus C02
BV 5 - spring chalky claystoneNa - Ca - Mg -
x) -HCO3-S049b Brvany 56 1.44 206 9.0 2.1 5.0 6 cretaceous CO2
BV I - spring chalky claystone
Ca - Na - Mg -x) - HCO; - SO410 Teplice L. v C. 10 0.25 177 7.7 0.9 2.2 31 penman quartzite T: 46' C
TP 41 - spring cretaceous
Na - Ca - chalky claystome
- HCO3 - S04I Bilina 93 2.39 1836 79.9 7.6 2.5 33 metamorphic rocks CO 2
BJ 6 - spring cretaceous
Na - chalky claystone
x) - HCO-
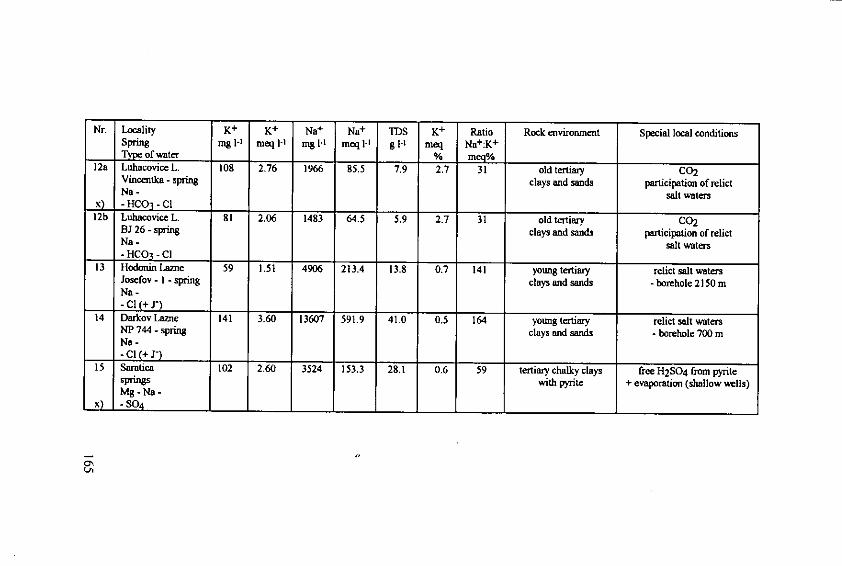
Nr. Locality K+ K+ Na+ Na+ TDS K+ Ratio Rock environment Special local conditionsSpring mg I- meq 1-I mg 1-1 meq 1-1 g F' meq Na+:K+
Type of water - % meq%12a Luhacovice L. 108 2.76 1966 85.5 7.9 2.7 31 old tertiary CO 2Vincentlk - spring clays and sands participation of relict
Na - salt watersx) - HCO - Cl
12b Luhacovice L. 81 2.06 1483 64.5 5.9 2.7 31 old tertiary CO 2BJ 26 - spring clays and sands participation of relictNa - salt waters- HCO1 - Cl
13 Hodonin Lazne 59 1.51 4906 213.4 13.8 0.7 141 young tertiary relict salt watersJosefov - I - spring clays and sands - borehole 2150 mNa-- Cl (+ J-)
14 Darkov Lane 141 3.60 13607 591.9 41.0 0.5 164 young tertiary relict salt watersNP 744 - spring clays and sands - borehole 700 noNa --Cl (+ J-)
15 Saratica 102 2.60 3524 153.3 28.1 0.6 59 tertiary chalky clays free H2 SO4 from pyritesprings with pyrite + evaporation (shallow wells)Mg - Na -
X) -SO 4
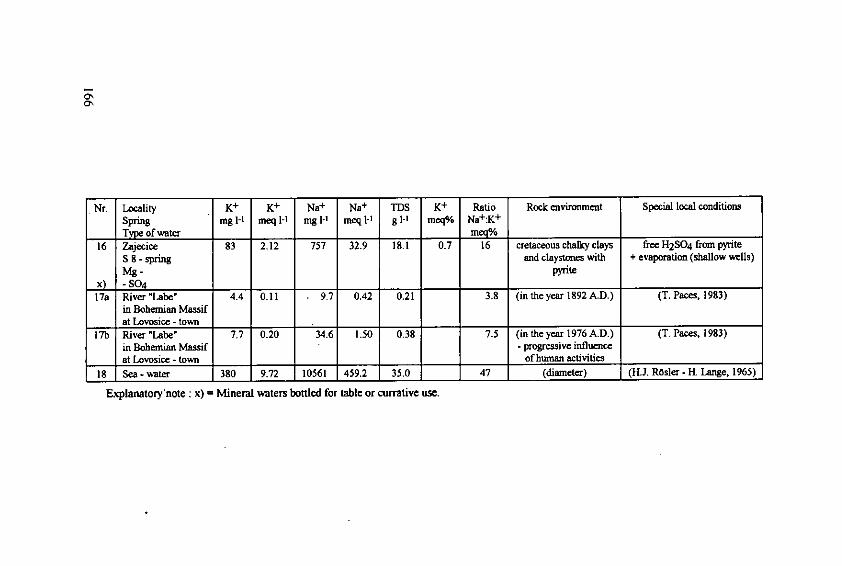
Nr. Locality K+ K+ Na+ Na+ TDS K+ Ratio Rock environment Special local conditionsSpring mg I- meq I-I mg I- meq I-1 g I-' meq% Na+:K+
Type of water meq%16 Zajecice 83 2.12 757 32.9 18.1 0.7 16 cretaceous chalky clays free H2 SO 4 from pyrite
S 8 - spring and claystones with + evaporation (shallow wells)Mg- pyrite
x) -SO417a River"Labe" 4.4 0.11 . 9.7 0.42 0.21 3.8 (in theyear 1892 A.D.) (T. Paces, 1983)
in Bohemian Massifat Lovosice - town
17b River "Labe" 7.7 0.20 34.6 1.50 0.38 7.5 (in the year 1976 A.D.) (T. Paces, 1983)in Bohenman Massif - progressive influeceat Lovosice - town of hmnan activities
18 Sea - water 380 9.72 10561 459.2 35.0 47 (diameter) (H.J. Rosler - H. Lange, 1965)
Explanatory'note : x) = Mineral waters bottled for table or currative use.
Composition of Deep-Well Water and Hydroponics
Sne, M., Director-Irrigation & Soil Field Service, Ministry of Agriculture,Arania St. 6, P.O.B. 7054, Tel Aviv 61070, Israel
Abstract
Most water resources in Israel contain high concentrations of dissolvedsalts, beyond the level suitable for hydroponics. Dedicated techniques weredeveloped to by-pass this limitation.
Underground water constitutes two thirds of the water potential of Israel.Generally, the quality of the underground water is better than that of thesurface water and deep-well water is favored over surface water in soillessculture. Chemically active media are preferred in hydroponic culture. Theyprovide buffer capacity, moderate fluctuations in ion composition andimprove the tolerance of plants to salinity.
Open systems are favored over the closed ones. Recirculation of thenutrient solution in close systems may increase salt concentration todetrimental level.
Roses and tomatoes were chosen to demonstrate the effect of watercomposition on hydroponics.
Introduction
Agriculture in Israel has to cope with severe shortage of land and water.The total arable land is 450,000 ha. and the estimated annual water potentialis of roughly 2 billion m3 (Goldberger, 1992). Rainfall is restricted to sixmonths in the winter, from November to April. The annual rainfall variesfrom 800 mm in the north to 30 in the south. Half of the country is arid withannual precipitation less than 200 mm. Only one half of the arable land isirrigated. Despite these constraints, Israel is self-sufficient in fresh fruit andvegetable production. The export of agricultural commodities offsets the costof imported products like grains, fodder and meat.
Population growth and the rise in the standard of living, has increasedwater demand by the urban population and decreased the available wateramount for agriculture. The expansion of intensive greenhouse agriculture isthe only way to guarantee adequate standard of living for farmers, steady
167
supply of fresh food to the local market and profitable export of high qualityagricultural products.
The advantages of the controlled environment in greenhouses can befully exploited by the optimization of the air-water relations and thechemical composition of the nutrient solution in the root-zone. Suchoptimization can be achieved only in soilless culture.
Two factors impede wide-scale utilization of hydroponics in Israel: thehigh cost of the investment required and the low quality of the water.
Definitions
Soilless culture means the growing of plants in nutrient solution - watercontaining dissolved chemical elements which are essential to plant growthand development.The soilless system may be "open" or "close".In open systems the solution is not recovered, excess water is drained andpoured out from the system.In close systems, the solution is recovered and recirculated.The plants grown in soilless culture have to be mechanically supported. Thesupport can be limited to the stabilization of the shoot while the bare rootsare immersed in the solution ("true hydroponics"). In another version thewhole root system is anchored and develops in the solid medium.
The medium (substrate) may be natural, artificial or a mixture of bothforms. The media can be inert or chemically-active.Natural substrates are: sand, gravel, quartz, tuff (volcanic ash), coal ash,peat, sawdust and tree bark.Artificial beds include rockwool, vermiculite, perlite and expanded plasticfoam.Rockwool, expanded plastic foam and perlite are regarded as inert materials.Flushed sand, riverbed flint aggregates, basalt and granite gravel are slightlychemically active.Volcanic tuff, calcareous gravel and vermiculite are further more active.Organic materials like peat and compost are the most chemically activemedia in soilless culture.
The principal growing techniques of bare root plants (true hydroponics)are (Adam, 1985):1. Deep Flowing System: plants are grown in long shallow pools and thenutrient solution is continuously aerated.
168
2. Nutrient Film Technique (NFf): plants are grown in a thin film ofrecirculating nutrient solution.3. Aeroponics: the bare roots are continuously sprayed with oxygen-richnutrient solution.4. Ein Gedi System (EGS): combines the deep flowing technique withaeroponics.
The main advantages of hydroponics are as follows:1. The chemical composition of the nutrient solution can be continuouslymeasured and optimized.2. Automatic regulation of water, air, nutrient supply and pH level.3. No interference of soil properties with the uptake of the nutrients by theplants.4. Feasibility of sterilization of the bed and the nutrient solution.5. Avoiding water and nutrient losses by deep percolation.6. Convenient harvest.7. Full exploitation of the yield potential.
The main drawbacks of hydroponics are the high cost of investmentneeded, the complexity of operation and the limited number of crops suitableto profitable commercial hydroponics.
Water quality and hydroponics
The chemical composition of the water used may affect hydroponics inthree ways:
1. Nutritional value: The economic value of the nutritional elementscontained in the water, has generally little significance.2. Interactions between the ions contained in the water and the appliedfertilizers: Intervention in the uptake of nutrients and harmful elements bythe plants and precipitation of insoluble salts from the solution.3. Contribution to the salinity of the nutrient solution, either by increasingthe Electrical Conductivity (EC) and the osmotic pressure or by specificdetrimental elements.
The water supply system in Israel is organized as a country-wideintegrated network. The majority of the water resources are located in thenorth of the country while more than half of the cultivated land is in thesouth. The backbone of the water supply system is the National Carrier,
169

delivering water from the Sea of Galilee in the north to the Negev region inthe south. On its way, the National Carrier supplies water to lands wherelocal resources are low and collects excess water from other wells.
Underground water is the main source of water in Israel - two thirds ofthe total annual water potential. Underground water resources are distributedin seven regional basins. A significant fraction of the water is brackish(above 400 mg 1-1 chloride).
Table 1. Natural water resources in Israel: annual potential in millions m3
(Goldberger, 1992)
Basin Total potential Brackish water
SURFACE WATERSea of Galilee 500 20West of watershed 100East of watershed 90Total surface water 690 20UNDERGROUND WATERSea of Galilee Basin 140Western Galilee 150 15Carmel 40 15Yarkon - Taninim Basin 350 35The Coastal Basin 340 40The Eastern Mountains Basin 330 120Negev and Arava 100 85Total Underground water 1 450 310Total water potential 2 140 330
Chemical composition of the water in the main underground aquifers
The two main underground aquifers in the Coastal Plain are the RockAquifer (Yarkon - Taninim) and the Coastal Aquifer. Two smaller aquifersextend to the north - the Western Galilee and the Cannel aquifers. Along theCoastal Plain, water is pumped from some 1500 wells. Well depth variesfrom 40 to 120 m., with some exceptions of depths up to 200 m. In theWestern Galilee and.the Gaza Strip exist some shallow wells, 10 - 40 m.deep.
170

The chemical composition of the water in the wells varies according to
location, distance from the sea, depth and proximity to polluting sites like
urban localities, garbage deposits and irrigated areas. The level of chloride
(Cl) and nitrate (NO 3) in the underground water in the Coastal Plain
Aquifers is increasing at 1-5 mg 1-I per year. This process is related to
continuous dwindling of the aquifers due to overpumping, penetration of
sea-water and deep saline layers from the bottom of the aquifers and
percolation of excessive nitrogen (N) from agricultural land and urban areas(Magaritz, 1986).
The most important constituents of deep-well water in the Coastal Plain
which may affect hydroponic culture, are: Bi-carbonate (HCO3"), chloride
(C-), calcium (Ca++), magnesium (Mg++), sodium (Na+), nitrate (NO3")and sulfate (SO4-). Potassium (K) is found at low levels (1-10 mg 1-1) in the
Coastal Plain aquifers. Phosphorous (P), ammonium (Ni4) and boron (B),exist in negligible concentrations.
Table 2. Levels of principal chemical constituents in underground water in
the Coastal Plain of Israel (mg 1-1) (Ronen, 1978)
Sub-region HCO3" Cl" Ca++ Mg++ Na+ N0 3 " SO4-
Western 183-488 24-691 28-178 8-115 11-321 0-65 19-120GalileeCarmel 329420 397-1407 108-218 42-93 193-701 0-62 67-221CoastSharon 73408 24-372 30-330 1-75 16-218 0- 5-124
173Shefela 152-457 21-1240 32-286 4-154 30-292 0- 5-86
100Negev 146-427 31-443 28-78 13-75 23-381 0-82 10-129
The Total Dissolved Salts (TDS) range is 200-2750 mg 1-1. Most of the
wells fall within the range 500-1000 mg 1-1.The EC range is 0.4-2.5 ds m-1 . The majority of the wells are included in the0.6-1.25 ds/m. range.The pH level is 7.0-8.2, with the great bulk of the wells being around the 7.5value.
The K level is generally negligible (1-3 mg 1-). In some dozens of wells
its concentration amounts to 10-35 mg 1-1. These wells are located in urban
areas, prone to water pollution and show a high level of NO 3.
171
More sources of deep-well water are spread in the peripheral zones.Many of them contain high concentrations of dissolved salts. In the upperGalilee, in the north, some wells have extremely low salt content (220400mg 1-1. TDS) (Tausig, 1976).
Hydroponics in Israel
Hydroponic systems irrigated by deep-well water are located mainly inthe plains. The relatively high content of salts in the underground water, aswell as in the surface water, called for the elaboration of suitable techniquesto overcome this constraint.
The total area of protected crops in Israel in 1991, was roughly 2000 ha.,located mainly in the Coastal Plain and in the Jordan Valley. About 600 ha.were grown on detached beds, the common term used for soilless culture.The main crops grown were tomatoes, cucumbers, strawberry, melons, roses,carnation, gypsophila, chrysanthemum and gerbera.
In some crops, yields on detached beds are much higher than in soilculture. In roses, record yields of more than 3 million flowers per ha. wereachieved, comparing with 1-1.5 million, the common yields in soil culture.In tomatoes, 250-300 tons/ha, were harvested comparing with 100-120 insoil culture. The growing season for tomatoes in Israel is shorter than inEurope and the yield potential is not fully exploited (Avidan, 1991).
Water quality affected the development of hydroponics in Israel in twomajor aspects :
1. The majority of the growing systems are open. Closed systems arerare. In the process of recirculation of the nutrient solution in closedsystems, salt concentration may increase to harmful degree.
2. Chemically active media are commonly preferred to the inert. Onlyfew underground water resources correspond with the limits of ionconcentration for rockwool culture, defined by Verwer and Wellham in1980. Namely : 50-100 mg 1-1 Cl, 30-50 mg I-1 Na and 40 mg 1-1 HCO3(Adam, 1985). Chemically active beds moderate fluctuations in ioncomposition and pH level and increase plant tolerance of salinity. Theaddition of organic materials -peat and compost, further increases the buffercapacity and enhances the tolerance of the plants to root diseases.
The leading growing bed in hydroponics in Israel is the volcanic tuff. Itis composed of porous aggregates of volcanic ash. The apparent density is0.75-0.85 while the specific density of the compressed material is 2.8. The
172
porosity is 65/-75% by volume. After irrigation, granular unweathered tuffholds 300400 ml. water and 300-350 ml. air in 1 1. volume of the substrate.Most of the water, some 85%-90% is retained at low tension, under 0.5 bar.That provides optimal balance between air and water in the root-zone and alarge amount of low-tension available water (Dan, 1989).
The Cation Exchange Capacity (CEC) of unweathered tuff is roughly 5meq 102 g-1. of substrate. In due time, the tuff gradually weathers and theCEC may amount to 25 meq 102 g-'. The main cations absorbed by the tuffare: Ca++, Mg+ + and K+. Phosphate is also absorbed.
Rockwool culture is used on a smaller scale, some 60 ha., mainly for thegrowing of roses. Preliminary work has been started with tomatoes but the
results are not yet satisfactory. The low water quality commits high ratio ofleaching and has environmental implications of the removal of the drainagesolution.In the usual bed layout the substrate is contained in expanded polystyrenetrays, 10-20 cm. deep.
Another widespread layout is V-shaped trenches dug in the soil. The bedis isolated from the soil by polyethylene sheets. Adequate drainage isachieved by the V-shaped bottom and longitudinal slope of 1.5-3%.
Hydroponic culture in bags and small pots is common in nurseries. Themedia are Composed of tuff or perlite mixed with organic substances.
The Vertical Column Technique is another interesting growing methodused on a limited scale. The column is composed of conical plastic pots, 15-20 cm. in diameter, laid one above another. The medium is a mixture ofperlite and vermiculite. This composition provides light weight, goodbalance between air and water and good nutrient retention. Water flowthrough the column is continuous and the excess solution is collected in thebottom of the column and recirqulated. In the process of recirculation, thecomposition of the nutrients and the pH level are adjusted. The solution istested for the presence of pathogens and can be sterilized by heating (Orlov,1990,1991).
Nutrient Film Technique (NFT) and aeroponics are only rarely used. TheEin Gedi System (EGS) which combines Deep Flowing Technique andaeroponics, is not popular, due to the complexity of operation and itssensitivity to malfunction.
Roses and tomatoes were chosen to demonstrate. the effect of deep-wellwater composition on hydroponics in Israel.
173
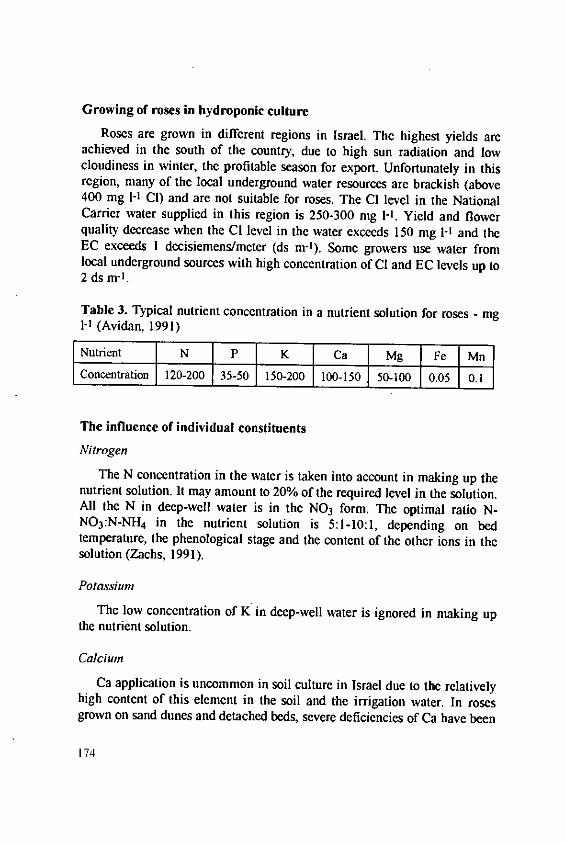
Growing of roses in hydroponic cultureRoses are grown in different regions in Israel. The highest yields are
achieved in the south of the country, due to high sun radiation and lowcloudiness in winter, the profitable season for export. Unfortunately in thisregion, many of the local underground water resources are brackish (above400 mg 1-1 Cl) and are not suitable for roses. The Cl level in the NationalCarrier water supplied in this region is 250-300 mg I-. Yield and flowerquality decrease when the Cl level in the water exceeds 150 mg I- and theEC exceeds 1 dcisiemens/meter (ds m-1). Some growers use water fromlocal underground sources with high concentration of Cl and EC levels up to2 ds m-1.Table 3. Typical nutrient concentration in a nutrient solution for roses - mg
1-1 (Avidan, 1991)
Nutrient N P K Ca Mg Fe MnConcentration 120-200 35-50 150-200 100-150 50-)00 0.05 0.1
The influence of individual constituents
Nitrogen
The N concentration in the water is taken into account in making up thenutrient solution. It may amount to 20% of the required level in the solution.All the N in decp-well water is in the NO3 form. The optimal ratio N-N03:N-NH4 in the nutrient solution is 5:1-10:1, depending on bedtemperature, the phenological stage and the content of the other ions in thesolution (Zachs, 1991).
Potassium
The low concentration of K in deep-well water is ignored in making upthe nutrient solution.
Calcium
Ca application is uncommon in soil culture in Israel due to the relativelyhigh content of this element in the soil and the irrigation water. In rosesgrown on sand dunes and detached beds, severe deficiencies of Ca have been
174
identified. Experimental work has shown that when the rate of waterabsorption by the plant is low, the Ca uptake is deficient. Low waterabsorption occurs in winter, when the transpiration rate is low and in eventsof heat stress. In these circumstances, the Ca supply in the nutrient solutionhas to be increased, considering the content of Ca in the supplied water.Complementary treatments of foliar nutrition with calcium-nitrate(Ca(N0 3)2) are recommended. The reaction to increased supply of Ca in thenutrient solution is more pronounced when the N-N0 3:N-NH 4 ratio ishigher than 8:1 (Zachs, 1991).
Magnesium
The Mg content in most deep-well water in the Coastal Plain does notfulfill the roses' demand. High K and NH4 level in the nutrient solutiondepresses the uptake of Mg. Mg deficiency is characterized by typicalchlorosis in the older leaves. As with Ca, the addition of Mg to the nutrientsolution, is not enough to correct severe deficiencies. Foliar spraying withmagnesium nitrate (Mg(N0 3)2) is the complementary treatment.
Bi-carbonate
The HCO 3 concentration in deep-well water is a key-factor in theregulation of the pH-level in the nutrient solution. Deep-well water in Israelcontains much HCO 3, in comparison with underground water in WesternEurope. This difference contributed to failures in the adoption of theEuropean growing schemes in soilless culture in Israel in the past. Due tothe high HC0 3 concentration, the pH-level of deep-well water in Israel is 7-8.2. To adjust the pH-level to 6, the optimal value for rose culture, theconcentration of the HCO3 in the nutrient solution has to be reduced to 50mg 1-1. The neutralization of the HCO3 is accomplished by acidification withH3PO 4, H2SO4 and HNO 3. The ratio between the different acids isdetermined by water composition and plant nutrition demand (Elad, 1990).
Chloride
The high level of CI in irrigation water induces non-uniform chlorosisand typical leaf-burns. The stems grow shorter and the flowers are smaller.A comparative survey in the Jezreel Valley, indicated a 20% decrease inyields when the water contained 300 mg 1-1 of Cl, compared with watercontaining 200 mg 1-i. An adjusted irrigation and fertilization regime can
175
decrease Cl damage. Watering has to be done at short intervals, the level ofthe N has to be kept higher and the ratio N-N0 3:N-NH 4, has to be keptabove 8:1. The high NO 3 concentration depresses Cl uptake.
The use of Cl-rich water in rose culture leads to high drainage. Growingroses on detached beds, requires watering with excess water, above the cropconsumption. Differential absorption of water and chemicals by the plant, aswell as losses of water by evaporation, cause continuous increase in ionconcentration and in the EC of the nutrient solution. The only way toprevent damage to the crop is by the drainage of the concentrated solution.Since Cl is one of the most detrimental ions, the higher the level in thesupplied water, the higher will be the required drainage ratio. In roses grownon tuff beds, a Cl concentration of 150 mg 1-1 in water, necessitates drainageratio of 25%, while a level of 200 mg 1-1 increases the ratio to 35/o-50%(depending on other constituents in the solution) (Schwartz, 1968; Avidan,1991).
Sodium
Na is another detrimental ion existing in deep-well water. The ratio ofNa:Ci in deep-well water varies from 1:1.25 to 1:3. Increasing the supply ofK and Ca in the nutrient solution, decreases Na uptake. In extreme cases ofexceptionally high level of Na in the water, the water is treated by ion-exchange. KNO3 is used to exchange Na+ ions with K+. The system isexperimental, some technical problems were encountered but the results arequite satisfactory.
Sulfur
The S requirement of roses is low, compared with other macronutrients.In soil culture, superphosphates and ammonium sulfate ((NH 4)2SO4),applied in preplant treatments, provide enough S to fulfill the crop demand.In soilless culture, S deficiencies were observed in roses grown on rockwooland irrigated with water extremely low in S. The S content of the water istaken into consideration when applying acids for acidification.
The Electrical Conductivity (EC)
Apart from the effect of specific ions, roses are sensitive to excessivetotal dissolved salts (TDS). The TDS is indirectly measured and expressedby the EC. The contribution to the increase in the EC value of the nutrient
176
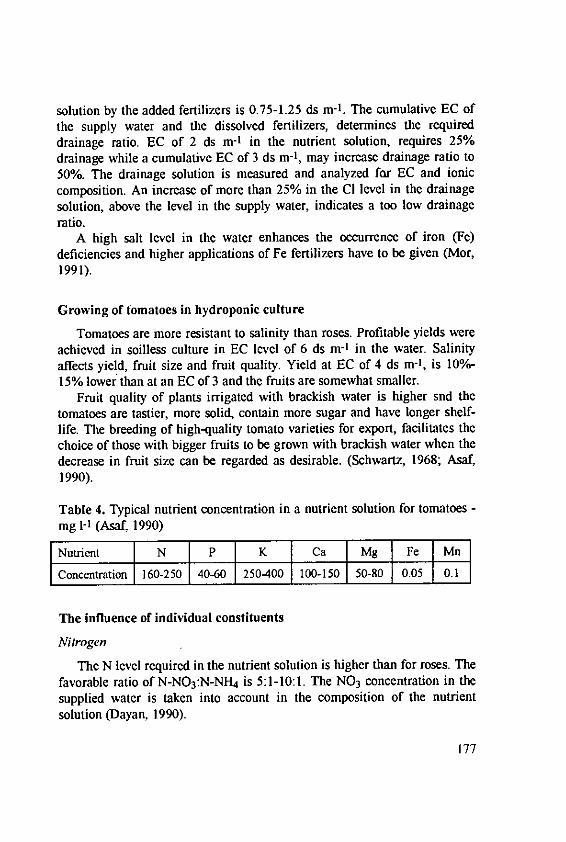
solution by the added fertilizers is 0.75-1.25 ds m-1. The cumulative EC ofthe supply water and the dissolved fertilizers, determines the requireddrainage ratio. EC of 2 ds rn-' in the nutrient solution, requires 25%drainage while a cumulative EC of 3 ds m-1, may increase drainage ratio to50%. The drainage solution is measured and analyzed for EC and ioniccomposition. An increase of more than 25% in the Cl level in the drainagesolution, above the level in the supply water, indicates a too low drainageratio.
A high salt level in the water enhances the occurrence of iron (Fe)deficiencies and higher applications of Fe fertilizers have to be given (Mor,1991).
Growing of tomatoes in hydroponic culture
Tomatoes are more resistant to salinity than roses. Profitable yields wereachieved in soilless culture in EC level of 6 ds m-1 in the water. Salinityaffects yield, fruit size and fruit quality. Yield at EC of 4 ds rn-1 , is 10/-15% lower than at an EC of 3 and the fruits are somewhat smaller.
Fruit quality of plants irrigated with brackish water is higher snd thetomatoes are tastier, more solid, contain more sugar and have longer shelf-life. The breeding of high-quality tomato varieties for export, facilitates thechoice of those with bigger fruits to be grown with brackish water when thedecrease in fruit size can be regarded as desirable. (Schwartz, 1968; Asaf,1990).
Table 4. Typical nutrient concentration in a nutrient solution for tomatoes -mg 1-1 (Asaf, 1990)
Nutrient N P K Ca Mg Fe Mn
Concentration 160-250 40-60 250400 100-150 50-80 0.05 0.1
The influence of individual constituents
Nitrogen
The N level required in the nutrient solution is higher than for roses. Thefavorable ratio of N-N0 3:N-NH 4 is 5:1-10:1. The NO3 concentration in thesupplied water is taken into account in the composition of the nutrientsolution (Dayan, 1990).
177
Potassium
Tomatoes consume significantly more K than roses. An adequate Ksupply is particularly important during the harvest season. The low contentof K in the water is not taken into consideration in the composition of thenutrient solution. In Cl-rich water, KNO3 is the preferred fertilizer while inCl-low water, KCI is applied without detrimental effects.
Calcium
Tomatoes are sensitive to disturbances in Ca supply. In the winter seasonand when heat stress occurs, Ca transfer in the plant lags behind the demandof the biochemically-active sinks. This phenomenon causes blossom end rot.In these circumstances, increase in Ca concentration in the nutrient solutionis needed, as well as complementary foliar sprays.
Magnesium
An adequate Mg supply is essential when growing tomatoes on soillessculture. Since the level of Mg in the underground water varies widely,growers are encouraged to check the Mg content in the water and to adjustthe Mg supply. Mg deficiency is induced by abundant fertilization withfertilizers containing K and NH4. Mg deficiency symptoms appear on the oldleaves, towards the beginning of the fruit ripening season. Mg applicationshave to be prophylactic. The increase in Mg supply in the nutrient solutionand the complementary foliar treatments with Mg(N0 3)2 have to be appliedbefore the appearance of the deficiency symptoms on the leaves.
Sulfur
In S-low water, H2SO4 is applied as the major constituent of theacidifying solution. High S concentrations in the water enhances the uptakeof Na by the plants while no damage to the yield was observed.
Microelements
Tomatoes are less sensitive than roses to Fe and Mn deficiencies butwhen using brackish water; Fe supply has to be increased. High applicationsof P may induce Zn deficiencies.
178
EC
The optimal EC of the nutrient solution is 3-4 ds n-l. At lower ECvalues, fruits are inferior in taste and length of shelf-life. When EC valuesare higher than 4 ds m-1 , the drainage ratio has to be increased to 25% ormore (Asaf, 1990).
Conclusions
The chemical composition of deep-well water in Israel directed thedevelopment of hydroponics in different path than that in countries owninghigh-quality water resources. Growing schemes were developed in order toenable the use in hydroponics of waters that were regarded as unsuitable tothis culture. It will no doubt have implications on the pattern of thedevelopment of hydroponics in the future.
The growing demand for high-quality agricultural commodities, thedeterioration in the quality of water resources and the higher awareness ofenvironmental issues, call for the elaboration of new techniques that willenable the expansion of hydroponics beyond its contemporary limited extent.
The customary open systems threaten to pollute the underground aquifersand surface water bodies. The main contaminant is N because of its fastpercolation and movement in the soil. The cations like Ca, Mg and K, aresignificantly less mobile. At the moment there is no proven evidence ofhazard to human health from the existence of these cations in drinkingwater. Cl affects the quality of the water in the aquifers for irrigation andexcessive Na may damage soil structure. In the future, the environmentalpressure will enforce the use of only close recirculating systems withadequate arrangements for drainage removal.
Collecting of rain-water runoff from greenhouse roofs, now inpreliminary examination, may enable the refreshing and recirculation oflow-quality drainage water. Local desalination by reverse osmosis iseconomically feasible for high-value crops. This technology will enable therecirculation of water in close systems at an affordable cost.
In some circumstances the desalination of sea-water, despite the highcosts of this technique, will be the only way to make soilless agricultureprofitable.
179
References
Adam, J., Savage, P.D. (ed), (1985) : Hydroponic Worldwide State of the Artin Soilless Crop Production. International Center for Special Studies,Honolulu, U.S.A.
Asaf, A. et al, (1990) : The Effect of Growing in Detached Beds on theYield and the Quality of Greenhouse Tomatoes. Hassadeh Vol. 70. No.12:1842-1843. Tel Aviv, Israel (Hebrew)
Avidan, A. et al, (1991) : Growing of Roses on Rockwool. Hassadeh Vol.71, No. 2:239-241. Tel Aviv, Israel (Hebrew)
Avigdori-Avidov, H., Orlov, D., London, 1., (1991): Growing of Strawberryin Vertical Columns with Circulating Nutrient Solution. Hassadeh Vol.71, No. 1:69-71. Tel Aviv, Israel (Hebrew)
Ayers, R.S., Westcot, D. W., (1976) : Water Quality for Agriculture. FAOIrrigation and Drainage Paper No. 29. FAO, Rome, Italy
Chen, Y. et al, (1991) : Growing of Melons on Detached Beds in the Arava.Hassadeh Vol. 71, No. 4:552-556. Tel Aviv, Israel (Hebrew)
Chen, Y. et al, (1991) : Growing of Melons on Detached Beds in the JordanValley. Hassadeh Vol. 71. No.8:1171-1176. Tel Aviv, Israel (Hebrew)
Cooper, A., (1974) : The ABC of NFT, Grower Books, London, UnitedKingdom
Dan, H., (1989) : Characterization of Volcanic Tuff. Irrigation & Soil FieldService, Beisan, Israel (Hebrew)
Dayan, R. et al, (1990) : Growing of Greenhouse Tomatoes in the Dead-seaRegion. Hassadeh Vol. 70. No. 8:1218-1222. Tel Aviv, Israel (Hebrew)
Elad, Y., (1990) : Fertilization for the Reduction of Gray Mold in Roses.Hassadeh Quarterly Vol. 1, No.1:3940. Tel Aviv, Israel
Goldberger, S., (1992) : The Potential of the Natural Water Resources ofIsrael. The Potential of Water Resources in Israel, Center for Research inAgricultural Economics:4-7, Rehovot, Israel (Hebrew)
Lin, ., (1991) : Vermiculite and Perlite in Agriculture. Hassadeh Vol. 72.,No. 2:267-270. Tel Aviv, Israel (Hebrew)
Magaritz, M., Ronen, D., (1986) : The Nitrate Problem in the Coastal PlainAquifer of Israel. Advances in Irrigation and Water Supply. WaterCommission: 14-17. Tel Aviv, Israel
Mor, Y., (1991) : Recirculation of Water in Greenhouses in Israel. HassadehVol. 71, No. 8:1218. Tel Aviv, Israel (Hebrew)
180
Orlov, D., (1990) : Growing High-Value Crops in Circulating NutrientSolutions in Vertical Container Assemblies. Proc. 5 Int. Conf. on
Irrigation: 89-96, Tel Aviv, IsraelOrlov, D., (1991) : Growing of Vegetables on Vertical Columns. Hassadeh
Vol. 71, No. 4:537-540. Tel Aviv, Israel. (Hebrew)Raviv, M. et at, (1991) : Water Tension in Root-Zone of Roses on Detached
Beds as Indicator of Irrigation Regime. Hassadeh Vol. 72, No. 3:359-362. Tel Aviv, Israel. (Hebrew)
Ronen, D., Knafi, Y., (1978) : The Chemical Quality of Underground Waterin the Yarkon-Taninim Aquifer. Water Commission, Tel Aviv, Israel(Hebrew)
Schwartz, M., (1968) : Guide to Commercial Hydroponics. IsraelUniversities Press, Jerusalem, Israel
Tausig, K., (1976) : Water Chemistry. Mekorot Water Co., Tel Aviv, IsraelZachs, M., Hazan, A., (1991) : Nitrate-Ammonium Relation and Calcium
Nutrition in Roses Growing on Rockwool. Publication Department,Extension Service, Ministry of Agriculture, Tel Aviv, Israel (Hebrew)
Zweig, A. & R., Aviram, H., Sade, A., (1992) : Growing of Tomatoes on
Organic Media. Hassadeh Vol. 72, No. 8:966. Tel Aviv, Israel (Hebrew)
181
Coordinator's Report on Session 2
Laudelout, H., Universit6 Catholique de Louvain, Centre de RecherchesForesti~res, Route de la Fagne 34, 6460 Chimay, Belgique
The use of the ecosystem-watershed concept has been most fruitfulduring the last thirty years since it was initiated in the United States.
Many results have been obtained by this approach on the biogeochemicalcycles of nutrients especially in forest ecosystems. This is because thestreamflow mirrors the processes occurring in the ecosystem as a wholethrough seasonal changes of its composition. The processes will be reflectedmore closely if most of the water movement occurs through subsurface flowwith little loss through the unsaturated zone towards ground water.
The presentation of Hagedorn on "Size of minimal catchment area fordrinking water as influenced by climate and population size" is aninteresting summary of the hydrological concepts necessary for the study of awatershed-ecosystem irrespective of the aims of the investigation. This paperis a very clear demonstration that the study of watersheds may yieldindispensable information not only for the understanding of biogeochemicalcycles in relation to the sustainability of forest ecosystems but also for thehighly practical problem of finding reliable water supplies for urban regions.
The communication of Johnston and Goulding has extended theapplication of this type of study to agro-ecosystems in relation to thebiogeochemical cycle of K in these systems with emphasis on the possibleleakage of K towards ground water. They suggested a useful rule of thumbaccording to which for each 100 mm of drainage about 1 kg ha-1 K would belost.
In spite of the unrealistically low level of K in drinking water which hasbeen set by the EEC's Drinking Water Directive, it is unlikely that this levelwill ever be exceeded from losses by agroecosystems due to the greatcapacity of most soils to retain K and the comparatively low level of Kmanuring.
In countries where mineral waters are of great economic importance,monitoring their composition is an interesting subject as done by Dvotk forthe mineral waters in Czechoslovakia, a country in which their use forhealth purposes has been known for centuries.
183
Sne's study dealt with the use of underground water for hydroponics inIsrael despite its concentration of dissolved salts, though this is better thanthat of surface water. Problems bound to concentration of salts and soilcontamination by used water are solved by recirculating the nutrientsolution.
Most of the above aspects, from the abundance of K in igneous rocks andthe weathering of K bearing minerals to K in the hydrological cycleincluding input of minerals by precipitation and their interception by theforest canopy, were comprehensively treated by Nativ.
184
Chairman of the Session 3
Dr. A. Vez, Federal AgriculturalResearch Station, Changins, Switzerland;member of the Scientific Board of theInternatioiial Potash Institute
Session 3
K in the Food Chain
185
Potassium in Human Nutrition
Anke, M, Losch, E., Mailler, Md., Krdmer, K., Glei, . and Bugdol, K.,
Friedrich Schiller University Jena, Biological Faculty, Institute forNutrition and Environment, Dornburger Str. 24, 0-6900 Jena, Germany
Summary
The K requirement of animals amounts to 5 to 7 g/kg ration dry matter,adults should consume 2 g K daily.
The analysis of 108 and 126 foodstuffs and beverages in nine- andsixfold repetition allows the determination of their K content in the case of
a local (1988) and a European offer of foodstuffs and beverages (1991). It
was demonstrated that e.g. white cabbage, tomatoes and cucumberscontained highly significantly more K in 1991 than in 1988 (cucumbers130 g/kg DM). Several other foodstuffs (e.g. meat, sausage, bread,confectionery, farinaceous products) too, were significantly K-richer in
1991 than in 1988. This is due to the fact that the cooking salt of theformer GDR contained 15, that of Germany contained and contains 68 gK/kg.
Mondamin, sugar, semolina, flour, vanilla pudding, candies, mixedmushrooms, margarine, butter and several kinds of cheese proved to beparticularly K-poor (< 2 g K/kg DM). White beans, most spices, coffee,cocoa, black tea, oranges, kiwi, lemons, bananas, many kinds of vegetablesand milk deliver more than 15 g K/kg DM.
The K intake of women and men was only insignificantly increased (4
and 6 %, resp.) by the transition from the local offer of foodstuffs andbeverages in 1988 to the European offer in 1991. This increased K
consumption might result from the higher K content in the cooking salt.On an average, the K intake of men and women amounted to > 2 g/day.
Thus, the consumption is assumed to meet the requirements.Women and men excreted 85 % of the K renally and 15 % faccally. On
the average, the K balance of women was slightly negative, that of menwas well-balanced with - 3 %.
The comparison of the K consumption with the duplicate method andthe basket method showed that the calculated K consumption of womenwas by 20 % higher and that of men by 25 % higher in both test years than
187

the K intake registered analytically with the duplicate method. The reasonsare discussed.
Neither K deficiency nor K excess were found for humans in CentralEurope.
1. Introduction
The K requirement of mammals and birds amounts to 5 - 7 g/kg rationdry matter (Anke, 1988) and is regularly met via feedstuffs or grazing(Anke et al., 1990). The K requirement of humans is not exactly known.In the USA (anonymous, 1980) and Germany (anonymous, 1991), a dailyK consumption of 1875 to 5625 mg or < 2000 mg/day is regarded asmeeting the requirements of adults.
In contrast to herbivores, a potential K excess is unusual in humans;there seems to be rather the danger of K deficiency. In India and Taiwan, aK consumption of 500 and 1029 and 1350 mg/day, resp., was registered inadults (Parr and Crawley, 1989). For these reasons, the K intake of adultsin the new states of German)' was investigated with the basket and theduplicate method both in 1988 with the local production of vegetables,meat and dairy products and in 1991 with a European offer of foodstuffsand beverages. The K excretion of two test populations served as control.Thus, it was possible to calculate the K balance of adults.
Furthermore, this kind of experiments made it possible to compare theresults of the basket method, which calculates the K intake, with those ofthe duplicate method, which measures the K intake during seven days, andto draw conclusions about the exactness of both procedures.
2. Material and methods
The analysis of the K content of foodstuffs and beverages was carriedout by means of 108 foodstuffs typical of the former GDR. They werebought in Jena, Weimar, Leipzig, Berlin (twice), Potsdam, Greifswald,Stralsund and Rostock in June and July, 1988. After the reunification ofGermany, 126 foodstuffs and beverages were collected in sixfold repetitionin Erfurt, Dresden, Magdeburg, Schwerin, Potsdam and Berlin andanalyzed. The K content of the foodstuffs was summed when there was nodifference between the samples of 1988 and 1991. The foodstuffs andbeverages marked with * were only analyzed in 1988, those marked with** only in 1991.
188
In 1988, the investigation of the K intake of adults was carded out in
four test populations from Brandenburg (Wusterhausen, Vetschau) and
Thuringia (Bad Langensalza, Jena), each consisting of 7 women and men
between 20 and 60 years of age. In 1991, after the reunification of
Germany, the same analyses were carried out according to the same
scheme in another four test populations from Bad Liebenstein and Bad
Langensalza (Thuringia), Wusterhausen (Brandenburg) and Greifswald
(Mecklenburg-Wester Pomerania). On 7 subsequent days, 56 test persons
collected all individually consumed foodstuffs and beverages every day
(duplicate method). The fruit, sweets, chocolate and beverages consumed
in the leisure time, during gardening and sports activities were also
collected and added to the daily sample.The individual samples of each healthy test person of the seven
experimental days were analyzed. Thus, it was possible to determine both
the weekly and the daily consumption. The collected samples of each day
(foodstuffs and beverages) were weighed, frozen in closed plastic bags or
vessels at -200C and afterwards the K content was determined apart from
the dry matter.The comparison of the K intake of men and women with the duplicate
and the basket method was carried out according to the procedure
described by Muller et al. (1991).It was possible to register the K excretion via urine and faeces in
women and men from Bad Liebenstein and Bad Langensalza in 1991. The
urine and the faeces of these 28 persons were collected daily and analyzed
individually. All samples were dried to constant weight at 105C. The
foodstuffs were raw and ready for use in the kitchen. After dry ashing of
the samples at 4500C, K was determined flame photometrically. The K
concentrations are either related to dry matter (DM) or to fresh matter
(FM).
3. Results
3.1. Potassium content of foodstuffs and beverages
The K content of all investigated foodstuffs was not subjected to such
variations as their Na content since it is not essentially changed by"salting" (Anke et al., 1990).
The K concentration of "cereals" is low apart from flour for dumplings
and leguminous seeds (Table 1). The starch-rich cornflour and maize flour
proved to be particularly K-poor. Semolina, rice, wheat flour, pearl barley,
189
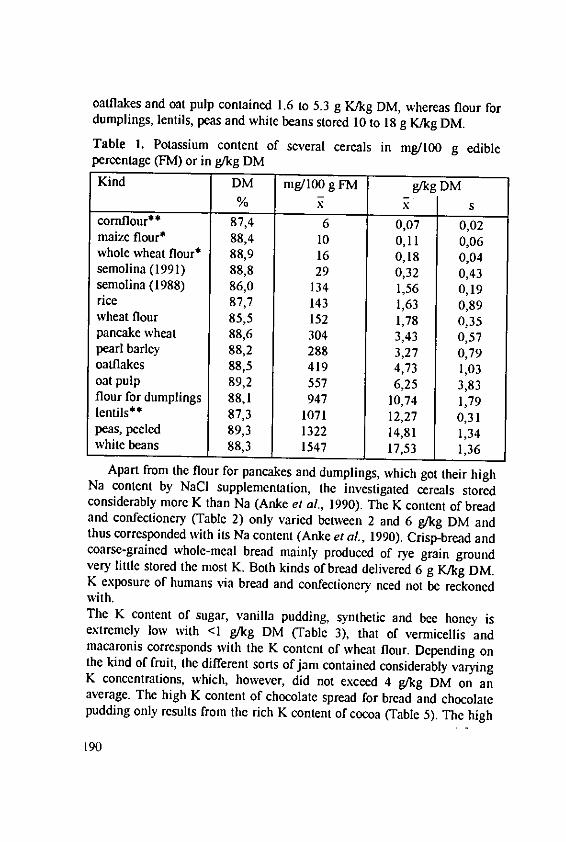
oatflakes and oat pulp contained 1.6 to 5.3 g K/kg DM, whereas flour fordumplings, lentils, peas and white beans stored 10 to 18 g K/kg DM.
Table 1. Potassium content of several cereals in mg/100 g ediblepercentage (FM) or in g/kg DMKind DM mg/100g FM g/kg DM
% xx scornflour** 87,4 6 0,07 0,02maize flour* 88,4 10 0,11 0,06whole wheat flour* 88,9 16 0,18 0,04semolina (1991) 88,8 29 0,32 0,43semolina (1988) 86,0 134 1,56 0,19rice 87,7 143 1,63 0,89wheat flour 85,5 152 1,78 0,35pancake wheat 88,6 304 3,43 0,57pearl barley 88,2 288 3,27 0,79oatflakes 88,5 419 4,73 1,03oat pulp 89,2 557 6,25 3,83flour for dumplings 88,1 947 10,74 1,79lentils** 87,3 1071 12,27 0,31peas, peeled 89,3 1322 14,81 1,34white beans 88,3 1547 17,53 1,36
Apart from the flour for pancakes and dumplings, which got their highNa content by NaCI supplementation, the investigated cereals storedconsiderably more K than Na (Anke et al., 1990). The K content of breadand confectionery (Table 2) only varied between 2 and 6 g/kg DM andthus corresponded with its Na content (Anke et al, 1990). Crisp-bread andcoarse-grained whole-meal bread mainly produced of rye grain groundvery little stored the most K. Both kinds of bread delivered 6 g K/kg DM.K exposure of humans via bread and confectionery need not be reckonedwith.The K content of sugar, vanilla pudding, synthetic and bee honey isextremely low with <1 g/kg DM (Table 3), that of vermicellis andmacaronis corresponds with the K content of wheat flour. Depending onthe kind of fruit, the different sorts of jam contained considerably varyingK concentrations, which, however, did not exceed 4 g/kg DM on anaverage. The high K content of chocolate spread for bread and chocolatepudding only results from the rich K content of cocoa (Table 5). The high
190
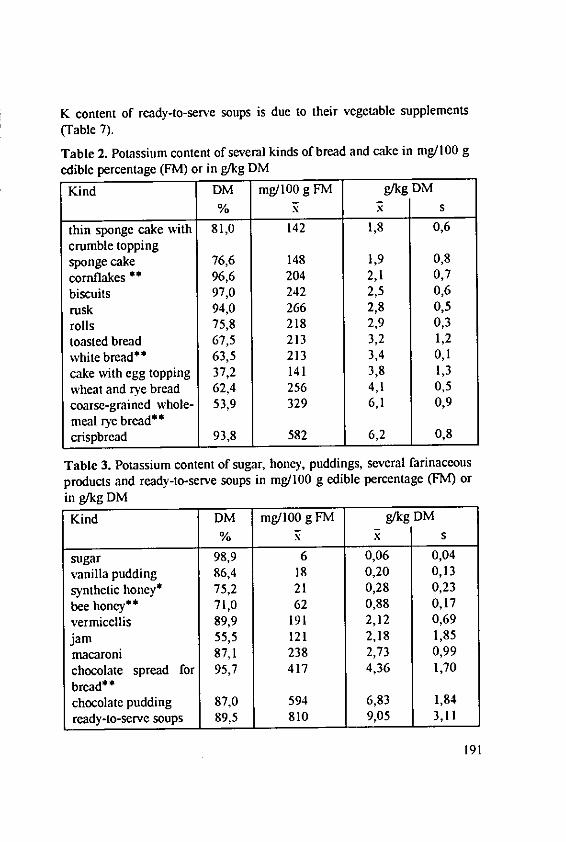
K content of ready-to-serve soups is due to their vegetable supplements
(Table 7).
Table 2. Potassium content of several kinds of bread and cake in mg/100 g
edible percentage (FM) or in g/kg DM
Kind DM mg/100 g FM g/kg DM% x x s
thin sponge cake with 81,0 142 1,8 0,6crumble toppingsponge cake 76,6 148 1,9 0,8
cornflakes ** 96,6 204 2,1 0,7
biscuits 97,0 242 2,5 0,6
rusk 94,0 266 2,8 0,5
rolls 75,8 218 2,9 0,3
toasted bread 67,5 213 3,2 1,2
white bread** 63,5 213 3,4 0,1
cake with egg topping 37,2 141 3,8 1,3
wheat and rye bread 62,4 256 4,1 0,5
coarse-grained whole- 53,9 329 6,1 0,9
meal rye bread**crispbread 93,8 582 6,2 0,8
Table 3. Potassium content of sugar, honey, puddings, several farinaceous
products and ready-to-serve soups in mg/100 g edible percentage (FM) orin g/kg DM
Kind DM mg/100 g FM g/kg DM
% R s
sugar 98,9 6 0,06 0,04
vanilla pudding 86,4 18 0,20 0,13
synthetic honey* 75,2 21 0,28 0,23
bee honey** 71,0 62 0,88 0,17
vermicellis 89,9 191 2,12 0,69
jam 55,5 121 2,18 1,85macaroni 87,1 238 2,73 0,99
chocolate spread for 95,7 417 4,36 1,70
bread**chocolate pudding 87,0 594 6,83 1,84
ready-to-serve soups 89,5 810 9,05 3,11
191
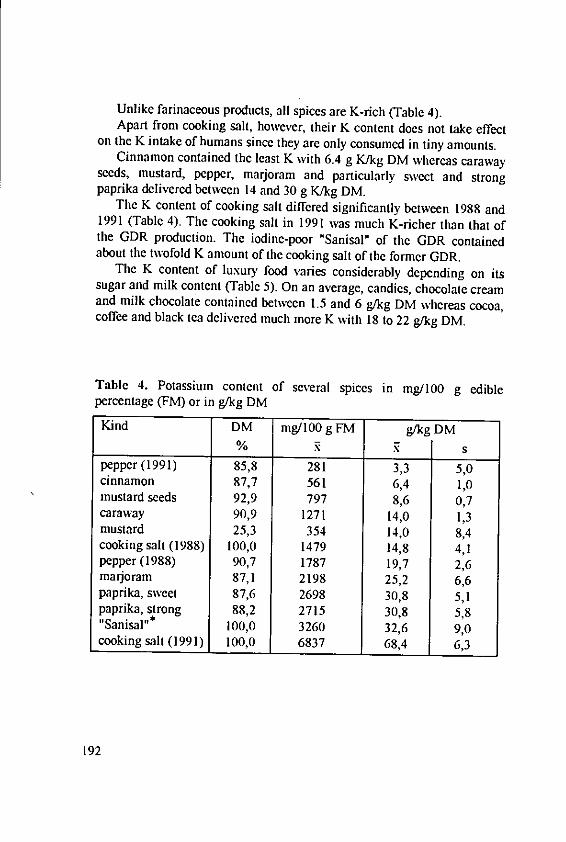
Unlike farinaceous products, all spices are K-rich (Table 4).Apart from cooking salt, however, their K content does not take effect
on the K intake of humans since they are only consumed in tiny amounts.Cinnamon contained the least K with 6.4 g K/kg DM whereas caraway
seeds, mustard, pepper, marjoram and particularly sweet and strongpaprika delivered between 14 and 30 g K/kg DM.
The K content of cooking salt differed significantly between 1988 and1991 (Table 4). The cooking salt in 1991 was much K-richer than that ofthe GDR production. The iodine-poor "Sanisal" of the GDR containedabout the twofold K amount of the cooking salt of the former GDR.
The K content of luxury food varies considerably depending on itssugar and milk content (Table 5). On an average, candies, chocolate creamand milk chocolate contained between 1.5 and 6 g/kg DM whereas cocoa,coffee and black tea delivered much more K with 18 to 22 g/kg DM.
Table 4. Potassium content of several spices in mg/100 g ediblepercentage (FM) or in g/kg DM
Kind DM i mg/100 g FM g/kg DM% x s
pepper (1991) 85,8 281 3,3 5,0cinnamon 87,7 561 6,4 1,0mustard seeds 92,9 797 8,6 0,7caraway 90,9 1271 14,0 1,3mustard 25,3 354 14,0 8,4cooking salt (1988) 100,0 1479 14,8 4,1pepper (1988) 90,7 1787 19,7 2,6marjoram 87,1 2198 25,2 6,6paprika, sweet 87,6 2698 30,8 5,1paprika, strong 88,2 2715 30,8 5,8"Sanisal"* 100,0 3260 32,6 9,0cooking salt (1991) 100,0 6837 68,4 6,3
192
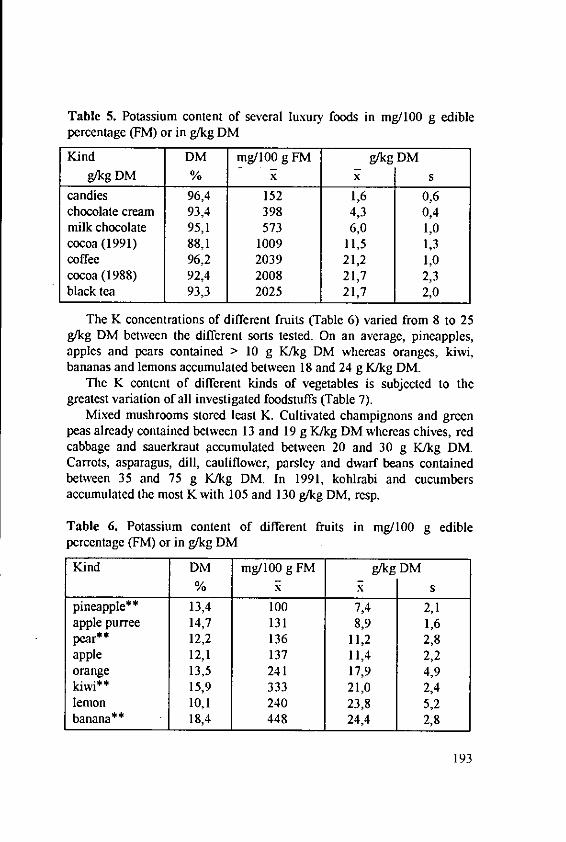
Table 5. Potassium content of several luxury foods in mg/100 g ediblepercentage (FM) or in g/kg DM
Kind DM mg/100 g FM g/kg DMg/kg DM % x x s
candies 96,4 152 1,6 0,6chocolate cream 93,4 398 4,3 0,4milk chocolate 95,1 573 6,0 1,0cocoa (1991) 88,1 1009 11,5 1,3coffee 96,2 2039 21,2 1,0cocoa (1988) 92,4 2008 21,7 2,3black tea 93,3 2025 21,7 2,0
The K concentrations of different fruits (Table 6) varied from 8 to 25g/kg DM between the different sorts tested. On an average, pineapples,apples and pears contained > 10 g K/kg DM whereas oranges, kiwi,bananas and lemons accumulated between 18 and 24 g K/kg DM.
The K content of different kinds of vegetables is subjected to thegreatest variation of all investigated foodstuffs (Table 7).
Mixed mushrooms stored least K. Cultivated champignons and greenpeas already contained between 13 and 19 g K/kg DM whereas chives, redcabbage and sauerkraut accumulated between 20 and 30 g K/kg DM.Carrots, asparagus, dill, cauliflower, parsley and dwarf beans containedbetween 35 and 75 g K/kg DM. In 1991, kohlrabi and cucumbersaccumulated the most K with 105 and 130 g/kg DM, resp.
Table 6. Potassium content of different fruits in mg/100 g ediblepercentage (FM) or in g/kg DM
Kind DM mg/100 g FM g/kg DM% R RX s
pineapple** 13,4 100 7,4 2,1apple purree 14,7 131 8,9 1,6pear** 12,2 136 11,2 2,8apple 12,1 137 11,4 2,2orange 13,5 241 17,9 4,9kiwi** 15,9 333 21,0 2,4lemon 10,1 240 23,8 5,2banana** 18,4 448 24,4 2,8
193
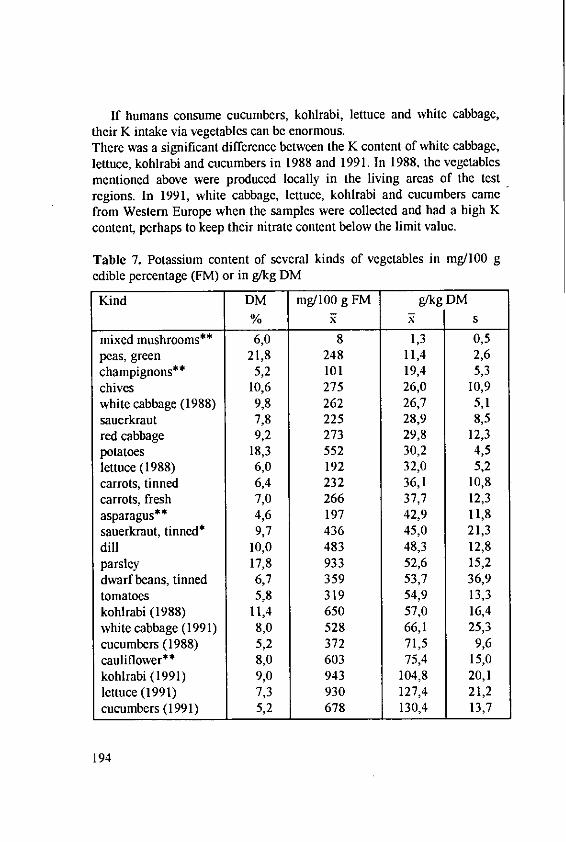
If humans consume cucumbers, kohlrabi, lettuce and white cabbage,their K intake via vegetables can be enormous.There was a significant difference between the K content of white cabbage,lettuce, kohlrabi and cucumbers in 1988 and 1991. In 1988, the vegetablesmentioned above were produced locally in the living areas of the testregions. In 1991, white cabbage, lettuce, kohlrabi and cucumbers camefrom Western Europe when the samples were collected and had a high Kcontent, perhaps to keep their nitrate content below the limit value.
Table 7. Potassium content of several kinds of vegetables in mg/100 gedible percentage (FM) or in g/kg DM
Kind DM mg/100 g FM g/kg DM% R X s
mixed mushrooms** 6,0 8 1,3 0,5peas, green 21,8 248 11,4 2,6champignons** 5,2 101 19,4 5,3chives 10,6 275 26,0 10,9white cabbage (1988) 9,8 262 26,7 5,1sauerkraut 7,8 225 28,9 8,5red cabbage 9,2 273 29,8 12,3potatoes 18,3 552 30,2 4,5lettuce (1988) 6,0 192 32,0 5,2carrots, tinned 6,4 232 36,1 10,8carrots, fresh 7,0 266 37,7 12,3asparagus** 4,6 197 42,9 11,8sauerkraut, tinned* 9,7 436 45,0 21,3dill 10,0 483 48,3 12,8parsley 17,8 933 52,6 15,2dwarf beans, tinned 6,7 359 53,7 36,9tomatoes 5,8 319 54,9 13,3kohlrabi (1988) 11,4 650 57,0 16,4white cabbage (1991) 8,0 528 66,1 25,3cucumbers (1988) 5,2 372 71,5 9,6cauliflower** 8,0 603 75,4 15,0kohlrabi (1991) 9,0 943 104,8 20,1lettuce (1991) 7,3 930 127,4 21,2cucumbers (1991) 5,2 678 130,4 13,7
194
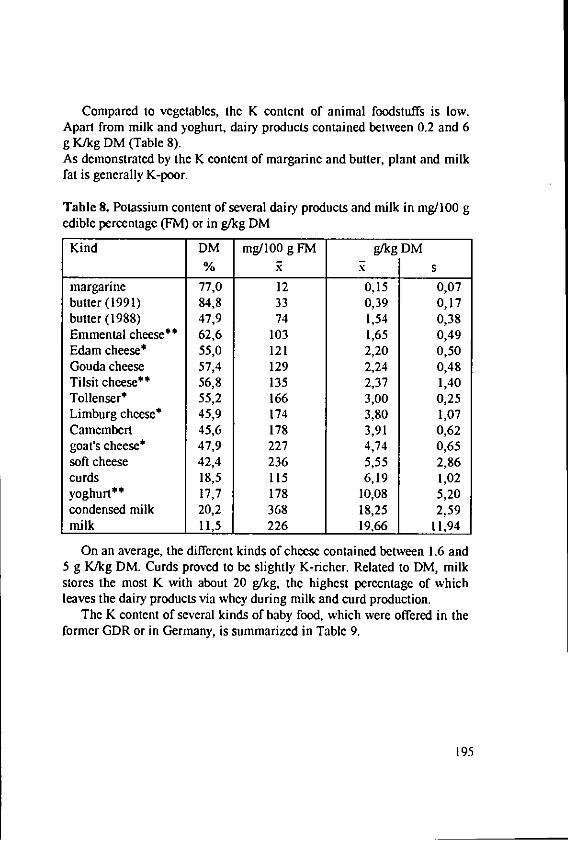
Compared to vegetables, the K content of animal foodstuffs is low.Apart from milk and yoghurt, dairy products contained between 0.2 and 6g K/kg DM (Table 8).As demonstrated by the K content of margarine and butter, plant and milkfat is generally K-poor.
Table 8. Potassium content of several dairy products and milk in mg/100 gedible percentage (FM) or in g/kg DM
Kind DM mg/100 g FM g/kg DM
% R R smargarine 77,0 12 0,15 0,07butter (1991) 84,8 33 0,39 0,17butter (1988) 47,9 74 1,54 0,38Emmental cheese** 62,6 103 1,65 0,49Edam cheese* 55,0 121 2,20 0,50Gouda cheese 57,4 129 2,24 0,48Tilsit cheese** 56,8 135 2,37 1,40Tollenser* 55,2 166 3,00 0,25Limburg cheese* 45,9 174 3,80 1,07Camembert 45,6 178 3,91 0,62goat's cheese* 47,9 227 4,74 0,65soft cheese 42,4 236 5,55 2,86curds 18,5 115 6,19 1,02yoghurt** 17,7 178 10,08 5,20condensed milk 20,2 368 18,25 2,59milk 11,5 226 19,66 11,94
On an average, the different kinds of cheese contained between 1.6 and5 g K/kg DM. Curds proved to be slightly K-richer. Related to DM, milkstores the most K with about 20 g/kg, the highest percentage of whichleaves the dairy products via whey during milk and curd production.
The K content of several kinds of baby food, which were offered in theformer GDR or in Germany, is summarized in Table 9.
195
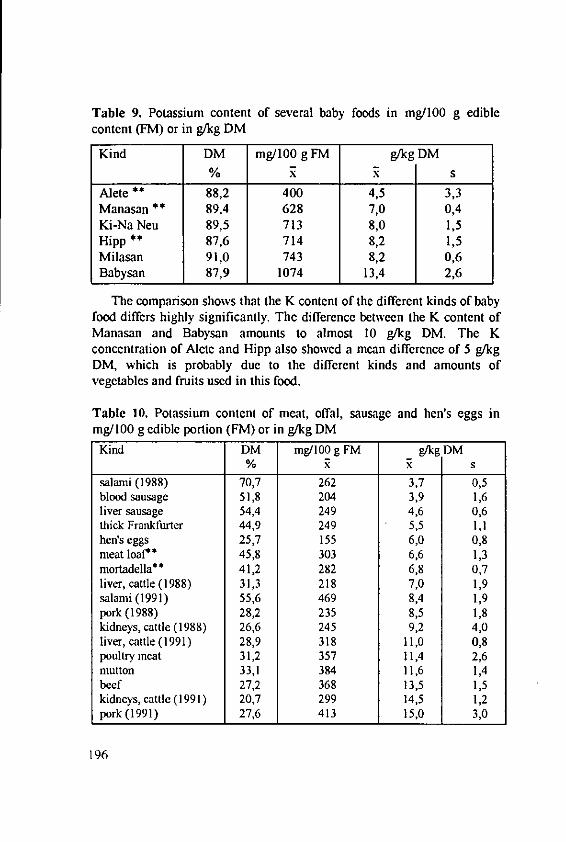
Table 9. Potassium content of several baby foods in mg/100 g ediblecontent (FM) or in g/kg DM
Kind DM mg/100 g FM g/kg DM% R R s
Alete ** 88,2 400 4,5 3,3Manasan ** 89,4 628 7,0 0,4Ki-Na Neu 89,5 713 8,0 1,5Hipp ** 87,6 714 8,2 1,5Milasan 91,0 743 8,2 0,6Babysan 87,9 1074 13,4 2,6
The comparison shows that the K content of the different kinds of babyfood differs highly significantly. The difference between the K content ofManasan and Babysan amounts to almost 10 g/kg DM. The Kconcentration of Alete and Hipp also showed a mean difference of 5 g/kgDM, which is probably due to the different kinds and amounts ofvegetables and fruits used in this food.
Table 10. Potassium content of meat, offal, sausage and hen's eggs inmg/100 g edible portion (FM) or in g/kg DM
Kind DM rag/100 g FM g/kg DM% x R s
salami (1988) 70,7 262 3,7 0,5blood sausage 51,8 204 3,9 1,6liver sausage 54,4 249 4,6 0,6thick Frankfurter 44,9 249 5,5 1,1hen's eggs 25,7 155 6,0 0,8meat loaf** 45,8 303 6,6 1,3mortadella** 41,2 282 6,8 0,7liver, cattle (1988) 31,3 218 7,0 1,9salami (1991) 55,6 469 8,4 1,9pork (1988) 28,2 235 8,5 1,8kidneys, cattle (1988) 26,6 245 9,2 4,0liver, cattle (1991) 28,9 318 11,0 0,8poultry meat 31,2 357 11,4 2,6mutton 33,1 384 11,6 1,4beef 27,2 368 13,5 1,5kidneys, cattle (1991) 20,7 299 14,5 1,2pork (1991) 27,6 413 15,0 3,0
196
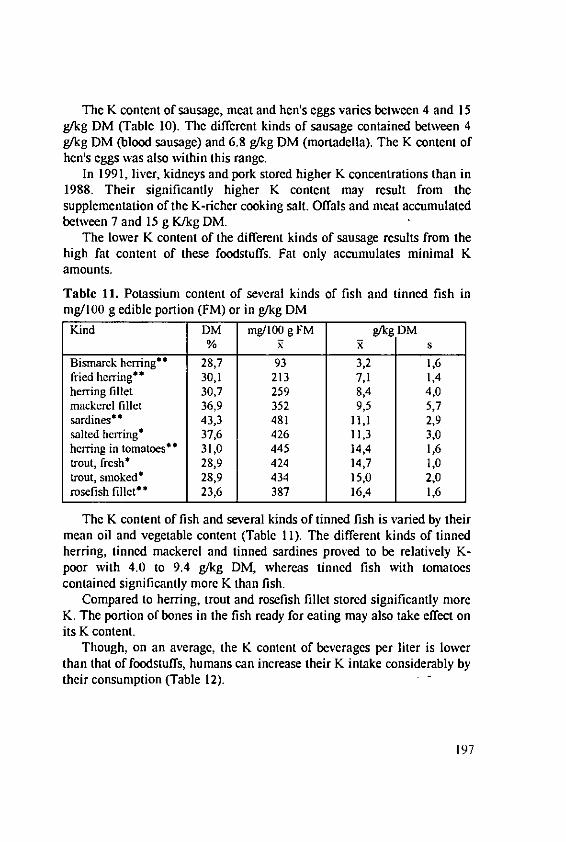
The K content of sausage, meat and hen's eggs varies between 4 and 15g/kg DM (Table 10). The different kinds of sausage contained between 4g/kg DM (blood sausage) and 6.8 g/kg DM (mortadella). The K content ofhen's eggs was also within this range.
In 1991, liver, kidneys and pork stored higher K concentrations than in1988. Their significantly higher K content may result from thesupplementation of the K-richer cooking salt. Offals and meat accumulatedbetween 7 and 15 g K/kg DM.
The lower K content of the different kinds of sausage results from thehigh fat content of these foodstuffs. Fat only accumulates minimal Kamounts.
Table 11. Potassium content of several kinds of fish and tinned fish inmg/100 g edible portion (FM) or in g/kg DM
Kind DM mg/t00 g FM g/kg DM% R R, I s
Bismarck herring" 28,7 93 3,2 1,6fried herring" 30,1 213 7,1 1,4herring fillet 30,7 259 8,4 4,0mackerel fillet 36,9 352 9,5 5,7sardines" 43,3 481 lll 2,9salted herring* 37,6 426 11,3 3,0herring in tomatoes" 31,0 445 14,4 1,6trout, fresh* 28,9 424 14,7 1,0trout, smoked* 28,9 434 15,0 2,0rosefish fillet" 23,6 387 16,4 1,6
The K content of fish and several kinds of tinned fish is varied by theirmean oil and vegetable content (Table 11). The different kinds of tinnedherring, tinned mackerel and tinned sardines proved to be relatively K-poor with 4.0 to 9.4 g/kg DM, whereas tinned fish with tomatoescontained significantly more K than fish.
Compared to herring, trout and rosefish fillet stored significantly moreK. The portion of bones in the fish ready for eating may also take effect onits K content.
Though, on an average, the K content of beverages per liter is lowerthan that of foodstuffs, humans can increase their K intake considerably bytheir consumption (Table 12).
197
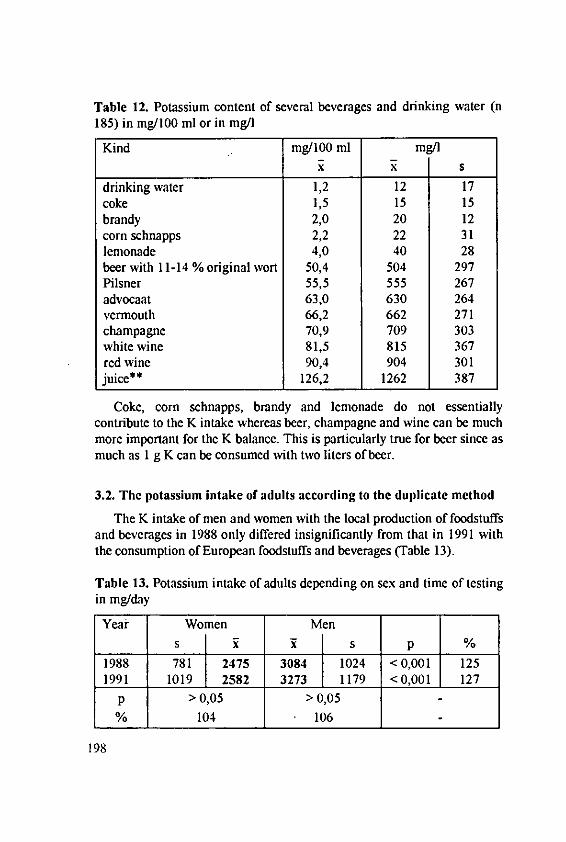
Table 12. Potassium content of several beverages and drinking water (n185) in mg/100 ml or in mg/l
Kind mg/100 ml mg/l
R R S
drinking water 1,2 12 17coke 1,5 15 15brandy 2,0 20 12corn schnapps 2,2 22 31lemonade 4,0 40 28beer with 11-14% original wort 50,4 504 297Pilsner 55,5 555 267advocaat 63,0 630 264vermouth 66,2 662 271champagne 70,9 709 303white wine 81,5 815 367red wine 90,4 904 301juice** 126,2 1262 387
Coke, corn schnapps, brandy and lemonade do not essentiallycontribute to the K intake whereas beer, champagne and wine can be muchmore important for the K balance. This is particularly true for beer since asmuch as 1 g K can be consumed with two liters of beer.
3.2. The potassium intake of adults according to the duplicate method
The K intake of men and women with the local production of foodstuffsand beverages in 1988 only differed insignificantly from that in 1991 withthe consumption of European foodstuffs and beverages (Table 13).
Table 13. Potassium intake of adults depending on sex and time of testingin mg/day
Year Women Men
s x i s p %
1988 781 2475 3084 1024 < 0,001 1251991 1019 2582 3273 1179 < 0,001 127
p > 0,05 > 0,05
% 104 106
198
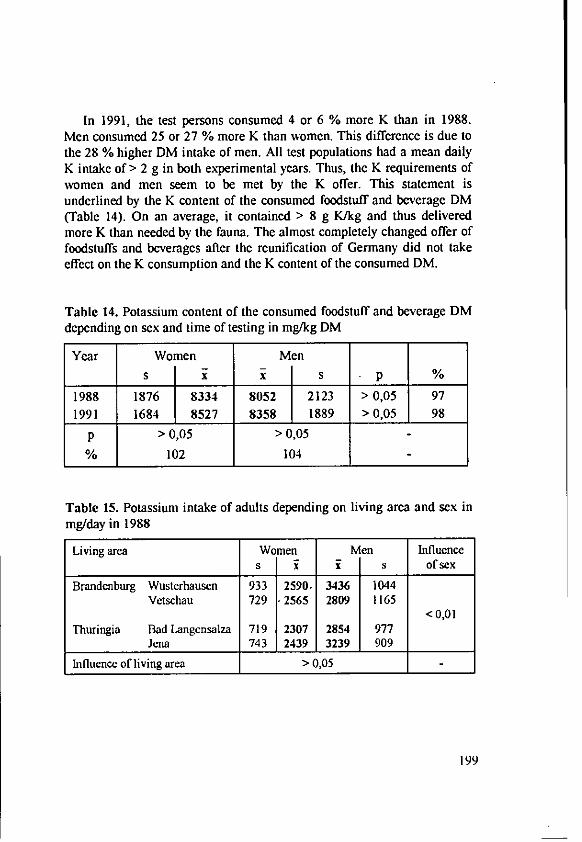
In 1991, the test persons consumed 4 or 6 % more K than in 1988.Men consumed 25 or 27 % more K than women. This difference is due tothe 28 % higher DM intake of men. All test populations had a mean dailyK intake of> 2 g in both experimental years. Thus, the K requirements ofwomen and men seem to be met by the K offer. This statement isunderlined by the K content of the consumed foodstuff and beverage DM(Table 14). On an average, it contained > 8 g K/kg and thus deliveredmore K than needed by the fauna. The almost completely changed offer offoodstuffs and beverages after the reunification of Germany did not takeeffect on the K consumption and the K content of the consumed DM.
Table 14. Potassium content of the consumed foodstuff and beverage DMdepending on sex and time of testing in mg/kg DM
Year Women Men
s x s p %
1988 1876 8334 8052 2123 > 0,05 971991 1684 8527 8358 1889 > 0,05 98
p > 0,05 > 0,05
% 102 104
Table 15. Potassium intake of adults depending on living area and sex inmg/day in 1988
Living area Women Men Influences i i s of sex
Brandenburg Wusterhausen 933 2590. 3436 1044Vetschau 729 2565 2809 1165
< 0,01Thuringia Bad Langcnsalza 719 2307 2854 977
Jena 743 2439 3239 909
Influence of living area > 0,05 -
199
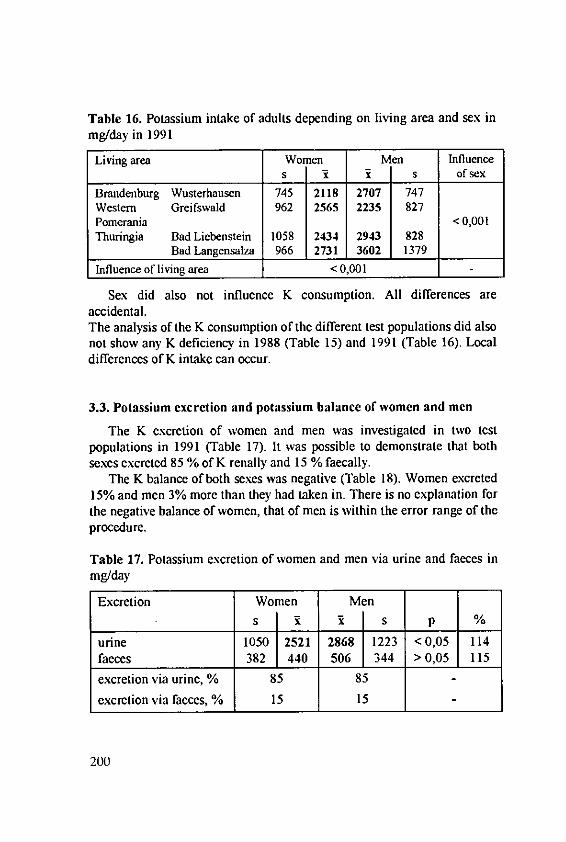
Table 16. Potassium intake of adults depending on living area and sex inmg/day in 1991
Living area Women Men Influences X X s of sex
Brandenburg Wusterhausen 745 2118 2707 747Western Greifswald 962 2565 2235 827Pomerania < 0,001Thuringia Bad Liebenstein 1058 2434 2943 828
Bad Langensalza 966 2731 3602 1379
Influence of living area <0,001
Sex did also not influence K consumption. All differences areaccidental.The analysis of the K consumption of the different test populations did alsonot show any K deficiency in 1988 (Table 15) and 1991 (Table 16). Localdifferences of K intake can occur.
3.3. Potassium excretion and potassium balance of women and men
The K excretion of women and men was investigated in two testpopulations in 1991 (Table 17). It was possible to demonstrate that bothsexes excreted 85 % of K renally and 15 % faecally.
The K balance of both sexes was negative (Table 18). Women excreted15% and men 3% more than they had taken in. There is no explanation forthe negative balance of women, that of men is within the error range of theprocedure.
Table 17. Potassium excretion of women and men via urine and faeces inmg/day
Excretion Women Men
s x i s p %
urine 1050 2521 2868 1223 <0,05 114
faeces 382 440 506 344 > 0,05 115
excretion via urine, % 85 85
excretion via faeces, % 15 15
200
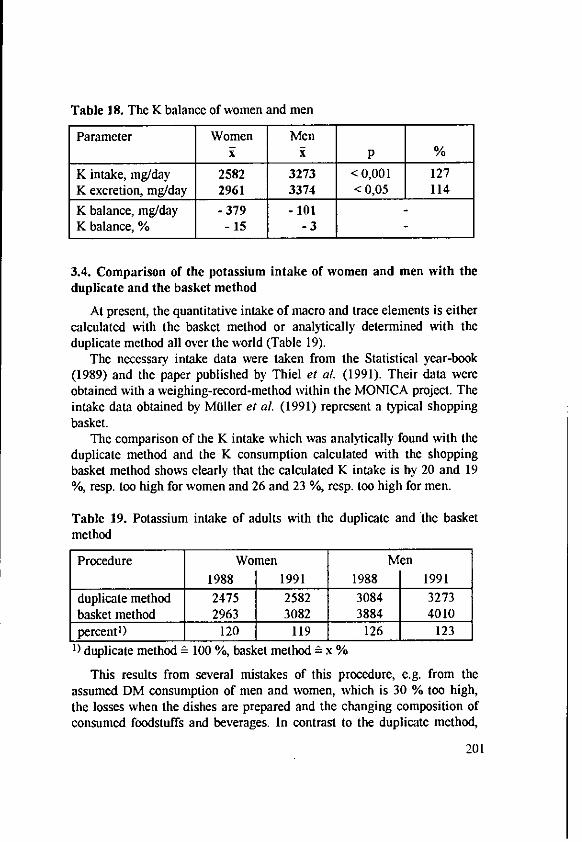
Table 18. The K balance of women and men
Parameter Women MenI x p%
K intake, mg/day 2582 3273 < 0,001 127K excretion, mg/day 2961 3374 < 0,05 114
K balance, mg/day - 379 - 101K balance, % - 15 - 3
3.4. Comparison of the potassium intake of women and men with theduplicate and the basket method
At present, the quantitative intake of macro and trace elements is eithercalculated with the basket method or analytically determined with theduplicate method all over the world (Table 19).
The necessary intake data were taken from the Statistical year-book(1989) and the paper published by Thiel et al. (1991). Their data wereobtained with a weighing-record-method within the MONICA project. Theintake data obtained by Moller et al (1991) represent a typical shoppingbasket.
The comparison of the K intake which was analytically found with theduplicate method and the K consumption calculated with the shoppingbasket method shows clearly that the calculated K intake is by 20 and 19%, resp. too high for women and 26 and 23 %, resp. too high for men.
Table 19. Potassium intake of adults with the duplicate and the basketmethod
Procedure Women Men
1988 1991 1988 1991
duplicate method 2475 2582 3084 3273basket method 2963 3082 3884 4010percent1 ) 120 119 126 123
1) duplicate method - 100 %, basket method - x %
This results from several mistakes of this procedure, e.g. from theassumed DM consumption of men and women, which is 30 % too high,the losses when the dishes are prepared and the changing composition ofconsumed foodstuffs and beverages. In contrast to the duplicate method,
201

the basket method allows the calculation of the percentage of the differentgroups of foodstuffs in the total K consumption (Fig. 1).
29% 33%24% 22%
8%
22% 17%16%
men womentotal intake 4010 mg/d total intake 3082 mg/d
foodstuffs
m milk, milk products m meat, sausage, fish othersvegetables E bread, confectionery
Fig. 1. K intake of men and women calculated with the basket method(1991)
4. Discussion of the results
The K content of foodstuffs and beverages and thus the K consumptionof humans can be influenced by most different factors, e.g. by thefertilization of the land, the K content of drinking water and bysupplements in foodstuffs. The systematic analysis of 108 foodstuffs andbeverages in 1988 and that of 126 in 1991 allowed to show certaininfluences. Several kinds of vegetables and fruits (e.g. white cabbage,cucumbers, tomatoes) contained highly significantly more K in 1991 thanin 1988.
202
On the other hand, several kinds of meat and sausage as well as breadand farinaceous products also proved to be significantly or insignificantly
K-richer in 1991 than in 1988. The reason for these changes is the Kcontent of cooking salt. In 1988, it contained 15 and in 1991 68 g K/kg.
This change took effect on the K content of salted foodstuffs to the above-described extent and probably also led to the insignificant increase of theK consumption of women and men to 2582 and 3273 mg/day. On theaverage, this K intake meets the K requirement of humans and can also becompared with that of adults in other countries. In Finland, they consumed4500 mg/day (Varo and Koivistoinen, 1980), in the Netherlands 4378mg/day (Van Dokkum el al., 1989), in Switzerland 2825 mg/day(Wyttenbach et al, 1987), in Great Britain 2956 mg/day (Lewis and Buss,1988). In the USA, a consumption of 1938 mg/day (Pennington et al.,
1988) and of 3120 mg/day (Kim el al., 1984) was registered in women and
of 2889 mg/day (Pennington et at, 1988) and of 3120 mg/day (Iyengar et
al, 1987) in men. Thus, the K consumption found in Germany is within
the international trend. Only the adults in Finland and the Netherlandshad a higher K intake. In spite of the registered slightly negative balance,the K requirement might be much lower than the recommended K intakeof 2 g/day.
The main K amount is renally (85 %) excreted by both sexes. It couldbe of considerable practical importance that the K intake calculated with
the basket method is by 20 to 25 % higher than the values determinedanalytically with the duplicate method. The results of nutrition studies
obtained with two procedures cannot be compared.
5. References
Anke, M.: Mineralstoffe. A. Poschner, 0. Simon, Grundlagen derTierernjhrung, Gustav Fischer Verlag, Jena, 45 (1988)
Anke, M., Gruber, G. , Kleemann, J., Miller, M.: Der Kaliumgehalt derNahrungsmittel bzw. Getrilnke und die Kaliumaufnahme Erwachsenerin Brandenburg und Thiringen, M. Anke et al., Mengen- undSpurenelemente, 10. Arbeitstagung, Friedrich- Schiller-Univ. Jena, 534(1990)
Anonym: Recommended Dietary Allowances - USA, Nat. Acad. Sci.,Washington, USA (1980)
Anonym: Empfehlungen far die Naihrstoffzufuhr, 5. erweiterteOberarbeitung, Umschau Verlag, Frankfurt (1991)
203
Iyengar, I., Tanner, J., Wolf, W., Zeisler, R.: Sci. Total Environ. 61, 235(1987)
Kim, W., Kelsey, J., Judd, J., Marshall, M., Mertz, W., Prather, E.: Am. J.Clin. Nutr. 40, 1327 (1984)
Lewis, J., Buss, D. H.: Brit. 1. Nutr. 60, 413 (1980)MOller, M., Anke, M., Krauter Ute: Ermittlung der Zinkaufnahme
Erwachsener mittels Duplikat- und Basketmethode - ein Vergleich, M.Anke et al., Mengen- und Spurenelemente, 11. Arbeitstagung,Friedrich-Schiller-Univ. Jena, 487 (1991).
Parr, R. N;., H. Crawley: Dietary intake of minor and trace elements: aglobal survey, WHO/FAO/IAEA Expert Consultation on TraceElements in Human Nutrition, version 2, WHO, Genf (1989)
Pennington, J., Young, B., Nilson, D., Johnson, R., Vanderveen, J.: Am.Diet. Assoc. 86, 876 (1986)
Statistisches Jahrbuch der DDR 1989: Staatsverlag der DDR, Berlin(1989)
Thiel, C., Thai, M., Heinemann, L., Johnson, P., Maller, W.:Ernahrungsumschau 38, 180 (1991)
Van Dokkum, W., de Vos, R. H., Muys, Th., Wesstra, J.: Brit. J. Nutr. 61,7 (1989)
Varo, P., Koivistonen, P.: Acta Agric. Scand. 22, 165 Suppl. (1980)Wyttenbach, A., Bajo, S., Tobler, L.: The concentrations of 19 trace
elements in the Swiss diet, P. BrAtter, P. Schramel, Trace Elements -Analytical Chemistry in Medicine and Biology, Vol. 4, Walter deGruyter & Co., Berlin, New York, 169 (1987)
204
Absorption and Secretion of Potassium in theGastrointestinal Tract
Rechkemmer, G., Department of Physiology, School of Veterinary Medicine,Hannover, Federal Republic of Germany
Summary
In animal cells potassium (K) is the major intracellular cation with an
average concentration between 120 and 150 mmol- 1 l. K+ concentration in
the extracellular fluid is only around 4.5 mmol- 1 ! and is kept within narrow
limits by regulatory mechanisms. Extracellular K+ concentration plays an
important physiological role in determining the excitability of muscles
(skeletal, smooth and heart cells) and nerves, because the resting potentials
in these cells are largely determined by K+ diffusion through special K+
channels. In epithelia in general and in the gastrointestinal tract in
particular only the membranes facing the blood side of the tissue are exposed
to the rather well regulated K+ concentration of extracellular fluid. The
luminal (apical) membrane, however, can be exposed to greatly varying K+
concentrations depending on the K+ content of the diet. In mammals K+
homeostasis is regulated by the mineralocorticoid aldosterone primarily
through urinary K+ excretion by the kidney. However, dietary K+ intake and
subsequent K+ transport in the gastrointestinal tract and final excretion ofK+ with feces are also involved in the regulation of K+ balance. This review
focuses on the mechanisms of K+ transport across the gastrointestinal wall.
Structural considerations
The inner surfaces of gastrointestinal organs (stomach, small and large
intestine) are lined by a single layer of specialized cells, the gastrointestinalepithelium. The epithelial cells are columnar in shape and are connected to
each other by unique structures, the tight junctions. The formation of tight
junctions allows the development of polarity, e.g. in the cellular membranes
facing the gastrointestinal lumen (apical membrane) and the blood side
(basolateral membrane) different ion transport systems can be established.This functional polarity is the hallmark of epithelia and enables them to
205
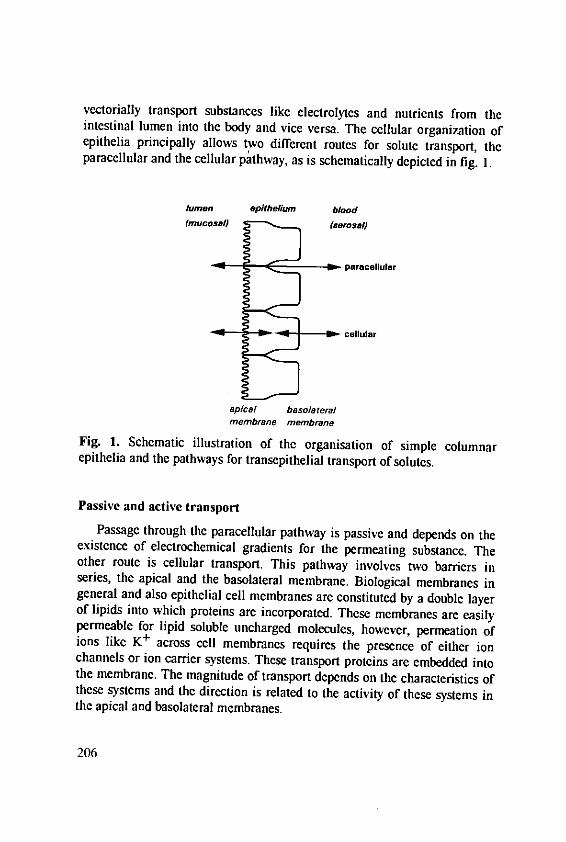
vectorially transport substances like electrolytes and nutrients from theintestinal lumen into the body and vice versa. The cellular organization ofepithelia principally allows two different routes for solute transport, theparacellular and the cellular pathway, as is schematically depicted in fig. 1.
lumen epithelium blood(mucosal) (serosal)
p,.a- paracallular
* cellular
apical basolateralmembrane membrane
Fig. 1. Schematic illustration of the organisation of simple columnarepithelia and the pathways for transepithelial transport of solutes.
Passive and active transportPassage through the paracellular pathway is passive and depends on the
existence of electrochemical gradients for the permeating substance. Theother route is cellular transport. This pathway involves two barriers inseries, the apical and the basolateral membrane. Biological membranes ingeneral and also epithelial cell membranes are constituted by a double layerof lipids into which proteins are incorporated. These membranes are easilypermeable for lipid soluble uncharged molecules, however, permeation ofions like K+ across cell membranes requires the presence of either ionchannels or ion carrier systems. These transport proteins are embedded intothe membrane. The magnitude of transport depends on the characteristics ofthese systems and the direction is related to the activity of these systems inthe apical and basolateral membranes.
206
Passive transport is determined by the concentration gradient for the
solute and the permeability characteristics of the epithelium and is describedin quantitative terms by Ficks's law of diffusion:
J= - P * Ac
J: fluxP: permeabilityAc: concentration difference
Diffusion of charged molecules like inorganic ions can establish
diffusion potentials if the membranes separating two compartments have ion
selective permeability characteristics. The magnitude of the diffusion
potential can be calculated by Nernst's law:E=R*T [c],
zOF [c]i
E: electrical potential differenceR: gas constantT: absolute temperaturez: charge of the ionF: Faraday's constantc0: concentration in outer solutionci: concentration in inner solution
In all segments of the gastrointestinal tract substances can move from the
lumen to blood and vice versa. These unidirectional fluxes (J) are high
especially in the small intestine. The net flux (Int) results from the
difference between the flux from lumen to blood, or in the terminology of
epithelial transport physiologists from the mucosal (m) to the serosal (s) side
J. and in the opposite direction J.. A positive J, (J= > J,) is designated
as absorption, a negative Jr (J= < J.) as secretion.The unidirectional fluxes can be measured by using radioactive isotopes
added to either the luminal or the blood side of the epithelium and
measuring the appearance on the side which previously did not contain any
isotope. The flux measurement can indicate whether an ion moves across an
epithelial barrier according to its electrochemical gradients, e.g. by passive
mechanisms, or whether active transport systems are involved in the
translocation process. According to the Ussing-flux ratio:
207
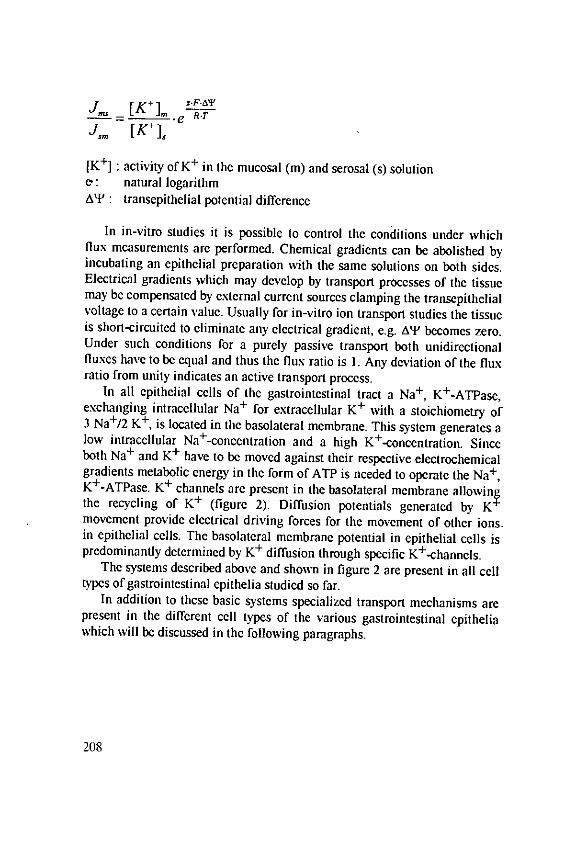
' m . [K .] 5
[K+] activity of K+ in the mucosal (in) and serosal (s) solution
e : natural logarithmAT: transepithelial potential difference
In in-vitro studies it is possible to control the conditions under whichflux measurements are performed. Chemical gradients can be abolished byincubating an epithelial preparation with the same solutions on both sides.Electrical gradients which may develop by transport processes of the tissuemay be compensated by external current sources clamping the transepithelialvoltage to a certain value. Usually for in-vitro ion transport studies the tissueis short-circuited to eliminate any electrical gradient, e.g. AT becomes zero.Under such conditions for a purely passive transport both unidirectionalfluxes have to be equal and thus the flux ratio is 1. Any deviation of the fluxratio from unity indicates an active transport process.
In all epithelial cells of the gastrointestinal tract a Na+ , K+-ATPase,exchanging intracellular Na + for extracellular K+ with a stoichiometry of3 Na+/2 K+, is located in the basolateral membrane. This system generates alow intracellular Na+-concentration and a high K+-concentration. Sinceboth Na+ and K+ have to be moved against their respective electrochemicalgradients metabolic energy in the form of ATP is needed to operate the Na+ ,
K+-ATPase. K+ channels are present in the basolateral membrane allowingthe recycling of K+ (figure 2). Diffusion potentials generated by K+
movement provide electrical driving forces for the movement of other ions.in epithelial cells. The basolateral membrane potential in epithelial cells ispredominantly determined by K+ diffusion through specific K+-channels.
The systems described above and shown in figure 2 are present in all celltypes of gastrointestinal epithelia studied so far.
In addition to these basic systems specialized transport mechanisms arepresent in the different cell types of the various gastrointestinal epitheliawhich will be discussed in the following paragraphs.
208
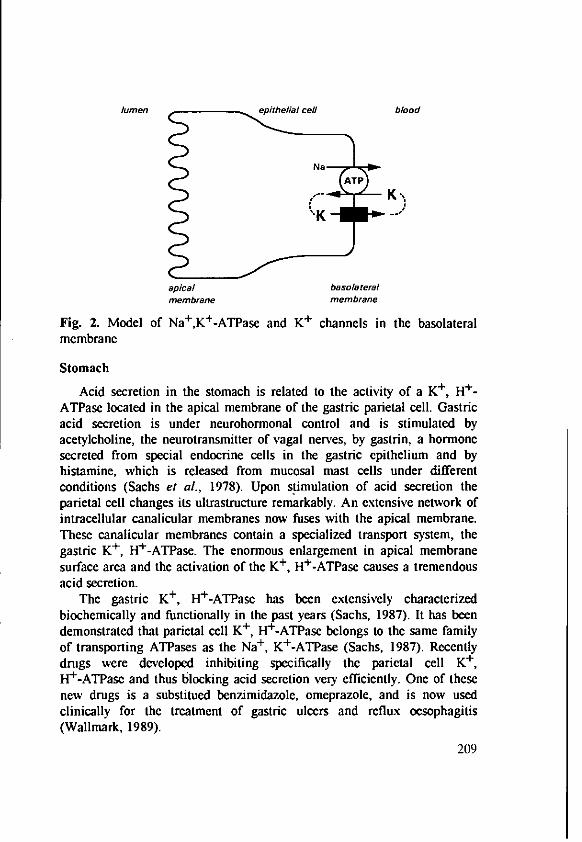
lumen epithefi/al cell blood
apical basolateralmembrane membrane
Fig. 2. Model of Na+,K+-ATPase and K+ channels in the basolateralmembrane
Stomach
Acid secretion in the stomach is related to the activity of a K+, H+ -
ATPase located in the apical membrane of the gastric parietal cell. Gastricacid secretion is under neurohormonal control and is stimulated byacetylcholine, the neurotransmitter of vagal nerves, by gastrin, a hormonesecreted from special endocrine cells in the gastric epithelium and byhistamine, which is released from mucosal mast cells under differentconditions (Sachs et al., 1978). Upon stimulation of acid secretion theparietal cell changes its ultrastructure remarkably. An extensive network ofintracellular canalicular membranes now fuses with the apical membrane.These canalicular membranes contain a specialized transport system, thegastric K+, H+-ATPase. The enormous enlargement in apical membranesurface area and the activation of the K+ , H+-ATPase causes a tremendousacid secretion.
The gastric K+, H+-ATPase has been extensively characterizedbiochemically and functionally in the past years (Sachs, 1987). It has beendemonstrated that parietal cell K+, H+-ATPase belongs to the same familyof transporting ATPases as the Na+ , K+-ATPase (Sachs, 1987). Recentlydrugs were developed inhibiting specifically the parietal cell K+,
H+-ATPase and thus blocking acid secretion very efficiently. One of thesenew drugs is a substitued benzimidazole, omeprazole, and is now usedclinically for the treatment of gastric ulcers and reflux oesophagitis(Wallmark, 1989).
209
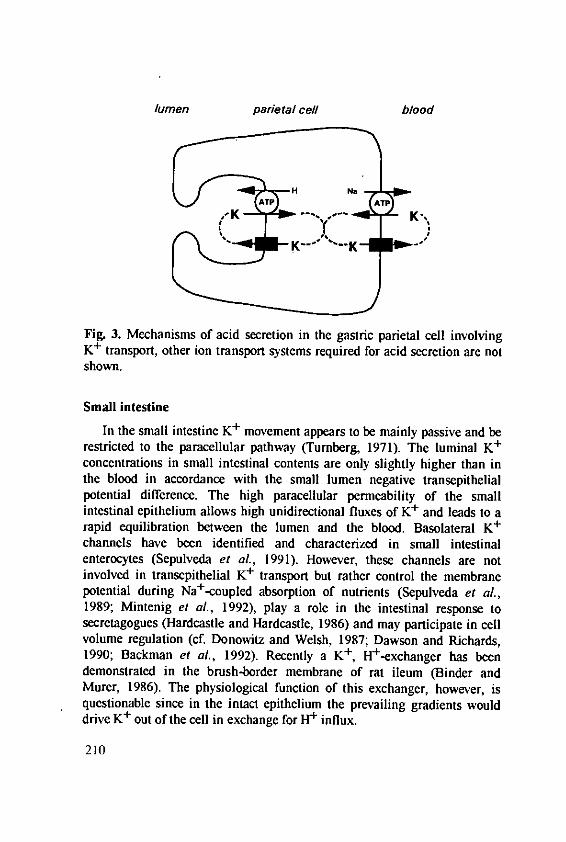
lumen parietal cell blood
~~K-- ___-K-==.-"
Fig. 3. Mechanisms of acid secretion in the gastric parietal cell involvingK+ transport, other ion transport systems required for acid secretion are notshown.
Small intestine
In the small intestine K+ movement appears to be mainly passive and berestricted to the paracellular pathway (Turnberg, 1971). The luminal K+concentrations in small intestinal contents are only slightly higher than inthe blood in accordance with the small lumen negative transepithelialpotential difference. The high paracellular permeability of the smallintestinal epithelium allows high unidirectional fluxes of K+ and leads to arapid equilibration between the lumen and the blood. Basolateral K+
channels have been identified and characterized in small intestinalenterocytes (Sepulveda et at, 1991). However, these channels are notinvolved in transepithelial K+ transport but rather control the membranepotential during Na+.coupled absorption of nutrients (Sepulveda et aL,1989; Mintenig et al., 1992), play a role in the intestinal response tosecretagogues (Hardeastle and Hardcastle, 1986) and may participate in cellvolume regulation (cf. DonoAitz and Welsh, 1987; Dawson and Richards,1990; Backman et al, 1992). Recently a K , H+exchanger has beendemonstrated in the brush-border membrane of rat ileum (Binder andMurer, 1986). The physiological function of this exchanger, however, isquestionable since in the intact epithelium the prevailing gradients woulddrive K+ out of the cell in exchange for H+ influx.
210
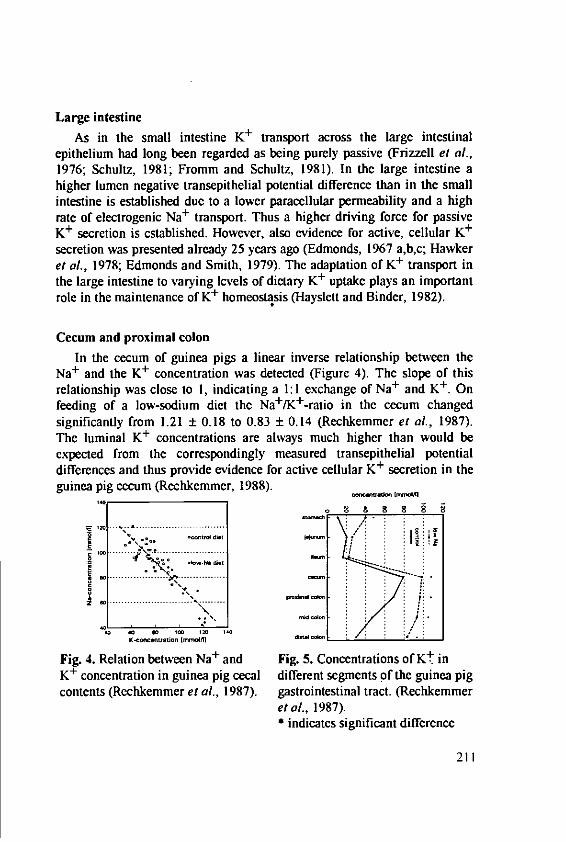
Large intestineAs in the small intestine K+ transport across the large intestinal
epithelium had long been regarded as being purely passive (Frizzell et al.,1976; Schultz, 1981; Fromm and Schultz, 1981). In the large intestine ahigher lumen negative transepithelial potential difference than in the smallintestine is established due to a lower paracellular permeability and a highrate of electrogenic Na+ transport. Thus a higher driving force for passiveK+ secretion is established. However, also evidence for active, cellular K+
secretion was presented already 25 years ago (Edmonds, 1967 a,b,c; Hawkeret al., 1978; Edmonds and Smith, 1979). The adaptation of K+ transport inthe large intestine to varying levels of dietary K+ uptake plays an importantrole in the maintenance of K+ homeostasis (Hayslett and Binder, 1982).
Cecum and proximal colon
In the cecum of guinea pigs a linear inverse relationship between theNa+ and the K+ concentration was detected (Figure 4). The slope of thisrelationship was close to 1, indicating a 1:1 exchange of Na+ and K+. Onfeeding of a low-sodium diet the Na+/K+-ratio in the cecum changedsignificantly from 1.21 ± 0.18 to 0.83 ± 0.14 (Rechkemmer et al, 1987).The luminal K+ concentrations are always much higher than would beexpected from the correspondingly measured transepithelial potentialdifferences and thus provide evidence for active cellular K+ secretion in theguinea pig cecum (Rechkemmer. 1988).
K -oc~rafion {rrnoA]
Fig. 4. Relation between Na+ and Fig. 5. Concentrations of Kt inK+ concentration in guinea pig cecal different segments of the guinea pigcontents (Rechkemmer et al., 1987). gastrointestinal tract. (Rechkemnmer
el al., 1987).indicates significant difference
211
Using in-vivo and in-vitro techniques a net K+ absorption has beenobserved for the rabbit proximal colon (Clauss and H6rnicke, 1984). Incontrast to these findings other investigators found no evidence for activeK+ uptake but could demonstrate net K+ secretion in the in-vitro rabbitproximal colon (Sullivan and Smith, 1986). In in-vivo perfusion studies asignificant K+ secretion was observed in the guinea pig proximal colon(Rechkemmer, 1992). K+ secretion in-vivo was not altered when theanimals were kept on a low-Na diet for 2 weeks (Rechkemmer, 1992),however, under in-vitro conditions an approximately 3-fold stimulation ofK+ secretion was observed (Rechkemmer, 1988). Thus the active cellularK+ secretion is increased by a low-Na diet and an increased plasmaaldosterone level but by unknown mechanisms is compensated in the in-vivosituation.
Distal colon
In the distal colon much progress has been made in the characterizationof active transport systems for K+ absorption and K+ secretion (Smith andMcCabe, 1984, Halm and Frizzell, 1986). Both processes and theirregulation have been extensively studied in different species and will beconsidered separately in the following paragraphs. In chronic renal failure inmen and animals net colonic K+ secretion is increased and thus the colon atleast partially compensates for the kidney (Sandle et at., 1988; Siga et al.,1989). The adaptation of these systems to different dietary K+ loadsparticipates in the regulation of K+ homeostasis and it has been shown thatthe major regulatory factor is the mineralocorticoid hormone aldosterone(Hayslett and Binder, 1982).
K+ absorption
K+ absorption in the rat distal colon is stimulated by dietary K+depletion (Wolffram et al. 1985; Tannen et al., 1986) and depressed bydietary K+ loading (Foster et al., 1986). The system responsible for K+
absorption in the distal colon has recently been identified as aK+ ,h+-ATPase similar to the gastric enzyme in several laboratory animalspecies (Gustin and Goodman, 1981, 1982; Kaunitz and Sachs, 1986;Suzuki and Kaneko, 1989; Takeguchi et al., 1990; Watanabe et at., 1990;DelCastillo et al., 1991).
212

lumen he/al cell blood
H Na
Fig. 6. Mechanisms for active K+ absorption in the distal colon.
In the distal colon this system is responsible for K+ absorption andluminal acidification and thus may also participate in the regulation of acid-base balance in animals (Suzuki and Kaneko, 1987). In contrast to thegastric K+,+-ATPase the colonic counterpart is not only inhibited byvanadate but in some species is also sensitive to ouabain, a substance whichso far was considered to be a specific inhibitor of the ubiquitous Na+,K+.ATPase. Ouabain-sensitivity of the colonic K+,H+-ATPase varies greatlyamong different species. In the guinea pig distal colon K+ absorption as wellas H+ secretion are inhibited by mucosal ouabain already in micromolarconcentrations with inhibitor constants between I and 4 jimol ouabain/1 forhalf-maximal inhibition (Suzuki and Kaneko, 1987, 1989; Watanabe et al.,
1990), while in the rat much higher concentrations in the millimolar rangeare needed to inhibit K+,H+-ATPase activity (DelCastillo et al., 1991).Using monoclonal antibodies it was demonstrated that the colonic K+,H+ -
ATPase is primarily confined to cells in the crypt region of the rabbit distalcolon (Takeguchi et aL, 1990).
K+ secretion
Active K+ secretion in the gastrointestinal tract is particular prominentin the distal colon. The parallel operation of active K+ absorption, however,may obscure K+ secretion and lead to the observed very small net fluxes
213
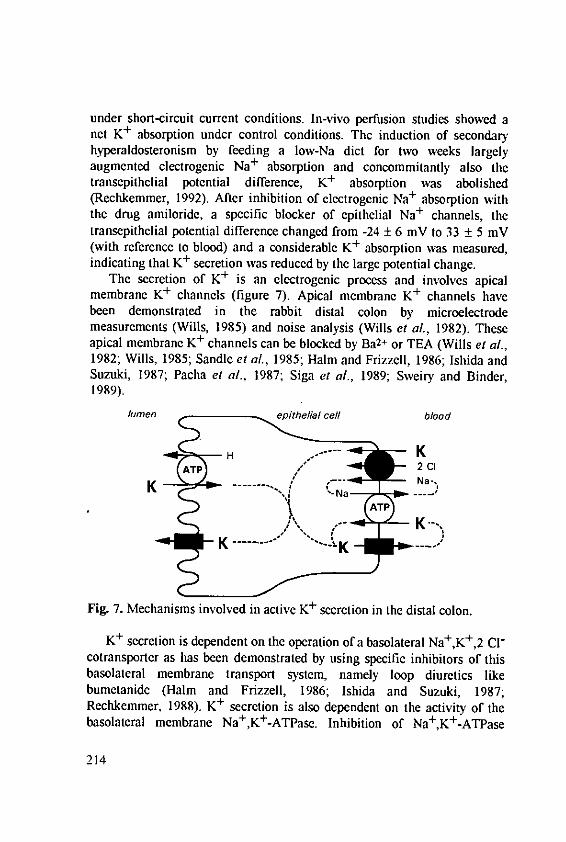
under short-circuit current conditions. In-vivo perfusion studies showed anet K+ absorption under control conditions. The induction of secondaryhyperaldosteronism by feeding a low-Na diet for two weeks largelyaugmented electrogenic Na+ absorption and concommitantly also thetransepithelial potential difference, K+ absorption was abolished(Rechkemmer, 1992). After inhibition of electrogenic Na+ absorption withthe drug amiloride, a specific blocker of epithelial Na + channels, thetransepithelial potential difference changed from -24 ± 6 mV to 33 ± 5 mV(with reference to blood) and a considerable K+ absorption was measured,indicating that K+ secretion was reduced by the large potential change.
The secretion of K+ is an electrogenic process and involves apicalmembrane K+ channels (figure 7). Apical membrane K+ channels havebeen demonstrated in the rabbit distal colon by microelectrodemeasurements (Wills, 1985) and noise analysis (Wills et al., 1982). Theseapical membrane K+ channels can be blocked by Ba 2+ or TEA (Wills et al.,1982; Wills, 1985; Sandle et al., 1985; Halm and Frizzell, 1986; Ishida andSuzuki, 1987; Pacha et al., 1987; Siga et al., 1989; Sweiry and Binder,1989).
lumen epithelial cell blood
H KcK. . . .. N a - ,
Fig. 7. Mechanisms involved in active K+ secretion in the distal colon.
K+ secretion is dependent on the operation of a basolateral Na+,K+,2 CI"cotransporter as has been demonstrated by using specific inhibitors of thisbasolateral membrane transport system, namely loop diuretics likebumetanide (Halm and Frizzell, 1986; Ishida and Suzuki, 1987;Rechkemmer, 1988). K+ secretion is also dependent on the activity of thebasolateral membrane Na+,K+-ATPase. Inhibition of Na+,K+-ATPase
214
activity by serosal application of ouabain abolishes K+ secretion (Haim andFrizzell, 1986; Ishida and Suzuki, 1987; Rechkemmer, 1988). The ratiobetween apical and basolateral membrane K+ conductance probablydetermines the magnitude of K+ secretion.
K+ secretion in the distal colon is related to dietary K+ uptake. DietaryK+ loading of rats stimulates a Na+ and Cl'-dependent K+ secretion (Fosteret at., 1986; Tannen et al., 1986).
K+ secretion is regulated by the hormone aldosterone independently ofits effects on Na + absorption in the distal colon of guinea pigs and rats(Rechkemmer and Haim, 1989; Sweiry and Binder, 1989). In the distalcolon of neonatal rats not only aldosterone but also the glucocorticoidscorticosterone and dexamethasone stimulate K+ secretion (Pacha et al.,1988).
Secretagogues like prostaglandins (McCabe and Smith, 1985; Haim andFrizzell, 1986), adrenergic agonists (Haim and Frizzell, 1986; Smith andMcCabe, 1986; Ishida and Suzuki, 1987), histamine (McCabe and Smith,1984), cyclic adenosine-monophosphate (cAMP) (Foster et al 1983;McCabe and Smith, 1985; Haim and Frizzell, 1986; Ishida and Suzuki,1987) or calcium-ionophore A23187 (Smith and McCabe, 1984) can induceK+ secretion. A recent study using electron microprobe analysis in theguinea pig distal colon epithelium indicated that prostaglandin E2 orepinephrine induced K+ secretion is confined to cells in the lower two-thirdsof colonic crypts (Haim and Rick, 1992).
Conclusions
Detailed studies of K+ transport across epithelia of the stomach, thedistal small intestine and the large intestine have now convincinglydemonstrated that active cellular mechanisms are the major pathways for K+
absorption and secretion. The regulation of these cellular pathways byhormones and neurotransmitters indicates that gastrointestinal epithelia areactively involved in overall K+ homeostasis. During acute dietary K+ loadsor K+ depletion passive transport in the small intestine mainly determinesthe uptake or loss of K+ into or from the body, respectively. If under thoseconditions the capacity of the active K+ absorptive or secretory mechanismsof the large intestine and the kidney is overloaded then a change in K+
concentration in the plasma may occur and lead to subsequent physiologicalchanges in excitability of muscles and nerves. During slowly occuring
215
chronic dietary changes in K+ uptake, particularly in K+ loading, the activeregulatory mechanisms of the large intestine and kidney adapt to thesechanges. In the intestine, particularly the stimulation of K+ secretion in thedistal colon during dietary K+ loading, elevetad plasma aldosteroneconcentrations, induced by prolonged feeding of a Na+ deficient diet or inrenal failure significantly contributes to the maintenance of K+ homeostasisin the body. To elucidate the physiological functions of the distal colonicK+,H+-ATPase and the participation of this system in the regulation of acid-base homeostasis remains as an important part of future research.
References
Backman, K.; Harrison, B.; Meyscnberg, M.; Schwartz, C.; Germann, W.:Inactivation of a Volume-Sensitive Basolateral Potassium Conductancein Turtle Colon - Effect of Metabolic Inhibitors. Biochim. Biophys. Acta1105: 89-96 (1992).
Binder, H. J.; Murer, H.: Potassium/Proton exchange in brush-bordermembrane of rat ileum. J. Membrane Biol. 91: 77-84 (1986).
Clauss, W.; H6rnicke, H.: Segmental differences in K-transport across rabbitproximal and distal colon in vivo and in vitro. Comp. Biochem. Physiol.79A: 267-269 (1984)
Dawson, D. C.; Richards, N. W.: Basolateral K conductance: role inregulation of NaCl absorption and secretion. Am. J. Physiol. 259: C181-C195 (1990).
DelCastillo, J. R.; Rajendran, V. M.; Binder, H. J.: Apical MembraneLocalization of Ouabain-Sensitive K+-Activated ATPase Activities inRat Distal Colon. Am. J. Physiol. 261: G1005-G11I (1991).
Donowitz, M.; Welsh, M. J.: Regulation of mammalian small intestinalelectrolyte secretion. In: Physiology of the Gastrointestinal Tract. SecondEdition, edited by Leonard R. Johnson. Raven Press, New York: 1351-1388 (1987).
Edmonds, C. J.: The gradient of electrical potential difference and of sodiumand potassium of the gut contents along the caecum and colon of normaland sodium-depleted rats. J. Physiol. 193: 571-588 (1967a).
Edmonds, C. J.: Transport of sodium and secretion of potassium andbicarbonate by the colon of normal and sodium-depleted rats. J. Physiol.193: 589-602 (1967b).
216
Edmonds, C. J.: Transport of potassium by the colon of normal and sodium-
depleted rats. J. Physiol. 193: 603-617 (1967c).Edmonds, C. J.; Smith, T.: Epithelial transport pathways of rat colon
determined in vivo by impulse response analysis. J. Physiol. 296: 471-
485 (1979).Foster, E. S.; Sandle, G. I.; Hayslett, J. P.; Binder, H. .: Cyclic adenosine
monophosphate stimulates active potassium secretion in the rat colon.
Gastroenterology. 84: 324-330 (1983).Foster, E. S.; Sandle, G. I.; Hayslett, J. P.; Binder, H. J.: Dietary potassium
modulates active potassium absorption and secretion in the rat distal
colon. Am. J. Physiol. 251: G619-G626 (1986).Frizzell, R. A.; Koch, M. J.; Schultz, S. G.: Ion transport by rabbit colon. 1.
Active and passive components. J. Membrane Biol. 27: 297-316 (1976).
Fromm, M.; Schultz, S. G.: Potassium transport across rabbit descending
colon in vitro: evidence for single-file diffusion through a paracellular
pathway. J. Membr. Biol. 63: 93-98 (1981).Gustin, M. C.; Goodman, D. B. P.: Isolation of brush-border membrane
from the rabbit descending colon epithelium. Partial characterization of a
unique K+-activated ATPase. J Biol. Chem. 256: 10651-10656 (1981).
Gustin, M. C.; Goodman, D. B. P.: Characterization of the phosphorylated
intermediate of the K+-ouabain-insensitive ATPase of the rabbit colon
brush border membrane. J. Biol Chem. 257: 9629-9633 (1982).
Halm, D. R.; Frizzell, R. A.: Active K transport across rabbit distal colon:
relation to Na absorption and Cl secretion. Am. J. Physiol. 251: C252-
C267 (1986).Halm D. R.; Rick, R.: Secretion of K and CI across colonic epithelium:
cellular localization using electron microprobe analysis. Am. J. Physiol.
262: C1392-C1402 (1992).Hardcastle, J.; Hardcastle, P. T.: The involvement of basolateral potassium
channels in the intestinal response to secretagogues in the rat. J. Physiol.
379: 331-345 (1986).Hawker, P C.; Mashiter, K. E.; Turnberg, L. A.: Mechanisms of transport of
Na, Cl, and K in the human colon. Gastroenterology 74: 1241-1247
(1978).Hayslett, J. P.; Binder, H. J.: Mechanism of potassium adaptation. Am. J.
Physiol. 243: F103-F112 (1982).Ishida, H.; Suzuki, Y.: Potassium secretion in the guinea pig distal colon.
lap. J. Physiol. 37: 33-48 (1987).
217
Kaunitz, J. D.; Sachs, G.: Identification of a vanadate-sensitivepotassium-dependent proton pump from rabbit colon. J. Biol. Chem. 261:14005-14010 (1986).
McCabe, R. D.; Smith, P. L.: Effects of histamine and histamine receptorantagonists on ion transport in rabbit descending colon. Am. J. Physiol.247: G411-G418 (1984).
Mintenig, G. M.; Monaghan, A. S.; Sepulveda, F. V.: A large conductanceK+-selective channel of guinea pig villus enterocytes is Ca2 +independent. Am. J. Physiol. 262: G369-G374 (1992).
Pacha, J.; Popp, M.; Capek, K.: Potassium secretion by neonatal rat distalcolon. Pflflgers Arch. 410: 362-368 (1987).
Pacha, J.; Popp, M.; Capek, K.: Corticosteroid regulation of Na+ and K+
transport in the rat distal colon during postnatal development. J.Develop. Physiol. 10: 531-540 (1988).
Rechkemmer, G.: Mechanismen und Regulation des Elektrolyttransports inverschiedenen Dickdarmabschnitten des Meerschweinchens.Habilitationsschrift, Tierrztliche Hochschule Hannover (1988).
Rechikemmer, G.: Effects of a low-sodium diet on electrolyte transport in theproximal and distal colon of the guinea pig (Cavia porcellus). Com.Biochem. Physiol. (in press).
Rechkemmer, G.; Halm, D. R.: Aldosterone stimulates K secretion acrossmammalian colon independent of Na absorption. Proc. Natl. Acad. Sci.USA. 86: 397-401 (1989).
Rechkemmer, G.; Krause, M.; Becker, G.; Engelhardt, W. V.:Konzentrationen von Elektrolyten und kurzkettigen Fettsauren imMagen-Darm-Trakt des Meerschweinchens bei Normaldi~t und beinatriumarmer DiAt. Dtsch tierdrztl Wschr. 94: 12-15 (1987).
Sachs, G.: The gastric proton pump: The H+,K+-ATPase. In: Physiology ofthe Gastrointestinal Tract, Second Edition, edited by Leonard R.Johnson, Raven Press, New York: 865-881 (1987).
Sachs, G.; Spenney, J. G.; Lewin, M.: H+ transport: regulation andmechanism in gastric mucosa and membrane vesicles. Phys. Rev. 58:106-173 (1978).
Sandle, G. I.; Foster, E. S.; Lewis, S. A.; Binder, H. J.; Hayslett, J. P.: Theelectrical basis for enhanced potassium secretion in rat distal colonduring dietary potassium loading. Pflilgers Arch. 403: 433-439 (1985).
Sandle, G. I.; McGlone, F.; Davies, R. J.: Electrophysiology of rat distalcolon after partial nephrectomy. Implications for K transport. PfldgersArch. 412: 172-182 (1988).
218
Schultz, S. G.: Potassium transport by rabbit descending colon in vitro. Fed.
Proc. 40: 2408-2411 (1981).Sepulveda, F. V.; Fargon, F.; McNaughton, P. A.: K+ and C1- currents in
enterocytes isolated form guinea-pig small intestine. J. Physiol. 434: 351-
367 (1991).Siga, E. L.; Martin, R. S.; lbarra, C.; Veron, D.; Ibarra, F.; Gimenez, M.;
Parisi, M.; Arrizurieta, E.: Voltage dependence and barium sensitivity of
colonic K secretion in renal failure. Am. J. Physiol. 256: F490-F496
(1989).Smith, P. L.; McCabe, R. D.: Mechanism and regulation of transcellular
potassium transport by the colon. Am. J. Physiol. 247: G445-G456(1984).
Smith, P. L.; McCabe, R. D.: A23187-induced changes in colonic K and CItransport are mediated by separate mechanisms. Am. J. Physiol. 247:
G695-G702 (1984).Smith, P. L.; McCabe, R. D.: Potassium secretion by rabbit descending
colon: effects of adrenergic stimuli. Am. J. Physiol. 250: G432-G439(1986).
Sullivan, S. K.; Smith, P. L.: Active potassium secretion by rabbit proximal
colon. Am. J. Physiol. 250: G475-G483 (1986).Suzuki, Y.; Kaneko, K.: Acid secretion in isolated guinea pig colon. Am. J.
Physiol. 253: G155-G1645 (1987).Suzuki, Y.; Kaneko, K.: Ouabain-sensitive H+-K+ exchange mechanism in
the apical membrane of guinea pig colon. Am. J. Physiol. 256: G979-
G988 (1989).Sweiry, J. H.; Binder, H. J.: Active Potassium Absorption in Rat Distal
Colon. Journal of Physiol. 423: 155-170 (1990).Sweiry, 1. H.; Binder, J. H.: Characterization of aldosterone-induced
potassium secretion in rat distal colon. J. Clin. Invest. 83: 844-851
(1989).Tannen, R. L.; Marino, R.; Dawson, D. C.: K+ transport by rat colon:
adaptation to a low potassium diet. Am. J. Physiol. 250: F483-F487
(1986).Takeguchi, M; Asana, S.; Tabuchi, Y.; Takeguchi, N.: The presence of
H+,K+-ATPase in the crypt of rabbit distal colon demonstrated with
monoclonal antibodies against gastric H+,K+-ATPase. Gastroenterology.99: 1339-1346 (1990).
Turnberg, L.: Potassium transport in the human small bowel. Gut. 12: 811-
818 (1971).
219
Wallmark, B.: Omeprazole: Mode of action and effect on acid secretion inanimals. Meth. Find. Exp. Clin. Pharmacol. 11 (Suppl. 1): 101-106(1989).
Watanabe, T.; Suzuki, T.; Suzuki, Y.: Ouabain-sensitive K+-ATPase inepithelial cells from guinea pig distal colon. Am. J. Physiol. 258: G506-G511 (1990).
Wills, N. K.: Apical membrane potassium and chloride permeabilities insurface cells of rabbit descending colon epithelium. J. Physiol. 358: 433-445 (1985).
Wills, N. K.; Zeiske, W.; VanDriessehe, W.: Noise analysis reveals K+
channel conductance fluctuations in the apical membrane of rabbit colon.J. Membrane Biol. 69: 187-197 (1982).
Wolffram, S.; Stingelin, Y.; Schneider, B.; Scharrer, E.: Dietary potassiumdepletion stimulates potassium absorption in rat distal colon. Nutr. Rep.Int. 32: 1099-1106 (1985).
220
Physiology and Pharmacology of K+ Channels
Zemkov6, H., Institute of Physiology, Czechoslovak Academy of Sciences,VidefiskA 1083, 142 20 Prague 4, Czechoslovakia
Summary
K+ channels are diverse group of ionic channels which play a role in the
broad spectrum of more or less specialized cellular functions including
establishing of the resting membrane potential, electrical excitability of the
membrane, control of synaptic efficacy and of heart beat, cell-cell
communication, secretion, mobility and cell proliferation. Resting
membrane potential apparently exists in all mature animal and plant cells,
its maintenance is a prerequisite for cellular homeostasis and can thus be
considered to be one of the basic characteristics of the living cells. There are
over 30 different K+ channels which have been characterized biophysically
up to now. Four of them, inward rectifier, delayed rectifier, Ca2+-activated
and ATP-dependent K+ channels are apparently responsible to a great
extent for the regulation of above mentioned functions. The heterogenity of
K+ channels has made it difficult to purify these channels for biochemical
studies. A number of workers have used channel blockers such as
tetraethylammonium (TEA), apamin and other toxins as agents to help
distinguish different K+ channels in a given cell. However, the affinity for
TEA is usually low and specific high affinity ligands for the most important
K+ channels are lacking. Generally these pharmacological separations are
most secure when the K+ channels are also separable on the grounds of their
physiological properties.
Plasma membrane transport systems
According to the membrane theory of Bernstein the cells are surrounded
by a membrane selectively permeable to K+, Na+ and CI" ions (Hodgkin and
Katz, 1949) which are freely distributed in the free cellular water. Ions have
a tendency to diffuse across the cell membrane from sites of higher
concentrations to lower concentration. Transmembrane concentration
gradients are maintained by pumps and other carriers which transport ions
actively against their concentration gradient.
221
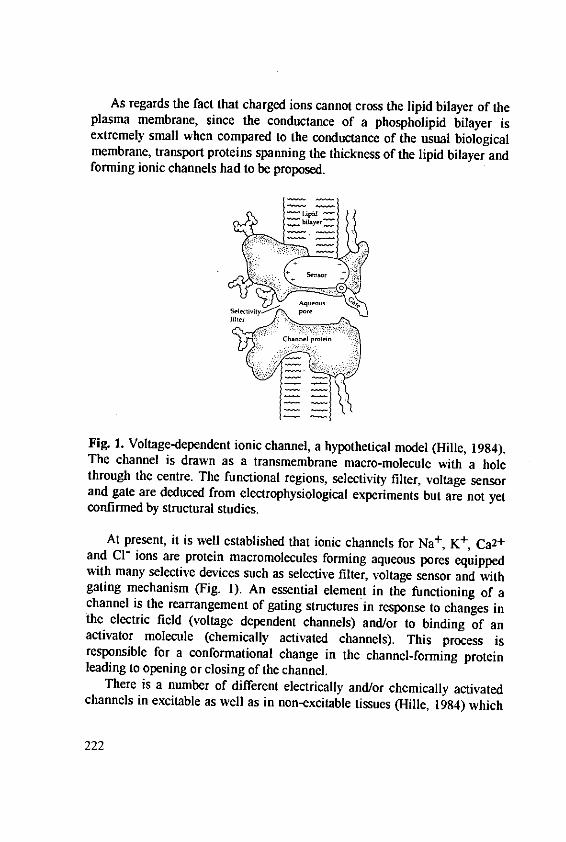
As regards the fact that charged ions cannot cross the lipid bilayer of theplasma membrane, since the conductance of a phospholipid bilayer isextremely small when compared to the conductance of the usual biologicalmembrane, transport proteins spanning the thickness of the lipid bilayer andforming ionic channels had to be proposed.
Lipid
Aqueous
Selectieiy poreflther )
Channel notein
Fig. 1. Voltage-dependent ionic channel, a hypothetical model (Hille, 1984).The channel is drawn as a transmembrane macro-molecule with a holethrough the centre. The functional regions, selectivity filter, voltage sensorand gate are deduced from electrophysiological experiments but are not yetconfirmed by structural studies.
At present, it is well established that ionic channels for Na+, K+, Ca 2+and CI- ions are protein macromolecules forming aqueous pores equippedwith many selective devices such as selective filter, voltage sensor and withgating mechanism (Fig. 1). An essential element in the functioning of achannel is the rearrangement of gating structures in response to changes inthe electric field (voltage dependent channels) and/or to binding of anactivator molecule (chemically activated channels). This process isresponsible for a conformational change in the channel-forming proteinleading to opening or closing of the channel.
There is a number of different electrically and/or chemically activatedchannels in excitable as well as in non-excitable tissues (Hille, 1984) which
222
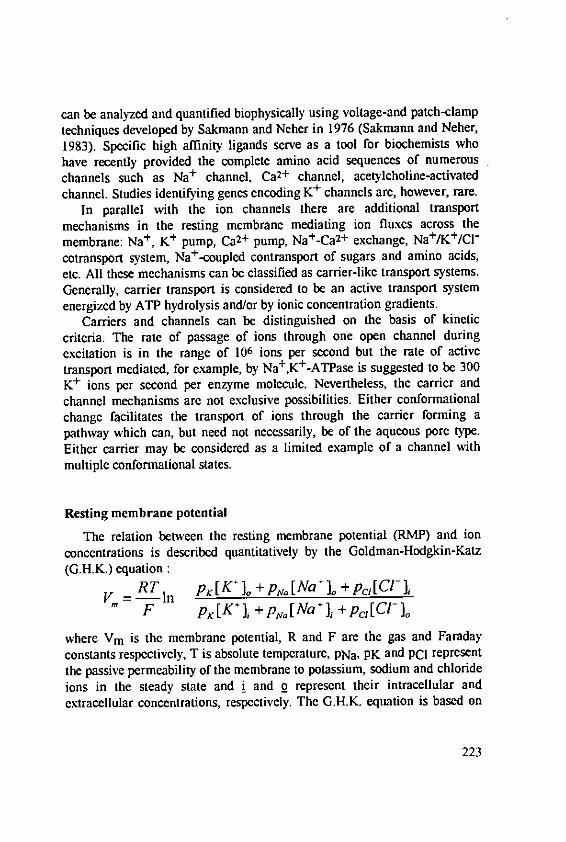
can be analyzed and quantified biophysically using voltage-and patch-clamptechniques developed by Sakmann and Neher in 1976 (Sakmann and Neher,1983). Specific high affinity ligands serve as a tool for biochemists whohave recently provided the complete amino acid sequences of numerouschannels such as Na+ channel, Ca2+ channel, acetylcholine-activatedchannel. Studies identifying genes encoding K+ channels are, however, rare.
In parallel with the ion channels there are additional transportmechanisms in the resting membrane mediating ion fluxes across themembrane: Na+, K+ pump, Ca2+ pump, Na+-Ca2+ exchange, Na+/K+/CI"cotransport system, Na+-coupled contransport of sugars and amino acids,etc. All these mechanisms can be classified as carrier-like transport systems.Generally, carrier transport is considered to be an active transport systemenergized by ATP hydrolysis and/or by ionic concentration gradients.
Carriers and channels can be distinguished on the basis of kineticcriteria. The rate of passage of ions through one open channel duringexcitation is in the range of 106 ions per second but the rate of activetransport mediated, for example, by Na+,K+-ATPase is suggested to be 300K+ ions per second per enzyme molecule. Nevertheless, the carrier andchannel mechanisms are not exclusive possibilities. Either conformationalchange facilitates the transport of ions through the carrier forming apathway which can, but need not necessarily, be of the aqueous pore type.Either carrier may be considered as a limited example of a channel withmultiple conformational states.
Resting membrane potential
The relation between the resting membrane potential (RMP) and ionconcentrations is described quantitatively by the Goldman-Hodgkin-Katz(G.H.K.) equation:
RT I p[K Io+pN[Na] +pc[C1_-]=F px[Ki+PNa[Na+i ]+Pci[Cl-]o
where Vm is the membrane potential, R and F are the gas and Faradayconstants respectively, T is absolute temperature, PNa, PK and PCI representthe passive permeability of the membrane to potassium, sodium and chlorideions in the steady state and i and o represent their intracellular andextracellular concentrations, respectively. The G.H.K. equation is based on
223
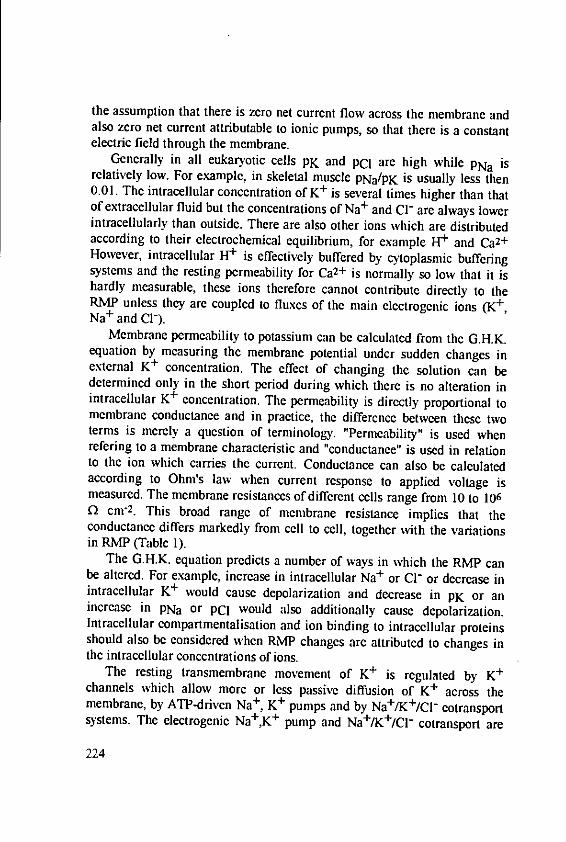
the assumption that there is zero net current flow across the membrane andalso zero net current attributable to ionic pumps, so that there is a constantelectric field through the membrane.
Generally in all eukaryotic cells PK and PCI are high while PNa isrelatively low. For example, in skeletal muscle PNa/PK is usually less then0.01. The intracellular concentration of K+ is several times higher than thatof extracellular fluid but the concentrations of Na+ and CI- are always lowerintracellularly than outside. There are also other ions which are distributedaccording to their electrochemical equilibrium, for example H+ and Ca2+However, intracellular H+ is effectively buffered by cytoplasmic bufferingsystems and the resting permeability for Ca2+ is normally so low that it ishardly measurable, these ions therefore cannot contribute directly to theRMP unless they are coupled to fluxes of the main clectrogenic ions (K+ ,
Na + and ClI).Membrane permeability to potassium can be calculated from the G.H.K.
equation by measuring the membrane potential under sudden changes inexternal K+ concentration. The effect of changing the solution can bedetermined only in the short period during which there is no alteration inintracellular K+ concentration. The permeability is directly proportional tomembrane conductance and in practice, the difference between these twoterms is merely a question of terminology. "Permeability" is used whenrefering to a membrane characteristic and "conductance" is used in relationto the ion which carries the current. Conductance can also be calculatedaccording to Ohm's law when current response to applied voltage ismeasured. The membrane resistances of different cells range from 10 to 106Q cm-2. This broad range of membrane resistance implies that theconductance differs markedly from cell to cell, together with the variationsin RMP (Table 1).
The G.H.K. equation predicts a number of ways in which the RMP canbe altered. For example, increase in intracellular Na+ or CI" or decrease inintracellular K+ would cause depolarization and decrease in PK or anincrease in PNa or PCI would also additionally cause depolarization.Intracellular compartmentalisation and ion binding to intracellular proteinsshould also be considered when RMP changes are attributed to changes inthe intracellular concentrations of ions.
The resting transmembrane movement of K+ is regulated by K+
channels which allow more or less passive diffusion of K+ across themembrane, by ATP-driven Na+, K+ pumps and by Na+/K+/CI- cotransportsystems. The electrogenic Na+,K+ pump and Na+/K+/C- cotransport are
224
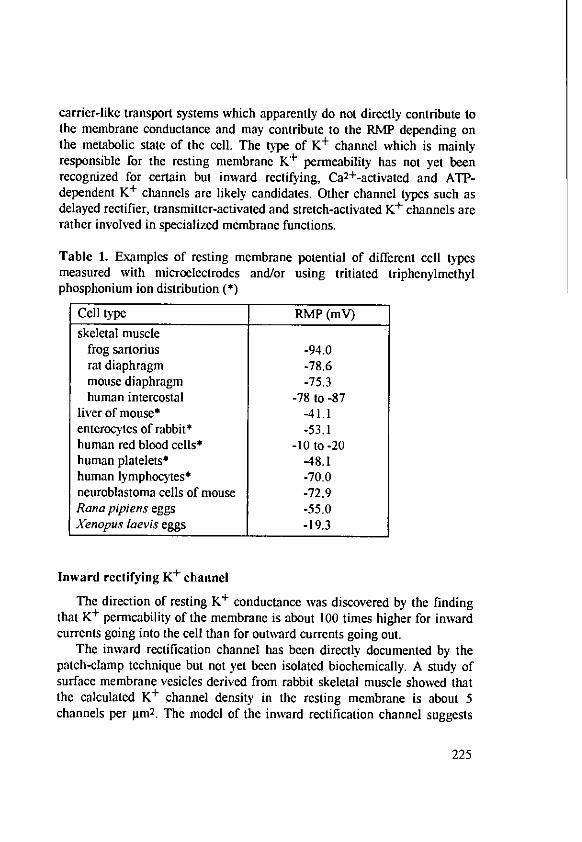
carrier-like transport systems which apparently do not directly contribute tothe membrane conductance and may contribute to the RMP depending onthe metabolic state of the cell. The type of K+ channel which is mainlyresponsible for the resting membrane K+ permeability has not yet beenrecognized for certain but inward rectifying, Ca2+-activated and ATP-dependent K+ channels are likely candidates. Other channel types such asdelayed rectifier, transmitter-activated and stretch-activated K+ channels arerather involved in specialized membrane functions.
Table 1. Examples of resting membrane potential of different cell typesmeasured with microelectrodes and/or using tritiated triphenylmethylphosphonium ion distribution (*)
Cell type RMP (mV)
skeletal musclefrog sartorius -94.0rat diaphragm -78.6mouse diaphragm -75.3human intercostal -78 to -87
liver of mouse* -41.1enterocytes of rabbit* -53.1human red blood cells* -10 to -20human platelets* -48.1human lymphocytes* -70.0neuroblastoma cells of mouse -72.9Rana pipiens eggs -55.0Xenopus laevis eggs -19.3
Inward rectifying K+ channel
The direction of resting K+ conductance was discovered by the findingthat K+ permeability of the membrane is about 100 times higher for inwardcurrents going into the cell than for outward currents going out.
The inward rectification channel has been directly documented by thepatch-clamp technique but not yet been isolated biochemically. A study ofsurface membrane vesicles derived from rabbit skeletal muscle showed thatthe calculated K+ channel density in the resting membrane is about 5channels per lm 2. The model of the inward rectification channel suggests
225
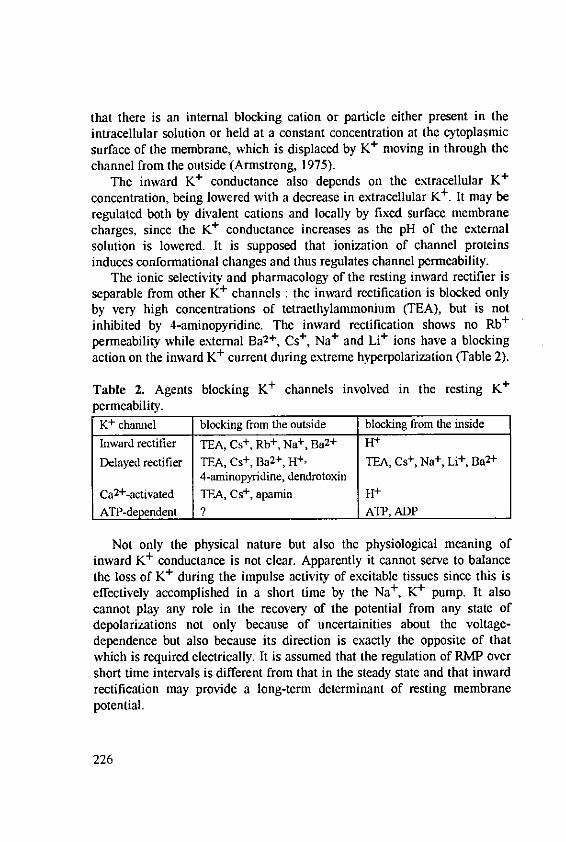
that there is an internal blocking cation or particle either present in theintracellular solution or held at a constant concentration at the cytoplasmicsurface of the membrane, which is displaced by K+ moving in through thechannel from the outside (Armstrong, 1975).
The inward K+ conductance also depends on the extracellular K+concentration, being lowered with a decrease in extracellular K+ . It may beregulated both by divalent cations and locally by fixed surface membranecharges, since the K+ conductance increases as the pH of the externalsolution is lowered. It is supposed that ionization of channel proteinsinduces conformational changes and thus regulates channel permeability.
The ionic selectivity and pharmacology of the resting inward rectifier isseparable from other K+ channels : the inward rectification is blocked onlyby very high concentrations of tetraethylammonium (TEA), but is notinhibited by 4-aminopyridine. The inward rectification shows no Rb+
permeability while external Ba 2+ , Cs+ , Na+ and Li+ ions have a blockingaction on the inward K+ current during extreme hyperpolarization (Table 2).
Table 2. Agents blocking K+ channels involved in the resting K+
permeability.K+ channel blocking from the outside blocking from the inside
Inward rectifier TEA, Cs+, Rb+, Na+, Ba 2+ H+
Delayed rectifier TEA, Cs +, Ba2+, H+ , TEA, Cs+ , Na+, Li+, Ba2+
4-aminopyridine, dendrotoxinCa 2+-activated TEA, Cs+, apamin H+
ATP-dependent ? ATP, ADP
Not only the physical nature but also the physiological meaning ofinward K+ conductance is not clear. Apparently it cannot serve to balancethe loss of K+ during the impulse activity of excitable tissues since this iseffectively accomplished in a short time by the Na+ , K+ pump. It alsocannot play any role in the recovery of the potential from any state ofdepolarizations not only because of uncertainities about the voltage-dependence but also because its direction is exactly the opposite of thatwhich is required electrically. It is assumed that the regulation of RMP overshort time intervals is different from that in the steady state and that inwardrectification may provide a long-term determinant of resting membranepotential.
226
Ca2+-activated K+-channel
Calcium-induced changes in K+ permeability were originally describedin human erythrocytes incubated in the absence of glucose and withglycolysis inhibited. The increase in the resting membrane permeability inthis case was attributed to a rise in intracellular Ca2+ since ATP depletioncauses inhibition of plasma membrane Ca2+-ATPas and cessation of activeCa2+ efflux. The Ca2+-dependence of K+ permeability has been confirmedin many cell types, for example in molluscan neurones injectedintracellularly with Ca2+, on Amphiuma red cells when the extracellularCa2+ was increased, on human red cells by using the Ca2+ ionophore A23187, and on metabolically damaged frog skeletal muscle whereintracellular Ca2+ increases as a consequence of inhibited Ca2+-transportingmechanisms in organells.
The existence of Ca2+-activated K+ channels has been directlydemonstrated in a variety of cells including ncurones, skeletal muscle cells,cardiac cells in culture and red blood cells by the patch clamp technique.The Ca2+-activated K+ channel has a high unitary conductance of 100 -200 pS. It is outwardly directed, mediating K+ efflux and is sensitive to
both extracellular K+ and intracellular Ca2+. The channel is voltagedependent but cannot be opened by depolarization alone but by thesimultaneous binding of Ca2+. In rat skeletal muscle cells in culture thereare two different classes of Ca2+-activated K+ channels with differentpharmacological properties. One class of channel is inhibited bytetraethylamonium while the other class of channel is blocked by apamin, abee venom polypeptide, and is resistant to TEA. Both types of channel areresistant to aminopyridines (Table 2). The Ca2+-activated K+ channel oferythrocytes is stimulated by calmodulin, an endogenous Ca2+-bindingprotein, and the calmodulin antagonist, trifluoperazine, can block the Ca2+-dependent increase in K+ permeability in a sarcolemmal preparation.
The activation of Ca2+-dependent K+ channels by micromolarconcentrations of Ca2+ is accompanied by membrane hyperpolarization. Incells which are not metabolically exhausted and where a Ca2+ pump isactive, this hyperpolarization is transient as the Ca2+-activated K+ channelsclose spontaneously within about 30 sec when the Ca2+ pump responds to anincrease in intracellular Ca2+ . Another possibility to explain transientactivation of Ca2+ -dependent K+channel is that the increase in intracellularCa2+ causes a decrease in intracellular pH as mitochondria take up divalent
227
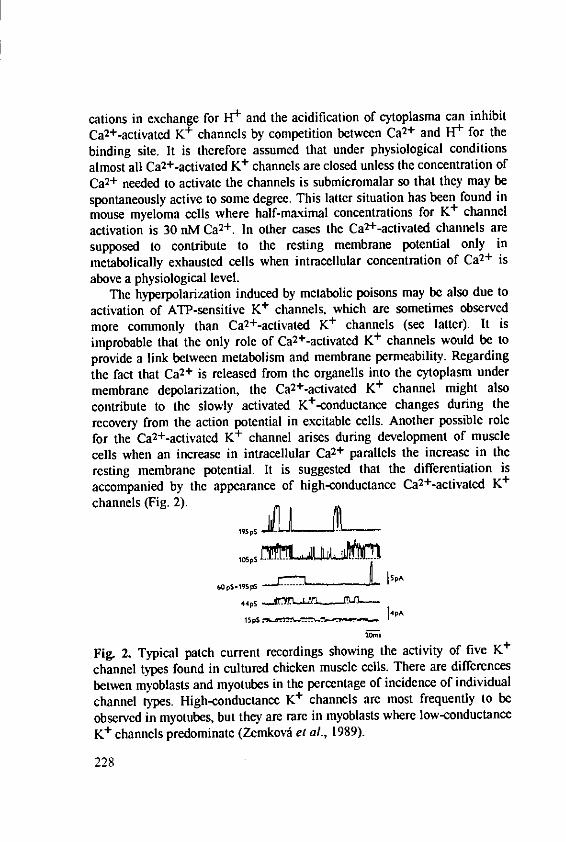
cations in exchange for H+ and the acidification of cytoplasma can inhibitCa2+-activated K+ channels by competition between Ca2+ and H+ for thebinding site. It is therefore assumed that under physiological conditionsalmost all Ca2+-activated K+ channels are closed unless the concentration ofCa2+ needed to activate the channels is submicromalar so that they may bespontaneously active to some degree. This latter situation has been found inmouse mycloma cells where half-maximal concentrations for K+ channelactivation is 30 nM Ca2+. In other cases the Ca 2+-activated channels aresupposed to contribute to the resting membrane potential only inmetabolically exhausted cells when intracellular concentration of Ca2+ is
above a physiological level.The hyperpolarization induced by metabolic poisons may be also due to
activation of ATP-sensitive K+ channels, which are sometimes observedmore commonly than Ca2+-activated K+ channels (see latter). It isimprobable that the only role of Ca2+-activated K+ channels would be toprovide a link between metabolism and membrane permeability. Regardingthe fact that Ca2+ is released from the organells into the cytoplasm undermembrane depolarization, the Ca2+-activated K+ channel might alsocontribute to the slowly activated K+-conductance changes during therecovery from the action potential in excitable cells. Another possible rolefor the Ca2+-activated K+ channel arises during development of musclecells when an increase in intracellular Ca2+ parallels the increase in theresting membrane potential. It is suggested that the differentiation isaccompanied by the appearance of high-conductance Ca 2+-activated K+
c h a n n e l s ( F i g . 2 ) . M P S
193pS
10 5p5
6opS-195P3 SpA
4 4pS
ISPS 14PA
20ms
Fig. 2. Typical patch current recordings showing the activity of five K+
channel types found in cultured chicken muscle cells. There are differencesbetwen myoblasts and myotubes in the percentage of incidence of individualchannel types. High-conductance K+ channels are most frequently to beobserved in myotubes, but they are rare in myoblasts where low-conductanceK+ channels predominate (ZemkovA et al., 1989).
228
ATP-dependent K+ channels
Recently it has been shown using the patch-clamp technique that cardiaccells, pancreatic B cells and frog skeletal muscle contain K+ channels whichare sensitive to intracellular ATP (Table 2). These channels are outwardlydirected, insensitive to Ca 2+and they are distinct from the K+ channelsassociated with the AT? receptors in mammalian sensory neurones whichare stimulated by ATP. ATP-sensitivc K+ channels are inhibited by ATP,they are stimulated by diazoxide and the hormone somatostatin. They areopened when the intracellular ATP decreases below 1 -2 mM but are closedat higher ATP concentrations. In skeletal muscle ATP-sensitive K+ channelopening is influenced by membrane potential, so that it is partly inactivatedby hyperpolarization. But in pancreatic B cells these channels are reported tobe insensitive to membrane potential. Channel conductance decreases withreduction in K+ concentration on the inner side of the membrane. Its unitaryconductance is 48 - 60 pS which is lower than the unitary conductance ofCa2+-activated K+ channels.
The mechanism of action of ATP is not yet known but it is believed thatATP closes channels without being metabolized since ADP has almost thesame effect. It has therefore been stated that ATP apparently increases thechance of the channel entering the closed state. The density of ATP-sensitiveK+ channels in skeletal muscle is reported to be as high as or even higherthan that of the voltage-dependent K+ channels involved in delayedrectification and to be higher than that of Ca2+-activated K+ channels inpancreatic B cells, but their physiological significance is not clear. Innormal cells the ATP concentration is high (3 - 5 mM) and, at least inskeletal muscle, it is maintained stable by creatine phosphate and creatinekinase. This means that under normal physiological conditions thesechannels should be blocked by intracellular ATP and make no contributionto the resting membrane potential. It is believed that the primary role of theATh-sensitive K+ channels is to sense the intracellular ATP levels and toprevent both ATP depletion and irreversible changes in energy metabolism.A secondary function of these channels may be to participate, in theregulation of resting membrane potential by cellular metabolism inmetabolically exhausted cells where hyperpolarization is a familiarphenomenon, until now ascribed only to the increase in intracellular Ca2 +
concentration.
229
Delayed rectifying K+ channel
In voltage-clamped squid giant axons the total membrane potassiumpermeability declines almost linearly with membrane hyperpolarization. Inskeletal muscle the total K+ permeability also depends substantially onmembrane potential. Voltage-dependent membrane conductance has beenobserved not only in excitable tissues where it has been extensively studied,but also in egg cells and in erythrocytes. The voltage-dependent K+conductance is apparently identical with the delayed rectification which isslowly activated by depolarization during action potential generation andwhich is directed outwardly i.e. mediates K+ current going out from the cell.The delayed K+ conductance can be blocked by TEA and related ammoniumsalts and by 4-aminopyridine and in special cases by dendrotoxin (Table 2).The selectivity sequence of this conductance is K+, Rb+, Cs+, Na+, Li+ , thelast having a very low permeability.
The K+ channel involved in delayed rectification has been identified insarcolemmal vesicles, prepared from frog skeletal muscle by enzymatictreatment, as a K+ channel with a unitary conductance of 15 pS. A similarlow conductance channel of 18 pS has been identified in red blood cells. Insquid axon the delayed rectifying K+ current is the major outward currentwhich is mainly responsible for the repolarizing phase of an action potentialbut in non-excitable tissues the function of these channels is still unclear.
The delayed rectifier in skeletal muscle is activated by depolarization to -40 mV, this voltage-dependent K+ channel is therefore assumed not tocontribute to the resting membrane potential. In the red blood cells thischannel is also not considered to play a role in the regulation of RMP but tobuffer the plasma K+ concentration and to regulate plasma volume since thered blood cells RMP is determined mainly by Cl" ions. Outward rectifyingK+ conductance in B lymphocytes can be modulated by second messengersand increases by interleukin suggesting the role for these channels instimulated proliferation.
Transmitter-modulated K+ channels
There is a group of K+ channels in the nervous system which aremodulated by neurotransmitters such as acetylcholine, serotonin andgamma-aminobutyric acid. In experiments on sensory neurones of Aplysia ithas been demonstrated that a single class of K+ channels is modulated inopposing direction by distinct neurotransmitters acting through distinct
230
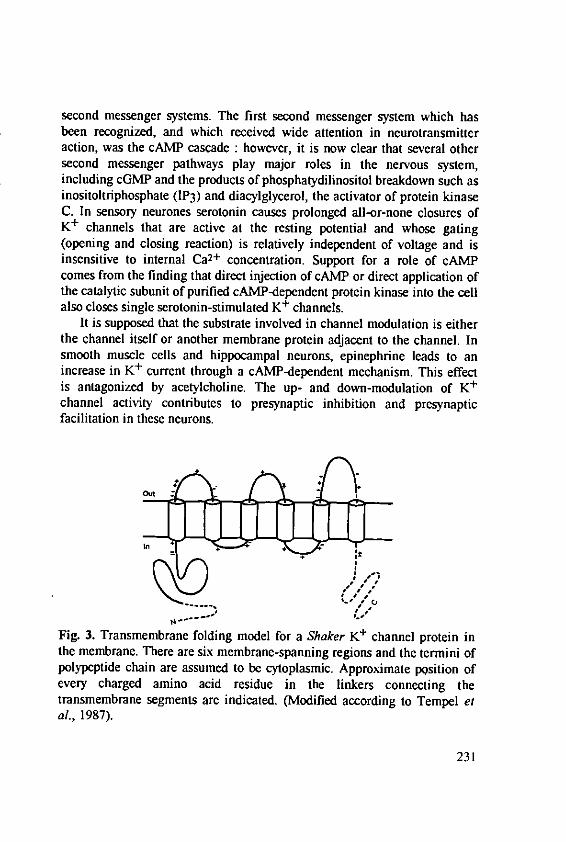
second messenger systems. The first second messenger system which hasbeen recognized, and which received wide attention in neurotransmitteraction, was the cAMP cascade : however, it is now clear that several othersecond messenger pathways play major roles in the nervous system,including cGMP and the products of phosphatydilinositol breakdown such asinositoltriphosphate (1P3) and diacylglycerol, the activator of protein kinaseC. In sensory neurones serotonin causes prolonged all-or-none closures ofK+ channels that are active at the resting potential and whose gating(opening and closing reaction) is relatively independent of voltage and isinsensitive to internal Ca2+ concentration. Support for a role of cAMPcomes from the finding that direct injection of cAMP or direct application ofthe catalytic subunit of purified cAMP-dependent protein kinase into the cellalso closes single serotonin-stimulated K+ channels.
It is supposed that the substrate involved in channel modulation is eitherthe channel itself or another membrane protein adjacent to the channel. Insmooth muscle cells and hippocampal neurons, epinephrine leads to anincrease in K+ current through a cAMP-dependent mechanism. This effectis antagonized by acetylcholine. The up- and down-modulation of K+channel activity contributes to presynaptic inhibition and presynapticfacilitation in these neurons.
Fig. 3. Transmembrane folding model for a Shaker K+ channel protein inthe membrane. There are six membrane-spanning regions and the termini ofpolypeptide chain arc assumed to be cytoplasmic. Approximate position ofevery charged amino acid residue in the linkers connecting thetransmembrane segments are indicated. (Modified according to Tempel etal., 1987).
231
Stretch-activated K+ channels
Most cell membranes express stretch-activated ion channels which openwith increase in membrane tension and behave as inward rectifiers. Stretch-activated channels can be further classified into two groups based onpermeation properties : non-selective cation channels and K+ selectivechannels. The non-selective channels are blocked by Ca2+ and otherdivalent cations including Zn2 +, Ni2+, Mn 2+, Co2+ and Cd2+. K+ selectivestretch-activated channels which are much more permeable to K+ than toNa+ are blocked by quinidine, Cs+ and Ba 2+ . A complete kinetic analysis ofstretch-activated channel gating has only been done for chick myotubeswhere the gating energy was proposed to be a quadratic function of appliedpressure. The channels have been found in a variety of cells : oocytes, redblood cells, hair cells, dorsal root ganglion neurones and epithelia cells. It isassumed that these channels play a crucial role in volume regulation but inmuscle cells the stretch activated channels may be the mechanolectricaltransducing elements responsible for the initiation of stretch-inducedcontraction.
Expression of channels in oocytes
On the basis of the clectrophysiological analysis of Shaker (a Drosophilagene) mutant, the Shaker locus has been cloned which encodes a structuralcomponent of voltage-dependent fast transient outward K+ channel withproperties of delayed rectifier. This hypothesis has been confirmed byexpression studies in frog oocytes injected with Shaker DNA. Thecomplementary DNA sequence predicts and integral membrane protein ofabout 70 kDa containing several membrane-spanning sequences (Fig. 3).The diversity of K+ channels may be generated by alternatively splicedtranscripts.
Conclusion
Potassium channels have been described mainly with respect to theirfunction in excitable cells (Kolb, 1990) where different voltage-dependentK+ channels define the shape and duration, time dependence and firingpattern of action potentials and may be involved in alterations in synapticefficacy and learning. Since the K+ currents are mainly inhibitory and
232
responsible for repolarization, an increase in the K+ conductance depresseselectrical excitability. In non-excitable systems such as pancreatic B cells(insulin secreting cells), hepatocytes, renal epithelial cells and leukocytesK+ channels are also involved in specific physiological functions. Inpancreatic B cells, the rythmic electrical activity evoked by glucose is closelyinvolved in regulation of insulin secretion and depends on variations of theK+ permeability. In hepatocytes, the membrane K+ permeability determinesthe rate of voltage dependent membrane transports of amino acids andglucose. In the nephron K+ channels play a role in regulation of K+
secretion together with the Na + , K+-ATPase. In many other cells K+
channels are required for activation of cell proliferation, are involved inhormone-activated increase in protein synthesis, interleukin-2 production,thymidine incorporation and volume regulation. Comparison of single K+
current properties in different tissues cannot help with final K+ channelclassification until the channels are not cloned and expressed, and thechannel structure is not determined. The genetic approach is now in fullprogress and this combined electrophysiological and biochemical approachswould yield a valuable classification of the K+ channels with respect totheir contribution to the specific function of the cell concerned. It wouldprovide a practicable way to improve our understanding of the physiologicalfunction of K+ channels.
References
Armstrong, C.M. : Potassium pores of nerve and muscle neurones. In:Membranes, G. Eisenman (ed.), Marcel Dekker, Inc., New York (1975)
Hille, B. : Ionic channels of excitable membranes. Sinauer Assoc. Inc.(1984)
Hodgkin, A.L. and Katz, B. : The effect of sodium ions on the electricalactivity of the giant axons of the squid. J. Physiol. (Lond.) 108, 37-77(1949)
Kolb, H.-A. : Potassium channels in excitable and non-excitable cells. Rev.Physiol. Biochem. Pharmacol. 115, 51-91 (1990)
Sakmann, B. and Neher, E. : Single channel recording. New York, PlenumPress (1983)
Stanfleld, P.R. : Tetraethylammonium ions and the potassium permeabilityof excitable cells. Rev. Physiol. Biochem. Pharmacol. 97, 1-67 (1983)
233
Tempel, B.L., Papazian, D.M. and Schwarz, T.L. : Sequence of a probablepotassium channel component encoded at Shaker locus of Drosophyla.Science 27, 770-775 (1987)
ZemkovA, H., Vysko6il, F., Tolar, M., VlachovA V. and Ujec, E. : Single K+
currents during differenciation of embryonic muscle cells in vitro.Biochim. Biophys. Acta 986, 146-150 (1989)
234
Therapeutic Implications of Alterations inEndogenous Potassium Concentrations for OrganFunctions
Kecskemfti, V., Semmelweis University of Medicine Department ofPharmacology, Budapest Nagyvlrad ttr 4, P.O.Box 370, 1445 Hungary
Summary
This report briefly summarizes the advance in our knowledge ofphysiology of potassium regulation including the pathophysiological aspectsof alterations of potassium homeostasis. This review focuses on theinteraction of hypo- and hyperkalemia with drugs effects and on the druginteractions that can result in hypo- or hyperkalemia, as well. The paperdeals with the most frequently used drugs (diuretics, antibiotics, hormones,mediator-like drugs, laxatives, cardiovascular drugs, non-steroid anti-inflammatory drugs) induced hypo- and hyperkalemia and with theirinteractions. It is especially important for clinicians to be aware of thesedrug-induced disturbances of K+ homeostasis to avoid the unexpectedcomplications.
1. Introduction
In the past decade, information has been accumulating on the occurenceof drug-induced disturbances in potassium homeostasis and the influence ofhypo- or hyperkalemia on the effects of drugs. The relationship between thealteration of potassium homeostasis and the actions of drugs are importantbecause the drug-used different electrolytes disturbances appear to be a greatpart of unexpected iatrogenic disorders (Rado, 1987). Based on the excellentcomprehensive recent reviews (Rado, 1987, 1989; Tannen, 1990) in thisreview we are shortly summarizing the physiology of potassium regulationand clinical sequelac of hypo-, hyperkalemia and focussing our interest todrug-induced potassium disorders and the drug-drug interactions in alteredpotassium homeostasis.
235
2. Potassium homeostasis and physiology of potassium regulation
In a normal, 20-year old man, total body content (TBK) is 58 meq kg-1 .This value is dependent on sex, age and muscle mass. About 90% of TBKcan be found in the intracellular space and 1.4% in the extracellular fluidwater compartment. The majority of intracellular K+ is located withinmuscle, the remainder is in other organs and erythrocytes (Tannen, 1990).Potassium concentration in plasma (serum) corresponds to its concentrationin extracellular fluid. Normal serum potassium concentration ranges from3.5 to 5.0 meq 1-1. Hypokalemia is defined as a state in which K+
concentration is below the normal range, while in hyperkalemia there is arise above the normal range. Hypo- or hyperkalemia do not necessarilyreflect a parallel change in intracellular potassium concentration. Howeverchanges in the intracellular potassium concentration are usually paralelledby alterations in serum concentration.
2.1. Normal dietary intake
Potassium homeostasis is regulated by dietary potassium intake, byelimination mechanism 90% by kidney (both are regarded as "externalbalance") and by the factors ensuring the maintenance of unequaldistribution of K+ between the intracellular and extracellular space("internal balance"). The mechanisms responsible for K + regulation arelisted in Table 1.
2.2. Factors affecting transcellular distribution
The intracellular K + content is regulated by a pump-leak mechanism.The Na-K pump catalysed by the enzyme Na-,K-ATPase ensures thetransport of K+ uphill into the cell exchanging for sodium from the cell intothe extracellular space. The exit of K+ from the cell is regulated by passiveforces, leak mechanisms. The chemical gradient is greater than the opposingelectric gradient (cell interior negative) and chiefly determines themembrane potential (log Ki/Ke). The leak process (K+ exit into theextracellular space is opposed by the electrical gradient and favored by thechemical gradient) is regulated by the permeability characteristics of themembrane. The permeability of the membrane to K + is determinedprimarily by ion selective K + channels. Different types of K+ channels exist
236
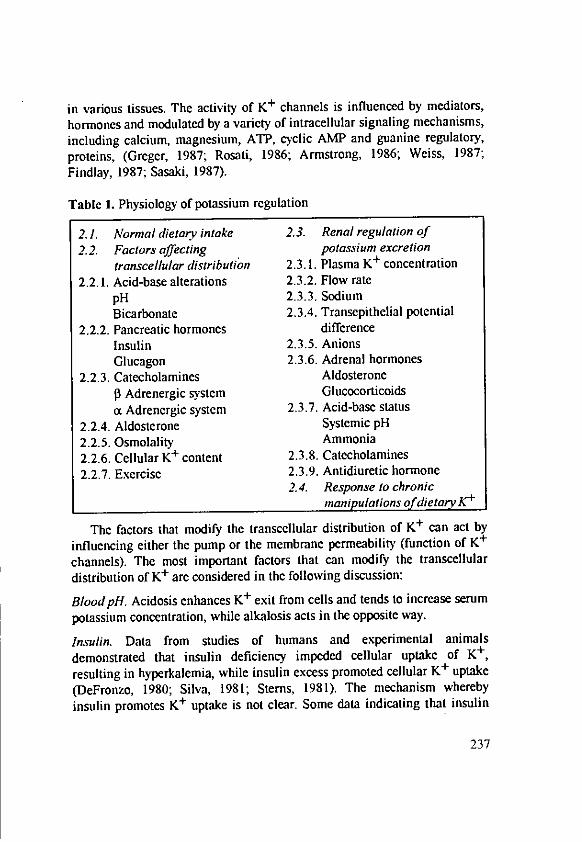
in various tissues. The activity of K+ channels is influenced by mediators,hormones and modulated by a variety of intracellular signaling mechanisms,
including calcium, magnesium, ATP, cyclic AMP and guanine regulatory,proteins, (Greger, 1987; Rosati, 1986; Armstrong, 1986; Weiss, 1987;
Findlay, 1987; Sasaki, 1987).
Table 1. Physiology of potassium regulation
2.1. Normal dietary intake 2.3. Renal regulation of2.2. Factors affecting potassium excretion
transcellular distribution 2.3.1. Plasma K+ concentration2.2.1. Acid-base alterations 2.3.2. Flow rate
pH 2.3.3. SodiumBicarbonate 2.3.4. Transepithelial potential
2.2.2. Pancreatic hormones differenceInsulin 2.3.5. AnionsGlucagon 2.3.6. Adrenal hormones
2.2.3. Catecholamines Aldosteronej Adrenergic system Glucocorticoids
a Adrenergic system 2.3.7. Acid-base status
2.2.4. Aldosterone Systemic pH
2.2.5. Osmolality Ammonia
2.2.6. Cellular K+ content 2.3.8. Catecholamines
2.2.7. Exercise 2.3.9. Antidiuretic hormone2.4. Response to chronic
manipulations of dietay K+
The factors that modify the transellular distribution of K+ can act byinfluencing either the pump or the membrane permeability (function of K+
channels). The most important factors that can modify the transellulardistribution of K+ are considered in the following discussion:
BloodpH. Acidosis enhances K+ exit from cells and tends to increase serumpotassium concentration, while alkalosis acts in the opposite way.
Insulin. Data from studies of humans and experimental animalsdemonstrated that insulin deficiency impeded cellular uptake of K+ ,
resulting in hyperkalemia, while insulin excess promoted cellular K+ uptake(DeFronzo, 1980; Silva, 1981; Stems, 1981). The mechanism wherebyinsulin promotes K+ uptake is not clear. Some data indicating that insulin
237
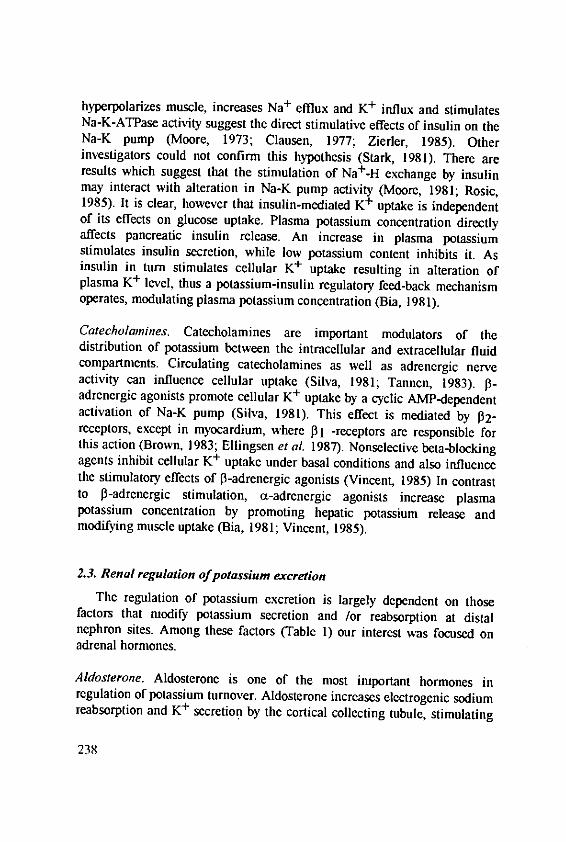
hyperpolarizes muscle, increases Na+ eftlux and K+ influx and stimulatesNa-K-ATPase activity suggest the direct stimulative effects of insulin on theNa-K pump (Moore, 1973; Clausen, 1977; Zierler, 1985). Otherinvestigators could not confirm this hypothesis (Stark, 1981). There areresults which suggest that the stimulation of Na+-H exchange by insulinmay interact with alteration in Na-K pump activity (Moore, 1981; Rosic,1985). It is clear, however that insulin-mediated K+ uptake is independentof its effects on glucose uptake. Plasma potassium concentration directlyaffects pancreatic insulin release. An increase in plasma potassiumstimulates insulin secretion, while low potassium content inhibits it. Asinsulin in turn stimulates cellular K+ uptake resulting in alteration ofplasma K+ level, thus a potassium-insulin regulatory feed-back mechanismoperates, modulating plasma potassium concentration (Bia, 1981).
Catecholanines. Catecholamines are important modulators of thedistribution of potassium between the intracellular and extracellular fluidcompartments. Circulating catecholamines as well as adrenergic nerveactivity can influence cellular uptake (Silva, 1981; Tannen, 1983). j3-adrenergic agonists promote cellular K+ uptake by a cyclic AMP-dependentactivation of Na-K pump (Silva, 1981). This effect is mediated by I32-receptors, except in myocardium, where 1I -receptors are responsible forthis action (Brown, 1983; Ellingsen et aL 1987). Nonselective beta-blockingagents inhibit cellular K+ uptake under basal conditions and also influencethe stimulatory effects of 0-adrenergic agonists (Vincent, 1985) In contrastto 1-adrenergic stimulation, ax-adrenergic agonists increase plasmapotassium concentration by promoting hepatic potassium release andmodifying muscle uptake (Bia, 1981; Vincent, 1985).
2.3. Renal regulation of potassium excretion
The regulation of potassium excretion is largely dependent on thosefactors that modify potassium secretion and /or reabsorption at distalnephron sites. Among these factors (Table 1) our interest was focused onadrenal hormones.
Aldosterone. Aldosterone is one of the most important hormones inregulation of potassium turnover. Aldosterone increases electrogenic sodiumreabsorption and K+ secretion by the cortical collecting tubule, stimulating
238
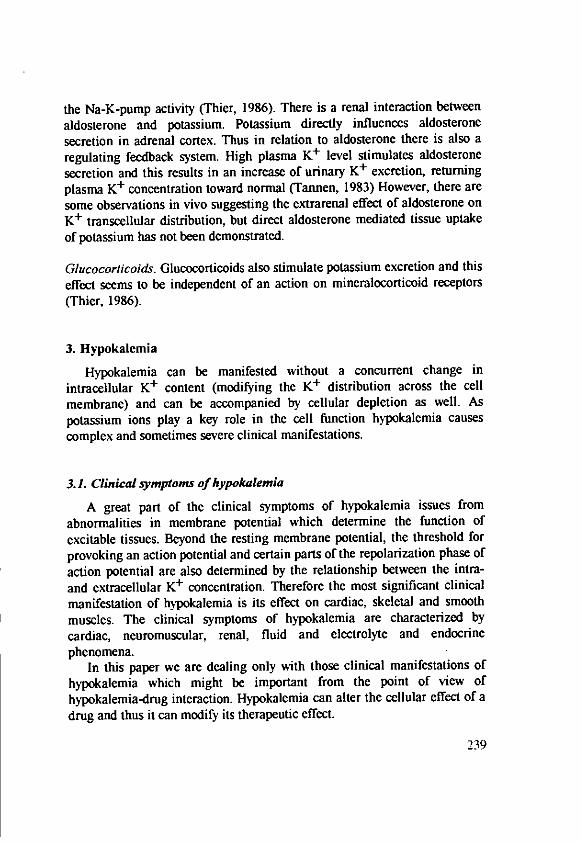
the Na-K-pump activity (Thier, 1986). There is a renal interaction betweenaldosterone and potassium. Potassium directly influences aldosteronesecretion in adrenal cortex. Thus in relation to aldosterone there is also aregulating feedback system. High plasma K+ level stimulates aldosteronesecretion and this results in an increase of urinary K+ excretion, returningplasma K+ concentration toward normal (Tannen, 1983) However, there aresome observations in vivo suggesting the extrarenal effect of aldosterone onK+ transcellular distribution, but direct aldosterone mediated tissue uptakeof potassium has not been demonstrated.
Glucocorticoids. Glucocorticoids also stimulate potassium excretion and thiseffect seems to be independent of an action on mineralocorticoid receptors(Thier, 1986).
3. Hypokalemia
Hypokalemia can be manifested without a concurrent change inintracellular K+ content (modifying the K+ distribution across the cellmembrane) and can be accompanied by cellular depletion as well. Aspotassium ions play a key role in the cell function hypokalemia causescomplex and sometimes severe clinical manifestations.
3.1. Clinical symptoms of hypokalemia
A great part of the clinical symptoms of hypokalemia issues fromabnormalities in membrane potential which determine the function ofexcitable tissues. Beyond the resting membrane potential, the threshold forprovoking an action potential and certain parts of the repolarization phase ofaction potential are also determined by the relationship between the intra-and extracellular K+ concentration. Therefore the most significant clinicalmanifestation of hypokalemia is its effect on cardiac, skeletal and smoothmuscles. The clinical symptoms of hypokalemia are characterized bycardiac, neuromuscular, renal, fluid and electrolyte and endocrinephenomena.
In this paper we are dealing only with those clinical manifestations ofhypokalemia which might be important from the point of view ofhypokalemia-drug interaction. Hypokalemia can alter the cellular effect of adrug and thus it can modify its therapeutic effect.
239
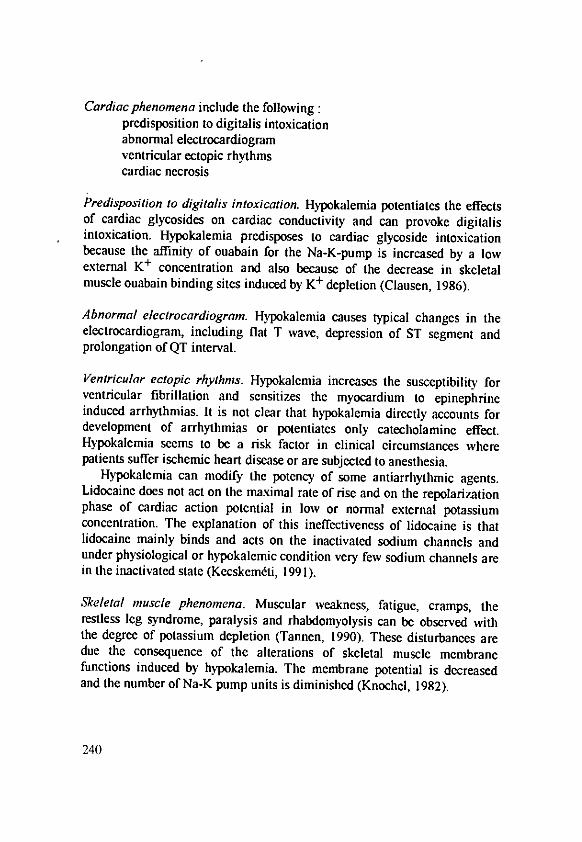
Cardiac phenomena include the following:predisposition to digitalis intoxicationabnormal electrocardiogramventricular ectopic rhythmscardiac necrosis
Predisposition to digitalis intoxication. Hypokalemia potentiates the effectsof cardiac glycosides on cardiac conductivity and can provoke digitalisintoxication. Hypokalemia predisposes to cardiac glycoside intoxicationbecause the affinity of ouabain for the Na-K-pump is increased by a lowexternal K+ concentration and also because of the decrease in skeletalmuscle ouabain binding sites induced by K+ depletion (Clausen, 1986).
Abnormal electrocardiogram. Hypokalemia causes typical changes in theelectrocardiogram, including flat T wave, depression of ST segment andprolongation of QT interval.
Ventricular ectopic rhythms. Hypokalemia increases the susceptibility forventricular fibrillation and sensitizes the myocardium to epinephrineinduced arrhythmias. It is not clear that hypokalemia directly accounts fordevelopment of arrhythmias or potentiates only catecholamine effect.Hypokalemia seems to be a risk factor in clinical circumstances wherepatients suffer isehemic heart disease or are subjected to anesthesia.
Hypokalemia can modify the potency of some antiarrhythmic agents.Lidocaine does not act on the maximal rate of rise and on the repolarizationphase of cardiac action potential in low or normal external potassiumconcentration. The explanation of this ineffectiveness of lidocaine is thatlidocaine mainly binds and acts on the inactivated sodium channels andunder physiological or hypokalemic condition very few sodium channels arein the inactivated state (Kecskemdti, 1991).
Skeletal muscle phenomena. Muscular weakness, fatigue, cramps, therestless leg syndrome, paralysis and rhabdomyolysis can be observed withthe degree of potassium depletion (Tannen, 1990). These disturbances aredue the consequence of the alterations of skeletal muscle membranefunctions induced by hypokalemia. The membrane potential is decreasedand the number of Na-K pump units is diminished (Knochel, 1982).
240
Endocrinological effects. Hypokalemia increases plasma renin anddecreases aldosterone level, modifies the number and affinity of angiotensinII receptors on adrenal and vascular tissues. This diminished sensitivity tothe pressor effects of angiotensin It results in a decreases in systemicvascular reistance and blood pressure. The pressor response to vasopressin isalso depressed in hypokalemia. Hypokalemia lowers the blood pressure inboth normotrensive and hypertensive animals (Tannen, 1990). The mostimportant endocrinological disturbances associated with potassium defiencyis the development of glucose intolerance which results from decreasedinsulin secretion.
3.2. Drug-induced hypokalemia
Many drugs frequently used in clinical practice can be implicated inpotassium regulation and induce hypo,-or hyperkalemia. Drugs can inducehypokalemia by causing potassium depletion (negative external balance) andby enhancing cellular potassium uptake (change of internal balance).Mechanisms responsible for drug-induced hypokalemia and the currentlyidentified drugs are seen in Table 2.
Gastrointestinal potassium loss. Hypokalemia can occur fromgastrointestinal losses (diarrhoea, vomiting) via several complementarymechanisms. Any drugs causing vomiting or diarrhoea can inducehypokalemia. Clinically this phenomenon is most often seen in patientsabusing laxatives or purgatives. The clinical setting (symptoms, laboratoryvalues) of these patients sometimes mimic Barter's syndrome (pseudo-Bartersyndrome) (Rado, 1987).
Relatively inadequate potassium intake. During the therapy of severeanemia hypokalemia can be developed as a result of a demand for potassiumto support cell growth which exceeds the amount of potassium intake.
241
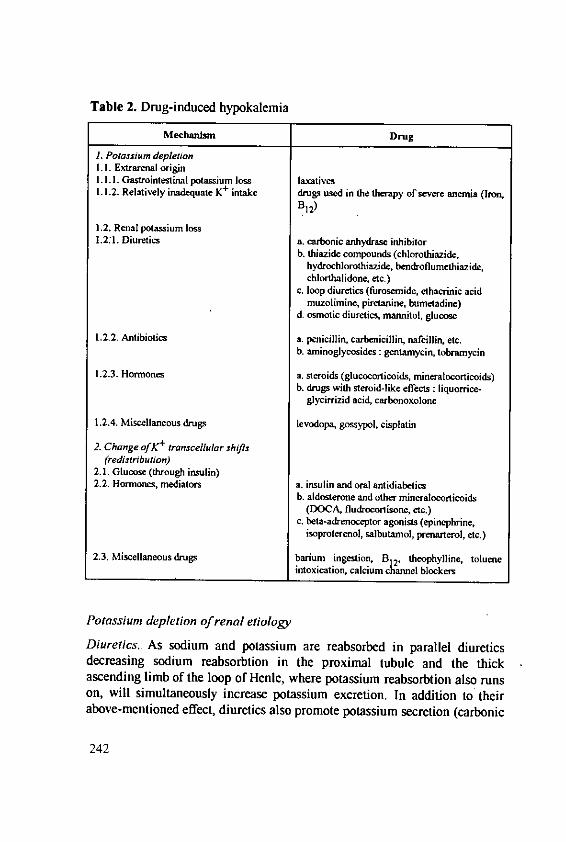
Table 2. Drug-induced hypokalemia
Mechanism Drug
1. Potassium depletion1.1. Extrarenal origin1.1.1. Gastrointestinal potassium loss laxatives1.1.2. Relatively inadequate K+ intake drugs used in the therapy of severe anemia (Iron,
B12)
1.2. Renal potassium loss1.2:1. Diuretics a. carbonic arthydrase inhibitor
b. thiazide compounds (chlorothiazide,hydrochlorothiazide, bendroflumethiazide,chlorthalidone, t.)
c. loop diuretics (furosemide, ethacrinic acidrmuzolimine, piretanine, bumetadine)
d. osmotic diuretics, mannitol, glucose
1.2.2. Antibiotics a. penicillin, carbenicillin, nalcillin, etc.b. aminogycosides : gentamycin, tobramycin
1.2.3. Hormones a. steroids (glucocorticoids, mineralocorticoids)b. drugs with steroid-like effects : liquorrice-
glycirrizid acid, carbonoxolone
1.2.4. Miscellaneous drugs levodopa, gossypol, cisplatin
2. Change of transcellular shifts(redistribution)
2.1. Glucose (through insulin)2.2. Hormones, mediators a. insulin and oral antidiabetics
b. aldosterone and other mineralocorticoids(DOCA, fludrocortisone, etc.)
c. beta-adrenoceptor agonists (epinephrine,isoproterenol, salbutamaol, prenarterol, etc.)
2.3. Miscellaneous drugs barium ingestion, B12, theophylline, tolueneintoxication, calcium channel blockers
Potassium depletion of renal etiology
Diuretics.. As sodium and potassium are reabsorbed in parallel diureticsdecreasing sodium reabsorbtion in the proximal tubule and the thickascending limb of the loop of Henle, where potassium reabsorbtion also runson, will simultaneously increase potassium excretion. In addition to theirabove-mentioned effect, diuretics also promote potassium secretion (carbonic
242
anhydrase inhibitors). The question is open about what magnitude ofdiuretics-induced potassium loss is clinically important (Tannen, 1990,Rado, 1989). Moreover, the necessity, the form and quantity of potassiumsupplementation or sparing arc also widely discussed (Tannen, 1987; Rado,1989). Of interest and potential therapeutic importance, some diuretics anddiseases (myocardial infarction) cause magnesium depletion .As the abilityof potassium to enter cells is influenced by magnesium, supplementationwith magnesium might be important in the therapy.
Antibiotics. Large doses of penicillin or penicillin derivatives (ampicillin,nafcillin, carbenicillin, ticarcillin, amoxicillin) and cephalexin result inrenal potassium loss. Increased renal potassium excretion results from theirpoorly resorbable negatively charged property. Aminoglycosides result inboth potassium and magnesium loss.
Hormones. A syndrome of mineralocorticoid excess (hypertension withhypo-kalemia) was observed using nasal spray containing a high dose ofmineralocorticoid. Carbenoxolone is an effective anti-ulcer drug withmineralocorticoid activity. True licorice contains glycirrihizic acid, a potentmineralocorticoid. As chewing tobaccos contain true licorice their use resultin the development of a clinical syndrome very similar to primaryhyperaldosteronism (Brass, 1982).
Miscellaneous drugs. Levodopa (L-DOPA) during the treatment ofParkinson's disease causes increased potassium excretion (Brass, 1982).Using cisplatin both hypokalemia and hypomagnesia can be observed.
Change in the redistribution ofpotassium
Hormones and mediators. Insulin, catecholamines and in a lesser degree,aldosterone all increase the potassium entry into the cell and result inhypokalemia. Excess insulin occurs in two clinical settings. First in healthypatients applying acute glucose load and secondly in the diabetics patientgiven exogenous insuline. The increase in endogenous catecholaminerelease accompaning severe acute pathologic condition (acute myocardialinfarction, head injuries, open heart surgery) also causes transienthypokalemia. Hypokalemia has been reported after the administration of nonselective beta-adrenergic agonists (epinephrine, isoprenaline) and selectivebeta2-agonist (salbutamol, terbutaline, fenoterol) for the therapy in asthmaand premature labour.
243
Miscellaneous drugs. These drugs result in hypokalemia by differentmechanisms. Theophylline enhances the release of catecholamines andinsulin and directly increases cyclic AMP. Barium induces hypokalemia byspecifically blocking the channels for potassium exit from cells. Calciumchannel blockers inhibit calcium-activated K+ channels resulting in adecrease in cellular K+ efilux.
4. Hyperkalemia
Hyperkalemia can occur in conditions that cause potassium retention andas a result of a variety of endogenous and exogenous factors that can modifythe redistribution of potassium across the cell membrane. Glucagon andsomatostatin (by inhibition of insulin secretion) and catecholamines withhigh alfa-receptor activity which are the most important endogenoussubstances result in hyperkalemia by inhibiting K+ uptake or enhancing K+effiux. Potassium retention results from either increased potassium intake ordiminished renal potassium excretion. This latter is the determinantmechanism. Under these circumstances clear-cut increases in cellularpotassium content have not been demonstrated, presumably becauseretention of a relatively small quantity of potassium results in life-threatening hyperkalemia.
4.1. Clinical sequelae of hyperkalemia
The most important manifestations of hyperkalemia similarly tohypokalemia result from aberations in membrane polarization of excitabletissue. The membrane is depolarized because the ratio of Ki/Ke is decreased.The major clinical manifestations of hyperkalemia result from thisdepolarization. The most prominent and sometimes severe symptoms ofhyperkalemia occur in the heart.
Cardiac symptoms. Hyperkalemia induces typical alterations in theelectrocardiogram. The T wave becomes peak and tented, P-R interval andQRS complex are prolonged. In very severe, life-threatening hyperkalemia Pwave is no longer recognizable and either ventricular fibrillation or arrestfollows. These signs result from the impaired cardiac conduction byhyperkalemia. The hyperkalemia-induced depolarization inactivates the fastsodium channels but tends to activate the slow Ca-channels. The slow Ca2+ -
244
dependent action potentials evoked by these latter channels are responsible
for a certain type of arrhythmias. Such slow response action potentials can
be observed in cardiac preparations obtained from patients submitted to
open-heart surgery (Kecskem6ti, 1985).
Neuromuscular effects. Paresthesia, weakness and flaccid paralysis
characterize the presence of hyperkalemia.
Endocrinologic manifestations. The endocrinologic effects including
increased aldosterone, insulin, glucagon and catecholamines secretion, do
not result in clinical problems.
Hemodynamic effects. High potassium intake lowers blood pressure both in
hyperkalemic animal models and human. This action is attributed to a
decrease in peripheral vascular resistance. High potassium diet,independently of antihypertensive action may protect against the
development of stroke.
4.2. Drug-induced hyperkalemia
The drugs that frequently induce hyperkalemia and their mechanisms of
action can be seen in Table 3.
Potassium containing drugs and foods
The most frequent sources of exogenous potassium are the various
potassium supplements (both oral and parenteral) or salt substitutes.
Extensive statistical study demonstrated the incidence of hyperkalemia in
elderly patients with renal insufficiency; in those receiving potassium both
orally and intravenously; in those receiving potassium in combination with
diuretics; in patients receiving high-dose intravenous injection of potassium-
penicillin (Rado, 1987).
245
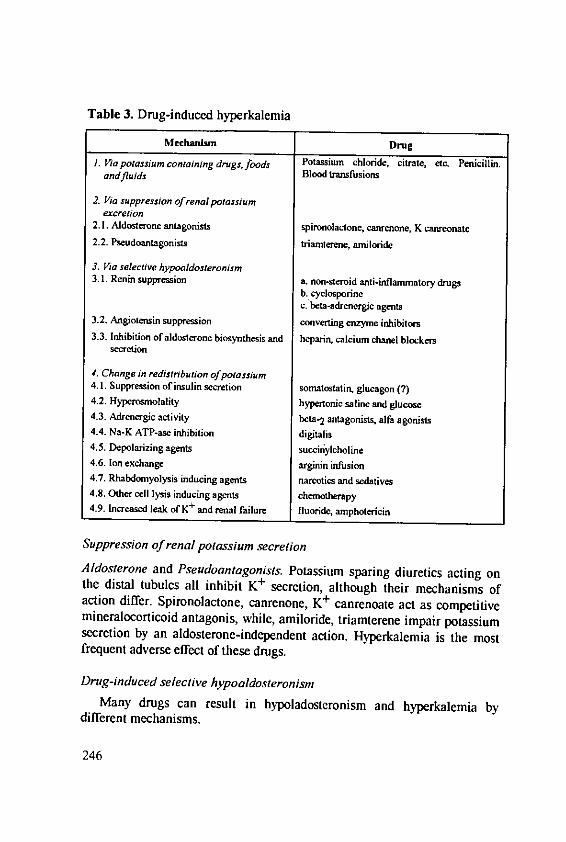
Table 3. Drg-induced hyperkalemia
Mechanism Drug1. Va potassium containing drugs. foods Potassium chloride, citrate, etc. Penicillin.
andfluids Blood transfusions
2. Via suppression of renal potassiumexcretion
2. 1. Aldosterone antagonists spironolactone, canrenone, K canreonate2.2. Pseudoantagonists triamierene, anjiloride
3. Via selective hypoaldosteronism3.1. Renin suppression a. non-steroid anti-inflammatory drugs
b. cyclosporinec. beta-adrenergic agents
3.2. Angiotensin suppression converting enzyme inhibitors3.3. Inhibition of aldosterone biosynthesis and heparin, calcium chanel blockers
secretion
4. Change in redistribution 0/potassium4.1. Suppression of insulin secretion sonatostatin, glucagon (?)4.2. Hyperosmolality hypertonic saline and glucose4.3. Adrenergic activity beta-2 antagonists, alfa agonists4.4. Na-K ATP-ase inhibition digitalis4.5. Depolarizing agents succirylcholine4.6. Ion exchange arginin infusion4.7. Rhabdonyolysis inducing agents narcotics and sedatives4.8. Other cell lysis inducing agents chemotherapy4.9. Increased leak of K+ and renal failure fluoride, amphotericin
Suppression of renal potassium secretion
Aldosterone and Pseudoantagonists. Potassium sparing diuretics acting onthe distal tubules all inhibit K+ secretion, although their mechanisms ofaction differ. Spironolactone, canrenone, K+ canrenoate act as competitivemineralocorticoid antagonis, while, amiloride, triamterene impair potassiumsecretion by an aldosterone-independent action. Hyperkalemia is the mostfrequent adverse effect of these drugs.
Drug-induced selective hypoaldosteronism
Many drugs can result in hypoladosteronism and hyperkalemia bydifferent mechanisms.
246
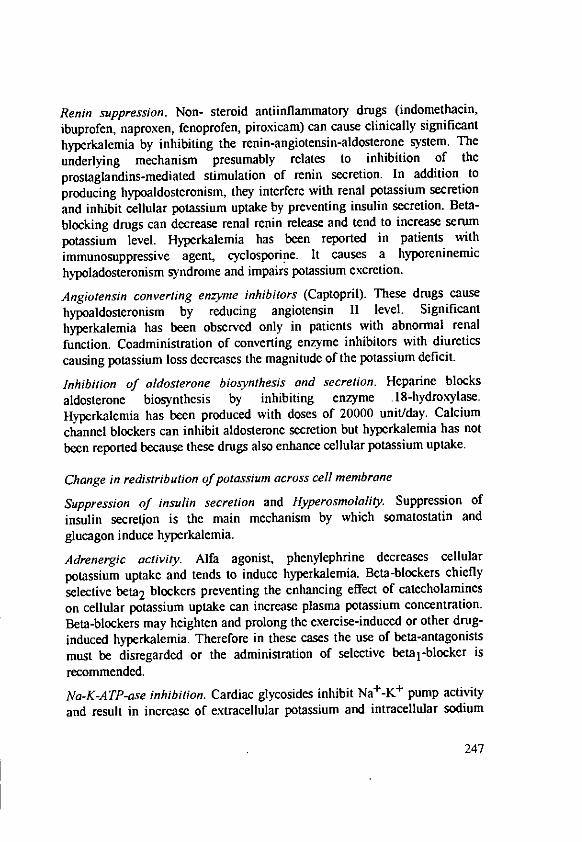
Renin suppression. Non- steroid antiinflamnmatory drugs (indomethacin,ibuprofen, naproxen, fenoprofen, piroxicam) can cause clinically significanthyperkalemia by inhibiting the renin-angiotensin-aldosterone system. Theunderlying mechanism presumably relates to inhibition of theprostaglandins-mediated stimulation of renin secretion. In addition toproducing hypoaldosteronism, they interfere with renal potassium secretionand inhibit cellular potassium uptake by preventing insulin secretion. Beta-blocking drugs can decrease renal renin release and tend to increase serumpotassium level. Hyperkalemia has been reported in patients withimmunosuppressive agent, cyclosporine. It causes a hyporeninemichypoladosteronism syndrome and impairs potassium excretion.
Angiotensin converting enzyme inhibitors (Captopril). These drugs cause
hypoaldosteronism by reducing angiotensin II level. Significanthyperkalemia has been observed only in patients with abnormal renalfunction. Coadministration of converting enzyme inhibitors with diureticscausing potassium loss decreases the magnitude of the potassium deficit.
Inhibition of aldosterone biosynthesis and secretion. Heparine blocks
aldosterone biosynthesis by inhibiting enzyme .18-hydroxylase.Hyperkalemia has been produced with doses of 20000 unit/day. Calciumchannel blockers can inhibit aldosterone secretion but hyperkalemia has notbeen reported because these drugs also enhance cellular potassium uptake.
Change in redistribution of potassium across cell membrane
Suppression of insulin secretion and Hyperosmolality. Suppression of
insulin secretjon is the main mechanism by which somatostatin andglucagon induce hyperkalemia.
Adrenergic activity. Alfa agonist, phenylephrine decreases cellularpotassium uptake and tends to induce hyperkalemia. Beta-blockers chieflyselective beta 2 blockers preventing the enhancing effect of catecholamineson cellular potassium uptake can increase plasma potassium concentration.Beta-blockers may heighten and prolong the exercise-induced or other drug-induced hyperkalemia. Therefore in these cases the use of beta-antagonistsmust be disregarded or the administration of selective beta1 -blocker isrecommended.
Na-K-ATP-ase inhibition. Cardiac glycosides inhibit Na+-K + pump activityand result in increase of extracellular potassium and intracellular sodium
247
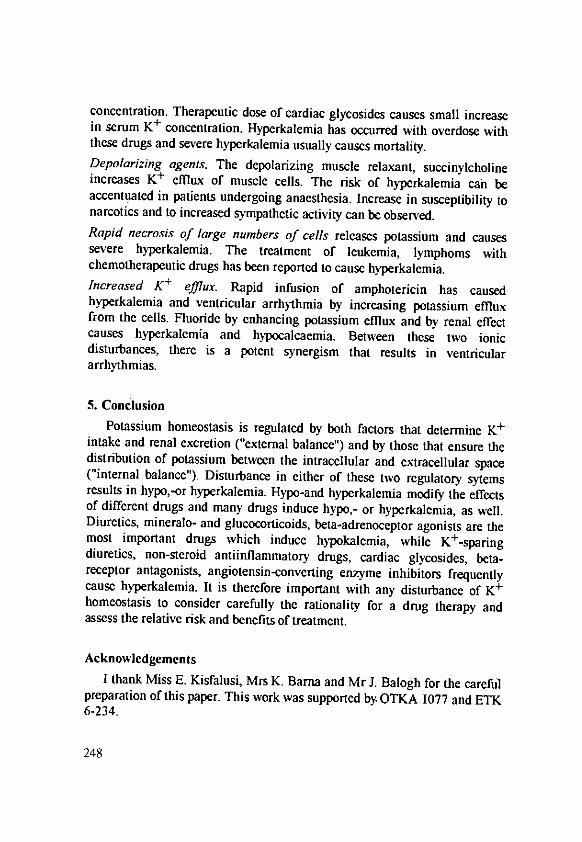
concentration. Therapeutic dose of cardiac glycosides causes small increasein serum K+ concentration. Hyperkalemia has occurred with overdose withthese drugs and severe hyperkalemia usually causes mortality.Depolarizing agents. The depolarizing muscle relaxant, succinytcholineincreases K+ effiux of muscle cells. The risk of hyperkalemia can beaccentuated in patients undergoing anaesthesia. Increase in susceptibility tonarcotics and to increased sympathetic activity can be observed.Rapid necrosis of large numbers of cells releases potassium and causessevere hyperkalemia. The treatment of leukemia, lymphoms withchemotherapeutic drugs has been reported to cause hyperkalemia.Increased K+ efflux. Rapid infusion of amphotericin has causedhyperkalemia and ventricular arrhythmia by increasing potassium effluxfrom the cells. Fluoride by enhancing potassium efflux and by renal effectcauses hyperkalemia and hypocalcaemia. Between these two ionicdisturbances, there is a potent synergism that results in ventriculararrhythmias.
5. ConclusionPotassium homeostasis is regulated by both factors that determine K+
intake and renal excretion ("external balance") and by those that ensure thedistribution of potassium between the intracellular and extracellular space("internal balance"). Disturbance in either of these two regulatory sytemsresults in hypo,-or hyperkalemia. Hypo-and hyperkalemia modify the effectsof different drugs and many drugs induce hypo,- or hyperkalemia, as well.Diuretics, mincralo- and glucocorticoids, beta-adrenoceptor agonists arc themost important drugs which induce hypokalemia, while K+-sparingdiuretics, non-steroid antiinflammatory drugs, cardiac glycosides, beta-receptor antagonists, angiotensin-converting enzyme inhibitors frequentlycause hyperkalemia. It is therefore important with any disturbance of K+homeostasis to consider carefully the rationality for a drug therapy andassess the relative risk and benefits of treatment.
Acknowledgements
I thank Miss E. Kisfalusi, Mrs K. Barna and Mr J. Balogh for the carefulpreparation of this paper. This work was supported by. OTKA 1077 and ETK6-234.
248
References
Agus, Z.S., Morad, M. : Modulation of cardiac ion channels by magnesium.
Annu. Rev. Physiol. 53, 299-307 (1991)
Alvestrand, A., Wahren, J., Smith, D., et al. : Insulin-mediated potassium
uptake is normal uremic and healthy subjects. Am. J. Physiol. 246,
E174-EI80 (1980)Armstrong, C.M., Matteson, DR. : The role of calcium ions in the closing
of K channels. J. Gen. Physiol. 87, 817-832 (1986)
Bia, M. J., DeFronzo, R. A. : Extrarenal potassium homeostasis. Am. J.
Physiol. 240, F257-F268 (1981)Brass, M.J., Thompson W.L. : Drug-induced electrolytes abnormability.
Drugs 24, 207-218(1982)Brown, MJ., Brown, D.C., Murphy, M.B. : Hypokalemia from beta2-
receptor stimulation by circulating epinephrine. N.Engl. J. Med. 309,
1414-1419 (1983)Clausen, T. : Regulation of Na+-K+ transport in skeletal muscle. Physiol.
Rev. 66, 542-580 (1986)Clausen, T., Kohn, P.G. : The effect of insulin on the transport of sodium
and potassium in rat soleus muscle. J. Physiol. (Lond) 265, 19-42 (1977)
Ellingsen, 0., Sejersted, O.M., Leraand, S. el al. :Catecholamine-induced
myocardial potrassium uptake mediated by betaI-adrenoceptors and
adenylate cyclase activation in the pig. Circ. Res. 65, 540-550 (1987)
DeFronzo, R. A., Felig, P., Ferrannini, E., et al. : Effect of graded doses of
insulin on splanchnic and peripheral potassium metabolism in man. Am.
J. Physiol. 238, E421-E427 (1980)
Findlay, 1. : ATP-sensitive K+ channels in rat ventricular myocytes are
blocked and inactivated by internal divalent cations. Pilugers Arch. 410,
313-320 (1987)Greger, R., Gogelein, H. : Role of K+ conductive pathways in the nephron.
Kidney Int. 31, 1055-1064 (1987)Kecskemdti, V., Kelemen, K., Solti, F., Szabo Z. : Physiological and
pharmacological analysis of transmembrane action potentials of human
atrial fibers. In: Advances in Myocardiology Vol. 6. Ed. Dhalla, N.S. and
Hearse, D.J. Plenum Publ., New York, 37-47 (1985)
Kecskemdti, V. : Molecular action of class I antiarrhythmic drugs and
clinical implications. Pharmacol. Res. 24, 131-141 (1991)
Knochel, J.P. Neuromuscular manifestations of electrolytes disorders. Am.
J. Med. 72, 521-535 (1982)
249
Moore, R. D. : Effect of insulin upon the sodium pump in frog skeletalmuscle. J. Physiol. (Lend) 219, 1178-1182 (1973)
Moore, R..D. : Elevation of intracellular pH by insulin in frog skeletalmuscle. Biochem. Biophys. Res. Commun. 91, 900-904 (1979)
Moore, R. D. : Stimulation of Na:H exchange by insulin. Biophys. J. 33,203-210 (1981)
Rado, J.P. : Drug-induced electrolytes disturbances. Giorn. It. Chim. Clin.12, 173-190 (1987)
Rado, J.P. : Endocrinological aspects of potassium metabolism. ActaPhysiol. Hung. 74, 95-102 (1989)
Rosati, C., Hannaert, P., Dausse, I.P. et aL : Stimulation of beta-adrenoceptors inhibits calcium-dependent potassium-channels in mousemacrophages. J. Cell. Physiol. 129, 310-314 (1986)
Rosic, N.K., Standaert, M. L., Pollet : The mechanism of insulin stimulationof (Na+, K+)-ATP-ase transport activity in muscle. J. Biol. Chem. 260,6206-6212 (1985)
Sasaki, K., Sato, M. : A single GTP-binding protein regulates K+-channelscoupled with dopamine, histamine and acetylcholine receptors. Nature325, 259-262 (1987)
Silva, P., Spokes, K. : Sympathetic system in potassium homeostasis. Am. J.Physiol. 241, FI51-FI55 (1981)
Stark, J., O'Doherty, J. : Intracellular Na+ and K+ activities during insulinstimulation of rat soleus muscle. Am. J. Physiol. 242, E193-E200 (1982)
Stems, R. H., Guzzo, J., Feig, P. U. : The disposition of intravenouspotassium in normal man: the role of insulin. Clin. Sci. 61, 23-28 (1981)
Tannen, R. L. : Potassium metabolism. In: Current Nephrology vol. 6, Ed.Gonick C.K., John Wiley, New York, 151-186 (1983)
Tannen, R. L. : Potassium disorders. In: Fluids and electrolytes, Ed. Kokko,J.P. and Tannen, R.L., Saunders, Philadelphia, 195-300 (1990)
Thier, S.C. : Potassium physiology. Am. J. Med. 80, 3-7 (1986)Vincent, H.H., Veld, A. J.M., Boomsma, F., Schalekamp, M.A. : Prevention
of epinephrine-induced hypokalemia by nonselective beta blockers. Am.J. Cardiol. 56, 10D-14D (1985)
Weiss, J. N., Lamp, S. T. : Glycolysis preferentially inhibits ATP-sensitiveK+ channels in isolated guinea pig cardiac myocytes. Science 238, 67-69(1987)
Zierler, K., Rogus, E. M., Scherer, R. W., Wu, F. S. : Insulin action onmembrane potential and glucose uptake : effects of high potassium. Am.J. Physiol. 249, E17-E25 (1985)
250
Potassium Concentration in Beverages as aGuidance for Potassium-Threshold Levels inDrinking Water
Grossklaus, R., Division of Clinical Nutrition, Max von Pettenkofer-Institute, Federal Health Office, P.O. Box 330013, D-Berlin
Summary
The EC Directive on the quality of water for human consumption has
established for potassium a guide level of 10 mg 1-1 and a minimum
admissible concentration (MAC) value of 12 mg 1-1. There are obviously no
health-related reasons for the determination of such low limit values in
drinking water, since the potassium concentrations in beverages are
substantially higher (e.g. fruit juices contain up to 2270 mg 1-1). The aim of
this contribution is to point out this discrepancy. In this connection, it is
important to consider the significance of potassium in physiological
processes, including the probability of dietary potassium deficiency or excess
and other health effects like the possible influence on blood pressure. The
levels of potassium found in the food chain clearly show that beverages
including tap water still represent 13.5% of the daily potassium intake and
have no health relevance in relation to the total potassium intake through
solid foods. In conclusion, it would be unsound from the viewpoint of
nutritional medicine to take the potassium concentrations in beverages as a
guide for the corresponding level in drinking water. The same applies to the
determination of a limit value for potassium itself.Key words : potassium; health effects; food chain; occurrence; daily intake.
1. Introduction
Directive 80/778/EEC on the quality of water for human consumption is
intended for use by the member states as a basis to harmonize their
legislation, and thus to ensure the safety of drinking water supplies in the
whole community (1). This EC Directive establishes for potassium a guide
level of 10 mg 1-1 and a maximum admissible concentration (MAC) value of
12 mg I-. WHO and USEPA do not consider this parameter (2,3).
251
For potassium and certain other substances, there is obviously no health-related, and thus, no uniform principle for the determination of limit values.In addition, according to Article 9 of Directive 80/778/EEC deviations fromthe limit value are permissible in the cases of potassium and some othersubstances such as magnesium and sulphate, if necessary for geogenicreasons. In this connexion, values have been determined only for sulphatefor reasons of health. With regard to infants, the content of sulphate shouldnot exceed 500 mg 1-1 because of its laxative effect (4).
The determination of an admissible limit value for potassium of 12 and50 mg 1-1 drinking water, respectively, (5) is of no importance for health dueto its low share in the total potassium intake. Levels of more than 12 mgpotassium 1-1 would be objectionable only if this would indicate fecalcontamination. In such cases, the potassium content in drinking water wouldbe higher than the sodium content (6). Apart from that, there is neither aphysiological nor toxicological justification for such a low limit value forpotassium (7). As is generally known, many beverages which are recognizedas being wholesome contain distinctly higher potassium concentrations thandrinking water.
Therefore, the objective of this contribution is to point out thisdiscrepancy. First of all, I would like to consider, for a better understanding,the significance of potassium in the human organism, in particular withregard to the health effects of a potassium deficiency or excess, beforetreating the subject proper, i.e. the occurrence of potassium in beverages, inorder to show the value of this element in the food chain in relation to anunnecessarily low limit value of potassium in drinking water.
2. Significance of potassium
2.1. Physiology
Potassium is essential for normal growth and existence. Total bodypotassium amounts to about 2000 mg kg-1 body weight, that is about 140 gfor the average adult. At least 95 per cent of this is intracellular, occurringin cell water at a concentration of 150 mM (5.9 g 1-1), more than 30 timesthe concentration at which it is found in plasma and interstitial fluid (3.5 to5.5 mM). This compartmentalisation of potassium is maintained by theenergy-dependent so-called sodium pump (8,9). This process is fundamentalto the cellular uptake of molecules against electrochemical andconcentration gradients, to the electrophysiology of nerves and muscle, to
252
acid-base regulation, and to the maintenance of normal blood pressure(10,11).
More than 90% of ingested potassium is absorbed from the
gastrointestinal tract, but higher or lower intakes are not reflected in
fluctuations in plasma potassium concentrations because the kidney can
regulate potassium balance. Potassium is lost from the body in urine and
gastrointestinal secretions, whereas only minimal amounts are excreted in
sweat. To maintain normal body stores and a normal concentration in
plasma and interstitial fluid, an intake of about 1600 mg per day may be
needed. Therefore, the estimated minimum potassium requirement of
healthy persons over 18 years was fixed at up to 2000 mg per day (12,13).
2.2. Potassium deficiency and excess
Potassium deficiency arising from an inadequate dietary intake is
unlikely because of the ubiquity of potassium in foodstuffs. The most
important cause of deficiency is excessive losses, usually through the
gastrointestinal tract or the kidney. Large alimentary potassium losses may
occur through prolonged vomiting, chronic diarrhoea, or laxative abuse. The
most common cause of excessive renal loss is drug-induced, especially by
diuretic agents. Some forms of chronic renal disease and metabolic
disturbances can also lead to severe potassium loss. The chief symptoms of
potassium deficiency are muscular weakness and mental confusion. The
effects on cardiac muscle are reflected by electrocardiographic changes
characteristic of impaired polarization which may lead to arrhythmia and
cardiac arrest. Similar functional changes in the intestinal muscle can cause
paralytic ileus; this leads to abdominal distension, which may be an
important early sign of potassium deficiency, especially in children. Since
potassium is an important component of lean tissue, potassium deficiency
can impair growth in children, in particular in those recovering from
protein-energy malnutrition.The effects of potassium excess are only reported as a result of sudden
enteral or parenteral increases of potassium intake to levels about 250 mg
kg-' body weight (18 g) for an adult. Such an excessive dose may induce
acute intoxication (hyperkalaemia) which may also cause sudden death by
stopping the heart. As long as renal function is normal it is almost
impossible to induce potassium excess on habitual dietary intakes (1.6 to 5.9
g d-1). Intake from drinking water represents less than 1 percent of the total
daily intake. In individuals with impaired renal function, adrenal
253
insufficiency or liver cirrhosis, the threshold for acute toxicity may be lower,at 80 to 100 mg kg-' body weight (14,15).
In the case of patients with disturbances of the potassium balance,constant control of the serum potassium level and of the potassium intakevia food (vegetable food rich in potassium!) are necessary. The contributionof potassium from drinking water to the total potassium intake has to beignored also under this aspect so that there is no reason for thedetermination of a low limit value for potassium in drinking water from theviewpoint of health (7).
2.3. Other health effectsThere is considerable evidence that dietary potassium exerts a beneficial
effect in hypertension, and recommendations for increased intake of fruitand vegetables (16) would raise the potassium intake of adults to about 3.5 gper day. In the Intersalt study, urinary potassium excretion, an assumedindicator of potassium intake, was negatively related to blood pressure aswas the urinary Na:potassium concentration ratio (17). Increasing potassiumintakes to above levels achievable with customary diets reduced bloodpressure in normotensive and hypertensive individuals and increased urinarysodium loss (18,19). Although some studies contradict these findings, ameta-analysis of published reports suggests that such observations are valid(20).
3. Occurrence in the food chainIt was accepted that, in the evaluation of the health effects of anyinorganic constituents, all routes of exposure had to be considered when
deciding upon a value for drinking water (2,3 1). Occurrence of potassium inthe food chain includes solid foods, beverages and drinking water.
3.1. Solid foodsAmong the solid foods, potassium is particularly abundant in vegetables,potatoes, fruit (especially bananas) and cereals. High concentration of
potassium is also found in meat, -fish, some milk products and egg(21,22,23,24). Consuming a mixed western diet, the reported averageintakes of potassium were in the range of 2.8 to 4.5 g/day (24,25,26,27,28).For example, in the Federal Republic of Germany (before 1990) women and
254
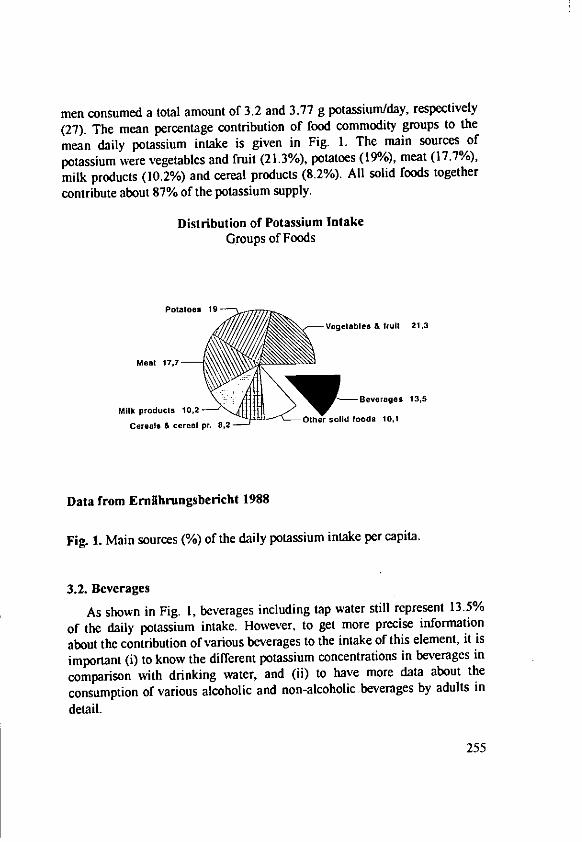
men consumed a total amount of 3.2 and 3.77 g potassium/day, respectively(27). The mean percentage contribution of food commodity groups to the
mean daily potassium intake is given in Fig. 1. The main sources of
potassium were vegetables and fruit (21.3%), potatoes (19%), meat (17.7%),
milk products (10.2%) and cereal products (8.2%). All solid foods together
contribute about 87% of the potassium supply.
Distribution of Potassium IntakeGroups of Foods
Potatoes 19
Vegetables & fruit 21.3
Meat 17,7
Milkproducts R10,2 ' B Beverages 13,5
Mp c 0Other solid foods 10,1
Cereals & cereal pr. 8.2
Data from Ernlihrungsbericht 1988
Fig. 1. Main sources (%) of the daily potassium intake per capita.
3.2. Beverages
As shown in Fig. 1, beverages including tap water still represent 13.5%
of the daily potassium intake. However, to get more precise information
about the contribution of various beverages to the intake of this element, it is
important (i) to know the different potassium concentrations in beverages in
comparison with drinking water, and (ii) to have more data about the
consumption of various alcoholic and non-alcoholic beverages by adults in
detail.
255
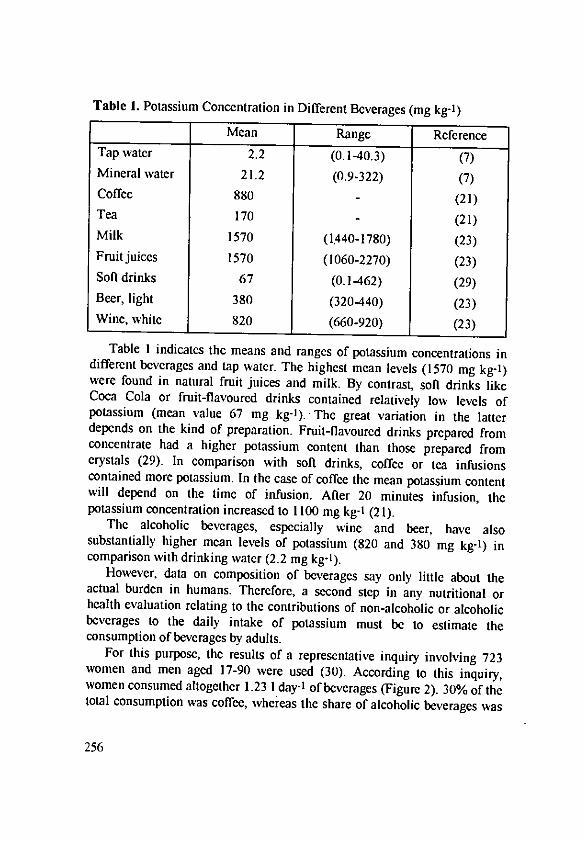
Table 1. Potassium Concentration in Different Beverages (mg kg-1)
Mean Range ReferenceTap water 2.2 (0.1-40.3) (7)Mineral water 21.2 (0.9-322) (7)Coffee 880 (21)Tea 170 (21)Milk 1570 (1440-1780) (23)Fruit juices 1570 (1060-2270) (23)Soft drinks 67 (0.1-462) (29)Beer, light 380 (320440) (23)Wine, white 820 (660-920) (23)
Table I indicates the means and ranges of potassium concentrations indifferent beverages and tap water. The highest mean levels (1570 mg kg-')were found in natural fruit juices and milk. By contrast, soft drinks likeCoca Cola or fruit-flavoured drinks contained relatively low levels ofpotassium (mean value 67 mg kg-'). The great variation in the latterdepends on the kind of preparation. Fruit-flavoured drinks prepared fromconcentrate had a higher potassium content than those prepared fromcrystals (29). In comparison with soft drinks, coffee or tea infusionscontained more potassium. In the case of coffee the mean potassium contentwill depend on the time of infusion. After 20 minutes infusion, thepotassium concentration increased to 1100 mg kg-1 (21).
The alcoholic beverages, especially wine and beer, have alsosubstantially higher mean levels of potassium (820 and 380 mg kg-') incomparison with drinking water (2.2 mg kg-i).
However, data on composition of beverages say only little about theactual burden in humans. Therefore, a second step in any nutritional orhealth evaluation relating to the contributions of non-alcoholic or alcoholicbeverages to the daily intake of potassium must be to estimate theconsumption of beverages by adults.
For this purpose, the results of a representative inquiry involving 723women and men aged 17-90 were used (30). According to this inquiry,women consumed altogether 1.23 I day-' of beverages (Figure 2). 30% of thetotal consumption was coffee, whereas the share of alcoholic beverages was
256
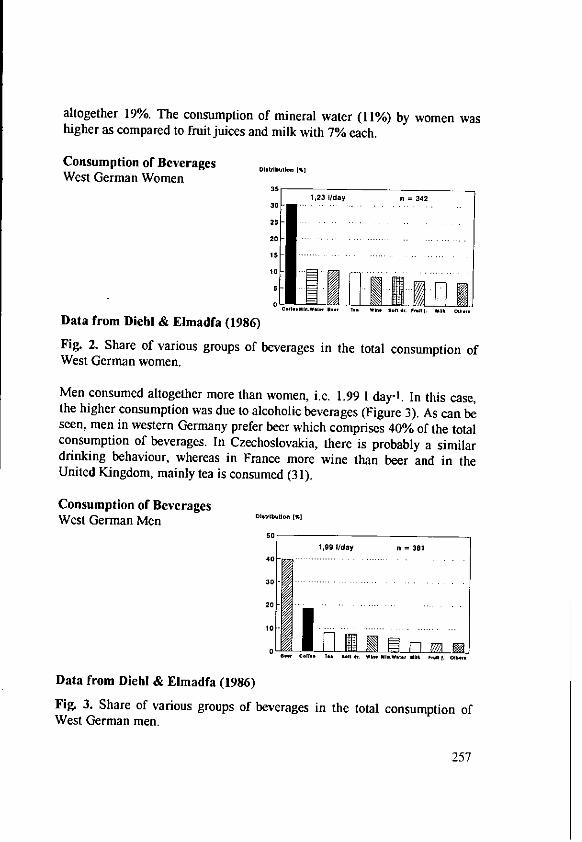
altogether 19%. The consumption of mineral water (11%) by women washigher as compared to fruit juices and milk with 7% each.
Consumption of Beverages o.but,.° 1%]
West German Women35
1,23 I/day n = 34230
25
20
10
Data from Diehl & Elmadfa (1986)
Fig. 2. Share of various groups of beverages in the total consumption ofWest German women.
Men consumed altogether more than women, i.e. 1.99 1 day-'. In this case,the higher consumption was due to alcoholic beverages (Figure 3). As can beseen, men in western Germany prefer beer which comprises 40% of the totalconsumption of beverages. In Czechoslovakia, there is probably a similardrinking behaviour, whereas in France more wine than beer and in theUnited Kingdom, mainly tea is consumed (31).
Consumption of BeveragesW est Germ an M en o,,tbuto (J,
50
1,99 I/day n = 38140. .......... .
30-
20tO............ .............
10
Data from Diehl & Elmadfa (1986)Fig. 3. Share of various groups of beverages in the total consumption ofWest German men.
257
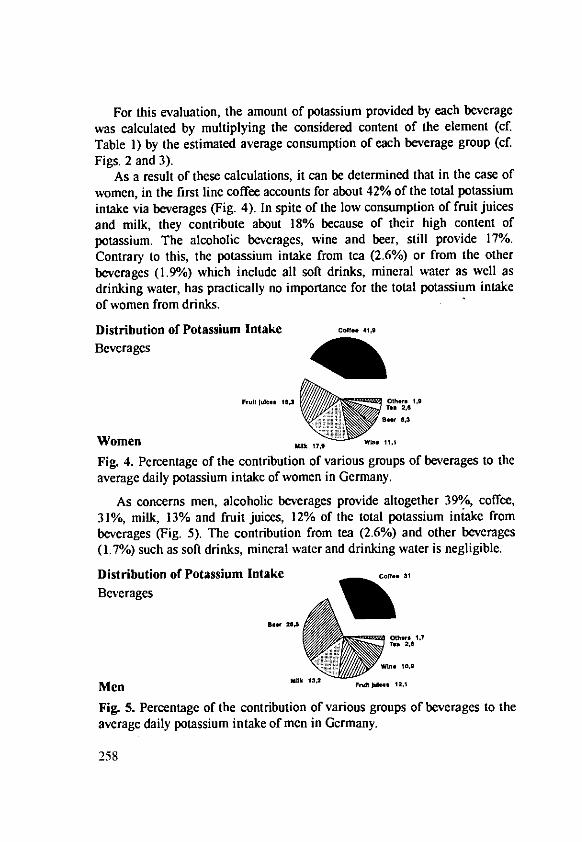
For this evaluation, the amount of potassium provided by each beveragewas calculated by multiplying the considered content of the element (cf.Table 1) by the estimated average consumption of each beverage group (cf.Figs. 2 and 3).
As a result of these calculations, it can be determined that in the case ofwomen, in the first line coffee accounts for about 42% of the total potassiumintake via beverages (Fig. 4). In spite of the low consumption of fruit juicesand milk, they contribute about 18% because of their high content ofpotassium. The alcoholic beverages, wine and beer, still provide 17%.Contrary to this, the potassium intake from tea (2.6%) or from the otherbeverages (1.9%) which include all soft drinks, mineral water as well asdrinking water, has practically no importance for the total potassium intakeof women from drinks.
Distribution of Potassium Intake Cofee. ,1,
Beverages
F-11l 1.1... 1843 / m Ooh'.e 1,9
wi. * 0,3
Women Milk 17i
Fig. 4. Percentage of the contribution of various groups of beverages to theaverage daily potassium intake of women in Germany.
As concerns men, alcoholic beverages provide altogether 39%, coffee,31%, milk, 13% and fruit juices, 12% of the total potassium intake frombeverages (Fig. 5). The contribution from tea (2.6%) and other beverages(1.7%) such as soft drinks, mineral water and drinking water is negligible.
Distribution of Potassium Intake C.fe 31
Beverages I
Be.* .,A
Mehre 1.7
T.. 2.0
Men oFru 12.,
Fig. 5. Percentage of the contribution of various groups of beverages to theaverage daily potassium intake of men in Germany.
258
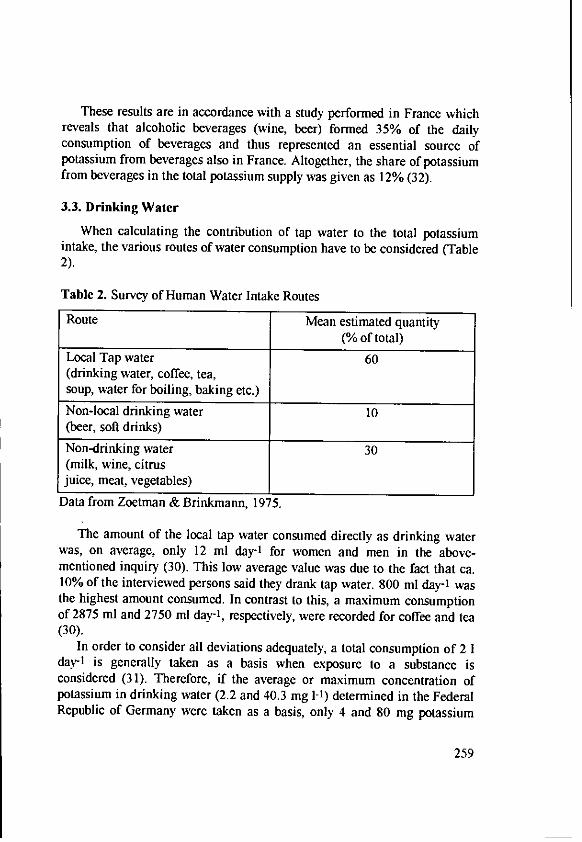
These results are in accordance with a study performed in France whichreveals that alcoholic beverages (wine, beer) formed 35% of the dailyconsumption of beverages and thus represented an essential source ofpotassium from beverages also in France. Altogether, the share of potassiumfrom beverages in the total potassium supply was given as 12% (32).
3.3. Drinking Water
When calculating the contribution of tap water to the total potassiumintake, the various routes of water consumption have to be considered (Table2).
Table 2. Survey of Human Water Intake Routes
Route Mean estimated quantity(% of total)
Local Tap water 60(drinking water, coffee, tea,soup, water for boiling, baking etc.)
Non-local drinking water 10(beer, soft drinks)Non-drinking water 30(milk, wine, citrusjuice, meat, vegetables)
Data from Zoetman & Brinkmann, 1975.
The amount of the local tap water consumed directly as drinking waterwas, on average, only 12 ml day-' for women and men in the above-mentioned inquiry (30). This low average value was due to the fact that ca.10% of the interviewed persons said they drank tap water. 800 ml day-1 wasthe highest amount consumed. In contrast to this, a maximum consumptionof 2875 ml and 2750 ml day-', respectively, were recorded for coffee and tea(30).
In order to consider all deviations adequately, a total consumption of 2 1day-' is generally taken as a basis when exposure to a substance isconsidered (31). Therefore, if the average or maximum concentration ofpotassium in drinking water (2.2 and 40.3 mg 1-1) determined in the FederalRepublic of Germany were taken as a basis, only 4 and 80 mg potassium
259
would be incorporated via this route. For this reason, the contribution ofdrinking water to the total potassium intake (3770 mg day-') should beignored from the viewpoint of nutritional physiology. It is, on an average,only 0.1% (7). The share of potassium in the total potassium intake mayincrease to 13.5% from beverages (cf. Fig. 1). Finally, this amount ofpotassium from beverages has no health relevance as compared with thecontribution from solid foods.
4. Conclusions
In consequence of the nutritional and health evaluation of potassium inwater and the levels found in beverages and solid foods, the MAC value forpotassium in drinking water is unnecessarily low. From the point of view ofnutritional medicine, a health relevance cannot be derived as an argument.
Although the contribution of potassium from beverages such as milk andfruit juices is considerably higher, it is, however, of minor importance inrelation to the total potassium intake through foods.
For this reason, it would be unsound from the viewpoint of nutritionalmedicine to take the potassium concentration in beverages as a guide for thecorresponding level in drinking water and the same applies to thedetermination of a limit value for potassium itself.
References
1. EC Directive 80/778/EC2. WHO : Guidelines for drinking-water quality. Vol. 1. Recommendations.
Geneva, 19843. US-Environmental Protection Agency (US-EPA) : National Interim
Primary Drinking Water Regulations. Fed. Reg. 59566-59588, Dec. 24,1975
4. U. Hisselbarth : Die Bedeutung der Grenzwerte fUr chemische Stoffe inder Trinkwasserverordnung und die Regelungen beim Uberschreiten vonGrenzwerten. In : K. Aurand, U. Hasselbarth, H. Lange-Asschenfeldt,W. Steuer (Hrsg.) Die Trinkwasserverordnung, 3., neubearbeiteteAuflage. Erich Schmidt Verlag, Berlin, pp. 126-140, 1991
5. Verordnung zur Anderung der Trinkwasserverordnung und der Mineral-und Tafelwasser-Verordnung vom 5 Dezember 1990 (BGBI I S. 2600)
6. K. H611 : Wasser. Untersuchung, Beurteilung, Aulbereitung, Chemie,Bakteriologie, Biologic. 5. Auflagc. Walter de Gruyter & Co., Berlin, p.88, 1990
260

7. R. Grossklaus : Vorkommen, Bedeutung und Bestimmung von Kalium.In: K. Aurand, U. Hasselbarth, H. Lange-Asschenfeldt, W. Steuer (Hrsg.)Die Trinkwasserverordnung. 3., neubearbeitete Auflage. Erich SchmidtVerlag, Berlin, pp. 387-392, 1991
8. I.M. Glynn, S.I.D. Karlish : The sodium pump. Annu. Rev. Physiol. 3713-55 (1975)
9. J. Patrick: Assessment of body potassium stores. Kidney Int. 11 : 476-490(1977)
10. F.C. Luft : Sodium, chloride and potassium. In: M. Brown (ed.) PresentKnowledge in Nutrition. 6th Edition. International Life SciencesInstitute Nutrition Foundation, Washington, DC., pp. 233-240, 1990
11. G.G. Krishna, E. Miller, S. Kapoor : Increased blood pressure duringpotassium depletion in normotensive men. N. Engl. J. Med. 320 : 1177-1182 (1989)
12. National Research Council : Recommended Dietary Allowances. 10thEdition. National Academy of Sciences, Washington, DC, 1989
13. Deutsche Gesellschaft fir Ernahrung : Empfehlungen fUr dieNahrstoffzufuhr, 5. Uberarbeitung. Umschau Verlag, Frankfurt/Main,1991
14. U. Binswanger : Klinische Stcrungen des Kaliumstoffwechsels. Schweiz.med. Wschr. 107 : 1049-1057 (1977)
15. S. Moeschlin : Klinik und Therapie der Vergiftungen, 5. neubearbeiteteund erweiterte Auflage. Georg Thieme Verlag, Stuttgart, pp. 119-120,1972
16. National Research Council : Diet and Health Implications for ReducingChronic Disease Risk. Report of the Committee on Diet and Health,Food and Nutrition Board, Commission of Life Sciences, SecondPrinting. National Academy Press, Washington, D.C., pp. 421-423, 1990
17. Intersalt Cooperative Research Group : Intersalt: an international studyof electrolyte excretion and blood pressure. Results for 24 hour urinarysodium and potassium excretion. Br. Med. J. 297 : 319-328 (1988)
18. G. Rose : Desirability of changing potassium intake in the community.In: P.K. Whelton, A.K. Whelton, W.G. Walker (eds.) Potassium inCardiovascular and Renal Disease. Marcel Dekker, New York, pp. 411-416, 1986
19. L.P. Svetkey, W.E. Yarger, J. Fenssner, E. DeLong, P.E. KlotmanDouble-blind, placebo-controlled trial of potassium chloride in thetreatment of mild hypertension. Hypertension 9 : 444-450 (1987)
261
20. F.P. Cappucio, G.A. MacGregor : Does potassium supplementationlower blood pressure? A meta-analysis of published trials. I.Hypertension 9 : 465473 (1991)
21. R.A. McCance, E.M. Widdowson : The composition of foods. Thirdimpression. Her Majesty's Stationary Office, London, 1973
22. J. Maples, R.B.H. Wills, H. Greenfield: Sodium and potassium levels inAustralian processed foods. Med. J. Aust. 2: 20-22 (1982)
23. S.W. Souci, W. Fachmann, H. Kraut: Food composition and nutritiontables 1989/90, 4th revised and completed edition. WissenschaftlicheVerlagsgesellschaft mbH, Stuttgart, 1989
24. M. Anke, G. Gruber, J. Kleemann, M. Miller: Der Kaliumgehalt derNahrungsmittel bzw. Getranke und die Kaliumaufnahme Erwachsener inBrandenburg und Thuringen. In : M. Anke, C. Brfickner, B. Groppel, H.Giirtler, M. Griln, I. Lombeck, H.-J. Schneider (Hrsg.) Mengen- undSpurenelemente. Universitt Jena, 10. Arbeitstagung 1990, Bd. 2, pp.534-541, 1990
25. D.R. Fischer, K.J. Morgan, M.E. Zabik : Cholesterol, saturated fattyacids, sodium, and potassium intakes of the United States population. J.Am. Coll. Nutr. 4 : 207-224 (1985)
26. J. Lewis, D.H. Buss : Trace nutrients. 5. Mineral and vitamins in theBritish household food supply. Br. J. Nutr. 60: 413-424 (1988)
27. Ernllhrungsbericht 1988 : Deutsche Gesellschaft flir Ernmahrung e.V.(ed.) Druckerei Henrich, Frankfurt/Main, 1988
28. W. Van Dokkum, R.H. De Vos, Th. Muys, J.A. Wesstra : Minerals andtrace elements in total diets in the Netherlands. Br. J. Nutr. 61 : 7-15(1989)
29. B.E. Wendland, G.S. Arbus : Oral fluid therapy: sodium and potassiumcontent and osmolality of some commercial "clear" soups, juices andbeverages. CMA Journal 121 : 564-571 (1979)
30. J.M. Diehl, I. Elmadfa : Der Konsum alkoholischer und alkoholfreierGetriinke im Erwachsenenalter. Akt. Ernhr. 11 : 258-268 (1986)
31. B.C.J. Zoeteman, F.J.J. Brinkmann : Human intake of minerals fromdrinking water in the European Communities. In : R.' Amaris, W.J.Hunter, J.G.P.M. Smects (eds.) Hardness of Drinking Water and PublicHealth. Pergamon Press, Oxford, pp. 173-202, 1975
32. G. Darret, F. Couzy, J.-M. Antoine, C. Magliola, J.-P. MareschiEstimation of minerals and trace elements provided by beverages for theadult in France. Ann. Nutr. Metab. 30 : 335-344 (1986)
262
Coordinator's Report on Session 3
Vez, A., Federal Agricultural Research Station, Changins, Switzerland
The interest of an agronomist in a session devoted to potassium in the foodchain is twofold:
1. Knowledge of K requirements of man and influence of K on health;2. Determination of the possible impact of K fertilization of crops on
man's health.It is important to answer these questions in order to determine whether
present K fertilizer treatment of crops should be modified.The role of potassium in the plant is well known. The function of more
than 60 enzymes depends on optimal K+ concentration in the cytoplasm. Animportant role is also attributed to potassium in maintaining water balancein the plant. Indeed, plants suffering from K deficiency are usuallyconsidered more drought susceptible, more liable to frost damage and lessresistant to the effects of salinity. K fertilizer is also considered to havemoderating effects with respect to plant diseases. Plants which are wellsupplied with potassium are less sensitive to fungal and bacterial diseasesand also to pest infestations. From an agronomic point of view thereforethere is no reason to limit K fertilizers unless there is a harmful influence onman or the environment.
We learned from the papers presented in this session that total bodypotassium accounts for 2 g kg-' body weight, i.e. about 140 g on average foran adult man or woman. According to R. Grossklaus, the minimum need forman has been established as 2000 mg per day in order to maintain normalbody reserves and a normal K+ concentration in plasma and interstitialfluid. Additional K intake does not seem to present any disadvantages. Theamounts which are not required are eliminated mainly by the kidneys butalso by gastro-intestinal secretion. Kecskemdti and Grossklaus even mentionthe beneficial effect of a high potassium diet for people suffering fromhypertension. Indeed high potassium intake lowers blood pressure.
Professor Anke stated that intakes by adults vary between 1875 and 5625mg day-' K in the USA and Germany. In a group of people in Germany, henoted average intakes of 2500 and 3200 mg day-' K for women and menrespectively. An exhaustive investigation of K in foods and beveragesshowed very important differences in the K content of foods.
263
Those rich in lipids (butter, cheese, sausages) are poor in K while manyvegetables (cabbage, lettuce, potato), coffee, fruit juices and milk are K-rich.As a result, the quantities absorbed by man seem to depend mainly on dietand not on the fertilizers applied to crops.
However, Grossklaus points out that an EEC guideline (80/778) sets themaximum admissible concentration (MAC) of drinking water at 12 mg1-1 Kwhereas the WHO does not suggest such a threshold level for K, as itobviously has no relevance to health. According to Grossklaus, mineralwaters contain on the average more than 20 mgl-' K; consequently, many ofthese should be considered undrinkable according to the EEC directive.Grossklaus also reminds us that the intake of K+ in drinking water is onlyabout 0.1% of total daily intake and, consequently, the MAC for K indrinking water is unjustified. Possible faccal contamination in drainage,ground and drinking water should therefore be detected by factors other thanthe simple determination of K as a tracer element.
Professor Kecskemdti noted the therapeutic implications of alterations inendogenous K+ concentration. Potassium deficiency involves a weakening ofthe skeletal and cardiac muscles. In serious cases, it can even lead to cardiacarrest and death. It was also pointed out that deficiency can affect a child'sgrowth. Potassium deficiencies (hypokalemia) can be caused by insufficiencyof K in the diet but, generally, they are the result of excessive loss throughthe gastro-intestinal tract (vomiting, chronic diarrhoea) or kidney. Sudden,excessive intake of K can also induce poisoning (hyperkalemia) whichaffects the heart and can cause sudden death. However, according toGrossklaus, as long as the renal functions are normal, it is almost impossibleto induce potassium excess with the normal diet. Hyperkalemia is due tostrong retention of potassium, generally caused by a reduction in renalpotassium excretion. According to Prof. Kecskemdti, several drugs(diuretics, antibiotics, hormones, laxatives, cardio-vascular drugs) affectretention and elimination of potassium and can cause hypo- andhyperkalemia. It seems, therefore, that disturbances in K- homeostasis ofhumans have no connections with the amount of K fertilizer applied tocrops.
H. Zemkovg and G. Rechkemmer both described systems ruling thetransport, compartmentalisation and homeostasis of potassium in the humanbody. Over 90% of potassium is found within the cells at a concentrationthirty times higher than that in the extra-cellular fluids (plasma andinterstitial fluid). K+ concentration in the extracellular fluids is kept withinnarrow limits by a regulatory mechanism. Different K+ channels ensure the
264
passage of this ion through the lipid bi-layer membrane of the cells whichcannot normally be crossed by potassium ions. According to Zemkovt, thesechannels are protein macromolecules forming pores equipped with manyselective devices. The high K+ concentration in the cell is maintained by K+
pumps and other carriers which transport ions actively against theirconcentration gradients. Potassium is absorbed in the gastro-intestinal tract,whereas elimination is the concern mainly of the renal system. However,about 15% of potassium is eliminated faecally, mainly in the colon. In thecase of renal insufficiency, K+ elimination in the colon seems to increaseand can, in this manner, partly compensate for renal insufficiency.
In conclusion, we may state that potassium is essential to maintainanimal physiological functions. K+ intake by humans depends mainly on thediet. A high diet in K has no harmful effect. It has even been observed that ahigh K intake is recommended for people suffering from hypertension.
As agronomists, we conclude that a reduction in K fertilizer usage justfor ecological or health reasons, as recommended for phosphorus andnitrogen, is in no way justified. The limits on potassium content of drinkingwater fixed by the EEC have no sound basis and are unjustified. They createconfusion for the consumer and incite him to consider potassium as aharmful element whereas the information given by the scientists proves thecontrary.
265
Chairman of the Session 4
Prof. Dr. A. van Diest, AgriculturalUniversity, Department of Soil Science andPlant Nutrition, Dreyenplein 10, 6703 HBWageningen, The Netherlands; member ofthe Scientific Board of the InternationalPotash Institute
Session 4
K Requirements in Different LandUse Systems
267
The Role of K in the Amelioration and Sustainabilityof Ecosystems
Vanek, V. and Batik, J., Department of Agrochemistry and Plant Nutrition,University of Agriculture, 165 21 Prague, Czechoslovakia
Summary
The consumption of commercial fertilizers in Czechoslovakia hasrecently been at a satisfactory level, generally suited to cropping intensityand local soil conditions. Small differences in rates between regions, farmsand fields., caused significant differences in soil K contents and thussignificant changes in K content in biomass.
Determinations of CEC and cation saturation indicate satisfactory Kstatus but also significant variation between regions, farms and fields. Kcontents were high in arable, hop-yard and orchard soils. At the same timecertain areas were characterised by low soil K. The main reasons fordifferences in soil K status are unreasonably heavy use of manures (cattleslurry always applied to the same fields), arbitrary rates of K fertilizer andunreasonable practices of reserve K fertilization. Mg saturation of the CECshows little variation but is usually low, indicating a need for Mgfertilization. Long-term trials in Czechoslovakia show that for maintenanceof necessary production, soil fertility and reasonable K content in soils, 60-90 kg K per ha per year is necessary, the exact quantity depending on localsoil conditions and intensity of biomass production.
Introduction
Potassium has recently received a great deal of attention due to itsimportance for plant development (biochemical aspects, crop yield andquality, etc.) and its relationship to other nutrients, mainly cations, itsbehaviour in soils and its influence upon soil properties and the ecosystem asa whole.
Quite unambiguously, even if not fully clarified is the activity ofpotassium in the most important processes in plants. K has a significanteffect on osmotic pressure and thus on the water transport in plants, on
269
photosynthesis and assimilate transport and on the activity of many enzymesand enzyme systems (Mengel, 1984). Very many authors state a positiveinfluence of K+ on the health conditions of plants (well reviewed byPerrenoud, 1990), and on improving technological properties, productionquality, etc.
Relatively good agreement in the literature could be found on thequantity of potassium necessary for safeguarding the vital plant functions.Mostly it has been stated that a content of 2.0-2.5% of K in leaf dry matter issatisfactory and that higher contents do not cause a significant increase inimportant processes, but can even cause some disharmonies, mainly in therelationship to other cations. Higher and more luxurious uptake of K maycause limitation in the uptake of Na, Mg, Ca and minor nutrient cations.
Our efforts therefore should be directed to creating conditionsguaranteeing a sufficient uptake of K for photosynthesis and other plantfunctions and preventing the possibility of luxury consumption with possiblenegative effects in production, including reduced fertilizer efficiency. Datawere published showing that higher K uptake increases the uptake ofnitrates (Krdlovic, 1984). Our results however do not confirm this (Balik,1992). It is obvious that there is a reversed tendency. Increased uptake andutilization of NO3 N in plants causes an increase in K uptake (Kirkby,1968).
High mobility of K in a plant and its activity in the soil solutiondetermine the principles of K nutrition and fertilization. The main source ofpotassium for plants is soil potassium bound on soil colloids and present insoil solution. The relationship between the quantities of the cations H+, K+,
Na+, Mg 2+ and Ca2+ in solution and on the solid soil components is mainlya function of ion exchange processes and is governed by the convertibility ofbound cations on the soil complex. The quantity of a single cationic specieson the colloid complex can be different and mutual relationships can causesignificant changes in plant uptake and plant growth. Our efforts must be tostabilize suitable quantities and ratios of cations on the sorption complex,thus creating conditions suitable for harmonious plant nutrition. The Ksupply should be 2-5% of the CEC (Gedrojc, 1955, Large, 1971, Baker andAmacher, 1981). Potassium should be present in the soil solution in aquantity of 0.5 me per liter, i.e. ca. 20 mg K in 1000 ml solution.
In view of the fact that K can be leached from the root zone, the rate ofits release from the solid soil phase is very important. Such release dependsnot only on the quantity of exchangeable potassium, and on the soil sorption
270
capacity, but also on the type of clay minerals (Grimme et aL, 1971,Kuchenbuch and Claasen, 1985).
Differences in potassium demands among crops and in accumulation ofpotassium in their tissues can lead to large differences in potassiumrecycling during the production of different crop species. For instance,
clover, sugar beet, potatoes, and some vegetables withdraw large quantitiesof potassium from the soil.
Comprehensibly, if such crops are well represented in a crop rotation, theneed for K fertilization increases. In contrast, when cereals dominate, theexport of potassium from the agro-ecosystem is small. A large part of Kabsorbed is concentrated in the straw, which remains on the field or returnsto the soil in the form of manure.
Trends in potassium supply in Czechoslovakia
Table 1 gives the most important data on N, P20 5 and K20 consumptionin the form of fertilizers in the period 1956-1991. It is evident that K uptakewas high and in the eighties reached an annual level of 85 kg K20 per ha.Czechoslovakia was regarded as one of the countries having the highest K
fertilizer consumption (Von Peter, 1979). Such a high level of consumptioncan be caused by the low production of manures of low K content.
In any case, during the period of the highest K fertilizer consumption,the supply of K exceeded K consumption by crops. The data in Table 1 showthat the K supply stagnated in later years and that a downward trend startedin the period 1987-1989. The supply of K originally outweighted that of Nand the ratio K20 : N fell under I as a result of unchanged consumption ofN fertilizers.
High rates of K fertilizers caused a gradual decrease in acreage having alow supply of soil K (Vostal, 1992).
Economic problems of farming, changes in land ownership andinsufficient attention by politicians led to a very severe decline in fertilizerusage, mainly of P and K in 1991 and again in 1992. It has become obviousthat the evident discrepancy between K uptake and K supply will, if itcontinues, lead to a serious decline in soil fertility.
271
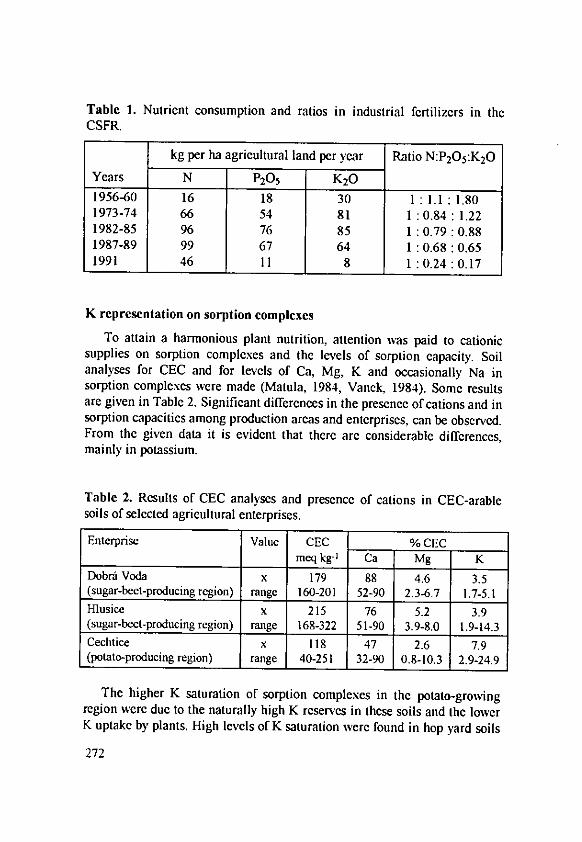
Table 1. Nutrient consumption and ratios in industrial fertilizers in theCSFR.
kg per ha agricultural land per year Ratio N:P 20 5 :K2 0
Years N P20 5 K201956-60 16 18 30 1 :1.1: 1.801973-74 66 54 81 1 :0.84 :1.221982-85 96 76 85 1 :0.79 :0.881987-89 99 67 64 1: 0.68 : 0.651991 46 11 8 1 :0.24 :0.17
K representation on sorption complexes
To attain a harmonious plant nutrition, attention was paid to cationicsupplies on sorption complexes and the levels of sorption capacity. Soilanalyses for CEC and for levels of Ca, Mg, K and occasionally Na insorption complexes were made (Matula, 1984, Vanck, 1984). Some resultsare given in Table 2. Significant differences in the presence of cations and insorption capacities among production areas and enterprises, can be observed.From the given data it is evident that there are considerable differences,mainly in potassium.
Table 2. Results of CEC analyses and presence of cations in CEC-arablesoils of selected agricultural enterprises.
Enterprise Value CEC % CECmeq kg-I Ca Mg K
Dobrg Voda x 179 88 4.6 3.5(sugar-beet-producing region) range 160-201 52-90 2.3-6.7 1.7-5-1Mlusice x 215 76 5.2 3.9(sugar-beet-producing region) range 168-322 51-90 3.9-8.0 1.9-14.3Ceclitice x 118 47 2.6 7.9(potato-producing region) range 40-251 32-90 0.8-10.3 2.9-24.9
The higher K saturation of sorption complexes in the potato-growingregion were due to the naturally high K reserves in these soils and the lowerK uptake by plants. High levels of K saturation were found in hop yard soils
272
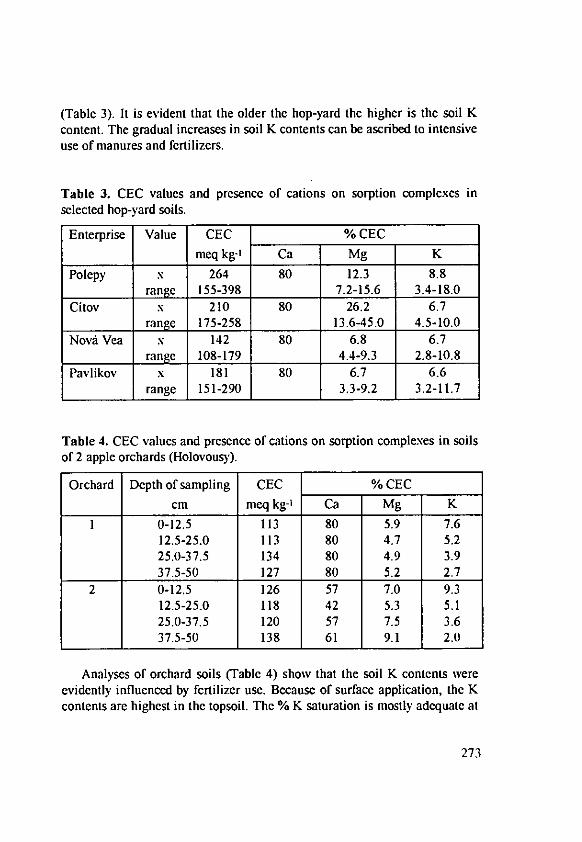
(Table 3). It is evident that the older the hop-yard the higher is the soil Kcontent. The gradual increases in soil K contents can be ascribed to intensiveuse of manures and fertilizers.
Table 3. CEC values and presence of cations on sorption complexes inselected hop-yard soils.
Enterprise Value CEC % CEC
meq kg-' Ca Mg K
Polepy x 264 80 12.3 8.8range 155-398 7.2-15.6 3.4-18.0
Citov x 210 80 26.2 6.7range 175-258 13.6-45.0 4.5-10.0
NovA Vea x 142 80 6.8 6.7range 108-179 4.4-9.3 2.8-10.8
Pavlikov x 181 80 6.7 6.6range 151-290 3.3-9.2 3.2-11.7
Table 4. CEC values and presence of cations on sorption complexes in soilsof 2 apple orchards (Holovousy).
Orchard Depth of sampling CEC % CECcm meq kg-' Ca Mg K
1 0-12.5 113 80 5.9 7.612.5-25.0 113 80 4.7 5.225.0-37.5 134 80 4.9 3.937.5-50 127 80 5.2 2.7
2 0-12.5 126 57 7.0 9.312.5-25.0 118 42 5.3 5.125.0-37.5 120 57 7.5 3.637.5-50 138 61 9.1 2.0
Analyses of orchard soils (Table 4) show that the soil K contents wereevidently influenced by fertilizer use. Because of surface application, the Kcontents are highest in the topsoil. The % K saturation is mostly adequate at
273
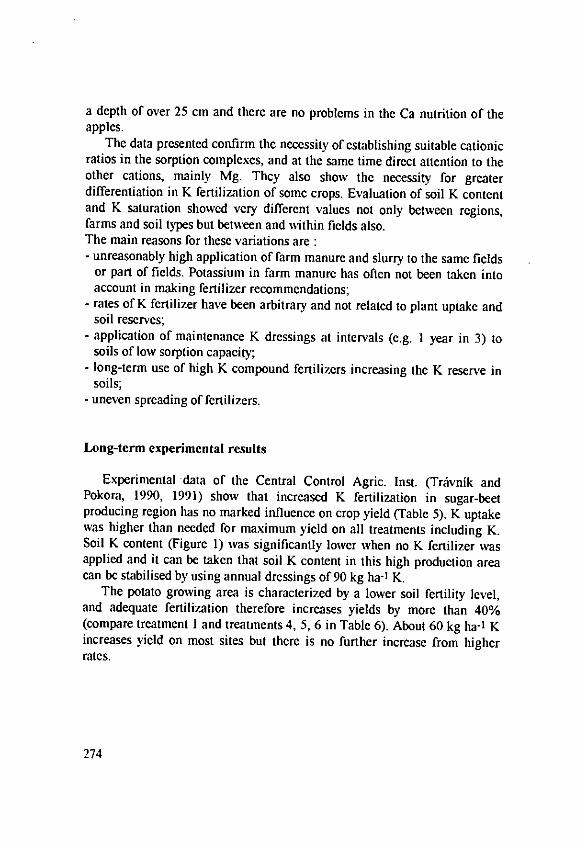
a depth of over 25 cm and there are no problems in the Ca nutrition of theapples.
The data presented confirm the necessity of establishing suitable cationicratios in the sorption complexes, and at the same time direct attention to theother cations, mainly Mg. They also show the necessity for greaterdifferentiation in K fertilization of some crops. Evaluation of soil K contentand K saturation showed very different values not only between regions,farms and soil types but between and within fields also.The main reasons for these variations are :- unreasonably high application of farm manure and slurry to the same fields
or part of fields. Potassium in farm manure has often not been taken intoaccount in making fertilizer recommendations;
- rates of K fertilizer have been arbitrary and not related to plant uptake andsoil reserves;
- application of maintenance K dressings at intervals (e.g. 1 year in 3) tosoils of low sorption capacity;
- long-term use of high K compound fertilizers increasing the K reserve insoils;
- uneven spreading of fertilizers.
Long-term experimental results
Experimental data of the Central Control Agric. Inst. (Trvnik andPokora, 1990, 1991) show that increased K fertilization in sugar-beetproducing region has no marked influence on crop yield (Table 5). K uptakewas higher than needed for maximum yield on all treatments including K.Soil K content (Figure 1) was significantly lower when no K fertilizer wasapplied and it can be taken that soil K content in this high production areacan be stabilised by using annual dressings of 90 kg ha-I K.
The potato growing area is characterized by a lower soil fertility level,and adequate fertilization therefore increases yields by more than 40%(compare treatment I and treatments 4, 5, 6 in Table 6). About 60 kg ha-1 Kincreases yield on most sites but there is no further increase from higherrates.
274
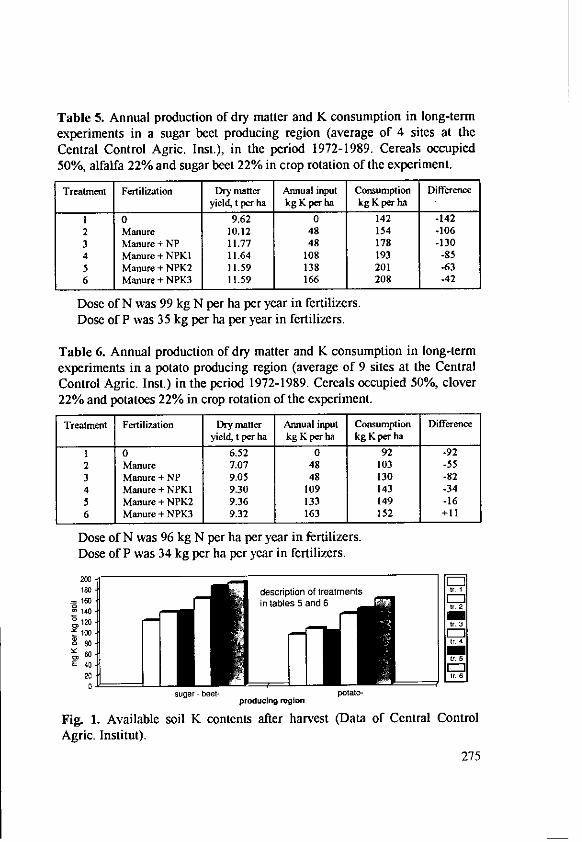
Table 5. Annual production of dry matter and K consumption in long-termexperiments in a sugar beet producing region (average of 4 sites at theCentral Control Agric. Inst.), in the period 1972-1989. Cereals occupied50%, alfalfa 22% and sugar beet 22% in crop rotation of the experiment.
Treatment Fertilization Dry matter Annual input Consumption Differenceyield, t per ha kgKper ha kg Kper ha
1 0 9.62 0 142 -1422 Manure 10.12 48 154 -1063 Manure + NP 11.77 48 178 -1304 Manure+NPK 11.64 108 193 -855 Manure + NPK2 11.59 138 201 -636 Manure + NPK3 11.59 166 208 -42
Dose of N was 99 kg N per ha per year in fertilizers.Dose of P was 35 kg per ha per year in fertilizers.
Table 6. Annual production of dry matter and K consumption in long-termexperiments in a potato producing region (average of 9 sites at the CentralControl Agric. Inst.) in the period 1972-1989. Cereals occupied 50%, clover22% and potatoes 22% in crop rotation of the experiment.
Treatment Fertilization Dry matter Annual input Consumption Differenceyield, t per ha kg K per ha kgK per ha
1 0 6.52 0 92 -922 Manure 7.07 48 103 -553 Manure + NP 9.05 48 130 -824 Manure + NPKI 9.30 109 143 -345 Manure + NPK2 9.36 133 149 -166 Manure + NPK3 9.32 163 152 +11
Dose of N was 96 kg N per ha per year in fertilizers.Dose of P was 34 kg per ha per year in fertilizers.
200.180 description of treatments E1160 in tables 5 and 6tr.2140-
t 120 tr. 3
E 40.20 V. 6
20
sugar beet- potato-producing region
Fig. 1. Available soil K contents after harvest (Data of Central ControlAgric. Institut).
275
Conclusion
Long-term trials in which the contents of available nutrients in soils weremonitored, show that for optimum production and quality of agriculturalproducts and for maintenance of adequate K contents in soils it is necessaryto supply the soils annualy with 60-90 kg K per ha of amble land withrespect to the local conditions and productive intensity.
At the same time it is necessary to maintain a correct balance of cationson the sorption complex and to differentiate fertilizer use according to plantuptake and K reserves in soils.
References
Baker, D.E., Amacher, M.C.: The development and interpretation of adiagnostic soil-testing program. Pa. St. Univ. Bull. No. 826, 3 (1981).
Balik, J.: Interakce iontI v pudnim roztoku ve vztahu k W nosu a kvalitesendzniho ovsa a silzni kukurice. Habilitacni prfce, VSZ Praha (1992).
Beringer, H.: The role of potassium in crop production. In: Proceedings ofthe joint international seminar. "The role of potassium in cropproduction", FFSA Publication No. 75 (1980).
Gedrojc, K.K.: Ucenije o poglotitelnej sposobnosti pocv. Moskva (1955).Grimme, H., Nemeth, K., Braunschweig, Von L.C.: Beziehungen zwischcn
dem Verhalten des Kaliums im Boden und der K-Ernahrung der Pflanze.Landw. Forsch. Sonderh. 26/1, 165-176 (1971).
Kirkby, E.A.: Influence of ammonium and nitrate nutrition on the cation-anion balance and nitrogen and carbohydrate metabolism of whitemustard plants grown in dilute nutrient solution. Soil Sci. 105, 133-141(1968).
Krlovic, J.: Probldmy s dusicnanmi v rastlinn~ch produktoch. Zahradnictvo5(1984).
Kuchenbuch, R. Claassen, N.: Kalium-Verfiigbarkeit und Kalium-Dynamikin der Rhizosphfre. Kali-Briefe 17 (6), 407-418 (1985).
Large, R.L.: Soil fertility recommendations based on a balanced saturationof the cation exchange capacity. Soil Science and Plant Analysis, 2 (2),109-115 (1971).
Matula, J.: KationtovA vmenni kapacita pfidy a jeji vyuziti ke hnojeni.Agrochdmia, 333-337 (1984).
Mengel, K.: Ernahrung und Stoffwechsel der Pflanze. Jena (1984).
276

Perrenoud, S.: Potassium and Plant Health. International Potash Institute,Bern/Switzerland (1990).
Von Peter, A.: The role of potassium in world agriculture. In: Proceedings ofthe joint international seminar. "The role of potassium in cropproduction", FSSA Publication No 75 (1979).
TrAvnik, K., Pokora, J.: Sledovdni vliru nizn'ch intenzit hnojeni na pudni6rodnost a zmeny agrochemick~ch vlastnosti. 7AverecnA zpr-Ava, UKZOZBrno (1990).
TrAvnik, KI, Pokora, J.: Vliv rozdilnd intenzity hnojeni na bilanci zivin vosevnim sledu. ZAverenA zprAva, IJKZUJZ Brno (1991).
Vanek, V.: Vyuziti sorpcni schopnosti pud pro hodnoceni obsahu zivin ahnojeni. Agrochdmia, 368-369 (1984).
Vostal, J., Tlustos, P.: Potassium balance in Czech agriculture. In: 23rdInternational IPI Colloquium "Potassium in ecosystems", 387-390, Prague(1992).
277
Potassium in Ecosystems, with Emphasis on the US
Munson, R. D., Fluid Fertilizer Foundation, 339 Consort Dr., Manchester,Missouri 63011, USA
Introduction
The aspect of K in the ecosystem of primary interest has to do with man
and food and fiber production. Secondarily, the environmental aspects come
into play. The imporiance and management of crop nutrients provided by
fertilizers in food and fiber production during the last half of the twentiethcentury cannot be underestimated, with potassium playing a major role.
There are those who believe nitrogen and world population growth are
closely linked (Smil, 1991), but because of N-K and P-K, especially in N2
fixation, relationships in plant nutrition, be assured that K plays a key role
in that link.From an agricultural-ecosystem standpoint it is important that a more
complete accounting of the nutrient inputs and outputs (flows) or dynamicsbe made and understood if one is to improve and sustain various ecosystems.Researchers and producers in China with their ecological systems approachto agriculture (Xie and Hasegawa, 1985 [emphasis on K], and Luo and Han,1990) probably come as close to any country in achieving such an
accounting in producing food for their nearly 1.2 billion population,
although soil erosion is still one of their major problems in terms of nutrientlosses. China now uses more fertilizer nutrients than any other country (IFA,1991).
In most production systems in developed countries, the overriding role of
K based on environmental concerns should be to improve nitrogen-,phosphorus- and water-use efficiencies. Environmentally, nitrogen and
phosphorus are the nutrients of most concern in the eutrophication of lakes1 ,
estuaries and coastal zonal areas, and nitrate-N is of concern in
llt needs to be remembered that peat bogs were formed through a natural
eutrophication process that occurred over millions of years, and that oil, coal
and lignite deposits that are now being exploited are a result of that process.
279
groundwater. With the growing interest in the causes of 'Red Tides' andassociated organisms and toxicities in coastal waters (Culotta, 1992), effortsto further decrease N and P in sewage and agricultural runoff and erosionwill increase.
Regarding nitrate-N in groundwater, a recent U.S well-water surveyindicates that it is much less of a problem than had initially been thought(Fedkiw, 1991). Bacterial contamination is a far greater problem in drinkingwater than nitrate. There is also evidence that nitrate-N in surface water inrivers, even in regions of high N-use that are tiled, has not materiallychanged from periods when the use of fertilizer N was extremely low in themid 1940s (Keeney and DeLuca, 1992).
Water year-in and year-out in the U.S. is the most limiting factor in cropproduction. That is undoubtedly the case in much of the rest of the world. Togive an idea of how limiting water is, in high-yield maize and soybeanproduction, irrigation increased the five-year average yield of maize by 8.78t ha- 1 (Flannery, 1985) and average yield of soybean by 2.35 t ha-i(Flannery, 1989). In irrigation studies in North Carolina, Anderson (1991)found irrigation increased the seven-year average yield of maize by 5.68 tha- 1. Average maize yields in the state of Washington, mostly irrigated, areas high as 10.98 t ha-1 . Cooper et al. (1992) found soybean yield increases ofnearly 3.7 t ha-1 with subirrigation of soybeans (40.6 cm watertable).Potassium has had a major role in increasing the water-use efficiency, andcontributes greatly to the yield of all crops.
In this discussion it is my objective to present a perspective that looksprimarily at K in our crop production ecosystem, and consider relationshipsthat may be useful for improving and sustaining K availability. Some of thepolicy and management changes occurring in the U.S. that are interacting inthat system will also be discussed. To do that requires some historicreflection, and a look at the present and the future as well. Much of theemphasis will be on U.S. production agriculture, although ideas for K use inother ecosystems and the future will be discussed.
Some Background-U.S. Agriculture
Nutrient Use
As in many regions of the world, there were and are soils that canproduce little until nutrient additions, such as K, have been applied. Suchwas and is the case in some areas of the U.S.. Nutrient use in the U.S.
280
started increasing during the 1940s, because food was badly needed during
World War II and the period of recovery that followed, especially in Europe
and Japan. By 1950 the N, P and K use was 1.06, 0.82 and 1.00 million
tons, respectively. Nutrient use continued to increase until the late 1970s and
early 1980s. Phosphorus use peaked in 1977 at over 2.23 million tons, while
nitrogen (N) and potassium use peaked in 1981 at 10.82 and 4.76 million
tons, respectively, which was 10.2, 2.7 and 4.7 times the 1950 use. Since
then nutrient use has been down or unchanged, being 10.4, 1.64, and 3.75
million tons of N, P and K, respectively, in 1991 (Fertilizer Statistics).
Because of improved fertility management, yields of most crops in the
U.S. have continued to increase without increased nutrient use. Also,
millions of hectares of less productive, environmentally sensitive land has
been removed from production by various programs. Therefore, nutrient-use
efficiencies for crops, except for wheat, have been increasing (Wallingford,
1990). The reason nutrient-use efficiencies for wheat has not shown
increases is that nutrient use was so low, that yields could not be increased
until use increased.The total estimated annual N, P and K inputs from fertilizers, animal
manures, sludge and crop residues in the U.S. are shown in Appendix Table
A. These values can be compared to the estimated annual nutrients lost to
runoff, eroded soil sediments and removed by crops (output). Based on a'nutrient balance' the estimated annual deficits in millions of tons of
nutrients amount to -4,069.4 for N, -715.8 for P and -56,507 for K based on
total losses. These losses are obviously less when only soluble or "available"
nutrients are considered, as is shown.During the 1970s, because of increased fertilizer-P and K use, soil test
levels in various states were increased. In data from the state of Iowa, one
can observe the increases in P and K soil test levels over three time-periods
(Table 1). This indicates that soils were being improved. If soil test K levels
of a field are adequate, for most crops there will be little crop response to
additional applied K. Large areas of soils of the semi-arid Great Plains
contain very high levels of K, and thus show little response to K fertilizers
unless chlorides are deficient.
281

Table 1. State average phosphorus and potassium soil test levels duringthree periods of time in Iowa (Killorn et at., 1990).
I Soil test*
Summary period P test K test Sample numbermg kg-I
'74-'79 24 126 75,000'80-'85 31 144 62,000'86-'89 33 160 61,140
*Bray P1 or ammonium acetate extraction used.
Crop Production Trends
From the late 1800s through the 1930s average yields of most crops inthe U.S. increased little. By the late 1930s hybrid maize had been developedand plant breeding programs were beginning to pay off. Lime, manure, andfertilizer phosphate and potash use were increasing alfalfa and legume yieldsso that more N was being fixed symbiotically. However, even for cropsgrown on the high organic matter soils of the Midwest, nitrogen was oftenthe most limiting nutrient. Much of the early research was on phosphorus.More potassium and phosphorus fertilizer resources were discovered anddeveloped. Ammonium nitrate and anhydrous ammonia became availablefollowing World War II. Nutrient use started increasing more rapidly duringthe 1950s. Also, the first herbicides came into use during the late 1940s. Thebenefits of technology and plant breeding began increasing crop yields,which are still trending upward.
In Europe the benefits of the combined technology on small grain yieldsover time is perhaps best documented from long-term research data from theRothamsted Experiment Station (Johnston, 1989, 1992), as well as in theaverage yields being achieved by regions. According to A. van Diest, wheatyields of over 8 t ha-1 are common in western Europe. In the U.S. thebenefits of soil fertility can be observed over time in the research data from'The Morrow Plots', initially established in 1876 at the University of Illinois(Odell et al., 1984; Runge et aL, 1990). After 109 years the average yield ofcontinuous maize without any applied nutrients for the past 31 years was2.79 t ha-1. These medium-textured soils were formed under tall prairiegrasses (mollisols) and were initially high in organic matter capable ofmineralizing considerable N, P and S. For the same period where manure,lime and phosphate (MLP) were applied the maize yields averaged 5.73 t
282
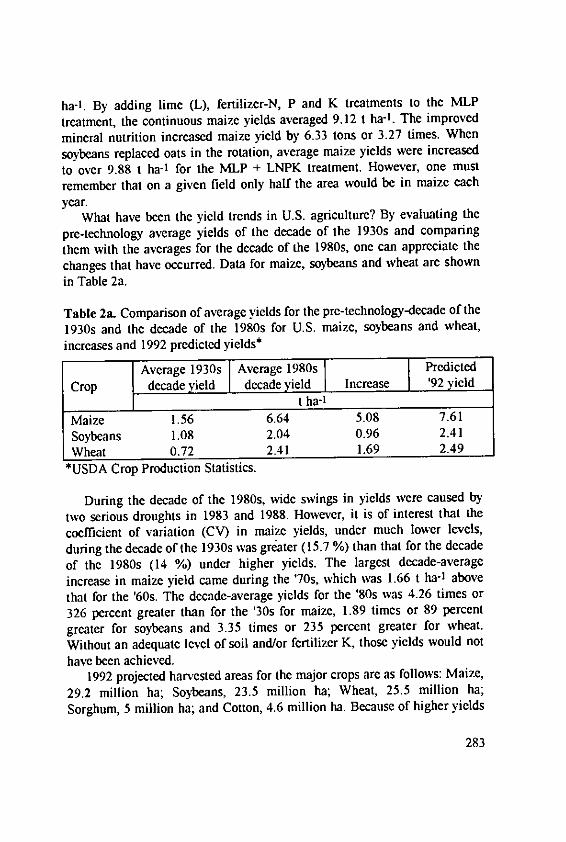
ha-1 . By adding lime (L), fertilizer-N, P and K treatments to the MLPtreatment, the continuous maize yields averaged 9.12 t ha-1. The improved
mineral nutrition increased maize yield by 6.33 tons or 3.27 times. When
soybeans replaced oats in the rotation, average maize yields were increased
to over 9.88 t ha-I for the MLP + LNPK treatment. However, one must
remember that on a given field only half the area would be in maize each
year.What have been the yield trends in U.S. agriculture? By evaluating the
pre-technology average yields of the decade of the 1930s and comparing
them with the averages for the decade of the 1980s, one can appreciate the
changes that have occurred. Data for maize, soybeans and wheat are shown
in Table 2a.
Table 2a. Comparison of average yields for the pre-technology-decade of the
1930s and the decade of the 1980s for U.S. maize, soybeans and wheat,increases and 1992 predicted yields*
Average 1930s Average 1980s j Predicted
Crop decade yield decade yield h Increase '92 yield
t ha-i
Maize 1.56 6.64 5.08 7.61
Soybeans 1.08 2.04 0.96 2.41
Wheat 0.72 2.41 1.69 2.49*USDA Crop Production Statistics.
During the decade of the 1980s, wide swings in yields were caused by
two serious droughts in 1983 and 1988. However, it is of interest that the
coefficient of variation (CV) in maize yields, under much lower levels,
during the decade of the 1930s was greater (15.7 %) than that for the decade
of the 1980s (14 %) under higher yields. The largest decade-average
increase in maize yield came during the '70s, which was 1.66 t ha-I above
that for the '60s. The decade-average yields for the '80s was 4.26 times or
326 percent greater than for the '30s for maize, 1.89 times or 89 percent
greater for soybeans and 3.35 times or 235 percent greater for wheat.
Without an adequate level of soil and/or fertilizer K, those yields would not
have been achieved.1992 projected harvested areas for the major crops are as follows: Maize,
29.2 million ha; Soybeans, 23.5 million ha; Wheat, 25.5 million ha;
Sorghum, 5 million ha; and Cotton, 4.6 million ha. Because of higher yields
283
in general, adequate grain supplies can be produced on fewer hectares, andenvironmentally sensitive soils can be set aside in the governmentalConservation Reserve Program. It has been projected that if yield levels wereat 1938-1940 levels, the U.S. would have to be farming an additional 169million ha (Miller and Larson, 1990).
With the previously mentioned increases in yields have come parallelincreases in dcy matter or biomass left in the fields by crop residues. Unlesshay, straw or residue are removed from fields, for example, as maize stover,an amount of dry matter (and the nutrients it contains) will be left in thefield essentially equal to the dry matter removed with the grain, not tomention the greater root mass of a well-fertilized crop. From a croputilization standpoint it is a very wasteful practice not to use half of the drymatter the crop accumulated during the season. However, if these residuesare removed from fields, there is a dramatic change in the environmental Kbalance in the ecosystem, and a decrease in the residue cover left on soils,exposing the soil to greater erosion. On many soils that were initially low inorganic matter, biomass additions from higher yields produced by properfertililization have increased soil organic matter levels, and improvednutrient cycling and soil productivity. This tends to increase the cationexchange capacities of soils, but potassium held by these charges isrelatively loosely bonded, which may increase K availability. However, itshould be remembered that this may also increase the susceptibility of K toleaching (Lucas, 1982). With higher yields on soils with adequate subsoil Klevels, greater biomass surface deposits tend to increase soil surface K levelsover time (Motavalli et al., 1992a, b).
With moldboard or chisel plowing crop residues are mixed back into thesoil, but in no-till systems they stay on the soil surface and K is leached fromthe residue and tends to remain there as if it had been top dressed. Initially itwas thought that on most soils, because of the residue-moisture-temperature-aeration relations, the K at the residue-soil interface may not be as availableas once thought. This may be true in ridge-till maize systems too (Allan etal., 1992; Darst and Murphy, 1992).
In the state of Minnesota maize yields from 1950 to 1991 were found tobe increasing at an average rate of 119 kg ha-1 yrl (1.9 bu/ac/yr). However,the average rate of increase was 150 kg ha- 1 yrl (2.4 bu/ac/yr) if the droughtyears, such as 1983 or 1988, were removed from the regressiondetermination (Baker, D. G., personal communication, 1991). Thus, whenone speaks of sustainability in ecosystems and crop production, one shouldthink in terms of sustainable growth. That is especially true for less
284
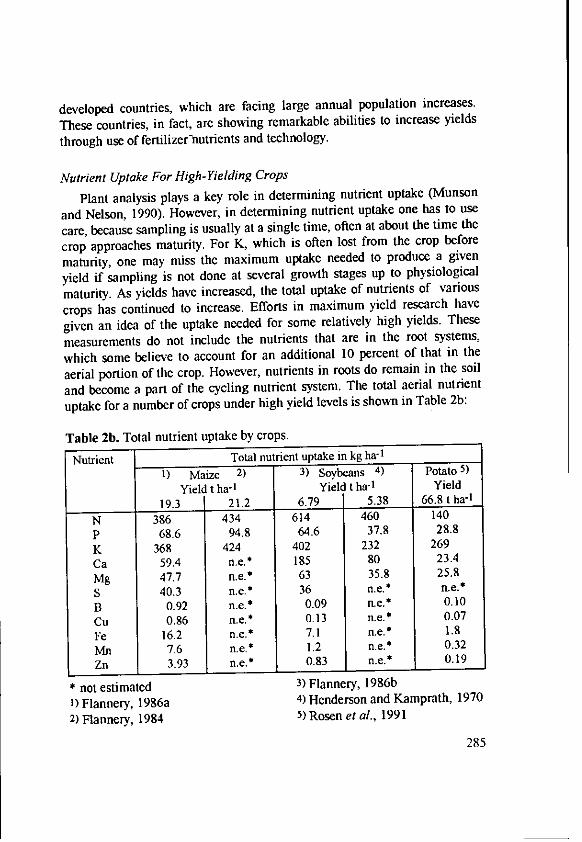
developed countries, which are facing large annual population increases.
These countries, in fact, are showing remarkable abilities to increase yields
through use of fertilizer-nutrients and technology.
Nutrient Uptake For High-Yielding Crops
Plant analysis plays a key role in determining nutrient uptake (Munson
and Nelson, 1990). However, in determining nutrient uptake one has to use
care, because sampling is usually at a single time, often at about the time the
crop approaches maturity. For K, which is often lost from the crop before
maturity, one may miss the maximum uptake needed to produce a given
yield if sampling is not done at several growth stages up to physiological
maturity. As yields have increased, the total uptake of nutrients of various
crops has continued to increase. Efforts in maximum yield research have
given an idea of the uptake needed for some relatively high yields. These
measurements do not include the nutrients that are in the root systems,
which some believe to account for an additional 10 percent of that in the
aerial portion of the crop. However, nutrients in roots do remain in the soil
and become a part of the cycling nutrient system. The total aerial nutrient
uptake for a number of crops under high yield levels is shown in Table 2b:
Table 2b. Total nutrient uptake by crops.
Nutrient Total nutrient uptake in kg ha-1
I) Maize 2) 3) Soybeans 4) Potato 5)
Yield t ha-1 Yield t ha-1 Yield
19.3 21.2 6.79 5.38 66.8 t ha-
N 386 434 614 460 140
P 68.6 94.8 64.6 37.8 28.8
K 368 424 402 232 269
Ca 59.4 n.e.* 185 80 23.4
Mg 47.7 n.e.* 63 35.8 25.8
S 40.3 n.e.* 36 n.e.* n.e.*
B 0.92 n.e.* 0.09 n.e.* 0.10
Cu 0.86 n.e.* 0.13 n.e.* 0.07
Fe 16.2 n.e.* 7.1 n.e.* 1.8
Mn 7.6 n.e.* 1.2 n.e.* 0.32
Zn 3.93 n.e.* 0.83 n.e.* 0.19
not estimated 3) Flannery, 1986b
1) Flannery, 1986a 4) Henderson and Kamprath, 1970
2) Flannery, 1984 5) Rosen et al., 1991
285

Table 2b. (cont.) Total nutrient uptake by crops.
Nutrient Total nutrient uptake in kg ha-IAlfalfa 1) Soft white Winter Hard red spring wheat 4)
winter wheat wheat 3)Yield t ha-' 2)
(hay) Yield t ha-' Yield t ha-' Yield t ha-'24.1 8.16 11.02 4.1 3.79
N 731 177 261 130 123P 66 48.5 42.8 11.4 16K 532 134 247 216 134Ca 301 23 43 14.6 16Mg 64 14 24 n.e.* 17S 64 11.4 34 18 a.e.*B ne.. n.e. n.e. n.e. ne.Cu n.e.* 0.034 0.056 0.034 n.e.*Fe n.e.* n.e.* n.e.* n.e.* n.e.*Mn n.e.* 0.4 0.9 0.006 n.e.*Zn ne.* 0.28 0.37 0.25 n.e.*
* not estimated 3) Brown, 19861) Kansas State University 4) Malzer, 19922) Koehler, personal communication
By dividing the total uptake of a nutrient by the measured unit of yield,one can determine the input:output relationships for the different nutrients.These values may be viewed as the internal nutrient requirement of the cropor the amount needed to grow a unit of yield or ton of grain, beans or forage.By taking the reciprocal of those values, one can determine the output oryield per unit of input for each nutrient. These can be useful values indetermining if hybrid or variety A is really more efficient in nutrient usethan hybrid or variety B. In looking at the yields of given hybrids orcultivars under given soil test levels it certainly appears that they havediffering capacities to recover both soil and fertilizer nutrients, as will bediscussed later.
There is interesting evidence that over relatively wide ranges in yieldlevels and environments, in general, if one considers the nutrient uptake perunit of yield for N, P and K, they appear to be reasonably stable. In otherwords, the crop- has an internal requirement or it takes a given amount ofeach nutrient to produce a unit of yield. For maize for grain yields thatranged from 5 to over 21 t ha-1 , the mean values (n = 13) were 20 kg N, 3.66
286
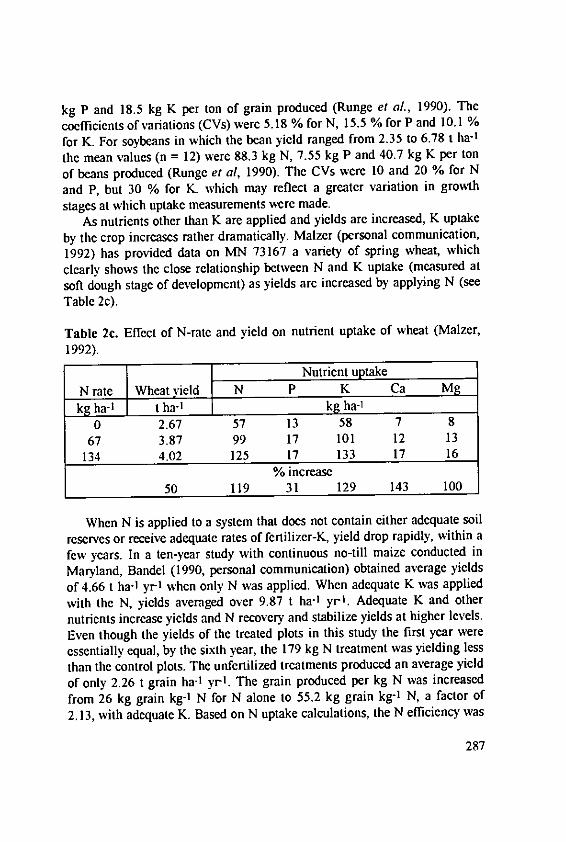
kg P and 18.5 kg K per ton of grain produced (Runge et aL, 1990). Thecoefficients of variations (CVs) were 5.18 % for N, 15.5 % for P and 10.1 %for K. For soybeans in which the bean yield ranged from 2.35 to 6.78 t ha-1
the mean values (n = 12) were 88.3 kg N, 7.55 kg P and 40.7 kg K per ton
of beans produced (Runge et al, 1990). The CVs were 10 and 20 % for N
and P, but 30 % for K. which may reflect a greater variation in growth
stages at which uptake measurements were made.As nutrients other than K are applied and yields are increased, K uptake
by the crop increases rather dramatically. Malzer (personal communication,1992) has provided data on MN 73167 a variety of spring wheat, which
clearly shows the close relationship between N and K uptake (measured at
soft dough stage of development) as yields are increased by applying N (see
Table 2c).
Table 2c. Effect of N-rate and yield on nutrient uptake of wheat (Malzer,1992).
INutrient uptakeN rate Wheat yield N P K Ca M _
kg ha-I t ha-I kg ha-1
0 2.67 57 13 58 7 8
67 3.87 99 17 101 12 13
134 4.02 125 17 133 17 16% increase
50 119 31 129 143 100
When N is applied to a system that does not contain either adequate soil
reserves or receive adequate rates of fertilizer-K, yield drop rapidly, within a
few years. In a ten-year study with continuous no-till maize conducted in
Maryland, Bandel (1990, personal communication) obtained average yields
of 4.66 t ha-1 yr-1 when only N was applied. When adequate K was applied
with the N, yields averaged over 9.87 t ha-1 yr-i. Adequate K and other
nutrients increase yields and N recovery and stabilize yields at higher levels.
Even though the yields of the treated plots in this study the first year were
essentially equal, by the sixth year, the 179 kg N treatment was yielding less
than the control plots. The unfertilized treatments produced an average yield
of only 2.26 t grain ha-1 yr-'. The grain produced per kg N was increased
from 26 kg grain kg-1 N for N alone to 55.2 kg grain kg-1 N, a factor of
2.13, with adequate K. Based on N uptake calculations, the N efficiency was
287
increased over 83 % (Munson and Runge, 1990). It took about 84 kg K ha- 1
yr 1 to maintain optimum yields in the system used.
Nutrient Removals Per Unit of Production
Grain or forage analyses can be used to determine nutrient removals perunit of yield, which in the long run become extremely important formaintaining soil productivity and sustainable growth in production torealistically face the future. Considering maize in which the yields rangedfrom 5 to over 23 t ha-1, the mean nutrient removal values (n = 15) for grainwere 12.9 kg N t-, 2.79 kg P t- and 3.41 kg K t-l. The CVs were 6.2percent for N, 12 percent for P and 20 percent for K. With newer singlecross maize hybrids, these values might be lower and show more variation inthe future. For soybeans in which the yields ranged from 2.68 to 7.96 t ha-1(n = 16), the N, P and K removals per ton of beans produced were 55.6, 5.42and 15.2 kg, respectively. CVs were 6.1 % for N, 12 % for P and 5 % for K.
For cropping systems involving maize and soybeans in areas where onlyone crop per year is obtained, the K removals in two years amount to 100 kgK ha-1 when maize yields average 11.29 t ha-1 and soybean average 4.03 tha-1. In research on the better soils of Indiana, Li and Barber (1988)reported 25-year average yields of over 9.4 t ha-1 for maize and 3.9 t ha-1 forsoybeans. For a maize-soybean-wheat-maize rotation they found that in thelong term, the most profitable rate of potassium use required 349 kg ha-1 Kevery four years or 87 kg ha-1 yrl (the most profitable rate of phosphoruswas met by applying 110 kg ha-1 P every four years or 28 kg P ha-1 yrl). Forsoils that fix K, more frequent applications are desirable. In some regionsfarmers are obtaining three or more crops a year. In others, they areobtaining three crops in two years. This management places increased stresson soils and fertilizer K levels needed for sustainable growth in production.
Effects of Long-term Cropping on Subsoil K
Initially many soils in the U.S. had fairly adequate levels of soilpotassium. With the improved yield levels resulting from increased nitrogenand phosphorus use, more soils developed K deficiencies. Also, where thesame crop has been grown year after year, as is the situation with cotton insome regions, subsoil K depletion appears to becoming an increasingproblem. Also, the development of higher-yielding cotton varieties, having a
288
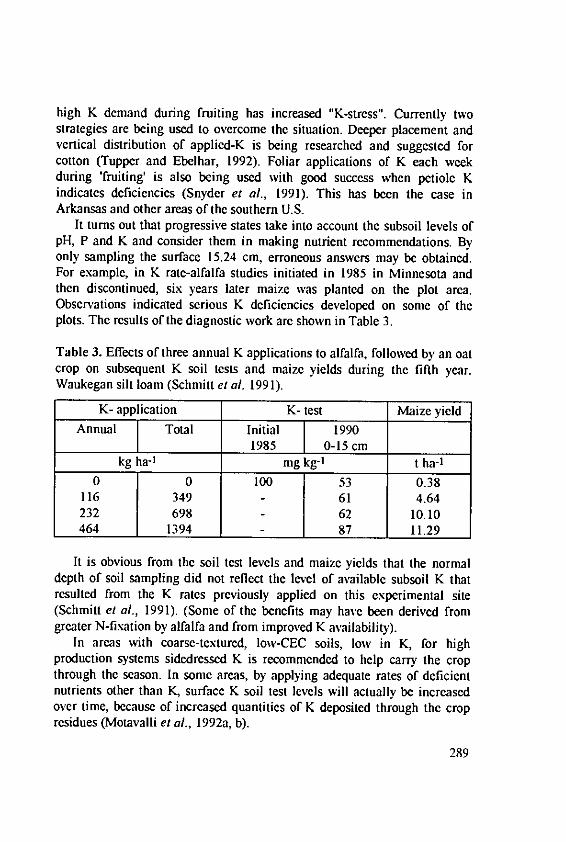
high K demand during fruiting has increased "K-stress". Currently twostrategies are being used to overcome the situation. Deeper placement andvertical distribution of applied-K is being researched and suggested forcotton (Tupper and Ebelhar, 1992). Foliar applications of K each weekduring 'fruiting' is also being used with good success when petiole Kindicates deficiencies (Snyder et at., 1991). This has been the case inArkansas and other areas of the southern U.S.
It turns out that progressive states take into account the subsoil levels ofpH, P and K and consider them in making nutrient recommendations. Byonly sampling the surface 15.24 cm, erroneous answers may be obtained.For example, in K rate-alfalfa studies initiated in 1985 in Minnesota andthen discontinued, six years later maize was planted on the plot area.Observations indicated serious K deficiencies developed on some of theplots. The results of the diagnostic work are shown in Table 3.
Table 3. Effects of three annual K applications to alfalfa, followed by an oatcrop on subsequent K soil tests and maize yields during the fifth year.Waukegan silt loam (Schmitt et al. 1991).
K- application K- test Maize yield
Annual Total Initial 19901985 0-15 cmkg ha-1 mg kg-1 t ha-1
0 0 100 53 0.38116 349 - 61 4.64232 698 62 10.10464 1394 87 11.29
It is obvious from the soil test levels and maize yields that the normaldepth of soil sampling did not reflect the level of available subsoil K thatresulted from the K rates previously applied on this experimental site(Schmitt et al., 1991). (Some of the benefits may have been derived fromgreater N-fixation by alfalfa and from improved K availability).
In areas with coarse-textured, low-CEC soils, low in K, for highproduction systems sidedressed K is recommended to help carry the cropthrough the season. In some areas, by applying adequate rates of deficientnutrients other than K, surface K soil test levels will actually be increasedover time, because of increased quantities of K deposited through the cropresidues (Motavalli et al., 1992a, b).
289
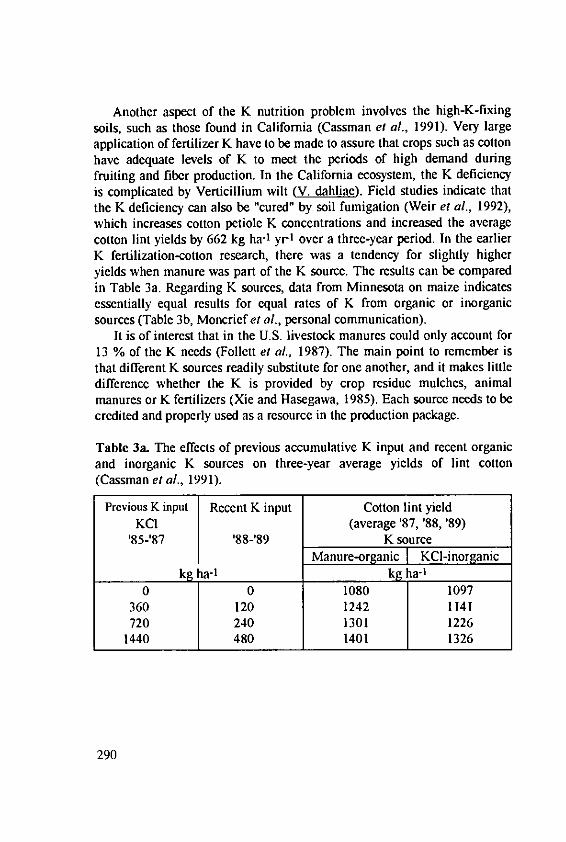
Another aspect of the K nutrition problem involves the high-K-fixingsoils, such as those found in California (Cassman et al., 1991). Very largeapplication of fertilizer K have to be made to assure that crops such as cottonhave adequate levels of K to meet the periods of high demand duringfruiting and fiber production. In the California ecosystem, the K deficiencyis complicated by Verticillium wilt (V. dahliae). Field studies indicate thatthe K deficiency can also be "cured" by soil fumigation (Weir et al., 1992),which increases cotton petiole K concentrations and increased the averagecotton lint yields by 662 kg ha- 1 yr-1 over a three-year period. In the earlierK fertilization-cotton research, there was a tendency for slightly higheryields when manure was part of the K source. The results can be comparedin Table 3a. Regarding K sources, data from Minnesota on maize indicatesessentially equal results for equal rates of K from organic or inorganicsources (Table 3b, Moncricf et al., personal communication).
It is of interest that in the U.S. livestock manures could only account for13 % of the K needs (Follett el al., 1987). The main point to remember isthat different K sources readily substitute for one another, and it makes littledifference whether the K is provided by crop residue mulches, animalmanures or K fertilizers (Xie and Hasegawa, 1985). Each source needs to becredited and properly used as a resource in the production package.
Table 3a. The effects of previous accumulative K input and recent organicand inorganic K sources on three-year average yields of lint cotton(Cassman et al., 1991).
Previous K input Recent K input Cotton lint yieldKCI (average '87, '88, '89)
'85-87 '88-'89 K sourceManure-organic KCI-inorganic
kg ha-1 kg ha-)0 0 1080 1097
360 120 1242 1141720 240 1301 12261440 480 1401 1326
290
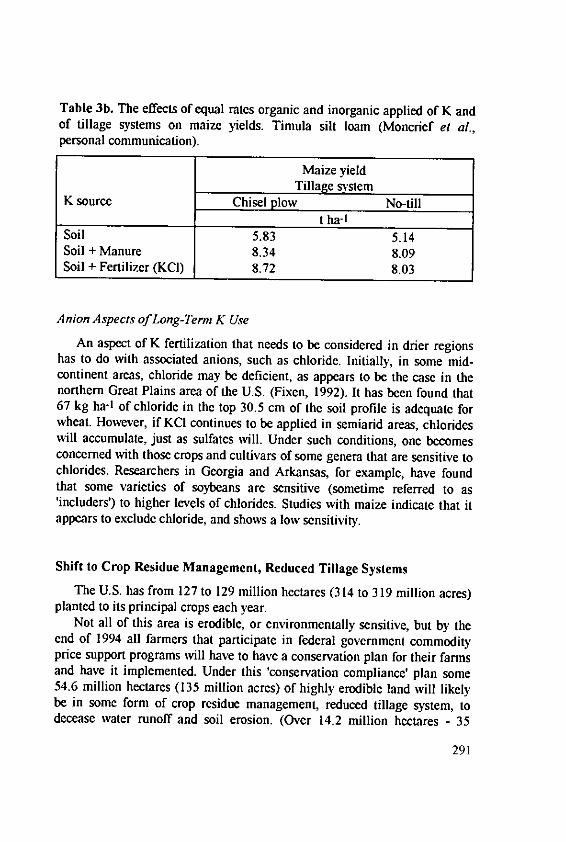
Table 3b. The effects of equal rates organic and inorganic applied of K andof tillage systems on maize yields. Timula silt loam (Moncrief et al.,personal communication).
Maize yieldTillage system
K source Chisel plow No-fillt ha-1
Soil 5.83 5.14Soil + Manure 8.34 8.09Soil + Fertilizer (KCI) 8.72 8.03
Anion Aspects of Long-Term K Use
An aspect of K fertilization that needs to be considered in drier regionshas to do with associated anions, such as chloride. Initially, in some mid-continent areas, chloride may be deficient, as appears to be the case in thenorthern Great Plains area of the U.S. (Fixen, 1992). It has been found that67 kg ha-1 of chloride in the top 30.5 cm of the soil profile is adequate forwheat. However, if KCI continues to be applied in semiarid areas, chlorideswill accumulate, just as sulfates will. Under such conditions, one becomesconcerned with those crops and cultivars of some genera that are sensitive tochlorides. Researchers in Georgia and Arkansas, for example, have foundthat some varieties of soybeans are sensitive (sometime referred to as'includers') to higher levels of chlorides. Studies with maize indicate that itappears to exclude chloride, and shows a low sensitivity.
Shift to Crop Residue Management, Reduced Tillage Systems
The U.S. has from 127 to 129 million hectares (314 to 319 million acres)planted to its principal crops each year.
Not all of this area is erodible, or environmentally sensitive, but by theend of 1994 all farmers that participate in federal government commodityprice support programs will have to have a conservation plan for their farmsand have it implemented. Under this 'conservation compliance' plan some54.6 million hectares (135 million acres) of highly erodible land will likelybe in some form of crop residue management, reduced tillage system, todecease water runoff and soil erosion. (Over 14.2 million hectares - 35
291
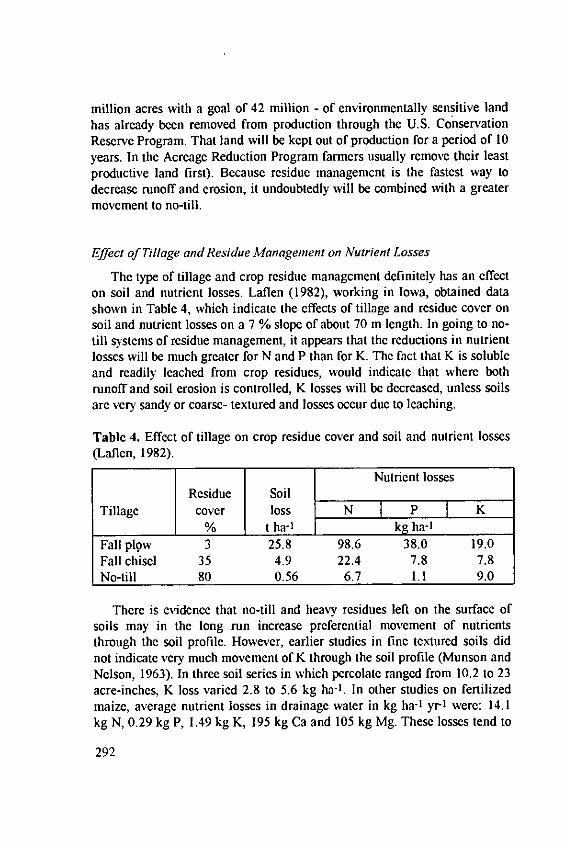
million acres with a goal of 42 million - of environmentally sensitive landhas already been removed from production through the U.S. ConservationReserve Program. That land will be kept out of production for a period of 10years. In the Acreage Reduction Program farmers usually remove their leastproductive land first). Because residue management is the fastest way todecrease runoff and erosion, it undoubtedly will be combined with a greatermovement to no-till.
Effect of Tillage and Residue Management on Nutrient Losses
The type of tillage and crop residue management definitely has an effecton soil and nutrient losses. Laflen (1982), working in Iowa, obtained datashown in Table 4, which indicate the effects of tillage and residue cover onsoil and nutrient losses on a 7 % slope of about 70 m length. In going to no-till systems of residue management, it appears that the reductions in nutrientlosses will be much greater for N and P than for K. The fact that K is solubleand readily leached from crop residues, would indicate that where bothrunoff and soil erosion is controlled, K losses will be decreased, unless soilsare very sandy or coarse- textured and losses occur due to leaching.
Table 4. Effect of tillage on crop residue cover and soil and nutrient losses(Laflen, 1982).
Nutrient lossesResidue Soil
Tillage cover loss N P K% t ha-1 kg ha-I
Fall plow 3 25.8 98.6 38.0 19.0Fall chisel 35 4.9 22.4 7.8 7.8No-till 80 0.56 6.7 1.1 9.0
There is evidence that no-till and heavy residues left on the surface ofsoils may in the long run increase preferential movement of nutrientsthrough the soil profile. However, earlier studies in fine textured soils didnot indicate very much movement of K through the soil profile (Munson andNelson, 1963). In three soil series in which percolate ranged from 10.2 to 23acre-inches, K loss varied 2.8 to 5.6 kg ha-1. In other studies on fertilizedmaize, average nutrient losses in drainage water in kg ha-1 yr-1 were: 14.1kg N, 0.29 kg P, 1.49 kg K, 195 kg Ca and 105 kg Mg. These losses tend to
292

parallel Barber's mass flow-diffusion results on the manner in whichnutrients move to roots (Barber, 1984). In most soils N, S, Ca and Mg wouldmove to roots by mass flow, and accumulate, while P and K move by themuch slower mechanism of diffusion. In coarse-textured soils K losses aregreater, but very dependent upon soil pH, especially for soils having pHdependent charges, as well as the method of application and source of Kapplied.
Method of Nutrient Application and Tillage Affect Nutrient Losses
Baker and Laflen (1983) studied erosion and nutrient losses when fallnutrient applications of 31 kg N, 35 kg P and 80 kg K per hectare usingdifferent methods of application and/or tillage following soybean harvestwhich left 5.7 t ha-I of surface residue, that covered 82 % of the surface. Theslope of the land was just over 4 %. Diammonium phosphate and potassiumchloride were the sources of the nutrients. The results are summarized inTable 5, following two rains totalling 183 mm. Surface nutrient applicationwithout tillage produced the highest K loss, while chisel plowing followingapplication produced the lowest loss of K. Considering the 80 kg rate ofapplication and an initial 153 mg kg-' K soil test, these losses are relativelylow.
Table 5. Effects of method of fall-fertilizer application and of tillage on soilerosion and N, P and K losses following a soybean crop and two simulatedrains (Baker and Laflen, 1983).
Nutrient Soil Nutrient lossestreatment erosion NH 4 - & NOI-N I P04-P K
Sha-g ha-1 kg ha-1
Control 0.54 313 97 3.8Spoke inj.* 0.56 239 90 2.9Surface 0.64 984 414 5.9Chisel 0.72 124 95 0.9Disk 2.31 488 320 3.1
*Injection was to a depth of 5 cm every 20 cm in rows 76 cm in width. Othertreatments were surface applied and then tilled. The measurements weremade during October (fall).
293
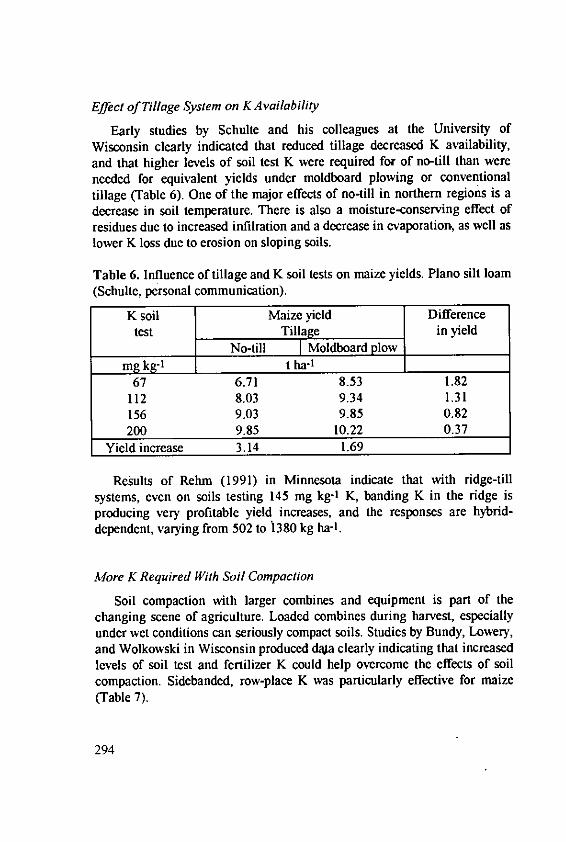
Effect of Tillage System on KAvailability
Early studies by Schulte and his colleagues at the University of
Wisconsin clearly indicated that reduced tillage decreased K availability,and that higher levels of soil test K were required for of no-till than wereneeded for equivalent yields under moldboard plowing or conventionaltillage (Table 6). One of the major effects of no-till in northern regions is adecrease in soil temperature. There is also a moisture-conserving effect ofresidues due to increased infilration and a decrease in evaporation, as well aslower K loss due to erosion on sloping soils.
Table 6. Influence of tillage and K soil tests on maize yields. Piano silt loam(Schulte, personal communication).
K soil Maize yield Differencetest Tillage in yield
No-till Moldboard plowmg kg-1 t ha-1
67 6.71 8.53 1.82112 8.03 9.34 1.31156 9.03 9.85 0.82200 9.85 10.22 0.37
Yield increase 3.14 1.69
Results of Rehm (1991) in Minnesota indicate that with ridge-tillsystems, even on soils testing 145 mg kg-I K, banding K in the ridge isproducing very profitable yield increases, and the responses are hybrid-dependent, varying from 502 to 1380 kg ha-1.
More K Required With Soil Compaction
Soil compaction with larger combines and equipment is part of thechanging scene of agriculture. Loaded combines during harvest, especiallyunder wet conditions can seriously compact soils. Studies by Bundy, Lowery,and Wolkowski in Wisconsin produced dala clearly indicating that increasedlevels of soil test and fertilizer K could help overcome the effects of soilcompaction. Sidebanded, row-place K was particularly effective for maize(Table 7).
294
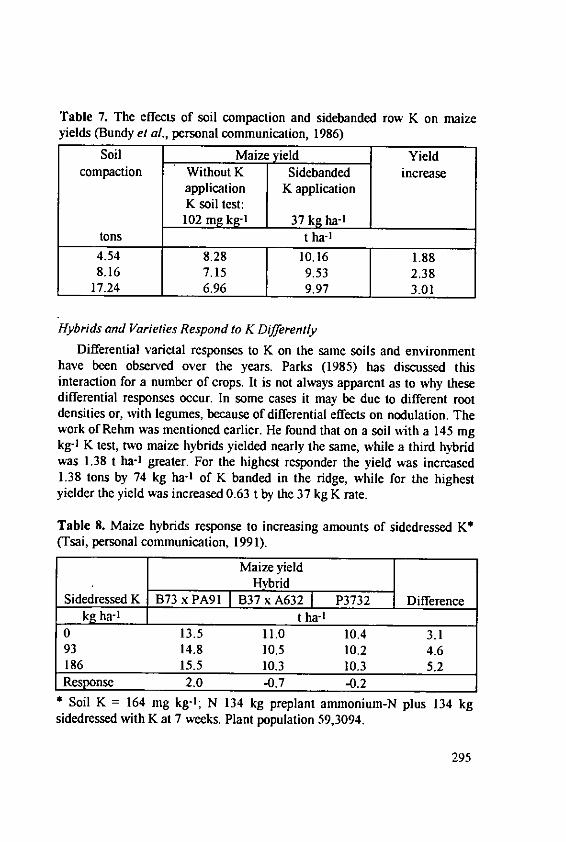
Table 7. The effects of soil compaction and sidebanded row K on maizeyields (Bundy et al., personal communication, 1986)
Soil Maize yield Yieldcompaction Without K Sidebanded increase
application K applicationK soil test:102 mg kg-1 37 kg ha-1
tons t haa-4.54 8.28 10.16 1.888.16 7.15 9.53 2.38
17.24 6.96 9.97 3.01
Hybrids and Varieties Respond to K Differently
Differential varietal responses to K on the same soils and environmenthave been observed over the years. Parks (1985) has discussed thisinteraction for a number of crops. It is not always apparent as to why thesedifferential responses occur. In some cases it may be due to different rootdensities or, with legumes, because of differential effects on nodulation. Thework of Rehm was mentioned earlier. He found that on a soil with a 145 mgkg-' K test, two maize hybrids yielded nearly the same, while a third hybridwas 1.38 t ha-I greater. For the highest responder the yield was increased1.38 tons by 74 kg ha-t of K banded in the ridge, while for the highestyielder the yield was increased 0.63 t by the 37 kg K rate.
Table 8. Maize hybrids response to increasing amounts of sidedressed K*(Tsai, personal communication, 1991).
Maize yieldHybrid
Sidedressed K B73 x PA91 B37 x A632 P3732 Differencekg ha-1 t ha-1
0 13.5 11.0 10.4 3.193 14.8 10.5 10.2 4.6186 15.5 10.3 10.3 5.2Response 2.0 -0.7 -0.2
* Soil K = 164 mg kg-'; N 134 kg preplant ammonium-N plus 134 kg
sidedressed with K at 7 weeks. Plant population 59,3094.
295
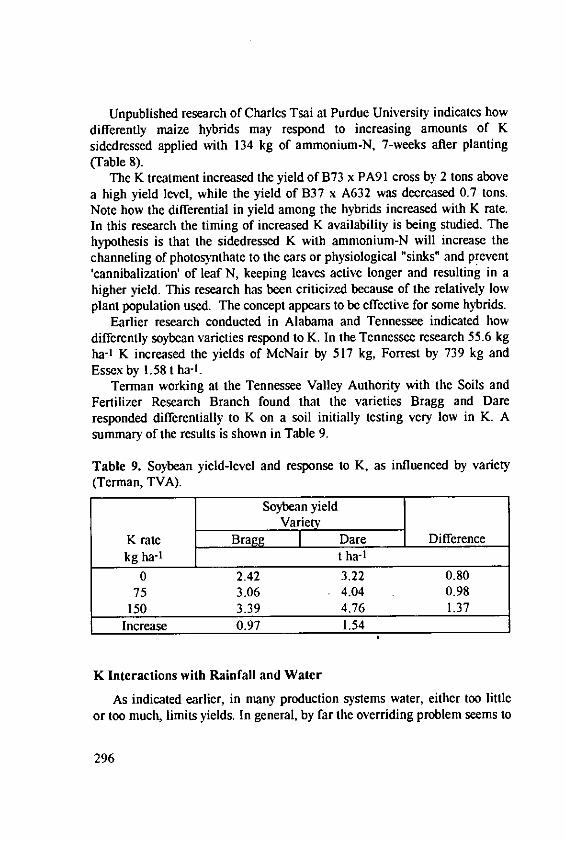
Unpublished research of Charles Tsai at Purdue University indicates howdifferently maize hybrids may respond to increasing amounts of Ksidedressed applied with 134 kg of ammonium-N, 7-weeks after planting(Table 8).
The K treatment increased the yield of B73 x PA91 cross by 2 tons abovea high yield level, while the yield of B37 x A632 was decreased 0.7 tons.Note how the differential in yield among the hybrids increased with K rate.In this research the timing of increased K availability is being studied. Thehypothesis is that the sidedressed K with ammonium-N will increase thechanneling of photosynthate to the ears or physiological "sinks" and prevent'cannibalization' of leaf N, keeping leaves active longer and resulting in ahigher yield. This research has been criticized because of the relatively lowplant population used. The concept appears to be effective for some hybrids.
Earlier research conducted in Alabama and Tennessee indicated howdifferently soybean varieties respond to K. In the Tennessee research 55.6 kgha-' K increased the yields of McNair by 517 kg, Forrest by 739 kg andEssex by 1.58 t ha-1.
Terman working at the Tennessee Valley Authority with the Soils andFertilizer Research Branch found that the varieties Bragg and Dareresponded differentially to K on a soil initially testing very low in K. Asummary of the results is shown in Table 9.
Table 9. Soybean yield-level and response to K, as influenced by variety(Terman, TVA).
Soybean yieldVariety
K rate Bragg Dare Differencekg ha-I t ha-1
0 2.42 3.22 0.8075 3.06 4.04 0.98
150 3.39 4.76 1.37Increase 0.97 1.54
K Interactions with Rainfall and Water
As indicated earlier, in many production systems water, either too littleor too much, limits yields. In general, by far the overriding problem seems to
296
be too little water, but tiling or drainage can also be a serious problem insome areas. For example, millions of hectares of farm land are tile-drainedin portions of two high production states, these being southern Minnesotaand north central Iowa. There should be little doubt that water should betreated as a nutrient, and that it interacts in a very special way with K+ andcertain other monovalent cations, such as Cs+ , Rb+ , and Li+ . We haveknown for some time based on enzyme activation research that theseelements have a special role in plant metabolism, as well as stomate control,but new research has been reported that could indicate a possible special'structural' role of K with water (Chem. & Eng. News, 1991). Based onresearch with Cs+ there are indications that these metal ions can be encagedin a stable clathrate, containing 20 molecules of water. Perhaps thisrelationship may relate to the apparent 'water-conserving' effects of K underlower levels of soil moisture.
My first observations and thinking about K and water relationshipoccurred in studying data of Lawton (1945) in which the effects of nutrientapplication (NP vs NPK), soil moisture (15 %, 25 % [field capacity], and40%) and aeration on maize growth and nutrient uptake were evaluated.
The data indicated that the highest dry matter yields (shoot + roots) ofmaize were obtained with the lowest level of soil moisture (15 o) with theNPK treatment, and that increasing soil moisture to 25 % and 40 %dramatically decreased yield and increased the Ca + Mg: K ratios (meq per100 g or cmol kg-' basis). When K was added to the NP treatment at 15 %moisture, dry matter yields were increased from about 34 to nearly 37 g/potand the Ca + Mg: K ratio was increased from about 0.4 to 0.8. When K wasadded to the NP-aerated treatment, at 40 % moisture the yield per pot wasincreased from 26 g to 45.5 g and the Ca + Mg: K ratio was decreased from1.38 to 0.49, indicating the importance of adequate K and aeration on Kuptake, Ca + Mg: K relations and K in soil-plant-water relations.
Results of early research on K indicated how K concentration in the soiland water interacted to influence K movement to crop roots, with diffusionusually being the dominating mechanism (Barber, 1984). This research onmaize clearly indicated lower responses, but higher yields, when soilmoisture was adequate. Results have shown largest responses to applied Kwhen crops are under drought-stress for both maize and soybeans (Johnson,1985). See Tables 10 and 11.
297
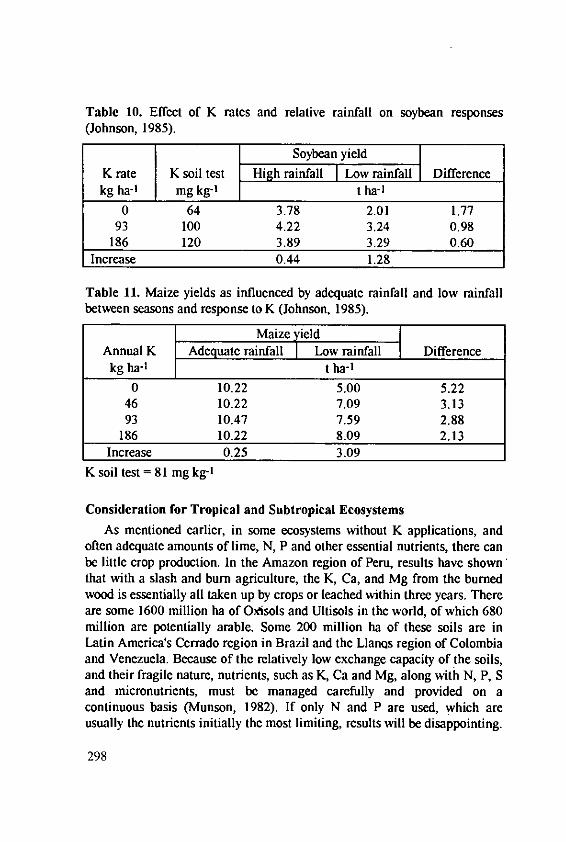
Table 10. Effect of K rates and relative rainfall on soybean responses(Johnson, 1985).
Soybean yield
K rate K soil test High rainfall I Low rainfall Differencekg ha-1 mg kg-' t ha-I
0 64 3.78 2.01 1.7793 100 4.22 3.24 0.98
186 120 3.89 3.29 0.60Increase 0.44 1.28
Table 11. Maize yields as influenced by adequate rainfall and low rainfallbetween seasons and response to K (Johnson, 1985).
Maize yield IAnnual K Adequate rainfall I Low rainfall Difference
kg ha-1 t ha-1
0 10.22 5.00 5.2246 10.22 7.09 3.1393 10.47 7.59 2.88
186 10.22 8.09 2.13Increase 0.25 3.09
K soil test = 81 mg kg-'
Consideration for Tropical and Subtropical EcosystemsAs mentioned earlier, in some ecosystems without K applications, and
often adequate amounts of lime, N, P and other essential nutrients, there canbe little crop production. In the Amazon region of Peru, results have shownthat with a slash and burn agriculture, the K, Ca, and Mg from the burnedwood is essentially all taken up by crops or leached within three years. Thereare some 1600 million ha of Oxisols and Ultisols in the world, of which 680million are potentially arable. Some 200 million ha of these soils are inLatin America's Cerrado region in Brazil and the Llanos region of Colombiaand Venezuela. Because of the relatively low exchange capacity of the soils,and their fragile nature, nutrients, such as K, Ca and Mg, along with N, P, Sand micronutrients, must be managed carefully and provided on acontinuous basis (Munson, 1982). If only N and P are used, which areusually the nutrients initially the most limiting, results will be disappointing.
298
China currently uses over 18.5 million tons of fertilizer N, while onlyusing 2.27 million tons of P and 996.8 thousand tons of K (IFA, 1991). Ofcourse, they use night soil, manures and crop residues, as well as someimported fertilizer K, but in many areas they are short of K. However, it isapparent on many crops that they must pay closer attention to K in theirecosystem in order to improve N efficiency and continue to improve theiryields. That is especially true if they plan to effectively use the increasingamounts of N they are producing and applying.
New Developments
Research is underway to test the use of plastic tubes placed just over 30cm below crop rows (one could think of this as a variation of trickleirrigation). These tubes can be used to infuse water and nutrients into thesystem based on the stage of growth and projected yields. These tubes canalso be used to periodically aerate the soil. Thus far the results of JayJohnson, Ohio State University, indicate that very high yields of maize andsoybeans can be achieved, grown no-till, with little effect oil theenvironment as far as N losses are concerned.
Fewer researchers are exploring way of making the crop productionpackage per unit area larger. Undue attention is being given toenvironmental issues, because that is where the research dollars are.However, more attention is now being given to cropping systems andmanaging cropping sequences to obtain a higher return per unit area perunit of time. This requiring closer nutrient management in both researchand on the farm operations.
Grid soil sampling (with a global positioning system) and testing enablesthe nutrient test results to be translated into nutrient recommendations forknow positions in the field. The results can be put on a computer chip, withthe encoded geo-positioning information, placed in an 'on-board computer'in the cab of new variable-rate and nutrient-combination field applicators.The applicator can then move across the field applying different rates andnutrient combinations based on the test results 2. This new technology has
2 Workshop on Research and Development Issues in Soil Specific Crop
Management, April 14-16, 1992, Minneapolis, MN. For the publicationcontact Dr. W. E. Larson, Soil Science Dept., University of Minnesota, St.Paul, MN 55108 USA
299
certain advantages where large variations exist within fields, and forsmoothing out nutrient level differences over time. It also is more applicablefor larger rather than smaller fields. However, in general, broadcast nutrientapplications are less efficient than those placed or timed based on stage ofcrop development or conditions. It will be interesting to see if this sametechnology can be applied to band or row applicators. As agriculturebecomes more environmentally aware, the industry will move more to site-specific soil and crop management. This should improve the use of K inecosystems, further increasing crop yields and improving N, P and wateruse- efficiencies.
From an environmental standpoint, the tailings left by the production ofK fertilizers is causing problems in Canada. When K was produced in thearid southwest in the U.S. they were not a problem. However, when youhave up to 300 millions of tons of high sodium tailings influencingproductive land, people become concerned. Schultz and Rutland, 1992, haverecently addressed these concerns and have estimated that the impact ofeffectively managing the byproduct salt and process wastewater will likelycost between US $11 to $21 per ton of K20 or US $6.7 to $12.6 per ton ofproduct in Canada. The idea of 'dumping' tailings into rivers as has beendone in Europe is no longer a viable option, and probably should never havebeen done.
Technology is available for extracting K from ocean waters. As weachieve nuclear fusion and energy becomes a non-issue, energy-nitrogen-potassium oceanside production sites can be established that will usehydrogen from electrolysis for the N production, and extract K and perhapsMg from the ocean.
Conclusion
There are so many aspects to K and mineral nutrition in the ecosystem,one can only touch on a fraction of them. However, I hope that thisdiscussion has brought out some of the points that may be helpful to thereader in more effectively evaluating the need for and use of K in assuringsustainable growth in agricultural production, so that lack food will not be afactor limiting the nourishment, health or welfare of the people of the world.Some of the relationships involving environmental issues are very complex.We must examine and sort out the issues that are important, from those that
300
are only 'smoke and mirrors' and being used to generate research funds andcomplicate actions and policy decisions.
World nutrient use is currently at about 78.8 million tons of N, 16.4millon tons of P and 22.1 million tons of K (IFA, 1991). There is littlc doubtthat K use worldwide will have to increase, but in some areas in somecountries with high K soil tests for a few years, we can exploit or use thoseresources as part of wise management. However, finally adequate K must beused, in balance with that cycling in the system and being introduced fromvarious sources.
301
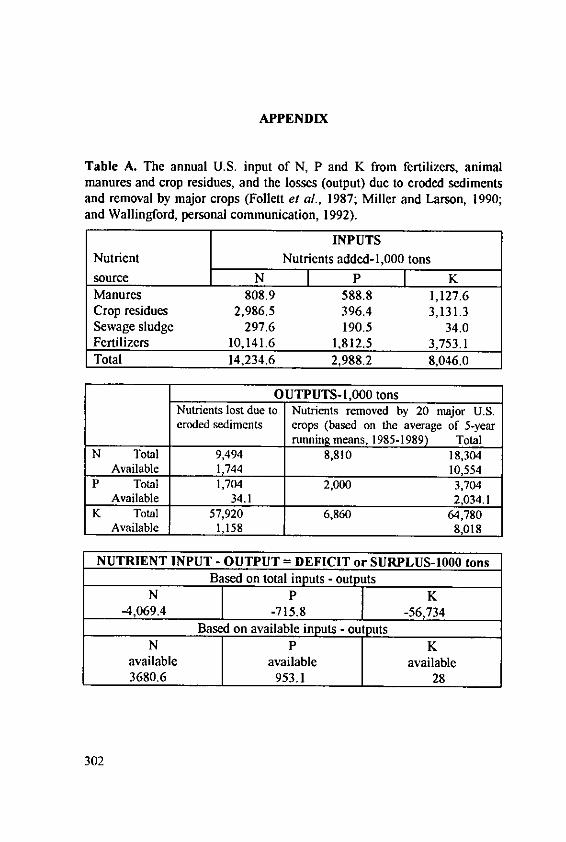
APPENDIX
Table A. The annual U.S. input of N, P and K from fertilizers, animalmanures and crop residues, and the losses (output) due to eroded sedimentsand removal by major crops (Follett et al., 1987; Miller and Larson, 1990;and Wallingford, personal communication, 1992).
INPUTSNutrient Nutrients added-1,000 tons
source N I P I KManures 808.9 588.8 1,127.6Crop residues 2,986.5 396.4 3,131.3Sewage sludge 297.6 190.5 34.0Fertilizers 10,141.6 1,812.5 3,753.1Total 14,234.6 2,988.2 8,046.0
OUTPUTS-l,000 tonsNutrients lost due to Nutrients removed by 20 major U.S.eroded sediments crops (based on the average of 5-year
running means, 1985-1989) TotalN Total 9,494 8,810 18,304
Available 1,744 10,554P Total 1,704 2,000 3,704
Available 34.1 2,034.1K Total 57,920 6,860 64,780
Available 1,158 8,018
NUTRIENT INPUT - OUTPUT = DEFICIT or SURPLUS-1000 tonsBased on total inputs - outputs
N P K4,069.4 -715.8 -56,734
Based on available inputs - out putsN P K
available available available3680.6 953.1 28
302
References
Allan, D., G. Rehm, J. Johnson and D. Hicks (1992): Soil and fertilizerpotassium effects on root distribution in corn. p. 88-97. In: H. F. Reetz,Jr., ed. Proceedings of Roots of Plant Nutrition Conference. July 8-10.Potash & Phosphate Institute, Atlanta, GA.
Anderson, J. R. (1991): Irrigated corn: Developing a profitable productionsystem with best management practices. Better Crops With Plant Food.75(3):3-5.
Baker, D. G. (1991): Personal communication. Dr. Baker is professor ofclimatology, Soil Science Department, University of Minnesota, St. Paul,MN, 55108, USA.
Baker, J. L., and J. M. Latlen (1983): Runoff losses of nutrients and soilfrom ground fall-fertilized after soybean harvest. p. 1122-1127. In:Transactions of the Amer. Soc. Agr. Engineers.
Barber, S. A. (1984): Nutrient uptake by plant roots growing in soil. p. 90-113. In: Soil Nutrient Bioavailability: A Mechanistic Approach. JohnWiley & Sons, NY.
Brown, B. D. (1986): Nutrient uptake of high yielding wheat. Better CropsWith Plant Food 70(2): 27.
Bundy, L. G., B. Lowery, and R. Wolkowski (1986): Personalcommunication. Soil Science Dept., University of Wisconsin, Madison,Wisconsin USA.
Cassman, K. G., S. M. Brouder, B. A- Roberts, and D. C. Bryant (1991):Cotton root growth in relation to localized nutrient supply and residualvalue of potassium fertilizer as influenced by organic additions tovermiculitic soils. p. 43-65. In: the 1991 Fluid Fertilizer FoundationResearch Symposium Proceedings. March 4-6. Scottsdale, AZ.Manchester, MO.
Chemical and Engineering News (1991): Science/Technology Concentrates:Cs+ encaged in gas-phase water clusters. Nov. 4, p. 29.
Cooper, R L., N. R. Fausey and J. G. Street (1992): Yield response ofsoybeans to nitrogen when grown under a subirrigation/drainage system.p. 19-31. In: 1992 Fluid Fertilizer Foundation Research SymposiumProceedings. March 9-10. Scottsdale, Arizona. The Fluid FertilizerFoundation, Manchester, Missouri.
Culotta, E. (1992): Research News: Red Menace in the world's oceans.Science 257:1476-1477.
303
Darst, B. C., and L. S. Murphy (1992): Perspectives on roots for the 1990sand beyond. p. 245-251. In: H. F. Reetz, Jr., ed. Proceedings of Roots ofPlant Nutrition Conference. July 8-10. Champaign, IL. Potash &Phosphate Institute, Potash & Phosphate Institute of Canada, andFoundation for Agronomic Research. Atlanta, GA.
Fedkiw, J. (1991): Nitrate Occurrence in U.S. Waters (and RelatedQuestions). USDA Working Group on Water Quality. U.S.D.A.,Washington, D. C.
Fertilizer Statistics. U.S. statistics used are based on U.S.D.A. informationor from Commercial Fertilizers published by the Tennessee ValleyAuthority, National Fertilizer and Environmental Research Center,Muscle Shoals, Alabama. World fertilizer statistics are from the FAO,IFA or the International Fertilizer Development Center.
Fixen, P. (1992): Can wheat yields be improved with chloride? Solutions36(6):22-23.
Flannery, R. L. (1985): Influence of management inputs on maximumresearch yields of com. p. 181-183. In: R. D. Munson, ed., Physiology,Biochemistry, and Chemistry Associated with Maximum Yield Corn.Proceedings of a Research Roundtable for Maximum Yield Research forthe Future. Potash & Phosphate Institute and Foundation for AgronomicResearch. Atlanta, GA.
Flannery, R. L. (1986a): Plant food uptake in a maximum yield corn study.1986 b. Plant food uptake in a maximum yield soybean study. BetterCrops with Plant Food. 70:4-7.
Flannery, R. L. (1989): The use of maximum yield research technology insoybean production. p. 160-174. In: R. D. Munson, ed., The Physiology,Biochemistry, Nutrition, and Bioengineering of Soybeans: Implicationsfor Future Management. Proceeding of A Research Roundtable withFocus on the Future. Potash & Phosphate Institute and Foundation forAgronomic Research. Atlanta, GA.
Follett, R. F., S. C. Gupta and P. G. Hunt (1987): Conservation practices:Relation to the management of plant nutrients in crop production. p. 19-51. In: Soil Fertility and Organic Matter as Critical Components ofProduction Systems. Soil Science Society of America, Inc., Madison, WIUSA.
Henderson, J. B., and E. J. Kamprath (1970): Nutrient and dry matteraccumulation by soybeans. Tech. Bul. 197. North Carolina Agr. Exp.Sta., North Carolina State Univ., Raleigh, NC 27695 USA.
304
IFA, (1991): World Fertilizer Consumption Statistics No. 23. International
Fertilizer Industry Association. Paris.Johnston, A. E. (1989): The value of long-term experiments in agricultural
research. p. 2-20 (Figure 1). In: Proceedings of the Sanborn FieldCentennial. Missouri Agr. Exp. Sta. SR-415. University of Missouri-
Columbia.Johnston, A. E. (1992): What the long-term experiments of Rothamsted
really show. p. 8-9. In: Fertilizer and Agriculture, July. InternationalFertilizer Industry Association.
Johnson, J. (1985): Personal communication. Agronomy Dept. The OhioState University. Columbus, OH 43210 USA.
Killorn, R., R. Voss and K. Eik (1990): Summary of soil test results by soil
area and county. ST-26, Revised. Iowa State Univ. Ext., Ames, Iowa.Keeney, D., and T. DeLuca (1992): Nitrate in the Des Moines River: Not a
new problem? p. 1 0 -1 1. In: Leopold Center Newsletter. Iowa StateUniversity, Ames, Iowa.
Koehler, F. E.: Personal communication. Agronomy and Soils Dept.Washington State University. Pullman, Washington, USA.
Laflen, J. M. (1982): Effect of tillage on soil erosion and plant nutrientlosses. In: Proceedings of Iowa's 34th Annual Fertilizer and AgChemicalDealers' Conference. CE-17201. Iowa State Coop. Ext. Ser., Iowa State
University, Ames.Lal, R., D. J. Eckert, N. R. Fausey and W. M. Edwards (1990): p.2 0 3 -2 2 5 .
In: C. A. Edwards et at., ed. Sustainable Agricultural Systems. Soil andWater Conservation Society. Ankeny, Iowa 50021, USA.
Lawton, K. (1945): The influence of soil aeration on the grovth and
absorption of nutrients by corn. Proc. Soil Sci. Soc. Am. 10: 263.
Lucas, R. E. (1982): Organic Soils (Histosols): Formation, Distribution,Physical and Chemical Properties and Management for Crop Production.Res. Rept. 435. Michigan and Florida Agric. Exp. Sta., Michigan State
University, East Lansing, Michigan.Luo, Shi ming, and Chun ru Han (1990): Ecological agriculture in China. p.
299-322. In: C. A. Edwards et al., ed. Sustainable Agricultural Systems.Soil and Water Conservation Society. Ankeny, Iowa 50021, USA.
Malzer, G. (1992): personal communication. Soil Science Dept., Universityof Minnesota, St. Paul, MN 55108 USA.
305
Miller, F. P., and W. E. Larson (1990): Low input effects on soilproductivity and nutrient cycling. p. 549-568. In: C. A. Edwards et al.,ed., Sustainable Agricultural Systems. Soil and Water ConservationSociety. Ankeny, Iowa 5002 1, USA.
Moncreif, J., and J. Swan: Personal communication. Soil ScienceDepartment, 439 Borlaug Hall, University of Minnesota, St. Paul, MN55108, USA.
Motavalli, P. P., L. G. Bundy, T. W. Andraski and A. E. Peterson (1992a):Residual effects of long-term N fertilization on corn yields and responseto applied N. p. 62-69. In: Proceedings of the 1992 Fertilizer, Aglime &Pest Management Conference. College of Agric. and Life Sciences.,University of Wisconsin, Madison.(1992b): Residual effects of long-term nitrogen fertilization on nitrogenavailability to corn. J. Prodn. Agric. 5(3):363-368.
Munson, R. D. (1982): Potassium, Calcium, and Magnesium in the Tropicsand Subtropics. Tech. Bul. IFDC-T-23, Muscle Shoals, AL 35660 USA.
Munson, R. D., ed. (1985): Potassium In Agriculture. Am. Soc. Agron., SoilSci. Soc. Am. and Crop Sci. Soc. Am. Madison, WI 53711 USA.
Munson, R. D., and W. L. Nelson (1990): Principles and pratices in plantanalysis. Chpt. 14. p. 359-387. In: R.L. Westerman, ed., Soil Testing andPlant Analysis. Soil Sci. Soc. Amer., Madison, Wisconsin 53711 USA.
Munson, R. D., and C. Ford Runge (1990): Improving Fertilizer andChemical Efficiency Through "High Precision Farming". Center ForInternational Food and Agricultural Policy. Univ. of Minnesota, St. Paul,MN.
Odell, R.T., W. M. Walker, L. V. Boone and M. G. Oldham (1984): TheMorrow Plots, A Century of Learning. Agr. Exp. Sta. University ofIllinois-Urbana. Bul. 775.
Parks, W. L. (1985): Interaction of potassium with crop varieties or hybrids.p. 535-558. In: R. D. Munson, ed., Potassium In Agriculture. Soil Sci.Soc. Amer., Amer. Soc. Agron., Crop Sci. Soc. Amer., Madison,Wisconsin.
Rehm, G. (1991): What's ahead for precision placement of P and K?Solutions 35(6): 30-32.
Rosen, C., F. Lauer, D. Birong, and L. America (1991): Nitrogen and boronutilization by potato: Effects on tuber quality and implications forgroundwater quality. p. 23-40. In: A Report on Field Research in Soils-1991. Misc. Pub. 71-1991. Minnesota Agr. Exp. Sta., University of MN-St. Paul, MN 55108 USA.
306

Runge, C.F., RD. Munson, E. Lotterman and J. Creason (1990):Agricultural Competitiveness, Farm Fertilizer and Chemical Use, andEnvironmental Quality: A Descriptive Analysis. Center for InternationalFood and Agricultural Policy. University of Minnesota-St. Paul, MN55108 USA.
Schulte, E.E.: Personal communication. Soil Science Dept. University ofWisconsin, Madison, Wisconsin USA.
Schultz, J.J., and D. W. Rutland (1992): Impact of environmental legislationon the supply and cost of fertilizer. IFDC, Muscle Shoals, AL 35662USA. A paper presented at the annual meeting of the AmericanChemical Society, Aug.23-28, 1992. Washington, D. C.
Smil, Vaclav (1991): Population growth and nitrogen: An exploration of acritical existential link. Population and Development Review. 17(4):569-601.
Snyder, C.S., W.N. Miley, D.M. Oosterhuis, and R.M. Maples (1991):Cotton Comments: Foliar application of potassium to cotton. ArkansasCoop. Ext. Ser., University of Arkansas, Fayetteville, AR 72701 USA.
Tsai, C.Y. (1991): Personal communication. Dept. of Botany and PlantPathology, Purdue University. West Lafayette, IN 47907 USA.
Tupper, G.R., and M.W. Ebelhar (1992): Nutrient management concepts-Potassium placement on cotton taproots and yield. p. 98-115. In: H.F.Reetz, Jr., ed. Proceedings: Roots of Plant Nutrition Conference. July 8-10. Champaign, IL. Potash & Phosphate Institute, Potash & PhosphateInstitute of Canada, and Foundation for Agronomic Research. Atlanta,GA.
Wallingford, G.W. (1990): U.S. fertilizer use efficiency near all-time high.Better Crops With Plant Food 74(4):27-29.
Wallingford, W.G. (1991): The U.S. nutrient budget is in the red. BetterCrops With Plant Food 75:16-18.
Wallingford, G.W. (1991): Fertilizer efficiency on corn near all-time high.Fertilizer use efficiency on soybeans increasing. Fertilizer use on U.S.wheat. Fertilizer efficiency on Cotton near all-time high. Mimeo paperspresented to the Southern Soil Fertility Conference, Oct. 15-16.Memphis, TN.
Wallingford, G.W. (1992): Personal communication. 2000 West HendersonRoad, Suite 290. Columbus, OH 43220 USA.
Weir, B.L., J.E. DeVay, and R.J. Wakeman (1992): Potassium deficienciesin cotton go down, yields go up. California Agriculture 46(3): 17-18.
307

Xie, Jian-chang and M. Hasegawa (1985): Organic and inorganic sources ofpotassium in intensive cropping systems: Experiences in the People'sRepublic of China and Japan. p. 1177-1199. In: Robert D. Munson, ed.,Potassium In Agriculture. Amer. Soc. Agron., Crop Sci. Soc. Amer. andSoil Sci. Soc. Amer. Madison, Wisconsin 53711 USA.
308
Need of K Fertilizers in Tropical and Temperate
Forests
Bonneau, A, INRA, Centre of Nancy, 54280 Champenoux, France
Summary
K deficiency, K fertilizer requirements and results of experiments are
reviewed. K nutrition is deficient mainly on peat soils in northern countries,on sandy soils from glacial or fluvioglacial deposits (for instance in
northeastern Germany, northeastern USA and southern Qudbec), calcareous
shallow soils particularly under Mediterranean climate, and strongly
weathered ferrallitic soils in the tropics. There are no common methods for
soil analysis and soil analysis interpretation; the different techniques used
according to ecological conditions are briefly reviewed. Foliar diagnosis is
probably very useful and sure, but wide gaps in knowledge remain for manyspecies, namely broadleaves.
Introduction
Foresters have for long used fertilizers in order to improve timber
production or, more recently, tree health. Usually, P and N have been found
the most effective. K was more rarely a key element for increase in growth
for the probable reason that it is very mobile in ecosystems. It is easily
released from clay minerals like biotite, phlogopite and illite and not
strongly held by kaolinite or organic matter ; it moves easily from colloids
into the soil solution and thence into plant roots. Turnover between foliage
and soil is rapid. More than half the return of K from the forest canopy to
the soil is via throughfall ; little N or P is returned in this way. Annual
uptake of K exceeds accumulation in wood and foliage, indicating very
active cycling (Table 1). Thus, despite the fact that the trees' K demand is
quite high, this is more easily satisfied than those for N, which is dependent
on mineralisation of soil organic matter, or P, which is generally strongly
held by soil colloids. Nevertheless, under a range of soil conditions, it has
proved useful to apply K along with N and P in order that the two later exerttheir maximum effect ; it can even be an "essential element" in its own right.
309
Hereunder the main conditions where K may be a primary or secondarygrowth limiting nutrient are reviewed.
K as a limiting factor in northern and temperate forests.In afforestation of peat soils with Pinus contorta, Picea sitchensis, Pinus
silvestris, K fertilization is essential together with P fertilization, as shownin many experiments in Scandinavian countries (Holmen, 1967;Heikurainen, 1967; Braekke, 1977); Scotland, Ireland (Dickson, 1972). Anapplication of 50 to 150 kg ha-1 K20 in addition P or NP fertilization maydouble height growth (Franz and Baule, 1962).The positive effect of K20 fertilizers may last for 10 to 20 years.
There are strong K deficiencies in Europe and North-America on sandysoils developed from glacial deposits. Many papers were devoted to theeffects of K fertilization on Pinus silvestris or Quercus rubra plantationsunder such conditions in northeastern Germany (Heinsdorf, 1966; Seibt etal., 1969, Krauss, 1967a and 1967b; Baule, 1974; Trillmich and Uebel,1970). In several cases K fertilization is inefficient if Mg is not addedtogether with K (Brining, 1961, 1963, 1967). In this area soils where Kfertilization is beneficial are characterized by a K concentration in A1horizons lower than 0.4 % after calcination and digestion in boiling 0.1 NHCI, or 0.11 % after digestion without calcination (Fiedler and Nebe, 1963)or a total K concentration lower than 800 mg kg- 1 after HF digestion(Krauss, 1967b; Heinsdorf, 1966; Brifning, 1967). On these poor sandy soilsK fertilization may protect P. silvestris from damage by the caterpillarRhyacyonia buolliana (Baule, 1968).
In Koo et al, 1970 in Korea observed a similar effect in Pinusdensiflora, in which, after a fungus attack, growth is strongly enhanced onK plots in comparison with controls.
310
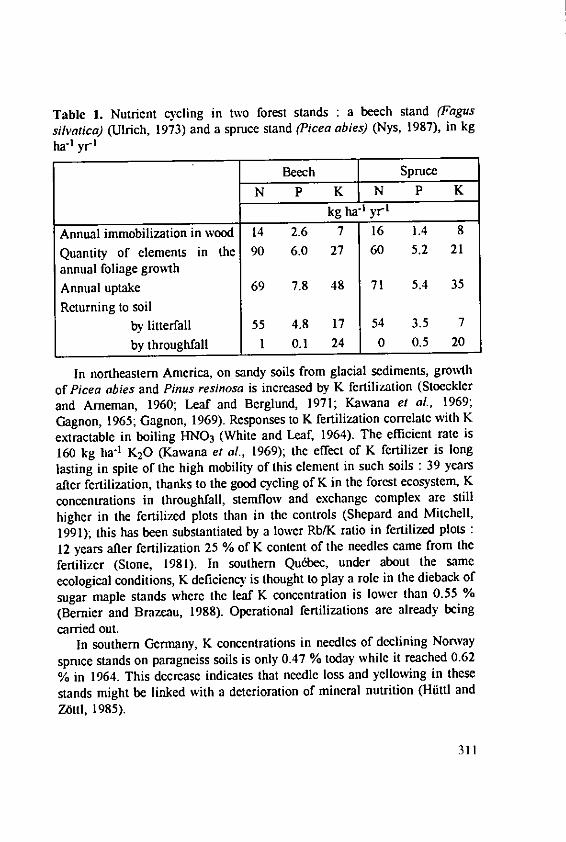
Table 1. Nutrient cycling in two forest stands : a beech stand (Fagussilvatica) (Ulrich, 1973) and a spruce stand (Picea abies) (Nys, 1987), in kgha-1 yr1
Beech Spruce
N P K IN P K
kg ha-' yr t
Annual immobilization in wood 14 2.6 7 16 1.4 8
Quantity of elements in the 90 6.0 27 60 5.2 21
annual foliage growth
Annual uptake 69 7.8 48 71 5.4 35
Returning to soil
by litterfall 55 4.8 17 54 3.5 7
by throughfall 1 0.1 24 0 0.5 20
In northeastern America, on sandy soils from glacial sediments, growth
of Picea abies and Pinus resinosa is increased by K fertilization (Stoeckler
and Arneman, 1960; Leaf and Berglund, 1971; Kawana et al., 1969;
Gagnon, 1965; Gagnon, 1969). Responses to K fertilization correlate with K
extractable in boiling HNO3 (White and Leaf, 1964). The efficient rate is
160 kg ha"1 K20 (Kawana et al., 1969); the effect of K fertilizer is long
lasting in spite of the high mobility of this element in such soils : 39 years
after fertilization, thanks to the good cycling of K in the forest ecosystem, K
concentrations in throughfall, stemflow and exchange complex are still
higher in the fertilized plots than in the controls (Shepard and Mitchell,
1991); this has been substantiated by a lower Rb/K ratio in fertilized plots :
12 years after fertilization 25 % of K content of the needles came from the
fertilizer (Stone, 1981). In southern Qudbec, under about the same
ecological conditions, K deficiency is thought to play a role in the dieback of
sugar maple stands where the leaf K concentration is lower than 0.55 %
(Bernier and Brazeau, 1988). Operational fertilizations are already being
carried out.In southern Germany, K concentrations in needles of declining Norway
spruce stands on paragneiss soils is only 0.47 % today while it reached 0.62
% in 1964. This decrease indicates that needle loss and yellowing in these
stands might be linked with a deterioration of mineral nutrition (Hiittl and
Z6ttl, 1985).
311
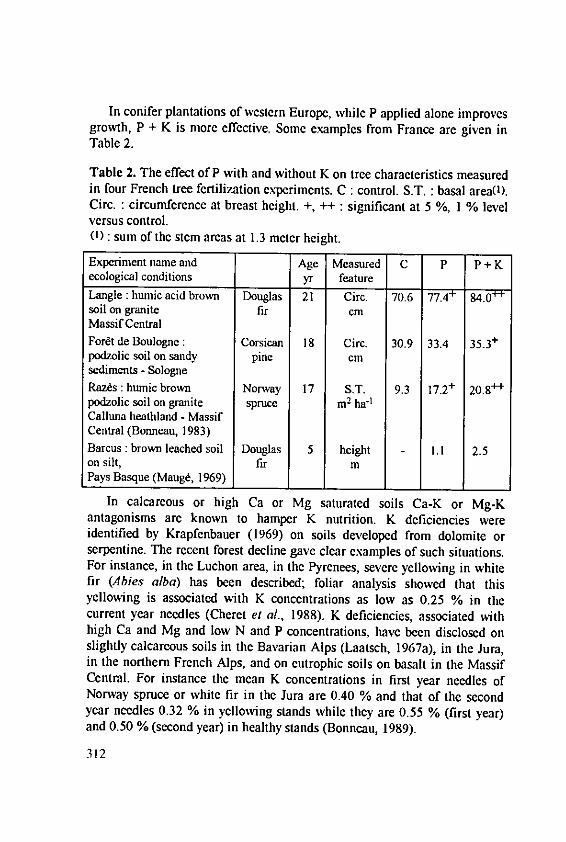
In conifer plantations of western Europe, while P applied alone improvesgrowth, P + K is more effective. Some examples from France are given inTable 2.
Table 2. The effect of P with and without K on tree characteristics measuredin four French tree fertilization experiments. C : control. S.T. : basal area(l).Circ. : circumference at breast height. +, ++ : significant at 5 %, I % levelversus control.(1) : sum of the stem areas at 1.3 meter height.
Experiment name and Age Measured C P P + Kecological conditions yr featureLangle: humic acid brown Douglas 21 Circ. 70.6 77.4 + 94.0 ++
soil on granite fir cmMassif CentralFort de Boulogne: Corsican 18 Circ. 30.9 33.4 35.3 +
podzolic soil on sandy pine cmsediments - SologneRazes: humic brown Norway 17 S.T. 9.3 17.2 +
20.8 ++
podzolic soil on granite spruce m2 ha-1
Calluna heathland - MassifCentral (Bonneau, 1983)Barcus : brown leached soil Douglas 5 height - 1.1 2.5on silt, fir mPays Basque (Maug6, 1969) , I
In calcareous or high Ca or Mg saturated soils Ca-K or Mg-Kantagonisms are known to hamper K nutrition. K deficiencies wereidentified by Krapfenbauer (1969) on soils developed from dolomite orserpentine. The recent forest decline gave clear examples of such situations.For instance, in the Luchon area, in the Pyrenees, severe yellowing in whitefir (Abies alba) has been described; foliar analysis showed that thisyellowing is associated with K concentrations as low as 0.25 % in thecurrent year needles (Cheret et al., 1988). K deficiencies, associated withhigh Ca and Mg and low N and P concentrations, have been disclosed onslightly calcareous soils in the Bavarian Alps (Laatsch, 1967a), in the Jura,in the northern French Alps, and on eutrophic soils on basalt in the MassifCentral. For instance the mean K concentrations in first year needles ofNorway spruce or white fir in the Jura are 0.40 % and that of the secondyear needles 0.32 % in yellowing stands while they are 0.55 % (first year)and 0.50 % (second year) in healthy stands (Bonneau, 1989).
312
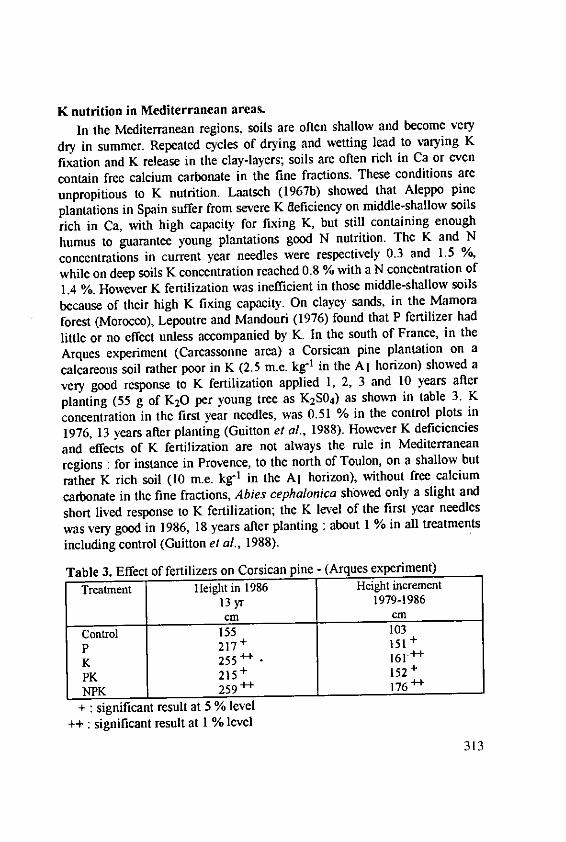
K nutrition in Mediterranean areas.
In the Mediterranean regions, soils are often shallow and become very
dry in summer. Repeated cycles of drying and wetting lead to varying K
fixation and K release in the clay-layers; soils are often rich in Ca or even
contain free calcium carbonate in the fine fractions. These conditions are
unpropitious to K nutrition. Laatsch (1967) showed that Aleppo pine
plantations in Spain suffer from severe K deficiency on middle-shallow soils
rich in Ca, with high capacity for fixing K, but still containing enough
humus to guarantee young plantations good N nutrition. The K and N
concentrations in current year needles were respectively 0.3 and 1.5 %,
while on deep soils K concentration reached 0.8 % with a N concentration of
1.4 %_ However K fertilization was inefficient in those middle-shallow soils
because of their high K fixing capacity. On clayey sands, in the Mamora
forest (Morocco), Lepoutre and Mandouri (1976) found that P fertilizer had
little or no effect unless accompanied by K. In the south of France, in the
Arques experiment (Carcassonne area) a Corsican pine plantation on a
calcareous soil rather poor in K (2.5 m.e. kg' t in the Al horizon) showed a
very good response to K fertilization applied 1, 2, 3 and 10 years after
planting (55 g of K20 per young tree as K2 S0 4) as shown in table 3. K
concentration in the first year needles, was 0.51 % in the control plots in
1976, 13 years after planting (Guitton et al., 1988). However K deficiencies
and effects of K fertilization are not always the rule in Mediterranean
regions : for instance in Provence, to the north of Toulon, on a shallow but
rather K rich soil (10 m.e. kg-1 in the Al horizon), without free calcium
carbonate in the fine fractions, Abies cephalonica showed only a slight and
short lived response to K fertilization; the K level of the first year needles
was very good in 1986, 18 years after planting about 1 % in all treatments
including control (Guitton et al., 1988).
Table 3. Effect of fertilizers on Corsican pine - (Arques experiment)
Treatment Height in 1986 Height increment13 yr 1979-1986cm cm
Control 155 103
P 217 + 151 +
K 255++ 161++PK 215 + 152 +
NPK 259-- 176++
+ significant result at 5 % level++: significant result at 1 % level
313
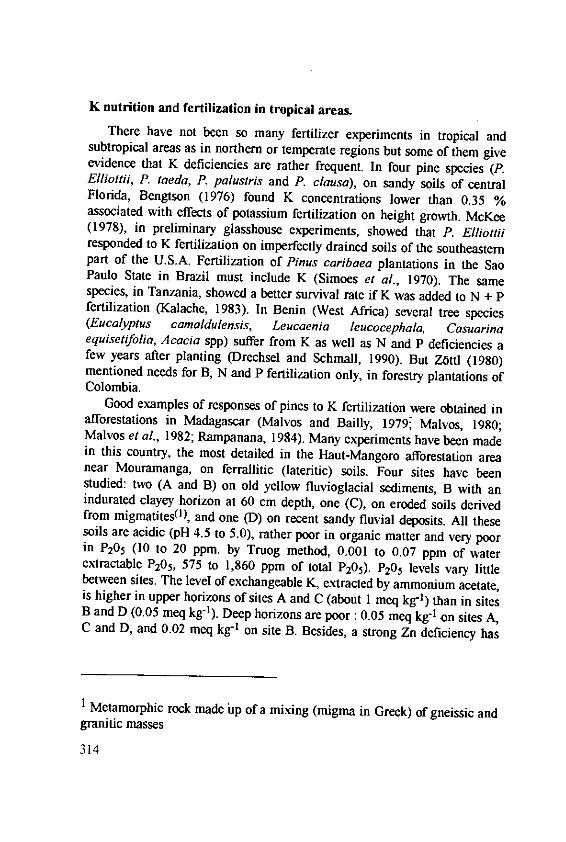
K nutrition and fertilization in tropical areas.There have not been so many fertilizer experiments in tropical and
subtropical areas as in northern or temperate regions but some of them giveevidence that K deficiencies are rather frequent. In four pine species (P.Elliottii, P. taeda, P. palustris and P. clausa), on sandy soils of centralFlorida, Bengtson (1976) found K concentrations lower than 0.35 %associated with effects of potassium fertilization on height growth. McKee(1978), in preliminary glasshouse experiments, showed that P. Elliottiresponded to K fertilization on imperfectly drained soils of the southeasternpart of the U.S.A. Fertilization of Pinus caribaea plantations in the SaoPaulo State in Brazil must include K (Simoes et al., 1970). The samespecies, in Tanzania, showed a better survival rate if K was added to N + Pfertilization (Kalache, 1983). In Benin (West Africa) several tree species(Eucalyptus camaldulensis, Leucaenia leucocephala, Casuarinaequisetifolia, Acacia spp) suffer from K as well as N and P deficiencies afew years after planting (Drechsel and Schmall, 1990). But Z6ttl (1980)mentioned needs for B, N and P fertilization only, in forestry plantations ofColombia.
Good examples of responses of pines to K fertilization were obtained inafforestations in Madagascar (Malvos and Bailly, 1979; Malvos, 1980;Malvos et al., 1982; Rampanana, 1984). Many experiments have been madein this country, the most detailed in the Haut-Mangoro afforestation areanear Mouramanga, on ferrallitic (lateritic) soils. Four sites have beenstudied: two (A and B) on old yellow fluvioglacial sediments, B with anindurated clayey horizon at 60 cm depth, one (C), on eroded soils derivedfrom migmatites(l), and one (D) on recent sandy fluvial deposits. All thesesoils are acidic (pH 4.5 to 5.0), rather poor in organic matter and very poorin P205 (10 to 20 ppm. by Truog method, 0.001 to 0.07 ppm of waterextractable P205, 575 to 1,860 ppm of total P205). P205 levels vary littlebetween sites. The level of exchangeable K, extracted by ammonium acetate,is higher in upper horizons of sites A and C (about I meq kg-') than in sitesB and D (0.05 meq kg'l). Deep horizons are poor: 0.05 meq kg- on sites A,C and D, and 0.02 meq kg' on site B. Besides, a strong Zn deficiency has
I Metamorphic rock made 'up of a mixing (migma in Greek) of gneissic andgranitic masses
314
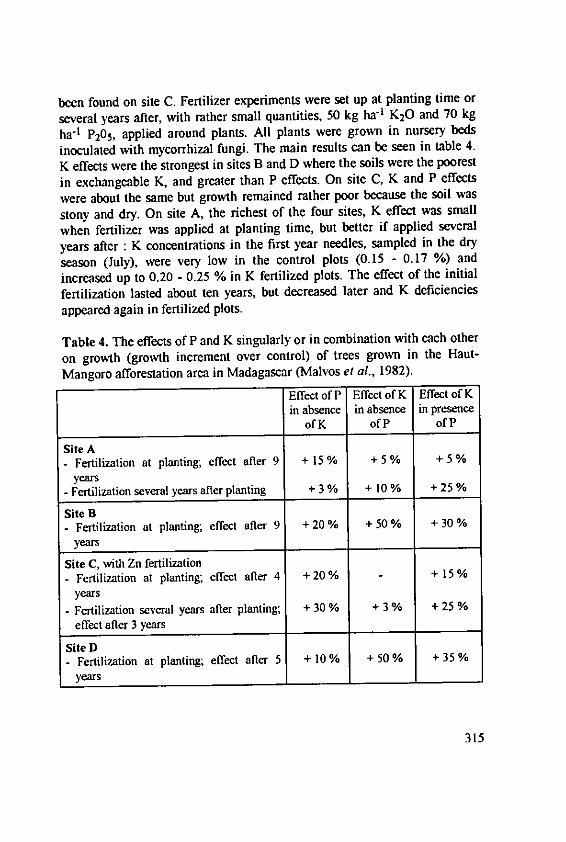
been found on site C. Fertilizer experiments were set up at planting time orseveral years after, with rather small quantities, 50 kg ha "| K20 and 70 kgha-1 P205, applied around plants. All plants were grown in nursery bedsinoculated with mycorrhizal fungi. The main results can be seen in table 4.
K effects were the strongest in sites B and D where the soils were the poorest
in exchangeable K, and greater than P effects. On site C, K and P effects
were about the same but growth remained rather poor because the soil wasstony and dry. On site A, the richest of the four sites, K effect was smallwhen fertilizer was applied at planting time, but better if applied several
years after : K concentrations in the first year needles, sampled in the dry
season (July), were very low in the control plots (0.15 - 0.17 %) and
increased up to 0.20 - 0.25 % in K fertilized plots. The effect of the initialfertilization lasted about ten years, but decreased later and K deficienciesappeared again in fertilized plots.
Table 4. The effects of P and K singularly or in combination with each other
on growth (growth increment over control) of trees grown in the Haut-Mangoro afforestation area in Madagascar (Malvos et al., 1982).
Effect of P Effect of K Effect of Kin absence in absence in presence
of K of P of P
Site A- Fertilization at planting; effect after 9 + 15% + 5% +5%
years- Fertilization several years after planting + 3 % + 10 % + 25 %
Site B- Fertilization at planting; effect after 9 + 20 % + 50 % + 30 %
years
Site C, with Zn fertilization- Fertilization at planting; effect after 4 + 20% - + 15 %
years
- Fertilization several years after planting; + 30 % + 3 % + 25 %effect after 3 years
Site D- Fertilization at planting; effect after 5 + 10 % + 50 % + 35 %
years
315
It was shown that 8-year-old pine accumulated 91 kg ha -1 K 2 0 iffertilized with K and P and 54 kg ha -1 if fertilized with P but without K (notincluding roots). Thus almost all K applied was consumed by the end of 8years. It still might increase growth by internal recycling, but K deficienciesappeared again later on, because the soil was not able to sustain this growthand K became more and more diluted in the tree biomass. As a matter of factthese soils do not contain more than 200 kg ha-1 of exchangeable K, or 400kg ha-1 of K extracted in 10 minutes by 0,5 N boiling HNO3 (White andLeaf, 1964). These quantities are very small when compared with the needsof a fast growing stand.
These results give a good illustration of the extreme impoverishment ofsome tropical soils, in which the very small K reserves are probably in theform of felspars, which weather very slowly, and clays are mainly kaolinit.
Diagnosis of K fertilizer needs in forest soils.
Soil analysis.
Extraction of exchangeable K by N ammonium acetate is the mostfrequently used method, but estimates of the critical value (below which Kfertilizer is effective) vary much according to the literature. These valuesdiffer from one tree species to another. For non high demanding species,such as pines, this critical value seems to be very low, for instance 0.26 meqkg-' in Florida for P. Elliottii (C.R.I.F.F., 1980). But Stoeckler andArneman (1960) estimated that 0.5 meq was the threshold value. This valueseems to be more realistic and to correspond rather well with the results ofthe experiments in Madagascar, where P. kesiya showed very strongresponses to K fertilization with 0.25 meq kg- 1 of exchangeable K in theupper soil horizons.
In more humic soils of temperate climates and for more demandingspecies such as Picea abies, the critical value is probably much higher ; onthe basis of our own experiments we propose 4 meq kg-' in A, horizons andI meq kg"1 in mineral horizons. These values are in good agreement withthose proposed by Siichting (1943).
Other authors proposed more drastic extraction methods, like 0.5 Nboiling HNO 3 for 10 minutes (White and Leaf, 1964). Fiedler and Nebe(1963) proposed a critical value of 4 g kg-' of K extracted from A, horizonsby 6N boiling HCI for one hour after calcination, or 1.1 g kg-' extractedwithout previous calcination. Brining (1967) and Heinsdorf (1966)
316
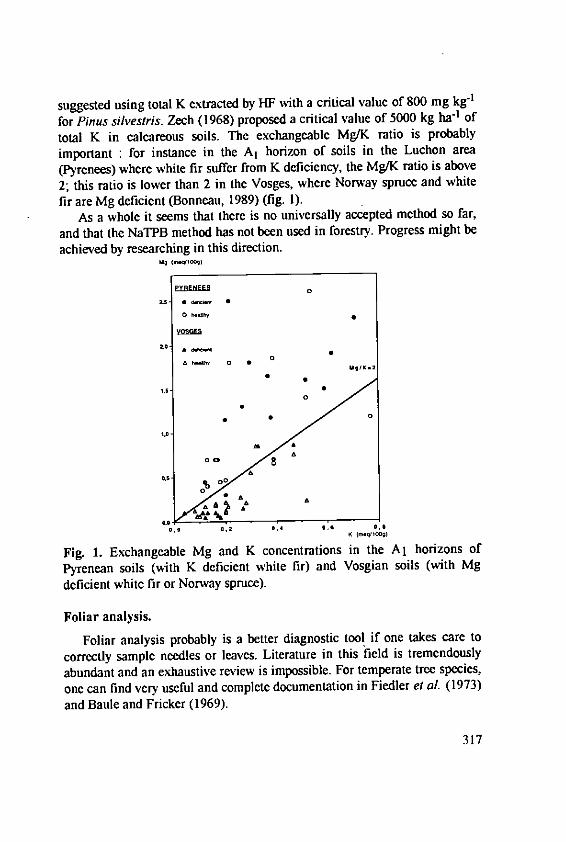
suggested using total K extracted by HF with a critical value of 800 mg kg"1
for Pinus silvestris. Zech (1968) proposed a critical value of 5000 kg ha4 oftotal K in calcareous soils. The exchangeable Mg/K ratio is probablyimportant : for instance in the A, horizon of soils in the Luchon area(Pyrenees) where white fir suffer from K deficiency, the Mg/K ratio is above2; this ratio is lower than 2 in the Vosges, where Norway spruce and whitefir are Mg deficient (Bonneau, 1989) (fig. I).
As a whole it seems that there is no universally accepted method so far,and that the NaTPB method has not been used in forestry. Progress might beachieved by researching in this direction.
Mg (,04cflO0¢g)
00
2.0-
00ahnr0 0
00
% 0.
oo
0
0.00.0] 0,2 *.4 0,0L 0,
Fig. 1. Exchangeable Mg and K concentrations in the Al horizons ofPyrenean soils (with K deficient white fir) and Vosgian soils (with Mgdeficient white fir or Norway spruce).
Foliar analysis.
Foliar analysis probably is a better diagnostic tool if one takes care tocorrectly sample needles or leaves. Literature in this field is tremendouslyabundant and an exhaustive review is impossible. For temperate tree species,one can find very useful and complete documentation in Fiedler et aL (1973)and Baule and Fricker (1969).
317
Pine species are probably the least demanding. P. kesiya can grow wellwith a K concentration in first year needles of about 0.3 % (Malvos et al.,1982). For P. Elliottii the critical value below which K fertilization has apositive effect is 0.35 % (Bengtson, 1976) and is the same forP. radiata inAustralia (Raupach and Hall, 1974). Healthy and well growing P. halepensisin Spain has a K concentration of 0.7 % while it is clearly deficient at 0.3 %(Laatsch, 1967b). P. silvestris seems to be more demanding : the deficiencythreshold is 0.35 %, the critical level about 0.40 - 0.45 % and the optimumconcentration 0.45 - 0.50 % (Fiedler et al., 1973). The K/Ca ratio isimportant for this species : Hofmann and Muller (1971) reported a linearcorrelation between K/Ca and height growth : height at age 70 was 16 m fora K/Ca ratio of 1.2, and 27 m for a K/Ca ratio of 2.0. Norway spruce isprobably a little more demanding than Scotch pine : according to our ownexperiments (Bonneau, 1972, 1983) the optimum concentration in the firstyear needles might be about 0.6 %, but some authors define a loweroptimum value, at about 0.45 - 0.50 % (Z6ttl, 1990) with a critical level forfertilization efficiency at 0.40 %, and a deficiency threshold at 0.25 %(Burgtorf, 1968 in Fiedler et al., 1973; Zech, 1968 in Fiedler et al., 1973).According to Keller (1966), a K/Ca ratio lower than 0.3 on clayeycalcareous nursery soils corresponds to clear K deficiency and thedeficiency-symptoms disappear at a K/Ca ratio higher than 0.5. Douglas firand larch are less known species with regard to K nutrition; however theiroptimum K concentration in needles is probably a little higher than that ofNorway spruce, perhaps 0.7 (Van Goor, 1971; Hhne, 1968 in Fiedler et al.,1973). According to Zech (1968) deficiency symptoms appear in larch oncalcareous soils at a K concentration lower than 0.3 %.
According to Bernier and Brazeau (1988) many declining stands of sugarmaple have less than 0.55 % K in the leaves while a normal value is about0.9 %. In the west of France natural seedlings of Quercus petraea grow wellwith about 0.6 to 0.7 % of K in the leaves in August. Other deciduous treesdo not grow satisfactorily at such K concentrations : optimum levels are atleast 1.3 % for birch (Trillmich and Uebel, 1970) and poplars (Sheedy andVallee, 1981) but according to Van der Meiden (1962) the optimum value isas high as 2 %.
318
Conclusion
Obviously everything is not known about needs for K fertilization in
forestry. The soils in which K nutrition is most clearly limited are- peat soils in northern countries;- sandy soils on glacial or fluvioglacial deposits;- calcareous and shallow soils mainly in Mediterranean areas;
- strongly weathered ferrallitic soils in the tropics.Besides these major K deficient areas, K may be a very useful fertilizer
together with P in many temperate and tropical soils. Soil analysis is notvery useful as a guide to K fertilizer requirement; it is unlikely, or perhaps
impossible, that any one method of analysis and interpretation from amongthe many which have been tried can be proposed for general use. An obviousreason is that plant available and reserve K occur in very different forms
according to variation in geological, soil and climatic conditions.Foliar diagnosis may offer a safer way but, while many forest species
have been reasonably investigated in this respect, we are still far from an
adequate knowledge of many others (mainly broadleaved species), both in
temperate and tropical areas where the major effort has been devoted topines.
References
Baule, H.: Zusammenhang zwischen Nahrstoffgchalten und Krankheitcn beiForstpflanzen. AlIg. Forstz. 49. (1968).
Baule, H.: Erfolge der Kalidungung in Oberforsterci Pila/Polen. Forst-Holzwirt 29 (2), 32-33. (1974).
Baule, H.; Fricker, C.: La fertilisation des arbres forestiers. BLVVerlaggesellschaft Miinchen. (1969).
Bengtson, G.W.: Comparative response of four southern pine species to
fertilization effect of P, NP and K applied at planting. Forest Science 22(4), 487-494. (1976).
Bcrnier , B.; Brazeau, M.: Foliar nutrient status in relation to sugar mapledieback and decline in the Quebec Appalachians. Can. J. For. Res. 18(6), 754-761 (1988).
Bernier, B.; Brazeau, M.: Nutrient deficiency symptoms associated withsugar maple dieback and decline in the Quebec Appalachians. Can. J.For. Res. 18 (6), 762-767 (1988).
319
Bonneau, M.: Contribution A l'Atude de la nutrition et de la fertilisation desplantations d'dpicda dans le Massif Central. Ann. Sci. For. 29 (1), 3-34(1972).
Bonneau, M.: Effet A 12 et 14 ans de la fertilisation sur deux plantationsd'dpicda commun de l'Ouest du Massif Central. Rev. For. Fr. 35 (2), 98-105 (1983).
Bonneau, M.: Etude de la nutrition mintrale de sapins et d'dpictasjaunissants du Jura Central et mdridional. DEFORPA Journ6es deTravail - fdvrier-mars 1989. Volume 3. 6-4 bis - I A 6-4 bis 16. INRACentre de Nancy (1989).
Bonneau, M.: Que sait-on maintenant des causes du "d6pdrissement" desfor~ts ? Rev. For. Fr. 49 (5), 367-385 (1989).
Braekke, F. H.: Fertilization for balanced mineral nutrition of forests onnutrient poor peat land. Suo 28 (3), 53-62 (1977).
Brining, D.: Ober die Wirkung von Pflanzennthrstoffen auf das Wachstumvon Kiefern in Jugendstadium. Alig. Forst- Jagdztg. 168-177 (1961).
Briining, D.: Einlluss einer mineralischen Dfingung auf dasJugendwachstum von Kiefern und Roteichen. Forstarchiv (2) 25-30(1963).
Briining, D.: 35 Jahre KMg Kieferndiingungsversuche Templin. Coll. For.Fertiliz. Jyvaiskyla, Finland. Int. Potash. Inst. Bern. 240-249 (1967).
Burgtorf H.: Exempel pa kaliumbust hos gran, planterad pa ukermark. Avd.f. skogsekologi, skogsh6sgskoland. rapporter och uppsatser 7 (1968).
Ch6ret, V.; Dagnac, J.; Fromard, F.: Le ddpdissement du sapin dans lesPyrdndes luchonnaises. Rev. For. Fr.39 n0 1, 12-34 (1987).
C.R.I.F.F. (Cooperative Research In Forest Fertilization): Gainesville -Florida - Annual report. (1980).
Dickson, D.: Fertilizing forests on peat in Northern Ireland. Suo 23 (3/4),70-74 (1972).
Drechsel, P.; Schmall, S.: Mineral deficiencies and fertilization of coastalreforestations in Benin, West Africa. Fertil. Res. 23, 125-133 (1990).
Fiedler, H.J.; Nebe, W. ; Hoffmann, F.: Forstliche PflanzenernAhrung undDflngung 481 p. Ed. Gustav Fischer Verlag, lena. (1973).
Fiedler, H.J.; Nebe, W.: Uber die Beurteilung der Dflngebediirftigkeit vonMittelgebirgsstandorten durch Bodenanalysen. Archiv Forstw. 12 (9),963-991 (1963).
Franz, F.; Baule, H.: D~ingerwirkung an Fichten auf Ubergangsmoor. Alig.Forstz. 17 (43/44), 705-707 (1962).
320
Gagnon, J.D.: Effect of magnesium and potassium fertilization on a 20 yearold red pine plantation. The Forestry Chronicle 41 (3), 290-295 (1965).
Gagnon, J.D.: Soil improvement trials using scarification and fertilization instagnant white spruce plantations, Quebec, Canada. Plant Soil 90 (1),22-32 (1969).
Goor, C.P. (Van) : Forstliche Diingung in der Niederlander.Exkursionsfdihrer, Wageningen (1961).
Guitton, J.L.; Bonneau, M.; Adrian, M.: Rdsultats de fertilisation mindraleen region mdditerran&nne. Rev. For. Fr. 40 (4), 315-320 (1988).
Haag, H.P.; Mello, F.A.F.; Mello, H.A.; Brasil, M.O.C.; Veiga, A.A.:Composition chimique de l'Eucalyptus alba Reinw et de I'Eucalyptusgrandis (Mill.) Maiden. Fertilitd 18, 9-14 (1961).
Heikureinen, L.: The effects of manuring on organic soils. Coll. For.Fertiliz. Jyvaskyla, Finland, Int. Potash. Inst. Bern 197-205 (1967).
Heinsdorf, D.: Untersuchungen ilber die Wirkung mineralischer Diingungauf das Wachstum und Ernmahrungszustand von Kiefernkulturen aufSandb6den im nordostdeutschen Tiefland. Arch. Forstw. 15, 1165-1194(1966).
Hoffmann, W.; Miller, W.: Beitrag zur Erforschung der Koniferen -Standorte in Thflringer Buntsandsteingebiet. Diss. T.U. Dresden. (1971).
H6hne, H.: Blattanalystische Untersuchungen an einem mit hohenStickstoffgaben gediingten Mischbestand. Deutsche Akad. Landwirtsch.Wiss. Berlin, Tag. Ber. 84,77-93 (1970).
Holmen, H.: Forest fertilization in Sweden. Coll. For. Fertiliz, Jyvlskyla,Finland, Int. Potash Inst. Bern (1967).
HOWtt, R.F.; Z6ttl, H.W.: ErnAhrungszustand von Tannenbestainden inSiiddeutschland - ein historischer Vergleich - Allg. Forstz. 38 (1985).
In Koo, Chung; Taik Kyu, You: Effect of potash application on needle castof the Korean red pine. J. Korean For. Soc. 10, 1-13 (1970).
Kalache, A.G.: The effect of inorganic fertilizers on the early performanceof Pinus Caribaea (Morelet) at Ruvo. Tanzania Silviculture TechnicalNote n°57 (1983).
Kawana, A.; Kenneth, G.; Leaf, AL.: Response of Pinus plantations topotassium fertilization on a potassium deficient site. Plant Soil 30 (3),439445, (1969).
Keller, T.H.: Versuche zur Bekampfung der winterlichenNadelverflrbungen an den Triebenden der Fichte in Forstpflanzengarten.J. For. Suisse 10, 706-719 (1966).
321
Krapfenbauer, A.: B6den auf Dolomit und Serpentin in ihrer Wirkung aufdie Waldernflhrung. Centralbl. Gesamte Forstw. 86 (4), 189-250, (1969).
Krauss, H.H.: Problemen der Forstdiingung in nordlichen Teil derDeutschen Demokratischen Republik. Sozialistische Forstwirtschaft, (6),(1967) (a).
Krauss, H.H.: Kaliemnahrung und Wachstum von Kiefernkulturen und -bestanden auf den verbreitesten Standorten in nordostdeutschenTiefland. Coil. For. Fertiliz. Jyv~lskylA, Finland. Inst. Potash Inst. Bern,206-216, (1967) (b).
Laatsch, W.: Beziehungen zwischen Standortsfaktoren, Ernahrungszustandund den Wuchsleistung von WaldbestAnden. XIV IUFRO - Kongr, Sekt.21, Miinchen, 22-35 (1967) (a).
Laatsch, W.: Beziehungen zvischen Standort, Emihrungszustand undWuchsleistungen von Kiefernaufforstungen in Mittelmeergebiet.Forstwiss. Centralbl. 86 (2), 69-81 (1967) (b).
Lamb, D.: Variation in the foliar concentrations of macro- andmicroelements in a fast growing tropical Eucalypt. Plant Soil 45 ,477-492 (1976).
Leaf, A.L.: K, Mg and S deficiencies in forest trees. In "Forest Fertilization,Theory and Practice". Symposium on Forest Fertilization, april 1967,Gainesville, Florida, 88-112 (1968).
Leaf, A.L.; Berglund J.V.: Growvth and nutrition of Picea abies and Pinusresinosa on a K deficient site subjected to K fertilization. 3rd conferenceon Forest Yield Forest-Fertilization (1971).
Lepoutre, B.; Mandouri T.: Rdsultats d'essais prdliminaires de fumuremindrale sur Pinus pinaster et Eucalyptus camaldulensis en Mamora.Ann. Rech. For. Maroc 16, 65-99 (1976).
Malvos, C.; Bailly, C.: Expdrimentations rdalisdes A Madagascar sur lafertilisation des boisements de pins apr~s plantation. Bois et Forets desTropiques. Cahier Scientifique 5, 105 p. (1979).
Malvos, C.: Rbles du potassium et du phosphore sur la croissance desreboisements de Pinus kesiya A Madagascar. Thse Univ. do Nancy(1980).
Malvos, C.; Bonneau, M.; Souchier, B.: R61e du potassium et du phosphoresur la croissance des reboisements do Pinus kesiya A Madagascar. Bois etFor6ts des Tropiques 198, 17-42 (1982).
Mc Kee, W.H.Jr.: Slash pine seedling response to potassium and calcium onimperfectly drained coastal plain soils. Plant Soil 50 (3), 615-624 (1978).
322

Maugd, J.P.: Effet de la potasse et de la magnsie A la plantation, surDouglas, dans lne station du Pays Basque, en fonction des doses et desmodalit6s d'apport. Association Fort Cellulose. C.R. d'activitt. 1968,103-119 (1969).
Meiden, H.A. Van der : Die Dingung der Pappel. Forstarchiv 33 (4), 69-72(1962).
Rampanana, L.: Nutrition mintrale du Pinus kesiya dans la zone duMangoro. Cas particulier du potassium et du zinc. These. Univ. deMadagascar. Etablissement d'Enseignement Supdrieur des Sciences, 141p. (1984).
Raupach, M ; Hall, M.J.: Foliar levels of potassium in relation to potassiumdeficiency symptoms in Radiata pine. Austral. For. 36 (3), 204-213(1974).
Sch6nau, A.P.G.: The effects of fertilizing on the foliar nutrientconcentrations in Eucalyptus grandis. Fertil. Res. 2 (2), 73-87 (1981).
Sch6nau, A.P.G.; Herbert, M.A.: Relationship between growth rate andfoliar concentration of nitrogen, phosphorus and potassium forEucalyptus grandis. S. Afr. For. J. n' 120, 19-23 (1982).
Seibt, G.; Knigge, W.; Reemitsma, J.B.; Ulrich, B.: Untersuchungen fberden Einfluss verschiedener Dtingungsmassnahmen auf Ertragsleistung,Holzeigenschaften, nadelanalytische Merkmale, und Bodenzustand derFichtenbestande in Dflngungsversuch Oerrel-Lintzel. Forst- Jagdztg. 139(3), 25-71 (1962).
Sheedy, G.; Vall(e, G.: Recherche et ddveloppement sur le peuplier. XVII.Comportement de 15 clones A la suite de l'application de trois traitementsde fertilisation. Gouvernement du Qudbec. Ministre de rEnergie ct desRessources. M6moire. n' 72, (1981).
Shepard, J.P.; Mitchell, M.J.: Solution chemistry in a red pine plantationthirty-nine years after potassium fertilization. Soil Sci. Soc. Am. J. 55(5), 1446-1452 (1991).
Simoes, J.W.; Mascarenha, S.; Sobrinho, J.; Melloch, A.; Couto, H.F.Z.:Fertilizing accelerates the initial development of Pinus caribaea var.bahamensis plantations. I.P.E.F. (1), 59-80 (1970).
Stoeckeler J.H.; Arneman, H.F.: Fertilizers in Forestry (1960).Stone, E.L.: Persistence of potassium in forest systems : further studies with
the rubidium/potassium technique. Soil Sci. Soc. Am. J. 45 (6), 1215-1218 (1981).
Sfichting, H.: Die Errthrungsverhaltnisse des Waldes. AlIg. Forst.- Jagdztg.114, 29-42 (1943).
323
Trillmich, H.D.; Uebel, E.: Ein Dfingungtest zu Birke. Archiv Forstw. 19(8), 797-810 (1970).
White, E.H.; Leaf A.L.: Soil and tree potassium content related to treegrowth. Soil Sci. 98, 395402 (1964).
Zeech, W.: Kalkhaltige Bbden als Nthrsubstrat ftir Koniferen. Diss.Mfinchen, (1968).
ZUttl, H.W.: Forestry investigations and industrial development projectColombia. Nutritional aspects of forestry plantations in Columbia.F.A.O. Report, PNUD/FAO/COL/74/005, PIF, n' 27 (1980).
Zdttl, H.W.: Ernihrung und Duingung der Fichte. Forstwiss. Centralbl. 109,130-137 (1990).
324
Potassium Requirements of Fast-growing TropicalTree Plantations
Kaupenjohann, M. and Zech, W., Lehrstuhl fir Bodenkunde undBodengeographie, UniversitAt Bayreuth, Postfach 101251, 8580 Bayreuth,Germany
Summary
A literature review has been conducted to compile data on K nutritionand K requirements (for above ground biomass production) of fast-growingtropical tree plantations. The paper focusses on Tectona grandis, Eucalyptussp. and Pinus sp. Potassium nutrition has been successfully characterized byfoliar analysis. Deficiency of the considered species is indicated by leafvalues of K < 2-6 mg g-1 (7' grandis), < 3 mg g-1 (Eucalyptus sp.) and <1.3-2.0 mg g-1 (Pinus sp.). Optimum supply needs foliar concentrations of 5-25 mg g-1. Teak has the highest demand while pines need the lowestconcentrations.
Likewise, the annual K requirements of teak are highest among theconsidered species, followed by eucalyptus. The data vary greatly andgenerally tend to increase with the age of the stands (up to about 25 years).Site fertility, water supply, fertilization, and use of biocides also explain partof the variability. Recorded data range up to 555 kg ha-1 a-1 K for teak, varyfrom 7.7 to about 25 for P. caribaea, and reached about 180 kg ha-I a-1 K inan intensively fertilized P. radiata stand. Up to 50% of the K requirementsof a forested site may be due to understorcy uptake of K.
Up to 70% of the K requirements are supplied by internalretranslocation. Mineralization of K from litter plays an important role for Ksupply, too. In the early stage of a forest plantation, however, the soil K isthe major source to cover the stand requirements.
Introduction
The total above ground nutrient requirements of forest trees as expressedin kg ha-1 a-t are considered to be the quantities necessary for annualincrements in branch and stem biomass plus the amount required for thereplacement of the foliage within one year (Switzer and Nelson, 1972). The
325
requirements for substitution of the root biomass have to be consideredadditionally when talking about the total nutrient requirement of trees. It hasto be assumed that root litter production is at least as high as annual leaflitter fall (Fabiao et al, 1985). Since, however, the data base on belowground biomass, element stores and root growth dynamics is very weak, thispaper is confined to the K requirements of the above ground biomassproduction. Additionally, canopy leaching of nutrients has to be substitutedby uptake. Although this quantity returns to the soil it has to be added to theannually required amount of nutrients. In order to evaluate the nutrientrequirements of a forested site the nutrient demands for understorey biomassproduction have also to be taken into account (Turner and Lambert, 1983).
A rough first estimate of the annual nutrient requirements (Rr) of foreststands from literature data may be derived by deviding the total stock ofnutrients at the time of harvest (Sr) plus the amount of nutrients recycled tothe soil via litter fall and canopy leaching (Lr) by the duration of the rotationperiod(Tr) (Eq. I).
Rr(kgha-I a-]) (Sr + L)(kg.ha')
Requirement data derived in this way will then provide average valuesneglecting, however, the significance of the specific dynamics of the annualnutrient demands during the forest plantation cycle. According to Miller(1984) the nutrient requirement can be considered in three distinct phases.In phase I, prior to canopy closure, the young trees have high nutrientrequirements. The major nutrient source in this phase is the soil. During thesecond phase, retranslocation of nutrients within the tree becomes the mainsource. Finally, in phase Ill, the growth rate of the trees declines, nutrientsare fixed in organic soil layers or are depleted from the soil (see also Attiwill1979).
Thus, if data are available it will be more convenient to estimate theannual nutrient requirement on a database collected during a growth periodor at least during vegetation periods where the requirements differ less(mean annual periodic requirements). Substituting the suffix r (rotation) bya (annual) and p (periodic) Eq. I turns into:
326
Ra~ (g a-I -l =(S , + L4)(kg.ho7')Ra~p~ghr~J~h~T,Pa)
According to the mass balance equation the annual nutrient requirementscan also be calculated as the sum of annual uptake (Ua) plus annual internalredistribution of nutrients before litterfall (Rea):
Ra (kg ha-I a-]) = Ua (kg ha-l a-r) + Re a (kg ha-/ a-i) (III)
Potassium requirements of fast growing tropical trees have beencalculated from literature data by means of one of Eq. 1 - III, depending onthe available data base. Before reviewing the requirement data, it is useful togive first some general rules for the diagnosis of the K demand and also, toevaluate the K nutrition status of tropical trees.
Diagnosis of potassium demands
The visual approach to identify the nutritional status of trees by specificdeficiency symptoms is rapid and inexpensive. Thus, there have beenattempts to provide special guides for diagnosis (Drechsel and Zech, 1992).Since K belongs to the phloem mobile nutrients symptoms of deficiency willin general, with some exceptions, first show on older plant tissue. Withrespect to K, Drechsel and Zech (1992) established the following diagnosticcriteria for eucalyptus, pines and teak :
Eucalyptus sp.: Symptoms are first localized in younger leaves, leavesare not abnormally discoloured, but margins and veins of the leaves aredying off. Leaves of seedlings are smaller than normal, often whith crinkledsurfaces and margins. Branching is pronounced, giving a bushy, round-topped appearance. However, the deficiency symptoms described are notalways in agreement and are not very clear for K (Sch6nau and Herbert,1989).
Pinus sp.: Older needles are affected, after tip yellowing the needle tipsturn brown-reddish, the transition of the discoloured needle tip to the greenbasal part is smooth, not distinct. Sometimes needles appear bluish-green.
Tectona grandis: Older leaves show well marked interveinal chlorosis,the margins of the leaves appear scorched. Younger leaves show wrinkledsurfaces, the leave margings curl inwards.
327
Visual symptoms, thus, may be useful in qualitative diagnosis. However,they are often readily apparent only after the deficiency has resulted inreduction of growth (Mead, 1984). Another disadvantage is that multiplemineral deficiencies make diagnosis difficult. Thus other techniques arerequired to get both early and precise information about the nutritionalstatus of trees. One of these techniques is foliar analysis.
Potassium foliar values of tropical trees
The tree foliage nutrient concentration is an indicator of the nutritionalstatus of a plantation since it integrates the soil nutrient availability over acertain period of time and also reflects actual changes when comparingfoliage of different ages. Thus, foliar analysis reveals a powerful tool toassess the nutritional status of plants (e.g. Lambert, 1984; Mead, 1984;Zech, 1984; Bergmann, 1986). Recently, Drechsel and Zech (1992) havesummarized the usefulness and limitations of foliar analysis and have giventechnical implications with respect to sampling, analysis and interpretationof data.
Drechsel and Zech (1991) have reviewed foliar nutrient levels of broad-leaved tropical tree species. The authors observed K-deficiency symptoms atK foliar concentrations less than 1.0 to 2.9 (5.7 for Terminalia superba) mgg-1. Potassium leaf concentrations of 1.8 to 9.2 mg g-' were considered to below and values from 3.1 to 30.0 mg g-1 were classified as intermediate. Thebroad range reflects first of all differences in the demand of species. Theenvironmental conditions may, however, also vary the need for nutrients.With respect to K the relation to soil water availability has often beendemonstrated (e.g., Larsen 1983). Zech (1986) observed symptoms of Kdeficiency (2.0 in foliage from the lower crown to 7.6 mg g-' K in tissuefrom the upper crown) in leaves of poorly growing T. grandis in Ivory Coast.However, only slightly higher foliar values (5.3 to 7.0 mg g-' K) wereobserved in vigorous T. grandis at a second site in Ivory Coast. The autorattributed growth differences to higher water supply at the better site.
The leaf position also affects the concentration of K. E. g., Lamb (1976)showed that K leaf concentrations of E. deglupta were highest in uppercrown distal tissue compared to lower crown and proximal positions. Evans(1979), however, found no inner-crown variability of K concentrations inGinelina arborea trees. This may be attributed to relatively high K
328
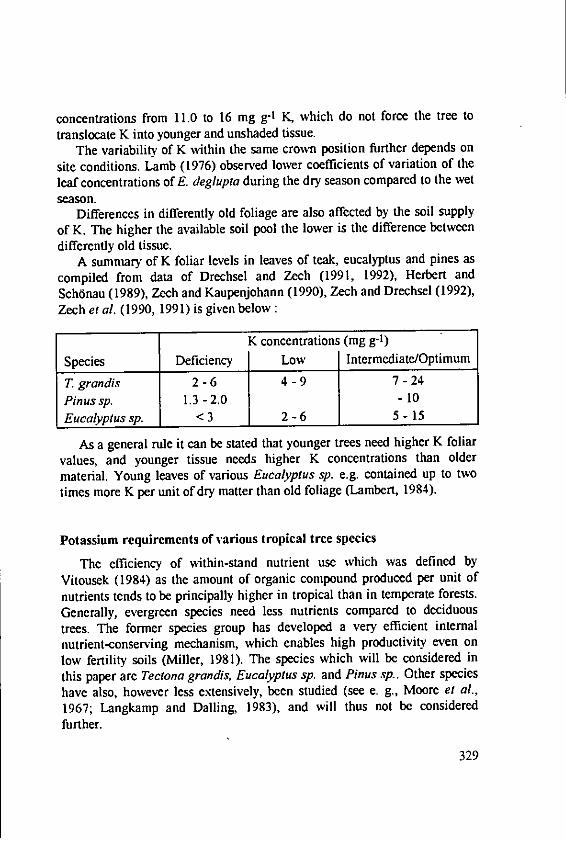
concentrations from 11.0 to 16 mg g-' K, which do not force the tree totranslocate K into younger and unshaded tissue.
The variability of K within the same crown position further depends onsite conditions. Lamb (1976) observed lower coefficients of variation of theleaf concentrations of E. deglupta during the dry season compared to the wetseason.
Differences in differently old foliage are also affected by the soil supplyof K. The higher the available soil pool the lower is the difference betweendifferently old tissue.
A summary of K foliar levels in leaves of teak, eucalyptus and pines ascompiled from data of Drechsel and Zech (1991, 1992), Herbert andSchbnau (1989), Zech and Kaupenjohann (1990), Zech and Drechsel (1992),Zech et al. (1990, 1991) is given below:
K concentrations (mg g-1)
Species Deficiency Low Intermediate/Optimum
T. grandis 2-6 4-9 7-24
Pinussp. 1.3 -2.0 -10
Eucalyptus sp. < 3 2-6 5-- 15
As a general rule it can be stated that younger trees need higher K foliarvalues, and younger tissue needs higher K concentrations than oldermaterial. Young leaves of various Eucalyptus sp. e.g. contained up to twotimes more K per unit of dry matter than old foliage (Lambert, 1984).
Potassium requirements of various tropical tree species
The efficiency of within-stand nutrient use which was defined byVitousek (1984) as the amount of organic compound produced per unit ofnutrients tends to be principally higher in tropical than in temperate forests.Generally, evergreen species need less nutrients compared to deciduoustrees. The former species group has developed a very efficient internalnutrient-conserving mechanism, which enables high productivity even onlow fertility soils (Miller, 1981). The species which will be considered inthis paper are Tectona grandis, Eucalyptus sp. and Pinus sp.. Other species
have also, however less extensively, been studied (see e. g., Moore et al.,1967; Langkamp and Dalling, 1983), and will thus not be consideredfurther.
329
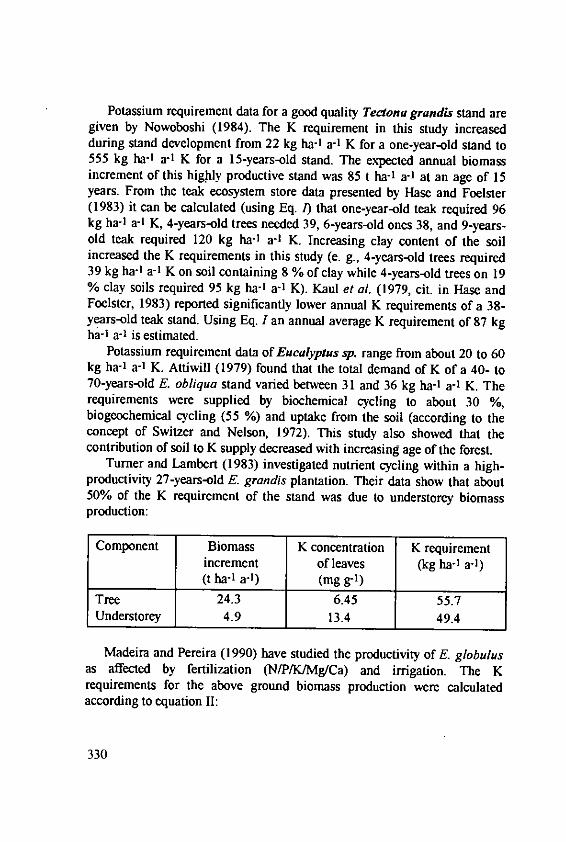
Potassium requirement data for a good quality Tectona grandis stand aregiven by Nowoboshi (1984). The K requirement in this study increasedduring stand development from 22 kg ha-1 a-' K for a one-year-old stand to555 kg ha-1 a-1 K for a 15-years-old stand. The expected annual biomassincrement of this highly productive stand was 85 t ha-I a-1 at an age of 15years. From the teak ecosystem store data presented by Hase and Foelster(1983) it can be calculated (using Eq. 1) that one-year-old teak required 96kg ha-1 a-' K, 4-years-old trees needed 39, 6-years-old ones 38, and 9-years-old teak required 120 kg ha-1 a-1 K. Increasing clay content of the soilincreased the K requirements in this study (e. g., 4-years-old trees required39 kg ha-' a-1 K on soil containing 8 % of clay while 4-years-old trees on 19% clay soils required 95 kg ha-1 a-1 K). Kaul et al. (1979, cit. in Hasc andFoelster, 1983) reported significantly lower annual K requirements of a 38-years-old teak stand. Using Eq. I an annual average K requirement of 87 kgha-1 a-1 is estimated.
Potassium requirement data of Eucalyptus sp. range from about 20 to 60kg ha-1 a-1 K. Attiwill (1979) found that the total demand of K of a 40- to70-years-old E. obliqua stand varied between 31 and 36 kg ha-I a-1 K. Therequirements were supplied by biochemical cycling to about 30 %,biogeochemical cycling (55 %) and uptake from the soil (according to theconcept of Switzer and Nelson, 1972). This study also showed that thecontribution of soil to K supply decreased with increasing age of the forest.
Turner and Lambert (1983) investigated nutrient cycling within a high-productivity 27-years-old E. grandis plantation. Their data show that about50% of the K requirement of the stand was due to understorey biomassproduction:
Component Biomass K concentration K requirementincrement of leaves (kg ha-' a-')(t ha-' a-') (mg g-l)
Tree 24.3 6.45 55.7Understorey 4.9 13.4 49.4
Madeira and Pereira (1990) have studied the productivity of E. globulusas affected by fertilization (N/P/K/Mg/Ca) and irrigation. The Krequirements for the above ground biomass production were calculatedaccording to equation II:
330
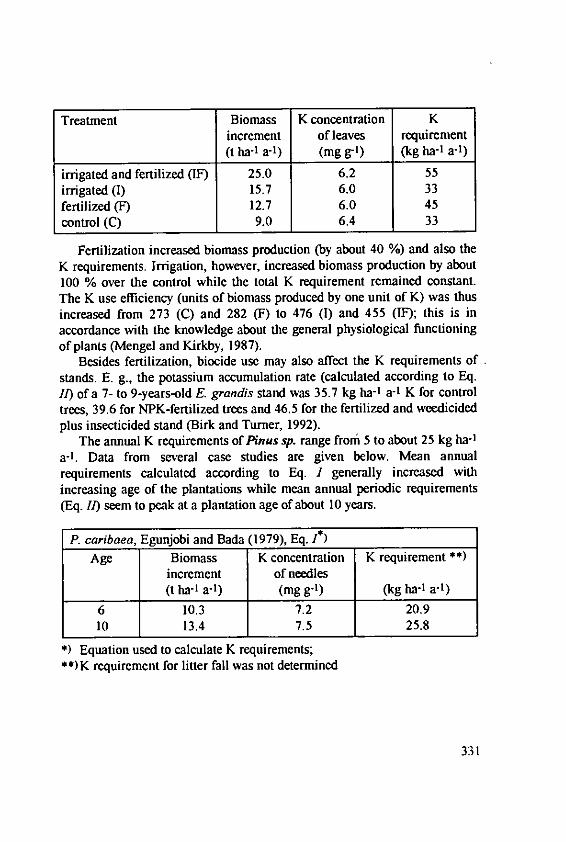
Treatment Biomass K concentration Kincrement of leaves requirement(t ha-I a-') (mg g-1) (kg ha-I a-1)
irrigated and fertilized (IF) 25.0 6.2 55irrigated (I) 15.7 6.0 33fertilized (F) 12.7 6.0 45control (C) 9.0 6.4 33
Fertilization increased biomass production (by about 40 %) and also theK requirements. Irrigation, however, increased biomass production by about100 % over the control while the total K requirement remained constant.The K use efficiency (units of biomass produced by one unit of K) was thusincreased from 273 (C) and 282 (F) to 476 (1) and 455 (IF); this is inaccordance with the knowledge about the general physiological functioningof plants (Mengel and Kirkby, 1987).
Besides fertilization, biocide use may also affect the K requirements ofstands. E. g., the potassium accumulation rate (calculated according to Eq.1i) of a 7- to 9-years-old E. grandis stand was 35.7 kg ha-I a-I K for controltrees, 39.6 for NPK-fertilized trees and 46.5 for the fertilized and weedicidedplus insecticided stand (Birk and Turner, 1992).
The annual K requirements of Pinus sp. range from 5 to about 25 kg ha-Ia-1. Data from several case studies are given below. Mean annualrequirements calculated according to Eq. 1 generally increased withincreasing age of the plantations while mean annual periodic requirements(Eq. 1H) seem to peak at a plantation age of about 10 years.
P. caribaea, Egunjobi and Bada (1979), Eq. I*)Age Biomass K concentration K requirement **)
increment of needles(t ha-I a-1) (mg g-') (kg ha-' a-')
6 10.3 7.2 20.910 13.4 7.5 25.8
*) Equation used to calculate K requirements;**)K requirement for litter fall was not determined
331
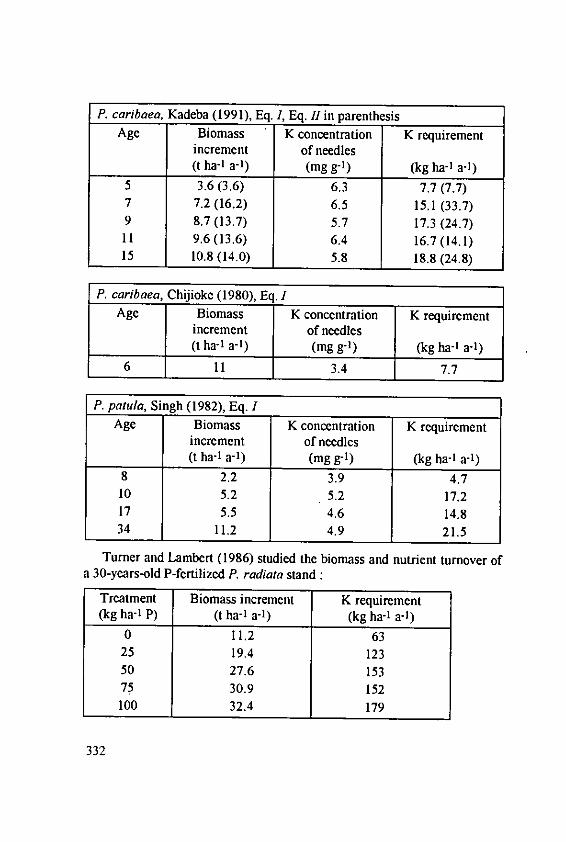
P. caribaea, Kadeba (1991), Eq. 1, Eq. 1 in parenthesisAge Biomass K concentration K requirement
increment of needles(t ha-I a-1) (mg g-1) (kg ha-' a-')
5 3.6 (3.6) 6.3 7.7 (7.7)7 7.2 (16.2) 6.5 15.1 (33.7)9 8.7 (13.7) 5.7 17.3 (24.7)
11 9.6 (13.6) 6.4 16.7 (14.1)15 10.8 (14.0) 5.8 18.8 (24.8)
P. caribaea, Chijioke (1980), Eq. ]Age Biomass K concentration K requirement
increment of needles(t ha-1 a-') (mg g-') (kg ha-I a-1)
6 11 3.4 7.7
P. patula, Singh (1982), Eq. 1Age Biomass K concentration K requirement
increment of needles(t ha-I a-1 ) (mg g-1) (kg ha- a-1)
8 2.2 3.9 4.710 5.2 5.2 17.217 5.5 4.6 14.834 11.2 4.9 21.5
Turner and Lambert (1986) studied the biomass and nutrient turnover ofa 30-years-old P-fertilized P. radiata stand:
Treatment Biomass increment K requirement(kg ha-I P) (t ha-I a-1) (kg ha-1 a-')
0 11.2 6325 19.4 12350 27.6 15375 30.9 152100 32.4 179
332

Fertilization of the poor quality stand increased the tree biomass
production by about three times. Accordingly, the K requirements for
biomass production increased by the same rate. In contrast, understorey
biomass production as well as understorey K uptake decreased with
increasing P application, presumably due to increased competition in the
treated plots.Soil fertility is generally one of the major factors explaining the variation
in the nutrient contents of the stand biomass (Drechsel and Zech, 1992);
both soil nutrient and water supply play a role.
Support of the K requirements of tropical forest plantations
Internal supply
Trees accumulate relatively large quantities of nutrients as their biomass
increases. This internal pool provides a forest with an opportunity for some
independence from external nutrient supply (Van den Driessche, 1984).
Retranslocation satisfies an important proportion of the trees' nutrient
requirements especially during growth stage II, as defined in the
introductory chapter. The potential of K retranslocation may be illustrated
simply by decreasing K concentrations during ageing of tissue as shown by
Ashton (1975) by the example of E. regnans leaves. Immature leaves
contained 12.5, 1st year leaves 11.3, 2nd year leaves 5.7 and fresh litter only
2.9 mg g-' K of dry matter. Retranslocation data which have been directly
taken from or were calculated on the data base of the cited papers are given
below:
Species/age Retranslocation % of foliage Reference(kg ha-1 a-1 K) content
E. grandis127 31.6 (57) Turner and Lambert 1983
E. obliqual45-60 12.8 70 Attiwill etal 1978
E. obliquafl5 20.8 70 Attiwill et al 1978
P. elliottii 9.3 84 Maggs 1985
In principle the contribution of retranslocation to K requirements for
seasonal growth should be related to the proportion of K in potentially
retranslocatable pools (foliage) versus immobile pools (wood). Since the
proportion of K in foliage related to K in wood decreases with tree age the
relative contribution of retranslocation to K supply should decrease with
333
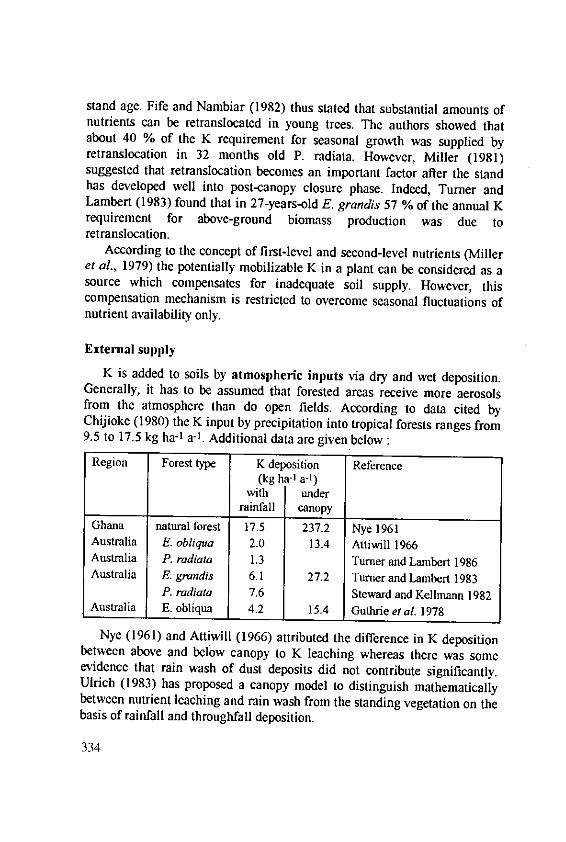
stand age. Fife and Nambiar (1982) thus stated that substantial amounts ofnutrients can be retranslocated in young trees. The authors showed thatabout 40 % of the K requirement for seasonal growth was supplied byretranslocation in 32 months old P. radiata. However, Miller (1981)suggested that retranslocation becomes an important factor after the standhas developed well into post-canopy closure phase. Indeed, Turner andLambert (1983) found that in 27-years-old E. grandis 57 % of the annual Krequirement for above-ground biomass production was due toretranslocation.
According to the concept of first-level and second-level nutrients (Milleret al., 1979) the potentially mobilizable K in a plant can be considered as asource which compensates for inadequate soil supply. However, thiscompensation mechanism is restricted to overcome seasonal fluctuations ofnutrient availability only.
External supply
K is added to soils by atmospheric inputs via dry and wet deposition.Generally, it has to be assumed that forested areas receive more aerosolsfrom the atmosphere than do open fields. According to data cited byChijioke (1980) the K input by precipitation into tropical forests ranges from9.5 to 17.5 kg ha-1 a-1. Additional data are given below:
Region Forest type K deposition Reference(kg ha-' a-')
with underrainfall canopy
Ghana natural forest 17.5 237.2 Nye 1961Australia E. obliqua 2.0 13.4 Attiwill 1966Australia P. radiata 1.3 Turner and Lambert 1986Australia E. grandis 6.1 27.2 Turner and Lambert 1983
P. radiata 7.6 Steward and Kellmann 1982Australia E. obliqua 4.2 15.4 Guthrieeta). 1978
Nye (1961) and Attiwill (1966) attributed the difference in K depositionbetween above and below canopy to K leaching whereas there was someevidence that rain wash of dust deposits did not contribute significantly.Ulrich (1983) has proposed a canopy model to distinguish mathematicallybetween nutrient leaching and rain wash from the standing vegetation on thebasis of rainfall and throughfall deposition.
334
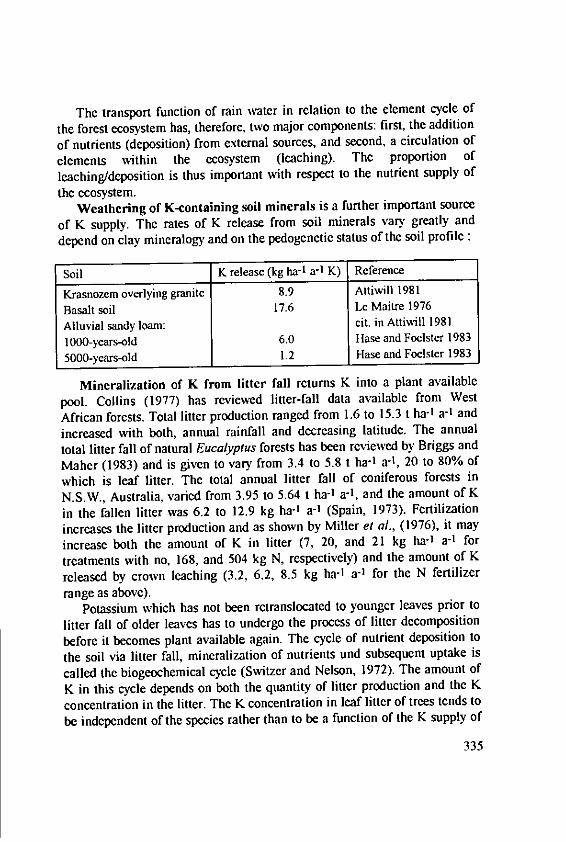
The transport function of rain water in relation to the element cycle of
the forest ecosystem has, therefore, two major components: first, the addition
of nutrients (deposition) from external sources, and second, a circulation of
elements within the ecosystem (leaching). The proportion of
leaching/deposition is thus important with respect to the nutrient supply of
the ecosystem.Weathering of K-containing soil minerals is a further important source
of K supply. The rates of K release from soil minerals vary greatly and
depend on clay mineralogy and on the pedogenetic status of the soil profile:
Soil K release (kg ha- I a-l K) Reference
Krasnozem overlying granite 8.9 Attiwill 1981
Basalt soil 17.6 Le Maitre 1976
Alluvial sandy loam: cit. in Attiwill 1981
1000-years-old 6.0 Hase and Foelster 1983
5000-years-old 1.2 Hase and Foelster 1983
Mineralization of K from litter fall returns K into a plant available
pool. Collins (1977) has reviewed litter-fall data available from West
African forests. Total litter production ranged from 1.6 to 15.3 t ha-1 a-' and
increased with both, annual rainfall and decreasing latitude. The annual
total litter fall of natural Eucalyptus forests has been reviewed by Briggs and
Maher (1983) and is given to vary from 3.4 to 5.8 t ha-1 a-1, 20 to 80% of
which is leaf litter. The total annual litter fall of coniferous forests in
N.S.W., Australia, varied from 3.95 to 5.64 t ha-1 a-1, and the amount of K
in the fallen litter was 6.2 to 12.9 kg ha-I a-] (Spain, 1973). Fertilization
increases the litter production and as shown by Miller et al., (1976), it may
increase both the amount of K in litter (7, 20, and 21 kg ha-1 a-I for
treatments with no, 168, and 504 kg N, respectively) and the amount of K
released by crown leaching (3.2, 6.2, 8.5 kg ha-1 a-1 for the N fertilizer
range as above).Potassium which has not been retranslocated to younger leaves prior to
litter fall of older leaves has to undergo the process of litter decomposition
before it becomes plant available again. The cycle of nutrient deposition to
the soil via litter fall, mineralization of nutrients und subsequent uptake is
called the biogeochemical cycle (Switzer and Nelson, 1972). The amount of
K in this cycle depends on both the quantity of litter production and the K
concentration in the litter. The K concentration in leaf litter of trees tends to
be independent of the species rather than to be a function of the K supply of
335
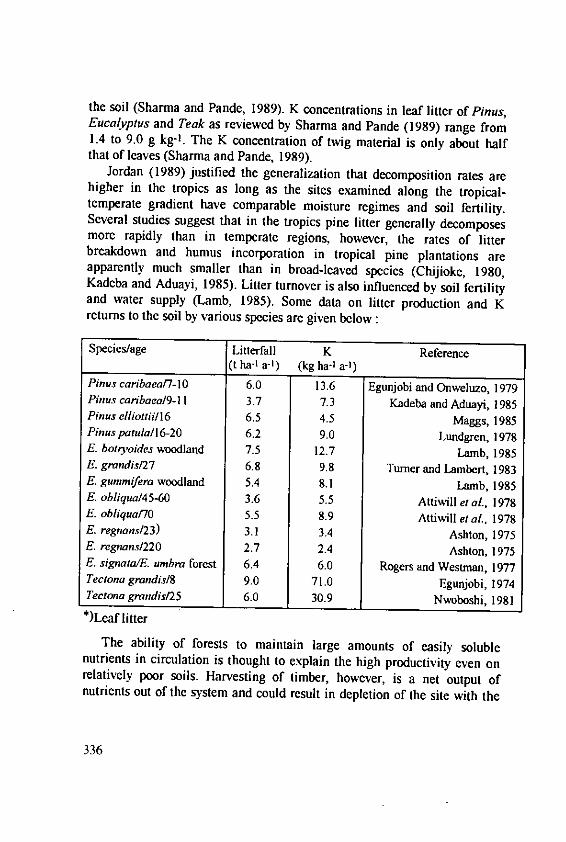
the soil (Sharma and Pande, 1989). K concentrations in leaf litter of Pinus,Eucalyptus and Teak as reviewed by Sharma and Pande (1989) range from1.4 to 9.0 g kg-'. The K concentration of twig material is only about halfthat of leaves (Sharma and Pande, 1989).
Jordan (1989) justified the generalization that decomposition rates arehigher in the tropics as long as the sites examined along the tropical-temperate gradient have comparable moisture regimes and soil fertility.Several studies suggest that in the tropics pine litter generally decomposesmore rapidly than in temperate regions, however, the rates of litterbreakdown and humus incorporation in tropical pine plantations areapparently much smaller than in broad-leaved species (Chijioke, 1980,Kadeba and Aduayi, 1985). Litter turnover is also influenced by soil fertilityand water supply (Lamb, 1985). Some data on litter production and Kreturns to the soil by various species are given below :
Species/age Litterfall K Reference(t ha-' a-') (kg ha-' a-)
Pinus caribaea7-10 6.0 13.6 Egunjobi and Onweluzo, 1979Pinus caribaeal9-11 3.7 7.3 Kadeba and Aduayi, 1985Pinus elliouii/16 6.5 4.5 Maggs, 1985Pinuspatula16-20 6.2 9.0 Lundgren, 1978E. botryoides woodland 7.5 12.7 Lamb, 1985E. grandis/27 6.8 9.8 Turner and Lambert, 1983E. gummifem woodland 5.4 8.1 Lamb, 1985E. obliqual45-60 3.6 5.5 Attiwill et aL, 1978E. obliquaflo 5.5 8.9 Attiwill et al, 1978E. regnans123) 3.1 3.4 Ashton, 1975E. regnans1220 2.7 2.4 Ashton, 1975E. signatalE. unbra forest 6.4 6.0 Rogers and Westman, 1977Tectona gmndisl8 9.0 71.0 Egunjobi, 1974Tectona grandis25 6.0 30.9 Nwoboshi, 1981*)Leaf litter
The ability of forests to maintain large amounts of easily solublenutrients in circulation is thought to explain the high productivity even onrelatively poor soils. Harvesting of timber, however, is a net output ofnutrients out of the system and could result in depletion of the site with the
336
ultimate effect that the soil will no longer produce satisfactory timber crops;this has already been pointed out in the 50ies (Rennie, 1955).
Thus, fertilizers are frequently used as an external nutrient source toovercome deficiencies. Several studies have evaluated the usefulness offertilizers in tropical forestry. The importance of fertilization of fast growingplantation forests has been impressively demonstrated by the example ofcuring the second rotation decline of P. radiata in South Australia (Woods,1990). Quantitatively most frequently used are N and P fertilizers. Aresponse to K, however, has been demonstrated on many sites after N and Pdeficiencies had been corrected. E. g., Grant (1989) showed that the totalvolume of a 10-years-old slash pine stand increased by 110 % over thecontrol as a result of applying 50 kg ha-1 K at planting. Herbert andSchbnau (1989) and Sch6nau and Herbert (1989) have reviewed the result offertilizer experiments on Pinus and Eucalyptus, respectively. Several of thecited studies showed a significant response to K fertilization. Potassiumresponse is primarily a function of site quality. Thus, K fertilizer demandshave been observed to be related to the geological reserves of soil parentmaterial. Whitemore (1989) speculates that the need of nutrient substition ofplantation forests may be systematically different on non-rejuvenating andrejuvenation soils, i.e. broadly between plains and hills.
Recorded response appears to occur mainly on soils derived from rocksinherently low in K and when the effective rainfall is marginal (Schdnauand Herbert, 1989). Potassium response also depends on tree age. By theexample of P. patula, Herbert and Sch6nau (1989) showed that K volumeresponse increases up to about 5 years of tree age and then declines again.However, on soils derived from geological formations low in K-bearingminerals, or in drier areas K-application is recommended at planting, with aK:P ratio which should generally not exceed I (Sch6nau and Herbert, 1989).Since the K demand is highly dependent on soil supply the rates of optimumK fertilization for older trees show a wide range. For Pinus doses up to 340kg ha-I K are recommended (Herbert and Sch6nau, 1989). High K demandslike these were needed at sites in Madagascar, which have been shown to bevery low in K-supply (Bailly et al., 1974; Malvos et al., 1983; Malvos et al.,1989). The majority of K-demanding sites, however, will require Kapplication rates ranging from 10 to 50 kg ha-1 for Pinus and from 5 to 40kg for E. grandis (Herbert and Schbnau, 1989).
Mika and Moore (1990) showed that N fertilizer effects on growth ofPseudotsuga menziesii were dependent on the K supply of the trees.
337
Suboptimal K was expressed in a reduced degree and duration of N fertilizerresponses.
Intensive management such as a combination of fertilization and weedcontrol may further increase wood production. Birk and Turner (1992)showed that one year of NPK-fertilization in combination with weed controlresulted in almost as much above-ground biomass of a 9-years-old E.grandis stand as 6 years of fertilizer input. Fertilizer plus weedicide plusinsecticide input over 6 years, the most intensive treatment of this trial,increased the standing biomass more than twice over the control from 133 tto 274 t ha-1. Biocide application increased the recovery of applied K fromabout 5 to 16 %.
Timing of forest fertilization operations needs to be considered inrelation to the stage of the stand development, climatic conditions and othersilvicultural practices (Ballard, 1984).
References
Ashton, D.H.: Studies of litter in Eucalyptus regnans forests. Aust. J. Bot.23, 413-433 (1975).
Attiwill, P.M., H.B. Guthrie and R. Leuning: Nutrient cycling in aEucalyptus obliqua (L'Hdrit.) Forest. 1. Litter production and nutrientreturn. Aust. J. Bot. 26, 79-91 (1978).
Attiwill, P.M.: Nutrient cycling in a Eucalyptus obliqua (L'Htrit.) forest. III.Growth, biomass, and net primary production. Aust. J. Bot 27, 439458(1979).
Attiwill, P.M.: The chemical composition of rainwater in relation to cyclingof nutrients in mature eucalyptus forest. Plant and Soil 23, 390406(1966).
Bailly, C., G. Ramanantsoavina, G. Benoit de Coignac, A.Rakotomanampison and C. Malvos: Fertilisation des plantations de pinsA Madagascar. Bois et Fordt des Tropiques 158, 13-32 (1974).
Ballard, R.: Fertilization of plantations: In: G.D. Bowen and E.K.S.Nambiar (eds.), Nutrition of Plantation Forests. Academic Press,London, 327-360 (1984).
Bergmann, W.: Farbatlas Eridhrungsst6rungen bi Kulturpflanzen. G.Fischer, Jena, 1-306 (1986).
338
Birk, E.M. and J. Turner: Response of flooded gum (E. grandis) to intensivecultural treatments: biomass and nutrient content of eucalypt plantationsand native forests. Forest Ecology and Management 47, 1-28 (1992).
Briggs, S.V. and M.T. Maher: Litter fall and decomposition in a river redgum (Eucalyptus camaldulensis) swamp. Aust. J. Bot. 31, 307-316(1983).
Chijioke, E.O.: Impact on soils of fast growing species in lowland humidtropic. FAO Forestry paper 21, 1-111 (1980).
Collins, N.M.: Vegetation and litter production in southern guinea savanna,Nigeria. Oecologia 28, 163-175 (1977).
Drechsel, P., S. Schmall and W. Zech: Relationships between growth,mineral nutrition, and soils in young teak plantations in Benin andLiberia. Water, Air, and Soil Pollution 54, 651-656 (1990).
Drechsel, P. and W. Zech: Mineral nutrition of tropical trees. In: L. Pancel(ed.), Tropical Forestry Handbook. Springer-Verlag, Berlin - New York(1992, in press).
Drechsel, P. and W. Zech: Foliar nutrient levels of broad-leaved tropicaltrees: A tabular review. Plant and Soil 131, 29-44 (1991).
Egunjobi, J.K. and B.S. Onweluzo: Litter fall, mineral turnover and litteraccumulation in Pinus caribaea L. stands at Ibadan, Nigeria. Biotropica11,251-255 (1979).
Egunjobi, J.K. and S.O. Bada: Biomass and nutrient distribution in stands ofPinus caribaea L. in the dry forest zone of Nigeria. Biotropica 11, 130-135 (1979).
Egunjobi, J.K.: Litter fall and mineralization in a teak (Tectona grandis)stand. OIKOS 25,222-226 (1974).
Evans, J.: The effects of leaf position and leaf age in foliar analysis ofGmelina arborea. Plant and Soil 52, 547-552 (1979).
Fabiao, A., H.A. Persson and E. Steen: Growth dynamics of superficial rootsin Portuguese plantations of Eucalyptus globulus Labill. studied with amesh bag technique. Plant and Soil 83, 233-242 (1985).
Fife, D.N. and E.K.S. Nambiar: Accumulation and retranslocation ofmineral nutrients in developing needles in relation to seasonal growth ofyoung radiata pine trees. Ann. Bot. 50, 817-829 (1982).
Grant, M.J.: Recent state of knowledge concerning the mineral nutrition ofconifer plantations in Queensland, Australia. Bayrcuther Bodenkundl.Ber. 21 (ISSN 0931-6442), 45-61 (1989).
339
Guthrie, H.B., P.M. Attiwill and R. Leuning: Nutrient cycling in aEucalyptus obliqua (L'Hdrit.) forest. II. A study in a small catchment.Aust. J. Bot. 26, 189-201 (1978).
Hase, H. and H. Foelster: Impact of plantation forestry with teak (Tectonagrandis) on the nutrient status of young alluvial soils in West Venezuela.Forest Ecology and Mangement 6, 33-57 (1983).
Herbert, M.A. and A.P.G. Sch6nau: Fertilizing commercial forest species inSouthern Africa: Research progress and problems. BayreutherBodenkundl. Ber. 21 (ISSN 0931-6442), 7-43 (1989).
Jordan, C.F.: Are process rates higher in tropical ecosystems? In: J. Proctor(ed.), Mineral Nutrients in Tropical Forest and Savanna Ecosystems.Oxford, 205-215 (1989).
Kadeba, 0. and E.A. Aduayi: Litter production, nutrient recycling and litteraccumulation in Pinus caribaca Morelet var. hondurensis stands in thenorthern Guinea savanna of Nigeria. Plant and Soil 86, 197-206 (1985).
Kadeba, 0.: Above-ground biomass production and nutrient accumulation inan age sequence of Pinus caribaea stands. Forest Ecology andManagement 41, 237-248 (1991).
Lamb, D.: Variations in the foliar concentrations of macro and microelements in a fast-growing tropical Eucalypt. Plant and Soil 45, 477-492(1976).
Lamb, R.J.: Litter fall and nutrient turnover in two Eucalypt Woodlands.Aust. J. Bot. 33, 1-14 (1985).
Lambert, M.J.: The use of foliar analysis in fertilizer research. Symposiumon site and productivity of fastgrowing plantations, Proceedings. IUFRO-Congress, South-Africa, Pretoria, 269-291 (1984).
Langkamp, P.J. and M.J. Dalling: Nutrient cycling in a stand of Acaciaholosericea A.Cunn. ex G. Don. III Calcium, magnesium, sodium andpotassium. Aust. J. Bot. 31, 141-149 (1983).
Lasen, B.: Drought resistence, water relations and growth of douglas fir andgrand fir in relation to nutrient supply (in German, Engl. summary). DetForstlige Forsogsvaesen i Danmark, 39, 1-82 (1983).
Lundgren, B.: Soil conditions and nutrient cycling under natural andplantation forests in Tanzanian highlands. Rep. Forest Ecol. and ForestSoils, Uppsala, 31, 1-426 (1978).
Madeira, M and J.S. Pereira: Productivity, nutrient immobilization and soilchemical properties in an Eucalyptus globulus plantation under differentirrigation and fertilization regimes. Water, Air, and Soil Pollution 54,621-634 (1990).
340
Maggs, J.: Litter fall and retranslocation of nutrients in a refertilized andprescribed burned Pinus elliottii plantation. Forest Ecology andManagement 12, 253-268 (1985).
Malvos, C., D. Louppe and J.-P. Bouillet: Fertilisation forestire sur letampoketsa d'ankazobe, station de Manankazo, Madagascar. Bois etForet des Tropiques 222, 3-26 (1989).
Malvos, C., M. Bonneau and B. Souchier: Rble du potassium et duphosphore sur la croissance des reboisements de Pinus kesiya AMadagascar. Bois et Foret des Tropiques 199, 29-42 (1983).
Mead, D.J.: Diagnosis of nutrient deficiencies in plantations. In: G.D.Bowen and E.K.S. Nambiar (eds.), Nutrition of Plantation RForests.Academic Press, London, 259-291 (1984).
Mengel, K. and A. Kirkby: Principles of Plant Nutrition (4th edition).International Potash Institute, Bern (1987).
Mika, P.G. and J.A. Moore: Foliar Potassium status explains douglas firresponse to nitrogen fertilization in the inland northwest, USA. Water,Air, and Soil Pollution 54, 477491 (1990).
Miller, H.G., J.M Cooper and J.D. Miller: Effect of nitrogen supply onnutrients in litter fall and crown leaching in a stand of Corsian pine. J.Appl. Ecol. 13, 233-248 (1976).
Miller, H.G., J.D. Cooper, J.M. Miller and O.J.L. Pauline: Nutrient cycles inpine and their adaption to poor soils. Can. J. For. Res. 9, 19-26 (1979).
Miller, H.G.: Dynamics of nutrient cycling in plantation ecosystems. In:G.D. Bowen and E.K.S. Nambiar (eds.), Nutrition of Plantation Forests.Academic Press, London, 53-78 (1984).
Miller, H.G.: Nutrient cycles in forest plantations, their change with age andthe consequence for fertilizer practice. In: Proceedings of the AustralianForest Nutrition Workshop, Productivity in Perpetuity, Canberra, 187-199 (1981).
Moore, A.W., J.S. Russell, and J.E. Coaldrake: Dry matter and nutrientcontent of a subtropical semiarid forest of Acacia harpophylla F. Muell.(Bringalow). Aust. J. Bot. 15, 11-24 (1967).
Nye, P.H.: Organic matter and nutrient cycles under moist tropical forest.Plant and Soil 13, 333-346 (1961).
Nwoboshi, L.C.: Growth and nutrient requirements in a teak plantation ageseries in Nigeria. II Nutrient Accumulation and Minimum AnnualRequirements. Forest Science 30, 35-40 (1984).
Rennie, P.J.: Uptake of nutrients by mature forest trees. Plant and Soil 7, 49-95 (1955).
341
Rogers, R.W. and W.E. Westman: Seasonal nutrient dynamics of litter in asubtropical Eucalypt forest, North Stradbroke Island. Aust. J. Bot. 25,47-58 (1977).
Schbnau, A.P.G. and M.A. Herbert: Fertilizing Eucalypts at plantationestablishment. Forest Ecology and Management 29, 221-244 (1989).
Sharma, S.C. and P.K. Pande: Patterns of litter nutrient concentration insome plantation ecosystems. Forest Ecology and Management 29, 151-163 (1989).
Shing, B.: Nutrient content of standing crop and biological cycling in Pinuspatula ecosystem. Forest Ecology and Management 4, 317-332 (1982).
Spain, A.V.: Litter fall in a New South Wales conifer forest: A multivariatecomparison of plant nutrient element status and return in four species. J.Appl. Ecol. 10, 527-556 (1973).
Stewart, H. and M. Kellman: Nutrient accumulation by Pinus caribea in itsnative savanna habitat. Plant and Soil 69, 105-118 (1982):
Switzer, G.L. and L.E. Nelson: Nutrient accumulation and cycling inLoblolly Pine (Pinus taeda L.) plantation ecosystems: The first twentyyears. Soil Sci. Soc. Amer. Proc. 36, 143-147 (1972).
Turner, J. and M.J. Lambert: Fate of applied nutrients in a long-termsuperphosphate trial in Pinus radiata. Plant and Soil 93, 373-382 (1986).
Turner, J. and M.J. Lambert: Nutrient cycling within a 27-year-oldEucalyptus grandis plantation in New South Wales. Forest Ecology andManagement 6, 155-168 (1983).
Ulrich, B. (1983): Interactions of forest canopies with atmosphericconstituents: SO 2, alkali and earth alkali cations and chloride. In: B.Ulrich and J. Pankrath (eds.), Effects of Accumulation of Air Pollutantsin Forest Ecosystems. D. Reidel Publishing Company, 3345.
Van den Driessche, R.: Nutrient storage, retranslocation and relationship ofstress to nutrition. In: Bowen, G.D. and E.K.S. Nambiar: Nutrition ofplantation forests. Academic Press, London, 181-209 (1984).
Vitousek, P.M.: Litterfall, nutrient cycling, and nutrient limitation intropical forests. Ecology 65, 285-298 (1984).
Whitemore, T.C.: Tropical forest nutrients, where do we stand? In: Proctor,J.: Mineral nutrients in tropical forest and savanna ecosystems. Oxford,1-13 (1989).
Woods, R.V.: Secound rotation decline in P. radiata plantations in SouthAustralia has been corrected. Water, Air, and Soil Plollution 54, 607-619(1990).
342
Zech, W., P. Drechsel and M. Kaupenjohann: Mineral nutrition and borontoxicity in forest plantations on arid sites in the central rangelands ofSomalia. Plant Research and Development 32, 26-41 (1990).
Zech, W. and M. Kaupenjohann: Carences en potassium et en phosphorechez Casuarina equisetifolia, Eucalyptus sp., Acacia auriculiformis etTectona grandis au Sud-Benin (Afrique Occidentale). Bois et ForEts desTropiques 226, 29-36 (1990).
Zech, W., P. Drechsel and B. Neugebauer: Mineral deficiencies of foresttrees in Yucatan (Mexico) and consequences for land-use. Turrialba(1991).
Zech, W. and P. Drechsel: Multiple mineral deficiencies in forestplantations in Liberia. Forest Ecology and Management 48, 121-143(1992).
Zech, W.: Kalkhaltige B~den als Nahrsubstrat ffir Koniferen. Dissertation,TU Munich, 1-165 (1968).
Zech, W.: Mineral nutrition of forest plantation near Tend, Sangoue, Segui6and Mopri, Part II. Report on a visit to SODEFOR, Ivory Coast, Inst. ofSoil Sci., Univ. of Bayreuth, 29 pp. (1986).
Zech, W.: Possibilities and limitations of leaf analysis as a means ofdetecting nutritional disorders in fast-growing plantations in WestAfrica. IUFRO-Congress, South-Africa, Pretoria, 691-699 (1984).
343
Losses of Potassium Through Runoff Erosion and"Slash and Burn" Agriculture
Pagliai, A., Istituto per la Chimica del Terreno, CNR, Via Corridoni, 78,56100 Pisa, Italy
Summary
The effects of several management practices in intensive agriculturalsystems on soil physical conditions are reported. Particular attention is givento the effects on the alteration of the pore system in soil. The strongalteration of the soil pore system sometimes takes the form of soildegradation phenomena such as compacted soil structure or soil surfacecrusting, which lead to a strong increase of surface runoff. Intensiveconventional tillage is principally responsible for soil structure degradationin the long-term, but other management practices, such as irrigation, ifadopted in a non-rational way, can also cause damage, sometimes severe, tosoil structure. In hilly areas the direction of tillage and wheel traffic is afundamental element in the prevention of soil degradation. It has beendemonstrated that reduced management practices can contribute mostappropriately to the maintenance of favourable soil conditions and theprevention of soil structure degradation.
K-losses are closely related to the structural conditions. Adoptingreduced management practices is therefore an essential contribution toreducing such losses (especially those arising from runoff and erosion) andavoiding environmental hazards.
Slash and burn, both in forestry and in agricultural systems, and aboveall in hilly environment, is the most dangerous practice because the lossescaused by runoff of nutrients, particularly potassium, can be very relevant. Inthe burnt areas the ashes are easily transported by runoff due to greaterhydrophobicity and degradation of soil surface.
Introduction
Long-term intensive arable cultivations have several effects on soilphysical properties, particularly on soil structure, with resulting effects on
345
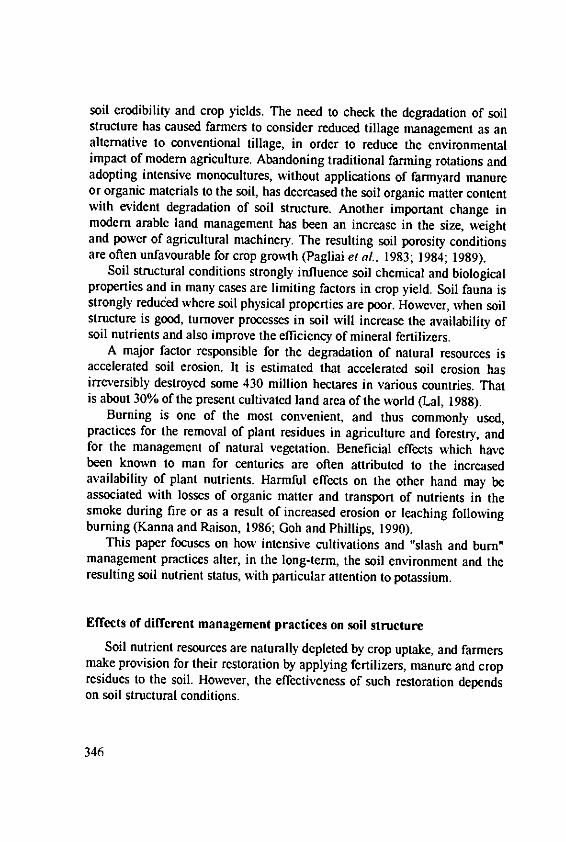
soil erodibility and crop yields. The need to check the degradation of soilstructure has caused farmers to consider reduced tillage management as analternative to conventional tillage, in order to reduce the environmentalimpact of modem agriculture. Abandoning traditional farming rotations andadopting intensive monocultures, without applications of farmyard manureor organic materials to the soil, has decreased the soil organic matter contentwith evident degradation of soil structure. Another important change inmodem arable land management has been an increase in the size, weightand power of agricultural machinery. The resulting soil porosity conditionsare often unfavourable for crop growth (Pagliai et aL. 1983; 1984; 1989).
Soil structural conditions strongly influence soil chemical and biologicalproperties and in many cases are limiting factors in crop yield. Soil fauna isstrongly reduced where soil physical properties are poor. However, when soilstructure is good, turnover processes in soil will increase the availability ofsoil nutrients and also improve the efficiency of mineral fertilizers.
A major factor responsible for the degradation of natural resources isaccelerated soil erosion. It is estimated that accelerated soil erosion hasirreversibly destroyed some 430 million hectares in various countries. Thatis about 30% of the present cultivated land area of the world (Lai, 1988).
Burning is one of the most convenient, and thus commonly used,practices for the removal of plant residues in agriculture and forestry, andfor the management of natural vegetation. Beneficial effects which havebeen known to man for centuries are often attributed to the increasedavailability of plant nutrients. Harmful effects on the other hand may beassociated with losses of organic matter and transport of nutrients in thesmoke during fire or as a result of increased erosion or leaching followingburning (Kanna and Raison, 1986; Goh and Phillips, 1990).
This paper focuses on how intensive cultivations and "slash and burn"management practices alter, in the long-term, the soil environment and theresulting soil nutrient status, with particular attention to potassium.
Effects of different management practices on soil structureSoil nutrient resources are naturally depleted by crop uptake, and farmers
make provision for their restoration by applying fertilizers, manure and cropresidues to the soil. However, the effectiveness of such restoration dependson soil structural conditions.
346
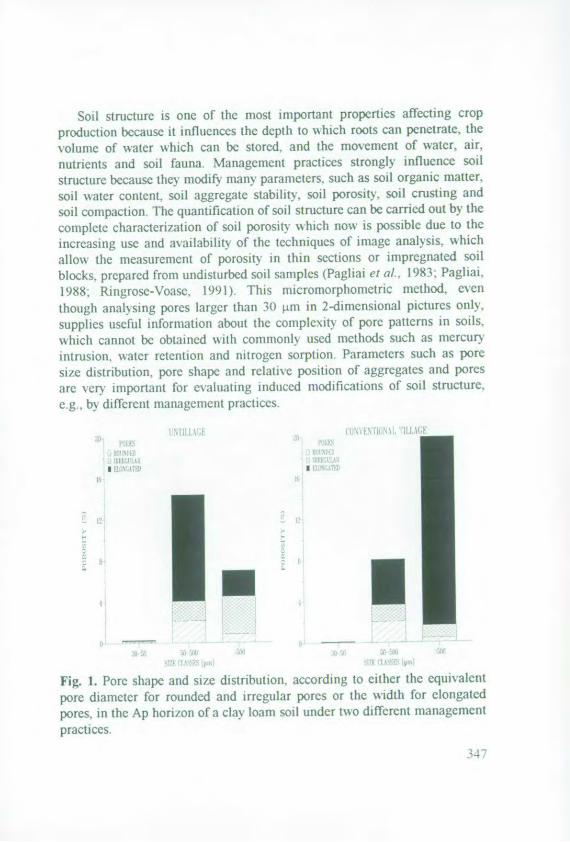
Soil structure is one of the most important properties affecting crop
production because it influences the depth to which roots can penetrate, thevolume of water which can be stored. and the movement of water, air,
nutrients and soil fauna. Management practices strongly influence soil
structure because they modify many parameters, such as soil organic matter.
soil water content, soil aggregate stability', soil porosity, soil cresting and
soil compaction. The quantification of soil structure can be carried out by the
complete characterization of soil porosity " hich now is possible due to the
increasing use and availability of the techniques of image analysis, which
all]o the measurement of porosity in thin sections or impregnated soil
blocks, prepared from undisturbed soil samples (Pagliai rI al. 1983: Pagliai.
1988: Ringrose-Voase. 1991), This micromorphometric method, cxen
though analysing pores larger than 30 trn in 2-dimensional pictures only,
supplies useful information about the complexity of pore patterns in soils.vhich cannot be obtained with commonly used methods such as mercur
intrusion. water retention and nitrogen sorption. Parameters such as pore
size distribution, pore shape and relative position of aggregates and pores
are very important for evaluating induced modifications of soil structure.
eg.. by different management practices.
}I
Fig. 1. Pore shape and size distribution, according to either the equivalcnt
pore diameter for rounded and irregular pores or the width for elongated
pores, in the Ap horizon of a clay. loam soil under twNo different managementpractices.
4
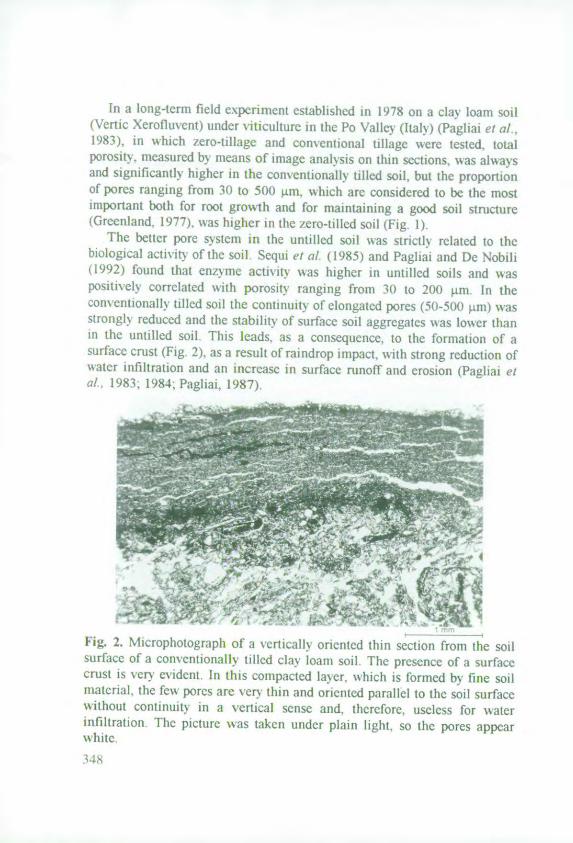
in a long-term field experiment established in 1978 on a clay loam soiltVeric Xcrofluvent) under viticulture in the Po Valley (Italy) (Pagliai el al
1983), in Ahich zero-tillage and conventional tillage were tested, totalporosity, measured by means of image analysis on thin sections, Nkas alwaysand significantly higher in the conventionally tilled soil, but the proportionof pores ranging from 30 to 500 4m. "hich are considered to be the mostimportant both for root growth and for maintaining a good soil structure(Greenland. 1977). was higher in the zero-tilled soil (Fig. 1)
The better pore s'ystem in the untilled soil was strictly' related to thebiological activity of the soil Sequi et at (1985) and Pagliai and De Nobili(1992) found that enzyme activity w as higher in untilled soils and waspositively, correlated witli porosily ranging from 30 to 200 p.m In theconventionally tilled soil the continuity of elongated pores (50-500 pi) wasstrongly reduced and tie stability of surface soil aggregates was Iower thanin the untilled soil. This leads, as a consequence, to the fbrmation of asurface crust (Fig. 2), as a result of raindrop impact. wNith strong reduction ofwater infiltration and an increase in surface runoff and erosion (Pagliai elal, 1983: 1984: Pagliai, 1987).
Fig. 2. Microphotograph of a vertically oriented thin section from the soilsurface of a conventionally tilled clay loam soil. The presence of a surfacecrust is very evident. In this compacted layer, Nhich is formed by fine soilmaterial, the few pores are vcry thin and oriented parallel to the soil surfacewithout continuity in a vertical sense and, therefore, useless for w.aterinfiltration The picture w\as taken under plain light, so the pores appearwhite.

Similar results were also obtained in a loam soil representative of theland along the Tyrrhenian coast (Italy) cultivated to grow autumn-sownwheat, in which minimum tillage and chisel ploughing were the mostappropriate tillage practices in maintaining favourable porosity andpreventing surface crust formation in the soil. The porosity was morehomogeneously distributed in the Ap horizon, and the proportion of
continuous elongated pores ranging from 50 to 500 ;±m was greater than in
the conventionally ploughed soil (Pagliai et al., 1989).Another aspect strictly connected with soil structure degradation and the
risk of erosion is soil compaction due to the traffic of agriculturalmachinery. Experiments on a sandy loam soil have demonstrated that wheeltraffic of agricultural tractors caused a strong decrease in soil porosity (3-4times) in the compacted topsoil with respect to the adjacent uncompactedareas (Pagliai et al., 1988). The recovery of soil structure in the compactedareas is very low and in many cases erosion phenomena start from thesecompacted areas (rill erosion).
It is evident from the data cited that, on intensively cultivated lands,reduced cultivation practices appear most appropriate for the maintenance offavourable soil conditions and for the prevention of run-off and soil erosion.
The adoption of reduced management practices is fundamental in
hillside environments. In these areas the direction of tillage and thedirection of soil compaction caused by the use of agricultural machinery playa very important part. This aspect was studied on a sandy clay loam soil in ahillside area of the Pliocene formation near Bologna (Italy) in which threemanagement practices (contour, diagonal and downhill ploughing) andwinter and spring crop rotation were tested (Rossi Pisa et al., 1986). Thetotal porosity was higher in the downhill-ploughed soil but the proportion of
pores ranging from 30 to 500 p m - the most important in terms of watermovement and root growth - was higher in the contour and diagonallyploughed soil (Fig. 3). Soil water content showed the same trend, i.e. it washigher in the contour-ploughed soil. In the downhill-ploughed soil most of
the porosity was represented by large (>500 pm) elongated pores orientedparallel to the soil surface and therefore useless for water infiltration.
349
DNTOUR lI.OUGII[NG OiNIIILL I',OUGIIING
OD 9 3OODU~rB
I ELONCAME I LVNGATKD
dimee f o W T- Wo M 5MOSIXl: IA M iN IZE CI AMO ( rn)
Fig. 3. Pore shape and size distribution, according to either the equivalentpore diameter for rounded and irregular pores or the width for elongatedpores, in the Ap horizon of a sandy clay loam soil under two differentdirections of ploughing.
Relationships between soil structural conditions and K losses due torunoff and erosion
The effect of the different tillage methods on soil erosion was alsoassessed in the latter cited field experiment (Rossi Pisa et al., 1986). Theaverage slope on the experiment was 11%. Some characteristics are listed inTable 1. The experiment was laid down in 1983 and loss of soil by erosion,expressed as t ha-I yearl, was measured in 1985 with the following results:Contour ploughed: 0.17; Diagonally ploughed: 0.21; Downhill ploughed:0.32. Even though these data showed that the erosion was lower thanexpected according to the evaluation reported in the literature in similarenvironments (Chisci and Spallacci, 1984), they clearly demonstrated that inthe downhill-ploughed soil erosion was double that in the contour-ploughedsoil. The particle size of the eroded material showed great differencesbetween the downhill-ploughed soil and the soil ploughed in the other twodirections (Table 2). Since texture did not show great differences in the fieldexperiment, it could be stressed that in the downhill-ploughed soil runoffwas able to transport coarse materials even with rain of low intensity as wasthe case of the period considered. In the soil of the other two directions of
350

ploughing the high percentage of clay found in the eroded material and the
lower percentage of sand seemed to indicate a lower intensity of
transportation by runoff (Meyer, 1985). The surface compaction in the
downhill-ploughed soil, which was illustrated, as already said, by the
presence of a platy structure, i.e. elongated pores oriented parallel to the
surface, was responsible for the lower water infiltration and, consequently,
for the increase in soil erosion. Such an increase was positively related to K
losses, which were approximately twice larger in the downhill-ploughed soil
than in the soil ploughed in the other two directions.
Table 1. Some characteristics of the soil samples from the Ap horizon of the
experimental field.
Sand, 200 i.tm-2 mm (%) 65.1
Silt, 2-200 urm (%) 10.5
Clay, <2 Vam (%) 24.4
Organic matter (%) 1.57Total N (%) 0.78
CaCO 3 equivalent (%) 6.0
Total P (% P205) 1.6Available P (ppm P20 5) 35.1Total K (% K20) 3.3
Exchangeable K (ppm K20) 112.9
pH (H-120) 8.0C.E.C. (mcq/100 g) 38.5
Table 2. Soil losses, particle size of the eroded material and K losses from
the experimental field.
Direction of ploughing
Contour Diagonal Downhill
Rainfall (mm) 580.6 580.6 580.6
Time of rainfall (h) 388 388 388
Soil losses (t ha-1 year') 0.17 0.21 0.32
Particle sizeSand (%) 17.7 24.5 45.4
Silt (%) 6.8 2.0 11.4
Clay (%) 75.5 72.5 43.2
K20 losses (kg ha- year-I) 0.58 0.69 1.02
351
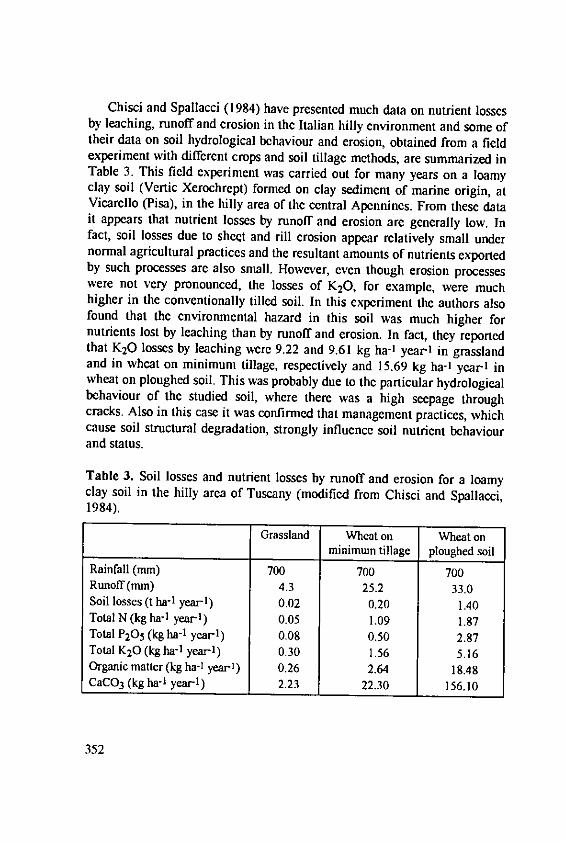
Chisci and Spallacci (1984) have presented much data on nutrient lossesby leaching, runoff and erosion in the Italian hilly environment and some oftheir data on soil hydrological behaviour and erosion, obtained from a fieldexperiment with different crops and soil tillage methods, are summarized inTable 3. This field experiment was carried out for many years on a loamyclay soil (Vertic Xerochrept) formed on clay sediment of marine origin, atVicarello (Pisa), in the hilly area of the central Apennines. From these datait appears that nutrient losses by runoff and erosion are generally low. Infact, soil losses due to sheqt and rill erosion appear relatively small undernormal agricultural practices and the resultant amounts of nutrients exportedby such processes are also small. However, even though erosion processeswere not very pronounced, the losses of K20, for example, were muchhigher in the conventionally tilled soil. In this experiment the authors alsofound that the environmental hazard in this soil was much higher fornutrients lost by leaching than by runoff and erosion. In fact, they reportedthat K20 losses by leaching were 9.22 and 9.61 kg ha-1 year1 in grasslandand in wheat on minimum tillage, respectively and 15.69 kg ha-1 year- inwheat on ploughed soil. This was probably due to the particular hydrologicalbehaviour of the studied soil, where there was a high seepage throughcracks. Also in this case it was confirmed that management practices, whichcause soil structural degradation, strongly influence soil nutrient behaviourand status.
Table 3. Soil losses and nutrient losses by runoff and erosion for a loamyclay soil in the hilly area of Tuscany (modified from Chisci and Spallacci,1984).
Grassland Wheat on Wheat onminimtun tillage ploughed soil
Rainfall (mm) 700 700 700Runoff(mm) 4.3 25.2 33.0Soil losses (t ha-1 year-1) 0.02 0.20 1.40Total N (kg ha- 1 year-1 ) 0.05 1.09 1.87Total P20 5 (kg ha-1 year-1) 0.08 0.50 2.87Total K20 (kg ha-I yearl) 0.30 1.56 5.16Organic matter (kg ha-1 year-1) 0.26 2.64 18.48CaCO3 (kg ha-i year-l) 2.23 22.30 156.10
352
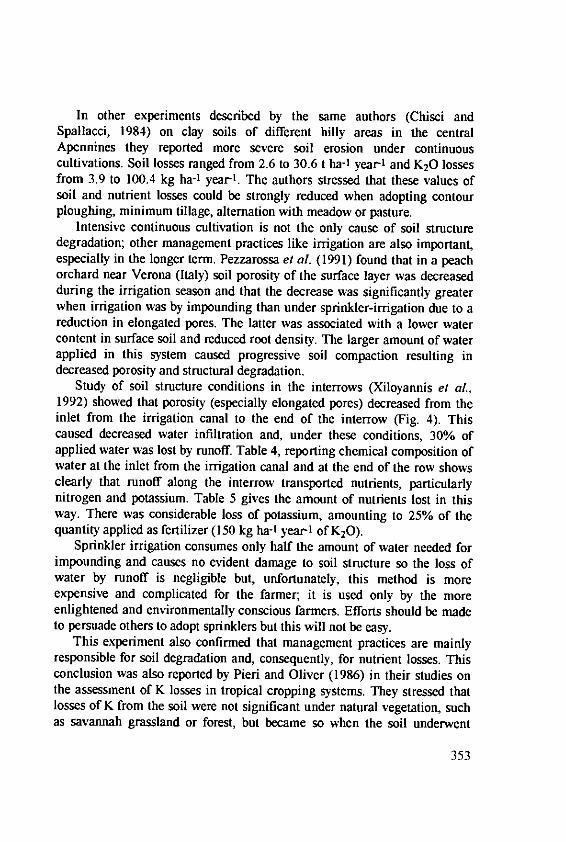
In other experiments described by the same authors (Chisci andSpallacci, 1984) on clay soils of different hilly areas in the centralApennines they reported more severe soil erosion under continuouscultivations. Soil losses ranged from 2.6 to 30.6 t ha-1 year' and K20 lossesfrom 3.9 to 100.4 kg ha-1 year-1 . The authors stressed that these values ofsoil and nutrient losses could be strongly reduced when adopting contourploughing, minimum tillage, alternation with meadow or pasture.
Intensive continuous cultivation is not the only cause of soil structuredegradation; other management practices like irrigation are also important,especially in the longer term. Pezzarossa et al. (1991) found that in a peachorchard near Verona (Italy) soil porosity of the surface layer was decreasedduring the irrigation season and that the decrease was significantly greaterwhen irrigation was by impounding than under sprinkler-irrigation due to areduction in elongated pores. The latter was associated with a lower watercontent in surface soil and reduced root density. The larger amount of waterapplied in this system caused progressive soil compaction resulting indecreased porosity and structural degradation.
Study of soil structure conditions in the interrows (Xiloyannis et aL,1992) showed that porosity (especially elongated pores) decreased from theinlet from the irrigation canal to the end of the interrow (Fig. 4). Thiscaused decreased water infiltration and, under these conditions, 30% ofapplied water was lost by runoff. Table 4, reporting chemical composition ofwater at the inlet from the irrigation canal and at the end of the row showsclearly that runoff along the interrow transported nutrients, particularlynitrogen and potassium. Table 5 gives the amount of nutrients lost in thisway. There was considerable loss of potassium, amounting to 25% of thequantity applied as fertilizer (150 kg ha-1 year-l of K20).
Sprinkler irrigation consumes only half the amount of water needed forimpounding and causes no evident damage to soil structure so the loss ofwater by runoff is negligible but, unfortunately, this method is moreexpensive and complicated for the farmer; it is used only by the moreenlightened and environmentally conscious farmers. Efforts should be madeto persuade others to adopt sprinklers but this will not be easy.
This experiment also confirmed that management practices are mainlyresponsible for soil degradation and, consequently, for nutrient losses. Thisconclusion was also reported by Pieri and Oliver (1986) in their studies onthe assessment of K losses in tropical cropping systems. They stressed thatlosses of K from the soil were not significant under natural vegetation, suchas savannah grassland or forest, but became so when the soil underwent
353
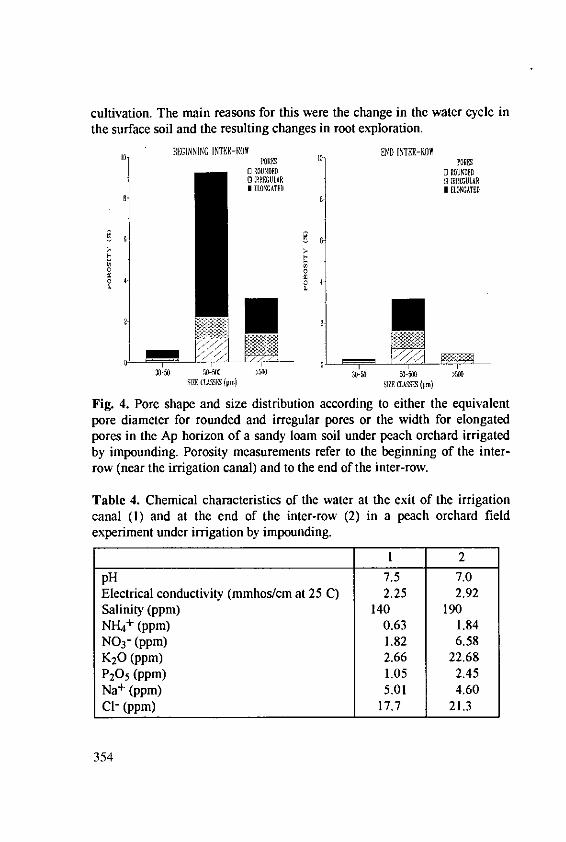
cultivation. The main reasons for this were the change in the water cycle inthe surface soil and the resulting changes in root exploration.
BEGINNING INTER-ROWR END INTER-ROW
SROU NDED [ ROUNDED0 IREG;ULAR 0 IRIULARI ELONGATED I ELONGATED
o 014
30-50 50-5DO >500 ao- 5 >50DSIZE (IASS UI I) SIZE CLAMS1S (Vm)
Fig. 4. Pore shape and size distribution according to either the equivalentpore diameter for rounded and irregular pores or the width for elongatedpores in the Ap horizon of a sandy loam soil under peach orchard irrigatedby impounding. Porosity measurements refer to the beginning of the inter-row (near the irrigation canal) and to the end of the inter-row.
Table 4. Chemical characteristics of the water at the exit of the irrigationcanal (1) and at the end of the inter-row (2) in a peach orchard fieldexperiment under irrigation by impounding.
1 2
pH 7.5 7.0Electrical conductivity (mmhos/cm at 25 C) 2.25 2.92Salinity (ppm) 140 190NH 4
+ (ppm) 0.63 1.84NO3- (ppm) 1.82 6.58K20 (ppm) 2.66 22.68P20 5 (ppm) 1.05 2.45Na + (ppm) 5.01 4.60CI- (ppm) 17.7 21.3
354

Table 5. Runoff and nutrient losses for a sandy loam soil of a peach orchardfield experiment irrigated by impounding.
Irrigation water applied (m3 ha-1 yearl) 6160Runoff (m3 ha-I yearl) 1848Total N (kg ha-1 yearl) 11.0Total K20 (kg ha-I yearl) 37.1Total P20 5 (kg ha-I year]) 2.6
Effect of "slash and burn" on soil structure and soil nutrient lossesFire has often been considered as a characteristic phenomenon for the
forest ecosystems in the Mediterranean area and its effect on the vegetationhas been the subject of many studies (Kruger et al., 1983). In recent decadesthe frequency of fire has increased throughout the Mediterranean area. Inthe same period accelerated soil erosion has become an increasingly seriousproblem in this area. It is generally attributed to changes in hill slope runoffcharacteristics, resulting from changes in the vegetation cover and in thetopsoil characteristics brought about by man, mainly through intensiveagriculture, deforestation and ever increasing forest and shrub fires. This isone of the major processes causing land degradation and leading to losses ofnutrients.
The increase in availability of plant nutrients after burning is commonlyrecognized as a beneficial effect of this management practice. Marion et al.(1991) demonstrated that the concentrations of nutrients in the ashes weremuch higher than those in the topsoil. Giovannini et al. (1990) showed thatthe effect of burning and heating of soil caused an increase. in bothexchangeable and water-extractable cations, such as K, Ca and Mg.Therefore, nutrient concentrations in the topsoil increased after burning withbeneficial effects on plant growth. However, such a situation is extremelyvulnerable, especially in hilly environments, because even light rainfollowing burning is sufficient to cause nutrient loss by runoff and erosion.The fire not only alters the chemical properties of the topsoil but also thephysical properties. The destruction of organic matter by burning causes aloss of soil aggregate stability and this may lead to a collapse in soilstructure with a reduction in soil porosity. Fig. 5 shows an example of soilstructure in the topsoil before burning. The presence of both dark amorphousorganic matter and plant remains associated with pores is very evident. Fig.6 shows an example of a degraded soil structure in the topsoil after burning.The porosity appears strongly reduced, the elongated continuous pores arevery few in number, if any, and most porosity was represented by spherical
355

pores (vesicles) formed by carbon dioxide liberated by the combustion oforganic matter. These pores are isolated in the soil matrix and produce a"vesicular structure" which is unstable and transitory (Pagliai et al., 1989).The presence of such a poor structure together with a subsurfacehydrophobic layer strongly reduces water infiltration with a consequentincrease of surface runoff, which is more dangerous the steeper the slope ofthe land is.
Sevink (1988) and Sevink et al. (1989) found that following forest fire inthe Mediterranea area, the ectorganic horizons were partially or completelydestroyed, while the hydrophobicity of the mineral layer was oftenpreserved. From these results it was inferred that hill-slope runoff anderosion would strongly increase after fire. These results were in agreementwith those of Giovannini and Lucchesi (1983) and Giovannini et al. (1987)in agricultural systems. The results of these authors indicated that burningcrop residues over many years generally reduced organic matter content,polysaccharides, and water-stable aggregates, all factors associated with soilerodibility. These studies have also demonstrated that on the burnt area awater-repellent layer is formed below and parallel to the soil surface. Thesubsurface layers, in which the fire had accumulated translocatedhydrophobic materials, kept these hydrophobic substances quantitativelyunaltered, but they appeared more strongly cemented, because thetranslocated organic matter, far from remaining inactive, could react,complexing polyvalent metals and expanding the organometallic cements.The resulting condition has been reported to cause an excess of soil erosionand water runoff.
The results of the studies of Sevink et al. (1989) on the effects of fire inforested areas and prescribed burning on runoff using rainfall simulationexperiments in the typical Mediterranean forests, clearly showed that runoffstrongly increased after fire (Table 6). The runoff reached the highest valuesin burnt plots and was greatly influenced by the hydrophobic behaviour ofthe uppermost mineral soil. In these studies the authors stressed that fireleads to the partial or complete destruction of the ectorganic layer, and to therelease of elements contained in it. They also concluded that highconcentrations of N, K, Ca and Mg are to be found in the runoff water.
Table 7 summarizes the possible nutrient loss in a clearfelled logged andburned Notofagus forest (Goh and Phillips, 1990). These values were 1.8 to2.5 times higher than those in the respective clearfelled logged but unburnedtreatments. This indicated that large proportions of the cation inputs fromthe ash layer were removed in solution.
356
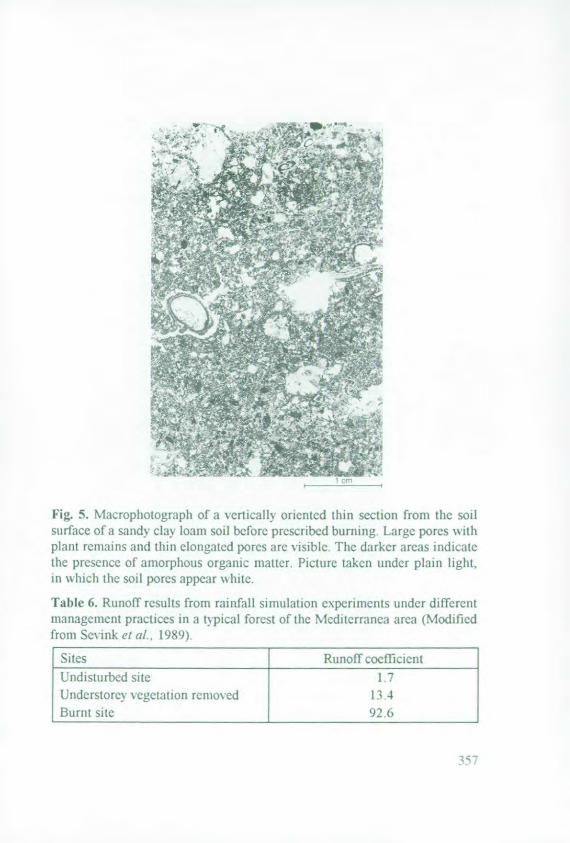
'
Fig. 5. Miacrophotograph of a verticall oriented thin section front the soilsurface ofa sand , clay loam soil before prescribed burning Large pores withplant remains and thin elongated pores are isible The da rker areas indicatethe presence of ainorphous organic matter. Pictire taken under plain light.in w hich the soil pores appear %hite
Fable 6. Runoff results from rainfall simulation experiments under differentmanagement practices in a ispical forest of the Mcditerranca area (Modifiedfrom Sexink et al, 1989)
Sites Runoff coefficientUndisturbed site 1 7Understorev vegetation removed I 3 4Burnt site 92 6
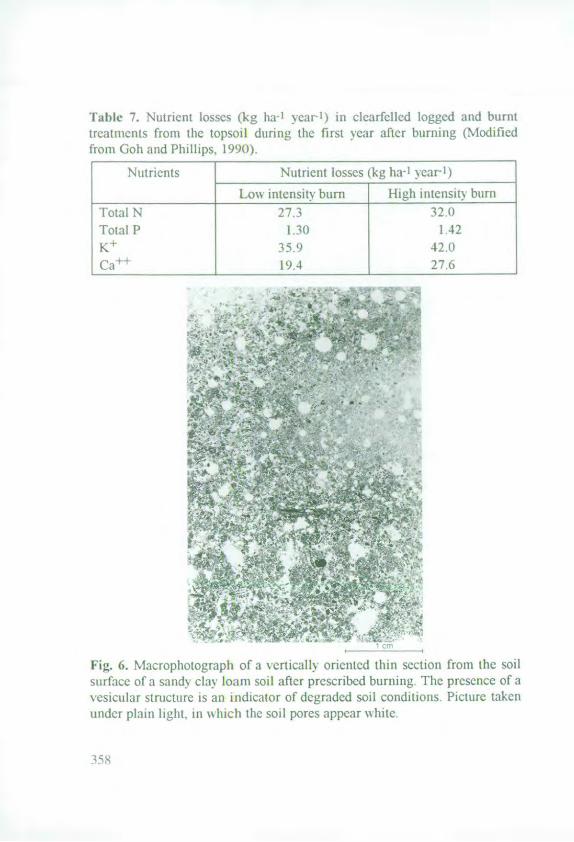
Table 7. Nutrient losses (kg ha-I ycar ) in clearfelled logged and burrttreatments from the topsoil during the first Year after burning (Modifiedfrom Gob and Phillips, 1990).
Nutrients NuMent losses (kg ha1 year)
Low inltensity burn High intcnsity burnIotal N 27.3 32 )Total P 1.30 142K + 35.9 42,0Ca 19,4 276
% '
Fig. 6. Macrophotograph of a vertically oriented thin section from the soilsurface ol a sandy cla, loam soil after prescribed burning. The presence of avesicular structure is an indicalor of degraded soil conditions Picture takenunder phi n light. in wihich the soil pores appear wNhite
From all data available in the international literature it is clearly evidentthat among all management practices slash-and-burn causes the mostdangerous environmental hazard with respect of losses of soil and nutrientsthrough runoff and erosion. Table 8, which confirms this, shows some datareported by Pieri and Oliver (1986) as regards their studies of erosion,surface runoff and soil K depletion in Francophone Africa. The strongincrease in both soil and potassium losses following the practice of burningcrop residues is very evident, especially in topographies with high slopevalues.
Table 8. Losses of soil by erosion in a pineapple field in Ivory Coast anddecline in exchangeable and total K (Modified from Pieri and Oliver, 1986).
Treatment Slope Rainfall Soil loss Potassium loss(%) (mm) (t ha-' year-') (kg ha-' year-')
Exch. Totalresidues burnt 4 3350 1.2 0.057 0.5residues burnt 20 3350 69.0 3.7 32.3residues as mulch 4 3350 0.1 traces tracesresidues as mulch 20 3350 1.0 0.06 0.5
Conclusion
The need to check the deterioration of soil structure caused by long-termintensive cultivation must be one of the most important aims of soilresearchers and agronomists. The most dangerous impact of long-termintensive agriculture on soil structure is the alteration of the pore system insoil. In fact, conventional continuous tillage causes decreases in bioporesand storage and transmission pores (0.5-500 pm equivalent pore diameter)normally allowing water storage, water movement and root growth.Moreover, other forms of soil degradation in continuous arable lands consistof the presence of a surface crust in many types of soils, of compaction dueto wheel traffic of heavy agricultural machinery, and of formation ofcompacted layers along the soil profile (plough pan).
Adopting reduced management practices (reduced tillage), avoiding thedownhill ploughing and reducing as much as possible the up and downwheel traffic in hilly areas, the adoption of appropriate irrigation systems,introducing crop rotation in farm planning, etc., seem the most appropriateways of maintaining favourable soil conditions (e.g. improvement of the
359
pore system in soil with associated better water management) andpreventing soil structure degradation.
From all experiments cited in this paper it is evident that nutrient lossesthrough runoff and erosion depend on the intensity of rainfall, the slope, thetype of soil, etc., but it is also very evident that by adopting managementpractices that preserve as much as possible the soil structural conditions it ispossible to limit nutrient losses to a level which does not causeenvironmental hazards.
Slash-and-burn management practices are the most dangerous in termsof environmental hazards both in forestry and agricultural ecosystems. Thebeneficial effects of the increase of plant-available nutrients can easily beoutweighed by increased nutrient loss through runoff and erosion and thelosses of nitrogen and potassium are significant. Such losses in agriculturalecosystems are both an environmental hazard and a source of economic lossbecause much of the fertilizer applied can be wasted.
References
Chisci, G. and Spallacci, P.: Nutrient losses by leaching and runoff andpossibilities of their control. Proceedings 18th IPI-Colloquium, GardoneRiviera, Italy, 137-135 (1984)
Giovannini, G. and Lucchesi, S.: Effect of fire on hydrophobic andcementing substances of soil aggregates. Soil Science 136, 231-236(1983)
Giovannini, G., Lucchesi, S. and Giachetti, M.: The natural evolution ofburned soil: a three-year investigation. Soil Science 143, 220-226 (1987)
Giovannini, G., Lucchesi, S. and Giachetti, M.: Effects of heating on somechemical parameters related to soil fertility and plant growth. SoilScience, 149, 344-350 (1990)
Goh, K.M. and Phillips, MJ.: Dynamics of phosphorus, nitrogen and othernutrients in variable charge soils as affected by clearfelled logged andclearfelled logged and burned Notofagus forest. Transactions XIVCongress of the International Society of Soil Science. Kyoto, 1990. Vol.II, pp. 222-227 (1990)
Greenland, D.J.: Soil damage by intensive arable cultivation: temporary orpermanent? Philosophical Transactions of the Royal Society of London,281, 193-208 (1977).
360
Kanna, P.K. and Raison, R-J.: Effect of fire intensity on solution chemistryof surface soil under a Eucalyptus pauciflora forest. Australian Journalof Soil Research 24, 423434 (1986)
Kruger, F.J., Mitchell, D.T. and Jarvis, J.U.M.: Mediterranean Type ofEcosystems: The Role of Nutrients. Springer Verlag, Hamburg (1983)
Lall, R.: Soil erosion and land degradation: The global risks. Advances inSoil Sciences 17, 123-152 (1988)
Marion, G.M., Moreno, J.M. and Oechel, W.C.: Fire severity, ashdeposition, and clipping effects on soil nutrients in Chaparral. SoilScience Society of America Journal 55: 235-240 (199 1)
Meyer, L.D.: Inter-rill erosion rates and sediment characteristics. In: S.A.EI-Swaify, W.C. Moldenhauer and L. Andrew (eds), Soil Erosion andConservation. Soil Conservation Society of America, Ankeny, Iowa(1985)
Pagliai, M_: Effects of different management practices on soil structure andsurface crusting. In: N. Fedoroff, L.M. Bresson and M.A. Courty(Editors), Soil Micromorphology. Proceedings of the VIIth InternationalWorking-Meeting on Soil Micromorphology. Paris - July 1985. AFES,Paris, pp. 415421 (1987)
Pagliai, M.: Soil porosity aspects. International Agrophysics 4, 215-232(1988)
Pagliai, M. and De Nobili, M.: Relationships between soil porosity, rootdevelopment and soil enzyme activity in cultivated soils. Geoderma(1992 in press).
Pagliai, M., La Marca, M. and Lucamante, G.: Micromorphometric andmicromorphological investigations of a clay loam soil in viticultureunder zero and conventional tillage. Journal of Soil Science 34, 391403(1983)
Pagliai, M., La Marca, M., Lucamante, G. and Genovese, L.: Effects of zeroand conventional tillage on the length and irregularity of elongated poresin a clay loam soil under viticulture. Soil and Tillage Research 4, 433-444 (1984)
Pagliai, M., Pezzarossa, B., La Marca, M. and Lucamante, G.: Variazionidella porositi del terreno in seguito al compattamento provocato dalpassaggio di trattori. Rivista di Ingegneria Agraria 2, 120-126 (1988)
Pagliai, M., Pezzarossa, B., Mazzoncini, M. and Bonari, E.: Effects oftillage on porosity and microstructure of a loam soil. Soil Technology 2,345-358 (1989)
361
Pezzarossa, B., Pagliai, M. and Xiloyannis C.: Effetti di differenti sistemi diirrigazione su alcune caratteristiche fisiche di un terreno investito apescheto. Rivista di Frutticoltura 7-8, 71-75 (1991)
Pied, C. and Oliver, R.: Assessment of K losses in tropical cropping systemsof Francophone Africa and Madagascar. Proceeding 13th IPI-CongressInternational Potash Institute, Bern, pp. 73-92 (1986)
Ringrose-Voase, A.J.: Micromorphology of soil structure: description,quantification, application. Australian Journal of Soil Research 29, 777-813 (1991)
Rossi Pisa, P., Ardizzoni, E., Gaspari, N. and Pagliai, M.: Effetti di diversedirezioni di lavorazioni su alcune caratteristiche fisiche di terreni inpendio. Rivista di Agronomia 20, 329-335 (1986)
Sequi, P., Cercignani, G., De Nobili, M. and Pagliai, M.: A positive trendamong two soil enzyme activities and a range of soil porosity under zeroand conventional tillage. Soil Biology Biochemistry 17, 255-256 (1985)
Sevink, J.: Soil organic horizons of mediterranean forest soils in NE-Catalonia (Spain): Their characteristics and significance for hillsloperunoff, and effects of management and fire. Catena 12, 3143 (1988)
Sevink, J., Imenson, A.C. and Verstraten, J.M.: Humus form developmentand hillslope runoff, and the effects of fire and management, undermediterranean forest in NE-Spain. Catena 16, 461475 (1989)
Xiloyannis, C., Baroni, G., Bovo, M., Angelini, P., Pagliai, M., andPezzarossa, B.: Lirrigazione per scorrimento nei frutteti del veronese:spreco di acqua e di concimi ed effetti sulla porosit del terreno. Rivistadi Frutticoltura. 6, 55-62 (1992).
362
Potassium Concentrations in Municipal and Agro-Industrial Effluents : Data Needed for GoodFertilization Practice
Muller, J. C., Institut National de la Recherche Agronomique. Stationd'Agronomie de Chflons sur Marne, Route de Montmirail, F-51510Fagni&cres, France
Summary
Urban areas and agro-industry produce large amounts of effluentscontaining plant nutrients which can be used in farming with resultingeconomy in fertilizer consumption. While the manurial value of theseeffluents, especially as concerns potassium has been the object of manyexperiments, little work has been done on how utilisation of these wasteproducts may affect farm management, crops, soils and pollution ofgroundwater. Taking potassium as an example, methods for using effluentsin farming and the data needed for defining good fertilization practice arediscussed in the light of nutrient supply, crop needs and effects on top soiland subsoil. Lysimeter studies and field trials have been used to estimate thenutritional value of the potassium in effluents, losses by leaching, K-enrichment of soils and crops and the effects of antagonisms between K, Mgand Na. The chief ways of using effluent potassium (direct spreading of low-concentration effluent, or elaboration of concentrated manure) are examined.Maximum permissible rate of application for the crop under reference,frequency of application in relation to cropping system and the need forcorrective fertilizer application to correct nutrient balance are importantaspects.
Introduction
Urban and industrial effluents have a definite agricultural value onaccount of the nutrients they contain. They can safely be used unless there isa risk of chemical toxicity or a heath risk in case they contain pathogens.However, usage must obey two rules : i) It must be consistent with soundfertilizer policy and ii) it should not lead to pollution of the soil or
363
groundwater. It is easier to obey these rules if the effluents are of uniformcomposition.
The fertilizing value of elements applied in effluents has been muchstudied (Ibrahim et al., 1988; Morizot, 1986, Nielsen et al., 1989; Nogaleset al., 1989; Steward et al., 1984; Wong, 1990) but insufficient attention hasbeen given to effects on farm management, and effects on soils and crops(Delas et al., 1985).
It is necessary to understand the various constraints related in the firstplace to their composition and then to the nature of soils, which, on accountof their physical, chemical and biological properties play an important partin purification and which affect cropping systems and ensure recycling ofnutrients throught the crop.
Using effluents as a source of plant nutrients results in economy in inputsin two ways : saving in the cost of nutrients, mainly nitrogen, phosphorusand potassium, contained therein, and economy in energy consumption. Formanufacture of fertilizers, 1.7, 0.33 and 0.26 TEP are needed, respectively,for a ton of N, P205 and K20.
Origin and state of potassium in plants
Potassium is contained in relatively high concentrations (I to 3 % in drymatter) in all plants; somewhat less than nitrogen but considerably morethan phosphorus and calcium. Table 1 gives, for selected crops,maximumuptakes of potassium by crops which can range from 50 to over 450 kg ha-1yr1 according to crop and yield. Some plant organs like sugarbeet roots,potato tubers and grapes are particularly rich in potassium and when treatedin the factory give effluents which are K-rich. Unlike nitrogen andphosphorus, potassium is not a constituent of essential organic compounds(carbohydrates, protein, lipids). It is important in regulating various aspectsof growth and development via enzyme systems. It is widely distributedthrough the plant, very mobile and occurs in the ionic form especially inintracellular liquid so that it is easily released when plant materiel comesinto contact with water, as happens in many agro-industrial processes.
364
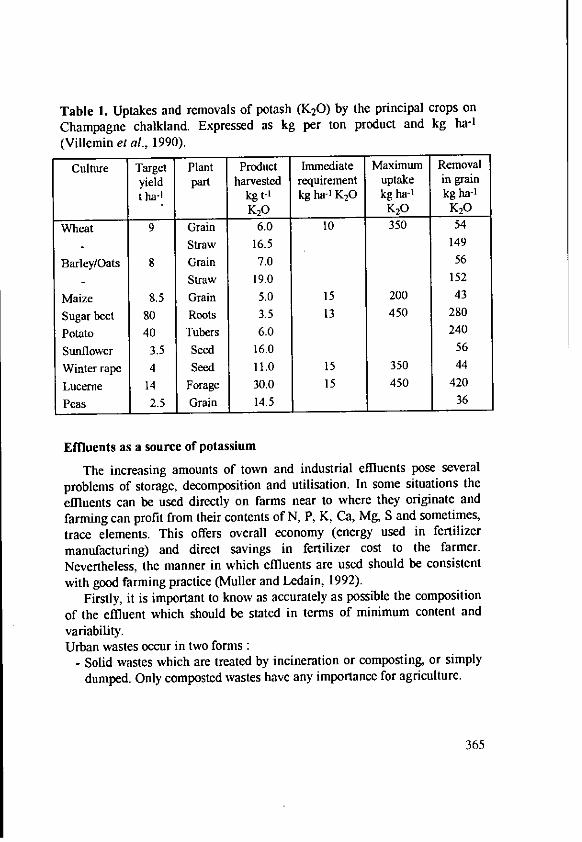
Table 1. Uptakes and removals of potash (K20) by the principal crops on
Champagne chalkland. Expressed as kg per ton product and kg ha-'(Villemin et al., 1990).
Culture Target Plant Product Immediate Maximum Removal
yield part harvested requirement uptake in grain
t ha-1 kg t-1 kg ha-1 K20 kg ha-' kg ha-1
K 20 K20 K20
Wheat 9 Grain 6.0 10 350 54
Straw 16.5 149
Barley/Oats 8 Grain 7.0 56
Straw 19.0 152
Maize 8.5 Grain 5.0 15 200 43
Sugar beet 80 Roots 3.5 13 450 280
Potato 40 Tubers 6.0 240
Sunflower 3.5 Seed 16.0 56
Winter rape 4 Seed 11.0 15 350 44
Lucerne 14 Forage 30.0 15 450 420
Peas 2.5 Grain 14.5 36
Effluents as a source of potassium
The increasing amounts of town and industrial effluents pose several
problems of storage, decomposition and utilisation. In some situations the
effluents can be used directly on farms near to where they originate and
farming can profit from their contents of N, P, K, Ca, Mg, S and sometimes,trace elements. This offers overall economy (energy used in fertilizer
manufacturing) and direct savings in fertilizer cost to the farmer.
Nevertheless, the manner in which effluents are used should be consistent
with good farming practice (Muller and Ledain, 1992).Firstly, it is important to know as accurately as possible the composition
of the effluent which should be stated in terms of minimum content and
variability.Urban wastes occur in two forms:
- Solid wastes which are treated by incineration or composting, or simply
dumped. Only composted wastes have any importance for agriculture.
365
- Liquid wastes which are usually treated in sewage plants which producepurified water drained to water courses plus sluge which can be used onthe land.
Agro-industrial wastes are principally liquid : residual water, originating inthe washing of produce with various by-products from factory processing.They comprise mainly the following :
- Sugarbeet : beet tops with some leaves from cleaning, residual waterfrom distillation, sugar extraction and refining, and concentrated lycs.
-Potatoes: mainly washing water.- Lucerne : composition of by-products depends on whether or not drying
is accompanied by protein recovery.In Champagne-Ardenne, these three industries alone produces yearly 2,7millions m3 effluent which can safely be used on 4300 hectares farmlandwithout risk to soils or groundwaters (Dutil et Muller, 1979; Muller etLedain, 1992).
- Wine : various wastes originate in vinification and distillation of residuesfrom vinification (filter press effluent, lyes from vinification, compostedmarc).
- Various other wastes arise in the food-processing industry from : cider,cider distillation, brewing, fruit and vegetable processing (carrots, peas,beans, sweet corn, etc). Generally speaking the volume of these locally isnot very large and is easily absorbed by farms. Additional effluentsoriginate in the dairy industry.
Table 2 gives mean potassium contents (as K20) in selected agro-industrialeffluents. The values show great variation and cannot be used as standard.Some control of effluent composition by the factory is possible and theeffluent should be sampled for analysis at regular intervals depending onhow great the variation is.
As would be expected, potassium content is most variable and dependsboth on the crop being processed and the manufacturing process. Sludgesobtained by decantation are usually low in K20 (<1 %) (dairy, cheese-making, urban wase). Washing water and water used for moving produce inthe factory can be quite high in potash (up to 5% K20) (beet factory, starchmanufacture, distillery). Solid or semi-liquid sludges from concentrationprocesses without washing can show very high values (> 10 %) (press mud,vinification dregs). In some cases these can be considered organic manures(concentrated beet distillery dregs which contain nearly 7% K20).
366
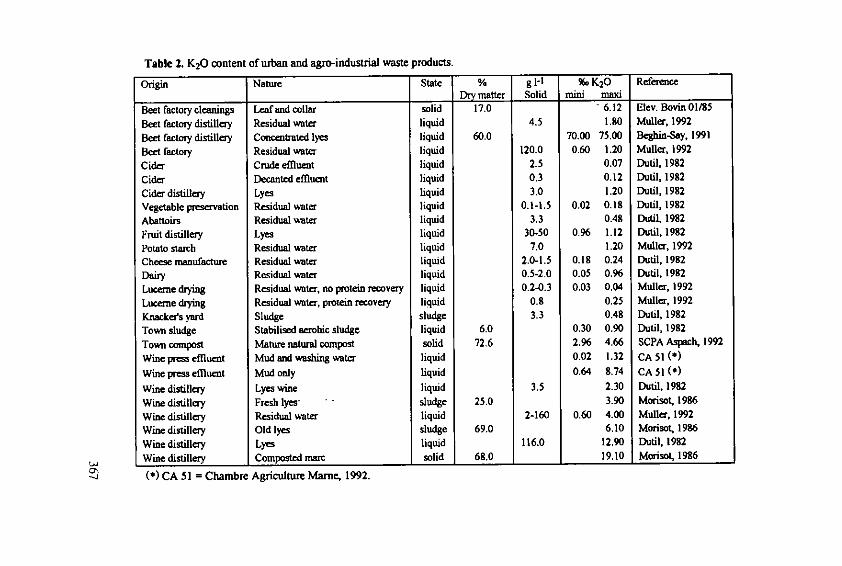
Table 2. K20 content of urban and agro-industrial waste products.
Origin Nature State % g 1-1 96.K20 ReferenceDry matter Solid mini maxt
Beet factory cleanings Leaf and collar solid 17.0 6.12 Elev. Bovin 01/85
Beet factory distillery Residual water liquid 4.5 1.80 Muller, 1992
Beet factory distillery Concentrated lyes liquid 60.0 70.00 75.00 Beghin-Say, 1991
Beet factory Residual water liquid 120.0 0.60 1.20 Muller, 1992
Cider Crude effluent liquid 2.5 0.07 Dutil, 1982
Cider Decanted effluent liquid 0.3 0.12 Dutil, 1982
Cider distillery Lyes liquid 3.0 1.20 Dutil, 1982
Vegetable preservation Residual water liquid 0.1-1.5 0.02 0.18 Dutil, 1982
Abattoirs Residual water liquid 3.3 0.48 Dutil, 1982
Fruit distillery Lyes liquid 30-50 0.96 1.12 Dutil, 1982
Potato starch Residual water liquid 7.0 1.20 Muller, 1992
Cheese manufacture Residual water liquid 2.0-1.5 0.18 0.24 Dutil, 1982
Dairy Residual water liquid 0.5-2.0 0.05 0.96 Dutil, 1982
Lucerne drying Residu water, no protein recovery liquid 0.2-0.3 0.03 0.04 Muller, 1992Lucerne drying Residual water, protein recovery liquid 0.8 0.25 Muller, 1992Knacker's yard Sludge sludge 3.3 0.48 Dutil, 1982Town sludge Stabilised aerobic sludge liquid 6.0 0.30 0.90 Dutil, 1982Town compost Mature natural compost solid 72.6 2.96 4.66 SCPAAspach, 1992Wine press effluent Mud and washing water liquid 0.02 1.32 CA 51 (*)Wine press effluent Mud only liquid 0.64 8.74 CA 51 ()
Wine distillery Lycs wine liquid 3.5 2.30 Dutil, 1982Wine distillery Fresh lyes sludge 25.0 3.90 Morisot, 1986Wine distillery Residual water liquid 2-160 0.60 4.00 Muller, 1992Wine distillery Old lyes sludge 69.0 6.10 Morisot, 1986Wine distillery Lyes liquid 116.0 12.90 Dutil, 1982Wine distillery Composted mart solid 68.0 19.10 Moisot, 1986
()CA 51 = Chambre Agriculture Marne, 1992.
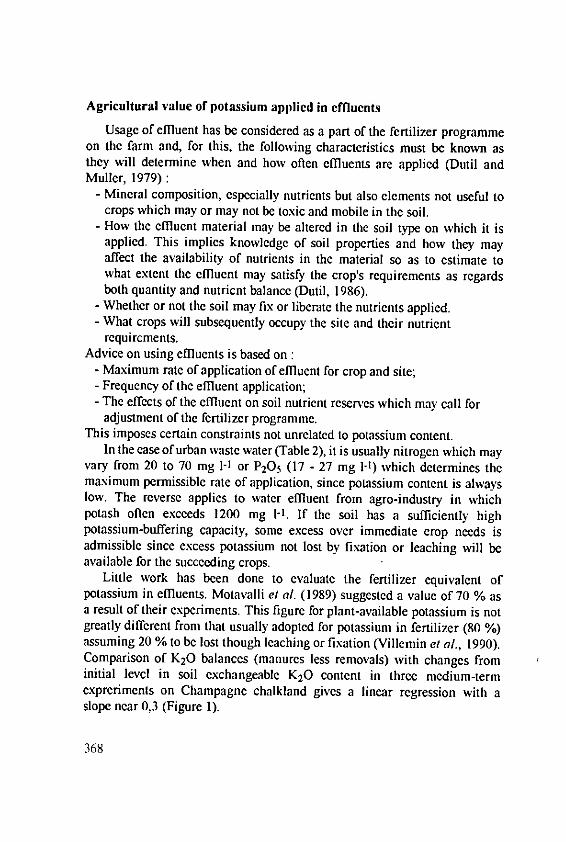
Agricultural value of potassium applied in effluents
Usage of effluent has be considered as a part of the fertilizer programmeon the farm and, for this, the following characteristics must be known asthey will determine when and how often effluents are applied (Dutil andMuller, 1979):
- Mineral composition, especially nutrients but also elements not useful tocrops which may or may not be toxic and mobile in the soil.
- How the effluent material may be altered in the soil type on which it isapplied. This implies knowledge of soil properties and how they mayaffect the availability of nutrients in the material so as to estimate towhat extent the effluent may satisfy the crop's requirements as regardsboth quantity and nutrient balance (Dutil, 1986).
- Whether or not the soil may fix or liberate the nutrients applied.- What crops will subsequently occupy the site and their nutrient
requirements.Advice on using effluents is based on:
- Maximum rate of application of effluent for crop and site;- Frequency of the effluent application;- The effects of the effluent on soil nutrient reserves which may call for
adjustment of the fertilizer programme.This imposes certain constraints not unrelated to potassium content.
In the case of urban waste water (Table 2), it is usually nitrogen which mayvary from 20 to 70 mg 1-1 or P20 5 (17 - 27 mg 1-1) which determines themaximum permissible rate of application, since potassium content is alwayslow. The reverse applies to water effluent from agro-industry in whichpotash often exceeds 1200 mg 1- 1. If the soil has a sufficiently highpotassium-buffering capacity, some excess over immediate crop needs isadmissible since excess potassium not lost by fixation or leaching will beavailable for the succeeding crops.
Little work has been done to evaluate the fertilizer equivalent ofpotassium in effluents. Motavalli el al. (1989) suggested a value of 70 % asa result of their experiments. This figure for plant-available potassium is notgreatly different from that usually adopted for potassium in fertilizer (80 %)assuming 20 % to be lost though leaching or fixation (Villemin et al., 1990).Comparison of K20 balances (manures less removals) with changes frominitial level in soil exchangeable K20 content in three medium-termexpreriments on Champagne chalkland gives a linear regression with aslope near 0,3 (Figure 1).
368
There are other soil constraints, important among which arc soil-waterrelationships. Soil acts as a physical filter, and mineral and organic particlesin the effluent may be retained on the soil surface when, if there is muchsuspended matter, there is a risk of surface -waterlogging with theconsequence of increased runoff. Soil water retention capacity should besufficient but not excessive in order to avoid too rapid movement of mobileelements. Clay and organic matter in the soil are concerned in ion fixationand liberation. According to the degree of saturation of the exchangecomplex there will be simultaneous fixation and exchange of ions (Ca 2+, K+,
Mg 2+, NH4+) and movement of ions which are not fixed (NO 3-, CI-, S042-)or those less strongly held (Na+). These are the physico-chemical propertiesof the soil which, in conjunction with the quantity of water in the effluentand in rainfall regulate the movement of nutrients in the soil, especially ofpotassium.
Prediction of optimum K-nutrional conditions for crop yield and qualitydepends on so many factors that it is impossible to fix a norm applicable toall situations. However, the norm expressed as the desirable level ofavailability for the most demanding crops in the rotation is useful.Exchangeable potassium is a useful indicator of availability as has beendemonstrated in many field experiments (Quemener, 1985). It is importantto have knowledge of response to a single high rate of potassium as is oftenapplied when effluents are used.
.i.. .a
00
-100 l l ien me__" 2"
exeiet on Chapanechlkan xprien " " om" Vel
.,.
.IOQ .500 0 500 100 150
i 0 SI n (Ifput *ffmv* (kg. 5*14I
Fig. 1. Comparison of K2 0 balance (manures less removals) with changesfrom initial level in soil exchangeable K2 0 content. Three medium-termexperiments on Champagne chalkland. Experiment "1" Somme-Vesle
1977-86; expt. "2" : Saint Jean sur Moivre 1968-90; expt. "3" Herbisse1981-85 (Villemin et a!, 1990).
369
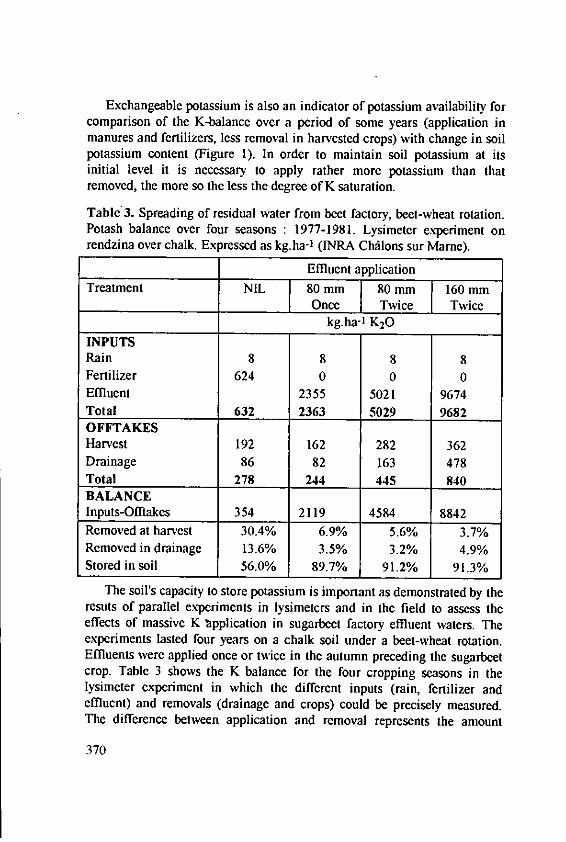
Exchangeable potassium is also an indicator of potassium availability forcomparison of the K-balance over a period of some years (application inmanures and fertilizers, less removal in harvested crops) with change in soilpotassium content (Figure 1). In order to maintain soil potassium at itsinitial level it is necessary to apply rather more potassium than thatremoved, the more so the less the degree of K saturation.
Table'3. Spreading of residual water from beet factory, beet-wheat rotation.Potash balance over four seasons : 1977-1981. Lysimeter experiment onrendzina over chalk. Expressed as kg.ha-I (INRA Chfilons sur Marne).
Effluent applicationTreatment NIL 80 mm 80 mm 160 mm
Once Twice Twicekg.ha-' K20
INPUTSRain 8 8 8 8Fertilizer 624 0 0 0Effluent 2355 5021 9674Total 632 2363 5029 9682OFFTAKESHarvest 192 162 282 362Drainage 86 82 163 478Total 278 244 445 840BALANCEInputs-Offtakes 354 2119 4584 8842Removed at harvest 30.4% 6.9% 5.6% 3.7%Removed in drainage 13.6% 3.5% 3.2% 4.9%Stored in soil 56.0% 89.7% 91.2% 91.3%
The soil's capacity to store potassium is important as demonstrated by theresuts of parallel experiments in lysimeters and in the field to assess theeffects of massive K bapplication in sugarbeet factory effluent waters. Theexperiments lasted four years on a chalk soil under a beet-wheat rotation.Effluents were applied once or twice in the autumn preceding the sugarbectcrop. Table 3 shows the K balance for the four cropping seasons in thelysimeter experiment in which the different inputs (rain, fertilizer andeffluent) and removals (drainage and crops) could be precisely measured.The difference between application and removal represents the amount
370

stored in the soil and this was almost proportional to the inputs. Theproportion stored in the soil ranged from 56 % with an application of 625 kgha-1 K20 to 91 % when 9682 kg ha- 1 was applied. The results of the fieldexperiment presented in Table 4 confirm those of the lysimeter experiment.
Table 4. Spreading of residual water from beet factory, beet-wheat rotation.Comparison of inputs (rain + fertilizer or residual water) and crop removals.Results of 4 years of field experiments on rendzina overlying chalk. kg.ha-IK (INRA* ASAE Chfilons sur Marne; ASAE = Association for monitoringof soils receiving residual water from crop processing industries inChampagne-Ardenne).
Effluent applicationTreatment NIL 80 mm 80 mm 160 mm
Once Twice Twice. kg ha-1 K20
Inputs 296 1899 4146 8170
Offtakes 79 118 214 302
Fraction removed 26.7% 6.2% 5.2% 3.7%
The experiment yielded some information on leaching losses on chalksoil. In both lysimeter and field experiments losses in drainage for an annualmean rate of application of 160 kg ha-1 amounted to 13,5 % of the amountapplied, or around 20 kg ha-1 yr K20. Though the proportion leacheddiminished as the rate of application increased (Table 3) the amounts lost inleaching can become relatively high at high of application; 40 kg ha year-1
for an application of 5 t K20 and 120 kg ha-'.year-' for 9.6 t. The results intable 5 show that leaching losses of potassium are much less than those ofother major elements under these conditions. The proportion of potassiumlost by drainage ranged in an small interval from to 61 % of the inputs inbare soil to 73 % under permanent grass, that is a situation very differentthan for nitrate. Excessive application of potassium could adversely affectground water quality. The maximum permissible level for K in water, asfixed by the EC, is 12 mg 1-1.
Application limits in relation to crops are dictated on the one hand by theimmediate crop demands and on the other by crop removals which willdetermine the variation in soil stock. Crop potassium needs are estimatedfrom crop K contents during growth or at harvest. Table I gives the Kcontents of different plant parts which may or may not be removed from the
371
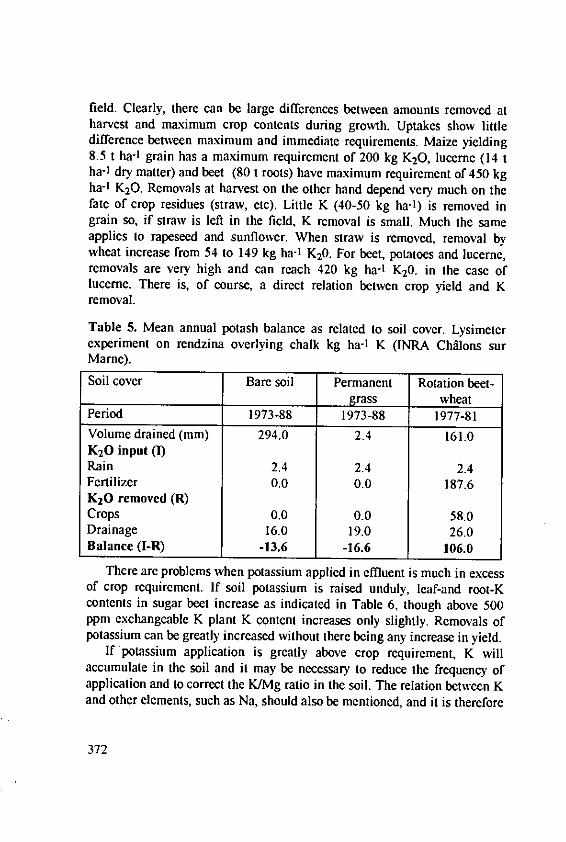
field. Clearly, there can be large differences between amounts removed atharvest and maximum crop contents during growth. Uptakes show littledifference between maximum and immediate requirements. Maize yielding8.5 t ha-1 grain has a maximum requirement of 200 kg K20, lucerne (14 1ha-1 dry matter) and beet (80 t roots) have maximum requirement of 450 kgha-1 K20. Removals at harvest on the other hand depend very much on thefate of crop residues (straw, etc). Little K (40-50 kg ha-') is removed ingrain so, if straw is left in the field, K removal is small. Much the sameapplies to rapeseed and sunflower. When straw is removed, removal bywheat increase from 54 to 149 kg ha-1 K20. For beet, potatoes and lucerne,removals are very high and can reach 420 kg ha-1 K2 0. in the case oflucerne. There is, of course, a direct relation betwen crop yield and Kremoval.
Table 5. Mean annual potash balance as related to soil cover. Lysimeterexperiment on rendzina overlying chalk kg ha-1 K (INRA Chftlons surMarne).
Soil cover Bare soil Permanent Rotation beet-grass wheat
Period 1973-88 1973-88 1977-81Volume drained (mm) 294.0 2.4 161.0K20 input (1)Rain 2.4 2.4 2.4Fertilizer 0.0 0.0 187.6K2 0 removed (R)Crops 0.0 0.0 58.0Drainage 16.0 19.0 26.0Balance (I-R) -13.6 -16.6 106.0
There are problems when potassium applied in effluent is much in excessof crop requirement. If soil potassium is raised unduly, leaf-and root-Kcontents in sugar beet increase as indicated in Table 6, though above 500ppm exchangeable K plant K content increases only slightly. Removals ofpotassium can be greatly increased without there being any increase in yield.
If potassium application is greatly above crop requirement, K willaccumulate in the soil and it may be necessary to reduce the frequency ofapplication and to correct the K/Mg ratio in the soil. The relation between Kand other elements, such as Na, should also be mentioned, and it is therefore
372
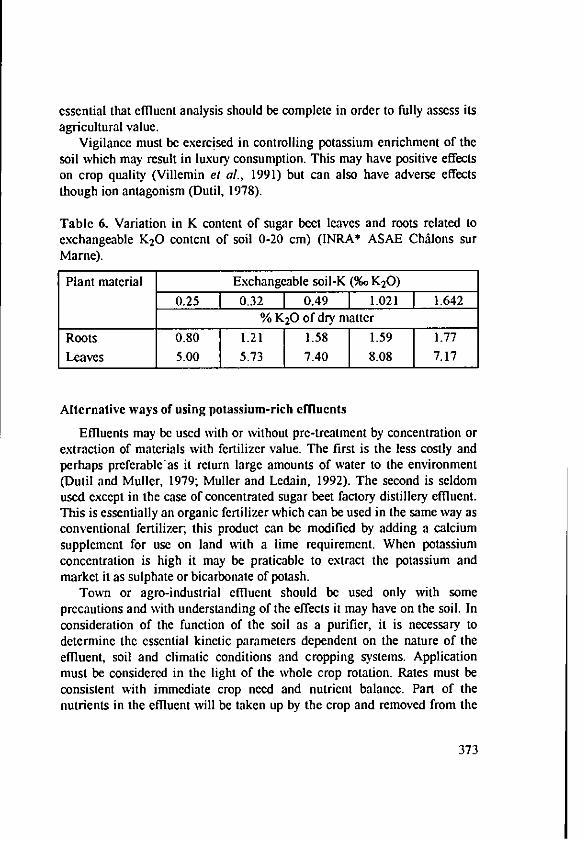
essential that effluent analysis should be complete in order to fully assess itsagricultural value.
Vigilance must be exercised in controlling potassium enrichment of thesoil which may result in luxury consumption. This may have positive effectson crop quality (Villemin et at., 1991) but can also have adverse effectsthough ion antagonism (Dutil, 1978).
Table 6. Variation in K content of sugar beet leaves and roots related toexchangeable K20 content of soil 0-20 cm) (INRA* ASAE Chdlons surMarne).
Plant material Exchangeable soil-K (%o K20)
0.25 0.32 0.49 1.021 1.642% K20 of dry matter
Roots 0.80 1.21 1.58 1.59 1.77Leaves 5.00 5.73 7.40 8.08 7.17
Alternative ways of using potassium-rich effluents
Effluents may be used with or without pre-treatment by concentration orextraction of materials with fertilizer value. The first is the less costly andperhaps preferable'as it return large amounts of water to the environment(Dutil and Muller, 1979; Muller and Ledain, 1992). The second is seldomused except in the case of concentrated sugar beet factory distillery effluent.This is essentially an organic fertilizer which can be used in the same way asconventional fertilizer; this product can be modified by adding a calciumsupplement for use on land with a lime requirement. When potassiumconcentration is high it may be praticable to extract the potassium andmarket it as sulphate or bicarbonate of potash.
Town or agro-industrial effluent should be used only with someprecautions and with understanding of the effects it may have on the soil. Inconsideration of the function of the soil as a purifier, it is necessary todetermine the essential kinetic parameters dependent on the nature of theeffluent, soil and climatic conditions and cropping systems. Applicationmust be considered in the light of the whole crop rotation. Rates must beconsistent with immediate crop need and nutrient balance. Part of thenutrients in the effluent will be taken up by the crop and removed from the
373
soil, and nutrients not taken up may be leached by winter rains and canpollute the groundwater. The following must be defined :1. Maximum permissible rate of application, usually expressed as mm water,in the light of the three following conditions as they apply to potassium andother elements :
a) allowing some storage, but not too large or permanent, in the soil;b) adjustment according to the potassium balance. If the soil is not K-
retentive, the total of K applied in the effluent + fertilizer together withthe supply from the soil should equate the K need of the first crop to begrown.
c) if the soil retains potassium, the rate of effluent to apply should becalculated in the light of the K requirement of the whole rotation.
2. Frequency of spreading effluent, which is determined by crop removal ofthe nutrient applied in the largest quantity between applications, by otherfertilizer applied and by losses through leaching and fixation as applied tothe whole rooting zone (topsoil + subsoil)
K applied in effluent+ Removal in crop
K from soil +Change in soil K
Loss by leaching and fixationA pratical example would be the application of potato starch factory
effluent containing 1200 mg 1-1 K20 and of which, in order that N supplyfor the immediate crop should not be excessive, the rate of application islimited to 80 mm. Comparison of inputs and offtakes of potassium willdetermine the interval between effluent spreadings and/or the rate offertilizer supplement to be applied for the 8-year rotation beet - wheat - beet- wheat - oats - lucerne - wheat - wheat for example. Crop potassiumremoval is calculated from the data in Table 1. If wheat straw is consistentlyremoved, K20 removal approximates 1900 kg ha-1, a figure which isreduced to 1600 if straw remains in the field. According to the situation, it. ispossible to calculate either the frequency of effluent spreading or the needfor supplementary potash if the frequency of application is dictated byanother limiting factor. Like that, the manner in which effluent is usedshould be consistent with good farming pratices.
We can say in conclusion that the use of effluents in farming rests uponsome simple propositions first mentioned by a French agriculturalist,
374
Bernard Palissy, in his "Trait6 des sels divers et de l'agriculture" publishedin 1563, from which we may quote:
- To maintain the fertility of the soil it is necessary to return to it thatwhich has been removed in the harvest.
- Human and animal excrements should be rendered to the soil for theyare forms ofsubstances contained in harvested crops.
References
Delas, J.; Dureau, P.; Goderfert, M.; Juste, C.; Menet, M.; Molot, C.; Soyer,
J.P. et Vessot, B. : Effets de ldpandage de vinasses de distillerie sur le
comportement de la vigne et les propridtds du sol. Science du sol, 3, 115-127 (1985)
Dutil, P. : Relation entre la fertilisation potassique et magntsienne et les
rendements de la luzerne. Rtsultats de l'enqudte Champagne 1976.Travaux de la Station d'Agronomie INRA de Chailons sur Marne, Public.n'54 (1978)
Dutil, Pet Muller, J.C. : L'6pandage des caux rdsiduaires des industriesagricoles en Champagne-Ardenne. C. R. Acad. Agric. France, 989-1005
(1979)Dutil, P. : L'pandage des eau rdsiduaires des industries agricoles en
Champagne-Ardenne. Evolution des iddes, solutions techniques. SocittdHydrotechnique de France. 17imes Journdes de l'Hydraulique, Nantes14-16 septembre 1982, 141-145 (1982)
Dutil, P. : Utilisation agricole des ddchets urbains et industriels et probl~mesde pollution lids A l'environnement. Techniques Agricoles 1390, 1-18(1986)
Morizot, A. : Utilisation agricole de quclques ddchets de distilleries de vinsrouges. Agronomie 6/2, 203-212 (1986)
lbrahim,S.S.; EI-Leboudi, A.E. and Abdel-Moez, M.R. : A Trial for Getting
Benefit from Organic Wastes of food Industry. Egypt J. Soil Sci. 28, n03,311-319 (1988)
Motavalli, P.P.; Kelling, K.A. and Converse, J.C. : First-year nutrient
availability from injected dairy manure. J. Environ. Qual. 18, 180-185(1989)
375
Muller, J.C. et Ledain, Ch. : Epandage des eaux rdsiduaires des industriesalimentaires ct agricoles et valorisation agronomique : dvolution desiddes et solutions techniques. Industries Agricoles ct Alimentaires, souspresse, (1992)
Nielsen, G.H.; Stevenson, D.S.; Fritzpatrick, J.J. and Brownlee, C.H.Nutrition and Yield of Young Apple Trees Irrigated with MunicipalWaste Water. J. Amer. Soc. Hort. Sci. 114 (3), 377-383 (1989)
Noales, R.; Gomez, M.Y. y Gallardo-Lara, F. : Influencia de la fertilizacioncon compost de basura urbana sobre la disponibilidad de potasioasimilable. Agrochimica 30/1-2, 45-57 (1986)
Quemener, J. : Compldmentaritd de l'expdrimentation et des 6tudes de ladynamique du potassium pour la rdgionalisation du commentaired'analyse de sol. C. R. Acad. Agric. France, 7114, 339401 (1985)
Steward, H.T.L. and Flin, D.W. : Establishment and early growth of treesirrigated with wastewater at four sites in Victoria, Australia. Forest,Ecology and Management, 8, 243-256 (1984)
Villemin, P.; Ballif, J.C. et Lefevre, F. : La fertilisation potassique en terresde craie. Publication du Centre de Recherches Agronomiques. SocittdCommerciale des Potasses et de l'Azote; F-68700 Aspach-le Bas, 24pages (1990)
Wong, M.H. : Comparison of Several Solid Wastes on the Growth ofVegetable Crops. Agriculture, Ecosystems and Environment, 30, 49-61(1990)
376
Replacement of Sodium in Home and IndustrialUses by Potassium : Importance and Possibilities
Avnimelech, Y., The Ministry of the Environment, P.O. Box 6234, Jerusalem
91061, Israel, Bazelet, AM., Dead Sea Works Lid, P.O. Box 75, Beer Sheva
94100, Israel and Weber, B., Association of Towns for Environmental
Quality "Southern Judeah", P.O. Box 437, Nes-Ziona 70400, Israel
Summary
Treatment of waste water is made necessary both by the ban on
discharge of effluents into the sea and rivers and in order to satisfy the
needs of an increasing population. Treatment aims to eliminate pathogens
and organic matter and to precipitate heavy metals; soluble salts are not
removed. Domestic and industrial use of water results in an increase in
salinity principally due to the use of sodium chloride in water softening.
The average annual increase in salinity in Israel is 170 mg Cl 1-1 per head
(about 17 kg NaC1 per head). The SAR is raised by 2.5 units and this leads
to sodium enrichment of soils which impairs soil quality. The high sodium
content of softened drinking water may be detrimental to human health.
The increased salinity of sewage effluents is a significant item in the salt
balance. It would be possible to reduce the SAR of effluents and so limit
salinity build-up by substituting potassium for sodium in water softening
and other processes. The Israeli Environment Ministry and the Dead Sea
Works arejointly sponsoring a project in this field.
Waste water recycling
Recycling of waste water is becoming a common practice all over the
world, especially in arid or semi-arid regions.
One reason for this is the increasing demand for water. In Israel, more
and more water must be diverted from agricultural to urban use. The
allocation of water for irrigation can be maintained only by using waste
water. Waste water recycling in the agricultural sector is increasing in many
countries: the USA, Egypt, China and others. Urban re-use of waste water is
also spreading. Several cities in Japan and in the USA are already using
properly treated waste water for residential irrigation or for toilet flushing.
377
The use of properly treated waste water for irrigation is environmentallysound. Waste water applied to soil is purified by the uptake of nutrients byplants, by biodegradation and through adsorption on soil colloids. Thus,irrigation of dry or wetlands is a common method of treating waste water.
The re-use of effluents imposes several requirements. Efforts are made atthe source to prevent the inclusion, of toxic wastes and heavy metals inindustrial waste water. Effluents for use in irrigation should be subjected tobiological, physical and chemical treatment to reduce or abolish potentialpathogenic factors. However there is no treatment to reduce the levels ofsoluble salts. Dessalinization of effluents is a very costly operation. Thus,any increase in salinity of the water is recycled with the water. It seems thatthis is a major problem associated with the large-scale use of waste water.
Salinity increments in municipal sewageThere have been several studies in Israel to evaluate salinity increases
arising municipal and industrial uses of water. Rebhun (1965) measured thesalinity in the supply and sewage water in Haifa. He found that the averageannual increase in salinity was 170 mg Cl/I, accompanied by an almostequivalent rise in sodium (115 mg/I), i.e. the added salinity consists mainlyof NaCI. Several more recent studies (Feigin et al., 1991) revealed anincrease in electrical conductivity averaging, in several communities, 0.5dS/m. This increase is equivalent to an increase of 175 mg CIA, whichagrees with Rebhun's results. The average SAR of the water increased,according to these studies, from 2.5 to 5.0 SAR units.
The increase in salinity due to domestic use alone was estimated inseveral studies. The daily per capita body excretion of salts amounts to about4-5 g chloride or 10-11 g total salts (Selkurt, 1961; Rebhun, 1965). The totalsalinity increment from domestic uses was evaluated in the USA (Metzger etal., 1958) and in Israel (Rebhun, 1961), to be about 7 g chloride per capitaper day. The expected increase in salinity, due to domestic uses, for anaverage per capita water consumption of 100 m3 per annum should be 26mg Cl/I as compared with the observed increase of 170 mg Cl/I. The largedifference (144 mg Cl/I) is explained by the contribution of chlorides fromindustry.
Simovici (1988) measured the chloride discharge from 100 big factoriesin the Dan (Tel-Aviv) metropolitan area. She found that the annualdischarge from this source amounted to 4,215 ton chlorides, equivalent to 48
378
mg Ct/I increment in the metropolitan waste water. This relatively low
chloride increase can be explained by the fact that the study did not cover all
industrial sources and by the low industrial effluent discharge in this area(about 10% of the total waste water).
Industrial sources of salinity and sodium
Industrial sources of salinity and sodium consist mainly of NaCl andNaOH (Table 1). The most important and largest source of salinity is water
softening, which usually uses NaCl solution for regeneration. Simovici
(1988) found that 94% of the chlorides discharged from the factories in the
Dan (Tel Aviv) metropolitan area consisted of NaCI and that 63% of the
total chlorides originated from water softening processes.Commercial water softening is based upon the use of cation exchange
columns. The hard water to be softened (typical water hardness in Israel is
ca 400 mg/I, expressed as CaCO 3) flows through a sodium-saturatedexchanger. When exhausted, the column is regenerated by through-washing
with concentrated NaCl solution (10-20%) followed by rinsing to remove
residual salts. These processes are inefficient, using on the average about 3 gNaCI per gram of removed hardness. The efficiency of the process is about
40%, i.e. the amount of NaCI used is 2.5 times the theoretical need.The major industrial uses of water softening are in steam generation,
cooling towers, laundries, textiles, etc. Moreover, it seems that water
softening is increasing, both for industrial and general household purposes,especially due to the popularity of laundry and dish-washing equipment.Home water softening leads to more sparkling glassware and prevents
scaling in cooking ustensiles.Other industrial uses of sodium salts are textile dyeing processes and in
flotation separation processes for food and agricultural products which use
saturated salt solutions. Large quantities of NaOH are consumed for
cleaning (especially in milk processing industries), textile treatment and in
the food industry. It is possible to replace NaOH. An additional use,common in Israel is the NaCI treatment of all meat products as demanded bythe Jewish dietary law.
379
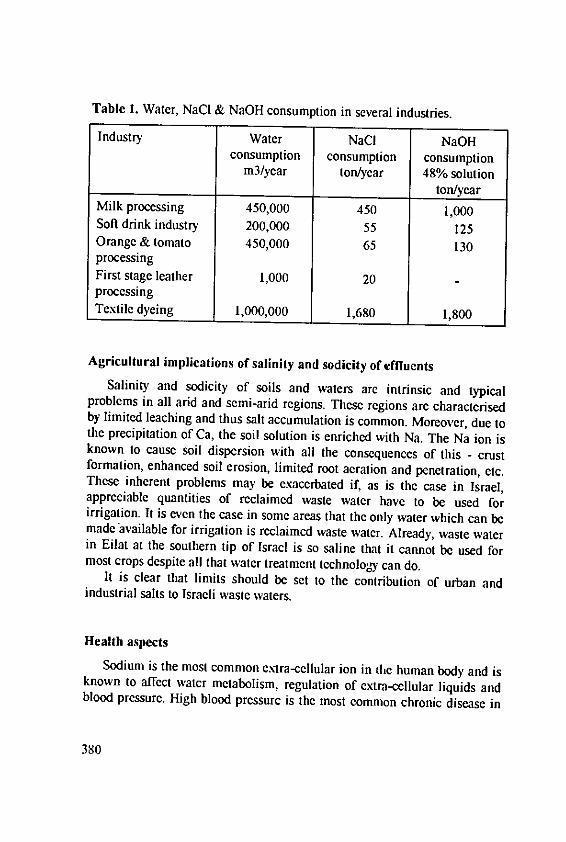
Table 1. Water, NaCI & NaOH consumption in several industries.
Industry Water NaCI NaOHconsumption consumption consumption
m3/year ton/year 48% solutionton/year
Milk processing 450,000 450 1,000Soft drink industry 200,000 55 125Orange & tomato 450,000 65 130processingFirst stage leather 1,000 20processingTextile dyeing 1,000,000 1,680 1,800
Agricultural implications of salinity and sodicity of effluentsSalinity and sodicity of soils and waters are intrinsic and typicalproblems in all arid and semi-arid regions. These regions are characterised
by limited leaching and thus salt accumulation is common. Moreover, due tothe precipitation of Ca, the soil solution is enriched with Na. The Na ion isknown to cause soil dispersion with all the consequences of this - crustformation, enhanced soil erosion, limited root aeration and penetration, etc.These inherent problems may be exacerbated if, as is the case in Israel,appreciable quantities of reclaimed waste water have to be used forirrigation. It is even the case in some areas that the only water which can bemade available for irrigation is reclaimed waste water. Already, waste waterin Eilat at the southern tip of Israel is so saline that it cannot be used formost crops despite all that water treatment technology can do.
It is clear that limits should be set to the contribution of urban andindustrial salts to Israeli waste waters.
Health aspects
Sodium is the most common extra-cellular ion in the human body and isknown to affect water metabolism, regulation of extra-cellular liquids andblood pressure. High blood pressure is the most common chronic disease in
380
modern societies with an incidence in adults of about 30%. It is more
common in areas where salt consumption is high.High Na intake tends to raise the blood pressure. Several investigators
recommend a reduction in Na intake for the whole population and not only
for those already affected. On the other hand, it was found that an addition
of potassium seems to lead to a drop in blood pressure, when sodium intake
is high. The Na/K ratio in urine is positively correlated with blood pressure.
Food is the main source of sodium. However, it is possible that in arid
and semi-arid zones, where water is usually hard and water consumption is
high, sodium intake through drinking softened water is not negligible.
Typical Israeli water, having a hardness of 400 mg as CaCO3, has when
softened, a sodium concentration of 8 meq/l. For a daily water consumption
of 2 1, this amounts to an intake of 16 meq Na, or almost 1 g NaCl, which
can be considered high. Several investigators have found a relationship
between high blood pressure and high sodium in drinking water.
Conclusions
The contributions of urban population to the total salt accumulation in
Israel are very significant. The average domestic use increment is about 2.6
kg Cl per annum per capita which is unavoidable. However, the total
increment is 17 kg Cl per annum per capita, mainly due to the use of salts
for industrial purposes and for water softening. Almost all of this addition
consists of NaCI. This addition can and should be controlled. In Israel, the
contributions of municipalities and industries.to the total salinity amount to
85,000 tons of chlorides per annum, which is equal to the input of salts from
the Sea of Galilee - a contribution of major national concern.The fraction of sodium in the total enrichment is high. This implies a
worsening of irrigation water quality. It seems that the rising fraction of
sodium in water also has consequences for human health, both directly and
indirectly. The use of softened water for drinking purposes leads to a
significant increase in sodium intake. The overall increase of sodium in
water may lead to increased sodium concentrations in irrigated crops and
thus to increased sodium intake by the population.A possible way to counter this trend is to use potassium rather than
sodium in water softening and other industrial activities.
Theoretically, potassium can replace sodium. Such a replacement has
been tested in a few industries in Israel and there seemed to be no major
381

problems. The price per unit potassium may be somewhat higher, especiallysince the equivalent weight of potassium is higher than that of sodium (1.28kg KCI are needed to replace 1 kg NaCI). However, the overall expense maybe reduced if more efficient ways of use can be developed. The replacementof sodium salts or NaOH by potassium will alleviate the potential damagecaused by sodium. Moreover, K as a major plant nutrient will be taken up bycrops and this will effectively reduce the soil salinity hazard.
It seems that the use of potassium rather than sodium in home watersofteners is of special importance, due to the health risk associated with Na-softened water and to the potential health gain associated with the use of K-softened water.
The Israeli Ministry of Environment, together with the Dead Sea Worksis now supporting a major Research and Development project to bring aboutsuch a transition. In addition to other related efforts initiated by the Ministryof the Environment, this will, undoubtedly, reduce the salinity load ofrecycled water.
ReferencesFeigin, A., Ravina, I. and Shalhevet, J. : Irrigation with treated sewage
effluents. Springler-Verlag, Berlin (1991).Metzger, D.F. : Emergency use of reclaimed water for potable supply at
Chanut, Kansas. J. Amer. Water Works Ass. 50: 1021 (1958).Rebhun, M. : Salinity increments in municipal sewage. Their significance
and sources and methods of reduction. Inter. J. Air Water Pollution, 9:253-261 (1961).
Selkurt, E.E. : Excretion of electrolytes. In: Encyclopedia of the BiologicalSciences, p. 371. Reinhold Publ. Co., NY (1961).
Simovici, E. : Reduction of salinity in industrial waste water from the Danregion. Report prepared by Tahal Consulting Engineering Ltd for theIsrael Water Commission (1988).
382
Coordinator's Report on Session 4
Van Diest, A., Agricultural University, Department of Soil Science andPlant Nutrition, Dreyenplein 10, 6703 HB Wageningen, The Netherlands
In the fourth session, devoted to K requirements in different land-usesystems, attention was paid both to replenishment of agro-ecosystems fromwhich K is withdrawn in the form of produce, and to prevention of losses ofK due to erosion arising from improper soil management.
In the first paper by Vanek and Balik, it was shown that generally theconsumption of fertilizer-K in Czechoslovakia is at a satisfactory level,although rather wide variations in K use exist, sometimes resulting in K-
induced Mg deficiency. Like in Western Europe, apparently the problem ofexcessive K supply in the form of cattle slurry can be the cause of undulyhigh levels of soil K. This once more points out the pressing need for a moreefficient distribution of nutrients present in manures.
In his comprehensive treatise of the role of potassium in agriculturalecosystems, Munson rightfully stressed the importance of K in improvingthe efficiencies not only of water, but also of nitrogen and phosphate. In our
western society, we are justifiably concerned about N and P causingeutrophication of our ecosystems. Too little attention so far has been paid,however, to the fact that often we have not created the proper conditions forplants to optimally utilize N and P supplied as fertilizers and/or manures.Frequently, these nutrients cannot be fully utilized by crops because othernutrients, like K, are not present in sufficient quantities. In other words, amore balanced supply of nutrients can be an effective safeguard againstenvironmental pollution. Munson offered many valuable suggestions for amore judicious use of fertilizers needed to produce more food and fiber for
an ever growing world population, without endangering the quality of ourenvironment.
Trees play an important role in our European environment, and we all
know that the health of our European forests is endangered. Slowly our
foresters are beginning to realize that one of the most effective means of
conditioning a tree against inclement factors, is to make sure that the tree isproperly fed. Bonneau, in his presentation, pointed this out, but he alsoemphasized that our current soil testing methods, as they are geared toagricultural use, are often not suitable for making recommendations on
383
forest fertilization. He stated that foliar analysis might be a more effectivetool for improving the nutritional status of our European forests.
Kaupenjohann showed the usefulness of knowledge of foliar nutrientconcentrations in tropical trees for maximum wood production. Surprisinglyhigh quantities of K are needed for proper development of fast-growingtropical trees. Here again, attention should be given to proper soilmanagement enabling an efficient recycling of K within the, plantationecosystem.
The hazards of slash-and-burn practices, both in forestry and agriculturalsystems, were also emphasized by Pagliai. From his presentation, it can beconcluded that in Europe far too much tillage is practiced, and that in hillyregions the direction of tillage is usually still wrong. Soil, moving down theslope, contains large quantities of nutrients. Measures taken to reduce soilerosion serve two important purposes : in the first place, the efficiency ofnutrients supplied in fertilizer form will be improved, and second, surfacewater will be protected from being charged with large quantities ofeutrophying nutrients.
The nutritional value of effluents was the topic of the paper presented byMuller. It became clear from his presentation that under certain restrictedconditions such effluents can replace fertilizers as nutrient suppliers, but thatthe application methods can have detrimental effects on the physicalcondition of a soil.
In countries with high water demands and with a high degree ofhardness of the available water, the use of NaCI as a water softener can addconsiderably to an ever increasing salinity problem. In their paper,Avnimelech, Bazelet and Weber announced the intention of Israeliauthorities to replace sodium by potassium.
When considering K in various agro-ecosystems, the read), availabilityand low prices of potash fertilizers in Europe and North America can easilylead to the erroneous conclusion that potassium nutrition of crops will neverbe a major problem. Unfortunately, the reverse is often the case in tropicalcountries. Many agro-ecosystems have become heavily depleted of K. Forexample, annually Thailand exports more K in cassava to the Netherlandsalone than it imports for its entire agriculture in the form of fertilizer.
Therefore, in the future the International Potash Institute will still havethe important task of convincing policymakers in Asia, Africa and LatinAmerica to purchase the K needed for a balanced nutrition of crops requiredin increasing quantities to feed an ever growing world population.
384
Chairman of the Poster Session
Prof. Dr. H. Beringer, Secretary of theScientific Board of the InternationalPotash Institute
Posters
1. Derivation of K-Fertilizer Recommendation
385
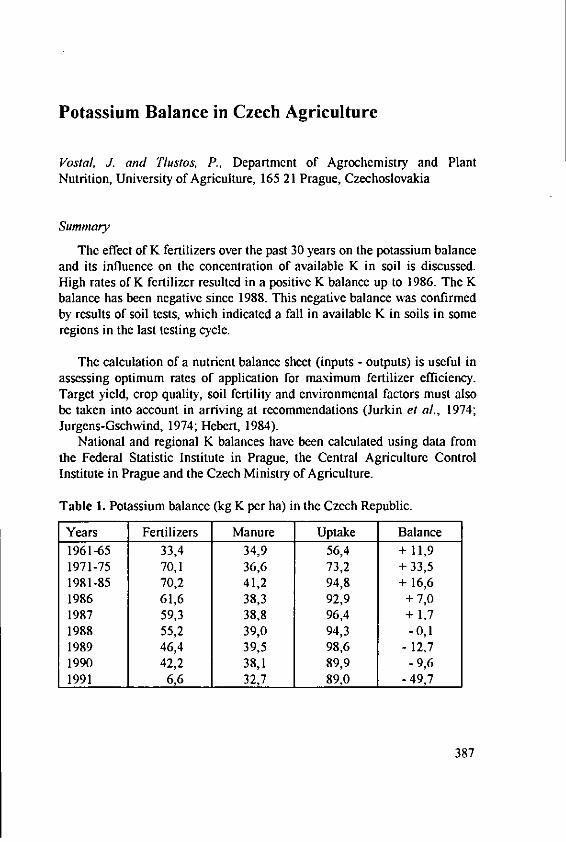
Potassium Balance in Czech Agriculture
Vostal, . and Tlustos, P., Department of Agrochemistry and PlantNutrition, University of Agriculture, 165 21 Prague, Czechoslovakia
Summary
The effect of K fertilizers over the past 30 years on the potassium balanceand its influence on the concentration of available K in soil is discussed.High rates of K fertilizer resulted in a positive K balance up to 1986. The Kbalance has been negative since 1988. This negative balance was confirmedby results of soil tests, which indicated a fall in available K in soils in someregions in the last testing cycle.
The calculation of a nutrient balance sheet (inputs - outputs) is useful inassessing optimum rates of application for maximum fertilizer efficiency.Target yield, crop quality, soil fertility and environmental factors must alsobe taken into account in arriving at recommendations (Jurkin et al., 1974;Jurgens-Gschwind, 1974; Hebert, 1984).
National and regional K balances have been calculated using data fromthe Federal Statistic Institute in Prague, the Central Agriculture ControlInstitute in Prague and the Czech Ministry of Agriculture.
Table 1. Potassium balance (kg K per ha) in the Czech Republic.
Years Fertilizers Manure Uptake Balance
1961-65 33,4 34,9 56,4 + 11,91971-75 70,1 36,6 73,2 + 33,51981-85 70,2 41,2 94,8 + 16,61986 61,6 38,3 92,9 + 7,01987 59,3 38,8 96,4 + 1,71988 55,2 39,0 94,3 -0,11989 46,4 39,5 98,6 - 12,71990 42,2 38,1 89,9 - 9,61991 6,6 32,7 89,0 -49,7
387

The balance was positive until 1985 due to generous application of Kfertilizer, then neutral for the next two years (inputs = outputs), but negativethereafter.
Table 2, again based on the whole country but distinguishing betweenarable and grassland soils, shows changes in the proportions of arable andgrassland soils falling in different categories for available K (ammoniumacetate/oxalate extraction after Schachtschabel, 1941). The classificationinto K categories takes into account soil texture indicated by the proportionof soil particles < 0,01 mm (Table 3). There was general improvement insoil K status up to 1983 (positive K balance) but the situation on thegrassland was not so satisfactory with still a high proportion of soils in thelow and very low categories.
Table 2. Percentage of soils in differing categories of K availability.
Category of availability
ARABLE SOIL
Years VL* L* M* H* I VH*
1961-65 37,6 39,9 22,51971-75 18,7 35,3 46,01976-80 1,4 10,6 34,3 33,1 20,61981-83 1,2 8,4 32,0 35,8 22,41984-86 1,0 8,4 31,0 35,5 24,11987-89 1,1 8,1 30,0 35,1 25,7
GRASSLAND1961-65 62,7 24,4 12,91971-75 49,8 26,0 24,21976-80 7,3 18,6 25,5 23,3 25,31981-83 5,8 14,0 23,6 25,1 31,51984-86 5,9 14,3 23,4 24,7 31,71987-89 6,5 16,3 23,8 22,5 30,9
*VL - very low L - low M - medium
H - high VH - very high
388
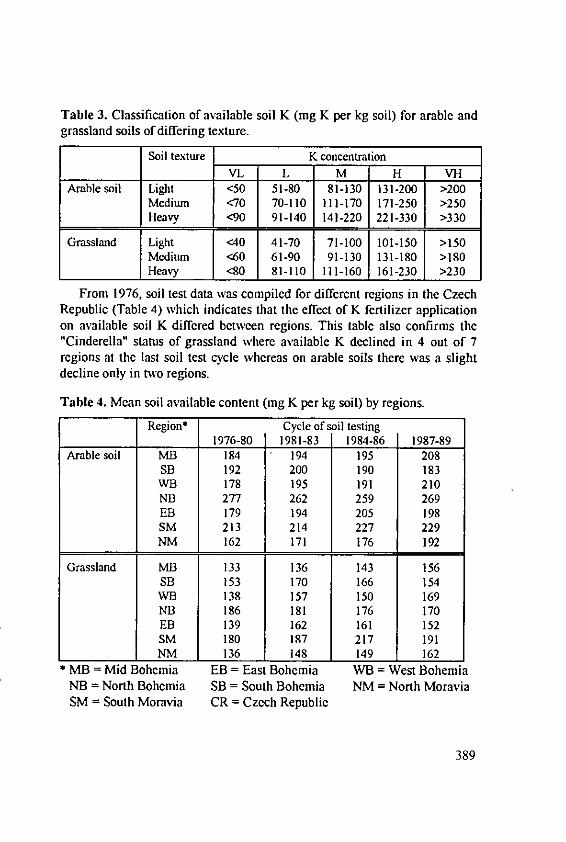
Table 3. Classification of available soil K (mg K per kg soil) for arable andgrassland soils of differing texture.
Soil texture K concentrationVL L M H VH
Arable soil Light <50 51-80 81-130 131-200 >200Medium <70 70-110 111-170 171-250 >250Heavy <90 91-140 141-220 221-330 >330
Grassland Light <40 41-70 71-100 101-150 >150Medium <60 61-90 91-130 131-180 >180Heavy <80 81-110 111-160 161-230 >230
From 1976, soil test data was compiled for different regions in the CzechRepublic (Table 4) which indicates that the effect of K fertilizer applicationon available soil K differed between regions. This table also confirms the"Cinderella" status of grassland where available K declined in 4 out of 7regions at the last soil test cycle whereas on arable soils there was a slightdecline only in two regions.
Table 4. Mean soil available content (mg K per kg soil) by regions.
Region* Cycle of soil testing1976-80 1981-83 1984-86 1987-89
Arable soil MB 184 194 195 208SB 192 200 190 183WB 178 195 191 210NB 277 262 259 269EB 179 194 205 198SM 213 214 227 229NM 162 171 176 192
Grassland MB 133 136 143 156SB 153 170 166 154WB 138 157 150 169NB 186 181 176 170EB 139 162 161 152SM 180 187 217 191NM 136 148 149 162
MB = Mid Bohemia EB = East Bohemia WB = West Bohemia
NB = North Bohemia SB = South Bohemia NM = North MoraviaSM - South Moravia CR = Czech Republic
389
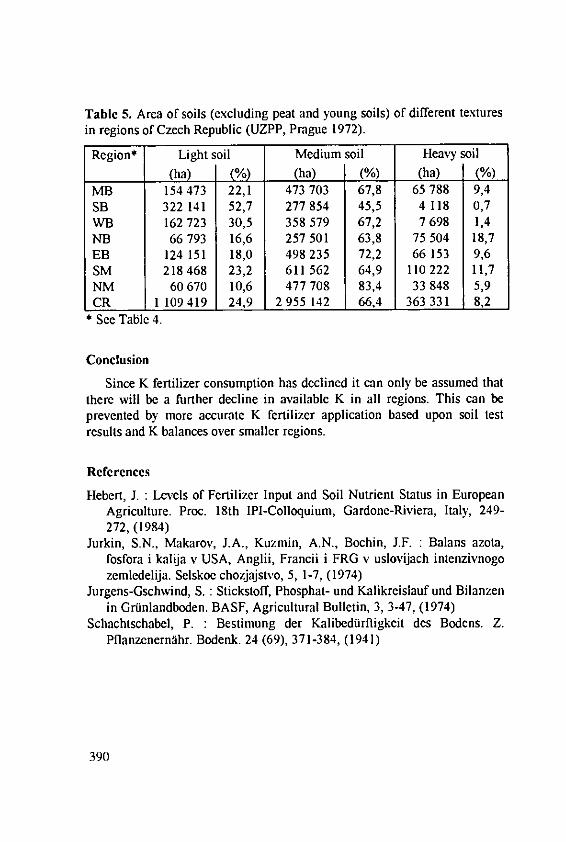
Table 5. Area of soils (excluding peat and young soils) of different texturesin regions of Czech Republic (UZPP, Prague 1972).
Region* Light soil Medium soil Heavy soil
(ha) (%) (ha) (%) (ha) j(%)MB 154 473 22,1 473 703 67,8 65788 9,4SB 322 141 52,7 277 854 45,5 4 118 0,7WB 162 723 30,5 358 579 67,2 7698 1,4NB 66793 16,6 257 501 63,8 75504 18,7EB 124 151 18,0 498 235 72,2 66 153 9,6SM 218468 23,2 611 562 64,9 110222 11,7NM 60 670 10,6 477 708 83,4 33 848 5,9CR 1 109419 24,9 2955 142 66,4 363 331 8,2
* See Table 4.
Conclusion
Since K fertilizer consumption has declined it can only be assumed thatthere will be a further decline in available K in all regions. This can beprevented by more accurate K fertilizer application based upon soil testresults and K balances over smaller regions.
References
Hebert, J. : Levels of Fertilizer Input and Soil Nutrient Status in EuropeanAgriculture. Proc. 18th IPI-Colloquium, Gardone-Riviera, Italy, 249-272, (1984)
Jurkin, S.N., Makarov, J.A., Kuzmin, A.N., Bochin, J.F. : Balans azota,fosfora i kalija v USA, Anglii, Francii i FRG v uslovijach intenzivnogozemledelija. Selskoe chozjajstvo, 5, 1-7, (1974)
Jurgens-Gschwind, S. : Stickstoff, Phosphat- und Kalikreislauf und Bilanzenin Grfinlandboden. BASF, Agricultural Bulletin, 3, 3-47, (1974)
Schachtschabel, P. : Bestimung der Kalibedurfligkeit des Bodens. Z.Pflanzenernahr. Bodenk. 24 (69), 371-384, (1941)
390
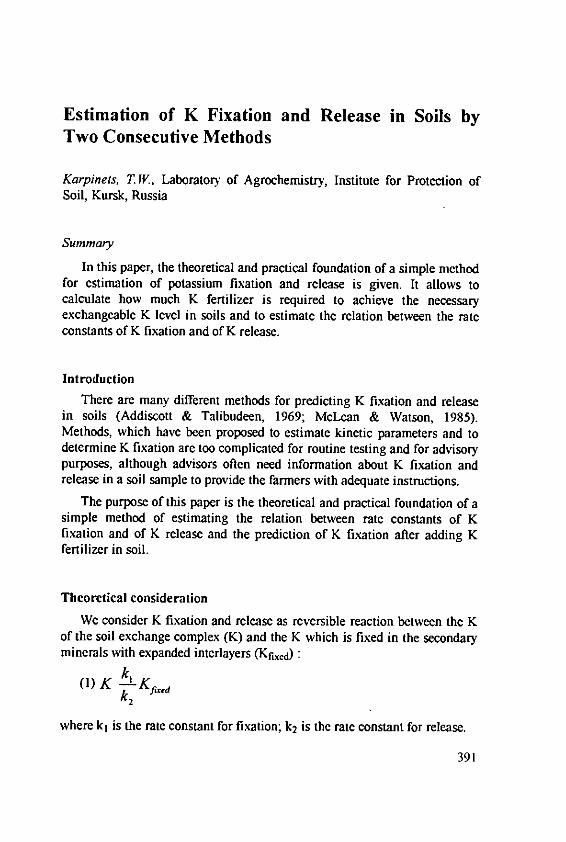
Estimation of K Fixation and Release in Soils byTwo Consecutive Methods
Karpinets, . I., Laboratory of Agrochemistry, Institute for Protection ofSoil, Kursk, Russia
Summary
In this paper, the theoretical and practical foundation of a simple methodfor estimation of potassium fixation and release is given. It allows tocalculate how much K fertilizer is required to achieve the necessaryexchangeable K level in soils and to estimate the relation between the rateconstants of K fixation and of K release.
IntroductionThere are many different methods for predicting K fixation and release
in soils (Addiscott & Talibudeen, 1969; McLean & Watson, 1985).Methods, which have been proposed to estimate kinetic parameters and todetermine K fixation are too complicated for routine testing and for advisorypurposes, although advisors often need information about K fixation andrelease in a soil sample to provide the farmers with adequate instructions.
The purpose of this paper is the theoretical and practical foundation of asimple method of estimating the relation between rate constants of Kfixation and of K release and the prediction of K fixation after adding Kfertilizer in soil.
Theoretical consideration
We consider K fixation and release as reversible reaction between the Kof the soil exchange complex (K) and the K which is fixed in the secondaryminerals with expanded interlayers (Kfixed)
(1) K k, Kfdk2
where k, is the rate constant for fixation; k2 is the rate constant for release.
391
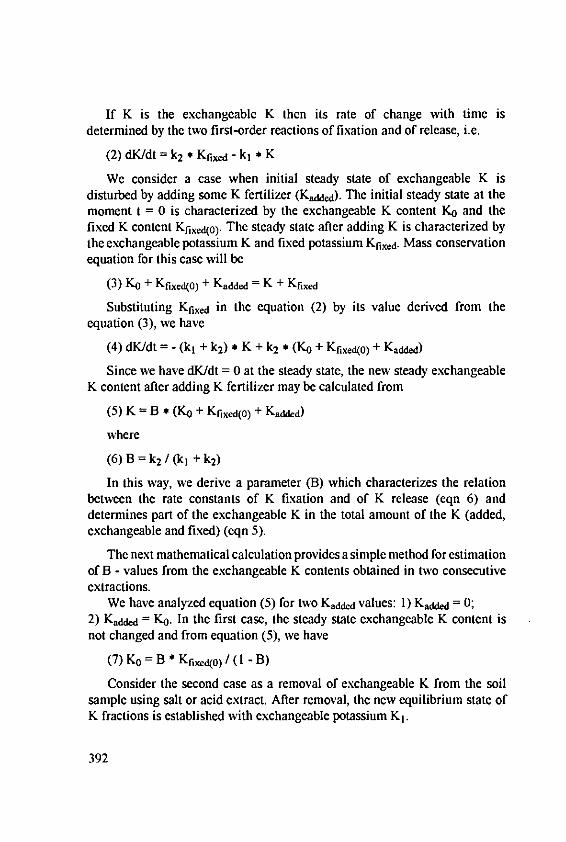
If K is the exchangeable K then its rate of change with time is
determined by the two first-order reactions of fixation and of release, i.e.
(2) dK/dt = k2 * K6,,, - kj * K
We consider a case when initial steady state of exchangeable K isdisturbed by adding some K fertilizer (Kwed). The initial steady state at themoment t = 0 is characterized by the exchangeable K content Ko and thefixed K content Kjjed(o). The steady state after adding K is characterized bythe exchangeable potassium K and fixed potassium Kfixed. Mass conservationequation for this case will be
(3) Ko + Kfixeod() + Kaddcd = K + Kfixed
Substituting Knixd in the equation (2) by its value derived from theequation (3), we have
(4) dK/dt = - (k1 + k2) * K + k2 * (Ko + Kfied(o) + Kaddd)
Since we have dK/dt = 0 at the steady state, the new steady exchangeableK content after adding K fertilizer may be calculated from
(5) K = B * (Ko + Kfix(o) + Kadd)
where
(6) B = k2 / (k1 + k2)
In this way, we derive a parameter (B) which characterizes the relationbetween the rate constants of K fixation and of K release (eqn 6) anddetermines part of the exchangeable K in the total amount of the K (added,exchangeable and fixed) (eqn 5).
The next mathematical calculation provides a simple method for estimationof B - values from the exchangeable K contents obtained in two consecutiveextractions.
We have analyzed equation (5) for two Kadjdd values: 1) Kadded = 0;2) Kadded = Ko. In the first case, the steady state exchangeable K content isnot changed and from equation (5), we have
(7) Ko = B * Kfixed(o) / (I - B)
Consider the second case as a removal of exchangeable K from the soilsample using salt or acid extract. After removal, the new equilibrium state ofK fractions is established with exchangeable potassium K1.
392
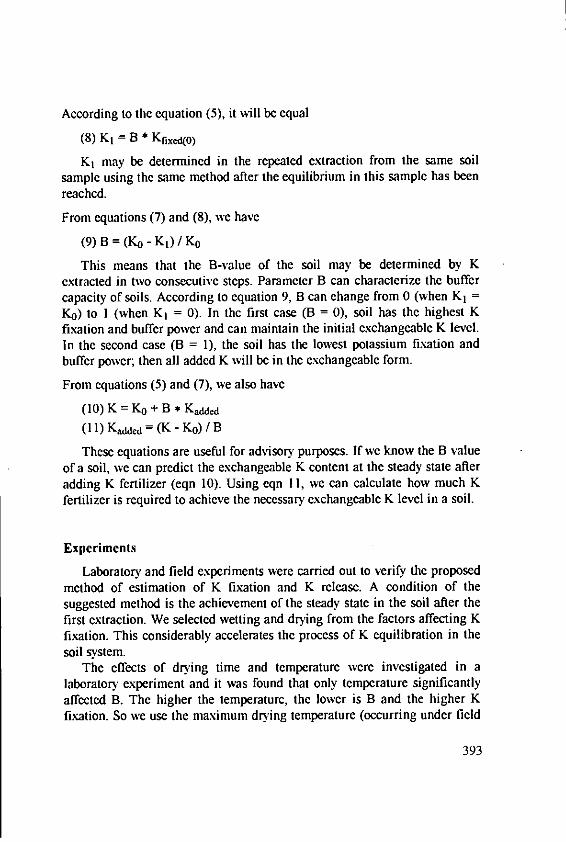
According to the equation (5), it will be equal
(8) K1 = B * Kixcd(o)
K, may be determined in the repeated extraction from the same soilsample using the same method after the equilibrium in this sample has beenreached.
From equations (7) and (8), we have
(9) B = (Ko - Kt) / Ko
This means that the B-value of the soil may be determined by Kextracted in two consecutive steps. Parameter B can characterize the buffercapacity of soils. According to equation 9, B can change from 0 (when K, =Ko) to I (when K1 = 0). In the first case (B = 0), soil has the highest Kfixation and buffer power and can maintain the initial exchangeable K level.In the second case (B = 1), the soil has the lowest potassium fixation andbuffer power; then all added K will be in the exchangeable form.
From equations (5) and (7), we also have
(10) K = KO + B * Kadded(11) Kadded = (K - Ko) / B
These equations are useful for advisory purposes. If we know the B valueof a soil, we can predict the exchangeable K content at the steady state afteradding K fertilizer (eqn 10). Using eqn 11, we can calculate how much Kfertilizer is required to achieve the necessary exchangeable K level in a soil.
Experiments
Laboratory and field experiments were carried out to verify the proposedmethod of estimation of K fixation and K release. A condition of thesuggested method is the achievement of the steady state in the soil after thefirst extraction. We selected wetting and drying from the factors affecting Kfixation. This considerably accelerates the process of K equilibration in thesoil system.
The effects of drying time and temperature were investigated in alaboratory experiment and it was found that only temperature significantlyaffected B. The higher the temperature, the lower is B and the higher Kfixation. So we use the maximum drying temperature (occurring under field
393
conditions) to obtain potential K fixation for a given soil. In general,therefore, the soil sample on the filter after the first extraction was air-dried(22-240 C) and the following procedure used to calculate B:
1. The determination of exchangeable K in the soil sample withammonium acetate.
2. The drying of this sample until the air-dry state.3. Determination of exchangeable K in the dried sample again with. ammonium acetate.
4. The calculation of B value using eqn 9.
For that purpose, 13 soil samples from typical chernozems (loam soils)with different exchangeable K content were used. K fixation was determinedin the soil samples by two methods : 1) using parameter B, and 2) from theexchangeable K content after addition of K fertilizer.
The square mean deviations, mistakes, model error and regressionanalysis coefficients were determined in order to compare the calculated andactual values of K fixation and presented evidence on the high degree ofagreement between them.
A field experiment on microplots investigated 20 typical chernozem soilswith the same parent material but differing in fertility. Four different cropswere grown without fertilizer over four years. Various characteristics of Kregime of the soils and yields recorded were subjected to correlation andregression analysis. B values correlated well with yield of barley, accountingfor most of the variation, as did various K extractants.
References
1. Addiscott, T.M. and Talibudeen, 0.: The buffering capacity of potassiumreserves in soils. Potash Rev. Subj. 4, 45th Suite (1967).
2. McLean, E.O. and Watson, M.E.: Soil measurement of plait-availablepotassium. In: R.D. Munson (ed.) "Potassium in Agriculture", Madison,USA, pp. 277-308, 1985.
394
Importance of Texture and CEC in K FertilizationAdvice
Schneider, A. and Villeinin, P., Centre de Recherches SCPA, 68700 Aspachle Bas, France
FERTILITY DIAGNOSIS...
Theoretical basis
Exchangeable K is the most frequently used indicator of soil-K fertility.It represents a quantity of potassium which is considered as totally availablefor plants. Nevertheless, this availability is related to soil texture : a samequantity of exchangeable K is less available in clay soils than in sandy ones.This is explained by the exchange properties of the soil which can beformally described by an exchange equation like Gapon's one. In non-acidcultivated soils under temperate climate, the Gapon's equation can besimplified as follows :
K, -k0 . (K)
Cae orCEC (Ca)"12
kG :Gapon selectivity coefficientK,, Cae exchangeable cations adsorbed on soil (meq.kg-1)(K), (Ca) cation concentration in soil solution (mole.l-')CEC cation exchange capacity
CEC is closely related to clay content, thus to soil texture. So a sameamount of potassium represents a lower potassium saturation ratio in a claysoil than in a sandy one. So does the potassium concentration in the soilsolution where plants take up their nutrients.
On the other hand, for a given plant uptake and a given soil-K saturationratio, the relative decrease of the saturation ratio is less important in a claysoil, and so the K concentration in the soil solution. Thus the given Kquantity will be absorbed in a shorter time in the case of the clay soil. More,a clay soil shows a higher non-exchangeable K reserve which is known toparticipate to the plant nutrition. These facts allow a lower saturation rate inclay soils to get the same availability.
395
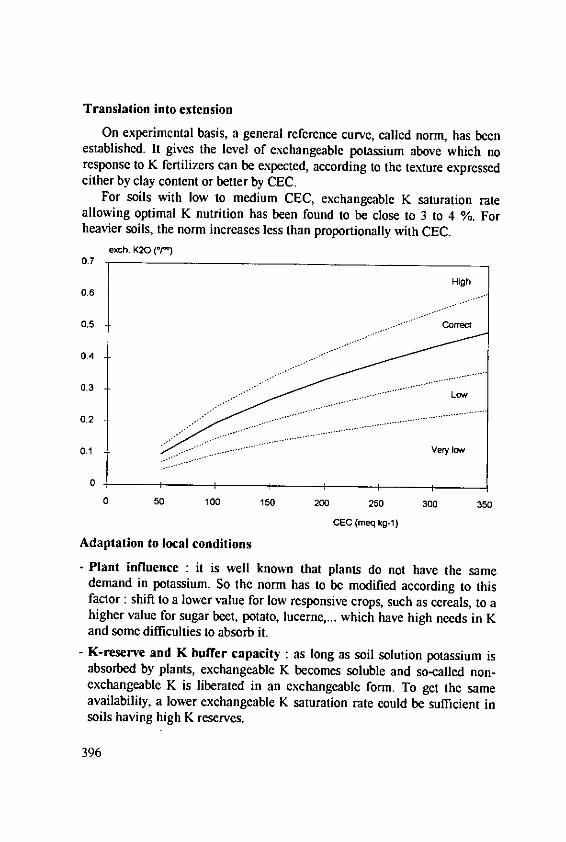
Translation into extension
On experimental basis, a general reference curve, called norm, has beenestablished. It gives the level of exchangeable potassium above which noresponse to K fertilizers can be expected, according to the texture expressedeither by clay content or better by CEC.
For soils with low to medium CEC, exchangeable K saturation rateallowing optimal K nutrition has been found to be close to 3 to 4 %. Forheavier soils, the norm increases less than proportionally with CEC.
exch. K20 (*r*)0.7
High0.6 ......
0.5 ....... Correct
0.4
0.3
0.2 ..........
1 .. Very low
0 -- - - - -- I I_
0 50 100 150 200 250 300 350
CEC (meq kg-1)
Adaptation to local conditions
- Plant influence : it is well known that plants do not have the samedemand in potassium. So the norm has to be modified according to thisfactor : shift to a lower value for low responsive crops, such as cereals, to ahigher value for sugar beet, potato, lucerne,... which have high needs in Kand some difficulties to absorb it.
- K-reserve and K buffer capacity : as long as soil solution potassium isabsorbed by plants, exchangeable K becomes soluble and so-called non-exchangeable K is liberated in an exchangeable form. To get the sameavailability, a lower exchangeable K saturation rate could be sufficient insoils having high K reserves.
396
In the same line, some clay soils (e.g. Groics in SW of France) have a verylow buffer capacity (the relationship between exchangeable and soilsolution potassium). In these soils, the high yields of irrigated maize, forex., require higher reference K levels.
- Volume of soil : according to the different types of soils, the quantity ofearth supplying nutrients to plants can vary in a large extent : 1200 t/ha instony calcareous soils to more than 4000 t/ha in deep loamy soils.Participation of the subsoil to the nutrition of the plant in homogeneousdeep soils is a well-known modifying factor even though, generally, not inuse in most of soil-test interpretation systems.
- Influence of climatic conditions : potassium release and fixation arehighly dependent on wetting and drying cycles and influenced by the claytype and content. Translation of basic studies on that topic into extensionrecommendations remains very difficult.
... AND FERTILIZER RECOMMENDATIONS
When soil K is above the critical level, the soil should receive fertiliser toreplace the various losses : removal in crop, fixation and leaching. Textureis an important factor for determining K leached under the root zone. Eithertables or formulas give leaching values according to the clay content, thedrainage and potassium buffer capacity.
When soil K is below the desired level, corrective measures are calledfor. Corrective requirement is calculated using the mass of soil in which theapplication will be diluted and a fixation coefficient. This coefficientdepends on the soil type and can be calculated according to statisticalformulas which are experimentally established. For example, in a loamy soilin the north of France, fixation capacity is given by :
fixation capacity (%) = 0.14 CEC (meq kg -I) - 0.056 exch. K20 (ppm) + 37(r2 = 0.79)
in which texture, estimated by CEC, plays a major role.The great influence of texture at the different steps of fertility diagnosis
or fertilizer recommendations can be explained by considerations about ionexchange, K-reserves (quantities and kinetics) and diffusion. Thesephenomena, among others, regulate potassium dynamics and behaviour inplant nutrition.
397
References
Quemener J., 1978 The measurement of soil potassium. I.P.I. ResearchTopic n' 4, 48 p.
Villemin P., 1987 Translation of laboratory K-data into K fertilizerrecommendations. Proceedings of the 20th Colloquium of theInternational Potash Institute - Wien/Austria.
398
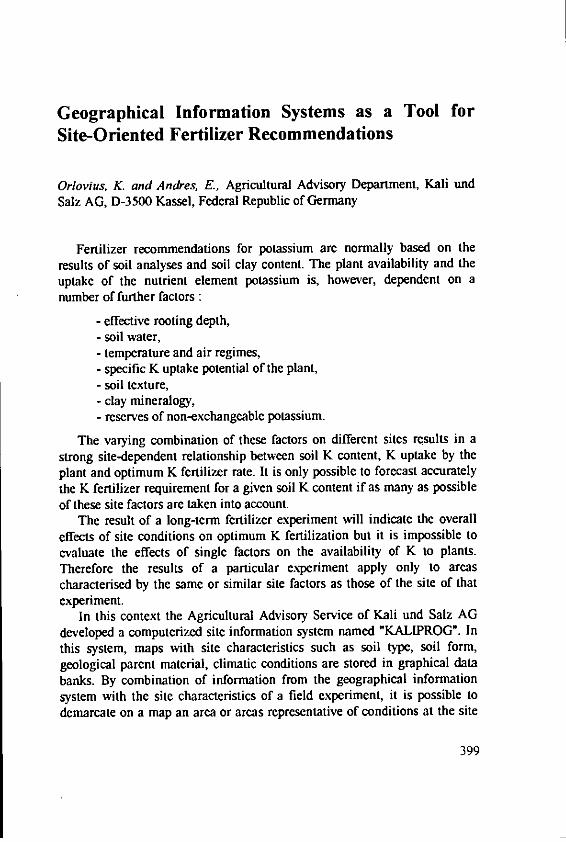
Geographical Information Systems as a Tool forSite-Oriented Fertilizer Recommendations
Orlovius, K. and Andres, E., Agricultural Advisory Department, Kali undSalz AG, D-3500 Kassel, Federal Republic of Germany
Fertilizer recommendations for potassium are normally based on theresults of soil analyses and soil clay content. The plant availability and theuptake of the nutrient clement potassium is, however, dependent on anumber of further factors :
- effective rooting depth,- soil water,- temperature and air regimes,- specific K uptake potential of the plant,- soil texture,- clay mineralogy,- reserves of non-exchangeable potassium.
The varying combination of these factors on different sites results in astrong site-dependent relationship between soil K content, K uptake by theplant and optimum K fertilizer rate. It is only possible to forecast accuratelythe K fertilizer requirement for a given soil K content if as many as possibleof these site factors are taken into account.
The result of a long-term fertilizer experiment will indicate the overalleffects of site conditions on optimum K fertilization but it is impossible toevaluate the effects of single factors on the availability of K to plants.Therefore the results of a particular experiment apply only to areascharacterised by the same or similar site factors as those of the site of thatexperiment.
In this context the Agricultural Advisory Service of Kali und Salz AGdeveloped a computerized site information system named "KALIPROG". Inthis system, maps with site characteristics such as soil type, soil form,geological parent material, climatic conditions are stored in graphical databanks. By combination of information from the geographical informationsystem with the site characteristics of a field experiment, it is possible todemarcate on a map an area or areas representative of conditions at the site
399
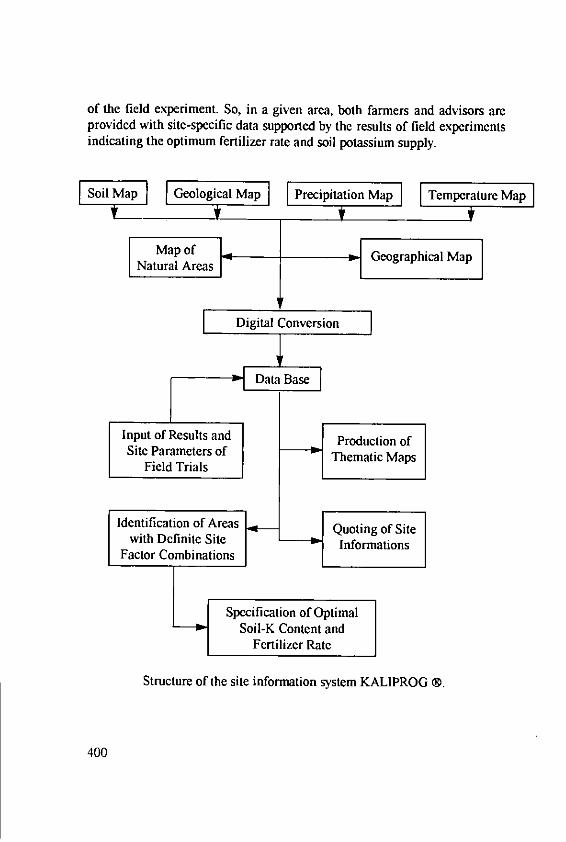
of the field experiment. So, in a given area, both farmers and advisors areprovided with site-specific data supported by the results of field experimentsindicating the optimum fertilizer rate and soil potassium supply.
SoilaMap Geological Map Precipitation Map Temperature Map
Map of [Geographical MapNatural Areas
Digital C sion
-aBase
Input of Results and Production ofSite Parameters of Thematic Maps
Field Trials
Identification of Areas Quoting of Sitewith Definite Site InformationsFactor Combinations
Specification of OptimalSoil-K Content and
Fertilizer Rate
Structure of the site information system KALIPROG ®.
400
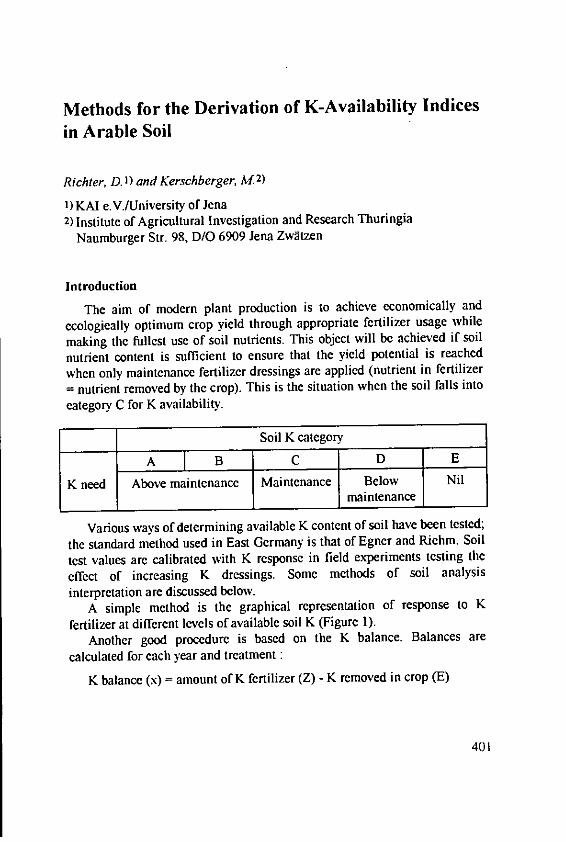
Methods for the Derivation of K-Availability Indicesin Arable Soil
Richter, D. ) and Kerschberger, M 2)
1) KAI e.V.IUniversity of Jena2 ) Institute of Agricultural Investigation and Research Thuringia
Naumburger Str. 98, D/O 6909 Jena Zwtzen
Introduction
The aim of modern plant production is to achieve economically and
ecologically optimum crop yield through appropriate fertilizer usage while
making the fullest use of soil nutrients. This object will be achieved if soil
nutrient content is sufficient to ensure that the yield potential is reached
when only maintenance fertilizer dressings are applied (nutrient in fertilizer
= nutrient removed by the crop). This is the situation when the soil falls into
category C for K availability.
Soil K category
A B C I D E
K need Above maintenance Maintenance Below Nilmaintenance
Various ways of determining available K content of soil have been tested;
the standard method used in East Germany is that of Egner and Riehm. Soil
test values are calibrated with K response in field experiments testing the
effect of increasing K dressings, Some methods of soil analysis
interpretation are discussed below.A simple method is the graphical representation of response to K
fertilizer at different levels of available soil K (Figure 1).Another good procedure is based on the K balance. Balances are
calculated for each year and treatment :
K balance (x) = amount of K fertilizer (Z) - K removed in crop (E)
401
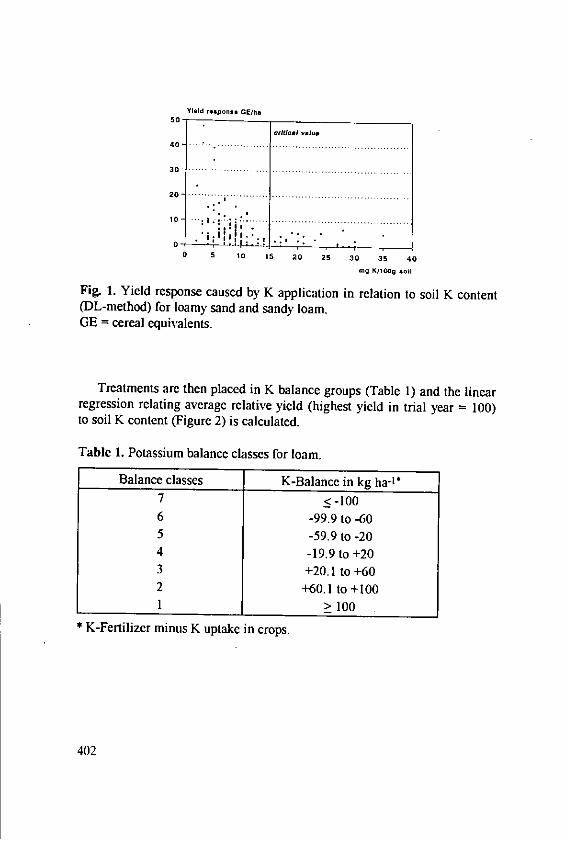
Yild rlspons. GEM.
50ajhk.om vahj.
40,
30 0 ... 0 ..........
20-
10 1 is 20 25 30 35 40
.9 K1I1009 Wol
Fig. 1. Yield response caused by K application in relation to soil K content(DL-method) for loamy sand and sandy loam.GE = cereal equivalents.
Treatments are then placed in K balance groups (Table 1) and the linearregression relating average relative yield (highest yield in trial year - 100)to soil K content (Figure 2) is calculated.
Table 1. Potassium balance classes for loam.
Balance classes K-Balance in kg ha-I*7 < -1006 -99.9 to -605 -59.9 to -204 -19.9 to +203 +20.1 to +602 +60.1 to+1001 >100
* K-Fertilizer minus K uptake in crops.
402
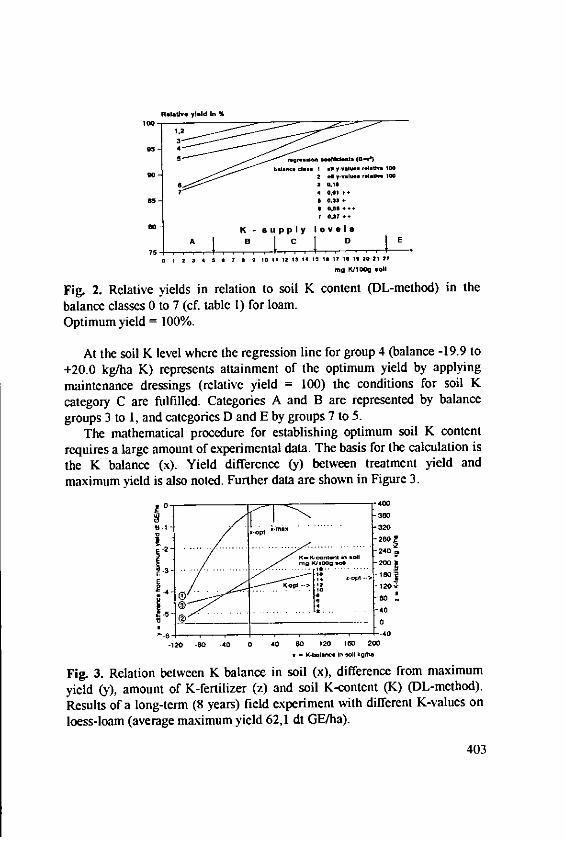
Relafe. yl.Id In %lWO
1.2
95- 3
05 4
65- I .al b clse 0 *to 7 am
At~ 0 th soi supl levelsweetergeso iefo ru blne-99t
5 . . . . ... , . . . .
grup 3 to 1, and caeore D and E b"y group 7' eI to
The. mahematicayild proeretor tabihnopiu soil K content (Lmto)i h
requires alare 0atount(of tablerimental dtam.Tebssfrtecluaini
mthenbance dressngsY(elatifferec y eweramn yield an0)thdodtin orsi
maximum yield is also noted. Further data arc shown in Figure 3.
.2. . 0 -".. 24- K4 upl lv
240P
.12 0 39 .4 0 4 0 CIII 0 *160 ~lI 20l2
ma 1004ci
Fieg. 2.) Reamtiv yild in-eationze to)an soil Kcontent (L-ethD)inethe)
loptimuom yivael maimmy100%.1dtG/h)
400
mint . enainbwe aance drsig rltv i soi 00), thfeciin fror soxiluK
he myathmautical proerefozr et ablsigdiu soil Kcontent ()(Lmto)
Reures ofa lrgemn ofyar)il experiment atah Thdaifrnt calution
los-or aeaemaximum yield isasonteFute dt r sEhw iigre3
-120 00 -0 0 0 00 1204023
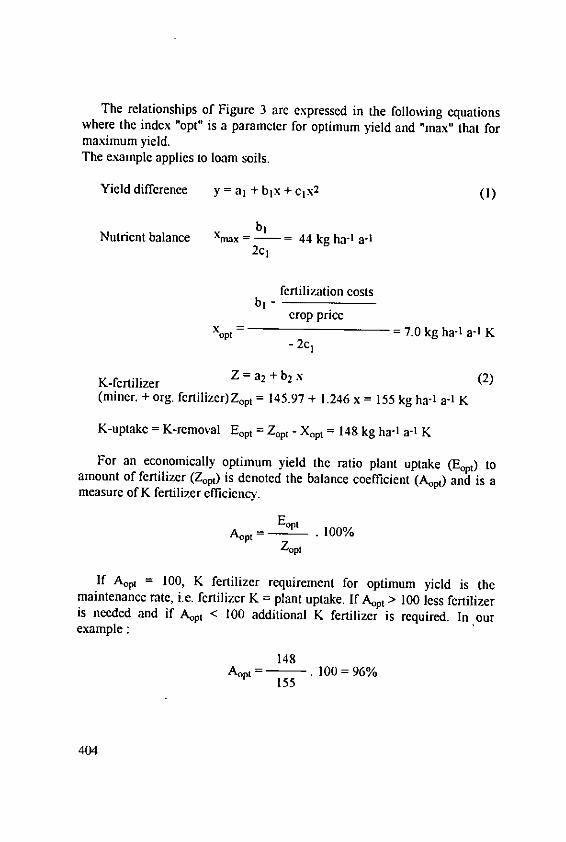
The relationships of Figure 3 are expressed in the following equationswhere the index "opt" is a parameter for optimum yield and "max" that formaximum yield.The example applies to loam soils.
Yield difference y = a + bx+cx 2 (1)
bjNutrient balance Xmax = - = 44 kg ha-1 a-1
2c,
fertilization costsbI-
crop priceXop- = 7.0 kg ha-1 a-1 K
- 2c 1
K-fertilizer Z = a2 + b2 x (2)(miner. + org. fertilizer)Zpt = 145.97 + 1.246 x = 155 kg ha-1 a-1 K
K-uptake = K-removal Eoot = Zopt - Xopj = 148 kg ha-1 a-1 K
For an economically optimum yield the ratio plant uptake (E0 pt) toamount of fertilizer (Z0 pt) is denoted the balance coefficient (Aopt) and is ameasure of K fertilizer efficiency.
EoptAopt =-- P . 100%
If Aopt = 100, K fertilizer requirement for optimum yield is themaintenance rate, i.e. fertilizer K = plant uptake. If Apt > 100 less fertilizeris needed and if Ap t < 100 additional K fertilizer is required. In ourexample
148Aopt - . 100 = 96%
155
404
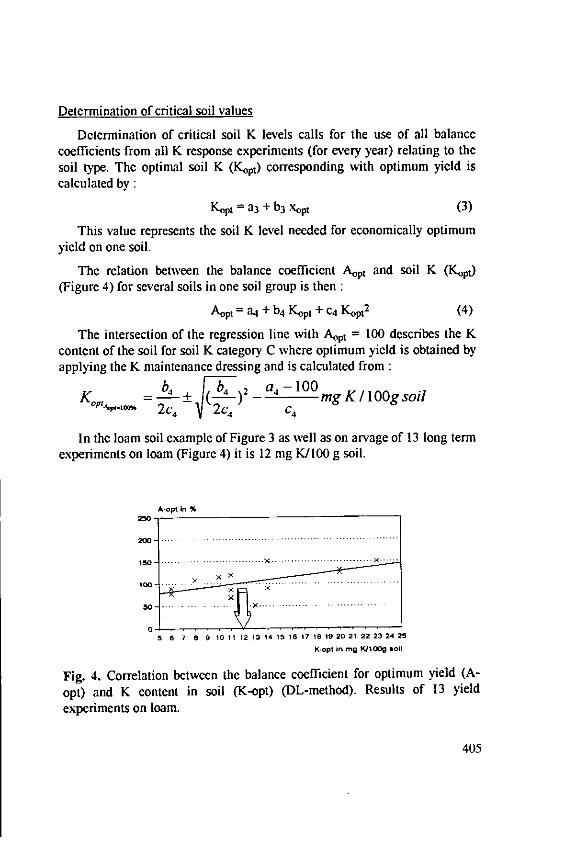
Determination of critical soil values
Determination of critical soil K levels calls for the use of all balancecoefficients from all K response experiments (for every year) relating to thesoil type. The optimal soil K (Kopt) corresponding with optimum yield iscalculated by:
Kopt = a3 + b3 Xopt (3)
This value represents the soil K level needed for economically optimumyield on one soil.
The relation between the balance coefficient Apt and soil K (Ktpt)(Figure 4) for several soils in one soil group is then :
Aopt -= a4 + b4 Kopt + C4 Kopt2 (4)
The intersection of the regression line with Apt = 100 describes the Kcontent of the soil for soil K category C where optimum yield is obtained byapplying the K maintenance dressing and is calculated from:
Ko,,. c (/c4)2 a41OOmgK/lOOgsoi
Opt~ c4 2c4 C
In the loam soil example of Figure 3 as well as on arvage of 13 long termexperiments on loam (Figure 4) it is 12 mg K/100 g soil.
56 7 8 9 101112 131415101718)92021 22232425
K-opt In mg 1,/1009 soil
Fig. 4. Correlation between the balance coefficient for optimum yield (A-opt) and K content in soil (K-opt) (DL-method). Results of 13 yieldexperiments on loam.
405
Effect of Potassium Sulphate on the Yield and
Quality of Vegetables
Loch, J. and Petho, F, Agricultural University Debrecen, Hungary
Introduction
Care is needed in the choice of the forms of K fertilizer to use onvegetables; they vary in their sensitivity to chloride (Geissler, 1953). Inaddition they differ in their sulphur requirements. Siegel and Barsch (1962)pointed out a requirement for sulphur in tomato, finding also that undercertain conditions high chloride concentration may decrease the yield oftomato. Uebel (1979) produced higher tomato yields by potassium chloridetreatments in Czechoslovakia; for green pepper, however, he recommendspotassium sulphate. Both forms of K have their effects on the quality ofvegetables.
Materials and methods
. Requirements vary not only between crops but also between varieties. In
the eastern parts of Hungary the PAZ Pallagi local variety pepper (Capsicumannuum spec. cultivar : PAZ Pallagi) and the Hungarian bred tomatovarieties (e.g. : Lycopersicum esculentum spec. cultivar : Prima), arecommonly grown. White radish (Raphanus sativus L. cult. Fehdr vaj), sorrel(Rumex acetosa v. Hort. cultivar : PNL) and cabbage (Brassica oleracea v.capitata calt. Hajd6sAgi) local varieties are also common.
Small plot experiments on the above varieties were conducted on brownforest soil(weakly acidic humid sand) in the years 1990-1991. The effects ofequal K20 rates as potassium chloride and potassium sulphate wereinvestigated at equal N and P rates (100 kg N, 54 kg P205, 250 kg K20/ha).The size of the plots was 20 m2, the applications were repeated 4 times.
407
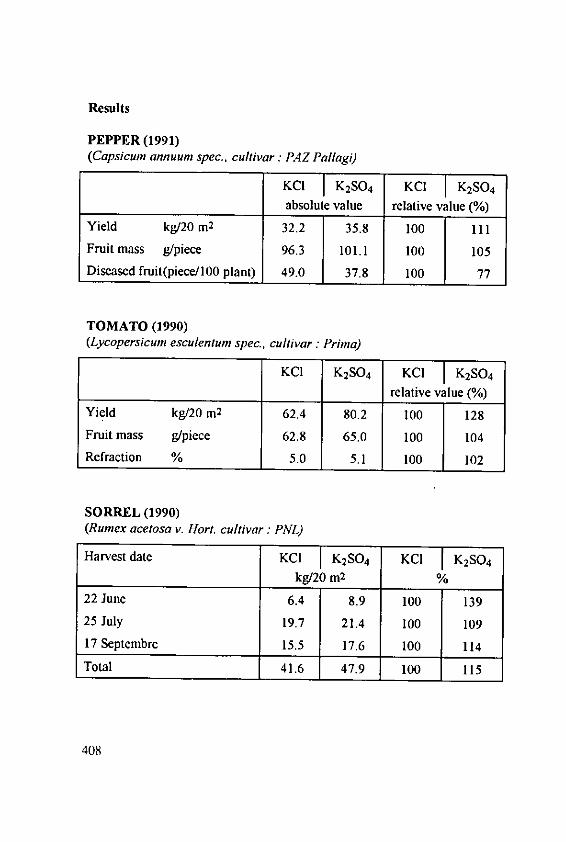
Results
PEPPER (1991)(Capsicum annuum spec., cultivar: PAZ Pallagi)
KCI K 2SO4 KCI K2SO4absolute value relative value (%)
Yield kg/20 M2 32.2 35.8 100 111Fruit mass g/piece 96.3 101.1 100 105Diseased fruit(piece/100 plant) 49.0 37.8 100 77
TOMATO (1990)(Lycopersicum esculentum spec., cultivar: Prima)
KCI K2 SO 4 KCI K2SO 4
relative value (%)Yield kg/20 M2 62.4 80.2 100 128Fruit mass g/piece 62.8 65.0 100 104Refraction % 5.0 5.1 100 102
SORREL (1990)(Rumex acetosa v. Hort. cultivar: PNL)
Harvest date KCI K2SO4 KCI K2SO4
kg/20 m2 %
22 June 6.4 8.9 100 139
25 July 19.7 21.4 100 10917 Septembre 15.5 17.6 100 114
Total 41.6 47.9 100 115
408
Conclusions
It can be concluded that potassium sulphate applications on the tested
pepper, tomato and sorrel varieties produced considerably better yields.
There were no significant changes in the yields of radish (cult. Fehdr vaj)
and cabbage (cult. Hajd&stgi), which indicate that these species and
varieties are not sensitive to chloride ions.
References
Geissler, Th. (1953) : Ober die Wirkung chlorid- und sulfathaltigcr
Diingemittel auf den Ertrag einiger Germisearten unter verschiedenen
Umweltverthiltnissen. Arch. Gartenbau 1, 233-342.
Siegel, 0. and Bjarsch, H.J. (1962) : Uber die Wirkung von Chlorid- und
Sulfationen auf den Stoffwechsel von Tomaten, Sellerie und Reben 1.-II.-
III. Gartenbauwiss. 27, 15-26.Uebel, E. (1979) : EinfluB unterschiedlicher Kalidiingermengen und -
formen auf Ertrag und 6konomisches Ergebnis 5 jahriger
Feldgemiisefruchtfolgen in der CSSR. Beitr. Kalidfingg. Landw.-,Forstwirt. (VEB Kali, DDR) 3, 1-11.
409

Effect of K Fertilizer on Yield of Maize on Meadow
Soils
Sarvari, M., Agricultural University of Debrecen, Hungary
Introduction
Potassium is important in plant nutrition and particularly so in its
interaction with nitrogen by ensuring balanced nutrition is confirmed by
results originating from the programme "National Uniform Experiments on
Fertilization" which has been in progress since 1966.
Results
The results presented here refer to experiments on meadow soil in
Hajdhb6sz6rmdny in which maize was grown in 3 rotations:
A. Pea - wheat - maize - maize;B. Wheat - maize - maize - wheat;C. Continuous maize.
The soil is high in organic matter (4.2%), fertile and similar to meadow
chernozem but on account of hardness (Arany's hardness number 52) and
other properties placed in the group of typical meadow soils. AL-soluble
P20 5 40 mg kg-1, Al-solublc K20 130 mg kg-1 on control (no P or K
fertilizer) plots.Treatments compared were factorial combinations of increasing rates of
N, P and K fertilizers (totals of 20 or 40 treatments according to the
experiment). Average yields and responses to K over 1I years from selected
treatments applied to the 3 rotations in one experiment are listed in Table 1.
Higher rates up to 250 kg ha-1 N, 200 kg ha-1 P20 5 and 200 kg ha-1 K20
were also tested.The mean yield increase from applying 100 kg ha-1 K20 was 1.67 t ha-1
but there was only a slight and statistically insignificant further response to
200 kg ha-1 K20. The optimum rates of K fertilizer appear to be 100-200 kg
ha-' K20 for maize grown in rotation and 120-150 kg ha-1 for maize in
monoculture. However, applying K fertilizer above these rates contributed to
411
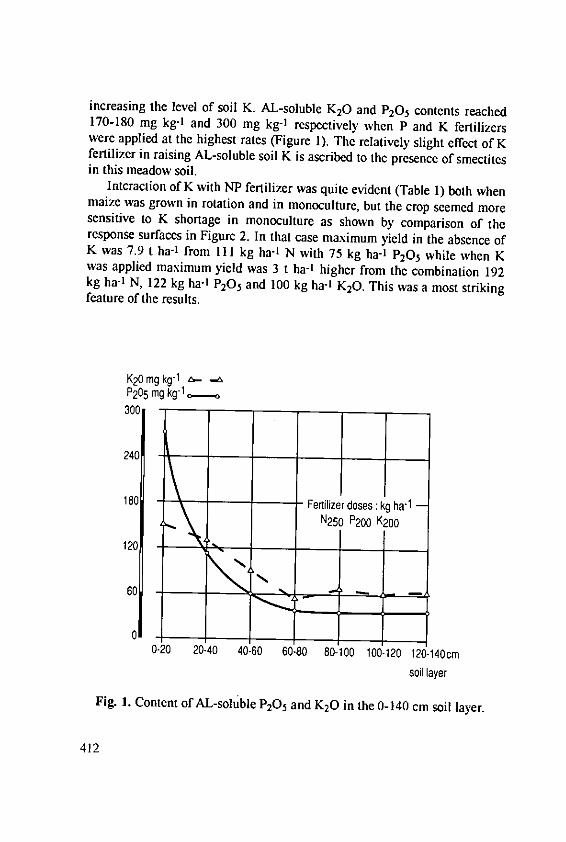
increasing the level of soil K. AL-soluble K 20 and P205 contents reached170-180 mg kg-l and 300 mg kg-1 respectively when P and K fertilizerswere applied at the highest rates (Figure 1). The relatively slight effect of Kfertilizer in raising AL-soluble soil K is ascribed to the presence of smectitesin this meadow soil.
Interaction of K with NP fertilizer was quite evident (Table 1) both whenmaize was grown in rotation and in monoculture, but the crop seemed moresensitive to K shortage in monoculture as shown by comparison of theresponse surfaces in Figure 2. In that case maximum yield in the absence ofK was 7.9 t ha-1 from I1I kg ha-l N with 75 kg ha-1 P205 while when Kwas applied maximum yield was 3 t ha-I higher from the combination 192kg ha-1 N, 122 kg ha-i P20 5 and 100 kg ha- K20. This was a most strikingfeature of the results.
K20 mg kg- 1 A- -6
P205 mg kg-1
300
240 T
180 - Fertilizer doses: kg hal -N250 P200 K200
120 "
60
0,0-20 20-40 40-60 60-80 80-100 100-120 120-140cm
soil layer
Fig. 1. Content of AL-soluble P20 5 and K20 in the 0-140 cm soil layer.
412
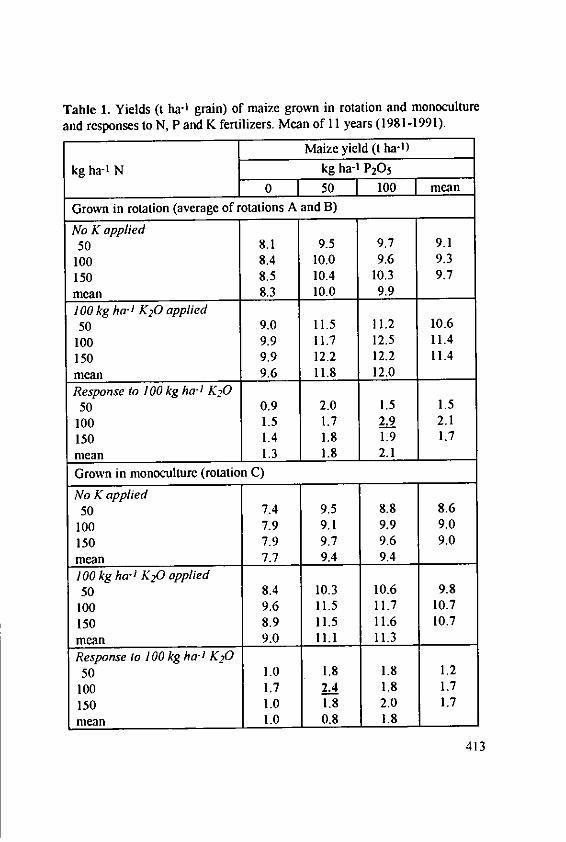
Table 1. Yields (t ha-1 grain) of maize grown in rotation and monoculture
and responses to N, P and K fertilizers. Mean of 11 years (1981-1991).
Maize yield (t ha-1)
kg ha-1 N kg ha-t P20 5
0 50 100 mean
Grown in rotation (average of rotations A and B)
No K applied50 8.1 9.5 9.7 9.1
100 8.4 10.0 9.6 9.3150 8.5 10.4 10.3 9.7mean 8.3 10.0 9.9
100 kg ha-1 K20 applied50 9.0 11.5 11.2 10.6100 9.9 11.7 12.5 11.4150 9.9 12.2 12.2 11.4
mean 9.6 11.8 12.0 1Response to 100 kg ha- I K20
50 0.9 2.0 1.5 1.5
100 1.5 1.7 2.9 2.1150 1.4 1.8 1.9 1.7mean 1.3 1.8 2.1
Grown in monoculture (rotation C)
No K applied50 7.4 9.5 8.8 8.6
100 7.9 9.1 9.9 9.0150 7.9 9.7 9.6 9.0mean 7.7 9.4 9.4100 kg ha-1 K20 applied50 8.4 10.3 10.6 9.8
100 9.6 11.5 11.7 10.7150 8.9 11.5 11.6 10.7mean 9.0 11.1 11.3Response to 100 kg ha-I K20
50 1.0 1.8 1.8 1.2100 1.7 2.4 1.8 1.7
150 1.0 1.8 2.0 1.7
mean 1.0 0.8 1.8
413
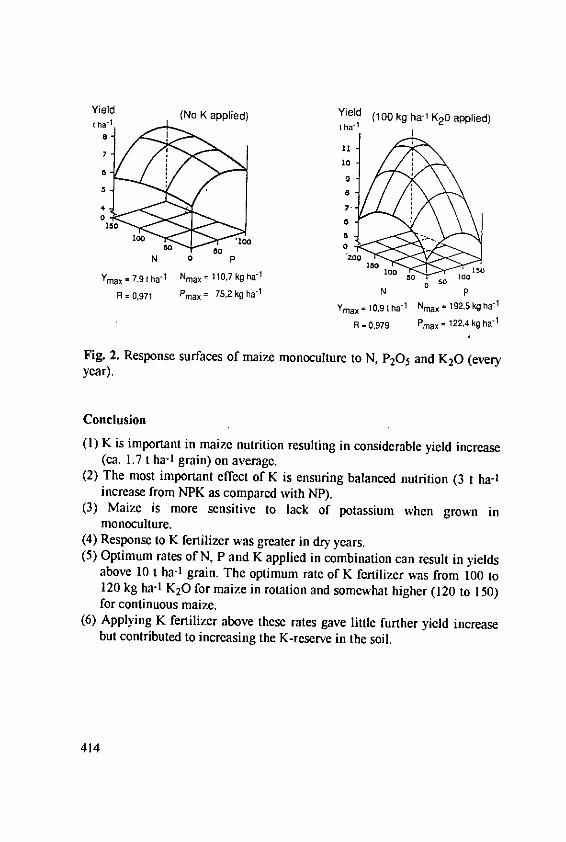
Yield (No K applied) Yield (100 kg ha-1 K20 applied)h.
1 h 2
10
9
47
IS 01W
50
0*.IN 0 P zoo
Ymax = 7,9 1 ha-1 Nmax = 110,7 kg ha
"1 1 0 0OI o
R = 0,971 Pmax = 75,2 kg ha- 1 N P
Ymax = 10,91 ha1
NMax = 192,5 kg ha-1
R = 0,979 Pmax = 122,4 kg ha-1
Fig. 2. Response surfaces of maize monoculture to N, P20 5 and K20 (everyyear).
Conclusion
(I) K is important in maize nutrition resulting in considerable yield increase(ca. 1.7 t ha-1 grain) on average.
(2) The most important effect of K is ensuring balanced nutrition (3 t ha-1increase from NPK as compared with NP).
(3) Maize is more sensitive to lack of potassium when grown inmonoculture.
(4) Response to K fertilizer was greater in dry years.(5) Optimum rates of N, P and K applied in combination can result in yields
above 10 t ha-1 grain. The optimum rate of K fertilizer was from 100 to120 kg ha-I K20 for maize in rotation and somewhat higher (120 to 150)for continuous maize.
(6) Applying K fertilizer above these rates gave little further yield increasebut contributed to increasing the K-reserve in the soil.
414
Regional K-Status of Soils in Bulgaria and K-Fertilizer Recommendations to Most ImportantCrops
Nikolova, M., N. Poushkarov Institute of Soil Science and Agroecology,Sofia, Bulgaria
Summary
Standard recommendations for K application to crops in Bulgaria are
described. Insufficient K fertilizer is imported to cover Bulgarian needs and
usage is only 42% of that recommended. A change in fertilizer policy is
called for.
Introduction
The control of soil fertility and recommendations for the efficient use of
fertilizers are the responsibility of the National Agrochemical System under
the management of the "N. Poushkarov" Institute. Soil K status
characteristics for the country are established on the basis of numerous
laboratory and pot experiments and long-term field experiments in
geographically representative areas of the country on the chief crops. Datafrom soil tests every 4 years on amble land and agricultural statistics are alsoused.
Bulgarian soils can be divided into 3 groups according to K status:
A. High-chernozems, smolnitzas, typical and leached cinnamonic forestsoils, many alluvial meadow soils;
B. Medium-dark grey forest soils, eroded and calcareous chemozems;C. Low-grey and light grey forest soils, pseudopodzolic cinnamonic
forest soils, light textured acid alluvial meadow soils.
415
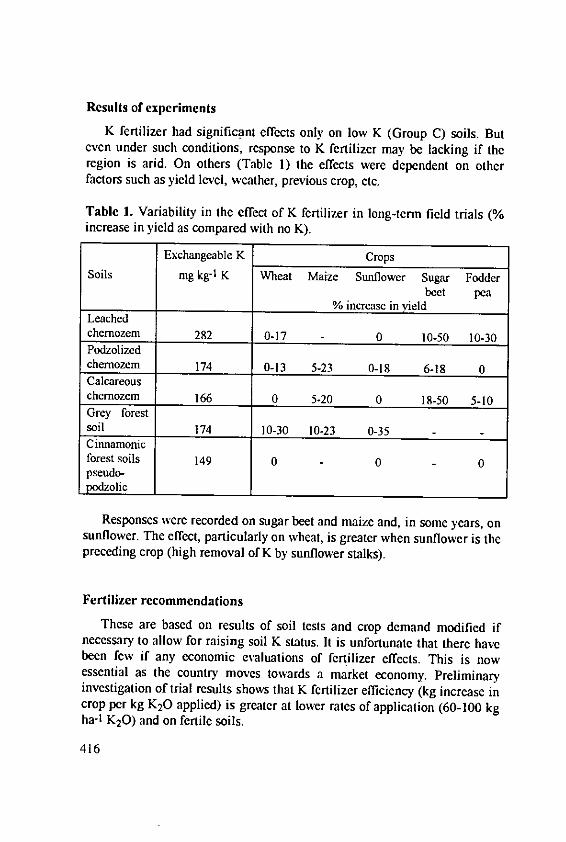
Results of experiments
K fertilizer had significant effects only on low K (Group C) soils. Buteven under such conditions, response to K fertilizer may be lacking if theregion is arid. On others (Table 1) the effects were dependent on otherfactors such as yield level, weather, previous crop, etc.
Table 1. Variability in the effect of K fertilizer in long-term field trials (%increase in yield as compared with no K).
Exchangeable K CropsSoils mg kg-1 K Wheat Maize Sunflower Sugar Fodder
beet pea% increase in yield
Leachedchemozem 282 0-17 - 0 10-50 10-30Podzolizedchemozem 174 0-13 5-23 0-18 6-18 0Calcareouschemozem 166 0 5-20 0 18-50 5-10Grey forestsoil 174 10-30 10-23 0-35 - -Cinnamonicforest soils 149 0 -0 - 0pseudo-podzolice ________
Responses were recorded on sugar beet and maize and, in some years, onsunflower. The effect, particularly on wheat, is greater when sunflower is thepreceding crop (high removal of K by sunflower stalks).
Fertilizer recommendations
These are based on results of soil tests and crop demand modified ifnecessary to allow for raising soil K status. It is unfortunate that there havebeen few if any economic evaluations of fertilizer effects. This is nowessential as the country moves towards a market economy. Preliminaryinvestigation of trial results shows that K fertilizer efficiency (kg increase incrop per kg K20 applied) is greater at lower rates of application (60-100 kgha-1 K2 0) and on fertile soils.
416
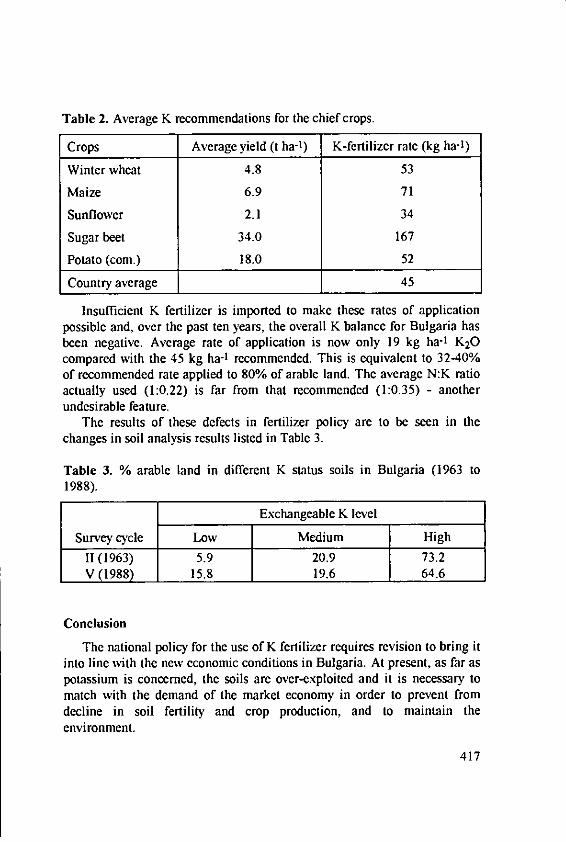
Table 2. Average K recommendations for the chief crops.
Crops Average yield (t ha-') K-fertilizer rate (kg ha-1)
Winter wheat 4.8 53
Maize 6.9 71
Sunflower 2.1 34
Sugar beet 34.0 167
Potato (com.) 18.0 52
Country average 45
Insufficient K fertilizer is imported to make these rates of applicationpossible and, over the past ten years, the overall K balance for Bulgaria hasbeen negative. Average rate of application is now only 19 kg ha-i K20compared with the 45 kg ha-1 recommended. This is equivalent to 3240%of recommended rate applied to 80% of arable land. The average N:K ratioactually used (1:0.22) is far from that recommended (1:0.35) - anotherundesirable feature.
The results of these defects in fertilizer policy are to be seen in thechanges in soil analysis results listed in Table 3.
Table 3. % arable land in different K status soils in Bulgaria (1963 to1988).
Exchangeable K level
Survey cycle Low Medium High
11(1963) 5.9 20.9 73.2V (1988) 15.8 19.6 64.6
Conclusion
The national policy for the use of K fertilizer requires revision to bring itinto line with the new economic conditions in Bulgaria. At present, as far aspotassium is concerned, the soils are over-exploited and it is necessary tomatch with the demand of the market economy in order to prevent fromdecline in soil fertility and crop production, and to maintain theenvironment.
417
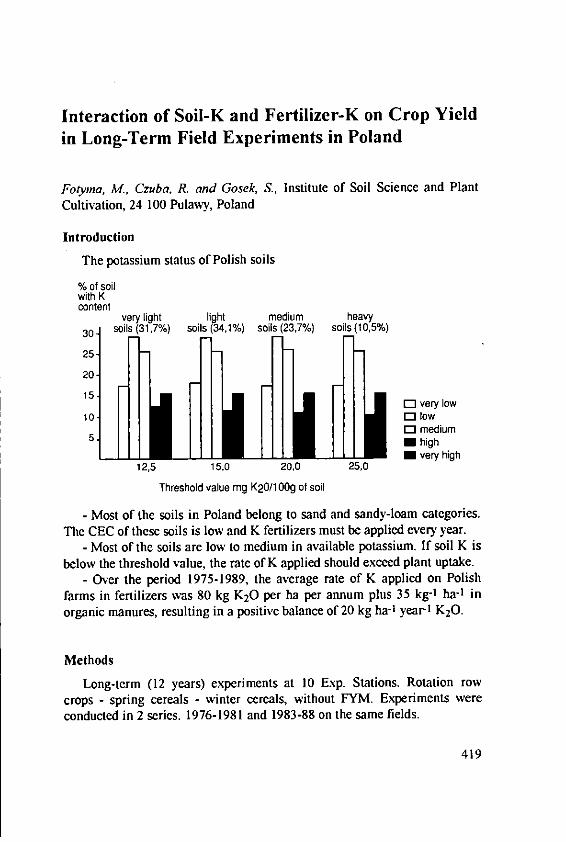
Interaction of Soil-K and Fertilizer-K on Crop Yieldin Long-Term Field Experiments in Poland
Fotyina, M., Czuba, R. and Gosek, S., Institute of Soil Science and PlantCultivation, 24 100 Pulawy, Poland
Introduction
The potassium status of Polish soils
% of soilwith Kcontent
very light light medium heavy30 soils (31,7%) soils (34,1%) soils (23,7%) soils (10,5%)
25
20
15CO very low
10 C3 low
5 E3 mediumU high* very high
12,5 15,0 20,0 25,0
Threshold value mg K20/1 Og of soil
- Most of the soils in Poland belong to sand and sandy-loam categories.The CEC of these soils is low and K fertilizers must be applied every year.
- Most of the soils are low to medium in available potassium. If soil K isbelow the threshold value, the rate of K applied should exceed plant uptake.
- Over the period 1975-1989, the average rate of K applied on Polish
farms in fertilizers was 80 kg K20 per ha per annum plus 35 kg-1 ha-1 in
organic manures, resulting in a positive balance of 20 kg ha-1 yeart K20.
Methods
Long-term (12 years) experiments at 10 Exp. Stations. Rotation rowcrops - spring cereals - winter cereals, without FYM. Experiments wereconducted in 2 series. 1976-1981 and 1983-88 on the same fields.
419
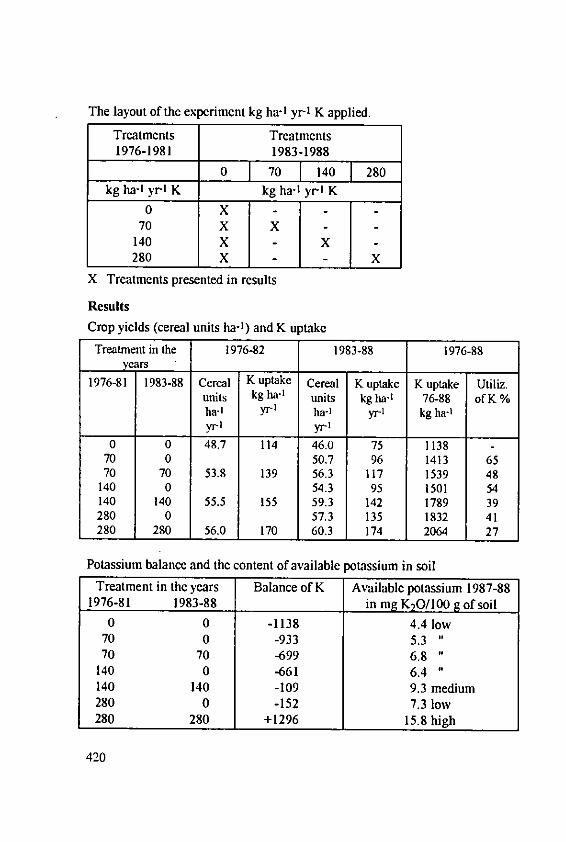
The layout of the experiment kg ha-I yr' K applied.
Treatments Treatments1976-1981 1983-1988
0 70 1140 280kg ha-I yr-I K kg ha-I yrI K
0 X70 X X140 X X280 X X
X Treatments presented in results
Results
Crop yields (cereal units ha-1) and K uptake
Treatment in the 1976-82 1983-88 1976-88years
1976-81 1983-88 Cereal K uptake Cereal K uptake K uptake Utiliz.units kg ha-I units kg ha-' 76-88 ofK %ha-I yr ha-' yr kg ha-'yr] yr'
0 0 48.7 114 46.0 75 1138 -70 0 50.7 96 1413 6570 70 53.8 139 56.3 117 1539 48
140 0 54.3 95 1501 54140 140 55.5 155 59.3 142 1789 39280 0 57.3 135 1832 41280 280 56.0 170 60.3 174 2064 27
Potassium balance and the content of available potassium in soil
Treatment in the years Balance of K Available potassium 1987-881976-81 1983-88 in mg K20/100 g of soil
0 0 -1138 4.4 low70 0 -933 5.3 "70 70 -699 6.8 "
140 0 -661 6.4 "140 140 -109 9.3 medium280 0 -152 7.3 low280 280 +1296 15.8 high
420
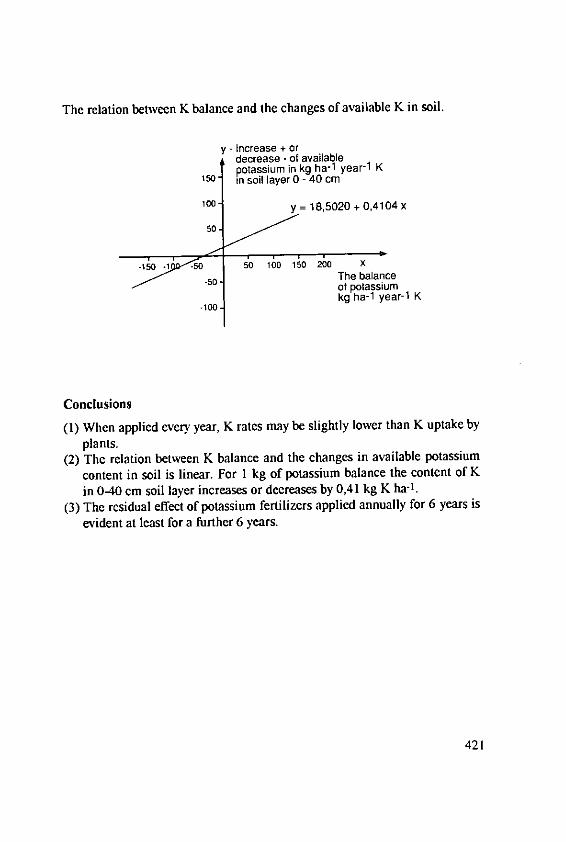
The relation between K balance and the changes of available K in soil.
y - Increase + ordecrease - of availablepotassium in kg ha-1 year-1 K
150 in soil layer 0 - 40 cm
100 y = 18,5020 + 0,4 104 x50.
50 100 150 200 xThe balanceof potassiumkg ha-1 year-1 K
Conclusions
(1) When applied every year, K rates may be slightly lower than K uptake byplants.
(2) The relation between K balance and the changes in available potassium
content in soil is linear. For 1 kg of potassium balance the content of Kin 0-40 cm soil layer increases or decreases by 0,41 kg K ha- t .
(3) The residual effect of potassium fertilizers applied annually for 6 years isevident at least for a further 6 years.
421
Hypothetical Potassium Balance Sheet for TotalArea under Principal Arable Crops in Romania1990
Bogaci, R. and Borlan, Z., Research Institute of Soil Science and
Agrochemistry, B-dul Marasti 61, Sector 1, Bucharest 71331, Romania
Introduction
Until recently, a potassium balance sheet (KBS) for Romanian
agriculture was thought to be of academic interest only because longrterm
field trials showed a lack of response to K fertilizer at the low to moderate
yields obtained, except on some limed Luvisols in submontane depressions
in the north-western parts of the country.It was thought that the soils contained sufficient available K to support
current crop yields and that therefore a temporary negative KBS would not
prejudice crop yield or soil fertility. Further, the crop price/fertilizer cost
ratio was not favourable.Agronomists and soil scientists had difficulty in establishing a KBS for
lack of adequate data on some input and output items.In spite of the difficulties (some of which are due to changes since 1989
in land ownership, planning and crop production statistics), we have
attempted to draw up for 1990 a KBS for the chief arable crops.
Data for the balance sheet
Inputs-alternatively K supplies to crops
Soil. To the unfertilized crop assumed to be up to 80% from the plough layer
(SK) and less than 20% from immediate subsoil (SSK) (not evaluated)
depending on rooting pattern, profile characteristics, texture and
compaction. These items will not appear in the balance sheet which
describes changes in K stocks in the soil.
Fertilizer. See Table 1. K in straight and compound fertilizers (KF) applied
at economically justified rates for relevant target yield and soil test data.
423
Current official guidance is that all fertilizers, including K, should beapplied at economically justified rates, ensuring maximum profit.Manures. See Table 2. Farmyard manures (FYM) from animal husbandryassumed to contain 2-16 kg t-1 K20 (Borlan et aL, 1983) depending onspecies and management.Rainfall (RW). 3-19 kg ha-! yr-l K20, the higher values applying nearindustrial centres and in the hills (VIad and Florea, 1984).Irrigation (IW). Danube water averages 3.7 mg 1-1 K20 and other rivers upto 9 mg 1-1 (Grigorcscu and Florea, 1977).Crop residues (CR) returned to the soil.Atmosphere (D). Terrestrial and cosmic dusts estimated to contribute 0.5-5kg ha- 1 yr-1.Seed. This, estimated at a total of about 10 t K20 for the whole area is notworth considering.
Outputs-alternatively K removed by crops and lossesIn crops made up of K in marketed produce (grain, tubers, etc.) (KPY) andthat in residues (straw, tops, etc.) (KSY) (Potash Export Co., Vienna, 1989).Leaching (L) in range 5-26 kg ha-I yr-1 K20 (Chisci and Spalacci, 1984).Runoff/erosion (R)Town refuse (KTR) not used on farms totalling approx. 4600 t yr-1 K 20.Humans (KHE) losses in town sewage 12800 to 38500 t yr-1 K20 for a townpopulation of 14 million.
The two last items, do not enter into the overall balance, being includedin crop removals.
The K balance sheet
for the main arable crops is then made up from:
INPUTS - OUTPUTSKF+FYM+RW+ W+D KPY+KSY+L+R
The amounts of K20 involved are given in Table 3.
424
The overall K balance as based on application of fertilizer at
recommended rates for 1990 was negative to the tune of about 20 kg ha-1
K20. In fact the deficit is greater since fertilizers are not always applied at
recommended rates and farmyard manure is not used. Even the
recommended rates would not compensate for K removed in crops.An appreciable part of the negative balance is due to failure to return
crop residues (which account for 2/3 of total crop K uptake) to the land
(straw, stems, etc. used in paper mills and as animal fodder). There is also
poor recovery from animal wastes (especially liquid) on intensive livestock
units using imported feeds. Available supplies of FYM could cover 39% of
the K output.Consumption of K fertilizers has risen from 4.3 kg ha-1 K20 in 1972
(FAO, 1988) to 27.7 kg ha-1 in 1990 but this has made only a minor
contribution to improving the K balance.
References
Borlan, Z., Rauta, C., Vintila, I.: Metode de evaluare a ingrasamintelororganice ca surse de substante nutritive. ICPA Metode, rapoarte,indrumari (1983).
Chisci, G., Spalacci, P.: Nutrient Losses by Leaching and Runoff and
Possibilities of their Control. In: Nutrient Balances and Fertilizers Needsin Temperate Agriculture. Proceedings of the 18th Colloq. of IPI, 137-156 (1984).
FAO: Fertilizer Yearbook 38, 21-22 (1988).Grigorescu, A., Florea, N.: Chimismul si calitatea apei folosita la irigare pe
teritoriul ICCPT Fundulea. Analele ICCPT Fundulea, XLII, 337-344(1977).
Potash Export Company Vienna (1989).Vlad, L., Florea, N.: Apa metcorica, sursa de saruri minerale in sol, Analele
ICPA, XLVI, 85-90 (1984).
425
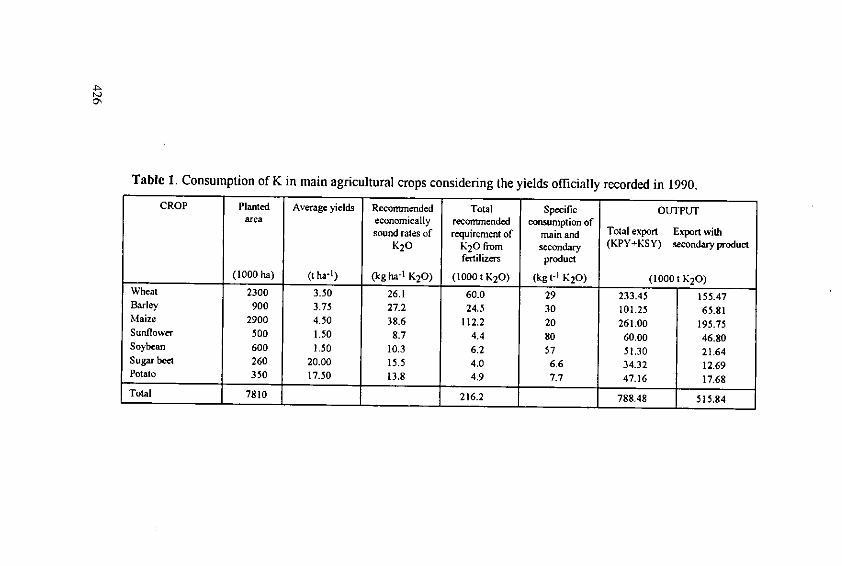
Table 1. Consumption of K in main agricultural crops considering the yields officially recorded in 1990.CROP Planted Average yields Recommended Total Specific OUTPUTarea economically recommended consumption of
sound rates of requirement of main and Total export Export withK20 K20 from secondary (KPY+KSY) secondary product
fertilizers product(1000 ha) (t ha-1) (kg ha-1 K2 0) (1000 t K2 0) (kgt-I K20) (1000 t K2 0)
Wheat 2300 3.50 26.1 60.0 29 233.45 155.47Barley 900 3.75 27.2 24.5 30 101.25 65.81Maize 2900 4.50 38.6 112.2 20 261.00 195.75Sunflower 500 1.50 8.7 4.4 80 60.00 46.80Soybean 600 1.50 10.3 6.2 57 51.30 21.64Sugar beet 260 20.00 15.5 4.0 6.6 34.32 12.69Potato 350 17.50 13.8 4.9 7.7 47.16 17.68Total 7810 216.2 788.48 515.84
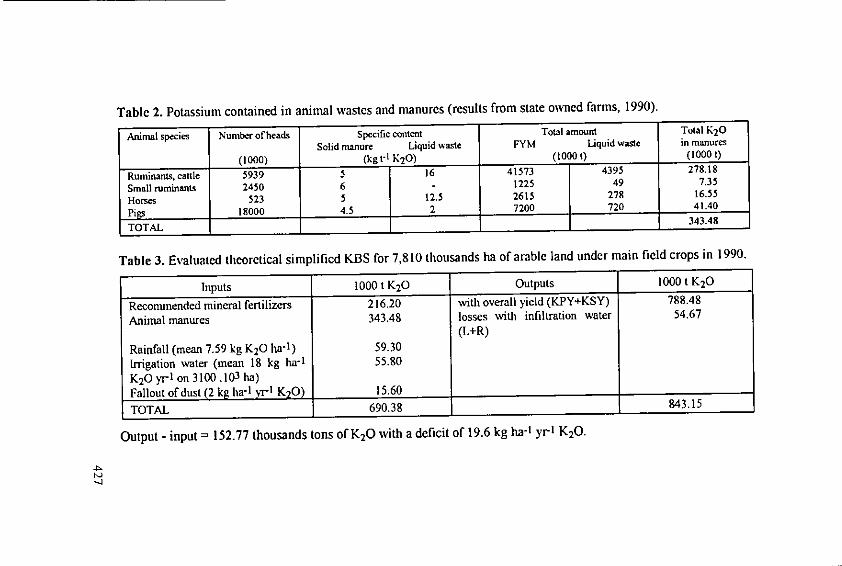
Table 2. Potassium contained in animal wastes and manures (results from state owned farms, 1990).
Animal species Number of heads Specific content Total amount Total K20Solid manure Liquid waste FYM Liquid waste in manures
(1000) (kgt' K2 0) (1000 t) (1000 t)
Ruminants, cattle 5939 5 16 41573 4395 278.18
Small ruminants 2450 6 - 1225 49 7.35
Horses 523 5 12.5 2615 278 16.55
Pigs 18000 4.5 2 7200 720 41.40
TOTAL 343.48
Table 3. Evaluated theoretical simplified KBS for 7,810 thousands ha of arable land under main field crops in 1990.
Inputs 1000 t K 20 Outputs 1000 t K 20
Recommended mineral fertilizers 216.20 with overall yield (KPY+KSY) 788.48
Animal manures 343.48 losses with infiltration water 54.67
(L+R)
Rainfall (mean 7.59 kg K 2 0 ha-1 ) 59.30
Irrigation water (mean 18 kg ha-1 55.80
K2 0 yr- I on 3100.103 ha)
Fallout of dust (2 kg ha-I vr 1 K2 0) 15.60
TOTAL 690.38 843.15
Output - input = 152.77 thousands tons of K20 with a deficit of 19.6 kg ha- yr1 K20.
N),
Potassium Balance in a Crop Rotation Experimentover 18 Years
Gorbanov, S., Matev, Y. and Tomov, T, Agricultural University, Plovdiv,
Bulgaria
Introduction
A widely held opinion (Cooke, 1984; Lamm and Nafady, 1973) suggests
that on well buffered soils it is convenient, and as efficient, to apply heavy
maintenance K dressings at intervals rather than the equivalent in small
dressings to all the crops of a rotation. This opinion has been tested in the
experiment described here. An earlier report (Stanchev et at., 1976) dealt
with P and K reserve fertilization.
Experimental results
The chief results from a long-term experiment on a slightly saline
meadow soil (pH 7.2, organic matter 3.1%, total K 2.4%) are given in
Tables 1 and 2, which also show the K fertilizer treatments applied. The
object was to study the effect of 600 kg ha-I K20 per 6-year rotation applied
either crop specifically to the 6 crops or all to the maize against a control
treatment receiving no K. 3 additional treatments with 600 kg ha-i K20 alsoreceived FYM, wheat straw or pea haulm. Nitrogen and phosphate was
applied uniformly at 600 kg ha-I N and 400 kg ha-1 P20 5 per 6 years. Three
cycles were completed (18 years).The pattern of response to treatments (Table 1) was essentially similar as
between the 1st, 2nd and 3rd rotations, hence the mean yields over the 3
rotations only are given. However it may be noted that maize yielded much
higher in the third rotation (8.4 t ha-1 vs 5.0 on control; 11.0 vs 8.7 on K-
treated) due to change to selected Bulgarian and imported types. All crops
reacted strongly to K fertilizer. The response was less when all the K was
applied to maize except for maize in the 2nd cycle when there was a
difference of 0.4 t/ha in favour of all to maize. Except in the 1st cycle when
treatment 4 on maize outyielded treatment 3 (by 0.5 t ha-1) there was no
429
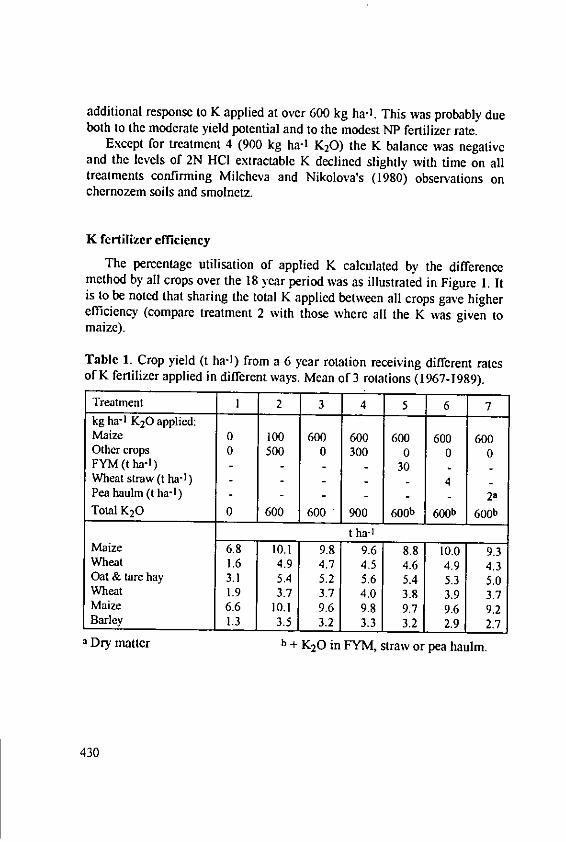
additional response to K applied at over 600 kg ha-1. This was probably dueboth to the moderate yield potential and to the modest NP fertilizer rate.
Except for treatment 4 (900 kg ha-1 K20) the K balance was negativeand the levels of 2N HCI extractable K declined slightly with time on alltreatments confirming Milcheva and Nikolova's (1980) observations onchernozem soils and smolnetz.
K fertilizer efficiency
The percentage utilisation of applied K calculated by the differencemethod by all crops over the 18 year period was as illustrated in Figure 1. Itis to be noted that sharing the total K applied between all crops gave higherefficiency (compare treatment 2 with those where all the K was given tomaize).
Table 1. Crop yield (t ha-') from a 6 year rotation receiving different ratesof K fertilizer applied in different ways. Mean of 3 rotations (1967-1989).
Treatment 1 2 3 4 5 6 7kg ha- 1 K20 applied:Maize 0 100 600 600 600 600 600Other crops 0 500 0 300 0 0 0FYM (t ha-l) - - - - 30Wheat straw (t ha -1) - - 4Pea haulm (t ha-1) - - - - - 2aTotal K20 0 600 600 900 600b 600b 600b
t ha-1
Maize 6.8 10.1 9.8 9.6 8.8 10.0 9.3Wheat 1.6 4.9 4.7 4.5 4.6 4.9 4.3Oat & tare hay 3.1 5.4 5.2 5.6 5.4 5.3 5.0Wheat 1.9 3.7 3.7 4.0 3.8 3.9 3.7Maize 6.6 10.1 9.6 9.8 9.7 9.6 9.2Barley 1.3 3.5 3.2 3.3 3.2 2.9 2.7
a Dry matter b + K20 in FYM, straw or pea haulm.
430
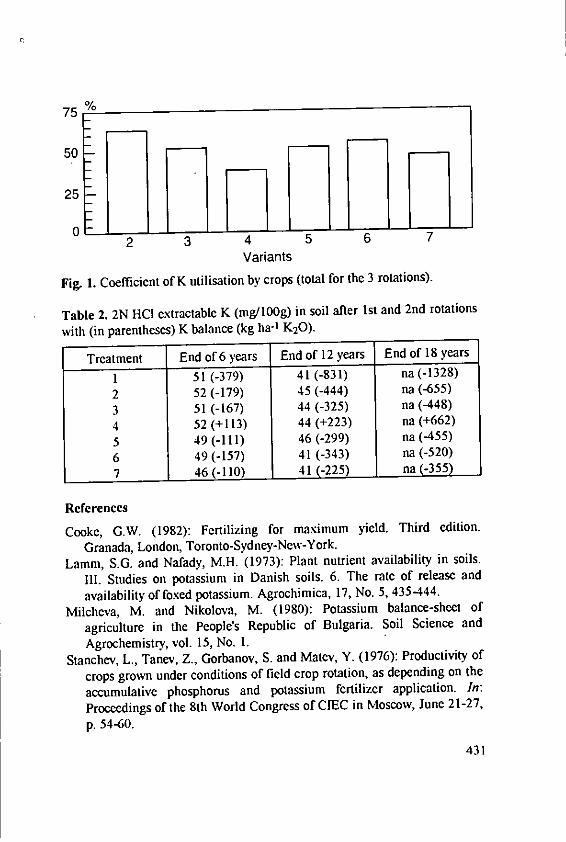
75 %
50
25
OF --2 3 4 5 6 7
Variants
Fig. 1. Coefficient of K utilisation by crops (total for the 3 rotations).
Table 2. 2N HCI extractable K (mg/100g) in soil after 1st and 2nd rotations
with (in parentheses) K balance (kg ha-1 K20).
Treatment End of 6 years End of 12 years End of 18 years
1 51 (-379) 41 (-831) na (-132 8)
2 52 (-179) 45 (-444) na (-655)
3 51 (-167) 44 (-325) na (448)
4 52 (+113) 44 (+223) na (+662)
5 49 (-111) 46 (-299) na (455)
6 49 (-157) 41 (-343) na (-520)
7 46 (-110) 41 (-225) na (-355)
References
Cooke, G.W. (1982): Fertilizing for maximum yield. Third edition.
Granada, London, Toronto-Sydney-New-York.Lamm, S.G. and Nafady, M.H. (1973): Plant nutrient availability in soils.
III. Studies on potassium in Danish soils. 6. The rate of release and
availability of foxed potassium. Agrochimica, 17, No. 5, 435-444.
Milcheva, M. and Nikolova, M. (1980): Potassium balance-sheet of
agriculture in the People's Republic of Bulgaria. Soil Science and
Agrochemistry, vol. 15, No. 1.Stanchev, L., Tanev, Z., Gorbanov, S. and Matev, Y. (1976): Productivity of
crops grown under conditions of field crop rotation, as depending on the
accumulative phosphorus and potassium fertilizer application. In:
Proceedings of the 8th World Congress of CIEC in Moscow, June 21-27,
p. 54-60.
431

Towards Unity and Clarity in European Soil Testing
van Diest, A., Horakova, H. and Houba, V.J.G., Agricultural University,Department of Soil Science and Plant Nutrition, Dreyenplein 10, 6703 HBWageningen, The Netherlands
Introduction
In the Netherlands, estimates of plant-available K are traditionallyobtained by extracting soils with 0.1 M HC1. Extensive fieldexperimentation with various crops made it clear, however, that a unitquantity of HCI-extractable K is worth less in terms of plant-available K, thehigher the CEC of the soil is. Consequently, the clay contents and/or theorganic matter contents of heavy-textured soils and sandy soils are takeninto account for correcting HCl-extractable K into plant-available K.Presently, efforts are made to simplify Dutch soil-testing procedures. A0.01M CaC12 solution is tested for use as a universal extracting agent,encompassing all nutrients. In Czechoslovakia, the Mehlich extractingsolution is used as universal extracting agent.
Experimental
Recently, H. Horakova (Dept. of Agrochemistry and Plant Nutrition,Prague Agric. Univ.) determined extractable K in Czechoslovakian soilsfrom three experimental sites with:
a. the Mehlich extraction procedureb. 0.01 M CaC 2 as extracting agent
(work conducted at the Dept. of Soil Science and Plant Nutrition, Agric.Univ. Wageningen, The Netherlands).
Some results are shown in Fig. 1, in which the relative yields of maizeare plotted against Mehlich method-extractable soil K. There appears to be arelation for the Caslav and Viglas soils, but not for the relatively heavy-textured Pohorelice soil.
433
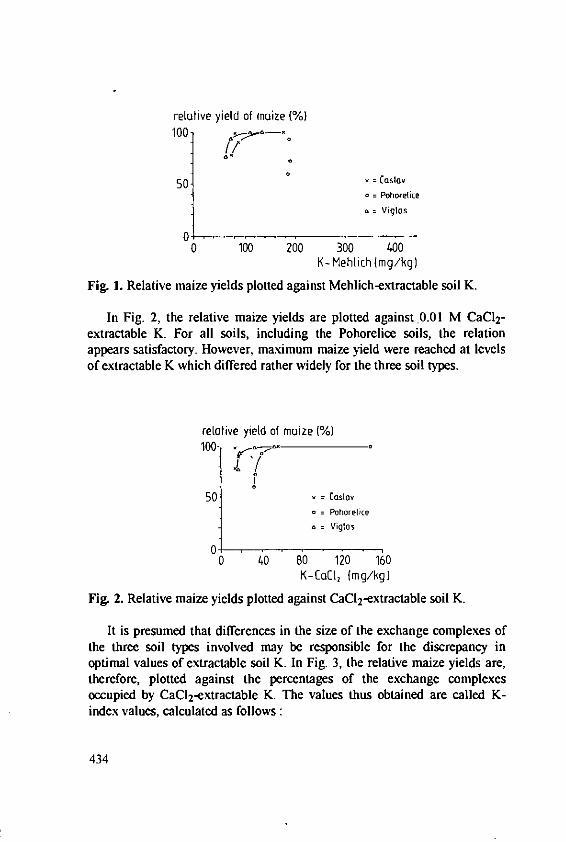
relative yield of maize (%)100
50 = Caslov= Pohorelice
= Viglos
00 100 200 300 400
K- Mehlich (mg/kg)
Fig. 1. Relative maize yields plotted against Mehlich-extractable soil K.
In Fig. 2, the relative maize yields are plotted against .0.01 M CaC 2-extractable K. For all soils, including the Pohorelice soils, the relationappears satisfactory. However, maximum maize yield were reached at levelsof extractable K which differed rather widely for the three soil types.
relative yield of maize (%)100 cA~2
50- = COSIGa= Pohorelice
= Vigtas
S0 40 80 120 160K-CoCt, (mg/kg)
Fig. 2. Relative maize yields plotted against CaCI 2 -extractable soil K.
It is presumed that differences in the size of the exchange complexes ofthe three soil types involved may be responsible for the discrepancy inoptimal values of extractable soil K. In Fig. 3, the relative maize yields are,therefore, plotted against the percentages of the exchange complexesoccupied by CaCI2 -extractable K. The values thus obtained are called K-index values, calculated as follows:
434
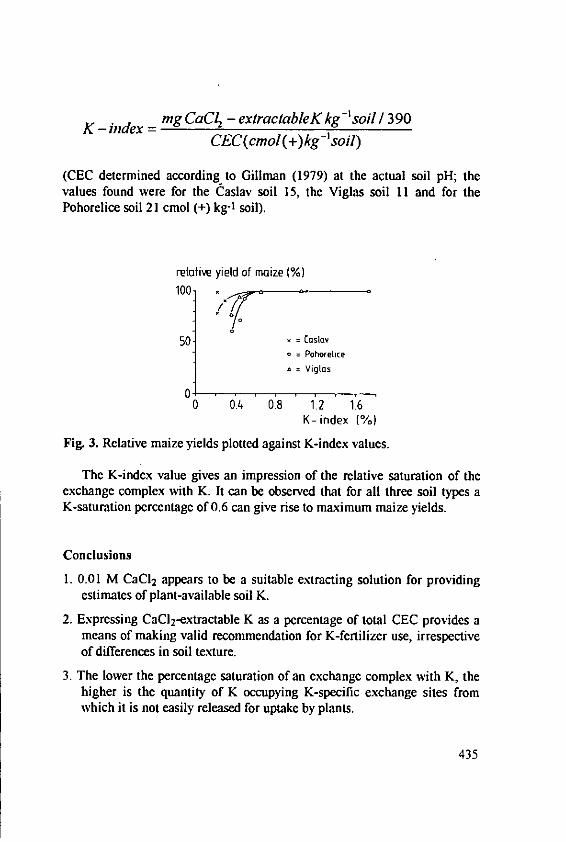
K - index = mg CaC - extractableK kg - soil / 390CEC(cmol(+)kg-'soil)
(CEC determined according to Gillman (1979) at the actual soil pH; thevalues found were for the Caslav soil 15, the Viglas soil 11 and for thePohorelice soil 21 cmol (+) kg-1 soil).
relative yield of maize (%)100
50 - osto,* = Pohorelice
= Viglos
00 0.4 0.8 1'2 1'6
K- index (O)
Fig. 3. Relative maize yields plotted against K-index values.
The K-index value gives an impression of the relative saturation of theexchange complex with K. It can be observed that for all three soil types aK-saturation percentage of 0.6 can give rise to maximum maize yields.
Conclusions
1. 0.01 M CaCI2 appears to be a suitable extracting solution for providingestimates of plant-available soil K.
2. Expressing CaCl 2-extractable K as a percentage of total CEC provides ameans of making valid recommendation for K-fertilizer use, irrespectiveof differences in soil texture.
3. The lower the percentage saturation of an exchange complex with K, thehigher is the quantity of K occupying K-specific exchange sites fromwhich it is not easily released for uptake by plants.
435

2. Ecological Aspects of Potassium Use
437
Effects of K and Mg Fertilizers in Forests on SoilsPreviously Used for Agriculture
Uebel, E. *, Agric. Extension Service, MdK, Erfurt, Germany and Chrzon, S.,Research Institution of Forestry, Eberswalde, Germany
IntroductionExtensive farming leads to increased K and Mg deficiency in the
northeastern German Lowlands. Various effects of K and Mg fertilizinghave been tested.
Material and methods
Fertilizer experiments have been carried out in the northeastern GermanLowlands for many years in forests on acid sandy soils of low exchangecapacity and low in organic matter, developed on glacial sand. These soilshave been degraded by extensive farming and the water-table is higher thanaverage.
Results
Seedling and thicket stage (pine and other trees)
K-Mg fertilizer applied as easily soluble neutral salt in simple doses of 60-120 kg ha-1 K20 and 40-80 kg ha-1 MgO leads to:
- rapid improvement in nutritional conditions,- improved tree survival,- improved tree growth (Figure 1),- more intensive rooting (Figure 2),- better development of mycorrhiza,- less pest infestation,- improved frost and drought resistance.
) Member of the "Society for promotion of ecologically controlled fertilizerapplication" (VFD), Erfurt, Germany.
439
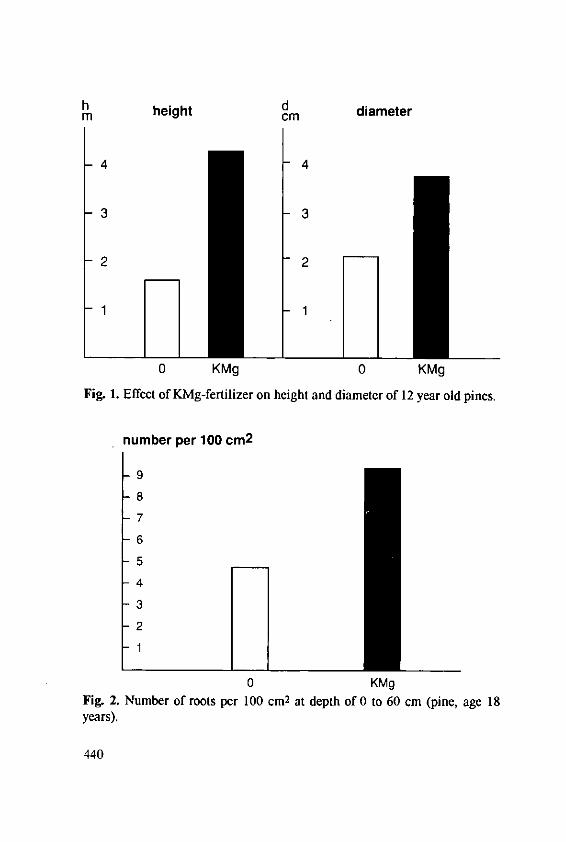
h height d
m cm diameter
4 4
3 3
2 2
0 KMg 0 KMg
Fig. 1. Effect of KMg-fertilizer on height and diameter of 12 year old pines.
number per 100 cm 2
9
8
7
6
5
4
3
21
0 KMgFig. 2. Number of roots per 100 cm2 at depth of 0 to 60 cm (pine, age 18years).
440
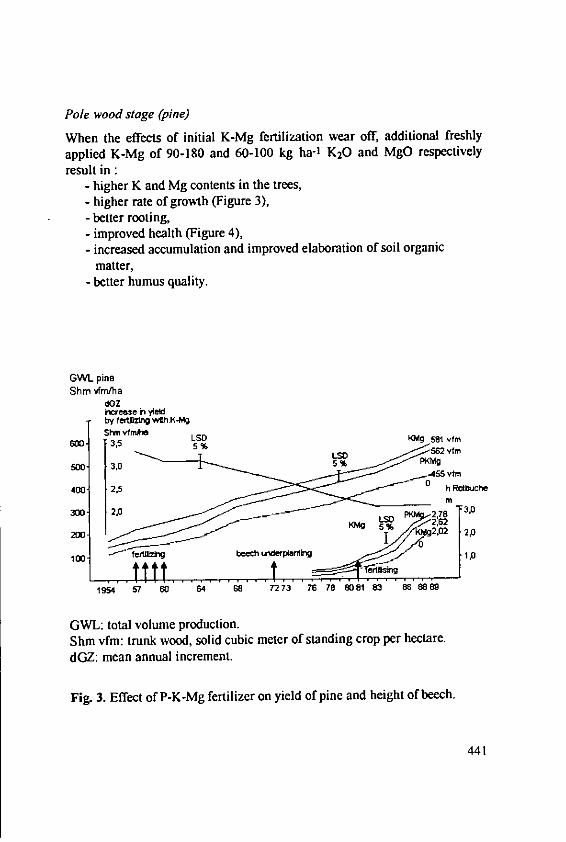
Pole wood stage (pine)
When the effects of initial K-Mg fertilization wear off, additional freshlyapplied K-Mg of 90-180 and 60-100 kg ha-1 K20 and MgO respectivelyresult in :
- higher K and Mg contents in the trees,- higher rate of growth (Figure 3),- better rooting,- improved health (Figure 4),- increased accumulation and improved elaboration of soil organic
matter,- better humus quality.
GVL pineShin vfniha
dOZincreese I yieldby fetlhK wth-Mgs"hn vftmLS9
600- , LLSDd 562 vfm
400- 2,5 0 h Rdbuche
300" 2,0 In T3 0
tel't~llg beech under antfV 1..01 . Tlt .... rifsn1954 57 60 64 68 7273 76 78 8081 83 86 89
GWL: total volume production.Shin vfm: trunk wood, solid cubic meter of standing crop per hectare.
dGZ: mean annual increment.
Fig. 3. Effect of P-K-Mg fertilizer on yield of pine and height of beech.
441
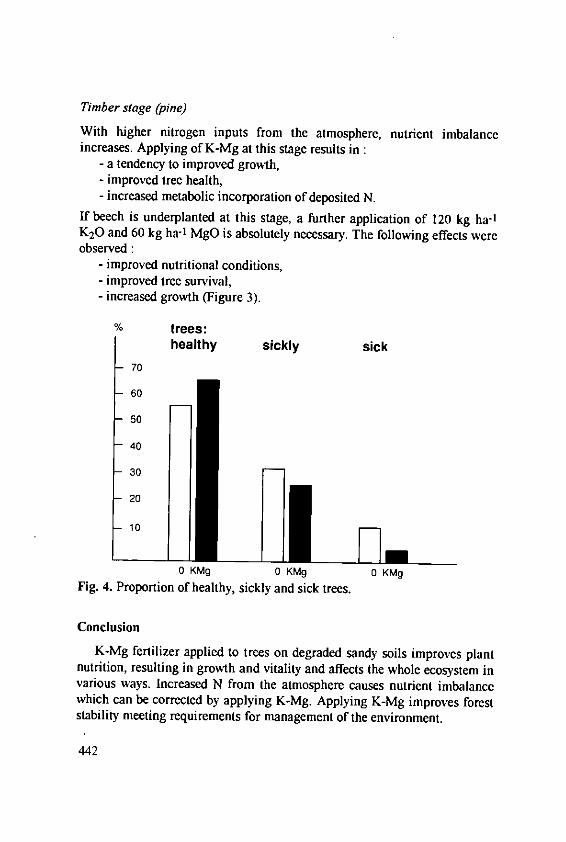
Timber stage (pine)
With higher nitrogen inputs from the atmosphere, nutrient imbalanceincreases. Applying of K-Mg at this stage results in:
- a tendency to improved growth,- improved tree health,- increased metabolic incorporation of deposited N.
If beech is underplanted at this stage, a further application of 120 kg ha-1
K20 and 60 kg ha-1 MgO is absolutely necessary. The following effects wereobserved :
- improved nutritional conditions,- improved tree survival,- increased growth (Figure 3).
% trees:healthy sickly sick
70
60
50
40
-30
20
- 10 D0 KMg 0 KMg 0 KMg
Fig. 4. Proportion of healthy, sickly and sick trees.
Conclusion
K-Mg fertilizer applied to trees on degraded sandy soils improves plantnutrition, resulting in growth and vitality and affects the whole ecosystem invarious ways. Increased N from the atmosphere causes nutrient imbalancewhich can be corrected by applying K-Mg. Applying K-Mg improves foreststability meeting requirements for management of the environment.
442
Non-Traditional Use of Potash Salts
Papulov, L., Uralkali, Berezniki, Russia
Summary
Unique properties of potash salts are used in various branches of national
economy. Production Association "Uralkali" carries on researches in
directions :" non-medical treatment of patients with non-specific chronic lung
diseases and some allergic diseases." organisation of effective storing of perishables." spelcoagroindustrial production of ecologically pure food-stuffs.
Underground spelcohospital
Since 1977, Underground speleohospital operates in Berezniki Mine 1.
Table 1. Number of patients treated.
Years 1980-84 1985-90 1991 1992
Number 1763 2335 402 208
Table 2. Indices of the effectiveness of treatment.
Disease % of recovery
Bronchial asthmaSlight severity 78Medium severity 57.6Asthmatic bronchitis 86.9
Surface spelcohospital
In 1992, surface speleohospital for children was put into operation.
443
Table 3. Characteristics of air in speleohospital (8 hour period).
Light aero-ions 800-1200 e/m 3
Micro-organisms, not more than 550-800 e/m 3
Volume activity of DPR Rn 0.025 x 10¹⁰ meq/m 3
Content of anthropotoxins 0.01 vol %
Vegetable store-house
To decrease the losses of agricultural products when storing potash spray isused.
Table 4, Indices of storing of potato in surface store (amount of potatodiseases).
Variant Disease %
Dry rot Wet rot Phytoptora Total RelativeI to contr.
Standardstorage 6.2 5.1 1.8 13.1 100Potash spray 5.6 0.7 0.9 7.2 54.9
Table 5. Indices of crop capacity of potato after its storing with potashspray.
Variant Number of Number Lenght stems Yieldblooming of stems cm t ha-1
plants
Standard storage 24.0 3.1 54.8 26.1Potash spray 33.6 4.2 57.2 29.37
Salt spray decreases the vital activity of micro-organisms, creates betterconditions for safe keeping of'juicy products.
444
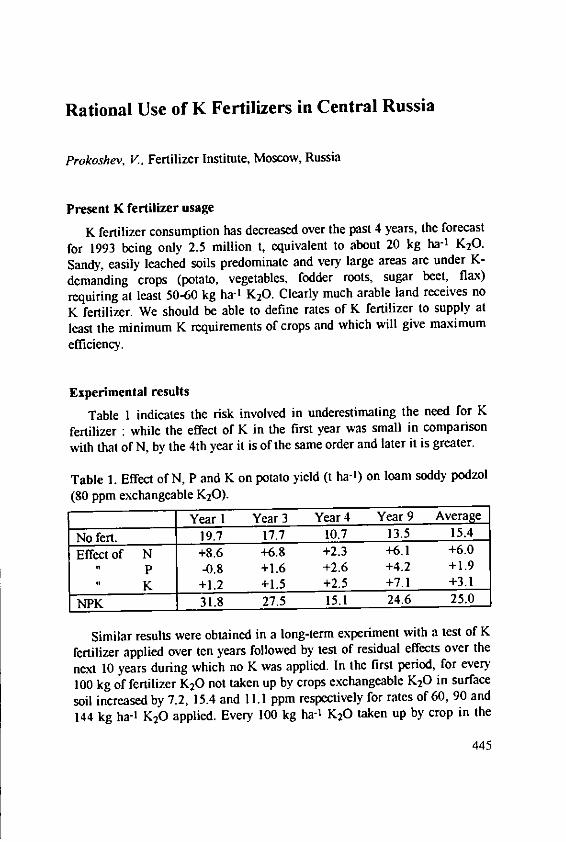
Rational Use of K Fertilizers in Central Russia
Prokoshev, V., Fertilizer Institute, Moscow, Russia
Present K fertilizer usage
K fertilizer consumption has decreased over the past 4 years, the forecast
for 1993 being only 2.5 million t, equivalent to about 20 kg ha-1 K20.
Sandy, easily leached soils predominate and very large areas are under K-
demanding crops (potato, vegetables, fodder roots, sugar beet, flax)
requiring at least 50-60 kg ha-1 K20. Clearly much arabic land receives no
K fertilizer. We should be able to define rates of K fertilizer to supply at
least the minimum K requirements of crops and which will give maximum
efficiency.
Experimental results
Table 1 indicates the risk involved in underestimating the need for K
fertilizer : while the effect of K in the first year was small in comparison
with that of N, by the 4th year it is of the same order and later it is greater.
Table 1. Effect of N, P and K on potato yield (t ha-1) on loam soddy podzol
(80 ppm exchangeable K20).
Year 1 Year 3 Year 4 Year 9 Average
No fert. 19.7 17.7 10.7 13.5 15.4
Effect of N +8.6 +6.8 +2.3 +6.1 +6.0
P -0.8 +1.6 +2.6 +4.2 +1.9
K +1.2 +1.5 +2.5 +7.1 +3.1
NPK 31.8 27.5 15.1 24.6 25.0
Similar results were obtained in a long-term experiment with a test of K
fertilizer applied over ten years followed by test of residual effects over the
next 10 years during which no K was applied. In the first period, for every
100 kg of fertilizer K20 not taken up by crops exchangeable K20 in surface
soil increased by 7.2, 15.4 and 11.1 ppm respectively for rates of 60, 90 and
144 kg ha-1 K20 applied. Every 100 kg ha-1 K20 taken up by crop in the
445

2nd (residual test) phase decreased exchangeable K20 by 23.5, 40.9 and35.0 ppm. Thus depletion in K20 had a greater effect than accretion.
In another experiment the returns from N fertilizer were on soils ofdifferent K status as shown in Table 2.
Table 2. Relative yield (69 ppm exch. K20 = 100) of total crop fresh matterper unit N applied.
69 pm exch.KO0 180 pm exch.KO(2
Maize 100 130Potato 100 app. 200Oats 100 134
Recommendations
Clearly in order to sustain productivity it is necessary to maintain soil Kat an adequate level to ensure efficiency of the other nutrients.Other benefits of so doing include :
1. Improved efficiency of liming on acid soils;2. Improved tolerance of pest and disease with economy in agrochemicals;3. Improved drought resistance (errors in irrigation) and toleration of
inappropriate sowing date;4. Decreased uptake of heavy metals. Recent work showed that uptake of
137Cs was decreased by a heavy dressing of K fertilizer (180-200 kg ha-1K20) by 2.5 - 7,3 - 10 and 3 - 4.5 times in arable crops, grass and woodyplants respectively.
However, some long-term trials have shown that on soils well suppliedwith K, yields may be sustained for quite a time although the K balance maybe negative. Present economic circumstances in Russia suggest that thereshould be economy in K fertilizer usage. We have therefore tried to assess towhat extent usual K fertilizer recommendations might be reduced withoutprejudicing crop performance. The permissible reduction depends on targetyield, soil K content, K saturation and clay content. Our suggestions forpermissible reduction in K application below crop K removal are listed inTable 3.
446
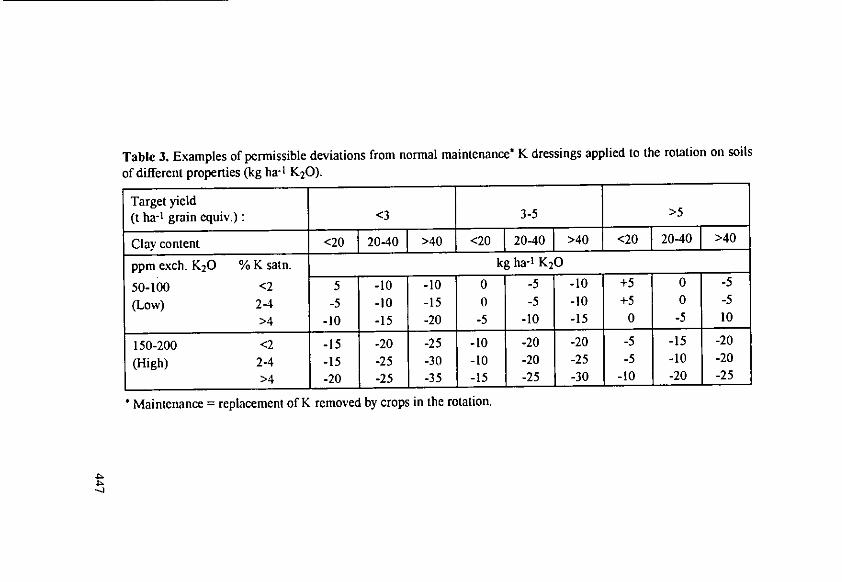
Table 3. Examples of permissible deviations from normal maintenance* K dressings applied to the rotation on soils
of different properties (kg ha-I K20).
Target yield(t ha-I grain equiv.) <3 3-5 >5
Clay content <20720-40 >40 <20 1 20-40 >40 <20 2040 >40
ppm exch. K20 % K satn. kg ha-1 K20
50-100 <2 5 -10 -10 0 -5 -10 +5 0 -5
(Low) 2-4 -5 -10 -15 0 -5 -10 +5 0 -5>4 -10 -15 -20 -5 -10 -15 0 -5 10
150-200 <2 -15 -20 -25 -10 -20 -20 -5 -15 -20
(High) 2-4 -15 -25 -30 -10 -20 -25 -5 -10 -20
>4 -20 -25 -35 -15 -25 -30 -10 -20 -25
* Maintenance = replacement of K removed by crops in the rotation.
K Balance and K Fertilization in ExtensiveGrassland Utilisation on Peat Soils
Kdding, H., Schalitz, G. and Behrendt,'A., Institute for Grassland andPeatland Ecology, 0-1551 Paulinenauc, Germany
Introduction
Peatlands in Germany are often managed extensively. In order to avoidover- or under-supply with potassium, account must be taken of the specialproperties of these soils (high organic matter content, poor adsorption ofcations, etc.) in considering the K balance and K fertilizer requirement.
The data
The peaty layer on the experimental area was 0.8 m thick and the watertable in the growing season was at a depth of from 50 to 80 cm. Summer(April to September) rainfall was 318 mm. A long-term (30 year)experiment investigated the effect of a uniform dressing of 126 kg ha-t K(152 kg K20) on K content of herbage and soil (Kreil, Kding and Leipnitz,1992). Other short term experiments (3-5 years) using varying rates of Kfertilizer were also taken into account. Leaching of K was studied inlysimeters (Mundel, 1990) and field experiments.
Results
K balance
Results from several experiments were used to set up the K balance. Highrates of K fertilizer raised herbage and soil K contents while high rates of Nfertilizer reduced them due to the increased biomass production andconsequent increased nutrient uptake. Figure 1 shows the additions andremovals of K in herbage and estimated leaching losses for a cut sward (3cuts per year). At a constant rate of K fertilizer K removal declined as therate of N fertilizer was reduced and K leaching increased from 5 to 20 kgha-1 K. At a yield of 7.5 t ha-1 dry matter about 165 kg ha- 1 K as fertilizer isrequired to replace removals.
449
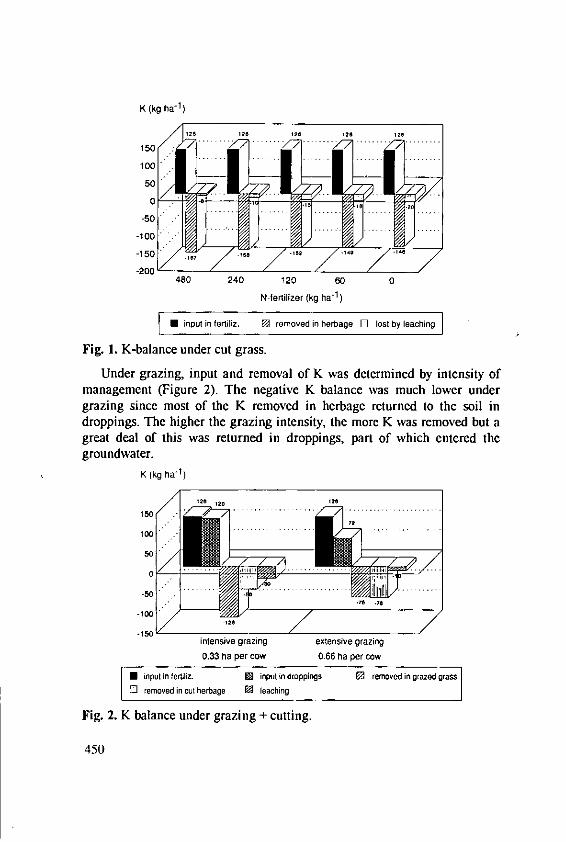
K (kg ha-1)
150
-100 ......... ...
480 240 120 60 0
N fertilizer (kg ha1 )
U input in feriliz. [ removed in herbage El lost by leaching]
Fig. 1. K-balance under cut grass.
Under grazing, input and removal of K was determined by intensity ofmanagement (Figure 2). The negative K balance was much lower undergrazing since most of the K removed in herbage returned to the soil indroppings. The higher the grazing intensity, the more K was removed but agreat deal of this was returned in droppings, part of which entered thegroundwater.
K (kg ha-1)
150Z1
100so50
.:00 12-128
-150intensive grazing extensive grazing0.33 ha per cow 0.66 ha per cow
* input in fortiliz. 1U input in droppings 0 removed ingrazedgrassl removed in cut herbage 0 leaching
Fig. 2. K balance under grazing + cutting.
450
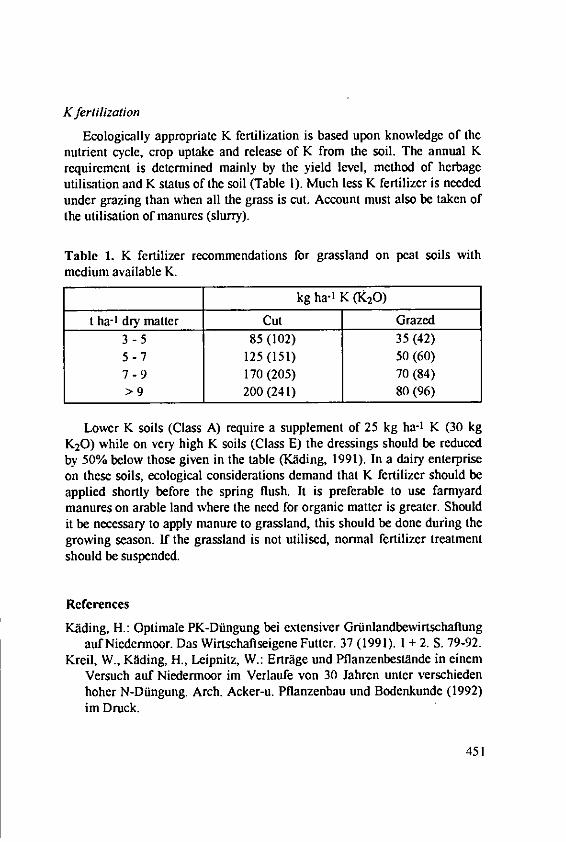
K fertilization
Ecologically appropriate K fertilization is based upon knowledge of thenutrient cycle, crop uptake and release of K from the soil. The annual Krequirement is determined mainly by the yield level, method of herbageutilisation and K status of the soil (Table 1). Much less K fertilizer is neededunder grazing than when all the grass is cut. Account must also be taken ofthe utilisation of manures (slurry).
Table 1. K fertilizer recommendations for grassland on peat soils with
medium available K.
kg ha-I K (K20)
t ha-1 dry matter Cut Grazed3 -5 85(102) 35(42)5-7 125(151) 50(60)7-9 170(205) 70(84)> 9 200(241) 80(96)
Lower K soils (Class A) require a supplement of 25 kg ha-1 K (30 kgK20) while on very high K soils (Class E) the dressings should be reducedby 50% below those given in the table (KAding, 1991). In a dairy enterpriseon these soils, ecological considerations demand that K fertilizer should beapplied shortly before the spring flush. It is preferable to use farmyardmanures on arable land where the need for organic matter is greater. Shouldit be necessary to apply manure to grassland, this should be done during thegrowing season. If the grassland is not utilised, normal fertilizer treatmentshould be suspended.
References
Kding, H.: Optimale PK-Dfingung bei extensiver GriinlandbewirtschaftungaufNiedermoor. Das Wirtschaftseigene Futter. 37 (1991). 1 + 2. S. 79-92.
Kreil, W., Kfiding, H., Leipnitz, W.: Ertrage und Pflanzenbestnde in cinemVersuch auf Niedermoor im Verlaufe von 30 Jahren unter verschiedenhoher N-Diingung. Arch. Acker-u. Pflanzenbau und Bodenkunde (1992)im Druck.
451

Mundel, G.: Kaliumvorrat und Kaliumhaushalt intensiv genutzterNiedernoorb6den - Lysimeterergebnisse. Arch. Acker-u. Pflanzenbauund Bodenkunde. Berlin 34, 9 (1990). S. 599-607.
452
Coordinator's Report on Poster Session
Beringer, H., Huensche Burg 10, 3520 Hofgeismar, Germany
The posters presented at this colloquium can be viewed from variousangles :
- an ecological point of view where we ask "what are the functions andthe needs for potassium and its inorganic salts in agriculture, horticulture,forestry and medicine ?"
- a planning aspect, where the problem prevails "what is the K-fertilizerbalance at the field-, farm-, regional or national level, how can this balancebe improved by better fertilizer distribution, by modifying the croppingsystem, by producing/importing more fertilizer 7"
- a scientific approach, where the main question is how the reserve ofplant-available K in soils and the needs for K-fertilizer can best bedetermined, which improvements in methodology do exist ?
Whatever approach is chosen a quotation from Justus von Liebig (1855)should be the general guideline to all concerned about the ecosystem, to thefarmer and his advisor as well as to the ecologist and policy-maker inenvironmental issues.
"Recycle to the soil exactly the nutrients which you have taken from it,neither more nor less. But if the land should become more fertile thequestion is different."
To make this clear and to reemphasize the need for unity and clarity inour scientific terminology some principles must be recalled:
- Plant roots absorb their nutrients from the soil solution. As far aspotassium is concerned clay minerals and organic colloids release potassiumions rather easily from their surface charges (exchangeable potassium), butless easily or hardly at all from their interlattice positions (non-exchangeablepotassium).
- If plants are to produce maximum yield they need a certain potassiumconcentration in the soil solution. Should they have to rely only on theadmittedly large, but only slowly available potassium reserves, growth wouldbe limited by an insufficient rate of potassium release.
- In achieving the required flux of K+ ions towards the root theinterrelationship between the quantity of available potassium and soil
453
moisture has to be borne in mind. Good growth can be achieved either byoptimising soil moisture at a relatively low K concentration in the soilsolution or when moisture is lacking by establishing higher levels ofavailable potassium i.e. higher concentration gradients through fertilizers.Threshold levels of potassium availability can thus be defined only by takinginto account clay content and the moisture regime in the rooted soil profile.
The easiest approach to an evaluation of the needs for K-fertilizers froma planning point of view is the calculation of K-balance sheets in the senseof Liebig's quotation above. Though simple and quick, such balance sheetshave the disadvantage of generalizing where more differentiation would beappropriate as to the exactness of the various input/output parameters aswell as to the status of soil in available nutrients on which the balance isestablished.
National and international nutrient balances are generally calculated byreferring to statistical yearbooks giving crop area and crop yield and byassuming an average quantity of nutrient required to produce a unit ofbiomass. In doing so, Bogaci and Borlan, Nikolova and Vostal havecalculated negative K-balances for Romania, Bulgaria and Czechoslovakiarespectively, while others have presented data from long-term fertilizerexperiments under different ecological and agronomic conditions (Fotymaand Czuba, Gorbanov et al., Kiding et al., Prokoshev and Sarvari).Although these balances may have been positive in previous decades thusimproving the status of K-availability, the present economic problems,especially in countries moving from centrally-planned state-farms to market-oriented private farm enterprises compel the farmers to set strong prioritiesin spending their limited financial resources. It is, therefore, understandablewhen Prokoshev tried to find the minimum level of available K down towhich soils could be exhausted and to find as well the least required quantityof K-fertilizer. Though thanks to the buffering capacity of soils for P and Kthe application of P- and K- fertilizers can be suspended for some years,regular soil tests and yield records are essential to detect the time when cropgrowth will become limited by insufficient K supply. Ecologically, however,the quotation of Liebig cited above should at least be borne in mind and evenbe stressed where soil fertility and food production have to be raised whichin most countries is still the major moral objective in crop production.
Consequently sbil chemists worldwide try to define the quantity and rateof K-availability required for high yields of the various crops growing in a
454
range of soils differing in pedogenesis and texture. Although each soil orlocation has its individuality groupings and generalisations are necessary.
The influence of clay content and type of clay mineral on K-availabilityhas been reemphasized by Schneider and Villemin. In soils with <2%organic matter clay minerals more or less represent the cation exchangecapacity, of which in humid, temperate regions approximately 24% shouldbe saturated with K+ ions in order to achieve K-concentrations in the soilsolution between 0.05 and 0.5 mM K required for high-yielding crops. Thisdegree of K-saturation can be lower when - as van Diest et al. have shown -instead of 1 M NH4-acetate only 0.01 M CaC12 is used as an extractant withthe advantage that also available nitrogen can be analysed in the soil extract.
The higher the clay content and the proportion of 2:1 clay minerals inthe soil the stronger is, on one hand, the adsorption (fixation) of K, but thegreater are, on the other hand, the reserves of exchangeable and non-exchangeable K in the soil. Due to the competition between clay particlesand plant roots for easily available K+ soils with higher clay content need ahigher level of available K/100 g soil to satisfy the K-requirement of a cropin quantity and rate as shown also in the posters by Fotyma and Czuba andby Richter and Kerschberger. Such soils, however, also have a greater K-buffer capacity whose contribution to the actual K-nutrition has longattracted attention of soil chemists, a point to which will be referred later.
Equally interesting to the researcher as well as to the ecologist is thequestion as to the most appropriate method for estimating K-fertilizerefficiency. Fotyma and Czuba and Richter and Kerschberger have presenteddata from long-term experiments. Both groups arrive at the sameconclusion: annual dressings of 140-150 kg ha-1 K20 are the maintenancerate if all above-ground crop is removed from the field. By using thedifference method for calculating fertilizer efficiency, Fotyma and Czubaand similarly Gorbanov et al., however, conclude that with increasing ratesof K-fertilizer only 65 to 27% of this fertilizer are utilised by the crop.Richter and Kerschberger, on the other hand, recommend to determine howyield response is affected by'the K-fertilizer balance. By doing so, they canderive the economic annual K-balance, the optimal K-fertilizer rate andfinally, by comparing K-uptake at the optimal yield level with the optimalK-fertilizer rate, they can define the so-called balance coefficient as ameasure of the K-fertilizer efficiency. This is usually close to 100%.Although, definitely, not all fertilizer-K will be taken up in the year ofapplication this method of calculation of fertilizer efficiency seems to bemore ecological than the assumption (in the difference method) that plants
455
growing at different rates of K-fertilizer absorb the same basic quantity ofsoil-K as the plants in the unfertilized treatment. In conclusion, neithermethod mirrors the real K-fertilizer efficiency and therefore the range ofoptimal K-availability in soil is still rather wide as demonstrated for loamsoils by Richter and Kerschberger.
Why are low levels of exchangeable K sufficient for optimal plant growthin some soils, while in others higher levels are required ? This questionabout K-buffer capacity, about K-fluxes in dependence of clay content andthe soil moisture regime has again challenged some poster-authors. Inaddition to the well-known, though complex, intensity/quantity relationshipsand potential buffer capacity of soils for K published by Beckett (1970),Karpinets has presented a new, simpler analytical approach to this problem.She recommends to extract a soil twice with NH4-acetate. The firstextraction gives the content of exchangeable K (KO) and the secondextraction after drying the soil again yields some additional K (KIl). Shedefines the K-buffer capacity as
B = (KO - Kl)/KoAssuming the second extraction (KI) gives the same quantity as the first oneK-buffering is very high (B=0). In her data for 20 chernozems the B valuecorrelated with barley yield with r=0.57, which, however, was not betterthan after only one extraction with ammonium acetate. The explanation forthis rather unexpected result may be the high K-availability in the soilsinvestigated and their high organic matter content as well as other sitespecific factors.
Such site specific parameters as geological parent material, pedogenesisand soil type, topography, rainfall, temperature, etc. can now all be puttogether and integrated in what is called a geographical information system.Orlovius and Andres have impressively demonstrated the ecologicalorientation as well as the economic benefits of such new approaches infertilizer advice. It is sincerely hoped that such ideas will be taken up andimproved by many other institutions in order to extricate fertilizerrecommendations from empirism and tradition.
As far as horticulture and the toe of K-fertilizer is concerned, Loch andPethd have provided evidence for K2S04 being superior to KCI in somevegetables. Interestingly fruit set and harvests were slightly accelerated,while in the KCI-treatments the period of shoot growth was obviouslyslightly extended.
456

Better scientific understanding of non-agricultural ecosystems would alsobe highly desirable. There are several indications that forests are not onlysuffering from acid rain, pollutants and/or pests and diseases, but also fromabsolute and/or induced nutrient deficiencies. Most susceptible to the latterare forests on sandy soils with low nutrient and moisture retention as well as
low pH, especially when such forests occur in areas with livestock intensity
i.e. N-imissions of >40 kg ha-I N. Uebel and Chrzon have provided long-term experimental evidence for the positive effects of K- and Mg-fertilizerson growth, health and yield of trees and their undercrown vegetation. As
forests and their soils have vital functions for our climate, as they are
essential for the protection of landscapes against erosion and as they areindispensable as filters of air and drinking water, no ecosystem should be
harvested without returning the inorganic nutrients essential for itsregeneration and sustainability.
At the 22nd IPI colloquium in Soligorsk, Scharf (1990) discussed the
environmental aspects in the production and handling of K-fertilizers. Thistime an interesting poster was presented by Papulov, showing the use of saltsand mines in the therapy of bronchial asthma, in the purification of air aswell as in the protection of perishable vegetables and planting material.Because in industrialised countries more and more allergies are reported it
will be interesting to pursue further development in this field.
"Potassium in ecosystems" is the general topic of this colloquium. For
the evaluation of the problems associated with this theme there are a numberof scientific criteria : we have long-term experience in soil-testing for plantavailable potassium, we know the critical levels for minerals in leafnecdleanalysis and for K-concentration in waters for human consumption. Theknown threshold levels provide good guidelines, but have, however, to be
modified according to geology, type of soil and landscape as well as
according to the targets of the respective ecosystem and the intensity of its
utilisation. Let us hope that all people will integrate their specializedknowledge into the important holistic consideration of ecosystems, their useand their sustainability.
457