research findings - international potash institute
TRANSCRIPT
3/43
e-ifc No. 66, March 2022
AbstractAgriculture is the primary source of livelihood for nearly 60% of the India’s population, a number that rises to 70% of the Indian population in rural areas. To meet the demand for food, farmers mostly engage in intensive cultivation which often results in nutrient mining which leads to a decline in the quality of soil. Declining quality of soil often results in reduced soil fertility and ultimately to poor production. Importantly, continuous nutrient exploitation without proper strategies for nutrient replenishment is a scenario that takes a long time to reverse.
This study aimed to assess the impact of potassium (K) depletion on soybean production by evaluating and demonstrating the important
Research Findings
contribution of K application from K-inclusive fertilization regimes to increasing soybean yield and profitability. To evaluate soybean’s K response when fertilizing with potash on K-depleted soils, a comprehensive experiment was carried out in Madhya Pradesh (M.P.) and Maharashtra states in India; 129 and 15 pairwise demonstration plot trials were set up in Madhya Pradesh and Maharashtra states, respectively. Two identical plots were laid side by side, one of which
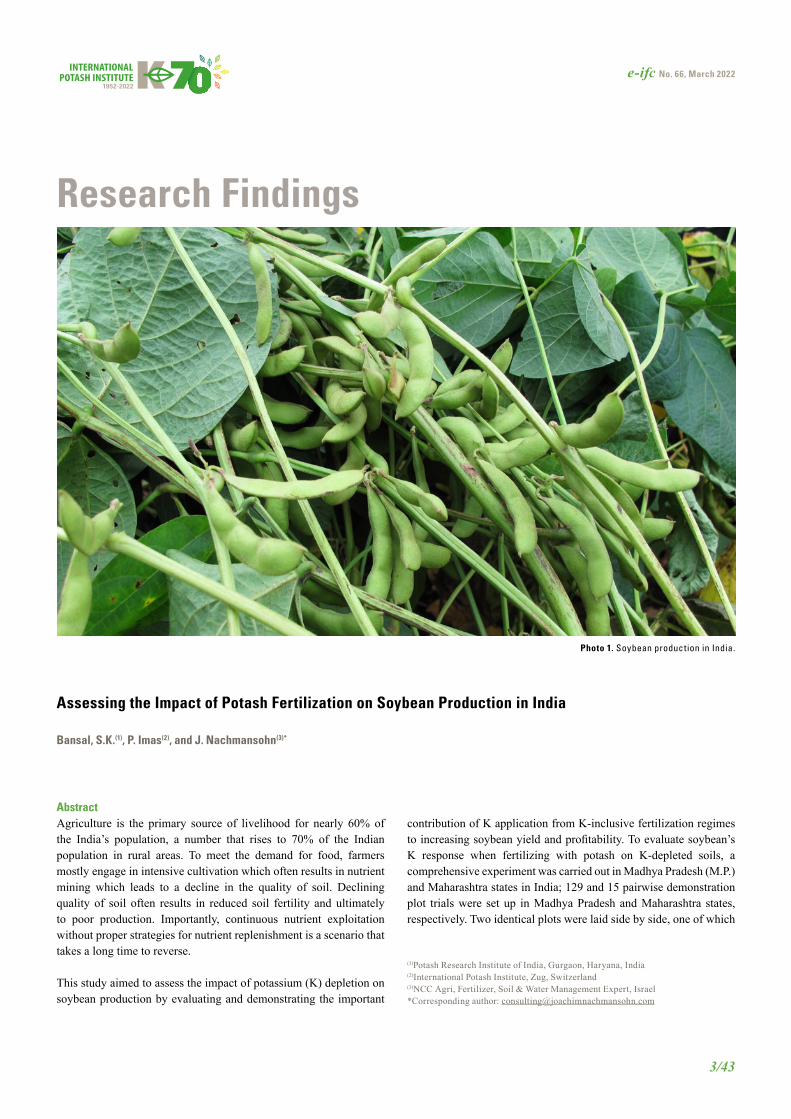
Photo 1. Soybean production in India.
Assessing the Impact of Potash Fertilization on Soybean Production in India
Bansal, S.K.(1), P. Imas(2), and J. Nachmansohn(3)*
(1)Potash Research Institute of India, Gurgaon, Haryana, India(2)International Potash Institute, Zug, Switzerland(3)NCC Agri, Fertilizer, Soil & Water Management Expert, Israel*Corresponding author: [email protected]
4/43
e-ifc No. 66, March 2022
was fertilized with additional potash fertilizer. The results showed a significant yield increase from the potash application; the average yield increase was 244 kg ha-1 or 26% in M.P., and 105 kg ha-1 or 36% in Maharashtra. This produced an average additional net profit of 6,681 INR ha-1 and 2,544 INR ha-1 in M.P. and Maharashtra, respectively. It was concluded that the plant available K in the soil is significantly lower than the plant demand for soybean production in the two states. The K dose employed in the present study can be recommended to soybean farmers in the short-term as a transient means to obtain higher yields and profits. Further research is however recommended to determine appropriate K doses and application practices to ensure balanced crop nutrition and efficient fertilizer use for optimal yields.
Keywords: Soybean, potassium, nutrient mining, nutrient depletion, potash, MOP
IntroductionSoil forms the basis for any crop production activity. However, declining soil fertility is one of the primary factors that directly affect crop productivity. Management of soil fertility is important for the maintenance of sustainable productivity and nutritional security (Prasad and Power, 1997). Fertilizers are important in ensuring soil fertility, productivity, and long-term profitability if used accordingly (FAO, 2005). Imbalanced and incorrect use of fertilizers afflicts nutrient use efficiency and leads to deterioration in soil quality (Wallace, 2008).
Soybean (Glycine max) is a major source of vegetable oil, protein, and animal feed. Across India. It is a Kharif crop mostly grown in Madhya Pradesh and Maharashtra, but also in other states. India
produces approximately 12 million metric tons of soybeans annually but unreliable rainfall, inadequate irrigation, outdated fertilizer practices, and imbalanced crop nutrition have, in specific instances, resulted in low yields (Chand, 2007; Sharma et al., 1996; Tiwari, 2001).
Soybean requires considerable amounts of potassium for improved yields and quality. In India, soybean farmers use nitrogen and phosphorus fertilizers but not potassium and sulfur (Bhatnagar and Joshi, 1999). The practice of omitting K from the regular fertilization is common and has been a standard practice in the past few decades, especially in soils that are, by definition, classified as “K-rich soils”. However, even K-rich soils can be depleted after years of intensive agricultural production. Many studies in the past have shown the importance of potassium in soybean production (Pettigrew, 2008; Yin and Vyn, 2003; Bhangoo and Albritton, 1972). However, it is well known that results from highly controlled studies do not necessarily translate into direct recommendations, especially in smallholder agriculture with sub-optimal practices overall, and where the producers have relatively low investment capacity. This study aims to report a positive soybean response to applied K in vertisols
Ratlam
Latur
Harda
Ujjain
INDIAINDIA
MADHYA PRADESHMADHYA PRADESH
MAHARASHTRAMAHARASHTRA
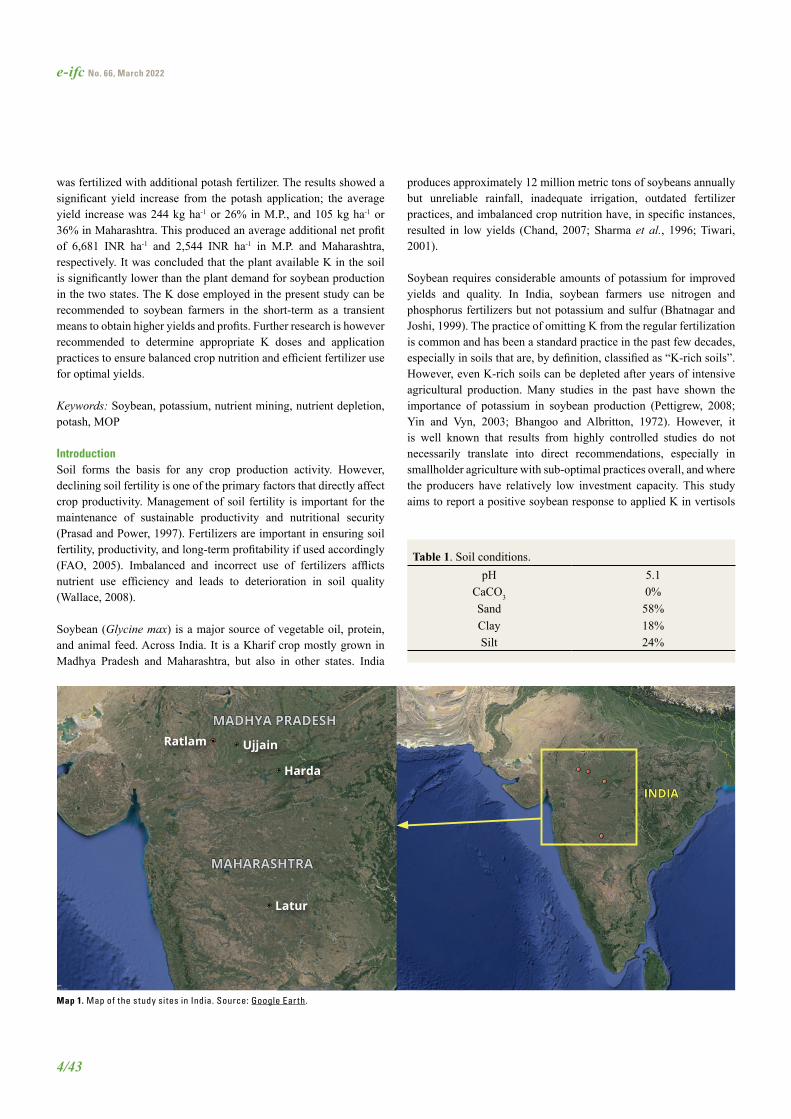
Map 1. Map of the study sites in India. Source: Google Earth.
Table 1. Soil conditions.pH 5.1
CaCO3 0%Sand 58%Clay 18%Silt 24%
e-ifc No. 66, March 2022
5/43
in India, which are considered to be rich in potassium (Singh and Wanjari, 2012; Dwivedi et al., 2007; Chen et al., 2000).
The objective of this study is to evaluate the response of soybean to potash (MOP, KCl) application and to raise awareness among smallholder farmers of the importance of K fertilization in soybean production.
Materials and methodsThe study was carried out in India in the states of Madhya Pradesh (M.P.) and Maharashtra. The trials were conducted in farmer fields in five different districts: Harda (9 plots), Mandsaur (47 plots), Ratlam (38 plots), Ujjain (35 plots), and Latur (15 plots) (Map 1).
Each study site consisted of two plots (0.4 ha each) laying side by side, one for each treatment. In Maharashtra, all plots were irrigated 1-3 times during the season, while in M.P. only plots in the district of Harda were irrigated. The improved soybean varieties recommended for each of the areas were used and all recommended agronomic practices were followed.
The study consisted of 2 treatments (Table 2) at each site:
■ Treatment 1 (T1): common fertilizer practices where urea, DAP, and manure were applied, and
■ Treatment 2 (T2): included MOP in addition to the common practice.
However, the local fertilizer practices varied between the districts as well as the states: the fertilizer regime was more extensive in M.P. compared to that of Maharashtra, not only in terms of NPK-dosage, but also in that farmyard manure (FYM) was only utilized in the state
of Maharashtra. The dose of FYM was not researcher-managed in this study and was based on the availability of manure and farmers’ usual practices. This way, the present study is able to evaluate if MOP application is beneficial without optimization of manure application, and regardless of farmer’s current manure practices.
The statistical analysis was performed using pairwise T-tests (paired two samples for the mean). Additionally, ANOVA-test was used when comparing more than two groups or statistical populations. When comparing only two groups or statistical populations, another kind of T-test was used, as they had different sample sizes (two-sample assuming unequal variance). Linear regression was performed to understand the relationship between two variables. In all tests the confidence level of 0.95.
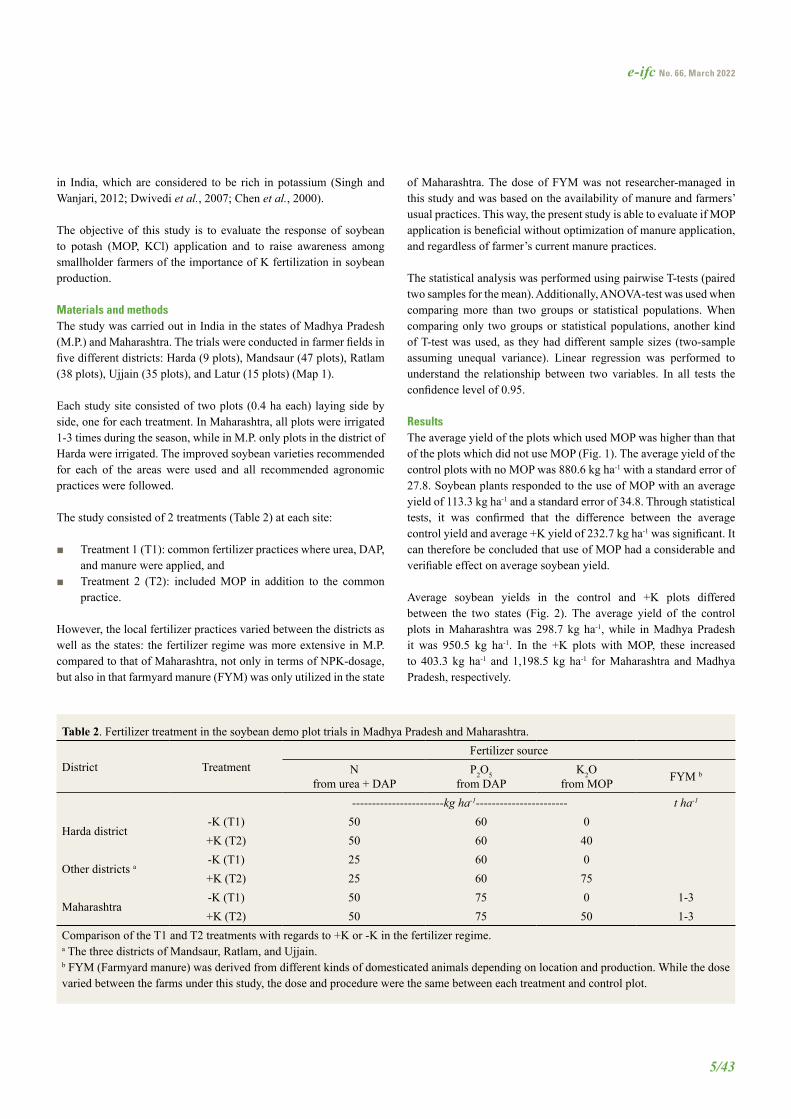
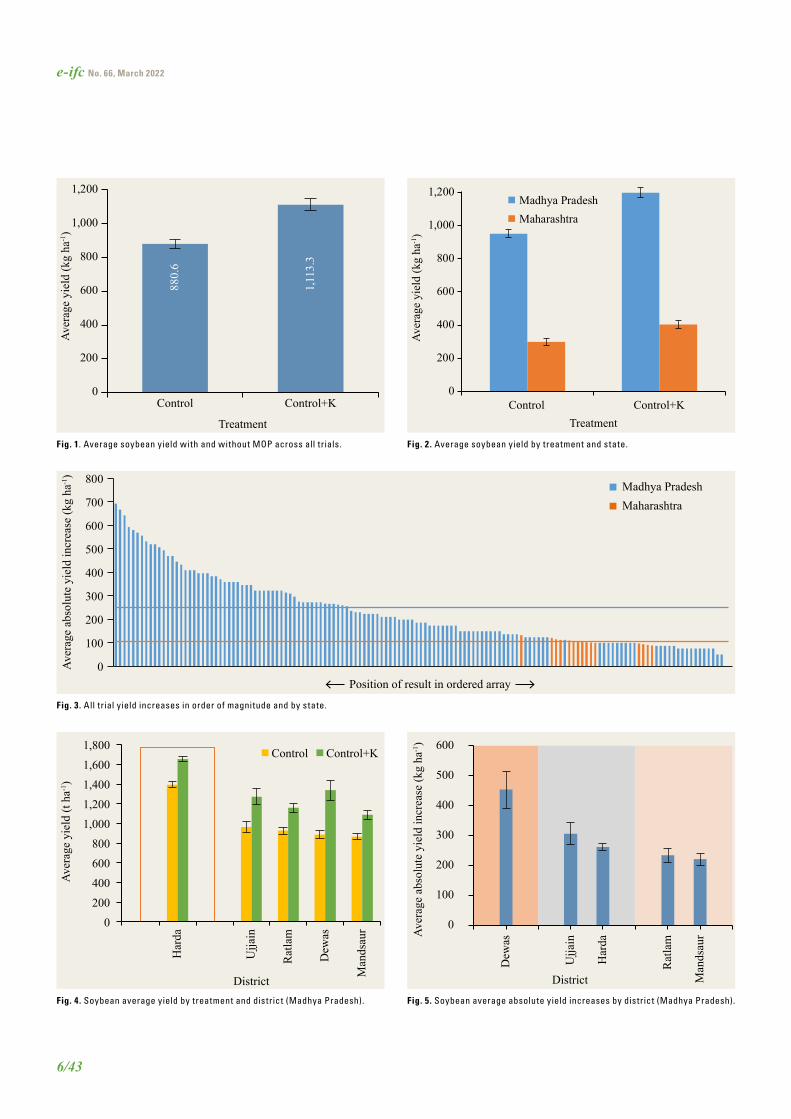
ResultsThe average yield of the plots which used MOP was higher than that of the plots which did not use MOP (Fig. 1). The average yield of the control plots with no MOP was 880.6 kg ha-1 with a standard error of 27.8. Soybean plants responded to the use of MOP with an average yield of 113.3 kg ha-1 and a standard error of 34.8. Through statistical tests, it was confirmed that the difference between the average control yield and average +K yield of 232.7 kg ha-1 was significant. It can therefore be concluded that use of MOP had a considerable and verifiable effect on average soybean yield.
Average soybean yields in the control and +K plots differed between the two states (Fig. 2). The average yield of the control plots in Maharashtra was 298.7 kg ha-1, while in Madhya Pradesh it was 950.5 kg ha-1. In the +K plots with MOP, these increased to 403.3 kg ha-1 and 1,198.5 kg ha-1 for Maharashtra and Madhya Pradesh, respectively.
Table 2. Fertilizer treatment in the soybean demo plot trials in Madhya Pradesh and Maharashtra.
District TreatmentFertilizer source
N from urea + DAP
P2O5 from DAP
K2O from MOP FYM b
-----------------------kg ha-1----------------------- t ha-1
Harda district-K (T1) 50 60 0+K (T2) 50 60 40
Other districts a-K (T1) 25 60 0+K (T2) 25 60 75
Maharashtra-K (T1) 50 75 0 1-3+K (T2) 50 75 50 1-3
Comparison of the T1 and T2 treatments with regards to +K or -K in the fertilizer regime.a The three districts of Mandsaur, Ratlam, and Ujjain.b FYM (Farmyard manure) was derived from different kinds of domesticated animals depending on location and production. While the dose varied between the farms under this study, the dose and procedure were the same between each treatment and control plot.
6/43
e-ifc No. 66, March 2022
Fig. 1. Average soybean yield with and without MOP across all trials.
880.
6
1,11
3.3
0
200
400
600
800
1,000
1,200
Control Control+K
Aver
age
yiel
d (k
g ha
-1)
Treatment
0
200
400
600
800
1,000
1,200
Aver
age
yiel
d (k
g ha
-1)
Madhya PradeshMaharashtra
Control Control+KTreatment
Fig. 2. Average soybean yield by treatment and state.
0
100
200
300
400
500
600
700
800
Aver
age
abso
lute
yie
ld in
crea
se (k
g ha
-1)
Madhya PradeshMaharashtra
Position of result in ordered array
Fig. 3. All trial yield increases in order of magnitude and by state.
Fig. 5. Soybean average absolute yield increases by district (Madhya Pradesh).
0
100
200
300
400
500
600
Dew
as
Ujja
in
Har
da
Rat
lam
Man
dsau
rAver
age
abso
lute
yie
ld in
crea
se (k
g ha
-1)
District
Fig. 4. Soybean average yield by treatment and district (Madhya Pradesh).
0
200
400
600
800
1,000
1,200
1,400
1,600
1,800
Har
da
Ujja
in
Rat
lam
Dew
as
Man
dsau
r
Aver
age
yiel
d (t
ha-1)
District
Control Control+K
e-ifc No. 66, March 2022
7/43
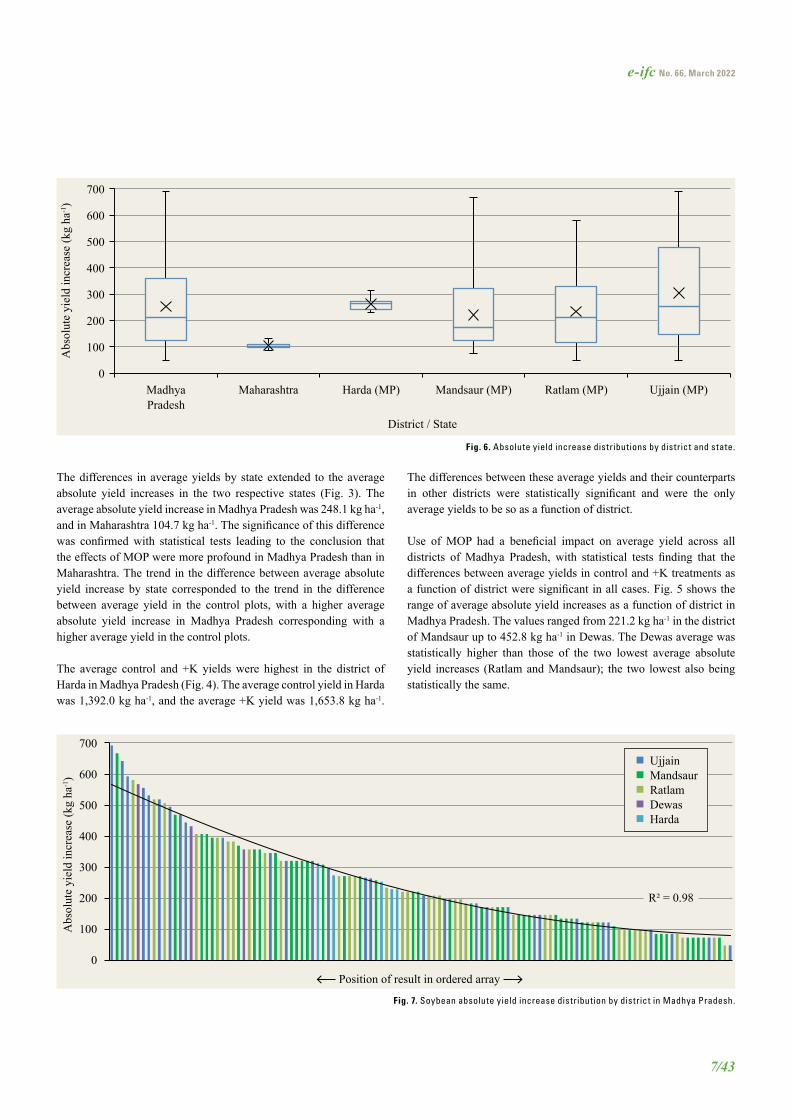
The differences in average yields by state extended to the average absolute yield increases in the two respective states (Fig. 3). The average absolute yield increase in Madhya Pradesh was 248.1 kg ha-1, and in Maharashtra 104.7 kg ha-1. The significance of this difference was confirmed with statistical tests leading to the conclusion that the effects of MOP were more profound in Madhya Pradesh than in Maharashtra. The trend in the difference between average absolute yield increase by state corresponded to the trend in the difference between average yield in the control plots, with a higher average absolute yield increase in Madhya Pradesh corresponding with a higher average yield in the control plots.
The average control and +K yields were highest in the district of Harda in Madhya Pradesh (Fig. 4). The average control yield in Harda was 1,392.0 kg ha-1, and the average +K yield was 1,653.8 kg ha-1.
The differences between these average yields and their counterparts in other districts were statistically significant and were the only average yields to be so as a function of district.
Use of MOP had a beneficial impact on average yield across all districts of Madhya Pradesh, with statistical tests finding that the differences between average yields in control and +K treatments as a function of district were significant in all cases. Fig. 5 shows the range of average absolute yield increases as a function of district in Madhya Pradesh. The values ranged from 221.2 kg ha-1 in the district of Mandsaur up to 452.8 kg ha-1 in Dewas. The Dewas average was statistically higher than those of the two lowest average absolute yield increases (Ratlam and Mandsaur); the two lowest also being statistically the same.
Fig. 6. Absolute yield increase distributions by district and state.
Fig. 7. Soybean absolute yield increase distribution by district in Madhya Pradesh.
0
100
200
300
400
500
600
700
MadhyaPradesh
Maharashtra Harda (MP) Mandsaur (MP) Ratlam (MP) Ujjain (MP)
Abs
olut
e yi
eld
incr
ease
(kg
ha-1)
District / State
R² = 0.98
0
100
200
300
400
500
600
700
Abs
olut
e yi
eld
incr
ease
(kg
ha-1)
UjjainMandsaurRatlamDewasHarda
Position of result in ordered array
8/43
e-ifc No. 66, March 2022
The distribution of absolute yield increases differed across the districts of Mandsaur, Ratlam, and Ujjain (Fig. 6). In Mandsaur, the minimum and maximum values were 74.1 kg ha-1 and 666.9 kg ha-1 respectively, giving a range of 592.8 kg ha-1. In Ratlam and Ujjain, these ranges were 531.1 kg ha-1 and 642.2 kg ha-1, respectively. In Harda, the range was much smaller (84.0 kg ha-1). Ujjain had the highest maximum absolute yield increase, as well as the highest upper quartile, giving the district the highest mean and the highest response distribution.
There were differences in absolute yield increase data distributions between the states. In Madhya Pradesh, the data followed a linear distribution except for the highest and lowest responses (Fig. 7). Across the data set as a whole, the distribution followed a 2nd order
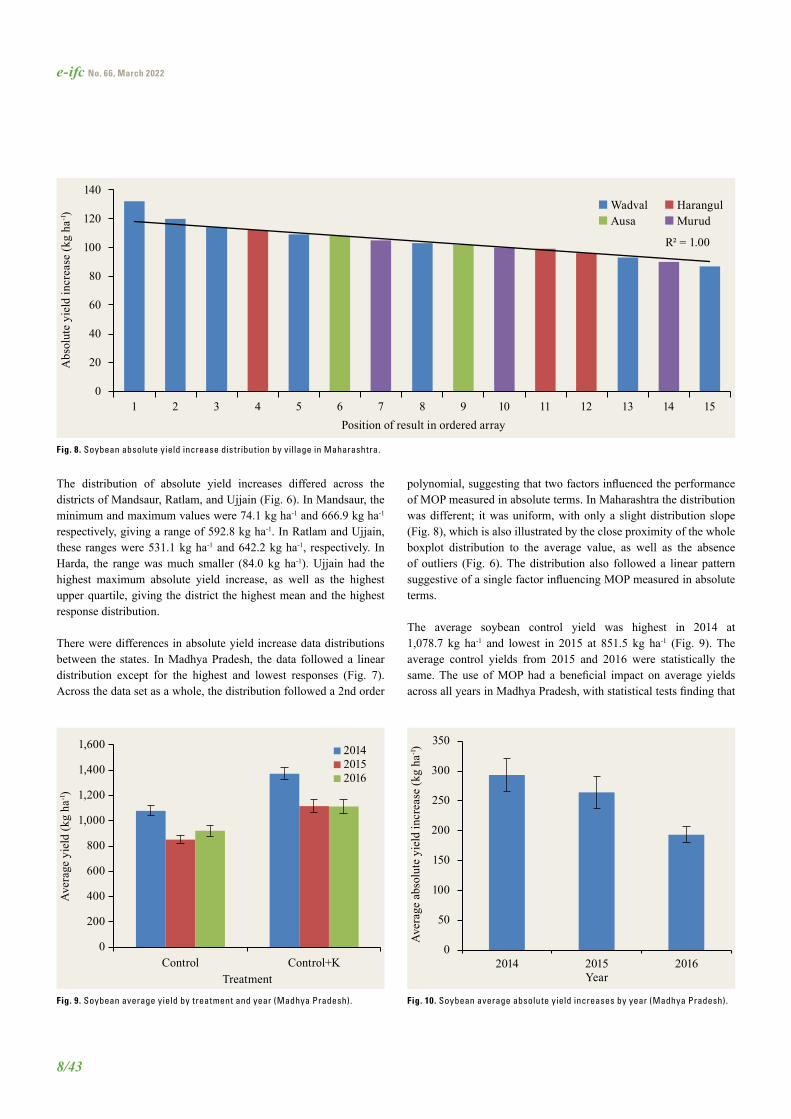
polynomial, suggesting that two factors influenced the performance of MOP measured in absolute terms. In Maharashtra the distribution was different; it was uniform, with only a slight distribution slope (Fig. 8), which is also illustrated by the close proximity of the whole boxplot distribution to the average value, as well as the absence of outliers (Fig. 6). The distribution also followed a linear pattern suggestive of a single factor influencing MOP measured in absolute terms.
The average soybean control yield was highest in 2014 at 1,078.7 kg ha-1 and lowest in 2015 at 851.5 kg ha-1 (Fig. 9). The average control yields from 2015 and 2016 were statistically the same. The use of MOP had a beneficial impact on average yields across all years in Madhya Pradesh, with statistical tests finding that
Fig. 8. Soybean absolute yield increase distribution by village in Maharashtra.
Fig. 9. Soybean average yield by treatment and year (Madhya Pradesh). Fig. 10. Soybean average absolute yield increases by year (Madhya Pradesh).
R² = 1.00
0
20
40
60
80
100
120
140
1 2 3 4 5 6 7 8 9 10 11 12 13 14 15
Abs
olut
e yi
eld
incr
ease
(kg
ha-1)
Position of result in ordered array
Wadval HarangulAusa Murud
0
200
400
600
800
1,000
1,200
1,400
1,600
Control Control+K
Ave
rage
yie
ld (k
g ha
-1)
Treatment
201420152016
0
50
100
150
200
250
300
350
2014 2015 2016
Ave
rage
abs
olut
e yi
eld
incr
ease
(kg
ha-1)
Year
e-ifc No. 66, March 2022
9/43
the differences between average control and average +K yields as a function of year were significant in all cases. However, there was variation in the extent to which MOP increased average yields (Fig. 10). The average absolute yield increases of 2014 were statistically the same, but both were higher than that of 2016. This correlated, to some extent, with average control yields by year.
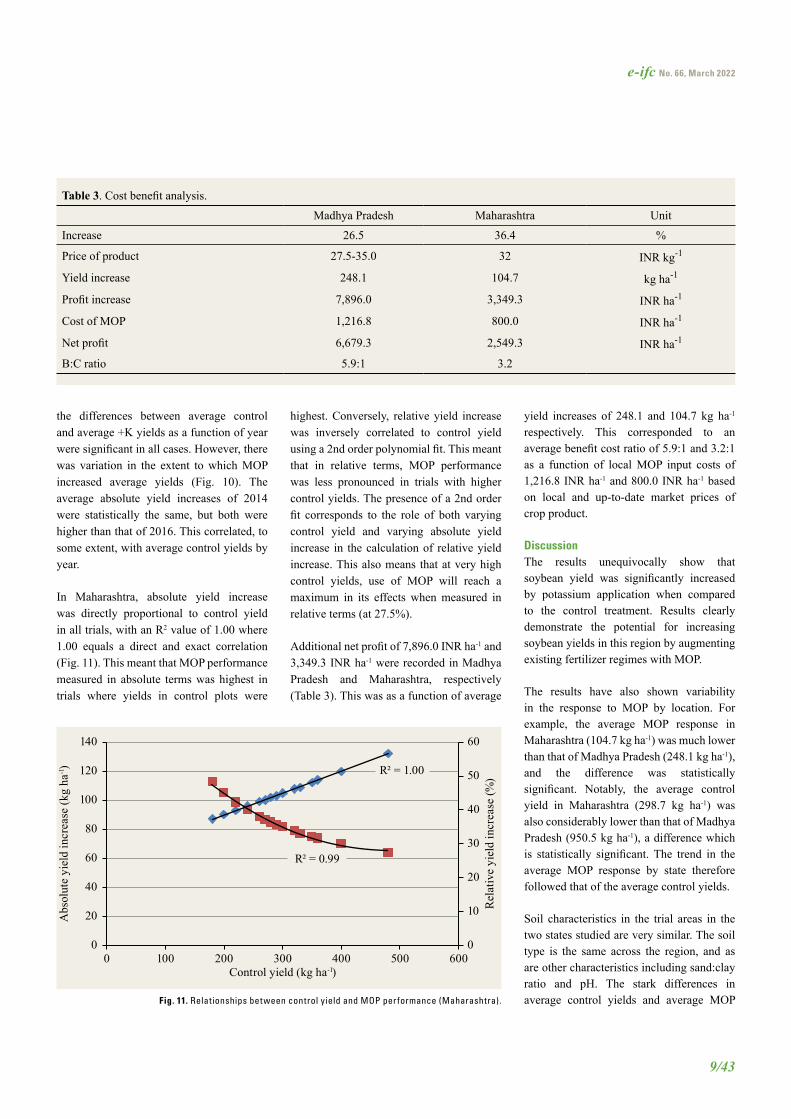
In Maharashtra, absolute yield increase was directly proportional to control yield in all trials, with an R2 value of 1.00 where 1.00 equals a direct and exact correlation (Fig. 11). This meant that MOP performance measured in absolute terms was highest in trials where yields in control plots were
highest. Conversely, relative yield increase was inversely correlated to control yield using a 2nd order polynomial fit. This meant that in relative terms, MOP performance was less pronounced in trials with higher control yields. The presence of a 2nd order fit corresponds to the role of both varying control yield and varying absolute yield increase in the calculation of relative yield increase. This also means that at very high control yields, use of MOP will reach a maximum in its effects when measured in relative terms (at 27.5%).
Additional net profit of 7,896.0 INR ha-1 and 3,349.3 INR ha-1 were recorded in Madhya Pradesh and Maharashtra, respectively (Table 3). This was as a function of average
Table 3. Cost benefit analysis.
Madhya Pradesh Maharashtra Unit
Increase 26.5 36.4 %
Price of product 27.5-35.0 32 INR kg-1
Yield increase 248.1 104.7 kg ha-1
Profit increase 7,896.0 3,349.3 INR ha-1
Cost of MOP 1,216.8 800.0 INR ha-1
Net profit 6,679.3 2,549.3 INR ha-1
B:C ratio 5.9:1 3.2
R² = 1.00
R² = 0.99
0
10
20
30
40
50
60
0
20
40
60
80
100
120
140
0 100 200 300 400 500 600
Rel
ativ
e yi
eld
incr
ease
(%)
Abs
olut
e yi
eld
incr
ease
(kg
ha-1)
Control yield (kg ha-1)
yield increases of 248.1 and 104.7 kg ha-1 respectively. This corresponded to an average benefit cost ratio of 5.9:1 and 3.2:1 as a function of local MOP input costs of 1,216.8 INR ha-1 and 800.0 INR ha-1 based on local and up-to-date market prices of crop product.
DiscussionThe results unequivocally show that soybean yield was significantly increased by potassium application when compared to the control treatment. Results clearly demonstrate the potential for increasing soybean yields in this region by augmenting existing fertilizer regimes with MOP.
The results have also shown variability in the response to MOP by location. For example, the average MOP response in Maharashtra (104.7 kg ha-1) was much lower than that of Madhya Pradesh (248.1 kg ha-1), and the difference was statistically significant. Notably, the average control yield in Maharashtra (298.7 kg ha-1) was also considerably lower than that of Madhya Pradesh (950.5 kg ha-1), a difference which is statistically significant. The trend in the average MOP response by state therefore followed that of the average control yields.
Soil characteristics in the trial areas in the two states studied are very similar. The soil type is the same across the region, and as are other characteristics including sand:clay ratio and pH. The stark differences in average control yields and average MOP Fig. 11. Relationships between control yield and MOP performance (Maharashtra).
10/43
e-ifc No. 66, March 2022
response cannot therefore be explained by examining the differences in these factors. The main notable difference, with respect to the conditions between the states, is growth period. All trials in Madhya Pradesh were planted and harvested between June and October respectively. This is the recommended growth period for soybean in this region, with the optimal sowing dates being the last two weeks of June and the ideal harvest date being before the end of October. It is also the period which receives the annual monsoon rains in July. In Maharashtra, trials were planted in mid-August and harvested in mid-November. As a result, rainfall was minimal to the extent that seven out of 10 trials were affected by drought. It is known that soybean yields fall the later in the season the plants are sown and harvested (Nath et al., 2017). This is owing to the less favourable climatic conditions typical of the latter part of the season. This research has confirmed this and has also shown that this dynamic limits the extent to which MOP can increase soybean yields.
Average control yields and MOP performance also varied between districts within Madhya Pradesh. Spatial factors relating to soil did not vary between any of these districts. The statistical tests found that the average control yield of only one district (Harda) was different to those of the other districts. Two factors differed between the trials in Harda and those of all other districts except Hoshangabad. These factors were application of one irrigation, and nitrogen dosing rate. In Harda and Hoshangabad plots received one irrigation, whilst in all other districts plots were rainfed only. Likewise, in Harda and Hoshangabad the nitrogen dosing rate was 50 kg ha-1 in all trials whilst in all other districts in Madhya Pradesh the dosing rate was 25 kg ha-1.
Climatic factors such as rainfall and temperature were comparable across the trials. Notably, the average control yields of the two trials in Hoshangabad were very high compared to the study average (1,470 kg ha-1 versus 950.5 kg ha-1). These higher control yields in Harda and Hoshangabad could therefore be due either to irrigation, higher nitrogen dosing rate or both. It was confirmed through tests that the difference between the average control yield of the trials in Harda and Hoshangabad and that of other districts was significant.
It is possible to explore the effects of irrigation by examining the trials in Maharashtra. In these trials, all plots received irrigation. The number of irrigations in Maharashtra varied between one and three. Applying irrigation in crop production is expected to have a significant impact on crop yields (Adebayo et al., 2018). However, the statistical tests found that the number of irrigations did not influence control yield (or MOP performance). Furthermore, the average yield in Maharashtra was sizably lower than that of Madhya Pradesh where only 7% of trials received irrigation. This leads to the conclusion that the higher average control yield in Harda (and Hoshangabad) was due to a doubling of the nitrogen dosing rate from 25 to 50 kg ha-1. This same higher dosing rate was also used in all trials of Maharashtra.
However, the later planting of the crops in Maharashtra may have precluded full use of the extra nitrogen applied.
Unlike the differences in MOP performance by state, the differences in MOP performance by district within Madhya Pradesh did not correspond with the differences in average control yields. The only average control yield by district in Madhya Pradesh shown to be statistically higher than those of other districts was that of Dewas. This shows that irrespective of factors such as nitrogen dosing rate and its influence on control yields, in certain instances there is an extremely high response to the use of MOP. This has not been linked to control yields within Madhya Pradesh. Given the similarity in conditions within Madhya Pradesh (i.e., soil type, growth period, rainfall, and temperature), it leads to the conclusion that another factor is behind the variability in MOP response within Madhya Pradesh. It is known that levels of K in soils in India vary considerably between different parts of the country (Hasan, 2002). Such variations in MOP response amidst similarity in other key factors leads to the conclusion that availability of K in the soils varies considerably between the parts of Madhya Pradesh included in this study.
In the year the trials took place in Dewas, very heavy rainfall preceded the planting season (rainfall departures of +1,500% in April of 2015). High rainfall preceding the planting season could therefore have provided the soil moisture necessary for better MOP performance, by lifting limits to growth and facilitating full use of K from the addition of MOP. Observing absolute yield increases as a function of both year and district, there is a clear correlation between heavy rainfall in excess of that expected (i.e., rainfall departures) and MOP performance. Soil condition – particularly soil moisture – may therefore also play a role in MOP performance, as well as natural availability of K in soils. The role of two factors in MOP performance would also align with the absolute yield increase distributions from Fig. 7. The distribution followed a 2nd order polynomial rather than a linear regression, indicating that more than one factor influenced MOP performance within Madhya Pradesh.
It was found that both average control yields and average absolute yield increases differed as a function of year. Observing rainfall patterns during the growing season (i.e., June to October) it is clear that the optimum control yields were achieved when average monthly rainfall was closest to the ideal amount of rainfall recommended for soybean growing in this region (80 cm of rainfall per month). This was also the year when MOP performance was highest (2014). This leads to the conclusion that MOP is most effective when rainfall is adequate but not excessive.
Average absolute yield increases as a function of cultivar were linearly proportional to average T1 (control) yields. This means that cultivars which offer higher T1 yields will result in greater yield increases for the same amount of MOP. Use of cultivar is a poignant topic within soybean production in India, with members of the sector
e-ifc No. 66, March 2022
11/43
The paper “Assessing the Impact of Potash Fertilization on Soybean Production in India” also appears on the IPI website.
asserting that the time for adopting new cultivars with higher yields is long overdue (Pushpendra et al., 2017). It is frequently asserted that widely used cultivars such as JS-335 should be replaced by newer, better cultivars (Pathak, 2017). This work shows that the beneficial effects of MOP on yields will likely be higher on newer, higher yielding cultivars. This puts use of MOP in a unique position to ensure high yields are achieved if and when the industry transitions towards newer cultivars.
In conclusion, application of MOP increased yield and profitability. The positive response of potassium application to soybean yield is attributed mostly to the low potassium levels in the soils rather than the secondary factors such as manure and irrigation which had very minor effect in attaining increased yields. Fertilizers that are K inclusive are important in the optimization of yields and the maximization of profit. Therefore, K doses employed in this study should be recommended to farmers for use in these states. Further research is also recommended to determine appropriate MOP doses and application practices to ensure balanced crop nutrition, optimal fertilizer use, sufficient K availability whenever needed, and sustainable soil fertility.
ReferencesAdebayo, O., O. Bolarin, A. Oyewale, and O. Kehinde. 2018. Impact
of Irrigation Technology use on Crop Yield, Crop Income and Household Food Security in Nigeria: a Treatment Effect Approach. AIMS Agric Food.
Bhangoo, M.S., and D.J. Albritton. 1972. Effect of Fertilizer Nitrogen, Phosphorus, and Potassium on Yield and Nutrient Content of Lee Soybeans. Agronomy Journal 64(6):743-746.
Bhatnagar, P.S., and O.P. Joshi. 1999. Soybean in Cropping Systems in India Pp 39. FAO Series on Integrated Crop Management, Rome, Italy.
Chand, R. 2007. Agro-industries Characterization and Appraisal: Soybeans in India. AGSF Working Document (FAO).
Chen, F., J.W. Lu, and Y.F. Wan. 2000. Effect of Long-Term Potassium Application on Soil Potassium Content and Forms. Acta Pedologica Sinica 37(2):233-241.
Dwivedi, A.K., M. Singh, D.L. Kauraw, R.H. Wanjari, and S.S. Chauhan. 2007. Research Bulletin on ‘Impact of Fertilizer and Manure Use for Three Decades on Crop Productivity and Sustainability, and Soil Quality under Soybean – Wheat System on Vertisol in Central India’. p. 1-51.
FAO-Food and Agriculture Organization of the United Nations (2005). Fertilizer Use by Crops in India. Accessed September 2018 from www.fao.org.
FAO-Food and Agriculture Organization of the United Nations (2004). The Role of Soybean in Fighting World Hunger. Accessed December 2018 from www.fao.org/3/a-bs958e.pdf.
Hasan, R. 2002. Potassium Status of Soils in India. Better Crops International, 16.
Nath, A., A.P. Karunakar, A. Kumar, and R.K. Nagar. 2017. Effect of Sowing Dates and Varieties on Soybean Performance in Vidarbha Region of Maharashtra, India. Journal of Applied and Natural Science 9, 544-550.
Pathak, D.N. 2017. Soybean Productivity in India Issues and Solutions. Indore: The Soybean Processors Association of India.
Pettigrew, W.T. 2008. Potassium Influences on Yield and Quality Production for Maize, Wheat, Soybean and Cotton. Physiologia plantarum 133(4):670-681.
Prasad, R., and J.F. Power. 1997. Soil Fertility Management for Sustainable Agriculture. CRC Press LLC, Boca Raton, Florida.
Pushpendra, Kamendra Singh, S.C. Saxena, N. Kumar, K.P. Singh, K.P. Raverkar, P.S. Shukla, N. Gaur, and A. Srivastava. 2017. Five Decades of Soybean Research at Pantnagar. Directorate of Experiment Station G.B. Pant University of Agriculture and Technology Pantnagar, Uttarakhand.
Sharma, H., S. Nahatkar, and M.M. Patel. 1996. Constraints of Soybean Production in Madhya Pradesh: An Analysis. Bhartiya Krishi Anusandhan Patrika 11(2):79-84.
Singh, M., and R.H. Wanjari. 2012. Potassium Responses and Requirement of Crops Grown in Vertisols: Experiences from Long Term Fertilizer Experiment. Indian Journal of Fertilizers 8(3):26-32.
Tiwari, S.P. 2001. Shattering the Production Constraints in Soybean-Based Cropping Systems. JNKVV Research Journal 35(182):1-10.
Wallace, A. 2008. Soil Acidification from use of too much Fertilizer. Com. Soil Sci. Plant Analysis 25(1-2):87-92.
Yin, X., and T.J. Vyn. 2003. Potassium Placement Effects on Yield and Seed Composition of No-Till Soybean Seeded in Alternate Row Widths. Agronomy Journal 95(1):126-132.