measurement of the b$^{0}_{d}$ oscillation frequency using kaons leptons and jet charge
TRANSCRIPT
EUROPEAN ORGANIZATION FOR NUCLEAR RESEARCH
CERN{PPE/96-06
25 January 1996
Measurement of the B0d oscillation
frequency using kaons, leptons and
jet charge
DELPHI Collaboration
Abstract
A measurement of the mass di�erence, �md, between the two physical B0
d
states has been obtained from the analysis of the impact parameter distributionof a lepton emitted at large transverse momentum (pt) relative to the jet axisand from the analysis of the ight distance distribution of secondary verticestagged by either a high pt lepton or an identi�ed kaon. In the opposite hemi-sphere of the event, the charge of the initial quark has been evaluated using ahigh pt lepton, a charged kaon or the mean jet charge. With 1.7 million hadronicZ0 decays recorded by DELPHI between 1991 and 1993, �md is found to be:
�md = 0:531+0:050�0:046 (stat:)� 0:078 (syst:) ps�1 :
(To be submitted to Zeit f. Physik C.)
ii
P.Abreu21, W.Adam50, T.Adye37, E.Agasi31 , I.Ajinenko42, R.Aleksan39 , G.D.Alekseev16 , R.Alemany49 ,
P.P.Allport22, S.Almehed24, U.Amaldi9, S.Amato47, A.Andreazza28, M.L.Andrieux14 , P.Antilogus9 ,
W-D.Apel17 , Y.Arnoud39, B.�Asman44, J-E.Augustin19 , A.Augustinus9 , P.Baillon9 , P.Bambade19, R.Barate14,
M.Barbi47 , D.Y.Bardin16, A.Baroncelli40 , O.Barring24 , J.A.Barrio26, W.Bartl50 , M.J.Bates37, M.Battaglia15 ,
M.Baubillier23 , J.Baudot39, K-H.Becks52, M.Begalli6 , P.Beilliere8 , Yu.Belokopytov9;53 , A.C.Benvenuti5 ,
M.Berggren47, D.Bertrand2 , F.Bianchi45 , M.Bigi45 , M.S.Bilenky16 , P.Billoir23 , D.Bloch10 , M.Blume52 ,
S.Blyth35 , T.Bolognese39 , M.Bonesini28 , W.Bonivento28 , P.S.L.Booth22, G.Borisov42, C.Bosio40 , S.Bosworth35 ,
O.Botner48, E.Boudinov31 , B.Bouquet19, C.Bourdarios9 , T.J.V.Bowcock22, M.Bozzo13, P.Branchini40 ,
K.D.Brand36, T.Brenke52, R.A.Brenner15, C.Bricman2, L.Brillault23 , R.C.A.Brown9, P.Bruckman18 ,
J-M.Brunet8, L.Bugge33 , T.Buran33, T.Burgsmueller52 , P.Buschmann52 , A.Buys9, S.Cabrera49, M.Caccia28 ,
M.Calvi28 , A.J.Camacho Rozas41, T.Camporesi9, V.Canale38, M.Canepa13 , K.Cankocak44 , F.Cao2, F.Carena9,
L.Carroll22 , C.Caso13, M.V.Castillo Gimenez49 , A.Cattai9, F.R.Cavallo5, L.Cerrito38, V.Chabaud9 ,
Ph.Charpentier9 , L.Chaussard25 , J.Chauveau23, P.Checchia36, G.A.Chelkov16, M.Chen2, R.Chierici45 ,
P.Chliapnikov42 , P.Chochula7, V.Chorowicz9, J.Chudoba30 , V.Cindro43, P.Collins9 , J.L.Contreras19,
R.Contri13, E.Cortina49, G.Cosme19, F.Cossutti46 , H.B.Crawley1, D.Crennell37 , G.Crosetti13,
J.Cuevas Maestro34, S.Czellar15 , E.Dahl-Jensen29 , J.Dahm52, B.Dalmagne19 , M.Dam29, G.Damgaard29 ,
P.D.Dauncey37 , M.Davenport9 , W.Da Silva23 , C.Defoix8, A.Deghorain2 , G.Della Ricca46 , P.Delpierre27 ,
N.Demaria35, A.De Angelis9 , W.De Boer17, S.De Brabandere2 , C.De Clercq2, C.De La Vaissiere23 ,
B.De Lotto46, A.De Min36, L.De Paula47 , C.De Saint-Jean39 , H.Dijkstra9, L.Di Ciaccio38 , F.Djama10,
J.Dolbeau8 , M.Donszelmann9 , K.Doroba51, M.Dracos10, J.Drees52, K.-A.Drees52, M.Dris32 , Y.Dufour9,
D.Edsall1 , R.Ehret17, G.Eigen4, T.Ekelof48, G.Ekspong44 , M.Elsing52 , J-P.Engel10, N.Ershaidat23 , B.Erzen43,
M.Espirito Santo21, E.Falk24, D.Fassouliotis32 , M.Feindt9 , A.Fenyuk42, A.Ferrer49, T.A.Filippas32 ,
A.Firestone1, P.-A.Fischer10, H.Foeth9, E.Fokitis32 , F.Fontanelli13 , F.Formenti9, B.Franek37, P.Frenkiel8 ,
D.C.Fries17, A.G.Frodesen4, F.Fulda-Quenzer19 , J.Fuster49, A.Galloni22 , D.Gamba45, M.Gandelman6 ,
C.Garcia49, J.Garcia41 , C.Gaspar9, U.Gasparini36 , Ph.Gavillet9 , E.N.Gazis32, D.Gele10, J-P.Gerber10,
M.Gibbs22 , R.Gokieli51 , B.Golob43 , G.Gopal37 , L.Gorn1, M.Gorski51, Yu.Gouz45;53 , V.Gracco13, E.Graziani40 ,
G.Grosdidier19 , K.Grzelak51 , S.Gumenyuk28;53 , P.Gunnarsson44 , M.Gunther48, J.Guy37, F.Hahn9, S.Hahn52 ,
A.Hallgren48 , K.Hamacher52, W.Hao31, F.J.Harris35, V.Hedberg24, R.Henriques21 , J.J.Hernandez49,
P.Herquet2, H.Herr9, T.L.Hessing35, E.Higon49 , H.J.Hilke9, T.S.Hill1, S-O.Holmgren44, P.J.Holt35,
D.Holthuizen31 , S.Hoorelbeke2 , M.Houlden22 , J.Hrubec50, K.Huet2, K.Hultqvist44 , J.N.Jackson22,
R.Jacobsson44 , P.Jalocha18, R.Janik7 , Ch.Jarlskog24, G.Jarlskog24 , P.Jarry39, B.Jean-Marie19 ,
E.K.Johansson44, L.Jonsson24, P.Jonsson24 , C.Joram9, P.Juillot10 , M.Kaiser17, F.Kapusta23, K.Karafasoulis11 ,
M.Karlsson44 , E.Karvelas11 , S.Katsanevas3 , E.C.Katsou�s32, R.Keranen4, Yu.Khokhlov42 , B.A.Khomenko16,
N.N.Khovanski16, B.King22 , N.J.Kjaer29, H.Klein9, A.Klovning4 , P.Kluit31, B.Koene31, P.Kokkinias11 ,
M.Koratzinos9 , K.Korcyl18 , C.Kourkoumelis3 , O.Kouznetsov13;16 , P.-H.Kramer52, M.Krammer50, C.Kreuter17,
I.Kronkvist24 , Z.Krumstein16 , W.Krupinski18 , P.Kubinec7 , W.Kucewicz18, K.Kurvinen15 , C.Lacasta49,
I.Laktineh25 , S.Lamblot23 , J.W.Lamsa1, L.Lanceri46 , D.W.Lane1, P.Langefeld52 , I.Last22, J-P.Laugier39,
R.Lauhakangas15 , G.Leder50, F.Ledroit14, V.Lefebure2, C.K.Legan1, R.Leitner30, Y.Lemoigne39, J.Lemonne2,
G.Lenzen52, V.Lepeltier19 , T.Lesiak36, D.Liko50 , R.Lindner52 , A.Lipniacka36 , I.Lippi36 , B.Loerstad24 ,
J.G.Loken35, J.M.Lopez41, D.Loukas11, P.Lutz39, L.Lyons35, J.MacNaughton50, G.Maehlum17 , A.Maio21 ,
V.Malychev16 , F.Mandl50 , J.Marco41, R.Marco41, B.Marechal47 , M.Margoni36 , J-C.Marin9, C.Mariotti40 ,
A.Markou11, T.Maron52, C.Martinez-Rivero41 , F.Martinez-Vidal49 , S.Marti i Garcia49 , J.Masik30 ,
F.Matorras41, C.Matteuzzi9, G.Matthiae38, M.Mazzucato36 , M.Mc Cubbin9 , R.Mc Kay1, R.Mc Nulty22 ,
J.Medbo48, M.Merk31, C.Meroni28 , S.Meyer17, W.T.Meyer1, A.Miagkov42 , M.Michelotto36 , E.Migliore45 ,
L.Mirabito25 , W.A.Mitaro�50 , U.Mjoernmark24, T.Moa44, R.Moeller29 , K.Moenig9, M.R.Monge13 ,
P.Morettini13 , H.Mueller17 , L.M.Mundim6 , W.J.Murray37, B.Muryn18 , G.Myatt35, F.Naraghi14 , F.L.Navarria5,
S.Navas49, K.Nawrocki51, P.Negri28, W.Neumann52 , N.Neumeister50, R.Nicolaidou3 , B.S.Nielsen29 ,
M.Nieuwenhuizen31 , V.Nikolaenko10 , P.Niss44, A.Nomerotski36 , A.Normand35, W.Oberschulte-Beckmann17 ,
V.Obraztsov42, A.G.Olshevski16 , A.Onofre21, R.Orava15, K.Osterberg15, A.Ouraou39, P.Paganini19 ,
M.Paganoni9 , P.Pages10, H.Palka18, Th.D.Papadopoulou32 , K.Papageorgiou11 , L.Pape9, C.Parkes35,
F.Parodi13 , A.Passeri40 , M.Pegoraro36, L.Peralta21, H.Pernegger50, M.Pernicka50 , A.Perrotta5, C.Petridou46 ,
A.Petrolini13 , M.Petrovyck28;53 , H.T.Phillips37 , G.Piana13 , F.Pierre39, M.Pimenta21 , M.Pindo28 ,
S.Plaszczynski19 , O.Podobrin17 , M.E.Pol6, G.Polok18 , P.Poropat46, V.Pozdniakov16 , M.Prest46, P.Privitera38 ,
N.Pukhaeva16 , A.Pullia28 , D.Radojicic35 , S.Ragazzi28 , H.Rahmani32 , J.Rames12, P.N.Rato�20, A.L.Read33,
M.Reale52 , P.Rebecchi19 , N.G.Redaelli28 , M.Regler50, D.Reid9 , P.B.Renton35, L.K.Resvanis3 , F.Richard19 ,
J.Richardson22 , J.Ridky12 , G.Rinaudo45 , I.Ripp39 , A.Romero45, I.Roncagliolo13 , P.Ronchese36, L.Roos14,
E.I.Rosenberg1, E.Rosso9, P.Roudeau19 , T.Rovelli5 , W.Ruckstuhl31 , V.Ruhlmann-Kleider39 , A.Ruiz41 ,
H.Saarikko15 , Y.Sacquin39 , A.Sadovsky16 , G.Sajot14, J.Salt49, J.Sanchez26, M.Sannino13 , M.Schimmelpfennig17 ,
H.Schneider17 , U.Schwickerath17 , M.A.E.Schyns52, G.Sciolla45 , F.Scuri46 , P.Seager20, Y.Sedykh16 , A.M.Segar35,
A.Seitz17, R.Sekulin37 , R.C.Shellard6 , I.Siccama31 , P.Siegrist39 , S.Simonetti39 , F.Simonetto36 , A.N.Sisakian16 ,
B.Sitar7, T.B.Skaali33 , G.Smadja25 , N.Smirnov42, O.Smirnova16 , G.R.Smith37 , O.Solovianov42 , R.Sosnowski51 ,
D.Souza-Santos6 , T.Spassov21, E.Spiriti40 , P.Sponholz52 , S.Squarcia13 , C.Stanescu40, S.Stapnes33 , I.Stavitski36 ,
F.Stichelbaut9 , A.Stocchi19, J.Strauss50, R.Strub10, B.Stugu4, M.Szczekowski51 , M.Szeptycka51, T.Tabarelli28 ,
iii
J.P.Tavernet23, O.Tchikilev42 , A.Tilquin27 , J.Timmermans31 , L.G.Tkatchev16, T.Todorov10, D.Z.Toet31,
A.Tomaradze2, B.Tome21, A.Tonazzo28, L.Tortora40, G.Transtromer24, D.Treille9 , W.Trischuk9, G.Tristram8,
A.Trombini19 , C.Troncon28, A.Tsirou9, M-L.Turluer39 , I.A.Tyapkin16 , M.Tyndel37 , S.Tzamarias22 ,
B.Ueberschaer52 , O.Ullaland9 , V.Uvarov42, G.Valenti5, E.Vallazza9 , C.Vander Velde2, G.W.Van Apeldoorn31 ,
P.Van Dam31, W.K.Van Doninck2 , J.Van Eldik31 , N.Vassilopoulos35 , G.Vegni28, L.Ventura36, W.Venus37,
F.Verbeure2, M.Verlato36, L.S.Vertogradov16, D.Vilanova39 , P.Vincent25, L.Vitale46 , E.Vlasov42 ,
A.S.Vodopyanov16 , V.Vrba12, H.Wahlen52, C.Walck44, F.Waldner46 , M.Weierstall52 , P.Weilhammer9 ,
C.Weiser17, A.M.Wetherell9 , D.Wicke52 , J.H.Wickens2, M.Wielers17 , G.R.Wilkinson35 , W.S.C.Williams35 ,
M.Winter10 , K.Woschnagg48 , K.Yip35, O.Yushchenko42, F.Zach25, A.Zaitsev42, A.Zalewska18 , P.Zalewski51 ,
D.Zavrtanik43 , E.Zevgolatakos11 , N.I.Zimin16, M.Zito39 , D.Zontar43 , R.Zuberi35 , G.C.Zucchelli44 , G.Zumerle36
1Ames Laboratory and Department of Physics, Iowa State University, Ames IA 50011, USA
2Physics Department, Univ. Instelling Antwerpen, Universiteitsplein 1, B-2610 Wilrijk, Belgium
and IIHE, ULB-VUB, Pleinlaan 2, B-1050 Brussels, Belgium
and Facult�e des Sciences, Univ. de l'Etat Mons, Av. Maistriau 19, B-7000 Mons, Belgium3Physics Laboratory, University of Athens, Solonos Str. 104, GR-10680 Athens, Greece
4Department of Physics, University of Bergen, All�egaten 55, N-5007 Bergen, Norway
5Dipartimento di Fisica, Universit�a di Bologna and INFN, Via Irnerio 46, I-40126 Bologna, Italy
6Centro Brasileiro de Pesquisas F�isicas, rua Xavier Sigaud 150, RJ-22290 Rio de Janeiro, Brazil
and Depto. de F�isica, Pont. Univ. Cat�olica, C.P. 38071 RJ-22453 Rio de Janeiro, Brazil
and Inst. de F�isica, Univ. Estadual do Rio de Janeiro, rua S~ao Francisco Xavier 524, Rio de Janeiro, Brazil
7Comenius University, Faculty of Mathematics and Physics, Mlynska Dolina, SK-84215 Bratislava, Slovakia
8Coll�ege de France, Lab. de Physique Corpusculaire, IN2P3-CNRS, F-75231 Paris Cedex 05, France
9CERN, CH-1211 Geneva 23, Switzerland
10Centre de Recherche Nucl�eaire, IN2P3 - CNRS/ULP - BP20, F-67037 Strasbourg Cedex, France
11Institute of Nuclear Physics, N.C.S.R. Demokritos, P.O. Box 60228, GR-15310 Athens, Greece
12FZU, Inst. of Physics of the C.A.S. High Energy Physics Division, Na Slovance 2, 180 40, Praha 8, Czech Republic
13Dipartimento di Fisica, Universit�a di Genova and INFN, Via Dodecaneso 33, I-16146 Genova, Italy
14Institut des Sciences Nucl�eaires, IN2P3-CNRS, Universit�e de Grenoble 1, F-38026 Grenoble Cedex, France
15Research Institute for High Energy Physics, SEFT, P.O. Box 9, FIN-00014 Helsinki, Finland
16Joint Institute for Nuclear Research, Dubna, Head Post O�ce, P.O. Box 79, 101 000 Moscow, Russian Federation
17Institut f�ur Experimentelle Kernphysik, Universit�at Karlsruhe, Postfach 6980, D-76128 Karlsruhe, Germany
18Institute of Nuclear Physics and University of Mining and Metalurgy, Ul. Kawiory 26a, PL-30055 Krakow, Poland
19Universit�e de Paris-Sud, Lab. de l'Acc�el�erateur Lin�eaire, IN2P3-CNRS, Bat. 200, F-91405 Orsay Cedex, France
20School of Physics and Materials, University of Lancaster, Lancaster LA1 4YB, UK
21LIP, IST, FCUL - Av. Elias Garcia, 14-1
o, P-1000 Lisboa Codex, Portugal
22Department of Physics, University of Liverpool, P.O. Box 147, Liverpool L69 3BX, UK
23LPNHE, IN2P3-CNRS, Universit�es Paris VI et VII, Tour 33 (RdC), 4 place Jussieu, F-75252 Paris Cedex 05, France
24Department of Physics, University of Lund, S�olvegatan 14, S-22363 Lund, Sweden
25Universit�e Claude Bernard de Lyon, IPNL, IN2P3-CNRS, F-69622 Villeurbanne Cedex, France
26Universidad Complutense, Avda. Complutense s/n, E-28040 Madrid, Spain
27Univ. d'Aix - Marseille II - CPP, IN2P3-CNRS, F-13288 Marseille Cedex 09, France
28Dipartimento di Fisica, Universit�a di Milano and INFN, Via Celoria 16, I-20133 Milan, Italy
29Niels Bohr Institute, Blegdamsvej 17, DK-2100 Copenhagen 0, Denmark
30NC, Nuclear Centre of MFF, Charles University, Areal MFF, V Holesovickach 2, 180 00, Praha 8, Czech Republic
31NIKHEF-H, Postbus 41882, NL-1009 DB Amsterdam, The Netherlands
32National Technical University, Physics Department, Zografou Campus, GR-15773 Athens, Greece
33Physics Department, University of Oslo, Blindern, N-1000 Oslo 3, Norway
34Dpto. Fisica, Univ. Oviedo, C/P. P�erez Casas, S/N-33006 Oviedo, Spain
35Department of Physics, University of Oxford, Keble Road, Oxford OX1 3RH, UK
36Dipartimento di Fisica, Universit�a di Padova and INFN, Via Marzolo 8, I-35131 Padua, Italy
37Rutherford Appleton Laboratory, Chilton, Didcot OX11 OQX, UK
38Dipartimento di Fisica, Universit�a di Roma II and INFN, Tor Vergata, I-00173 Rome, Italy
39Centre d'Etudes de Saclay, DSM/DAPNIA, F-91191 Gif-sur-Yvette Cedex, France
40Istituto Superiore di Sanit�a, Ist. Naz. di Fisica Nucl. (INFN), Viale Regina Elena 299, I-00161 Rome, Italy
41Instituto de Fisica de Cantabria (CSIC-UC), Avda. los Castros, S/N-39006 Santander, Spain, (CICYT-AEN93-0832)
42Inst. for High Energy Physics, Serpukov P.O. Box 35, Protvino, (Moscow Region), Russian Federation
43J. Stefan Institute and Department of Physics, University of Ljubljana, Jamova 39, SI-61000 Ljubljana, Slovenia
44Fysikum, Stockholm University, Box 6730, S-113 85 Stockholm, Sweden
45Dipartimento di Fisica Sperimentale, Universit�a di Torino and INFN, Via P. Giuria 1, I-10125 Turin, Italy
46Dipartimento di Fisica, Universit�a di Trieste and INFN, Via A. Valerio 2, I-34127 Trieste, Italy
and Istituto di Fisica, Universit�a di Udine, I-33100 Udine, Italy47Univ. Federal do Rio de Janeiro, C.P. 68528 Cidade Univ., Ilha do Fund~ao BR-21945-970 Rio de Janeiro, Brazil
48Department of Radiation Sciences, University of Uppsala, P.O. Box 535, S-751 21 Uppsala, Sweden
49IFIC, Valencia-CSIC, and D.F.A.M.N., U. de Valencia, Avda. Dr. Moliner 50, E-46100 Burjassot (Valencia), Spain
50Institut f�ur Hochenergiephysik, �Osterr. Akad. d. Wissensch., Nikolsdorfergasse 18, A-1050 Vienna, Austria
51Inst. Nuclear Studies and University of Warsaw, Ul. Hoza 69, PL-00681 Warsaw, Poland
52Fachbereich Physik, University of Wuppertal, Postfach 100 127, D-42097 Wuppertal 1, Germany
53On leave of absence from IHEP Serpukhov
1
1 Introduction
In the Standard Model, the B0
q ��B0
q (q = d; s) mixing is a direct consequence of
second order weak interactions. Starting with a B0
q meson produced at time t = 0, the
probability, P, to observe a B0
q decaying at the time t can be written, neglecting e�ectsfrom CP violation:
P(B0
q ! B0
q) =�q
2e��qt(cosh(
��q
2t) + cos(�mqt))
where �q =�Hq + �
Lq
2, ��q = �L
q � �Hq and �mq = mL
q � mHq . L and H denote
respectively the light and heavy physical states. The oscillation period gives a directmeasurement of the mass di�erence between the two physical states.
For B0
d mesons, the Standard Model predicts that ��d � �md. Therefore theprevious expression simpli�es to:
P(B0
d ! B0
d) = �de��dt cos2(�mdt
2)
and similarly:
P(B0
d ! B0
d) = �de��dt sin2(�mdt
2) :
Measurements of time integrated probabilities for mixing �q =x2q
2(1 + x2q)with
xq = �mq
�qhave been already derived from �(4S) and LEP results [1]. Time depen-
dent oscillations of B0
d mesons have also been measured at LEP [2].The analysis presented here gives a measurement of �md based on data taken by
DELPHI at LEP1 from 1991 to 1993. The principle of the method is the following: afterhaving divided the charged and neutral particles from Z0 decay into two hemispheresseparated by the plane transverse to the sphericity axis, a \production sign" is de�nedon one side, which is correlated to the sign of the initial quark at the production point;in the other hemisphere the ight distance of the B hadron is evaluated and a \decay
sign" is de�ned, correlated to the B0=B0 nature of the decaying hadron. Three taggingprocedures have been used, which give a measurement of the charge of the b or b quarkwhen it decays inside the B hadron:
� Direct semileptonic decays of b quarks produce a negative lepton, with a branchingfraction close to 10% per each lepton avour. These leptons have usually a largertransverse momentum, relative to the axis of the jet they belong to, than thoseproduced in lighter avour decays.
� The dominant decay chain b! c! s generates an excess of K� relative to K+ in B
hadron decays (apart for B0
s mesons for which similar numbers of kaons of the twosigns are expected). Kaons from B hadron decays can be isolated by requiring thattheir measured trajectory has a signi�cant o�set relative to the position of the Z0
decay.� Finally the value of the mean charge of particles produced in a jet is sensitive to thecharge of the b quark producing the jet.
In section 2 the components of the DELPHI detector which are important for thisanalysis are described. Section 3 presents the event selection, particle identi�cation andMonte-Carlo simulation. In section 4 a measurement of �md is obtained from the dileptonevent sample alone. In section 5 the analysis is extended to other tagging procedures andconclusions are given in section 6. As the extended analysis includes most of the dileptonsample, only this last measurement has been quoted as the �nal result.

2
2 The DELPHI detector
The events used in this analysis were collected at LEP running near the Z0 peakwith the DELPHI detector [3]. The performance of the detector is detailed in [4]. Therelevant parts for lepton identi�cation are the muon chambers and the electromagneticcalorimeters. The Vertex Detector is used in combination with the central tracking devicesto measure precisely the charged particle trajectories close to the beam interaction point.
The DELPHI reference frame is de�ned with z along the e� beam, x towards thecentre of LEP and y upwards. Angular coordinates are �, measured from z, the azimuth,�, from the x-axis, while R is the distance from the z-axis.
The muon chambers are drift chambers located at the periphery of DELPHI. Thebarrel part (�0:63 < cos(�) < 0:63) is composed of three sets of modules, each of twoactive layers, and gives z and R� coordinates. In the forward part, two layers of twoplanes give the x and y coordinates in the transverse plane. The precision of thesedetectors has to be taken into account for muon identi�cation: it has been measured tobe �1 cm in z and �0:2 cm in R� for the barrel part, and �0:4 cm for each of the twocoordinates given by the forward part. The number of absorption lengths determines thehadron contamination and is approximatively 8 at 90�.
Electrons are absorbed in electromagnetic calorimeters; the High density ProjectionChamber (HPC) covers the barrel part and provides three dimensional information onelectromagnetic showers with 18 radiation lengths thickness. Calorimeters in the endcapregions are not used in this analysis because their acceptance is not matched with thesolid angle covered by the vertex detector.
During the relevant period of data taking (1991 to 1993), the Vertex Detector (VD) [5]consisted of three cylinders of silicon strip detectors, at average radii of 6.3, 9 and 11 cm.This detector measured the coordinates of charged particle tracks in the transverse planewith respect to the beam direction with a precision of �8�m. The association of thisdetector to the central tracking system of DELPHI, consisting of the Time Projection
Chamber (TPC) and the Inner and Outer Detectors, gave aq242 + (69=p)2 �m (p in
GeV/c units) precision on the impact parameter of charged particles with respect to theprimary vertex. The 192 sense wires of the TPC also measure the speci�c energy loss,or dE/dx, of charged particles, as the 80% truncated mean of the amplitudes of the wiresignals, with a minimum requirement of 30 wires. This dE/dx measurement is availablefor 75% of charged particles in hadronic jets, with a precision which has been measuredto be �7:5%. It has been used for electron identi�cation.
To identify kaons with momenta between 3 and 15 GeV/c (this range corresponds toa typical kaon from a B decay), the gas radiator of the barrel Ring Imaging CHerenkovdetector (RICH) is used: below 8.5 GeV/c, it works in the \veto" mode (kaons andprotons give no Cherenkov photons and are thus distinguished from pions and leptons,but not from each other); above this threshold, kaons are distinguished from all othercharged particles by measuring the radius of the ring of detected Cherenkov photons. Acomplete description of this detector is given in [6].
3 Event Selection
Hadronic decays of the Z0 were selected by requiring the total energy of the chargedparticles in each hemisphere to exceed 3 GeV (assuming all charged particles to be pions),the total energy of the charged particles to exceed 15 GeV and at least 5 charged particles
3
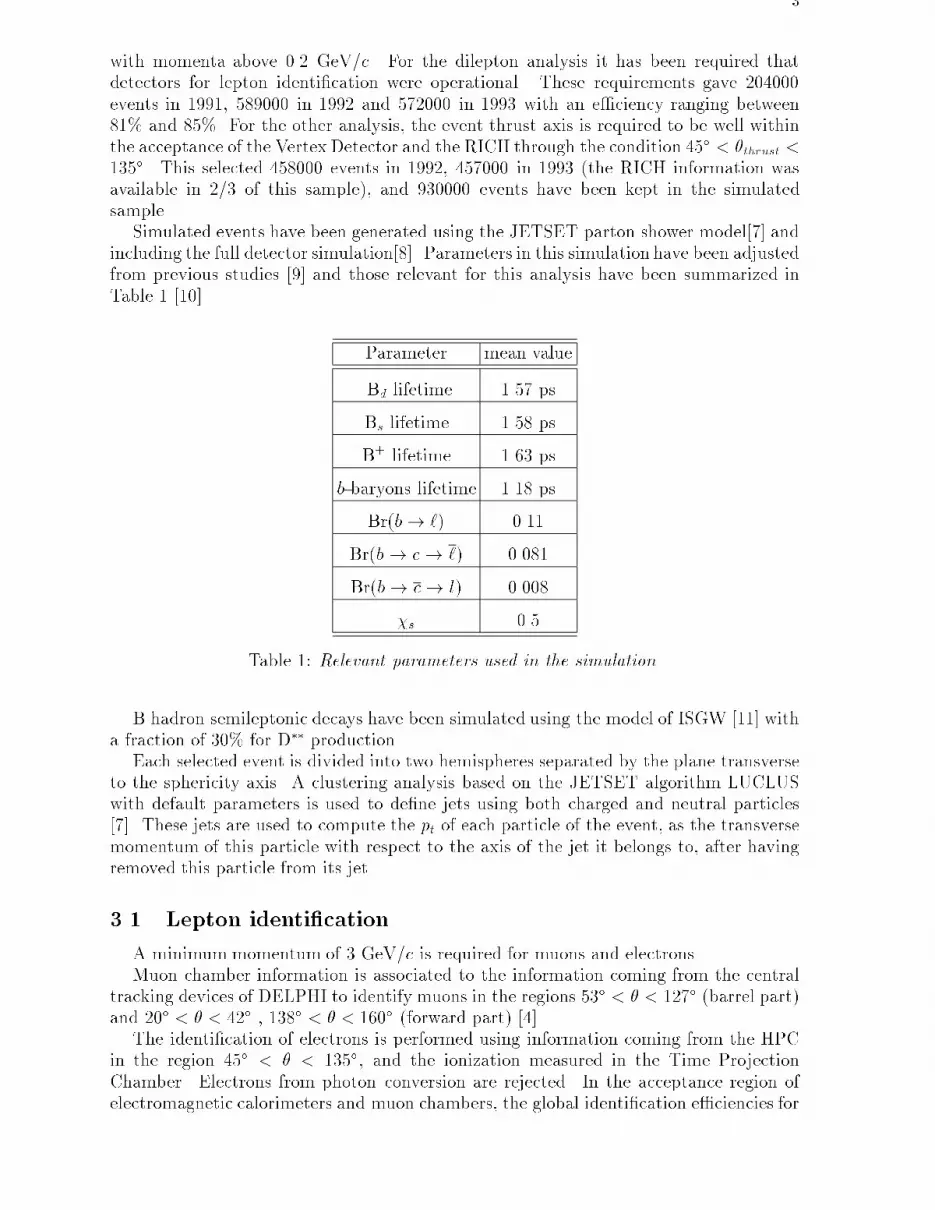
with momenta above 0.2 GeV/c. For the dilepton analysis it has been required thatdetectors for lepton identi�cation were operational. These requirements gave 204000events in 1991, 589000 in 1992 and 572000 in 1993 with an e�ciency ranging between81% and 85%. For the other analysis, the event thrust axis is required to be well withinthe acceptance of the Vertex Detector and the RICH through the condition 45� < �thrust <
135�. This selected 458000 events in 1992, 457000 in 1993 (the RICH information wasavailable in 2/3 of this sample), and 930000 events have been kept in the simulatedsample.
Simulated events have been generated using the JETSET parton shower model[7] andincluding the full detector simulation[8]. Parameters in this simulation have been adjustedfrom previous studies [9] and those relevant for this analysis have been summarized inTable 1 [10].
Parameter mean value
Bd lifetime 1.57 ps
Bs lifetime 1.58 ps
B+ lifetime 1.63 ps
b-baryons lifetime 1.18 ps
Br(b! `) 0.11
Br(b! c! `) 0.081
Br(b! c! l) 0.008
�s 0.5
Table 1: Relevant parameters used in the simulation.
B hadron semileptonic decays have been simulated using the model of ISGW [11] witha fraction of 30% for D�� production.
Each selected event is divided into two hemispheres separated by the plane transverseto the sphericity axis. A clustering analysis based on the JETSET algorithm LUCLUSwith default parameters is used to de�ne jets using both charged and neutral particles[7]. These jets are used to compute the pt of each particle of the event, as the transversemomentum of this particle with respect to the axis of the jet it belongs to, after havingremoved this particle from its jet.
3.1 Lepton identi�cation
A minimum momentum of 3 GeV/c is required for muons and electrons.Muon chamber information is associated to the information coming from the central
tracking devices of DELPHI to identify muons in the regions 53� < � < 127� (barrel part)and 20� < � < 42� , 138� < � < 160� (forward part) [4].
The identi�cation of electrons is performed using information coming from the HPCin the region 45� < � < 135�, and the ionization measured in the Time ProjectionChamber. Electrons from photon conversion are rejected. In the acceptance region ofelectromagnetic calorimeters and muon chambers, the global identi�cation e�ciencies for
4
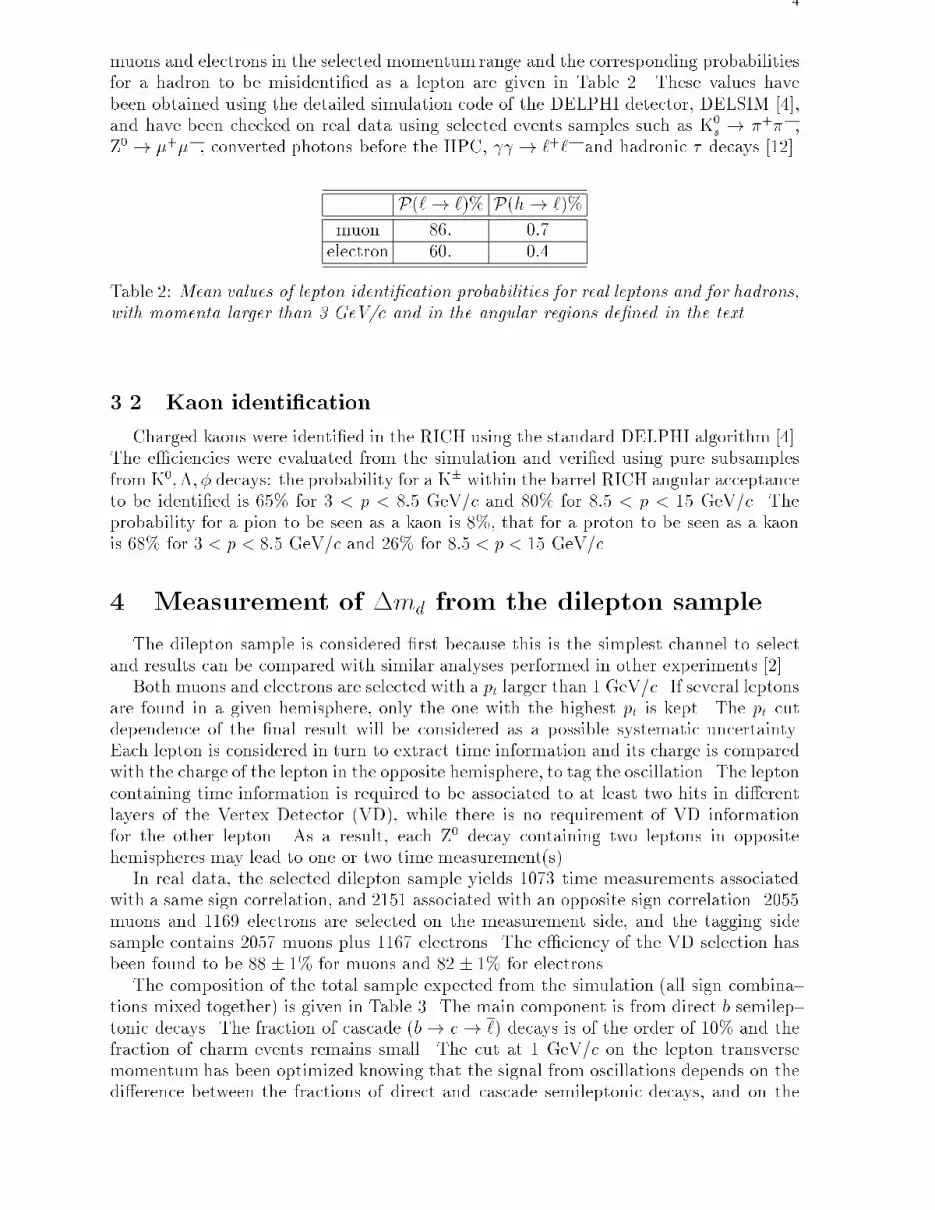
muons and electrons in the selected momentum range and the corresponding probabilitiesfor a hadron to be misidenti�ed as a lepton are given in Table 2. These values havebeen obtained using the detailed simulation code of the DELPHI detector, DELSIM [4],and have been checked on real data using selected events samples such as K0
s ! �+��,Z0 ! �+��, converted photons before the HPC, ! `+`� and hadronic � decays [12].
P(`! `)% P(h! `)%
muon 86: 0:7electron 60: 0:4
Table 2: Mean values of lepton identi�cation probabilities for real leptons and for hadrons,
with momenta larger than 3 GeV/c and in the angular regions de�ned in the text.
3.2 Kaon identi�cation
Charged kaons were identi�ed in the RICH using the standard DELPHI algorithm [4].The e�ciencies were evaluated from the simulation and veri�ed using pure subsamplesfrom K0;�; � decays: the probability for a K� within the barrel RICH angular acceptanceto be identi�ed is 65% for 3 < p < 8:5 GeV/c and 80% for 8:5 < p < 15 GeV/c. Theprobability for a pion to be seen as a kaon is 8%, that for a proton to be seen as a kaonis 68% for 3 < p < 8:5 GeV/c and 26% for 8:5 < p < 15 GeV/c.
4 Measurement of �md from the dilepton sample
The dilepton sample is considered �rst because this is the simplest channel to selectand results can be compared with similar analyses performed in other experiments [2].
Both muons and electrons are selected with a pt larger than 1 GeV/c. If several leptonsare found in a given hemisphere, only the one with the highest pt is kept. The pt cutdependence of the �nal result will be considered as a possible systematic uncertainty.Each lepton is considered in turn to extract time information and its charge is comparedwith the charge of the lepton in the opposite hemisphere, to tag the oscillation. The leptoncontaining time information is required to be associated to at least two hits in di�erentlayers of the Vertex Detector (VD), while there is no requirement of VD informationfor the other lepton. As a result, each Z0 decay containing two leptons in oppositehemispheres may lead to one or two time measurement(s).
In real data, the selected dilepton sample yields 1073 time measurements associatedwith a same sign correlation, and 2151 associated with an opposite sign correlation. 2055muons and 1169 electrons are selected on the measurement side, and the tagging sidesample contains 2057 muons plus 1167 electrons. The e�ciency of the VD selection hasbeen found to be 88 � 1% for muons and 82 � 1% for electrons.
The composition of the total sample expected from the simulation (all sign combina-tions mixed together) is given in Table 3. The main component is from direct b semilep-tonic decays. The fraction of cascade (b! c! `) decays is of the order of 10% and thefraction of charm events remains small. The cut at 1 GeV/c on the lepton transversemomentum has been optimized knowing that the signal from oscillations depends on thedi�erence between the fractions of direct and cascade semileptonic decays, and on the

5
number of selected events. The remaining events contain the following categories, withsmall associated fractions: semileptonic decays in a b decay chain, fake leptons in a b
decay chain, charged particles coming from the primary vertex in bb events and lightquark events.
Lepton origin Relative fraction
b! ` 79.4%
b! c! ` 9.6%
other leptons in a b decay chain 3.0%
fake leptons in a b decay chain 2.7%
primary vertex particles in a b hemisphere 1.5%
c! ` lepton 3.3%
u; d; s! lepton 0.5%
Table 3: Composition of the simulated sample on the impact parameter measurement side.
4.1 Measurement of the B decay time using the lepton impact
parameter
The measurement of �md is extracted from a study of the impact parameter distri-bution obtained from same sign and opposite sign dilepton events: a primary vertex isreconstructed in the transverse (R�) plane for each event, through an iterative vertex �tincluding the beam pro�le information [13,4], where at each step the track contributingmost to the �2 is removed until none contributes more than 5 �2 units. The impactparameter � of the lepton is measured with respect to the primary vertex position andhas a positive or negative lifetime sign depending on the relative position of the primaryvertex and the intersection of the lepton with the jet along the jet direction. t� = �=c isthe time sensitive variable which is used in the analysis.
The precision on the impact parameter is dominated by the accuracy on the primaryvertex determination (approximatively �50�m in the horizontal and �20�m in the ver-tical direction).
The correlation between t� and the true proper time of the B meson is smeared by thedecay kinematics and by the energy distribution of B mesons. The e�ective proper timeresolution (t� � ttrueB )=ttrueB has a width of 70% and a 40% shift towards lower values dueto the reconstruction procedure which is performed in the transverse plane only; such aresolution is in fact su�cient to study the slow B0
d oscillation.The data and simulated samples are composed of events with one t� measurement in
a single hemisphere, and of events with t� measurements in both hemispheres. The datasample contains 249 same sign and 455 opposite sign events with one measurement, 412same sign and 848 opposite sign events with two measurements. When �md is set to 0.45ps�1 in the simulation, the simulated sample contains 752 same sign and 1418 oppositesign events with one measurement, and 1407 same sign and 3032 opposite sign eventswith two measurements.
6
4.2 Fitting method and results
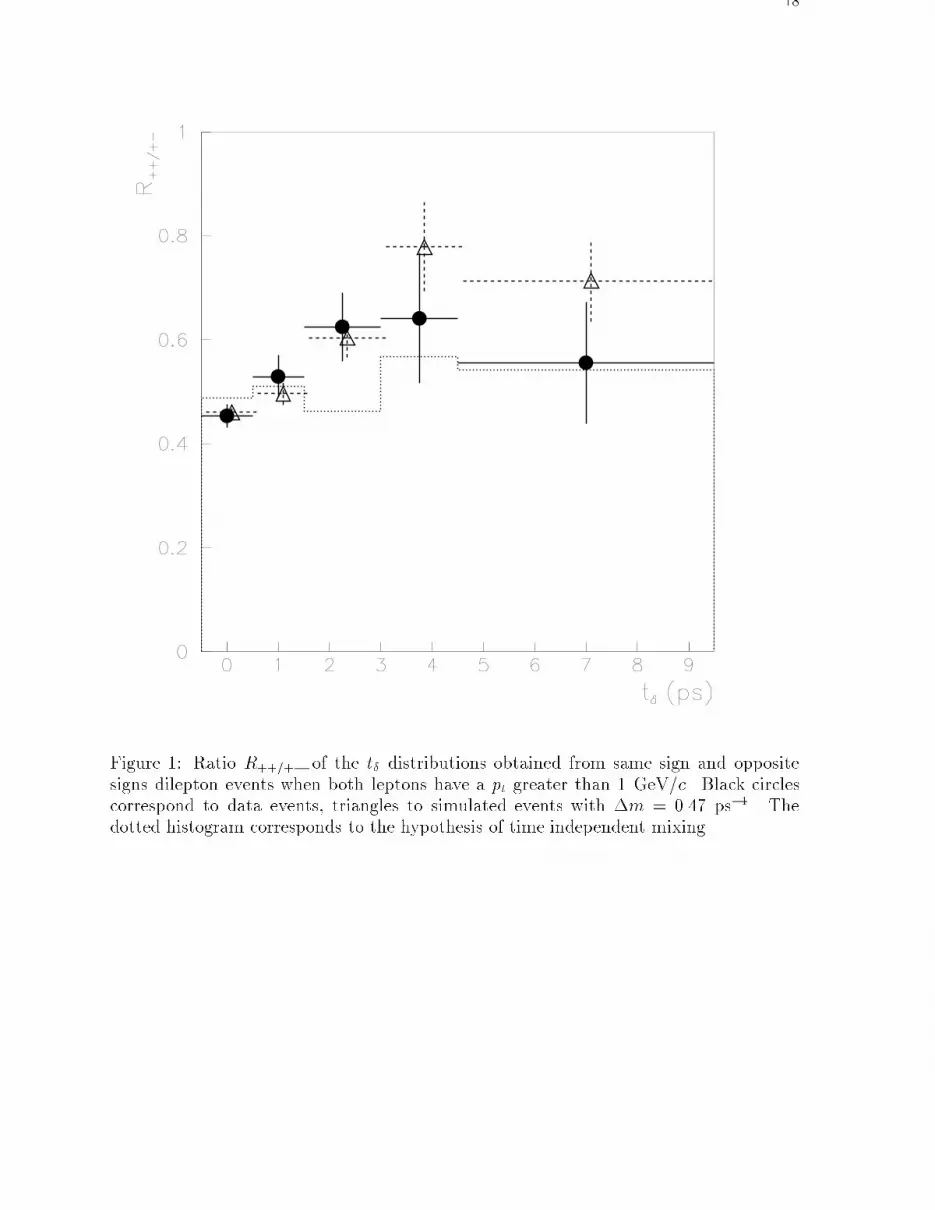
The t� distribution obtained from same sign events has been divided by the t� distri-bution obtained using opposite sign events, and the resulting distribution will be referredto as the R++=+�(t�) distribution (Figure 1). Each t� measurement enters once in this
distribution. In the absence of B0
d oscillations, the distribution is expected to be at atlarge t�; the observed time dependence comes from B0
d oscillations.The R++=+� distributions obtained from the data and from the simulation have been
compared using a binned �2 �t with �md as the only free parameter. For a given �md
in the �t the simulated data have been adjusted to conform to the probabilities given inthe introduction. Events with one and two time measurements have been treated sepa-rately in the �t. For events with two measurements, the two-dimensional distributionsR++=+�(t�1; t�2) have been compared. The binning used in this �t and in the followinghas been de�ned such that each bin or each box contains at least 10 events. To satisfythis condition, 3 bins were used for events with a single t� measurement (grouping the last3 bins of Figure 1 together), and a 3�3 grid was used for events with two measurements.
The �md measurement obtained in this way is
�md = 0:47� 0:08 ps�1
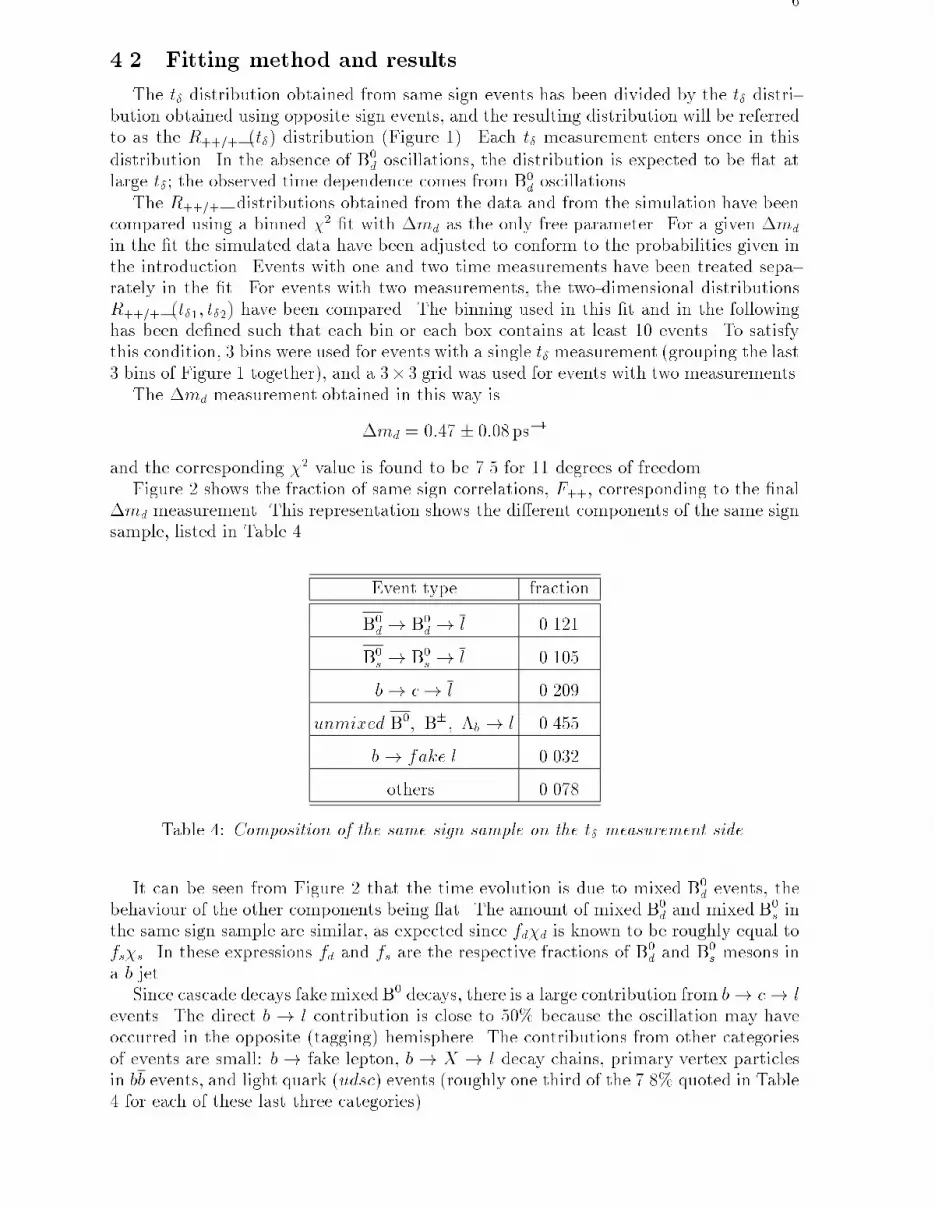
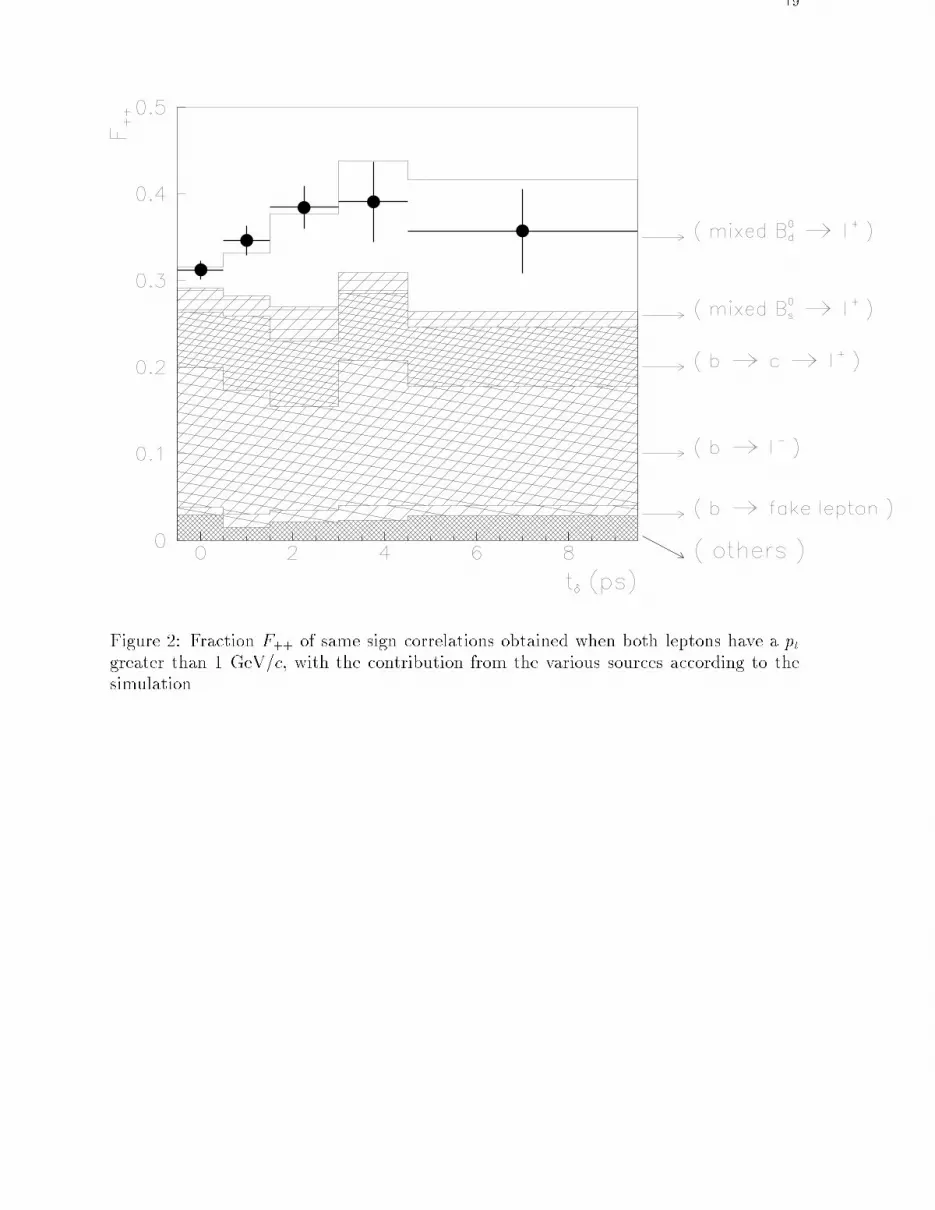
and the corresponding �2 value is found to be 7.5 for 11 degrees of freedom.Figure 2 shows the fraction of same sign correlations, F++, corresponding to the �nal
�md measurement. This representation shows the di�erent components of the same signsample, listed in Table 4.
Event type fraction
B0
d ! B0
d ! l 0.121
B0
s ! B0
s ! l 0.105
b! c! l 0.209
unmixed B0; B�; �b ! l 0.455
b! fake l 0.032
others 0.078
Table 4: Composition of the same sign sample on the t� measurement side.
It can be seen from Figure 2 that the time evolution is due to mixed B0
d events, thebehaviour of the other components being at. The amount of mixed B0
d and mixed B0
s inthe same sign sample are similar, as expected since fd�d is known to be roughly equal tofs�s. In these expressions fd and fs are the respective fractions of B
0
d and B0
s mesons ina b jet.
Since cascade decays fake mixedB0 decays, there is a large contribution from b! c! �levents. The direct b ! l contribution is close to 50% because the oscillation may haveoccurred in the opposite (tagging) hemisphere. The contributions from other categoriesof events are small: b! fake lepton, b ! X ! l decay chains, primary vertex particlesin bb events, and light quark (udsc) events (roughly one third of the 7.8% quoted in Table4 for each of these last three categories).
7
4.3 Study of systematic uncertainties
The systematic uncertainty on the above measured value is computed by varying, inturn, the relevant parameters of the simulation and then re-making the �md �t.
Four dominant e�ects have been studied (see Table 5):
� B hadron lifetimes: the largest contribution comes from the uncertainty on the B0
d
lifetime.� B hadron production rate: the fractions fd and fs of B
0
d and B0
s mesons producedin the fragmentation of a b quark have been obtained from the measurements of theintegrated oscillation rates � and �d obtained at LEP, by other experiments andat the �(4S) [14]. The fraction of b-baryon production, fb�baryon = (11:6 � 3:2%)has been taken from measurements of �c production in c jets [15], assuming thatit is similar for �b in b jets and using a rate of (2 � 2%) for �b states. From theexpressions:
1 = fd + fu + fs + fb�baryon and � = fd�d + fs�s
and assuming fd = fu because, for B mesons, as opposed to D mesons, no asymmetrybetween the B0
d and B� production rates is expected from the decay of excited states
one obtains:
fd =(1�fb�baryon)�s��
2�s��dand fs =
2��(1�fb�baryon)�d2�s��d
.
Using �s = 0:5, � = 0:116 � 0:006 and �d = 0:168 � 0:016 one obtains fd =(39:2 � 2:2%) and fs = (10:0 � 2:2%). The uncertainties on fd and on fs appear tobe weakly correlated. The error on fd is dominated by the uncertainty on fb�baryonand the error on fs receives similar contributions from the errors on � and on �d. As aconsequence, in the following, it has been assumed that fd and fs vary independentlyand that their corresponding variation is compensated by a change in fb�baryon.
� Lepton origin: uncertainties on direct and cascade branching fractions remain thesecond source of uncertainty after the e�ect from fd=fs. Uncertainties on direct andcascade semileptonic branching fractions have been treated independently and thequoted values include the additional uncertainties coming from the modelling of thedecays.
� Finally, �s is varied separately, and the corresponding variation on �md is 0.015ps�1.
It has been checked that the contribution from the uncertainty on the b quark frag-mentation distribution is negligible by �tting the simulated b fragmentation function witha Peterson function, and changing the � parameter so that the mean fraction of the beamenergy, taken by the B meson, varies between 0.68 and 0.72.
Performing the �t on the sample of events which give only one t� measurement leadsto:
�md = 0:46+0:15�0:12 ps�1 ;
and using only events with two t� measurements gives:
�md = 0:47+0:11�0:10 ps
�1 :
It has also been checked that the results found using muons or electrons only, as wellas 1992 or 1993 data only, were compatible within the statistical errors. Because of thelimited statistics, these last checks were done using a global one-dimensional �t to theR++=+�(t�) distribution with each t� measurement entering once.

8
Parameter Central value Uncertainty E�ect on �md (ps�1)
Bd lifetime 1.57 ps � 0.05 ps � 0.012global b lifetime 1.567 ps � 0.020 ps � 0.003
fd 0.392 � 0.022 � 0.010fs 0.100 � 0.022 � 0.045
Br(b! l) 0.110 � 0.010 � 0.050Br(b! c! l) 0.081 � 0.008 � 0.046
c! l fraction 0.030 � 0.003 � 0.003Background fraction 0.034 � 0.007 � 0.015
�s 0.50 -0.03 +0.015
Table 5: Contributions to the systematic error on �md.
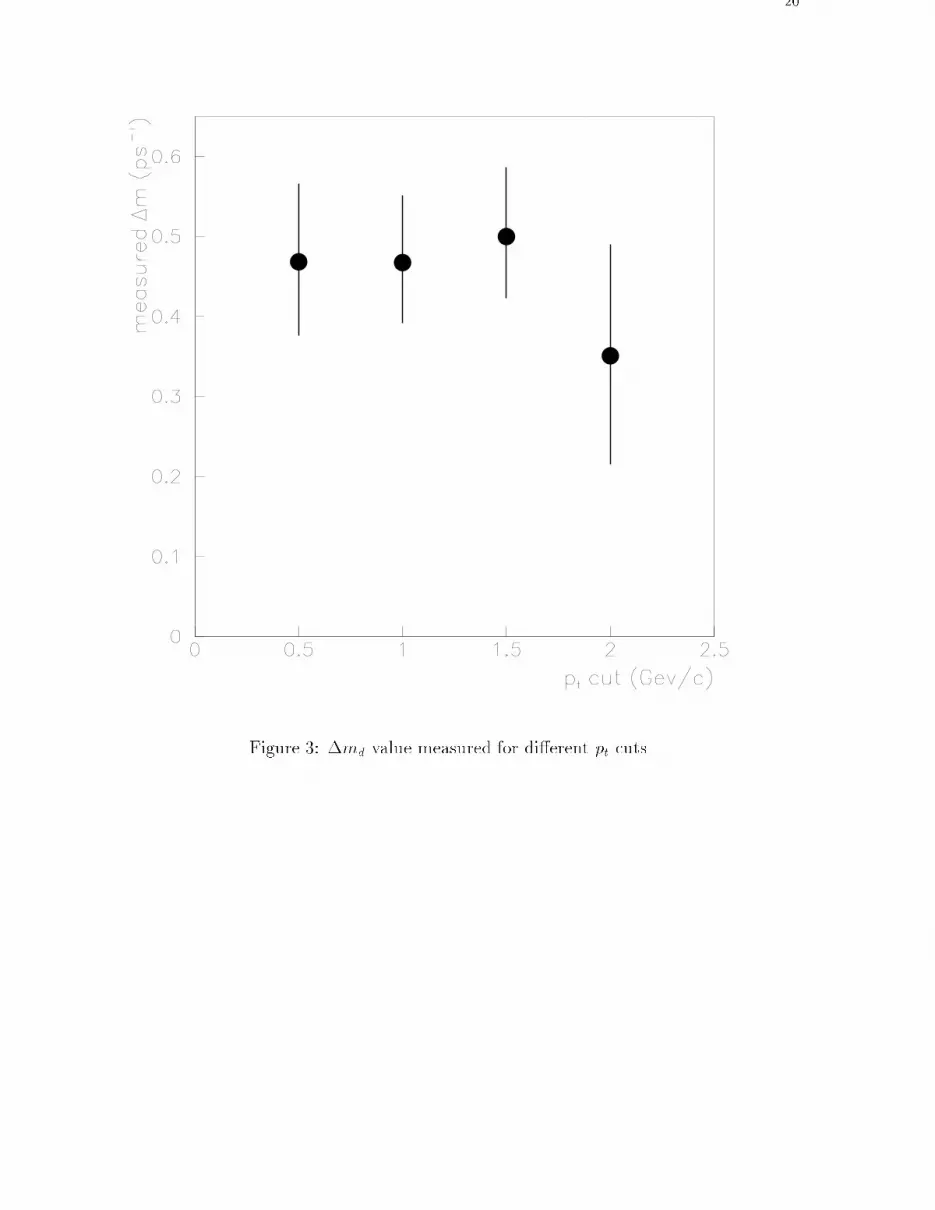
Finally, the pt cut was varied (keeping the same momentum cuts), and no systematice�ect was observed (Figure 3).
Adding in quadrature the contributions to the systematic error given in Table 5 yieldsthe result:
�md = 0:47� 0:08 (stat:)+0:09�0:08 (syst:)ps
�1 :
5 Measurement of �md using leptons, K� and jet
charge
In the following, the analysis of section 4 has been extended to include additional �nalstates using identi�ed charged kaons and the mean jet charge. The B decay distance willalso be evaluated in space to enhance the sensitivity of the measurement to oscillations.
Tagging procedures used to de�ne the samples of mixed and unmixed events candidatesare described along with the algorithm used to measure the B hadron decay distance.The �tting procedure used to measure �md is then given and the sources of systematicuncertainties are analyzed. The tagging probabilities and decay distance parametrizationshave been evaluated for seven categories of hemispheres: u=d, s, c, B�, B0
d, B0
s, b-baryons.
For each category and each tagging indicator the probabilities Prighttag and Pwrong
tag , tohave a right sign or a wrong sign, have been obtained from simulation. They have beende�ned as \right" (\wrong") if the \production" sign is the same as (opposite to) the signof the quark or of the antiquark emitted in the hemisphere, assuming that its avour isalways beauty. For B0
d mesons these probabilities include the e�ect of the time-integratedoscillation: they have been computed for di�erent values of �md and the correspondingvalues are compatible with a linear interpolation. The B0
s oscillation frequency is assumedto be high enough to give constant values, independent of the decay distance. Table 6gives the results.
5.1 Tagging procedures
The measurements of the signs of three variables have been used, in a combined way,to establish the presence of a b or a b quark in a given hemisphere (\production" sign)and to identify a B or a B meson when it decays (\decay" sign). These variables are:

9
� The charge of leptons emitted at pt larger than 1GeV/c. Lepton selection cuts aresimilar to those applied in section 4. If two particles of opposite sign ful�ll theseconditions, in the same hemisphere, the event is not kept. This \production" sign isde�ned in 9 % of the b hemispheres and the ratio right sign/wrong sign to correctlyidentify a b or a b quark is about 5.
� The charge of kaons produced at a secondary vertex. This tag is based on thedominant decay chain b ! c ! s which implies that the sign of a secondary kaonis strongly correlated to the sign of the decaying quark. This has been studied indetail and measured in [16], and the fractions of decays with a right/wrong signkaon (excluding ambiguous cases with a K+ and a K� in the same hemisphere )are roughly 50% and 10 % respectively. Kaons have been identi�ed by the RICHdetector in the range 3 < p < 15 GeV/c. An additional cut is applied to favour asecondary K� from a B by requiring that its impact parameter with respect to themain vertex be larger than 1.5 times the measurement error. This production signis de�ned in 23 % of cases, i.e. more frequently than the lepton sign, but the ratioright sign/wrong sign, of about 2, is lower. More background is also expected fromu; d; s; c avors.
� The mean jet charge, which is a weighted sum of the charges of particles belongingto the most energetic jet in the hemisphere. It depends on the charge of the quarkproducing this jet and is de�ned as:
Qjet = (X
qip�i )=(
Xp�i )
where, in the denominator, the sum is extended also to neutral particles. pi andqi are the individual particle momenta and charges. The weighting exponent � ischosen to be 0:6 to optimize the discrimination [17] (however its precise value is notcrucial). The mean value of Qjet is slightly biased by nuclear interactions in thedetector: in practice the sign of (Qjet � 0:015) gives the right b=b nature in 62 % ofthe cases.The b purity, which is the fraction of bb events in the selected sample, is improved byapplying a b-tagging condition obtained from the values of the impact parameters,�, of the ntr: charged particles in the jet, relative to the event main vertex:
1
ntr: � 1
ntr:�1X
i=1
�2i�2�i
> 2
The track with the largest contribution has been excluded from the sum to reducee�ects of secondary interactions, decays or poor measurements. Uncertainties ontrack impact parameters, ��, include track measurement errors and uncertainties onthe Z0 decay point.
To optimize the discrimination and to reduce double counting, the \production" signhas been obtained using the following indicators for a hemisphere:
� Jet sign and lepton sign (j + l) in agreement: this discriminates better than thelepton sign alone. This indicator is de�ned in 8% of the b hemispheres.
� Jet sign and kaon sign in agreement (j +K): this indicator is de�ned in 16% of theb hemispheres.
� Jet sign alone with b-tagging condition (j+b tag): this is used when the other criteriaare not de�ned, provided jQjet� 0:015j > 0:1. This condition gives on average 67 %of right sign assignments and is de�ned for 39% of the b hemispheres.
10
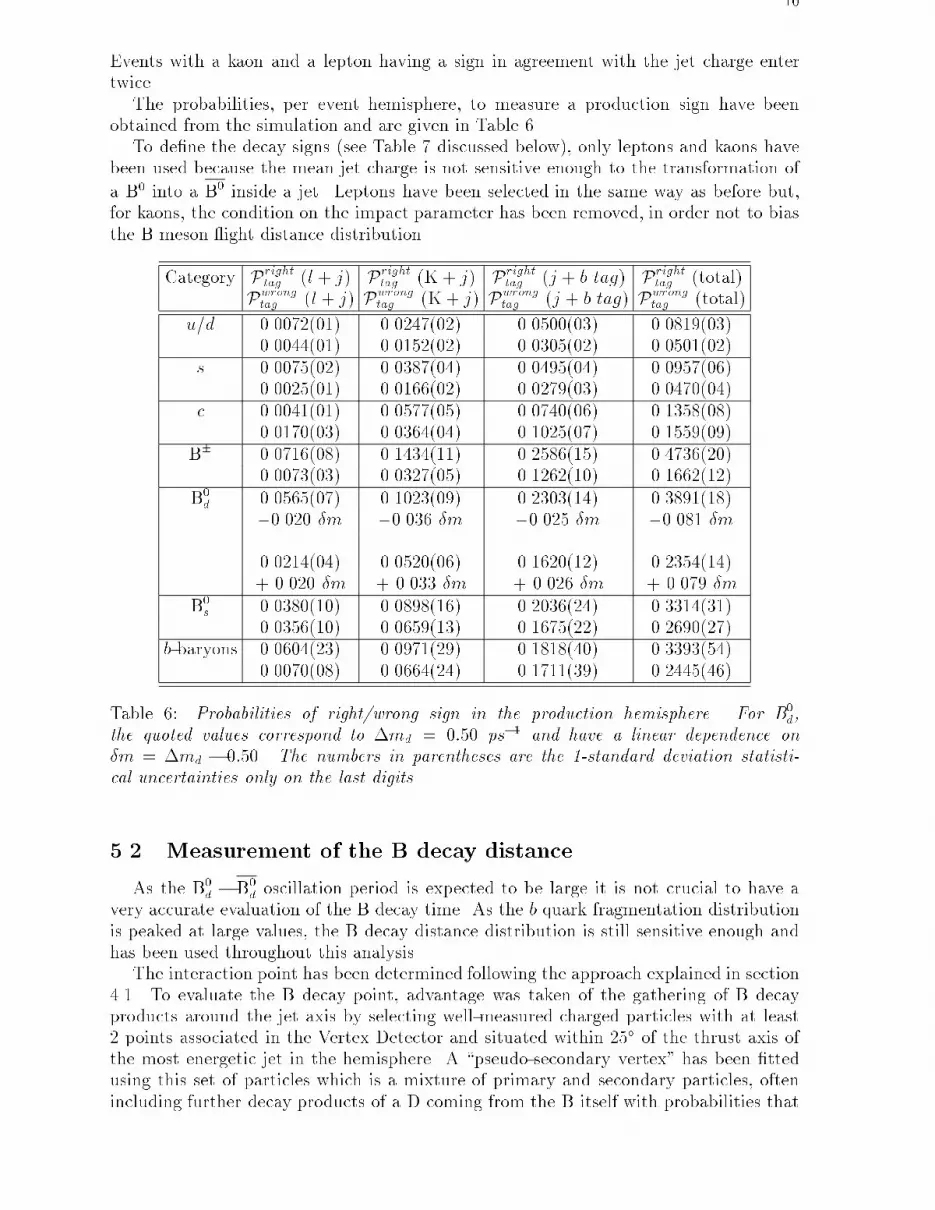
Events with a kaon and a lepton having a sign in agreement with the jet charge entertwice.
The probabilities, per event hemisphere, to measure a production sign have beenobtained from the simulation and are given in Table 6.
To de�ne the decay signs (see Table 7 discussed below), only leptons and kaons havebeen used because the mean jet charge is not sensitive enough to the transformation of
a B0 into a B0 inside a jet. Leptons have been selected in the same way as before but,for kaons, the condition on the impact parameter has been removed, in order not to biasthe B meson ight distance distribution.
Category Prighttag (l + j) P
righttag (K + j) P
righttag (j + b tag) P
righttag (total)
Pwrongtag (l + j) Pwrong
tag (K + j) Pwrongtag (j + b tag) Pwrong
tag (total)
u=d 0.0072(01) 0.0247(02) 0.0500(03) 0.0819(03)0.0044(01) 0.0152(02) 0.0305(02) 0.0501(02)
s 0.0075(02) 0.0387(04) 0.0495(04) 0.0957(06)0.0025(01) 0.0166(02) 0.0279(03) 0.0470(04)
c 0.0041(01) 0.0577(05) 0.0740(06) 0.1358(08)0.0170(03) 0.0364(04) 0.1025(07) 0.1559(09)
B� 0.0716(08) 0.1434(11) 0.2586(15) 0.4736(20)0.0073(03) 0.0327(05) 0.1262(10) 0.1662(12)
B0
d 0.0565(07) 0.1023(09) 0.2303(14) 0.3891(18)- 0.020 �m - 0.036 �m - 0.025 �m - 0.081 �m
0.0214(04) 0.0520(06) 0.1620(12) 0.2354(14)+ 0.020 �m + 0.033 �m + 0.026 �m + 0.079 �m
B0
s 0.0380(10) 0.0898(16) 0.2036(24) 0.3314(31)0.0356(10) 0.0659(13) 0.1675(22) 0.2690(27)
b-baryons 0.0604(23) 0.0971(29) 0.1818(40) 0.3393(54)0.0070(08) 0.0664(24) 0.1711(39) 0.2445(46)
Table 6: Probabilities of right/wrong sign in the production hemisphere. For B0
d,
the quoted values correspond to �md = 0:50 ps�1 and have a linear dependence on
�m = �md � 0:50. The numbers in parentheses are the 1-standard deviation statisti-
cal uncertainties only on the last digits.
5.2 Measurement of the B decay distance
As the B0
d � B0
d oscillation period is expected to be large it is not crucial to have avery accurate evaluation of the B decay time. As the b quark fragmentation distributionis peaked at large values, the B decay distance distribution is still sensitive enough andhas been used throughout this analysis.
The interaction point has been determined following the approach explained in section4.1. To evaluate the B decay point, advantage was taken of the gathering of B decayproducts around the jet axis by selecting well-measured charged particles with at least2 points associated in the Vertex Detector and situated within 25� of the thrust axis ofthe most energetic jet in the hemisphere. A \pseudo-secondary vertex" has been �ttedusing this set of particles which is a mixture of primary and secondary particles, oftenincluding further decay products of a D coming from the B itself with probabilities that

11
are independent of the B ight. In order to keep long ight distances no cut has beenapplied on the �2 probability of this vertex. As a result, the expectation value, �, of thedistance from the primary vertex to this pseudo-secondary vertex depends linearly onthe actual ight as shown in Figure 4. The tails in the distributions have been removedpartially by a cut on the longitudinal error of the vertex �t. This procedure does not biasthe decay distance distribution because it does not rely on the actual value of the �2 ofthe vertex �t. Figure 5 compares the normalized � distribution for data and simulatedevents. An additional smearing of the simulated distribution has been performed byadding a random term distributed according to a Breit-Wigner function, with a half-width of 140�m, so that the two distributions agree for negative values of �.
5.3 Parametrization of the decay distance distributions
The basic assumption is that the probabilities of correctly de�ning the productionsign, the decay sign and the distance estimate are independent for a given avour. Asa consequence the two hemispheres can be parametrized separately but the di�erent Bhadrons have to be distinguished.
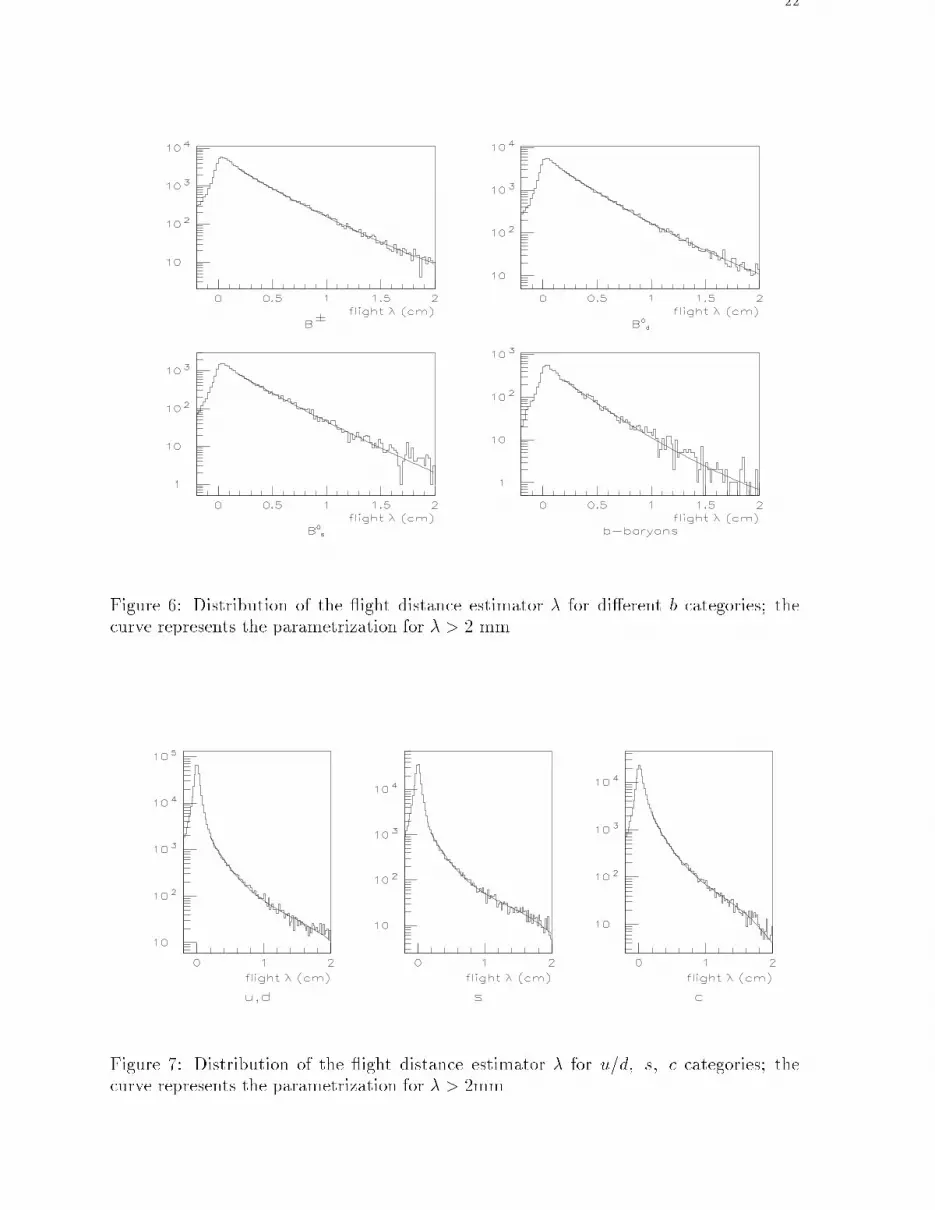
Let � be the ight distance estimator and Pcat(�) the probability density distributionto observe a given value of � in a hemisphere for a given category. For b categories thedistribution Pcat(�) is the convolution of the exponential b-decay time distribution withthe b quark fragmentation function and with the resolution function on �. As a result,it is di�cult to write a reliable analytic expression for Pcat. The simplest solution is totake this distribution from the simulation. Small values of � are largely contaminated bythe u; d; s; c background and contain very little information on the oscillation frequency,because they correspond to times where the sin2(�mdt=2) factor is small. For � largerthan 2 mm the Pcat(�) distributions are close to exponentials. Figure 6 shows how theslopes corresponding to di�erent B hadrons, simulated with the same lifetime, exhibitslight di�erences due to the topological selection because the fractions of primary andsecondary particles at the pseudo-secondary vertex are not exactly the same. For u=d; scategories, the shape of Pcat(�) is dominated by the resolution (see Figure 7), while, forthe c category, charm decays give also a signi�cant contribution. The Pcat(�) distributionshave been parametrized using the exponential of a fourth order polynomial in the range� > 2mm.
These distributions have been normalized so thatR1
�minPcat(�) = 1.
As for the quark tagging procedures, at decay time the B meson can be correctly signed
or not by the lepton or kaon charges and the corresponding probabilities (Pright=wrongdec;cat )
have been evaluated for all values of � larger than �min.For charged B mesons or b-baryons the �nal probability density distribution to measure
a decay distance � is then:
Pright=wrongdec;cat (�) = P
right=wrongdec;cat Pcat(�) :
For B0
d mesons these probabilities are di�erent if they have oscillated (Pright=wrongdec;osc ) or not
(Pright=wrongdec;noosc ) and have been evaluated separately. Table 7 shows that the right/wrong
probabilities are not far from being simply exchanged when the B0 has oscillated.Then the distance-dependent probability may be written:
Pright=wrongdec (�) = [ P
right=wrongdec;noosc (1 �Posc(�)) + P
right=wrongdec;osc Posc(�) ] PB0
d
(�)
where Posc(�) is the probability, for a B0
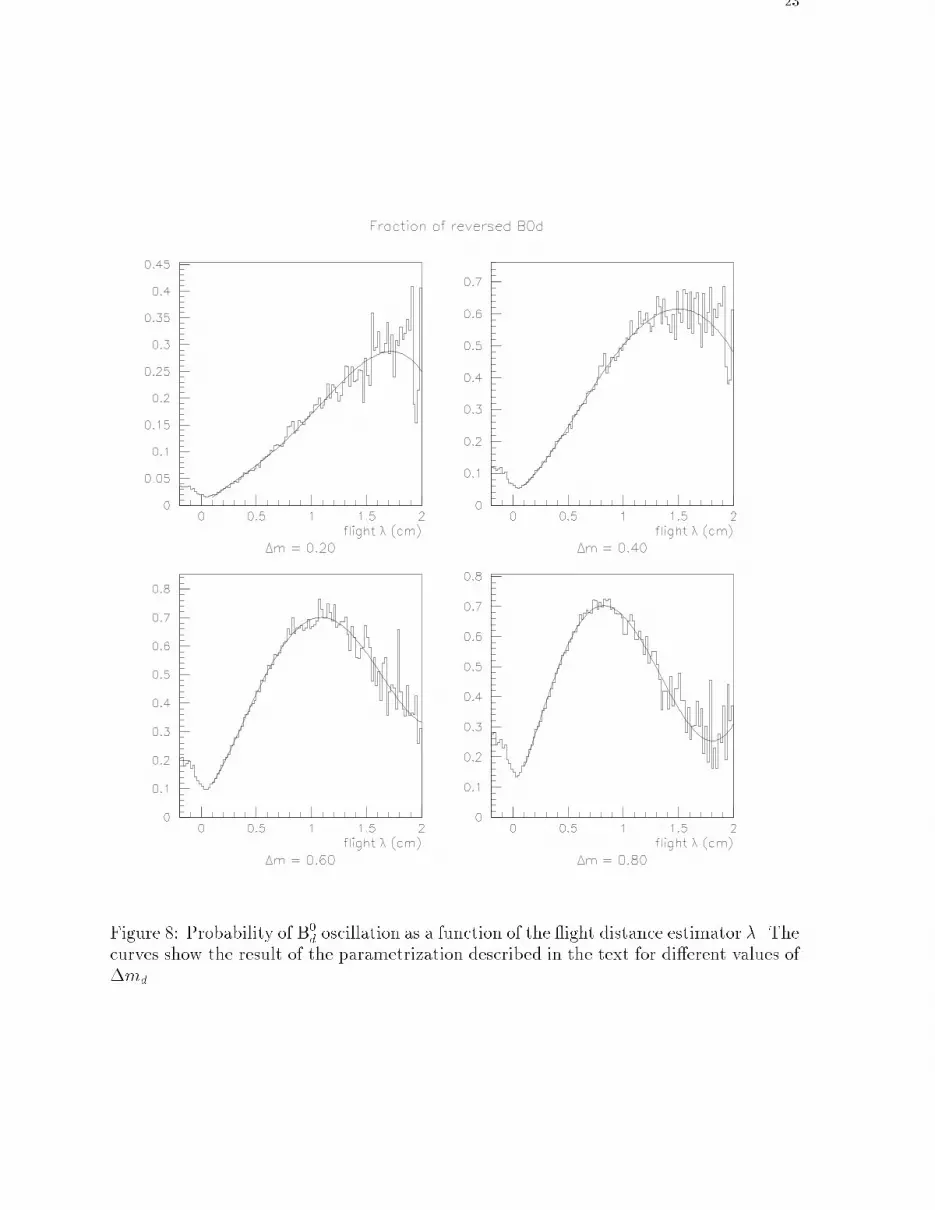
d decaying at �, to have oscillated. It has beenparametrized by a polynomial of degree 4 or 5 in � for 16 di�erent values of �md between
12
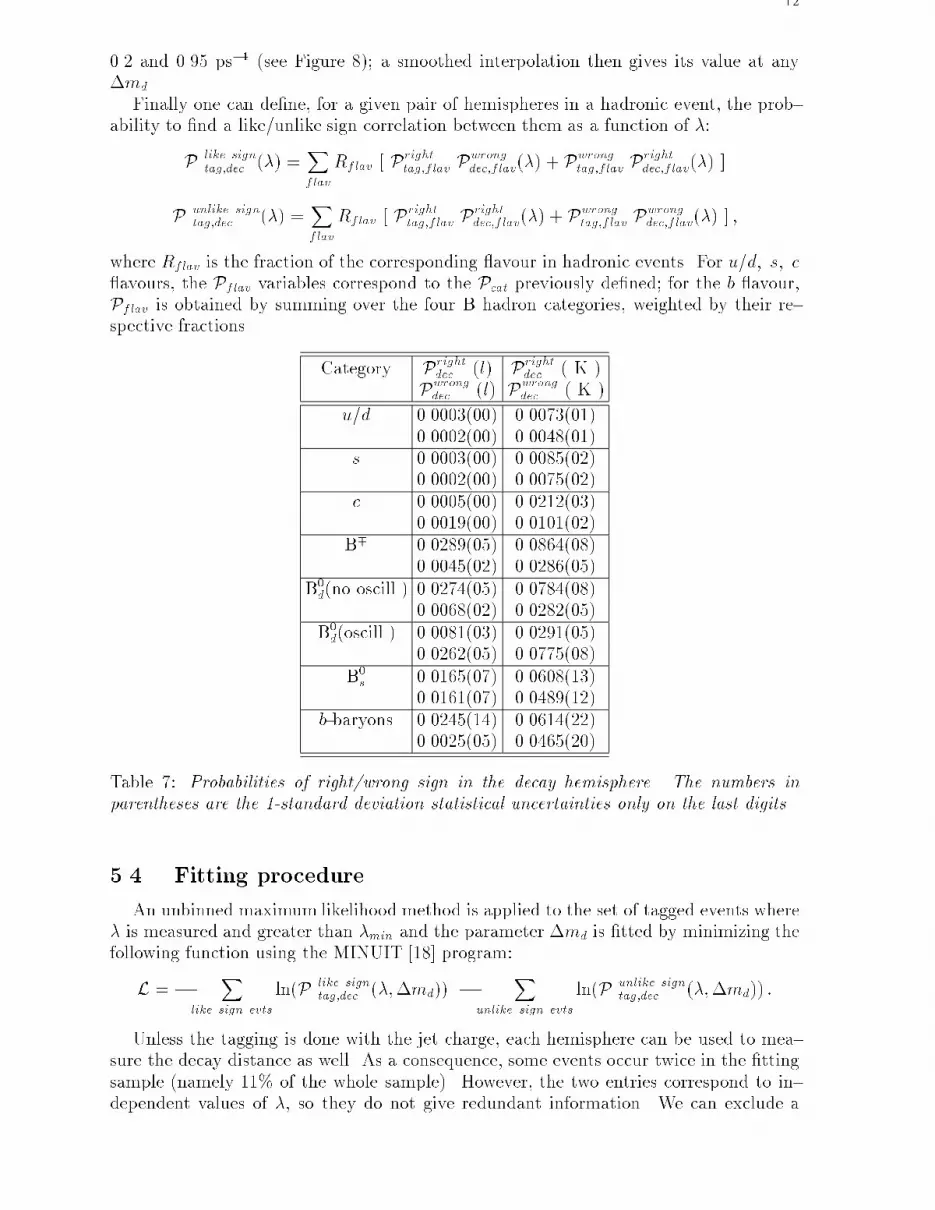
0.2 and 0.95 ps�1 (see Figure 8); a smoothed interpolation then gives its value at any�md.
Finally one can de�ne, for a given pair of hemispheres in a hadronic event, the prob-ability to �nd a like/unlike sign correlation between them as a function of �:
Plike signtag;dec (�) =
X
flav
Rflav [ Prighttag;f lav P
wrongdec;f lav(�) + P
wrongtag;f lav P
rightdec;f lav(�) ]
Punlike signtag;dec (�) =
X
flav
Rflav [ Prighttag;f lav P
rightdec;f lav(�) + P
wrongtag;f lav P
wrongdec;f lav(�) ] ;
where Rflav is the fraction of the corresponding avour in hadronic events. For u=d; s; c avours, the Pflav variables correspond to the Pcat previously de�ned; for the b avour,Pflav is obtained by summing over the four B hadron categories, weighted by their re-spective fractions.
Category Prightdec (l) P
rightdec ( K )
Pwrongdec (l) P
wrongdec ( K )
u=d 0.0003(00) 0.0073(01)0.0002(00) 0.0048(01)
s 0.0003(00) 0.0085(02)0.0002(00) 0.0075(02)
c 0.0005(00) 0.0212(03)0.0019(00) 0.0101(02)
B� 0.0289(05) 0.0864(08)0.0045(02) 0.0286(05)
B0
d(no oscill.) 0.0274(05) 0.0784(08)0.0068(02) 0.0282(05)
B0
d(oscill.) 0.0081(03) 0.0291(05)0.0262(05) 0.0775(08)
B0
s 0.0165(07) 0.0608(13)0.0161(07) 0.0489(12)
b-baryons 0.0245(14) 0.0614(22)0.0025(05) 0.0465(20)
Table 7: Probabilities of right/wrong sign in the decay hemisphere. The numbers in
parentheses are the 1-standard deviation statistical uncertainties only on the last digits.
5.4 Fitting procedure
An unbinned maximum likelihood method is applied to the set of tagged events where� is measured and greater than �min and the parameter �md is �tted by minimizing thefollowing function using the MINUIT [18] program:
L = �X
like sign evts
ln(P like signtag;dec (�;�md)) �
X
unlike sign evts
ln(P unlike signtag;dec (�;�md)) :
Unless the tagging is done with the jet charge, each hemisphere can be used to mea-sure the decay distance as well. As a consequence, some events occur twice in the �ttingsample (namely 11% of the whole sample). However, the two entries correspond to in-dependent values of �, so they do not give redundant information. We can exclude a

13
signi�cant underestimate of the statistical error through the following test: when sup-pressing completely the double counting (by excluding randomly one of the two entriesfor the same event), the statistical error is increased by about 10%; the e�ect of doublecounting is necessarily smaller because this procedure corresponds to a loss of informationin the sample.
The same procedure is applied to simulated events to check its consistency.
5.5 Results and study of systematic errors
The �t has been performed on real data with �min = 2mm. Table 8 gives the numberof entries available for each combination of sign indicators. The result is:
�md = 0:568+0:050�0:046 (stat:) ps
�1 :
decay sign # tag sign ! j + l j +K j + b tag
l 1383 1347 7350
K 2264 4494 12575
Table 8: Number of entries for each sign combination with � > 2 mm.
The same procedure, applied on a simulated sample generated with �md = 0:50 ps�1
and with similar statistics as the data, gives
�md = 0:470 � 0:039 ps�1 ;
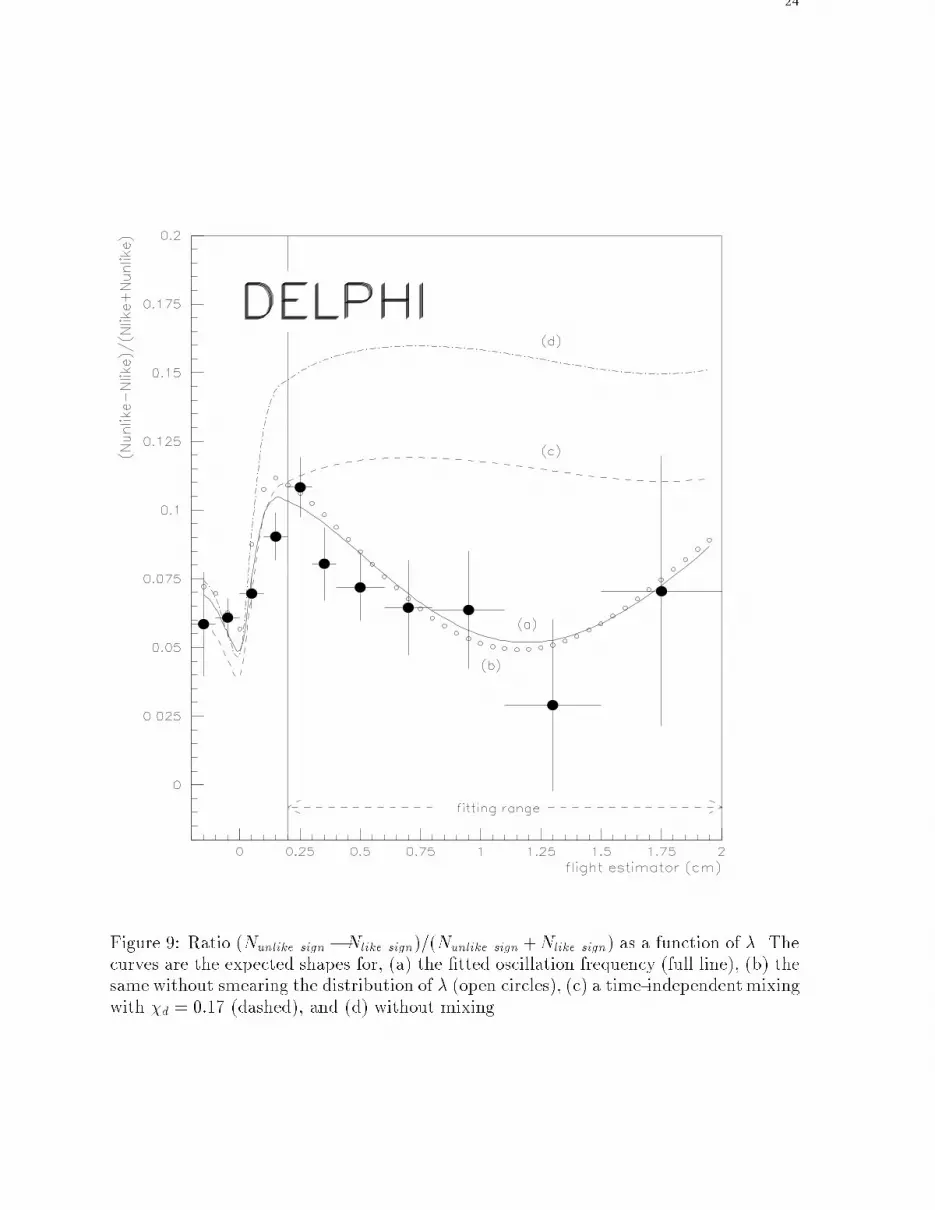
in good agreement with the input value.Figure 9 gives the ratio:
� =Nunlike sign �Nlike sign
Nunlike sign +Nlike sign
for the data as a function of � (summing the results from all sign indicators) togetherwith the curve corresponding to the �tted value of �md (a), the same without smearingthe distribution of � (see sect. 4) (b), the curve obtained with a time-independent mixingwith a probability �d = 0:17 (c) and the curve expected if no mixing occurs (d). At smallvalues of � the e�ect of the smearing (di�erence between (a) and (b) ) is comparableto the di�erence induced by the oscillation itself, so that the �t could be dominated bysystematic errors. However this e�ect is small in the range used in the �t (� > 2 mm)where the data disagree with the no-mixing and time-independent-mixing hypotheses by12 and 6 standard deviations respectively.
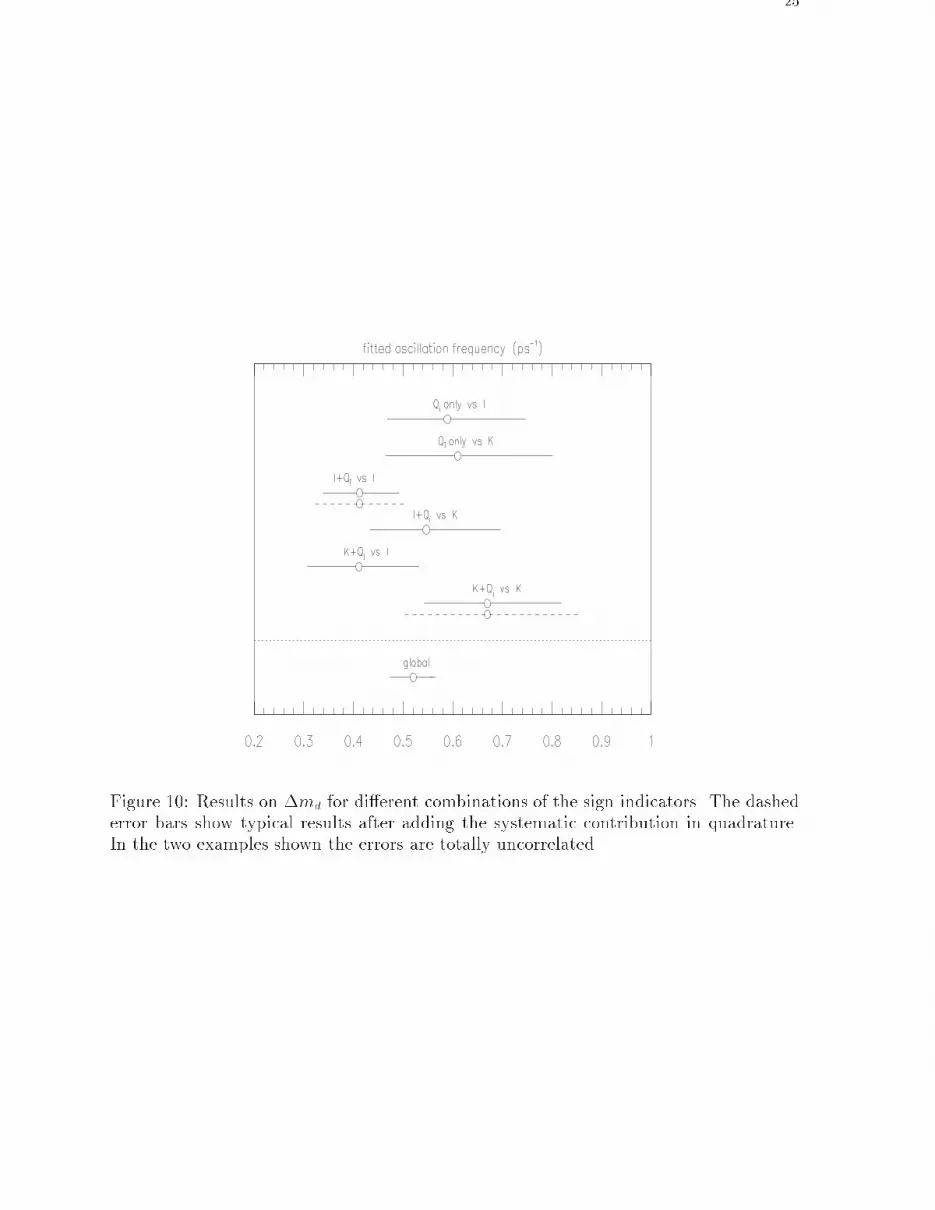
The likelihood �t was redone separately for each of the six combinations of taggingmethods and results have been summarized in Figure 10 (after correction for a systematice�ect due the multiplicities of charged kaons in B decays, as described in the next section).The results are all compatible with the �nal combination, particularly if the systematicerrors which are speci�c to kaons or leptons are taken into account. As an example, thesecontributions are completely uncorrelated in the (l + j versus l) and (K + j versus K)subsamples: they are quadratically added to the statistical errors to give the dashed linesin Figure 10.
14
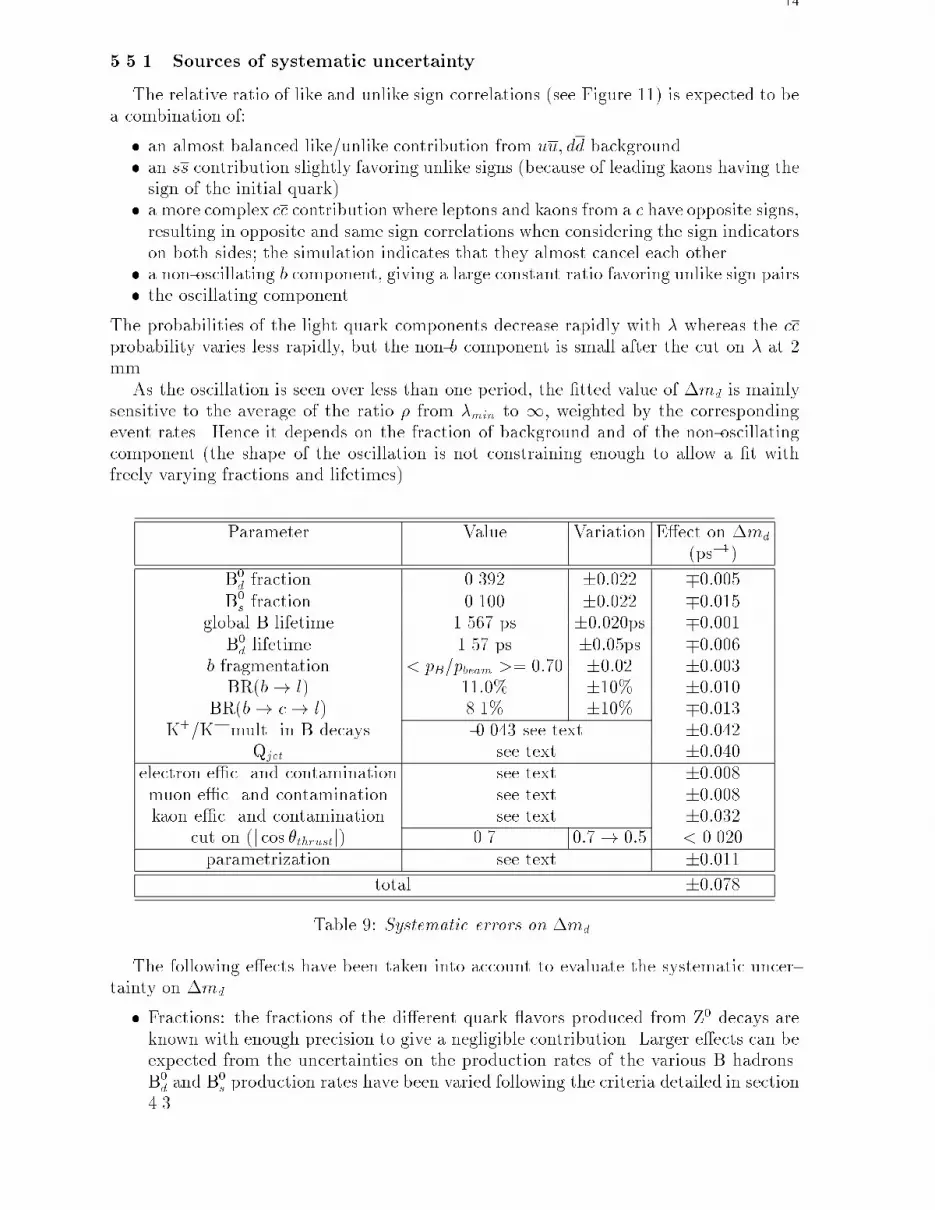
5.5.1 Sources of systematic uncertainty
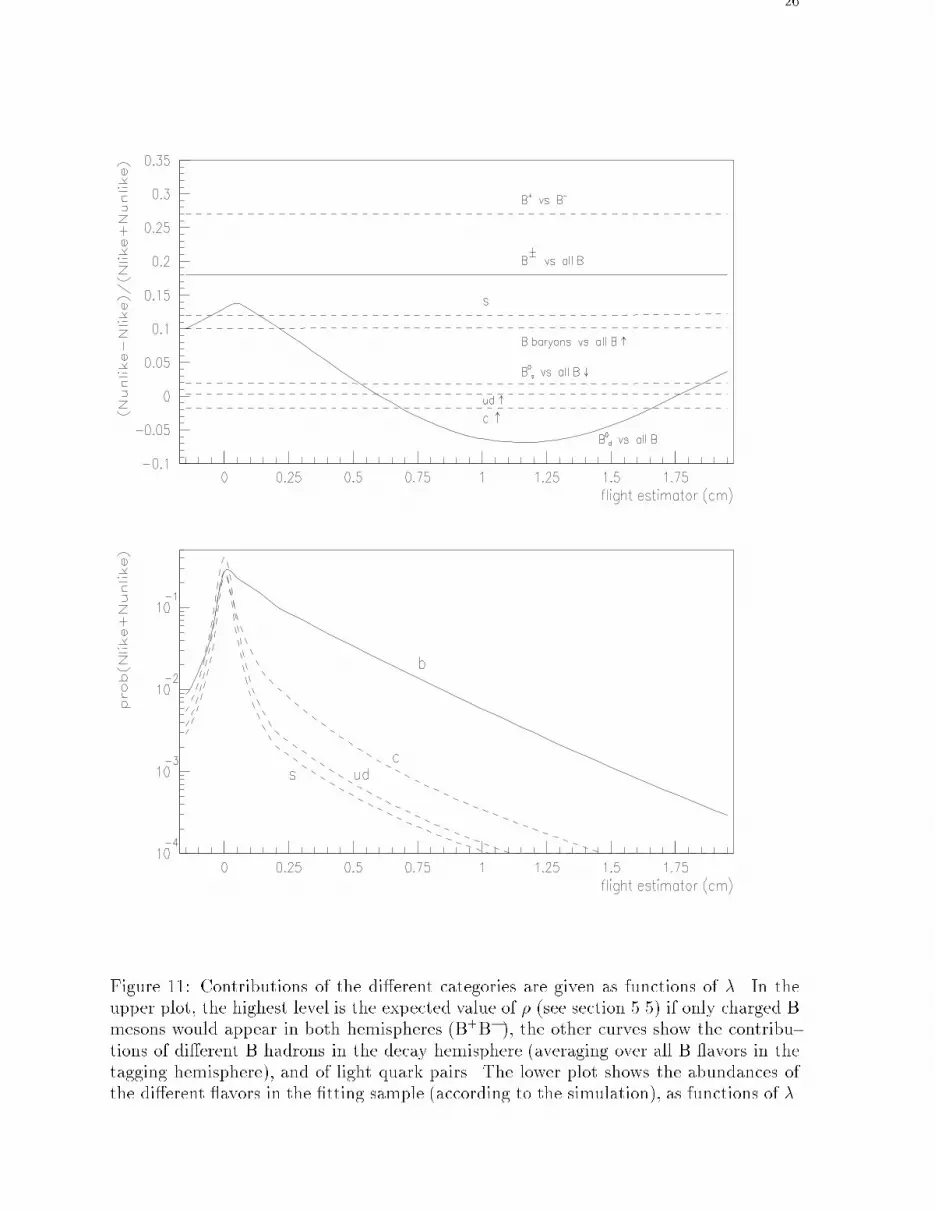
The relative ratio of like and unlike sign correlations (see Figure 11) is expected to bea combination of:
� an almost balanced like/unlike contribution from uu; dd background� an ss contribution slightly favoring unlike signs (because of leading kaons having thesign of the initial quark)
� a more complex cc contribution where leptons and kaons from a c have opposite signs,resulting in opposite and same sign correlations when considering the sign indicatorson both sides; the simulation indicates that they almost cancel each other.
� a non-oscillating b component, giving a large constant ratio favoring unlike sign pairs� the oscillating component.
The probabilities of the light quark components decrease rapidly with � whereas the ccprobability varies less rapidly, but the non-b component is small after the cut on � at 2mm.
As the oscillation is seen over less than one period, the �tted value of �md is mainlysensitive to the average of the ratio � from �min to 1, weighted by the correspondingevent rates. Hence it depends on the fraction of background and of the non-oscillatingcomponent (the shape of the oscillation is not constraining enough to allow a �t withfreely varying fractions and lifetimes).
Parameter Value Variation E�ect on �md
(ps�1)
B0
d fraction 0.392 �0:022 �0:005B0
s fraction 0.100 �0:022 �0:015global B lifetime 1.567 ps �0:020ps �0:001
B0
d lifetime 1.57 ps �0:05ps �0:006b fragmentation < pB=pbeam >= 0:70 �0:02 �0:003
BR(b! l) 11:0% �10% �0:010BR(b! c! l) 8.1% �10% �0:013
K+=K� mult. in B decays -0.043 see text �0:042Qjet see text �0:040
electron e�c. and contamination see text �0:008muon e�c. and contamination see text �0:008kaon e�c. and contamination see text �0:032
cut on (j cos �thrustj) 0.7 0:7! 0:5 < 0.020parametrization see text �0:011
total �0:078
Table 9: Systematic errors on �md.
The following e�ects have been taken into account to evaluate the systematic uncer-tainty on �md.
� Fractions: the fractions of the di�erent quark avors produced from Z0 decays areknown with enough precision to give a negligible contribution. Larger e�ects can beexpected from the uncertainties on the production rates of the various B hadrons.B0
d and B0
s production rates have been varied following the criteria detailed in section4.3.

15
� Lifetimes: the simulation was done with the same lifetime for all B-hadrons. Acommon variation of all B lifetimes (�0:02 ps) gives, as it is expected with low udsc
background, a small variation on �md (�0:001 ps�1); on the contrary, a di�erencebetween �B0
d
and the other lifetimes makes the fraction of B0
d depend on �, and
then the ratio (like sign)/(unlike sign) is distorted. If only the simulated B0
d lifetimevaries by �0:05 ps the variation of �md is �0:006 ps
�1. The di�erence between thevalues of the B0
d lifetimes used in the simulation and in Table 1 gives a correction of+0:006 ps�1 on �md.
� Fragmentation: the B momentum spectrum was varied in such a way that< pB=pbeam > was 0:70 � 0:02, giving a contribution of �0:003 ps�1.
� Semileptonic branching ratios: the values of the semileptonic branching ratios usedin the simulation were: Br(b ! l) = 11:0% , Br(b ! c ! l) = 8:10% . A relativevariation of Br(b! l) of �10% gives �0:010 ps�1 on �md , and �10% on Br(b!c! l) gives �0:013 ps�1 on �md.
� K+=K� multiplicities in B decays: the simulation used in this study di�ers signi�-cantly from the values measured in [16], so that the �tted value of �md is probablyoverestimated; to determine a correction, weights were applied to the simulatedevents, in order to reproduce each of the fractions B+
! K+X, B+! K�X,
B0
d ! K+X, B0
d ! K�X, measured in [16], and their uncertainties. As the ef-fect of B� was found to be predominant, it was not possible to take advantage of thefact that the fractions averaged over B� and B0
d have been measured with a betterprecision. Finally the correction on �md was evaluated to �0:043�0:042 ps�1 (witha quadratic addition of the uncertainties from the four B! K fractions)
� Jet charge (including detector e�ects): the probability p of �nding the right \pro-duction" sign from Qjet has been cross checked on data by comparing the chargesmeasured in opposite hemispheres. The fraction of events with unlike signs (ex-pected to be p2 + (1 � p)2 if p is the same for all avors) was evaluated on bothdata and simulated hadronic events, with di�erent b enrichment; the results werefound to be compatible within a margin corresponding to �0:005 on p . However theextrapolation to pure bb samples depends on the assumed fraction of B0
s and thenthe uncertainty on p was estimated to 0.010, giving a variation of �0:040 ps�1 on�md.
� Lepton identi�cation: changing the electron identi�cation e�ciency by �5% changesthe �tted value of �md by �0:008 ps�1; changing by �10% the hadron misiden-ti�cation probability gives �0:002 ps�1 for �md. For muons, the correspondinguncertainties induced on �md are �0:007 and � 0:005 ps�1.
� Kaon identi�cation: the uncertainty in the kaon identi�cation e�ciency of the RICHwas estimated to be �10%; the e�ect on �md is �0:016 . A margin of �30% on thecontamination by pions gives �0:028 ps�1on �md.
� Geometrical acceptance: to check possible edge e�ects in the acceptance of the RICHdetector, the range on j cos(�thrust)j was reduced in steps from 0.7 down to 0.5; thecorresponding uncertainty on �md is estimated to be less than 0:020 ps�1.
� Parametrization: there are statistical uncertainties on Pright=wrongtag and P
right=wrongdec ,
and on the parametrizations of Pcat(�) and Posc(�). By splitting the simulated eventssample into ten subsamples and computing with each of them an independent set ofcoe�cients, the observed dispersion of the �tted �md values was 0.024 ps�1. Theuncertainty for the total sample is then estimated to be 0.008 ps�1.The smearing introduced in the resolution function of the distance estimation (seesect. 4) modi�es the parametrization of the functions Pcat(�). The �tted value of

16
�md is then moved by 0:007 ps�1: this quantity has been added to the systematicerror.
� Choice of �min: the �t was redone with di�erent values of �min between 1 and 4 mm:the result is stable. The dispersion of results is compatible with the statistical uctuations, and the systematic error is estimated to be less than 0:020 ps�1.
Table 9 summarizes the contributions to the total systematic uncertainty on �md.Taking into account the corrections due to di�erences in lifetimes values and in the
charged K rates in B meson decays between data [16] and the simulation, the measuredvalue of �md is then:
�md = 0:531+0:050�0:046 (stat:)� 0:078 (syst:) ps�1 :
6 Conclusions
The time-dependent B0
d � B0
d oscillations have been measured from the distributionsof high pt lepton impact parameter obtained separately for same sign and opposite signdilepton events:
�md = 0:47 � 0:08 (stat:)+0:09�0:08 (syst:) ps
�1 :
The analysis has been extended to include charged kaons from secondary vertices andthe mean jet charge to tag the produced and decaying B mesons giving:
�md = 0:531+0:050�0:046 (stat:)� 0:078 (syst:) ps�1
or equivalently:�md = (3:49+0:33�0:30 � 0:52)10�4 eV=c2 :
Using the averaged value of �B0
d
= 1:57 � 0:050 ps [10] this gives:
xd = �md=� = 0:834+0:080�0:074 � 0:125 :
The data deviate from the hypothesis of a time-independent mixing (with a probability�d = 0:17) by 6 standard deviations.
Acknowledgements
We are greatly indebted to our technical collaborators and to the funding agencies fortheir support in building and operating the DELPHI detector, and to the members ofthe CERN-SL Division for the excellent performance of the LEP collider.
17
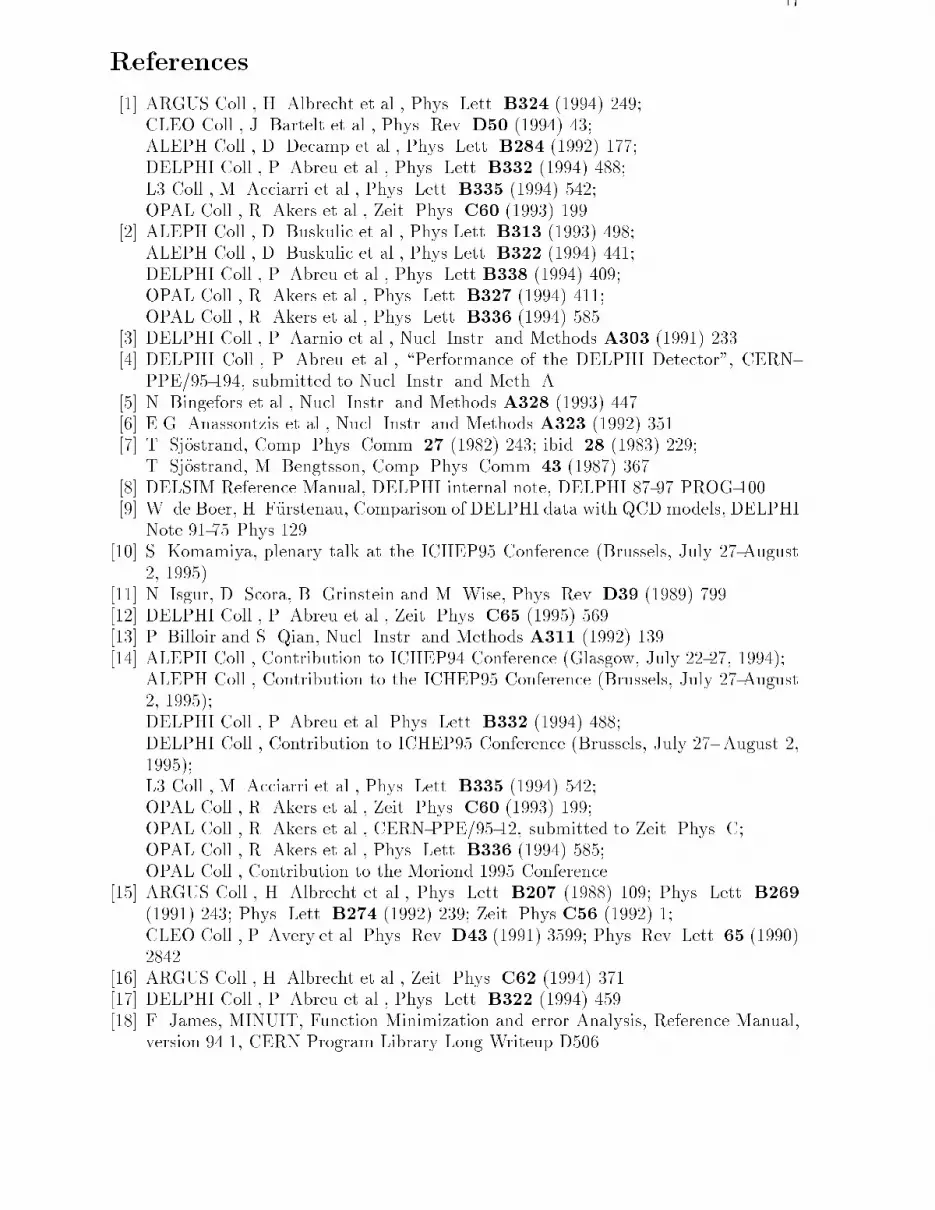
References
[1] ARGUS Coll., H. Albrecht et al., Phys. Lett. B324 (1994) 249;CLEO Coll., J. Bartelt et al., Phys. Rev. D50 (1994) 43;ALEPH Coll., D. Decamp et al., Phys. Lett. B284 (1992) 177;DELPHI Coll., P. Abreu et al., Phys. Lett. B332 (1994) 488;L3 Coll., M. Acciarri et al., Phys. Lett. B335 (1994) 542;OPAL Coll., R. Akers et al., Zeit. Phys. C60 (1993) 199.
[2] ALEPH Coll., D. Buskulic et al., Phys.Lett. B313 (1993) 498;ALEPH Coll., D. Buskulic et al., Phys.Lett. B322 (1994) 441;DELPHI Coll., P. Abreu et al., Phys. Lett B338 (1994) 409;OPAL Coll., R. Akers et al., Phys. Lett. B327 (1994) 411;OPAL Coll., R. Akers et al., Phys. Lett. B336 (1994) 585.
[3] DELPHI Coll., P. Aarnio et al., Nucl. Instr. and Methods A303 (1991) 233.[4] DELPHI Coll., P. Abreu et al., \Performance of the DELPHI Detector", CERN-
PPE/95-194, submitted to Nucl. Instr. and Meth. A.[5] N. Bingefors et al., Nucl. Instr. and Methods A328 (1993) 447.[6] E.G. Anassontzis et al., Nucl. Instr. and Methods A323 (1992) 351.[7] T. Sj�ostrand, Comp. Phys. Comm. 27 (1982) 243; ibid. 28 (1983) 229;
T. Sj�ostrand, M. Bengtsson, Comp. Phys. Comm. 43 (1987) 367.[8] DELSIM Reference Manual, DELPHI internal note, DELPHI 87-97 PROG-100.[9] W. de Boer, H. F�urstenau, Comparison of DELPHI data with QCD models, DELPHI
Note 91-75 Phys 129.[10] S. Komamiya, plenary talk at the ICHEP95 Conference (Brussels, July 27-August
2, 1995).[11] N. Isgur, D. Scora, B. Grinstein and M. Wise, Phys. Rev. D39 (1989) 799.[12] DELPHI Coll., P. Abreu et al., Zeit. Phys. C65 (1995) 569.[13] P. Billoir and S. Qian, Nucl. Instr. and Methods A311 (1992) 139.[14] ALEPH Coll., Contribution to ICHEP94 Conference (Glasgow, July 22-27, 1994);
ALEPH Coll., Contribution to the ICHEP95 Conference (Brussels, July 27-August2, 1995);DELPHI Coll., P. Abreu et al. Phys. Lett. B332 (1994) 488;DELPHI Coll., Contribution to ICHEP95 Conference (Brussels, July 27- August 2,1995);L3 Coll., M. Acciarri et al., Phys. Lett. B335 (1994) 542;OPAL Coll., R. Akers et al., Zeit. Phys. C60 (1993) 199;OPAL Coll., R. Akers et al., CERN-PPE/95-12, submitted to Zeit. Phys. C;OPAL Coll., R. Akers et al., Phys. Lett. B336 (1994) 585;OPAL Coll., Contribution to the Moriond 1995 Conference.
[15] ARGUS Coll., H. Albrecht et al., Phys. Lett. B207 (1988) 109; Phys. Lett. B269(1991) 243; Phys. Lett. B274 (1992) 239; Zeit. Phys C56 (1992) 1;CLEO Coll., P. Avery et al. Phys. Rev.D43 (1991) 3599; Phys. Rev. Lett. 65 (1990)2842.
[16] ARGUS Coll., H. Albrecht et al., Zeit. Phys. C62 (1994) 371.[17] DELPHI Coll., P. Abreu et al., Phys. Lett. B322 (1994) 459.[18] F. James, MINUIT, Function Minimization and error Analysis, Reference Manual,
version 94.1, CERN Program Library Long Writeup D506.
18
Figure 1: Ratio R++=+� of the t� distributions obtained from same sign and oppositesigns dilepton events when both leptons have a pt greater than 1 GeV/c. Black circlescorrespond to data events, triangles to simulated events with �m = 0.47 ps�1. Thedotted histogram corresponds to the hypothesis of time independent mixing.
19
Figure 2: Fraction F++ of same sign correlations obtained when both leptons have a ptgreater than 1 GeV/c, with the contribution from the various sources according to thesimulation.
20
Figure 3: �md value measured for di�erent pt cuts.

21
Figure 4: Flight distance estimator � versus the simulated distance in b hemispheres.
Figure 5: Comparison of the decay distance (�) distribution in real and simulated dataafter having applied the additional smearing as explained in section 5.2.
22
Figure 6: Distribution of the ight distance estimator � for di�erent b categories; thecurve represents the parametrization for � > 2 mm.
Figure 7: Distribution of the ight distance estimator � for u=d; s; c categories; thecurve represents the parametrization for � > 2mm.
23
Figure 8: Probability of B0
d oscillation as a function of the ight distance estimator �. Thecurves show the result of the parametrization described in the text for di�erent values of�md.
24
Figure 9: Ratio (Nunlike sign �Nlike sign)=(Nunlike sign +Nlike sign) as a function of �. Thecurves are the expected shapes for, (a) the �tted oscillation frequency (full line), (b) thesame without smearing the distribution of � (open circles), (c) a time-independentmixingwith �d = 0:17 (dashed), and (d) without mixing.
25
Figure 10: Results on �md for di�erent combinations of the sign indicators. The dashederror bars show typical results after adding the systematic contribution in quadrature.In the two examples shown the errors are totally uncorrelated.
26
Figure 11: Contributions of the di�erent categories are given as functions of �. In theupper plot, the highest level is the expected value of � (see section 5.5) if only charged Bmesons would appear in both hemispheres (B+B�), the other curves show the contribu-tions of di�erent B hadrons in the decay hemisphere (averaging over all B avors in thetagging hemisphere), and of light quark pairs. The lower plot shows the abundances ofthe di�erent avors in the �tting sample (according to the simulation), as functions of �.