combined effect of el niño-southern oscillation and pacific decadal oscillation on the east asian...
TRANSCRIPT
Combined effect of El Nino-Southern Oscillation and PacificDecadal Oscillation on the East Asian winter monsoon
Ji-Won Kim • Sang-Wook Yeh • Eun-Chul Chang
Received: 24 September 2012 / Accepted: 7 March 2013 / Published online: 24 March 2013
� Springer-Verlag Berlin Heidelberg 2013
Abstract Using long-term observational data and
numerical model experiments, the combined effect of the
El Nino-Southern Oscillation (ENSO) and Pacific Decadal
Oscillation (PDO) on the variability of the East Asian
winter monsoon is examined. In the observations, it is
found that when the ENSO and PDO are in-phase combi-
nations (i.e., El Nino/positive PDO phase and La Nina/
negative PDO phase), a negative relationship between
ENSO and East Asian winter monsoon is significantly
intensified. In other words, when El Nino (La Nina) occurs
with positive (negative) PDO phase, anomalous warm
(cold) temperatures are dominant over the East Asian
winter continent. On the other hand, there are no significant
temperature anomalies when the ENSO and PDO are out-
of-phase combinations (i.e., El Nino/negative PDO phase
and La Nina/positive PDO phase). Further analyses indi-
cate that the anticyclone over the western North Pacific
including the East Asian marginal seas plays an essential
role in modulating the intensity of the East Asian winter
monsoon under the changes of ENSO–PDO phase rela-
tionship. Long-lasting high pressure and warm sea surface
temperature anomalies during the late fall/winter and fol-
lowing spring over the western North Pacific, which appear
as the El Nino occurs with positive PDO phase, can lead to
a weakened East Asian winter monsoon by transporting
warm and wet conditions into the East Asian continent
through the southerly wind anomalies along the western
flank of the anomalous high pressure, and vice versa as the
La Nina occurs with negative PDO phase. In contrast, the
anomalous high pressure over the western North Pacific
does not show a prominent change under the out-of-phase
combinations of ENSO and PDO. Numerical model
experiments confirm the observational results, accompa-
nying dominant warm temperature anomalies over East
Asia via strong anticyclonic circulation anomalies near the
Philippine Sea as the El Nino occurs with positive PDO
phase, whereas such warming is weakened as the El Nino
occurs with negative PDO phase. This result supports the
argument that the changes in the East Asian winter mon-
soon intensity with ENSO are largely affected by the
strength of the anticyclone over the western North Pacific,
which significantly changes according to the ENSO–PDO
phase relationship.
1 Introduction
The East Asian winter monsoon (EAWM) that brings
severe cold surges and heavy snowfall can cause serious
damage to crops, daily life, and economic activities over
East Asia. The EAWM is not only an important factor that
influences the local weather but it is also one of the most
active components in the global climate system during the
boreal winter season. This is because the EAWM is
J.-W. Kim
Climate Change Research Team, APEC Climate Center,
Busan, Korea
Present Address:
J.-W. Kim
Department of Atmospheric Sciences,
Yonsei University, Seoul, Korea
S.-W. Yeh (&)
Department of Environmental Marine Sciences and Convergent
Technology, ERICA, Hanyang University, Ansan, Korea
e-mail: [email protected]
E.-C. Chang
Atmosphere and Ocean Research Institute,
University of Tokyo, Kashiwa, Japan
123
Clim Dyn (2014) 42:957–971
DOI 10.1007/s00382-013-1730-z
associated with a powerful atmospheric circulation system
named Siberian-Mongolian High, which is generated by
the large thermal contrast between the world’s largest
landmass, Eurasia, and the Indo-Pacific Ocean (Li 1955;
Tao 1957). Hence, there have been many efforts to
understand the variability of the EAWM (Chang et al.
1979, 2006; Chang and Lau 1982; Lau and Li 1984; Ding
1994; Huang et al. 2003, 2007; Chan and Li 2004; Wang
et al. 2010).
According to previous studies, it has been known that
the variability of the EAWM is closely linked to the tropics
(Lau and Chang 1987; Zhang et al. 1997b) as well as some
other forcings such as the Arctic Oscillation (AO), the
North Atlantic Oscillation (NAO), the Southern Hemi-
sphere annular mode (SAM), and the anthropogenic global
warming (Gong et al. 2001; Jhun and Lee 2004; Wu et al.
2006, 2009; Li and Bates 2007). In particular, the El Nino-
Southern Oscillation (ENSO) exerts the greatest influence
on the EAWM on interannual timescales (Zhang et al.
1996; Tomita and Yasunari 1996; Ji et al. 1997; Wang et al.
2000; Hamada et al. 2002; Chang et al. 2004). Wang et al.
(2000), one of the pioneering works, reported that a key
system that bridges El Nino (La Nina) events in the eastern
tropical Pacific and the weak (strong) EAWM is an
anomalous lower-tropospheric anticyclone (cyclone) loca-
ted near the Philippine Sea. These anticyclonic (cyclonic)
wind anomalies cause anomalously warm (cold) and wet
(dry) conditions over East Asia. In other words, the mature
phase of El Nino (La Nina) is normally accompanied by a
weaker (stronger) than normal EAWM. The so-called
Pacific-East Asian teleconnection pattern can explain the
aforementioned relationship between the ENSO and East
Asian winter climate on interannual timescales.
However, it has been recognized that the Pacific-East
Asian teleconnection pattern is not stationary, a fact that may
be due to decadal-to-multidecadal variations in the sea sur-
face temperature (SST) in the Pacific Ocean. Therefore, such
variations should be considered as an additional element that
modifies the ENSO–EAWM relationship (Tsonis et al. 2007;
Swanson and Tsonis 2009). In particular, the Pacific Decadal
Oscillation (PDO; Mantua et al. 1997), which is the most
dominant mode of SST oscillation in the North Pacific on
interdecadal timescale, has been proposed as an important
modulation factor on ENSO-related teleconnections from
the tropics to the mid-latitudes (Gershunov and Barnett
1998; Pavia et al. 2006; Yoon and Yeh 2010). Although the
PDO fluctuates on the low-frequency timescales that are
quite different from those of the ENSO, the PDO has been
described by some as a long-lived ENSO-like pattern of
Pacific climate variability because climate anomalies asso-
ciated with the PDO are somewhat similar to those connected
to the ENSO (Latif and Barnett 1996; Zhang et al. 1997a).
In fact, extensive researches have been conducted in an
effort to understand the interdecadal modulation effect of
the PDO on the impact of the ENSO on extratropical cli-
mate (Kung and Chern 1995; Paegle and Mo 2002; Kayano
and Andreoli 2007; Lupo et al. 2007; Wang et al. 2008; Hu
and Huang 2009; McCabe et al. 2011). Among them, Hu
and Huang (2009) examined the influence of PDO and
ENSO on the climate variability over the Great Plains with
considering the short timescale variations of PDO. Wang
et al. (2008) insisted that when the PDO is in its high phase,
there is no robust relationship between the ENSO and
EAWM on interannual timescale. In contrast, when the
PDO is in its low phase, the ENSO exerts a strong impact
on the EAWM with robust and significant low-level tem-
perature changes occurring over East Asia. However, the
PDO modulation effect on the ENSO–EAWM relationship
on the low-frequency timescales has not been sufficiently
elucidated in the aforementioned studies because focus was
mostly placed on the two phases of the PDO without
considering the combined effect of the ENSO on interan-
nual timescales and PDO phases on the low-frequency
timescales. Moreover, details regarding the physical
mechanisms for the modulation of the PDO are still
unknown.
The main purpose of the present study is therefore to
investigate the influence of phase combinations of the
ENSO and PDO on the EAWM using long-term observa-
tional datasets. As in the study of Wang et al. (2010), we
chose surface air temperature (SAT) as the key variable to
examine the EAWM variability unlike most other previous
studies which have taken circulation variables as measures
of its strength (e.g., Guo 1982; Ji et al. 1997; Lu and Chan
1999; Cui and Sun 1999; Chen et al. 2000; Li and Zeng
2002; Jhun and Lee 2004; Wu et al. 2006). Furthermore, an
attempt will be made to understand the physical mecha-
nism of the interdecadal PDO modulation effect on the
EAWM variability as shown in Sect. 3.
This paper is organized as follows: The datasets and the
methodologies utilized in this study are introduced briefly
in Sect. 2. In Sect. 3, we investigate the individual effect of
the ENSO and PDO on the diverse background fields to
quantify how much they are related to the EAWM vari-
ability and compare their combined effect on the EAWM
using the conditional composite analysis method. Possible
interpretations, including the physical mechanism for
modifying the EAWM and the role of atmospheric circu-
lation patterns in accordance with the conventional Pacific-
East Asian teleconnection concept, are explained in Sect.
3.3. In addition, the findings in this study are assessed by
means of numerical model experiments. Finally, a sum-
mary and discussion of the results and avenues for further
study are presented in Sect. 4.
958 J.-W. Kim et al.
123
2 Data and methodology
2.1 Observational datasets
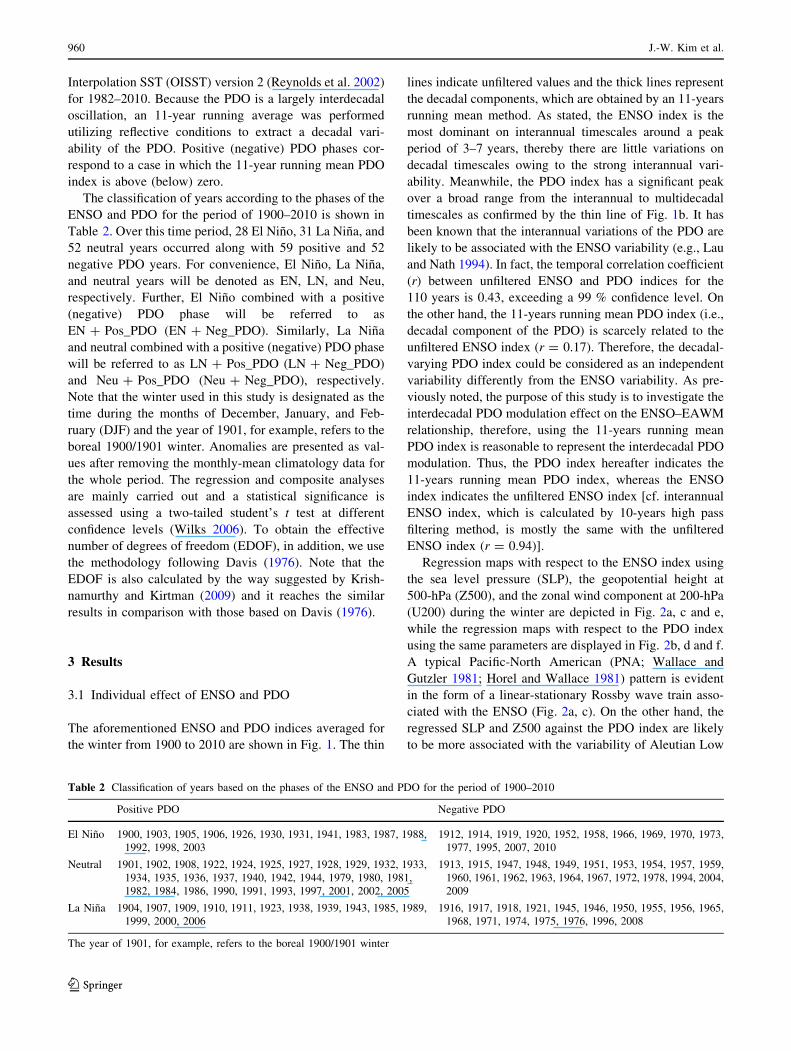
Four types of observed monthly mean datasets and two cli-
mate indices are used in this study; detailed descriptions of
each are given in Table 1. Global land surface air tempera-
ture data developed at the University of Delaware, which
covers the period from January 1900 to December 2008, was
utilized (http://jisao.washington.edu/data_sets/ud). These
data are provided in native 0.5 degree latitude-longitude
resolution and a variety of analysis techniques were applied
for spatial interpolation and cross-validation. Several upda-
ted sources for the data include a recent version of the Global
Historical Climatology Network version 2 (GHCN2; Peter-
son and Vose 1997), the Atmospheric Environment Service/
Environment Canada, the State Hydrometeorological Insti-
tute, St. Petersburg, Russia, Greenland-from the GC-Net
(Steffen et al. 1996), the Automatic Weather Station Project,
the Global Synoptic Climatology Network, and the Global
Surface Summary of the day.
Monthly-mean meteorological datasets obtained from
the 40-years European Centre for Medium-Range Weather
Forecasts (ECMWF) Re-Analysis (ERA-40) (Uppala
et al. 2005; http://data-portal.ecmwf.int/data/d/era40_moda/)
were also employed. The datasets cover the period from
September 1957 to August 2002 with a horizontal resolu-
tion of approximately 2.5� 9 2.5� in both latitude and
longitude. This resolution extends from 1,000- to 1-hPa
with 23 vertical pressure levels. In addition, the monthly
means of daily means ERA-Interim datasets, also produced
by the ECMWF, were used (Simmons et al. 2006; http://
data-portal.ecmwf.int/data/d/interim_moda/). The ERA-
Interim data have a 1.5� 9 1.5� average horizontal reso-
lution and a hybrid vertical coordinate system with 60
levels and covers the period from January 1979 to
December 2010.
In this study, the atmospheric variables used as back-
grounds were created by two different datasets: ERA-40
and ERA-Interim. As noted above, the period of the ERA-
40 data has a limitation from September 1957 to August
2002. To extend the analysis period, we therefore con-
nected ERA-Interim data by using a bilinear interpolation
method, beginning from January 2002 to December 2010.
To maintain spatial homogeneity, the rectilinear grid of the
ERA-Interim data was interpolated into that of the ERA-40
data. Hereafter, the unified data will be referred to as the
combined-ERA data. The monthly-mean SST values were
obtained from the National Oceanic and Atmospheric
Administration (NOAA) Extended Reconstructed SST
version 3b data (ERSSTv3b) on a 2.0� 9 2.0� horizontal
grid globally, which spans from January 1854 to December
2010 (Smith et al. 2008; http://www.esrl.noaa.gov/psd/
data/gridded/).
2.2 Climatic index and methodology
Two essential climatic oscillation indices were utilized.
One is the ENSO index, which covers January 1868–
December 2010 and follows the definition provided by the
Japan Meteorological Agency (http://coaps.fsu.edu/jma.
shtml). This index is a widely accepted definition of the
ENSO that has been used in many climatic studies (e.g.,
Birk et al. 2010 and references therein). Based on the index
derived from observed SST anomalies, the ENSO is cate-
gorized into three phases: El Nino, La Nina, and neutral
phases. A particular phase of the ENSO is determined by a
5-month running mean of spatially averaged SST anoma-
lies over the eastern tropical Pacific (4�S–4�N, 150–90�W).
In order for a particular year to be classified as an El Nino
(La Nina) year, the SST anomalies must be 0.5 �C
(-0.5 �C) or greater (less) for 6 consecutive months
including October, November, and December. Alterna-
tively, neutral years are determined when the SST anom-
alies are between 0.5 and -0.5 �C. The other is the PDO
index, which spans from January 1900 to December
2010 (http://jisao.washington.edu/data_sets/pdo/). The PDO
index is defined as the leading Empirical Orthogonal
Function (EOF) PC time series of mean November through
March de-trended SST anomalies for the Pacific Ocean to
the north of 20�N using Met Office Historical SST data
(Parker et al. 1995) for 1900–1981 and the Optimum
Table 1 Datasets utilized in
this studyHorizontal
resolution
Range of
years
Source
Surface air
temperature
(Univ. of Delaware)
0.5� 9 0.5� 1900–2008 http://jisao.washington.edu/data_sets/ud
ERA-40 2.5� 9 2.5� 1957–2002 Uppala et al. (2005)
ERA-Interim 1.5� 9 1.5� 1979–2010 Simmons et al. (2006)
ERSSTv3b 2.0� 9 2.0� 1854–2010 Smith et al. (2008)
ENSO index 1868–2010 http://coaps.fsu.edu/jma.shtml
PDO index 1900–2010 http://jisao.washington.edu/data_sets/pdo/
Combined effect of El Nino-Southern Oscillation 959
123
Interpolation SST (OISST) version 2 (Reynolds et al. 2002)
for 1982–2010. Because the PDO is a largely interdecadal
oscillation, an 11-year running average was performed
utilizing reflective conditions to extract a decadal vari-
ability of the PDO. Positive (negative) PDO phases cor-
respond to a case in which the 11-year running mean PDO
index is above (below) zero.
The classification of years according to the phases of the
ENSO and PDO for the period of 1900–2010 is shown in
Table 2. Over this time period, 28 El Nino, 31 La Nina, and
52 neutral years occurred along with 59 positive and 52
negative PDO years. For convenience, El Nino, La Nina,
and neutral years will be denoted as EN, LN, and Neu,
respectively. Further, El Nino combined with a positive
(negative) PDO phase will be referred to as
EN ? Pos_PDO (EN ? Neg_PDO). Similarly, La Nina
and neutral combined with a positive (negative) PDO phase
will be referred to as LN ? Pos_PDO (LN ? Neg_PDO)
and Neu ? Pos_PDO (Neu ? Neg_PDO), respectively.
Note that the winter used in this study is designated as the
time during the months of December, January, and Feb-
ruary (DJF) and the year of 1901, for example, refers to the
boreal 1900/1901 winter. Anomalies are presented as val-
ues after removing the monthly-mean climatology data for
the whole period. The regression and composite analyses
are mainly carried out and a statistical significance is
assessed using a two-tailed student’s t test at different
confidence levels (Wilks 2006). To obtain the effective
number of degrees of freedom (EDOF), in addition, we use
the methodology following Davis (1976). Note that the
EDOF is also calculated by the way suggested by Krish-
namurthy and Kirtman (2009) and it reaches the similar
results in comparison with those based on Davis (1976).
3 Results
3.1 Individual effect of ENSO and PDO
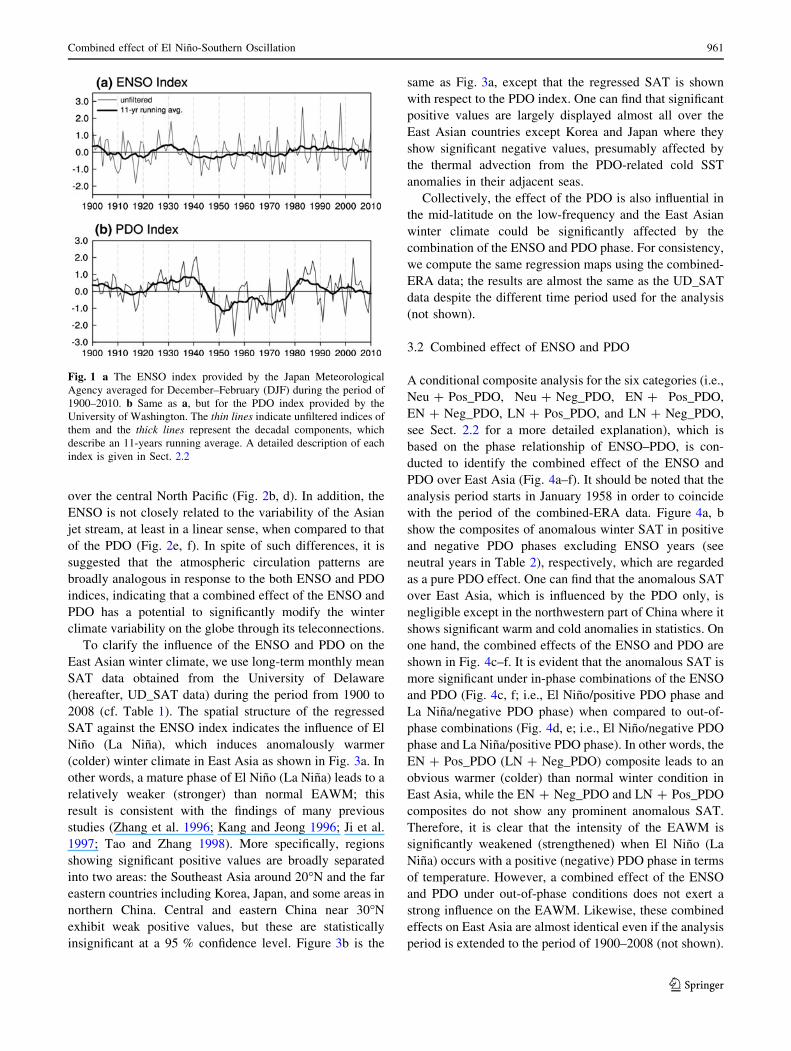
The aforementioned ENSO and PDO indices averaged for
the winter from 1900 to 2010 are shown in Fig. 1. The thin
lines indicate unfiltered values and the thick lines represent
the decadal components, which are obtained by an 11-years
running mean method. As stated, the ENSO index is the
most dominant on interannual timescales around a peak
period of 3–7 years, thereby there are little variations on
decadal timescales owing to the strong interannual vari-
ability. Meanwhile, the PDO index has a significant peak
over a broad range from the interannual to multidecadal
timescales as confirmed by the thin line of Fig. 1b. It has
been known that the interannual variations of the PDO are
likely to be associated with the ENSO variability (e.g., Lau
and Nath 1994). In fact, the temporal correlation coefficient
(r) between unfiltered ENSO and PDO indices for the
110 years is 0.43, exceeding a 99 % confidence level. On
the other hand, the 11-years running mean PDO index (i.e.,
decadal component of the PDO) is scarcely related to the
unfiltered ENSO index (r = 0.17). Therefore, the decadal-
varying PDO index could be considered as an independent
variability differently from the ENSO variability. As pre-
viously noted, the purpose of this study is to investigate the
interdecadal PDO modulation effect on the ENSO–EAWM
relationship, therefore, using the 11-years running mean
PDO index is reasonable to represent the interdecadal PDO
modulation. Thus, the PDO index hereafter indicates the
11-years running mean PDO index, whereas the ENSO
index indicates the unfiltered ENSO index [cf. interannual
ENSO index, which is calculated by 10-years high pass
filtering method, is mostly the same with the unfiltered
ENSO index (r = 0.94)].
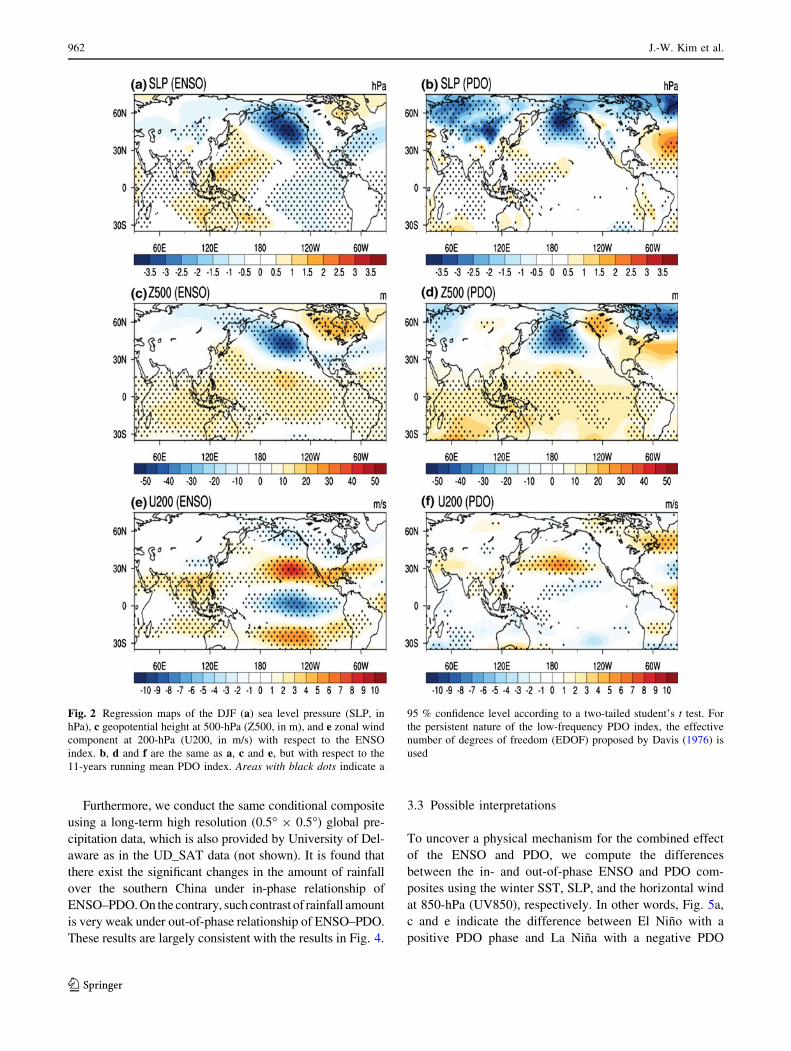
Regression maps with respect to the ENSO index using
the sea level pressure (SLP), the geopotential height at
500-hPa (Z500), and the zonal wind component at 200-hPa
(U200) during the winter are depicted in Fig. 2a, c and e,
while the regression maps with respect to the PDO index
using the same parameters are displayed in Fig. 2b, d and f.
A typical Pacific-North American (PNA; Wallace and
Gutzler 1981; Horel and Wallace 1981) pattern is evident
in the form of a linear-stationary Rossby wave train asso-
ciated with the ENSO (Fig. 2a, c). On the other hand, the
regressed SLP and Z500 against the PDO index are likely
to be more associated with the variability of Aleutian Low
Table 2 Classification of years based on the phases of the ENSO and PDO for the period of 1900–2010
Positive PDO Negative PDO
El Nino 1900, 1903, 1905, 1906, 1926, 1930, 1931, 1941, 1983, 1987, 1988,
1992, 1998, 2003
1912, 1914, 1919, 1920, 1952, 1958, 1966, 1969, 1970, 1973,
1977, 1995, 2007, 2010
Neutral 1901, 1902, 1908, 1922, 1924, 1925, 1927, 1928, 1929, 1932, 1933,
1934, 1935, 1936, 1937, 1940, 1942, 1944, 1979, 1980, 1981,
1982, 1984, 1986, 1990, 1991, 1993, 1997, 2001, 2002, 2005
1913, 1915, 1947, 1948, 1949, 1951, 1953, 1954, 1957, 1959,
1960, 1961, 1962, 1963, 1964, 1967, 1972, 1978, 1994, 2004,
2009
La Nina 1904, 1907, 1909, 1910, 1911, 1923, 1938, 1939, 1943, 1985, 1989,
1999, 2000, 2006
1916, 1917, 1918, 1921, 1945, 1946, 1950, 1955, 1956, 1965,
1968, 1971, 1974, 1975, 1976, 1996, 2008
The year of 1901, for example, refers to the boreal 1900/1901 winter
960 J.-W. Kim et al.
123
over the central North Pacific (Fig. 2b, d). In addition, the
ENSO is not closely related to the variability of the Asian
jet stream, at least in a linear sense, when compared to that
of the PDO (Fig. 2e, f). In spite of such differences, it is
suggested that the atmospheric circulation patterns are
broadly analogous in response to the both ENSO and PDO
indices, indicating that a combined effect of the ENSO and
PDO has a potential to significantly modify the winter
climate variability on the globe through its teleconnections.
To clarify the influence of the ENSO and PDO on the
East Asian winter climate, we use long-term monthly mean
SAT data obtained from the University of Delaware
(hereafter, UD_SAT data) during the period from 1900 to
2008 (cf. Table 1). The spatial structure of the regressed
SAT against the ENSO index indicates the influence of El
Nino (La Nina), which induces anomalously warmer
(colder) winter climate in East Asia as shown in Fig. 3a. In
other words, a mature phase of El Nino (La Nina) leads to a
relatively weaker (stronger) than normal EAWM; this
result is consistent with the findings of many previous
studies (Zhang et al. 1996; Kang and Jeong 1996; Ji et al.
1997; Tao and Zhang 1998). More specifically, regions
showing significant positive values are broadly separated
into two areas: the Southeast Asia around 20�N and the far
eastern countries including Korea, Japan, and some areas in
northern China. Central and eastern China near 30�N
exhibit weak positive values, but these are statistically
insignificant at a 95 % confidence level. Figure 3b is the
same as Fig. 3a, except that the regressed SAT is shown
with respect to the PDO index. One can find that significant
positive values are largely displayed almost all over the
East Asian countries except Korea and Japan where they
show significant negative values, presumably affected by
the thermal advection from the PDO-related cold SST
anomalies in their adjacent seas.
Collectively, the effect of the PDO is also influential in
the mid-latitude on the low-frequency and the East Asian
winter climate could be significantly affected by the
combination of the ENSO and PDO phase. For consistency,
we compute the same regression maps using the combined-
ERA data; the results are almost the same as the UD_SAT
data despite the different time period used for the analysis
(not shown).
3.2 Combined effect of ENSO and PDO
A conditional composite analysis for the six categories (i.e.,
Neu ? Pos_PDO, Neu ? Neg_PDO, EN ? Pos_PDO,
EN ? Neg_PDO, LN ? Pos_PDO, and LN ? Neg_PDO,
see Sect. 2.2 for a more detailed explanation), which is
based on the phase relationship of ENSO–PDO, is con-
ducted to identify the combined effect of the ENSO and
PDO over East Asia (Fig. 4a–f). It should be noted that the
analysis period starts in January 1958 in order to coincide
with the period of the combined-ERA data. Figure 4a, b
show the composites of anomalous winter SAT in positive
and negative PDO phases excluding ENSO years (see
neutral years in Table 2), respectively, which are regarded
as a pure PDO effect. One can find that the anomalous SAT
over East Asia, which is influenced by the PDO only, is
negligible except in the northwestern part of China where it
shows significant warm and cold anomalies in statistics. On
one hand, the combined effects of the ENSO and PDO are
shown in Fig. 4c–f. It is evident that the anomalous SAT is
more significant under in-phase combinations of the ENSO
and PDO (Fig. 4c, f; i.e., El Nino/positive PDO phase and
La Nina/negative PDO phase) when compared to out-of-
phase combinations (Fig. 4d, e; i.e., El Nino/negative PDO
phase and La Nina/positive PDO phase). In other words, the
EN ? Pos_PDO (LN ? Neg_PDO) composite leads to an
obvious warmer (colder) than normal winter condition in
East Asia, while the EN ? Neg_PDO and LN ? Pos_PDO
composites do not show any prominent anomalous SAT.
Therefore, it is clear that the intensity of the EAWM is
significantly weakened (strengthened) when El Nino (La
Nina) occurs with a positive (negative) PDO phase in terms
of temperature. However, a combined effect of the ENSO
and PDO under out-of-phase conditions does not exert a
strong influence on the EAWM. Likewise, these combined
effects on East Asia are almost identical even if the analysis
period is extended to the period of 1900–2008 (not shown).
Fig. 1 a The ENSO index provided by the Japan Meteorological
Agency averaged for December–February (DJF) during the period of
1900–2010. b Same as a, but for the PDO index provided by the
University of Washington. The thin lines indicate unfiltered indices of
them and the thick lines represent the decadal components, which
describe an 11-years running average. A detailed description of each
index is given in Sect. 2.2
Combined effect of El Nino-Southern Oscillation 961
123
Furthermore, we conduct the same conditional composite
using a long-term high resolution (0.5� 9 0.5�) global pre-
cipitation data, which is also provided by University of Del-
aware as in the UD_SAT data (not shown). It is found that
there exist the significant changes in the amount of rainfall
over the southern China under in-phase relationship of
ENSO–PDO. On the contrary, such contrast of rainfall amount
is very weak under out-of-phase relationship of ENSO–PDO.
These results are largely consistent with the results in Fig. 4.
3.3 Possible interpretations
To uncover a physical mechanism for the combined effect
of the ENSO and PDO, we compute the differences
between the in- and out-of-phase ENSO and PDO com-
posites using the winter SST, SLP, and the horizontal wind
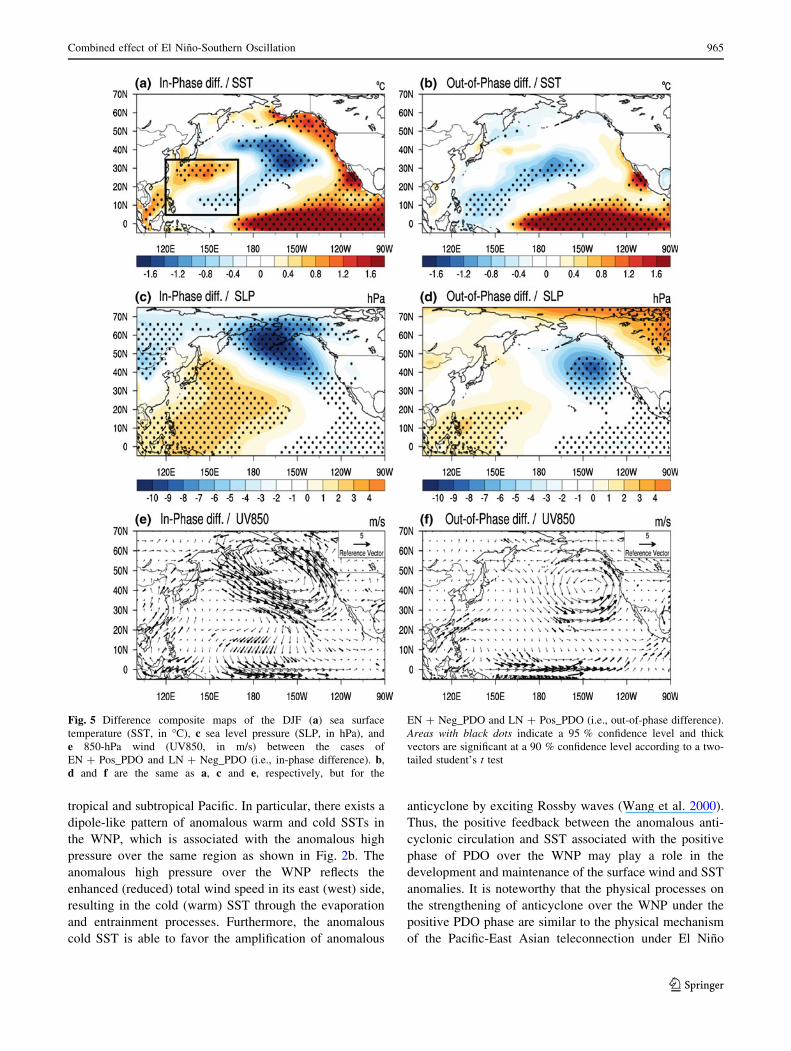
at 850-hPa (UV850), respectively. In other words, Fig. 5a,
c and e indicate the difference between El Nino with a
positive PDO phase and La Nina with a negative PDO
Fig. 2 Regression maps of the DJF (a) sea level pressure (SLP, in
hPa), c geopotential height at 500-hPa (Z500, in m), and e zonal wind
component at 200-hPa (U200, in m/s) with respect to the ENSO
index. b, d and f are the same as a, c and e, but with respect to the
11-years running mean PDO index. Areas with black dots indicate a
95 % confidence level according to a two-tailed student’s t test. For
the persistent nature of the low-frequency PDO index, the effective
number of degrees of freedom (EDOF) proposed by Davis (1976) is
used
962 J.-W. Kim et al.
123
phase (i.e., EN ? Pos_PDO minus LN ? Neg_PDO). In
contrast, the difference between El Nino with a negative
PDO phase and La Nina with a positive PDO phase (i.e.,
EN ? Neg_PDO minus LN ? Pos_PDO) is illustrated in
Fig. 5b, d and f. Note that the significance test for the
UV850 is assessed using a 90 % confidence level as dif-
ferent as other variables.
In the extratropics, both the in- and out-of-phase dif-
ference composites of SST (Fig. 5a, b) are characterized by
cold SST anomalies centered at 155�W and 30�N and
warm SST anomalies around the west coast of North
America. Meanwhile, strong warm SST anomalies extend
from the eastern tropical Pacific to the central tropical
Pacific, indicating that it represents a typical structure of El
Nino event. The western North Pacific (WNP) region
(5–35�N, 120–170�E; black rectangle in Fig. 5a) exerts a
dipole-like structure of warm and cold SST anomalies in
the in-phase difference composite. In contrast, there is no
significant anomalous warm SST in the WNP region in the
out-of-phase difference composite (Fig. 5b), which is dif-
ferent in comparison with the in-phase difference com-
posite. This result suggests a possibility that the WNP is a
notable region in modulating the EAWM regarding the
combined effect of the ENSO and PDO.
As expected, the spatial structures of atmospheric cir-
culations are also quite different in the in- and out-of-phase
differences (Fig. 5c–f). Massive anticyclonic circulation
anomalies (i.e., high pressure anomalies) cover both the
tropics and mid-latitudes from the western to central North
Pacific, almost expanding to 50�N and 150�W in the in-
phase difference SLP composite (Fig. 5c). Indeed, the
extent of the anticyclonic anomalies is much larger and
expands northward compared to that of the out-of-phase
difference composite (Fig. 5d). These well-developed
anomalous anticyclones effectively induce southerly wind
anomalies at the lower-tropospheric level, which can in
turn transport warm and moist air toward the East Asian
winter continent. Consistently, in-phase difference com-
posite of UV850 demonstrates the enhanced low-level
southerly wind anomalies initiating around 15�N and
110�E that follow the contour lines in the western flank of
the anomalous anticyclonic circulations over the western
Pacific (Fig. 5e). Because of these structures, the winter
climate in East Asia is most likely to be warmer and wetter
than normal, resulting in a weakening of the EAWM. On
the other hand, the anticyclonic anomalies in the out-of-
phase difference of UV850 are drastically confined to the
tropics so that southerly wind anomalies turn eastward
towards the subtropical western and central North Pacific
(Fig. 5f). As such, there is little impact on the EAWM
when the ENSO and PDO are combined with the out-of-
phase, regardless of the El Nino and/or La Nina events
which would induce the Pacific-East Asian teleconnection
pattern. Therefore, these results indicate that the PDO
contributes to the strength of the WNP anticyclone by
overlapping its effects on ENSO on the low-frequency
timescales.
To understand the role of the PDO in the development
and maintenance of the WNP anticyclone, we calculate the
regressed SST anomalies against with the PDO index for
the period of 1900–2010 (Fig. 6a). The spatial manifesta-
tions of the positive PDO phase are characterized by cold
SST in the western and central North Pacific with an
elliptical shape and are accompanied by warm SST in the
Fig. 3 a Regression map of the DJF surface air temperature (SAT, in
�C) provided by the University of Delaware with respect to the ENSO
index. b Same as a, but with respect to the 11-year running mean
PDO index. Areas with black dots indicate a 95 % confidence level
according to a two-tailed student’s t test
Combined effect of El Nino-Southern Oscillation 963
123
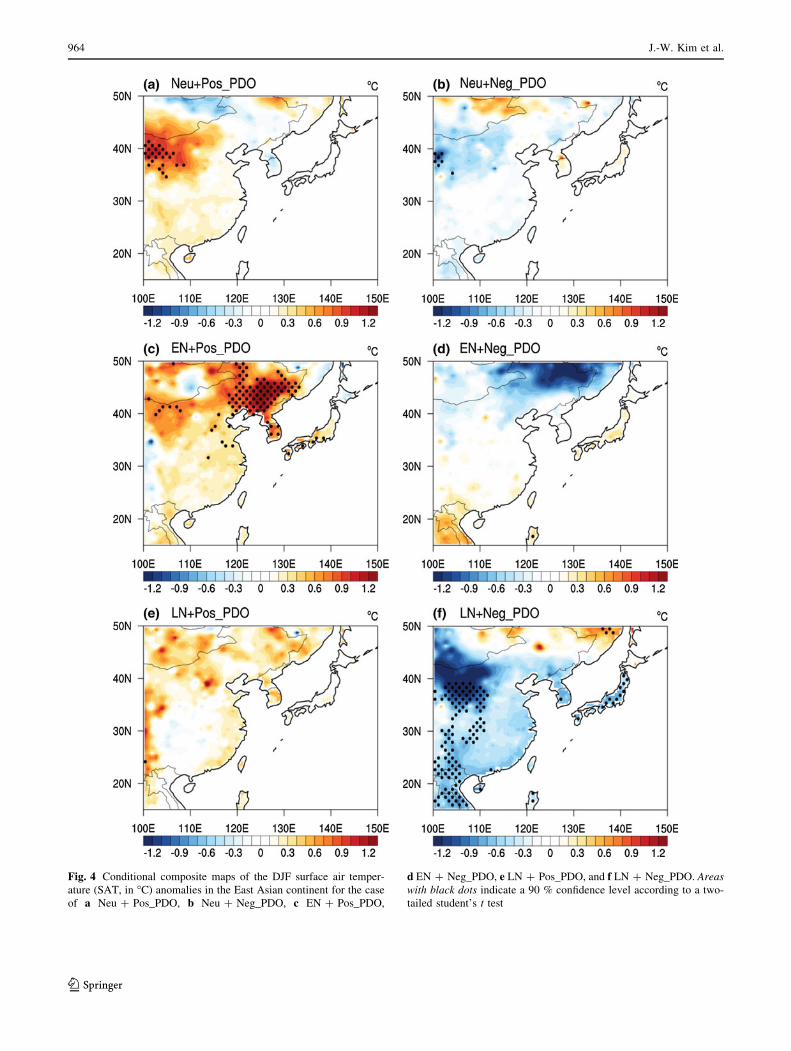
Fig. 4 Conditional composite maps of the DJF surface air temper-
ature (SAT, in �C) anomalies in the East Asian continent for the case
of a Neu ? Pos_PDO, b Neu ? Neg_PDO, c EN ? Pos_PDO,
d EN ? Neg_PDO, e LN ? Pos_PDO, and f LN ? Neg_PDO. Areas
with black dots indicate a 90 % confidence level according to a two-
tailed student’s t test
964 J.-W. Kim et al.
123
tropical and subtropical Pacific. In particular, there exists a
dipole-like pattern of anomalous warm and cold SSTs in
the WNP, which is associated with the anomalous high
pressure over the same region as shown in Fig. 2b. The
anomalous high pressure over the WNP reflects the
enhanced (reduced) total wind speed in its east (west) side,
resulting in the cold (warm) SST through the evaporation
and entrainment processes. Furthermore, the anomalous
cold SST is able to favor the amplification of anomalous
anticyclone by exciting Rossby waves (Wang et al. 2000).
Thus, the positive feedback between the anomalous anti-
cyclonic circulation and SST associated with the positive
phase of PDO over the WNP may play a role in the
development and maintenance of the surface wind and SST
anomalies. It is noteworthy that the physical processes on
the strengthening of anticyclone over the WNP under the
positive PDO phase are similar to the physical mechanism
of the Pacific-East Asian teleconnection under El Nino
Fig. 5 Difference composite maps of the DJF (a) sea surface
temperature (SST, in �C), c sea level pressure (SLP, in hPa), and
e 850-hPa wind (UV850, in m/s) between the cases of
EN ? Pos_PDO and LN ? Neg_PDO (i.e., in-phase difference). b,
d and f are the same as a, c and e, respectively, but for the
EN ? Neg_PDO and LN ? Pos_PDO (i.e., out-of-phase difference).
Areas with black dots indicate a 95 % confidence level and thick
vectors are significant at a 90 % confidence level according to a two-
tailed student’s t test
Combined effect of El Nino-Southern Oscillation 965
123
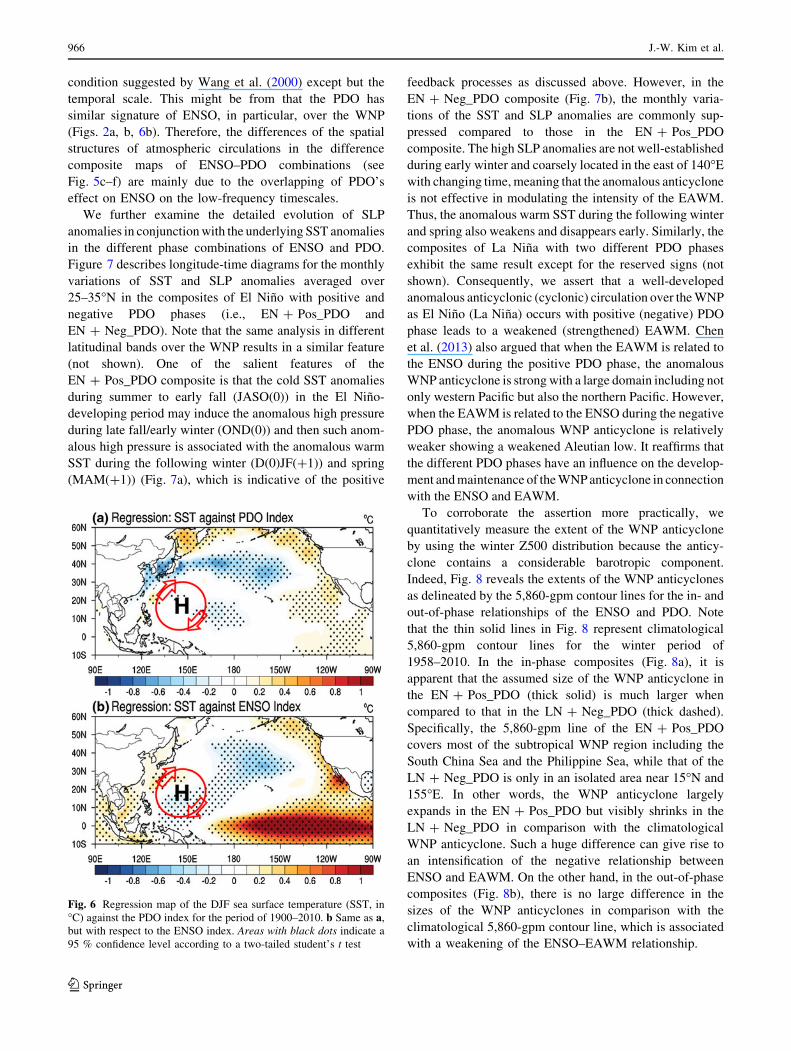
condition suggested by Wang et al. (2000) except but the
temporal scale. This might be from that the PDO has
similar signature of ENSO, in particular, over the WNP
(Figs. 2a, b, 6b). Therefore, the differences of the spatial
structures of atmospheric circulations in the difference
composite maps of ENSO–PDO combinations (see
Fig. 5c–f) are mainly due to the overlapping of PDO’s
effect on ENSO on the low-frequency timescales.
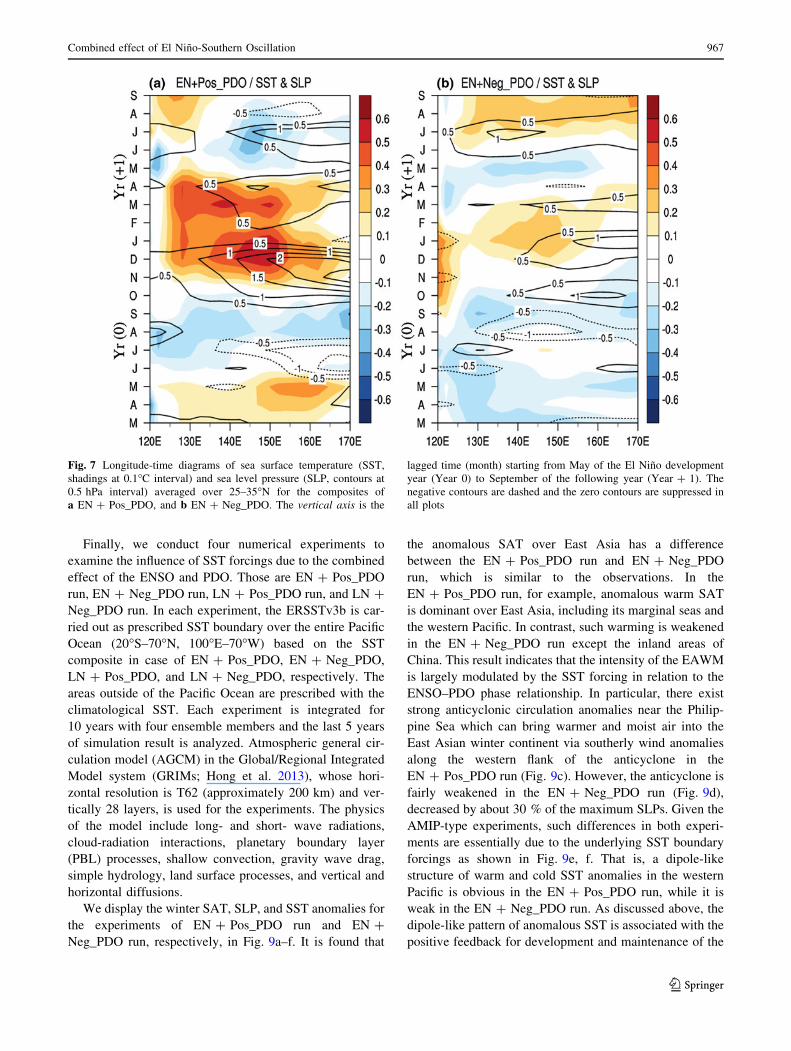
We further examine the detailed evolution of SLP
anomalies in conjunction with the underlying SST anomalies
in the different phase combinations of ENSO and PDO.
Figure 7 describes longitude-time diagrams for the monthly
variations of SST and SLP anomalies averaged over
25–35�N in the composites of El Nino with positive and
negative PDO phases (i.e., EN ? Pos_PDO and
EN ? Neg_PDO). Note that the same analysis in different
latitudinal bands over the WNP results in a similar feature
(not shown). One of the salient features of the
EN ? Pos_PDO composite is that the cold SST anomalies
during summer to early fall (JASO(0)) in the El Nino-
developing period may induce the anomalous high pressure
during late fall/early winter (OND(0)) and then such anom-
alous high pressure is associated with the anomalous warm
SST during the following winter (D(0)JF(?1)) and spring
(MAM(?1)) (Fig. 7a), which is indicative of the positive
feedback processes as discussed above. However, in the
EN ? Neg_PDO composite (Fig. 7b), the monthly varia-
tions of the SST and SLP anomalies are commonly sup-
pressed compared to those in the EN ? Pos_PDO
composite. The high SLP anomalies are not well-established
during early winter and coarsely located in the east of 140�E
with changing time, meaning that the anomalous anticyclone
is not effective in modulating the intensity of the EAWM.
Thus, the anomalous warm SST during the following winter
and spring also weakens and disappears early. Similarly, the
composites of La Nina with two different PDO phases
exhibit the same result except for the reserved signs (not
shown). Consequently, we assert that a well-developed
anomalous anticyclonic (cyclonic) circulation over the WNP
as El Nino (La Nina) occurs with positive (negative) PDO
phase leads to a weakened (strengthened) EAWM. Chen
et al. (2013) also argued that when the EAWM is related to
the ENSO during the positive PDO phase, the anomalous
WNP anticyclone is strong with a large domain including not
only western Pacific but also the northern Pacific. However,
when the EAWM is related to the ENSO during the negative
PDO phase, the anomalous WNP anticyclone is relatively
weaker showing a weakened Aleutian low. It reaffirms that
the different PDO phases have an influence on the develop-
ment and maintenance of the WNP anticyclone in connection
with the ENSO and EAWM.
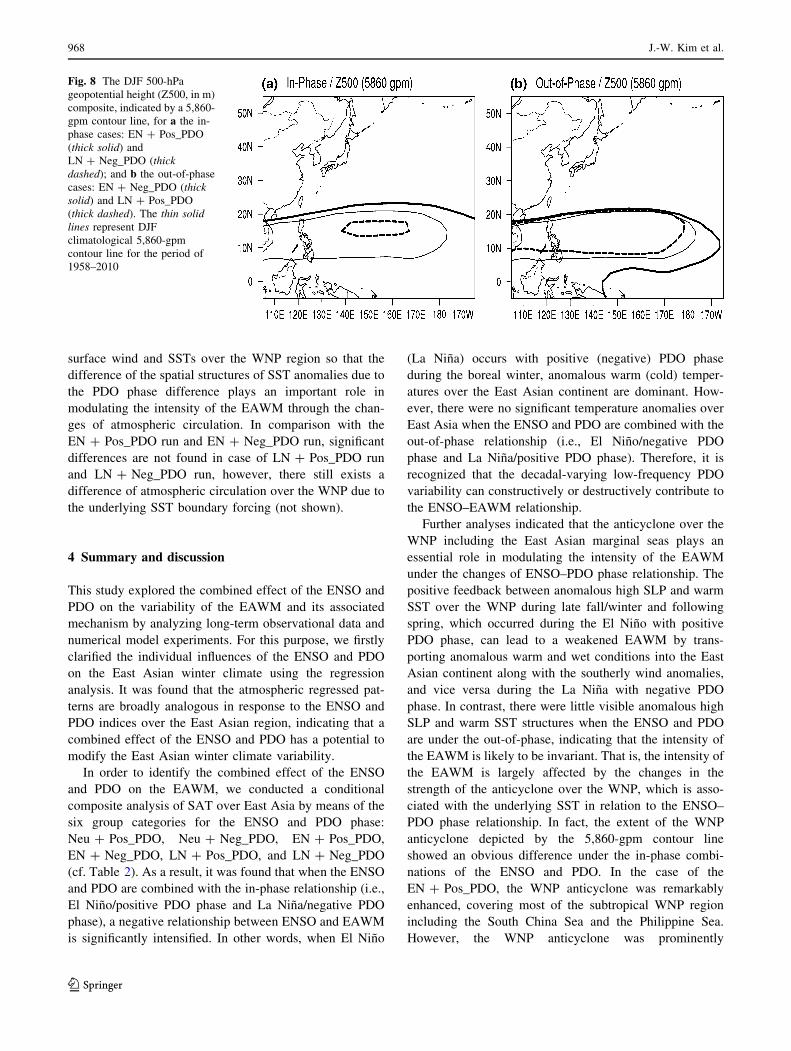
To corroborate the assertion more practically, we
quantitatively measure the extent of the WNP anticyclone
by using the winter Z500 distribution because the anticy-
clone contains a considerable barotropic component.
Indeed, Fig. 8 reveals the extents of the WNP anticyclones
as delineated by the 5,860-gpm contour lines for the in- and
out-of-phase relationships of the ENSO and PDO. Note
that the thin solid lines in Fig. 8 represent climatological
5,860-gpm contour lines for the winter period of
1958–2010. In the in-phase composites (Fig. 8a), it is
apparent that the assumed size of the WNP anticyclone in
the EN ? Pos_PDO (thick solid) is much larger when
compared to that in the LN ? Neg_PDO (thick dashed).
Specifically, the 5,860-gpm line of the EN ? Pos_PDO
covers most of the subtropical WNP region including the
South China Sea and the Philippine Sea, while that of the
LN ? Neg_PDO is only in an isolated area near 15�N and
155�E. In other words, the WNP anticyclone largely
expands in the EN ? Pos_PDO but visibly shrinks in the
LN ? Neg_PDO in comparison with the climatological
WNP anticyclone. Such a huge difference can give rise to
an intensification of the negative relationship between
ENSO and EAWM. On the other hand, in the out-of-phase
composites (Fig. 8b), there is no large difference in the
sizes of the WNP anticyclones in comparison with the
climatological 5,860-gpm contour line, which is associated
with a weakening of the ENSO–EAWM relationship.
Fig. 6 Regression map of the DJF sea surface temperature (SST, in
�C) against the PDO index for the period of 1900–2010. b Same as a,
but with respect to the ENSO index. Areas with black dots indicate a
95 % confidence level according to a two-tailed student’s t test
966 J.-W. Kim et al.
123
Finally, we conduct four numerical experiments to
examine the influence of SST forcings due to the combined
effect of the ENSO and PDO. Those are EN ? Pos_PDO
run, EN ? Neg_PDO run, LN ? Pos_PDO run, and LN ?
Neg_PDO run. In each experiment, the ERSSTv3b is car-
ried out as prescribed SST boundary over the entire Pacific
Ocean (20�S–70�N, 100�E–70�W) based on the SST
composite in case of EN ? Pos_PDO, EN ? Neg_PDO,
LN ? Pos_PDO, and LN ? Neg_PDO, respectively. The
areas outside of the Pacific Ocean are prescribed with the
climatological SST. Each experiment is integrated for
10 years with four ensemble members and the last 5 years
of simulation result is analyzed. Atmospheric general cir-
culation model (AGCM) in the Global/Regional Integrated
Model system (GRIMs; Hong et al. 2013), whose hori-
zontal resolution is T62 (approximately 200 km) and ver-
tically 28 layers, is used for the experiments. The physics
of the model include long- and short- wave radiations,
cloud-radiation interactions, planetary boundary layer
(PBL) processes, shallow convection, gravity wave drag,
simple hydrology, land surface processes, and vertical and
horizontal diffusions.
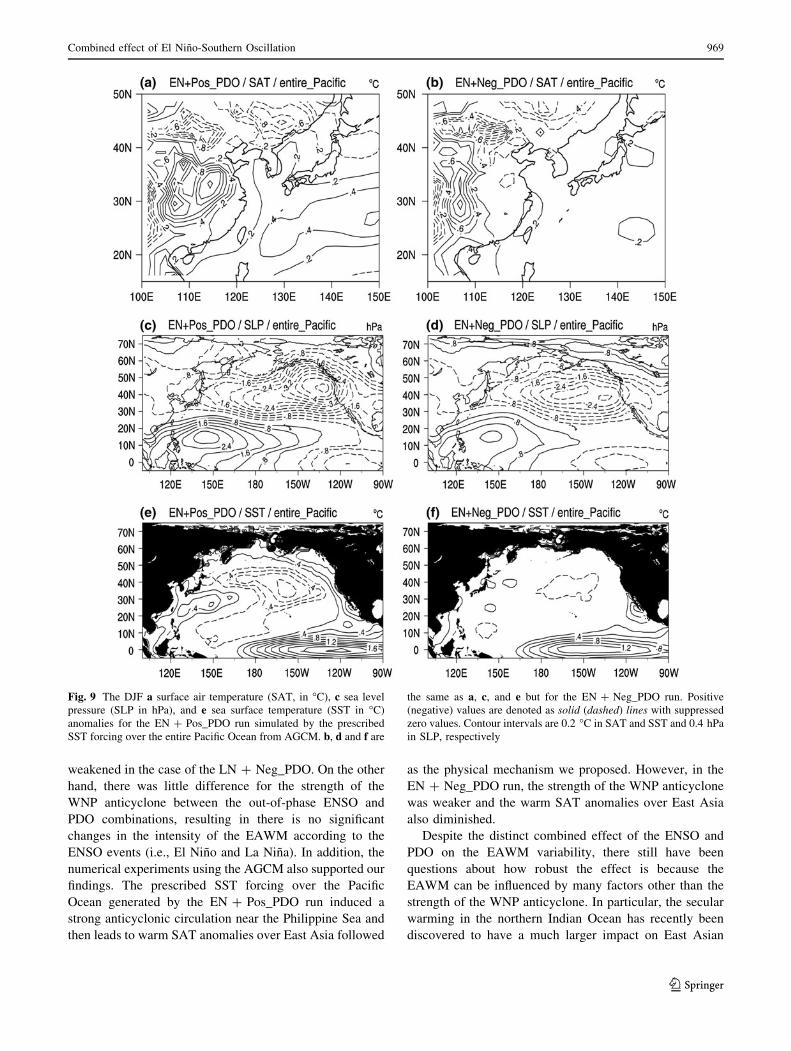
We display the winter SAT, SLP, and SST anomalies for
the experiments of EN ? Pos_PDO run and EN ?
Neg_PDO run, respectively, in Fig. 9a–f. It is found that
the anomalous SAT over East Asia has a difference
between the EN ? Pos_PDO run and EN ? Neg_PDO
run, which is similar to the observations. In the
EN ? Pos_PDO run, for example, anomalous warm SAT
is dominant over East Asia, including its marginal seas and
the western Pacific. In contrast, such warming is weakened
in the EN ? Neg_PDO run except the inland areas of
China. This result indicates that the intensity of the EAWM
is largely modulated by the SST forcing in relation to the
ENSO–PDO phase relationship. In particular, there exist
strong anticyclonic circulation anomalies near the Philip-
pine Sea which can bring warmer and moist air into the
East Asian winter continent via southerly wind anomalies
along the western flank of the anticyclone in the
EN ? Pos_PDO run (Fig. 9c). However, the anticyclone is
fairly weakened in the EN ? Neg_PDO run (Fig. 9d),
decreased by about 30 % of the maximum SLPs. Given the
AMIP-type experiments, such differences in both experi-
ments are essentially due to the underlying SST boundary
forcings as shown in Fig. 9e, f. That is, a dipole-like
structure of warm and cold SST anomalies in the western
Pacific is obvious in the EN ? Pos_PDO run, while it is
weak in the EN ? Neg_PDO run. As discussed above, the
dipole-like pattern of anomalous SST is associated with the
positive feedback for development and maintenance of the
Fig. 7 Longitude-time diagrams of sea surface temperature (SST,
shadings at 0.1�C interval) and sea level pressure (SLP, contours at
0.5 hPa interval) averaged over 25–35�N for the composites of
a EN ? Pos_PDO, and b EN ? Neg_PDO. The vertical axis is the
lagged time (month) starting from May of the El Nino development
year (Year 0) to September of the following year (Year ? 1). The
negative contours are dashed and the zero contours are suppressed in
all plots
Combined effect of El Nino-Southern Oscillation 967
123
surface wind and SSTs over the WNP region so that the
difference of the spatial structures of SST anomalies due to
the PDO phase difference plays an important role in
modulating the intensity of the EAWM through the chan-
ges of atmospheric circulation. In comparison with the
EN ? Pos_PDO run and EN ? Neg_PDO run, significant
differences are not found in case of LN ? Pos_PDO run
and LN ? Neg_PDO run, however, there still exists a
difference of atmospheric circulation over the WNP due to
the underlying SST boundary forcing (not shown).
4 Summary and discussion
This study explored the combined effect of the ENSO and
PDO on the variability of the EAWM and its associated
mechanism by analyzing long-term observational data and
numerical model experiments. For this purpose, we firstly
clarified the individual influences of the ENSO and PDO
on the East Asian winter climate using the regression
analysis. It was found that the atmospheric regressed pat-
terns are broadly analogous in response to the ENSO and
PDO indices over the East Asian region, indicating that a
combined effect of the ENSO and PDO has a potential to
modify the East Asian winter climate variability.
In order to identify the combined effect of the ENSO
and PDO on the EAWM, we conducted a conditional
composite analysis of SAT over East Asia by means of the
six group categories for the ENSO and PDO phase:
Neu ? Pos_PDO, Neu ? Neg_PDO, EN ? Pos_PDO,
EN ? Neg_PDO, LN ? Pos_PDO, and LN ? Neg_PDO
(cf. Table 2). As a result, it was found that when the ENSO
and PDO are combined with the in-phase relationship (i.e.,
El Nino/positive PDO phase and La Nina/negative PDO
phase), a negative relationship between ENSO and EAWM
is significantly intensified. In other words, when El Nino
(La Nina) occurs with positive (negative) PDO phase
during the boreal winter, anomalous warm (cold) temper-
atures over the East Asian continent are dominant. How-
ever, there were no significant temperature anomalies over
East Asia when the ENSO and PDO are combined with the
out-of-phase relationship (i.e., El Nino/negative PDO
phase and La Nina/positive PDO phase). Therefore, it is
recognized that the decadal-varying low-frequency PDO
variability can constructively or destructively contribute to
the ENSO–EAWM relationship.
Further analyses indicated that the anticyclone over the
WNP including the East Asian marginal seas plays an
essential role in modulating the intensity of the EAWM
under the changes of ENSO–PDO phase relationship. The
positive feedback between anomalous high SLP and warm
SST over the WNP during late fall/winter and following
spring, which occurred during the El Nino with positive
PDO phase, can lead to a weakened EAWM by trans-
porting anomalous warm and wet conditions into the East
Asian continent along with the southerly wind anomalies,
and vice versa during the La Nina with negative PDO
phase. In contrast, there were little visible anomalous high
SLP and warm SST structures when the ENSO and PDO
are under the out-of-phase, indicating that the intensity of
the EAWM is likely to be invariant. That is, the intensity of
the EAWM is largely affected by the changes in the
strength of the anticyclone over the WNP, which is asso-
ciated with the underlying SST in relation to the ENSO–
PDO phase relationship. In fact, the extent of the WNP
anticyclone depicted by the 5,860-gpm contour line
showed an obvious difference under the in-phase combi-
nations of the ENSO and PDO. In the case of the
EN ? Pos_PDO, the WNP anticyclone was remarkably
enhanced, covering most of the subtropical WNP region
including the South China Sea and the Philippine Sea.
However, the WNP anticyclone was prominently
Fig. 8 The DJF 500-hPa
geopotential height (Z500, in m)
composite, indicated by a 5,860-
gpm contour line, for a the in-
phase cases: EN ? Pos_PDO
(thick solid) and
LN ? Neg_PDO (thick
dashed); and b the out-of-phase
cases: EN ? Neg_PDO (thick
solid) and LN ? Pos_PDO
(thick dashed). The thin solid
lines represent DJF
climatological 5,860-gpm
contour line for the period of
1958–2010
968 J.-W. Kim et al.
123
weakened in the case of the LN ? Neg_PDO. On the other
hand, there was little difference for the strength of the
WNP anticyclone between the out-of-phase ENSO and
PDO combinations, resulting in there is no significant
changes in the intensity of the EAWM according to the
ENSO events (i.e., El Nino and La Nina). In addition, the
numerical experiments using the AGCM also supported our
findings. The prescribed SST forcing over the Pacific
Ocean generated by the EN ? Pos_PDO run induced a
strong anticyclonic circulation near the Philippine Sea and
then leads to warm SAT anomalies over East Asia followed
as the physical mechanism we proposed. However, in the
EN ? Neg_PDO run, the strength of the WNP anticyclone
was weaker and the warm SAT anomalies over East Asia
also diminished.
Despite the distinct combined effect of the ENSO and
PDO on the EAWM variability, there still have been
questions about how robust the effect is because the
EAWM can be influenced by many factors other than the
strength of the WNP anticyclone. In particular, the secular
warming in the northern Indian Ocean has recently been
discovered to have a much larger impact on East Asian
Fig. 9 The DJF a surface air temperature (SAT, in �C), c sea level
pressure (SLP in hPa), and e sea surface temperature (SST in �C)
anomalies for the EN ? Pos_PDO run simulated by the prescribed
SST forcing over the entire Pacific Ocean from AGCM. b, d and f are
the same as a, c, and e but for the EN ? Neg_PDO run. Positive
(negative) values are denoted as solid (dashed) lines with suppressed
zero values. Contour intervals are 0.2 �C in SAT and SST and 0.4 hPa
in SLP, respectively
Combined effect of El Nino-Southern Oscillation 969
123
climate variability, including the EAWM (Watanabe and
Jin 2002; Watanabe and Jin 2003; Annamalai et al. 2005;
Yang et al. 2007). The persistence of El Nino-induced
warm SST anomalies in the northern Indian Ocean could
be another important factor to form the WNP anticyclone
with emanating a Kelvin wave propagating into the WNP
(cf. the Indian Ocean capacitor mechanism; Xie et al.
2009). Furthermore, the WNP anticyclone can persist until
summer through the Kelvin wave-induced Ekman diver-
gence mechanism, thereby influencing on the variability of
the East Asian summer monsoon. This long-term persis-
tence of the WNP anticyclone is quite similar to our results
as shown in Fig. 7. Thus, the influence of the northern
Indian Ocean warming in conjunction with the combined
effect of the ENSO and PDO should be investigated in a
future study.
Acknowledgments This work was supported by the National
Research Foundation of Korea Grant funded by the Korean Govern-
ment (MEST) (NRF-2009-C1AAA001-2009-0093042). S.-W. Yeh
was funded by the Korea Meteorological Administration Research
and Development Program under Grant CATER 2012–3041.
References
Annamalai H, Liu P, Xie SP (2005) Southwest Indian Ocean SST
variability: its local effect and remote influence on Asian
monsoons. J Clim 18:4150–4167
Birk K, Lupo AR, Guinan P, Barbieri CE (2010) The interannual
variability of Midwestern temperatures and precipitation as
related to the ENSO and PDO. Atmosfera 23:95–128
Chan JCL, Li C (2004) The East Asia winter monsoon. In: Chang CP
(ed) East Asian monsoon. World Scientific Series on Meteorol-
ogy of East Asia, vol. 2. World Scientific, pp 54–106
Chang CP, Lau KM (1982) Short-term planetary-scale interaction
over the tropics and the midlatitudes during northern winter. Part
1: contrast between active and inactive periods. Mon Wea Rev
110:933–946
Chang CP, Erickson JE, Lau KM (1979) Northeasterly cold waves
and near-equatorial disturbances over the winter MONEX area
during December 1974. Part I: synoptic aspects. Mon Wea Rev
107:812–829
Chang CP, Wang Z, Ju J, Li T (2004) On the relationship between
western maritime continent monsoon rainfall and ENSO during
northern winter. J Clim 17:665–672
Chang CP, Wang Z, Hendon H (2006) The Asian winter monsoon. In:
Wang B (ed) The Asian monsoon. Springer, Berlin, pp 89–127
Chen W, Graf H, Huang RH (2000) The interannual variability of
East Asian winter monsoon and its relation to the summer
monsoon. Adv Atmos Sci 17:48–60
Chen W, Feng J, Wu R (2013) Roles of ENSO and PDO in the Link
of the East Asian winter monsoon to the following summer
monsoon. J Clim 26:622–635
Cui X, Sun Z (1999) East Asian winter monsoon index and its
variation analysis. J Nanjing Inst Meteor 22:321–325
Davis RE (1976) Predictability of sea surface temperature and sea
level pressure anomalies over the North Pacific Ocean. J Phys
Oceanogr 6:249–266
Ding YH (1994) Monsoons over China. Atmospheric sciences library,
vol. 16. Kluwer Academic Publishers, Dordrecht, p 432
Gershunov A, Barnett TP (1998) Interdecadal modulation of ENSO
teleconnections. Bull Am Meteorol Soc 79(12):2715–2725
Gong DY, Wang SW, Zhu JH (2001) East Asian winter monsoon and
Arctic Oscillation. Geophys Res Lett 28:2073–2076
Guo QY (1982) Relationship between the variations of East Asian
winter monsoon and temperature anomalies in China. Chin J
Appl Meteor 5:218–225
Hamada JI, Yamanaka M, Matsumoto J, Fukao S, Winarso P,
Sribimawati T (2002) Spatial and temporal variations of the
rainy season over Indonesia and their link to ENSO. J Meteor
Soc Jpn 80:285–310
Hong SY, Park H, Cheong HB, Kim JE, Koo MS, Jang J, Ham S,
Hwang SO, Park BK, Chang EC, Li H (2013) The global/
regional integrated model system (GRIMs). Asia-Pac J Atmos
Sci 49(2):219–243
Horel JD, Wallace JM (1981) Planetary-scale atmospheric phenom-
ena associated with the Southern Oscillation. Mon Wea Rev
109:813–829
Hu ZZ, Huang BH (2009) Interferential impact of ENSO and PDO on
dry and wet conditions in the U.S. Great plains. J Clim
22:6047–6065
Huang RH, Zhou LT, Chen W (2003) The progresses of recent studies
on the variabilities of the East Asian monsoon and their causes.
Adv Atmos Sci 20:55–69
Huang RH, Chen JL, Huang G (2007) Characteristics and variations
of the East Asian monsoon system and its impacts on climate
disasters in China. Adv Atmos Sci 24:993–1023. doi:
10.1007/s00376-007-0993-x
Jhun JG, Lee EJ (2004) A new East Asian winter monsoon index
and associated characteristics of winter monsoon. J Clim 17:
711–726
Ji LR, Shuqing S, Arpe K, Bengtsson L (1997) Model study on the
interannual variability of Asian winter monsoon. Adv Atmos Sci
14:1–22
Kang I, Jeong Y (1996) Association of interannual variations of
temperature and precipitation in Seoul with principal modes of
Pacific SST. J Korean Meteor Soc 32:339–345
Kayano MT, Andreoli RV (2007) Relations of South American
summer rainfall interannual variations with the Pacific Decadal
Oscillation. Int J Climatol 27:531–540
Krishnamurthy V, Kirtman BP (2009) Relation between Indian
monsoon variability and SST. J Clim 22:4437–4458
Kung EC, Chern JG (1995) Prevailing anomaly patterns of the global
sea surface temperatures and tropospheric responses. Atmosfera
8:99–114
Latif M, Barnett TP (1996) Decadal climate variability over the North
Pacific and North America: dynamics and predictability. J Clim
9:2407–2423
Lau KM, Chang CP (1987) Planetary scale aspects of the winter
monsoon and atmospheric teleconnections. In: Chang CP,
Krishnamurti TN (eds) Monsoon meteorology. Oxford Univer-
sity Press, Oxford, pp 161–201
Lau KM, Li MT (1984) The monsoon of East Asia and its global
associations—a survey. Bull Am Meteor Soc 65:114–125
Lau NC, Nath MJ (1994) A modeling study of the relative roles of
tropical and extratropical SST anomalies in the variability of the
global atmosphere-ocean system. J Clim 7:1184–1207
Li X (1955) A study of cold waves in East Asia. In: Scientific works
in Modern China-Meteorology (1919–1949) (in Chinese). Sci-
ence Press, Beijing, pp 35–118
Li S, Bates G (2007) Influence of the Atlantic multidecadal oscillation
on the winter climate of East China. Adv Atmos Sci 24:126–135
Li J, Zeng Q (2002) A unified monsoon index. Geophys Res Lett
29:1274. doi:10.1029/2001GL013874
Lu E, Chan J (1999) A unified monsoon index for south China. J Clim
12:2375–2385
970 J.-W. Kim et al.
123
Lupo AR, Kelsey EP, Weitlich DK, Mokhov II, Akyuz FA, Guinan
PE, Woolard JE (2007) Interannual and interdecadal variability
in the predominant Pacific Region SST anomaly patterns and
their impact on a local climate. Atmosfera 20:171–196
Mantua NJ, Hare SR, Zhang Y, Wallace JM, Francis RC (1997) A
Pacific interdecadal climate oscillation with impacts on salmon
production. Bull Am Meteorol Soc 78(6):1069–1079
McCabe GJ, Ault TR, Cook BI, Betancourt JL, Schwartz MD (2011)
Influences of the El Nino Southern Oscillation and the Pacific
Decadal Oscillation on the timing of the North American spring.
Int J Climatol (published online). doi:10.1002/joc.3400
Paegle JN, Mo KC (2002) Linkages between summer rainfall
variability over South America and sea surface temperature
anomalies. J Clim 15:1389–1407
Parker DE, Folland CK, Jackson M (1995) Marine surface temper-
ature: observed variations and data requirements. Clim Change
31:559–600
Pavia EG, Graef F, Reyes J (2006) PDO-ENSO effects in the climate
of Mexico. J Clim 19:6433–6438
Peterson TC, Vose RS (1997) An overview of the Global Historical
Climatology Network temperature database. Bull Am Meteorol
Soc 78:2837–2849
Reynolds RW, Rayner NA, Smith TM, Stokes DC, Wang W (2002)
An improved in situ and satellite SST analysis for climate.
J Clim 15:1609–1625
Simmons A, Uppala S, Dee D, Kobayashi S (2006) ERA-Interim: new
ECMWF reanalysis products from 1989 onwards. ECMWF
Newsl 110:26–35
Smith TM, Reynolds RW, Peterson TC, Lawrimore J (2008)
Improvements to NOAA’s historical merged land-ocean surface
temperature analysis (1880–2006). J Clim 21:2283–2296
Steffen K, Box JE, Abdalati W (1996) Greenland climate network:
GC-Net. In: Colbeck SC (ed) CRREL 96-27 special report on
glaciers, ice sheets and volcanoes, trib. to M. Meier, pp 98–103
Swanson KL, Tsonis AA (2009) Has climate recently shifted?
Geophys Res Lett 36:L06711. doi:10.1029/2008GL037022
Tao SY (1957) A study of activities of cold airs in East Asian winter.
In: China Meteorological Administration (eds) Handbook of
short-term forecast. Meteorology Press, pp 60–92
Tao S, Zhang Q (1998) Response of the East Asian summer monsoon
to ENSO events (in Chinese). Sci Atmos Sinica 22:399–407
Tomita T, Yasunari T (1996) Role of the northeast winter monsoon on
the biennial oscillation of the ENSO/monsoon system. J Meteor
Soc Jpn 74:399–413
Tsonis AA, Swanson KL, Kravtsov S (2007) A new dynamical
mechanism for major climate shift. Geophys Res Let 34:L13705.
doi:10.1029/2007GL030288
Uppala SM et al (2005) The ERA-40 reanalysis. Q J R Meteorol Soc
131:2961–3012 560, 1992
Wallace JM, Gutzler DS (1981) Teleconnections in the geopotential
height field during the northern hemisphere winter. Mon Wea
Rev 109:784–812
Wang B, Wu R, Fu X (2000) Pacific-east Asian teleconnection: how
does ENSO affect east Asian climate? J Clim 13:1517–1536
Wang L, Chen W, Huang R (2008) Interdecadal modulation of PDO
on the impact of ENSO on the East Asian winter monsoon.
Geophys Res Lett 35:L20702. doi:10.1029/2008GL035287
Wang B, Wu Z, Chang C, Liu J, Li J, Zhou T (2010) Another look at
interannual-to-interdecadal variations of the East Asian Winter
Monsoon: the Northern and Southern temperature modes. J Clim
23:1495–1512
Watanabe M, Jin F (2002) Role of Indian Ocean warming in the
development of Philippine Sea anticyclone during ENSO.
Geophys Res Lett 29(10):1478. doi:10.1029/2001GL014318
Watanabe M, Jin FF (2003) A moist linear baroclinic model: coupled
dynamical—convective response to El Nino. J Clim 16:
1121–1139
Wilks DS (2006) Statistical methods in the atmospheric science.
Academic Press, San Diego, p 648
Wu BY, Zhang R, D’Arrigo R (2006) Distinct modes of the East
Asian winter monsoon. Mon Wea Rev 134:2165–2179
Wu Z, Li J, Wang B, Liu X (2009) Can the Southern Hemisphere
annular mode affect Chinese winter monsoon? J Geophys Res
114:D11107. doi:10.1029/2008JD011501
Xie S-P, Hu K, Hafner J, Tokinaga H, Du Y, Huang G, Sampe T
(2009) Indian Ocean capacitor effect on Indo-western Pacific
climate during the summer following El Nino. J Clim
22:730–747
Yang J, Liu Q, Xie SP, Liu Z, Wu L (2007) Impact of the Indian
Ocean SST basin mode on the Asian summer monsoon. Geophys
Res Lett 34:L02708. doi:10.1029/2006GL028571
Yoon JH, Yeh SW (2010) Influence of the Pacific Decadal Oscillation
on the Relationship between El Nino and the Northeast Asian
summer monsoon. J Clim 23:4525–4537
Zhang R, Sumi A, Kimoto M (1996) Impact of El Nino on the East
Asian monsoon: a diagnostic study of the ’86/87 and ’91/92
events. J Meteor Soc Jpn 74:49–62
Zhang Y, Wallace JM, Battisti DS (1997a) ENSO-like interdecadal
variability: 1900–93. J Clim 10:1004–1020
Zhang Y, Sperber KR, Boyle JS (1997b) Climatology and interannual
variation of the East Asian winter monsoon: results from the
1979–95 NCEP/NCAR reanalysis. Mon Wea Rev 125:
2605–2619
Combined effect of El Nino-Southern Oscillation 971
123