el niño–southern oscillation diversity and southern africa teleconnections during austral summer
TRANSCRIPT

1 23
Climate DynamicsObservational, Theoretical andComputational Research on the ClimateSystem ISSN 0930-7575 Clim DynDOI 10.1007/s00382-014-2414-z
El Niño–Southern Oscillation diversity andSouthern Africa teleconnections duringAustral Summer
Andrew Hoell, Chris Funk, TamukaMagadzire, Jens Zinke & Greg Husak

1 23
Your article is protected by copyright and
all rights are held exclusively by Springer-
Verlag Berlin Heidelberg. This e-offprint is
for personal use only and shall not be self-
archived in electronic repositories. If you wish
to self-archive your article, please use the
accepted manuscript version for posting on
your own website. You may further deposit
the accepted manuscript version in any
repository, provided it is only made publicly
available 12 months after official publication
or later and provided acknowledgement is
given to the original source of publication
and a link is inserted to the published article
on Springer's website. The link must be
accompanied by the following text: "The final
publication is available at link.springer.com”.
1 3
DOI 10.1007/s00382-014-2414-zClim Dyn
El Niño–Southern Oscillation diversity and Southern Africa teleconnections during Austral Summer
Andrew Hoell · Chris Funk · Tamuka Magadzire · Jens Zinke · Greg Husak
Received: 27 June 2014 / Accepted: 11 November 2014 © Springer-Verlag Berlin Heidelberg 2014
Indian Ocean, are associated with precipitation reductions over Southern Africa. The regional precipitation reduc-tions are forced primarily by large-scale mid-tropospheric subsidence associated with anticyclonic circulation in the upper troposphere. El Niño events with cooler than average SST over the Indian Ocean are associated with precipita-tion increases over Southern Africa associated with lower tropospheric cyclonic circulation and mid-tropospheric ascent. La Niña events, with cool SST anomalies over the central Pacific and warm SST over the west Pacific and Indian Ocean, are associated with precipitation increases over Southern Africa. The regional precipitation increases are forced primarily by lower tropospheric cyclonic circula-tion, resulting in mid-tropospheric ascent and an increased flux of moisture into the region.
Keywords ENSO Diversity · El Niño · La Niña · Teleconnections · Southern Africa
1 Introduction
Extremes in the El Niño–Southern Oscillation (ENSO) have been linked to global climate modifications (e.g., Ropelewski and Halpert 1987, 1989; Trenberth et al. 1998; Diaz et al. 2001) with particular severity over the African Continent south of 15
◦S latitude, a region hereafter referred
to as Southern Africa (e.g., Nicholson and Entekhabi 1986; Lindesay 1988; Jury et al. 1994; Rocha and Simmonds 1997; Nicholson and Kim 1997; Reason et al. 2000). Though the impacts of ENSO over Southern Africa have been documented, individual El Niño and La Niña events associated with different sea surface temperature (SST) pat-terns over the Indo-Pacific have been shown to force vary-ing regional circulations (Reason and Jagadheesha 2005;
Abstract A wide range of sea surface temperature (SST) expressions have been observed during the El Niño–South-ern Oscillation events of 1950–2010, which have occurred simultaneously with different global atmospheric circu-lations. This study examines the atmospheric circulation and precipitation during December–March 1950–2010 over the African Continent south of 15 S, a region hereaf-ter known as Southern Africa, associated with eight tropi-cal Pacific SST expressions characteristic of El Niño and La Niña events. The self-organizing map method along with a statistical distinguishability test was used to isolate the SST expressions of El Niño and La Niña. The seasonal precipitation forcing over Southern Africa associated with the eight SST expressions was investigated in terms of the horizontal winds, moisture budget and vertical motion. El Niño events, with warm SST across the east and cen-tral Pacific Ocean and warmer than average SST over the
A. Hoell (*) · G. Husak Department of Geography, University of California Santa Barbara, Santa Barbara, CA, USAe-mail: [email protected]
G. Husak e-mail: [email protected]
C. Funk U.S. Geological Survey, Department of Geography, University of California Santa Barbara, Santa Barbara, CA, USAe-mail: [email protected]
T. Magadzire Famine Early Warning Systems Network, Gaborone, Bostwanae-mail: [email protected]
J. Zinke University of Western Australia, Perth, Australiae-mail: [email protected]
Author's personal copy
A. Hoell et al.
1 3
Ratnam et al. 2014) and precipitation (Nicholson and Kim 1997). Johnson (2013) identified that the SST expression of individual ENSO events during 1950–2010 could be explained by one of eight characteristic SST patterns. Here, we examine the circulation and precipitation as forced by the eight characteristic SST expressions during December–March (DJFM) 1950–2010 to better understand the impacts of ENSO on Southern Africa.
The tropical Pacific SST expressions of El Niño and La Niña can vary considerably from one event to another (Wyrtki 1975). Despite the variations in SST patterns and magnitudes, and their associated atmospheric responses, ENSO events are commonly classified as either eastern Pacific (EP) ENSO, also known as canonical ENSO (Ras-musson and Carpenter 1982), or central Pacific (CP) ENSO (Kao and Yu 2009; Yeh et al. 2012), which has also been referred to as dateline ENSO (Larkin and Harrison 2005), El Niño Modoki (Ashok et al. 2007) and warm pool El Niño (Kug et al. 2009). The EP and CP classifications of ENSO are not always adequate, as they fail to properly identify the wide range of possible SST expressions of ENSO over the Pacific as well as the Atlantic and Indian Oceans. Over Southern Africa, static indices of ENSO, which may include EP and CP ENSO, have been shown to be poor predictors of the regional climate variability (Jury et al. 1994). Therefore, understanding the atmospheric response to the many SST expressions of ENSO is of criti-cal importance to the predictability of climate over South-ern Africa.
ENSO strongly modulates precipitation throughout Southern Africa (Nicholson and Kim 1997), with particu-lar severity over eastern equatorial and southeastern Africa (Ropelewski and Halpert 1987, 1989; Nicholson and Kim 1997). During Austral Summer, ENSO events strongly influence the Walker circulation, which enhance and reduce convective activity over the west and central Indian Ocean during El Niño and La Niña events, respectively (Reason et al. 2000). Changes in convective activity during El Niño and La Niña events modify the regional circulation and pre-cipitation over Southern Africa.
Since EP and CP ENSO classifications are not always adequate, (Johnson 2013) developed a method to iso-late the characteristic SST patterns of ENSO. He used the self-organizing map method in addition to a statistical distinguishability test to identify eight ENSO-related SST patterns, four La Niña patterns and four El Niño patterns. Johnson (2013) then classified each ENSO event for 1950–2010 using one of the eight patterns. The eight ENSO-related SST patterns are related to statistically signifi-cant anomalous SST over the tropical Atlantic and Indian Oceans as well as the tropical Pacific Ocean.
The inter-event variability of teleconnections associ-ated with El Niño and La Niña events, called inter-El
Niño variations by Kumar and Hoerling (1997), have been observed globally (Kumar et al. 2005; Trenberth and Smith 2009), throughout the Southern Hemisphere (Vera et al. 2004) and most especially over Southern Africa (Reason and Jagadheesha 2005; Nicholson and Kim 1997). Consid-erable variations in horizontal winds and moisture fluxes between individual El Niño and La Niña events (Reason and Jagadheesha 2005) force different timing and magnitudes of seasonal precipitation (Nicholson and Kim 1997). Ratnam et al. (2014) examined the differences in the atmospheric circulation and precipitation over Southern Africa between canonical El Niño (EP El Niño) and El Niño Modoki (CP El Niño). Ratnam et al. (2014) found that canonical El Niño resulted in significant precipitation reductions over Southern Africa compared to El Niño Modoki, which only resulted in weak to moderate precipitation reductions for the 1982–2011 period. Here, we expand on the work of Reason and Jagad-heesha (2005) and Ratnam et al. (2014) and examine the cir-culation and precipitation over Southern Africa associated with eight characteristic Indo-Pacific SST patterns of ENSO for 1950–2010, which includes both El Niño and La Niña, defined by Johnson (2013) using atmospheric reanalyses and an atmospheric climate model forced by observed SST.
Strong SST anomalies over tropical Atlantic and Indian Oceans are also present during ENSO events, which in turn at least partially force inter-El Niño variations over Southern Africa (Nicholson 1997; Goddard and Graham 1999). Nicholson and Kim (1997) found that SST vari-ability over the Atlantic Ocean is most important during La Niña while SST variability over the Indian Ocean is most important during El Niño. Furthermore, SST dipole pat-terns (e.g.,Chambers et al. 1999; Webster et al. 1999; Saji et al. 1999) over the Indian Ocean can occur during ENSO events, and have important influences on the regional cir-culation over Southern Africa (Reason et al. 2000). Rea-son and Jagadheesha (2005) also found that atmospheric models forced by observed SST correctly replicate the atmospheric response in part due to Indian Ocean SST as well as SST over the tropical Pacific. However, when all El Niño and La Niña events are considered in the aggre-gate, Indian Ocean SST average to zero, making it difficult to directly understand the Indian Ocean influences during ENSO events (Reason et al. 2000). While the ENSO SST pattern separation of Johnson (2013) identified the tropical Pacific SST expressions of ENSO, these eight SST patterns are also related to significant SST changes over the Atlantic and Indian Oceans. Therefore, our examination of the rela-tionship between Southern Africa climate variability and the eight characteristic SST patterns of ENSO include the influences of all three tropical oceans: the Atlantic, Indian and Pacific.
In Sects. 2 and 3, we describe the data and methods used, respectively, as well as the SST patterns associated
Author's personal copy

ENSO diversity and Southern Africa teleconnections
1 3
with the eight ENSO SST patterns found by Johnson (2013). In Sects. 3 and 4 we examine the regional circula-tion and precipitation modifications over Southern Africa in terms of the horizontal wind, vertical motions and moisture fluxes associated with the SST expressions of El Niño and La Niña, respectively. In Sect. 5 we provide a summary and brief discussion.
2 Data
2.1 SST
Monthly SST were drawn from the Extended Recon-structed Sea Surface Temperature (ERSST) analysis ver-sion 3b (Smith et al. 2008) for 1950–2010 on a fixed 2.0
◦× 2.0
◦ latitude-longitude grid. The seasonal cycle of SST was removed relative to the entire period of record considered.
2.2 Reanalysis atmospheric circulation
Horizontal wind, vertical velocity and vertically inte-grated moisture flux were derived from the four times daily National Centers for Environmental Prediction-National Center for Atmospheric Research (NCEP-NCAR) reanal-ysis fields (Kalnay et al. 1996) for 1950–2010 on a fixed 2.5
◦× 2.5
◦ latitude-longitude pressure level grid. The sea-sonal cycle of each variable was removed relative to the entire period of record considered. NCEP-NCAR reanaly-sis variables were compared to and show strong similarities with, the Modern Era Retrospective-analysis for Research and Applications (MERRA) (Rienecker et al. 2011) on a fixed 1.25
◦× 1.25
◦ latitude-longitude pressure level grid for 1979–2010.
2.3 Observed precipitation
Monthly precipitation was drawn from the Global Precipi-tation Climatology Center (GPCC) monthly precipitation dataset version 6 (Becker et al. 2013) for 1950–2010 on a fixed 0.5
◦× 0.5
◦ latitude-longitude grid. The seasonal cycle of precipitation was removed relative to the entire period of record considered.
3 Methods
3.1 Statistical significance
A bootstrapping approach is used to test for significant dif-ferences in the mean of atmospheric circulations, precipi-tation and SST during different flavors of ENSO from the
long-term mean. 10,000 composites were constructed from the average number of randomly selected seasonal anom-alies for the variable in question. The number of seasons selected for each composite is the same as the number of ENSO events of a particular phase and season. Statistical significance for each grid point was determined from the distribution created by the 10,000 composites. We focus on anomalies significant at p < 0.10 using a two-sided test. Therefore, anomalies greater than the 95th percentile or lower than the 5th percentile of the synthetic distribution are significant.
For example, the statistical significance calculation for the composite precipitation anomaly during El Niño phase 3 (Fig. 9) is explained. Nine DJFM seasons, corresponding to the number of El Niño phase 3 occurrences for DJFM (Table 1), were selected randomly without replacement from the possible 60 DJFM seasons in the 1950–2010 record. The nine random samples were averaged at all grid points. The process was repeated to generate 10,000 com-posites. The 10,000 composites were sorted according to rank at all grid points, and statistical significance was com-puted from this distribution.
3.2 ENSO SST pattern separation
The method of Johnson (2013) is used to separate the Pacific SST expressions of ENSO in time and space. This method paired a neural network-based cluster analysis, called self-organizing map (SOM) analysis, and a statistical distinguishability test for September–February 1950–2010 tropical Pacific SST anomalies to yield nine unique Pacific SST expressions of ENSO.
Johnson (2013) found that El Niño and La Niña are each related to four SST anomaly cluster patterns. The four El Niño and four La Niña patterns are statistically distinguish-able from each other at the 5 % significance level based on a field significance test. The temporal duration of El
Table 1 September–February occurrences of El Niño phases identi-fied by Johnson (2013)
EN1 EN2 EN3 EN4
1953–1954 1951–1952 1957–1958 1972–1973
1958–1959 1963–1964 1965–1966 1982–1983
1977–1978 1968–1969 1986–1987 1997–1998
1969–1970 1987–1988
1976–1977 1991–1992
2004–2005 1994–1995
2002–2003
2006–2007
2009–2010
Author's personal copy

A. Hoell et al.
1 3
Niño and La Niña events for September–February are dis-played in Tables 1 and 2, respectively, and the and compos-ite observed SST anomalies of these El Niño and La Niña events over the tropical Atlantic and Indo-Pacific are shown in Figs. 1 and 2, respectively.
Johnson (2013) defines El Niño (La Niña) events to occur when at least four months during September-Feb-ruary meet the El Niño (La Niña) criteria of the National Oceanographic and Atmospheric Administration (NOAA) Climate Prediction Center (CPC). NOAA CPC classi-fies El Niño (La Niña) episodes when the three-month running mean Niño3.4 index is greater (less) than 0.5
◦C
(−0.5◦C) for at least five consecutive and overlapping
three-month seasons. Since we focus on the DJFM sea-son over Southern Africa, El Niño (La Niña) events iden-tified by Johnson (2013) are assumed to extend through March, a small change from his temporal definition of September–February.
There are considerable differences between the El Niño and La Niña-related SST expressions in terms of temporal occurrence and the longitudinal position and magnitude of the associated Pacific SST anomalies. For El Niño (Fig. 1),
Patterns 1–3 are characteristic of CP events identified by such authors as Kug et al. (2009). Pattern 4 is the only pat-tern characteristic of EP events, which includes the El Niño episodes of 1972–1973, 1982–1983 and 1997–1998. Giese and Ray (2011) and Ray and Giese (2012) have found that while all EP El Niño events have similar longitudinal posi-tion of strong positive SST anomalies, the positive SST anomalies during all other El Niño episodes are spread across the eastern and central tropical Pacific basin, con-sistent with Patterns 1–3. El Niño Patterns 3 and 4 are char-acterized by warm Indian and tropical Atlantic SST while El Niño Pattern 1 is characterized by cool tropical Atlantic SST.
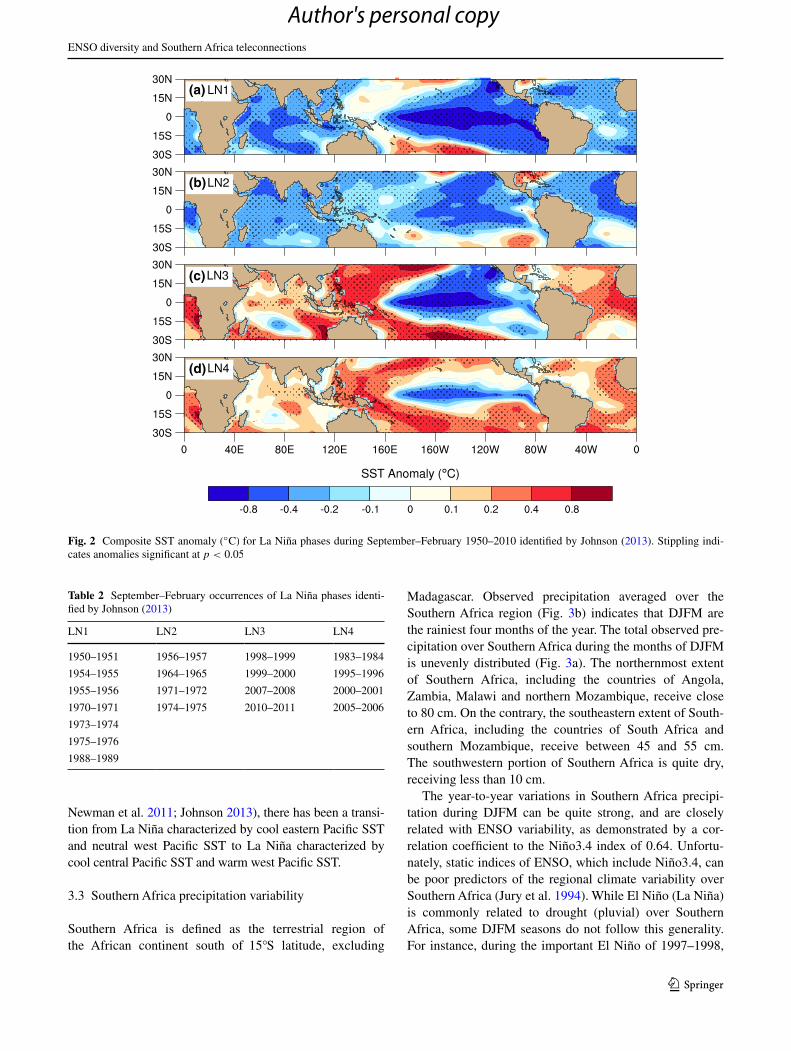
For La Niña (Fig. 2), Patterns 1 and 2 are characteristic of EP events, whereas Patterns 3 and 4 are characteristic of CP events. Warm west Pacific SST as well as warm tropical Atlantic SST also occur during Patterns 3 and 4. The longi-tudinal variations of SST anomalies across the Pacific during La Niña events have demonstrated a temporal trend during 1950–2010. Patterns 1 and 2 dominated La Niña events prior to 1990 while Patterns 3 and 4 dominated La Niña events after 1995. As noted by many authors (e.g., Yeh et al. 2011;
(a)
(b)
(c)
(d)
Fig. 1 Composite SST anomaly (◦C) for El Niño phases during September–February 1950–2010 identified by Johnson (2013). Stippling indi-cates anomalies significant at p < 0.05
Author's personal copy
ENSO diversity and Southern Africa teleconnections
1 3
Newman et al. 2011; Johnson 2013), there has been a transi-tion from La Niña characterized by cool eastern Pacific SST and neutral west Pacific SST to La Niña characterized by cool central Pacific SST and warm west Pacific SST.
3.3 Southern Africa precipitation variability
Southern Africa is defined as the terrestrial region of the African continent south of 15
◦S latitude, excluding
Madagascar. Observed precipitation averaged over the Southern Africa region (Fig. 3b) indicates that DJFM are the rainiest four months of the year. The total observed pre-cipitation over Southern Africa during the months of DJFM is unevenly distributed (Fig. 3a). The northernmost extent of Southern Africa, including the countries of Angola, Zambia, Malawi and northern Mozambique, receive close to 80 cm. On the contrary, the southeastern extent of South-ern Africa, including the countries of South Africa and southern Mozambique, receive between 45 and 55 cm. The southwestern portion of Southern Africa is quite dry, receiving less than 10 cm.
The year-to-year variations in Southern Africa precipi-tation during DJFM can be quite strong, and are closely related with ENSO variability, as demonstrated by a cor-relation coefficient to the Niño3.4 index of 0.64. Unfortu-nately, static indices of ENSO, which include Niño3.4, can be poor predictors of the regional climate variability over Southern Africa (Jury et al. 1994). While El Niño (La Niña) is commonly related to drought (pluvial) over Southern Africa, some DJFM seasons do not follow this generality. For instance, during the important El Niño of 1997–1998,
(a)
(b)
(c)
(d)
Fig. 2 Composite SST anomaly (◦C) for La Niña phases during September–February 1950–2010 identified by Johnson (2013). Stippling indi-cates anomalies significant at p < 0.05
Table 2 September–February occurrences of La Niña phases identi-fied by Johnson (2013)
LN1 LN2 LN3 LN4
1950–1951 1956–1957 1998–1999 1983–1984
1954–1955 1964–1965 1999–2000 1995–1996
1955–1956 1971–1972 2007–2008 2000–2001
1970–1971 1974–1975 2010–2011 2005–2006
1973–1974
1975–1976
1988–1989
Author's personal copy

A. Hoell et al.
1 3
DJFM precipitation over Southern Africa was nearly average.
Climate modes characterized by dipoles over the Indian Ocean; for example, the Indian Ocean Dipole (e.g., Cham-bers et al. 1999; Webster et al. 1999; Saji et al. 1999) and the Subtropical Indian Ocean Dipole (Behera et al. 2000; Behera and Yamagata 2001) have also been shown to affect the regional circulation over Southern Africa. The Indian Ocean Dipole strongly modifies the zonal winds over the Indian Ocean (Saji et al. 1999), which in turn modifies the moisture transports over Africa (Behera et al. 2005). For the Subtropical Indian Ocean Dipole, positive (negative) events, which are characterized by warm (cool) SST in the southwest Indian Ocean increase (decrease) the flux of
moisture and precipitation (Reason 2001). Problematically, the influences of the Indian Ocean vary between ENSO events due to the complex interaction of SST forcing, mak-ing it difficult to directly understand the influences of the Indian Ocean during ENSO events (Reason et al. 2000). This is evidenced by the relatively weak correlations of the Indian Ocean Dipole and the Subtropical Indian Ocean Dipole with Southern Africa precipitation of 0.26 and 0.25, respectively. Therefore, for the purposes of prediction, it is important to understand how the specific SST patterns over the Atlantic, Indian and Pacific Ocean during ENSO force Southern Africa climate (Fig. 4).
4 El Niño and Southern Africa variability
El Niño Pattern 1 (EN1, Fig. 1a) is represented by a warm tropical central Pacific SST anomaly. EN1 is also related to cool west Pacific Ocean SST, cool tropical and subtropical Southern Atlantic SST and intermittent cool SST over the Indian Ocean. EN1 drives convection decreases over the west Pacific Ocean and Maritime Continent (Fig. 5a), but is not related to the large areas of tropical convection changes over much of the Indian Ocean resulting from intermittent regional SST anomalies in space.
EN1 is not related to strong Indo-Pacific circulation changes relative to each of the other El Niño patterns con-sidered, with the exception of a statistically significant cyclone at 200 hPa centered over Australia (Fig. 6a). How-ever, strong regional circulation changes occur over the southwest Indian Ocean and Southern Africa, which are co-located with cold SST anomalies over the Atlantic Ocean and southwest Indian Ocean. At 200 hPa, observed condi-tions indicate an upper tropospheric anticyclone located over the Mozambique Channel (Fig. 6a). The upper tropo-spheric anticyclone helps to drive anomalous subsidence over the Mozambique Channel and southern Madagas-car, which itself is only marginally statistically significant (Fig. 5a). To the west of the anomalous subsidence area, statistically insignificant anomalous ascent, in an effort to balance subsidence to the east, drives the statistically sig-nificant precipitation increases over northeastern Namibia, southeastern Angola, southwestern Zambia, northern Bot-swana, Zimbabwe and northeastern South Africa (Fig. 9a). Also, the vertically integrated moisture flux (Fig. 8a) indicates the presence of lower tropospheric cyclonic cir-culation, which would help to drive the convergence of
(a)
(b)
Fig. 3 a DJFM 1950–2010 average precipitation (cm). b Monthly average 1950–2010 precipitation (cm) spatially averaged over land areas bounded by the domain 12.5◦E–42.5◦E, 15◦S–37.5◦S
Fig. 4 a–c DJFM 1950–2010 precipitation anomaly (cm) averaged over the land areas bounded by the domain 12.5 ◦E–42.5 ◦E, 15 ◦S
–37.5 ◦S as depicted by bars. Indo-Pacific modes of SST variability shown in terms of a Niño3.4, b Indian Ocean Dipole and c Subtropi-cal Indian Ocean Dipole shown as lines
▸
Author's personal copy

ENSO diversity and Southern Africa teleconnections
1 3
(a)
(b)
(c)
Author's personal copy
A. Hoell et al.
1 3
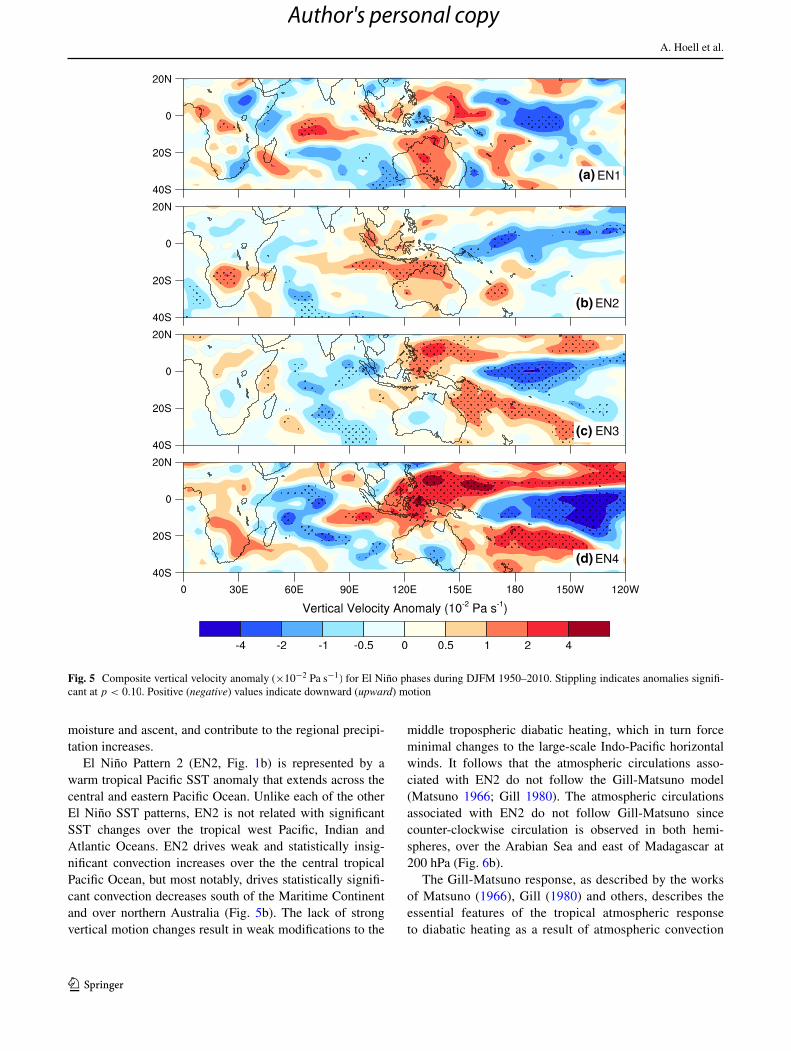
moisture and ascent, and contribute to the regional precipi-tation increases.
El Niño Pattern 2 (EN2, Fig. 1b) is represented by a warm tropical Pacific SST anomaly that extends across the central and eastern Pacific Ocean. Unlike each of the other El Niño SST patterns, EN2 is not related with significant SST changes over the tropical west Pacific, Indian and Atlantic Oceans. EN2 drives weak and statistically insig-nificant convection increases over the the central tropical Pacific Ocean, but most notably, drives statistically signifi-cant convection decreases south of the Maritime Continent and over northern Australia (Fig. 5b). The lack of strong vertical motion changes result in weak modifications to the
middle tropospheric diabatic heating, which in turn force minimal changes to the large-scale Indo-Pacific horizontal winds. It follows that the atmospheric circulations asso-ciated with EN2 do not follow the Gill-Matsuno model (Matsuno 1966; Gill 1980). The atmospheric circulations associated with EN2 do not follow Gill-Matsuno since counter-clockwise circulation is observed in both hemi-spheres, over the Arabian Sea and east of Madagascar at 200 hPa (Fig. 6b).
The Gill-Matsuno response, as described by the works of Matsuno (1966), Gill (1980) and others, describes the essential features of the tropical atmospheric response to diabatic heating as a result of atmospheric convection
(a)
(b)
(c)
(d)
Fig. 5 Composite vertical velocity anomaly (×10−2 Pa s−1) for El Niño phases during DJFM 1950–2010. Stippling indicates anomalies signifi-
cant at p < 0.10. Positive (negative) values indicate downward (upward) motion
Author's personal copy

ENSO diversity and Southern Africa teleconnections
1 3
by utilizing the shallow water approximations of the equations of motion of the atmosphere. The horizontal response to diabatic heating in the Gill-Matsuno frame-work is equatorially-trapped, and is characterized by a Kelvin wave response to the east of the diabatic heat-ing and two Rossby waves poleward and westward of the heating. The horizontal response in the Gill-Matsuno framework is on two levels, an upper and lower level, that have the opposite sign. Here, the Gill-Matsuno framework is useful in describing the atmospheric response to diaba-tic heating as forced by the different SST expressions of ENSO.
EN2 is related to statistically significant anomalies in the tropospheric circulation over the southwest Indian
Ocean and Southern Africa. A baroclinic Rossby wave is present over Southern Africa, as evidenced by cyclonic circulation at 200 hPa (Fig. 6b) and anticyclonic circu-lation at 700 hPa (Fig. 7b). The Rossby wave drives the regional anomalous descent at 500 hPa (Fig. 5b) and sta-tistically significant precipitation decreases (Fig. 9b). Furthermore, anticyclonic circulation in the vertically integrated moisture flux (Fig. 8b) drives the divergence of moisture and descent, which contributes to the strong and statistically significant precipitation decreases over South-ern Africa.
El Niño Pattern 3 (EN3, Fig. 1c) is characterized by a warm tropical Pacific SST anomaly that extends across the central and eastern Pacific Ocean with the strongest
(a)
(b)
(c)
(d)
Fig. 6 Composite 200 hPa wind anomaly (m s−1) for El Niño phases during DJFM 1950–2010. Blue shading indicates anomalies signifi-cant at p < 0.10
(a)
(b)
(c)
(d)
Fig. 7 Composite 700 hPa wind anomaly (m s−1) for El Niño phases during DJFM 1950–2010. Blue shading indicates anomalies signifi-cant at p < 0.10
Author's personal copy

A. Hoell et al.
1 3
anomalous SST between the Dateline and 120◦W. EN3
is related to anomalous cool SST over the west Pacific that is only statistically significant poleward of 10
◦. EN3 is also related with statistically significant basin-wide warming of the Indian Ocean, except for an area off of the west coast of Australia, and warm Atlantic SST off of the western coast of Southern Africa. EN3 drives sta-tistically significant convection increases over the tropi-cal west-central Pacific Ocean and convection decreases over the west Pacific Ocean and Maritime Continent, which are statistically significant poleward of 10
◦ from the equator in each hemisphere (Fig. 5c). Over the central Indian Ocean, anomalous warm SST drives convection increases.
The large-scale response to EN3 follows a Gill-Mat-suno response (Matsuno 1966; Gill 1980), as evidenced by twin cyclones at 200 hPa poleward and westward of the diabatic heating created by anomalous convection over the Maritime Continent and central Pacific Ocean. The Gill-Matsuno circulation is easily seen in the 200 hPa horizon-tal winds (Fig. 6c), with the Northern Hemisphere cyclone present over China and southeast Asia and the Southern Hemisphere cyclone present off of the western coast of Australia. However, at 700 hPa, the horizontal winds do not demonstrate they Gill-Matsuno circulation as clearly (Fig. 7c).
The circulation changes over Southern Africa and the surrounding oceanic areas concomitant with EN3 appear to be a result of regional SST anomalies over the Atlantic and Indian Oceans instead of the Pacific SST patterns directly forced by El Niño. A broad barotropic cyclone, with the same circulation pattern at 200 hPa (Fig. 6c) as at 700 hPa (Fig. 7c) occurs over a wide range of longitudes centered at 35 S latitude, extending from Mozambique to the east-ern Indian Ocean. Over Southern Africa the atmospheric circulation only provides tenuous support for precipita-tion decreases during EN3 (Fig. 9c). The 500 hPa vertical motions (Fig. 5c) and 700 hPa horizontal winds (Fig. 7c) do not indicate what is forcing the regional precipitation. The vertically integrated moisture flux (Fig. 8c) demon-strates weak anticyclonic circulation and the divergence of moisture that would reduce the regional precipitation, but this may not be enough evidence to support regional significant precipitation decreases of that magnitude over Southern Africa (Fig. 9c). Therefore, the inter-event vari-ability of EN3, which accounts for the largest occurrence of El Niño events (Table 1), needs to be examined more closely.
El Niño Pattern 4 (EN4, Fig. 1d) is characterized by a warm tropical Pacific SST anomaly that extends across the central and eastern Pacific Ocean, resembling the canonical ENSO pattern of Rasmusson and Carpenter (1982). EN4 is made up of the 1972–1973, 1982–1983, 1997–1998 El Niño events, during which time the larg-est tropical Pacific SST anomalies were observed. EN4 is related with statistically significant cool SST over the west Pacific Ocean and statistically significant warm SST off of the Atlantic coastline of Southern Africa. EN4 is also related with strong positive SST anomalies over the entire Indian Ocean. In the aggregate, the western Indian Ocean was warmer than the eastern Indian Ocean during EN4 events, which demonstrates the presence of a posi-tive Indian Ocean dipole (Saji et al. 1999). EN4 drives strong changes to the vertical motions across the Indian and Pacific Oceans as well as the surrounding land areas (Fig. 5d). EN4 drives statistically significant increases in
(a)
(b)
(c)
(d)
Fig. 8 Composite vertically integrated moisture flux anomaly, 1g
∫ ps
0qVdp, in units of m s−1 for El Niño phases during DJFM 1950–
2010. Blue shading indicates anomalies significant at p < 0.10
Author's personal copy

ENSO diversity and Southern Africa teleconnections
1 3
convection over the central Pacific Ocean and decreases in convection over the Maritime Continent and west Pacific Ocean. Enhanced statistically significant convection is also a feature over the western Indian Ocean associated with the positive Indian Ocean dipole.
EN4 is related with statistically significant basin-wide Gill-Matsuno-like circulation over the Indian Ocean (Fig. 6d). The Gill-Matsuno-like circulation is demon-strated by twin anticyclones at 200 hPa; the Northern Hemisphere anticyclone is located over the Arabia Sea and the Southern Hemisphere anticyclone is located over over the Somalia Basin north of Madagascar. The center of the Gill-Matsuno circulation is located at 5◦
S latitude and 70
◦E longitude, co-located with an area of strong convec-
tion (Fig. 5d) and diabatic heating increases. Therefore, it appears that this Gill-Matsuno-like circulation during EN4 is forced by convection and diabatic heating changes over the Indian Ocean, a direct response to the combined effects of Pacific and Indian Ocean SST, and specifically the Indian Ocean Dipole.
Over Southern Africa, the strong upper tropospheric anticyclone that is part of the Gill-Matsuno circulation (Fig. 6d) aids to drive regional subsidence (Fig. 5d). The vertically integrated moisture flux indicates anticyclonic circulation (Fig. 8d), which is tenuously statistically signif-icant. The anticyclonic circulation of moisture flux results in divergence and subsidence that contributes to the strong and significant precipitation decreases over Southern Africa (Fig. 9d).
5 La Niña and Southern Africa variability
La Niña Pattern 1 (LN1, Fig. 2a) is characterized by cool SST across almost the entire Pacific Ocean basin, except for near zero SST anomalies just to the east of the Mari-time Continent. Basin-wide cool SST also occurs over the Indian Ocean as well as cool Atlantic SST off of the west-ern coast of Southern Africa. LN1 drives weak decreases in convection over the tropical central Pacific and weak
Fig. 9 Composite precipita-tion anomaly (cm) for El Niño phases during DJFM 1950–2010. Stippling indi-cates anomalies significant at p < 0.10
(a)
(c) (d)
(b)
Author's personal copy

A. Hoell et al.
1 3
increases in convection over the Maritime Continent and west Pacific Ocean. However, over the Indian Ocean, there are no large-scale spatially coherent changes to convec-tion, only spotty areas of significant decreases in convec-tion likely associated with cooler than average SST. LN1 drives changes in the atmospheric circulation in the vicinity of the Maritime Continent and Pacific Ocean that follow a Gill-Matsuno response. The Gill-Matsuno response is dem-onstrated by anticyclonic circulation at 200 hPa (Fig. 11a) and cyclonic circulation at 700 hPa (Fig. 12a) poleward and westward of the anomalous diabatic heating over the west Pacific Ocean.
The Gill-Matsuno response does not directly influence the strong changes in regional Southern Africa circula-tion. Over Southern Africa at 200 hPa, the circulation is cyclonic, centered at 15
◦S latitude (Fig. 11a). At 700 hPa
(Fig. 12a), there are no discernible circulation cells, only statistically significant flow from Madagascar and the Mozambique Channel into Southern Africa. The lower tropospheric onshore flow toward Southern Africa forces statistically significant increases in vertically integrated moisture flux (Fig. 13a). The cyclonic circulation above Southern Africa coupled with moisture-providing onshore flow force statistically significant precipitation increases over Southern Africa (Fig. 14a).
La Niña Pattern 2 (LN2, Fig. 2b) is characterized by cool SST across the entire Pacific Ocean basin, the Indian Ocean and the Atlantic Ocean off of the west coast of Southern Africa. The cool SST anomalies associated with LN2 are much weaker than those observed during the other SST expressions of La Niña. The magnitude of the SST anoma-lies coupled with the lack of zonal SST gradients result in no significant changes to the vertical motions throughout the tropical Indo-Pacific basin (Lindzen and Nigam 1987; Hoell and Funk 2013).
The circulation changes over Southern Africa are driven by regional influences, perhaps as a result of Atlantic and Indian Ocean SST. The primary changes to the circulation that are statistically significant occur over northern parts of Southern Africa at 700 hPa, namely over the Democratic Republic of Congo and Tanzania. There are no coherent and statistically significant changes to the regional circulation in the upper troposphere (Fig. 11b). The vertically integrated moisture flux mirrors the circu-lation at 700 hPa, with an onshore flux of moisture from the Atlantic Ocean (Fig. 13b). In the absence of strong circulation features throughout the troposphere, vertical motions are weak at 500 hPa (Fig. 10b), so coupled with weak fluxes in moisture, there are no coherent changes to the regional precipitation over Southern Africa in observation (Fig. 14b). These precipitation increases are
realistic provided there is ascent required to form clouds and precipitation.
La Niña Pattern 3 (LN3, Fig. 2c) is characterized by cool SST over the eastern and central Pacific Ocean and warm SST over the west Pacific Ocean, with both SST areas sep-arated by a strong gradient in SST (Hoell and Funk 2013). A negative Indian Ocean dipole is also a characteristic fea-ture, with warm SST over the eastern Indian Ocean and cool SST over the western Indian Ocean. Atlantic SST off of the Southern Africa coastline are also warm during LN3 events.
The atmospheric response to the LN3 SST expres-sion is very strong (Hoell et al. 2013). LN3 drives strong changes to the tropical Indo-Pacific vertical motions with decreased convection over the central Pacific and increased convection over the Maritime Continent (Fig. 10c). The changes in convection result in tropo-spheric diabatic heating changes, which in turn force a Gill-Matusno response over the Indian Ocean basin and surrounding continental areas. The Gill-Matsuno response is demonstrated by robust anticyclonic circulation at 200 hPa and robust cyclonic circulation at 700 hPa poleward and westward of the anomalous diabatic heating over the Maritime Continent. The size of the Northern Hemip-shere and Southern Hemisphere Rossby waves are dif-ferent. The Northern Hemisphere Rossby wave extends from Arabia to the Pacific Ocean centered at 30
◦N latitude
whereas the Southern Hemisphere Rossby wave extends from the central Indian Ocean at 75
◦E longitude to the
east coast of Australia.The circulation over Southern Africa is not directly
influenced by the Gill-Matsuno response to diabatic heat-ing changes over the Maritime Continent and central Pacific Ocean. To the west of the Southern Hemisphere Rossby wave associated with the Gill-Matsuno response, a barotropic Rossby wave, as evidenced by cyclonic cir-culation at 200 hPa (Fig. 11c) and 700 hPa (Fig. 12c), extends across Southern Africa. The cyclonic circula-tion throughout the troposphere drives ascent responsi-ble for large regional precipitation increases in observa-tion (Fig. 14c). Furthermore, the cyclonic circulation in the vertically integrated moisture flux (Fig. 13c) centered over Namibia and Angola results in the convergence of moisture and ascent, which also aids in increasing the regional precipitation.
La Niña Pattern 4 (LN4, Fig. 2d) is characterized by cool SST over the eastern and central Pacific Ocean and warm SST over the west Pacific Ocean, with both SST areas separated by a strong gradient in SST (Hoell and Funk 2013), similar to LN3. LN3 and LN4 are also simi-lar in that Atlantic SST off of the coast of Southern Africa
Author's personal copy

ENSO diversity and Southern Africa teleconnections
1 3
are warm. Unlike LN3, the Indian Ocean dipole is not a characteristic pattern of LN4. In fact, the only statistically significant SST changes over the Indian Ocean are present over the central Indian Ocean during LN4.
The changes in tropical Indo-Pacific convection pat-terns during LN4 are similar to LN3, but the magnitudes are not as strong (Fig. 10d). Therefore, the changes to the tropospheric diabatic heating as a result of modified convection during LN4 drive a similar, yet weaker, Gill-Matsuno response over the Indo-Pacific when compared to LN3. The Gill-Matsuno response is demonstrated by
anticyclonic circulation at 200 hPa (Fig. 11d) and cyclonic circulation at 700 hPa (Fig. 12c) poleward and westward of the anomalous diabatic heating over the Maritime Con-tinent. Unlike LN3, the Rossby waves in the Northern and Southern Hemispheres at 200 hPa are nearly equal size, extending between 75
◦E and 150
◦E longitudes, during LN4
(Fig. 11d).During LN4, the circulation over Southern Africa is
not directly influenced by the Gill-Matsuno response to diabatic heating changes over the Maritime Conti-nent and central tropical Pacific Ocean. At 200 hPa, the
(a)
(b)
(c)
(d)
Fig. 10 Composite vertical velocity anomaly (×10−2 Pa s−1) for La Niña phases during DJFM 1950–2010. Stippling indicates anomalies sig-nificant at p < 0.10. Positive (negative) values indicate downward (upward) motion
Author's personal copy

A. Hoell et al.
1 3
circulation over Southern Africa is statistically insignifi-cant, and indicates anticyclonic circulation (Fig. 11d). However, the statistically significant circulation at 700 hPa (Fig. 12d), as well as the vertically integrated mois-ture flux (Fig. 13d), indicates cyclonic circulation, a con-vergence of moisture that support ascent and strong and statistically significant precipitation increases during LN4 (Fig. 14d).
6 Summary
The SST expression of El Niño and La Niña events can vary considerably from one to the next (Wyrtki 1975),
which results in different atmospheric circulation and seasonal precipitation over Southern Africa during Aus-tral Summer (Nicholson and Kim 1997; Reason and Jagadheesha 2005). While previous studies have exam-ined the relationship between Southern Africa climate variability and different classifications of ENSO [e.g. canonical El Niño vs. El Niño Modoki, Ratnam et al. (2014)], the previous studies have not examined the rela-tionship between Southern Africa and the full variety of SST expressions characteristic of ENSO. Therefore, in this study, we examined the atmospheric circulation and precipitation over Southern Africa during DJFM 1950–2010 related to eight characteristic SST expressions of ENSO, four for El Niño and four for La Niña, identified
(a)
(b)
(c)
(d)
Fig. 11 Composite 200 hPa wind anomaly (m s−1) for La Niña phases during DJFM 1950–2010. Blue shading indicates anomalies significant at p < 0.10
(a)
(b)
(c)
(d)
Fig. 12 Composite 700 hPa wind anomaly (m s−1) for La Niña phases during DJFM 1950–2010. Blue shading indicates anomalies significant at p < 0.10
Author's personal copy

ENSO diversity and Southern Africa teleconnections
1 3
by Johnson (2013). Improved understanding the atmos-pheric response to the many SST expressions of ENSO is of critical importance to the predictability of climate over Southern Africa.
Previous studies have shown that Atlantic and Indian Ocean SST have strong influences on the climate of Southern Africa during ENSO events. SST variabil-ity over the Atlantic Ocean is most important during La Niña while SST variability over the Indian Ocean is most important during El Niño (Nicholson and Kim 1997). Also, SST dipole patterns across the Indian Ocean have important influences on the atmospheric circulation over Southern Africa (Reason et al. 2000). Here, alongside
our effort to understand how the eight SST expressions of ENSO in the aggregate force the climate variability over Southern Africa, we identified areas of the Atlantic, Indian and Pacific Oceans that may be important contrib-utors to the overall forcing.
While the El Niño SST expressions of Johnson (2013) are all characterized by warm SST of varying magni-tudes across the tropical Pacific Ocean, the Indian Ocean and Atlantic Ocean bordering Southern Africa are all different (Fig. 1), which occur contemporaneously with different rainfall patterns over Southern Africa (Fig. 9). Strong and significant precipitation decreases occur over Southern Africa contemporaneously with warmer than average SST over the Indian Ocean, particularly when the western Indian Ocean is warmer than the eastern Indian Ocean (Figs. 1b, c, d, 9b, c, d). The precipita-tion decreases over Southern Africa are even stronger when Atlantic SST off of the coast of Southern Africa and Indian Ocean SST are warm simultaneously during El Niño events (Figs. 1c, d, 9c, d). However, significant precipitation increases occur over Southern Africa con-temporaneously with cool SST over the Indian Ocean during El Niño (Figs. 1a, 9a).
The results here corroborate those of Nicholson and Kim (1997), and indicate that Indian and Atlantic Ocean SST are key drivers of Southern Africa circulation during El Niño events. While the Pacific SST expressions of ENSO drive the Indo-Pacific circulation, the Indian and Atlantic Ocean SST play a key role in modifying the circulation over Southern Africa. Even when Southern Africa precipi-tation is influenced directly by the large-scale circulation that closely resembles a Gill-Matsuno response during EN4 (Fig. 6d), the Gill-Matsuno response appears to be forced at least in part by Indian Ocean diabatic heating changes (Fig. 5d) forced by Indian Ocean SST anomalies (Fig. 1d).
Our results also agree with the study by Neukom et al. (2014), a paleoclimatic reconstruction of rainfall over Southern Africa, showing evidence for the complex inter-play between large-scale ENSO teleconnections, regional SSTs and local effects in modulating southern African rainfall variability over long timescales. In particular, Neu-kom et al. (2014) showed the importance of a dipole in SST between 20
◦S and 40
◦S in the southwestern Indian for
the South African summer rainfall zone. This subtropical dipole pattern with a warmer core off southern Africa and a cool central Indian Ocean off East Madagsacar resem-bles to some extend the LN3 and LN4 SST patterns in the southern Indian Ocean associated with high rainfall over Southern Africa. The opposite subtropical Indian Ocean dipole pattern is similar to EN4 associated with drying of Southern Africa.
(a)
(b)
(c)
(d)
Fig. 13 Composite vertically integrated moisture flux anomaly, 1g
∫ ps
0qVdp, in units of m s−1 for La Niña phases during DJFM 1950–
2010. Blue shading indicates anomalies significant at p < 0.10
Author's personal copy

A. Hoell et al.
1 3
Acknowledgments We thank two anonymous reviewers for their constructive and helpful comments. NCEP Reanalysis and ERSST data were provided by the NOAA/OAR/ESRL PSD, Boul-der, Colorado, USA, from their web site at http://www.esrl.noaa.gov/psd/http://www.esrl.noaa.gov/psd/. This research builds upon a multi-year research project carried out under a US Agency for Inter-national Development-funded Famine Early Warning Systems Net-work agreement with the US Geological Survey. This research was supported by NASA SERVIR Grant NNX13AQ95A.
References
Ashok K, Behera SK, Rao SA, Weng H, Yamagata T (2007) El nino modoki and its possible teleconnection. J Geophys Res 112(C11):C11,007. doi:10.1029/2006JC003798
Becker A, Finger P, Meyer-Christoffer A, Rudolf B, Schamm K, Sch-neider U, Ziese M (2013) A description of the global land-surface precipitation data products of the global precipitation climatology centre with sample applications including centennial (trend) anal-ysis from 1901 present. Earth Syst Sci Data 5(1):71–99. doi:10.5194/essd-5-71-2013. http://www.earth-syst-sci-data.net/5/71/2013/
Behera SK, Yamagata T (2001) Subtropical SST dipole events in the southern indian ocean. Geophys Res Lett 28(2):327–330. doi:10.1029/2000GL011451
Behera SK, Salvekar PS, Yamagata T (2000) Simulation of inter-annual SST variability in the tropical indian ocean. J Clim 13(19):3487–3499. doi:10.1175/1520-0442(2000)013<3487:SOISVI>2.0.CO;2
Behera SK, Luo JJ, Masson S, Delecluse P, Gualdi S, Navarra A, Yamagata T (2005) Paramount impact of the indian ocean dipole on the east african short rains: a CGCM study. J Clim 18(21):4514–4530. doi:10.1175/JCLI3541.1
Chambers DP, Tapley BD, Stewart RH (1999) Anomalous warming in the Indian Ocean coincident with El Nio. J Geophys Res Ocean 104(C2):3035–3047. doi:10.1029/1998JC900085
Diaz HF, Hoerling MP, Eischeid JK (2001) ENSO variability, telecon-nections and climate change. Int J Climatol 21(15):1845–1862. doi:10.1002/joc.631
Gill AE (1980) Some simple solutions for heat-induced tropical cir-culation. Q J R Meteorol Soc 106(449):447–462. doi:10.1002/qj.49710644905
Goddard L, Graham NE (1999) Importance of the indian ocean for simulating rainfall anomalies over eastern and southern africa. J Geophys Res Atmos 104(D16):19,099–19,116. doi:10.1029/1999JD900326
Hoell A, Funk C (2013) The ENSO-related west pacific sea sur-face temperature gradient. J Clim 26(23):9545–9562. doi:10.1175/JCLI-D-12-00344.1
Hoell A, Funk C, Barlow M (2013) The regional forcing of north-ern hemisphere drought during recent warm tropical west
Fig. 14 Composite pre-cipitation anomaly (cm) for La Niña phases during DJFM 1950–2010. Stippling indi-cates anomalies significant at p < 0.10
(a)
(c) (d)
(b)
Author's personal copy

ENSO diversity and Southern Africa teleconnections
1 3
Pacific Ocean La Nia events. Clim Dyn 1–23. doi:10.1007/s00382-013-1799-4
Johnson NC (2013) How many ENSO flavors can we distinguish?*. J Clim 26(13):4816–4827. doi:10.1175/JCLI-D-12-00649.1
Jury M, Mc Queen C (1994) SOI and QBO signals in the african region. Theor Appl Climatol 50(1–2):103–115. doi:10.1007/BF00864907
Kalnay E, Kanamitsu M, Kistler R, Collins W, Deaven D, Gandin L, Iredell M, Saha S, White G, Woollen J, Zhu Y, Leetmaa A, Reynolds R, Chelliah M, Ebisuzaki W, Higgins W, Janowiak J, Mo KC, Ropelewski C, Wang J, Jenne R, Joseph D (1996) The NCEP/NCAR 40-year reanalysis project. Bull Amer Meteor Soc 77(3):437–471. doi:10.1175/1520-0477(1996)077<0437:TNYRP>2.0.CO;2
Kao HY, Yu JY (2009) Contrasting eastern-pacific and central-pacific types of ENSO. J Clim 22(3):615–632. doi:10.1175/2008JCLI2309.1
Kug JS, Jin FF, An SI (2009) Two types of El Nio events: cold tongue El Nio and warm pool El Nio. J Clim 22(6):1499–1515. doi:10.1175/2008JCLI2624.1
Kumar A, Hoerling MP (1997) Interpretation and implications of the observed interel nino variability. J Clim 10(1):83–91. doi:10.1175/1520-0442(1997) 010<0083:IAIOTO>2.0.CO;2
Kumar A, Zhang Q, Peng P, Jha B (2005) SST-forced atmospheric variability in an atmospheric general circulation model. J Clim 18(19):3953–3967. doi:10.1175/JCLI3483.1
Larkin NK, Harrison DE (2005) On the definition of El Nino and associated seasonal average US weather anomalies. Geophys Res Lett 32(13):L13,705. doi:10.1029/2005GL022738
Lindesay JA (1988) South African rainfall, the Southern Oscilla-tion and a Southern Hemisphere semi-annual cycle. J Climatol 8(1):17–30. doi:10.1002/joc.3370080103
Lindzen RS, Nigam S (1987) On the role of sea surface tempera-ture gradients in forcing low-level winds and convergence in the tropics. J Atmos Sci 44(17):2418–2436. doi:10.1175/ 1520-0469(1987)044<2418:OTROSS>2.0.CO;2
Matsuno T (1966) Quasi-geostrophic motions in the equatorial area. J Meteorol Soc Jpn Ser II 44(1):25–43
Neukom R, Nash D, Endfield G, Grab S, Grove C, Kelso C, Vogel C, Zinke J (2014) Multi-proxy summer and winter precipitation reconstruction for southern Africa over the last 200 years. Clim Dyn 42(9–10):2713–2726. doi:10.1007/s00382-013-1886-6
Newman M, Shin SI, Alexander MA (2011) Natural variation in ENSO flavors. Geophys Res Lett 38(14):L14,705. doi:10.1029/2011GL047658
Nicholson S, Entekhabi D (1986) The quasi-periodic behavior of rain-fall variability in africa and its relationship to the southern oscil-lation. Arch Meteorol Geophys Bioclimatol Ser A 34(3–4):311–348. doi:10.1007/BF02257765
Nicholson SE (1997) An analysis of the ENSO signal in the tropical Atlantic and western Indian oceans. Int J Climatol 17(4):345–375. doi:10.1002/(SICI)1097-0088(19970330)17:4<345:AID-JOC127>3.0.CO;2-3
Nicholson SE, Kim J (1997) The relationship of the el nino-southern oscil-lation to african rainfall. Int J Climatol 17(2):117–135. doi:10.1002/(SICI)1097-0088(199702)17:2<117:AID-JOC84>3.0.CO;2-O
Rasmusson EM, Carpenter TH (1982) Variations in tropical sea sur-face temperature and surface wind fields associated with the Southern Oscillation/El Nino. Mon Wea Rev 110(5), 354–384. doi:10.1175/1520-0493(1982)110<0354:VITSST>2.0.CO;2
Ratnam JV, Behera SK, Masumoto Y, Yamagata T (2014) Remote effects of El Nio and Modoki events on the austral summer precipitation of Southern Africa. J Clim 27(10):3802–3815. doi:10.1175/JCLI-D-13-00431.1
Reason C, Allan R, Lindesay J, Ansell T (2000) ENSO and climatic signals across the indian ocean basin in the global context: part I, interannual composite patterns. Int J Climatol 20(11):1285–1327. doi:10.1002/1097-0088(200009)20:11<1285:AID-JOC536>3.0.CO;2-R
Reason CJC (2001) Subtropical Indian ocean SST dipole events and Southern African rainfall. Geophys Res Lett 28(11):2225–2227. doi:10.1029/2000GL012735
Reason CJC, Jagadheesha D (2005) A model investigation of recent ENSO impacts over Southern Africa. Meteorol Atmos Phys 89(1–4):181–205. doi:10.1007/s00703-005-0128-9
Rienecker MM, Suarez MJ, Gelaro R, Todling R, Bacmeister J, Liu E, Bosilovich MG, Schubert SD, Takacs L, Kim GK, Bloom S, Chen J, Collins D, Conaty A, da Silva A, Gu W, Joiner J, Koster RD, Lucchesi R, Molod A, Owens T, Pawson S, Pegion P, Red-der CR, Reichle R, Robertson FR, Ruddick AG, Sienkiewicz M, Woollen J (2011) MERRA: NASAs modern-era retrospective analysis for research and applications. J Clim 24(14):3624–3648. doi:10.1175/JCLI-D-11-00015.1
Rocha A, Simmonds I (1997) South-eastern African summer rain-fall. Part 1: relationships with air sea interaction processes. Int J Climatol 17(3):235–265. doi:10.1002/(SICI)1097- 0088(19970315)17:3<235:AID-JOC123>3.0.CO;2-N
Ropelewski CF, Halpert MS (1987) Global and regional scale precipitation patterns associated with the el nino/southern oscillation. Mon Wea Rev 115(8):1606–1626. doi:10.1175/ 1520-0493(1987)115<1606:GARSPP>2.0.CO;2
Ropelewski CF, Halpert MS (1989) Precipitation patterns associated with the high index phase of the southern oscillation. J Clim 2(3):268–284. doi:10.1175/1520-0442(1989)002<0268:PPAWTH>2.0.CO;2
Saji NH, Goswami BN, Vinayachandran PN, Yamagata T (1999) A dipole mode in the tropical indian ocean. Nature 401(6751):360–363
Smith TM, Reynolds RW, Peterson TC, Lawrimore J (2008) Improve-ments to NOAAs historical merged land–ocean surface tempera-ture analysis (1880–2006). J Clim 21(10):2283–2296. doi:10.1175/2007JCLI2100.1
Trenberth KE, Smith L (2009) Variations in the three-dimensional structure of the atmospheric circulation with different flavors of El Nino. J Clim 22(11):2978–2991. doi:10.1175/2008JCLI2691.1
Trenberth KE, Branstator GW, Karoly D, Kumar A, Lau NC, Ropelewski C (1998) Progress during TOGA in understanding and modeling global teleconnections associated with tropical sea surface temperatures. J Geophys Res 103(C7):14,291–14,324. doi:10.1029/97JC01444
Vera C, Silvestri G, Barros V, Carril A (2004) Differences in el nino response over the southern hemisphere. J Clim 17(9):1741–1753. doi:10.1175/1520-0442(2004)017<1741:DIENRO>2.0.CO;2
Webster PJ, Moore AM, Loschnigg JP, Leben RR (1999) Coupled ocean–atmosphere dynamics in the Indian Ocean during 1997–1998. Nature 401(6751):356–360. doi:10.1038/43848
Wyrtki K (1975) El Nino-the dynamic response of the equatorial Pacific oceanto atmospheric forcing. J Phys Oceanogr 5(4):572–584. doi:10.1175/1520-0485(1975)005<0572:ENTDRO>2.0.CO;2
Yeh SW, Kirtman BP, Kug JS, Park W, Latif M (2011) Natural vari-ability of the central Pacific El Nio event on multi-centennial timescales. Geophys Res Lett 38(2):L02,704. doi:10.1029/2010GL045886
Yeh SW, Ham YG, Lee JY (2012) Changes in the tropical pacific SST trend from CMIP3 to CMIP5 and its implication of ENSO*. J Clim 25(21):7764–7771. doi:10.1175/JCLI-D-12-00304.1
Author's personal copy