laser cutting of carbon fibre-reinforced
TRANSCRIPT
LASER CUTTING OF CARBON
FIBRE-REINFORCED POLYMER
COMPOSITE MATERIALS
A thesis submitted to
The University of Manchester
For the degree of
Doctor of Philosophy (PhD)
in the Faculty of Engineering and Physical Sciences
2010
Reza Negarestani
School of Mechanical, Aerospace and Civil Engineering

2
(This page is intentionally left blank)
Table of Contents
3
TABLE OF CONTENTS
Table of Contents ......................................................................................................................................... 3
List of Figures .............................................................................................................................................. 9
List of Tables ............................................................................................................................................. 17
Nomenclature ............................................................................................................................................. 19
List of Abbreviations.................................................................................................................................. 21
List of Publications .................................................................................................................................... 23
Abstract ...................................................................................................................................................... 25
Declaration ................................................................................................................................................. 26
Copyright Statement................................................................................................................................... 27
Acknowledgments...................................................................................................................................... 28
Dedication .................................................................................................................................................. 29
CHAPTER 1 INTRODUCTION .....................................................................30
1.1 Overview..................................................................................................................................... 30
1.2 Objectives ................................................................................................................................... 31
1.3 Thesis structure.......................................................................................................................... 32
CHAPTER 2 REVIEW ON LASERS, LASER CUTTING AND FIBRE-
REINFORCED POLYMER COMPOSITES.......................................................34
2.1 Introduction................................................................................................................................ 34
2.2 Laser............................................................................................................................................ 36
2.2.1 History..................................................................................................................................... 36
2.2.2 Principal configurations .......................................................................................................... 37
2.2.2.1 Operation fundamentals................................................................................................. 37
2.2.2.2 Characteristics of laser light .......................................................................................... 40
2.2.2.2.1 Monochromaticity..................................................................................................... 40
2.2.2.2.2 Coherence ................................................................................................................. 40
2.2.2.2.3 Directionality ............................................................................................................ 41
2.2.2.2.4 Brightness ................................................................................................................. 41
2.2.2.2.5 Mode Structure ......................................................................................................... 41
2.2.2.2.6 Beam quality ............................................................................................................. 42
2.2.2.2.7 Beam polarisation ..................................................................................................... 42
2.2.2.3 Laser system and temporal configurations .................................................................... 43
Table of Contents
4
2.2.3 Laser types .............................................................................................................................. 44
2.2.3.1 CO2 laser........................................................................................................................ 44
2.2.3.2 Nd:YAG laser ................................................................................................................ 46
2.2.3.3 Fibre laser ...................................................................................................................... 47
2.2.3.4 Excimer laser ................................................................................................................. 49
2.2.4 Laser interaction with matter................................................................................................... 50
2.2.5 Laser cutting............................................................................................................................ 52
2.2.5.1 Mechanisms................................................................................................................... 53
2.2.5.1.1 Sublimation cutting................................................................................................... 54
2.2.5.1.2 Fusion cutting ........................................................................................................... 55
2.2.5.1.3 Oxygen assisted laser cutting.................................................................................... 56
2.2.5.1.4 Scribing..................................................................................................................... 56
2.2.5.1.5 Controlled fracture cutting........................................................................................ 56
2.2.5.1.6 Photo-chemical cutting (cold cutting)....................................................................... 56
2.2.5.2 Laser grooving............................................................................................................... 57
2.2.5.3 Process parameters ........................................................................................................ 58
2.2.5.3.1 System parameters .................................................................................................... 58
2.2.5.3.2 Material conditions ................................................................................................... 59
2.2.5.3.3 Operational parameters ............................................................................................. 59
2.2.5.4 Assist gas in laser cutting .............................................................................................. 60
2.2.5.5 Improvements in laser cutting ....................................................................................... 61
2.3 Fibre-reinforced polymer composites ...................................................................................... 63
2.3.1 Definition ................................................................................................................................ 63
2.3.2 Characteristics ......................................................................................................................... 65
2.3.3 Properties ................................................................................................................................ 67
2.3.3.1 Specific strength and specific modulus ......................................................................... 67
2.3.3.2 Rule of mixtures ............................................................................................................ 67
2.3.3.3 Thermal conductivity..................................................................................................... 68
2.3.4 Carbon fibre-reinforced polymer composites.......................................................................... 70
2.3.4.1 Constituents ................................................................................................................... 70
2.3.4.2 Applications................................................................................................................... 71
CHAPTER 3 LITERATURE REVIEW ON MACHINING FIBRE-
REINFORCED POLYMER COMPOSITES.......................................................74
3.1 Mechanical machining............................................................................................................... 74
3.2 Abrasive waterjet machining .................................................................................................... 76
Table of Contents
5
3.3 Electrical discharge machining (EDM).................................................................................... 77
3.4 Ultra-sound machining (USM) ................................................................................................. 78
3.5 Laser machining......................................................................................................................... 79
3.5.1 Overview................................................................................................................................. 79
3.5.2 Laser power density and interaction time................................................................................ 81
3.5.3 Infrared vs. ultraviolet beam processing ................................................................................. 84
3.5.4 Material effect ......................................................................................................................... 86
3.5.5 Quality criteria ........................................................................................................................ 88
3.6 Summary .................................................................................................................................... 89
CHAPTER 4 METHODOLOGY AND EQUIPMENT .....................................92
4.1 Materials..................................................................................................................................... 92
4.2 Experimental procedure............................................................................................................ 93
4.2.1 General out line ....................................................................................................................... 93
4.2.2 Design of experiments (DoE).................................................................................................. 94
4.2.2.1 Response surface methodology (RSM) ......................................................................... 95
4.2.2.2 Optimisation .................................................................................................................. 98
4.2.3 Characterisation of cut quality .............................................................................................. 100
4.3 Laser systems............................................................................................................................ 101
4.3.1 1 kW ytterbium doped fibre laser (1070 nm) ........................................................................ 101
4.3.2 400 W nanosecond pulsed Nd:YAG laser (1064 nm) ........................................................... 102
4.3.3 80 W KrF excimer laser (248 nm) ........................................................................................ 103
4.3.4 10 W DPSS Nd:YVO4 laser (355 nm) .................................................................................. 103
4.4 Summary .................................................................................................................................. 104
CHAPTER 5 INVESTIGATION OF FIBRE LASER CUTTING OF CFRP
COMPOSITE MATERIALS.............................................................................105
5.1 Introduction.............................................................................................................................. 105
5.2 Experimental procedure.......................................................................................................... 105
5.3 Results and discussion ............................................................................................................. 108
5.3.1 CW beam single-pass cutting................................................................................................ 108
5.3.1.1 Establishing the ranges of process parameters............................................................. 108
Table of Contents
6
5.3.1.2 Design of experiments ................................................................................................. 111
5.3.1.2.1 Matrix recession at the beam entrance .................................................................... 113
5.3.1.2.2 Kerf width at the beam entrance ............................................................................. 114
5.3.1.2.3 Cutting depth .......................................................................................................... 114
5.3.1.2.4 Optimisation ........................................................................................................... 115
5.3.2 Effect of assist gas................................................................................................................. 116
5.3.3 Effect of focal plane position ................................................................................................ 118
5.3.4 Effect of energy per unit length ratio .................................................................................... 120
5.3.5 Effect of beam modulation.................................................................................................... 124
5.3.6 Classification of quality factors............................................................................................. 126
5.4 Summary .................................................................................................................................. 128
CHAPTER 6 INVESTIGATION ON THE EFFECT OF LASER BEAM
CHARACTERISTICS, THE MATERIAL AND CUT DIRECTION ...................129
6.1 Effect of material type ............................................................................................................. 129
6.1.1 Experimental procedure ........................................................................................................ 129
6.1.2 Results and discussion........................................................................................................... 131
6.1.2.1 Process rate.................................................................................................................. 132
6.1.2.2 Kerf width and matrix recession.................................................................................. 133
6.1.2.3 Optimisation ................................................................................................................ 137
6.1.2.4 Effect of cut direction .................................................................................................. 137
6.2 UV beam laser cutting ............................................................................................................. 139
6.2.1 Experimental procedure ........................................................................................................ 139
6.2.2 Results and discussion........................................................................................................... 141
6.2.2.1 Kerf width.................................................................................................................... 141
6.2.2.2 Matrix recession .......................................................................................................... 143
6.2.2.3 Optimisation ................................................................................................................ 144
6.3 Summary .................................................................................................................................. 145
CHAPTER 7 NANOSECOND PULSED DPSS ND:YAG LASER CUTTING
OF CFRP COMPOSITES WITH MIXED REACTIVE AND INERT GASES....148
7.1 General Outline........................................................................................................................ 148
7.2 Thermal decomposition of CFRPs.......................................................................................... 148
7.3 Experimental Procedure ......................................................................................................... 151
Table of Contents
7
7.3.1 Process Parameters................................................................................................................ 152
7.3.2 Assist Gas.............................................................................................................................. 153
7.4 Results ....................................................................................................................................... 153
7.4.1 DoE analysis ......................................................................................................................... 153
7.4.2 Assist gas effect .................................................................................................................... 158
7.4.2.1 Assist gas pressure effect............................................................................................. 158
7.4.2.2 Effect of oxygen volume fraction in the assist gas ...................................................... 159
7.5 Discussion ................................................................................................................................. 163
7.5.1 Statistical analysis ................................................................................................................. 163
7.5.2 Thermal degradation development........................................................................................ 165
7.5.3 Assist gas pressure effect ...................................................................................................... 166
7.5.4 Oxygen volume fraction effect.............................................................................................. 167
7.5.5 Effect of cut direction............................................................................................................ 170
7.6 Summary .................................................................................................................................. 172
CHAPTER 8 NUMERICAL SIMULATION OF LASER CUTTING OF CFRP
COMPOSITES 174
8.1 General outline ......................................................................................................................... 174
8.2 Introduction.............................................................................................................................. 174
8.3 Experimental setup .................................................................................................................. 176
8.4 Finite element analysis............................................................................................................. 177
8.4.1 Procedure and assumptions ................................................................................................... 177
8.4.2 Geometric model and FE mesh ............................................................................................. 178
8.4.3 Material properties ................................................................................................................ 179
8.4.4 Governing equations and solution strategy ........................................................................... 181
8.5 Results and Validation............................................................................................................. 182
8.5.1 Effect of laser scanning speed............................................................................................... 183
8.5.2 Effect of spacing between laser scans ................................................................................... 188
8.6 Discussion ................................................................................................................................. 191
8.7 Summary .................................................................................................................................. 196
Table of Contents
8
CHAPTER 9 CONCLUSIONS AND FUTURE WORK
RECOMMENDATIONS ..................................................................................197
REFERENCES ...............................................................................................200
APPENDIX A OPERATIONAL PARAMETERS AND THE EXPERIMENTAL
RESULTS USED IN DESIGN OF EXPERIMENTS ANALYSIS .....................214
APPENDIX B ANALYSIS OF VARIANCE, A SUMMARY AND TABLES ..225
B1) A summary of the procedure ....................................................................................................... 225
B2) ANOVA tables for the DOE study in Chapter 5 .......................................................................... 227
B3) ANOVA Tables for the DOE study in Chapter 7 ......................................................................... 230
APPENDIX C THERMAL GRAVIMETRIC ANALYSIS, A SUMMARY AND
CHARTS.........................................................................................................236
C1) A summary of the procedure ........................................................................................................ 236
C2) Charts for the CFRP sample used in Chapter 7 ............................................................................ 236
List of Figures
9
LIST OF FIGURES
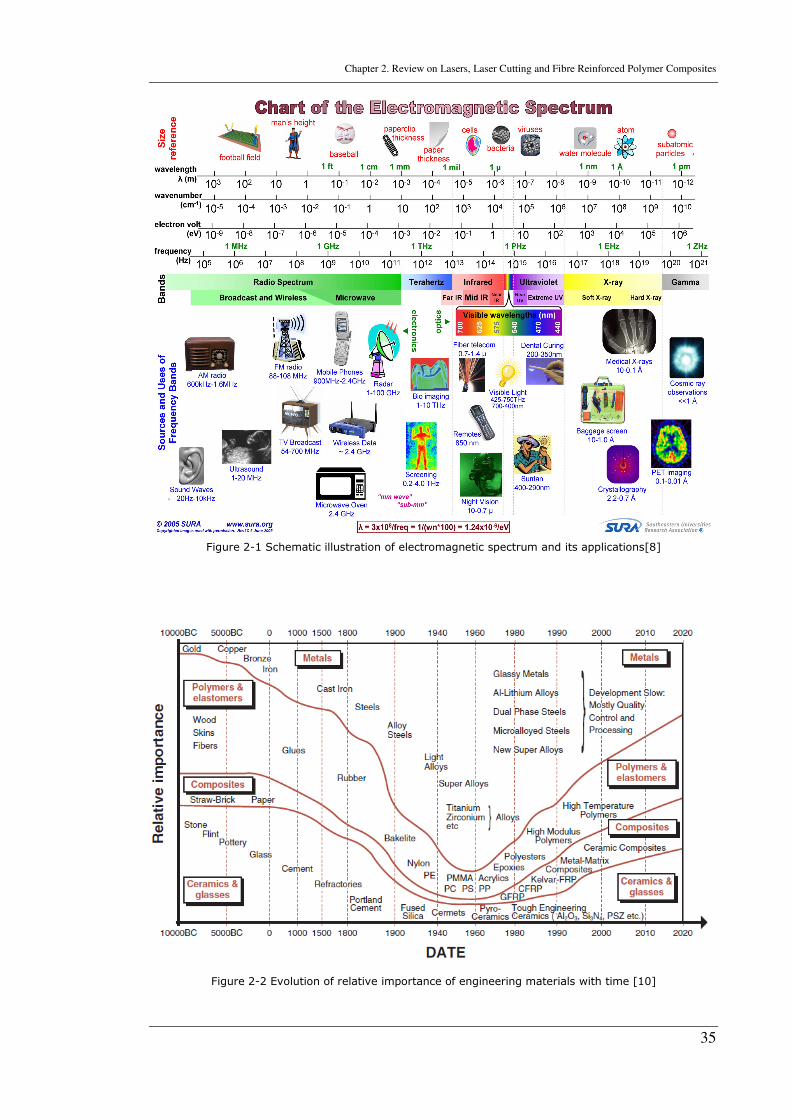
Figure 2-1 Schematic illustration of electromagnetic spectrum and its applications[8] 35
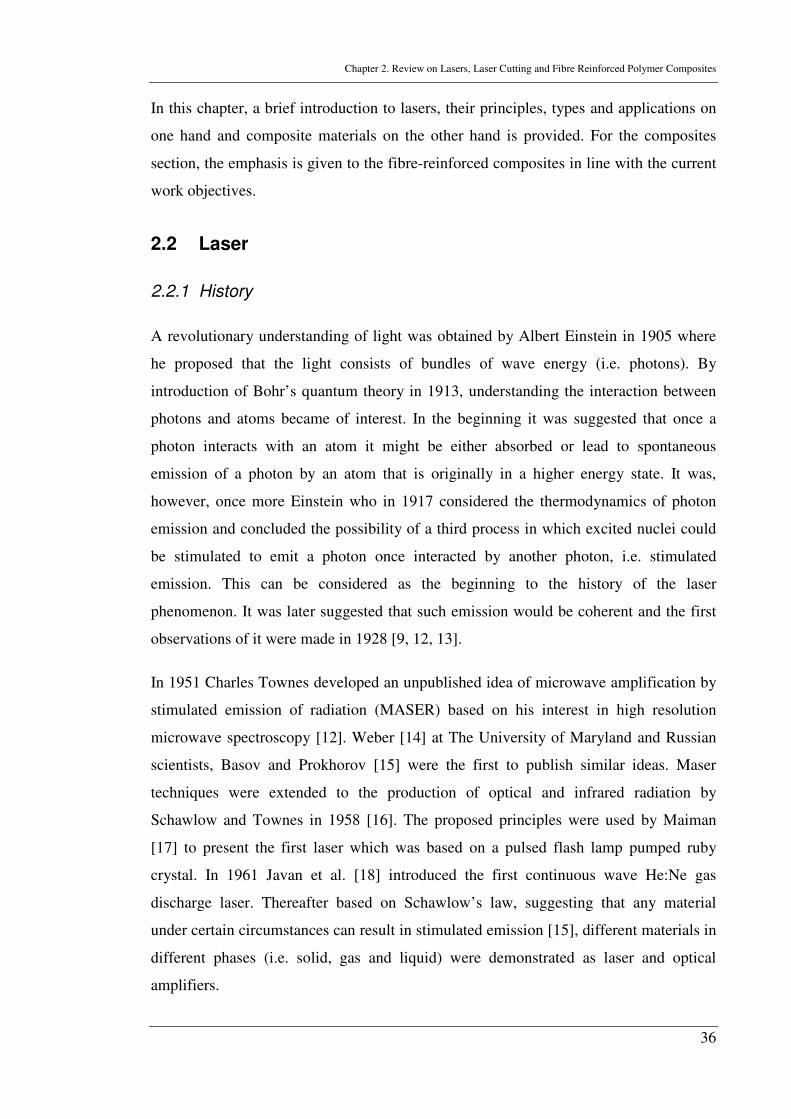
Figure 2-2 Evolution of relative importance of engineering materials with time [10] .. 35
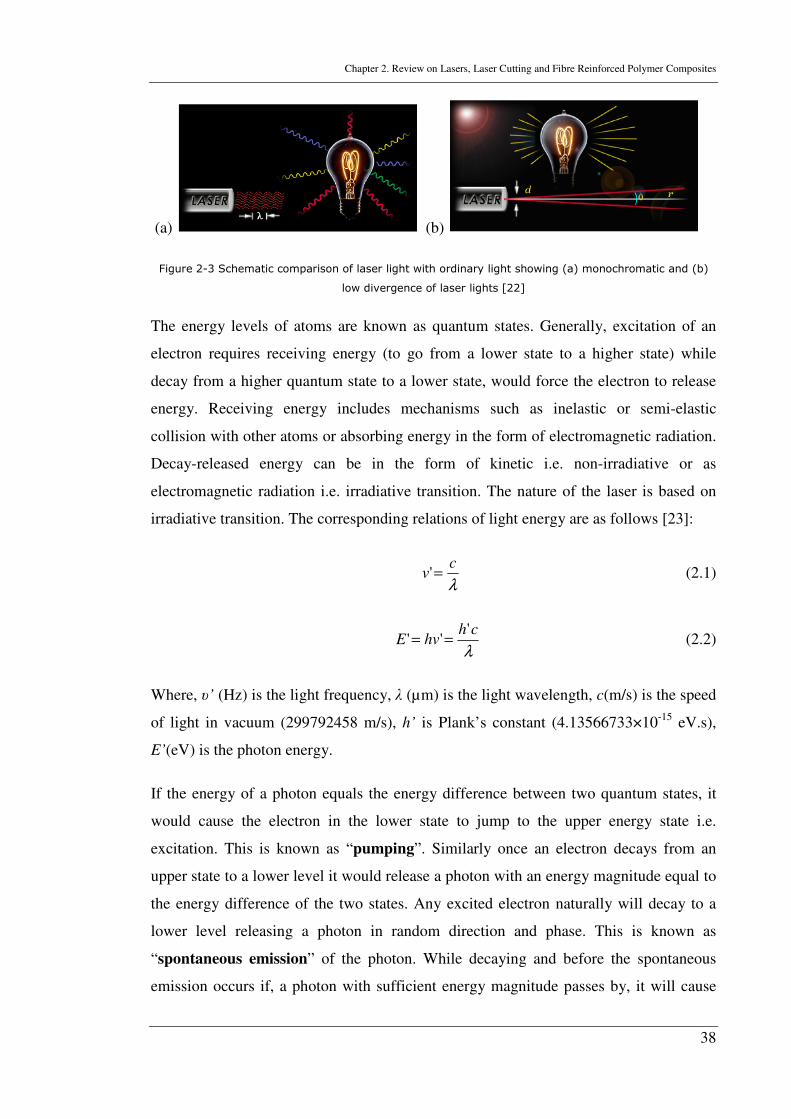
Figure 2-3 Schematic comparison of laser light with ordinary light showing (a)
monochromatic and (b) low divergence of laser lights [22]................................... 38
Figure 2-4 Evolution of light amplification by stimulated emission of radiation [25] .. 39
Figure 2-5 Some transverse electromagnetic modes [9] ................................................ 42
Figure 2-6 Discharge and gas flow configurations for CO2 laser (a) slow axial (b) fast
axial and (c) transverse flow and discharge [29] .................................................... 46
Figure 2-7 Typical components of an Nd:YAG laser [30] ............................................ 47
Figure 2-8 Principles of (a) fibre optic structure (b) fibre optic connector and (c) fibre
laser system [34, 37] ............................................................................................... 48
Figure 2-9 Typical beam parameter product (BPP) of common industrial lasers for the
same beam waist radius of ω0= 0.1 mm [21].......................................................... 49
Figure 2-10 Schematic of excimer laser work station for micro machining [41] .......... 50
Figure 2-11 Photo-thermal phenomena occurring when a high-power laser beam strikes
the material [9]........................................................................................................ 51
Figure 2-12 Photo-chemical phenomena occurring when a high photon energy laser
beam strikes the material [44]................................................................................. 52
Figure 2-13 Principle of laser cutting and its quality factors [46] ................................. 53
Figure 2-14 Schematic representation of core factors in laser cutting [48] ................... 54
Figure 2-15 Control surface for analytical modelling of laser grooving [26]................ 57
Figure 2-16 Aerodynamic interactions of assist gas in laser cutting [58]...................... 61
Figure 2-17 Classification of different approaches used to improve laser cutting process
................................................................................................................................ 62
Figure 2-18 (a) Constituent based classification of composites and (b) schematic
illustration of typical fibre-reinforced composite structures [78]........................... 65
List of Figures
10
Figure 2-19 Schematic illustration of the structure of 22% composite made Airbus A380
aeroplane [81] ......................................................................................................... 66
Figure 2-20 Performance map of typical FRPs (redrawn from [82])............................. 67
Figure 2-21 Schematic of HAZ ellipse formation in UD FRPs (adopted from [83]) .... 69
Figure 2-22 Thermal resistance model used to estimate heat conduction in UD FRPs in
(a) parallel direction and (b) cross direction to the fibre orientation [84, 85] ........ 69
Figure 2-23 Principal reinforcing and matrix materials [88] ......................................... 71
Figure 2-24 Relative efficiency of aircraft materials [7] ............................................... 72
Figure 3-1 Typical applications of mechanical machining of CFRP composites (a)
surface milling (b) different drilling methods (c) edge milling (d) trimming and
edging [94].............................................................................................................. 74
Figure 3-2 Principal factors influencing mechanical machining of FRPs ..................... 75
Figure 3-3 Different tool materials used for drilling FRPs [88] .................................... 76
Figure 3-4 Typical defects in laser machining of FRPs (redrawn from [123]).............. 79
Figure 3-5 Cause-effect diagram on the quality in laser machining of FRPs [125] ...... 80
Figure 3-6 Limit conditions for vaporisation of common constituents of FRPs; power
intensity versus interaction time (redrawn from [123]) .......................................... 81
Figure 3-7 Relationship of laser pulse parameters for standard rectangular pulses....... 83
Figure 3-8 Influence of fibre type and laser system on cut surface quality; (a) and (b)
CW CO2 (i.e. IR beam) cutting of Kevlar and CFRP respectively (c) and (d) pulsed
Excimer (i.e. UV beam) cutting of Kevlar and CFRP respectively [134] .............. 86
Figure 3-9 Possible beam-fibre geometric configuration [84]....................................... 87
Figure 3-10 SEM micrograph of laser processed CFRP (a) fibre swelling and matrix
recession, (b) squeezed matrix and cavities between fibres and (c) partially affected
fibres near the cut edge [138] ................................................................................. 88
Figure 3-11 Typical cut surface quality characteristics in laser cutting of FRPs [139]. 89
Figure 4-1 Schematic view of cutting strategies used in the experiments (a) cross-
cutting (b) parallel-cutting ...................................................................................... 93
List of Figures
11
Figure 4-2 Sequential procedure of experimental investigations................................... 95
Figure 4-3 Central composite design points for three factors (i.e. 321 ,, fff ) ............... 96
Figure 4-4 Schematic view of typical quality measurements applied in the study...... 100
Figure 4-5 The IPG YLR-1000-SM fibre laser system................................................ 101
Figure 4-6 (a) Precitec HP1.5”(Z)/FL fibre laser cutting head, (b) Precitec MC870
motor control and operating controller ................................................................. 102
Figure 4-7 Powerlase AO4 DPSS Nd:YAG laser system............................................ 103
Figure 4-8 GSI Lumonics IPEX 848 excimer (KrF) laser system............................... 103
Figure 4-9 Coherent Avia™ third harmonic DPSS laser system................................. 104
Figure 5-1 Minimum spot size diameter on the surface (with 1 mm standoff distance)
for Pricitec HP1.5” laser cutting head used with IPG YLR-1000-SM laser system
[157]...................................................................................................................... 106
Figure 5-2 Experimental setup in fibre laser cutting experiments ............................... 107
Figure 5-3 Schematic illustration of different energy delivery patterns of IPG YLR-
1000-SM fibre laser system (a) CW, (b) pulsed and (c) hybrid modulation ........ 107
Figure 5-4 Relationship between power and scanning speed for through cuts using fibre
laser in assistance of 5 bar N2 ............................................................................... 109
Figure 5-5 Energy per unit length (power/scanning speed) required for cut through the
material in assistance of 5 bar N2 ......................................................................... 109
Figure 5-6 Variation of kerf widths and matrix recessions at the beam entrance and
beam exit in assistance of 5 bar N2 ....................................................................... 110
Figure 5-7 Matrix recession in CW beam fibre laser cutting of 2 mm thick CFRP
laminates at 500 W power, 20 mm/s scanning speed and 5 bar (a) compressed air
(b) nitrogen and (c) oxygen assist gas .................................................................. 111
Figure 5-8 Concept of focal plane position with regards to the surface of the workpiece
.............................................................................................................................. 112
Figure 5-9 (a) Contour graph of power and FPP and (b) scanning speed, on the matrix
recession at the beam entrance.............................................................................. 113
List of Figures
12
Figure 5-10 Effect of significant factors (i.e. power and FPP) on kerf width at the beam
entrance................................................................................................................. 114
Figure 5-11 Effect of significant factors (i.e. power and scanning speed) on the cut
depth ..................................................................................................................... 115
Figure 5-12 Influence of assist gas type and pressure on the matrix recession at (a)beam
entrance and (b) beam exit and the kerf width at (c) beam entrance and (d) beam
exit (laser power 340 W, scanning speed 20 mm/s and FPP=-2.38 mm)............. 117
Figure 5-13 Influence of focal plane position and assist gas type on (a) matrix recession
and (b) kerf width at the beam entrance at 8 bar assist gas pressure .................... 118
Figure 5-14 Influence of assist gas (oxygen and nitrogen) pressure on (a) matrix
recession and (b) kerf width at the beam exit with FPP=0 ................................... 119
Figure 5-15 Comparison of thermal damage at the beam exit at different assist gas
pressures in presence of (a) nitrogen and (b) oxygen with FPP=0 ....................... 119
Figure 5-16 Effect of variation of power and scanning speed at constant energy per unit
length ratio of 17 J/mm on (a) matrix recession and kerf width at the beam entrance
and (b) depth of cut (at -2.38 mm FPP and 8 bar nitrogen).................................. 121
Figure 5-17 Effect of scanning speed and number of passes in multiple-pass cutting on
(a) matrix recession and kerf width at the beam entrance and (b) depth of cut (at
340 W power and -2.38 mm FPP) ........................................................................ 122
Figure 5-18 Effect of scanning speed on the number of passes required in experiments
for through-cuts and the exponential predicted trend (340 W power, -2.38 mm FPP
and 8 bar nitrogen)................................................................................................ 123
Figure 5-19 Influence of increasing speed in multiple-pass cutting on delamination at
(a) 20 mm/s (1 pass), (b) 40 mm/s (2 passes) and (c) 80 mm/s (12 passes) using 340
W power, -2.38 mm FPP and 8 bar N2 ................................................................. 123
Figure 5-20 Different overlap phenomena in moving beam pulsed laser process (a)
overlapping, (b)minimum overlap and (c)no overlap........................................... 124
Figure 5-21 Non-continuous cut path caused by no overlapping between consecutive
pulses at 340 W maximum power, 20 mm/s scanning speed, 1 ms pulse-on and 6
ms pulse-off time .................................................................................................. 125
List of Figures
13
Figure 5-22 Influence of pulse-off duration on matrix recession and kerf width at the
beam entrance in pulsed (Figure 5-3b) fibre laser cutting (340 W power, 20 mm/s
scanning speed, -2.38 mm FPP and 1 ms pulse-on time) ..................................... 125
Figure 5-23 Influence of increasing lower power limit in hybrid beam modulation
(Figure 5-3c) on matrix recession and kerf width at the beam entrance side as
compared to pulsed beam and CW mode results (340 W higher power limit, 20
mm/s scanning speed, -2.38 mm FPP, 1 ms higher pulse time and 4 ms lower pulse
time)...................................................................................................................... 126
Figure 5-24 SEM images of typical quality defects in laser cutting of CFRP composites
(a) large heat-affected zone, (b) matrix recession, (c) delamination between two
lamina, (d) fibre end swelling............................................................................... 127
Figure 5-25 Quality factors in laser cutting of CFRP composites ............................... 127
Figure 6-1 Setup in cutting experiments using Starlase DPSS Nd:YAG laser ............ 131
Figure 6-2 Perturbation graphs (at coded values of factors) for the number of passes
required to cut through (a) carbon fibre/vinyl ester and (b) carbon fibre/epoxy
composite laminates.............................................................................................. 133
Figure 6-3 Statistical assessment of the validity of experimental results for matrix
recession at the beam entrance in Nd:YAG laser cutting of 1.6 mm thick
unidirectional CFRP laminates (a) normal plot of residuals, (b) studentised
residuals according to the run number and (c) comparative studentised residuals of
the results on the two materials (carbon fibre/epoxy and carbon fibre/vinyl ester)
.............................................................................................................................. 134
Figure 6-4 Interaction graphs for frequency and material type (significant factors)
influencing (a) kerf width and (b) matrix recession at the beam entrance ........... 136
Figure 6-5 Interaction graphs for the significant factors affecting (a) kerf width and (b)
matrix recession at the beam exit.......................................................................... 136
Figure 6-6 Comparison of cut direction on different quality factors in laser cutting of
unidirectional carbon fibre/vinyl ester composite at 25 mJ pulse energy, 200 mm/s
scanning speed and 3 kHz frequency.................................................................... 138
Figure 6-7 Comparison of cut quality at beam entrance and beam exit sides in (a) cross-
List of Figures
14
cutting and (b) parallel-cutting; 1.6 mm thick carbon fibre-reinforced vinyl ester
composite at scanning speed of 200 mm/s and number of passes of 52; (using
pulses of 25 mJ energy delivered at 3 kHz frequency from DPSS 1064 nm
Nd:YAG) .............................................................................................................. 139
Figure 6-8 Schematic illustration of the experimental setup used in excimer laser cutting
.............................................................................................................................. 140
Figure 6-9 The influence of pulse frequency and energy on the kerf width at (a) beam
entrance and (b) beam exit in excimer laser cutting of CFRP laminates.............. 142
Figure 6-10 The influence of scanning speed and pulse energy on kerf width at the beam
entrance in excimer laser cutting of CFRP laminates (frequency: 75 Hz) ........... 143
Figure 6-11 Perturbation graphs (at coded values of process factors) for matrix recession
at (a) beam entrance and (b) beam exit................................................................. 144
Figure 6-12 Characteristics of matrix recession at (a) the beam entry (b) the beam exit
and (c) kerf entry cross-section at 7 mJ pulse energy, 75 Hz pulse frequency and 6
mm/s ..................................................................................................................... 145
Figure 7-1 Generic structure of epoxy resin [163]....................................................... 149
Figure 7-2 (a) weight loss and (b) derivative weight loss TGA of CFRPs in nitrogen
(inert) and air (oxidative) at 10 K/min and 50 K/min heating rates ..................... 150
Figure 7-3 Schematic view of the experimental set up ................................................ 152
Figure 7-4 Modelled influence of significant factors (in assistant of 8 bar nitrogen)
affecting: (a) matrix recession at beam entrance (b) matrix recession at beam exit
(c) kerf width at beam entrance and (d) kerf width at beam exit.......................... 154
Figure 7-5 Kerf geometry used to calculate MRR and taper angle.............................. 155
Figure 7-6 Influence of significant factors on (a) material removal rate and (b) taper
angle...................................................................................................................... 156
Figure 7-7 Modelled influence of significant factors on bottom to top ratio, 'R ........ 157
Figure 7-8 Variation of (a) matrix recession at beam entrance, (b) matrix recession at
beam exit and (c) MRR in response to gas pressure effect in assistance individual
N2, Ar and O2 gases and their half by half proportions ........................................ 158
List of Figures
15
Figure 7-9 Influence of oxygen volume fraction (in 8 bar assist gas pressured balanced
with Ar and N2) on the kerf width and matrix recession at (a) beam entrance and (b)
beam exit............................................................................................................... 160
Figure 7-10 Influence of oxygen volume fraction (in 8 bar assist gas pressure balanced
with Ar and N2) on (a) MRR (b)taper angle and matrix recession to kerf width ratio
on (c) beam entrance, aR and (d) beam exit, bR ................................................. 161
Figure 7-11(a) Top view and (b) bottom view of multiple-pass laser cut kerf at 7 mJ
pulse energy, 125 mm/s scanning speed and 5 kHz frequency using 8 bar assist gas
composed of (i) pure oxygen (ii) pure nitrogen (iii) pure argon (iv) 12.5% oxygen
balanced with nitrogen and (v) 12.5% oxygen balanced with argon.................... 162
Figure 7-12 (a) Thermal degradation development on beam entrance, kerf depth and
beam exit sections (b) kerf depth development, at 7 mJ pulse energy delivered at 5
kHz frequency and 125 mm/s scanning speed and using 8 bar nitrogen gas........ 166
Figure 7-13 Influence of (a) 5 bar nitrogen and (b) 5 bar oxygen on decomposition of
matrix at the beam exit side; scanning speed: 125 mm/s, pulse energy: 7 mJ, pulse
frequency: 5 kHz................................................................................................... 170
Figure 7-14 (a) Top view and (b) bottom view of the laser cut kerf (parallel to the fibres
direction in top and bottom layers) at 5 kHz frequency, 7 mJ pulse energy and 125
mm/s in assistance of: (i) 8 bars pure oxygen, (ii) 8 bars 12.5% oxygen mixed with
87.5% nitrogen and (iii) 8 bars pure nitrogen....................................................... 171
Figure 7-15 Comparison of cut characteristics at the beam exit in assistance of 2 bar
oxygen in (a) cross and (b) parallel-cutting direction at 7 mJ pulse energy, 5 kHz
frequency and 125 mm/s scanning speed ............................................................. 171
Figure 7-16 Comparison of cross-section view of cut kerfs in (a) cross-cutting and (b)
parallel-cutting direction in assistance of 8 bar assist gas (12.5% O2-87.5% N2) at 7
mJ pulse energy, 5 kHz frequency and 125 mm/s scanning speed....................... 172
Figure 8-1 Strategies used for laser machining (a) A sketch of laser beam scanning on
single track with multiple-pass i.e. single line cutting and (b) Sketch of laser beam
scanning on two tracks with multiple-pass i.e. double line cutting ...................... 177
Figure 8-2 Finite element mesh used for the analysis.................................................. 179
List of Figures
16
Figure 8-3 Thermal gravimetric analysis results for the used CFRP in air................. 179
Figure 8-4 HAZ profile for various scanning speeds after one track at scanning speed of:
(a) 50 mm/s , (b) 100 mm/s, (Continued in next page…)..................................... 184
Figure 8-5 SEM images of the experimental results at (a) 50 mm/s, (b) 200 mm/s and
(c) 800 mm/s scanning speed................................................................................ 186
Figure 8-6 Predicted HAZ after a single pass compared to the experiments (the dashed
line for FEA refers to matrix recession exceeding the mesh geometry)............... 187
Figure 8-7 FEA prediction of ablation depth after a single pass compared to the
experiments........................................................................................................... 188
Figure 8-8 Predicted material removal for various values of spacing distances of: (a) 75
µm, (b) 100 µm, (Continued in next page…) ....................................................... 189
Figure 8-9 FEA predicted and experimental ablation depth at different scanning spaces
in double-line processing...................................................................................... 191
Figure 8-10 (a) Effective modelling of the matrix recession in the FEA analysis
compared to (b) the surface morphology of the experimental result at a 50 mm/s
scanning speed ...................................................................................................... 194
Figure 8-11 (a) FEA predicted chip formation compared to (b) typical chip formed in
the experiments at 150 µm scan spacing in double line processing ..................... 195
List of Tables
17
LIST OF TABLES
Table 2-1 Characteristics and applications of CFRP composite materials [90]............. 72
Table 2-2 Global application of CFRPs [91] ................................................................. 73
Table 3-1 Typical thermal properties of selected constituents of FRP composites, L:
Longitudinal i.e. along fibre length, T: Transverse i.e. in radial direction [85, 123-
127] ......................................................................................................................... 80
Table 3-2 Representative data for laser cutting of FRP composites [123, 124, 129, 130]
................................................................................................................................ 82
Table 3-3 Desirability sequence of the characteristics of machining processes for CFRP
composite materials ................................................................................................ 91
Table 4-1 CFRP materials used in experiments............................................................. 92
Table 4-2 Laser beam characteristic of the DPSS Starlase AO4 Nd:YAG laser ......... 102
Table 5-1 The range of parameters in CCD analysis of single pass fibre laser cutting112
Table 5-2 Optimum solutions predicted for the fibre laser cutting of 2 mm thick carbon
fibre/epoxy laminates............................................................................................ 116
Table 6-1 Numerical and categorical factors and their ranges in DoE ........................ 131
Table 6-2 Optimum condition and desirability of Nd:YAG laser cutting of the two
CFRP materials ..................................................................................................... 137
Table 6-3 Factors used in DoE for excimer laser experiments .................................... 141
Table 6-4 Preference sequence of the used laser systems, cutting strategy, cut direction
and material type in laser cutting CFRP composite materials .............................. 147
Table 7-1 Properties of oxygen, nitrogen and argon gases [55, 168, 169] .................. 151
Table 7-2 Process parameters ranges in DoE............................................................... 152
Table 7-3 Optimum solutions from the statistical DoE analysis ................................. 158
Table 7-4 Preference sequence of assist gas composition and cutting direction in laser
cutting of [0/90]14 carbon fibre/epoxy laminates .................................................. 173
Table 8-1 Properties of the CFRP used for the analysis [85, 126]............................... 180

List of Tables
18
Table 8-2 Anisotropic temperature dependent thermal conductivity, k (W/(m.K)), of
carbon fibre and epoxy resin as used in the model ............................................... 181
Table 8-3 Process parameters used for study............................................................... 183

Nomenclature
19
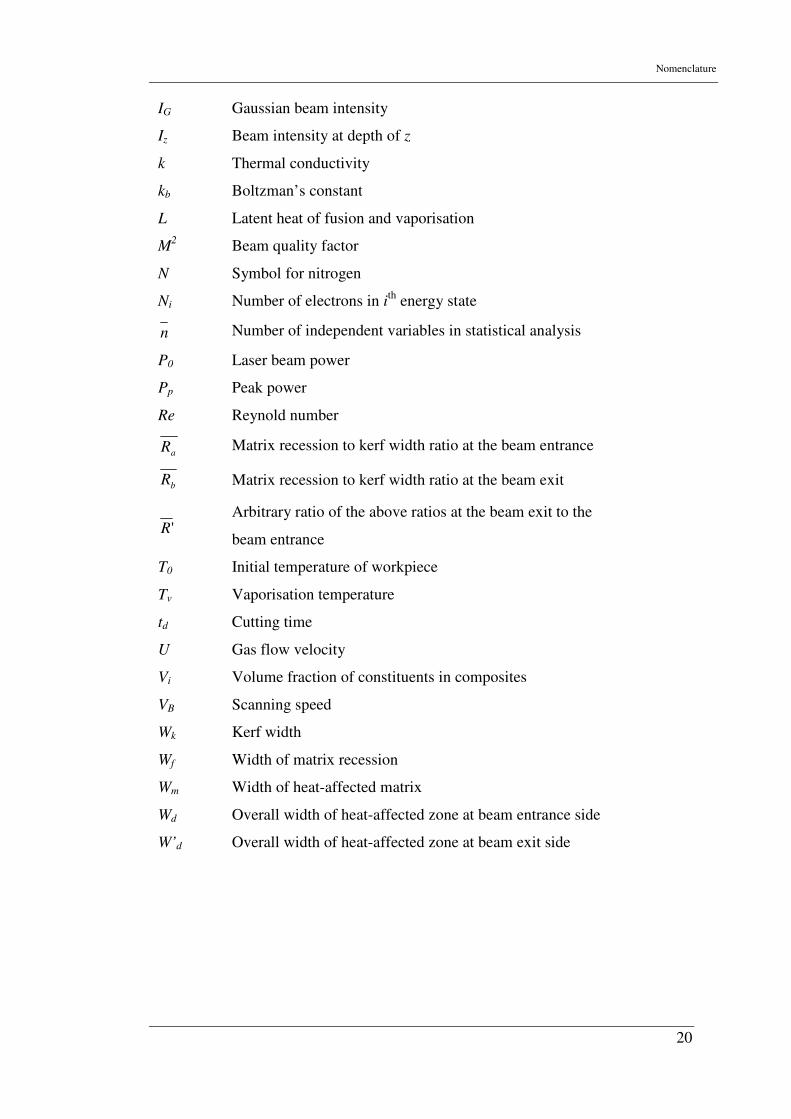
NOMENCLATURE
Notation Description
α Thermal diffusivity
α' Coded level of factors in statistical analysis
υ Light frequency
λ Light wavelength
c Speed of light in vacuum
θ Beam divergence angle
ρ Density
φ Velocity of gas
η Coefficient of absorption
ηr Response value in statistical analysis
ϕ Number of points in statistical analysis
τ Laser pulse width
∆DG Incremental groove depth
∆DGC Incremental groove depth for composites
Cp Specific heat capacity
D workpiece thickness
Dp Thermal penetration depth
D’ Demagnification ratio
dB Beam spot diameter
dw Beam waist diameter
Ep Pulse energy
E Young’s modulus
E’ Photon energy
FA Thrust force
Fc Cutting force
f Laser pulse repetition rate
f Independent factors in statistical analysis
h' Plank’s constant
I0 Incident beam intensity
Nomenclature
20
IG Gaussian beam intensity
Iz Beam intensity at depth of z
k Thermal conductivity
kb Boltzman’s constant
L Latent heat of fusion and vaporisation
M2 Beam quality factor
N Symbol for nitrogen
Ni Number of electrons in ith energy state
n Number of independent variables in statistical analysis
P0 Laser beam power
Pp Peak power
Re Reynold number
aR Matrix recession to kerf width ratio at the beam entrance
bR Matrix recession to kerf width ratio at the beam exit
'R Arbitrary ratio of the above ratios at the beam exit to the
beam entrance
T0 Initial temperature of workpiece
Tv Vaporisation temperature
td Cutting time
U Gas flow velocity
Vi Volume fraction of constituents in composites
VB Scanning speed
Wk Kerf width
Wf Width of matrix recession
Wm Width of heat-affected matrix
Wd Overall width of heat-affected zone at beam entrance side
W’d Overall width of heat-affected zone at beam exit side
List of Abbreviations
21
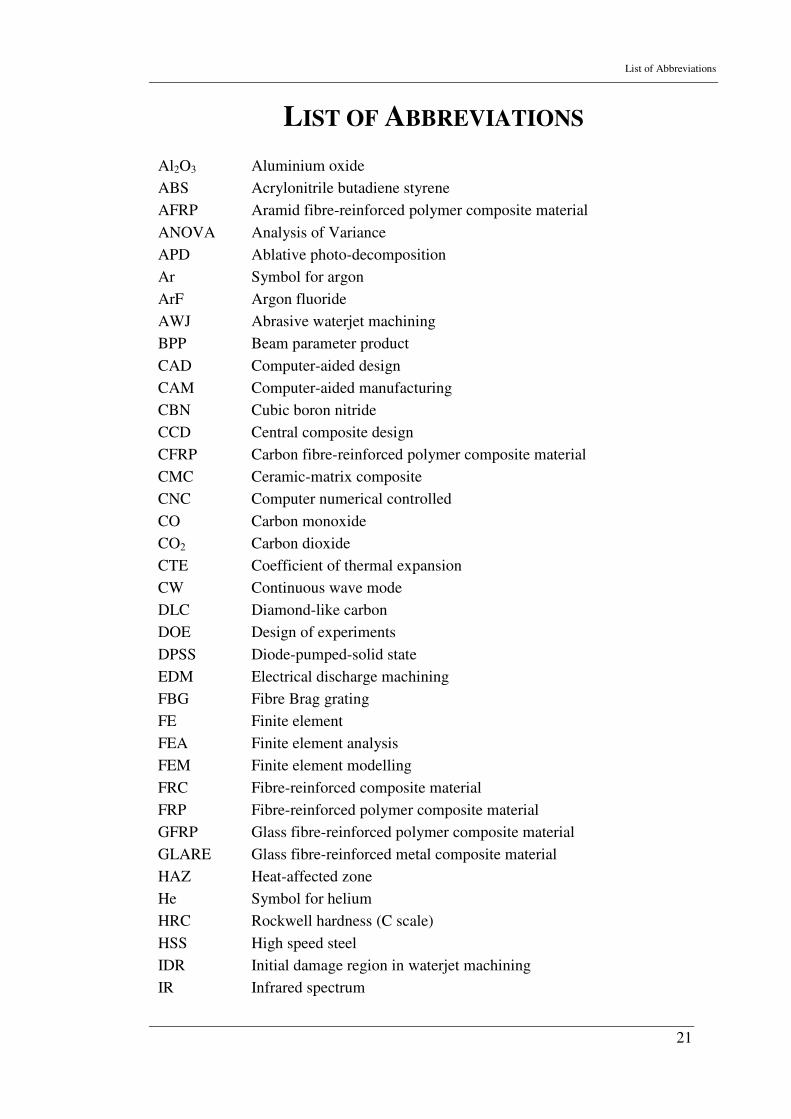
LIST OF ABBREVIATIONS
Al2O3 Aluminium oxide
ABS Acrylonitrile butadiene styrene
AFRP Aramid fibre-reinforced polymer composite material
ANOVA Analysis of Variance
APD Ablative photo-decomposition
Ar Symbol for argon
ArF Argon fluoride
AWJ Abrasive waterjet machining
BPP Beam parameter product
CAD Computer-aided design
CAM Computer-aided manufacturing
CBN Cubic boron nitride
CCD Central composite design
CFRP Carbon fibre-reinforced polymer composite material
CMC Ceramic-matrix composite
CNC Computer numerical controlled
CO Carbon monoxide
CO2 Carbon dioxide
CTE Coefficient of thermal expansion
CW Continuous wave mode
DLC Diamond-like carbon
DOE Design of experiments
DPSS Diode-pumped-solid state
EDM Electrical discharge machining
FBG Fibre Brag grating
FE Finite element
FEA Finite element analysis
FEM Finite element modelling
FRC Fibre-reinforced composite material
FRP Fibre-reinforced polymer composite material
GFRP Glass fibre-reinforced polymer composite material
GLARE Glass fibre-reinforced metal composite material
HAZ Heat-affected zone
He Symbol for helium
HRC Rockwell hardness (C scale)
HSS High speed steel
IDR Initial damage region in waterjet machining
IR Infrared spectrum
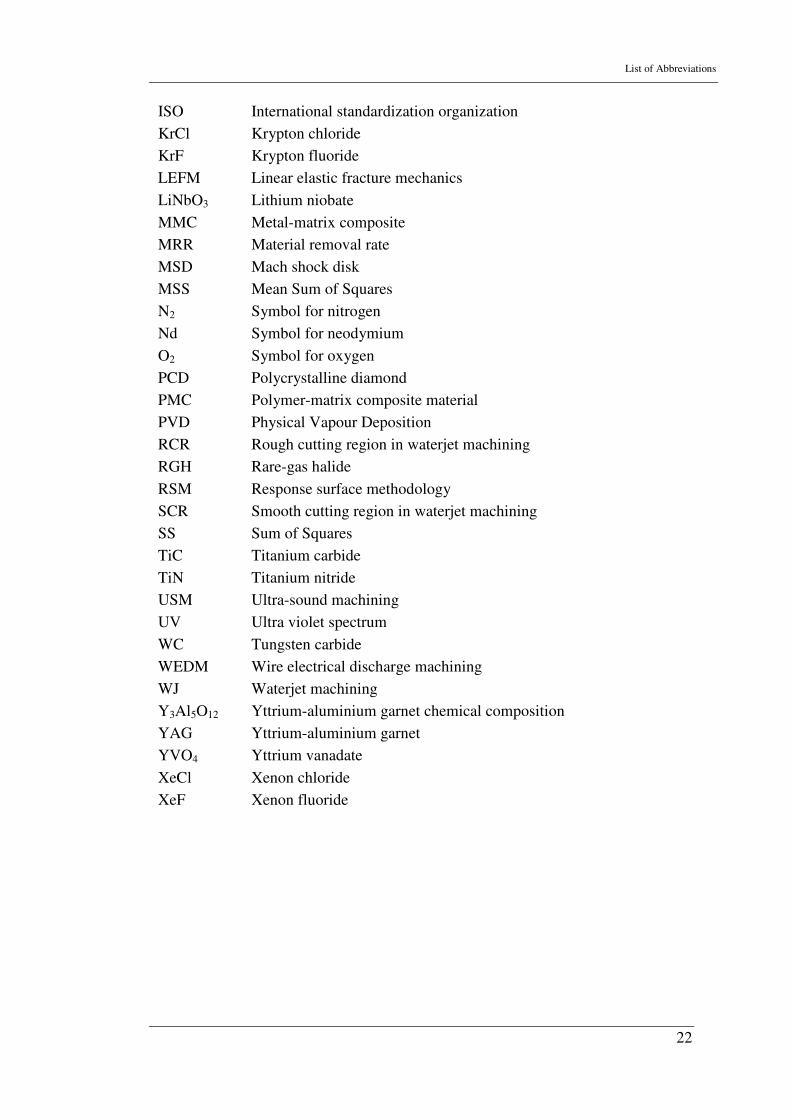
List of Abbreviations
22
ISO International standardization organization
KrCl Krypton chloride
KrF Krypton fluoride
LEFM Linear elastic fracture mechanics
LiNbO3 Lithium niobate
MMC Metal-matrix composite
MRR Material removal rate
MSD Mach shock disk
MSS Mean Sum of Squares
N2 Symbol for nitrogen
Nd Symbol for neodymium
O2 Symbol for oxygen
PCD Polycrystalline diamond
PMC Polymer-matrix composite material
PVD Physical Vapour Deposition
RCR Rough cutting region in waterjet machining
RGH Rare-gas halide
RSM Response surface methodology
SCR Smooth cutting region in waterjet machining
SS Sum of Squares
TiC Titanium carbide
TiN Titanium nitride
USM Ultra-sound machining
UV Ultra violet spectrum
WC Tungsten carbide
WEDM Wire electrical discharge machining
WJ Waterjet machining
Y3Al5O12 Yttrium-aluminium garnet chemical composition
YAG Yttrium-aluminium garnet
YVO4 Yttrium vanadate
XeCl Xenon chloride
XeF Xenon fluoride
List of Publications
23
LIST OF PUBLICATIONS
Journal Publications
� Negarestani, R., L. Li, H. Sezer, D. Whitehead and J. Methven, Nano-second
pulsed DPSS Nd:YAG laser cutting of CFRP composites with mixed reactive
and inert gases. The International Journal of Advanced Manufacturing
Technology, 2010. 49(5): p. 553-566.
� Negarestani, R., M. Sundar, M.A. Sheikh, P. Mativenga, L. Li, Z.L. Li, P.L.
Chu, C.C. Khin, H.Y. Zheng and G.C. Lim, Numerical simulation of laser
machining of carbon-fibre-reinforced composites. Proceedings of the Institution
of Mechanical Engineers, Part B: Journal of Engineering Manufacture, 2010.
224(B7): p. 1017-1027.
Book Chapter
� Li, Z.L., P.L. Chu, H.Y. Zheng, G.C. Lim, L. Li, S. Marimuthu, R. Negarestani,
M.A. Sheikh and P. Mativenga, Laser machining of carbon fibre-reinforced
plastic composites, in Advances in laser materials processing technology:
Technology, research and application, J. Lawrence, et al., Editors. 2010,
Woodhead Publishing Limited: Cambridge.
Conferences
� Li, Z.L., H.Y. Chu, G.C. Lim, L. Li, S. Marimuthu, R. Negarestani, M. Sheikh
and P. Mativenga. Process development of laser machining of carbon fibre
reinforced plastic composites. in International Congress on Applications of
Lasers and Elctro-Optics, ICALEO. 2008. Temecula, CA, USA.
� Negarestani, R. and L. Li, Laser cutting of carbon fibre polymer reinforced
composites, in Postgraduate Research Conference. 2008, School of Mechanical,
Aerospace and Civil Engineering, The University of Manchester: Manchester.

List of Publications
24
� Negarestani, R., L. Li, J. Methven, D. Whitehead and H.K. Sezer. Assistance of
mixed reactive and inert gases in high power DPSS Nd:YAG laser cutting of
CFRP composites. in Postgraduate Research Conference. 2009. Manchester:
School of Mechanical, Aerospace and Civil Engineering, The University of
Manchester.
Abstract
25
ABSTRACT
Carbon fibre-reinforced polymer (CFRP) composite materials are in increasingly high
demand, particularly in aerospace and automotive industries for reduced fuel
consumption. This is due to their superior structural characteristics (both in fatigue and
static conditions) and light weight. Anisotropic and heterogeneous features of these
materials, however, have posed serious challenges in machining of CFRPs. Hence new
machining technologies need to be investigated. Laser is a non-contact (eliminating tool
wear) thermal process. Therefore, the thermal properties of the material are of crucial
importance. Especially for composite materials which consist of different constituent
materials. In CFRPs, carbon fibres are excellent conductors of heat (thermal
conductivity of 50 W/(m.K)) while the polymer matrix is poor conductor (thermal
conductivity of 0.1-0.3 W/(m.K)). This significant difference that can be similarly
traced for other thermal properties such as heat of vaporisation and specific heat
capacity are the source of defects in laser cutting of CFRP composites. Major quality
challenges in laser cutting of these materials are delamination and matrix recession.
Various laser systems and cutting techniques are investigated in this work to minimise
these defects.
Multiple-pass cutting using a high beam quality continuous wave (CW) mode fibre laser
is found to be effective to minimise delamination at low power level and high scanning
speeds. Multiple-pass cutting using nanosecond pulsed DPSS Nd:YAG laser is shown
to reduce matrix recession. A novel technique using mixing of reactive and inert gases
is introduced and demonstrated to minimise the matrix recession.
In order to improve the quality and dimensional accuracy of CFRP laser machining, it is
important to understand the mechanism of transient thermal behaviour and its effect on
material removal. A three-dimensional model to simulate the transient temperature field
and subsequent material removal is developed, for the first time, on a heterogeneous
fibre-matrix mesh. In addition to the transient temperature field, the model also predicts
the dimensions of the matrix recession during the laser machining process.

Declaration
26
DECLARATION
I hereby declare that no portion the work referred to in the thesis has been submitted in
support of an application for another degree or qualification of this or any other
university or other institute of learning.
Copy Right Statement
27
COPYRIGHT STATEMENT
I. The author of this thesis (including any appendices and/or schedules to this
thesis) owns certain copyright or related rights in it (the “Copyright”) and s/he
has given The University of Manchester certain rights to use such Copyright,
including for administrative purposes.
II. Copies of this thesis, either in full or in extracts and whether in hard or
electronic copy, may be made only in accordance with the Copyright, Designs
and Patents Act 1988 (as amended) and regulations issued under it or, where
appropriate, in accordance with licensing agreements which the University has
from time to time. This page must form part of any such copies made.
III. The ownership of certain Copyright, patents, designs, trade marks and other
intellectual property (the “Intellectual Property”) and any reproductions of
copyright works in the thesis, for example graphs and tables (“Reproductions”),
which may be described in this thesis, may not be owned by the author and may
be owned by third parties. Such Intellectual Property and Reproductions cannot
and must not be made available for use without the prior written permission of
the owner(s) of the relevant Intellectual Property and/or Reproductions.
IV. Further information on the conditions under which disclosure, publication and
commercialisation of this thesis, the Copyright and any Intellectual Property
and/or Reproductions described in it may take place is available in the
University IP Policy (see http://www.campus.manchester.ac.uk/medialibrary/policies/
intellectual-property.pdf), in any relevant Thesis restriction declarations deposited in
the University Library, The University Library’s regulations (see
http://www.manchester.ac.uk/library/aboutus/regulations) and in The University’s policy
on presentation of Theses.
Acknowledgments
28
ACKNOWLEDGMENTS
Now that by blessing and mercy of God I have been through with submission of thesis, I
would like to convey my profound thanks to my supervisors. Prof. Li, for his continuous
support and enthusiastic advice on work and Dr. Mohammad A. Sheikh, for his
encouragement and key suggestions. I hereby also like to thank Dr. Zhongli Li from
Singapore Institute of Manufacturing Technology for her kind support.
I am thankful to my entire family. Their support on the work may never be fully
thanked. I am especially thankful to my wife Anahita, for her profound love and
understanding throughout the study.
I would like to thank all my friends and colleagues within the university and the Laser
Processing Research Centre (LPRC). Particularly, I thank Dr. James Methven, Dr. M.
Sundar and Dr. H. K. Sezer, for their patient and generous cooperation on the project.
My special thanks also to the experimental officers of LPRC, Dr. Marc Schmidt and Dr.
David Whitehead for their cooperation and useful suggestions. I thank all of whom
supported me on the work and shared happy time during my stay in Manchester. These
include, but by no means limited to, Prof. Philip Crouse, Dr. Mohammad Sobih, Dr.
Juan-Carlos Hernandez, Dr. Hui-Chi Chen, Dr. Alhaji Kamara, Dr. Nazanin
Mirhosseini, Dr. Amin Abdolvand, Dr. Sohib Khan, Dr. Gareth Littlewood, Dr. Stephen
Leigh, Dr. Salman Nisar, Dr. Imran Syed Jaffery, Dr. Wajeed Khan, Ashfaq Khan,
Mostafa Okasha, Naveed Ahsan, Ramadan Eghlio, Ana Pena, Nourhafiza Mahmoud,
Micheal Vogel, Juansethi Rames, Kamran Shah, Sabri Jamil, Maturose Suchatawat and
Kalid Mahmood. I am pleased to know them and that I had their kind support and
friendship. I profoundly wish all of them an ever successful and happy life in future.
Last, but not least I also thank the support offered by the Agency for Science,
Technology and Research (A*STAR) of Singapore and the joint support of the
Engineering and Physical Sciences Research Council (EPSRC) and the Technology
Strategy Board (TSB), UK under the ELMACT grant DT/E010512/1.
I hope this study would be a prosperous source in further investigations.

Dedication
29
DEDICATION
Entirely to
my son
Roham
whom I am proud of
and
the memory of my uncle
Mohammad Negarestani
a genius youth who sacrificed his life for
his country in Iran-Iraq war.
Chapter 1: Introduction
30
CHAPTER 1
INTRODUCTION
1.1 Overview
One of main advantages of composites is reduction of machining requirements by net
shape manufacturing of these structures for large and complex components (i.e.
production in final or near the final product shape). However, even these semi-finished
products still require post processes such as edging, cutting for dimensional
requirements, trimming the peripheral edges of the part and drilling of fastener holes [1-
3]. Machining of composites in general and fibre-reinforced polymer composites (FRPs)
in particular is very different from machining of metals. This is due to inhomogeneous
and anisotropic properties of these structures. Moreover since the fibres and the matrix
are combined together physically (i.e. not chemically), despite utilising the structural
properties, they retain their own mechanical and thermal properties which are usually
largely different between them (i.e. heterogeneous properties) [4].
As composite materials become commonplace, the search for efficient methods of
machining becomes even more significant. Mechanical machining processes (owing to
the availability and experience) are widely applied to the composite materials. Usually,
the reinforcing fibres such as glass, graphite, boron, alumina and silicon carbide are
highly abrasive and hard (sometimes as hard as or even harder than the tool material).
Therefore, special cutting tool materials and design must be used to minimise tool wear.
Currently, the machining and assembly of composites is challenging. 60% of part
rejections are due to machining errors and special tool design and operating conditions
requirements [3].
The machining challenges are particularly experienced in the case of carbon fibre-
reinforced polymer composites (CFRPs). This is due to high difference between
mechanical and thermal properties of the constituents. Machining defects including both
inter-laminar and intra-laminar delamination, fibre pullout, and poor surface quality
may affect part performance. Additionally, an inability to meet dimensional tolerances
may require secondary rework, or even part rejections. The cost for machining CFRP is
Chapter 1: Introduction
31
hence as high as half of the total cost of the manufacturing [5]. Therefore, alternative
machining processes are being studied. Abrasive waterjet (AWJ) has shown to be an
effective medium for composite trimming. The low thermal and mechanical forces of
AWJ machining are ideal for FRPs. Process parameters including supply pressure,
standoff distance, abrasive size, flow rate, and cutting speed may be adjusted to achieve
the desired cut surface quality and kerf taper [6]. However, delamination and trapping
of abrasives in the composite laminates may be the issues of concern. Other issues
related to the abrasive waterjet machining are the noise level and abrasive slurry
generated during the process, which are potential health hazards to the operators and
environment.
Lasers as non-contacting and non-abrasive machining tools exhibit unique advantages
in materials processing, eliminating tool wear, vibrations and cutting forces. Laser
cutting can be easily automated and can be performed at high cutting speed. Therefore,
lasers have often been proposed as a promising tool for machining of composites over
the past 30 years. The quality defects such as large heat-affected zone (HAZ), charring,
resin recession and delamination due to intense thermal effects have been major
obstacles for industrial applications of laser machining of CFRP composites in the past
[7]. Recent developments in laser materials processing technology have opened new
opportunities. These include availability of high power, high beam quality and fine
modulated short and ultra short pulsed systems as well as modern stages and
galvanometer mirror scanner systems that allow rapid laser-material interaction to
improve process productivity and accuracy. The visible light and near infrared
wavelength laser beam can also be transmitted through fibre optics and manipulated to
robots (to distances over 200 m from the laser unit). Thereby feasibility, characteristics
and process improvement of laser processing of CFRPs using different systems,
techniques and process conditions is investigated in this study.
1.2 Objectives
� Identification and characterising of quality in laser cutting of CFRPs.
� Investigating feasibility of different laser systems on cutting characteristics for
CFRPs.
Chapter 1: Introduction
32
� Improving the quality criteria associated with laser cutting of CFRPs.
� Introducing novel processing conditions and techniques to produce the laser cuts
of CFRPs with increased desirability of cut quality.
� Understanding thermal behaviour of CFRPs during laser cutting.
1.3 Thesis structure
This thesis addresses a number of scientific and experimental aspects associated with
laser cutting of CFRP composites. It consists of nine chapters. After the current
introductory chapter, scientific aspects are highlighted in Chapter 2 and Chapter 3.
Chapter 2 consists of an introduction to lasers, laser cutting and CFRP composite
materials. In the lasers section of Chapter 2, fundamentals of laser generation, systems
with high industrial applications and the laser-matter interaction phenomena are
discussed. Later, in the laser cutting section of Chapter 2, mechanisms, process
parameters, the role of assist gas and the approaches used to improve laser cutting are
explained. In the last section of Chapter 2, an introduction to composites and fibre-
reinforced composite materials is given. Then CFRP composites and their applications
are discussed. Thermal conductivity as a crucial material property that influences laser
cutting performance is discussed in more detail. Chapter 3 gives a literature review on
the current processes and the involved challenges in machining FRPs in general and
CFRPs in particular. The process fundamentals, advantages and drawbacks of laser
cutting is discussed.
Chapter 4 introduces the methodology and equipment used in the study. Fibre lasers as a
high quality, high performance and high reliability system have found great potential for
laser processing on the industrial scale. The availability of high power and high beam
quality increase the potential of high speed processing. Hence, Chapter 5 includes an
extensive research in laser cutting characteristics using a 1 kW single mode ytterbium-
doped fibre laser (1070 nm). The major quality factors are identified and characterised.
Alternative cutting strategies are suggested that successfully reduce thermal damage. An
outline of the multiple-pass technique as compared to single pass cutting is given.
Reduced delamination is achieved. CFRPs proved to be thermal sensitive and hence
require controlling mechanisms on the heat input in laser cutting. Therefore, alternative
Chapter 1: Introduction
33
laser systems to the CW and millisecond modulated beam fibre laser system are also
used in this study. An investigation on the effect of laser beam characteristics, the
material and cut direction are discussed in Chapter 6. A 400 W nanosecond pulsed
Nd:YAG laser (1064 nm) and 80 W KrF excimer laser (248 nm) are used in this section
of the study. A tabular summary of the findings is presented.
Reduced thermal effect on surrounding material through a nanosecond pulsed system
and the effect of assist gas conditions on the laser cut quality are discussed in Chapter 7.
It gives an explanation of thermal degradation and presents experimental results where
thermal damage is reduced by applying the innovation of a mixture of reactive and inert
gases as the assist gas. Chapter 8 introduces a novel approach in numerical simulation
of laser cutting of CFRPs. The simulation results are experimentally verified by Q-
switched DPSS Nd:YVO4 system that showed good laser cutting quality on CFRPs.
Finally Chapter 9 consists of the conclusions of the work and recommendations for
future work.
Chapter 2. Review on Lasers, Laser Cutting and Fibre Reinforced Polymer Composites
34
CHAPTER 2
REVIEW ON LASERS, LASER CUTTING AND
FIBRE-REINFORCED POLYMER COMPOSITES
2.1 Introduction
Light is an energy source consisting of electromagnetic waves. The electromagnetic
spectrum is divided into gamma-rays, X-rays, ultra violet, optical, infrared and radio
with respect to the increasing magnitude of the wavelength. The fact that materials can
absorb electromagnetic energy has opened a wide field of application for light.
Figure 2-1, illustrates the modern applications of light according to its characteristics
[8]. Originated from the source, light waves spread in straight lines and all directions,
take the bulb lamp light for instance. Obtaining a directed monochromatic light with
single wavelength and frequency is the efficient use of this power source. It may be
achieved by exciting the atoms of materials which in reacting with absorbing energy
release light. This was from where the idea of light amplification by stimulated
emission of radiation (LASER) emerged. It was in 1960’s that early applications of
laser light in measurement and communication systems emerged and later by a more
industrial use as material processing [9].
Along with laser evolution, engineering materials evolution started a dramatic turning
point in 1960’s [10]. The relative importance of polymer and composites as well as
ceramic based materials, has made a rapid growth since then (Figure 2-2) [10].
Therefore, it was not so long before laser material processing met the composite
materials in early 1970’s [11]. High processing cost and time of the composites are the
challenges to encourage applying fast, clean, tidy and comparatively cheap laser
systems for machining of composites.
Chapter 2. Review on Lasers, Laser Cutting and Fibre Reinforced Polymer Composites
35
Figure 2-1 Schematic illustration of electromagnetic spectrum and its applications[8]
Figure 2-2 Evolution of relative importance of engineering materials with time [10]
Chapter 2. Review on Lasers, Laser Cutting and Fibre Reinforced Polymer Composites
36
In this chapter, a brief introduction to lasers, their principles, types and applications on
one hand and composite materials on the other hand is provided. For the composites
section, the emphasis is given to the fibre-reinforced composites in line with the current
work objectives.
2.2 Laser
2.2.1 History
A revolutionary understanding of light was obtained by Albert Einstein in 1905 where
he proposed that the light consists of bundles of wave energy (i.e. photons). By
introduction of Bohr’s quantum theory in 1913, understanding the interaction between
photons and atoms became of interest. In the beginning it was suggested that once a
photon interacts with an atom it might be either absorbed or lead to spontaneous
emission of a photon by an atom that is originally in a higher energy state. It was,
however, once more Einstein who in 1917 considered the thermodynamics of photon
emission and concluded the possibility of a third process in which excited nuclei could
be stimulated to emit a photon once interacted by another photon, i.e. stimulated
emission. This can be considered as the beginning to the history of the laser
phenomenon. It was later suggested that such emission would be coherent and the first
observations of it were made in 1928 [9, 12, 13].
In 1951 Charles Townes developed an unpublished idea of microwave amplification by
stimulated emission of radiation (MASER) based on his interest in high resolution
microwave spectroscopy [12]. Weber [14] at The University of Maryland and Russian
scientists, Basov and Prokhorov [15] were the first to publish similar ideas. Maser
techniques were extended to the production of optical and infrared radiation by
Schawlow and Townes in 1958 [16]. The proposed principles were used by Maiman
[17] to present the first laser which was based on a pulsed flash lamp pumped ruby
crystal. In 1961 Javan et al. [18] introduced the first continuous wave He:Ne gas
discharge laser. Thereafter based on Schawlow’s law, suggesting that any material
under certain circumstances can result in stimulated emission [15], different materials in
different phases (i.e. solid, gas and liquid) were demonstrated as laser and optical
amplifiers.
Chapter 2. Review on Lasers, Laser Cutting and Fibre Reinforced Polymer Composites
37
In 1962 to 1968 basic development on different types of lasers occurred which generally
suffered poor reliability, poor durability and being limited for laboratory demonstrations
only [19]. From 1968 the engineering development of lasers improved so substantially
that by the mid 1970’s lasers had taken their place as a truly practical tool in industry
for cutting, welding, machine tool alignment, distance measurement etc. [12].
Remarkable developments in laser applications happened in the 1980’s to the mid
1990’s. They were applied for a variety of applications from consumer products such as
compact optical disks, laser printers and barcode scanners to advanced and particular
applications such as separation of uranium isotopes [12]. Currently, the worldwide
commercial sales of lasers exceeds $3 billion [20].
Later, replacement of flash law-pumping by diode-pumping as the energy source on one
hand and substitution of rods in solid state lasers by disks and fibre optics as the gain
medium on the other hand, contributed significant improvements in the laser industry.
Together, these energy source and gain medium improvements have led to systems with
practically negligible energy coupling loss, high beam quality, compact and reliable
systems with minimal maintenance requirements. However, the automated process
capability of diode pumped solid state (DPSS) lasers are largely dependant on fibre
beam delivery and robot manipulation. Currently, the disk and the fibre lasers are two
competing technologies to change the operational performance of industrial lasers
dominated by CO2 and Nd:YAG lasers [21].
2.2.2 Principal configurations
2.2.2.1 Operation fundamentals
Laser light differs from ordinary light in that it consists of photons that possess the same
frequency and phase. It is monochromatic, low divergence and temporal coherence (see
Figure 2-3). This means that the light of a laser beam can be focused to a small spot,
and can produce extremely high power density. This enables it to find wide applications
in materials processing, as well as surgery, communications, and measurement.
Chapter 2. Review on Lasers, Laser Cutting and Fibre Reinforced Polymer Composites
38
(a) (b)
Figure 2-3 Schematic comparison of laser light with ordinary light showing (a) monochromatic and (b)
low divergence of laser lights [22]
The energy levels of atoms are known as quantum states. Generally, excitation of an
electron requires receiving energy (to go from a lower state to a higher state) while
decay from a higher quantum state to a lower state, would force the electron to release
energy. Receiving energy includes mechanisms such as inelastic or semi-elastic
collision with other atoms or absorbing energy in the form of electromagnetic radiation.
Decay-released energy can be in the form of kinetic i.e. non-irradiative or as
electromagnetic radiation i.e. irradiative transition. The nature of the laser is based on
irradiative transition. The corresponding relations of light energy are as follows [23]:
λ
cv =' (2.1)
λ
chhvE
''' == (2.2)
Where, υ’ (Hz) is the light frequency, λ (µm) is the light wavelength, c(m/s) is the speed
of light in vacuum (299792458 m/s), h’ is Plank’s constant (4.13566733×10⁻¹⁵ eV.s),
E’(eV) is the photon energy.
If the energy of a photon equals the energy difference between two quantum states, it
would cause the electron in the lower state to jump to the upper energy state i.e.
excitation. This is known as “pumping”. Similarly once an electron decays from an
upper state to a lower level it would release a photon with an energy magnitude equal to
the energy difference of the two states. Any excited electron naturally will decay to a
lower level releasing a photon in random direction and phase. This is known as
“spontaneous emission” of the photon. While decaying and before the spontaneous
emission occurs if, a photon with sufficient energy magnitude passes by, it will cause
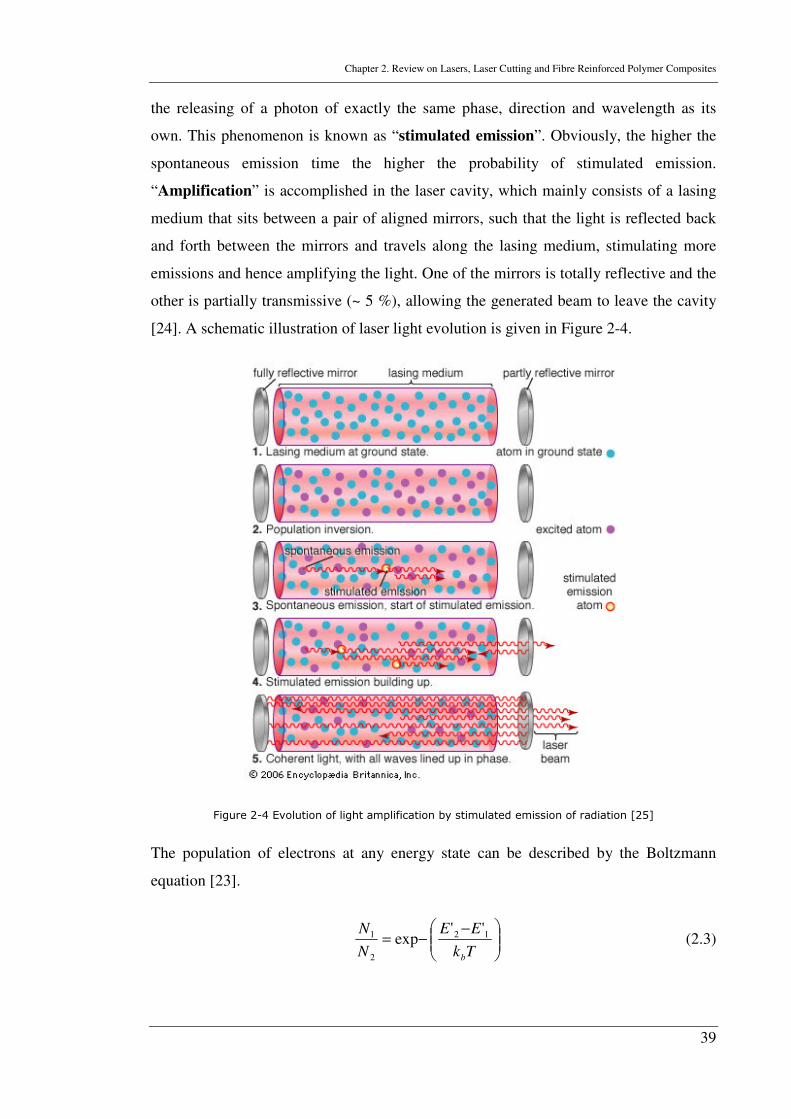
Chapter 2. Review on Lasers, Laser Cutting and Fibre Reinforced Polymer Composites
39
the releasing of a photon of exactly the same phase, direction and wavelength as its
own. This phenomenon is known as “stimulated emission”. Obviously, the higher the
spontaneous emission time the higher the probability of stimulated emission.
“Amplification” is accomplished in the laser cavity, which mainly consists of a lasing
medium that sits between a pair of aligned mirrors, such that the light is reflected back
and forth between the mirrors and travels along the lasing medium, stimulating more
emissions and hence amplifying the light. One of the mirrors is totally reflective and the
other is partially transmissive (~ 5 %), allowing the generated beam to leave the cavity
[24]. A schematic illustration of laser light evolution is given in Figure 2-4.
Figure 2-4 Evolution of light amplification by stimulated emission of radiation [25]
The population of electrons at any energy state can be described by the Boltzmann
equation [23].
−−=
Tk
EE
N
N
b
12
2
1 ''exp (2.3)
Chapter 2. Review on Lasers, Laser Cutting and Fibre Reinforced Polymer Composites
40
where N1 and N2 are the number of electrons at energy states 1 and 2 respectively, E1
and E2 are the energy values for states 1 and 2, T is the absolute temperature of the
medium, and kb is Boltzmann’s constant (1.38 × 10⁻²³ J/K). Under equilibrium
conditions, the lower energy level is always more densely populated than the upper
level. In order to establish stimulated emission, the number of atoms with electrons in
the upper energy level must be statistically greater than the number of atoms with
electrons in the ground state. This is called “population inversion”. Pumping, followed
by the process of stimulation, population inversion and amplification results in the
creation of a laser beam that possesses temporal and spatial coherence.
2.2.2.2 Characteristics of laser light
The properties that distinguish laser beam from ordinary light include mono-
chromaticity, coherence, directionality, and brightness that are briefly explained here.
2.2.2.2.1 Monochromaticity
This means that the range of frequencies emitted is narrow, typically of a single or a few
spectral lines of very narrow widths [26]. Generally, during oscillation only an
electromagnetic wave of frequency, v0, is amplified and this is further reduced to the
resonance frequencies of the laser cavity leading to the monochromaticity.
2.2.2.2.2 Coherence
Coherence refers to the relationship between the electronic and magnetic components of
an electromagnetic wave [26]. It consists of a temporal and spatial relationship.
Temporal coherence refers to correlation in phase at the same point in space at different
times, whereas spatial coherence refers to correlation in phase at the same time but at
different points in space. The coherence of the laser light, hence means it consists of
continuous waves of photons travelling in the same direction. The light wave is also not
broken up into randomly distributed photons and hence is continuous.
Chapter 2. Review on Lasers, Laser Cutting and Fibre Reinforced Polymer Composites
41
2.2.2.2.3 Directionality
The highly collimated, directional nature of the laser beam allows the energy carried by
a laser beam to be easily collected and focused to a small area [9]. A laser beam is very
direct and can propagate over a long distance with little loss of beam intensity. Due to
the low diffraction (as compared to ordinary light), laser beams have low divergence
angles. This is the angle at which the beam spreads out as it leaves the laser invariably
less than 10 mrad, typically in the order of 1 mrad. For a beam with wavelength of λ and
beam waist diameter of dw, the lower limit on beam divergence follows [9]:
wdπ
λθ
2= (2.4)
2.2.2.2.4 Brightness
One of the significant attributes of lasers is their high brightness (radiance). This
quantity is defined by the power emitted per unit area per solid angle for the light
source. Unlike the intensity of light (power per unit area) that can be increased by
focusing, the brightness of a source is an invariant quantity, and cannot be altered by a
lens or other optical system.
2.2.2.2.5 Mode Structure
In laser cavities (resonators) usually the length between the mirrors is much greater than
the lateral dimension. Therefore the field configurations (to promote stimulated
emission) can be separated in longitudinal and transverse modes. Transverse modes
represent the beam intensity variation along a path perpendicular to the direction of
propagation. They are of importance in laser material processing since beam
divergence, beam diameter, and energy distribution are governed by the transverse
modes [9]. Electromagnetic field variations inside optical resonators are described by
transverse electromagnetic modes as TEMmnq where m is the number of radial zero
fields, n is the number of angular zero fields, and q is the number of longitudinal fields.
Usually, only the first two indices are used to specify a TEM mode where the first
subscript indicates the number of rings and the second subscript indicates the number of
bars across the pattern (see Figure 2-5). For higher order of the modes, the focusing of
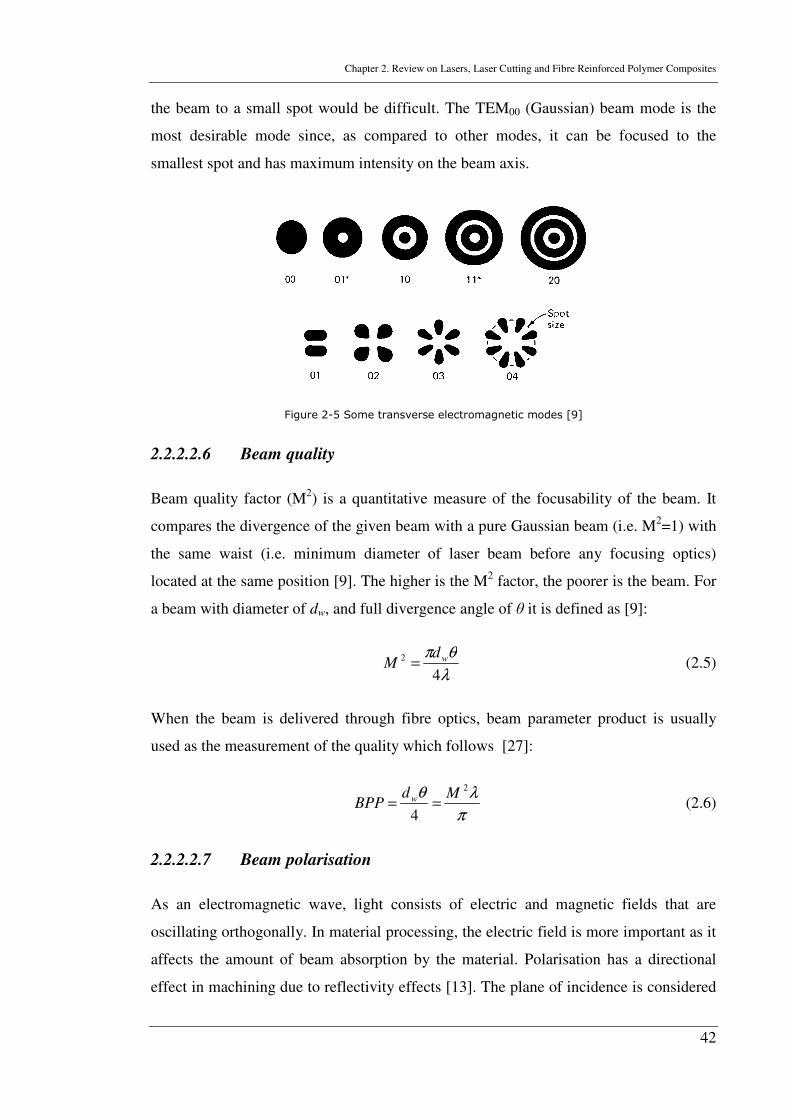
Chapter 2. Review on Lasers, Laser Cutting and Fibre Reinforced Polymer Composites
42
the beam to a small spot would be difficult. The TEM00 (Gaussian) beam mode is the
most desirable mode since, as compared to other modes, it can be focused to the
smallest spot and has maximum intensity on the beam axis.
Figure 2-5 Some transverse electromagnetic modes [9]
2.2.2.2.6 Beam quality
Beam quality factor (M2) is a quantitative measure of the focusability of the beam. It
compares the divergence of the given beam with a pure Gaussian beam (i.e. M2=1) with
the same waist (i.e. minimum diameter of laser beam before any focusing optics)
located at the same position [9]. The higher is the M2 factor, the poorer is the beam. For
a beam with diameter of dw, and full divergence angle of θ it is defined as [9]:
λ
θπ
4
2 wdM = (2.5)
When the beam is delivered through fibre optics, beam parameter product is usually
used as the measurement of the quality which follows [27]:
π
λθ 2
4
MdBPP w == (2.6)
2.2.2.2.7 Beam polarisation
As an electromagnetic wave, light consists of electric and magnetic fields that are
oscillating orthogonally. In material processing, the electric field is more important as it
affects the amount of beam absorption by the material. Polarisation has a directional
effect in machining due to reflectivity effects [13]. The plane of incidence is considered
Chapter 2. Review on Lasers, Laser Cutting and Fibre Reinforced Polymer Composites
43
normal to the material surface. If the oscillation of electric field vector is perpendicular
to the incidence plane it is known as s-polarised and if it lies in the plane of incidence it
is considered as p-polarised. For other angles the electric field is configured by p and s
components.
2.2.2.3 Laser system and temporal configurations
Generally, laser systems consist of a gain medium (also known as lasing material or
lasent), energy (pumping) source, resonators, cavity and a cooling system. The gain
(also known as amplifying or lasing) medium is a medium that has the potential for
optical gain. It can be in the form of gas, liquid, solid or semi-conductor. The energy
source, is a means by which gain medium atoms would undergo excitation. This energy
is provided by highly energetic electrons (moving at rapid speeds of the order of 108 to
109 cm/s), energetic heavier particles such as protons, neutrons or even other atoms or
electromagnetic radiation (light) [24]. Energetic electrons are typically used in most gas
and semiconductor lasers while light is often used in liquid lasers and crystalline solid-
state lasers. Resonators, are the feedback system used to increase the stimulated
emission. Typically two fine mirrors, one totally reflective and the other partially
reflective. The latter is the output path of the laser beam. The cavity is the chamber in
which the lasing medium and resonators are placed to avoid escaping of photons. Since
the photon release elevates the medium temperature, cooling is essential and a cooling
system is used. Water or chilled air is usually used as coolant.
Depending on the desired beam quality and power, different crystal and pumping
variations are used in lasers. A cylindrical rod lasing medium is typically 100 mm in
length and 12 mm in diameter. Laser power will increase with increasing rod size.
However, the beam quality will deteriorate. The optical pump source also strongly
influences laser characteristics. The lasing medium can be pumped either using flash
lamps or laser diodes. Diode-pumped-solid state (DPSS) systems offer much higher
efficiency, compactness and smaller beam size than lamp-pumped lasers of similar
output owing to emitting a light with a wavelength close to the output laser beam [9].
These have facilitated extending the laser system configurations in Q-switching, mode-
locking and harmonic generation to achieve high energy, efficient, cost-effective,
compact systems with short and ultra-short pulses. Compared to mode-locking, Q-
Chapter 2. Review on Lasers, Laser Cutting and Fibre Reinforced Polymer Composites
44
switching, leads to much lower pulse repetition rates, much higher pulse energy and
much longer pulse duration. In Q-switching the energy is gradually accumulated in the
laser medium (by putting a lossy optical element into the cavity) and then released
suddenly producing a high-power burst of light. Q-switching has pulse duration longer
than nanoseconds because of the required pulse build-up time. Mode-locking is a
process in which large numbers of modes are placed in lock step with each other, which
leads to short pulses (typically in a range shorter than picosecond regime) of extremely
high peak power.
In harmonic generation the range of wavelengths at which high laser powers are
available are expanded. It leads to a single harmonic of shorter wavelength than the
fundamental wavelength of 1.06 µm, providing the option of operating in second, third
and fourth harmonics of the fundamental frequency of Nd:YAG, at wavelengths of 532,
355, and 266 nm respectively (shifting the wavelength into the green and ultraviolet).
This is achieved by using an optical nonlinear material like LiNbO3, and there are a
multitude of crystals available for harmonic conversion. For instance, in a second
harmonic generation process, two photons with the same wavelength are combined in
the nonlinear optical crystal to produce another photon with twice the energy. The
emerging radiation will hence be 532 nm in wavelength. Repeating this process will
give ultraviolet light. Operating at these harmonic wavelengths is beneficial as the
shorter wavelengths can couple more efficiently with some target materials. It can also
produce a smaller focus spot. However, harmonic generation involves to energy losses
which increase for higher harmonics.
2.2.3 Laser types
2.2.3.1 CO2 laser
CO2 gas lasers contribute to over 40% of the industrial lasers [28]. The CO2 gain
medium is usually mixed with N2 and He with typical respective contribution
proportion of 1:1:8 (for increased efficiency of excitation), emitting an infrared invisible
laser beam i.e. wavelength is 10.6 µm. The overall efficiency of the CO2 laser is greatly
increased by the incorporation of N2. Nitrogen molecules that are vibrationally excited
in the laser medium, excite the upper CO2 laser level by collision. The role of He in the
Chapter 2. Review on Lasers, Laser Cutting and Fibre Reinforced Polymer Composites
45
laser mixture is, on one hand, to quench the population that is build up in low-lying
levels of the CO2 molecule after laser emission has occurred and to stabilise the glow
discharge, on the other hand. Helium atoms are translationally excited during such
processes. The efficiency of conversion of electrical energy into optical energy of these
systems usually lies in the range of 10% - 15% and a beam power of up to 45 kW can
be achieved. Therefore, it is desirable for various material processing applications. High
power CO2 lasers are generally flowing gas systems (i.e. gas flows through the system
and is exhausted). This is to avoid the degradation of laser output as a result of harmful
products that form by decomposition of the gas molecules in exposure to pump source.
Fast flow of gas provides better cooling and also high output power from small volumes
of gas.
Developing slow axial gas flow, fast axial gas flow, perpendicular direction of gas flow
to the laser optical path and perpendicular direction of electrical discharge to the optical
path are different evolution states of the CO2 lasers to enhance output power and
efficiency (see Figure 2-6 [29]). Sealed CO2 lasers are also designed for situations
where gas flow is not feasible. This (generally low power) laser would last for
thousands of hours and involve the use of a getter to remove the harmful decomposition
products [9, 13, 29]. CO2 lasers are often used in continuous wave (CW) mode, but they
may be pulsed by pulsing the electrical power supply. At relatively low power, the
beam quality of CO2 laser can be excellent, but as the output power increases, the beam
divergence angle increases therefore limiting the desirability for material processing
application with good focusing quality requirements. As another restriction of the
system it can be noted that because of the wavelength the beam cannot be delivered by
fibre optics.
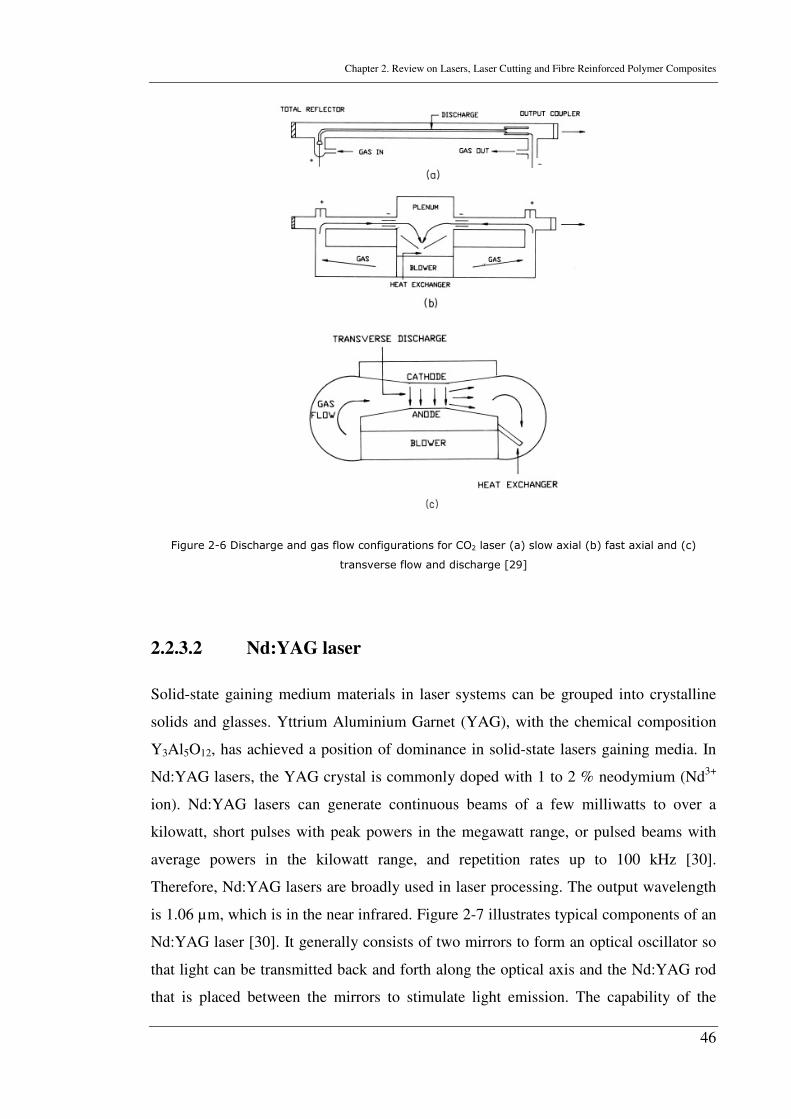
Chapter 2. Review on Lasers, Laser Cutting and Fibre Reinforced Polymer Composites
46
Figure 2-6 Discharge and gas flow configurations for CO2 laser (a) slow axial (b) fast axial and (c)
transverse flow and discharge [29]
2.2.3.2 Nd:YAG laser
Solid-state gaining medium materials in laser systems can be grouped into crystalline
solids and glasses. Yttrium Aluminium Garnet (YAG), with the chemical composition
Y3Al5O12, has achieved a position of dominance in solid-state lasers gaining media. In
Nd:YAG lasers, the YAG crystal is commonly doped with 1 to 2 % neodymium (Nd3+
ion). Nd:YAG lasers can generate continuous beams of a few milliwatts to over a
kilowatt, short pulses with peak powers in the megawatt range, or pulsed beams with
average powers in the kilowatt range, and repetition rates up to 100 kHz [30].
Therefore, Nd:YAG lasers are broadly used in laser processing. The output wavelength
is 1.06 µm, which is in the near infrared. Figure 2-7 illustrates typical components of an
Nd:YAG laser [30]. It generally consists of two mirrors to form an optical oscillator so
that light can be transmitted back and forth along the optical axis and the Nd:YAG rod
that is placed between the mirrors to stimulate light emission. The capability of the
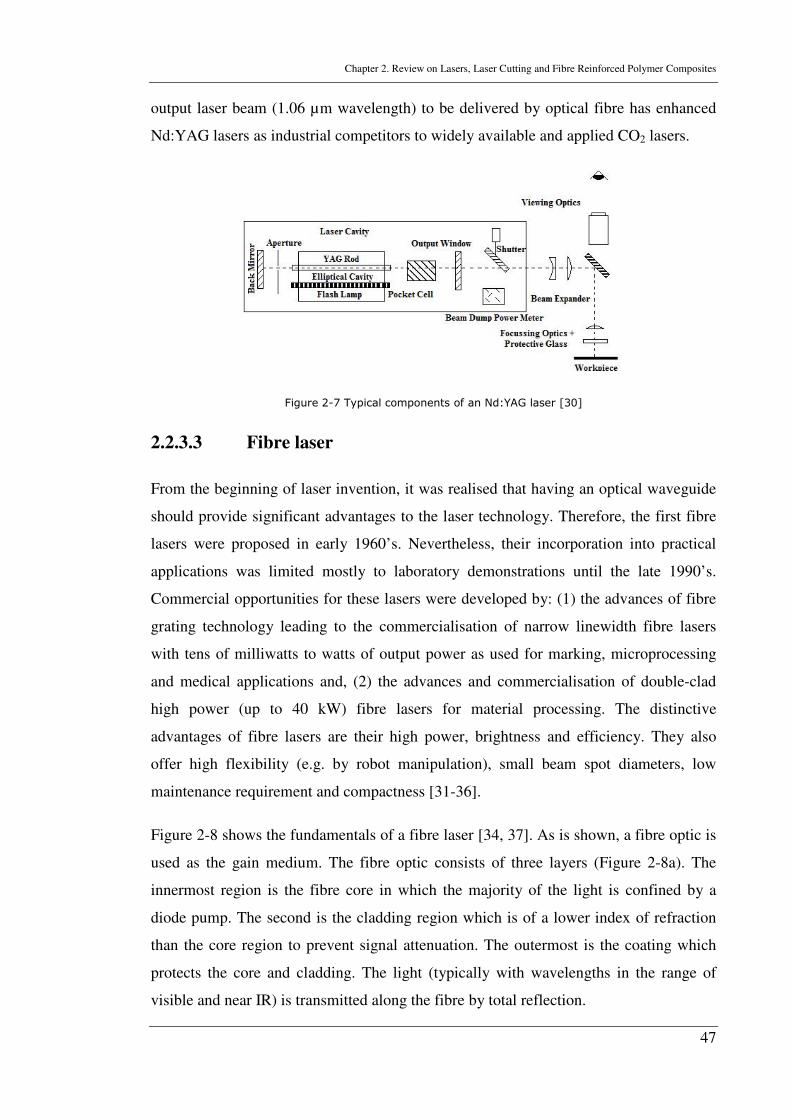
Chapter 2. Review on Lasers, Laser Cutting and Fibre Reinforced Polymer Composites
47
output laser beam (1.06 µm wavelength) to be delivered by optical fibre has enhanced
Nd:YAG lasers as industrial competitors to widely available and applied CO2 lasers.
Figure 2-7 Typical components of an Nd:YAG laser [30]
2.2.3.3 Fibre laser
From the beginning of laser invention, it was realised that having an optical waveguide
should provide significant advantages to the laser technology. Therefore, the first fibre
lasers were proposed in early 1960’s. Nevertheless, their incorporation into practical
applications was limited mostly to laboratory demonstrations until the late 1990’s.
Commercial opportunities for these lasers were developed by: (1) the advances of fibre
grating technology leading to the commercialisation of narrow linewidth fibre lasers
with tens of milliwatts to watts of output power as used for marking, microprocessing
and medical applications and, (2) the advances and commercialisation of double-clad
high power (up to 40 kW) fibre lasers for material processing. The distinctive
advantages of fibre lasers are their high power, brightness and efficiency. They also
offer high flexibility (e.g. by robot manipulation), small beam spot diameters, low
maintenance requirement and compactness [31-36].
Figure 2-8 shows the fundamentals of a fibre laser [34, 37]. As is shown, a fibre optic is
used as the gain medium. The fibre optic consists of three layers (Figure 2-8a). The
innermost region is the fibre core in which the majority of the light is confined by a
diode pump. The second is the cladding region which is of a lower index of refraction
than the core region to prevent signal attenuation. The outermost is the coating which
protects the core and cladding. The light (typically with wavelengths in the range of
visible and near IR) is transmitted along the fibre by total reflection.
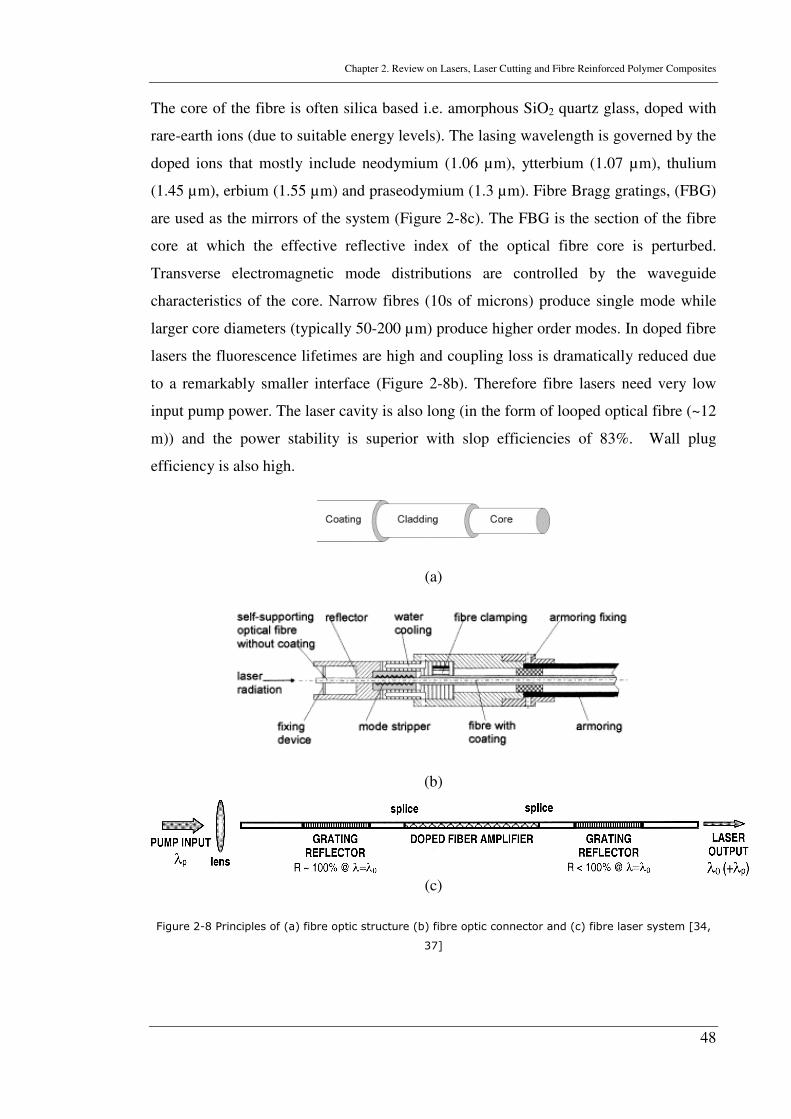
Chapter 2. Review on Lasers, Laser Cutting and Fibre Reinforced Polymer Composites
48
The core of the fibre is often silica based i.e. amorphous SiO2 quartz glass, doped with
rare-earth ions (due to suitable energy levels). The lasing wavelength is governed by the
doped ions that mostly include neodymium (1.06 µm), ytterbium (1.07 µm), thulium
(1.45 µm), erbium (1.55 µm) and praseodymium (1.3 µm). Fibre Bragg gratings, (FBG)
are used as the mirrors of the system (Figure 2-8c). The FBG is the section of the fibre
core at which the effective reflective index of the optical fibre core is perturbed.
Transverse electromagnetic mode distributions are controlled by the waveguide
characteristics of the core. Narrow fibres (10s of microns) produce single mode while
larger core diameters (typically 50-200 µm) produce higher order modes. In doped fibre
lasers the fluorescence lifetimes are high and coupling loss is dramatically reduced due
to a remarkably smaller interface (Figure 2-8b). Therefore fibre lasers need very low
input pump power. The laser cavity is also long (in the form of looped optical fibre (~12
m)) and the power stability is superior with slop efficiencies of 83%. Wall plug
efficiency is also high.
(a)
(b)
(c)
Figure 2-8 Principles of (a) fibre optic structure (b) fibre optic connector and (c) fibre laser system [34,
37]
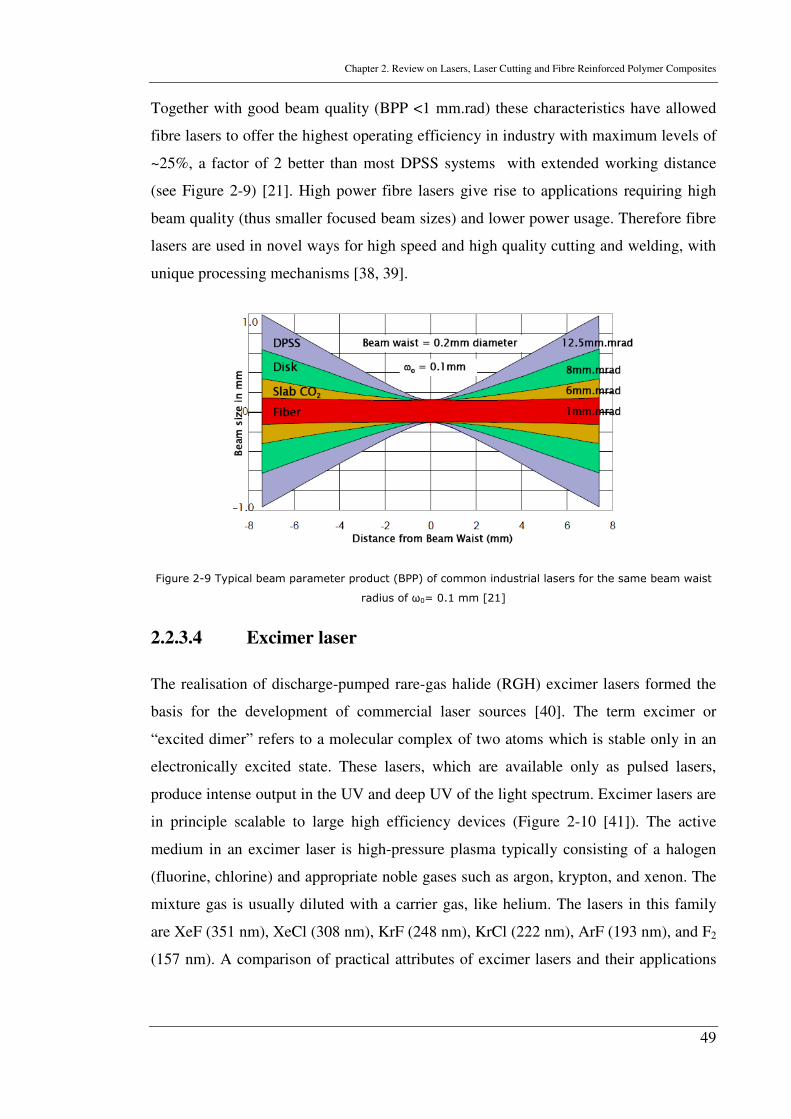
Chapter 2. Review on Lasers, Laser Cutting and Fibre Reinforced Polymer Composites
49
Together with good beam quality (BPP <1 mm.rad) these characteristics have allowed
fibre lasers to offer the highest operating efficiency in industry with maximum levels of
~25%, a factor of 2 better than most DPSS systems with extended working distance
(see Figure 2-9) [21]. High power fibre lasers give rise to applications requiring high
beam quality (thus smaller focused beam sizes) and lower power usage. Therefore fibre
lasers are used in novel ways for high speed and high quality cutting and welding, with
unique processing mechanisms [38, 39].
Figure 2-9 Typical beam parameter product (BPP) of common industrial lasers for the same beam waist
radius of ω0= 0.1 mm [21]
2.2.3.4 Excimer laser
The realisation of discharge-pumped rare-gas halide (RGH) excimer lasers formed the
basis for the development of commercial laser sources [40]. The term excimer or
“excited dimer” refers to a molecular complex of two atoms which is stable only in an
electronically excited state. These lasers, which are available only as pulsed lasers,
produce intense output in the UV and deep UV of the light spectrum. Excimer lasers are
in principle scalable to large high efficiency devices (Figure 2-10 [41]). The active
medium in an excimer laser is high-pressure plasma typically consisting of a halogen
(fluorine, chlorine) and appropriate noble gases such as argon, krypton, and xenon. The
mixture gas is usually diluted with a carrier gas, like helium. The lasers in this family
are XeF (351 nm), XeCl (308 nm), KrF (248 nm), KrCl (222 nm), ArF (193 nm), and F2
(157 nm). A comparison of practical attributes of excimer lasers and their applications
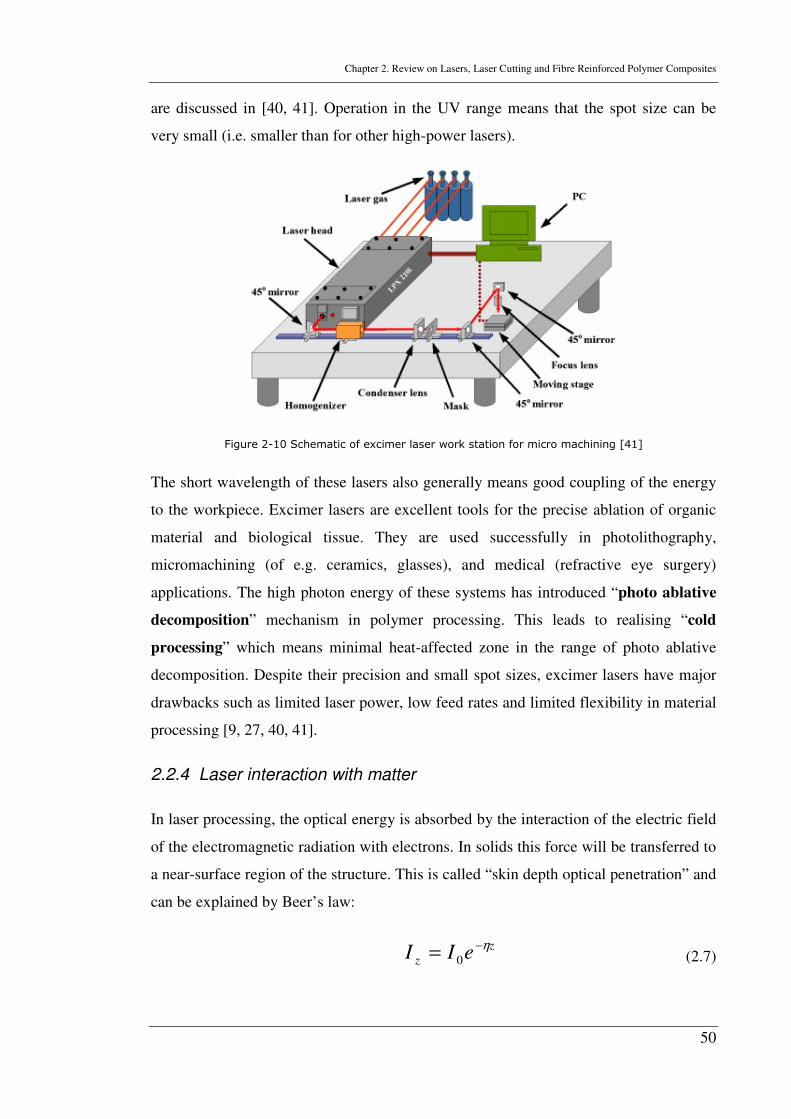
Chapter 2. Review on Lasers, Laser Cutting and Fibre Reinforced Polymer Composites
50
are discussed in [40, 41]. Operation in the UV range means that the spot size can be
very small (i.e. smaller than for other high-power lasers).
Figure 2-10 Schematic of excimer laser work station for micro machining [41]
The short wavelength of these lasers also generally means good coupling of the energy
to the workpiece. Excimer lasers are excellent tools for the precise ablation of organic
material and biological tissue. They are used successfully in photolithography,
micromachining (of e.g. ceramics, glasses), and medical (refractive eye surgery)
applications. The high photon energy of these systems has introduced “photo ablative
decomposition” mechanism in polymer processing. This leads to realising “cold
processing” which means minimal heat-affected zone in the range of photo ablative
decomposition. Despite their precision and small spot sizes, excimer lasers have major
drawbacks such as limited laser power, low feed rates and limited flexibility in material
processing [9, 27, 40, 41].
2.2.4 Laser interaction with matter
In laser processing, the optical energy is absorbed by the interaction of the electric field
of the electromagnetic radiation with electrons. In solids this force will be transferred to
a near-surface region of the structure. This is called “skin depth optical penetration” and
can be explained by Beer’s law:
z
z eII η−= 0 (2.7)
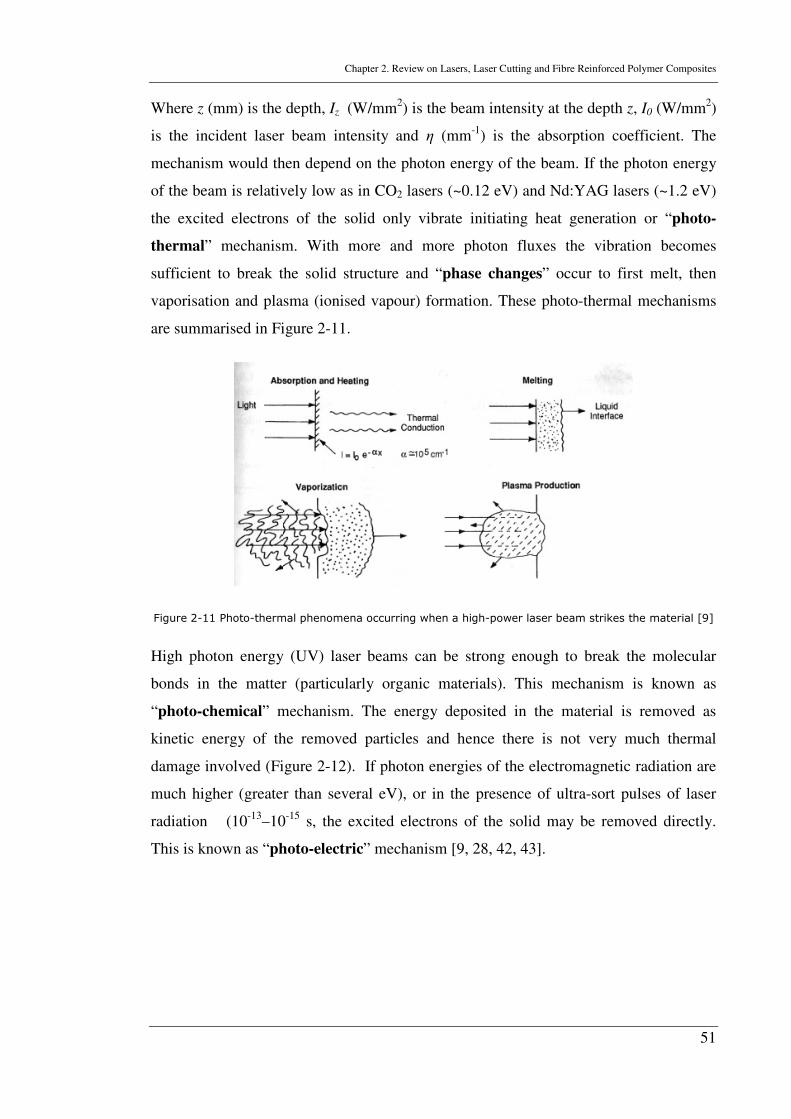
Chapter 2. Review on Lasers, Laser Cutting and Fibre Reinforced Polymer Composites
51
Where z (mm) is the depth, Iz (W/mm2) is the beam intensity at the depth z, I0 (W/mm2)
is the incident laser beam intensity and η (mm-1) is the absorption coefficient. The
mechanism would then depend on the photon energy of the beam. If the photon energy
of the beam is relatively low as in CO2 lasers (~0.12 eV) and Nd:YAG lasers (~1.2 eV)
the excited electrons of the solid only vibrate initiating heat generation or “photo-
thermal” mechanism. With more and more photon fluxes the vibration becomes
sufficient to break the solid structure and “phase changes” occur to first melt, then
vaporisation and plasma (ionised vapour) formation. These photo-thermal mechanisms
are summarised in Figure 2-11.
Figure 2-11 Photo-thermal phenomena occurring when a high-power laser beam strikes the material [9]
High photon energy (UV) laser beams can be strong enough to break the molecular
bonds in the matter (particularly organic materials). This mechanism is known as
“photo-chemical” mechanism. The energy deposited in the material is removed as
kinetic energy of the removed particles and hence there is not very much thermal
damage involved (Figure 2-12). If photon energies of the electromagnetic radiation are
much higher (greater than several eV), or in the presence of ultra-sort pulses of laser
radiation (10-13–10-15 s, the excited electrons of the solid may be removed directly.
This is known as “photo-electric” mechanism [9, 28, 42, 43].
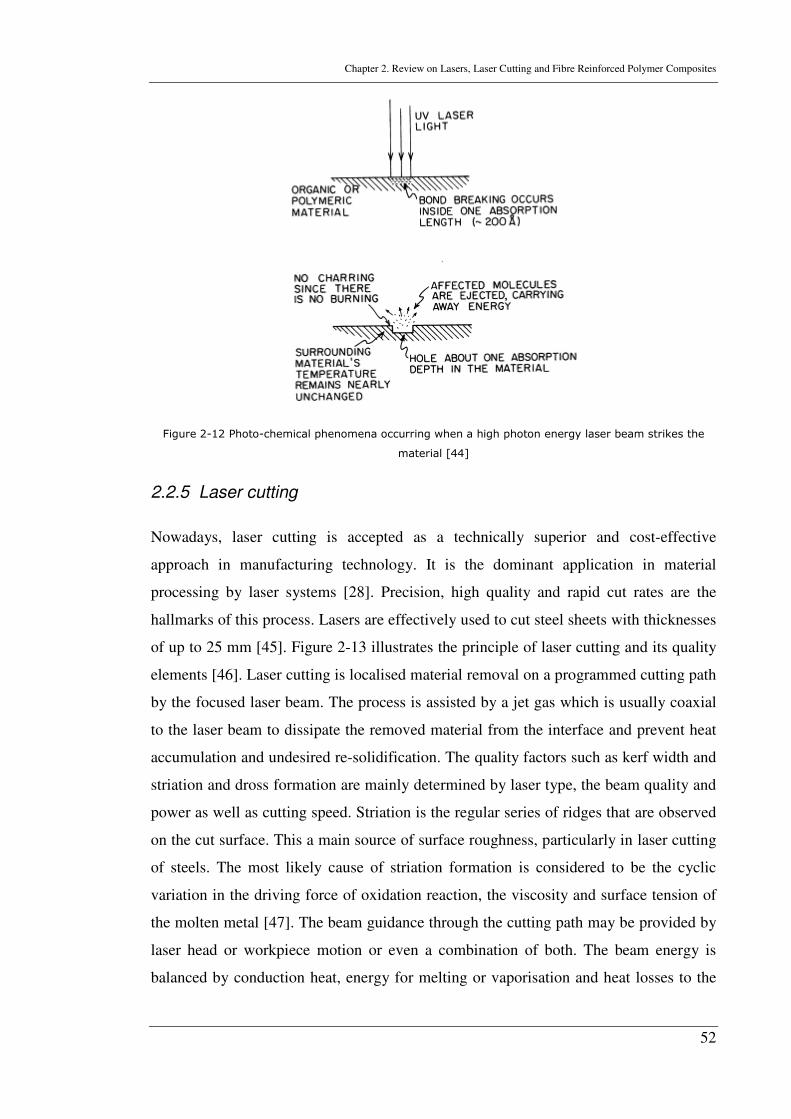
Chapter 2. Review on Lasers, Laser Cutting and Fibre Reinforced Polymer Composites
52
Figure 2-12 Photo-chemical phenomena occurring when a high photon energy laser beam strikes the
material [44]
2.2.5 Laser cutting
Nowadays, laser cutting is accepted as a technically superior and cost-effective
approach in manufacturing technology. It is the dominant application in material
processing by laser systems [28]. Precision, high quality and rapid cut rates are the
hallmarks of this process. Lasers are effectively used to cut steel sheets with thicknesses
of up to 25 mm [45]. Figure 2-13 illustrates the principle of laser cutting and its quality
elements [46]. Laser cutting is localised material removal on a programmed cutting path
by the focused laser beam. The process is assisted by a jet gas which is usually coaxial
to the laser beam to dissipate the removed material from the interface and prevent heat
accumulation and undesired re-solidification. The quality factors such as kerf width and
striation and dross formation are mainly determined by laser type, the beam quality and
power as well as cutting speed. Striation is the regular series of ridges that are observed
on the cut surface. This a main source of surface roughness, particularly in laser cutting
of steels. The most likely cause of striation formation is considered to be the cyclic
variation in the driving force of oxidation reaction, the viscosity and surface tension of
the molten metal [47]. The beam guidance through the cutting path may be provided by
laser head or workpiece motion or even a combination of both. The beam energy is
balanced by conduction heat, energy for melting or vaporisation and heat losses to the
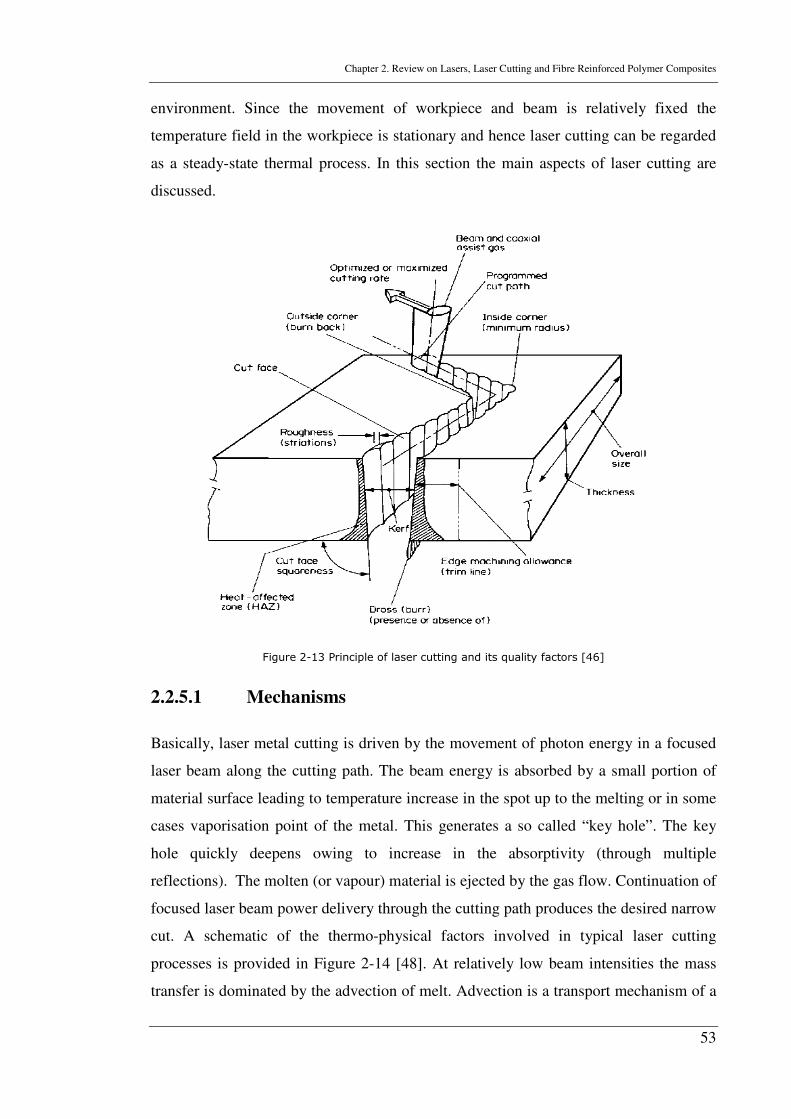
Chapter 2. Review on Lasers, Laser Cutting and Fibre Reinforced Polymer Composites
53
environment. Since the movement of workpiece and beam is relatively fixed the
temperature field in the workpiece is stationary and hence laser cutting can be regarded
as a steady-state thermal process. In this section the main aspects of laser cutting are
discussed.
Figure 2-13 Principle of laser cutting and its quality factors [46]
2.2.5.1 Mechanisms
Basically, laser metal cutting is driven by the movement of photon energy in a focused
laser beam along the cutting path. The beam energy is absorbed by a small portion of
material surface leading to temperature increase in the spot up to the melting or in some
cases vaporisation point of the metal. This generates a so called “key hole”. The key
hole quickly deepens owing to increase in the absorptivity (through multiple
reflections). The molten (or vapour) material is ejected by the gas flow. Continuation of
focused laser beam power delivery through the cutting path produces the desired narrow
cut. A schematic of the thermo-physical factors involved in typical laser cutting
processes is provided in Figure 2-14 [48]. At relatively low beam intensities the mass
transfer is dominated by the advection of melt. Advection is a transport mechanism of a
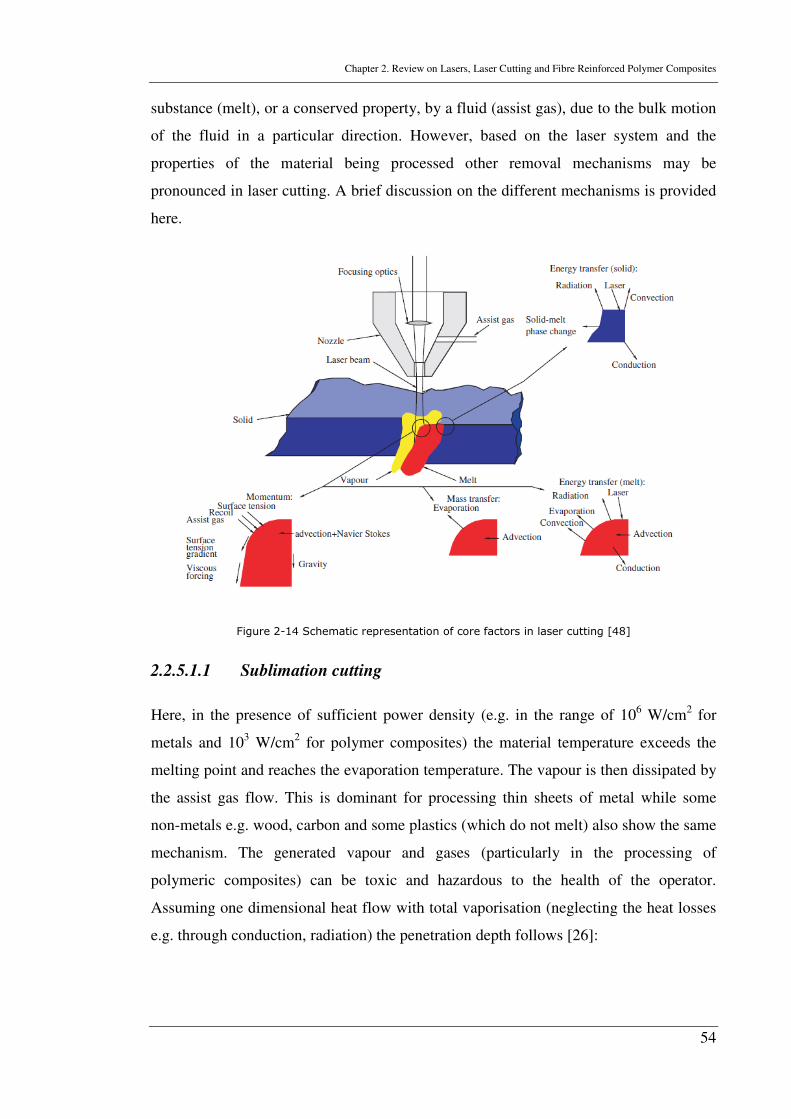
Chapter 2. Review on Lasers, Laser Cutting and Fibre Reinforced Polymer Composites
54
substance (melt), or a conserved property, by a fluid (assist gas), due to the bulk motion
of the fluid in a particular direction. However, based on the laser system and the
properties of the material being processed other removal mechanisms may be
pronounced in laser cutting. A brief discussion on the different mechanisms is provided
here.
Figure 2-14 Schematic representation of core factors in laser cutting [48]
2.2.5.1.1 Sublimation cutting
Here, in the presence of sufficient power density (e.g. in the range of 106 W/cm2 for
metals and 103 W/cm2 for polymer composites) the material temperature exceeds the
melting point and reaches the evaporation temperature. The vapour is then dissipated by
the assist gas flow. This is dominant for processing thin sheets of metal while some
non-metals e.g. wood, carbon and some plastics (which do not melt) also show the same
mechanism. The generated vapour and gases (particularly in the processing of
polymeric composites) can be toxic and hazardous to the health of the operator.
Assuming one dimensional heat flow with total vaporisation (neglecting the heat losses
e.g. through conduction, radiation) the penetration depth follows [26]:
Chapter 2. Review on Lasers, Laser Cutting and Fibre Reinforced Polymer Composites
55
( )( )0
0
TTCLdV
PD
vpBB
p−+
=ρ
η
(2.8)
The time at which the beam with transverse velocity of VB travels a distance equal to its
diameter dB , follows:
B
B
dV
dt =
(2.9)
Assuming instant penetration through the material thickness, the volume removed per
second per unit area equals the penetration velocity:
B
Bp
pd
VDV =
(2.10)
and hence [13]:
))(( 0
2
0
TTCLd
PV
vpB
p−+
=ρ
η
(2.11)
Where Dp (mm) is the penetration depth, η is the absorptivity (1-reflectivity) of the
material, P0 (W) is the laser beam power, dB (mm) is the focused beam diameter, VB
(mm/s) is the transverse velocity of the beam, Vp (mm/s) is the penetration velocity, td
(s) is the time elapsed to travel a distance d, ρ (kg/m3) is the workpiece density, L (J/kg)
is the latent heat of fusion and vaporisation, Cp (J/(kg.K)) is the heat capacity of
workpiece, Tv is the vaporisation temperature (K) and T0 (K) is the initial temperature of
material.
2.2.5.1.2 Fusion cutting
Here, the laser beam power raises the material temperature only up to the melting point
and the melt is then removed by the flow of an inert assist gas. The energy requirement
is much lower than in vaporisation cutting. This is common mechanism in cutting of
thick metals [49].
Chapter 2. Review on Lasers, Laser Cutting and Fibre Reinforced Polymer Composites
56
2.2.5.1.3 Oxygen assisted laser cutting
When oxygen i.e. reactive gas, is used as the assist gas it reacts with the heated material
as an exothermal reaction. This combustion or burning phenomena is particularly useful
for cutting thick plates of mild steel and would affect the process in two ways [13, 46]:
� Enforcing additional exothermal energy to the interface, and hence accelerating
the cutting process.
� Generating low viscous melt with less surface tension which can be easily
removed from the cutting zone, assisting the surface quality.
FRPs are heat-sensitive. Using a reactive gas accelerates the thermal decomposition
through exothermal chemical reactions (See Chapter 6). By-products can also be much
hazardous and hence exhausting the by-products from the cutting area is much more
necessary.
2.2.5.1.4 Scribing
This technique involves creating a slot or series of blind holes on the surface of the
workpiece enough to raise the stress locally so that the material can be easily fractured
along the desired line.
2.2.5.1.5 Controlled fracture cutting
Here a low power laser beam is used to propagate a crack (at speeds up to 1 m/s) by
inducing localised thermal stresses. This approach is particularly used for cutting brittle
materials such as glass. The main associated problem is deviation of the cut path at the
edges.
2.2.5.1.6 Photo-chemical cutting (cold cutting)
Here a laser beam with high photon energy (UV) is used to directly break the chemical
molecular bonds and form new components. It is especially practical for woods and
elastomers. However, the machining rate is lower as compared to the others.
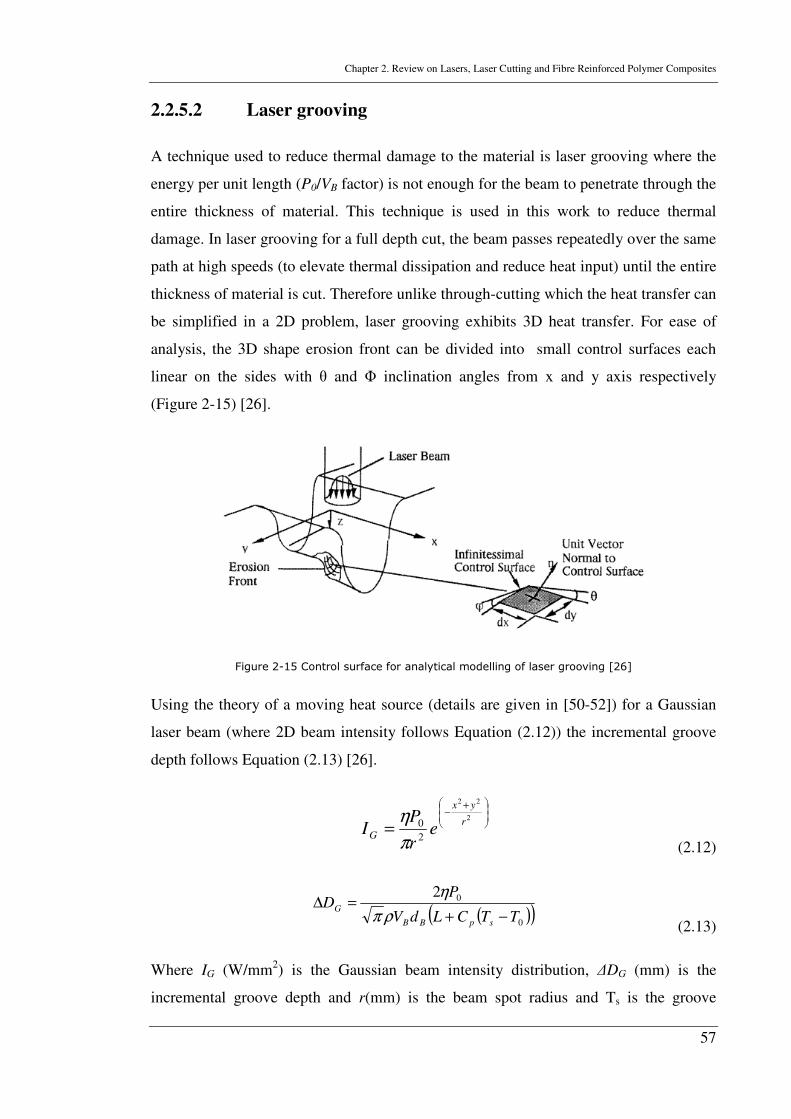
Chapter 2. Review on Lasers, Laser Cutting and Fibre Reinforced Polymer Composites
57
2.2.5.2 Laser grooving
A technique used to reduce thermal damage to the material is laser grooving where the
energy per unit length (P0/VB factor) is not enough for the beam to penetrate through the
entire thickness of material. This technique is used in this work to reduce thermal
damage. In laser grooving for a full depth cut, the beam passes repeatedly over the same
path at high speeds (to elevate thermal dissipation and reduce heat input) until the entire
thickness of material is cut. Therefore unlike through-cutting which the heat transfer can
be simplified in a 2D problem, laser grooving exhibits 3D heat transfer. For ease of
analysis, the 3D shape erosion front can be divided into small control surfaces each
linear on the sides with θ and Φ inclination angles from x and y axis respectively
(Figure 2-15) [26].
Figure 2-15 Control surface for analytical modelling of laser grooving [26]
Using the theory of a moving heat source (details are given in [50-52]) for a Gaussian
laser beam (where 2D beam intensity follows Equation (2.12)) the incremental groove
depth follows Equation (2.13) [26].
+−
=2
22
2
0 r
yx
G er
PI
π
η
(2.12)
( )( )0
02
TTCLdV
PD
spBB
G−+
=∆ρπ
η
(2.13)
Where IG (W/mm2) is the Gaussian beam intensity distribution, ∆DG (mm) is the
incremental groove depth and r(mm) is the beam spot radius and Ts is the groove
Chapter 2. Review on Lasers, Laser Cutting and Fibre Reinforced Polymer Composites
58
surface temperature units. Here also a total vaporisation mechanism is assumed and the
thermal conduction is considered to be only normal to the groove surface. Chryssolouris
et al. [53] used these assumptions to predict the groove depth in processing of FRPs.
They used the thermal properties as the volume fraction average of the matrix and fibre
material values. For the centreline change in the groove depth (y=0 and Φ=0) the
incremental depth for composites (∆DGC (mm)) was given as [53]:
)2(
0
spBB
GCTCLdV
PD
+=∆
ρ
ηπ (2.14)
This was experimentally validated to be a fair prediction for high diffusivity material
such as carbon composites whilst overestimated for material with lower thermal
diffusivities such as glass composites. This can be attributed to lack of convection heat
losses to the environment in the model. The total depth of cut can be gained by
multiplying the number of elapsed passes into the central incremental groove depths
(i.e. for both Equation (2.13) and Equation (2.14)).
2.2.5.3 Process parameters
Most previous studies in laser cutting involve metal cutting. Therefore, a consistent
understanding on the effect of parameters in laser cutting of fibre reinforced polymer
composites is not available. Here, a general description on various parameters that
influence the laser cutting is provided. A more detail discussion on the parameters
influencing the laser cutting of CFRPs is given in machining review chapter (Chapter
3).
2.2.5.3.1 System parameters
These include the parameters imposed by the equipment specifications (e.g. apparatus
efficiency and maximum power) and the physics of the employed beam (e.g. waist
diameter, wavelength, spot size, mode, pulsed or CW beam, polarisation and focal
length of the focusing lens). This list contributes to typical system parameters. Other
values can also become important. For instance, fibre optics has enhanced remote and
multiple simultaneous cutting operations. However, the fibre diameter and the amount
Chapter 2. Review on Lasers, Laser Cutting and Fibre Reinforced Polymer Composites
59
of beam power that would be lost along the transferring fibre which should also be
considered as an influencing process parameter.
2.2.5.3.2 Material conditions
Physical, thermal and certain mechanical properties of the material have a great role in
the efficiency of the process. In other words, these are the dominant conditions that
would determine the type of laser and the parameters to be applied and includes melting
temperature, thermal conductivity, electrical conductivity, absorption to the
electromagnetic wavelength, preheating history of the material. The preheating of the
material would assist the process by increasing the cutting speed while the temperature
gradient of the material would be decreased. A drawback to preheating is the situation
where complex shapes are to be cut from the same sheet. Here the accumulated
temperature is likely to reduce the cut quality.
2.2.5.3.3 Operational parameters
These are the parameters chosen by the operator depending on material thickness and
characteristics. These parameters typically include power, cutting speed, stand-off
distance, geometry of nozzle, type and pressure of the assist gas and focal plane position
(FPP). If a pulsed laser is being used the pulsing frequency (repetition rate), duty cycle
(pulse on/pulse off time ratio) and the peak power of the laser would be other operating
parameters to be considered. In laser cutting of non-metals (e.g. CFRPs), temporal
mode of the beam, cutting speed, focal plane position and assist gas pressure are
particularly important [54]. A reduction in FPP will give a smaller focal spot diameter
and therefore, a higher energy density. This will generally, mean an increase in the
cutting speed and reduction in kerf width. The influence of FPP can be more complex.
A focal plane position near the bottom surface can potentially prevent dross formation
in fusion cutting. In laser oxygen cutting in contrast, the focal plane position should be
in the upper half of the material for smoother surface finish [27]. The effect of assist gas
in laser cutting is discussed in more detail.
Chapter 2. Review on Lasers, Laser Cutting and Fibre Reinforced Polymer Composites
60
2.2.5.4 Assist gas in laser cutting
Besides the focused laser beam, the assist gas is a complementary component of the
laser cutting process. The role of the assist gas can be summarised as:
� Inducing shear forces and pressure gradients to remove molten or gaseous by-
products from the kerf.
� Protecting the focusing optics from vapour and spatter from the interaction zone.
� Protecting the interaction zone from oxidation (in inert assist gas process), or
� Providing additional energy through exothermic reactions (in oxygen assist gas
cutting) to enhance the process performance.
Composition, pressure and nozzle conditions (geometry and stand-off distance) govern
the role of the assist gas in laser cutting. The latter two confirm the assist gas dynamic
effects on the kerf. The aerodynamic behaviour of the high-pressure assist gas jet in
laser cutting is complex. There are basically two categories in assist gas pressure. Low
pressure processing (~1-6 bar usually with oxygen) and high pressure processing (as
high as 20 bar with inert gases). The acceleration of the jet (and hence increase in flow
velocity) is achieved by supplying high pressure to the nozzle where the gas flow is
expanded and injected to the cutting front. Both pressure gradient and shear forces
increase with increasing gas flow velocity. In a converging nozzle, the gas flow
undergoes a transition from laminar to turbulent flow when the Reynold number (Re)
exceeds 3.2×10⁵ known as the “separation point” or the “critical Reynold number”
[55]. Re is defined as:
ϕ
ρ gUD=Re (2.15)
Where U (m/s) is the gas flow velocity, D (m) is the workpiece thickness, ρg (kg/m3) is
the gas density and φ (kg/(m.s)) is the viscosity of the gas. The separation point is the
limit that the gas velocity equals the velocity of sound (i.e. Mach number=1) insofar as
initial pressure is equal to absolute critical pressure (i.e. 1.89 bar ~2 times the ambient
pressure) [56-58]. Above the ambient pressure, radial expansion waves occur in order to
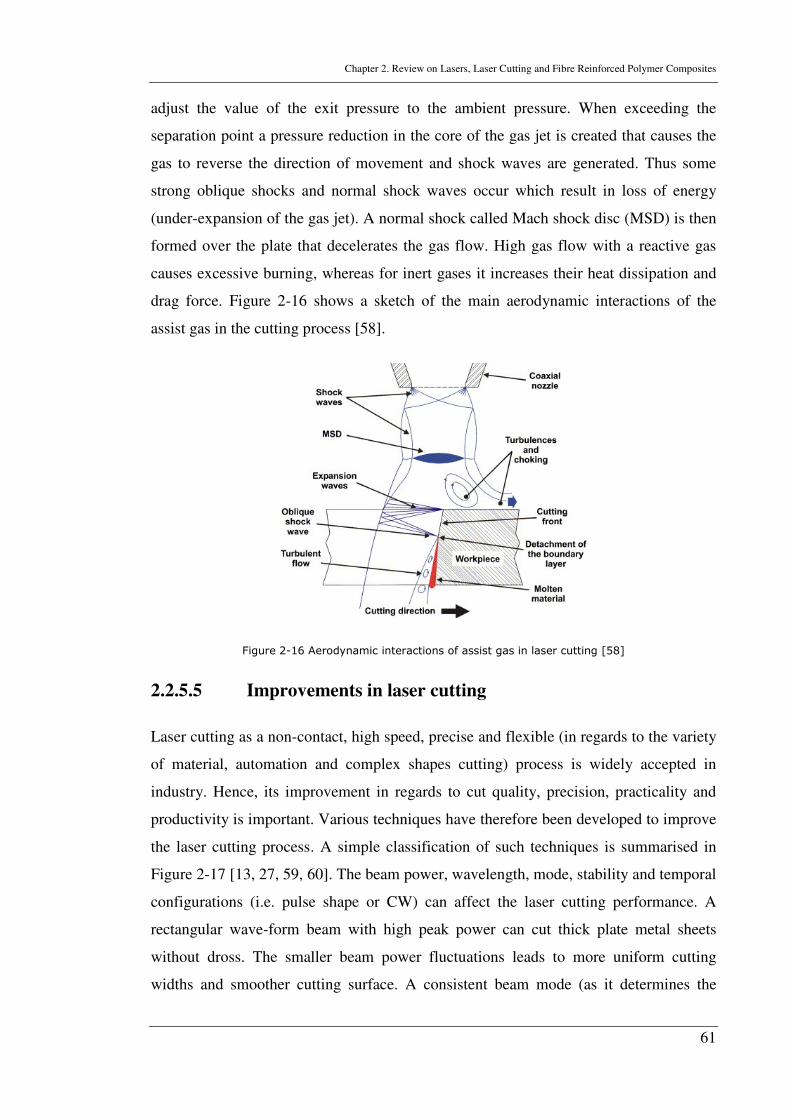
Chapter 2. Review on Lasers, Laser Cutting and Fibre Reinforced Polymer Composites
61
adjust the value of the exit pressure to the ambient pressure. When exceeding the
separation point a pressure reduction in the core of the gas jet is created that causes the
gas to reverse the direction of movement and shock waves are generated. Thus some
strong oblique shocks and normal shock waves occur which result in loss of energy
(under-expansion of the gas jet). A normal shock called Mach shock disc (MSD) is then
formed over the plate that decelerates the gas flow. High gas flow with a reactive gas
causes excessive burning, whereas for inert gases it increases their heat dissipation and
drag force. Figure 2-16 shows a sketch of the main aerodynamic interactions of the
assist gas in the cutting process [58].
Figure 2-16 Aerodynamic interactions of assist gas in laser cutting [58]
2.2.5.5 Improvements in laser cutting
Laser cutting as a non-contact, high speed, precise and flexible (in regards to the variety
of material, automation and complex shapes cutting) process is widely accepted in
industry. Hence, its improvement in regards to cut quality, precision, practicality and
productivity is important. Various techniques have therefore been developed to improve
the laser cutting process. A simple classification of such techniques is summarised in
Figure 2-17 [13, 27, 59, 60]. The beam power, wavelength, mode, stability and temporal
configurations (i.e. pulse shape or CW) can affect the laser cutting performance. A
rectangular wave-form beam with high peak power can cut thick plate metal sheets
without dross. The smaller beam power fluctuations leads to more uniform cutting
widths and smoother cutting surface. A consistent beam mode (as it determines the
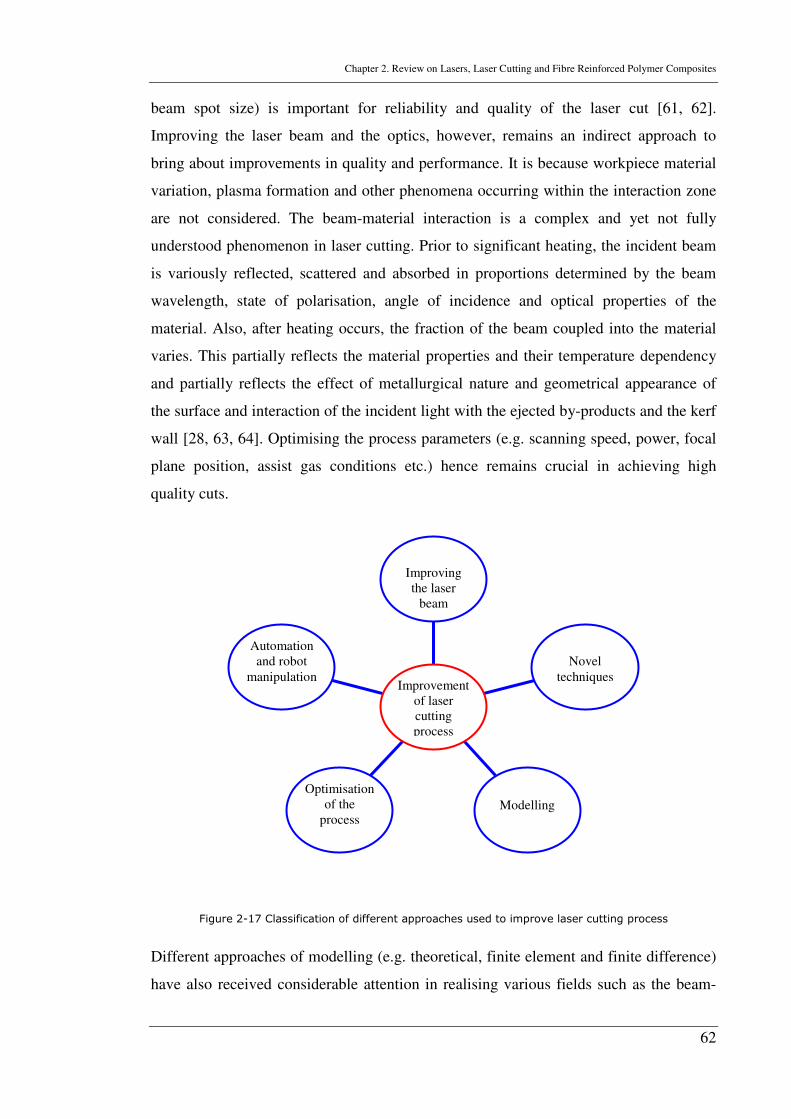
Chapter 2. Review on Lasers, Laser Cutting and Fibre Reinforced Polymer Composites
62
beam spot size) is important for reliability and quality of the laser cut [61, 62].
Improving the laser beam and the optics, however, remains an indirect approach to
bring about improvements in quality and performance. It is because workpiece material
variation, plasma formation and other phenomena occurring within the interaction zone
are not considered. The beam-material interaction is a complex and yet not fully
understood phenomenon in laser cutting. Prior to significant heating, the incident beam
is variously reflected, scattered and absorbed in proportions determined by the beam
wavelength, state of polarisation, angle of incidence and optical properties of the
material. Also, after heating occurs, the fraction of the beam coupled into the material
varies. This partially reflects the material properties and their temperature dependency
and partially reflects the effect of metallurgical nature and geometrical appearance of
the surface and interaction of the incident light with the ejected by-products and the kerf
wall [28, 63, 64]. Optimising the process parameters (e.g. scanning speed, power, focal
plane position, assist gas conditions etc.) hence remains crucial in achieving high
quality cuts.
Figure 2-17 Classification of different approaches used to improve laser cutting process
Different approaches of modelling (e.g. theoretical, finite element and finite difference)
have also received considerable attention in realising various fields such as the beam-
Automation and robot
manipulation
Optimisation of the
process Modelling
Novel
techniques
Improving the laser
beam
Improvement of laser cutting process
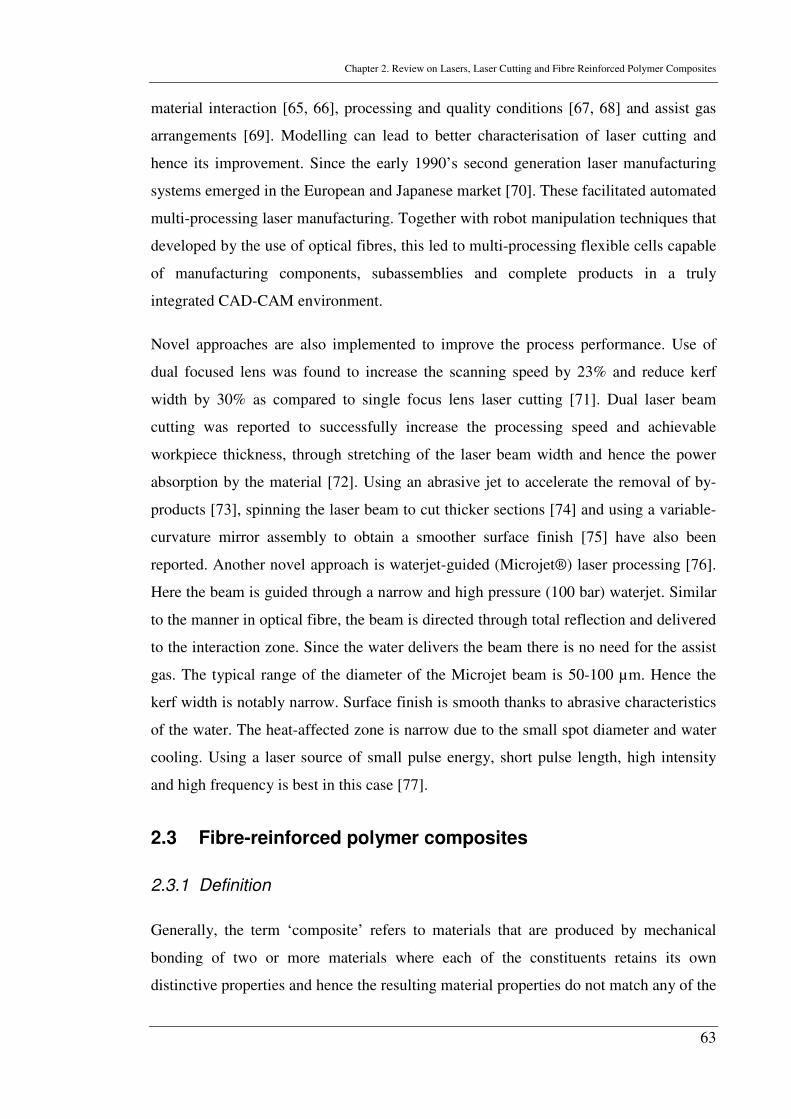
Chapter 2. Review on Lasers, Laser Cutting and Fibre Reinforced Polymer Composites
63
material interaction [65, 66], processing and quality conditions [67, 68] and assist gas
arrangements [69]. Modelling can lead to better characterisation of laser cutting and
hence its improvement. Since the early 1990’s second generation laser manufacturing
systems emerged in the European and Japanese market [70]. These facilitated automated
multi-processing laser manufacturing. Together with robot manipulation techniques that
developed by the use of optical fibres, this led to multi-processing flexible cells capable
of manufacturing components, subassemblies and complete products in a truly
integrated CAD-CAM environment.
Novel approaches are also implemented to improve the process performance. Use of
dual focused lens was found to increase the scanning speed by 23% and reduce kerf
width by 30% as compared to single focus lens laser cutting [71]. Dual laser beam
cutting was reported to successfully increase the processing speed and achievable
workpiece thickness, through stretching of the laser beam width and hence the power
absorption by the material [72]. Using an abrasive jet to accelerate the removal of by-
products [73], spinning the laser beam to cut thicker sections [74] and using a variable-
curvature mirror assembly to obtain a smoother surface finish [75] have also been
reported. Another novel approach is waterjet-guided (Microjet®) laser processing [76].
Here the beam is guided through a narrow and high pressure (100 bar) waterjet. Similar
to the manner in optical fibre, the beam is directed through total reflection and delivered
to the interaction zone. Since the water delivers the beam there is no need for the assist
gas. The typical range of the diameter of the Microjet beam is 50-100 µm. Hence the
kerf width is notably narrow. Surface finish is smooth thanks to abrasive characteristics
of the water. The heat-affected zone is narrow due to the small spot diameter and water
cooling. Using a laser source of small pulse energy, short pulse length, high intensity
and high frequency is best in this case [77].
2.3 Fibre-reinforced polymer composites
2.3.1 Definition
Generally, the term ‘composite’ refers to materials that are produced by mechanical
bonding of two or more materials where each of the constituents retains its own
distinctive properties and hence the resulting material properties do not match any of the
Chapter 2. Review on Lasers, Laser Cutting and Fibre Reinforced Polymer Composites
64
individual constituents. Commonly, composites have a bulk and continuous phase
called the matrix and a discontinuous phase called the reinforcement. This
reinforcement can be in the form of thin fibres or small particles. The boundary surface
of these two phases where discontinuity of physical or mechanical properties happens is
known as the interface. The main concept of composite structures is that the matrix, on
one hand, holds the structure together, spreading the imposing load into a large area and
further transferring it to the reinforcement i.e. shear resistance. On the other hand, the
reinforcement would provide it with high stiffness and hence tension resistance,
providing the final material with high stiffness and strength. Consequently, the
composite structure resists aggregate compression with significant density reduction as
compared to other materials.
Theoretically, there are numerous reinforcing and matrix materials that may be
combined in countless ways to produce a composite structure matching a particular
application of the structure. Composite materials are usually classified according to
either both matrix or reinforcement depending on their material and type as presented in
Figure 2-18a. A fibre-reinforced laminate structure consists of numerous layers (lamina)
of unidirectional or woven fibres lying within the matrix (Figure 2-18b). Ideally, the
material should have similar properties in different directions (i.e. isotropic) while it has
same properties for any point of the body (i.e. homogenous). This means that no matter
where and in which direction on the body, the measured properties would be same.
Unidirectional fibre-reinforced materials show poor properties in the transverse
direction of the fibres. Hence the fibres (if not woven) are usually laminated at different
angles, see Figure 2-18b. Particulate based composites are quasi-isotropic and therefore
generally more uniformly machineable.
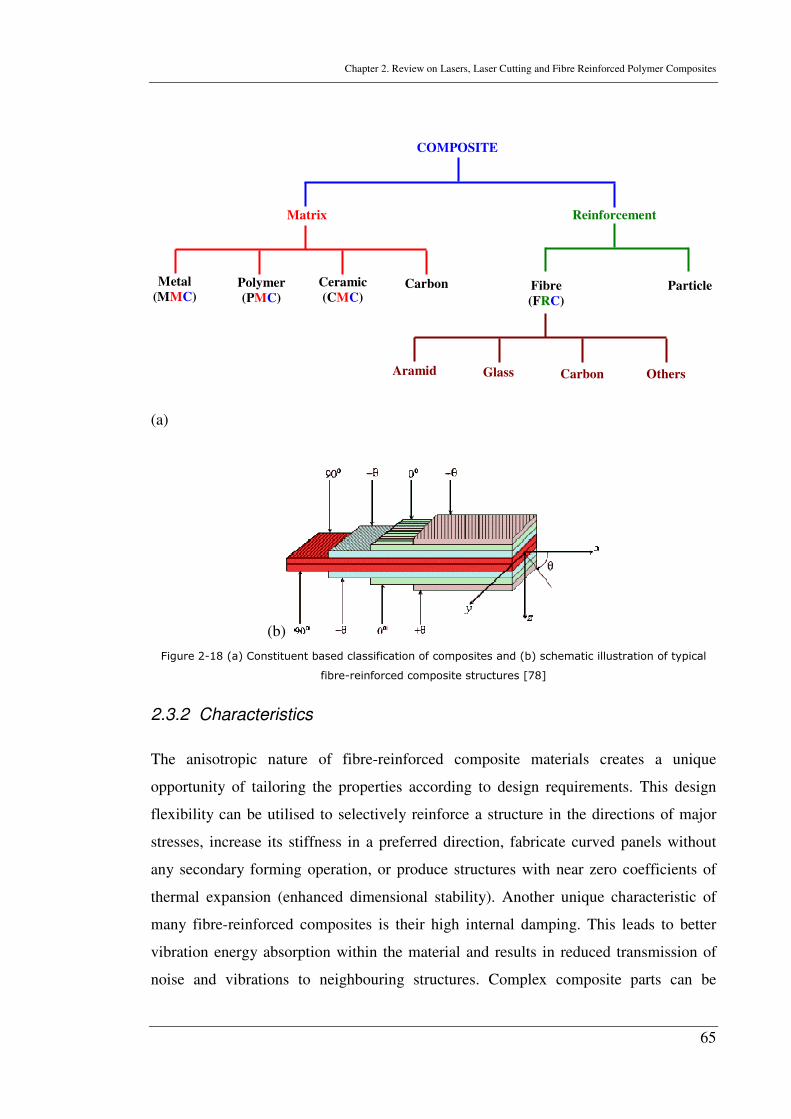
Chapter 2. Review on Lasers, Laser Cutting and Fibre Reinforced Polymer Composites
65
(a)
(b)
Figure 2-18 (a) Constituent based classification of composites and (b) schematic illustration of typical
fibre-reinforced composite structures [78]
2.3.2 Characteristics
The anisotropic nature of fibre-reinforced composite materials creates a unique
opportunity of tailoring the properties according to design requirements. This design
flexibility can be utilised to selectively reinforce a structure in the directions of major
stresses, increase its stiffness in a preferred direction, fabricate curved panels without
any secondary forming operation, or produce structures with near zero coefficients of
thermal expansion (enhanced dimensional stability). Another unique characteristic of
many fibre-reinforced composites is their high internal damping. This leads to better
vibration energy absorption within the material and results in reduced transmission of
noise and vibrations to neighbouring structures. Complex composite parts can be
Aramid
Glass
Carbon
Others
Fibre
(FRC)
Particle
Metal
(MMC)
Polymer
(PMC)
Ceramic
(CMC)
Carbon
Reinforcement Matrix
COMPOSITE
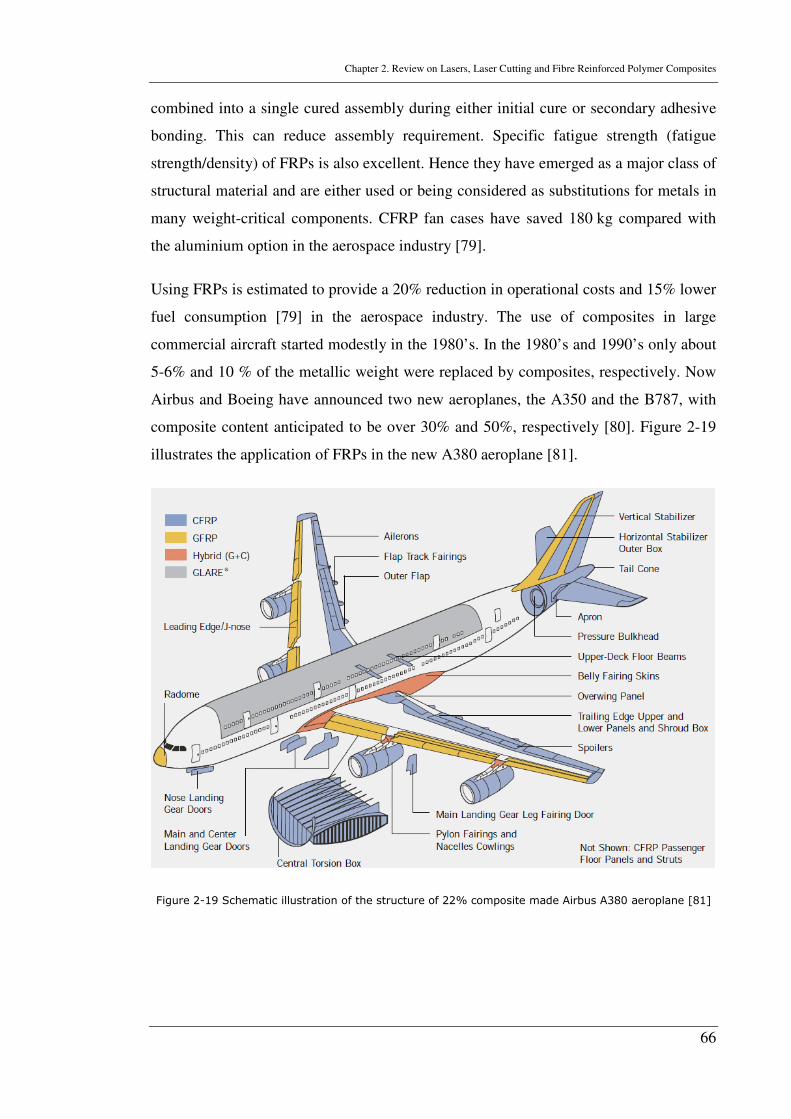
Chapter 2. Review on Lasers, Laser Cutting and Fibre Reinforced Polymer Composites
66
combined into a single cured assembly during either initial cure or secondary adhesive
bonding. This can reduce assembly requirement. Specific fatigue strength (fatigue
strength/density) of FRPs is also excellent. Hence they have emerged as a major class of
structural material and are either used or being considered as substitutions for metals in
many weight-critical components. CFRP fan cases have saved 180 kg compared with
the aluminium option in the aerospace industry [79].
Using FRPs is estimated to provide a 20% reduction in operational costs and 15% lower
fuel consumption [79] in the aerospace industry. The use of composites in large
commercial aircraft started modestly in the 1980’s. In the 1980’s and 1990’s only about
5-6% and 10 % of the metallic weight were replaced by composites, respectively. Now
Airbus and Boeing have announced two new aeroplanes, the A350 and the B787, with
composite content anticipated to be over 30% and 50%, respectively [80]. Figure 2-19
illustrates the application of FRPs in the new A380 aeroplane [81].
Figure 2-19 Schematic illustration of the structure of 22% composite made Airbus A380 aeroplane [81]
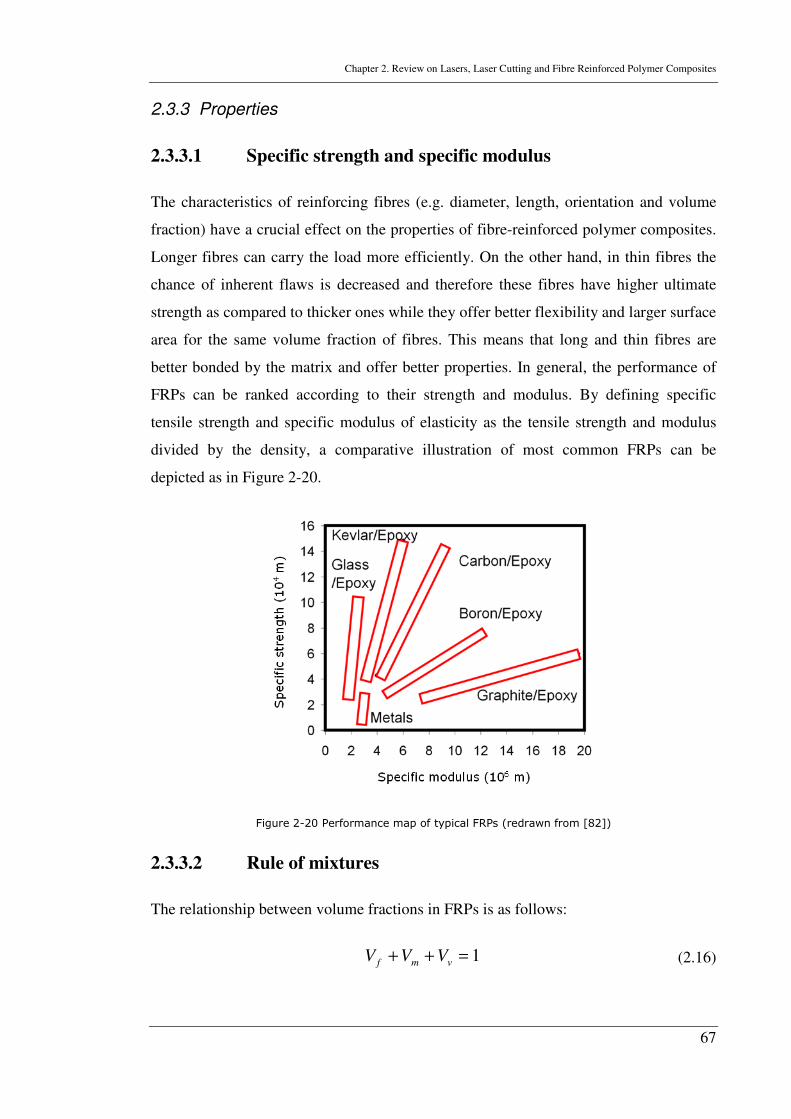
Chapter 2. Review on Lasers, Laser Cutting and Fibre Reinforced Polymer Composites
67
2.3.3 Properties
2.3.3.1 Specific strength and specific modulus
The characteristics of reinforcing fibres (e.g. diameter, length, orientation and volume
fraction) have a crucial effect on the properties of fibre-reinforced polymer composites.
Longer fibres can carry the load more efficiently. On the other hand, in thin fibres the
chance of inherent flaws is decreased and therefore these fibres have higher ultimate
strength as compared to thicker ones while they offer better flexibility and larger surface
area for the same volume fraction of fibres. This means that long and thin fibres are
better bonded by the matrix and offer better properties. In general, the performance of
FRPs can be ranked according to their strength and modulus. By defining specific
tensile strength and specific modulus of elasticity as the tensile strength and modulus
divided by the density, a comparative illustration of most common FRPs can be
depicted as in Figure 2-20.
Figure 2-20 Performance map of typical FRPs (redrawn from [82])
2.3.3.2 Rule of mixtures
The relationship between volume fractions in FRPs is as follows:
1=++ vmf VVV (2.16)
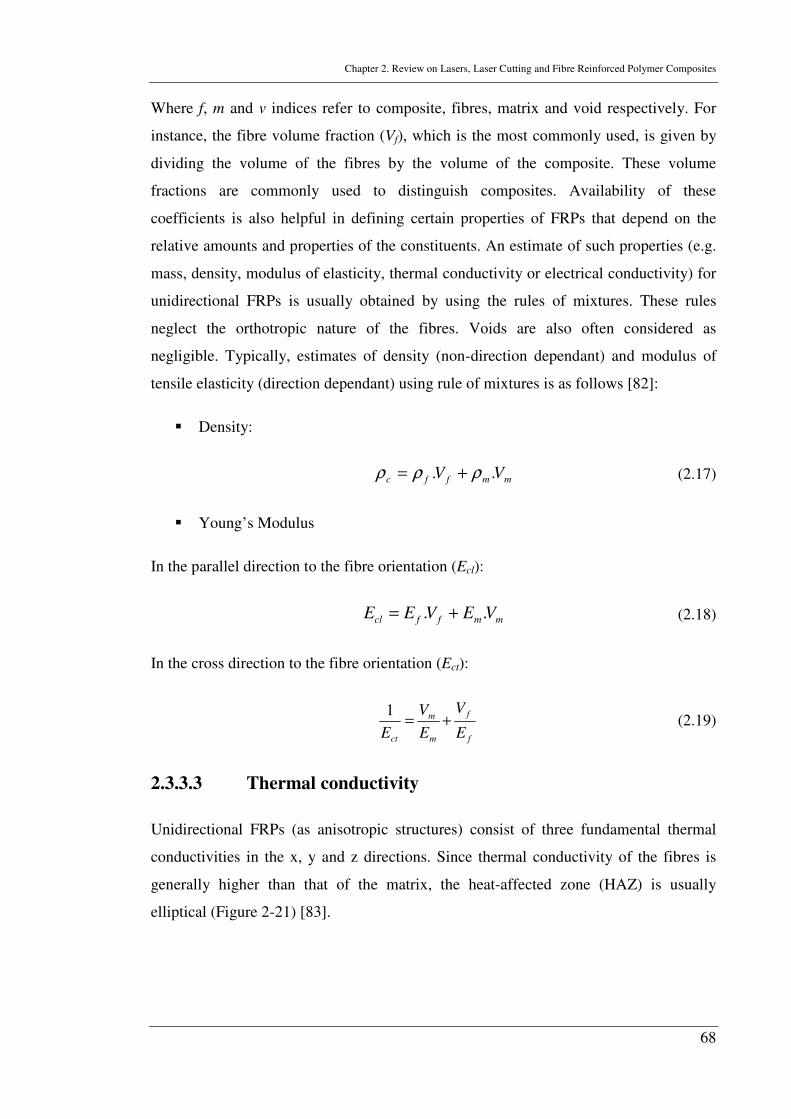
Chapter 2. Review on Lasers, Laser Cutting and Fibre Reinforced Polymer Composites
68
Where f, m and v indices refer to composite, fibres, matrix and void respectively. For
instance, the fibre volume fraction (Vf), which is the most commonly used, is given by
dividing the volume of the fibres by the volume of the composite. These volume
fractions are commonly used to distinguish composites. Availability of these
coefficients is also helpful in defining certain properties of FRPs that depend on the
relative amounts and properties of the constituents. An estimate of such properties (e.g.
mass, density, modulus of elasticity, thermal conductivity or electrical conductivity) for
unidirectional FRPs is usually obtained by using the rules of mixtures. These rules
neglect the orthotropic nature of the fibres. Voids are also often considered as
negligible. Typically, estimates of density (non-direction dependant) and modulus of
tensile elasticity (direction dependant) using rule of mixtures is as follows [82]:
� Density:
mmffc VV .. ρρρ += (2.17)
� Young’s Modulus
In the parallel direction to the fibre orientation (Ecl):
mmffcl VEVEE .. += (2.18)
In the cross direction to the fibre orientation (Ect):
f
f
m
m
ct E
V
E
V
E+=
1 (2.19)
2.3.3.3 Thermal conductivity
Unidirectional FRPs (as anisotropic structures) consist of three fundamental thermal
conductivities in the x, y and z directions. Since thermal conductivity of the fibres is
generally higher than that of the matrix, the heat-affected zone (HAZ) is usually
elliptical (Figure 2-21) [83].
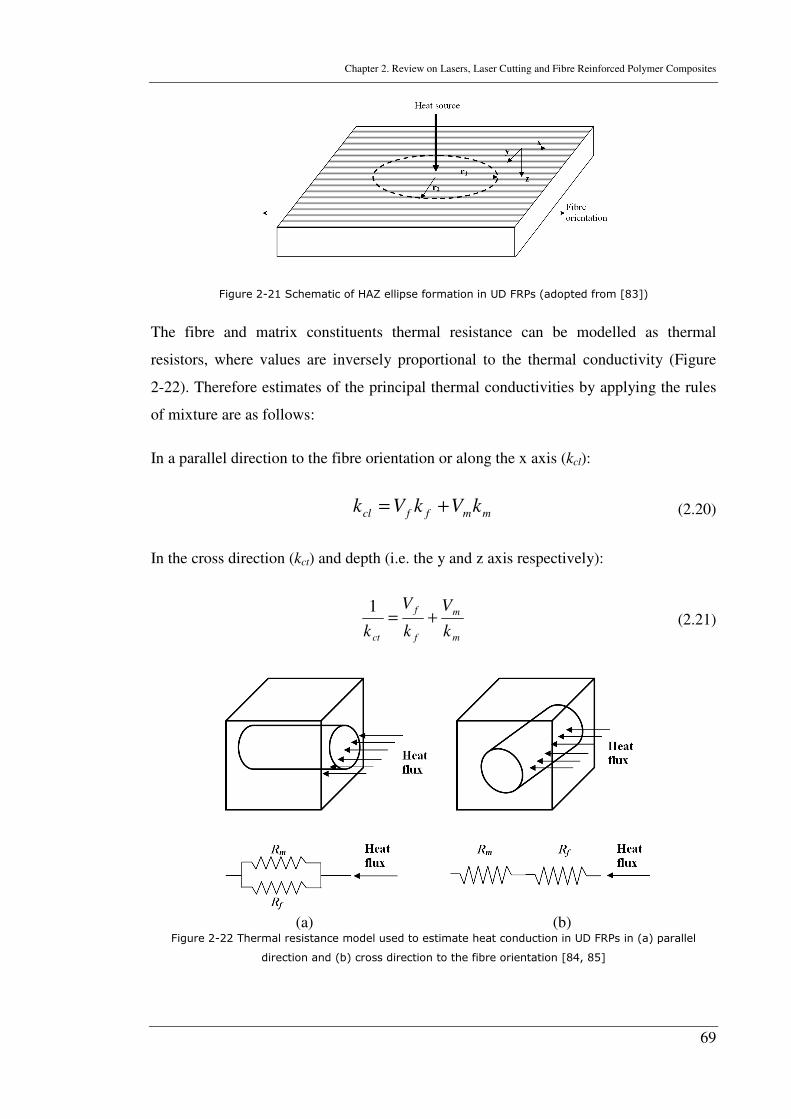
Chapter 2. Review on Lasers, Laser Cutting and Fibre Reinforced Polymer Composites
69
Figure 2-21 Schematic of HAZ ellipse formation in UD FRPs (adopted from [83])
The fibre and matrix constituents thermal resistance can be modelled as thermal
resistors, where values are inversely proportional to the thermal conductivity (Figure
2-22). Therefore estimates of the principal thermal conductivities by applying the rules
of mixture are as follows:
In a parallel direction to the fibre orientation or along the x axis (kcl):
mmffcl kVkVk += (2.20)
In the cross direction (kct) and depth (i.e. the y and z axis respectively):
m
m
f
f
ct k
V
k
V
k+=
1 (2.21)
(a) (b)
Figure 2-22 Thermal resistance model used to estimate heat conduction in UD FRPs in (a) parallel
direction and (b) cross direction to the fibre orientation [84, 85]
Chapter 2. Review on Lasers, Laser Cutting and Fibre Reinforced Polymer Composites
70
Thermal penetration depends on the thermal diffusivity, (α) and time (t) as [13]:
tαδ = (2.22)
Thermal diffusivity on the other hand follows [83]:
pC
k
ρα = (2.23)
Where k (W/(m.K)) is the thermal conductivity, ρ (kg/m3) is the density and Cp
(J/(kg.K)) is the specific heat capacity. Thereby, Pan and Hocheng [83] applied an
isotherm method and confirmed an estimate of the ratio between depth of penetration in
the parallel an cross directions as:
cl
ct
k
k
r
r=
1
2 (2.24)
2.3.4 Carbon fibre-reinforced polymer composites
2.3.4.1 Constituents
A revolutionary point in composite industry has been associated with the development
of carbon fibres in the 1960s [86]. Carbon fibres are produced by controlled oxidation,
carbonisation and graphitisation of carbon-rich organic precursors. Polyacrylonitrile
(PAN) is the most common precursor as it offers the best carbon fibre properties, but
fibres can also be made from pitch or cellulose. Depending on the graphitisation process
carbon fibres can be produced as high strength (at ~2600°C) or high modulus fibres (at
~3000°C) with other types in between. After formation the carbon fibres usually have a
surface treatment to improve matrix bonding and chemical sizing. Carbon fibres are
commonly referred to as: high strength (HS) (modulus typically <265 GPa),
intermediate modulus (IM) (265 GPa<E<320 GPa), high modulus (HM) (320
GPa<E<440 GPa) and ultra high modulus (UHM) [4]. The diameter of most types is
about 5-8 µm. Carbon fibres have the highest specific stiffness among all commercially
available fibres, very high strength in both tension and compression and a high
resistance to corrosion, creep and fatigue. Their impact strength, however, is lower than
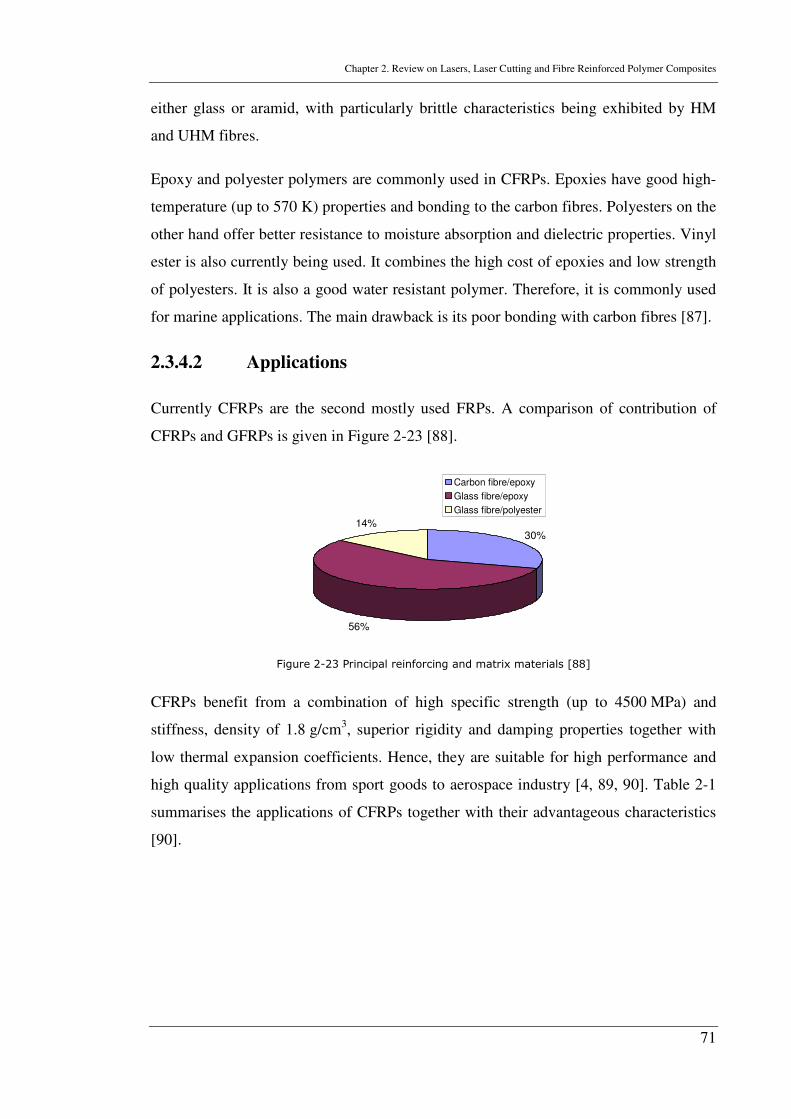
Chapter 2. Review on Lasers, Laser Cutting and Fibre Reinforced Polymer Composites
71
either glass or aramid, with particularly brittle characteristics being exhibited by HM
and UHM fibres.
Epoxy and polyester polymers are commonly used in CFRPs. Epoxies have good high-
temperature (up to 570 K) properties and bonding to the carbon fibres. Polyesters on the
other hand offer better resistance to moisture absorption and dielectric properties. Vinyl
ester is also currently being used. It combines the high cost of epoxies and low strength
of polyesters. It is also a good water resistant polymer. Therefore, it is commonly used
for marine applications. The main drawback is its poor bonding with carbon fibres [87].
2.3.4.2 Applications
Currently CFRPs are the second mostly used FRPs. A comparison of contribution of
CFRPs and GFRPs is given in Figure 2-23 [88].
30%
56%
14%
Carbon fibre/epoxy
Glass fibre/epoxy
Glass fibre/polyester
Figure 2-23 Principal reinforcing and matrix materials [88]
CFRPs benefit from a combination of high specific strength (up to 4500 MPa) and
stiffness, density of 1.8 g/cm3, superior rigidity and damping properties together with
low thermal expansion coefficients. Hence, they are suitable for high performance and
high quality applications from sport goods to aerospace industry [4, 89, 90]. Table 2-1
summarises the applications of CFRPs together with their advantageous characteristics
[90].
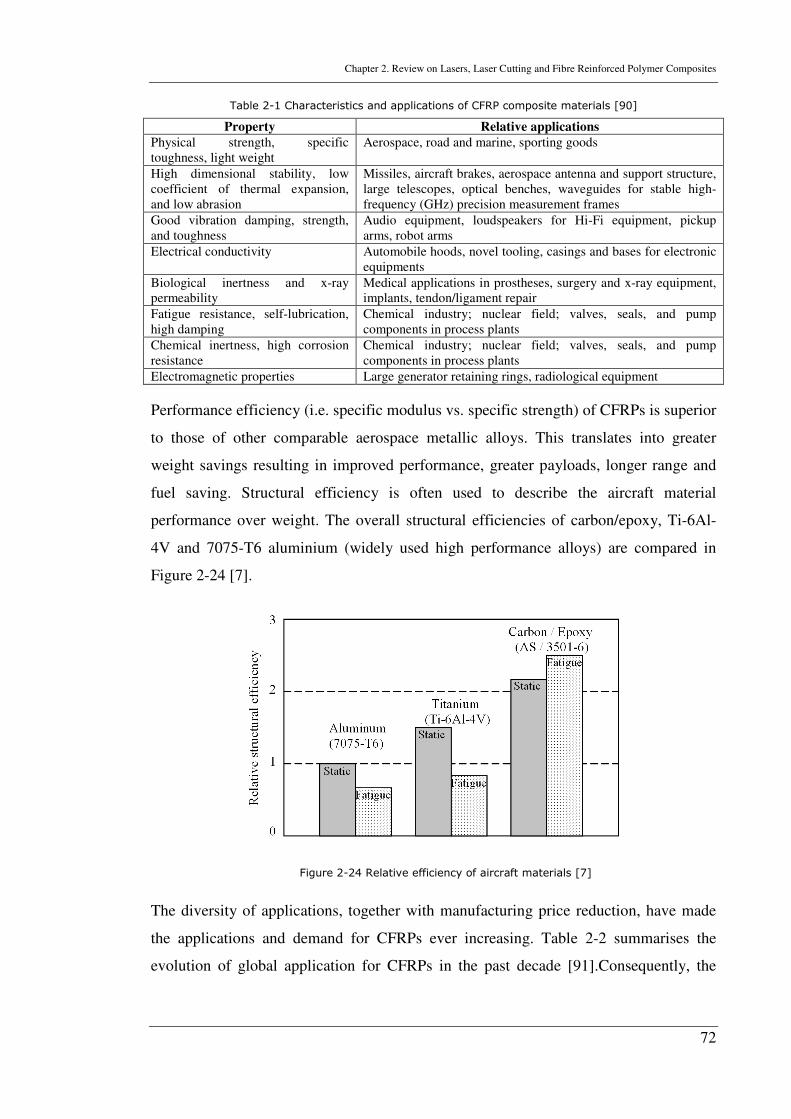
Chapter 2. Review on Lasers, Laser Cutting and Fibre Reinforced Polymer Composites
72
Table 2-1 Characteristics and applications of CFRP composite materials [90]
Property Relative applications
Physical strength, specific toughness, light weight
Aerospace, road and marine, sporting goods
High dimensional stability, low coefficient of thermal expansion, and low abrasion
Missiles, aircraft brakes, aerospace antenna and support structure, large telescopes, optical benches, waveguides for stable high-frequency (GHz) precision measurement frames
Good vibration damping, strength, and toughness
Audio equipment, loudspeakers for Hi-Fi equipment, pickup arms, robot arms
Electrical conductivity Automobile hoods, novel tooling, casings and bases for electronic equipments
Biological inertness and x-ray permeability
Medical applications in prostheses, surgery and x-ray equipment, implants, tendon/ligament repair
Fatigue resistance, self-lubrication, high damping
Chemical industry; nuclear field; valves, seals, and pump components in process plants
Chemical inertness, high corrosion resistance
Chemical industry; nuclear field; valves, seals, and pump components in process plants
Electromagnetic properties Large generator retaining rings, radiological equipment
Performance efficiency (i.e. specific modulus vs. specific strength) of CFRPs is superior
to those of other comparable aerospace metallic alloys. This translates into greater
weight savings resulting in improved performance, greater payloads, longer range and
fuel saving. Structural efficiency is often used to describe the aircraft material
performance over weight. The overall structural efficiencies of carbon/epoxy, Ti-6Al-
4V and 7075-T6 aluminium (widely used high performance alloys) are compared in
Figure 2-24 [7].
Figure 2-24 Relative efficiency of aircraft materials [7]
The diversity of applications, together with manufacturing price reduction, have made
the applications and demand for CFRPs ever increasing. Table 2-2 summarises the
evolution of global application for CFRPs in the past decade [91].Consequently, the
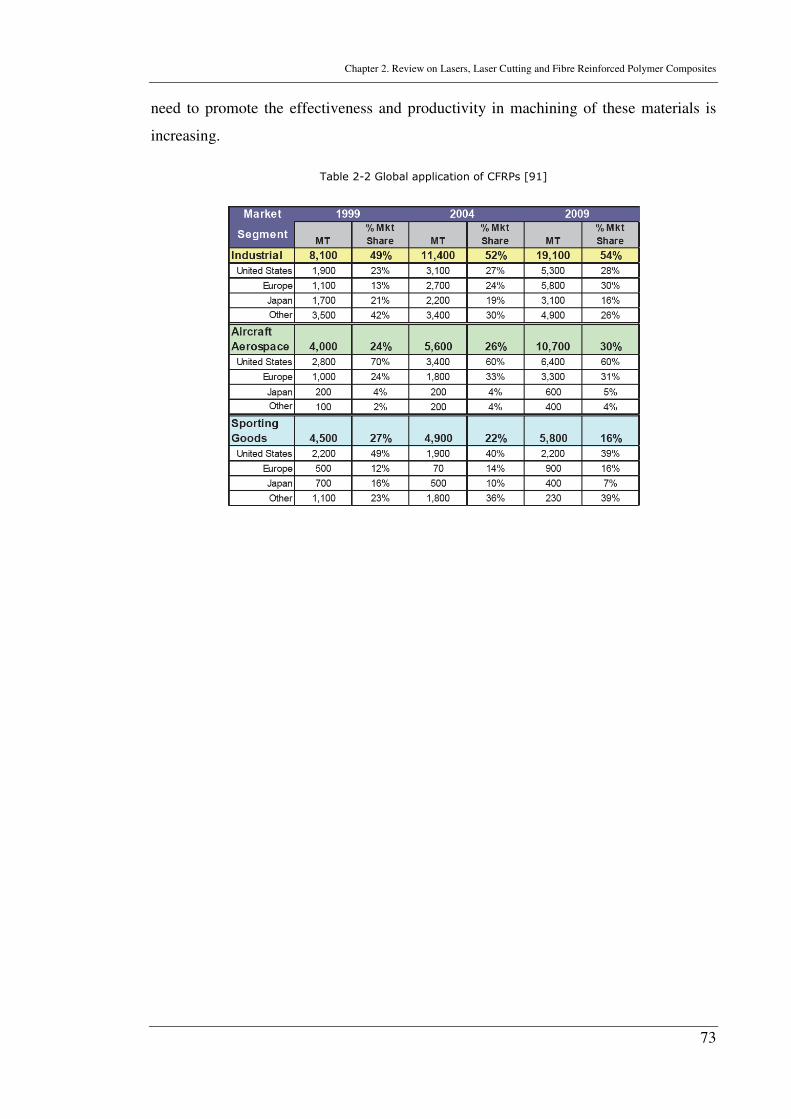
Chapter 2. Review on Lasers, Laser Cutting and Fibre Reinforced Polymer Composites
73
need to promote the effectiveness and productivity in machining of these materials is
increasing.
Table 2-2 Global application of CFRPs [91]
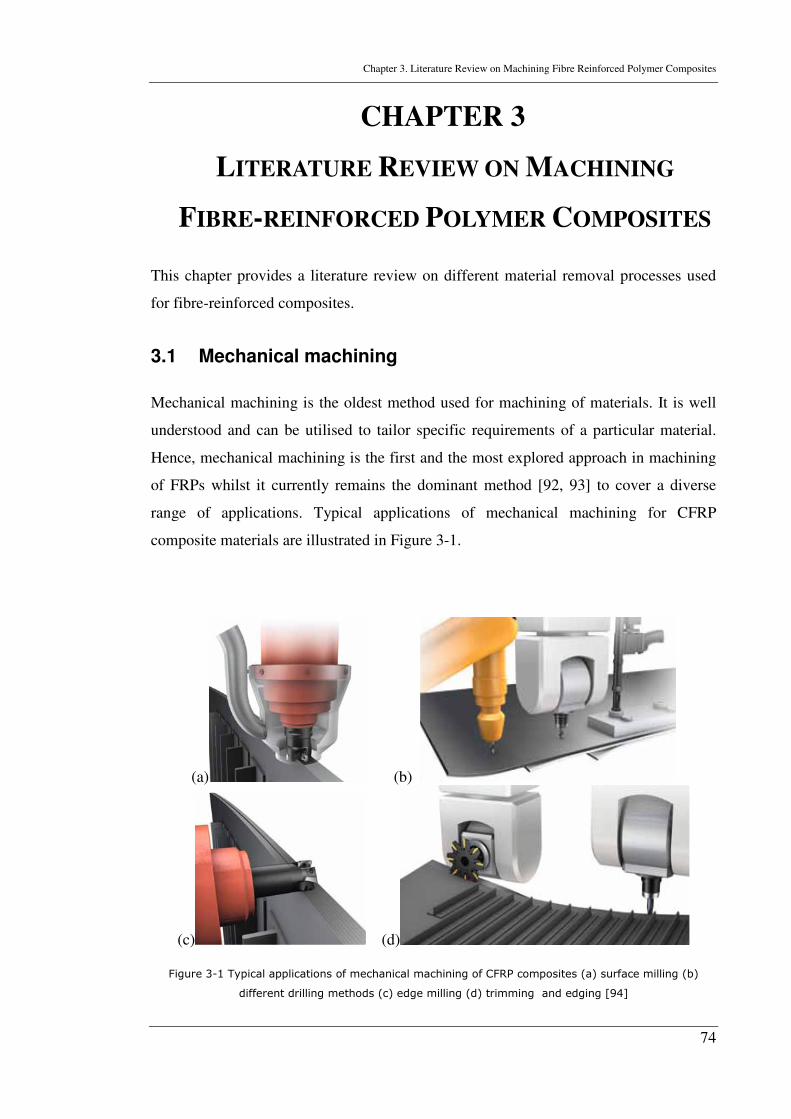
Chapter 3. Literature Review on Machining Fibre Reinforced Polymer Composites
74
CHAPTER 3
LITERATURE REVIEW ON MACHINING
FIBRE-REINFORCED POLYMER COMPOSITES
This chapter provides a literature review on different material removal processes used
for fibre-reinforced composites.
3.1 Mechanical machining
Mechanical machining is the oldest method used for machining of materials. It is well
understood and can be utilised to tailor specific requirements of a particular material.
Hence, mechanical machining is the first and the most explored approach in machining
of FRPs whilst it currently remains the dominant method [92, 93] to cover a diverse
range of applications. Typical applications of mechanical machining for CFRP
composite materials are illustrated in Figure 3-1.
(a) (b)
(c) (d)
Figure 3-1 Typical applications of mechanical machining of CFRP composites (a) surface milling (b)
different drilling methods (c) edge milling (d) trimming and edging [94]
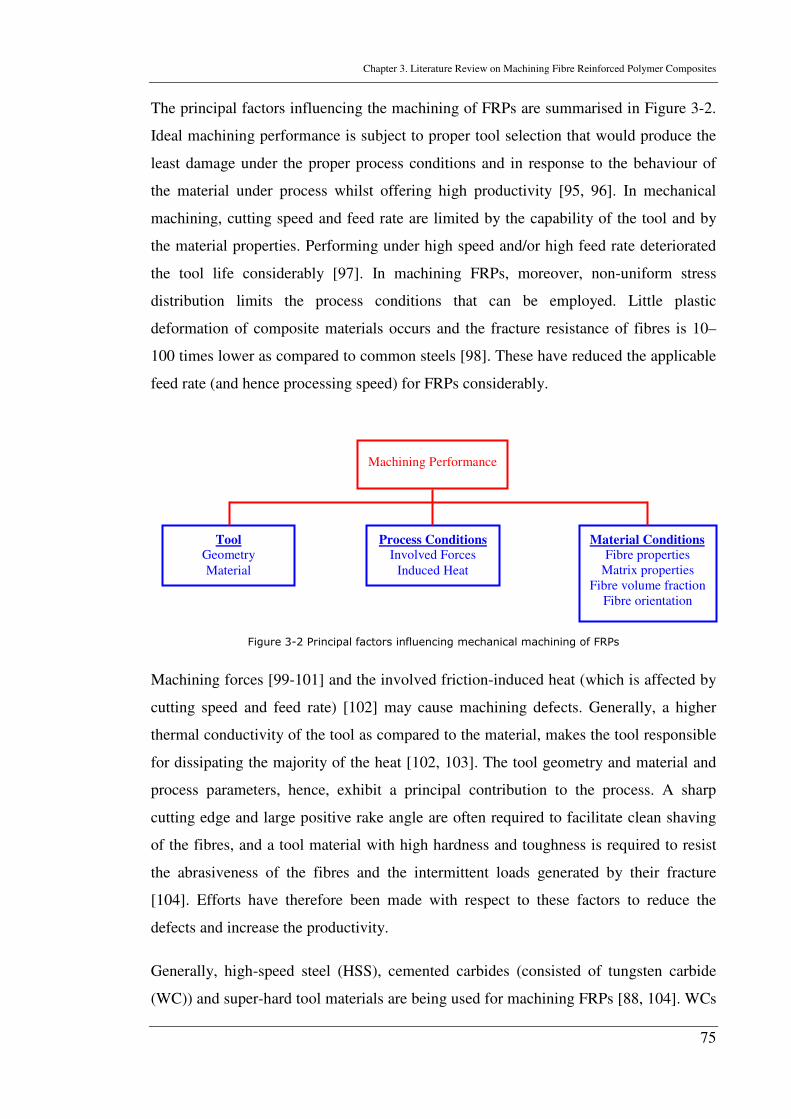
Chapter 3. Literature Review on Machining Fibre Reinforced Polymer Composites
75
The principal factors influencing the machining of FRPs are summarised in Figure 3-2.
Ideal machining performance is subject to proper tool selection that would produce the
least damage under the proper process conditions and in response to the behaviour of
the material under process whilst offering high productivity [95, 96]. In mechanical
machining, cutting speed and feed rate are limited by the capability of the tool and by
the material properties. Performing under high speed and/or high feed rate deteriorated
the tool life considerably [97]. In machining FRPs, moreover, non-uniform stress
distribution limits the process conditions that can be employed. Little plastic
deformation of composite materials occurs and the fracture resistance of fibres is 10–
100 times lower as compared to common steels [98]. These have reduced the applicable
feed rate (and hence processing speed) for FRPs considerably.
Figure 3-2 Principal factors influencing mechanical machining of FRPs
Machining forces [99-101] and the involved friction-induced heat (which is affected by
cutting speed and feed rate) [102] may cause machining defects. Generally, a higher
thermal conductivity of the tool as compared to the material, makes the tool responsible
for dissipating the majority of the heat [102, 103]. The tool geometry and material and
process parameters, hence, exhibit a principal contribution to the process. A sharp
cutting edge and large positive rake angle are often required to facilitate clean shaving
of the fibres, and a tool material with high hardness and toughness is required to resist
the abrasiveness of the fibres and the intermittent loads generated by their fracture
[104]. Efforts have therefore been made with respect to these factors to reduce the
defects and increase the productivity.
Generally, high-speed steel (HSS), cemented carbides (consisted of tungsten carbide
(WC)) and super-hard tool materials are being used for machining FRPs [88, 104]. WCs
Machining Performance
Tool
Geometry Material
Process Conditions
Involved Forces Induced Heat
Material Conditions
Fibre properties Matrix properties
Fibre volume fraction Fibre orientation
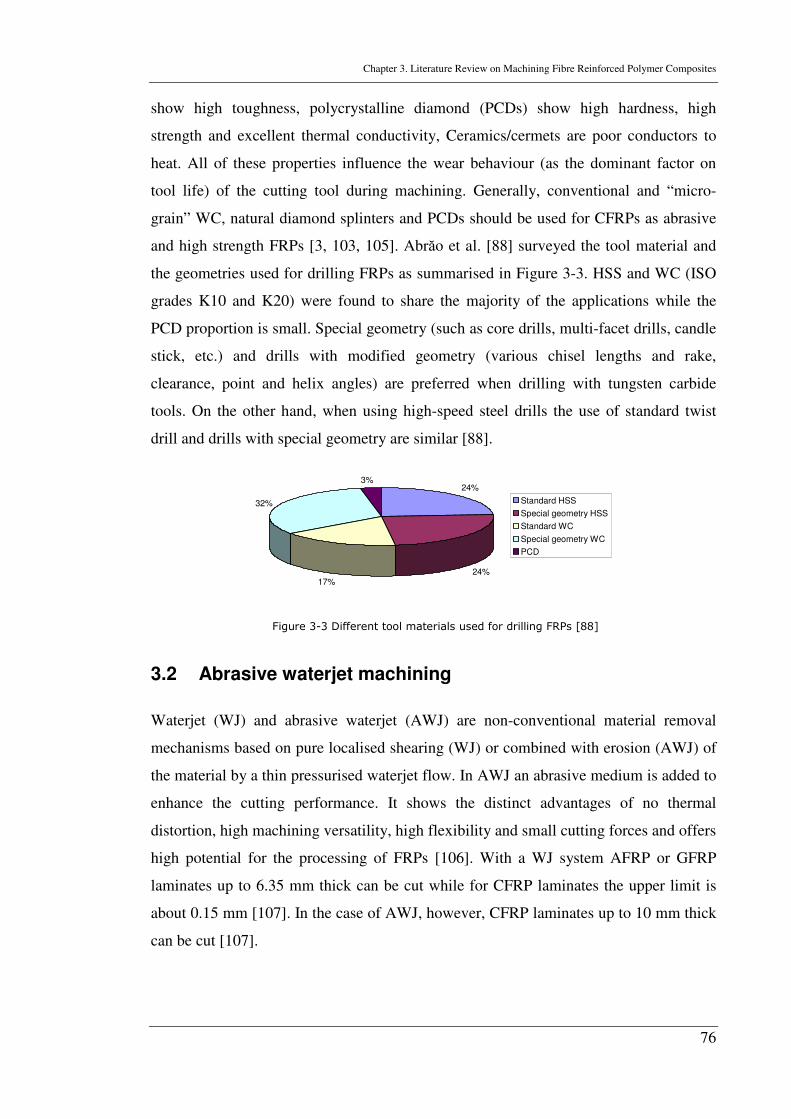
Chapter 3. Literature Review on Machining Fibre Reinforced Polymer Composites
76
show high toughness, polycrystalline diamond (PCDs) show high hardness, high
strength and excellent thermal conductivity, Ceramics/cermets are poor conductors to
heat. All of these properties influence the wear behaviour (as the dominant factor on
tool life) of the cutting tool during machining. Generally, conventional and “micro-
grain” WC, natural diamond splinters and PCDs should be used for CFRPs as abrasive
and high strength FRPs [3, 103, 105]. Abrăo et al. [88] surveyed the tool material and
the geometries used for drilling FRPs as summarised in Figure 3-3. HSS and WC (ISO
grades K10 and K20) were found to share the majority of the applications while the
PCD proportion is small. Special geometry (such as core drills, multi-facet drills, candle
stick, etc.) and drills with modified geometry (various chisel lengths and rake,
clearance, point and helix angles) are preferred when drilling with tungsten carbide
tools. On the other hand, when using high-speed steel drills the use of standard twist
drill and drills with special geometry are similar [88].
24%
24%17%
32%
3%
Standard HSS
Special geometry HSS
Standard WC
Special geometry WC
PCD
Figure 3-3 Different tool materials used for drilling FRPs [88]
3.2 Abrasive waterjet machining
Waterjet (WJ) and abrasive waterjet (AWJ) are non-conventional material removal
mechanisms based on pure localised shearing (WJ) or combined with erosion (AWJ) of
the material by a thin pressurised waterjet flow. In AWJ an abrasive medium is added to
enhance the cutting performance. It shows the distinct advantages of no thermal
distortion, high machining versatility, high flexibility and small cutting forces and offers
high potential for the processing of FRPs [106]. With a WJ system AFRP or GFRP
laminates up to 6.35 mm thick can be cut while for CFRP laminates the upper limit is
about 0.15 mm [107]. In the case of AWJ, however, CFRP laminates up to 10 mm thick
can be cut [107].
Chapter 3. Literature Review on Machining Fibre Reinforced Polymer Composites
77
In AWJ cutting of CFRPs, the material removal mechanism occurs via brittle fracture
through abrasive induced shear loading [6, 108]. The surface quality, part performance
and relative extent in AWJ machining is highly dependent on machining parameters
including supply pressure, standoff distance, abrasive size, flow rate, and cutting speed
[6, 106]. Standoff distance shows the most significant effect on the kerf entrance
roundness [6]. This is due to jet expansion prior to impingement. Kerf width and taper
of thin laminates (i.e. <5 mm) are hence also primarily influenced by the standoff
distance and both can be minimised with low standoff distance [6]. The surface
roughness is preliminary influenced by the size of abrasive particles. The transverse
speed and the pressure influence the surface roughness and waviness towards the jet exit
[6, 109]. Delamination may also occur in AWJ of FRPs due to the high pressure of the
jet [108, 110, 111]. The mechanism of development of delamination is presented in
[111]. Delamination at the jet exit side can also occur by the normal loading of the jet
on the bottom layers through elastic bending [108, 110, 112]. Here the magnitude of the
force is determined by the jet velocity which is dependant the water pressure [112].
3.3 Electrical discharge machining (EDM)
In electrical discharge machining, also called electro-discharge or spark-erosion
machining the electrical energy (direct current (DC) power source) is utilised as thermal
energy through electrical discharges occurring between the electrode and the workpiece
(at a distance with sufficient potential difference) separated by a dielectric (electrically
non-conductive) fluid [113]. The final shape of the product is confirmed by the tool
shape. Wire electrical discharge machining (WEDM) for instance, is widely used for
cutting applications. The thermal energy generates a channel of plasma between the
cathode and anode at a temperature in the range of 8000 to 12000°C [114]. This induces
a substantial amount of heating and melting of the material at the surface of both poles.
Tool wear is hence a major concern in the EDM processes. When the pulsating DC
current supply (at 20 to 30 kHz rate) is turned off the plasma channel breaks down and
the temperature reduces suddenly allowing the dielectric fluid to flush the molten
material from the pole surface in the form of microscopic debris [115].
Carbon fibres, unlike glass and aramid fibres, are good electrical conductors. Therefore
EDM may be used to machine CFRPs [116] or carbon fibre-reinforced carbon (CFRCs)
Chapter 3. Literature Review on Machining Fibre Reinforced Polymer Composites
78
composites [117]. WEDM of CFRPs yields good cutting edge quality and control of the
process parameters with little workpiece surface damage [115, 116]. However, EDM
shows a slow MRR on CFRPs (typically in order of 2-5 mm3/min) [116, 118, 119]. It
can also induce some thermal damage to the material [119]. Therefore, EDM is a
feasible process with possibility of producing complex shapes with good surface finish
and dimensional accuracy on CFRPs. However, low current density (i.e. low MRR)
should be used to avoid excessive thermal damage [116, 119]. Copper and graphite
tools produced comparable material removal rates and accuracies, but lower tool wear
rates were observed with the copper tool [119]. It was also suggested that positive
polarity tool electrodes yield higher material removal rates and lower wear rates as
compared to negative tool electrodes [119]. The material removal rate was found to
increase with an increase in pulse duration [119].
3.4 Ultra-sound machining (USM)
In USM, also known as impact grinding, high frequency electrical energy is converted
into mechanical vibrations via a transducer/booster combination which are then
transmitted through an energy focusing device i.e. horn/tool assembly [120]. Unlike
other non-traditional processes such as laser beam and electrical discharge machining,
etc., USM neither produces thermal, chemical or metallurgical damage in the workpiece
nor introduces significant residual stress, either aspect is important for the reliability in
service [121]. USM drilling produces better surface finish and hole quality than
conventional drilling but tool wear and taper limits hole depth to width ratio to about 3
to 1 [97]. Cavities and configurations that would be impossible to fabricate by
conventional methods can be fabricated in graphite-epoxy or glass-epoxy laminates by
ultrasonic machining [107]. Top quality in drilling composite material can be achieved
by this method [121, 122]. The drawback is the very slow machining speed, such as a
few minutes for a hole [121].
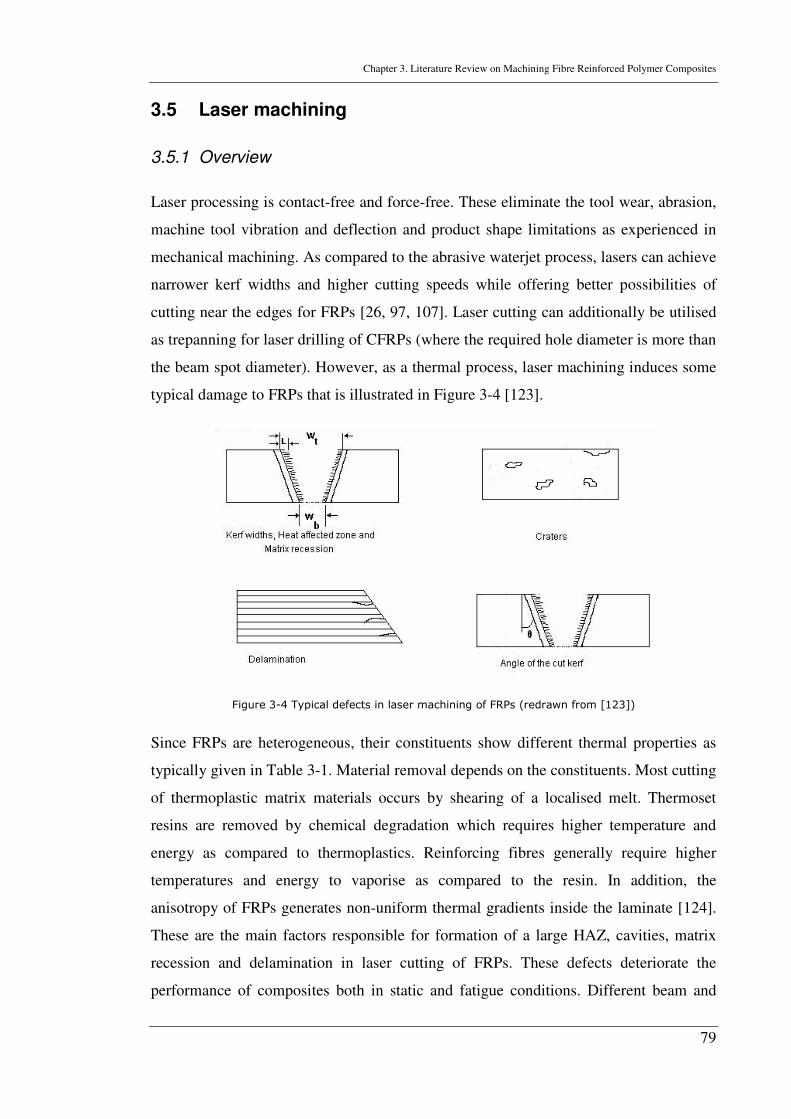
Chapter 3. Literature Review on Machining Fibre Reinforced Polymer Composites
79
3.5 Laser machining
3.5.1 Overview
Laser processing is contact-free and force-free. These eliminate the tool wear, abrasion,
machine tool vibration and deflection and product shape limitations as experienced in
mechanical machining. As compared to the abrasive waterjet process, lasers can achieve
narrower kerf widths and higher cutting speeds while offering better possibilities of
cutting near the edges for FRPs [26, 97, 107]. Laser cutting can additionally be utilised
as trepanning for laser drilling of CFRPs (where the required hole diameter is more than
the beam spot diameter). However, as a thermal process, laser machining induces some
typical damage to FRPs that is illustrated in Figure 3-4 [123].
Figure 3-4 Typical defects in laser machining of FRPs (redrawn from [123])
Since FRPs are heterogeneous, their constituents show different thermal properties as
typically given in Table 3-1. Material removal depends on the constituents. Most cutting
of thermoplastic matrix materials occurs by shearing of a localised melt. Thermoset
resins are removed by chemical degradation which requires higher temperature and
energy as compared to thermoplastics. Reinforcing fibres generally require higher
temperatures and energy to vaporise as compared to the resin. In addition, the
anisotropy of FRPs generates non-uniform thermal gradients inside the laminate [124].
These are the main factors responsible for formation of a large HAZ, cavities, matrix
recession and delamination in laser cutting of FRPs. These defects deteriorate the
performance of composites both in static and fatigue conditions. Different beam and
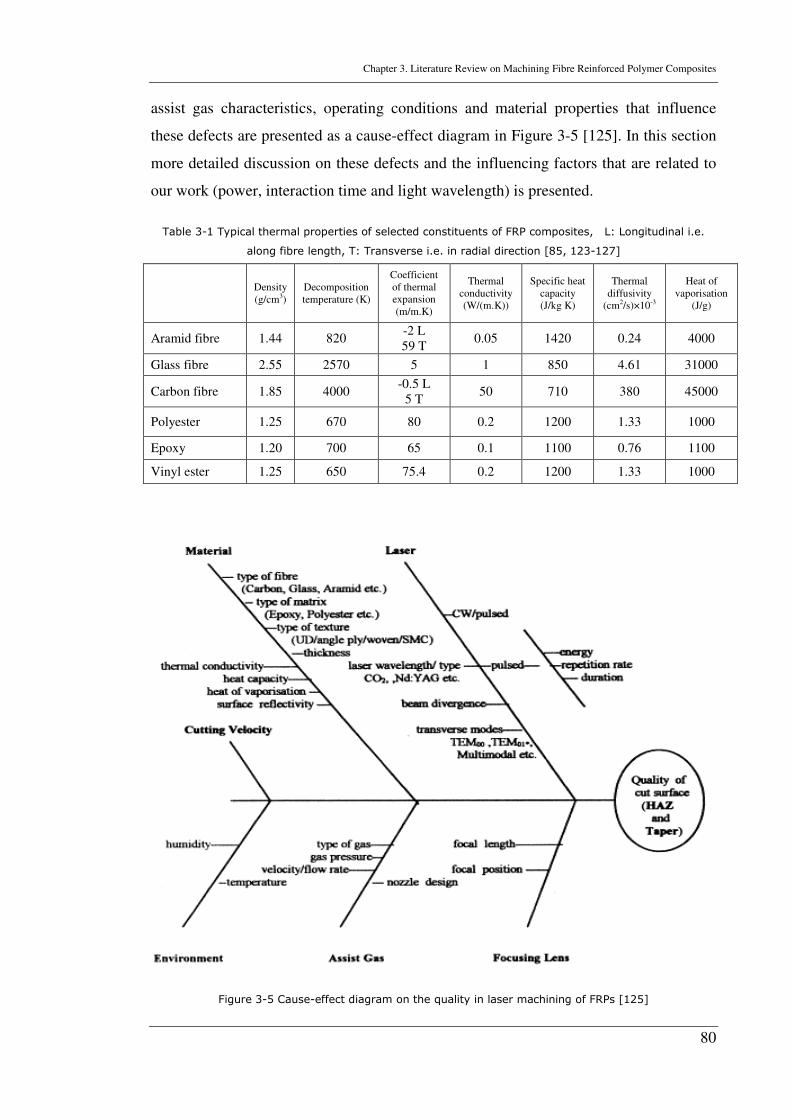
Chapter 3. Literature Review on Machining Fibre Reinforced Polymer Composites
80
assist gas characteristics, operating conditions and material properties that influence
these defects are presented as a cause-effect diagram in Figure 3-5 [125]. In this section
more detailed discussion on these defects and the influencing factors that are related to
our work (power, interaction time and light wavelength) is presented.
Table 3-1 Typical thermal properties of selected constituents of FRP composites, L: Longitudinal i.e.
along fibre length, T: Transverse i.e. in radial direction [85, 123-127]
Density (g/cm3)
Decomposition temperature (K)
Coefficient of thermal expansion (m/m.K)
Thermal conductivity (W/(m.K))
Specific heat capacity (J/kg K)
Thermal diffusivity
(cm2/s)×10-3
Heat of vaporisation
(J/g)
Aramid fibre 1.44 820 -2 L 59 T
0.05 1420 0.24 4000
Glass fibre 2.55 2570 5 1 850 4.61 31000
Carbon fibre 1.85 4000 -0.5 L
5 T 50 710 380 45000
Polyester 1.25 670 80 0.2 1200 1.33 1000
Epoxy 1.20 700 65 0.1 1100 0.76 1100
Vinyl ester 1.25 650 75.4 0.2 1200 1.33 1000
Figure 3-5 Cause-effect diagram on the quality in laser machining of FRPs [125]
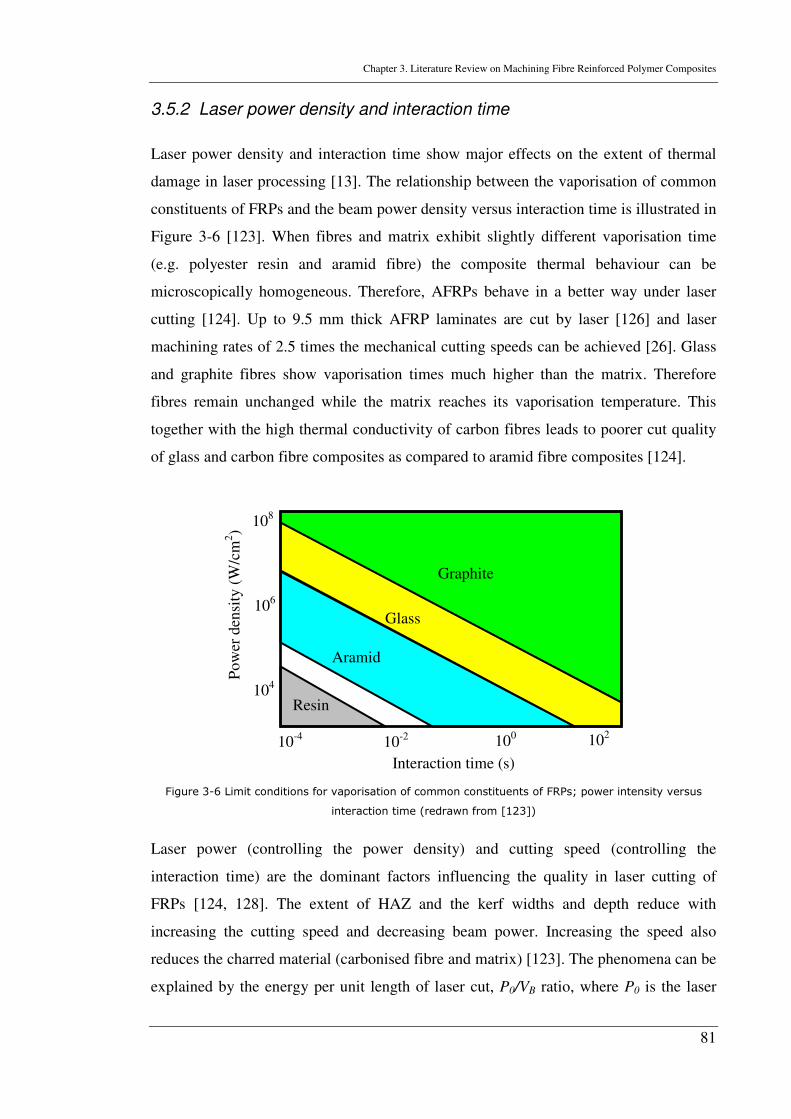
Chapter 3. Literature Review on Machining Fibre Reinforced Polymer Composites
81
3.5.2 Laser power density and interaction time
Laser power density and interaction time show major effects on the extent of thermal
damage in laser processing [13]. The relationship between the vaporisation of common
constituents of FRPs and the beam power density versus interaction time is illustrated in
Figure 3-6 [123]. When fibres and matrix exhibit slightly different vaporisation time
(e.g. polyester resin and aramid fibre) the composite thermal behaviour can be
microscopically homogeneous. Therefore, AFRPs behave in a better way under laser
cutting [124]. Up to 9.5 mm thick AFRP laminates are cut by laser [126] and laser
machining rates of 2.5 times the mechanical cutting speeds can be achieved [26]. Glass
and graphite fibres show vaporisation times much higher than the matrix. Therefore
fibres remain unchanged while the matrix reaches its vaporisation temperature. This
together with the high thermal conductivity of carbon fibres leads to poorer cut quality
of glass and carbon fibre composites as compared to aramid fibre composites [124].
Figure 3-6 Limit conditions for vaporisation of common constituents of FRPs; power intensity versus
interaction time (redrawn from [123])
Laser power (controlling the power density) and cutting speed (controlling the
interaction time) are the dominant factors influencing the quality in laser cutting of
FRPs [124, 128]. The extent of HAZ and the kerf widths and depth reduce with
increasing the cutting speed and decreasing beam power. Increasing the speed also
reduces the charred material (carbonised fibre and matrix) [123]. The phenomena can be
explained by the energy per unit length of laser cut, P0/VB ratio, where P0 is the laser
Graphite
Aramid
Glass
Resin
10-4 10-2 100 102
104
106
108
Interaction time (s)
Po
wer
den
sity
(W
/cm
2)
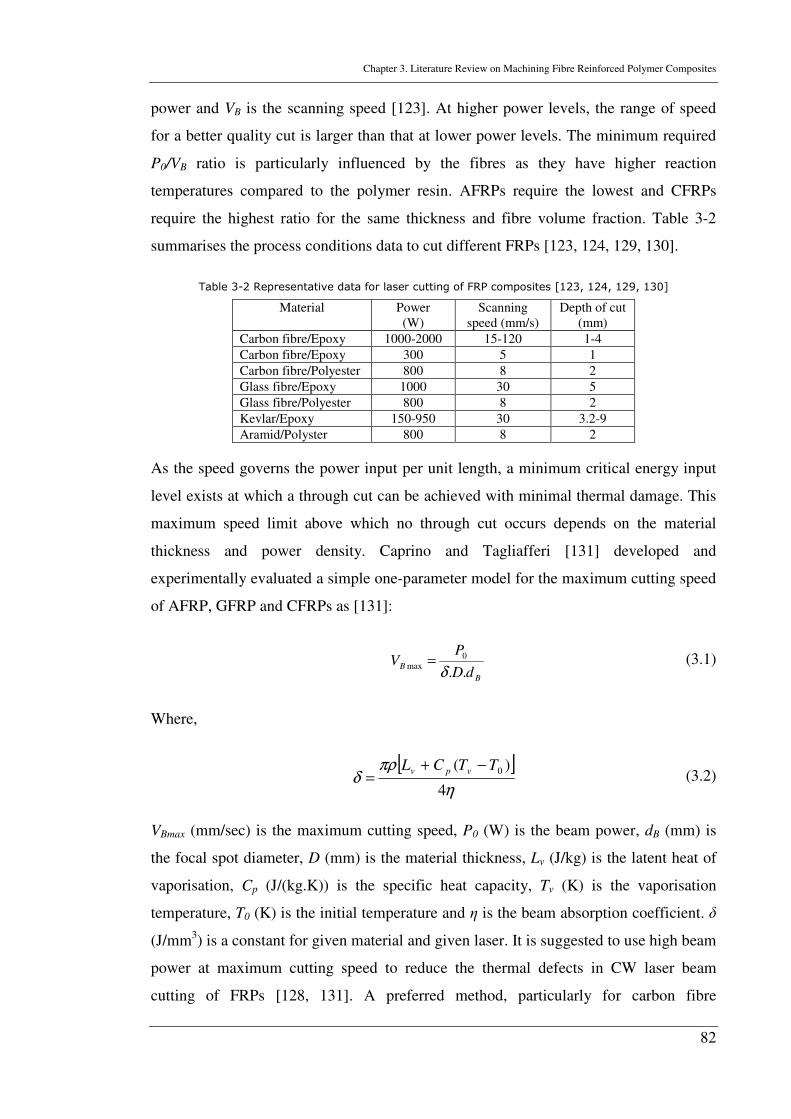
Chapter 3. Literature Review on Machining Fibre Reinforced Polymer Composites
82
power and VB is the scanning speed [123]. At higher power levels, the range of speed
for a better quality cut is larger than that at lower power levels. The minimum required
P0/VB ratio is particularly influenced by the fibres as they have higher reaction
temperatures compared to the polymer resin. AFRPs require the lowest and CFRPs
require the highest ratio for the same thickness and fibre volume fraction. Table 3-2
summarises the process conditions data to cut different FRPs [123, 124, 129, 130].
Table 3-2 Representative data for laser cutting of FRP composites [123, 124, 129, 130]
Material Power (W)
Scanning speed (mm/s)
Depth of cut (mm)
Carbon fibre/Epoxy 1000-2000 15-120 1-4
Carbon fibre/Epoxy 300 5 1
Carbon fibre/Polyester 800 8 2
Glass fibre/Epoxy 1000 30 5
Glass fibre/Polyester 800 8 2
Kevlar/Epoxy 150-950 30 3.2-9
Aramid/Polyster 800 8 2
As the speed governs the power input per unit length, a minimum critical energy input
level exists at which a through cut can be achieved with minimal thermal damage. This
maximum speed limit above which no through cut occurs depends on the material
thickness and power density. Caprino and Tagliafferi [131] developed and
experimentally evaluated a simple one-parameter model for the maximum cutting speed
of AFRP, GFRP and CFRPs as [131]:
B
BdD
PV
..
0max
δ= (3.1)
Where,
[ ]η
πρδ
4
)( 0TTCL vpv −+= (3.2)
VBmax (mm/sec) is the maximum cutting speed, P0 (W) is the beam power, dB (mm) is
the focal spot diameter, D (mm) is the material thickness, Lv (J/kg) is the latent heat of
vaporisation, Cp (J/(kg.K)) is the specific heat capacity, Tv (K) is the vaporisation
temperature, T0 (K) is the initial temperature and η is the beam absorption coefficient. δ
(J/mm3) is a constant for given material and given laser. It is suggested to use high beam
power at maximum cutting speed to reduce the thermal defects in CW laser beam
cutting of FRPs [128, 131]. A preferred method, particularly for carbon fibre
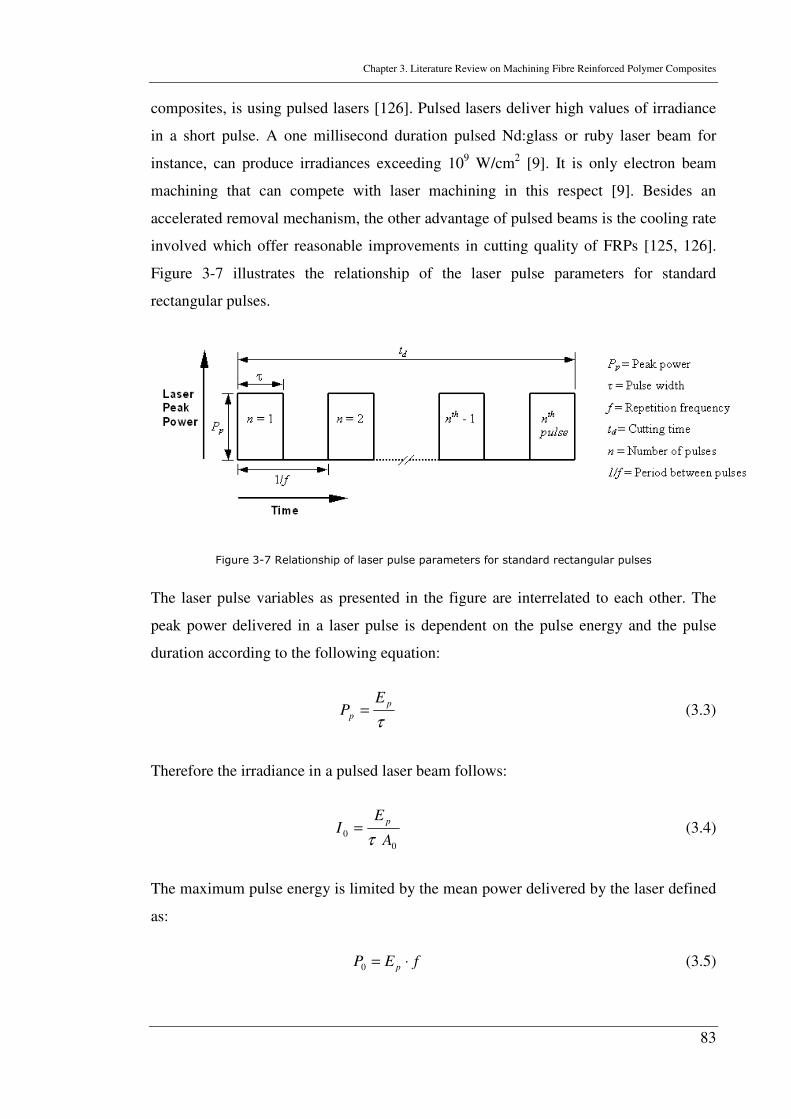
Chapter 3. Literature Review on Machining Fibre Reinforced Polymer Composites
83
composites, is using pulsed lasers [126]. Pulsed lasers deliver high values of irradiance
in a short pulse. A one millisecond duration pulsed Nd:glass or ruby laser beam for
instance, can produce irradiances exceeding 109 W/cm2 [9]. It is only electron beam
machining that can compete with laser machining in this respect [9]. Besides an
accelerated removal mechanism, the other advantage of pulsed beams is the cooling rate
involved which offer reasonable improvements in cutting quality of FRPs [125, 126].
Figure 3-7 illustrates the relationship of the laser pulse parameters for standard
rectangular pulses.
Figure 3-7 Relationship of laser pulse parameters for standard rectangular pulses
The laser pulse variables as presented in the figure are interrelated to each other. The
peak power delivered in a laser pulse is dependent on the pulse energy and the pulse
duration according to the following equation:
τ
p
p
EP = (3.3)
Therefore the irradiance in a pulsed laser beam follows:
0
0A
EI
p
τ= (3.4)
The maximum pulse energy is limited by the mean power delivered by the laser defined
as:
fEP p ⋅=0 (3.5)
Chapter 3. Literature Review on Machining Fibre Reinforced Polymer Composites
84
Equation (3.4) shows the average value of the laser irradiance in time and space within
each pulse. In fact, a more accurate laser power description considering the variation of
laser energy in both temporal and spatial dimensions is usually considered with better
coupling with the target material [13].
Consequently, the higher beam intensity, less interaction time and better focusing
behaviour of pulsed Nd:YAG lasers for instance, leads to less thermal load and hence
less thermal damage to CFRPs as compared to a continuous wave CO2 laser [126].
Mathew et al. [125] conducted a systematic study on pulsed Nd:YAG laser cutting of
CFRP composites. It was observed that the HAZ is proportional to the pulse energy.
The higher the pulse energy is, the larger the HAZ is. The effects of laser-material
interaction time are more complicated. It is represented by few parameters: laser energy
delivery mode (continuous wave or pulsed laser beam), repetition rate, pulse duration
and cutting speed. High repetition rate, long pulse duration and slow cutting speed
generally increase interaction time and produce larger HAZ.
3.5.3 Infrared vs. ultraviolet beam processing
When a high power laser beam interacts with a material, light absorption and interaction
occur. Depending on the wavelength, power density, interaction time as well as material
properties, heat generation, conduction and material removal take place with different
mechanisms. In general, long wavelength laser-material interaction is more thermal due
to the fact that only molecular vibrations are excited by the long wavelength photons.
However, electronic excitation is induced by UV wavelength, which has a less thermal
characteristic. Laser processing of FRP composites has been mostly studied by means of
industrial lasers, such as CO2 (10.6 µm wavelength), fundamental YAG (1.6 µm
wavelength) and excimer (UV range) lasers. FRPs generally show high absorption of
infrared spectrum light so that deep penetration occurs at significantly lower power
intensities (102-3 W/cm2) than for metals (106 W/cm2) [124, 126]. Deep penetration is a
removal mechanism in which the power intensity of the beam is high enough to
vaporise material and a vapour column is formed [9]. FRPs do not generally undergo a
fusion reaction and hence the vapour column is not surrounded by melted material as it
is in case of metals [124].
Chapter 3. Literature Review on Machining Fibre Reinforced Polymer Composites
85
CO2 lasers (10.6 µm) have been used to investigate laser cutting of CFRPs both in the
CW [124, 131] and pulsed mode [132]. Nevertheless, Nd:YAG laser (1.06 µm) has been
reported to give less thermal damage due to pulse-off cooling [126]. Lau et al. [133]
studied the quality factors in response to different process parameters using a pulsed
Nd:YAG system. They demonstrated the effectiveness of pulse width and the cooling
gas on the quality. Mathew et al. [125] also studied Nd:YAG laser cutting of CFRPs on
the basis of optimising the process factors. None of the studies though resulted in good
quality according to the quality classes defined in [131] (see section 3.5.5) which
suggests the acceptable extent of fibre pull out as less than 150 µm and the kerf width
close to the beam spot diameter with no fibre swelling.
Ablative photodecomposition (i.e. photo-ablation) is an alternative mechanism to reduce
the thermal damage of the thermal decomposition mechanism. It can be defined as a
mechanism of UV (high photon energy beam) laser-material interaction in which the
atomic and/or molecular bonds are broken down [134]. Each material exhibits an
ablation threshold (depending on its molecular bond energy). A beam with a photon
energy equal or above this threshold causes a photo-ablation mechanism [134]. For
instance, far-UV (e.g.193 nm) wavelength laser pulses cause ablative photo-
decomposition (APD) of organic polymers while longer wavelengths (e.g. 532 nm) also
ablate but via distortion and melting [135].
A comparison of cut surface quality in CO2 (i.e. IR beam) and excimer (i.e. UV beam)
cutting is presented in Figure 3-8 for Kevlar (i.e. AFRP) and CFRP laminates. As can
be observed AFRPs exhibit a more homogeneous surface in both IR and UV beam
processing owing to closer thermal properties of the fibres and the resin as compared to
CFRPs. Charring in IR beam cutting of AFRPs (Figure 3-8a) is observed while IR
cutting of CFRPs faces more challenging defects such as large cavities and matrix
recession (Figure 3-8b). UV beam cutting of AFRPs shows a smooth surface finish
(Figure 3-8c) which could be attributed to closer molecular/atomic bond strengths of
fibres and polymer resin to the beam photon energy [134] and hence less thermal
reactions involved as compared to CFRPs. Decreasing the energy and frequency,
increases the homogeneity of the cut surface [134]. Ablation and photochemical
reactions in the laser processing of CFRPs using UV beam systems have been reported
[116, 136] to considerably reduce thermal damage.
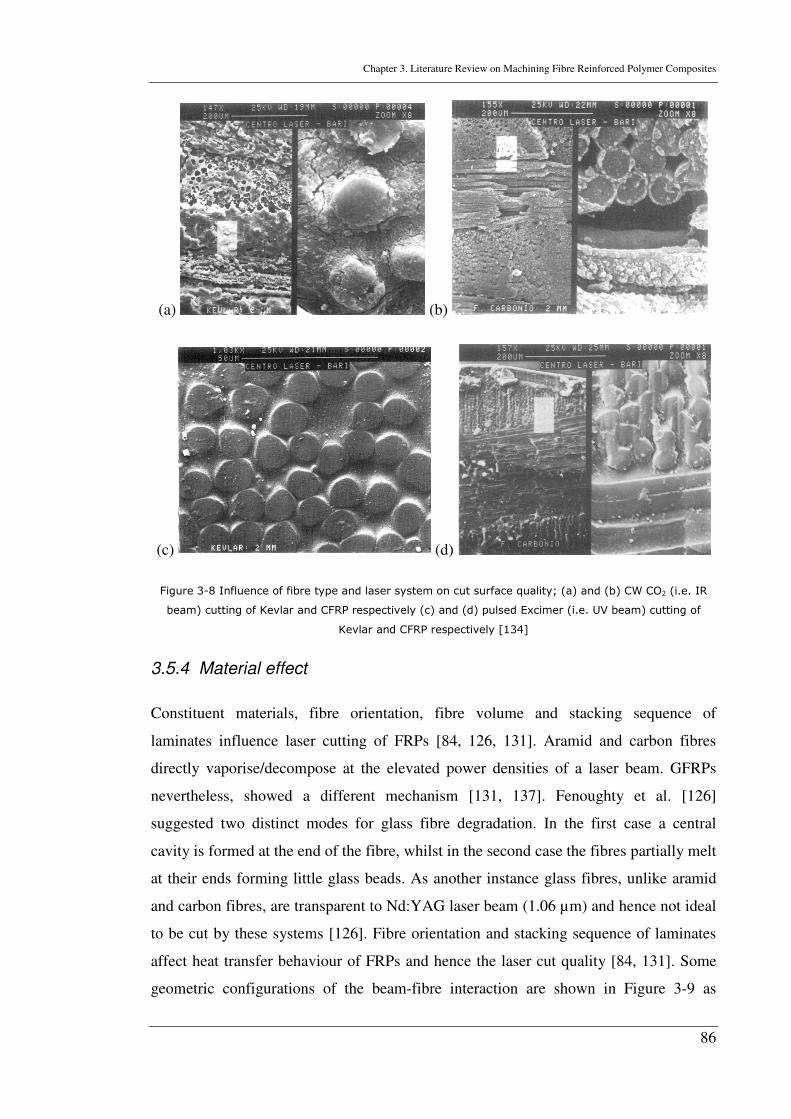
Chapter 3. Literature Review on Machining Fibre Reinforced Polymer Composites
86
(a) (b)
(c) (d)
Figure 3-8 Influence of fibre type and laser system on cut surface quality; (a) and (b) CW CO2 (i.e. IR
beam) cutting of Kevlar and CFRP respectively (c) and (d) pulsed Excimer (i.e. UV beam) cutting of
Kevlar and CFRP respectively [134]
3.5.4 Material effect
Constituent materials, fibre orientation, fibre volume and stacking sequence of
laminates influence laser cutting of FRPs [84, 126, 131]. Aramid and carbon fibres
directly vaporise/decompose at the elevated power densities of a laser beam. GFRPs
nevertheless, showed a different mechanism [131, 137]. Fenoughty et al. [126]
suggested two distinct modes for glass fibre degradation. In the first case a central
cavity is formed at the end of the fibre, whilst in the second case the fibres partially melt
at their ends forming little glass beads. As another instance glass fibres, unlike aramid
and carbon fibres, are transparent to Nd:YAG laser beam (1.06 µm) and hence not ideal
to be cut by these systems [126]. Fibre orientation and stacking sequence of laminates
affect heat transfer behaviour of FRPs and hence the laser cut quality [84, 131]. Some
geometric configurations of the beam-fibre interaction are shown in Figure 3-9 as
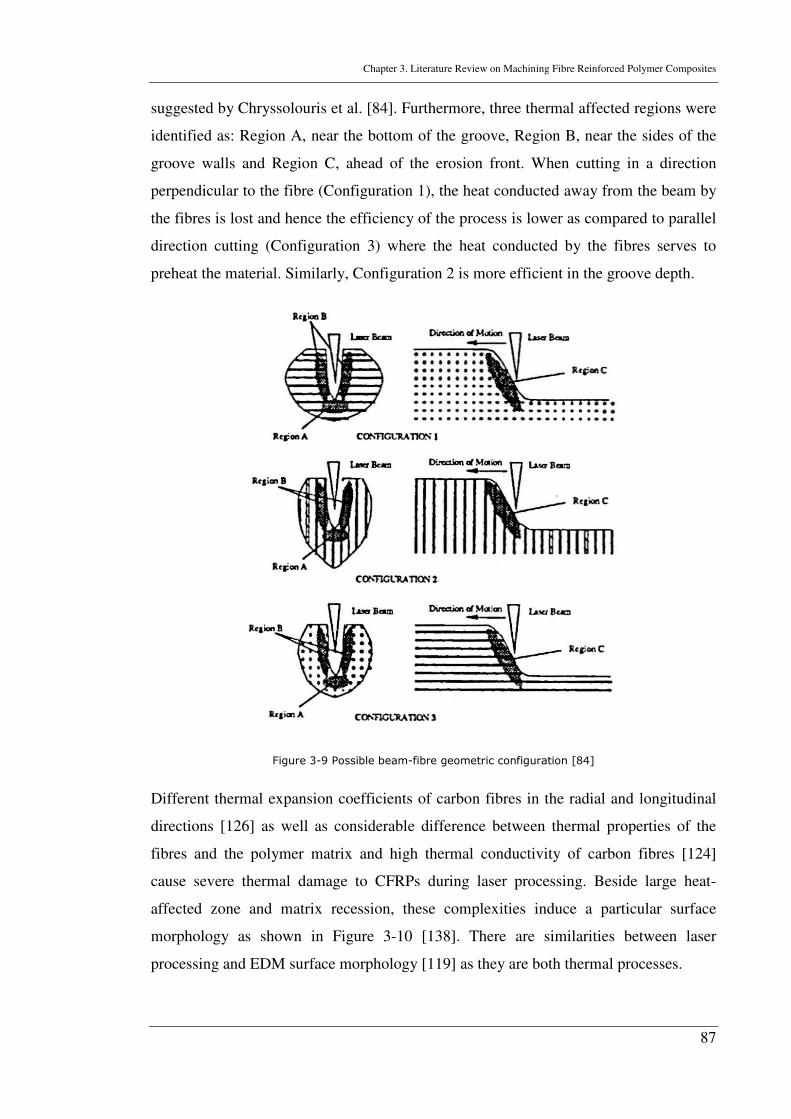
Chapter 3. Literature Review on Machining Fibre Reinforced Polymer Composites
87
suggested by Chryssolouris et al. [84]. Furthermore, three thermal affected regions were
identified as: Region A, near the bottom of the groove, Region B, near the sides of the
groove walls and Region C, ahead of the erosion front. When cutting in a direction
perpendicular to the fibre (Configuration 1), the heat conducted away from the beam by
the fibres is lost and hence the efficiency of the process is lower as compared to parallel
direction cutting (Configuration 3) where the heat conducted by the fibres serves to
preheat the material. Similarly, Configuration 2 is more efficient in the groove depth.
Figure 3-9 Possible beam-fibre geometric configuration [84]
Different thermal expansion coefficients of carbon fibres in the radial and longitudinal
directions [126] as well as considerable difference between thermal properties of the
fibres and the polymer matrix and high thermal conductivity of carbon fibres [124]
cause severe thermal damage to CFRPs during laser processing. Beside large heat-
affected zone and matrix recession, these complexities induce a particular surface
morphology as shown in Figure 3-10 [138]. There are similarities between laser
processing and EDM surface morphology [119] as they are both thermal processes.
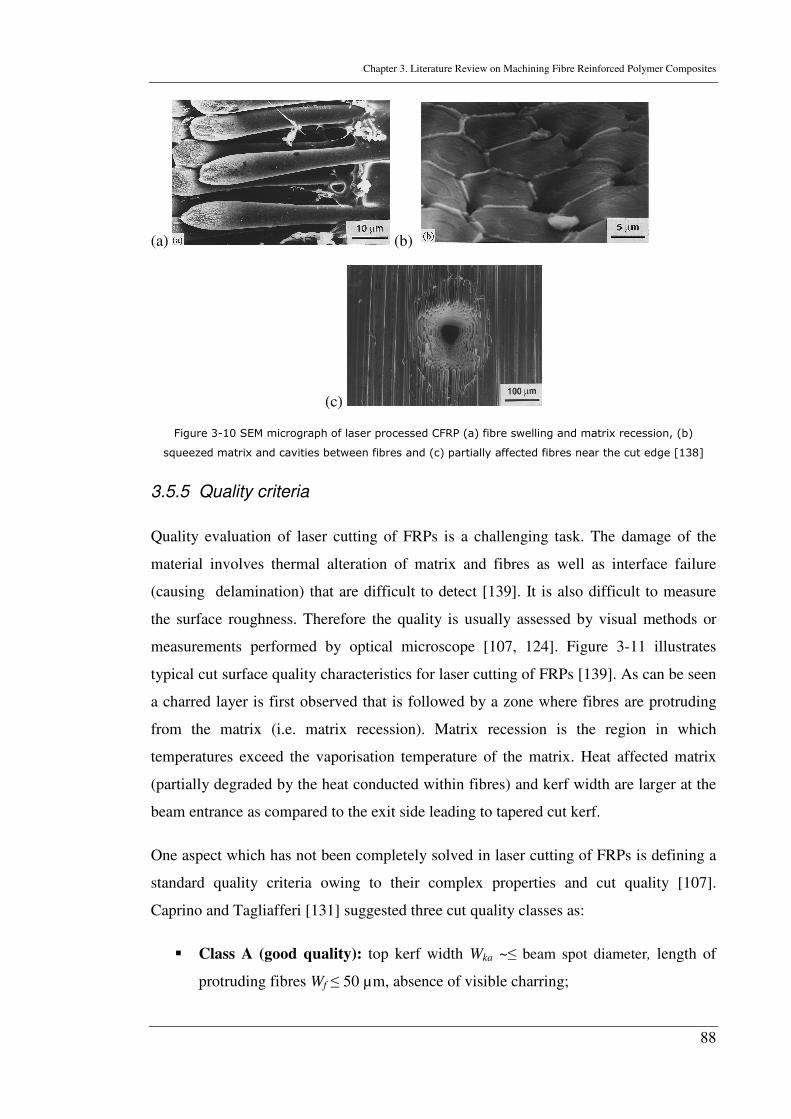
Chapter 3. Literature Review on Machining Fibre Reinforced Polymer Composites
88
(a) (b)
(c)
Figure 3-10 SEM micrograph of laser processed CFRP (a) fibre swelling and matrix recession, (b)
squeezed matrix and cavities between fibres and (c) partially affected fibres near the cut edge [138]
3.5.5 Quality criteria
Quality evaluation of laser cutting of FRPs is a challenging task. The damage of the
material involves thermal alteration of matrix and fibres as well as interface failure
(causing delamination) that are difficult to detect [139]. It is also difficult to measure
the surface roughness. Therefore the quality is usually assessed by visual methods or
measurements performed by optical microscope [107, 124]. Figure 3-11 illustrates
typical cut surface quality characteristics for laser cutting of FRPs [139]. As can be seen
a charred layer is first observed that is followed by a zone where fibres are protruding
from the matrix (i.e. matrix recession). Matrix recession is the region in which
temperatures exceed the vaporisation temperature of the matrix. Heat affected matrix
(partially degraded by the heat conducted within fibres) and kerf width are larger at the
beam entrance as compared to the exit side leading to tapered cut kerf.
One aspect which has not been completely solved in laser cutting of FRPs is defining a
standard quality criteria owing to their complex properties and cut quality [107].
Caprino and Tagliafferi [131] suggested three cut quality classes as:
� Class A (good quality): top kerf width Wka ~≤ beam spot diameter, length of
protruding fibres Wf ≤ 50 µm, absence of visible charring;
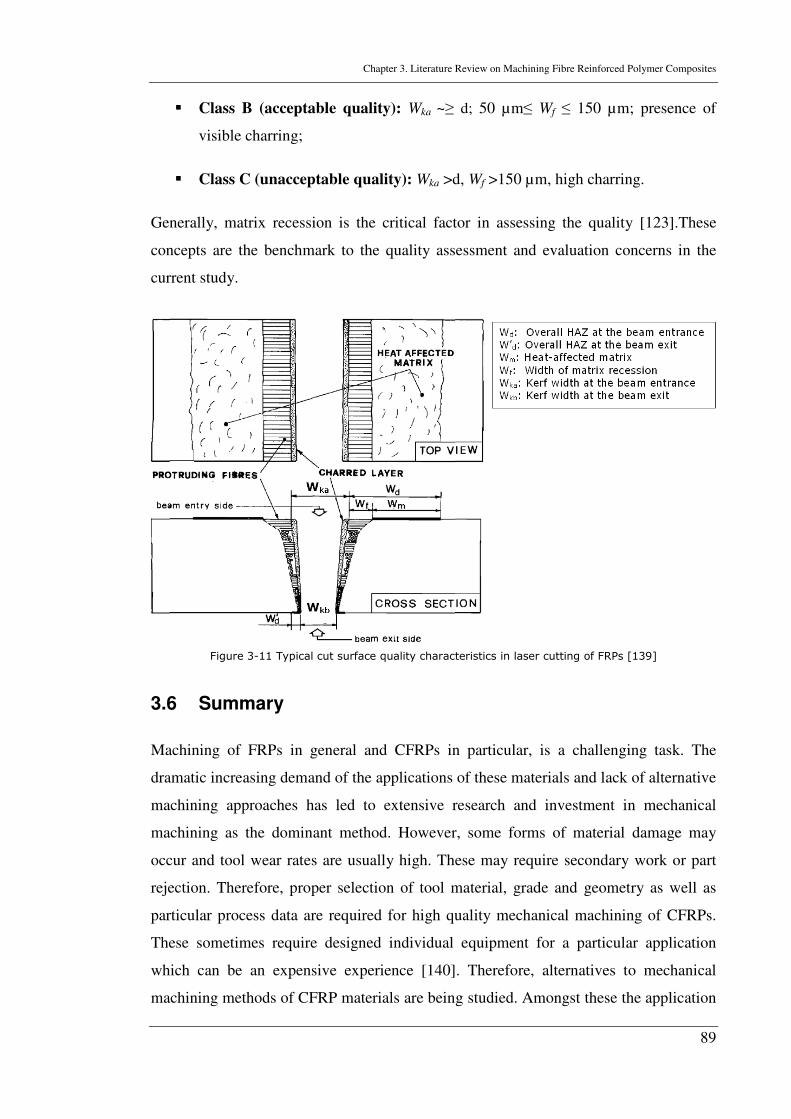
Chapter 3. Literature Review on Machining Fibre Reinforced Polymer Composites
89
� Class B (acceptable quality): Wka ~≥ d; 50 µm≤ Wf ≤ 150 µm; presence of
visible charring;
� Class C (unacceptable quality): Wka >d, Wf >150 µm, high charring.
Generally, matrix recession is the critical factor in assessing the quality [123].These
concepts are the benchmark to the quality assessment and evaluation concerns in the
current study.
Figure 3-11 Typical cut surface quality characteristics in laser cutting of FRPs [139]
3.6 Summary
Machining of FRPs in general and CFRPs in particular, is a challenging task. The
dramatic increasing demand of the applications of these materials and lack of alternative
machining approaches has led to extensive research and investment in mechanical
machining as the dominant method. However, some forms of material damage may
occur and tool wear rates are usually high. These may require secondary work or part
rejection. Therefore, proper selection of tool material, grade and geometry as well as
particular process data are required for high quality mechanical machining of CFRPs.
These sometimes require designed individual equipment for a particular application
which can be an expensive experience [140]. Therefore, alternatives to mechanical
machining methods of CFRP materials are being studied. Amongst these the application
Chapter 3. Literature Review on Machining Fibre Reinforced Polymer Composites
90
of EDM (applicable to CFRPs only, since carbon fibres are electrically conductive) and
USM is limited mostly owing to their very low material removal rate. High tool wear
and thermal induced damages are other constraints in the case of EDM.
Laser and abrasive waterjet on the other hand, have shown their potential to be
industrially viable methods in the cutting of CFRPs. Each of these technologies have
their own advantages. Lasers are found to be of more use in high-speed cutting of thin
laminates and AWJ in the cutting of thicker polymer laminates [126]. Since AWJ
involves low thermal and mechanical forces, it is ideal for composite materials. In the
case of CFRPs, generally, high jet pressures, low standoff distances, low to medium
transverse speeds, small abrasive particle size and small nozzle diameter are used to
reduce taper angle and surface roughness and irregularities including delamination and
waviness [6, 108, 112, 141-143]. New techniques including cutting with forward
angling the jet in the cutting plane [106], multiple-pass cutting [142], and controlled
nozzle oscillation [144-147] have been also used in AWJ to enhance the cutting
performance of this technology, such as the depth of cut and surface finish.
Lasers on the other hand, benefit from their capability of being transmitted through
fibre-optics (to distances over 200 m from the laser unit), robot manipulation and
automation. These separate them from the workshop-based CNC AWJ machines. A
summary of the desirability of different machining processes for CFRPs is given in
Table 3-3. As can be seen, laser machining offers some desirability of characteristics.
The challenges to laser processing are to minimise or eliminate thermal damage and
maintain high processing speed. Quality defects, such as large HAZ, charring, resin
recession and delamination due to intense thermal effects, are major obstacles for
industrial applications of laser machining of CFRP composites. Quality improvements
achieved in laser cutting of CFRPs using techniques such as an additional coolant
(water) [84] or cryogenic assist gas [83, 85], pulsed and/or UV beam processing [125,
136] show the potential in laser machining of CFRPs. This study aims to contribute in
the progress of laser cutting of CFRPs.
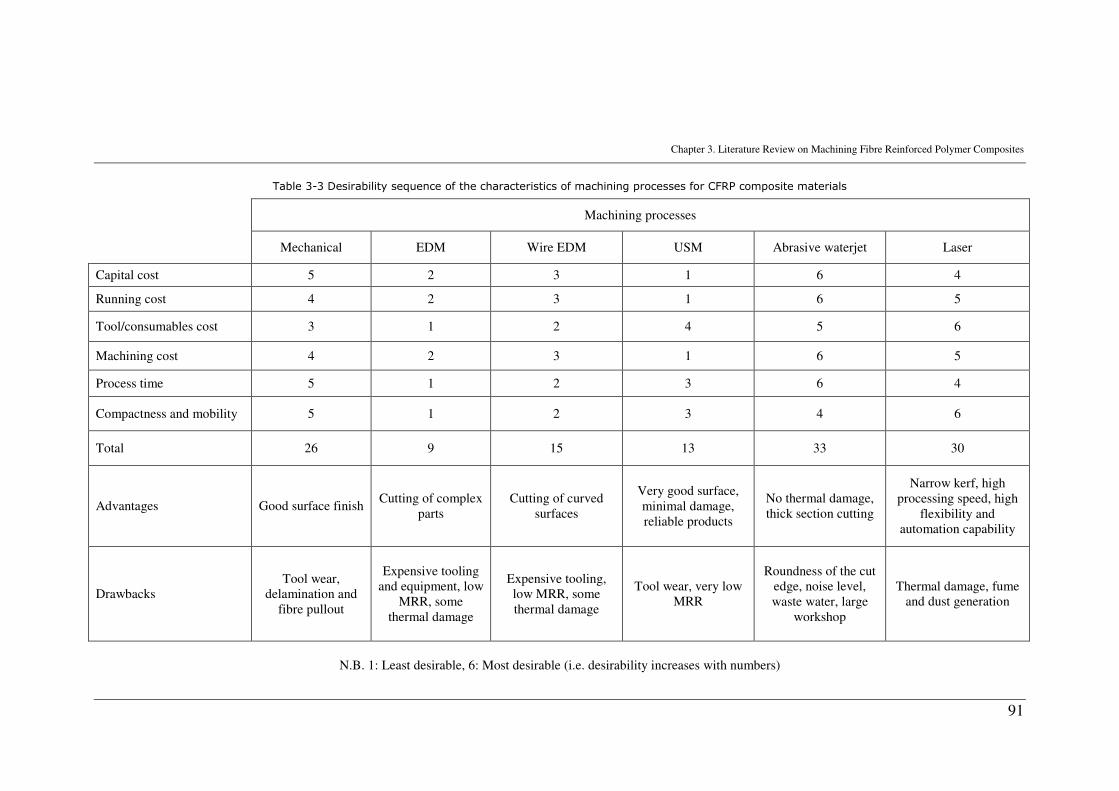
Chapter 3. Literature Review on Machining Fibre Reinforced Polymer Composites
91
Table 3-3 Desirability sequence of the characteristics of machining processes for CFRP composite materials
Machining processes
Mechanical EDM Wire EDM USM Abrasive waterjet Laser
Capital cost 5 2 3 1 6 4
Running cost 4 2 3 1 6 5
Tool/consumables cost 3 1 2 4 5 6
Machining cost 4 2 3 1 6 5
Process time 5 1 2 3 6 4
Compactness and mobility 5 1 2 3 4 6
Total 26 9 15 13 33 30
Advantages Good surface finish Cutting of complex
parts Cutting of curved
surfaces
Very good surface, minimal damage, reliable products
No thermal damage, thick section cutting
Narrow kerf, high processing speed, high
flexibility and automation capability
Drawbacks Tool wear,
delamination and fibre pullout
Expensive tooling and equipment, low
MRR, some thermal damage
Expensive tooling, low MRR, some thermal damage
Tool wear, very low MRR
Roundness of the cut edge, noise level, waste water, large
workshop
Thermal damage, fume and dust generation
N.B. 1: Least desirable, 6: Most desirable (i.e. desirability increases with numbers)
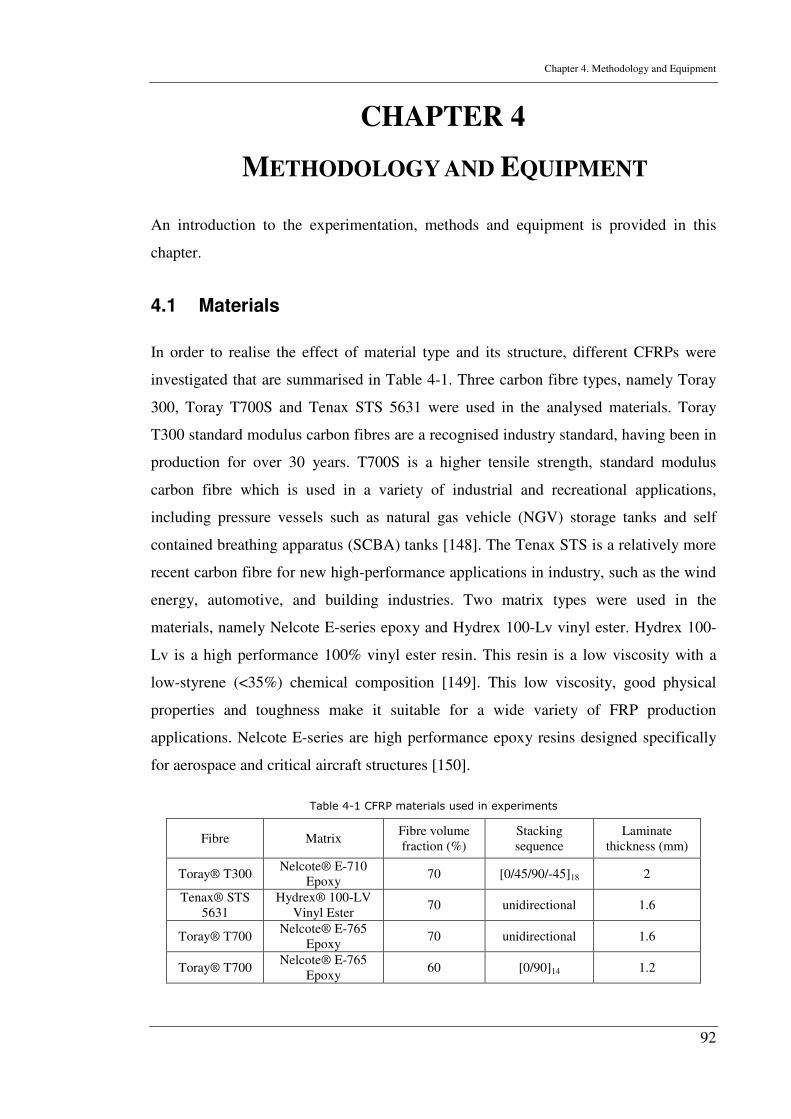
Chapter 4. Methodology and Equipment
92
CHAPTER 4
METHODOLOGY AND EQUIPMENT
An introduction to the experimentation, methods and equipment is provided in this
chapter.
4.1 Materials
In order to realise the effect of material type and its structure, different CFRPs were
investigated that are summarised in Table 4-1. Three carbon fibre types, namely Toray
300, Toray T700S and Tenax STS 5631 were used in the analysed materials. Toray
T300 standard modulus carbon fibres are a recognised industry standard, having been in
production for over 30 years. T700S is a higher tensile strength, standard modulus
carbon fibre which is used in a variety of industrial and recreational applications,
including pressure vessels such as natural gas vehicle (NGV) storage tanks and self
contained breathing apparatus (SCBA) tanks [148]. The Tenax STS is a relatively more
recent carbon fibre for new high-performance applications in industry, such as the wind
energy, automotive, and building industries. Two matrix types were used in the
materials, namely Nelcote E-series epoxy and Hydrex 100-Lv vinyl ester. Hydrex 100-
Lv is a high performance 100% vinyl ester resin. This resin is a low viscosity with a
low-styrene (<35%) chemical composition [149]. This low viscosity, good physical
properties and toughness make it suitable for a wide variety of FRP production
applications. Nelcote E-series are high performance epoxy resins designed specifically
for aerospace and critical aircraft structures [150].
Table 4-1 CFRP materials used in experiments
Fibre Matrix Fibre volume fraction (%)
Stacking sequence
Laminate thickness (mm)
Toray® T300 Nelcote® E-710
Epoxy 70 [0/45/90/-45]18 2
Tenax® STS 5631
Hydrex® 100-LV Vinyl Ester
70 unidirectional 1.6
Toray® T700 Nelcote® E-765
Epoxy 70 unidirectional 1.6
Toray® T700 Nelcote® E-765
Epoxy 60 [0/90]14 1.2
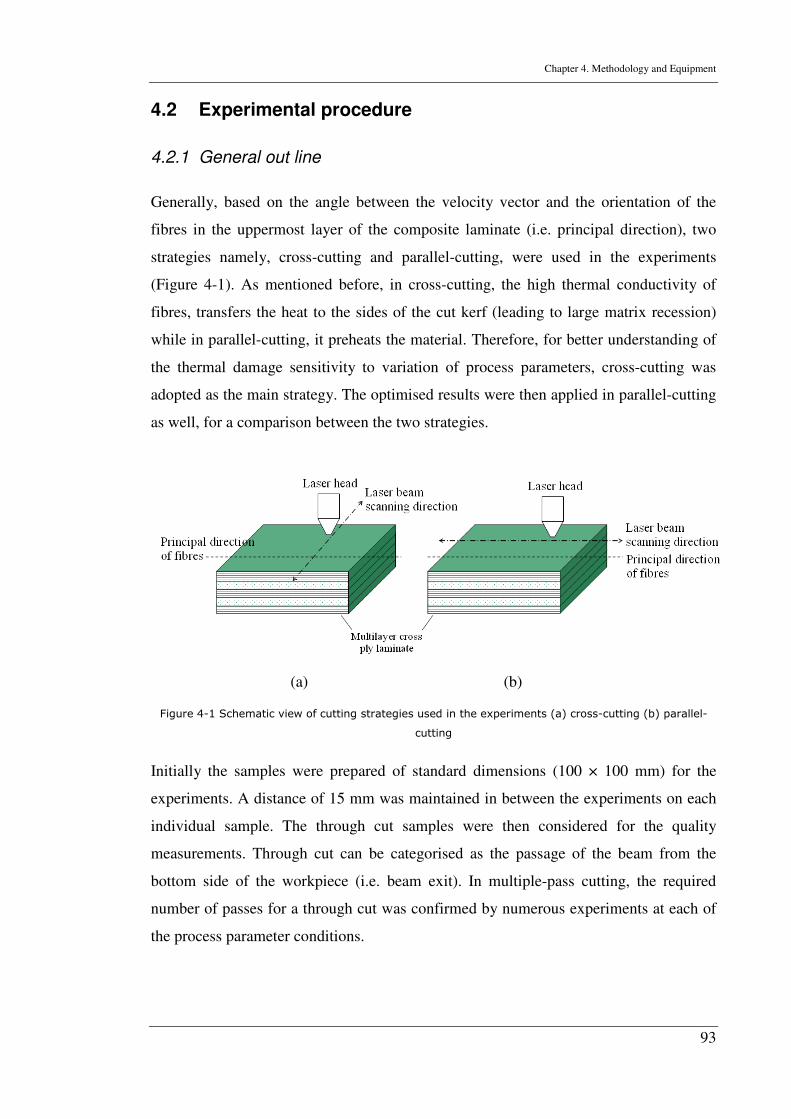
Chapter 4. Methodology and Equipment
93
4.2 Experimental procedure
4.2.1 General out line
Generally, based on the angle between the velocity vector and the orientation of the
fibres in the uppermost layer of the composite laminate (i.e. principal direction), two
strategies namely, cross-cutting and parallel-cutting, were used in the experiments
(Figure 4-1). As mentioned before, in cross-cutting, the high thermal conductivity of
fibres, transfers the heat to the sides of the cut kerf (leading to large matrix recession)
while in parallel-cutting, it preheats the material. Therefore, for better understanding of
the thermal damage sensitivity to variation of process parameters, cross-cutting was
adopted as the main strategy. The optimised results were then applied in parallel-cutting
as well, for a comparison between the two strategies.
(a) (b)
Figure 4-1 Schematic view of cutting strategies used in the experiments (a) cross-cutting (b) parallel-
cutting
Initially the samples were prepared of standard dimensions (100 × 100 mm) for the
experiments. A distance of 15 mm was maintained in between the experiments on each
individual sample. The through cut samples were then considered for the quality
measurements. Through cut can be categorised as the passage of the beam from the
bottom side of the workpiece (i.e. beam exit). In multiple-pass cutting, the required
number of passes for a through cut was confirmed by numerous experiments at each of
the process parameter conditions.
Chapter 4. Methodology and Equipment
94
4.2.2 Design of experiments (DoE)
Commonly in laser cutting of materials the quality is assessed in response to variation
of one process parameter at a time. This requires a large number of experimental runs
and hence can be lengthy, expensive with respects to both the process and the material
requirements. Investigating the interaction effect between two parameters is also very
difficult in this approach. In laser material processing, parameter interaction is known as
the influence of the combination of two process parameters. Statistical analysis as a
scientific approach has been diversely accepted in experimental research studies to
minimise the experimental runs on one hand and optimise the quality criteria during the
process on the other hand [125, 151, 152]. Hence, it allows all main effects as well as
interactions to be evaluated with the minimum number of experiments. The statistical
design of experiments can be customised depending on the desired number of
experiments (i.e. sample size), the suitable order of experimental runs (based on the
experimental system and its restrictions) and confirming whether or not blocking or
other randomisation restrictions are involved. This is hence effective both in respect to
the material usage and the research time. Particularly, for laser cutting of CFRP as a
thermal sensitive material where large thermal damage is often observed [125].
Therefore, it was considered expedient to apply a statistical design of experiments. In
order to estimate the model parameters as accurate as possible it is essential to carefully
plan the experimental design. Hence, numerous screening experimental runs were
performed in order to obtain proper ranges for the parameters. These ranges were then
applied in the statistical analysis. Thereby, the process parameters to be experimented
were designed (Appendix A). The experiments were then performed according to this
suggested design. The experimental results were then measured and recorded as
responses. This was then followed by analysis of variance (ANOVA) and optimisation.
This approach narrows down the process parameters window. This window was then
used for further analyses on the given system. A summary of the experimental
procedure is given in Figure 4-2.
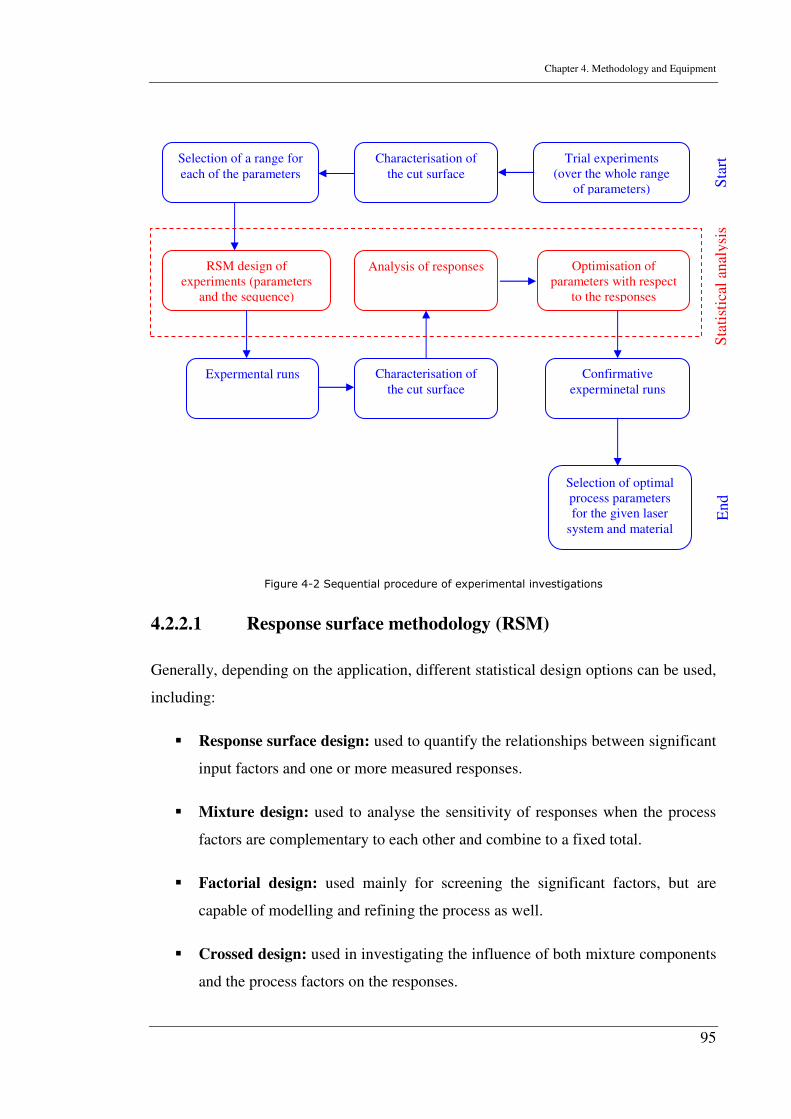
Chapter 4. Methodology and Equipment
95
Figure 4-2 Sequential procedure of experimental investigations
4.2.2.1 Response surface methodology (RSM)
Generally, depending on the application, different statistical design options can be used,
including:
� Response surface design: used to quantify the relationships between significant
input factors and one or more measured responses.
� Mixture design: used to analyse the sensitivity of responses when the process
factors are complementary to each other and combine to a fixed total.
� Factorial design: used mainly for screening the significant factors, but are
capable of modelling and refining the process as well.
� Crossed design: used in investigating the influence of both mixture components
and the process factors on the responses.
Trial experiments (over the whole range
of parameters)
Characterisation of the cut surface
Selection of a range for each of the parameters
RSM design of experiments (parameters
and the sequence)
Expermental runs Characterisation of the cut surface
Analysis of responses Optimisation of parameters with respect
to the responses
Confirmative experminetal runs
Selection of optimal process parameters for the given laser
system and material
Sta
tist
ical
an
aly
sis
Sta
rt
En
d
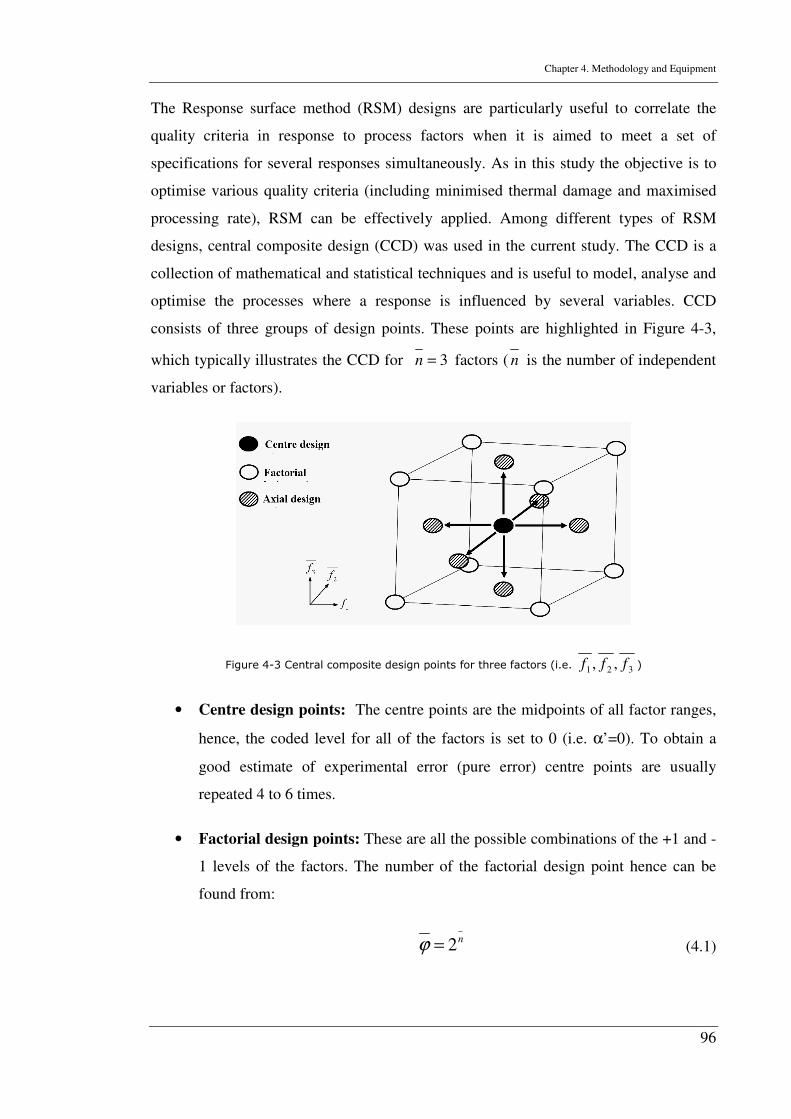
Chapter 4. Methodology and Equipment
96
The Response surface method (RSM) designs are particularly useful to correlate the
quality criteria in response to process factors when it is aimed to meet a set of
specifications for several responses simultaneously. As in this study the objective is to
optimise various quality criteria (including minimised thermal damage and maximised
processing rate), RSM can be effectively applied. Among different types of RSM
designs, central composite design (CCD) was used in the current study. The CCD is a
collection of mathematical and statistical techniques and is useful to model, analyse and
optimise the processes where a response is influenced by several variables. CCD
consists of three groups of design points. These points are highlighted in Figure 4-3,
which typically illustrates the CCD for 3=n factors ( n is the number of independent
variables or factors).
Figure 4-3 Central composite design points for three factors (i.e. 321 ,, fff )
• Centre design points: The centre points are the midpoints of all factor ranges,
hence, the coded level for all of the factors is set to 0 (i.e. α’=0). To obtain a
good estimate of experimental error (pure error) centre points are usually
repeated 4 to 6 times.
• Factorial design points: These are all the possible combinations of the +1 and -
1 levels of the factors. The number of the factorial design point hence can be
found from:
n2=ϕ (4.1)
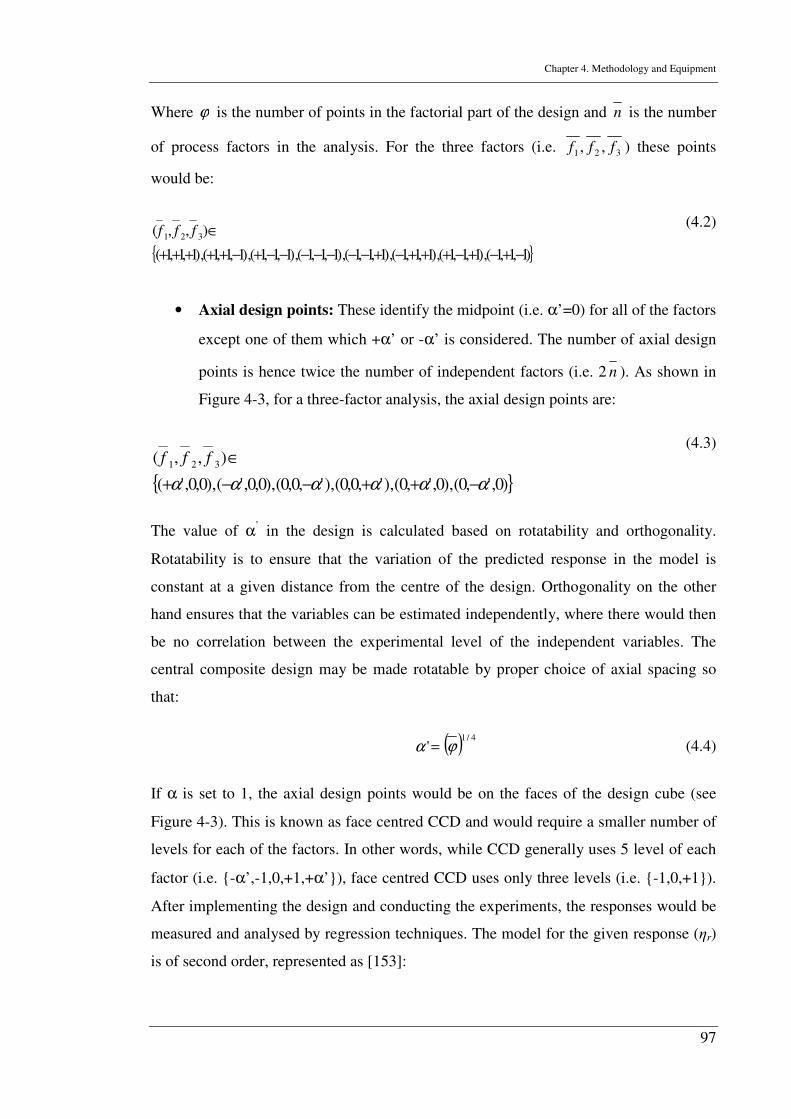
Chapter 4. Methodology and Equipment
97
Where ϕ is the number of points in the factorial part of the design and n is the number
of process factors in the analysis. For the three factors (i.e. 321 ,, fff ) these points
would be:
(4.2)
• Axial design points: These identify the midpoint (i.e. α’=0) for all of the factors
except one of them which +α’ or -α’ is considered. The number of axial design
points is hence twice the number of independent factors (i.e. 2 n ). As shown in
Figure 4-3, for a three-factor analysis, the axial design points are:
(4.3)
The value of α’ in the design is calculated based on rotatability and orthogonality.
Rotatability is to ensure that the variation of the predicted response in the model is
constant at a given distance from the centre of the design. Orthogonality on the other
hand ensures that the variables can be estimated independently, where there would then
be no correlation between the experimental level of the independent variables. The
central composite design may be made rotatable by proper choice of axial spacing so
that:
( ) 4/1
' ϕα = (4.4)
If α is set to 1, the axial design points would be on the faces of the design cube (see
Figure 4-3). This is known as face centred CCD and would require a smaller number of
levels for each of the factors. In other words, while CCD generally uses 5 level of each
factor (i.e. {-α’,-1,0,+1,+α’}), face centred CCD uses only three levels (i.e. {-1,0,+1}).
After implementing the design and conducting the experiments, the responses would be
measured and analysed by regression techniques. The model for the given response (ηr)
is of second order, represented as [153]:
}{ )1,1,1(),1,1,1(),1,1,1(),1,1,1(),1,1,1(),1,1,1(),1,1,1(),1,1,1(
),,( 321
−+−+−+++−+−−−−−−−+−+++++
∈fff
}{ )0,',0(),0,',0(),',0,0(),',0,0(),0,0,'(),0,0,'(
),,( 321
αααααα −++−−+
∈fff
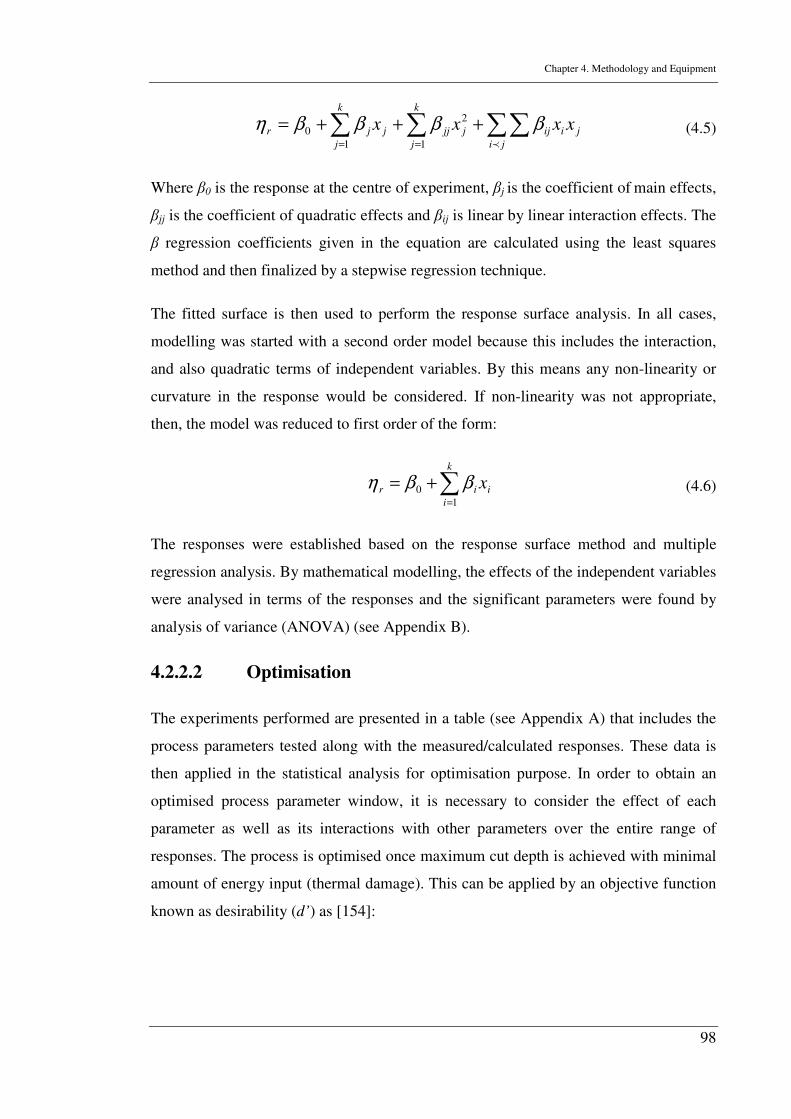
Chapter 4. Methodology and Equipment
98
∑ ∑∑∑==
+++=k
j ji
jiijjjj
k
j
jjr xxxx1
2
1
0
p
ββββη (4.5)
Where β0 is the response at the centre of experiment, βj is the coefficient of main effects,
βjj is the coefficient of quadratic effects and βij is linear by linear interaction effects. The
β regression coefficients given in the equation are calculated using the least squares
method and then finalized by a stepwise regression technique.
The fitted surface is then used to perform the response surface analysis. In all cases,
modelling was started with a second order model because this includes the interaction,
and also quadratic terms of independent variables. By this means any non-linearity or
curvature in the response would be considered. If non-linearity was not appropriate,
then, the model was reduced to first order of the form:
i
k
i
ir x∑=
+=1
0 ββη (4.6)
The responses were established based on the response surface method and multiple
regression analysis. By mathematical modelling, the effects of the independent variables
were analysed in terms of the responses and the significant parameters were found by
analysis of variance (ANOVA) (see Appendix B).
4.2.2.2 Optimisation
The experiments performed are presented in a table (see Appendix A) that includes the
process parameters tested along with the measured/calculated responses. These data is
then applied in the statistical analysis for optimisation purpose. In order to obtain an
optimised process parameter window, it is necessary to consider the effect of each
parameter as well as its interactions with other parameters over the entire range of
responses. The process is optimised once maximum cut depth is achieved with minimal
amount of energy input (thermal damage). This can be applied by an objective function
known as desirability (d’) as [154]:
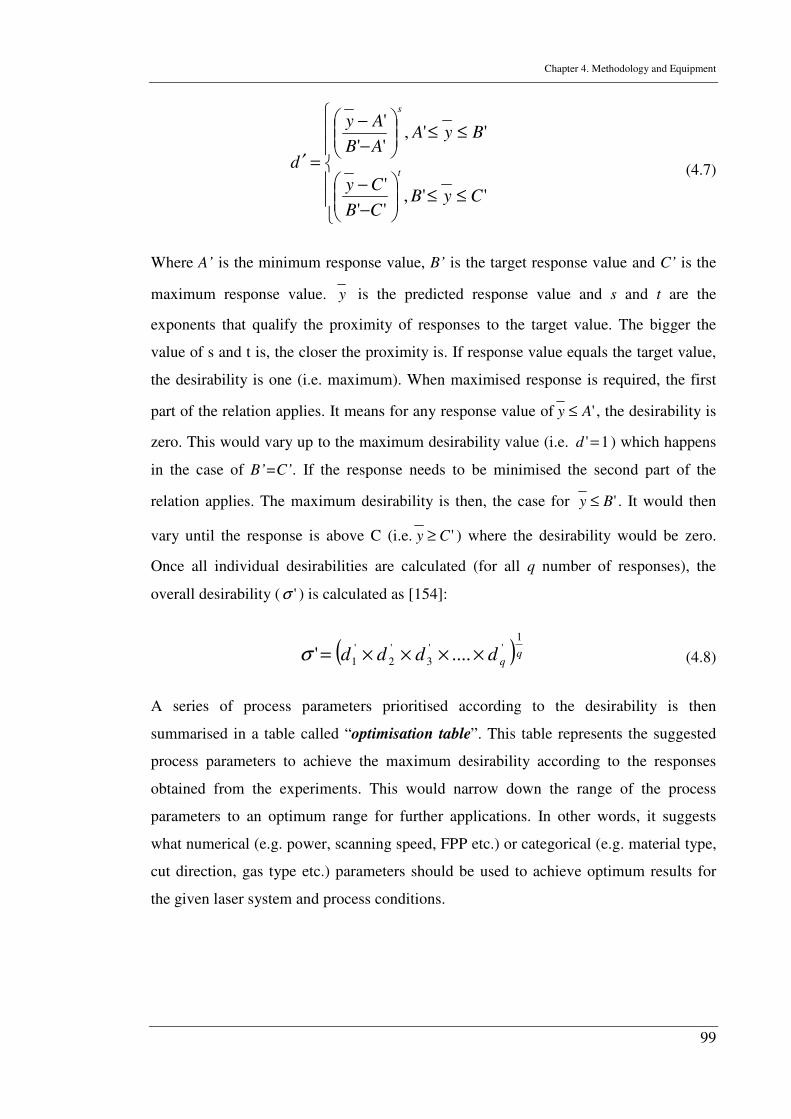
Chapter 4. Methodology and Equipment
99
≤≤
−
−
≤≤
−
−
=′
'',''
'
'',''
'
CyBCB
Cy
ByAAB
Ay
dt
s
(4.7)
Where A’ is the minimum response value, B’ is the target response value and C’ is the
maximum response value. y is the predicted response value and s and t are the
exponents that qualify the proximity of responses to the target value. The bigger the
value of s and t is, the closer the proximity is. If response value equals the target value,
the desirability is one (i.e. maximum). When maximised response is required, the first
part of the relation applies. It means for any response value of 'Ay ≤ , the desirability is
zero. This would vary up to the maximum desirability value (i.e. 1'=d ) which happens
in the case of B’=C’. If the response needs to be minimised the second part of the
relation applies. The maximum desirability is then, the case for 'By ≤ . It would then
vary until the response is above C (i.e. 'Cy ≥ ) where the desirability would be zero.
Once all individual desirabilities are calculated (for all q number of responses), the
overall desirability ( 'σ ) is calculated as [154]:
( )qqdddd
1''
3
'
2
'
1 ....' ××××=σ (4.8)
A series of process parameters prioritised according to the desirability is then
summarised in a table called “optimisation table”. This table represents the suggested
process parameters to achieve the maximum desirability according to the responses
obtained from the experiments. This would narrow down the range of the process
parameters to an optimum range for further applications. In other words, it suggests
what numerical (e.g. power, scanning speed, FPP etc.) or categorical (e.g. material type,
cut direction, gas type etc.) parameters should be used to achieve optimum results for
the given laser system and process conditions.
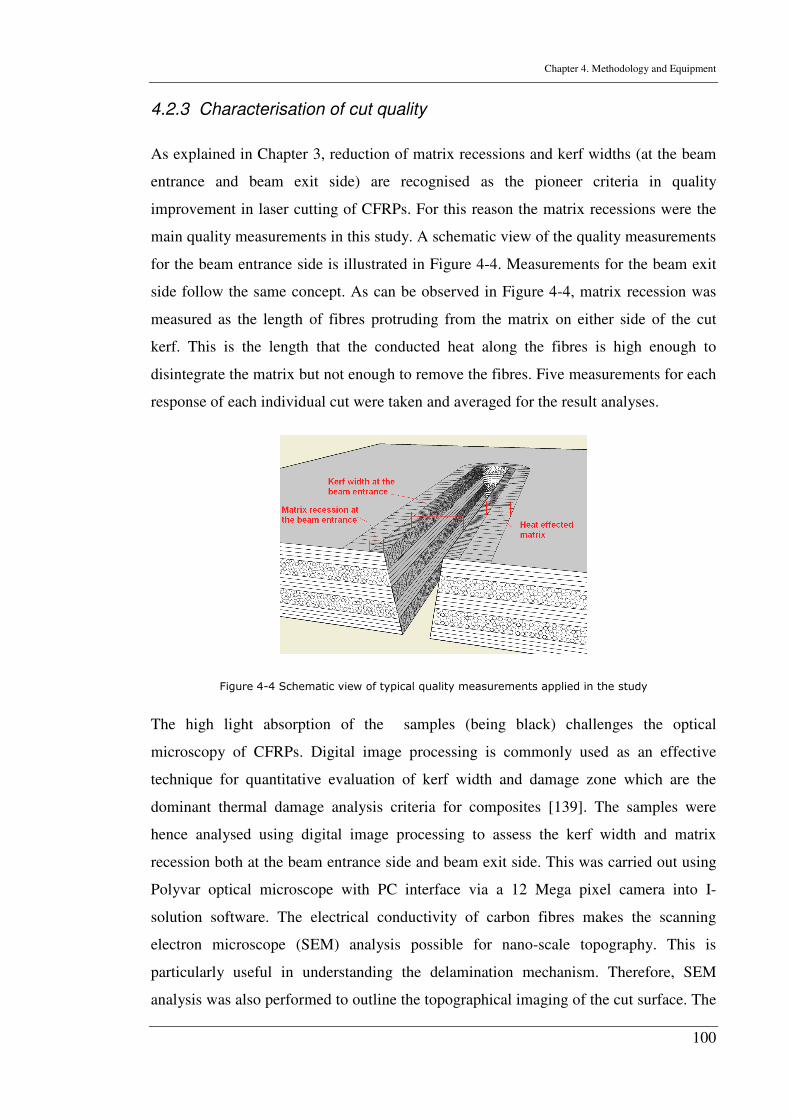
Chapter 4. Methodology and Equipment
100
4.2.3 Characterisation of cut quality
As explained in Chapter 3, reduction of matrix recessions and kerf widths (at the beam
entrance and beam exit side) are recognised as the pioneer criteria in quality
improvement in laser cutting of CFRPs. For this reason the matrix recessions were the
main quality measurements in this study. A schematic view of the quality measurements
for the beam entrance side is illustrated in Figure 4-4. Measurements for the beam exit
side follow the same concept. As can be observed in Figure 4-4, matrix recession was
measured as the length of fibres protruding from the matrix on either side of the cut
kerf. This is the length that the conducted heat along the fibres is high enough to
disintegrate the matrix but not enough to remove the fibres. Five measurements for each
response of each individual cut were taken and averaged for the result analyses.
Figure 4-4 Schematic view of typical quality measurements applied in the study
The high light absorption of the samples (being black) challenges the optical
microscopy of CFRPs. Digital image processing is commonly used as an effective
technique for quantitative evaluation of kerf width and damage zone which are the
dominant thermal damage analysis criteria for composites [139]. The samples were
hence analysed using digital image processing to assess the kerf width and matrix
recession both at the beam entrance side and beam exit side. This was carried out using
Polyvar optical microscope with PC interface via a 12 Mega pixel camera into I-
solution software. The electrical conductivity of carbon fibres makes the scanning
electron microscope (SEM) analysis possible for nano-scale topography. This is
particularly useful in understanding the delamination mechanism. Therefore, SEM
analysis was also performed to outline the topographical imaging of the cut surface. The
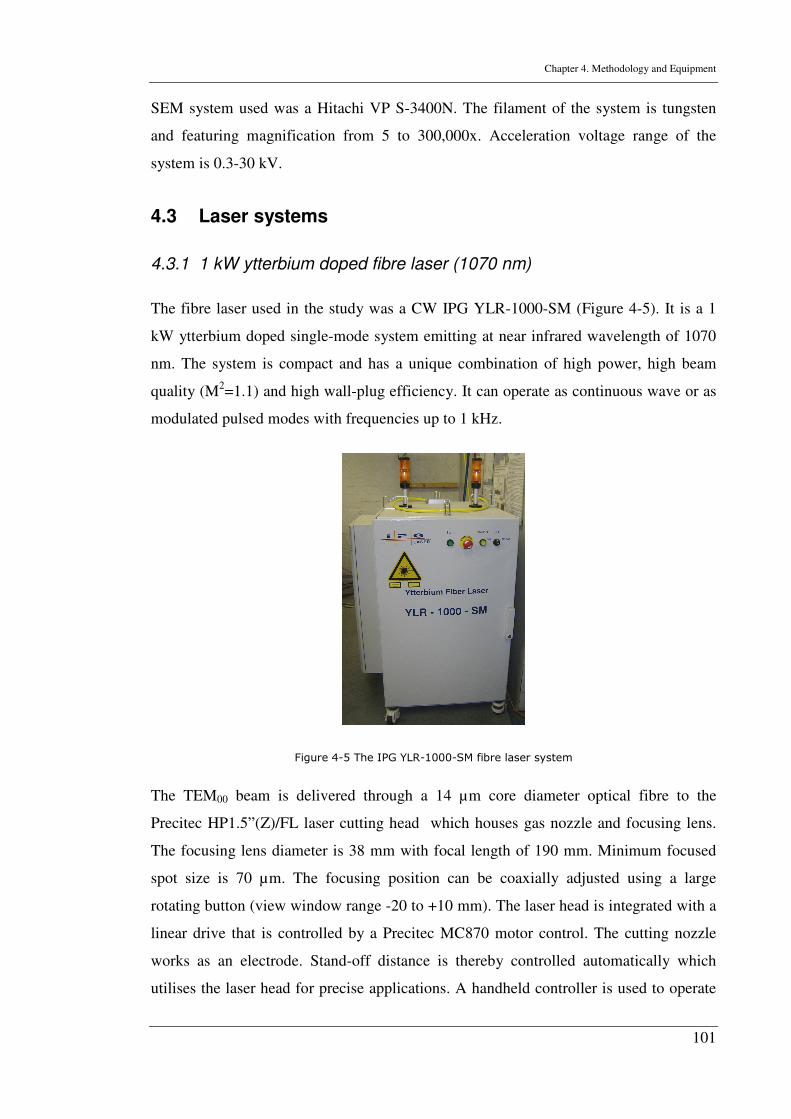
Chapter 4. Methodology and Equipment
101
SEM system used was a Hitachi VP S-3400N. The filament of the system is tungsten
and featuring magnification from 5 to 300,000x. Acceleration voltage range of the
system is 0.3-30 kV.
4.3 Laser systems
4.3.1 1 kW ytterbium doped fibre laser (1070 nm)
The fibre laser used in the study was a CW IPG YLR-1000-SM (Figure 4-5). It is a 1
kW ytterbium doped single-mode system emitting at near infrared wavelength of 1070
nm. The system is compact and has a unique combination of high power, high beam
quality (M2=1.1) and high wall-plug efficiency. It can operate as continuous wave or as
modulated pulsed modes with frequencies up to 1 kHz.
Figure 4-5 The IPG YLR-1000-SM fibre laser system
The TEM00 beam is delivered through a 14 µm core diameter optical fibre to the
Precitec HP1.5”(Z)/FL laser cutting head which houses gas nozzle and focusing lens.
The focusing lens diameter is 38 mm with focal length of 190 mm. Minimum focused
spot size is 70 µm. The focusing position can be coaxially adjusted using a large
rotating button (view window range -20 to +10 mm). The laser head is integrated with a
linear drive that is controlled by a Precitec MC870 motor control. The cutting nozzle
works as an electrode. Stand-off distance is thereby controlled automatically which
utilises the laser head for precise applications. A handheld controller is used to operate
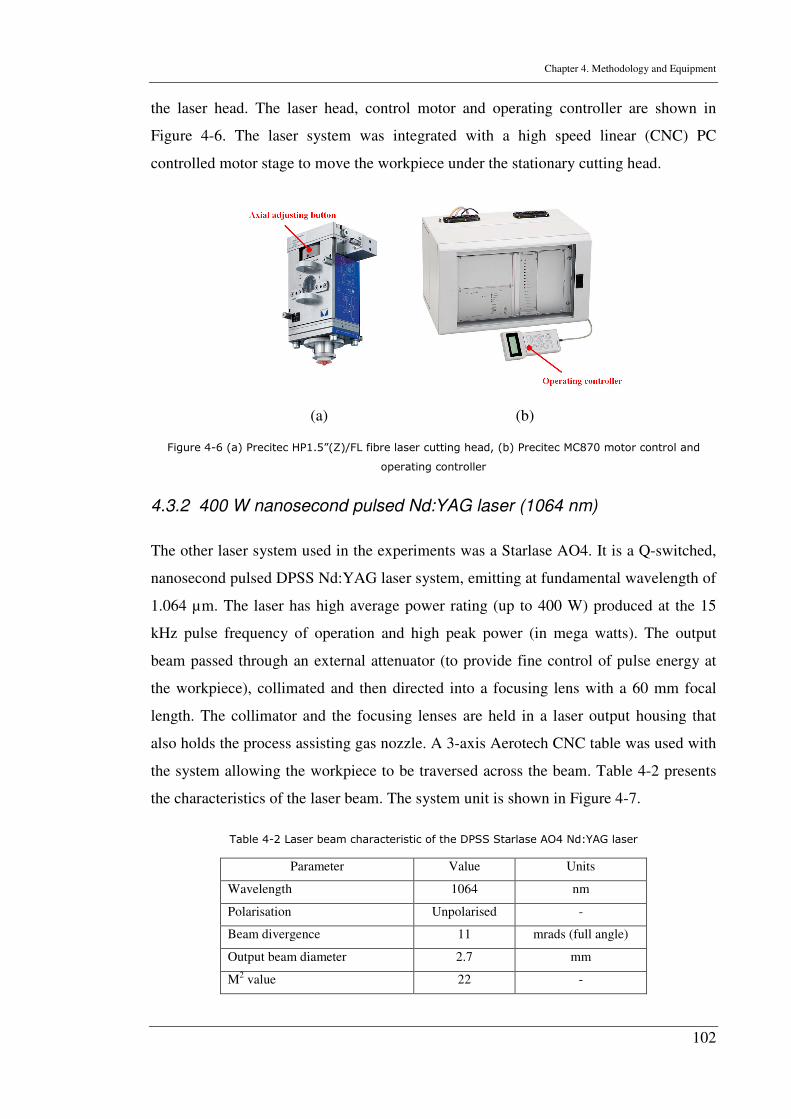
Chapter 4. Methodology and Equipment
102
the laser head. The laser head, control motor and operating controller are shown in
Figure 4-6. The laser system was integrated with a high speed linear (CNC) PC
controlled motor stage to move the workpiece under the stationary cutting head.
(a) (b)
Figure 4-6 (a) Precitec HP1.5”(Z)/FL fibre laser cutting head, (b) Precitec MC870 motor control and
operating controller
4.3.2 400 W nanosecond pulsed Nd:YAG laser (1064 nm)
The other laser system used in the experiments was a Starlase AO4. It is a Q-switched,
nanosecond pulsed DPSS Nd:YAG laser system, emitting at fundamental wavelength of
1.064 µm. The laser has high average power rating (up to 400 W) produced at the 15
kHz pulse frequency of operation and high peak power (in mega watts). The output
beam passed through an external attenuator (to provide fine control of pulse energy at
the workpiece), collimated and then directed into a focusing lens with a 60 mm focal
length. The collimator and the focusing lenses are held in a laser output housing that
also holds the process assisting gas nozzle. A 3-axis Aerotech CNC table was used with
the system allowing the workpiece to be traversed across the beam. Table 4-2 presents
the characteristics of the laser beam. The system unit is shown in Figure 4-7.
Table 4-2 Laser beam characteristic of the DPSS Starlase AO4 Nd:YAG laser
Parameter Value Units
Wavelength 1064 nm
Polarisation Unpolarised -
Beam divergence 11 mrads (full angle)
Output beam diameter 2.7 mm
M2 value 22 -
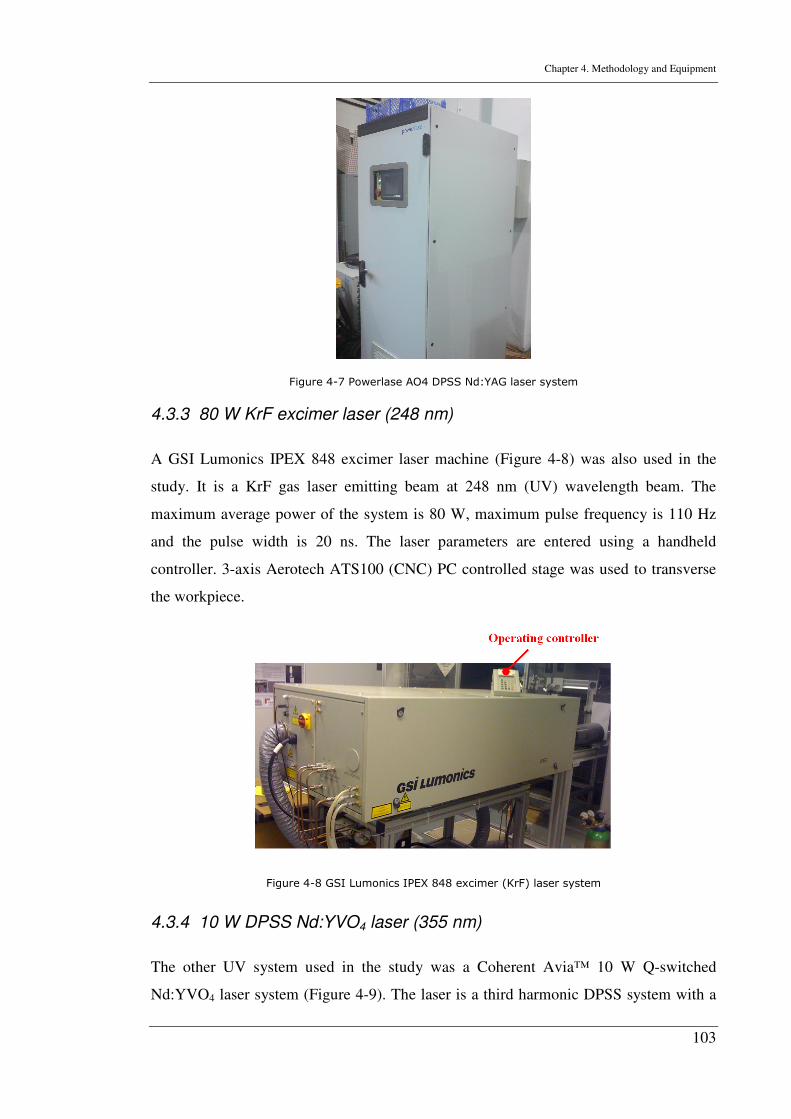
Chapter 4. Methodology and Equipment
103
Figure 4-7 Powerlase AO4 DPSS Nd:YAG laser system
4.3.3 80 W KrF excimer laser (248 nm)
A GSI Lumonics IPEX 848 excimer laser machine (Figure 4-8) was also used in the
study. It is a KrF gas laser emitting beam at 248 nm (UV) wavelength beam. The
maximum average power of the system is 80 W, maximum pulse frequency is 110 Hz
and the pulse width is 20 ns. The laser parameters are entered using a handheld
controller. 3-axis Aerotech ATS100 (CNC) PC controlled stage was used to transverse
the workpiece.
Figure 4-8 GSI Lumonics IPEX 848 excimer (KrF) laser system
4.3.4 10 W DPSS Nd:YVO4 laser (355 nm)
The other UV system used in the study was a Coherent Avia™ 10 W Q-switched
Nd:YVO4 laser system (Figure 4-9). The laser is a third harmonic DPSS system with a
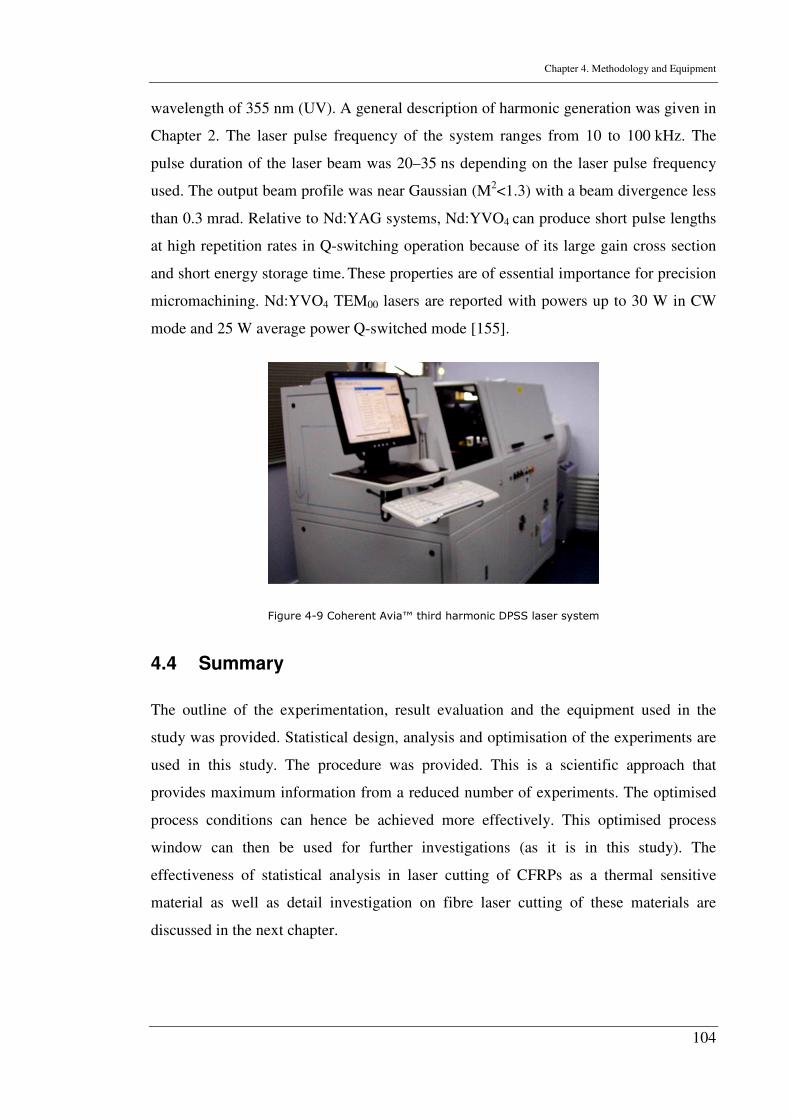
Chapter 4. Methodology and Equipment
104
wavelength of 355 nm (UV). A general description of harmonic generation was given in
Chapter 2. The laser pulse frequency of the system ranges from 10 to 100 kHz. The
pulse duration of the laser beam was 20–35 ns depending on the laser pulse frequency
used. The output beam profile was near Gaussian (M2<1.3) with a beam divergence less
than 0.3 mrad. Relative to Nd:YAG systems, Nd:YVO4 can produce short pulse lengths
at high repetition rates in Q-switching operation because of its large gain cross section
and short energy storage time. These properties are of essential importance for precision
micromachining. Nd:YVO4 TEM00 lasers are reported with powers up to 30 W in CW
mode and 25 W average power Q-switched mode [155].
Figure 4-9 Coherent Avia™ third harmonic DPSS laser system
4.4 Summary
The outline of the experimentation, result evaluation and the equipment used in the
study was provided. Statistical design, analysis and optimisation of the experiments are
used in this study. The procedure was provided. This is a scientific approach that
provides maximum information from a reduced number of experiments. The optimised
process conditions can hence be achieved more effectively. This optimised process
window can then be used for further investigations (as it is in this study). The
effectiveness of statistical analysis in laser cutting of CFRPs as a thermal sensitive
material as well as detail investigation on fibre laser cutting of these materials are
discussed in the next chapter.
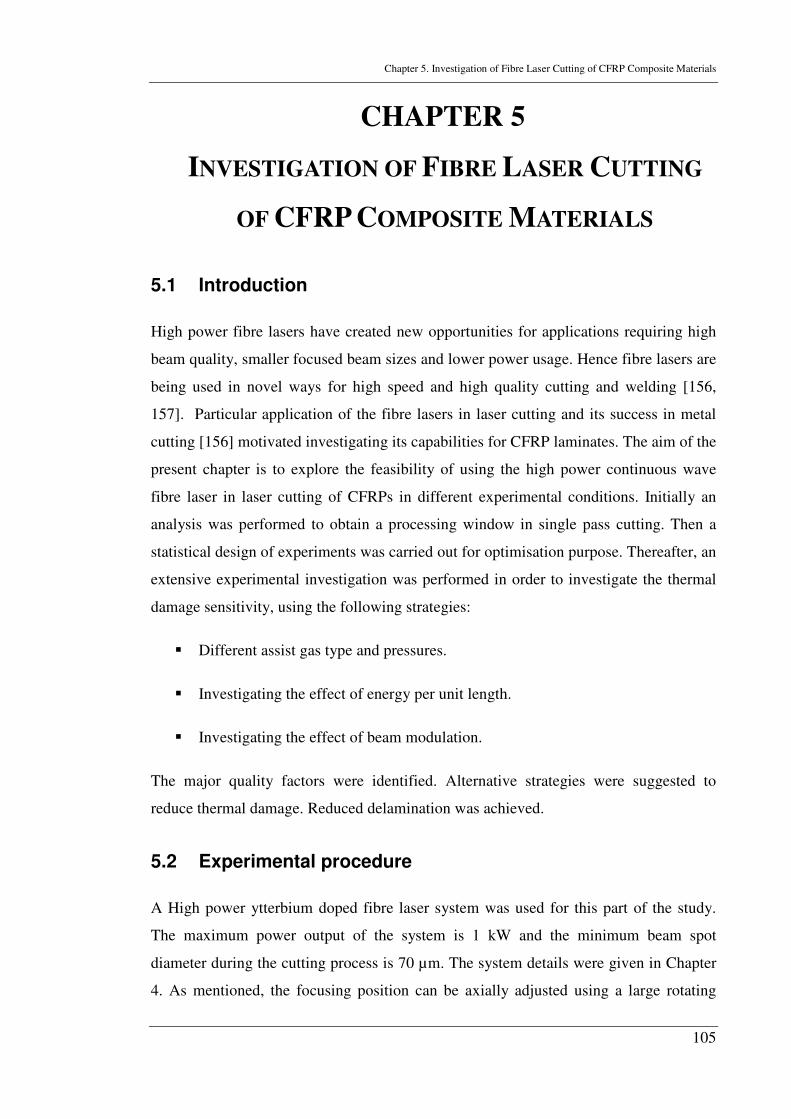
Chapter 5. Investigation of Fibre Laser Cutting of CFRP Composite Materials
105
CHAPTER 5
INVESTIGATION OF FIBRE LASER CUTTING
OF CFRP COMPOSITE MATERIALS
5.1 Introduction
High power fibre lasers have created new opportunities for applications requiring high
beam quality, smaller focused beam sizes and lower power usage. Hence fibre lasers are
being used in novel ways for high speed and high quality cutting and welding [156,
157]. Particular application of the fibre lasers in laser cutting and its success in metal
cutting [156] motivated investigating its capabilities for CFRP laminates. The aim of the
present chapter is to explore the feasibility of using the high power continuous wave
fibre laser in laser cutting of CFRPs in different experimental conditions. Initially an
analysis was performed to obtain a processing window in single pass cutting. Then a
statistical design of experiments was carried out for optimisation purpose. Thereafter, an
extensive experimental investigation was performed in order to investigate the thermal
damage sensitivity, using the following strategies:
� Different assist gas type and pressures.
� Investigating the effect of energy per unit length.
� Investigating the effect of beam modulation.
The major quality factors were identified. Alternative strategies were suggested to
reduce thermal damage. Reduced delamination was achieved.
5.2 Experimental procedure
A High power ytterbium doped fibre laser system was used for this part of the study.
The maximum power output of the system is 1 kW and the minimum beam spot
diameter during the cutting process is 70 µm. The system details were given in Chapter
4. As mentioned, the focusing position can be axially adjusted using a large rotating
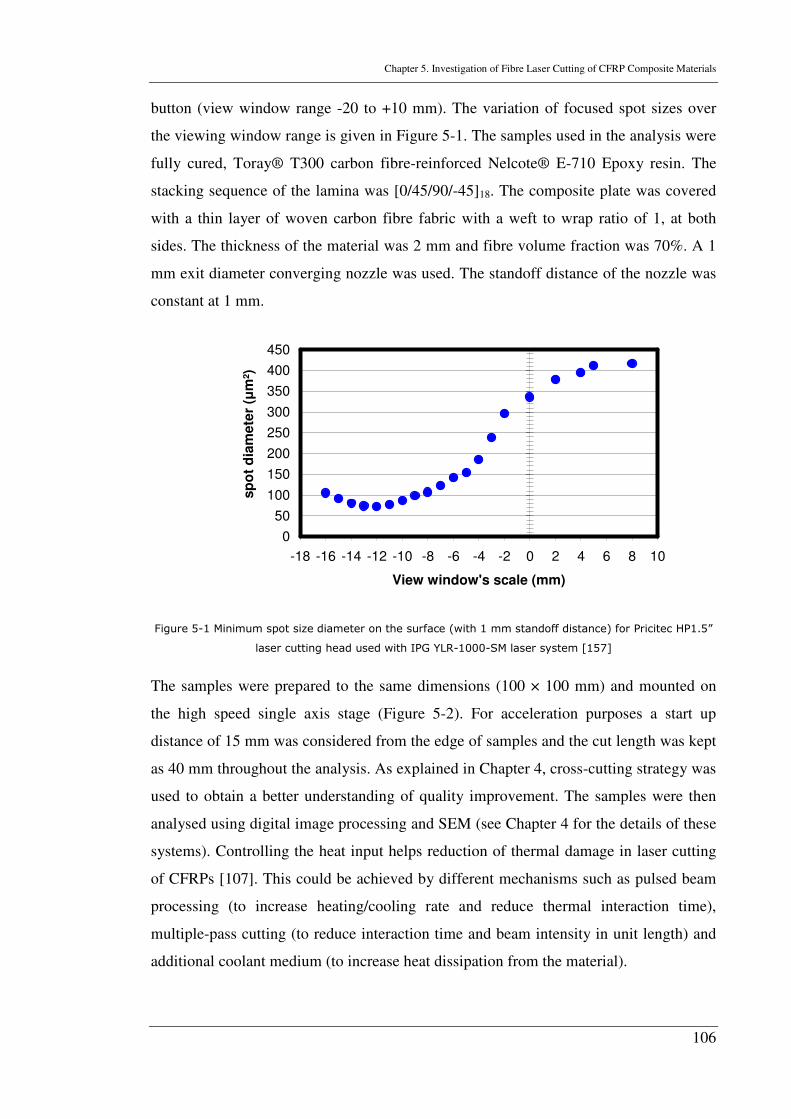
Chapter 5. Investigation of Fibre Laser Cutting of CFRP Composite Materials
106
button (view window range -20 to +10 mm). The variation of focused spot sizes over
the viewing window range is given in Figure 5-1. The samples used in the analysis were
fully cured, Toray® T300 carbon fibre-reinforced Nelcote® E-710 Epoxy resin. The
stacking sequence of the lamina was [0/45/90/-45]18. The composite plate was covered
with a thin layer of woven carbon fibre fabric with a weft to wrap ratio of 1, at both
sides. The thickness of the material was 2 mm and fibre volume fraction was 70%. A 1
mm exit diameter converging nozzle was used. The standoff distance of the nozzle was
constant at 1 mm.
0
50
100
150
200
250
300
350
400
450
-18 -16 -14 -12 -10 -8 -6 -4 -2 0 2 4 6 8 10
View window's scale (mm)
sp
ot
dia
mete
r (µ
m²)
Figure 5-1 Minimum spot size diameter on the surface (with 1 mm standoff distance) for Pricitec HP1.5”
laser cutting head used with IPG YLR-1000-SM laser system [157]
The samples were prepared to the same dimensions (100 × 100 mm) and mounted on
the high speed single axis stage (Figure 5-2). For acceleration purposes a start up
distance of 15 mm was considered from the edge of samples and the cut length was kept
as 40 mm throughout the analysis. As explained in Chapter 4, cross-cutting strategy was
used to obtain a better understanding of quality improvement. The samples were then
analysed using digital image processing and SEM (see Chapter 4 for the details of these
systems). Controlling the heat input helps reduction of thermal damage in laser cutting
of CFRPs [107]. This could be achieved by different mechanisms such as pulsed beam
processing (to increase heating/cooling rate and reduce thermal interaction time),
multiple-pass cutting (to reduce interaction time and beam intensity in unit length) and
additional coolant medium (to increase heat dissipation from the material).
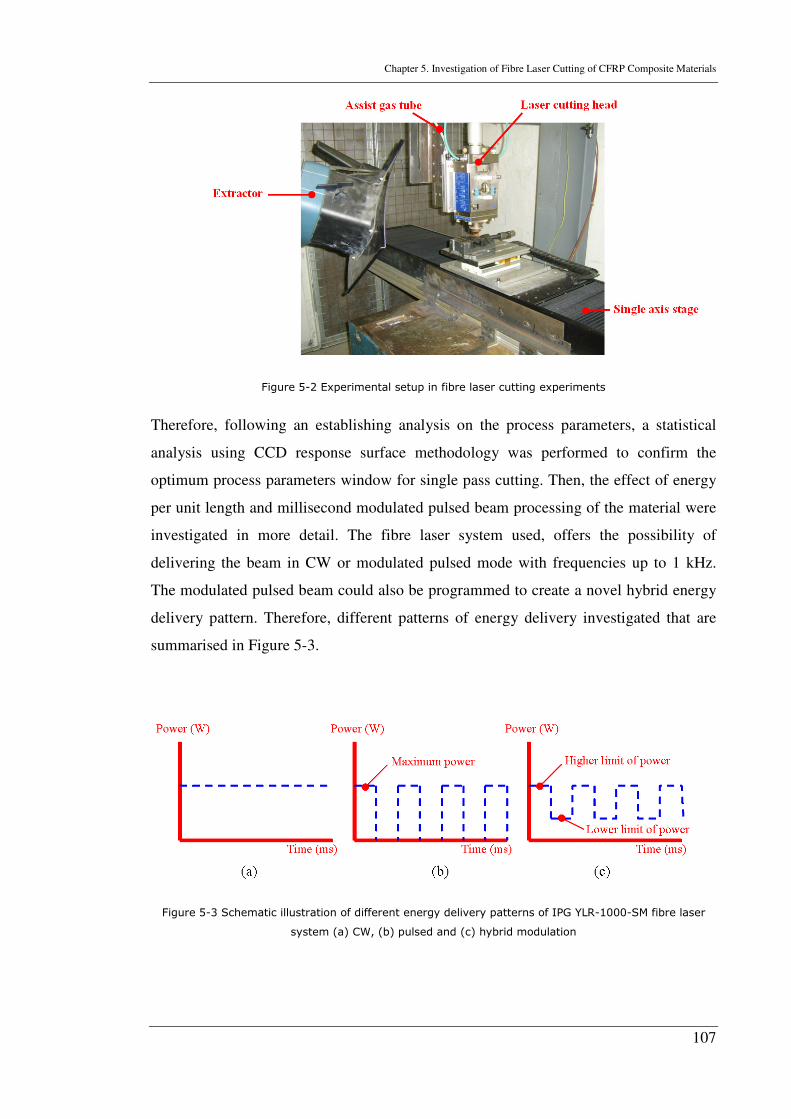
Chapter 5. Investigation of Fibre Laser Cutting of CFRP Composite Materials
107
Figure 5-2 Experimental setup in fibre laser cutting experiments
Therefore, following an establishing analysis on the process parameters, a statistical
analysis using CCD response surface methodology was performed to confirm the
optimum process parameters window for single pass cutting. Then, the effect of energy
per unit length and millisecond modulated pulsed beam processing of the material were
investigated in more detail. The fibre laser system used, offers the possibility of
delivering the beam in CW or modulated pulsed mode with frequencies up to 1 kHz.
The modulated pulsed beam could also be programmed to create a novel hybrid energy
delivery pattern. Therefore, different patterns of energy delivery investigated that are
summarised in Figure 5-3.
Figure 5-3 Schematic illustration of different energy delivery patterns of IPG YLR-1000-SM fibre laser
system (a) CW, (b) pulsed and (c) hybrid modulation
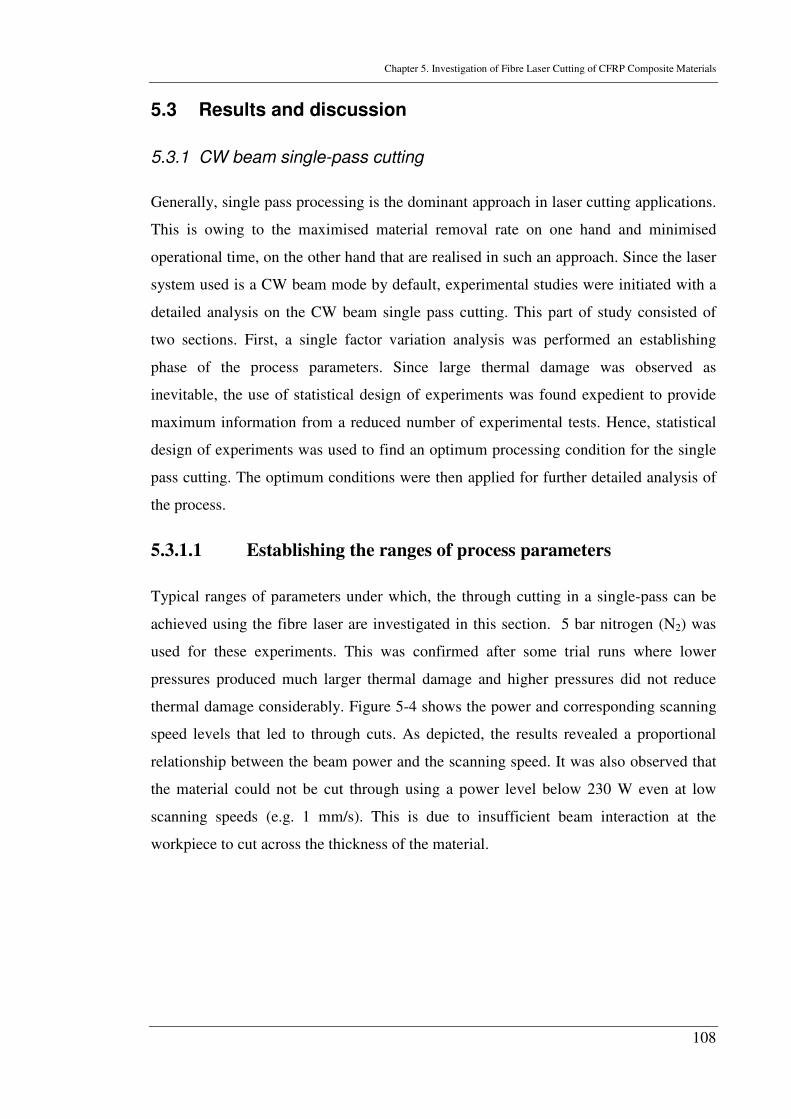
Chapter 5. Investigation of Fibre Laser Cutting of CFRP Composite Materials
108
5.3 Results and discussion
5.3.1 CW beam single-pass cutting
Generally, single pass processing is the dominant approach in laser cutting applications.
This is owing to the maximised material removal rate on one hand and minimised
operational time, on the other hand that are realised in such an approach. Since the laser
system used is a CW beam mode by default, experimental studies were initiated with a
detailed analysis on the CW beam single pass cutting. This part of study consisted of
two sections. First, a single factor variation analysis was performed an establishing
phase of the process parameters. Since large thermal damage was observed as
inevitable, the use of statistical design of experiments was found expedient to provide
maximum information from a reduced number of experimental tests. Hence, statistical
design of experiments was used to find an optimum processing condition for the single
pass cutting. The optimum conditions were then applied for further detailed analysis of
the process.
5.3.1.1 Establishing the ranges of process parameters
Typical ranges of parameters under which, the through cutting in a single-pass can be
achieved using the fibre laser are investigated in this section. 5 bar nitrogen (N2) was
used for these experiments. This was confirmed after some trial runs where lower
pressures produced much larger thermal damage and higher pressures did not reduce
thermal damage considerably. Figure 5-4 shows the power and corresponding scanning
speed levels that led to through cuts. As depicted, the results revealed a proportional
relationship between the beam power and the scanning speed. It was also observed that
the material could not be cut through using a power level below 230 W even at low
scanning speeds (e.g. 1 mm/s). This is due to insufficient beam interaction at the
workpiece to cut across the thickness of the material.
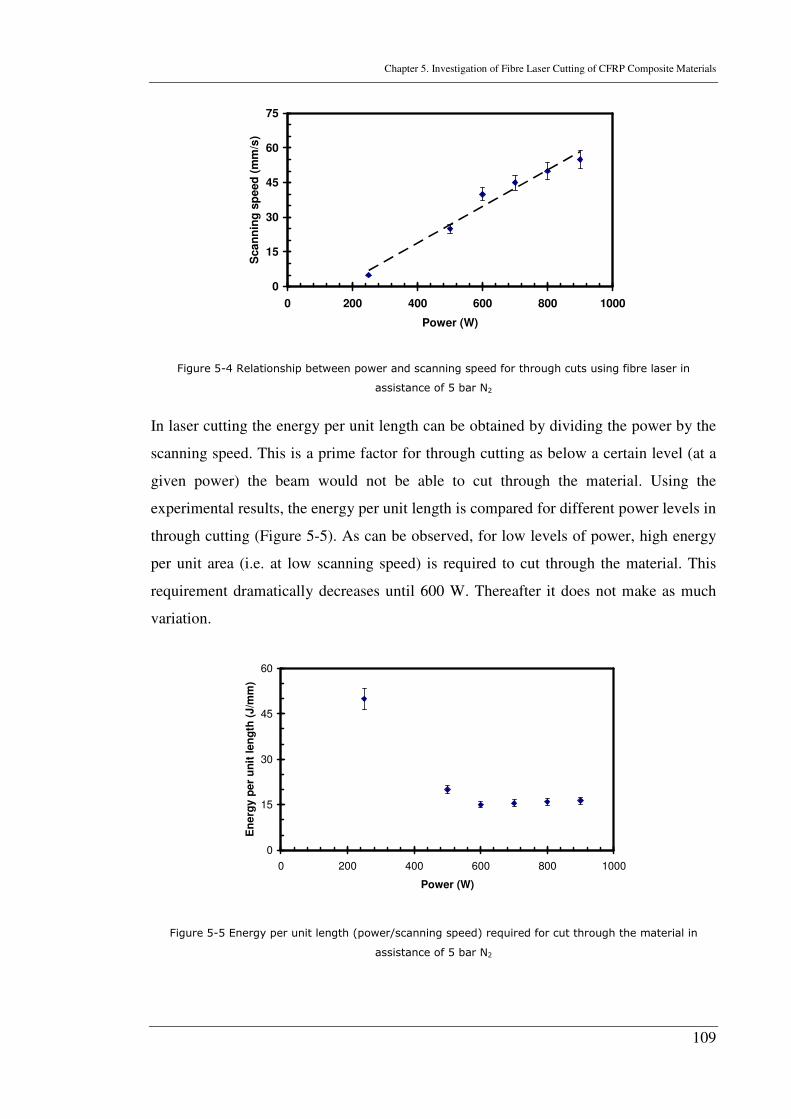
Chapter 5. Investigation of Fibre Laser Cutting of CFRP Composite Materials
109
0
15
30
45
60
75
0 200 400 600 800 1000
Power (W)
Sca
nn
ing
sp
eed
(m
m/s
)
Figure 5-4 Relationship between power and scanning speed for through cuts using fibre laser in
assistance of 5 bar N2
In laser cutting the energy per unit length can be obtained by dividing the power by the
scanning speed. This is a prime factor for through cutting as below a certain level (at a
given power) the beam would not be able to cut through the material. Using the
experimental results, the energy per unit length is compared for different power levels in
through cutting (Figure 5-5). As can be observed, for low levels of power, high energy
per unit area (i.e. at low scanning speed) is required to cut through the material. This
requirement dramatically decreases until 600 W. Thereafter it does not make as much
variation.
0
15
30
45
60
0 200 400 600 800 1000
Power (W)
En
erg
y p
er
un
it l
en
gth
(J
/mm
)
Figure 5-5 Energy per unit length (power/scanning speed) required for cut through the material in
assistance of 5 bar N2
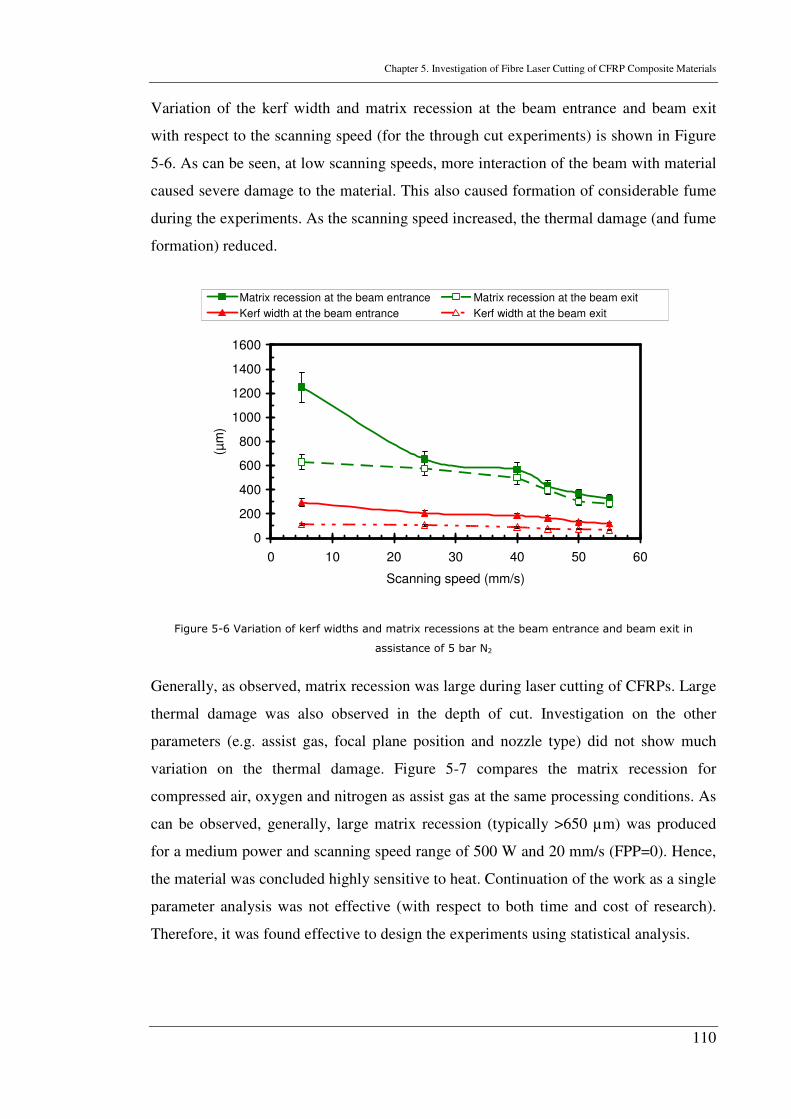
Chapter 5. Investigation of Fibre Laser Cutting of CFRP Composite Materials
110
Variation of the kerf width and matrix recession at the beam entrance and beam exit
with respect to the scanning speed (for the through cut experiments) is shown in Figure
5-6. As can be seen, at low scanning speeds, more interaction of the beam with material
caused severe damage to the material. This also caused formation of considerable fume
during the experiments. As the scanning speed increased, the thermal damage (and fume
formation) reduced.
0
200
400
600
800
1000
1200
1400
1600
0 10 20 30 40 50 60
Scanning speed (mm/s)
(µm
)
Matrix recession at the beam entrance Matrix recession at the beam exit
Kerf width at the beam entrance Kerf width at the beam exit
Figure 5-6 Variation of kerf widths and matrix recessions at the beam entrance and beam exit in
assistance of 5 bar N2
Generally, as observed, matrix recession was large during laser cutting of CFRPs. Large
thermal damage was also observed in the depth of cut. Investigation on the other
parameters (e.g. assist gas, focal plane position and nozzle type) did not show much
variation on the thermal damage. Figure 5-7 compares the matrix recession for
compressed air, oxygen and nitrogen as assist gas at the same processing conditions. As
can be observed, generally, large matrix recession (typically >650 µm) was produced
for a medium power and scanning speed range of 500 W and 20 mm/s (FPP=0). Hence,
the material was concluded highly sensitive to heat. Continuation of the work as a single
parameter analysis was not effective (with respect to both time and cost of research).
Therefore, it was found effective to design the experiments using statistical analysis.
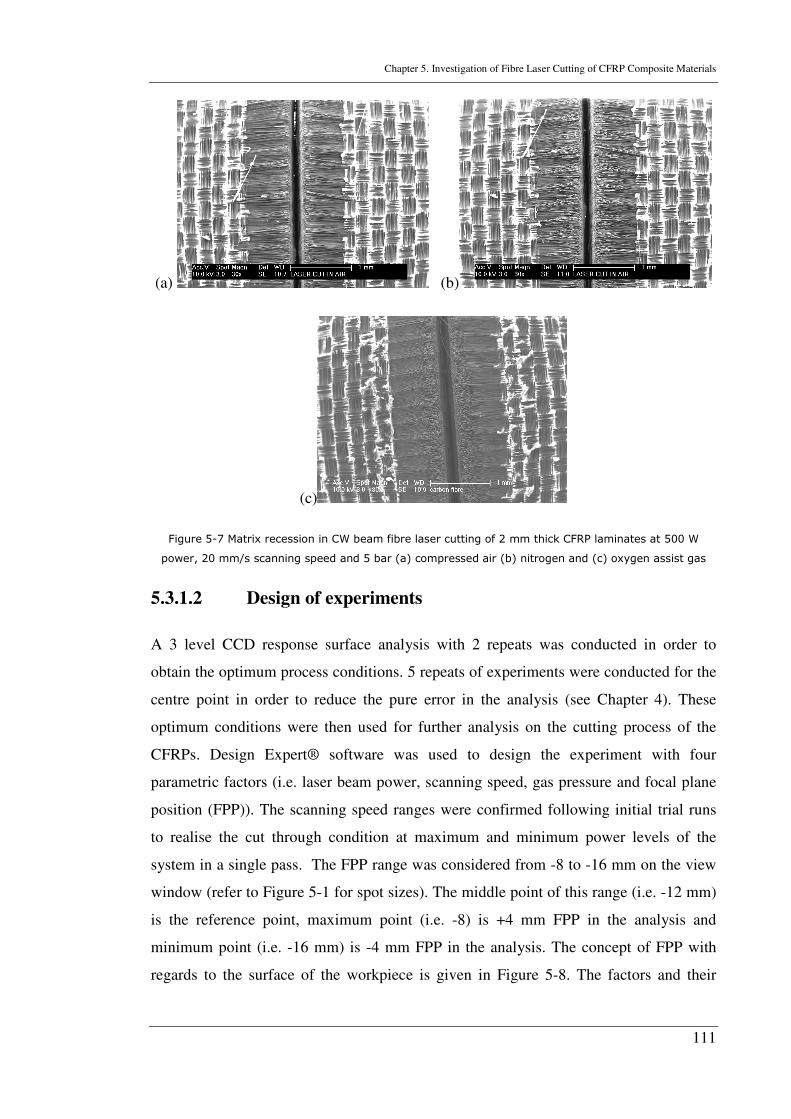
Chapter 5. Investigation of Fibre Laser Cutting of CFRP Composite Materials
111
(a) (b)
(c)
Figure 5-7 Matrix recession in CW beam fibre laser cutting of 2 mm thick CFRP laminates at 500 W
power, 20 mm/s scanning speed and 5 bar (a) compressed air (b) nitrogen and (c) oxygen assist gas
5.3.1.2 Design of experiments
A 3 level CCD response surface analysis with 2 repeats was conducted in order to
obtain the optimum process conditions. 5 repeats of experiments were conducted for the
centre point in order to reduce the pure error in the analysis (see Chapter 4). These
optimum conditions were then used for further analysis on the cutting process of the
CFRPs. Design Expert® software was used to design the experiment with four
parametric factors (i.e. laser beam power, scanning speed, gas pressure and focal plane
position (FPP)). The scanning speed ranges were confirmed following initial trial runs
to realise the cut through condition at maximum and minimum power levels of the
system in a single pass. The FPP range was considered from -8 to -16 mm on the view
window (refer to Figure 5-1 for spot sizes). The middle point of this range (i.e. -12 mm)
is the reference point, maximum point (i.e. -8) is +4 mm FPP in the analysis and
minimum point (i.e. -16 mm) is -4 mm FPP in the analysis. The concept of FPP with
regards to the surface of the workpiece is given in Figure 5-8. The factors and their
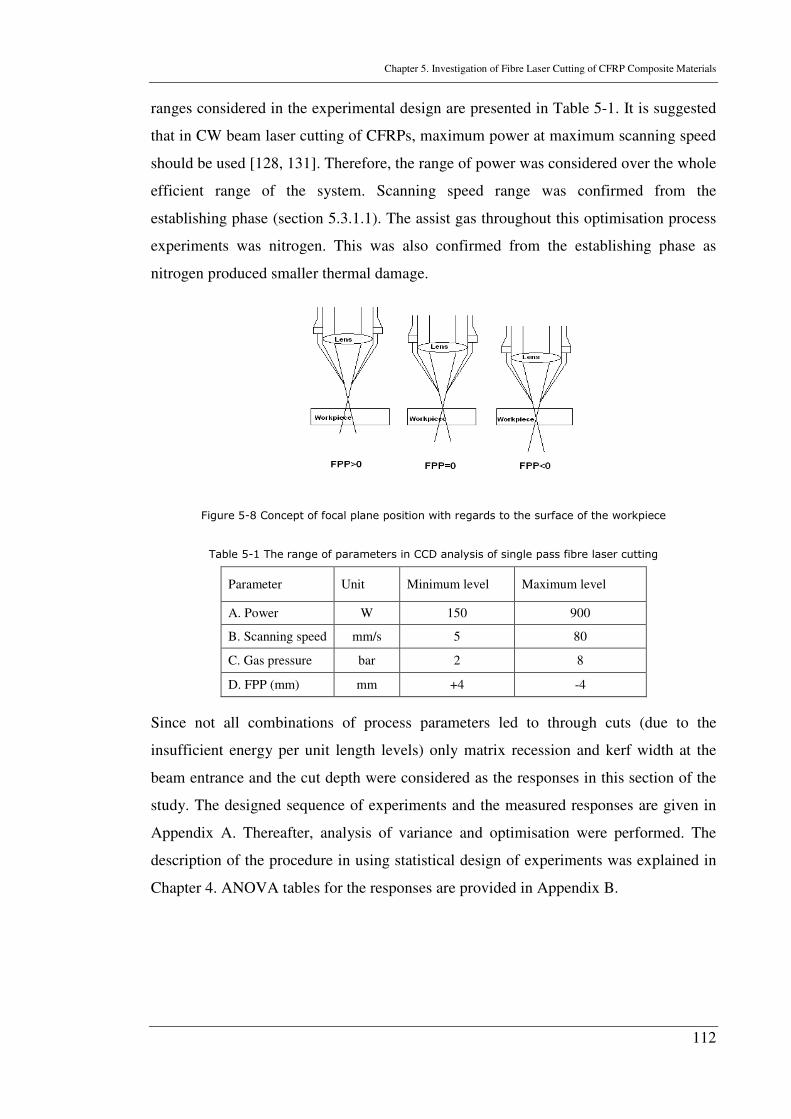
Chapter 5. Investigation of Fibre Laser Cutting of CFRP Composite Materials
112
ranges considered in the experimental design are presented in Table 5-1. It is suggested
that in CW beam laser cutting of CFRPs, maximum power at maximum scanning speed
should be used [128, 131]. Therefore, the range of power was considered over the whole
efficient range of the system. Scanning speed range was confirmed from the
establishing phase (section 5.3.1.1). The assist gas throughout this optimisation process
experiments was nitrogen. This was also confirmed from the establishing phase as
nitrogen produced smaller thermal damage.
Figure 5-8 Concept of focal plane position with regards to the surface of the workpiece
Table 5-1 The range of parameters in CCD analysis of single pass fibre laser cutting
Parameter Unit Minimum level Maximum level
A. Power W 150 900
B. Scanning speed mm/s 5 80
C. Gas pressure bar 2 8
D. FPP (mm) mm +4 -4
Since not all combinations of process parameters led to through cuts (due to the
insufficient energy per unit length levels) only matrix recession and kerf width at the
beam entrance and the cut depth were considered as the responses in this section of the
study. The designed sequence of experiments and the measured responses are given in
Appendix A. Thereafter, analysis of variance and optimisation were performed. The
description of the procedure in using statistical design of experiments was explained in
Chapter 4. ANOVA tables for the responses are provided in Appendix B.
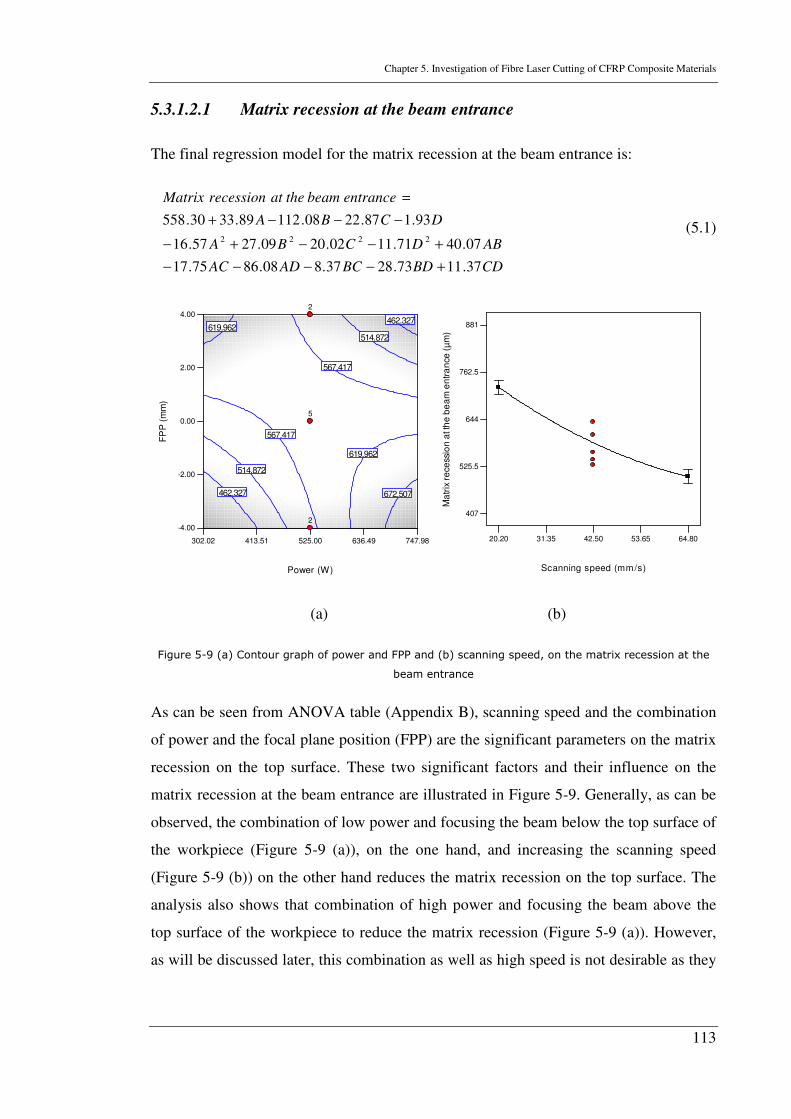
Chapter 5. Investigation of Fibre Laser Cutting of CFRP Composite Materials
113
5.3.1.2.1 Matrix recession at the beam entrance
The final regression model for the matrix recession at the beam entrance is:
CDBDBCADAC
ABDCBA
DCBA
entrancebeamtheatrecessionMatrix
37.1173.2837.808.8675.17
07.4071.1102.2009.2757.16
93.187.2208.11289.3330.5582222
+−−−−
+−−+−
−−−+
=
(5.1)
Power (W)
FP
P (
mm
)
302.02 413.51 525.00 636.49 747.98
-4.00
-2.00
0.00
2.00
4.00
462.327
462.327
514.872
514.872
567.417
567.417
619.962
619.962
672.507
2
2
5
20.20 31.35 42.50 53.65 64.80
407
525.5
644
762.5
881
Scanning speed (mm/s)
Ma
trix
re
cess
ion
at t
he
be
am
en
tra
nce
(µ
m)
(a) (b)
Figure 5-9 (a) Contour graph of power and FPP and (b) scanning speed, on the matrix recession at the
beam entrance
As can be seen from ANOVA table (Appendix B), scanning speed and the combination
of power and the focal plane position (FPP) are the significant parameters on the matrix
recession on the top surface. These two significant factors and their influence on the
matrix recession at the beam entrance are illustrated in Figure 5-9. Generally, as can be
observed, the combination of low power and focusing the beam below the top surface of
the workpiece (Figure 5-9 (a)), on the one hand, and increasing the scanning speed
(Figure 5-9 (b)) on the other hand reduces the matrix recession on the top surface. The
analysis also shows that combination of high power and focusing the beam above the
top surface of the workpiece to reduce the matrix recession (Figure 5-9 (a)). However,
as will be discussed later, this combination as well as high speed is not desirable as they
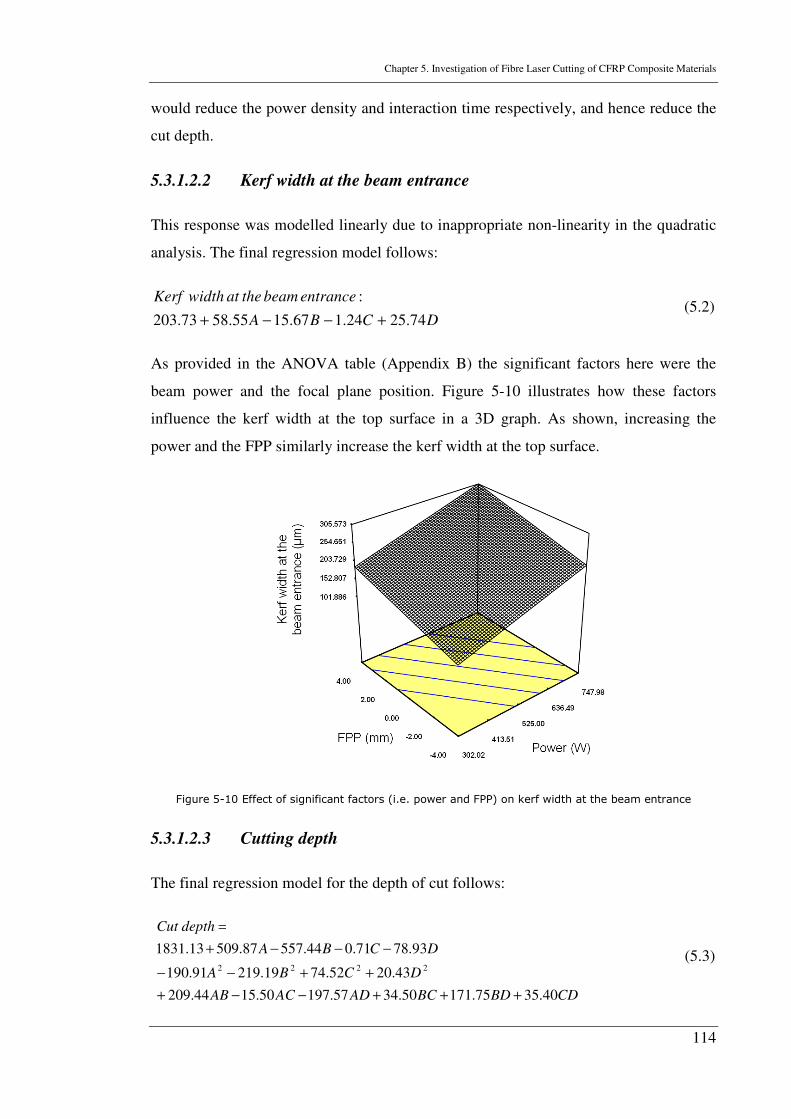
Chapter 5. Investigation of Fibre Laser Cutting of CFRP Composite Materials
114
would reduce the power density and interaction time respectively, and hence reduce the
cut depth.
5.3.1.2.2 Kerf width at the beam entrance
This response was modelled linearly due to inappropriate non-linearity in the quadratic
analysis. The final regression model follows:
DCBA
entrancebeamtheatwidthKerf
74.2524.167.1555.5873.203
:
+−−+ (5.2)
As provided in the ANOVA table (Appendix B) the significant factors here were the
beam power and the focal plane position. Figure 5-10 illustrates how these factors
influence the kerf width at the top surface in a 3D graph. As shown, increasing the
power and the FPP similarly increase the kerf width at the top surface.
Figure 5-10 Effect of significant factors (i.e. power and FPP) on kerf width at the beam entrance
5.3.1.2.3 Cutting depth
The final regression model for the depth of cut follows:
CDBDBCADACAB
DCBA
DCBA
depthCut
40.3575.17150.3457.19750.1544.209
43.2052.7419.21991.190
93.7871.044.55787.50913.18312222
+++−−+
++−−
−−−+
=
(5.3)
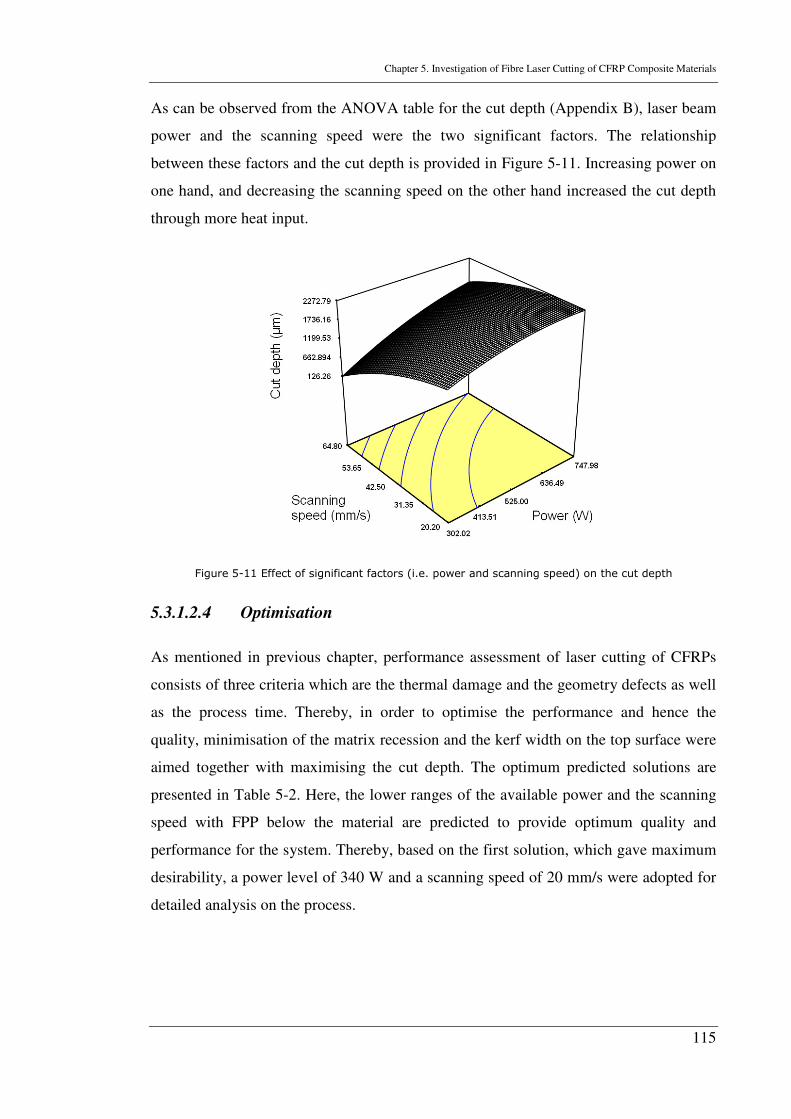
Chapter 5. Investigation of Fibre Laser Cutting of CFRP Composite Materials
115
As can be observed from the ANOVA table for the cut depth (Appendix B), laser beam
power and the scanning speed were the two significant factors. The relationship
between these factors and the cut depth is provided in Figure 5-11. Increasing power on
one hand, and decreasing the scanning speed on the other hand increased the cut depth
through more heat input.
Figure 5-11 Effect of significant factors (i.e. power and scanning speed) on the cut depth
5.3.1.2.4 Optimisation
As mentioned in previous chapter, performance assessment of laser cutting of CFRPs
consists of three criteria which are the thermal damage and the geometry defects as well
as the process time. Thereby, in order to optimise the performance and hence the
quality, minimisation of the matrix recession and the kerf width on the top surface were
aimed together with maximising the cut depth. The optimum predicted solutions are
presented in Table 5-2. Here, the lower ranges of the available power and the scanning
speed with FPP below the material are predicted to provide optimum quality and
performance for the system. Thereby, based on the first solution, which gave maximum
desirability, a power level of 340 W and a scanning speed of 20 mm/s were adopted for
detailed analysis on the process.
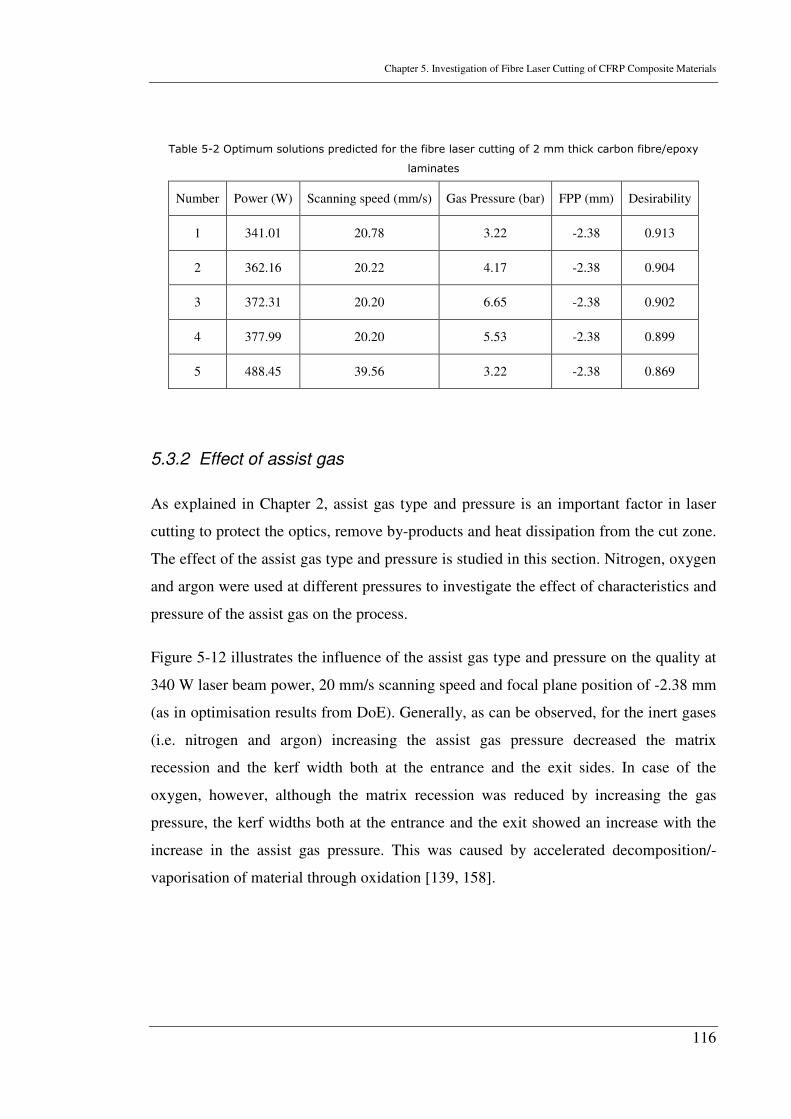
Chapter 5. Investigation of Fibre Laser Cutting of CFRP Composite Materials
116
Table 5-2 Optimum solutions predicted for the fibre laser cutting of 2 mm thick carbon fibre/epoxy
laminates
Number Power (W) Scanning speed (mm/s) Gas Pressure (bar) FPP (mm) Desirability
1 341.01 20.78 3.22 -2.38 0.913
2 362.16 20.22 4.17 -2.38 0.904
3 372.31 20.20 6.65 -2.38 0.902
4 377.99 20.20 5.53 -2.38 0.899
5 488.45 39.56 3.22 -2.38 0.869
5.3.2 Effect of assist gas
As explained in Chapter 2, assist gas type and pressure is an important factor in laser
cutting to protect the optics, remove by-products and heat dissipation from the cut zone.
The effect of the assist gas type and pressure is studied in this section. Nitrogen, oxygen
and argon were used at different pressures to investigate the effect of characteristics and
pressure of the assist gas on the process.
Figure 5-12 illustrates the influence of the assist gas type and pressure on the quality at
340 W laser beam power, 20 mm/s scanning speed and focal plane position of -2.38 mm
(as in optimisation results from DoE). Generally, as can be observed, for the inert gases
(i.e. nitrogen and argon) increasing the assist gas pressure decreased the matrix
recession and the kerf width both at the entrance and the exit sides. In case of the
oxygen, however, although the matrix recession was reduced by increasing the gas
pressure, the kerf widths both at the entrance and the exit showed an increase with the
increase in the assist gas pressure. This was caused by accelerated decomposition/-
vaporisation of material through oxidation [139, 158].
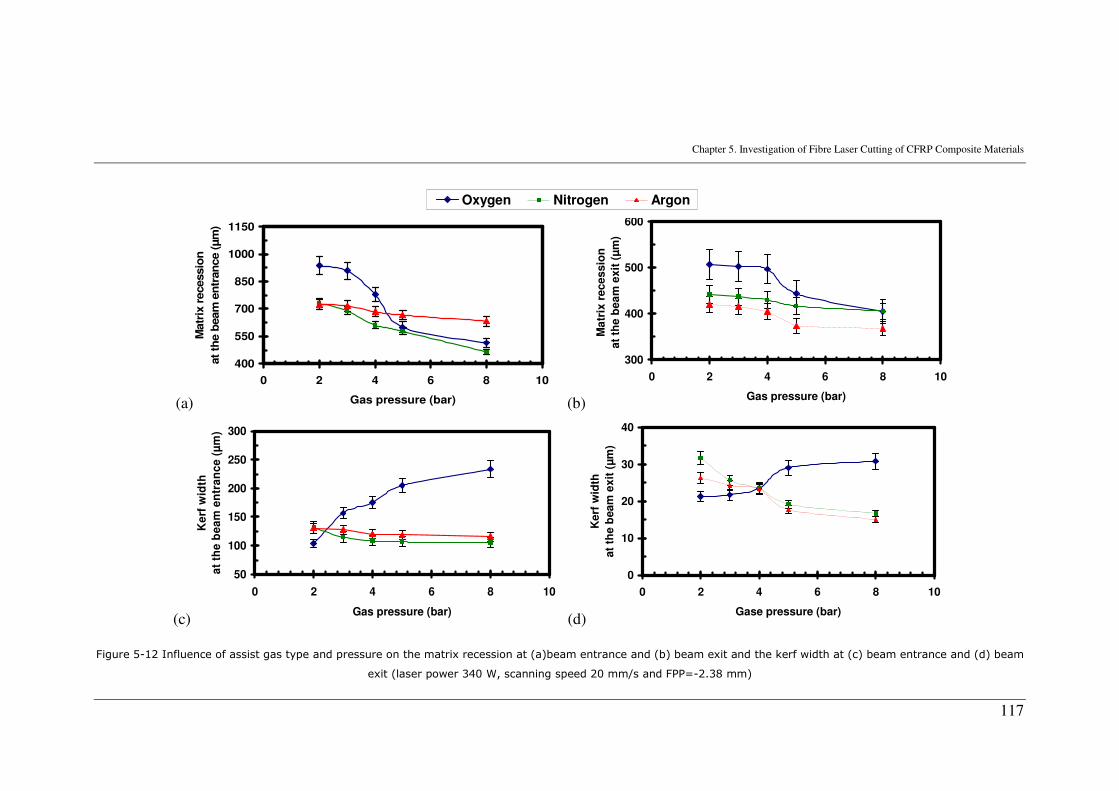
Chapter 5. Investigation of Fibre Laser Cutting of CFRP Composite Materials
117
Oxygen Nitrogen Argon
(a)
400
550
700
850
1000
1150
0 2 4 6 8 10
Gas pressure (bar)
Matr
ix r
ecessio
n
at
the b
eam
en
tran
ce (
µm
)
(b)
300
400
500
600
0 2 4 6 8 10
Gas pressure (bar)
Ma
trix
recessio
n
at
the
bea
m e
xit
(µ
m)
(c)
50
100
150
200
250
300
0 2 4 6 8 10
Gas pressure (bar)
Ke
rf w
idth
at
the
be
am
en
tra
nc
e (
µm
)
(d)
0
10
20
30
40
0 2 4 6 8 10
Gase pressure (bar)
Kerf
wid
th
at
the b
eam
exit
(µ
m)
Figure 5-12 Influence of assist gas type and pressure on the matrix recession at (a)beam entrance and (b) beam exit and the kerf width at (c) beam entrance and (d) beam
exit (laser power 340 W, scanning speed 20 mm/s and FPP=-2.38 mm)
Chapter 5. Investigation of Fibre Laser Cutting of CFRP Composite Materials
118
5.3.3 Effect of focal plane position
Focal plane position, as another process parameter, is influential in laser cutting. In the
case of composite materials, the research on the effect of this factor is limited. The
influence of FPP on fibre laser cutting of CFRPs is investigated in this section. The
power density at the workpiece surface varies with changing FPP, with the change in
induced beam spot size at the surface. This influences the thermal damage on the
material. Figure 5-13 illustrates matrix recession and kerf width at the beam entrance
side for different FPPs (i.e. range of -2.38 mm to 2.38 mm) at the constant process
parameters of 340 W power, 20 mm/s scanning speed and 8 bar assist gas pressure.
300
400
500
600
700
800
900
-2.38 0 2.38
Focal plane position (mm)
Ma
trix
re
ces
sio
n
at
the b
ea
m e
ntr
an
ce (
µm
)
Oxygen
Nitrogen
Argon
75
175
275
375
475
-2.38 0 2.38
Focal plane position (mm)
Kerf
wid
th
at
the b
eam
en
tran
ce (
µm
)
Oxygen
Nitrogen
Argon
(a) (b) Figure 5-13 Influence of focal plane position and assist gas type on (a) matrix recession and (b) kerf
width at the beam entrance at 8 bar assist gas pressure
Generally, as the FPP was moved upward from FPP=-2.38 mm, the heat damage at the
beam entrance increased which in return reduced the thermal damage towards the beam
exit side. This effect caused non-through cuts at 2.38 mm focal plane position. For the
focal plane positioned on the top surface (FFP=0) the process did not lead to through
cuts in the presence of argon. The effect of gas pressure on kerf width and matrix
recession at the beam exit side for oxygen and nitrogen processing gases is illustrated in
Figure 5-14. Matrix recession decreased in both measurements with increase in assist
gas pressure. At 8 bar neither oxygen nor nitrogen assisted processes lead to through
cuts. This shows the combination of FPP and assist gas characteristics is influential in
laser cutting of CFRPs.
Figure 5-15 illustrates the microphotograph comparison between the thermal damage at
the beam exit side in presence of oxygen and nitrogen with the focal plane positioned on
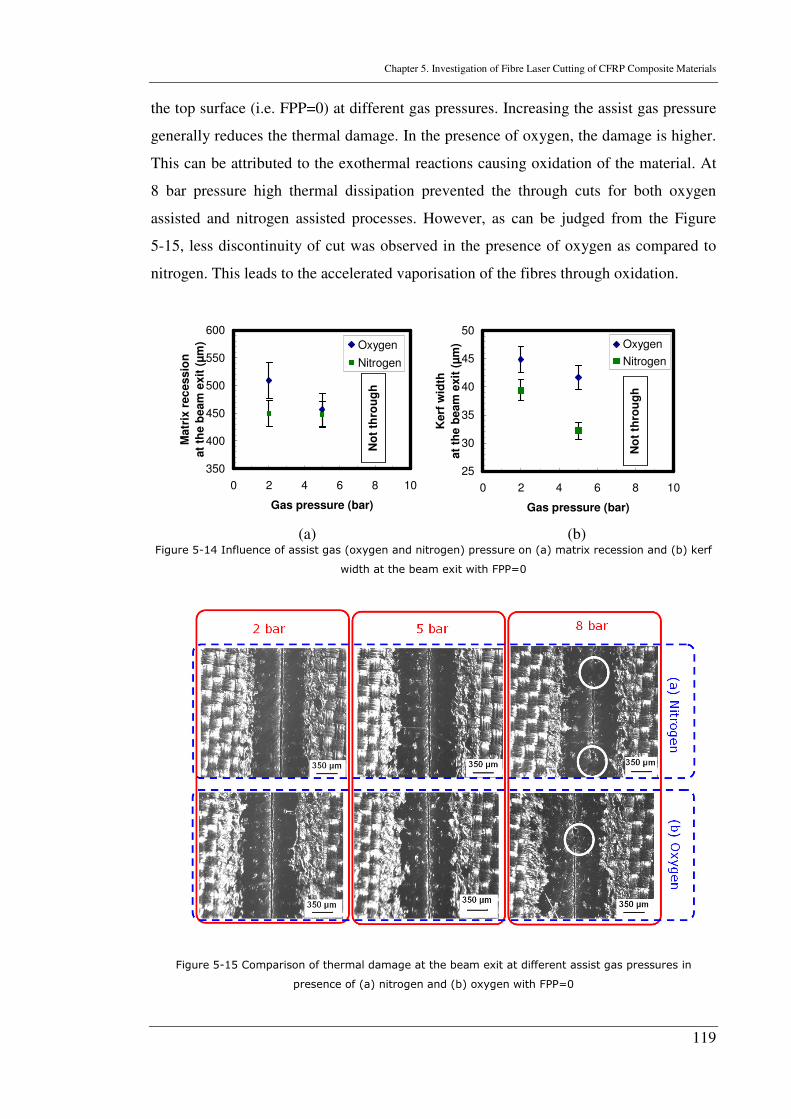
Chapter 5. Investigation of Fibre Laser Cutting of CFRP Composite Materials
119
the top surface (i.e. FPP=0) at different gas pressures. Increasing the assist gas pressure
generally reduces the thermal damage. In the presence of oxygen, the damage is higher.
This can be attributed to the exothermal reactions causing oxidation of the material. At
8 bar pressure high thermal dissipation prevented the through cuts for both oxygen
assisted and nitrogen assisted processes. However, as can be judged from the Figure
5-15, less discontinuity of cut was observed in the presence of oxygen as compared to
nitrogen. This leads to the accelerated vaporisation of the fibres through oxidation.
350
400
450
500
550
600
0 2 4 6 8 10
Gas pressure (bar)
Matr
ix r
ec
essio
n
at
the b
eam
exit
(µ
m) Oxygen
NitrogenN
ot
thro
ug
h
25
30
35
40
45
50
0 2 4 6 8 10
Gas pressure (bar)
Kerf
wid
th
at
the
beam
exit
(µ
m) Oxygen
Nitrogen
No
t th
rou
gh
(a) (b) Figure 5-14 Influence of assist gas (oxygen and nitrogen) pressure on (a) matrix recession and (b) kerf
width at the beam exit with FPP=0
Figure 5-15 Comparison of thermal damage at the beam exit at different assist gas pressures in
presence of (a) nitrogen and (b) oxygen with FPP=0
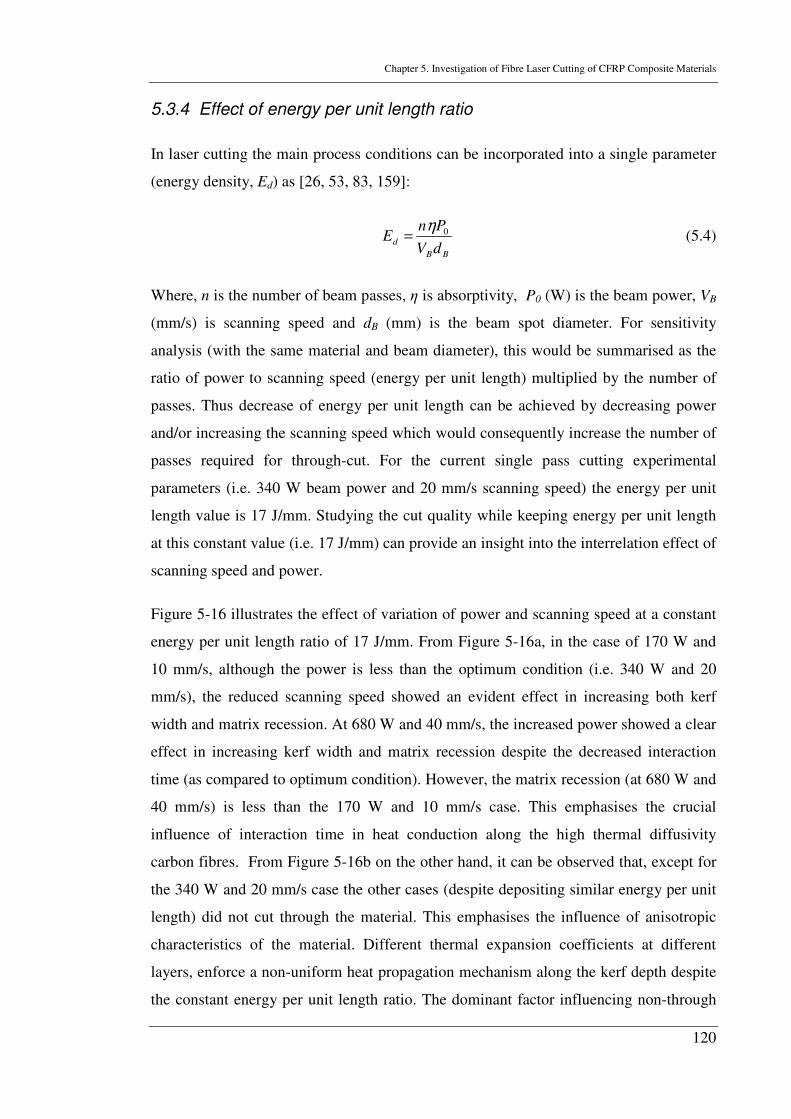
Chapter 5. Investigation of Fibre Laser Cutting of CFRP Composite Materials
120
5.3.4 Effect of energy per unit length ratio
In laser cutting the main process conditions can be incorporated into a single parameter
(energy density, Ed) as [26, 53, 83, 159]:
BB
ddV
PnE 0η
= (5.4)
Where, n is the number of beam passes, η is absorptivity, P0 (W) is the beam power, VB
(mm/s) is scanning speed and dB (mm) is the beam spot diameter. For sensitivity
analysis (with the same material and beam diameter), this would be summarised as the
ratio of power to scanning speed (energy per unit length) multiplied by the number of
passes. Thus decrease of energy per unit length can be achieved by decreasing power
and/or increasing the scanning speed which would consequently increase the number of
passes required for through-cut. For the current single pass cutting experimental
parameters (i.e. 340 W beam power and 20 mm/s scanning speed) the energy per unit
length value is 17 J/mm. Studying the cut quality while keeping energy per unit length
at this constant value (i.e. 17 J/mm) can provide an insight into the interrelation effect of
scanning speed and power.
Figure 5-16 illustrates the effect of variation of power and scanning speed at a constant
energy per unit length ratio of 17 J/mm. From Figure 5-16a, in the case of 170 W and
10 mm/s, although the power is less than the optimum condition (i.e. 340 W and 20
mm/s), the reduced scanning speed showed an evident effect in increasing both kerf
width and matrix recession. At 680 W and 40 mm/s, the increased power showed a clear
effect in increasing kerf width and matrix recession despite the decreased interaction
time (as compared to optimum condition). However, the matrix recession (at 680 W and
40 mm/s) is less than the 170 W and 10 mm/s case. This emphasises the crucial
influence of interaction time in heat conduction along the high thermal diffusivity
carbon fibres. From Figure 5-16b on the other hand, it can be observed that, except for
the 340 W and 20 mm/s case the other cases (despite depositing similar energy per unit
length) did not cut through the material. This emphasises the influence of anisotropic
characteristics of the material. Different thermal expansion coefficients at different
layers, enforce a non-uniform heat propagation mechanism along the kerf depth despite
the constant energy per unit length ratio. The dominant factor influencing non-through
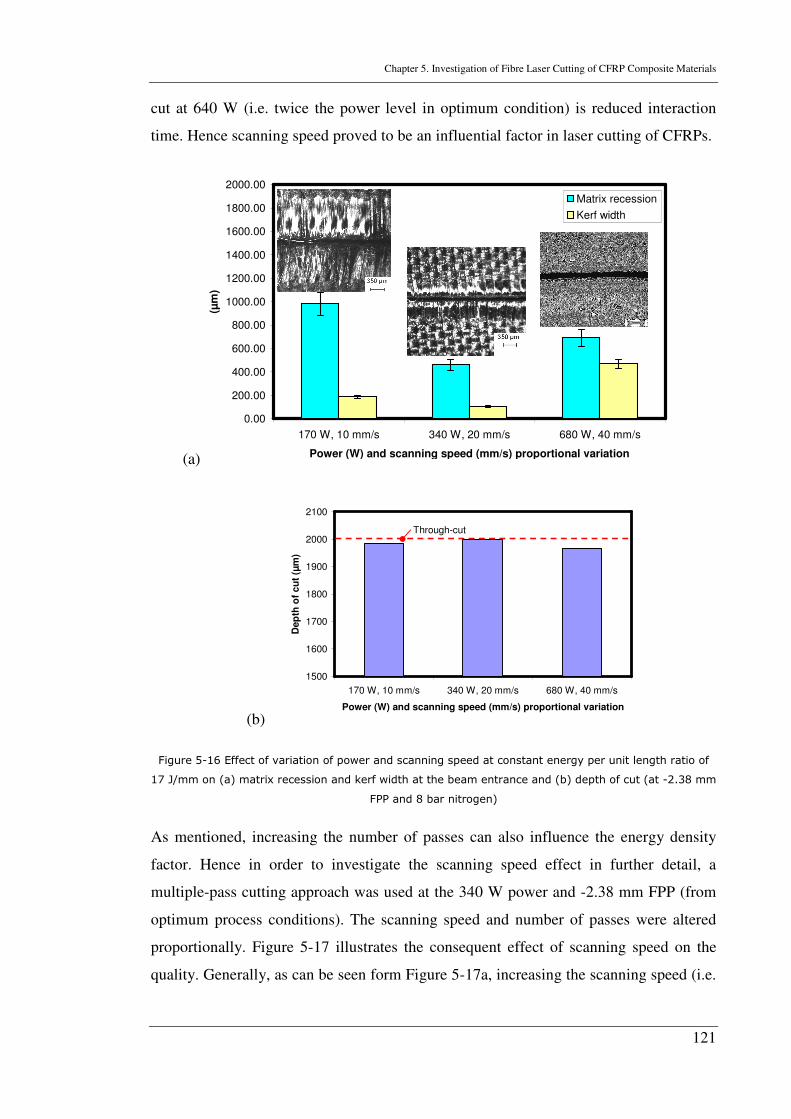
Chapter 5. Investigation of Fibre Laser Cutting of CFRP Composite Materials
121
cut at 640 W (i.e. twice the power level in optimum condition) is reduced interaction
time. Hence scanning speed proved to be an influential factor in laser cutting of CFRPs.
(a)
0.00
200.00
400.00
600.00
800.00
1000.00
1200.00
1400.00
1600.00
1800.00
2000.00
170 W, 10 mm/s 340 W, 20 mm/s 680 W, 40 mm/s
Power (W) and scanning speed (mm/s) proportional variation
(µm
)
Matrix recession
Kerf width
(b)
1500
1600
1700
1800
1900
2000
2100
170 W, 10 mm/s 340 W, 20 mm/s 680 W, 40 mm/s
Power (W) and scanning speed (mm/s) proportional variation
Dep
th o
f c
ut
(µm
)
Through-cut
Figure 5-16 Effect of variation of power and scanning speed at constant energy per unit length ratio of
17 J/mm on (a) matrix recession and kerf width at the beam entrance and (b) depth of cut (at -2.38 mm
FPP and 8 bar nitrogen)
As mentioned, increasing the number of passes can also influence the energy density
factor. Hence in order to investigate the scanning speed effect in further detail, a
multiple-pass cutting approach was used at the 340 W power and -2.38 mm FPP (from
optimum process conditions). The scanning speed and number of passes were altered
proportionally. Figure 5-17 illustrates the consequent effect of scanning speed on the
quality. Generally, as can be seen form Figure 5-17a, increasing the scanning speed (i.e.
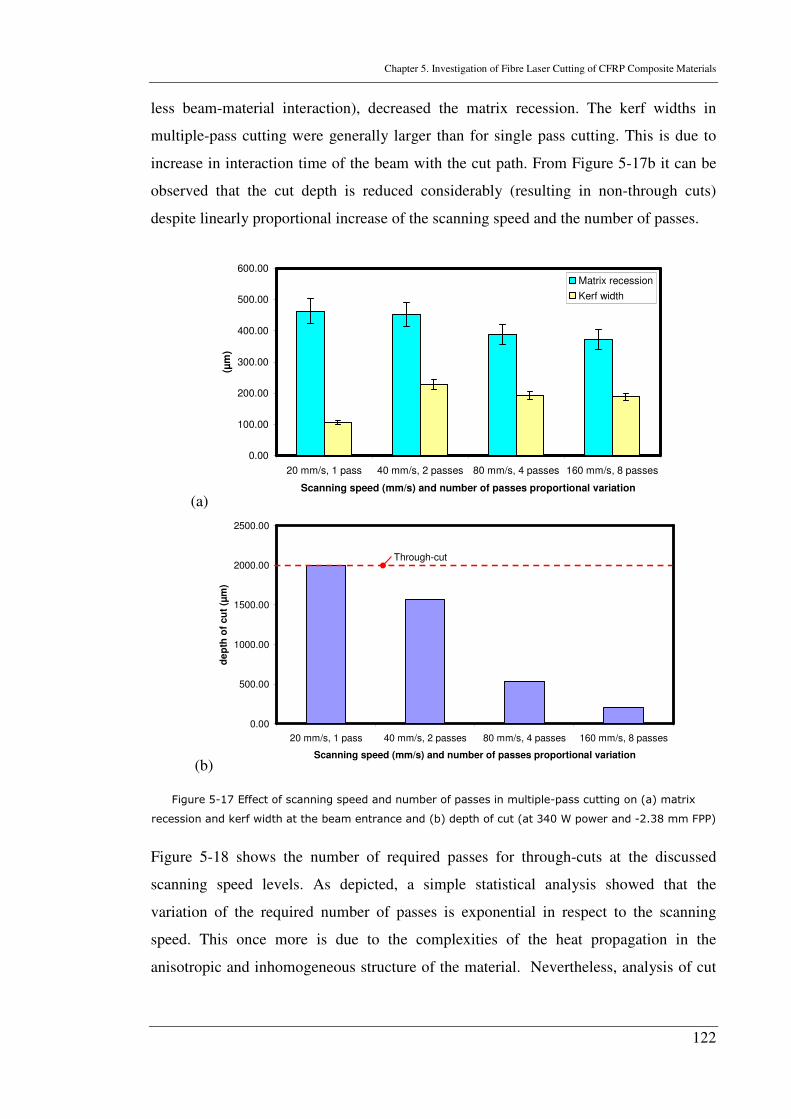
Chapter 5. Investigation of Fibre Laser Cutting of CFRP Composite Materials
122
less beam-material interaction), decreased the matrix recession. The kerf widths in
multiple-pass cutting were generally larger than for single pass cutting. This is due to
increase in interaction time of the beam with the cut path. From Figure 5-17b it can be
observed that the cut depth is reduced considerably (resulting in non-through cuts)
despite linearly proportional increase of the scanning speed and the number of passes.
(a)
0.00
100.00
200.00
300.00
400.00
500.00
600.00
20 mm/s, 1 pass 40 mm/s, 2 passes 80 mm/s, 4 passes 160 mm/s, 8 passes
Scanning speed (mm/s) and number of passes proportional variation
(µm
)
Matrix recession
Kerf width
(b)
0.00
500.00
1000.00
1500.00
2000.00
2500.00
20 mm/s, 1 pass 40 mm/s, 2 passes 80 mm/s, 4 passes 160 mm/s, 8 passes
Scanning speed (mm/s) and number of passes proportional variation
de
pth
of
cu
t (µ
m)
Through-cut
Figure 5-17 Effect of scanning speed and number of passes in multiple-pass cutting on (a) matrix
recession and kerf width at the beam entrance and (b) depth of cut (at 340 W power and -2.38 mm FPP)
Figure 5-18 shows the number of required passes for through-cuts at the discussed
scanning speed levels. As depicted, a simple statistical analysis showed that the
variation of the required number of passes is exponential in respect to the scanning
speed. This once more is due to the complexities of the heat propagation in the
anisotropic and inhomogeneous structure of the material. Nevertheless, analysis of cut
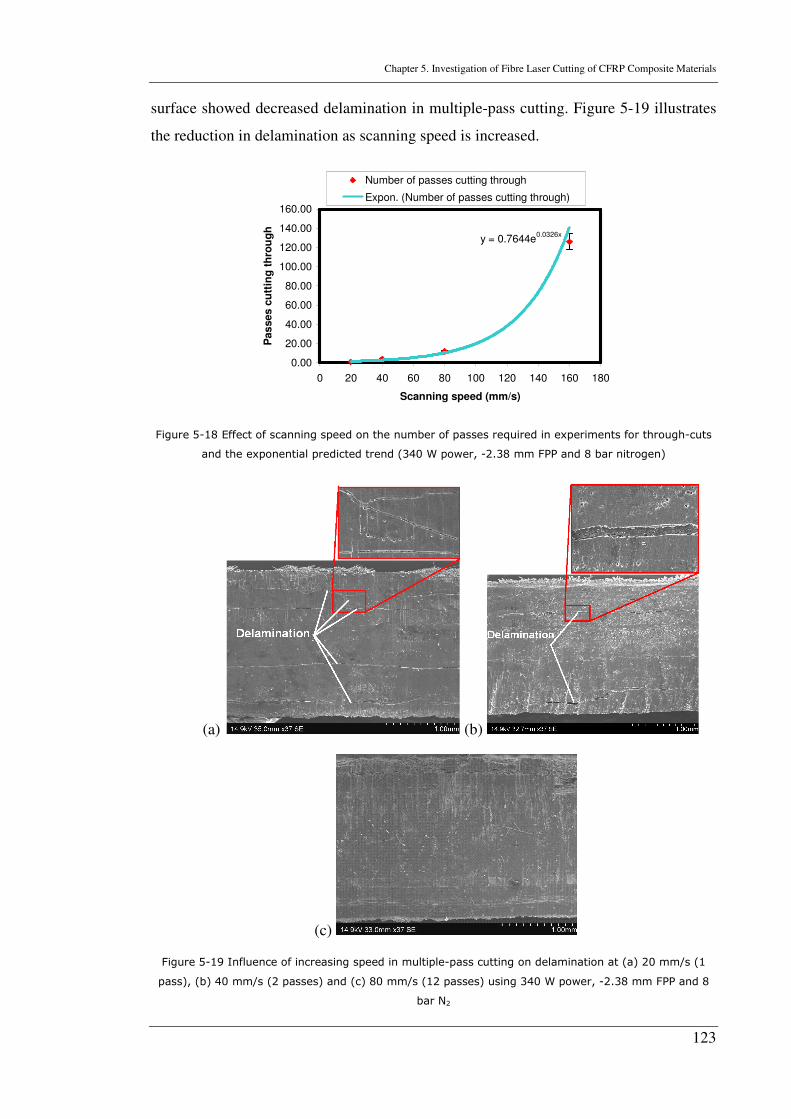
Chapter 5. Investigation of Fibre Laser Cutting of CFRP Composite Materials
123
surface showed decreased delamination in multiple-pass cutting. Figure 5-19 illustrates
the reduction in delamination as scanning speed is increased.
y = 0.7644e0.0326x
0.00
20.00
40.00
60.00
80.00
100.00
120.00
140.00
160.00
0 20 40 60 80 100 120 140 160 180
Scanning speed (mm/s)
Pas
ses c
utt
ing
th
rou
gh
Number of passes cutting through
Expon. (Number of passes cutting through)
Figure 5-18 Effect of scanning speed on the number of passes required in experiments for through-cuts
and the exponential predicted trend (340 W power, -2.38 mm FPP and 8 bar nitrogen)
(a) (b)
(c)
Figure 5-19 Influence of increasing speed in multiple-pass cutting on delamination at (a) 20 mm/s (1
pass), (b) 40 mm/s (2 passes) and (c) 80 mm/s (12 passes) using 340 W power, -2.38 mm FPP and 8
bar N2
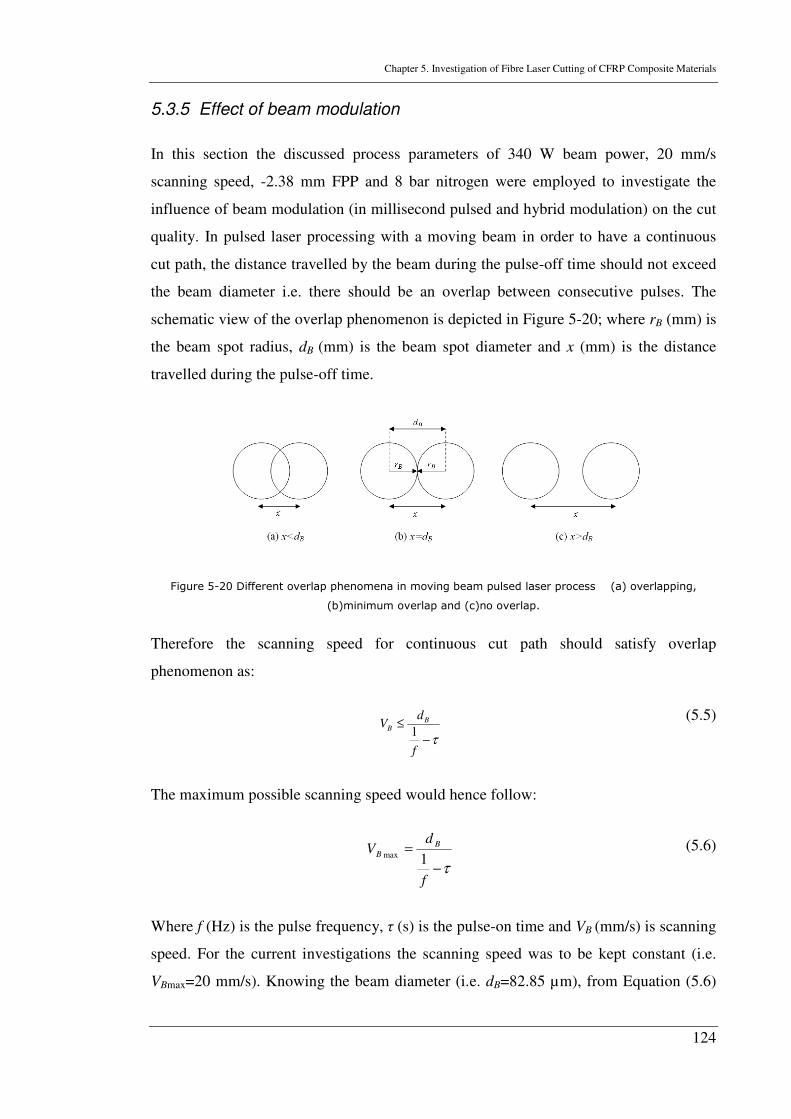
Chapter 5. Investigation of Fibre Laser Cutting of CFRP Composite Materials
124
5.3.5 Effect of beam modulation
In this section the discussed process parameters of 340 W beam power, 20 mm/s
scanning speed, -2.38 mm FPP and 8 bar nitrogen were employed to investigate the
influence of beam modulation (in millisecond pulsed and hybrid modulation) on the cut
quality. In pulsed laser processing with a moving beam in order to have a continuous
cut path, the distance travelled by the beam during the pulse-off time should not exceed
the beam diameter i.e. there should be an overlap between consecutive pulses. The
schematic view of the overlap phenomenon is depicted in Figure 5-20; where rB (mm) is
the beam spot radius, dB (mm) is the beam spot diameter and x (mm) is the distance
travelled during the pulse-off time.
Figure 5-20 Different overlap phenomena in moving beam pulsed laser process (a) overlapping,
(b)minimum overlap and (c)no overlap.
Therefore the scanning speed for continuous cut path should satisfy overlap
phenomenon as:
τ−
≤
f
dV B
B 1
(5.5)
The maximum possible scanning speed would hence follow:
τ−
=
f
dV B
B 1max (5.6)
Where f (Hz) is the pulse frequency, τ (s) is the pulse-on time and VB (mm/s) is scanning
speed. For the current investigations the scanning speed was to be kept constant (i.e.
VBmax=20 mm/s). Knowing the beam diameter (i.e. dB=82.85 µm), from Equation (5.6)
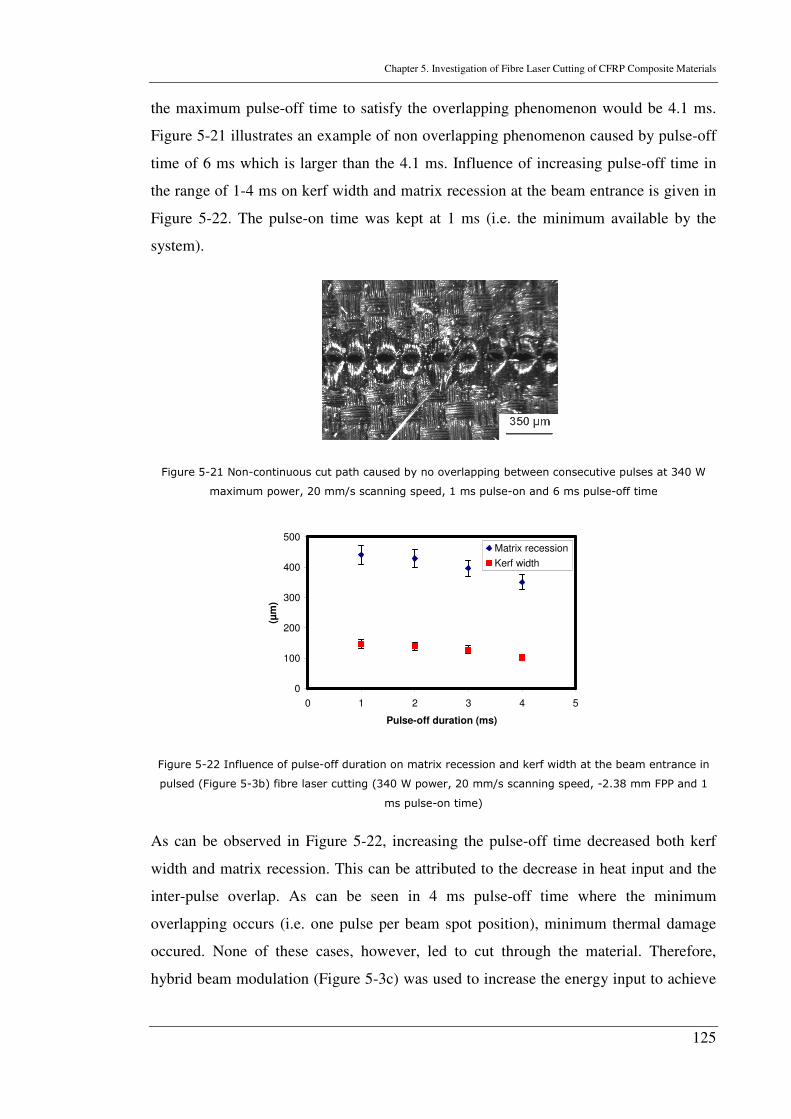
Chapter 5. Investigation of Fibre Laser Cutting of CFRP Composite Materials
125
the maximum pulse-off time to satisfy the overlapping phenomenon would be 4.1 ms.
Figure 5-21 illustrates an example of non overlapping phenomenon caused by pulse-off
time of 6 ms which is larger than the 4.1 ms. Influence of increasing pulse-off time in
the range of 1-4 ms on kerf width and matrix recession at the beam entrance is given in
Figure 5-22. The pulse-on time was kept at 1 ms (i.e. the minimum available by the
system).
Figure 5-21 Non-continuous cut path caused by no overlapping between consecutive pulses at 340 W
maximum power, 20 mm/s scanning speed, 1 ms pulse-on and 6 ms pulse-off time
0
100
200
300
400
500
0 1 2 3 4 5
Pulse-off duration (ms)
(µm
)
Matrix recession
Kerf width
Figure 5-22 Influence of pulse-off duration on matrix recession and kerf width at the beam entrance in
pulsed (Figure 5-3b) fibre laser cutting (340 W power, 20 mm/s scanning speed, -2.38 mm FPP and 1
ms pulse-on time)
As can be observed in Figure 5-22, increasing the pulse-off time decreased both kerf
width and matrix recession. This can be attributed to the decrease in heat input and the
inter-pulse overlap. As can be seen in 4 ms pulse-off time where the minimum
overlapping occurs (i.e. one pulse per beam spot position), minimum thermal damage
occured. None of these cases, however, led to cut through the material. Therefore,
hybrid beam modulation (Figure 5-3c) was used to increase the energy input to achieve
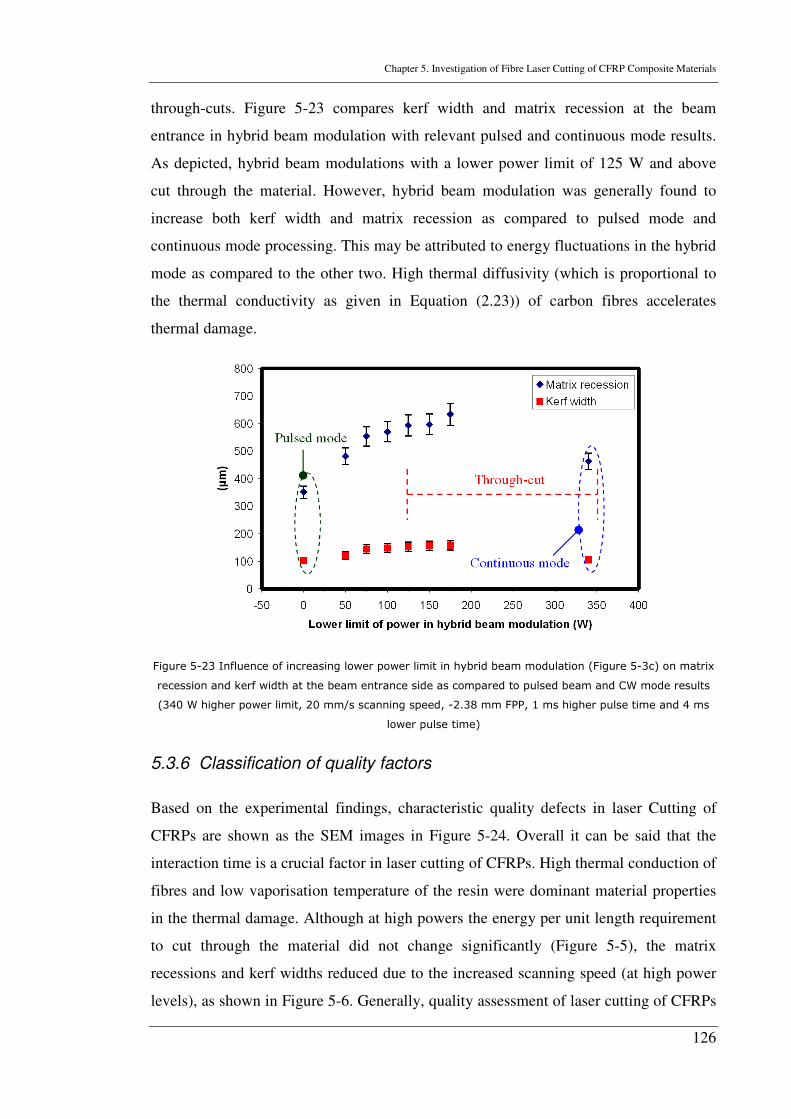
Chapter 5. Investigation of Fibre Laser Cutting of CFRP Composite Materials
126
through-cuts. Figure 5-23 compares kerf width and matrix recession at the beam
entrance in hybrid beam modulation with relevant pulsed and continuous mode results.
As depicted, hybrid beam modulations with a lower power limit of 125 W and above
cut through the material. However, hybrid beam modulation was generally found to
increase both kerf width and matrix recession as compared to pulsed mode and
continuous mode processing. This may be attributed to energy fluctuations in the hybrid
mode as compared to the other two. High thermal diffusivity (which is proportional to
the thermal conductivity as given in Equation (2.23)) of carbon fibres accelerates
thermal damage.
Figure 5-23 Influence of increasing lower power limit in hybrid beam modulation (Figure 5-3c) on matrix
recession and kerf width at the beam entrance side as compared to pulsed beam and CW mode results
(340 W higher power limit, 20 mm/s scanning speed, -2.38 mm FPP, 1 ms higher pulse time and 4 ms
lower pulse time)
5.3.6 Classification of quality factors
Based on the experimental findings, characteristic quality defects in laser Cutting of
CFRPs are shown as the SEM images in Figure 5-24. Overall it can be said that the
interaction time is a crucial factor in laser cutting of CFRPs. High thermal conduction of
fibres and low vaporisation temperature of the resin were dominant material properties
in the thermal damage. Although at high powers the energy per unit length requirement
to cut through the material did not change significantly (Figure 5-5), the matrix
recessions and kerf widths reduced due to the increased scanning speed (at high power
levels), as shown in Figure 5-6. Generally, quality assessment of laser cutting of CFRPs
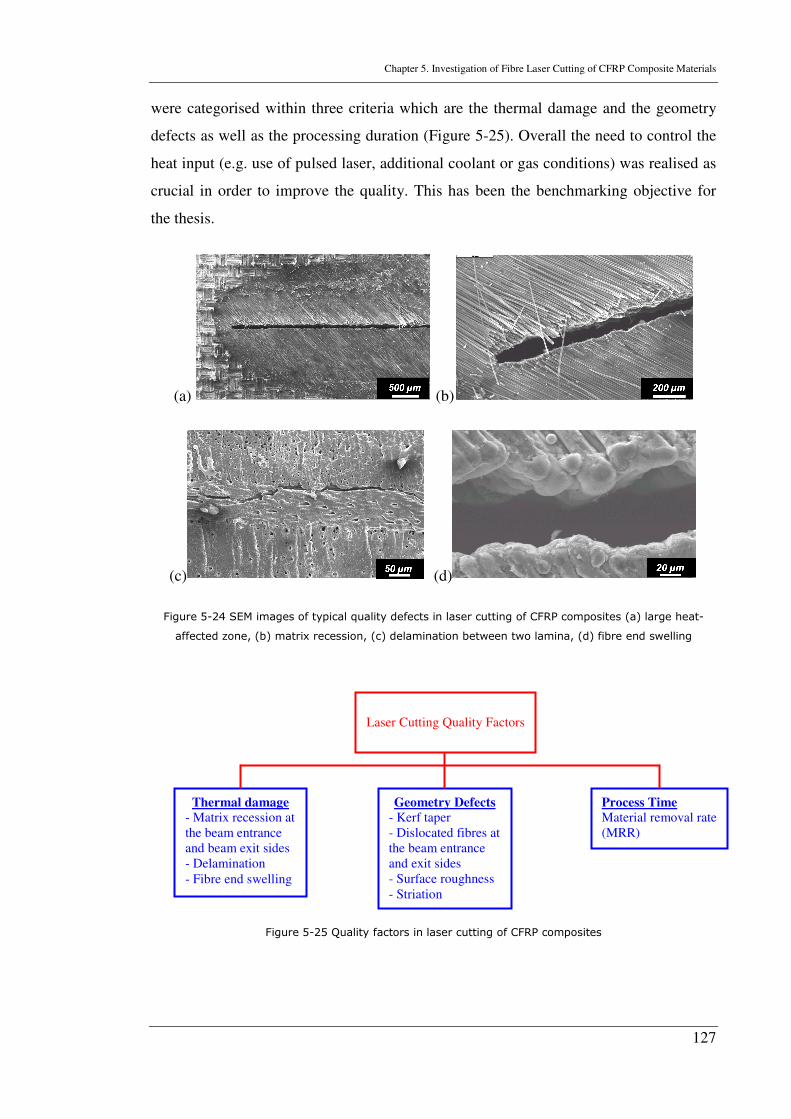
Chapter 5. Investigation of Fibre Laser Cutting of CFRP Composite Materials
127
were categorised within three criteria which are the thermal damage and the geometry
defects as well as the processing duration (Figure 5-25). Overall the need to control the
heat input (e.g. use of pulsed laser, additional coolant or gas conditions) was realised as
crucial in order to improve the quality. This has been the benchmarking objective for
the thesis.
(a) (b)
(c) (d)
Figure 5-24 SEM images of typical quality defects in laser cutting of CFRP composites (a) large heat-
affected zone, (b) matrix recession, (c) delamination between two lamina, (d) fibre end swelling
Figure 5-25 Quality factors in laser cutting of CFRP composites
Laser Cutting Quality Factors
Thermal damage
- Matrix recession at the beam entrance and beam exit sides - Delamination - Fibre end swelling
Geometry Defects
- Kerf taper - Dislocated fibres at the beam entrance and exit sides - Surface roughness - Striation
Process Time
Material removal rate (MRR)
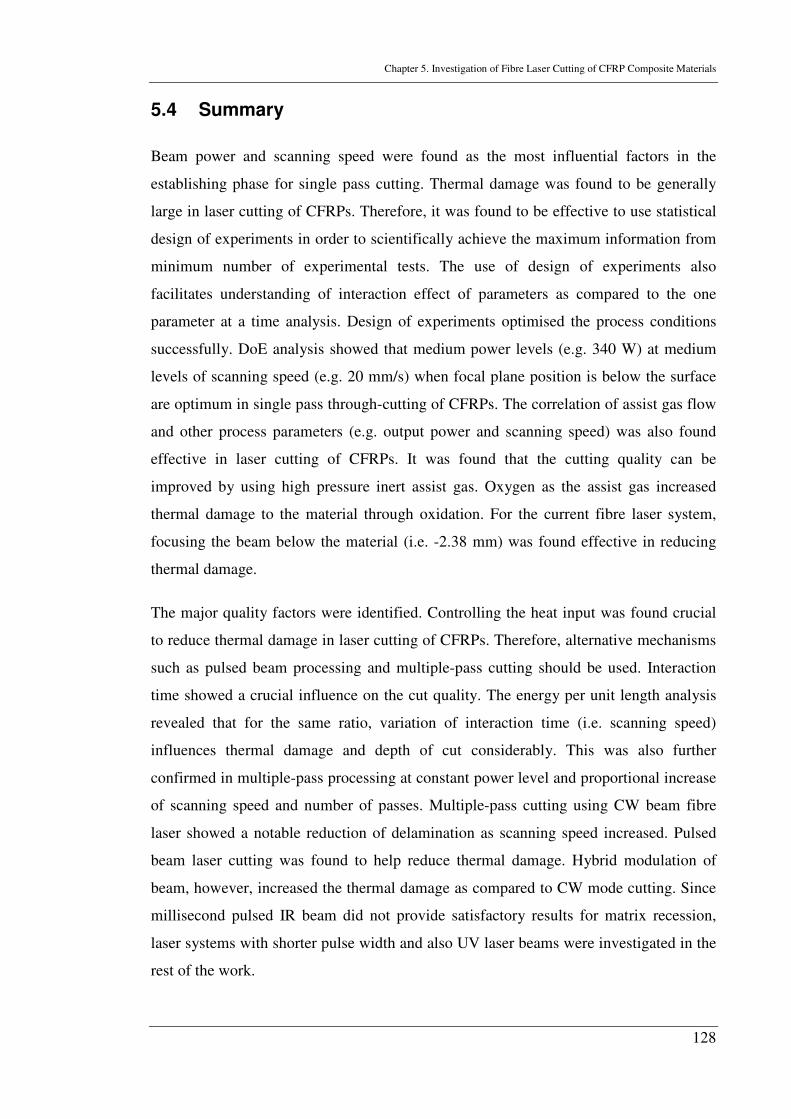
Chapter 5. Investigation of Fibre Laser Cutting of CFRP Composite Materials
128
5.4 Summary
Beam power and scanning speed were found as the most influential factors in the
establishing phase for single pass cutting. Thermal damage was found to be generally
large in laser cutting of CFRPs. Therefore, it was found to be effective to use statistical
design of experiments in order to scientifically achieve the maximum information from
minimum number of experimental tests. The use of design of experiments also
facilitates understanding of interaction effect of parameters as compared to the one
parameter at a time analysis. Design of experiments optimised the process conditions
successfully. DoE analysis showed that medium power levels (e.g. 340 W) at medium
levels of scanning speed (e.g. 20 mm/s) when focal plane position is below the surface
are optimum in single pass through-cutting of CFRPs. The correlation of assist gas flow
and other process parameters (e.g. output power and scanning speed) was also found
effective in laser cutting of CFRPs. It was found that the cutting quality can be
improved by using high pressure inert assist gas. Oxygen as the assist gas increased
thermal damage to the material through oxidation. For the current fibre laser system,
focusing the beam below the material (i.e. -2.38 mm) was found effective in reducing
thermal damage.
The major quality factors were identified. Controlling the heat input was found crucial
to reduce thermal damage in laser cutting of CFRPs. Therefore, alternative mechanisms
such as pulsed beam processing and multiple-pass cutting should be used. Interaction
time showed a crucial influence on the cut quality. The energy per unit length analysis
revealed that for the same ratio, variation of interaction time (i.e. scanning speed)
influences thermal damage and depth of cut considerably. This was also further
confirmed in multiple-pass processing at constant power level and proportional increase
of scanning speed and number of passes. Multiple-pass cutting using CW beam fibre
laser showed a notable reduction of delamination as scanning speed increased. Pulsed
beam laser cutting was found to help reduce thermal damage. Hybrid modulation of
beam, however, increased the thermal damage as compared to CW mode cutting. Since
millisecond pulsed IR beam did not provide satisfactory results for matrix recession,
laser systems with shorter pulse width and also UV laser beams were investigated in the
rest of the work.
Chapter 6. Investigation on the Effect of Laser Beam Characteristics, the Material and Cut Direction
129
CHAPTER 6
INVESTIGATION ON THE EFFECT OF LASER
BEAM CHARACTERISTICS, THE MATERIAL
AND CUT DIRECTION
As mentioned, controlling the heat input helps reduction of thermal damage in laser
cutting of CFRPs. This could be achieved by different mechanisms such as pulsed beam
processing (to increase heating/cooling rate and reduce thermal interaction time),
multiple-pass cutting (to reduce interaction time and energy deposited per unit length).
In the previous chapter, multiple-pass cutting using a CW mode fibre laser (1070 nm)
was found to show promising improvement in cut characteristics, particularly for
delamination. The work was hence carried on with the aim to investigate the mechanism
of thermal damage reduction, furthermore. As the modulated pulsed and hybrid beam
modes (in millisecond regime) of the fibre laser (IR mode) were not promising,
alternative pulsing regimes, as well as systems with wavelength in UV range were also
used in this study. In this chapter, a detailed experimental investigation was carried out
to outline the quality and removal rate sensitivity in laser cutting of CFRPs, when
different laser systems (i.e. laser beam wavelengths and pulse repetition rates) are used.
A nanosecond pulsed Nd:YAG laser (1064 nm) system was used to investigate the cut
characteristics with different types of materials were used. Investigations were also
conducted to realise the influence of variation of cut direction in the process. A KrF
excimer laser (248 nm) laser was then used to investigate the response of material to
UV beam laser system. A tabular summary of the findings of the investigations was
concluded at the end.
6.1 Effect of material type
6.1.1 Experimental procedure
In order to investigate the influence of the matrix constituent in CFRPs laser cutting, a
comparison study was conducted between carbon fibre/vinyl ester and carbon
Chapter 6. Investigation on the Effect of Laser Beam Characteristics, the Material and Cut Direction
130
fibre/epoxy composites. The samples used were 1.6 mm thick and unidirectional fibre
orientated laminates. As mentioned, pulsed mode lasers are an alternative over CW
mode lasers to reduce thermal damage. Therefore, the Starlase nanosecond pulse DPSS
Nd:YAG laser (1064 nm wavelength) was used for this part of study. Advantages and
procedure of statistical analysis of the experiments were explained in Chapter 4. A
privilege of statistical analysis is that they can facilitate the scientific design, analysis
and optimisation of experiments for non-numeric (i.e. categorical) factors such as
material type as well as the numeric factors (e.g. pulse energy, pulse frequency,
scanning speed etc.). Therefore, a 5 level CCD response surface model with three
repetitions was implemented for this part of study by using Design Expert® software.
The details of the parameters, the sequence of experimental runs and the experimental
responses are provided in Appendix A.
Three numeric factors (i.e. pulse frequency, pulse energy and scanning speed) and one
categorical factor (i.e. material type) were investigated. Characteristics of the laser
system used were explained in Chapter 4. The system offers up to 15 kHz pulse
frequency and 50 mJ pulse energy. A high speed (up to 200 mm/s) 3-axis Aerotech
stage was used. Thermal damage is found to increase significantly with an increase in
pulse energy and pulse frequency and decrease in scanning speed, in pulsed Nd:YAG
laser cutting of CFRPs [125]. As explained in Chapter 5, multiple-pass cutting
technique was found to successfully reduce thermal damage (owing to reduction in
energy deposited per unit length of the material). Therefore, a multiple-pass technique
was applied. This was particularly useful since a high speed stage was used in the
experiments. A considerable number of screening tests were conducted prior to the
design of experiments to determine the range of parameters. Such a determination of the
ranges of parameters is important for the accuracy of the statistical analysis, on one
hand, and efficiency of the experimental study (time and cost), especially for laser
cutting of CFRPs where noticeable thermal damage is usually observed, on the other
hand. The concept of the noticeable thermal damage in laser cutting of CFRPs and
effectiveness of scientific design and analysis of the experiments was experimented and
explained in Chapter 5.
The above mentioned screening tests showed significant increase in thermal damage
once pulse frequency range of above 7 kHz and pulse energy levels of above 25 mJ
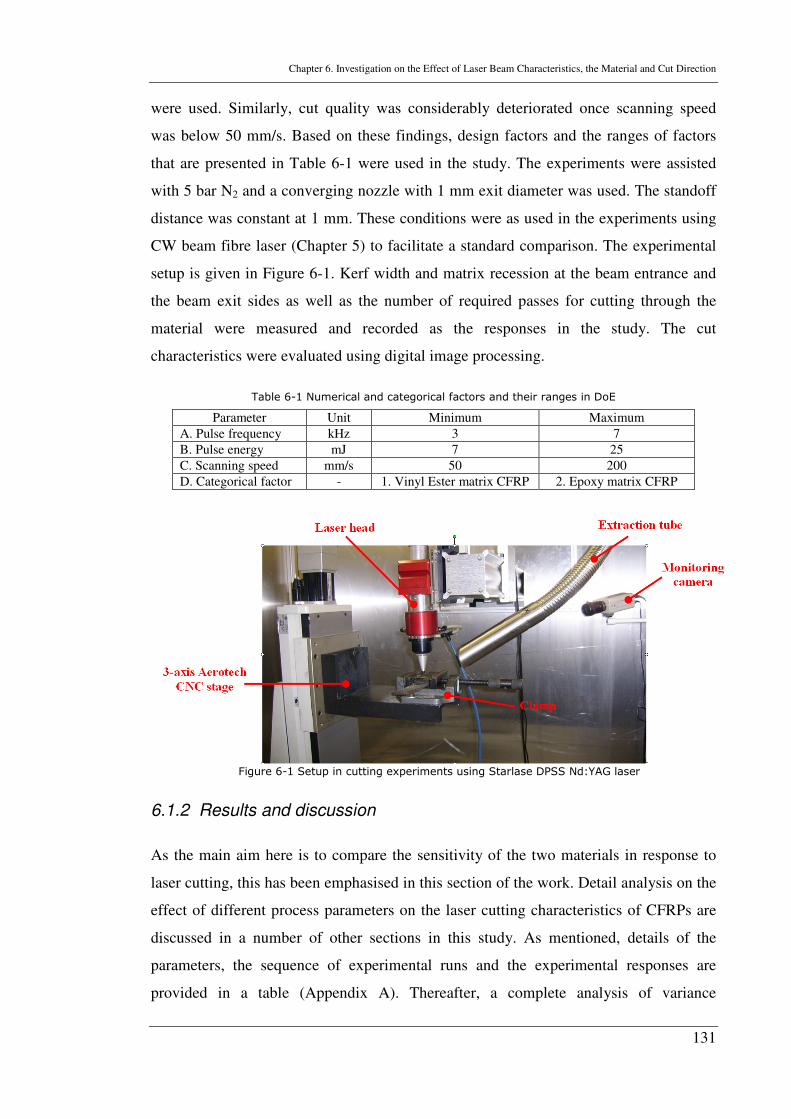
Chapter 6. Investigation on the Effect of Laser Beam Characteristics, the Material and Cut Direction
131
were used. Similarly, cut quality was considerably deteriorated once scanning speed
was below 50 mm/s. Based on these findings, design factors and the ranges of factors
that are presented in Table 6-1 were used in the study. The experiments were assisted
with 5 bar N2 and a converging nozzle with 1 mm exit diameter was used. The standoff
distance was constant at 1 mm. These conditions were as used in the experiments using
CW beam fibre laser (Chapter 5) to facilitate a standard comparison. The experimental
setup is given in Figure 6-1. Kerf width and matrix recession at the beam entrance and
the beam exit sides as well as the number of required passes for cutting through the
material were measured and recorded as the responses in the study. The cut
characteristics were evaluated using digital image processing.
Table 6-1 Numerical and categorical factors and their ranges in DoE
Parameter Unit Minimum Maximum
A. Pulse frequency kHz 3 7
B. Pulse energy mJ 7 25
C. Scanning speed mm/s 50 200
D. Categorical factor - 1. Vinyl Ester matrix CFRP 2. Epoxy matrix CFRP
Figure 6-1 Setup in cutting experiments using Starlase DPSS Nd:YAG laser
6.1.2 Results and discussion
As the main aim here is to compare the sensitivity of the two materials in response to
laser cutting, this has been emphasised in this section of the work. Detail analysis on the
effect of different process parameters on the laser cutting characteristics of CFRPs are
discussed in a number of other sections in this study. As mentioned, details of the
parameters, the sequence of experimental runs and the experimental responses are
provided in a table (Appendix A). Thereafter, a complete analysis of variance
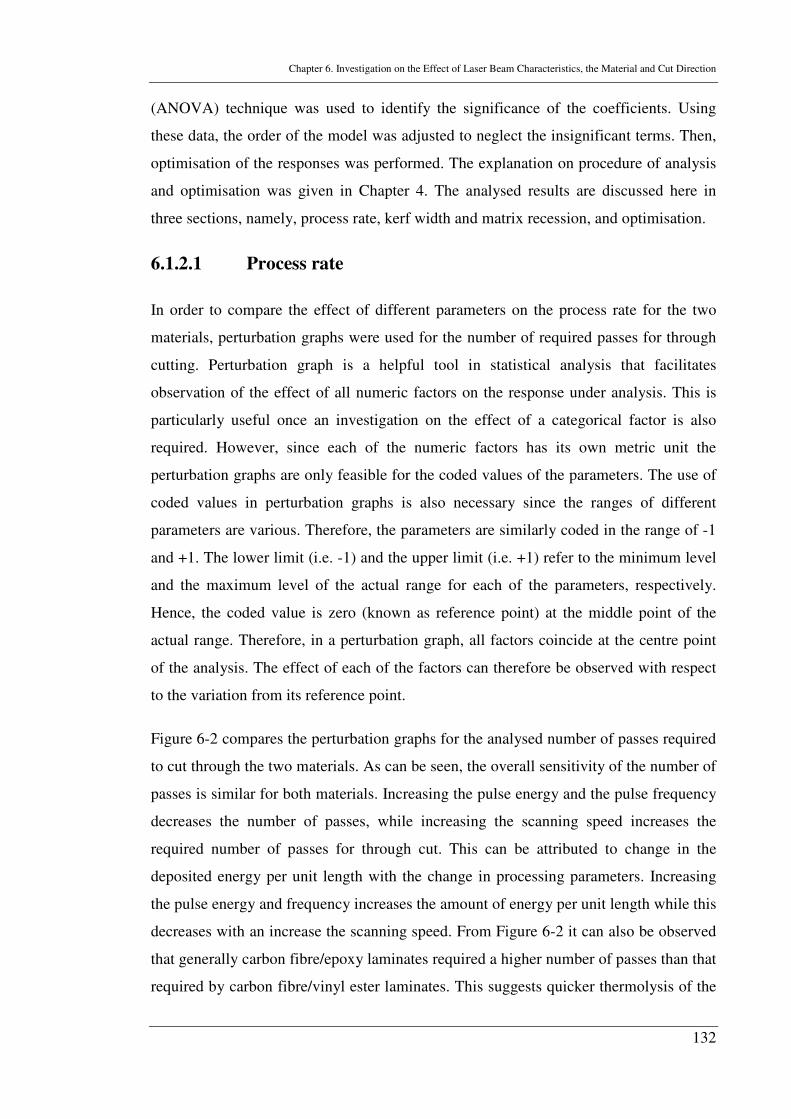
Chapter 6. Investigation on the Effect of Laser Beam Characteristics, the Material and Cut Direction
132
(ANOVA) technique was used to identify the significance of the coefficients. Using
these data, the order of the model was adjusted to neglect the insignificant terms. Then,
optimisation of the responses was performed. The explanation on procedure of analysis
and optimisation was given in Chapter 4. The analysed results are discussed here in
three sections, namely, process rate, kerf width and matrix recession, and optimisation.
6.1.2.1 Process rate
In order to compare the effect of different parameters on the process rate for the two
materials, perturbation graphs were used for the number of required passes for through
cutting. Perturbation graph is a helpful tool in statistical analysis that facilitates
observation of the effect of all numeric factors on the response under analysis. This is
particularly useful once an investigation on the effect of a categorical factor is also
required. However, since each of the numeric factors has its own metric unit the
perturbation graphs are only feasible for the coded values of the parameters. The use of
coded values in perturbation graphs is also necessary since the ranges of different
parameters are various. Therefore, the parameters are similarly coded in the range of -1
and +1. The lower limit (i.e. -1) and the upper limit (i.e. +1) refer to the minimum level
and the maximum level of the actual range for each of the parameters, respectively.
Hence, the coded value is zero (known as reference point) at the middle point of the
actual range. Therefore, in a perturbation graph, all factors coincide at the centre point
of the analysis. The effect of each of the factors can therefore be observed with respect
to the variation from its reference point.
Figure 6-2 compares the perturbation graphs for the analysed number of passes required
to cut through the two materials. As can be seen, the overall sensitivity of the number of
passes is similar for both materials. Increasing the pulse energy and the pulse frequency
decreases the number of passes, while increasing the scanning speed increases the
required number of passes for through cut. This can be attributed to change in the
deposited energy per unit length with the change in processing parameters. Increasing
the pulse energy and frequency increases the amount of energy per unit length while this
decreases with an increase the scanning speed. From Figure 6-2 it can also be observed
that generally carbon fibre/epoxy laminates required a higher number of passes than that
required by carbon fibre/vinyl ester laminates. This suggests quicker thermolysis of the
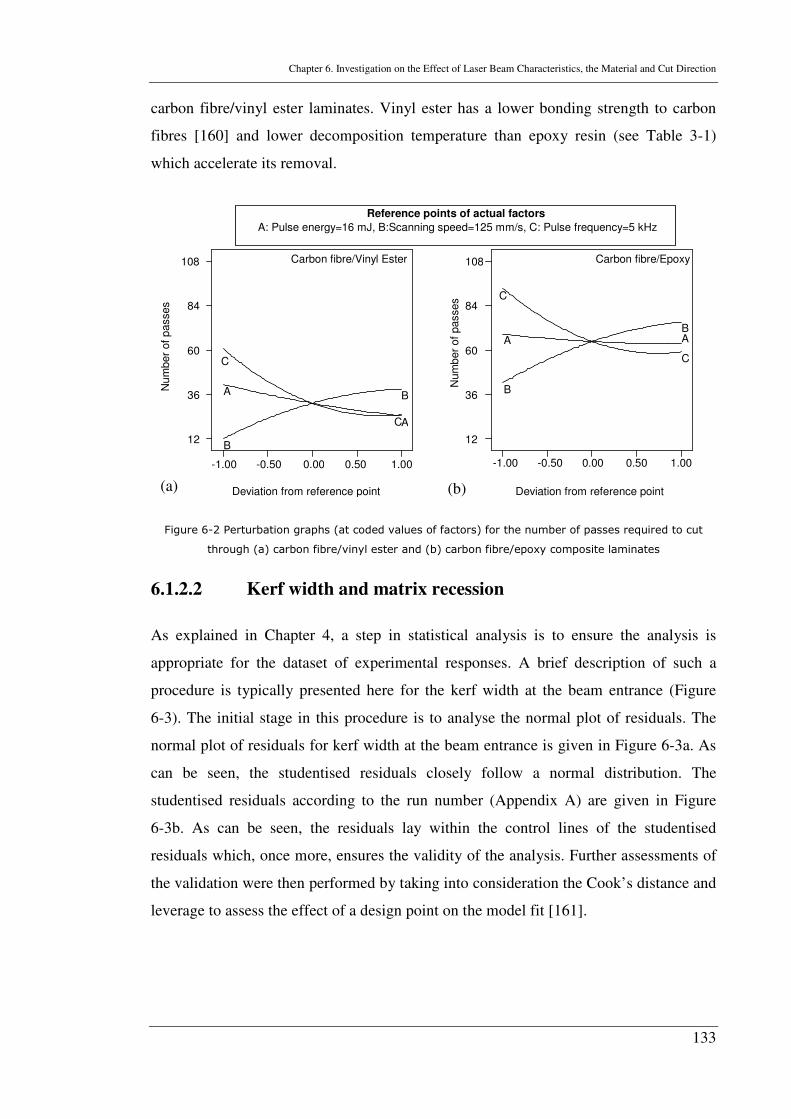
Chapter 6. Investigation on the Effect of Laser Beam Characteristics, the Material and Cut Direction
133
carbon fibre/vinyl ester laminates. Vinyl ester has a lower bonding strength to carbon
fibres [160] and lower decomposition temperature than epoxy resin (see Table 3-1)
which accelerate its removal.
Figure 6-2 Perturbation graphs (at coded values of factors) for the number of passes required to cut
through (a) carbon fibre/vinyl ester and (b) carbon fibre/epoxy composite laminates
6.1.2.2 Kerf width and matrix recession
As explained in Chapter 4, a step in statistical analysis is to ensure the analysis is
appropriate for the dataset of experimental responses. A brief description of such a
procedure is typically presented here for the kerf width at the beam entrance (Figure
6-3). The initial stage in this procedure is to analyse the normal plot of residuals. The
normal plot of residuals for kerf width at the beam entrance is given in Figure 6-3a. As
can be seen, the studentised residuals closely follow a normal distribution. The
studentised residuals according to the run number (Appendix A) are given in Figure
6-3b. As can be seen, the residuals lay within the control lines of the studentised
residuals which, once more, ensures the validity of the analysis. Further assessments of
the validation were then performed by taking into consideration the Cook’s distance and
leverage to assess the effect of a design point on the model fit [161].
-1.00 -0.50 0.00 0.50 1.00
12
36
60
84
108
A
A
B
B
C
C
Deviation from reference point
Num
ber
of
passes
-1.00 -0.50 0.00 0.50 1.00
12
36
60
84
108
A A
B
B
C
C
Deviation from reference point
Nu
mber
of p
asses
Carbon fibre/Vinyl Ester Carbon fibre/Epoxy
Reference points of actual factors
A: Pulse energy=16 mJ, B:Scanning speed=125 mm/s, C: Pulse frequency=5 kHz
(b) (a)
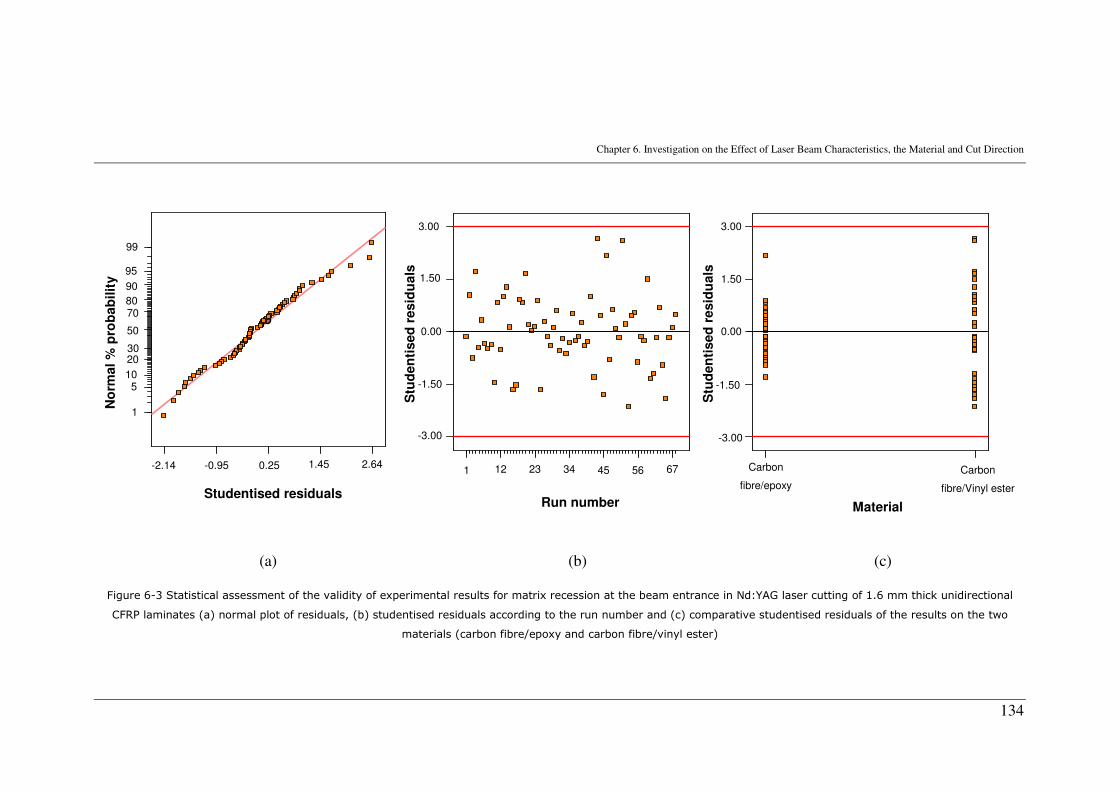
Chapter 6. Investigation on the Effect of Laser Beam Characteristics, the Material and Cut Direction
134
(a) (b) (c) Figure 6-3 Statistical assessment of the validity of experimental results for matrix recession at the beam entrance in Nd:YAG laser cutting of 1.6 mm thick unidirectional
CFRP laminates (a) normal plot of residuals, (b) studentised residuals according to the run number and (c) comparative studentised residuals of the results on the two
materials (carbon fibre/epoxy and carbon fibre/vinyl ester)
Studentised residuals
-2.14 -0.95 0.25 1.45 2.64
1
5 10
20 30
50
70 80
90
95
99
Run number
-3.00
-1.50
0.00
1.50
3.00
1 12 23 34 45 56 67
Material
-3.00
-1.50
0.00
1.50
3.00
Carbon
fibre/epoxy
No
rmal %
pro
bab
ilit
y
Stu
den
tised
resid
uals
Stu
den
tised
resid
uals
Carbon
fibre/Vinyl ester
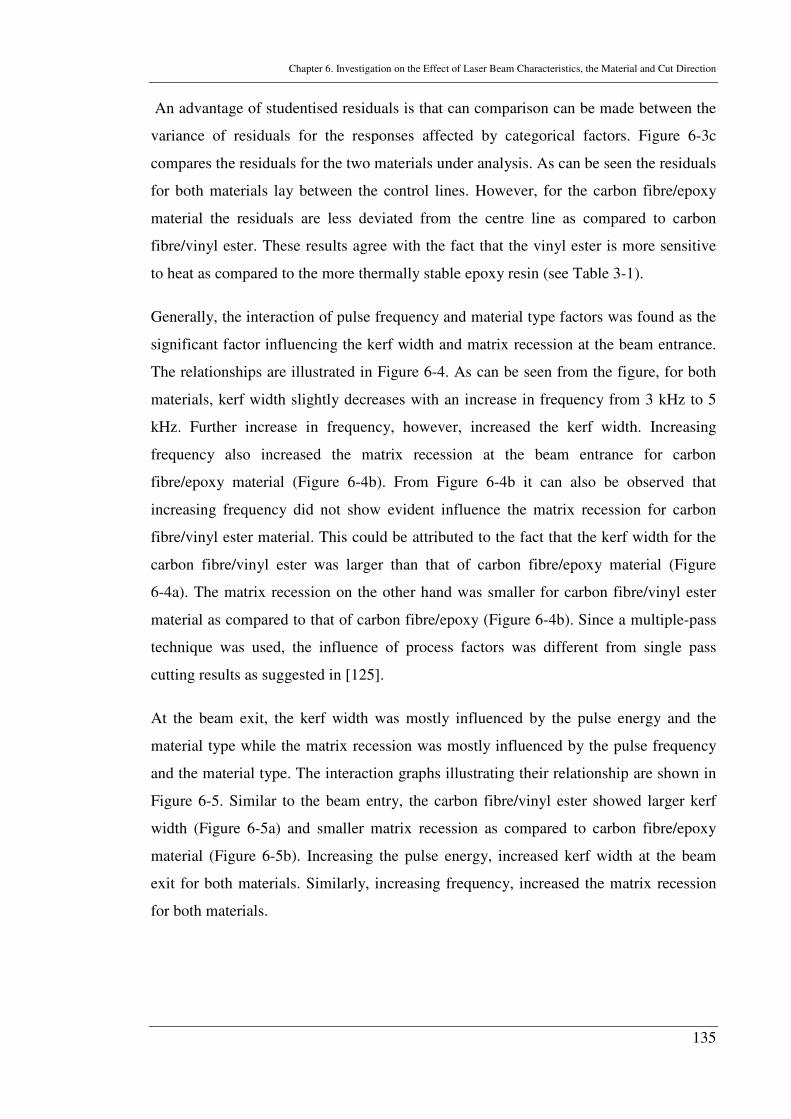
Chapter 6. Investigation on the Effect of Laser Beam Characteristics, the Material and Cut Direction
135
An advantage of studentised residuals is that can comparison can be made between the
variance of residuals for the responses affected by categorical factors. Figure 6-3c
compares the residuals for the two materials under analysis. As can be seen the residuals
for both materials lay between the control lines. However, for the carbon fibre/epoxy
material the residuals are less deviated from the centre line as compared to carbon
fibre/vinyl ester. These results agree with the fact that the vinyl ester is more sensitive
to heat as compared to the more thermally stable epoxy resin (see Table 3-1).
Generally, the interaction of pulse frequency and material type factors was found as the
significant factor influencing the kerf width and matrix recession at the beam entrance.
The relationships are illustrated in Figure 6-4. As can be seen from the figure, for both
materials, kerf width slightly decreases with an increase in frequency from 3 kHz to 5
kHz. Further increase in frequency, however, increased the kerf width. Increasing
frequency also increased the matrix recession at the beam entrance for carbon
fibre/epoxy material (Figure 6-4b). From Figure 6-4b it can also be observed that
increasing frequency did not show evident influence the matrix recession for carbon
fibre/vinyl ester material. This could be attributed to the fact that the kerf width for the
carbon fibre/vinyl ester was larger than that of carbon fibre/epoxy material (Figure
6-4a). The matrix recession on the other hand was smaller for carbon fibre/vinyl ester
material as compared to that of carbon fibre/epoxy (Figure 6-4b). Since a multiple-pass
technique was used, the influence of process factors was different from single pass
cutting results as suggested in [125].
At the beam exit, the kerf width was mostly influenced by the pulse energy and the
material type while the matrix recession was mostly influenced by the pulse frequency
and the material type. The interaction graphs illustrating their relationship are shown in
Figure 6-5. Similar to the beam entry, the carbon fibre/vinyl ester showed larger kerf
width (Figure 6-5a) and smaller matrix recession as compared to carbon fibre/epoxy
material (Figure 6-5b). Increasing the pulse energy, increased kerf width at the beam
exit for both materials. Similarly, increasing frequency, increased the matrix recession
for both materials.
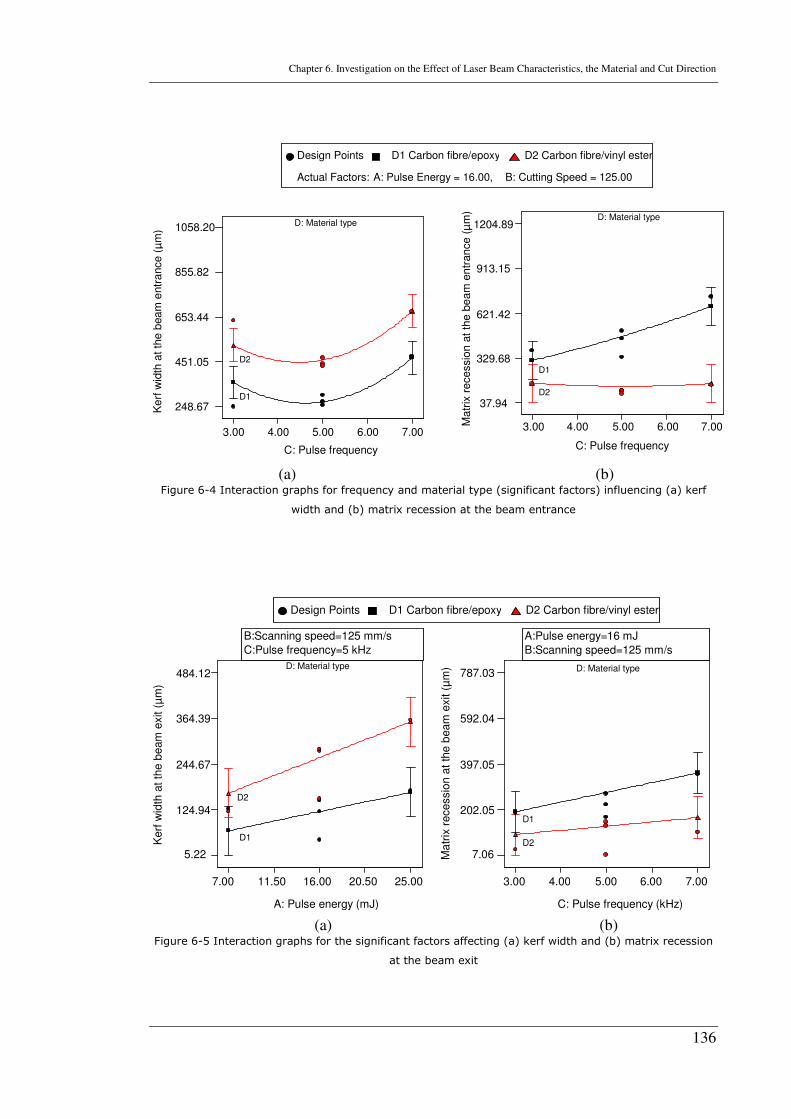
Chapter 6. Investigation on the Effect of Laser Beam Characteristics, the Material and Cut Direction
136
Design Points D1 Carbon fibre/epoxy D2 Carbon fibre/vinyl ester
Actual Factors: A: Pulse Energy = 16.00, B: Cutting Speed = 125.00
D: Material type
Ma
trix
re
ce
ssio
n a
t th
e b
ea
m e
ntr
an
ce
(µ
m)
C: Pulse frequency
3.00 4.00 5.00 6.00 7.00
37.94
329.68
621.42
913.15
1204.89
D1
D2
D: Material type
Ke
rf w
idth
at th
e b
ea
m e
ntr
ance
(µ
m)
C: Pulse frequency
3.00 4.00 5.00 6.00 7.00
248.67
451.05
653.44
855.82
1058.20
D1
D2
(a) (b) Figure 6-4 Interaction graphs for frequency and material type (significant factors) influencing (a) kerf
width and (b) matrix recession at the beam entrance
D: Material type
Kerf
wid
th a
t th
e b
eam
exit (
µm
)
A: Pulse energy (mJ)
7.00 11.50 16.00 20.50 25.00
5.22
124.94
244.67
364.39
484.12
D1
D2
D: Material type
Ma
trix
recessio
n a
t th
e b
eam
exit (
µm
)
C: Pulse frequency (kHz)
3.00 4.00 5.00 6.00 7.00
7.06
202.05
397.05
592.04
787.03
D1
D2
Design Points D1 Carbon fibre/epoxy D2 Carbon fibre/vinyl ester
B:Scanning speed=125 mm/s
C:Pulse frequency=5 kHz
A:Pulse energy=16 mJ
B:Scanning speed=125 mm/s
(a) (b) Figure 6-5 Interaction graphs for the significant factors affecting (a) kerf width and (b) matrix recession
at the beam exit
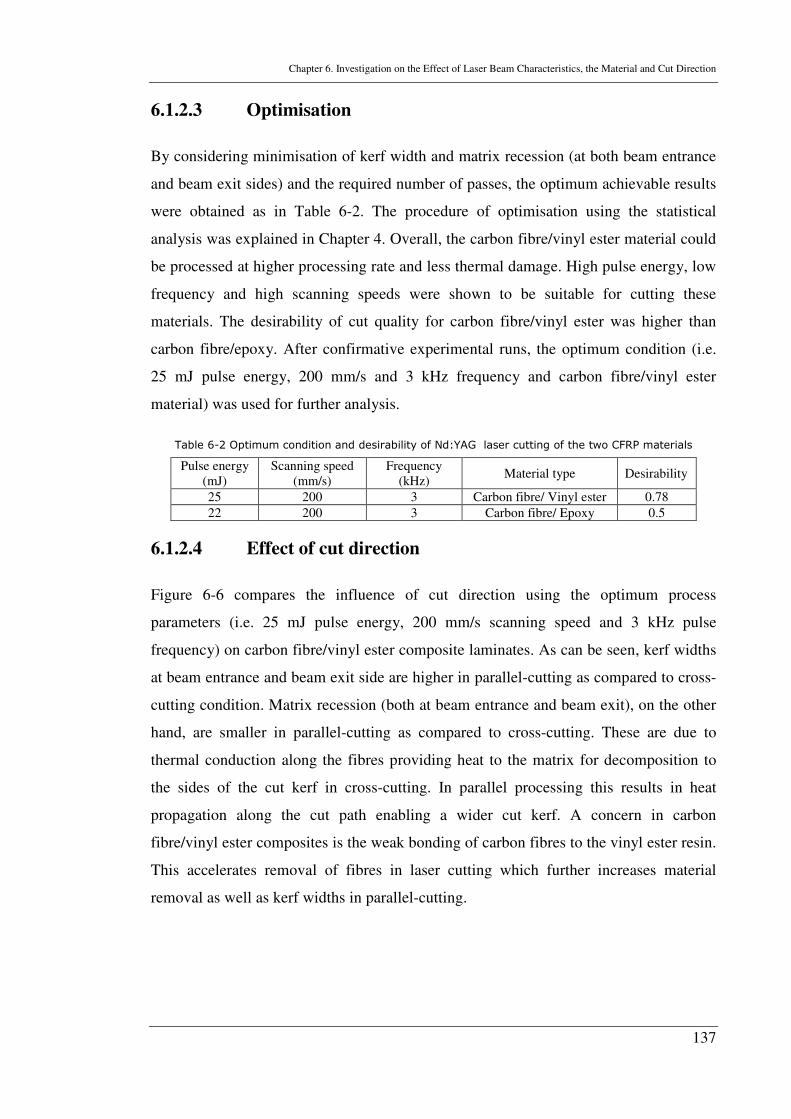
Chapter 6. Investigation on the Effect of Laser Beam Characteristics, the Material and Cut Direction
137
6.1.2.3 Optimisation
By considering minimisation of kerf width and matrix recession (at both beam entrance
and beam exit sides) and the required number of passes, the optimum achievable results
were obtained as in Table 6-2. The procedure of optimisation using the statistical
analysis was explained in Chapter 4. Overall, the carbon fibre/vinyl ester material could
be processed at higher processing rate and less thermal damage. High pulse energy, low
frequency and high scanning speeds were shown to be suitable for cutting these
materials. The desirability of cut quality for carbon fibre/vinyl ester was higher than
carbon fibre/epoxy. After confirmative experimental runs, the optimum condition (i.e.
25 mJ pulse energy, 200 mm/s and 3 kHz frequency and carbon fibre/vinyl ester
material) was used for further analysis.
Table 6-2 Optimum condition and desirability of Nd:YAG laser cutting of the two CFRP materials
Pulse energy (mJ)
Scanning speed (mm/s)
Frequency (kHz)
Material type Desirability
25 200 3 Carbon fibre/ Vinyl ester 0.78
22 200 3 Carbon fibre/ Epoxy 0.5
6.1.2.4 Effect of cut direction
Figure 6-6 compares the influence of cut direction using the optimum process
parameters (i.e. 25 mJ pulse energy, 200 mm/s scanning speed and 3 kHz pulse
frequency) on carbon fibre/vinyl ester composite laminates. As can be seen, kerf widths
at beam entrance and beam exit side are higher in parallel-cutting as compared to cross-
cutting condition. Matrix recession (both at beam entrance and beam exit), on the other
hand, are smaller in parallel-cutting as compared to cross-cutting. These are due to
thermal conduction along the fibres providing heat to the matrix for decomposition to
the sides of the cut kerf in cross-cutting. In parallel processing this results in heat
propagation along the cut path enabling a wider cut kerf. A concern in carbon
fibre/vinyl ester composites is the weak bonding of carbon fibres to the vinyl ester resin.
This accelerates removal of fibres in laser cutting which further increases material
removal as well as kerf widths in parallel-cutting.
Chapter 6. Investigation on the Effect of Laser Beam Characteristics, the Material and Cut Direction
138
0
100
200
300
400
500
600
Matrix
recession at the
beam entrance
(µm)
Kerf width at
the beam
entrance (µm)
Matrix
recession at the
beam exit (µm)
Kerf width at
the beam exit
(µm)
Number of
passes cutting
through
Cross cutting
Parallel cutting
Figure 6-6 Comparison of cut direction on different quality factors in laser cutting of unidirectional
carbon fibre/vinyl ester composite at 25 mJ pulse energy, 200 mm/s scanning speed and 3 kHz
frequency
Figure 6-7, compares the microphotographs of cross-cutting with parallel-cutting
obtained on the material at 25 mJ pulse energy, 3 kHz frequency and 200 mm/s
scanning speed. Minimal matrix recession was observed in parallel-cutting. The laser
system was found to be promising to cut carbon fibre/vinyl ester materials. Cautions
were, however, required for proper extraction as the fume and dust released in
processing of this material was higher than the carbon fibre/epoxy materials. This
encouraging result from DPSS Nd:YAG system motivated using this system in more
details to improve the quality of the laser cut quality on carbon fibre/epoxy materials as
well. More in depth experiments were hence conducted using this system in the next
chapter.
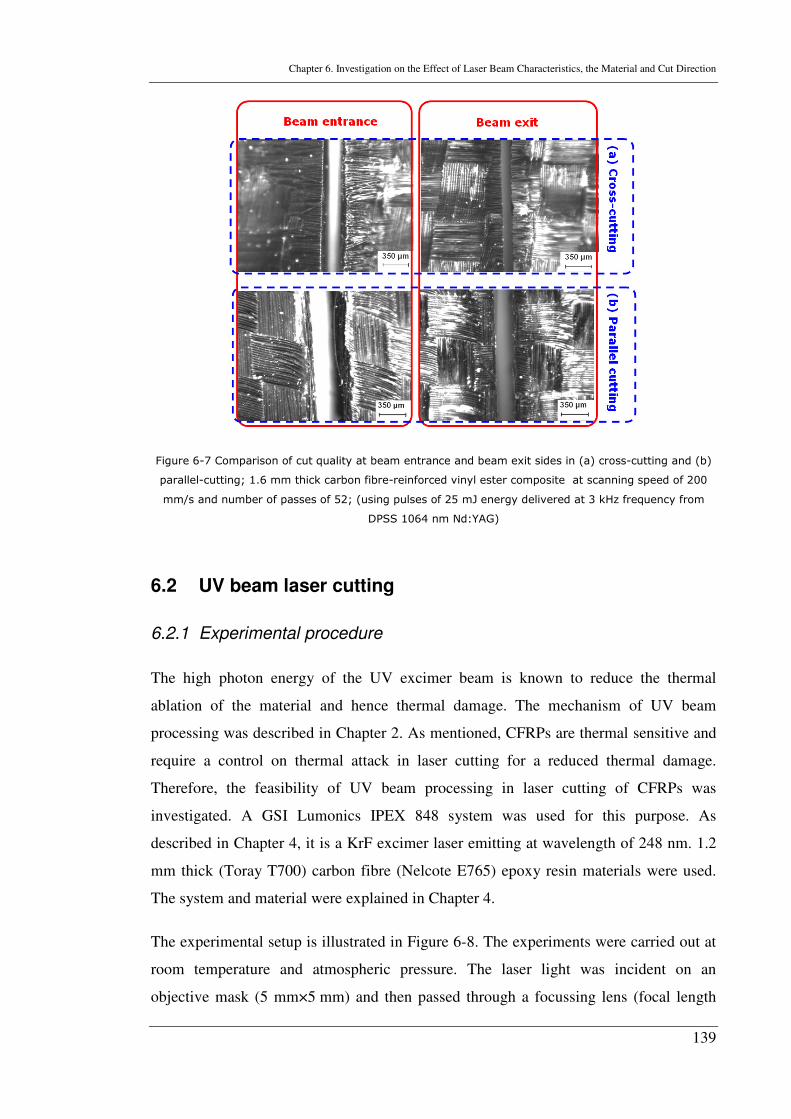
Chapter 6. Investigation on the Effect of Laser Beam Characteristics, the Material and Cut Direction
139
Figure 6-7 Comparison of cut quality at beam entrance and beam exit sides in (a) cross-cutting and (b)
parallel-cutting; 1.6 mm thick carbon fibre-reinforced vinyl ester composite at scanning speed of 200
mm/s and number of passes of 52; (using pulses of 25 mJ energy delivered at 3 kHz frequency from
DPSS 1064 nm Nd:YAG)
6.2 UV beam laser cutting
6.2.1 Experimental procedure
The high photon energy of the UV excimer beam is known to reduce the thermal
ablation of the material and hence thermal damage. The mechanism of UV beam
processing was described in Chapter 2. As mentioned, CFRPs are thermal sensitive and
require a control on thermal attack in laser cutting for a reduced thermal damage.
Therefore, the feasibility of UV beam processing in laser cutting of CFRPs was
investigated. A GSI Lumonics IPEX 848 system was used for this purpose. As
described in Chapter 4, it is a KrF excimer laser emitting at wavelength of 248 nm. 1.2
mm thick (Toray T700) carbon fibre (Nelcote E765) epoxy resin materials were used.
The system and material were explained in Chapter 4.
The experimental setup is illustrated in Figure 6-8. The experiments were carried out at
room temperature and atmospheric pressure. The laser light was incident on an
objective mask (5 mm×5 mm) and then passed through a focussing lens (focal length
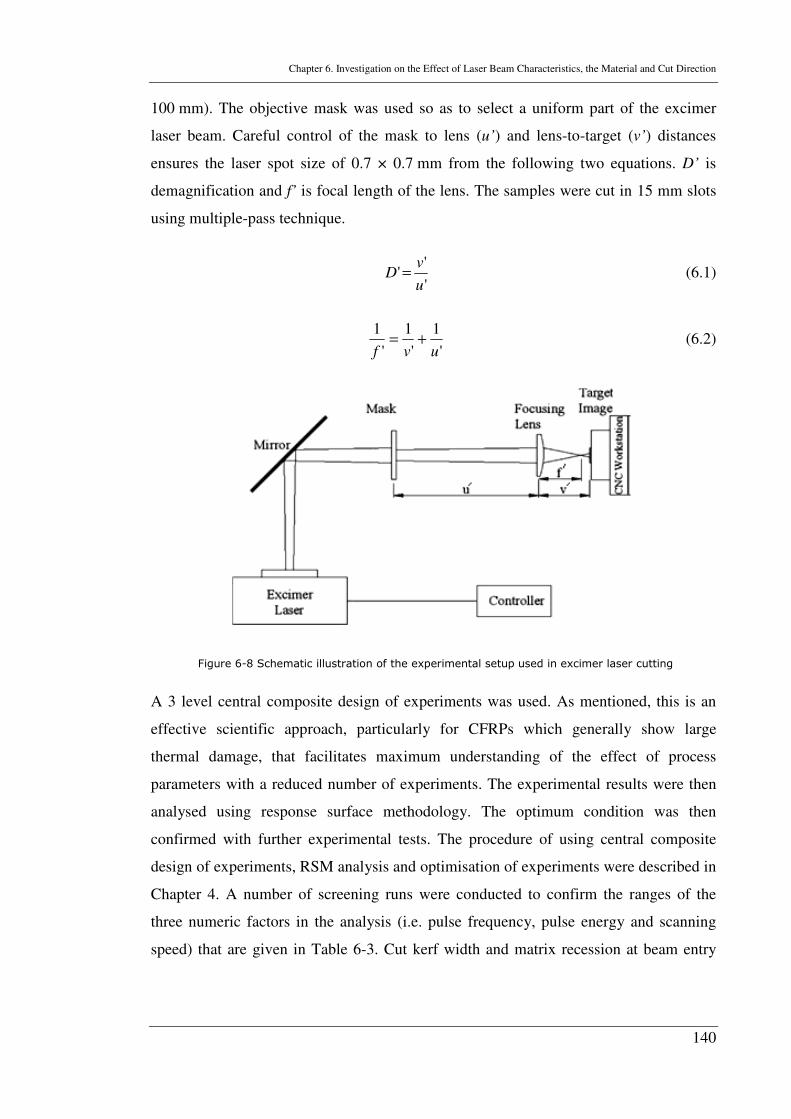
Chapter 6. Investigation on the Effect of Laser Beam Characteristics, the Material and Cut Direction
140
100 mm). The objective mask was used so as to select a uniform part of the excimer
laser beam. Careful control of the mask to lens (u’) and lens-to-target (v’) distances
ensures the laser spot size of 0.7 × 0.7 mm from the following two equations. D’ is
demagnification and f’ is focal length of the lens. The samples were cut in 15 mm slots
using multiple-pass technique.
'
''
u
vD = (6.1)
'
1
'
1
'
1
uvf+= (6.2)
Figure 6-8 Schematic illustration of the experimental setup used in excimer laser cutting
A 3 level central composite design of experiments was used. As mentioned, this is an
effective scientific approach, particularly for CFRPs which generally show large
thermal damage, that facilitates maximum understanding of the effect of process
parameters with a reduced number of experiments. The experimental results were then
analysed using response surface methodology. The optimum condition was then
confirmed with further experimental tests. The procedure of using central composite
design of experiments, RSM analysis and optimisation of experiments were described in
Chapter 4. A number of screening runs were conducted to confirm the ranges of the
three numeric factors in the analysis (i.e. pulse frequency, pulse energy and scanning
speed) that are given in Table 6-3. Cut kerf width and matrix recession at beam entry
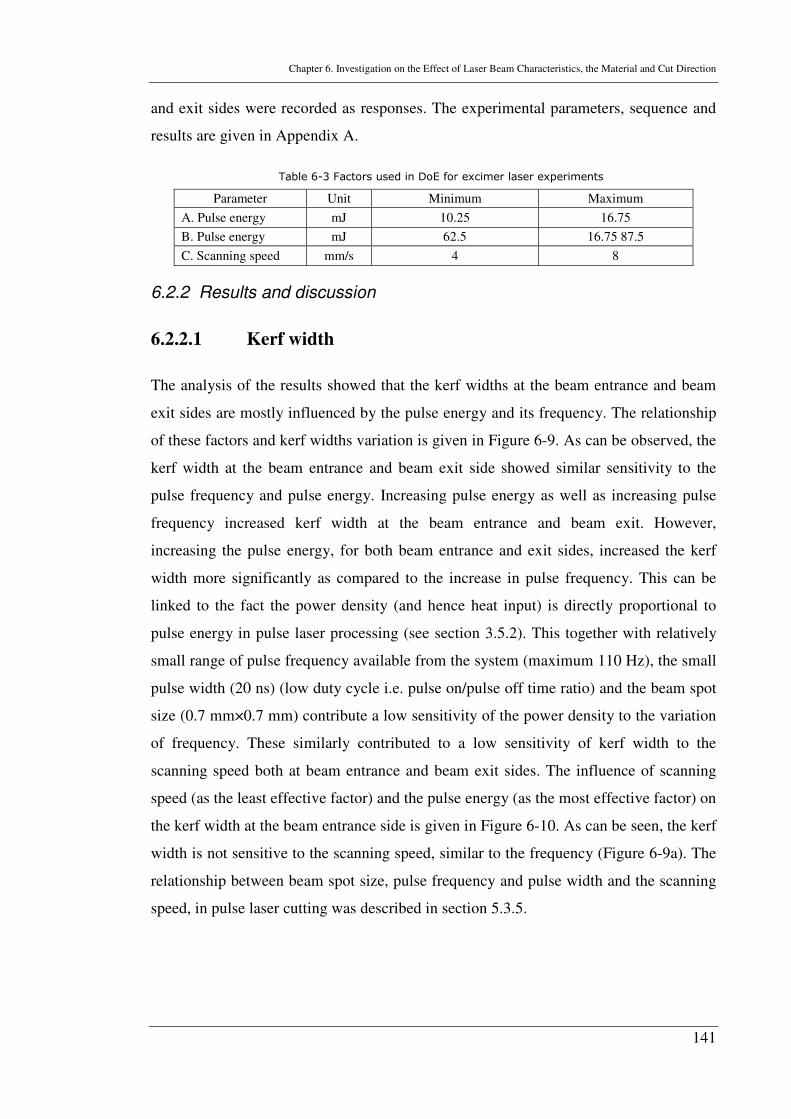
Chapter 6. Investigation on the Effect of Laser Beam Characteristics, the Material and Cut Direction
141
and exit sides were recorded as responses. The experimental parameters, sequence and
results are given in Appendix A.
Table 6-3 Factors used in DoE for excimer laser experiments
Parameter Unit Minimum Maximum
A. Pulse energy mJ 10.25 16.75
B. Pulse energy mJ 62.5 16.75 87.5
C. Scanning speed mm/s 4 8
6.2.2 Results and discussion
6.2.2.1 Kerf width
The analysis of the results showed that the kerf widths at the beam entrance and beam
exit sides are mostly influenced by the pulse energy and its frequency. The relationship
of these factors and kerf widths variation is given in Figure 6-9. As can be observed, the
kerf width at the beam entrance and beam exit side showed similar sensitivity to the
pulse frequency and pulse energy. Increasing pulse energy as well as increasing pulse
frequency increased kerf width at the beam entrance and beam exit. However,
increasing the pulse energy, for both beam entrance and exit sides, increased the kerf
width more significantly as compared to the increase in pulse frequency. This can be
linked to the fact the power density (and hence heat input) is directly proportional to
pulse energy in pulse laser processing (see section 3.5.2). This together with relatively
small range of pulse frequency available from the system (maximum 110 Hz), the small
pulse width (20 ns) (low duty cycle i.e. pulse on/pulse off time ratio) and the beam spot
size (0.7 mm×0.7 mm) contribute a low sensitivity of the power density to the variation
of frequency. These similarly contributed to a low sensitivity of kerf width to the
scanning speed both at beam entrance and beam exit sides. The influence of scanning
speed (as the least effective factor) and the pulse energy (as the most effective factor) on
the kerf width at the beam entrance side is given in Figure 6-10. As can be seen, the kerf
width is not sensitive to the scanning speed, similar to the frequency (Figure 6-9a). The
relationship between beam spot size, pulse frequency and pulse width and the scanning
speed, in pulse laser cutting was described in section 5.3.5.
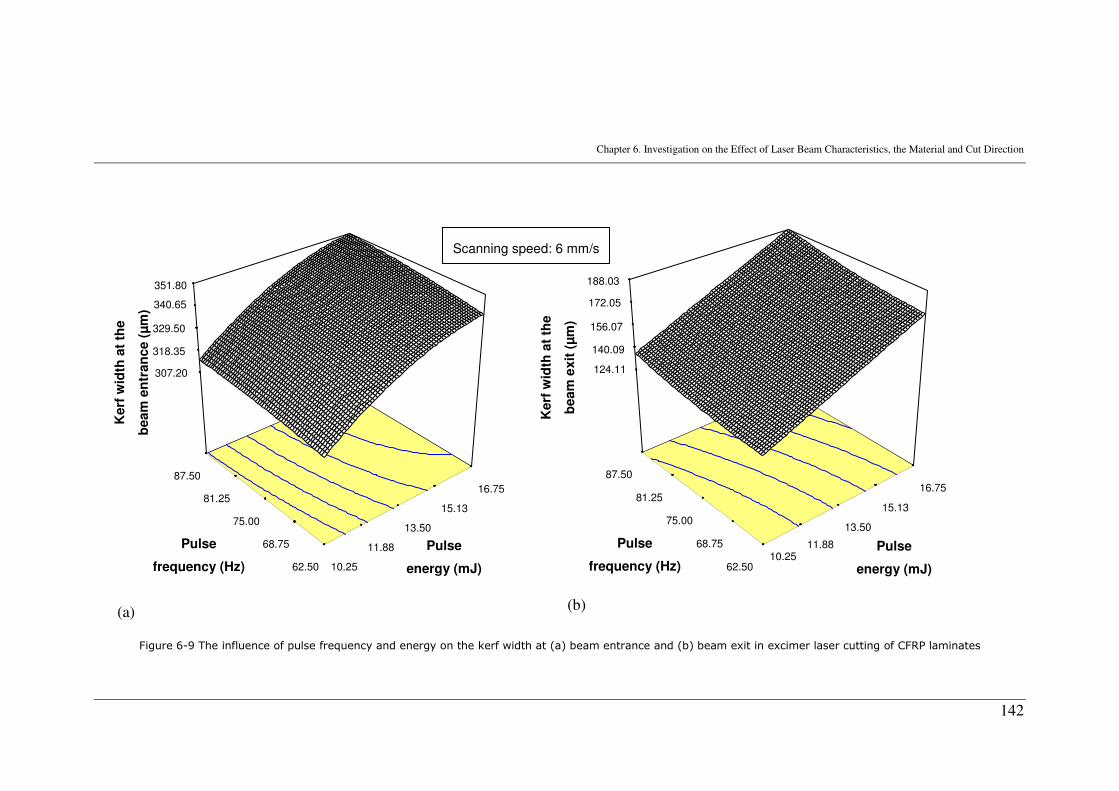
Chapter 6. Investigation on the Effect of Laser Beam Characteristics, the Material and Cut Direction
142
Figure 6-9 The influence of pulse frequency and energy on the kerf width at (a) beam entrance and (b) beam exit in excimer laser cutting of CFRP laminates
307.20
318.35
329.50
340.65
351.80
10.25
11.88
13.50
15.13
16.75
62.50
68.75
75.00
81.25
87.50
Pulse
energy (mJ)
Pulse
frequency (Hz)
124.11
140.09
156.07
172.05
188.03
10.25 11.88
13.50
15.13
16.75
62.50
68.75
75.00
81.25
87.50
Pulse
energy (mJ)
Pulse
frequency (Hz)
Kerf
wid
th a
t th
e
beam
en
tran
ce (
µm
)
Kerf
wid
th a
t th
e
beam
exit
(µ
m)
Scanning speed: 6 mm/s
(a) (b)
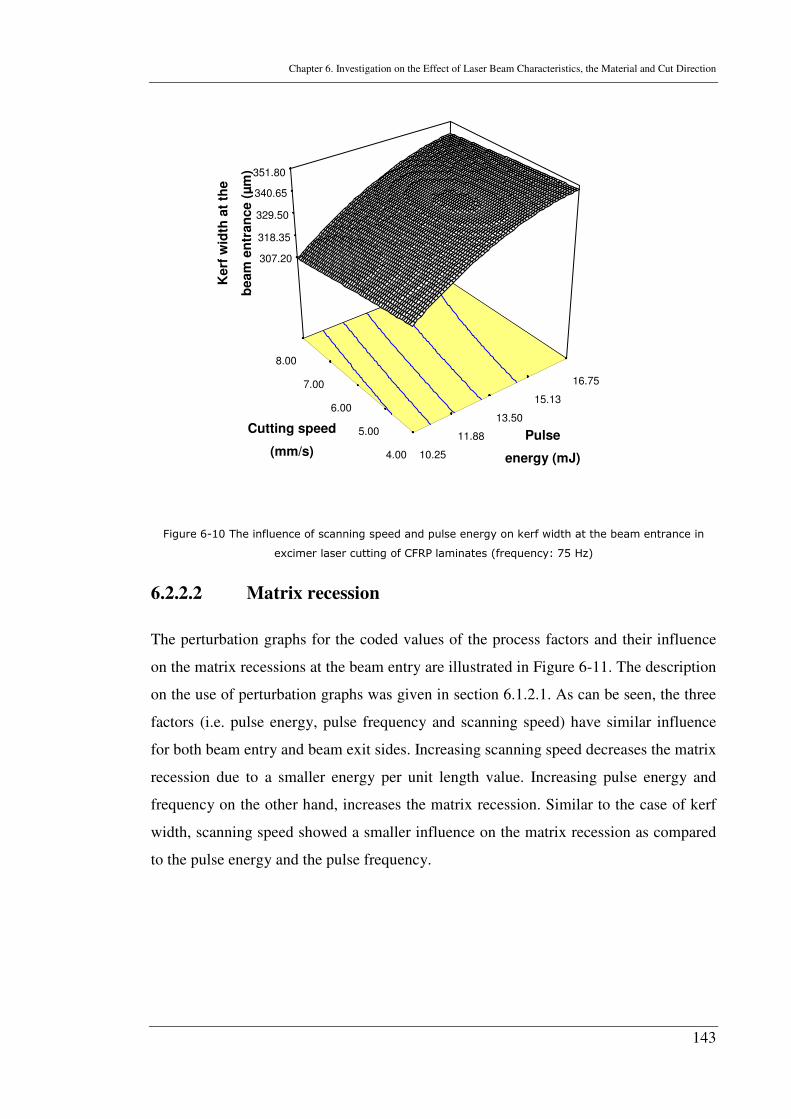
Chapter 6. Investigation on the Effect of Laser Beam Characteristics, the Material and Cut Direction
143
Figure 6-10 The influence of scanning speed and pulse energy on kerf width at the beam entrance in
excimer laser cutting of CFRP laminates (frequency: 75 Hz)
6.2.2.2 Matrix recession
The perturbation graphs for the coded values of the process factors and their influence
on the matrix recessions at the beam entry are illustrated in Figure 6-11. The description
on the use of perturbation graphs was given in section 6.1.2.1. As can be seen, the three
factors (i.e. pulse energy, pulse frequency and scanning speed) have similar influence
for both beam entry and beam exit sides. Increasing scanning speed decreases the matrix
recession due to a smaller energy per unit length value. Increasing pulse energy and
frequency on the other hand, increases the matrix recession. Similar to the case of kerf
width, scanning speed showed a smaller influence on the matrix recession as compared
to the pulse energy and the pulse frequency.
307.20
318.35
329.50
340.65
351.80
10.25
11.88
13.50
15.13
16.75
4.00
5.00
6.00
7.00
8.00
Pulse
energy (mJ)
Cutting speed
(mm/s)
Kerf
wid
th a
t th
e
beam
en
tran
ce (
µm
)
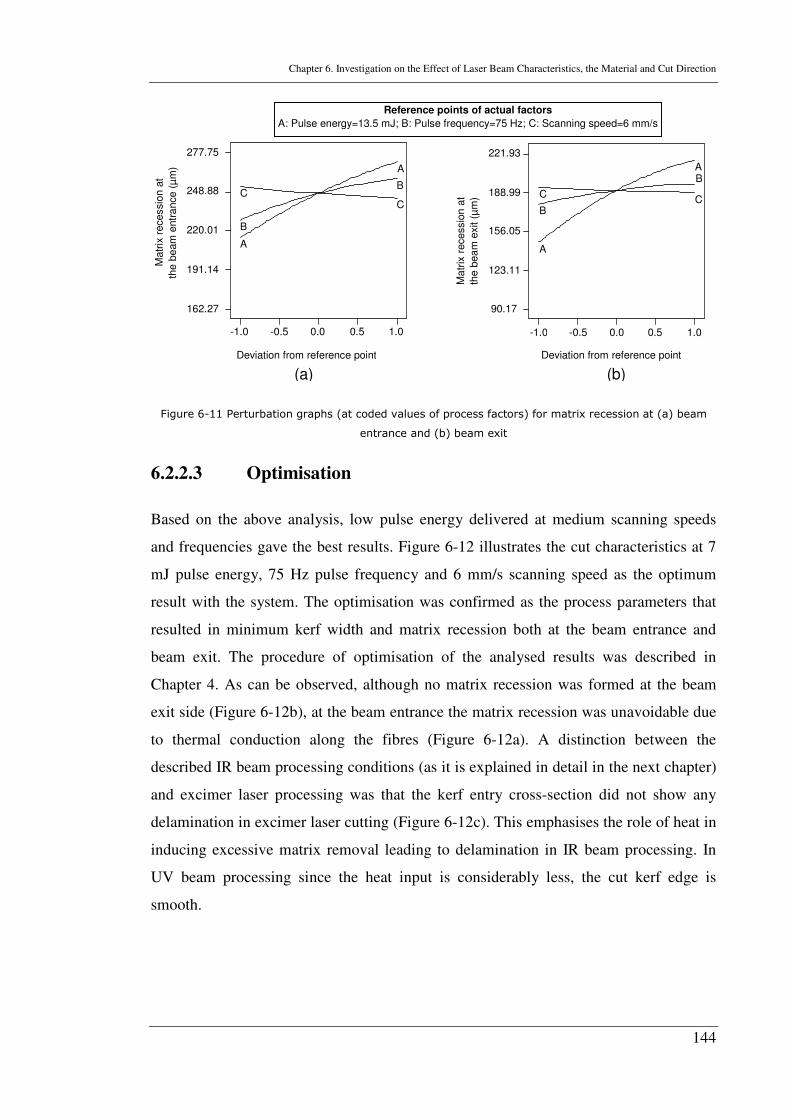
Chapter 6. Investigation on the Effect of Laser Beam Characteristics, the Material and Cut Direction
144
Deviation from reference point
Matr
ix r
ecessio
n a
t
the
be
am
entr
ance (
µm
)
-1.0 -0.5 0.0 0.5 1.0
162.27
191.14
220.01
248.88
277.75
A
A
B
BC
C
Deviation from reference point
Ma
trix
recessio
n a
t
the
bea
m e
xit (
µm
)
-1.0 -0.5 0.0 0.5 1.0
90.17
123.11
156.05
188.99
221.93
A
A
B
B
CC
(a) (b)
Reference points of actual factors
A: Pulse energy=13.5 mJ; B: Pulse frequency=75 Hz; C: Scanning speed=6 mm/s
Figure 6-11 Perturbation graphs (at coded values of process factors) for matrix recession at (a) beam
entrance and (b) beam exit
6.2.2.3 Optimisation
Based on the above analysis, low pulse energy delivered at medium scanning speeds
and frequencies gave the best results. Figure 6-12 illustrates the cut characteristics at 7
mJ pulse energy, 75 Hz pulse frequency and 6 mm/s scanning speed as the optimum
result with the system. The optimisation was confirmed as the process parameters that
resulted in minimum kerf width and matrix recession both at the beam entrance and
beam exit. The procedure of optimisation of the analysed results was described in
Chapter 4. As can be observed, although no matrix recession was formed at the beam
exit side (Figure 6-12b), at the beam entrance the matrix recession was unavoidable due
to thermal conduction along the fibres (Figure 6-12a). A distinction between the
described IR beam processing conditions (as it is explained in detail in the next chapter)
and excimer laser processing was that the kerf entry cross-section did not show any
delamination in excimer laser cutting (Figure 6-12c). This emphasises the role of heat in
inducing excessive matrix removal leading to delamination in IR beam processing. In
UV beam processing since the heat input is considerably less, the cut kerf edge is
smooth.
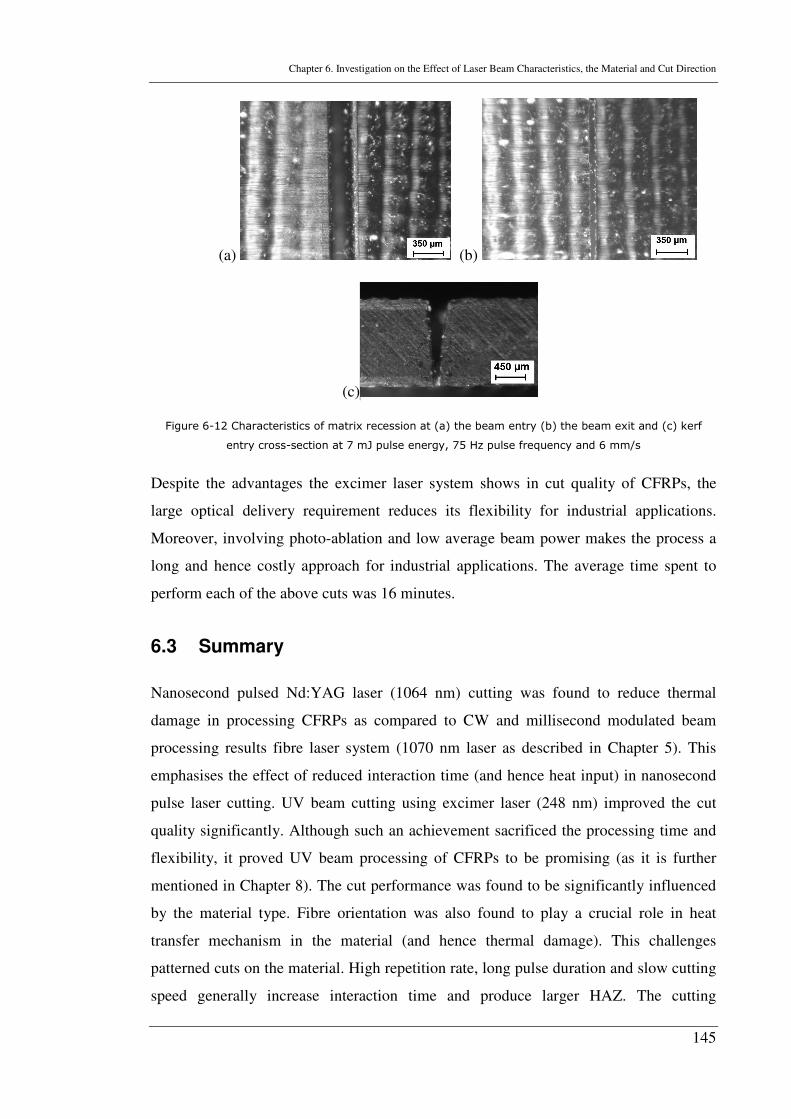
Chapter 6. Investigation on the Effect of Laser Beam Characteristics, the Material and Cut Direction
145
(a) (b)
(c)
Figure 6-12 Characteristics of matrix recession at (a) the beam entry (b) the beam exit and (c) kerf
entry cross-section at 7 mJ pulse energy, 75 Hz pulse frequency and 6 mm/s
Despite the advantages the excimer laser system shows in cut quality of CFRPs, the
large optical delivery requirement reduces its flexibility for industrial applications.
Moreover, involving photo-ablation and low average beam power makes the process a
long and hence costly approach for industrial applications. The average time spent to
perform each of the above cuts was 16 minutes.
6.3 Summary
Nanosecond pulsed Nd:YAG laser (1064 nm) cutting was found to reduce thermal
damage in processing CFRPs as compared to CW and millisecond modulated beam
processing results fibre laser system (1070 nm laser as described in Chapter 5). This
emphasises the effect of reduced interaction time (and hence heat input) in nanosecond
pulse laser cutting. UV beam cutting using excimer laser (248 nm) improved the cut
quality significantly. Although such an achievement sacrificed the processing time and
flexibility, it proved UV beam processing of CFRPs to be promising (as it is further
mentioned in Chapter 8). The cut performance was found to be significantly influenced
by the material type. Fibre orientation was also found to play a crucial role in heat
transfer mechanism in the material (and hence thermal damage). This challenges
patterned cuts on the material. High repetition rate, long pulse duration and slow cutting
speed generally increase interaction time and produce larger HAZ. The cutting
Chapter 6. Investigation on the Effect of Laser Beam Characteristics, the Material and Cut Direction
146
mechanism in multiple-pass cutting was found to be more complicated than single pass
cutting. However, multiple-pass cutting reduced thermal damage due to reduction in
energy deposited per unit length of material. A tabular summary of the overall
performance of the used laser systems, cutting direction and matrix material (based on
findings in Chapter 5 and Chapter 6) is given in Table 6-4. The feasibility of the
nanosecond pulsed Nd:YAG laser cutting of CFRPs, motivated further investigation on
its characteristics. More in depth experimental analysis were hence conducted using this
system as given in the next chapter.
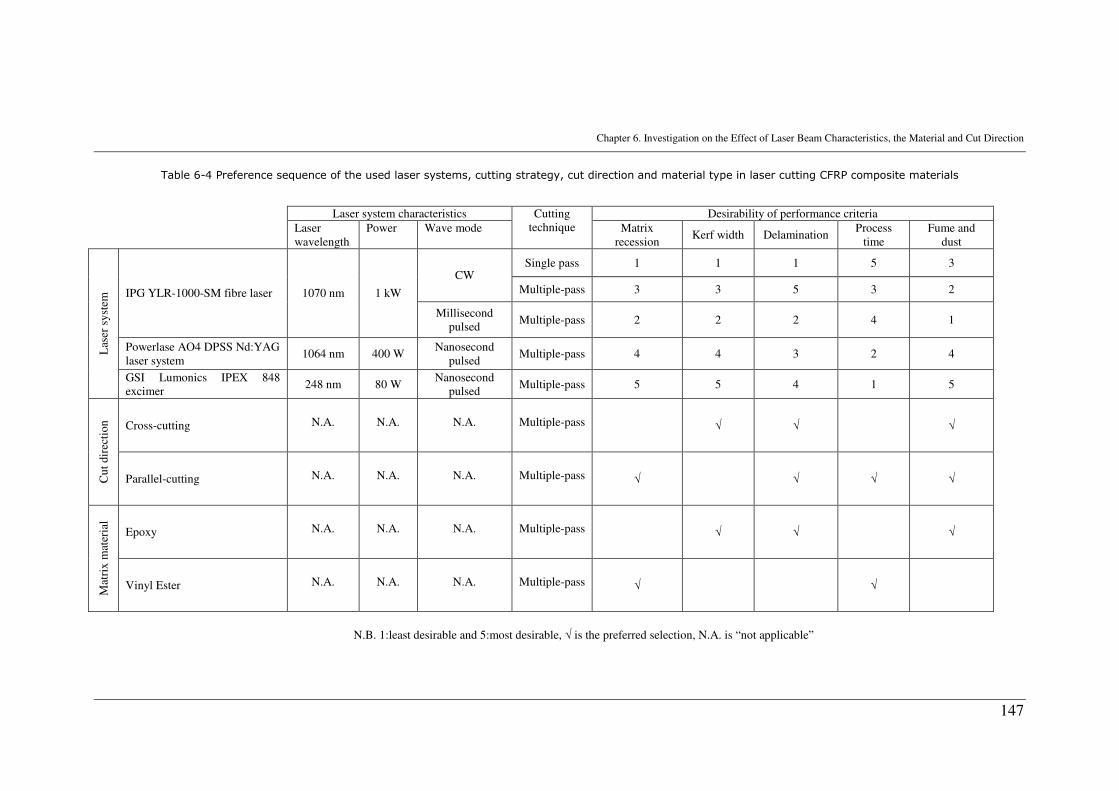
Chapter 6. Investigation on the Effect of Laser Beam Characteristics, the Material and Cut Direction
147
Table 6-4 Preference sequence of the used laser systems, cutting strategy, cut direction and material type in laser cutting CFRP composite materials
N.B. 1:least desirable and 5:most desirable, √ is the preferred selection, N.A. is “not applicable”
Laser system characteristics Desirability of performance criteria
Laser wavelength
Power Wave mode
Cutting technique Matrix
recession Kerf width Delamination
Process time
Fume and dust
Single pass 1 1 1 5 3 CW
Multiple-pass 3 3 5 3 2 IPG YLR-1000-SM fibre laser 1070 nm 1 kW
Millisecond pulsed
Multiple-pass 2 2 2 4 1
Powerlase AO4 DPSS Nd:YAG laser system
1064 nm 400 W Nanosecond
pulsed Multiple-pass 4 4 3 2 4 L
aser
sy
stem
GSI Lumonics IPEX 848 excimer
248 nm 80 W Nanosecond
pulsed Multiple-pass 5 5 4 1 5
Cross-cutting N.A. N.A. N.A. Multiple-pass √ √ √
Cu
t dir
ecti
on
Parallel-cutting N.A. N.A. N.A. Multiple-pass √ √ √ √
Epoxy N.A. N.A. N.A. Multiple-pass √ √ √
Mat
rix
mat
eria
l
Vinyl Ester N.A. N.A. N.A. Multiple-pass √ √
Chapter 7. Nanosecond Pulsed DPSS Nd:YAG Laser Cutting of CFRP Composites with Mixed Reactive and Inert Gases
148
CHAPTER 7
NANOSECOND PULSED DPSS Nd:YAG
LASER CUTTING OF CFRP COMPOSITES
WITH MIXED REACTIVE AND INERT GASES
7.1 General Outline
In this chapter the thermal degradation characteristics in laser cutting of CFRPs are
investigated. A statistical analysis is performed for the optimisation of the process
parameters. Furthermore, quality improvement of the process is achieved with the use
of low oxygen content assistant gas simultaneously with an inert gas shield. The
controlled presence of oxygen as a burning mechanism reduced the matrix recession up
to 55% with a high processing rate at the same time. Assist gas is an important process
factor which can affect the processing results in Nd:YAG laser cutting of CFRPs [133].
Controlled composition of oxygen (O2) and inert gases (nitrogen N2 and argon Ar)
carried out here aims to utilise the combined positive effects for improving the quality
of the cut whilst keeping the MRR at reasonable levels. The 400 W DPSS Nd:YAG
(1064 nm) laser system is used. This system offers more reliability, higher efficiency,
narrower frequency linewidths and higher peak powers as compared to the arc lamp
pumped laser systems used in previous studies [133]. High repetition rate of 3 to 15
kHz and short pulse duration (i.e. 28-47 ns) of the system distinguished this system
from the millisecond pulsed Nd:YAG lasers used in most of the previous CFRP laser
cutting studies [125, 133].
7.2 Thermal decomposition of CFRPs
Typically, epoxy structures are produced by combining a resin and a hardener. It mainly
consists of carbon (above 70%) and small proportion of other constituents such as
hydrogen (below 10%), nitrogen (around 3%) and oxygen (above 15%) [162]. Hence,
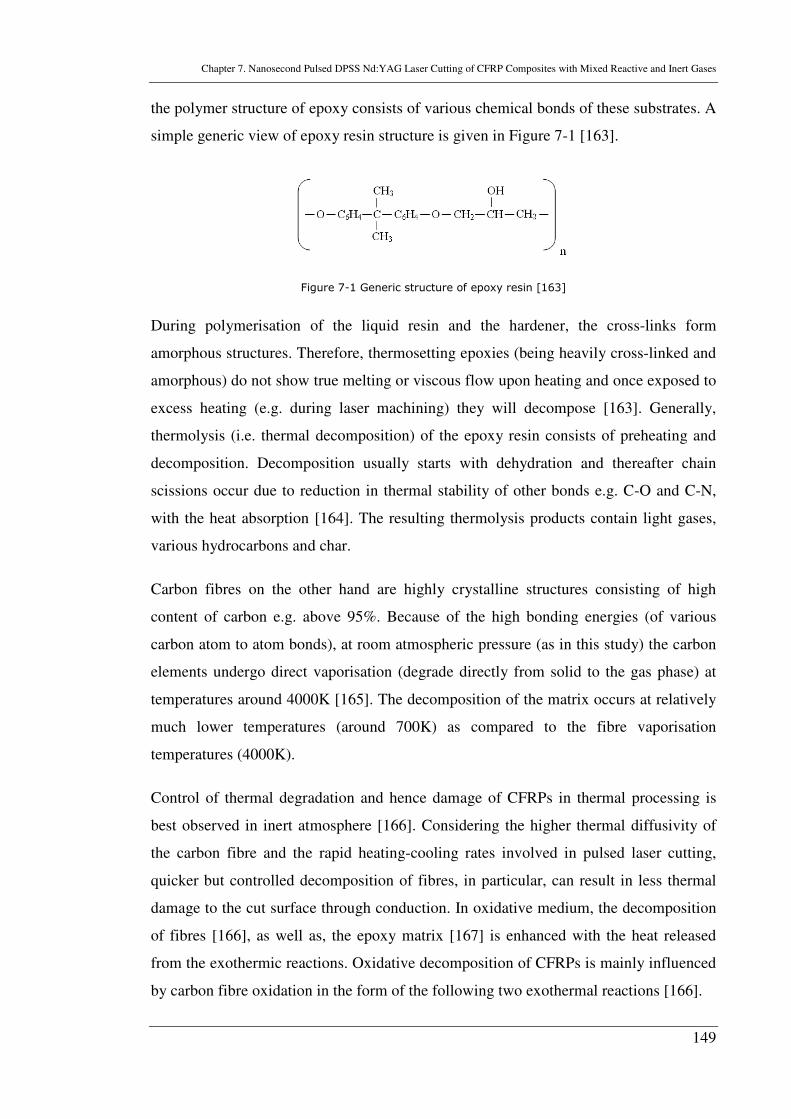
Chapter 7. Nanosecond Pulsed DPSS Nd:YAG Laser Cutting of CFRP Composites with Mixed Reactive and Inert Gases
149
the polymer structure of epoxy consists of various chemical bonds of these substrates. A
simple generic view of epoxy resin structure is given in Figure 7-1 [163].
Figure 7-1 Generic structure of epoxy resin [163]
During polymerisation of the liquid resin and the hardener, the cross-links form
amorphous structures. Therefore, thermosetting epoxies (being heavily cross-linked and
amorphous) do not show true melting or viscous flow upon heating and once exposed to
excess heating (e.g. during laser machining) they will decompose [163]. Generally,
thermolysis (i.e. thermal decomposition) of the epoxy resin consists of preheating and
decomposition. Decomposition usually starts with dehydration and thereafter chain
scissions occur due to reduction in thermal stability of other bonds e.g. C-O and C-N,
with the heat absorption [164]. The resulting thermolysis products contain light gases,
various hydrocarbons and char.
Carbon fibres on the other hand are highly crystalline structures consisting of high
content of carbon e.g. above 95%. Because of the high bonding energies (of various
carbon atom to atom bonds), at room atmospheric pressure (as in this study) the carbon
elements undergo direct vaporisation (degrade directly from solid to the gas phase) at
temperatures around 4000K [165]. The decomposition of the matrix occurs at relatively
much lower temperatures (around 700K) as compared to the fibre vaporisation
temperatures (4000K).
Control of thermal degradation and hence damage of CFRPs in thermal processing is
best observed in inert atmosphere [166]. Considering the higher thermal diffusivity of
the carbon fibre and the rapid heating-cooling rates involved in pulsed laser cutting,
quicker but controlled decomposition of fibres, in particular, can result in less thermal
damage to the cut surface through conduction. In oxidative medium, the decomposition
of fibres [166], as well as, the epoxy matrix [167] is enhanced with the heat released
from the exothermic reactions. Oxidative decomposition of CFRPs is mainly influenced
by carbon fibre oxidation in the form of the following two exothermal reactions [166].
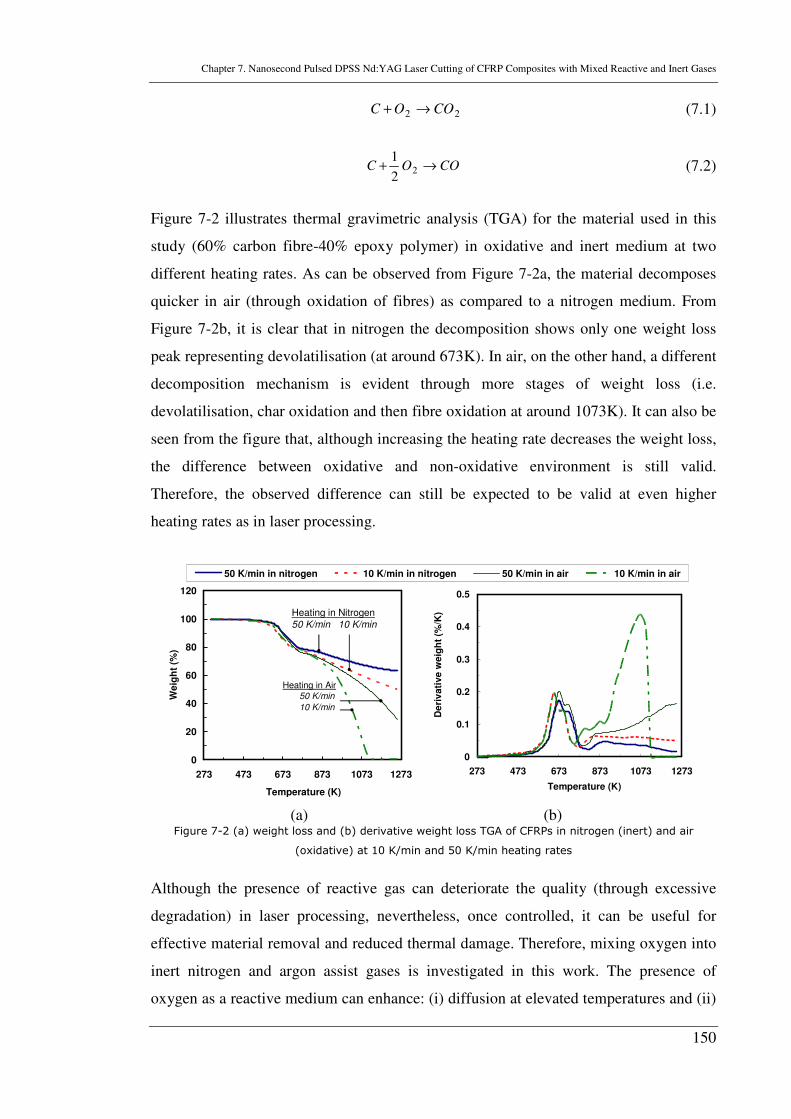
Chapter 7. Nanosecond Pulsed DPSS Nd:YAG Laser Cutting of CFRP Composites with Mixed Reactive and Inert Gases
150
22 COOC →+ (7.1)
COOC →+ 22
1 (7.2)
Figure 7-2 illustrates thermal gravimetric analysis (TGA) for the material used in this
study (60% carbon fibre-40% epoxy polymer) in oxidative and inert medium at two
different heating rates. As can be observed from Figure 7-2a, the material decomposes
quicker in air (through oxidation of fibres) as compared to a nitrogen medium. From
Figure 7-2b, it is clear that in nitrogen the decomposition shows only one weight loss
peak representing devolatilisation (at around 673K). In air, on the other hand, a different
decomposition mechanism is evident through more stages of weight loss (i.e.
devolatilisation, char oxidation and then fibre oxidation at around 1073K). It can also be
seen from the figure that, although increasing the heating rate decreases the weight loss,
the difference between oxidative and non-oxidative environment is still valid.
Therefore, the observed difference can still be expected to be valid at even higher
heating rates as in laser processing.
0
20
40
60
80
100
120
273 473 673 873 1073 1273
Temperature (K)
We
igh
t (%
)
50 K/min in nitrogen 10 K/min in nitrogen 50 K/min in air 10 K/min in air
Heating in Nitrogen
50 K/min 10 K/min
Heating in Air
50 K/min
10 K/min
0
0.1
0.2
0.3
0.4
0.5
273 473 673 873 1073 1273
Temperature (K)
De
riv
ati
ve
weig
ht
(%/K
)
(a) (b)
Figure 7-2 (a) weight loss and (b) derivative weight loss TGA of CFRPs in nitrogen (inert) and air
(oxidative) at 10 K/min and 50 K/min heating rates
Although the presence of reactive gas can deteriorate the quality (through excessive
degradation) in laser processing, nevertheless, once controlled, it can be useful for
effective material removal and reduced thermal damage. Therefore, mixing oxygen into
inert nitrogen and argon assist gases is investigated in this work. The presence of
oxygen as a reactive medium can enhance: (i) diffusion at elevated temperatures and (ii)
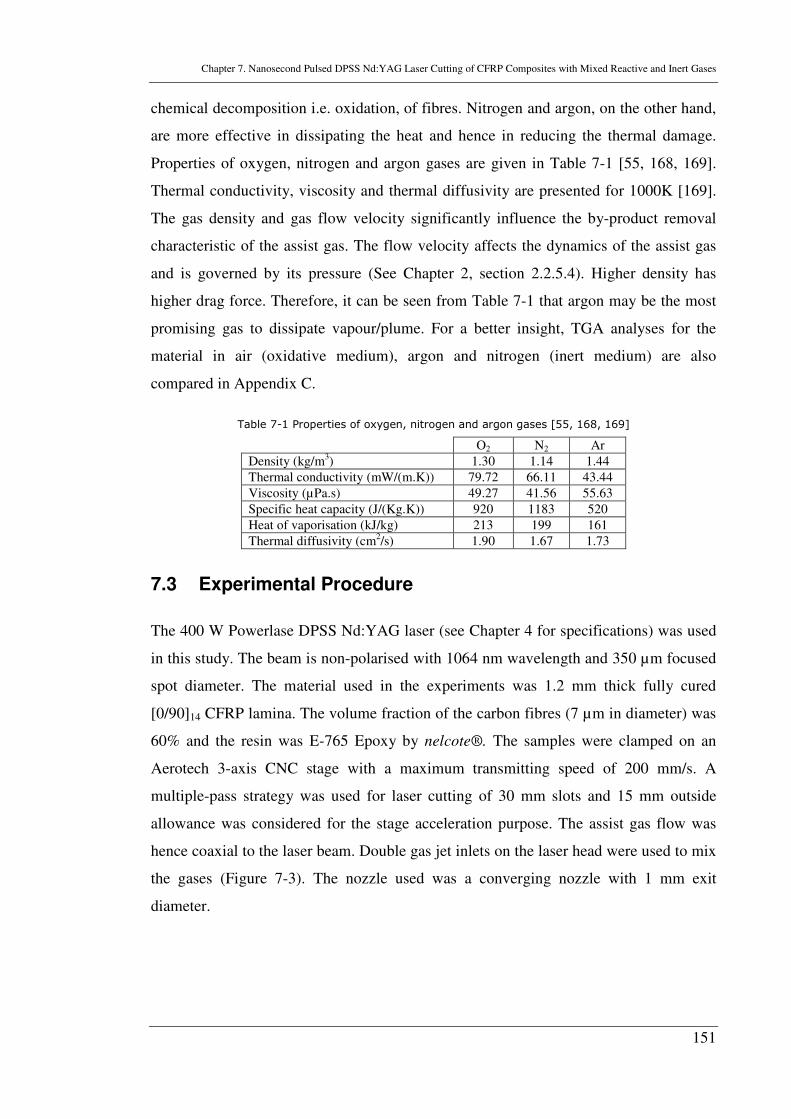
Chapter 7. Nanosecond Pulsed DPSS Nd:YAG Laser Cutting of CFRP Composites with Mixed Reactive and Inert Gases
151
chemical decomposition i.e. oxidation, of fibres. Nitrogen and argon, on the other hand,
are more effective in dissipating the heat and hence in reducing the thermal damage.
Properties of oxygen, nitrogen and argon gases are given in Table 7-1 [55, 168, 169].
Thermal conductivity, viscosity and thermal diffusivity are presented for 1000K [169].
The gas density and gas flow velocity significantly influence the by-product removal
characteristic of the assist gas. The flow velocity affects the dynamics of the assist gas
and is governed by its pressure (See Chapter 2, section 2.2.5.4). Higher density has
higher drag force. Therefore, it can be seen from Table 7-1 that argon may be the most
promising gas to dissipate vapour/plume. For a better insight, TGA analyses for the
material in air (oxidative medium), argon and nitrogen (inert medium) are also
compared in Appendix C.
Table 7-1 Properties of oxygen, nitrogen and argon gases [55, 168, 169]
O2 N2 Ar
Density (kg/m3) 1.30 1.14 1.44
Thermal conductivity (mW/(m.K)) 79.72 66.11 43.44
Viscosity (µPa.s) 49.27 41.56 55.63
Specific heat capacity (J/(Kg.K)) 920 1183 520
Heat of vaporisation (kJ/kg) 213 199 161
Thermal diffusivity (cm2/s) 1.90 1.67 1.73
7.3 Experimental Procedure
The 400 W Powerlase DPSS Nd:YAG laser (see Chapter 4 for specifications) was used
in this study. The beam is non-polarised with 1064 nm wavelength and 350 µm focused
spot diameter. The material used in the experiments was 1.2 mm thick fully cured
[0/90]14 CFRP lamina. The volume fraction of the carbon fibres (7 µm in diameter) was
60% and the resin was E-765 Epoxy by nelcote®. The samples were clamped on an
Aerotech 3-axis CNC stage with a maximum transmitting speed of 200 mm/s. A
multiple-pass strategy was used for laser cutting of 30 mm slots and 15 mm outside
allowance was considered for the stage acceleration purpose. The assist gas flow was
hence coaxial to the laser beam. Double gas jet inlets on the laser head were used to mix
the gases (Figure 7-3). The nozzle used was a converging nozzle with 1 mm exit
diameter.
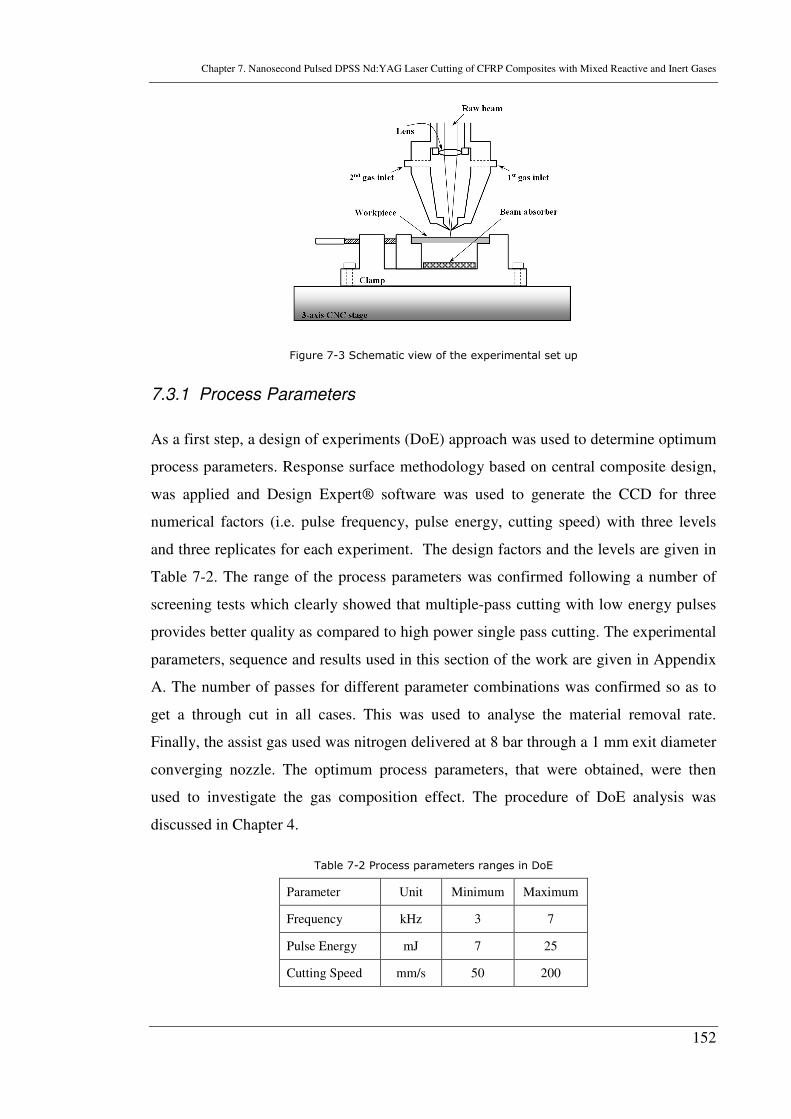
Chapter 7. Nanosecond Pulsed DPSS Nd:YAG Laser Cutting of CFRP Composites with Mixed Reactive and Inert Gases
152
Figure 7-3 Schematic view of the experimental set up
7.3.1 Process Parameters
As a first step, a design of experiments (DoE) approach was used to determine optimum
process parameters. Response surface methodology based on central composite design,
was applied and Design Expert® software was used to generate the CCD for three
numerical factors (i.e. pulse frequency, pulse energy, cutting speed) with three levels
and three replicates for each experiment. The design factors and the levels are given in
Table 7-2. The range of the process parameters was confirmed following a number of
screening tests which clearly showed that multiple-pass cutting with low energy pulses
provides better quality as compared to high power single pass cutting. The experimental
parameters, sequence and results used in this section of the work are given in Appendix
A. The number of passes for different parameter combinations was confirmed so as to
get a through cut in all cases. This was used to analyse the material removal rate.
Finally, the assist gas used was nitrogen delivered at 8 bar through a 1 mm exit diameter
converging nozzle. The optimum process parameters, that were obtained, were then
used to investigate the gas composition effect. The procedure of DoE analysis was
discussed in Chapter 4.
Table 7-2 Process parameters ranges in DoE
Parameter Unit Minimum Maximum
Frequency kHz 3 7
Pulse Energy mJ 7 25
Cutting Speed mm/s 50 200
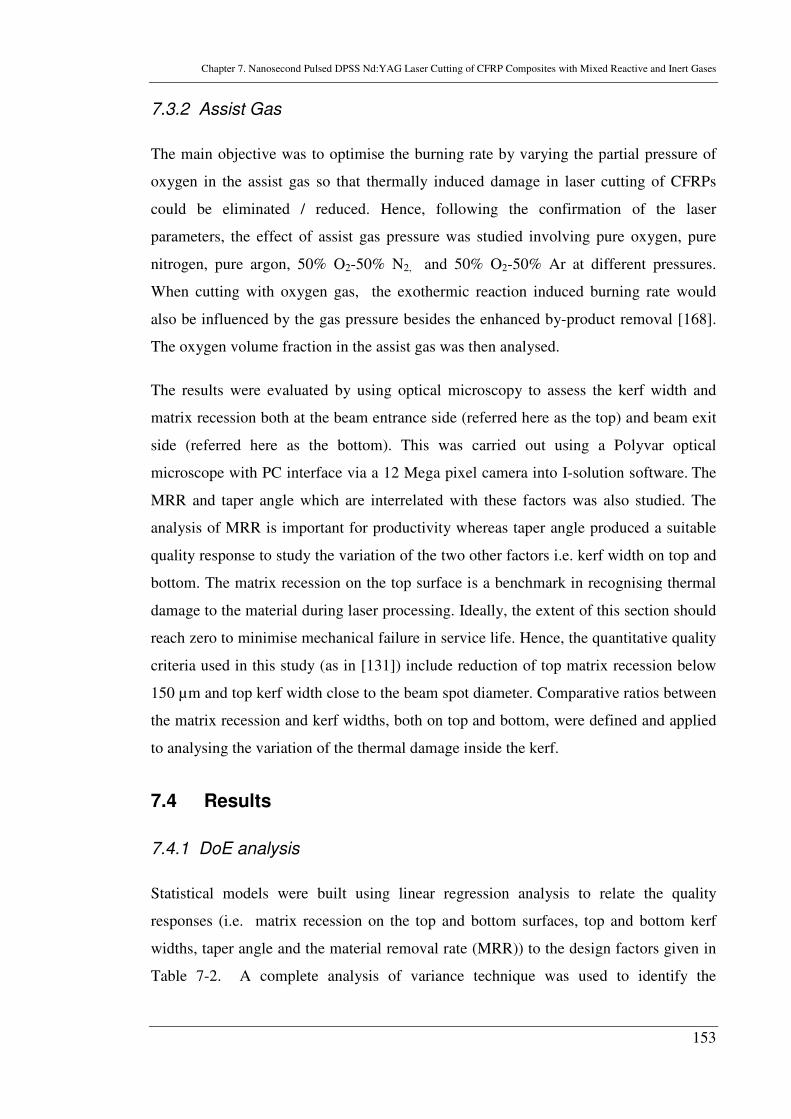
Chapter 7. Nanosecond Pulsed DPSS Nd:YAG Laser Cutting of CFRP Composites with Mixed Reactive and Inert Gases
153
7.3.2 Assist Gas
The main objective was to optimise the burning rate by varying the partial pressure of
oxygen in the assist gas so that thermally induced damage in laser cutting of CFRPs
could be eliminated / reduced. Hence, following the confirmation of the laser
parameters, the effect of assist gas pressure was studied involving pure oxygen, pure
nitrogen, pure argon, 50% O2-50% N2, and 50% O2-50% Ar at different pressures.
When cutting with oxygen gas, the exothermic reaction induced burning rate would
also be influenced by the gas pressure besides the enhanced by-product removal [168].
The oxygen volume fraction in the assist gas was then analysed.
The results were evaluated by using optical microscopy to assess the kerf width and
matrix recession both at the beam entrance side (referred here as the top) and beam exit
side (referred here as the bottom). This was carried out using a Polyvar optical
microscope with PC interface via a 12 Mega pixel camera into I-solution software. The
MRR and taper angle which are interrelated with these factors was also studied. The
analysis of MRR is important for productivity whereas taper angle produced a suitable
quality response to study the variation of the two other factors i.e. kerf width on top and
bottom. The matrix recession on the top surface is a benchmark in recognising thermal
damage to the material during laser processing. Ideally, the extent of this section should
reach zero to minimise mechanical failure in service life. Hence, the quantitative quality
criteria used in this study (as in [131]) include reduction of top matrix recession below
150 µm and top kerf width close to the beam spot diameter. Comparative ratios between
the matrix recession and kerf widths, both on top and bottom, were defined and applied
to analysing the variation of the thermal damage inside the kerf.
7.4 Results
7.4.1 DoE analysis
Statistical models were built using linear regression analysis to relate the quality
responses (i.e. matrix recession on the top and bottom surfaces, top and bottom kerf
widths, taper angle and the material removal rate (MRR)) to the design factors given in
Table 7-2. A complete analysis of variance technique was used to identify the
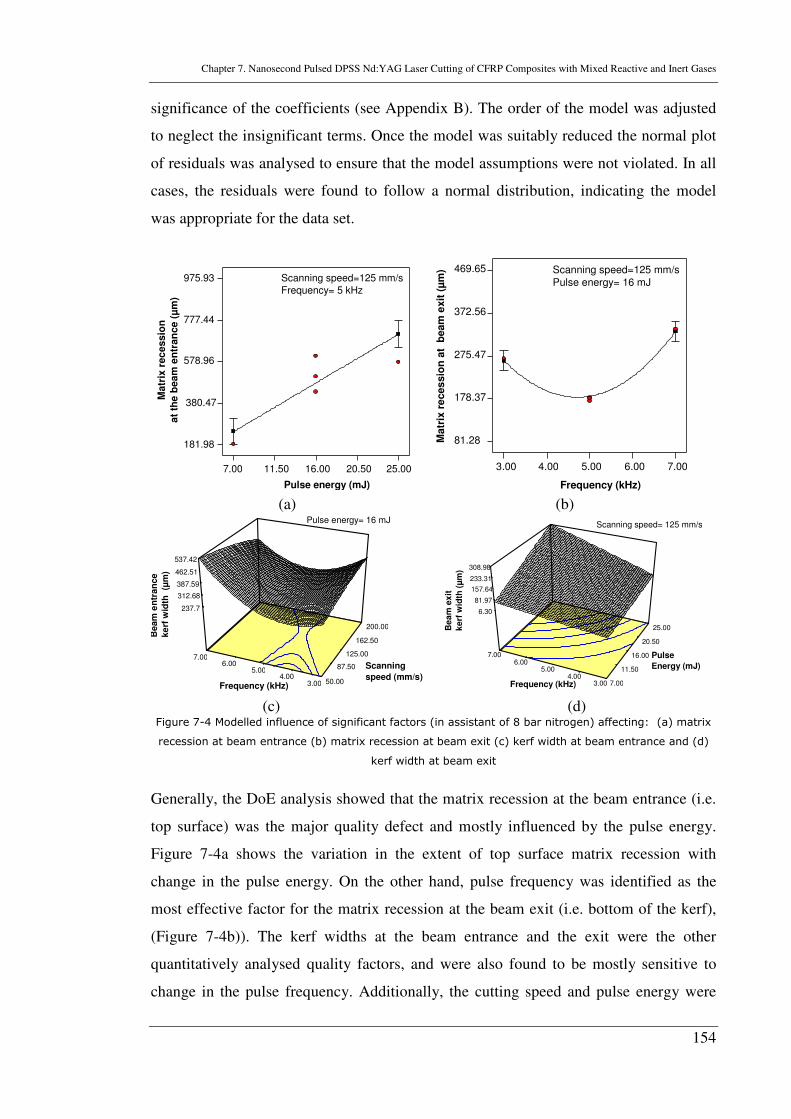
Chapter 7. Nanosecond Pulsed DPSS Nd:YAG Laser Cutting of CFRP Composites with Mixed Reactive and Inert Gases
154
significance of the coefficients (see Appendix B). The order of the model was adjusted
to neglect the insignificant terms. Once the model was suitably reduced the normal plot
of residuals was analysed to ensure that the model assumptions were not violated. In all
cases, the residuals were found to follow a normal distribution, indicating the model
was appropriate for the data set.
7.00 11.50 16.00 20.50 25.00
181.98
380.47
578.96
777.44
975.93
Pulse energy (mJ)
Matr
ix r
ec
essio
n
at
the
beam
en
tran
ce (
µm
)
Scanning speed=125 mm/s
Frequency= 5 kHz
3.00 4.00 5.00 6.00 7.00
81.28
178.37
275.47
372.56
469.65
Frequency (kHz)
Matr
ix r
eces
sio
n a
t b
eam
exit
(µ
m) Scanning speed=125 mm/s
Pulse energy= 16 mJ
(a) (b)
237.7
312.68
387.59
462.51
537.42
Beam
en
tran
ce
ke
rf w
idth
(µ
m)
50.00
87.50
125.00
162.50
200.00
3.00 4.00
5.00 6.00
7.00
Frequency (kHz)
Scanning
speed (mm/s)
Pulse energy= 16 mJ
6.30
81.97
157.64
233.31
308.98
Be
am
ex
it
ke
rf w
idth
(µ
m)
7.00
11.50
16.00
20.50
25.00
3.00 4.00
5.00 6.00
7.00 Pulse
Energy (mJ)
Frequency (kHz)
Scanning speed= 125 mm/s
(c) (d) Figure 7-4 Modelled influence of significant factors (in assistant of 8 bar nitrogen) affecting: (a) matrix
recession at beam entrance (b) matrix recession at beam exit (c) kerf width at beam entrance and (d)
kerf width at beam exit
Generally, the DoE analysis showed that the matrix recession at the beam entrance (i.e.
top surface) was the major quality defect and mostly influenced by the pulse energy.
Figure 7-4a shows the variation in the extent of top surface matrix recession with
change in the pulse energy. On the other hand, pulse frequency was identified as the
most effective factor for the matrix recession at the beam exit (i.e. bottom of the kerf),
(Figure 7-4b)). The kerf widths at the beam entrance and the exit were the other
quantitatively analysed quality factors, and were also found to be mostly sensitive to
change in the pulse frequency. Additionally, the cutting speed and pulse energy were
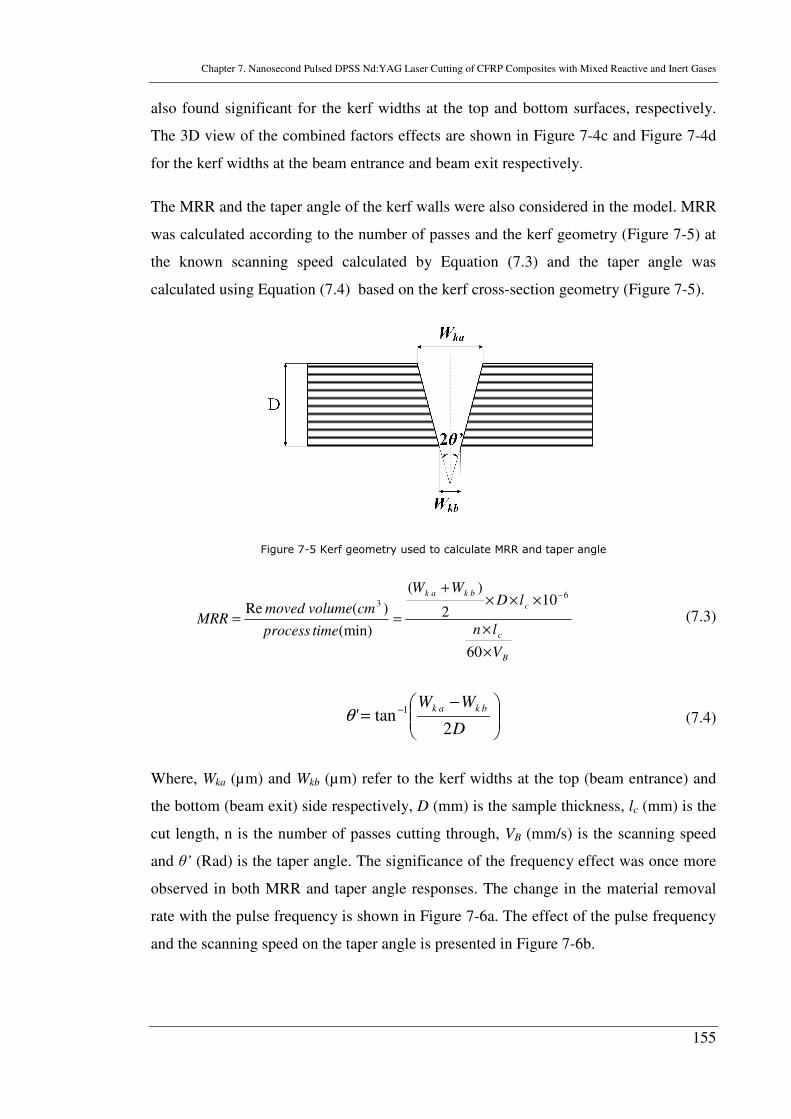
Chapter 7. Nanosecond Pulsed DPSS Nd:YAG Laser Cutting of CFRP Composites with Mixed Reactive and Inert Gases
155
also found significant for the kerf widths at the top and bottom surfaces, respectively.
The 3D view of the combined factors effects are shown in Figure 7-4c and Figure 7-4d
for the kerf widths at the beam entrance and beam exit respectively.
The MRR and the taper angle of the kerf walls were also considered in the model. MRR
was calculated according to the number of passes and the kerf geometry (Figure 7-5) at
the known scanning speed calculated by Equation (7.3) and the taper angle was
calculated using Equation (7.4) based on the kerf cross-section geometry (Figure 7-5).
Figure 7-5 Kerf geometry used to calculate MRR and taper angle
B
c
c
bkak
V
ln
lDWW
timeprocess
cmvolumemovedMRR
×
×
×××+
==
−
60
102
)(
(min)
)(Re6
3
(7.3)
−= −
D
WW bkak
2tan' 1θ (7.4)
Where, Wka (µm) and Wkb (µm) refer to the kerf widths at the top (beam entrance) and
the bottom (beam exit) side respectively, D (mm) is the sample thickness, lc (mm) is the
cut length, n is the number of passes cutting through, VB (mm/s) is the scanning speed
and θ’ (Rad) is the taper angle. The significance of the frequency effect was once more
observed in both MRR and taper angle responses. The change in the material removal
rate with the pulse frequency is shown in Figure 7-6a. The effect of the pulse frequency
and the scanning speed on the taper angle is presented in Figure 7-6b.
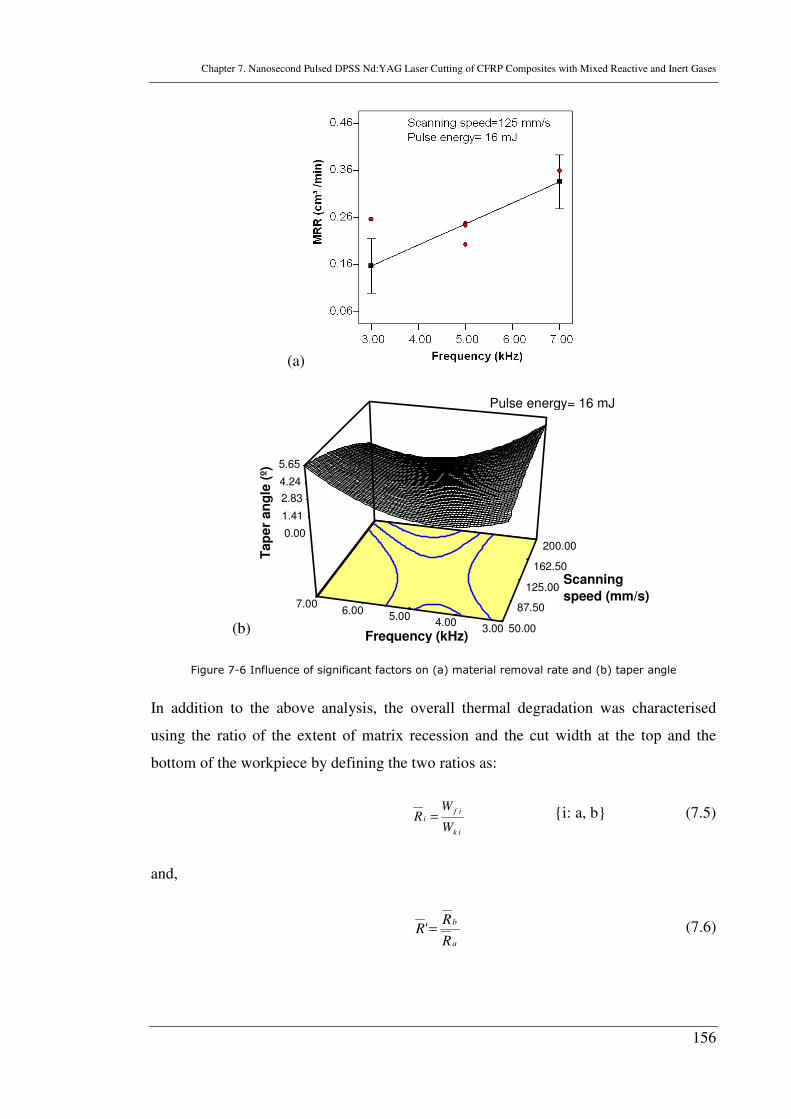
Chapter 7. Nanosecond Pulsed DPSS Nd:YAG Laser Cutting of CFRP Composites with Mixed Reactive and Inert Gases
156
(a)
0.00
1.41
2.83
4.24
5.65
T
ap
er
an
gle
(º)
50.00
87.50
125.00
162.50
200.00
3.00 4.00
5.00 6.00
7.00
Scanning
speed (mm/s)
Frequency (kHz)
Pulse energy= 16 mJ
Figure 7-6 Influence of significant factors on (a) material removal rate and (b) taper angle
In addition to the above analysis, the overall thermal degradation was characterised
using the ratio of the extent of matrix recession and the cut width at the top and the
bottom of the workpiece by defining the two ratios as:
ik
ifi
W
WR = {i: a, b} (7.5)
and,
a
b
R
RR =' (7.6)
(b)
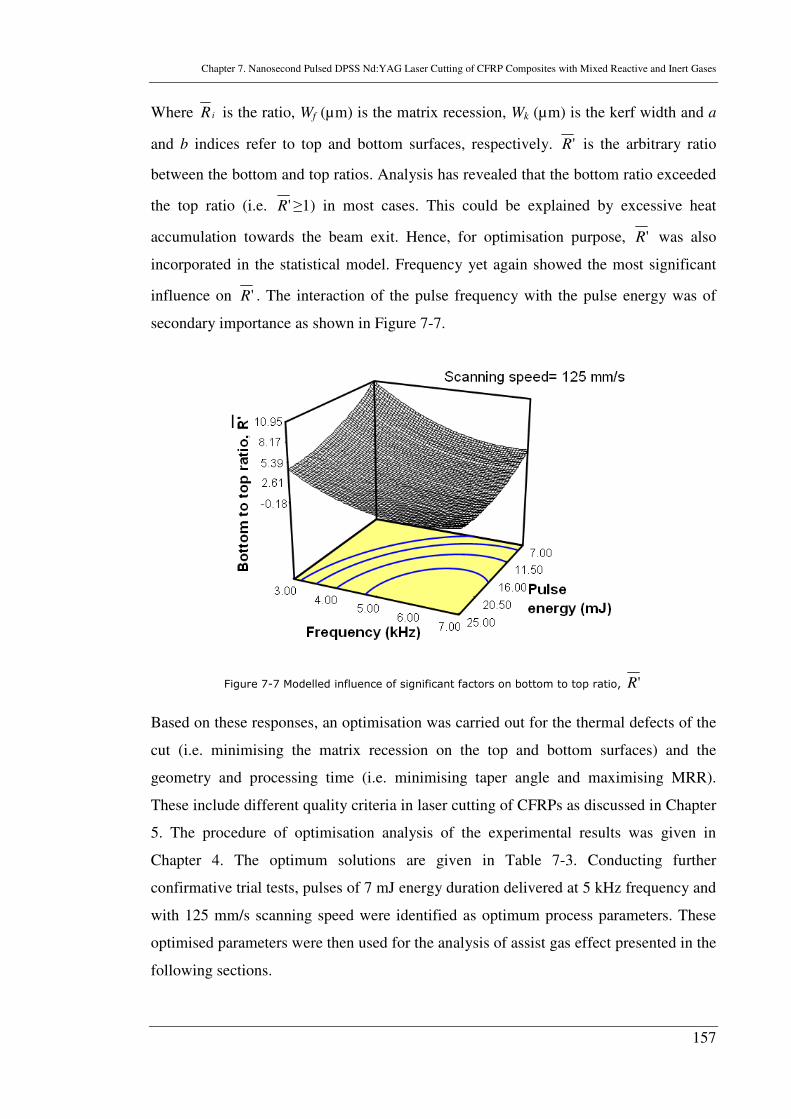
Chapter 7. Nanosecond Pulsed DPSS Nd:YAG Laser Cutting of CFRP Composites with Mixed Reactive and Inert Gases
157
Where iR is the ratio, Wf (µm) is the matrix recession, Wk (µm) is the kerf width and a
and b indices refer to top and bottom surfaces, respectively. 'R is the arbitrary ratio
between the bottom and top ratios. Analysis has revealed that the bottom ratio exceeded
the top ratio (i.e. 'R ≥1) in most cases. This could be explained by excessive heat
accumulation towards the beam exit. Hence, for optimisation purpose, 'R was also
incorporated in the statistical model. Frequency yet again showed the most significant
influence on 'R . The interaction of the pulse frequency with the pulse energy was of
secondary importance as shown in Figure 7-7.
Figure 7-7 Modelled influence of significant factors on bottom to top ratio, 'R
Based on these responses, an optimisation was carried out for the thermal defects of the
cut (i.e. minimising the matrix recession on the top and bottom surfaces) and the
geometry and processing time (i.e. minimising taper angle and maximising MRR).
These include different quality criteria in laser cutting of CFRPs as discussed in Chapter
5. The procedure of optimisation analysis of the experimental results was given in
Chapter 4. The optimum solutions are given in Table 7-3. Conducting further
confirmative trial tests, pulses of 7 mJ energy duration delivered at 5 kHz frequency and
with 125 mm/s scanning speed were identified as optimum process parameters. These
optimised parameters were then used for the analysis of assist gas effect presented in the
following sections.
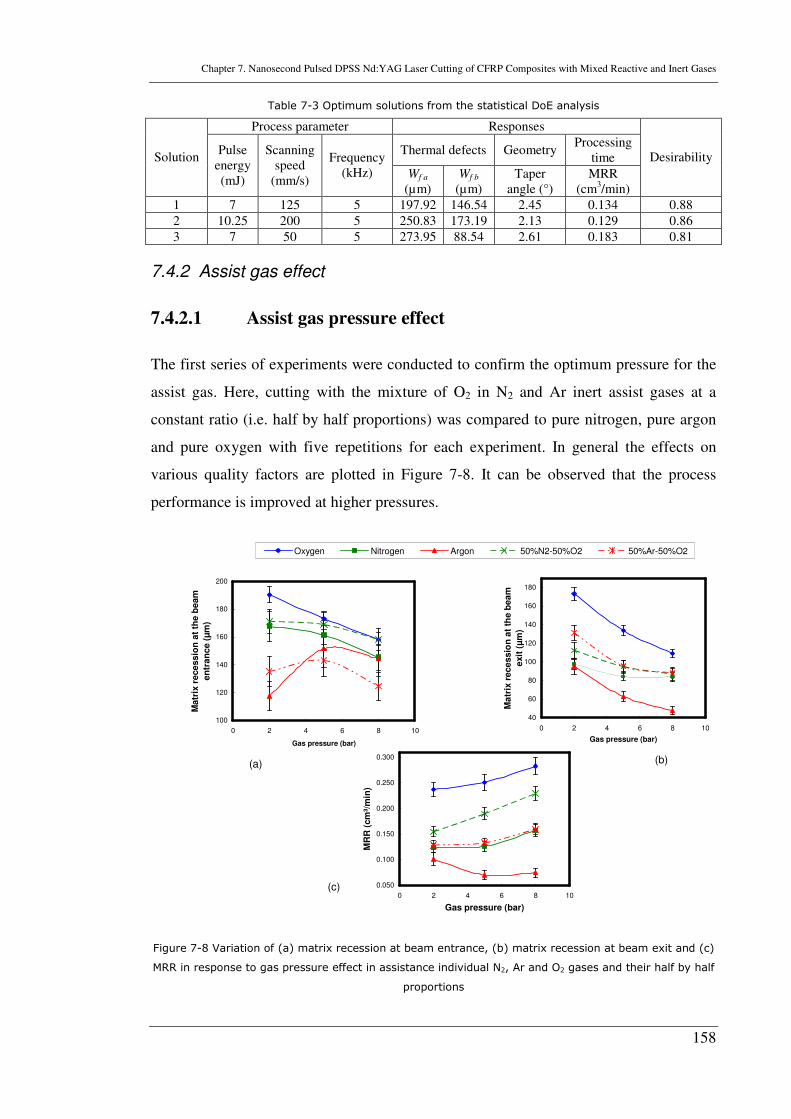
Chapter 7. Nanosecond Pulsed DPSS Nd:YAG Laser Cutting of CFRP Composites with Mixed Reactive and Inert Gases
158
Table 7-3 Optimum solutions from the statistical DoE analysis
Process parameter Responses
Thermal defects Geometry Processing
time Solution Pulse
energy (mJ)
Scanning speed
(mm/s)
Frequency (kHz) Wf a
(µm) Wf b
(µm) Taper
angle (°) MRR
(cm3/min)
Desirability
1 7 125 5 197.92 146.54 2.45 0.134 0.88
2 10.25 200 5 250.83 173.19 2.13 0.129 0.86
3 7 50 5 273.95 88.54 2.61 0.183 0.81
7.4.2 Assist gas effect
7.4.2.1 Assist gas pressure effect
The first series of experiments were conducted to confirm the optimum pressure for the
assist gas. Here, cutting with the mixture of O2 in N2 and Ar inert assist gases at a
constant ratio (i.e. half by half proportions) was compared to pure nitrogen, pure argon
and pure oxygen with five repetitions for each experiment. In general the effects on
various quality factors are plotted in Figure 7-8. It can be observed that the process
performance is improved at higher pressures.
0.050
0.100
0.150
0.200
0.250
0.300
0 2 4 6 8 10
Gas pressure (bar)
MR
R (
cm
³/m
in)
Oxygen Nitrogen Argon 50%N2-50%O2 50%Ar-50%O2
100
120
140
160
180
200
0 2 4 6 8 10
Gas pressure (bar)
Matr
ix r
ecessio
n a
t th
e b
eam
en
tran
ce (
µm
)
40
60
80
100
120
140
160
180
0 2 4 6 8 10
Gas pressure (bar)
Matr
ix r
ecessio
n a
t th
e b
eam
exit
(µ
m)
(a)
(c)
(b)
Figure 7-8 Variation of (a) matrix recession at beam entrance, (b) matrix recession at beam exit and (c)
MRR in response to gas pressure effect in assistance individual N2, Ar and O2 gases and their half by half
proportions
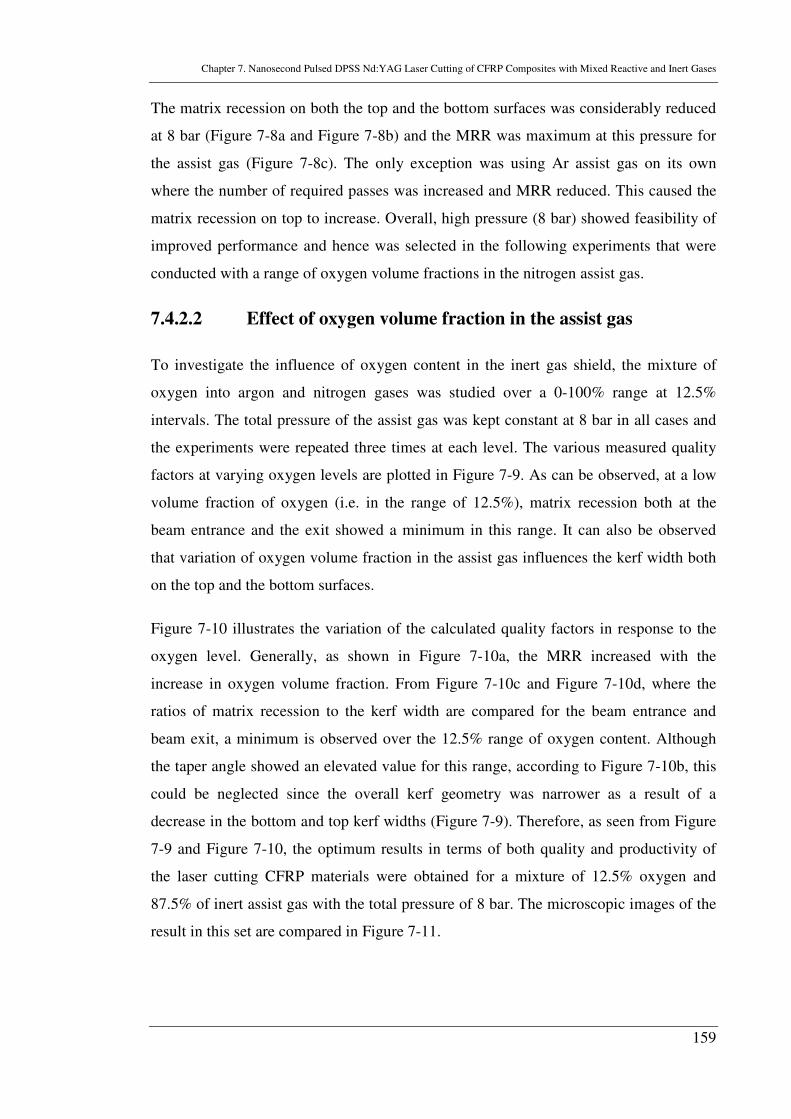
Chapter 7. Nanosecond Pulsed DPSS Nd:YAG Laser Cutting of CFRP Composites with Mixed Reactive and Inert Gases
159
The matrix recession on both the top and the bottom surfaces was considerably reduced
at 8 bar (Figure 7-8a and Figure 7-8b) and the MRR was maximum at this pressure for
the assist gas (Figure 7-8c). The only exception was using Ar assist gas on its own
where the number of required passes was increased and MRR reduced. This caused the
matrix recession on top to increase. Overall, high pressure (8 bar) showed feasibility of
improved performance and hence was selected in the following experiments that were
conducted with a range of oxygen volume fractions in the nitrogen assist gas.
7.4.2.2 Effect of oxygen volume fraction in the assist gas
To investigate the influence of oxygen content in the inert gas shield, the mixture of
oxygen into argon and nitrogen gases was studied over a 0-100% range at 12.5%
intervals. The total pressure of the assist gas was kept constant at 8 bar in all cases and
the experiments were repeated three times at each level. The various measured quality
factors at varying oxygen levels are plotted in Figure 7-9. As can be observed, at a low
volume fraction of oxygen (i.e. in the range of 12.5%), matrix recession both at the
beam entrance and the exit showed a minimum in this range. It can also be observed
that variation of oxygen volume fraction in the assist gas influences the kerf width both
on the top and the bottom surfaces.
Figure 7-10 illustrates the variation of the calculated quality factors in response to the
oxygen level. Generally, as shown in Figure 7-10a, the MRR increased with the
increase in oxygen volume fraction. From Figure 7-10c and Figure 7-10d, where the
ratios of matrix recession to the kerf width are compared for the beam entrance and
beam exit, a minimum is observed over the 12.5% range of oxygen content. Although
the taper angle showed an elevated value for this range, according to Figure 7-10b, this
could be neglected since the overall kerf geometry was narrower as a result of a
decrease in the bottom and top kerf widths (Figure 7-9). Therefore, as seen from Figure
7-9 and Figure 7-10, the optimum results in terms of both quality and productivity of
the laser cutting CFRP materials were obtained for a mixture of 12.5% oxygen and
87.5% of inert assist gas with the total pressure of 8 bar. The microscopic images of the
result in this set are compared in Figure 7-11.
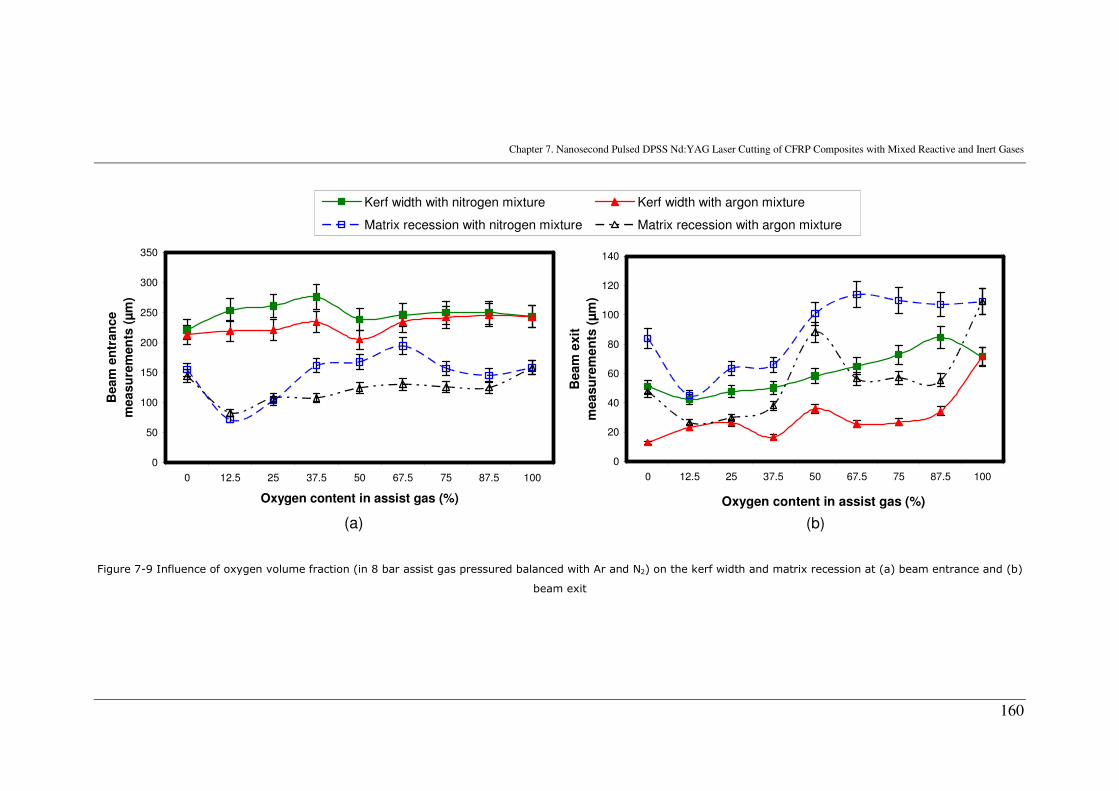
Chapter 7. Nanosecond Pulsed DPSS Nd:YAG Laser Cutting of CFRP Composites with Mixed Reactive and Inert Gases
160
0
50
100
150
200
250
300
350
0 12.5 25 37.5 50 67.5 75 87.5 100
Oxygen content in assist gas (%)
Beam
en
tran
ce
mea
su
rem
en
ts (
µm
)
Kerf width with nitrogen mixture Kerf width with argon mixture
Matrix recession with nitrogen mixture Matrix recession with argon mixture
0
20
40
60
80
100
120
140
0 12.5 25 37.5 50 67.5 75 87.5 100
Oxygen content in assist gas (%)
Beam
exit
measu
rem
en
ts (
µm
)
(b)(a)
Figure 7-9 Influence of oxygen volume fraction (in 8 bar assist gas pressured balanced with Ar and N2) on the kerf width and matrix recession at (a) beam entrance and (b)
beam exit
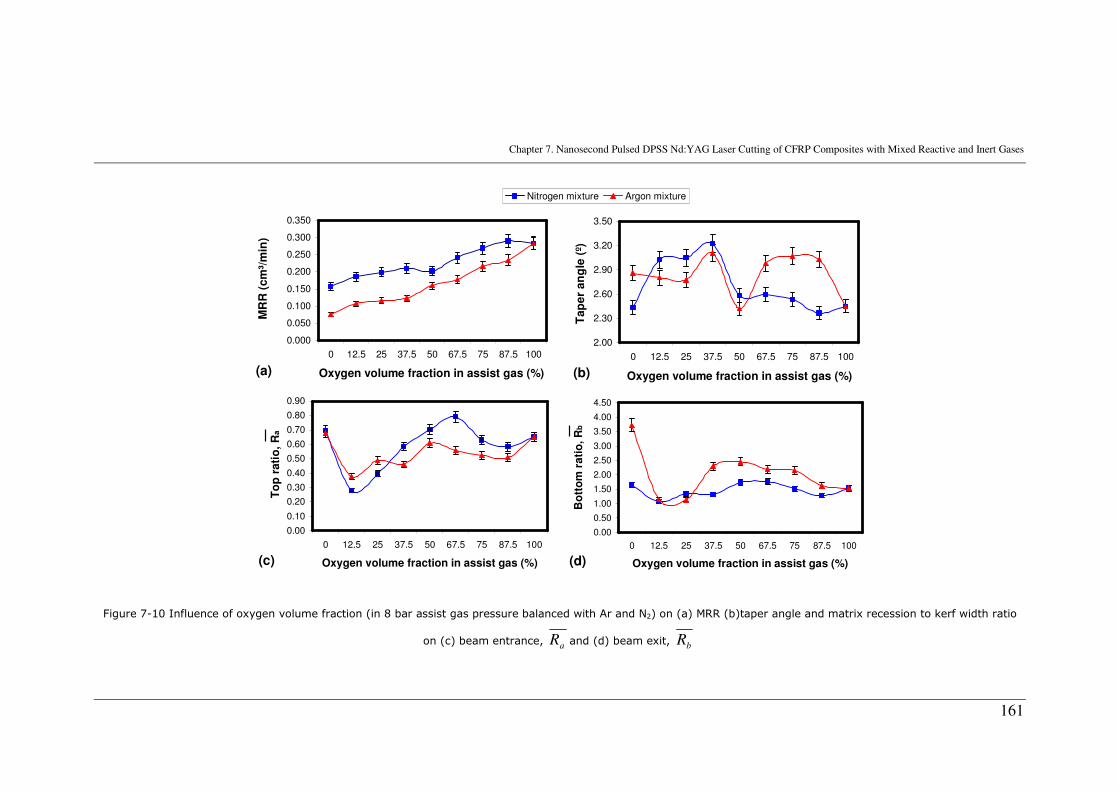
Chapter 7. Nanosecond Pulsed DPSS Nd:YAG Laser Cutting of CFRP Composites with Mixed Reactive and Inert Gases
161
0.000
0.050
0.100
0.150
0.200
0.250
0.300
0.350
0 12.5 25 37.5 50 67.5 75 87.5 100
Oxygen volume fraction in assist gas (%)
MR
R (
cm
³/m
in)
Nitrogen mixture Argon mixture
2.00
2.30
2.60
2.90
3.20
3.50
0 12.5 25 37.5 50 67.5 75 87.5 100
Oxygen volume fraction in assist gas (%)
Tap
er
an
gle
(º)
(b)
0.00
0.10
0.20
0.30
0.40
0.50
0.60
0.70
0.80
0.90
0 12.5 25 37.5 50 67.5 75 87.5 100
Oxygen volume fraction in assist gas (%)
To
p r
ati
o,
Ra
0.00
0.50
1.00
1.50
2.00
2.50
3.00
3.50
4.00
4.50
0 12.5 25 37.5 50 67.5 75 87.5 100
Oxygen volume fraction in assist gas (%)
Bo
tto
m r
ati
o, R
b
(a)
(c) (d)
Figure 7-10 Influence of oxygen volume fraction (in 8 bar assist gas pressure balanced with Ar and N2) on (a) MRR (b)taper angle and matrix recession to kerf width ratio
on (c) beam entrance, aR and (d) beam exit, bR
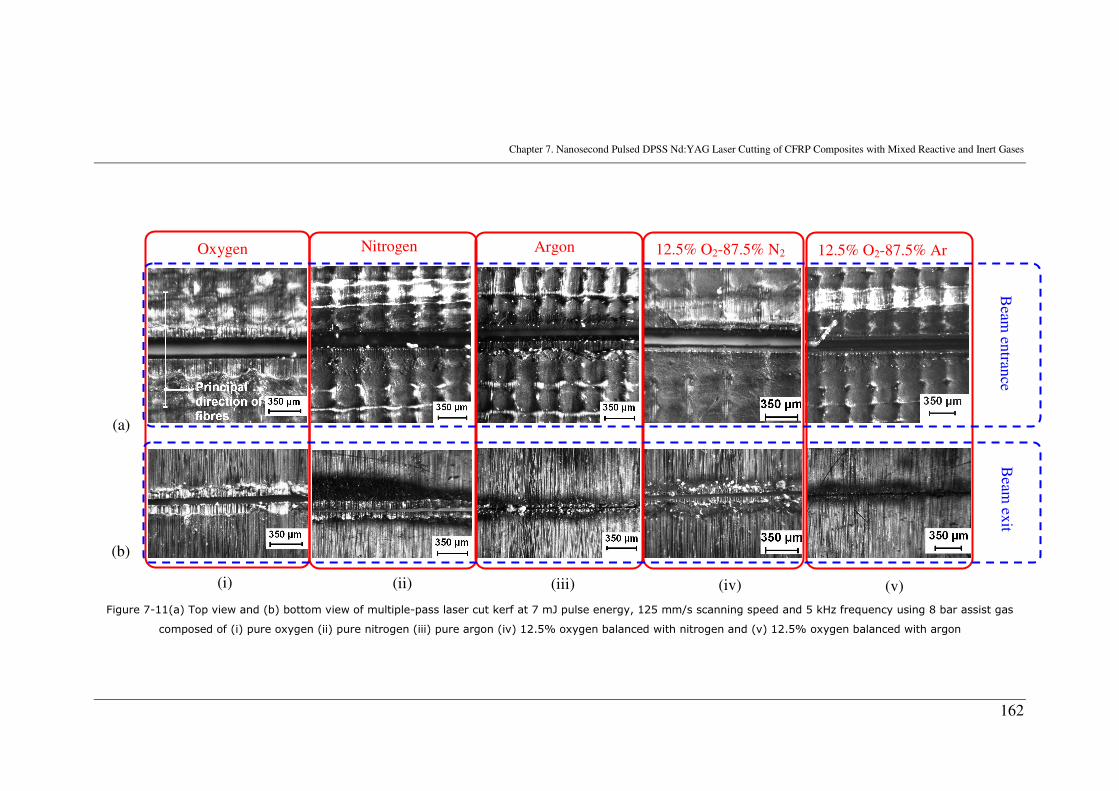
Chapter 7. Nanosecond Pulsed DPSS Nd:YAG Laser Cutting of CFRP Composites with Mixed Reactive and Inert Gases
162
Figure 7-11(a) Top view and (b) bottom view of multiple-pass laser cut kerf at 7 mJ pulse energy, 125 mm/s scanning speed and 5 kHz frequency using 8 bar assist gas
composed of (i) pure oxygen (ii) pure nitrogen (iii) pure argon (iv) 12.5% oxygen balanced with nitrogen and (v) 12.5% oxygen balanced with argon
Oxygen Nitrogen Argon 12.5% O2-87.5% N2 12.5% O2-87.5% Ar
Beam
entran
ce B
eam ex
it
(a)
(b)
(i) (ii) (iii) (iv) (v)
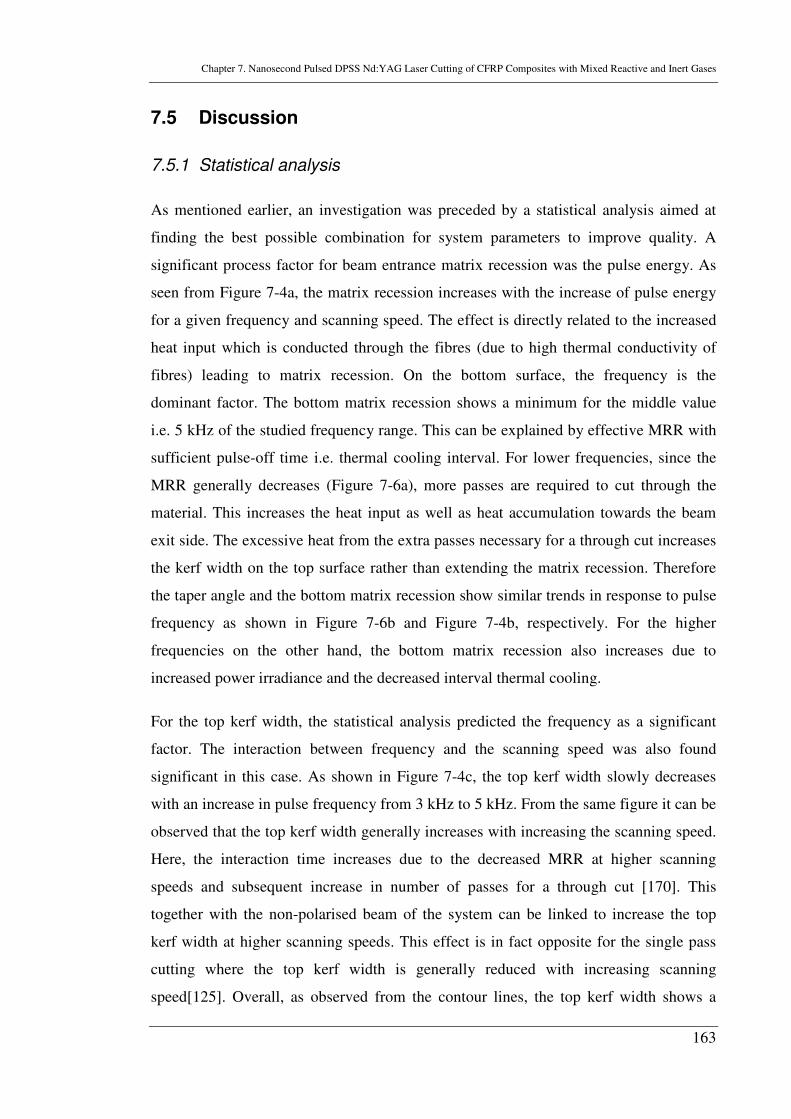
Chapter 7. Nanosecond Pulsed DPSS Nd:YAG Laser Cutting of CFRP Composites with Mixed Reactive and Inert Gases
163
7.5 Discussion
7.5.1 Statistical analysis
As mentioned earlier, an investigation was preceded by a statistical analysis aimed at
finding the best possible combination for system parameters to improve quality. A
significant process factor for beam entrance matrix recession was the pulse energy. As
seen from Figure 7-4a, the matrix recession increases with the increase of pulse energy
for a given frequency and scanning speed. The effect is directly related to the increased
heat input which is conducted through the fibres (due to high thermal conductivity of
fibres) leading to matrix recession. On the bottom surface, the frequency is the
dominant factor. The bottom matrix recession shows a minimum for the middle value
i.e. 5 kHz of the studied frequency range. This can be explained by effective MRR with
sufficient pulse-off time i.e. thermal cooling interval. For lower frequencies, since the
MRR generally decreases (Figure 7-6a), more passes are required to cut through the
material. This increases the heat input as well as heat accumulation towards the beam
exit side. The excessive heat from the extra passes necessary for a through cut increases
the kerf width on the top surface rather than extending the matrix recession. Therefore
the taper angle and the bottom matrix recession show similar trends in response to pulse
frequency as shown in Figure 7-6b and Figure 7-4b, respectively. For the higher
frequencies on the other hand, the bottom matrix recession also increases due to
increased power irradiance and the decreased interval thermal cooling.
For the top kerf width, the statistical analysis predicted the frequency as a significant
factor. The interaction between frequency and the scanning speed was also found
significant in this case. As shown in Figure 7-4c, the top kerf width slowly decreases
with an increase in pulse frequency from 3 kHz to 5 kHz. From the same figure it can be
observed that the top kerf width generally increases with increasing the scanning speed.
Here, the interaction time increases due to the decreased MRR at higher scanning
speeds and subsequent increase in number of passes for a through cut [170]. This
together with the non-polarised beam of the system can be linked to increase the top
kerf width at higher scanning speeds. This effect is in fact opposite for the single pass
cutting where the top kerf width is generally reduced with increasing scanning
speed[125]. Overall, as observed from the contour lines, the top kerf width shows a
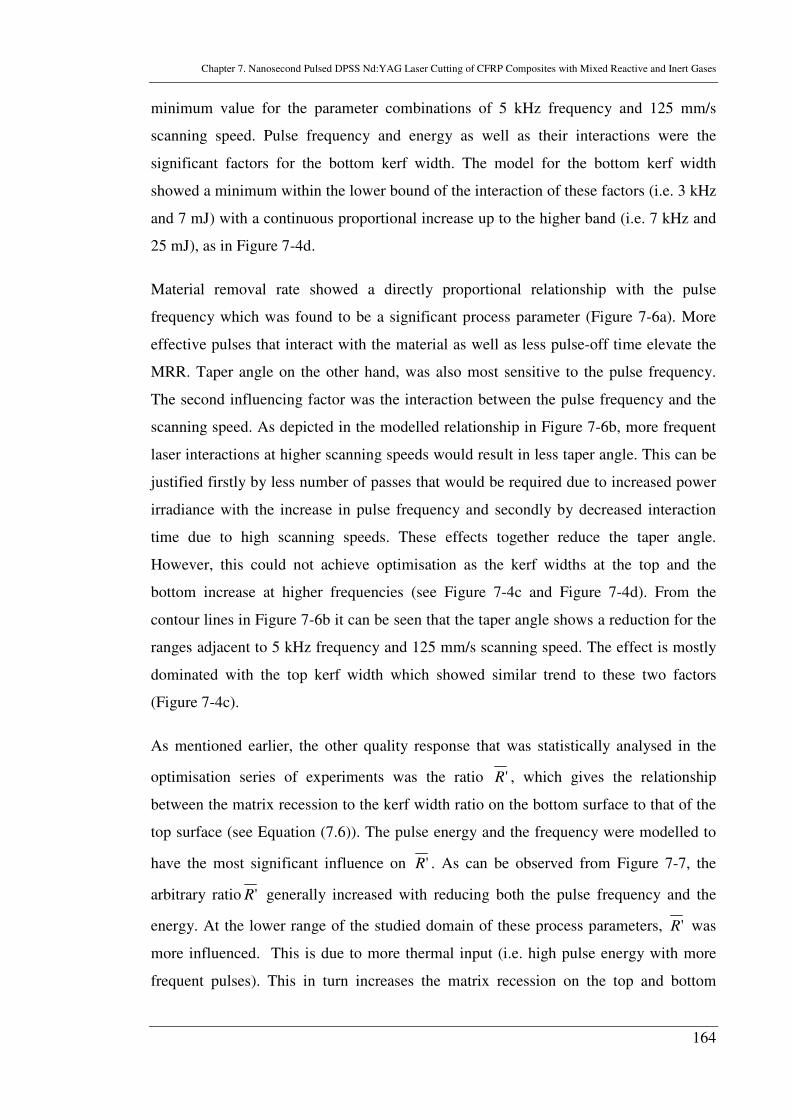
Chapter 7. Nanosecond Pulsed DPSS Nd:YAG Laser Cutting of CFRP Composites with Mixed Reactive and Inert Gases
164
minimum value for the parameter combinations of 5 kHz frequency and 125 mm/s
scanning speed. Pulse frequency and energy as well as their interactions were the
significant factors for the bottom kerf width. The model for the bottom kerf width
showed a minimum within the lower bound of the interaction of these factors (i.e. 3 kHz
and 7 mJ) with a continuous proportional increase up to the higher band (i.e. 7 kHz and
25 mJ), as in Figure 7-4d.
Material removal rate showed a directly proportional relationship with the pulse
frequency which was found to be a significant process parameter (Figure 7-6a). More
effective pulses that interact with the material as well as less pulse-off time elevate the
MRR. Taper angle on the other hand, was also most sensitive to the pulse frequency.
The second influencing factor was the interaction between the pulse frequency and the
scanning speed. As depicted in the modelled relationship in Figure 7-6b, more frequent
laser interactions at higher scanning speeds would result in less taper angle. This can be
justified firstly by less number of passes that would be required due to increased power
irradiance with the increase in pulse frequency and secondly by decreased interaction
time due to high scanning speeds. These effects together reduce the taper angle.
However, this could not achieve optimisation as the kerf widths at the top and the
bottom increase at higher frequencies (see Figure 7-4c and Figure 7-4d). From the
contour lines in Figure 7-6b it can be seen that the taper angle shows a reduction for the
ranges adjacent to 5 kHz frequency and 125 mm/s scanning speed. The effect is mostly
dominated with the top kerf width which showed similar trend to these two factors
(Figure 7-4c).
As mentioned earlier, the other quality response that was statistically analysed in the
optimisation series of experiments was the ratio 'R , which gives the relationship
between the matrix recession to the kerf width ratio on the bottom surface to that of the
top surface (see Equation (7.6)). The pulse energy and the frequency were modelled to
have the most significant influence on 'R . As can be observed from Figure 7-7, the
arbitrary ratio 'R generally increased with reducing both the pulse frequency and the
energy. At the lower range of the studied domain of these process parameters, 'R was
more influenced. This is due to more thermal input (i.e. high pulse energy with more
frequent pulses). This in turn increases the matrix recession on the top and bottom
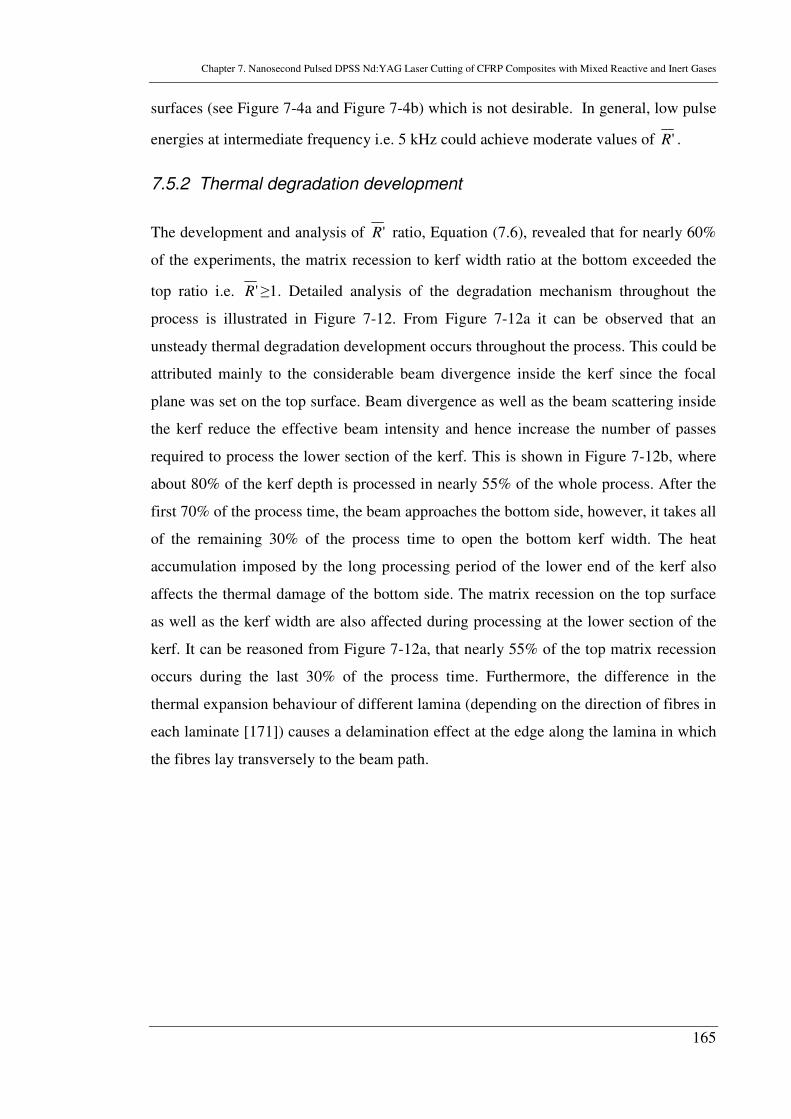
Chapter 7. Nanosecond Pulsed DPSS Nd:YAG Laser Cutting of CFRP Composites with Mixed Reactive and Inert Gases
165
surfaces (see Figure 7-4a and Figure 7-4b) which is not desirable. In general, low pulse
energies at intermediate frequency i.e. 5 kHz could achieve moderate values of 'R .
7.5.2 Thermal degradation development
The development and analysis of 'R ratio, Equation (7.6), revealed that for nearly 60%
of the experiments, the matrix recession to kerf width ratio at the bottom exceeded the
top ratio i.e. 'R ≥1. Detailed analysis of the degradation mechanism throughout the
process is illustrated in Figure 7-12. From Figure 7-12a it can be observed that an
unsteady thermal degradation development occurs throughout the process. This could be
attributed mainly to the considerable beam divergence inside the kerf since the focal
plane was set on the top surface. Beam divergence as well as the beam scattering inside
the kerf reduce the effective beam intensity and hence increase the number of passes
required to process the lower section of the kerf. This is shown in Figure 7-12b, where
about 80% of the kerf depth is processed in nearly 55% of the whole process. After the
first 70% of the process time, the beam approaches the bottom side, however, it takes all
of the remaining 30% of the process time to open the bottom kerf width. The heat
accumulation imposed by the long processing period of the lower end of the kerf also
affects the thermal damage of the bottom side. The matrix recession on the top surface
as well as the kerf width are also affected during processing at the lower section of the
kerf. It can be reasoned from Figure 7-12a, that nearly 55% of the top matrix recession
occurs during the last 30% of the process time. Furthermore, the difference in the
thermal expansion behaviour of different lamina (depending on the direction of fibres in
each laminate [171]) causes a delamination effect at the edge along the lamina in which
the fibres lay transversely to the beam path.
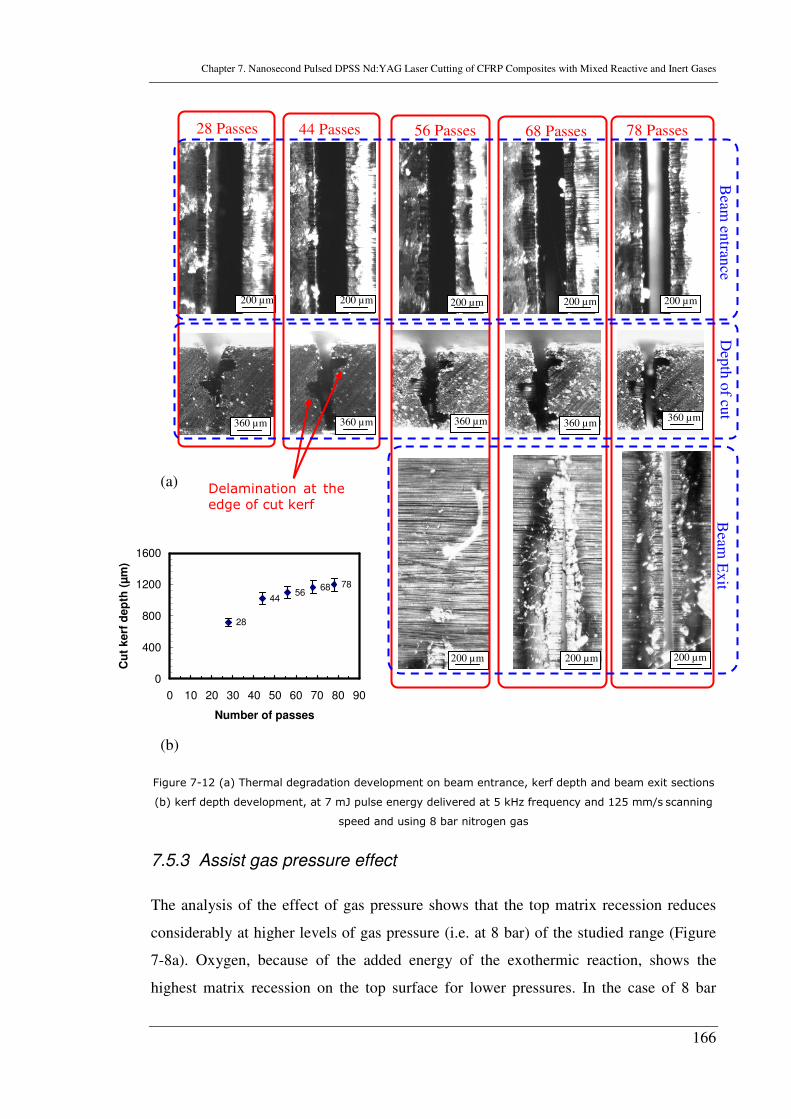
Chapter 7. Nanosecond Pulsed DPSS Nd:YAG Laser Cutting of CFRP Composites with Mixed Reactive and Inert Gases
166
28
4456
68 78
0
400
800
1200
1600
0 10 20 30 40 50 60 70 80 90
Number of passes
Cu
t kerf
dep
th (
µm
)
Figure 7-12 (a) Thermal degradation development on beam entrance, kerf depth and beam exit sections
(b) kerf depth development, at 7 mJ pulse energy delivered at 5 kHz frequency and 125 mm/s scanning
speed and using 8 bar nitrogen gas
7.5.3 Assist gas pressure effect
The analysis of the effect of gas pressure shows that the top matrix recession reduces
considerably at higher levels of gas pressure (i.e. at 8 bar) of the studied range (Figure
7-8a). Oxygen, because of the added energy of the exothermic reaction, shows the
highest matrix recession on the top surface for lower pressures. In the case of 8 bar
Beam
Ex
it
Delamination at the edge of cut kerf
200 µm 200 µm 200 µm 200 µm 200 µm
200 µm 200 µm 200 µm
360 µm 360 µm 360 µm 360 µm 360 µm
(a)
(b)
28 Passes 44 Passes 56 Passes 68 Passes 78 Passes
Beam
entran
ce D
epth
of cu
t
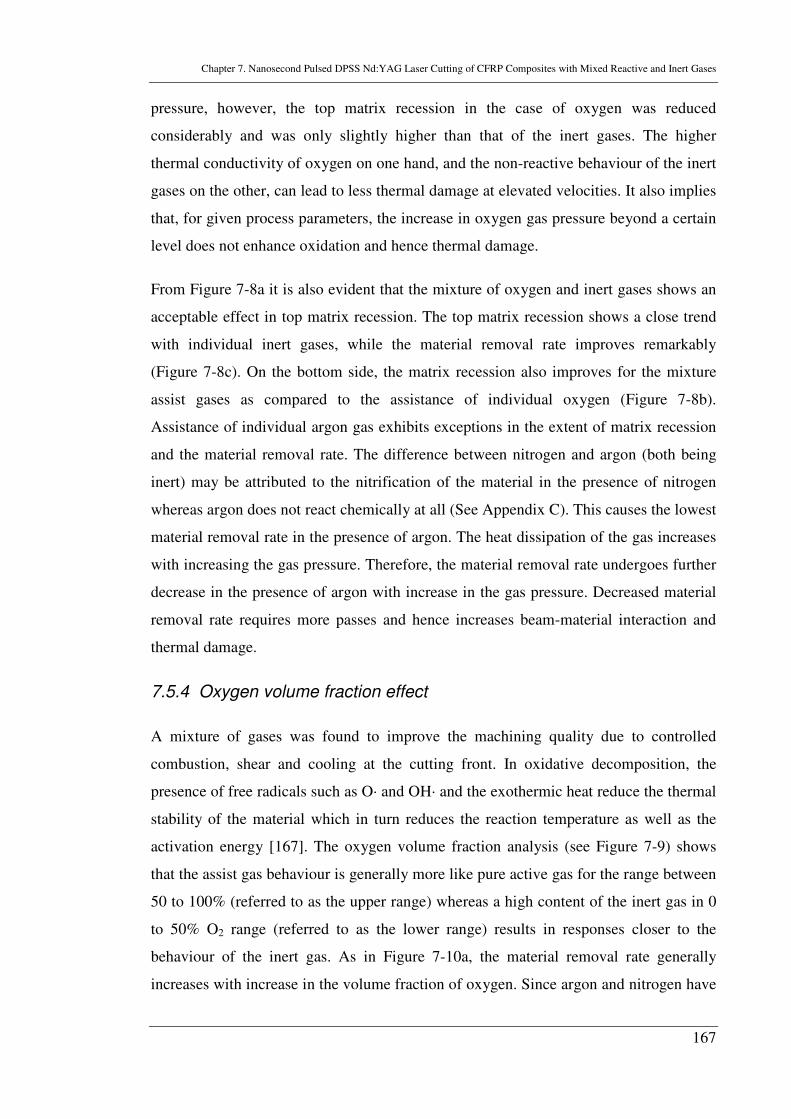
Chapter 7. Nanosecond Pulsed DPSS Nd:YAG Laser Cutting of CFRP Composites with Mixed Reactive and Inert Gases
167
pressure, however, the top matrix recession in the case of oxygen was reduced
considerably and was only slightly higher than that of the inert gases. The higher
thermal conductivity of oxygen on one hand, and the non-reactive behaviour of the inert
gases on the other, can lead to less thermal damage at elevated velocities. It also implies
that, for given process parameters, the increase in oxygen gas pressure beyond a certain
level does not enhance oxidation and hence thermal damage.
From Figure 7-8a it is also evident that the mixture of oxygen and inert gases shows an
acceptable effect in top matrix recession. The top matrix recession shows a close trend
with individual inert gases, while the material removal rate improves remarkably
(Figure 7-8c). On the bottom side, the matrix recession also improves for the mixture
assist gases as compared to the assistance of individual oxygen (Figure 7-8b).
Assistance of individual argon gas exhibits exceptions in the extent of matrix recession
and the material removal rate. The difference between nitrogen and argon (both being
inert) may be attributed to the nitrification of the material in the presence of nitrogen
whereas argon does not react chemically at all (See Appendix C). This causes the lowest
material removal rate in the presence of argon. The heat dissipation of the gas increases
with increasing the gas pressure. Therefore, the material removal rate undergoes further
decrease in the presence of argon with increase in the gas pressure. Decreased material
removal rate requires more passes and hence increases beam-material interaction and
thermal damage.
7.5.4 Oxygen volume fraction effect
A mixture of gases was found to improve the machining quality due to controlled
combustion, shear and cooling at the cutting front. In oxidative decomposition, the
presence of free radicals such as O· and OH· and the exothermic heat reduce the thermal
stability of the material which in turn reduces the reaction temperature as well as the
activation energy [167]. The oxygen volume fraction analysis (see Figure 7-9) shows
that the assist gas behaviour is generally more like pure active gas for the range between
50 to 100% (referred to as the upper range) whereas a high content of the inert gas in 0
to 50% O2 range (referred to as the lower range) results in responses closer to the
behaviour of the inert gas. As in Figure 7-10a, the material removal rate generally
increases with increase in the volume fraction of oxygen. Since argon and nitrogen have
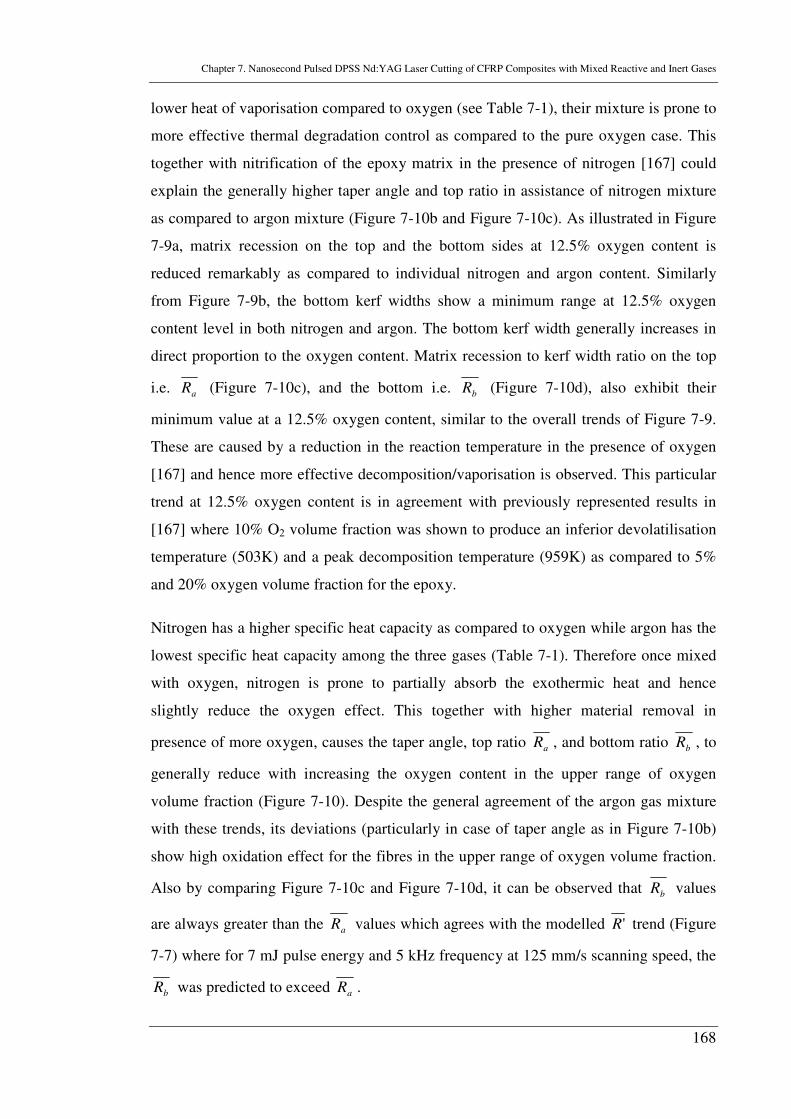
Chapter 7. Nanosecond Pulsed DPSS Nd:YAG Laser Cutting of CFRP Composites with Mixed Reactive and Inert Gases
168
lower heat of vaporisation compared to oxygen (see Table 7-1), their mixture is prone to
more effective thermal degradation control as compared to the pure oxygen case. This
together with nitrification of the epoxy matrix in the presence of nitrogen [167] could
explain the generally higher taper angle and top ratio in assistance of nitrogen mixture
as compared to argon mixture (Figure 7-10b and Figure 7-10c). As illustrated in Figure
7-9a, matrix recession on the top and the bottom sides at 12.5% oxygen content is
reduced remarkably as compared to individual nitrogen and argon content. Similarly
from Figure 7-9b, the bottom kerf widths show a minimum range at 12.5% oxygen
content level in both nitrogen and argon. The bottom kerf width generally increases in
direct proportion to the oxygen content. Matrix recession to kerf width ratio on the top
i.e. aR (Figure 7-10c), and the bottom i.e. bR (Figure 7-10d), also exhibit their
minimum value at a 12.5% oxygen content, similar to the overall trends of Figure 7-9.
These are caused by a reduction in the reaction temperature in the presence of oxygen
[167] and hence more effective decomposition/vaporisation is observed. This particular
trend at 12.5% oxygen content is in agreement with previously represented results in
[167] where 10% O2 volume fraction was shown to produce an inferior devolatilisation
temperature (503K) and a peak decomposition temperature (959K) as compared to 5%
and 20% oxygen volume fraction for the epoxy.
Nitrogen has a higher specific heat capacity as compared to oxygen while argon has the
lowest specific heat capacity among the three gases (Table 7-1). Therefore once mixed
with oxygen, nitrogen is prone to partially absorb the exothermic heat and hence
slightly reduce the oxygen effect. This together with higher material removal in
presence of more oxygen, causes the taper angle, top ratio aR , and bottom ratio bR , to
generally reduce with increasing the oxygen content in the upper range of oxygen
volume fraction (Figure 7-10). Despite the general agreement of the argon gas mixture
with these trends, its deviations (particularly in case of taper angle as in Figure 7-10b)
show high oxidation effect for the fibres in the upper range of oxygen volume fraction.
Also by comparing Figure 7-10c and Figure 7-10d, it can be observed that bR values
are always greater than the aR values which agrees with the modelled 'R trend (Figure
7-7) where for 7 mJ pulse energy and 5 kHz frequency at 125 mm/s scanning speed, the
bR was predicted to exceed aR .
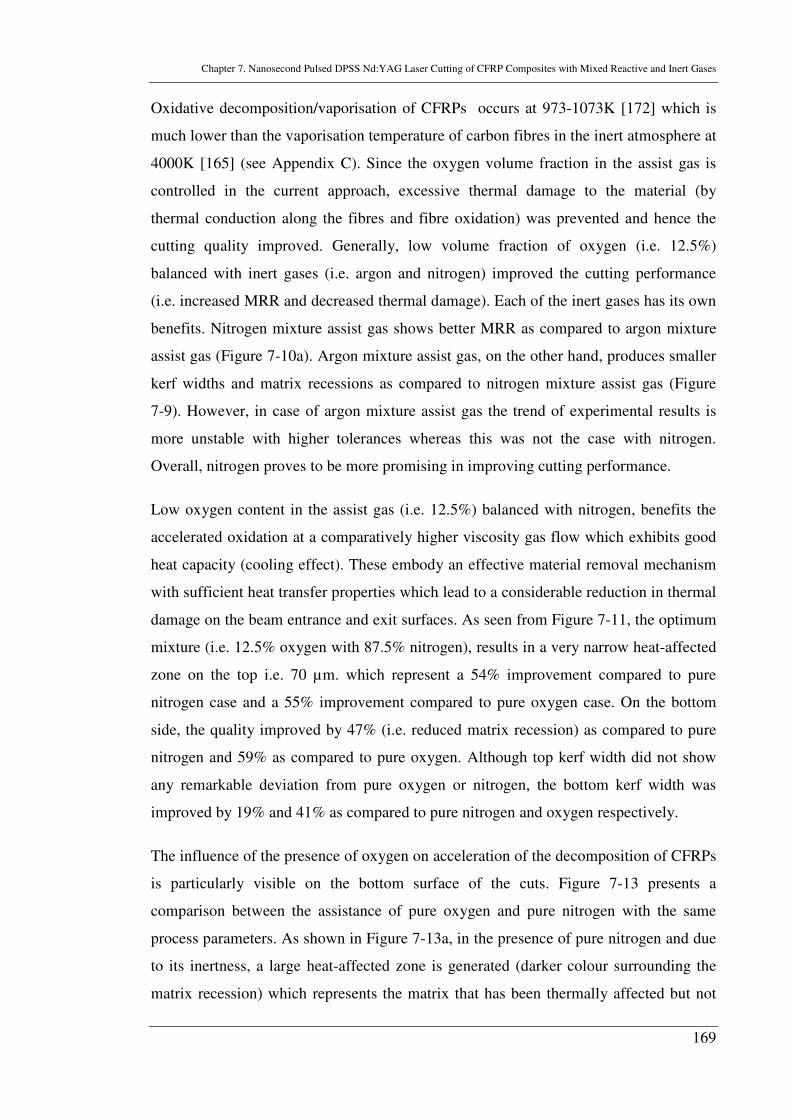
Chapter 7. Nanosecond Pulsed DPSS Nd:YAG Laser Cutting of CFRP Composites with Mixed Reactive and Inert Gases
169
Oxidative decomposition/vaporisation of CFRPs occurs at 973-1073K [172] which is
much lower than the vaporisation temperature of carbon fibres in the inert atmosphere at
4000K [165] (see Appendix C). Since the oxygen volume fraction in the assist gas is
controlled in the current approach, excessive thermal damage to the material (by
thermal conduction along the fibres and fibre oxidation) was prevented and hence the
cutting quality improved. Generally, low volume fraction of oxygen (i.e. 12.5%)
balanced with inert gases (i.e. argon and nitrogen) improved the cutting performance
(i.e. increased MRR and decreased thermal damage). Each of the inert gases has its own
benefits. Nitrogen mixture assist gas shows better MRR as compared to argon mixture
assist gas (Figure 7-10a). Argon mixture assist gas, on the other hand, produces smaller
kerf widths and matrix recessions as compared to nitrogen mixture assist gas (Figure
7-9). However, in case of argon mixture assist gas the trend of experimental results is
more unstable with higher tolerances whereas this was not the case with nitrogen.
Overall, nitrogen proves to be more promising in improving cutting performance.
Low oxygen content in the assist gas (i.e. 12.5%) balanced with nitrogen, benefits the
accelerated oxidation at a comparatively higher viscosity gas flow which exhibits good
heat capacity (cooling effect). These embody an effective material removal mechanism
with sufficient heat transfer properties which lead to a considerable reduction in thermal
damage on the beam entrance and exit surfaces. As seen from Figure 7-11, the optimum
mixture (i.e. 12.5% oxygen with 87.5% nitrogen), results in a very narrow heat-affected
zone on the top i.e. 70 µm. which represent a 54% improvement compared to pure
nitrogen case and a 55% improvement compared to pure oxygen case. On the bottom
side, the quality improved by 47% (i.e. reduced matrix recession) as compared to pure
nitrogen and 59% as compared to pure oxygen. Although top kerf width did not show
any remarkable deviation from pure oxygen or nitrogen, the bottom kerf width was
improved by 19% and 41% as compared to pure nitrogen and oxygen respectively.
The influence of the presence of oxygen on acceleration of the decomposition of CFRPs
is particularly visible on the bottom surface of the cuts. Figure 7-13 presents a
comparison between the assistance of pure oxygen and pure nitrogen with the same
process parameters. As shown in Figure 7-13a, in the presence of pure nitrogen and due
to its inertness, a large heat-affected zone is generated (darker colour surrounding the
matrix recession) which represents the matrix that has been thermally affected but not
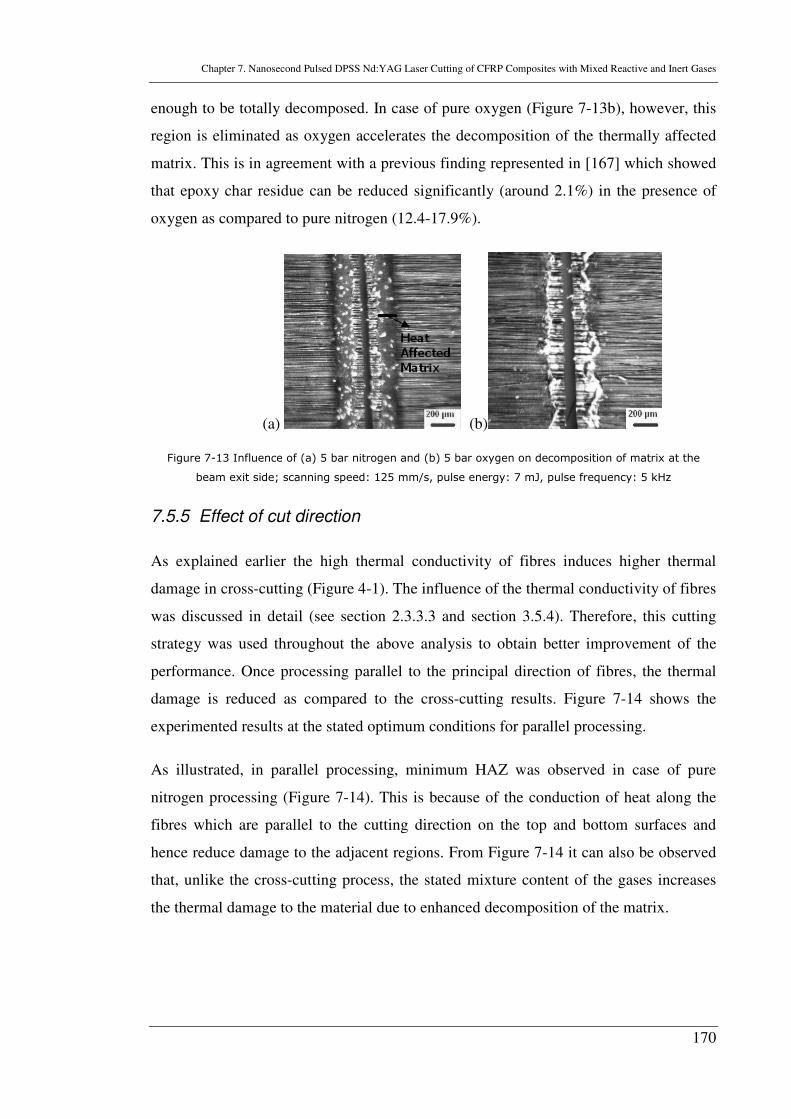
Chapter 7. Nanosecond Pulsed DPSS Nd:YAG Laser Cutting of CFRP Composites with Mixed Reactive and Inert Gases
170
enough to be totally decomposed. In case of pure oxygen (Figure 7-13b), however, this
region is eliminated as oxygen accelerates the decomposition of the thermally affected
matrix. This is in agreement with a previous finding represented in [167] which showed
that epoxy char residue can be reduced significantly (around 2.1%) in the presence of
oxygen as compared to pure nitrogen (12.4-17.9%).
(a) (b)
Figure 7-13 Influence of (a) 5 bar nitrogen and (b) 5 bar oxygen on decomposition of matrix at the
beam exit side; scanning speed: 125 mm/s, pulse energy: 7 mJ, pulse frequency: 5 kHz
7.5.5 Effect of cut direction
As explained earlier the high thermal conductivity of fibres induces higher thermal
damage in cross-cutting (Figure 4-1). The influence of the thermal conductivity of fibres
was discussed in detail (see section 2.3.3.3 and section 3.5.4). Therefore, this cutting
strategy was used throughout the above analysis to obtain better improvement of the
performance. Once processing parallel to the principal direction of fibres, the thermal
damage is reduced as compared to the cross-cutting results. Figure 7-14 shows the
experimented results at the stated optimum conditions for parallel processing.
As illustrated, in parallel processing, minimum HAZ was observed in case of pure
nitrogen processing (Figure 7-14). This is because of the conduction of heat along the
fibres which are parallel to the cutting direction on the top and bottom surfaces and
hence reduce damage to the adjacent regions. From Figure 7-14 it can also be observed
that, unlike the cross-cutting process, the stated mixture content of the gases increases
the thermal damage to the material due to enhanced decomposition of the matrix.
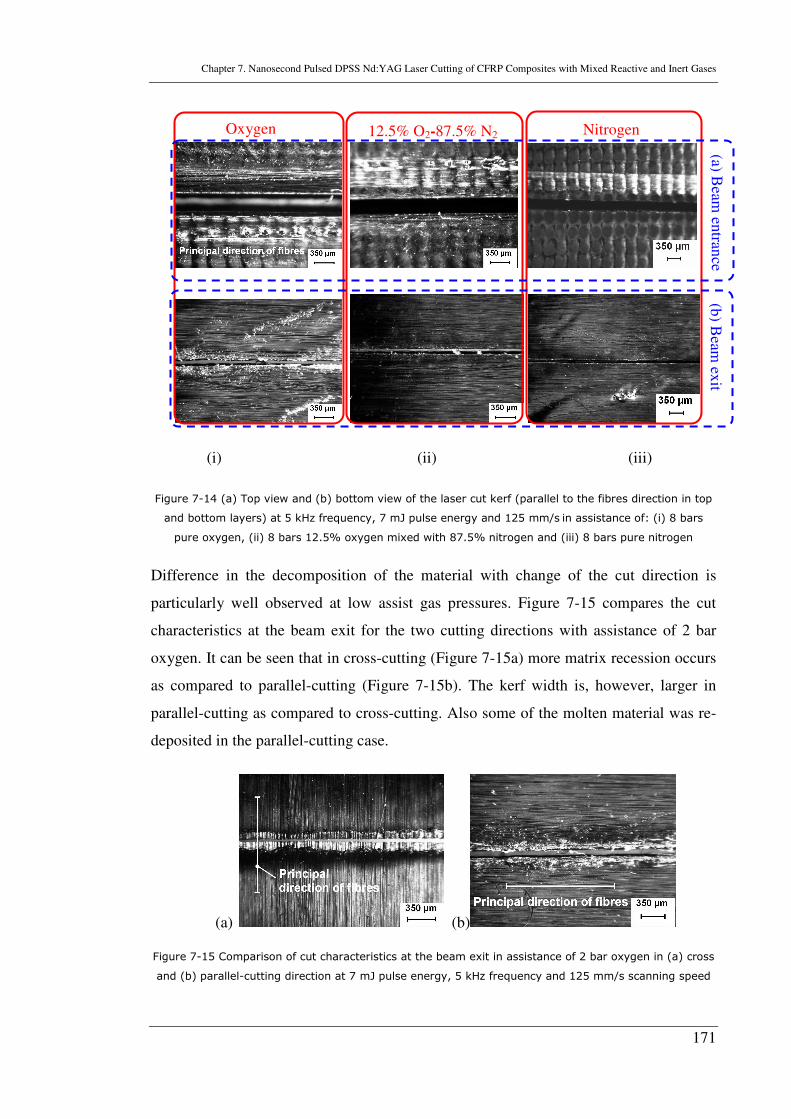
Chapter 7. Nanosecond Pulsed DPSS Nd:YAG Laser Cutting of CFRP Composites with Mixed Reactive and Inert Gases
171
(i) (ii) (iii)
Figure 7-14 (a) Top view and (b) bottom view of the laser cut kerf (parallel to the fibres direction in top
and bottom layers) at 5 kHz frequency, 7 mJ pulse energy and 125 mm/s in assistance of: (i) 8 bars
pure oxygen, (ii) 8 bars 12.5% oxygen mixed with 87.5% nitrogen and (iii) 8 bars pure nitrogen
Difference in the decomposition of the material with change of the cut direction is
particularly well observed at low assist gas pressures. Figure 7-15 compares the cut
characteristics at the beam exit for the two cutting directions with assistance of 2 bar
oxygen. It can be seen that in cross-cutting (Figure 7-15a) more matrix recession occurs
as compared to parallel-cutting (Figure 7-15b). The kerf width is, however, larger in
parallel-cutting as compared to cross-cutting. Also some of the molten material was re-
deposited in the parallel-cutting case.
(a) (b) Figure 7-15 Comparison of cut characteristics at the beam exit in assistance of 2 bar oxygen in (a) cross
and (b) parallel-cutting direction at 7 mJ pulse energy, 5 kHz frequency and 125 mm/s scanning speed
Oxygen Nitrogen 12.5% O2-87.5% N2
(a) Beam
entran
ce (b
) Beam
exit
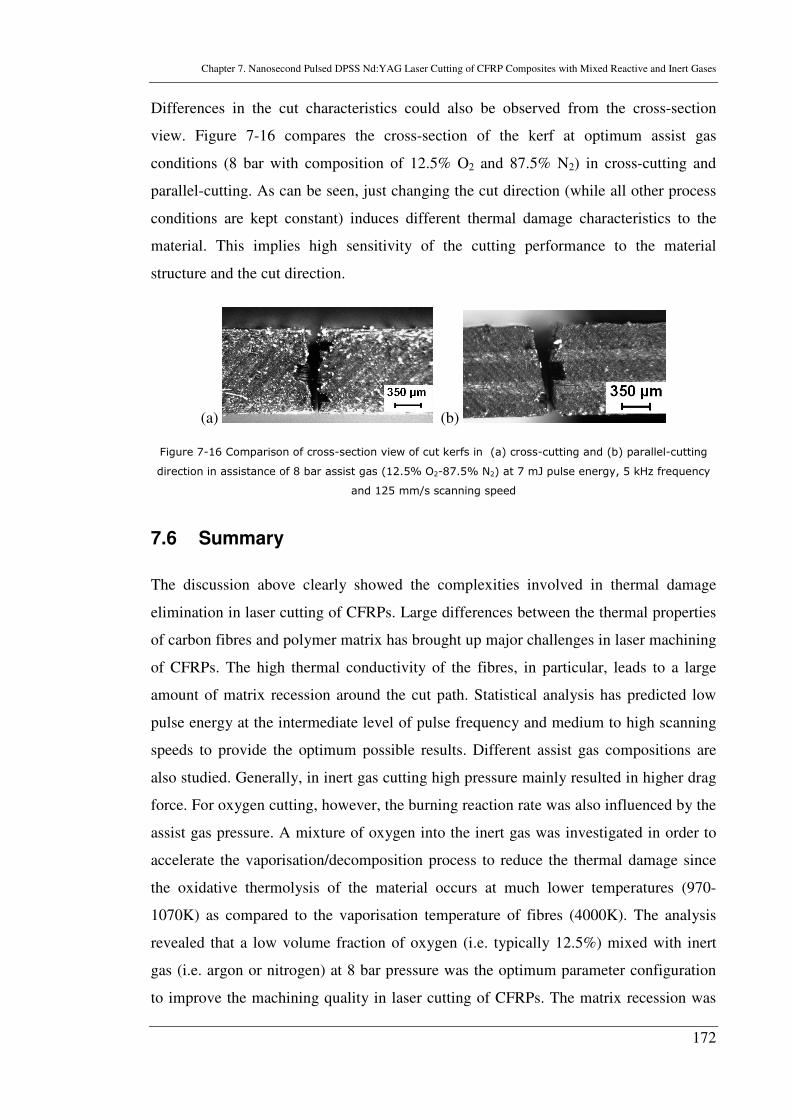
Chapter 7. Nanosecond Pulsed DPSS Nd:YAG Laser Cutting of CFRP Composites with Mixed Reactive and Inert Gases
172
Differences in the cut characteristics could also be observed from the cross-section
view. Figure 7-16 compares the cross-section of the kerf at optimum assist gas
conditions (8 bar with composition of 12.5% O2 and 87.5% N2) in cross-cutting and
parallel-cutting. As can be seen, just changing the cut direction (while all other process
conditions are kept constant) induces different thermal damage characteristics to the
material. This implies high sensitivity of the cutting performance to the material
structure and the cut direction.
(a) (b) Figure 7-16 Comparison of cross-section view of cut kerfs in (a) cross-cutting and (b) parallel-cutting
direction in assistance of 8 bar assist gas (12.5% O2-87.5% N2) at 7 mJ pulse energy, 5 kHz frequency
and 125 mm/s scanning speed
7.6 Summary
The discussion above clearly showed the complexities involved in thermal damage
elimination in laser cutting of CFRPs. Large differences between the thermal properties
of carbon fibres and polymer matrix has brought up major challenges in laser machining
of CFRPs. The high thermal conductivity of the fibres, in particular, leads to a large
amount of matrix recession around the cut path. Statistical analysis has predicted low
pulse energy at the intermediate level of pulse frequency and medium to high scanning
speeds to provide the optimum possible results. Different assist gas compositions are
also studied. Generally, in inert gas cutting high pressure mainly resulted in higher drag
force. For oxygen cutting, however, the burning reaction rate was also influenced by the
assist gas pressure. A mixture of oxygen into the inert gas was investigated in order to
accelerate the vaporisation/decomposition process to reduce the thermal damage since
the oxidative thermolysis of the material occurs at much lower temperatures (970-
1070K) as compared to the vaporisation temperature of fibres (4000K). The analysis
revealed that a low volume fraction of oxygen (i.e. typically 12.5%) mixed with inert
gas (i.e. argon or nitrogen) at 8 bar pressure was the optimum parameter configuration
to improve the machining quality in laser cutting of CFRPs. The matrix recession was
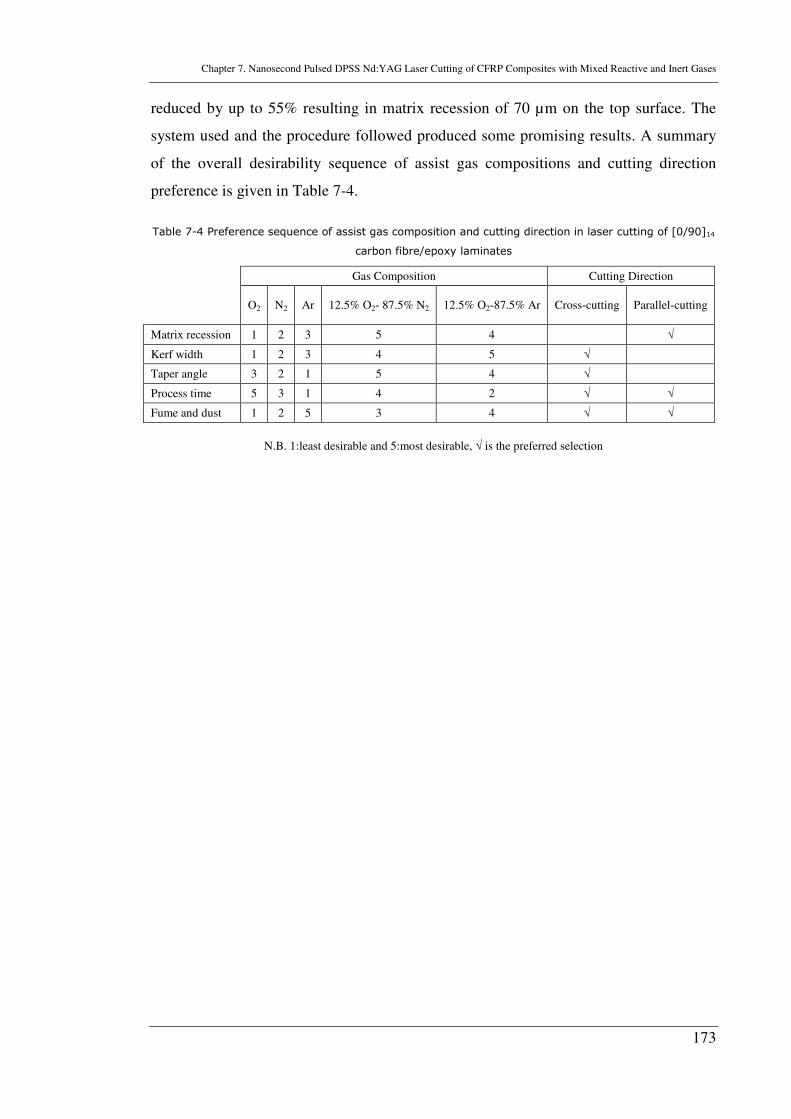
Chapter 7. Nanosecond Pulsed DPSS Nd:YAG Laser Cutting of CFRP Composites with Mixed Reactive and Inert Gases
173
reduced by up to 55% resulting in matrix recession of 70 µm on the top surface. The
system used and the procedure followed produced some promising results. A summary
of the overall desirability sequence of assist gas compositions and cutting direction
preference is given in Table 7-4.
Table 7-4 Preference sequence of assist gas composition and cutting direction in laser cutting of [0/90]14
carbon fibre/epoxy laminates
N.B. 1:least desirable and 5:most desirable, √ is the preferred selection
Gas Composition Cutting Direction
O2 N2 Ar 12.5% O2- 87.5% N2 12.5% O2-87.5% Ar Cross-cutting Parallel-cutting
Matrix recession 1 2 3 5 4 √
Kerf width 1 2 3 4 5 √
Taper angle 3 2 1 5 4 √
Process time 5 3 1 4 2 √ √
Fume and dust 1 2 5 3 4 √ √
Chapter 8. Numerical Simulation of Laser Machining of CFRP Composites
174
CHAPTER 8
NUMERICAL SIMULATION OF LASER
CUTTING OF CFRP COMPOSITES
8.1 General outline
The heterogeneous, inhomogeneous and anisotropic material properties of CFRP
composites, issues related to formation of the HAZ, charring and potential delamination
during laser processing are the main obstacles in industrial applications of laser cut
CFRPs. In order to improve the quality and dimensional accuracy of CFRP laser
machining, it is important to understand the mechanism of transient thermal behaviour
and its effect on material removal. Based on the "element death" procedure in the finite
element method (FEM), a three-dimensional model for simulating the transient
temperature field and subsequent material removal has been developed for the first time
in a heterogeneous fibre-matrix model. In addition to the transient temperature field, the
model also predicts the dimensions of the HAZ during the laser machining process. A
new technique, utilising the high thermal conductivity of carbon fibres, was used to
machine thick laminates of CFRPs in double paths with a predefined distance in
between. Experimental results obtained with same process variables using a 355 nm
DPSS Nd:YVO4 laser were used to validate the model. Based on the investigations, a
mechanism of the material removal in the laser composite machining is proposed. The
results suggest that the employed FEM approach can be used to simulate pulsed laser
cutting of FRP composites.
8.2 Introduction
It is challenging to develop a process envelop for laser machining of CFRP composites
due to the inhomogeneous properties and structures of CFRPs. The decomposition
/vaporisation of the matrix and the fibres in a CFRP occurs in different temperature
ranges [124]. During laser processing, the temperature at the machining front may not
reach the vaporisation temperature of the fibres, but it can be significantly higher than

Chapter 8. Numerical Simulation of Laser Machining of CFRP Composites
175
the degradation or decomposition temperature of the polymer matrix. This results in
degradation of the polymer matrix around the ablation site. The large difference in the
thermal properties between the two constituent materials also results in a large HAZ
[134, 173]. High thermal conductivity of carbon fibres in particular results in severe
thermal damage to these materials during laser processing [124]. Simulation of the laser
cutting process is therefore required, not only to understand the formation of the HAZ
but also to improve the quality of the laser cut with respect to surface quality and
dimensional accuracy [123]. This would lead to gain a better understanding of the
underlying phenomena and mechanisms.
Various analyses have been reported on HAZ prediction using simple 1D [124] and 2D
[85, 174] models or the material removal depth [53, 175] using analytical and numerical
modelling of laser machining of FRPs, in general, and CFRPs, in particular. The
feasibility of FEM as an alternative modelling approach has been reported in two
previous publications. Chen and Cheng [176] developed a finite element model to
determine the size of the HAZ during cutting of Kevlar, glass and carbon fibre
composites based on the material properties and cutting parameters. They applied a
prescribed temperature-time history to a reference node in the model. The material
removal was not modelled and heat loss was not considered. Newnham and Abrate
[177] presented a general 2D formulation for the finite element analysis (FEA) of heat
transfer in CFRP composites. Their model was based on anisotropic (depending on the
fibres orientation relative to cutting direction) and homogeneous (average of volume
fraction of the matrix and fibres) material properties. Their model showed a complex
temperature distribution near the laser beam but did not include the material removal.
The diversity of the factors involved in the modelling of composite machining
processes, especially those associated with anisotropic material properties and
simultaneous evaporation of two different materials (fibres and the resin), imposes
serious limitations on the analytical modelling approaches.
Here, a 3D finite element model is developed for predicting the transient temperature
field together with the subsequent material removal during laser machining of CFRPs,
for the first time. A commercial FE program (ANSYS) is used for this purpose utilising
its Parametric Design Language. The model represents a heterogeneous mesh (fibre and
matrix) for the composite with anisotropic material properties. The material properties
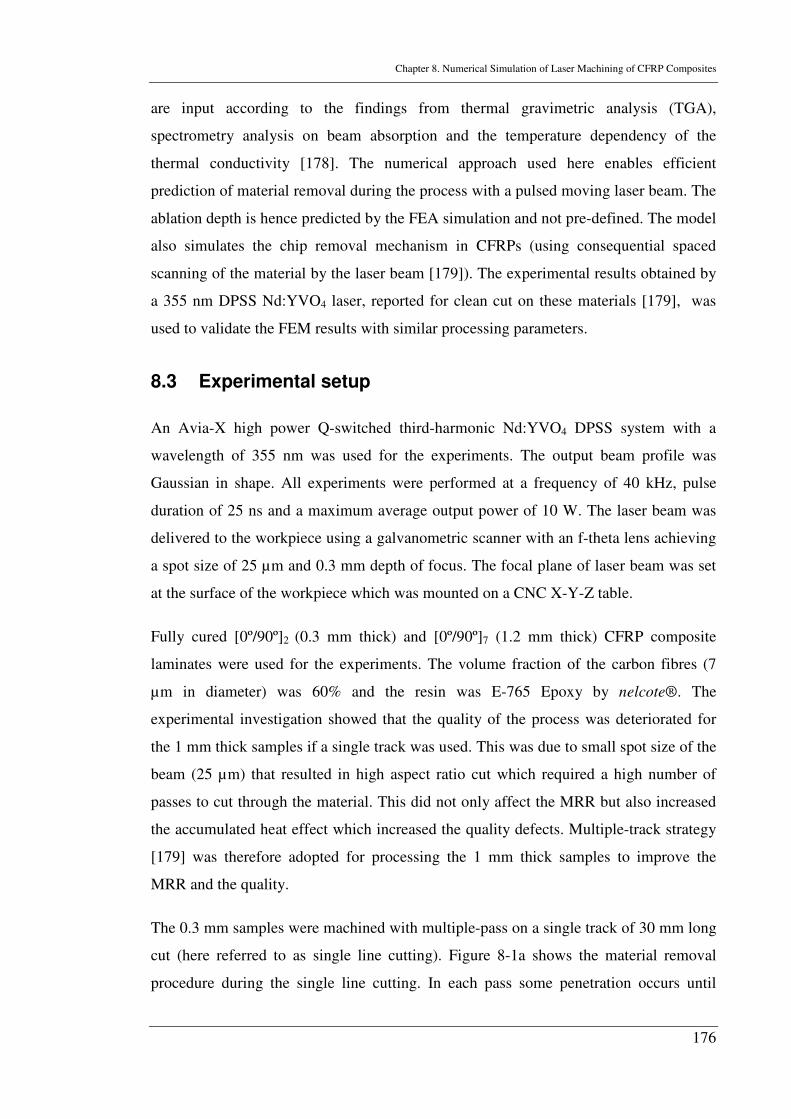
Chapter 8. Numerical Simulation of Laser Machining of CFRP Composites
176
are input according to the findings from thermal gravimetric analysis (TGA),
spectrometry analysis on beam absorption and the temperature dependency of the
thermal conductivity [178]. The numerical approach used here enables efficient
prediction of material removal during the process with a pulsed moving laser beam. The
ablation depth is hence predicted by the FEA simulation and not pre-defined. The model
also simulates the chip removal mechanism in CFRPs (using consequential spaced
scanning of the material by the laser beam [179]). The experimental results obtained by
a 355 nm DPSS Nd:YVO4 laser, reported for clean cut on these materials [179], was
used to validate the FEM results with similar processing parameters.
8.3 Experimental setup
An Avia-X high power Q-switched third-harmonic Nd:YVO4 DPSS system with a
wavelength of 355 nm was used for the experiments. The output beam profile was
Gaussian in shape. All experiments were performed at a frequency of 40 kHz, pulse
duration of 25 ns and a maximum average output power of 10 W. The laser beam was
delivered to the workpiece using a galvanometric scanner with an f-theta lens achieving
a spot size of 25 µm and 0.3 mm depth of focus. The focal plane of laser beam was set
at the surface of the workpiece which was mounted on a CNC X-Y-Z table.
Fully cured [0º/90º]2 (0.3 mm thick) and [0º/90º]7 (1.2 mm thick) CFRP composite
laminates were used for the experiments. The volume fraction of the carbon fibres (7
µm in diameter) was 60% and the resin was E-765 Epoxy by nelcote®. The
experimental investigation showed that the quality of the process was deteriorated for
the 1 mm thick samples if a single track was used. This was due to small spot size of the
beam (25 µm) that resulted in high aspect ratio cut which required a high number of
passes to cut through the material. This did not only affect the MRR but also increased
the accumulated heat effect which increased the quality defects. Multiple-track strategy
[179] was therefore adopted for processing the 1 mm thick samples to improve the
MRR and the quality.
The 0.3 mm samples were machined with multiple-pass on a single track of 30 mm long
cut (here referred to as single line cutting). Figure 8-1a shows the material removal
procedure during the single line cutting. In each pass some penetration occurs until
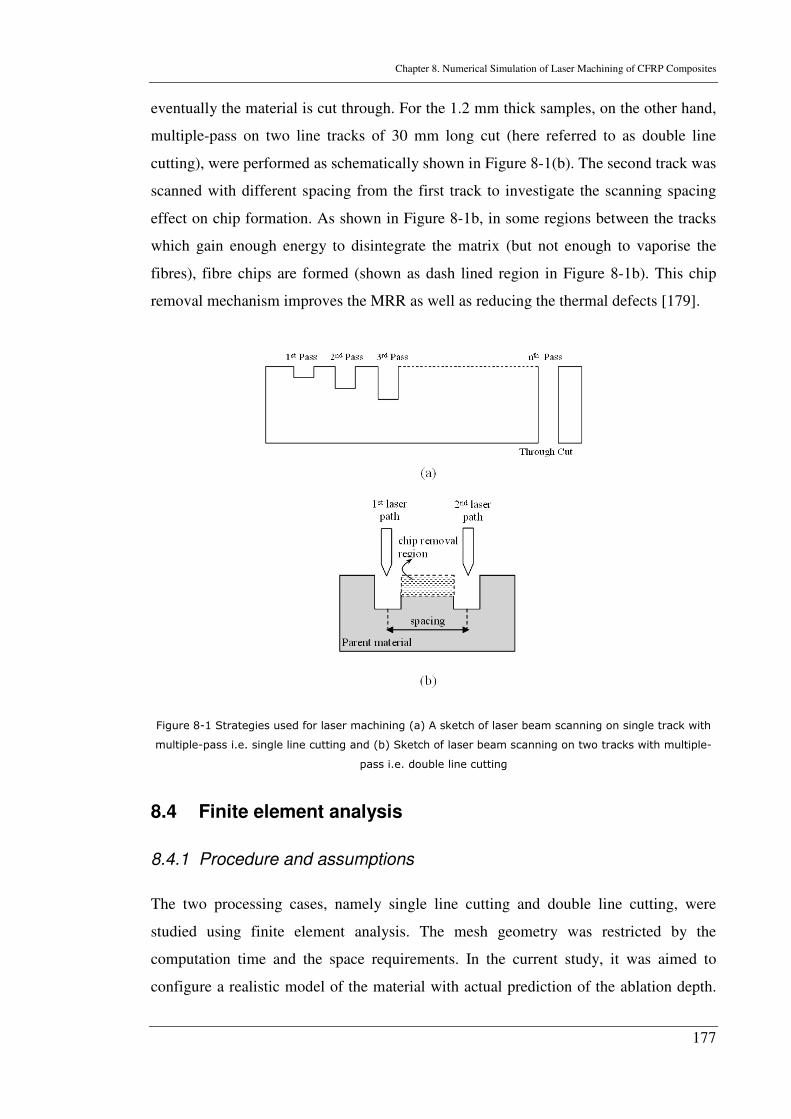
Chapter 8. Numerical Simulation of Laser Machining of CFRP Composites
177
eventually the material is cut through. For the 1.2 mm thick samples, on the other hand,
multiple-pass on two line tracks of 30 mm long cut (here referred to as double line
cutting), were performed as schematically shown in Figure 8-1(b). The second track was
scanned with different spacing from the first track to investigate the scanning spacing
effect on chip formation. As shown in Figure 8-1b, in some regions between the tracks
which gain enough energy to disintegrate the matrix (but not enough to vaporise the
fibres), fibre chips are formed (shown as dash lined region in Figure 8-1b). This chip
removal mechanism improves the MRR as well as reducing the thermal defects [179].
Figure 8-1 Strategies used for laser machining (a) A sketch of laser beam scanning on single track with
multiple-pass i.e. single line cutting and (b) Sketch of laser beam scanning on two tracks with multiple-
pass i.e. double line cutting
8.4 Finite element analysis
8.4.1 Procedure and assumptions
The two processing cases, namely single line cutting and double line cutting, were
studied using finite element analysis. The mesh geometry was restricted by the
computation time and the space requirements. In the current study, it was aimed to
configure a realistic model of the material with actual prediction of the ablation depth.
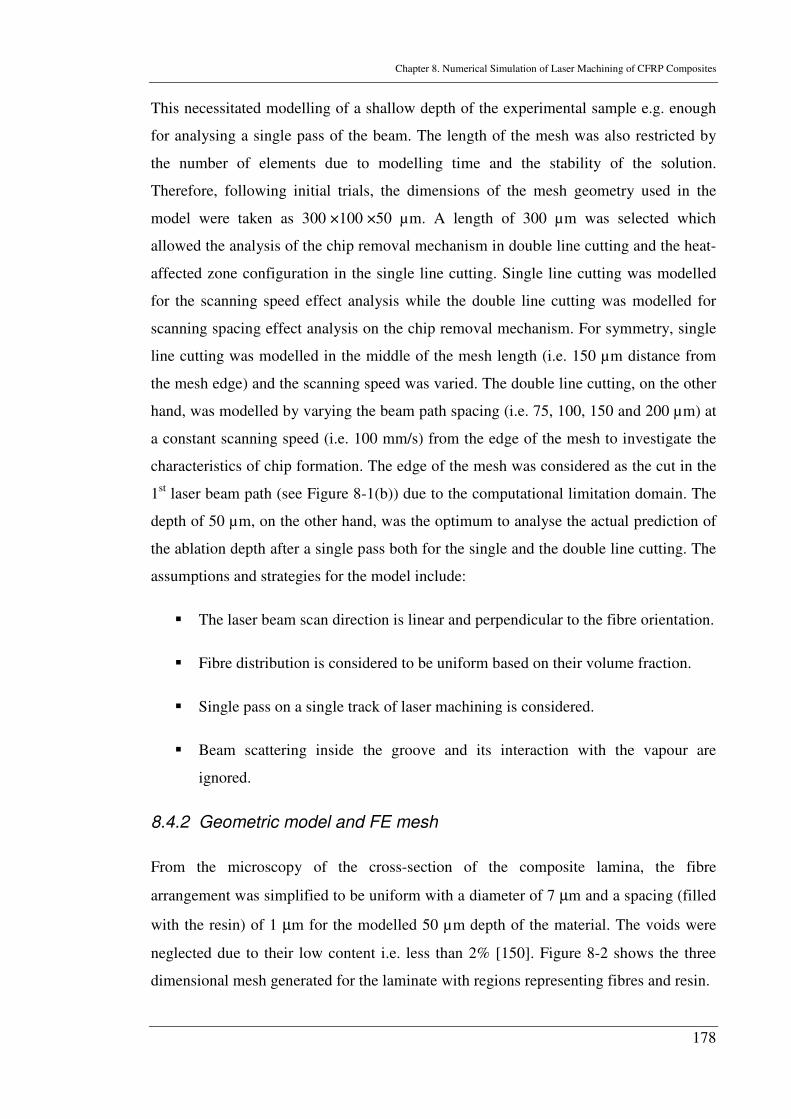
Chapter 8. Numerical Simulation of Laser Machining of CFRP Composites
178
This necessitated modelling of a shallow depth of the experimental sample e.g. enough
for analysing a single pass of the beam. The length of the mesh was also restricted by
the number of elements due to modelling time and the stability of the solution.
Therefore, following initial trials, the dimensions of the mesh geometry used in the
model were taken as 300 ×100 ×50 µm. A length of 300 µm was selected which
allowed the analysis of the chip removal mechanism in double line cutting and the heat-
affected zone configuration in the single line cutting. Single line cutting was modelled
for the scanning speed effect analysis while the double line cutting was modelled for
scanning spacing effect analysis on the chip removal mechanism. For symmetry, single
line cutting was modelled in the middle of the mesh length (i.e. 150 µm distance from
the mesh edge) and the scanning speed was varied. The double line cutting, on the other
hand, was modelled by varying the beam path spacing (i.e. 75, 100, 150 and 200 µm) at
a constant scanning speed (i.e. 100 mm/s) from the edge of the mesh to investigate the
characteristics of chip formation. The edge of the mesh was considered as the cut in the
1st laser beam path (see Figure 8-1(b)) due to the computational limitation domain. The
depth of 50 µm, on the other hand, was the optimum to analyse the actual prediction of
the ablation depth after a single pass both for the single and the double line cutting. The
assumptions and strategies for the model include:
� The laser beam scan direction is linear and perpendicular to the fibre orientation.
� Fibre distribution is considered to be uniform based on their volume fraction.
� Single pass on a single track of laser machining is considered.
� Beam scattering inside the groove and its interaction with the vapour are
ignored.
8.4.2 Geometric model and FE mesh
From the microscopy of the cross-section of the composite lamina, the fibre
arrangement was simplified to be uniform with a diameter of 7 µm and a spacing (filled
with the resin) of 1 µm for the modelled 50 µm depth of the material. The voids were
neglected due to their low content i.e. less than 2% [150]. Figure 8-2 shows the three
dimensional mesh generated for the laminate with regions representing fibres and resin.
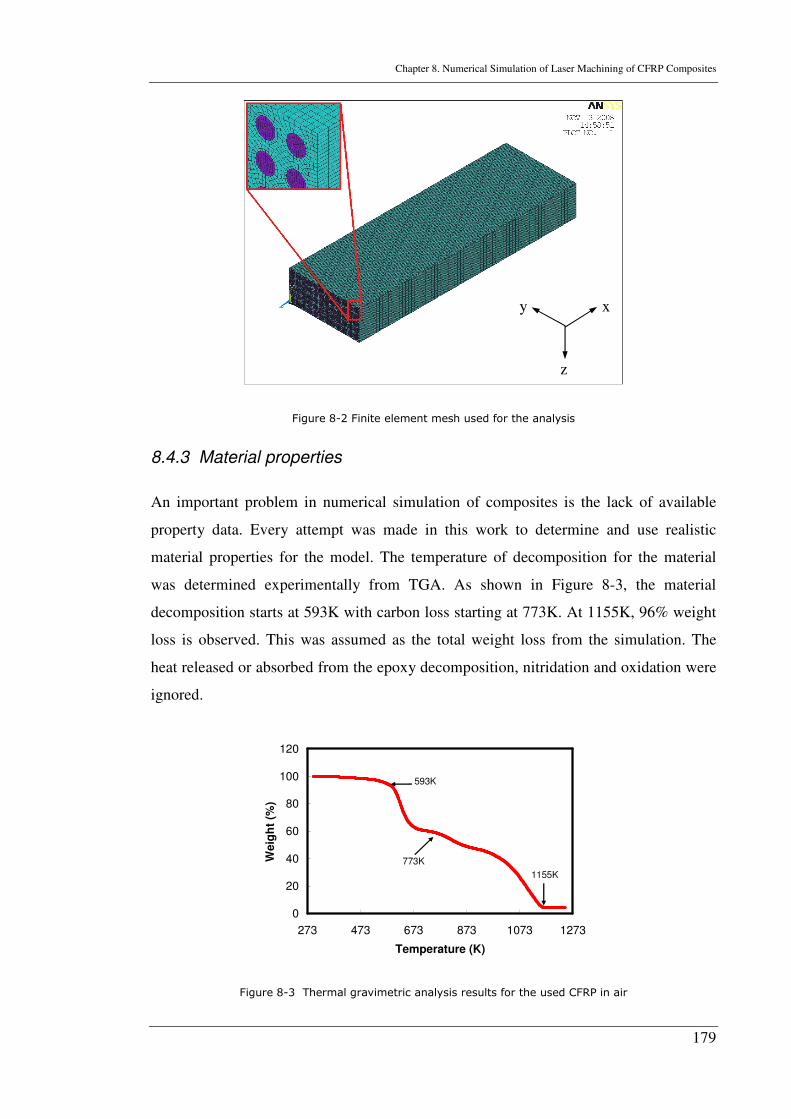
Chapter 8. Numerical Simulation of Laser Machining of CFRP Composites
179
Figure 8-2 Finite element mesh used for the analysis
8.4.3 Material properties
An important problem in numerical simulation of composites is the lack of available
property data. Every attempt was made in this work to determine and use realistic
material properties for the model. The temperature of decomposition for the material
was determined experimentally from TGA. As shown in Figure 8-3, the material
decomposition starts at 593K with carbon loss starting at 773K. At 1155K, 96% weight
loss is observed. This was assumed as the total weight loss from the simulation. The
heat released or absorbed from the epoxy decomposition, nitridation and oxidation were
ignored.
0
20
40
60
80
100
120
273 473 673 873 1073 1273
Temperature (K)
Weig
ht
(%)
593K
773K
1155K
Figure 8-3 Thermal gravimetric analysis results for the used CFRP in air
x
z
y
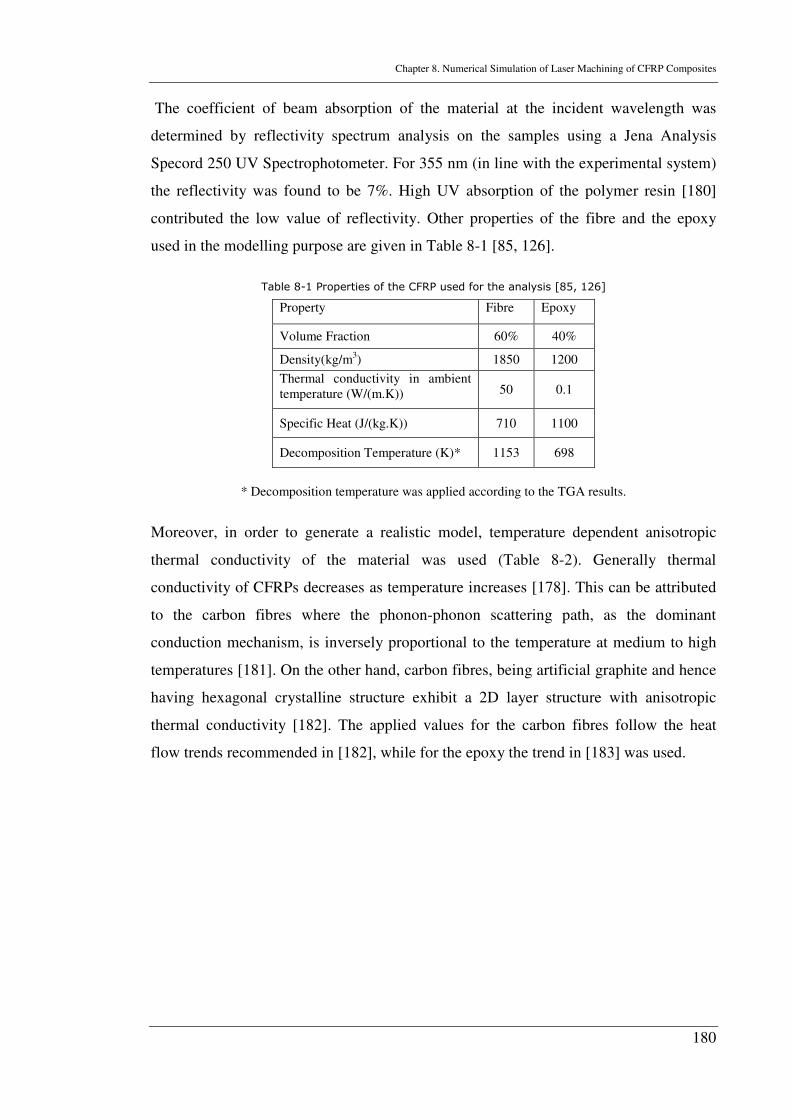
Chapter 8. Numerical Simulation of Laser Machining of CFRP Composites
180
The coefficient of beam absorption of the material at the incident wavelength was
determined by reflectivity spectrum analysis on the samples using a Jena Analysis
Specord 250 UV Spectrophotometer. For 355 nm (in line with the experimental system)
the reflectivity was found to be 7%. High UV absorption of the polymer resin [180]
contributed the low value of reflectivity. Other properties of the fibre and the epoxy
used in the modelling purpose are given in Table 8-1 [85, 126].
Table 8-1 Properties of the CFRP used for the analysis [85, 126]
Property Fibre Epoxy
Volume Fraction 60% 40%
Density(kg/m3) 1850 1200
Thermal conductivity in ambient temperature (W/(m.K)) 50 0.1
Specific Heat (J/(kg.K)) 710 1100
Decomposition Temperature (K)* 1153 698
* Decomposition temperature was applied according to the TGA results.
Moreover, in order to generate a realistic model, temperature dependent anisotropic
thermal conductivity of the material was used (Table 8-2). Generally thermal
conductivity of CFRPs decreases as temperature increases [178]. This can be attributed
to the carbon fibres where the phonon-phonon scattering path, as the dominant
conduction mechanism, is inversely proportional to the temperature at medium to high
temperatures [181]. On the other hand, carbon fibres, being artificial graphite and hence
having hexagonal crystalline structure exhibit a 2D layer structure with anisotropic
thermal conductivity [182]. The applied values for the carbon fibres follow the heat
flow trends recommended in [182], while for the epoxy the trend in [183] was used.
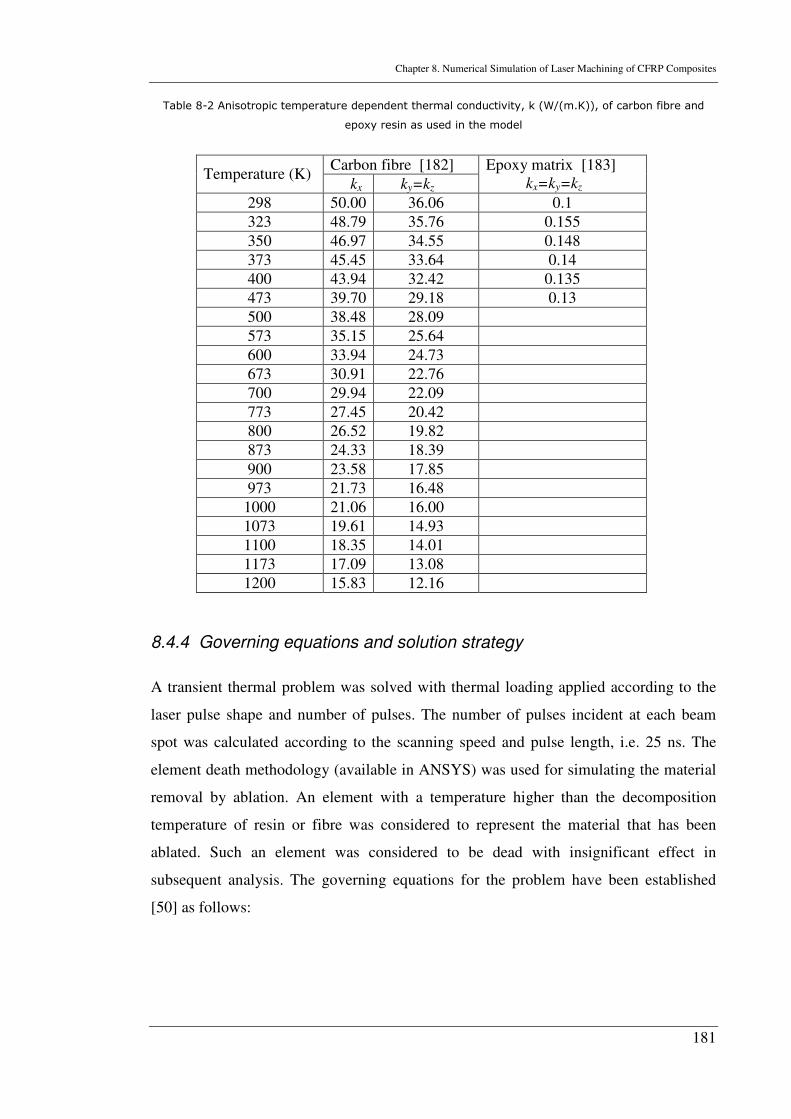
Chapter 8. Numerical Simulation of Laser Machining of CFRP Composites
181
Table 8-2 Anisotropic temperature dependent thermal conductivity, k (W/(m.K)), of carbon fibre and
epoxy resin as used in the model
8.4.4 Governing equations and solution strategy
A transient thermal problem was solved with thermal loading applied according to the
laser pulse shape and number of pulses. The number of pulses incident at each beam
spot was calculated according to the scanning speed and pulse length, i.e. 25 ns. The
element death methodology (available in ANSYS) was used for simulating the material
removal by ablation. An element with a temperature higher than the decomposition
temperature of resin or fibre was considered to represent the material that has been
ablated. Such an element was considered to be dead with insignificant effect in
subsequent analysis. The governing equations for the problem have been established
[50] as follows:
Carbon fibre [182] Temperature (K)
kx ky=kz
Epoxy matrix [183] kx=ky=kz
298 50.00 36.06 0.1
323 48.79 35.76 0.155
350 46.97 34.55 0.148
373 45.45 33.64 0.14
400 43.94 32.42 0.135
473 39.70 29.18 0.13
500 38.48 28.09
573 35.15 25.64
600 33.94 24.73
673 30.91 22.76
700 29.94 22.09
773 27.45 20.42
800 26.52 19.82
873 24.33 18.39
900 23.58 17.85
973 21.73 16.48
1000 21.06 16.00
1073 19.61 14.93
1100 18.35 14.01
1173 17.09 13.08
1200 15.83 12.16
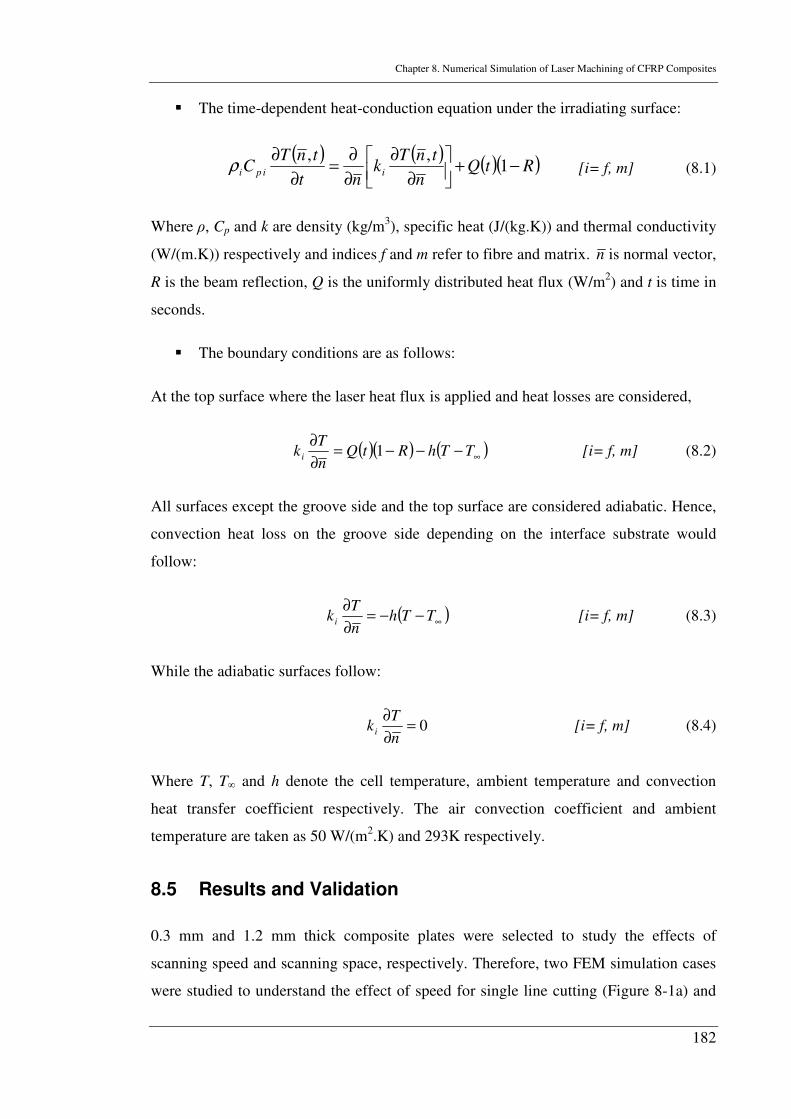
Chapter 8. Numerical Simulation of Laser Machining of CFRP Composites
182
� The time-dependent heat-conduction equation under the irradiating surface:
( ) ( ) ( )( )RtQ
n
tnTk
nt
tnTC iipi −+
∂
∂
∂
∂=
∂
∂1
,,ρ [i= f, m] (8.1)
Where ρ, Cp and k are density (kg/m3), specific heat (J/(kg.K)) and thermal conductivity
(W/(m.K)) respectively and indices f and m refer to fibre and matrix. n is normal vector,
R is the beam reflection, Q is the uniformly distributed heat flux (W/m2) and t is time in
seconds.
� The boundary conditions are as follows:
At the top surface where the laser heat flux is applied and heat losses are considered,
( )( ) ( )∞−−−=∂
∂TThRtQ
n
Tk i 1 [i= f, m] (8.2)
All surfaces except the groove side and the top surface are considered adiabatic. Hence,
convection heat loss on the groove side depending on the interface substrate would
follow:
( )∞−−=∂
∂TTh
n
Tk i [i= f, m] (8.3)
While the adiabatic surfaces follow:
0=∂
∂
n
Tk i [i= f, m] (8.4)
Where T, T∞ and h denote the cell temperature, ambient temperature and convection
heat transfer coefficient respectively. The air convection coefficient and ambient
temperature are taken as 50 W/(m2.K) and 293K respectively.
8.5 Results and Validation
0.3 mm and 1.2 mm thick composite plates were selected to study the effects of
scanning speed and scanning space, respectively. Therefore, two FEM simulation cases
were studied to understand the effect of speed for single line cutting (Figure 8-1a) and
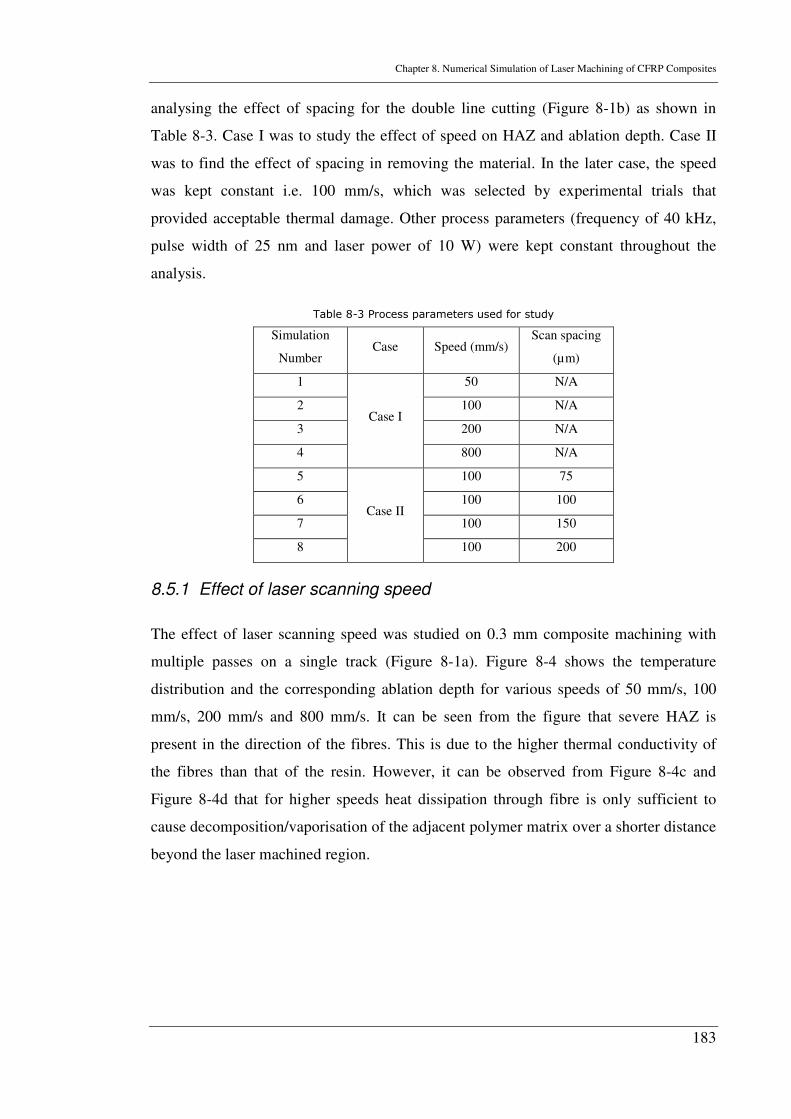
Chapter 8. Numerical Simulation of Laser Machining of CFRP Composites
183
analysing the effect of spacing for the double line cutting (Figure 8-1b) as shown in
Table 8-3. Case I was to study the effect of speed on HAZ and ablation depth. Case II
was to find the effect of spacing in removing the material. In the later case, the speed
was kept constant i.e. 100 mm/s, which was selected by experimental trials that
provided acceptable thermal damage. Other process parameters (frequency of 40 kHz,
pulse width of 25 nm and laser power of 10 W) were kept constant throughout the
analysis.
Table 8-3 Process parameters used for study
Simulation
Number Case Speed (mm/s)
Scan spacing
(µm)
1 50 N/A
2 100 N/A
3 200 N/A
4
Case I
800 N/A
5 100 75
6 100 100
7 100 150
8
Case II
100 200
8.5.1 Effect of laser scanning speed
The effect of laser scanning speed was studied on 0.3 mm composite machining with
multiple passes on a single track (Figure 8-1a). Figure 8-4 shows the temperature
distribution and the corresponding ablation depth for various speeds of 50 mm/s, 100
mm/s, 200 mm/s and 800 mm/s. It can be seen from the figure that severe HAZ is
present in the direction of the fibres. This is due to the higher thermal conductivity of
the fibres than that of the resin. However, it can be observed from Figure 8-4c and
Figure 8-4d that for higher speeds heat dissipation through fibre is only sufficient to
cause decomposition/vaporisation of the adjacent polymer matrix over a shorter distance
beyond the laser machined region.
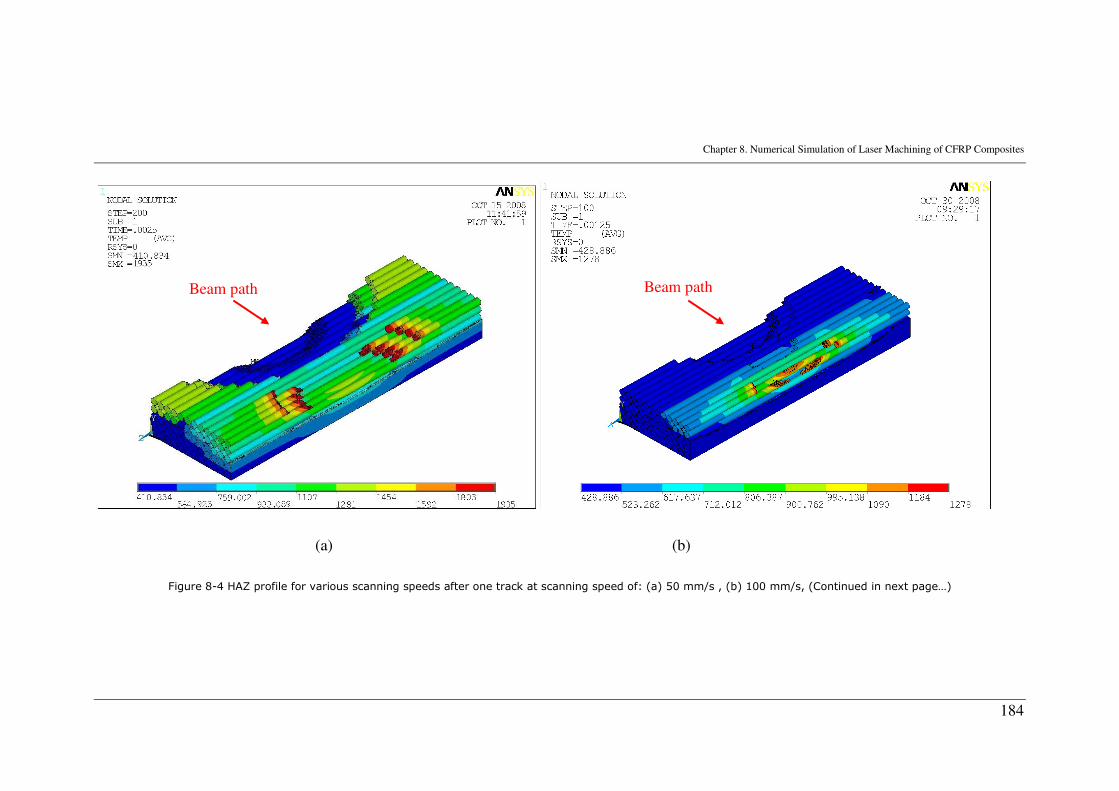
Chapter 8. Numerical Simulation of Laser Machining of CFRP Composites
184
(a) (b)
Figure 8-4 HAZ profile for various scanning speeds after one track at scanning speed of: (a) 50 mm/s , (b) 100 mm/s, (Continued in next page…)
Beam path Beam path
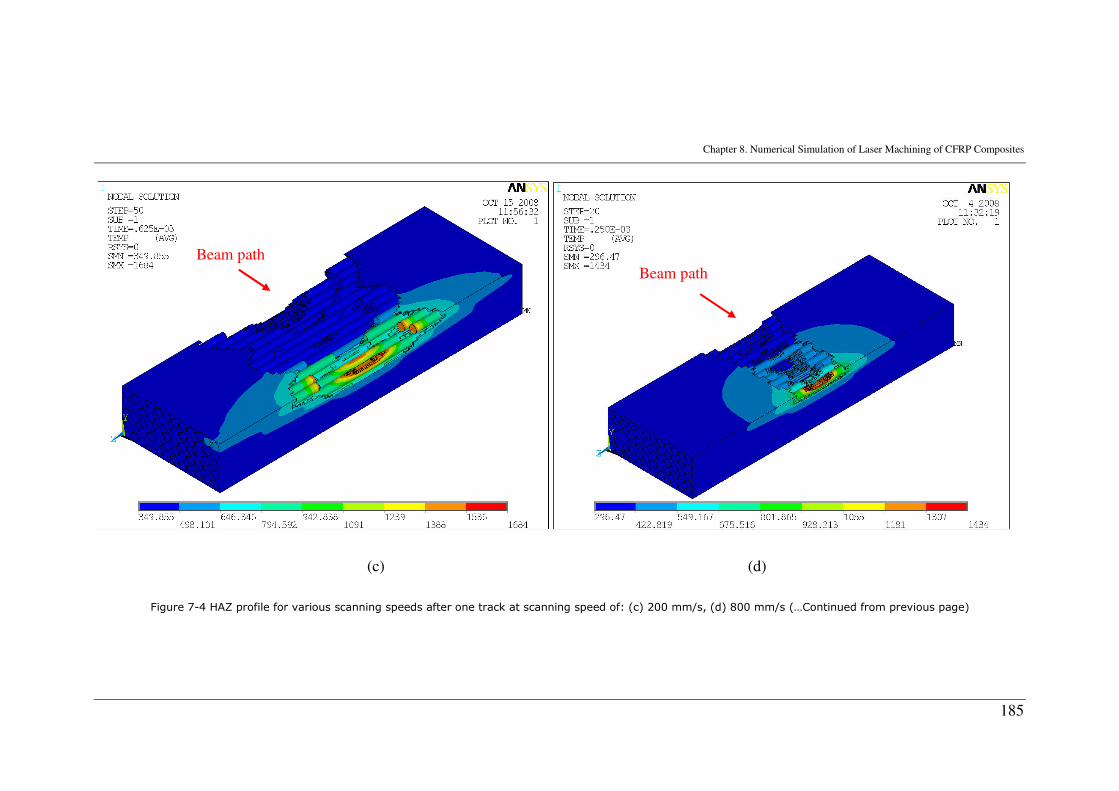
Chapter 8. Numerical Simulation of Laser Machining of CFRP Composites
185
(c) (d)
Figure 7-4 HAZ profile for various scanning speeds after one track at scanning speed of: (c) 200 mm/s, (d) 800 mm/s (…Continued from previous page)
Beam path Beam path
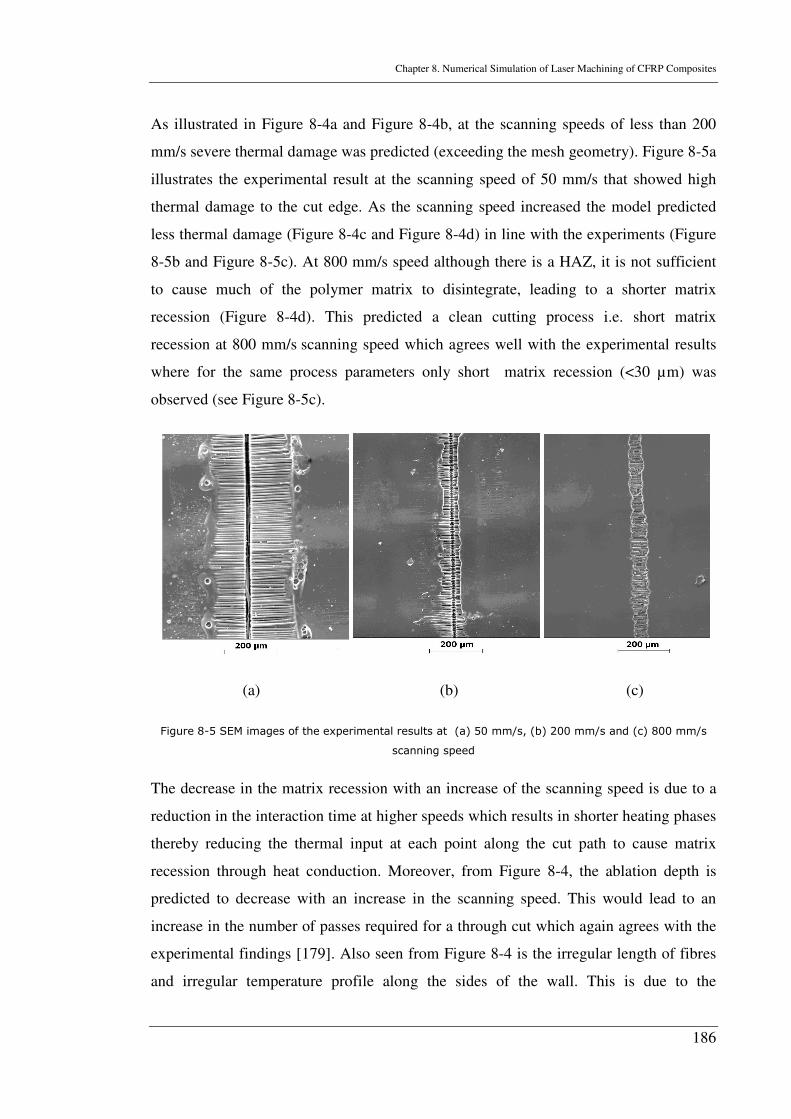
Chapter 8. Numerical Simulation of Laser Machining of CFRP Composites
186
As illustrated in Figure 8-4a and Figure 8-4b, at the scanning speeds of less than 200
mm/s severe thermal damage was predicted (exceeding the mesh geometry). Figure 8-5a
illustrates the experimental result at the scanning speed of 50 mm/s that showed high
thermal damage to the cut edge. As the scanning speed increased the model predicted
less thermal damage (Figure 8-4c and Figure 8-4d) in line with the experiments (Figure
8-5b and Figure 8-5c). At 800 mm/s speed although there is a HAZ, it is not sufficient
to cause much of the polymer matrix to disintegrate, leading to a shorter matrix
recession (Figure 8-4d). This predicted a clean cutting process i.e. short matrix
recession at 800 mm/s scanning speed which agrees well with the experimental results
where for the same process parameters only short matrix recession (<30 µm) was
observed (see Figure 8-5c).
(a) (b) (c)
Figure 8-5 SEM images of the experimental results at (a) 50 mm/s, (b) 200 mm/s and (c) 800 mm/s
scanning speed
The decrease in the matrix recession with an increase of the scanning speed is due to a
reduction in the interaction time at higher speeds which results in shorter heating phases
thereby reducing the thermal input at each point along the cut path to cause matrix
recession through heat conduction. Moreover, from Figure 8-4, the ablation depth is
predicted to decrease with an increase in the scanning speed. This would lead to an
increase in the number of passes required for a through cut which again agrees with the
experimental findings [179]. Also seen from Figure 8-4 is the irregular length of fibres
and irregular temperature profile along the sides of the wall. This is due to the
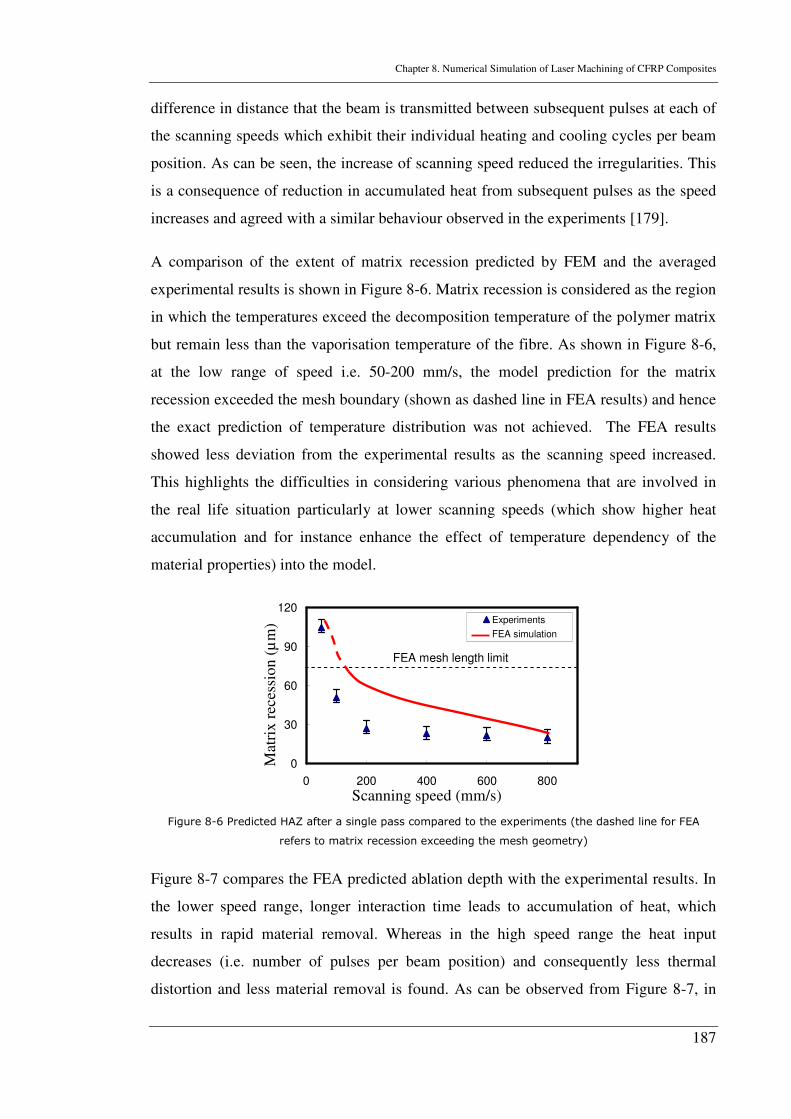
Chapter 8. Numerical Simulation of Laser Machining of CFRP Composites
187
difference in distance that the beam is transmitted between subsequent pulses at each of
the scanning speeds which exhibit their individual heating and cooling cycles per beam
position. As can be seen, the increase of scanning speed reduced the irregularities. This
is a consequence of reduction in accumulated heat from subsequent pulses as the speed
increases and agreed with a similar behaviour observed in the experiments [179].
A comparison of the extent of matrix recession predicted by FEM and the averaged
experimental results is shown in Figure 8-6. Matrix recession is considered as the region
in which the temperatures exceed the decomposition temperature of the polymer matrix
but remain less than the vaporisation temperature of the fibre. As shown in Figure 8-6,
at the low range of speed i.e. 50-200 mm/s, the model prediction for the matrix
recession exceeded the mesh boundary (shown as dashed line in FEA results) and hence
the exact prediction of temperature distribution was not achieved. The FEA results
showed less deviation from the experimental results as the scanning speed increased.
This highlights the difficulties in considering various phenomena that are involved in
the real life situation particularly at lower scanning speeds (which show higher heat
accumulation and for instance enhance the effect of temperature dependency of the
material properties) into the model.
0
30
60
90
120
0 200 400 600 800
Experiments
FEA simulation
FEA mesh length limit
Figure 8-6 Predicted HAZ after a single pass compared to the experiments (the dashed line for FEA
refers to matrix recession exceeding the mesh geometry)
Figure 8-7 compares the FEA predicted ablation depth with the experimental results. In
the lower speed range, longer interaction time leads to accumulation of heat, which
results in rapid material removal. Whereas in the high speed range the heat input
decreases (i.e. number of pulses per beam position) and consequently less thermal
distortion and less material removal is found. As can be observed from Figure 8-7, in
Scanning speed (mm/s)
Mat
rix
rec
essi
on
(µ
m)
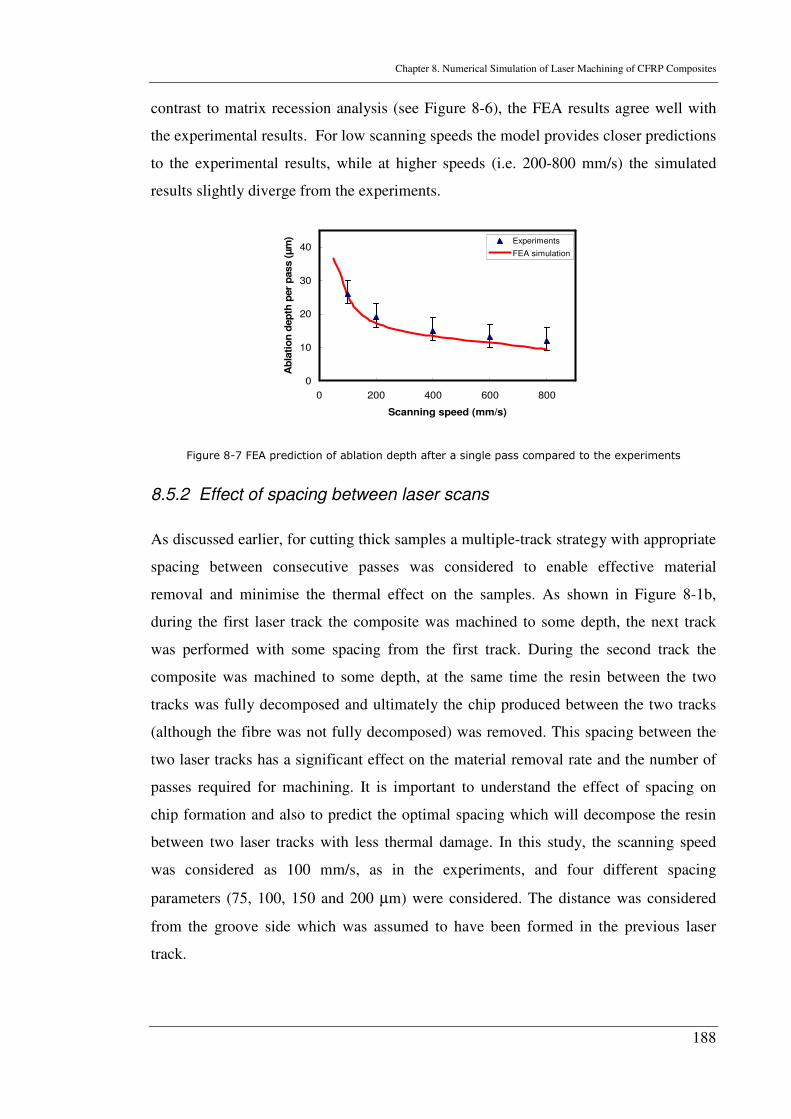
Chapter 8. Numerical Simulation of Laser Machining of CFRP Composites
188
contrast to matrix recession analysis (see Figure 8-6), the FEA results agree well with
the experimental results. For low scanning speeds the model provides closer predictions
to the experimental results, while at higher speeds (i.e. 200-800 mm/s) the simulated
results slightly diverge from the experiments.
0
10
20
30
40
0 200 400 600 800
Scanning speed (mm/s)
Ab
lati
on
dep
th p
er
pass (
µm
) Experiments
FEA simulation
Figure 8-7 FEA prediction of ablation depth after a single pass compared to the experiments
8.5.2 Effect of spacing between laser scans
As discussed earlier, for cutting thick samples a multiple-track strategy with appropriate
spacing between consecutive passes was considered to enable effective material
removal and minimise the thermal effect on the samples. As shown in Figure 8-1b,
during the first laser track the composite was machined to some depth, the next track
was performed with some spacing from the first track. During the second track the
composite was machined to some depth, at the same time the resin between the two
tracks was fully decomposed and ultimately the chip produced between the two tracks
(although the fibre was not fully decomposed) was removed. This spacing between the
two laser tracks has a significant effect on the material removal rate and the number of
passes required for machining. It is important to understand the effect of spacing on
chip formation and also to predict the optimal spacing which will decompose the resin
between two laser tracks with less thermal damage. In this study, the scanning speed
was considered as 100 mm/s, as in the experiments, and four different spacing
parameters (75, 100, 150 and 200 µm) were considered. The distance was considered
from the groove side which was assumed to have been formed in the previous laser
track.
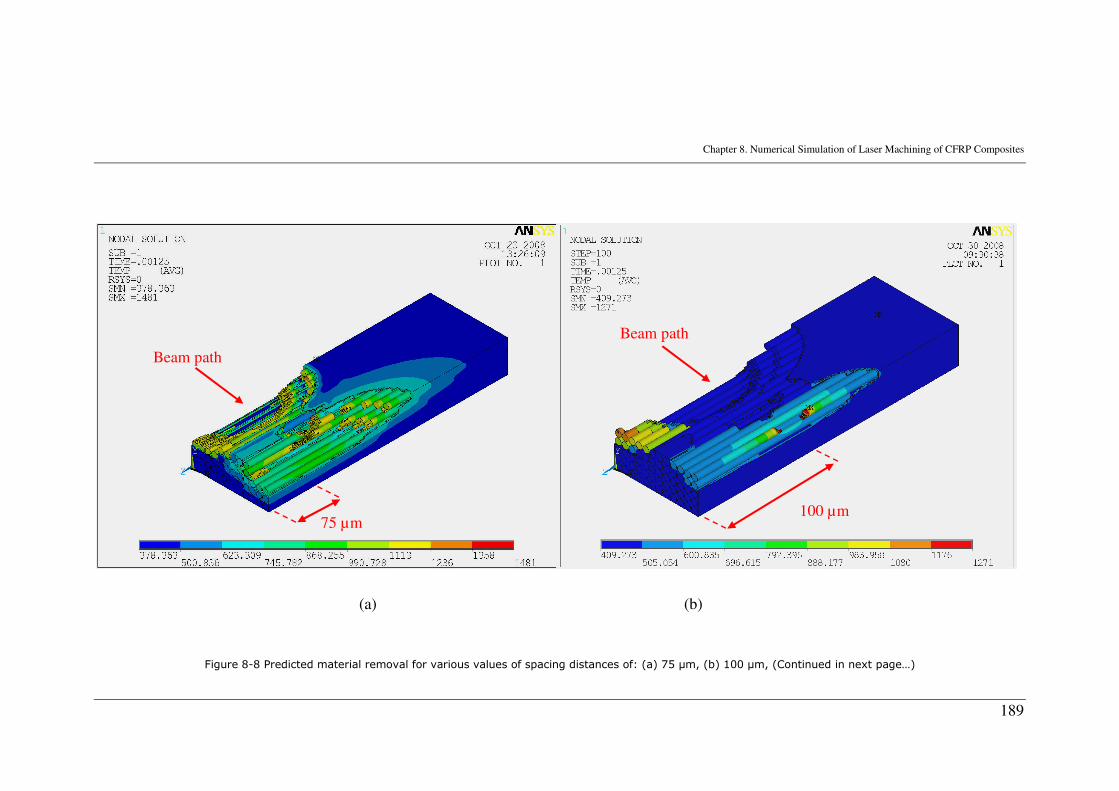
Chapter 8. Numerical Simulation of Laser Machining of CFRP Composites
189
(a) (b)
Figure 8-8 Predicted material removal for various values of spacing distances of: (a) 75 µm, (b) 100 µm, (Continued in next page…)
Beam path
Beam path
100 µm 75 µm
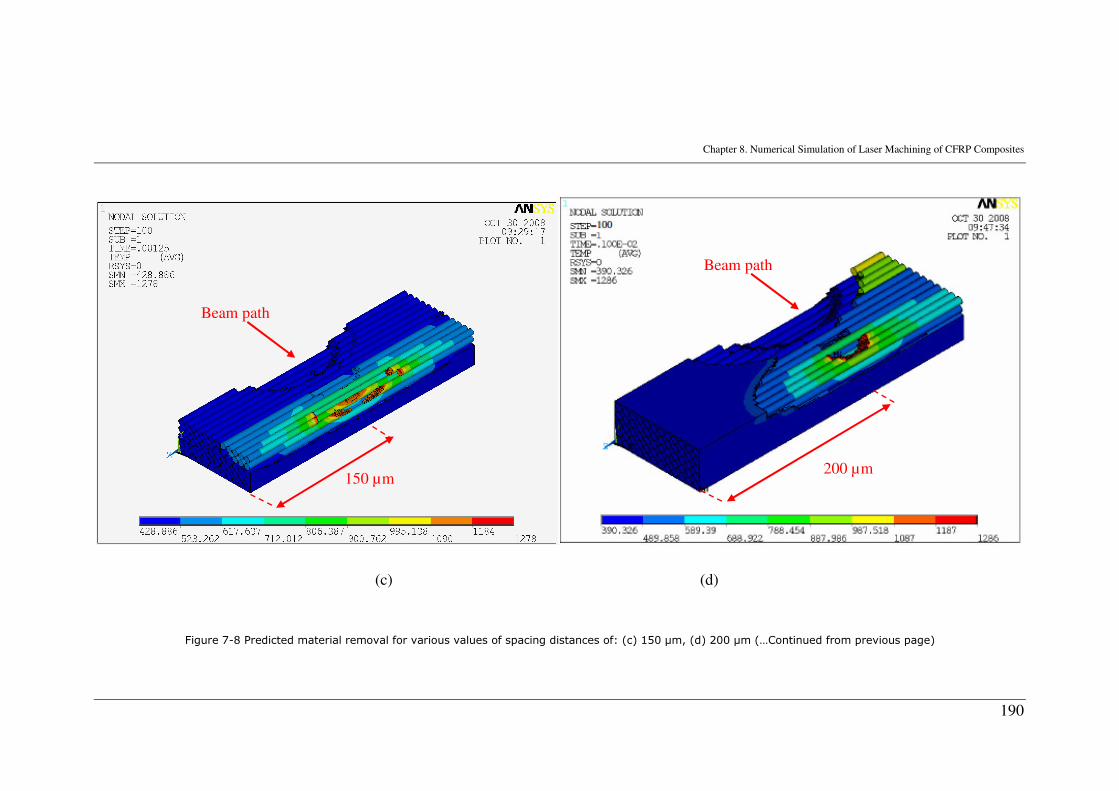
Chapter 8. Numerical Simulation of Laser Machining of CFRP Composites
190
(c) (d)
Figure 7-8 Predicted material removal for various values of spacing distances of: (c) 150 µm, (d) 200 µm (…Continued from previous page)
Beam path
Beam path
150 µm 200 µm
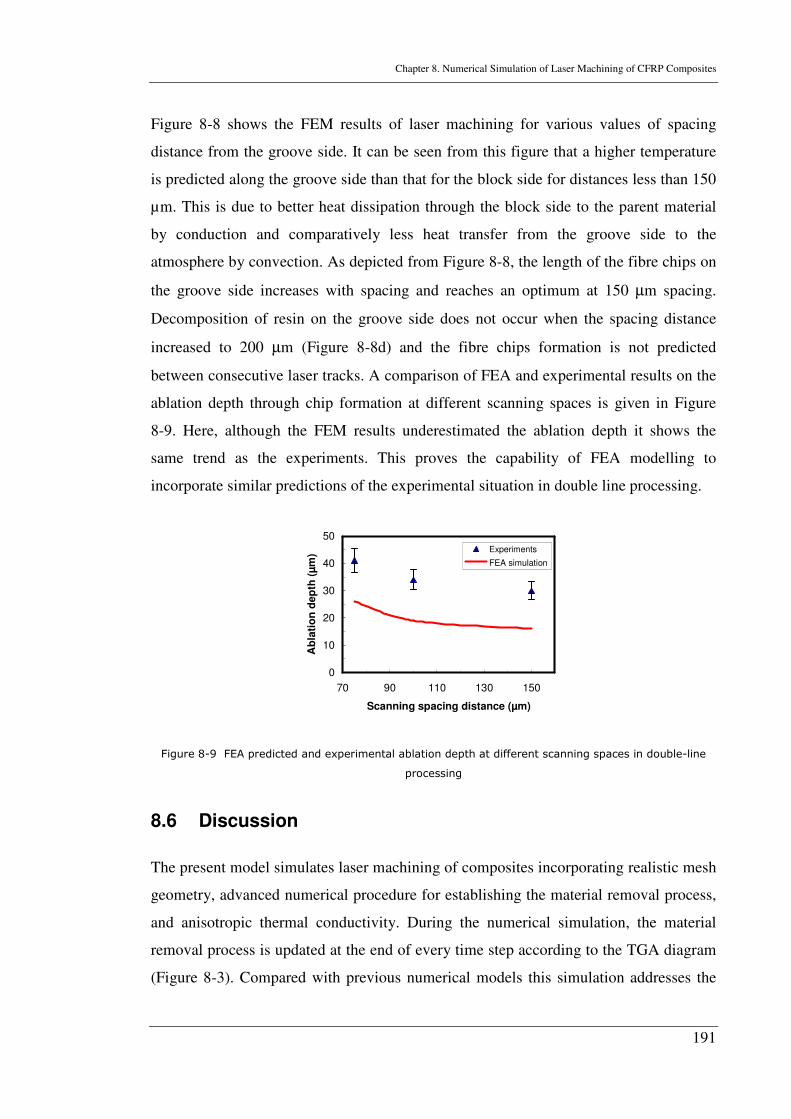
Chapter 8. Numerical Simulation of Laser Machining of CFRP Composites
191
Figure 8-8 shows the FEM results of laser machining for various values of spacing
distance from the groove side. It can be seen from this figure that a higher temperature
is predicted along the groove side than that for the block side for distances less than 150
µm. This is due to better heat dissipation through the block side to the parent material
by conduction and comparatively less heat transfer from the groove side to the
atmosphere by convection. As depicted from Figure 8-8, the length of the fibre chips on
the groove side increases with spacing and reaches an optimum at 150 µm spacing.
Decomposition of resin on the groove side does not occur when the spacing distance
increased to 200 µm (Figure 8-8d) and the fibre chips formation is not predicted
between consecutive laser tracks. A comparison of FEA and experimental results on the
ablation depth through chip formation at different scanning spaces is given in Figure
8-9. Here, although the FEM results underestimated the ablation depth it shows the
same trend as the experiments. This proves the capability of FEA modelling to
incorporate similar predictions of the experimental situation in double line processing.
0
10
20
30
40
50
70 90 110 130 150
Scanning spacing distance (µm)
Ab
lati
on
dep
th (
µm
) Experiments
FEA simulation
Figure 8-9 FEA predicted and experimental ablation depth at different scanning spaces in double-line
processing
8.6 Discussion
The present model simulates laser machining of composites incorporating realistic mesh
geometry, advanced numerical procedure for establishing the material removal process,
and anisotropic thermal conductivity. During the numerical simulation, the material
removal process is updated at the end of every time step according to the TGA diagram
(Figure 8-3). Compared with previous numerical models this simulation addresses the
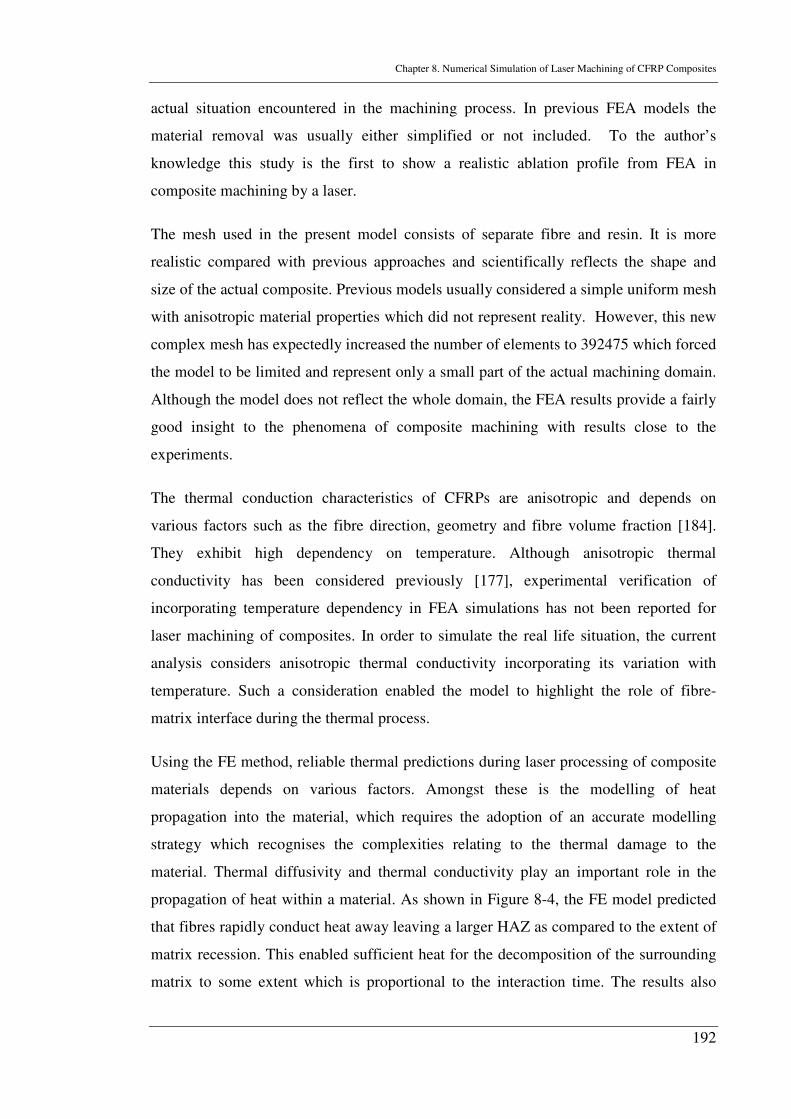
Chapter 8. Numerical Simulation of Laser Machining of CFRP Composites
192
actual situation encountered in the machining process. In previous FEA models the
material removal was usually either simplified or not included. To the author’s
knowledge this study is the first to show a realistic ablation profile from FEA in
composite machining by a laser.
The mesh used in the present model consists of separate fibre and resin. It is more
realistic compared with previous approaches and scientifically reflects the shape and
size of the actual composite. Previous models usually considered a simple uniform mesh
with anisotropic material properties which did not represent reality. However, this new
complex mesh has expectedly increased the number of elements to 392475 which forced
the model to be limited and represent only a small part of the actual machining domain.
Although the model does not reflect the whole domain, the FEA results provide a fairly
good insight to the phenomena of composite machining with results close to the
experiments.
The thermal conduction characteristics of CFRPs are anisotropic and depends on
various factors such as the fibre direction, geometry and fibre volume fraction [184].
They exhibit high dependency on temperature. Although anisotropic thermal
conductivity has been considered previously [177], experimental verification of
incorporating temperature dependency in FEA simulations has not been reported for
laser machining of composites. In order to simulate the real life situation, the current
analysis considers anisotropic thermal conductivity incorporating its variation with
temperature. Such a consideration enabled the model to highlight the role of fibre-
matrix interface during the thermal process.
Using the FE method, reliable thermal predictions during laser processing of composite
materials depends on various factors. Amongst these is the modelling of heat
propagation into the material, which requires the adoption of an accurate modelling
strategy which recognises the complexities relating to the thermal damage to the
material. Thermal diffusivity and thermal conductivity play an important role in the
propagation of heat within a material. As shown in Figure 8-4, the FE model predicted
that fibres rapidly conduct heat away leaving a larger HAZ as compared to the extent of
matrix recession. This enabled sufficient heat for the decomposition of the surrounding
matrix to some extent which is proportional to the interaction time. The results also
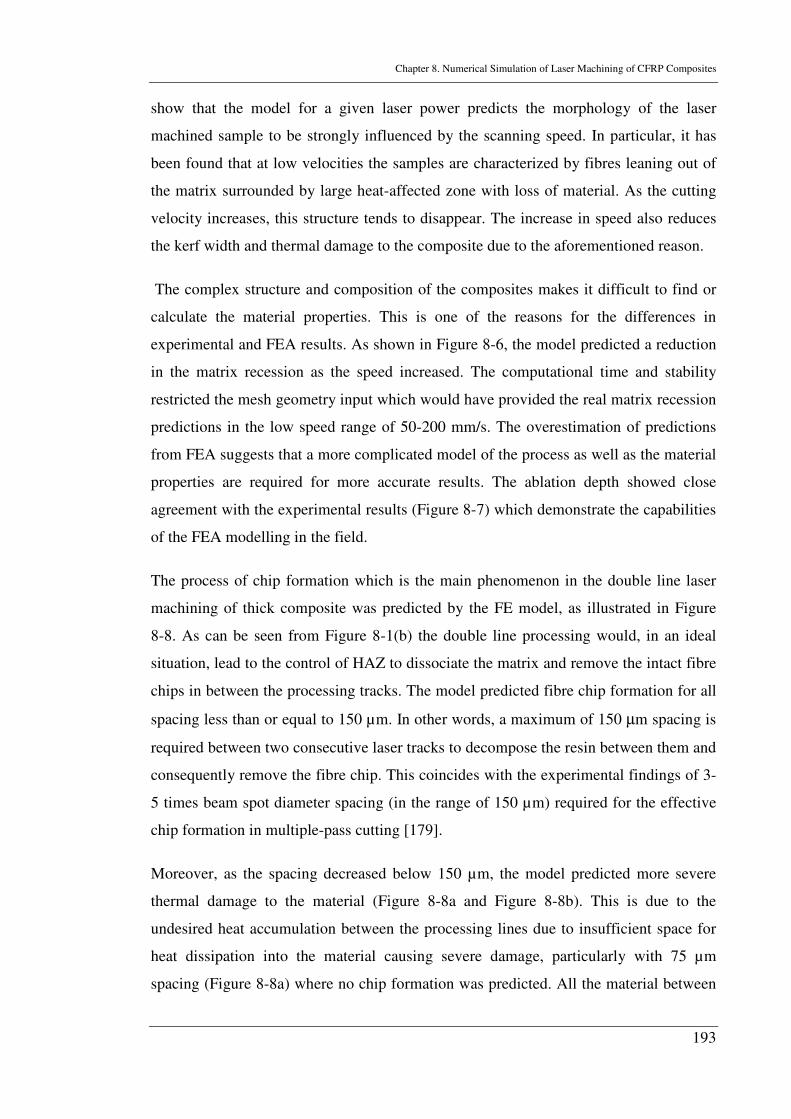
Chapter 8. Numerical Simulation of Laser Machining of CFRP Composites
193
show that the model for a given laser power predicts the morphology of the laser
machined sample to be strongly influenced by the scanning speed. In particular, it has
been found that at low velocities the samples are characterized by fibres leaning out of
the matrix surrounded by large heat-affected zone with loss of material. As the cutting
velocity increases, this structure tends to disappear. The increase in speed also reduces
the kerf width and thermal damage to the composite due to the aforementioned reason.
The complex structure and composition of the composites makes it difficult to find or
calculate the material properties. This is one of the reasons for the differences in
experimental and FEA results. As shown in Figure 8-6, the model predicted a reduction
in the matrix recession as the speed increased. The computational time and stability
restricted the mesh geometry input which would have provided the real matrix recession
predictions in the low speed range of 50-200 mm/s. The overestimation of predictions
from FEA suggests that a more complicated model of the process as well as the material
properties are required for more accurate results. The ablation depth showed close
agreement with the experimental results (Figure 8-7) which demonstrate the capabilities
of the FEA modelling in the field.
The process of chip formation which is the main phenomenon in the double line laser
machining of thick composite was predicted by the FE model, as illustrated in Figure
8-8. As can be seen from Figure 8-1(b) the double line processing would, in an ideal
situation, lead to the control of HAZ to dissociate the matrix and remove the intact fibre
chips in between the processing tracks. The model predicted fibre chip formation for all
spacing less than or equal to 150 µm. In other words, a maximum of 150 µm spacing is
required between two consecutive laser tracks to decompose the resin between them and
consequently remove the fibre chip. This coincides with the experimental findings of 3-
5 times beam spot diameter spacing (in the range of 150 µm) required for the effective
chip formation in multiple-pass cutting [179].
Moreover, as the spacing decreased below 150 µm, the model predicted more severe
thermal damage to the material (Figure 8-8a and Figure 8-8b). This is due to the
undesired heat accumulation between the processing lines due to insufficient space for
heat dissipation into the material causing severe damage, particularly with 75 µm
spacing (Figure 8-8a) where no chip formation was predicted. All the material between
Chapter 8. Numerical Simulation of Laser Machining of CFRP Composites
194
the two rings in this case (i.e. with 75 µm spacing) was predicted to be vaporised which
is in agreement with the experiments. As a notable feature of the model, the length of
fibre chips was predicted to increase in proportion to the scan spacing up to 150 µm.
Above this spacing the materials (fibre and resin) between consecutive laser passes were
not removed and subsequently the laser machining by chip removal mechanism failed
(Figure 8-8d).
An advantageous feature of the model was successful prediction of matrix recession i.e.
intact fibres with decomposed matrix. Figure 8-10 compares typical matrix recession in
the experiments (for clarity only the surface after through cut is shown) and in the FE
results for similar processing parameters. This capability enabled the model to predict
the chip removal mechanism in double line processing quite effectively. With 150 µm
as the optimum distance, the typical length of fibre chips in the experiments was around
100 µm. This represented the trend of the modelling results, where the predicted length
of fibre chips exceeded the mesh geometry as shown in Figure 8-8(c). A comparison of
a typical chip formed during the experiments at 150 µm spacing distance and the FE
results for the same case is given in Figure 8-11.
(a) (b) Figure 8-10 (a) Effective modelling of the matrix recession in the FEA analysis compared to (b) the
surface morphology of the experimental result at a 50 mm/s scanning speed
Chapter 8. Numerical Simulation of Laser Machining of CFRP Composites
195
(a) (b)
Figure 8-11 (a) FEA predicted chip formation compared to (b) typical chip formed in the experiments at
150 µm scan spacing in double line processing
The model was capable of predicting more effective material removal in the double line
processing case. As is shown in Figure 8-9, the ablation depth variation was predicted
with similar trend and reasonably close agreement to the experiments. The uncertainty
of the results can be attributed to the factors such as vapour formation, vapour-beam
interaction and beam scattering inside the grooves that were not considered in the FEA
model.
Generally, the FE model was capable of predicting similar trends as the experimental
result for both single line and double line cutting. Despite all attempts to simulate the
material as close to the real life situation as possible, the simulations overestimated the
matrix recession in single line cutting whilst underestimating the ablation depth in
double-line cutting. Although the difference between the model and the experiments for
ablation depth in single line cutting was small (Figure 8-7), for the double line cutting
the difference was larger (Figure 8-9). The wide differences both in the length of matrix
recession and the ablation depth reflect the complexities involved in modelling with a
mesh that can fully satisfy the composite structure specifications. Lack of consideration
of other phenomena in the model such as, laser beam interaction with the plume and
groove wall beam absorption also accounts for the difference between the experimental
results and the FEM simulations.
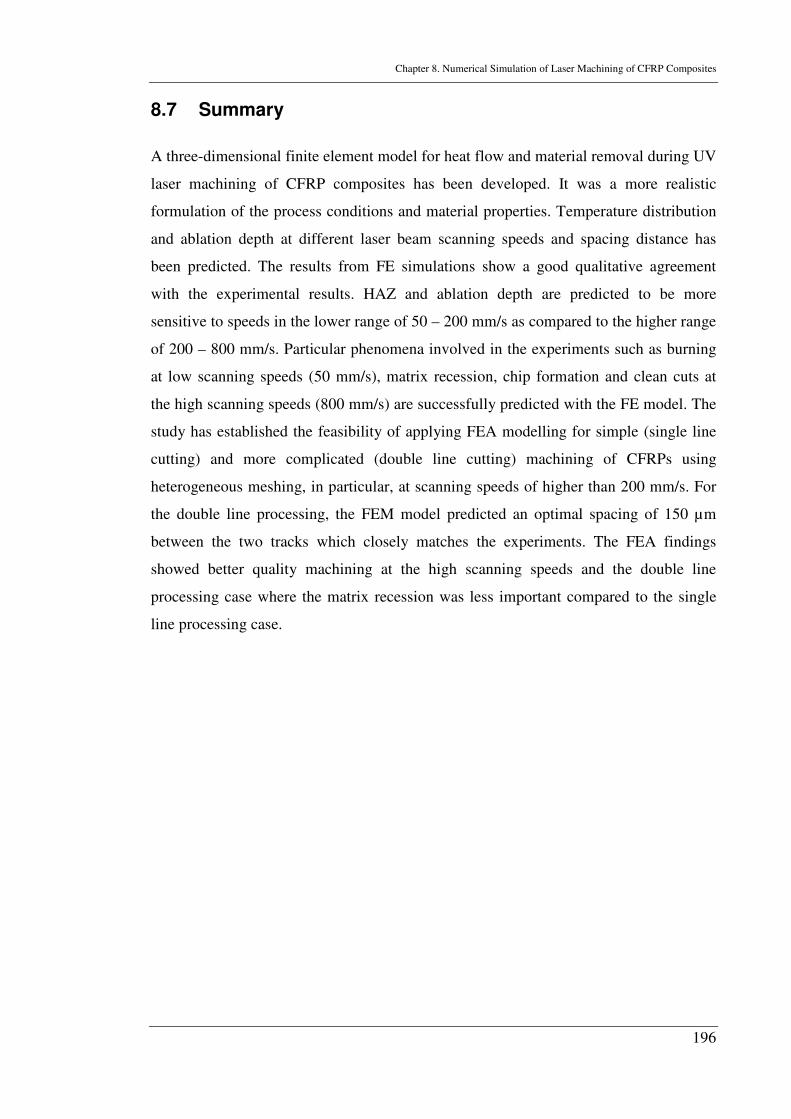
Chapter 8. Numerical Simulation of Laser Machining of CFRP Composites
196
8.7 Summary
A three-dimensional finite element model for heat flow and material removal during UV
laser machining of CFRP composites has been developed. It was a more realistic
formulation of the process conditions and material properties. Temperature distribution
and ablation depth at different laser beam scanning speeds and spacing distance has
been predicted. The results from FE simulations show a good qualitative agreement
with the experimental results. HAZ and ablation depth are predicted to be more
sensitive to speeds in the lower range of 50 – 200 mm/s as compared to the higher range
of 200 – 800 mm/s. Particular phenomena involved in the experiments such as burning
at low scanning speeds (50 mm/s), matrix recession, chip formation and clean cuts at
the high scanning speeds (800 mm/s) are successfully predicted with the FE model. The
study has established the feasibility of applying FEA modelling for simple (single line
cutting) and more complicated (double line cutting) machining of CFRPs using
heterogeneous meshing, in particular, at scanning speeds of higher than 200 mm/s. For
the double line processing, the FEM model predicted an optimal spacing of 150 µm
between the two tracks which closely matches the experiments. The FEA findings
showed better quality machining at the high scanning speeds and the double line
processing case where the matrix recession was less important compared to the single
line processing case.
Chapter 9. Conclusions and Future Work Recommendations
197
CHAPTER 9
CONCLUSIONS AND FUTURE WORK
RECOMMENDATIONS
A systematic study on laser cutting of carbon fibre-reinforced polymer composite
materials was conducted in this work. Different laser systems, cutting techniques and
composites with different matrix constituents were used. Matrix recession and
delamination were identified and emphasised as the major quality defects which their
minimisation/elimination is essential in desirability of the cut quality. The study
successfully introduced novel techniques to reduce these quality defects. A summary of
the conclusions and future work recommendations are given below.
In CW beam fibre laser (1070 nm) processing, medium power and scanning speeds
were optimum in single-pass through-cutting of CFRPs. Typically, for a 2 mm thick
fully cured cross-plied laminate with 70% fibre volume fraction a beam power to speed
(i.e. energy per unit length) ratio of 17 J/mm was found to be optimum. The assist gas
composition and pressure and its combination with other process parameters,
particularly focal plane position, was found of high importance in laser cutting of
CFRPs. Focusing the beam below the material (i.e. -2.38 mm) was found effective in
reducing thermal damage in CW beam fibre laser cutting. Interaction time showed a
crucial influence on the cut quality. For a constant energy per unit length ratio, variation
of interaction time (i.e. scanning speed) influenced thermal damage and depth of cut
considerably. These analyses on single pass cutting with CW laser beam showed that
special techniques and/or laser systems such as pulsed lasers and multiple-pass cutting
(to reduce energy per unit length ratio) are necessary to reduce thermal damage.
High speed multiple-pass cutting using the fibre laser in CW mode reduced
delamination considerably. However, the fibre laser system in any of its operational
modes (i.e. CW, millisecond or modulated pulsed) did not provide satisfactory
reduction in matrix recession. Therefore, other laser systems were also used in the
study. The cut quality improved substantially when UV beam lasers (KrF excimer (248
Chapter 9. Conclusions and Future Work Recommendations
198
nm) and third harmonic Nd:YVO4 (355 nm)) were used. These systems however,
sacrificed processing time and flexibility.
Nanosecond pulsed Nd:YAG laser (1064 nm) cutting reduced thermal damage as
compared to the fibre laser while retaining high processing rate as compared to the UV
laser systems. High repetition rate, long pulse duration and slow cutting speed generally
increase interaction time and produce larger HAZ. Optimum results were observed
using multiple-pass cutting at low pulse energy (e.g. 7 mJ) at the intermediate level of
pulse frequency (e.g. 5 kHz) and high scanning speeds (125 mm/s). As a novel
technique, a mixture of oxygen into the inert gas was used to accelerate the
vaporisation/decomposition process and reduce thermal damage. The analysis revealed
that a low volume fraction of oxygen (i.e. typically 12.5%) mixed with inert gas (i.e.
argon or nitrogen) at 8 bar pressure improves the cut quality. The matrix recession was
reduced by up to 55% resulting in matrix recession of 70 µm at the beam entrance.
When nitrogen was used as the individual or in the mixture assist gas composition,
higher material removal rates were observed (due to nitride formation) as compared to
the argon gas.
Relative direction of the cut path to the fibre orientation influenced the cut quality
considerably. In cross-cutting, high thermal conductivity of fibres causes thermal
damage to the sides of the cut while in parallel-cutting it preheats the cut path. For a
unidirectional laminate, the kerf widths are larger in parallel-cutting while the matrix
recession is larger in cross-cutting. The material removal rate is also higher in parallel-
cutting. Material properties of matrix constituent were also found to influence the
process. Vinyl-ester matrix composites showed higher MRR as compared to epoxy
matrix materials.
Generally, the material showed the best cut quality once the 355 nm Nd:YVO4 system
was used. Using a double-line technique, 1 mm thick cross-plied laminate was cut with
a minimal matrix recession (< 30 µm). Its process conditions (i.e. 25 ns pulse duration,
25 µm beam spot diameter, 40 kHz pulse frequency and 10 W average power) were,
hence, used to develop a three-dimensional finite element model for better
understanding of heat flow and material removal. A heterogeneous mesh and realistic
formulation of the process conditions and material properties were included.
Chapter 9. Conclusions and Future Work Recommendations
199
Temperature distribution and ablation depth at different laser beam scanning speeds and
spacing distance were predicted. The results from FE simulations show a good
qualitative agreement with the experimental results. Particular phenomena involved in
the experiments such as burning at low scanning speeds (50 mm/s), matrix recession,
chip formation and clean cuts at the high scanning speeds (800 mm/s) are successfully
predicted with the FE model. The feasibility of such approach was verified for simple
(single-line) and more complex (double-line) processes. Including the fibre-matrix
interface features in similar models in future can improve the desirability of the FEA
results. The other factors that should be considered for the accuracy purpose of the
model include vapour formation, material-vapour interaction (its role on heat input
calibration), the groove wall beam absorption as well as the polymer matrix
decomposition and fibre vaporisation temperatures mechanisms that are not fully
understood at extremely high heating rate of laser machining.
Applying laser cutting for CFRPs is a relatively new research area. The current study
revealed some potentials of the laser technology. The successful role of pulsed beam
processing, multiple-pass cutting approach, UV beam processing, mixed reactive and
inert gases as the assist gas and double-line cutting were identified. Generally, high
beam quality and small spot size (of fibre laser) at multiple-pass cutting reduced
delamination of the material. Nanosecond pulsed beam multiple-pass cutting on the
other hand, mainly reduced the matrix recession. It could hence be recommended to use
high beam quality nanosecond pulsed beam laser systems at high speed multiple-pass
cutting to minimise thermal damage on CFRP materials. Low content of reactive gas in
the inert assist gas showed improvements both for quality and productivity of the
process. Developing a mechanised mixing apparatus is hence also helpful and effective
to increase the performance of the system in future.
References
200
REFERENCES
1. Ravishankar, S.R. and C.R.L. Murthy, Characteristics of AE signals obtained
during drilling composite laminates. NDT & E International, 2000. 33(5): p. 341-348.
2. Caprino, G. and V. Tagliaferri, Damage development in drilling glass fibre
reinforced plastics. International Journal of Machine Tools and Manufacture, 1995. 35(6): p. 817-829.
3. Abrate, S. and D.A. Walton, Machining of composites. Part I: Traditional
methods. Composite Manufacturing, 1992. 3(2): p. 75-83.
4. Jacobs, J.A. and T.F. Kilduff, Engineering materials technology, structures,
processing, properties and selection. 3rd ed. 1997, London: Prentice-Hall, Inc.
5. Koren, D. Machining composites by conventional means. 2005 [cited 20.07.2010]; Available from: http://www.mmsonline.com/articles/machining- composites-by-conventional-means.
6. Arola, D. and M. Ramulu, A Study of kerf characteristics in abrasive waterjet
machining of graphite/epoxy composite. Journal of Engineering Materials and Technology, 1996. 118(2): p. 256-265.
7. Campbell, F.C., Manufacturing processes for advanced composites. 2004, Oxford: Elsevier.
8. Chart of the electromagnetic spectrum. 2005 [cited 2010 15th Feb]; Available from: http://www.sura.org/commercialization/docs/SURA_EMS_chart_full.jpg.
9. Ready, J.F., Industrial applications of lasers. 2nd ed. 1998, New York: Academic Press.
10. Ashby, M.F., Material selection in mechanical design. 3rd ed. 2005, London: Elsevier.
11. König, W., L. Cronjäger, G. Spur, H.K. Tönshoff, M. Vigneau and W.J. Zdeblick, Machining of new materials. Annals of CIRP, 1990. 39(2): p. 673-681.
12. Ion, J.C., Laser processing of engineering materials: principles, procedure and
industrial application. 2005, Oxford: Elsevier Butterworth-Heinemann.
13. Steen, W.M., Laser material processing. 3rd ed. 2005, London: Springer-Verlag.
14. Weber, J., Amplification of microwave radiation by substances not in thermal
equilibrium. 1953. 3: p. 1-4.
References
201
15. Slusher, R.E., Laser technology. Reviews of modern physics, 1999. 71(2): p. s471-s479.
16. Schawlow, A.L. and C.H. Townes, Infrared and Optical Masers. Physical Review, 1958. 112(6): p. 1940-1949.
17. Maiman, T.H., Stimulated optical radiation in ruby. Nature, 1960. 187: p. 493-494.
18. Javan, A., W.R. Bennett and D.R. Herriott, Polpulation inversion and
continuous optical maser oscillation in a gas discharge containing He-Ne
mixture. Physical Review Letters, 1961. 6(3): p. 106-110.
19. Bromberg, J.L., The laser in America. 1991, Cambridge: MIT Press.
20. Anderson, S.G., Reveiw and forcast of laser markets, in Laser focus world. 1996. p. 50-69.
21. O'Neill, W., M. Sparkes, M. Varnham, R. Horley, M. Brich, S. Woods and A. Harker. High power high brightness industrial fibre laser technology. in International congress on applications of lasers & electro-optics (ICALEO). 2004. San Francisco: Laser institute of America.
22. Introduction to lasers. 2006, The council for scientific and industrial research (CSIR) Presented at WITS.
23. Eberly, J.H., P.W. Milonni and A.M. Robert, Quantum Optics, in Encyclopedia
of Physical Science and Technology. 2001, Academic Press: New York. p. 409-439.
24. Silfvast, W.T. and A.M. Robert, Lasers, in Encyclopedia of Physical Science
and Technology. 2001, Academic Press: New York. p. 267-281.
25. Stimulated emission. 2006 [cited 02.12.2010]; Available from: http://www.britannica.com/EBchecked/topic-art/330874/90017/Stimulated-emission-in-a-laser-cavity.
26. Chryssolouris, G., Laser Machining: Theroy and Practice. Mechanical Engineering, ed. F.F. Ling. 1991: Springer-Verlag.
27. Ready, J.F. and D.F. Farson, LIA handbook of laser materials processing. Laser Institute of America. 2001: Magnolia Publishing, Inc.
28. Steen, W.M., Laser material processing-an overview. Journal of optics A:Pure and applied optics, 2003. 5: p. S3-S7.
29. Duley, W.W. and A.M. Robert, Lasers, Gas, in Encyclopedia of Physical
Science and Technology. 2001, Academic Press: New York. p. 399-408.
References
202
30. May, A.B., Continuous wave and Q-switched Nd:YAG lasers, in Laser
processing in manufacturing, R.C. Crafer and P.J. Oakley, Editors. 1993: London. p. 91-114.
31. Mickelson, A. and B.D. Guenther, Fiber and guided wave optics: overview, in Encyclopedia of Modern Optics. 2005, Elsevier: Oxford. p. 425-432.
32. Snitzer, E., Proposed Fiber Cavities for Optical Masers. Journal of Applied Physics, 1961. 32(1): p. 36-39.
33. Snitzer, E., Optical Maser Action of Nd+3 in a Barium Crown Glass. Physical Review Letters, 1961. 7(12): p. 444.
34. Town, G.E., Lasers, Optical Fibre, in Encyclopedia of Physical Science and
Technology, R.A. Meyers, Editor. 2004. p. 419-441.
35. MacFadyen, A.J. and B.R. Jennings, Fibre-optic systems for dynamic light
scattering -- a review. Optics & Laser Technology, 1990. 22(3): p. 175-187.
36. France, P.W., Optical Fibre Lasers and Amplifires. 1991: British Telecom Research Laboratories.
37. Beck, T., N. Reng and H. Weber, Optical fibres for material processing lasers. Optics and Lasers in Engineering, 2000. 34(4-6): p. 255-272.
38. Sobih, M., Laser Cutting of Materials of Non-Uniform Thickness, in School of
Mechanical, Aerospace and Civil Engineering. 2008, Manchester University: Manchester.
39. Li, L., Sobih, M., Crouse, P.L., Striation free laser cutting of mild steel sheets. Annals of the CIRP, 2007. 56.
40. Wehner, M., Part II: overview, in Excimer laser technology, D. Basting, Editor. 2005, Springer-Verlag: Berlin.
41. Tseng, A.A., Y.-T. Chen, C.-L. Chao, K.-J. Ma and T.P. Chen, Recent
developments on microablation of glass materials using excimer lasers. Optics and Lasers in Engineering, 2007. 45(10): p. 975-992.
42. Chryssolouris, G., G. Tsoukantas, K. Salonitis, P. Stavropoulos and S. Karagiannis, Laser machining modelling and experimentation- an overview. Proceedings of SPIE, 2003. 5131: p. 158-168.
43. Dutta Majumdar, J. and I. Manna, Laser processing of materials. Sadhana, 2003. 28(3): p. 495-562.
44. Bass, M., A. Kar and A.M. Robert, Laser-Materials Interactions, in Encyclopedia of Physical Science and Technology. 2001, Academic Press: New York. p. 247-265.
References
203
45. Abdel Ghany, K. and M. Newishy, Cutting of 1.2 mm thick Austenitic Stainless
Steel Sheet using Pulsed and CW Nd:YAG Laser. Journal of Materials Processing Technology 2005. 168: p. 438-447.
46. Belforte, D.A., K.H.J. Buschow, W.C. Robert, C.F. Merton, I. Bernard, J.K. Edward, M. Subhash and V. Patrick, Laser Cutting, in Encyclopedia of
Materials: Science and Technology. 2001, Elsevier: Oxford. p. 4399-4402.
47. Ivarson, A., J. Powell, J. Kamalu and C. Magnusson, The oxidation dynamics of
laser cutting of mild steel and the generation of striations on the cut edge. Journal of Materials Processing Technology, 1994. 40(3-4): p. 359-374.
48. Gross, M.S., I. Black and W.H. Müller, Determination of the lower complexity
limit for laser cut quality modelling. Modelling and simulation in materials science and engineering, 2004. 12: p. 1237-1249.
49. Ghany, K.A. and M. Newishy, Cutting of 1.2 mm thick austenitic stainless steel
sheet using pulsed and CW Nd:YAG laser. Journal of Materials Processing Technology, 2005. 168(3): p. 438-447.
50. Carslaw, H.S. and J.C. Jeager, Conduction of heat in solids. 2nd ed. 1959: Oxford Science Publications.
51. Rosenthal, D., The theory of moving sources of heat and its application to metal
treatment. Transactions of A.S.M.E., 1946: p. 849-866.
52. Cline, H.E. and T.R. Anthony, Heat treating and melting material with a
scanning laser of electron beam. Journal of Applied Physics, 1977. 48(9): p. 3859-3900.
53. Chryssolouris, G., P. Sheng and W.C. Choi, Investigation of laser grooving for
composite materials. Annals of the CIRP, 1988. 37(1): p. 161-164.
54. Powell, J., CO2 Laser cutting. 1993, Berlin: Springer-Verlag.
55. Rao, B.T., R. Kaul, P. Tiwari and A.K. Nath, Inert gas cutting of titanium sheet
with pulsed mode CO2 laser. Optics and Lasers in Engineering, 2005. 43(12): p. 1330-1348.
56. Man, H.C., J. Duan and T.M. Yue, Design and characteristic analysis of
supersonic nozzles for high gas pressure laser cutting. Journal of Materials Processing Technology, 1997. 63(1-3): p. 217-222.
57. Quintero, F., J. Pou, F. Lusquinos, M. Boutinguiza, R. Soto and M. Perez-Amor, Comparative study of the influence of the gas injection system on the
Nd:yttrium-aluminum-garnet laser cutting of advanced oxide ceramics. Review of Scientific Instruments, 2003. 74(9): p. 4199-4205.
58. Quintero, F., J. Pou, J.L. Fernández, A.F. Doval, F. Lusquiños, M. Boutinguiza, R. Soto and M. Pérez-Amor, Optimization of an off-axis nozzle for assist gas
References
204
injection in laser fusion cutting. Optics and Lasers in Engineering, 2006. 44(11): p. 1158-1171.
59. Di Pietro, P. and Y.L. Yao, An investigation into characterizing and optimizing
laser cutting quality -- A review. International Journal of Machine Tools and Manufacture, 1994. 34(2): p. 225-243.
60. Dubey, A.K. and V. Yadava, Laser beam machining- a review. International Journal of Machine Tools and Manufacture, 2008. 48: p. 609-628.
61. Tabata, N., S. Yagi and M. Hishii, Present and future of lasers for fine cutting of
metal plate. Journal of Materials Processing Technology, 1996. 62(4): p. 309-314.
62. Meijer, J., Laser beam machining (LBM), state of the art and new opportunities. Journal of Materials Processing Technology, 2004. 149(1-3): p. 2-17.
63. Kaplan, A., Theoretical analysis of laser beam cutting. 2002, Aachen: Shaker Publishing.
64. Yilbas, B.S., R. Davies and Z. Yilbas, Study into the measurement and
prediction of penetration time during CO2 laser cutting process Proceedings of the Institution of Mechanical Engineers, Part B: Journal of Engineering Manufacture, 1990. 204(B2): p. 105-113.
65. Kaplan, A.F.H., An analytical mode of metal cutting with a laser beam. Journal of Applied Physics, 1995. 79(5): p. 2189-2208.
66. Schuöcker, D., Dynamic phenomena in laser cutting and cut quality. Applied Physics B:Photo-Physics and Laser Chemistry, 1986. 40: p. 9-14.
67. Yilbas, B.S. and A. Kar, Thermal and efficiency analysis of CO2 laser cutting
process. Optics and Lasers in Engineering, 1998. 29(1): p. 17-32.
68. Wee, L.M. and L. Li, An analytical model for striation formation in laser
cutting. Applied Surface Science, 2005. 247(1-4): p. 277-284.
69. Farooq, K. and A. Kar, Removal of laser-melted material with an assist gas. Journal of Applied Physics, 1998. 83(12): p. 7467-7473.
70. La Rocca, A.V., Second generation laser manufacturing systems. SPIE proceedings 1996. 2713: p. 202-214.
71. Powell, J., W.K. Tan, P. Maclennan, D. Rudd, C. Wykes and H. Engstrom, Laser cutting stainless steel with dual focus lenses. Journal of Laser Applications, 2000. 12(6): p. 224-231.
72. Molian, P.A., Dual-beam CO2 laser cutting of thick metallic materials. Journal of materials science, 1993. 28(7): p. 1738-1748.
References
205
73. Li, L., J.H. Kim and M.H. Abdul Shukor, Abrasive laser machining. Proceedings of ICALEO, 1997. 83: p. A51-A60.
74. Arai, T. and S. Riches, Thick plate cutting with spinning laser beam. Proceedings of ICALEO, 1997. 83(B19-B26).
75. Okada, T., Laser cutting method, in United states patent and trademark office. 2003, Sumitomo Electric Industries, Ltd.: USA.
76. Richerzhagen, B., Industrial application of water-jet guided laser. 2002, Synova. p. 28-30.
77. Anh Mai, T., B. Richerzhagen and K. Stasy, Recent advances in precision
machining of various material with the Laser Microjet. Proceedings of ICALEO, 2007: p. 191-197.
78. Stiffness reduction of the laminates 2002 [cited 02.12.2010]; Available from: http://www.pmi.lv/soft/stirel/index.htm.
79. Shyha, I., S.L. Soo, D. Aspinwall and S. Bradley, Effect of laminate
configuration and feed rate on cutting performance when drilling holes in
carbon fibre reinforced plastic composites. Journal of Materials Processing Technology, 2010. In Press, Accepted Manuscript.
80. Hexcel corporation annual report. 2004 [cited 25.02.2010]; Available from: http://www.hexcel.com/.
81. Hexcel corporation annual report. 2000 [cited 29.02.2010]; Available from: http://www.hexcel.com.
82. Daniel, I.M. and O. Ishai, Engineering Mechanics of Composite Materials. 2nd ed, ed. O.U. Press. 2006.
83. Pan, C.T. and H. Hocheng, Evaluation of anisotropic thermal conductivity for
unidirectional FRP in laser machining. Composites Part A: Applied Science and Manufacturing, 2001. 32(11): p. 1657-1667.
84. Chryssolouris, G., P. Sheng and N. Anastasia, Laser grooving of composite
materials with aid of a water jet. Transactions of ASME, 1993. 115: p. 62-72.
85. Pan, C.T. and H. Hocheng, The anisotropic heat-affect zone in the laser
grooving of fibre-reinforced composite material. Journal of Material Processing Technology, 1996. 62: p. 54-60.
86. Ashby, M.F., S.F. Bush, N. Swindells, R. Bullough, G. Ellison, Y. Lindblom, R.W. Cahn and J.F. Barnes, Technology of the 1990s: Advanced Materials and
Predictive Design [and Discussion]. Philosophical Transactions of the Royal Society of London. Series A, Mathematical and Physical Sciences, 1987. 322(1567): p. 393-407.
References
206
87. Marsh, G., Vinyl ester -the midway boat building resin. Reinforced Plastics, 2007. 51(8): p. 20-23.
88. Abrão, A.M., P.E. Faria, J.C.C. Rubio, P. Reis and J.P. Davim, Drilling of fiber
reinforced plastics: A review. Journal of Materials Processing Technology, 2007. 186(1-3): p. 1-7.
89. Shyha, I.S., D.K. Aspinwall, S.L. Soo and S. Bradley, Drill geometry and
operating effects when cutting small diameter holes in CFRP. International Journal of Machine Tools and Manufacture, 2009. 49(12-13): p. 1008-1014.
90. Hegde, R., A. Dahiya and M.G. Kamath. Carbon fibres. 2004 [cited 06.07.2010]; Available from: http://www.engr.utk.edu/mse/Textiles/CARBON %20FIBERS.htm.
91. Composite induster statistics 2005, A.C.M. Association, Editor. 2006.
92. Teti, R., Machining of composite materials. CIRP Annals-Manufacturing Technology, 2002. 51(2): p. 611-634.
93. Rahman, M., S. Ramakrishna and H.C. Thoo, Machinability study of
carbon/PEEK composites. Machining science and technology: an international journal, 1999. 3(1): p. 49 - 59.
94. Solutions for composite applications. Sandvik Coromant ®. 2009 [cited 08.02.2010]; Available from: http://www2.coromant.sandvik.com/coromant/ downloads/brochure/eng/C-2940-130.pdf.
95. Shaw, M.C., Metal cutting principles. 2nd ed. 2005, New York: Oxford University Press.
96. Trent, E.M. and P.K. Wright, Metal cutting. 4th ed. 2000, Woburn: Butterworth-Heinemann.
97. DeGarmo, E.P., J.T. Black and R.A. Kohser, Materials and processes in
manufacturing. 8th ed. 1999, New York: Wiley and Sons
98. Hocheng, H. and C.C. Tsao, Effects of special drill bits on drilling-induced
delamination of composite materials. International Journal of Machine Tools and Manufacture, 2006. 46(12-13): p. 1403-1416.
99. Tsao, C.C. and H. Hocheng, Effects of exit back-up on delamination in drilling
composite materials using a saw drill and a core drill. International Journal of Machine Tools and Manufacture, 2005. 45(11): p. 1261-1270.
100. Lee, S.-C., S.-T. Jeong, J.-N. Park, S.-J. Kim and G.-J. Cho, Study on drilling
characteristics and mechanical properties of CFRP composites. Acta Mechanica Solida Sinica, 2008. 21(4): p. 364-368.
References
207
101. Hocheng, H. and H.Y. Puw, On drilling characteristics of fiber-reinforced
thermoset and thermoplastics. International Journal of Machine Tools and Manufacture, 1992. 32(4): p. 583-592.
102. Tsao, C.C. and H. Hocheng, Effect of tool wear on delamination in drilling
composite materials. International Journal of Mechanical Sciences, 2007. 49(8): p. 983-988.
103. Piquet, R., B. Ferret, F. Lachaud and P. Swider, Experimental analysis of
drilling damage in thin carbon/epoxy plate using special drills. Composites Part A: Applied Science and Manufacturing, 2000. 31(10): p. 1107-1115.
104. Sheikh-Ahmad, J.Y., Machining of polymer composites. 2009, New York: Springer
105. Ferreira, J.R., N.L. Coppini and G.W.A. Miranda, Machining optimisation in
carbon fibre reinforced composite materials. Journal of Materials Processing Technology, 1999. 92-93: p. 135-140.
106. Wang, J., Abrasive waterjet machining of polymer matrix composites-cutting
performance, erosive and predictive models. International journal of advanced manufacturing technology, 1999. 15: p. 757-768.
107. Abrate, S. and D.A. Walton, Machining of composite materials. Part II: Non-
traditional methods. Composite Manufacturing, 1992. 3(2): p. 85-94.
108. Ramulu, M. and D. Arola, The influence of abrasive waterjet cutting conditions
on the surface quality of graphite/epoxy laminates. International Journal of Machine Tools and Manufacture, 1994. 34(3): p. 295-313.
109. Shanmugam, D.K., F.L. Chen, E. Siores and M. Brandt, Comparative study of
jetting machining technologies over laser machining technology for cutting
composite materials. Composites Structures, 2002. 57: p. 289-296.
110. Ramulu, M. and D. Arola, Water jet and abrasive water jet cutting of
unidirectional graphite/epoxy composite. Composites, 1993. 24(4): p. 299-308.
111. Shanmugam, D.K., T. Nguyen and J. Wang, A study of delamination on
graphite/epoxy composites in abrasive waterjet machining. Composites Part A: Applied Science and Manufacturing, 2008. 39(6): p. 923-929.
112. Ho-Cheng, H., A failure analysis of water jet drilling in composite laminates. International Journal of Machine Tools and Manufacture, 1990. 30(3): p. 423-429.
113. Kalpakjan, Manufacturing engineering and technology. 3rd ed. 1995, New York: Adison-Wesley
114. Ho, K.H. and S.T. Newman, State of the art electrical discharge machining
(EDM). International Journal of Machine Tools and Manufacture, 2003. 43(13): p. 1287-1300.
References
208
115. Ho, K.H., S.T. Newman, S. Rahimifard and R.D. Allen, State of the art in wire
electrical discharge machining (WEDM). International Journal of Machine Tools and Manufacture, 2004. 44(12-13): p. 1247-1259.
116. Lau, W.S., T.M. Yue, T.C. Lee and W.B. Lee, Un-conventional machining of
composite materials. Journal of Materials Processing Technology, 1995. 48: p. 199-205.
117. Guu, Y.H., H. Hocheng, N.H. Tai and S.Y. Liu, Effect of electrical discharge
machining on the characteristics of carbon fibre reinforced carbon composites. Journal of materials science, 2001. 36: p. 2037-2043.
118. Cope, R.D. and J.C. Brown, An investigation of electrical discharge machining
of graphite/epoxy composites. Composites Manufacturing, 1990. 1(3): p. 167-171.
119. Lau, W.S., M. Wang and W.B. Lee, Electrical discharge machining of carbon
fibre composite materials. International Journal of Machine Tools and Manufacture, 1990. 30(2): p. 297-308.
120. Thoe, T.B., D.K. Aspinwall and M.L.H. Wise, Review on ultrasonic machining. International Journal of Machine Tools and Manufacture, 1998. 38(4): p. 239-255.
121. Hocheng, H. and C.C. Tsao, The path towards delamination-free drilling of
composite materials. Journal of Materials Processing Technology, 2005. 167: p. 251-264.
122. Hocheng, H. and C.C. Hsu, Preliminary study of ultrasonic drilling of fiber-
reinforced plastics. Journal of Materials Processing Technology, 1995. 48(1-4): p. 255-266.
123. Cenna, A.A. and P. Mathew, Evaluation of cut quality of fibre reinforced
plastics-a review. International Journal of Machine Tools and Manufacture, 1997. 37(6): p. 723-736.
124. Tagliaferri, V., A. Di Ilio and I.C. Visconti, Laser cutting of fibre-reinforced
polyesters. Composites, 1985. 16(4): p. 317-325.
125. Mathew, J., G.L. Goswami, N. Ramakrishnan and N.K. Naik, Parametric
studies on pulsed Nd:YAG laser cutting of carbon fibre reinforced plastic
composites. Journal of Material Processing Technology, 1999. 89-90: p. 198-203.
126. Fenoughty, K.A., A. Jawaid and I.R. Pashby, Machining of advanced
engineering materials using traditional and laser techniques. Journal of Material Processing Technology, 1994. 42: p. 391-400.
127. Voisey, K.T., S. Fouquet, D. Roy and T.W. Clyne, Fibre swelling during laser
drilling of carbon fibre composites. Optics and Lasers in Engineering, 2006. 44: p. 1185-1197.
References
209
128. Tagliaferri, V., I. Crivelli and A. Di Illio. Machining of fibre reinforced
materials with laser beam: Cut quality evaluation. in International Conference
on Composite Materials, ICCM. 1987. London.
129. Schucher, D. and G. Vees, Laser material processing of composite materials, in Proceedings of the ASM Materials Congress. 1993, ASM: Pittersburg. p. 153-158.
130. König, W., C. Wulf, P. Graß and H. Willerscheid, Machining of fibre reinforced
plastics. CIRP Annals - Manufacturing Technology, 1985. 34(2): p. 537-548.
131. Caprino, G. and V. Tagliaferri, Maximum cutting speed in laser cutting of Fibre
Reinforced Plastics. International Journal of Machine Tools & Manufacture, 1988. 28(4): p. 389-398.
132. De Iorio, I., V. Tagliaferri and A.M. De Ilio. Cut edge quality of GFRP by
pulsed laser: laser-material interaction analysis. in LAMP'87. 1987. Osaka.
133. Lau, W.S., W.B. Lee and S.Q. Pang, Pulsed Nd:YAG laser cutting of carbon
fibre composite materials. Annals of the CIRP, 1990. 39: p. 179-182.
134. Dell'Erba, M., L.M. Galantucci and S. Miglietta, An experimental study on laser
drilling and cutting of composite materials for the aerospace industry using
excimer and CO2 sources. Composites Manufacturing, 1992. 3(1): p. 14-19.
135. Garrison, B.J. and R. Srinivasan, Laser ablation of organic polymers:
microscopic models for photochemical and thermal processes Journal of Applied Physics, 1985. 57(8): p. 2909-2914.
136. Denkena, B., F. Völkermeyer, R. Kling and J. Hermsdorf. Novel UV-laser
applications for carbon fibre reinforced plastics. in Applied Production
Technology APT'07. 2007. Bremen.
137. Müller, R., R. Nuss and M. Geiger. CO2 laser cutting fibre reinforced polymers. in High Power lasers and laser machining technology. 1989: SPIE.
138. Cheng, C.F., Y.C. Tsui and T.W. Clyne, Application of a three-dimensional heat
flow model to treat laser drilling of carbon fibre composites. Acta Materialia, 1998. 46(12): p. 4273-4285.
139. Di Illio, A., V. Tagliaferri and F. Veniali, Machining parameters and cut quality
in laser cutting of Aramid Fibre Reinforced Plastics. Materials and Manufacturing Processes, 1990. 5(4): p. 591-608.
140. Hempstead, B., B. Thayer and S. Williams, Composite Automatic Wing Drilling
Equipment (CAWDE), in SAE world congress. 2006: Detroit, USA.
141. Shanmugam, D.K. and S.H. Masood, An investigation on kerf characteristics in
abrasive waterjet cutting of layered composites. Journal of Materials Processing Technology, 2009. 209(8): p. 3887-3893.
References
210
142. Wang, J., T. Kuriyagawa and C.Z. Huang, An experimental study to enhance the
cutting performance in abrasive waterjet machining. Machining Science and Technology: An International Journal, 2003. 7(2): p. 191-207.
143. Wang, J. and D.M. Guo, A predictive depth of penetration model for abrasive
waterjet cutting of polymer matrix composites. Journal of Materials Processing Technology, 2002. 121: p. 390-394.
144. Siores, E., W.C.K. Wong, L. Chen and J.G. Wager, Enhancing Abrasive
Waterjet Cutting of Ceramics by Head Oscillation Techniques. CIRP Annals - Manufacturing Technology, 1996. 45(1): p. 327-330.
145. Wang, J., Predictive depth of jet penetration models for abrasive waterjet
cutting of alumina ceramics. International Journal of Mechanical Sciences, 2007. 49(3): p. 306-316.
146. Lemma, E., L. Chen, E. Siores and J. Wang, Optimising the AWJ cutting process
of ductile materials using nozzle oscillation technique. International Journal of Machine Tools and Manufacture, 2002. 42(7): p. 781-789.
147. Wang, J., Depth of cut models for multipass abrasive waterjet cutting of alumina
ceramics with nozzle oscillation. Frontiers of Mechanical Engineering in China. 5(1): p. 19-32.
148. Toray technical data sheet. 2008 [cited 28.11.2010]; Available from: http://www.toraycfa.com/pdfs/T300DataSheet.pdf.
149. Hydrex® 100-LV. 2008 [cited 28.11.2010]; Available from: http://www. reichhold.com/documents/953_HYDREX100lv3326025.pdf.
150. E-765 epoxy prepregs: product overview. 2008 [cited 09.09.2009]; Available from: http://www.parkelectro.com/parkelectro/images/E-765.pdf.
151. Tam, S.C., L.E.N. Lim and K.Y. Quek, Application of Taguchi methods in the
optimization of the laser-cutting process. Journal of Materials Processing Technology, 1992. 29(1-3): p. 63-74.
152. El-Taweel, T., A. Abdel-Maaboud, B. Azzam and A. Mohammad, Parametric
studies on the the CO2 laser cutting of Kevlar-49 composite The International Journal of Advanced Manufacturing Technology, 2009. 40(9): p. 907-917.
153. Myers, R.H. and D.C. Montgomery, Response surface methodology: process
and product optimization using designed experiments probability and mathematical statistics, ed. Wiley. 1995: New York
154. Derringer, G. and R. Suich, Simultaneous optimization of several response
variables. Journal of quality technology, 1980. 12(4): p. 214-219.
155. Du, K., D. Li, H. Zhang, P. Shi, X. Wei and R. Diart, Electro-optically Q-
switched Nd:YVO4 slab laser with a high repitation rate and short pulse width. Optics Letters, 2003. 28(2): p. 87-89.
References
211
156. Li, L., M. Sobih and P.L. Crouse, Striation free laser cutting of mild steel sheets. Annals of CIRP, 2007. 56.
157. Sobih, M., Laser cutting of materials of non-uniform thickness, in School of
mechanical, aerospace and civil engineering. 2008, The University of Manchester: Manchester.
158. Chen, S.-L., The effects of high-pressure assistant-gas flow on high-power CO2
laser cutting. Journal of Materials Processing Technology, 1999. 88(1-3): p. 57-66.
159. Chryssolouris, G., P. Sheng and W.C. Choi, Three-Dimensional Laser
Machining of Composite Materials. Journal of Engineering Materials and Technology, 1990. 112(4): p. 387-392.
160. Daniel, I.M., E.E. Gdoutos, Y.D.S. Rajapakse, F. Vautard, L. Xu and L.T. Drzal, Carbon Fiber—Vinyl Ester Interfacial Adhesion Improvement by the Use of an
Epoxy Coating, in Major Accomplishments in Composite Materials and
Sandwich Structures. 2009, Springer Netherlands. p. 27-50.
161. Montgomery, D.C., Design and analysis of experiments. 4th ed. 1997, New York: Wiley.
162. Braun, U., A.I. Balabanovich, B. Schartel, U. Knoll, J. Artner, M. Ciesielski, M. Drِing, R. Perez, J.K.W. Sandler, V. Altstdt, T. Hoffmann, and D. Pospiech, Influence of the oxidation state of phosphorus on the decomposition and fire
behaviour of flame-retarded epoxy resin composites. Polymer, 2006. 47(26): p. 8495-8508.
163. Ashby, M.F. and D.R.H. Jones, Engineering materials 2: An introduction to
microstructures, processing and design. 2nd ed. 1998: Butterworth-Heinemann.
164. Levchik, S.V. and E.D. Weil, Thermal decomposition, combustion and flame-
retardancy of epoxy resins- a review of the recent literature. Polymer International, 2004. 53: p. 1901-1929.
165. Bundy, F.P., Pressure-temperature phase diagram of elemental carbon. Physica A: Statistical Mechanics and its Applications, 1989. 156(1): p. 169-178.
166. Yin, Y., J.G.P. Binner, T.E. Cross and S.J. Marshall, The oxidation behaviour of
carbon fibres. Journal of Materials Science, 1994. 29(8): p. 2250-2254.
167. Chen, K.S., R.Z. Yeh and C.H. Wu, Kinetics of thermal decomposition of epoxy
resin in nitrogen-oxygen atmosphere. Journal of Environmental Engineering, 1997. 123(10): p. 1041-1046.
168. Chen, S.-L., The effects of gas composition on the CO2 laser cutting of mild
steel. Journal of Materials Processing Technology, 1998. 73(1-3): p. 147-159.
References
212
169. Jacobsen, R.T., E.W. Lemmon, S.G. Penoncello and Z. Shan, Thermophysical
properties of fluids and materials, in Heat transfer handbook, A. Bejan and A.D. Kraus, Editors. 2003, John Wiely & Sons: New Jersey.
170. Yung, K.C., H.H. Zhu and T.M. Yue, Theoretical and experimental study on the
kerf profile of the laser micro-cutting NiTi shape memory alloy using 355 nm
Nd:YAG. Smart Materials and Structures, 2005. 14(2): p. 337-342.
171. Rodden, W.S.O., S.S. Kudesia, D.P. Hand and J.D.C. Jones, A comprehensive
study of the long pulse Nd:YAG laser drilling of multi layer carbon fibre
composites. Optics Communications, 2002. 210: p. 319-328.
172. Jiang, G., S.J. Pickering, G.S. Walker, N. Bowering, K.H. Wong and C.D. Rudd, Soft ionisation analysis of evolved gas for oxidative decomposition of an epoxy
resin/carbon fibre composite. Thermochimica Acta, 2007. 454(2): p. 109-115.
173. Aoyama, E., H. Inoue, T. Hirogaki, H. Nobe, Y. Kitahara and T. Katayama, Study on small diameter drilling in GFRP. Composite Structures, 1995. 32(1-4): p. 567-573.
174. Uhlmann, E., G. Spur, H. Hocheng, S. Leibelt and C.T. Pan, The extent of laser-
induced thermal damage of UD and crossply composite laminates. International Journal of Machine Tools and Manufacture, 1999. 39: p. 639-650.
175. Sheng, P. and G. Chryssololouris, Theortical model of laser grooving for
composite materials. Journal of Composite Materials, 1995. 29: p. 96-112.
176. Chen, C.C. and W. Cheng. Material properties and laser cutting of composites. in 23rd International SAMPE Technical Conference. 1991. Covina, CA, USA: SAMPE.
177. Newnham, P. and S. Abrate, Finite element analysis of heat transfer in
anisotropic solids: application to manufacturing problems. Journal of Reinforced Plastics and Composites, 1993. 12: p. 854-864.
178. Griffis, C.A., R.A. Masumura and C.I. Chang, Thermal response of graphite
epoxy composite subjected to rapid heating. Journal of Composite Materials, 1981. 15: p. 427-442.
179. Li, Z.L., H.Y. Chu, G.C. Lim, L. Li, S. Marimuthu, R. Negarestani, M. Sheikh and P. Mativenga. Process development of laser machining of carbon fibre
reinforced plastic composites. in International Congress on Applications of
Lasers and Elctro-Optics, ICALEO. 2008. Temecula, CA, USA.
180. Allcock, H.R. and F.W. Lampe, Contemporary polymer chemistry. 2nd ed. 1990: Prentice-Hall. 624.
181. Savage, G., Carbon-Carbon composites. 1993, London: Chapman & Hall.
References
213
182. Ho, C.Y., R.W. Powell and P.E. Liley, Thermal conductivity of the elements: A
comprehensive review. Journal of Physical and Chemical Reference Data. Vol. 3. 1974: American Institute of Physics, Inc.
183. Sundqvist, B., O. Sandberg and G. Bäckström, The thermal conductivity of an
epoxy resin at high pressure and temperature. Journal of Physics D: Applied Physics, 1977. 10: p. 1397-1403.
184. Halpin, J.C., Primer on composite materials: Analysis. 1984, USA: Technomic Publishing Company.
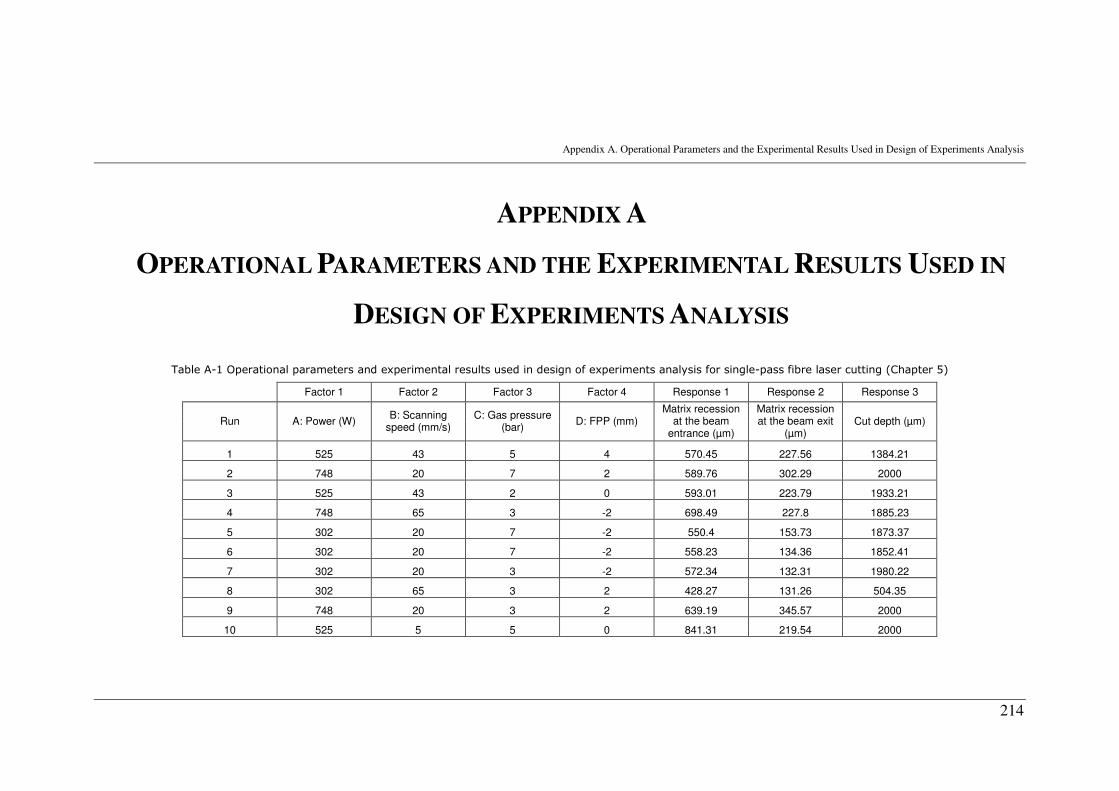
Appendix A. Operational Parameters and the Experimental Results Used in Design of Experiments Analysis
214
APPENDIX A
OPERATIONAL PARAMETERS AND THE EXPERIMENTAL RESULTS USED IN
DESIGN OF EXPERIMENTS ANALYSIS
Table A-1 Operational parameters and experimental results used in design of experiments analysis for single-pass fibre laser cutting (Chapter 5)
Factor 1 Factor 2 Factor 3 Factor 4 Response 1 Response 2 Response 3
Run A: Power (W) B: Scanning
speed (mm/s) C: Gas pressure
(bar) D: FPP (mm)
Matrix recession at the beam
entrance (µm)
Matrix recession at the beam exit
(µm) Cut depth (µm)
1 525 43 5 4 570.45 227.56 1384.21
2 748 20 7 2 589.76 302.29 2000
3 525 43 2 0 593.01 223.79 1933.21
4 748 65 3 -2 698.49 227.8 1885.23
5 302 20 7 -2 550.4 153.73 1873.37
6 302 20 7 -2 558.23 134.36 1852.41
7 302 20 3 -2 572.34 132.31 1980.22
8 302 65 3 2 428.27 131.26 504.35
9 748 20 3 2 639.19 345.57 2000
10 525 5 5 0 841.31 219.54 2000

Appendix A. Operational Parameters and the Experimental Results Used in Design of Experiments Analysis
215
Table A-1 Operational parameters and experimental results used in design of experiments analysis for single-pass fibre laser cutting (Continued…) (Chapter 5)
Factor 1 Factor 2 Factor 3 Factor 4 Response 1 Response 2 Response 3
Run A: Power (W) B: Scanning
speed (mm/s) C: Gas pressure
(bar) D: FPP (mm)
Matrix recession at the beam
entrance (µm)
Matrix recession at the beam exit
(µm) Cut depth (µm)
11 525 43 8 0 512.27 179.33 1844.28
12 525 43 5 0 543.02 186.49 1965.32
13 900 43 5 0 609.08 272.46 2000.42
14 525 43 8 0 489.19 211.67 1863.53
15 525 5 5 0 881.41 253.42 2000
16 302 65 7 2 407.24 196.22 697.41
17 525 43 5 0 530.27 206.91 1915.32
18 525 43 5 -4 573.21 135.74 1950.21
19 525 43 5 0 605.32 196.25 1975.26
20 900 43 5 0 603.28 284.48 2000
21 150 43 5 0 492.24 89.4 276.22
22 525 43 5 0 561.29 191.32 1937.92
23 748 20 3 2 609.81 354.43 2000
24 525 80 5 0 499.23 175.25 131.27
25 150 43 5 0 492.58 97.27 294.42
26 748 65 7 -2 563.06 171.49 1843.31
27 302 65 7 2 441.52 201.44 711.29
28 748 65 3 -2 693.31 218.19 1829.21
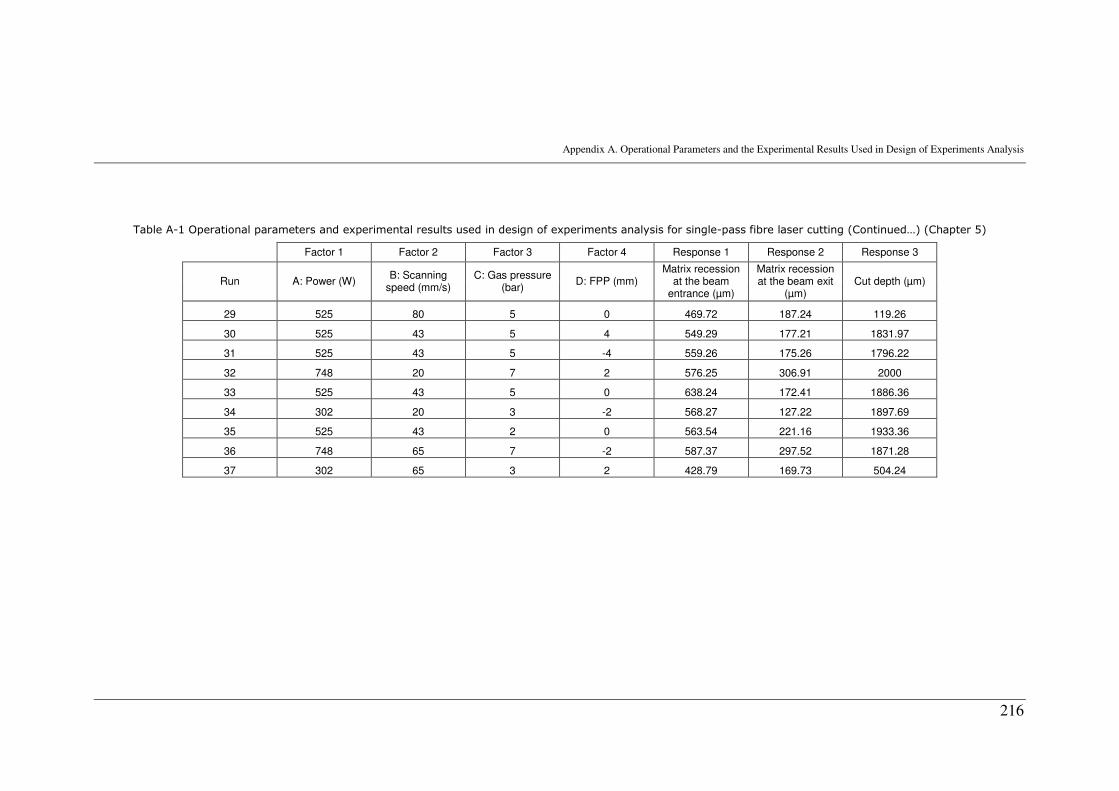
Appendix A. Operational Parameters and the Experimental Results Used in Design of Experiments Analysis
216
Table A-1 Operational parameters and experimental results used in design of experiments analysis for single-pass fibre laser cutting (Continued…) (Chapter 5)
Factor 1 Factor 2 Factor 3 Factor 4 Response 1 Response 2 Response 3
Run A: Power (W) B: Scanning
speed (mm/s) C: Gas pressure
(bar) D: FPP (mm)
Matrix recession at the beam
entrance (µm)
Matrix recession at the beam exit
(µm) Cut depth (µm)
29 525 80 5 0 469.72 187.24 119.26
30 525 43 5 4 549.29 177.21 1831.97
31 525 43 5 -4 559.26 175.26 1796.22
32 748 20 7 2 576.25 306.91 2000
33 525 43 5 0 638.24 172.41 1886.36
34 302 20 3 -2 568.27 127.22 1897.69
35 525 43 2 0 563.54 221.16 1933.36
36 748 65 7 -2 587.37 297.52 1871.28
37 302 65 3 2 428.79 169.73 504.24
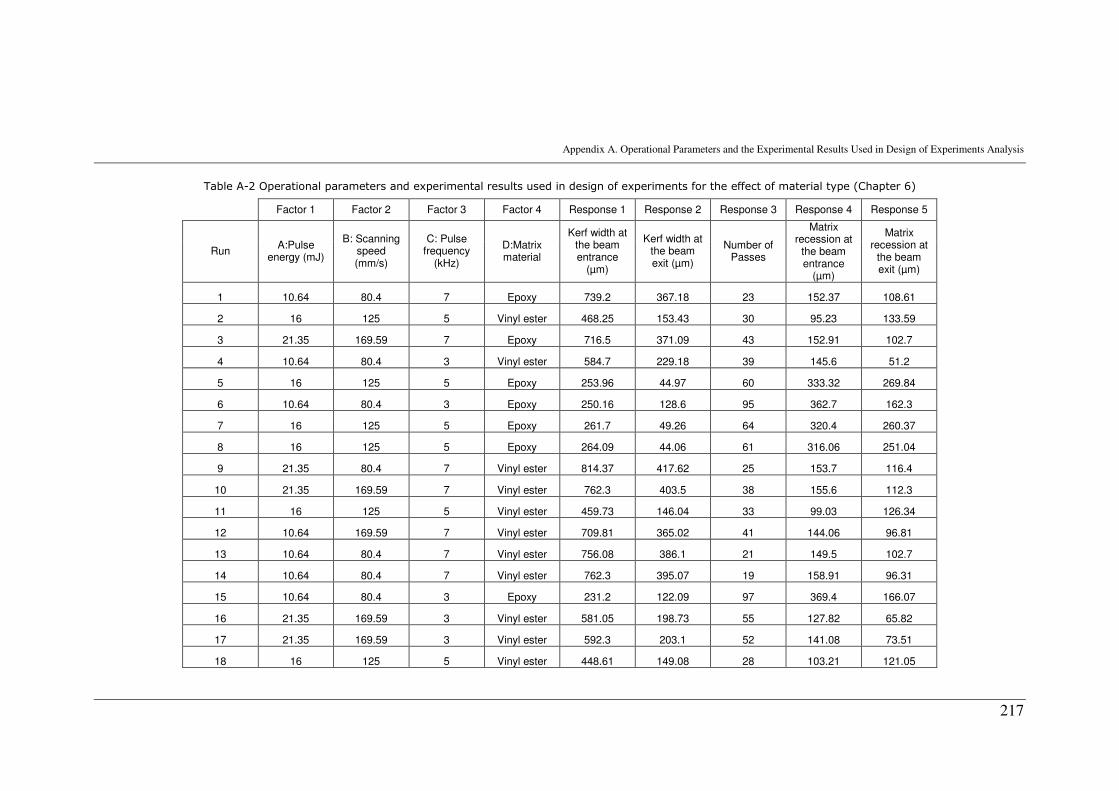
Appendix A. Operational Parameters and the Experimental Results Used in Design of Experiments Analysis
217
Table A-2 Operational parameters and experimental results used in design of experiments for the effect of material type (Chapter 6)
Factor 1 Factor 2 Factor 3 Factor 4 Response 1 Response 2 Response 3 Response 4 Response 5
Run A:Pulse
energy (mJ)
B: Scanning speed (mm/s)
C: Pulse frequency
(kHz)
D:Matrix material
Kerf width at the beam entrance
(µm)
Kerf width at the beam exit (µm)
Number of Passes
Matrix recession at
the beam entrance
(µm)
Matrix recession at
the beam exit (µm)
1 10.64 80.4 7 Epoxy 739.2 367.18 23 152.37 108.61
2 16 125 5 Vinyl ester 468.25 153.43 30 95.23 133.59
3 21.35 169.59 7 Epoxy 716.5 371.09 43 152.91 102.7
4 10.64 80.4 3 Vinyl ester 584.7 229.18 39 145.6 51.2
5 16 125 5 Epoxy 253.96 44.97 60 333.32 269.84
6 10.64 80.4 3 Epoxy 250.16 128.6 95 362.7 162.3
7 16 125 5 Epoxy 261.7 49.26 64 320.4 260.37
8 16 125 5 Epoxy 264.09 44.06 61 316.06 251.04
9 21.35 80.4 7 Vinyl ester 814.37 417.62 25 153.7 116.4
10 21.35 169.59 7 Vinyl ester 762.3 403.5 38 155.6 112.3
11 16 125 5 Vinyl ester 459.73 146.04 33 99.03 126.34
12 10.64 169.59 7 Vinyl ester 709.81 365.02 41 144.06 96.81
13 10.64 80.4 7 Vinyl ester 756.08 386.1 21 149.5 102.7
14 10.64 80.4 7 Vinyl ester 762.3 395.07 19 158.91 96.31
15 10.64 80.4 3 Epoxy 231.2 122.09 97 369.4 166.07
16 21.35 169.59 3 Vinyl ester 581.05 198.73 55 127.82 65.82
17 21.35 169.59 3 Vinyl ester 592.3 203.1 52 141.08 73.51
18 16 125 5 Vinyl ester 448.61 149.08 28 103.21 121.05
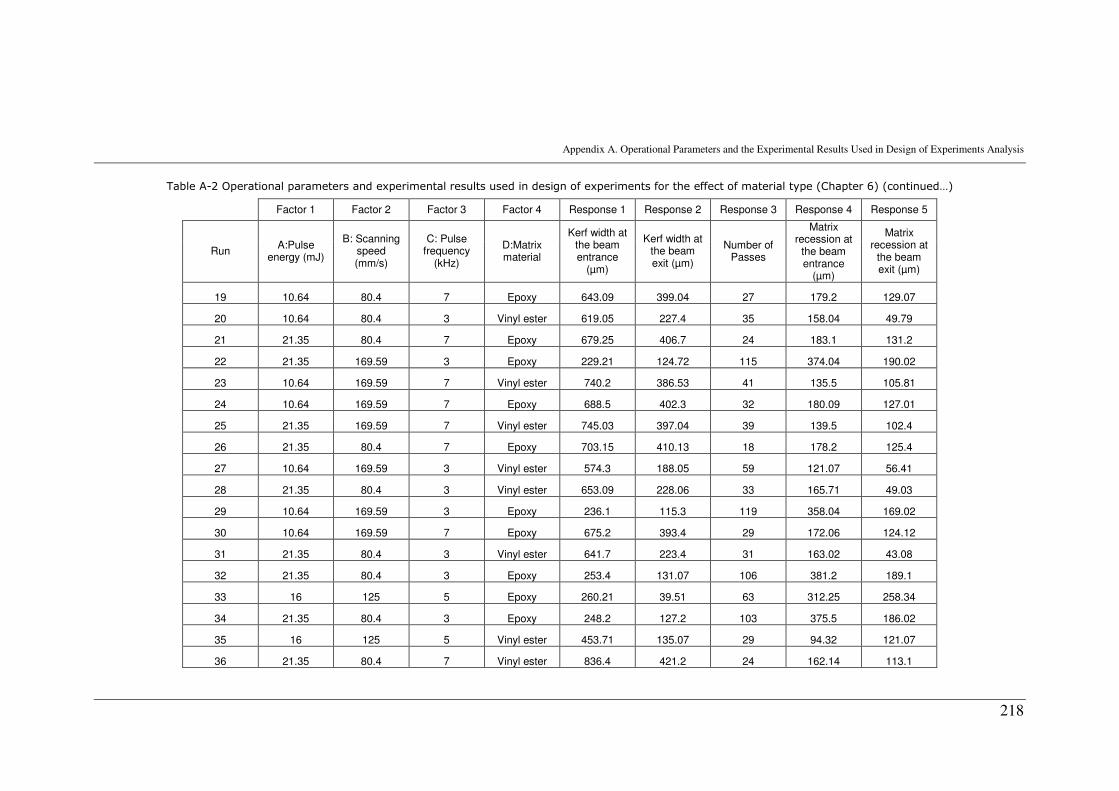
Appendix A. Operational Parameters and the Experimental Results Used in Design of Experiments Analysis
218
Table A-2 Operational parameters and experimental results used in design of experiments for the effect of material type (Chapter 6) (continued…)
Factor 1 Factor 2 Factor 3 Factor 4 Response 1 Response 2 Response 3 Response 4 Response 5
Run A:Pulse
energy (mJ)
B: Scanning speed (mm/s)
C: Pulse frequency
(kHz)
D:Matrix material
Kerf width at the beam entrance
(µm)
Kerf width at the beam exit (µm)
Number of Passes
Matrix recession at
the beam entrance
(µm)
Matrix recession at
the beam exit (µm)
19 10.64 80.4 7 Epoxy 643.09 399.04 27 179.2 129.07
20 10.64 80.4 3 Vinyl ester 619.05 227.4 35 158.04 49.79
21 21.35 80.4 7 Epoxy 679.25 406.7 24 183.1 131.2
22 21.35 169.59 3 Epoxy 229.21 124.72 115 374.04 190.02
23 10.64 169.59 7 Vinyl ester 740.2 386.53 41 135.5 105.81
24 10.64 169.59 7 Epoxy 688.5 402.3 32 180.09 127.01
25 21.35 169.59 7 Vinyl ester 745.03 397.04 39 139.5 102.4
26 21.35 80.4 7 Epoxy 703.15 410.13 18 178.2 125.4
27 10.64 169.59 3 Vinyl ester 574.3 188.05 59 121.07 56.41
28 21.35 80.4 3 Vinyl ester 653.09 228.06 33 165.71 49.03
29 10.64 169.59 3 Epoxy 236.1 115.3 119 358.04 169.02
30 10.64 169.59 7 Epoxy 675.2 393.4 29 172.06 124.12
31 21.35 80.4 3 Vinyl ester 641.7 223.4 31 163.02 43.08
32 21.35 80.4 3 Epoxy 253.4 131.07 106 381.2 189.1
33 16 125 5 Epoxy 260.21 39.51 63 312.25 258.34
34 21.35 80.4 3 Epoxy 248.2 127.2 103 375.5 186.02
35 16 125 5 Vinyl ester 453.71 135.07 29 94.32 121.07
36 21.35 80.4 7 Vinyl ester 836.4 421.2 24 162.14 113.1
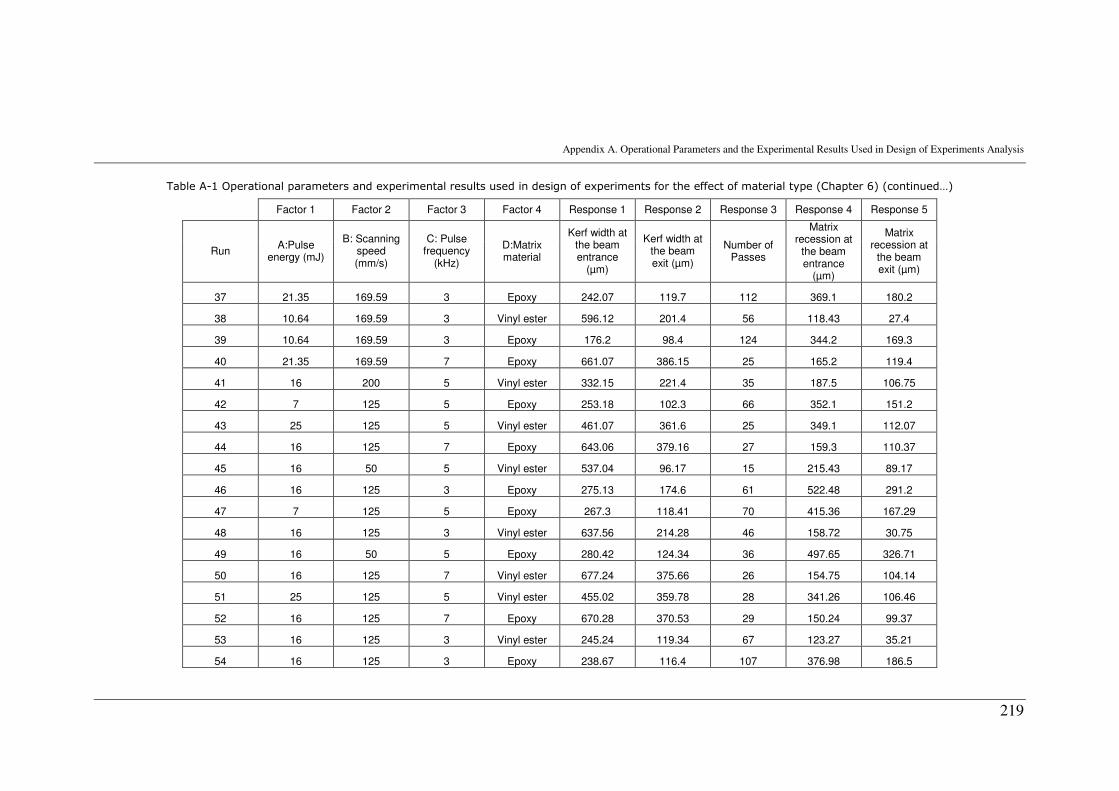
Appendix A. Operational Parameters and the Experimental Results Used in Design of Experiments Analysis
219
Table A-1 Operational parameters and experimental results used in design of experiments for the effect of material type (Chapter 6) (continued…)
Factor 1 Factor 2 Factor 3 Factor 4 Response 1 Response 2 Response 3 Response 4 Response 5
Run A:Pulse
energy (mJ)
B: Scanning speed (mm/s)
C: Pulse frequency
(kHz)
D:Matrix material
Kerf width at the beam entrance
(µm)
Kerf width at the beam exit (µm)
Number of Passes
Matrix recession at
the beam entrance
(µm)
Matrix recession at
the beam exit (µm)
37 21.35 169.59 3 Epoxy 242.07 119.7 112 369.1 180.2
38 10.64 169.59 3 Vinyl ester 596.12 201.4 56 118.43 27.4
39 10.64 169.59 3 Epoxy 176.2 98.4 124 344.2 169.3
40 21.35 169.59 7 Epoxy 661.07 386.15 25 165.2 119.4
41 16 200 5 Vinyl ester 332.15 221.4 35 187.5 106.75
42 7 125 5 Epoxy 253.18 102.3 66 352.1 151.2
43 25 125 5 Vinyl ester 461.07 361.6 25 349.1 112.07
44 16 125 7 Epoxy 643.06 379.16 27 159.3 110.37
45 16 50 5 Vinyl ester 537.04 96.17 15 215.43 89.17
46 16 125 3 Epoxy 275.13 174.6 61 522.48 291.2
47 7 125 5 Epoxy 267.3 118.41 70 415.36 167.29
48 16 125 3 Vinyl ester 637.56 214.28 46 158.72 30.75
49 16 50 5 Epoxy 280.42 124.34 36 497.65 326.71
50 16 125 7 Vinyl ester 677.24 375.66 26 154.75 104.14
51 25 125 5 Vinyl ester 455.02 359.78 28 341.26 106.46
52 16 125 7 Epoxy 670.28 370.53 29 150.24 99.37
53 16 125 3 Vinyl ester 245.24 119.34 67 123.27 35.21
54 16 125 3 Epoxy 238.67 116.4 107 376.98 186.5
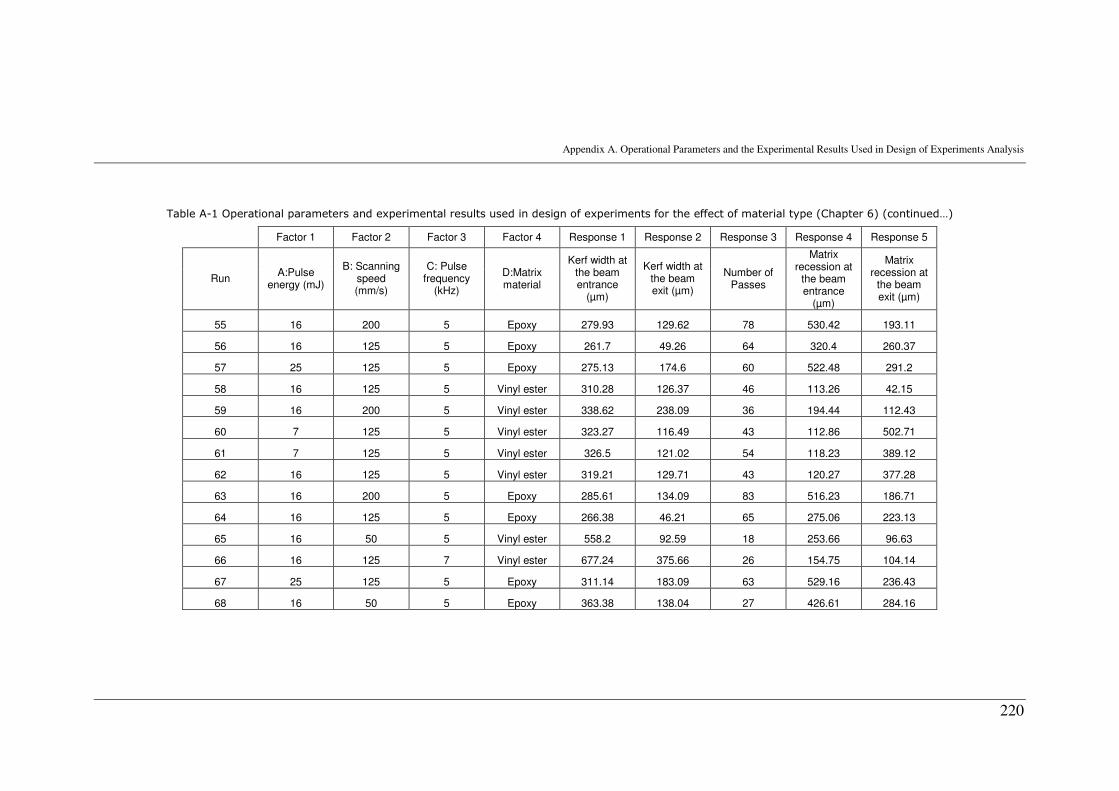
Appendix A. Operational Parameters and the Experimental Results Used in Design of Experiments Analysis
220
Table A-1 Operational parameters and experimental results used in design of experiments for the effect of material type (Chapter 6) (continued…)
Factor 1 Factor 2 Factor 3 Factor 4 Response 1 Response 2 Response 3 Response 4 Response 5
Run A:Pulse
energy (mJ)
B: Scanning speed (mm/s)
C: Pulse frequency
(kHz)
D:Matrix material
Kerf width at the beam entrance
(µm)
Kerf width at the beam exit (µm)
Number of Passes
Matrix recession at
the beam entrance
(µm)
Matrix recession at
the beam exit (µm)
55 16 200 5 Epoxy 279.93 129.62 78 530.42 193.11
56 16 125 5 Epoxy 261.7 49.26 64 320.4 260.37
57 25 125 5 Epoxy 275.13 174.6 60 522.48 291.2
58 16 125 5 Vinyl ester 310.28 126.37 46 113.26 42.15
59 16 200 5 Vinyl ester 338.62 238.09 36 194.44 112.43
60 7 125 5 Vinyl ester 323.27 116.49 43 112.86 502.71
61 7 125 5 Vinyl ester 326.5 121.02 54 118.23 389.12
62 16 125 5 Vinyl ester 319.21 129.71 43 120.27 377.28
63 16 200 5 Epoxy 285.61 134.09 83 516.23 186.71
64 16 125 5 Epoxy 266.38 46.21 65 275.06 223.13
65 16 50 5 Vinyl ester 558.2 92.59 18 253.66 96.63
66 16 125 7 Vinyl ester 677.24 375.66 26 154.75 104.14
67 25 125 5 Epoxy 311.14 183.09 63 529.16 236.43
68 16 50 5 Epoxy 363.38 138.04 27 426.61 284.16
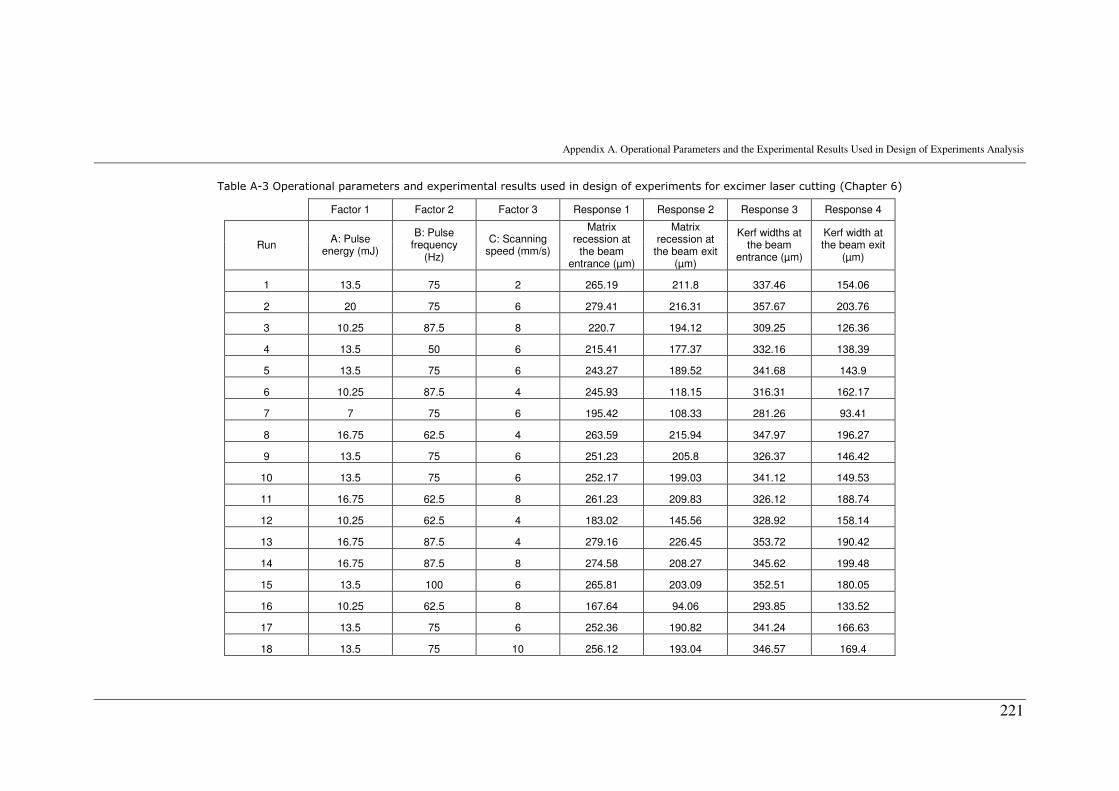
Appendix A. Operational Parameters and the Experimental Results Used in Design of Experiments Analysis
221
Table A-3 Operational parameters and experimental results used in design of experiments for excimer laser cutting (Chapter 6)
Factor 1 Factor 2 Factor 3 Response 1 Response 2 Response 3 Response 4
Run A: Pulse
energy (mJ)
B: Pulse frequency
(Hz)
C: Scanning speed (mm/s)
Matrix recession at
the beam entrance (µm)
Matrix recession at
the beam exit (µm)
Kerf widths at the beam
entrance (µm)
Kerf width at the beam exit
(µm)
1 13.5 75 2 265.19 211.8 337.46 154.06
2 20 75 6 279.41 216.31 357.67 203.76
3 10.25 87.5 8 220.7 194.12 309.25 126.36
4 13.5 50 6 215.41 177.37 332.16 138.39
5 13.5 75 6 243.27 189.52 341.68 143.9
6 10.25 87.5 4 245.93 118.15 316.31 162.17
7 7 75 6 195.42 108.33 281.26 93.41
8 16.75 62.5 4 263.59 215.94 347.97 196.27
9 13.5 75 6 251.23 205.8 326.37 146.42
10 13.5 75 6 252.17 199.03 341.12 149.53
11 16.75 62.5 8 261.23 209.83 326.12 188.74
12 10.25 62.5 4 183.02 145.56 328.92 158.14
13 16.75 87.5 4 279.16 226.45 353.72 190.42
14 16.75 87.5 8 274.58 208.27 345.62 199.48
15 13.5 100 6 265.81 203.09 352.51 180.05
16 10.25 62.5 8 167.64 94.06 293.85 133.52
17 13.5 75 6 252.36 190.82 341.24 166.63
18 13.5 75 10 256.12 193.04 346.57 169.4
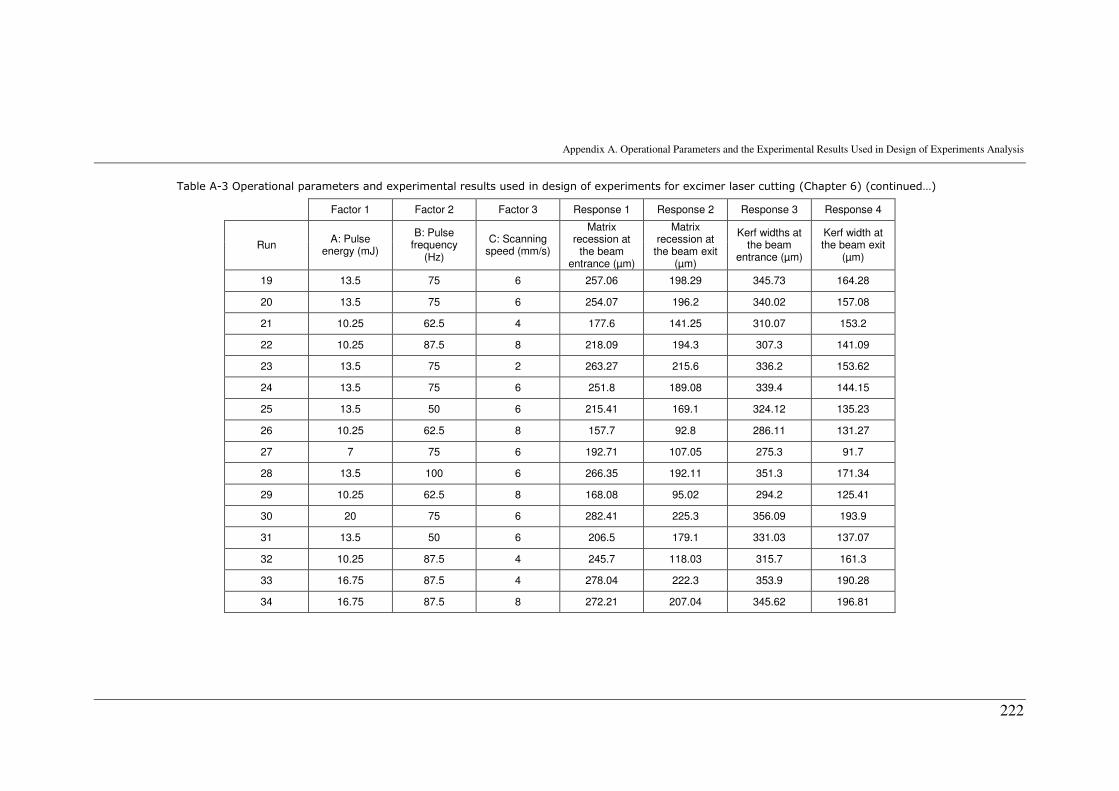
Appendix A. Operational Parameters and the Experimental Results Used in Design of Experiments Analysis
222
Table A-3 Operational parameters and experimental results used in design of experiments for excimer laser cutting (Chapter 6) (continued…)
Factor 1 Factor 2 Factor 3 Response 1 Response 2 Response 3 Response 4
Run A: Pulse
energy (mJ)
B: Pulse frequency
(Hz)
C: Scanning speed (mm/s)
Matrix recession at
the beam entrance (µm)
Matrix recession at
the beam exit (µm)
Kerf widths at the beam
entrance (µm)
Kerf width at the beam exit
(µm)
19 13.5 75 6 257.06 198.29 345.73 164.28
20 13.5 75 6 254.07 196.2 340.02 157.08
21 10.25 62.5 4 177.6 141.25 310.07 153.2
22 10.25 87.5 8 218.09 194.3 307.3 141.09
23 13.5 75 2 263.27 215.6 336.2 153.62
24 13.5 75 6 251.8 189.08 339.4 144.15
25 13.5 50 6 215.41 169.1 324.12 135.23
26 10.25 62.5 8 157.7 92.8 286.11 131.27
27 7 75 6 192.71 107.05 275.3 91.7
28 13.5 100 6 266.35 192.11 351.3 171.34
29 10.25 62.5 8 168.08 95.02 294.2 125.41
30 20 75 6 282.41 225.3 356.09 193.9
31 13.5 50 6 206.5 179.1 331.03 137.07
32 10.25 87.5 4 245.7 118.03 315.7 161.3
33 16.75 87.5 4 278.04 222.3 353.9 190.28
34 16.75 87.5 8 272.21 207.04 345.62 196.81
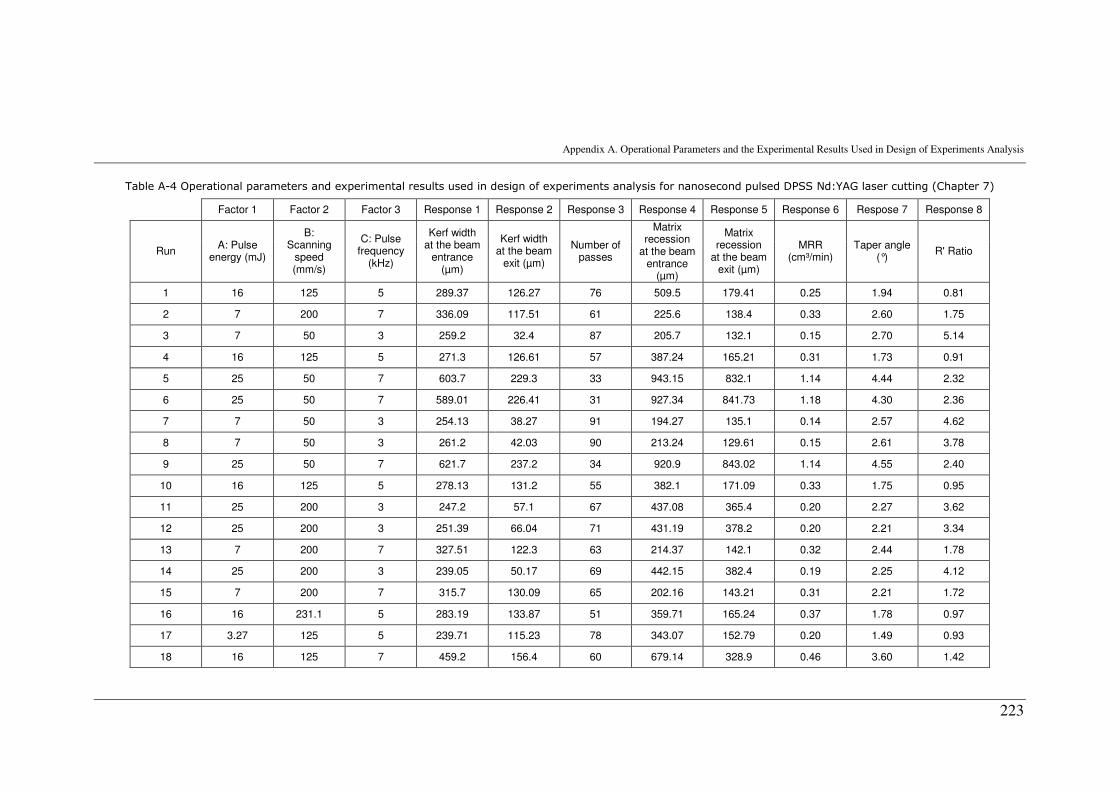
Appendix A. Operational Parameters and the Experimental Results Used in Design of Experiments Analysis
223
Table A-4 Operational parameters and experimental results used in design of experiments analysis for nanosecond pulsed DPSS Nd:YAG laser cutting (Chapter 7)
Factor 1 Factor 2 Factor 3 Response 1 Response 2 Response 3 Response 4 Response 5 Response 6 Respose 7 Response 8
Run A: Pulse
energy (mJ)
B: Scanning
speed (mm/s)
C: Pulse frequency
(kHz)
Kerf width at the beam
entrance (µm)
Kerf width at the beam
exit (µm)
Number of passes
Matrix recession
at the beam entrance
(µm)
Matrix recession
at the beam exit (µm)
MRR (cm³/min)
Taper angle (°)
R' Ratio
1 16 125 5 289.37 126.27 76 509.5 179.41 0.25 1.94 0.81
2 7 200 7 336.09 117.51 61 225.6 138.4 0.33 2.60 1.75
3 7 50 3 259.2 32.4 87 205.7 132.1 0.15 2.70 5.14
4 16 125 5 271.3 126.61 57 387.24 165.21 0.31 1.73 0.91
5 25 50 7 603.7 229.3 33 943.15 832.1 1.14 4.44 2.32
6 25 50 7 589.01 226.41 31 927.34 841.73 1.18 4.30 2.36
7 7 50 3 254.13 38.27 91 194.27 135.1 0.14 2.57 4.62
8 7 50 3 261.2 42.03 90 213.24 129.61 0.15 2.61 3.78
9 25 50 7 621.7 237.2 34 920.9 843.02 1.14 4.55 2.40
10 16 125 5 278.13 131.2 55 382.1 171.09 0.33 1.75 0.95
11 25 200 3 247.2 57.1 67 437.08 365.4 0.20 2.27 3.62
12 25 200 3 251.39 66.04 71 431.19 378.2 0.20 2.21 3.34
13 7 200 7 327.51 122.3 63 214.37 142.1 0.32 2.44 1.78
14 25 200 3 239.05 50.17 69 442.15 382.4 0.19 2.25 4.12
15 7 200 7 315.7 130.09 65 202.16 143.21 0.31 2.21 1.72
16 16 231.1 5 283.19 133.87 51 359.71 165.24 0.37 1.78 0.97
17 3.27 125 5 239.71 115.23 78 343.07 152.79 0.20 1.49 0.93
18 16 125 7 459.2 156.4 60 679.14 328.9 0.46 3.60 1.42
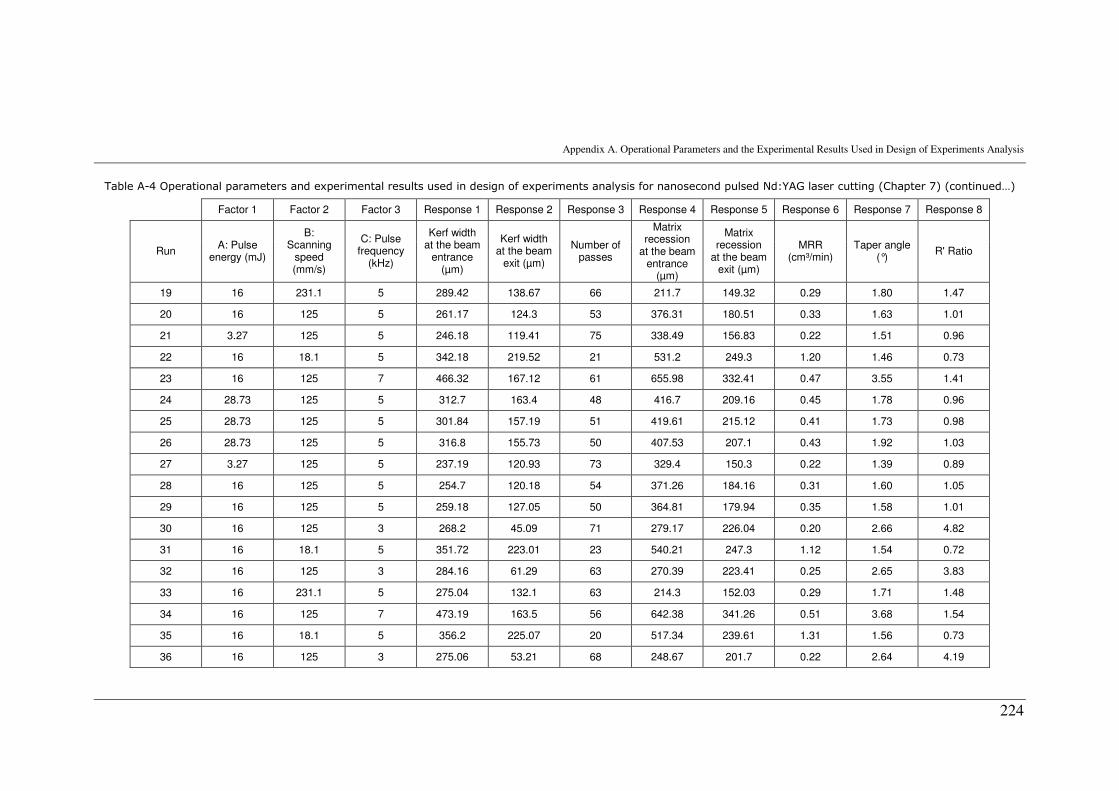
Appendix A. Operational Parameters and the Experimental Results Used in Design of Experiments Analysis
224
Table A-4 Operational parameters and experimental results used in design of experiments analysis for nanosecond pulsed Nd:YAG laser cutting (Chapter 7) (continued…)
Factor 1 Factor 2 Factor 3 Response 1 Response 2 Response 3 Response 4 Response 5 Response 6 Response 7 Response 8
Run A: Pulse
energy (mJ)
B: Scanning
speed (mm/s)
C: Pulse frequency
(kHz)
Kerf width at the beam
entrance (µm)
Kerf width at the beam
exit (µm)
Number of passes
Matrix recession
at the beam entrance
(µm)
Matrix recession
at the beam exit (µm)
MRR (cm³/min)
Taper angle (°)
R' Ratio
19 16 231.1 5 289.42 138.67 66 211.7 149.32 0.29 1.80 1.47
20 16 125 5 261.17 124.3 53 376.31 180.51 0.33 1.63 1.01
21 3.27 125 5 246.18 119.41 75 338.49 156.83 0.22 1.51 0.96
22 16 18.1 5 342.18 219.52 21 531.2 249.3 1.20 1.46 0.73
23 16 125 7 466.32 167.12 61 655.98 332.41 0.47 3.55 1.41
24 28.73 125 5 312.7 163.4 48 416.7 209.16 0.45 1.78 0.96
25 28.73 125 5 301.84 157.19 51 419.61 215.12 0.41 1.73 0.98
26 28.73 125 5 316.8 155.73 50 407.53 207.1 0.43 1.92 1.03
27 3.27 125 5 237.19 120.93 73 329.4 150.3 0.22 1.39 0.89
28 16 125 5 254.7 120.18 54 371.26 184.16 0.31 1.60 1.05
29 16 125 5 259.18 127.05 50 364.81 179.94 0.35 1.58 1.01
30 16 125 3 268.2 45.09 71 279.17 226.04 0.20 2.66 4.82
31 16 18.1 5 351.72 223.01 23 540.21 247.3 1.12 1.54 0.72
32 16 125 3 284.16 61.29 63 270.39 223.41 0.25 2.65 3.83
33 16 231.1 5 275.04 132.1 63 214.3 152.03 0.29 1.71 1.48
34 16 125 7 473.19 163.5 56 642.38 341.26 0.51 3.68 1.54
35 16 18.1 5 356.2 225.07 20 517.34 239.61 1.31 1.56 0.73
36 16 125 3 275.06 53.21 68 248.67 201.7 0.22 2.64 4.19
Appendix B. Analysis of Variance, a Summary and Tables
225
APPENDIX B
ANALYSIS OF VARIANCE, A SUMMARY AND
TABLES
B1) A summary of the procedure
The analysis of variance (ANOVA) is concerned with the investigation of the factors
that are likely to have significant effect on the response. It provides the variation
analysis for the influence of different factors individually and the associated statistical
model. The results of the total sum of squares, degree of freedom, expected mean of
squares and the analysis of F value are summarised in a table known as ANOVA table.
Such a table simplifies the related quantities used in computation of F value. An
interpretation to the statistics used in ANOVA is provided here.
Sum of squares: The sum of the squared deviations from the mean value as:
2
1
)()( ∑=
−=n
i
i XXSSsquaresofsumTotal (B.1)
where n is the number of levels for the term, iX is the ith level of the term and X is the
mean of levels’ values of the terms. The test procedure involves dividing the total sum
of squares (SS) into the regression (or the model) and the residual (or the error) sum of
squares, so:
ER SSSSSS += (B.2)
Where SSR is the sum of squares due to the model and SSE is the sum of square due to
the error.
Degree of freedom (DF): The number of values that are free to vary. For model the DF
equals the number of regressor variables in the model (k) and for the error, DF is n-k-1.
The total degrees of freedom would hence be n-1.
Appendix B. Analysis of Variance, a Summary and Tables
226
Mean square: Estimation of the variance of the term. It is calculated by the following
equations for different partitions of the analysis.
k
SSSS R
R = (B.3)
1−−=
kn
SSSS E
E (B.4)
1−=
n
SSSS (B.5)
F value (F test): Comparative test between the term variance and residual (error)
variance (Equation (B.6)). For close variances (i.e. ratio is nearly one) there is less
probability that the term has a significant effect on the response.
E
R
SS
SSF = (B.6)
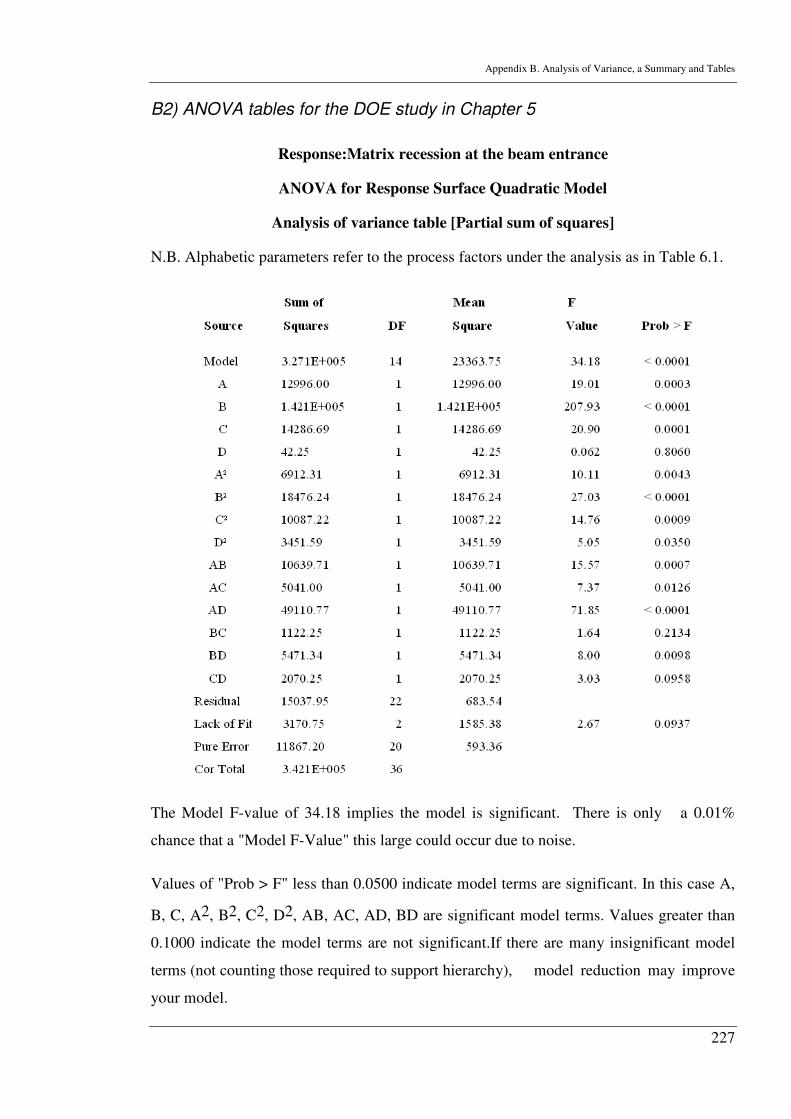
Appendix B. Analysis of Variance, a Summary and Tables
227
B2) ANOVA tables for the DOE study in Chapter 5
Response:Matrix recession at the beam entrance
ANOVA for Response Surface Quadratic Model
Analysis of variance table [Partial sum of squares]
N.B. Alphabetic parameters refer to the process factors under the analysis as in Table 6.1.
The Model F-value of 34.18 implies the model is significant. There is only a 0.01%
chance that a "Model F-Value" this large could occur due to noise.
Values of "Prob > F" less than 0.0500 indicate model terms are significant. In this case A,
B, C, A2, B2, C2, D2, AB, AC, AD, BD are significant model terms. Values greater than
0.1000 indicate the model terms are not significant.If there are many insignificant model
terms (not counting those required to support hierarchy), model reduction may improve
your model.
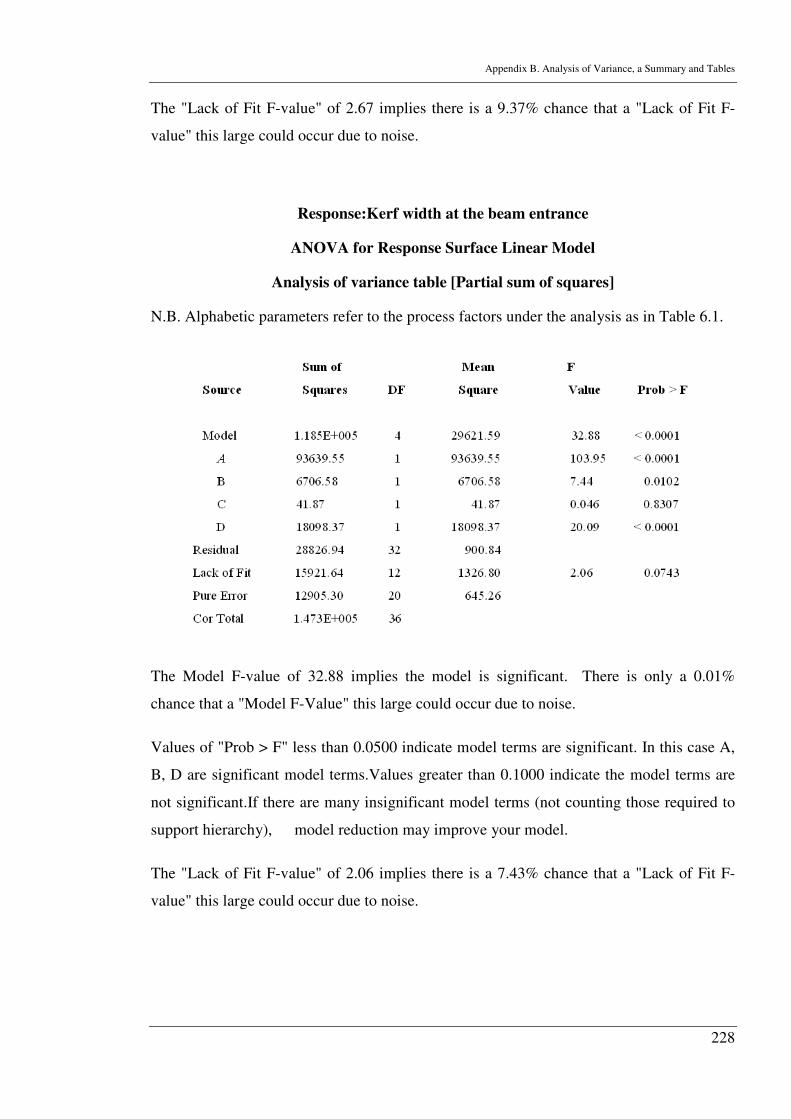
Appendix B. Analysis of Variance, a Summary and Tables
228
The "Lack of Fit F-value" of 2.67 implies there is a 9.37% chance that a "Lack of Fit F-
value" this large could occur due to noise.
Response:Kerf width at the beam entrance
ANOVA for Response Surface Linear Model
Analysis of variance table [Partial sum of squares]
N.B. Alphabetic parameters refer to the process factors under the analysis as in Table 6.1.
The Model F-value of 32.88 implies the model is significant. There is only a 0.01%
chance that a "Model F-Value" this large could occur due to noise.
Values of "Prob > F" less than 0.0500 indicate model terms are significant. In this case A,
B, D are significant model terms.Values greater than 0.1000 indicate the model terms are
not significant.If there are many insignificant model terms (not counting those required to
support hierarchy), model reduction may improve your model.
The "Lack of Fit F-value" of 2.06 implies there is a 7.43% chance that a "Lack of Fit F-
value" this large could occur due to noise.
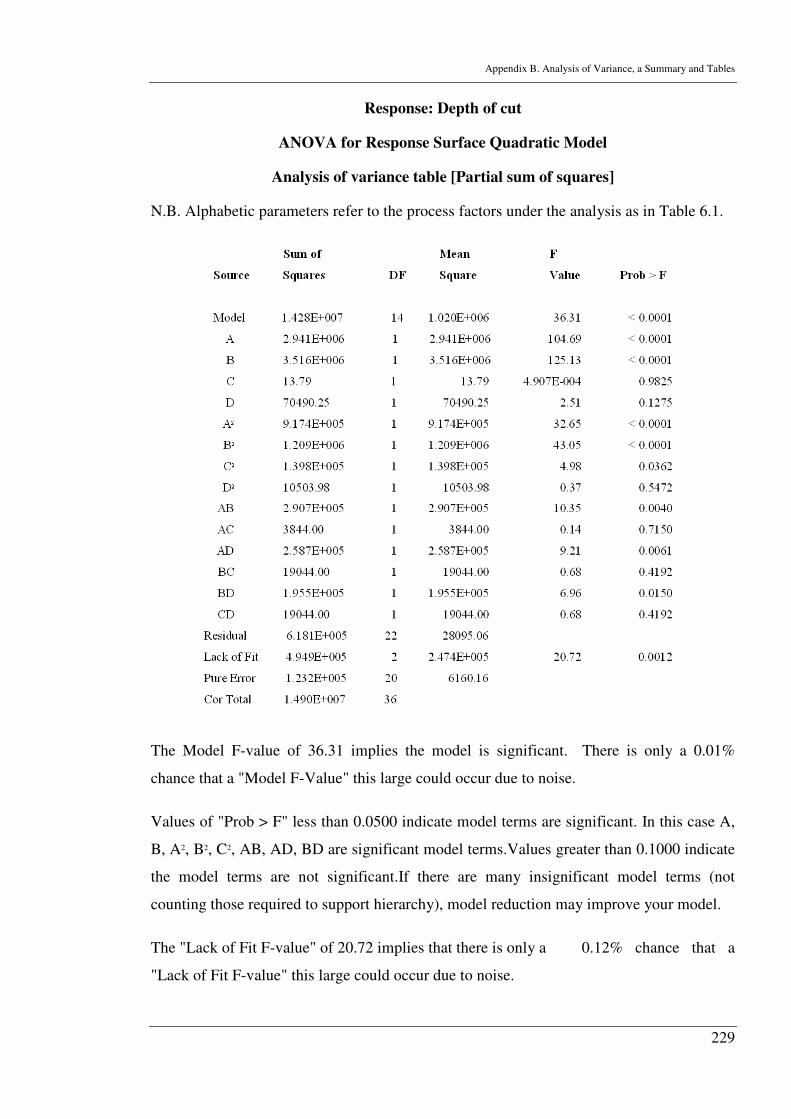
Appendix B. Analysis of Variance, a Summary and Tables
229
Response: Depth of cut
ANOVA for Response Surface Quadratic Model
Analysis of variance table [Partial sum of squares]
N.B. Alphabetic parameters refer to the process factors under the analysis as in Table 6.1.
The Model F-value of 36.31 implies the model is significant. There is only a 0.01%
chance that a "Model F-Value" this large could occur due to noise.
Values of "Prob > F" less than 0.0500 indicate model terms are significant. In this case A,
B, A2, B2, C2, AB, AD, BD are significant model terms.Values greater than 0.1000 indicate
the model terms are not significant.If there are many insignificant model terms (not
counting those required to support hierarchy), model reduction may improve your model.
The "Lack of Fit F-value" of 20.72 implies that there is only a 0.12% chance that a
"Lack of Fit F-value" this large could occur due to noise.
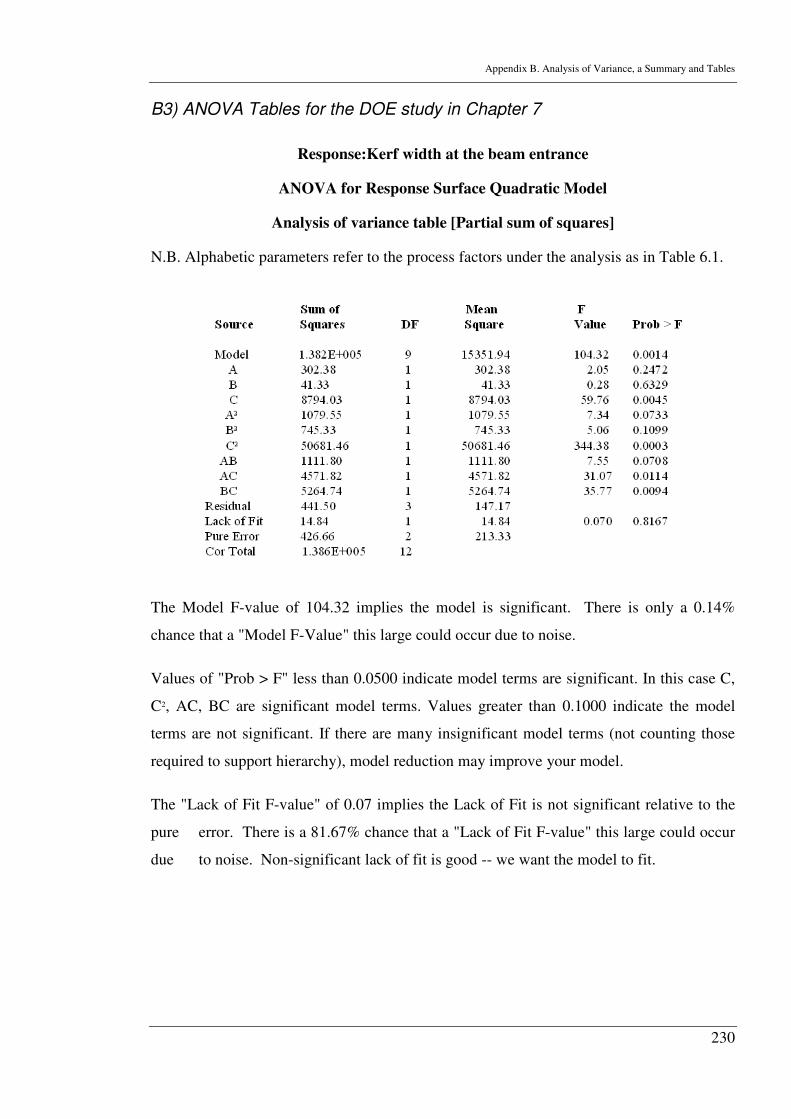
Appendix B. Analysis of Variance, a Summary and Tables
230
B3) ANOVA Tables for the DOE study in Chapter 7
Response:Kerf width at the beam entrance
ANOVA for Response Surface Quadratic Model
Analysis of variance table [Partial sum of squares]
N.B. Alphabetic parameters refer to the process factors under the analysis as in Table 6.1.
The Model F-value of 104.32 implies the model is significant. There is only a 0.14%
chance that a "Model F-Value" this large could occur due to noise.
Values of "Prob > F" less than 0.0500 indicate model terms are significant. In this case C,
C2, AC, BC are significant model terms. Values greater than 0.1000 indicate the model
terms are not significant. If there are many insignificant model terms (not counting those
required to support hierarchy), model reduction may improve your model.
The "Lack of Fit F-value" of 0.07 implies the Lack of Fit is not significant relative to the
pure error. There is a 81.67% chance that a "Lack of Fit F-value" this large could occur
due to noise. Non-significant lack of fit is good -- we want the model to fit.
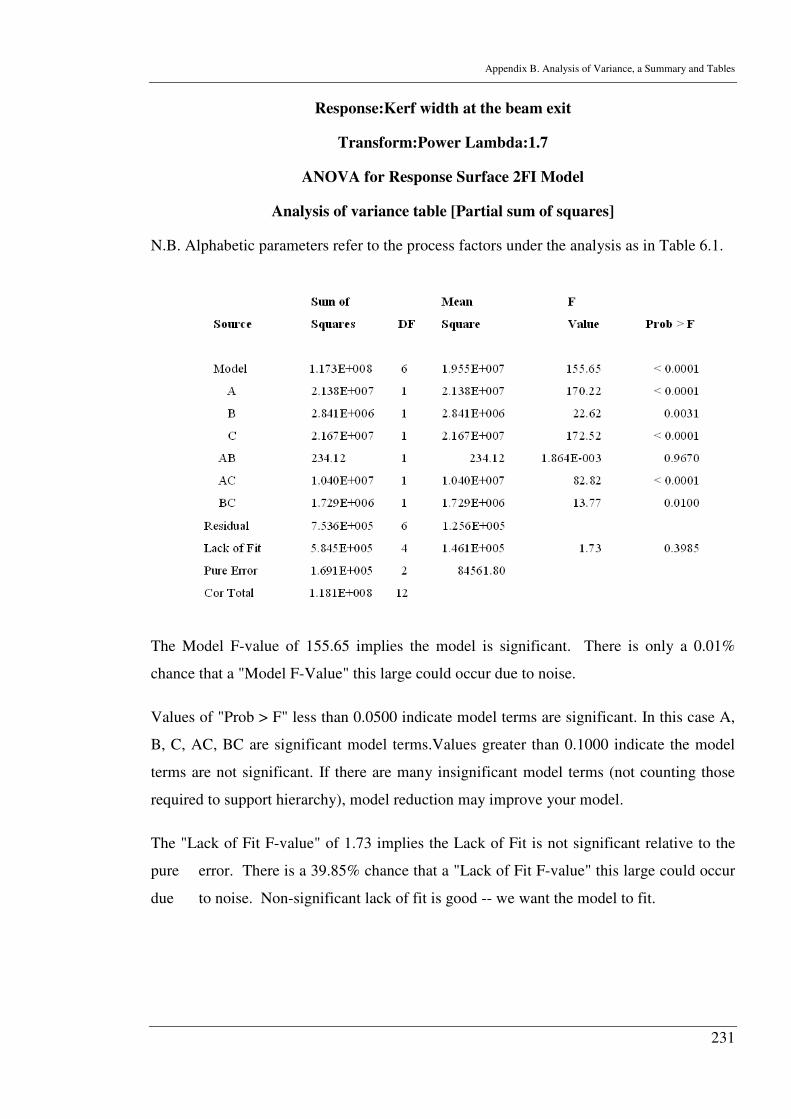
Appendix B. Analysis of Variance, a Summary and Tables
231
Response:Kerf width at the beam exit
Transform:Power Lambda:1.7
ANOVA for Response Surface 2FI Model
Analysis of variance table [Partial sum of squares]
N.B. Alphabetic parameters refer to the process factors under the analysis as in Table 6.1.
The Model F-value of 155.65 implies the model is significant. There is only a 0.01%
chance that a "Model F-Value" this large could occur due to noise.
Values of "Prob > F" less than 0.0500 indicate model terms are significant. In this case A,
B, C, AC, BC are significant model terms.Values greater than 0.1000 indicate the model
terms are not significant. If there are many insignificant model terms (not counting those
required to support hierarchy), model reduction may improve your model.
The "Lack of Fit F-value" of 1.73 implies the Lack of Fit is not significant relative to the
pure error. There is a 39.85% chance that a "Lack of Fit F-value" this large could occur
due to noise. Non-significant lack of fit is good -- we want the model to fit.
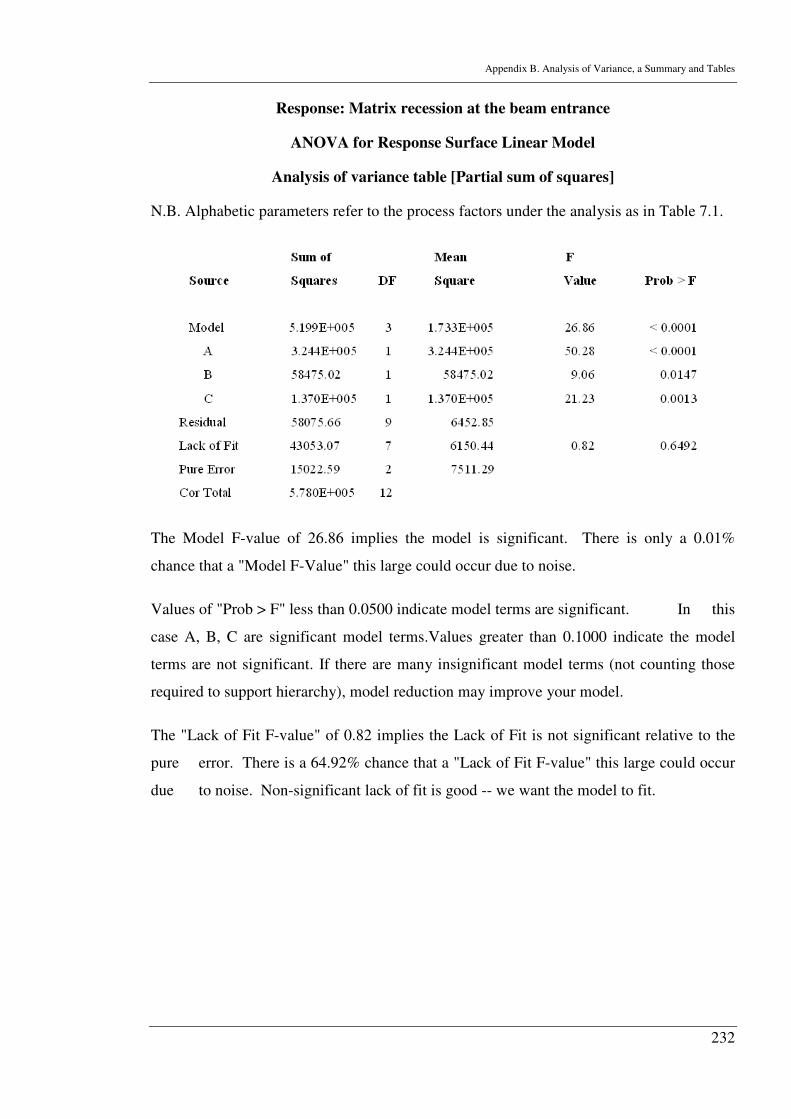
Appendix B. Analysis of Variance, a Summary and Tables
232
Response: Matrix recession at the beam entrance
ANOVA for Response Surface Linear Model
Analysis of variance table [Partial sum of squares]
N.B. Alphabetic parameters refer to the process factors under the analysis as in Table 7.1.
The Model F-value of 26.86 implies the model is significant. There is only a 0.01%
chance that a "Model F-Value" this large could occur due to noise.
Values of "Prob > F" less than 0.0500 indicate model terms are significant. In this
case A, B, C are significant model terms.Values greater than 0.1000 indicate the model
terms are not significant. If there are many insignificant model terms (not counting those
required to support hierarchy), model reduction may improve your model.
The "Lack of Fit F-value" of 0.82 implies the Lack of Fit is not significant relative to the
pure error. There is a 64.92% chance that a "Lack of Fit F-value" this large could occur
due to noise. Non-significant lack of fit is good -- we want the model to fit.
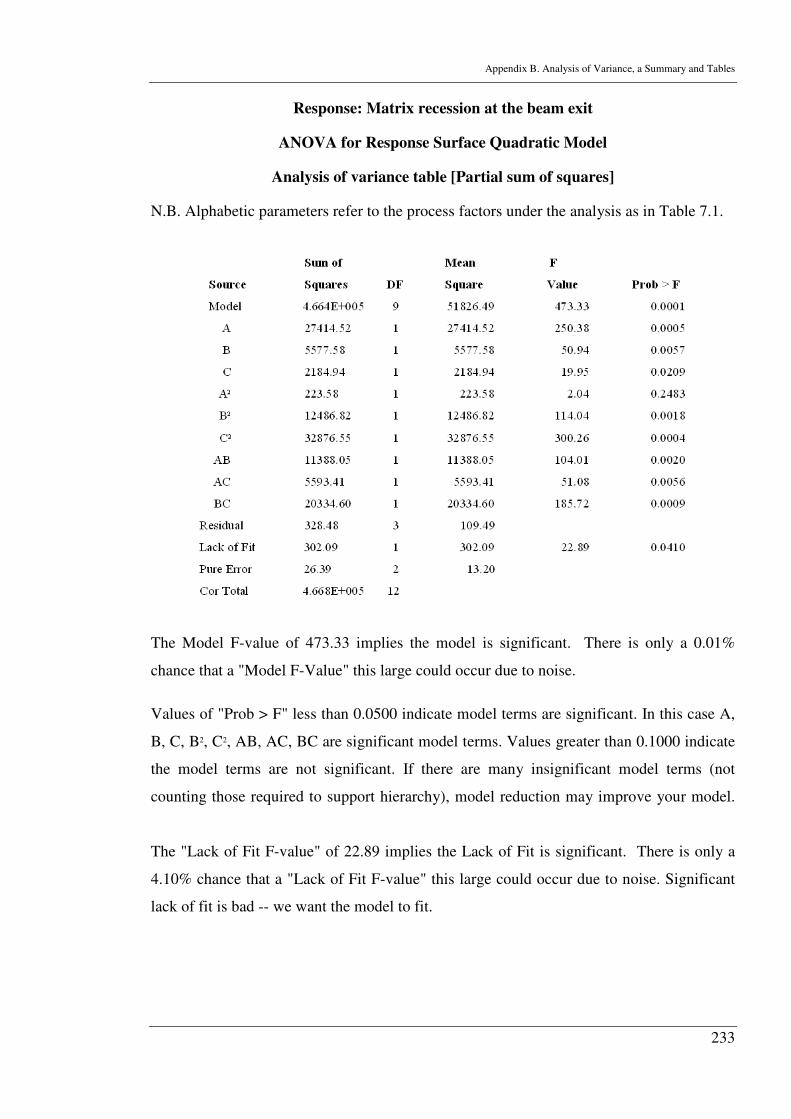
Appendix B. Analysis of Variance, a Summary and Tables
233
Response: Matrix recession at the beam exit
ANOVA for Response Surface Quadratic Model
Analysis of variance table [Partial sum of squares]
N.B. Alphabetic parameters refer to the process factors under the analysis as in Table 7.1.
The Model F-value of 473.33 implies the model is significant. There is only a 0.01%
chance that a "Model F-Value" this large could occur due to noise.
Values of "Prob > F" less than 0.0500 indicate model terms are significant. In this case A,
B, C, B2, C2, AB, AC, BC are significant model terms. Values greater than 0.1000 indicate
the model terms are not significant. If there are many insignificant model terms (not
counting those required to support hierarchy), model reduction may improve your model.
The "Lack of Fit F-value" of 22.89 implies the Lack of Fit is significant. There is only a
4.10% chance that a "Lack of Fit F-value" this large could occur due to noise. Significant
lack of fit is bad -- we want the model to fit.
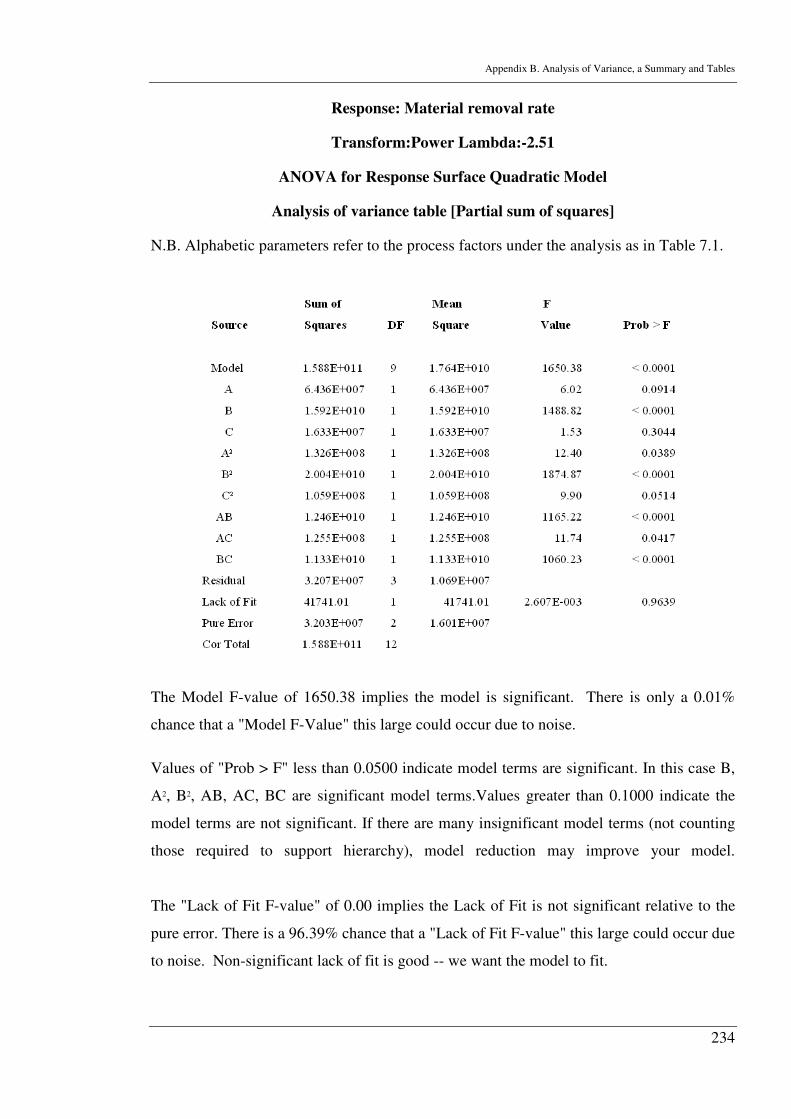
Appendix B. Analysis of Variance, a Summary and Tables
234
Response: Material removal rate
Transform:Power Lambda:-2.51
ANOVA for Response Surface Quadratic Model
Analysis of variance table [Partial sum of squares]
N.B. Alphabetic parameters refer to the process factors under the analysis as in Table 7.1.
The Model F-value of 1650.38 implies the model is significant. There is only a 0.01%
chance that a "Model F-Value" this large could occur due to noise.
Values of "Prob > F" less than 0.0500 indicate model terms are significant. In this case B,
A2, B2, AB, AC, BC are significant model terms.Values greater than 0.1000 indicate the
model terms are not significant. If there are many insignificant model terms (not counting
those required to support hierarchy), model reduction may improve your model.
The "Lack of Fit F-value" of 0.00 implies the Lack of Fit is not significant relative to the
pure error. There is a 96.39% chance that a "Lack of Fit F-value" this large could occur due
to noise. Non-significant lack of fit is good -- we want the model to fit.
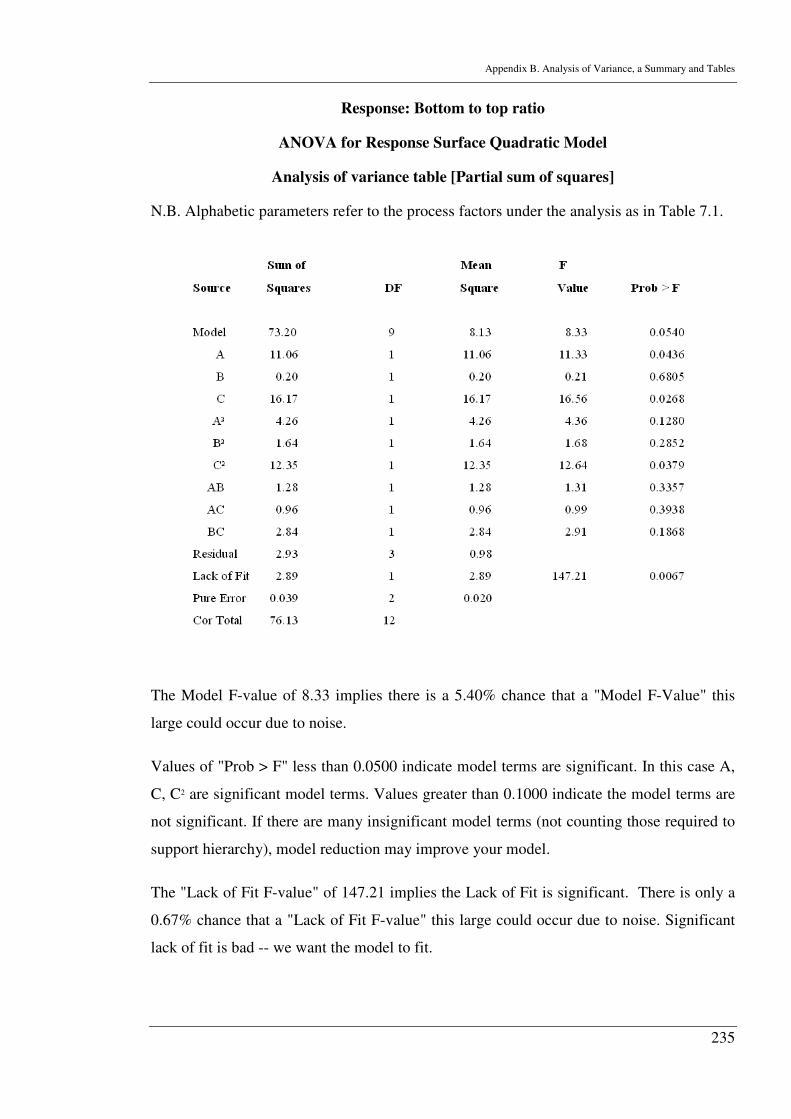
Appendix B. Analysis of Variance, a Summary and Tables
235
Response: Bottom to top ratio
ANOVA for Response Surface Quadratic Model
Analysis of variance table [Partial sum of squares]
N.B. Alphabetic parameters refer to the process factors under the analysis as in Table 7.1.
The Model F-value of 8.33 implies there is a 5.40% chance that a "Model F-Value" this
large could occur due to noise.
Values of "Prob > F" less than 0.0500 indicate model terms are significant. In this case A,
C, C2 are significant model terms. Values greater than 0.1000 indicate the model terms are
not significant. If there are many insignificant model terms (not counting those required to
support hierarchy), model reduction may improve your model.
The "Lack of Fit F-value" of 147.21 implies the Lack of Fit is significant. There is only a
0.67% chance that a "Lack of Fit F-value" this large could occur due to noise. Significant
lack of fit is bad -- we want the model to fit.
Appendix C. Thermal Gravimetric Analysis, a Summary and Charts
236
APPENDIX C
THERMAL GRAVIMETRIC ANALYSIS, A
SUMMARY AND CHARTS
C1) A summary of the procedure
TGA is used to determine thermal stability of material and its volatile components by
monitoring the weight change of the sample subjected to temperature gradient.
Temperature calibration, heating rate and the sample govern the outcome of the
analysis. The temperature may be that of the furnace chamber, the temperature near the
sample (close to the sample container) or the temperature of the sample. The latter is the
best option as the thermocouple is in contact with the sample (or its container). At any
temperature, the rate of weight loss is a function of material and the nature and relative
amounts of degradation products present. Thereby, temperature dependant charts may
be recorded as weight loss or derivative weight loss. The heating rates usually are
between 10-50 K/min. The original sample size normally is below 15 mg in weight.
C2) Charts for the CFRP sample used in Chapter 7
Figure B-1 shows the TGA results of the CFRP composite heating in argon and
nitrogen. Different weight loss behaviours were observed in different atmospheres.
When heating in the argon atmosphere, weight loss of 48% between 320~424 oC was
observed which associated with polymer decomposition/vaporisation. When heating in
the nitrogen gas, polymer decomposition was first took place from the temperature of
320 oC. Up to about 375 oC the weight loss trace deviated from the one in argon, and
tends to a slower weight loss rate until 580 oC. This may be attributed to the reaction of
the polymer to nitrogen which elevates the polymer decomposition/vaporisation to a
higher temperature. Above 580 oC, the weight loss rate increases again. The weight loss
rate changes in the temperature rate of 375 ~ 1000 oC indicated serial chemical reactions
occur as temperature increasing in the nitrogen, for instance, interaction between
nitrogen and polymer, decomposition of the nitrides and carbon fibre reacts with
nitrogen forming gases.
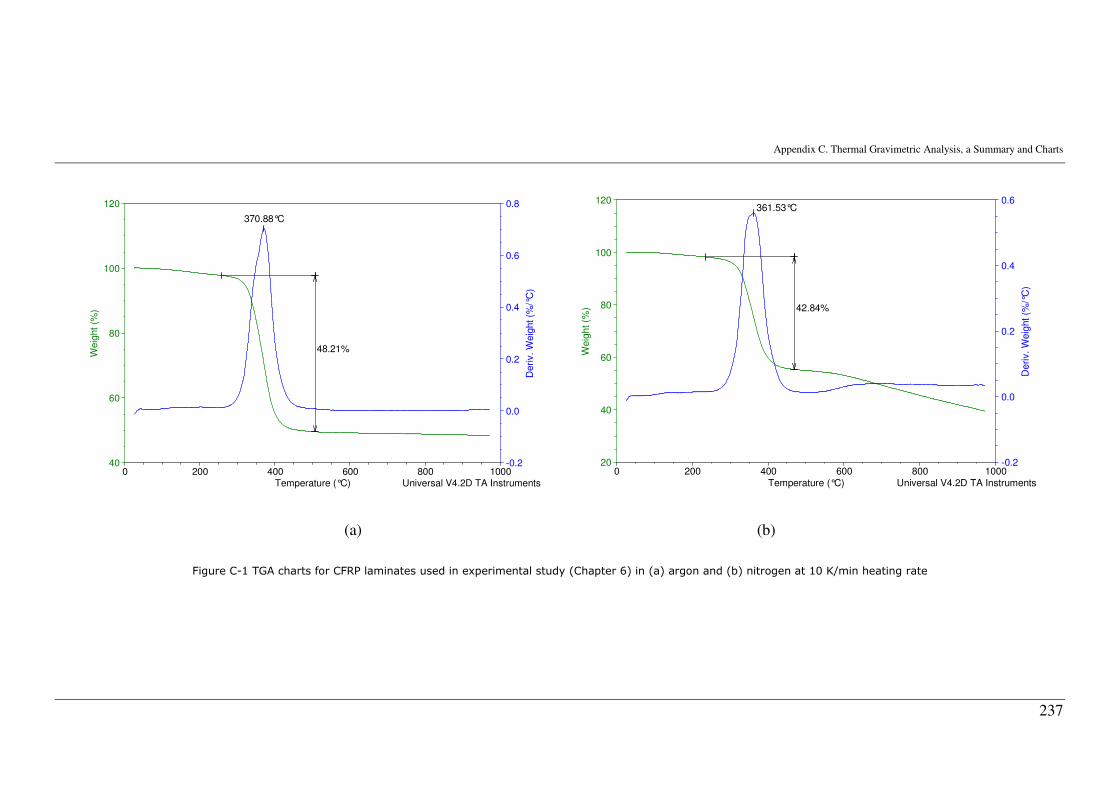
Appendix C. Thermal Gravimetric Analysis, a Summary and Charts
237
370.88°C
48.21%
-0.2
0.0
0.2
0.4
0.6
0.8
Deri
v. W
eig
ht
(%/°
C)
40
60
80
100
120
Weig
ht
(%)
0 200 400 600 800 1000Temperature (°C) Universal V4.2D TA Instruments
361.53°C
42.84%
-0.2
0.0
0.2
0.4
0.6
Deriv. W
eig
ht (%
/°C
)
20
40
60
80
100
120
Weig
ht (%
)
0 200 400 600 800 1000Temperature (°C) Universal V4.2D TA Instruments
(a) (b)
Figure C-1 TGA charts for CFRP laminates used in experimental study (Chapter 6) in (a) argon and (b) nitrogen at 10 K/min heating rate
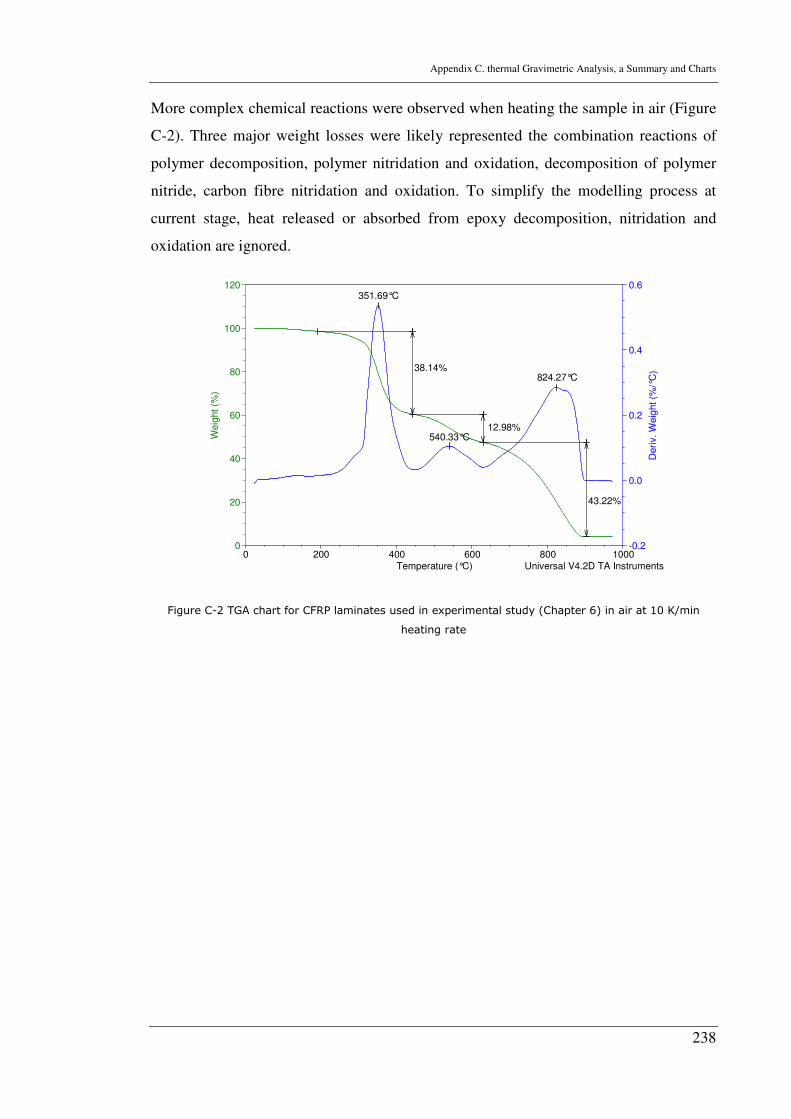
Appendix C. thermal Gravimetric Analysis, a Summary and Charts
238
More complex chemical reactions were observed when heating the sample in air (Figure
C-2). Three major weight losses were likely represented the combination reactions of
polymer decomposition, polymer nitridation and oxidation, decomposition of polymer
nitride, carbon fibre nitridation and oxidation. To simplify the modelling process at
current stage, heat released or absorbed from epoxy decomposition, nitridation and
oxidation are ignored.
351.69°C
540.33°C
824.27°C38.14%
12.98%
43.22%
-0.2
0.0
0.2
0.4
0.6
Deri
v.
We
ight
(%/°
C)
0
20
40
60
80
100
120
Weig
ht
(%)
0 200 400 600 800 1000Temperature (°C) Universal V4.2D TA Instruments
Figure C-2 TGA chart for CFRP laminates used in experimental study (Chapter 6) in air at 10 K/min
heating rate

239
(This page is intentionally left blank)