fractographic observation of various loading modes of fibre reinforced laminates
TRANSCRIPT
Fractographic Observation of Various Loading Modes of Fibre Reinforced Laminates
Rosa Marat-Mendes1,3,a and Manuel de Freitas2,3,b
1Escola Superior de Tecnologia de Setúbal, Rua do Vale de Chaves, Estefanilha,
2910-761 Setúbal, Portugal
2Instituto Superior Técnico, Universidade Técnica de Lisboa, Av. Rovisco Pais, 1049-001 Lisboa, Portugal
3ICEMS, Instituto Superior Técnico, TULisbon, Av. Rovisco Pais, 1049-001 Lisboa, Portugal.
a [email protected] (corresponding author), b [email protected]
Keywords: Fractographic analysis; Glass fibre epoxy; Interlaminar fracture; Delamination.
Abstract One of the major disadvantages of laminated composites is their tendency to delaminate.
Unidirectional glass/epoxy laminates have been tested under static conditions by the use of fracture
mechanics. Mode I, mode II, mixed mode I-II, mode III and mixed mode II-III tests were
performed. Double cantilever beam (DCB), end-notched flexure (ENF), mixed-mode bending
(MMB) and edge crack torsion (ECT) specimens were used.
Scanning electron microscopy technique was used to identify distinguishing fractographic features
and to establish the differences between the various modes of fracture after specimens testing. The
propagated orientation of the delamination could be specified from the patterns of fracture surface.
Scanning electron micrographs of fractured surfaces showed that the most predominant
fractographic features in mode I and mode II are the large amount of fibre pull-out and the cusps
markings respectively. In the MMB specimen the fracture surfaces are characterized by fibre
breakage under shearing with fractures localized in the resin with cusps having an orientation of 90º
(mode II) and also fractures localized in the resin and along the resin/fibre interface (mode I).
Mode III characterization concluded that some limited mixed mode II-III seems to be present for
ECT specimen on delamination initiation and growth, but a large majority of mode III delamination
is present.
1. Introduction
Delamination is one of the most common reasons for failure of composite laminates and can cause
major reductions in the stiffness or strength of a structure. However, delamination can be relatively
difficult to detect and quantify since they constitute sub-surface damage. The present paper
concentrates on the fractographic characteristics of delamination in laminates under different known
loading modes. Fractographic techniques can identify damage initiation and subsequent directions
of propagation. In metallic materials the fractographic analysis techniques are well established and
are a valuable diagnostic technique for failure analysis of components and structures failed in
service. Similar studies have been carried out in composite materials but only at a small extent are
available.
It is possible to evaluate, based on fractographic analysis, how the composite structures failed and
also the nature of the applied loads/modes. In order to study the delamination failure of composite
materials, experimental studies were carried out to characterize the modes of failure.
Various damage mechanisms can readily be established and the modes of failure or the mixity of
different modes may also be calculated. The known modes of loading have been applied by using
standard fracture mechanics testing methods. Specifically, these included double cantilever beam
(DCB) [1], end-notch flexure (ENF) [2], mixed-mode bending (MMB) [3] and edge crack torsion
(ECT) [4-5] test coupons under static loading conditions.
Materials Science Forum Vols. 730-732 (2013) pp 337-342Online available since 2012/Nov/12 at www.scientific.net© (2013) Trans Tech Publications, Switzerlanddoi:10.4028/www.scientific.net/MSF.730-732.337
All rights reserved. No part of contents of this paper may be reproduced or transmitted in any form or by any means without the written permission of TTP,www.ttp.net. (ID: 193.137.47.115-04/12/12,17:41:39)
2. Experimental
Fracture toughness specimens were subjected to a fractographic examination following testing in a
variety of loading modes. The DCB, ENF and MMB specimens were manufactured from 24-ply
laminates with a unidirectional stacking sequence of [0]24. The ECT specimens were manufactured
from 28-ply laminates with a stacking sequence of [90/(+45/-45)3/(-45/+45)3/90]s. An initial
artificial delamination was simulated along the midplane by means of a non-adhesive 12.7 µm
Teflon®
insert.
The fibre/resin system was UE400REM/ET443 which consists of an epoxy resin reinforced with E
glass fibres. The applied loading modes are given in Table 1 together with the particular test
methods and the stacking sequence that were used.
Table 1. Fracture modes and respective methods used for fracture testing.
Fracture mode Coupon test method Stacking
Mode I DCB [0]24
Mode II ENF [0]24
Mixed Mode I-II MMB [0]24
Mixed Mode II-III ECT [90/(+45/-45)3/(-45/+45)3/90]s
Mode III ECT [90/(+45/-45)3/(-45/+45)3/90]s
The specimens have been mounted into the test fixtures and quasi-static tests were conducted under
displacement control at a crosshead displacement rate of 0.5 mm/min on an INSTRON3369 load
frame under deflection-controlled loading. Load-displacement plots, P-δ, were recorded during the
tests. Prior to fracture testing the initial crack length was marked on one side of the specimen edge
and all fracture tests were performed from the end of the (straight) insert without pre-cracking the
specimen.
Samples were cut from the fractured specimens using a diamond-coated saw after experimental
tests. Several samples were taken from both surfaces of each specimen. The areas considered to be
most interesting were at the end of the insert (i.e. the start of the crack) and the area around the
crack tip.
Each sample was then mounted on an aluminium disc and its edges coated with conductive paint
and gold coating. A Hitachi S-2400 scanning electron microscope was used. Micrographs of various
features were taken from different regions of several samples of each fracture specimen. The results
of the SEM examination are presented for each mode in the following sections. In all micrographs,
the white arrow indicates the globally induced crack propagation direction, and the magnification is
given.
3. Results and Discussion
3.1. Mode I and Mode II
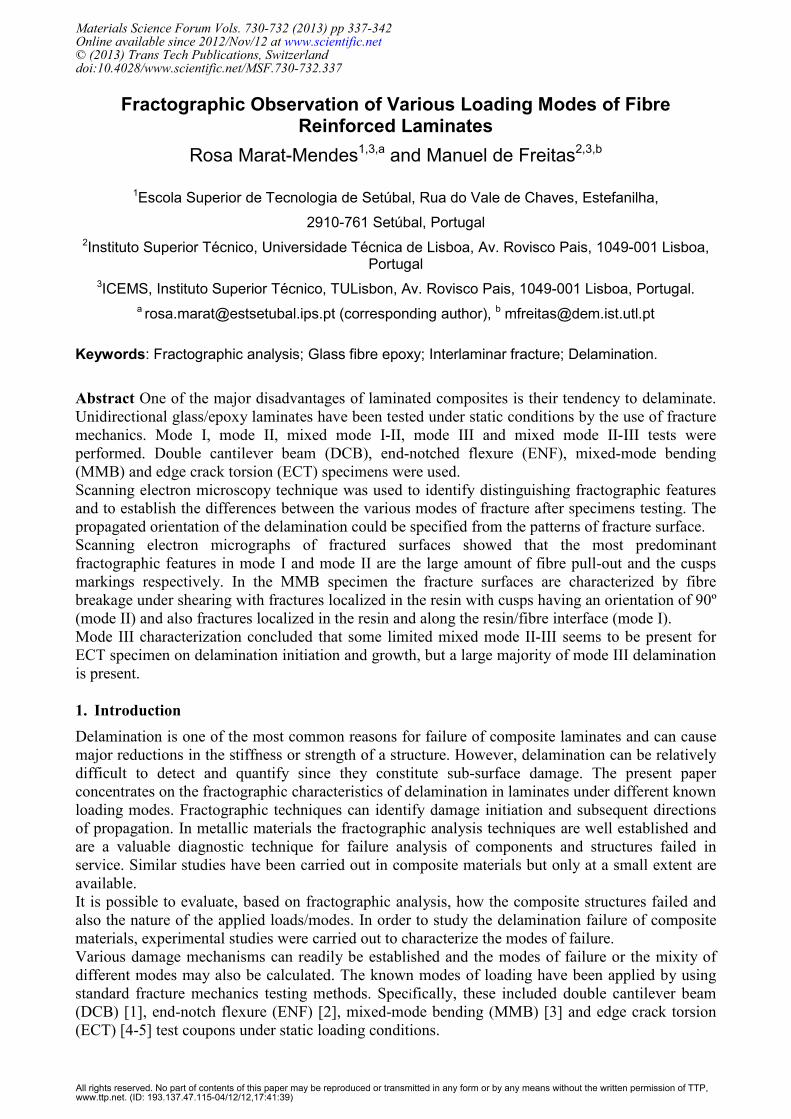
In the DCB specimen a pure mode I delamination exists and a typical SEM image of the fracture
surface is generally smooth with few fibre fractures and the failure mechanism is characterized by
fractures localised mainly in the resin and along the resin/fibre interface [6]. SEM images of the
opened surfaces in the starter region (Fig. 1) clearly shows broken fibres pulled out from the resin
as an evidence of fibre bridging. Also the appearance of scarps parallel to the crack growth
direction and textured microflow appears in the mode I fracture surface.
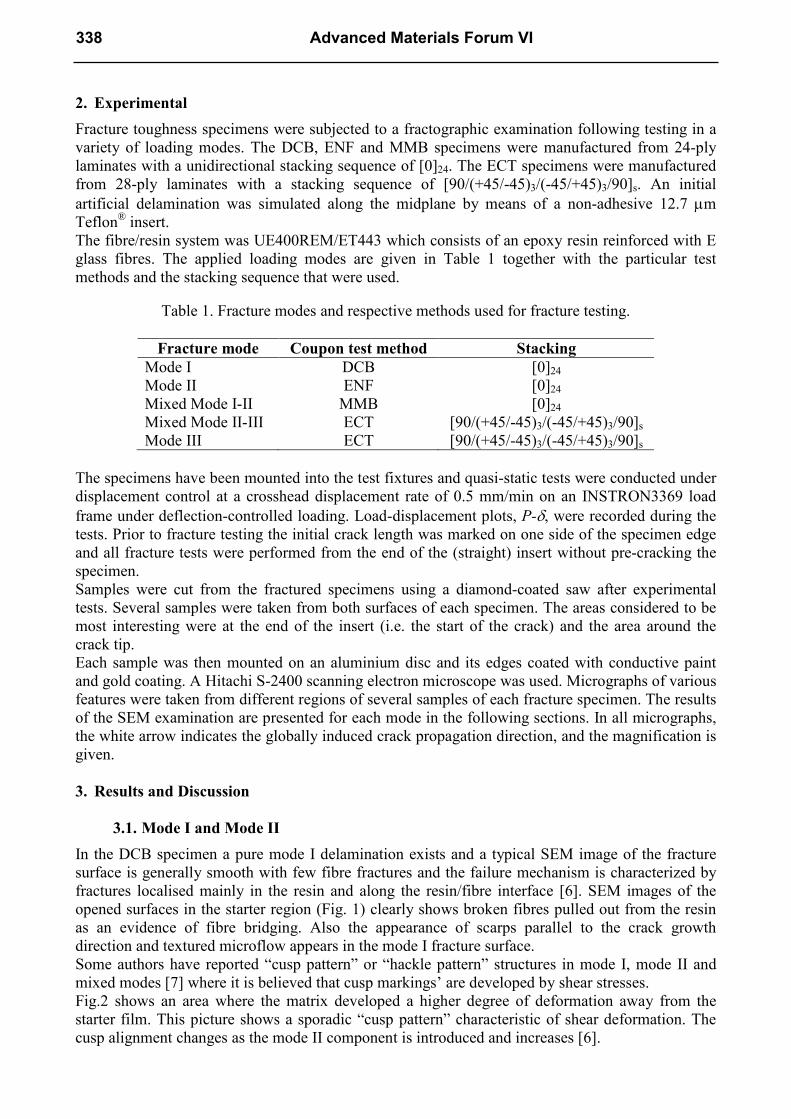
Some authors have reported “cusp pattern” or “hackle pattern” structures in mode I, mode II and
mixed modes [7] where it is believed that cusp markings’ are developed by shear stresses.
Fig.2 shows an area where the matrix developed a higher degree of deformation away from the
starter film. This picture shows a sporadic “cusp pattern” characteristic of shear deformation. The
cusp alignment changes as the mode II component is introduced and increases [6].
338 Advanced Materials Forum VI
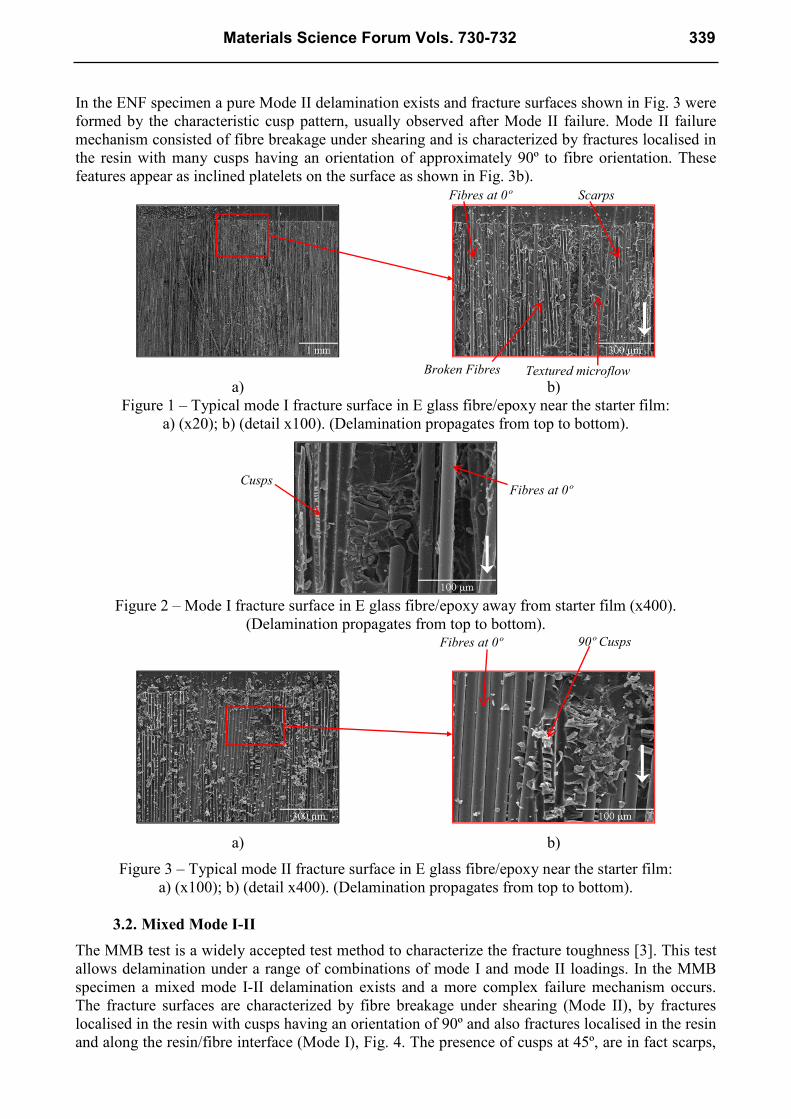
In the ENF specimen a pure Mode II delamination exists and fracture surfaces shown in Fig. 3 were
formed by the characteristic cusp pattern, usually observed after Mode II failure. Mode II failure
mechanism consisted of fibre breakage under shearing and is characterized by fractures localised in
the resin with many cusps having an orientation of approximately 90º to fibre orientation. These
features appear as inclined platelets on the surface as shown in Fig. 3b).
a) b)
Figure 1 – Typical mode I fracture surface in E glass fibre/epoxy near the starter film:
a) (x20); b) (detail x100). (Delamination propagates from top to bottom).
Figure 2 – Mode I fracture surface in E glass fibre/epoxy away from starter film (x400).
(Delamination propagates from top to bottom).
a) b)
Figure 3 – Typical mode II fracture surface in E glass fibre/epoxy near the starter film:
a) (x100); b) (detail x400). (Delamination propagates from top to bottom).
3.2. Mixed Mode I-II
The MMB test is a widely accepted test method to characterize the fracture toughness [3]. This test
allows delamination under a range of combinations of mode I and mode II loadings. In the MMB
specimen a mixed mode I-II delamination exists and a more complex failure mechanism occurs.
The fracture surfaces are characterized by fibre breakage under shearing (Mode II), by fractures
localised in the resin with cusps having an orientation of 90º and also fractures localised in the resin
and along the resin/fibre interface (Mode I), Fig. 4. The presence of cusps at 45º, are in fact scarps,
Broken Fibres
Fibres at 0º Scarps
Textured microflow
Fibres at 0º Cusps
Fibres at 0º 90º Cusps
Materials Science Forum Vols. 730-732 339
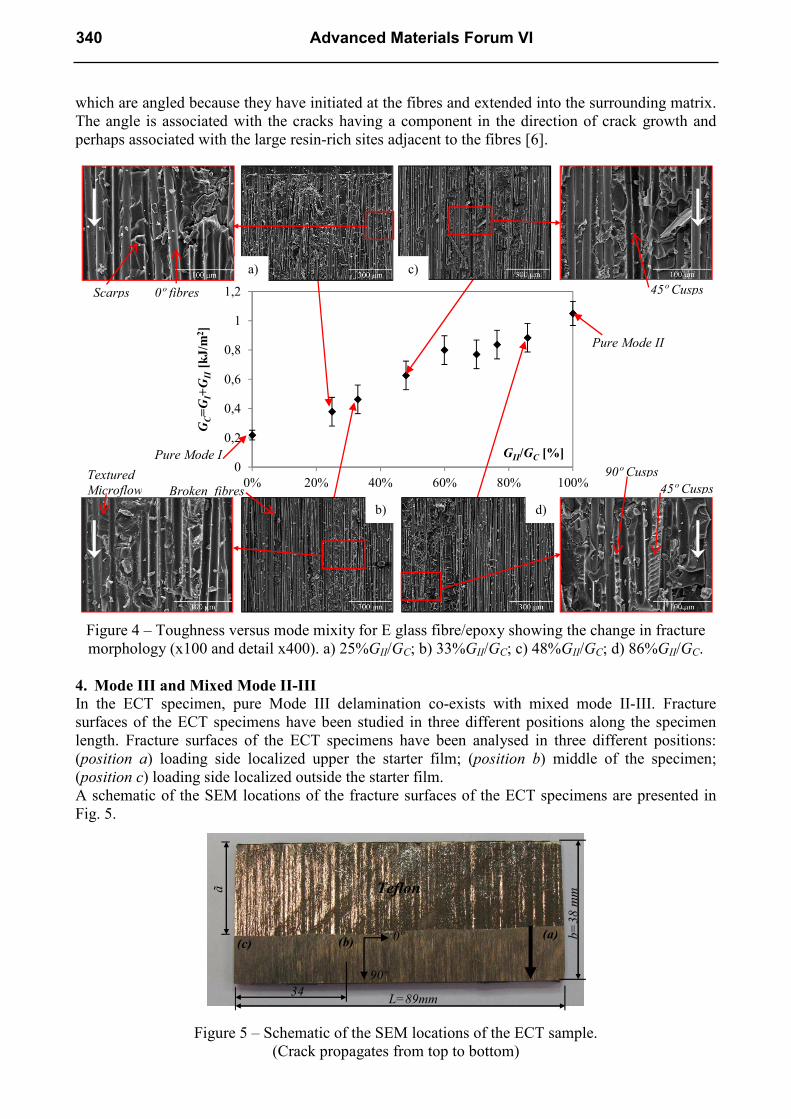
which are angled because they have initiated at the fibres and extended into the surrounding matrix.
The angle is associated with the cracks having a component in the direction of crack growth and
perhaps associated with the large resin-rich sites adjacent to the fibres [6].
Figure 4 – Toughness versus mode mixity for E glass fibre/epoxy showing the change in fracture
morphology (x100 and detail x400). a) 25%GII/GC; b) 33%GII/GC; c) 48%GII/GC; d) 86%GII/GC.
4. Mode III and Mixed Mode II-III
In the ECT specimen, pure Mode III delamination co-exists with mixed mode II-III. Fracture
surfaces of the ECT specimens have been studied in three different positions along the specimen
length. Fracture surfaces of the ECT specimens have been analysed in three different positions:
(position a) loading side localized upper the starter film; (position b) middle of the specimen;
(position c) loading side localized outside the starter film.
A schematic of the SEM locations of the fracture surfaces of the ECT specimens are presented in
Fig. 5.
Figure 5 – Schematic of the SEM locations of the ECT sample.
(Crack propagates from top to bottom)
0
0,2
0,4
0,6
0,8
1
1,2
0% 20% 40% 60% 80% 100%
GC=
GI+
GII
[kJ
/m2]
GII/GC [%]
a) d)
b) c)
Pure Mode II
Pure Mode I
Scarps 0º fibres
Broken fibres
Textured
Microflow 45º Cusps
90º Cusps
45º Cusps
a)
b)
c)
d)
b=
38
mm
ã
(a) (b) (c)
L=89mm 34
Teflon
90º
0º
340 Advanced Materials Forum VI
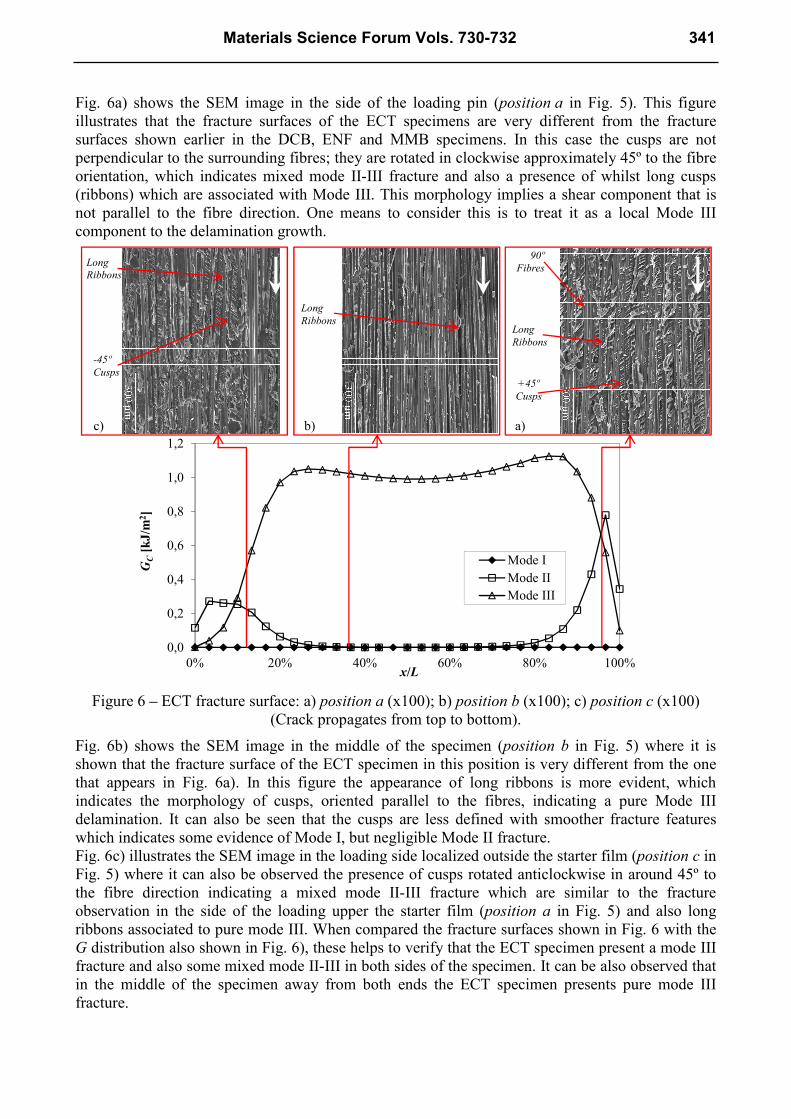
Fig. 6a) shows the SEM image in the side of the loading pin (position a in Fig. 5). This figure
illustrates that the fracture surfaces of the ECT specimens are very different from the fracture
surfaces shown earlier in the DCB, ENF and MMB specimens. In this case the cusps are not
perpendicular to the surrounding fibres; they are rotated in clockwise approximately 45º to the fibre
orientation, which indicates mixed mode II-III fracture and also a presence of whilst long cusps
(ribbons) which are associated with Mode III. This morphology implies a shear component that is
not parallel to the fibre direction. One means to consider this is to treat it as a local Mode III
component to the delamination growth.
Figure 6 – ECT fracture surface: a) position a (x100); b) position b (x100); c) position c (x100)
(Crack propagates from top to bottom).
Fig. 6b) shows the SEM image in the middle of the specimen (position b in Fig. 5) where it is
shown that the fracture surface of the ECT specimen in this position is very different from the one
that appears in Fig. 6a). In this figure the appearance of long ribbons is more evident, which
indicates the morphology of cusps, oriented parallel to the fibres, indicating a pure Mode III
delamination. It can also be seen that the cusps are less defined with smoother fracture features
which indicates some evidence of Mode I, but negligible Mode II fracture.
Fig. 6c) illustrates the SEM image in the loading side localized outside the starter film (position c in
Fig. 5) where it can also be observed the presence of cusps rotated anticlockwise in around 45º to
the fibre direction indicating a mixed mode II-III fracture which are similar to the fracture
observation in the side of the loading upper the starter film (position a in Fig. 5) and also long
ribbons associated to pure mode III. When compared the fracture surfaces shown in Fig. 6 with the
G distribution also shown in Fig. 6), these helps to verify that the ECT specimen present a mode III
fracture and also some mixed mode II-III in both sides of the specimen. It can be also observed that
in the middle of the specimen away from both ends the ECT specimen presents pure mode III
fracture.
0,0
0,2
0,4
0,6
0,8
1,0
1,2
0% 20% 40% 60% 80% 100%
GC
[kJ
/m2]
x/L
Mode I
Mode II
Mode III
a) b) c)
-45º
Cusps
Long
Ribbons
+45º
Cusps
Long
Ribbons
90º
Fibres Long
Ribbons
Materials Science Forum Vols. 730-732 341
5. Conclusions
The present investigation has examined the fractographic features associated with delamination in
unidirectional laminates of E glass fibre/epoxy composite. Pure mode I, pure mode II, and mixed
modes I-II and II-III of loading have been considered under static condition. This entitled the use of
DCB, ENF, MMB and ECT fracture mechanics coupons.
The predominant fractographic feature found in mode I was broken fibres and pull-out from fibre
bridging. In mode II testing the most predominant morphology was the cusp pattern. The fracture
surface of the mixed mode I-II testing are characterized by fibre breakage under shearing (mode II)
and fractures localized in the resin and along the resin/fibre interface (mode I). In mixed mode II-III
the most predominant morphology were the cusps with 45º of orientation to the fibre alignment
(mixed mode II-III) and long ribbons (mode III) indicating the presence of some mode III fracture
in both sides of the specimen and also some mixed mode II-III. The fractographic feature of ECT
shows also pure mode III loading in the middle of the specimen away from both ends.
This study allowed to characterize the delamination surfaces occurred due to different types of
applied loading and may be considered a valuable way to help studies of engineering failure
analysis of components and structures made of composite materials.
References
[1] ASTM D 5528 – 01, Sandard test method for mode I interlaminar fracture toughness of
unidirectional fiber-reinforced polymer matrix composites: American Society for Testing and
Materials. Annual Book of ASTM Standards. (2001)
[2] P. Davies (Ed.), ESIS Protocol for Interlaminar Fracture Testing of Composites, ESIS-Polymers
& Composites Task Group (1993)
[3] ASTM D 6671 – 06, Standard test method for mixed mode I-mode II interlaminar fracture
toughness of unidirectional fiber reinforced polymer matrix composites: American Society for
Testing and Materials. Annual Book of ASTM Standards. (2006)
[4] R. Marat-Mendes, M. Freitas, Characterisation of the edge crack torsion (ECT) test for the
measurement of the mode III interlaminar fracture toughness. Engineering Fracture Mechanics.
76 (2009) 2799-2809.
[5] J.G. Ratcliffe, Characterization of the edge crack torsion (ECT) test for mode III fracture
toughness measurement of laminated composites. Langley Research Center, Hampton, Virginia:
National Research Council (2004)
[6] E.S. Greenhalgh, Failure analysis and fractography of polymer composites. Woodhead
Publishing Ltd, 2009, pp. 164-227.
[7] J. Bonhomme, A. Argüelles, J. Viña, I. Viña, Fractography and failure mechanisms in static
mode I and mode II delamination testing of unidirectional carbon reinforced composites.
Polymer Testing. 28 (2009) 612-617.
342 Advanced Materials Forum VI

Advanced Materials Forum VI 10.4028/www.scientific.net/MSF.730-732
Fractographic Observation of Various Loading Modes of Fibre Reinforced Laminates
10.4028/www.scientific.net/MSF.730-732.337