drilling of carbon fibre reinforced plastic composites
TRANSCRIPT

DRILLING OF CARBON FIBRE REINFORCED PLASTIC COMPOSITES
by
ISLAM SAAD ELSAYED MOHAMED SHYHA M.Sc., B.Sc. (Hons)
A thesis submitted to The University of Birmingham
for the degree of DOCTOR OF PHILOSOPHY
School of Mechanical Engineering The University of Birmingham
August 2010

University of Birmingham Research Archive
e-theses repository This unpublished thesis/dissertation is copyright of the author and/or third parties. The intellectual property rights of the author or third parties in respect of this work are as defined by The Copyright Designs and Patents Act 1988 or as modified by any successor legislation. Any use made of information contained in this thesis/dissertation must be in accordance with that legislation and must be properly acknowledged. Further distribution or reproduction in any format is prohibited without the permission of the copyright holder.

SYNOPSIS
II
SYNOPSIS
Following an extensive literature survey focusing on the machinability of carbon fibre
reinforced plastics (CFRP), three main phases of experimental work were undertaken to
evaluate the drilling of CFRP and associated stack materials. Phase 1 and 2 involved small
diameter holes (1.5 mm) in thin CFRP laminates (3 mm thick) while Phase 3 addressed the
feasibility of one-shot drilling (6.35 mm diameter holes) in multilayer workpiece stacks
comprising titanium, CFRP and aluminium. Machinability was assessed in terms of tool
life/wear, force/torque, hole size and geometrical accuracy, workpiece surface integrity and
chip morphology. Initial trials (Phase 1A) were performed to investigate the effect of peel ply
layers (~100 μm thick nylon sheet attached on both sides of the laminate to assist the bleeding
of volatiles and air during curing as well as preventing surface contamination) on hole entry
and exit quality, as current industrial practice involves removal of the protective sheet prior to
drilling. The results indicated that the presence of the peel ply significantly improved hole
quality, particularly in respect of entry and exit delamination with considerable reduction in
defects such as fuzzing and edge chipping. The lack of information prompted tests to
determine the influence of tool geometry and operating conditions in Phase 1B. In Phase 2
experiments, the effect of composite material orientation/properties and the performance of
several diamond based coatings were evaluated with respect to tool life and workpiece
quality. The data indicated that a maximum operating feed rate of 0.2 mm/rev was advisable
for the stepped drill configuration to avoid tool fracture, while conventional twist drill
geometry was viable up to 0.3 mm/rev. Uncoated and diamond like carbon (DLC) coated
tools outperformed chemical vapour deposition (CVD) diamond coated drills in terms of tool
life (~ 2500 holes versus 1300 holes), as well as producing superior hole quality. In general,
machining of woven laminates resulted in lower delamination levels compared to equivalent
unidirectional (UD) composites, despite similar results in tool life.
Phase 3 of the research assessed the impact of stack arrangement/sequence and the
performance of PCD tools together with various coated WC drills and operating parameters.
Here, drilling involved 6.35 mm diameter holes in 30 mm thick Ti/CFRP/Al stacks under high
pressure through spindle coolant and spray mist environments. While results showed that
drilling of stacks in a single shot operation was feasible, drill material and geometry played a
critical role. Stack order also significantly affected process performance as drilling into

SYNOPSIS
III
Ti/CFRP/Al produced lower forces and higher productivity than when the sequence was
Al/CFRP/Ti. A tool life of approximately 300 holes was achieved using either uncoated or C7
hardmetal coated drills in contrast to ~ 200 holes with CVD diamond coated tools. Titanium
chips adhered to the machined hole surface and in production would necessitate an additional
finishing process. Relatively low surface roughness values of up to 1 and 0.3 μm Ra were
obtained for Ti and Al surfaces respectively whereas up to 9 μm Ra was recorded for CFRP.
It was concluded that further design improvements to PCD tools are required in order to
accommodate the cutting of stack material due to the catastrophic failure experienced when
machining the Ti section.

ACKNOWLEDGMENTS
IV
ACKNOWLEDGMENTS
The author would like to thank Dr. Sein Leung Soo (Lecturer) and Mr. David Aspinwall
(Reader in Advanced Manufacturing Technology and Head of the Machining Research
Group) both in the School of Mechanical Engineering, University of Birmingham for their
academic supervision and guidance over the course of the research. Thanks also go to Mrs.
Elaine Aspinwall for her generous time and help relating to experimental design and statistical
analysis techniques.
I am indebted to Mr. Richard Fasham, Mr. Andy Loat and Mr. Alan Saywell, Technical
Engineers within the School of Mechanical Engineering for their invaluable assistance with
the experimental work and preparation of workpiece material. Useful discussions and the
support from members of the Machining Research Group, School of Mechanical Engineering
over the duration of the project is gratefully acknowledged.
My sincerest gratitude and appreciation are due to Mr. Sam Bradley and Mr. Richard Perry
(GKN Aerospace), Mr. Neels Pretorius and Dr. Peter Harden (Element Six Ltd) and Mr.
Stuart Dawson (Unimerco Ltd) for sharing their experience and knowledge as well as
providing workpiece materials, tooling and funding for the work.
Special thanks go to Universities UK (for an Overseas Research Students Awards Scheme
Scholarship), University of Birmingham, GKN Aerospace (UK), Element Six Limited
(Ireland), Unimerco Limited (UK) and the Egyptian Ministry for Higher Education and
Scientific Research for financial support.
Last but certainly not least, I wish to express my love and deepest gratitude to my beloved
parents, wife and kids for their understanding, endless encouragement, support, patience and
love throughout this work.

TABLE OF CONTENTS
V
TABLE OF CONTENTS
1. INTRODUCTION 1
1.1. Background to the project 1
1.2. Aims and objectives 2
2. LITERATURE REVIEW 3
2.1. Composite materials 3
2.1.1. Overview 3
2.1.2. Classification of composite materials 3
2.1.3. Fibre reinforced plastic (FRP) composites 6
2.1.3.1. Properties of different fibres 8
2.1.3.2. Matrix systems for FRP composites 10
2.1.3.3. Description/nomenclature of FRP composite components 11
2.1.4. Carbon fibre reinforced plastic (CFRP) composites 13
2.1.4.1. Manufacturing of CFRP 13
2.1.4.2. Properties of CFRP 13
2.1.4.3. Health and safety aspects 14
2.2. Titanium alloys 16
2.2.1. Introduction 16
2.2.2. Properties and applications of Ti-6Al-4V 16
2.3. Aluminium alloys 17
2.3.1. Introduction 17
2.3.2. Properties of Al-7050-T7651 18
2.4. Machining of composites 18
2.4.1. Background 18
2.4.2. Machinability of FRP composites 18
2.4.2.1. Effect of material properties 19
2.4.2.2. Effect of cutting conditions 21
2.4.2.3. Effect of tool materials/geometries 21
2.5. Drilling of CFRP composites 22
2.5.1. Introduction 22
2.5.2. Twist drilling in CFRP 23
2.5.2.1. Drilled hole quality 24
2.5.2.2. Cutting forces and torque 32

TABLE OF CONTENTS
VI
2.5.2.3. Methods for reduction of drilling forces 34
2.5.2.4. Tool life/tool wear and cutting temperature 36
2.5.3. Alternative techniques for cutting small holes in FRP 39
2.5.4. Modelling the drilling of FRP composites 45
2.6. Machining of titanium alloys 46
2.6.1. Overview 46
2.6.2. Cutting temperature when machining titanium alloys 46
2.6.3. Tool wear when machining titanium alloys 47
2.6.4. Cutting conditions when machining titanium alloys 48
2.6.5. Chip formation and surface integrity when machining titanium alloys
48
2.6.6. Drilling Ti-6Al-4V 49
2.7. Machining of aluminium alloys 51
2.8. Drilling of multilayered composite/metallic materials 52
2.8.1. Background 52
2.8.2. Drilling of metallic/composite stacks 53
2.9. Cutting tool materials and coatings 56
2.9.1. Introduction 56
2.9.2. Tungsten carbide tools 57
2.9.3. CVD diamond and DLC coatings 58
2.9.4. Polycrystalline diamond (PCD) drills 60
2.10. Statistical experimental design techniques 61
2.10.1. Introduction 61
2.10.2. Taguchi experimental design procedure 62
2.10.3. Overview of analysis of variance (ANOVA) technique 62
3. EXPERIMENTAL WORK 63
3.1. Workpiece materials 63
3.1.1. CFRP composite laminates for Phase 1 and Phase 2 tests 63
3.1.2. Ti/CFRP/Al stacks for Phase 3 tests 66
3.1.2.1. CFRP composite laminates 66
3.1.2.2. Titanium - Ti-6Al-4V alloy 67
3.1.2.3. Aluminium - Al-7050 alloy 67
3.2. Tool geometries, materials and coatings 68
3.2.1. Small diameter carbide drills for Phase 1 and 2 68
3.2.2. Drills for Phase 3 test programme 70

TABLE OF CONTENTS
VII
3.3. Equipment 73
3.3.1. Machine tool and cutting fluid application 73
3.3.1.1. Matsuura FX-5 high speed machining centre 73
3.3.1.2. Cutting fluid application 73
3.3.1.3. Experimental setup 74
3.3.2. Force measurement 75
3.3.3. Tool wear, workpiece delamination and chip analysis 76
3.3.4. Hole diameter, cylindricity and out of roundness measurement 77
3.3.5. Surface roughness and burr height assessment 79
3.3.6. Hole surface integrity analysis and microscopy 79
3.4. Experimental design and test arrays 81
3.4.1. Phase 1A: Preliminary small hole drilling of CFRP and the influence of peel ply layers
81
3.4.2. Phase 1B: Effect of tool geometry and operating parameters 81
3.4.3. Phase 2A: Effect of composite material, fibre orientation and machining parameters
83
3.4.4. Phase 2B: Evaluation of diamond based coatings 85
3.4.5. Phase 3A: Preliminary drilling trials in separate CFRP and Ti workpieces and multilayer stacks
86
3.4.6. Phase 3B: Impact of stack arrangement and performance of PCD tools
87
3.4.7. Phase 3C: Effect of tool coatings and operating parameters 89
4. RESULTS AND DISCUSSION 91
4.1. Phase 1A: Preliminary small hole drilling of CFRP and the influence of peel ply layers
91
4.2. Phase 1B: Effect of tool geometry and operating parameters 97
4.2.1. Tool wear and tool life 97
4.2.2. Thrust force and torque 101
4.2.3. Drilled hole quality and damage 106
4.2.4. Hole size measurement 114
4.2.5. Confirmation test 116
4.3. Phase 2A: Effect of composite material, fibre orientation and machining parameters
117
4.3.1. Tool wear and tool life 117
4.3.2. Thrust force and torque 121

TABLE OF CONTENTS
VIII
4.3.3. Drilled hole quality and damage 126
4.3.4. Hole size measurement 135
4.3.5. Chip analysis 137
4.4. Phase 2B: Evaluation of diamond based coatings 138
4.4.1. Tool wear and tool life 138
4.4.2. Thrust force and torque 143
4.4.3. Drilled hole quality and damage 147
4.5. Phase 3A: Preliminary drilling trials in separate CFRP and Ti workpieces and multilayer stacks
152
4.5.1. Tool wear and tool life 152
4.5.2. Thrust force and torque 154
4.5.3. Hole surface roughness 156
4.5.4. Burr height for Ti sections 156
4.5.5. Entry/exit hole damage 157
4.6. Phase 3B: Impact of stack arrangement and performance of PCD tools
159
4.6.1. Tool wear and tool life 159
4.6.2. Thrust force and torque 162
4.7. Phase 3C: Effect of tool coatings and operating parameters 166
4.7.1. Tool wear and tool life 166
4.7.2. Thrust force and torque 170
4.7.3. Hole size and geometrical accuracy 178
4.7.4. Hole surface roughness 182
4.7.5. Burr height for Ti and Al sections 186
4.7.6. Hole edge quality 190
4.7.7. Microhardness for metallic sections 192
4.7.8. Chip analysis 193
5. CONCLUSIONS 196
5.1. Literature review 196
5.2. Experimental work – small hole (1.5 mm) drilling of CFRP 197
5.2.1. Influence of peel ply layers 197
5.2.2. Effect of tool geometry and operating parameters 197
5.2.3. Effect of composite material, fibre orientation and machining parameters
198
5.2.4. Evaluation of diamond based coatings 198

TABLE OF CONTENTS
IX
5.3. Experimental work – drilling of multilayer stacks 199
5.3.1. Preliminary drilling trials in separate CFRP and Ti plates and multilayer stacks
199
5.3.2. Impact of stack arrangement and performance of PCD tools 200
5.3.3. Effect of tool coatings and operating parameters 200
5.4. Overall conclusions and recommended operating conditions 202
5.4.1. Small hole drilling in CFRP 202
5.4.2. Drilling of multilayer stacks (Ti/CFRP/Al) 203
6. RECOMMENDATIONS FOR FUTURE WORK 205
REFERENCES 206
APPENDICES 217
A: Industrial collaborator’s contact details 218
B: Manufacturing procedure for CFRP composite part 219
C: Material safety data sheet (MSDS) for CFRP 221
D: Additional force and torque curves, charts and ANOVA results 224
E: Cutting temperature measurement results (Phase 2A) 228
F: List of publications 231

LIST OF FIGURES
X
LIST OF FIGURES
Figure 2.1 Properties of various metals and composites [5] 4
Figure 2.2 Classification for various composites according to reinforcement format [4] 4
Figure 2.3 The most commonly used fabric types [5] 6
Figure 2.4 Example of stacking sequence in multidirectional layup 6
Figure 2.5 Relative properties for various individual fibres [5] 7
Figure 2.6 Microscopic image for cross sectioned CFRP laminate 12
Figure 2.7 Different possible ply orientation for UD laminate layup 13
Figure 2.8 Cutting mechanisms in the orthogonal machining of FRP composites [48] 20
Figure 2.9 Microstructure when orthogonal cutting of graphite/epoxy composite: (a) θ =150o
and 0.05 mm depth of cut and (b) θ = 120o and 0.1 mm depth of cut [49]
21
Figure 2.10 Flank wear results of different tool materials when turning CFRP [41] 22
Figure 2.11 Twist drill terminology [53] 23
Figure 2.12 Fishbone diagram detailing factors affecting the drilling of CFRP 24
Figure 2.13 Quality criteria when drilling FRPs [43] 25
Figure 2.14 Delamination forms: (a) peel-up at entrance and (b) push-out at exit [68, 71] 26
Figure 2.15 Spalling at exit surface when drilling MD CFRP: (a) schematic of spalling, (b)
spalling at chisel edge penetration and (c) spalling after drilling [60]
27
Figure 2.16 Schematic of delamination factor calculation 28
Figure 2.17 Correlation between delamination factor and number of drilled holes when using
carbide drills for cutting CFRP [61]
28
Figure 2.18 Examples of extreme delamination patterns when drilling FRP laminates: a) fine
cracks and b) uniform damage area [64]
30
Figure 2.19 Various drill types/designs (diameter = 10 mm, spindle speed = 100 rpm, feed =
0.012mm/rev) (a) twist drill, (b) saw drill, (c) candlestick drill, (d) core drill, (e)
step drill [69]
31
Figure 2.20 Images for different step-core drills [82, 83] 31
Figure 2.21 Thrust force and torque versus time plots for a single cutting operation [93] 33
Figure 2.22 Thrust force curves with and without pilot hole [94] 35
Figure 2.23 Measured and estimated thrust force values when drilling CFRP [94] 35
Figure 2.24 Drilling induced delamination (1000 rpm, 0.016 mm/rev): a, c: drilling without
backup - b, d: drilling with backup [95]
35
Figure 2.25 Comparison between thrust force when vibration assisted and conventional 36
LIST OF FIGURES
XI
drilling [96]
Figure 2.26 A cross section of a replica from a cutting edge when machining FRPs (αo is the
rake angle and γo is the clearance angle) [12]
37
Figure 2.27 Effect of number of drilled holes on tool wear, thrust force and torque for
uncoated, TiN and DLC coated drills when drilling CFRP [93]
38
Figure 2.28 Flank temperature when drilling CFRP versus feed rate and cutting speed [61] 39
Figure 2.29 The definition of the edge position angle (γ) [104] 40
Figure 2.30 Number of drilled holes versus: (a) surface roughness and (b) hole damage [104] 40
Figure 2.31 Damage width around the drilled hole (1 mm diameter, 80,000 rpm and 50
μm/rev feed) [106]
41
Figure 2.32 SEM image of perforated UD CFRP with resin damage on: (a) drilling side and
(b) exit side [113]
43
Figure 2.33 Various workpiece defects when laser drilling of CFR thermoplastic composites
[119]
44
Figure 2.34 Entry/exit quality when ultrasonic drilling of CFR Si/C [125] 44
Figure 2.35 Distribution of thermal load when machining titanium and steel [27] 47
Figure 2.36 Continuous-serrated chips produced from turning Ti-6Al-4V at 75 m/min cutting
speed and feed rate of: (a) 0.05 mm/rev and (b) 0.28 mm/rev [140]
49
Figure 2.37 Burr types formed in: (a) dry cutting and (b) wet cutting [144] 50
Figure 2.38 SEM image of drill rake face (15 holes) [143] 51
Figure 2.39 (a) Thrust force and (b) torque profiles versus drilling depth when using HSS
drill with 660 rpm and 0.2 mm/rev feed rate [159]
54
Figure 2.40 Some hole quality parameters in drilling graphite/titanium hybrid composites
[160]
55
Figure 2.41 Chip removal problem when drilling Ti-6Al-4V in a metallic/composite stack
[163]
56
Figure 2.42 The relationship between toughness and hardness for various cutting tool
materials [166]
57
Figure 2.43 (a) PCBN and (b) PCD tools used to machine Al-SiC MMC at 50 m/min without
coolant [181]
61
Figure 3.1 Cross section micrographs of: (a) UD and (b) woven MTM44-1/HTS OC
laminates with associated fibre orientation
64
Figure 3.2 (a) Ti/CFRP/Al stacks and (b) cross section schematic 66
Figure 3.3 SEM images for: (a) conventional twist drill, (b) stepped drill and (c) end view
for conventional drill used for Phase 1B tests
68

LIST OF FIGURES
XII
Figure 3.4 Stepped drill geometry used in the test programme (All dimensions in mm and all
angles in degrees)
69
Figure 3.5 Sandvik drills used in Phase 3A tests (Courtesy of Sandvik Coromant) 71
Figure 3.6 Straight fluted PCD drills used in Phase 3A: (a) side view and (b) end view 71
Figure 3.7 Uncoated and coated WC drills used in Phase 3 and supplied by Unimerco 72
Figure 3.8 Brazed PCD drill used in Phase 3B: (a) side view and (b) end view 72
Figure 3.9 Helical fluted domed PCD drill used in Phase 3B: (a) side view and (b) end view 72
Figure 3.10 Matsuura FX5 high speed machining centre 74
Figure 3.11 Filtermist Dustomat 15 extraction unit 74
Figure 3.12 (a) Drilling jig and (b) experimental setup in Phase 1 and 2 testing 75
Figure 3.13 Experimental setup for Phase 3 tests: (a) Through coolant adaptor with force
measurement and (b) spray mist unit
75
Figure 3.14 (a) 9123C Kistler rotating force dynamometer, (b) 9273 Kistler drilling
dynamometer, (c) 5011A charge amplifiers connected to a PC running Dynoware
and (d) 5223A charge amplifier used with the RD
76
Figure 3.15 Tool wear measurement setup 77
Figure 3.16 SEM images of typical worn cutting lip of: (a) pilot and (b) step drill sections 77
Figure 3.17 (a) 3 axis DEA Mistral coordinate measuring machine (CMM) with a 1 mm ruby
ball stylus and (b) measurement positions for each material layer
78
Figure 3.18 Taylor Hobson Talyrond series 300 78
Figure 3.19 (a) Taylor Hobson Talysurf 120L, (b) setup for Ra and (c) setup for burr height
measurement
79
Figure 3.20 (a) Buehler mounting press, (b) Buehler grinder-polisher and (c) Leica DMLM
microscope
80
Figure 3.21 (a) JOEL 6060 Scanning electron microscope (SEM) and (b) sputter coater (SC
7640)
80
Figure 3.22 Measures used in calculating the delamination factor 83
Figure 3.23 Drilling arrangement when cutting Al/CFRP/Ti stacks 88
Figure 3.24 Drilling arrangement when cutting Ti/CFRP/Al stacks 90
Figure 4.1 Entry/exit delamination factor for drilling with peel ply layer 91
Figure 4.2 (a) Entry damage for the 1250th hole and (b) Exit damage (fraying) of the 625th
hole for un-backed materials
92
Figure 4.3 SEM images showing progression of damage at hole entry 92
Figure 4.4 SEM images showing progression of damage at hole exit 93
Figure 4.5 Flank wear for drilling nylon backed and un-backed CFRP materials 94

LIST OF FIGURES
XIII
Figure 4.6 WC drills: (a) new, (b) used for drilling un-backed CFRP and (c) used for nylon
backed CFRP
94
Figure 4.7 (a) Thrust force and (b) hole diameter versus number of drilled holes for backed
and un-backed CFRP
95
Figure 4.8 Average surface roughness for drilling backed and un-backed CFRP materials 96
Figure 4.9 3D topography maps for un-backed (left) and backed (right) materials 96
Figure 4.10 (a) Various forms of damage at the cut surface and (b) incompletely cut fibres 97
Figure 4.11 Drill wear graph for all tests (based on the maximum flank wear criterion) 98
Figure 4.12 New and worn drills for Test 5 and Test 11 98
Figure 4.13 Drill flank wear evolution for Test 11 (TiN conventional drill, 118o, 24o, 15
m/min and 0.1 mm/rev)
99
Figure 4.14 Drill wear pattern for all tests at end of tool life 99
Figure 4.15 Drill wear details for Test 11 after 1450 holes (conventional drill, TiN coating,
118o helix angle, 24o point angle, 15 m/min cutting speed and 0.2 mm/rev feed
rate)
100
Figure 4.16 Main effects plot, means for tool life (Phase 1B) 101
Figure 4.17 Thrust force profile for the first hole drilled using (a) conventional drill and (b)
stepped drill (Test 3 and 5 respectively)
102
Figure 4.18 Thrust force and torque results for tests showing the highest tool life 103
Figure 4.19 Main effects plot, means for thrust force (Phase 1B) 104
Figure 4.20 Main effects plot, means for torque (Phase 1B) 105
Figure 4.21 SEM images for hole exit (Test 9) 106
Figure 4.22 Hole entry and exit at first hole 107
Figure 4.23 Hole entry and exit at last hole (all to the same flank wear criterion) 108
Figure 4.24 Main effects plot, means for entry Fd for the first hole (Phase 1B) 109
Figure 4.25 Main effects plot, means for entry Fd for the last hole (Phase 1B) 110
Figure 4.26 Main effects plot, means for exit Fd for the first hole (Phase 1B) 111
Figure 4.27 Main effects plot, means for exit Fd for the last hole (Phase 1B) 112
Figure 4.28 Various types/configurations of damage produced when drilling CFRP 113
Figure 4.29 Damage caused by removal of the peel ply layer 113
Figure 4.30 Internal hole damage forms 114
Figure 4.31 Hole diameter results (Phase 1B) 115
Figure 4.32 Main effects plot, means for hole diameter (Phase 1B) 115
Figure 4.33 Flank wear curves for tests carried out using stepped drills 117
Figure 4.34 Flank wear curves for tests carried out using conventional drills 118

LIST OF FIGURES
XIV
Figure 4.35 Tool life in terms of number of drilled holes (* tests experienced tool fracture) 118
Figure 4.36 Micrographs of tool at test cessation (tests performed using the stepped drills) 119
Figure 4.37 Main effects plot, means for tool life (Phase 2A) 120
Figure 4.38 Subsurface microscopic analysis of (a) UD and (b) woven 8552/AS4 AC 121
Figure 4.39 Typical force diagram for a single hole drilled using a stepped drill in woven
8552/AS4 AC laminate at 0.2 mm/rev
122
Figure 4.40 Thrust force results for the first hole drilled (Phase 2A) 122
Figure 4.41 Thrust force results for the last hole drilled (Phase 2A) 123
Figure 4.42 Main effects plot, means for thrust force (first hole) 124
Figure 4.43 Main effects plot, means for thrust force (last hole) 124
Figure 4.44 Drilling torque results (Phase 2A) 125
Figure 4.45 Main effects plot, means for torque (Phase 2A) 126
Figure 4.46 Entry delamination factor results for first hole drilled (Phase 2A) 127
Figure 4.47 Entry delamination factor results for last hole drilled (Phase 2A) 127
Figure 4.48 Exit delamination factor results for first hole drilled (Phase 2A) 128
Figure 4.49 Exit delamination factor results for last hole drilled (Phase 2A) 128
Figure 4.50 Delamination for (a) hole entry and (b) hole exit at 0.2 mm/rev feed rate for first
drilled hole (stepped drill)
129
Figure 4.51 Exit delamination at 0.4 mm/rev feed rate for: a) the first and b) the last drilled
hole (stepped drill)
130
Figure 4.52 Exit delamination at 0.4 mm/rev feed rate for: a) stepped and b) conventional
drill (last drilled hole)
130
Figure 4.53 Extent of delamination caused by pilot portion of drill 131
Figure 4.54 Main effects plot, means for entry Fd for the first hole (Phase 2A) 132
Figure 4.55 Main effects plot, means for entry Fd for the last hole (Phase 2A) 132
Figure 4.56 Main effects plot, means for exit Fd for the first hole (Phase 2A) 133
Figure 4.57 Main effects plot, means for exit Fd for the last hole (Phase 2A) 134
Figure 4.58 Examples for conventional and adjusted Fd: a) Last hole exit – Test 1, b) Last
hole exit – Test 10, c) First hole exit – Test 5 and d) First hole entry –Test 10
135
Figure 4.59 Hole diameter measurement results (Phase 2A) 136
Figure 4.60 Main effects plot, means for hole diameter (Phase 2A) 137
Figure 4.61 Continuous/spiral nylon peel ply chip 137
Figure 4.62 Various chip shapes when drilling CFRP 138
Figure 4.63 SEM images for chips produced from tests in Phase 2A 138
Figure 4.64 Flank wear results for different coatings when drilling UD MTM 44-1/HTS 139

LIST OF FIGURES
XV
Figure 4.65 Tool life in terms of number of drilled holes 140
Figure 4.66 Micrographs of tools used at 0.2 mm/rev feed rate: (a) UD MTM44-1/HTS and
(b) woven 977-2 laminates, number of drilled holes is shown for the worn tools
140
Figure 4.67 SEM images for the drills used at 0.4 mm/rev feed rate: (a) new and (b) worn 141
Figure 4.68 Tool life for uncoated and DLC coated drills 142
Figure 4.69 Main effects plot, means for tool life (Phase 2B) 142
Figure 4.70 Thrust force results for the first hole drilled (Phase 2B) 143
Figure 4.71 Thrust force results for the last hole drilled (Phase 2B) 144
Figure 4.72 Main effects plot, means of thrust force (first hole) 145
Figure 4.73 Main effects plot, means of thrust force (last hole) 145
Figure 4.74 Torque results for the last hole drilled (Phase 2B) 146
Figure 4.75 Main effects plot, means of torque (last hole) 147
Figure 4.76 Sample drilled holes showing exit delamination when drilling UD MTM44-1 and
woven 977-2 laminates using Rhobest diamond coated drill at 0.4 mm/rev feed
rate
148
Figure 4.77 Exit delamination images for the last hole 148
Figure 4.78 Exit delamination factor results for all drills used at 0.4 mm/rev feed rate 149
Figure 4.79 Exit delamination factor results (Phase 2B) 149
Figure 4.80 Main effects plot, means for exit Fd for the first hole (Phase 2B) 150
Figure 4.81 Main effects plot, means for exit Fd for the last hole (Phase 2B) 151
Figure 4.82 Tool wear results for tests performed using through coolant adaptor 152
Figure 4.83 Micrographs for new and worn cutting edges used in Phase 3A 153
Figure 4.84 Micrographs for a worn coated Sandvik R846 drill (Test 5) showing titanium
adhered to cutting edges
153
Figure 4.85 Force and torque signals when drilling 1st hole in CFRP/Ti stack (84/42 m/min
and 0.1 mm/rev)
154
Figure 4.86 Thrust force results for Phase 3A 155
Figure 4.87 Torque results for Phase 3A 155
Figure 4.88 Surface roughness results for CFRP and Ti hole surfaces 156
Figure 4.89 Burr height results for entry and exit holes drilled on Ti workpiece 157
Figure 4.90 Entry and exit hole damage for CFRP sections 158
Figure 4.91 Hole edge quality at hole entry and exit (Ti - Test 5) 158
Figure 4.92 Chip disposal difficulties encountered when drilling CFRP/Ti stacks 159
Figure 4.93 Tool wear curves for tests performed in Phase 3B 160
Figure 4.94 Micrographs for new and worn cutting edges (Phase 3B) 161

LIST OF FIGURES
XVI
Figure 4.95 Tool wear evolution for Test 3 (C7 – 83/30 m/min – 0.15 mm/rev – wet cutting) 162
Figure 4.96 Evolution of thrust force versus number of drilled holes in Test 1 (C7 coated drill
– 60/20 m/min – 0.05 mm/rev – wet cutting in Al/CFRP/Ti stack)
163
Figure 4.97 Force and torque profiles when drilling various stack orders 164
Figure 4.98 Samples for typical thrust force and torque signatures 165
Figure 4.99 Tool wear curves for tests performed using flood coolant 166
Figure 4.100 Tool wear curves for tests performed using spray mist 167
Figure 4.101 Tool life results using wet cutting 168
Figure 4.102 Sample flank wear micrographs 168
Figure 4.103 Main effects plot, means for tool life (Phase 3C) 170
Figure 4.104 Samples for typical thrust force and torque signatures 171
Figure 4.105 Evolution of thrust force and torque versus number of drilled holes in Test 1
(uncoated drill – 20/40 m/min – 0.05 mm/rev – wet cutting)
172
Figure 4.106 Thrust force results for new tool (first hole) 173
Figure 4.107 Torque results for the last hole (worn tool) 174
Figure 4.108 Main effects plot, means for thrust force following the first hole (new tool) 175
Figure 4.109 Main effects plot, means for torque following the first hole 177
Figure 4.110 Hole diameter results at Ti layer 179
Figure 4.111 Hole diameter results for the first and last holes drilled at all material sections 179
Figure 4.112 Captured images for sample measurements of (a) cylindricity and (b) roundness 180
Figure 4.113 Roundness measurement results 181
Figure 4.114 Cylindricity measurement results 181
Figure 4.115 Average surface roughness (Ra) results for the three materials in Test 1 183
Figure 4.116 Average surface roughness (Ra) results for the Ti section 183
Figure 4.117 Average surface roughness (Ra) results for the CFRP section 184
Figure 4.118 Average surface roughness (Ra) results for the Al section 184
Figure 4.119 3D topographic maps for the last hole drilled: (a) Test 1 and (b) Test 7 185
Figure 4.120 SEM images for the machined surface quality (Test 1): (a), (b) middle of hole 1,
(c) entry of hole 1 and (d) entry of hole 310
186
Figure 4.121 Uniform burr formation at entry and exit last hole drilled in Ti and Al 187
Figure 4.122 SEM images for exit burr formation at Test 1: (a) titanium and (b) aluminium 188
Figure 4.123 Crown burr formation when spray mist was used (Al exit, Test 12) 188
Figure 4.124 Burr height results for tests performed using: (a) uncoated (Test 1) and (b) C7
coated (Test 7) drills using flood coolant
189
Figure 4.125 Burr height results for holes entry and exit (Ti and Al sections) 190

LIST OF FIGURES
XVII
Figure 4.126 Hole edge quality for Ti layer 191
Figure 4.127 Hole edge quality for CFRP layer 191
Figure 4.128 Microhardness results for Al sectioned holes 192
Figure 4.129 Microhardness results for Ti sectioned holes 193
Figure 4.130 Various chips produced from Ti and Al holes 194
Figure 4.131 Curled/deformed aluminium swarf (formed in the spray mist environment) 194
Figure 4.132 Spiral titanium swarf 195
Figure 4.133 (a) CFRP particles fused with aluminium swarf and (b) CFRP chips formed
according to contour of drill flutes
195
Figure 4.134 CFRP particles attached to Al swarf causing clogging of drill flutes under spray
mist conditions
195
Figure B-1 different forms of fibre prepregs 218
Figure B-2 Typical curing cycle for monolithic components 220
Figure D-1 Thrust force results for Phase 2A 224
Figure D-2 Torque results for Phase 2A 224
Figure D-3 Thrust force for the last hole drilled at 0.4 mm/rev feed rate 225
Figure D-4 Torque for the last hole drilled at 0.4 mm/rev feed rate 225
Figure D-5 Thrust force and torque profiles recorded when drilling the first hole 226
Figure D-6 Thrust force and torque profiles recorded when drilling hole number 115 226
Figure D-7 Thrust force results corresponding to the last hole drilled 227
Figure D-8 Torque results corresponding to the first hole drilled 227
Figure E-1 Cutting temperature setup on Matsuura FX-5 using ThermaCAM which was
loaned from EPSRC
228
Figure E-2 Drilling UD MTM44-1/HTS OOAC at 0.4mm/rev feed rate using worn standard
twin lipped twist drill (after 3250 holes)
229
Figure E-3 Temperature curve when drilling UD MTM44-1/HTS OOAC at 0.4 mm/rev feed
rate using worn standard twin lipped twist drill (following 3250 holes)
229
Figure E-4 Maximum drilling temperature development when cutting woven 977-2/HTS AC
at 0.4 mm/rev feed rate
230

LIST OF TABLES
XVIII
LIST OF TABLES
Table 2.1 Properties of various carbon fibre types [18] 9
Table 2.2 Classification of carbon fibres based on their tensile strength and modulus [18] 9
Table 2.3 Mechanical and thermal properties of epoxy resin against steel and aluminium [12] 11
Table 2.4 Mechanical properties for carbon fibre laminate [5] 14
Table 2.5 Mechanical properties for the common CFRP laminates against GFRP and AFRP
composites [2]
14
Table 2.6 Identification for expected hazards [23] 15
Table 2.7 Critical values of exposure [24] 15
Table 2.8 A list of typical commercial titanium alloys 16
Table 2.9 Properties of Al-7050 and Ti-6Al-4V alloys [30, 34] 18
Table 2.10 Critical feed rate for various drill bits [69] 31
Table 2.11 Properties of WC-Co tool materials [29] 58
Table 3.1 Details of workpiece materials for Phase 1 tests 64
Table 3.2 Details of workpiece materials for Phase 2 tests 65
Table 3.3 Mechanical properties of the CFRP laminates post curing [55] 67
Table 3.4 Mechanical properties of Ti-6Al-4V alloy [32] 67
Table 3.5 Mechanical properties of Al-7050 alloy [30] 67
Table 3.6 Specification for coating materials used in Phase 1 and 2 69
Table 3.7 Small diameter carbide drills used in Phase 1 and 2 test programme 70
Table 3.8 Characteristics of the dust extraction system 74
Table 3.9 Fixed factors and their corresponding levels for Phase 1A 81
Table 3.10 Process control variables for Phase 1B 82
Table 3.11 A modified OA L12 for process control variables (A–F) and their corresponding
levels for Phase 1B
82
Table 3.12 Phase 2A process control variables and levels 83
Table 3.13 Phase 2A full factorial test array 84
Table 3.14 Phase 2A fixed factors and levels 84
Table 3.15 Phase 2B process control variables and their corresponding levels 85
Table 3.16 Phase 2B test array 86
Table 3.17 Drilling test matrix for Phase 3A 87
Table 3.18 Initial plan for Phase 3B control factors and levels 88
Table 3.19 Drilling tests conducted for Phase 3B 88

LIST OF TABLES
XIX
Table 3.20 Process control variable and levels for Phase 3C 89
Table 3.21 L18 OA in real variable values 90
Table 4.1 ANOVA results for tool life (Phase 1B) 101
Table 4.2 ANOVA results for thrust force at the last hole drilled (Phase 1B) 104
Table 4.3 ANOVA results for drilling torque (Phase 1B) 105
Table 4.4 ANOVA results for entry Fd for the first hole (Phase 1B) 109
Table 4.5 ANOVA results for entry Fd for the last hole (Phase 1B) 110
Table 4.6 ANOVA results for exit Fd for the first hole (Phase 1B) 111
Table 4.7 ANOVA results for exit Fd for the last hole (Phase 1B) 112
Table 4.8 ANOVA results for hole diameter (Phase 1B) 116
Table 4.9 ANOVA results for tool life (Phase 2A) 120
Table 4.10 ANOVA results for thrust force (first hole) 124
Table 4.11 ANOVA results for entry Fd (first hole) 132
Table 4.12 ANOVA results for entry Fd (last hole) 133
Table 4.13 ANOVA results for exit Fd (first hole) 133
Table 4.14 ANOVA results for exit Fd (last hole) 134
Table 4.15 ANOVA results for tool life (Phase 2B) 143
Table 4.16 ANOVA results for thrust force (first hole) 145
Table 4.17 ANOVA results for thrust force (last hole) 146
Table 4.18 ANOVA results for torque (last hole) 147
Table 4.19 ANOVA results for exit delamination factor (first hole) 151
Table 4.20 ANOVA results for exit delamination factor (last hole) 151
Table 4.21 Tool life results for Phase 3B 160
Table 4.22 ANOVA results for tool life in terms number of drilled holes (Phase 3C) 170
Table 4.23 ANOVA results for thrust force corresponded to Ti layer (new tool) 176
Table 4.24 ANOVA results for thrust force corresponded to CFRP layer (new tool) 176
Table 4.25 ANOVA results for thrust force corresponded to Al layer (new tool) 176
Table 4.26 ANOVA results for torque corresponded to Ti layer (new tool) 177
Table 4.27 ANOVA results for torque corresponded to CFRP layer (new tool) 177
Table 4.28 ANOVA results for torque corresponded to Al layer (new tool) 178
Table 5.1 List of preferred operating parameters and workpiece material for small hole
drilling of CFRP
203
Table 5.2 List of preferred operating parameters for drilling multilayer stacks 204

NOMENCLATURE
XX
NOMENCLATURE
5HS : Five harness satin woven carbon fibre
A : Aramid
ACF : Activated carbon fibres
ACGIH : American Conference of Governmental Industrial Hygienists
Ad : Damaged area around the hole (mm2)
AFRP : Aramid fibre reinforced plastic
Al : Aluminium
Al2O3 : Aluminium oxide
Amax : Maximum damage area based on Dmax (mm2)
ANOVA : Analysis of variance
Ao : Drilled hole area (mm2)
AWJ : Abrasive waterjet
C : Carbon
CFRP : Carbon fibre reinforced plastic
CMC : Ceramic matrix composite
Co : Cobalt
COF : Coefficient of friction
Cp : Specific heat (kJ/kg oC)
CrCN : Chromium carbon nitride
CTE : Coefficient of thermal expansion (10-6 oC)
CVD : Chemical vapour deposition
DF : Degree of freedom
DLC : Diamond like carbon
Dmax : Maximum damage zone diameter (mm)
Do : Drilled hole diameter (mm)
E : Modulus of elasticity (GPa)
Exp SS : Expected sum of squares
F : f-test value
FA : Critical thrust forces at which push-out occurs (N)
Fc : Critical thrust forces at which peel-up occurs (N)
Fd : Conventional delamination factor
Fda : Adjusted delamination factor

NOMENCLATURE
XXI
FE : Finite element
FRP : Fibre reinforced plastic
G : Glass
G1c : Critical energy release rate for delamination
GFRP : Glass fibre reinforced plastic
GP : General purpose
h : Depth of material remaining to be cut under the tool (mm)
H : Composite laminate thickness (mm)
H : Helix angle (o)
HAZ : Heat affected zone
HM : High modulus carbon fibre
HP : High performance
HS : High strength carbon fibre
HSS : High speed steel
HT : High tenacity carbon fibre
IADS : International Alloy Designation System
IM : Intermediate modulus carbon fibre
K : Thermal conductivity (W/m oC)
k : Peeling factor which is a function of the coefficient of friction between drill and workpiece and the drill helix angle
LM : Low modulus carbon fibre
MD : Multidirectional
MMC : Metal matrix composite
MQL : Minimum quantity lubrication
MRR : Material removal rate (mm3)
NIOSH : The National Institute for Occupational Safety and Health
OA : Orthogonal array
P : Point angle (o)
P : Probability
PAN : polyacrylonitrile based carbon
PCD : Polycrystalline diamond
PCR : Percentage contribution ratio
PMC : Polymer matrix composite
PVD : Physical vapour deposition
Ra : Average surface roughness (μm)

NOMENCLATURE
XXII
Rmax : Maximum surface roughness (μm)
RTM : Resin transfer moulding
Sa : Average surface roughness for 3D (μm)
Si3N4 : Silicon nitride
SiC : Silicon carbide
SM : Standard modulus carbon fibre
SS : Sum of squares
taC : Tetrahedral amorphous carbon
Tg : Glass transition temperature (oC)
Ti : Titanium
TiAlN : Titanium aluminium nitride
TiC : Titanium carbide
TiCN : Titanium carbon nitride
TiN : Titanium nitride
Tm : Melting temperature (oC)
TWA : Time weighted average
UD : Unidirectional
UHM : Ultrahigh modulus carbon fibre
USM : Ultrasonic machining
v : Poisson’s ratio
VBBmax : Maximum flank wear (mm)
Vf : Fibre volume fraction
Vm : Matrix volume fraction
w : Weight (kg)
WC : Tungsten carbide
WEDM : Wire electrical discharge machining
α : Traditional delamination factor weight
β : Ratio between the damaged area
εu : Strain to failure (%)
γ : Edge position angle between the cutting direction and the fibre direction (o)
θ : Fibre orientation (o)
ρ : Density (g/cm3)
σT : Tensile strength (MPa)
σu : Ultimate tensile strength (MPa)

CHAPTER 1: INTRODUCTION
1
1. INTRODUCTION
1.1 Background to the project
Composites use in the aerospace industry is expanding, with carbon fibre reinforced
plastics (CFRP) arguably at the forefront for replacing more conventional workpiece materials
such as aluminium and steel in aircraft structural components. The nature of CFRP products
still often necessitates the use of various machining processes in order to fulfil performance
and design requirements. Of these, hole drilling is one of the most widely used operations as a
means to facilitate mechanical joining of composite parts with other elements. Despite
considerable developments in tooling and machine tool technology as well as improved
process capability over the past decade, innovations are constantly being pursued by industry
to obtain greater productivity and improved surface quality/integrity.
While there is a significant body of research on the drilling of CFRP, the vast majority
of publications deal (understandably) with fixing holes in the region of 5 – 6 mm diameter,
however there is also a need for data relating to the machinability of smaller diameter holes (<
3 mm), for example in relation to acoustic panels, where sections can incorporate up to
100,000 of such holes. More recently, multilayer metallic/composite stack materials
consisting of CFRP, titanium and/or aluminium have also seen a surge in demand/use,
particularly for aerospace structures subjected to high mechanical loads during service.
Challenges faced when drilling such structures include not only the marked anisotropy/in-
homogeneity, lack of plastic deformation and abrasive characteristics for the CFRP
composites but also the dissimilar mechanical/physical properties for the stack materials.
These aspects impact on selection of appropriate operating parameters, fluid supply, swarf
evacuation etc. with consequent adverse effects on tool life and workpiece quality.
The research presented in this thesis was undertaken as part of a Doctor of Philosophy
(PhD) degree programme based within the Machining Research Group in the School of
Mechanical Engineering at the University of Birmingham. The project was carried out in
collaboration with a consortium of industrial organisations including GKN Aerospace,
Element Six Ltd and Unimerco Ltd who provided both financial and in-kind contributions
(workpiece materials, tool materials, tooling.), see Appendix A for list of contacts. An

CHAPTER 1: INTRODUCTION
2
Overseas Research Student Awards Scheme (ORSAS) scholarship from Universities UK
together with additional funding from the School provided further support.
1.2 Aims and objectives
The aim of the work was to extend the fundamental knowledge when machining CFRP
through the (a) assessment of small hole twist drilling of carbon fibre reinforced plastic
(CFRP) to improve productivity and workpiece quality and (b) investigation into the
feasibility of single shot drilling of multilayer metallic/composite stacks. The specific
objectives of the work were to:
• Perform a comprehensive literature survey of previous research and published
machinability data for drilling CFRP and metallic/composite stacks.
• Establish the influence of operating parameters (cutting speed and feed rate),
tool geometries/coatings (helix, point angles and CVD diamond based coatings)
and workpiece material properties (ply configuration, prepreg form etc.) on key
output measures including tool life, geometrical accuracy, cutting forces/torque
and workpiece integrity criteria (surface roughness, fibre pullout/delamination
etc.) when drilling 1.5 mm diameter holes in CFRP panels.
• Evaluate the performance of various tool materials (WC, PCD) and coatings,
tool designs as well as the effect of operating parameters, when drilling
composite/metallic stacks of Ti/CFRP/Al in a one shot operation.
• Determine the preferred operating parameters and conditions for twist drilling of
6.35 mm diameter holes in Ti/CFRP/Al stacks in order to achieve acceptable
productivity levels.

CHAPTER 2: LITERATURE REVIEW
3
2. LITERATURE REVIEW
2.1 Composite materials
2.1.1 Overview
Composites are materials which comprise two or more constituent parts resulting in a
product with superior properties compared to its individual elements [1, 2]. One is generally a
hard, stiff and strong dispersed phase known as reinforcement, which is embedded within a
softer bulk phase called the matrix [3]. The former can be in the form of particles, fibres
(continuous and discontinuous), wires, whiskers, etc., and are commonly made from glass,
carbon, Kevlar (aramid), ceramic or metallic compounds while the latter is either a polymer,
metal or ceramic [3, 4]. While such elements retain their individual characteristics when
joined to form the composite, they also influence the resulting properties of the material.
More recently, the term ‘advanced composites’ has been used to describe materials fabricated
from sheets of pre-impregnated fibres in a suitable resin matrix [3, 5]. These sheets, which are
also known as prepregs or plies, are typically 100-150 μm thick. The main advantages
provided by advanced composites are high strength/stiffness to weight ratios resulting in
significant weight reduction, superior rigidity and damping, tailorable characteristics to satisfy
loading requirements and near-net-shape formability. They are particularly attractive for
components in the aerospace, automotive, oil and gas, sports equipment and medical device
sectors [6-10]. For example, the use of composites is expanding in the civilian aircraft
industry where approximately 50% of the total weight for the new Boeing 787 Dreamliner is
made from composites compared to less than 5% in the Boeing 757/767 produced in the
1980s [11, 12]. Similarly, CFRP accounts for 22-25% (35 tons) of the structural weight of the
new Airbus A380 [12-14], which is estimated to provide a 12% reduction in fuel consumption
[13]. A comparison between properties of various materials including conventional metals
and composites is presented in Figure 2.1 [5].
2.1.2 Classification of composite materials
Composites are generally classified according to the matrix system used and are broadly
divided into; metal matrix composites (MMCs), ceramic matrix composites (CMCs) or
polymer matrix composites (PMCs). Alternatively, they can also be categorised based on their
reinforcement format/arrangement which typically involves particles, whiskers, fibres

CHAPTER 2: LITERATURE REVIEW
4
(continuous, discontinuous, aligned and random) and structural arrangements, see Figure 2.2
[4].
Figure 2.1: Properties of various metals and composites [5]
Figure 2.2: Classification for various composites according to reinforcement format [4]
(b)
(c)
Density (kg/m3) (a)
Tensile modulus (GPa)
Tensile strength (MPa)

CHAPTER 2: LITERATURE REVIEW
5
Metal matrix composites are typically used for moderate operating temperature
applications and examples in this group include Al-6061-T6 (51% B, continuous fibres) and
Al 2124-T6 (20% SiC, particle reinforcement) [2]. The benefits of MMCs include non-
flammability and high resistance to degradation by organic fluids, however, they are usually
heavier than FRP’s (density of Al matrix reinforced with 30% SiC MMC is 2.9 g/cm3
compared to 1.6 g/cm3 for CFRP) and can suffer from interfacial degradation at the
fibre/matrix interface as well as being prone to corrosion [1]. Ceramic matrix composites have
higher specific modulus and mechanical properties than metals at elevated temperatures
which allow their use up to 2000oC, although applications are limited because of inherent
brittleness [1]. Reinforcement with SiC or C can significantly improve the fracture toughness
of CMCs. Examples of matrix systems for CMCs include Si3N4 and Al2O3 [15]. The third
group involving PMCs will be discussed further in Section 2.1.3.
Dispersion strengthened composites comprise small particles (approximately 10-5 mm to
10-4 mm in diameter) which are added to the matrix material. These particles help the matrix
to resist deformation and results in a harder and stronger material. With large-particle
reinforced composites, the particle diameter is typically in the order of several micrometres
and carries a major fraction of the load [4]. The automobile tyre is an example of this
configuration, which has relatively large carbon particles embedded within a poly-isobutylene
elastomeric polymer matrix. Whiskers are anisotropic single crystals typically fabricated by
chemical vapour deposition (CVD), and have length/diameter ratios of 10 – 100, where the
diameter is typically between 0.1 – 1 μm. Particles and whiskers are mainly used with
MMC’s and CMC’s because they distribute randomly to retain composites’ isotropic nature.
Fibre reinforced composites were first produced around 4000 B.C. in ancient Egypt for
writing paper made from the Papyrus plant [1]. Fibres currently used for ‘engineering’
applications have comparatively long axis and are often circular in shape (up to several tens of
micrometres in diameter) and have greater mechanical properties along the length axis. Fibre
reinforced composites will be described in greater detail in the following section. Structural
composites are typically fabricated by stacking multiple layers of fibre reinforced plastic
sheets/plies to produce a homogeneous material known as laminates. The laminate properties
depend on the individual layers as well as the geometrical design of the structure (i.e. fibre
orientation of the different layers) [4]. Laminates are occasionally used to create sandwich
panels containing a honeycomb structure.

CHAPTER 2: LITERATURE REVIEW
6
2.1.3 Fibre reinforced plastic (FRP) composites
Polymer matrix composites are often referred to as FRPs (fibre reinforced plastics)
when strong/brittle fibres are incorporated within a ductile/soft polymer matrix [2].
Continuous filaments/fibres in the form of unidirectional (UD) or woven fabrics are the
principal fibrous patterns in FRP composites. The term unidirectional refers to the material
(prior to laying up) having fibres arranged in a single direction while woven structures
involve perpendicularly intersecting fibres. Woven fabrics include plain weaves (each fibre
yarn passing over and under every other perpendicular fibre yarn), twill weaves and satin
weaves (e.g. five-harness satin refers to each yarn passing under every fifth perpendicular
fibre yarn) [1], see Figure 2.3. Both UD and woven plies can be laid up to produce
multidirectional composite laminates as shown in Figure 2.4. Carbon, glass and aramid are the
most common types of fibres used in PMC, where the letters C, G or A are placed before the
acronym FRP to specify the nature of the reinforcing fibres [2]. For instance, CFRP is the
abbreviation for Carbon Fibre Reinforced Plastic while GFRP and AFRP are abbreviations for
Glass and Aramid Fibre Reinforced Plastic, respectively. Boron and polyethylene fibres are
also used for FRP composites albeit to a lesser extent. General mechanical properties and
relative cost information for the various individual fibres are shown in Figure 2.5 [5].
(a) Plain weave (b) 2 x 2 Twill weave (c) Five-harness satin weave
Figure 2.3: The most commonly used fabric types [5]
Figure 2.4: Example of stacking sequence in multidirectional layup

CHAPTER 2: LITERATURE REVIEW
7
Figure 2.5: Relative properties for various individual fibres [5]
2000
2600
3200
3800
4400
5000
0
50
100
150
200
250
300
350
400
450
500
High modulus carbon
High strength carbon
E-glass S-glass Aramid Polyethylene
Tens
ile m
odul
us (M
Pa)
Mod
ulus
of e
last
icity
(GP
a)
Modulus of elasticity (Gpa)
Tensile strength (MPa)
0
0.5
1
1.5
2
2.5
3
3.5
0
50
100
150
200
250
300
350
High modulus carbon
High strength carbon
E-glass S-glass Aramid Polyethylene
Den
sity
(g/c
m3 )
Cos
t rat
io
Cost ratio
Density
(b)
(a)

CHAPTER 2: LITERATURE REVIEW
8
2.1.3.1 Properties of different fibres
Fibres are typically produced by drawing liquid material or pulling a precursor
(initial/raw state of fibre material) through an orifice. They are subsequently supplied in the
form of tows consisting of individual continuous fibre filaments, which generally contain in
the region of between 3,000 to 30,000 filaments [1]. The three main fibre types used in
industry are discussed below and include glass, Kevlar/aramid and carbon fibres.
a. Glass is the most frequently used fibre to reinforce polymer matrices because of its high
tensile strength (up to 4600 MPa), low density (~2.5 g/cm3), excellent chemical, fire and
heat resistance as well as low cost compared to other fibres. Electrical glass (E-glass) is the
type most commonly used in industry, which has superior electrical properties and
durability (σu = 3450 MPa and E = 73 GPa [16]). High strength and stiffness glass fibre (S-
glass) is comparatively more expensive (σu = 4600 MPa and E = 85.5 GPa [16]) with
greater alumina content [16]. Glass fibre composites are used for piping in the chemical
industry and for marine applications due to their high wear and corrosion resistance.
Unfortunately, glass fibres are highly abrasive, and adversely affect the machinability of
GFRP composites.
b. Kevlar is the commercial name for aramid fibres (aromatic polyamide) [1, 4, 16]. They are
characterised by high tensile strength and tensile modulus (σu = 3720 MPa and E = 63-143
GPa) together with low density (1.44 g/cm3) [17]. Stiffness can be as high as 125 GPa and
although very strong in tension, they have very poor compression and shear properties. In
addition to their superior impact, creep and fatigue failure resistance, aramid fibres can
maintain their mechanical properties between -200 and 200 oC [4]. Kevlar fibres are mostly
used to increase toughness in brittle matrices for pressure vessels, automotive brakes,
clutch linings and gaskets [4]. Cutting of aramid fibre composites requires tools to have a
high degree of edge sharpness and a small cutting edge radius as they are capable of
sustaining large deformation in bending with subsequent spring-back causing fuzzing of
the machined surface [12].
c. Carbon fibres were first introduced in the 1960’s [1]. In addition to having a low density
(~1.6 g/cm3), they have a wide range of modulii and tensile strengths which can be up to 3
times the stiffness of steel and 15 times the strength of construction steel (σT is up to 5000
MPa) [18]. Carbon fibres can be short or continuous with either a crystalline, amorphous or
part crystalline structure. Commercial carbon fibres are produced from precursors

CHAPTER 2: LITERATURE REVIEW
9
including polyacrylonitrile (PAN) or pitch [18, 19]. The manufacturing process of carbon
fibres with any of the aforementioned precursors is almost identical. It involves initially
burning the non-carbon elements such as oxygen, nitrogen, and others from the precursor
fibre. They are subsequently placed in a furnace in an oxidising atmosphere to produce
either carbon fibres (80-95 % carbon) or graphite fibres at higher temperature (99%
carbon) [1]. The properties of the fibres are determined according to the rearrangement of
carbon atoms in the furnace. The PAN-based fibre is the most commonly used precursor as
pitch-based carbon fibres have lower compressive strengths. Carbon fibres are broadly
classified into three categories, namely general purpose (GP), high performance (HP), and
activated carbon fibres (ACF) [18]. The general purpose type is characterised by an
amorphous and isotropic structure, low tensile strength, low tensile modulus and cost.
Conversely, the high performance variant has relatively high strength and modulus but is
considerably more expensive. With activated carbon fibres, the presence of a large number
of open micro-pores which can act as adsorption points limits its use. They are however
utilised to produce environmental protection equipment such as water treatment units and
gas masks. Table 2.1 details properties of the different carbon fibre types while Table 2.2
presents properties of carbon fibres classified according to their tensile strength and
strength/modulus ratio [18].
Type Diameter (μm) Tensile strength (MPa)
Tensile modulus of elasticity (GPa)
General purpose (GP) (7 – 15) 700 40 High performance (HP pitch) (9 – 11) 5000 350 High performance polyacrylonitrile (HP PAN) (4 – 8) 2000 200-800
Activated carbon fibres (ACF) (7 – 15) 200 1500
Table 2.1: Properties of various carbon fibre types [18]
Type Tensile modulus (GPa) Strength to modulus ratio % UHM (ultra high modulus) > 500 - HM (high modulus) > 300 < 1 IM (intermediate modulus) < 300 > 1 LM (low modulus) < 100 Isotropic structure HT (high strength) Tensile strength > 3 GPa 1.5 - 2
Table 2.2: Classification of carbon fibres based on their tensile strength and modulus [18]

CHAPTER 2: LITERATURE REVIEW
10
2.1.3.2 Matrix systems for FRP composites
In FRP composites, the matrix is used to support and bond the reinforcement phase,
transmit and distribute external applied loads to the reinforcement, control chemical and
electrical composite properties and forestall any crack propagation [3]. In addition, as the
matrix normally softens, melts or degrades at a lower temperature than the fibres, it governs
the maximum operating temperature for the composite part (i.e. PMCs cannot be used near or
above the glass transition temperature Tg, at which many of its physical properties
change/degrade abruptly [1]). The matrix phase can be pure or mixed with other materials
(additives) to improve its properties (e.g. increasing the allowable operating temperature,
improving mechanical properties such as stiffness, strength and impact/wear resistance).
Two groups of matrix materials commonly employed in FRP composites are thermoset
polymers (e.g. polyester, epoxy) and thermoplastic (e.g. polyamide, PEEK). Thermosets
consist of long chains of hydrocarbon atoms held together by primary covalent bonds while
thermoplastics have secondary bonds which are relatively weaker. Thermosets remain rigid
when heated and are quite strong and stiff but have poor ductility due to the lack of atomic
mobility and superior cross-linking between their randomly arranged molecules [2]. The
polyester matrix is widely used due to its lower cost but is mainly employed in glass fibre
composites. With carbon fibre based products, epoxies are usually selected for their lower
shrinkage on curing, which allows high fabrication accuracy, superior mechanical properties
and good environmental resistance. Epoxy resins can be used in various composite
manufacturing techniques including press moulding, vacuum oven and autoclave curing
processing, filament winding and resin transfer moulding. Since epoxies are relatively
expensive and provide superior mechanical properties with moisture resistance, they are
primarily employed for aerospace applications [1, 12]. Table 2.3 details the mechanical and
thermal properties of a typical epoxy resin matrix used in CFRP composites against widely
employed metallic materials such as cold drawn AISI 1020 steel and Al-7075-T6 aluminium
alloy.

CHAPTER 2: LITERATURE REVIEW
11
Material Epoxy resin AISI 1020 steel (cold drawn)
Aluminium alloy (Al-7075-T6)
ρ (g/cm3) 1.1 – 1.3 7.85 2.8 E (GPa) 2.6 – 3.8 207 71 σT (MPa) 60 - 85 420 572 Ductility (%) 2 – 10 15 (minimum) 11 K (W/moC) 0.17 – 0.2 51.9 130 Cp (kJ/kgoC) 1.05 0.48 0.96 CTE (10-6m/oC) 45 – 65 11.7 23.4 Tg (oC) 65 - 175 - -
Table 2.3: Mechanical and thermal properties of epoxy resin against steel and aluminium [12]
2.1.3.3 Description/nomenclature of FRP composite components
The basic element of a continuous fibre composite part is a single unidirectional
lamina/ply (shown in Figure 2.6), which behaves orthotropically [20]. This is typically
fabricated either by prepregging, filament winding, pultrusion or resin transfer moulding
(RTM) [1]. The properties of an individual lamina can be identified by the material supplier.
These values provide the theoretical maximum for a given fibre/matrix volume of the
individual lamina in the fibre direction, which in general is greater than those in the transverse
direction. Mechanical property analysis gives the average properties of an individual ply
based on its constituents, the relative amounts in the structure and the fibre/matrix bond [1, 4,
12]. The acceptable amount of voids in a composite component ranges between 1 and 5% of
volume [12]. Voids reduce the overall density of the composite material and the difference
between the actual and nominal/designed density is considered as the volume of voids present
in the laminate [21].
The density for a composite part is calculated as follows [12]:
wc = wf + wm weight balance (1)
ρcvc = ρfvf + ρmvm density x volume (weight) (2)
ρc = ρfVf + ρmVm law of composite mixture (3)
Where;
Subscripts c, f and m refer to composite, fibre and matrix, respectively
w, v, ρ and V refer to weight, volume, density and volume fraction, respectively

CHAPTER 2: LITERATURE REVIEW
12
Figure 2.6: Microscopic image for cross sectioned CFRP laminate
Laminates are typically fabricated by stacking unidirectional or woven fabric layers at
different fibre orientations according to the intended application [1]. For an N layer laminate,
each ply has a distinct fibre orientation which is numbered from the top surface. The laminate
is coded according to the angles of the reinforcing fibres within the plies from a reference axis
(0o), with either (+) and (-) signs representing the orientation (from the reference axis) of a
single ply on the stack, as shown in Figure 2.7. The designation used for describing the
stacking sequence of a FRP laminate includes brackets, parentheses, slashes and subscripts.
Brackets “[ ]” are used to indicate all the fibre orientations present within a laminate (i.e. unit
block) in accordance with the stacking sequence, while slashes “/” are used to separate layers
or group of layers in a particular direction, designate repeated groups by a subscript n, where
n is the number of repeated times and the subscript s (outside the brackets) denotes a
symmetric laminate. A symmetric laminate should have an even number of plies with only
half the layers quoted [3]. For example, [02/90/90/02]s refers to a laminate consisting of 12
plies, the first in the 0o orientation and repeated twice and the laminate is symmetric with
respect to a mid-plane. If the laminate is independent of fibre direction, or in other words, has
equal number of plies at each principal fibre orientation (e.g. [0/45/-45/90]s), it is known as a
quasi-isotropic laminate structure.
50 μm
Single carbon fibre
Matrix

CHAPTER 2: LITERATURE REVIEW
13
Figure 2.7: Different possible ply orientation for UD laminate layup
2.1.4 Carbon fibre reinforced plastic (CFRP) composites
2.1.4.1 Manufacturing of CFRP
As mentioned previously, various methods can be used for the manufacture of advanced
composite components including vacuum bag moulding (oven cured), autoclave moulding,
filament winding, press moulding, pressure bag moulding, thermal expansion moulding and
pultrusion [12]. However, as oven and autoclave curing processes were the only methods
used to fabricate workpieces for the current work, these are detailed in Appendix B.
2.1.4.2 Properties of CFRP
Carbon fibre reinforced plastic has relatively low thermal conductivity especially across
the fibre direction (maximum of 1 W/mK as opposed to ~80 W/mK along the fibre direction)
[22]. Table 2.4 details sample mechanical properties for a UD and woven carbon fibre
composite laminate manufactured by the oven cured vacuum bag process. The unidirectional
lamina has a 60% Vf while the value is 55% for the fabric woven data. It is evident that the
UD laminate has superior properties compared to the woven material. Table 2.5 details
various mechanical properties for the most commonly used CFRP composites against
equivalent GFRP and AFRP composites.

CHAPTER 2: LITERATURE REVIEW
14
Property 145 gsm* 12k HTS5631 UD 283 gsm 3k HTA5131 CF0604 5-HS Fabric
Tensile modulus (GPa) 128.9 62.6 Tensile strength (MPa) 2159 927 Compression modulus (GPa) 123.2 59.4 Compression strength (MPa) 1330 729 Flexural modulus (GPa) 121.9 57.1 Flexural strength (MPa) 1958 1181
* gsm is the fibre areal density in grams per square metre 12k indicates 12,000 fibres in each tow 5-HS fabric is five harness satin weave
Table 2.4: Mechanical properties for carbon fibre laminate [5]
FRP material Tensile strength σu (MPa)
Elastic modulus, E (MPa)
Strain to failure, εu (%)
Density, ρ (g/cm3)
CFRP Unidirectional (Vf = 60%) High strength 1,200 145,000 0.9 1.6
Unidirectional (Vf = 60%) High modulus 800 220,000 0.3 1.6
GFRP Unidirectional (Vf =
60%) 1,000 45,000 2.3 2.1
Woven cloth* 100 - 300 10,000 – 20,000 - 1.5 - 2.1 Chopped roving* (short
fibres) 50 - 200 6,000 – 12,000 - 1.3 – 2.1
Sheet moulding compound* (short fibres) 10 – 20 500 – 2,000 - 1.3 – 1.9
AFRP Unidirectional (Vf =
60%) 1,000 75,000 1.6 1.4
* For these materials Vf = 20 – 50%
Table 2.5: Mechanical properties for the common CFRP laminates against GFRP and AFRP composites [2]
2.1.4.3 Health and safety aspects
Processing of CFRP requires special precautions/considerations due to the potential
hazards presented by the dust and fumes produced during decomposition or cutting. The
current body of evidence suggests that in all likelihood, carbon fibres are not carcinogenic but
may cause irritation, coughing and pulmonary edema. Table 2.6 details the identification of
general hazards relative to different composite material elements [23]. Critical values of
exposure to carbon fibre and epoxy resin are presented in Table 2.7. Special precautions are
usually required when handling CFRP which include:

CHAPTER 2: LITERATURE REVIEW
15
• Electrical equipment, enclosures and circuits in or near areas where carbon fibres are
used should be protected against infiltration or contact with airborne particles.
• Store carbon fibre products in original containers and avoid conditions that may
generate carbon dust or lint.
• As with all industrial products, selection of specific personal protective equipment
(e.g., gloves, disposable, clothing, respirators) and general control (e.g., local exhaust
ventilation) depends upon the type of operation and exposure potential. To avoid
ingestion incidental to handling, food and tobacco should not be present in the work
area. Wash exposed skin areas with soap and water after contact.
Composite component Organ target Possible health effect
Epoxy resins Skin, lungs and eyes Contact and allergic dermatitis, conjunctivitis
Carbon fibres Skin and lungs Skin and respiratory irritation, contact dermatitis (chronic interstitial lung disease)
Table 2.6: Identification for expected hazards [23]
Component Type Value
Carbon Fibre
ACGIH-TWA 10 mg/m³
NIOSH-TWA 3 fibres/cm³ for fibres less than or equal to 3.5 μm in diameter and greater than or equal to 10μm in length.
Formulated Epoxy Resin
TWA (Total) 15 mg/m³ TWA (Respirable) 5 mg/m³
ACGIH: American Conference of Governmental Industrial Hygienists NIOSH: The National Institute for Occupational Safety and Health TWA: Time weighted average
Table 2.7: Critical values of exposure [24]
Machining of FRP composites generally produce high emissions of dust and gases [25].
More specifically when cutting CFRP, clumps of material comprising resin with embedded
fibres are normally produced. Commercially available engineering dust extraction systems are
capable of filtering out particles down to 0.3 μm, which is much smaller than the size of
typical carbon fibres which is ~6 μm diameter. Furthermore, as the diameter of these fibres
are > 3 μm, they would not normally be respirable [26]. Additionally, in a study on aerosol
emission when milling FRP, a maximum fibre concentration of ~3 mg/m3 was reported,
which was found to be within the safe respirable limit (5 mg/m3) [25]. Additional information
relating to material safety data sheet for CFRP can be found in Appendix C.

CHAPTER 2: LITERATURE REVIEW
16
2.2 Titanium alloys
2.2.1 Introduction
Over the last few decades, the use of titanium and its alloys has expanded in many
industrial sectors including automotive, aerospace, petroleum refining, pulp and paper, food
processing and marine due to their superior properties [27]. These include high specific
strength combined with exceptional fracture and corrosion resistance even under extremely
aggressive environments [28]. Hardness and strength can generally be enhanced by increasing
the alloying elements, albeit with a corresponding decrease in ductility [29]. Titanium alloys
can be classified according to their alloying elements (stabilisers) and metallurgical features
into three main groups namely, hexagonal close-packed α and near α alloys, body-centred
cubic β alloys and α−β alloys [27]. Stabilisers are normally added to improve physical and
mechanical properties of the alloy [30]. Table 2.8 details a list of commercial titanium alloys
according to this classification system. The most commonly used group of titanium alloys is
the α−β group.
α and near α alloys β alloys α−β alloys Ti-5Al-2.5Sn Ti-8Al-1Mo-1V Ti-6Al-5Zr-0.5Mo-0.25Si Ti-6Al-2Sn-4Zr-2Mo
Ti-3Al-8V-6Cr-4Mo-4Zr Ti-10V-2Fe-3Al
Ti-6Al-4V Ti-4Al-2Sn-4Mo-0.5Si Ti-6Al-2Sn
Table 2.8: A list of typical commercial titanium alloys
2.2.2 Properties and applications of Ti-6Al-4V
Alloy Ti-6Al-4V is generally regarded as the ‘workhorse’ of the titanium industry and
accounts for ~ 60% of the total titanium alloy production [30-32]. Four heat treatments are
typically used for Ti-6Al-4V including mill-annealed, recrystallise annealed, beta annealed or
solution treated and aged [33]. The mill “partial” annealed alloy (general purpose treatment)
is popular due to its moderate fracture toughness (66 MPa.m1/2), high fatigue resistance and
superior strength at relatively high operating temperatures (900 MPa at up to 400oC) [33]. Ti-
6Al-4V is widely used for applications such as rocket motor casings, aircraft components
involving blades and discs for turbines and compressors, fuselage, wings, tail assembly
structures, as well as for applications involving medical prosthetics/implants, chemical
equipments, sports goods, forgings and fasteners, pressure vessels, marine components and
steam turbine blades [30, 33-36].

CHAPTER 2: LITERATURE REVIEW
17
2.3 Aluminium alloys
2.3.1 Introduction
Aluminium alloys are used for a broad range of applications in the aerospace,
automotive and food processing sectors due to their superior combination of properties. These
include low density (2.6 - 2.8 g/cm3), coupled with relatively high strength (e.g. yield and
ultimate strength of Aluminium 2014-T651 is 414 and 483 MPa, respectively) [30].
Aluminium alloys are classified using a numerical series designated by a four digit
identification code in accordance with the International Alloy Designation System (IADS).
This classification divides aluminium alloys into groups based on the principal alloying
elements as follows [30]:
• 1xxx: Pure unalloyed aluminium, used mainly in electrical and chemical industries.
• 2xxx: Copper is the principal alloying element and is widely used in the aircraft
sector.
• 3xxx: Manganese is the prime alloying element, typically used for architectural
applications.
• 4xxx: Silicon is the main alloying element, used for welding rods and brazing
sheets.
• 5xxx: Magnesium is the principal alloying element, used in marine applications.
• 6xxx: Magnesium and silicon are the principal alloying elements and are widely
used for marine and automotive applications.
• 7xxx: Zinc is the principal alloying element and is commonly used in aircraft
structural components and high strength applications (strongest series alloys).
• 8xxx: Series of alloys with miscellaneous compositions, e.g. tin, lithium or iron.
• 9xxx: Reserved for future use.
In addition, each series is followed by a temper designation which typically comprises a letter
followed by one to four digit numbers (e.g. Al-7150-T651, used for wing structures of the
Boeing 767 and 757 planes [37]). This indicates the treatment of the alloy (e.g. F “as
fabricated” and T “heat treated”) and the numbers refer to the secondary treatment used to
influence properties [30].

CHAPTER 2: LITERATURE REVIEW
18
2.3.2 Properties of Al-7050-T7651
Al-7050-T7651 is a high strength aluminium alloy commonly used in aircraft structures
due to its high resistance to corrosion and stress-corrosion cracking, high fracture toughness
and fatigue resistance. Table 2.9 lists the mechanical properties of Al-7050-T7651 alloy
against Ti-6Al-4V.
Property Ti-6Al-4V Al-7050-T7651 Density (g/cm3) 4.43 2.83 Hardness (HV) 340 171
Ultimate tensile strength 950 MPa 515 MPa Yield strength 830 MPa 455 MPa
Modulus of elasticity 114 GPa 72 GPa Shear modulus 44 GPa 27 GPa
CTE 8.6 – 9.7 μm/mK 25 μm/mK Thermal conductivity 6.7 W/mk 154 W/mk
Chemical composition 6% Al, >0.3% Fe, >0.2% O, 89-90% Ti and 4% V
89% Al, 6% Zn, 2% Mg, 2% Cu and 1% other materials
Table 2.9: Properties of Al-7050 and Ti-6Al-4V alloys [30, 34]
2.4 Machining of composites
2.4.1 Background
The machinability of composites differs from conventional materials and their alloys in
many aspects such as chip formation, cutting tool requirements and operating parameters [38-
40]. This is primarily due to the non-homogeneous and anisotropic nature of composites as
well as the dissimilar mechanical and thermal properties of the reinforcement and matrix [2,
39, 41, 42]. For example, the different thermal expansion coefficients of the fibre and matrix
material in FRP composites can result in thermal stresses causing deformation with a
possibility of part damage. Separation of surface layer/delamination can also occur due to low
interlaminate strength and high cutting forces [43]. Such detrimental forces can however be
reduced/minimised through the proper selection of tool geometry/material and cutting
parameters/conditions [12].
2.4.2 Machinability of FRP composites
Although the fabrication of FRP composites produces near net shape products, various
machining operations including edge trimming, drilling, milling, routing, sawing etc. are often

CHAPTER 2: LITERATURE REVIEW
19
still necessary to meet part quality/dimensional requirements and assembly needs [41-44].
Conventional machining of FRP composites requires tools with sharp cutting edges to
cut/shear abrasive fibres effectively, while relatively low operating parameters are specified in
order to achieve better surface quality and limit cutting temperatures [12]. Machining
performance when cutting FRPs is dependent on the composite specification including fibre
and matrix properties, fibre orientation, type of weave and curing conditions, in addition to
appropriate selection of cutting parameters and tool materials/geometry [38, 39, 41, 42, 44-
49].
2.4.2.1 Effect of material properties
Fibre orientation (commonly denoted by θ) has been found to be the main governing
factor when cutting FRP’s [50, 51]. It significantly affects cutting forces, torque, machined
surface quality and chip formation [38, 39, 42, 48, 49]. Unlike metallic workpieces, material
removal in FRP workpieces is typically the result of a series of mini-fractures owing to the
brittleness of the material elements [52]. Wang et al. [48] were among the first to describe the
various types of cutting mechanisms involved in chip formation observed when machining
FRP composites and classified them into five categories, which were determined by the
primary fibre orientation of the workpiece with respect to the cutting direction and tool rake
angle. These were designated as delamination (Type I), fibre buckling (Type II), fibre cutting
(Type III), deformation (Type IV) and shearing (Type V) [12, 48]. Type I was seen to occur
when cutting parallel to the fibre direction (θ = 0o) with positive rake geometry as shown in
Figure 2.8 (a). Following crack initiation at the tool tip, the damage propagates along the
fibre/matrix interface. As the tool advances into the workpiece, the peeled layer slides up the
rake face, causing it to bend in a manner similar to a cantilever. Bending-induced fracture
then occurs ahead of the cutting edge perpendicular to the fibre direction. Small,
discontinuous and irregular chips are typically produced under these conditions. Additionally,
the cutting forces generally fluctuate with the repeated cycles of peeling, fibre bending, and
fracture. Fibre buckling (Type II) however becomes prevalent when zero or negative rake
angle tools are employed to cut along the fibre direction, see Figure 2.8 (b). Here, fibres are
subjected to compressive loading along their axis resulting in buckling loads. Progress of the
cutting edge causes cracks at the fibre/matrix interface and eventually fractures the fibres
perpendicular to their axis under intense bucking. This also results in small discontinuous
chips. While the fluctuation in cutting forces is smaller than that in Type I, the machined

CHAPTER 2: LITERATURE REVIEW
20
surface is comparable. Fibre cutting or Type III mechanism occurs when θ is between 0o and
90o, irrespective of tool rake angle. Here, the chip formation is a combination of fracture from
compression induced shear across the fibre axis together with fibre/matrix interfacial shearing
along the fibre direction. During compression, cracks are generated in the fibres above and
below the cutting plane, with the latter remaining within the machined surface, see Figure 2.8
(c) and (d). Under these conditions, the chip morphology may be continuous or discontinuous.
When cutting perpendicular to fibre orientation (θ = 90o), increasing inter-laminar shear
leading to fracture of the chip segments along the fibre/matrix interface becomes the dominant
chip formation mode (Type IV), see Figure 2.8 (e). Type V (shearing) occurs mainly at a fibre
orientation of 105o–150o and is typically dominated by macro-fracture, see Figure 2.8 (f). As
cutting progresses, severe fibre deformation occurs resulting in excessive inter-laminar shear
along the fibre/matrix interface. Chip formation is then produced by the extensive elastic
bending which results in cracks in both fibres and matrix producing relatively long chips.
Here, the machined surface is irregular and the fibre ends have different lengths because
fracture occurs at different points along their length. Elastic recovery also takes place
following fibre shearing and leaves an irregular cut surface, see Figure 2.9 [49].
Figure 2.8: Cutting mechanisms in the orthogonal machining of FRP composites [48]
(b) Type II; θ = 0o, negative rake angle Fibre buckling
(a) Type I; θ = 0o (180o) Delamination
(c) Type III; θ = 45o
Fibre cutting (d) Type III; θ = 45o, negative rake angle
Fibre cutting
(e) Type IV; θ = 90o Deformation
(f) Type V; θ = 135o Shearing
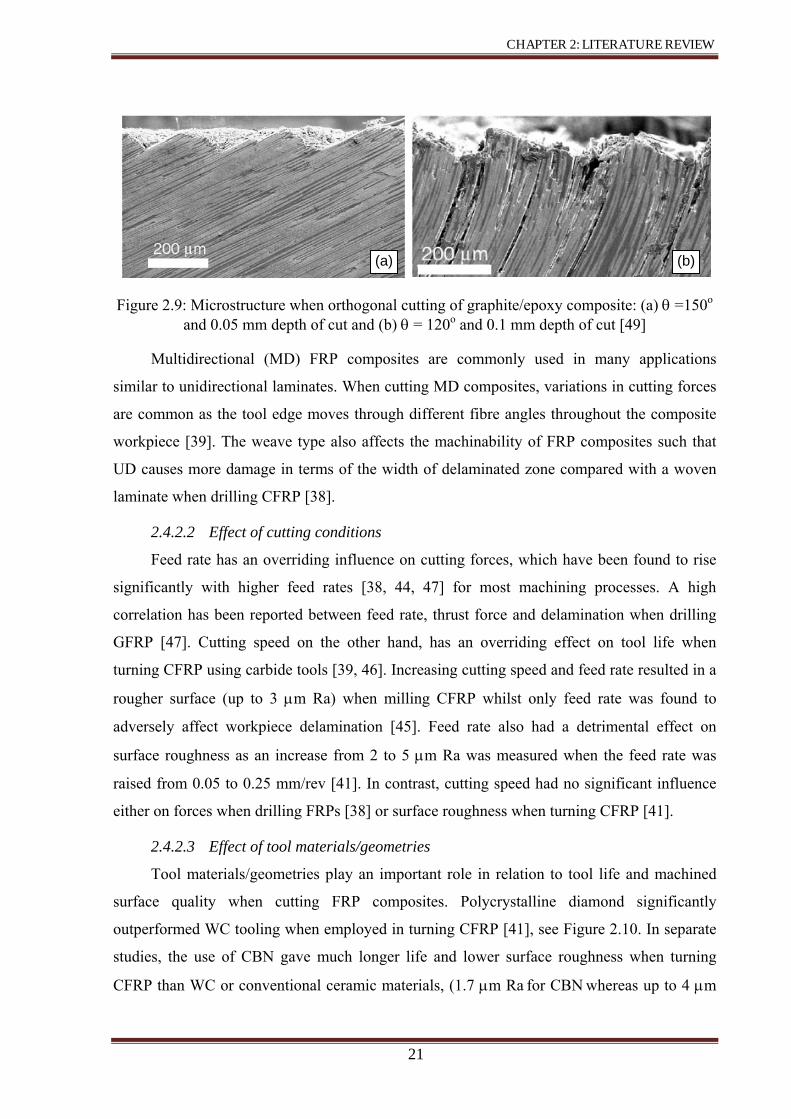
CHAPTER 2: LITERATURE REVIEW
21
Figure 2.9: Microstructure when orthogonal cutting of graphite/epoxy composite: (a) θ =150o and 0.05 mm depth of cut and (b) θ = 120o and 0.1 mm depth of cut [49]
Multidirectional (MD) FRP composites are commonly used in many applications
similar to unidirectional laminates. When cutting MD composites, variations in cutting forces
are common as the tool edge moves through different fibre angles throughout the composite
workpiece [39]. The weave type also affects the machinability of FRP composites such that
UD causes more damage in terms of the width of delaminated zone compared with a woven
laminate when drilling CFRP [38].
2.4.2.2 Effect of cutting conditions
Feed rate has an overriding influence on cutting forces, which have been found to rise
significantly with higher feed rates [38, 44, 47] for most machining processes. A high
correlation has been reported between feed rate, thrust force and delamination when drilling
GFRP [47]. Cutting speed on the other hand, has an overriding effect on tool life when
turning CFRP using carbide tools [39, 46]. Increasing cutting speed and feed rate resulted in a
rougher surface (up to 3 μm Ra) when milling CFRP whilst only feed rate was found to
adversely affect workpiece delamination [45]. Feed rate also had a detrimental effect on
surface roughness as an increase from 2 to 5 μm Ra was measured when the feed rate was
raised from 0.05 to 0.25 mm/rev [41]. In contrast, cutting speed had no significant influence
either on forces when drilling FRPs [38] or surface roughness when turning CFRP [41].
2.4.2.3 Effect of tool materials/geometries
Tool materials/geometries play an important role in relation to tool life and machined
surface quality when cutting FRP composites. Polycrystalline diamond significantly
outperformed WC tooling when employed in turning CFRP [41], see Figure 2.10. In separate
studies, the use of CBN gave much longer life and lower surface roughness when turning
CFRP than WC or conventional ceramic materials, (1.7 μm Ra for CBN whereas up to 4 μm
(a) (b)

CHAPTER 2: LITERATURE REVIEW
22
Ra for ceramic and WC) [46]. Employing positive rake angles also reduced surface
roughness, especially when lower feed rates were used [41]. The use of standard point angle
(118o) increased the thrust force by 25% and reduced torque when drilling GFRP [44]. In
contrast, when drilling GFRP, special drill formats including web thinning with an 85o point
angle and tripod “3 fluted” geometry drills also helped to reduce thrust force and hence
delamination was controlled. Delamination factor, Fd (detailed in the following section) was
1.04, 1.15 and 1.5 for tripod, web thinned tipped and conventional drills respectively [47].
Figure 2.10: Flank wear results of different tool materials when turning CFRP [41]
2.5 Drilling of CFRP composites
2.5.1 Introduction
Standard twin lipped twist drills involving two main cutting edges and flutes are the
most commonly used tools and are suitable of a wide range of applications. Other drill
formats include step, candle, core, spade, centre, counter-boring and countersinking drills [53,
54]. Drill life is usually measured in terms of the number of holes produced prior to reaching
the tool life criterion. Increasing tool wear produces greater levels of thrust force and torque,
which can have a detrimental effect on hole quality/accuracy. Figure 2.11 depicts the
terminology used for a standard twist drill.

CHAPTER 2: LITERATURE REVIEW
23
Figure 2.11: Twist drill terminology [53]
2.5.2 Twist drilling in CFRP
In many composite material related applications, mechanical joining methods are
preferred to adhesive bonding due to the difficulty of disassembly for component inspection
or repair, furthermore surface treatments may be required with the latter [20]. While
incorporating holes in the part during the moulding stage would be desirable, it is generally
unrealistic due to the inherent shrinkage that occurs in the curing stage and also as a
consequence of the complexity of tooling, especially when many thousands of holes are
involved (as is usually the case in small diameter hole-making) [55]. Difficulties are further
exacerbated when considering complex shape components and the necessity of producing
consistent laminate quality throughout the part (e.g. acoustic liners which are currently being
developed for use in next generation aero-engine intake systems at GKN Aerospace, UK).
Consequently, hole production is a key process in composite manufacture with drilling
normally conducted as a post cure operation.
Drilling of CFRPs is not straightforward even with advanced diamond tooling as cutting
is hampered by factors including fibre orientation and the type of weave [38, 56]. Since poor
hole quality accounts for an estimated 60% of all part rejections [57], considerable attention
should be given to all factors affecting the drilling of the composite material. Figure 2.12
shows a fishbone diagram that identifies all factors influencing output measures when drilling
CFRP composites. Compared to more conventional workpiece materials, a larger number of
factors must be considered when cutting CFRP due to the complexity of material structures,

CHAPTER 2: LITERATURE REVIEW
24
due in part to the wide range of possible curing conditions. However, the factors in boxes
have been highlighted for further investigation in small hole drilling of CFRP.
Figure 2.12: Fishbone diagram detailing factors affecting the drilling of CFRP
2.5.2.1 Drilled hole quality
Hole quality is arguably the most important measure when assessing drilling
performance because it influences the service life of composite parts post assembly. Konig
and Grass [43] described a methodology for assessing hole quality by classifying defects
commonly associated with drilled holes in FRPs, see Figure 2.13. Here, quality
criteria/categories include cracks, damage to surface layers, damage within a peripheral zone,
workpiece surface roughness, hole roundness error and dimensional errors. Similarly, Abrao
et al. [58] reviewed the main hole quality defects when drilling CFRP, which include surface
delamination, fibre/resin pullout and inadequate surface roughness. Damage of surface layers
is further subdivided into spalling, edge chipping, delamination and fuzzing. Additionally,
defects when drilling CFRP composites have also been categorised not only in relation to the
workpiece but also in relation to the tool [59]. Tool wear, the presence of powdery chips,
workpiece surface delamination, internal delamination, fibre/resin pullout and decreased
flexural strength significantly affect composite part strength and fatigue life. Whereas spalling
was observed as the primary hole defect in a study by Zhang et al. [60], surface delamination
was reported to be the dominant damage criterion when drilling CFRP in a number of other
publications [52, 61-78]. Delamination is generally acknowledged to be the main reason for
Machine Tool
Cutting Parameters Drilling Tool
Composite Properties
Maintenance
Calibration
Environment
Vibration
Fibre orientation
Fibre volume fraction Matrix
properties
Fibre properties
Curing conditions
Drill configuration
Geometry
Material
Coating Cutting speed
Cooling Drill diameter
Feed rate
Aspect ratio
Wear
Outputs
• Tool life/tool wear • Drilled hole quality • Productivity • Drilled hole cost
Operator
Power level

CHAPTER 2: LITERATURE REVIEW
25
stiffness/strength reduction in composite structures leading to catastrophic failure of the
laminate under bending or shear loading conditions [58, 67]. Delamination can take two
different forms, either push-out at the hole exit and/or peel–up at hole entry as illustrated in
Figure 2.14. The former was found to be more severe and detrimental to component service
life [71]. Peel up occurs at hole entry when the tool pulls away from the upper layer of the
composite laminate resulting in separation and the formation of an entry delamination zone.
As the drill approaches the bottom end of the hole, the uncut laminate thickness is no longer
able to resist deformation and the tool acts like a punch which separates the thin uncut layer(s)
from the remainder of the laminate [57]. Subsequently, push-out delamination initiates at the
hole exit when the thrust force exceeds the interlaminar bond strength of the material [68].
Due to the high correlation observed between thrust force and delamination, Hocheng and
Dharan [68] proposed relationships to calculate the critical thrust force at which the onset of
push-out and peel-up delamination would occur, which are shown by Equation 4 and 5
respectively [68, 71].
Figure 2.13: Quality criteria when drilling FRPs [43]
Fuzzing Delamination
Damage of surface layersCrack formation
Damage to peripheral zone Surface roughness
Roundness error Dimensional error
Edge chipping Spalling
Rt, Ra
Rz
ΔD = d - D
d
100 μm
200 μm 5 mm
Wd
100 μm

CHAPTER 2: LITERATURE REVIEW
26
Figure 2.14: Delamination forms: (a) peel-up at entrance and (b) push-out at exit [68, 71]
83 1
/
(4)
8
3 1
/
(5)
where FA and Fc are the critical thrust forces at which push-out and peel-up occurs
respectively, G1c is the critical energy release rate for delamination, E and v are modulus of
elasticity and Poisson’s ratio, respectively, h is the depth of material remaining to be cut
under the tool, H is the composite laminate thickness and k is the peeling factor which is a
function of the coefficient of friction between drill and workpiece and the drill helix angle.
Hole defects were also investigated by Zhang et al. [60] when drilling unidirectional
and multidirectional CFRP using 4-facet point carbide drills (4.8 and 5.5 mm diameter
tools). They found that spalling and fuzzing, as shown schematically in Figure 2.15, were the
major exit defects, with spalling being more prominent. Additionally, the geometry of drill
chisel and cutting edges were identified as the main cause of hole exit spalling which
resulted in greater thrust force. An increase in operating parameters (rotational speed, feed
rate/speed) and drill diameter further exacerbated spalling, with UD laminates seen to exhibit
greater damage than MD laminates. A key finding of their work was the critical ratio of
cutting speed to feed speed (both in units of mm/min) at which spalling was maintained
below 1 mm. These were 5300 and 2800 for the UD and MD CFRP material respectively
[60].
Peel-up
Push-out
Peeling action

CHAPTER 2: LITERATURE REVIEW
27
Figure 2.15: Spalling at exit surface when drilling MD CFRP: (a) schematic of spalling, (b) spalling at chisel edge penetration and (c) spalling after drilling [60]
Davim and Reis [62, 63] studied the delamination following drilling of woven CFRP
using HSS and various cemented carbide drills. Their results were quantified in terms of a
delamination factor (Fd), which is defined as the ratio between the maximum diameter of the
damaged area to the required nominal diameter of the hole as illustrated in Figure 2.16. Their
findings suggested that Fd was larger with higher cutting speeds and feed rates, with the
former being the more significant parameter affecting delamination. Conversely, when Tsao
and Hocheng [73] investigated the effect of varying drill bits/configurations (conventional
twin lipped, saw, and candlestick twist drills), cutting parameters and drill diameter on a
similar workpiece material using Taguchi experimental design techniques, feed rate was
highlighted as the most critical factor in terms of delamination when using conventional twist
drills, while drill diameter was the significant factor with candlestick drills. With saw drills,
feed rate, drill diameter and spindle speed were statistically significant, all three having
approximately equal percentage contribution ratios (~ 33%). Chen [61] reported an increase in
delamination factor with increasing number of holes drilled as outlined in Figure 2.17.
Understandably, this was attributed to the growth in tool wear resulting in increased thrust
force. Lin and Chen [70] found that during drilling of UD CFRP using carbide drills,
improved hole quality was obtained when utilising low values of feed rate despite the
relatively high cutting speeds used in the study. Enemuoh et al. [65] employed a combination
of Taguchi experimental analysis and a multi-objective optimisation criterion to identify
preferred drilling parameters (feed rate, cutting speed and drill point angle) with reference to
delamination, surface roughness and thrust force. They observed that in order to produce
delamination-free holes with good surface finish, high cutting speeds and low feed rates were
necessary. Additionally, other researchers have found that in order to reduce entry
(b) (c) (a)
Fibre direction of surface layer
Secondary spalling region
Main spalling region Secondary
spalling region
Main spalling region
Fuzzing
Smooth region
Drill rotation

CHAPTER 2: LITERATURE REVIEW
28
delamination, a combination of high cutting speed with small drill point angle and low feed
rate is preferable when utilising cemented carbide drills [66].
Figure 2.16: Schematic of delamination factor calculation
Figure 2.17: Correlation between delamination factor and number of drilled holes when using carbide drills for cutting CFRP [61]
The effect of tool wear on delamination when drilling 6 mm thick woven CFRP
laminates was investigated by Tsao and Hocheng [79] using standard HSS twist drills under
dry cutting conditions, at cutting speeds and feeds of 20, 30, 40 m/min and 10, 15, 20 mm/min
respectively. Their findings showed that tool wear was the major factor affecting thrust force
and hence delamination damage but also that the measured thrust force was greater than the
predicted threshold for the onset of exit delamination as derived by Hocheng and Dharan [68].
1.05
1.07
1.09
1.11
1.13
1.15
1.17
1.19
0 4 8 12 16 20 24 28No. of Drilled Holes
Del
amin
atio
n Fa
ctor
n = 6900 rpmn = 3700 rpm
Number of drilled holes
Del
amin
atio
n fa
ctor
Fd = Dmax/Do

CHAPTER 2: LITERATURE REVIEW
29
More recently, work by Rawat and Attia [80] in drilling woven CFRP showed that even when
using backup material on both sides, relatively high entry Fd values were observed (up to 1.5
at 24 m/min and 0.8 mm/rev) and was attributed to the somewhat excessive feed rate used.
Delamination was also evaluated by Davim et al. [64] who employed a digital image
processing analysis technique when drilling CFRP laminates using conventional WC drills.
The authors concluded that an ‘adjusted’ delamination factor (Fda) was more realistic, which
was determined as a function of the actual/effective damage area. The advantage of the
suggested measure is illustrated in Figure 2.18, where Fd’s for the two examples shown are
identical, despite the obvious difference in damage. The calculation of the adjusted
delamination factor is shown below:
ooda A
AD
DF maxmax βα += (6)
Where,
(7)
α + β = 1 (8)
(9)
(10)
where Ao is the drilled hole area, Do the drilled hole diameter, Ad the damaged area
around hole, Amax the maximum damage area, Dmax the maximum damage zone diameter, Fd
the traditional delamination factor, Fda the adjusted delamination factor, α the traditional
delamination factor weight, β the ratio between the damaged area (Ad) and (Amax) - (Ao).
)max(
o
d
AAA
−=β
max
od D
DF =
) .()(
2
maxdd
o
ddda FF
AAAFF −
−+=

CHAPTER 2: LITERATURE REVIEW
30
Figure 2.18: Examples of extreme delamination patterns when drilling FRP laminates: a) fine cracks and b) uniform damage area [64]
Tsao and Hocheng [69, 73, 74] carried out comprehensive investigations on the effect of
different high speed steel drills on delamination when cutting CFRP. Diamond-plated core
drills gave the lowest delamination damage followed by candlestick drills, saw drills and step
drills, while the conventional twist drill produced the most damage as shown in Figure 2.19.
All special drill types achieved higher values of critical feed rate before the onset of
workpiece exit delamination compared to the conventional twist drill as illustrated in Table
2.10. In an investigation of tool materials and configurations, Davim and Reis [62, 63]
reported that two flute cemented carbide helical drills introduced less damage than with four
flute drills and that carbide products gave better performance compared to equivalent HSS
tools. In addition, the brad & spur carbide drill design (similar to the candlestick
configuration), produced less exit delamination than that for conventional helical flute drills.
No reasons for this were given however it is likely that this was due to the avoidance of chisel
edge ‘push out’. In the Kungl Tekniska Hogskolan (KTH) drilling technique (analogous in
part to trochoidal milling) detailed by Persson et al. [81], holes were machined axially and
radially using a diamond coated core drill which is smaller in diameter than the required hole.
They reported that the approach produced higher strength and fatigue life in composite parts
when compared with results from drilling using conventional PCD tipped and carbide dagger
drills. This was attributed to the reduction in thrust force due to the elimination of a stationary
tool centre with little or no damage around the holes. In recent tests aimed at minimising
induced exit delamination, Tsao [82, 83] introduced a new compound drill design known as
the step-core drill with alternative step-core twist, step-core saw and step-core candlestick
drills designs as shown in Figure 2.20. Results from his work showed that the former
configuration exhibited less delamination and that a 0.74 diameter ratio between the internal
(b)(a)

CHAPTER 2: LITERATURE REVIEW
31
and external parts of the step-core drill gave lower delamination than with a corresponding
0.55 ratio tool.
Figure 2.19: Various drill types/designs (diameter = 10 mm, spindle speed = 100 rpm, feed =
0.012mm/rev) (a) twist drill, (b) saw drill, (c) candlestick drill, (d) core drill, (e) step drill [69]
Drill bit Critical feed rate (*10-3 mm/rev) Core drill 7.5
Candlestick drill 6.9 Saw drill 5.1 Step drill 4.9
Twist drill 4.7 Table 2.10: Critical feed rate for various drill bits [69]
Figure 2.20: Images for different step-core drills [82, 83]
Workpiece surface roughness when drilling CFRP can vary significantly depending on
material properties, cutting conditions and tool geometries. In a study using candlestick drills,
feed rate and spindle speed were the most influential parameters affecting the average surface
roughness of drilled holes [84]. Hole surface roughness Ra of up to 15 μm was measured
following the drilling of CFRP using PCD drills and various carbide drills [85, 86]. Fibre
orientation (with respect to feed direction) can also significantly affect surface roughness
especially when θ = 135o, where fibres would be compressively loaded [38]. In terms of chip
(a) Step-core twist drill (b) Step-core saw drill (c) Step-core candlestick drill
Secondary stage
Primary stage
(a) (b) (c) (d) (e)

CHAPTER 2: LITERATURE REVIEW
32
morphology, the brittle nature of the epoxy and fibres regularly cause fibre breakage/pull out
and matrix cracking during machining, and discontinuous chips are almost exclusively
produced irrespective of the cutting conditions used [52].
2.5.2.2 Cutting forces and torque
The majority of published research has highlighted the strong correlation between thrust
force and delamination, particularly at hole exit. Monitoring of thrust force has been shown to
provide major benefits in drill wear assessment as well as minimisation of workpiece damage.
Chen [61] reported that cutting speed had a negligible effect on thrust force and torque when
drilling UD and MD CFRPs, while understandably, feed rate had a marked influence on both
aspects, and was in agreement with study by Davim and Reis [62]. Similar results were also
obtained by Tsao [82] and Won and Dharan [87] who analytically modelled the drilling of
MD CFRP. Estimated thrust force results were in close agreement with experimentally
measured data. Furthermore, the estimated allowable feed rate which resulted in damage free
holes was 0.145 mm/rev when using 6.35 mm diameter carbide-tipped twist drills. This was
because the thrust force was below the critical value for onset of exit delamination. Rawat and
Attia [80] found that thrust force increased significantly with a decrease in cutting speed
across the range of feed rate levels employed (0.02 – 0.8 mm/rev), while Jain and Yang [88]
showed forces increasing significantly with drill diameter when cutting UD CFRP laminates
using HSS drills. In work by Fernandes and Cook [89], thrust force and torque were shown to
increase with spiral distance cut (associated with thicker material), which was understandable.
A similar trend was obtained by Abrate and Walton [57] for thrust force in relation to the
number of holes drilled, which was attributed to the chipping and wear of the cutting tool.
In an investigation of drilling UD laminates using HSS twist drills, Jain and Yang [90]
found that chisel edge length had a significant influence on thrust force and workpiece
delamination. Chen [61] found that larger point angles produced higher thrust forces with
correspondingly lower torque levels, however both responses increased with an increase in
web thickness, reduced helix angles and smaller chisel edge rake angles. Tsao and Hocheng
[91] noted that core drills were preferable to twist drills as the thrust force tended to be
uniformly distributed around the periphery rather than focussed at the drill centre and cutting
edges, however manufacturing of small diameter core drills is extremely complex in practice.
In terms of tool material, Wang et al. [92] reported that HSS drills induced higher thrust
forces than carbide drills when drilling CFRP, however no indication was given as to why this

CHAPTER 2: LITERATURE REVIEW
33
occurred. It is assumed that the results reflect the higher wear rate that would be expected
with HSS. This was confirmed by tests undertaken by Malhotra [59] on 8 mm thick woven
CFRP laminates using HSS and carbide drills with a feed rate ranging from 0.03 to 0.4
mm/rev. This suggested that carbide drills performed better than HSS drills in terms of tool
wear and surface finish. Figure 2.21 shows thrust force and torque responses during the
drilling of 4 mm thick quasi-isotropic CFRP and clearly identifies six distinct regions [93].
The work involved four straight fluted carbide drills incorporating a double point angle
geometry. Maximum thrust force and torque occurred as the drill exited the laminate,
although for the first few holes, maximum torque was registered when the second cutting edge
corner (largest diameter location) entered the workpiece. In contrast to the profile obtained
with the special tool design, thrust force increased steadily up to a constant value
corresponding to steady state cutting when employing drills with standard geometries. This
was followed by a sharp drop as the tool exited the hole. The torque was initially found to
increase rapidly until the cutting edges engaged completely with the workpiece followed by a
more gradual rise until a maximum value was reached owing to the increased friction between
drill lands and hole wall [57]. Stone and Krishnamurthy [71] developed a neural network
model to control thrust force (via variation of feed rate) when drilling a graphite/epoxy quasi-
isotropic composite using PCD tipped drills. The model was trained during experimentation
to forecast thrust force based on current and preceding feed rate levels together with
previously measured thrust force data, which in turn resulted in the minimisation of
workpiece delamination.
Figure 2.21: Thrust force and torque versus time plots for a single cutting operation [93]
Time (seconds) Time (seconds)

CHAPTER 2: LITERATURE REVIEW
34
2.5.2.3 Methods for reduction of drilling forces
It is evident that thrust force has a major influence on the incidence of delamination
when drilling CFRP and extensive research has been carried out aimed at reducing drilling
forces and hence workpiece damage. A widely employed strategy is the use of smaller pre-
drilled/pilot holes prior to the main drilling cycle, such as that suggested by Won and Dharan
[94] involving carbide tipped twist drills in combination with HSS pilot tools for drilling
woven CFRP. The introduction of an initial pilot hole reduced the thrust force by ~ 65%
during the subsequent primary drilling cycle as illustrated in Figure 2.22, due to the absence
of interaction between the workpiece material and twist drill chisel edge. In addition, this
approach allowed higher feed rates to be utilised without significant increase in thrust force,
as shown in Figure 2.23. An investigation into the use of backup material (2 mm thick
aluminium plate) revealed that delamination was inhibited when drilling woven CFRP using
both saw and core drills, see Figure 2.24 [95]. Furthermore, such an arrangement permitted
the use of higher feed rates and greater productivity before the onset of delamination,
although at the expense of higher thrust forces. Additionally, Wang et al. [92] reported a
reduction in thrust force of more than 50% when utilising vibration assisted drilling (at
frequencies ranges from 100 to 500 Hz) with both carbide and HSS drills. They attributed this
to changes in the mechanics of chip formation and the subsequent effect on cutting energy. A
similar conclusion was reported by Arul et al. [96], see Figure 2.25. Special drill
configurations were also tested by Piquet et al. [97], aimed at minimising the induced thrust
force when drilling carbon epoxy composites. The work involved the use of straight fluted
WC drills having three cutting edges with measurements of thrust force, torque and hole
inlet/exit damage. The results showed that the bespoke drills produced less hole inlet/exit
damage compared to conventional twin lipped twist drills together with reduced roundness
error due to lower cutting edge loading.

CHAPTER 2: LITERATURE REVIEW
35
Figure 2.22: Thrust force curves with and without pilot hole [94]
Figure 2.23: Measured and estimated thrust force values when drilling CFRP [94]
Figure 2.24: Drilling induced delamination (1000 rpm, 0.016 mm/rev): a, c: drilling without backup - b, d: drilling with backup [95]
(b) (a) (d) (c)
Saw drill (without backup) Saw drill (with backup) Core drill (without backup) Core drill (with backup)
Hole depth (mm)
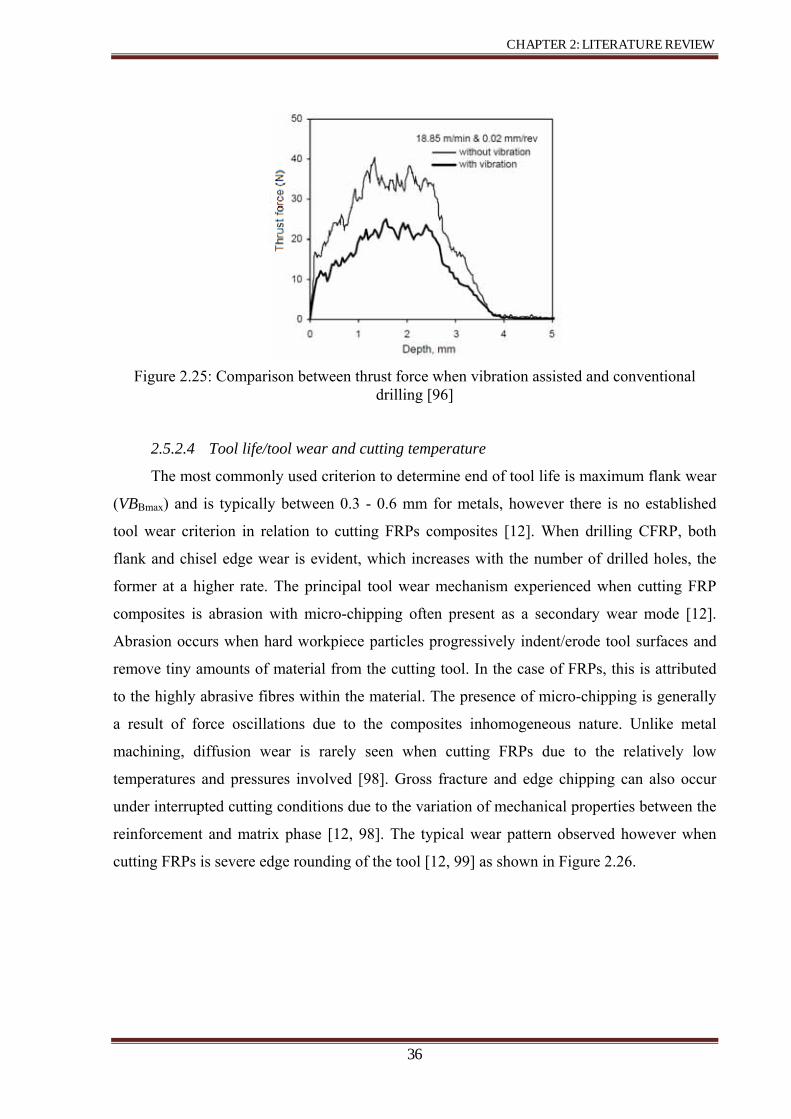
CHAPTER 2: LITERATURE REVIEW
36
Figure 2.25: Comparison between thrust force when vibration assisted and conventional drilling [96]
2.5.2.4 Tool life/tool wear and cutting temperature
The most commonly used criterion to determine end of tool life is maximum flank wear
(VBBmax) and is typically between 0.3 - 0.6 mm for metals, however there is no established
tool wear criterion in relation to cutting FRPs composites [12]. When drilling CFRP, both
flank and chisel edge wear is evident, which increases with the number of drilled holes, the
former at a higher rate. The principal tool wear mechanism experienced when cutting FRP
composites is abrasion with micro-chipping often present as a secondary wear mode [12].
Abrasion occurs when hard workpiece particles progressively indent/erode tool surfaces and
remove tiny amounts of material from the cutting tool. In the case of FRPs, this is attributed
to the highly abrasive fibres within the material. The presence of micro-chipping is generally
a result of force oscillations due to the composites inhomogeneous nature. Unlike metal
machining, diffusion wear is rarely seen when cutting FRPs due to the relatively low
temperatures and pressures involved [98]. Gross fracture and edge chipping can also occur
under interrupted cutting conditions due to the variation of mechanical properties between the
reinforcement and matrix phase [12, 98]. The typical wear pattern observed however when
cutting FRPs is severe edge rounding of the tool [12, 99] as shown in Figure 2.26.

CHAPTER 2: LITERATURE REVIEW
37
Figure 2.26: A cross section of a replica from a cutting edge when machining FRPs (αo is the rake angle and γo is the clearance angle) [12]
Davim and Reis [63] found negligible wear on carbide drills compared to HSS tools
when drilling 4 mm thick CFRP plate, with the latter producing a wear scar of 0.012 mm after
relatively few holes. Results from experimental work undertaken by Lin and Chen [70]
relating to the effect of cutting speed on tool wear when drilling UD and MD CFRP laminates
were comparable. Cutting speed ranged from 210 to 850 m/min whereas feed rate varied
between 0.03 and 0.07 mm/rev using 7 mm WC conventional and multi-faceted drills. Both
drill geometries however showed a significant decrease in tool life with increasing cutting
speed. When using coated tungsten carbide drills, Murphy et al. [93] reported that TiN and
diamond like carbon (DLC) coatings had no beneficial effect on reducing either delamination
or thrust forces when drilling MD CFRP as detailed in Figure 2.27. Surprisingly, literature on
the use of brazed and veined PCD or even CVD diamond coated tools for drilling composites
is relatively scant, however the limited amount of published data indicates that superior
workpiece surface roughness, lower workpiece damage and longer tool life when machining
both UD and MD CFRP can be expected when compared with carbide and HSS tools [16, 48,
49]. Additionally, there is evidence that special drill configurations and geometries such as
core, candlestick, straight flute and saw drills can provide significant tool life advantages [69,
100].
Cutting direction

CHAPTER 2: LITERATURE REVIEW
38
Figure 2.27: Effect of number of drilled holes on tool wear, thrust force and torque for uncoated, TiN and DLC coated drills when drilling CFRP [93]
Cutting temperatures exceeding 1000o C are not uncommon when machining metallic
materials such as high strength nickel based super-alloys and titanium alloys, which have a
highly detrimental effect on tool life [101, 102]. Considerably lower tool-workpiece interface
temperatures are produced when machining FRP composites [61, 103], with the heat
generated typically distributed at a ratio of 0.5:0.25:0.25 to the tool, workpiece and chip
respectively [57]. No significant temperature change was recorded by Masuda et al. [103]
when turning CFRP using WC tools despite the doubling of cutting speed from 100 to 200
m/min (increase from 220 to 260oC). However, when drilling MD CFRP using HSS drills,
flank surface temperatures increased significantly (generally ranging between 60 to 300oC)
with reducing feed rate and increasing cutting speed [61]. As feed rate was varied between
0.05 to 0.4 mm/rev at a cutting speed of ~ 23 m/min, the recorded temperature changed from
~120 to 60oC respectively while for cutting speed, an increase from 40 to 200 m/min caused a
rise in temperatures ranging from ~120 to 300oC at a constant feed rate of 0.05 mm/rev, see
Figure 2.28. Similar results were obtained by Rawat and Attia [80], where a flank surface
temperature of up to 300 oC was measured when drilling woven CFRP using two-fluted
uncoated carbide drills at a feed rate and cutting speed of 0.06 mm/rev and 235 m/min,
respectively.

CHAPTER 2: LITERATURE REVIEW
39
Figure 2.28: Flank temperature when drilling CFRP versus feed rate and cutting speed [61]
2.5.3 Alternative techniques for cutting small holes in FRP
The production of small holes less than 3 mm diameter is of considerable interest in
many industries/applications, not least in the manufacture of printed circuit boards (~ 1 mm
diameter), acoustic panels in aerospace components (~ 1.5 mm diameter), sports products and
in medical prostheses (< 1 mm diameter). In addition to conventional twist drilling operations,
a number of non-conventional machining processes including waterjet machining and laser
drilling are also employed. Conventional drilling of small diameter holes in carbon fibre
composites requires the use of moderate to high spindle speeds to achieve good hole quality.
The majority of studies on the drilling of small holes in composites have involved glass fibre
reinforced plastics with comparatively limited research conducted on CFRP. Drilling of 1 mm
diameter holes in woven GFRP was investigated by Aoyama et al. [104] and Ogawa et al.
[105]. Their results included surface roughness which was measured against edge position
angle γ (the relative angle between the cutting direction and fibre direction as shown in Figure
2.29). Here, roughness value was found to be a maximum (~ 50 μm Rmax) at an edge position
angle of γ = 30o. Furthermore, surface roughness typically increased with feed rate and
rotational speed. The variation in Rmax in different fibre orientation reduced significantly as
0
50
100
150
200
250
0
0.1
0.2
0.3
0.4
0.5
0 50 100 150 200 250 300 350
Cut
ting
spee
d (m
/min
)
Feed
rate
(mm
/rev)
Tool flank temperature (oC)
Feed rate (mm/rev) at 23 m/min cutting speed
Cutting speed (m/min) at 0.05 mm/rev feed rate

CHAPTER 2: LITERATURE REVIEW
40
the number of drilled holes increased as shown in Figure 2.30 (a) while hole damage
increased with the latter, see Figure 2.30 (b).
Figure 2.29: The definition of the edge position angle (γ) [104]
Figure 2.30: Number of drilled holes versus: (a) surface roughness and (b) hole damage [104]
Inoue et al. [106] evaluated the drilling of 1.6 mm thick woven GFRP using 0.4 – 5 mm
diameter cemented carbide drills under high rotational speeds of up to 80,000 rpm and feed
rates up to 0.05 mm/rev. Their results showed that the ratio of drill radius to yarn width was a
significant factor affecting tool life. A maximum damage width of ~ 30 μm occurred at γ of
45o – 60o for the first hole while the anisotropy around the drilled hole decreased with
increasing tool wear and number of holes. When using a 1 mm diameter drill, the damage
width was approximately constant at all edge position angles following the 8000th hole as
detailed in Figure 2.31. Aoyama et al. [107] investigated the internal damage produced when
drilling glass/epoxy printed wiring boards (PWB) using 1 mm diameter drills at a constant
rotational speed of 5000 rpm and feed rate ranging between 5 and 63 μm/rev. Aluminium and
bakelite plates were employed as stiffeners on the top and bottom surfaces respectively to
(b)(a)
Hole radius
Damage radius
Rotation direction of drillCutting edge

CHAPTER 2: LITERATURE REVIEW
41
prevent drill run-out with the primary aim of minimising delamination at hole entry and exit.
Internal damage width was seen to increase with the rise of surface roughness, fibre bundle
thickness and feed rate. For the same fibre bundle thickness, a maximum damage width of
~100 μm occurred at an edge position angle of γ = 45o, which was consistent with the
conclusion of Inoue et al. [106].
Figure 2.31: Damage width around the drilled hole (1 mm diameter, 80000 rpm and 50 μm/rev feed) [106]
Small hole production in CFRP was investigated by Wang et al. [92] using 0.5 mm
diameter HSS and carbide drills, which were employed at a constant rotational speed of
22,000 rpm (35 m/min cutting speed) and feed speed of 50 mm/min. Low levels of thrust
force were produced compared with results for larger drill diameters previously detailed in
Section 2.5.2.2, and ranged from 2 to 4 N and 6 to 10 N for the HSS and carbide drills
respectively.
Fibre reinforced plastics have also been machined using various non-conventional
techniques although results to date have shown limited success especially in terms of
machining time and production costs. It is therefore not surprising that such processes have
yet to be adopted in industry to cut CFRP despite certain advantages/benefits.
A number of researchers have investigated the feasibility of using waterjet machining
for the cutting of FRPs. An obvious advantage is the lack of thermal damage however, severe
delamination and chipping is still present at hole exit, in addition to the relatively high cost
and power consumption of the process. Shanmugam et al. [108] showed that abrasive waterjet
(AWJ) machining produced superior surface roughness (6 - 7 μm Ra) compared to plain
waterjet cutting of graphite epoxy composites (12 - 15 μm Ra). Kerf taper angles (4o – 6o),

CHAPTER 2: LITERATURE REVIEW
42
burr formation and high surface waviness were the main problems recorded by Wang [109]
when AWJ was utilised to cut a 3 mm thick polymer matrix composite material. Similarly,
Lemma et al. [110] reported that average surface roughness varied between 3 and 8 μm Ra
when cutting 10 mm thick UD GFRP laminates, while Miller [111] successfully employed
micro-abrasive waterjet machining involving a 50 μm diameter jet to profile carbon fibre
composites.
Vibration assisted drilling with frequencies ranging between 100 and 600 Hz was used
to reduce thrust force (by ~50%) and minimise hole damage especially at the hole exit [92].
Arul et al. [96] succeeded in producing approximately 50 holes in 5 mm thick GFRP with
HSS drills when using vibration assisted drilling while only 30 holes were achieved with
conventional drilling for the same level of tool wear. In work by Linbo et al. [112] involving
the drilling of 2 mm diameter holes in CFRP using HSS drills, machining and vibration
variables were continuously altered during operation in response to the detected thrust force
level. This technique succeeded in reducing exit delamination by over 50% compared to
conventional vibration drilling.
Laser machining is another potential non-traditional process capable of drilling FRP
composites, however, precise control of the focus position, feed rate and gas flow are
required. Understandably, thermal damage is a key consideration in relation to the matrix
phase where burning generates smoke and fumes. The process is also expensive due to the
high power consumption and use of expensive gases (helium and argon), in addition to low
productivity. Laser drilling was utilised by Young and O’ Driscoll [113] to produce 50 μm
diameter holes in 1.25 mm thick UD and woven CFRP, which resulted in a reduction of up to
30% of the workpiece specimen’s stiffness based on subsequent tensile and compression tests.
An area of resin damage (burn out) was present surrounding each hole as illustrated in Figure
2.32. Tagliaferri et al. [114] performed tests using a CO2 laser with a 0.25 mm beam diameter
to cut various composite materials including aramid, glass and graphite. In contrast to the
glass and aramid based materials, the graphite/polyester composites experienced poor
uniformity and surface morphology. This was attributed to the high vaporisation temperature
and thermal conductivity of the fibres compared to the matrix material.

CHAPTER 2: LITERATURE REVIEW
43
Figure 2.32: SEM image of perforated UD CFRP with resin damage on: (a) drilling side and (b) exit side [113]
The formation of a heat affected zone (HAZ) is one of the main limitations of laser
cutting which has been shown to cause matrix recession/decomposition, disorientation and
distortion of fibres, as well as delamination [115-117]. Pan and Hocheng [118] investigated
the formation of a HAZ following laser grooving of 8 mm thick UD carbon/epoxy composite
plates. Cutting was performed both in parallel and perpendicular to the fibre axis directions.
Thermal damage led to poor assembly tolerances and long term deterioration. Furthermore,
irregular holes that were slightly larger in diameter along the fibre direction were obtained.
This was possibly due to the higher thermal conductivity of the composite parallel to the fibre
axis, as shown in Figure 2.33 (a) [119]. Additionally, the matrix volatilised in the vicinity of
the hole close to the top surface, allowing fibres in that region to curve upwards as highlighted
in Figure 2.33 (b). Further analysis revealed a depleted matrix region together with a marked
degree of fibre swelling, as an increase in hole diameter of up to 50% was observed, see
Figure 2.33 (c). Other limitations and drawbacks when laser drilling FRPs include charred
material [120], generation of smoke and fumes, elliptical hole sections, larger diameter exit
holes, discontinuities in the profile at interfaces between adjacent layers [121], swelling of
carbon fibres in the heat affected zone adjacent to drilled holes (fibre diameter increase ~
50%) [119], taper angle of the kerf surface [122] and reduction of tensile and compression
strength of the drilled part [113].
(a) (b)

CHAPTER 2: LITERATURE REVIEW
44
Figure 2.33: Various workpiece defects when laser drilling of CFR thermoplastic composites [119]
Although ultrasonic machining (USM) can be used for producing small features/holes in
hard/brittle materials such as glass, ceramics, precious stones, etc, it is not a preferred
technique for the machining of CFRP due to a number of limitations [123]. Problems
associated with USM mainly relate to the accuracy of the setup and dynamics of the
equipment [124], with low productivity a major shortcoming particularly in respect of single
hole production [100]. In an investigation involving ultrasonic drilling of carbon fibre
reinforced silicon carbide composites, Hocheng et al. [125] reported low material removal
rate (2 – 10 mm3/sec), where a 4.5 mm diameter x 2.35 mm deep hole took 15 seconds to
produce. Delamination and fibre splintering was still apparent with the occurrence more
severe at hole exit, see Figure 2.34. Additionally, tool wear was also cited as a problem (axial
tool wear of up to 38.9 μm per hole), which caused changes in the resonance frequency of the
tool and high values of hole clearance (up to 0.35 mm per hole with coarse abrasive grit).
Unlike laser machining however, ultrasonically drilled holes are typically free of heat affected
zones as well as thermal stresses and can be more economical than waterjet and laser drilling
for simultaneous multi-hole production [125].
Figure 2.34: Entry/exit quality when ultrasonic drilling of CFR Si/C [125]
Entry
(a) (b) (c)
Exit

CHAPTER 2: LITERATURE REVIEW
45
2.5.4 Modelling the drilling of FRP composites
The use of modelling techniques to investigate the drilling of fibre-reinforced
composites has been the subject of considerable research in recent years. Although, the
majority have involved analytical and empirical schemes, a few have utilised the finite
element (FE) method to simulate drilling of fibre-reinforced laminates. Many models have
been developed for the prediction of critical thrust force at which the onset of delamination
occurs. These have included push-out and peel-up for hole exit and entry respectively [68]
and linear fracture mechanisms by Tsao and Chen [126].
A comprehensive analysis based on the law of energy conservation and linear elastic
fracture mechanisms was performed when drilling fibre reinforced laminates using various
drill types including saw, candlestick, core, step, core-saw and standard twist drills in order to
estimate the critical thrust force triggering the onset of delamination [69, 127, 128]. Findings
showed that special drill types gave higher levels of critical thrust forces than standard twist
drills which allowed the use of larger feed rates and hence improved productivity. The
influence of pilot holes on delamination when drilling fibre reinforced laminates has been
analytically modelled by Tsao and Hocheng [129]. The use of a pilot hole significantly
reduced the thrust force by 25 – 50%, which was more than the reduction of the critical thrust
(~ 11%). In related work, Tsao and Hocheng [95] developed an analytical model to predict
critical thrust force when drilling of CFRP using backup material. They found that under such
circumstances, higher levels of critical thrust force were predicted, which meant that greater
feed rates could be employed while still maintaining delamination free holes. The effect of
increasing drill eccentricity was studied analytically and was predicted to lower the critical
thrust force, which necessitated to use of lower feed rates in order to avoid delamination
[130]. More recently, Tsao [72] modelled the influence of inaccurate tool regrinding on
workpiece delamination when drilling FRPs and found that drill deviation from its nominal
geometry reduced the critical thrust force level and hence operational productivity. Empirical
models based on experimental data have also been developed to estimate thrust force and
torque when drilling CFRP [131]. In terms of computational techniques, a FE based
simulation to predict the critical thrust force for the onset of delamination when drilling of
quasi-isotropic CFRP was developed by Zitoune and Collombet [132]. The results from their
model showed agreement with experimentally measured data. Predictive FE models for thrust
force and torque have also been developed by Singh et al. [44] when drilling UD-GFRP. The

CHAPTER 2: LITERATURE REVIEW
46
model was used to study the effect of drill point angle on drilling induced damage with
outputs suggesting that a 90o drill point angle produces less damage compared to drills with
angles of 104o and 118o.
2.6 Machining of titanium alloys
2.6.1 Overview
Titanium and its alloys are generally considered to have poor machinability [29] owing
to their low thermal conductivity (7 W/mK for Ti-6Al-4V compared to 50.7 W/mK for AISI
1045 steel, [133]), high chemical reactivity, relatively low modulus of elasticity (114 GPa for
Ti-6Al-4V) and high tensile strength (950 MPa for Ti-6Al-4V). The main problems
associated with the machining of titanium alloys can be summarised as follows [134];
• High chemical reactivity resulting in diffusion and welding of the workpiece material to
the cutting edge leading to rapid tool wear, chipping and premature tool failure.
• Poor dissipation of heat during cutting producing high tool/workpiece interface
temperatures even at moderate cutting speeds.
• Retention of strength at elevated temperatures.
• Localised shear strains in the chip leading to the formation of serrated chips. Such chip
morphologies can cause vibration/high frequency dynamic forces which coupled with
high cutting temperatures produce micro-fatigue loading on the cutting tool resulting in
severe flank wear and tool failure.
• High stresses due to the small chip/tool contact length (typically a third of that
compared to cutting steel at similar conditions).
2.6.2 Cutting temperature when machining titanium alloys
Although alloying elements (e.g. aluminium and vanadium) present in titanium
materials are incorporated to improve mechanical properties, varying the amounts of additives
can however raise cutting temperatures [29]. An example of this was reported by Freeman
[135] where the allowable cutting speed was reduced from 91 m/min to 53 m/min when
oxygen content was raised from 0.13% to 0.2% (in order to maintain a cutting temperature of
900oC). Workpiece/tool interface temperatures of ~1100oC are not unusual when machining
Ti-6Al-4V alloy and 70 - 80% of the heat produced is conducted to the tool due to the low

CHAPTER 2: LITERATURE REVIEW
47
thermal conductivity of the workpiece, see Figure 2.35 [27]. In comparison, the ratio when
machining steels is approximately 50:50.
Figure 2.35: Distribution of thermal load when machining titanium and steel [27]
2.6.3 Tool wear when machining titanium alloys
The common modes of tool failure when cutting titanium alloys include notching, crater
and flank wear, micro chipping and catastrophic edge fracture [134]. The inherent chemical
reactivity of titanium alloys with all cutting tool materials has often resulted in
dissolution/diffusion wear being the dominant wear mechanism, in addition to attrition and
plastic deformation [136]. Uncoated cemented carbide (6% Co and WC grain size of 0.8 - 1.4
μm) and high speed steel tools are generally recommended for the cutting of titanium alloys
with hardmetal coatings such as TiN and TiCN providing no significant benefits [134]. An
investigation by Nabhani [136] showed that a TiN/TiC coating layer was rapidly removed
when machining titanium alloy TA48, which exposed the WC substrate to crater wear. The
performance of conventional ceramic tools (Al2O3) when machining titanium alloys is
similarly poor due to their low thermal conductivity, low fracture toughness and chemical
affinity with titanium [27, 133]. Limited research on using PCD has shown encouraging
results with lower wear rates reported compared to other cutting tool materials when
maintaining cutting temperatures below a critical threshold [134]. Conversely, Narutaki et al.

CHAPTER 2: LITERATURE REVIEW
48
[133], showed that PCD performed poorly when used for machining titanium alloys due to
their low fracture toughness and high chemical reactivity.
2.6.4 Cutting conditions when machining titanium alloys
In general, cutting speed has the most significant effect on the machinability of titanium
alloys. High clearance and negative rake angles are generally preferred when cutting titanium
alloys in order to reduce the contact between the tool flank face and workpiece. The use of
cutting fluids are recommended, which act not only as a coolant to reduce tool and workpiece
temperatures but also as a lubricant, thus lowering cutting forces and the incidence of chips
welding onto tool cutting edges [134]. This also enables the use of higher cutting speeds when
turning alloys such as Ti-6Al-4V [133]. Although most researchers recommend the
application of cutting fluids when machining titanium alloys, studies employing dry cutting
and minimum quantity lubrication (MQL) have received increased attention due to
environmental and economic considerations [137, 138].
2.6.5 Chip formation and surface integrity when machining titanium alloys
Chip morphology has been found to be highly dependent on cutting speed, with
discontinuous chips produced at low speed (60 m/min), and serrated chips at higher cutting
speed (120 m/min) when turning Ti-6Al-4V [139]. Researchers have also reported
continuous-serrated chips at 75 m/min cutting speed at low and high feed rates when turning
the same alloy [140], see Figure 2.36. The formation of serrated chips was attributed to the
high dynamic/cyclic cutting force while a continuous chip was associated with the static force
component.
The quality or integrity of the workpiece surface/subsurface after machining can play a
significant role in terms of the functional performance of a component, with heat affected
zones, variations in hardness, micro cracks etc. adversely affecting fatigue performance. Such
flaws must be avoided/minimised, particularly with safety critical components [14]. In terms
of workpiece microhardness when turning Ti-6Al-4V, Che-Haron and Jawaid [141]
highlighted an increase of ~ 20% in surface hardness at test cessation (up to 410 HV), which
extended up to 0.5 mm beneath the machined surface. This was ascribed to the work/strain
hardening effect when using worn tooling.
Average surface roughness (Ra) decreased from 1.4 to 1.04 μm as cutting speed was
increased from 55 to 90 m/min when dry turning of Ti-6Al-4V using uncoated carbide tools

CHAPTER 2: LITERATURE REVIEW
49
[142]. A further increase in cutting speed however (110 m/min) resulted in severe tool wear
which in turn produced a poorer surface finish (up 3.5 μm Ra). The lower wear rate
experienced by PCD tools translated to a superior Ra of 2 μm when cutting annealed TA48
titanium alloy compared with 11 μm Ra when using TiC/TiC-N/TiN coated carbide tools
[136].
Figure 2.36: Continuous-serrated chips produced from turning Ti-6Al-4V at 75 m/min cutting speed and feed rate of: (a) 0.05 mm/rev and (b) 0.28 mm/rev [140]
2.6.6 Drilling of Ti-6Al-4V
A substantial body of research focusing on the drilling of Ti-6Al-4V has been carried
out over the last few decades to investigate the effect of cutting conditions, tool
geometries/materials and cutting environment on hole quality and process productivity [143-
148]. In general, use of cutting fluid is deemed essential [144-147], however several studies
have been conducted to evaluate the feasibility of dry or minimum quantity lubrication
(MQL) machining [143, 144, 148]. Various types of burr formation were reported when dry
drilling including rolled-back (at high feed rate and cutting speed) and uniform burrs, see
Figure 2.37 (a). In contrast, only uniform burrs either with or without attachments (caps and
rings) were observed when wet cutting as shown in Figure 2.37 (b) [144]. Burr height
typically varied from 0.1 - 0.15 mm when operating at cutting speeds of 6 – 10 m/min and
feed rates of 0.05 – 0.2 mm/rev with wet cutting [144], while higher values of up to 0.3 mm
were measured under dry cutting conditions at 50 m/min and 0.07 mm/rev [143]. In addition,
Dornfeld et al. [144] reported that a combination of tools with 30o and 130o helix and point
angles respectively with high pressure coolant produced shorter burrs.
(b) (a)

CHAPTER 2: LITERATURE REVIEW
50
Figure 2.37: Burr types formed in: (a) dry cutting and (b) wet cutting [144]
When wet drilling through 20 mm thick Ti-6Al-4V using 6 mm diameter tools, Sharif
and Rahim [147] reported that TiAlN coated drills outperformed their uncoated WC
counterparts. The former produced longer tool life (25 holes at 25 m/min and 7 holes at 45
m/min) compared to the latter which wore very rapidly (only 1 hole at 25 m/min). This was
attributed to the likely formation of a thin Al2O3 film that thermally insulated the cutting tool
and reduced friction at the tool/workpiece interface. Increasing cutting speed had an adverse
effect on tool life although Ra was generally below 1.3 μm regardless of the operating
conditions. The difference in cutting temperature when drilling under MQL and wet
conditions were studied using thermocouples embedded in the Ti-6Al-4V workpiece by
Zeilmann et al. [148]. A temperature of 450oC was recorded when operating at a cutting speed
of 15 m/min, which increased to 550oC when the speed was doubled to 30 m/min.
Conversely, when flood coolant was employed via through holes in the tool, a temperature of
150oC at 30 m/min was measured, which only increased to 300oC at 50 m/min. In related
studies by Li et al. [145] and Li and Shih [146] involving the use of ultra high cutting speeds
(up to 183 m/min with feed rates up to 0.15 mm/rev) when drilling 6.35 mm thick Ti-6Al-4V
plates with a special drill design (spiral point having 0.72 mm web thickness as opposed to
0.45 mm for conventional twist drills), extremely high cutting temperatures approaching
1210oC were generated even for the first hole drilled under dry conditions. This value dropped
by almost 50% to 651oC when employing internal tool coolant. Maximum tool life of 204
holes was obtained at a cutting speed and feed rate of 91 m/min and 0.1 mm/rev respectively.
In general, the spiral point drill performed better against the conventional twist drill in terms
of tool life, thrust force, torque, workpiece surface roughness and burr height. This special
drill however was not suitable for machining FRP composites as thinner web dimensions are
typically required to reduce the effect of chisel edges on thrust force and hence minimise
delamination. With regard to tool coatings, use of CrCN and TiAlN [148] led to moderately
reduced cutting temperatures (~100oC less) which was in agreement with results by Sharif and
Rahim [147]. The lower coefficient of friction provided by the coatings was thought to be the
(b)(a) Burr Exit surfaces
Uniform Leaned-back Rolled-back
Uniform with ring Uniform with capUniform

CHAPTER 2: LITERATURE REVIEW
51
most likely reason for the observation. Reduction of thrust forces was also evident at higher
cutting temperatures and reflected softening of the workpiece material. Additionally, adhesion
(smearing) on hole surfaces was reported owing to the presence of plastic deformation at high
cutting temperatures (> 500oC) [148]. Smearing was also found on the drill rake face when
dry cutting as shown in Figure 2.38 [143].
Figure 2.38: SEM image of drill rake face (15 holes) [143]
Canter et al. [143] investigated the effects of varying cooling frequency when dry
drilling of Ti-6Al-4V. This involved directing compressed air to the tool and workpiece either
after each hole (condition I) or following every 8 holes (condition II) drilled. The former
arrangement (condition I) gave a threefold increase in tool life compared to the latter.
2.7 Machining of aluminium alloys
Aluminium alloys are generally considered easy to machine in terms of tool life, cutting
force, material removal rate, chip formation and surface roughness [29]. The melting point of
aluminium alloys range between 530 – 670oC depending on additive content [30] and
consequently the temperatures generated during machining are insufficient to cause any
significant damage to carbide tools, even when dry cutting, although the use of cutting fluids
when drilling aluminium alloys is still recommended in order to minimise cutting
temperatures, reduce adhesion and facilitate chip transport. More problematic is the relatively
high coefficient of thermal expansion of ~18-25 μm/mK linked with the high thermal
conductivity (~154 W/mK) for aluminium alloys. A temperature variation of ~200oC will
cause a 50 μm change in the dimension of a 10 mm workpiece and can result in difficulties
with achieving product tolerances. Typical problems encountered when cutting aluminium
Adhered Ti-6Al-4V
Tool substrate WC K40
Tool rake surface (TiN coating)

CHAPTER 2: LITERATURE REVIEW
52
alloys include significant burr formation particularly when using high feed rates together with
poor lubrication [149], difficulties with swarf evacuation leading to tool clogging when dry
drilling [150], and built-up edge formation/loss of cutting edge sharpness under low cutting
speeds conditions (< 25 m/min) [151]. The maximum tool-chip interface temperature when
dry drilling aluminium AA2024 was found to be ~80oC at low cutting speeds (25 m/min),
which rose up to 220oC at 300 m/min [152]. On the tooling front, various coatings including
DLC and TiC have been shown to provide superior performance in terms of tool life and hole
quality compared to uncoated tools when drilling various aluminium alloys [149, 152-154].
The anti-sticking property of DLC coatings lead to much longer drill life (i.e. 150 holes was
achieved compared to 50 holes using HSS tools) in addition to lower thrust force and torque
(i.e. 2 N.m as opposed to 4 N.m using HSS tools at test cessation) [154, 155]. In general,
small and discontinuous chips are desirable when drilling aluminium alloys in order to avoid
clogging difficulties associated with long swarf, which promote increased torque and cutting
temperatures leading to drill failure [156]. While Al-7050 alloy is used in the current work as
workpiece material (Phase 3), published information on its machinability is extremely limited.
An investigation by Tang et al. [157] however evaluated the effect of tool flank wear on
residual stresses induced during milling of Al-7050 material. Wear had a significant influence
on residual stresses as even small levels of flank wear caused either tensile and compressive
stresses between -20 to 20 MPa, while higher wear levels at test cessation (0.25 mm flank
wear on carbide cutter) produced tensile residual stresses on the machined surface of up to
127 MPa. Cutting temperatures and corresponding forces of up to 200oC and 360 N
respectively were also measured as the tool was worn.
2.8 Drilling of multilayered composite/metallic materials
2.8.1 Background
The combination of CFRP with titanium and/or aluminium to form multilayered
material stacks has gained prominence in recent years. This is especially true for applications
such as aerospace structures subject to extreme mechanical loads [14]. Joining of these
materials typically requires the production of fastener holes. At present, such holes for wing
and tail plane components are manufactured via a multi-shot routine which necessitates pre-
drilling of each individual layer followed by a deburring cycle [55]. The stack is then
assembled and temporarily held together (mechanically) prior to hole reaming. The disparity

CHAPTER 2: LITERATURE REVIEW
53
in workpiece mechanical properties (e.g. different elastic modulus, thermal expansion
coefficient etc.), often presents an obstacle towards achieving the required tolerance levels.
Problems encountered when cutting these dissimilar materials typically include severe tool
wear, heat induced damage, large hole size, roundness deviation and the presence of metallic
burrs [158]. Therefore, relatively low cutting speeds involving manual drilling together with
low feed rates are usually employed, which in turn results in extensive fabrication times
(typically of the order of several minutes per hole). In addition, the high tool wear rates
encountered when drilling CFRP and titanium further impacts on process productivity.
2.8.2 Drilling of metallic/composite stacks
Contrary to the extensive information on the machining of CFRP’s, published data on
the drilling of two or three layer metal/composite materials is somewhat limited. The
available literature however indicates that the main challenge when drilling
composite/titanium stacks relates to the excessive tool wear induced by the titanium layer as
well as damage caused by the metallic chips on the hole surface of the composite section [14,
57]. Drilling of graphite composite/titanium stacks were investigated by Kim and Ramulu
[158] and Ramulu et al. [159]. Here, the performance of 5 mm diameter HSS and carbide
drills were evaluated over a range of operating parameters including feed rates of 0.02 and 0.3
mm/rev and rotational speeds from 660 to 5440 rpm (10 – 85 m/min). In general, carbide
tools outperformed HSS equivalents in terms of lower thrust force and torque, longer tool life
(35 drilled holes compared with 4 holes using HSS drills [159]), reduced burr height and
smoother surface finish on both Ti and composite materials. The surface roughness (Ra) of
the titanium alloy surface was found to be 5 and 2 μm as opposed to 14 and 6 μm for the
composite layer when HSS and carbide drills were used respectively [159]. Additionally, the
thrust force and torque profiles show several distinct regions as the tool moves through the
stack, with the maximum value obtained when the drill was completely engaged in the
titanium layer, see Figure 2.39. The height of burrs produced on the titanium layers increased
with higher cutting speeds and lower feed rates. When carbide drills were employed, entry
and exit height were up to 0.15 mm (at 10 m/min and 0.25 mm/rev) and 1 mm (at 40 m/min
and 0.08 mm/rev) respectively [158, 159]. Optimum parameters of 0.08 mm/rev feed rate and
660 rpm (10 m/min) were reported for drilling 12.4 mm thick graphite/titanium stacks with
carbide drills [159].
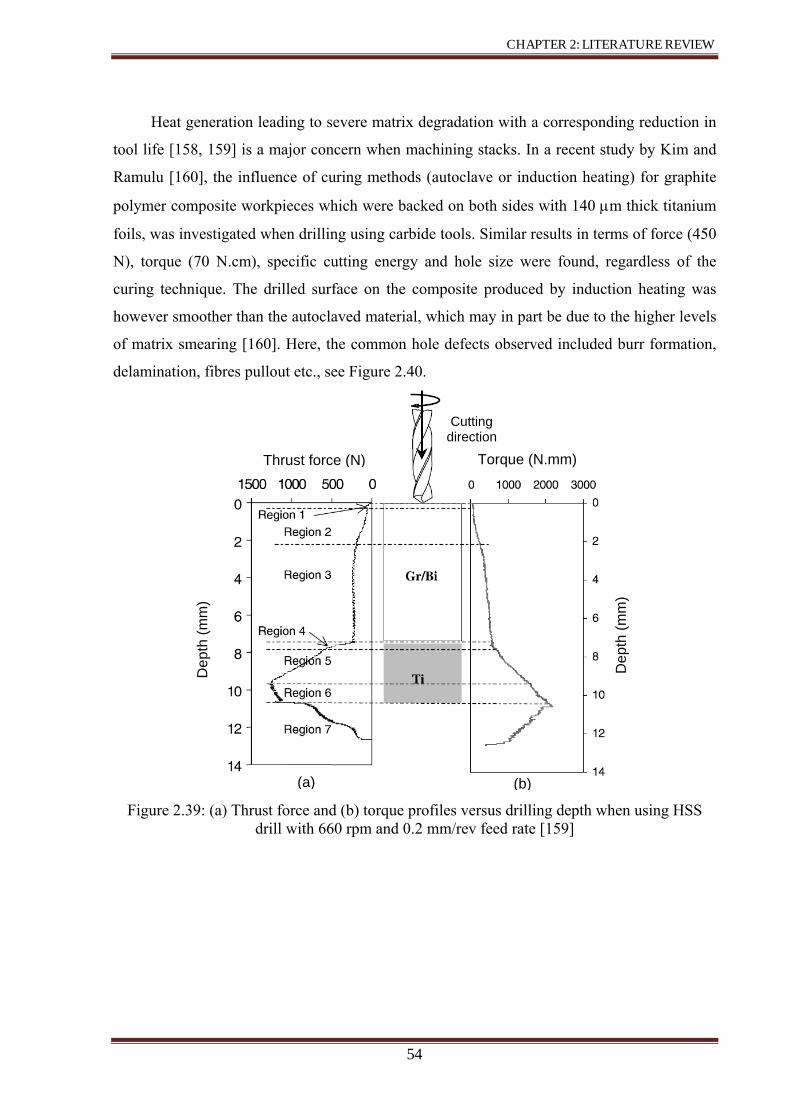
CHAPTER 2: LITERATURE REVIEW
54
Heat generation leading to severe matrix degradation with a corresponding reduction in
tool life [158, 159] is a major concern when machining stacks. In a recent study by Kim and
Ramulu [160], the influence of curing methods (autoclave or induction heating) for graphite
polymer composite workpieces which were backed on both sides with 140 μm thick titanium
foils, was investigated when drilling using carbide tools. Similar results in terms of force (450
N), torque (70 N.cm), specific cutting energy and hole size were found, regardless of the
curing technique. The drilled surface on the composite produced by induction heating was
however smoother than the autoclaved material, which may in part be due to the higher levels
of matrix smearing [160]. Here, the common hole defects observed included burr formation,
delamination, fibres pullout etc., see Figure 2.40.
Figure 2.39: (a) Thrust force and (b) torque profiles versus drilling depth when using HSS drill with 660 rpm and 0.2 mm/rev feed rate [159]
Torque (N.mm) Thrust force (N) Torque (N.mm) Thrust force (N)
(a) (b)
Dep
th (m
m)
Dep
th (m
m)
Cutting direction

CHAPTER 2: LITERATURE REVIEW
55
Figure 2.40: Some hole quality parameters in drilling graphite/titanium hybrid composites [160]
Drilling of composite/aluminium stacks (comprising 4.2 mm CFRP laminates followed
by a 3 mm layer of Al 2024) was recently studied by Zitoune et al. [161], using different sizes
of uncoated WC tools. Thrust force and torque on both CFRP and aluminium layers generally
increased with higher feed rate and cutting speed, however at high spindle speeds, thrust force
when machining the CFRP layer decreased. This was attributed to the large amount of heat
generated, which reduced the epoxy’s resistance to cutting. Additionally, drill diameter had a
significant influence on thrust force as a result of larger chisel edge dimensions (e.g. 0.6 mm
chisel edge length for 4 mm drill diameter while it was 1.6 mm for 8 mm drill diameter)
leading to an increase in chip cross sectional area. The effect of chisel edge (60 %
contribution) was consistent with the findings by Won and Dahran [94]. Similarly, chip
breakability when drilling the CFRP/aluminium stack was improved when using drills with
diameters > 6 mm at a feed rate of 0.1 mm/rev [161]. Results reported by Zitoune et al. [161]
also suggest that cutting force values are only stable/acceptable within the first 30 – 60 holes,
and that high surface roughness Ra values of between 4 μm to 8 μm (feed rate of 0.05 - 0.15
mm/rev) are produced in the CFRP. The corresponding Ra in the Al layer was up to 3 μm, but
unfortunately this exceeds the typical industrial upper limit which is 1.6 μm and 3.2 μm for
metallic and composite surfaces respectively [162].
Delamination
Graphite polymer composite Titanium
Titanium
Ti burrs Surface profileFibre pullout
Surface texture Entrance/exit hole damage
Hole size error Hole size Roundness

CHAPTER 2: LITERATURE REVIEW
56
A key paper by Brinksmeier and Janssen [163] describes some of the difficulties
associated with through drilling of multilayer Al/CFRP/Ti stacks using uncoated and coated
tungsten carbide tools. These include low tool life (~ 30 holes), clogging of drill flutes due to
poor evacuation of continuous titanium chips from the bottom layer and severe
damage/erosion of the CFRP hole surface caused by sharp Ti swarf, see Figure 2.41.
Aluminium built-up edge formation on the main cutting lips combined with excessive tool
wear was also observed to adversely affect the machined hole quality. Support offered to the
CFRP laminate by the Al and Ti plates is anticipated to inhibit delamination of the composite
surfaces during drilling in accordance with data reported by Tsao and Hocheng [95], where
use of a backup layer (2 mm thick Al plate) was seen to impede the progress of laminate
failure. Additionally, reduced burr formation on the titanium and aluminium material at the
interface with the CFRP layer can also be expected [164]. No tests however were performed
to evaluate the influence of stack arrangement/drilling sequence (i.e. machining commenced
from Ti layer rather than Al) on process performance.
Figure 2.41: Chip removal problem when drilling Ti-6Al-4V in a metallic/composite stack [163]
2.9 Cutting tool materials and coatings
2.9.1 Introduction
There are numerous different tool materials with a wide range of properties,
performance levels and cost available for various machining applications. The choice of tool
material is governed by several factors including workpiece specification, productivity
requirements, product design, machine tool condition and tooling cost. Generally, desirable
characteristics for cutting tools include high hot hardness, good thermal conductivity, good
Aluminium
CFRP
Ti-6Al-4V
High chip temperatures
Friction contact chip/workpiece
Tool

CHAPTER 2: LITERATURE REVIEW
57
chemical inertness relative to the workpiece material, high toughness and fatigue resistance
together with high compressive, tensile and shear strength [27]. Tool materials are commonly
classified into three main groups in accordance with their mechanical properties (e.g.
hardness, toughness, strength, etc.) namely high speed steels (HSS), cemented carbides and
ceramic/superhard materials [165]. Of these, cemented carbides are the most widely used due
to their favourable balance of properties in terms of toughness and hardness/abrasion
resistance which cannot be matched by other materials, see Figure 2.42 [166]. While
possessing superior toughness, the main limitation of HSS tools is their relatively low
hardness and moderate strength, which make them unsuitable for cutting highly abrasive
materials such as FRPs [12]. Therefore, no further details of HSS tools will be presented in
the following sections.
Figure 2.42: The relationship between toughness and hardness for various cutting tool materials [166]
2.9.2 Tungsten carbide tools
Cemented tungsten carbide (WC) tools comprising hard carbide particles (mainly WC)
are ‘held together’ by a metallic binder (mainly Co although other elements can also be
present), which is generally in a liquid phase at the sintering temperature of above 1300oC
[12, 167]. The cobalt content is typically between 4 – 12 %, depending on the grade of
carbide [29, 167]. Mechanical/physical properties of WC-Co tool materials are highly
dependent on the cobalt content and carbide grain size [29, 165, 167], see Table 2.11. In
general, a smaller grain size results in higher hardness and wear resistance while both
hardness and compressive strength also improve with lower cobalt content [12, 29].
Hot hardness and abrasion
resistance
Toughness and bending strength
Ideal cutting tool material

CHAPTER 2: LITERATURE REVIEW
58
Therefore, submicron/fine grain sized carbides are preferred for the machining composites in
order to withstand abrasion attack from the reinforcement [12].
Table 2.11: Properties of WC-Co tool materials [29]
2.9.3 CVD diamond and DLC coatings
The chemical vapour deposition (CVD) process involves a gas-phase chemical reaction
such as methane, nitrogen, aluminium chloride or titanium tetrachloride etc. in an excess of
hydrogen above a solid surface such as a carbide cutting tool, and is typically performed at
temperatures of 800-1100oC [167, 168]. Several microns of a single layer or multilayer
coating which can include hardmetals (TiC, TiN etc.) and diamond are deposited on the tool
surface in order to improve their wear resistance [12]. Diamond, with its unrivalled hardness
level (10,000 HV), relatively low coefficient of friction (0.03), high thermal conductivity
(2000 W/mK at room temperature), low chemical reactivity (except ferrous workpieces) and
high tensile and compressive strength [168, 169] make it an ideal material for the machining
of nonferrous high strength/abrasive materials. The properties of the diamond or hardmetal
layer are determined to a large extent by the gas mixing ratio (typically the precursor gas is
CH4 which is diluted in an excess of hydrogen by 1-2% volume) and the preparation
temperature of the tool surface (1000 – 1400 K) [168]. The main limitation of the CVD
diamond coating process however is the poor adhesion of diamond due to the presence of
cobalt in the carbide tool substrate [29]. In order to improve coating adhesion, cobalt has to be
either removed or stabilised by the formation of inert chemical compounds. Here, the typical
procedure involves two etching steps comprising an initial tool substrate surface roughing,
which is typically performed mechanically by sandblasting followed by chemical pre-
treatment to deplete or dissolve cobalt and form CoSO4 and Co-oxides [166, 170].
Co % Mean WC grain size
(μm)
Hardness (HV)
Transverse rupture strength
(MPa)
Compressive strength (MPa)
Young’s modulus
(GPa)
Fracture toughness (MPa.m1/2)
3 0.7 2020 1000 - - - 1.4 1820 - - - 8
6 0.7 1800 1750 4550 - - 1.4 1575 2300 4250 630 10
9 0.7 1670 2300 - - - 1.4 1420 2400 4000 588 13 4.0 1210 2770 4000 - -
15 0.7 1400 2770 - 538 - 1.4 1160 2600 3500 - 18

CHAPTER 2: LITERATURE REVIEW
59
CVD diamond coated tools have been evaluated by a number of researchers for cutting
composite materials with somewhat encouraging results [169, 171]. The optimum thickness
of the CVD diamond coating was found to be 9 – 10 μm, which outperformed a 6 μm thick
layer (30% longer tool life) when used for the turning of CFRP [170]. In terms of drilling,
CVD diamond coated tools (e.g. CCDia Fiberspeed from Cemecon, Germany) produced 500
holes in CFRP compared to 90 holes with uncoated carbide drills under comparable operating
conditions. Corresponding hole quality of H8 was achieved with the CVD coated tools, which
was not replicated by either the uncoated or PVD coated drills [13]. Davim and Mata [169]
measured lower cutting forces with CVD diamond coated tools compared to WC and PCD
inserts when turning composites although the surface roughness produced was approximately
the same. Further benefits of CVD diamond coatings compared to equivalent solid ultrahard
tool materials is their lower cost (~ 30% cheaper than brazed PCD) and relative ease of
implementation on complex tool geometries (i.e. helical fluted small drills and end mills) [12,
169].
Diamond-like carbon (DLC) is a mixture of hard carbon atoms (diamond and graphite
are commonly referred to as sp3 and sp2 hybrid carbon based bonded arrangements
respectively) which are linked together in an amorphous structure similar to natural diamond
[172, 173], with comparable mechanical/physical properties [172, 174-176]. Unlike CVD
diamond products, DLC coatings are produced using the physical vapour deposition (PVD)
technique involving sputter deposition or an ion-beam system operating at significantly lower
temperatures (up to 500oC) [175], which does not cause any difficulties with the cobalt binder
in carbide tools. The PVD process also results in a finer microstructure, greater toughness and
reduced substrate deterioration [12]. The hardness of DLC depends primarily on the sp3
element concentration in the mixture. Where the element concentration approaches 100%, the
coating hardness approximates that of natural diamond (8000 – 10000 HV), but drops by
~50% (3000 – 5000 HV) when the sp3 diamond concentration is reduced to ~ 15 – 20% [173].
DLC layer thickness is typically of the order of several microns, whereas diamond coatings
can be up to 18 μm. To date, the use of DLC coated tools for the machining of metal matrix
composites [173] or FRP composites [93] is still limited. Despite their superior properties,
Murphy et al. [93] found limited benefits in using DLC coatings over uncoated tools in terms
of tool wear when drilling CFRP.

CHAPTER 2: LITERATURE REVIEW
60
2.9.4 Polycrystalline diamond (PCD) drills
Synthetic polycrystalline diamond is produced by sintering diamond grits (2 – 50 μm) at
high temperatures and pressures of 1500 oC and 60 GPa respectively [177]. A metal
catalyst/binder (mainly cobalt) is used to promote diamond inter-growth and ensure a suitably
dense product [178, 179]. The resulting material typically has high hardness (8000 – 10000
HV) with more uniform mechanical properties than natural diamond. Polycrystalline diamond
blanks are normally produced in a disc format up to 75 mm diameter with a 0.5 – 0.7 mm
thick diamond layer bonded onto a WC substrate. The various insert shapes are produced by
fabricating tools using segments/sectors of PCD cut from the initial disc or blank [166]. The
properties of PCD tools depend upon the diamond grain size, the degree of diamond inter-
growth together with the quantity and distribution of the catalyst material [178]. Contrary to
tungsten carbide tools, larger diamond grit products have higher hardness while finer grains
are preferred when edge sharpness is of importance [178, 180]. At temperatures of above
~800oC the diamond reverts to graphite and consequently cutting temperatures must not be
allowed to exceed this level [179]. Since the cutting temperatures of FRP composites are
generally below this figure, PCD tools can potentially be successfully employed.
PCD tools are widely utilised for the machining non-ferrous workpiece materials [86,
166, 180, 181] while their use for ferrous material is prohibited because of reaction with
ferrite at high operating temperatures resulting in a back-transformation to graphite. Ramulu
et al. [180] observed uniform flank wear, edge rounding, cracking and chipping when using
PCD tools to cut graphite/epoxy composites. When turning Al/SiC MMC’s, PCD tooling was
able to achieve a tool life of 5 min when operating at a cutting speed of 1000 m/min, as
opposed to 0.2 min reported for WC tools, working at a considerably lower cutting speed of
50 m/min. Ding et al. [181] also suggests that when turning Al/SiC MMC’s, PCD exhibited a
marked reduction in flank wear and surface roughness compared with various grades of
PCBN, see Figure 2.43. This was attributed to their higher abrasion and fracture resistance
together with a lower affinity for adhesion with aluminium based materials. Despite the
superiority of PCD tools in terms of tool life and machined quality, their capital cost is
generally considerably higher than other tool materials [178]. Additionally, their use is only
recommended when the dominant wear mechanism is abrasion [166].
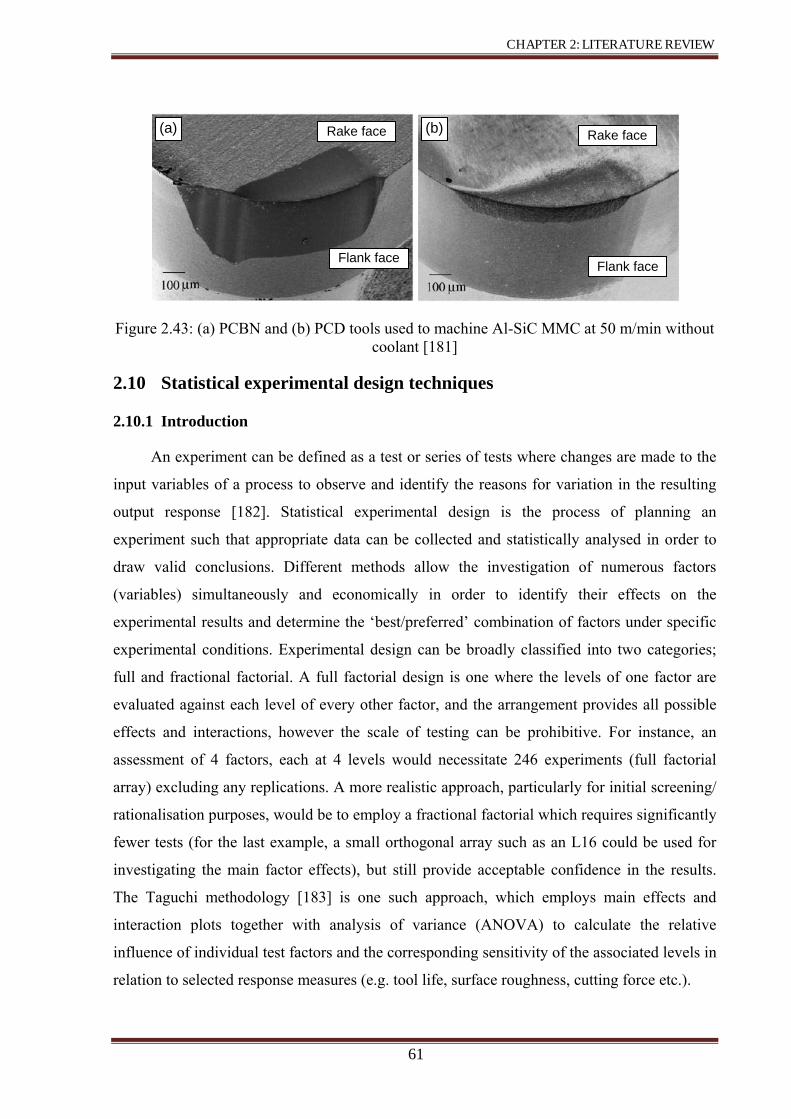
CHAPTER 2: LITERATURE REVIEW
61
Figure 2.43: (a) PCBN and (b) PCD tools used to machine Al-SiC MMC at 50 m/min without coolant [181]
2.10 Statistical experimental design techniques
2.10.1 Introduction
An experiment can be defined as a test or series of tests where changes are made to the
input variables of a process to observe and identify the reasons for variation in the resulting
output response [182]. Statistical experimental design is the process of planning an
experiment such that appropriate data can be collected and statistically analysed in order to
draw valid conclusions. Different methods allow the investigation of numerous factors
(variables) simultaneously and economically in order to identify their effects on the
experimental results and determine the ‘best/preferred’ combination of factors under specific
experimental conditions. Experimental design can be broadly classified into two categories;
full and fractional factorial. A full factorial design is one where the levels of one factor are
evaluated against each level of every other factor, and the arrangement provides all possible
effects and interactions, however the scale of testing can be prohibitive. For instance, an
assessment of 4 factors, each at 4 levels would necessitate 246 experiments (full factorial
array) excluding any replications. A more realistic approach, particularly for initial screening/
rationalisation purposes, would be to employ a fractional factorial which requires significantly
fewer tests (for the last example, a small orthogonal array such as an L16 could be used for
investigating the main factor effects), but still provide acceptable confidence in the results.
The Taguchi methodology [183] is one such approach, which employs main effects and
interaction plots together with analysis of variance (ANOVA) to calculate the relative
influence of individual test factors and the corresponding sensitivity of the associated levels in
relation to selected response measures (e.g. tool life, surface roughness, cutting force etc.).
Rake face Rake face
Flank face Flank face
(b)(a)

CHAPTER 2: LITERATURE REVIEW
62
2.10.2 Taguchi experimental design procedure
It is suggested that a simple step-by-step approach to experimental design can be
implemented without an expert background in statistics [184]. This results in a set of
procedures that initially involves selecting a suitable orthogonal array (OA) from a set of
standard designs (e.g. L4, L8, L16, L32 for two and four levels factors & L12, L18 for two
and three levels combination & L9, L27 for three levels factors), followed by assignment of
factors into the OA using linear graphs or assignment tables and finally analysis of the
experimental data. The best factor combination is extracted from a one-shot experiment
followed by a confirmation run in order to validate the results. Useful sets of orthogonal
arrays, linear graphs and assignment tables are presented by Taguchi [185]. The main
limitation of the technique is that it underestimates the importance of factor interaction
effects, although Taguchi implies that their effects can be eliminated by correctly specifying
the response variable and carefully selecting corresponding design factors and levels [184].
2.10.3 Overview of analysis of variance (ANOVA) technique
For analysing experimental results, the analysis of variance (ANOVA) technique can be
used to interpret experimental data and make necessary decisions. ANOVA is a statistically
based, objective decision making tool for detecting differences in the average performance of
a group of factors examined [183]. As its name suggests, the procedure involves partitioning
the total variability of a response into its individual components. In essence, the technique
compares the variability in the mean of an individual factor with the inherent experimental
error. A confirmation experiment, especially when a fractional factorial design has been
applied, is used in order to validate the conclusions drawn from the analysis [183]. More
details can be found in the reference by Ross [183].

CHAPTER 3: EXPERIMENTAL WORK
63
3. EXPERIMENTAL WORK
The research involved three main phases of experimental testing. Phase 1 and 2
investigated the drilling of small diameter holes (1.5 mm) in thin sheet CFRP laminates while
Phase 3 involved one-shot drilling (6.35 mm diameter holes) of multilayer workpiece stacks
comprising titanium, CFRP and aluminium. Each phase was further divided into appropriate
sub-phases as listed below:
Phase 1A: Preliminary small hole drilling of CFRP and the influence of peel ply layers
Phase 1B: Effect of tool geometry and operating parameters
Phase 2A: Effect of composite material, fibre orientation and machining parameters
Phase 2B: Evaluation of diamond based coatings
Phase 3A: Preliminary drilling trials in separate CFRP and Ti workpiece and multilayer stacks
Phase 3B: Impact of stack arrangement and performance of PCD tools
Phase 3C: Effect of tool coatings and operating parameters
The following sections detail the workpiece materials, tooling and equipment used in
the trials together with a comprehensive description of the experimental procedure and
associated test arrays.
3.1 Workpiece materials
Carbon fibre reinforced plastic (CFRP) composite laminates were used throughout
Phase 1 and 2 trials while Phase 3 work utilised stack material comprising CFRP sandwiched
between Ti-6Al-4V and Al-7050. All workpiece materials were supplied by GKN Aerospace
(UK).
3.1.1 CFRP composite laminates for Phase 1 and 2 tests
All CFRP workpiece materials used in Phase 1 and 2 tests were manually laid up with 12 pre-impregnated (prepreg) layers each measuring 0.25 mm thick to provide ~3 mm thick
symmetric CFRP plates. Woven glass scrims (100 μm thickness) were applied to both sides of
all plates with a further 100 μm thick peel ply sheet comprising J2 (HS013) MF Nylon overlayed prior to curing, which was retained during drilling (except for Phase 1A tests). All
prepregs employed carbon fibres approximately 6 – 8 μm in diameter with a toughened epoxy

CHAPTER 3: EXPERIMENTAL WORK
64
matrix/resin and were produced (by GKN) from different manufacturers. Workpiece test specimens were subsequently cut into 120 mm x 120 mm plates in order to fit a specially designed jig with clearance holes. All the composite laminates used in Phase 1 involved unidirectional (UD) prepregs (MTM44-1/HTS) but with different lay-up and curing conditions employed for Phase 1A and 1B respectively, see Table 3.1 for details. For Phase 2, three different prepreg/resin systems (from different manufacturers) encompassing both UD and woven fibre arrangements were evaluated, see Table 3.2. Figure 3.1 shows cross sectional micrographs of the fibre orientation seen in UD and woven laminates respectively.
Figure 3.1: Cross section micrographs of: (a) UD and (b) woven MTM44-1/HTS OC
laminates with associated fibre orientation
Phase 1A Prepreg supplier Advanced Composite Group (ACG) Prepreg specifications
Reinforcement Toho Tenax HTS 12K, 268gsm, 1/4 mm, UD, 1.76g/cm3(ρ) Matrix ACG MTM44-1 1.18g/cm3 (ρ) Fibre/resin code ACG MTM44-1/HTS-268-12K (Vf = 56.5%)
Fibre weave type Unidirectional (UD) Fibre orientation (lay-up) (45o/0o/135o/90o/45o/0o)s* Curing conditions
Ramp rate 1oC/min at vacuum pressure of 0.9 bar
Curing Oven cured with a step dwell of 80°C for 30 minutes then heat up to 135°C
Phase 1B Curing conditions
Initial curing
Oven cured with a heating rate of 1°C/min with a step dwell at 80°C for 30 minutes followed by a heating rate of
1°C/min to 135°C which was maintained for 4 hours, all held at a minimum vacuum pressure of 27"Hg (0.914 bar)
Post curing Heating rate of 2.5°C/min to 135°C followed by a slower heating rate of 0.2°C/min to 180°C and held for 2 hours.
Free standing with no vacuum applied All other factors same as in Phase 1A * The subscript “s” indicates the laminate is symmetric
Table 3.1: Details of workpiece materials for Phase 1 tests
Nylon peel plyNylon peel ply
Nylon peel ply Nylon peel ply
Glass scrimGlass scrim
Glass scrim Glass scrim
(b)(a)

CHAPTER 3: EXPERIMENTAL WORK
65
Properties common between all materials used in Phase 2 Fibre
orientation UD (45o/0o/135o/90o/45o/0o)s*
Woven (135o/45o/90o/0o/135o/90o)s* Material Phase 2A
977-2/HTS
Prepreg supplier Cytec Engineered Materials
UD prepreg specifications
Reinforcement Toho Tenax HTS 12K, 268gsm, 1/4 mm,
UD, 1.76g/cm3 (ρ) Matrix Cytec 977-2 1.31 g/cm3 (ρ)
Fibre/resin code 977-2/HTS-268-12K (Vf = 59%)
Woven prepreg specifications
Reinforcement Toho Tenax HTA, 2x2 twill, 285gsm, 1.8g/
cm3 (ρ) Matrix Cytec 977-2 1.31 g/cm3
Fibre/resin code Cytec 977-2/HTS-285-6K 2x2 twill (Vf = 55%)
Curing conditions
Autoclave cured with a heating rate between 0.5 and 3.5oC/min and held for 180 minutes at 180°C. 100 psi (7 bar)
pressure during cure.
8552/AS4
Prepreg supplier Hexcel
UD prepreg specifications
Reinforcement Hexcel AS4, 145gsm, 1.79g/cm3 (ρ) Matrix Hexcel 8552 1.3g/cm3 (ρ)
Fibre/resin code Hexcel 8552/AS4-145-12K (Vf = 58.5%)
Woven prepreg specifications
Reinforcement Hexcel 3K AS4 286gsm 5HS Matrix Hexcel 8552 1.3g/cm3 (ρ)
Fibre/resin code Hexcel 8552/AS4-286-5HS (Vf = 55%)
Curing conditions
Autoclave cured with a heating rate of 1-3oC/min to 110oC with a dwell for 60 minutes. Heating at 1-3oC to 180oC with a
dwell for 2 hours. 100 psi (7 bar) pressure during curing.
MTM44-1/HTS
Prepreg supplier Advanced Composite Group (ACG)
UD prepreg specifications
Reinforcement Same as in Phase 1A Matrix
Fibre/resin code
Woven prepreg specifications
Reinforcement Toho Tenax 3K, HTS 5131, 283gsm, CF0604 5HS fabric
Matrix ACG MTM44-1 1.18g/cm3 (ρ) Fibre/resin code ACG MTM44-1/HTS-283-5HS (Vf = 55%)
Curing conditions
Initial curing Same as in Phase 1B Post curing
* The subscript “s” indicates the laminate is symmetric
Table 3.2: Details of workpiece materials for Phase 2 tests

CHAPTER 3: EXPERIMENTAL WORK
66
3.1.2 Ti/CFRP/Al stacks for Phase 3 tests
Each material in the stack had a nominal thickness of 10 mm and was bonded together
using a strong film adhesive (3M AF163) which helped to ensure that cutting forces and
exit/entry hole damage were not adversely affected by material separation. For the primary
tests, the 30 mm thick workpiece specimens were cut into 120x120 mm blocks, see Figure
3.2. A limited number of test blocks were also assembled using an interfay sealant (PR
2001B2-BA1002) instead of the adhesive, which were cut into 17 mm wide strips and bolted
together at each end with M6 screws to prevent breakup of the stack during drilling. This
enabled thrust force and hole accuracy analysis to be undertaken at different levels of tool
wear, as well as easy disassembly of the stack workpiece samples for evaluation of hole
quality and interface damage.
Figure 3.2: (a) Ti/CFRP/Al stacks and (b) cross section schematic
3.1.2.1 CFRP composite laminates
Quasi-isotropic UD CFRP laminates formed of 36 prepreg layers (~ 10 mm thick) were
used. The prepregs were of the type supplied by ACG (see Table 3.1 for matrix and fibre
specification/properties) with a ~100 μm thick glass scrim layer applied on both sides of the
plates in order to prevent galvanic corrosion as well as minimise the incidence of drill
breakage. Table 3.3 details the mechanical properties of the CFRP laminates following the
curing process [55].
120 x 120 mm stack
(b)(a)
Film adhesive (3M AF163)
Ti-6Al-4V
CFRP
Al-7050

CHAPTER 3: EXPERIMENTAL WORK
67
Property Value Property Value
Density 1.6 g/cm3 Shear strength (interlaminal) 14 MPa
Hardness 60-65 Barcol CTE Up to 25 μm/moC
Ultimate tensile strength 2000 MPa Modulus of elasticity 150 GPa (yield)
Thermal conductivity 1 W/mK perpendicular & 70 W/mK parallel to fibre direction
Fibre volume fraction 0.5 - 0.6
Table 3.3: Mechanical properties of the CFRP laminates post curing [55]
3.1.2.2 Titanium - Ti-6Al-4V alloy
The titanium employed was an alpha-beta alloy with an elemental composition of 90%
titanium, 6% aluminium and 4% vanadium. The plates were annealed according to MIL-T-
9046 specifications. Table 3.4 shows typical properties of the Ti-6Al-4V workpiece material
[32].
Property Value Property Value
Density 4.43 g/cm3 Shear modulus 44 GPa
Hardness 350 HV Shear strength 550 MPa
Ultimate tensile strength 950 MPa CTE 9.2 μm/moC Modulus of elasticity 115 GPa Thermal conductivity 7 W/mK
Table 3.4: Mechanical properties of Ti-6Al-4V alloy [32]
3.1.2.3 Aluminium - Al-7050 alloy
A relatively high strength aluminium alloy – Al-7050-T7651 AMS 4050 was used as
the third layer in the stacks. This grade is typically used in aircraft structures due to its high
resistance to exfoliation corrosion and stress-corrosion cracking, high fracture toughness and
fatigue resistance. Table 3.5 lists the mechanical properties of the Al-7050 alloy [30].
Property Value Property Value
Density 2.83 g/cm3 Shear modulus 27 GPa
Hardness 171 HV Shear strength 324 MPa
Ultimate tensile strength 552 MPa CTE 25 μm/moC Modulus of elasticity 72 GPa Thermal conductivity 153 W/mK
Chemical composition 89% Al, 6% Zn, 2% Mg, 2% Cu and 1% other elements
Table 3.5: Mechanical properties of Al-7050 alloy [30]

CHAPTER 3: EXPERIMENTAL WORK
68
3.2 Tool geometries, materials and coatings
Phase 1 and 2 experimental work involved tooling to produce 1.5 mm diameter holes. A
range of uncoated and coated (TiN, amorphous carbon and CVD diamond) twin lipped
tungsten carbide (WC) drills with varying geometry were evaluated. For Phase 3 trials, 6.35
mm diameter drills were employed and involved uncoated and coated WC together with
polycrystalline diamond (PCD) products. Further details of tools and coatings are given in the
following sections.
3.2.1 Small diameter carbide drills for Phase 1 and 2
Two different drill types were used, (i) conventional twist drill and (ii) stepped drill,
which were manufactured from 90% WC and 10% cobalt composition by Dixi Polytool (Le
Locle, Switzerland), see Figure 3.3. The former had a constant diameter of 1.5 mm over the
length of the tool (shank and fluted sections) while the latter comprised a 3 mm long pilot
section of 1 mm diameter connected to a 1.5 mm diameter sizing portion, see Figure 3.4. Four
different tool geometries were employed with two helix angles (24o and 30o) and two point
angles (118o and 140o). The performance of a physical vapour deposition (PVD) TiN coating
was evaluated in Phase 1 while various advanced coatings were tested in Phase 2. These
included a PVD diamond like carbon (DLC) coating together with chemical vapour
deposition (CVD) diamond coatings from 3 different manufacturers. Details of material
composition, physical properties and supplier information of all the coatings used are given in
Table 3.6 while Table 3.7 provides a summary of the drills including cost.
Figure 3.3: SEM images for: (a) conventional twist drill, (b) stepped drill and (c) end view for
conventional drill used for Phase 1B tests
(b)(a) (c)

CHAPTER 3: EXPERIMENTAL WORK
69
Figure 3.4: Stepped drill geometry used in the test programme (All dimensions in mm and all
angles in degrees)
Coating type TiN DLC Rhobest diamond
Diamond plus
Diamond fibre speed
Coating material
Titanium nitride taC* Nanocrystalline
diamond CrCN +
DLC Nanocrystalline
Diamond Micro
hardness (HV) 2300 5300 Up to 10000 2800 10000
COF† 0.5 0.03 Max.
operating temp. (oC)
560 500 NA 500 700
Coating technique PVD PVD CVD CVD CVD
Supplier Dixi
Polytool, Switzerland
Argor-Aljba,
Switzerland
ρ-Best coating, Austria
Cemecon, Germany
Cemecon, Germany
* tetrahedral amorphous carbon † COF: coefficient of friction
Table 3.6: Specification for coating materials used in Phase 1 and 2

CHAPTER 3: EXPERIMENTAL WORK
70
Phase and number of tools used Drill description Tool coating Cost per
drill Phase 1a 2 drills DIXI 1126, P=118o, H=30o Uncoated £6.20
Phase 1b 36 drills
DIXI 1130, P=118o, H=24o Uncoated £6.65 TiN £8.40
DIXI 1130, P=118o, H=30o Uncoated £7.00 DIXI 1130, P=140o, H=24o TiN £8.40
DIXI 1130, P=140o, H=30o Uncoated £7.00 TiN £8.68
DIXI 1501, P=140o, H=24o Uncoated £15.05 TiN £17.50
DIXI 1501, P=140o, H=30o Uncoated £15.05 DIXI 1501, P=118o, H=30o TiN £17.50 DIXI 1501, P=118o, H=24o Uncoated £15.05
Phase 2a 40 drills
DIXI 1501, P=118o, H=24o Uncoated £10.50 DIXI 1130, P=118o, H=24o Uncoated £6.65
Phase 2b 40 drills DIXI 1130, P=118o, H=24o
Uncoated £4.80 DLC £8.40
Rho-best £24.00 Diamond plus £46.40 Diamond fibre
speed £28.80
Notes P: point angle, H: helix angle. All drills had 40 mm total length and 8 mm maximum cutting length. Drills coded DIXI 1130 and 1126 were conventional twist drills. Drills coded DIXI 1501 were stepped drill geometry and had the same point & helix angles on both pilot and sizing sections.
Table 3.7: Small diameter carbide drills used in Phase 1 and 2 test programme
3.2.2 Drills for Phase 3 test programme
Initial trials involved the benchmarking of a novel straight fluted (0o helix angle)
‘domed’ PCD drill designed and fabricated by Element Six (E6 – Ireland) against
commercially available multilayer TiN/TiAlN PVD coated WC drills from Sandvik
Coromant. The carbide tools recommended for composite/Ti drilling were the R840-0635-50-
A1A (6.35 mm diameter) and R846-0680-50-A1A (6.8 mm diameter as the R846 series was
not available in 6.35 mm and has different cutting edge geometry), see Figure 3.5. The domed
PCD drills consisted of cylindrical PCD blanks (92% diamond –14 μm grain size and 8% Co)
with a ‘hemispherical’ end, which was brazed onto carbide shafts and ground to the required
geometry, see Figure 3.6. Drills for mainstream testing were supplied by Unimerco and
included uncoated tungsten carbide together with CVD diamond and C7 coated tools and

CHAPTER 3: EXPERIMENTAL WORK
71
brazed PCD tools, see Figure 3.7 for drills used in Phase 3C. The CVD diamond coating
(CCDia FiberSpeed) produced by Cemecon in Germany had a hardness of 10000 HV and
operating limit of 700oC while the C7 product (proprietary to Unimerco) consisted of a nano-
composite structure with nano-crystalline AlTiN grains embedded in an amorphous matrix of
silicon nitride (Si3N4). This coating had an oxidation limit of 1100oC and a hardness of 45
GPa (4600 HV). The brazed PCD drills employed sandwich tipped 10 μm grain PCD blanks
from MegaDiamond which were subsequently inserted into a pre-machined slot at the end of
a carbide drill. This ensured that the chisel edge and major cutting edges of the tool were
composed of PCD, see Figure 3.8. In addition, the performance of a modified domed PCD
drill (helical flutes instead of straight) was also evaluated, see Figure 3.9. All drills were twin
fluted and incorporated internal coolant holes with corresponding helix and point angles of
30o and 130o, respectively (except for the brazed PCD drills, where the values were 20o and
135o).
Figure 3.5: Sandvik drills used in Phase 3A tests (Courtesy of Sandvik Coromant)
Figure 3.6: Straight fluted PCD drills used in Phase 3A: (a) side view and (b) end view
(a) (b)
R846-0680-50-A1A R840-0635-50-A1A
Through cutting fluid holes
Through coolant hole

CHAPTER 3: EXPERIMENTAL WORK
72
Figure 3.7: Uncoated and coated WC drills used in Phase 3 and supplied by Unimerco
Figure 3.8: Brazed PCD drill used in Phase 3B: (a) side view and (b) end view
Figure 3.9: Helical fluted domed PCD drill used in Phase 3B: (a) side view and (b) end view
CVD diamond coated drill
C7 coated drill
Uncoated drill
5 mm
WC body
PCD tip
500 μm
Domed PCD tip Through
coolant holes
(a)
(b)
(a)
(b)
WC substrate
PCD layer
500 μm
PCD tip Brazing
Through coolant holes

CHAPTER 3: EXPERIMENTAL WORK
73
3.3 Equipment
3.3.1 Machine tool and cutting fluid application
3.3.1.1 Matsuura FX-5 high speed machining centre
All tests were carried out on a Matsuura FX-5 vertical high speed CNC machining
centre (see Figure 3.10) which has a variable speed spindle capable of up to 20,000 rpm rated
at 15 kW and a corresponding maximum feed rate of 15 m/min. The machine was fitted with
a Renishaw touch trigger probe for tool length setting and also equipped with a Dustomat 15
extraction system (supplied by Filtermist Ltd) and able to remove airborne CFRP particles ≥
0.3 μm, see Figure 3.11. A full specification of the unit is given in Table 3.8. Two extraction
points were installed with the system, the first via a direct connection which was placed on the
ceiling of the machine guard while the second used an adjustable self-supporting lock-line.
3.3.1.2 Cutting fluid application
All tests in Phase 1 and 2 were carried out dry, however, Phase 3 tests were performed
using two different cutting environments; flood coolant and spray mist. The flood coolant
involved a water/oil emulsion containing a 7-8 % volume solution of Hocut 3380 mineral oil.
This was kept constant and monitored using an Atago N1 refractometer. The cutting fluid was
delivered to the cutting zone via a retrofit “through coolant” spindle adaptor (6000 rpm
maximum) incorporating a BT40 tool holder. A flow rate of 30 litres per minute and
corresponding pressure of 70 bar (7 MPa) was used. An externally delivered spray mist
environment was generated using a Jet Thrust two fluid (coolant and lubricant) system,
supplied by Freddy Products Ltd. Soluble oil coolant and mineral oil lubricant stored in
separate tanks were pumped to a mixing jet at a pressure of 0.7 bar (0.07 MPa), which was
subsequently discharged through a front nozzle having a 5 mm diameter orifice using
compressed air (3 – 4 bar), to produce a fine particle spray. In the current work, the coolant
utilised was a fully synthetic fluid incorporating a corrosion inhibitor diluted in water to
provide a 7 – 8% volume solution, while the lubricant was a special purpose mineral oil
blended with a high performance additive.

CHAPTER 3: EXPERIMENTAL WORK
74
Figure 3.10: Matsuura FX5 high speed machining centre
Figure 3.11: Filtermist Dustomat 15 extraction unit
Parameter ValueFilter surface size 3.5 m2
Minimum chip size can be drawn 0.3 μm
Dust collection bin 100 L
Dimensions (mm) 1230*530*1757
Extraction rate 720 m3/hr
Approximate total cost (£) £ 6000
Table 3.8: Characteristics of the dust extraction system
3.3.1.3 Experimental setup
The 3 mm thick CFRP specimens used in Phase 1 and 2 testing were held in a bespoke
drilling jig with an array (25x25) of pre-fabricated 3 mm diameter clearance holes. Figure
3.12 shows a schematic of the jig design and associated experimental setup. Figure 3.13
details examples of the experimental arrangement employed in Phase 3 work when using (a)
the through coolant adaptor (shown here during the force measurement procedure) and (b)
spray mist unit, respectively. Similarly, the 30 mm high stack workpiece material was
clamped onto a custom made drilling fixture with 9 mm diameter clearance holes to allow
unsupported through hole drilling and a simulation of industrial practice.
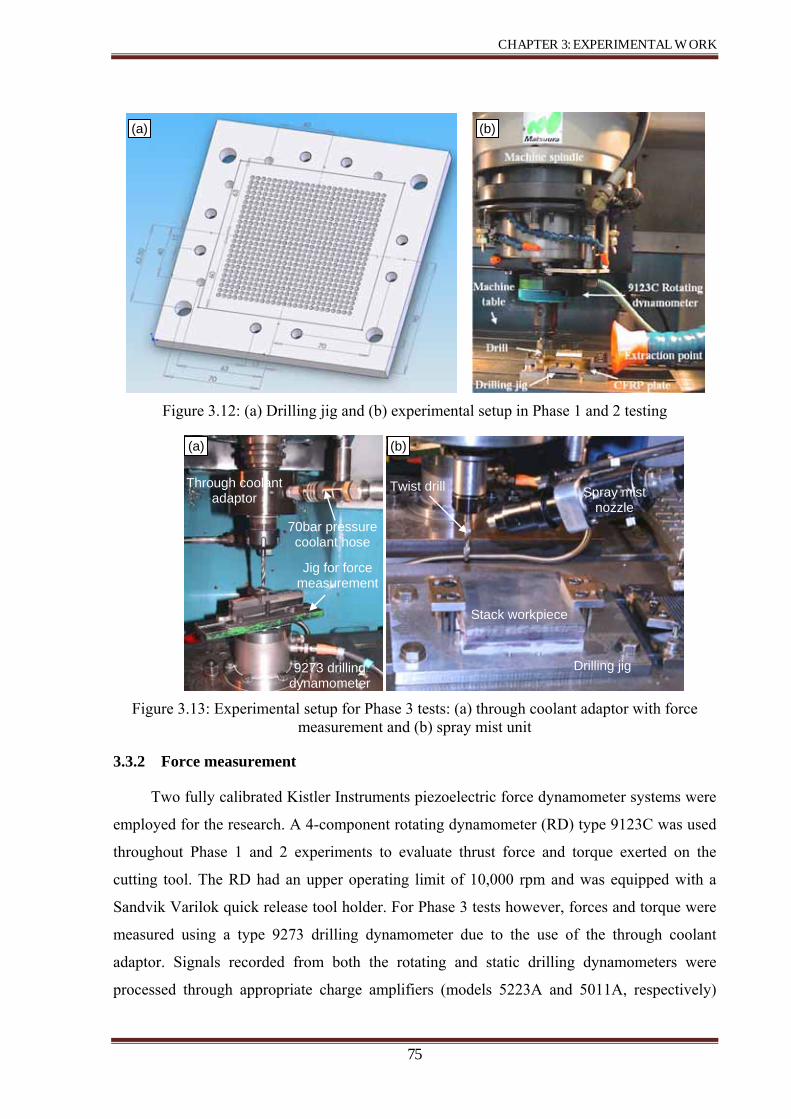
CHAPTER 3: EXPERIMENTAL WORK
75
Figure 3.12: (a) Drilling jig and (b) experimental setup in Phase 1 and 2 testing
Figure 3.13: Experimental setup for Phase 3 tests: (a) through coolant adaptor with force
measurement and (b) spray mist unit
3.3.2 Force measurement
Two fully calibrated Kistler Instruments piezoelectric force dynamometer systems were
employed for the research. A 4-component rotating dynamometer (RD) type 9123C was used
throughout Phase 1 and 2 experiments to evaluate thrust force and torque exerted on the
cutting tool. The RD had an upper operating limit of 10,000 rpm and was equipped with a
Sandvik Varilok quick release tool holder. For Phase 3 tests however, forces and torque were
measured using a type 9273 drilling dynamometer due to the use of the through coolant
adaptor. Signals recorded from both the rotating and static drilling dynamometers were
processed through appropriate charge amplifiers (models 5223A and 5011A, respectively)
Through coolant adaptor
Drilling jig
Stack workpiece
Spray mist nozzle
Twist drill
70bar pressure coolant hose
9273 drilling dynamometer
Jig for force measurement
(a) (b)
(a) (b)

CHAPTER 3: EXPERIMENTAL WORK
76
before being channelled through an A/D board connected to a PC for subsequent analysis
using Dynoware software. Figure 3.14 shows the respective dynamometers and charge
amplifiers used during the test programme.
Figure 3.14: (a) 9123C Kistler rotating force dynamometer, (b) 9273 Kistler drilling dynamometer, (c) 5011A charge amplifiers connected to a PC running Dynoware and (d)
5223A charge amplifier used with the RD
3.3.3 Tool wear, workpiece delamination and chip analysis
Tool wear was measured using a WILD M3Z toolmaker’s microscope having a XY
digital micrometer platform (0.001 mm resolution); see Figure 3.15 which shows the typical
wear measurement setup. A special tilting rotating table was modified and mounted on the
measuring platform in order to accommodate the through coolant adaptor arrangement. When
stepped drills were employed (Phase 1B and 2A), tool wear assessment was performed on the
cutting lips of the pilot section only due to its high correlation with forces and delamination,
which is detailed in Section 4.3.3. Additionally, SEM analysis of worn cutting lips (pilot and
step) showed that the pilot cutting lips were subject to comparable levels of wear as with the
step (see Figure 3.16) however, the former was easier to measure. Therefore, the accuracy of
the final hole was measured and correlated with tool life measured at the cutting lips of the
pilot drill section.
(a) (b)
(c) (d)

CHAPTER 3: EXPERIMENTAL WORK
77
Digital photographs of new/worn drills, swarf from various workpiece materials and
hole entry/exit delamination were captured using a high resolution Nikon EOS 400D digital
camera (10 Mega pixels) attached to the microscope. These were subsequently processed with
digital imaging software (Omnimet 8.7) for analysis.
Figure 3.15: Tool wear measurement setup
Figure 3.16: SEM images of typical worn cutting lip of: (a) pilot and (b) step drill sections
3.3.4 Hole diameter, cylindricity and out of roundness measurement
The small diameter drilled holes (nominally 1.5 mm) were measured using a 3 axis
DEA Mistral coordinate measuring machine (CMM) equipped with a Renishaw head and 1
Rotating table
Through coolant adaptor
(a) (b)

CHAPTER 3: EXPERIMENTAL WORK
78
mm diameter ruby ball stylus (product code: A-5003-1325) as shown in Figure 3.17 (a). Final
hole diameter was determined by measurement at three axial positions; 0.5, 1.5 and 2.5 mm
from hole entry, as shown in Figure 3.17 (b). Twenty seven points were taken for each hole
axial position and replicated twice with an average calculated. The diameter of the larger
holes (6.35 mm) together with associated geometrical characteristics including cylindricity
and out of roundness (ovality) was assessed using a Taylor Hobson Talyrond series 300
system, see Figure 3.18. Hole diameter and geometrical characteristics for the stacks was
assessed by measurement at three axial positions; 2, 5 and 8 mm from hole entry for each
material layer.
Figure 3.17: (a) 3 axis DEA Mistral coordinate measuring machine (CMM) with a 1 mm ruby ball stylus and (b) measurement positions for each material layer
Figure 3.18: Taylor Hobson Talyrond series 300

CHAPTER 3: EXPERIMENTAL WORK
79
3.3.5 Surface roughness and burr height assessment
Following geometrical analysis of the drilled holes, the 3 mm thick CFRP plates and 30
mm thick Ti/CFRP/Al specimens were sectioned using an Agie-Charmilles Robofil FI 240ccs
5-axis CNC wire EDM machine. Hole surface roughness evaluation was primarily performed
for Phase 1A and Phase 3C specimens on a Taylor Hobson Talysurf series 120L laser
interferometric transducer, which produced both 2D and 3D surface topography plots (Ra and
Sa). This was done using a standard conisphere diamond tipped stylus of 2 μm radius at 0.8
mm cut off length over a 4 mm evaluation length. In addition, the machine was also used to
measure entry and exit burr heights on the Ti and Al material from Phase 3C tests, see Figure
3.19. 3D maps were only produced of samples from tests which showed the highest tool life.
Figure 3.19: (a) Taylor Hobson Talysurf 120L, (b) setup for Ra and (c) setup for burr height measurement
3.3.6 Hole surface integrity analysis and microscopy
Microstructural analysis of CFRP specimens used in Phase 1 and 2 were sectioned using
a band saw followed by cold mounting in an epoxy resin. In Phase 3 tests, Al and Ti samples
for microhardness evaluation were hot mounted in Bakelite using a Buehler Simpliment 2
mounting press; see Figure 3.20 (a). All mounted specimens (from Phase 1 – 3) were ground
(b) (c)
3 mm thick CFRP specimen
(a)

CHAPTER 3: EXPERIMENTAL WORK
80
and polished using a Buehler Alpha 2 grinder-polisher shown in Figure 3.20 (b) using
appropriate regimes. Optical investigation of microstructural alterations in CFRP was
undertaken on Leica DMLM microscope fitted with a PixeLINK camera, as shown in Figure
3.20 (c) while a JOEL 6060 scanning electron microscope (SEM) was also used for assessing
hole quality and cutting tool edges. Due to the relatively poor electrical conductivity of CFRP,
specimens were gold coated using a sputter coater (model SC 7640) prior to analysis, see
Figure 3.21.
Micro-hardness measurements of cross sectioned holes in the Al-7050 and Ti-6Al-4V
layers were undertaken using a Mitutoyo HM-124 micro-hardness with a Knoop indenter at a
load of 25g over a 15 second dwell time. The bulk hardness/baseline value of each material
was initially determined from an average of five random measurements taken at different
positions of the specimen. A hardness depth profile was obtained by taking measurements at
appropriate intervals (average of 3 readings at each depth level) starting at 10 μm from the
machined surface and extending up to 1000 μm.
Figure 3.20: (a) Buehler mounting press, (b) Buehler grinder-polisher and (c) Leica DMLM microscope
Figure 3.21: (a) JOEL 6060 Scanning electron microscope (SEM) and (b) sputter coater (SC 7640)
(a)(b)
(a) (b) (c)

CHAPTER 3: EXPERIMENTAL WORK
81
3.4 Experimental design and test arrays
The following sections describe the experimental procedure and associated test arrays
used in the 3 experimental phases.
3.4.1 Phase 1A: Preliminary small hole drilling of CFRP and the influence of peel ply
layers
Peel ply sheets assist the bleeding of volatiles and air from the laminate during curing as
well as helping to prevent surface contamination which would jeopardise secondary bonding.
In a production environment, this layer is generally removed from the composite surfaces
prior to the drilling operation. Two comparative tests between CFRP laminates with the peel
ply layers retained and removed were performed to assess their effect on hole entry and exit
delamination, tool wear, thrust force, torque, hole accuracy and surface roughness. The
experiments were performed using uncoated conventional twist drills with geometry as
detailed in Section 3.2.1. Tests wear halted when the maximum flank wear VBΒ reached 100
μm. Table 3.9 details the test parameters including tooling and composite material employed.
Fixed factors Levels Cutting speed 45 m/min (9600 rpm) Feed rate 0.15 mm/rev (1440 mm/min) Drill diameter 1.5 mm Drill format Conventional twin lipped twist drill (DIXI 1126) Drill material Uncoated WC Workpiece material ACG carbon fibre reinforced plastics Workpiece thickness 3 mm Cutting medium Dry
Table 3.9: Fixed factors and their corresponding levels for Phase 1A
3.4.2 Phase 1B: Effect of tool geometry and operating parameters
Phase 1B aimed to establish the influence of process parameters and drill
geometry/material on key output measures including tool life, productivity, geometrical
accuracy and workpiece integrity (fibre pullout, delamination, etc.). The experimental work
utilised a fractional factorial design involving a modified L12 Taguchi orthogonal array. This
considered variation in six process control variables (factors) including drill type, coating,
point angle, helix angle, cutting speed and feed rate; each at two levels as shown in Table
3.10. Experiments were performed in a random order with a confirmation test performed in

CHAPTER 3: EXPERIMENTAL WORK
82
accordance with results from the statistical analysis. Table 3.11 shows the modified Taguchi
orthogonal array.
Factors Level 1 Level 2 Drill type (A) Conventional Stepped Surface condition (B) Uncoated TiN Point angle (o) (C) 118 140 Helix angle (o) (D) 24 30 Cutting speed (m/min) (E) 15 45 Feed rate (mm/rev) (F) 0.1 0.2
Table 3.10: Process control variables for Phase 1B
Exp. No. Drill type (A)
Surface condition
(B)
Point angle (o) (C)
Helix angle (o) (D)
Speed m/min (rpm) (E)
Feed mm/rev (mm/min) (F)
1 Stepped Uncoated 140 24 15 (3200) 0.1 (320) 2 Stepped TiN 118 30 15 (3200) 0.1 (320) 3 Conventional TiN 140 24 45 (9600) 0.1 (960) 4 Stepped Uncoated 140 30 15 (3200) 0.2 (640) 5 Stepped TiN 118 30 45 (9600) 0.1 (960) 6 Stepped TiN 140 24 45 (9600) 0.2 (1920) 7 Conventional TiN 140 30 15 (3200) 0.2 (640) 8 Conventional Uncoated 140 30 45 (9600) 0.1 (960) 9 Conventional Uncoated 118 30 45 (9600) 0.2 (1920) 10 Stepped Uncoated 118 24 45 (9600) 0.2 (1920) 11 Conventional TiN 118 24 15 (3200) 0.2 (640) 12 Conventional Uncoated 118 24 15 (3200) 0.1 (320)
Table 3.11: A modified OA L12 for process control variables (A–F) and their corresponding levels for Phase 1B
Minitab software (version 15.1.20.0) was used to perform statistical analysis and
produce main effects plots. Tool wear was measured in accordance with ISO 8688-2 with an
end of test criterion of 100 μm maximum flank wear (VBBmax). This was based on the
lip/cutting edge on new drills having a grind width of 100 – 120 µm. Micrographs of the drills
both in the new and worn condition were taken together with photographs of hole entry and
exit in the CFRP in order to evaluate workpiece delamination/damaged. The latter was
quantified using a parameter known as the delamination factor (Fd), which is defined as the
ratio of maximum damage diameter (Dmax) to drilled hole diameter (Do), see Figure 3.22 and

CHAPTER 3: EXPERIMENTAL WORK
83
Equation (1). Entry and exit delamination were evaluated for both first and last holes drilled.
Thrust force, drilling torque and flank wear measurements were recorded at intervals of ~300
holes. All tests were performed dry.
Fd = Dmax / Do (3)
Figure 3.22: Measures used in calculating the delamination factor
3.4.3 Phase 2A: Effect of composite material, fibre orientation and machining
parameters
This phase comprised a 4 factor (1 at 3 levels and 3 at 2 levels, shown in Table 3.12)
full factorial experimental design which entailed 24 runs, as shown in Table 3.13. The control
variables considered were prepreg type (977- 2/HTS autoclave cured, 8552/AS4 autoclave
cured and MTM44-1/HTS oven cured), prepreg form (UD & woven), drill feed rate (0.2 and
0.4 mm/rev) and drill type (conventional and stepped geometry). Table 3.14 details factors
which were kept constant. These were selected based on results from Phase 1B which
identified the preferred cutting speed and drill geometry/material. Trials where drills
experienced catastrophic fracture were replicated. Tool flank wear was measured according to
ISO 8688-2 and tests were halted when the maximum VBB reached 100 μm or catastrophic
tool failure occurred. Thrust force and torque were also recorded at intervals of ~300 holes.
Final hole diameter was measured according to the procedure detailed in section 3.3.4.
Level Prepreg type (A) Prepreg form (B)
Feed rate (mm/rev) (C) Drill type (D)
1 Cytec (977-2/HTS) AC UD 0.2 (1920 mm/min) Conventional
2 Hexcel (8552/AS4) AC Woven 0.4 (3840 mm/min) Stepped
3 ACG (MTM44-1/HTS) OOAC
Table 3.12: Phase 2A process control variables and levels

CHAPTER 3: EXPERIMENTAL WORK
84
Test no. (A) (B) (C) (D) 1 977-2/HTS AC (1) UD (1) 0.2 (1) Conventional (1)2 8552/AS4 AC (2) UD (1) 0.2 (1) Conventional (1)3 MTM44-1/HTS OOAC (3) UD (1) 0.2 (1) Conventional (1)4 977-2/HTS AC (1) Woven (2) 0.2 (1) Conventional (1)5 8552/AS4 AC (2) Woven (2) 0.2 (1) Conventional (1)6 MTM44-1/HTS OOAC (3) Woven (2) 0.2 (1) Conventional (1)7 977-2/HTS AC (1) UD (1) 0.4 (2) Conventional (1)8 8552/AS4 AC (2) UD (1) 0.4 (2) Conventional (1)9 MTM44-1/HTS OOAC (3) UD (1) 0.4 (2) Conventional (1)10 977-2/HTS AC (1) Woven (2) 0.4 (2) Conventional (1)11 8552/AS4 AC (2) Woven (2) 0.4 (2) Conventional (1)12 MTM44-1/HTS OOAC (3) Woven (2) 0.4 (2) Conventional (1)13 977-2/HTS AC (1) UD (1) 0.2 (1) Stepped (2) 14 8552/AS4 AC (2) UD (1) 0.2 (1) Stepped (2) 15 MTM44-1/HTS OOAC (3) UD (1) 0.2 (1) Stepped (2) 16 977-2/HTS AC (1) Woven (2) 0.2 (1) Stepped (2) 17 8552/AS4 AC (2) Woven (2) 0.2 (1) Stepped (2) 18 MTM44-1/HTS OOAC (3) Woven (2) 0.2 (1) Stepped (2) 19 977-2/HTS AC (1) UD (1) 0.4 (2) Stepped (2) 20 8552/AS4 AC (2) UD (1) 0.4 (2) Stepped (2) 21 MTM44-1/HTS OOAC (3) UD (1) 0.4 (2) Stepped (2) 22 977-2/HTS AC (1) Woven (2) 0.4 (2) Stepped (2) 23 8552/AS4 AC (2) Woven (2) 0.4 (2) Stepped (2) 24 MTM44-1/HTS OOAC (3) Woven (2) 0.4 (2) Stepped (2)
Table 3.13: Phase 2A full factorial test array
Fixed factors Levels Cutting speed 45 m/min (9600 rpm) Drill geometry Twin lipped twist drill 118o point angle and 24o helix angle Drill material Uncoated WC Workpiece thickness 3 mm Cutting environment Dry
Table 3.14: Phase 2A fixed factors and levels
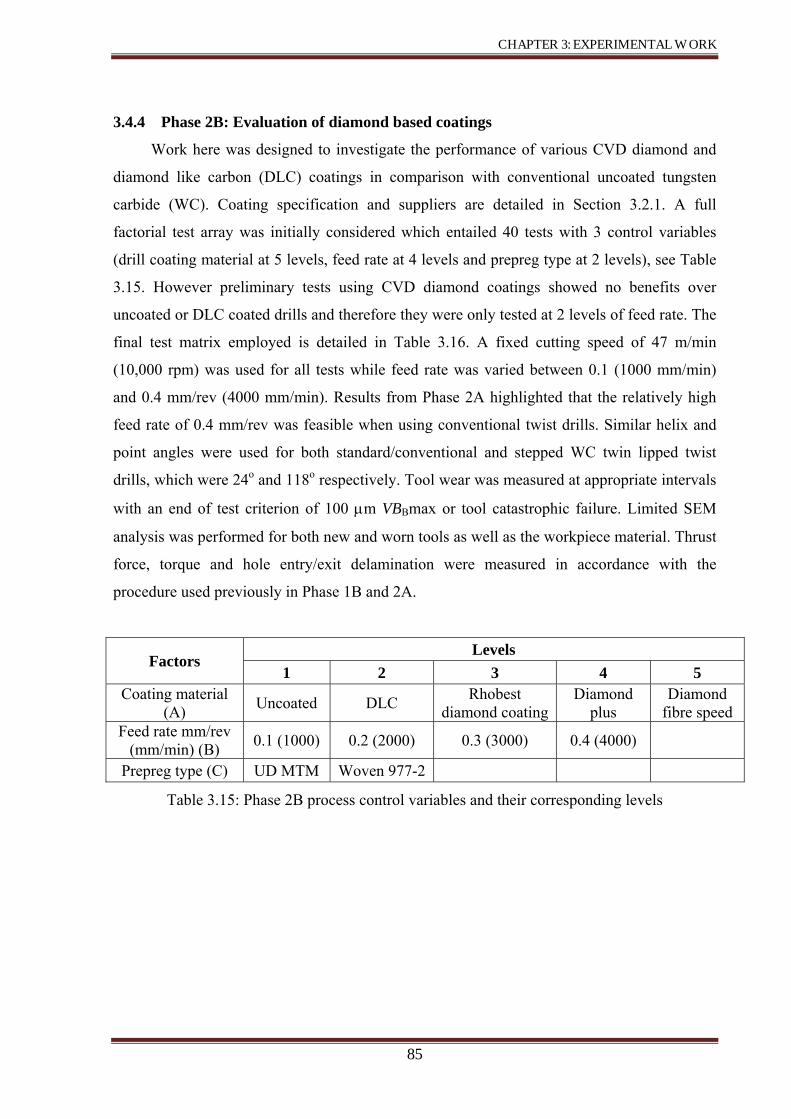
CHAPTER 3: EXPERIMENTAL WORK
85
3.4.4 Phase 2B: Evaluation of diamond based coatings
Work here was designed to investigate the performance of various CVD diamond and
diamond like carbon (DLC) coatings in comparison with conventional uncoated tungsten
carbide (WC). Coating specification and suppliers are detailed in Section 3.2.1. A full
factorial test array was initially considered which entailed 40 tests with 3 control variables
(drill coating material at 5 levels, feed rate at 4 levels and prepreg type at 2 levels), see Table
3.15. However preliminary tests using CVD diamond coatings showed no benefits over
uncoated or DLC coated drills and therefore they were only tested at 2 levels of feed rate. The
final test matrix employed is detailed in Table 3.16. A fixed cutting speed of 47 m/min
(10,000 rpm) was used for all tests while feed rate was varied between 0.1 (1000 mm/min)
and 0.4 mm/rev (4000 mm/min). Results from Phase 2A highlighted that the relatively high
feed rate of 0.4 mm/rev was feasible when using conventional twist drills. Similar helix and
point angles were used for both standard/conventional and stepped WC twin lipped twist
drills, which were 24o and 118o respectively. Tool wear was measured at appropriate intervals
with an end of test criterion of 100 μm VBBmax or tool catastrophic failure. Limited SEM
analysis was performed for both new and worn tools as well as the workpiece material. Thrust
force, torque and hole entry/exit delamination were measured in accordance with the
procedure used previously in Phase 1B and 2A.
Factors Levels
1 2 3 4 5 Coating material
(A) Uncoated DLC Rhobest diamond coating
Diamond plus
Diamond fibre speed
Feed rate mm/rev (mm/min) (B) 0.1 (1000) 0.2 (2000) 0.3 (3000) 0.4 (4000)
Prepreg type (C) UD MTM Woven 977-2
Table 3.15: Phase 2B process control variables and their corresponding levels

CHAPTER 3: EXPERIMENTAL WORK
86
Test number Coating material (A)
Feed rate (B) (mm/rev) Prepreg type (C)
1
Uncoated WC
0.1 UD MTM 2 Woven 977-2 3 0.2 UD MTM 4 Woven 977-2 5 0.3 UD MTM 6 Woven 977-2 7 0.4 UD MTM 8 Woven 977-2 9
Diamond like carbon (DLC)
0.1 UD MTM 10 Woven 977-2 11 0.2 UD MTM 12 Woven 977-2 13 0.3 UD MTM 14 Woven 977-2 15 0.4 UD MTM 16 Woven 977-2 17
Rhobest diamond coating
0.2 UD MTM 18 Woven 977-2 19 0.4 UD MTM 20 Woven 977-2 21
Diamond plus 0.2 UD MTM
22 Woven 977-2 23 0.4 UD MTM 24 Woven 977-2 25
Diamond fibre speed
0.2 UD MTM 26 Woven 977-2 27 0.4 UD MTM 28 Woven 977-2
Table 3.16: Phase 2B test array
3.4.5 Phase 3A: Preliminary drilling trials in separate CFRP and Ti workpieces and
multilayer stacks
Phase 3A involved initial experimental trials to determine the performance of a novel
straight fluted domed PCD tipped drill (designed and fabricated by Element Six) against an
off-the-shelf WC tool (Sandvik R840) when machining thick sections of CFRP and Ti
workpieces. This comprised drilling 6.35 mm diameter holes in separate ~10 mm thick UD
977-2 CFRP laminates and 18 mm thick Ti-6Al-4V plates. Cutting speed was fixed at 80
m/min and 40 m/min for CFRP and Ti respectively while feed rate was kept constant at 0.1
mm/rev for all tests. Tool flank wear (VBB in accordance with ISO 8688-2) was measured

CHAPTER 3: EXPERIMENTAL WORK
87
with tests halted when average flank wear reached 0.3 mm or when 1200 holes were
produced. A further test was carried out on drilling through a combined CFRP/Ti stack (held
together using a mechanical jig) under similar operating parameters using a R846 Sandvik
WC drill which was recommended for composite/metallic workpieces. Table 3.17 details the
test matrix. All tests were conducted wet with 70 bar through coolant. Thrust force, torque,
surface roughness (Ra) and burr height were determined as comparative performance
measures.
Test no. Drill used Drill
diameterMaterial
cut
WP thickness
(mm)Cutting speed (m/min) (rpm)
1 E6 domed PCD 6.35 CFRP 9 80 (4000) 2 Sandvik R840 6.35 CFRP 9 80 (4000) 3 Sandvik R840 6.35 Ti 18 40 (2000) 4 E6 domed PCD 6.35 Ti 18 40 (2000) 5 Sandvik R846 6.8 CFRP/Ti 9+18 84/42 (4000/2000)
Table 3.17: Drilling test matrix for Phase 3A
3.4.6 Phase 3B: Impact of stack arrangement and performance of PCD tools
Following the preliminary trials in Phase 3A, experiments involving one shot drilling
through multilayer 30 mm thick stacks of Al, CFRP and Ti were performed. Tests were
planned involving C7 and CVD diamond coated WC drills together with brazed PCD and
modified domed PCD tools (helical flute). Drilling commenced from the Al-7050 section and
progressed through the CFRP and Ti layers in line with industrial practice, see Figure 3.23.
Due to the significant difference in mechanical properties of the different workpiece
materials, a dual level cutting speed was employed during drilling, with that for Al and CFRP
being higher than that for the Ti. The initial levels for control variables are shown in Table
3.18. Four levels for both cutting speed and feed rate were selected. Unfortunately the
performance of all tools, even at lowest operating parameters was poor with severe noise in
force signals as well as the poor coolant transport to the titanium layer. A number of tests
were then carried out with the drilling commencing from the Ti layer (Test 9 – 11). All tests
in Phase 3B were performed wet. Table 3.19 details the final array for Phase 3B.
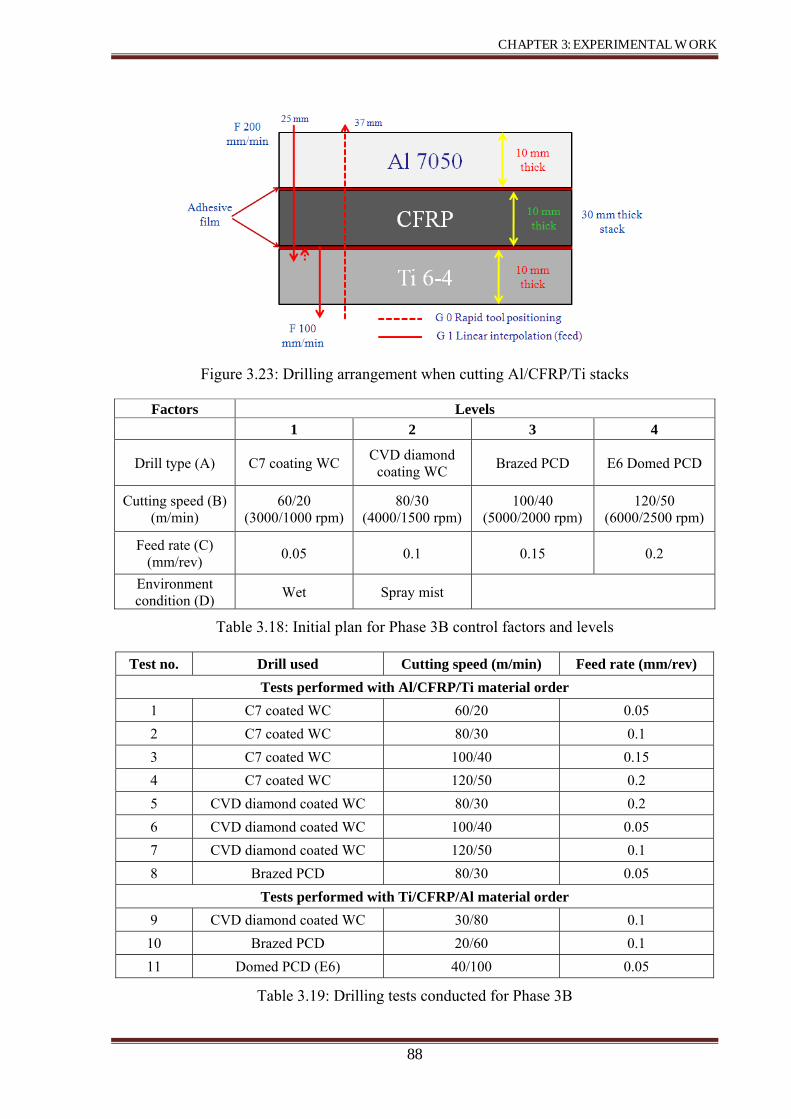
CHAPTER 3: EXPERIMENTAL WORK
88
Figure 3.23: Drilling arrangement when cutting Al/CFRP/Ti stacks
Factors Levels 1 2 3 4
Drill type (A) C7 coating WC CVD diamond coating WC Brazed PCD E6 Domed PCD
Cutting speed (B) (m/min)
60/20 (3000/1000 rpm)
80/30 (4000/1500 rpm)
100/40 (5000/2000 rpm)
120/50 (6000/2500 rpm)
Feed rate (C) (mm/rev) 0.05 0.1 0.15 0.2
Environment condition (D) Wet Spray mist
Table 3.18: Initial plan for Phase 3B control factors and levels
Test no. Drill used Cutting speed (m/min) Feed rate (mm/rev) Tests performed with Al/CFRP/Ti material order
1 C7 coated WC 60/20 0.05 2 C7 coated WC 80/30 0.1 3 C7 coated WC 100/40 0.15 4 C7 coated WC 120/50 0.2 5 CVD diamond coated WC 80/30 0.2 6 CVD diamond coated WC 100/40 0.05 7 CVD diamond coated WC 120/50 0.1 8 Brazed PCD 80/30 0.05
Tests performed with Ti/CFRP/Al material order 9 CVD diamond coated WC 30/80 0.1
10 Brazed PCD 20/60 0.1 11 Domed PCD (E6) 40/100 0.05
Table 3.19: Drilling tests conducted for Phase 3B

CHAPTER 3: EXPERIMENTAL WORK
89
3.4.7 Phase 3C: Effect of tool coatings and operating parameters
Phase 3C comprised a fractional factorial design based on a L18 Taguchi orthogonal
array (OA) involving variations in environment condition, drill coating, cutting speed and
feed rate as shown in Table 3.20. Table 3.21 details the corresponding OA with the respective
parameter levels. In terms of drill type, C7 and CVD diamond were tested alongside an
equivalent uncoated WC tool. The cutting speed when drilling through CFRP and Al was
twice that utilised for the Ti material. Three levels of cutting speed and feed rate were
investigated, which were selected based on results from Phase 3A and 3B and the limited
published literature [163]. Figure 3.24 shows the stack arrangement used, where cutting
commenced from the titanium layer. Tests were carried out wet using the through coolant
adaptor (specifications provided in Section 3.3.1.2) or using spray mist. Tool life criterion
was identical to that employed in Phase 3B while thrust force and torque were measured at
intervals of ~10-30 holes for all tests. Hole geometrical characteristics, burr height and
surface roughness were only assessed for tests which produced more than 150 drilled holes in
addition to the longest tool life obtained with spray mist. Final hole diameter was measured at
the mid position for every layer. Cylindricity error for the entire stack (based on 9 axial
positions) and for the individual layers were also obtained (3 axial positions/layers, similar to
roundness positions). Hole entry and exit burr height for the Al and Ti layers were recorded
while hole edge quality for all materials was assessed. The surface roughness (Ra) was
measured at three positions within each layer of the stack and then averaged. Chips from the
various workpiece materials were collected and photographed for analysis. Microhardness
measurement for the Al and Ti holes was performed only for two tests which demonstrated
the longest tool life.
Factor No of levels Levels
Environment condition (A) 2 Wet Spray mist
Drill type (B) 3 Uncoated WC CVD diamond coating WC C7 coating WC
Cutting speed (C) Ti/CFRP/Al (m/min) 3 20/40
(1000/2000 rpm) 40/80
(2000/4000 rpm ) 60/120
(3000/6000 rpm) Feed rate (D)
(mm/rev) 3 0.05 0.10 0.15
Table 3.20: Process control variable and levels for Phase 3C

CHAPTER 3: EXPERIMENTAL WORK
90
Test Environment condition (A) Coating (B) Cutting speed
(C) (m/min) Feed rate (D)
(mm/rev) 1 Wet (1) Uncoated (1) 20/40 (1) 0.05 (1) 2 Wet (1) Uncoated (1) 40/80 (2) 0.1 (2) 3 Wet (1) Uncoated (1) 60/120 (3) 0.15 (3) 4 Wet (1) CVD coated (2) 20/40 (1) 0.05 (1) 5 Wet (1) CVD coated (2) 40/80 (2) 0.1 (2) 6 Wet (1) CVD coated (2) 60/120 (3) 0.15 (3) 7 Wet (1) C7 coated (3) 20/40 (1) 0.1 (2) 8 Wet (1) C7 coated (3) 40/80 (2) 0.15 (3) 9 Wet (1) C7 coated (3) 60/120 (3) 0.05 (1) 10 Spray mist (2) Uncoated (1) 20/40 (1) 0.15 (3) 11 Spray mist (2) Uncoated (1) 40/80 (2) 0.05 (1) 12 Spray mist (2) Uncoated (1) 60/120 (3) 0.1 (2) 13 Spray mist (2) CVD coated (2) 20/40 (1) 0.1 (2) 14 Spray mist (2) CVD coated (2) 40/80 (2) 0.15 (3) 15 Spray mist (2) CVD coated (2) 60/120 (3) 0.05 (1) 16 Spray mist (2) C7 coated (3) 20/40 (1) 0.15 (3) 17 Spray mist (2) C7 coated (3) 40/80 (2) 0.05 (1) 18 Spray mist (2) C7 coated (3) 60/120 (3) 0.1 (2)
Table 3.21: L18 OA in real variable values
Figure 3.24: Drilling arrangement when cutting Ti/CFRP/Al stacks

CHAPTER 4: RESULTS AND DISCUSSION
91
4. RESULTS AND DISCUSSION
4.1 Phase 1A: Preliminary small hole drilling of CFRP and the influence
of peel ply layers
Figure 4.1 shows the progression of entry and exit delamination factor against number
of drilled holes for tests performed with the nylon peel ply backed CFRP material. Workpiece
delamination was understandably found to be greater at the hole exit compared to entry due to
the lack of support to prevent matrix/fibre fracture during tool breakout. At cessation of the
trial, hole entry and exit showed an Fd of 1.30 and 1.35 respectively. In contrast, the test
carried out on laminates without the peel ply layer experienced severe workpiece damage in
the form of fuzzing, incomplete fibre cutting and edge chipping both at hole entry and exit in
addition to delamination, see Figure 4.2. Unfortunately, the damage was such that it prevented
the evaluation of delamination factor for specimens without the peel ply layers.
Figure 4.1: Entry/exit delamination factor for drilling with peel ply layer
1.10
1.15
1.20
1.25
1.30
1.35
1.40
1 251 501 751 1001 1251 1501 1751
Del
amin
atio
n fa
ctor
Fd
Number of drilled holes
Entry delamination factorExit delamination factor

CHAPTER 4: RESULTS AND DISCUSSION
92
A comparison of hole quality obtained when drilling workpieces with and without the
peel ply layer at various points of the test is shown in Figure 4.3 and Figure 4.4. The CFRP
with the nylon layer maintained excellent hole edge integrity even after 1250 holes however the
situation was markedly different with the non peel ply specimens. Here, fuzzing was the
primary defect observed at hole entry, while substantial edge chipping was present at the exit
after only several holes. The benefits accorded by the peel ply layer are analogous to the
advantages/benefits provided when employing backup material during the drilling of FRP
composites, as detailed in the results by Tsao and Hocheng [95].
Hole number Without peel ply With peel ply
1
1875 (Last)
Figure 4.3: SEM images showing progression of damage at hole entry
Figure 4.2: (a) Entry damage for the 1250th hole and (b) Exit damage (fraying) of the 625th
hole for un-backed materials
Uncut fibres
Fuzzing
Fuzzing
(b)(a)

CHAPTER 4: RESULTS AND DISCUSSION
93
Hole number Without peel ply With peel ply
1
1875 (Last)
Figure 4.4: SEM images showing progression of damage at hole exit
Drill flank wear was measured at regular intervals of ~ 150 holes during each test.
Figure 4.5 details the progression of tool flank wear with number of holes drilled for the
backed and un-backed CFRP material. While wear progression followed a similar trend in
both tests, the wear rate was somewhat higher in the case where a peel ply was employed.
This can be attributed to the cumulative increase in workpiece material thickness of 375 mm
over 1875 holes as a result of the peel ply layer (~ 200 μm per hole). An additional 5 μm of
flank wear was observed at the end of the tests. SEM images of new and worn WC
conventional twist drills following drilling of the backed and un-backed materials are shown
in Figure 4.6. Blunting/rounding of the cutting and chisel edges due to abrasion was the
principal wear mode. Trials carried out with the peel ply samples revealed a greater tendency
for the resulting chips (composed of fibre and matrix elements) to adhere onto the secondary
flank of the tool, owing to the melting/softening of the nylon layer.
Uncut fibres
Material cracks
Limited delamination

CHAPTER 4: RESULTS AND DISCUSSION
94
Figure 4.5: Flank wear for drilling nylon backed and un-backed CFRP materials
(a) (b) (c)
Figure 4.6: WC drills: (a) new, (b) used for drilling un-backed CFRP and (c) used for nylon
backed CFRP
0
10
20
30
40
50
60
70
80
90
100
0 200 400 600 800 1000 1200 1400 1600 1800 2000
Flan
k w
ear (μm
)
Number of drilled holes
For nylon backed material
For un-backed material
Cutting and chisel edge rounding
Flank wear Fibre and resin
fragments

CHAPTER 4: RESULTS AND DISCUSSION
95
Figure 4.7 (a) shows the thrust force values recorded when drilling peel ply backed and
un-backed CFRPs respectively. Typically, the forces were seen to double from the start (26 –
29 N) to the end (49 – 52N) of the tests in both cases. On average, the absence of the peel ply
layer also reduced thrust forces by approximately 10%. This corresponded to the higher tool
wear levels associated with the nylon backed material as previously indicated. Dimensional
error refers to the difference between the required/nominal hole diameter (1.5 mm) and the
actual hole dimension produced. Here, the use of a peel ply layer presented no significant
effect on dimensional error as the measured diameter values were approximately similar over
the test duration for both material conditions; see Figure 4.7 (b). As expected, the size of the
holes decreased as the experiment progressed, which reflected the reduction in drill diameter
as a result of tool wear. Despite this, the percentage dimensional error was extremely small,
in the region of ~ 2% (maximum of ~ 30 μm undersize) after 1875 holes. This was deemed to
be within the acceptable limits of tolerance for some of the applications envisaged.
Figure 4.7: (a) Thrust force and (b) hole diameter versus number of drilled holes for backed and un-backed CFRP
In terms of hole surface quality, the average surface roughness (Sa) was relatively low (<
0.8 µm) for the first ~ 30 holes, irrespective of the material drilled. This was most likely due to
the sharpness of cutting edges with new tools. The surface roughness however quickly
deteriorated with a two fold increase after approximately 625 holes, in line with tool wear
progression, see Figure 4.8. This steep rate of decline in surface quality subsequently stabilised,
with only a further very small increase in surface roughness up to test cessation, see Figure 4.9.
Despite an obvious trend in the data, there is nonetheless concern regarding the reliability and
value of surface roughness as a performance measure due to the inhomogeneous and fibrous
nature of the composite material.
20
25
30
35
40
45
50
55
0 500 1000 1500 2000
Thru
st fo
rce
(N)
Number of drilled holes
For nylon backed CFRP
For un-backed CFRP1.465
1.470
1.475
1.480
1.485
1.490
1.495
1.500
0 500 1000 1500 2000
Hol
e di
amet
er (m
m)
Number of drilled holes
For nylon backed material
For un-backed material
(a) (b) Diameter error
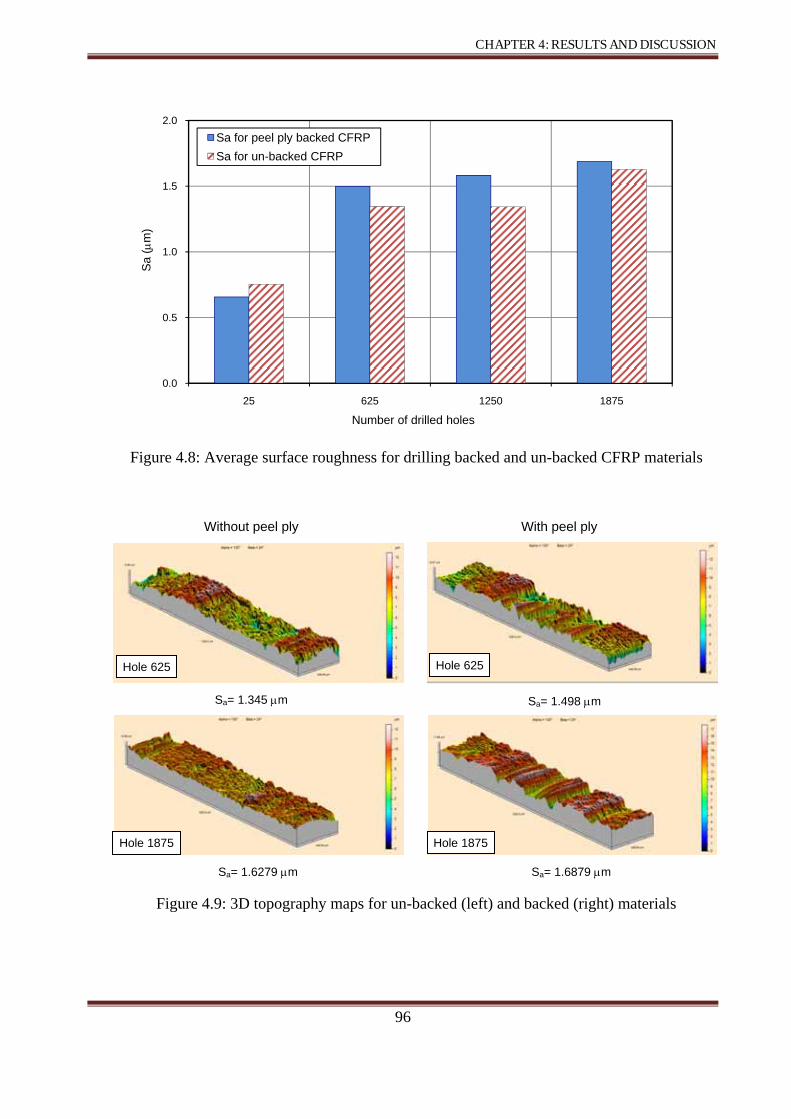
CHAPTER 4: RESULTS AND DISCUSSION
96
Figure 4.8: Average surface roughness for drilling backed and un-backed CFRP materials
Without peel ply With peel ply
Sa= 1.345 μm
Sa= 1.498 μm
Sa= 1.6279 μm
Sa= 1.6879 μm
Figure 4.9: 3D topography maps for un-backed (left) and backed (right) materials
0.0
0.5
1.0
1.5
2.0
25 625 1250 1875
Sa (μ
m)
Number of drilled holes
Sa for peel ply backed CFRPSa for un-backed CFRP
Hole 625 Hole 625
Hole 1875 Hole 1875
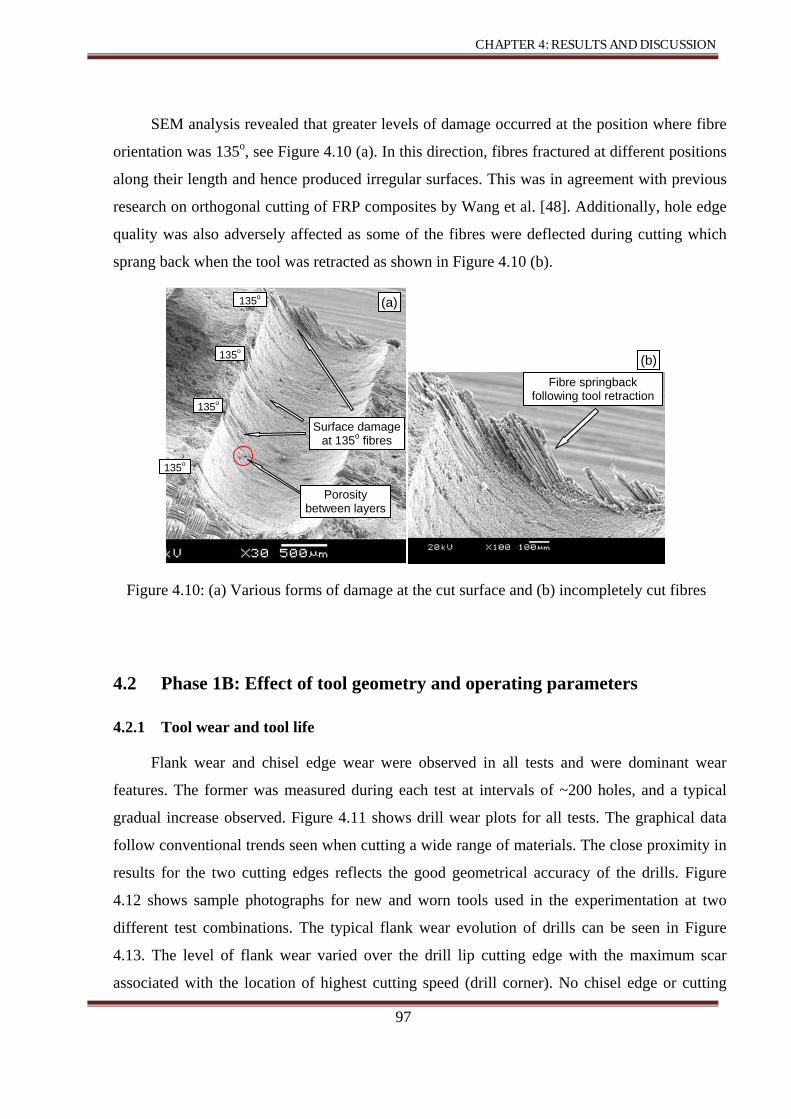
CHAPTER 4: RESULTS AND DISCUSSION
97
SEM analysis revealed that greater levels of damage occurred at the position where fibre
orientation was 135o, see Figure 4.10 (a). In this direction, fibres fractured at different positions
along their length and hence produced irregular surfaces. This was in agreement with previous
research on orthogonal cutting of FRP composites by Wang et al. [48]. Additionally, hole edge
quality was also adversely affected as some of the fibres were deflected during cutting which
sprang back when the tool was retracted as shown in Figure 4.10 (b).
Figure 4.10: (a) Various forms of damage at the cut surface and (b) incompletely cut fibres
4.2 Phase 1B: Effect of tool geometry and operating parameters
4.2.1 Tool wear and tool life
Flank wear and chisel edge wear were observed in all tests and were dominant wear
features. The former was measured during each test at intervals of ~200 holes, and a typical
gradual increase observed. Figure 4.11 shows drill wear plots for all tests. The graphical data
follow conventional trends seen when cutting a wide range of materials. The close proximity in
results for the two cutting edges reflects the good geometrical accuracy of the drills. Figure
4.12 shows sample photographs for new and worn tools used in the experimentation at two
different test combinations. The typical flank wear evolution of drills can be seen in Figure
4.13. The level of flank wear varied over the drill lip cutting edge with the maximum scar
associated with the location of highest cutting speed (drill corner). No chisel edge or cutting
Fibre springback following tool retraction
Surface damage at 135o fibres
135o
135o
135o
135o
Porosity between layers
(b)
(a)

CHAPTER 4: RESULTS AND DISCUSSION
98
edge fractures occurred in any of the tests, and all tools showed similar wear patterns at test
cessation, see Figure 4.14. Additionally, peeling of the coating (Figure 4.15) from the main
cutting edge and chisel edge rounding were also observed in tests. The findings are in
agreement with results by Faraz et al. [99] who reported that edge rounding is the dominant
wear mode when machining CFRP composites due to the highly abrasive nature of the fibres.
Figure 4.11: Drill wear graph for all tests (based on the maximum flank wear criterion)
(a) Test 11, conventional drill, TiN coated (b) Test 5, stepped drill, TiN coated
Figure 4.12: New and worn drills for Test 5 and Test 11
0
20
40
60
80
100
120
0 500 1000 1500 2000 2500 3000
Flan
k w
ear (μm
)
Number of drilled holes
Test1Test2Test3Test4Test5Test6Test7Test8Test9Test10Test11Test12
500 μm 500 μm
New
New Worn Worn
Flank wear scar

CHAPTER 4: RESULTS AND DISCUSSION
99
Figure 4.13: Drill flank wear evolution for Test 11 (TiN conventional drill, 118o, 24o, 15 m/min and 0.1 mm/rev)
Figure 4.14: Drill wear pattern for all tests at end of tool life
800 μm500 μm
1450 holes 1450 holes New
1250 holes950 holes625 holes450 holes
250 holes75 holes25 holesNew
Test 1 Test 2 Test 3 Test 4
Test 5 Test 6 Test 7 Test 8
Test 9 Test 10 Test 11 Test 12

CHAPTER 4: RESULTS AND DISCUSSION
100
Figure 4.15: Drill wear details for Test 11 after 1450 holes (conventional drill, TiN coating, 118o helix angle, 24o point angle, 15 m/min cutting speed and 0.2 mm/rev feed rate)
Figure 4.16 shows the main effects plot for tool life. In general, tool life ranged between
700 and 2900 holes with the statistical analysis showing that the main contributing factors
were drill type and feed rate, each having high PCR’s of 37.2% and 32.6% respectively, while
tool surface condition was also significant but with a more moderate PCR of 20%, see Table
4.1. Essentially the results showed that higher tool life could be obtained when employing a
stepped drill, higher feed rate and an uncoated tool. Stepped drills are preferred as they
exhibited higher productivity compared to conventional twist drills. In the present work their
use contributed to a significant reduction in thrust force during second stage drilling (when
the 1.5 mm diameter sizing section was involved in cutting) due to the lack of interaction
between the chisel edge and workpiece material. This corresponds with published data by
Tsao and Hocheng [69, 73-74]. As feed rate was increased, contact time between the cutting
tool and workpiece material reduced, resulting in a reduction in the spiral distance cut,
anticipated lower cutting temperatures and hence tool wear. The longer tool life achieved with
the uncoated drills was however somewhat unexpected but may have been due to the sharper
cutting edges present in comparison with the coated tools. In any event, the ~10% error level
associated with tool life evaluation was within acceptable limits, suggesting all important
factors had been considered as well as measurements performed accurately.

CHAPTER 4: RESULTS AND DISCUSSION
101
Figure 4.16: Main effects plot, means for tool life (Phase 1B)
Factor DF SS Exp SS F P PCR Drill type 1 1829102 1765947 50.20 0.001* 37.21 Surface condition 1 1012102 948947 27.78 0.003* 19.99 Point angle (o) 1 752 -62403 0.02 0.891 0 Helix angle (o) 1 36852 -26303 1.01 0.361 0 Cutting speed (m/min) 1 74419 11263.6 2.04 0.212 0.23 Feed rate (mm/rev) 1 1609669 1546514 44.18 0.001* 32.59 Error 5 182160 10.18 Total 11 4745056
DF = Degrees of freedom SS = Sum of squares Exp SS = Expected sum of squares * Significant at the 5% level
F = F-test valueF calculated for all factors = 6.61 P = Probability PCR = Percentage contribution ratio
Table 4.1: ANOVA results for tool life (Phase 1B)
4.2.2 Thrust force and torque
Figure 4.17 shows the thrust force profile for a typical hole drilled using (a)
conventional and (b) stepped drill geometries at identical cutting speed and feed rate (45
m/min and 0.1 mm/rev respectively) levels. When using conventional drill geometry, the
force signal recorded was as expected [57]. With the stepped drill however, the thrust force
profile principally comprised two regions, which corresponded to the operation of the pilot
section of 1 mm diameter and sizing region (1.5 mm diameter) respectively. A significant
reduction in maximum thrust force (~ 42%) was observed with an anticipated drop in stress
acting on tool edges. This explains the greater performance in terms of longer tool life
1000
1200
1400
1600
1800
2000
2200
2400
Con
vent
iona
l
Ste
pped
Unc
oate
d
TiN
118
140 24 30 15 45 0.1
0.2
Drill type Surface condition Point angle (degree)
Helix angle (degree)
Cutting speed (m/min)
Feed rate (mm/rev)
Tool
life
(num
ber o
f dril
led
hole
s)
Average tool life
Significant Significant Significant

CHAPTER 4: RESULTS AND DISCUSSION
102
obtained when the stepped drill was utilised. Additionally, the thrust force fluctuations
experienced over the workpiece depth were the result of tool edges passing through different
fibre orientations as well as the different properties between fibres and matrix. The findings
are in agreement with results by Bhatnagar et al. [39] who reported that thrust force behaves
in a cyclic fashion when machining FRP composites. Figure 4.18 shows the respective thrust
force and torque data for tests producing the highest tool life (Test 4 and 10), with the
remaining results presented in Appendix D. A typical gradual increase in both responses with
number of holes drilled was seen as a result of regular cutting edge wear [57, 89].
Figure 4.17: Thrust force profile for the first hole drilled using (a) conventional drill and (b) stepped drill (Test 3 and 5 respectively)
(a)
(b)
45o 0o 135o 90o 45o 0o 0o 45o 90o 135o 0o 45o
Mean value where the reading was taken

CHAPTER 4: RESULTS AND DISCUSSION
103
Figure 4.18: Thrust force and torque results for tests showing the highest tool life
40
50
60
70
80
90
100
110
120
130
140
0
10
20
30
40
50
60
70
80
90
100
0 500 1000 1500 2000 2500 3000
Torq
ue (N
.mm
)
Thru
st fo
rce
(N)
Number of drilled holes
Thrust force for Test 4Thrust force for Test 10Torque for Test 4Torque for Test 10

CHAPTER 4: RESULTS AND DISCUSSION
104
Figure 4.19 and Table 4.2 show the main effects plot and corresponding ANOVA
results relating to means for thrust force at cession of tests, which were typically below 100 N
(38 – 93 N). Understandably, feed rate had the most influential effect with the highest PCR of
61.8% followed by drill type at 25.5%. This was in line with other studies on drilling CFRP
(albeit involving larger hole diameters) [61, 62]. Surface condition and point angle were also
found to be significant at the 5% level although their PCR’s were relatively small (7.4% and
1.6%, respectively).
Figure 4.19: Main effects plot, means for thrust force (Phase 1B)
Factor DF SS Exp SS F P PCR Drill type 1 850 843.92 139.7 0.00* 25.46 Surface condition 1 60.75 54.67 9.98 0.025* 1.65 Point angle (o) 1 252.08 245.99 41.43 0.001* 7.42 Helix angle (o) 1 30.08 23.99 4.94 0.077 0.72 Cutting speed (m/min) 1 36.75 30.67 6.04 0.057 0.92 Feed rate (mm/rev) 1 2054.1 2048 337.6 0.000* 61.79 Error 5 30.42 2.02 Total 11 3314.25 F table = 6.61
Table 4.2: ANOVA results for thrust force at the last hole drilled (Phase 1B)
50
55
60
65
70
75
80
85
Con
vent
iona
l
Ste
pped
Unc
oate
d
TiN
118
140 24 30 15 45 0.1
0.2
Drill type Surface condition Point angle (degree)
Helix angle (degree)
Cutting speed (m/min)
Feed rate (mm/rev)
Thru
st f
orce
(N)
Average thrust force
SignificantSignificantSignificantSignificant

CHAPTER 4: RESULTS AND DISCUSSION
105
In terms of torque results, cutting speed was the main contributory factor with a PCR of
53.7%, while feed rate and drill type had moderate effects of 21.6% and 11.6% respectively
see Figure 4.20 and Table 4.3. Torque increased with feed rate and conversely as cutting
speed decreased. This can be attributed to the greater rubbing associated with lower cutting
speeds while the use of higher feed rate increased the un-deformed chip thickness producing
higher forces and torque.
Figure 4.20: Main effects plot, means for torque (Phase 1B)
Factor DF SS Exp SS F P PCR Drill type 1 252.08 224.4 9.10 0.029* 11.63 Surface condition 1 4.08 -23.6 0.15 0.717 0 Point angle (o) 1 2.08 -25.6 0.07 0.795 0 Helix angle (o) 1 24.08 -3.6 0.87 0.394 0 Cutting speed (m/min) 1 1064.08 1036.4 38.48 0.002* 53.73 Feed rate (mm/rev) 1 444.08 416.4 16.04 0.010* 21.59 Error 5 138.42 13.05 Total 11 1928.92 F table = 6.61
Table 4.3: ANOVA results for drilling torque (Phase 1B)
45
50
55
60
65
70
Con
vent
iona
l
Ste
pped
Unc
oate
d
TiN
118
140 24 30 15 45 0.1
0.2
Drill type Surface condition Point angle (degree)
Helix angle (degree)
Cutting speed (m/min)
Feed rate (mm/rev)
Torq
ue (N
.mm
)
Average torque
Significant
Significant
Significant

CHAPTER 4: RESULTS AND DISCUSSION
106
4.2.3 Drilled hole quality and damage
Figure 4.21 shows sample SEM images of hole exit for Test 9 at various periods during
the trial. Only minor damage in the form of fuzzing on hole edges can be seen even after more
than 2000 holes owing to the supportive action provided by the peel ply layer. The apparent
weave pattern shown corresponds to the peel ply surface which was removed post drilling.
The superior edge quality obtained in respect of both hole entry and exit for first holes drilled
in all tests is shown in Figure 4.22. This can be attributed to the low thrust force levels and
sharp cutting edge conditions during early stages of the experiment. Damage in the form of
delamination, spalling, fuzzing and edge chipping/fracture (typical damage shapes when
drilling FRPs [43]) however developed as drilling progressed, and was further exacerbated
during the last several hundred holes, similar to that detailed in Figure 4.23. This suggests a
correlation between increasing flank wear and thrust force with respect to hole
quality/damage. Delamination was found to be the dominant form of hole surface damage and
was further assessed quantitatively using optical microscopy.
Figure 4.21: SEM images for hole exit (Test 9)
Hole 1 Hole 1000 Hole 2025

CHAPTER 4: RESULTS AND DISCUSSION
107
Hole entry Hole exit Test Test Test Test
1
7 1
7
2
8 2
8
3
9 3
9
4
10 4
10
5
11 5
11
6
12 6
12
Figure 4.22: Hole entry and exit at first hole

CHAPTER 4: RESULTS AND DISCUSSION
108
Hole entry Hole exit Test Test Test Test
1
7 1
7
2
8 2
8
3
9 3
9
4
10 4
10
5
11 5
11
6
12 6
12
Figure 4.23: Hole entry and exit at last hole (all to the same flank wear criterion)

CHAPTER 4: RESULTS AND DISCUSSION
109
Figure 4.24 - Figure 4.25 and Table 4.4 - Table 4.5 show the main effects plots and
associated ANOVA results for entry delamination factor (Fd) during the first and last hole
respectively. Feed rate was the main parameter which influenced entry delamination factor for
the first hole with a PCR of 78% while helix angle was also significant but with a low
contribution of 5.75%. For the last hole, drill type and feed rate were the main contributing
factors affecting entry Fd, each providing PCR values of ~ 47 and 31%, respectively. A larger
Fd was however obtained with stepped drills and higher feed rates for the last hole drilled. The
latter was most probably attributed to the higher thrust force generated [68, 71].
Figure 4.24: Main effects plot, means for entry Fd for the first hole (Phase 1B)
Factor DF SS Exp SS F P PCR Drill type 1 0.00163 0.00127 4.56 0.086 3.33 Surface condition 1 0.00013 -0.00022 0.38 0.566 0.00 Point angle (o) 1 0.00129 0.00093 3.6 0.116 2.43 Helix angle (o) 1 0.00256 0.00220 7.14 0.044* 5.75 Cutting speed (m/min) 1 0.00061 0.00026 1.71 0.247 0.67 Feed rate (mm/rev) 1 0.03027 0.02991 84.51 0.000* 78.12 Error 5 0.00179 9.71 Total 11 0.03829 F table = 6.61
Table 4.4: ANOVA results for entry Fd for the first hole (Phase 1B)
1.15
1.17
1.19
1.21
1.23
1.25
1.27
Con
vent
iona
l
Ste
pped
Unc
oate
d
TiN
118
140 24 30 15 45 0.1
0.2
Drill type Surface condition Point angle (degree)
Helix angle (degree)
Cutting speed (m/min)
Feed rate (mm/rev)
Ent
ry d
elam
inat
ion
fact
or (F
d)
Average Fd Significant
Significant

CHAPTER 4: RESULTS AND DISCUSSION
110
Figure 4.25: Main effects plot, means for entry Fd for the last hole (Phase 1B)
Factor DF SS Exp SS F P PCR Drill type 1 0.20317 0.19652 30.54 0.003* 47.25 Surface condition 1 0.01071 0.00406 1.61 0.26 0.98 Point angle (o) 1 0.01275 0.00610 1.92 0.225 1.47 Helix angle (o) 1 0.00216 -0.00449 0.32 0.594 0.00 Cutting speed (m/min) 1 0.01986 0.01321 2.99 0.145 3.18 Feed rate (mm/rev) 1 0.13397 0.12731 20.14 0.006* 30.61 Error 5 0.03326 16.52 Total 11 0.41588 F table = 6.61
Table 4.5: ANOVA results for entry Fd for the last hole (Phase 1B)
In terms of exit delamination, feed rate similarly had the largest influence in relation to
the first hole drilled with an associated PCR of ~45% (see Figure 4.26 and Table 4.6) while
point angle and cutting speed were the significant contributing factors affecting the exit Fd for
last hole drilled with PCR’s of 24 and 20%, respectively (see Figure 4.27 and Table 4.7).
Despite the fact that exit Fd was generally found to be higher than that for hole entry, the
mean value obtained for both was marginally lower at hole exit compared to corresponding
entry positions. This was probably due to the presence of nylon peel ply and glass scrim layer,
which helped to constrain fibre push out and minimised workpiece deflection/bursting at the
exit. In general, average Fd was ~1.5 for last hole drilled, however with Test 4 (longest tool
life with ~ 2900 holes produced), entry and exit delamination factors were 1.88 and 1.62
respectively. Unfortunately, the level of error in respect of exit Fd analysis was relatively high
1.30
1.35
1.40
1.45
1.50
1.55
1.60
1.65
1.70
Con
vent
iona
l
Ste
pped
Unc
oate
d
TiN
118
140 24 30 15 45 0.1
0.2
Drill type Surface condition Point angle (degree)
Helix angle (degree)
Cutting speed (m/min)
Feed rate (mm/rev)
Ent
ry d
elam
inat
ion
fact
or (F
d)
Average Fd
Significant Significant

CHAPTER 4: RESULTS AND DISCUSSION
111
both for first and last hole drilled (~ 54% and 31.5% respectively). Such levels are much
higher than the ~15% deemed acceptable with Taguchi experiments [183] and were felt due to
measurement difficulties/accuracy.
Figure 4.26: Main effects plot, means for exit Fd for the first hole (Phase 1B)
Factor DF SS Exp SS F P PCR Drill type 1 0.00103 0.00020 1.24 0.316 1.42 Surface condition 1 0.00019 -0.00064 0.23 0.653 0.00 Point angle (o) 1 0.00047 -0.00036 0.57 0.484 0.00 Helix angle (o) 1 0.00036 -0.00047 0.44 0.537 0.00 Cutting speed (m/min) 1 0.00070 -0.00013 0.84 0.402 0.00 Feed rate (mm/rev) 1 0.00706 0.00623 8.51 0.033* 44.65 Error 5 0.00415 53.93 Total 11 0.01395 F table = 6.61
Table 4.6: ANOVA results for exit Fd for the first hole (Phase 1B)
1.08
1.09
1.10
1.11
1.12
1.13
1.14
Con
vent
iona
l
Ste
pped
Unc
oate
d
TiN
118
140 24 30 15 45 0.1
0.2
Drill type Surface condition Point angle (degree)
Helix angle (degree)
Cutting speed (m/min)
Feed rate (mm/rev)
Exi
t del
amin
atio
n fa
ctor
(Fd)
Average Fd Significant

CHAPTER 4: RESULTS AND DISCUSSION
112
Figure 4.27: Main effects plot, means for exit Fd for the last hole (Phase 1B)
Factor DF SS Exp SS F P PCR Drill type 1 0.01894 0.01334 3.38 0.125 7.80 Surface condition 1 0.03305 0.02744 5.9 0.06 16.05 Point angle (o) 1 0.04716 0.04156 8.41 0.034* 24.30 Helix angle (o) 1 0.00006 -0.00555 0.01 0.924 0.00 Cutting speed (m/min) 1 0.04047 0.03487 7.22 0.043 20.39 Feed rate (mm/rev) 1 0.00330 -0.00231 0.59 0.478 0.00
Error 5 0.02803 31.46 Total 11 0.17101 F table = 6.61
Table 4.7: ANOVA results for exit Fd for the last hole (Phase 1B)
Drilling with the peel ply attached significantly reduced the occurrence of surface
damage such as fuzzing and severe delamination (see Figure 4.28), however the subsequent
removal of this layer sometimes caused additional damage around the drilled hole and
occasionally left small segments of peel ply debris, see Figure 4.29. Fibre/matrix cracking,
porosity and layer separation were seen on the inner hole surfaces, and were present even
during the early stages of drilling, see Figure 4.30. The helical pattern of damage shown in
Figure 4.30 (b) confirms that the machined surfaces are irregular and that their quality is
highly dependent on fibre orientation angle as reported by Wang et al. [48]. The poor thermal
conductivity of CFRP is a contributory factor in relation to resin melt which typically occurs
at 300 - 400oC, however damage may occur at lower temperature associated with the onset of
1.40
1.42
1.44
1.46
1.48
1.50
1.52
1.54
1.56
Con
vent
iona
l
Ste
pped
Unc
oate
d
TiN
118
140 24 30 15 45 0.1
0.2
Drill type Surface condition Point angle (degree)
Helix angle (degree)
Cutting speed (m/min)
Feed rate (mm/rev)
Exi
t del
amin
atio
n fa
ctor
(Fd)
Average Fd SignificantSignificant

CHAPTER 4: RESULTS AND DISCUSSION
113
plastic deformation. Limited cutting temperature measurements were carried out and are
detailed in Appendix E. Results showed that the maximum cutting temperature when drilling
CFRP under the cutting conditions used was 250oC.
(a) Test 11, hole entry, hole
number 1000 (b) Test 6, hole entry, hole
number 1250 (c) Test 8, hole exit, hole
number 1375
Figure 4.28: Various types/configurations of damage produced when drilling CFRP
(a) Test 6, hole entry, hole number 1000 (b) Test 6, hole entry, hole number 2050
Figure 4.29: Damage caused by removal of the peel ply layer
Fuzzing and spalling
Edge chipping/fracture
Minor entry delamination
Peel ply debris Damage due to
peel ply removal

CHAPTER 4: RESULTS AND DISCUSSION
114
(a) Test 11, from hole exit, hole number 250 (b) Test 3, sectioned hole, first hole
(c) Absence of resin between layers (porosity) (d) Resin loss
Figure 4.30: Internal hole damage forms
4.2.4 Hole size measurement
Measurement of hole diameter showed all holes to be undersize compared to the
nominal drill dimension by up to 2.8% upon reaching the tool life criterion, see Figure 4.31.
The main effects plot and ANOVA results for hole diameter following test cessation are
shown in Figure 4.32 and Table 4.8 respectively. The data revealed that drill type and feed
rate were the principal factors affecting hole size with associated PCR’s of ~ 27.8 and 25.5%.
Cutting speed and point angle were also statistically significant albeit with lower contribution
ratios. Average tool life when conventional drills were employed was shorter than that when
using stepped drills (1370 and 2152 holes respectively), which probably resulted in less drill
land wear and consequently produced better hole accuracy.
Internal damage
Absence of resin (porosity) Resin loss between fibres
which can be seen

CHAPTER 4: RESULTS AND DISCUSSION
115
Figure 4.31: Hole diameter results (Phase 1B)
Figure 4.32: Main effects plot, means for hole diameter (Phase 1B)
1.45
1.46
1.47
1.48
1.49
1.5
1.51
1.52
0 500 1000 1500 2000 2500 3000
Hol
e di
amet
er (m
m)
Number of drilled holes
Test1 Test2 Test3Test4 Test5 Test6Test7 Test8 Test9Test10 Test11 Test12 0 μm diameter error (Nominal size)
40 μm diameter error
1.468
1.470
1.472
1.474
1.476
1.478
1.480
Con
vent
iona
l
Ste
pped
Unc
oate
d
TiN
118
140 24 30 15 45 0.1
0.2
Drill type Surface condition Point angle (degree)
Helix angle (degree)
Cutting speed (m/min)
Feed rate (mm/rev)
Hol
e di
amet
er (m
m)
Average hole diameter
Significant Significant Significant Significant

CHAPTER 4: RESULTS AND DISCUSSION
116
Factor DF SS Exp SS F P PCR Drill type 1 0.0002117 0.00020002 18.13 0.008* 27.83 Surface condition 1 0.000032 0.00002032 2.74 0.159 2.827 Point angle (o) 1 0.0000801 0.00006842 6.86 0.047* 9.52 Helix angle (o) 1 0.0000488 0.00003712 4.18 0.096 5.164 Cutting speed (m/min) 1 0.0000941 0.00008242 8.06 0.036* 11.468 Feed rate (mm/rev) 1 0.0001936 0.00018192 15.58 0.01* 25.312
Error 5 0.0000584 17.876 Total 11 0.0007187 F table = 6.61
Table 4.8: ANOVA results for hole diameter (Phase 1B)
4.2.5 Confirmation test
The maximum tool life (corresponding to the preferred factor levels of A2, B1, C2, D2,
E1, and F2) achieved during the experiment was 2900 holes/tool. A confirmation test was
performed using the above conditions in order to validate results from the statistical analysis
(L12 OA). The responses considered include tool life, thrust force and delamination factors
for hole entry and exit. The confidence interval (95%) for results of the confirmation test was
calculated using the following equation;
holes 3517 2282 limits confidence and 617 -/2900 interval Confidence
1.7143 61
12
1 and 36432 6.61, mean estimatingin used items with associated freedom of degrees [total1
experimenton confirmati for the size sample dualerror/resi with theassociated square of summean dualerror/resi with theassociated freedom of degrees
interval confidence 95% afor valueF tabulated
interval Confidence )]/1()/1[(),1(
and
n
rVF
nsobservatioofnumberTotaln
rV
Feffee
eff
e
eff
e
e
rnVF
=+=
=+
=
===+
=
====
= +
α
α
υ
α υ
Following the confirmation test, the number of drilled holes obtained was 3075 holes,
which was within the confidence interval calculated, indicating that the experiment was
statistically acceptable. Thrust force and torque during the first hole were 41 N and 50 N.mm
respectively which increased to 68 N and 80 N.mm following the last hole drilled. A
corresponding delamination factor Fd for last hole drilled of 1.65 was obtained for both hole
entry and exit, which was comparable to that observed in the mainstream testing for hole exit
(Fd = 1.62) and marginally lower than that for hole entry (Fd = 1.85).

CHAPTER 4: RESULTS AND DISCUSSION
117
4.3 Phase 2A: Effect of composite material, fibre orientation and
machining parameters
4.3.1 Tool wear and tool life
Figure 4.33 details evaluation of flank wear results for experiments using stepped drills
while Figure 4.34 shows data obtained with conventional drills. Trials carried out at the lower
feed rate (0.2 mm/rev) displayed typical ‘steady’ wear progress (flank & chisel edge wear) up
to the maximum flank wear criterion. Figure 4.35 shows corresponding tool life end point
comparisons. The majority of stepped drills tested at a feed rate of 0.4 mm/rev were observed
to experience catastrophic failure (fracture) while all tests carried out at 0.2 mm/rev or using
conventional geometry reached the tool life criterion via gradual progression of tool flank
wear, see Figure 4.36. Despite this however, the longest tool life (3750 holes) was obtained
when machining woven MTM44-1/HTS OC laminates at the higher feed rate level using
stepped geometry. A similar result (up to 3250 holes) was also recorded in the tests involving
UD 977-2/HTS AC and MTM44-1/HTS OC materials drilled at 0.4 mm/rev feed rate using
stepped and conventional drills, respectively. In addition, the effect of prepreg form on tool
life was only prominent when employing a higher feed rate using stepped geometry (up to a
44 fold increase in tool life between UD & woven).
Figure 4.33: Flank wear curves for tests carried out using stepped drills
0
20
40
60
80
100
120
0 500 1000 1500 2000 2500 3000 3500 4000
Flan
k w
ear (μm
)
Number of drilled holes
Flank wear criterion = 100 μm
3750 holes
Higher feed rate (0.4 mm/rev)

CHAPTER 4: RESULTS AND DISCUSSION
118
Figure 4.34: Flank wear curves for tests carried out using conventional drills
Figure 4.35: Tool life in terms of number of drilled holes (* tests experienced tool fracture)
0
20
40
60
80
100
120
0 500 1000 1500 2000 2500 3000 3500
Flan
k w
ear (μm
)
Number of drilled holes
Flank wear criterion = 100 μm
3250 holes
15751741
2200
1250
1875
2991 3100
475
82231
995
3750
8821250
1773
950 1042
2020
1183
400
3250
1087
744
2500
0
500
1000
1500
2000
2500
3000
3500
4000
977-
2/H
TS
8552
/AS
4
MTM
44-1
/HTS
977-
2/H
TS
8552
/AS
4
MTM
44-1
/HTS
977-
2/H
TS
8552
/AS
4
MTM
44-1
/HTS
977-
2/H
TS
8552
/AS
4
MTM
44-1
/HTS
UD Woven UD Woven
0.2 mm/rev feed rate 0.4 mm/rev feed rate
Num
ber o
f dril
led
hole
s
Stepped drill
Conventional drill
* * * *

CHAPTER 4: RESULTS AND DISCUSSION
119
Figure 4.36: Micrographs of tool at test cessation (tests performed using the stepped drills)
The main effects plot shown in Figure 4.37 indicates that best tool life/highest number
of holes drilled would be obtained when drilling woven MTM44-1/HTS OC prepreg
composites at low feed rate using stepped drill. The associated analysis of variance (ANOVA)
however showed that only prepreg type was statistically significant at the 5% level with a
PCR of 24%, but there was an unusually high level of error (~75%), see Table 4.9. The reason
for this was probably due to the premature failure of drills in several tests performed at high
feed rates. Replication of the tests where tool fracture occurred also yielded similar outcomes
on each occasion. Taking into account the fact that most of the failures occurred in the pilot
portion of the stepped drill, it was surmised that the strength of the 1 mm diameter section
was probably insufficient to withstand the machining conditions imposed by operating at a
feed rate of 0.4 mm/rev. The above hypothesis was further reinforced by the fact that the tool
fractures observed when stepped drills were employed were not mirrored in comparative tests
employing conventional twist drills (1.5 mm diameter throughout). The findings were at odds
with published data by Tsao and Hocheng [69, 73 – 74] where stepped drills were used
successfully to cut CFRP, however significantly lower feed rates were employed (up to 0.03
mm/rev).
Catastrophic tool failure Typical flank wear progress

CHAPTER 4: RESULTS AND DISCUSSION
120
Figure 4.37: Main effects plot, means for tool life (Phase 2A)
Factor DF SS Exp SS F P PCR A (prepreg type) 2 7204937 5536231 4.32 0.029* 24.21 B (prepreg form) 1 96774 -737579 0.12 0.737 0.00
C (feed rate mm/rev) 1 127896 -706457 0.15 0.7 0.00 D (drill type) 1 422411 -411942 0.51 0.486 0.00
Error 18 15018352 75.79 Total 23 22870370
Table 4.9: ANOVA results for tool life (Phase 2A)
At 0.2 mm/rev feed rate, stepped drills produced longer tool lives compared with
conventional geometry while at feed rate of 0.4 mm/rev, unpredictable tool life was obtained
due to the premature tool fracture. In terms of the influence of prepreg form, average tool life
for woven laminates was marginally higher than that for UD. An investigation of the different
CFRP laminate lay-up structures revealed a generally higher fibre density/concentration in the
UD configurations compared to the woven arrangements, see Figure 4.38. It is likely that this
led to increased interaction between the tool and abrasive fibres during drilling, resulting in
lower tool life as seen with the majority of UD laminates in contrast to their woven
counterparts. The presence of extensive voids/cavities in the woven composites was expected
to cause a reduction in inter-laminar strength and abrasiveness, however their incidence would
be lower following high pressure autoclave curing of the 977-2/HTS AC and 8552/AS4 AC
laminates. In contrast, the MTM44-1/HTS OC laminates were simply oven cured under
atmospheric pressure. This, coupled with the relatively low fibre tensile strength and modulus
(2159MPa / 129GPa as opposed to 4480MPa / 231GPa for the 8552/AS4 AC laminate), as
1000
1200
1400
1600
1800
2000
2200
2400
977-
2
8552
MTM
44-1 UD
Wov
en 0.2
0.4
Ste
pped
Con
vent
iona
l
Prepreg type Prepreg form Feed rate (mm/rev) Drill type
Tool
life
(num
ber o
f dril
led
hole
s)
Average tool life
Significant

CHAPTER 4: RESULTS AND DISCUSSION
121
well as the inconsistency of the composite structure (porosity etc.), was thought to partially
account for the unexpectedly high tool life seen when drilling the woven MTM44-1/HTS OC
workpiece using both drill geometries.
Figure 4.38: Subsurface microscopic analysis of (a) UD and (b) woven 8552/AS4 AC
4.3.2 Thrust force and torque
For tests performed using the stepped drill geometry, thrust force and torque results
were based on the average value measured during cutting with the pilot section (part B, Figure
4.39) due to its higher contribution to workpiece delamination (explained further in Section
4.3.3). This concurred with the hypothesis by Won and Dharan [94], who determined that the
pilot section of a stepped drill contributed ~ 65% of the total thrust force during cutting. For
the conventional geometry, thrust force and torque results were based on an average value
when the tool was completely engaged with the workpiece. Figure 4.40 and Figure 4.41 detail
thrust force results recorded following the first and last holes drilled respectively. In the
former case, thrust forces were generally found to be constant around ~ 45 N when a feed rate
of 0.2 mm/rev was used, irrespective of the prepreg material or its associated prepreg form.
These forces however increased by up to two fold (ranging between 40 N and 90 N) when
operating at the higher feed rate level, and had a detrimental effect on hole quality in terms of
workpiece delamination/damage (detailed further later in Section 4.3.3). As expected, last
hole thrust forces were substantially higher (by an average of ~75%) due to the incidence of
tool wear, in particular for drills which reached the maximum wear criterion.
(a)
Absence of fibres
(b)

CHAPTER 4: RESULTS AND DISCUSSION
122
Figure 4.39: Typical force diagram for a single hole drilled using a stepped drill in woven 8552/AS4 AC laminate at 0.2 mm/rev
Figure 4.40: Thrust force results for the first hole drilled (Phase 2A)
4044
40 42 4240
76
86
72
58
77
70
40
48
42 42
4945
4044
82
90
50
41
30
40
50
60
70
80
90
100
977-
2/H
TS
8552
/AS
4
MTM
44-1
/HTS
977-
2/H
TS
8552
/AS
4
MTM
44-1
/HTS
977-
2/H
TS
8552
/AS
4
MTM
44-1
/HTS
977-
2/H
TS
8552
/AS
4
MTM
44-1
/HTS
UD Woven UD Woven
0.2 mm/rev feed rate 0.4 mm/rev feed rate
Thru
st fo
rce
for f
irst h
ole
(N)
Stepped drill
Conventional drill
E

CHAPTER 4: RESULTS AND DISCUSSION
123
Figure 4.41: Thrust force results for the last hole drilled (Phase 2A)
The main effects plot and corresponding ANOVA table for first hole thrust force is
shown in Figure 4.42 and Table 4.10 respectively. Drill feed rate had an overriding influence
with a percentage contribution ratio of 42.53%, while the effect of prepreg type & form were
largely negligible. This was not unexpected and broadly agreed with data previously reported
by several researchers [61, 82 and 87]. With the exception of feed rate which had a 10% PCR,
variation in factor levels for the last hole thrust force, (see Figure 4.43) produced a negligible
change in the measured response and none of the factors evaluated were found to be
statistically significant at the 5% level. Unfortunately, the analysis of variance also revealed a
higher than acceptable error level for both first and last hole thrust force which was probably
due to suspected interactions between variables as well as the premature failure of the drills in
several tests conducted at high feed rates.
73
88
6470
7769
121
94
73
80
96
105
75
94
72 70
85
7570 65
142136
68
58
50
60
70
80
90
100
110
120
130
140
150
977-
2/H
TS
8552
/AS
4
MTM
44-1
/HTS
977-
2/H
TS
8552
/AS
4
MTM
44-1
/HTS
977-
2/H
TS
8552
/AS
4
MTM
44-1
/HTS
977-
2/H
TS
8552
/AS
4
MTM
44-1
/HTS
UD Woven UD Woven
0.2 mm/rev feed rate 0.4 mm/rev feed rate
Thru
st fo
rce
for l
ast h
ole
(N)
Stepped drill
Conventional drill

CHAPTER 4: RESULTS AND DISCUSSION
124
Figure 4.42: Main effects plot, means for thrust force (first hole)
Factor DF SS Exp SS F P PCR A (prepreg type) 2 9.3 -376.533 0.02 0.976 0.00 B (prepreg form) 1 2.7 -190.217 0.01 0.908 0.00
C (feed rate mm/rev) 1 3082.7 2889.783 15.98 0.001* 42.53 D (drill type) 1 228.2 35.28333 1.18 0.291 0.52
Error 18 3472.5 56.95 Total 23 6795.3
Table 4.10: ANOVA results for thrust force (first hole)
Figure 4.43: Main effects plot, means for thrust force (last hole)
40
45
50
55
60
65
70
977-
2
8552
MTM
44-1 UD
Wov
en 0.2
0.4
Ste
pped
Con
vent
iona
l
Prepreg type Prepreg form Feed rate (mm/rev) Drill type
Thru
st f
orce
(N)
Average thrust force
Significant
70
75
80
85
90
95
977-
2
8552
MTM
44-1 UD
Wov
en 0.2
0.4
Ste
pped
Con
vent
iona
l
Prepreg type Prepreg form Feed rate (mm/rev) Drill type
Thru
st f
orce
(N)
Average thrust force

CHAPTER 4: RESULTS AND DISCUSSION
125
The maximum torque level did not exceed 65 and 95 N.mm over the range of
parameters tested for stepped and conventional drills respectively, see Figure 4.44. A larger
cutting area was the likely reason for the higher values associated with conventional drill
geometry. None of the factors or interactions relating to torque were found to be significant at
the 5% level however prepreg type and drill type showed greater variation, see Figure 4.45.
This corresponded to findings detailed in Section 4.2 where cutting speed was shown to have
an overriding influence on drilling torque over other variables.
Figure 4.44: Drilling torque results (Phase 2A)
43 45 45
60
4549
6055 56
65
55
45
62 62 63 6165
52
37 35
9195
35 33
30
40
50
60
70
80
90
100
977-
2/H
TS
8552
/AS
4
MTM
44-1
/HTS
977-
2/H
TS
8552
/AS
4
MTM
44-1
/HTS
977-
2/H
TS
8552
/AS
4
MTM
44-1
/HTS
977-
2/H
TS
8552
/AS
4
MTM
44-1
/HTS
UD Woven UD Woven
0.2 mm/rev feed rate 0.4 mm/rev feed rate
Torq
ue (N
.mm
)
Stepped drill
Conventional drill

CHAPTER 4: RESULTS AND DISCUSSION
126
Figure 4.45: Main effects plot, means for torque (Phase 2A)
4.3.3 Drilled hole quality and damage
Entry and exit delamination were evaluated for both the first and last holes drilled.
Figure 4.46 - Figure 4.49 detail the calculated delamination factors at the entry and exit. In
general, delamination factor was found to be marginally greater at hole exit with a maximum
of 2.1 obtained when cutting UD 977-2/HTS using a stepped drill and 8552/AS4 AC using
conventional geometry at 0.4 mm/rev. Fd was up to 1.95 at hole entry for the experimental
parameters employed. Hole edge quality also largely deteriorated with respect to the
increasing number of holes produced, in particular at hole exit, which agreed with results
obtained by Chen [61]. This was in part due to the decline in drill edge sharpness which
caused an elevation in thrust forces, as described in Section 4.3.2.
47
51
55
59
63
977-
2
8552
MTM
44-1 UD
Wov
en 0.2
0.4
Ste
pped
Con
vent
iona
l
Prepreg type Prepreg form Feed rate (mm/rev) Drill type
Torq
ue (N
.mm
)
Average torque

CHAPTER 4: RESULTS AND DISCUSSION
127
Figure 4.46: Entry delamination factor results for first hole drilled (Phase 2A)
Figure 4.47: Entry delamination factor results for last hole drilled (Phase 2A)
1.00
1.10
1.20
1.30
1.40
1.50
1.60
1.70
1.80
1.90
2.00
977-
2/H
TS
8552
/AS
4
MTM
44-1
/HTS
977-
2/H
TS
8552
/AS
4
MTM
44-1
/HTS
977-
2/H
TS
8552
/AS
4
MTM
44-1
/HTS
977-
2/H
TS
8552
/AS
4
MTM
44-1
/HTS
UD Woven UD Woven
0.2 mm/rev feed rate 0.4 mm/rev feed rate
Ent
ry F
dfo
r the
firs
t hol
e
Stepped drill
Conventional drill
1.00
1.10
1.20
1.30
1.40
1.50
1.60
1.70
1.80
1.90
2.00
977-
2/H
TS
8552
/AS
4
MTM
44-1
/HTS
977-
2/H
TS
8552
/AS
4
MTM
44-1
/HTS
977-
2/H
TS
8552
/AS
4
MTM
44-1
/HTS
977-
2/H
TS
8552
/AS
4
MTM
44-1
/HTS
UD Woven UD Woven
0.2 mm/rev feed rate 0.4 mm/rev feed rate
Ent
ry F
dfo
r the
last
hol
e
Stepped drill
Conventional drill

CHAPTER 4: RESULTS AND DISCUSSION
128
Figure 4.48: Exit delamination factor results for first hole drilled (Phase 2A)
Figure 4.49: Exit delamination factor results for last hole drilled (Phase 2A)
1.00
1.10
1.20
1.30
1.40
1.50
1.60
1.70
1.80
1.90
977-
2/H
TS
8552
/AS
4
MTM
44-1
/HTS
977-
2/H
TS
8552
/AS
4
MTM
44-1
/HTS
977-
2/H
TS
8552
/AS
4
MTM
44-1
/HTS
977-
2/H
TS
8552
/AS
4
MTM
44-1
/HTS
UD Woven UD Woven
0.2 mm/rev feed rate 0.4 mm/rev feed rate
Exit
F dfo
r the
firs
t hol
e
Stepped drill
Conventional drill
1.00
1.20
1.40
1.60
1.80
2.00
2.20
977-
2/H
TS
8552
/AS
4
MTM
44-1
/HTS
977-
2/H
TS
8552
/AS
4
MTM
44-1
/HTS
977-
2/H
TS
8552
/AS
4
MTM
44-1
/HTS
977-
2/H
TS
8552
/AS
4
MTM
44-1
/HTS
UD Woven UD Woven
0.2 mm/rev feed rate 0.4 mm/rev feed rate
Exit
F dfo
r the
last
hol
e
Stepped drill
Conventional drill

CHAPTER 4: RESULTS AND DISCUSSION
129
A closer inspection of the results from first holes drilled showed the Fd to be in most
cases lower at hole exit compared to corresponding entry positions. This fact is clearly
illustrated by the micrographs detailed in Figure 4.50. This was in line with the finding of
Section 4.2.3 where average Fd results were marginally higher associated with hole entry. The
presence of nylon peel ply layers which essentially function as backup/support material, was
thought to increase the critical thrust force level at which the onset of delamination occurred
thereby inhibiting the progress of fibre push out. Superior or comparable delamination factor
values were also obtained in certain instances at the exit side of the last holes drilled with the
lower feed rate. As the feed rate was increased from 0.2 to 0.4 mm/rev however, there was a
sharp decline in composite integrity around hole entry and exit for all laminate types. The
only exceptions where higher Fd occurred with a 0.2 mm/rev feed rate was at the hole exit of
8552/AS4 AC prepregs. This was despite the higher thrust forces generated when drilling at
high feed rate. In terms of the composite resin system, the 8552/AS4 prepregs experienced the
worst level of damage even with new tools when operating at 0.4 mm/rev feed rate, especially
at the exit position, see Figure 4.51. This was almost similar for both the UD and woven
laminates. No significant variation in terms of damage was seen for the two drill geometries
employed, see Figure 4.52. This was in line with thrust force results detailed in Section 4.3.2,
which were comparable when using either stepped or conventional drills.
Figure 4.50: Delamination for: (a) hole entry and (b) hole exit at 0.2 mm/rev feed rate for first drilled hole (stepped drill)
(a) (b)

CHAPTER 4: RESULTS AND DISCUSSION
130
Figure 4.51: Exit delamination at 0.4 mm/rev feed rate for: a) the first and b) the last drilled hole (stepped drill)
Figure 4.52: Exit delamination at 0.4 mm/rev feed rate for: a) stepped and b) conventional drill (last drilled hole)
In general, the contribution of the pilot section (1 mm diameter) of the drill on the thrust
force was more significant than the step portion (1.5 mm diameter). As shown previously, the
latter only produced a force signature approximately 30% of that for the pilot (see Figure
4.39). This agreed with published data by Jain and Yang [90] who reported that the chisel
edge of a drill typically contributes about 50-70% of the thrust force generated. In addition,
checks on measurement of delamination diameter after the pilot operation compared with that
following final sizing with the step portion of the drill, indicated that the majority of damage
(up to ~ 90%), was due to the action of the pilot section of the drill. In connection with this,
Figure 4.53 shows a hole produced using the pilot portion of the drill only and the
corresponding damage produced. The average diameter of damage following final hole sizing
(1.5 mm) is also indicated, and it can be seen that the majority of damage was already present
prior to operation with the step section.
(a)
(a) (b)
(b)

CHAPTER 4: RESULTS AND DISCUSSION
131
Figure 4.53: Extent of delamination caused by pilot portion of drill
Subsequent statistical analysis however showed near identical results in relation to the
influence of process variables on entry/exit delamination for both first and last drilled holes.
Main effect plots for calculated delamination factor pointed to the lowest Fd being obtained
when drilling woven MTM44-1/HTS OC composites at 0.2 mm/rev feed rate using
conventional drills (or either geometries for the last hole drilled), see Figure 4.54 - Figure
4.57. Average delamination factor for the last hole drilled was 1.48 and 1.59 for entry and exit
positions respectively. ANOVA results revealed that feed rate had an overwhelming effect on
entry Fd both for first and last hole drilled with a high PCR of 64 and 78% respectively, see
Table 4.11 and Table 4.12. This further confirmed the strong correlation between
delamination and thrust force, which has been reported by several researchers [68, 71, 73].
None of the other factors or interactions evaluated were found to be statistically significant at
the 5% level in terms of entry Fd.
With regard to exit Fd analysis, feed rate was the sole significant factor for first hole
drilled with a PCR of 25%, while feed rate, prepreg type and prepreg form had significant
influence in relation to last hole drilled with PCRs of 39, 31 and 5% respectively, see Table
4.13 and Table 4.14.
500 μm
1.5 mm ∅
1 mm ∅
Average damage diameter following the step portion
Typical damage caused by pilot

CHAPTER 4: RESULTS AND DISCUSSION
132
Figure 4.54: Main effects plot, means for entry Fd for the first hole (Phase 2A)
Factor DF SS Exp SS F P PCR A (prepreg type) 2 0.01901 -0.031 0.38 0.689 0.00 B (prepreg form) 1 0.00734 -0.01766 0.29 0.595 0.00
C (feed rate mm/rev) 1 1.01024 0.985236 40.4 0.000* 63.98 D (drill type) 1 0.05324 0.028236 2.13 0.162 1.83
Error 18 0.45007 34.19 Total 23 1.5399
Table 4.11: ANOVA results for entry Fd (first hole)
Figure 4.55: Main effects plot, means for entry Fd for the last hole (Phase 2A)
1.15
1.20
1.25
1.30
1.35
1.40
1.45
1.50
977-
2
8552
MTM
44-1 UD
Wov
en 0.2
0.4
Ste
pped
Con
vent
iona
l
Prepreg type Prepreg form Feed rate (mm/rev) Drill type
Del
amin
atio
n fa
ctor
(Fd)
Average Fd
Significant
1.35
1.40
1.45
1.50
1.55
1.60
1.65
977-
2
8552
MTM
44-1 UD
Wov
en 0.2
0.4
Ste
pped
Con
vent
iona
l
Prepreg type Prepreg form Feed rate (mm/rev) Drill type
Del
amin
atio
n fa
ctor
(Fd)
Average Fd
Significant

CHAPTER 4: RESULTS AND DISCUSSION
133
Factor DF SS Exp SS F P PCR A (prepreg type) 2 0.27103 0.130477 1.93 0.174 8.47 B (prepreg form) 1 0.11402 0.043743 1.62 0.219 2.84
C (feed rate mm/rev) 1 1.27724 1.206963 18.17 0.000* 78.38 D (drill type) 1 0.01874 -0.05154 0.27 0.612 0.00
Error 18 1.26498 10.31 Total 23 2.94601
Table 4.12: ANOVA results for entry Fd (last hole)
Figure 4.56: Main effects plot, means for exit Fd for the first hole (Phase 2A)
Factor DF SS Exp SS F P PCR A (prepreg type) 2 0.30992 0.141626 1.84 0.187 4.40 B (prepreg form) 1 0.14644 0.062293 1.74 0.204 1.94
C (feed rate mm/rev) 1 0.89174 0.807593 10.6 0.004* 25.09 D (drill type) 1 0.35561 0.271463 4.23 0.055 8.43
Error 18 1.51465 60.14 Total 23 3.21836
Table 4.13: ANOVA results for exit Fd (first hole)
1.00
1.05
1.10
1.15
1.20
1.25
1.30
1.35
1.40
977-
2
8552
MTM
44-1 UD
Wov
en 0.2
0.4
Ste
pped
Con
vent
iona
l
Prepreg type Prepreg form Feed rate (mm/rev) Drill type
Del
amin
atio
n fa
ctor
(Fd)
Average Fd
Significant

CHAPTER 4: RESULTS AND DISCUSSION
134
Figure 4.57: Main effects plot, means for exit Fd for the last hole (Phase 2A)
Factor DF SS Exp SS F P PCR A (prepreg type) 2 2.6397 2.4654 15.15 0* 31.46 B (prepreg form) 1 0.4972 0.41005 5.71 0.028* 5.23
C (feed rate mm/rev) 1 3.1187 3.03155 35.79 0* 38.68 D (drill type) 1 0.0127 -0.07445 0.15 0.707 0.00
Error 18 1.5687 24.63 Total 23 7.8371
Table 4.14: ANOVA results for exit Fd (last hole)
The nature and extent of delamination around drilled holes in composites can vary
significantly and can be generally difficult to quantify/characterise by the traditional
delamination factor (Fd) parameter alone, where only a diameter ratio is considered. A more
representative assessment can be provided in some cases by the adjusted delamination factor
(Fda) which was detailed in Chapter 2. Figure 4.58 shows selected cases where the adjusted
delamination factor gave better discrimination of hole damage compared to the conventional
Fd, which was identical for these examples. A closer visual inspection of the damage patterns
at the exit of the last hole drilled in Test 1 and 10 (both having the same Fd value) further
emphasises the greater discriminating ability of the Fda parameter, see Figure 4.58 (a) & (b).
Although not detailed, the main effects plots and analysis of variance on Fda for both hole
entry and exit were equivalent to results based on Fd. In addition, feed rate was found to give
the highest contribution in all cases evaluated, with a PCR of up to 78%, while residuals for
Fda were equivalent to those for Fd.
1.351.401.451.501.551.601.651.701.751.801.85
977-
2
8552
MTM
44-1 UD
Wov
en 0.2
0.4
Ste
pped
Con
vent
iona
l
Prepreg type Prepreg form Feed rate (mm/rev) Drill type
Del
amin
atio
n fa
ctor
(Fd)
Average Fd
SignificantSignificant Significant

CHAPTER 4: RESULTS AND DISCUSSION
135
Figure 4.58: Examples for conventional and adjusted Fd: a) Last hole exit – Test 1, b) Last hole exit – Test 10, c) First hole exit – Test 5 and d) First hole entry –Test 10
4.3.4 Hole size measurement
Holes with a small taper were observed where the larger diameter occurred at hole
entry. The maximum diametrical difference measured between hole entry and exit was 17 μm
over a 2 mm height. Only the middle point reading (1.5 mm distance from hole entry or exit)
was considered in further analysis. Here, the diameter of the drilled holes was found to be
undersize for all conditions tested by up to 73 μm (~5%) and 39 μm (2.6%) at the end of tool
life using stepped and conventional drills respectively as shown in Figure 4.59. This is not
uncommon in the drilling process due to tool wear, which reduces tool diameter (and hence
hole diameter) as the operation proceeds.
Fd
Fda

CHAPTER 4: RESULTS AND DISCUSSION
136
Figure 4.59: Hole diameter measurement results (Phase 2A)
The main effects plot and associated ANOVA however revealed that none of the
evaluated variables were statistically significant. This was most likely due to the catastrophic
fractures which occurred with several of the stepped drills. The average hole diameter over all
trials was 1.469 mm (undersized holes by 31 μm), see Figure 4.60. The plot also shows that
superior hole tolerance was obtained at the higher feed rate. This however was somewhat
misleading as all cases of premature tool fracture took place at 0.4 mm/rev before the tool
wear criterion was achieved (lower number of holes drilled) and consequently the holes had
less variation from the nominal size.
1.473
1.462
1.475 1.4731.477
1.472 1.471
1.493
1.461
1.478
1.492
1.483
1.42
1.43
1.44
1.45
1.46
1.47
1.48
1.49
1.50
977-
2/H
TS
8552
/AS
4
MTM
44-1
/HTS
977-
2/H
TS
8552
/AS
4
MTM
44-1
/HTS
977-
2/H
TS
8552
/AS
4
MTM
44-1
/HTS
977-
2/H
TS
8552
/AS
4
MTM
44-1
/HTS
UD Woven UD Woven
0.2 mm/rev feed rate 0.4 mm/rev feed rate
Hol
e di
amet
er (m
m)
Stepped drill
Conventional drill
* * * *

CHAPTER 4: RESULTS AND DISCUSSION
137
Figure 4.60: Main effects plot, means for hole diameter (Phase 2A)
4.3.5 Chip analysis
Limited chip analysis was carried out using optical microscopy. Two different shapes of
swarf were obtained; continuous/spiral chips produced from cutting the peel ply (Figure 4.61)
and discontinuous swarf from the panel core (CFRP) in the shape of fragmented and powdery
chips. This was due to brittle fracture of both the fibres as well as the cured matrix [12].
Neither type of chip caused flute packing and cleared easily from the cutting zone, which was
subject to a particle extraction system able to remove dust down to ~ 0.3 μm. Figure 4.62
shows micrographs for different shapes of chip when drilling CFRP. Additionally, SEM
analysis confirmed that chips were predominantly in the form of discontinuous clumps (fibres
gathered by the matrix material) as shown in Figure 4.63, which was similar to results from
Hocheng and Puw [52].
Figure 4.61: Continuous/spiral nylon peel ply chip
1.460
1.464
1.468
1.471
1.475
1.479
977-
2
8552
MTM
44-1 UD
Wov
en 0.2
0.4
Ste
pped
Con
vent
iona
l
Prepreg type Prepreg form Feed rate (mm/rev) Drill type
Hol
e di
amet
er (m
m)
Average hole diameter
Less diameter error

CHAPTER 4: RESULTS AND DISCUSSION
138
977-2/HTS 8552/AS4 MTM44-1/HTS
UD,
first hole,
0.2 mm/rev
Woven,
last hole,
0.2 mm/rev
Figure 4.62: Various chip shapes when drilling CFRP
Figure 4.63: SEM images of chips produced from tests in Phase 2A
4.4 Phase 2B: Evaluation of diamond based coatings
4.4.1 Tool wear and tool life
Figure 4.64 shows flank wear progress when drilling the UD MTM44-1/HTS composite
at 0.2 mm/rev feed rate. Similar trends were also obtained when cutting the woven 977-2/HTS
laminate at the same feed rate but with comparatively lower tool lives. Figure 4.65 shows
corresponding tool life end point comparisons for tests conducted at the low and high feed
Powder-like chips Powder-like chips Powder-like chips
Clumps of fibre/matrix Clumps of fibre/matrix Discontinuous chips
Clumps of fibre/matrix

CHAPTER 4: RESULTS AND DISCUSSION
139
rate levels. DLC coated drills had the longest tool lives, particularly when machining UD
MTM44-1/HTS CFRP at 0.2 mm/rev feed rate, where up to 1800 holes was obtained prior to
reaching the tool wear criterion. Conversely, all three CVD diamond coated tools experienced
catastrophic failure at an early stage with the exception of the Rhobest diamond coated drill at
0.2 mm/rev. Figure 4.66 shows micrographs of all the drills used at 0.2 mm/rev feed rate in
the new and worn (end of life) conditions. The majority of the CVD coated drills fractured
after < 50 holes. SEM analysis of new uncoated and DLC coated tools revealed
sharp/consistent cutting and chisel edges while poor edge definition/rounded edges together
with bubbles/clumps and rough surfaces were seen on the corresponding CVD diamond
coated drills, see Figure 4.67 (a). A possible factor causing the premature tool fracture
experienced by the CVD diamond coated drills was the likely cobalt depletion from the
carbide substrate during the coating process and consequent reduction of tool strength. It was
also observed that the diamond coating layers generally ‘peeled away’ prior to
chipping/fracture of the tools, see Figure 4.67 (b).
Figure 4.64: Flank wear results for different coatings when drilling UD MTM 44-1/HTS
0
20
40
60
80
100
120
0 200 400 600 800 1000 1200 1400 1600 1800 2000
Flan
k w
ear (μm
)
Tool life (number of drilled holes)
Uncoated drillDLC coated drillRhobest diamond coated drillDiamond fibre speed coated drillDiamond plus coated drill

CHAPTER 4: RESULTS AND DISCUSSION
140
Figure 4.65: Tool life in terms of number of drilled holes
Figure 4.66: Micrographs of tools used at 0.2 mm/rev feed rate: (a) UD MTM44-1/HTS and (b) woven 977-2 laminates, number of drilled holes is shown for the worn tools
0
200
400
600
800
1000
1200
1400
1600
1800
2000
UD
MTM
44-1
/HTS
Wov
en 9
77-2
/HTS
UD
MTM
44-1
/HTS
Wov
en 9
77-2
/HTS
UD
MTM
44-1
/HTS
Wov
en 9
77-2
/HTS
UD
MTM
44-1
/HTS
Wov
en 9
77-2
/HTS
UD
MTM
44-1
/HTS
Wov
en 9
77-2
/HTS
Uncoated WC Diamond like carbon (DLC)
Rhobest diamond coating
Diamond plus Diamond fibre speed
Tool
life
(num
ber o
f dril
led
hole
s)
0.2 mm/rev feed rate
0.4 mm/rev feed rate
Discounted from the full test plan
(a)
(b)
1719 1790 1070 25 25
781 450 1315 25 25

CHAPTER 4: RESULTS AND DISCUSSION
141
Uncoated drill DLC coated drill CVD Rhobest diamond coated drill
CVD Diamond plus coated drill
Figure 4.67: SEM images for the drills used at 0.4 mm/rev feed rate: (a) new and (b) worn
Figure 4.68 details tool life for tests conducted using uncoated and DLC coated drills at
the various feed rates. The use of DLC coated drills to machine UD MTM44-1/HTS gave the
highest tool life (~ 2500 holes) with a maximum allowable operating feed rate of 0.3 mm/rev.
The majority of tools experienced typical flank wear growth except when cutting the UD
MTM44-1/HTS at 0.4 mm/rev, at which premature edge fracture occurred. This was
attributed to the excessive loads on the tool cutting edges as well as the highly abrasive nature
of the fibres. The associated main effects plot is shown in Figure 4.69. Average tool life
results for the uncoated drills marginally exceeded that for DLC drills although they both
exhibited similar performance when cutting UD MTM44-1/HTS. This was in agreement with
findings by Murphy et al. [93] who concluded that DLC coatings gave limited beneficial
effect when drilling CFRP. Associated ANOVA results however revealed that feed rate and
prepreg type together with interactions in coating material /prepreg type and feed rate/prepreg
type were statistically significant at the 5% level. The highest PCR (39.46%) was
understandably associated with the interaction between feed rate and prepreg type, where both
variables were individually significant in influencing tool life. While the UD MTM44-1/HTS
material caused catastrophic tool failure at the high feed rate (0.4 mm/rev), the woven 977-
2/HTS laminates produced longer tool lives. This indicates a strong correlation / interaction
between composite properties and the allowable operating feed rate. Additionally, a very low
error level (2.46%) was obtained with the ANOVA results, affirming that all important
variables were considered in the trials.
(a)
(b)
Sharp main and chisel edges
Typical flank wear
Coating and bulk removal
Rough coated surface
Catastrophic fracture
Edge rounding
Notch wear

CHAPTER 4: RESULTS AND DISCUSSION
142
Figure 4.68: Tool life for uncoated and DLC coated drills
Figure 4.69: Main effects plot, means for tool life (Phase 2B)
1112
1719
2404
25
18751790
2500
25
571
781
10611134
656
450
168
578
0
500
1000
1500
2000
2500
3000
0.1 mm/rev 0.2 mm/rev 0.3 mm/rev 0.4 mm/rev 0.1 mm/rev 0.2 mm/rev 0.3 mm/rev 0.4 mm/rev
Uncoated WC Diamond like carbon (DLC)
Tool
life
(num
ber o
f dril
led
hole
s)UD MTM44-1/HTS Woven 977-2/HTS
0
200
400
600
800
1000
1200
1400
1600
1800
Unc
oate
d
DLC 0.
1
0.2
0.3
0.4
UD
MTM
44-1
/HTS
Wov
en 9
77-2
/HTS
Coating material Feed rate (mm/rev) Prepreg type
Tool
life
(num
ber o
f dril
led
hole
s)
Average tool lifeSignificant Significant

CHAPTER 4: RESULTS AND DISCUSSION
143
Factor DF SS Exp SS F P PCR A (Coating material) 1 36577 21086.33 2.36 0.222 0.22
B (Feed rate) (mm/rev) 3 2432095 2385623 52.33 0.004* 25.27 C (Prepreg type) 1 2326388 2310897 150.18 0.001* 24.48
AB 3 396186 349714 8.53 0.056 3.70 AC 1 430664 415173.3 27.8 0.013* 4.40 BC 3 3771376 3724904 81.15 0.002* 39.46
Error 3 46472 2.46 Total 15 9439756
Table 4.15: ANOVA results for tool life (Phase 2B)
4.4.2 Thrust force and torque
In general, thrust force during the first hole ranged between 24 and 125 N depending on
the operating feed rate, when uncoated and DLC coated drills were used as detailed in Figure
4.70. Similar trends were observed for the last hole drilled where thrust force gradually
increased with feed rate as expected up to 160 N at 0.4 mm/rev, see Figure 4.71. Initial trials
also highlighted a significant increase in thrust force to ~ 380 N with CVD diamond coated
drills, which may account for their premature fracture, further details are provided in
Appendix D.
Figure 4.70: Thrust force results for the first hole drilled (Phase 2B)
3640
50
115
24
40
60
120
26
41
60
82
25
43
70
125
0
20
40
60
80
100
120
140
0.1 mm/rev 0.2 mm/rev 0.3 mm/rev 0.4 mm/rev 0.1 mm/rev 0.2 mm/rev 0.3 mm/rev 0.4 mm/rev
Uncoated WC Diamond like carbon (DLC)
Thru
st fo
rce
(N)
UD MTM44-1/HTS Woven 977-2/HTS

CHAPTER 4: RESULTS AND DISCUSSION
144
Figure 4.71: Thrust force for the last hole drilled (Phase 2B)
Main effects plot and ANOVA results in relation to thrust force for both first and last
holes were similar. The average thrust force increased from 60 to 95 N from the first to the
last hole drilled as a result of tool wear, see Figure 4.72 and Figure 4.73. Feed rate had an
overriding effect on thrust force in both cases with extremely high PCR’s of between 76% -
90%, as detailed in Table 4.16 - Table 4.17. The non-linear progression of feed rate in the
main effects plot would appear to suggest that a critical/limiting feed rate level exists. Based
on the data in Figure 4.72 together with previous results relating to tool life, the critical feed
rate was estimated to be 0.3 mm/rev. The best factor/level combination for achieving
minimum thrust force (during the last hole) corresponded to that found for maximum tool life
i.e. DLC coating and UD MTM44-1/HTS. In contrast to tool life results, no interactions
between any of the specified operating parameters were found.
84 80
108
120
60
78
110
122
60
75
118
130
58
7277
160
0
20
40
60
80
100
120
140
160
180
0.1 mm/rev 0.2 mm/rev 0.3 mm/rev 0.4 mm/rev 0.1 mm/rev 0.2 mm/rev 0.3 mm/rev 0.4 mm/rev
Uncoated WC Diamond like carbon (DLC)
Thru
st fo
rce
(N)
UD MTM44-1/HTS Woven 977-2/HTS

CHAPTER 4: RESULTS AND DISCUSSION
145
Figure 4.72: Main effects plot, means of thrust force (first hole)
Factor DF SS Exp SS F P PCR A (Coating material) 1 203.1 81.29 1.67 0.226 0.47
B (Feed rate) (mm/rev) 3 15804.7 15439.27 43.25 0* 89.57 C (Prepreg type) 1 10.6 -111.21 0.09 0.774 0.00
Error 10 1218.1 9.95 Total 15 17236.4
Table 4.16: ANOVA results for thrust force (first hole)
Figure 4.73: Main effects plot, means of thrust force (last hole)
0
20
40
60
80
100
120
Unc
oate
d
DLC 0.
1
0.2
0.3
0.4
UD
MTM
44-1
/HTS
Wov
en 9
77-2
/HTS
Coating material Feed rate (mm/rev) Prepreg type
Thru
st fo
rce
(N)
Average thrust force
Significant
60
70
80
90
100
110
120
130
140
Unc
oate
d
DLC 0.
1
0.2
0.3
0.4
UD
MTM
44-1
/HTS
Wov
en 9
77-2
/HTS
Coating material Feed rate (mm/rev) Prepreg type
Thru
st fo
rce
(N)
Average thrust forceSignificant

CHAPTER 4: RESULTS AND DISCUSSION
146
Factor DF SS Exp SS F P PCR A (Coating material) 1 90.3 -149.62 0.38 0.553 0.00
B (Feed rate) (mm/rev) 3 10931.5 10211.74 15.19 0* 76.04 C (Prepreg type) 1 9 -230.92 0.04 0.85 0.00
Error 10 2399.2 23.96 Total 15 13430
Table 4.17: ANOVA results for thrust force (last hole)
In general, low torque values were measured with the maximum associated with 0.3
mm/rev feed rate of up to 78 N.mm, see Figure 4.74. Main effects plot and ANOVA results
for torque at last hole drilled are shown in Figure 4.75 and Table 4.18 respectively. In general,
average torque was 54 N.mm, which increased gradually with feed rate up to 0.3 mm/rev,
followed by a sudden drop at 0.4 mm/rev. This was in all likelihood due to the premature tool
fracture which prevented the progress of wear at drill lands. Similarly, the use of DLC
coatings when drilling UD MTM44-1/HTS prepreg material was expected to produce
minimum torque.
Figure 4.74: Torque results for the last hole drilled (Phase 2B)
24
63
78
24
50
64
72
24
50
60
70 72
49
5862
33
0
10
20
30
40
50
60
70
80
90
0.1 mm/rev 0.2 mm/rev 0.3 mm/rev 0.4 mm/rev 0.1 mm/rev 0.2 mm/rev 0.3 mm/rev 0.4 mm/rev
Uncoated WC Diamond like carbon (DLC)
Torq
ue (N
.mm
)
UD MTM44-1/HTS Woven 977-2/HTS
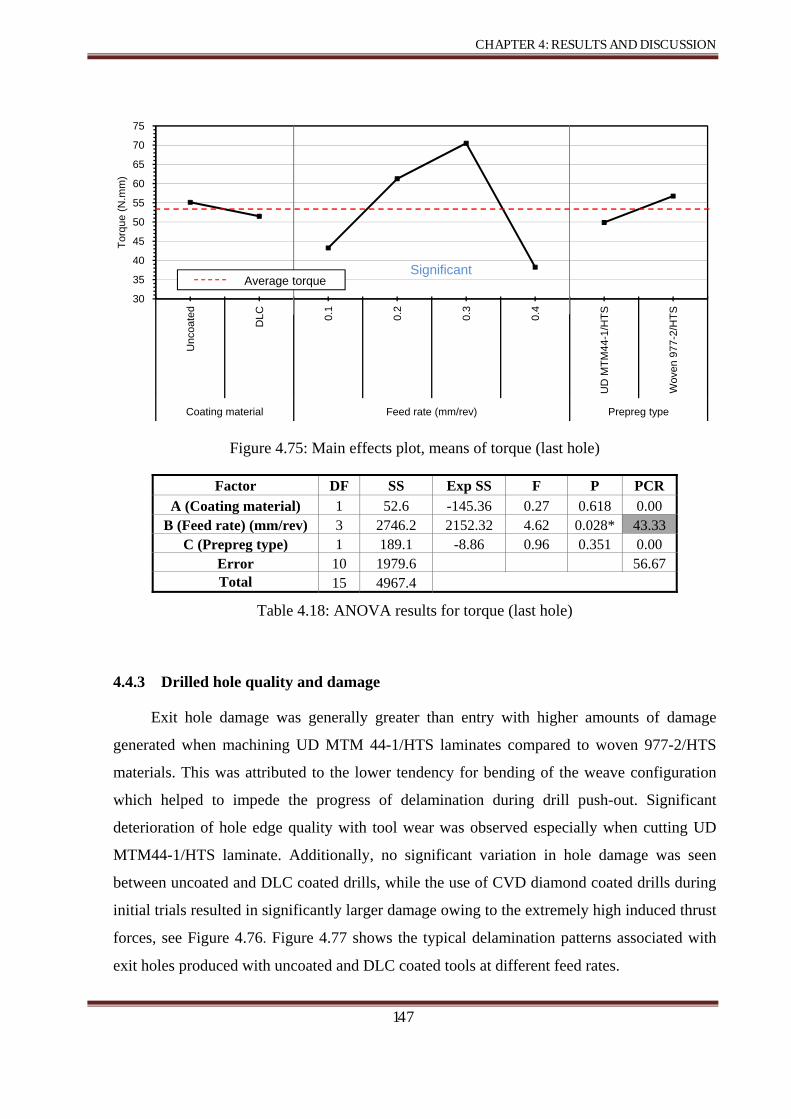
CHAPTER 4: RESULTS AND DISCUSSION
147
Figure 4.75: Main effects plot, means of torque (last hole)
Factor DF SS Exp SS F P PCR A (Coating material) 1 52.6 -145.36 0.27 0.618 0.00
B (Feed rate) (mm/rev) 3 2746.2 2152.32 4.62 0.028* 43.33 C (Prepreg type) 1 189.1 -8.86 0.96 0.351 0.00
Error 10 1979.6 56.67 Total 15 4967.4
Table 4.18: ANOVA results for torque (last hole)
4.4.3 Drilled hole quality and damage
Exit hole damage was generally greater than entry with higher amounts of damage
generated when machining UD MTM 44-1/HTS laminates compared to woven 977-2/HTS
materials. This was attributed to the lower tendency for bending of the weave configuration
which helped to impede the progress of delamination during drill push-out. Significant
deterioration of hole edge quality with tool wear was observed especially when cutting UD
MTM44-1/HTS laminate. Additionally, no significant variation in hole damage was seen
between uncoated and DLC coated drills, while the use of CVD diamond coated drills during
initial trials resulted in significantly larger damage owing to the extremely high induced thrust
forces, see Figure 4.76. Figure 4.77 shows the typical delamination patterns associated with
exit holes produced with uncoated and DLC coated tools at different feed rates.
30
35
40
45
50
55
60
65
70
75
Unc
oate
d
DLC 0.
1
0.2
0.3
0.4
UD
MTM
44-1
/HTS
Wov
en 9
77-2
/HTS
Coating material Feed rate (mm/rev) Prepreg type
Torq
ue (N
.mm
)
Average torqueSignificant

CHAPTER 4: RESULTS AND DISCUSSION
148
UD MTM44-1/HTS Woven 977-2/HTS
First hole Last hole First hole Last hole
Figure 4.76: Sample drilled holes showing exit delamination when drilling UD MTM44-1 and woven 977-2 laminates using Rhobest diamond coated drill at 0.4 mm/rev feed rate
Figure 4.77: Exit delamination images for the last hole
Figure 4.78 shows exit delamination results when employing various coated drills at 0.4
mm/rev feed rate. Here, the exit delamination factor (Fd) ranged between 1 and 1.9 for the
first hole drilled, with the damage seen to be significantly worse when employing CVD
diamond coated tools irrespective of the CFRP laminate structure. Not surprisingly, the Fd
increased dramatically for the last hole cut, with levels of up to 2.2 recorded for the Diamond
plus coating when machining UD MTM44-1/HTS. Where only uncoated and DLC coated
tools were utilised, Fd was up to 1.84 and 1.15 for UD MTM44-1/HTS and woven 977-2/HTS
laminates respectively as shown in Figure 4.79.
1 mm

CHAPTER 4: RESULTS AND DISCUSSION
149
Figure 4.78: Exit delamination factor results for all drills used at 0.4 mm/rev feed rate
Figure 4.79: Exit delamination factor results (Phase 2B)
1
1.2
1.4
1.6
1.8
2
2.2
UD MTM44-1/HTS Woven 977-2/HTS UD MTM44-1/HTS Woven 977-2/HTS
First hole Last hole
Del
amin
atio
n fa
ctor
Fd
UncoatedDLCRhobest diamond coatingDiamond plusDiamond fibre speed
1.04
1.12
1.18 1.17
1.10 1.11 1.09
1.21
1.12
1.37
1.84
1.61
1.55 1.56
1.69
1.56
1.09 1.091.12 1.14
1.12 1.111.08
1.15
1.00
1.10
1.20
1.30
1.40
1.50
1.60
1.70
1.80
1.90
0.1 mm/rev 0.2 mm/rev 0.3 mm/rev 0.4 mm/rev 0.1 mm/rev 0.2 mm/rev 0.3 mm/rev 0.4 mm/rev
Uncoated WC Diamond like carbon (DLC)
Del
amin
atio
n fa
ctor
Fd
UD MTM44-1/HTS (first hole) Woven 977-2/HTS (first hole)
UD MTM44-1/HTS (last hole) Woven 977-2/HTS (last hole)

CHAPTER 4: RESULTS AND DISCUSSION
150
Figure 4.80 and Figure 4.81 show the corresponding main effects plots for mean exit Fd
of the first and last hole with average values of 1.07 and 1.32 respectively. In terms of
laminate configuration, the woven 977-2/HTS material consistently showed lower exit
delamination, with the uncoated drill producing marginally better results. First hole Fd
increased gradually with variation in feed rate up to 0.3 mm/rev, while a steep rise was
observed between 0.3 to 0.4 mm/rev indicating that this feed rate can be considered as the
critical/limiting operating level. A similar trend was reported for last hole Fd except that a
drop was seen when feed rate varied from 0.3 to 0.4 mm/rev, which was primarily due to the
premature end of several tests conducted at 0.4 mm/rev. Table 4.19 and Table 4.20 detail the
corresponding ANOVA results for exit Fd measured for the first and last hole respectively. In
both cases, prepreg type was the key variable affecting exit Fd with PCR’s of 62 and 66%
respectively. The analysis of variance also revealed slightly higher than acceptable error
levels for both the first and last hole Fd, indicating a possible contribution from interactions
between control factors as well as difficulties in measurement.
Figure 4.80: Main effects plot, means for exit Fd for the first hole (Phase 2B)
1.00
1.02
1.04
1.06
1.08
1.10
1.12
1.14
Unc
oate
d
DLC 0.
1
0.2
0.3
0.4
UD
MTM
44-1
/HTS
Wov
en 9
77-2
/HTS
Coating material Feed rate (mm/rev) Prepreg type
Del
amin
atio
n fa
ctor
Fd
Average Fd Significant

CHAPTER 4: RESULTS AND DISCUSSION
151
Figure 4.81: Main effects plot, means for exit Fd for the last hole (Phase 2B)
Factor DF SS Exp SS F P PCR A (Coating material) 1 0.000314 -0.00106 0.23 0.643 0.00
B (Feed rate) (mm/rev) 3 0.012666 0.008532 3.06 0.078 11.39 C (Prepreg type) 1 0.048135 0.046757 34.93 0* 62.43
Error 10 0.01378 26.18 Total 15 0.074895
Table 4.19: ANOVA results for exit delamination factor (first hole)
Factor DF SS Exp SS F P PCR A (Coating material) 1 0.0117 -0.00991 0.54 0.479 0.00
B (Feed rate) (mm/rev) 3 0.10466 0.03983 1.61 0.247 3.77 C (Prepreg type) 1 0.72331 0.7017 33.47 0* 66.46
Error 10 0.2161 29.77 Total 15 1.05579
Table 4.20: ANOVA results for exit delamination factor (last hole)
1.00
1.10
1.20
1.30
1.40
1.50
1.60
Unc
oate
d
DLC 0.
1
0.2
0.3
0.4
UD
MTM
44-1
/HTS
Wov
en 9
77-2
/HTS
Coating material Feed rate (mm/rev) Prepreg type
Del
amin
atio
n fa
ctor
Fd
Average Fd Significant

CHAPTER 4: RESULTS AND DISCUSSION
152
4.5 Phase 3A: Preliminary drilling trials in separate CFRP and Ti
workpieces and multilayer stacks
4.5.1 Tool wear and tool life
Figure 4.82 details tool wear results for wet drilling trials in individual CFRP and Ti-
6Al-4V plates together with a stack of CFRP/Ti. The bespoke straight fluted domed PCD drill
(developed/manufactured by E6) significantly outperformed the Sandvik tool when employed
for CFRP where 1213 holes were produced, corresponding to a flank wear of 157 μm
(estimated 2400 holes at 300 μm flank wear level, ~10 fold increase in tool life). Conversely,
the drill experienced catastrophic failure during the first hole when used to cut Ti-6Al-4V,
which was most likely due to poor chip evacuation with the straight flute geometry leading to
separation of the PCD tip from the carbide base. Coated drills on the other hand were more
reliable as wear developed ‘normally’ towards the flank wear criterion with both CFRP and Ti
as well as the stack material. The trial involving the stack (Test 5) however had to be halted
after 105 holes due to the limited availability of workpiece material. Severe edge rounding
was the dominant form of wear when drilling CFRP as shown in
Figure 4.83 while typical adhesion and peeling of the coating layer was encountered when
drilling Ti-6Al-4V see Figure 4.84. Similar wear has been reported by other researchers [134,
143, 148].
Figure 4.82: Tool wear results for tests performed using through coolant adaptor
75136
207409
610912
1213105
206
257
51
1141
54
105
0
50
100
150
200
250
300
350
0 200 400 600 800 1000 1200 1400
Aver
age
flank
wea
r (μm
)
Tool life (number of drilled holes )
Drilling CFRP using E6 domed PCD drill (Test 1)
Drilling CFRP using Sandvik drill R840 (Test 2)
Drilling Ti using Sandvik drill R840 (Test 3)
Drilling Ti using E6 domed PCD drill (Test 4)
Drilling CFRP/Ti stacks using Sandvik drill R846 (Test 5)

CHAPTER 4: RESULTS AND DISCUSSION
153
Figure 4.83: Micrographs for new and worn cutting edges used in Phase 3A
Figure 4.84: Micrographs for a worn coated Sandvik R846 drill (Test 5) showing titanium
adhered to cutting edges
New tool Worn tool
Test 1
Domed PCD
Test 2
Coated Sandvik
R840
Test 3
Coated Sandvik
R840
Test 4
Domed PCD
Test 5
Coated Sandvik
R846
200 μm
1 mm
1 mm
1 mm
1 mm
1 mm
1 mm 200 μm
Adhered material

CHAPTER 4: RESULTS AND DISCUSSION
154
4.5.2 Thrust force and torque
Figure 4.85 displays the typical thrust force and torque profile obtained when drilling a
single hole through a CFRP/Ti stack. The momentary drop in thrust force relates to a
programmed retraction (1 mm) of the drill as it initially penetrates the CFRP layer in order to
accommodate the transition of tool rotational speed. While thrust force increased rapidly to its
maximum level, the torque associated with the titanium layer was found to rise gradually
(over ~3 s period) to its steady state. This was most likely due to the adhesion of titanium on
the cutting edges and subsequent rubbing with the hole surface. Not surprisingly, measured
force and torque when cutting titanium was up to 3 times higher than when drilling CFRP.
The maximum thrust force (at end of life) when drilling CFRP was 866 N when using the
coated Sandvik R840 tool. In contrast, thrust force peaked at 1641 N when drilling the Ti
section within the stack material, see Figure 4.86. Additionally, torque levels reached 66 and
629 N.cm when drilling CFRP and Ti respectively, see Figure 4.87. In terms of tooling, PCD
tools produced considerably lower thrust force and torque when used to cut CFRP compared
with the coated carbide tools as a consequence of their higher hardness, which resulted in a
significantly lower wear rate (greater resistance to abrasion by carbon fibres).
Figure 4.85: Force and torque signals when drilling 1st hole in CFRP/Ti stack (84/42 m/min
and 0.1 mm/rev)

CHAPTER 4: RESULTS AND DISCUSSION
155
Figure 4.86: Thrust force results for Phase 3A
Figure 4.87: Torque results for Phase 3A
321 360 375 394 422 438
626800 866
1154
2000
445553
1641
0
200
400
600
800
1000
1200
1400
1600
1800
2000
0 200 400 600 800 1000 1200 1400
Thru
st fo
rce
(N)
Tool life (number of drilled holes )
Drilling CFRP using E6 domed PCD drill
Drilling CFRP using Sandvik drill R840
Drilling Ti using Sandvik drill R840
Drilling Ti using E6 domed PCD drill
Drilling CFRP/Ti stacks using Sandvik drill R846 (CFRP)
Drilling CFRP/Ti stacks using Sandvik drill R846 (Ti)
43 44 44 44
64 66
629
574
0
100
200
300
400
500
600
700
0 50 100 150 200 250 300
Torq
ue (N
.cm
)
Tool life (number of drilled holes )
Drilling CFRP using E6 domed PCD drill
Drilling CFRP using Sandvik drill R840
Drilling Ti using Sandvik drill R840
Drilling Ti using E6 domed PCD drill
Drilling CFRP/Ti stacks using Sandvik drill R846 (CFRP)
Drilling CFRP/Ti stacks using Sandvik drill R846 (Ti)
Test 1 extended as same torque level up to 1200 holes

CHAPTER 4: RESULTS AND DISCUSSION
156
4.5.3 Hole surface roughness
Figure 4.88 displays surface roughness results measured from the sectioned CFRP and
Ti holes. In general, higher Ra values were obtained on CFRP surfaces with a maximum of
5.47 μm at test cessation when employing the coated Sandvik drill. This was attributed to the
fibrous nature of CFRP where fibre pull-out as well as matrix decomposition/degradation
during the cutting created craters/voids on the machined surfaces, which is not uncommon
when drilling such materials [43]. Additionally, sharp titanium swarf may scratch CFRP hole
surfaces, also contributing to greater surface roughness levels. Conversely, measured Ra at Ti
hole surfaces gave a maximum of 0.6 μm at the end of the experiment.
Figure 4.88: Surface roughness results for CFRP and Ti hole surfaces
4.5.4 Burr height on Ti sections
A maximum burr height of 150 μm was recorded at hole exit when drilling using the
coated R846 Sandvik drill as shown in Figure 4.89. Typically, exit burrs are generally larger
than those at hole entry however in the current work, entry burrs on the Ti plates drilled using
the Sandvik R840 tool were found to be uncharacteristically larger than corresponding exit
burrs by approximately 36% (131 μm versus 96 μm). Conversely, measured burr height at
0.50
0.510.66 0.63 0.59
3.48
4.58
1.741.98
2.69
5.47
0
1
2
3
4
5
6
0 200 400 600 800 1000 1200 1400
Ra
(μm
)
Tool life (number of drilled holes )
Drilling CFRP using E6 domed PCD drill
Drilling CFRP using Sandvik drill R840
Drilling Ti using Sandvik drill R840
Drilling Ti using E6 domed PCD drill
Drilling CFRP/Ti stacks using Sandvik drill R846 (CFRP)
Drilling CFRP/Ti stacks using Sandvik drill R846 (Ti)

CHAPTER 4: RESULTS AND DISCUSSION
157
hole exit when drilling CFRP/Ti stacks was up to 150 μm compared to 129 μm recorded for
hole entry. This was attributed to the supportive action of the CFRP material on the hole entry
at the Ti section.
Figure 4.89: Burr height results for entry and exit holes on Ti workpiece
4.5.5 Entry/exit hole damage
Typical damage forms when drilling un-backed composites were observed at hole exit
[43, 95]. These include spalling, fuzzing, delamination and edge chipping as shown in Figure
4.90 (Test 1 and 2). Significantly improved edge quality was obtained when machining CFRP
in the stack arrangement as the Ti layer served to arrest the progress of composite
delamination/damage (Test 5). Limited defects were observed at hole entry in all cases, even
for last holes drilled. Conversely, hole edge quality on Ti sections was principally affected by
the formation of burrs at the both entry and exit. Plastic deformation extended around the
periphery of the drilled hole resulting mainly in uniform burrs, see Figure 4.91. Additionally,
some limited adhered material can be seen at different locations around the hole edge,
indicating that a further finishing process may be necessary. Ti burr caps and swarf were also
occasionally found to remain in the drilled holes resulting in various forms of damage
particularly in the CFRP section as highlighted in Figure 4.92.
80
90
100
110
120
130
140
150
160
170
180
0 20 40 60 80 100 120
Bur
r hei
ght (μm
)
Tool life (number of drilled holes )
Drilling Ti using Sandvik drill R840 (Entry)
Drilling CFRP/Ti stacks using Sandvik drill R846 (Entry)
Drilling Ti using Sandvik drill R840 (Exit)
Drilling CFRP/Ti stacks using Sandvik drill R846 (Exit)

CHAPTER 4: RESULTS AND DISCUSSION
158
Entry Exit First hole Last hole First hole Last hole
Test 1
Test 2
Test 5
Figure 4.90: Entry and exit hole damage for CFRP sections
Figure 4.91: Hole edge quality at hole entry and exit (Ti - Test 5)
2 mm

CHAPTER 4: RESULTS AND DISCUSSION
159
Figure 4.92: Chip disposal difficulties encountered when drilling CFRP/Ti stacks
4.6 Phase 3B: Impact of stack arrangement and performance of PCD
tools
4.6.1 Tool wear and tool life
Table 4.21 details tool life results for tests performed using two different stack
arrangements (Al/CFRP/Ti and Ti/CFRP/Al). The corresponding tool wear curves are shown
in Figure 4.93. The majority of tests performed with the Al/CFRP/Ti stack order experienced
premature catastrophic tool fracture or in the case of the brazed PCD drills, chisel edge
failure, see Figure 4.94. For drills which reached the end of life criteria, severe peeling of the
coating layer along the cutting edge and chisel edge was prevalent. Additionally, all coated
drills experienced severe corner rounding after only a few holes. This tended to cause rubbing
between the drill and workpiece material when retracting the tool from the holes. While
contrary to initial expectations, the poor performance of the brazed PCD drills can be
attributed to the relatively thin chisel edge section (due to the absence of carbide backing),
which was unable to withstand the loads during drilling, see Figure 3.8 (b). All drills used at
the high feed rate (0.2 mm/rev) experienced fracture at early stages of the test (<5 holes).
Another contributing factor was the poor titanium chip evacuation from the bottom of the
stack.

CHAPTER 4: RESULTS AND DISCUSSION
160
Test no. Drill used Cutting speed
(m/min) Feed rate (mm/rev)
Tool life (no of drilled holes) and tool failure mode
Tests performed with Al/CFRP/Ti material order 1 C7 coated WC 60/20 0.05 150 holes (207 mm flank wear)
2 C7 coated WC 80/30 0.1 21 holes (tool broke)
3 C7 coated WC 100/40 0.15 150 holes (300 mm flank wear)
4 C7 coated WC 120/50 0.2 1 hole (tool fractured)
5 CVD diamond coated 80/30 0.2 1 hole (tool fractured)
6 CVD diamond coated 100/40 0.05 4 holes (cutting edge fractured)
7 CVD diamond coated 120/50 0.1 1 hole (cutting edge fractured)
8 Brazed PCD 80/30 0.05 24 holes (chisel edge fractured)Tests performed with Ti/CFRP/Al material order
9 CVD diamond coated 30/80 0.1 108 holes (136 mm flank wear)
10 Brazed PCD 20/60 0.1 1 hole (chisel edge fractured)
11 Domed PCD (E6) 40/100 0.05 1 hole (tool broke)
Table 4.21: Tool life results for Phase 3B
Figure 4.93: Tool wear curves for tests performed in Phase 3B
0
50
100
150
200
250
300
350
400
0 20 40 60 80 100 120 140 160
Aver
age
flank
wea
r (μm
)
Number of drilled holes
Test 01 (C7 - 60/20 m/min - 0.05 mm/rev) Test 02 (C7 - 80/30 m/min - 0.1 mm/rev)
Test 03 (C7 - 100/30 m/min - 0.15 mm/rev) Test 06 (CVD - 100/40 m/min - 0.05 mm/rev)
Test 08 (Brazed PCD - 80/30 m/min - 0.05 mm/rev) Test 09 (CVD - 30/80 m/min - 0.1 mm/rev)

CHAPTER 4: RESULTS AND DISCUSSION
161
Test number / tool used New cutting edge End of tool life
6
CVD diamond
8
Brazed PCD
9
CVD diamond
10
Brazed PCD
11
Domed PCD
Figure 4.94: Micrographs for new and worn cutting edges (Phase 3B)
When cutting commenced from the Ti layer (over a similar range of drilling conditions),
the diamond coated drills showed the best results where cutting progressed smoothly without
tool clogging. Here, the tool life of the CVD diamond coated drills improved significantly to
108 holes (at 136 μm flank wear) compared with <5 holes when drilling commenced from
aluminium layer. Unfortunately, no significant benefit was obtained from varying the material
sequence of the stack in relation to the brazed and domed PCD drills. The former again
suffered failure at the chisel edge while the modified domed PCD design experienced
catastrophic fracture on the tool body. A possible reason for the extremely poor performance
of the PCD drills was the relatively low fracture toughness of the material (~6.89 MPam1/2,
1 mm

CHAPTER 4: RESULTS AND DISCUSSION
162
compared to 14 MPam1/2 for K10 carbide). The cutting edge failure of the PCD tools when
machining titanium alloys was not unexpected, which was also reported by Narutaki et al.
[133] when using PCD tools for turning Ti-6Al-4V. However, results with the domed PCD
drill suggests that flute clogging by titanium/aluminium swarf leading to high stresses was the
primary failure mode rather than cutting edge wear. There is therefore scope for further
development of the current domed PCD drill geometry in order to accommodate the drilling
of metallic/composite stacks. Another observation when drilling the Al/CFRP/Ti
configuration was the severe noise (squealing) encountered while the tool was in contact with
the titanium layer, which significantly reduced when the stack was turned over. All coated
tools also showed evidence of adhered workpiece material on both cutting and chisel edges,
see Figure 4.95. This built up layer was seen from the first hole and was formed principally
due to the high pressures developed during machining and the high chemical affinity between
the workpiece (Ti) and tool material. This was in line with published data by Rahman et al.,
Centero et al. and Zeilmann et al. [134, 143, 148].
New 13 holes 66 holes
150 holes
Figure 4.95: Tool wear evolution for Test 3 (C7 – 83/30 m/min – 0.15 mm/rev – wet cutting)
4.6.2 Thrust force and torque
Figure 4.96 shows thrust force against the number of drilled holes from the three
materials when the sequence of drilling was Al/CFRP/Ti as tool flank wear experienced
gradual growth (Test 1). In general, the force levels for Ti were 3 times higher than for CFRP
and Al sections. Cutting of stacks in the reverse order (Ti/CFRP/Al) significantly reduced
force and torque signal fluctuations, which were most probably due to improved evacuation of
Peeling of coating region Flank wear
region
Titanium /aluminium adhered on cutting edge
1 mm
200 μm

CHAPTER 4: RESULTS AND DISCUSSION
163
titanium swarf from the hole, see Figure 4.97. The thrust force reduced by ~ 30% and torque
by ~ 60% (1100 N to 650 N and 600 N.cm to 200 N.cm). With the domed PCD drill however,
a steep spike in thrust force was recorded while cutting through aluminium, which was
probably due to the chip clogging, see Figure 4.98 (a). The force profile recorded when using
the brazed PCD drill suggests that the chisel edge fracture (shown in Figure 4.94) occurred as
tool penetrated the Ti layer and consequently resulted in severe signal fluctuations, see Figure
4.98 (b).
Figure 4.96: Evolution of thrust force versus number of drilled holes in Test 1 (C7 coated drill – 60/20 m/min – 0.05 mm/rev – wet cutting in Al/CFRP/Ti stack)
0
200
400
600
800
1000
1200
1400
1600
1800
2000
0 20 40 60 80 100 120 140 160
Thru
st fo
rce
(N)
Number of drilled holes
Ti layerCFRP layerAl layer

CHAPTER 4: RESULTS AND DISCUSSION
164
Figure 4.97: Force and torque profiles when drilling various stack orders
(b) Test 9, hole 13 (Ti/CFRP/Al drilling)
Tool retraction for changing rpm
(a) Test 3, hole 13 (Al/CFRP/Ti drilling)

CHAPTER 4: RESULTS AND DISCUSSION
165
Figure 4.98: Samples for typical thrust force and torque signatures
(a) Hole 1 (Domed PCD drill – 40/100 m/min – 0.05 mm/rev – wet cutting)
(b) Hole 1 (Brazed PCD drill – 20/60 m/min – 0.1 mm/rev – wet cutting)

CHAPTER 4: RESULTS AND DISCUSSION
166
4.7 Phase 3C: Effect of tool coatings and operating parameters
4.7.1 Tool wear and tool life
Figure 4.99 and Figure 4.100 show tool flank wear progression versus number of drilled
holes under wet/flood coolant and spray mist conditions respectively. The best performance
(310 holes) was obtained when cutting wet using an uncoated drill at 20/40 m/min with a
corresponding feed rate of 0.05 mm/rev. All trials performed at the lowest cutting speed under
spray mist application experienced elevated noise levels due to rubbing between the tool and
titanium layer, regardless of drill coating. Tool life was poor in comparison and the number of
drilled holes did not exceed 100, with test cessation brought about by catastrophic tool failure
(discussed later). Further tests at intermediate and high cutting speed using the uncoated drill
exacerbated the squealing and tool life was even shorter, furthermore sparking was also
observed. Based on this, trials involving CVD diamond and C7 coated drills at intermediate
and high speeds were also expected to give a similarly undesirable performance and were
therefore withdrawn from the test programme.
Figure 4.99: Tool wear curves for tests performed using flood coolant
310
431
197
122
268
10564
0
50
100
150
200
250
300
350
0 50 100 150 200 250 300 350
Aver
age
flank
wea
r (μm
)
Number of drilled holes
Lower cutting speed (20/40 m/min)

CHAPTER 4: RESULTS AND DISCUSSION
167
Figure 4.100: Tool wear curves for tests performed using spray mist
Figure 4.101 details tool life results as a function of operating parameters and drill
coating for experiments carried out with flood coolant application. Cutting speed had an
overriding influence on tool life with a steep decline in the number of drilled holes as speed
was trebled from 20/40 m/min to 60/120 m/min, irrespective of the magnitude of feed rate or
tool coating. This trend was particularly evident when uncoated drills were used where the
tool failed after only one hole when machining at the highest speed level. Figure 4.102 shows
sample micrographs of worn drills for the different coating types at varying test parameters.
Peeling of the CVD diamond coating was apparent in all tests involving this tool and typically
occurred within the first few holes drilled, however this did not appear to be a limiting factor
in terms of tool life, especially at the lowest cutting speed.
923312
33
68
0
50
100
150
200
250
300
350
0 50 100 150 200 250 300 350
Aver
age
flank
wea
r (μm
)
Number of drilled holes
20/40 m/min cutting speed

CHAPTER 4: RESULTS AND DISCUSSION
168
Figure 4.101: Tool life results using wet cutting
New cutting edge 157 holes 310 holes
(a) Uncoated – 20/40 m/min – 0.05 mm/rev – wet cutting
New cutting edge 105 holes 197 holes
(b) CVD diamond coated drill – 20/40 m/min – 0.05 mm/rev – wet cutting
New cutting edge 33 holes 64 holes
(c) C7 coated drill – 60/120 m/min – 0.05 mm/rev – wet cutting
New cutting edge 33 holes 64 holes
(d) Uncoated drill – 20/40 m/min – 0.15 mm/rev – spray mist cutting
Figure 4.102: Sample flank wear micrographs
310
43
1
197
122105
268
105
64
0
50
100
150
200
250
300
350
20/40 0.05
40/80 0.1
60/120 0.15
20/40 0.05
40/80 0.1
60/120 0.15
20/40 0.1
40/80 0.15
60/120 0.05
Uncoated CVD diamond coated C7 coated
Tool
life
in te
rms
of n
umbe
r of d
rille
d ho
les
500 μm
Peeling of coating Edge chipping
BUE BUE Edge chipping
Edge corner rounding

CHAPTER 4: RESULTS AND DISCUSSION
169
The 3 drills employed at 20/40 m/min under wet conditions generally exhibited steady
flank wear evolution up to the end of life criterion, although edge chipping was seen with the
CVD diamond coated tool after 197 holes. All other drills however experienced sudden tool
failure through various mechanisms. These included tool breakage at the cutting portion,
which was thought to be associated with high torque values caused by adhesion of titanium to
the tool in addition to clogging of drill flutes by chips (Tests 2, 3, 10, 13 and 16), fracture of
cutting lips as a result of built up edge (BUE) formation/smearing (Tests 4, 5, 6 and 9) and
severe cutting edge corner rounding due to the abrasion by CFRP (Test 8). BUE was
prevalent in trials involving spray mist application and was found to form mainly on the
primary cutting lips as well as drill margins. A likely reason for this was the poor
access/transport of the spray mist lubricant to the cutting zone, especially as the drill moved
deeper into the stack.
The main effects plot and corresponding ANOVA table for tool life are shown in Figure
4.103 and Table 4.22 respectively. The former suggests that the maximum number of holes
would be obtained by operating at the lowest cutting speed and feed rate under wet
conditions, irrespective of drill coating. However, the ANOVA highlighted that cutting speed
and environment were the only statistically significant factors at the 5% level with percentage
contribution ratios of 41.9% and 31.6% respectively. A relatively high residual error value
(26.3%) was also observed, most probably due to the premature failure of drills encountered
in several of the tests together with possible interaction between factors. The considerable
influence of cutting speed on tool life can be attributed to the probable increase in temperature
at higher drilling speeds coupled with the poor thermal conductivity of both titanium (~ 7
W/mK) and CFRP (~ 1 W/mK perpendicular to the fibre direction), which restricted the
dissipation of heat from the cutting zone. Similarly, the greater cooling capacity of the high
pressure (70 bar) through coolant spindle system was thought to partially account for the
higher average tool life achieved, despite the superior lubricity of the spray mist
configuration.

CHAPTER 4: RESULTS AND DISCUSSION
170
Figure 4.103: Main effects plot, means for tool life (Phase 3C)
Factor DF SS Exp SS F P PCR Environment condition 1 48568 45986 18.81 0.001* 31.66
Drill type 2 30 -5134 0.01 0.994 0.00 Cutting speed (m/min) 2 66136 60972 12.81 0.002* 41.98
Feed rate (mm/rev) 2 4686 -478 0.91 0.434 0.00 Error 10 25820 26.36 Total 17 145241
Table 4.22: ANOVA results for tool life in terms number of drilled holes (Phase 3C)
4.7.2 Thrust force and torque
Figure 4.104 displays typical thrust force and torque signals obtained when drilling a
single hole through the Ti/CFRP/Al stack using different conditions. Oscillation of the force
signal was clearly seen when uncoated drills were employed, see Figure 4.104 (a), owing to
the tendency for titanium to adhere to the drill, which agreed with previous investigations by
Rahman et al. [134]. Coated tools did not experience a similar response, see Figure 4.104 (b)
which was most probably due to the lower friction at the tool/chip interface. When spray mist
was employed, severe noise in the force profile was observed when drilling the aluminium
layer as a consequence of the possible lack of fluid supply and poor chip evacuation, see
Figure 4.104 (c).
0
20
40
60
80
100
120
140
160
180
Wet
Spr
ay m
ist
Unc
oate
d
CV
D d
iam
ond
C7
20/4
0
40/8
0
60/1
20
0.05 0.1
0.15
Environment condition
Drill type Cutting speed (m/min) Feed rate (mm/rev)
Tool
life
(num
ber o
f dril
led
hole
s)
Average tool life
Significant Significant

CHAPTER 4: RESULTS AND DISCUSSION
171
Figure 4.104: Samples for typical thrust force and torque signatures
(a) Hole 33 (uncoated drill – 20/40 m/min – 0.05 mm/rev – wet cutting)
(b) Hole 33 (CVD diamond coated drill – 20/40 m/min – 0.05 mm/rev – wet cutting)
(c) Hole 65 (uncoated drill – 20/40 m/min – 0.15 mm/rev – spray mist)
Signal oscillation indicating workpiece material adhering to cutting edges

CHAPTER 4: RESULTS AND DISCUSSION
172
The progression of average thrust forces and torque with respect to number of drilled
holes for the individual material layers (Ti, CFRP & Al) in Test 1 are detailed in Figure 4.105.
In general, the force levels recorded when drilling Ti were ~ 3 times greater compared to
those when cutting CFRP and Al, which were approximately equal over the duration of the
test, except when tools were in the new condition. Similar results were obtained in the
majority of trials prior to the onset of catastrophic tool failure. Torque was found to be lowest
when drilling the CFRP followed by Al and Ti, which can be explained by the tendency for
both titanium and aluminium swarf to adhere onto drill edges and lips. The greater sensitivity
of thrust force to changes in tool wear compared to torque was in accordance with results
from previous work by [186]. In any event, the maximum thrust force attained with worn
tools was approximately 2400 N while torque did not exceed 600 N.cm over the test
conditions employed.
Figure 4.105: Evolution of thrust force and torque versus number of drilled holes in Test 1 (uncoated drill – 20/40 m/min – 0.05 mm/rev – wet cutting)
0
200
400
600
800
1000
1200
1400
1600
1800
2000
2200
0 50 100 150 200 250 300 350
Thru
st fo
rce
(N) a
nd to
rque
(N.c
m)
Number of drilled holes
Thrust force at Ti Torque at TiThrust force at CFRP Torque at CFRPThrust force at Al Torque at Al

CHAPTER 4: RESULTS AND DISCUSSION
173
Figure 4.106 details the thrust forces recorded in the 3 different material layers for the
first hole drilled (new tool) for each test. As outlined previously, the forces associated with Ti
(ranging from 285 – 600 N depending on operating parameters) were considerably higher
compared to both Al (135 – 342 N) and CFRP (44 – 190 N) when cutting with flood coolant.
This however was not the case with the spray mist environment, where thrust forces in the Al
layer (234 – 540 N) were comparable, and in some cases exceeded the values produced in the
Ti alloy (239 – 426 N). The results would appear to support the earlier assertion that reduced
levels of spray mist lubricant penetrated to the Al layer. In terms of thrust force for the last
hole drilled (worn tool), the maximum corresponded to the use of a C7 coated drill at 20/40
m/min and 0.1 mm/rev where this was 2343, 814 and 817 N in the Ti, CFRP and Al layers
respectively (thrust force results for the worn tool can be seen in Appendix D).
Figure 4.106: Thrust force results for new tool (first hole)
0
100
200
300
400
500
600
20/40 0.05
40/80 0.1
60/120 0.15
20/40 0.05
40/80 0.1
60/120 0.15
20/40 0.1
40/80 0.15
60/120 0.05
20/40 0.15
40/80 0.05
60/120 0.1
20/40 0.1
20/40 0.15Uncoated
CVD diamond coated C7 coated Uncoated CVD diam
C7
Wet cuttingSpray mist cutting
Thru
st fo
rce
(N)
Thrust force at CFRP Thrust force at Al Thrust force at Ti
* Drill failed at first hole
**
Cutting speed (m/min)
feed rate (mm/rev)

CHAPTER 4: RESULTS AND DISCUSSION
174
Figure 4.107 shows torque results for worn tools (at test cessation). The data however
relates to the last measurement recorded and may not necessarily correspond to the actual
value at the last hole drilled, particularly if the tool experienced an unexpected fracture prior
to a periodic collection of force and torque results. This was one of the reasons why the
average torque relating to the spray mist test appeared to be lower than that for wet cutting. In
general, torque values associated with Ti (156 – 566 N.cm) were considerably higher
compared to both Al (95 – 313 N.cm) and CFRP (30 – 84 N.cm) when cutting with flood
coolant. This however was not the case with spray mist application, where torque in the Al
layer was up to 313 N.cm, which exceeded the values produced in the Ti layer (up to 302
N.cm). Therefore, excessive torque level can be considered as a limiting factor affecting the
machinability of composite/metallic stacks and can be taken as a good indicator for
monitoring drilling process performance and predicting tool life.
Figure 4.107: Torque results for the last hole (worn tool)
0
100
200
300
400
500
600
20/40 0.05
40/80 0.1
20/40 0.05
40/80 0.1
60/120 0.15
20/40 0.1
40/80 0.15
60/120 0.05
20/40 0.15
40/80 0.05
60/120 0.1
20/40 0.1
20/40 0.15Uncoated
CVD diamond coated C7 coated Uncoated CVD diam
C7
Wet cuttingSpray mist cutting
Torq
ue (N
.cm
)
Torque at CFRP Torque at Al Torque at Ti
* Drill failed at first hole
**
Cutting speed (m/min)
feed rate (mm/rev)
*

CHAPTER 4: RESULTS AND DISCUSSION
175
The main effects plot for thrust force when cutting through Ti/CFRP/Al stacks during
the first hole is shown in Figure 4.108. All three materials exhibited near identical trends with
respect to changes in control variable levels. The sole exception was the response of
aluminium where thrust force was higher with spray mist as opposed to wet conditions, in
contradiction to results seen for titanium and carbon fibre composite. Related ANOVA data,
shown in Table 4.23, Table 4.24 and Table 4.25 highlighted the fact that feed rate had a
significant impact on thrust force in all 3 layers with PCR’s of 40%, 31% and 20% for Ti,
CFRP and Al respectively. The environment condition was also a major contributing factor
when drilling the Ti and Al with PCR’s of 22% and 32%, while drill coating was only
prominent in respect of the Ti layer (PCR of 23%). In terms of thrust force results using worn
tools (last hole), environment condition consistently had an overriding influence on the three
materials with corresponding PCR’s of 62, 68 and 33 for Ti, CFRP and Al layers respectively.
Surprisingly, feed rate was not statistically significant at the 5% level owing to the large
contribution of the environment condition variable.
Figure 4.108: Main effects plot, means for thrust force following the first hole (new tool)
0
100
200
300
400
500
600
Wet
Spr
ay m
ist
Unc
oate
d
CV
D d
iam
ond
C7
20/4
0
40/8
0
60/1
20
0.05 0.1
0.15
Environment condition
Drill coating Cutting speed (m/min) Feed rate (mm/rev)
Thru
st fo
rce
(N)
TiAl
CFRP
Ti average CFRP average Al average

CHAPTER 4: RESULTS AND DISCUSSION
176
Factor DF SS Exp SS F P PCR Environment condition 1 45321 43832 32.52 0* 21.83
Drill type 2 55855 52877 14.87 0.001* 26.33 Cutting speed (m/min) 2 3785 807 0.58 0.581 0.40
Feed rate (mm/rev) 2 82457 79479 27.7 0* 39.58 Error 10 13397 11.86 Total 17 200815
Table 4.23: ANOVA results for thrust force corresponded to Ti layer (new tool)
Factor DF SS Exp SS F P PCR Environment condition 1 2793 1976.6 3.9 0.08 7.22
Drill type 2 6729.8 5097 2.73 0.118 18.63 Cutting speed (m/min) 2 487.7 -1145.1 0.4 0.682 0.00
Feed rate (mm/rev) 2 10008.1 8375.3 6.13 0.021* 30.60 Error 10 7347.6 43.55 Total 17 27366.2
Table 4.24: ANOVA results for thrust force corresponded to CFRP layer (new tool)
Factor DF SS Exp SS F P PCR Environment condition 1 108311 98796 9.8 0.012* 31.92
Drill type 2 20309 1279 1.01 0.403 0.41 Cutting speed (m/min) 2 8462 -10568 0.19 0.827 0.00
Feed rate (mm/rev) 2 86768 67738 4.56 0.043* 21.89 Error 10 85634 45.78 Total 17 309482
Table 4.25: ANOVA results for thrust force corresponded to Al layer (new tool)
Figure 4.109 depicts the main effects plot for torque when cutting through Ti/CFRP/Al
stacks during the first hole. As expected, torque values for each material increased with
increasing feed rate although this parameter was only significant for Ti and Al, the former
with a PCR of 72% and 24% for the Al. Conversely, cutting environment had the greatest
influence in the Al section where it had a moderate effect on CFRP drilling and Ti, see Table
4.26, Table 4.27 and Table 4.28. As anticipated, cutting speed showed a significant effect on
torque with the CFRP. In terms of the last hole drilled, environment condition had the greatest
effect on torque at last hole drilled at Ti with a PCR of 71% while only feed rate was
statistically significant in the CFRP section (41%). Although none of the control variables had
significant influence on torque results following last hole drilled in Al layer at the 5% level,
environment condition had the greatest PCR of 40%. This may be due to the high level of
signal noise encountered with Al torque and force profiles in addition to the premature tool

CHAPTER 4: RESULTS AND DISCUSSION
177
failure experienced in several tests.
Figure 4.109: Main effects plot, means for torque following the first hole
Factor DF SS Exp SS F P PCR Environment condition 1 1925 1535.6 7.16 0.025* 4.17
Drill type 2 3042.8 2264 2.19 0.168 6.15 Cutting speed (m/min) 2 1004 225.2 0.53 0.606 0.61
Feed rate (mm/rev) 2 27354 26575.2 35.13 0* 72.16 Error 10 3504 16.92 Total 17 36830
Table 4.26: ANOVA results for torque corresponded to Ti layer (new tool)
Factor DF SS Exp SS F P PCR Environment condition 1 2623.6 2361.5 9.69 0.012* 24.44
Drill type 2 328.3 -195.9 0.53 0.604 0.00 Cutting speed (m/min) 2 2931 2406.8 5.19 0.032* 24.91
Feed rate (mm/rev) 2 1418.4 894.2 2.71 0.12 9.26 Error 10 2359.2 41.39 Total 17 9660.5
Table 4.27: ANOVA results for torque corresponded to CFRP layer (new tool)
0
50
100
150
200
250
300
Wet
Spr
ay m
ist
Unc
oate
d
CV
D d
iam
ond
C7
20/4
0
40/8
0
60/1
20
0.05 0.1
0.15
Environment condition
Drill coating Cutting speed (m/min) Feed rate (mm/rev)
Torq
ue (N
.cm
)
TiAlCFRP
Ti average CFRP average Al average

CHAPTER 4: RESULTS AND DISCUSSION
178
Factor DF SS Exp SS F P PCR Environment condition 1 70434 67523 22.44 0.001* 40.71
Drill type 2 14053 8231 2.11 0.178 4.96 Cutting speed (m/min) 2 9665 3843 0.83 0.465 2.32
Feed rate (mm/rev) 2 45524 39702 7.82 0.011* 23.93 Error 10 26199 28.08 Total 17 165876
Table 4.28: ANOVA results for torque corresponded to Al layer (new tool)
As mentioned previously in Chapter 3, geometrical characteristics, burr height and
surface roughness were only assessed for tests which produced more than 150 drilled holes in
addition to the longest tool life obtained with spray mist operation. These include test number
1, 4, 7 and 10. Microhardness measurements for the Al and Ti holes were only performed for
two tests which demonstrated the longest tool life (Test 1 and 7).
4.7.3 Hole size and geometrical accuracy
Hole diameter results measured in the Ti section are presented in Figure 4.110. All tests
performed using flood coolant produced undersized holes at test cessation, with the largest
deviation of 14 μm corresponding to Test 7. Conversely, the test conducted under the spray
mist environment resulted in oversized holes by up to 6 μm at the end the trial. The variation
in hole diameter produced between drills in the new and worn conditions was up to 20 μm.
Surprisingly, a smaller discrepancy was reported for the test producing the longest tool life
(Test 1), at which hole tolerance ranged between -10 μm and +7 μm. This was possibly due to
the lower torque values recorded when cutting Ti.
In terms of hole size in the CFRP layer, the majority of holes produced under wet
cutting conditions were undersized, with a maximum error of -20 μm (Test 1) as shown in
Figure 4.111. Contrastingly, the spray mist trials gave rise to significantly oversized holes in
the CFRP of up to 120 μm for worn drills. This was most likely due to thermal expansion of
the matrix from the increased cutting temperature caused by the lack of lubricant/coolant
access and poor chip evacuation. Variation of diameter within each hole over the three
material sections was evident, which was likely due to the different mechanical properties of
the stack and in particular elastic modulus [163]. With regard to hole size in the Al layer, the
limits ranged between -15 μm (Test 1) and + 12 μm (Test 7) for tests involving flood coolant.
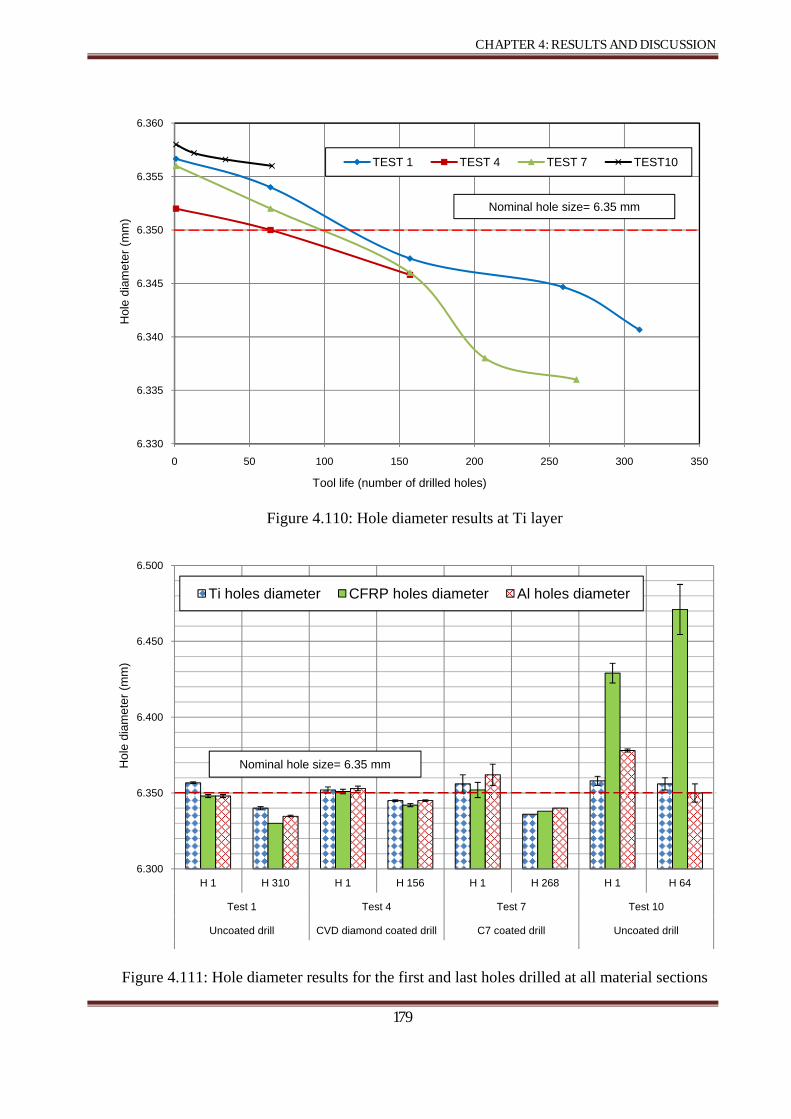
CHAPTER 4: RESULTS AND DISCUSSION
179
Figure 4.110: Hole diameter results at Ti layer
Figure 4.111: Hole diameter results for the first and last holes drilled at all material sections
6.330
6.335
6.340
6.345
6.350
6.355
6.360
0 50 100 150 200 250 300 350
Hol
e di
amet
er (m
m)
Tool life (number of drilled holes)
TEST 1 TEST 4 TEST 7 TEST10
Nominal hole size= 6.35 mm
6.300
6.350
6.400
6.450
6.500
H 1 H 310 H 1 H 156 H 1 H 268 H 1 H 64
Test 1 Test 4 Test 7 Test 10
Uncoated drill CVD diamond coated drill C7 coated drill Uncoated drill
Hol
e di
amet
er (m
m)
Ti holes diameter CFRP holes diameter Al holes diameter
Nominal hole size= 6.35 mm

CHAPTER 4: RESULTS AND DISCUSSION
180
An example of geometrical error measures in terms of cylindricity and roundness are
presented in Figure 4.112. Roundness shows how the individual circular cross section of a
hole approximates a true circle while cylindricity refers to how much the entire cylinder
deviates. In terms of the hole shape, typical three looped holes were produced in the majority
of sections. Surprisingly, roundness and cylindricity both improved as the tests proceeded
except for the one performed with spray mist application as shown in Figure 4.113 and Figure
4.114. In general, variations in hole roundness was up to 78, 39 and 53 μm for the Ti, CFRP
and Al layers respectively while cylindricity error over the entire stack varied between 23 and
120 μm when cutting wet. This increased up to an average of 170 μm in the spray mist
environment. The geometrical discrepancies observed however were not considered high and
could be minimised/eliminated with a post process operation following drilling.
Figure 4.112: Captured images for sample measurements of (a) cylindricity and (b) roundness

CHAPTER 4: RESULTS AND DISCUSSION
181
Figure 4.113: Roundness measurement results
Figure 4.114: Cylindricity measurement results
0
10
20
30
40
50
60
70
80
H 1 H 310 H 1 H 156 H 1 H 268 H 1 H 64
Test 1 Test 4 Test 7 Test 10
Uncoated drill CVD diamond coated drill C7 coated drill Uncoated drill
Wet cutting Spray mist
Rou
ndne
ss (μ
m)
Ti roundness CFRP roundness Al roundness
0
20
40
60
80
100
120
140
160
180
200
H 1 H 310 H 1 H 156 H 1 H 268 H 1 H 64
Test 1 Test 4 Test 7 Test 10
Uncoated drill CVD diamond coated drill C7 coated drill Uncoated drill
Wet cutting Spray mist
Cyl
indr
icity
(μm
)
Average hole cylindricity Ti cylindricity
CFRP cylindricity Al cylindricity

CHAPTER 4: RESULTS AND DISCUSSION
182
4.7.4 Hole surface roughness
Figure 4.115 details the progression of average surface roughness for the three materials
in Test 1 (wet cutting – uncoated drill – 20/40 m/min – 0.05 mm/rev). The Ra on the CFRP
surfaces reached ~5 μm after 310 holes while corresponding values on the Ti and Al were
only 0.9 μm and 0.2 μm respectively. In terms of the influence of operating conditions, Figure
4.116 shows Ra values for the Ti layer for Tests 1, 4, 7 and 10. Surface roughness did not
exceed 1 μm Ra regardless of the drill type, cutting parameters or environment conditions. As
drilling commenced from the Ti layer, sufficient coolant and lubrication reached the cutting
zone, even when spray mist was used. Conversely, CFRP surfaces showed elevated roughness
values of up to 9 μm Ra together with a large scattering of data (particularly with Test 7), see
Figure 4.117. The lowest Ra was obtained when cutting with the CVD diamond coated drill
(Test 4, up to 2.7 μm Ra) while the trial carried out at the lowest cutting parameters (Test 1)
experienced moderately high Ra of up to ~ 5 μm. The increased Ra levels on CFRP surfaces
were in part because of the inhomogeneous nature of the laminates [85, 86].
Hole surfaces in the Al plates were consistently smooth, and stabilised at ~ 0.2 μm Ra
for all 3 tests carried out using flood coolant. The surface quality however deteriorated rapidly
under spray mist conditions, see Figure 4.118. No evidence of damage due to Al swarf or
marks from tool feed/retraction were seen on CFRP hole surfaces however small parallel
grooves were observed on 3D topographic maps made at test cessation, as shown in Figure
4.119 (a) and (b). These could indicate possible interlaminar separation between fibre layers
and may explain the elevated surface roughness values associated with the CFRP holes.

CHAPTER 4: RESULTS AND DISCUSSION
183
Figure 4.115: Average surface roughness (Ra) results for the three materials in Test 1
Figure 4.116: Average surface roughness (Ra) results for the Ti section
0
1
2
3
4
5
6
0 50 100 150 200 250 300 350
Aver
age
Ra
(μm
)
Tool life (number of drilled holes)
Ti layer Al layer CFRP layer
0.3
0.4
0.5
0.6
0.7
0.8
0.9
1
0 50 100 150 200 250 300 350
Aver
age
Ra
(μm
)
Tool life (number of drilled holes)
Test 1 Test 4 Test 7 Test 10

CHAPTER 4: RESULTS AND DISCUSSION
184
Figure 4.117: Average surface roughness (Ra) results for the CFRP section
Figure 4.118: Average surface roughness (Ra) results for the Al section
0
1
2
3
4
5
6
7
8
9
10
0 50 100 150 200 250 300 350
Aver
age
Ra
(μm
)
Tool life (number of drilled holes)
Test 1 Test 4 Test 7 Test 10
0
0.2
0.4
0.6
0.8
1
1.2
1.4
1.6
0 50 100 150 200 250 300 350
Aver
age
Ra
(μm
)
Tool life (number of drilled holes)
Test 1 Test 4 Test 7 Test 10

CHAPTER 4: RESULTS AND DISCUSSION
185
Figure 4.119: 3D topographic maps for the last hole drilled in CFRP: (a) Test 1 and (b) Test 7
SEM analysis showed that the majority of holes in titanium had chips redeposited onto
the machined surfaces as detailed in Figure 4.120. This was probably the result of
trapped/adhered material between drill flutes which was subsequently transferred and pressure
welded to the hole surfaces as the tool passed through the stack. The findings are in agreement
with results by Sharman et al. [187] who reported similar adhering chips when drilling
Inconel 718. In contrast, surfaces on the aluminium layer showed very limited chip
adhesion/workpiece smearing, which was attributed to the lower tendency of Al-7050 to
adhere compared to Ti-6Al-4V. This could partly account for the higher surface roughness
found with the titanium section as opposed to aluminium.
Hole 310, Test 1 Hole 268, Test 7
(a) (b)
Parallel grooves seen

CHAPTER 4: RESULTS AND DISCUSSION
186
Titanium Aluminium
Figure 4.120: SEM images for the machined surface quality (Test 1): (a), (b) middle of hole 1,
(c) entry of hole 1 and (d) entry of hole 310
4.7.5 Burr height for Ti and Al sections
Figure 4.121 shows sample burrs from the last hole drilled in the Ti and Al layers (Test
1 and 7). In general, uniform burrs with and without caps were obtained throughout the test
programme at hole exit while rolled-back burrs were prevalent at hole entry. Rolled-back
burrs are not uncommon at hole entry as previously reported by Dornfeld et al. [144] when
dry and wet cutting of Ti alloys. Figure 4.122 shows sample SEM images for burr formation
at the hole exit of titanium and aluminium workpieces. Greater deformation was seen with the
latter due to its un-backed condition, and the higher ductility of Al-7050 (E = 72 GPa)
compared to Ti-6Al-4V (E = 114 GPa) [30, 34].
(b)(a)
(d)(c)
Smearing
Entry burr formation
Adhering chips
Adhering chips Only feed marks can be seen here
Feed marks combined with smearing

CHAPTER 4: RESULTS AND DISCUSSION
187
Test 1 Test 7 Ti
tani
um
Entry
Ex
it A
lum
iniu
m
Entry
Ex
it
Figure 4.121: Uniform burr formation at entry and exit last hole drilled in Ti and Al

CHAPTER 4: RESULTS AND DISCUSSION
188
Crown burrs were only obtained when spray mist was employed, especially under high
cutting speeds, see Figure 4.123. As expected, burr size increased as tool wear progressed, see
Figure 4.124. For last holes drilled in titanium (worn tool), burr height was generally up to
300 μm while this reached 450 μm for the Al section, except in Test 4 when the cutting edge
partially fractured (CVD diamond coated drill at hole 197) causing the exit burrs to reach ~1
mm. Additionally, exit burrs were typically larger than corresponding entry burrs, see Figure
4.125.
Figure 4.122: SEM images for exit burr formation at Test 1: (a) titanium and (b) aluminium
Figure 4.123: Crown burr formation when spray mist was used (Al exit, Test 12)
2 mm
(b)(a)

CHAPTER 4: RESULTS AND DISCUSSION
189
Figure 4.124: Burr height results for tests performed using: (a) uncoated (Test 1) and (b) C7
coated (Test 7) drills using flood coolant
0
50
100
150
200
250
300
350
0 50 100 150 200 250 300 350
Bur
r hei
ght (μm
)
Tool life (number of drilled holes)
TI ENTRY TI EXIT
AL ENTRY AL EXIT
0
50
100
150
200
250
300
350
400
450
500
0 50 100 150 200 250 300
Bur
r hei
ght (μm
)
Tool life (number of drilled holes)
TI ENTRY TI EXIT
AL ENTRY AL EXIT
(b)
(a)

CHAPTER 4: RESULTS AND DISCUSSION
190
Figure 4.125: Burr height results for holes entry and exit (Ti and Al sections)
4.7.6 Hole edge quality
Limited damage was seen as a result of burr formation particularly at Ti hole exit. This
extended to only several tens of micrometres and no evidence was seen for other damage, see
Figure 4.126. In terms of CFRP hole edge quality, a significant reduction in both entry and
exit damage was achieved when drilling them in a stack arrangement, see Figure 4.127.
Typical defects including delamination and fibre pull out were not encountered regardless of
the cutting conditions used due to the supportive backing provided by the Ti and Al layers.
0
50
100
150
200
250
300
350
400
450
500
Hole 1 Hole 310 Hole 1 Hole 197 Hole 1 Hole 268 Hole 1 Hole 65
Test 1 Test 4 Test 7 Test 10
Uncoated drill CVD diamond coated drill C7 coated drill Uncoated drill
Wet cutting Spray mist
Bur
r hei
ght (μm
)
Ti entry Ti exitAl entry Al exit
Extended to 961 μm

CHAPTER 4: RESULTS AND DISCUSSION
191
Test 1 Test 4 Test 7 Test 10 H
ole
entry
First
Last
Hol
e ex
it
First
Last
Figure 4.126: Hole edge quality for Ti layer
Test 1 Test 4 Test 7 Test 10
Hol
e en
try
First
Last
Hol
e ex
it
First
Last
Figure 4.127: Hole edge quality for CFRP layer
3 mm
3 mm

CHAPTER 4: RESULTS AND DISCUSSION
192
4.7.7 Microhardness of metallic sections
Figure 4.128 and Figure 4.129 show microhardness depth profile results following the
last hole drilled in the Al and Ti sections respectively (only for Test 1 and 7). Limited strain
hardening on both materials was measured which extended up to ~500 μm beneath the
machined surface in Al and ~800 μm for the Ti. The hardness increase in the Al was between
20 and 30 HK while for the Ti, it was 42 to 50 HK. Such responses are common when cutting
Ti and Al and have been reported even for alternative machining processes [141].
Figure 4.128: Microhardness results for Al sectioned holes
150
155
160
165
170
175
180
185
190
195
200
0 200 400 600 800 1000 1200
Har
dnes
s (H
K)
Distance from the machined surface (μm)
Test 1, Hole 310
Test 7, Hole 268

CHAPTER 4: RESULTS AND DISCUSSION
193
Figure 4.129: Microhardness results for Ti sectioned holes
4.7.8 Chip analysis
Figure 4.130 shows the different types of chips obtained in the test programme. In
general, long and short spiral titanium swarf were seen when cutting stacks, especially when
drilling using new cutting edges under both wet cutting and spray mist, regardless of the
operating conditions and tool coating type. Similarly, long and short aluminium chips were
produced when wet cutting, while curled/deformed swarf was obtained when spray mist was
employed, see Figure 4.131. Chips frequently remained/clogged in drill flute which resulted
in premature tool failure. SEM analysis of the titanium swarf showed typical sharp and
serrated edges which accounts for the high dynamic/cyclic cutting forces [140] similar to
those detailed in Section 2.6.5, see Figure 4.132. CFRP particles/debris were seen to regularly
attach onto aluminium swarf or take the contour shape of the drill flute when spray mist was
employed as shown in Figure 4.133. Dust-like CFRP particles was predominant when wet
cutting was used. The combination of aluminium and CFRP chips resulted in clogging of the
drill flutes and was a reason for increased cutting temperature and variability in tool life, see
Figure 4.134.
350
360
370
380
390
400
410
0 200 400 600 800 1000 1200
Har
dnes
s (H
K)
Distance from the machined surface (μm)
Test 1, hole 310
Test 7, hole 268

CHAPTER 4: RESULTS AND DISCUSSION
194
Test 1 Test 4 Test 7 Test 10
Tita
nium
chi
ps
First
Last
Alu
min
ium
chi
ps First
Last
Figure 4.130: Various chips produced from Ti and Al holes
Figure 4.131: Curled/deformed aluminium swarf (formed in the spray mist environment)

CHAPTER 4: RESULTS AND DISCUSSION
195
Figure 4.132: Spiral titanium swarf
Figure 4.133: (a) CFRP particles fused with aluminium swarf and (b) CFRP chips formed
according to contour of drill flutes
Figure 4.134: CFRP particles attached to Al swarf causing clogging of drill flutes under spray
mist conditions
(a) (b)

CHAPTER 5: CONCLUSIONS
196
5. CONCLUSIONS
5.1 Literature review
• Research into the drilling of CFRP composites is extensive however the vast majority of
published work has involved drills in the region of 5 – 6 mm diameter. The preferred
cutting speed and feed rate when using HSS tools is ~ 60 m/min and ~ 185 mm/min
respectively. The maximum feed rate recommended when drilling CFRP using carbide
twist drills (while maintaining acceptable workpiece quality) is 0.145 mm/rev, however
this is generally considered low for practical applications, particularly in relation to
aerospace and automotive components.
• Special drill types/geometries such as core, candlestick, core-saw, straight flute and saw
drills have typically been shown to produce lower workpiece damage and
correspondingly higher tool life when compared to standard twist drills. Delamination is
commonly seen as the primary damage form when drilling CFRP. The magnitude and
onset of composite delamination can usually be correlated to thrust force (critical force)
which is dependent on feed rate, drill bit geometry and tool wear.
• Limited investigations employing advanced hardmetal and diamond coatings have
shown considerable potential for improving performance and productivity when cutting
CFRP.
• Laser drilling demonstrated significantly greater cutting rates compared to conventional
twist drilling (approximately 10 – 20 times), however the resulting heat affected zone
and fumes were cited as major drawbacks. Conversely, low cutting speeds, high
operational costs and noise were given as the principal limitations of waterjet drilling.
While ultrasonic drilling generally produces superior workpiece surface finish as
compared to other processes, its relatively high investment cost, low productivity and
high tool wear rates have curtailed industrial adoption.
• Extremely limited research has been reported on the drilling of multilayer stacks,
particularly those involving Ti, Al and CFRP.
CHAPTER 5: CONCLUSIONS
197
5.2 Experimental work – small hole (1.5 mm) drilling of CFRP (Phase 1
and 2)
5.2.1 Influence of peel ply layers
• The presence of the nylon peel ply layer significantly improved hole quality,
particularly in respect of entry and exit delamination with considerable reduction in
defects such as fibre breakage, fuzzing and edge chipping. The peel ply was thought to
provide a ‘barrier’ against peel-up and push-out delamination at hole entry and exit
respectively.
• Both tool wear and thrust force were found to be marginally lower with samples where
the peel ply was removed however there was no substantial difference in terms of
internal hole surface roughness and dimensional accuracy. Additionally, dimensional
error/hole undersize did not exceed 30μm on diameter, even after 1875 holes.
5.2.2 Effect of tool geometry and operating parameters
• Drill type/geometry and feed rate were the main contributing factors affecting tool life
and thrust force, while cutting speed and feed rate had the most significant effect on
torque.
• In terms of tool life, uncoated stepped drills with 140o point and 30o helix angles, at 15
m/min cutting speed and 0.2 mm/rev feed rate produced the maximum number of
drilled holes (2900). Low thrust force values of up 100 N were recorded even at test
cessation while drilling torque levels reached 85 N.mm.
• The reduction in thrust force when employing the stepped geometry was due to the
lower chisel edge/workpiece material interaction, while the increase in feed rate
minimised contact time between the cutting tool and workpiece material, thus reducing
the abrasive action and anticipated rise in cutting temperature.
• Entry and exit delamination factor (Fd) did not exceed 2 even at the end of tool life,
while the type of damage present was very similar on both the entry and exit surfaces.

CHAPTER 5: CONCLUSIONS
198
5.2.3 Effect of composite material, fibre orientation and machining parameters
• The longest tool life was achieved when drilling woven MTM44-1/HTS at a feed rate of
0.4 mm/rev (3750 holes) using a stepped drill configuration. The corresponding
ANOVA revealed that the most significant factor was prepreg type with a PCR of
~25%. However, the majority of stepped drills tested at the higher feed rate level
(0.4mm/rev) experienced catastrophic failure, which was attributed to the reduction in
strength of the tool due to the smaller diameter of the pilot segment.
• A maximum allowable operating feed rate of 0.2 mm/rev is recommended for stepped
drills irrespective of composite orientation while conventional drill geometry can be
used at higher feed rates.
• Measured thrust forces ranged from 40 to 90 N for the first hole drilled which increased
to between 58 and 142 N for the last hole, with feed rate having a statistically
significant effect. Torque values were generally below 100 N.mm.
• Entry delamination factor (Fd) was below ~1.9 while the maximum corresponding exit
Fd was up to 2.1, with damage tending to be somewhat more severe for last holes. The
associated ANOVA results showed that feed rate had an overriding effect on
delamination factor with an overwhelming PCR of up to 73%. In terms of material
influence, the UD and woven 8552/AS4 AC resin system (fibre tensile strength and
modulus are 4480 MPa and 231 GPa respectively) typically experienced greater
damage, especially when drilling at high feed rate (0.4 mm/rev).
• The diameter of drilled holes was generally undersize by 36 μm (~2.5%) and 73 μm
(~5%) at the end of tool life for conventional and stepped drills respectively.
• The results from statistical analysis of the adjusted delamination factor (Fda) were
generally in agreement with results based on Fd, although the Fda measure provided
better discrimination of damage in certain cases.
5.2.4 Evaluation of diamond based coatings
• When machining UD MTM44-1/HTS laminates, uncoated or diamond like carbon
(DLC) coated drills were found to be the best/preferred choice in order to maximise tool
life. The results suggest adopting a maximum allowable operating feed rate of 0.3
mm/rev with either uncoated and DLC coated conventional twist drills.

CHAPTER 5: CONCLUSIONS
199
• Severe tool wear and catastrophic tool fracture was prevalent when using CVD diamond
coated drills. Tool life was less than 100 holes for the vast majority of tests.
• Thrust force ranged from 60 to 160 N when using uncoated or DLC coated drills while
relatively high thrust forces were obtained (~380 N) when CVD diamond coated drills
were employed. This was attributed in part to the inferior cutting edge
condition/sharpness and rougher surface of the CVD diamond coating. Additionally,
relatively low values of torque were generated (from 25 to 80 N.mm) over the range of
variables evaluated.
• DLC coated and uncoated drills typically produced lower values of exit delamination
factor compared to the 3 different CVD diamond coated tools, with the Rhobest product
causing the greatest degree of workpiece damage (Fd of ~2.9).
• The unexpectedly poor performance of the CVD diamond coated drills could be
ascribed in part to the likely reduction of cobalt binder content in the carbide substrate
leading to a weakening of the tool.
• The relatively high feed rate (0.4 mm/rev) utilised in the present investigation was
unsuitable when employing CVD diamond coated drills and resulted in premature tool
failure and unacceptable hole quality.
5.3 Experimental work – drilling of multilayer stacks (Phase 3)
5.3.1 Preliminary drilling trials in separate CFRP and Ti plates and multilayer stacks
• Higher tool life was achieved when drilling 10 mm thick CFRP laminates using the
novel E6 domed PCD drills (1213 holes for only 157 μm flank wear), while alternative
WC coated drills produced only 257 holes for 300 μm flank wear.
• The straight fluted E6 domed PCD drill however broke during the first hole when
drilling Ti-6Al-4V with corresponding high thrust force values of ~1100 N.
• Burr height in titanium holes was generally less than 200 μm for both hole entry and
exit while severe exit damage was observed when drilling CFRP irrespective of tool
material. This significantly decreased when CFRP was drilled in a stack arrangement
with titanium.

CHAPTER 5: CONCLUSIONS
200
• When drilling stacks of CFRP/Ti, the spiral titanium swarf regularly caused damage to
the CFRP hole surface. Surface roughness ranged from 0.2 to 0.5 μm Ra for Ti holes
while it exceeded 5 μm in the CFRP.
5.3.2 Impact of stack arrangement and performance of PCD tools
• When drilling stacks of Al/CFRP/Ti, higher tool life was achieved using C7 coated
drills (150 holes at 300 μm flank wear) while CVD diamond coated drills produced < 5
holes regardless of the operating conditions.
• The performance of CVD diamond coated drills improved significantly when drilling
the stack in the sequence: Ti/CFRP/Al (tool life increased to 108 holes at 136 μm flank
wear level compared to <5 holes when machining commenced from the Al layer).
• Brazed PCD drills generally experienced fracture on the chisel edge while the helical
fluted, domed PCD drills typically broke at the carbide sections of the tool due to poor
chip evacuation/high chip packing. The former are expected to perform better if the
chisel edge is strengthened with either carbide support or by increasing the diamond
thickness. The domed PCD drills however require further design modifications in order
to accommodate the drilling of metallic/composite stacks (such as different helix angles
etc.).
• Unusually high thrust force and torque levels were measured when employing domed
PCD and brazed PCD drills; 1400 and 800 N respectively with torque up to 400 N.cm.
• Drilling stacks comprising Ti/CFRP/Al sections is preferred over Al/CFRP/Ti due to
improved titanium swarf evacuation as well as better coolant transport to the titanium
section.
• When drilling in the Al/CFRP/Ti configuration, severe noise was encountered as the
tool engaged the titanium layer.
5.3.3 Effect of tool coatings and operating parameters
• Tool life in terms of number of drilled holes was primarily dependent on cutting speed
and cutting environment. Here, up to 310 holes in Ti/CFRP/Al stacks was achieved
when employing an uncoated drill at low cutting speed (20/40 m/min) and feed rate of
(0.05 mm/rev) under flood coolant conditions. The corresponding ANOVA showed that

CHAPTER 5: CONCLUSIONS
201
cutting speed and environment condition were statistically significant with PCRs of
42% and 32% respectively. No major benefits in terms of tool life, thrust force or torque
were apparent when using the CVD diamond or C7 hardmetal coating over uncoated
WC drills.
• Higher feed rate (0.15 mm/rev) levels with spray mist caused catastrophic fracture while
coated drills experienced partial cutting edge fracture in a wet cutting environment.
• When cutting wet with new drills, thrust force was highest in the titanium layer (up to
600 N) while lowest levels were recorded with the CFRP material (190 N). Tests
involving spray mist application however generally highlighted greater thrust forces in
the aluminium alloy. The corresponding ANOVA showed that feed rate and
environment condition were statistically significant at the 5% level in relation to thrust
force for both Ti and Al. Both factors were also found to influence torque generation
within the Ti and Al layers of the stack. While feed rate had an overriding 72% effect on
Ti, environment condition was the primary variable affecting torque with Al.
• In general, the use of high pressure through spindle coolant (~ 70 bar) is recommended
over external spray mist application due to the superior cooling properties and improved
access to the cutting zone provided by the former.
• When cutting using flood coolant, undersized holes were produced at test cessation,
with the largest deviation of 14 μm on diameter at the Ti section corresponding to Test
7 (C7 coated drill at 20/40 m/min and 0.05 mm/rev), while this was 20 and 15 μm at the
CFRP and Al layers respectively for Test 1 (uncoated drill at 20/40 m/min and 0.05
mm/rev). Conversely, the spray mist trials gave rise to oversized holes in the CFRP of
up to 120 μm for worn drills.
• Surface roughness was considerably lower when using through spindle coolant in
comparison to spray mist application, especially at the Al section. High surface
roughness of up to 9 μm Ra was obtained on CFRP hole surfaces while values of up to
1 and 0.3 μm Ra were measured on corresponding Ti and Al surfaces respectively. The
surface roughness at the Al section however deteriorated to 1.5 μm Ra at test cessation
when spray mist environment was employed (after only 64 drilled holes). Adhering
chips were seen on Ti machined surfaces as was workpiece smearing, indicating the
potential need of a finishing process when drilling Ti/CFRP/Al stacks.

CHAPTER 5: CONCLUSIONS
202
• Burr height was generally below 500 μm except when spray mist was used, which
increased burr levels significantly up to ~ 1 mm, particularly in the Al section.
• Delamination of the CFRP laminates was significantly reduced due to support from the
Al and Ti layers. Only minor damage around hole edges of the CFRP was observed,
which was caused by sharp Ti exit burrs.
• Microhardness results showed marginal hardening up to 800 μm from the machined Ti
surface (maximum of 50 HK0.025 above the bulk value) while strain hardening extended
to a depth of 500 μm in the Al material.
5.4 Overall conclusions and recommended operating conditions
5.4.1 Small hole drilling in CFRP
• Despite slightly higher forces, retention of the nylon peel ply layer during drilling is
imperative to significantly improve hole quality as well as reduce delamination and
fibre breakage.
• Rounding of the cutting and chisel edges due to abrasion was the principal wear mode.
• Cutting speed (over the range investigated) had no significant effect on all responses
investigated. A maximum operating feed rate of 0.2 mm/rev is recommended for
stepped drill geometry while for conventional drills this was 0.3 mm/rev. This provided
a cutting time of between 0.4 – 0.7 seconds per hole (including drill positioning and
retraction).
• In general, woven laminates produced lower delamination than UD laminates.
• CVD diamond coated tools showed no appreciable benefits over uncoated or PVD
diamond coated drills. Therefore, uncoated WC (K10) drills are recommended for small
hole drilling of CFRP.
• In general, the longest tool life (3000 – 3500 holes depending on feed rate and drill type
used) was achieved when drilling MTM44-1/HTS prepreg laminates.
• Table 5.1 lists recommended/preferred operating conditions when small hole drilling in
CFRP.

CHAPTER 5: CONCLUSIONS
203
5.4.2 Drilling of multilayer stacks (Ti/CFRP/Al)
• Stacks comprising Ti/CFRP/Al layers can be successfully drilled in a one shot operation
using WC tools (K10). In terms of preferred cutting conditions, low to moderate feed
rate (0.05 – 0.1 mm/rev) together with low cutting speed (20/40 m/min) provided the
best tool life (~ 300 holes).
• BUE on the primary cutting lips as well as drill margins was prevalent in trials
involving spray mist application, while rounding on the main cutting and chisel edge as
well as adhered workpiece material (Ti and/or Al) were found in tests performed using
flood coolant.
• Uncoated and C7 coated WC drills outperformed PCD and CVD diamond coated tools
in terms of tool life and with no appreciable improvement in hole quality characteristics.
• Thrust force and torque were found to be 3 - 5 times greater when cutting the Ti
compared to the Al and CFRP even when flood coolant was used.
• The use of high pressure through spindle coolant (70 bar) is essential when drilling
multilayer metallic/composite stacks to ensure sufficient transport of lubrication/coolant
to the bottom of the stack in addition to aiding chip evacuation.
• Table 5.2 details the recommended/preferred operating conditions for one shot drilling
of Ti/CFRP/Al stacks.
Parameter Value Cutting speed 40 - 50 m/min Feed rate 0.2 – 0.3 mm/rev Tool material / coating Uncoated WC Tool geometry Conventional twist drill with 118o and 24o
point and helix angle Composite resin system MTM 44-1/HTS Prepreg form UD or woven Expected tool life 3000 holes in 3 mm thick CFRP laminate
Table 5.1: List of preferred operating parameters and workpiece material for small hole drilling of CFRP

CHAPTER 5: CONCLUSIONS
204
Parameter Value Cutting speed 20 m/min for Ti
40 m/min for CFRP and Al Feed rate 0.05 – 0.1 mm/rev Tool coating Uncoated or C7 coated WC Cutting environment High pressure through spindle flood
coolant (70 bar) Stack sequence Ti/CFRP/Al Expected tool life 300 holes in 30 mm thick stacks
Table 5.2: List of preferred operating parameters for drilling multilayer stacks

CHAPTER6: RECOMMENDATIONS FOR FUTURE WORK
205
6. RECOMMENDATIONS FOR FUTURE WORK
A list of publications stemming from the project is shown in Appendix F, however a
number of areas were highlighted during the research which warrants further investigation.
These include:
• Investigation of the use of small diameter PCD drills to improve productivity
and performance when machining CFRP.
• Measurement of induced cutting temperature when cutting dissimilar multilayer
stacks (implanted thermocouple).
• Further design development of PCD drills to accommodate the successful
drilling of Ti/CFRP/Al stacks.
• Investigation of scale effects through correlation of output measures at the
macro-meso-micro levels when drilling FRPs.
• Further analysis relating to the fundamentals of step drill engagement when
drilling small diameter holes in CFRP.
• Evaluation of vibration assisted drilling of Ti/CFRP/Al stacks in order to
improve chip evacuation / formation and consequently enhance productivity and
surface finish/integrity.
• Use of finite element modelling (FEM) to simulate the drilling of CFRP and
multilayer stack workpiece materials.
• Analysis of different cost elements involved when drilling CFRP and multilayer
stacks.

REFERENCES
206
REFERENCES
1. Herakovich, C., Mechanics of fibrous composites. 1998, New York: John Wiley & Sons,
Inc., ISBN: 0471106364 2. Teti, R., Machining of composite materials. Annals of the CIRP, 2002. 51(2): p. 611-634,
ISSN: 0007-8506. 3. Peters, S. T., Introduction, composite basic and road map, in Handbook of Composites, S.
T. Peters, Editor. 1998, Chapman & Hall: London. p. 1-20, ISBN: 0412540207. 4. William D. Callister, J., Fundamentals of materials science and engineering. 5th Edition
ed. 2000: Wiley, ISBN: 047139551X. 5. Anon, An introduction to advanced composites and prepreg technology. 2009, The centre
of composite technology, Advanced composites group Ltd. p. 1-26. 6. Burton, R., Of developing importance, in Aerospace manufacturing. 2008, MIT
publishing limited: Kent, UK. p. 21-22. 7. Calder, N., Advances Composites Applications, in Aerospace Manufacturing. 2008, MIT
Publishing Limited: Kent, UK. p. 19-20. 8. Herbeck, L., Wilmes, H., Kolesnikov, B. and Kleineberg, M., Technology and design
development for a CFRP fuselage. SAMPLE Europe 2003, 2003, 9. Kaddick, C., Stur, S. and Hipp, E., Mechanical simulation of composite hip stems.
Medical Engineering & Physics, 1997. 19(5): p. 431-439, ISSN: 1350-4533. 10. Soutis, C., Carbon fiber reinforced plastics in aircraft construction. Materials Science and
Engineering A, 2005. 412(1-2): p. 171-176, ISSN: 0921-5093. 11. Aspinwall, D. K. and Soo, S. L., Keeping pace with composites. Metal Working
Production, 2007. 151(2): p. 42-43, ISSN: 0026-1033. 12. Sheikh-Ahmed, J. Y., Machining of polymer composites. 2009, New York: Springer,
ISBN: 9780387355399. 13. Anon, Sky high success for CVD diamond coated tools. Industrial Diamond Review,
2007(3): p. 69-70, ISSN: 0019-8145. 14. Garrick, R., Drilling advanced aircraft structures with PCD (Poly-crystalline diamond)
drills. SAE International, 2007. ATC-18, 15. Samant, A. N. and Dahotre, N. B., Laser machining of structural ceramics--A review.
Journal of the European Ceramic Society, 2009. 29(6): p. 969-993, ISSN: 0955-2219. 16. Reinhart, T. J., Overview of composite materials, in Handbook of Composites, S. T.
Peters, Editor. 1998, Chapman & Hall: London. p. 21-26, ISBN: 0412540207. 17. Clements, L., Organic fibers, in Handbook of Composites, S. T. Peters, Editor. 1998,
Chapman & Hall: London. p. 201-209, ISBN: 0412540207. 18. Chung, D. D. L., Carbon Fiber Composites. 1994, Newton: Butterworth-Heinemann. 215,
ISBN: 0750691697 19. Lafdi, K. and Wright, M., Carbon fibres, in Handbook of Composites, S. T. Peters, Editor.
1998, Chapman & Hall: London. p. 169-186, ISBN: 0412540207. 20. Capello, E., Langella, A., Nele, L., Paoletti, A., Santo, L. and Tagliaferri, V., Drilling
polymeric matrix composites, in Machining: Fundamentals and recent advances, J. P. Davim, Editor. 2008, Springer: London. p. 167-194, ISBN: 9781848002128.
21. Daniel, I. M. and Ishai, O., Engineering mechanics of composite materials. 2nd ed. 2006, New York: Oxford University Press, ISBN: 019515097X

REFERENCES
207
22. Shim, H., Seo, M. and Park, S., Thermal conductivity and mechanical properties of various cross-section types carbon fiber-reinforced composites. Journal of materials science, 2002. 37(9): p. 1881-1885, ISSN: 0022-2461.
23. Osha, Polymer matrix materials: Advanced composites, in OSHA technical manual. 2010, Occupational safety and health administration (OSHA).
24. Anon, Safety data sheet for SL-2 ComfortWalk Prepreg. 2006, Otto Bock Health Care: Minneapolis.
25. Klocke, F., Koenig, W., Wuertz, C. and Dietz, C., Environmental effects and safety in machining fibrous composites, in Machining of Ceramics and Composites, S. Jahanmir, M. Ramulu and P. Koshy, Editors. 1999, CRC Press. p. 411-425, ISBN: 082470178X.
26. Fletcher, D., Analysis of carbon fibres chips produced from drilling process. 2007, Health and Safety Laboratory: Derbyshire.
27. Ezugwu, E. O. and Wang, Z. M., Titanium alloys and their machinability--a review. Journal of Materials Processing Technology, 1997. 68(3): p. 262-274, ISSN: 0924-0136.
28. Lütjering, G. and Williams, J., Titanium. 2nd ed, ed. B. Derby. 2007, New York: Springer, ISBN: 9783540713975.
29. Trent, E. and Wright, P., Metal cutting. 4th ed. 2001, Boston: Butterworth-Heinemann. 464, ISBN: 075067069X.
30. Polmear, I., Light alloys: Metallurgy of the light metals. 3rd ed. 1995, London: Arnold,Hodder Headline PLC, ISBN: 0340700777
31. Ezugwu, E. O., Bonney, J. and Yamane, Y., An overview of the machinability of aeroengine alloys. Journal of Materials Processing Technology, 2003. 134(2): p. 233-253, ISSN: 0924-0136.
32. Anon, ASM Materials properties handbook - Titanium alloys. 4th ed, ed. R. Boyer, G. Welsch and E. Collings. 2007: USA: ASM International, ISBN: 0871704811.
33. Boyer, R. R., An overview on the use of titanium in the aerospace industry. Materials Science and Engineering: A, 1996. 213 (1-2): p. 103-114, ISSN: 0921-5093.
34. Anon, metals reference book. 3rd ed. ASM International, ed. M. Bauccio. 1993, USA, ISBN: 0871704781.
35. Yamada, M., An overview on the development of titanium alloys for non-aerospace application in Japan. Materials Science and Engineering: A, 1996. 213(1-2): p. 8-15, ISSN: 0921-5093.
36. Niinomi, M., Recent research and development in titanium alloys for biomedical applications and healthcare goods. Science and Technology of Advanced Materials, 2003. 4(5): p. 445-454, ISSN: 1468-6996.
37. Williams, J. C. and Starke, E. A., Progress in structural materials for aerospace systems. Acta Materialia, 2003. 51(19): p. 5775-5799, ISSN: 1359-6454.
38. Konig, W., Wulf, C., Grass, P. and Willerscheid, H., Machining of fibre reinforced plastics. Annals of the CIRP, 1985. 34(2): p. 537-548, ISSN: 0007-8506.
39. Bhatnagar, N., Ramakrishnan, N., Naik, N. K. and Komanduri, R., On the machining of fiber reinforced plastic (FRP) composite laminates. International Journal of Machine Tools and Manufacture, 1995. 35(5): p. 701-716, ISSN: 0890-6955.
40. Mkaddem, A., Demirci, I. and Mansori, M. E., A micro-macro combined approach using FEM for modelling of machining of FRP composites: Cutting forces analysis. Composites Science and Technology, 2008. 68(15-16): p. 3123-3127, ISSN: 0266-3538.
41. Ferreira, J. R., Coppini, N. L. and Miranda, G. W. A., Machining optimisation in carbon fibre reinforced composite materials. Journal of Materials Processing Technology, 1999. 92-93: p. 135-140, ISSN: 0924-0136.

REFERENCES
208
42. Rao, G. V. G., Mahajan, P. and Bhatnagar, N., Micro-mechanical modeling of machining of FRP composites - Cutting force analysis. Composites Science and Technology, 2007. 67(3-4): p. 579-593, ISSN: 0266-3538.
43. Konig, W. and Grass, P., quality definition and assessment in drilling of fibre reinforced thermosets. Annals of the CIRP, 1989. 38(1): p. 119-124, ISSN: 0007-8506.
44. Singh, I., Bhatnagar, N. and Viswanath, P., Drilling of uni-directional glass fiber reinforced plastics: Experimental and finite element study. Materials & Design, 2008. 29(2): p. 546-553, ISSN: 0261-3069.
45. Davim, J. P. and Reis, P., Damage and dimensional precision on milling carbon fiber-reinforced plastics using design experiments. Journal of Materials Processing Technology, 2005. 160(2): p. 160-167, ISSN: 0924-0136.
46. Rahman, M., Ramakrishna, S., Prakash, J. R. S. and Tan, D. C. G., Machinability study of carbon fiber reinforced composite. Journal of Materials Processing Technology, 1999. 89-90: p. 292-297, ISSN: 0924-0136.
47. Velayudham, A. and Krishnamurthy, R., Effect of point geometry and their influence on thrust and delamination in drilling of polymeric composites. Journal of Materials Processing Technology, 2007. 185(1-3): p. 204-209, ISSN: 0924-0136.
48. Wang, D. H., Ramulu, M. and Arola, D., Orthogonal cutting mechanisms of graphite/epoxy composite. Part I: unidirectional laminate. International Journal of Machine Tools and Manufacture, 1995. 35(12): p. 1623-1638, ISSN: 0890-6955.
49. Wang, X. M. and Zhang, L. C., An experimental investigation into the orthogonal cutting of unidirectional fibre reinforced plastics. International Journal of Machine Tools and Manufacture, 2003. 43(10): p. 1015-1022, ISSN: 0890-6955.
50. Arola, D., Ramulu, M. and Wang, D. H., Chip formation in orthogonal trimming of graphite/epoxy composite. Composites Part A: Applied Science and Manufacturing, 1996. 27(2): p. 121-133, ISSN: 1359-835X.
51. Nayak, D., A Bhatnagar, N. and A Mahajan, P., Machining studies of uni-directional glass fiber reinforced plastic (UD-GFRP) composites Part 1: Effect of geometrical and process parameters. Machining Science and Technology, 2005. 9: p. 481-501, ISSN: 1532-2483.
52. Hocheng, H. and Puw, H. Y., On drilling characteristics of fiber-reinforced thermoset and thermoplastics. International Journal of Machine Tools and Manufacture, 1992. 32(4): p. 583-592, ISSN: 0890-6955.
53. Kalpakjian, S. and Schmid, S., Manufacturing Engineering and Technology. 5th Edition ed. 2006: Prentice Hall, ISBN: 0201361310
54. Youssef, H. and El-Hofy, H., Machining technology: Machine tools and operations 1st ed. 2008, New York: CRC Press. 672, ISBN: 9781420043396.
55. Bradley, S., Personal communication. GKN Aerospace, 2010, 56. Zhang, L. B., Wang, L. J. and Liu, X. Y., A mechanical model for predicting critical thrust
forces in drilling composite laminates. Proceedings of the Institution of Mechanical Engineers, Part B: Journal of Engineering Manufacture, 2001. 215(2): p. 135-146, ISSN: 0954-4054.
57. Abrate, S. and Walton, D. A., Machining of composite materials. Part I: Traditional methods. Composites Manufacturing, 1992. 3(2): p. 75-83, ISSN: 0956-7143.
58. Abrao, A. M., Faria, P. E., Rubio, J. C. C., Reis, P. and Davim, J. P., Drilling of fiber reinforced plastics: A review. Journal of Materials Processing Technology, 2007. 186(1-3): p. 1-7, ISSN: 0924-0136.
59. Malhotra, S. K., Some studies on drilling of fibrous composites. Journal of Materials Processing Technology, 1990. 24: p. 291-300, ISSN: 0924-0136.

REFERENCES
209
60. Zhang, H., Chen, W., Chen, D. and Zhang, L., Assessment of the exit defects in carbon fibre-reinforced plastic plates caused by drilling. Key Engineering Materials, 2001. 196: p. 43-52, ISSN: 1662-9795.
61. Chen, W. C., Some experimental investigations in the drilling of carbon fiber-reinforced plastic (CFRP) composite laminates. International Journal of Machine Tools and Manufacture, 1997. 37(8): p. 1097-1108, ISSN: 0890-6955.
62. Davim, J. P. and Reis, P., Drilling carbon fiber reinforced plastics manufactured by autoclave-experimental and statistical study. Materials and Design, 2003. 24(5): p. 315-324, ISSN: 0261-3069.
63. Davim, J. P. and Reis, P., Study of delamination in drilling carbon fiber reinforced plastics (CFRP) using design experiments. Composite Structures, 2003. 59(4): p. 481-487, ISSN: 0263-8223.
64. Davim, J. P., Rubio, J. C. and Abrao, A. M., A novel approach based on digital image analysis to evaluate the delamination factor after drilling composite laminates. Composites Science and Technology, 2007. 67(9): p. 1939-1945, ISSN: 0266-3538.
65. Enemuoh, E. U., El-Gizawy, A. S. and Chukwujekwu Okafor, A., An approach for development of damage-free drilling of carbon fiber reinforced thermosets. International Journal of Machine Tools and Manufacture, 2001. 41(12): p. 1795-1814, ISSN: 0890-6955.
66. Gaitonde, V. N., Karnik, S. R., Rubio, J. C., Correia, A. E., Abrão, A. M. and Davim, J. P., Analysis of parametric influence on delamination in high-speed drilling of carbon fiber reinforced plastic composites. Journal of Materials Processing Technology, 2008. 203(1-3): p. 431-438, ISSN: 0924-0136.
67. Gilchrist, M. D. and Svensson, N., A fractographic analysis of delamination within multidirectional carbon/epoxy laminates. Composites Science and Technology, 1995. 55(2): p. 195-207, ISSN: 0266-3538.
68. Ho-Cheng, H. and Dharan, C. K. H., Delamination during drilling in composite laminates. Journal of engineering for industry, 1990. 112(3): p. 236-239, ISSN: 0022-1817.
69. Hocheng, H. and Tsao, C. C., Effects of special drill bits on drilling-induced delamination of composite materials. International Journal of Machine Tools and Manufacture, 2006. 46(12-13): p. 1403-1416, ISSN: 0890-6955.
70. Lin, S. C. and Chen, I. K., Drilling carbon fiber-reinforced composite material at high speed. Wear, 1996. 194(1-2): p. 156-162, ISSN: 0043-1648.
71. Stone, R. and Krishnamurthy, K., A neural network thrust force controller to minimize delamination during drilling of graphite-epoxy laminates. International Journal of Machine Tools and Manufacture, 1996. 36(9): p. 985-1003, ISSN: 0890-6955.
72. Tsao, C. C., Effect of deviation on delamination by saw drill. International Journal of Machine Tools and Manufacture, 2007. 47(7-8): p. 1132-1138, ISSN: 0890-6955.
73. Tsao, C. C. and Hocheng, H., Taguchi analysis of delamination associated with various drill bits in drilling of composite material. International Journal of Machine Tools and Manufacture, 2004. 44(10): p. 1085-1090, ISSN: 0890-6955.
74. Tsao, C. C. and Hocheng, H., Computerized tomography and C-Scan for measuring delamination in the drilling of composite materials using various. International Journal of Machine Tools and Manufacture, 2005. 45(11): p. 1282-1287, ISSN: 0890-6955.
75. Karnik, S. R., Gaitonde, V. N., Rubio, J. C., Correia, A. E., Abrão, A. M. and Davim, J. P., Delamination analysis in high speed drilling of carbon fiber reinforced plastics (CFRP) using artificial neural network model. Materials & Design, 2008. 29(9): p. 1768-1776, ISSN: 0261-3069.

REFERENCES
210
76. Marques, A. T., Durão, L. M., Magalhães, A. G., Silva, J. F. and Tavares, J. M. R. S., Delamination analysis of carbon fibre reinforced laminates: Evaluation of a special step drill. Composites Science and Technology, 2009. 69(14): p. 2376-2382, ISSN: 0266-3538.
77. Park, K., Choi, J. and Lee, D., Delamination-Free and High Efficiency Drilling of Carbon Fiber Reinforced Plastics. Journal of Composite Materials, 1995. 29: p. 1988 - 2002, ISSN: 1530-793X.
78. Rubio, J., Abrao, A., Faria, P., Correia, A. and Davim, J., Delamination in High Speed Drilling of Carbon Fiber Reinforced Plastic (CFRP). Journal of Composite Materials, 2008. 42: p. 1523-1532, ISSN: 1530-793X.
79. Tsao, C. C. and Hocheng, H., Effect of tool wear on delamination in drilling composite materials. International Journal of Mechanical Sciences, 2007. 49(8): p. 983-988, ISSN: 0020-7403.
80. Rawat, S. and Attia, H., Characterization of the dry high speed drilling process of woven composites using Machinability Maps approach. CIRP Annals - Manufacturing Technology, 2009. 58(1): p. 105-108, ISSN: 0007-8506.
81. Persson, E., Eriksson, I. and Zackrisson, L., Effects of hole machining defects on strength and fatigue life of composite laminates. Composites Part A: Applied Science and Manufacturing, 1997. 28(2): p. 141-151, ISSN: 1359-835X.
82. Tsao, C. C., Investigation into the effects of drilling parameters on delamination by various step-core drills. Journal of Materials Processing Technology, 2008. 206(1-3): p. 405-411, ISSN: 0924-0136.
83. Tsao, C. C., Experimental study of drilling composite materials with step-core drill. Materials & Design, 2008. 29(9): p. 1740-1744, ISSN: 0261-3069.
84. Tsao, C. C. and Hocheng, H., Evaluation of thrust force and surface roughness in drilling composite material using Taguchi analysis and neural network. Journal of Materials Processing Technology, 2008. 203(1-3): p. 342-348, ISSN: 0924-0136.
85. Durão, L. M. P., Gonçalves, D. J. S., Tavares, J. M. R. S., De Albuquerque, V. H. C., Aguiar Vieira, A. and Torres Marques, A., Drilling tool geometry evaluation for reinforced composite laminates. Composite Structures. 92(7): p. 1545-1550, ISSN: 0263-8223.
86. Wern, C. W., Ramulu, M. and Colligan, K., A study of the surface texture of composite drilled holes. Journal of Materials Processing Technology, 1993. 37(1-4): p. 373-389, ISSN: 0924-0136.
87. Won, M. S. and Dharan, C. K. H., Drilling of aramid and carbon fiber polymer composites. Journal of Manufacturing Science and Engineering, Transactions of the ASME, 2002. 124(4): p. 778-783, ISSN: 10871357.
88. Jain, S. and Yang, D. C. H., Delamination-free drilling of composite laminates. Journal of Engineering for industry, Transactions of the ASME, 1994. 116: p. 475-481, ISSN: 0022-0817.
89. Fernandes, M. and Cook, C., Drilling of carbon composites using a one shot drill bit. Part I: Five stage representation of drilling and factors. International Journal of Machine Tools and Manufacture, 2006. 46(1): p. 70-75, ISSN: 0890-6955.
90. Jain, S. and Yang, D. C. H., Effects of Feedrate and Chisel Edge on Delamination in Composites Drilling. Journal of Engineering for industry, Transactions of the ASME, 1993. 115: p. 398-405, ISSN: 0022-0817.
91. Tsao, C. C. and Hocheng, H., Parametric study on thrust force of core drill. Journal of Materials Processing Technology, 2007. 192-193: p. 37-40, ISSN: 0924-0136.
92. Wang, X., Wang, L. J. and Tao, J. P., Investigation on thrust in vibration drilling of fiber-reinforced plastics. Journal of Materials Processing Technology, 2004. 148(2): p. 239-244, ISSN: 0924-0136.

REFERENCES
211
93. Murphy, C., Byrne, G. and Gilchrist, M. D., The performance of coated tungsten carbide drills when machining carbon fibre-reinforced epoxy composite materials. Proceedings of the Institution of Mechanical Engineers, Part B: Journal of Engineering Manufacture, 2002. 216(2): p. 143-152, ISSN: 0954-4054.
94. Won, M. S. and Dharan, C. K. H., Chisel edge and pilot hole effects in drilling composite laminates. Journal of Manufacturing Science and Engineering, Transactions of the ASME, 2002. 124(2): p. 242-247, ISSN: 10871357.
95. Tsao, C. C. and Hocheng, H., Effects of exit back-up on delamination in drilling composite materials using a saw drill and a core drill. International Journal of Machine Tools and Manufacture, 2005. 45(11): p. 1261-1270, ISSN: 0890-6955.
96. Arul, S., Vijayaraghavan, L., Malhotra, S. K. and Krishnamurthy, R., The effect of vibratory drilling on hole quality in polymeric composites. International Journal of Machine Tools and Manufacture, 2006. 46(3-4): p. 252-259, ISSN: 0890-6955.
97. Piquet, R., Ferret, B., Lachaud, F. and Swider, P., Experimental analysis of drilling damage in thin carbon/epoxy plate using special drills. Composites Part A: Applied Science and Manufacturing, 2000. 31(10): p. 1107-1115, ISSN: 1359-835X.
98. Shaw, M., Metal cutting principles. 1st ed. 1997, New York: Oxford University Press Inc. 594, ISBN: 0198590202.
99. Faraz, A., Biermann, D. and Weinert, K., Cutting edge rounding: An innovative tool wear criterion in drilling CFRP composite laminates. International Journal of Machine Tools and Manufacture, 2009. 49(15): p. 1185-1196, ISSN: 0890-6955.
100. Hocheng, H. and Tsao, C. C., The path towards delamination-free drilling of composite materials. Journal of Materials Processing Technology, 2005. 167(2-3): p. 251-264, ISSN: 0924-0136.
101. Hong, S. Y. and Ding, Y., Cooling approaches and cutting temperatures in cryogenic machining of Ti-6Al-4V. International Journal of Machine Tools and Manufacture, 2001. 41(10): p. 1417-1437, ISSN: 0890-6955.
102. Kitagawa, T., Kubo, A. and Maekawa, K., Temperature and wear of cutting tools in high-speed machining of Inconel 718 and Ti-6Al-6V-2Sn. Wear, 1997. 202(2): p. 142-148, ISSN: 0043-1648.
103. Masuda, M., Kuroshima, Y. and Chujo, Y., Failure of tungsten carbide-cobalt alloy tools in machining of carbon materials. Wear, 1993. 169(2): p. 135-140, ISSN: 0043-1648.
104. Aoyama, E., Inoue, H., Hirogaki, T., Nobe, H., Kitahara, Y. and Katayama, T., Study on small diameter drilling in GFRP. Composite Structures, 1995. 32(1-4): p. 567-573, ISSN: 0263-8223.
105. Ogawa, K., Aoyama, E., Inoue, H., Hirogaki, T., Nobe, H., Kitahara, Y., Katayama, T. and Gunjima, M., Investigation on cutting mechanism in small diameter drilling for GFRP (thrust force and surface roughness at drilled hole wall). Composite Structures, 1997. 38(1-4): p. 343-350, ISSN: 0263-8223.
106. Inoue, H., Aoyama, E., Hirogaki, T., Ogawa, K., Matushita, H., Kitahara, Y. and Katayama, T., Influence of tool wear on internal damage in small diameter drilling in GFRP. Composite Structures, 1997. 39(1-2): p. 55-62, ISSN: 0263-8223.
107. Aoyama, E., Nobe, H. and Hirogaki, T., Drilled hole damage of small diameter drilling in printed wiring board. Journal of Materials Processing Technology, 2001. 118(1-3): p. 436-441, ISSN: 0924-0136.
108. Shanmugam, D. K., Chen, F. L., Siores, E. and Brandt, M., Comparative study of jetting machining technologies over laser machining technology for cutting composite materials. Composite Structures, 2002. 57(1-4): p. 289-296, ISSN: 0263-8223.

REFERENCES
212
109. Wang, J., A machinability study of polymer matrix composites using abrasive waterjet cutting technology. Journal of Materials Processing Technology, 1999. 94(1): p. 30-35, ISSN: 0924-0136.
110. Lemma, E., Chen, L., Siores, E. and Wang, J., Study of cutting fiber-reinforced composites by using abrasive water-jet with cutting head oscillation. Composite Structures, 2002. 57(1-4): p. 297-303, ISSN: 0263-8223.
111. Miller, D. S., Micromachining with abrasive waterjets. Journal of Materials Processing Technology, 2004. 149(1-3): p. 37-42, ISSN: 0924-0136.
112. Linbo, Z., Lijiang, W. and Xin, W., Study on vibration drilling of fiber reinforced plastics with hybrid variation parameters method. Composites Part A: Applied Science and Manufacturing, 2003. 34(3): p. 237-244, ISSN: 1359-835X.
113. Young, T. and O'driscoll, D., Impact of Nd-YAG laser drilled holes on the strength and stiffness of laminar flow carbon fibre reinforced composite panels. Composites Part A: Applied Science and Manufacturing, 2002. 33(1): p. 1-9, ISSN: 1359-835X.
114. Tagliaferri, V., Di Ilio, A. and Visconti, C., Laser cutting of fibre-reinforced polyesters. Composites, 1985. 16(4): p. 317-325, ISSN: 1359-835X.
115. Cenna, A. A. and Mathew, P., Analysis and prediction of laser cutting parameters of fibre reinforced plastics (FRP) composite materials. International Journal of Machine Tools and Manufacture, 2002. 42(1): p. 105, ISSN: 0890-6955.
116. Pan, C. T. and Hocheng, H., Evaluation of anisotropic thermal conductivity for unidirectional FRP in laser machining. Composites Part A: Applied Science and Manufacturing, 2001. 32(11): p. 1657-1667, ISSN: 1359-835X.
117. Lau, W. S., Yue, T. M., Lee, T. C. and Lee, W. B., Un-conventional machining of composite materials. Journal of Materials Processing Technology, 1995. 48(1-4): p. 199-205, ISSN: 0924-0136.
118. Pan, C. T. and Hocheng, H., The anisotropic heat-affected zone in the laser grooving of fiber-reinforced composite material. Journal of Materials Processing Technology, 1996. 62(1-3): p. 54-60, ISSN: 0924-0136.
119. Cheng, C. F., Tsui, Y. C. and Clyne, T. W., Application of a three-dimensional heat flow model to treat laser drilling of carbon fibre composites. Acta Materialia, 1998. 46(12): p. 4273-4285, ISSN: 1359-6454.
120. Cenna, A. A. and Mathew, P., Evaluation of cut quality of fibre-reinforced plastics - A review. International Journal of Machine Tools and Manufacture, 1997. 37(6): p. 723-736, ISSN: 0890-6955.
121. Rodden, W. S. O., Kudesia, S. S., Hand, D. P. and Jones, J. D. C., A comprehensive study of the long pulse Nd:YAG laser drilling of multi-layer carbon fibre composites. Optics Communications, 2002. 210(3-6): p. 319-328, ISSN: 0030-4018.
122. Hirogaki, T., Aoyama, E., Inoue, H., Ogawa, K., Maeda, S. and Katayama, T., Laser drilling of blind via holes in aramid and glass/epoxy composites for multi-layer printed wiring boards. Composites Part A: Applied Science and Manufacturing, 2001. 32(7): p. 963-968, ISSN: 1359-835X.
123. Hocheng, H. and Hsu, C. C., Preliminary study of ultrasonic drilling of fiber-reinforced plastics. Journal of Materials Processing Technology, 1995. 48(1-4): p. 255-266, ISSN: 0924-0136.
124. Masuzawa, T., State of the art of micromachining Annals of the CIRP, 2000. 49(2): p. 473-488, ISSN: 0007-8506.
125. Hocheng, H., Tai, N. H. and Liu, C. S., Assessment of ultrasonic drilling of C/SiC composite material. Composites Part A: Applied Science and Manufacturing, 2000. 31(2): p. 133-142, ISSN: 1359-835X.

REFERENCES
213
126. Tsao, C. C. and Chen, W. C., Prediction of the location of delamination in the drilling of composite laminates. Journal of Materials Processing Technology, 1997. 70(1-3): p. 185-189, ISSN: 0924-0136.
127. Hocheng, H. and Tsao, C. C., Comprehensive analysis of delamination in drilling of composite materials with various drill bits. Journal of Materials Processing Technology, 2003. 140(1-3 SPEC.): p. 335-339, ISSN: 0924-0136.
128. Hocheng, H. and Tsao, C. C. Analysis of delamination in drilling composite materials using core-saw drill. in 7th International Conference on Progress of Machining Technology. 2004. p. 38-43.
129. Tsao, C. C. and Hocheng, H., The effect of chisel length and associated pilot hole on delamination when drilling composite materials. International Journal of Machine Tools and Manufacture, 2003. 43(11): p. 1087-1092, ISSN: 0890-6955.
130. Tsao, C. C. and Hocheng, H., Effect of eccentricity of twist drill and candle stick drill on delamination in drilling composite materials. International Journal of Machine Tools and Manufacture, 2005. 45(2): p. 125-130, ISSN: 0890-6955.
131. Fernandes, M. and Cook, C., Drilling of carbon composites using a one shot drill bit. Part II: empirical modeling of maximum thrust force. International Journal of Machine Tools and Manufacture, 2006. 46(1): p. 76-79, ISSN: 0890-6955.
132. Zitoune, R. and Collombet, F., Numerical prediction of the thrust force responsible of delamination during the drilling of the long-fibre composite structures. Composites Part A: Applied Science and Manufacturing, 2007. 38(3): p. 858-866, ISSN: 1359-835X.
133. Narutaki, N., Murakoshi, A., Motonishi, S. and Takeyama, H., Study on Machining of Titanium Alloys. CIRP Annals - Manufacturing Technology, 1983. 32(1): p. 65-69, ISSN: 0007-8506.
134. Rahman, M., Wong, Y. and Zareena, A., Machinability of Titanium Alloys. JSME International Journal Series C, 2003. 46 (Special Issue on Advanced Production Scheduling ): p. 107-115, ISSN: 1344-7653.
135. Freeman, R., The machining of titanium and some of its alloys, in Department of Industrial Metallurgy. 1974, University of Birmingham: Birmingham.
136. Nabhani, F., Machining of aerospace titanium alloys. Robotics and Computer-Integrated Manufacturing, 2001. 17(1-2): p. 99-106, ISSN: 0736-5845.
137. Sreejith, P. S. and Ngoi, B. K. A., Dry machining: Machining of the future. Journal of Materials Processing Technology, 2000. 101(1-3): p. 287-291, ISSN: 0924-0136.
138. Kamata, Y. and Obikawa, T., High speed MQL finish-turning of Inconel 718 with different coated tools. Journal of Materials Processing Technology, 2007. 192-193: p. 281-286, ISSN: 0924-0136.
139. Hua, J. and Shivpuri, R., Prediction of chip morphology and segmentation during the machining of titanium alloys. Journal of Materials Processing Technology, 2004. 150(1-2): p. 124-133, ISSN: 0924-0136.
140. Sun, S., Brandt, M. and Dargusch, M. S., Characteristics of cutting forces and chip formation in machining of titanium alloys. International Journal of Machine Tools and Manufacture, 2009. 49(7-8): p. 561-568, ISSN: 0890-6955.
141. Che-Haron, C. H. and Jawaid, A., The effect of machining on surface integrity of titanium alloy Ti-6% Al-4% V. Journal of Materials Processing Technology, 2005. 166(2): p. 188-192, ISSN: 0924-0136.
142. Ribeiro, M. V., Moreira, M. R. V. and Ferreira, J. R., Optimization of titanium alloy (6Al-4V) machining. Journal of Materials Processing Technology, 2003. 143-144: p. 458-463, ISSN: 0924-0136.
REFERENCES
214
143. Cantero, J. L., Tardío, M. M., Canteli, J. A., Marcos, M. and Miguélez, M. H., Dry drilling of alloy Ti-6Al-4V. International Journal of Machine Tools and Manufacture, 2005. 45(11): p. 1246-1255, ISSN: 0890-6955.
144. Dornfeld, D. A., Kim, J. S., Dechow, H., Hewson, J. and Chen, L. J., Drilling Burr Formation in Titanium Alloy, Ti-6AI-4V. CIRP Annals - Manufacturing Technology, 1999. 48(1): p. 73-76, ISSN: 0007-8506.
145. Li, R., Hegde, P. and Shih, A. J., High-throughput drilling of titanium alloys. International Journal of Machine Tools and Manufacture, 2007. 47(1): p. 63-74, ISSN: 0890-6955.
146. Li, R. and Shih, A. J., Spiral point drill temperature and stress in high-throughput drilling of titanium. International Journal of Machine Tools and Manufacture, 2007. 47(12-13): p. 2005-2017, ISSN: 0890-6955.
147. Sharif, S. and Rahim, E. A., Performance of coated- and uncoated-carbide tools when drilling titanium alloy--Ti-6Al4V. Journal of Materials Processing Technology, 2007. 185(1-3): p. 72-76, ISSN: 0924-0136.
148. Zeilmann, R. P. and Weingaertner, W. L., Analysis of temperature during drilling of Ti6Al4V with minimal quantity of lubricant. Journal of Materials Processing Technology, 2006. 179(1-3): p. 124-127, ISSN: 0924-0136.
149. Rivero, A., Aramendi, G., Herranz, S. and López De Lacalle, L. N., An experimental investigation of the effect of coatings and cutting parameters on the dry drilling performance of aluminium alloys. The International Journal of Advanced Manufacturing Technology, 2006. 28(1-2): p. 1-11, ISSN: 0268-3768.
150. Kelly, J. F. and Cotterell, M. G., Minimal lubrication machining of aluminium alloys. Journal of Materials Processing Technology, 2002. 120(1-3): p. 327-334, ISSN: 0924-0136.
151. List, G., Nouari, M., Géhin, D., Gomez, S., Manaud, J. P., Le Petitcorps, Y. and Girot, F., Wear behaviour of cemented carbide tools in dry machining of aluminium alloy. Wear, 2005. 259(7-12): p. 1177-1189, ISSN: 0043-1648.
152. Nouari, M., List, G., Girot, F. and Géhin, D., Effect of machining parameters and coating on wear mechanisms in dry drilling of aluminium alloys. International Journal of Machine Tools and Manufacture, 2005. 45(12-13): p. 1436-1442, ISSN: 0890-6955.
153. Bhowmick, S. and Alpas, A. T., The performance of hydrogenated and non-hydrogenated diamond-like carbon tool coatings during the dry drilling of 319 Al. International Journal of Machine Tools and Manufacture, 2008. 48(7-8): p. 802-814, ISSN: 0890-6955.
154. Bhowmick, S. and Alpas, A. T., Minimum quantity lubrication drilling of aluminium-silicon alloys in water using diamond-like carbon coated drills. International Journal of Machine Tools and Manufacture, 2008. 48(12-13): p. 1429-1443, ISSN: 0890-6955.
155. Hanyu, H., Kamiya, S., Murakami, Y. and Kondoh, Y., The improvement of cutting performance in semi-dry condition by the combination of DLC coating and CVD smooth surface diamond coating. Surface and Coatings Technology, 2005. 200(1-4): p. 1137-1141, ISSN: 0257-8972.
156. Batzer, S. A., Haan, D. M., Rao, P. D., Olson, W. W. and Sutherland, J. W., Chip morphology and hole surface texture in the drilling of cast Aluminum alloys. Journal of Materials Processing Technology, 1998. 79(1-3): p. 72-78, ISSN: 0924-0136.
157. Tang, Z. T., Liu, Z. Q., Pan, Y. Z., Wan, Y. and Ai, X., The influence of tool flank wear on residual stresses induced by milling aluminum alloy. Journal of Materials Processing Technology, 2009. 209(9): p. 4502-4508, ISSN: 0924-0136.
158. Kim, D. and Ramulu, M., Drilling process optimization for graphite/bismaleimide-titanium alloy stacks. Composite Structures, 2004. 63(1): p. 101-114, ISSN: 0263-8223.
159. Ramulu, M., Branson, T. and Kim, D., A study on the drilling of composite and titanium stacks. Composite Structures, 2001. 54(1): p. 67-77, ISSN: 0263-8223.

REFERENCES
215
160. Kim, D. and Ramulu, M., Study on the Drilling of Titanium/Graphite Hybrid Composites. Journal of Engineering Materials and Technology, 2007. 129(3): p. 390-396, ISSN: 1528-8889.
161. Zitoune, R., Krishnaraj, V. and Collombet, F., Study of drilling of composite material and aluminium stack. Composite Structures, 2010. 92(5): p. 1246-1255, ISSN: 0263-8223.
162. Dawson, S., Personal communication. 2010, Unimerco Ltd. 163. Brinksmeier, E. and Janssen, R., Drilling of Multi-Layer Composite Materials consisting
of Carbon Fiber Reinforced Plastics (CFRP), Titanium and Aluminum Alloys. CIRP Annals - Manufacturing Technology, 2002. 51(1): p. 87-90, ISSN: 0007-8506.
164. Park, I. W. and Dornfeld, D. A., A Study of Burr Formation Processes Using the Finite Element Method: Part II-The Influences of Exit Angle, Rake Angle, and Backup Material on Burr Formation Processes. Journal of Engineering Materials and Technology, 2000. 122(2): p. 229-237, ISSN: 1528-8889.
165. Mills, B., Recent developments in cutting tool materials. Journal of Materials Processing Technology, 1996. 56(1-4): p. 16-23, ISSN: 0924-0136.
166. Heath, P. J., Developments in applications of PCD tooling. Journal of Materials Processing Technology, 2001. 116(1): p. 31-38, ISSN: 0924-0136.
167. Brookes, K., World dictionary and handbook of hardmetals and hard materials. 6th ed. 1996, Hertfordshire: International carbide data. 750, ISBN: 0950899542.
168. May, P. W., CVD diamond: a new technology for the future? Endeavour, 1995. 19(3): p. 101-106, ISSN: 0160-9327.
169. Davim, J. P. and Mata, F., Chemical vapour deposition (CVD) diamond coated tools performance in machining of PEEK composites. Materials & Design, 2008. 29(8): p. 1568-1574, ISSN: 0261-3069.
170. Köpf, A., Feistritzer, S. and Udier, K., Diamond coated cutting tools for machining of non-ferrous metals and fibre reinforced polymers. International Journal of Refractory Metals and Hard Materials, 2006. 24(5): p. 354-359, ISSN: 0263-4368.
171. Gäbler, J., Schäfer, L. and Westermann, H., Chemical vapour deposition diamond coated microtools for grinding, milling and drilling. Diamond and Related Materials. 9(3-6): p. 921-924, ISSN: 0925-9635.
172. Miyake, S., Tribological properties of hard carbon films: extremely low friction mechanism of amorphous hydrogenated carbon films and amorphous hydrogenated SiC films in vacuum. Surface and Coatings Technology, 1992. 54-55(Part 2): p. 563-569, ISSN: 0257-8972.
173. Vandevelde, T. C. S., Vandierendonck, K., Van Stappen, M., Du Mong, W. and Perremans, P., Cutting applications of DLC, hard carbon and diamond films. Surface and Coatings Technology, 1999. 113(1-2): p. 80-85, ISSN: 0257-8972.
174. Jiang, J. and Arnell, R. D., The effect of substrate surface roughness on the wear of DLC coatings. Wear, 2000. 239(1): p. 1-9, ISSN: 0043-1648.
175. Monaghan, D. P., Teer, D. G., Logan, P. A., Efeoglu, I. and Arnell, R. D., Deposition of wear resistant coatings based on diamond like carbon by unbalanced magnetron sputtering. Surface and Coatings Technology, 1993. 60(1-3): p. 525-530, ISSN: 0257-8972.
176. Kinoshita, H., Ippei, I., Sakai, H. and Ohmae, N., Synthesis and mechanical properties of carbon nanotube/diamond-like carbon composite films. Diamond and Related Materials, 2007. 16(11): p. 1940-1944, ISSN: 0925-9635.
177. Smith, G., Cutting Tool Technology 2008, London: Springer. 25, ISBN: 9781848002043. 178. Coelho, R. T., Yamada, S., Aspinwall, D. K. and Wise, M. L. H., The application of
polycrystalline diamond (PCD) tool materials when drilling and reaming aluminium based

REFERENCES
216
alloys including MMC. International Journal of Machine Tools and Manufacture, 1995. 35(5): p. 761-774, 0890-6955.
179. Schouwenaars, R., Jacobo, V. H. and Ortiz, A., Transition from normal to severe wear in PCD during high-speed cutting of a ductile material. International Journal of Refractory Metals and Hard Materials, 2009. 27(2): p. 403-408, ISSN: 0263-4368.
180. Ramulu, M., Faridinia, M., Garbini, J. and Jorgensen, J., Machining of Graphite/Epoxy Composite Materials with Polycrystalline Diamond (PCD) Tools. Journal of engineering materials and technology, Transactions of the ASME, 1991. 113: p. 430-436, ISSN: 10871357.
181. Ding, X., Liew, W. Y. H. and Liu, X. D., Evaluation of machining performance of MMC with PCBN and PCD tools. Wear, 2005. 259(7-12): p. 1225-1234, ISSN: 0043-1648.
182. Montgomery, D. C., Design and Analysis of Experiments. 6th ed. 2005, New York: Wiley, ISBN: 047148735X
183. Ross, P. J., Taguchi Techniques for quality Engineering. 2nd edition ed. 1996, New York: McGraw-Hill, ISBN: 0070539588.
184. Pignatiello, J. and Ramberg, J., Top ten triumphs and tragedies of Genichi Taguchi. Quality engineering, 1991-92. 4(2): p. 211-225, ISSN: 1532-4222.
185. Taguchi, G., Taguchi Quality Engineering 2005, New Jersey: Wiley, ISBN: 0471413348. 186. Lin, S. C. and Ting, C. J., Tool wear monitoring in drilling using force signals. Wear,
1995. 180(1-2): p. 53-60, ISSN: 0043-1648. 187. Sharman, A. R. C., Amarasinghe, A. and Ridgway, K., Tool life and surface integrity
aspects when drilling and hole making in Inconel 718. Journal of Materials Processing Technology, 2008. 200 (1-3): p. 424-432, ISSN: 0924-0136.

APPENDICES
217
APPENDIX A
Industrial collaborator’s contact details
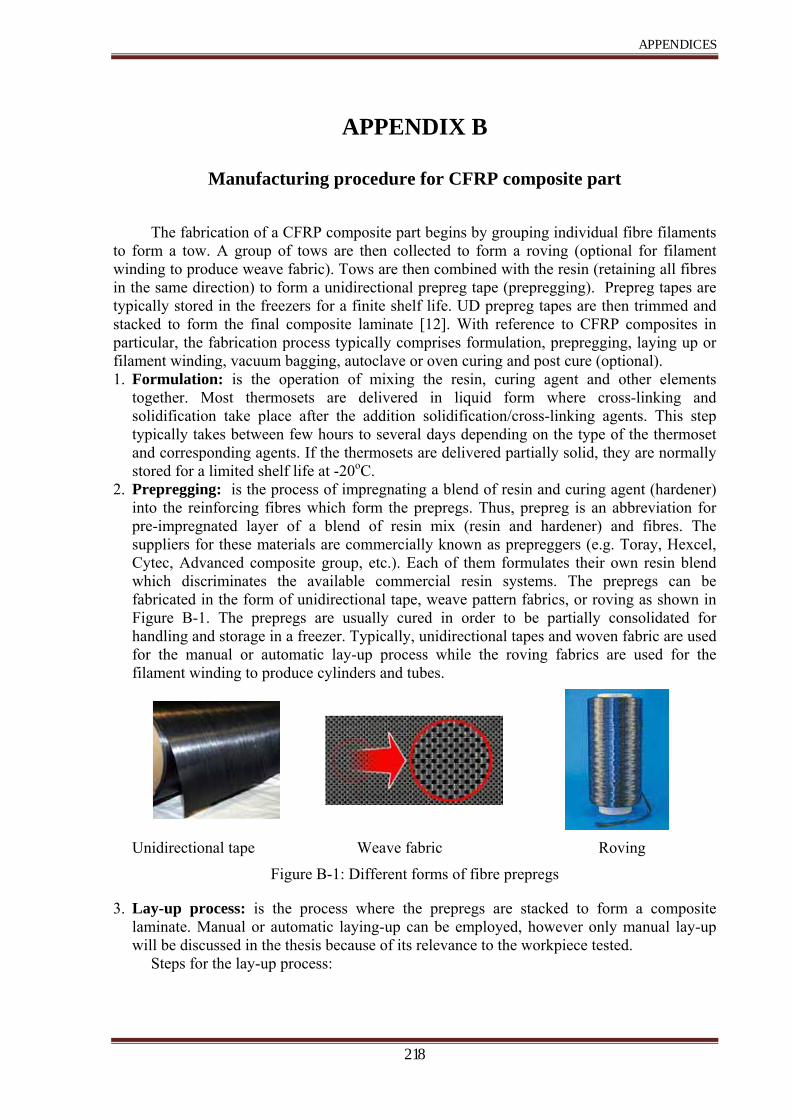
APPENDICES
218
APPENDIX B
Manufacturing procedure for CFRP composite part
The fabrication of a CFRP composite part begins by grouping individual fibre filaments to form a tow. A group of tows are then collected to form a roving (optional for filament winding to produce weave fabric). Tows are then combined with the resin (retaining all fibres in the same direction) to form a unidirectional prepreg tape (prepregging). Prepreg tapes are typically stored in the freezers for a finite shelf life. UD prepreg tapes are then trimmed and stacked to form the final composite laminate [12]. With reference to CFRP composites in particular, the fabrication process typically comprises formulation, prepregging, laying up or filament winding, vacuum bagging, autoclave or oven curing and post cure (optional). 1. Formulation: is the operation of mixing the resin, curing agent and other elements
together. Most thermosets are delivered in liquid form where cross-linking and solidification take place after the addition solidification/cross-linking agents. This step typically takes between few hours to several days depending on the type of the thermoset and corresponding agents. If the thermosets are delivered partially solid, they are normally stored for a limited shelf life at -20oC.
2. Prepregging: is the process of impregnating a blend of resin and curing agent (hardener) into the reinforcing fibres which form the prepregs. Thus, prepreg is an abbreviation for pre-impregnated layer of a blend of resin mix (resin and hardener) and fibres. The suppliers for these materials are commercially known as prepreggers (e.g. Toray, Hexcel, Cytec, Advanced composite group, etc.). Each of them formulates their own resin blend which discriminates the available commercial resin systems. The prepregs can be fabricated in the form of unidirectional tape, weave pattern fabrics, or roving as shown in Figure B-1. The prepregs are usually cured in order to be partially consolidated for handling and storage in a freezer. Typically, unidirectional tapes and woven fabric are used for the manual or automatic lay-up process while the roving fabrics are used for the filament winding to produce cylinders and tubes.
Unidirectional tape Weave fabric Roving
Figure B-1: Different forms of fibre prepregs
3. Lay-up process: is the process where the prepregs are stacked to form a composite laminate. Manual or automatic laying-up can be employed, however only manual lay-up will be discussed in the thesis because of its relevance to the workpiece tested.
Steps for the lay-up process:

APPENDICES
219
a) Prepreg rolls should be removed from the freezer and allowed to thaw with the polyethylene bag. This typically takes a few hours for the 20 linear metre roll extracted from -18 oC freezer.
b) The prepregs are trimmed into the required shape in addition to other various material layers which are used in the vacuum bagging process. Glass scrim (optional layer for aerospace applications), is used to prevent galvanic corrosion (if aluminium fittings are used) as well as a method of minimising the effect of drill breakout. The nylon peel ply layer can be left on the composite laminate to reduce the risk of breakout during machining processes and also helps to keep the surface clean if secondary bonding is to take place. Perforated film is to regulate the flow of the excess resin from the part into the bleeder layer. The bleeder material absorbs and retains excess resin drawn from composite part while the release film prevents resin from crossing into the breather material. Breather layer (same material as bleeder) is used to enable the vacuum to uniformly pass and distribute through the fabric and ensure consistent and even pressure over the entire laminate. Finally, cutting the vacuum bag material oversize in order to cover the entire mould and also protects the component at the curing process in the autoclave.
c) The laying up process begins with putting a release film on a wood or carbon mould followed by prepregs, glass scrim, peel ply, perforated film, bleeder, release film, breather, and finally the vacuum bag. Prepregs are laid up on the mould in accordance with design instructions. Every 3 - 4 plies, the prepregs should be debulked by applying a vacuum in order to pull out bubbles and air gaps between the prepregs and to ensure that the laminate matches the mould shape.
d) The mould edges are also covered with pressure sensitive tape and sealing tape in order to seal the vacuum bag with the mould surface. The layup product is subsequently placed under vacuum (750 - 980 mbar) for 5 – 10 minutes in order to release air and compress the lay-up laminate. Vacuum should be checked using gauges positioned on different locations on the vacuum bag to ensure even distribution. 4. Curing process: is used to release the moisture, excess air, volatiles from the composite
laminate and facilitate composite laminate consolidation, this is typically carried out in either an oven or autoclave. Two elements are essential for the curing cycle; heating and pressure. Heating is used to cure the resin material and reduce its viscosity while pressure is employed to consolidate and compress the composite laminate, see Figure B-2 for typical curing cycle for a monolithic composite component. The oven is used with the vacuum bag moulding for complex and relatively large components curing. Even pressure is applied up to 1bar. Vacuum bag and oven can produce reasonable quality components despite their relatively low cost compared to the autoclave process. Autoclave is a large heated pressure vessel which is similar to the vacuum bag and oven cured processing except the required additional pressure (up to 7 bar). The autoclave is employed when high quality composite components are required, e.g. for aircraft structural components such as wing spars and skins, fins and fuselage. Curing can be in two stages (initial and post curing) or only one stage (full curing). Post curing is essential for products initially cured below 150oC where full properties of the composite part such as maximum Tg can be achieved.

APPENDICES
220
Figure B-2: Typical curing cycle for monolithic components [Adopted from Hexcel
Corporation]
An example for the curing cycle is detailed below (courtesy of ACG for MTM44-1 prepregs).
Curing: Oven cured with a heat up rate of 1°C/min with a step dwell of 80°C for 30 minutes followed by a heat up rate of 1°C to 135°C for 4 hrs all held at a minimum vacuum of 27"Hg (914 mbar). Post curing: heat up rate of 2.5°C/min to 135°C followed by a heat up rate of 0.2°C/min to a temperature of 180 - 200°C for 4 hrs. Free standing with no vacuum applied. Subsequently, cool at rate of 2oC/min to 70oC.
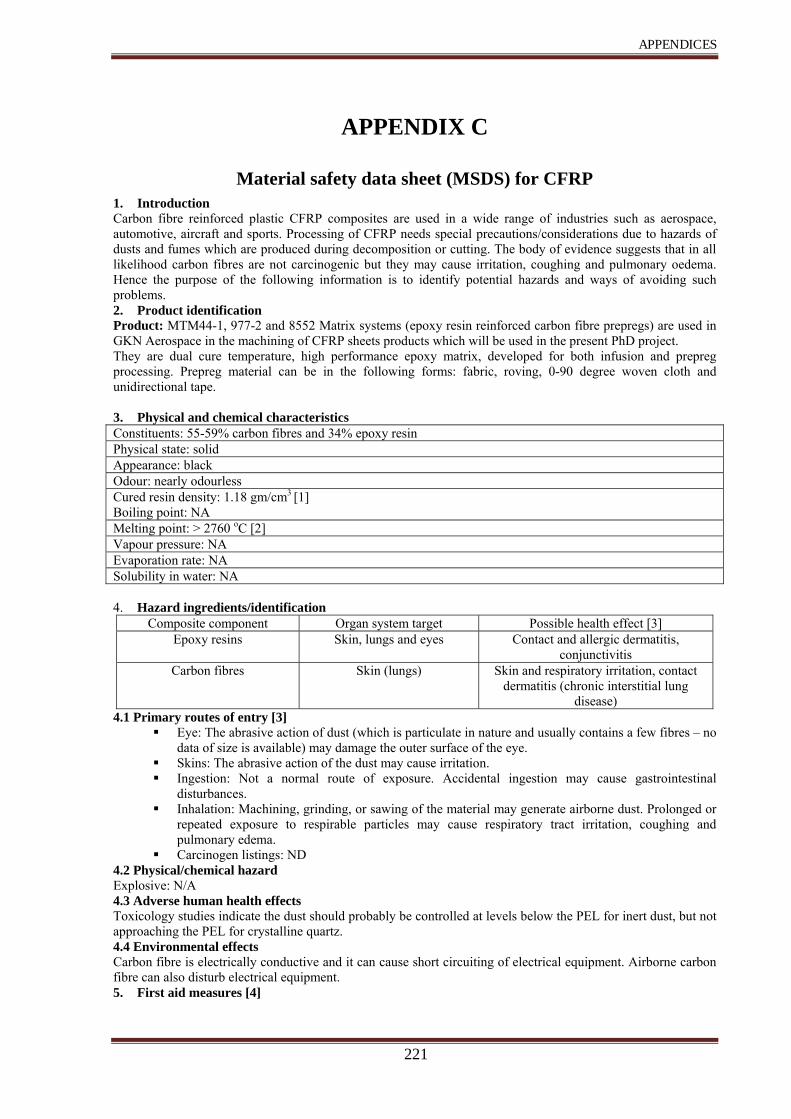
APPENDICES
221
APPENDIX C
Material safety data sheet (MSDS) for CFRP 1. Introduction Carbon fibre reinforced plastic CFRP composites are used in a wide range of industries such as aerospace, automotive, aircraft and sports. Processing of CFRP needs special precautions/considerations due to hazards of dusts and fumes which are produced during decomposition or cutting. The body of evidence suggests that in all likelihood carbon fibres are not carcinogenic but they may cause irritation, coughing and pulmonary oedema. Hence the purpose of the following information is to identify potential hazards and ways of avoiding such problems. 2. Product identification Product: MTM44-1, 977-2 and 8552 Matrix systems (epoxy resin reinforced carbon fibre prepregs) are used in GKN Aerospace in the machining of CFRP sheets products which will be used in the present PhD project. They are dual cure temperature, high performance epoxy matrix, developed for both infusion and prepreg processing. Prepreg material can be in the following forms: fabric, roving, 0-90 degree woven cloth and unidirectional tape. 3. Physical and chemical characteristics Constituents: 55-59% carbon fibres and 34% epoxy resin Physical state: solid Appearance: black Odour: nearly odourless Cured resin density: 1.18 gm/cm3 [1] Boiling point: NA Melting point: > 2760 oC [2] Vapour pressure: NA Evaporation rate: NA Solubility in water: NA
4. Hazard ingredients/identification
Composite component Organ system target Possible health effect [3] Epoxy resins Skin, lungs and eyes Contact and allergic dermatitis,
conjunctivitis Carbon fibres Skin (lungs) Skin and respiratory irritation, contact
dermatitis (chronic interstitial lung disease)
4.1 Primary routes of entry [3] Eye: The abrasive action of dust (which is particulate in nature and usually contains a few fibres – no
data of size is available) may damage the outer surface of the eye. Skins: The abrasive action of the dust may cause irritation. Ingestion: Not a normal route of exposure. Accidental ingestion may cause gastrointestinal
disturbances. Inhalation: Machining, grinding, or sawing of the material may generate airborne dust. Prolonged or
repeated exposure to respirable particles may cause respiratory tract irritation, coughing and pulmonary edema.
Carcinogen listings: ND 4.2 Physical/chemical hazard Explosive: N/A 4.3 Adverse human health effects Toxicology studies indicate the dust should probably be controlled at levels below the PEL for inert dust, but not approaching the PEL for crystalline quartz. 4.4 Environmental effects Carbon fibre is electrically conductive and it can cause short circuiting of electrical equipment. Airborne carbon fibre can also disturb electrical equipment. 5. First aid measures [4]

APPENDICES
222
General information: Change contaminated clothing. Eye: Flush eyes with large amounts of water for 15 minutes. Eyelids should be held away from the
eyeballs to ensure through rinsing. Seek medical attention if irritation persists. Skin: Wash gently with soap and water to remove dust and fibres. Ingestion: Drink extra water to assist natural elimination. Seek medical attention if gastrointestinal
irritation persists or other symptoms such as nausea, vomiting, or abdominal pain occur. Inhalation: Move to fresh air. Drink water to clear throat and blow nose to remove fibres. Get
medical attention if necessary. 6. Fire fighting measures [5]
Flash point: Not known, but very high Flammable limits: NA
Fire extinguishing media: Non-burning. Special fire fighting procedures: Treat the surrounding fire
Unusual fire and explosion hazards: ND Hazardous combustion products: ND
7. Accidental release measures [6]
Action to take for spills/leaks: NA Personal precautions: wear protective equipment.
Avoid contact with skin, eyes, and clothing. Keep away from unprotected people. Provide adequate ventilation.
Environmental precautions: Do not allow to enter ground soil, sewage or drains.
Methods for cleaning up / spillage removal: Remove mechanically, placing in appropriate containers for disposal.
8. Exposure controls / personal protection 8.1 Critical values of exposure [6]
Chemical name type Value
Fibre (Carbon Fibre or Glass Fibre)
ACGIH-TWA 10 mg/m³
NIOSH-TWA 3 fibers/cm³ for (Fibres less than or equal to 3.5 μm in diameter and greater than or equal to 10μm in length.)
Formulated Epoxy Resin TWA (Total) 15 mg/m³ TWA (Respirable) 5 mg/m³
8.2 Limitation and monitoring of exposure at workplace [6]. Provide good ventilation and/or an exhaust system in the work area.
Respiratory protection: In case of insufficient ventilation or when dust concentration exceeds recommended TLV of 10 mg/m3 (total dust) or 5 mg/m3 (respirable dust) wear an approved particulate respirator. Respiratory protection is also required when product is heated to 48°C or above.
Hand protection: Rubber or plastic gloves according to EN 374. The glove manufacturer's instructions must be observed concerning the penetrability and the wearing-out time. Apply barrier cream or wear long sleeved shirt to prevent fibrous matter from contacting exposed skin. Wash exposed skin areas before eating and at end of work day.
Eye protection: Tightly sealed safety glasses with side shields according to EN 166. General protection and hygiene measures:
Wash hands when done working with material; at breaks, lunch, shift changes. Avoid contact with skin and eyes. When working, do not eat, drink or smoke. Eye wash facility must be provided. Wash work clothing frequently.

APPENDICES
223
9. Stability and reactivity Conditions to avoid (hazardous reactions):
Keep away from heat. Carbon Fibre is electrical conductive. It may cause short circuits of electrical apparatus, especially when airborne fibres are drifting in the area.
Materials to avoid: Avoid contact with strong acids, strong bases and oxidizing agents. Hazardous decomposition products: In case of fire may form carbon monoxide and carbon dioxide
and may form toxic materials. Polymerization: will not occur
10. Handling and storage
Handling: store in plastic bags in which the product is shipped, tightly sealed. Storage: No special storage considerations are known.
11. Toxicological information
General remarks: Prolonged periods of contamination may lead to mild irritation. Sensitization: May cause sensitization by skin contact.
12. Disposal considerations
Do not incinerate. Waste material should be bagged or containerized, sealed and disposed of in an approved landfill in accordance with local regulations. Product as shipped is not considered a hazardous waste under current RCRA regulations.
13. Special precautions
Electrical equipment, enclosures and circuits in or near areas where carbon fibres are used should be protected against infiltration of or contact with airborne particles or filaments.
Store carbon fibres product in original containers and avoid conditions that may generate carbon dust or lint.
As with all industrial products, selection of specific personal protective equipment (e.g., gloves, disposable, clothing, respirators) and general control (e.g., local exhaust ventilation) depends upon the type of operation and exposure potential. To avoid ingestion incidental to handling, food and tobacco should not be present in the work area. Wash skin contact areas with soap and water after handling.
Abbreviations CFRE Carbon Fibre Reinforced Epoxy OSHA Occupational Safety & Health Administration PEL Personal Exposure Limit N/A Not Applicable N/D Not Determined EN European Standards RCRA Resource Conservation and Recovery Act (US Environmental protection agency) TLV Threshold Limit Value References [1] Advanced composites group Ltd., MTM 44-1. [2] Fibre Glast Development Corporation, material safety data sheet for THORNEL pan based standard modulus carbon fibres. [3] Occupational safety and health administration, http://www.osha.gov. [4] OSHA’s hazard communication standard, MSDS 29 CFR 1910.1200. [5] MSDS for product no. 91202, 91202-2, 91202-3, 91202-20 carbon fibre, http://www.tedpella.com/msds_html/91202,91202-2,91202-20,91202-3msds.htm [6] Otto Bock safety data sheet for SL-1 – ADP, SP II, GM, Footplates, http://www.otoobockus.com.
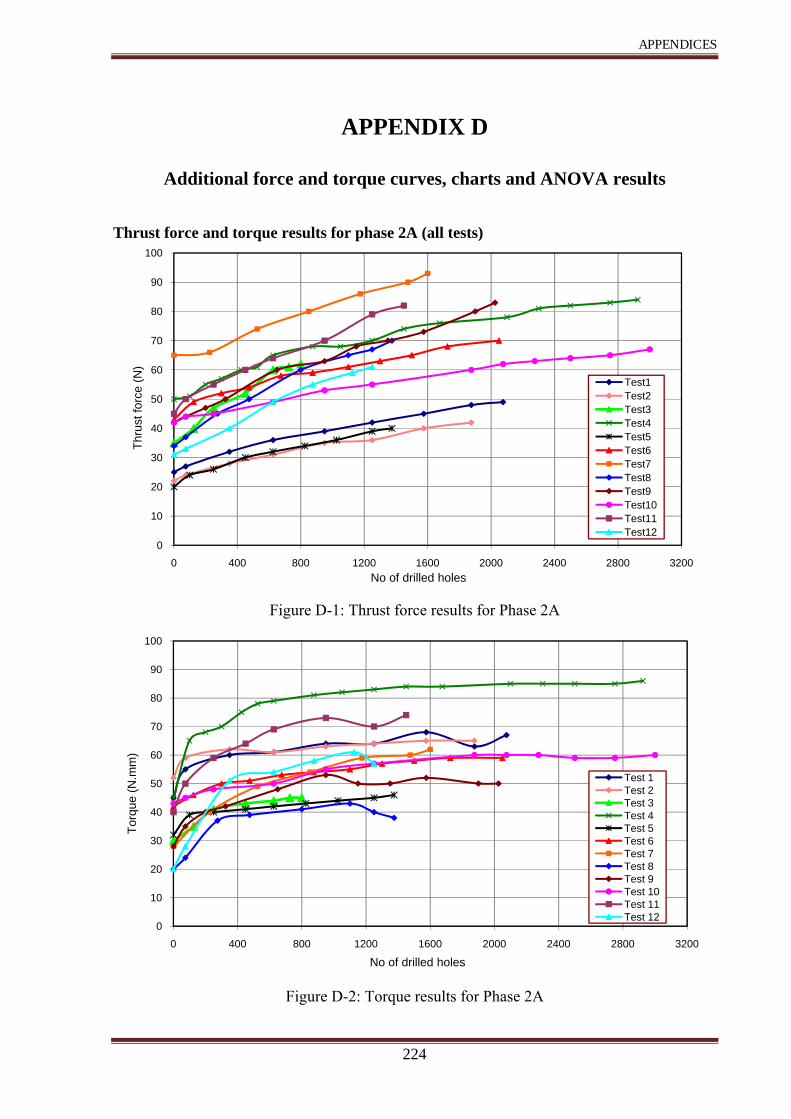
APPENDICES
224
APPENDIX D
Additional force and torque curves, charts and ANOVA results
Thrust force and torque results for phase 2A (all tests)
Figure D-1: Thrust force results for Phase 2A
Figure D-2: Torque results for Phase 2A
0
10
20
30
40
50
60
70
80
90
100
0 400 800 1200 1600 2000 2400 2800 3200
Thru
st fo
rce
(N)
No of drilled holes
Test1Test2Test3Test4Test5Test6Test7Test8Test9Test10Test11Test12
0
10
20
30
40
50
60
70
80
90
100
0 400 800 1200 1600 2000 2400 2800 3200
Torq
ue (N
.mm
)
No of drilled holes
Test 1Test 2Test 3Test 4Test 5Test 6Test 7Test 8Test 9Test 10Test 11Test 12

APPENDICES
225
Thrust force and torque results for phase 2B Figures D-3 and D-4 show thrust force and torque results when using CVD diamond coated drills at 0.4 mm/rev feed rate respectively. Thrust force reached ~ 380 N when using Rhobest diamond coated tools in contrast to up to 170 N for uncoated and DLC coated equivalent.
Figure D-3: Thrust force for the last hole drilled at 0.4 mm/rev feed rate
Figure D-4: Torque for the last hole drilled at 0.4 mm/rev feed rate
0
50
100
150
200
250
300
350
400
Uncoated DLC Rhobest diamond coating
Diamond plus Diamond fibre speed
Thru
st fo
rce
(N)
Coating type
UD MTM44-1/HTS
Woven 977-2/HTS
0
10
20
30
40
50
60
70
80
90
Uncoated DLC Rhobest diamond coating
Diamond plus Diamond fibre speed
Torq
ue (N
.mm
)
Coating type
UD MTM44-1/HTS
Woven 977-2/HTS

APPENDICES
226
Force and torque profiles recorded in Phase 3A Figures D-5 and D-6 show thrust force and torque signatures when drilling using pecking and no pecking respectively. Chatter and noise in the signals were reduced in addition to the benefit of saving retraction time.
Figure D-5: Thrust force and torque profiles recorded when drilling the first hole
Figure D-6: Thrust force and torque profiles recorded when drilling hole number 115
S = 750 rpm, V = 15 m/min, F= 0.1 mm/rev, Vf= 75 mm/min, Pecking = 5 mm, Tool retraction = 1 mm
Time (seconds)
Chatter
Torque continued to increase until tool reached chatter point
Thru
st fo
rce
(N) a
nd to
rque
(N.c
m)
0 4 8 12 16 20 24 28
S = 2000 rpm, V = 40 m/min, F= 0.1 mm/rev, Vf= 200 mm/min, Pecking = No
Chatter/noise was marginally reduced
0 1 2 3 4 5 6 7 8 Time (seconds)
Thru
st fo
rce
(N) a
nd to
rque
(N.c
m)

APPENDICES
227
Thrust force and torque results for phase 3C Figure D-7 depicts thrust force results corresponding to last hole drilled. A maximum force was measured when drilling titanium and was up to ~2500 N at a cutting speed of 20/40 m/min and feed rate of 0.1 mm/rev. Figure D-8 shows torque results corresponding to the first hole. Higher torque levels were measured for tests experiencing premature tool failures in contrast to tests with gradual wear which had comparatively lower torque values.
Figure D-7: Thrust force results corresponding to the last hole drilled
Figure D-8: Torque results corresponding to the first hole drilled
0
500
1000
1500
2000
2500
20/40 0.05
40/80 0.1
60/120 0.15
20/40 0.05
40/80 0.1
60/120 0.15
20/40 0.1
40/80 0.15
60/120 0.05
20/40 0.15
40/80 0.05
60/120 0.1
20/40 0.1
20/40 0.15Uncoated
CVD diamond coated C7 coated Uncoated CVD diam
C7
Wet cuttingSpray mist cutting
Thru
st fo
rce
(N)
Thrust force at CFRPThrust force at AlThrust force at Ti
* Drill failed at first hole
**
*
050
100150200250300350
20/40 0.05
40/80 0.1
60/120 0.15
20/40 0.05
40/80 0.1
60/120 0.15
20/40 0.1
40/80 0.15
60/120 0.05
20/40 0.15
40/80 0.05
60/120 0.1
20/40 0.1
20/40 0.15Uncoated
CVD diamond coated C7 coated Uncoated CVD
diamC7
Wet cuttingSpray mist cutting
Torq
ue (N
.cm
)
Torque at CFRPTorque at AlTorque at Ti

APPENDICES
228
APPENDIX E
Cutting temperature measurement results (Phase 2A) Introduction ThermaCAM cameras measure and produce images from all infrared radiation received from an object. Infrared radiation is a function of object surface temperature and this makes it possible for the camera to calculate and display this temperature. Emissivity is the most important object parameter to set correctly for accurate temperature measurement. Values fall in a range from 0.0 to 1.0. Figure E-1 shows the experimental setup employed. ThermaCAM S640 specifications
Accuracy +/- 2 oC or +/- 2% of the reading
Thermal sensitivity < 0.06 oC @ +30 oC
Resolution 640x480 pixels
Operating temperature range 0 – 500 oC
Lens 40 mm
Display type Large 5.6” Swivel / Color LCD
Emissivity adjustment 0.0 – 1.0
Figure E-1: Cutting temperature setup on Matsuura FX-5 using ThermaCAM which was loaned from EPSRC

APPENDICES
229
Figure E-2: Drilling UD MTM44-1/HTS OOAC at 0.4 mm/rev feed rate using worn standard twin lipped twist drill (after 3250 holes)
Figure E-3: Temperature curve when drilling UD MTM44-1/HTS OOAC at 0.4 mm/rev feed rate using worn standard twin lipped twist drill (following 3250 holes)
Findings Limited temperature measurements were performed including UD MTM44-1/HTS and woven 977-2/HTS laminates using new and worn cutting tools at the higher feed rate level used in the current work (0.4 mm/rev) respectively. Maximum cutting temperature of ~250 oC after 3350 holes was recorded when cutting UD MTM44-1/HTS (see Figure E-2 and E-3) while this was up to 200 oC when cutting woven 977-2/HTS was measured as shown in Figure E-4.
Tool holder
Twist drill
CFRP plate
~ 250 oC

APPENDICES
230
Figure E-4: Maximum drilling temperature development when cutting woven 977-2/HTS AC at 0.4 mm/rev feed rate
Tool life (number of drilled holes)

APPENDICES
231
APPENDIX F
List of publications and awards
Papers published Islam Shyha, Sein Leung Soo, David K. Aspinwall, Sam Bradley Effect of peel ply when drilling small holes in CFRP Proceedings of the Institution of Mechanical Engineers, Part B: Journal of Engineering Manufacture, Accepted in press, 2010 ISSN: 2041-2975 Islam Shyha, Sein Leung Soo, David K. Aspinwall, Sam Bradley, Stuart Dawson, Cornelius J. Pretorius Drilling of Titanium/CFRP/Aluminium Stacks Key Engineering Materials Vols. 447-448 (2010) pp 624-633 (Selected, peer reviewed paper from the ICoPE2010 & 13th ICPE International Conference on Precision Engineering, Singapore, 28 – 30 July 2010) ISSN: 1013-9826 Islam Shyha, Sein Leung Soo, David Aspinwall, Sam Bradley Effect of laminate configuration and feed rate on cutting performance when drilling holes in carbon fibre reinforced plastic composites Journal of Materials Processing Technology, Volume 210, Issue 8, 1 June 2010, Pages 1023-1034 ISSN: 0924-0136 I.S. Shyha, D.K. Aspinwall, S.L. Soo, S. Bradley Drill geometry and operating effects when cutting small diameter holes in CFRP International Journal of Machine Tools and Manufacture, Volume 49, Issues 12-13, October 2009, Pages 1008-1014 ISSN: 0890-6955 Islam Shyha, Sein Leung Soo, David Aspinwall, Sam Bradley Small hole drilling of carbon fibre composites using diamond coated drills Energy Efficient & Low Carbon Manufacturing, Proceedings of the 26th International Manufacturing Conference (IMC26), Trinity College Dublin, Ireland, 02-04 September 2009, pp. 87-94 ISBN: 978-0-9562303-8-6 Islam Shyha, Sein Leung Soo, David Aspinwall, Sam Bradley Experimental study of small hole drilling in diverse CFRP laminate configurations Proceedings of the 9th International Conference on Production Engineering, Design and Control (PEDAC 2009), Alexandria, Egypt, 10-12 February 2009 Papers under preparation Islam Shyha, David K. Aspinwall, Sein Leung Soo Drilling of Carbon Fibre reinforced Plastic Composites: A Review Islam Shyha, Sein Leung Soo, David K. Aspinwall, Sam Bradley, Stuart Dawson, Cornelius J. Pretorius Hole quality assessment when drilling metallic/composite stacks using diamond coated drills
Awards 2009 Best conference student paper award, awarded by the Consortium of Manufacturing engineering
Heads (COMEH) at the International Manufacturing Conference (IMC26) for the paper “Small hole drilling of carbon fibre composites using diamond coated drills”