john zobolas_phd.pdf - ntnu open
TRANSCRIPT
ISBN 978-82-326-6941-7 (printed ver.)ISBN 978-82-326-6260-9 (electronic ver.)
ISSN 1503-8181 (printed ver.)ISSN 2703-8084 (online ver.)
Doctoral theses at NTNU, 2021:255
John Zobolas
Software implementationsallowing new approachestoward data analysis, modelingand curation ofbiological knowledge forSystems Medicine
Doc
tora
l the
sis
Doctoral theses at N
TNU
, 2021:255John Zobolas
NTN
UN
orw
egia
n U
nive
rsity
of S
cien
ce a
nd T
echn
olog
yTh
esis
for t
he D
egre
e of
Philo
soph
iae
Doc
tor
Facu
lty o
f Nat
ural
Sci
ence
sD
epar
tmen
t of B
iolo
gy

Thesis for the Degree of Philosophiae Doctor
Trondheim, August 2021
Norwegian University of Science and TechnologyFaculty of Natural SciencesDepartment of Biology
John Zobolas
Software implementationsallowing new approachestoward data analysis, modelingand curation ofbiological knowledge forSystems Medicine

NTNUNorwegian University of Science and Technology
Thesis for the Degree of Philosophiae Doctor
Faculty of Natural SciencesDepartment of Biology
© John Zobolas
ISBN 978-82-326-6941-7 (printed ver.)ISBN 978-82-326-6260-9 (electronic ver.)ISSN 1503-8181 (printed ver.)ISSN 2703-8084 (online ver.)
Doctoral theses at NTNU, 2021:255
Printed by NTNU Grafisk senter
Contents
Acknowledgements v
Abstract vii
Paper list xiPrimary . . . . . . . . . . . . . . . . . . . . . . . . . . . . . . . . . . . . . . . . . . . xiAdditional . . . . . . . . . . . . . . . . . . . . . . . . . . . . . . . . . . . . . . . . . . xii
Abbreviations xiii
Summary 1One for all . . . . . . . . . . . . . . . . . . . . . . . . . . . . . . . . . . . . . . . . . . 1Dots and lines . . . . . . . . . . . . . . . . . . . . . . . . . . . . . . . . . . . . . . . . 3Knowledge from a stack of papers . . . . . . . . . . . . . . . . . . . . . . . . . . . . . 5Biological Dictionaries aid in the curation of complex knowledge . . . . . . . . . . . . . 8Sharing causal interactions with PSICQUIC . . . . . . . . . . . . . . . . . . . . . . . . 11Biological modeling: a Prelude . . . . . . . . . . . . . . . . . . . . . . . . . . . . . . . 15Clean Code . . . . . . . . . . . . . . . . . . . . . . . . . . . . . . . . . . . . . . . . . 18Get the right rules . . . . . . . . . . . . . . . . . . . . . . . . . . . . . . . . . . . . . . 24Discussion & Future Perspectives . . . . . . . . . . . . . . . . . . . . . . . . . . . . . . 28
Links to software, documentation and data analyses 33GitHub organizations . . . . . . . . . . . . . . . . . . . . . . . . . . . . . . . . . . . . 33Documentation . . . . . . . . . . . . . . . . . . . . . . . . . . . . . . . . . . . . . . . 33DrugLogics software modules . . . . . . . . . . . . . . . . . . . . . . . . . . . . . . . 33R community packages . . . . . . . . . . . . . . . . . . . . . . . . . . . . . . . . . . . 34Miscellaneous data analyses and repositories . . . . . . . . . . . . . . . . . . . . . . . . 34
References 35
Papers 51
iii

iv
AcknowledgementsI first acknowledge funding from the ERACoSysMed project COLOSYS. Now to people,
the most important part: I would like to thank everyone that interacted with me during the years Iconducted my PhD research (2017-2021), even for a tiny bit. A person is only a small node in acomplex network of interactions, which only when considered together, make up the person. Inother words, you are not just you! So, you were all important for me (and for others I am sure)!Importance though is measured in varying degrees. Therefore now, I will proceed to give somepersonal credits (the part that most of you came here to read :)
A big THANK YOU to my supervisor, Prof. Martin Kuiper. He gave me the opportunityto come to Norway, which opened a world of possibilities. The dream supervisor everyone shouldhave and a caring human being above all. A true gentleman and an unsurpassed cook as well!
To Dr. Åsmund Flobak for excellent co-supervision, the nice scientific discussions we hadand for introducing me into R, which largely influenced the way I do science. Spending time withhis lively family was always a nice change of pace. That day we were all together at Amsterdam’szoo and I saw my first penguins, will remain unforgettable!
To Dr. Steven Vercruysse for our scientific discussions and for teaching me and ins and outsof web software development. I will never forget the ELIXIR Biohackathon 2020, great laughs andgreat work, all in one. And of course, I will never forget the “tour” . Thanks Steven!
To Prof. Astrid Laegreid, for suggesting to me to participate in the Responsible Researchand Innovation (RRI) course, which inspired me to think more broadly about my research and theworld we live in, and of course meet several wonderful people! That’s also how I became acquaintedwith Digital Life Norway (DLN). Liv Eggset Falkenberg did an excellent job at coordinating theDLN Research School and she was co-organizer of the Walkshop in Jotunheimen (September 2019),which was a truly wonderful experience. With DLN, I had the benefit of participating in variousconferences across Norway and the opportunity to do an industry internship in Sweden during thecold winter of 2021, so thanks DLN and Liv!
To Noemi Del Toro Ayllon, for introducing me to the professional world of softwaredevelopment and project management with Java. Visiting the IntAct team at EBI during thesummer of 2018 was a memorable experience and when she came to Trondheim later in 2019, wehad such a great time, so thank you Noe!
v
To Henning Hermjacob, for not just being the scientific host for my visits to EBI in England,but also for hosting me in his lovely Airbnb house each time! Spending a few months in Cambridgeduring my PhD was a truly marvelous experience, so thanks Henning!
To Professors Denis Thieffry, Pedro T. Monteiro and Jin-Dong Kim for the nice discussionswe had, resulting in excellent collaborations.
And of course, to my colleagues from the DrugLogics group, for the good times we spentinside and outside of work! I am especially grateful to Barbara Niederdorfer and Evelina Folkessonfor our music sessions.1 Eirini Tsirvouli has been a very positive, dynamic presence. Rafel RiudavetsPuig has been a really close friend - I hope that in the future we get to continue our random walks thatsomehow always end up in McDonalds! Marcio Luis Acencio has been a good friend as well, with awonderful family that gained two new members I got to meet before he left our group! VasundraTouré has been a wonderful colleague, a true source of light for the time we spend at our office inGloshaugen (and it was really dark in general). Wine, cheese, standards and good memories! Also,favorite cafe buddies with Anamika Chatterjee - we certainly made Espresso House richer (though Ilater switched to Dromedar, say sorry)! Lastly, thanks to Miguel Vazquez, our Spanish collaborator,who taught me my first tricks with R programming, and is a really nice person to spend time withoutside work!
Last but not least, a big THANKS to the beautiful city of Trondheim! I’ve had some reallyinspirational walks in these historic roads. And to its nice coffee shops I’ve been working throughoutmy PhD! Diverse working environment is extremely important and as it was perfectly stated:
John Zobolas, June 2021
1Check our wonderful duet here: https://youtu.be/_BzE7DlHs5g
vi
AbstractCancer is one the most prevalent human diseases. The scientific community has devoted
considerable efforts to understand the mechanisms behind this disease and search for treatments thatpromise a better quality of life for patients. To accomplish this goal, Biology and Medicine havejoined forces with Computer Sciences, using the power of Computational modeling, Mathematics,Machine Learning and Statistics. This interdisciplinary effort to address the cancer problem,constitutes the basis upon which this thesis was formed. We present several contributions to thiseffort, consisting of software, data analyses and mathematical investigations, which have enabledthe more efficient curation of biological knowledge, the use of computer models to prioritize drugtreatments for cancer and the derivation of molecular mechanistic insights from the simulationresults.
In order to build a computational model of a biological system such as a cancer cell, wefirst need a way to describe the structure of such a system. A common network-based approachprovides an elegant representation of such a structure, where molecular entities such as proteins andgenes are connected to each other via causal interactions, which in turn determine cellular behaviorand the functional properties of the cell as an integrated system of individual components. Theseinteractions form the Prior Knowledge Network (PKN), which serves as the basic building blockfor most computational biological models. Nonetheless, several challenges exist, even at this earlystage of the modeling process.
The first problem is that biological information by its very nature is largely complex, andtherefore its formalization to a structured, computable form for use in modeling applications,demands extra attention. The translation of scientific knowledge from publications into such acomputable form is achieved with the use of specialized software tools and is the main responsibilityof biocurators. In order to help biocurators be more efficient in their annotation tasks, we proposedthe Visual Syntax Method (VSM) as an alternative approach for general-purpose knowledge formal-ization. In particular, we implemented a user interface component (VSM-box) that enables curatorsto annotate any type of information, no matter its complexity, and translate it into an intuitive, flexiblesentence-like format. This software was used to build a prototype curation interface (CausalBuilder)for the annotation of molecular causal interactions, which constitute the cornerstone of a model’sPKN.
vii
The second problem concerns the availability and ease of access of causal molecular interac-tion data for modeling or other scientific endeavors. A standard format for the representation of suchsignaling information was developed (CausalTAB), and we supported the export of the causalitystatements from CausalBuilder’s interface to this format. But there exist several other molecularinteraction databases that could update their data to fit the new CausalTAB standard. PSICQUIC is aweb-service platform that was initially built so that users can conveniently fetch in a standard waymolecular interaction data from different sources. We extended PSICQUIC to incorporate the newCausalTAB format, so that causality-enriched information generated by our curation prototype toolor from other data providers could be shared through a common channel.
A third major problem arose during the design process of the VSM-box and its application,CausalBuilder. Behind the scenes, the curator interface has to communicate with a large numberof diverse biological data resources, each with its own online API service that provides access tothe respective data. In order to present to the user the available terms that pertain to a specificannotation of interest, a uniform way to query all these resources was needed. This prompted us tobuild the Unified Biological Dictionaries (UBDs), a software suite that provides a unified gatewayfor life science data, helping users retrieve the right query terms. In addition, curators sometimescome across new knowledge that is not yet available through the standard authoritative resources.To address this related problem, we connected UBDs with PubDictionaries, an online resource ofsimple dictionaries, allowing curators to publicly create and share ad-hoc terms, and further usethem as annotations in VSM-based applications.
After the signaling information has been curated and the causal interactions assembled toform the PKN, we then need to specify the mathematical equations of the cancer cell model. Thisallows us to describe and analyze its dynamical behavior subject to external stimuli, such as drugperturbations. The modeling approaches can in general range from qualitative to quantitative and inthis work we focused on Boolean modeling, where signaling components are assigned either an activeor inactive state. An automated computational pipeline was developed to produce an ensemble ofBoolean models from a PKN, calibrated to a specific cancer cell signaling phenotype. These modelsare then analyzed to suggest possible synergistic drug combinations and the results are comparedwith experimental findings, where all possible combinations are tested in a high-throughput screensetup. We demonstrated that our pipeline could prioritize specific drug combinations, reducingthe number of drugs that need to be tested in experiments, before a viable treatment is found fora patient. Moreover, several analyses indicated that our models can be used to derive mechanisticinsights about the diseased model and generate novel biological hypotheses. Lastly, we showed thesignificance of the PKN quality, where even small modifications to the cancer signaling networkcould severely affect our pipeline’s drug prediction performance.
viii
To exploit the range of parameterizations present in the Boolean models produced by ourpipeline, we devised several strategies to split and compare the different models in a dedicatedR package (emba). This supplementary effort allowed us to find potential biomarkers, whichare nodes whose state is decisive for the global behavior of the models and can indicate parts ofthe PKN that are responsible for a drug combination to be synergistic. Additionally, we noticedparticular patterns in the way specific equations always correspond to specific signaling states inour models, so we more deeply investigated the influence of the choice of parameterization on theoutput behavior of these nodes. This led us to propose a list of Boolean function metrics that canassist modelers in choosing more appropriate equations, meaning those that are consistent with theregulatory information present in the PKN and whose expected output better matches experimentalobservations. Finally, results from a study of diverse Boolean functions indicated that these alsoexhibit diverse output behaviors, with some being highly biased towards specific Boolean outcomeswhile others depending more on the ratio between positive and negative regulators, as these arederived from the two distinct types of causal interactions present in the model’s PKN.
ix

x
Paper list
Primary
Papers that I am first author:
• Paper 1: UniBioDicts: Unified access to Biological DictionariesZobolas, J., Touré, V., Kuiper, M., & Vercruysse, S. [1]
SV and VT identified the need for software to connect with the resources listed in MI2CASTused in the CausalBuilder tool. JZ implemented the software and wrote the manuscript. Allco-authors revised and provided inputs to the manuscript.
• Paper 2: Linking PubDictionaries with UniBioDicts to support Community CurationZobolas, J., Kim, J.-D., Kuiper, M., & Vercruysse, S. [2]
MK and SV developed the original idea for this project. JZ wrote the application for aBioHackathon project and invited JDK to collaborate. JZ implemented the client side, JDKthe server side. JZ wrote the manuscript. All co-authors revised and provided inputs to themanuscript.
• Paper 3: Fine tuning a logical model of cancer cells to predict drug synergies: combiningmanual curation and automated parameterization2
Flobak, Å., Zobolas J., Vazquez M., Steigedal T., Thommesen L., Grislingås A., NiederdorferB., Folkesson E., Kuiper M.
AF designed the project, developed initial software and executed experiments. JZ extendedthe software, ran all simulations, produced and analyzed results. AF and MK added biologicalinterpretation and wrote the manuscript. JZ provided various inputs and text to the manuscript.TS, LT and AG helped AF with experiments. MV developed prototype software. BN and EFdid curation work and performed experiments.
2(Manuscript) Shared first co-authorship, to be submitted to the Molecular Systems Biology Journal
xi
• Paper 4: emba: R package for analysis and visualization of biomarkers in Boolean modelensemblesZobolas, J., Kuiper, M., & Flobak, Å. [3]
AF developed the idea of this project. JZ wrote the software and the manuscript. All co-authorsrevised and provided inputs to the manuscript.
• Paper 5: Boolean function metrics can assist modelers to check and choose logical rules3
Zobolas, J., Monteiro, P. T., Kuiper, M., & Flobak, Å. [4]
JZ designed this project and wrote the manuscript. PTM and AF provided feedback and ideasto better shape the content of the manuscript. All co-authors revised and provided inputs tothe manuscript.
Additional
In the following papers I have contributed to the underlying software and manuscript text:
1. VSM-box: General-purpose Interface for Biocuration and Knowledge RepresentationVercruysse, S., Zobolas, J., Touré, V., Andersen, M. K., & Kuiper, M. [5]
2. CausalBuilder: Bringing the MI2CAST Causal Interaction Annotation Standard to the CuratorTouré, V., Zobolas, J., Kuiper, M., & Vercruysse, S. [6]
3. CausalTAB: the PSI-MITAB 2.8 updated format for signalling data representation and dis-seminationPerfetto, L., Acencio, M. L., Bradley, G., Cesareni, G., Del Toro, N., Fazekas, D., Hermjakob,H., Korcsmaros, T., Kuiper, M., Lægreid, A., Lo Surdo, P., Lovering, R. C., Orchard, S.,Porras, P., Thomas, P. D., Touré, V., Zobolas, J., & Licata, L. [7]
3(Preprint) To be submitted to the Journal of Theoretical Biology
xii
Abbreviations
abmlog All possible Boolean Models Link Operator GeneratorAGS Gastric Adenocarcinoma (cell line)API Application Programming InterfaceAUC Area Under the CurveBioPax Biological Pathway Exchange
CASCADE CAncer Signaling CAusality DatabasECNA Copy Number AlterationsCOVID-19 COrona VIrus Disease 2019Drabme Drug Response Analysis to Boolean Model Ensemblesemba Ensemble (Boolean) Model Biomarker Analysis
Gitsbe Generic Interactions To Specific Boolean EquationsGO Gene OntologyGREEKC Gene Regulation Ensemble Effort for the Knowledge CommonsHPC High Performance ComputingHUPO-PSI HUman Proteome Organization - Proteomics Standards Initiative
IMEx The International Molecular Exchange ConsortiumMI2CAST Minimum Information about a Molecular Interaction CAusal STatementMIQL Molecular Interactions Query LanguageMITAB Molecular Interaction TABular formatODE Ordinary Differential Equation
PDE Partial Differential EquationPKN Prior Knowledge NetworkPPI Protein-Protein InteractionPRC Precision Recall CurvePSICQUIC Proteomics Standard Initiative Common QUery InterfaCe
ROC Receiver Operating CharacteristicSBGN Systems Biology Graphical Notation
xiii

TAMs Tumor Associated MacrophagesTF-TG Transcription Factor - Target GeneUBDs (UniBioDicts) Unified Biological Dictionaries
UMAP Uniform Manifold Approximation and Projection (for dimension reduction)VSM Visual Syntax MethodWC Whole Cell (modeling)XML Extensible Markup Language
xiv

Summary
One for all
Scientific and technological progress has been the foundation for some of the most astoundingachievements of humankind. In the last century in particular, discoveries were made that contributedto the sustainable development of the economy and society, affecting our lives in an unprecedentedmanner and making possible what was considered impossible. The invention of the digital computerand the Internet for example, revolutionized the access, dissemination and analysis of information[8,9]. We have been to the Moon, a breakthrough that has opened up the possibilities of spaceexploration and interstellar travel. The industrial revolution of the latest century has enabled us todesign machines for every conceivable need. Human well-being has become significantly better:compare a middle class household and the appliances within, with one from 60 years ago. Witha higher standard of living and the ongoing efforts to alleviate hunger, poverty and inequality ona global scale, people have started caring more about the planet, paving the way for sustainableeconomic and environmental growth [10]. Due to advancements in Biology and Medicine, theapplication of public health interventions such as vaccinations and hygiene measures has becomecommon practice, causing a rapid increase in the global life expectancy during the last century[11]. The genome-editing technology CRISPR [12] has enabled the discovery of new therapeuticsolutions for a variety of genetic diseases and has been beneficially used in several agriculture andplant biotechnology applications [13]. The list of achievements is truly endless and all the datapoints to the fact that the world is getting better [14].
There are three factors that have made technological progress possible. Firstly, every humaninnovation is based on basic scientific research, without which the development of new technologieswould have been impossible. Secondly, society is developing new contracts with science [15],where researchers can only be trusted to continue their work (and get funding for it), if they tacklereal-world problems and produce knowledge characterized by a fully transparent and participativespirit. Practically, this means that better communication skills are a necessity for today’s scientistsand that their research should have translational potential to deliver on society’s expectations. Butsolving these real-world problems is incredibly hard, and so, they cannot be addressed by applying
1
knowledge from specific fields only, e.g. either from the Computer or the Biological Sciencesalone. This brings us to the third factor: in order for science to deliver on its promises to society,collaboration across fields of science is the only way forward.
Medicine, from research to develop new therapies up to delivering the actual product orservices to the patients, constitutes the perfect example that encompasses all three reasons that haveenabled progress to transpire in its domain. It first starts with a real-life problem: people get sick.The existence of diseases is a societal problem and a hard one at that, since people usually lack thenecessary knowledge or the means to deal with it on their own. They have in fact exchanged some oftheir freedom to have a place in society, and ensure that they receive proper treatment when needed(along with other forms of security, access to free education, etc.). To manage such a complexproblem, society provides healthcare services, which have significantly increased across the worldin recent years [16]. For most people, the single most applied healthcare interaction is the use ofdrugs, prescribed by medical doctors. Drugs are the translational product of the pharmaceuticalindustry, which is the result of basic interdisciplinary research. Medical doctors alone wouldn’t beable to find the cause and understand the mechanisms behind many of the diseases that exist today.This knowledge has been the culmination of years of scientific knowledge, built atop collaborationacross fields, from Medicine and Biology to Computer Science and Engineering.
So, only by using every possible method and knowledge at our disposal and by workingtogether, we can achieve the solution to complex problems such as human diseases. When theseconditions are met, societal challenges can be addressed and science stands as one unified body forthe good and progress of all mankind. The field of Systems Medicine has been the direct embodimentof this notion, promising improved prevention, prognosis, diagnosis and treatment of patients via anintegrative, interdisciplinary approach [17].
2

Dots and lines
One of the simplest ways to conceptualize complex systems, either man-made or existingfreely in nature, is using the notion of a network or graph. The idea is that any system is composed ofindividual entities or components of interest (nodes) and these components interact with each otherin various, usually non-obvious ways (links). These two properties, namely having some objects tostudy, and relationships between these objects, form the basis for the conceptualization of a network(Figure 1). From a cognitive point of view, the conceptualization of a network manifests as a visualrepresentation in our brain, consisting of a bunch of dots (nodes) connected with numerous lines(links) [18]. Such a projection is usually close to what people instinctively draw on paper when theyattempt to describe their knowledge about a system and its inner workings (thereby “connecting thedots”). Simple schematics that are abstractly similar to dots and lines, along with further contextualinformation (e.g. node labels, coloring, directed links, etc.), seem to be able to capture and renderinformation derived from our thought processes, in a unique and comprehensible way.
Figure 1: Two examples of networks, composed of dots and lines. The left network is a random graph based on theErdos–Rényi model [19] and the one on the right is created using the preferential attachment principle that characterizesscale-free networks with hub nodes, such as the World Wide Web [20].
Since studying complex systems falls intro the domain of science’s responsibilities, andgraphs seem to be an intuitive way of representing such systems, the emergence of a new fieldcalled network science was inevitable [21]. Its purpose is to establish a unified set of tools andmethods to study the properties of any type of network that emerges across disparate fields. Avariety of software tools for network visualization and analysis have been released throughoutthe years, ranging from generic-purpose [22–25], to tools more suitable for studying biological[26–29] or social networks [30,31]. The use of such tools enables the discovery of fundamental
3
laws that characterize the function of systems represented by networks. In addition, it allowsus to study in detail the networks’ systemic structure and derive key principles that drive theirevolution and emergent behavior. Anthropological research for example uses network theory tostudy people and their relationships, and explain emergent complex phenomena such as humanbehavior. Neuroscience uses network analysis methods to detect anomalies in diseased human brains[32]. The impact of online social networks is studied to understand and predict future personal andprofit-oriented communication (online marketing) [33]. Epidemiologists use graph-based methodsto model the spread of diseases like COVID-19, predict the future course of outbreaks and evaluatestrategies to control epidemics [34]. Molecular biologists study intra- and intercellular signalingnetworks to understand the mechanisms behind biological processes and investigate the causesof network dysregulation, often leading to the emergence of particular disease phenotypes. Suchnetwork-based approaches have significant clinical applications since they have the potential toassist in the discovery of new disease genes and modules, and the identification of drug targets andbiomarkers for complex diseases [35].
The work presented in this thesis is heavily based on this network medicine paradigm,with causal molecular interaction networks as the main object of study. Our primary focus is onprotein-protein interaction (PPI) networks, with proteins as nodes and their physical contacts andinteractions as links, and gene regulatory networks, represented for example by directed regulatoryrelationships between transcription factors and genes (TF-TG networks). These types of networksdemonstrate a system of signal transduction pathways connected by crosstalk and embedded infeedback loops, forming what is known as the Prior Knowledge Network (PKN). The causalityproperty of the PKN stems from the fact that the network links are directed (i.e. protein X affectsprotein Y) and signed (Y is inhibited or activated as a result). It is exactly this causality informationthat allows the investigation of behaviors from a systems perspective. Such networks form the basisfor the study and computational modeling of cancer, which is another subject of investigation inthis thesis. In the subsequent chapters, we will discuss how we addressed problems related to theformalization, access and public sharing of the knowledge encoded in the PKN.
4
Knowledge from a stack of papers
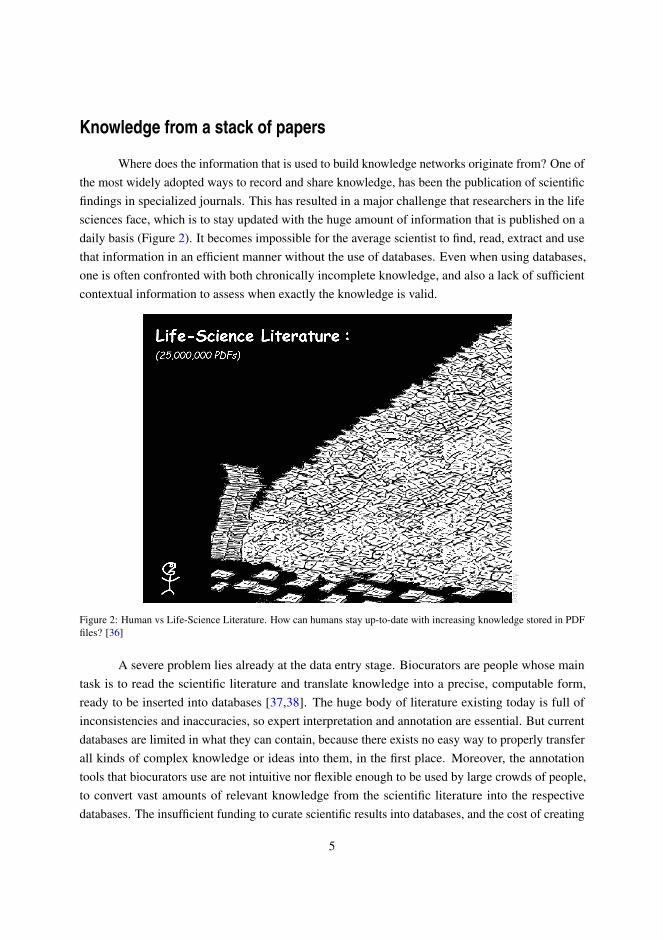
Where does the information that is used to build knowledge networks originate from? One ofthe most widely adopted ways to record and share knowledge, has been the publication of scientificfindings in specialized journals. This has resulted in a major challenge that researchers in the lifesciences face, which is to stay updated with the huge amount of information that is published on adaily basis (Figure 2). It becomes impossible for the average scientist to find, read, extract and usethat information in an efficient manner without the use of databases. Even when using databases,one is often confronted with both chronically incomplete knowledge, and also a lack of sufficientcontextual information to assess when exactly the knowledge is valid.
Figure 2: Human vs Life-Science Literature. How can humans stay up-to-date with increasing knowledge stored in PDFfiles? [36]
A severe problem lies already at the data entry stage. Biocurators are people whose maintask is to read the scientific literature and translate knowledge into a precise, computable form,ready to be inserted into databases [37,38]. The huge body of literature existing today is full ofinconsistencies and inaccuracies, so expert interpretation and annotation are essential. But currentdatabases are limited in what they can contain, because there exists no easy way to properly transferall kinds of complex knowledge or ideas into them, in the first place. Moreover, the annotationtools that biocurators use are not intuitive nor flexible enough to be used by large crowds of people,to convert vast amounts of relevant knowledge from the scientific literature into the respectivedatabases. The insufficient funding to curate scientific results into databases, and the cost of creating
5
a new knowledge base for every new project, are some extra confounding factors. Because of this,researchers all over the world have to spend considerable time performing ad-hoc manual curationof publications that are relevant for their project, often with improvised approaches (Word, Excel).At best they also spend time developing a specialized curation platform or computational methods toextract knowledge, which can only capture a fraction of the “actual reported truth” [39]. Nonetheless,all these efforts form a significant part of the scientific enterprise, assisting in the creation of digitalknowledge repositories, which are subsequently used to build PKNs for the computational modelingof biological processes.
A list of tools have been created to assist biocurators in their annotation tasks. Notably,the IntAct editor is an open-source desktop application software that enables IntAct curators andmembers of the IMEx consortium to annotate molecular interactions [40]. Because of the lack ofinstallation instructions and documentation, coupled with a complex interface, specialized trainingfrom senior IntAct curators is required to learn how to use this software. Nonetheless, it is one ofthe most used and effective tools for the job, since it has been around for a lot of years and duringthat time, there has always been a spirit of close collaboration between developers and curators toimplement features, solve bugs and in general improve the annotation capabilities of the software.Canto is another tool that was built to support community curation in the PomBase fission yeastdatabase [41]. It has now expanded its original purpose to support curation of other model organismdatabases and different molecular data types (e.g. annotation of a larger set of GO terms). Canto’srespective website provides extensive documentation and step-by-step user guidance throughoutthe annotation procedure [42]. A user management mechanism is incorporated in the softwareso as to allow proper monitoring of curation tasks and efficient communication between curatorsfor work prioritization. In addition, two relatively new tools have been developed for the curationand visualization of molecular interaction maps: NaviCell [43] and MINERVA [44]. These toolsfacilitate knowledge exploration in addition to knowledge annotation, allowing for an interactiveuser experience (e.g. feedback via comments), enabling content sharing, supporting well knowndata standards (e.g. SBGN [45]) and thus allowing for data interoperability and re-use. All theaforementioned annotation tools are limited by the fact that they are not generic enough to curateany type of information, with most of them representing specialized solutions pertaining to specificannotation purposes. Most tools require extra technical configurations and software to includeadditional levels of contextualized details required for current and future curation efforts.
6
To obtain support from computational pipelines that will help us process vast amounts ofknowledge and advance our understanding of processes in nature, we must be able to efficientlyannotate and store information that is highly detailed and contextualized. Hereby, the knowledge’sinherent complexity should be kept manageable and understandable by humans and machines alike.In order to accommodate for a much more powerful, flexible, and reusable annotation process, anintuitive curation and knowledge formalization method was developed, called VSM (Visual SyntaxMethod) [46]. VSM enables scientists to capture any type of knowledge with any type of contextualinformation, in a way that is understandable by both humans and computers.
Part of the work in this thesis has been to assist in the implementation of a softwaremodule that implements VSM as a general-purpose, web-based user interface, named VSM-box[5]. This software component was used to build CausalBuilder, a prototype curation interface forthe annotation of causal molecular interactions [6]. CausalBuilder uses VSM to generate concrete,customizable templates that represent causal statements. It supports the export of the annotatedstatements in standard signaling formats, such as CausalTAB [7], which can be stored in relevantdatabases or used to build computational models of biological processes. To support the largevariety of contextual information related to causal molecular interactions between biological entities,allowing for a finer disambiguation between seemingly similar or conflicting causality statements(e.g. a transcription factor simultaneously up and down regulating a target gene in different cellularcontexts), CausalBuilder was designed to comply with a list of guidelines (MI2CAST) that weredeveloped exactly for this purpose [47]. All in all, CausalBuilder provides biologists and curatorswith a simple user interface for the annotation of causal regulatory knowledge, translating highlycontextual information about molecular interactions from scientific publications to a computableform.
7
Biological Dictionaries aid in the curation of complex knowledge
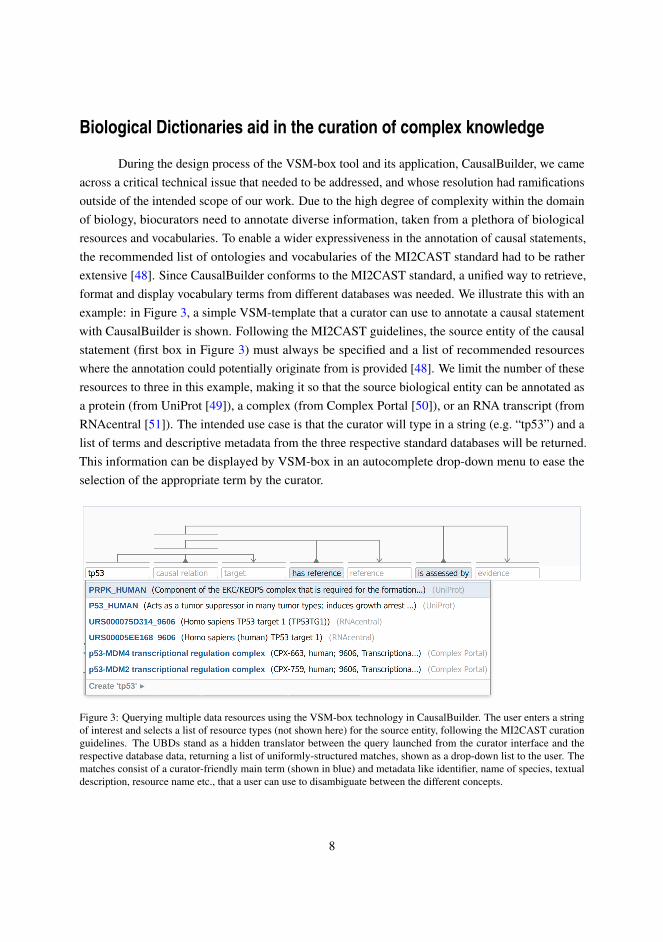
During the design process of the VSM-box tool and its application, CausalBuilder, we cameacross a critical technical issue that needed to be addressed, and whose resolution had ramificationsoutside of the intended scope of our work. Due to the high degree of complexity within the domainof biology, biocurators need to annotate diverse information, taken from a plethora of biologicalresources and vocabularies. To enable a wider expressiveness in the annotation of causal statements,the recommended list of ontologies and vocabularies of the MI2CAST standard had to be ratherextensive [48]. Since CausalBuilder conforms to the MI2CAST standard, a unified way to retrieve,format and display vocabulary terms from different databases was needed. We illustrate this with anexample: in Figure 3, a simple VSM-template that a curator can use to annotate a causal statementwith CausalBuilder is shown. Following the MI2CAST guidelines, the source entity of the causalstatement (first box in Figure 3) must always be specified and a list of recommended resourceswhere the annotation could potentially originate from is provided [48]. We limit the number of theseresources to three in this example, making it so that the source biological entity can be annotated asa protein (from UniProt [49]), a complex (from Complex Portal [50]), or an RNA transcript (fromRNAcentral [51]). The intended use case is that the curator will type in a string (e.g. “tp53”) and alist of terms and descriptive metadata from the three respective standard databases will be returned.This information can be displayed by VSM-box in an autocomplete drop-down menu to ease theselection of the appropriate term by the curator.
Figure 3: Querying multiple data resources using the VSM-box technology in CausalBuilder. The user enters a stringof interest and selects a list of resource types (not shown here) for the source entity, following the MI2CAST curationguidelines. The UBDs stand as a hidden translator between the query launched from the curator interface and therespective database data, returning a list of uniformly-structured matches, shown as a drop-down list to the user. Thematches consist of a curator-friendly main term (shown in blue) and metadata like identifier, name of species, textualdescription, resource name etc., that a user can use to disambiguate between the different concepts.
8
We can now clearly state the heart of the problem: the resources that offer protein, RNAand multiprotein complex data, have different online APIs to serve their information, and it isusually structured in diverse formats. Therefore, it was necessary to design a generic solution thatwould translate all the necessary information from the recommended resources of the MI2CASTstandard into a unified representation schema. Then, we could implement modules that “talk” tothe databases and translate the provided information into this uniform data format. As a resultof having a standardized way to represent data from various disparate resources, VSM-box andother curation tools could easily process the returned data load and create drop-down menus tohelp users in their annotation tasks (as shown in Figure 3). The outcome of all this effort wasthe implementation of UBDs (Unified Biological Dictionaries, see Paper 1). The reason for thename dictionaries originates from the abstract data type called associative array (also known asmap or dictionary), which is a collection of (key, value) pairs, and is an integrated feature of manyprogramming languages. For our application, we reasoned that the minimum information that isneeded for the unique identification of concepts for curation tasks is a computer-friendly ID and ahuman-friendly term, precisely matching the key and value of the associative array’s data structure.
An unforeseen consequence of the UBDs implementation was that by covering most ofthe vocabularies and ontologies recommended by the MI2CAST standard, we ended up mappinginto a unified format a large amount of diverse terminologies across life sciences. This happenedbecause our solution encapsulated and extended other similar efforts, such as the BioPortal [52] andEBI Search [53] web services. We therefore managed to bring even more biomedical ontologiesand biological data resources under one umbrella, and subsequently increase the accessibility,interoperability and reusability of the provided data [54]. So, even though UBDs main user isthe software engineer building curation tools (as we were at the beginning of this effort withCausalBuilder), several computational researchers can benefit from our implementation, if they needto query disparate biological resources for lightweight information (i.e. terms, identifiers and somemetadata) using a single programmatic interface. In the end, the feedback we got from biocuratorswho tested the CausalBuilder tool was very encouraging, pointing out that we had proceeded in theright direction with our efforts to build UBDs, the hidden machinery enabling all the autocomplete“magic” to happen in VSM-box’s user interface.
The implementation of UBDs put us in a position to confront problems that biocurators faceduring their annotation tasks, which haven’t yet been properly addressed by any existing technology.One of these challenges is that biocurators often need to annotate terms in a specific domain or novelfield, for which there is still no authoritative database or ontology nor a community consensus aboutthe respective terminology [55]. A similar challenge manifests when new knowledge is discoveredor similarly, further contextual information related to existing knowledge comes into light, as aresult of scientists’ constant drive for progress. This eventually leads to the constant refactoring ofontologies and identifiers, subsequently making biocurators life even more difficult. To respond
9

to these challenges, biocurators create project-specific, ad-hoc vocabularies that are not openlyaccessible and usually become obsolete after some time passes. We reasoned that with the UBDsinfrastructure in place, we could do better.
In summary, the core of the problem is two-fold: first, biocurators need a simple way toannotate new information that does not yet exist in any resource and second, this informationneeds to be shared publicly for further review and management by expert communities. To tacklethis problem, we collaborated with experts from PubDictionaries, an online repository of publiclyaccessible and editable dictionaries [56]. Using the online interface of PubDictionaries, curators cancreate simple dictionaries, consisting of terms and identifiers of their own choice, solving the secondpart of the problem. Additionally, by updating the PubDictionaries API and connecting all existingand future public dictionaries with UBDs and their underlying unified format, we streamlined theiruse in annotation tools and solved the first part of the problem. The technical work was carried outduring an intense hacking week at the ELIXIR Biohackathon 2021 event and the implementationdetails are described in Paper 2 of this thesis. As a final result, we showcased a demo in whichcurators could use their public, ad-hoc terminologies from PubDictionaries, to annotate a simplesentence using the VSM-box interface.
10

Sharing causal interactions with PSICQUIC
Defining standards is a very important initiative across scientific disciplines, since it facilitatesthe accessibility and sharing of information amongst data users as well as the interoperability ofsoftware tools that produce or process the respective data, thereby increasing the quality of researchfindings [54]. Following this logic, after the curation of causal molecular interactions from scientificliterature has been achieved, the next step is to store this information to a standard data format. Oneof the most detailed, community-standard formats for representing molecular interaction data isthe PSI molecular interaction (MI) XML format, released by the Human Proteome OrganizationProteomics Standards Initiative (HUPO-PSI) [57]. The newest version of this standard is the PSI-MIXML 3.0 [58]. A simplified format for interaction data was provided by the same organization, calledthe Molecular Interaction Tabular format (PSI-MITAB). PSI-MITAB has become popular amongstthe scientific community since it is more user-friendly and Microsoft Excel-compatible, comparedto the respective XML-based format [59]. PSI-MITAB version 2.7 in particular, encapsulated manydetails of interest regarding a molecular interaction in a total of 42 columns, but it did not includeinformation about its causality. This resulted in an effort to standardize the signaling information andsubsequent vocabulary terminology for causal molecular interactions, originally led by SIGNOR’sdatabase curators [60]. The new PSI-MITAB version 2.8 (also called CausalTAB), included fournew columns to incorporate additional details related to a molecular interaction’s directionality(defining the biological roles of the regulator and target, one column each), regulatory mechanism(e.g. indirect causal regulation or post-translational modification) and resulting effect (up or downregulation of the target) [7].
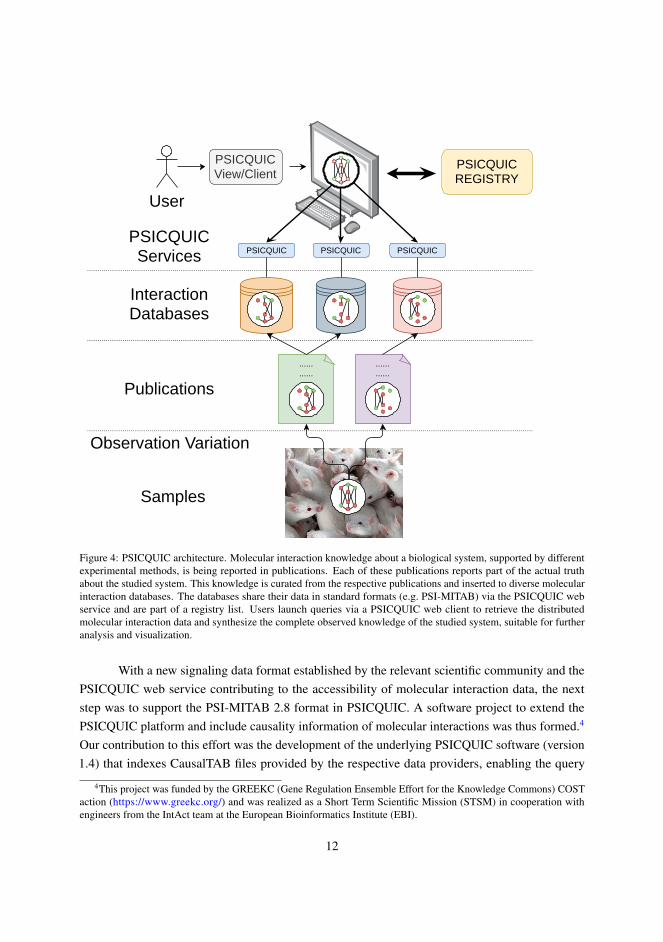
After having a signaling data format for molecular interactions in place, the next challengewas to find a way to share such information efficiently. The heart of the problem was the same evenwithout the addition of causality information: a large number of molecular interaction databasesexist, each one with different APIs to access the respective data. Since no single database canincorporate the totality of molecular interactions pertaining to a specific biological system of interest,users have to collect data from diverse databases by launching queries in different websites or bydirectly downloading the respective files, which might not always be offered in standardized formats.To ease the computational access and retrieval of molecular interaction data from various resources,a web service with a common query interface (PSICQUIC) and language (MIQL) was developed[61]. Using the PSICQUIC web service, users can now download all relevant data files from theirdatabases of interest in different PSI-MI compliant formats, suitable for further analysis (Figure 4).
11
Samples
Observation Variation
Publications
InteractionDatabases
PSICQUICServices
......
..................
PSICQUIC PSICQUIC PSICQUIC
User
PSICQUICREGISTRY
PSICQUICView/Client
Figure 4: PSICQUIC architecture. Molecular interaction knowledge about a biological system, supported by differentexperimental methods, is being reported in publications. Each of these publications reports part of the actual truthabout the studied system. This knowledge is curated from the respective publications and inserted to diverse molecularinteraction databases. The databases share their data in standard formats (e.g. PSI-MITAB) via the PSICQUIC webservice and are part of a registry list. Users launch queries via a PSICQUIC web client to retrieve the distributedmolecular interaction data and synthesize the complete observed knowledge of the studied system, suitable for furtheranalysis and visualization.
With a new signaling data format established by the relevant scientific community and thePSICQUIC web service contributing to the accessibility of molecular interaction data, the nextstep was to support the PSI-MITAB 2.8 format in PSICQUIC. A software project to extend thePSICQUIC platform and include causality information of molecular interactions was thus formed.4
Our contribution to this effort was the development of the underlying PSICQUIC software (version1.4) that indexes CausalTAB files provided by the respective data providers, enabling the query
4This project was funded by the GREEKC (Gene Regulation Ensemble Effort for the Knowledge Commons) COSTaction (https://www.greekc.org/) and was realized as a Short Term Scientific Mission (STSM) in cooperation withengineers from the IntAct team at the European Bioinformatics Institute (EBI).
12
and subsequent download of causality-enriched interactions. The PSICQUIC View website sourcecode was updated to show the four new columns in the HTML table results. Additionally, severalclients that enable programmatic access to the distributed signaling data (written in Java, Pythonand Perl programming languages), were refactored to comply with data fitting the new standardformat. Lastly, the relevant PSICQUIC documentation was improved and reformatted to enhanceuser readability [62].
The aforementioned development effort spurred a series of actions that led to several im-provements in the PSICQUIC platform. The Molecular Interactions Community, is an open sourcecommunity providing tools, standard formats, ontologies and modules for manipulating molecularinteraction data [63]. For example, some of these modules are used to read and write PSI-MITABfiles across different versions. Since these modules had not been updated for years (showing signsof software rot [64]), we had to refactor the codebase and add tests to ensure its future reliabilityand quality. In the end, even though we managed to complete the task and support CausalTAB inPSICQUIC via updating these modules, the need to replace them with a newer library was imminent.JAMI is such a library, integrating all standard molecular interaction data formats such as the PSI-MIXML and PSI-MITAB, into a unified implementation, hiding the complex details of each formatfrom the developers and thereby making their work easier [65]. The implementation work wasinitiated in a GREEKC workshop [66] and continued during the first ELIXIR BioHackathon in Paris[67]. Upon finishing the support for CausalTAB in JAMI,5 we provided the first PSICQUIC serviceindexing SIGNOR’s CausalTAB data at the time, made available through a development server [68].
During the ELIXIR BioHackathon, the architecture details of a new cloud-based, distributedPSICQUIC service were discussed and documented for future development efforts. The goal is toenable the data providers to upload their molecular interaction data in a fully automated processand add support for data validation. This service will minimize the long-term commitment andmaintenance from the data providers, which they cannot always afford (e.g. deployment of the serverhosting PSICQUIC). Another outcome of the BioHackathon was the draft implementation of a newPSICQUIC View interface, aiming to modernize and update the current web application used toaccess PSICQUIC [69]. Further work needs to be done to import and use newer technologies inthe interface, which will result in better filtering and sorting of the HTML table results and moreinteractive, graph-based visualizations of the PSICQUIC data. To broadly facilitate the sharing ofcausal interaction data, additional development efforts are needed, in particular towards improvingexisting PSICQUIC clients. One such example is the PSICQUIC Universal Client, a Cytoscape appfor querying multiple PSICQUIC-compliant interaction data services from a simple user interface[70]. This client has been used in tutorials to guide novice users in the visualization and analysis ofmolecular interaction networks [71]. Lastly, two more clients that need to be updated to support
5During the GREEKC Marseille Hackathon 2019 event, see more info on the project here: https://github.com/GREEKC/hackathon-marseille/tree/master/project_descriptions/causal_psicquic
13

the latest CausalTAB signaling format are the PSICQUIC [72] and PItools R packages [73]. Thesepackages enable the translation of molecular interaction data directly into formats suitable forcomputational analysis with R, and therefore are crucial for relevant computational tasks.
14
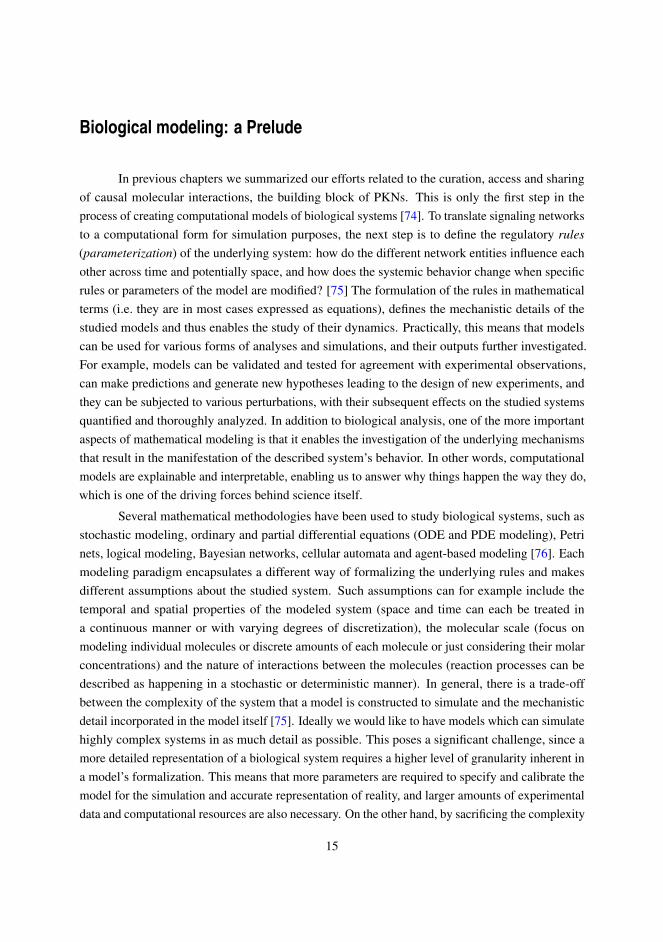
Biological modeling: a Prelude
In previous chapters we summarized our efforts related to the curation, access and sharingof causal molecular interactions, the building block of PKNs. This is only the first step in theprocess of creating computational models of biological systems [74]. To translate signaling networksto a computational form for simulation purposes, the next step is to define the regulatory rules(parameterization) of the underlying system: how do the different network entities influence eachother across time and potentially space, and how does the systemic behavior change when specificrules or parameters of the model are modified? [75] The formulation of the rules in mathematicalterms (i.e. they are in most cases expressed as equations), defines the mechanistic details of thestudied models and thus enables the study of their dynamics. Practically, this means that modelscan be used for various forms of analyses and simulations, and their outputs further investigated.For example, models can be validated and tested for agreement with experimental observations,can make predictions and generate new hypotheses leading to the design of new experiments, andthey can be subjected to various perturbations, with their subsequent effects on the studied systemsquantified and thoroughly analyzed. In addition to biological analysis, one of the more importantaspects of mathematical modeling is that it enables the investigation of the underlying mechanismsthat result in the manifestation of the described system’s behavior. In other words, computationalmodels are explainable and interpretable, enabling us to answer why things happen the way they do,which is one of the driving forces behind science itself.
Several mathematical methodologies have been used to study biological systems, such asstochastic modeling, ordinary and partial differential equations (ODE and PDE modeling), Petrinets, logical modeling, Bayesian networks, cellular automata and agent-based modeling [76]. Eachmodeling paradigm encapsulates a different way of formalizing the underlying rules and makesdifferent assumptions about the studied system. Such assumptions can for example include thetemporal and spatial properties of the modeled system (space and time can each be treated ina continuous manner or with varying degrees of discretization), the molecular scale (focus onmodeling individual molecules or discrete amounts of each molecule or just considering their molarconcentrations) and the nature of interactions between the molecules (reaction processes can bedescribed as happening in a stochastic or deterministic manner). In general, there is a trade-offbetween the complexity of the system that a model is constructed to simulate and the mechanisticdetail incorporated in the model itself [75]. Ideally we would like to have models which can simulatehighly complex systems in as much detail as possible. This poses a significant challenge, since amore detailed representation of a biological system requires a higher level of granularity inherent ina model’s formalization. This means that more parameters are required to specify and calibrate themodel for the simulation and accurate representation of reality, and larger amounts of experimentaldata and computational resources are also necessary. On the other hand, by sacrificing the complexity
15
of the studied system and making simpler models, we face overwhelming uncertainties that needto be properly quantified and integrated in any interpretation of results from such a model [77]. Inthe end, the modeling scope is a crucial factor for the choice of the appropriate methodology, andthus sufficient knowledge of the advantages and disadvantages of each formalism can be beneficialtowards selecting the approach deemed most suitable for the realization of the modeling objectives.
In this thesis we focus on Boolean modeling, one of the simplest formalizations for themodeling of complex biological systems [78]. In this type of qualitative approach, every individualentity has a binary state denoting activity (1) or inactivity (0) and time is discretized [79]. Everyinteraction that affects a target entity is assembled into a Boolean equation which defines thatparticular target’s output activity in the next time step. To formulate such a Boolean equation, onlyknowledge of the regulatory network topology is needed, along with the use of logical operatorsthat describe how the combined activity of the regulators affects the target. This inherent simplicityin defining the rules is what makes the Boolean formalism attractive to modelers. Moreover, sincethe PKN is one of the core elements that characterize the Boolean rules, this explains why wespent a large amount of our efforts in this thesis to make sure modelers get the proper contextualprior knowledge. Lastly, another advantage of Boolean modeling is that it does not require thespecification of parameters such as kinetic rate constants and initial concentrations that are a strongprerequisite in other modeling formalisms (e.g. in ODE modeling), where there is always a needfor large and expensive amounts of data that might be either lacking or not enough to adequatelycharacterize the rules.
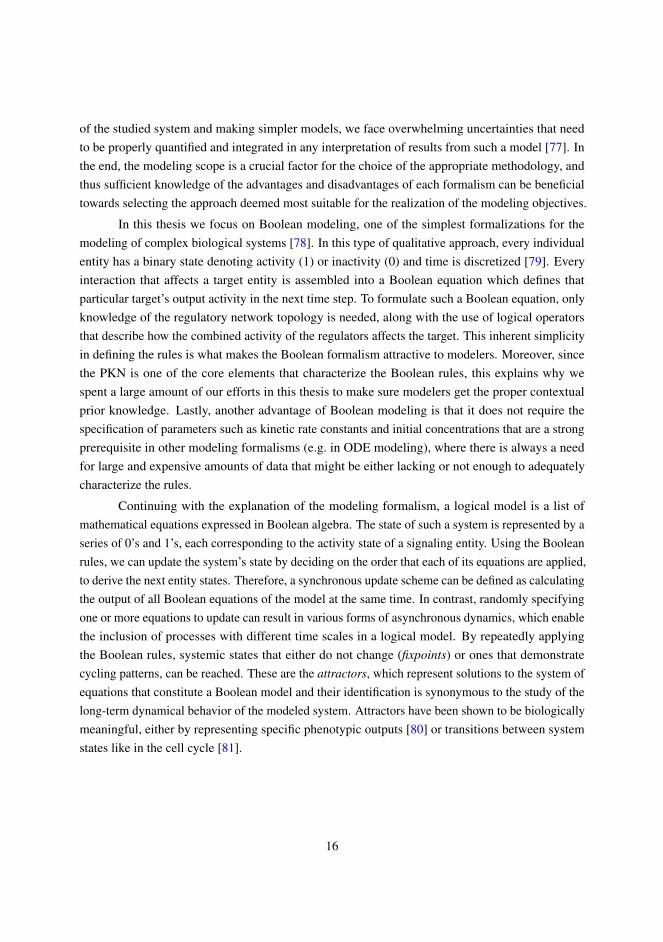
Continuing with the explanation of the modeling formalism, a logical model is a list ofmathematical equations expressed in Boolean algebra. The state of such a system is represented by aseries of 0’s and 1’s, each corresponding to the activity state of a signaling entity. Using the Booleanrules, we can update the system’s state by deciding on the order that each of its equations are applied,to derive the next entity states. Therefore, a synchronous update scheme can be defined as calculatingthe output of all Boolean equations of the model at the same time. In contrast, randomly specifyingone or more equations to update can result in various forms of asynchronous dynamics, which enablethe inclusion of processes with different time scales in a logical model. By repeatedly applyingthe Boolean rules, systemic states that either do not change (fixpoints) or ones that demonstratecycling patterns, can be reached. These are the attractors, which represent solutions to the system ofequations that constitute a Boolean model and their identification is synonymous to the study of thelong-term dynamical behavior of the modeled system. Attractors have been shown to be biologicallymeaningful, either by representing specific phenotypic outputs [80] or transitions between systemstates like in the cell cycle [81].
16

Several computational tools have been developed to aid in the dynamical analysis of Booleanmodels [82]. These tools enable users to easily create and edit logical models, identify differ-ent types of attractors and their reachability properties, analyze model state evolution over time,investigate phenotypic outputs subject to various types of perturbations, explore different modelparameterizations and calibrate models to fit experimental data, among others [83]. The existence ofsuch a plethora of tools has enabled the modeling of complex diseases, the discovery of potentialtherapeutic solutions and the investigation of biomarkers that correlate with patients’ response tospecific pharmaceutical drugs. In particular, the derivation of mechanistic insights related to themanifestation of diseases, is one of the main challenges that computational modeling efforts striveto address towards achieving the goal of personalized medicine [84]. In light of this, several logicalmodeling approaches have been used to stratify patients based on the integration of multi-omicsdata [85], build patient-specific models that aid in the understanding of drug sensitivity and cancerresistance mechanisms [86–88] and help identify novel therapeutic targets [89–91]. Part of the workin this thesis has been to complement the aforementioned approaches by developing a softwarepipeline that uses causal prior knowledge and tailors Boolean models to cell-specific cancer signalingactivities (Paper 3). These models can subsequently be used to predict combinatorial treatmentsthat aid in the prioritization of drugs in high-throughput screening technologies and will eventuallyprovide better clinical decision support for cancer patients, helping us find optimal drug-patientmatches.
17
Clean Code
Our main goal is to use causal molecular knowledge and signaling activity data to build andparameterize Boolean models to represent specific cancer cell systems, and study their behavior inthe presence of in-silico drug perturbations. As such, the importance of the underlying scientificsoftware that enables these computational tasks is unquestionable. Such software needs to satisfya list of requirements pertaining to its suitability for practical use [92]. Such practices ensure thatthe software does what it is intended to do and its produced scientific simulations can be used toinform decision-making for clinical applications. In other words, for the scientific results of thesimulations to be actionable and trustworthy [93], the following software requirements are not justoptional, but rather a necessity. At first, challenges related to automation, efficiency and optimizationin terms of the computational resources necessary to perform the simulations and analyses, needto be properly addressed. To promote collaboration and allow others to study, use and furtherdevelop the software, the respective codebase needs to be open sourced [94,95]. Standard formatsfor input and output should be supported, as well as standard libraries for common programmingtasks, enabling the effortless integration with related software. Also, sufficient documentation needsto be provided, containing installation guidelines and explanations for the various configurationsused in the simulations [96]. Simple examples of use and related tutorials should be part of suchdocumentation as well [97]. The usability of the software can also be increased by applying betterprogramming architecture and design principles (e.g. writing modular code), which also makes thesoftware easier to test, extend and verify. Making the results of the simulations verifiable (i.e. byensuring that the algorithmic procedures and the model equations are correctly coded),6 will increasetheir reproducibility, further supporting the aforementioned goals [98]. All in all, there can only begains if the code is clean and properly taken care of [99].
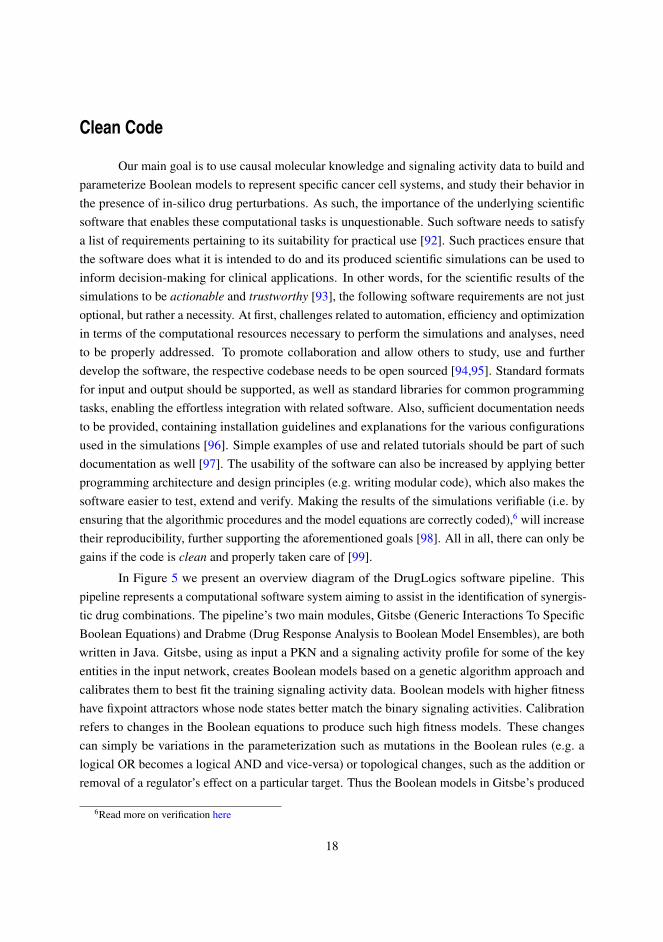
In Figure 5 we present an overview diagram of the DrugLogics software pipeline. Thispipeline represents a computational software system aiming to assist in the identification of synergis-tic drug combinations. The pipeline’s two main modules, Gitsbe (Generic Interactions To SpecificBoolean Equations) and Drabme (Drug Response Analysis to Boolean Model Ensembles), are bothwritten in Java. Gitsbe, using as input a PKN and a signaling activity profile for some of the keyentities in the input network, creates Boolean models based on a genetic algorithm approach andcalibrates them to best fit the training signaling activity data. Boolean models with higher fitnesshave fixpoint attractors whose node states better match the binary signaling activities. Calibrationrefers to changes in the Boolean equations to produce such high fitness models. These changescan simply be variations in the parameterization such as mutations in the Boolean rules (e.g. alogical OR becomes a logical AND and vice-versa) or topological changes, such as the addition orremoval of a regulator’s effect on a particular target. Thus the Boolean models in Gitsbe’s produced
6Read more on verification here
18
ensemble are parameterized differently, but are all essentially approximate representations of thesame biological system. These variant Boolean models are then used as input to Drabme, to test theeffect of several perturbations from a given drug panel and quantify their combinatorial interactionpatterns using well-known synergy frameworks (namely HSA [100] and Bliss [101]). Leveragingthe wisdom of the crowds [102,103] using Gitsbe’s models, Drabme’s output predictions contributein reducing the exponentially large drug space that is associated with combinatorial treatments forthe targeted therapy of cancer, providing a list of candidate combinations to test in the lab, before aviable solution is found for a patient.
Figure 5: The DrugLogics software pipeline. A series of connected modules that build a regulatory topology incorporat-ing specific drug targets, parameterize Boolean models to a specific cancer signaling profile assembled from variousomics data and simulate drug combination perturbations. The output models and their predictions can be further analyzedto explain the difference between phenotypes and thus identify biomarkers that make a particular drug combinationsynergistic.
The development of Drabme and Gitsbe was part of the latest stages of a previous researchthesis and it was mostly exploratory work [104]. To lay the groundwork for the analyses andinvestigations of the papers included in this thesis, additional software development needed to bedone. We started by refactoring the source code to increase its readability, maintainability andextensibility. Java classes were restructured, variables and functions were renamed to reflect currentbest programming practices, code written from scratch for common tasks such as string manipulationwas replaced with reusable Java components (e.g. using libraries from Apache Commons [105]) andthe Maven project management tool [106] was used to enable easier source compilation, installationand packaging (all the Java code was bundled in a single compressed file for ease of use). Toincrease interoperability of our software, we used the Java library BioLQM [107] to enable theexport of the produced Gitsbe models to standardized formats in the logical modeling community,such as GINML (used in GINsim, a software tool enabling the definition, analysis and simulationof regulatory graphs based on the logical formalism [108]), SBML-qual (a standard designed forthe representation of multivalued qualitative models of biological networks [109]) and BoolNet
19
(file format of the models built with the BoolNet R package, used for the simulation and analysisof Boolean networks [110]). For the calculation of fixpoint attractors, an external scripting-basedtool was used by default [111]. We added a built-in, integrated Java solution using BioLQM, whichapart from fixpoints can also identify minimal trapspaces, a generic type of attractor that allows fora deeper exploration of dynamics.
A practical outcome of these efforts was that the code became more modular, enabling theaddition of software tests using the JUnit5 framework [112] and specialized libraries [113,114].With more tests, hidden or otherwise impossible to pinpoint bugs were identified and fixed. Someof these were critical for the validity of the output findings, since they related to how changes inthe parameterization or topology were encoded in the software equivalent of a Boolean model’sequations. Moreover, it became much easier to add new features to the software, e.g. we supported theexecution of parallel simulations in Gitsbe (a significant performance optimization) and incorporateda new synergy framework for the identification of synergistic drug combinations in Drabme (Bliss).Gitsbe’s simulation is the core computational process that produces the “best-fit” models resultingfrom the evolutionary approach of the genetic algorithms. Selecting a few of those best-fit modelsat the end of each simulation and executing multiple simulations in parallel, each one associatedwith a different random seed number, is what generates a reproducible list of Boolean models foruse in Drabme (or other software if models are exported to standard formats). Lastly, we sharedpublicly the developed modules in GitHub7 and built an extensive online documentation using the Rpackage bookdown [115] to gather all related information in one place with regard to the software’sconfiguration parameters, the mathematical calculations used, installation instructions and examplesof use.8 This online documentation became a central virtual hub, providing information on all thesoftware modules in the pipeline. One of these modules was druglogics-synergy, a Javapackage used to serially execute Gitsbe and Drabme in one go, and which was employed for thesimulations of Paper 3.
With all the main code in proper order, we could start investigating the outputs of oursoftware and assess the quality of the produced drug synergy predictions. The results of theseefforts, along with biologically-relevant mechanistic insights derived from further analyzing thesimulation data and performing various investigations, are analytically presented in Paper 3, andin even more detail at the ags-paper repository,9 which also includes reproducibility guidelines.In the following paragraphs we are going to briefly explain the input data and software that eitherneeded to be in place before we started the experimentation with the in-silico simulations or was builtto help further analyze the output Boolean models from Gitsbe and Drabme’s synergy predictions.
7See respective repositories here8See documentation repositories here9See ags-paper repository here
20
To begin with, we had to choose a reference drug combination dataset to compare ourpredictions against. The argument here is to use a dataset that you know very well so that you canfirst experiment with the software and its configurations, and only later test your predictions on otherpublished (and potentially larger) datasets. Therefore, we chose the Flobak et al. (2019) dataset, witha total of 153 combinations of 18 targeted drugs, involving measurements across 8 cancer cell lines[116]. Next, we needed to assess in a computational manner which of the drug combinations in thereference dataset (per cell line) are synergistic and which are not. Our first attempt was to manuallycheck the output growth curves and derive a majority-assessed gold standard (so it was more of acurative group effort). We continued by performing a thorough analysis using the CImbinator tool[117] and established a methodology which computed the synergy classification of the referencedataset that best matched our internal curation efforts to call synergy.10 All in all, we had a referencedataset and a list of drug combinations designated as synergistic from it, ready to be used to evaluateDrabme’s predictions on the same dataset.
On another front, we also needed a PKN suitable for our analysis. In particular, the targetsof the drugs used in the reference dataset should be entities in the network, so as to enable thesimulation of drug perturbations in Gitsbe’s derived Boolean models. Moreover, several of the mostimportant pathways in cancer cell biology (e.g. PI3K, ERK and TGFB signaling [118]) would haveto be included as well. A PKN that fits all the above characteristics was curated within our researchgroup and refined throughout many years, resulting in the topology that was used for the simulationsof Paper 3 (CASCADE).11 In addition, proper signaling data was needed to train the Gitsbe modelsto a cancer proliferating phenotype. For that purpose, we used the literature curated activity profilefor a set of nodes in CASCADE, which was the result of a previous research effort [90]. This activityprofile concerns only one of the cell lines in the reference dataset, namely the gastric adenocarcinomacell line (AGS). In summation, by employing a curated topology and training data from only one cellline, we could focus more on the model parameterization aspects of our software, the performanceassessment of the synergy predictions and the rest of the investigations of Paper 3.
While exploring various configuration options for the Gitsbe and Drabme simulations,12 weneeded a tool to quickly assess their effect on the pipeline’s performance and see which were the mostimportant to tune. The pipeline’s performance here refers to Drabme’s output synergy predictions(continuous scores, each one for a different drug combination, ranging from negative and moresynergistic values, to positive and more antagonistic values), validated against the computationallyderived set of synergistic drug combinations for the AGS cell line (gold standard). This is a typicalbinary classification problem, where an imaginary threshold scans the range of Drabme’s predictedsynergy scores to derive various performance scores. Specifically, each threshold demarcates the
10See sintef-obs-synergies repository here11See CASCADE repository here12See DrugLogics software documentation here
21
Drabme predictions
Drug Combo Synergy Score
A - B - 0.3C - D - 0.1
... ...A - D + 0.1
True synergy
TruePositives
(0)
FalsePositives
(1)
FalseNegatives
(1)
TrueNegatives
(1)
threshold = - 0.2
Pred
icte
d sy
nerg
y
Gold standard synergy
Synergy
Antagonism
Y
N
Y N
...
Allthresholds
Recall (TPR) = TP/(TP+FN)Precision = TP/(TP+FP)FPR = FP/(FP+TN)
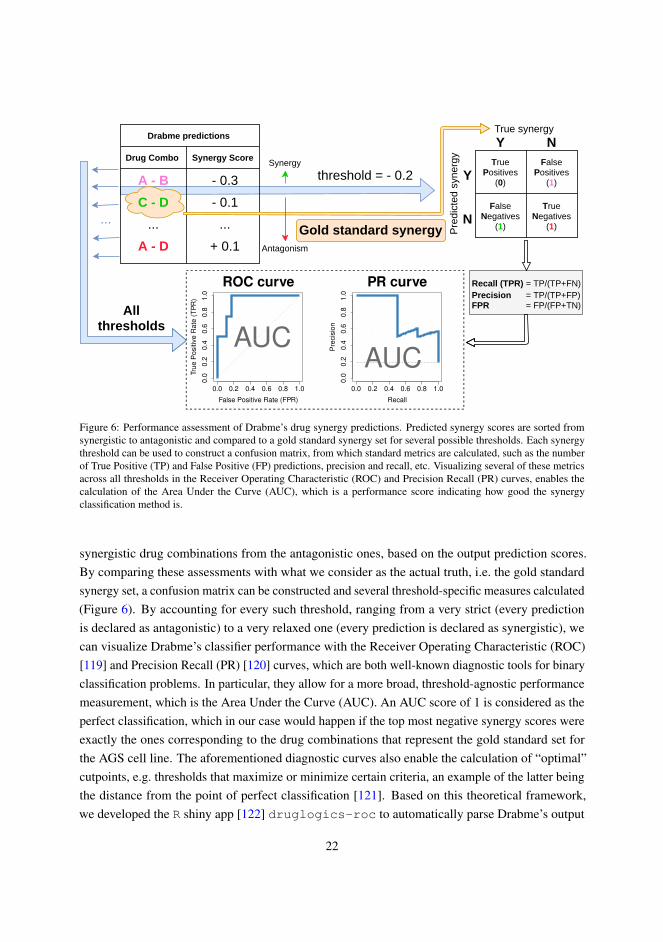
Figure 6: Performance assessment of Drabme’s drug synergy predictions. Predicted synergy scores are sorted fromsynergistic to antagonistic and compared to a gold standard synergy set for several possible thresholds. Each synergythreshold can be used to construct a confusion matrix, from which standard metrics are calculated, such as the numberof True Positive (TP) and False Positive (FP) predictions, precision and recall, etc. Visualizing several of these metricsacross all thresholds in the Receiver Operating Characteristic (ROC) and Precision Recall (PR) curves, enables thecalculation of the Area Under the Curve (AUC), which is a performance score indicating how good the synergyclassification method is.
synergistic drug combinations from the antagonistic ones, based on the output prediction scores.By comparing these assessments with what we consider as the actual truth, i.e. the gold standardsynergy set, a confusion matrix can be constructed and several threshold-specific measures calculated(Figure 6). By accounting for every such threshold, ranging from a very strict (every predictionis declared as antagonistic) to a very relaxed one (every prediction is declared as synergistic), wecan visualize Drabme’s classifier performance with the Receiver Operating Characteristic (ROC)[119] and Precision Recall (PR) [120] curves, which are both well-known diagnostic tools for binaryclassification problems. In particular, they allow for a more broad, threshold-agnostic performancemeasurement, which is the Area Under the Curve (AUC). An AUC score of 1 is considered as theperfect classification, which in our case would happen if the top most negative synergy scores wereexactly the ones corresponding to the drug combinations that represent the gold standard set forthe AGS cell line. The aforementioned diagnostic curves also enable the calculation of “optimal”cutpoints, e.g. thresholds that maximize or minimize certain criteria, an example of the latter beingthe distance from the point of perfect classification [121]. Based on this theoretical framework,we developed the R shiny app [122] druglogics-roc to automatically parse Drabme’s output
22
files and produce a table [123] with the confusion matrix values per synergy threshold, along withinteractive plots of the ROC (using the R package plotly [124]) and PR curves (using the Rpackage PRROC [125]) and their respective AUC scores. This app is now part of the DrugLogicssoftware suite,13 facilitating the visualization of the pipeline’s performance.
The Boolean model ensembles produced by Gitsbe were a unique source for further dataanalyses. Since such an ensemble contains a large variety of models, all representing the samebiological system, we investigated how these models differ in terms of each network node’s activity(in the respective attractor) and parameterization. Moreover, we were interested in how these typesof model differences translate to variations in prediction performance, i.e. make some models predictspecific drug combinations as synergistic or not. By assigning Gitsbe models into different classesbased on their individual prediction performance, we could identify nodes that were relatively moreactive (or inhibited) in the upper tier models compared to the lower tier models of the performancehierarchy. For example, we verified across many analyses14 that the ERK node of the CASCADEsignaling network was particularly overexpressed in the models that predicted most of the goldstandard synergies in the AGS cell line from the reference drug combination dataset. This wasan interesting finding, since knowledge gathered from the scientific literature indicates conflictingmeasurements of ERK activity in AGS cells [90] and so our modeling results, upon further analysis,have the potential of providing useful information related to the studied biological system (thisparticular result is also shown using a different methodology in Paper 3). In addition to the activity-based analyses, we also explored differences with respect to the Boolean model parameterization,i.e. if higher performance models tend to have specific logical operators (or not) in some equations.This also motivated us to study how the diversity in particular Boolean rule assignments in thedifferent model classes translates to the respective target nodes’ activity (the link between nodeparameterization and activity was further investigated in Paper 5). To enable all the aforementionedinvestigations, we began writing functions in several scripts while getting familiar with the world ofprofessional software development in R [126]. In the end, we spent considerable effort to organizeall these functions into a single, clean, modularized and tested codebase, with the purpose to fill in aniche for data analysis-oriented software that performs auxiliary automated analyses on Booleanmodel datasets. The result was the creation of the emba R package and its addition to the DrugLogicssoftware suite (Paper 4).
13See druglogics-roc repository here14See gitsbe-model-analysis repository here
23
Get the right rules
In the previous chapter we described in detail all the different requirements that a softwareneeds to satisfy so as to deliver on its promise to do what it was made to do. In other words, itis entirely the software developer’s responsibility to make sure that the underlying algorithms areprogrammed correctly, the model equations and their solutions are correct and that in general, thesoftware works as expected. In the case of our modeling pipeline, this translates for example to theprecise and error-free implementation of the genetic algorithm as well as taking the extra effort to testand ensure that the Boolean models are assigned the desired parameterization and their attractors arecorrectly calculated. The aforementioned procedure is semantically synonymous to verification: thesoftware works in a manner that directly reflects the underlying theories and modeling assumptions.This is part of what makes the simulation results trustworthy and actionable, in the sense that theycan be used to provide solutions to real-world problems, making the respective models valuable fordiverse applications, both in industrial and clinical contexts.
It is a totally different matter if the solutions that the software was made to produce, (e.g. thesimulation results in the case of modeling software), are pragmatic. What good are models if theiroutputs do not agree with real observations, no matter how skillfully the developer translated thetheoretical ideas in software code? All models are wrong since they are approximate representationsof reality, but they should at least have some use and therefore it is important to be able to pinpointexactly where this wrongness originates and what it pertains to. If a biological model for examplecannot reproduce basic observations about the phenotype of the system it simulates (via its respectivesoftware), then that model is not useful and it probably needs further refinement. That leads to thequestion of what makes a model able to better match experimental data and become a more faithfulapproximation of reality. In other words, what aspect of the model needs refinement? The first steptowards answering this question is understanding that a model is more than just the code. A model,as explained in a previous chapter, is a set of mathematical rules applied to a list of biological entities(also referred to as model parameterization). So, extra care should be given to make sure we havethe right equations in our models. This crucial next step is known as the validation of the modelingsoftware and its basic assumption is that more “right” equations result in better fit to observations,which lead to better models (their behavior corresponds more accurately to reality) and subsequently,better simulation results (predictions about the studied system).
So for every modeling application and subsequent software, not only do we need to havethe rules right (verification), but it is of equal or maybe even more significance to have the rightrules (validation) [127]. In that aspect, the parameterization of the Boolean models in our software,i.e. the choice of logical equations that define the regulatory activity of every target in the underlyingcancer signaling network, stands as one of the most important parts of the ensuing modeling process.Since parameterization is so important, how can we find which are the “right” rules or similarly,
24
how can we distinguish between those that are right versus those that are not (or are less so), sothat we can choose the former for our models? Practically, the way that researchers in the logicalmodeling community have dealt with this problem is by establishing standard logical equation formsto represent regulatory interactions upon a signaling target [128]. Based on such a foundation for theinitial construction of the logical rules, the next step is to tweak them properly, by changing logicaloperators and removing/adding variables (regulators), so that a better match with experimentalobservations can be achieved. This process of calibrating the rules to fit the respective data can beeither the result of manual curation [90,129,130], or the outcome of automated computational searchfor optimal logical equations [131,132] (for similar efforts in this thesis see Paper 3). In addition,several other methods are used to convert various input sources to the appropriate Boolean rules,e.g. by translating molecular interaction maps directly to Boolean models [133] or user-providedtext to suitable logical equations via web-based tools [134].
Be it the modelers or the computers that refine and produce the final Boolean equations inthe respective models, we reasoned that a proper framework to characterize the Boolean functionsthat constitute the rules in these models, is currently missing. The main idea is that, since themathematical rules are the heart of modeling and we need to have the right rules (or as best aspossible) for validating and further refining our models, a proper toolkit is needed to differentiateand choose between the possible parameterization options. The plethora of potential equations thatcan be just “right” are a direct consequence of the fact that the number of possible parameterizationsincreases dramatically with the number of regulators [135]. In addition, a large number of Booleanequations may fit equally well the experimental observations or it might even be the case that thedata are not enough to uniquely define the model equations [136]. Either way, fitting the model tomatch the expected outputs is just one side of the validation process. We need to go deeper thanthat though if we are to reach our goal of finding biologically reasonable and functionally usefulrules for our models. To establish a practical framework assisting in the choice of a particularlogical model parameterization, we need to search for ways to expand our knowledge of the rulesand gain insights into these from different perspectives. Following this logic, there are functionproperties that Boolean mathematics research has thoroughly studied and which, when brought tothe context of modeling, can be beneficial for both modelers and software applications that specifyor calibrate the rules of a logical model [135,137,138]. For example, such properties could be usedto investigate if the equations contradict the structure of the underlying regulatory topology (PKN)or that biologically important regulators manifest in the equations as proportionally influential to therespective Boolean output. Our efforts constitute a first attempt to compile such a list of Booleanfunction metrics in a unified framework that could be used to refine the search for the optimal rulesto use (Paper 5). The analyses in that paper also show the differences between varying Booleanparameterizations in terms of expected output behavior and how this information, when known apriori (based on precise mathematical formalization and subsequent calculation), can assist in thechoice of better rules for the considered models.
25

While establishing a framework to help in the identification of the right rules for a Booleanmodel, we leveraged the benefits of variation in model parameterization (Figure 7). Exploring theeffects of variation in the values of model parameters, enables the identification of variables whichhave the largest influence in the behavior of the studied systems and can provide mechanistic insightsto explain several phenomena [75]. For example, in Eduati et al. (2017) [86], the authors studyhow logical model parameters are related with cellular sensitivity to anti-cancer drugs. Simply put,by tweaking a biologically meaningful parameter in their model (the responsiveness of the GSK3signaling node), you could explain why a drug combination involving a MEK and a GSK3 inhibitor issensitive in some cancer cell lines and resistant in others. This computational finding was supportedby experimental evidence, thereby providing a proof-of-concept in how the investigation of modelparameterization can suggest new mechanisms for the manifestation of particular drug synergies.On a more theoretical front, in Abou-Jaoudé et al. (2019) [139], the authors formally describe theconcept of logical bifurcation diagrams, a framework to assess how changes in the logical parametersresult in the change of the dynamics of logical models. This methodology was used to displaythe attractors of the simple p53-Mdm2 signaling network as a function of the degradation rate ofubiquitin ligase Mdm2 in the nucleus, allowing for a more concise characterization of its maindynamical properties [140].
...A activates BA activates C C inhibits B D inhibits C
...
PKN
...B = A AND NOT CC = A AND NOT D...
...B = A AND NOT CC = A OR NOT D...
...B = A OR NOT CC = A AND NOT D...
...B = A OR NOT CC = A OR NOT D...
Boolean Models
Figure 7: Exploring Boolean model parameterization with the abmlog software. Using as input causal regulatoryknowledge, all possible Boolean models that conform to a standardized logical equation form [128] and its most basicvariation are produced. Target nodes B and C have two regulators each, and their respective Boolean equations can beformalized in two ways, producing a total of four possible models for further analysis.
26

Such approaches inspired us to explore the space of Boolean model parameterization,pertaining to the equations used to construct and mutate the models in the genetic algorithm ofGitsbe (Paper 3). We made a Java software package that can produce either a random sampleor all possible Boolean models, based on a standardized equation form [128] and its most basicvariation (Figure 7). The abmlog package is now also part of the DrugLogics software suiteand was used in the analyses of Paper 5 to show how the output behavior of the two alternativeparameterization options of the Gitsbe models varies based on the number of regulators in therespective equations and the ratio of positive to negative regulators (as these were defined in theoriginal PKN). Moreover, a large number of CASCADE-based Boolean models were produced usingthe abmlog package to explore parameterization variation. Exploiting the dimension reduction andvisualization method UMAP [141], we constructed several Boolean model maps and were able tovisualize model differences such as fitness to training data and prediction performance.15 Furtheranalysis identified important nodes which drive the change of dynamics (number of attractors in theCASCADE Boolean models) and whose parameterization could be used to visually separate theUMAP embedded models in distinct clusters.
15See bool-param-maps repository here
27
Discussion & Future Perspectives
In most of the papers included in this thesis there is a separate section discussing potentialfuture tasks, the fulfillment of which will advance the efforts towards achieving the goals of eachrespective research work. We also discussed in a previous chapter16 additional implementation workthat is crucial for establishing a robust infrastructure for the sharing of causal molecular interactionsto a wider community of users with PSICQUIC. Here, we will discuss further implementationsand research that needs to be done related to modeling efforts for combating cancer. First, we willfocus on clarifying several aspects in our own computational work and suggest future directions.Secondly, we will reflect on the more broad problem of understanding cancer and briefly describe thechallenges that the computational biology community as a whole needs to overcome to drive futuremodeling efforts towards enabling more proactive, predictive and personalized Systems Medicineapproaches [84].
In Paper 3, we outline four key prerequisites that a software pipeline designed to constructpatient specific logical models should satisfy, in order to facilitate the identification of potentialtherapeutic solutions for cancer. These were expressed as (1) assembling a network topology fromprior knowledge databases, (2) translating baseline cancer cell line biomarker data into signalingactivities, (3) calibrating logical models, created from PKNs, by modifying logical equations tomatch the observed signaling activities, and (4) predicting phenotypic consequences of combinatorialinterventions to the simulated model behavior. These four generic requirements were embodied inthe respective software modules of Figure 5. Gitsbe and Drabme were our proposed solutions for (3)and (4) and the resulting simulations and analyses was the main scope of Paper 3. Atopo aims tofulfill objective (1) while Aomics is the module that encapsulates the work needed for objective (2).In the following text, we are going to discuss the reasons why these solutions were not included inPaper 3 and our future objectives for improvements on the Atopo and Aomics modules.
Starting with the assembly of the PKN, we previously set a list of requirements that such anoutput network should satisfy to be suitable for our analyses. These were the inclusion of the drugtargets so that they can be perturbed using subsequent pipeline software and the incorporation ofmajor cancer pathways in the PKN. Atopo is a software module (Figure 5) precisely implementedwith these specifications in mind, using SIGNOR’s causal molecular interaction data to constructself-contained topologies that include specific signaling entities [104]. The self-contained topologysolves a practical issue, since it allows for smaller logical models with fewer fixpoint attractors,increasing computational efficiency. It is also tightly related to the hypothesis that cancer is a diseasesystem in itself, not dictated by external factors. Put in other words, whatever makes a cancer cellkeep proliferating, comes from within the cell itself. Moreover, the signaling entities used in Atopo,refer in our case not only to the drug targets, but also to nodes that define the phenotypic output of
16See Sharing causal interactions with PSICQUIC.
28
the computational models later in the pipeline. In the end, due to the methodology used to prune thenetwork in Atopo and the molecular interaction content included in SIGNOR’s database (dated April2018), the Atopo-generated PKN was hard to make sense of, especially when trying to interpret thesimulation results in terms of mechanistic insights. For example, some analyses using the emba Rpackage from Paper 4 produced confusing results with regard to the nodes designated as importantfor the manifestation of particular synergies.17 Since we had curated the CASCADE family oftopologies from literature to incorporate cancer signaling pathways and associated key regulatorytargets, it presented itself as a trustable and already refined solution that perfectly fitted our needs.Our future goal is to combine molecular interaction data from different causal knowledge databases,using software like PSICQUIC [61] or OmniPath [142], to build larger and more comprehensivePKNs, suitable for our logical modeling applications in the context of cancer signaling.
To derive an accurate activity profile for the signaling entities in CASCADE, we usedmultiple omics datasets such as copy number alterations (CNA) and expression data (transcriptomicsor proteomics) pertaining to each of the cell lines of interest in the reference drug combination datasetchosen for our simulations [116]. These datasets were given as input to appropriate software tools topredict the signaling activity information [143]. Extensive effort was spent in subsequent software,which resulted in the Aomics family of internal tools (Figure 5). Sadly, we failed to produce reliablesignaling activities for the 8 cell lines of the reference drug combination dataset. For example, modeloutput nodes that are known to be inactivated in cancer cells (e.g. the family of Caspases), werecomputed as being active, contradicting basic biological knowledge. The conversion of variousomics datasets to binary signaling information and their efficient integration for modeling purposesis an emerging area of research [85,144–146]. We acknowledge the fact that such discretizationmethodologies might be a bit coarse and ill-suited given the continuous nature of some omicsdatasets, but they are nonetheless a prerequisite for qualitative modeling methodologies such as ours.We hope that in the future more standardized methods will be available to handle such datasets andmake them better suited for our needs.
Overall, the Aomics endeavor represents a practical example where validation of the variousinput data sources of a scientific software fails and so, as researchers, we have to use every meansavailable at our disposal to further progress our goals (i.e. in our case this meant to use a curatedPKN and literature-derived signaling observations). Nonetheless, we can exploit the informationpresented in such input data sources to further investigate their quality, which can reveal the varyingdegrees of importance with which such inputs affect the simulation results of the software. Forexample, in Paper 3 we investigated how severely the pipeline’s synergy prediction performancewas affected by either changes to the input training activity data or the input topology (PKN). Inthe end, the results indicated that the topology is far more important, demonstrating the need forhigh quality prior knowledge and the significance of related curation efforts that translate scientific
17See gitsbe-model-analysis repository here
29
literature to structured knowledge infrastructures.
The work described in this thesis focuses on the qualitative modeling of a single cancer cell,aiming at predicting its phenotypic behavior subject to various drug perturbations. Our work, alongwith similar efforts from the Computational Biology community, has only been the first step in themechanistic modeling of biological systems. To help scientists better understand cancer cell biology,we need to achieve a better understanding of the processes occurring inside the cell and pave the wayfor the systematic analysis of cells on a broader scale than what is currently possible. Up to now,researchers have been constructing, simulating and analyzing models to answer specific questionspertaining to context-specific modeling scenarios. Such concentrated modeling efforts are usuallyrestrictive, because of their limited scope and the choice of a single mathematical framework toformalize the respective models (e.g. Boolean mathematics or ODEs). Thus the resulting biologicalmodels are inadequate and can not provide the necessary temporal and spatial resolution of themodeled systems that is required to holistically describe and interpret complex cellular behavior.
There is a gradual shift to replace focused models with larger, multiscale hybrid models.These types of fine-grained models can incorporate multiple levels of granularity in their associ-ated mathematical representation and simulated molecular scale, and their aim is to provide anaccurate description of the cellular phenotype from its respective genotype [147]. Such in-silicowhole-cell (WC) models are powerful scientific tools that will allow us to identify gaps in ourunderstanding of cell biology and unify our fragmented knowledge of disease development. Theirmain advantage is that they can be used to address multiple scientific questions, and conduct complexin-silico experiments that would otherwise be impractical to perform in the laboratory with currenttechnologies. Such approaches to modeling complex biological systems are foreseen to have asignificant impact in a number of applications, both in research and industry (e.g. biotechnology),serving as a platform to facilitate model-driven discovery [148]. In parallel, research on multicellularmodeling aims to improve our understanding of the interactions between the different cells thatsend and receive signals to communicate and perform tissue- and organism-level functions. Suchmodels can help us describe in more detail the processes that drive tumor pathogenesis and favor thedevelopment and progression of cancer [149]. For example, multicellular models could elucidatethe mechanisms by which tumor associated macrophages (TAMs) interact with cancer cells in theinflammatory microenvironment of solid tumors [150,151], provide comprehensive explanationsof how multicellular cancer resistance manifests [152], and propose novel therapeutic targets thatdamage the communication of tumor cells with their microenvironment [153].
There exist several challenges in building accurate and comprehensive WC models [154].To fully characterize the function of every gene product and predict the dynamics of all molecularspecies of a cell over its entire life cycle, WC models need to be able to synthesize information thatis subject to different molecular as well as spatiotemporal scales, and perform multi-algorithmic
30
simulations. Despite the fact that several software tools have been built to enable the constructionand simulation of WC models [155,156], a complete integration of all the different algorithmicmethodologies representing molecular detail at every possible scale, is currently lacking. Moreover,a proper theoretical foundation that specifies how the different modeling formalisms can workunder a hybrid mathematical framework for WC modeling is also missing [157]. On anotherfront, the heterogeneous data needed for the scalable design, construction, calibration, simulationand validation of WC models, are incomplete, imprecise and noisy, calling for the developmentof new experimental methods and tools to more properly characterize cells at multiple levels ofmolecular granularity and expression (e.g. different omics data) [158]. Literature curation tools, usedto annotate and extract knowledge from scientific publications, complement the aforementionedefforts by providing a systematic way to assemble the comprehensive prior knowledge that isrequired for WC modeling. Therefore, software implementations allowing for new approachestowards the annotation and sharing of causal molecular interactions (as were presented in this thesis),significantly contribute to such efforts. In addition, we anticipate that the use of machine learningand text mining automated tools are going to be detrimental for future curation efforts, leveragingthe vast amounts of biological knowledge for the creation of more accurate WC models.
There are major computational bottlenecks that we need to overcome to enable the compre-hensive modeling of complex cells. Due to the high computational costs required for the calibrationand simulation of WC models (e.g. parameter estimation is particularly resource intensive), high-performance modeling algorithms need to be implemented, along with better parallel processingsimulators [159]. Additionally, technological advancements such as cloud and high performancecomputing (HPC) services [160] will allow us to take advantage of modern computational resourcesand harness their scalability and processing power, surpassing the limitations of conventional singlemachines that are unsuitable for such large-scale modeling efforts. On another front, WC models andtheir subcomponents (e.g. signaling pathway models corresponding to distinct cellular processes)need to be interoperable to allow for proper model integration, extension and reuse, as well as enablereproducible simulation results. During the 2015 WC Modeling Summer School event, effortsdirected towards translating a WC model to community formats such as SBML [161] (for modelencoding) and SBGN [45] (for model visualization), indicated the need for additional standards,databases and software to accelerate WC modeling [162].
Current approaches to build comprehensive WC models of simple organisms such as thepathogen Mycoplasma genitalium [147,163], and the bacterium Escherichia Coli [164] constitutesignificant achievements towards addressing all the aforementioned challenges. Moreover, they pavethe way for the construction of mammalian WC models and eventually whole-organism models[165,166] (the pinnacle of which should be a complete human model), where the communicationand coordination between different WC models (representing different cell types), at differenthierarchical levels, is going to be one of the most difficult issues to tackle. Despite the difficulty
31

inherent in such aspiring projects, many recent research efforts have been focused on studyingmulticellular systems with potential applications in cancer immunology and therapeutics. Notably,several tools have been developed using agent-based or similar modeling approaches, providingways to intuitively represent multicellular biological systems [167–171]. Such methodologiesfacilitate the integration of multiple scales for the study of cell population dynamics, and some alsoincorporate various spatial aspects of the modeled systems. The respective software simulatorsmake use of coarse-grained characterizations of the interacting cells (i.e. the agents), significantlyreducing the computational simulation costs. Even though current multicellular models do notencapsulate a realistic picture of the intracellular signaling (since it is impractical to incorporate fullWC models) nor of the cell communication mechanics, they have been successfully used to validateseveral experimental findings and study interacting cells in dynamic tissue microenvironments suchas heterogeneous cell tumors. Moreover, multicellular models have the potential to assist in theexploration of the effects that the genetic alteration of individual cells has to the population level(e.g. how knocking out genes in specific cells can limit tumor growth), the investigation of responseto various anti-cancer treatments, as well as the study of the cellular mechanisms and dynamics ofcarcinogenesis. We can only expect that in the future, biological and medical applications will pushthe boundaries of what is achievable by such software modeling solutions and that multicellular andWC models will drive progress in the cancer-related research areas and beyond.
Lastly, we stress the necessity of interdisciplinarity and collaboration across the research andindustrial spectrum, to solve all the grand challenges involved in the modeling of complex biologicalsystems and the efforts to combat diseases such as cancer. Building a cohesive ComputationalBiology community also plays an important role, as it promotes a common vision and a collaborativespirit amongst the members of the community. The success story of the COMBINE initiative’sstandardization efforts in computational biological modeling, has been empowered by the promotionof its standards via tutorials, workshops and dedicated sessions at international conferences [172].As scientists, we are called to take risks, not only to explore the unknown and yet uncharted territoryof our world but also to face the social and communication challenges between ourselves. Onlytogether, as one community, can we set the world in order, tackle the problems of today, and create abetter tomorrow for all humankind.
32
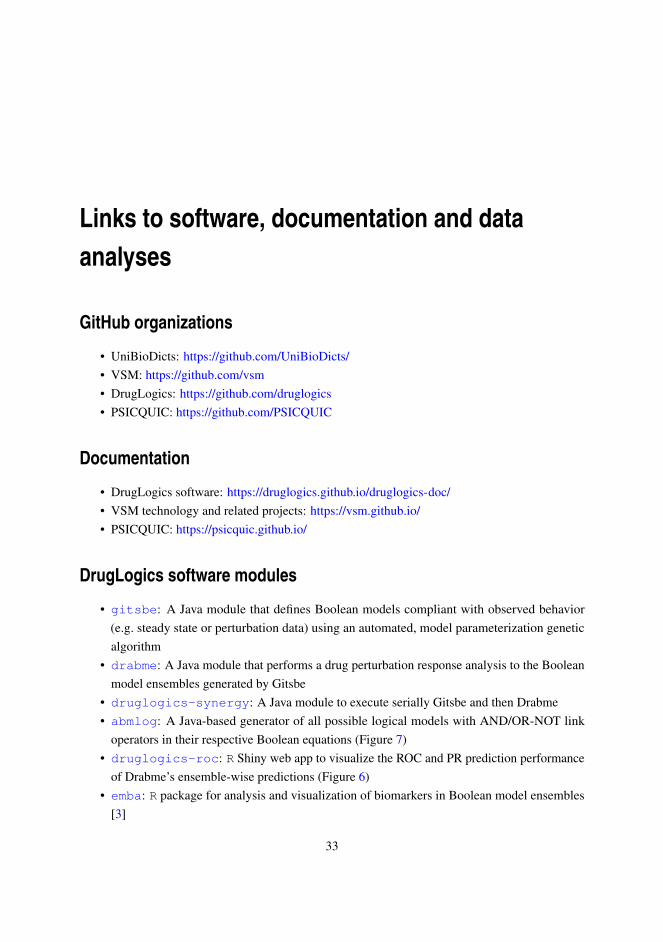
Links to software, documentation and dataanalyses
GitHub organizations
• UniBioDicts: https://github.com/UniBioDicts/• VSM: https://github.com/vsm• DrugLogics: https://github.com/druglogics• PSICQUIC: https://github.com/PSICQUIC
Documentation
• DrugLogics software: https://druglogics.github.io/druglogics-doc/• VSM technology and related projects: https://vsm.github.io/• PSICQUIC: https://psicquic.github.io/
DrugLogics software modules
• gitsbe: A Java module that defines Boolean models compliant with observed behavior(e.g. steady state or perturbation data) using an automated, model parameterization geneticalgorithm
• drabme: A Java module that performs a drug perturbation response analysis to the Booleanmodel ensembles generated by Gitsbe
• druglogics-synergy: A Java module to execute serially Gitsbe and then Drabme• abmlog: A Java-based generator of all possible logical models with AND/OR-NOT link
operators in their respective Boolean equations (Figure 7)• druglogics-roc: R Shiny web app to visualize the ROC and PR prediction performance
of Drabme’s ensemble-wise predictions (Figure 6)• emba: R package for analysis and visualization of biomarkers in Boolean model ensembles
[3]
33
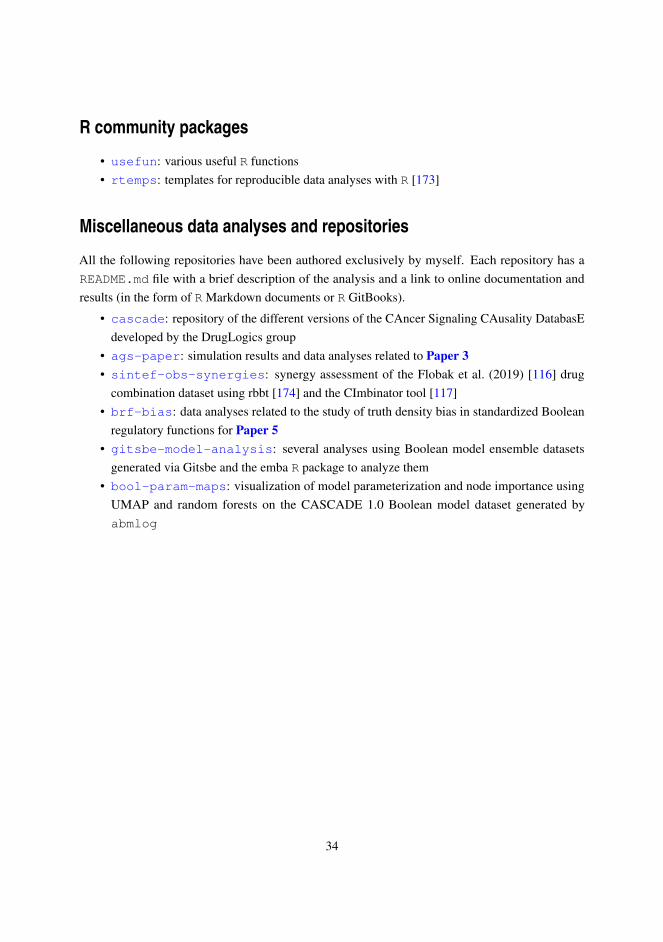
R community packages
• usefun: various useful R functions• rtemps: templates for reproducible data analyses with R [173]
Miscellaneous data analyses and repositories
All the following repositories have been authored exclusively by myself. Each repository has aREADME.md file with a brief description of the analysis and a link to online documentation andresults (in the form of R Markdown documents or R GitBooks).
• cascade: repository of the different versions of the CAncer Signaling CAusality DatabasEdeveloped by the DrugLogics group
• ags-paper: simulation results and data analyses related to Paper 3• sintef-obs-synergies: synergy assessment of the Flobak et al. (2019) [116] drug
combination dataset using rbbt [174] and the CImbinator tool [117]• brf-bias: data analyses related to the study of truth density bias in standardized Boolean
regulatory functions for Paper 5• gitsbe-model-analysis: several analyses using Boolean model ensemble datasets
generated via Gitsbe and the emba R package to analyze them• bool-param-maps: visualization of model parameterization and node importance using
UMAP and random forests on the CASCADE 1.0 Boolean model dataset generated byabmlog
34
References
1. Zobolas, J., Touré, V., Kuiper, M., & Vercruysse, S. (2020). UniBioDicts: Unified access toBiological Dictionaries. Bioinformatics, 37(1), 143–144. https://doi.org/10.1093/bioinformatics/btaa1065
2. Zobolas, J., Kim, J.-D., Kuiper, M., & Vercruysse, S. (2020). Linking PubDictionaries withUniBioDicts to support Community Curation. BioHackrXiv. https://doi.org/10.37044/osf.io/gzfa8
3. Zobolas, J., Kuiper, M., & Flobak, Å. (2020). emba: R package for analysis and visualizationof biomarkers in boolean model ensembles. Journal of Open Source Software, 5(53), 2583.https://doi.org/10.21105/joss.02583
4. Zobolas, J., Monteiro, P. T., Kuiper, M., & Flobak, Å. (2021). Boolean function metrics can assistmodelers to check and choose logical rules. http://arxiv.org/abs/2104.01279
5. Vercruysse, S., Zobolas, J., Touré, V., Andersen, M. K., & Kuiper, M. (2020). VSM-box:general-purpose interface for biocuration and knowledge representation. Preprints. https://doi.org/10.20944/preprints202007.0557.v1
6. Touré, V., Zobolas, J., Kuiper, M., & Vercruysse, S. (2021). CausalBuilder: bringing theMI2CAST causal interaction annotation standard to the curator. Database. https://doi.org/10.1093/database/baaa107
7. Perfetto, L., Acencio, M. L., Bradley, G., Cesareni, G., Del Toro, N., Fazekas, D., Hermjakob,H., Korcsmaros, T., Kuiper, M., Lægreid, A., Lo Surdo, P., Lovering, R. C., Orchard, S.,Porras, P., Thomas, P. D., Touré, V., Zobolas, J., & Licata, L. (2019). CausalTAB: the PSI-MITAB 2.8 updated format for signalling data representation and dissemination. Bioinformatics.https://doi.org/10.1093/bioinformatics/btz132
8. Abbate, J. (2000). Inventing the internet. MIT press.
9. Naughton, J. (2016). The evolution of the Internet: from military experiment to General PurposeTechnology. Journal of Cyber Policy, 1(1), 5–28. https://doi.org/10.1080/23738871.2016.1157619
10. Polasky, S., Kling, C. L., Levin, S. A., Carpenter, S. R., Daily, G. C., Ehrlich, P. R., Heal, G.M., & Lubchenco, J. (2019). Role of economics in analyzing the environment and sustainable
35
development. Proceedings of the National Academy of Sciences of the United States of America,116(12), 5233–5238. https://doi.org/10.1073/pnas.1901616116
11. Roser, M., Ortiz-Ospina, E., & Ritchie, H. (2013). Life Expectancy. https://ourworldindata.org/life-expectancy (15 May 2021, date last accessed).
12. Jinek, M., Chylinski, K., Fonfara, I., Hauer, M., Doudna, J. A., & Charpentier, E. (2012). Aprogrammable dual-RNA–guided DNA endonuclease in adaptive bacterial immunity. Science,337(6096), 816–821.
13. Zhu, H., Li, C., & Gao, C. (2020). Applications of CRISPR–Cas in agriculture and plantbiotechnology. Nature Reviews Molecular Cell Biology, 21(11), 661–677. https://doi.org/10.1038/s41580-020-00288-9
14. Bailey, R., & Tupy, M. L. (2020). Ten Global Trends Every Smart Person Should Know: AndMany Others You Will Find Interesting. Cato Institute.
15. Gibbons, M. (1999). Science’s new social contract with society. Nature, 402, C81–C84.https://doi.org/10.1038/35011576
16. Healthcare Access and Quality Index. (2015). https://ourworldindata.org/grapher/healthcare-access-and-quality-index (15 May 2021, date last accessed).
17. Apweiler, R., Beissbarth, T., Berthold, M. R., Blüthgen, N., Burmeister, Y., Dammann, O.,Deutsch, A., Feuerhake, F., Franke, A., Hasenauer, J., Hoffmann, S., Höfer, T., Jansen, P.L., Kaderali, L., Klingmüller, U., Koch, I., Kohlbacher, O., Kuepfer, L., Lammert, F., . . .Wolkenhauer, O. (2018). Whither systems medicine? Experimental & Molecular Medicine,50(3), e453. https://doi.org/10.1038/emm.2017.290
18. Trudeau, R. J. (1976). Dots and lines. Kent State University Press.
19. Erdos, P., & Rényi, A. (1960). On the evolution of random graphs. Publ. Math. Inst. Hung.Acad. Sci, 5(1), 17–60.
20. Barabási, A. L., & Albert, R. (1999). Emergence of scaling in random networks. Science,286(5439), 509–512. https://doi.org/10.1126/science.286.5439.509
21. Barabási, A. L. (2013). Network science. Philosophical Transactions of the Royal Society A:Mathematical, Physical and Engineering Sciences, 371(1987). https://doi.org/10.1098/rsta.2012.0375
22. Csardi, G., & Nepusz, T. (2006). The igraph software package for complex network research.InterJournal, Complex Systems, 1695(5), 1–9. http://igraph.org
23. Bastian, M., Heymann, S., & Jacomy, M. (2009). Gephi: an open source software for exploringand manipulating networks. Proceedings of the International AAAI Conference on Web andSocial Media.
24. Mrvar, A., & Batagelj, V. (2016). Analysis and visualization of large networks with program
36
package Pajek. Complex Adaptive Systems Modeling, 4(1), 1–8. https://doi.org/10.1186/s40294-016-0017-8
25. Shannon, P., Markiel, A., Ozier, O., Baliga, N. S., Wang, J. T., Ramage, D., Amin, N.,Schwikowski, B., & Ideker, T. (2003). Cytoscape: a software environment for integrated modelsof biomolecular interaction networks. Genome Research, 13(11), 2498–2504.
26. Dahlquist, K. D., Salomonis, N., Vranizan, K., Lawlor, S. C., & Conklin, B. R. (2002).GenMAPP, a new tool for viewing and analyzing microarray data on biological pathways.Nature Genetics, 31(1), 19–20. https://doi.org/10.1038/ng0502-19
27. Breitkreutz, B.-J., Stark, C., & Tyers, M. (2003). Osprey: a network visualization system.Genome Biology, 4(3), R22. https://doi.org/10.1186/gb-2003-4-3-r22
28. Funahashi, A., Morohashi, M., Kitano, H., & Tanimura, N. (2003). CellDesigner: a processdiagram editor for gene-regulatory and biochemical networks. BIOSILICO, 1(5), 159–162.https://doi.org/10.1016/s1478-5382(03)02370-9
29. Sidiropoulos, K., Viteri, G., Sevilla, C., Jupe, S., Webber, M., Orlic-Milacic, M., Jassal, B.,May, B., Shamovsky, V., Duenas, C., Rothfels, K., Matthews, L., Song, H., Stein, L., Haw, R.,D’Eustachio, P., Ping, P., Hermjakob, H., & Fabregat, A. (2017). Reactome enhanced pathwayvisualization. Bioinformatics, 33(21), 3461–3467. https://doi.org/10.1093/bioinformatics/btx441
30. Smith, M. A., Shneiderman, B., Milic-Frayling, N., Mendes Rodrigues, E., Barash, V., Dunne,C., Capone, T., Perer, A., & Gleave, E. (2009). Analyzing (social media) networks with NodeXL.Proceedings of the Fourth International Conference on Communities and Technologies - c&t’09, 255. https://doi.org/10.1145/1556460.1556497
31. Kalamaras, D. (2014). Social Networks Visualizer (SocNetV): Social network analysis andvisualization software. http://socnetv.org
32. Chatterjee, T., Albert, R., Thapliyal, S., Azarhooshang, N., & DasGupta, B. (2021). Detectingnetwork anomalies using Forman–Ricci curvature and a case study for human brain networks.Scientific Reports, 11(1), 8121. https://doi.org/10.1038/s41598-021-87587-z
33. Mislove, A., Marcon, M., Gummadi, K. P., Druschel, P., & Bhattacharjee, B. (2007). Mea-surement and analysis of online social networks. Proceedings of the ACM SIGCOMM InternetMeasurement Conference, IMC, 29–42. https://doi.org/10.1145/1298306.1298311
34. Maheshwari, P., & Albert, R. (2020). Network model and analysis of the spread of Covid-19with social distancing. Applied Network Science, 5(1), 1–13. https://doi.org/10.1007/s41109-020-00344-5
35. Barabási, A.-L., Gulbahce, N., & Loscalzo, J. (2011). Network medicine: a network-basedapproach to human disease. Nature Reviews. Genetics, 12(1), 56–68. https://doi.org/10.1038/nrg2918
36. Vercruysse, S. (2019). VSM Pages. https://vsm.github.io/vsm-pages/intro (15 May 2021, date
37
last accessed).
37. Howe, D., Costanzo, M., Fey, P., Gojobori, T., Hannick, L., Hide, W., Hill, D. P., Kania, R.,Schaeffer, M., St Pierre, S., Twigger, S., White, O., & Yon Rhee, S. (2008). Big data: The futureof biocuration. Nature, 455(7209), 47–50. https://doi.org/10.1038/455047a
38. Ammari, M., Chatr Aryamontri, A., Attrill, H., Bairoch, A., Berardini, T., Blake, J., Chen, Q.,Collado, J., Dauga, D., Dudley, J. T., Engel, S., Erill, I., Fey, P., Gibson, R., Hermjakob, H.,Holliday, G., Howe, D., Hunter, C., Landsman, D., . . . Zhang, Z. (2018). Biocuration: Distillingdata into knowledge. PLOS Biology, 16(4), e2002846. https://doi.org/10.1371/journal.pbio.2002846
39. Jenssen, T.-K., Lægreid, A., Komorowski, J., & Hovig, E. (2001). A literature network ofhuman genes for high-throughput analysis of gene expression. Nature Genetics, 28(1), 21–28.https://doi.org/10.1038/ng0501-21
40. IntAct editor. (2007). https://github.com/EBI-IntAct/intact-editor (15 May 2021, date lastaccessed).
41. Rutherford, K. M., Harris, M. A., Lock, A., Oliver, S. G., & Wood, V. (2014). Canto: anonline tool for community literature curation. Bioinformatics, 30(12), 1791–1792. https://doi.org/10.1093/bioinformatics/btu103
42. Canto Documentation. (2014). https://curation.pombase.org/pombe/docs/index/, (15 May 2021,date last accessed).
43. Kuperstein, I., Cohen, D. P. A., Pook, S., Viara, E., Calzone, L., Barillot, E., & Zinovyev, A.(2013). NaviCell: A web-based environment for navigation, curation and maintenance of largemolecular interaction maps. BMC Systems Biology, 7(1), 100. https://doi.org/10.1186/1752-0509-7-100
44. Gawron, P., Ostaszewski, M., Satagopam, V., Gebel, S., Mazein, A., Kuzma, M., Zorzan,S., McGee, F., Otjacques, B., Balling, R., & Schneider, R. (2016). MINERVA—A platformfor visualization and curation of molecular interaction networks. Npj Systems Biology andApplications, 2(1), 1–6. https://doi.org/10.1038/npjsba.2016.20
45. Novère, N. L., Hucka, M., Mi, H., Moodie, S., Schreiber, F., Sorokin, A., Demir, E., Wegner, K.,Aladjem, M. I., Wimalaratne, S. M., Bergman, F. T., Gauges, R., Ghazal, P., Kawaji, H., Li, L.,Matsuoka, Y., Villéger, A., Boyd, S. E., Calzone, L., . . . Kitano, H. (2009). The Systems BiologyGraphical Notation. Nature Biotechnology, 27(8), 735–741. https://doi.org/10.1038/nbt.1558
46. Vercruysse, S., & Kuiper, M. (2020). Intuitive representation of computable knowledge.Preprints. https://doi.org/10.20944/preprints202007.0486.v2
47. Touré, V., Vercruysse, S., Acencio, M. L., Lovering, R., Orchard, S., Bradley, G., Casals-Casas, C., Chaouiya, C., Del-Toro, N., Flobak, Å., Gaudet, P., Hermjakob, H., Licata, L.,Lægreid, A., Mungall, C., Niknejad, A., Panni, S., Perfetto, L., Porras, P., . . . Kuiper, M.
38
(2020). The Minimum Information about a Molecular Interaction Causal Statement (MI2CAST).Bioinformatics. https://doi.org/10.1093/bioinformatics/btaa622
48. Vasundra, T. (2020). MI2CAST Documentation. https://github.com/MI2CAST/MI2CAST/blob/master/docs/MI2CAST_guideline.md (15 May 2021, date last accessed).
49. The UniProt Consortium. (2019). UniProt: a worldwide hub of protein knowledge. NucleicAcids Research, 47(D1), D506–D515. https://doi.org/10.1093/nar/gky1049
50. Meldal, B. H. M., Bye-A-Jee, H., Gajdoš, L., Hammerová, Z., Horácková, A., Melicher, F.,Perfetto, L., Pokorný, D., Lopez, M. R., Türková, A., Wong, E. D., Xie, Z., Casanova, E. B.,Del-Toro, N., Koch, M., Porras, P., Hermjakob, H., & Orchard, S. (2019). Complex Portal 2018:extended content and enhanced visualization tools for macromolecular complexes. Nucleic AcidsResearch, 47(D1), D550–D558. https://doi.org/10.1093/nar/gky1001
51. The RNAcentral Consortium. (2018). RNAcentral: a hub of information for non-coding RNAsequences. Nucleic Acids Research, 47(D1), D1250–D1251. https://doi.org/10.1093/nar/gky1206
52. Whetzel, P. L., Noy, N. F., Shah, N. H., Alexander, P. R., Nyulas, C., Tudorache, T., & Musen,M. A. (2011). BioPortal: enhanced functionality via new Web services from the National Centerfor Biomedical Ontology to access and use ontologies in software applications. Nucleic AcidsResearch, 39(Web Server issue), W541–5. https://doi.org/10.1093/nar/gkr469
53. Madeira, F., Park, Y. mi, Lee, J., Buso, N., Gur, T., Madhusoodanan, N., Basutkar, P., Tivey,A. R. N., Potter, S. C., Finn, R. D., & Lopez, R. (2019). The EMBL-EBI search and sequenceanalysis tools APIs in 2019. Nucleic Acids Research, 47(W1), W636–W641. https://doi.org/10.1093/nar/gkz268
54. Wilkinson, M. D., Dumontier, M., Aalbersberg, Ij. J., Appleton, G., Axton, M., Baak, A.,Blomberg, N., Boiten, J. W., da Silva Santos, L. B., Bourne, P. E., Bouwman, J., Brookes, A. J.,Clark, T., Crosas, M., Dillo, I., Dumon, O., Edmunds, S., Evelo, C. T., Finkers, R., . . . Mons, B.(2016). The FAIR Guiding Principles for scientific data management and stewardship. ScientificData, 3(1), 1–9. https://doi.org/10.1038/sdata.2016.18
55. Hartmann, N. B., Hüffer, T., Thompson, R. C., Hassellöv, M., Verschoor, A., Daugaard, A.E., Rist, S., Karlsson, T., Brennholt, N., Cole, M., Herrling, M. P., Hess, M. C., Ivleva, N. P.,Lusher, A. L., & Wagner, M. (2019). Are We Speaking the Same Language? Recommendationsfor a Definition and Categorization Framework for Plastic Debris. Environmental Science andTechnology, 53(3), 1039–1047. https://doi.org/10.1021/acs.est.8b05297
56. Kim, J.-D., Wang, Y., Fujiwara, T., Okuda, S., Callahan, T. J., & Cohen, K. B. (2019). OpenAgile text mining for bioinformatics: the PubAnnotation ecosystem. Bioinformatics, 35(21),4372–4380. https://doi.org/10.1093/bioinformatics/btz227
57. Hermjakob, H., Montecchi-Palazzi, L., Bader, G., Wojcik, J., Salwinski, L., Ceol, A., Moore, S.,
39
Orchard, S., Sarkans, U., Mering, C. von, Roechert, B., Poux, S., Jung, E., Mersch, H., Kersey,P., Lappe, M., Li, Y., Zeng, R., Rana, D., . . . Apweiler, R. (2004). The HUPO PSI’s MolecularInteraction format—a community standard for the representation of protein interaction data.Nature Biotechnology, 22(2), 177–183. https://doi.org/10.1038/nbt926
58. Sivade, M., Alonso-López, D., Ammari, M., Bradley, G., Campbell, N. H., Ceol, A., Cesareni,G., Combe, C., De Las Rivas, J., Del-Toro, N., Heimbach, J., Hermjakob, H., Jurisica, I., Koch,M., Licata, L., Lovering, R. C., Lynn, D. J., Meldal, B. H. M., Micklem, G., . . . Orchard,S. (2018). Encompassing new use cases - level 3.0 of the HUPO-PSI format for molecularinteractions. BMC Bioinformatics, 19(1), 134. https://doi.org/10.1186/s12859-018-2118-1
59. Kerrien, S., Orchard, S., Montecchi-Palazzi, L., Aranda, B., Quinn, A. F., Vinod, N., Bader, G.D., Xenarios, I., Wojcik, J., Sherman, D., Tyers, M., Salama, J. J., Moore, S., Ceol, A., Chatr-aryamontri, A., Oesterheld, M., Stümpflen, V., Salwinski, L., Nerothin, J., . . . Hermjakob, H.(2007). Broadening the horizon – level 2.5 of the HUPO-PSI format for molecular interactions.BMC Biology, 5(1), 44. https://doi.org/10.1186/1741-7007-5-44
60. Licata, L., Lo Surdo, P., Iannuccelli, M., Palma, A., Micarelli, E., Perfetto, L., Peluso, D.,Calderone, A., Castagnoli, L., & Cesareni, G. (2019). SIGNOR 2.0, the SIGnaling NetworkOpen Resource 2.0: 2019 update. Nucleic Acids Research. https://doi.org/10.1093/nar/gkz949
61. Aranda, B., Blankenburg, H., Kerrien, S., Brinkman, F. S. L., Ceol, A., Chautard, E., Dana, J. M.,De Las Rivas, J., Dumousseau, M., Galeota, E., Gaulton, A., Goll, J., Hancock, R. E. W., Isserlin,R., Jimenez, R. C., Kerssemakers, J., Khadake, J., Lynn, D. J., Michaut, M., . . . Hermjakob,H. (2011). PSICQUIC and PSISCORE: accessing and scoring molecular interactions. NatureMethods, 8(7), 528–529. https://doi.org/10.1038/nmeth.1637
62. MITAB 2.8 Documentation. (2018). http://psicquic.github.io/MITAB28Format.html, (15 May2021, date last accessed).
63. Molecular Interactions Community. (2015). https://github.com/MICommunity, (15 May 2021,date last accessed).
64. Software rot (Wikipedia entry). (2014). https://en.wikipedia.org/wiki/Software_rot, (15 May2021, date last accessed).
65. Sivade, M., Koch, M., Shrivastava, A., Alonso-López, D., De Las Rivas, J., Del-Toro, N.,Combe, C. W., Meldal, B. H. M., Heimbach, J., Rappsilber, J., Sullivan, J., Yehudi, Y., &Orchard, S. (2018). JAMI: a Java library for molecular interactions and data interoperability.BMC Bioinformatics, 19(1), 133. https://doi.org/10.1186/s12859-018-2119-0
66. GREEKC Hinxton Workshop. (2018). https://www.greekc.org/activity/hinxton-workshop/, (15May 2021, date last accessed).
67. ELIXIR BioHackathon Paris. (2018). https://2018.biohackathon-europe.org/, (15 May 2021,date last accessed).
40
68. Del-Toro, N., Zobolas, J., & Touré, V. (2019). Signor Dataset in CausalTAB (PSICQUIC DevServer). http://wwwdev.ebi.ac.uk/Tools/webservices/psicquic/causality/webservices/current/search/query/*?firstResult=0&maxResults=10&format=tab28, (15 May 2021, date last accessed).
69. PSICQUIC View. (2011). http://www.ebi.ac.uk/Tools/webservices/psicquic/view/main.xhtml,(15 May 2021, date last accessed).
70. PSICQUIC Universal Client (Cytoscape app). (2012). https://apps.cytoscape.org/apps/psicquicuniversalclient, (15 May 2021, date last accessed).
71. Millán, P. P. (2013). Visualization and analysis of biological networks. Methods in MolecularBiology, 1021, 63–88. https://doi.org/10.1007/978-1-62703-450-0_4
72. Shannon, P. (2020). PSICQUIC: Proteomics Standard Initiative Common QUery InterfaCe. Rpackage version 1.28.0. https://doi.org/10.18129/B9.bioc.PSICQUIC
73. Kleshchevnikov, V. (2021). PItools: Protein interaction data tools. R package. GitHub.https://github.com/vitkl/PItools
74. Wang, R.-S., Saadatpour, A., & Albert, R. (2012). Boolean modeling in systems biology: anoverview of methodology and applications. Physical Biology, 9(5), 55001. https://doi.org/10.1088/1478-3975/9/5/055001
75. Aldridge, B. B., Burke, J. M., Lauffenburger, D. A., & Sorger, P. K. (2006). Physicochemicalmodelling of cell signalling pathways. Nature Cell Biology, 8(11), 1195–1203. https://doi.org/10.1038/ncb1497
76. ElKalaawy, N., & Wassal, A. (2015). Methodologies for the modeling and simulation ofbiochemical networks, illustrated for signal transduction pathways: A primer. Biosystems, 129,1–18. https://doi.org/10.1016/J.BIOSYSTEMS.2015.01.008
77. Groen, D., Arabnejad, H., Jancauskas, V., Edeling, W. N., Jansson, F., Richardson, R. A., Lakhlili,J., Veen, L., Bosak, B., Kopta, P., Wright, D. W., Monnier, N., Karlshoefer, P., Suleimenova, D.,Sinclair, R., Vassaux, M., Nikishova, A., Bieniek, M., Luk, O. O., . . . Coveney, P. V. (2021).VECMAtk: a scalable verification, validation and uncertainty quantification toolkit for scientificsimulations. Philosophical Transactions of the Royal Society A: Mathematical, Physical andEngineering Sciences, 379(2197). https://doi.org/10.1098/rsta.2020.0221
78. Schwab, J. D., Kühlwein, S. D., Ikonomi, N., Kühl, M., & Kestler, H. A. (2020). Con-cepts in Boolean network modeling: What do they all mean? Computational and StructuralBiotechnology Journal, 18, 571–582. https://doi.org/10.1016/j.csbj.2020.03.001
79. Kauffman, S. A. (1969). Metabolic stability and epigenesis in randomly constructed genetic nets.Journal of Theoretical Biology, 22(3), 437–467. https://doi.org/10.1016/0022-5193(69)90015-0
80. Kauffman, S. A. (1993). The origins of order: Self-organization and selection in evolution.Oxford University Press, USA.
81. Faure, A., Naldi, A., Chaouiya, C., & Thieffry, D. (2006). Dynamical analysis of a generic
41
Boolean model for the control of the mammalian cell cycle. Bioinformatics, 22(14), e124–e131.https://doi.org/10.1093/bioinformatics/btl210
82. Abou-Jaoudé, W., Traynard, P., Monteiro, P. T., Saez-Rodriguez, J., Helikar, T., Thieffry, D., &Chaouiya, C. (2016). Logical Modeling and Dynamical Analysis of Cellular Networks. Frontiersin Genetics, 7, 94. https://doi.org/10.3389/fgene.2016.00094
83. Naldi, A., Hernandez, C., Levy, N., Stoll, G., Monteiro, P. T., Chaouiya, C., Helikar, T., Zinovyev,A., Calzone, L., Cohen-Boulakia, S., Thieffry, D., & Paulevé, L. (2018). The CoLoMoToInteractive Notebook: Accessible and Reproducible Computational Analyses for QualitativeBiological Networks. Frontiers in Physiology, 9, 680. https://doi.org/10.3389/fphys.2018.00680
84. Hood, L., & Friend, S. H. (2011). Predictive, personalized, preventive, participatory (P4) cancermedicine. Nature Reviews Clinical Oncology, 8(3), 184–187. https://doi.org/10.1038/nrclinonc.2010.227
85. Béal, J., Montagud, A., Traynard, P., Barillot, E., & Calzone, L. (2018). Personalization ofLogical Models With Multi-Omics Data Allows Clinical Stratification of Patients. Frontiers inPhysiology, 9, 1965. https://doi.org/10.3389/fphys.2018.01965
86. Eduati, F., Doldàn-Martelli, V., Klinger, B., Cokelaer, T., Sieber, A., Kogera, F., Dorel, M.,Garnett, M. J., Blüthgen, N., & Saez-Rodriguez, J. (2017). Drug Resistance Mechanisms inColorectal Cancer Dissected with Cell Type-Specific Dynamic Logic Models. Cancer Research,77(12), 3364–3375. https://doi.org/10.1158/0008-5472.CAN-17-0078
87. Béal, J., Pantolini, L., Noël, V., Barillot, E., & Calzone, L. (2021). Personalized logical modelsto investigate cancer response to BRAF treatments in melanomas and colorectal cancers. PLOSComputational Biology, 17(1), e1007900. https://doi.org/10.1371/journal.pcbi.1007900
88. Tognetti, M., Gabor, A., Yang, M., Cappelletti, V., Windhager, J., Rueda, O. M., Charmpi,K., Esmaeilishirazifard, E., Bruna, A., Souza, N. de, Caldas, C., Beyer, A., Picotti, P., Saez-Rodriguez, J., & Bodenmiller, B. (2021). Deciphering the signaling network of breast cancerimproves drug sensitivity prediction. Cell Systems, 12. https://doi.org/10.1016/j.cels.2021.04.002
89. Saadatpour, A., Wang, R.-S., Liao, A., Liu, X., Loughran, T. P., Albert, I., & Albert, R. (2011).Dynamical and Structural Analysis of a T Cell Survival Network Identifies Novel CandidateTherapeutic Targets for Large Granular Lymphocyte Leukemia. PLoS Computational Biology,7(11), e1002267. https://doi.org/10.1371/journal.pcbi.1002267
90. Flobak, Å., Baudot, A., Remy, E., Thommesen, L., Thieffry, D., Kuiper, M., & Lægreid, A.(2015). Discovery of Drug Synergies in Gastric Cancer Cells Predicted by Logical Modeling.PLOS Computational Biology, 11(8). https://doi.org/10.1371/journal.pcbi.1004426
91. Eduati, F., Jaaks, P., Wappler, J., Cramer, T., Merten, C. A., Garnett, M. J., & Saez-Rodriguez,J. (2020). Patient-specific logic models of signaling pathways from screenings on cancerbiopsies to prioritize personalized combination therapies. Molecular Systems Biology, 16(2).
42

https://doi.org/10.15252/msb.20188664
92. Wilson, G., Aruliah, D. A., Brown, C. T., Chue Hong, N. P., Davis, M., Guy, R. T., Haddock,S. H. D., Huff, K. D., Mitchell, I. M., Plumbley, M. D., Waugh, B., White, E. P., & Wilson,P. (2014). Best Practices for Scientific Computing. PLoS Biology, 12(1), e1001745. https://doi.org/10.1371/journal.pbio.1001745
93. Coveney, P. V., & Highfield, R. R. (2021). When we can trust computers (and when wecan’t). Philosophical Transactions. Series A, Mathematical, Physical, and Engineering Sciences,379(2197), 20200067. https://doi.org/10.1098/rsta.2020.0067
94. Barnes, N. (2010). Publish your computer code: it is good enough. Nature, 467(7317), 753–753.https://doi.org/10.1038/467753a
95. Prlic, A., & Procter, J. B. (2012). Ten Simple Rules for the Open Development of ScientificSoftware. PLoS Computational Biology, 8(12), e1002802. https://doi.org/10.1371/journal.pcbi.1002802
96. Karimzadeh, M., & Hoffman, M. M. (2018). Top considerations for creating bioinformaticssoftware documentation. Briefings in Bioinformatics, 19(4), 693–699. https://doi.org/10.1093/bib/bbw134
97. List, M., Ebert, P., & Albrecht, F. (2017). Ten Simple Rules for Developing Usable Software inComputational Biology. PLoS Computational Biology, 13(1), e1005265. https://doi.org/10.1371/journal.pcbi.1005265
98. Sandve, G. K., Nekrutenko, A., Taylor, J., & Hovig, E. (2013). Ten simple rules for reproduciblecomputational research. PLoS Computational Biology, 9(10), e1003285. https://doi.org/10.1371/journal.pcbi.1003285
99. Martin, R. C. (2009). Clean code: a handbook of agile software craftsmanship. PearsonEducation.
100. Gaddum, J. H. (1940). Pharmacology. Oxford University Press, London.
101. Bliss, C. I. (1939). The Toxicity of Poisons Applied Jointly. Annals of Applied Biology, 26(3),585–615. https://doi.org/10.1111/j.1744-7348.1939.tb06990.x
102. Galton, F. (1907). Vox populi. Nature, 75(1949), 450–451. https://doi.org/10.1038/075450a0
103. Marbach, D., Costello, J. C., Küffner, R., Vega, N. M., Prill, R. J., Camacho, D. M., Allison,K. R., Kellis, M., Collins, J. J., Aderhold, A., Stolovitzky, G., Bonneau, R., Chen, Y., Cordero,F., Crane, M., Dondelinger, F., Drton, M., Esposito, R., Foygel, R., . . . Zimmer, R. (2012).Wisdom of crowds for robust gene network inference. Nature Methods, 9(8), 796–804. https://doi.org/10.1038/nmeth.2016
104. Flobak, Å. (2016). Systems Medicine: From Modeling Systems Perturbations to PredictingDrug Synergies. PhD Thesis. https://ntnuopen.ntnu.no/ntnu-xmlui/handle/11250/2385695
43

105. Apache Commons. (2021). https://commons.apache.org/, (15 May 2021, date last accessed).
106. Apache Maven. (2021). https://maven.apache.org/, (15 May 2021, date last accessed).
107. Naldi, A. (2018). BioLQM: A Java Toolkit for the Manipulation and Conversion of LogicalQualitative Models of Biological Networks. Frontiers in Physiology, 9, 1605. https://doi.org/10.3389/fphys.2018.01605
108. Naldi, A., Hernandez, C., Abou-Jaoudé, W., Monteiro, P. T., Chaouiya, C., & Thieffry, D.(2018). Logical Modeling and Analysis of Cellular Regulatory Networks With GINsim 3.0.Frontiers in Physiology, 9, 646. https://doi.org/10.3389/fphys.2018.00646
109. Chaouiya, C., Bérenguier, D., Keating, S. M., Naldi, A., Iersel, M. P. van, Rodriguez, N.,Dräger, A., Büchel, F., Cokelaer, T., Kowal, B., Wicks, B., Gonçalves, E., Dorier, J., Page,M., Monteiro, P. T., Kamp, A. von, Xenarios, I., Jong, H. de, Hucka, M., . . . Helikar, T.(2013). SBML qualitative models: A model representation format and infrastructure to fosterinteractions between qualitative modelling formalisms and tools. BMC Systems Biology, 7(1),1–15. https://doi.org/10.1186/1752-0509-7-135
110. Müssel, C., Hopfensitz, M., & Kestler, H. A. (2010). BoolNet—an R package for generation,reconstruction and analysis of Boolean networks. Bioinformatics, 26(10), 1378–1380. https://doi.org/10.1093/bioinformatics/btq124
111. Veliz-Cuba, A., Aguilar, B., Hinkelmann, F., & Laubenbacher, R. (2014). Steady state analysisof Boolean molecular network models via model reduction and computational algebra. BMCBioinformatics, 15(1), 221. https://doi.org/10.1186/1471-2105-15-221
112. JUnit 5. (2021). https://junit.org/junit5/, (15 May 2021, date last accessed).
113. AssertJ - fluent assertions java library. (2021). https://assertj.github.io/doc/, (15 May 2021,date last accessed).
114. Mockito framework site. (2021). https://site.mockito.org/, (15 May 2021, date last accessed).
115. Xie, Y. (2016). bookdown: Authoring Books and Technical Documents with R Markdown.Chapman; Hall/CRC. https://bookdown.org/yihui/bookdown
116. Flobak, Å., Niederdorfer, B., Nakstad, V. T., Thommesen, L., Klinkenberg, G., & Lægreid, A.(2019). A high-throughput drug combination screen of targeted small molecule inhibitors incancer cell lines. Scientific Data, 6(1), 237. https://doi.org/10.1038/s41597-019-0255-7
117. Flobak, Å., Vazquez, M., Lægreid, A., & Valencia, A. (2017). CImbinator: a web-based toolfor drug synergy analysis in small- and large-scale datasets. Bioinformatics, 33(15), 2410–2412.https://doi.org/10.1093/bioinformatics/btx161
118. KEGG PATHWAY: Pathways in cancer - Homo sapiens (human). (2000). https://www.genome.jp/kegg-bin/show_pathway?hsa05200, (15 May 2021, date last accessed).
119. Fawcett, T. (2006). An introduction to ROC analysis. Pattern Recognition Letters, 27(8),
44
861–874. https://doi.org/10.1016/j.patrec.2005.10.010
120. Saito, T., & Rehmsmeier, M. (2015). The Precision-Recall Plot Is More Informative thanthe ROC Plot When Evaluating Binary Classifiers on Imbalanced Datasets. PLOS ONE, 10(3),e0118432. https://doi.org/10.1371/journal.pone.0118432
121. Perkins, N. J., & Schisterman, E. F. (2006). The Inconsistency of “Optimal” Cutpoints Obtainedusing Two Criteria based on the Receiver Operating Characteristic Curve. American Journal ofEpidemiology, 163(7), 670–675. https://doi.org/10.1093/aje/kwj063
122. Chang, W., Cheng, J., Allaire, J. J., Sievert, C., Schloerke, B., Xie, Y., Allen, J., McPherson,J., Dipert, A., & Borges, B. (2021). shiny: Web Application Framework for R. https://cran.r-project.org/package=shiny, R package version 1.6.0.
123. Xie, Y., Cheng, J., & Tan, X. (2021). DT: A Wrapper of the JavaScript Library ’DataTables’.https://cran.r-project.org/package=DT, R package version 0.18.
124. Sievert, C. (2020). Interactive Web-Based Data Visualization with R, plotly, and shiny.Chapman; Hall/CRC. https://plotly-r.com
125. Grau, J., Grosse, I., & Keilwagen, J. (2015). PRROC: computing and visualizing precision-recall and receiver operating characteristic curves in R. Bioinformatics, 31(15), 2595–2597.https://doi.org/10.1093/bioinformatics/btv153
126. Wickham, H. (2015). R packages: organize, test, document, and share your code. O’ReillyMedia, Inc.
127. Roache, P. J. (1997). Quantification of uncertainty in computational fluid dynamics. AnnualReview of Fluid Mechanics, 29, 123–160. https://doi.org/10.1146/annurev.fluid.29.1.123
128. Mendoza, L., & Xenarios, I. (2006). A method for the generation of standardized qualitativedynamical systems of regulatory networks. Theoretical Biology and Medical Modelling, 3(1),13. https://doi.org/10.1186/1742-4682-3-13
129. Fauré, A., & Thieffry, D. (2009). Logical modelling of cell cycle control in eukaryotes: Acomparative study. Molecular BioSystems, 5(12), 1569–1581. https://doi.org/10.1039/b907562n
130. Niederdorfer, B., Touré, V., Vazquez, M., Thommesen, L., Kuiper, M., Lægreid, A., & Flobak,Å. (2020). Strategies to Enhance Logic Modeling-Based Cell Line-Specific Drug SynergyPrediction. Frontiers in Physiology, 11, 862. https://doi.org/10.3389/fphys.2020.00862
131. Videla, S., Saez-Rodriguez, J., Guziolowski, C., & Siegel, A. (2016). Caspo: A toolbox forautomated reasoning on the response of logical signaling networks families. Bioinformatics,33(6), 947–950. https://doi.org/10.1093/bioinformatics/btw738
132. Gjerga, E., Trairatphisan, P., Gabor, A., Koch, H., Chevalier, C., Ceccarelli, F., Dugourd, A.,Mitsos, A., & Saez-Rodriguez, J. (2020). Converting networks to predictive logic models fromperturbation signalling data with CellNOpt. Bioinformatics. https://doi.org/10.1093/bioinformatics/btaa561
45
133. Aghamiri, S. S., Singh, V., Naldi, A., Helikar, T., Soliman, S., & Niarakis, A. (2020). Automatedinference of Boolean models from molecular interaction maps using CaSQ. Bioinformatics.https://doi.org/10.1093/bioinformatics/btaa484
134. Helikar, T., Kowal, B., Madrahimov, A., Shrestha, M., Pedersen, J., Limbu, K., Thapa, I.,Rowley, T., Satalkar, R., Kochi, N., Konvalina, J., & Rogers, J. A. (2012). Bio-Logic Builder: ANon-Technical Tool for Building Dynamical, Qualitative Models. PLoS ONE, 7(10), e46417.https://doi.org/10.1371/journal.pone.0046417
135. Cury, J. E. R., Monteiro, P. T., & Chaouiya, C. (2019). Partial Order on the set of BooleanRegulatory Functions. arXiv. http://arxiv.org/abs/1901.07623
136. Saez-Rodriguez, J., Alexopoulos, L. G., Epperlein, J., Samaga, R., Lauffenburger, D. A.,Klamt, S., & Sorger, P. K. (2009). Discrete logic modelling as a means to link protein signallingnetworks with functional analysis of mammalian signal transduction. Molecular Systems Biology,5(1), 331. https://doi.org/10.1038/msb.2009.87
137. Shmulevich, I., & Kauffman, S. A. (2004). Activities and sensitivities in Boolean networkmodels. Physical Review Letters, 93(4), 048701. https://doi.org/10.1103/PhysRevLett.93.048701
138. Gherardi, M., & Rotondo, P. (2016). Measuring logic complexity can guide pattern discoveryin empirical systems. Complexity, 21, 397–408. https://doi.org/10.1002/cplx.21819
139. Abou-Jaoudé, W., & Monteiro, P. T. (2019). On logical bifurcation diagrams. Journal ofTheoretical Biology, 466, 39–63. https://doi.org/10.1016/j.jtbi.2019.01.008
140. Abou-Jaoudé, W., Ouattara, D. A., & Kaufman, M. (2009). From structure to dynamics:Frequency tuning in the p53-Mdm2 network. I. Logical approach. Journal of TheoreticalBiology, 258(4), 561–577. https://doi.org/10.1016/j.jtbi.2009.02.005
141. McInnes, L., Healy, J., & Melville, J. (2018). UMAP: Uniform Manifold Approximation andProjection for Dimension Reduction. arXiv. http://arxiv.org/abs/1802.03426
142. Türei, D., Korcsmáros, T., & Saez-Rodriguez, J. (2016). OmniPath: guidelines and gatewayfor literature-curated signaling pathway resources. Nature Methods, 13(12), 966–967. https://doi.org/10.1038/nmeth.4077
143. Vaske, C. J., Benz, S. C., Sanborn, J. Z., Earl, D., Szeto, C., Zhu, J., Haussler, D., & Stuart,J. M. (2010). Inference of patient-specific pathway activities from multi-dimensional cancergenomics data using PARADIGM. Bioinformatics, 26(12), i237–i245. https://doi.org/10.1093/bioinformatics/btq182
144. Martignetti, L., Calzone, L., Bonnet, E., Barillot, E., & Zinovyev, A. (2016). ROMA:Representation and quantification of module activity from target expression data. Frontiers inGenetics, 7, 18. https://doi.org/10.3389/fgene.2016.00018
145. Schubert, M., Klinger, B., Klünemann, M., Sieber, A., Uhlitz, F., Sauer, S., Garnett, M.J., Blüthgen, N., & Saez-Rodriguez, J. (2018). Perturbation-response genes reveal signaling
46
footprints in cancer gene expression. Nature Communications, 9(1), 1–11. https://doi.org/10.1038/s41467-017-02391-6
146. Dugourd, A., Kuppe, C., Sciacovelli, M., Gjerga, E., Gabor, A., Emdal, K. B., Vieira, V., Bekker-Jensen, D. B., Kranz, J., Bindels, Eric. M. J., Costa, A. S. H., Sousa, A., Beltrao, P., Rocha,M., Olsen, J. V., Frezza, C., Kramann, R., & Saez-Rodriguez, J. (2021). Causal integration ofmulti-omics data with prior knowledge to generate mechanistic hypotheses. Molecular SystemsBiology, 17(1). https://doi.org/10.15252/msb.20209730
147. Karr, J. R., Sanghvi, J. C., MacKlin, D. N., Gutschow, M. V., Jacobs, J. M., Bolival, B., Assad-Garcia, N., Glass, J. I., & Covert, M. W. (2012). A whole-cell computational model predictsphenotype from genotype. Cell, 150(2), 389–401. https://doi.org/10.1016/j.cell.2012.05.044
148. Carrera, J., & Covert, M. W. (2015). Why Build Whole-Cell Models? Trends in Cell Biology,25(12), 719–722. https://doi.org/10.1016/j.tcb.2015.09.004
149. Senft, D., Leiserson, M. D. M., Ruppin, E., & Ronai, Z. A. (2017). Precision Oncology: TheRoad Ahead. Trends in Molecular Medicine, 23(10), 874–898. https://doi.org/10.1016/j.molmed.2017.08.003
150. Fukuda, K., Kobayashi, A., & Watabe, K. (2012). The Role of tumor-associated macrophage intumor progression. Frontiers in Bioscience - Scholar, 2, 787–798. https://doi.org/10.2741/s299
151. Marku, M., Verstraete, N., Raynal, F., Madrid-Mencía, M., Domagala, M., Fournié, J. J.,Ysebaert, L., Poupot, M., & Pancaldi, V. (2020). Insights on TAM formation from a booleanmodel of macrophage polarization based on in vitro studies. Cancers, 12(12), 1–23. https://doi.org/10.3390/cancers12123664
152. Desoize, B., & Jardillier, J. C. (2000). Multicellular resistance: A paradigm for clinicalresistance? Critical Reviews in Oncology/Hematology, 36(2-3), 193–207. https://doi.org/10.1016/S1040-8428(00)00086-X
153. Komohara, Y., Fujiwara, Y., Ohnishi, K., & Takeya, M. (2016). Tumor-associated macrophages:Potential therapeutic targets for anti-cancer therapy. Advanced Drug Delivery Reviews, 99,180–185. https://doi.org/10.1016/j.addr.2015.11.009
154. Karr, J. R. (2020). An introduction to whole-cell modeling (v0.0.1). https://docs.karrlab.org/intro_to_wc_modeling/master/0.0.1/, (15 May 2021, date last accessed).
155. Tomita, M., Hashimoto, K., Takahashi, K., Shimizu, T. S., Matsuzaki, Y., Miyoshi, F., Saito, K.,Tanida, S., Yugi, K., Venter, J. C., & Hutchison, C. A. (1999). E-CELL: Software environmentfor whole-cell simulation. Bioinformatics, 15(1), 72–84. https://doi.org/10.1093/bioinformatics/15.1.72
156. Blinov, M. L., Schaff, J. C., Vasilescu, D., Moraru, I. I., Bloom, J. E., & Loew, L. M. (2017).Compartmental and Spatial Rule-Based Modeling with Virtual Cell. Biophysical Journal, 113(7),1365–1372. https://doi.org/10.1016/j.bpj.2017.08.022
47
157. Karr, J. R., Takahashi, K., & Funahashi, A. (2015). The principles of whole-cell modeling.Current Opinion in Microbiology, 27, 18–24. https://doi.org/10.1016/j.mib.2015.06.004
158. Macklin, D. N., Ahn-Horst, T. A., Choi, H., Ruggero, N. A., Carrera, J., Mason, J. C., Sun,G., Agmon, E., DeFelice, M. M., Maayan, I., Lane, K., Spangler, R. K., Gillies, T. E., Paull, M.L., Akhter, S., Bray, S. R., Weaver, D. S., Keseler, I. M., Karp, P. D., . . . Covert, M. W. (2020).Simultaneous cross-evaluation of heterogeneous E. coli datasets via mechanistic simulation.Science, 369(6502). https://doi.org/10.1126/science.aav3751
159. Hallock, M. J., Stone, J. E., Roberts, E., Fry, C., & Luthey-Schulten, Z. (2014). Simulationof reaction diffusion processes over biologically relevant size and time scales using multi-GPUworkstations. Parallel Computing, 40(5-6), 86–99. https://doi.org/10.1016/j.parco.2014.03.009
160. Supercomputer (Wikipedia entry). (2020). https://en.wikipedia.org/wiki/Supercomputer, (15May 2021, date last accessed).
161. Keating, S. M., Waltemath, D., König, M., Zhang, F., Dräger, A., Chaouiya, C., Bergmann,F. T., Finney, A., Gillespie, C. S., Helikar, T., Hoops, S., Malik-Sheriff, R. S., Moodie, S. L.,Moraru, I. I., Myers, C. J., Naldi, A., Olivier, B. G., Sahle, S., Schaff, J. C., . . . Zucker, J. (2020).SBML Level 3: an extensible format for the exchange and reuse of biological models. MolecularSystems Biology, 16(8), 1–21. https://doi.org/10.15252/msb.20199110
162. Waltemath, D., Karr, J. R., Bergmann, F. T., Chelliah, V., Hucka, M., Krantz, M., Liebermeister,W., Mendes, P., Myers, C. J., Pir, P., Alaybeyoglu, B., Aranganathan, N. K., Baghalian, K.,Bittig, A. T., Burke, P. E. P., Cantarelli, M., Chew, Y. H., Costa, R. S., Cursons, J., . . . Schreiber,F. (2016). Toward Community Standards and Software for Whole-Cell Modeling. IEEETransactions on Biomedical Engineering, 63(10), 2007–2014. https://doi.org/10.1109/TBME.2016.2560762
163. Burke, P. E. P., Campos, C. B. de L., Costa, L. da F., & Quiles, M. G. (2020). A biochemicalnetwork modeling of a whole-cell. Scientific Reports, 10(1), 13303. https://doi.org/10.1038/s41598-020-70145-4
164. Carrera, J., Estrela, R., Luo, J., Rai, N., Tsoukalas, A., & Tagkopoulos, I. (2014). An integrative,multi-scale, genome-wide model reveals the phenotypic landscape of Escherichia coli. MolecularSystems Biology, 10(7), 735. https://doi.org/10.15252/msb.20145108
165. Szigeti, B., Gleeson, P., Vella, M., Khayrulin, S., Palyanov, A., Hokanson, J., Currie, M.,Cantarelli, M., Idili, G., & Larson, S. (2014). OpenWorm: an open-science approach tomodeling Caenorhabditis elegans. Frontiers in Computational Neuroscience, 8(November), 1–7.https://doi.org/10.3389/fncom.2014.00137
166. Viceconti, M., & Hunter, P. (2016). The Virtual Physiological Human: Ten Years after. AnnualReview of Biomedical Engineering, 18, 103–113. https://doi.org/10.1146/annurev-bioeng-110915-114742
48
167. Ghaffarizadeh, A., Heiland, R., Friedman, S. H., Mumenthaler, S. M., & Macklin, P. (2018).PhysiCell: An open source physics-based cell simulator for 3-D multicellular systems. PLoSComputational Biology, 14(2). https://doi.org/10.1371/journal.pcbi.1005991
168. Letort, G., Montagud, A., Stoll, G., Heiland, R., Barillot, E., Macklin, P., Zinovyev, A., &Calzone, L. (2018). PhysiBoSS: a multi-scale agent-based modelling framework integratingphysical dimension and cell signalling. Bioinformatics, 35(7), 1188–1196. https://doi.org/10.1093/bioinformatics/bty766
169. Varela, P. L., Ramos, C. V., Monteiro, P. T., & Chaouiya, C. (2018). Epilog: A software for thelogical modelling of epithelial dynamics [version 2; peer review: 3 approved]. F1000Research,7, 1145. https://doi.org/10.12688/F1000RESEARCH.15613.2
170. Cooper, F. R., Baker, R. E., Bernabeu, M. O., Bordas, R., Bowler, L., Bueno-Orovio, A., Byrne,H. M., Carapella, V., Cardone-Noott, L., Cooper, J., Dutta, S., Evans, B. D., Fletcher, A. G.,Grogan, J. A., Guo, W., Harvey, D. G., Hendrix, M., Kay, D., Kursawe, J., . . . Gavaghan, D. J.(2020). Chaste: Cancer, Heart and Soft Tissue Environment. Journal of Open Source Software,5(47), 1848. https://doi.org/10.21105/joss.01848
171. Stoll, G., Naldi, A., Noël, V., Viara, E., Barillot, E., Kroemer, G., Thieffry, D., & Calzone,L. (2020). UPMaBoSS: a novel framework for dynamic cell population modeling. bioRxiv.https://doi.org/10.1101/2020.05.31.126094
172. Hucka, M., Nickerson, D. P., Bader, G. D., Bergmann, F. T., Cooper, J., Demir, E., Garny,A., Golebiewski, M., Myers, C. J., Schreiber, F., Waltemath, D., & Le Novere, N. (2015).Promoting Coordinated Development of Community-Based Information Standards for Modelingin Biology: The COMBINE Initiative. Frontiers in Bioengineering and Biotechnology, 3, 19.https://doi.org/10.3389/fbioe.2015.00019
173. Zobolas, J. (2020). Rtemps: R Templates for Reproducible Data Analyses. GitHub. https://github.com/bblodfon/rtemps
174. Vázquez, M., Nogales, R., Carmona, P., Pascual, A., & Pavón, J. (2010). Rbbt: A Frameworkfor Fast Bioinformatics Development with Ruby (pp. 201–208). Springer, Berlin, Heidelberg.https://doi.org/10.1007/978-3-642-13214-8_26
49

50

Papers
51


PAPER 1
52

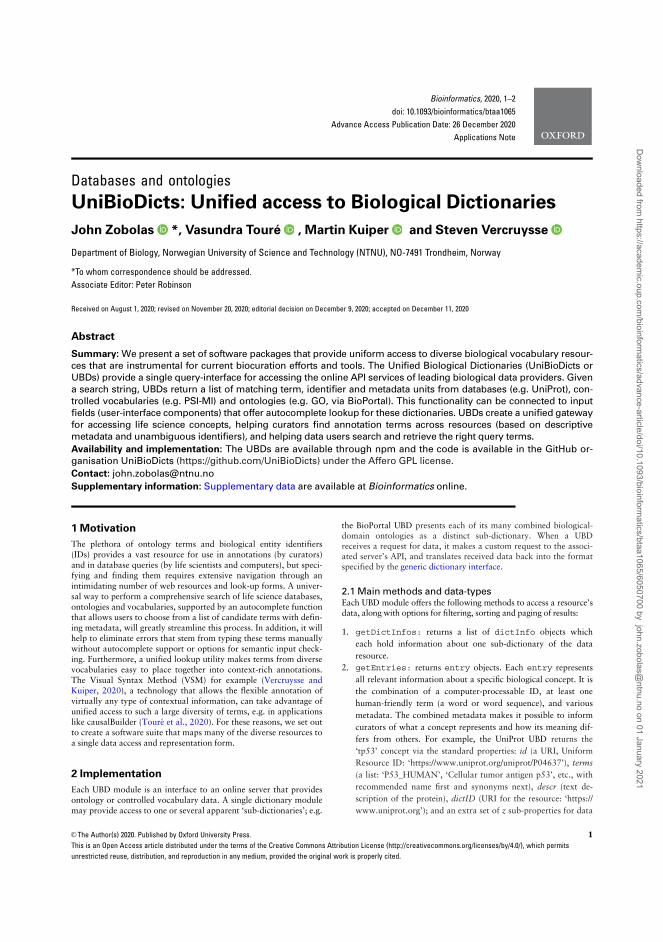
Databases and ontologies
UniBioDicts: Unified access to Biological Dictionaries
John Zobolas *, Vasundra Toure , Martin Kuiper and Steven Vercruysse
Department of Biology, Norwegian University of Science and Technology (NTNU), NO-7491 Trondheim, Norway
*To whom correspondence should be addressed.
Associate Editor: Peter Robinson
Received on August 1, 2020; revised on November 20, 2020; editorial decision on December 9, 2020; accepted on December 11, 2020
Abstract
Summary: We present a set of software packages that provide uniform access to diverse biological vocabulary resour-ces that are instrumental for current biocuration efforts and tools. The Unified Biological Dictionaries (UniBioDicts orUBDs) provide a single query-interface for accessing the online API services of leading biological data providers. Givena search string, UBDs return a list of matching term, identifier and metadata units from databases (e.g. UniProt), con-trolled vocabularies (e.g. PSI-MI) and ontologies (e.g. GO, via BioPortal). This functionality can be connected to inputfields (user-interface components) that offer autocomplete lookup for these dictionaries. UBDs create a unified gatewayfor accessing life science concepts, helping curators find annotation terms across resources (based on descriptivemetadata and unambiguous identifiers), and helping data users search and retrieve the right query terms.
Availability and implementation: The UBDs are available through npm and the code is available in the GitHub or-ganisation UniBioDicts (https://github.com/UniBioDicts) under the Affero GPL license.
Contact: [email protected]
Supplementary information: Supplementary data are available at Bioinformatics online.
1 Motivation
The plethora of ontology terms and biological entity identifiers(IDs) provides a vast resource for use in annotations (by curators)and in database queries (by life scientists and computers), but speci-fying and finding them requires extensive navigation through anintimidating number of web resources and look-up forms. A univer-sal way to perform a comprehensive search of life science databases,ontologies and vocabularies, supported by an autocomplete functionthat allows users to choose from a list of candidate terms with defin-ing metadata, will greatly streamline this process. In addition, it willhelp to eliminate errors that stem from typing these terms manuallywithout autocomplete support or options for semantic input check-ing. Furthermore, a unified lookup utility makes terms from diversevocabularies easy to place together into context-rich annotations.The Visual Syntax Method (VSM) for example (Vercruysse andKuiper, 2020), a technology that allows the flexible annotation ofvirtually any type of contextual information, can take advantage ofunified access to such a large diversity of terms, e.g. in applicationslike causalBuilder (Toure et al., 2020). For these reasons, we set outto create a software suite that maps many of the diverse resources toa single data access and representation form.
2 Implementation
Each UBD module is an interface to an online server that providesontology or controlled vocabulary data. A single dictionary modulemay provide access to one or several apparent ‘sub-dictionaries’; e.g.
the BioPortal UBD presents each of its many combined biological-domain ontologies as a distinct sub-dictionary. When a UBDreceives a request for data, it makes a custom request to the associ-ated server’s API, and translates received data back into the formatspecified by the generic dictionary interface.
2.1 Main methods and data-typesEach UBD module offers the following methods to access a resource’sdata, along with options for filtering, sorting and paging of results:
1. getDictInfos: returns a list of dictInfo objects which
each hold information about one sub-dictionary of the data
resource.
2. getEntries: returns entry objects. Each entry represents
all relevant information about a specific biological concept. It is
the combination of a computer-processable ID, at least one
human-friendly term (a word or word sequence), and various
metadata. The combined metadata makes it possible to inform
curators of what a concept represents and how its meaning dif-
fers from others. For example, the UniProt UBD returns the
‘tp53’ concept via the standard properties: id (a URI, Uniform
Resource ID: ‘https://www.uniprot.org/uniprot/P04637’), terms
(a list: ‘P53_HUMAN’, ‘Cellular tumor antigen p53’, etc., with
recommended name first and synonyms next), descr (text de-
scription of the protein), dictID (URI for the resource: ‘https://
www.uniprot.org’); and an extra set of z sub-properties for data
VC The Author(s) 2020. Published by Oxford University Press. 1
This is an Open Access article distributed under the terms of the Creative Commons Attribution License (http://creativecommons.org/licenses/by/4.0/), which permits
unrestricted reuse, distribution, and reproduction in any medium, provided the original work is properly cited.
Bioinformatics, 2020, 1–2
doi: 10.1093/bioinformatics/btaa1065
Advance Access Publication Date: 26 December 2020
Applications Note
Dow
nloaded from https://academ
ic.oup.com/bioinform
atics/advance-article/doi/10.1093/bioinformatics/btaa1065/6050700 by john.zobolas@
ntnu.no on 01 January 2021
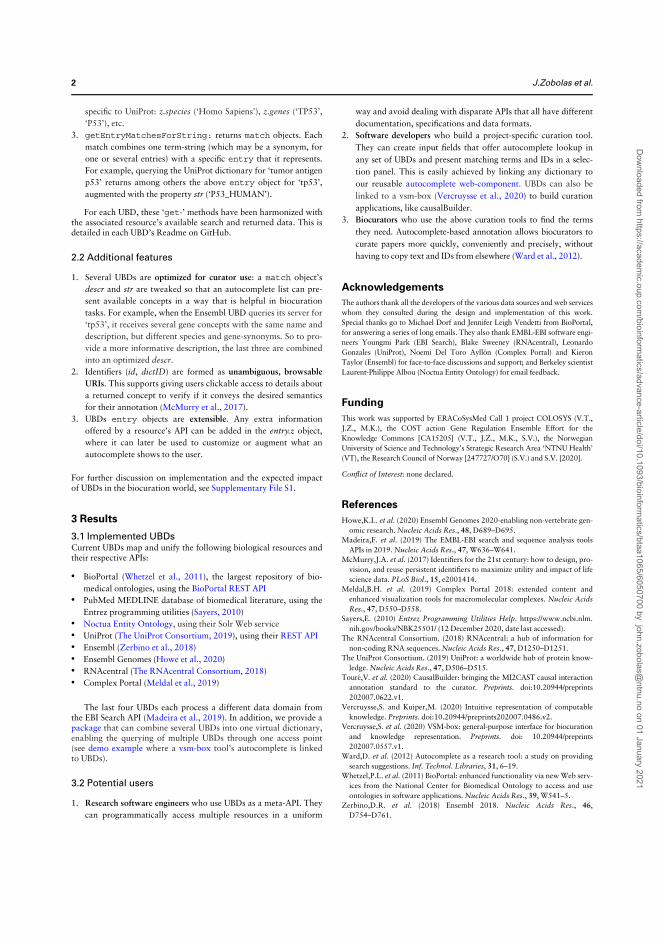
specific to UniProt: z.species (‘Homo Sapiens’), z.genes (‘TP53’,
‘P53’), etc.
3. getEntryMatchesForString: returns match objects. Each
match combines one term-string (which may be a synonym, for
one or several entries) with a specific entry that it represents.
For example, querying the UniProt dictionary for ‘tumor antigen
p53’ returns among others the above entry object for ‘tp53’,
augmented with the property str (‘P53_HUMAN’).
For each UBD, these ‘get-’ methods have been harmonized withthe associated resource’s available search and returned data. This isdetailed in each UBD’s Readme on GitHub.
2.2 Additional features
1. Several UBDs are optimized for curator use: a match object’s
descr and str are tweaked so that an autocomplete list can pre-
sent available concepts in a way that is helpful in biocuration
tasks. For example, when the Ensembl UBD queries its server for
‘tp53’, it receives several gene concepts with the same name and
description, but different species and gene-synonyms. So to pro-
vide a more informative description, the last three are combined
into an optimized descr.
2. Identifiers (id, dictID) are formed as unambiguous, browsable
URIs. This supports giving users clickable access to details about
a returned concept to verify if it conveys the desired semantics
for their annotation (McMurry et al., 2017).
3. UBDs entry objects are extensible. Any extra information
offered by a resource’s API can be added in the entry.z object,
where it can later be used to customize or augment what an
autocomplete shows to the user.
For further discussion on implementation and the expected impactof UBDs in the biocuration world, see Supplementary File S1.
3 Results
3.1 Implemented UBDsCurrent UBDs map and unify the following biological resources andtheir respective APIs:
• BioPortal (Whetzel et al., 2011), the largest repository of bio-
medical ontologies, using the BioPortal REST API• PubMed MEDLINE database of biomedical literature, using the
Entrez programming utilities (Sayers, 2010)• Noctua Entity Ontology, using their Solr Web service• UniProt (The UniProt Consortium, 2019), using their REST API• Ensembl (Zerbino et al., 2018)• Ensembl Genomes (Howe et al., 2020)• RNAcentral (The RNAcentral Consortium, 2018)• Complex Portal (Meldal et al., 2019)
The last four UBDs each process a different data domain fromthe EBI Search API (Madeira et al., 2019). In addition, we provide apackage that can combine several UBDs into one virtual dictionary,enabling the querying of multiple UBDs through one access point(see demo example where a vsm-box tool’s autocomplete is linkedto UBDs).
3.2 Potential users
1. Research software engineers who use UBDs as a meta-API. They
can programmatically access multiple resources in a uniform
way and avoid dealing with disparate APIs that all have different
documentation, specifications and data formats.
2. Software developers who build a project-specific curation tool.
They can create input fields that offer autocomplete lookup in
any set of UBDs and present matching terms and IDs in a selec-
tion panel. This is easily achieved by linking any dictionary to
our reusable autocomplete web-component. UBDs can also be
linked to a vsm-box (Vercruysse et al., 2020) to build curation
applications, like causalBuilder.
3. Biocurators who use the above curation tools to find the terms
they need. Autocomplete-based annotation allows biocurators to
curate papers more quickly, conveniently and precisely, without
having to copy text and IDs from elsewhere (Ward et al., 2012).
Acknowledgements
The authors thank all the developers of the various data sources and web services
whom they consulted during the design and implementation of this work.
Special thanks go to Michael Dorf and Jennifer Leigh Vendetti from BioPortal,
for answering a series of long emails. They also thank EMBL-EBI software engi-
neers Youngmi Park (EBI Search), Blake Sweeney (RNAcentral), Leonardo
Gonzales (UniProt), Noemi Del Toro Ayllon (Complex Portal) and Kieron
Taylor (Ensembl) for face-to-face discussions and support; and Berkeley scientist
Laurent-Philippe Albou (Noctua Entity Ontology) for email feedback.
Funding
This work was supported by ERACoSysMed Call 1 project COLOSYS (V.T.,
J.Z., M.K.), the COST action Gene Regulation Ensemble Effort for the
Knowledge Commons [CA15205] (V.T., J.Z., M.K., S.V.), the Norwegian
University of Science and Technology’s Strategic Research Area ‘NTNU Health’
(VT), the Research Council of Norway [247727/O70] (S.V.) and S.V. [2020].
Conflict of Interest: none declared.
References
Howe,K.L. et al. (2020) Ensembl Genomes 2020-enabling non-vertebrate gen-
omic research. Nucleic Acids Res., 48, D689–D695.
Madeira,F. et al. (2019) The EMBL-EBI search and sequence analysis tools
APIs in 2019. Nucleic Acids Res., 47, W636–W641.
McMurry,J.A. et al. (2017) Identifiers for the 21st century: how to design, pro-
vision, and reuse persistent identifiers to maximize utility and impact of life
science data. PLoS Biol., 15, e2001414.
Meldal,B.H. et al. (2019) Complex Portal 2018: extended content and
enhanced visualization tools for macromolecular complexes. Nucleic Acids
Res., 47, D550–D558.
Sayers,E. (2010) Entrez Programming Utilities Help. https://www.ncbi.nlm.
nih.gov/books/NBK25501/ (12 December 2020, date last accessed).
The RNAcentral Consortium. (2018) RNAcentral: a hub of information for
non-coding RNA sequences. Nucleic Acids Res., 47, D1250–D1251.
The UniProt Consortium. (2019) UniProt: a worldwide hub of protein know-
ledge. Nucleic Acids Res., 47, D506–D515.
Toure,V. et al. (2020) CausalBuilder: bringing the MI2CAST causal interaction
annotation standard to the curator. Preprints. doi:10.20944/preprints
202007.0622.v1.
Vercruysse,S. and Kuiper,M. (2020) Intuitive representation of computable
knowledge. Preprints. doi:10.20944/preprints202007.0486.v2.
Vercruysse,S. et al. (2020) VSM-box: general-purpose interface for biocuration
and knowledge representation. Preprints. doi: 10.20944/preprints
202007.0557.v1.
Ward,D. et al. (2012) Autocomplete as a research tool: a study on providing
search suggestions. Inf. Technol. Libraries, 31, 6–19.
Whetzel,P.L. et al. (2011) BioPortal: enhanced functionality via new Web serv-
ices from the National Center for Biomedical Ontology to access and use
ontologies in software applications. Nucleic Acids Res., 39, W541–5.
Zerbino,D.R. et al. (2018) Ensembl 2018. Nucleic Acids Res., 46,
D754–D761.
2 J.Zobolas et al.
Dow
nloaded from https://academ
ic.oup.com/bioinform
atics/advance-article/doi/10.1093/bioinformatics/btaa1065/6050700 by john.zobolas@
ntnu.no on 01 January 2021
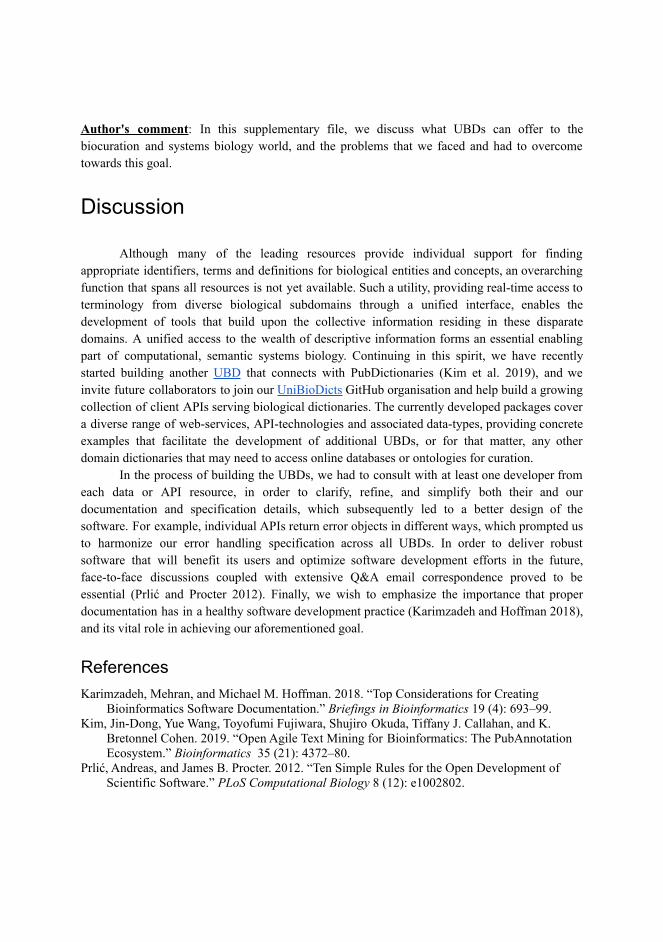
Author's comment: In this supplementary file, we discuss what UBDs can offer to thebiocuration and systems biology world, and the problems that we faced and had to overcometowards this goal.
Discussion
Although many of the leading resources provide individual support for findingappropriate identifiers, terms and definitions for biological entities and concepts, an overarchingfunction that spans all resources is not yet available. Such a utility, providing real-time access toterminology from diverse biological subdomains through a unified interface, enables thedevelopment of tools that build upon the collective information residing in these disparatedomains. A unified access to the wealth of descriptive information forms an essential enablingpart of computational, semantic systems biology. Continuing in this spirit, we have recentlystarted building another UBD that connects with PubDictionaries (Kim et al. 2019), and weinvite future collaborators to join our UniBioDicts GitHub organisation and help build a growingcollection of client APIs serving biological dictionaries. The currently developed packages covera diverse range of web-services, API-technologies and associated data-types, providing concreteexamples that facilitate the development of additional UBDs, or for that matter, any otherdomain dictionaries that may need to access online databases or ontologies for curation.
In the process of building the UBDs, we had to consult with at least one developer fromeach data or API resource, in order to clarify, refine, and simplify both their and ourdocumentation and specification details, which subsequently led to a better design of thesoftware. For example, individual APIs return error objects in different ways, which prompted usto harmonize our error handling specification across all UBDs. In order to deliver robustsoftware that will benefit its users and optimize software development efforts in the future,face-to-face discussions coupled with extensive Q&A email correspondence proved to beessential (Prlić and Procter 2012). Finally, we wish to emphasize the importance that properdocumentation has in a healthy software development practice (Karimzadeh and Hoffman 2018),and its vital role in achieving our aforementioned goal.
ReferencesKarimzadeh, Mehran, and Michael M. Hoffman. 2018. “Top Considerations for Creating
Bioinformatics Software Documentation.” Briefings in Bioinformatics 19 (4): 693–99.Kim, Jin-Dong, Yue Wang, Toyofumi Fujiwara, Shujiro Okuda, Tiffany J. Callahan, and K.
Bretonnel Cohen. 2019. “Open Agile Text Mining for Bioinformatics: The PubAnnotationEcosystem.” Bioinformatics 35 (21): 4372–80.
Prlić, Andreas, and James B. Procter. 2012. “Ten Simple Rules for the Open Development ofScientific Software.” PLoS Computational Biology 8 (12): e1002802.


PAPER 2
56

Linking PubDictionaries with UniBioDicts to supportCommunity CurationJohn Zobolas1, *, Jin-Dong Kim2, *, Martin Kuiper1, and StevenVercruysse3
1 Department of Biology, Norwegian University of Science and Technology (NTNU), Trondheim,Norway 2 Database Center for Life Science (DBCLS), Tokyo, Japan 3 Independent Scientist,Trondheim, Norway * Shared first authorship
BioHackathon series:BioHackathon Europe 2020Virtual conference 2020
Submitted: 01 Jan 2021
LicenseAuthors retain copyright andrelease the work under a CreativeCommons Attribution 4.0International License (CC-BY).
Published by BioHackrXiv.org
AbstractOne of the many challenges that biocurators face, is the continuous evolution of ontologies andcontrolled vocabularies and their lack of coverage of biological concepts. To help biocuratorsannotate new information that cannot yet be covered with terms from authoritative resources,we produced an update of PubDictionaries: a resource of publicly editable, simple-structureddictionaries, accessible through a dedicated REST API. PubDictionaries was equipped withboth an enhanced API and a new software client that connects it to the Unified BiologicalDictionaries (UBDs) uniform data exchange format. This client enables efficient search andretrieval of ad hoc created terms, and easy integration with tools that further support thecurator’s specific annotation tasks. A demo that combines the Visual Syntax Method (VSM)interface for general-purpose knowledge formalization, with this new PubDictionaries-poweredUBD client, shows it is now easy to incorporate the user-created PubDictionaries terminologiesinto biocuration tools.
IntroductionThe curation of biological information is met with several challenges today. The constantrefactoring of ontologies, nomenclature and identifiers, as well as the discovery of new types ofinformation and new uses thereof, makes the life of knowledge curators difficult, especially inthe highly diverse domain of biology. For example, expert curators who rely on specializedsoftware tools in the annotation process might come across a new concept or feature thatdoes not exist within an ontology or vocabulary that their annotation tool connects to. Similardifficulties are faced by non-expert curators. Some biologists want to create a project-specificknowledge resource in a biological niche that is only minimally or not yet covered by existingcontrolled vocabularies. Under time pressure of project milestones, these biologists may notimmediately have the resources to organize a multilateral effort to standardize the terminologyin their field. Instead they typically resort to creating ‘private’ vocabularies within their projects,that may later serve as a first step toward larger-scale coordination (Hartmann et al., 2019).In cases where there is an abundance of resources for controlled vocabularies, ontologies andidentifiers, it may still be challenging to coordinate access to these many necessary resources fordedicated annotation endeavours. Alternatively, in cases where no proper controlled vocabularywould exist, the results from all the work that goes into creating new vocabularies will remainlargely isolated from general use, if no term sharing mechanism is available. Existing toolswould then also be unable to access these newly created terms and for example serve them tocurators in an autocomplete panel, to make their task easier and less error-prone.
John Zobolas & Jin-Dong Kim et al., (2021). BioHackrXiv.org 1
These problems are addressed by two complementary initiatives. On the one hand, UnifiedBiological Dictionaries (UniBioDicts or UBDs) (Zobolas, Touré, Kuiper, & Vercruysse,2020) is a set of software packages that offers a unified, single access point to biologicalterminology resources, and is available to be plugged into any curation platform currently inoperation (for example the general-purpose curation interface ‘vsm-box’ (Vercruysse et al.,2020), based on VSM (Vercruysse & Kuiper, 2020), is out-of-the-box compatible with UBDs).On the other hand, PubDictionaries (Kim et al., 2019) is a public repository of dictionarieswhere users can create and immediately share their own dictionaries based on a simple dataformat consisting of a term and an identifier.During the ELIXIR BioHackathon 2020, we updated and improved the PubDictionaries APIas well as developed a new UBD client that directly communicates with that API. Theseimplementation efforts constitute a significant step towards the unification of some of themost important data resources across all biological domains. The addition of PubDictionariesto the list of UniBioDicts-interoperable resources now provides a uniform way to search andautocomplete terms from all these community-created dictionaries as well. Such functionalityenables the easier integration of PubDictionaries in any curation tool that may have a need fortheir terms and for such a term suggestion feature.
ResultsIn the following two subsections, we briefly summarize the results of the hackathon efforts,grouped into two categories:
• Updating the PubDictionaries REST API• Creating a new UBD client library to access the above API
PubDictionaries REST APIPubDictionaries is a public repository of dictionaries, where each dictionary is a collection oflabels (human-friendly terms) and identifiers (unambiguous IDs, used by computers). Eachlabel + ID pair is called an entry. Multiple entries can have the same ID (for synonymouslabels) and the same label can occur in multiple entries (for ambiguous ones). Users can createtheir own dictionaries and add entries to them via the web-interface. The dictionaries can beused to annotate any piece of text via the PubAnnotation ecosystem (Kim et al., 2019) or tosimply lookup terms, and both these services are supported by a RESTful API (Kim, 2020).All the API responses are structured as JSON objects. Prior to the BioHackathon event, theREST service provided the following main endpoints:
1. find_ids: given some specific terms and dictionary names, this endpoint returns thecorresponding IDs that approximately match the terms in these dictionaries. Example:https://pubdictionaries.org/find_ids.json?labels=TP53&dictionaries=human-UniProt
2. prefix_completion/substring_completion: given a term (or partial term string),these endpoints search for prefix (respectively substring) matches in a specified dictionaryand return the corresponding entries. Note that only a first page of results was returnedwith at most 15 entries, prior to the hackathon efforts. Example: https://pubdictionaries.org/dictionaries/human-UniProt/prefix_completion?term=p53
3. text_annotation: given a piece of text and dictionary names, this endpointreturns the result of annotation to the text using the dictionaries. The annotation isperformed based on computation of string similarity between dictionary entries andexpressions in the text. Example: https://pubdictionaries.org/text_annotation.json?dictionary=human-UniProt&text=The%20tumor%20suppressor%20p53%20(TP53)%20is%20the%20most%20frequently%20mutated%20human%20gene
John Zobolas & Jin-Dong Kim et al., (2021). BioHackrXiv.org 2
The following REST Service endpoints were added during the BioHackathon:1. dictionaries endpoint: returns information about a specific dictionary, such as
its id, name, a text description, the number of entries it has, etc. Example: https://pubdictionaries.org/dictionaries/human-UniProt.json, where human-UniProt can beany existing dictionary name.
2. entries endpoint: returns all entries of a specific dictionary, paginated and sorted bylabel. Example: https://pubdictionaries.org/dictionaries/human-UniProt/entries.json?page=1&per_page=15 Note that the users (software developers) can explicitly configurehow the result should be paginated, i.e. how many entries of a dictionary should beincluded in one ‘result-page’, and what page they want to get results back from.
3. find_terms endpoint: this is the complement of the find_ids endpoint in the sense thatit returns a list of terms and dictionary names that match the given IDs. The result is firstsorted by ID and then by dictionary name. If no dictionary name is given to this endpoint,then it searches for the given IDs in all dictionaries. Example: https://pubdictionaries.org/find_terms.json?dictionaries=&ids=https://www.uniprot.org/uniprot/P04637
4. mixed_completion endpoint: a combined and updated version of the prefix_completion and substring_completion endpoints. For a given term (or partial term string)and a specified dictionary it returns a list of entries, putting the prefix completionsin the top half and the substring completions in the bottom half, while pruning anypossible common entries. In addition, this endpoint supports pagination which is a directresult of extending the prefix and substring endpoints to support this feature as well.Example: https://pubdictionaries.org/dictionaries/human-UniProt/mixed_completion?term=p53&page=2&per_page=3
Additional work on the PubDictionaries server-side included the support of create (via theHTTP POST method) and delete operations of a specific dictionary, given certified usercredentials.Lastly, the error handling was harmonized across all REST URL endpoints. In particular,when a user searches for a non-existent dictionary name, the PubDictionaries server returnsa proper HTTP response status code, 400 (Bad Request), together with a JSON-formatteddescription as follows: { "message": "Unknown dictionary: <name>." }. For example,all the following URL links return such a response object:
• https://pubdictionaries.org/dictionaries/non-existent-dictionary-name.json• https://pubdictionaries.org/find_terms.json?dictionaries=non-existent-dictionary-name&
ids=id1,id2• https://pubdictionaries.org/dictionaries/non-existent-dictionary-name/entries.json
UBD Client for PubDictionariesUBDs are a set of software packages that provide a unified query-interface for accessing theonline API services of key biological vocabulary-data providers (Zobolas et al., 2020). The mainfeature of UBDs is their string-search functionality, which returns for a given label (or partiallabel) a list of matching term, identifier and metadata units from databases (e.g. UniProt (TheUniProt Consortium, 2019)), controlled vocabularies (e.g. PSI-MI), and ontologies (e.g. GeneOntology, via BioPortal (Whetzel et al., 2011)). This feature makes UBDs ideal for enablingautocomplete support in user-interface components that serve terms to curators from disparateresources, thus allowing the more efficient annotation of information.Our work in the ELIXIR BioHackathon 2020 included the creation of a new UBD client(vsm-pubdictionaries) that utilizes the updated PubDictionaries API in order to solve a long-standing problem in the biocurator community: how can ad hoc, project-specific terms andnew information be effectively annotated with, and served via a curation platform, withoutthe need to first negotiate the storage, update and reconciliation of that information with athird party, e.g. a database or ontology provider? Our client software addresses this problem
John Zobolas & Jin-Dong Kim et al., (2021). BioHackrXiv.org 3
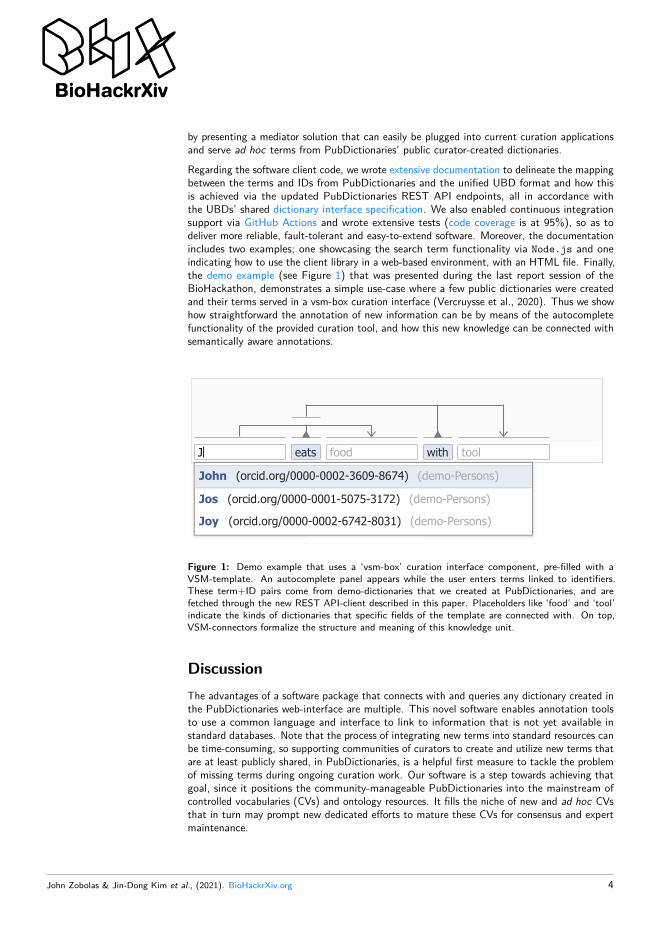
by presenting a mediator solution that can easily be plugged into current curation applicationsand serve ad hoc terms from PubDictionaries’ public curator-created dictionaries.Regarding the software client code, we wrote extensive documentation to delineate the mappingbetween the terms and IDs from PubDictionaries and the unified UBD format and how thisis achieved via the updated PubDictionaries REST API endpoints, all in accordance withthe UBDs’ shared dictionary interface specification. We also enabled continuous integrationsupport via GitHub Actions and wrote extensive tests (code coverage is at 95%), so as todeliver more reliable, fault-tolerant and easy-to-extend software. Moreover, the documentationincludes two examples; one showcasing the search term functionality via Node.js and oneindicating how to use the client library in a web-based environment, with an HTML file. Finally,the demo example (see Figure 1) that was presented during the last report session of theBioHackathon, demonstrates a simple use-case where a few public dictionaries were createdand their terms served in a vsm-box curation interface (Vercruysse et al., 2020). Thus we showhow straightforward the annotation of new information can be by means of the autocompletefunctionality of the provided curation tool, and how this new knowledge can be connected withsemantically aware annotations.
Figure 1: Demo example that uses a ‘vsm-box’ curation interface component, pre-filled with aVSM-template. An autocomplete panel appears while the user enters terms linked to identifiers.These term+ID pairs come from demo-dictionaries that we created at PubDictionaries, and arefetched through the new REST API-client described in this paper. Placeholders like ‘food’ and ‘tool’indicate the kinds of dictionaries that specific fields of the template are connected with. On top,VSM-connectors formalize the structure and meaning of this knowledge unit.
DiscussionThe advantages of a software package that connects with and queries any dictionary created inthe PubDictionaries web-interface are multiple. This novel software enables annotation toolsto use a common language and interface to link to information that is not yet available instandard databases. Note that the process of integrating new terms into standard resources canbe time-consuming, so supporting communities of curators to create and utilize new terms thatare at least publicly shared, in PubDictionaries, is a helpful first measure to tackle the problemof missing terms during ongoing curation work. Our software is a step towards achieving thatgoal, since it positions the community-manageable PubDictionaries into the mainstream ofcontrolled vocabularies (CVs) and ontology resources. It fills the niche of new and ad hoc CVsthat in turn may prompt new dedicated efforts to mature these CVs for consensus and expertmaintenance.
John Zobolas & Jin-Dong Kim et al., (2021). BioHackrXiv.org 4
John (demo-Persons)
(demo-Persons)
(demo-Persons)
(orcid.or g/0000-0002-3609-8674)
Jos (orcid.or g/0000-0001-5075-3172)
Joy (orcid.or g/0000-0002-6742-8031)
Propelled by an ELIXIR BioHackathon event, our work underpins the goals of several ofELIXIR’s activities, or so-called ‘Platforms’. In the ELIXIR Data Platform, the drive to use,re-use and value life science data takes precedence. Our efforts exemplify how to achieve thisby providing a scalable solution for curation platforms, especially ones that include supportfor annotation efforts that involve new information types. Furthermore, our main objectivematches the goals of the ELIXIR Interoperability Platform: we offer a way to publicly-accessand integrate new curated knowledge in a unified form, which enables new knowledge tobe used by humans and machines alike, and to build knowledge systems that will aid futureendeavors in understanding biological processes.
Future WorkOur future work includes updates on the PubDictionaries API to support the addition, updateand deletion of dictionary entries, which is a functionality currently only available in theweb-interface of PubDictionaries. Consequently, a further update on the UBD client willprovide the necessary backbone to help build user interfaces, where curators would not evenneed to log in to the PubDictionaries website to create new dictionaries, and add, update ordelete entries, but rather would be able to do that from within their own in-house curationtool. This functionality is currently not offered by any other biological data provider. Lastly,we expect that these updates, coupled with the search-string functionality provided by thePubDictionaries UBD client, will contribute in efforts to significantly increase the autonomy ofbiocurators and their potential for creating shareable annotations.
Links to software and documentation• PubDictionaries API documentation: https://docs.pubdictionaries.org• PubDictionaries source code: https://github.com/pubannotation/pubdictionaries• UBD Client for PubDictionaries: https://github.com/UniBioDicts/vsm-pubdictionaries• Demo example with vsm-box curation interface: https://github.com/UniBioDicts/
vsm-pubdictionaries/blob/master/test/test_vsm_box_pubdictionaries.html
AcknowledgementsThis work was carried out during the virtual Europe BioHackathon event that was organized byELIXIR in November 2020. We would like to thank the organizers for the excellent managementof such a large-scale, virtual event with 200+ participants and for creating the opportunity tomeet, discuss, collaborate and share ideas and technologies with many new people.
ReferencesHartmann, N. B., Hüffer, T., Thompson, R. C., Hassellöv, M., Verschoor, A., Daugaard, A.E., Rist, S., et al. (2019). Are We Speaking the Same Language? Recommendations fora Definition and Categorization Framework for Plastic Debris. Environmental Science andTechnology, 53(3), 1039–1047. doi:10.1021/acs.est.8b05297Kim, J.-D. (2020). PubDictionaries REST API documentation. Retrieved from https://docs.pubdictionaries.org/Kim, J.-D., Wang, Y., Fujiwara, T., Okuda, S., Callahan, T. J., & Cohen, K. B. (2019). OpenAgile text mining for bioinformatics: the PubAnnotation ecosystem. Bioinformatics, 35(21),4372–4380. doi:10.1093/bioinformatics/btz227The UniProt Consortium. (2019). UniProt: a worldwide hub of protein knowledge. NucleicAcids Research, 47(D1), D506–D515. doi:10.1093/nar/gky1049
John Zobolas & Jin-Dong Kim et al., (2021). BioHackrXiv.org 5

Vercruysse, S., & Kuiper, M. (2020). Intuitive representation of computable knowledge.Preprints. doi:10.20944/preprints202007.0486.v2Vercruysse, S., Zobolas, J., Touré, V., Andersen, M. K., & Kuiper, M. (2020). VSM-box: general-purpose interface for biocuration and knowledge representation. Preprints.doi:10.20944/preprints202007.0557.v1Whetzel, P. L., Noy, N. F., Shah, N. H., Alexander, P. R., Nyulas, C., Tudorache, T., & Musen,M. A. (2011). BioPortal: enhanced functionality via new Web services from the NationalCenter for Biomedical Ontology to access and use ontologies in software applications. Nucleicacids research, 39(Web Server issue), W541–5. doi:10.1093/nar/gkr469Zobolas, J., Touré, V., Kuiper, M., & Vercruysse, S. (2020). UniBioDicts: Unified access toBiological Dictionaries. Bioinformatics. doi:10.1093/bioinformatics/btaa1065
John Zobolas & Jin-Dong Kim et al., (2021). BioHackrXiv.org 6

PAPER 3
63

Fine tuning a logical model of cancercells to predict drug synergies:combining manual curation andautomated parameterization
AuthorsÅsmund Flobak1,2, John Zobolas1, Miguel Vazquez, Tonje Steigedal, Liv Thommesen, AsleGrislingås, Barbara Niederdorfer, Evelina Folkesson, Martin Kuiper
1 These authors contributed equally2 Corresponding author
Author contributionsÅF: Devised the project and developed the main conceptual ideas. Designed and developedprototype for simulation pipeline. Developed and implemented drug response combinationsimulation software. Analysed drug response prediction data and model performance. Designedand executed cell line experiments. Manually curated drug combination response data.Designed and executed xenograft experiment. Supervised drug combination matrixexperiments. Supervised tissue microarray experiments.JZ: Developed and implemented production-ready drug response combination simulationsoftware. Executed various simulations, analysed drug response prediction data and modelperformance, produced resulting figures, produced supplementary information, produced githubrepositories, made all analyses reproducible.MV: Analysed drug combination data. Developed and implemented drug response combinationsimulation software.TS: Supervised xenograft experiments.LT: Supervised xenograft experiments.AG: Prepared and analysed tissue microarrays of xenograft tumours.BN: Manually curated drug combination response data. Designed and executed drugcombination matrix experiments.EF: Manually curated drug combination response data. Designed and executed drugcombination matrix experiments.MK: Analysed drug response prediction data and model performance. Supervised the project.All authors contributed to the manuscript.
1
AffiliationsÅF1: Department of Clinical and Molecular Medicine, Norwegian University of Science andTechnology, Trondheim, Norway.ÅF2: The Cancer Clinic, St. Olav’s Hospital, Trondheim, Norway.JZ: Department of Biology, Norwegian University of Science and Technology, Trondheim,Norway.MV: Barcelona Supercomputing Center, SpainTS: Department of Clinical and Molecular Medicine, Norwegian University of Science andTechnology, Trondheim, NorwayLT: Department of Biomedical Laboratory Science, Norwegian University of Science andTechnology, Trondheim, NorwayAG: Department of Biomedical Laboratory Science, Norwegian University of Science andTechnology, Trondheim, NorwayBN: Department of Clinical and Molecular Medicine, Norwegian University of Science andTechnology, Trondheim, NorwayEF: Department of Clinical and Molecular Medicine, Norwegian University of Science andTechnology, Trondheim, NorwayMK: Department of Biology, Norwegian University of Science and Technology, Trondheim,Norway
2
AbstractTreatment with combinations of drugs carries great promise for personalized therapy for avariety of diseases. We have previously shown that synergistic combinations of cancer signalinginhibitors can be identified based on a logical framework by manual model definition. We nowdemonstrate how automated adjustments of model topology and logic equations both cangreatly reduce the workload traditionally associated with logical model optimization. Ourmethodology allows the exploration of larger model ensembles that all obey a set ofobservations, while being less restrained for parts of the model where parameterization is notguided by biological data. We benchmark the synergy prediction performance of our logicalmodels in a dataset of 153 targeted drug combinations. We show that well-performing manualmodels faithfully represent measured biomarker data and that their performance can beoutmatched by automated parameterization using a genetic algorithm. Whereas the predictiveperformance of a curated model is strongly affected by simulated curation errors, data-guideddeletion of a small subset of regulatory model edges can significantly improve prediction quality.With correct topology we find evidence of some tolerance to simulated errors in the biomarkercalibration data, yet performance decreases with reduced data quality. Moreover, we show thatpredictive logical models are valuable for proposing mechanisms underpinning observedsynergies. With our framework we predict the synergy of joint inhibition of PI3K and TAK1, andfurther substantiate this prediction with observation in cancer cell cultures and in xenograftexperiments.
Introduction
Combining specific and targeted drugs in one therapy to fight disease increases chances oftreatment success1. Drug combinations that together act in synergy are especially attractivebecause they allow for pushing treatment effects beyond those obtainable by each drug alone2,with drug dosages that can be well below levels where individual drugs begin to cause adverseeffects. In addition, synergistic drug combinations may have reduced side-effects by improvedselectivity in a specific biological context, for instance by allowing targeting of only certain celltypes in an organism3. Lastly, searching for new combination therapies has the additional benefitthat already approved drugs can act beneficially in novel combinations, and thus even allowbypassing initial drug development phases.
While the development of rational drug combination treatment has become a major priority dueto hopes of increased treatment potency, a grand challenge remains in dealing with theiridentification in the vast potential drug combination space. Currently, more than two hundred
3 Lehár, J. et al. Synergistic drug combinations tend to improve therapeutically relevant selectivity. Nat.Biotechnol. 27, 659–66 (2009)
2 Al-Lazikani, B., Banerji, U. & Workman, P. Combinatorial drug therapy for cancer in the post-genomicera. Nat. Biotechnol. 30, 679–92 (2012)
1 Hanahan, D. & Weinberg, R. a. Hallmarks of cancer: the next generation. Cell 144, 646–74 (2011).
3
drugs have been approved by the FDA to treat cancer(https://www.cancer.gov/about-cancer/treatment/drugs). The testing of drugs in all combinationswith other drugs in a panel needs assays in numbers that increase exponentially with increasingdrug numbers. Even a modestly sized drug panel of 150 drugs corresponds to over 10.000pairwise drug combinations. Testing high numbers of drug combinations in high throughputscreens on cell lines or other patient-specific model systems is costly and at some pointprohibitively expensive and cumbersome. Therefore, help is needed from in silico drug effectsimulations to produce high quality predictions that can guide drug combination screens ortherapy choices for testing in cell lines or patients. In silico simulations may help identify thosecombinations that are unlikely to produce synergies, which can be of significant help to reducethe large experimental search space that otherwise would need to be covered in exhaustivescreens. As many drug synergies can be seen as emergent properties arising from molecularcausality networks, analytical frameworks from computational systems biology seem to be wellsuited to the task.
Several mathematical frameworks have already been tested to mechanistically model drugcombination effects, including continuous, discrete, and hybrid modeling approaches. Publishedapproaches generally depend on molecular causalities downloaded from prior knowledgedatabases, extracted from large-scale data, or obtained by a combination of the two. Based ona dataset capturing proteomic responses of 14 targeted drugs, Miller et al. used ordinarydifferential equations to study mechanisms of synergy between inhibitors of CDK4 and IGF1R,revealing that the mechanisms rely on the activity of AKT4. Nelander et al. explored ODEmodels derived from observations on phospho-proteins and cell cycle markers following 21pairwise applications of targeted drugs, with the aim to use best-performing pairs for design ofnew combination therapies5. In a semi-qualitative modeling approach, Klinger et al. used aperturbation dataset for MAPK, PI3K and NF-κB signaling to inform a model showing thatcombined inactivation of MEK and EGFR could inactivate endpoints of RAS, ERK and AKTsignaling6. Jin et al. explored enhanced Petri nets to describe molecular processes for thesynergy of an EGFR inhibitor (gefitinib) with chemotherapy (docetaxel) and identified KRT8 as acandidate gene to explain the synergy7. However, all of these approaches rely on extensive andcostly combinatorial drug perturbation data, be it transcriptomic, proteomic, viability etc., fordescribing mechanisms of synergy, and therefore they require vast investments in dataproduction and do not provide a feasible solution for the testing of the large drug combinationspace.
In order to reduce dependence on a priori perturbation experiments, attempts have been madeto predict drug synergies from data obtained in a marginal experimental search space, rather
7 Jin, G., Zhao, H., Zhou, X. & Wong, S. T. C. An enhanced Petri-net model to predict synergistic effectsof pairwise drug combinations from gene microarray data. Bioinformatics 27, i310–6 (2011)
6 Klinger, B. et al. Network quantification of EGFR signaling unveils potential for targeted combinationtherapy. Mol. Syst. Biol. 9, 673 (2013)
5 Nelander, S. et al. Models from experiments: combinatorial drug perturbations of cancer cells. Mol. Syst.Biol. 4, 216 (2008)
4 Miller, M. L. et al. Drug Synergy Screen and Network Modeling in Dedifferentiated LiposarcomaIdentifies CDK4 and IGF1R as Synergistic Drug Targets. Sci. Signal. 6, ra85 (2013)
4

than the full combinatorial space. Fröhlich et al. used ODE models informed by transcriptomicand viability data to predict drug combination responses, finding that highly accurate predictionscould be produced for those drugs for which they had viability response data8. In the DREAM7 -NCI-DREAM, Drug Sensitivity and Drug Synergy Challenges9,10,11 (NCI-DREAM), pairwise drugresponses were predicted from response data obtained for each drug alone. The bestperforming teams in the NCI-DREAM challenge obtained a probabilistic concordance (PC) indexof 0.61, on a scale ranging from 0.9 (perfect prediction) to 0.1 (perfect opposite prediction).Although this is better than random (PC index of 0.5), it clearly illustrates that obtaining accuratesynergy predictions is far from trivial, due to a variety of reasons that will be discussed in thispaper. In the more recent AstraZeneca-Sanger Drug Combination Prediction DREAMChallenge12 (AZS-DREAM), one of the aims was to develop and demonstrate drug combinationresponse predictability independent of extensive perturbation data. The development of suchpowerful prediction approaches has the advantage of being relevant not only to preclinical drugscreens, but also to bed-side applications. Drug perturbation data clearly will not be trivial toobtain for individual patients, unless patient-derived experimental assays that mimic patientresponses can be developed (e.g. xenografts, explants etc.). Sobering results from theAZS-DREAM challenge showed that most teams had balanced accuracies of 0.5-0.6, with thebest performing team obtaining a balanced accuracy of only 0.69.
With the availability of training data, machine learning algorithms have also been explored topredict drug synergies13,14,15. However, major limitations of such approaches are the lack ofmechanistic insight16, and dependence on high quantities of training data. Despite someincrease in their availability, large scale datasets on drug responses for machine learning topredict combination effects are still largely missing, in part due to great experimental complexity
16 Yu, M. K., Ma, J., Fisher, J., Kreisberg, J. F., Raphael, B. J., & Ideker, T. (2018). Visible MachineLearning for Biomedicine. Cell, 173(7), 1562–1565. http://doi.org/10.1016/j.cell.2018.05.056
15 Tang, J., Gautam, P., Gupta, A., He, L., Timonen, S., Akimov, Y., … Aittokallio, T. (2019). Networkpharmacology modeling identifies synergistic Aurora B and ZAK interaction in triple-negative breastcancer. Npj Systems Biology and Applications, 5(1). http://doi.org/10.1038/s41540-019-0098-z
14 Gayvert, K. M., Aly, O., Platt, J., Bosenberg, M. W., Stern, D. F., & Elemento, O. (2017). AComputational Approach for Identifying Synergistic Drug Combinations. PLoS Computational Biology,13(1), 1–11. doi:10.1371/journal.pcbi.1005308
13 Preuer, K., Lewis, R. P. I., Hochreiter, S., Bender, A., Bulusu, K. C., & Klambauer, G. (2017).DeepSynergy: Predicting anti-cancer drug synergy with Deep Learning. Bioinformatics (Oxford, England),(December). doi:10.1093/bioinformatics/btx806
12 Menden, M. P., Wang, D., Mason, M. J., Szalai, B., Bulusu, K. C., Guan, Y., … Saez-Rodriguez, J.(2019). Community assessment to advance computational prediction of cancer drug combinations in apharmacogenomic screen. Nature Communications, 10(1), 2674.http://doi.org/10.1038/s41467-019-09799-2
11 Goswami, C. P., Cheng, L., Alexander, P. S., Singal, a & Li, L. A New Drug Combinatory EffectPrediction Algorithm on the Cancer Cell Based on Gene Expression and Dose-Response Curve. CPTpharmacometrics Syst. Pharmacol. 4, e9 (2015).
10 Sun, Y. et al. Combining genomic and network characteristics for extended capability in predictingsynergistic drugs for cancer. Nat. Commun. 6, 8481 (2015).
9 Bansal, M. et al. A community computational challenge to predict the activity of pairs of compounds. Nat.Biotechnol. (2014). doi:10.1038/nbt.3052
8 Fröhlich, F., Kessler, T., Weindl, D., Shadrin, A., Schmiester, L., Hache, H., … Hasenauer, J. (2018).Efficient Parameter Estimation Enables the Prediction of Drug Response Using a MechanisticPan-Cancer Pathway Model. Cell Systems, 7, 1–13. http://doi.org/10.1016/j.cels.2018.10.013
5
and high economic cost. Whereas efficient in silico therapy based on patient-specific modelsultimately should be integrated into the clinical decision process, here we further investigate theperformance of logical modeling of drug response of cancer cell lines. In order to reduce thedependency on large training datasets, we explore the use of cell lines measurements ofbiomolecules obtained at a single time point at steady state proliferation. To reduce datadependency and to improve mechanistic insights, these measurements are combined with priorknowledge to construct logical model ensembles to simulate drug combination effects. Logicalmodel building is known to require meticulous involvement of curators and bioinformaticians,with substantial commitment to manual tinkering of models before the behavior of one modelmatches that of its experimental counterpart. We have previously published logical models ofcancer cell lines, named CASCADE 1.0, CASCADE 2.0 and CASCADE 3.0, which demonstratethe potential of logical modeling for the prediction of drug synergies17,18,19. However, the curationeffort required to assemble a cancer signaling network and the dedicated interactive effortsneeded to optimally modify logical rule definitions becomes a clear obstacle when constructinglarger models.
If patient specific logical models are to be used routinely, such logical models should be trivial toconstruct for any cell line or patient-derived cell culture, and for any repertoire of targeted drugs.We therefore set out to automate processes required to calibrate a logical model from a set ofmolecular causative statements, i.e. a prior knowledge network. A software pipeline developedto that end would have to 1) assemble a network topology from structured data obtained fromprior knowledge databases, 2) interpret baseline cancer cell line biomarker data into a signalingentity activity score, 3) calibrate generic logical models, created from prior knowledge data, bymodifying logic equations to match the observed activity scores, and 4) predict phenotypicconsequences of combinatorial interventions to the simulated model behavior. Our softwaresolution for realizing points 3 and 4 is available at https://github.com/druglogics. We use agenetic algorithm to automatically parameterize a set of logic equations representing cancergrowth-promoting signaling in the AGS gastric adenocarcinoma cell line. We demonstrate ourapproach by reproducing results from a previous manual effort and next test its utility with alarger model that was benchmarked against a dataset from a drug effect screen of 153 drugcombinations. Experiments that simulate different levels of curation quality and biomarker dataquality indicate the need for a reliable PKN, while still allowing for model improvement bynetwork link pruning and parameter optimization.
19 Tsirvouli, E., Touré, V., Niederdorfer, B., Vázquez, M., Flobak, Å., & Kuiper, M. (2020). A Middle-OutModeling Strategy to Extend a Colon Cancer Logical Model Improves Drug Synergy Predictions inEpithelial-Derived Cancer Cell Lines. Frontiers in Molecular Biosciences, 7, 502573.http://doi.org/10.3389/fmolb.2020.502573
18 Niederdorfer, B., Touré, V., Vazquez, M., Thommesen, L., Kuiper, M., Lægreid, A., & Flobak, Å. (2020).Strategies to Enhance logical modeling-Based Cell Line-Specific Drug Synergy Prediction. Frontiers inPhysiology, 11(July), 862. http://doi.org/10.3389/fphys.2020.00862
17 Flobak, Å., Baudot, A., Remy, E., Thommesen, L., Thieffry, D., Kuiper, M., & Lægreid, A. (2015).Discovery of Drug Synergies in Gastric Cancer Cells Predicted by Logical Modeling. PLoS ComputationalBiology, 11(8), e1004426. https://doi.org/10.1371/journal.pcbi.1004426
6
Methods
Logical modelingLogical models rely on the formalism initially proposed by Stuart Kauffman20 and RenéThomas21. Their approach first defines a regulatory graph consisting of nodes representingsignaling entities (model components), and signed and directed edges representing regulatoryinteractions that connect signaling entities. The activities of all model components are thenassociated with the Boolean values ‘True’ and ‘False’, represented by 1 and 0, corresponding toactivity and inactivity, respectively. This dichotomy of activity levels can be interpreted as activitybeing above or below a “threshold”: a component is “active” when its activity level is sufficientlyhigh to influence a target component’s activity levels. In model simulations, specific modelcomponents can be defined as ‘output nodes’, whose activity values serve as a proxy for aphenotype of interest. This allows us to compute an overall ‘growth’ value in our simulations, byintegrating all activity values of model output nodes, and scaling this sum to [0..1]. For example,if the anti-survival model output nodes CASP8, CASP9 and FOXO3 are inactive and thepro-survival model output nodes MYC, CCND1 and TCF7 are active, the global output ‘growth’is 1.0. Inhibitory effects of a drug are simulated by fixing the drug target to an activity level of 0,i.e. simulating a block in signaling activity of the drug target node.
Model attractors were determined using the software bioLQM, which provides a fast algorithmfor finding stable state(s) and complex attractors22. For some of the simulations that were toocomputationally taxing, we used a modified version of the algorithm BNReduction23, whichallows the identification of single stable state phenotypes that are most prevalent with ourself-contained CASCADE topologies.
Model calibration by parameterization optimization
A genetic algorithm is applied to automate model parameterization, as follows:
The input for model calibration consists of:
23 Veliz-Cuba, A., Aguilar, B., Hinkelmann, F., & Laubenbacher, R. (2014). Steady state analysis ofBoolean molecular network models via model reduction and computational algebra. BMC Bioinformatics,15, 221. http://doi.org/10.1186/1471-2105-15-221
22 Naldi, A. (2018). BioLQM: A Java toolkit for the manipulation and conversion of logical qualitativemodels of biological networks. Frontiers in Physiology, 9(NOV), 1–10.http://doi.org/10.3389/fphys.2018.01605
21 Thomas, R. (1973). Boolean formalization of genetic control circuits. Journal of Theoretical Biology,42(3), 563–585. http://doi.org/10.1016/0022-5193(74)90172-6
20 Kauffman, S. a. (1969). Metabolic stability and epigenesis in randomly constructed genetic nets.Journal of Theoretical Biology, 22(3), 437–467. http://doi.org/10.1016/0022-5193(69)90015-0
7
● Interactions: binary signed and directed interactions (SIF format24).● Steady state: Boolean vector containing states of nodes in input interactions, where
nodes that should be active are assigned the value 1, and nodes that should be inactiveare assigned the value 0. For nodes whose state cannot be determined a dash (-) canoptionally be used to explicitly declare that the node state is undetermined. This steadystate vector will be used for evaluating the correctness of a model’s stable state.
The output from an automated model calibration is an ensemble of models with a stable stateoptimized to match the input steady state.
To run the parameter configuration, interactions are first assembled to logic equations, based ona default equation25 relating a node with its regulators, for instance:
Target *= (A or B or C) and not (D or E or F),
where activating regulators A, B and C of a target are combined with logical ‘or’ operators, andinhibitory regulators D, E and F are combined with ‘and not’ operators to determine the state ofthe target node in the next time step. The operator ‘and not’, which directs the integration ofactivating and inactivating regulators, is referred to as the link operator in this manuscript. Thetopology is ‘self-contained’, meaning that any regulator is itself regulated by one or morecomponents from within the network topology, effectively meaning there are no ‘user-controlled’inputs to the network through e.g. hormone receptors.
Next, a genetic algorithm is used to iteratively refine the parameterization to produce a logicalmodel with a stable state matching the specified input steady state. First, an initial generation ofmodels is formulated, where a large number of mutations to the parameterization is introduced:randomly selected equations are mutated from “and not” to “or not”, or vice versa. For eachmodel a fitness score is computed: each matching Boolean value between the vector of a stablestate and the steady state improves the fitness score. Models without a stable state have afitness of zero. Models with n stable states obtain a final fitness after integrating all Booleanvalues in a stable state vector and dividing the resulting overall fitness by n, thus penalizingmodels with multiple stable states.
For each generation, a user-defined number of models were selected for populating the nextgeneration of models. For our simulations three models were selected, specifically the ones thatachieved the highest fitness scores in each generation, to populate a next generation of 20models. First, crossover was performed, where each selected model would exchange logicequations with other selected models (including itself, thus also enabling asexual reproduction).Then a number of mutations were introduced as described above. For our simulations up to
25 Mendoza, L., & Xenarios, I. (2006). A method for the generation of standardized qualitative dynamicalsystems of regulatory networks. Theoretical Biology and Medical Modelling, 3, 1–18.http://doi.org/10.1186/1742-4682-3-13
24 Shannon, P., Markiel, A., Ozier, O., Baliga, N. S., Wang, J. T., Ramage, D., … Ideker, T. (2003).Cytoscape: a software environment for integrated models of biomolecular interaction networks. GenomeResearch, 13(11), 2498–2504. https://doi.org/10.1101/gr.1239303
8
three mutations were introduced. Before a stable state was obtained, the number of mutationsintroduced per generation was increased by a user-defined factor. The large number ofmutations in the initial phase ensured that a large variation in parameterization could beexplored. For our simulations we chose the factor to be 1000, effectively ensuring that the initialgenerations were randomly sampled from all possible model configurations. Evolution washalted when a user-specified threshold fitness was reached. In case this fitness could not bereached, evolution was halted when a user-defined maximum number of generations had beenspanned. For our simulations we allowed for a maximum of 20 generations.
Model calibration by topology optimizationIn order to introduce variations to the topology, the genetic algorithm modified a whitelist and ablacklist of regulators of the prior knowledge network, while always preserving at least oneregulator for each target, so as to not break the self-contained property of the network. Basedon the same formula as shown above,
Target *= (A or B or C) and not (D or E or F),
this means that the genetic algorithm takes out some subset of the regulators A, B, C, D, E or F(blacklisting). After a regulator has been eliminated, the genetic algorithm is also allowed tobring back regulators originally defined in the PKN (whitelisting). For our simulations, during theinitialization phase we introduced 50 such topology mutations and when models with stablestates were found, we reduced this number to 10, so as to not severely reduce the PKN edges.
Model simulation and synergy predictionAfter repeating evolution a specified number of times, model ensembles were analyzed in athird step of the software pipeline, as follows:
The input to model simulation and synergy prediction consists of:● An ensemble of logical models● A drug panel: List of drugs and their target node(s) in the model● Perturbations: the perturbations to be analyzed.● Model output nodes with weighted score to evaluate global output (i.e. ‘growth’)
Output from model simulation and synergy prediction:● Drug synergy predictions from ensembles of models
For each model, all perturbations specified were simulated. For each perturbation, the drugpanel was consulted to fix the state of the specified node(s) to the value 0 (node state could inprinciple also be fixed to the value 1 for a drug that activates a signaling entity, but this featurewas not used here as all drugs inhibit nodes in the model, thereby representing inhibition of theirtarget in a cell). After simulating a perturbation, the global output parameter ‘growth’ wascomputed by integrating the weighted score depending on the states of model output nodes. Forexample, if two output nodes A (weight 1) and B (weight -1) were found to have the states A=1,
9
B=1 for a perturbation, the global output would evaluate to Astate×Aweight + Bstate×Bweight = 1×1 +1×(-1) = 0. This value was then scaled from 0 to 1 based on the theoretical minimum andtheoretical maximum ‘growth’, for this example, the range [-1,1], the global output would be 0.5.The scaled global output (‘growth’) was then used to compute synergies (see below).
All steps of the software pipeline were implemented in the OpenJDK Java v1.8 language andrun on Linux 4.15.0-122-generic/Ubuntu 18.04.4 LTS. The pipeline can be accessed athttps://github.com/druglogics. For an extensive documentation of the methods used in this work,see https://github.com/druglogics/ags-paper.
In silico definition of synergySynergy is defined as an additional response beyond what is expected from a reference modelof drug combination responses. Both for in silico simulations and in vitro experiments anobserved combination effect can be formally defined as the effect E observed for two drugs aand b, where E(a,b) is the observed effect in a combination experiment, A(a,b) is the drugcombination effect expected from each individual drug’s properties as based on a referencemodel for combination responses, and S(a,b) is any difference between the observed and theexpected drug combination effect, such that E(a,b) = A(a,b) + S(a,b)26. In the case of excesseffects observed for a combination, S(a,b) is positive and synergy is called, and conversely forattenuated effects, S(a,b) is negative and antagonism is called. Finally, for drug combinationswhere E(a,b) equals A(a,b), the drug combination effect can fully be anticipated by each drugresponse independently, and neither synergy nor antagonism is called.
In model simulations the expected drug combination response is defined as the product of thetwo global output ‘growth’ values for each single drug, similarly to the Bliss independence27
synergy metric used in lab experiments: when a combinatorial perturbation in simulations isfound to predict a lower growth than expected, i.e. growth(a,b) < growth(a) * growth(b), thecombinatorial perturbation response is declared synergistic.
Gold standard synergiesOur previously published dataset of targeted drug combinations[17] was used to benchmark thealgorithms. The drugs included comprised the inhibitors 5Z-7-oxozeaenol (5Z), AKTi-1,2 (AK),BIRB0796 (BI), CT99021 (CT), PD0325901 (PD), PI103 (PI), PKF118-310 (PK), JNK InhibitorXVI (JN), BI-D1870 (D1), BI605906 (BIX02514) (60), Ruxolitinib (INCB18424) (SB), SB-505124(RU), D4476 (D4), KU-55933 (KU), 10058-F4 (F4), Stattic (ST), GSK2334470 (G2),GSK-429286 (G4), P 505-15 (P5). For the drug synergy calling in the 153 combinations drug
27 Bliss, C. I. (1939). The Toxicity of Poisons Applied Jointly. Annals of Applied Biology, 26(3), 585–615.http://doi.org/10.1111/j.1744-7348.1939.tb06990.x
26 Li, H., Li, T., Quang, D., & Guan, Y. (2018). Network propagation predicts drug synergy in cancers.Cancer Research, 78(18), 5446–5457. https://doi.org/10.1158/0008-5472.CAN-18-0740
10
screen, three curators were asked to evaluate growth curves and decide on which showedinteresting combination effects that could have warranted further investigations. A consensus listwas then used to identify a threshold for drug synergy assessment using the softwareCImbinator28 and configured to compute synergies per the Bliss metric. The analysis identifiedsix drug synergies (AK-BI, PI-D1, BI-D1, PI-G2, PD-PI, 5Z-PI). Note that two drug synergies inthe drug screen performed in 2015 were not captured by this analysis, probably relating to thedifferent readouts used in the drug screen performed in 2019 (xCELLigence and CellTiter Glo,respectively).
NormalizationNormalization of synergy predictions was performed by computing the exponential fold changefor the ratio of output from models calibrated to steady state biomarker data (x) to output frommodels calibrated to a random yet proliferative phenotype (y):
synergy = exp((growthx(a,b) - growthx(a)*growthx(b))-(growthy(a,b) - growthy(a)*growthy(b)))
Our random proliferative phenotype corresponds to a cell with all anti-apoptotic signalsinactivated, and at least one prosurvival signal active.
Mouse xenograft experiments40 female Balb/c mice 4-5 weeks old (Taconic) were inoculated with two million AGS cellssubcutaneously in the right dorsal flank. Cells were mixed with Matrigel to improve probability ofsuccessfully establishing a xenograft model: in a small pilot (n=3) we observed that none ofthree mice injected with cells in medium (DMEM) developed tumors, while two of three miceinjected with cells in medium and Matrigel developed tumors. 100 µl of cell suspension inHAM’S F12 medium (Invitrogen, Carlsbad, CA) with 10% fetal calf serum (FCS; Euroclone,Devon, UK), and 10 U/ml penicillin-streptomycin (Invitrogen) was mixed with 100 µl of ECM Gelfrom Engelbreth-Holm-Swarm murine sarcoma (Sigma-Aldrich). After four weeks, minuscule butpalpable tumors had formed in 30 mice, which were randomized to four groups and subjected totreatment: 1) 5Z-7-oxozeaenol (3 mg/kg/d), 2) PI103 (5 mg/kg/d), 3) 5Z-7-oxozeaenol (3mg/kg/d) + PI103 (5 mg/kg/d), 4) vehicle. Randomization ensured that average tumor volumewas similar in the four groups. Weights of mice ranged from 14.9 to 20.0 grams at onset oftreatment, with average weight 17.66 g and standard deviation of 1.06 g. All mice received thesame dose of drugs, and the dose was adjusted for a body weight one standard deviation belowaverage, i.e. 16.6 g. Drugs were diluted in medium with 40% DMSO for a total injection volumeof 250 µl and injected intraperitoneally three times per week for a total of seven injections.Maximum (a) and minimum (b) tumor diameters were measured twice weekly with a caliper, andthe volume V of the tumor was estimated from the formula V = 0.5 a × b2.
28 Flobak, Å., Vazquez, M., Lægreid, A., & Valencia, A. (2017). CImbinator: A web-based tool for drugsynergy analysis in small- and large-scale datasets. Bioinformatics (Oxford, England), (March), 1–3.https://doi.org/10.1093/bioinformatics/btx161
11
ResultsFor reliable simulation of drug responses of cancer cell lines, computational models mustadequately represent the regulatory network (topology) underlying cell fate decisions, meaningthat high quality molecular causal relationship data must exist and be converted to regulatorygraphs. In addition, the activity states of molecular regulatory components must be measured,demanding high quality biomarker data. From the regulatory graph the response of componentsto upstream source nodes and influence on downstream target nodes needs to be specified inthe form of logical rules and calibrated so as to accurately represent the biological decisionmechanisms of these cells in a Boolean framework. Finally, good benchmarking data must existto evaluate the performance of the model, e.g. for our purposes in the form of drug synergydata, see figure 1A.
Design of an automated model parameterization modulePreviously we have shown the feasibility of logical model predictions of drug synergies17 usingthe cancer cell line AGS, chosen due to known deregulations of several core cell survivalsignaling pathways. A Prior Knowledge Network (PKN) was curated to represent these signalingpathways, and converted to a set of mathematical rules formulated in Boolean logic. This model,available from https://github.com/druglogics/cascade as CASCADE 1.0 (Fig. 2A), consists of 75nodes representing cancer signaling entities and 149 edges representing regulatoryinteractions, and it could predict five synergies of which four were experimentally confirmed17.Since our model is based on prior knowledge, amenable to interpretation by molecularbiologists, the model also can be used for inspection as to which signaling pathways areimportant for particular drug response observations, e.g. we have suggested that FOXOsignaling was crucial to the drug synergy effect of joint PI3K and MEK inhibition17. Whereas formany of the logical rules the definition of the logical operators (AND, OR, NOT) was more orless evident from literature and database knowledge, analysis of Boolean model attractorsindicated that some logical rules needed further manual optimization in a stepwise manner sothat ultimately the model stable state behavior matched the observed pattern of signalingentities at steady state in proliferating AGS cells. We now report on how we automated andgeneralized these steps required to parameterize an in silico model of a cancer cell line, byemploying a genetic algorithm for deriving logical rules from prior knowledge and steady statesignaling observations, see figure 1B. From a curated network topology a set of standardizedlogic equations are obtained by defining one logic equation for each model target node, withmodel source nodes as operands25. For example, if protein T is activated by proteins A and B,while protein C inhibits protein T, the equation could read as T = (A OR B) AND NOT C.Subsequently, the parameterization (choices of logical operators) is optimized by a geneticalgorithm, specifically modifying the AND NOT/OR NOT parameter. The genetic algorithmiteratively modifies the parameterization of a small subset of the equations, and selects bestperforming models for defining a new generation of candidate models. Best performing modelsare chosen based on their compliance with reproducing known baseline cell signaling states, asfar as the available cell line data allows it. Evaluating fitness from a match with baseline
12
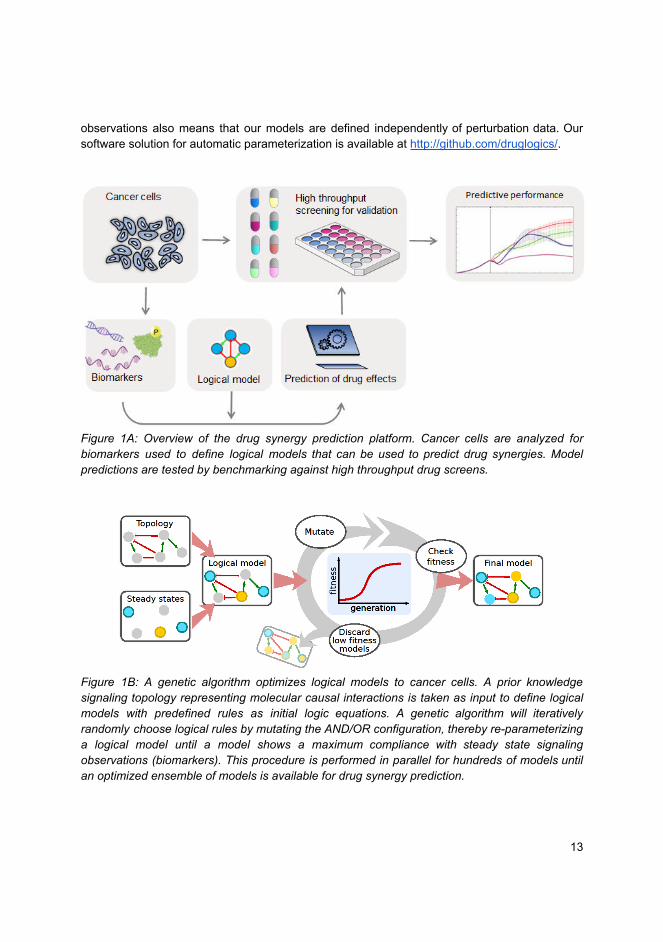
observations also means that our models are defined independently of perturbation data. Oursoftware solution for automatic parameterization is available at http://github.com/druglogics/.
Figure 1A: Overview of the drug synergy prediction platform. Cancer cells are analyzed forbiomarkers used to define logical models that can be used to predict drug synergies. Modelpredictions are tested by benchmarking against high throughput drug screens.
Figure 1B: A genetic algorithm optimizes logical models to cancer cells. A prior knowledgesignaling topology representing molecular causal interactions is taken as input to define logicalmodels with predefined rules as initial logic equations. A genetic algorithm will iterativelyrandomly choose logical rules by mutating the AND/OR configuration, thereby re-parameterizinga logical model until a model shows a maximum compliance with steady state signalingobservations (biomarkers). This procedure is performed in parallel for hundreds of models untilan optimized ensemble of models is available for drug synergy prediction.
13
Automated logical rule definitions perform on par with manuallycurated rules
To compare results from our manually constructed logical rules with automated rule definitions,our software translates the graph, as encoded in a SIF file format, to a set of 75 logic equationsin a standardized format25. Logic equations are then optimized using a genetic algorithm in aprocess where the fitness of each model is calculated by comparing the matches of its stablestate nodes with observed activities of signaling entities for proliferating cancer cells. For theAGS cells, this process comprised 20 generations, in which each generation received mutationsto a small subset of logic equations iteratively, with 20 models per generation tested for fitness.In order to adequately cover the space of local optima, the evolutionary process was repeated50 times and the three best performing models from each evolution were retained, whichresulted in an ensemble of 150 models. A theoretical maximal fitness of one would be reached ifall nodes have a state matching the observed activity state of the corresponding protein. As canbe seen in figure 2B, the population average fitness of each generation increases exponentiallybefore plateauing at a fitness close to the theoretical maximal fitness, per Holland’s SchemaTheorem29, indicating that the theoretical models can be parameterized so as to be compliantwith experimentally observed signaling states. While a genetic algorithm cannot guarantee aglobal optimum, our results clearly indicate that we quickly achieve convergence to a localoptimum.
Whereas these model ensembles provide the testing ground for the in silico drug effectsimulations, it is to be expected that certain motifs of the network topology itself will create ‘blindspots’ resulting in some synergies to be impossible to predict. For example, if two directlysequential signaling nodes are targeted by two different drugs, while no other influences fromother signaling entities are allowed by the topology, then these two drugs cannot be predicted toact synergistically in our logical modeling framework. To remedy such situations extensions tothe prior knowledge network are necessary, or conversion to non-discrete modeling. On theother hand, if two drug targets are active and are the only (activating) source nodes of a jointdownstream target node, with their joint effect on the target governed by an OR logical operator,this may constitute a synergy that is highly likely to stand out in an analysis, since the ORoperator would cause either drug alone to not affect a joint downstream node. Between thesetwo extremes, the topology will be more or less likely to produce a particular synergy predictionfor a given combination perturbation. In order to correct for topology-intrinsic propensities forpredicting some synergies we next employed a normalization strategy where synergypredictions for an automatically parameterized model ensemble are normalized to a randomlyparameterized model, meaning a model ensemble that covers many different selections of ORand AND operators, irrespective of any particular stable state. This means that in our furtheranalyses we used the fold change of the predicted synergy score of a test model against arandomly yet proliferative parameterized model (see Methods).
29 Holland, J. H. (1992). Adaptation in Natural and Artificial Systems. Adaptation in Natural and ArtificialSystems (Reprint). Cambridge, Massachusetts: The MIT Press.http://doi.org/10.7551/mitpress/1090.001.0001
14
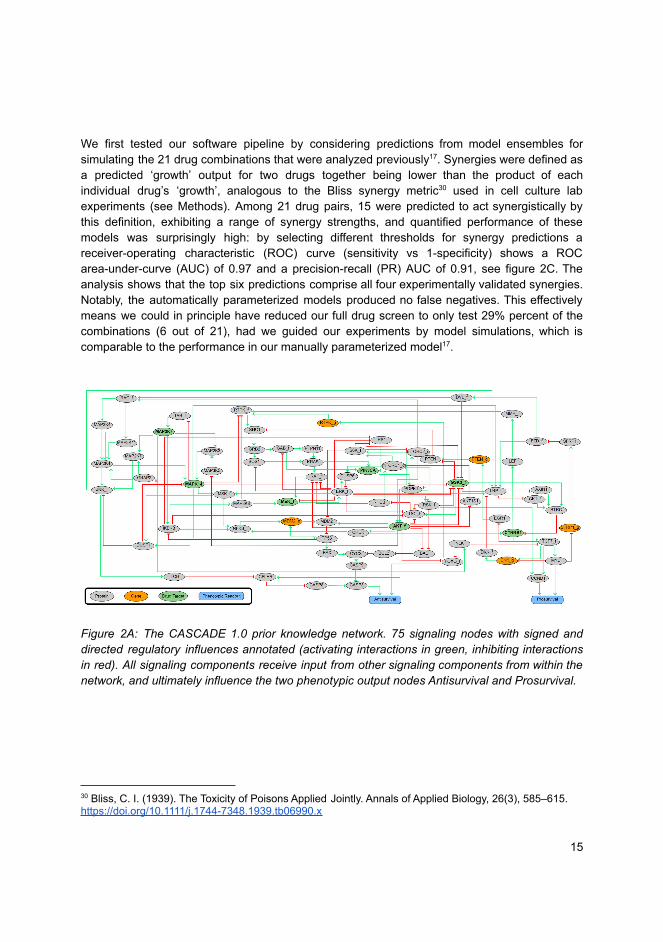
We first tested our software pipeline by considering predictions from model ensembles forsimulating the 21 drug combinations that were analyzed previously17. Synergies were defined asa predicted ‘growth’ output for two drugs together being lower than the product of eachindividual drug’s ‘growth’, analogous to the Bliss synergy metric30 used in cell culture labexperiments (see Methods). Among 21 drug pairs, 15 were predicted to act synergistically bythis definition, exhibiting a range of synergy strengths, and quantified performance of thesemodels was surprisingly high: by selecting different thresholds for synergy predictions areceiver-operating characteristic (ROC) curve (sensitivity vs 1-specificity) shows a ROCarea-under-curve (AUC) of 0.97 and a precision-recall (PR) AUC of 0.91, see figure 2C. Theanalysis shows that the top six predictions comprise all four experimentally validated synergies.Notably, the automatically parameterized models produced no false negatives. This effectivelymeans we could in principle have reduced our full drug screen to only test 29% percent of thecombinations (6 out of 21), had we guided our experiments by model simulations, which iscomparable to the performance in our manually parameterized model17.
Figure 2A: The CASCADE 1.0 prior knowledge network. 75 signaling nodes with signed anddirected regulatory influences annotated (activating interactions in green, inhibiting interactionsin red). All signaling components receive input from other signaling components from within thenetwork, and ultimately influence the two phenotypic output nodes Antisurvival and Prosurvival.
30 Bliss, C. I. (1939). The Toxicity of Poisons Applied Jointly. Annals of Applied Biology, 26(3), 585–615.https://doi.org/10.1111/j.1744-7348.1939.tb06990.x
15
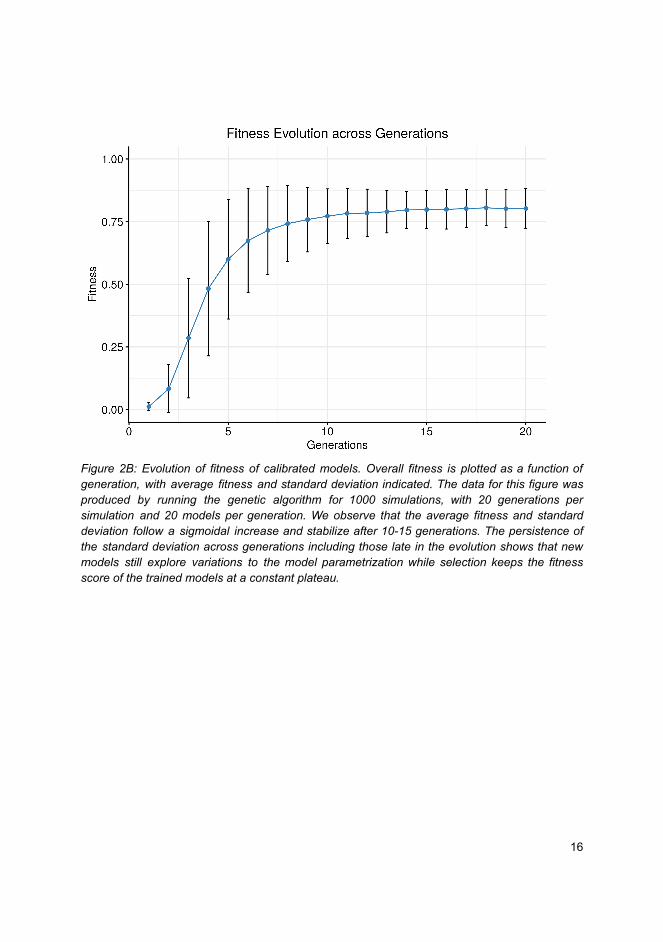
Figure 2B: Evolution of fitness of calibrated models. Overall fitness is plotted as a function ofgeneration, with average fitness and standard deviation indicated. The data for this figure wasproduced by running the genetic algorithm for 1000 simulations, with 20 generations persimulation and 20 models per generation. We observe that the average fitness and standarddeviation follow a sigmoidal increase and stabilize after 10-15 generations. The persistence ofthe standard deviation across generations including those late in the evolution shows that newmodels still explore variations to the model parametrization while selection keeps the fitnessscore of the trained models at a constant plateau.
16
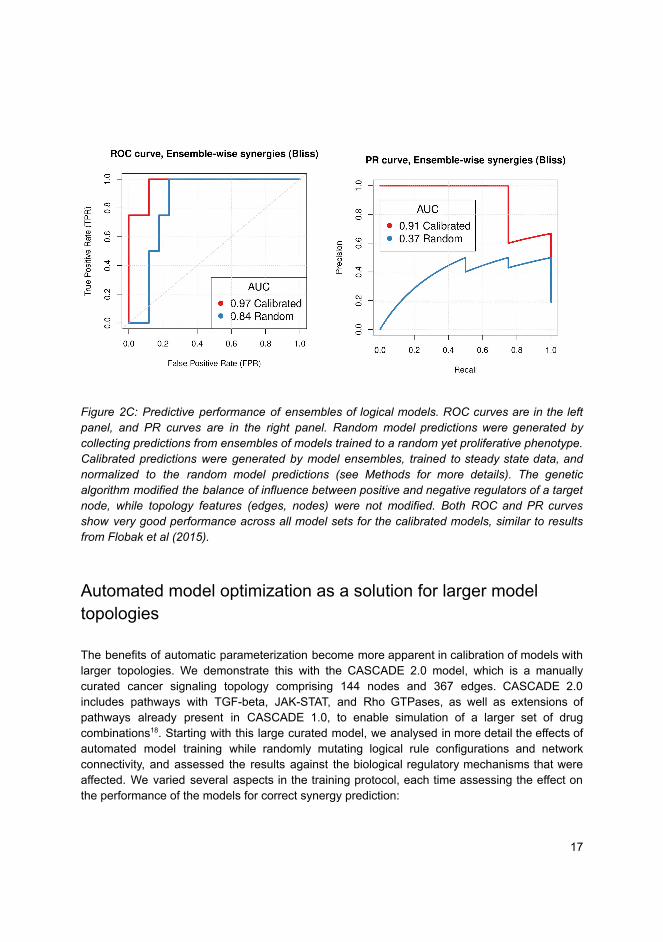
Figure 2C: Predictive performance of ensembles of logical models. ROC curves are in the leftpanel, and PR curves are in the right panel. Random model predictions were generated bycollecting predictions from ensembles of models trained to a random yet proliferative phenotype.Calibrated predictions were generated by model ensembles, trained to steady state data, andnormalized to the random model predictions (see Methods for more details). The geneticalgorithm modified the balance of influence between positive and negative regulators of a targetnode, while topology features (edges, nodes) were not modified. Both ROC and PR curvesshow very good performance across all model sets for the calibrated models, similar to resultsfrom Flobak et al (2015).
Automated model optimization as a solution for larger modeltopologies
The benefits of automatic parameterization become more apparent in calibration of models withlarger topologies. We demonstrate this with the CASCADE 2.0 model, which is a manuallycurated cancer signaling topology comprising 144 nodes and 367 edges. CASCADE 2.0includes pathways with TGF-beta, JAK-STAT, and Rho GTPases, as well as extensions ofpathways already present in CASCADE 1.0, to enable simulation of a larger set of drugcombinations18. Starting with this large curated model, we analysed in more detail the effects ofautomated model training while randomly mutating logical rule configurations and networkconnectivity, and assessed the results against the biological regulatory mechanisms that wereaffected. We varied several aspects in the training protocol, each time assessing the effect onthe performance of the models for correct synergy prediction:
17
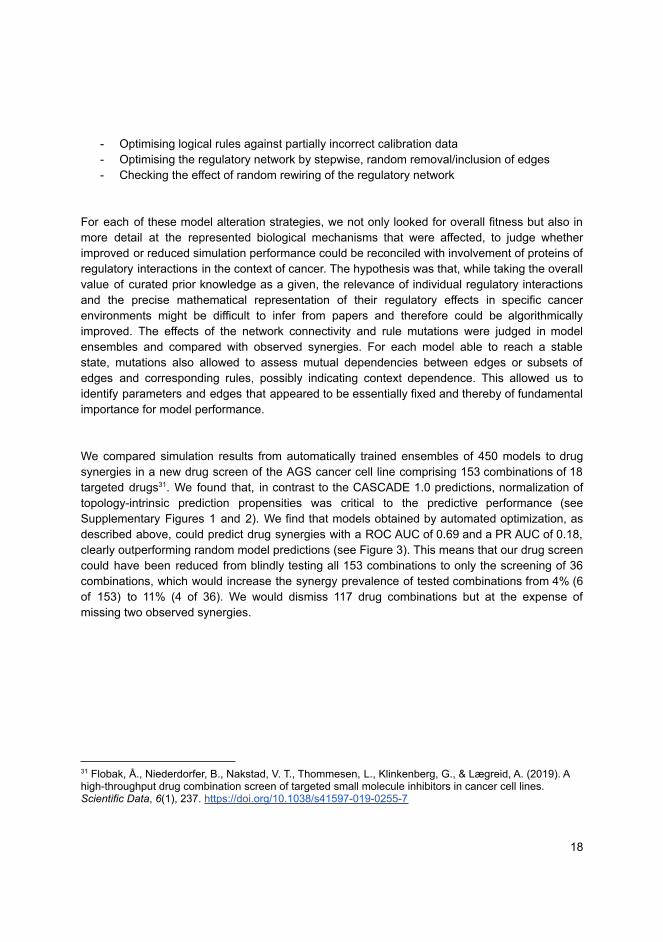
- Optimising logical rules against partially incorrect calibration data- Optimising the regulatory network by stepwise, random removal/inclusion of edges- Checking the effect of random rewiring of the regulatory network
For each of these model alteration strategies, we not only looked for overall fitness but also inmore detail at the represented biological mechanisms that were affected, to judge whetherimproved or reduced simulation performance could be reconciled with involvement of proteins ofregulatory interactions in the context of cancer. The hypothesis was that, while taking the overallvalue of curated prior knowledge as a given, the relevance of individual regulatory interactionsand the precise mathematical representation of their regulatory effects in specific cancerenvironments might be difficult to infer from papers and therefore could be algorithmicallyimproved. The effects of the network connectivity and rule mutations were judged in modelensembles and compared with observed synergies. For each model able to reach a stablestate, mutations also allowed to assess mutual dependencies between edges or subsets ofedges and corresponding rules, possibly indicating context dependence. This allowed us toidentify parameters and edges that appeared to be essentially fixed and thereby of fundamentalimportance for model performance.
We compared simulation results from automatically trained ensembles of 450 models to drugsynergies in a new drug screen of the AGS cancer cell line comprising 153 combinations of 18targeted drugs31. We found that, in contrast to the CASCADE 1.0 predictions, normalization oftopology-intrinsic prediction propensities was critical to the predictive performance (seeSupplementary Figures 1 and 2). We find that models obtained by automated optimization, asdescribed above, could predict drug synergies with a ROC AUC of 0.69 and a PR AUC of 0.18,clearly outperforming random model predictions (see Figure 3). This means that our drug screencould have been reduced from blindly testing all 153 combinations to only the screening of 36combinations, which would increase the synergy prevalence of tested combinations from 4% (6of 153) to 11% (4 of 36). We would dismiss 117 drug combinations but at the expense ofmissing two observed synergies.
31 Flobak, Å., Niederdorfer, B., Nakstad, V. T., Thommesen, L., Klinkenberg, G., & Lægreid, A. (2019). Ahigh-throughput drug combination screen of targeted small molecule inhibitors in cancer cell lines.Scientific Data, 6(1), 237. https://doi.org/10.1038/s41597-019-0255-7
18
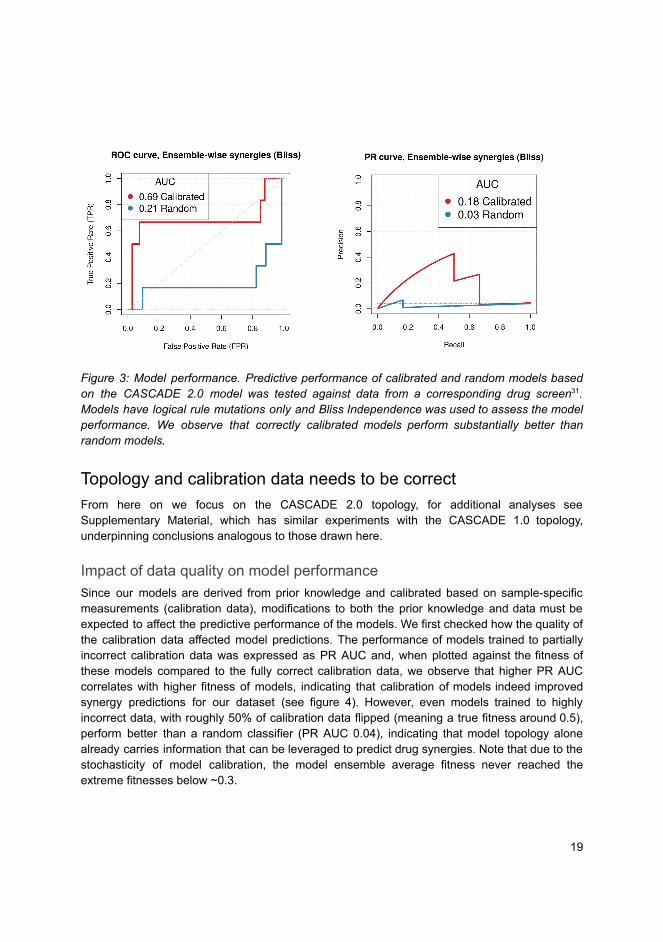
Figure 3: Model performance. Predictive performance of calibrated and random models basedon the CASCADE 2.0 model was tested against data from a corresponding drug screen31.Models have logical rule mutations only and Bliss Independence was used to assess the modelperformance. We observe that correctly calibrated models perform substantially better thanrandom models.
Topology and calibration data needs to be correctFrom here on we focus on the CASCADE 2.0 topology, for additional analyses seeSupplementary Material, which has similar experiments with the CASCADE 1.0 topology,underpinning conclusions analogous to those drawn here.
Impact of data quality on model performanceSince our models are derived from prior knowledge and calibrated based on sample-specificmeasurements (calibration data), modifications to both the prior knowledge and data must beexpected to affect the predictive performance of the models. We first checked how the quality ofthe calibration data affected model predictions. The performance of models trained to partiallyincorrect calibration data was expressed as PR AUC and, when plotted against the fitness ofthese models compared to the fully correct calibration data, we observe that higher PR AUCcorrelates with higher fitness of models, indicating that calibration of models indeed improvedsynergy predictions for our dataset (see figure 4). However, even models trained to highlyincorrect data, with roughly 50% of calibration data flipped (meaning a true fitness around 0.5),perform better than a random classifier (PR AUC 0.04), indicating that model topology alonealready carries information that can be leveraged to predict drug synergies. Note that due to thestochasticity of model calibration, the model ensemble average fitness never reached theextreme fitnesses below ~0.3.
19
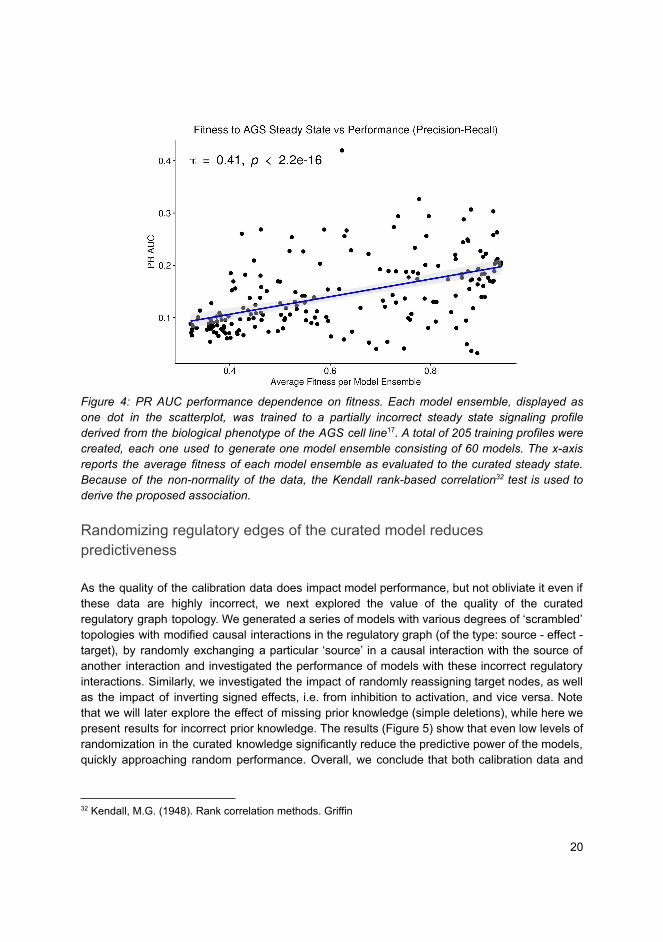
Figure 4: PR AUC performance dependence on fitness. Each model ensemble, displayed asone dot in the scatterplot, was trained to a partially incorrect steady state signaling profilederived from the biological phenotype of the AGS cell line17. A total of 205 training profiles werecreated, each one used to generate one model ensemble consisting of 60 models. The x-axisreports the average fitness of each model ensemble as evaluated to the curated steady state.Because of the non-normality of the data, the Kendall rank-based correlation32 test is used toderive the proposed association.
Randomizing regulatory edges of the curated model reducespredictiveness
As the quality of the calibration data does impact model performance, but not obliviate it even ifthese data are highly incorrect, we next explored the value of the quality of the curatedregulatory graph topology. We generated a series of models with various degrees of ‘scrambled’topologies with modified causal interactions in the regulatory graph (of the type: source - effect -target), by randomly exchanging a particular ‘source’ in a causal interaction with the source ofanother interaction and investigated the performance of models with these incorrect regulatoryinteractions. Similarly, we investigated the impact of randomly reassigning target nodes, as wellas the impact of inverting signed effects, i.e. from inhibition to activation, and vice versa. Notethat we will later explore the effect of missing prior knowledge (simple deletions), while here wepresent results for incorrect prior knowledge. The results (Figure 5) show that even low levels ofrandomization in the curated knowledge significantly reduce the predictive power of the models,quickly approaching random performance. Overall, we conclude that both calibration data and
32 Kendall, M.G. (1948). Rank correlation methods. Griffin
20
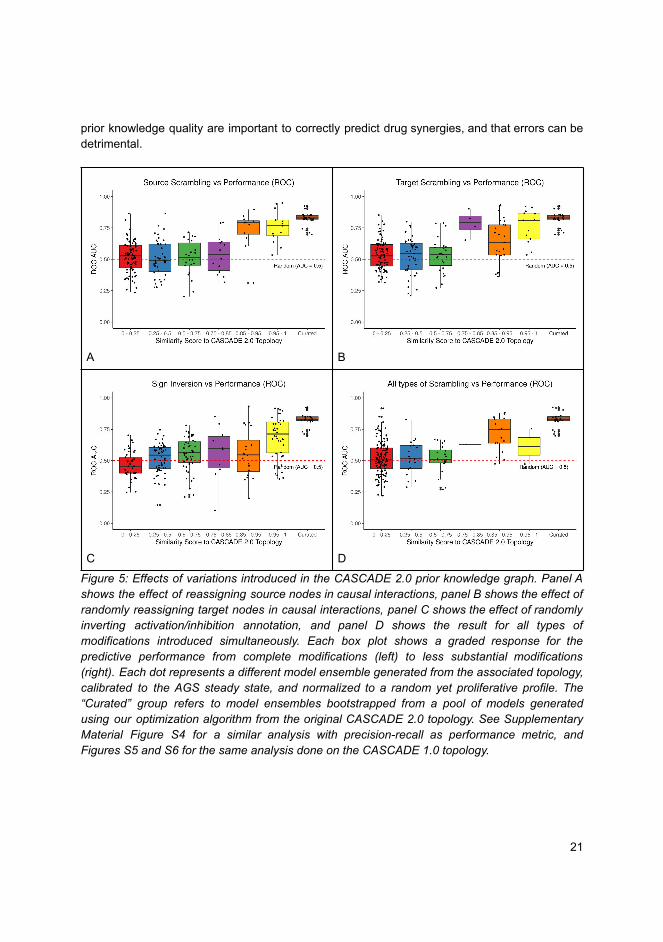
prior knowledge quality are important to correctly predict drug synergies, and that errors can bedetrimental.
A B
C D
Figure 5: Effects of variations introduced in the CASCADE 2.0 prior knowledge graph. Panel Ashows the effect of reassigning source nodes in causal interactions, panel B shows the effect ofrandomly reassigning target nodes in causal interactions, panel C shows the effect of randomlyinverting activation/inhibition annotation, and panel D shows the result for all types ofmodifications introduced simultaneously. Each box plot shows a graded response for thepredictive performance from complete modifications (left) to less substantial modifications(right). Each dot represents a different model ensemble generated from the associated topology,calibrated to the AGS steady state, and normalized to a random yet proliferative profile. The“Curated” group refers to model ensembles bootstrapped from a pool of models generatedusing our optimization algorithm from the original CASCADE 2.0 topology. See SupplementaryMaterial Figure S4 for a similar analysis with precision-recall as performance metric, andFigures S5 and S6 for the same analysis done on the CASCADE 1.0 topology.
21

Model ensemble heterogeneity and mechanistic insightTo appreciate the heterogeneity amongst models in model ensembles obtained through theparameter optimization, we studied both attractor and parameterization heterogeneity againstmodel fitness, in subsets of these ensembles selected for specific features (modelsub-ensembles). In the heatmap grouped by K-means clustering (Figure 6), calibrated modelsto a relatively large extent obey the calibration data, with states of steady state nodes mostlyidentical to the data to which they were trained (the subset of nodes (24 of 144) that werespecified in the calibration data). Model stable state vectors (rows in Figure 6) have notableareas of homogeneity, as judged by large stretches of nodes (indicated on the X-axis) that areeither all activated (green) or inhibited (red) in all models, but in other areas (e.g. theupper-middle panel of the heatmap) the heterogeneity and discrepancies with calibration data isquite substantial. This heterogeneity was much more widespread in the parameterization space.For some nodes there is high correlation between their parameterization (link operatorAND-NOT vs OR-NOT) and stable state (Inactive or Active, respectively), but for many thecorrelation is surprisingly low (see Agreement panel in Figure 6). These observations indicatethat a) a limited set of training nodes was sufficient to provide homogeneity in parts of theattractor space, and b) large heterogeneity in the parameterization space still can be compliantwith homogeneity in the attractor space (see in particular the large green (active) area of thestable-state heatmap). In other words: there are many logical rule configurations that yieldmodels properly representing biological observations compliant with calibration data. Thisunderpins the decision to use model ensembles rather than single models, since theseensembles cover a larger set of parameterizations (behavior) that are all compliant with theinput data.
The analysis of node states and parameterization allows us to investigate mechanismsunderlying observed behavior and to look for biological explanations for some of theobservations. As shown in Figure 6, indicated by panel ‘COSMIC’, the models allow theprediction of activity of several proteins implicated in cancer. Figure 7 shows the analysis of theiractivity state, and it appears that proteins from genes annotated as oncogenes in COSMIC tendto be active, while proteins from genes annotated as tumor suppressor genes (TSG) tend to beinactive in overall steady states. This is biologically plausible and attests to the capability of ourmechanistic model to generate hypotheses about the underlying molecular biology.
The training of the models to biomarker data never results in the absolute maximum fitness (1),and the stable state analysis (Figure 6) shows that three data points are most often violated:JNK signaling (JNK_f), ERK signaling (ERK_f) and p38 signaling (MAPK14), all member of theMAPK pathway (see Figure 6, stable state panel, black rectangles). These network nodes areall clustered in the highly heterogeneous section in the steady state heatmap. In the manualcuration of the CASCADE 1.0 topology17 it was noted that reports on the activity of ERK in AGScells varied frequently, with only slightly more than half of the publications reporting ERK to beactive. We found that the predictive performance of model versions with ERK being active wassignificantly higher than the sub-ensemble where ERK is inactive (see Figure 8), suggesting thatfrom a functional point of view ERK should be considered active in AGS cells.
22
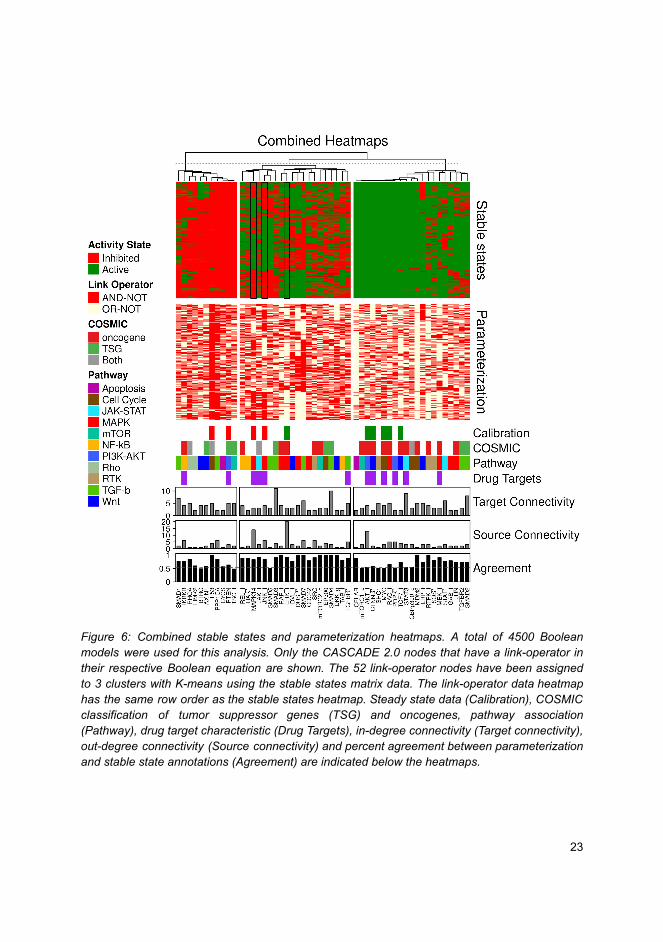
Figure 6: Combined stable states and parameterization heatmaps. A total of 4500 Booleanmodels were used for this analysis. Only the CASCADE 2.0 nodes that have a link-operator intheir respective Boolean equation are shown. The 52 link-operator nodes have been assignedto 3 clusters with K-means using the stable states matrix data. The link-operator data heatmaphas the same row order as the stable states heatmap. Steady state data (Calibration), COSMICclassification of tumor suppressor genes (TSG) and oncogenes, pathway association(Pathway), drug target characteristic (Drug Targets), in-degree connectivity (Target connectivity),out-degree connectivity (Source connectivity) and percent agreement between parameterizationand stable state annotations (Agreement) are indicated below the heatmaps.
23
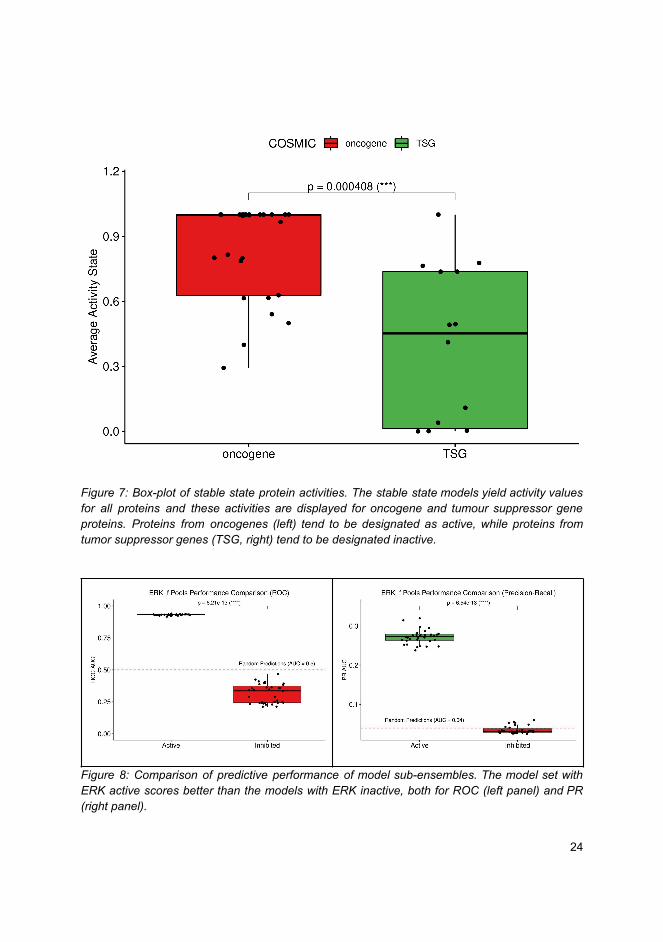
Figure 7: Box-plot of stable state protein activities. The stable state models yield activity valuesfor all proteins and these activities are displayed for oncogene and tumour suppressor geneproteins. Proteins from oncogenes (left) tend to be designated as active, while proteins fromtumor suppressor genes (TSG, right) tend to be designated inactive.
Figure 8: Comparison of predictive performance of model sub-ensembles. The model set withERK active scores better than the models with ERK inactive, both for ROC (left panel) and PR(right panel).
24
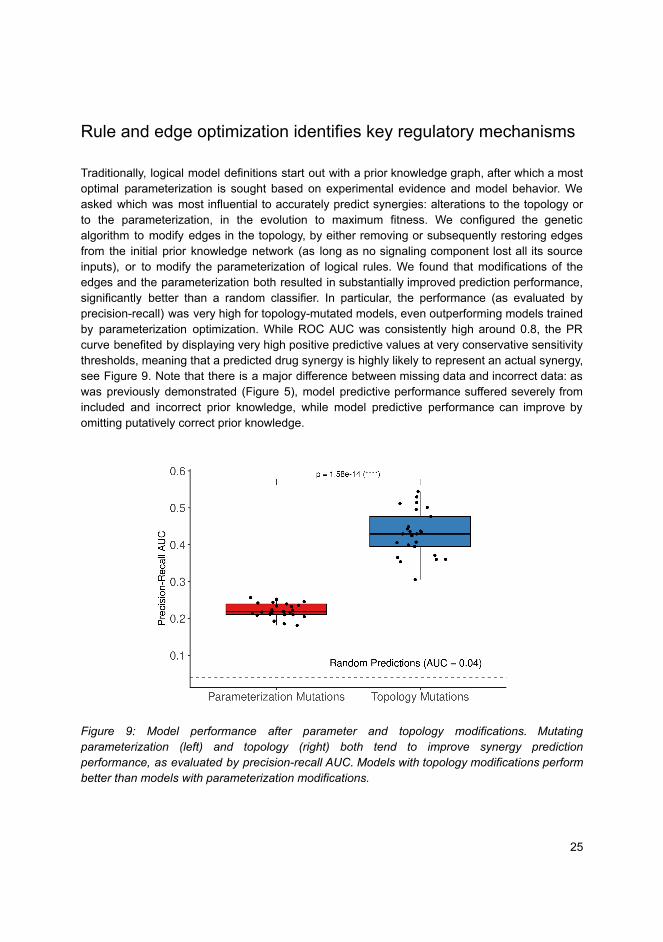
Rule and edge optimization identifies key regulatory mechanisms
Traditionally, logical model definitions start out with a prior knowledge graph, after which a mostoptimal parameterization is sought based on experimental evidence and model behavior. Weasked which was most influential to accurately predict synergies: alterations to the topology orto the parameterization, in the evolution to maximum fitness. We configured the geneticalgorithm to modify edges in the topology, by either removing or subsequently restoring edgesfrom the initial prior knowledge network (as long as no signaling component lost all its sourceinputs), or to modify the parameterization of logical rules. We found that modifications of theedges and the parameterization both resulted in substantially improved prediction performance,significantly better than a random classifier. In particular, the performance (as evaluated byprecision-recall) was very high for topology-mutated models, even outperforming models trainedby parameterization optimization. While ROC AUC was consistently high around 0.8, the PRcurve benefited by displaying very high positive predictive values at very conservative sensitivitythresholds, meaning that a predicted drug synergy is highly likely to represent an actual synergy,see Figure 9. Note that there is a major difference between missing data and incorrect data: aswas previously demonstrated (Figure 5), model predictive performance suffered severely fromincluded and incorrect prior knowledge, while model predictive performance can improve byomitting putatively correct prior knowledge.
Figure 9: Model performance after parameter and topology modifications. Mutatingparameterization (left) and topology (right) both tend to improve synergy predictionperformance, as evaluated by precision-recall AUC. Models with topology modifications performbetter than models with parameterization modifications.
25
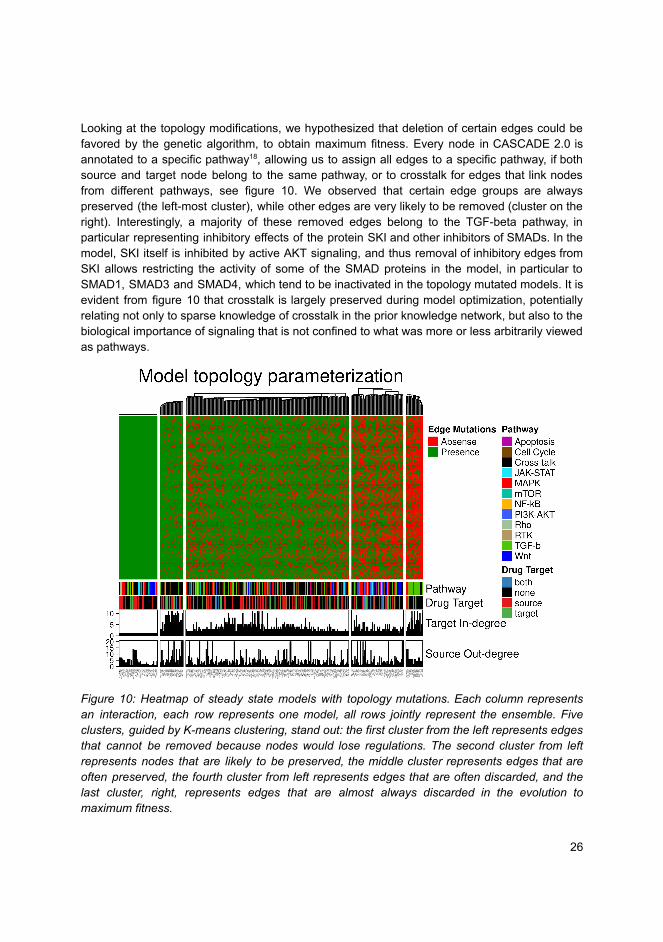
Looking at the topology modifications, we hypothesized that deletion of certain edges could befavored by the genetic algorithm, to obtain maximum fitness. Every node in CASCADE 2.0 isannotated to a specific pathway18, allowing us to assign all edges to a specific pathway, if bothsource and target node belong to the same pathway, or to crosstalk for edges that link nodesfrom different pathways, see figure 10. We observed that certain edge groups are alwayspreserved (the left-most cluster), while other edges are very likely to be removed (cluster on theright). Interestingly, a majority of these removed edges belong to the TGF-beta pathway, inparticular representing inhibitory effects of the protein SKI and other inhibitors of SMADs. In themodel, SKI itself is inhibited by active AKT signaling, and thus removal of inhibitory edges fromSKI allows restricting the activity of some of the SMAD proteins in the model, in particular toSMAD1, SMAD3 and SMAD4, which tend to be inactivated in the topology mutated models. It isevident from figure 10 that crosstalk is largely preserved during model optimization, potentiallyrelating not only to sparse knowledge of crosstalk in the prior knowledge network, but also to thebiological importance of signaling that is not confined to what was more or less arbitrarily viewedas pathways.
Figure 10: Heatmap of steady state models with topology mutations. Each column representsan interaction, each row represents one model, all rows jointly represent the ensemble. Fiveclusters, guided by K-means clustering, stand out: the first cluster from the left represents edgesthat cannot be removed because nodes would lose regulations. The second cluster from leftrepresents nodes that are likely to be preserved, the middle cluster represents edges that areoften preserved, the fourth cluster from left represents edges that are often discarded, and thelast cluster, right, represents edges that are almost always discarded in the evolution tomaximum fitness.
26
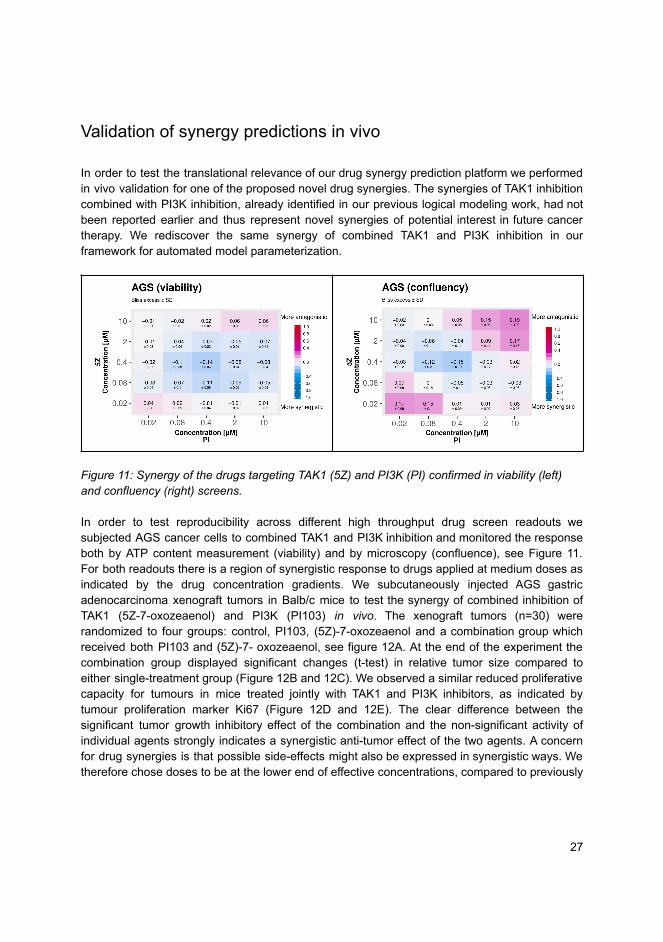
Validation of synergy predictions in vivo
In order to test the translational relevance of our drug synergy prediction platform we performedin vivo validation for one of the proposed novel drug synergies. The synergies of TAK1 inhibitioncombined with PI3K inhibition, already identified in our previous logical modeling work, had notbeen reported earlier and thus represent novel synergies of potential interest in future cancertherapy. We rediscover the same synergy of combined TAK1 and PI3K inhibition in ourframework for automated model parameterization.
Figure 11: Synergy of the drugs targeting TAK1 (5Z) and PI3K (PI) confirmed in viability (left)and confluency (right) screens.
In order to test reproducibility across different high throughput drug screen readouts wesubjected AGS cancer cells to combined TAK1 and PI3K inhibition and monitored the responseboth by ATP content measurement (viability) and by microscopy (confluence), see Figure 11.For both readouts there is a region of synergistic response to drugs applied at medium doses asindicated by the drug concentration gradients. We subcutaneously injected AGS gastricadenocarcinoma xenograft tumors in Balb/c mice to test the synergy of combined inhibition ofTAK1 (5Z-7-oxozeaenol) and PI3K (PI103) in vivo. The xenograft tumors (n=30) wererandomized to four groups: control, PI103, (5Z)-7-oxozeaenol and a combination group whichreceived both PI103 and (5Z)-7- oxozeaenol, see figure 12A. At the end of the experiment thecombination group displayed significant changes (t-test) in relative tumor size compared toeither single-treatment group (Figure 12B and 12C). We observed a similar reduced proliferativecapacity for tumours in mice treated jointly with TAK1 and PI3K inhibitors, as indicated bytumour proliferation marker Ki67 (Figure 12D and 12E). The clear difference between thesignificant tumor growth inhibitory effect of the combination and the non-significant activity ofindividual agents strongly indicates a synergistic anti-tumor effect of the two agents. A concernfor drug synergies is that possible side-effects might also be expressed in synergistic ways. Wetherefore chose doses to be at the lower end of effective concentrations, compared to previously
27
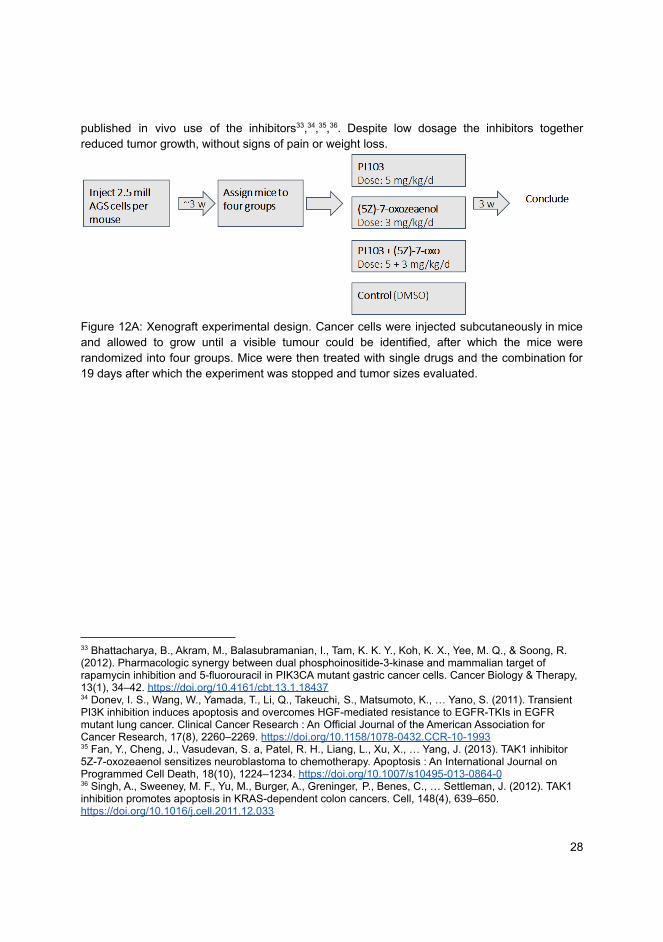
published in vivo use of the inhibitors33,34,35,36. Despite low dosage the inhibitors togetherreduced tumor growth, without signs of pain or weight loss.
Figure 12A: Xenograft experimental design. Cancer cells were injected subcutaneously in miceand allowed to grow until a visible tumour could be identified, after which the mice wererandomized into four groups. Mice were then treated with single drugs and the combination for19 days after which the experiment was stopped and tumor sizes evaluated.
36 Singh, A., Sweeney, M. F., Yu, M., Burger, A., Greninger, P., Benes, C., … Settleman, J. (2012). TAK1inhibition promotes apoptosis in KRAS-dependent colon cancers. Cell, 148(4), 639–650.https://doi.org/10.1016/j.cell.2011.12.033
35 Fan, Y., Cheng, J., Vasudevan, S. a, Patel, R. H., Liang, L., Xu, X., … Yang, J. (2013). TAK1 inhibitor5Z-7-oxozeaenol sensitizes neuroblastoma to chemotherapy. Apoptosis : An International Journal onProgrammed Cell Death, 18(10), 1224–1234. https://doi.org/10.1007/s10495-013-0864-0
34 Donev, I. S., Wang, W., Yamada, T., Li, Q., Takeuchi, S., Matsumoto, K., … Yano, S. (2011). TransientPI3K inhibition induces apoptosis and overcomes HGF-mediated resistance to EGFR-TKIs in EGFRmutant lung cancer. Clinical Cancer Research : An Official Journal of the American Association forCancer Research, 17(8), 2260–2269. https://doi.org/10.1158/1078-0432.CCR-10-1993
33 Bhattacharya, B., Akram, M., Balasubramanian, I., Tam, K. K. Y., Koh, K. X., Yee, M. Q., & Soong, R.(2012). Pharmacologic synergy between dual phosphoinositide-3-kinase and mammalian target ofrapamycin inhibition and 5-fluorouracil in PIK3CA mutant gastric cancer cells. Cancer Biology & Therapy,13(1), 34–42. https://doi.org/10.4161/cbt.13.1.18437
28
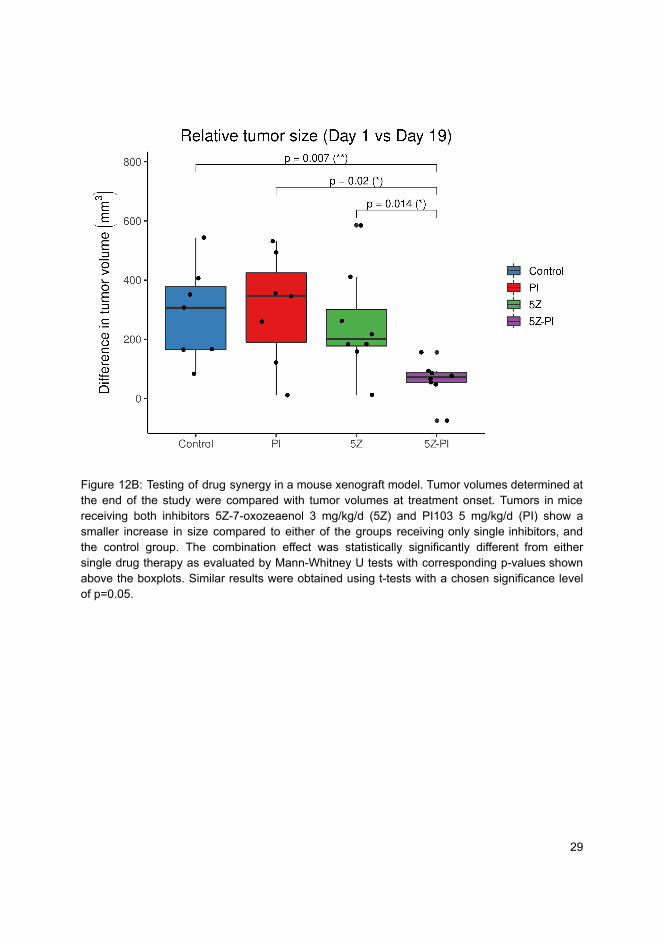
Figure 12B: Testing of drug synergy in a mouse xenograft model. Tumor volumes determined atthe end of the study were compared with tumor volumes at treatment onset. Tumors in micereceiving both inhibitors 5Z-7-oxozeaenol 3 mg/kg/d (5Z) and PI103 5 mg/kg/d (PI) show asmaller increase in size compared to either of the groups receiving only single inhibitors, andthe control group. The combination effect was statistically significantly different from eithersingle drug therapy as evaluated by Mann-Whitney U tests with corresponding p-values shownabove the boxplots. Similar results were obtained using t-tests with a chosen significance levelof p=0.05.
29
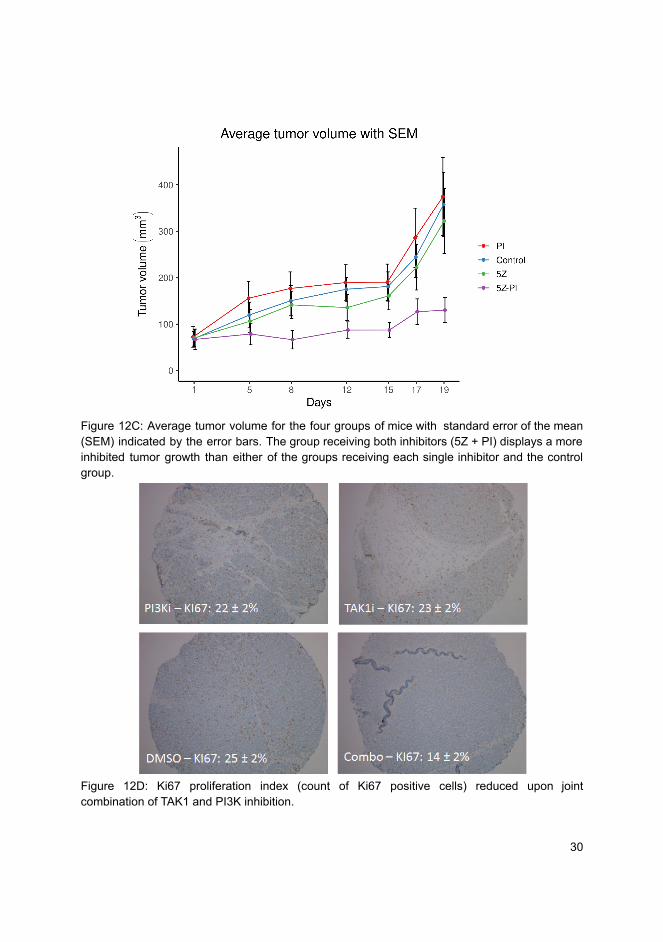
Figure 12C: Average tumor volume for the four groups of mice with standard error of the mean(SEM) indicated by the error bars. The group receiving both inhibitors (5Z + PI) displays a moreinhibited tumor growth than either of the groups receiving each single inhibitor and the controlgroup.
Figure 12D: Ki67 proliferation index (count of Ki67 positive cells) reduced upon jointcombination of TAK1 and PI3K inhibition.
30
DiscussionOur results show that a curated prior knowledge network with an initial set of logical rules canbe automatically parameterized by a genetic algorithm, using a fitness score reflecting how wellthe global stable state of a model matches the experimentally determined local states ofsignaling components of a cell line in its native growing state. We showed that the predictiveperformance from an automatically parameterized ensemble of models was on par with ouroriginal, curated CASCADE 1.0 model. We next used our parameterization software to calibratethe larger CASCADE 2.0 network topology. With larger topologies, benefits of automationbecome more apparent, and can be used to enable simulation for larger numbers of drugs andnumbers of cell lines.
Finding drug synergies among the vast set of possible combinations of drugs calls for newapproaches. To rationally reduce the prohibitively large experimental search space, we foundthat our approach can be highly useful to identify sets of drugs that are unlikely to displaysynergy and that should not be prioritized for testing. Even tackling the combinatorial complexityfor standardized cancer models is already challenging, as exemplified by the AZS-DREAMChallenge37, where pairwise combinations of 118 drugs (6903 possible drug-drug combinations)are tested against a panel of 85 cell lines. If all combinations are screened in 6x6 matrices thiscorresponds to over 200.000 384-well plates for four technical replicates, clearly indicating thata trial-and-error approach is not economic for drug synergy discovery. Whereas mostapproaches for drug synergy predictions rely on perturbation data for training aclassifier38,39,40,41, our approach works well with calibration data based only on data from anunperturbed system, which greatly reduces the cost of data acquisition and opens possibilitiesfor clinical applications.
Assessing the performance of drug synergy predictions is met with several challenges. First,targeted drugs, as those employed here (‘small molecule’ inhibitors), can affect a number ofother targets in addition to their intended target, known as ‘off-target’ effects42. Since our
42 Klaeger, S., Heinzlmeir, S., Wilhelm, M., Polzer, H., Vick, B., Koenig, P.-A., … Kuster, B. (2017). Thetarget landscape of clinical kinase drugs. Science (New York, N.Y.), 358(6367), eaan4368.https://doi.org/10.1126/science.aan4368
41 Fröhlich, F., Kessler, T., Weindl, D., Shadrin, A., Schmiester, L., Hache, H., … Hasenauer, J. (2018).Efficient Parameter Estimation Enables the Prediction of Drug Response Using a MechanisticPan-Cancer Pathway Model. Cell Systems, 7, 1–13. http://doi.org/10.1016/j.cels.2018.10.013
40 Ianevski, A., Giri, A. K., Gautam, P., Kononov, A., Potdar, S., Saarela, J., … Aittokallio, T. (2019).Prediction of drug combination effects with a minimal set of experiments. Nature Machine Intelligence,1(12), 568–577. http://doi.org/10.1038/s42256-019-0122-4
39 Yang, J., Tang, H., Li, Y., Zhong, R., Wang, T., Wong, S. T. C., … Xie, Y. (2015). DIGRE: Drug-inducedgenomic residual effect model for successful prediction of multidrug effects. CPT: Pharmacometrics andSystems Pharmacology, 4(2), 91–97. http://doi.org/10.1002/psp4.1
38 Preuer, K., Lewis, R. P. I., Hochreiter, S., Bender, A., Bulusu, K. C., & Klambauer, G. (2017).DeepSynergy: Predicting anti-cancer drug synergy with Deep Learning. Bioinformatics (Oxford, England),(December), 1–9. http://doi.org/10.1093/bioinformatics/btx806
37 Menden, M. P., Wang, D., Guan, Y., Mason, M., Bulusu, K. C., Yu, T., … Saez-rodriguez, J. (2017).Community assessment of cancer drug combination screens identifies strategies for synergy prediction.http://doi.org/10.1101/200451
31
simulation is based on canonical drug targets annotated for each drug, any information missingabout off-target effects must be expected to impact simulations. In addition, drug synergy is anelusive concept itself, with different mathematical reference models producing different synergyscores43. Finally, high throughput drug screens, as employed here, typically reports drugresponses based on measured residual ATP content after drug exposure, which is known not tocapture all growth-reducing drug responses44,45,46. Despite these limitations, which must beexpected to reduce the performance of any drug synergy prediction approach, our logicalsimulation-based in-silico pre-selection approach performs immensely better than a blindedscreen that would assay the same numbers of candidates: at a sensitivity of 50%, roughly35-40% of a pre-selected set of predicted synergies will be observed in follow up drug synergyexperiments in drug screen where only 4% of drug combinations acted synergistically overall.
Our choice of a logical framework for computational simulations comes both with some benefitsand limitations. Logic equations are very quick to evaluate, with high simulation speed enablingextensive simulations even on regular desktop computers. However, logic equations asemployed here only allow two activity states for model components: active and inactive.Moreover, only two interaction strengths between components are allowed: full interaction or nointeraction. These limitations, however, still to a large extent meet the demands and possibilitiesoffered by experiments with present day laboratory techniques. Data from these experimentsoften lack finer-grained observations that would be needed for continuous modeling approachesand therefore logical modeling represents a valid compromise between molecular data richnessand computation speed. Our implementation of logical model simulations only computes stablestates, thereby discarding any potential complex attractor of models. This choice was based oncomputational efficiency, as computation of complex attractor in addition to stable states wouldseverely tax our simulations. One possible avenue for future research will be to account for alsocomplex attractors, either by approximations as offered by e.g. trap space analysis, or by a fullcharacterization of model behaviour.
We find that our approach is somewhat sensitive to errors in the calibration data, and even moresensitive to errors in the prior knowledge, indicating that curation quality is paramount to ourmodeling approach. This demands for adequate causal statement curation protocols and
46 Folkesson, E., Niederdorfer, B., Nakstad, V. T., Thommesen, L., Klinkenberg, G., Lægreid, A., & Flobak,Å. (2020). High-throughput screening reveals higher synergistic effect of MEK inhibitor combinations incolon cancer spheroids. Scientific Reports, 10(1), 11574. https://doi.org/10.1038/s41598-020-68441-0
45 Gautam, P., Karhinen, L., Szwajda, A., Jha, S. K., Yadav, B., Aittokallio, T., & Wennerberg, K. (2016).Identification of selective cytotoxic and synthetic lethal drug responses in triple negative breast cancercells. Molecular Cancer, 15(1), 1–16. https://doi.org/10.1186/s12943-016-0517-3
44 Bae, S. Y., Guan, N., Yan, R., Warner, K., Taylor, S. D., & Meyer, A. S. (2020). Measurement andmodels accounting for cell death capture hidden variation in compound response. Cell Death andDisease, 11(4). https://doi.org/10.1038/s41419-020-2462-8
43 Vlot, A. H. C., Aniceto, N., Menden, M. P., Ulrich-Merzenich, G., & Bender, A. (2019). Applying drugsynergy metrics to oncology combination screening data: agreements, disagreements and pitfalls. DrugDiscovery Today, 00(00). https://doi.org/10.1016/j.drudis.2019.09.002
32
standards that feed into high quality general and cancer signaling databases, a demand that ismaterializing47,48,49,50,51.
Interestingly, we found that deleting a small fraction of the regulatory links from the priorknowledge network can be very powerful in optimizing models for drug synergy predictions,whereas randomly rearranging regulatory links is very detrimental to model performance.Logical model construction can be performed by curating data resources or the literature, or byrelying on high quality curated databases like Signor, SignaLink or IntAct. If quality of theseresources, or the ad hoc curation of literature, would not be of high standard, this wouldsignificantly limit the performance of the resulting model. On the other hand, calling a priorknowledge network complete is essentially a judgement call, as all models are limited. Thisdemonstrates that, while lacking in completeness, high quality curation can produce models thatcan predict drug synergies. Furthermore, whereas the inclusion of a regulatory link ideally needsevidence from observations about the functional relevance of such a link in the cell that ismodeled, our observations about ERK activity highlight the variability of experimental dataconcerning such observations. It is therefore not unreasonable to accept that an optimizationalgorithm can choose to dismiss regulatory links for the benefit of improved model performance.The increasing availability of high quality curated molecular causal interaction data opens aperspective to fully automated model building, where algorithmic topology optimization can finetune a model to perform adequately, for any target node requirements and cell type for whichbaseline biomarker data is available. A welcome feature of automatically parameterized logicalmodels is their innate ability to suggest mechanisms underpinning a particular observation.Such model-driven hypotheses can lay foundations for targeted follow-up experiments thatprovide observations for directed model revisions, resulting in a model with higher validity.
51 Cristobal Monraz Gomez, L., Kondratova, M., Ravel, J. M., Barillot, E., Zinovyev, A., & Kuperstein, I.(2019). Application of Atlas of Cancer Signalling Network in preclinical studies. Briefings in Bioinformatics,20(2), 701–716. https://doi.org/10.1093/bib/bby031
50 Touré, V., Zobolas, J., Kuiper, M., & Vercruysse, S. (2021). CausalBuilder: bringing the MI2CASTcausal interaction annotation standard to the curator. Database : The Journal of Biological Databases andCuration, 2021, 1–6. https://doi.org/10.1093/database/baaa107
49 Touré, V., Vercruysse, S., Acencio, M. L., Lovering, R. C., Orchard, S., Bradley, G., … Kuiper, M.(2020). The Minimum Information about a Molecular Interaction Causal Statement (MI2CAST).Bioinformatics (Oxford, England), 1–8. https://doi.org/10.1093/bioinformatics/btaa622
48 Türei, D., Korcsmáros, T., & Saez-Rodriguez, J. (2016). OmniPath: guidelines and gateway forliterature-curated signaling pathway resources. Nature Methods, 13(12), 966–967.http://doi.org/10.1038/nmeth.4077
47 Licata, L., Lo Surdo, P., Iannuccelli, M., Palma, A., Micarelli, E., Perfetto, L., … Cesareni, G. (2020).SIGNOR 2.0, the SIGnaling Network Open Resource 2.0: 2019 update. Nucleic Acids Research, 48(D1),D504–D510. http://doi.org/10.1093/nar/gkz949
33
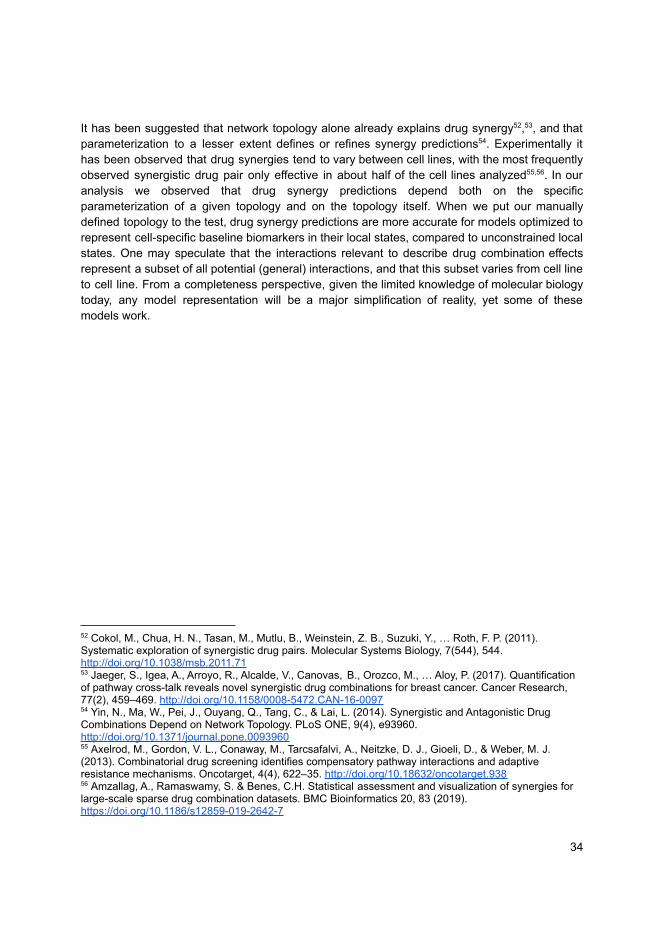
It has been suggested that network topology alone already explains drug synergy52,53, and thatparameterization to a lesser extent defines or refines synergy predictions54. Experimentally ithas been observed that drug synergies tend to vary between cell lines, with the most frequentlyobserved synergistic drug pair only effective in about half of the cell lines analyzed55,56. In ouranalysis we observed that drug synergy predictions depend both on the specificparameterization of a given topology and on the topology itself. When we put our manuallydefined topology to the test, drug synergy predictions are more accurate for models optimized torepresent cell-specific baseline biomarkers in their local states, compared to unconstrained localstates. One may speculate that the interactions relevant to describe drug combination effectsrepresent a subset of all potential (general) interactions, and that this subset varies from cell lineto cell line. From a completeness perspective, given the limited knowledge of molecular biologytoday, any model representation will be a major simplification of reality, yet some of thesemodels work.
56 Amzallag, A., Ramaswamy, S. & Benes, C.H. Statistical assessment and visualization of synergies forlarge-scale sparse drug combination datasets. BMC Bioinformatics 20, 83 (2019).https://doi.org/10.1186/s12859-019-2642-7
55 Axelrod, M., Gordon, V. L., Conaway, M., Tarcsafalvi, A., Neitzke, D. J., Gioeli, D., & Weber, M. J.(2013). Combinatorial drug screening identifies compensatory pathway interactions and adaptiveresistance mechanisms. Oncotarget, 4(4), 622–35. http://doi.org/10.18632/oncotarget.938
54 Yin, N., Ma, W., Pei, J., Ouyang, Q., Tang, C., & Lai, L. (2014). Synergistic and Antagonistic DrugCombinations Depend on Network Topology. PLoS ONE, 9(4), e93960.http://doi.org/10.1371/journal.pone.0093960
53 Jaeger, S., Igea, A., Arroyo, R., Alcalde, V., Canovas, B., Orozco, M., … Aloy, P. (2017). Quantificationof pathway cross-talk reveals novel synergistic drug combinations for breast cancer. Cancer Research,77(2), 459–469. http://doi.org/10.1158/0008-5472.CAN-16-0097
52 Cokol, M., Chua, H. N., Tasan, M., Mutlu, B., Weinstein, Z. B., Suzuki, Y., … Roth, F. P. (2011).Systematic exploration of synergistic drug pairs. Molecular Systems Biology, 7(544), 544.http://doi.org/10.1038/msb.2011.71
34
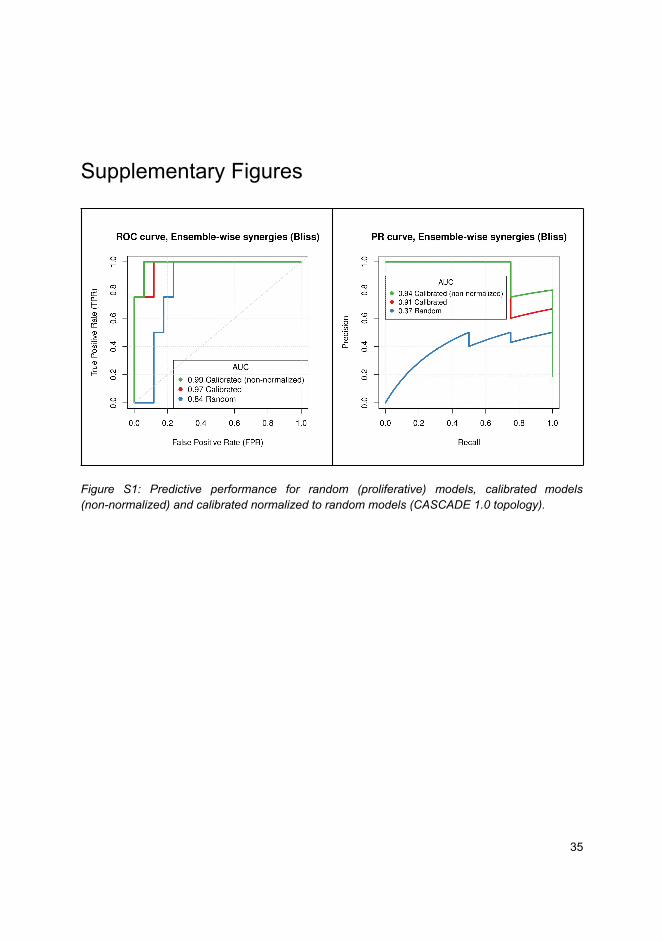
Supplementary Figures
Figure S1: Predictive performance for random (proliferative) models, calibrated models(non-normalized) and calibrated normalized to random models (CASCADE 1.0 topology).
35
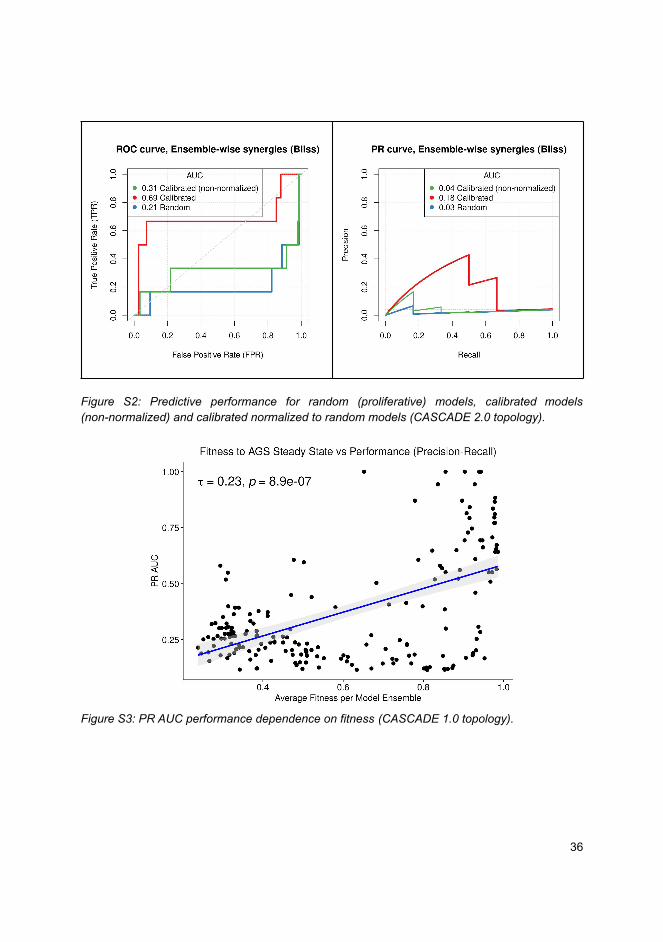
Figure S2: Predictive performance for random (proliferative) models, calibrated models(non-normalized) and calibrated normalized to random models (CASCADE 2.0 topology).
Figure S3: PR AUC performance dependence on fitness (CASCADE 1.0 topology).
36
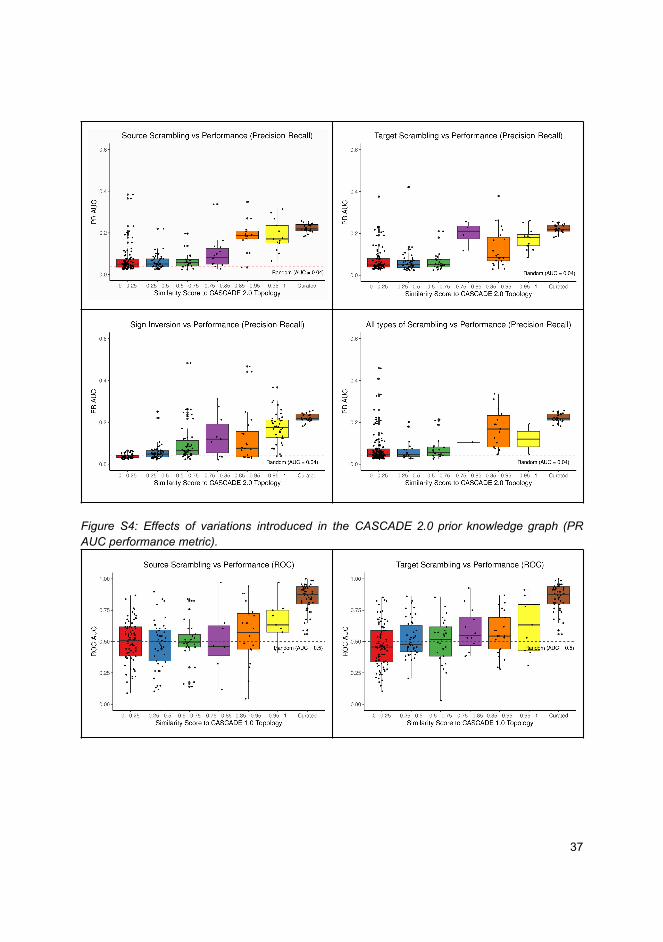
Figure S4: Effects of variations introduced in the CASCADE 2.0 prior knowledge graph (PRAUC performance metric).
37
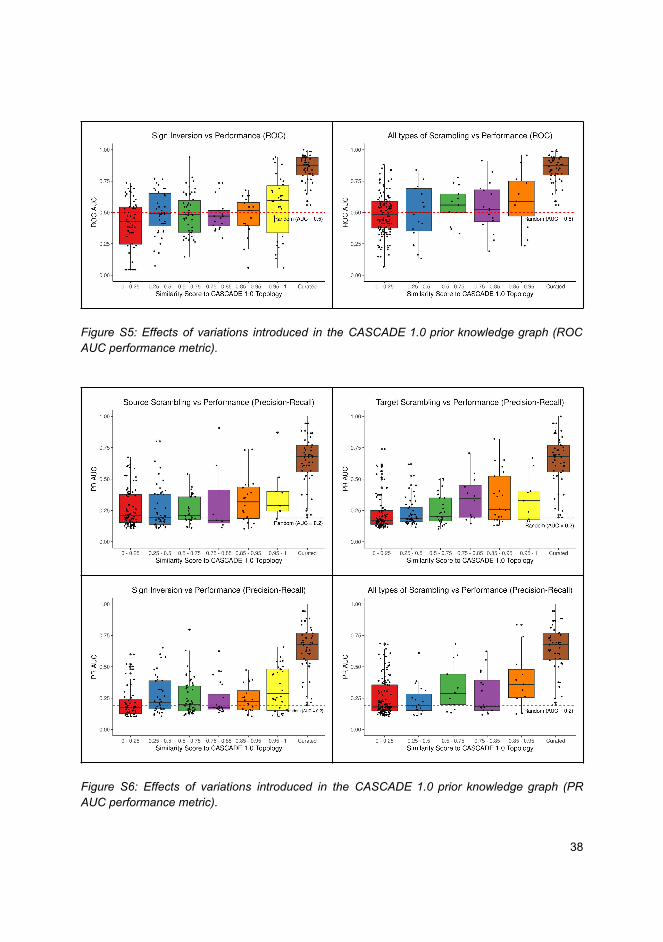
Figure S5: Effects of variations introduced in the CASCADE 1.0 prior knowledge graph (ROCAUC performance metric).
Figure S6: Effects of variations introduced in the CASCADE 1.0 prior knowledge graph (PRAUC performance metric).
38

PAPER 4
102

emba: R package for analysis and visualization ofbiomarkers in boolean model ensemblesJohn Zobolas1, 2, Martin Kuiper1, and Åsmund Flobak2, 3
1 Department of Biology, Norwegian University of Science and Technology (NTNU), Trondheim,Norway 2 Department of Clinical and Molecular Medicine, Norwegian University of Science andTechnology (NTNU), Trondheim, Norway 3 The Cancer Clinic, St. Olav’s Hospital, Trondheim,Norway
DOI: 10.21105/joss.02583
Software• Review• Repository• Archive
Editor: Mikkel Meyer Andersen
Reviewers:• @neerajdhanraj• @edifice1989
Submitted: 28 July 2020Published: 26 September 2020
LicenseAuthors of papers retaincopyright and release the workunder a Creative CommonsAttribution 4.0 InternationalLicense (CC BY 4.0).
Introduction
Computational modeling of cellular systems has been one of the most powerful tools used tobuild interpretable knowledge of biological processes and help identify molecular mechanismsthat drive diseases such as cancer (Aldridge, Burke, Lauffenburger, & Sorger, 2006). Inparticular, the use of logical modeling has proven to be a substantially useful approach, since itallows the easy construction, simulation and analysis of predictive models, capable of providinga qualitative and insightful view on the extremely complex landscape of biological systems(Abou-Jaoudé et al., 2016; Morris, Saez-Rodriguez, Sorger, & Lauffenburger, 2010; Wang,Saadatpour, & Albert, 2012). Such mechanistic models, with the systematic integrationof prior knowledge and experimental data, have been extensively used to better understandwhat drives deregulation of signal transduction, the outcome of which is the manifestation ofdiseases (Traynard, Tobalina, Eduati, Calzone, & Saez-Rodriguez, 2017). Furthermore, theirexplanatory power has been used to provide insights into a drug’s mode of action, investigatethe mechanisms of resistance to drugs (Eduati et al., 2017) and suggest new therapeuticcombination candidates, among others (Flobak et al., 2015).One of the major challenges in systems medicine, has been the identification of scientificallyvalidated, predictive biomarkers that correlate with patient response to given therapies. Theanalysis of biological predictive markers of pharmacologic response can not only further our un-derstanding of the systemic processes involved in diseases but can also help to classify patientsinto groups with similar responses to specific therapeutic interventions, advancing personal-ized medicine (Senft, Leiserson, Ruppin, & Ronai, 2017). In addition, the identification ofbiomarkers in tumor cells (e.g. mutations) has enabled the discovery of drug targets whichare utilized in combinatorial molecular-targeted therapies - a strategy which aims to treatspecific patient subgroups and has shown larger overall survival rates and reduced side-effectsthan monotherapy (Al-Lazikani, Banerji, & Workman, 2012). Despite the huge advancementstowards drug combination therapy, genetic heterogeneity, drug resistance and drug combina-tion synergy mechanisms still pose fundamental challenges to clinicians, modelers and labresearchers.To help bridge the model simulation results with the (clinical) laboratory observations, severaloptimization methods have been used, such as model calibration, parameter estimation andsensitivity analysis. These methods also allow us to determine which model parameters havethe biggest influence in the overall behaviour of the system (Aldridge et al., 2006). Forexample, in Fröhlich et al. (2018), a computational framework that allowed for the efficientparameterization and contextualization of a large-scale cancer signaling network, was used topredict combination treatment outcome from single drug data. This model was calibrated tofit and accurately describe specific cell-line experimental data, while enabling the identification
Zobolas et al., (2020). emba: R package for analysis and visualization of biomarkers in boolean model ensembles. Journal of Open SourceSoftware, 5(53), 2583. https://doi.org/10.21105/joss.02583
1
of biomarkers of drug sensitivity as well as molecular mechanisms that affect drug resistance.Furthermore, in Dorier et al. (2016), a network optimization approach which topologicallyparameterized boolean models according to a genetic algorithm was used, in order to bestmatch the experimentally observed behaviour. This method resulted in an ensemble of booleanmodels which can be used to simulate response under drug perturbations in order to assessthe underlying mechanisms and to generate new testable hypotheses. Such an aggregation ofbest-fit models (wisdom of the crowds) has been shown to be quite robust and effective formodel prediction performance (Marbach et al., 2012).
Statement of need
There is a plethora of software tools devoted to the qualitative modeling and analysis of biolog-ical networks. The Consortium for the development of Logical Models and Tools (CoLoMoTo)is a community effort which aims to standardize the representation of logical networks andprovide a common repository of methods and tools to analyze these networks (Naldi et al.,2015). Furthermore, to facilitate the access to several software logical modeling tools andenable reproducible computational workflows, the CoLoMoTo Interactive Notebook was intro-duced as a unified computational framework (Aurélien Naldi, Hernandez, Levy, et al., 2018).The incorporated tools are accessed via a common programming interface (though originallyimplemented in different programming languages e.g. Java, Python, C++ and R) and offera collection of features like accessing online model repositories (Helikar et al., 2012), modelediting (Aurélien Naldi, Hernandez, Abou-Jaoudé, et al., 2018), dynamical analysis (finding at-tractors, stochastic simulations, reachability properties, model-checking techniques) (Klarner,Streck, Siebert, & Sahinalp, 2016; Müssel, Hopfensitz, & Kestler, 2010; Aurélien Naldi, 2018;Paulevé, 2017; Stoll et al., 2017) and model parameterization/optimization to fit perturbationsignaling data (Gjerga et al., 2020; Terfve et al., 2012). Despite the diverse and multi-purposelogical modeling tools that exist, there is still a lack of data analysis-oriented software thatassists with the discovery of predictive biomarkers in ensembles of parameterized booleannetworks that have been subject to drug combination perturbations.The emba R package aims to fill that gap and provide a first implementation of such a novelsoftware. Initially, it was designed as a complementary software tool, to help the analysisof the parameterized boolean model ensembles which were produced by modules from theDrugLogics NTNU software pipeline (see respective documentation (Zobolas, 2020a)). Later,we generalized most of the functions in the package and modularized them to package-essential(that form the core of the emba package) and various general-purpose yet useful functions(that are now part of the dependency package usefun (Zobolas, 2020b)).
Summary
The main functionality of the emba R package is to find performance and synergy biomarkers.Performance biomarkers are nodes in the input boolean networks whose activity state and/ormodel parameterization affects the predictive performance of those models. The predictionperformance can be assessed via the number of true positive predictions or the Matthewscorrelation coefficient score which is more robust to class imbalances (Chicco & Jurman, 2020).On the other hand, synergy biomarkers are nodes which provide hints for the mechanismsbehind the complex process of synergy manifestation in drug combination datasets.For more information, see our “Get started guide” and the reference manual in the packagewebsite (Zobolas, 2020c). Several analyses using the emba R package are available in aseparate repository (Zobolas, 2020d). Future developments will include the implementationof a method for the identification of topology biomarkers, where we will be able to assess
Zobolas et al., (2020). emba: R package for analysis and visualization of biomarkers in boolean model ensembles. Journal of Open SourceSoftware, 5(53), 2583. https://doi.org/10.21105/joss.02583
2
which interactions in the network are important for the manifestation of synergies in specificcell-contexts.
Acknowledgements
This work was supported by ERACoSysMed grant COLOSYS (JZ, MK) and The NTNUStrategic Research Area NTNU Health (AF).
References
Abou-Jaoudé, W., Traynard, P., Monteiro, P. T., Saez-Rodriguez, J., Helikar, T., Thieffry, D.,& Chaouiya, C. (2016). Logical Modeling and Dynamical Analysis of Cellular Networks.Frontiers in genetics, 7, 94. doi:10.3389/fgene.2016.00094
Aldridge, B. B., Burke, J. M., Lauffenburger, D. A., & Sorger, P. K. (2006). Physicochemicalmodelling of cell signalling pathways. Nature Cell Biology, 8(11), 1195–1203. doi:10.1038/ncb1497
Al-Lazikani, B., Banerji, U., & Workman, P. (2012). Combinatorial drug therapy for cancerin the post-genomic era. Nature Biotechnology, 30(7), 679–692. doi:10.1038/nbt.2284
Chicco, D., & Jurman, G. (2020). The advantages of the Matthews correlation coefficient(MCC) over F1 score and accuracy in binary classification evaluation. BMC Genomics,21(1). doi:10.1186/s12864-019-6413-7
Dorier, J., Crespo, I., Niknejad, A., Liechti, R., Ebeling, M., & Xenarios, I. (2016). Booleanregulatory network reconstruction using literature based knowledge with a genetic algo-rithm optimization method. BMC Bioinformatics, 17(1). doi:10.1186/s12859-016-1287-z
Eduati, F., Doldàn-Martelli, V., Klinger, B., Cokelaer, T., Sieber, A., Kogera, F., Dorel, M.,et al. (2017). Drug Resistance Mechanisms in Colorectal Cancer Dissected with CellType-Specific Dynamic Logic Models. Cancer research, 77(12), 3364–3375. doi:10.1158/0008-5472.CAN-17-0078
Flobak, Å., Baudot, A., Remy, E., Thommesen, L., Thieffry, D., Kuiper, M., & Lægreid,A. (2015). Discovery of Drug Synergies in Gastric Cancer Cells Predicted by LogicalModeling. (I. Xenarios, Ed.)PLOS Computational Biology, 11(8), e1004426. doi:10.1371/journal.pcbi.1004426
Fröhlich, F., Kessler, T., Weindl, D., Shadrin, A., Schmiester, L., Hache, H., Muradyan, A.,et al. (2018). Efficient Parameter Estimation Enables the Prediction of Drug ResponseUsing a Mechanistic Pan-Cancer Pathway Model. Cell Systems, 7(6), 567–579.e6. doi:10.1016/J.CELS.2018.10.013
Gjerga, E., Trairatphisan, P., Gabor, A., Koch, H., Chevalier, C., Ceccarelli, F., Dugourd, A.,et al. (2020). Converting networks to predictive logic models from perturbation signallingdata with CellNOpt. Bioinformatics. doi:10.1093/bioinformatics/btaa561
Helikar, T., Kowal, B., McClenathan, S., Bruckner, M., Rowley, T., Madrahimov, A., Wicks,B., et al. (2012). The Cell Collective: Toward an open and collaborative approach tosystems biology. BMC Systems Biology, 6(1), 96. doi:10.1186/1752-0509-6-96
Klarner, H., Streck, A., Siebert, H., & Sahinalp, C. (2016). PyBoolNet: a python packagefor the generation, analysis and visualization of boolean networks. Bioinformatics, 33(5),btw682. doi:10.1093/bioinformatics/btw682
Zobolas et al., (2020). emba: R package for analysis and visualization of biomarkers in boolean model ensembles. Journal of Open SourceSoftware, 5(53), 2583. https://doi.org/10.21105/joss.02583
3
Marbach, D., Costello, J. C., Küffner, R., Vega, N. M., Prill, R. J., Camacho, D. M., Allison,K. R., et al. (2012). Wisdom of crowds for robust gene network inference. NatureMethods, 9(8), 796–804. doi:10.1038/nmeth.2016
Morris, M. K., Saez-Rodriguez, J., Sorger, P. K., & Lauffenburger, D. A. (2010). Logic-basedmodels for the analysis of cell signaling networks. Biochemistry, 49(15), 3216–3224.doi:10.1021/bi902202q
Müssel, C., Hopfensitz, M., & Kestler, H. A. (2010). BoolNet—an R package for generation,reconstruction and analysis of Boolean networks. Bioinformatics, 26(10), 1378–1380.doi:10.1093/bioinformatics/btq124
Naldi, A. (2018). BioLQM: A Java Toolkit for the Manipulation and Conversion of LogicalQualitative Models of Biological Networks. Frontiers in Physiology, 9, 1605. doi:10.3389/fphys.2018.01605
Naldi, A., Hernandez, C., Abou-Jaoudé, W., Monteiro, P. T., Chaouiya, C., & Thieffry, D.(2018). Logical Modeling and Analysis of Cellular Regulatory Networks With GINsim 3.0.Frontiers in Physiology, 9, 646. doi:10.3389/fphys.2018.00646
Naldi, A., Hernandez, C., Levy, N., Stoll, G., Monteiro, P. T., Chaouiya, C., Helikar, T.,et al. (2018). The CoLoMoTo Interactive Notebook: Accessible and Reproducible Com-putational Analyses for Qualitative Biological Networks. Frontiers in Physiology, 9, 680.doi:10.3389/fphys.2018.00680
Naldi, A., Monteiro, P. T., Mussel, C., Kestler, H. A., Thieffry, D., Xenarios, I., Saez-Rodriguez, J., et al. (2015). Cooperative development of logical modelling standards andtools with CoLoMoTo. Bioinformatics, 31(7), 1154–1159. doi:10.1093/bioinformatics/btv013
Paulevé, L. (2017). Pint: A Static Analyzer for Transient Dynamics of Qualitative Networkswith IPython Interface. In CMSB 2017 - 15th conference on computational methods forsystems biology, Lecture notes in computer science (Vol. 10545, pp. 316–370). Springer.doi:10.1007/978-3-319-67471-1_20
Senft, D., Leiserson, M. D. M., Ruppin, E., & Ronai, Z. A. (2017). Precision Oncology: TheRoad Ahead. Trends in Molecular Medicine, 23(10), 874–898. doi:10.1016/j.molmed.2017.08.003
Stoll, G., Caron, B., Viara, E., Dugourd, A., Zinovyev, A., Naldi, A., Kroemer, G., et al.(2017). MaBoSS 2.0: an environment for stochastic Boolean modeling. (J. Wren,Ed.)Bioinformatics, 33(14), 2226–2228. doi:10.1093/bioinformatics/btx123
Terfve, C., Cokelaer, T., Henriques, D., MacNamara, A., Goncalves, E., Morris, M. K., Iersel,M. van, et al. (2012). CellNOptR: a flexible toolkit to train protein signaling networksto data using multiple logic formalisms. BMC Systems Biology, 6(1), 133. doi:10.1186/1752-0509-6-133
Traynard, P., Tobalina, L., Eduati, F., Calzone, L., & Saez-Rodriguez, J. (2017). LogicModeling in Quantitative Systems Pharmacology. CPT: Pharmacometrics & SystemsPharmacology, 6(8), 499–511. doi:10.1002/psp4.12225
Wang, R.-S., Saadatpour, A., & Albert, R. (2012). Boolean modeling in systems biology: anoverview of methodology and applications. Physical Biology, 9(5), 55001. doi:10.1088/1478-3975/9/5/055001
Zobolas, J. (2020a). DrugLogics software documentation. GitHub Pages. Retrieved fromhttps://druglogics.github.io/druglogics-doc/
Zobolas, J. (2020b). Usefun: A collection of useful functions by john. Retrieved from https://github.com/bblodfon/usefun
Zobolas et al., (2020). emba: R package for analysis and visualization of biomarkers in boolean model ensembles. Journal of Open SourceSoftware, 5(53), 2583. https://doi.org/10.21105/joss.02583
4

Zobolas, J. (2020c). Emba package website. GitHub Pages. Retrieved from https://bblodfon.github.io/emba/
Zobolas, J. (2020d). Ensemble boolean model analyses related to drug prediction performance.GitHub. Retrieved from https://github.com/bblodfon/gitsbe-model-analysis
Zobolas et al., (2020). emba: R package for analysis and visualization of biomarkers in boolean model ensembles. Journal of Open SourceSoftware, 5(53), 2583. https://doi.org/10.21105/joss.02583
5


PAPER 5
108

Boolean function metrics can assist modelers tocheck and choose logical rules
John Zobolas1,*, Pedro T. Monteiro2,3, Martin Kuiper1 and Åsmund Flobak4,5
1Department of Biology, Norwegian University of Science and Technology (NTNU), Trondheim, Norway2Department of Computer Science and Engineering, Instituto Superior Técnico (IST) - Universidade deLisboa, Lisbon, Portugal3INESC-ID, Lisbon, Portugal4Department of Clinical and Molecular Medicine, Norwegian University of Science and Technology (NTNU),Trondheim, Norway5The Cancer Clinic, St. Olav’s Hospital, Trondheim, Norway*To whom correspondence should be addressed.
April 6, 2021
Abstract
Computational models of biological processes provide one of the most powerful methods for adetailed analysis of the mechanisms that drive the behavior of complex systems. Logic-basedmodeling has enhanced our understanding and interpretation of those systems. Defining rulesthat determine how the output activity of biological entities is regulated by their respectiveinputs has proven to be challenging. Partly this is because of the inherent noise in data thatallows multiple model parameterizations to fit the experimental observations, but some of itis also due to the fact that models become increasingly larger, making the use of automatedtools to assemble the underlying rules indispensable.
We present several Boolean function metrics that provide modelers with the appropriateframework to analyze the impact of a particular model parameterization. We demonstratethe link between a semantic characterization of a Boolean function and its consistency withthe model’s underlying regulatory structure. We further define the properties that outlinesuch consistency and show that several of the Boolean functions under study violate them,questioning their biological plausibility and subsequent use. We also illustrate that regulatoryfunctions can have major differences with regard to their asymptotic output behavior, withsome of them being biased towards specific Boolean outcomes when others are dependent onthe ratio between activating and inhibitory regulators.
Application results show that in a specific signaling cancer network, the function bias canbe used to guide the choice of logical operators for a model that matches data observations.Moreover, graph analysis indicates that the standardized Boolean function bias becomes moreprominent with increasing numbers of regulators, confirming the fact that rule specificationcan effectively determine regulatory outcome despite the complex dynamics of biologicalnetworks.
Keywords Boolean regulatory networks · Boolean functions · Truth Density · Bias · Complexity
arX
iv:2
104.
0127
9v1
[q-
bio.
MN
] 2
Apr
202
1
A preprint - April 6, 2021
1 Introduction
The understanding of biological processes has been greatly stimulated by systems biology approaches [1, 2, 3].The integration of mathematical models with the underlying biological knowledge and empirical observationscan help us observe emergent systems properties, test new hypotheses, enhance the interpretability of thestudied systems and guide innovations in areas such as medicine and drug discovery [4]. While multiplemathematical modeling frameworks exist, the scarcity of experimental data and the challenges posed by thedevelopment of quantitative large-scale biological networks, has favoured the simplicity and intuitiveness ofmore qualitative approaches, such as logic-based modeling [5].
At the heart of the mathematical representation of molecular biological networks lies the concept of regulation.Regulation of activity, typically by changing the modification state, location or concentration of a biologicalentity, is a process which can be expressed by a mathematical function that combines the various regulatoryinputs that affect the target, with a logic that describes how these regulators are integrated. In Booleanlogic-based modeling, the regulatory inputs are entities which can be expressed in two states: active (1) orinactive (0). These entities are combined with logical rules to derive the Boolean regulatory function (BRF)of the target entity. For every possible regulatory input (combination of 0 and 1’s) the BRF will produce theend regulatory product, which is the activity of the target (0 or 1).
The construction of a Boolean computational model starts with the assembly of information from literatureand experimental observations, in the form of a Prior Knowledge Network (PKN), i.e. a list of network entitiesand their causal interactions (positive or negative) [6, 7]. The use of a PKN for accurate representation ofbiological reality and subsequent analysis and simulation requires the definition of the model formalism. Thisis one of the most important steps in dynamical modeling since it directly translates to the choice of BRFs,i.e. the logical rules that together with the regulators define the activity state of each network target [8].There have been several approaches related to the choice of BRFs, from using a standardized format [9], toautomatically generating all possible BRFs compatible with the PKN and calibrating the rules in order to fitperturbation data [10, 11, 12]. State-of-the-art approaches involve the automated construction of large-scalelogical networks by inferring the logical rules from the topology and semantics of molecular interaction maps[13].
Regardless of how a logical model is constructed, it has been shown in practice that expert curation, i.e. themanual fine-tuning of the logical rules to fit experimental data, can result in highly predictive models [14, 15],yet this is not trivially obtained with automatically constructed networks [16]. Because of the large functionspace complemented with a sparsity of observations and inherent noise in existing data, there is a wide rangeof plausible BRFs. Thus, it is crucial to properly define function characteristics that can guide the modelerto a more informed function choice. Our work is focused on explicating some of these metrics and usingthem to show for example which BRFs can be discarded due to biological inconsistencies with the underlyingregulatory topology and which are biased towards specific Boolean outcomes.
The paper is structured as follows: Section 2 provides a list of notations and definitions to be used later in thetext. In Section 3, we discuss the benefits of using the equivalent disjunctive normal form of a Boolean functionto delineate its biological interpretability. In Section 4, we provide a set of properties that characterize theBoolean functions that are consistent with a given regulatory topology and show that several functions understudy violate them. In Section 5, we present the truth density metric as a means to evaluate if a Booleanfunction is biased or balanced with increasing number of regulators. We also discuss the asymptotic propertiesof different functions relating to the ratio between activators and inhibitors. Lastly, in Section 6, we presentevidence that the standardized Boolean functions are indeed biased and show how modelers can exploit suchinformation for their own benefit. The results are demonstrated in Boolean models derived from a cancersignaling network as well as from scale-free topologies that are applicable to most biological networks. Weclose the paper with some discussion points in Section 7 and directions for future research in Section 8.
2
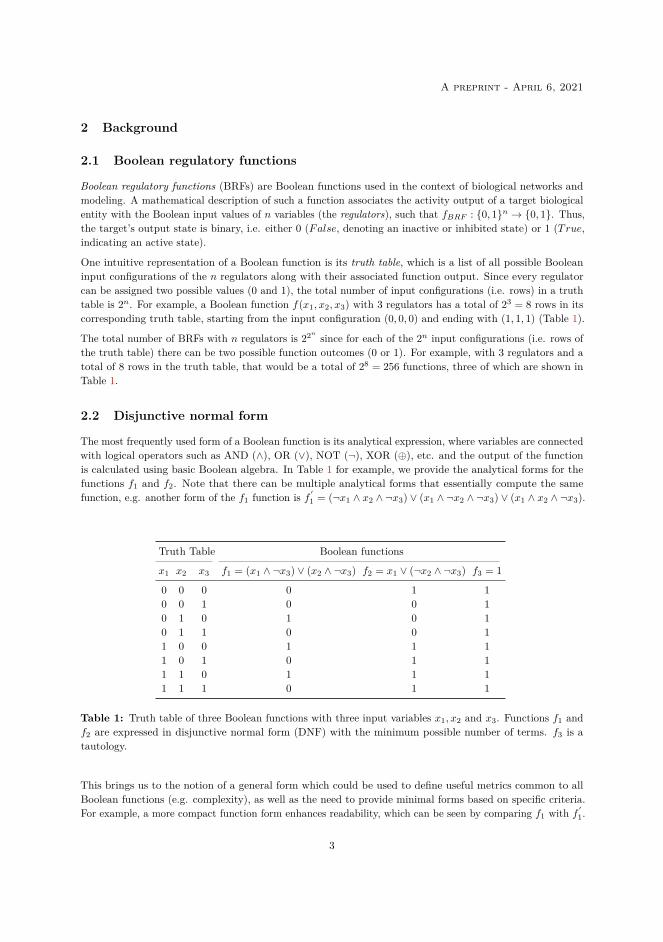
A preprint - April 6, 2021
2 Background
2.1 Boolean regulatory functions
Boolean regulatory functions (BRFs) are Boolean functions used in the context of biological networks andmodeling. A mathematical description of such a function associates the activity output of a target biologicalentity with the Boolean input values of n variables (the regulators), such that fBRF : {0, 1}n → {0, 1}. Thus,the target’s output state is binary, i.e. either 0 (False, denoting an inactive or inhibited state) or 1 (True,indicating an active state).
One intuitive representation of a Boolean function is its truth table, which is a list of all possible Booleaninput configurations of the n regulators along with their associated function output. Since every regulatorcan be assigned two possible values (0 and 1), the total number of input configurations (i.e. rows) in a truthtable is 2n. For example, a Boolean function f(x1, x2, x3) with 3 regulators has a total of 23 = 8 rows in itscorresponding truth table, starting from the input configuration (0, 0, 0) and ending with (1, 1, 1) (Table 1).
The total number of BRFs with n regulators is 22n since for each of the 2n input configurations (i.e. rows ofthe truth table) there can be two possible function outcomes (0 or 1). For example, with 3 regulators and atotal of 8 rows in the truth table, that would be a total of 28 = 256 functions, three of which are shown inTable 1.
2.2 Disjunctive normal form
The most frequently used form of a Boolean function is its analytical expression, where variables are connectedwith logical operators such as AND (∧), OR (∨), NOT (¬), XOR (⊕), etc. and the output of the functionis calculated using basic Boolean algebra. In Table 1 for example, we provide the analytical forms for thefunctions f1 and f2. Note that there can be multiple analytical forms that essentially compute the samefunction, e.g. another form of the f1 function is f ′
1 = (¬x1 ∧ x2 ∧ ¬x3) ∨ (x1 ∧ ¬x2 ∧ ¬x3) ∨ (x1 ∧ x2 ∧ ¬x3).
Truth Table Boolean functions
x1 x2 x3 f1 = (x1 ∧ ¬x3) ∨ (x2 ∧ ¬x3) f2 = x1 ∨ (¬x2 ∧ ¬x3) f3 = 1
0 0 0 0 1 10 0 1 0 0 10 1 0 1 0 10 1 1 0 0 11 0 0 1 1 11 0 1 0 1 11 1 0 1 1 11 1 1 0 1 1
Table 1: Truth table of three Boolean functions with three input variables x1, x2 and x3. Functions f1 andf2 are expressed in disjunctive normal form (DNF) with the minimum possible number of terms. f3 is atautology.
This brings us to the notion of a general form which could be used to define useful metrics common to allBoolean functions (e.g. complexity), as well as the need to provide minimal forms based on specific criteria.For example, a more compact function form enhances readability, which can be seen by comparing f1 with f ′
1.
3
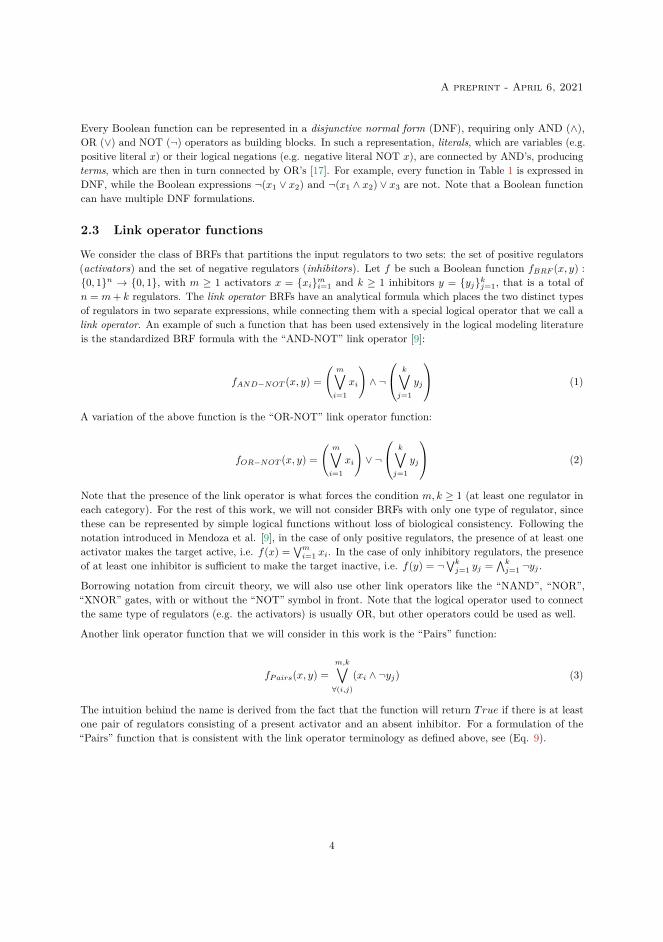
A preprint - April 6, 2021
Every Boolean function can be represented in a disjunctive normal form (DNF), requiring only AND (∧),OR (∨) and NOT (¬) operators as building blocks. In such a representation, literals, which are variables (e.g.positive literal x) or their logical negations (e.g. negative literal NOT x), are connected by AND’s, producingterms, which are then in turn connected by OR’s [17]. For example, every function in Table 1 is expressed inDNF, while the Boolean expressions ¬(x1 ∨ x2) and ¬(x1 ∧ x2) ∨ x3 are not. Note that a Boolean functioncan have multiple DNF formulations.
2.3 Link operator functions
We consider the class of BRFs that partitions the input regulators to two sets: the set of positive regulators(activators) and the set of negative regulators (inhibitors). Let f be such a Boolean function fBRF (x, y) :{0, 1}n → {0, 1}, with m ≥ 1 activators x = {xi}mi=1 and k ≥ 1 inhibitors y = {yj}kj=1, that is a total ofn = m+ k regulators. The link operator BRFs have an analytical formula which places the two distinct typesof regulators in two separate expressions, while connecting them with a special logical operator that we call alink operator. An example of such a function that has been used extensively in the logical modeling literatureis the standardized BRF formula with the “AND-NOT” link operator [9]:
fAND−NOT (x, y) =
(m∨i=1
xi
)∧ ¬
k∨j=1
yj
(1)
A variation of the above function is the “OR-NOT” link operator function:
fOR−NOT (x, y) =
(m∨i=1
xi
)∨ ¬
k∨j=1
yj
(2)
Note that the presence of the link operator is what forces the condition m, k ≥ 1 (at least one regulator ineach category). For the rest of this work, we will not consider BRFs with only one type of regulator, sincethese can be represented by simple logical functions without loss of biological consistency. Following thenotation introduced in Mendoza et al. [9], in the case of only positive regulators, the presence of at least oneactivator makes the target active, i.e. f(x) =
∨mi=1 xi. In the case of only inhibitory regulators, the presence
of at least one inhibitor is sufficient to make the target inactive, i.e. f(y) = ¬∨kj=1 yj =
∧kj=1 ¬yj .
Borrowing notation from circuit theory, we will also use other link operators like the “NAND”, “NOR”,“XNOR” gates, with or without the “NOT” symbol in front. Note that the logical operator used to connectthe same type of regulators (e.g. the activators) is usually OR, but other operators could be used as well.
Another link operator function that we will consider in this work is the “Pairs” function:
fPairs(x, y) =
m,k∨∀(i,j)
(xi ∧ ¬yj) (3)
The intuition behind the name is derived from the fact that the function will return True if there is at leastone pair of regulators consisting of a present activator and an absent inhibitor. For a formulation of the“Pairs” function that is consistent with the link operator terminology as defined above, see (Eq. 9).
4
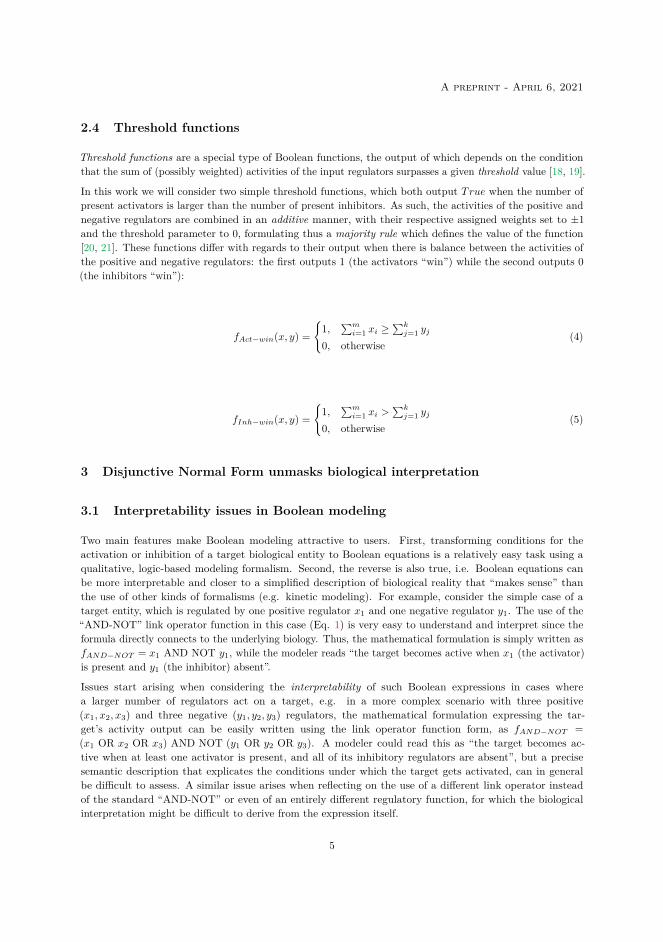
A preprint - April 6, 2021
2.4 Threshold functions
Threshold functions are a special type of Boolean functions, the output of which depends on the conditionthat the sum of (possibly weighted) activities of the input regulators surpasses a given threshold value [18, 19].
In this work we will consider two simple threshold functions, which both output True when the number ofpresent activators is larger than the number of present inhibitors. As such, the activities of the positive andnegative regulators are combined in an additive manner, with their respective assigned weights set to ±1and the threshold parameter to 0, formulating thus a majority rule which defines the value of the function[20, 21]. These functions differ with regards to their output when there is balance between the activities ofthe positive and negative regulators: the first outputs 1 (the activators “win”) while the second outputs 0(the inhibitors “win”):
fAct−win(x, y) =
{1,
∑mi=1 xi ≥
∑kj=1 yj
0, otherwise(4)
fInh−win(x, y) =
{1,
∑mi=1 xi >
∑kj=1 yj
0, otherwise(5)
3 Disjunctive Normal Form unmasks biological interpretation
3.1 Interpretability issues in Boolean modeling
Two main features make Boolean modeling attractive to users. First, transforming conditions for theactivation or inhibition of a target biological entity to Boolean equations is a relatively easy task using aqualitative, logic-based modeling formalism. Second, the reverse is also true, i.e. Boolean equations canbe more interpretable and closer to a simplified description of biological reality that “makes sense” thanthe use of other kinds of formalisms (e.g. kinetic modeling). For example, consider the simple case of atarget entity, which is regulated by one positive regulator x1 and one negative regulator y1. The use of the“AND-NOT” link operator function in this case (Eq. 1) is very easy to understand and interpret since theformula directly connects to the underlying biology. Thus, the mathematical formulation is simply written asfAND−NOT = x1 AND NOT y1, while the modeler reads “the target becomes active when x1 (the activator)is present and y1 (the inhibitor) absent”.
Issues start arising when considering the interpretability of such Boolean expressions in cases wherea larger number of regulators act on a target, e.g. in a more complex scenario with three positive(x1, x2, x3) and three negative (y1, y2, y3) regulators, the mathematical formulation expressing the tar-get’s activity output can be easily written using the link operator function form, as fAND−NOT =
(x1 OR x2 OR x3) AND NOT (y1 OR y2 OR y3). A modeler could read this as “the target becomes ac-tive when at least one activator is present, and all of its inhibitory regulators are absent”, but a precisesemantic description that explicates the conditions under which the target gets activated, can in generalbe difficult to assess. A similar issue arises when reflecting on the use of a different link operator insteadof the standard “AND-NOT” or even of an entirely different regulatory function, for which the biologicalinterpretation might be difficult to derive from the expression itself.
5
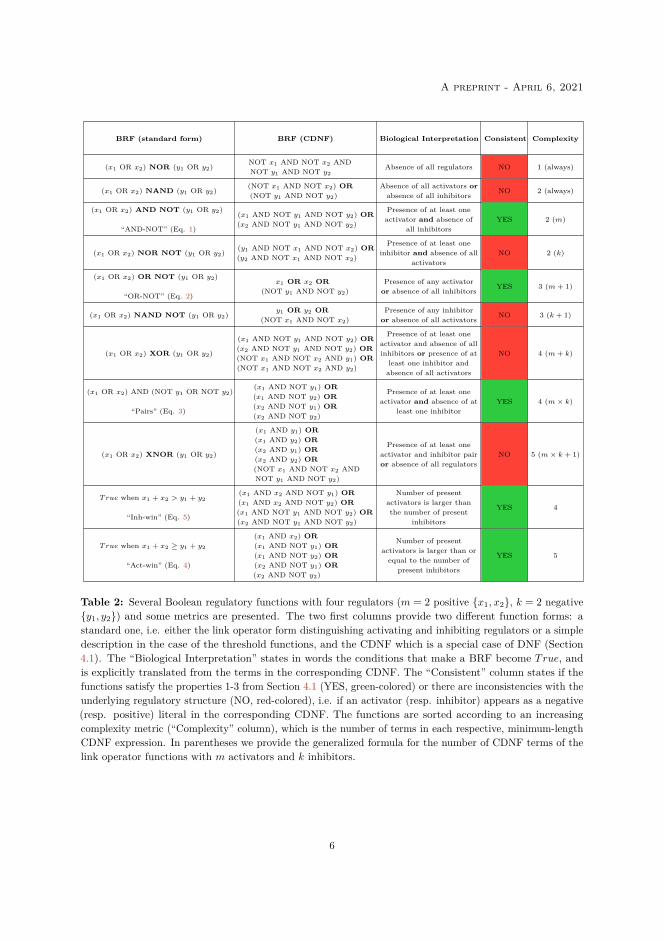
A preprint - April 6, 2021
BRF (standard form) BRF (CDNF) Biological Interpretation Consistent Complexity
(x1 OR x2) NOR (y1 OR y2)NOT x1 AND NOT x2 ANDNOT y1 AND NOT y2
Absence of all regulators NO 1 (always)
(x1 OR x2) NAND (y1 OR y2)(NOT x1 AND NOT x2) OR(NOT y1 AND NOT y2)
Absence of all activators orabsence of all inhibitors NO 2 (always)
(x1 OR x2) AND NOT (y1 OR y2)
“AND-NOT” (Eq. 1)
(x1 AND NOT y1 AND NOT y2) OR(x2 AND NOT y1 AND NOT y2)
Presence of at least oneactivator and absence of
all inhibitorsYES 2 (m)
(x1 OR x2) NOR NOT (y1 OR y2)(y1 AND NOT x1 AND NOT x2) OR(y2 AND NOT x1 AND NOT x2)
Presence of at least oneinhibitor and absence of all
activatorsNO 2 (k)
(x1 OR x2) OR NOT (y1 OR y2)
“OR-NOT” (Eq. 2)
x1 OR x2 OR(NOT y1 AND NOT y2)
Presence of any activatoror absence of all inhibitors YES 3 (m+ 1)
(x1 OR x2) NAND NOT (y1 OR y2)y1 OR y2 OR
(NOT x1 AND NOT x2)
Presence of any inhibitoror absence of all activators NO 3 (k + 1)
(x1 OR x2) XOR (y1 OR y2)
(x1 AND NOT y1 AND NOT y2) OR(x2 AND NOT y1 AND NOT y2) OR(NOT x1 AND NOT x2 AND y1) OR(NOT x1 AND NOT x2 AND y2)
Presence of at least oneactivator and absence of allinhibitors or presence of at
least one inhibitor andabsence of all activators
NO 4 (m+ k)
(x1 OR x2) AND (NOT y1 OR NOT y2)
“Pairs” (Eq. 3)
(x1 AND NOT y1) OR(x1 AND NOT y2) OR(x2 AND NOT y1) OR(x2 AND NOT y2)
Presence of at least oneactivator and absence of at
least one inhibitorYES 4 (m× k)
(x1 OR x2) XNOR (y1 OR y2)
(x1 AND y1) OR(x1 AND y2) OR(x2 AND y1) OR(x2 AND y2) OR(NOT x1 AND NOT x2 ANDNOT y1 AND NOT y2)
Presence of at least oneactivator and inhibitor pairor absence of all regulators
NO 5 (m× k + 1)
True when x1 + x2 > y1 + y2
“Inh-win” (Eq. 5)
(x1 AND x2 AND NOT y1) OR(x1 AND x2 AND NOT y2) OR(x1 AND NOT y1 AND NOT y2) OR(x2 AND NOT y1 AND NOT y2)
Number of presentactivators is larger thanthe number of present
inhibitors
YES 4
True when x1 + x2 ≥ y1 + y2
“Act-win” (Eq. 4)
(x1 AND x2) OR(x1 AND NOT y1) OR(x1 AND NOT y2) OR(x2 AND NOT y1) OR(x2 AND NOT y2)
Number of presentactivators is larger than orequal to the number of
present inhibitors
YES 5
Table 2: Several Boolean regulatory functions with four regulators (m = 2 positive {x1, x2}, k = 2 negative{y1, y2}) and some metrics are presented. The two first columns provide two different function forms: astandard one, i.e. either the link operator form distinguishing activating and inhibiting regulators or a simpledescription in the case of the threshold functions, and the CDNF which is a special case of DNF (Section4.1). The “Biological Interpretation” states in words the conditions that make a BRF become True, andis explicitly translated from the terms in the corresponding CDNF. The “Consistent” column states if thefunctions satisfy the properties 1-3 from Section 4.1 (YES, green-colored) or there are inconsistencies with theunderlying regulatory structure (NO, red-colored), i.e. if an activator (resp. inhibitor) appears as a negative(resp. positive) literal in the corresponding CDNF. The functions are sorted according to an increasingcomplexity metric (“Complexity” column), which is the number of terms in each respective, minimum-lengthCDNF expression. In parentheses we provide the generalized formula for the number of CDNF terms of thelink operator functions with m activators and k inhibitors.
6
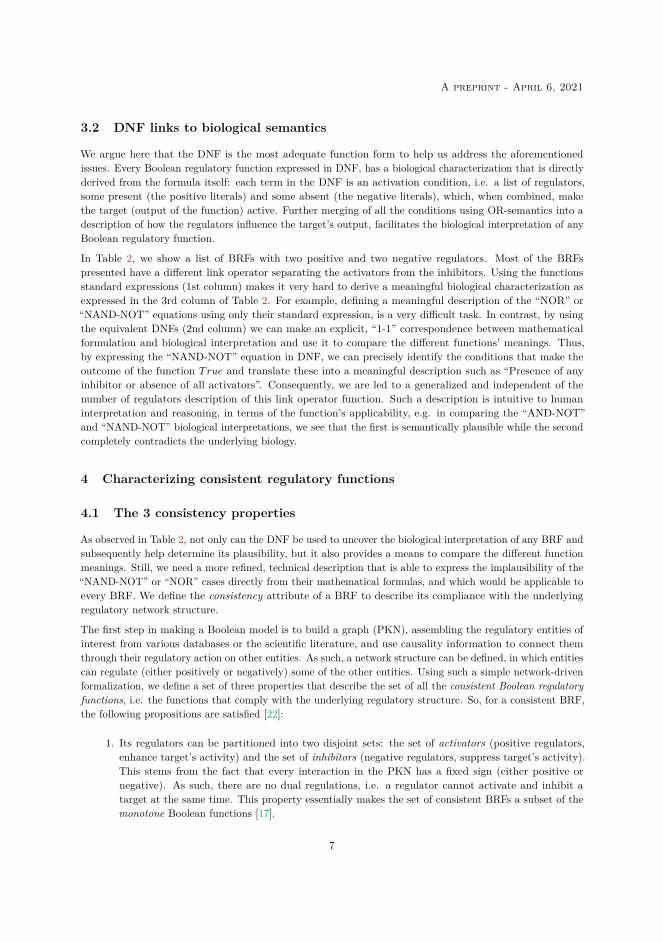
A preprint - April 6, 2021
3.2 DNF links to biological semantics
We argue here that the DNF is the most adequate function form to help us address the aforementionedissues. Every Boolean regulatory function expressed in DNF, has a biological characterization that is directlyderived from the formula itself: each term in the DNF is an activation condition, i.e. a list of regulators,some present (the positive literals) and some absent (the negative literals), which, when combined, makethe target (output of the function) active. Further merging of all the conditions using OR-semantics into adescription of how the regulators influence the target’s output, facilitates the biological interpretation of anyBoolean regulatory function.
In Table 2, we show a list of BRFs with two positive and two negative regulators. Most of the BRFspresented have a different link operator separating the activators from the inhibitors. Using the functionsstandard expressions (1st column) makes it very hard to derive a meaningful biological characterization asexpressed in the 3rd column of Table 2. For example, defining a meaningful description of the “NOR” or“NAND-NOT” equations using only their standard expression, is a very difficult task. In contrast, by usingthe equivalent DNFs (2nd column) we can make an explicit, “1-1” correspondence between mathematicalformulation and biological interpretation and use it to compare the different functions’ meanings. Thus,by expressing the “NAND-NOT” equation in DNF, we can precisely identify the conditions that make theoutcome of the function True and translate these into a meaningful description such as “Presence of anyinhibitor or absence of all activators”. Consequently, we are led to a generalized and independent of thenumber of regulators description of this link operator function. Such a description is intuitive to humaninterpretation and reasoning, in terms of the function’s applicability, e.g. in comparing the “AND-NOT”and “NAND-NOT” biological interpretations, we see that the first is semantically plausible while the secondcompletely contradicts the underlying biology.
4 Characterizing consistent regulatory functions
4.1 The 3 consistency properties
As observed in Table 2, not only can the DNF be used to uncover the biological interpretation of any BRF andsubsequently help determine its plausibility, but it also provides a means to compare the different functionmeanings. Still, we need a more refined, technical description that is able to express the implausibility of the“NAND-NOT” or “NOR” cases directly from their mathematical formulas, and which would be applicable toevery BRF. We define the consistency attribute of a BRF to describe its compliance with the underlyingregulatory network structure.
The first step in making a Boolean model is to build a graph (PKN), assembling the regulatory entities ofinterest from various databases or the scientific literature, and use causality information to connect themthrough their regulatory action on other entities. As such, a network structure can be defined, in which entitiescan regulate (either positively or negatively) some of the other entities. Using such a simple network-drivenformalization, we define a set of three properties that describe the set of all the consistent Boolean regulatoryfunctions, i.e. the functions that comply with the underlying regulatory structure. So, for a consistent BRF,the following propositions are satisfied [22]:
1. Its regulators can be partitioned into two disjoint sets: the set of activators (positive regulators,enhance target’s activity) and the set of inhibitors (negative regulators, suppress target’s activity).This stems from the fact that every interaction in the PKN has a fixed sign (either positive ornegative). As such, there are no dual regulations, i.e. a regulator cannot activate and inhibit atarget at the same time. This property essentially makes the set of consistent BRFs a subset of themonotone Boolean functions [17].
7
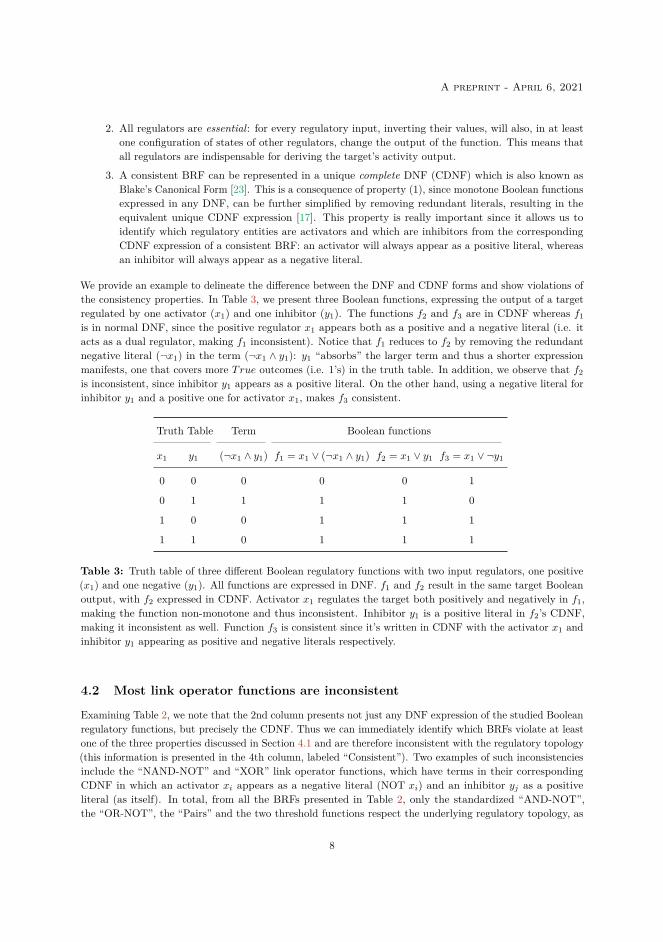
A preprint - April 6, 2021
2. All regulators are essential: for every regulatory input, inverting their values, will also, in at leastone configuration of states of other regulators, change the output of the function. This means thatall regulators are indispensable for deriving the target’s activity output.
3. A consistent BRF can be represented in a unique complete DNF (CDNF) which is also known asBlake’s Canonical Form [23]. This is a consequence of property (1), since monotone Boolean functionsexpressed in any DNF, can be further simplified by removing redundant literals, resulting in theequivalent unique CDNF expression [17]. This property is really important since it allows us toidentify which regulatory entities are activators and which are inhibitors from the correspondingCDNF expression of a consistent BRF: an activator will always appear as a positive literal, whereasan inhibitor will always appear as a negative literal.
We provide an example to delineate the difference between the DNF and CDNF forms and show violations ofthe consistency properties. In Table 3, we present three Boolean functions, expressing the output of a targetregulated by one activator (x1) and one inhibitor (y1). The functions f2 and f3 are in CDNF whereas f1is in normal DNF, since the positive regulator x1 appears both as a positive and a negative literal (i.e. itacts as a dual regulator, making f1 inconsistent). Notice that f1 reduces to f2 by removing the redundantnegative literal (¬x1) in the term (¬x1 ∧ y1): y1 “absorbs” the larger term and thus a shorter expressionmanifests, one that covers more True outcomes (i.e. 1’s) in the truth table. In addition, we observe that f2is inconsistent, since inhibitor y1 appears as a positive literal. On the other hand, using a negative literal forinhibitor y1 and a positive one for activator x1, makes f3 consistent.
Truth Table Term Boolean functions
x1 y1 (¬x1 ∧ y1) f1 = x1 ∨ (¬x1 ∧ y1) f2 = x1 ∨ y1 f3 = x1 ∨ ¬y1
0 0 0 0 0 1
0 1 1 1 1 0
1 0 0 1 1 1
1 1 0 1 1 1
Table 3: Truth table of three different Boolean regulatory functions with two input regulators, one positive(x1) and one negative (y1). All functions are expressed in DNF. f1 and f2 result in the same target Booleanoutput, with f2 expressed in CDNF. Activator x1 regulates the target both positively and negatively in f1,making the function non-monotone and thus inconsistent. Inhibitor y1 is a positive literal in f2’s CDNF,making it inconsistent as well. Function f3 is consistent since it’s written in CDNF with the activator x1 andinhibitor y1 appearing as positive and negative literals respectively.
4.2 Most link operator functions are inconsistent
Examining Table 2, we note that the 2nd column presents not just any DNF expression of the studied Booleanregulatory functions, but precisely the CDNF. Thus we can immediately identify which BRFs violate at leastone of the three properties discussed in Section 4.1 and are therefore inconsistent with the regulatory topology(this information is presented in the 4th column, labeled “Consistent”). Two examples of such inconsistenciesinclude the “NAND-NOT” and “XOR” link operator functions, which have terms in their correspondingCDNF in which an activator xi appears as a negative literal (NOT xi) and an inhibitor yj as a positiveliteral (as itself). In total, from all the BRFs presented in Table 2, only the standardized “AND-NOT”,the “OR-NOT”, the “Pairs” and the two threshold functions respect the underlying regulatory topology, as
8
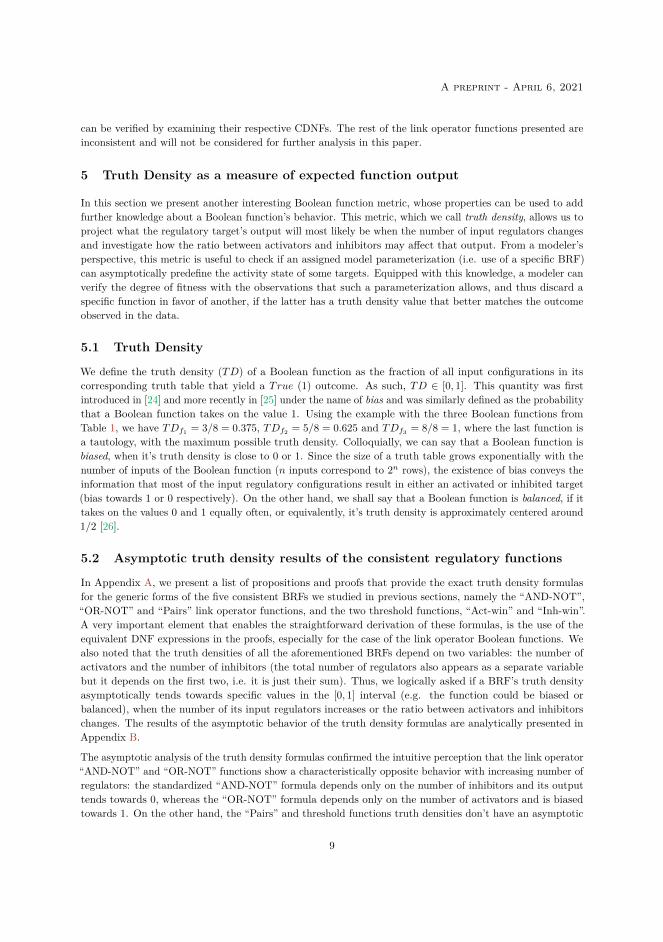
A preprint - April 6, 2021
can be verified by examining their respective CDNFs. The rest of the link operator functions presented areinconsistent and will not be considered for further analysis in this paper.
5 Truth Density as a measure of expected function output
In this section we present another interesting Boolean function metric, whose properties can be used to addfurther knowledge about a Boolean function’s behavior. This metric, which we call truth density, allows us toproject what the regulatory target’s output will most likely be when the number of input regulators changesand investigate how the ratio between activators and inhibitors may affect that output. From a modeler’sperspective, this metric is useful to check if an assigned model parameterization (i.e. use of a specific BRF)can asymptotically predefine the activity state of some targets. Equipped with this knowledge, a modeler canverify the degree of fitness with the observations that such a parameterization allows, and thus discard aspecific function in favor of another, if the latter has a truth density value that better matches the outcomeobserved in the data.
5.1 Truth Density
We define the truth density (TD) of a Boolean function as the fraction of all input configurations in itscorresponding truth table that yield a True (1) outcome. As such, TD ∈ [0, 1]. This quantity was firstintroduced in [24] and more recently in [25] under the name of bias and was similarly defined as the probabilitythat a Boolean function takes on the value 1. Using the example with the three Boolean functions fromTable 1, we have TDf1 = 3/8 = 0.375, TDf2 = 5/8 = 0.625 and TDf3 = 8/8 = 1, where the last function isa tautology, with the maximum possible truth density. Colloquially, we can say that a Boolean function isbiased, when it’s truth density is close to 0 or 1. Since the size of a truth table grows exponentially with thenumber of inputs of the Boolean function (n inputs correspond to 2n rows), the existence of bias conveys theinformation that most of the input regulatory configurations result in either an activated or inhibited target(bias towards 1 or 0 respectively). On the other hand, we shall say that a Boolean function is balanced, if ittakes on the values 0 and 1 equally often, or equivalently, it’s truth density is approximately centered around1/2 [26].
5.2 Asymptotic truth density results of the consistent regulatory functions
In Appendix A, we present a list of propositions and proofs that provide the exact truth density formulasfor the generic forms of the five consistent BRFs we studied in previous sections, namely the “AND-NOT”,“OR-NOT” and “Pairs” link operator functions, and the two threshold functions, “Act-win” and “Inh-win”.A very important element that enables the straightforward derivation of these formulas, is the use of theequivalent DNF expressions in the proofs, especially for the case of the link operator Boolean functions. Wealso noted that the truth densities of all the aforementioned BRFs depend on two variables: the number ofactivators and the number of inhibitors (the total number of regulators also appears as a separate variablebut it depends on the first two, i.e. it is just their sum). Thus, we logically asked if a BRF’s truth densityasymptotically tends towards specific values in the [0, 1] interval (e.g. the function could be biased orbalanced), when the number of its input regulators increases or the ratio between activators and inhibitorschanges. The results of the asymptotic behavior of the truth density formulas are analytically presented inAppendix B.
The asymptotic analysis of the truth density formulas confirmed the intuitive perception that the link operator“AND-NOT” and “OR-NOT” functions show a characteristically opposite behavior with increasing number ofregulators: the standardized “AND-NOT” formula depends only on the number of inhibitors and its outputtends towards 0, whereas the “OR-NOT” formula depends only on the number of activators and is biasedtowards 1. On the other hand, the “Pairs” and threshold functions truth densities don’t have an asymptotic
9
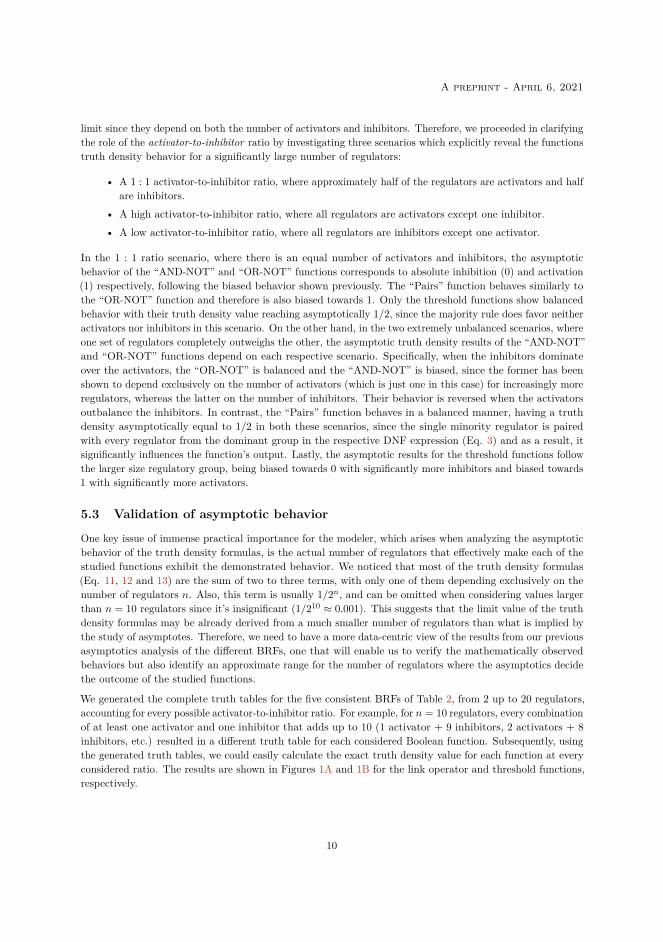
A preprint - April 6, 2021
limit since they depend on both the number of activators and inhibitors. Therefore, we proceeded in clarifyingthe role of the activator-to-inhibitor ratio by investigating three scenarios which explicitly reveal the functionstruth density behavior for a significantly large number of regulators:
• A 1 : 1 activator-to-inhibitor ratio, where approximately half of the regulators are activators and halfare inhibitors.
• A high activator-to-inhibitor ratio, where all regulators are activators except one inhibitor.• A low activator-to-inhibitor ratio, where all regulators are inhibitors except one activator.
In the 1 : 1 ratio scenario, where there is an equal number of activators and inhibitors, the asymptoticbehavior of the “AND-NOT” and “OR-NOT” functions corresponds to absolute inhibition (0) and activation(1) respectively, following the biased behavior shown previously. The “Pairs” function behaves similarly tothe “OR-NOT” function and therefore is also biased towards 1. Only the threshold functions show balancedbehavior with their truth density value reaching asymptotically 1/2, since the majority rule does favor neitheractivators nor inhibitors in this scenario. On the other hand, in the two extremely unbalanced scenarios, whereone set of regulators completely outweighs the other, the asymptotic truth density results of the “AND-NOT”and “OR-NOT” functions depend on each respective scenario. Specifically, when the inhibitors dominateover the activators, the “OR-NOT” is balanced and the “AND-NOT” is biased, since the former has beenshown to depend exclusively on the number of activators (which is just one in this case) for increasingly moreregulators, whereas the latter on the number of inhibitors. Their behavior is reversed when the activatorsoutbalance the inhibitors. In contrast, the “Pairs” function behaves in a balanced manner, having a truthdensity asymptotically equal to 1/2 in both these scenarios, since the single minority regulator is pairedwith every regulator from the dominant group in the respective DNF expression (Eq. 3) and as a result, itsignificantly influences the function’s output. Lastly, the asymptotic results for the threshold functions followthe larger size regulatory group, being biased towards 0 with significantly more inhibitors and biased towards1 with significantly more activators.
5.3 Validation of asymptotic behavior
One key issue of immense practical importance for the modeler, which arises when analyzing the asymptoticbehavior of the truth density formulas, is the actual number of regulators that effectively make each of thestudied functions exhibit the demonstrated behavior. We noticed that most of the truth density formulas(Eq. 11, 12 and 13) are the sum of two to three terms, with only one of them depending exclusively on thenumber of regulators n. Also, this term is usually 1/2n, and can be omitted when considering values largerthan n = 10 regulators since it’s insignificant (1/210 ≈ 0.001). This suggests that the limit value of the truthdensity formulas may be already derived from a much smaller number of regulators than what is implied bythe study of asymptotes. Therefore, we need to have a more data-centric view of the results from our previousasymptotics analysis of the different BRFs, one that will enable us to verify the mathematically observedbehaviors but also identify an approximate range for the number of regulators where the asymptotics decidethe outcome of the studied functions.
We generated the complete truth tables for the five consistent BRFs of Table 2, from 2 up to 20 regulators,accounting for every possible activator-to-inhibitor ratio. For example, for n = 10 regulators, every combinationof at least one activator and one inhibitor that adds up to 10 (1 activator + 9 inhibitors, 2 activators + 8
inhibitors, etc.) resulted in a different truth table for each considered Boolean function. Subsequently, usingthe generated truth tables, we could easily calculate the exact truth density value for each function at everyconsidered ratio. The results are shown in Figures 1A and 1B for the link operator and threshold functions,respectively.
10
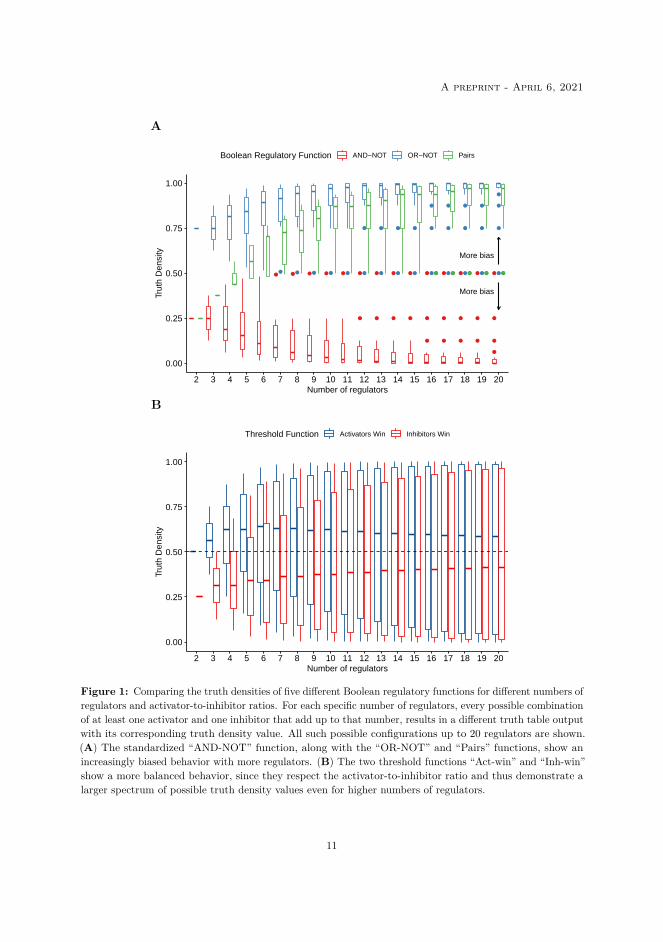
A preprint - April 6, 2021
A
● ● ● ● ●
●
●
●
●
●
●
●
●
●
●
●
●
●
●
●
●
●
●
●
●
●
●
●
●● ● ● ● ● ●
●
●
●
●
●
●
●
●
●
●
●
●
●
●
●
●
●
●
●
●
●
●
●
●● ●● ●● ●● ●●
More bias
More bias
0.00
0.25
0.50
0.75
1.00
2 3 4 5 6 7 8 9 10 11 12 13 14 15 16 17 18 19 20Number of regulators
Trut
h D
ensi
tyBoolean Regulatory Function AND−NOT OR−NOT Pairs
B
0.00
0.25
0.50
0.75
1.00
2 3 4 5 6 7 8 9 10 11 12 13 14 15 16 17 18 19 20Number of regulators
Trut
h D
ensi
ty
Threshold Function Activators Win Inhibitors Win
Figure 1: Comparing the truth densities of five different Boolean regulatory functions for different numbers ofregulators and activator-to-inhibitor ratios. For each specific number of regulators, every possible combinationof at least one activator and one inhibitor that add up to that number, results in a different truth table outputwith its corresponding truth density value. All such possible configurations up to 20 regulators are shown.(A) The standardized “AND-NOT” function, along with the “OR-NOT” and “Pairs” functions, show anincreasingly biased behavior with more regulators. (B) The two threshold functions “Act-win” and “Inh-win”show a more balanced behavior, since they respect the activator-to-inhibitor ratio and thus demonstrate alarger spectrum of possible truth density values even for higher numbers of regulators.
11
A preprint - April 6, 2021
The data in general shows that the different regulatory functions demonstrate quite dissimilar behaviorswith regard to their asymptotic outcome. In particular, we recapitulate the findings from the asymptoticsanalysis, namely the bias of the link operator functions, which is evident even from 7 to 10 input regulators.Interestingly, the “Pairs” function follows asymptotically the behavior of the “OR-NOT” function but is ingeneral less biased. We note that the outliers in Figure 1A with truth density values closer to 1/2, representimbalanced activator-to-inhibitor ratio scenarios, i.e. either considerably more activators than inhibitorsfor the “AND-NOT” function and the reverse for the “OR-NOT” function, or any imbalanced ratio for the“Pairs” function. Lastly, Figure 1B shows that the threshold functions exhibit a more balanced behavior,expressed as a higher spectrum of truth density values for any single number of regulators and with themedian truth density asymptotically reaching 1/2. This result is due to the fact that threshold functionsfaithfully follow the activator-to-inhibitor ratio, i.e. with more activators the outcome is biased towards 1whereas with more inhibitors the function outcome tends towards 0.
6 Link operator parameterization determines activity state in biologicalnetworks
In this section we investigate if a model’s parameterization can effectively decide the activity state of nodes inbiological networks. In more detail, we will use the “AND-NOT” link operator function [9] and its symmetricfunction “OR-NOT” (Eq. 1 and 2), to build Boolean models from prior causal knowledge and check if theiractivity state profile as determined by dynamic attractor analysis, shows the biased behavior that we observedin Section 5.
A major motivation for this analysis is the fact that the “AND-NOT” function is extensively used by logicalmodelers and thus the knowledge of its bias, made possible through the lens of the truth density metric,should be clearly demonstrated in practical use cases, e.g. biological network targets should mostly be in aninhibited state when the “AND-NOT” parameterization is used in their respective Boolean equations and inan active state in the case of the “OR-NOT”. As such, a modeler could make use of the link operator functionbias to select the appropriate model parameterization which statistically guarantees an activity state profilethat best matches the one supported by experimental evidence.
6.1 From topology to link operator Boolean models
In order to define Boolean models with the “AND-NOT” and “OR-NOT” link operator parameterizationforms, we implemented the software abmlog, which stands for “All possible Boolean Models Link OperatorGenerator” (Software and Data Availability). Given a simple interaction (.sif) format file [7], representinga PKN with clearly defined, positive and negative causal interactions, the abmlog software outputs allcombinatorially possible Boolean models where each link operator equation (deciding the state of a linkoperator node, i.e. one whose Boolean activity state is determined by both positive and negative regulators)will have either the “AND-NOT” or the “OR-NOT” function form. The models are saved in both thewidely-used BoolNet (.bnet) [27] format and the gitsbe format [28], with the latter additionally includingthe attractors of the Boolean model, calculated via the BioLQM Java library [29]. A simple overview of thesoftware is presented in Figure 2.
By default, abmlog generates all possible Boolean models with the two link operator parameterizations, thenumber of which depends on the number of link operator nodes. For example, if a network has 12 nodes withboth activating and inhibitory regulators, then a total of 212 = 4096 Boolean models will be generated. Incase the number of all possible Boolean models is very large or space restrictions do not allow the storageof that many models, the software can also be used to generate a random sample of link operator Booleanmodels from the total parameterization space. In summary, abmlog is a useful tool that can generate a largepool of Boolean models for subsequent analyses, each with a unique link operator parameterization.
12

A preprint - April 6, 2021
...A activates BA activates C C inhibits B D inhibits C
...
Topology.sif file
...B = A AND NOT CC = A AND NOT D...
...00...
...B = A AND NOT CC = A OR NOT D...
...B = A OR NOT CC = A AND NOT D...
...B = A OR NOT CC = A OR NOT D...
Boolean Models Binary ModelNumber
...01...
...10...
...11...
...10...
...00...
ModelsStable States
...01...
...10...
...10...
...10...
Contingency Table (B,C nodes)
InhibitedState
Active State Total
AND-NOT 6 1 7
OR-NOT 1 4 5Total 7 5 12
10 agreements over 12possible comparisons
Figure 2: Data-flow overview diagram of the abmlog software and its related contingency table betweenoutput model parameterization and stable state activity. A simple interaction file is given as an input toproduce a series of Boolean models where equations with both activating and inhibitory regulators have eitherthe “AND-NOT” or the “OR-NOT” formulation. Two link operator equations give rise to a total of 22 = 4
different Boolean models. Each unique parameterization can be represented by a single binary model number,where a “0” corresponds to an equation with the “AND-NOT” link operator and a “1” to an equation withthe “OR-NOT”. This representation of parameterization can be directly compared to each of the models’stable states, which enables the creation of a contingency table for the data pertaining to nodes B and C andthe derivation of measures of agreement (see Section 6.2).
6.2 Measuring agreement between parameterization and stable state
In order to quantify the link operator function bias, we use measures of agreement between parameterizationand stable state. The idea is that the more biased the link operator parameterization is, the higher theexpected agreement will be between a target node’s link operator assignment and its corresponding stablestate. For the rest of this work, we shall use two measures of agreement, namely the percent agreement andCohen’s kappa statistic [30].
In more detail, using the Boolean model data generated by abmlog, we focus in two categorical variables relatedto a particular node of interest: its link operator parameterization (“AND-NOT”/“0” or “OR-NOT”/“1”) andits corresponding stable state activity (“inhibition” or “activation”), obtained via attractor analysis. We shallsay that these two variables “agree” when a node whose target Boolean equation has the “AND-NOT” linkoperator (resp. “OR-NOT”) ends up with an inhibited (resp. active) state in the corresponding attractor. Inthe case of a Boolean model with multiple attractors, each of the stable states is used separately to measurethe agreement between the two aforementioned variables, since the activity of a node might change betweenthe different attractors, but its parameterization stays the same.
To define measures of agreement between the two proposed categorical variables, we visualize their interrelationusing a contingency table. A total of four data comparison counts can be used to fill in the table’s cells: twowhere the parameterization and stable state match (i.e. node had the “AND-NOT” link operator form andan inhibited stable state or the “OR-NOT” form and an active state) and two where they differ (i.e. nodehad the “OR-NOT” form and its state was inhibited, or the “AND-NOT” form and an active state). The
13
A preprint - April 6, 2021
percent agreement is then simply defined as the total number of matches divided by the total number ofcomparisons and is directly interpreted as the percentage of data that the two variables agree upon. In theexample of Figure 2, the corresponding contingency table counts all the matches and mismatches betweenthe link operator assignments for nodes B and C and their corresponding activity state (12 comparisons intotal). Since there are only two mismatches, the percent agreement is equal to 10/12 = 0.83, meaning that in83% of the presented data, the link operator parameterization dictated function outcome. Naturally, a valueof 0 is the absolute minimum score and indicates complete disagreement between the two variables while aperfect agreement score is equal to 1 or 100%.
A more robust statistic that we also apply in the Boolean model data is Cohen’s kappa (κ) coefficient [30].This statistic is used to measure the extent to which data collectors (raters) assign the same score to thesame variable (inter-rater reliability) and takes into account the possibility of agreement occurring by chance.In our case, this can be conceived as one rater that assigns link operator parameterization (“AND-NOT”or “OR-NOT”) and another that assigns stable state activity (“inhibition” or “activation”). Both variablesare converted to a binary outcome (0 or 1), allowing the creation of a contingency table and subsequentlythe calculation of Cohen’s formula for κ. The kappa statistic ranges from −1 to +1, where a value of 0represents the amount of agreement that can be expected from random chance, and a value of 1 (resp. −1)indicates perfect agreement (resp. disagreement) between the raters. In the example contingency table ofFigure 2, κ = 0.657, which is a considerable reduction in the level of congruence compared to the 0.83 percentagreement.
6.3 Truth Density bias in biological networks
6.3.1 Bias guides model parameterization in a cancer signaling network
We used abmlog on a cancer signaling network, consisting of 77 nodes and a total of 149 curated causalinteractions that cover a variety of pathways linked to prosurvival and antisurvival cell signaling (e.g. cyclinexpression and caspase activation). This PKN, named CASCADE (CAncer Signaling CAusality DatabasE),was successfully used to build a Boolean model able to predict anti-cancer drug combination effects in gastriccell lines [14]. We used the CASCADE version from the Flobak paper (version CASCADE 1.0), with somenode naming changes for compatibility with the newest versions [31]. The number of nodes with bothactivating and inhibiting regulators in the CASCADE 1.0 topology is 23, while the rest of the nodes haveregulators that belong to only one of the two regulatory categories. Thus, using abmlog, we generated all223 possible Boolean models with the “AND-NOT” and “OR-NOT” link operator parameterizations. Theresulting stable state distribution across all produced models is presented in Figure 3A. For our subsequentanalysis we will use only the 2 802 224 Boolean models that had exactly one stable state, as it makes thecalculation of agreement between a node’s assigned link operator and its corresponding activity state acrossall the selected models more straightforward.
The agreement results between link operator parameterization and stable state activity across all the selectedCASCADE models are presented in Figures 3B (percent agreement, per node) and 3C (Cohen’s κ, nodeswith the same number of regulators are grouped together). The percent agreement results show a highvariability across the link operator nodes and range from a minimum of 53% to a perfect agreement (100%).This suggests that for all nodes, across any selected CASCADE 1.0 Boolean model, there is a higher thanrandom probability that the assignment of the “AND-NOT” (resp. “OR-NOT”) link operator formula in theassociated Boolean equations will result in the inhibition (resp. activation) of the target nodes. So, eventhough none of the nodes have more than 5 regulators, we already start seeing signs of the truth density biasin the link operator regulatory functions across a wide range of Boolean models.
When applying Cohen’s κ to evaluate level of agreement, we chose a conservative threshold equal to 0.6,corresponding empirically to a substantial level of agreement [32, 33]. We found that 60% (14 out of 23) of
14
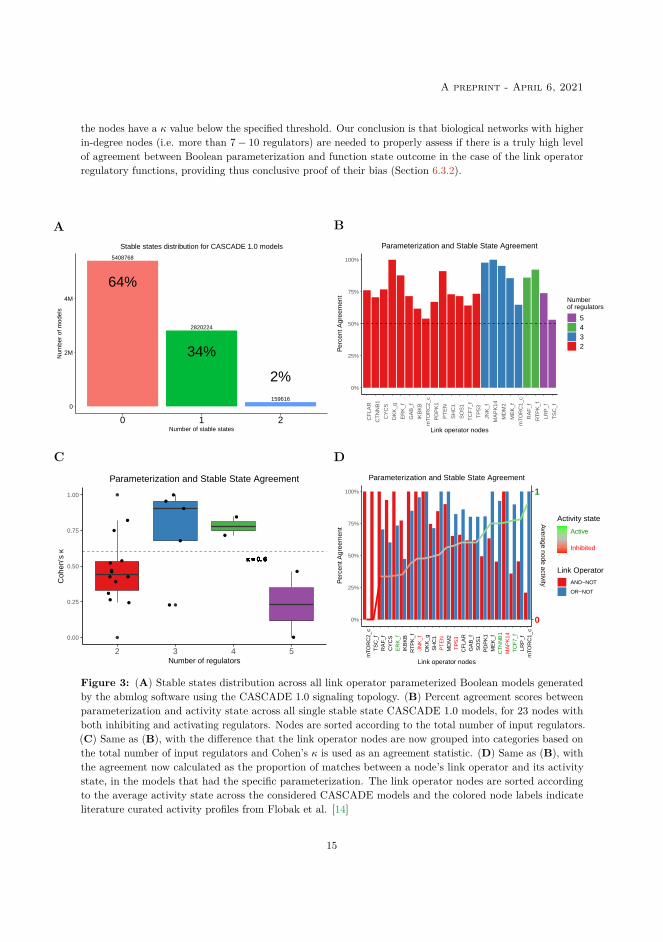
A preprint - April 6, 2021
the nodes have a κ value below the specified threshold. Our conclusion is that biological networks with higherin-degree nodes (i.e. more than 7− 10 regulators) are needed to properly assess if there is a truly high levelof agreement between Boolean parameterization and function state outcome in the case of the link operatorregulatory functions, providing thus conclusive proof of their bias (Section 6.3.2).
A
5408768
2820224
159616
64%
34%
2%
0
2M
4M
0 1 2Number of stable states
Num
ber
of m
odel
s
Stable states distribution for CASCADE 1.0 models
B
0%
25%
50%
75%
100%
CF
LAR
CT
NN
B1
CY
CS
DK
K_g
ER
K_f
GA
B_f
IKB
KB
mTO
RC
2_c
PD
PK
1
PT
EN
SH
C1
SO
S1
TC
F7_
f
TP
53
JNK
_f
MA
PK
14
MD
M2
ME
K_f
mTO
RC
1_c
RA
F_f
RT
PK
_f
LRP
_f
TS
C_f
Link operator nodes
Per
cent
Agr
eem
ent
Numberof regulators
5432
Parameterization and Stable State Agreement
C
●
●
●
●
●
●
●
●
●
●
●
●
●
●
●
●
●
●
●
●●
●
●
●
κ = 0. 6κ = 0. 6κ = 0. 6κ = 0. 6κ = 0. 6κ = 0. 6κ = 0. 6κ = 0. 6κ = 0. 6κ = 0. 6κ = 0. 6κ = 0. 6κ = 0. 6κ = 0. 6κ = 0. 6κ = 0. 6κ = 0. 6κ = 0. 6κ = 0. 6κ = 0. 6κ = 0. 6κ = 0. 6κ = 0. 6
0.00
0.25
0.50
0.75
1.00
2 3 4 5Number of regulators
Coh
en′s
κ
Parameterization and Stable State Agreement
D
0%
25%
50%
75%
100%
0
1
mTO
RC
2_c
TS
C_f
RA
F_f
CY
CS
ER
K_f
IKB
KB
RT
PK
_fJN
K_f
DK
K_g
SH
C1
PT
EN
MD
M2
TP
53C
FLA
RG
AB
_fS
OS
1P
DP
K1
ME
K_f
CT
NN
B1
MA
PK
14T
CF
7_f
LRP
_fm
TOR
C1_
c
Link operator nodes
Per
cent
Agr
eem
ent
Average node activity
Inhibited
Active
Activity state
Link Operator
AND−NOT
OR−NOT
Parameterization and Stable State Agreement
Figure 3: (A) Stable states distribution across all link operator parameterized Boolean models generatedby the abmlog software using the CASCADE 1.0 signaling topology. (B) Percent agreement scores betweenparameterization and activity state across all single stable state CASCADE 1.0 models, for 23 nodes withboth inhibiting and activating regulators. Nodes are sorted according to the total number of input regulators.(C) Same as (B), with the difference that the link operator nodes are now grouped into categories based onthe total number of input regulators and Cohen’s κ is used as an agreement statistic. (D) Same as (B), withthe agreement now calculated as the proportion of matches between a node’s link operator and its activitystate, in the models that had the specific parameterization. The link operator nodes are sorted accordingto the average activity state across the considered CASCADE models and the colored node labels indicateliterature curated activity profiles from Flobak et al. [14]
15
A preprint - April 6, 2021
Regardless of the presence of bias or not, the agreement results can be used to show how experimental dataand topological regulatory knowledge (e.g. the activator-to-inhibitor ratio) can be coupled with the truthdensity metric to guide the choice of regulatory functions. In one example scenario, a modeler asks whatthe most probable link operator parameterization is among the “AND-NOT” and “OR-NOT” forms thatmatches available experimental evidence. We used a literature curated activity profile derived for the AGScell line from [14], to annotate 7 of the link operator nodes in Figure 3D according to their experimentallyvalidated state (activation or inhibition). To clearly identify which of the two parameterizations best fits theobserved data, for each node we split the CASCADE models in two model pools, representing the “AND-NOT”and “OR-NOT” node parameterizations, and calculated the proportion of models within each pool whoselink operator matched the expected state outcome. For example, in the contingency table of Figure 2,the equivalent calculation would be to divide the number of matches in each row with the correspondingrow total sum, resulting in 6/7 = 85.7% of the “AND-NOT” Boolean equations with an inhibited stablestate and 4/5 = 80% of the “OR-NOT” equations with an active target node. Moreover, the link operatornodes of Figure 3D are sorted in increasing order by their average stable state activity in the consideredCASCADE 1.0 Boolean models. It is evident that nodes with higher average activity in the stable statehave a higher agreement with the “OR-NOT” parameterization whereas nodes with lower average activity, ahigher agreement with the “AND-NOT” parameterization (0.85 and −0.74 Pearson correlation coefficientswith pOR-NOT
corr = 2.6× 10⁻⁷ and pAND-NOTcorr = 5× 10⁻⁵ respectively, see Software and Data Availability).
More specifically, we observe that for all experimentally validated nodes, a modeler could a priori set thelink operator to the appropriate form and get a stable state activation profile that matches the observations(“AND-NOT” to match an inhibition node profile or “OR-NOT” for an activation profile) with a higherprobability than if he was randomly choosing one of the two. For example, the data shows that 90% ofthe models with an “OR-NOT” Boolean equation for the target family node TCF7_f, had the node asactive in their respective stable state. The same is observed for the CTNNB1 (92%) and ERK_f active nodes(74%), as well as for the TP53 (65%) and PTEN (85%) inhibited nodes with the choice of the “AND-NOT”parameterization. Additionally, all the aforementioned nodes have two regulators (one activator and oneinhibitor) and using the respective truth density formulas (Eq. 6 and 7) with n = 2 and m = k = 1, we havethat TDAND−NOT = 0.25 (closer to 0 or inhibition) and TDOR−NOT = 0.75 (closer to 1 or activation), aswas also shown in Figure 1A. As such, the nodes observed output matches the statistically expected binaryoutcomes, showing that even with a low number of regulators, the BRF bias can be used to guide functionchoice.
In another scenario, a modeler knows that a particular node has a skewed activator-to-inhibitor ratio andwants to exploit such knowledge to make the node conform to a particular activity state of his choice. Anice example from our data is the family node LRP_f, with four activators and one inhibitor. Using thetruth density formulas for the two link operator parameterizations (Eq. 6 and 7) with n = 5, m = 4 andk = 1, we have that TDAND−NOT = 0.47 and TDOR−NOT = 0.97. So, if the modeler wants to have anactive LRP_f in the stable state, the “OR-NOT” parameterization should be preferred since the “AND-NOT”has an approximate 50% probability for this to happen from a statistical point of view. These truth densityvalues also match the results from Figure 3D, since only half of the models that use the “AND-NOT”parameterization end up with an inhibited LRP_f in the stable state while all of them have an active LRP_f(100% agreement) in the case where the “OR-NOT” form is used. Also, the average activity of LRP_f acrossall models is one of the highest in the data, suggesting that imbalanced activator-to-inhibitor ratios couldbe a direct proxy for predicting regulation outcome. In a similar situation, but at the other range of theactivity spectrum, we have the TSC_f family node with one activator and four inhibitors. The truth densityvalues (now using n = 5, m = 1 and k = 4) are TDAND−NOT = 0.03 and TDOR−NOT = 0.53 respectively.Therefore, the “AND-NOT” parameterization guarantees the inhibition of the TSC_f node (data shows 100%agreement) and it should be a modeler’s first choice if that is the desired outcome. On the other hand, if theactivation of TSC_f was a modeler’s preference, then the choice of the “OR-NOT” form would be the most
16
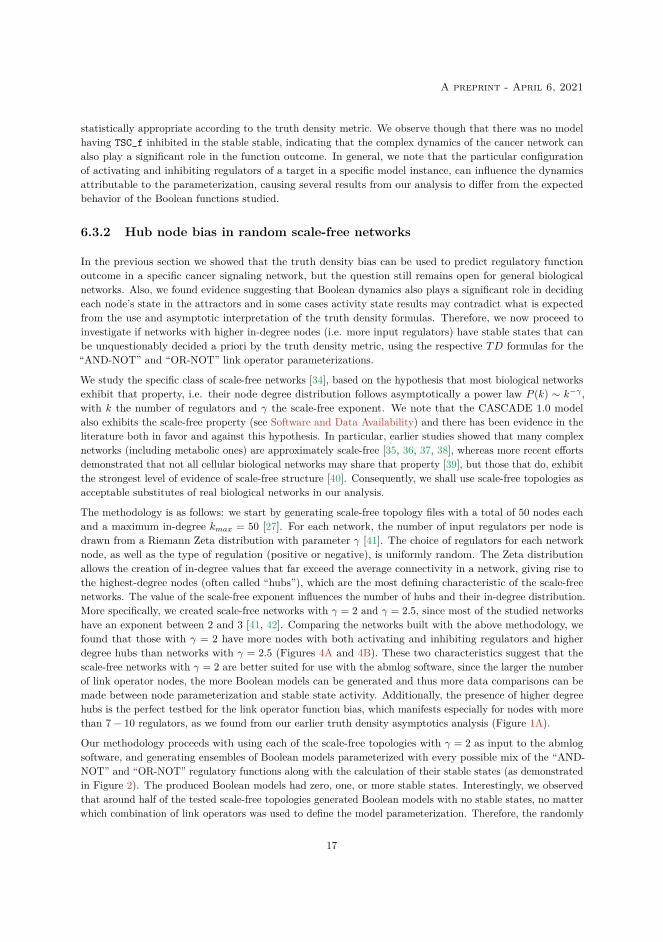
A preprint - April 6, 2021
statistically appropriate according to the truth density metric. We observe though that there was no modelhaving TSC_f inhibited in the stable stable, indicating that the complex dynamics of the cancer network canalso play a significant role in the function outcome. In general, we note that the particular configurationof activating and inhibiting regulators of a target in a specific model instance, can influence the dynamicsattributable to the parameterization, causing several results from our analysis to differ from the expectedbehavior of the Boolean functions studied.
6.3.2 Hub node bias in random scale-free networks
In the previous section we showed that the truth density bias can be used to predict regulatory functionoutcome in a specific cancer signaling network, but the question still remains open for general biologicalnetworks. Also, we found evidence suggesting that Boolean dynamics also plays a significant role in decidingeach node’s state in the attractors and in some cases activity state results may contradict what is expectedfrom the use and asymptotic interpretation of the truth density formulas. Therefore, we now proceed toinvestigate if networks with higher in-degree nodes (i.e. more input regulators) have stable states that canbe unquestionably decided a priori by the truth density metric, using the respective TD formulas for the“AND-NOT” and “OR-NOT” link operator parameterizations.
We study the specific class of scale-free networks [34], based on the hypothesis that most biological networksexhibit that property, i.e. their node degree distribution follows asymptotically a power law P (k) ∼ k−γ ,with k the number of regulators and γ the scale-free exponent. We note that the CASCADE 1.0 modelalso exhibits the scale-free property (see Software and Data Availability) and there has been evidence in theliterature both in favor and against this hypothesis. In particular, earlier studies showed that many complexnetworks (including metabolic ones) are approximately scale-free [35, 36, 37, 38], whereas more recent effortsdemonstrated that not all cellular biological networks may share that property [39], but those that do, exhibitthe strongest level of evidence of scale-free structure [40]. Consequently, we shall use scale-free topologies asacceptable substitutes of real biological networks in our analysis.
The methodology is as follows: we start by generating scale-free topology files with a total of 50 nodes eachand a maximum in-degree kmax = 50 [27]. For each network, the number of input regulators per node isdrawn from a Riemann Zeta distribution with parameter γ [41]. The choice of regulators for each networknode, as well as the type of regulation (positive or negative), is uniformly random. The Zeta distributionallows the creation of in-degree values that far exceed the average connectivity in a network, giving rise tothe highest-degree nodes (often called “hubs”), which are the most defining characteristic of the scale-freenetworks. The value of the scale-free exponent influences the number of hubs and their in-degree distribution.More specifically, we created scale-free networks with γ = 2 and γ = 2.5, since most of the studied networkshave an exponent between 2 and 3 [41, 42]. Comparing the networks built with the above methodology, wefound that those with γ = 2 have more nodes with both activating and inhibiting regulators and higherdegree hubs than networks with γ = 2.5 (Figures 4A and 4B). These two characteristics suggest that thescale-free networks with γ = 2 are better suited for use with the abmlog software, since the larger the numberof link operator nodes, the more Boolean models can be generated and thus more data comparisons can bemade between node parameterization and stable state activity. Additionally, the presence of higher degreehubs is the perfect testbed for the link operator function bias, which manifests especially for nodes with morethan 7− 10 regulators, as we found from our earlier truth density asymptotics analysis (Figure 1A).
Our methodology proceeds with using each of the scale-free topologies with γ = 2 as input to the abmlogsoftware, and generating ensembles of Boolean models parameterized with every possible mix of the “AND-NOT” and “OR-NOT” regulatory functions along with the calculation of their stable states (as demonstratedin Figure 2). The produced Boolean models had zero, one, or more stable states. Interestingly, we observedthat around half of the tested scale-free topologies generated Boolean models with no stable states, no matterwhich combination of link operators was used to define the model parameterization. Therefore, the randomly
17
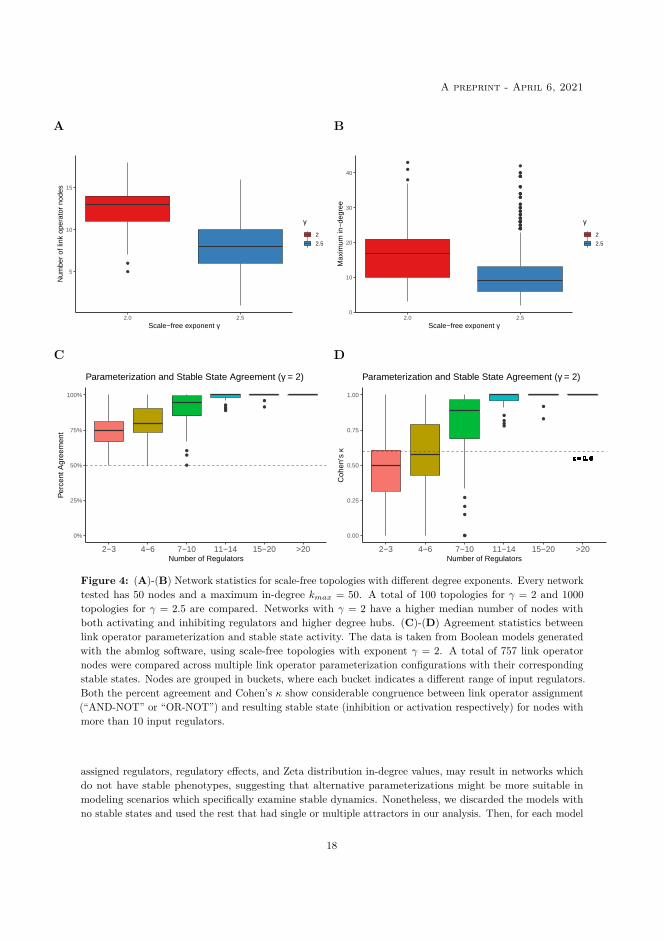
A preprint - April 6, 2021
A
●
●5
10
15
2.0 2.5
Scale−free exponent γ
Num
ber
of li
nk o
pera
tor
node
s
γ
2
2.5
B
●
●
●
●
●
●
●
●
●
●
●
●
●
●
●
●
●
●
●
●
●
●
●
●
●
●
●
●
●
●
●
●
●
●
●
●
●
●
●
●
●
●
●
●
●
●
●
●
●
●
●
●
●
●
●
●
0
10
20
30
40
2.0 2.5
Scale−free exponent γ
Max
imum
in−
degr
ee
γ
2
2.5
C
●
●
●
●●
●●
●
●
0%
25%
50%
75%
100%
2−3 4−6 7−10 11−14 15−20 >20Number of Regulators
Per
cent
Agr
eem
ent
Parameterization and Stable State Agreement (γ = 2)
D
●
●
●
●
●
●
●
●●
●
●
κ = 0. 6κ = 0. 6κ = 0. 6κ = 0. 6κ = 0. 6κ = 0. 6κ = 0. 6κ = 0. 6κ = 0. 6κ = 0. 6κ = 0. 6κ = 0. 6κ = 0. 6κ = 0. 6κ = 0. 6κ = 0. 6κ = 0. 6κ = 0. 6κ = 0. 6κ = 0. 6κ = 0. 6κ = 0. 6κ = 0. 6κ = 0. 6κ = 0. 6κ = 0. 6κ = 0. 6κ = 0. 6κ = 0. 6κ = 0. 6κ = 0. 6κ = 0. 6κ = 0. 6κ = 0. 6κ = 0. 6κ = 0. 6κ = 0. 6κ = 0. 6κ = 0. 6κ = 0. 6κ = 0. 6κ = 0. 6κ = 0. 6κ = 0. 6κ = 0. 6κ = 0. 6κ = 0. 6κ = 0. 6κ = 0. 6κ = 0. 6κ = 0. 6κ = 0. 6κ = 0. 6κ = 0. 6κ = 0. 6κ = 0. 6κ = 0. 6κ = 0. 6κ = 0. 6κ = 0. 6κ = 0. 6κ = 0. 6κ = 0. 6κ = 0. 6κ = 0. 6κ = 0. 6κ = 0. 6κ = 0. 6κ = 0. 6κ = 0. 6κ = 0. 6κ = 0. 6κ = 0. 6κ = 0. 6κ = 0. 6κ = 0. 6κ = 0. 6κ = 0. 6κ = 0. 6κ = 0. 6κ = 0. 6κ = 0. 6κ = 0. 6κ = 0. 6κ = 0. 6κ = 0. 6κ = 0. 6κ = 0. 6κ = 0. 6κ = 0. 6κ = 0. 6κ = 0. 6κ = 0. 6κ = 0. 6κ = 0. 6κ = 0. 6κ = 0. 6κ = 0. 6κ = 0. 6κ = 0. 6κ = 0. 6κ = 0. 6κ = 0. 6κ = 0. 6κ = 0. 6κ = 0. 6κ = 0. 6κ = 0. 6κ = 0. 6κ = 0. 6κ = 0. 6κ = 0. 6κ = 0. 6κ = 0. 6κ = 0. 6κ = 0. 6κ = 0. 6κ = 0. 6κ = 0. 6κ = 0. 6κ = 0. 6κ = 0. 6κ = 0. 6κ = 0. 6κ = 0. 6κ = 0. 6κ = 0. 6κ = 0. 6κ = 0. 6κ = 0. 6κ = 0. 6κ = 0. 6κ = 0. 6κ = 0. 6κ = 0. 6κ = 0. 6κ = 0. 6κ = 0. 6κ = 0. 6κ = 0. 6κ = 0. 6κ = 0. 6κ = 0. 6κ = 0. 6κ = 0. 6κ = 0. 6κ = 0. 6κ = 0. 6κ = 0. 6κ = 0. 6κ = 0. 6κ = 0. 6κ = 0. 6κ = 0. 6κ = 0. 6κ = 0. 6κ = 0. 6κ = 0. 6κ = 0. 6κ = 0. 6κ = 0. 6κ = 0. 6κ = 0. 6κ = 0. 6κ = 0. 6κ = 0. 6κ = 0. 6κ = 0. 6κ = 0. 6κ = 0. 6κ = 0. 6κ = 0. 6κ = 0. 6κ = 0. 6κ = 0. 6κ = 0. 6κ = 0. 6κ = 0. 6κ = 0. 6κ = 0. 6κ = 0. 6κ = 0. 6κ = 0. 6κ = 0. 6κ = 0. 6κ = 0. 6κ = 0. 6κ = 0. 6κ = 0. 6κ = 0. 6κ = 0. 6κ = 0. 6κ = 0. 6κ = 0. 6κ = 0. 6κ = 0. 6κ = 0. 6κ = 0. 6κ = 0. 6κ = 0. 6κ = 0. 6κ = 0. 6κ = 0. 6κ = 0. 6κ = 0. 6κ = 0. 6κ = 0. 6κ = 0. 6κ = 0. 6κ = 0. 6κ = 0. 6κ = 0. 6κ = 0. 6κ = 0. 6κ = 0. 6κ = 0. 6κ = 0. 6κ = 0. 6κ = 0. 6κ = 0. 6κ = 0. 6κ = 0. 6κ = 0. 6κ = 0. 6κ = 0. 6κ = 0. 6κ = 0. 6κ = 0. 6κ = 0. 6κ = 0. 6κ = 0. 6κ = 0. 6κ = 0. 6κ = 0. 6κ = 0. 6κ = 0. 6κ = 0. 6κ = 0. 6κ = 0. 6κ = 0. 6κ = 0. 6κ = 0. 6κ = 0. 6κ = 0. 6κ = 0. 6κ = 0. 6κ = 0. 6κ = 0. 6κ = 0. 6κ = 0. 6κ = 0. 6κ = 0. 6κ = 0. 6κ = 0. 6κ = 0. 6κ = 0. 6κ = 0. 6κ = 0. 6κ = 0. 6κ = 0. 6κ = 0. 6κ = 0. 6κ = 0. 6κ = 0. 6κ = 0. 6κ = 0. 6κ = 0. 6κ = 0. 6κ = 0. 6κ = 0. 6κ = 0. 6κ = 0. 6κ = 0. 6κ = 0. 6κ = 0. 6κ = 0. 6κ = 0. 6κ = 0. 6κ = 0. 6κ = 0. 6κ = 0. 6κ = 0. 6κ = 0. 6κ = 0. 6κ = 0. 6κ = 0. 6κ = 0. 6κ = 0. 6κ = 0. 6κ = 0. 6κ = 0. 6κ = 0. 6κ = 0. 6κ = 0. 6κ = 0. 6κ = 0. 6κ = 0. 6κ = 0. 6κ = 0. 6κ = 0. 6κ = 0. 6κ = 0. 6κ = 0. 6κ = 0. 6κ = 0. 6κ = 0. 6κ = 0. 6κ = 0. 6κ = 0. 6κ = 0. 6κ = 0. 6κ = 0. 6κ = 0. 6κ = 0. 6κ = 0. 6κ = 0. 6κ = 0. 6κ = 0. 6κ = 0. 6κ = 0. 6κ = 0. 6κ = 0. 6κ = 0. 6κ = 0. 6κ = 0. 6κ = 0. 6κ = 0. 6κ = 0. 6κ = 0. 6κ = 0. 6κ = 0. 6κ = 0. 6κ = 0. 6κ = 0. 6κ = 0. 6κ = 0. 6κ = 0. 6κ = 0. 6κ = 0. 6κ = 0. 6κ = 0. 6κ = 0. 6κ = 0. 6κ = 0. 6κ = 0. 6κ = 0. 6κ = 0. 6κ = 0. 6κ = 0. 6κ = 0. 6κ = 0. 6κ = 0. 6κ = 0. 6κ = 0. 6κ = 0. 6κ = 0. 6κ = 0. 6κ = 0. 6κ = 0. 6κ = 0. 6κ = 0. 6κ = 0. 6κ = 0. 6κ = 0. 6κ = 0. 6κ = 0. 6κ = 0. 6κ = 0. 6κ = 0. 6κ = 0. 6κ = 0. 6κ = 0. 6κ = 0. 6κ = 0. 6κ = 0. 6κ = 0. 6κ = 0. 6κ = 0. 6κ = 0. 6κ = 0. 6κ = 0. 6κ = 0. 6κ = 0. 6κ = 0. 6κ = 0. 6κ = 0. 6κ = 0. 6κ = 0. 6κ = 0. 6κ = 0. 6κ = 0. 6κ = 0. 6κ = 0. 6κ = 0. 6κ = 0. 6κ = 0. 6κ = 0. 6κ = 0. 6κ = 0. 6κ = 0. 6κ = 0. 6κ = 0. 6κ = 0. 6κ = 0. 6κ = 0. 6κ = 0. 6κ = 0. 6κ = 0. 6κ = 0. 6κ = 0. 6κ = 0. 6κ = 0. 6κ = 0. 6κ = 0. 6κ = 0. 6κ = 0. 6κ = 0. 6κ = 0. 6κ = 0. 6κ = 0. 6κ = 0. 6κ = 0. 6κ = 0. 6κ = 0. 6κ = 0. 6κ = 0. 6κ = 0. 6κ = 0. 6κ = 0. 6κ = 0. 6κ = 0. 6κ = 0. 6κ = 0. 6κ = 0. 6κ = 0. 6κ = 0. 6κ = 0. 6κ = 0. 6κ = 0. 6κ = 0. 6κ = 0. 6κ = 0. 6κ = 0. 6κ = 0. 6κ = 0. 6κ = 0. 6κ = 0. 6κ = 0. 6κ = 0. 6κ = 0. 6κ = 0. 6κ = 0. 6κ = 0. 6κ = 0. 6κ = 0. 6κ = 0. 6κ = 0. 6κ = 0. 6κ = 0. 6κ = 0. 6κ = 0. 6κ = 0. 6κ = 0. 6κ = 0. 6κ = 0. 6κ = 0. 6κ = 0. 6κ = 0. 6κ = 0. 6κ = 0. 6κ = 0. 6κ = 0. 6κ = 0. 6κ = 0. 6κ = 0. 6κ = 0. 6κ = 0. 6κ = 0. 6κ = 0. 6κ = 0. 6κ = 0. 6κ = 0. 6κ = 0. 6κ = 0. 6κ = 0. 6κ = 0. 6κ = 0. 6κ = 0. 6κ = 0. 6κ = 0. 6κ = 0. 6κ = 0. 6κ = 0. 6κ = 0. 6κ = 0. 6κ = 0. 6κ = 0. 6κ = 0. 6κ = 0. 6κ = 0. 6κ = 0. 6κ = 0. 6κ = 0. 6κ = 0. 6κ = 0. 6κ = 0. 6κ = 0. 6κ = 0. 6κ = 0. 6κ = 0. 6κ = 0. 6κ = 0. 6κ = 0. 6κ = 0. 6κ = 0. 6κ = 0. 6κ = 0. 6κ = 0. 6κ = 0. 6κ = 0. 6κ = 0. 6κ = 0. 6κ = 0. 6κ = 0. 6κ = 0. 6κ = 0. 6κ = 0. 6κ = 0. 6κ = 0. 6κ = 0. 6κ = 0. 6κ = 0. 6κ = 0. 6κ = 0. 6κ = 0. 6κ = 0. 6κ = 0. 6κ = 0. 6κ = 0. 6κ = 0. 6κ = 0. 6κ = 0. 6κ = 0. 6κ = 0. 6κ = 0. 6κ = 0. 6κ = 0. 6κ = 0. 6κ = 0. 6κ = 0. 6κ = 0. 6κ = 0. 6κ = 0. 6κ = 0. 6κ = 0. 6κ = 0. 6κ = 0. 6κ = 0. 6κ = 0. 6κ = 0. 6κ = 0. 6κ = 0. 6κ = 0. 6κ = 0. 6κ = 0. 6κ = 0. 6κ = 0. 6κ = 0. 6κ = 0. 6κ = 0. 6κ = 0. 6κ = 0. 6κ = 0. 6κ = 0. 6κ = 0. 6κ = 0. 6κ = 0. 6κ = 0. 6κ = 0. 6κ = 0. 6κ = 0. 6κ = 0. 6κ = 0. 6κ = 0. 6κ = 0. 6κ = 0. 6κ = 0. 6κ = 0. 6κ = 0. 6κ = 0. 6κ = 0. 6κ = 0. 6κ = 0. 6κ = 0. 6κ = 0. 6κ = 0. 6κ = 0. 6κ = 0. 6κ = 0. 6κ = 0. 6κ = 0. 6κ = 0. 6κ = 0. 6κ = 0. 6κ = 0. 6κ = 0. 6κ = 0. 6κ = 0. 6κ = 0. 6κ = 0. 6κ = 0. 6κ = 0. 6κ = 0. 6κ = 0. 6κ = 0. 6κ = 0. 6κ = 0. 6κ = 0. 6κ = 0. 6κ = 0. 6κ = 0. 6κ = 0. 6κ = 0. 6κ = 0. 6κ = 0. 6κ = 0. 6κ = 0. 6κ = 0. 6κ = 0. 6κ = 0. 6κ = 0. 6κ = 0. 6κ = 0. 6κ = 0. 6κ = 0. 6κ = 0. 6κ = 0. 6κ = 0. 6κ = 0. 6κ = 0. 6κ = 0. 6κ = 0. 6κ = 0. 6κ = 0. 6κ = 0. 6κ = 0. 6κ = 0. 6κ = 0. 6κ = 0. 6κ = 0. 6κ = 0. 6κ = 0. 6κ = 0. 6κ = 0. 6κ = 0. 6κ = 0. 6κ = 0. 6κ = 0. 6κ = 0. 6κ = 0. 6κ = 0. 6κ = 0. 6κ = 0. 6κ = 0. 6κ = 0. 6κ = 0. 6κ = 0. 6κ = 0. 6κ = 0. 6κ = 0. 6κ = 0. 6κ = 0. 6κ = 0. 6κ = 0. 6κ = 0. 6κ = 0. 6κ = 0. 6κ = 0. 6κ = 0. 6κ = 0. 6κ = 0. 6κ = 0. 6κ = 0. 6κ = 0. 6κ = 0. 6κ = 0. 6κ = 0. 6κ = 0. 6κ = 0. 6κ = 0. 6κ = 0. 6κ = 0. 6κ = 0. 6κ = 0. 6κ = 0. 6κ = 0. 6κ = 0. 6κ = 0. 6κ = 0. 6κ = 0. 6κ = 0. 6κ = 0. 6κ = 0. 6κ = 0. 6κ = 0. 6κ = 0. 6κ = 0. 6κ = 0. 6κ = 0. 6κ = 0. 6κ = 0. 6κ = 0. 6κ = 0. 6κ = 0. 6κ = 0. 6κ = 0. 6κ = 0. 6κ = 0. 6κ = 0. 6κ = 0. 6κ = 0. 6κ = 0. 6κ = 0. 6κ = 0. 6κ = 0. 6κ = 0. 6κ = 0. 6κ = 0. 6κ = 0. 6κ = 0. 6κ = 0. 6κ = 0. 6κ = 0. 6κ = 0. 6κ = 0. 6κ = 0. 6κ = 0. 6κ = 0. 6κ = 0. 6κ = 0. 6κ = 0. 6κ = 0. 6κ = 0. 6κ = 0. 6κ = 0. 6κ = 0. 6κ = 0. 6κ = 0. 6κ = 0. 6κ = 0. 6κ = 0. 6κ = 0. 6κ = 0. 6κ = 0. 6κ = 0. 6κ = 0. 6κ = 0. 6
0.00
0.25
0.50
0.75
1.00
2−3 4−6 7−10 11−14 15−20 >20Number of Regulators
Coh
en′s
κ
Parameterization and Stable State Agreement (γ = 2)
Figure 4: (A)-(B) Network statistics for scale-free topologies with different degree exponents. Every networktested has 50 nodes and a maximum in-degree kmax = 50. A total of 100 topologies for γ = 2 and 1000
topologies for γ = 2.5 are compared. Networks with γ = 2 have a higher median number of nodes withboth activating and inhibiting regulators and higher degree hubs. (C)-(D) Agreement statistics betweenlink operator parameterization and stable state activity. The data is taken from Boolean models generatedwith the abmlog software, using scale-free topologies with exponent γ = 2. A total of 757 link operatornodes were compared across multiple link operator parameterization configurations with their correspondingstable states. Nodes are grouped in buckets, where each bucket indicates a different range of input regulators.Both the percent agreement and Cohen’s κ show considerable congruence between link operator assignment(“AND-NOT” or “OR-NOT”) and resulting stable state (inhibition or activation respectively) for nodes withmore than 10 input regulators.
assigned regulators, regulatory effects, and Zeta distribution in-degree values, may result in networks whichdo not have stable phenotypes, suggesting that alternative parameterizations might be more suitable inmodeling scenarios which specifically examine stable dynamics. Nonetheless, we discarded the models withno stable states and used the rest that had single or multiple attractors in our analysis. Then, for each model
18
A preprint - April 6, 2021
node with both activating and inhibiting regulators, we compared its assigned link operator with the activitystate value in the corresponding stable state(s), across all the link operator parameterization spectrum thatyielded models with stable phenotypes. The agreement results between parameterization and stable stateactivity are presented in Figure 4C for the percent agreement and in Figure 4D for Cohen’s kappa statistic.
We observe that both presented statistics show a large variation of agreement for nodes with less than 10
regulators and an increasing agreement with more regulators. This agreement manifests in link operator nodesparameterized with the “AND-NOT” or “OR-NOT” Boolean functions, while at the same time exhibitinginhibited or active states respectively in the associated model attractors. Therefore, we conclude that theconsidered standardized Boolean regulatory functions are biased and their outcomes can be determined apriori from the choice of the corresponding link operator parameterization, especially for nodes with morethan 7− 10 regulators.
7 Discussion
The specification of mathematical rules that describe the behavior of biological systems is one of the coreaspects of computational modeling. It is therefore of considerable value to have a list of metrics that can beused to compare different model parameterizations and make an informed decision with regard to the selectionof an appropriate regulatory function that better matches the expected behavior in a specific modelingapplication.
We specifically discussed two characterizations that can assist modelers in comparing various regulatoryfunctions and select the most plausible ones with regard to the causal interaction-based knowledge at hand.Expressing Boolean functions in DNF makes biological interpretation concrete by explicitly specifying theconditions (presence or absence of the positive and negative regulators, respectively) that make a targetactive. Expressing the functions in CDNF allows to easily check for compliance with the underlying regulatorytopology and subsequently, the rejection of functions that violate such consistency. The difference betweenthese two characterizations lies in the fact that the consistency terminology stems from the mathematicalworld, while biological interpretability is tightly connected to the world of language semantics and thus closerto the modeler’s point of view. Finally, truth density is an informative measure which can be used to verifyif the function parameterization dictates biased Boolean outcomes. It can also be used as a test metric tounderstand how a function behaves when the number of regulators increases or the balance between thenumber of activators and inhibitors changes.
Using the truth density metric, we showed the presence of link operator function bias in the hubs of randomlyconstructed scale-free networks. A potential application of this finding could be to dramatically decrease thetime needed to train Boolean models to fit observations via various optimization methods, by pre-assigningthe parameterization of link operator nodes with sufficiently many regulators. The pruning of the searchableparameterization space, guided by the truth density metric, can result in more efficient automated methodsand can enable the training of larger models against data from numerous resources (e.g. large cell line panels).The hub node bias has also interesting links to the presence of order in biological networks [43]. The dynamicsof a Boolean network can exhibit ordered or chaotic behavior. Ordered dynamics is characterized by thepresence of less stable states and limit cycle attractors with smaller mean length (number of states in acomplex attractor) and transition times (number of steps needed to reach an attractor starting out from anarbitrary configuration) [41]. It is also known that the truth density (probability of target expression) as wellas the degree exponent γ (related to network connectivity) can modulate the dynamic transition between theordered and chaotic phases. Moreover, it has been shown that above the critical value of γc ∼ 2.47, orderedbehavior in the form of stable state dynamics manifests independently of the truth density, whereas for valuescloser to γ = 2, order coincides with the presence of high biased nodes (see Fig. 4 in [41]). Our work confirmsthis phenomenon, since the use of the link operator parameterization guarantees the presence of biased hubs,
19
A preprint - April 6, 2021
which enable the scale-free networks to exhibit stability and homogeneity in terms of regulatory output, andthus stay in the ordered dynamic regime.
Searching for other function metrics that are applicable to logical modeling, the sensitivity of a Booleanfunction is one of the most relevant [44]. As its name suggests, it measures how sensitive the output of thefunction is to small changes of its inputs. Sensitivity is tightly linked to the truth density metric, since ahighly homogeneous Boolean function (i.e. a biased one), is unlikely to change its value between similarregulatory input configurations and so, its sensitivity is relatively low. To compute the average sensitivityvalue for an arbitrary Boolean function we need to sum over all the influences of the input variables, whichessentially represent a way to measure individual variable importance. In the context of regulatory functions,a regulator’s influence is defined as the probability that a random toggle on its activity (from active toinactive and vice-versa) will change the value of the Boolean function [45]. Therefore, by calculating theinfluence of every regulator, the modeler can gain knowledge of which ones are more important and controlthe respective function’s outcome. This transition of perspective from the function level to the regulator levelmight be advantageous in cases where the modeler’s intention is to compare different parameterizations andchoose the one for which a particular regulator is labeled as significantly more important than the others,based on the available biological knowledge.
Lastly, an important addition to a universal list of Boolean function metrics for modeling purposes, is thenotion of function complexity. A recent definition is given by Gherardi et al. [25], where the authors definedit as the number of terms in the shortest possible DNF expression of a given Boolean function, divided by thetotal number of rows in the corresponding truth table. We presented this information in the last column ofTable 2, where the BRFs are sorted from lower to higher complexity (note that the CDNF has the minimumnumber of terms for every BRF included in the table). One useful observation is that the standardized“AND-NOT” formula [9] is the function with the lowest complexity that is also consistent and thus biologicallyplausible - all properties that make it a good choice from the modeler’s perspective. Assessing the complexityof the studied regulatory functions using the derived formulas for the minimum number of CDNF terms forany number of activators m and inhibitors k (see last column of Table 2), we comment on the fact that allBRFs have very low complexity since O(m× k)� 2m+k, i.e. the number of function terms does not grow asfast as the number of rows in the corresponding truth table. Same observation has been shown to be true inmanually-tuned, experimentally-validated Boolean functions [25], providing us with another confirmationthat the consistent functions from Table 2 are good candidates for logic-based modeling approaches.
8 Future work
In this work we make an attempt to address the logical rule specification problem, which can be simply statedas: “Many functions may fit the available observations, which one is the most proper to use?” Of coursewhat is “proper” can be fairly subjective, but the main point is that a careful consideration of the underlyingapplication context (i.e. what output do I expect in a specific scenario of interest) along with a list of metricsthat explicate a Boolean function’s behavior and semantics, provides the user with the appropriate frameworkto decide on the function parameterization that sets the basis for further model analysis and simulation. Inthat regard, interesting directions for further research include the application of the metrics presented in thiswork in different published biological models, and the subsequent comparison of different regulatory functionswithin this framework. Such meta-analyses could potentially indicate regulatory functions that achieve ahigher degree of fitness with the observed data or general properties that are common in all Boolean functionsused to model biological systems.
An interesting study for example would be to analyze Boolean functions from published biological modelsthat have extreme activator-to-inhibitor ratios. If such imbalanced ratios also result in proportionally skewedBoolean outcomes (i.e. with more activators, the truth density is closer to 1 and the reverse with moreinhibitors), suggesting that target outcome follows the majority regulatory groups, then the use of threshold
20
A preprint - April 6, 2021
functions could be a more proper parameterization alternative, as was shown in Figure 1B. Of course, wenote that each individual case must be examined with care, since there might be high influence nodes, whoseactivity defines the target’s output even in the presence of a much larger regulatory group with oppositeeffects. For example, CASP3 is a biological entity that, when activated, will almost certainly result in the cell’sdeath even in the presence of a majority of proliferation-positive regulators at any given time. Subsequently,a more appropriate choice based on the results of this study can be made, either by choosing between thebiased functions, which demonstrate a more balanced behavior for such extreme activator-to-inhibitor ratios(e.g. using the “Pairs” or the “AND-NOT” functions which are balanced vs using the “OR-NOT” whichwould make the target activated most of the time, see Scenario 2) or by using refined threshold functions, inwhich each regulator’s weight will differ in order to match the influence that it has on the target.
There have been only a handful examples of published logical models [46, 47] and research papers [21, 48, 49,50, 51, 52, 53, 54] that use the threshold modeling framework in biological systems. This is partly due to thelack of tools that make threshold functions accessible to the average user, and the availability of such softwarein open-source environments such as the CoLoMoTo Interactive Notebook [55]. We believe that the existenceof such novel software will enable the construction and configuration of generic Boolean threshold models andprovide users of the logical-modeling community and beyond with the necessary toolbox to further studythese models. This will enable applications that depend on the dynamical analysis of Boolean thresholdmodels (identification of attractors, reachability properties, formal verification and control) and the use ofoptimization methods to calibrate the threshold function parameters to best fit the available experimentaldata, as is done currently with analytical logic-based functions [12].
Software and Data Availability
The abmlog software that was used to generate Boolean models with the “AND-NOT” and “OR-NOT”Boolean regulatory functions is available at https://github.com/druglogics/abmlog under the MITLicense. We used the version 1.6.0 for this analysis, which is also offered as a standalone package athttps://github.com/druglogics/abmlog/packages.
An extended analysis accompanying the results of this paper is available at https://druglogics.github.io/brf-bias. It includes links to the produced model datasets and scripts to reproduce the results andfigures of this paper. In particular, the correlation analysis between average node state in the CASCADE1.0 models and percent agreement per each link operator is available at https://druglogics.github.io/brf-bias/cascade-1-0-data-analysis.html#node-state-and-percent-agreement-correlation. Thedegree distribution of the CASCADE 1.0 topology and other network statistics are examined in https://druglogics.github.io/brf-bias/cascade-1-0-data-analysis.html#network-properties.
Funding
This work was supported by ERACoSysMed Call 1 project COLOSYS (JZ, MK), project UIDB/50021/2020from Fundação para a Ciência e a Tecnologia - INESC-ID multi-annual funding (PM), the NorwegianUniversity of Science and Technology’s Strategic Research Area ‘NTNU Health’ and The Joint ResearchCommittee between St. Olavs hospital and the Faculty of Medicine and Health Sciences, NTNU - FFU (ÅF).
Conflict of Interest: none declared.
Acknowledgments
The authors acknowledge Dr. Vasundra Touré for her contribution in the improvement of Figure 2 and itscaption.
21
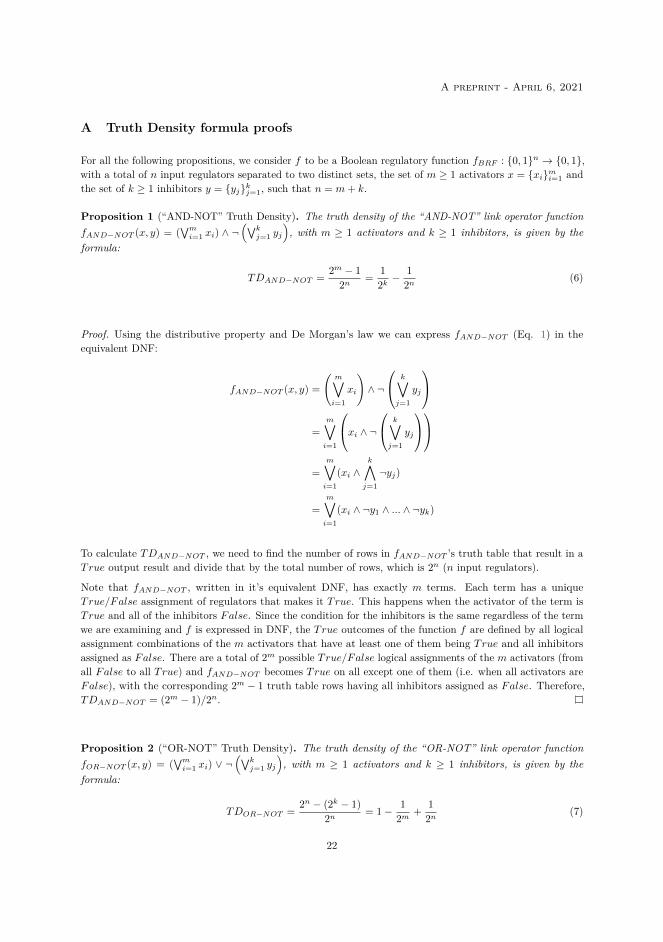
A preprint - April 6, 2021
A Truth Density formula proofs
For all the following propositions, we consider f to be a Boolean regulatory function fBRF : {0, 1}n → {0, 1},with a total of n input regulators separated to two distinct sets, the set of m ≥ 1 activators x = {xi}mi=1 andthe set of k ≥ 1 inhibitors y = {yj}kj=1, such that n = m+ k.
Proposition 1 (“AND-NOT” Truth Density). The truth density of the “AND-NOT” link operator functionfAND−NOT (x, y) = (
∨mi=1 xi) ∧ ¬
(∨kj=1 yj
), with m ≥ 1 activators and k ≥ 1 inhibitors, is given by the
formula:
TDAND−NOT =2m − 1
2n=
1
2k− 1
2n(6)
Proof. Using the distributive property and De Morgan’s law we can express fAND−NOT (Eq. 1) in theequivalent DNF:
fAND−NOT (x, y) =
(m∨i=1
xi
)∧ ¬
k∨j=1
yj
=
m∨i=1
xi ∧ ¬ k∨j=1
yj
=
m∨i=1
(xi ∧k∧j=1
¬yj)
=
m∨i=1
(xi ∧ ¬y1 ∧ ... ∧ ¬yk)
To calculate TDAND−NOT , we need to find the number of rows in fAND−NOT ’s truth table that result in aTrue output result and divide that by the total number of rows, which is 2n (n input regulators).
Note that fAND−NOT , written in it’s equivalent DNF, has exactly m terms. Each term has a uniqueTrue/False assignment of regulators that makes it True. This happens when the activator of the term isTrue and all of the inhibitors False. Since the condition for the inhibitors is the same regardless of the termwe are examining and f is expressed in DNF, the True outcomes of the function f are defined by all logicalassignment combinations of the m activators that have at least one of them being True and all inhibitorsassigned as False. There are a total of 2m possible True/False logical assignments of the m activators (fromall False to all True) and fAND−NOT becomes True on all except one of them (i.e. when all activators areFalse), with the corresponding 2m − 1 truth table rows having all inhibitors assigned as False. Therefore,TDAND−NOT = (2m − 1)/2n.
Proposition 2 (“OR-NOT” Truth Density). The truth density of the “OR-NOT” link operator functionfOR−NOT (x, y) = (
∨mi=1 xi) ∨ ¬
(∨kj=1 yj
), with m ≥ 1 activators and k ≥ 1 inhibitors, is given by the
formula:
TDOR−NOT =2n − (2k − 1)
2n= 1− 1
2m+
1
2n(7)
22

A preprint - April 6, 2021
Proof. Using De Morgan’s law we can express fOR−NOT (Eq. 2) in the equivalent DNF:
fOR−NOT (x, y) =
(m∨i=1
xi
)∨ ¬
k∨j=1
yj
=
(m∨i=1
xi
)∨
k∧j=1
¬yj
= x1 ∨ x2 ∨ ... ∨ xm ∨ (¬y1 ∧ ... ∧ ¬yk)
To calculate TDOR−NOT , we find the number of rows of fOR−NOT ’s truth table that result in a False output(Rfalse), subtract that number from the total number of rows (2n) to get the rows that result in f beingTrue, and then divide by the total number of rows. As such, TDOR−NOT = (2n −Rfalse)/2n.
Note that fOR−NOT , expressed in it’s equivalent DNF, has exactly m+ 1 terms. To make fOR−NOT False,we assign the m activators as False and then we investigate which logical assignments of the inhibitors{yj}kj=1 make the last DNF term also False. Out of all the possible 2k True/False logical assignments ofthe k inhibitors (ranging from all False to all True) there is only one that does not make the last term offOR−NOT False, which happens specifically when all k inhibitors are False. Therefore, Rfalse = 2k − 1 andTDOR−NOT = (2n − (2k − 1))/2n.
Proposition 3 (“Pairs” Truth Density). The truth density of the “Pairs” link operator function fPairs(x, y) =∨m,k∀(i,j)(xi ∧ ¬yj), with m ≥ 1 activators and k ≥ 1 inhibitors, is given by the formula:
TDPairs =(2m − 1)(2k − 1)
2n(8)
Proof. Using the distributive property we can express fPairs (Eq. 3) in its equivalent conjunction normalform (CNF), where two separate clauses are connected with AND’s (∧) and inside the clauses the literals areconnected with OR’s (∨):
fPairs(x, y) =
m,k∨∀(i,j)
(xi ∧ ¬yj) =
(m∨i=1
xi
)∧
k∨j=1
¬yj
(9)
To calculate TDPairs, based on its given CNF, we find the number of rows in its truth table that have atleast one True activator (Ract) and subtract from these the rows in which all inhibitors are True (Rinh).Therefore, only the rows that have at least one True activator and at least one False inhibitor will be left,corresponding to the biological interpretation of fPairs. As such, TDPairs = (Ract −Rinh)/2n.
Ract can be found by subtracting from the total number of rows (2n), the rows that have all activators asFalse. The number of these rows depends on the number of inhibitors, since for each one of the total possible2k True/False logical assignments of the k inhibitors (ranging from all False to all True), there will be arow in the truth table with all activators as False. Therefore, Ract = 2n − 2k = 2m+k − 2k = 2k(2m − 1).
Rinh depends on the number of activators, since for each one of the total possible 2m True/False logicalassignments of the m activators (ranging from all False to all True), there will be a row in the truth tablewith all inhibitors as True. Note that we have to exclude one row from this result, which is exactly therow that has all activators as False since it’s not included in the Ract rows. Therefore, Rinh = 2m − 1 andTDPairs = (Ract −Rinh)/2n = (2k(2m − 1)− (2m − 1))/2n.
23
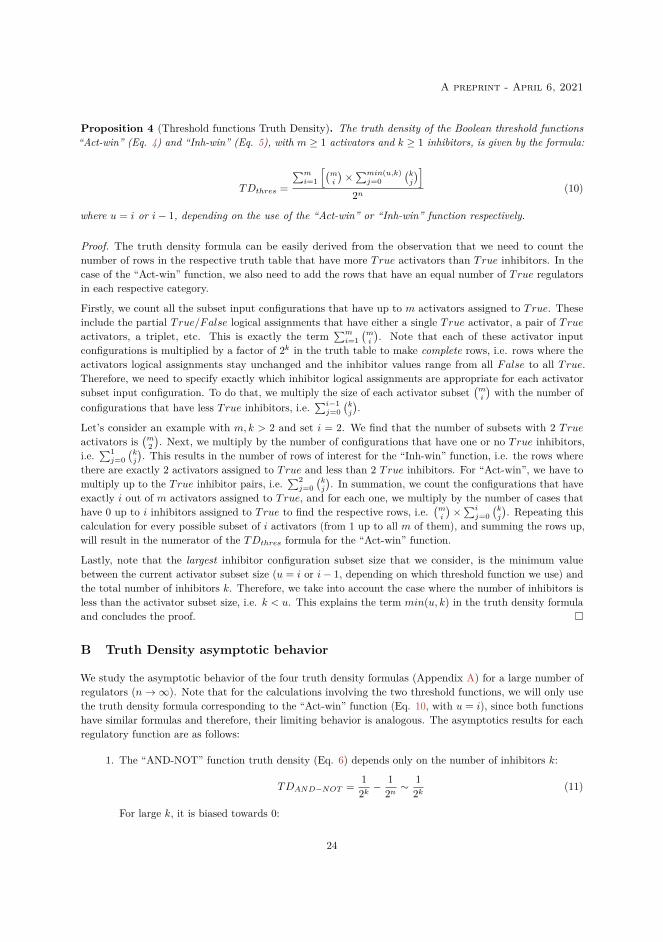
A preprint - April 6, 2021
Proposition 4 (Threshold functions Truth Density). The truth density of the Boolean threshold functions“Act-win” (Eq. 4) and “Inh-win” (Eq. 5), with m ≥ 1 activators and k ≥ 1 inhibitors, is given by the formula:
TDthres =
∑mi=1
[(mi
)×∑min(u,k)j=0
(kj
)]2n
(10)
where u = i or i− 1, depending on the use of the “Act-win” or “Inh-win” function respectively.
Proof. The truth density formula can be easily derived from the observation that we need to count thenumber of rows in the respective truth table that have more True activators than True inhibitors. In thecase of the “Act-win” function, we also need to add the rows that have an equal number of True regulatorsin each respective category.
Firstly, we count all the subset input configurations that have up to m activators assigned to True. Theseinclude the partial True/False logical assignments that have either a single True activator, a pair of Trueactivators, a triplet, etc. This is exactly the term
∑mi=1
(mi
). Note that each of these activator input
configurations is multiplied by a factor of 2k in the truth table to make complete rows, i.e. rows where theactivators logical assignments stay unchanged and the inhibitor values range from all False to all True.Therefore, we need to specify exactly which inhibitor logical assignments are appropriate for each activatorsubset input configuration. To do that, we multiply the size of each activator subset
(mi
)with the number of
configurations that have less True inhibitors, i.e.∑i−1j=0
(kj
).
Let’s consider an example with m, k > 2 and set i = 2. We find that the number of subsets with 2 True
activators is(m2
). Next, we multiply by the number of configurations that have one or no True inhibitors,
i.e.∑1j=0
(kj
). This results in the number of rows of interest for the “Inh-win” function, i.e. the rows where
there are exactly 2 activators assigned to True and less than 2 True inhibitors. For “Act-win”, we have tomultiply up to the True inhibitor pairs, i.e.
∑2j=0
(kj
). In summation, we count the configurations that have
exactly i out of m activators assigned to True, and for each one, we multiply by the number of cases thathave 0 up to i inhibitors assigned to True to find the respective rows, i.e.
(mi
)×∑ij=0
(kj
). Repeating this
calculation for every possible subset of i activators (from 1 up to all m of them), and summing the rows up,will result in the numerator of the TDthres formula for the “Act-win” function.
Lastly, note that the largest inhibitor configuration subset size that we consider, is the minimum valuebetween the current activator subset size (u = i or i− 1, depending on which threshold function we use) andthe total number of inhibitors k. Therefore, we take into account the case where the number of inhibitors isless than the activator subset size, i.e. k < u. This explains the term min(u, k) in the truth density formulaand concludes the proof.
B Truth Density asymptotic behavior
We study the asymptotic behavior of the four truth density formulas (Appendix A) for a large number ofregulators (n→∞). Note that for the calculations involving the two threshold functions, we will only usethe truth density formula corresponding to the “Act-win” function (Eq. 10, with u = i), since both functionshave similar formulas and therefore, their limiting behavior is analogous. The asymptotics results for eachregulatory function are as follows:
1. The “AND-NOT” function truth density (Eq. 6) depends only on the number of inhibitors k:
TDAND−NOT =1
2k− 1
2n∼ 1
2k(11)
For large k, it is biased towards 0:
24

A preprint - April 6, 2021
TDAND−NOT =1
2kk→∞−−−−→ 0
2. The “OR-NOT” function truth density (Eq. 7) depends only on the number of activators m:
TDOR−NOT = 1− 1
2m+
1
2n∼ 1− 1
2m(12)
For large m, it is biased towards 1:
TDOR−NOT = 1− 1
2mm→∞−−−−→ 1
3. The “Pairs” function truth density (Eq. 8) depends on both activators and inhibitors:
TDPairs =(2m − 1)(2k − 1)
2n=
2n − 2m − 2k + 1
2n= 1− 2m + 2k
2n+
1
2n∼ 1− 1
2k− 1
2m(13)
4. The threshold functions truth density (Eq. 10) depends on both m and k variables and does nothave a single fixed limit for n→∞.
We now focus on the effect of the ratio (m : k) between number of activators and inhibitors on the asymptotictruth density values for n→∞. We consider the following three scenarios for each of the Boolean functions:
Scenario 1 A 1 : 1 activator-to-inhibitor ratio, where approximately half of the regulators are activatorsand half are inhibitors, i.e. m ≈ k ≈ n/2 (consider n is even without loss of generality).
1. The “AND-NOT” function truth density is biased towards 0:
(Eq. 11)⇒ TDAND−NOT ∼1
2n/2n→∞−−−−→ 0
2. The “OR-NOT” function truth density is biased towards 1:
(Eq. 12)⇒ TDOR−NOT ∼ 1− 1
2n/2n→∞−−−−→ 1
3. The “Pairs” function truth density is biased towards 1:
(Eq. 13)⇒ TDPairs ∼ 1− 1
2n/2− 1
2n/2n→∞−−−−→ 1
4. The threshold functions truth density is balanced, meaning its limit asymptotically approaches 1/2.
Proof. We first rewrite the truth density formula substituting m = k = n/2:
(Eq. 10)⇒ TDthres =
∑n/2i=1
[(n/2i
)×∑min(i,n/2)j=0
(n/2j
)]2n
=
∑n/2i=1
[(n/2i
)×∑ij=0
(n/2j
)]2n
=N
2n
Next we simplify N , by using the notation z = n/2 and x as a meta-symbol for(zx
). For example,(
n/21
)=(z1
)= 1. N is therefore expressed as:
N = 1(0+ 1) + 2(0+ 1+ 2) + ...+ z(0+ 1...+ z)
Using the symmetry of binomial coefficients:(zx
)=(z
z−x)∼ x = z − x, we can re-write N as:
N = (z − 1)[z + (z − 1)] + (z − 2)[z + (z − 1) + (z − 2)] + ...+ 0[z + ...+ 0]
Adding the two expressions for N we have that:
25

A preprint - April 6, 2021
2N = [0+ 1...+ z]2 + 12 + 22 + ...+ (z − 1)2 = 22z +
z−1∑x=1
x2
Substituting back(zx
)= x and i = x (change of index) in expression N , we have that the threshold
functions truth density is written as:
TDthres =N
22z=
(1/2)[22z +
∑z−1i=1
(zi
)2]22z
As n→∞ (and hence z →∞), the term∑z−1i=1
(zi
)2 does not grow as fast as 22z - it is smaller by afactor of
√πz (see answer to Problem 9.18 in [56]), and so it becomes negligible:
limz→∞
TDthres = limz→∞
(1/2)22z
22z=
1
2
Scenario 2 A high activator-to-inhibitor ratio (n− 1 : 1), where all regulators are activators except oneinhibitor, i.e. m = n− 1, k = 1.
1. The “AND-NOT” function truth density is balanced:
(Eq. 11)⇒ TDAND−NOT ∼1
21=
1
22. The “OR-NOT” function truth density is biased towards 1:
(Eq. 12)⇒ TDOR−NOT ∼ 1− 1
2n−1n→∞−−−−→ 1
3. The “Pairs” function truth density is balanced:
(Eq. 13)⇒ TDPairs ∼ 1− 1
21− 1
2n−1n→∞−−−−→ 1
24. The threshold functions truth density is biased towards 1:
(Eq. 10)⇒ TDthres =
∑n−1i=1
[(n−1i
)×∑min(i,1)j=0
(1j
)]2n
=
∑n−1i=1
[(n−1i
)×∑1j=0
(1j
)]2n
=
∑n−1i=1
(n−1i
)× 2
2n=
2n−1 − 1
2n−1= 1− 1
2n−1n→∞−−−−→ 1
Scenario 3 A low activator-to-inhibitor ratio (1 : n− 1), where all regulators are inhibitors except oneactivator, i.e. m = 1, k = n− 1.
1. The “AND-NOT” function truth density is biased towards 0:
(Eq. 11)⇒ TDAND−NOT ∼1
2n−1n→∞−−−−→ 0
2. The “OR-NOT” function truth density is balanced:
(Eq. 12)⇒ TDOR−NOT ∼ 1− 1
21=
1
23. The “Pairs” function truth density is balanced:
(Eq. 13)⇒ TDPairs ∼ 1− 1
2n−1− 1
21n→∞−−−−→ 1
24. The threshold functions truth density is biased towards 0:
(Eq. 10)⇒ TDthres =
∑1i=1
[(1i
)×∑min(i,n−1)j=0
(n−1j
)]2n
=
∑min(1,n−1)j=0
(n−1j
)2n
=
∑1j=0
(n−1j
)2n
=1 + (n− 1)
2n=
n
2nn→∞−−−−−−−−−→
L’Hôpital Rule0
26
A preprint - April 6, 2021
References[1] Hiroaki Kitano. Computational systems biology. Nature, 420(6912):206–210, Nov 2002. ISSN 00280836.
doi: 10.1038/nature01254.
[2] Han-Yu Chuang, Matan Hofree, and Trey Ideker. A Decade of Systems Biology. Annual Re-view of Cell and Developmental Biology, 26(1):721–744, Nov 2010. ISSN 1081-0706. doi: 10.1146/annurev-cellbio-100109-104122.
[3] Rolf Apweiler, Tim Beissbarth, Michael R Berthold, Nils Blüthgen, Yvonne Burmeister, Olaf Dammann,Andreas Deutsch, Friedrich Feuerhake, Andre Franke, Jan Hasenauer, Steve Hoffmann, Thomas Höfer,Peter LM Jansen, Lars Kaderali, Ursula Klingmüller, Ina Koch, Oliver Kohlbacher, Lars Kuepfer, FrankLammert, Dieter Maier, Nico Pfeifer, Nicole Radde, Markus Rehm, Ingo Roeder, Julio Saez-Rodriguez,Ulrich Sax, Bernd Schmeck, Andreas Schuppert, Bernd Seilheimer, Fabian J Theis, Julio Vera, and OlafWolkenhauer. Whither systems medicine? Experimental & Molecular Medicine, 50(3):e453, Mar 2018.ISSN 2092-6413. doi: 10.1038/emm.2017.290.
[4] Bree B. Aldridge, John M. Burke, Douglas A. Lauffenburger, and Peter K. Sorger. Physicochemicalmodelling of cell signalling pathways. Nature Cell Biology, 8(11):1195–1203, Nov 2006. ISSN 1465-7392.doi: 10.1038/ncb1497.
[5] Melody K. Morris, Julio Saez-Rodriguez, Peter K. Sorger, and Douglas A. Lauffenburger. Logic-basedmodels for the analysis of cell signaling networks. Biochemistry, 49(15):3216–3224, Apr 2010. ISSN00062960. doi: 10.1021/bi902202q.
[6] Pauline Traynard, Luis Tobalina, Federica Eduati, Laurence Calzone, and Julio Saez-Rodriguez. LogicModeling in Quantitative Systems Pharmacology. CPT: Pharmacometrics & Systems Pharmacology, 6(8):499–511, Aug 2017. ISSN 21638306. doi: 10.1002/psp4.12225.
[7] Vasundra Touré, Åsmund Flobak, Steven Vercruysse, Anna Niarakis, and Martin Kuiper. The statusof causality in biological databases: data resources and data retrieval possibilities to support logicalmodeling. Briefings in Bioinformatics, 2020. doi: 10.1093/bib/bbaa390.
[8] Rui-Sheng Wang, Assieh Saadatpour, and Réka Albert. Boolean modeling in systems biology: an overviewof methodology and applications. Physical Biology, 9(5):55001, Sep 2012. doi: 10.1088/1478-3975/9/5/055001.
[9] Luis Mendoza and Ioannis Xenarios. A method for the generation of standardized qualitative dynamicalsystems of regulatory networks. Theoretical Biology and Medical Modelling, 3(1):13, Mar 2006. ISSN17424682. doi: 10.1186/1742-4682-3-13.
[10] Julio Saez-Rodriguez, Leonidas G Alexopoulos, Jonathan Epperlein, Regina Samaga, Douglas A Lauffen-burger, Steffen Klamt, and Peter K Sorger. Discrete logic modelling as a means to link protein signallingnetworks with functional analysis of mammalian signal transduction. Molecular Systems Biology, 5(1):331, Jan 2009. ISSN 1744-4292. doi: 10.1038/msb.2009.87.
[11] Santiago Videla, Julio Saez-Rodriguez, Carito Guziolowski, and Anne Siegel. caspo: a toolbox forautomated reasoning on the response of logical signaling networks families. Bioinformatics, 33(6):947–950, 2016. ISSN 1367-4803. doi: 10.1093/bioinformatics/btw738.
[12] Enio Gjerga, Panuwat Trairatphisan, Attila Gabor, Hermann Koch, Celine Chevalier, Franceco Ceccarelli,Aurelien Dugourd, Alexander Mitsos, and Julio Saez-Rodriguez. Converting networks to predictive logicmodels from perturbation signalling data with CellNOpt. Bioinformatics, 2020. ISSN 1367-4803. doi:10.1093/bioinformatics/btaa561.
[13] Sara Sadat Aghamiri, Vidisha Singh, Aurélien Naldi, Tomáš Helikar, Sylvain Soliman, and Anna Niarakis.Automated inference of Boolean models from molecular interaction maps using CaSQ. Bioinformatics,2020. ISSN 1367-4803. doi: 10.1093/bioinformatics/btaa484.
27
A preprint - April 6, 2021
[14] Åsmund Flobak, Anaïs Baudot, Elisabeth Remy, Liv Thommesen, Denis Thieffry, Martin Kuiper, andAstrid Lægreid. Discovery of Drug Synergies in Gastric Cancer Cells Predicted by Logical Modeling. PLOSComputational Biology, 11(8):e1004426, Aug 2015. ISSN 1553-7358. doi: 10.1371/journal.pcbi.1004426.
[15] Barbara Niederdorfer, Vasundra Touré, Miguel Vazquez, Liv Thommesen, Martin Kuiper, Astrid Lægreid,and Åsmund Flobak. Strategies to Enhance Logic Modeling-Based Cell Line-Specific Drug SynergyPrediction. Frontiers in Physiology, 11:862, Jul 2020. ISSN 1664-042X. doi: 10.3389/fphys.2020.00862.
[16] Amel Bekkar, Anne Estreicher, Anne Niknejad, Cristina Casals-Casas, Alan Bridge, Ioannis Xenarios,Julien Dorier, and Isaac Crespo. Expert curation for building network-based dynamical models: a casestudy on atherosclerotic plaque formation. Database, 2018(2018):31, Jan 2018. ISSN 1758-0463. doi:10.1093/database/bay031.
[17] Yves Crama and Peter L Hammer. Boolean functions: Theory, algorithms, and applications. CambridgeUniversity Press, 2011.
[18] Warren S McCulloch and Walter Pitts. A logical calculus of the ideas immanent in nervous activity.The bulletin of mathematical biophysics, 5(4):115–133, 1943.
[19] J. J. Hopfield. Neural networks and physical systems with emergent collective computational abilities.Proceedings of the National Academy of Sciences of the United States of America, 79(8):2554–2558, Apr1982. ISSN 00278424. doi: 10.1073/pnas.79.8.2554.
[20] Stefan Bornholdt. Boolean network models of cellular regulation: prospects and limitations. Journal ofThe Royal Society Interface, 5, Aug 2008. ISSN 1742-5689. doi: 10.1098/rsif.2008.0132.focus.
[21] Claudine Chaouiya, Ouerdia Ourrad, and Ricardo Lima. Majority Rules with Random Tie-Breakingin Boolean Gene Regulatory Networks. PLoS ONE, 8(7):69626, Jul 2013. ISSN 19326203. doi:10.1371/journal.pone.0069626.
[22] José E. R. Cury, Pedro T. Monteiro, and Claudine Chaouiya. Partial Order on the set of BooleanRegulatory Functions, Jan 2019. arXiv preprint arXiv:1901.07623.
[23] Archie Blake. Canonical expressions in boolean algebra. PhD Thesis, 1937. Department of Mathematics,University of Chicago.
[24] Stuart A Kauffman. The origins of order: Self-organization and selection in evolution. Oxford UniversityPress, USA, 1993.
[25] Marco Gherardi and Pietro Rotondo. Measuring logic complexity can guide pattern discovery in empiricalsystems. Complexity, 21:397–408, Aug 2016.
[26] Itai Benjamini, Oded Schramm, and David B. Wilson. Balanced Boolean functions that can be evaluatedso that every input bit is unlikely to be read. In Proceedings of the Annual ACM Symposium on Theoryof Computing, pages 244–250, New York, USA, 2005. ACM Press. doi: 10.1145/1060590.1060627.
[27] Christoph Müssel, Martin Hopfensitz, and Hans A. Kestler. BoolNet — an R package for generation,reconstruction and analysis of Boolean networks. Bioinformatics, 26(10):1378–1380, May 2010. ISSN1460-2059. doi: 10.1093/bioinformatics/btq124.
[28] John Zobolas. Gitsbe format documentation, 2020. Retrieved from https://druglogics.github.io/druglogics-doc/gitsbe-config.html#gitsbe-format.
[29] Aurélien Naldi. BioLQM: A Java Toolkit for the Manipulation and Conversion of Logical QualitativeModels of Biological Networks. Frontiers in Physiology, 9:1605, Nov 2018. ISSN 1664-042X. doi:10.3389/fphys.2018.01605.
[30] Jacob Cohen. A Coefficient of Agreement for Nominal Scales. Educational and Psychological Measurement,20(1):37–46, Apr 1960. ISSN 0013-1644. doi: 10.1177/001316446002000104.
28
A preprint - April 6, 2021
[31] Eirini Tsirvouli, Barbara Niederdorfer, John Zobolas, Touré Vasundra, Åsmund Flobak, and MartinKuiper. CASCADE - CAncer Signaling CAusality DatabasE, Oct 2020. Retrieved from https://github.com/druglogics/cascade.
[32] J. Richard Landis and Gary G. Koch. The Measurement of Observer Agreement for Categorical Data.Biometrics, 33(1):159, Mar 1977. ISSN 0006341X. doi: 10.2307/2529310.
[33] Mary L. McHugh. Interrater reliability: The kappa statistic. Biochemia Medica, 22(3):276–282, Oct2012. ISSN 13300962. doi: 10.11613/bm.2012.031.
[34] Albert László Barabási and Réka Albert. Emergence of scaling in random networks. Science, 286(5439):509–512, Oct 1999. ISSN 00368075. doi: 10.1126/science.286.5439.509.
[35] H. Jeong, B. Tombor, R. Albert, Z. N. Oltval, and A. L. Barabási. The large-scale organization ofmetabolic networks. Nature, 407(6804):651–654, Oct 2000. ISSN 00280836. doi: 10.1038/35036627.
[36] Stefan Wuchty. Scale-Free Behavior in Protein Domain Networks. Molecular Biology and Evolution, 18(9):1694–1702, Sep 2001. ISSN 1537-1719. doi: 10.1093/oxfordjournals.molbev.a003957.
[37] Réka Albert. Scale-free networks in cell biology. Journal of Cell Science, 118(21):4947–4957, Nov 2005.ISSN 00219533. doi: 10.1242/jcs.02714.
[38] Maximino Aldana, Enrique Balleza, Stuart Kauffman, and Osbaldo Resendiz. Robustness and evolvabilityin genetic regulatory networks. Journal of Theoretical Biology, 245(3):433–448, Apr 2007. ISSN 00225193.doi: 10.1016/j.jtbi.2006.10.027.
[39] Raya Khanin and Ernst Wit. How scale-free are biological networks. Journal of Computational Biology,13(3):810–818, Apr 2006. ISSN 10665277. doi: 10.1089/cmb.2006.13.810.
[40] Anna D. Broido and Aaron Clauset. Scale-free networks are rare. Nature Communications, 10(1):1–10,Dec 2019. ISSN 20411723. doi: 10.1038/s41467-019-08746-5.
[41] Maximino Aldana. Boolean dynamics of networks with scale-free topology. Physica D: NonlinearPhenomena, 185(1):45–66, 2003. doi: 10.1016/S0167-2789(03)00174-X.
[42] Réka Albert and Albert László Barabási. Statistical mechanics of complex networks. Reviews of ModernPhysics, 74(1):47–97, Jan 2002. ISSN 00346861. doi: 10.1103/RevModPhys.74.47.
[43] S. A. Kauffman. Metabolic stability and epigenesis in randomly constructed genetic nets. Journal ofTheoretical Biology, 22(3):437–467, Mar 1969. ISSN 10958541. doi: 10.1016/0022-5193(69)90015-0.
[44] Ilya Shmulevich and Stuart A. Kauffman. Activities and sensitivities in Boolean network models. PhysicalReview Letters, 93(4):048701, Jul 2004. ISSN 00319007. doi: 10.1103/PhysRevLett.93.048701.
[45] I. Shmulevich, E. R. Dougherty, S. Kim, and W. Zhang. Probabilistic Boolean networks: a rule-baseduncertainty model for gene regulatory networks. Bioinformatics, 18(2):261–274, Feb 2002. ISSN 1367-4803.doi: 10.1093/bioinformatics/18.2.261.
[46] Fangting Li, Tao Long, Ying Lu, Qi Ouyang, and Chao Tang. The yeast cell-cycle network is robustlydesigned. Proceedings of the National Academy of Sciences of the United States of America, 101(14):4781–4786, Apr 2004. ISSN 00278424. doi: 10.1073/pnas.0305937101.
[47] Maria I. Davidich and Stefan Bornholdt. Boolean Network Model Predicts Cell Cycle Sequence of FissionYeast. PLoS ONE, 3(2), Feb 2008. ISSN 1932-6203. doi: 10.1371/journal.pone.0001672.
[48] Andreas Wagner. Evolution of gene networks by gene duplications: A mathematical model and itsimplications on genome organization. Proceedings of the National Academy of Sciences of the UnitedStates of America, 91(10):4387–4391, May 1994. ISSN 00278424. doi: 10.1073/pnas.91.10.4387.
[49] Panos Oikonomou and Philippe Cluzel. Effects of topology on network evolution. Nature Physics, 2(8):532–536, Aug 2006. ISSN 17452481. doi: 10.1038/nphys359.
29
A preprint - April 6, 2021
[50] Lars Kaderali, Eva Dazert, Ulf Zeuge, Michael Frese, and Ralf Bartenschlager. Reconstructing signalingpathways from RNAi data using probabilistic Boolean threshold networks. Bioinformatics, 25(17):2229–2235, Sep 2009. ISSN 1460-2059. doi: 10.1093/bioinformatics/btp375.
[51] Sam F Greenbury, Iain G Johnston, Matthew A Smith, Jonathan P K Doye, and Ard A Louis. Theeffect of scale-free topology on the robustness and evolvability of genetic regulatory networks. Journal ofTheoretical Biology, 267(1):48–61, 2010. ISSN 0022-5193. doi: 10.1016/j.jtbi.2010.08.006.
[52] John Jack, John F. Wambaugh, and Imran Shah. Simulating Quantitative Cellular Responses UsingAsynchronous Threshold Boolean Network Ensembles. BMC Systems Biology, 5(1):1–13, Jul 2011. ISSN17520509. doi: 10.1186/1752-0509-5-109.
[53] Jorge G.T. Zañudo, Maximino Aldana, and Gustavo Martínez-Mekler. Boolean threshold networks:Virtues and limitations for biological modeling. Information Processing and Biological Systems, 11:113–151, 2011. ISSN 18684394. doi: 10.1007/978-3-642-19621-8_6.
[54] Roded Sharan and Richard M. Karp. Reconstructing Boolean Models of Signaling. Journal of Computa-tional Biology, 20(3):249–257, Mar 2013. ISSN 1066-5277. doi: 10.1089/cmb.2012.0241.
[55] Aurélien Naldi, Céline Hernandez, Nicolas Levy, Gautier Stoll, Pedro T. Monteiro, Claudine Chaouiya,Tomáš Helikar, Andrei Zinovyev, Laurence Calzone, Sarah Cohen-Boulakia, Denis Thieffry, and LoïcPaulevé. The CoLoMoTo Interactive Notebook: Accessible and Reproducible Computational Analysesfor Qualitative Biological Networks. Frontiers in Physiology, 9:680, Jun 2018. ISSN 1664-042X. doi:10.3389/fphys.2018.00680.
[56] Ronald L Graham, Donald E Knuth, and Oren Patashnik. Concrete Mathematics: A Foundation forComputer Science. Addison-Wesley Longman Publishing Co., Inc., USA, 2nd edition, 1994. ISBN0201558025.
30

End of Thesis
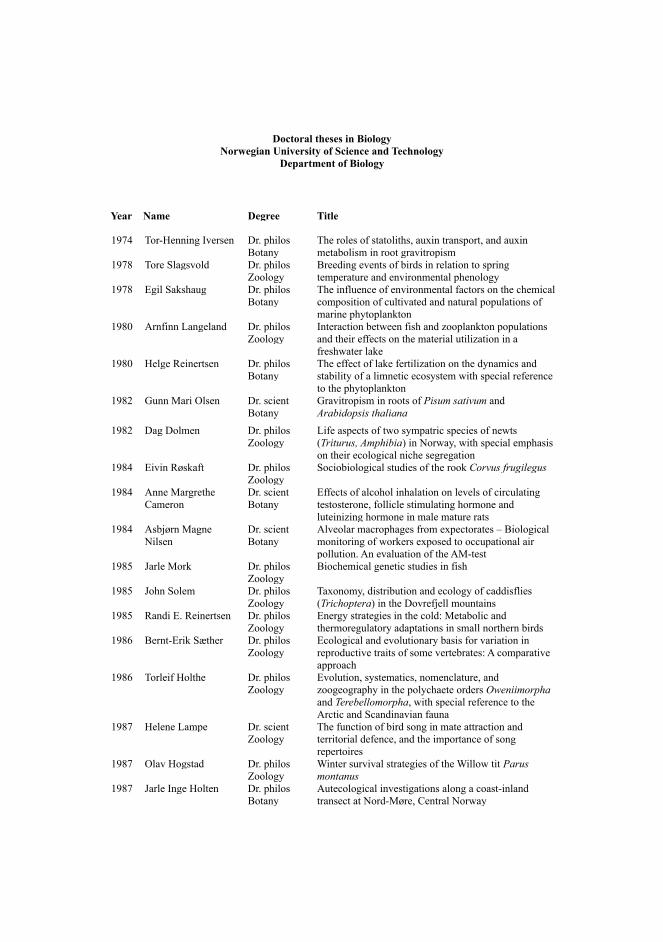
Doctoral theses in BiologyNorwegian University of Science and Technology
Department of Biology
Year Name Degree Title
1974 Tor-Henning Iversen Dr. philosBotany
The roles of statoliths, auxin transport, and auxinmetabolism in root gravitropism
1978 Tore Slagsvold Dr. philosZoology
Breeding events of birds in relation to springtemperature and environmental phenology
1978 Egil Sakshaug Dr. philosBotany
The influence of environmental factors on the chemicalcomposition of cultivated and natural populations ofmarine phytoplankton
1980 Arnfinn Langeland Dr. philosZoology
Interaction between fish and zooplankton populationsand their effects on the material utilization in afreshwater lake
1980 Helge Reinertsen Dr. philosBotany
The effect of lake fertilization on the dynamics andstability of a limnetic ecosystem with special referenceto the phytoplankton
1982 Gunn Mari Olsen Dr. scientBotany
Gravitropism in roots of Pisum sativum andArabidopsis thaliana
1982 Dag Dolmen Dr. philosZoology
Life aspects of two sympatric species of newts(Triturus, Amphibia) in Norway, with special emphasison their ecological niche segregation
1984 Eivin Røskaft Dr. philosZoology
Sociobiological studies of the rook Corvus frugilegus
1984 Anne MargretheCameron
Dr. scientBotany
Effects of alcohol inhalation on levels of circulatingtestosterone, follicle stimulating hormone andluteinizing hormone in male mature rats
1984 Asbjørn MagneNilsen
Dr. scientBotany
Alveolar macrophages from expectorates – Biologicalmonitoring of workers exposed to occupational airpollution. An evaluation of the AM-test
1985 Jarle Mork Dr. philosZoology
Biochemical genetic studies in fish
1985 John Solem Dr. philosZoology
Taxonomy, distribution and ecology of caddisflies(Trichoptera) in the Dovrefjell mountains
1985 Randi E. Reinertsen Dr. philosZoology
Energy strategies in the cold: Metabolic andthermoregulatory adaptations in small northern birds
1986 Bernt-Erik Sæther Dr. philosZoology
Ecological and evolutionary basis for variation inreproductive traits of some vertebrates: A comparativeapproach
1986 Torleif Holthe Dr. philosZoology
Evolution, systematics, nomenclature, andzoogeography in the polychaete orders Oweniimorphaand Terebellomorpha, with special reference to theArctic and Scandinavian fauna
1987 Helene Lampe Dr. scientZoology
The function of bird song in mate attraction andterritorial defence, and the importance of songrepertoires
1987 Olav Hogstad Dr. philosZoology
Winter survival strategies of the Willow tit Parusmontanus
1987 Jarle Inge Holten Dr. philosBotany
Autecological investigations along a coast-inlandtransect at Nord-Møre, Central Norway
1987 Rita Kumar Dr. scientBotany
Somaclonal variation in plants regenerated from cellcultures of Nicotiana sanderae and Chrysanthemummorifolium
1987 Bjørn ÅgeTømmerås
Dr. scientZoology
Olfaction in bark beetle communities: Interspecificinteractions in regulation of colonization density,predator - prey relationship and host attraction
1988 Hans ChristianPedersen
Dr. philosZoology
Reproductive behaviour in willow ptarmigan withspecial emphasis on territoriality and parental care
1988 Tor G. Heggberget Dr. philosZoology
Reproduction in Atlantic Salmon (Salmo salar):Aspects of spawning, incubation, early life history andpopulation structure
1988 Marianne V. Nielsen Dr. scientZoology
The effects of selected environmental factors on carbonallocation/growth of larval and juvenile mussels(Mytilus edulis)
1988 Ole Kristian Berg Dr. scientZoology
The formation of landlocked Atlantic salmon (Salmosalar L.)
1989 John W. Jensen Dr. philosZoology
Crustacean plankton and fish during the first decade ofthe manmade Nesjø reservoir, with special emphasis onthe effects of gill nets and salmonid growth
1989 Helga J. Vivås Dr. scientZoology
Theoretical models of activity pattern and optimalforaging: Predictions for the Moose Alces alces
1989 Reidar Andersen Dr. scientZoology
Interactions between a generalist herbivore, the mooseAlces alces, and its winter food resources: a study ofbehavioural variation
1989 Kurt Ingar Draget Dr. scientBotany
Alginate gel media for plant tissue culture
1990 Bengt Finstad Dr. scientZoology
Osmotic and ionic regulation in Atlantic salmon,rainbow trout and Arctic charr: Effect of temperature,salinity and season
1990 Hege Johannesen Dr. scientZoology
Respiration and temperature regulation in birds withspecial emphasis on the oxygen extraction by the lung
1990 Åse Krøkje Dr. scientBotany
The mutagenic load from air pollution at twowork-places with PAH-exposure measured with AmesSalmonella/microsome test
1990 Arne Johan Jensen Dr. philosZoology
Effects of water temperature on early life history,juvenile growth and prespawning migrations ofAtlantic salmon (Salmo salar) and brown trout (Salmotrutta): A summary of studies in Norwegian streams
1990 Tor Jørgen Almaas Dr. scientZoology
Pheromone reception in moths: Responsecharacteristics of olfactory receptor neurons to intra-and interspecific chemical cues
1990 Magne Husby Dr. scientZoology
Breeding strategies in birds: Experiments with theMagpie Pica pica
1991 Tor Kvam Dr. scientZoology
Population biology of the European lynx (Lynx lynx) inNorway
1991 Jan Henning L'AbêeLund
Dr. philosZoology
Reproductive biology in freshwater fish, brown troutSalmo trutta and roach Rutilus rutilus in particular
1991 Asbjørn Moen Dr. philosBotany
The plant cover of the boreal uplands of CentralNorway. I. Vegetation ecology of Sølendet naturereserve; haymaking fens and birch woodlands
1991 Else Marie Løbersli Dr. scientBotany
Soil acidification and metal uptake in plants
1991 Trond Nordtug Dr. scientZoology
Reflectometric studies of photomechanical adaptationin superposition eyes of arthropods
1991 Thyra Solem Dr. scientBotany
Age, origin and development of blanket mires inCentral Norway
1991 Odd Terje Sandlund Dr. philosZoology
The dynamics of habitat use in the salmonid generaCoregonus and Salvelinus: Ontogenic niche shifts andpolymorphism
1991 Nina Jonsson Dr. philosZoology
Aspects of migration and spawning in salmonids
1991 Atle Bones Dr. scientBotany
Compartmentation and molecular properties ofthioglucoside glucohydrolase (myrosinase)
1992 Torgrim Breiehagen Dr. scientZoology
Mating behaviour and evolutionary aspects of thebreeding system of two bird species: the Temminck'sstint and the Pied flycatcher
1992 Anne Kjersti Bakken Dr. scientBotany
The influence of photoperiod on nitrate assimilationand nitrogen status in timothy (Phleum pratense L.)
1992 Tycho Anker-Nilssen Dr. scientZoology
Food supply as a determinant of reproduction andpopulation development in Norwegian PuffinsFratercula arctica
1992 Bjørn Munro Jenssen Dr. philosZoology
Thermoregulation in aquatic birds in air and water:With special emphasis on the effects of crude oil,chemically treated oil and cleaning on the thermalbalance of ducks
1992 Arne Vollan Aarset Dr. philosZoology
The ecophysiology of under-ice fauna: Osmoticregulation, low temperature tolerance and metabolismin polar crustaceans.
1993 Geir Slupphaug Dr. scientBotany
Regulation and expression of uracil-DNA glycosylaseand O6-methylguanine-DNA methyltransferase inmammalian cells
1993 Tor Fredrik Næsje Dr. scientZoology
Habitat shifts in coregonids.
1993 Yngvar AsbjørnOlsen
Dr. scientZoology
Cortisol dynamics in Atlantic salmon, Salmo salar L.:Basal and stressor-induced variations in plasma levelsand some secondary effects.
1993 Bård Pedersen Dr. scientBotany
Theoretical studies of life history evolution in modularand clonal organisms
1993 Ole Petter Thangstad Dr. scientBotany
Molecular studies of myrosinase in Brassicaceae
1993 Thrine L. M.Heggberget
Dr. scientZoology
Reproductive strategy and feeding ecology of theEurasian otter Lutra lutra.
1993 Kjetil Bevanger Dr. scientZoology
Avian interactions with utility structures, a biologicalapproach.
1993 Kåre Haugan Dr. scientBotany
Mutations in the replication control gene trfA of thebroad host-range plasmid RK2
1994 Peder Fiske Dr. scientZoology
Sexual selection in the lekking great snipe (Gallinagomedia): Male mating success and female behaviour atthe lek
1994 Kjell Inge Reitan Dr. scientBotany
Nutritional effects of algae in first-feeding of marinefish larvae
1994 Nils Røv Dr. scientZoology
Breeding distribution, population status and regulationof breeding numbers in the northeast-Atlantic GreatCormorant Phalacrocorax carbo carbo
1994 Annette-SusanneHoepfner
Dr. scientBotany
Tissue culture techniques in propagation and breedingof Red Raspberry (Rubus idaeus L.)
1994 Inga Elise Bruteig Dr. scientBotany
Distribution, ecology and biomonitoring studies ofepiphytic lichens on conifers
1994 Geir Johnsen Dr. scientBotany
Light harvesting and utilization in marinephytoplankton: Species-specific and photoadaptiveresponses

1994 Morten Bakken Dr. scientZoology
Infanticidal behaviour and reproductive performance inrelation to competition capacity among farmed silverfox vixens, Vulpes vulpes
1994 Arne Moksnes Dr. philosZoology
Host adaptations towards brood parasitism by theCockoo
1994 Solveig Bakken Dr. scientBotany
Growth and nitrogen status in the moss Dicranummajus Sm. as influenced by nitrogen supply
1994 Torbjørn Forseth Dr. scientZoology
Bioenergetics in ecological and life history studies offishes.
1995 Olav Vadstein Dr. philosBotany
The role of heterotrophic planktonic bacteria in thecycling of phosphorus in lakes: Phosphorusrequirement, competitive ability and food webinteractions
1995 Hanne Christensen Dr. scientZoology
Determinants of Otter Lutra lutra distribution inNorway: Effects of harvest, polychlorinated biphenyls(PCBs), human population density and competitionwith mink Mustela vision
1995 Svein HåkonLorentsen
Dr. scientZoology
Reproductive effort in the Antarctic Petrel Thalassoicaantarctica; the effect of parental body size andcondition
1995 Chris Jørgen Jensen Dr. scientZoology
The surface electromyographic (EMG) amplitude as anestimate of upper trapezius muscle activity
1995 Martha KoldBakkevig
Dr. scientZoology
The impact of clothing textiles and construction in aclothing system on thermoregulatory responses, sweataccumulation and heat transport
1995 Vidar Moen Dr. scientZoology
Distribution patterns and adaptations to light in newlyintroduced populations of Mysis relicta and constraintson Cladoceran and Char populations
1995 Hans HaavardsholmBlom
Dr. philosBotany
A revision of the Schistidium apocarpum complex inNorway and Sweden
1996 Jorun Skjærmo Dr. scientBotany
Microbial ecology of early stages of cultivated marinefish; impact fish-bacterial interactions on growth andsurvival of larvae
1996 Ola Ugedal Dr. scientZoology
Radiocesium turnover in freshwater fishes
1996 Ingibjørg Einarsdottir Dr. scientZoology
Production of Atlantic salmon (Salmo salar) and Arcticcharr (Salvelinus alpinus): A study of somephysiological and immunological responses to rearingroutines
1996 Christina M. S.Pereira
Dr. scientZoology
Glucose metabolism in salmonids: Dietary effects andhormonal regulation
1996 Jan Fredrik Børseth Dr. scientZoology
The sodium energy gradients in muscle cells of Mytilusedulis and the effects of organic xenobiotics
1996 Gunnar Henriksen Dr. scientZoology
Status of Grey seal Halichoerus grypus and Harbourseal Phoca vitulina in the Barents sea region
1997 Gunvor Øie Dr. scientBotany
Evaluation of rotifer Brachionus plicatilis quality inearly first feeding of turbot Scophtalmus maximus L.larvae
1997 Håkon Holien Dr. scientBotany
Studies of lichens in spruce forest of Central Norway.Diversity, old growth species and the relationship tosite and stand parameters
1997 Ole Reitan Dr. scientZoology
Responses of birds to habitat disturbance due todamming
1997 Jon Arne Grøttum Dr. scientZoology
Physiological effects of reduced water quality on fishin aquaculture
1997 Per Gustav Thingstad Dr. scientZoology
Birds as indicators for studying natural andhuman-induced variations in the environment, withspecial emphasis on the suitability of the PiedFlycatcher
1997 Torgeir Nygård Dr. scientZoology
Temporal and spatial trends of pollutants in birds inNorway: Birds of prey and Willow Grouse used as
1997 Signe Nybø Dr. scientZoology
Impacts of long-range transported air pollution on birdswith particular reference to the dipper Cinclus cinclusin southern Norway
1997 Atle Wibe Dr. scientZoology
Identification of conifer volatiles detected by receptorneurons in the pine weevil (Hylobius abietis), analysedby gas chromatography linked to electrophysiology andto mass spectrometry
1997 Rolv Lundheim Dr. scientZoology
Adaptive and incidental biological ice nucleators
1997 Arild Magne Landa Dr. scientZoology
Wolverines in Scandinavia: ecology, sheep depredationand conservation
1997 Kåre Magne Nielsen Dr. scientBotany
An evolution of possible horizontal gene transfer fromplants to sail bacteria by studies of naturaltransformation in Acinetobacter calcoacetius
1997 Jarle Tufto Dr. scientZoology
Gene flow and genetic drift in geographicallystructured populations: Ecological, population genetic,and statistical models
1997 Trygve Hesthagen Dr. philosZoology
Population responses of Arctic charr (Salvelinusalpinus (L.)) and brown trout (Salmo trutta L.) toacidification in Norwegian inland waters
1997 Trygve Sigholt Dr. philosZoology
Control of Parr-smolt transformation and seawatertolerance in farmed Atlantic Salmon (Salmo salar)Effects of photoperiod, temperature, gradual seawateracclimation, NaCl and betaine in the diet
1997 Jan Østnes Dr. scientZoology
Cold sensation in adult and neonate birds
1998 SeethaledsumyVisvalingam
Dr. scientBotany
Influence of environmental factors on myrosinases andmyrosinase-binding proteins
1998 Thor Harald Ringsby Dr. scientZoology
Variation in space and time: The biology of a Housesparrow metapopulation
1998 Erling Johan Solberg Dr. scientZoology
Variation in population dynamics and life history in aNorwegian moose (Alces alces) population:consequences of harvesting in a variable environment
1998 Sigurd MjøenSaastad
Dr. scientBotany
Species delimitation and phylogenetic relationshipsbetween the Sphagnum recurvum complex(Bryophyta): genetic variation and phenotypicplasticity
1998 Bjarte Mortensen Dr. scientBotany
Metabolism of volatile organic chemicals (VOCs) in ahead liver S9 vial equilibration system in vitro
1998 Gunnar Austrheim Dr. scientBotany
Plant biodiversity and land use in subalpine grasslands.– A conservation biological approach
1998 Bente Gunnveig Berg Dr. scientZoology
Encoding of pheromone information in two relatedmoth species
1999 Kristian Overskaug Dr. scientZoology
Behavioural and morphological characteristics inNorthern Tawny Owls Strix aluco: An intra- andinterspecific comparative approach
1999 Hans KristenStenøien
Dr. scientBotany
Genetic studies of evolutionary processes in variouspopulations of nonvascular plants (mosses, liverwortsand hornworts)
1999 Trond Arnesen Dr. scientBotany
Vegetation dynamics following trampling and burningin the outlying haylands at Sølendet, Central Norway
1999 Ingvar Stenberg Dr. scientZoology
Habitat selection, reproduction and survival in theWhite-backed Woodpecker Dendrocopos leucotos
1999 Stein Olle Johansen Dr. scientBotany
A study of driftwood dispersal to the Nordic Seas bydendrochronology and wood anatomical analysis
1999 Trina FalckGalloway
Dr. scientZoology
Muscle development and growth in early life stages ofthe Atlantic cod (Gadus morhua L.) and Halibut(Hippoglossus hippoglossus L.)
1999 Marianne Giæver Dr. scientZoology
Population genetic studies in three gadoid species: bluewhiting (Micromisistius poutassou), haddock(Melanogrammus aeglefinus) and cod (Gadus morhua)in the North-East Atlantic
1999 Hans Martin Hanslin Dr. scientBotany
The impact of environmental conditions of densitydependent performance in the boreal forest bryophytesDicranum majus, Hylocomium splendens, Plagiochilaasplenigides, Ptilium crista-castrensis andRhytidiadelphus lokeus
1999 Ingrid BysveenMjølnerød
Dr. scientZoology
Aspects of population genetics, behaviour andperformance of wild and farmed Atlantic salmon(Salmo salar) revealed by molecular genetic techniques
1999 Else Berit Skagen Dr. scientBotany
The early regeneration process in protoplasts fromBrassica napus hypocotyls cultivated under variousg-forces
1999 Stein-Are Sæther Dr. philosZoology
Mate choice, competition for mates, and conflicts ofinterest in the Lekking Great Snipe
1999 Katrine WangenRustad
Dr. scientZoology
Modulation of glutamatergic neurotransmission relatedto cognitive dysfunctions and Alzheimer’s disease
1999 Per Terje Smiseth Dr. scientZoology
Social evolution in monogamous families:
1999 Gunnbjørn Bremset Dr. scientZoology
Young Atlantic salmon (Salmo salar L.) and Browntrout (Salmo trutta L.) inhabiting the deep pool habitat,with special reference to their habitat use, habitatpreferences and competitive interactions
1999 Frode Ødegaard Dr. scientZoology
Host specificity as a parameter in estimates ofarthropod species richness
1999 Sonja Andersen Dr. scientZoology
Expressional and functional analyses of human,secretory phospholipase A2
2000 Ingrid Salvesen Dr. scientBotany
Microbial ecology in early stages of marine fish:Development and evaluation of methods for microbialmanagement in intensive larviculture
2000 Ingar Jostein Øien Dr. scientZoology
The Cuckoo (Cuculus canorus) and its host: adaptionsand counteradaptions in a coevolutionary arms race
2000 Pavlos Makridis Dr. scientBotany
Methods for the microbial control of live food used forthe rearing of marine fish larvae
2000 Sigbjørn Stokke Dr. scientZoology
Sexual segregation in the African elephant (Loxodontaafricana)
2000 Odd A. Gulseth Dr. philosZoology
Seawater tolerance, migratory behaviour and growth ofCharr, (Salvelinus alpinus), with emphasis on the highArctic Dieset charr on Spitsbergen, Svalbard
2000 Pål A. Olsvik Dr. scientZoology
Biochemical impacts of Cd, Cu and Zn on brown trout(Salmo trutta) in two mining-contaminated rivers inCentral Norway
2000 Sigurd Einum Dr. scientZoology
Maternal effects in fish: Implications for the evolutionof breeding time and egg size
2001 Jan Ove Evjemo Dr. scientZoology
Production and nutritional adaptation of the brineshrimp Artemia sp. as live food organism for larvae ofmarine cold water fish species
2001 Olga Hilmo Dr. scientBotany
Lichen response to environmental changes in themanaged boreal forest systems
2001 Ingebrigt Uglem Dr. scientZoology
Male dimorphism and reproductive biology incorkwing wrasse (Symphodus melops L.)
2001 Bård Gunnar Stokke Dr. scientZoology
Coevolutionary adaptations in avian brood parasitesand their hosts
2002 Ronny Aanes Dr. scientZoology
Spatio-temporal dynamics in Svalbard reindeer(Rangifer tarandus platyrhynchus)
2002 Mariann Sandsund Dr. scientZoology
Exercise- and cold-induced asthma. Respiratory andthermoregulatory responses
2002 Dag-Inge Øien Dr. scientBotany
Dynamics of plant communities and populations inboreal vegetation influenced by scything at Sølendet,Central Norway
2002 Frank Rosell Dr. scientZoology
The function of scent marking in beaver (Castor fiber)
2002 Janne Østvang Dr. scientBotany
The Role and Regulation of Phospholipase A2 inMonocytes During Atherosclerosis Development
2002 Terje Thun Dr. philosBiology
Dendrochronological constructions of Norwegianconifer chronologies providing dating of historicalmaterial
2002 Birgit HafjeldBorgen
Dr. scientBiology
Functional analysis of plant idioblasts (Myrosin cells)and their role in defense, development and growth
2002 Bård Øyvind Solberg Dr. scientBiology
Effects of climatic change on the growth of dominatingtree species along major environmental gradients
2002 Per Winge Dr. scientBiology
The evolution of small GTP binding proteins in cellularorganisms. Studies of RAC GTPases in Arabidopsisthaliana and the Ral GTPase from Drosophilamelanogaster
2002 Henrik Jensen Dr. scientBiology
Causes and consequences of individual variation infitness-related traits in house sparrows
2003 Jens Rohloff Dr. philosBiology
Cultivation of herbs and medicinal plants in Norway –Essential oil production and quality control
2003 Åsa Maria O.Espmark Wibe
Dr. scientBiology
Behavioural effects of environmental pollution inthreespine stickleback Gasterosteus aculeatur L.
2003 Dagmar Hagen Dr. scientBiology
Assisted recovery of disturbed arctic and alpinevegetation – an integrated approach
2003 Bjørn Dahle Dr. scientBiology
Reproductive strategies in Scandinavian brown bears
2003 Cyril LebogangTaolo
Dr. scientBiology
Population ecology, seasonal movement and habitat useof the African buffalo (Syncerus caffer) in ChobeNational Park, Botswana
2003 Marit Stranden Dr. scientBiology
Olfactory receptor neurones specified for the sameodorants in three related Heliothine species(Helicoverpa armigera, Helicoverpa assulta andHeliothis virescens)
2003 Kristian Hassel Dr. scientBiology
Life history characteristics and genetic variation in anexpanding species, Pogonatum dentatum
2003 David Alexander Rae Dr. scientBiology
Plant- and invertebrate-community responses to speciesinteraction and microclimatic gradients in alpine andArctic environments
2003 Åsa A Borg Dr. scientBiology
Sex roles and reproductive behaviour in gobies andguppies: a female perspective
2003 Eldar ÅsgardBendiksen
Dr. scientBiology
Environmental effects on lipid nutrition of farmedAtlantic salmon (Salmo salar L.) parr and smolt
2004 Torkild Bakken Dr. scientBiology
A revision of Nereidinae (Polychaeta, Nereididae)
2004 Ingar Pareliussen Dr. scientBiology
Natural and Experimental Tree Establishment in aFragmented Forest, Ambohitantely Forest Reserve,Madagascar
2004 Tore Brembu Dr. scientBiology
Genetic, molecular and functional studies of RACGTPases and the WAVE-like regulatory proteincomplex in Arabidopsis thaliana
2004 Liv S. Nilsen Dr. scientBiology
Coastal heath vegetation on central Norway; recentpast, present state and future possibilities
2004 Hanne T. Skiri Dr. scientBiology
Olfactory coding and olfactory learning of plant odoursin heliothine moths. An anatomical, physiological andbehavioural study of three related species (Heliothisvirescens, Helicoverpa armigera and Helicoverpaassulta)
2004 Lene Østby Dr. scientBiology
Cytochrome P4501A (CYP1A) induction and DNAadducts as biomarkers for organic pollution in thenatural environment
2004 Emmanuel J. Gerreta Dr. philosBiology
The Importance of Water Quality and Quantity in theTropical Ecosystems, Tanzania
2004 Linda Dalen Dr. scientBiology
Dynamics of Mountain Birch Treelines in the ScandesMountain Chain, and Effects of Climate Warming
2004 Lisbeth Mehli Dr. scientBiology
Polygalacturonase-inhibiting protein (PGIP) incultivated strawberry (Fragaria x ananassa):characterisation and induction of the gene followingfruit infection by Botrytis cinerea
2004 Børge Moe Dr. scientBiology
Energy-Allocation in Avian Nestlings FacingShort-Term Food Shortage
2005 Matilde SkogenChauton
Dr. scientBiology
Metabolic profiling and species discrimination fromHigh-Resolution Magic Angle Spinning NMR analysisof whole-cell samples
2005 Sten Karlsson Dr. scientBiology
Dynamics of Genetic Polymorphisms
2005 Terje Bongard Dr. scientBiology
Life History strategies, mate choice, and parentalinvestment among Norwegians over a 300-year period
2005 Tonette Røstelien PhD Biology Functional characterisation of olfactory receptorneurone types in heliothine moths
2005 Erlend Kristiansen Dr. scientBiology
Studies on antifreeze proteins
2005 Eugen G. Sørmo Dr. scientBiology
Organochlorine pollutants in grey seal (Halichoerusgrypus) pups and their impact on plasma thyroidhormone and vitamin A concentrations
2005 Christian Westad Dr. scientBiology
Motor control of the upper trapezius
2005 Lasse Mork Olsen PhD Biology Interactions between marine osmo- and phagotrophs indifferent physicochemical environments
2005 Åslaug Viken PhD Biology Implications of mate choice for the management ofsmall populations
2005 Ariaya Hymete SahleDingle
PhD Biology Investigation of the biological activities and chemicalconstituents of selected Echinops spp. growing inEthiopia
2005 Anders GravbrøtFinstad
PhD Biology Salmonid fishes in a changing climate: The winterchallenge
2005 Shimane WashingtonMakabu
PhD Biology Interactions between woody plants, elephants and otherbrowsers in the Chobe Riverfront, Botswana
2005 Kjartan Østbye Dr. scientBiology
The European whitefish Coregonus lavaretus (L.)species complex: historical contingency and adaptiveradiation
2006 Kari Mette Murvoll PhD Biology Levels and effects of persistent organic pollutants(POPs) in seabirds, Retinoids and α-tocopherol –potential biomarkers of POPs in birds?
2006 Ivar Herfindal Dr. scientBiology
Life history consequences of environmental variationalong ecological gradients in northern ungulates
2006 Nils Egil Tokle PhD Biology Are the ubiquitous marine copepods limited by food orpredation? Experimental and field-based studies withmain focus on Calanus finmarchicus
2006 Jan Ove Gjershaug Dr. philosBiology
Taxonomy and conservation status of some bootedeagles in south-east Asia
2006 Jon Kristian Skei Dr. scientBiology
Conservation biology and acidification problems in thebreeding habitat of amphibians in Norway
2006 Johanna Järnegren PhD Biology Acesta oophaga and Acesta excavata – a study ofhidden biodiversity
2006 Bjørn Henrik Hansen PhD Biology Metal-mediated oxidative stress responses in browntrout (Salmo trutta) from mining contaminated rivers inCentral Norway
2006 Vidar Grøtan PhD Biology Temporal and spatial effects of climate fluctuations onpopulation dynamics of vertebrates
2006 Jafari R Kideghesho PhD Biology Wildlife conservation and local land use conflicts inWestern Serengeti Corridor, Tanzania
2006 Anna Maria Billing PhD Biology Reproductive decisions in the sex role reversed pipefishSyngnathus typhle: when and how to invest inreproduction
2006 Henrik Pärn PhD Biology Female ornaments and reproductive biology in thebluethroat
2006 Anders J. Fjellheim PhD Biology Selection and administration of probiotic bacteria tomarine fish larvae
2006 P. Andreas Svensson PhD Biology Female coloration, egg carotenoids and reproductivesuccess: gobies as a model system
2007 Sindre A. Pedersen PhD Biology Metal binding proteins and antifreeze proteins in thebeetle Tenebrio molitor - a study on possiblecompetition for the semi-essential amino acid cysteine
2007 Kasper Hancke PhD Biology Photosynthetic responses as a function of light andtemperature: Field and laboratory studies on marinemicroalgae
2007 Tomas Holmern PhD Biology Bushmeat hunting in the western Serengeti:Implications for community-based conservation
2007 Kari Jørgensen PhD Biology Functional tracing of gustatory receptor neurons in theCNS and chemosensory learning in the moth Heliothisvirescens
2007 Stig Ulland PhD Biology Functional Characterisation of Olfactory ReceptorNeurons in the Cabbage Moth, (Mamestra brassicaeL.) (Lepidoptera, Noctuidae). Gas ChromatographyLinked to Single Cell Recordings and MassSpectrometry
2007 Snorre Henriksen PhD Biology Spatial and temporal variation in herbivore resources atnorthern latitudes
2007 Roelof Frans May PhD Biology Spatial Ecology of Wolverines in Scandinavia
2007 Vedasto GabrielNdibalema
PhD Biology Demographic variation, distribution and habitat usebetween wildebeest sub-populations in the SerengetiNational Park, Tanzania
2007 Julius WilliamNyahongo
PhD Biology Depredation of Livestock by wild Carnivores andIllegal Utilization of Natural Resources by Humans inthe Western Serengeti, Tanzania
2007 Shombe NtaralukaHassan
PhD Biology Effects of fire on large herbivores and their forageresources in Serengeti, Tanzania
2007 Per-Arvid Wold PhD Biology Functional development and response to dietarytreatment in larval Atlantic cod (Gadus morhua L.)Focus on formulated diets and early weaning
2007 Anne SkjetneMortensen
PhD Biology Toxicogenomics of Aryl Hydrocarbon- and EstrogenReceptor Interactions in Fish: Mechanisms andProfiling of Gene Expression Patterns in ChemicalMixture Exposure Scenarios
2008 Brage BremsetHansen
PhD Biology The Svalbard reindeer (Rangifer tarandusplatyrhynchus) and its food base: plant-herbivoreinteractions in a high-arctic ecosystem
2008 Jiska van Dijk PhD Biology Wolverine foraging strategies in a multiple-uselandscape
2008 Flora John Magige PhD Biology The ecology and behaviour of the Masai Ostrich(Struthio camelus massaicus) in the SerengetiEcosystem, Tanzania
2008 Bernt Rønning PhD Biology Sources of inter- and intra-individual variation in basalmetabolic rate in the zebra finch, Taeniopygia guttata
2008 Sølvi Wehn PhD Biology Biodiversity dynamics in semi-natural mountainlandscapes - A study of consequences of changedagricultural practices in Eastern Jotunheimen
2008 Trond MoxnessKortner
PhD Biology The Role of Androgens on previtellogenic oocytegrowth in Atlantic cod (Gadus morhua): Identificationand patterns of differentially expressed genes inrelation to Stereological Evaluations
2008 Katarina MariannJørgensen
Dr. scientBiology
The role of platelet activating factor in activation ofgrowth arrested keratinocytes and re-epithelialisation
2008 Tommy Jørstad PhD Biology Statistical Modelling of Gene Expression Data
2008 Anna Kusnierczyk PhD Biology Arabidopsis thaliana Responses to Aphid Infestation
2008 Jussi Evertsen PhD Biology Herbivore sacoglossans with photosyntheticchloroplasts
2008 John EilifHermansen
PhD Biology Mediating ecological interests between locals andglobals by means of indicators. A study attributed tothe asymmetry between stakeholders of tropical forestat Mt. Kilimanjaro, Tanzania
2008 Ragnhild Lyngved PhD Biology Somatic embryogenesis in Cyclamen persicum.Biological investigations and educational aspects ofcloning
2008 Line ElisabethSundt-Hansen
PhD Biology Cost of rapid growth in salmonid fishes
2008 Line Johansen PhD Biology Exploring factors underlying fluctuations in whiteclover populations – clonal growth, populationstructure and spatial distribution
2009 Astrid JullumstrøFeuerherm
PhD Biology Elucidation of molecular mechanisms forpro-inflammatory phospholipase A2 in chronic disease
2009 Pål Kvello PhD Biology Neurons forming the network involved in gustatorycoding and learning in the moth Heliothis virescens:
Physiological and morphological characterisation, andintegration into a standard brain atlas
2009 Trygve DevoldKjellsen
PhD Biology Extreme Frost Tolerance in Boreal Conifers
2009 Johan Reinert Vikan PhD Biology Coevolutionary interactions between common cuckoosCuculus canorus and Fringilla finches
2009 Zsolt Volent PhD Biology Remote sensing of marine environment: Appliedsurveillance with focus on optical properties ofphytoplankton, coloured organic matter and suspendedmatter
2009 Lester Rocha PhD Biology Functional responses of perennial grasses to simulatedgrazing and resource availability
2009 Dennis Ikanda PhD Biology Dimensions of a Human-lion conflict: Ecology ofhuman predation and persecution of African lions(Panthera leo) in Tanzania
2010 Huy Quang Nguyen PhD Biology Egg characteristics and development of larval digestivefunction of cobia (Rachycentron canadum) in responseto dietary treatments - Focus on formulated diets
2010 Eli Kvingedal PhD Biology Intraspecific competition in stream salmonids: theimpact of environment and phenotype
2010 Sverre Lundemo PhD Biology Molecular studies of genetic structuring anddemography in Arabidopsis from Northern Europe
2010 Iddi Mihijai Mfunda PhD Biology Wildlife Conservation and People’s livelihoods:Lessons Learnt and Considerations for Improvements.The Case of Serengeti Ecosystem, Tanzania
2010 Anton TinchovAntonov
PhD Biology Why do cuckoos lay strong-shelled eggs? Tests of thepuncture resistance hypothesis
2010 Anders Lyngstad PhD Biology Population Ecology of Eriophorum latifolium, a ClonalSpecies in Rich Fen Vegetation
2010 Hilde Færevik PhD Biology Impact of protective clothing on thermal and cognitiveresponses
2010 Ingerid Brænne Arbo PhD Medicaltechnology
Nutritional lifestyle changes – effects of dietarycarbohydrate restriction in healthy obese andoverweight humans
2010 Yngvild Vindenes PhD Biology Stochastic modeling of finite populations withindividual heterogeneity in vital parameters
2010 Hans-RichardBrattbakk
PhD Medicaltechnology
The effect of macronutrient composition, insulinstimulation, and genetic variation on leukocyte geneexpression and possible health benefits
2011 Geir Hysing Bolstad PhD Biology Evolution of Signals: Genetic Architecture, NaturalSelection and Adaptive Accuracy
2011 Karen de Jong PhD Biology Operational sex ratio and reproductive behaviour in thetwo-spotted goby (Gobiusculus flavescens)
2011 Ann-Iren Kittang PhD Biology Arabidopsis thaliana L. adaptation mechanisms tomicrogravity through the EMCS MULTIGEN-2experiment on the ISS: The science of spaceexperiment integration and adaptation to simulatedmicrogravity
2011 Aline Magdalena Lee PhD Biology Stochastic modeling of mating systems and their effecton population dynamics and genetics
2011 ChristopherGravningen Sørmo
PhD Biology Rho GTPases in Plants: Structural analysis of ROPGTPases; genetic and functional studies of MIROGTPases in Arabidopsis thaliana
2011 Grethe Robertsen PhD Biology Relative performance of salmonid phenotypes acrossenvironments and competitive intensities

2011 Line-Kristin Larsen PhD Biology Life-history trait dynamics in experimental populationsof guppy (Poecilia reticulata): the role of breedingregime and captive environment
2011 Maxim A. K.Teichert
PhD Biology Regulation in Atlantic salmon (Salmo salar): Theinteraction between habitat and density
2011 Torunn BeateHancke
PhD Biology Use of Pulse Amplitude Modulated (PAM)Fluorescence and Bio-optics for Assessing MicroalgalPhotosynthesis and Physiology
2011 Sajeda Begum PhD Biology Brood Parasitism in Asian Cuckoos: Different Aspectsof Interactions between Cuckoos and their Hosts inBangladesh
2011 Kari J. K. Attramadal PhD Biology Water treatment as an approach to increase microbialcontrol in the culture of cold water marine larvae
2011 Camilla KalvatnEgset
PhD Biology The Evolvability of Static Allometry: A Case Study
2011 AHM Raihan Sarker PhD Biology Conflict over the conservation of the Asian elephant(Elephas maximus) in Bangladesh
2011 Gro Dehli Villanger PhD Biology Effects of complex organohalogen contaminantmixtures on thyroid hormone homeostasis in selectedarctic marine mammals
2011 Kari Bjørneraas PhD Biology Spatiotemporal variation in resource utilisation by alarge herbivore, the moose
2011 John Odden PhD Biology The ecology of a conflict: Eurasian lynx depredation ondomestic sheep
2011 Simen Pedersen PhD Biology Effects of native and introduced cervids on smallmammals and birds
2011 MohsenFalahati-Anbaran
PhD Biology Evolutionary consequences of seed banks and seeddispersal in Arabidopsis
2012 Jakob HønborgHansen
PhD Biology Shift work in the offshore vessel fleet: circadianrhythms and cognitive performance
2012 Elin Noreen PhD Biology Consequences of diet quality and age on life-historytraits in a small passerine bird
2012 Irja Ida Ratikainen PhD Biology Foraging in a variable world: adaptations tostochasticity
2012 Aleksander Handå PhD Biology Cultivation of mussels (Mytilus edulis): Feedrequirements, storage and integration with salmon(Salmo salar) farming
2012 Morten Kraabøl PhD Biology Reproductive and migratory challenges inflicted onmigrant brown trout (Salmo trutta L.) in a heavilymodified river
2012 Jisca Huisman PhD Biology Gene flow and natural selection in Atlantic salmon
2012 Maria Bergvik PhD Biology Lipid and astaxanthin contents and biochemicalpost-harvest stability in Calanus finmarchicus
2012 Bjarte Bye Løfaldli PhD Biology Functional and morphological characterization ofcentral olfactory neurons in the model insect Heliothisvirescens.
2012 Karen MarieHammer
PhD Biology Acid-base regulation and metabolite responses inshallow- and deep-living marine invertebrates duringenvironmental hypercapnia
2012 Øystein NordrumWiggen
PhD Biology Optimal performance in the cold
2012 Robert DominikusFyumagwa
Dr. PhilosBiology
Anthropogenic and natural influence on diseaseprevalence at the human –livestock-wildlife interface inthe Serengeti ecosystem, Tanzania
2012 Jenny Bytingsvik PhD Biology Organohalogenated contaminants (OHCs) in polar bearmother-cub pairs from Svalbard, Norway. Maternaltransfer, exposure assessment and thyroid hormonedisruptive effects in polar bear cubs
2012 Christer MoeRolandsen
PhD Biology The ecological significance of space use and movementpatterns of moose in a variable environment
2012 Erlend KjeldsbergHovland
PhD Biology Bio-optics and Ecology in Emiliania huxleyi Blooms:Field and Remote Sensing Studies in NorwegianWaters
2012 Lise Cats Myhre PhD Biology Effects of the social and physical environment onmating behaviour in a marine fish
2012 Tonje Aronsen PhD Biology Demographic, environmental and evolutionary aspectsof sexual selection
2012 Bin Liu PhD Biology Molecular genetic investigation of cell separation andcell death regulation in Arabidopsis thaliana
2013 Jørgen Rosvold PhD Biology Ungulates in a dynamic and increasingly humandominated landscape – A millennia-scale perspective
2013 Pankaj Barah PhD Biology Integrated Systems Approaches to Study Plant StressResponses
2013 Marit Linnerud PhD Biology Patterns in spatial and temporal variation in populationabundances of vertebrates
2013 Xinxin Wang PhD Biology Integrated multi-trophic aquaculture driven by nutrientwastes released from Atlantic salmon (Salmo salar)farming
2013 Ingrid ErtshusMathisen
PhD Biology Structure, dynamics, and regeneration capacity at thesub-arctic forest-tundra ecotone of northern Norwayand Kola Peninsula, NW Russia
2013 Anders Foldvik PhD Biology Spatial distributions and productivity in salmonidpopulations
2013 Anna Marie Holand PhD Biology Statistical methods for estimating intra- andinter-population variation in genetic diversity
2013 Anna Solvang Båtnes PhD Biology Light in the dark – the role of irradiance in the highArctic marine ecosystem during polar night
2013 Sebastian Wacker PhD Biology The dynamics of sexual selection: effects of OSR,density and resource competition in a fish
2013 Cecilie Miljeteig PhD Biology Phototaxis in Calanus finmarchicus – light sensitivityand the influence of energy reserves and oil exposure
2013 Ane Kjersti Vie PhD Biology Molecular and functional characterisation of the IDAfamily of signalling peptides in Arabidopsis thaliana
2013 Marianne Nymark PhD Biology Light responses in the marine diatom Phaeodactylumtricornutum
2014 Jannik Schultner PhD Biology Resource Allocation under Stress - Mechanisms andStrategies in a Long-Lived Bird
2014 Craig Ryan Jackson PhD Biology Factors influencing African wild dog (Lycaon pictus)habitat selection and ranging behaviour: conservationand management implications
2014 Aravind Venkatesan PhD Biology Application of Semantic Web Technology to establishknowledge management and discovery in the LifeSciences
2014 Kristin Collier Valle PhD Biology Photoacclimation mechanisms and light responses inmarine micro- and macroalgae
2014 Michael Puffer PhD Biology Effects of rapidly fluctuating water levels on juvenileAtlantic salmon (Salmo salar L.)
2014 Gundula S. Bartzke PhD Biology Effects of power lines on moose (Alces alces) habitatselection, movements and feeding activity
2014 Eirin MarieBjørkvoll
PhD Biology Life-history variation and stochastic populationdynamics in vertebrates
2014 Håkon Holand PhD Biology The parasite Syngamus trachea in a metapopulation ofhouse sparrows
2014 Randi MagnusSommerfelt
PhD Biology Molecular mechanisms of inflammation – a central rolefor cytosolic phospholipase A2
2014 Espen Lie Dahl PhD Biology Population demographics in white-tailed eagle at anon-shore wind farm area in coastal Norway
2014 Anders Øverby PhD Biology Functional analysis of the action of plantisothiocyanates: cellular mechanisms and in vivo rolein plants, and anticancer activity
2014 Kamal PrasadAcharya
PhD Biology Invasive species: Genetics, characteristics and traitvariation along a latitudinal gradient.
2014 Ida BeatheØverjordet
PhD Biology Element accumulation and oxidative stress variables inArctic pelagic food chains: Calanus, little auks (Allealle) and black-legged kittiwakes (Rissa tridactyla)
2014 Kristin MøllerGabrielsen
PhD Biology Target tissue toxicity of the thyroid hormone system intwo species of arctic mammals carrying high loads oforganohalogen contaminants
2015 Gine Roll Skjervø Dr. philosBiology
Testing behavioral ecology models with historicalindividual-based human demographic data fromNorway
2015 Nils Erik GustafForsberg
PhD Biology Spatial and Temporal Genetic Structure in LandraceCereals
2015 Leila Alipanah PhD Biology Integrated analyses of nitrogen and phosphorusdeprivation in the diatoms Phaeodactylum tricornutumand Seminavis robusta
2015 Javad Najafi PhD Biology Molecular investigation of signaling components insugar sensing and defense in Arabidopsis thaliana
2015 Bjørnar Sporsheim PhD Biology Quantitative confocal laser scanning microscopy:optimization of in vivo and in vitro analysis ofintracellular transport
2015 Magni OlsenKyrkjeeide
PhD Biology Genetic variation and structure in peatmosses(Sphagnum)
2015 Keshuai Li PhD Biology Phospholipids in Atlantic cod (Gadus morhua L.)larvae rearing: Incorporation of DHA in live feed andlarval phospholipids and the metabolic capabilities oflarvae for the de novo synthesis
2015 Ingvild FladvadStørdal
PhD Biology The role of the copepod Calanus finmarchicus inaffecting the fate of marine oil spills
2016 Thomas Kvalnes PhD Biology Evolution by natural selection in age-structuredpopulations in fluctuating environments
2016 Øystein Leiknes PhD Biology The effect of nutrition on important life-history traits inthe marine copepod Calanus finmarchicus
2016 Johan HenrikHårdensson Berntsen
PhD Biology Individual variation in survival: The effect ofincubation temperature on the rate of physiologicalageing in a small passerine bird
2016 Marianne OpsahlOlufsen
PhD Biology Multiple environmental stressors: Biologicalinteractions between parameters of climate change andperfluorinated alkyl substances in fish
2016 Rebekka Varne PhD Biology Tracing the fate of escaped cod (Gadus morhua L.) in aNorwegian fjord system
2016 Anette AntonsenFenstad
PhD Biology Pollutant Levels, Antioxidants and Potential GenotoxicEffects in Incubating Female Common Eiders(Somateria mollissima)
2016 Wilfred NjamaMarealle
PhD Biology Ecology, Behaviour and Conservation Status of MasaiGiraffe (Giraffa camelopardalis tippelskirchi) inTanzania
2016 Ingunn Nilssen PhD Biology Integrated Environmental Mapping and Monitoring: AMethodological approach for end users.
2017 Konika Chawla PhD Biology Discovering, analysing and taking care of knowledge.
2017 Øystein HjortholOpedal
PhD Biology The Evolution of Herkogamy: Pollinator Reliability,Natural Selection, and Trait Evolvability.
2017 Ane Marlene Myhre PhD Biology Effective size of density dependent populations influctuating environments
2017 Emmanuel HosianaMasenga
PhD Biology Behavioural Ecology of Free-ranging and ReintroducedAfrican Wild Dog (Lycaon pictus) Packs in theSerengeti Ecosystem, Tanzania
2017 Xiaolong Lin PhD Biology Systematics and evolutionary history of Tanytarsus vander Wulp, 1874 (Diptera: Chironomidae)
2017 Emmanuel ClamsenMmassy
PhD Biology Ecology and Conservation Challenges of the Koribustard in the Serengeti National Park
2017 Richard DanielLyamuya
PhD Biology Depredation of Livestock by Wild Carnivores in theEastern Serengeti Ecosystem, Tanzania
2017 Katrin Hoydal PhD Biology Levels and endocrine disruptive effects of legacy POPsand their metabolites in long-finned pilot whales of theFaroe Islands
2017 Berit Glomstad PhD Biology Adsorption of phenanthrene to carbon nanotubes andits influence on phenanthrene bioavailability/toxicity inaquatic organism
2017 Øystein NordeideKielland
PhD Biology Sources of variation in metabolism of an aquaticectotherm
2017 Narjes Yousefi PhD Biology Genetic divergence and speciation in northernpeatmosses (Sphagnum)
2018 SigneChristensen-Dalgaard
PhD Biology Drivers of seabird spatial ecology - implications fordevelopment of offshore wind-power in Norway
2018 Janos Urbancsok PhD Biology Endogenous biological effects induced by externallysupplemented glucosinolate hydrolysis products(GHPs) on Arabidopsis thaliana
2018 Alice Mühlroth PhD Biology The influence of phosphate depletion on lipidmetabolism of microalgae
2018 Franco Peniel Mbise PhD Biology Human-Carnivore Coexistence and Conflict in theEastern Serengeti, Tanzania
2018 Stine SvalheimMarkussen
PhD Biology Causes and consequences of intersexual life historyvariation in a harvested herbivore population
2018 Mia Vedel Sørensen PhD Biology Carbon budget consequences of deciduous shrubexpansion in alpine tundra ecosystems
2018 Hanna Maria Kauko PhD Biology Light response and acclimation of microalgae in achanging Arctic
2018 Erlend I. F. Fossen PhD Biology Trait evolvability: effects of thermal plasticity andgenetic correlations among traits
2019 Peter Sjolte Ranke PhD Biology Demographic and genetic and consequences ofdispersal in house sparrows
2019 Mathilde Le Moullec PhD Biology Spatiotemporal variation in abundance of key tundraspecies: from local heterogeneity to large-scalesynchrony
2019 Endre Grüner Ofstad PhD Biology Causes and consequences of variation in resource useand social structure in ungulates
2019 Yang Jin PhD Biology Development of lipid metabolism in early life stage ofAtlantic salmon (Salmo salar)
2019 Elena Albertsen PhD Biology Evolution of floral traits: from ecological contex tofunctional integration
2019
2019
2019
2019
2019
2019
2019
2019
2019
2019
2019
2020
2020
2020
2020
2020
2020
2020
Mominul IslamNahid
Knut Jørgen Egelie
Thomas Ray Haaland
Kwaslema MalleHariohayMari Engvig Løseth
Joseph MbyatiMukekaHelene LøvstrandSvarva
Nathalie Briels
Anders L.Kolstad
Bart Peeters
Alex Kojo Datsomor
Ingun Næve
Rachael Morgan
Mahsa Jalili
Haiqing Wang
Louis Hunninck
KateLayton-MatthewsAmit Kumar Sharma
PhD Biology
Phd Biology
Phd Biology
Phd Biology
Phd Biology
Phd Biology
Phd Biology
Phd Biology
Phd Biology
Phd Biology
Phd Biology
Phd Biology
Phd Biology
Phd Biology
Phd Biology
Phd Biology
Phd Biology
Phd Biology
Interaction between two Asian cuckoos and their hostsin Bangladesh
Management of intellectual property inuniversity-industry collaborations – public access toand control of knowledgeAdaptive responses to enviromental stochasticity ondifferent evolutionary time-scalesHuman wildlife interactions in the Ruaha-RungwaEcosystem, Central TanzaniaExposure and effects of emerging and legacy organicpollutants in white-tailed eagle (Haliaeetis albicilla)nestlingsHuman-Wildlife Conflicts and Compensation forLosses in Kenya: Dynamics, Characteristics andCorrelatesDendroclimatology in southern Norway: tree rings,demography and climateExposure and effects of legacy and emerging organicpollutants in developing birds – Laboratory and fieldstudiesMoose browsing effects on boreal production forests –implications for ecosystems and human societyPopulation dynamics under climate change adharvesting: Results from the high Arctic SvalbardreindeerThe molecular basis of long chain polyunsaturated fattyacid (LC-PUFA) biosynthesis in Atlantic salmon(Salmo salar L): In vivo functions, functionalredundancy and transcriptional regulation of LC-PUFAbiosynthetic enzymesDevelopment of non-invasive methods usingultrasound technology in monitoring of Atlantic salmon(Salmo salar) production and reproductionPhysiological plasticity and evolution of thermalperformance in zebrafishEffects of different dietary ingredients on the immuneresponses and antioxidant status in Atlantic salmon(Salmo salar L.): possible nutriomics approachesUtilization of the polychaete Hediste diversicolor (O.F.Millier, 1776) in recycling waste nutrients fromland-based fish farms for value adding applications'Physiological and behavioral adaptations of impala toanthropogenic disturbances in the Serengeti ecosystemsDemographic consequences of rapid climate changeand density dependence in migratory Arctic geeseGenome editing of marine algae: Technologydevelopment and use of the CRISPR/Cas9 system forstudies of light harvesting complexes and regulation ofphosphate homeostasisDrivers of change in meso-carnivore distributions in anorthern ecosystem
2020
2020
2020
2020
2020
2020
2020
2021
2021
2021
2021
2021
2021
2021
2021
2021
2021
Lars Rød-Eriksen
Lone Sunniva Jevne
Sindre HåvarsteinEldøy
Vasundra Touré
Silje Forbord
Jørn Olav Løkken
Kristin OddenNystuen
Sam Perrin
Lara Veylit
Semona Issa
Monica Shilereyo
Vanessa Bieker
Håkon AustadLangberg
Julie Renberg
Olena Meleshko
Essa Ahsan Khan
Tanja Kofod Petersen
Phd Biology
Phd Biology
Phd Biology
Phd Biology
Phd Biology
Phd Biology
Phd Biology
Phd Biology
Phd Biology
Phd Biology
Phd Biology
Phd Biology
Phd Biology
Phd Biology
Phd Biology
Phd Biology
Phd Biology
Development and dispersal of salmon lice(Lepeophtheirus salmonis Krøyer, 1837) in commercialsalmon farming localities
The influence of physiology, life history andenvironmental conditions on the marine migrationpatterns of sea trout
Improving the FAIRness of causal interactions insystems biology: data curation and standardisation tosupport systems modelling applications
Cultivation of Saccharina latissima (Phaeophyceae) intemperate marine waters; nitrogen uptake kinetics,growth characteristics and chemical composition
Change in vegetation composition and growth in theforest-tundra ecotone – effects of climate warming andherbivory
Drivers of plant recruitment in alpine vegetation
Freshwater Fish Community Responses to ClimateChange and Invasive Species
Causes and consequences of body growth variation inhunted wild boar populations
Combined effects of environmental variation andpollution on zooplankton life history and populationdynamics
Small Mammal Population Ecology and EctoparasiteLoad: Assessing Impacts of Land Use and RainfallSeasonality in the Serengeti Ecosystem, Tanzania
Using historical herbarium specimens to elucidate theevolutionary genomics of plant invasion
Fate and transport of forever chemicals in the aquaticenvironment: Partitioning and biotransformation ofmixtures of Per- and Polyfluoroalkyl Substances(PFAS) from different point sources and resultingconcentrations in biota
Muscular and metabolic load and manual functionwhen working in the cold
Gene flow and genome evolution on peatmosses(Sphagnum)
Systems toxicology approach for evaluating the effectsof contaminants on fish ovarian development andreproductive endocrine physiology:A combination offield-, in vivo and ex vivo studies using Atlantic cod(Gadus morhua)
Biodiversity dynamics in urban areas under changingland-uses

2021 Katariina Vuorinen Phd BiologyWhen do ungulates override the climate? Defining theinterplay of two key drivers of northern vegetationdynamics

ISBN 978-82-326-6941-7 (printed ver.)ISBN 978-82-326-6260-9 (electronic ver.)
ISSN 1503-8181 (printed ver.)ISSN 2703-8084 (online ver.)
Doctoral theses at NTNU, 2021:255
John Zobolas
Software implementationsallowing new approachestoward data analysis, modelingand curation ofbiological knowledge forSystems Medicine
Doc
tora
l the
sis
Doctoral theses at N
TNU
, 2021:255John Zobolas
NTN
UN
orw
egia
n U
nive
rsity
of S
cien
ce a
nd T
echn
olog
yTh
esis
for t
he D
egre
e of
Philo
soph
iae
Doc
tor
Facu
lty o
f Nat
ural
Sci
ence
sD
epar
tmen
t of B
iolo
gy