shareq mohd nazir - ntnu open
TRANSCRIPT
Doctoral theses at NTNU, 2018:129
Doctoral theses at NTN
U, 2018:129Shareq M
ohd Nazir
Shareq Mohd NazirTECHNO-ECONOMIC ANALYSIS OFCOMBINED CYCLE POWER PLANTSINTEGRATED WITH CHEMICALLOOPING REFORMING AND CO2CAPTURE
ISBN 978-82-326-3048-6 (printed version)ISBN 978-82-326-3049-3 (electronic version)
ISSN 1503-8181
NTNU
Nor
weg
ian
Univ
ersi
ty o
fSc
ienc
e an
d Te
chno
logy
Facu
lty o
f Eng
inee
ring
Depa
rtm
ent o
f Ene
rgy
and
Proc
ess
Engi
neer
ing
Norwegian University of Science and Technology
Thesis for the degree of Philosophiae Doctor
Shareq Mohd Nazir
TECHNO-ECONOMIC ANALYSIS OFCOMBINED CYCLE POWER PLANTSINTEGRATED WITH CHEMICALLOOPING REFORMING AND CO2CAPTURE
Trondheim, May 2018
Faculty of EngineeringDepartment of Energy and Process Engineering
NTNUNorwegian University of Science and Technology
Thesis for the degree of Philosophiae Doctor
ISBN 978-82-326-3048-6 (printed version)ISBN 978-82-326-3049-3 (electronic version)ISSN 1503-8181
Doctoral theses at NTNU, 2018:129
© Shareq Mohd Nazir
Faculty of EngineeringDepartment of Energy and Process Engineering
Printed by Skipnes Kommunikasjon as

For the hard work and sacrifices of my family for my education


iii
Preface
This thesis is submitted to the Norwegian University of Science and Technology (NTNU) in
partial fulfilment of the requirements for the degree of Doctor of Philosophy (PhD). This work
was carried out at the Department of Energy and Process Engineering, Norwegian University
of Science and Technology, Trondheim, Norway. Professor Olav Bolland has been the main
supervisor and Dr. Shahriar Amini has been the co-supervisor.
This PhD project was possible due to the financial support from the European Commission
through the EU - FP7-NMP research and innovation programme under grant agreement number
604656 for the project Nanosim.

iv
Acknowledgements
“I don’t want you to be a chemical engineer. I want you to be a good chemical engineer.” Prof
Srinivas at BITS Pilani K.K. Birla Goa Campus told these words to me in the year 2009. I have
always tried chasing the word “good” from that time. Completing my PhD thesis is one of the
milestones in that chase.
Firstly, I would like to appreciate Prof. Olav Bolland for giving me the opportunity to do my
PhD studies at NTNU. I would like to thank him for being a wonderful supervisor. I am grateful
to him for giving me the freedom to express my ideas related to work and never doubting me.
His guidance and help through discussions during the PhD were phenomenal. Not only did he
impart his technical wisdom, but also influenced my way of life. Just by observing him, I have
tried to learn to maintain a healthy work life balance. Humility is one of his traits that stands
out for me.
I would like to thank my co-supervisor, Dr. Shahriar Amini. His energy levels are second to
none. His motivation and drive to reach goals have always kept me on track towards the
completion of my PhD project and thesis. I am hopeful that we will collaborate in future.
I would like to thank the European Commission for funding this PhD within the EU FP7 Project
NanoSim (grant agreement no. 604656). I express my thanks to the project consortium partners.
I do have many people to thank and I will try not to miss anyone. Let me start with the
colleagues at the Department of Energy and Process Engineering (EPT) at NTNU for providing
a very warm and welcoming environment. I am short of words to express my gratitude towards
the admin group (Tøve, Anita, Gerd-Randi, Tonje, Nina, Trond, Gunhild, Wenche, Tiril) for
being ever ready to help me. Cheers to the “rice group” (Luca, Ruben, Jonas, Bjørn, Renga,
Tian, Vu, Fredrik, Karl Oscar, Karl Lindqvist), for the fun times and the weirdest and out of
topic discussions we have had. I am thankful to Christian, Alexis, Kolbeinn and Henrik for
being informative and helping me settle during my initial days in Trondheim. I wish to thank
my office mates (Christian, Kolbeinn, Henrik, Henri, Mogahid, Ambrose, Karl Lindqvist, Joana
and Arpit) at A514 for bearing with me and creating a friendly atmosphere. EPTraining needs
a special mention, since it helped to develop the social life of people at EPT including me, and
certainly helped me learn skiing. St. Olavsloppet was quite enjoyable too. I am also thankful to
Lars Nord, Rahul, Simon, Abdel and Schalk for the technical discussions and the times during
the conferences.

v
I have enjoyed my time being an active member of different organizations in Trondheim like
DION, Indian Family in Trondhiem, Spektra Cricket Klubb and Trondheim Badminton Klubb.
I am indebted to Srikanth, Anupama, Niranjan, Sneha, Pavan, Akshay, Shraddha, Riju, Vidya,
Rohan, Vipin, Konika, Ravindra, Giri and Koti for being my family in Trondheim. They never
made me miss my home. I also thank Solomon, Elvire, Mona and Sandra for being good friends
in Trondheim. I am also thankful to Gaurav, Shukun, Sundari and PVK Srikanth for being
wonderful friends over the years.
My life in Trondheim hovers around friends with whom I have spent more time than I have
spent being alone myself. Himanshu, our friendship has continued from the nerdy days at BITS
to the even nerdier days at NTNU. Jimita and Joana, guess we have seen the ups and downs but
have still been there for each other. Arpit Singhal, thank you for all the advices, the planning of
the trips, cryptos and commodities, bearing with all my cribbing and being the true batman.
Everything I wish to achieve is for my family. The love of my sister (Sameena) and brother
(Tareq) has always been the foundation for whatever I have achieved or seen in my life until
now. Their immense trust in me is what motivates me every day. Thanking them with words
would not do justice. I would like to thank my brother in law, Zayd, for the pleasant
conversations we have had. The dedication of my parents (Nazir Sharif and Ayesha) towards
bringing me up with strong values is unquestionable. Their sacrifices for my education and up
bringing is beyond estimates. Their support has always helped me move forward in life. I also
thank Dr Ponnani for his teachings that has helped me over time. In the end, I might just be
another PhD graduate from NTNU, but I want you see this from the eyes of that kid, whose
father’s bike has broken down and all he wants to do is just go to school. That kid, who didn’t
know how his parents would manage the next month’s school fee. Finally, for that same person
to see with the very same eyes, receive a PhD from NTNU under the supervision of Prof Olav
Bolland is nothing more than living a dream. Anyhow, there are people who create a strong
impact and direct you to the right path. I would have never aligned myself to this path of
receiving a PhD if not for Prof Srinivas’s belief in me. Hence, I would like to dedicate this
thesis to my family and Prof Srinivas. I sincerely hope that I have made you proud.
vi
Summary
The current thesis is a part of the EU FP7 Project titled NanoSim. It focuses on techno-economic
analysis of combined cycle power plants with integrated pre-combustion CO2 capture and
reforming of Natural Gas (NG). The process consists of reforming of NG, Water-Gas Shift
(WGS) reactors, CO2 capture and compression section, and a hydrogen-fueled combined cycle
power plant. Two reactor concepts for reforming of NG, Chemical Looping Reforming (CLR)
and Gas Switching Reforming (GSR), were considered in this thesis. The respective integrated
processes are denoted as CLR-CC and GSR-CC. Both the CLR and GSR involve gas-solid
reactions and use a metallic oxygen carrier for the reforming of NG. Exergy analysis carried
out shows that CLR has a better thermodynamic potential when compared to the traditional gas-
gas partial oxidation process.
The design pressure in the CLR was found to be an important parameter in the CLR-CC process
that effects the process design and integration. Hence, the CLR-CC process was designed and
analysed at different design pressures in the CLR between 5 to 30 bar. The net electrical
efficiency of the process increases with an increase in pressure. Anyhow, beyond a pressure of
18 bar, which is also the pressure of the air bleed from the compressor discharge of the selected
gas turbine system (F-class gas turbine system in this case), an additional air compressor is
required with relatively lower gain in the net electrical efficiency. It was also understood that
the reforming and water-gas shift reactions are exothermic, and the heat recovery from these
reaction steps to produce steam for the steam cycle in the power plant affects the net electrical
efficiency. Different options for heat integration were analysed without modifying the basic
design of the Heat Recovery Steam Generator (HRSG). The net electrical efficiency of the
CLR-CC process was estimated to be between 40.6 and 46.5%. Producing high-pressure steam
instead of low-pressure steam from heat recovery from reforming and water-gas shift reactions,
and integrating with HRSG shows a difference of 4%-points in the net electrical efficiency.
To carry out the techno-economic analysis of the CLR-CC, a 1D model (includes kinetics of
gas-solid reactions and hydrodynamics in the reactor) of the CLR developed in MATLAB was
linked with the steady state process models for WGS, CO2 capture and compression section in
Aspen Hysys V8.6, and the steady state combined cycle power plant model in Thermoflex
component of the Thermoflow Suite V26. The multi-scale model linking approach was
established to link the dynamic 1D model of the CLR with the steady state process models for
vii
a smooth interaction and flow of process data between them. With the help of this linking
approach, a sensitivity study for the effect of air flowrate in the oxidation reactor, steam/carbon
ratio in the fuel reactor and the oxidation reactor outlet temperature of the CLR, on the net
electrical efficiency was carried out. The levelised cost of electricity (LCOE) of the CLR-CC
was also estimated and it was found that it is highly sensitive to the fuel cost followed by the
process contingency costs (capital costs accounting for maturity of the process technology).
The LCOE of the CLR-CC process lies between 75.3 and 144.8 $/MWh. The CO2 avoidance
rates of more than 85% is possible in CLR-CC.
Techno-economic assessment of the GSR-CC process was carried out and the net electrical
efficiency, CO2 avoidance rates and LCOE were estimated. Sensitivity studies with respect to
oxygen carrier utilization and steam/carbon ratio in the GSR is presented in the thesis. The net
electrical efficiency of the GSR-CC process lies between 45.1 and 46.2% with CO2 avoidance
rates of more than 95%. A case without the WGS in the GSR-CC was also studied and the net
electrical efficiency was estimated to be around 47.3%. The LCOE of the GSR-CC process is
found to be highly sensitive to the fuel cost and can be as low as 80 $/MWh when the NG price
is 4.5 $/GJ-LHV (when compared to 9.8 $/GJ-LHV considered in analysis of GSR-CC). There
is still scope to improve and optimize the CLR-CC and GSR-CC processes. Further research
on these processes can help in improving the techno-economic behavior and make it
competitive against the post-combustion capture technologies.
viii
Contents
Preface ....................................................................................................................................... iii
Acknowledgements ................................................................................................................... iv
Summary ................................................................................................................................... vi
List of Figures ........................................................................................................................... xi
List of tables ............................................................................................................................ xiii
Nomenclature .......................................................................................................................... xiv
Chapter 1: Introduction .............................................................................................................. 1
1.1 Background and motivation ......................................................................................... 1
1.2 Objectives .................................................................................................................... 2
1.3 Scope ........................................................................................................................... 3
1.4 Contribution ................................................................................................................. 4
1.5 Outline of the thesis ..................................................................................................... 5
1.6 Papers included in the thesis ........................................................................................ 5
Chapter 2: Technical Background .............................................................................................. 7
2.1 Climate Change and CO2 Capture and Sequestration (CCS) ...................................... 7
2.2 Pre-combustion capture in NG based combined cycle power plants ........................ 12
2.3 Choice of different process systems .......................................................................... 13
2.3.1 Reforming method .............................................................................................. 13
2.3.2 Water-gas Shift ................................................................................................... 14
2.3.3 CO2 Capture and Compression .......................................................................... 14
2.3.4 Power Plant ........................................................................................................ 15
2.4 Chemical Looping Reforming (CLR) ........................................................................ 15
2.4.1 Introduction to Chemical Looping Reforming ................................................... 15
2.4.2 Scientific literature in context to CLR ............................................................... 17
2.4.3 Exergy analysis of CLR and Conventional Partial Oxidation (POX) ................ 18
2.5 Gas Switching Reforming (GSR) .............................................................................. 25
Chapter 3: Methodology ........................................................................................................... 27
3.1 Reference NGCC power plant without CO2 capture ................................................. 27
3.2 Process description of CLR-CC process ................................................................... 29
3.3 Process description of GSR-CC process ................................................................... 32
3.4 Multi-scale model linking approach (Linking of 1D model to power plant
simulations) .......................................................................................................................... 34
3.5 Methodology adopted for economic analysis ............................................................ 36
ix
Chapter 4: Process integration and analysis of CLR-CC process ............................................ 39
4.1 Introduction ............................................................................................................... 39
4.2 Process integration of CLR in NGCC plant with pre-combustion CO2 capture (CLR-
CC) 39
4.2.1 Methods and assumptions for process modeling and analysis ........................... 39
4.2.2 Results and discussion ........................................................................................ 42
4.2.3 Conclusions ........................................................................................................ 45
4.3 CLR-CC operated at different design pressures in CLR ........................................... 46
4.3.1 Methodology for sensitivity analysis with respect to pressure in CLR .............. 46
4.3.2 Results and discussion ........................................................................................ 47
4.3.3 Conclusions ........................................................................................................ 50
4.4 Heat integration options for CLR-CC process .......................................................... 51
4.4.1 Methodology to analyze different heat integration options ............................... 51
4.4.2 Results and discussion ........................................................................................ 55
4.4.3 Conclusions ........................................................................................................ 57
Chapter 5: Techno-economic analysis of CLR-CC process ..................................................... 59
5.1 Introduction ............................................................................................................... 59
5.2 Methodology and assumptions to carry out techno-economic analysis of CLR-CC 59
5.2.1 1D Model for CLR ............................................................................................. 59
5.2.2 WGS and CO2 capture and compression process model .................................... 60
5.2.3 Power plant process model ................................................................................. 61
5.2.4 Assumptions for economic analysis ................................................................... 62
5.2.5 Defining criteria for techno-economic assessment of CLR-CC process ............ 64
5.3 Results and Discussion .............................................................................................. 67
5.3.1 Effect of air flowrate (O2/CH4 ratio) in oxidation reactor of CLR ..................... 72
5.3.2 Effect of oxidation reactor outlet temperature ................................................... 73
5.3.3 Effect of steam/carbon ratio near the inlet of fuel reactor of CLR..................... 74
5.3.4 Effect of fuel cost and process contingency on LCOE ...................................... 75
5.4 Concluding remarks on techno-economics of CLR-CC process ............................... 76
Chapter 6: Techno-economic analysis of GSR-CC process ..................................................... 78
6.1 Introduction ............................................................................................................... 78
6.2 Methods and Assumptions ......................................................................................... 79
6.2.1 Modeling of GSR and assumptions .................................................................... 79
6.2.2 Modeling of WGS, PSA and power plant .......................................................... 82
6.2.3 Economic analysis methodology and assumptions ............................................ 83
x
6.3 Results and Discussion .............................................................................................. 86
6.3.1 Effect of oxygen carrier utilization .................................................................... 91
6.3.2 Effect of Steam/Carbon ratio .............................................................................. 92
6.3.3 Effect of excluding WGS ................................................................................... 93
6.3.4 Sensitivity to NG price ....................................................................................... 93
6.4 Conclusions ............................................................................................................... 94
Chapter 7: Conclusions and future work .................................................................................. 96
7.1 Conclusions from the thesis ....................................................................................... 96
7.2 Future work in the area .............................................................................................. 99
Bibliography ........................................................................................................................... 101
Appendix ................................................................................................................................ 108
xi
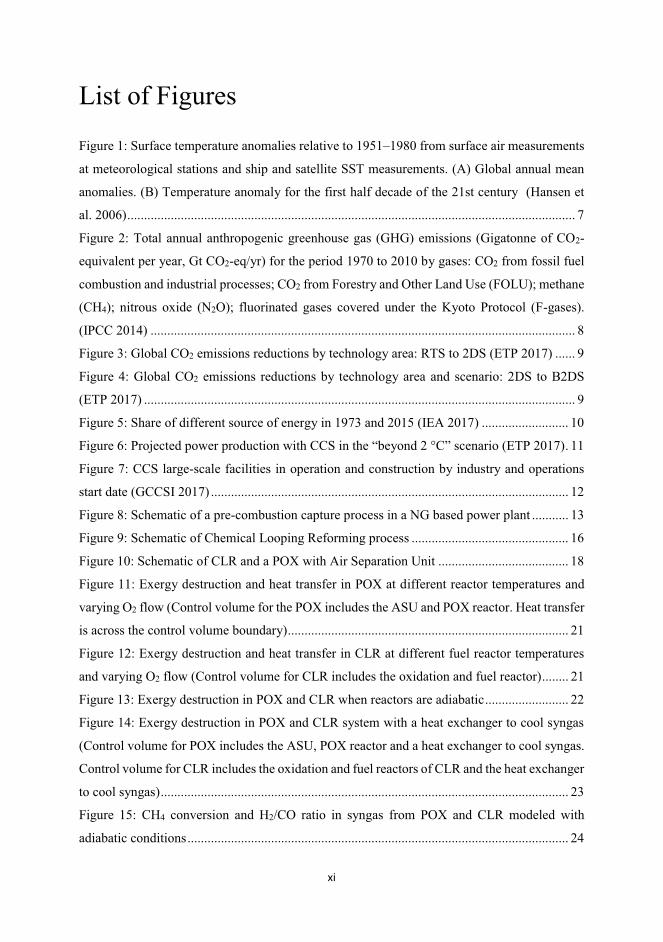
List of Figures
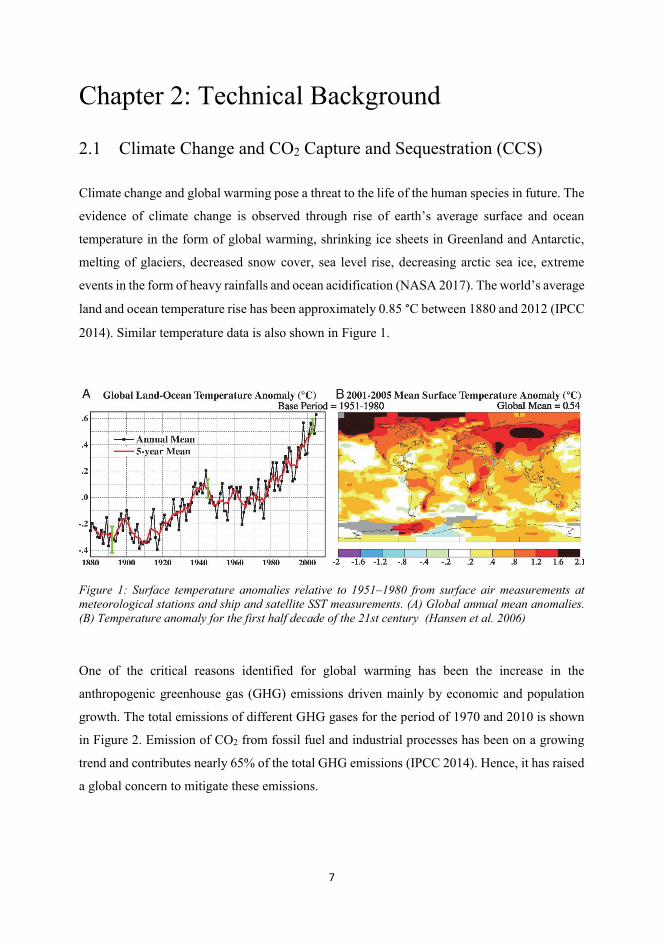
Figure 1: Surface temperature anomalies relative to 1951–1980 from surface air measurements
at meteorological stations and ship and satellite SST measurements. (A) Global annual mean
anomalies. (B) Temperature anomaly for the first half decade of the 21st century (Hansen et
al. 2006) ...................................................................................................................................... 7
Figure 2: Total annual anthropogenic greenhouse gas (GHG) emissions (Gigatonne of CO2-
equivalent per year, Gt CO2-eq/yr) for the period 1970 to 2010 by gases: CO2 from fossil fuel
combustion and industrial processes; CO2 from Forestry and Other Land Use (FOLU); methane
(CH4); nitrous oxide (N2O); fluorinated gases covered under the Kyoto Protocol (F-gases).
(IPCC 2014) ............................................................................................................................... 8
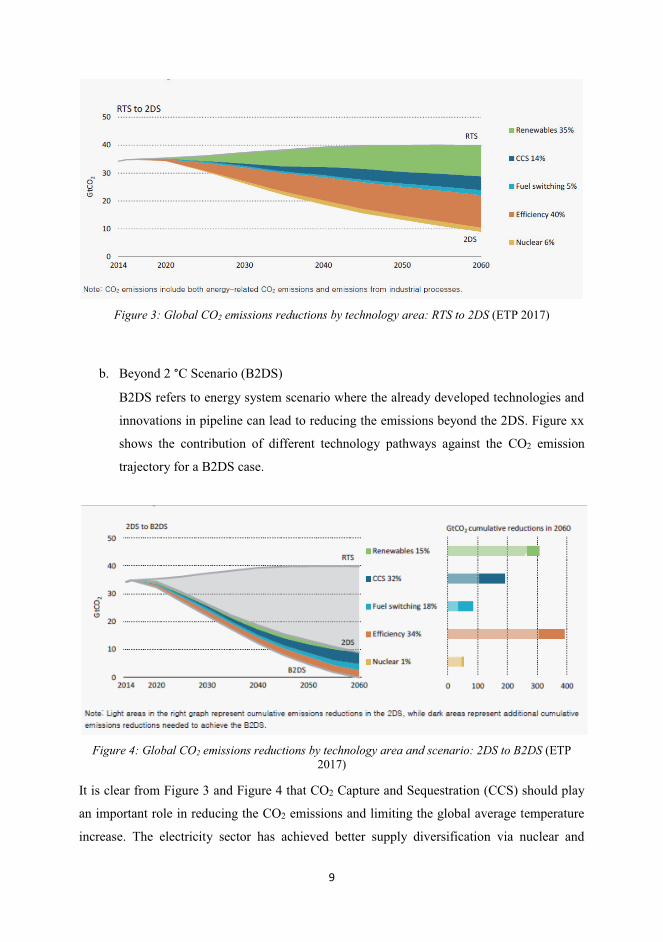
Figure 3: Global CO2 emissions reductions by technology area: RTS to 2DS (ETP 2017) ...... 9
Figure 4: Global CO2 emissions reductions by technology area and scenario: 2DS to B2DS
(ETP 2017) ................................................................................................................................. 9
Figure 5: Share of different source of energy in 1973 and 2015 (IEA 2017) .......................... 10
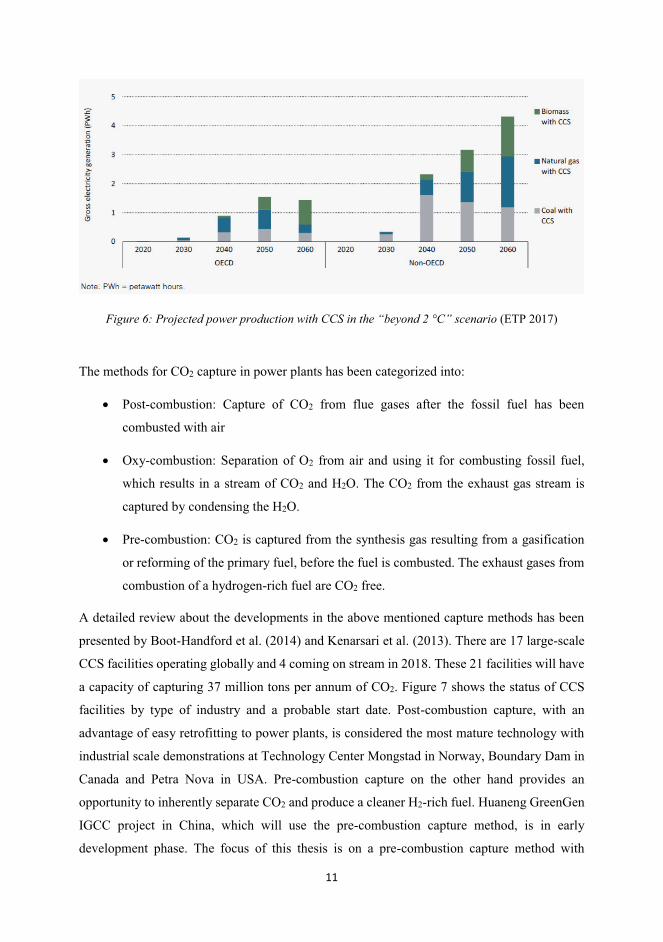
Figure 6: Projected power production with CCS in the “beyond 2 °C” scenario (ETP 2017) . 11
Figure 7: CCS large-scale facilities in operation and construction by industry and operations
start date (GCCSI 2017) ........................................................................................................... 12
Figure 8: Schematic of a pre-combustion capture process in a NG based power plant ........... 13
Figure 9: Schematic of Chemical Looping Reforming process ............................................... 16
Figure 10: Schematic of CLR and a POX with Air Separation Unit ....................................... 18
Figure 11: Exergy destruction and heat transfer in POX at different reactor temperatures and
varying O2 flow (Control volume for the POX includes the ASU and POX reactor. Heat transfer
is across the control volume boundary) .................................................................................... 21
Figure 12: Exergy destruction and heat transfer in CLR at different fuel reactor temperatures
and varying O2 flow (Control volume for CLR includes the oxidation and fuel reactor) ........ 21
Figure 13: Exergy destruction in POX and CLR when reactors are adiabatic ......................... 22
Figure 14: Exergy destruction in POX and CLR system with a heat exchanger to cool syngas
(Control volume for POX includes the ASU, POX reactor and a heat exchanger to cool syngas.
Control volume for CLR includes the oxidation and fuel reactors of CLR and the heat exchanger
to cool syngas) .......................................................................................................................... 23
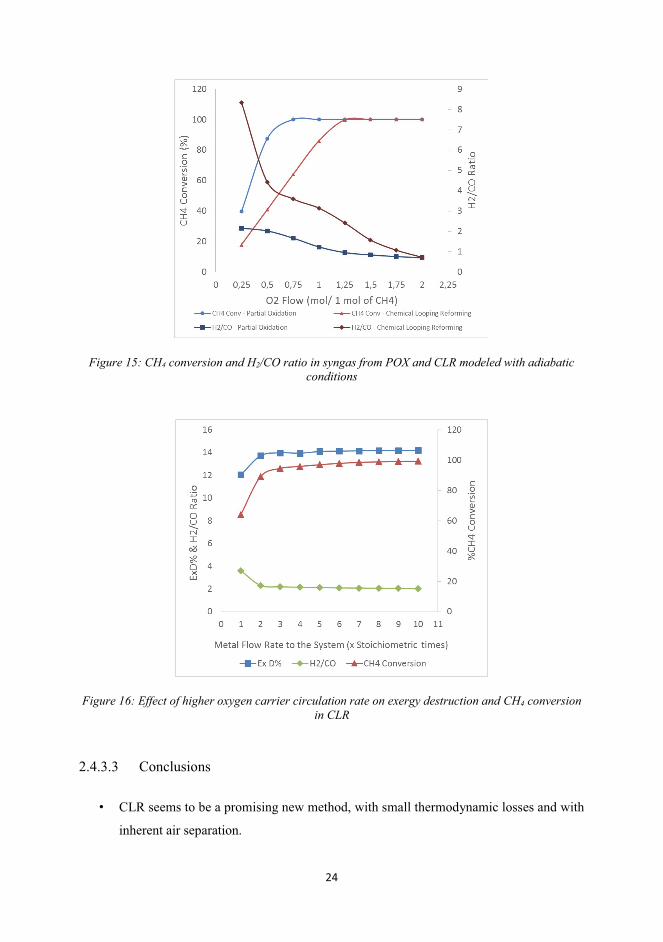
Figure 15: CH4 conversion and H2/CO ratio in syngas from POX and CLR modeled with
adiabatic conditions .................................................................................................................. 24
xii
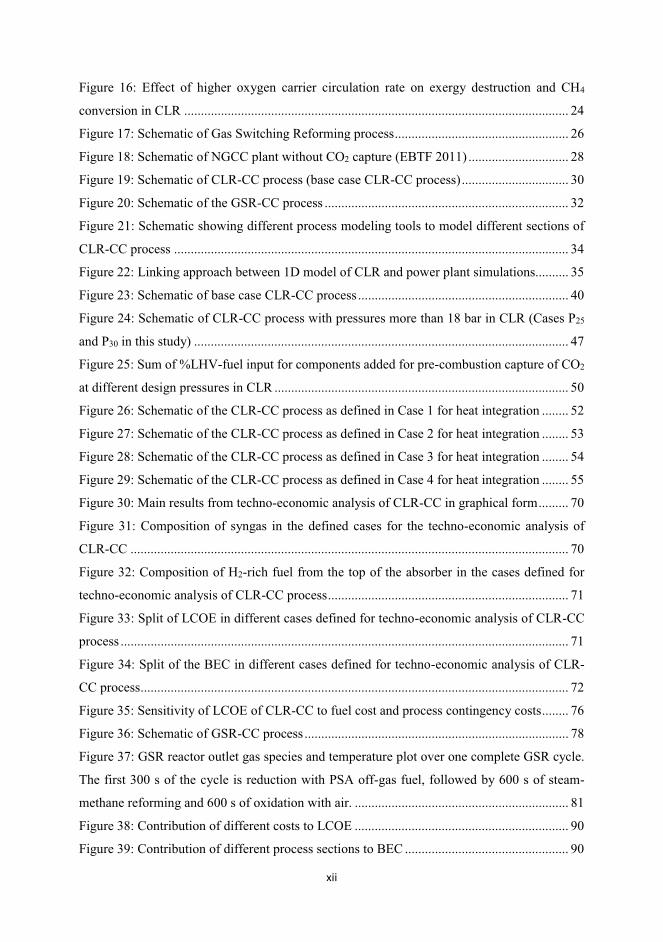
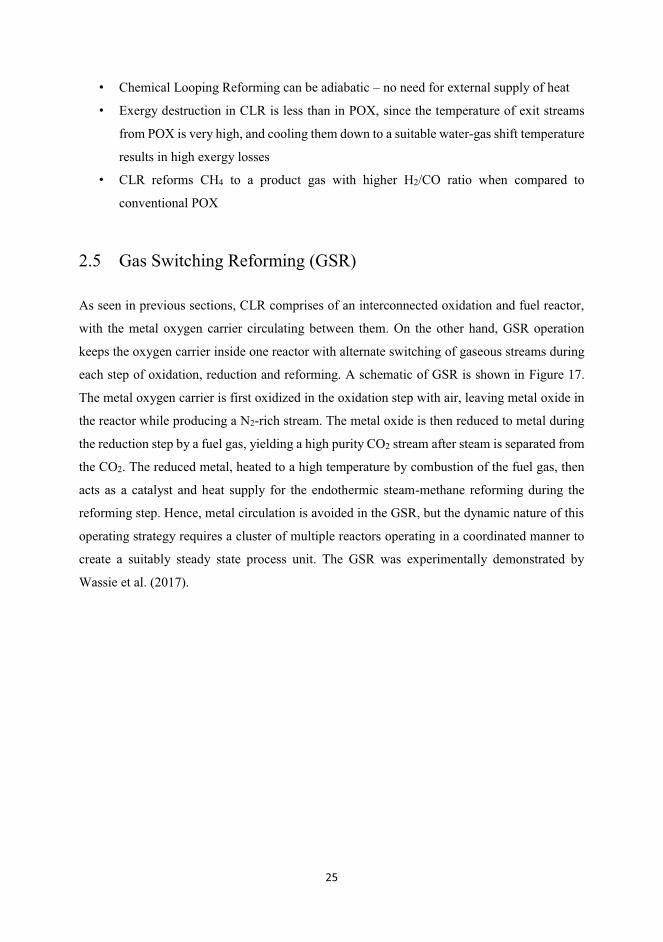
Figure 16: Effect of higher oxygen carrier circulation rate on exergy destruction and CH4
conversion in CLR ................................................................................................................... 24
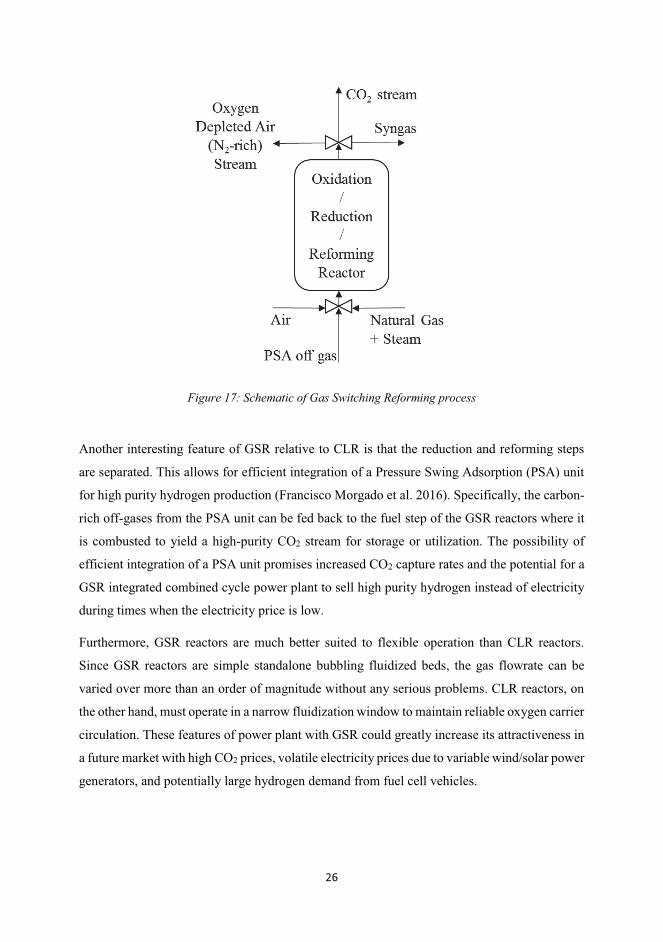
Figure 17: Schematic of Gas Switching Reforming process .................................................... 26
Figure 18: Schematic of NGCC plant without CO2 capture (EBTF 2011) .............................. 28
Figure 19: Schematic of CLR-CC process (base case CLR-CC process) ................................ 30
Figure 20: Schematic of the GSR-CC process ......................................................................... 32
Figure 21: Schematic showing different process modeling tools to model different sections of
CLR-CC process ...................................................................................................................... 34
Figure 22: Linking approach between 1D model of CLR and power plant simulations.......... 35
Figure 23: Schematic of base case CLR-CC process ............................................................... 40
Figure 24: Schematic of CLR-CC process with pressures more than 18 bar in CLR (Cases P25
and P30 in this study) ................................................................................................................ 47
Figure 25: Sum of %LHV-fuel input for components added for pre-combustion capture of CO2
at different design pressures in CLR ........................................................................................ 50
Figure 26: Schematic of the CLR-CC process as defined in Case 1 for heat integration ........ 52
Figure 27: Schematic of the CLR-CC process as defined in Case 2 for heat integration ........ 53
Figure 28: Schematic of the CLR-CC process as defined in Case 3 for heat integration ........ 54
Figure 29: Schematic of the CLR-CC process as defined in Case 4 for heat integration ........ 55
Figure 30: Main results from techno-economic analysis of CLR-CC in graphical form ......... 70
Figure 31: Composition of syngas in the defined cases for the techno-economic analysis of
CLR-CC ................................................................................................................................... 70
Figure 32: Composition of H2-rich fuel from the top of the absorber in the cases defined for
techno-economic analysis of CLR-CC process ........................................................................ 71
Figure 33: Split of LCOE in different cases defined for techno-economic analysis of CLR-CC
process ...................................................................................................................................... 71
Figure 34: Split of the BEC in different cases defined for techno-economic analysis of CLR-
CC process ................................................................................................................................ 72
Figure 35: Sensitivity of LCOE of CLR-CC to fuel cost and process contingency costs ........ 76
Figure 36: Schematic of GSR-CC process ............................................................................... 78
Figure 37: GSR reactor outlet gas species and temperature plot over one complete GSR cycle.
The first 300 s of the cycle is reduction with PSA off-gas fuel, followed by 600 s of steam-
methane reforming and 600 s of oxidation with air. ................................................................ 81
Figure 38: Contribution of different costs to LCOE ................................................................ 90
Figure 39: Contribution of different process sections to BEC ................................................. 90
xiii
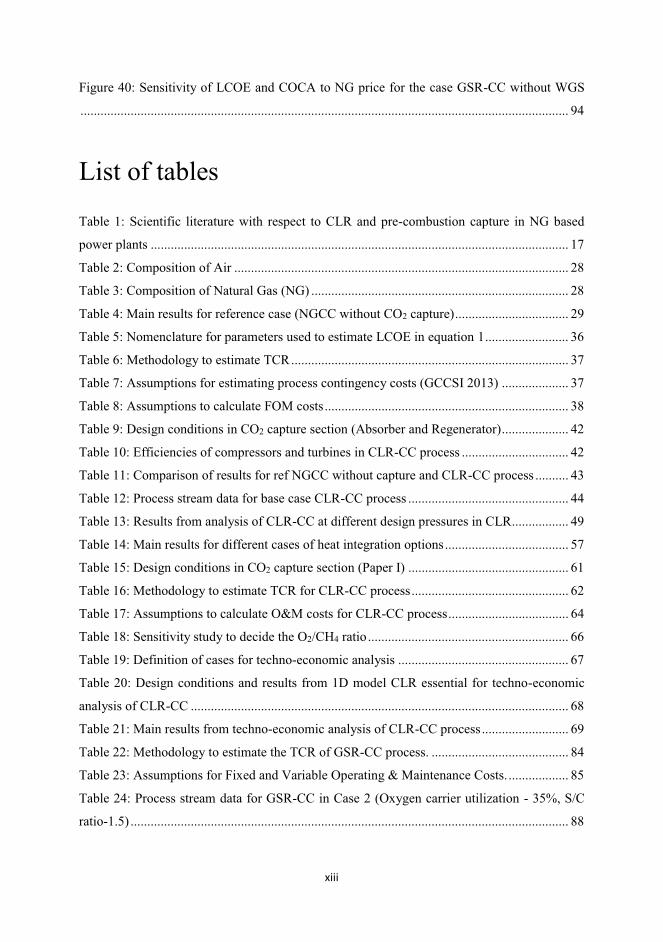
Figure 40: Sensitivity of LCOE and COCA to NG price for the case GSR-CC without WGS
.................................................................................................................................................. 94
List of tables
Table 1: Scientific literature with respect to CLR and pre-combustion capture in NG based
power plants ............................................................................................................................. 17
Table 2: Composition of Air .................................................................................................... 28
Table 3: Composition of Natural Gas (NG) ............................................................................. 28
Table 4: Main results for reference case (NGCC without CO2 capture) .................................. 29
Table 5: Nomenclature for parameters used to estimate LCOE in equation 1 ......................... 36
Table 6: Methodology to estimate TCR ................................................................................... 37
Table 7: Assumptions for estimating process contingency costs (GCCSI 2013) .................... 37
Table 8: Assumptions to calculate FOM costs ......................................................................... 38
Table 9: Design conditions in CO2 capture section (Absorber and Regenerator) .................... 42
Table 10: Efficiencies of compressors and turbines in CLR-CC process ................................ 42
Table 11: Comparison of results for ref NGCC without capture and CLR-CC process .......... 43
Table 12: Process stream data for base case CLR-CC process ................................................ 44
Table 13: Results from analysis of CLR-CC at different design pressures in CLR ................. 49
Table 14: Main results for different cases of heat integration options ..................................... 57
Table 15: Design conditions in CO2 capture section (Paper I) ................................................ 61
Table 16: Methodology to estimate TCR for CLR-CC process ............................................... 62
Table 17: Assumptions to calculate O&M costs for CLR-CC process .................................... 64
Table 18: Sensitivity study to decide the O2/CH4 ratio ............................................................ 66
Table 19: Definition of cases for techno-economic analysis ................................................... 67
Table 20: Design conditions and results from 1D model CLR essential for techno-economic
analysis of CLR-CC ................................................................................................................. 68
Table 21: Main results from techno-economic analysis of CLR-CC process .......................... 69
Table 22: Methodology to estimate the TCR of GSR-CC process. ......................................... 84
Table 23: Assumptions for Fixed and Variable Operating & Maintenance Costs. .................. 85
Table 24: Process stream data for GSR-CC in Case 2 (Oxygen carrier utilization - 35%, S/C
ratio-1.5) ................................................................................................................................... 88
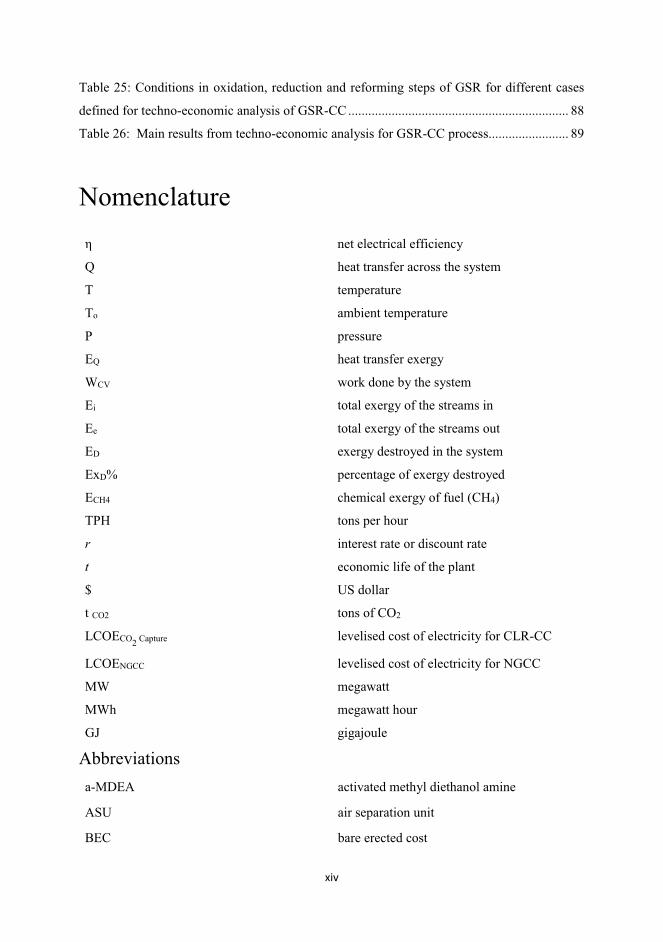
xiv
Table 25: Conditions in oxidation, reduction and reforming steps of GSR for different cases
defined for techno-economic analysis of GSR-CC .................................................................. 88
Table 26: Main results from techno-economic analysis for GSR-CC process........................ 89
Nomenclature
η net electrical efficiency
Q heat transfer across the system
T temperature
To ambient temperature
P pressure
EQ heat transfer exergy
WCV work done by the system
Ei total exergy of the streams in
Ee total exergy of the streams out
ED exergy destroyed in the system
ExD% percentage of exergy destroyed
ECH4 chemical exergy of fuel (CH4)
TPH tons per hour
r interest rate or discount rate
t economic life of the plant
$ US dollar
t CO2 tons of CO2
LCOECO2
Capture levelised cost of electricity for CLR-CC
LCOENGCC levelised cost of electricity for NGCC
MW megawatt
MWh megawatt hour
GJ gigajoule
Abbreviations
a-MDEA activated methyl diethanol amine
ASU air separation unit
BEC bare erected cost
xv
CCS carbon capture and sequestration
CF capacity factor
CLC chemical looping combustion
CLR chemical looping reforming
COCA cost of CO2 avoided
EPCC engineering procurement and construction cost
FC fuel cost
FCF fixed charge factor
FOM fixed operating and maintenance
GSR gas switching reforming
GT gas turbine
HHV higher heating value
HP high pressure
HR heat rate
HTS high temperature shift
HRSG heat recovery steam generator
LCOE levelised cost of electricity
LHV lower heating value
LP low pressure
LTS low temperature shift
MP medium pressure
NG natural gas
POX partial oxidation
SPECCA specific energy consumption for CO2 avoidance
ST steam turbine
TCR total capital requirement
TOC total overnight cost
TPC total plant cost
VOM variable operating and maintenance
WGS water-gas shift

xvi
1
Chapter 1: Introduction
1.1 Background and motivation
The current PhD project is a part of EU FP7 Project: NanoSim (A Multiscale Simulation-Based
Design Platform for Cost-Effective CO2 Capture Processes using Nano-Structured Materials).
NanoSim aims to develop efficient and cost-effective multi-scale simulation platform named
PORTO (Hagelien 2014), based on free and open source codes. PORTO platform will connect
models with scales ranging from atomistic level, particle and cluster, industrial equipment and
full plant scale. The models developed will describe the relevant physical phenomena at each
scale and then will pass on the data to the next coarser scale. Sophisticated software and data
management will be implemented to support the scientific coupling and automatic flow of data
between models at each scale.
The PORTO platform within NanoSim is used to demonstrate the rational design of second-
generation gas-particle contact CO2 capture process, with special focus on Chemical Looping
Reforming (CLR). Nevertheless, the developed platform will be generic in nature and hence
can be used for any other gas-solid contact processes.
The Project NanoSim is within the EU FP7 framework and comprises of ten different work
packages spread around with nine consortium partners from Europe. The consortium partners
include SINTEF Materials and Chemistry (Norway), TU Graz (Austria), University College
London (United Kingdom), INPT Toulouse (France), NTNU (Norway), DCS Computing
GmbH (Austria), Andritz Energy and Environment GmbH (Austria) and Universidade de
Coimbra (Portugal). The current thesis focuses on techno-economic evaluation of a power
generation process based on reforming processes that involve gas-solid reactions.
The need for CCS from power plants has been thoroughly debated and presented in ETP (2012).
Within the framework of CCS, three types of CO2 capture methods have been extensively
studied, post-combustion, oxy-combustion and pre-combustion capture. A review on these
capture methods has been presented by Boot-Handford et al. (2014). Although, post-
combustion capture seems to be well advanced in terms of maturity, pre-combustion capture
using chemical looping processes possess an attractive thermodynamic potential for reduced
energy consumption.
2
The two most studied chemical looping options are Chemical Looping Combustion (CLC) and
Chemical Looping Reforming (CLR). The focus of this thesis is on CLR. CLR involves metallic
oxygen carriers circulating between two interconnected reactors to reform Natural Gas into
syngas. Studies have been reported in literature with respect to CLR on the choice of oxygen
carrier (Tang, Xu, and Fan 2015, Adanez et al. 2012), reactor-scale experimental and modeling
studies (Chiesa et al. 2008, Ortiz et al. 2010, Pröll et al. 2010, Tong et al. 2013, Yahom et al.
2014), where the focus was on syngas production and reactor performance. Analysis of pre-
combustion capture methods like steam methane reforming, auto-thermal reforming and Ca-Cu
looping integrated with combined cycle power plants have also been reported (Cormos,
Petrescu, and Cormos 2014, Martínez et al. 2013, Romano, Chiesa, and Lozza 2010, Nord,
Anantharaman, and Bolland 2009, Kvamsdal, Jordal, and Bolland 2007). Anyhow, there is still
a gap in knowledge on integrating the CLR with combined cycle power plants and CO2 capture.
The current PhD thesis aims at bridging that gap by carrying out process design and integration
studies followed by techno-economic assessment of the gas-fired combined cycle power plant
with pre-combustion CO2 capture and CLR. The thesis also involves techno-economic
assessment of combined cycle power plants with CO2 capture and a novel reforming concept,
Gas Switching Reforming (GSR).
1.2 Objectives
The primary objective of the thesis is to speed up the development of second-generation CCS
processes (technologies ready for commercialization by the year 2030 and beyond). It deals
with process design, integration and techno-economic analysis of combined cycle power plants
based on two reforming processes, the chemical looping reforming and gas switching
reforming. The thesis is in line with the objectives of NanoSim project and the objectives are
listed below.
� Establish multi-scale model linking methodology to link dynamic state 1D model of
CLR with the steady state process models for CO2 capture section and power plant,
thereby reducing the time taken in design of novel CCS processes.
� Process design and integration studies of pre-combustion CO2 capture methods
including chemical looping reforming and gas switching reforming in combined
cycle power plants.
3
� Obtain suitable design conditions in CLR and GSR through sensitivity studies to
improve the process in terms of net electrical efficiency and CO2 avoidance rates
� Estimate the levelised cost of electricity using an established methodology to carry
out techno-economic analysis, for the combined cycle power plants integrated with
pre-combustion capture and CLR and GSR.
� The main overlying objective of this PhD thesis is to contribute to the ongoing
research in CCS through scientific publications and presentations.
1.3 Scope
� The current thesis focuses on system scale analysis of pre-combustion capture methods
in gas-fired combined cycle power plants. Standard commercial tools like Aspen Plus,
Aspen Hysys and Thermoflow for process simulation and analysis are used. The 1D
model of the CLR and 0D model of the GSR developed using MATLAB does not fall
in the scope of this thesis. Anyhow, linking of the 1D model and 0D model with the
process model for CO2 capture and power plant in Aspen Hysys and Thermoflow is
within the scope of this thesis.
� Design of gas turbines is not included as a part of this thesis. Standard available gas
turbine models in Thermoflow database are used for analysis.
� Studies related to synthesizing or choice of oxygen carrier is not within the scope of this
thesis.
� The economic assessment of the process is carried out based on the methodology
proposed by GCCSI (2013).
� Techno-economic assessment of a gas-fired combined cycle power plant with pre-
combustion CO2 capture method and reforming processes like CLR and GSR falls
within the scope of this thesis.
� Optimization of the process is not in scope of this thesis. Anyhow, sensitivity analysis
on the performance of the process provides an insight to identify suitable design
conditions in CLR and GSR.
4
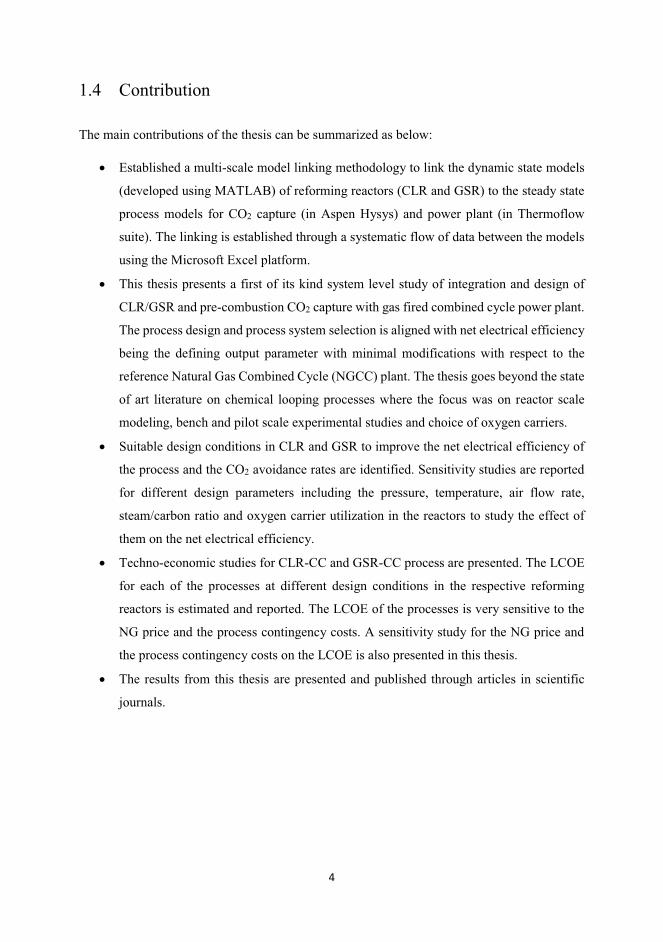
1.4 Contribution
The main contributions of the thesis can be summarized as below:
� Established a multi-scale model linking methodology to link the dynamic state models
(developed using MATLAB) of reforming reactors (CLR and GSR) to the steady state
process models for CO2 capture (in Aspen Hysys) and power plant (in Thermoflow
suite). The linking is established through a systematic flow of data between the models
using the Microsoft Excel platform.
� This thesis presents a first of its kind system level study of integration and design of
CLR/GSR and pre-combustion CO2 capture with gas fired combined cycle power plant.
The process design and process system selection is aligned with net electrical efficiency
being the defining output parameter with minimal modifications with respect to the
reference Natural Gas Combined Cycle (NGCC) plant. The thesis goes beyond the state
of art literature on chemical looping processes where the focus was on reactor scale
modeling, bench and pilot scale experimental studies and choice of oxygen carriers.
� Suitable design conditions in CLR and GSR to improve the net electrical efficiency of
the process and the CO2 avoidance rates are identified. Sensitivity studies are reported
for different design parameters including the pressure, temperature, air flow rate,
steam/carbon ratio and oxygen carrier utilization in the reactors to study the effect of
them on the net electrical efficiency.
� Techno-economic studies for CLR-CC and GSR-CC process are presented. The LCOE
for each of the processes at different design conditions in the respective reforming
reactors is estimated and reported. The LCOE of the processes is very sensitive to the
NG price and the process contingency costs. A sensitivity study for the NG price and
the process contingency costs on the LCOE is also presented in this thesis.
� The results from this thesis are presented and published through articles in scientific
journals.
5
1.5 Outline of the thesis
The thesis contains seven chapters and four papers. The introduction to thesis is described in
Chapter 1. The overlying motivation and background, objectives, scope of work and the list of
publications are also specified in Chapter 1. Chapter 2 gives the technical background to the
current thesis topic. The need for CCS to mitigate climate change, the current scenario of pre-
combustion capture methods, an introduction to CLR and GSR and selection of different
process systems is described in Chapter 2. Chapter 3 describes the methodology adopted to
meet the objectives of the thesis. Chapter 3 provides description of the processes, the list of
assumptions, multi-scale model linking approach and the methodology adopted to carry out
economic analysis. Chapter 4, Paper I and Paper II present the integration of CLR with the
combined cycle power plant and a sensitivity study to identify suitable design conditions for
the CLR-CC process. Chapter 5 and Paper III present the techno-economic analysis of CLR-
CC process using the results from the 1D model for CLR. Chapter 6 and Paper IV present the
techno-economic analysis of GSR-CC process. Chapter 7 specifies the conclusions from the
thesis and opportunities for future work. The papers included in the thesis are attached in the
appendix.
1.6 Papers included in the thesis
The list of papers included in the thesis and ready for evaluation are Paper I, Paper II, Paper III
and Paper IV. Nazir has been the first author for these four papers. Nazir has been responsible
for process modeling and simulation, linking the 1D model of CLR with the power plant
simulations, analysis of the results and writing all the four papers presented in this thesis. In
Paper III, Morgado shared equal responsibility of the work with Nazir, since Morgado was
responsible for developing the 1D model of CLR and providing the results from it for Paper III.
Quinta-Ferreira was responsible for reviewing the results from the 1D model of CLR for Paper
III. Cloete was responsible to provide the results from the GSR reactor model for Paper IV.
Bolland (main supervisor) and Amini (co-supervisor) have been Nazir’s supervisors for the
PhD and have contributed to the papers through rigorous technical discussions, suggestions and
comments and reviewing the manuscripts.
6
Paper I
Nazir, S. M., Bolland, O., Amini, S., Full Plant Scale Analysis of Natural Gas Fired Power
Plants with Pre-Combustion CO2 Capture and Chemical Looping Reforming (CLR). Energy
Procedia 2017, 114, 2146-2155.
Paper II
Nazir, S., Bolland, O., Amini, S., Analysis of Combined Cycle Power Plants with Chemical
Looping Reforming of Natural Gas and Pre-Combustion CO2 Capture. Energies 2018, 11 (1),
147.
Paper III
Nazir S.M., Morgado J.F., Bolland O., Quinta-Ferreira R., Amini S., Techno-economic
assessment of chemical looping reforming of Natural Gas for Hydrogen production and power
generation with integrated CO2 capture. International Journal of Greenhouse Gas Control
(2018). (Under Review).
Paper IV
Nazir S.M., Cloete S., Bolland O., Amini S., Techno-economic assessment of the novel Gas
Switching Reforming (GSR) concept for gas-fired power production with integrated CO2
capture. International Journal of Hydrogen Energy (2018). (Accepted for publication)
7
Chapter 2: Technical Background
2.1 Climate Change and CO2 Capture and Sequestration (CCS)
Climate change and global warming pose a threat to the life of the human species in future. The
evidence of climate change is observed through rise of earth’s average surface and ocean
temperature in the form of global warming, shrinking ice sheets in Greenland and Antarctic,
melting of glaciers, decreased snow cover, sea level rise, decreasing arctic sea ice, extreme
events in the form of heavy rainfalls and ocean acidification (NASA 2017). The world’s average
land and ocean temperature rise has been approximately 0.85 °C between 1880 and 2012 (IPCC
2014). Similar temperature data is also shown in Figure 1.
Figure 1: Surface temperature anomalies relative to 1951–1980 from surface air measurements at meteorological stations and ship and satellite SST measurements. (A) Global annual mean anomalies. (B) Temperature anomaly for the first half decade of the 21st century (Hansen et al. 2006)
One of the critical reasons identified for global warming has been the increase in the
anthropogenic greenhouse gas (GHG) emissions driven mainly by economic and population
growth. The total emissions of different GHG gases for the period of 1970 and 2010 is shown
in Figure 2. Emission of CO2 from fossil fuel and industrial processes has been on a growing
trend and contributes nearly 65% of the total GHG emissions (IPCC 2014). Hence, it has raised
a global concern to mitigate these emissions.
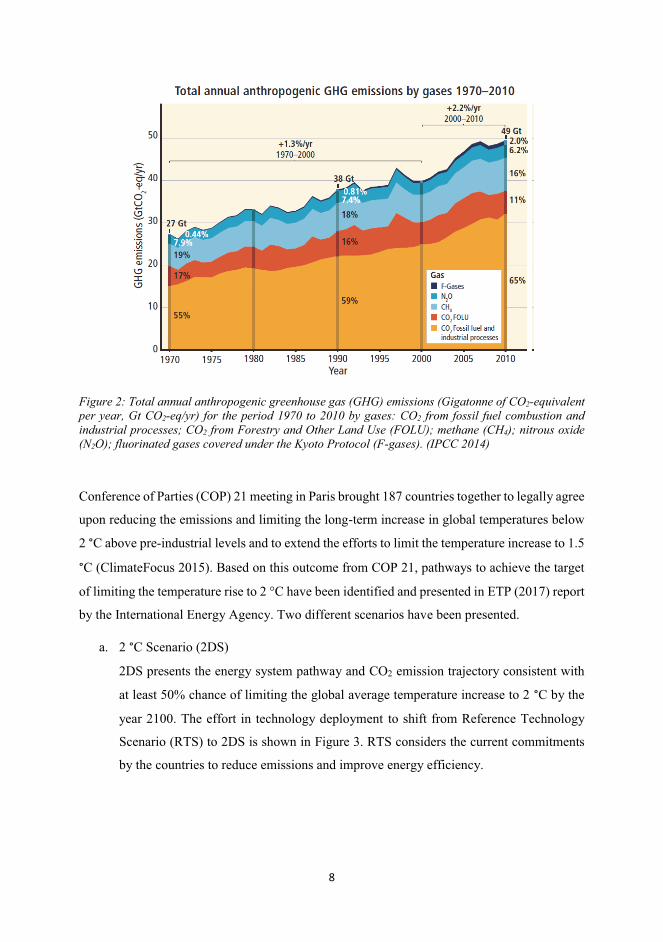
8
Figure 2: Total annual anthropogenic greenhouse gas (GHG) emissions (Gigatonne of CO2-equivalent per year, Gt CO2-eq/yr) for the period 1970 to 2010 by gases: CO2 from fossil fuel combustion and industrial processes; CO2 from Forestry and Other Land Use (FOLU); methane (CH4); nitrous oxide (N2O); fluorinated gases covered under the Kyoto Protocol (F-gases). (IPCC 2014)
Conference of Parties (COP) 21 meeting in Paris brought 187 countries together to legally agree
upon reducing the emissions and limiting the long-term increase in global temperatures below
2 °C above pre-industrial levels and to extend the efforts to limit the temperature increase to 1.5
°C (ClimateFocus 2015). Based on this outcome from COP 21, pathways to achieve the target
of limiting the temperature rise to 2 °C have been identified and presented in ETP (2017) report
by the International Energy Agency. Two different scenarios have been presented.
a. 2 °C Scenario (2DS)
2DS presents the energy system pathway and CO2 emission trajectory consistent with
at least 50% chance of limiting the global average temperature increase to 2 °C by the
year 2100. The effort in technology deployment to shift from Reference Technology
Scenario (RTS) to 2DS is shown in Figure 3. RTS considers the current commitments
by the countries to reduce emissions and improve energy efficiency.
9
Figure 3: Global CO2 emissions reductions by technology area: RTS to 2DS (ETP 2017)
b. Beyond 2 °C Scenario (B2DS)
B2DS refers to energy system scenario where the already developed technologies and
innovations in pipeline can lead to reducing the emissions beyond the 2DS. Figure xx
shows the contribution of different technology pathways against the CO2 emission
trajectory for a B2DS case.
Figure 4: Global CO2 emissions reductions by technology area and scenario: 2DS to B2DS (ETP
2017)
It is clear from Figure 3 and Figure 4 that CO2 Capture and Sequestration (CCS) should play
an important role in reducing the CO2 emissions and limiting the global average temperature
increase. The electricity sector has achieved better supply diversification via nuclear and
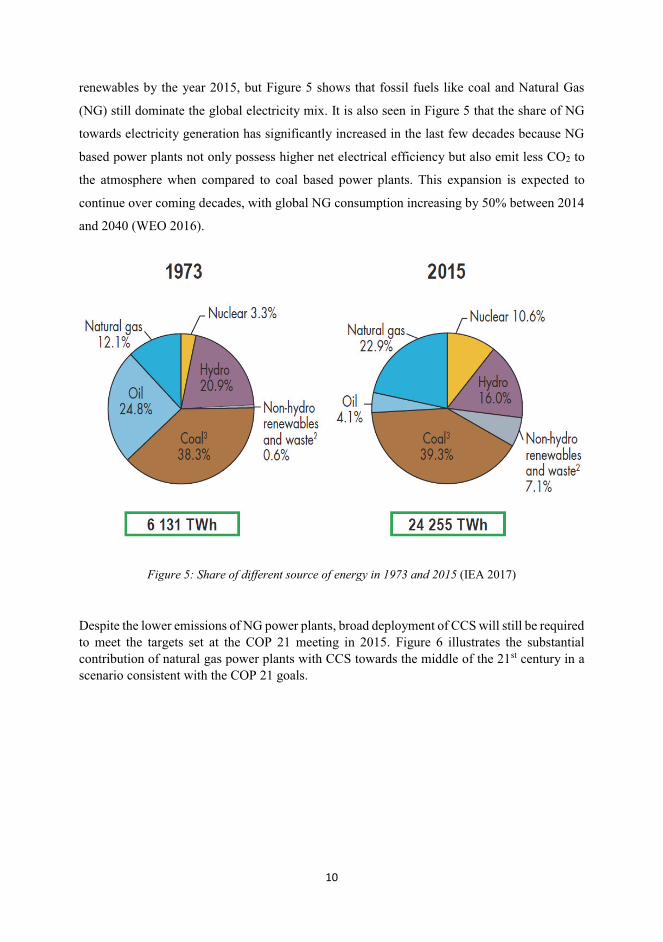
10
renewables by the year 2015, but Figure 5 shows that fossil fuels like coal and Natural Gas
(NG) still dominate the global electricity mix. It is also seen in Figure 5 that the share of NG
towards electricity generation has significantly increased in the last few decades because NG
based power plants not only possess higher net electrical efficiency but also emit less CO2 to
the atmosphere when compared to coal based power plants. This expansion is expected to
continue over coming decades, with global NG consumption increasing by 50% between 2014
and 2040 (WEO 2016).
Figure 5: Share of different source of energy in 1973 and 2015 (IEA 2017)
Despite the lower emissions of NG power plants, broad deployment of CCS will still be required
to meet the targets set at the COP 21 meeting in 2015. Figure 6 illustrates the substantial
contribution of natural gas power plants with CCS towards the middle of the 21st century in a
scenario consistent with the COP 21 goals.
11
Figure 6: Projected power production with CCS in the “beyond 2 °C” scenario (ETP 2017)
The methods for CO2 capture in power plants has been categorized into:
� Post-combustion: Capture of CO2 from flue gases after the fossil fuel has been
combusted with air
� Oxy-combustion: Separation of O2 from air and using it for combusting fossil fuel,
which results in a stream of CO2 and H2O. The CO2 from the exhaust gas stream is
captured by condensing the H2O.
� Pre-combustion: CO2 is captured from the synthesis gas resulting from a gasification
or reforming of the primary fuel, before the fuel is combusted. The exhaust gases from
combustion of a hydrogen-rich fuel are CO2 free.
A detailed review about the developments in the above mentioned capture methods has been
presented by Boot-Handford et al. (2014) and Kenarsari et al. (2013). There are 17 large-scale
CCS facilities operating globally and 4 coming on stream in 2018. These 21 facilities will have
a capacity of capturing 37 million tons per annum of CO2. Figure 7 shows the status of CCS
facilities by type of industry and a probable start date. Post-combustion capture, with an
advantage of easy retrofitting to power plants, is considered the most mature technology with
industrial scale demonstrations at Technology Center Mongstad in Norway, Boundary Dam in
Canada and Petra Nova in USA. Pre-combustion capture on the other hand provides an
opportunity to inherently separate CO2 and produce a cleaner H2-rich fuel. Huaneng GreenGen
IGCC project in China, which will use the pre-combustion capture method, is in early
development phase. The focus of this thesis is on a pre-combustion capture method with
12
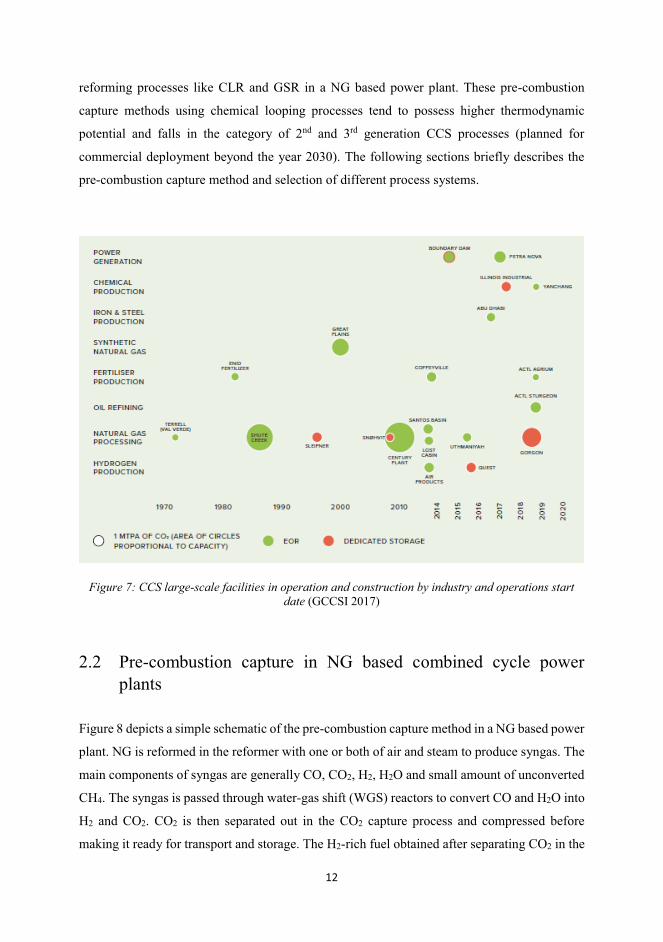
reforming processes like CLR and GSR in a NG based power plant. These pre-combustion
capture methods using chemical looping processes tend to possess higher thermodynamic
potential and falls in the category of 2nd and 3rd generation CCS processes (planned for
commercial deployment beyond the year 2030). The following sections briefly describes the
pre-combustion capture method and selection of different process systems.
Figure 7: CCS large-scale facilities in operation and construction by industry and operations start date (GCCSI 2017)
2.2 Pre-combustion capture in NG based combined cycle power
plants
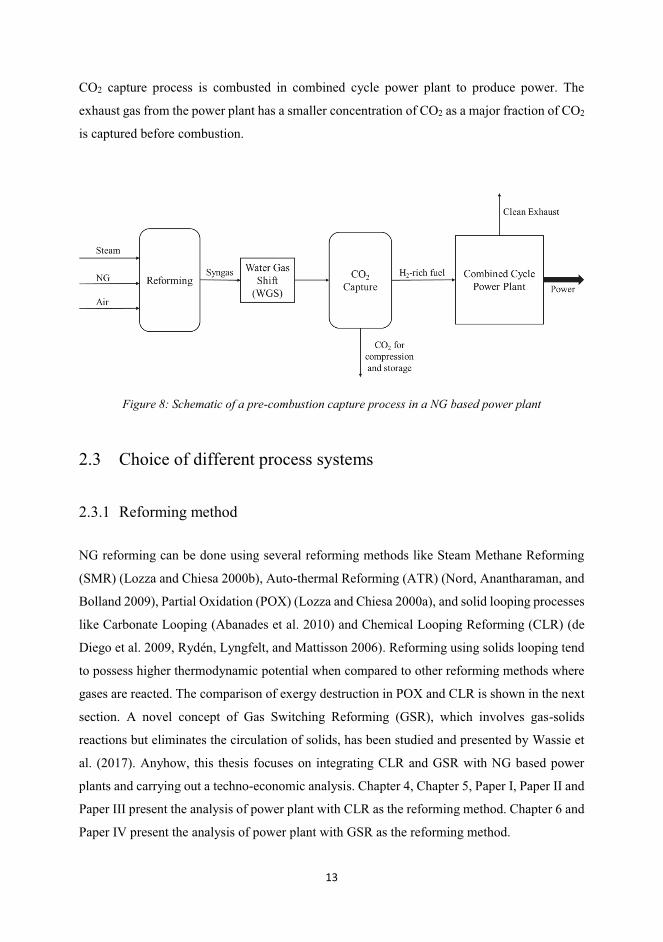
Figure 8 depicts a simple schematic of the pre-combustion capture method in a NG based power
plant. NG is reformed in the reformer with one or both of air and steam to produce syngas. The
main components of syngas are generally CO, CO2, H2, H2O and small amount of unconverted
CH4. The syngas is passed through water-gas shift (WGS) reactors to convert CO and H2O into
H2 and CO2. CO2 is then separated out in the CO2 capture process and compressed before
making it ready for transport and storage. The H2-rich fuel obtained after separating CO2 in the
13
CO2 capture process is combusted in combined cycle power plant to produce power. The
exhaust gas from the power plant has a smaller concentration of CO2 as a major fraction of CO2
is captured before combustion.
Figure 8: Schematic of a pre-combustion capture process in a NG based power plant
2.3 Choice of different process systems
2.3.1 Reforming method
NG reforming can be done using several reforming methods like Steam Methane Reforming
(SMR) (Lozza and Chiesa 2000b), Auto-thermal Reforming (ATR) (Nord, Anantharaman, and
Bolland 2009), Partial Oxidation (POX) (Lozza and Chiesa 2000a), and solid looping processes
like Carbonate Looping (Abanades et al. 2010) and Chemical Looping Reforming (CLR) (de
Diego et al. 2009, Rydén, Lyngfelt, and Mattisson 2006). Reforming using solids looping tend
to possess higher thermodynamic potential when compared to other reforming methods where
gases are reacted. The comparison of exergy destruction in POX and CLR is shown in the next
section. A novel concept of Gas Switching Reforming (GSR), which involves gas-solids
reactions but eliminates the circulation of solids, has been studied and presented by Wassie et
al. (2017). Anyhow, this thesis focuses on integrating CLR and GSR with NG based power
plants and carrying out a techno-economic analysis. Chapter 4, Chapter 5, Paper I, Paper II and
Paper III present the analysis of power plant with CLR as the reforming method. Chapter 6 and
Paper IV present the analysis of power plant with GSR as the reforming method.
14
2.3.2 Water-gas Shift
The water-gas shift (WGS) process converts CO and H2O into CO2 and H2 as per the reaction
2.1
�� � ���� � ��� � ���������� ���� � � ��������� (2.1)
To achieve high conversion of CO at lower steam requirements, the WGS is divided into two
steps, a High Temperature Shift (HTS) and a Low Temperature Shift (LTS) (Newsome 1980).
For the process analysis in all the proceeding chapters and papers, the conditions in the WGS
are kept the same where the inlet to the HTS is assumed to be at 400 °C and the inlet to the LTS
is assumed 200 °C.
2.3.3 CO2 Capture and Compression
Different CO2 capture methods have been reported in literature, which includes absorption
(chemical and physical), adsorption (pressure and temperature swing), membranes, cryogenic
distillation and gas hydrate crystallization. A review on these methods have been presented by
Kenarsari et al. (2013). The selection of the type of capture method in power plants is based on
the partial pressures of CO2 in the feed process stream, and on the extent of separation. In the
CLR-CC process, which is analysed and presented in Chapter 4, Chapter 5, Paper I, Paper II
and Paper III, the chemical absorption method using activated methyl diethanol amine (a-
MDEA) solution is considered since the partial pressures of CO2 at the inlet of the absorption
system are moderate (Appl 1999). The purity of H2-rich fuel obtained after CO2 separation is
also high (>90% H2), which is suitable for power generation. In the GSR-CC process, which is
analysed and presented in Chapter 6 and Paper IV, Pressure Swing Adsorption (PSA) was
considered because the off gas from PSA is used in the GSR, and it produces H2-rich fuel with
99.99% H2 purity. Using PSA not only produces H2-rich fuel for power generation, but also
provides an opportunity to produce and store pure H2 during the downtime of the power plant.
The CO2 compression chain used in this thesis is very similar to the one described in EBTF
(2011). CO2 is compressed to 110 bar in four stages with intercooling before being transport
and storage ready.
15
2.3.4 Power Plant
A Natural Gas Combined Cycle (NGCC) power plant as described in EBTF (2011) is taken as
a reference. The CLR and GSR along with the CO2 capture step is integrated with the gas-fired
combined cycle power plant to reduce CO2 emissions. The configuration of the power plant
considered in this thesis consists of two large “F” class Gas Turbines (GT), two Heat Recovery
Steam Generators (HRSG) and one Steam Turbine (ST) system. The GT considered in this
thesis is GE 9371FB (EBTF 2011). The selected GT is robust to fuel composition changes
(EBTF 2011). The steam cycle has a three-pressure level steam generation with reheat for the
medium pressure steam. The ST system consists of on High Pressure (HP) turbine, one Medium
Pressure (MP) turbine and dual-flow Low Pressure (LP) turbines. The HP/MP/LP steam levels
are assumed at 166/37.2/3.4 bar. A single or dual pressure steam cycle could also be considered
as a possibility in such processes with pre-combustion capture and reforming (Nord and Bolland
2010), but the effect of HRSG design was chosen not to be included in the scope of this thesis.
A design of a three-pressure level steam cycle as in the reference NGCC plant is kept the same
in the analysis of the power plants with CLR and GSR.
2.4 Chemical Looping Reforming (CLR)
2.4.1 Introduction to Chemical Looping Reforming
Chemical looping processes like Chemical Looping Combustion (CLC) and Chemical Looping
Reforming (CLR) use metallic oxygen carriers in the process of conversion of chemical
potential of fossil fuel into work. The concept was proposed by Richter and Knoche (1983) and
a first of its kind CLC-based power generation cycle was presented by Ishida, Zheng, and
Akehata (1987). CLC converts the chemical energy of the fossil fuel into heat at relatively low
temperatures (T ≈ 800-1100 °C) compared to normal combustion (Consonni et al. 2006, Naqvi
and Bolland 2007, Iloeje, Zhao, and Ghoniem 2015). On the other hand, CLR converts the
chemical energy of fossil fuel into a H2-rich fuel, which in a combustion process may result in
higher temperatures (Turbine inlet temperatures ≈ 1400-1500 oC).
16
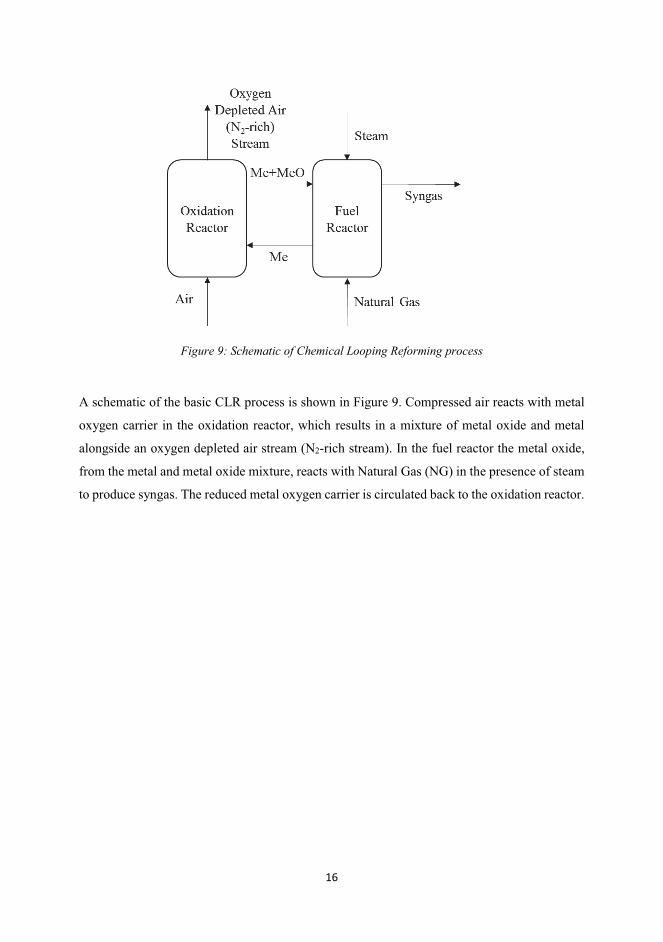
Figure 9: Schematic of Chemical Looping Reforming process
A schematic of the basic CLR process is shown in Figure 9. Compressed air reacts with metal
oxygen carrier in the oxidation reactor, which results in a mixture of metal oxide and metal
alongside an oxygen depleted air stream (N2-rich stream). In the fuel reactor the metal oxide,
from the metal and metal oxide mixture, reacts with Natural Gas (NG) in the presence of steam
to produce syngas. The reduced metal oxygen carrier is circulated back to the oxidation reactor.
17
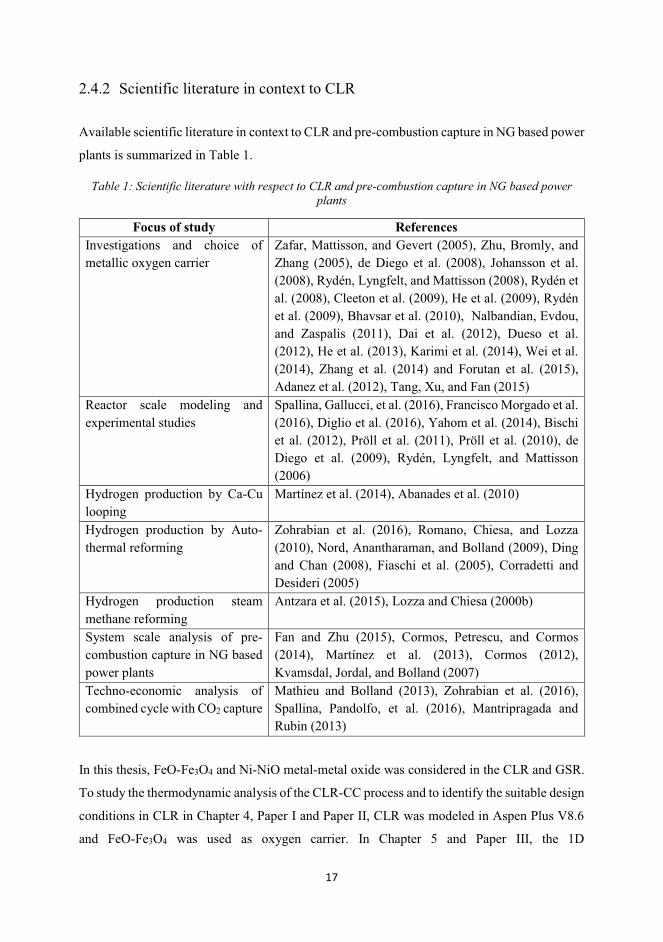
2.4.2 Scientific literature in context to CLR
Available scientific literature in context to CLR and pre-combustion capture in NG based power
plants is summarized in Table 1.
Table 1: Scientific literature with respect to CLR and pre-combustion capture in NG based power plants
Focus of study References Investigations and choice of
metallic oxygen carrier
Zafar, Mattisson, and Gevert (2005), Zhu, Bromly, and
Zhang (2005), de Diego et al. (2008), Johansson et al.
(2008), Rydén, Lyngfelt, and Mattisson (2008), Rydén et
al. (2008), Cleeton et al. (2009), He et al. (2009), Rydén
et al. (2009), Bhavsar et al. (2010), Nalbandian, Evdou,
and Zaspalis (2011), Dai et al. (2012), Dueso et al.
(2012), He et al. (2013), Karimi et al. (2014), Wei et al.
(2014), Zhang et al. (2014) and Forutan et al. (2015),
Adanez et al. (2012), Tang, Xu, and Fan (2015)
Reactor scale modeling and
experimental studies
Spallina, Gallucci, et al. (2016), Francisco Morgado et al.
(2016), Diglio et al. (2016), Yahom et al. (2014), Bischi
et al. (2012), Pröll et al. (2011), Pröll et al. (2010), de
Diego et al. (2009), Rydén, Lyngfelt, and Mattisson
(2006)
Hydrogen production by Ca-Cu
looping
Martínez et al. (2014), Abanades et al. (2010)
Hydrogen production by Auto-
thermal reforming
Zohrabian et al. (2016), Romano, Chiesa, and Lozza
(2010), Nord, Anantharaman, and Bolland (2009), Ding
and Chan (2008), Fiaschi et al. (2005), Corradetti and
Desideri (2005)
Hydrogen production steam
methane reforming
Antzara et al. (2015), Lozza and Chiesa (2000b)
System scale analysis of pre-
combustion capture in NG based
power plants
Fan and Zhu (2015), Cormos, Petrescu, and Cormos
(2014), Martínez et al. (2013), Cormos (2012),
Kvamsdal, Jordal, and Bolland (2007)
Techno-economic analysis of
combined cycle with CO2 capture
Mathieu and Bolland (2013), Zohrabian et al. (2016),
Spallina, Pandolfo, et al. (2016), Mantripragada and
Rubin (2013)
In this thesis, FeO-Fe3O4 and Ni-NiO metal-metal oxide was considered in the CLR and GSR.
To study the thermodynamic analysis of the CLR-CC process and to identify the suitable design
conditions in CLR in Chapter 4, Paper I and Paper II, CLR was modeled in Aspen Plus V8.6
and FeO-Fe3O4 was used as oxygen carrier. In Chapter 5 and Paper III, the 1D
18
phenomenological model developed by Francisco Morgado et al. (2016) for CLR was
integrated with the simulations of the other parts of the process. In Chapter 6 and Paper IV, a
0D model for GSR was integrated with simulations of the other parts of the process. Ni-NiO
was used as the oxygen carrier in the 1D model of CLR and 0D model of GSR.
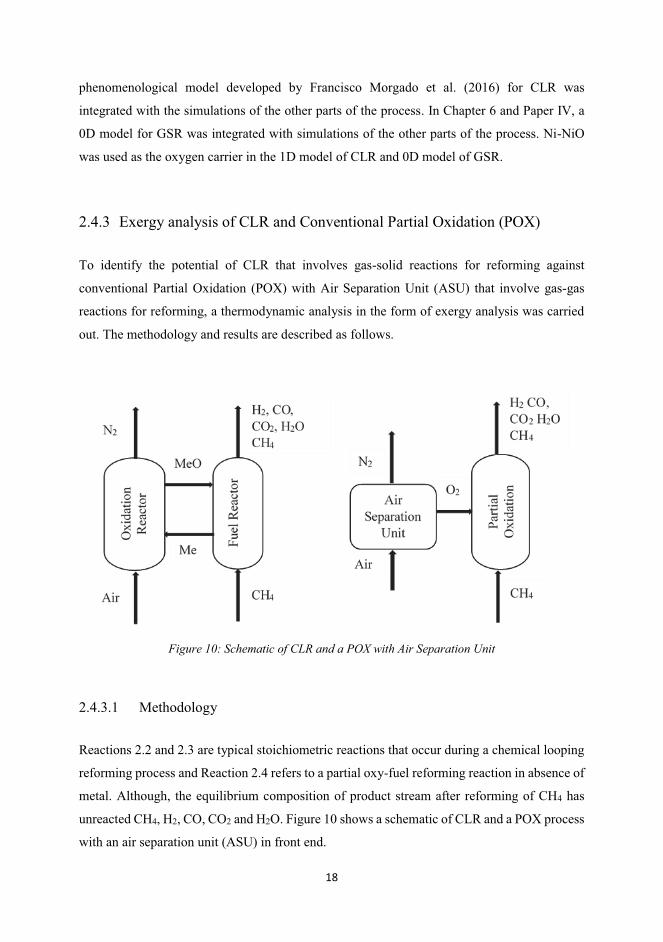
2.4.3 Exergy analysis of CLR and Conventional Partial Oxidation (POX)
To identify the potential of CLR that involves gas-solid reactions for reforming against
conventional Partial Oxidation (POX) with Air Separation Unit (ASU) that involve gas-gas
reactions for reforming, a thermodynamic analysis in the form of exergy analysis was carried
out. The methodology and results are described as follows.
Figure 10: Schematic of CLR and a POX with Air Separation Unit
2.4.3.1 Methodology
Reactions 2.2 and 2.3 are typical stoichiometric reactions that occur during a chemical looping
reforming process and Reaction 2.4 refers to a partial oxy-fuel reforming reaction in absence of
metal. Although, the equilibrium composition of product stream after reforming of CH4 has
unreacted CH4, H2, CO, CO2 and H2O. Figure 10 shows a schematic of CLR and a POX process
with an air separation unit (ASU) in front end.
19
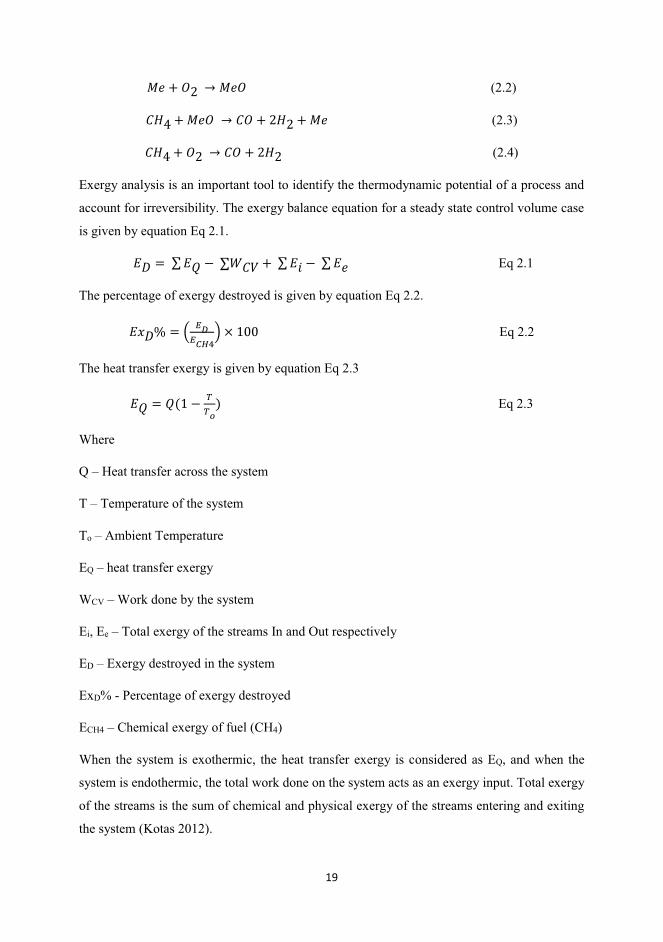
�� � ��� � ��� (2.2)
��� � ���� � �� � ��� � �� (2.3)
��� � ��� � �� � ��� (2.4)
Exergy analysis is an important tool to identify the thermodynamic potential of a process and
account for irreversibility. The exergy balance equation for a steady state control volume case
is given by equation Eq 2.1.
�� � �� �� ����� ��� � �� ��� Eq 2.1
The percentage of exergy destroyed is given by equation Eq 2.2.
�!�" � # $%$&'() * �++ Eq 2.2
The heat transfer exergy is given by equation Eq 2.3
�� � �,� --./ Eq 2.3
Where
Q – Heat transfer across the system
T – Temperature of the system
To – Ambient Temperature
EQ – heat transfer exergy
WCV – Work done by the system
Ei, Ee – Total exergy of the streams In and Out respectively
ED – Exergy destroyed in the system
ExD% - Percentage of exergy destroyed
ECH4 – Chemical exergy of fuel (CH4)
When the system is exothermic, the heat transfer exergy is considered as EQ, and when the
system is endothermic, the total work done on the system acts as an exergy input. Total exergy
of the streams is the sum of chemical and physical exergy of the streams entering and exiting
the system (Kotas 2012).
20
The schematic of the CLR and POX processes is shown in Figure 10. Air and CH4 is considered
to enter the system at 25 oC and 1 atm. Air is considered as a binary mixture of N2 (79 mol %)
and O2 (21 mol %). The N2 and O2 leaving the ASU is at 25 oC and 1 atm. The work done in
ASU is 4.7 times the ideal work of separation (Fu and Gundersen 2012, Pfaff and Kather 2009).
A Ni/NiO system was here considered as the metal oxygen carrier. The oxygen carrier flow in
the CLR was assumed to be stoichiometric i.e. for one mole of CH4, one mole of oxygen carrier
was used. The equilibrium data at different conditions for reactions considered in the study was
estimated using the method of minimization of Gibbs Free Energy of the system (in ASPEN
Plus). The Peng Robinson Equation of State was considered as the property method (Yahom et
al. 2014). Different cases for POX and CLR were studied to identify suitable design conditions
when the exergy destroyed in the system is at a minimum.
The results include
� Exergy destruction with the extent of reforming by varying the stoichiometric amount
of O2 flow to the reformer when isothermal conditions are considered for the reforming
(fuel) reactor
� Exergy destruction in POX and CLR when the reformers are adiabatic
� CH4 conversion and H2/CO ratio in POX and CLR
� Exergy destruction at different oxygen carrier circulation in CLR.
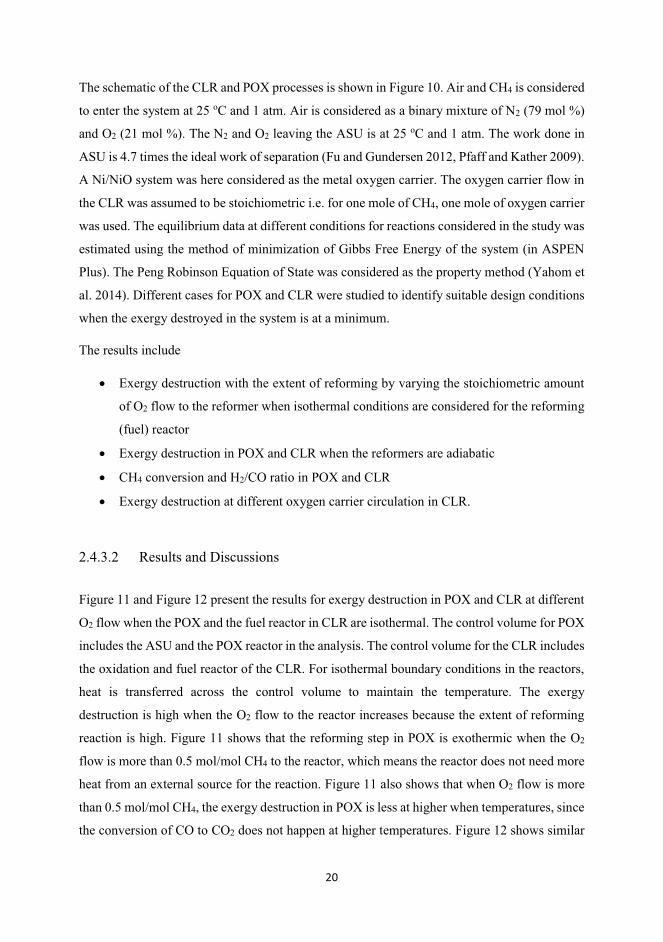
2.4.3.2 Results and Discussions
Figure 11 and Figure 12 present the results for exergy destruction in POX and CLR at different
O2 flow when the POX and the fuel reactor in CLR are isothermal. The control volume for POX
includes the ASU and the POX reactor in the analysis. The control volume for the CLR includes
the oxidation and fuel reactor of the CLR. For isothermal boundary conditions in the reactors,
heat is transferred across the control volume to maintain the temperature. The exergy
destruction is high when the O2 flow to the reactor increases because the extent of reforming
reaction is high. Figure 11 shows that the reforming step in POX is exothermic when the O2
flow is more than 0.5 mol/mol CH4 to the reactor, which means the reactor does not need more
heat from an external source for the reaction. Figure 11 also shows that when O2 flow is more
than 0.5 mol/mol CH4, the exergy destruction in POX is less at higher when temperatures, since
the conversion of CO to CO2 does not happen at higher temperatures. Figure 12 shows similar
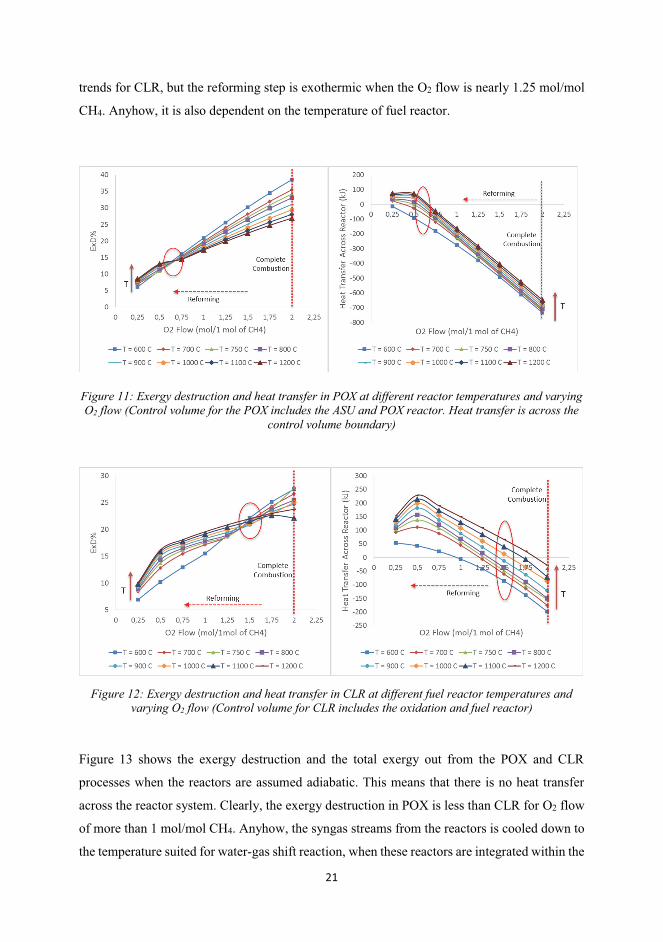
21
trends for CLR, but the reforming step is exothermic when the O2 flow is nearly 1.25 mol/mol
CH4. Anyhow, it is also dependent on the temperature of fuel reactor.
Figure 11: Exergy destruction and heat transfer in POX at different reactor temperatures and varying O2 flow (Control volume for the POX includes the ASU and POX reactor. Heat transfer is across the
control volume boundary)
Figure 12: Exergy destruction and heat transfer in CLR at different fuel reactor temperatures and varying O2 flow (Control volume for CLR includes the oxidation and fuel reactor)
Figure 13 shows the exergy destruction and the total exergy out from the POX and CLR
processes when the reactors are assumed adiabatic. This means that there is no heat transfer
across the reactor system. Clearly, the exergy destruction in POX is less than CLR for O2 flow
of more than 1 mol/mol CH4. Anyhow, the syngas streams from the reactors is cooled down to
the temperature suited for water-gas shift reaction, when these reactors are integrated within the
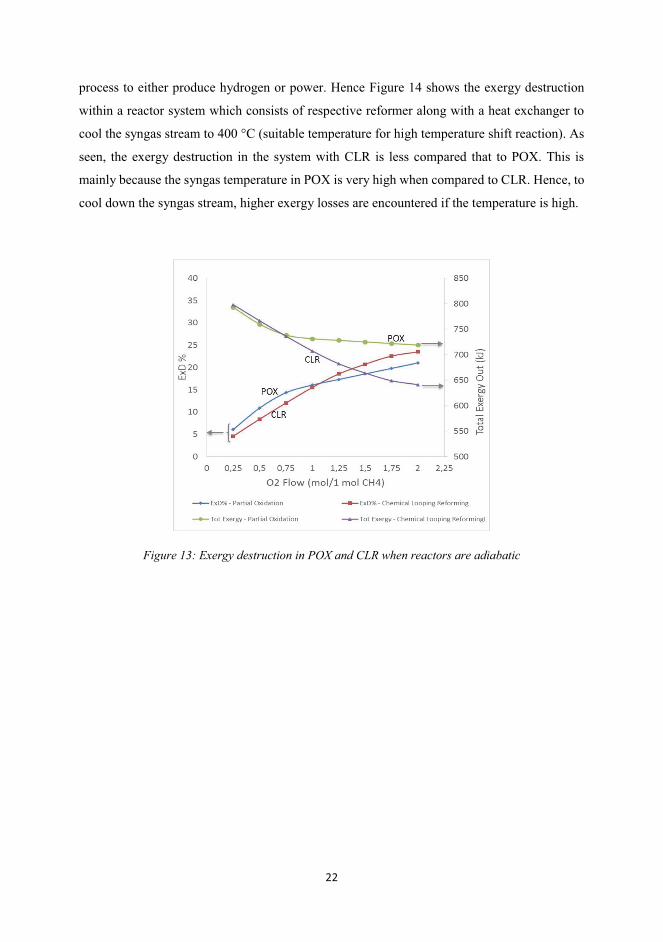
22
process to either produce hydrogen or power. Hence Figure 14 shows the exergy destruction
within a reactor system which consists of respective reformer along with a heat exchanger to
cool the syngas stream to 400 °C (suitable temperature for high temperature shift reaction). As
seen, the exergy destruction in the system with CLR is less compared that to POX. This is
mainly because the syngas temperature in POX is very high when compared to CLR. Hence, to
cool down the syngas stream, higher exergy losses are encountered if the temperature is high.
Figure 13: Exergy destruction in POX and CLR when reactors are adiabatic
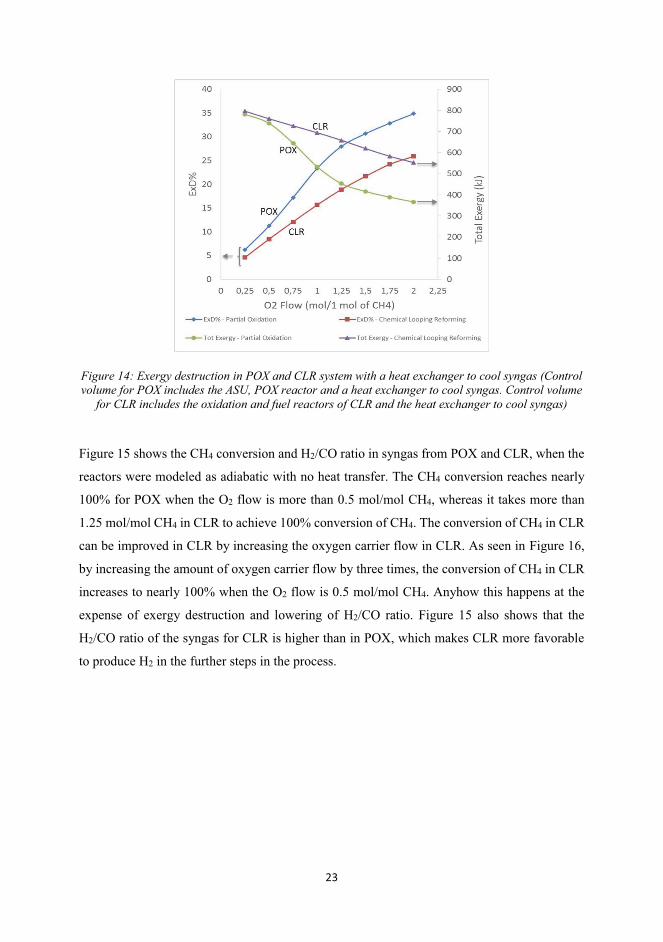
23
Figure 14: Exergy destruction in POX and CLR system with a heat exchanger to cool syngas (Control volume for POX includes the ASU, POX reactor and a heat exchanger to cool syngas. Control volume
for CLR includes the oxidation and fuel reactors of CLR and the heat exchanger to cool syngas)
Figure 15 shows the CH4 conversion and H2/CO ratio in syngas from POX and CLR, when the
reactors were modeled as adiabatic with no heat transfer. The CH4 conversion reaches nearly
100% for POX when the O2 flow is more than 0.5 mol/mol CH4, whereas it takes more than
1.25 mol/mol CH4 in CLR to achieve 100% conversion of CH4. The conversion of CH4 in CLR
can be improved in CLR by increasing the oxygen carrier flow in CLR. As seen in Figure 16,
by increasing the amount of oxygen carrier flow by three times, the conversion of CH4 in CLR
increases to nearly 100% when the O2 flow is 0.5 mol/mol CH4. Anyhow this happens at the
expense of exergy destruction and lowering of H2/CO ratio. Figure 15 also shows that the
H2/CO ratio of the syngas for CLR is higher than in POX, which makes CLR more favorable
to produce H2 in the further steps in the process.
24
Figure 15: CH4 conversion and H2/CO ratio in syngas from POX and CLR modeled with adiabatic conditions
Figure 16: Effect of higher oxygen carrier circulation rate on exergy destruction and CH4 conversion in CLR
2.4.3.3 Conclusions
• CLR seems to be a promising new method, with small thermodynamic losses and with
inherent air separation.
25
• Chemical Looping Reforming can be adiabatic – no need for external supply of heat
• Exergy destruction in CLR is less than in POX, since the temperature of exit streams
from POX is very high, and cooling them down to a suitable water-gas shift temperature
results in high exergy losses
• CLR reforms CH4 to a product gas with higher H2/CO ratio when compared to
conventional POX
2.5 Gas Switching Reforming (GSR)
As seen in previous sections, CLR comprises of an interconnected oxidation and fuel reactor,
with the metal oxygen carrier circulating between them. On the other hand, GSR operation
keeps the oxygen carrier inside one reactor with alternate switching of gaseous streams during
each step of oxidation, reduction and reforming. A schematic of GSR is shown in Figure 17.
The metal oxygen carrier is first oxidized in the oxidation step with air, leaving metal oxide in
the reactor while producing a N2-rich stream. The metal oxide is then reduced to metal during
the reduction step by a fuel gas, yielding a high purity CO2 stream after steam is separated from
the CO2. The reduced metal, heated to a high temperature by combustion of the fuel gas, then
acts as a catalyst and heat supply for the endothermic steam-methane reforming during the
reforming step. Hence, metal circulation is avoided in the GSR, but the dynamic nature of this
operating strategy requires a cluster of multiple reactors operating in a coordinated manner to
create a suitably steady state process unit. The GSR was experimentally demonstrated by
Wassie et al. (2017).
26
Figure 17: Schematic of Gas Switching Reforming process
Another interesting feature of GSR relative to CLR is that the reduction and reforming steps
are separated. This allows for efficient integration of a Pressure Swing Adsorption (PSA) unit
for high purity hydrogen production (Francisco Morgado et al. 2016). Specifically, the carbon-
rich off-gases from the PSA unit can be fed back to the fuel step of the GSR reactors where it
is combusted to yield a high-purity CO2 stream for storage or utilization. The possibility of
efficient integration of a PSA unit promises increased CO2 capture rates and the potential for a
GSR integrated combined cycle power plant to sell high purity hydrogen instead of electricity
during times when the electricity price is low.
Furthermore, GSR reactors are much better suited to flexible operation than CLR reactors.
Since GSR reactors are simple standalone bubbling fluidized beds, the gas flowrate can be
varied over more than an order of magnitude without any serious problems. CLR reactors, on
the other hand, must operate in a narrow fluidization window to maintain reliable oxygen carrier
circulation. These features of power plant with GSR could greatly increase its attractiveness in
a future market with high CO2 prices, volatile electricity prices due to variable wind/solar power
generators, and potentially large hydrogen demand from fuel cell vehicles.
27
Chapter 3: Methodology
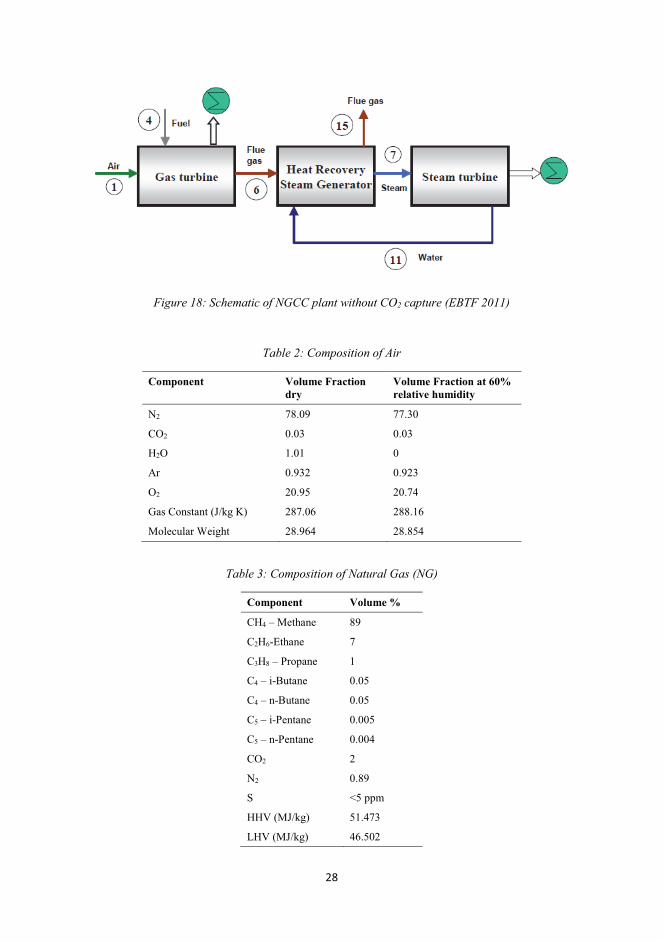
3.1 Reference NGCC power plant without CO2 capture
The configuration of the reference Natural Gas Combined Cycle (NGCC) power plant is similar
to as defined in the EBTF (2011). A simple schematic of the NGCC plant without capture is
shown in Figure 18. The NGCC comprises of two identical large scale ‘F’ class gas turbines
equipped with a HRSG for each one. The HRSG is a three pressure level with reheat for the
medium pressure steam. The two HRSGs feed a single steam turbine system. The gas turbine
is run at full load and the NG fuel flow rate is set to maintain a fixed Turbine Inlet Temperature
(TIT). The compositions and conditions for air and natural gas has been taken from the EBTF
(2011) and is shown in Table 2 and Table 3 respectively. Atmospheric air is considered to be
at 15 °C and 1.01325 bar. Natural gas is delivered at 10 °C and 70 MPa. The case was modeled
using ‘GT Pro’ component of the Themoflow Suite V26. The main results for the power output
from the NGCC without capture is shown in
Table 4. The ‘-’ in
Table 4 represents that the respective component consumed power. The net electrical efficiency
(η) is the parameter that defines the technical performance of the power plant. It is defined in
equation Eq 3.1 below. The net electrical efficiency is also referred to as overall process
efficiency in this thesis. Any further comparisons to the reference case NGCC plant without
CO2 capture will be referred to this section of the thesis.
0�1����213 24���55 2 �627�,8/ � � 9::�*�;<=�<><?=@A?A=B�[email protected]?<DF'G�.H�;I�AJCE=�=.�=K<�C@.?<LL Eq 3.1
28
Figure 18: Schematic of NGCC plant without CO2 capture (EBTF 2011)
Table 2: Composition of Air
Component Volume Fraction dry
Volume Fraction at 60% relative humidity
N2 78.09 77.30
CO2 0.03 0.03
H2O 1.01 0
Ar 0.932 0.923
O2 20.95 20.74
Gas Constant (J/kg K) 287.06 288.16
Molecular Weight 28.964 28.854
Table 3: Composition of Natural Gas (NG)
Component Volume %
CH4 – Methane 89
C2H6-Ethane 7
C3H8 – Propane 1
C4 – i-Butane 0.05
C4 – n-Butane 0.05
C5 – i-Pentane 0.005
C5 – n-Pentane 0.004
CO2 2
N2 0.89
S <5 ppm
HHV (MJ/kg) 51.473
LHV (MJ/kg) 46.502
29
Table 4: Main results for reference case (NGCC without CO2 capture)
Unit NGCC without CO2 Capture
Turbine Inlet Temperature °C 1427
Turbine Exhaust Temperature °C 644
Gas Turbine % of LHV Input 37.7
Steam Turbine % of LHV Input 21.9
Auxiliaries % of LHV Input - 1.3
Net Electrical Output MW 883
Mass of NG Input TPH 117.1
LHV of NG – Input MW 1513
Net Electrical Efficiency % 58.4
3.2 Process description of CLR-CC process
This section describes the CLR-CC process in detail. The process described in this section will
be referred as the base case CLR-CC process hereafter in the thesis. The process described in
this section have been referred to in Chapter 4, Paper I and Paper II. Figure 19 shows a
schematic of the CLR-CC process where the design pressure in oxidation reactor of CLR is 18
bar. Pressure inside the CLR is an important parameter and affects the process design decisions
and also the overall process efficiency. The performance of the process and design changes at
different pressures in CLR is discussed in Chapter 4 and Paper II. Compressed air at 18 bar is
reacted with the oxygen carrier in the oxidation reactor of the CLR. FeO-Fe3O4 oxygen carrier
system has been assumed in analysis presented in Chapter 4, Paper I and Paper II. Ni-NiO
oxygen carrier system has been chosen for analysis presented in Chapter 5 and Paper III. The
choice of oxygen carrier is not within the scope of this thesis. Iron based oxygen carriers are
less expensive and non-hazardous when compared to Ni based carriers (Adanez et al. 2012).
Anyhow, Ni-NiO oxygen carrier system was considered in analysis in Chapter 5 and Paper III
because the 1D model developed for CLR was validated against reforming experiments using
Ni based oxygen carriers (Francisco Morgado et al. 2016). 12% of the air bled (by mass) at the
compressor discharge in the gas turbine of the power plant is mixed with compressed air stream
from a separate air compressor before entering the oxidation reactor. The oxygen carrier is
oxidized and the depleted air stream (N2-rich stream) is released which contains mainly
Nitrogen. Natural gas is partially oxidized with oxygen carrier in the presence of steam. The
N2-rich stream from the oxidation reactor is expanded in a turbine (efficiency 90%) and cooled
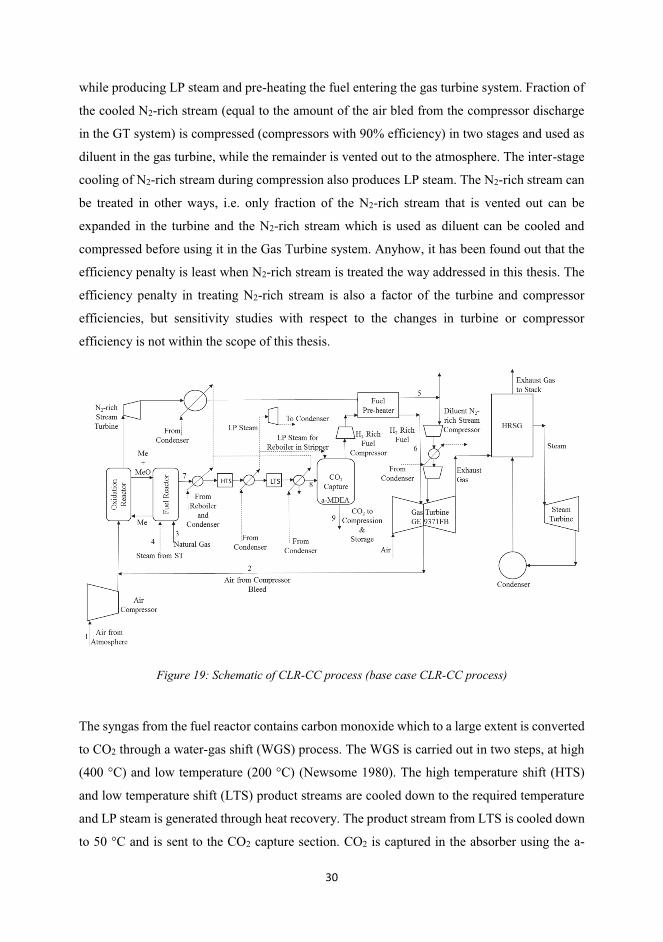
30
while producing LP steam and pre-heating the fuel entering the gas turbine system. Fraction of
the cooled N2-rich stream (equal to the amount of the air bled from the compressor discharge
in the GT system) is compressed (compressors with 90% efficiency) in two stages and used as
diluent in the gas turbine, while the remainder is vented out to the atmosphere. The inter-stage
cooling of N2-rich stream during compression also produces LP steam. The N2-rich stream can
be treated in other ways, i.e. only fraction of the N2-rich stream that is vented out can be
expanded in the turbine and the N2-rich stream which is used as diluent can be cooled and
compressed before using it in the Gas Turbine system. Anyhow, it has been found out that the
efficiency penalty is least when N2-rich stream is treated the way addressed in this thesis. The
efficiency penalty in treating N2-rich stream is also a factor of the turbine and compressor
efficiencies, but sensitivity studies with respect to the changes in turbine or compressor
efficiency is not within the scope of this thesis.
Figure 19: Schematic of CLR-CC process (base case CLR-CC process)
The syngas from the fuel reactor contains carbon monoxide which to a large extent is converted
to CO2 through a water-gas shift (WGS) process. The WGS is carried out in two steps, at high
(400 °C) and low temperature (200 °C) (Newsome 1980). The high temperature shift (HTS)
and low temperature shift (LTS) product streams are cooled down to the required temperature
and LP steam is generated through heat recovery. The product stream from LTS is cooled down
to 50 °C and is sent to the CO2 capture section. CO2 is captured in the absorber using the a-
31
MDEA amine solution. The CO2 rich amine is then sent to the stripper for regeneration of
amine. The captured CO2 is compressed to 110 bar and is ready for transportation and storage.
The CO2 compression steps are similar to the process described in EBTF (2011). The H2-rich
stream from the top of the absorber is used as fuel in the power generation process. Fraction of
the LP steam produced from cooling of the N2-rich stream, syngas and WGS reaction is utilized
in the reboiler of the stripper in CO2 capture section, and the remaining LP steam is expanded
in a separate steam turbine (additional LP steam turbine with 85% efficiency) to generate
power. The condensed water from the reboiler is converted to steam by utilizing heat from
syngas. The condensate from the additional LP steam turbine is sent to the condenser in the
power plant.
The H2-rich stream is compressed (compressor with 85% efficiency), pre-heated and mixed
with diluent N2-rich stream before being combusted with air in a GE 9371FB gas turbine
system. The gas turbine exhaust is passed through the Heat Recovery Steam Generator (HRSG)
to produce steam for the steam cycle before being released to the atmosphere. The steam cycle
consists of three pressure level steam generators and steam turbines at 166 bar, 32.7 bar, 3.4 bar
for high pressure (HP), medium pressure (MP) and low pressure (LP) steam respectively. The
water and steam mixture from the steam turbine (ST) system is condensed in a condenser to
prepare feed water for the steam cycle. A natural draft cooling tower supplies the cooling water
to the condenser and it fulfils the cooling water requirement in the entire process.
The power plant comprises of two gas turbines (GT), two HRSGs with one steam turbine system
comprising of one high pressure steam turbine, one medium pressure steam turbine and two
flow low pressure turbines. The chosen power plant configuration is the same as in the reference
case NGCC plant without CO2 capture described in Section 3.1. The HRSG comprises of low,
medium and high pressure economizers, boilers and super-heaters. The exhaust from the GT
provides heat to produce superheated HP, MP and LP steam, which is expanded in the
respective turbines to produce power. The MP steam also undergoes a reheat before being
expanded in the MP steam turbine. In the base case design of CLR-CC described in this section,
the additional steam generated from the heat of reforming and shift reactions is not added to the
HRSG. Anyhow, generating steam at high pressure and mixing it with streams in HRSG
improves the process efficiency. Analysis of cases with different heat recovery and integration
options is discussed in Chapter 4 and Paper II.
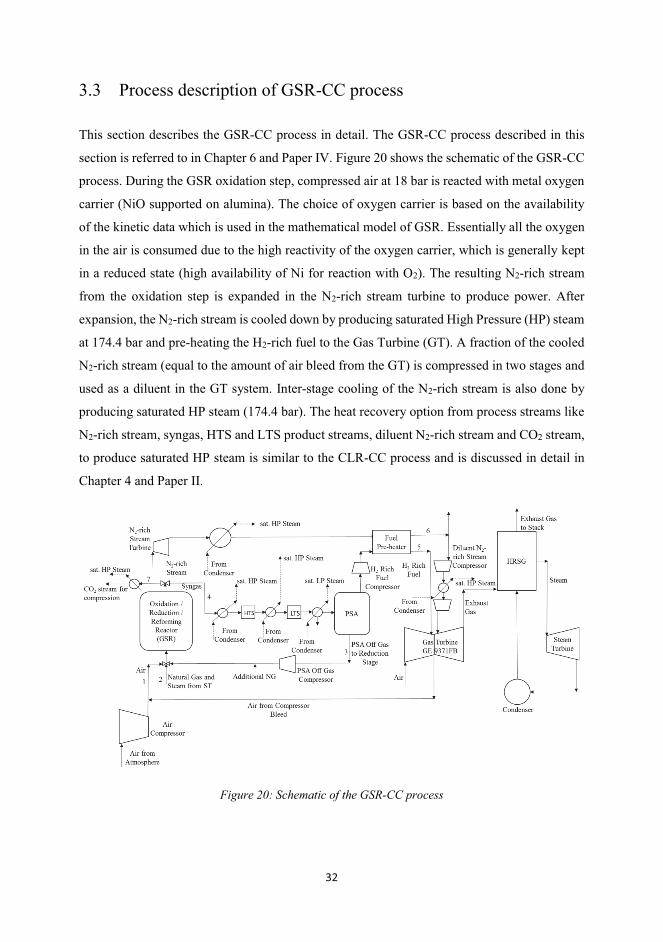
32
3.3 Process description of GSR-CC process
This section describes the GSR-CC process in detail. The GSR-CC process described in this
section is referred to in Chapter 6 and Paper IV. Figure 20 shows the schematic of the GSR-CC
process. During the GSR oxidation step, compressed air at 18 bar is reacted with metal oxygen
carrier (NiO supported on alumina). The choice of oxygen carrier is based on the availability
of the kinetic data which is used in the mathematical model of GSR. Essentially all the oxygen
in the air is consumed due to the high reactivity of the oxygen carrier, which is generally kept
in a reduced state (high availability of Ni for reaction with O2). The resulting N2-rich stream
from the oxidation step is expanded in the N2-rich stream turbine to produce power. After
expansion, the N2-rich stream is cooled down by producing saturated High Pressure (HP) steam
at 174.4 bar and pre-heating the H2-rich fuel to the Gas Turbine (GT). A fraction of the cooled
N2-rich stream (equal to the amount of air bleed from the GT) is compressed in two stages and
used as a diluent in the GT system. Inter-stage cooling of the N2-rich stream is also done by
producing saturated HP steam (174.4 bar). The heat recovery option from process streams like
N2-rich stream, syngas, HTS and LTS product streams, diluent N2-rich stream and CO2 stream,
to produce saturated HP steam is similar to the CLR-CC process and is discussed in detail in
Chapter 4 and Paper II.
Figure 20: Schematic of the GSR-CC process
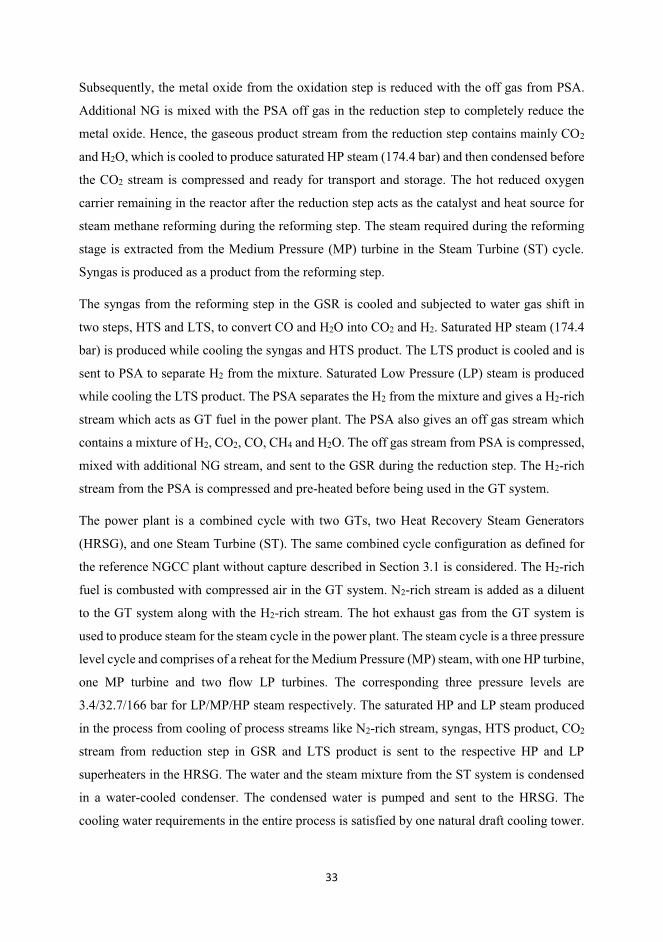
33
Subsequently, the metal oxide from the oxidation step is reduced with the off gas from PSA.
Additional NG is mixed with the PSA off gas in the reduction step to completely reduce the
metal oxide. Hence, the gaseous product stream from the reduction step contains mainly CO2
and H2O, which is cooled to produce saturated HP steam (174.4 bar) and then condensed before
the CO2 stream is compressed and ready for transport and storage. The hot reduced oxygen
carrier remaining in the reactor after the reduction step acts as the catalyst and heat source for
steam methane reforming during the reforming step. The steam required during the reforming
stage is extracted from the Medium Pressure (MP) turbine in the Steam Turbine (ST) cycle.
Syngas is produced as a product from the reforming step.
The syngas from the reforming step in the GSR is cooled and subjected to water gas shift in
two steps, HTS and LTS, to convert CO and H2O into CO2 and H2. Saturated HP steam (174.4
bar) is produced while cooling the syngas and HTS product. The LTS product is cooled and is
sent to PSA to separate H2 from the mixture. Saturated Low Pressure (LP) steam is produced
while cooling the LTS product. The PSA separates the H2 from the mixture and gives a H2-rich
stream which acts as GT fuel in the power plant. The PSA also gives an off gas stream which
contains a mixture of H2, CO2, CO, CH4 and H2O. The off gas stream from PSA is compressed,
mixed with additional NG stream, and sent to the GSR during the reduction step. The H2-rich
stream from the PSA is compressed and pre-heated before being used in the GT system.
The power plant is a combined cycle with two GTs, two Heat Recovery Steam Generators
(HRSG), and one Steam Turbine (ST). The same combined cycle configuration as defined for
the reference NGCC plant without capture described in Section 3.1 is considered. The H2-rich
fuel is combusted with compressed air in the GT system. N2-rich stream is added as a diluent
to the GT system along with the H2-rich stream. The hot exhaust gas from the GT system is
used to produce steam for the steam cycle in the power plant. The steam cycle is a three pressure
level cycle and comprises of a reheat for the Medium Pressure (MP) steam, with one HP turbine,
one MP turbine and two flow LP turbines. The corresponding three pressure levels are
3.4/32.7/166 bar for LP/MP/HP steam respectively. The saturated HP and LP steam produced
in the process from cooling of process streams like N2-rich stream, syngas, HTS product, CO2
stream from reduction step in GSR and LTS product is sent to the respective HP and LP
superheaters in the HRSG. The water and the steam mixture from the ST system is condensed
in a water-cooled condenser. The condensed water is pumped and sent to the HRSG. The
cooling water requirements in the entire process is satisfied by one natural draft cooling tower.
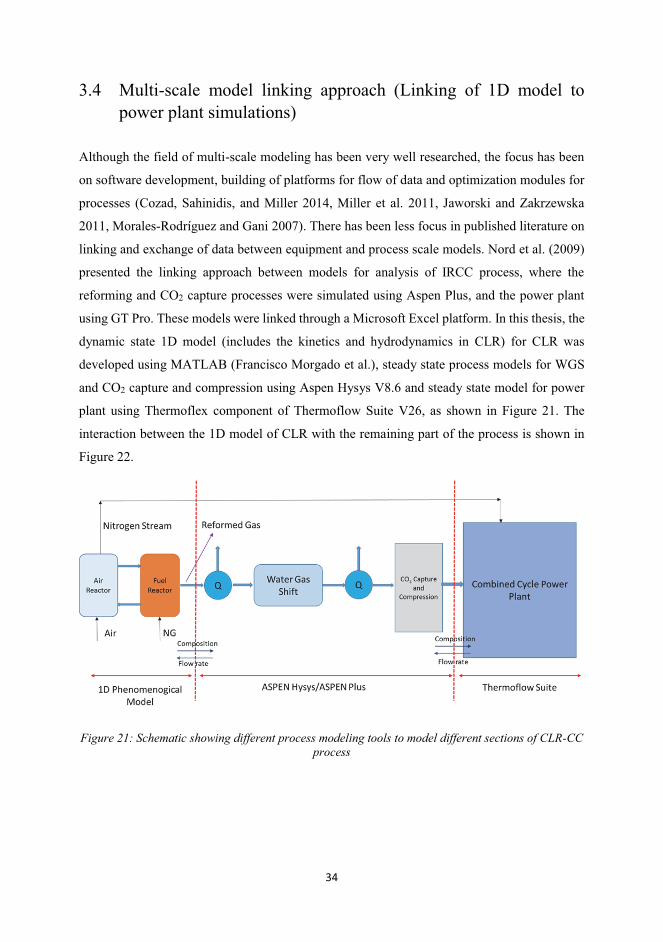
34
3.4 Multi-scale model linking approach (Linking of 1D model to
power plant simulations)
Although the field of multi-scale modeling has been very well researched, the focus has been
on software development, building of platforms for flow of data and optimization modules for
processes (Cozad, Sahinidis, and Miller 2014, Miller et al. 2011, Jaworski and Zakrzewska
2011, Morales-Rodríguez and Gani 2007). There has been less focus in published literature on
linking and exchange of data between equipment and process scale models. Nord et al. (2009)
presented the linking approach between models for analysis of IRCC process, where the
reforming and CO2 capture processes were simulated using Aspen Plus, and the power plant
using GT Pro. These models were linked through a Microsoft Excel platform. In this thesis, the
dynamic state 1D model (includes the kinetics and hydrodynamics in CLR) for CLR was
developed using MATLAB (Francisco Morgado et al.), steady state process models for WGS
and CO2 capture and compression using Aspen Hysys V8.6 and steady state model for power
plant using Thermoflex component of Thermoflow Suite V26, as shown in Figure 21. The
interaction between the 1D model of CLR with the remaining part of the process is shown in
Figure 22.
Figure 21: Schematic showing different process modeling tools to model different sections of CLR-CC process
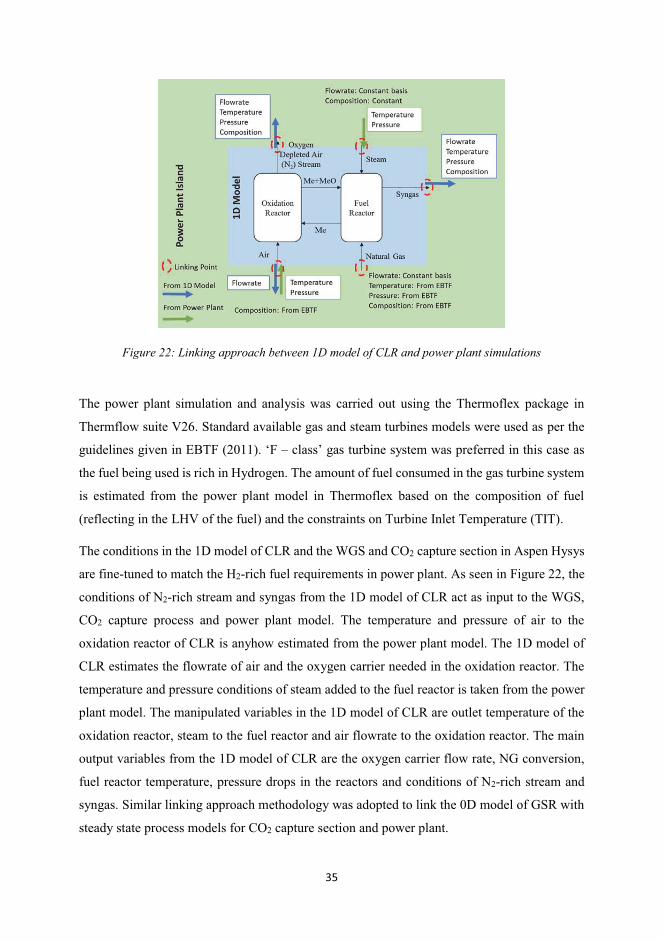
35
Figure 22: Linking approach between 1D model of CLR and power plant simulations
The power plant simulation and analysis was carried out using the Thermoflex package in
Thermflow suite V26. Standard available gas and steam turbines models were used as per the
guidelines given in EBTF (2011). ‘F – class’ gas turbine system was preferred in this case as
the fuel being used is rich in Hydrogen. The amount of fuel consumed in the gas turbine system
is estimated from the power plant model in Thermoflex based on the composition of fuel
(reflecting in the LHV of the fuel) and the constraints on Turbine Inlet Temperature (TIT).
The conditions in the 1D model of CLR and the WGS and CO2 capture section in Aspen Hysys
are fine-tuned to match the H2-rich fuel requirements in power plant. As seen in Figure 22, the
conditions of N2-rich stream and syngas from the 1D model of CLR act as input to the WGS,
CO2 capture process and power plant model. The temperature and pressure of air to the
oxidation reactor of CLR is anyhow estimated from the power plant model. The 1D model of
CLR estimates the flowrate of air and the oxygen carrier needed in the oxidation reactor. The
temperature and pressure conditions of steam added to the fuel reactor is taken from the power
plant model. The manipulated variables in the 1D model of CLR are outlet temperature of the
oxidation reactor, steam to the fuel reactor and air flowrate to the oxidation reactor. The main
output variables from the 1D model of CLR are the oxygen carrier flow rate, NG conversion,
fuel reactor temperature, pressure drops in the reactors and conditions of N2-rich stream and
syngas. Similar linking approach methodology was adopted to link the 0D model of GSR with
steady state process models for CO2 capture section and power plant.
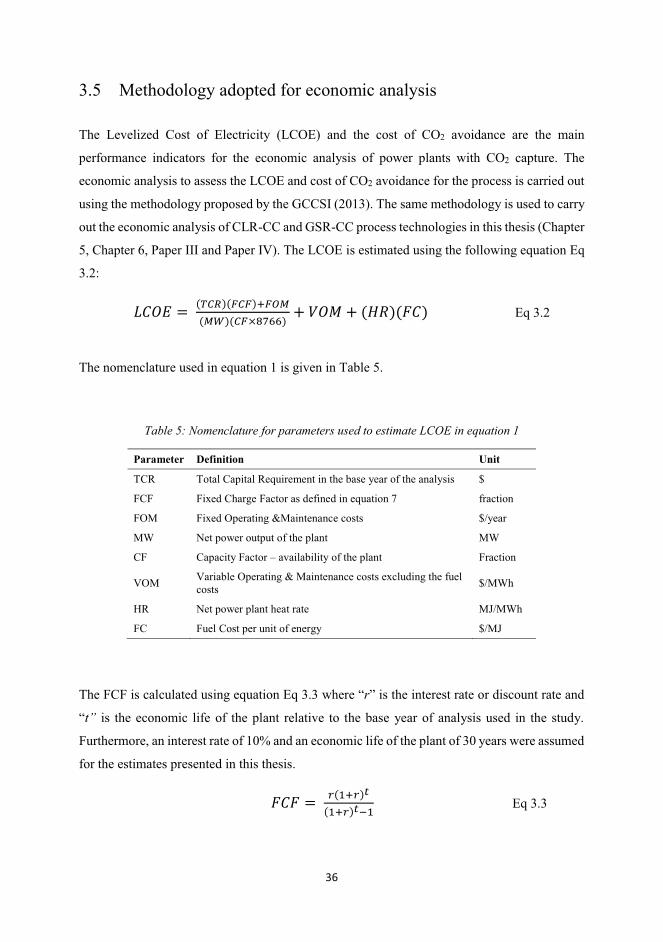
36
3.5 Methodology adopted for economic analysis
The Levelized Cost of Electricity (LCOE) and the cost of CO2 avoidance are the main
performance indicators for the economic analysis of power plants with CO2 capture. The
economic analysis to assess the LCOE and cost of CO2 avoidance for the process is carried out
using the methodology proposed by the GCCSI (2013). The same methodology is used to carry
out the economic analysis of CLR-CC and GSR-CC process technologies in this thesis (Chapter
5, Chapter 6, Paper III and Paper IV). The LCOE is estimated using the following equation Eq
3.2:
M��� � � ,-&N/,O&O/POQR,RS/,&O*TUVV/ � ��� � ,�W/,X�/ Eq 3.2
The nomenclature used in equation 1 is given in Table 5.
Table 5: Nomenclature for parameters used to estimate LCOE in equation 1
Parameter Definition Unit
TCR Total Capital Requirement in the base year of the analysis $
FCF Fixed Charge Factor as defined in equation 7 fraction
FOM Fixed Operating &Maintenance costs $/year
MW Net power output of the plant MW
CF Capacity Factor – availability of the plant Fraction
VOM Variable Operating & Maintenance costs excluding the fuel costs
$/MWh
HR Net power plant heat rate MJ/MWh
FC Fuel Cost per unit of energy $/MJ
The FCF is calculated using equation Eq 3.3 where “r” is the interest rate or discount rate and
“t” is the economic life of the plant relative to the base year of analysis used in the study.
Furthermore, an interest rate of 10% and an economic life of the plant of 30 years were assumed
for the estimates presented in this thesis.
X�X � � @,9P@/=,9P@/=Y9 Eq 3.3
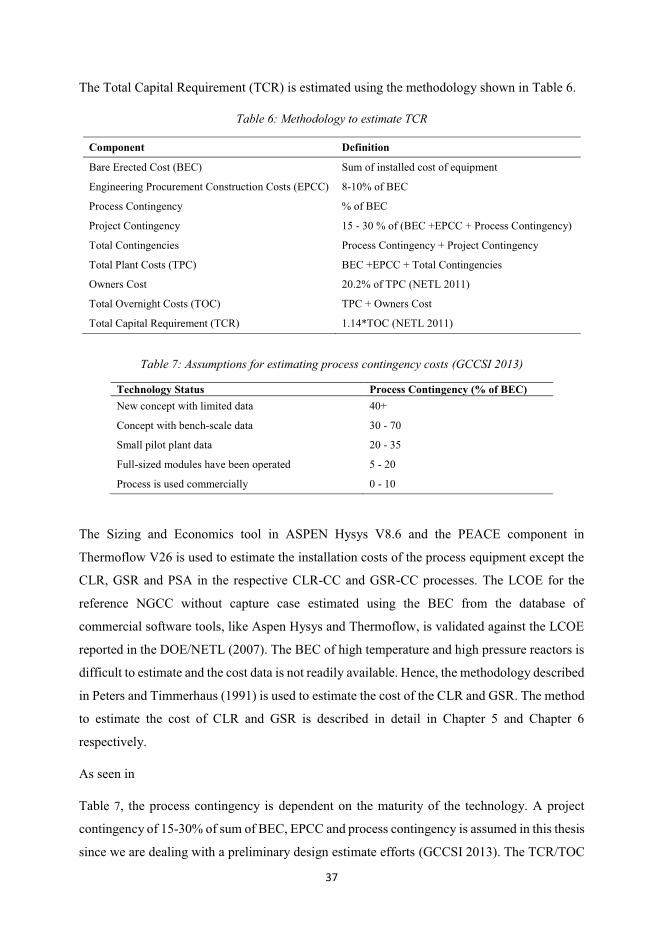
37
The Total Capital Requirement (TCR) is estimated using the methodology shown in Table 6.
Table 6: Methodology to estimate TCR
Component Definition
Bare Erected Cost (BEC) Sum of installed cost of equipment
Engineering Procurement Construction Costs (EPCC) 8-10% of BEC
Process Contingency % of BEC
Project Contingency 15 - 30 % of (BEC +EPCC + Process Contingency)
Total Contingencies Process Contingency + Project Contingency
Total Plant Costs (TPC) BEC +EPCC + Total Contingencies
Owners Cost 20.2% of TPC (NETL 2011)
Total Overnight Costs (TOC) TPC + Owners Cost
Total Capital Requirement (TCR) 1.14*TOC (NETL 2011)
Table 7: Assumptions for estimating process contingency costs (GCCSI 2013)
Technology Status Process Contingency (% of BEC) New concept with limited data 40+
Concept with bench-scale data 30 - 70
Small pilot plant data 20 - 35
Full-sized modules have been operated 5 - 20
Process is used commercially 0 - 10
The Sizing and Economics tool in ASPEN Hysys V8.6 and the PEACE component in
Thermoflow V26 is used to estimate the installation costs of the process equipment except the
CLR, GSR and PSA in the respective CLR-CC and GSR-CC processes. The LCOE for the
reference NGCC without capture case estimated using the BEC from the database of
commercial software tools, like Aspen Hysys and Thermoflow, is validated against the LCOE
reported in the DOE/NETL (2007). The BEC of high temperature and high pressure reactors is
difficult to estimate and the cost data is not readily available. Hence, the methodology described
in Peters and Timmerhaus (1991) is used to estimate the cost of the CLR and GSR. The method
to estimate the cost of CLR and GSR is described in detail in Chapter 5 and Chapter 6
respectively.
As seen in
Table 7, the process contingency is dependent on the maturity of the technology. A project
contingency of 15-30% of sum of BEC, EPCC and process contingency is assumed in this thesis
since we are dealing with a preliminary design estimate efforts (GCCSI 2013). The TCR/TOC
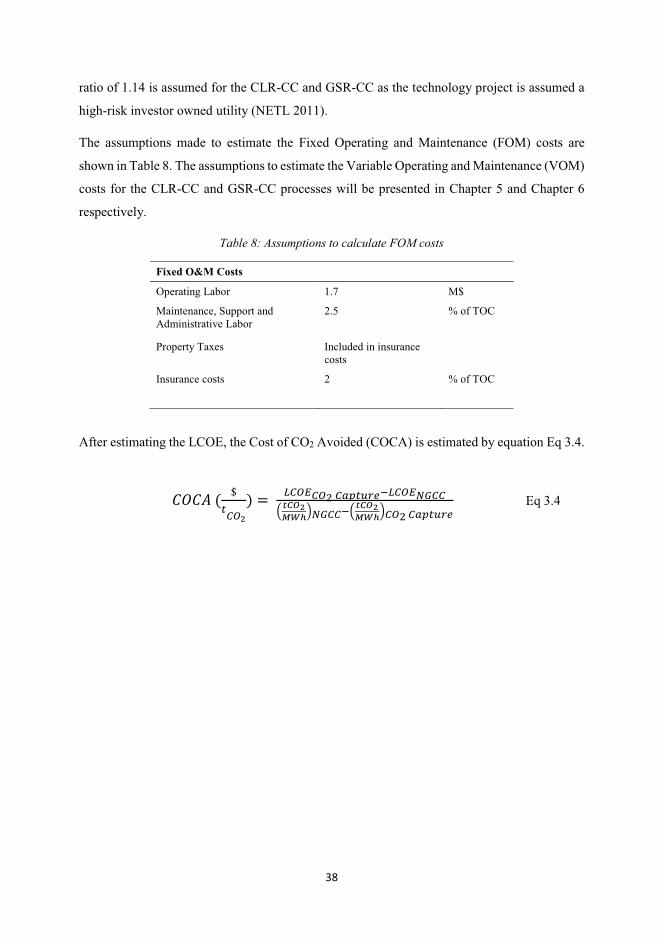
38
ratio of 1.14 is assumed for the CLR-CC and GSR-CC as the technology project is assumed a
high-risk investor owned utility (NETL 2011).
The assumptions made to estimate the Fixed Operating and Maintenance (FOM) costs are
shown in Table 8. The assumptions to estimate the Variable Operating and Maintenance (VOM)
costs for the CLR-CC and GSR-CC processes will be presented in Chapter 5 and Chapter 6
respectively.
Table 8: Assumptions to calculate FOM costs
Fixed O&M Costs
Operating Labor 1.7 M$
Maintenance, Support and Administrative Labor
2.5
% of TOC
Property Taxes Included in insurance costs
Insurance costs 2 % of TOC
After estimating the LCOE, the Cost of CO2 Avoided (COCA) is estimated by equation Eq 3.4.
���Z�, [=&Q\/ � � F&Q$&Q]�&^C=E@<YF&Q$;I&&#_`a\bcd);I&&Y#_`a\bcd)&Q]�&^C=E@< Eq 3.4
39
Chapter 4: Process integration and analysis of
CLR-CC process
4.1 Introduction
This chapter mainly focuses on the process integration and analysis of the CLR-CC process.
The base case CLR-CC process was described in Section 3.3. In the following sections of this
chapter, the analysis of the base case CLR-CC process is discussed, followed by the sensitivity
study for the CLR-CC process with different design pressures in CLR. Lastly, different heat
integration options to improve the efficiency of the CLR-CC process have been presented. The
main results from this chapter are also reflected in Paper I and Paper II.
4.2 Process integration of CLR in NGCC plant with pre-combustion
CO2 capture (CLR-CC)
4.2.1 Methods and assumptions for process modeling and analysis
The base case design for CLR-CC process was analysed and presented in Paper I. Anyhow,
there were modifications done to the process when the same analysis formed a reference for the
analysis in Paper II. The main changes involved correcting the polytropic efficiency of the air
compressor and having a two-stage compression with intercooling for the N2-rich stream that
is mixed with the H2-rich fuel for GT system as diluent. The modeling methodology and
assumptions in the models are discussed in this section. The schematic of the base case CLR-
CC process is shown below in Figure 23.
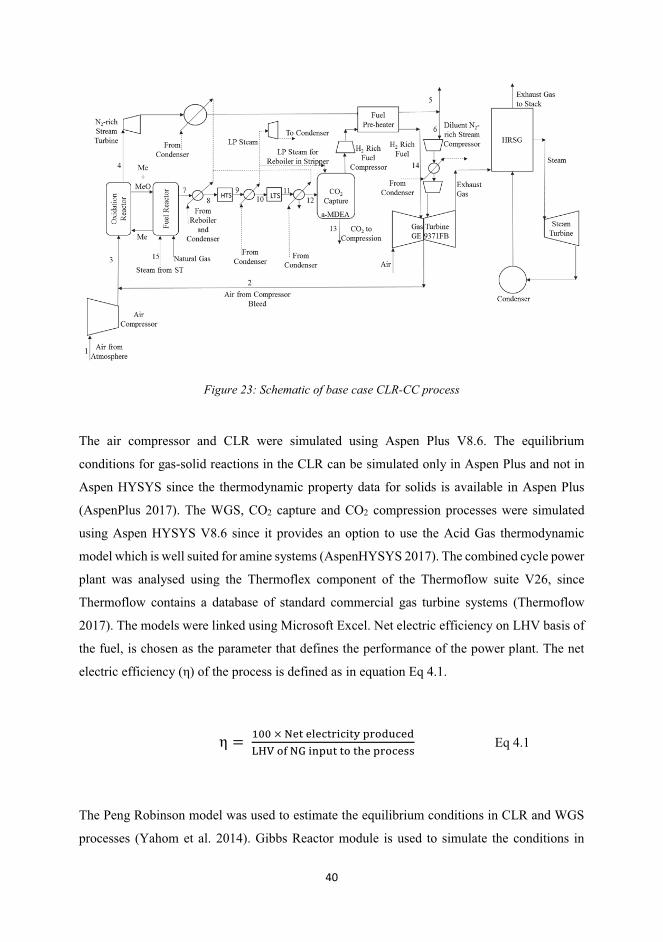
40
Figure 23: Schematic of base case CLR-CC process
The air compressor and CLR were simulated using Aspen Plus V8.6. The equilibrium
conditions for gas-solid reactions in the CLR can be simulated only in Aspen Plus and not in
Aspen HYSYS since the thermodynamic property data for solids is available in Aspen Plus
(AspenPlus 2017). The WGS, CO2 capture and CO2 compression processes were simulated
using Aspen HYSYS V8.6 since it provides an option to use the Acid Gas thermodynamic
model which is well suited for amine systems (AspenHYSYS 2017). The combined cycle power
plant was analysed using the Thermoflex component of the Thermoflow suite V26, since
Thermoflow contains a database of standard commercial gas turbine systems (Thermoflow
2017). The models were linked using Microsoft Excel. Net electric efficiency on LHV basis of
the fuel, is chosen as the parameter that defines the performance of the power plant. The net
electric efficiency (η) of the process is defined as in equation Eq 4.1.
e � � 9::�*�fgh�gigjhkljlhm�nkopqjgprst�ou�fv�lwnqh�ho�hxg�nkojgyy Eq 4.1
The Peng Robinson model was used to estimate the equilibrium conditions in CLR and WGS
processes (Yahom et al. 2014). Gibbs Reactor module is used to simulate the conditions in
41
oxidation and fuel reactor of the CLR. In the base case design, the oxidation reactor of CLR is
operated at pressure close the pressure of compressor bleed from the GT system which is 18
bar. Compressor bleed flow is 12% of the air entering the GT system. The percentage of air
bled from the compressor of the gas turbine system can be varied and the effect on the overall
performance can be observed. Anyhow, a sensitivity on the percentage of the air bled is not in
scope of this study. The remainder of the air needed is taken from atmosphere and compressed
using separate air compressor, which operates with a polytropic efficiency of 90.9%. Steam to
carbon ratio of 0.9 is assumed at the inlet of fuel reactor. Steam is extracted from the MP Steam
Turbine in the power plant. The air flow and the oxygen carrier circulation is adjusted to get a
99% conversion of CH4 at equilibrium in the fuel reactor alongside limiting the oxidation
reactor outlet temperature at 1200 °C. The pressure drop in oxidation and fuel reactor is 5%.
The compositions, temperatures and pressures for Air and NG has been considered from the
EBTF (2011).
The HTS and LTS processes were simulated using the equilibrium reactor module in Aspen
HYSYS. The pressure drop of 3% was assumed in each of the WGS steps in this study. The
heat exchangers between the processes have 2% pressure drop on the gaseous stream and 0.4
bar pressure drop when the fluid flowing is liquid (EBTF 2011). Saturated LP steam at 3.8 bar
is produced when process streams are cooled. The CO2 capture section consists of an absorber
and a stripper, where 45% by mass a-MDEA is used as a solvent. The a-MDEA solvent serves
well for CO2 capture for moderate partial pressures of CO2 at the absorber inlet (Appl 1999).
The design conditions in the absorber and regenerator to capture CO2 and regenerate the amine
are adjusted to maintain a CO2 capture rate of 95% across the absorber. The main conditions in
the CO2 capture section are shown in Table 9. Saturated LP steam at 3.8 bar is used in the
reboiler of the stripper to regenerate the amine. The captured CO2 is compressed and pumped
to 110 bar through a compression cycle proposed in EBTF (2011).
42
Table 9: Design conditions in CO2 capture section (Absorber and Regenerator)
Number of absorber trays 20
Number of stripper trays 20
Pressure drop in the absorber (bar) 0.1
Pressure drop in the stripper (bar) 0.1
Lean amine loading (mol CO2/mol MDEA) 0.301
Rich Amine Loading (mol CO2/mol MDEA) 0.666
Lean Amine Flowrate (Std Liq Flow) (m3/s) 1.55
Condenser Temperature in Stripper (°C) 46.11
Reboiler Duty (MJ/kg CO2 separated in stripper) 1.95
Reboiler Duty (MJ/kg CO2 captured) 1.48
The combined cycle power plant has been modeled using the Thermoflex component of
Thermoflow suite. The GT is run at 100% load with a LHV fuel input of approximately 1.55
GW at the GT inlet and 1430 °C as the Turbine Inlet Temperature (TIT). Based on these
constraints, the amount of fuel input is estimated. To compensate for the compressor bleed in
the GT system, which is used in the oxidation reactor in CLR, the same amount of N2-rich
stream, coming as an outlet from oxidation reactor, is added to the GT combustor as a diluent.
Table 10 presents the assumptions on the efficiency of the turbines and compressors, which are
added to the NGCC plant because of integration of CLR and pre-combustion capture.
Table 10: Efficiencies of compressors and turbines in CLR-CC process
Component Assumed efficiency (%)
N2-rich stream turbine 90
Compressors for N2-rich stream acting as diluent for GT system 90
H2-rich fuel compressor 85
Additional LP steam turbine 85
4.2.2 Results and discussion
The main results of the full plant scale analysis of CLR-CC is summarized in Table 11 and the
stream data in Table 12. Table 11 includes the comparison of results for reference case NGCC
plant without capture and base case CLR-CC process. The power consumed in the fuel, air and
N2-rich stream compressors and in auxiliaries, along with power output from the generator
terminals are shown in the form of percentage of the LHV of fuel input to the process. The
auxiliaries include the GT and ST auxiliaries and boiler feed water (BFW) pumps. In the CLR-
43
CC process, additional auxiliaries include the pumps in heat recovery from reforming and
water-gas shift steps.
The net plant efficiency for the power plant with CLR and CO2 capture and compression at
100% load is 42.5% with a net electrical output of 909 MW. The net power output is estimated
by subtracting the power consumed in air compressor, fuel compressor, N2-rich stream
compressor, CO2 compression, pump for regenerated amine, compressor for diluent N2-rich
stream and auxiliaries from gross power output from the generator terminals.
Table 11: Comparison of results for ref NGCC without capture and CLR-CC process
Ref. NGCC CLR-CC
Gas Turbine % - LHV input 37.7 28.5
Steam Turbine % - LHV input 21.9 13.9
N2-rich Stream Turbine % - LHV input - 8.5
Additional LP steam Turbine % - LHV input - 3.1
Diluent N2-rich Stream Compression % - LHV input - -4.6
H2-rich fuel Compressor % - LHV input - -1.0
Air Compressor % - LHV input - -2.9
Pump for Regenerated Amine % - LHV input - -0.1
CO2 Compression % - LHV input - -1.8
Auxiliaries % - LHV input - 1.3 -1.2
LHV of NG – Input GW 1.51 2.14
Net Electrical Efficiency % 58.4 42.5
CO2 Avoidance % - 83.7
CO2 Capture % - 88.6
Energy to compress captured CO2 kWhr/kg CO2 - 0.1
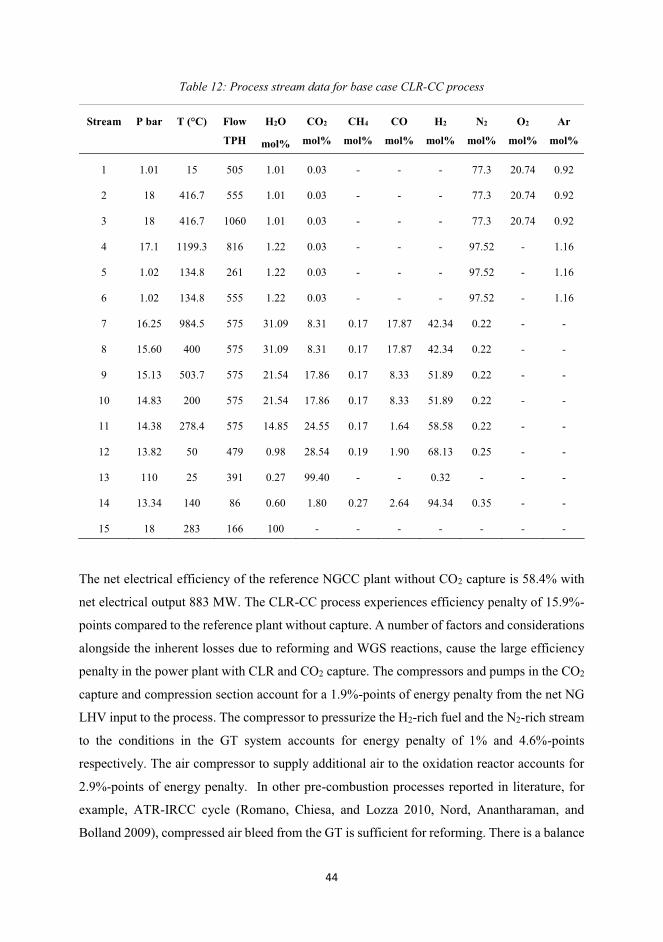
44
Table 12: Process stream data for base case CLR-CC process
Stream P bar T (°C) Flow
TPH
H2O
mol%
CO2
mol%
CH4
mol%
CO
mol%
H2
mol%
N2
mol%
O2
mol%
Ar
mol%
1 1.01 15 505 1.01 0.03 - - - 77.3 20.74 0.92
2 18 416.7 555 1.01 0.03 - - - 77.3 20.74 0.92
3 18 416.7 1060 1.01 0.03 - - - 77.3 20.74 0.92
4 17.1 1199.3 816 1.22 0.03 - - - 97.52 - 1.16
5 1.02 134.8 261 1.22 0.03 - - - 97.52 - 1.16
6 1.02 134.8 555 1.22 0.03 - - - 97.52 - 1.16
7 16.25 984.5 575 31.09 8.31 0.17 17.87 42.34 0.22 - -
8 15.60 400 575 31.09 8.31 0.17 17.87 42.34 0.22 - -
9 15.13 503.7 575 21.54 17.86 0.17 8.33 51.89 0.22 - -
10 14.83 200 575 21.54 17.86 0.17 8.33 51.89 0.22 - -
11 14.38 278.4 575 14.85 24.55 0.17 1.64 58.58 0.22 - -
12 13.82 50 479 0.98 28.54 0.19 1.90 68.13 0.25 - -
13 110 25 391 0.27 99.40 - - 0.32 - - -
14 13.34 140 86 0.60 1.80 0.27 2.64 94.34 0.35 - -
15 18 283 166 100 - - - - - - -
The net electrical efficiency of the reference NGCC plant without CO2 capture is 58.4% with
net electrical output 883 MW. The CLR-CC process experiences efficiency penalty of 15.9%-
points compared to the reference plant without capture. A number of factors and considerations
alongside the inherent losses due to reforming and WGS reactions, cause the large efficiency
penalty in the power plant with CLR and CO2 capture. The compressors and pumps in the CO2
capture and compression section account for a 1.9%-points of energy penalty from the net NG
LHV input to the process. The compressor to pressurize the H2-rich fuel and the N2-rich stream
to the conditions in the GT system accounts for energy penalty of 1% and 4.6%-points
respectively. The air compressor to supply additional air to the oxidation reactor accounts for
2.9%-points of energy penalty. In other pre-combustion processes reported in literature, for
example, ATR-IRCC cycle (Romano, Chiesa, and Lozza 2010, Nord, Anantharaman, and
Bolland 2009), compressed air bleed from the GT is sufficient for reforming. There is a balance
45
between the power consumed in compressors for diluent N2-rich stream, H2-rich fuel and air
with the power generated from the N2-rich stream turbine, additional LP steam turbine and
expansion of MP steam extracted from the ST system. These compressors and turbines can be
mounted on a single shaft to reduce motor and generator losses.
In these analysis, the HRSG design is not modified so as to avoid complexity in process
integration. The heat from the N2-rich stream, the reforming and water-gas shift reactions is
used to produce 738 TPH of saturated LP steam at 3.8 bar, of which 262 TPH is used in the
reboiler of the stripper in the CO2 capture section. The remaining 476 TPH of LP steam is
expanded in an additional LP steam turbine to produce work. The total rate of heat transfer in
cooling syngas, HTS and LTS product streams and N2-rich stream to produce 476 TPH of
saturated LP steam is 344 MW. Anyhow, only 67 MW power is generated when 476 TPH of
saturated LP steam is expanded in a steam turbine. There is a 12.9%-points energy efficiency
loss in the process of converting the heat from process streams into electricity. Better heat
integration to produce steam at three different levels and integrating them with the HRSG
network will improve the net plant efficiency. Studies related to process improvement with heat
integration are discussed in the Section 4.4 and Paper II.
NG used in the pre-combustion capture process is 41.5% more than the amount used in
reference NGCC power plant without capture. The excess NG in the CO2 capture route is
because of the energy losses at various points in the process apart from maintaining the full
load conditions and similar LHV input at the GT inlet. The CO2 avoidance rate is 83.7% and is
defined as the ratio of CO2 avoided in the process and the CO2 emitted by the reference plant
without CO2 capture. The CO2 capture rate of the overall process is 88.6%. The CO2 capture
rate is defined as the fraction of CO2 formed which is captured and compressed for storage.
4.2.3 Conclusions
The net electrical efficiency estimated for the base case CLR-CC process is 42.5%, which is
15.9%-points less than the reference NGCC plant without capture. Efficiency losses between 8
and 16%-points have been reported in literature for pre-combustion capture processes in natural
gas based power plants (Jansen et al. 2015, Romano, Chiesa, and Lozza 2010, Nord,
Anantharaman, and Bolland 2009). The major efficiency loss in the current process, alongside
the inherent exergy destruction due to reforming and WGS reactions, comes from the air
46
compressor (2.9%), diluent N2-rich stream compressor (4.6%) and converting the heat from
syngas, N2-rich stream, HTS and LTS product streams into electricity.
A fairly low level of heat integration is present in the base case CLR-CC process, which is
reflective through not changing the HRSG design, producing saturated LP steam from cooling
of syngas, HTS and LTS product streams and N2-rich stream, and using a separate steam turbine
to generate power from saturated LP steam. Although the low degree of integration avoids
complexity, it effects the overall efficiency of the process. The energy efficiency loss in
producing saturated LP steam and producing power from it is 12.9%-points. Improvements in
heat integration and a modified HRSG design will improve the net plant efficiency.
4.3 CLR-CC operated at different design pressures in CLR
4.3.1 Methodology for sensitivity analysis with respect to pressure in CLR
The pressure inside the CLR is a parameter, which not only affects the performance of the
reactor, but also is important for the integration of CLR with the power generation process. The
sensitivity study on pressure inside the CLR gives an insight into making decisions for process
design of the CLR-CC process.The sensitivity study is carried out for the process at six different
design pressures in CLR (including the base case CLR-CC process), without changing the
design of the process significantly. P5, P10, P15, base case (P18), P25 and P30 represent the cases
where the pressures at the inlet of the oxidation reactor are 5, 10, 15, 18, 25 and 30 bar
respectively. The case P18 is similar to the base case CLR-CC described in Section 4.2. In cases
P5, P10 and P15, the air bled from the compressor in the GT system is at 5, 10 and 15 bar
respectively. The compressor discharge pressure in the GT system in power plant is 18.6 bar.
Hence, in cases P18, P25 and P30, the air bled from the compressor is at the discharge pressure.
In cases P25 and P30, an additional air compressor is added to the process, to raise the pressure
of the air bleed stream from the discharge pressure to the respective pressure at the inlet of the
oxidation reactor in CLR. The efficiency of the additional air compressor in cases P25 and P30
is similar to the efficiency of the air compressor, which is compressing atmospheric air used in
the oxidation reactor. A schematic of the CLR-CC process for cases with pressures more than
18 bar (P25 and P30) in CLR is shown in Figure 25. The assumptions in the process models to
carry out this sensitivity study are similar to the assumptions mentioned in Section 4.2.1. The
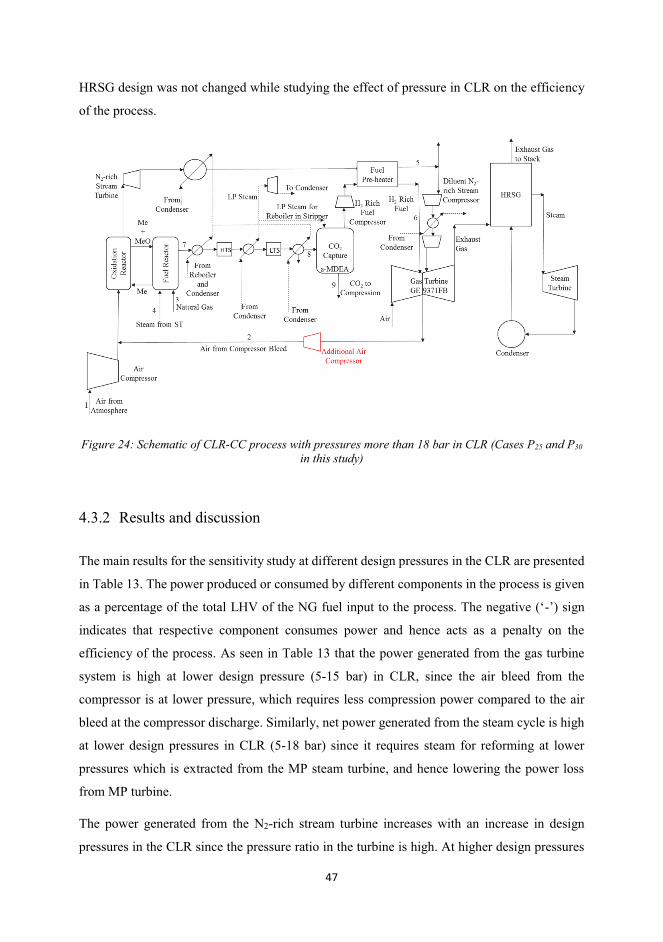
47
HRSG design was not changed while studying the effect of pressure in CLR on the efficiency
of the process.
Figure 24: Schematic of CLR-CC process with pressures more than 18 bar in CLR (Cases P25 and P30 in this study)
4.3.2 Results and discussion
The main results for the sensitivity study at different design pressures in the CLR are presented
in Table 13. The power produced or consumed by different components in the process is given
as a percentage of the total LHV of the NG fuel input to the process. The negative (‘-’) sign
indicates that respective component consumes power and hence acts as a penalty on the
efficiency of the process. As seen in Table 13 that the power generated from the gas turbine
system is high at lower design pressure (5-15 bar) in CLR, since the air bleed from the
compressor is at lower pressure, which requires less compression power compared to the air
bleed at the compressor discharge. Similarly, net power generated from the steam cycle is high
at lower design pressures in CLR (5-18 bar) since it requires steam for reforming at lower
pressures which is extracted from the MP steam turbine, and hence lowering the power loss
from MP turbine.
The power generated from the N2-rich stream turbine increases with an increase in design
pressures in the CLR since the pressure ratio in the turbine is high. At higher design pressures
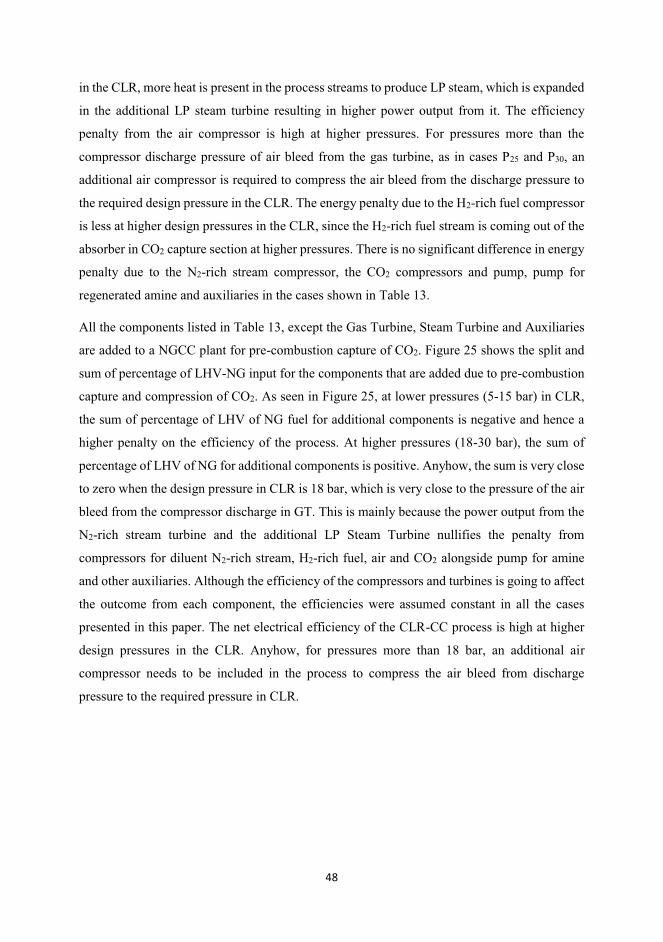
48
in the CLR, more heat is present in the process streams to produce LP steam, which is expanded
in the additional LP steam turbine resulting in higher power output from it. The efficiency
penalty from the air compressor is high at higher pressures. For pressures more than the
compressor discharge pressure of air bleed from the gas turbine, as in cases P25 and P30, an
additional air compressor is required to compress the air bleed from the discharge pressure to
the required design pressure in the CLR. The energy penalty due to the H2-rich fuel compressor
is less at higher design pressures in the CLR, since the H2-rich fuel stream is coming out of the
absorber in CO2 capture section at higher pressures. There is no significant difference in energy
penalty due to the N2-rich stream compressor, the CO2 compressors and pump, pump for
regenerated amine and auxiliaries in the cases shown in Table 13.
All the components listed in Table 13, except the Gas Turbine, Steam Turbine and Auxiliaries
are added to a NGCC plant for pre-combustion capture of CO2. Figure 25 shows the split and
sum of percentage of LHV-NG input for the components that are added due to pre-combustion
capture and compression of CO2. As seen in Figure 25, at lower pressures (5-15 bar) in CLR,
the sum of percentage of LHV of NG fuel for additional components is negative and hence a
higher penalty on the efficiency of the process. At higher pressures (18-30 bar), the sum of
percentage of LHV of NG for additional components is positive. Anyhow, the sum is very close
to zero when the design pressure in CLR is 18 bar, which is very close to the pressure of the air
bleed from the compressor discharge in GT. This is mainly because the power output from the
N2-rich stream turbine and the additional LP Steam Turbine nullifies the penalty from
compressors for diluent N2-rich stream, H2-rich fuel, air and CO2 alongside pump for amine
and other auxiliaries. Although the efficiency of the compressors and turbines is going to affect
the outcome from each component, the efficiencies were assumed constant in all the cases
presented in this paper. The net electrical efficiency of the CLR-CC process is high at higher
design pressures in the CLR. Anyhow, for pressures more than 18 bar, an additional air
compressor needs to be included in the process to compress the air bleed from discharge
pressure to the required pressure in CLR.
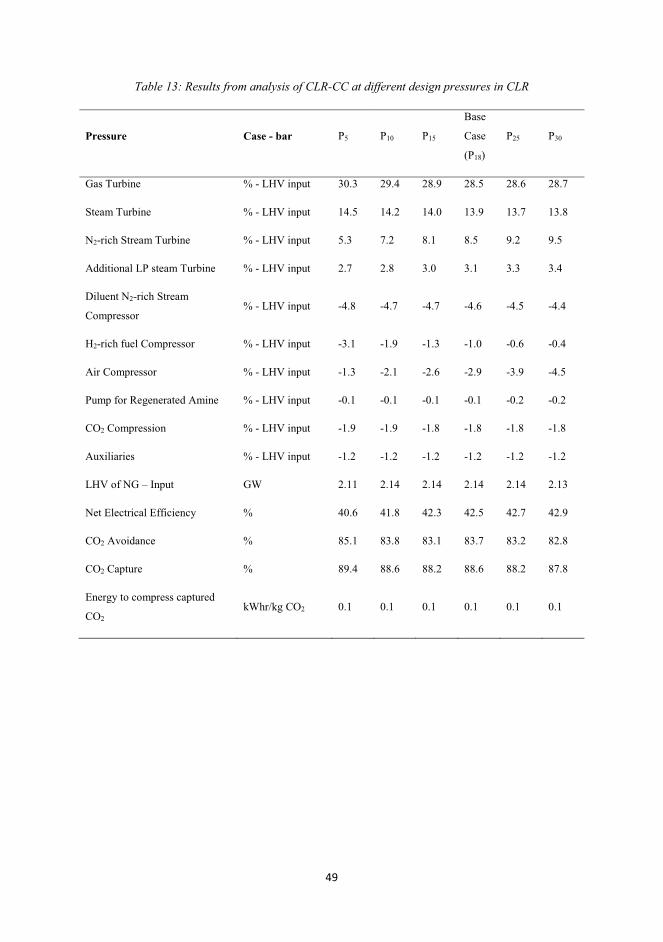
49
Table 13: Results from analysis of CLR-CC at different design pressures in CLR
Pressure Case - bar P5 P10 P15
Base
Case
(P18)
P25 P30
Gas Turbine % - LHV input 30.3 29.4 28.9 28.5 28.6 28.7
Steam Turbine % - LHV input 14.5 14.2 14.0 13.9 13.7 13.8
N2-rich Stream Turbine % - LHV input 5.3 7.2 8.1 8.5 9.2 9.5
Additional LP steam Turbine % - LHV input 2.7 2.8 3.0 3.1 3.3 3.4
Diluent N2-rich Stream
Compressor % - LHV input -4.8 -4.7 -4.7 -4.6 -4.5 -4.4
H2-rich fuel Compressor % - LHV input -3.1 -1.9 -1.3 -1.0 -0.6 -0.4
Air Compressor % - LHV input -1.3 -2.1 -2.6 -2.9 -3.9 -4.5
Pump for Regenerated Amine % - LHV input -0.1 -0.1 -0.1 -0.1 -0.2 -0.2
CO2 Compression % - LHV input -1.9 -1.9 -1.8 -1.8 -1.8 -1.8
Auxiliaries % - LHV input -1.2 -1.2 -1.2 -1.2 -1.2 -1.2
LHV of NG – Input GW 2.11 2.14 2.14 2.14 2.14 2.13
Net Electrical Efficiency % 40.6 41.8 42.3 42.5 42.7 42.9
CO2 Avoidance % 85.1 83.8 83.1 83.7 83.2 82.8
CO2 Capture % 89.4 88.6 88.2 88.6 88.2 87.8
Energy to compress captured
CO2 kWhr/kg CO2 0.1 0.1 0.1 0.1 0.1 0.1
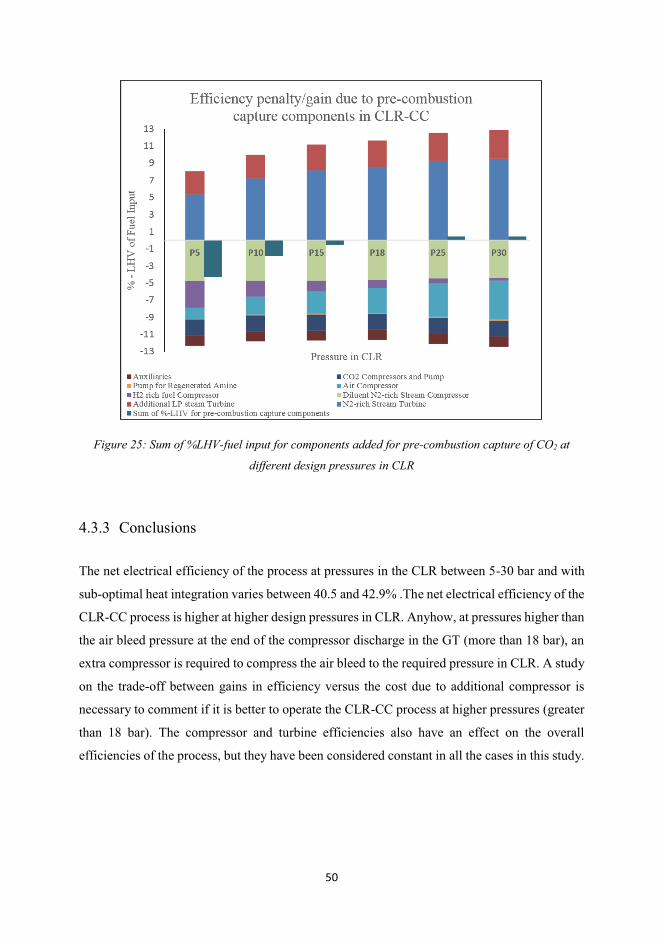
50
Figure 25: Sum of %LHV-fuel input for components added for pre-combustion capture of CO2 at
different design pressures in CLR
4.3.3 Conclusions
The net electrical efficiency of the process at pressures in the CLR between 5-30 bar and with
sub-optimal heat integration varies between 40.5 and 42.9% .The net electrical efficiency of the
CLR-CC process is higher at higher design pressures in CLR. Anyhow, at pressures higher than
the air bleed pressure at the end of the compressor discharge in the GT (more than 18 bar), an
extra compressor is required to compress the air bleed to the required pressure in CLR. A study
on the trade-off between gains in efficiency versus the cost due to additional compressor is
necessary to comment if it is better to operate the CLR-CC process at higher pressures (greater
than 18 bar). The compressor and turbine efficiencies also have an effect on the overall
efficiencies of the process, but they have been considered constant in all the cases in this study.
51
4.4 Heat integration options for CLR-CC process
4.4.1 Methodology to analyze different heat integration options
As reported in Section 4.2, improvement in efficiency of CLR-CC process can be attained by
better heat integration. Four different cases have been analyzed and compared against the base
case CLR-CC process. The base case CLR-CC process is similar to case P18 described in
Section 4.3. In all the cases studied for improving heat integration in the process, the pressure
in CLR is assumed to be 18 bar. In addition, the process conditions in CLR, WGS, CO2 capture
and compression sections are same as in the base case, except for the quality of steam prepared
from cooling of process streams. The conditions of the steam produced are based on the point
at which it is integrated in the steam cycle and the pressure drops encountered in economizers,
boilers and super-heaters in the HRSG. This section defines the different options for heat
integration and the changes made in the process with respect to the base case.
Base Case: This case is similar to the Case P18 (base case) described in Section 4.3 when cases
to study the sensitivity with respect to pressures in CLR have been defined. Syngas, HTS and
LTS product streams, N2-rich stream from turbine and diluent N2-rich stream during the inter-
stage compression is cooled to produce saturated LP steam at 3.8 bar. A fraction of the saturated
LP steam is used in the reboiler of the CO2 capture section and the remainder of it is sent to
steam turbine to produce work.
Case 1: Syngas at 984 °C is cooled to 400 °C to produce superheated HP steam at 166 bar and
600 °C, which is mixed with the HP steam from the HRSG before being expanded in the HP
turbine. N2-rich stream from the turbine is cooled to produce superheated MP steam at 36.4 bar
and 371 °C, which is mixed with MP steam before reheat, and sent to HRSG. Saturated LP
steam at 3.8 bar is prepared from LTS product cooling and is sent to HRSG for LP superheating.
Heat from HTS product and diluent N2-rich stream from inter-stage cooling of compressor is
used to produce saturated LP steam at 3.8 bar for reboiler (represented by ‘*’ mark in the
figures). The changes in the process with respect to the base case is shown in Figure 26.
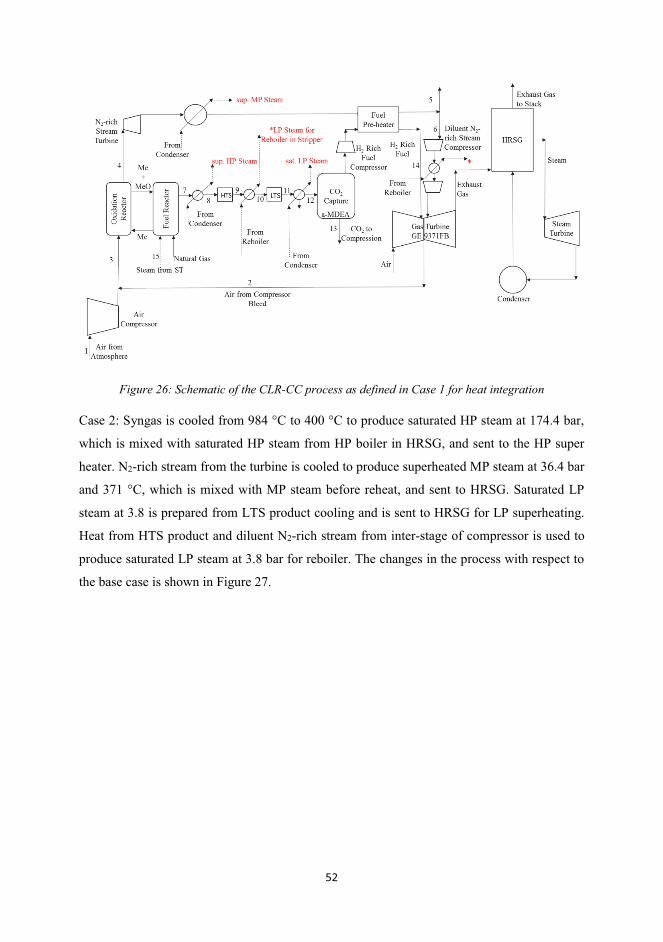
52
Figure 26: Schematic of the CLR-CC process as defined in Case 1 for heat integration
Case 2: Syngas is cooled from 984 °C to 400 °C to produce saturated HP steam at 174.4 bar,
which is mixed with saturated HP steam from HP boiler in HRSG, and sent to the HP super
heater. N2-rich stream from the turbine is cooled to produce superheated MP steam at 36.4 bar
and 371 °C, which is mixed with MP steam before reheat, and sent to HRSG. Saturated LP
steam at 3.8 is prepared from LTS product cooling and is sent to HRSG for LP superheating.
Heat from HTS product and diluent N2-rich stream from inter-stage of compressor is used to
produce saturated LP steam at 3.8 bar for reboiler. The changes in the process with respect to
the base case is shown in Figure 27.
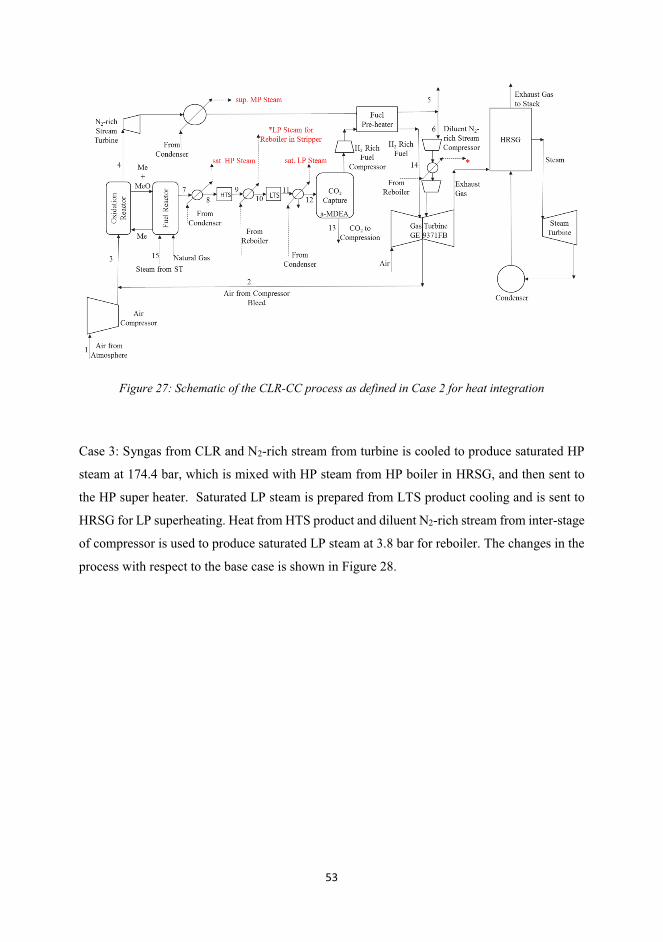
53
Figure 27: Schematic of the CLR-CC process as defined in Case 2 for heat integration
Case 3: Syngas from CLR and N2-rich stream from turbine is cooled to produce saturated HP
steam at 174.4 bar, which is mixed with HP steam from HP boiler in HRSG, and then sent to
the HP super heater. Saturated LP steam is prepared from LTS product cooling and is sent to
HRSG for LP superheating. Heat from HTS product and diluent N2-rich stream from inter-stage
of compressor is used to produce saturated LP steam at 3.8 bar for reboiler. The changes in the
process with respect to the base case is shown in Figure 28.
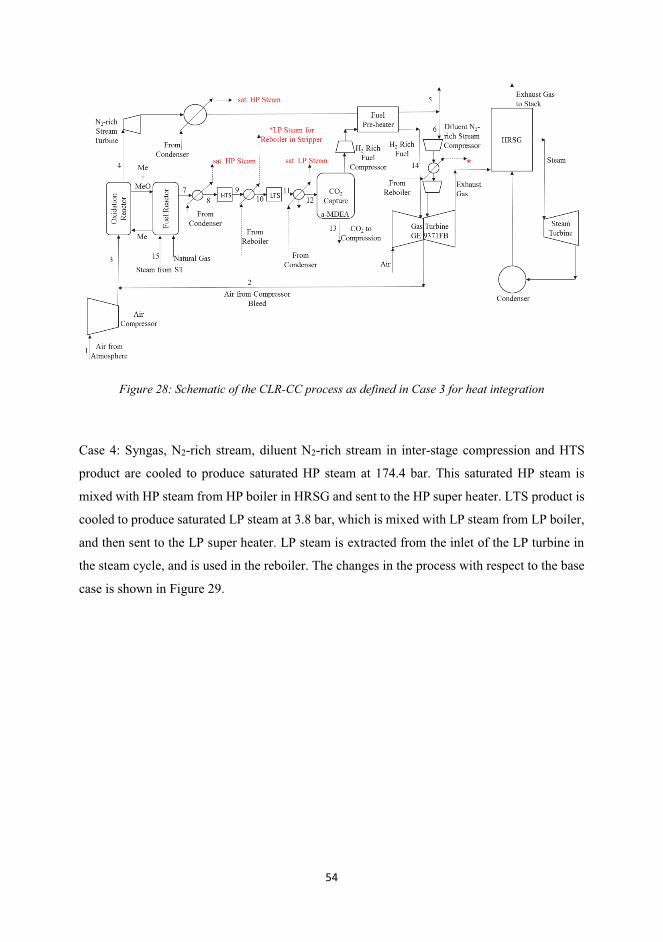
54
Figure 28: Schematic of the CLR-CC process as defined in Case 3 for heat integration
Case 4: Syngas, N2-rich stream, diluent N2-rich stream in inter-stage compression and HTS
product are cooled to produce saturated HP steam at 174.4 bar. This saturated HP steam is
mixed with HP steam from HP boiler in HRSG and sent to the HP super heater. LTS product is
cooled to produce saturated LP steam at 3.8 bar, which is mixed with LP steam from LP boiler,
and then sent to the LP super heater. LP steam is extracted from the inlet of the LP turbine in
the steam cycle, and is used in the reboiler. The changes in the process with respect to the base
case is shown in Figure 29.
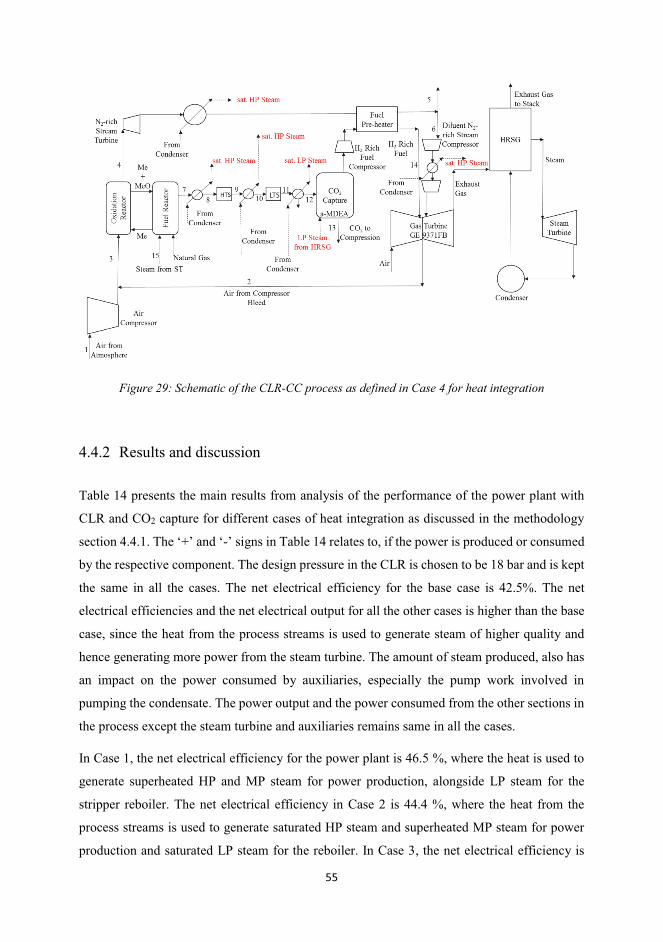
55
Figure 29: Schematic of the CLR-CC process as defined in Case 4 for heat integration
4.4.2 Results and discussion
Table 14 presents the main results from analysis of the performance of the power plant with
CLR and CO2 capture for different cases of heat integration as discussed in the methodology
section 4.4.1. The ‘+’ and ‘-’ signs in Table 14 relates to, if the power is produced or consumed
by the respective component. The design pressure in the CLR is chosen to be 18 bar and is kept
the same in all the cases. The net electrical efficiency for the base case is 42.5%. The net
electrical efficiencies and the net electrical output for all the other cases is higher than the base
case, since the heat from the process streams is used to generate steam of higher quality and
hence generating more power from the steam turbine. The amount of steam produced, also has
an impact on the power consumed by auxiliaries, especially the pump work involved in
pumping the condensate. The power output and the power consumed from the other sections in
the process except the steam turbine and auxiliaries remains same in all the cases.
In Case 1, the net electrical efficiency for the power plant is 46.5 %, where the heat is used to
generate superheated HP and MP steam for power production, alongside LP steam for the
stripper reboiler. The net electrical efficiency in Case 2 is 44.4 %, where the heat from the
process streams is used to generate saturated HP steam and superheated MP steam for power
production and saturated LP steam for the reboiler. In Case 3, the net electrical efficiency is
56
same as in Case 2, but the heat from the process streams is used to produce saturated HP steam
for power production and saturated LP steam for the stripper reboiler. Case 4 has the net
electrical efficiency of 44.8 %, where the heat from the process streams is used to produce
saturated HP and LP steam for power production, and the steam required in the stripper reboiler
is extracted from the LP steam turbine in the steam cycle.
The net electrical efficiency in Case 1 is the highest. Anyhow, producing superheated HP steam
by recovering heat from a stream of gas containing H2 and CO at high temperatures and
pressures might cause corrosion of tubes in the form of metal dusting. Metal dusting is highly
prevalent when temperatures of streams are between 450 and 800 °C and the gas stream
containing H2 and CO is cooled to produce steam (Young et al. 2011). Hence, metal dusting
could be a limiting factor in improving the efficiency of the process.
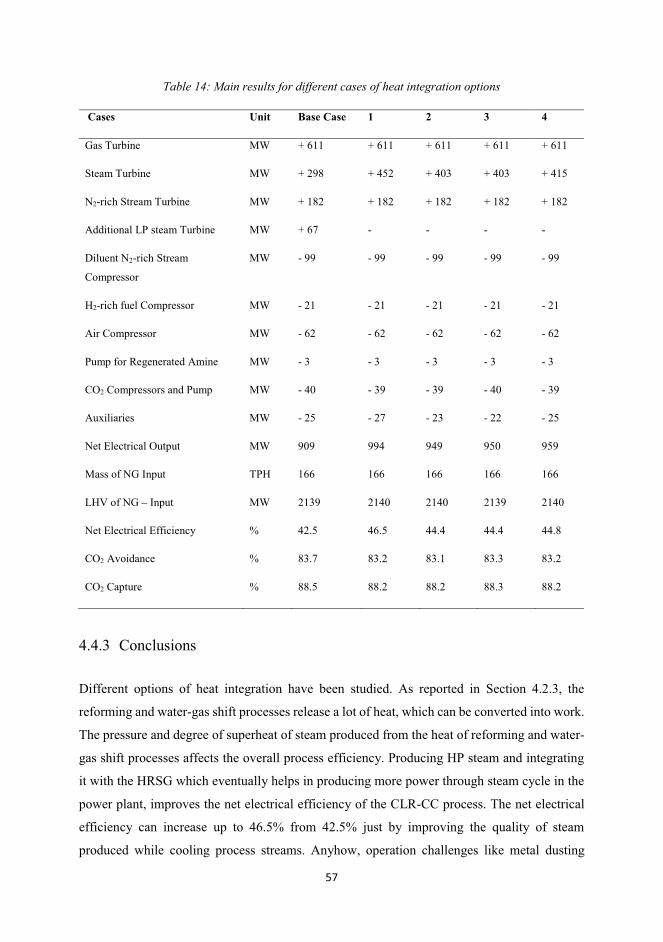
57
Table 14: Main results for different cases of heat integration options
Cases Unit Base Case 1 2 3 4
Gas Turbine MW + 611 + 611 + 611 + 611 + 611
Steam Turbine MW + 298 + 452 + 403 + 403 + 415
N2-rich Stream Turbine MW + 182 + 182 + 182 + 182 + 182
Additional LP steam Turbine MW + 67 - - - -
Diluent N2-rich Stream
Compressor
MW - 99 - 99 - 99 - 99 - 99
H2-rich fuel Compressor MW - 21 - 21 - 21 - 21 - 21
Air Compressor MW - 62 - 62 - 62 - 62 - 62
Pump for Regenerated Amine MW - 3 - 3 - 3 - 3 - 3
CO2 Compressors and Pump MW - 40 - 39 - 39 - 40 - 39
Auxiliaries MW - 25 - 27 - 23 - 22 - 25
Net Electrical Output MW 909 994 949 950 959
Mass of NG Input TPH 166 166 166 166 166
LHV of NG – Input MW 2139 2140 2140 2139 2140
Net Electrical Efficiency % 42.5 46.5 44.4 44.4 44.8
CO2 Avoidance % 83.7 83.2 83.1 83.3 83.2
CO2 Capture % 88.5 88.2 88.2 88.3 88.2
4.4.3 Conclusions
Different options of heat integration have been studied. As reported in Section 4.2.3, the
reforming and water-gas shift processes release a lot of heat, which can be converted into work.
The pressure and degree of superheat of steam produced from the heat of reforming and water-
gas shift processes affects the overall process efficiency. Producing HP steam and integrating
it with the HRSG which eventually helps in producing more power through steam cycle in the
power plant, improves the net electrical efficiency of the CLR-CC process. The net electrical
efficiency can increase up to 46.5% from 42.5% just by improving the quality of steam
produced while cooling process streams. Anyhow, operation challenges like metal dusting

58
might limit the improvement in efficiency. Case 4 is considered in the further studies since it
does not involve producing superheated HP or MP steam, which reduces the probability of
operational challenges.
59
Chapter 5: Techno-economic analysis of CLR-
CC process
5.1 Introduction
This chapter presents the techno-economic analysis of the CLR-CC process. The schematic of
the process is shown in Figure 19 in Section 3.2 of the thesis. The description of the process is
also similar to as described in Section 3.2. A 1D model was developed using MATLAB (not
part of this thesis work) and is used to study the performance of CLR, whereas the remaining
part of the process was analysed using commercial software tools like Aspen and Thermoflow.
The effect of design conditions in CLR, mainly the air flowrate to the oxidation reactor,
oxidation reactor outlet temperature and the steam/carbon ration at the inlet of fuel reactor of
CLR, on the overall techno-economic performance of the CLR-CC process is reported. 12 cases
have been studied to study the effect of these parameters on the overall process performance.
The CH4 conversion in CLR, net electrical efficiency, CO2 avoidance rate and the Levelised
Cost of Electricity (LCOE) have been identified as techno-economic performance indicators.
The results from this chapter have also been reported in Paper III.
5.2 Methodology and assumptions to carry out techno-economic
analysis of CLR-CC
The techno-economic assessment of the CLR-CC process was carried out using the process
models to assess different sections of the process, and the economic model as described by
GCCSI (2013), which is also briefed in Section 3.5 of this thesis. The description of the models
and the respective assumptions alongside criteria for technical assessment is briefed below.
5.2.1 1D Model for CLR
The 1D model used in this work consists of a 1D generic phenomenological model for fluidized
bed reactors applied to CLR (Morgado et al. 2016) developed using MATLAB. The generic
model formulation is based on the averaging probabilistic approach developed by Thompson et
60
al. (Thompson, Bi, and Grace 1999, Abba et al. 2003) and couples the three most frequent
fluidization regimes in industry (bubbling, turbulent and fast fluidization). Furthermore, it
relies on the two-phase theory that distinguishes between a low and high dense phase, poor and
highly concentrated in solids, respectively. The material and energy balances as well as the
empirical closure laws used to describe the hydrodynamics of the system under different
fluidization regimes are described by Morgado et al. (2016). The use of kinetic models like this
one helps in evaluating the process more accurately at different design conditions and dynamics
of the process. In this work the Dual Circulating Fluidized Bed (DCFB) configuration proposed
by Pröll et al. was considered. Therefore, both reactors operate under the same fluidization
regimes that is turbulent and/or fast fluidization (Schmid et al. 2011, Kolbitsch et al. 2009).
Adiabatic conditions were assumed in both oxidation and fuel reactors. The temperature at the
outlet of the oxidation reactor was limited to 1200 ± 10 °C due to the thermal degradation of
the oxygen carrier and was used to estimate the oxygen carrier circulation rate between the
oxidation and fuel reactors. Adding on to it, the effect of changing the temperature at the outlet
of oxidation reactor to 1100 ± 10 °C is also presented in this chapter. The air flowrate entering
the oxidation reactor was defined to meet higher conversion rates of methane in the fuel reactor.
The steam/carbon ratio at the inlet of fuel reactor was assumed based on the CO/H2O ratio
required for favorable conditions in WGS. NG is assumed to be 100% CH4 at 10 °C and 7 MPa
pressure in this chapter. Atmospheric air composition is assumed to be 21 % O2 and 79% N2 by
moles at 15 °C and 1.01325 bar.
The dimensions of the reactors (height and diameter) were established in order to meet the
equilibrium conversions in the fuel reactor alongside maintaining the fluidization regimes as in
DCFB. Due to the excellent heat transfer properties of fluidized bed reactors, the temperature
in the low and high dense phases was considered equal. The superficial velocity of the gas
inside the reactors has been constrained so that it is always higher or equal to the minimum
fluidization velocity. The particle size of the oxygen carrier is assumed 250 μm.
5.2.2 WGS and CO2 capture and compression process model
The WGS reactors, CO2 capture and compression processes were simulated in ASPEN Hysys
V8.6 (AspenHYSYS 2017). Peng-Robinson thermodynamic model is considered for the WGS
and CO2 compression sections, whereas Acid-Gas Model is used to estimate the equilibrium
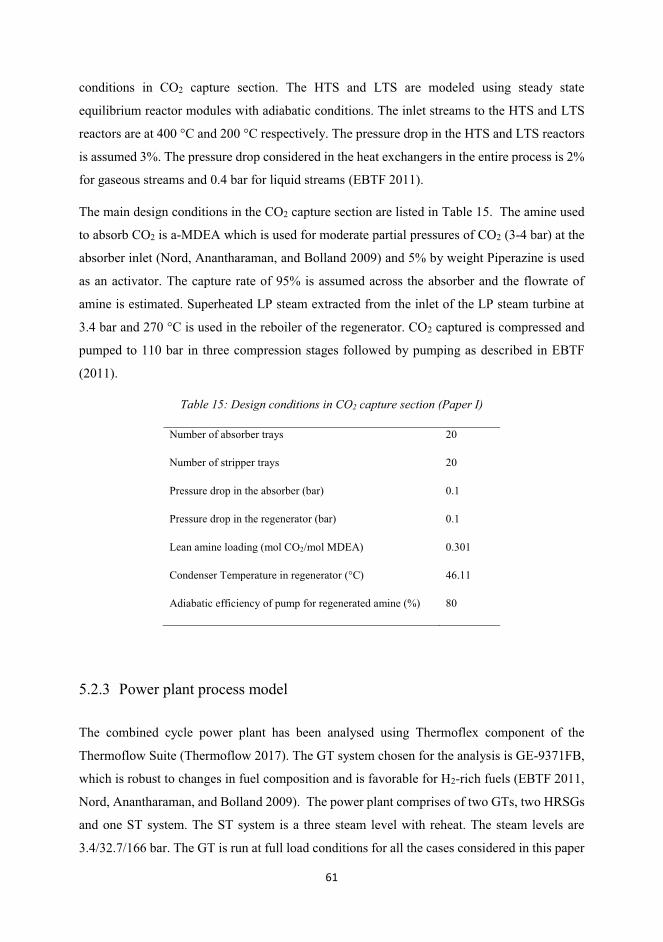
61
conditions in CO2 capture section. The HTS and LTS are modeled using steady state
equilibrium reactor modules with adiabatic conditions. The inlet streams to the HTS and LTS
reactors are at 400 °C and 200 °C respectively. The pressure drop in the HTS and LTS reactors
is assumed 3%. The pressure drop considered in the heat exchangers in the entire process is 2%
for gaseous streams and 0.4 bar for liquid streams (EBTF 2011).
The main design conditions in the CO2 capture section are listed in Table 15. The amine used
to absorb CO2 is a-MDEA which is used for moderate partial pressures of CO2 (3-4 bar) at the
absorber inlet (Nord, Anantharaman, and Bolland 2009) and 5% by weight Piperazine is used
as an activator. The capture rate of 95% is assumed across the absorber and the flowrate of
amine is estimated. Superheated LP steam extracted from the inlet of the LP steam turbine at
3.4 bar and 270 °C is used in the reboiler of the regenerator. CO2 captured is compressed and
pumped to 110 bar in three compression stages followed by pumping as described in EBTF
(2011).
Table 15: Design conditions in CO2 capture section (Paper I)
Number of absorber trays 20
Number of stripper trays 20
Pressure drop in the absorber (bar) 0.1
Pressure drop in the regenerator (bar) 0.1
Lean amine loading (mol CO2/mol MDEA) 0.301
Condenser Temperature in regenerator (°C) 46.11
Adiabatic efficiency of pump for regenerated amine (%) 80
5.2.3 Power plant process model
The combined cycle power plant has been analysed using Thermoflex component of the
Thermoflow Suite (Thermoflow 2017). The GT system chosen for the analysis is GE-9371FB,
which is robust to changes in fuel composition and is favorable for H2-rich fuels (EBTF 2011,
Nord, Anantharaman, and Bolland 2009). The power plant comprises of two GTs, two HRSGs
and one ST system. The ST system is a three steam level with reheat. The steam levels are
3.4/32.7/166 bar. The GT is run at full load conditions for all the cases considered in this paper
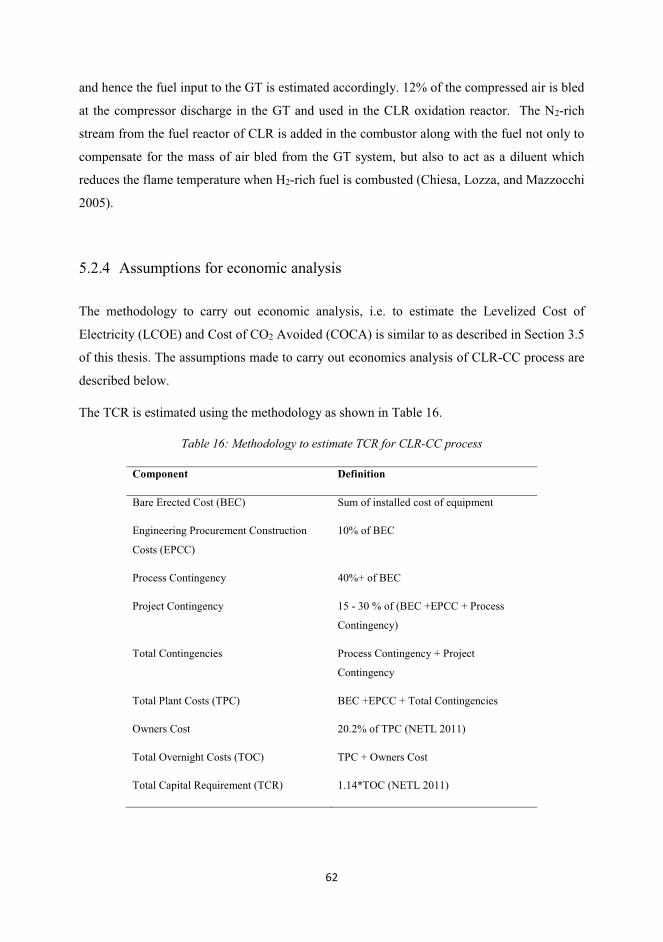
62
and hence the fuel input to the GT is estimated accordingly. 12% of the compressed air is bled
at the compressor discharge in the GT and used in the CLR oxidation reactor. The N2-rich
stream from the fuel reactor of CLR is added in the combustor along with the fuel not only to
compensate for the mass of air bled from the GT system, but also to act as a diluent which
reduces the flame temperature when H2-rich fuel is combusted (Chiesa, Lozza, and Mazzocchi
2005).
5.2.4 Assumptions for economic analysis
The methodology to carry out economic analysis, i.e. to estimate the Levelized Cost of
Electricity (LCOE) and Cost of CO2 Avoided (COCA) is similar to as described in Section 3.5
of this thesis. The assumptions made to carry out economics analysis of CLR-CC process are
described below.
The TCR is estimated using the methodology as shown in Table 16.
Table 16: Methodology to estimate TCR for CLR-CC process
Component Definition
Bare Erected Cost (BEC) Sum of installed cost of equipment
Engineering Procurement Construction
Costs (EPCC)
10% of BEC
Process Contingency 40%+ of BEC
Project Contingency 15 - 30 % of (BEC +EPCC + Process
Contingency)
Total Contingencies Process Contingency + Project
Contingency
Total Plant Costs (TPC) BEC +EPCC + Total Contingencies
Owners Cost 20.2% of TPC (NETL 2011)
Total Overnight Costs (TOC) TPC + Owners Cost
Total Capital Requirement (TCR) 1.14*TOC (NETL 2011)
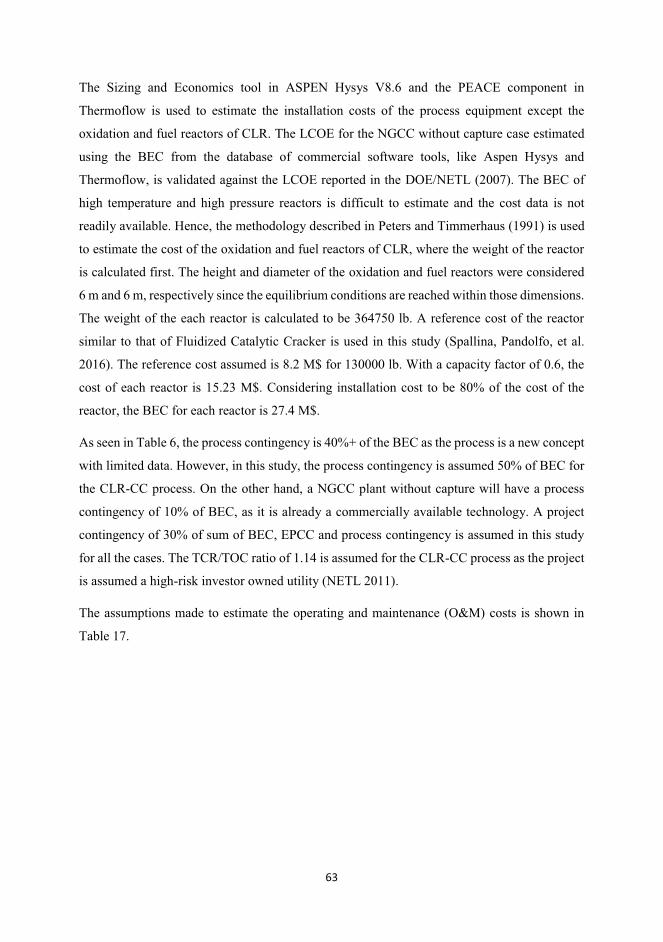
63
The Sizing and Economics tool in ASPEN Hysys V8.6 and the PEACE component in
Thermoflow is used to estimate the installation costs of the process equipment except the
oxidation and fuel reactors of CLR. The LCOE for the NGCC without capture case estimated
using the BEC from the database of commercial software tools, like Aspen Hysys and
Thermoflow, is validated against the LCOE reported in the DOE/NETL (2007). The BEC of
high temperature and high pressure reactors is difficult to estimate and the cost data is not
readily available. Hence, the methodology described in Peters and Timmerhaus (1991) is used
to estimate the cost of the oxidation and fuel reactors of CLR, where the weight of the reactor
is calculated first. The height and diameter of the oxidation and fuel reactors were considered
6 m and 6 m, respectively since the equilibrium conditions are reached within those dimensions.
The weight of the each reactor is calculated to be 364750 lb. A reference cost of the reactor
similar to that of Fluidized Catalytic Cracker is used in this study (Spallina, Pandolfo, et al.
2016). The reference cost assumed is 8.2 M$ for 130000 lb. With a capacity factor of 0.6, the
cost of each reactor is 15.23 M$. Considering installation cost to be 80% of the cost of the
reactor, the BEC for each reactor is 27.4 M$.
As seen in Table 6, the process contingency is 40%+ of the BEC as the process is a new concept
with limited data. However, in this study, the process contingency is assumed 50% of BEC for
the CLR-CC process. On the other hand, a NGCC plant without capture will have a process
contingency of 10% of BEC, as it is already a commercially available technology. A project
contingency of 30% of sum of BEC, EPCC and process contingency is assumed in this study
for all the cases. The TCR/TOC ratio of 1.14 is assumed for the CLR-CC process as the project
is assumed a high-risk investor owned utility (NETL 2011).
The assumptions made to estimate the operating and maintenance (O&M) costs is shown in
Table 17.
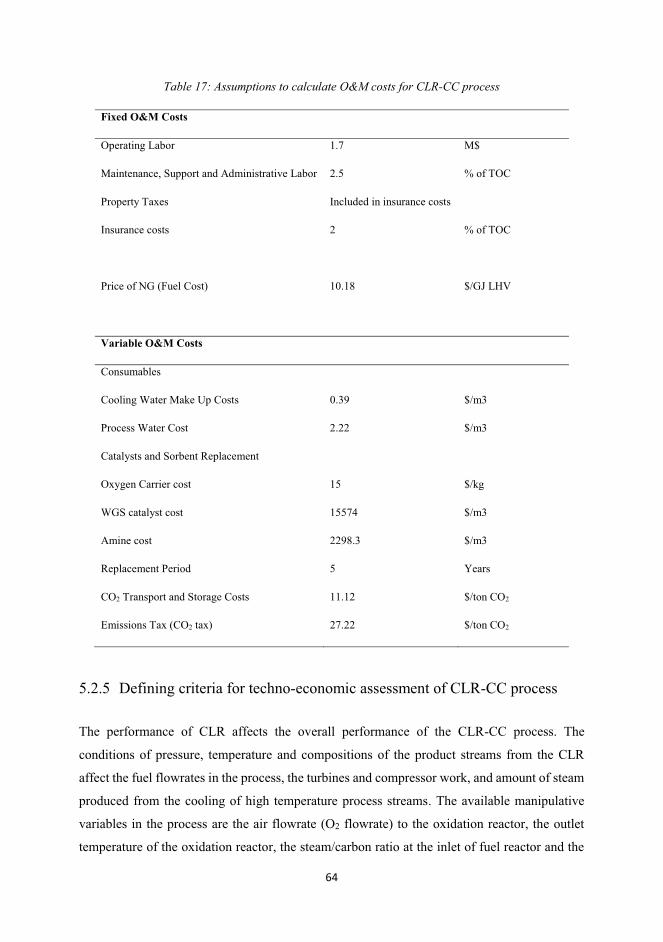
64
Table 17: Assumptions to calculate O&M costs for CLR-CC process
Fixed O&M Costs
Operating Labor 1.7 M$
Maintenance, Support and Administrative Labor 2.5 % of TOC
Property Taxes Included in insurance costs
Insurance costs 2 % of TOC
Price of NG (Fuel Cost) 10.18 $/GJ LHV
Variable O&M Costs
Consumables
Cooling Water Make Up Costs 0.39 $/m3
Process Water Cost 2.22 $/m3
Catalysts and Sorbent Replacement
Oxygen Carrier cost 15 $/kg
WGS catalyst cost 15574 $/m3
Amine cost 2298.3 $/m3
Replacement Period 5 Years
CO2 Transport and Storage Costs 11.12 $/ton CO2
Emissions Tax (CO2 tax) 27.22 $/ton CO2
5.2.5 Defining criteria for techno-economic assessment of CLR-CC process
The performance of CLR affects the overall performance of the CLR-CC process. The
conditions of pressure, temperature and compositions of the product streams from the CLR
affect the fuel flowrates in the process, the turbines and compressor work, and amount of steam
produced from the cooling of high temperature process streams. The available manipulative
variables in the process are the air flowrate (O2 flowrate) to the oxidation reactor, the outlet
temperature of the oxidation reactor, the steam/carbon ratio at the inlet of fuel reactor and the
65
design pressure in the oxidation reactor. The impact of pressure inside the oxidation reactor has
already been reported in Chapter 4 and Paper II of this thesis. Thus, only the remaining three
independent variables (air flowrate, oxidation reactor outlet temperature and steam/carbon ratio
near fuel reactor inlet) were studied in this work. To evaluate the performance of the CLR-CC
process while manipulating these independent variables, different performance indicators were
defined. The conversion of CH4 and the oxygen carrier utilization are the main performance
indicators for the CLR process. The CO2 avoidance and the net electrical efficiency are the
performance indicators considered for the CLR-CC process. The LCOE is the main
performance indicator for the economic performance of the process. The CO2 avoidance and
net electrical efficiency are defined in equations Eq 5.1 and Eq 5.2 respectively.
����Zz� {462��,"/ ��9::�*�,&Q]�<|A==<D�AJ�;I&&�}A=K.E=�?^C=E@<�Y�&Q]�<|A==<D�AJ�;I&&�}A=K�?^C=E@</&Q]�<|A==<D�AJ�;I&&�}A=K.E=�?^C=E@< Eq 5.1
0�1����213 24���55 2 �627�,8/ � � 9::�*;<=�<><?=@A?A=B�[email protected]?<D�F'G�.H�;I�AJCE=�=.�=K<�C@.?<LL Eq 5.2
Considering the amount of air flowrate to the oxidation reactor, the stoichiometry given by the
reforming reaction of CH4 implies that 0.5 moles of O2 are needed to reform CH4 into CO and
H2 (reaction 5.1).
��( � +~���] �� �� � ���] (5.1)
Hence, the availability of oxygen in the fuel reactor through the metal oxide (NiO) plays an
important role in the conversion of CH4. A sensitivity study was carried out varying the amount
of oxygen entering the CLR by considering the stoichiometric molar ratio of O2/CH4 in the
system to be 0.5, 0.75 and 0.9. In these cases, the temperature at the outlet of oxidation reactor
was assumed to be 1200 ± 10 °C and the steam/carbon ratio was assumed to be 0.9 at the inlet
of fuel reactor. The equilibrium conversion of CH4 at different O2/CH4 molar ratio is shown in
Table 18.
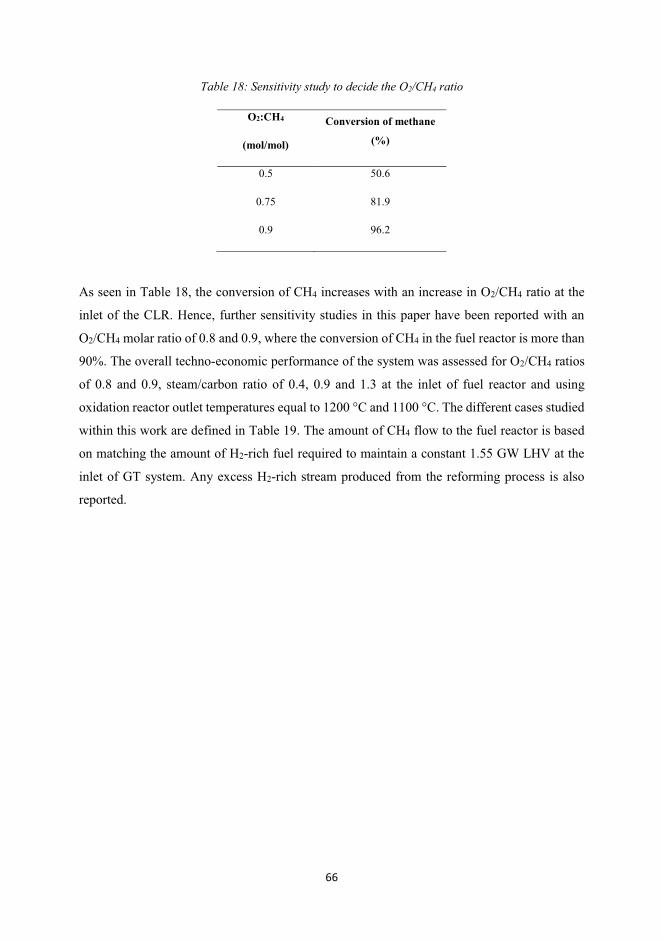
66
Table 18: Sensitivity study to decide the O2/CH4 ratio
O2:CH4
(mol/mol)
Conversion of methane
(%)
0.5 50.6
0.75 81.9
0.9 96.2
As seen in Table 18, the conversion of CH4 increases with an increase in O2/CH4 ratio at the
inlet of the CLR. Hence, further sensitivity studies in this paper have been reported with an
O2/CH4 molar ratio of 0.8 and 0.9, where the conversion of CH4 in the fuel reactor is more than
90%. The overall techno-economic performance of the system was assessed for O2/CH4 ratios
of 0.8 and 0.9, steam/carbon ratio of 0.4, 0.9 and 1.3 at the inlet of fuel reactor and using
oxidation reactor outlet temperatures equal to 1200 °C and 1100 °C. The different cases studied
within this work are defined in Table 19. The amount of CH4 flow to the fuel reactor is based
on matching the amount of H2-rich fuel required to maintain a constant 1.55 GW LHV at the
inlet of GT system. Any excess H2-rich stream produced from the reforming process is also
reported.
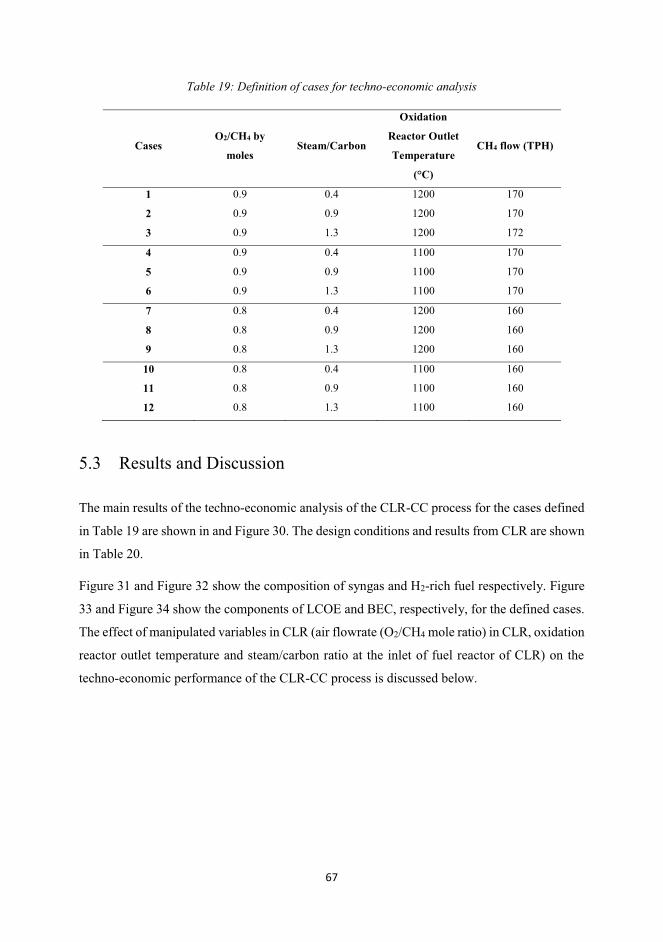
67
Table 19: Definition of cases for techno-economic analysis
Cases O2/CH4 by
moles Steam/Carbon
Oxidation
Reactor Outlet
Temperature
(°C)
CH4 flow (TPH)
1 0.9 0.4 1200 170
2 0.9 0.9 1200 170
3 0.9 1.3 1200 172
4 0.9 0.4 1100 170
5 0.9 0.9 1100 170
6 0.9 1.3 1100 170
7 0.8 0.4 1200 160
8 0.8 0.9 1200 160
9 0.8 1.3 1200 160
10 0.8 0.4 1100 160
11 0.8 0.9 1100 160
12 0.8 1.3 1100 160
5.3 Results and Discussion
The main results of the techno-economic analysis of the CLR-CC process for the cases defined
in Table 19 are shown in and Figure 30. The design conditions and results from CLR are shown
in Table 20.
Figure 31 and Figure 32 show the composition of syngas and H2-rich fuel respectively. Figure
33 and Figure 34 show the components of LCOE and BEC, respectively, for the defined cases.
The effect of manipulated variables in CLR (air flowrate (O2/CH4 mole ratio) in CLR, oxidation
reactor outlet temperature and steam/carbon ratio at the inlet of fuel reactor of CLR) on the
techno-economic performance of the CLR-CC process is discussed below.
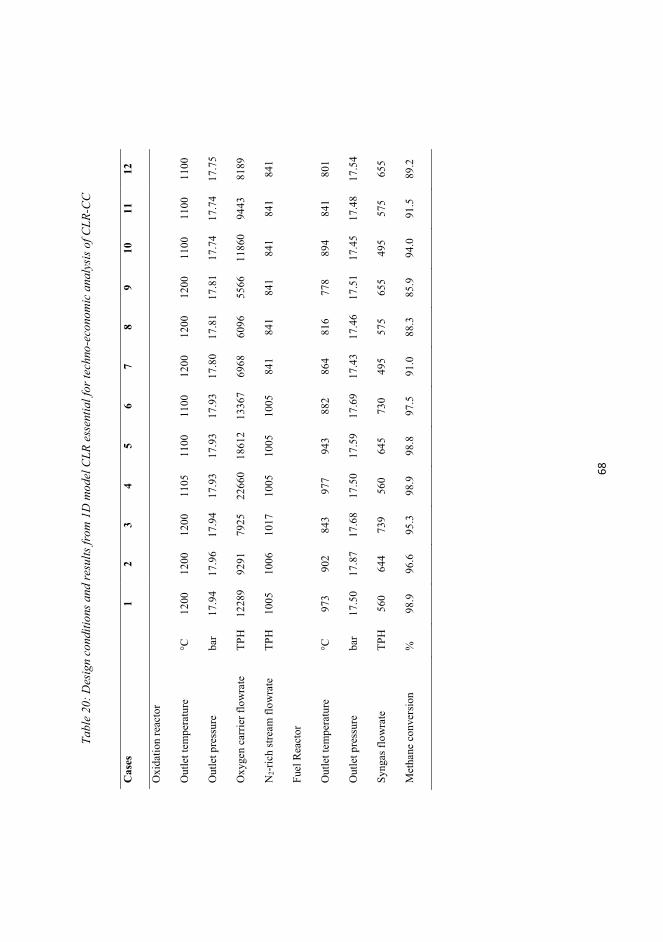
68
Tabl
e 20
: Des
ign
cond
ition
s and
resu
lts fr
om 1
D m
odel
CLR
ess
entia
l for
tech
no-e
cono
mic
ana
lysi
s of C
LR-C
C
Cas
es
1
2 3
4 5
6 7
8 9
10
11
12
Ox
idat
ion r
eact
or
Ou
tlet
tem
per
atu
re
°C
12
00
12
00
12
00
11
05
11
00
11
00
12
00
12
00
12
00
11
00
11
00
11
00
Outl
et p
ress
ure
b
ar
17
.94
17
.96
17
.94
17
.93
17
.93
17
.93
1
7.8
0
17
.81
17
.81
17
.74
17
.74
1
7.7
5
Ox
ygen
car
rier
flo
wra
te
TP
H
12
289
92
91
79
25
22
660
18
612
13
367
69
68
60
96
55
66
11
860
94
43
81
89
N2-r
ich s
trea
m f
low
rate
T
PH
1
00
5
10
06
10
17
10
05
10
05
10
05
84
1
84
1
84
1
84
1
84
1
84
1
Fuel
Rea
cto
r
Ou
tlet
tem
per
atu
re
°C
97
3
90
2
84
3
97
7
94
3
88
2
86
4
81
6
77
8
89
4
84
1
80
1
Outl
et p
ress
ure
b
ar
17
.50
17
.87
17
.68
17
.50
17
.59
17
.69
1
7.4
3
17
.46
17
.51
17
.45
17
.48
1
7.5
4
Syngas
flo
wra
te
TP
H
56
0
64
4
73
9
56
0
64
5
73
0
49
5
57
5
65
5
49
5
57
5
65
5
Met
han
e co
nver
sio
n
%
98
.9
96
.6
95
.3
98
.9
98
.8
97
.5
91
.0
88
.3
85
.9
94
.0
91
.5
89
.2
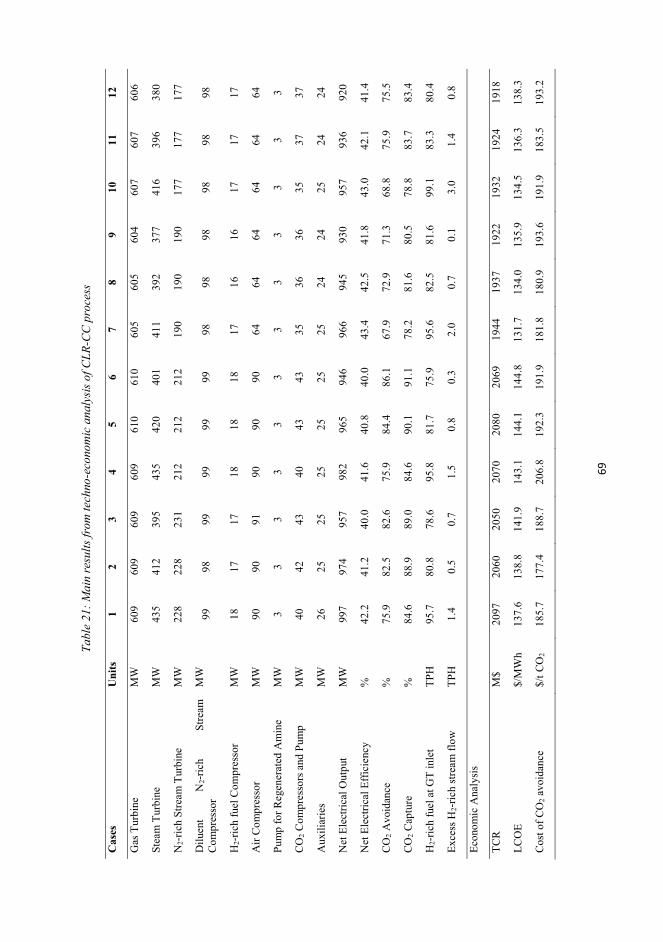
69
Tabl
e 21
: Mai
n re
sults
from
tech
no-e
cono
mic
ana
lysis
of C
LR-C
C p
roce
ss
Cas
es
Uni
ts
1 2
3 4
5 6
7 8
9 10
11
12
Gas
Turb
ine
MW
6
09
60
9
60
9
60
9
61
0
61
0
60
5
60
5
60
4
60
7
60
7
60
6
Ste
am T
urb
ine
MW
4
35
41
2
39
5
43
5
42
0
40
1
41
1
39
2
37
7
41
6
39
6
38
0
N2-r
ich S
trea
m T
urb
ine
MW
2
28
22
8
23
1
21
2
21
2
21
2
19
0
19
0
19
0
17
7
17
7
17
7
Dil
uen
t N
2-r
ich
Str
eam
C
om
pre
sso
r M
W
99
98
99
99
99
99
98
98
98
98
98
98
H2-r
ich f
uel
Co
mp
ress
or
MW
1
8
17
17
18
18
18
17
16
16
17
17
17
Air
Co
mp
ress
or
MW
9
0
90
91
90
90
90
64
64
64
64
64
64
Pu
mp
fo
r R
egen
erat
ed A
min
e
MW
3
3
3
3
3
3
3
3
3
3
3
3
CO
2 C
om
pre
sso
rs a
nd
Pu
mp
M
W
40
42
43
40
43
43
35
36
36
35
37
37
Au
xil
iari
es
MW
2
6
25
25
25
25
25
25
24
24
25
24
24
Net
Ele
ctri
cal
Ou
tput
MW
9
97
97
4
95
7
98
2
96
5
94
6
96
6
94
5
93
0
95
7
93
6
92
0
Net
Ele
ctri
cal
Eff
icie
ncy
%
4
2.2
4
1.2
4
0.0
4
1.6
4
0.8
4
0.0
4
3.4
4
2.5
4
1.8
4
3.0
4
2.1
4
1.4
CO
2 A
vo
idan
ce
%
75
.9
82
.5
82
.6
75
.9
84
.4
86
.1
67
.9
72
.9
71
.3
68
.8
75
.9
75
.5
CO
2 C
aptu
re
%
84
.6
88
.9
89
.0
84
.6
90
.1
91
.1
78
.2
81
.6
80
.5
78
.8
83
.7
83
.4
H2-r
ich f
uel
at
GT
inle
t T
PH
9
5.7
8
0.8
7
8.6
9
5.8
8
1.7
7
5.9
9
5.6
8
2.5
8
1.6
9
9.1
8
3.3
8
0.4
Exce
ss H
2-r
ich s
trea
m f
low
T
PH
1
.4
0.5
0
.7
1.5
0
.8
0.3
2
.0
0.7
0
.1
3.0
1
.4
0.8
Eco
no
mic
Anal
ysi
s
TC
R
M$
2
09
7
20
60
20
50
20
70
20
80
20
69
19
44
19
37
19
22
19
32
19
24
19
18
LC
OE
$/M
Wh
13
7.6
1
38
.8
14
1.9
1
43
.1
14
4.1
1
44
.8
13
1.7
1
34
.0
13
5.9
1
34
.5
13
6.3
1
38
.3
Co
st o
f C
O2 a
vo
idan
ce
$/t C
O2
18
5.7
1
77
.4
18
8.7
2
06
.8
19
2.3
1
91
.9
18
1.8
1
80
.9
19
3.6
1
91
.9
18
3.5
1
93
.2
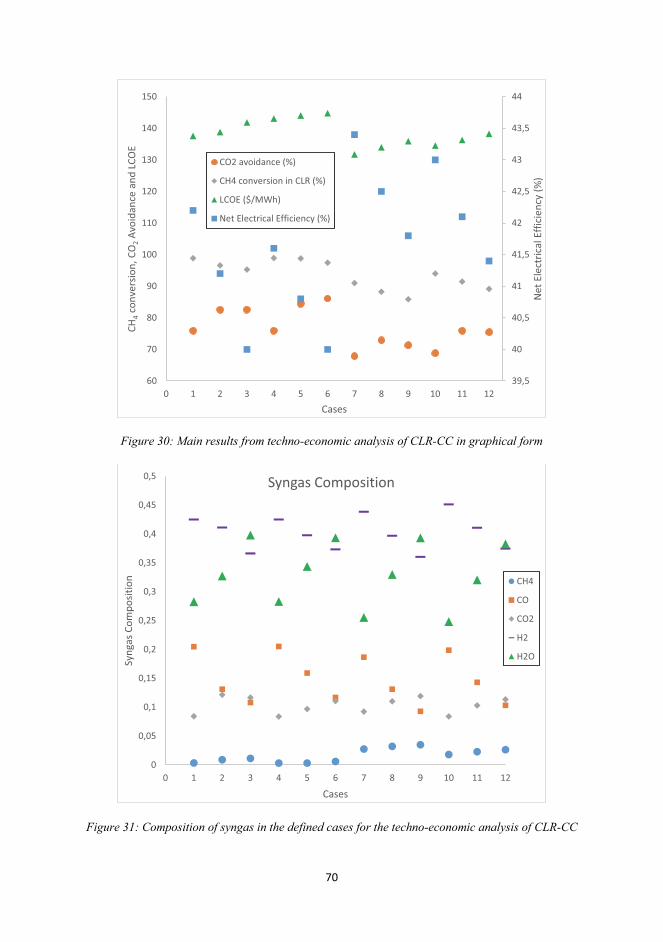
70
Figure 30: Main results from techno-economic analysis of CLR-CC in graphical form
Figure 31: Composition of syngas in the defined cases for the techno-economic analysis of CLR-CC
39,5
40
40,5
41
41,5
42
42,5
43
43,5
44
60
70
80
90
100
110
120
130
140
150
0 1 2 3 4 5 6 7 8 9 10 11 12
Net
Ele
ctric
al E
ffici
ency
(%)
CH4
conv
ersio
n, C
O2
Avoi
danc
e an
d LC
OE
Cases
CO2 avoidance (%)
CH4 conversion in CLR (%)
LCOE ($/MWh)
Net Electrical Efficiency (%)
0
0,05
0,1
0,15
0,2
0,25
0,3
0,35
0,4
0,45
0,5
0 1 2 3 4 5 6 7 8 9 10 11 12
Syng
as C
ompo
sitio
n
Cases
Syngas Composition
CH4
CO
CO2
H2
H2O
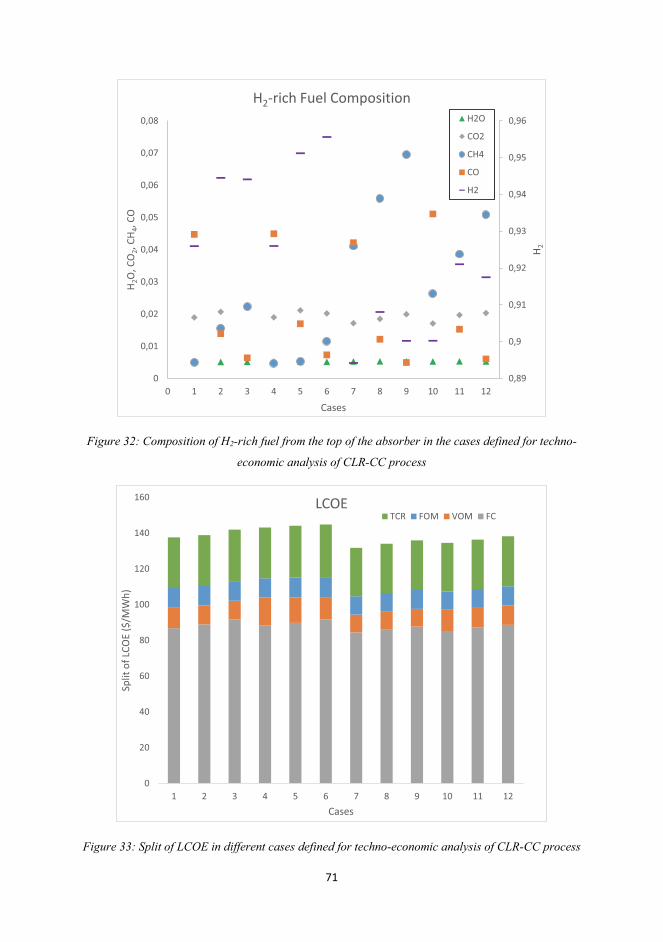
71
Figure 32: Composition of H2-rich fuel from the top of the absorber in the cases defined for techno-
economic analysis of CLR-CC process
Figure 33: Split of LCOE in different cases defined for techno-economic analysis of CLR-CC process
0,89
0,9
0,91
0,92
0,93
0,94
0,95
0,96
0
0,01
0,02
0,03
0,04
0,05
0,06
0,07
0,08
0 1 2 3 4 5 6 7 8 9 10 11 12
H 2
H 2O
, CO
2, CH
4, CO
Cases
H2-rich Fuel CompositionH2O
CO2
CH4
CO
H2
0
20
40
60
80
100
120
140
160
1 2 3 4 5 6 7 8 9 10 11 12
Split
of L
COE
($/M
Wh)
Cases
LCOETCR FOM VOM FC
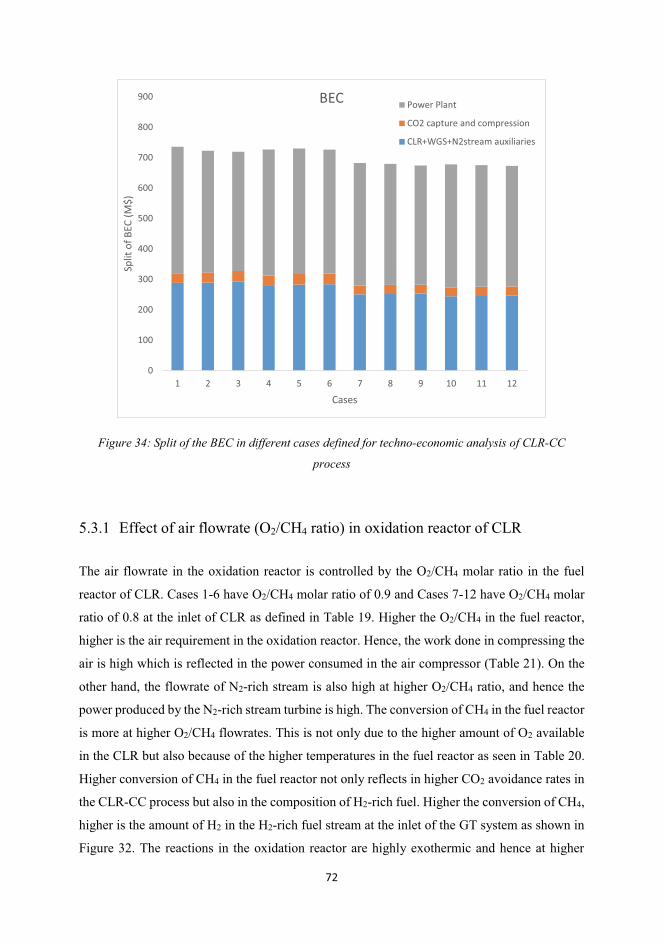
72
Figure 34: Split of the BEC in different cases defined for techno-economic analysis of CLR-CC
process
5.3.1 Effect of air flowrate (O2/CH4 ratio) in oxidation reactor of CLR
The air flowrate in the oxidation reactor is controlled by the O2/CH4 molar ratio in the fuel
reactor of CLR. Cases 1-6 have O2/CH4 molar ratio of 0.9 and Cases 7-12 have O2/CH4 molar
ratio of 0.8 at the inlet of CLR as defined in Table 19. Higher the O2/CH4 in the fuel reactor,
higher is the air requirement in the oxidation reactor. Hence, the work done in compressing the
air is high which is reflected in the power consumed in the air compressor (Table 21). On the
other hand, the flowrate of N2-rich stream is also high at higher O2/CH4 ratio, and hence the
power produced by the N2-rich stream turbine is high. The conversion of CH4 in the fuel reactor
is more at higher O2/CH4 flowrates. This is not only due to the higher amount of O2 available
in the CLR but also because of the higher temperatures in the fuel reactor as seen in Table 20.
Higher conversion of CH4 in the fuel reactor not only reflects in higher CO2 avoidance rates in
the CLR-CC process but also in the composition of H2-rich fuel. Higher the conversion of CH4,
higher is the amount of H2 in the H2-rich fuel stream at the inlet of the GT system as shown in
Figure 32. The reactions in the oxidation reactor are highly exothermic and hence at higher
0
100
200
300
400
500
600
700
800
900
1 2 3 4 5 6 7 8 9 10 11 12
Split
of B
EC (M
$)
Cases
BEC Power Plant
CO2 capture and compression
CLR+WGS+N2stream auxiliaries
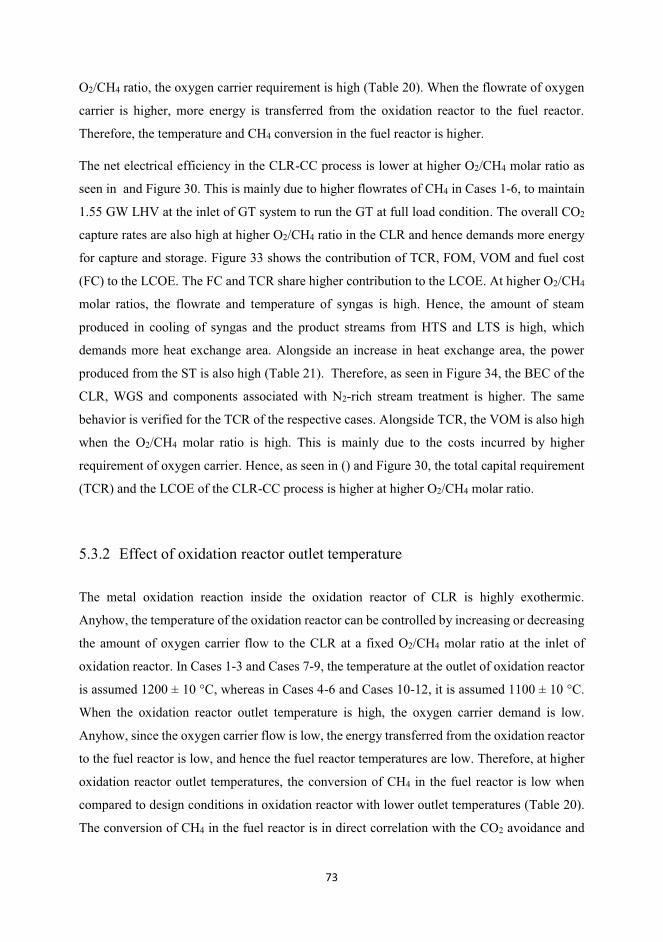
73
O2/CH4 ratio, the oxygen carrier requirement is high (Table 20). When the flowrate of oxygen
carrier is higher, more energy is transferred from the oxidation reactor to the fuel reactor.
Therefore, the temperature and CH4 conversion in the fuel reactor is higher.
The net electrical efficiency in the CLR-CC process is lower at higher O2/CH4 molar ratio as
seen in and Figure 30. This is mainly due to higher flowrates of CH4 in Cases 1-6, to maintain
1.55 GW LHV at the inlet of GT system to run the GT at full load condition. The overall CO2
capture rates are also high at higher O2/CH4 ratio in the CLR and hence demands more energy
for capture and storage. Figure 33 shows the contribution of TCR, FOM, VOM and fuel cost
(FC) to the LCOE. The FC and TCR share higher contribution to the LCOE. At higher O2/CH4
molar ratios, the flowrate and temperature of syngas is high. Hence, the amount of steam
produced in cooling of syngas and the product streams from HTS and LTS is high, which
demands more heat exchange area. Alongside an increase in heat exchange area, the power
produced from the ST is also high (Table 21). Therefore, as seen in Figure 34, the BEC of the
CLR, WGS and components associated with N2-rich stream treatment is higher. The same
behavior is verified for the TCR of the respective cases. Alongside TCR, the VOM is also high
when the O2/CH4 molar ratio is high. This is mainly due to the costs incurred by higher
requirement of oxygen carrier. Hence, as seen in () and Figure 30, the total capital requirement
(TCR) and the LCOE of the CLR-CC process is higher at higher O2/CH4 molar ratio.
5.3.2 Effect of oxidation reactor outlet temperature
The metal oxidation reaction inside the oxidation reactor of CLR is highly exothermic.
Anyhow, the temperature of the oxidation reactor can be controlled by increasing or decreasing
the amount of oxygen carrier flow to the CLR at a fixed O2/CH4 molar ratio at the inlet of
oxidation reactor. In Cases 1-3 and Cases 7-9, the temperature at the outlet of oxidation reactor
is assumed 1200 ± 10 °C, whereas in Cases 4-6 and Cases 10-12, it is assumed 1100 ± 10 °C.
When the oxidation reactor outlet temperature is high, the oxygen carrier demand is low.
Anyhow, since the oxygen carrier flow is low, the energy transferred from the oxidation reactor
to the fuel reactor is low, and hence the fuel reactor temperatures are low. Therefore, at higher
oxidation reactor outlet temperatures, the conversion of CH4 in the fuel reactor is low when
compared to design conditions in oxidation reactor with lower outlet temperatures (Table 20).
The conversion of CH4 in the fuel reactor is in direct correlation with the CO2 avoidance and
74
overall capture rates in the CLR-CC process (Table 21). At higher oxidation reactor outlet
temperatures, the work done in CO2 capture and compression is less.
Since the temperatures of syngas from the fuel reactor are lower when the oxidation reactor
outlet temperature is high, the amount of steam produced in cooling of syngas is low. Hence,
the power produced from the ST is less. Anyhow, when the oxidation reactor outlet
temperatures are high, the power produced from the N2-rich stream turbine is more. The net
electrical efficiency of the CLR-CC process is high when the oxidation reactor outlet
temperature is high. On the other hand, the LCOE of the CLR-CC process is low when the
oxidation reactor outlet temperature is high (Table 21 and Figure 30). This is because the TCR
and VOM is relatively low. TCR is low because of the lower heat exchange area if less steam
is produced, and VOM is low as the amount of oxygen carrier is less (Figure 33 and Table 20).
5.3.3 Effect of steam/carbon ratio near the inlet of fuel reactor of CLR
The effect of steam/carbon ratio near the inlet of fuel reactor was studied by assuming the ratio
equal to 0.4, 0.9 and 1.3 at the inlet of fuel reactor. At higher steam/carbon ratios, the steam
flowrate is high and hence the equilibrium temperature in the fuel reactor is low since the
temperature of steam is low. Hence, the oxygen carrier requirement in the oxidation reactor is
low to compensate for the lower temperature in fuel reactor (Table 20). When the steam flow
rate in the fuel reactor is more, the overall syngas flowrate is also higher (Table 20). The
conversion of CH4 in the fuel reactor is low when the steam flowrate is high because the
temperature in fuel reactor is low. The CO content in the syngas and H2-rich fuel is low at
higher steam flowrates (Figure 31 and Figure 32) whereas the H2 content in the H2-rich fuel is
high (Figure 32). This is due to higher extent of water-gas shift reaction when the steam flowrate
is high. The higher extent of water-gas shift reaction means higher conversion of CO into CO2.
Therefore, higher the extent of WGS reaction, higher the CO2 avoidance and capture rates.
The steam added to the fuel reactor is extracted from the MP steam turbine and hence at higher
steam flowrates in the fuel reactor (i.e. higher steam/carbon ratios), the power produced from
the ST is less. Therefore, the net electrical efficiency of the CLR-CC process is low when the
steam flowrates to the fuel reactor are high (Table 21 and Figure 30). The LCOE of the CLR-
CC process is high when the steam flowrates in the fuel reactor are high. This is mainly because
the heat rate (HR) in the process is high at higher steam flowrates, and hence the component of
75
LCOE due to fuel cost is high. Anyhow, the TCR is low when the steam flowrates are higher.
This is due to the smaller size of HRSG and ST when steam extracted from the MP steam
turbine is high. Hence the power plant cost component in the total plant BEC is low when the
steam flowrates in fuel reactor are high, resulting in lower TCR (Figure 33 and Figure 34).
5.3.4 Effect of fuel cost and process contingency on LCOE
Figure 33 clearly shows that the major contributors to the LCOE of the process is the fuel costs
and the TCR. While estimating the TCR of the CLR-CC process, the process contingency was
assumed 50% of BEC, which is for a process which is considered to be a new concept with
limited data (GCCSI 2013). The fuel cost was assumed 10.18 $/GJ-LHV. Anyhow, the process
contingency of the process depends completely on its level of maturity and the fuel cost is very
much dependent on the region from where it is imported. Figure 35 provides a sensitivity study
for the defined cases when the process contingency is 50% and 10% of BEC, and the fuel cost
is 10.18 and 4.5 $/GJ-LHV. As seen in Figure 35, the LCOE for the CLR-CC process varies
between 75.3 and 144.8 $/MWh.
76
Figure 35: Sensitivity of LCOE of CLR-CC to fuel cost and process contingency costs
5.4 Concluding remarks on techno-economics of CLR-CC process
The conditions in the CLR were simulated using the 1-D phenomenological model developed
by Francisco Morgado et al. (2016). Three manipulative variables, air flowrate (O2/CH4 molar
ratio) at the inlet of oxidation reactor, oxidation reactor outlet temperature and steam/carbon
ratio at the inlet of the fuel reactor, were selected. The effect of changes in these variables on
the overall techno-economic performance of the CLR-CC process was analysed. The
manipulative variables were varied as defined in Table 19 across 12 different cases. The main
techno-economic performance indicators of the process are CH4 conversion in the fuel reactor,
CO2 avoidance rates, net electrical efficiency and the LCOE. Among the 12 cases, Case 1 and
Case 4 exhibit the highest conversion of CH4 in the fuel reactor where the steam/carbon ratio is
low. Anyhow, Case 4 has higher conversion of CH4 even at lower O2/CH4 ratio. Hence, the
conversion of CH4 is high when the steam/carbon ratio near the fuel reactor inlet and the
oxidation reactor outlet temperature is low at a O2/CH4 molar ratio of 0.9 in the CLR, as in Case
4. The CO2 avoidance rate in Case 6 is the highest with 86.1% when the O2/CH4 molar ratio is
0.9, steam/carbon ratio is high and the oxidation reactor outlet temperature is low. Even though
60
70
80
90
100
110
120
130
140
150
0 1 2 3 4 5 6 7 8 9 10 11 12
LCO
E ($
/MW
h)
Cases
FC=10.18$/GJ-LHV PC=50% of BECFC=10.18$/GJ-LHV PC=10% of BECFC=4.5$/GJ-LHV PC=10% of BECFC=4.5$/GJ-LHV PC=50% of BEC
77
the CH4 conversion in Case 6 is lower than in other cases, the extent of water-gas shift reaction
is high. Consequently, most of the CO is converted to CO2. Hence, the CO2 avoidance is higher
in the process when the O2/CH4 molar ratio at the inlet of oxidation reactor and the steam
flowrates to the fuel reactor are high.
Case 7 exhibits the highest net electrical efficiency followed by Case 10, where the O2/CH4
molar ratio is 0.8 and the steam/carbon ratio near the fuel reactor inlet is low. The oxidation
reactor outlet temperature is higher in Case 7 than Case 10. Anyhow, in these two cases there
is a compromise made on the CO2 avoidance rates. Case 7 also exhibits the least LCOE among
all the other cases. Hence, the net electrical efficiency is high and the LCOE is less for the CLR-
CC process with design conditions in CLR having lower O2/CH4 molar ratio at the inlet of
oxidation reactor and lower steam/carbon ratios near the inlet of fuel reactor, and at high
oxidation reactor outlet temperatures, but the CO2 avoidance rate is lower. Apart from the effect
of the technical performance of the process on LCOE, the process contingency and the fuel
costs have a significant contribution to the LCOE. Hence, lower fuel costs and process
contingency can bring down the LCOE to 75.3 $/MWh (in Case 7) for the CLR-CC process.
To conclude, this study helps in identifying the design conditions in the CLR based on techno-
economic performance when it is integrated in a gas-fired combined cycle power plant with
pre-combustion CO2 capture.
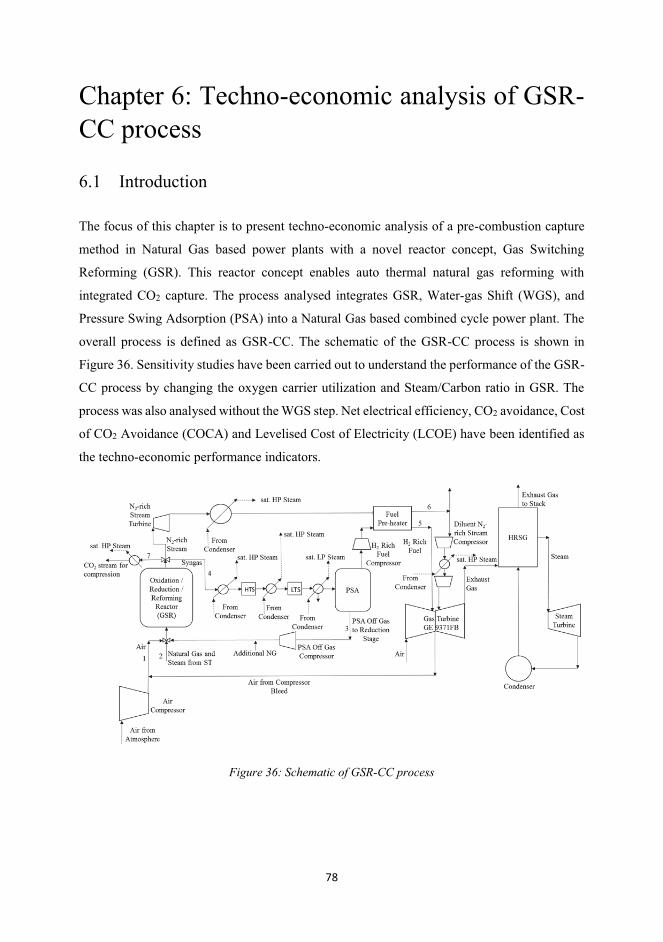
78
Chapter 6: Techno-economic analysis of GSR-
CC process
6.1 Introduction
The focus of this chapter is to present techno-economic analysis of a pre-combustion capture
method in Natural Gas based power plants with a novel reactor concept, Gas Switching
Reforming (GSR). This reactor concept enables auto thermal natural gas reforming with
integrated CO2 capture. The process analysed integrates GSR, Water-gas Shift (WGS), and
Pressure Swing Adsorption (PSA) into a Natural Gas based combined cycle power plant. The
overall process is defined as GSR-CC. The schematic of the GSR-CC process is shown in
Figure 36. Sensitivity studies have been carried out to understand the performance of the GSR-
CC process by changing the oxygen carrier utilization and Steam/Carbon ratio in GSR. The
process was also analysed without the WGS step. Net electrical efficiency, CO2 avoidance, Cost
of CO2 Avoidance (COCA) and Levelised Cost of Electricity (LCOE) have been identified as
the techno-economic performance indicators.
Figure 36: Schematic of GSR-CC process
79
6.2 Methods and Assumptions
6.2.1 Modeling of GSR and assumptions
The 0D model of the GSR reactor was modelled as a Continuously Stirred Tank Reactor
(CSTR), which is generally a good assumption for a well-mixed fluidized bed. In addition,
thermal and chemical equilibrium was assumed. Thermal equilibrium is easily achieved in
fluidized beds due to the very fast gas-particle heat transfer resulting from the dynamic mixing
and small particle size. Chemical equilibrium is also a good assumption due to the highly active
Ni-based oxygen carrier employed. Earlier 1D model simulations of a CLR fuel reactor showed
that reactor length (gas residence time) had a very small influence on reactor performance
because the fast reactions quickly reach equilibrium (Francisco Morgado et al. 2016).
6.2.1.1 Initial and boundary conditions
Gas inlet stream flowrates, temperatures and compositions to the different process steps were
case-dependent. However, the inlet and outlet pressures were fixed to 18 and 17 bar respectively
(1 bar pressure drop over the reactor). The reactor was specified to be 10 m in height and 6.7 m
in in diameter and filled with oxygen carrier to yield a total reactor void fraction of 0.65. The
oxygen carrier density was set to 4000 kg/m3 in its initial fully reduced state, with a Ni mass
fraction of 0.3 and the balance Al2O3 support material.
Gas feed rates were specified to keep the superficial velocity through the reactor around 0.5 m/s
to facilitate bubbling fluidization. The duration of the different steps in the GSR process was
adjusted based on the degree of oxygen carrier utilization specified, but a ratio of
oxidation:reduction:reforming duration of 2:1:2 was always maintained to enable steady
operation with a GSR reactor cluster containing any multiple of 5 reactors.
6.2.1.2 Reactor performance and link to process model
This section will present some typical reactor model outputs and describe how these results are
then incorporated in the process and power plant modelling. The basic behavior of the GSR
reactor is illustrated in Figure 37. During the reduction step, all the incoming fuel gases are
80
converted to CO2 and H2 and the reactor temperature slowly reduces, mostly due to the necessity
to heat up the incoming fuel gases.
At the start of the reforming step (300 s in Figure 37), some remaining NiO must still be reduced
and the incoming CH4 is therefore converted to H2O and CO2. Some NiO is purposefully left at
the end of the reduction step to account for the fact that the reduction reaction rates will slow
down as the oxygen carrier comes close to full conversion, potentially leading to some
undesired fuel slip. After this brief initial period of complete oxygen carrier reduction, the
reforming reactions take place, producing H2 and CO. Due to the endothermic nature of the
reforming reaction, the temperature drops faster than in the reduction step. As the reactor
temperature reduces, the CH4 conversion and H2 production also decline due to less favorable
thermodynamics.
Finally, the oxidation step starts (900 s in Figure 37) to oxidize the oxygen carrier and heat up
the reactor. During the first few seconds of oxidation, some H2 and CO left in the reactor are
converted to H2O and CO2. Following this brief period, the outlet gases comprise of almost
pure N2 as all the O2 in the air is consumed by the oxidation reaction.
Figure 37 also illustrates some undesired mixing between N2 and CO2 before and after the
oxidation step. This mixing is due to the CSTR assumption and will lower the CO2 capture rate
and CO2 purity achieved by the system. Nevertheless, the CO2 capture performance of the
system remains very high as will be described in the results and discussion section.
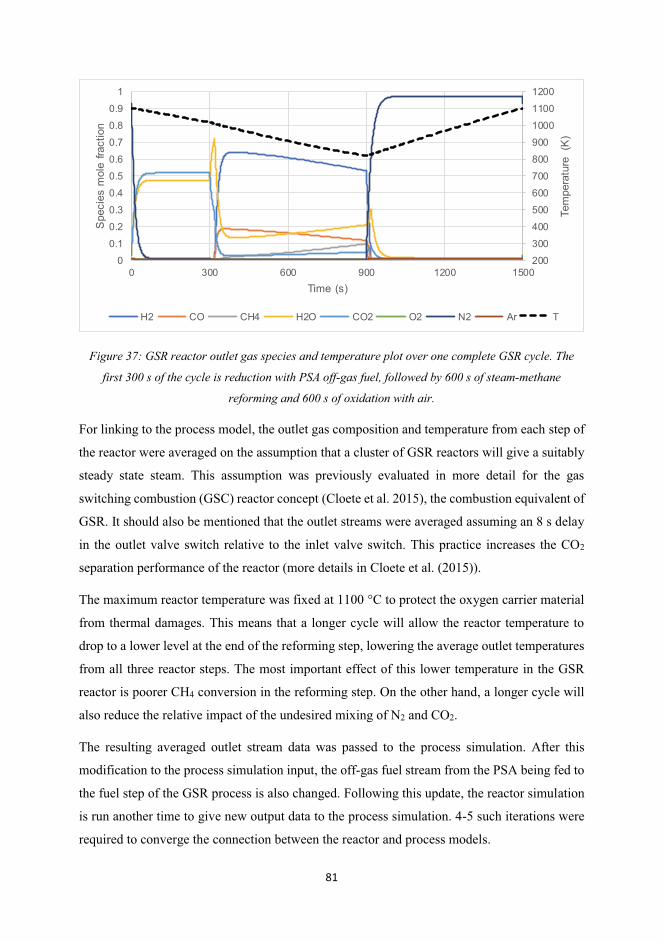
81
Figure 37: GSR reactor outlet gas species and temperature plot over one complete GSR cycle. The
first 300 s of the cycle is reduction with PSA off-gas fuel, followed by 600 s of steam-methane
reforming and 600 s of oxidation with air.
For linking to the process model, the outlet gas composition and temperature from each step of
the reactor were averaged on the assumption that a cluster of GSR reactors will give a suitably
steady state steam. This assumption was previously evaluated in more detail for the gas
switching combustion (GSC) reactor concept (Cloete et al. 2015), the combustion equivalent of
GSR. It should also be mentioned that the outlet streams were averaged assuming an 8 s delay
in the outlet valve switch relative to the inlet valve switch. This practice increases the CO2
separation performance of the reactor (more details in Cloete et al. (2015)).
The maximum reactor temperature was fixed at 1100 °C to protect the oxygen carrier material
from thermal damages. This means that a longer cycle will allow the reactor temperature to
drop to a lower level at the end of the reforming step, lowering the average outlet temperatures
from all three reactor steps. The most important effect of this lower temperature in the GSR
reactor is poorer CH4 conversion in the reforming step. On the other hand, a longer cycle will
also reduce the relative impact of the undesired mixing of N2 and CO2.
The resulting averaged outlet stream data was passed to the process simulation. After this
modification to the process simulation input, the off-gas fuel stream from the PSA being fed to
the fuel step of the GSR process is also changed. Following this update, the reactor simulation
is run another time to give new output data to the process simulation. 4-5 such iterations were
required to converge the connection between the reactor and process models.
200300400500600700800900100011001200
00.10.20.30.40.50.60.70.80.9
1
0 300 600 900 1200 1500
Tem
pera
ture
(K
)
Spe
cies
mol
e fra
ctio
n
Time (s)
H2 CO CH4 H2O CO2 O2 N2 Ar T
82
6.2.2 Modeling of WGS, PSA and power plant
The air compressor, WGS, PSA off gas compressor, reduction step product cooling and CO2
compression has been modeled using Aspen Hysys V8.6 (AspenHYSYS 2017). Peng-Robinson
equation of state was used to estimate the thermodynamic properties in the process model. The
composition and condition of atmospheric air is according to EBTF (2011) report. The
atmospheric air is compressed to 18 bar in the air compressor before being mixed with the
compressed air bleed stream from the exit of the compressor in the GT system. 12% of the total
air inlet to the GT is bled at the compressor outlet of the GT and is used in the oxidation step in
GSR. The polytropic efficiency of the air compressor is 90.9%.
Equilibrium reactor module in Aspen Hysys V8.6 was used to model the conditions in HTS and
LTS. The inlet product streams to the HTS and LTS are at 400 °C and 200 °C respectively. The
pressure drop in both the WGS reactors is assumed 3%. The heat exchangers in the entire
process have a pressure drop of 2% for gaseous streams, and 0.4 bar for liquid streams.
The PSA in this study has been modeled as a “black box”. The purity of H2 in the H2-rich stream
from the PSA is assumed 99.99% with 86% recovery of H2 (Riboldi and Bolland 2017, Sircar
and Golden 2000). The off gas from the PSA is at atmospheric pressure and temperature
conditions. The PSA off gas is compressed to 18 bar before being mixed with additional NG
stream and sent to the GSR reduction step. The additional NG stream is heated up to the
temperature of compressed PSA off gas stream before it is mixed. The PSA off gas compressor
has a polytropic efficiency of 90%. The flow rate of additional CH4 to the reduction step in
GSR is dependent on the amount of metal oxide remaining to be reduced. The product stream
from the reduction step contains mainly CO2 and H2O. It is cooled and condensed before the
CO2 stream is compressed to 110 bar and is ready for transport and storage. The CO2
compression cycle is similar to the one presented in EBTF (2011). The saturated HP steam
produced while cooling syngas, HTS product, N2-rich stream and reduction step product stream
is at 174.8 bar. The saturated LP steam produced while cooling LTS product stream is at 3.8
bar. The saturated steam pressures are based on the point at which they are being mixed with
the other steam lines in the HRSG.
The combined cycle power plant along with the N2-rich stream treatment has been modeled and
analysed using the Thermoflex component of the Thermoflow Suite V26 (Thermoflow 2017).
Themoflow suite contains a database of the models of standard commercial GT systems. The
N2-rich stream is expanded in a N2-rich stream turbine and cooled. Fraction of the N2-rich
83
stream, equivalent to the amount of the compressor bleed flow rate from the GT system is
compressed in two stages and used as diluent during the H2-rich fuel combustion in the
combustor of GT (Chiesa, Lozza, and Mazzocchi 2005). The polytropic efficiency of the
compressors used for compressing N2-rich stream is 90%. The GT system considered in this
study is GE-9371FB model as it exhibits robustness to the fuel types, especially to H2-rich fuels
(EBTF 2011, Nord, Anantharaman, and Bolland 2009). The power plant comprises of two GTs,
two HRSGs and one ST system. The steam cycle consists of a three-pressure level with reheat
before the MP turbine. The GT is run at full load conditions and the Lower Heating Value
(LHV) input at the GT inlet is 1.55 GW in all the cases studied and presented in this paper. The
net electrical efficiency (η), the CO2 avoidance and the specific energy consumption for CO2
avoided (SPECCA) are defined in Eq. 6.1, Eq. 6.2 and Eq. 6.3.
0�1����213 24���55 2 �627�,8/ � � 9::�*;<=�<><?=@A?A=B�[email protected]?<D�F'G�.H�;I�AJCE=�=.�=K<�C@.?<LL Eq. 6.1
����Zz� {462�,"/ � 9::�*�,&Q]�<|A==<D�AJ�;I&&�Y�&Q]�<|A==<D�AJ�I�N&&/&Q]�<|A==<D�AJ�;I&&� Eq. 6.2
�����Z �� 'NY'N@<H�#_`a\bcd)Y#_`a\bcd)@<H� Eq. 6.3
6.2.3 Economic analysis methodology and assumptions
The methodology for economic analysis is similar to the one described in Section 3.5 of this
thesis. Anyhow, the assumptions in carrying out the economic analysis of the GSR-CC are
described here. The interest rate “r” and the economic lifetime of the plant is considered as 10%
and 30 years in this study. The methodology to estimate the Total Capital Requirement (TCR)
of the GSR-CC process is shown in Table 22. The Engineering Procurement Construction Costs
(EPCC), Process and Project Contingency have been assumed considering that the GSR-CC
technology is in an advanced state of maturity (GCCSI 2013).
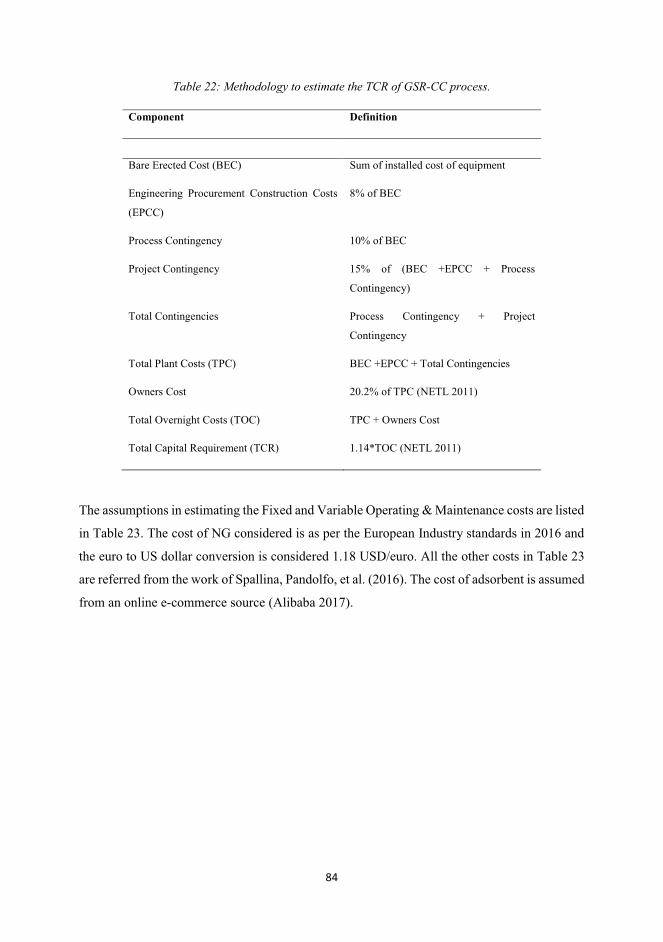
84
Table 22: Methodology to estimate the TCR of GSR-CC process.
Component Definition
Bare Erected Cost (BEC) Sum of installed cost of equipment
Engineering Procurement Construction Costs
(EPCC)
8% of BEC
Process Contingency 10% of BEC
Project Contingency 15% of (BEC +EPCC + Process
Contingency)
Total Contingencies Process Contingency + Project
Contingency
Total Plant Costs (TPC) BEC +EPCC + Total Contingencies
Owners Cost 20.2% of TPC (NETL 2011)
Total Overnight Costs (TOC) TPC + Owners Cost
Total Capital Requirement (TCR) 1.14*TOC (NETL 2011)
The assumptions in estimating the Fixed and Variable Operating & Maintenance costs are listed
in Table 23. The cost of NG considered is as per the European Industry standards in 2016 and
the euro to US dollar conversion is considered 1.18 USD/euro. All the other costs in Table 23
are referred from the work of Spallina, Pandolfo, et al. (2016). The cost of adsorbent is assumed
from an online e-commerce source (Alibaba 2017).
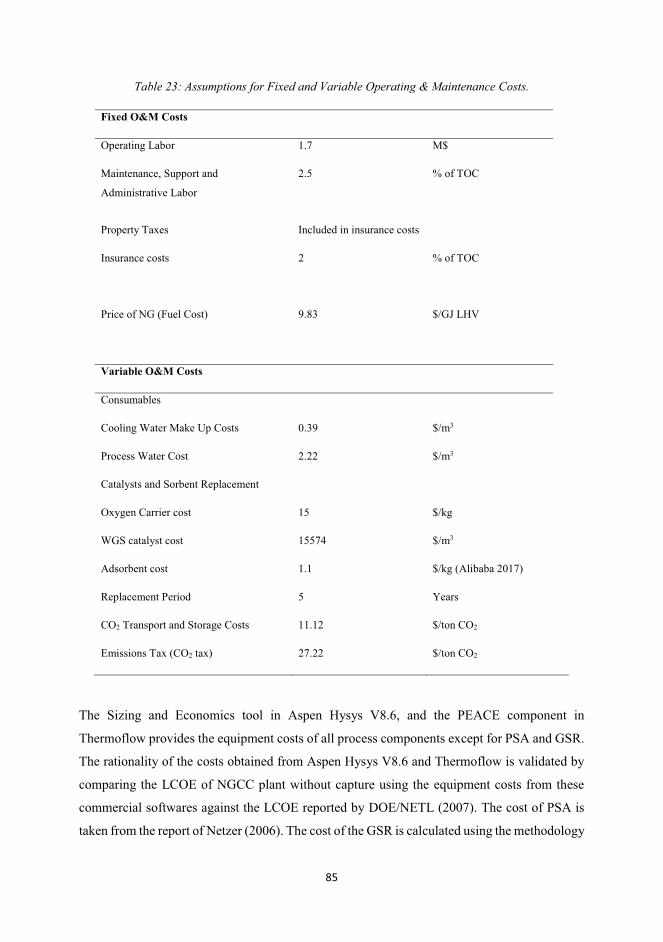
85
Table 23: Assumptions for Fixed and Variable Operating & Maintenance Costs.
Fixed O&M Costs
Operating Labor 1.7 M$
Maintenance, Support and
Administrative Labor
2.5
% of TOC
Property Taxes Included in insurance costs
Insurance costs 2 % of TOC
Price of NG (Fuel Cost) 9.83 $/GJ LHV
Variable O&M Costs
Consumables
Cooling Water Make Up Costs 0.39 $/m3
Process Water Cost 2.22 $/m3
Catalysts and Sorbent Replacement
Oxygen Carrier cost 15 $/kg
WGS catalyst cost 15574 $/m3
Adsorbent cost 1.1 $/kg (Alibaba 2017)
Replacement Period 5 Years
CO2 Transport and Storage Costs 11.12 $/ton CO2
Emissions Tax (CO2 tax) 27.22 $/ton CO2
The Sizing and Economics tool in Aspen Hysys V8.6, and the PEACE component in
Thermoflow provides the equipment costs of all process components except for PSA and GSR.
The rationality of the costs obtained from Aspen Hysys V8.6 and Thermoflow is validated by
comparing the LCOE of NGCC plant without capture using the equipment costs from these
commercial softwares against the LCOE reported by DOE/NETL (2007). The cost of PSA is
taken from the report of Netzer (2006). The cost of the GSR is calculated using the methodology
86
described in Peters and Timmerhaus (1991). The weight of the reactor is calculated, and a
reference cost similar to that of Fluidized Catalytic Cracker is used along with a capacity factor
or 0.6 (Spallina, Pandolfo, et al. 2016). The GSR is assumed to have a height of 10 m and
diameter of 6.7 m. 10 standalone reactors are assumed to operate for the power plant in this
study. Zero inflation rate for the costs have been assumed in this study.
6.3 Results and Discussion
The main results from the techno-economic analysis of the GSR-CC process and its comparison
to the reference case NGCC plant without capture are shown in Table 26. Table 25 presents the
design conditions in the GSR. Table 24 shows the process stream data for Case 2 where the
oxygen carrier utilization is 35% and S/C ratio is 1.5. Figure 38 shows the contribution of
different costs like Fuel Costs (FC), TCR, FOM and VOM to the LCOE, whereas Figure 39
shows the contribution of costs of different process sections to the BEC.
The penalty on the net electrical efficiency observed in the cases presented for GSR-CC in this
study is between 11.6-13.3 %-points with respect to the reference case. Apart from the inherent
losses due to reforming and water-gas shift reactions, the energy penalty in the GSR-CC process
comes from the additional process components with respect to the reference case.
Gross power production from the turbomachinery in the GSR-CC plants is similar to the
reference case (around 59% of LHV input). At first glance, this is a counter-intuitive finding
because the thermal energy in the streams exiting the GSR reactors is converted to work at
lower temperatures than the reference case. For example, the CO2-rich gases exiting the
reduction step of the GSR reactors (stream 7 in Figure 36) are used to generate steam for
powering the steam turbine, whereas all process gases power the combined cycle as in the
reference case. In addition, a significant amount of MP steam is extracted from the steam turbine
for feeding the reforming stage of the GSR reactors. However, the expansion work that is lost
through these mechanisms is compensated by additional energy input to the process streams
though the compressors for air, diluent N2-rich stream, PSA off gas, CO2 for storage, and H2-
rich fuel, ultimately creating a similar gross power output.
Another important energy penalty in the GSR-CC system is related to the practical requirements
of the primary gas turbine. Firstly, the compressor for the diluent N2-rich stream, required to
prevent excessive NOx formation when combusting the H2-rich fuel, consumes a significant
87
amount of power (4.4% of LHV input). To generate this compressed N2-rich stream at 30 bar,
the outlet gases from the air stage of the GSR reactors (stream 6 in Figure 36) must first be
expanded at a relatively low temperature (<1000 °C), resulting in less useful work compared to
the reference case where all gases enter the primary gas turbine at temperatures exceeding 1400
°C. In addition, the H2-rich fuel from the PSA unit must be further compressed for injection
into the combustion chamber at an additional energy penalty of 0.8 %-points.
Ideally, no diluent would be added to the H2-rich fuel, and the hot N2-rich stream from the air
stage of the GSR reactors would be fed directly to the combustion chamber to be heated up
further before expansion. This arrangement would significantly increase efficiency and reduce
the number of process units, but is not feasible with currently available gas turbines.
Additional energy penalties arise from the PSA off-gas and CO2 compressors. The electricity
consumption from the pressure swing separation of H2 amounts to 1.9 % of LHV input, whereas
the further compression of the CO2-rich stream for transport and storage imposes an additional
0.9 %-points in energy penalty.
The TCR for the GSR-CC process is more than 3 times the TCR of reference case. As shown
in Figure 39, the GSR reactors represent the largest single capital cost increase, but significant
capital costs are also attributed to other plant components. In addition, the significant energy
penalty also enforces larger plant components for a given electricity output. The LCOE for the
GSR-CC process is higher than the reference case, since the GSR-CC encounters more fuel,
capital and operating and maintenance costs. The substantial increase in FOM is primarily
attributed to replacement costs of the GSR oxygen carrier. As a result of the significant increase
in LCOE, the GSR-CC plants assessed in this study impose a CO2 avoidance cost of 111-134
$/ton CO2 on top of the 27.22 $/ton CO2 emissions tax assumed.
To analyze the techno-economic performance of GSR-CC at different design conditions in
GSR, for cases 1, 2 and 3 in Table 25, the Steam/Carbon ratio in the reforming step is kept
constant whereas the cycle time in oxidation step is varied to result in oxidation of 25%, 35%
and 45% of the available Ni during the oxidation step of the GSR reactors. This independent
variable is henceforth called “oxygen carrier utilization”. In cases 2, 4 and 5, the oxygen carrier
utilization is kept constant at 35% and the Steam/Carbon ratio in reforming step is evaluated at
levels of 1.5, 1.2 and 2. Case 6 shows the results for a GSR-CC process without the WGS step.
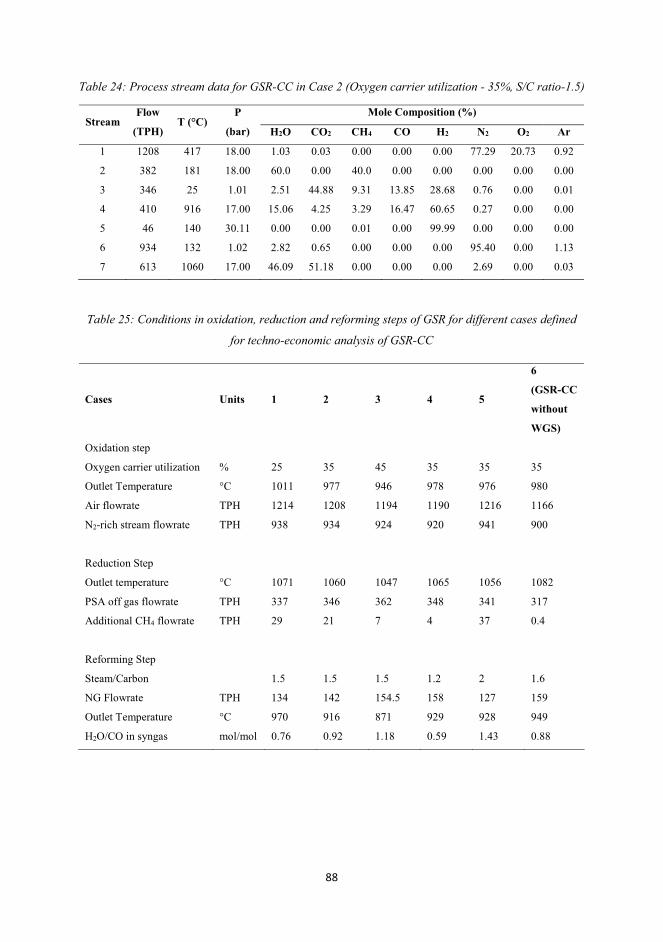
88
Table 24: Process stream data for GSR-CC in Case 2 (Oxygen carrier utilization - 35%, S/C ratio-1.5)
Stream Flow
(TPH) T (°C)
P
(bar)
Mole Composition (%)
H2O CO2 CH4 CO H2 N2 O2 Ar
1 1208 417 18.00 1.03 0.03 0.00 0.00 0.00 77.29 20.73 0.92
2 382 181 18.00 60.0 0.00 40.0 0.00 0.00 0.00 0.00 0.00
3 346 25 1.01 2.51 44.88 9.31 13.85 28.68 0.76 0.00 0.01
4 410 916 17.00 15.06 4.25 3.29 16.47 60.65 0.27 0.00 0.00
5 46 140 30.11 0.00 0.00 0.01 0.00 99.99 0.00 0.00 0.00
6 934 132 1.02 2.82 0.65 0.00 0.00 0.00 95.40 0.00 1.13
7 613 1060 17.00 46.09 51.18 0.00 0.00 0.00 2.69 0.00 0.03
Table 25: Conditions in oxidation, reduction and reforming steps of GSR for different cases defined
for techno-economic analysis of GSR-CC
Cases Units 1 2 3 4 5
6
(GSR-CC
without
WGS)
Oxidation step
Oxygen carrier utilization % 25 35 45 35 35 35
Outlet Temperature °C 1011 977 946 978 976 980
Air flowrate TPH 1214 1208 1194 1190 1216 1166
N2-rich stream flowrate TPH 938 934 924 920 941 900
Reduction Step
Outlet temperature °C 1071 1060 1047 1065 1056 1082
PSA off gas flowrate TPH 337 346 362 348 341 317
Additional CH4 flowrate TPH 29 21 7 4 37 0.4
Reforming Step
Steam/Carbon 1.5 1.5 1.5 1.2 2 1.6
NG Flowrate TPH 134 142 154.5 158 127 159
Outlet Temperature °C 970 916 871 929 928 949
H2O/CO in syngas mol/mol 0.76 0.92 1.18 0.59 1.43 0.88
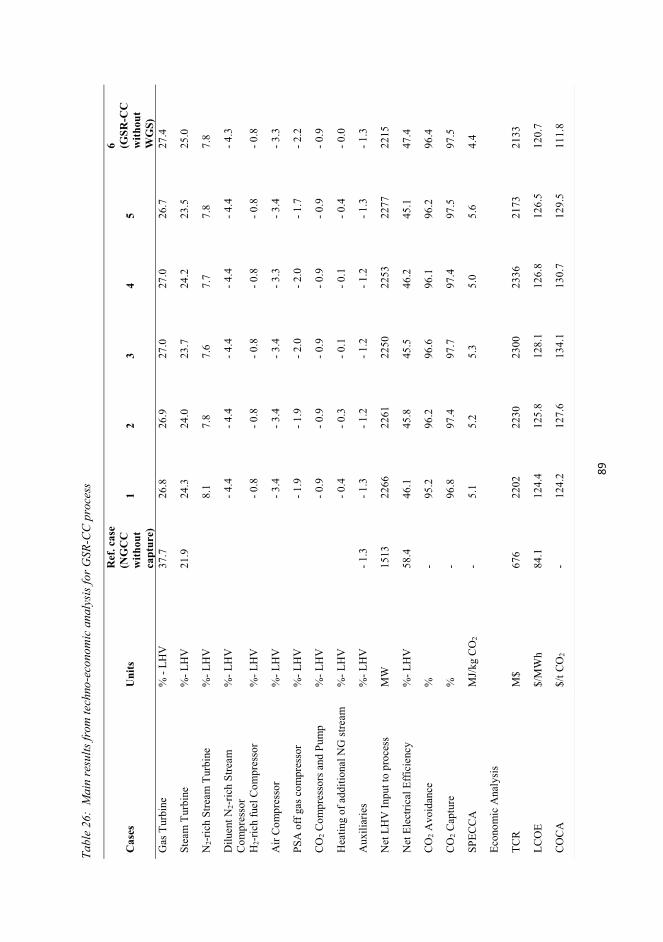
89
Tabl
e 26
: M
ain
resu
lts fr
om te
chno
-eco
nom
ic a
naly
sis fo
r GSR
-CC
pro
cess
Cas
es
Uni
ts
Ref
. cas
e (N
GC
C
with
out
capt
ure)
1 2
3 4
5
6 (GSR
-CC
w
ithou
t W
GS)
G
as T
urb
ine
% -
LH
V
37
.7
26
.8
26
.9
27
.0
27
.0
26
.7
27
.4
Ste
am T
urb
ine
%-
LH
V
21
.9
24
.3
24
.0
23
.7
24
.2
23
.5
25
.0
N2-r
ich S
trea
m T
urb
ine
%-
LH
V
8
.1
7.8
7
.6
7.7
7
.8
7.8
Dil
uen
t N
2-r
ich S
trea
m
Co
mp
ress
or
%-
LH
V
-
4.4
-
4.4
-
4.4
-
4.4
-
4.4
-
4.3
H2-r
ich f
uel
Co
mp
ress
or
%-
LH
V
-
0.8
-
0.8
-
0.8
-
0.8
-
0.8
-
0.8
Air
Co
mp
ress
or
%-
LH
V
-
3.4
-
3.4
-
3.4
-
3.3
-
3.4
-
3.3
PS
A o
ff g
as c
om
pre
sso
r %
- L
HV
- 1
.9
- 1
.9
- 2
.0
- 2
.0
- 1
.7
- 2
.2
CO
2 C
om
pre
sso
rs a
nd
Pu
mp
%
- L
HV
- 0
.9
- 0
.9
- 0
.9
- 0
.9
- 0
.9
- 0
.9
Hea
tin
g o
f ad
dit
ional
NG
str
eam
%
- L
HV
- 0
.4
- 0
.3
- 0
.1
- 0
.1
- 0
.4
- 0
.0
Au
xil
iari
es
%-
LH
V
- 1
.3
- 1
.3
- 1
.2
- 1
.2
- 1
.2
- 1
.3
- 1
.3
Net
LH
V I
np
ut
to p
roce
ss
MW
1
51
3
22
66
22
61
22
50
22
53
22
77
22
15
Net
Ele
ctri
cal
Eff
icie
ncy
%
- L
HV
5
8.4
4
6.1
4
5.8
4
5.5
4
6.2
4
5.1
4
7.4
CO
2 A
vo
idan
ce
%
- 9
5.2
9
6.2
9
6.6
9
6.1
9
6.2
9
6.4
CO
2 C
aptu
re
%
- 9
6.8
9
7.4
9
7.7
9
7.4
9
7.5
9
7.5
SP
EC
CA
M
J/kg C
O2
- 5
.1
5.2
5
.3
5.0
5
.6
4.4
Eco
no
mic
Anal
ysi
s
TC
R
M$
6
76
22
02
22
30
23
00
23
36
21
73
21
33
LC
OE
$/M
Wh
84
.1
12
4.4
1
25
.8
12
8.1
1
26
.8
12
6.5
1
20
.7
CO
CA
$
/t C
O2
- 1
24
.2
12
7.6
1
34
.1
13
0.7
1
29
.5
11
1.8
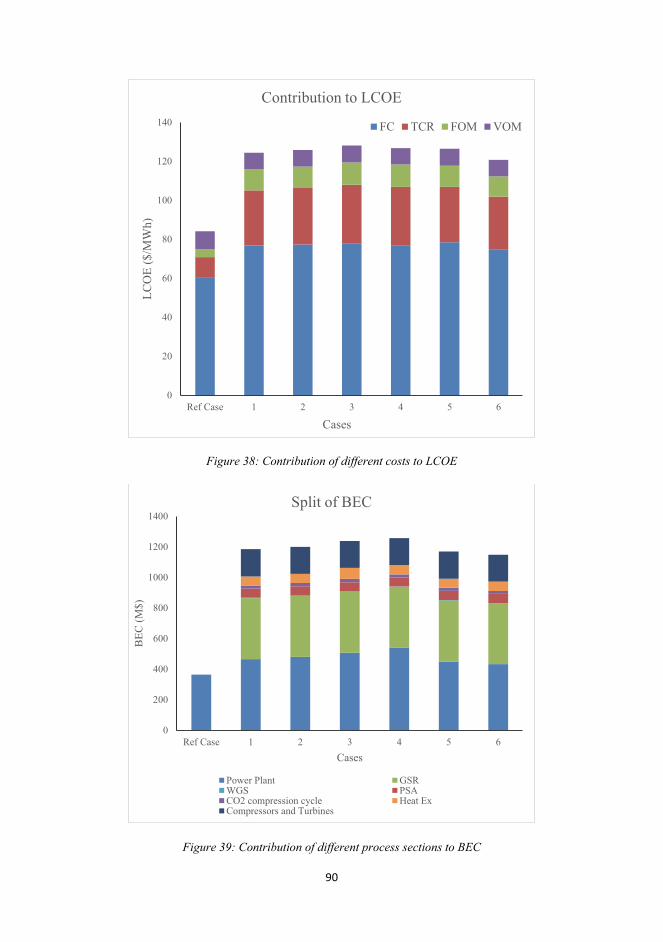
90
Figure 38: Contribution of different costs to LCOE
Figure 39: Contribution of different process sections to BEC
0
20
40
60
80
100
120
140
Ref Case 1 2 3 4 5 6
LC
OE
($
/MW
h)
Cases
Contribution to LCOE
FC TCR FOM VOM
0
200
400
600
800
1000
1200
1400
Ref Case 1 2 3 4 5 6
BE
C (
M$
)
Cases
Split of BEC
Power Plant GSRWGS PSACO2 compression cycle Heat ExCompressors and Turbines
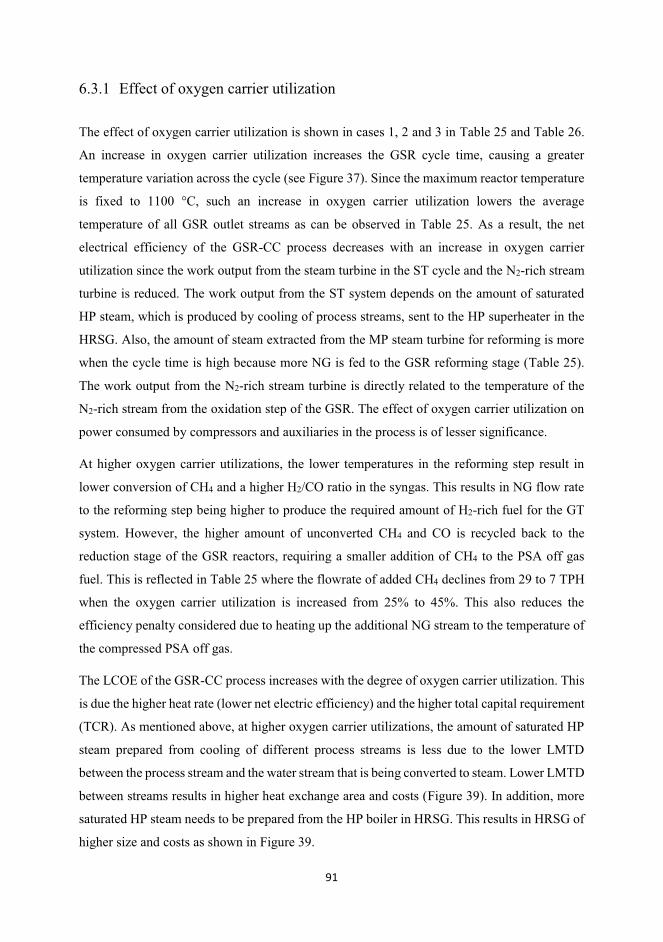
91
6.3.1 Effect of oxygen carrier utilization
The effect of oxygen carrier utilization is shown in cases 1, 2 and 3 in Table 25 and Table 26.
An increase in oxygen carrier utilization increases the GSR cycle time, causing a greater
temperature variation across the cycle (see Figure 37). Since the maximum reactor temperature
is fixed to 1100 °C, such an increase in oxygen carrier utilization lowers the average
temperature of all GSR outlet streams as can be observed in Table 25. As a result, the net
electrical efficiency of the GSR-CC process decreases with an increase in oxygen carrier
utilization since the work output from the steam turbine in the ST cycle and the N2-rich stream
turbine is reduced. The work output from the ST system depends on the amount of saturated
HP steam, which is produced by cooling of process streams, sent to the HP superheater in the
HRSG. Also, the amount of steam extracted from the MP steam turbine for reforming is more
when the cycle time is high because more NG is fed to the GSR reforming stage (Table 25).
The work output from the N2-rich stream turbine is directly related to the temperature of the
N2-rich stream from the oxidation step of the GSR. The effect of oxygen carrier utilization on
power consumed by compressors and auxiliaries in the process is of lesser significance.
At higher oxygen carrier utilizations, the lower temperatures in the reforming step result in
lower conversion of CH4 and a higher H2/CO ratio in the syngas. This results in NG flow rate
to the reforming step being higher to produce the required amount of H2-rich fuel for the GT
system. However, the higher amount of unconverted CH4 and CO is recycled back to the
reduction stage of the GSR reactors, requiring a smaller addition of CH4 to the PSA off gas
fuel. This is reflected in Table 25 where the flowrate of added CH4 declines from 29 to 7 TPH
when the oxygen carrier utilization is increased from 25% to 45%. This also reduces the
efficiency penalty considered due to heating up the additional NG stream to the temperature of
the compressed PSA off gas.
The LCOE of the GSR-CC process increases with the degree of oxygen carrier utilization. This
is due the higher heat rate (lower net electric efficiency) and the higher total capital requirement
(TCR). As mentioned above, at higher oxygen carrier utilizations, the amount of saturated HP
steam prepared from cooling of different process streams is less due to the lower LMTD
between the process stream and the water stream that is being converted to steam. Lower LMTD
between streams results in higher heat exchange area and costs (Figure 39). In addition, more
saturated HP steam needs to be prepared from the HP boiler in HRSG. This results in HRSG of
higher size and costs as shown in Figure 39.
92
CO2 capture efficiency increases slightly with an increase in oxygen carrier utilization because
the constant amount of undesired gas mixing when switching between stages (see Figure 37)
becomes relatively smaller with longer cycle times. Despite this improvement, however, the
Cost of CO2 Avoidance (COCA) still increases with oxygen carrier utilization due the increase
in LCOE.
6.3.2 Effect of Steam/Carbon ratio
Cases 2, 4 and 5 in Table 25 and Table 26 show the effect of Steam/Carbon ratio in the
reforming step on the overall techno-economic performance of the GSR-CC process. The
oxygen carrier utilization is kept constant at 35% for these cases and the Steam/Carbon molar
ratio is assumed 1.5 in Case 2, 1.2 in Case 4, and 2 in Case 5. With different Steam/Carbon
ratios in the reforming step of GSR, the temperatures in the oxidation step, reduction and
reforming steps in the three cases do not vary much at a constant cycle time. However, the
amount of NG reformed in GSR to produce the H2-rich fuel for the GT system increases with
Steam/Carbon ratio. This results in lower flowrates of PSA off gas stream and higher additional
CH4 flowrates when the Steam/Carbon ratio is high. Hence, less power is consumed by the PSA
off gas compressor, but on the contrary, a higher efficiency penalty due to heating up of the
additional NG stream.
The net electrical efficiency of the GSR-CC process is low when the Steam/Carbon ratio in the
reforming step of GSR is high. The main difference in net electrical efficiency is due to the
power produced from the ST cycle, power consumed by the PSA off gas compressor and the
penalty due to heating up of additional NG stream. The primary reason for the trend of reduced
steam turbine power output with increasing Steam/Carbon ratio is that it requires higher MP
steam extraction from the ST.
The TCR is low when the Steam/Carbon ratio is high. The main cost impact is due to the cost
of power plant section, which is low when the amount of saturated HP steam produced from
heat recovery from process streams is high (Table 26). When steam produced by heat recovery
from process streams is high, the size of the HP boiler in the HRSG system is low, and hence
lower the cost of HRSG. Although, the size of heat exchangers used for heat recovery from
process streams might increase, but it is also dependent on the LMTD in the heat exchanger.
The LCOE of the GSR-CC process does not differ much in cases 2, 4 and 5 as lower TCR at
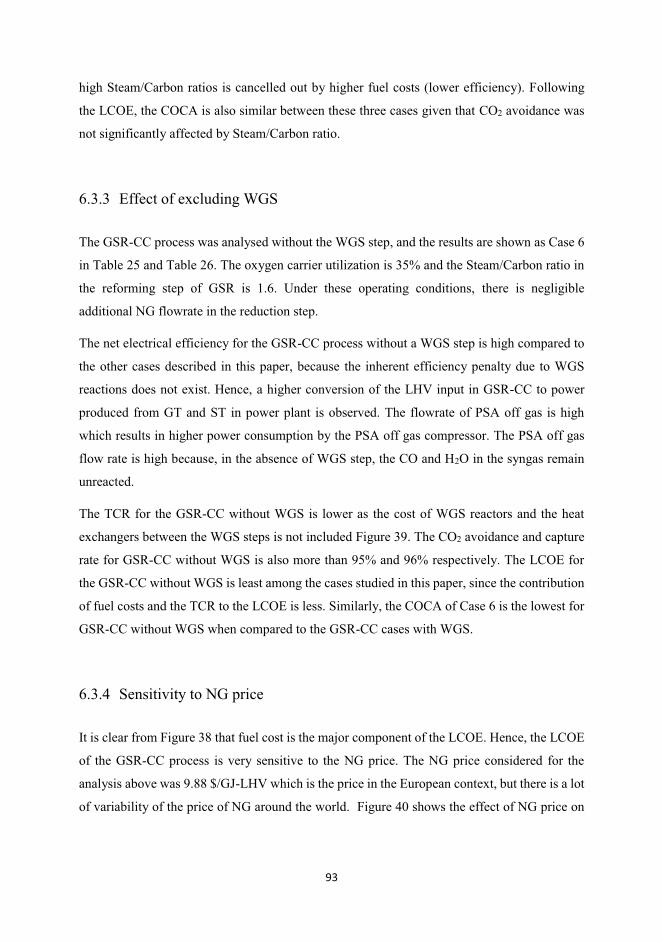
93
high Steam/Carbon ratios is cancelled out by higher fuel costs (lower efficiency). Following
the LCOE, the COCA is also similar between these three cases given that CO2 avoidance was
not significantly affected by Steam/Carbon ratio.
6.3.3 Effect of excluding WGS
The GSR-CC process was analysed without the WGS step, and the results are shown as Case 6
in Table 25 and Table 26. The oxygen carrier utilization is 35% and the Steam/Carbon ratio in
the reforming step of GSR is 1.6. Under these operating conditions, there is negligible
additional NG flowrate in the reduction step.
The net electrical efficiency for the GSR-CC process without a WGS step is high compared to
the other cases described in this paper, because the inherent efficiency penalty due to WGS
reactions does not exist. Hence, a higher conversion of the LHV input in GSR-CC to power
produced from GT and ST in power plant is observed. The flowrate of PSA off gas is high
which results in higher power consumption by the PSA off gas compressor. The PSA off gas
flow rate is high because, in the absence of WGS step, the CO and H2O in the syngas remain
unreacted.
The TCR for the GSR-CC without WGS is lower as the cost of WGS reactors and the heat
exchangers between the WGS steps is not included Figure 39. The CO2 avoidance and capture
rate for GSR-CC without WGS is also more than 95% and 96% respectively. The LCOE for
the GSR-CC without WGS is least among the cases studied in this paper, since the contribution
of fuel costs and the TCR to the LCOE is less. Similarly, the COCA of Case 6 is the lowest for
GSR-CC without WGS when compared to the GSR-CC cases with WGS.
6.3.4 Sensitivity to NG price
It is clear from Figure 38 that fuel cost is the major component of the LCOE. Hence, the LCOE
of the GSR-CC process is very sensitive to the NG price. The NG price considered for the
analysis above was 9.88 $/GJ-LHV which is the price in the European context, but there is a lot
of variability of the price of NG around the world. Figure 40 shows the effect of NG price on
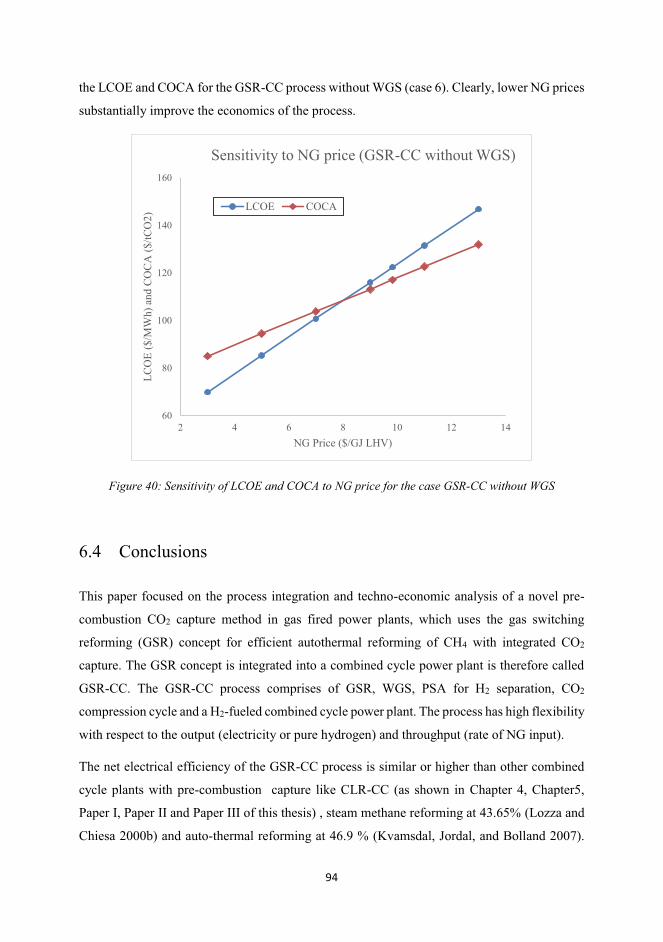
94
the LCOE and COCA for the GSR-CC process without WGS (case 6). Clearly, lower NG prices
substantially improve the economics of the process.
Figure 40: Sensitivity of LCOE and COCA to NG price for the case GSR-CC without WGS
6.4 Conclusions
This paper focused on the process integration and techno-economic analysis of a novel pre-
combustion CO2 capture method in gas fired power plants, which uses the gas switching
reforming (GSR) concept for efficient autothermal reforming of CH4 with integrated CO2
capture. The GSR concept is integrated into a combined cycle power plant is therefore called
GSR-CC. The GSR-CC process comprises of GSR, WGS, PSA for H2 separation, CO2
compression cycle and a H2-fueled combined cycle power plant. The process has high flexibility
with respect to the output (electricity or pure hydrogen) and throughput (rate of NG input).
The net electrical efficiency of the GSR-CC process is similar or higher than other combined
cycle plants with pre-combustion capture like CLR-CC (as shown in Chapter 4, Chapter5,
Paper I, Paper II and Paper III of this thesis) , steam methane reforming at 43.65% (Lozza and
Chiesa 2000b) and auto-thermal reforming at 46.9 % (Kvamsdal, Jordal, and Bolland 2007).
60
80
100
120
140
160
2 4 6 8 10 12 14
LC
OE
($
/MW
h)
and
CO
CA
($
/tC
O2
)
NG Price ($/GJ LHV)
Sensitivity to NG price (GSR-CC without WGS)
LCOE COCA
95
The CO2 avoidance observed in GSR-CC is more than the other pre-combustion and post-
combustion capture methods (Kvamsdal, Jordal, and Bolland 2007). Sensitivity analyses
showed a slight efficiency increase (~1 %-point) when the oxygen carrier utilization and the
S/C ratio are reduced. If WGS was removed from the GSR-CC process, the net electrical
efficiency was observed to be 1 %-point higher.
Although there exists advantages of GSR-CC over other capture methods especially with regard
to efficiency and CO2 avoidance, the TCR of GSR-CC is over 3 times the TCR of reference
NGCC plant without capture. The primary capital cost increase comes from the reactor cost that
is more than 30% of the total capital costs. Despite this large capital cost increase, fuel remains
the primary cost component when European NG prices are used (9.83 $/GJ-LHV). In this case,
the increase in LCOE of the GSR-CC with respect to the LCOE of reference plant comes from
the fuel cost (40% of the increase in LCOE), followed by the capital cost of the additional
process equipment in GSR-CC (35% of the increase in LCOE) and the larger size of the process
equipment due to efficiency penalty of the process (25% of the increase in LCOE). When the
price of the NG is halved, the capital cost of the additional process equipment in GSR-CC
becomes the primary cost increase (44% of the increase in LCOE), followed by costs due to
larger equipment size because of efficiency penalty of the process (31% of the increase in
LCOE) and fuel cost (25% of the increase in LCOE).
Given the large cost increase from fuel costs and larger sized process components caused by
lower net electric efficiency, further efficiency improvements are highly desirable.
Thermodynamic optimization was not in the scope of this study, but it is expected that the net
electrical efficiency of the GSR-CC process can be improved substantially by detailed energy
integration and optimization.
96
Chapter 7: Conclusions and future work
7.1 Conclusions from the thesis
Two different reactor concepts for reforming of natural gas integrated with pre-combustion CO2
capture in gas fired combined cycle power plants (with F-class gas turbines that are robust to
fuel changes) were analysed to perform a system level integration study followed by techno-
economic analysis. In these processes, natural gas is first reformed to syngas, which is
converted to a stream of CO2 and H2 in high and low temperature water-gas shift reactors. CO2
is separated to produce a H2-rich fuel, which is used for power generation in a combined cycle.
The reactors that are used for reforming of natural gas are Chemical Looping Reformer (CLR)
and Gas Switching Reformer (GSR). The respective combined cycle power plants are referred
to as CLR-CC and GSR-CC.
The CLR involves metallic oxygen carrier circulation between an oxidation and a fuel reactor.
Hence, the process inherently separates air in the oxidation reactor, and the oxygen from the
oxidized metal reforms the natural gas in the fuel reactor. This route of reforming that involves
gas-solids reactions, results in less exergy destruction when compared to traditional gas-gas
partial oxidation (POX) reaction. The H2/CO ratio observed in the syngas from CLR is also
higher than in POX. The reforming in CLR takes place at a lower temperature compared to
POX.
To analyze the CLR-CC and GSR-CC processes, different modeling and simulation tools were
used. For thermodynamic analysis of CLR-CC process, the equilibrium conditions in CLR were
modeled in Apsen Plus V8.6 since Aspen Plus contains thermodynamic property data for solids
(metallic oxygen carriers). On the other hand, to carry out a techno-economic analysis of the
CLR-CC process, a 1D model for CLR was developed in MATLAB. Similarly, a 0D model for
the GSR was developed in MATLAB. The 1D model of CLR account for the hydrodynamics
and kinetics of the reactions inside the reactor, whereas the 0D model of GSR accounts for the
kinetics. Hence, the models are dynamic. The WGS, CO2 capture and compression sections
were modeled in Aspen Hysys V8.6 since Aspen Hysys contains the Acid Gas thermodynamic
model which has the property data for amines used in CO2 capture section. The power plant
was modeled using the Thermoflex component of the Thermoflow suite V26 since Thermoflow
contains a database of standard commercial gas turbine systems. The process models in Aspen
97
Hysys V8.6 and Thermoflow suite V26 are steady state models whereas the 1D model for CLR
and the 0D model for GSR are dynamic models. A multi-scale modeling methodology
established as a part of this thesis links the dynamic 1D and 0D models with the steady state
process models developed in commercial software tools. The different process models in the
respective software tools were linked on a Microsoft Excel platform. The Aspen Simulation
Workbook and the Thermoflow E-Link plug-ins help in establishing the linking of software
tools in Excel.
The CLR-CC process integrates CLR, WGS, CO2 capture and compression in a gas-fired
combined cycle power plant. The net electrical efficiency of the CLR-CC process, which
involves all the heat recovery from the high temperature process streams to prepare LP steam
that is further expanded in a ST to produce power and for the process when the design pressure
in CLR is 18 bar, is 42.5%. The net electrical efficiency for such a cycle is 16%-points less than
the reference case NGCC plant without CO2 capture. Apart from the inherent efficiency penalty
due to reforming and WGS reactions, the heat recovery and additional components due to CLR
and pre-combustion capture in the CLR-CC process cause higher efficiency penalty. Producing
HP steam to recover heat from the process streams in the CLR-CC process can improve the net
electrical efficiency to 46.5 %. Anyhow, operational challenges like metal dusting might limit
the improvement in efficiency from different heat integration options. The design pressure of
the CLR-CC cycle is an important parameter to make decisions on process design and it affects
the net electrical efficiency of the CLR-CC process. The higher the design pressure of the CLR-
CC cycle, the higher is the net electrical efficiency of the process. Anyhow, when the CLR is
designed for pressures higher than the GT system’s compressor bleed discharge pressure (~18
bar), an additional air compressor to compress the air bleed from GT is needed in the process.
A sensitivity analysis was carried out to study the effect of three other process parameters on
the performance of the CLR-CC process: 1) The air flowrate to the oxidation reactor, 2)
steam/carbon ratio in the fuel reactor and 3) oxidation reactor outlet temperature. These
parameters were varied in 12 cases. The net electrical efficiency of the CLR-CC was calculated
to be between 40 - 44% for CO2 avoidance rates between 68 - 86%. For the same cases, an
economic analysis was carried out to estimate the LCOE. The LCOE is highly sensitive to the
natural gas price and the process contingency costs (additional capital costs accounting for level
of maturity of the process). A sensitivity study to see the effect of natural gas price (between
4.5 and 10.2 $/GJ-LHV) and process contingency (between 10 and 50% of the bare erected
98
costs) on LCOE was also carried out. The LCOE of the CLR-CC process lies between 75-145
$/MWh.
GSR seems to be a good alternative to CLR since it eliminates the external circulation of oxygen
carrier under pressurized situation like in CLR, and the gas flow rate can be varied over more
than an order of magnitude because it is a simple standalone bubbling fluidized bed reactor. In
addition, the reduction and reforming steps in GSR are separated and hence this allows an
efficient integration of the PSA unit to produce high purity hydrogen. Anyhow, the dynamic
nature of operation requires a cluster of multiple reactors to produce steady flow rate of fuel for
the power plant. A techno-economic analysis of the GSR-CC process was carried out, and the
net electrical efficiency, CO2 avoidance rates and the LCOE were reported. The sensitivity of
oxygen carrier utilization in the oxidation step and steam to carbon ratio in the reforming step
on the net electrical efficiency of the GSR-CC process were also reported. The net electrical
efficiency for the GSR-CC process lies between 45.1 and 46.2 %. The GSR-CC process also
allows for a design of the process without WGS, since CO component in the syngas from the
GSR is converted to CO2 during the reduction step of the GSR. The net electrical efficiency of
the GSR-CC process without WGS is about 1-2%-points more than the GSR-CC with WGS.
The capital cost of the cluster of GSR reactors is about 35% of the total capital costs of the
GSR-CC plant. The LCOE of the GSR-CC process lies between 121 and 128 $/MWh when the
natural gas price considered is 9.8 $/GJ-LHV. Anyhow, the LCOE of the GSR-CC process is
highly sensitive to the fuel cost and the LCOE can be as low as 80 $/MWh if the natural gas
price is 4.5 $/GJ-LHV. The CO2 avoidance in the GSR-CC process is more than 95% in all the
cases studied.
The thesis presents first of its kind system level techno-economic analysis of the CLR-CC and
GSR-CC processes. Both the process technologies appear to be very promising second-
generation CCS technologies. The net electrical efficiency of these processes are comparable
to and higher than the other traditional reforming based combined cycles which involve steam
methane reforming (~44%) and auto-thermal reforming (~47%). The efficiencies for the CLR-
CC and GSR-CC obtained in this thesis is less than post-combustion capture in NGCC plants,
where the net electrical efficiency is in the range of 49-51%. Anyhow, there is still a potential
of improvement in the CLR-CC and GSR-CC processes in terms of efficiency and costs,
especially if fuel pre-heating and advanced and more heat-integrated design of the HRSG is/are
used. One straight out importance of process technologies like CLR-CC and GSR-CC is that
they provide an additional degree of freedom to run a power plant, where pure H2 can be
99
produced when the electricity demand is low. With the economy shifting towards integrating
renewables in the existing grids and with a scenario of increasing H2 demand in future, CLR-
CC and GSR-CC provide flexibility between power and H2 production.
7.2 Future work in the area
The process design and integration studies in this thesis was directed towards estimating the net
electrical efficiency and the LCOE for the CLR-CC and GSR-CC. Sensitivity studies on the
selected parameters (pressure, temperature, steam/carbon ratio and oxygen carrier utilization)
in the CLR and GSR were carried out. Anyhow, several other design parameters (like efficiency
of compressors and turbines, extent of N2 dilution etc.) in the overall process effect the techno-
economic performance of the CLR-CC and GSR-CC, which can be optimized.
In the CLR-CC process, the CO2 was separated using chemical absorption with a-MDEA as the
absorbent. For CO2 capture rates of 95% in the absorber, the H2-rich fuel has 90% H2 purity.
Having a PSA followed by a chemical absorption system will not only help in producing
>99.99% pure H2, but also have higher capture rates of CO2. It will be interesting to estimate
and compare the CO2 avoidance costs for a CLR-CC with different CO2 capture methods
(chemical absorption and PSA).
The reforming and WGS reactions in the CLR-CC and GSR-CC process are exothermic and a
lot of steam is generated in cooling the syngas and product streams from the two WGS reactors.
The steam produced is directly mixed with the other streams in the HRSG. Hence, the total
amount of steam in the HRSG system is very high when compared to the steam flow in HRSG
for a NGCC without CO2 capture. In the analysis presented in the thesis, the HRSG design is
similar to the HRSG design of a NGCC plant without capture as presented in the EBTF (2011)
and consists of a three-pressure level with reheat. The HRSG design was not modified in the
analysis presented in the thesis. Anyhow, as reported by Nord and Bolland (2010), HRSG
design can be modified for NGCC plants with reforming to reduce the complexity in heat
integration and also to improve the net electrical efficiency of the process. A heat integration
study involving pinch analysis and options for fuel pre-heating, will also help improving the
net electrical efficiency for the CLR-CC and GSR-CC processes.
Several alternatives to the current process design can be evaluated in future work. Operating
the CLR-CC and GSR-CC process at higher pressures (more than 18 bar) and directly using the

100
N2-rich stream from the oxidation reaction step in the GT, without going through a route of
expansion and then compression, should be techno-economically evaluated. Further process
optimization might make the CLR-CC and GSR-CC processes competitive with the post-
combustion capture combined cycles. One of the stand out features of CLR-CC and GSR-CC
technology is that they give the flexibility to produce pure H2 when the demand of electricity is
low. Hence, a part-load analysis for the CLR-CC and GSR-CC will help us estimate the net
electrical efficiency of the power plant during the fluctuations in the electricity demand. The
load-following capability of the CLR-CC and GSR-CC processes can be studied with respect
to the dynamics of load changes between power and H2. In addition, advanced gas turbine
machinery, with higher turbine inlet temperature limits and pressure ratios designed for H2-rich
fuel combustion should be explored.
101
Bibliography
Abanades, J. C., R. Murillo, J. R. Fernandez, G. Grasa, and I. Martínez. 2010. "New CO2 capture process for hydrogen production combining Ca and Cu chemical loops." Environmental Science and Technology 44 (17):6901-6904. doi: 10.1021/es101707t.
Abba, I. a, J. R. Grace, H. T. Bi, and M. L. Thompson. 2003. "Spanning the flow regimes: Generic fluidized-bed reactor model." AIChE Journal 49:1838-1848. doi: 10.1002/aic.690490720.
Adanez, J., A. Abad, F. Garcia-Labiano, P. Gayan, and L. F. De Diego. 2012. "Progress in chemical-looping combustion and reforming technologies." Progress in Energy and Combustion Science 38 (2):215-282. doi: 10.1016/j.pecs.2011.09.001.
Alibaba. 2017. accessed 31 October 2017. https://www.alibaba.com/. Antzara, A., E. Heracleous, D. B. Bukur, and A. A. Lemonidou. 2015. "Thermodynamic
analysis of hydrogen production via chemical looping steam methane reforming coupled with in situ CO2 capture." International Journal of Greenhouse Gas Control 32 (0):115-128. doi: http://dx.doi.org/10.1016/j.ijggc.2014.11.010.
Appl, Max. 1999. "Ammonia: Principles and Industrial Practice." AspenHYSYS. 2017. Aspen HYSYS V8.6 User Guide. Aspen Technology Inc., Bedford,
Massachusetts, USA. AspenPlus. 2017. Aspen Plus V8.6 User Guide. Aspen Technology Inc., Bedford,
Massachusetts, USA. Bhavsar, S. K., M. Najera, R. D. Solunke, and G. Veser. 2010. "Syngas production via chemical
looping." 10AIChE - 2010 AIChE Annual Meeting, Conference Proceedings. Bischi, A., Ø Langørgen, J. X. Morin, J. Bakken, M. Ghorbaniyan, M. Bysveen, and O. Bolland.
2012. "Hydrodynamic viability of chemical looping processes by means of cold flow model investigation." Applied Energy 97:201-216. doi: 10.1016/j.apenergy.2011.12.051.
Boot-Handford, M. E., J. C. Abanades, E. J. Anthony, M. J. Blunt, S. Brandani, N. Mac Dowell, J. R. Fernández, M. C. Ferrari, R. Gross, J. P. Hallett, R. S. Haszeldine, P. Heptonstall, A. Lyngfelt, Z. Makuch, E. Mangano, R. T. J. Porter, M. Pourkashanian, G. T. Rochelle, N. Shah, J. G. Yao, and P. S. Fennell. 2014. "Carbon capture and storage update." Energy and Environmental Science 7 (1):130-189.
Chiesa, P., G. Lozza, A. Malandrino, M. Romano, and V. Piccolo. 2008. "Three-reactors chemical looping process for hydrogen production." International Journal of Hydrogen Energy 33 (9):2233-2245. doi: 10.1016/j.ijhydene.2008.02.032.
Chiesa, Paolo, Giovanni Lozza, and Luigi Mazzocchi. 2005. "Using Hydrogen as Gas Turbine Fuel." Journal of Engineering for Gas Turbines and Power 127 (1):73-80. doi: 10.1115/1.1787513.
Cleeton, J. P. E., C. D. Bohn, C. R. Müller, J. S. Dennis, and S. A. Scott. 2009. "Different methods of manufacturing FE-based oxygen carrier particles for reforming via chemical looping, and their effect on performance." Proceedings of the 20th International Conference on Fluidized Bed Combustion.
ClimateFocus. 2015. The Paris Agreement: Summary. Cloete, Schalk, Matteo C. Romano, Paolo Chiesa, Giovanni Lozza, and Shahriar Amini. 2015.
"Integration of a Gas Switching Combustion (GSC) system in integrated gasification combined cycles." International Journal of Greenhouse Gas Control 42 (Supplement C):340-356. doi: https://doi.org/10.1016/j.ijggc.2015.08.012.
102
Consonni, S., G. Lozza, G. Pelliccia, S. Rossini, and F. Saviano. 2006. "Chemical-looping combustion for combined cycles with CO2 capture." Journal of Engineering for Gas Turbines and Power 128 (3):525-534. doi: 10.1115/1.1850501.
Cormos, C. C. 2012. "Evaluation of syngas-based chemical looping applications for hydrogen and power co-generation with CCS." International Journal of Hydrogen Energy 37 (18):13371-13386. doi: 10.1016/j.ijhydene.2012.06.090.
Cormos, C. C., L. Petrescu, and A. M. Cormos. 2014. Assessment of hydrogen production systems based on natural gas conversion with carbon capture and storage. In Computer Aided Chemical Engineering.
Corradetti, Alessandro, and Umberto Desideri. 2005. "Analysis of Gas-Steam Combined Cycles With Natural Gas Reforming and CO2 Capture." Journal of Engineering for Gas Turbines and Power 127 (3):545-552. doi: 10.1115/1.1850941.
Cozad, A., N. V. Sahinidis, and D. C. Miller. 2014. "Learning surrogate models for simulation-based optimization." AIChE Journal 60 (6):2211-2227.
Dai, X. P., J. Li, J. T. Fan, W. S. Wei, and J. Xu. 2012. "Synthesis gas generation by chemical-looping reforming in a circulating fluidized bed reactor using Perovskite LaFeO 3-based oxygen carriers." Industrial and Engineering Chemistry Research 51 (34):11072-11082. doi: 10.1021/ie300033e.
de Diego, L. F., M. Ortiz, J. Adánez, F. García-Labiano, A. Abad, and P. Gayán. 2008. "Synthesis gas generation by chemical-looping reforming in a batch fluidized bed reactor using Ni-based oxygen carriers." Chemical Engineering Journal 144 (2):289-298. doi: 10.1016/j.cej.2008.06.004.
de Diego, L. F., M. Ortiz, F. García-Labiano, J. Adánez, A. Abad, and P. Gayán. 2009. "Hydrogen production by chemical-looping reforming in a circulating fluidized bed reactor using Ni-based oxygen carriers." Journal of Power Sources 192 (1):27-34. doi: 10.1016/j.jpowsour.2008.11.038.
Diglio, Giuseppe, Piero Bareschino, Erasmo Mancusi, and Francesco Pepe. 2016. "Simulation of hydrogen production through chemical looping reforming process in a packed-bed reactor." Chemical Engineering Research and Design 105:137-151. doi: http://dx.doi.org/10.1016/j.cherd.2015.11.013.
Ding, O. L., and S. H. Chan. 2008. "Autothermal reforming of methane gas—Modelling and experimental validation." International Journal of Hydrogen Energy 33 (2):633-643. doi: http://dx.doi.org/10.1016/j.ijhydene.2007.10.037.
DOE/NETL. 2007. Cost and Performance Baseline for Fossil Energy Plants. Dueso, C., M. Ortiz, A. Abad, F. García-Labiano, L. F. De Diego, P. Gayán, and J. Adánez.
2012. "Reduction and oxidation kinetics of nickel-based oxygen-carriers for chemical-looping combustion and chemical-looping reforming." Chemical Engineering Journal 188:142-154. doi: 10.1016/j.cej.2012.01.124.
EBTF. 2011. European best practice guidelines for assessment of CO2 capture technologies. CESAR -project 7th FrameWork Programme. Collaborative Project– GA No. 213569.
ETP. 2012. Energy Technology Perspectives 2012. International Energy Agency. ETP. 2017. Energy Technology Perspectives. International Energy Agency. Fan, J., and L. Zhu. 2015. "Performance analysis of a feasible technology for power and high-
purity hydrogen production driven by methane fuel." Applied Thermal Engineering 75:103-114. doi: 10.1016/j.applthermaleng.2014.10.013.
Fiaschi, Daniele, Francesco Gamberi, Michael Bartlett, and Timothy Griffin. 2005. "The air membrane-ATR integrated gas turbine power cycle: A method for producing electricity with low CO2 emissions." Energy Conversion and Management 46 (15–16):2514-2529. doi: http://dx.doi.org/10.1016/j.enconman.2004.11.008.
103
Forutan, H. R., E. Karimi, A. Hafizi, M. R. Rahimpour, and P. Keshavarz. 2015. "Expert representation chemical looping reforming: A comparative study of Fe, Mn, Co and Cu as oxygen carriers supported on Al2O3." Journal of Industrial and Engineering Chemistry 21:900-911. doi: 10.1016/j.jiec.2014.04.031.
Francisco Morgado, J., S. Cloete, J. Morud, T. Gurker, and S. Amini. 2016. "Modelling study of two chemical looping reforming reactor configurations: Looping vs. switching." Powder Technology. doi: 10.1016/j.powtec.2016.11.059.
Francisco Morgado, Joana, Schalk Cloete, John Morud, Thomas Gurker, and Shahriar Amini. "Modelling study of two chemical looping reforming reactor configurations: looping vs. switching." Powder Technology. doi: http://dx.doi.org/10.1016/j.powtec.2016.11.059.
Fu, C., and T. Gundersen. 2012. "Using exergy analysis to reduce power consumption in air separation units for oxy-combustion processes." Energy 44 (1):60-68.
GCCSI. 2013. Global CCS Institute - TOWARD A COMMON METHOD OF COST ESTIMATION FOR CO2 CAPTURE AND STORAGE AT FOSSIL FUEL POWER PLANTS.
GCCSI. 2017. The Global Status of CCS: 2017. Global CCS Institute. Hagelien, Thomas F. 2014. Porto API documentation. SINTEF. Hansen, James, Makiko Sato, Reto Ruedy, Ken Lo, David W. Lea, and Martin Medina-Elizade.
2006. "Global temperature change." Proceedings of the National Academy of Sciences 103 (39):14288-14293. doi: 10.1073/pnas.0606291103.
He, F., X. Li, K. Zhao, Z. Huang, G. Wei, and H. Li. 2013. "The use of La1-xSrxFeO3 perovskite-type oxides as oxygen carriers in chemical-looping reforming of methane." Fuel 108:465-473. doi: 10.1016/j.fuel.2012.11.035.
He, F., Y. Wei, H. Li, and H. Wang. 2009. "Synthesis gas generation by Chemical-looping reforming using Ce-based oxygen carriers modified with Fe, Cu, and Mn oxides." Energy and Fuels 23 (4):2095-2102. doi: 10.1021/ef800922m.
IEA. 2017. Key World Energy Statistics 2017. Iloeje, C., Z. Zhao, and A. F. Ghoniem. 2015. "Analysis of thermally coupled chemical looping
combustion-based power plants with carbon capture." International Journal of Greenhouse Gas Control 35:56-70. doi: 10.1016/j.ijggc.2015.01.013.
IPCC. 2014. Summary for Policy Makers. In Climate Change 2014: Synthesis Report. Ishida, M., D. Zheng, and T. Akehata. 1987. "Evaluation of a chemical-looping-combustion
power-generation system by graphic exergy analysis." Energy 12 (2):147-154. doi: http://dx.doi.org/10.1016/0360-5442(87)90119-8.
Jansen, Daniel, Matteo Gazzani, Giampaolo Manzolini, Eric van Dijk, and Michiel Carbo. 2015. "Pre-combustion CO2 capture." International Journal of Greenhouse Gas Control 40:167-187. doi: http://dx.doi.org/10.1016/j.ijggc.2015.05.028.
Jaworski, Zdzisław, and Barbara Zakrzewska. 2011. "Towards multiscale modelling in product engineering." Computers & Chemical Engineering 35 (3):434-445. doi: http://dx.doi.org/10.1016/j.compchemeng.2010.05.009.
Johansson, M., T. Mattisson, A. Lyngfelt, and A. Abad. 2008. "Using continuous and pulse experiments to compare two promising nickel-based oxygen carriers for use in chemical-looping technologies." Fuel 87 (6):988-1001. doi: 10.1016/j.fuel.2007.08.010.
Karimi, E., H. R. Forutan, M. Saidi, M. R. Rahimpour, and A. Shariati. 2014. "Experimental study of chemical-looping reforming in a fixed-bed reactor: Performance investigation of different oxygen carriers on Al2O 3 and TiO2 support." Energy and Fuels 28 (4):2811-2820. doi: 10.1021/ef5003765.
104
Kenarsari, S. D., D. Yang, G. Jiang, S. Zhang, J. Wang, A. G. Russell, Q. Wei, and M. Fan. 2013. "Review of recent advances in carbon dioxide separation and capture." RSC Advances 3 (45):22739-22773.
Kolbitsch, P., T. Pröll, J. Bolhar�Nordenkampf, and H. Hofbauer. 2009. "Design of a Chemical Looping Combustor using a Dual Circulating Fluidized Bed (DCFB) Reactor System." Chemical Engineering & Technology 32 (3):398-403. doi: 10.1002/ceat.200800378.
Kotas, T. J. 2012. The Exergy Method of Thermal Plant Analysis: Exergon Publishing Company UK Ltd. Reprint, POD edition.
Kvamsdal, H. M., K. Jordal, and O. Bolland. 2007. "A quantitative comparison of gas turbine cycles with CO2 capture." Energy 32 (1):10-24. doi: 10.1016/j.energy.2006.02.006.
Lozza, G., and P. Chiesa. 2000a. "Natural Gas Decarbonization to Reduce CO2 Emission From Combined Cycles—Part I: Partial Oxidation." Journal of Engineering for Gas Turbines and Power 124 (1):82-88. doi: 10.1115/1.1395581.
Lozza, G., and P. Chiesa. 2000b. "Natural Gas Decarbonization to Reduce CO2 Emission From Combined Cycles—Part II: Steam-Methane Reforming." Journal of Engineering for Gas Turbines and Power 124 (1):89-95. doi: 10.1115/1.1395582.
Mantripragada, H. C., and E. S. Rubin. 2013. "Chemical looping for pre-combustion CO2 capture - Performance and cost analysis." Energy Procedia.
Martínez, I., R. Murillo, G. Grasa, J. R. Fernández, and J. C. Abanades. 2013. "Integrated combined cycle from natural gas with CO2 capture using a Ca-Cu chemical loop." AIChE Journal 59 (8):2780-2794. doi: 10.1002/aic.14054.
Martínez, I., M. C. Romano, J. R. Fernández, P. Chiesa, R. Murillo, and J. C. Abanades. 2014. "Process design of a hydrogen production plant from natural gas with CO2 capture based on a novel Ca/Cu chemical loop." Applied Energy 114:192-208. doi: 10.1016/j.apenergy.2013.09.026.
Mathieu, Philippe, and Olav Bolland. 2013. "Comparison of Costs for Natural gas Power Generation with CO2 Capture." Energy Procedia 37 (0):2406-2419. doi: http://dx.doi.org/10.1016/j.egypro.2013.06.122.
Miller, D. C., J. C. Eslick, A. Lee, and J. E. Morinelly. 2011. "A modular framework for the analysis and optimization of power generation systems with CCS." Energy Procedia.
Morales-Rodríguez, Ricardo, and Rafiqul Gani. 2007. "Computer-aided multiscale modelling for chemical process engineering." In Computer Aided Chemical Engineering, edited by Pleşu Valentin and Agachi Paul Şerban, 207-212. Elsevier.
Morgado, Joana Francisco, Schalk Cloete, John Morud, Thomas Gurker, and Shahriar Amini. 2016. "Modelling study of two chemical looping reforming reactor configurations: Looping vs. switching." Powder Technology In Press. doi: http://dx.doi.org/10.1016/j.powtec.2016.11.059.
Nalbandian, L., A. Evdou, and V. Zaspalis. 2011. "La1-xSrxMyFe1-yO 3-δ perovskites as oxygen-carrier materials for chemical-looping reforming." International Journal of Hydrogen Energy 36 (11):6657-6670. doi: 10.1016/j.ijhydene.2011.02.146.
Naqvi, R., and O. Bolland. 2007. "Multi-stage chemical looping combustion (CLC) for combined cycles with CO2 capture." International Journal of Greenhouse Gas Control 1 (1):19-30. doi: 10.1016/S1750-5836(07)00012-6.
NASA. 2017. "https://climate.nasa.gov/evidence/." accessed 12 November. NETL. 2011. Cost Estimation Methodology for NETL Assessments of Power Plant
Performance. Netzer, David. 2006. Alberta Bitumen Processing Integration Study: Final Report: publisher
not identified. Newsome, David S. 1980. "The Water-Gas Shift Reaction." Catalysis Reviews 21 (2):275-318.
doi: 10.1080/03602458008067535.
105
Nord, L. O., R. Anantharaman, and O. Bolland. 2009. "Design and off-design analyses of a pre-combustion CO2 capture process in a natural gas combined cycle power plant." International Journal of Greenhouse Gas Control 3 (4):385-392. doi: 10.1016/j.ijggc.2009.02.001.
Nord, L. O., A. Kothandaraman, H. Herzog, G. McRae, and O. Bolland. 2009. "A modeling software linking approach for the analysis of an integrated reforming combined cycle with hot potassium carbonate CO2 capture." Energy Procedia.
Nord, Lars O., and Olav Bolland. 2010. "HRSG Design for Integrated Reforming Combined Cycle With CO2 Capture." Journal of Engineering for Gas Turbines and Power 133 (1):011702-011702. doi: 10.1115/1.4001822.
Ortiz, M., L. F. de Diego, A. Abad, F. García-Labiano, P. Gayán, and J. Adánez. 2010. "Hydrogen production by auto-thermal chemical-looping reforming in a pressurized fluidized bed reactor using Ni-based oxygen carriers." International Journal of Hydrogen Energy 35 (1):151-160. doi: 10.1016/j.ijhydene.2009.10.068.
Peters, Max S., and Klaus D. Timmerhaus. 1991. PLANT DESIGN AND ECONOMICS FOR CHEMICAL ENGINEERS. Fourth Edition ed: McGraw-Hill, Inc.
Pfaff, Imo, and Alfons Kather. 2009. "Comparative thermodynamic analysis and integration issues of CCS steam power plants based on oxy-combustion with cryogenic or membrane based air separation." Energy Procedia 1 (1):495-502. doi: http://dx.doi.org/10.1016/j.egypro.2009.01.066.
Pröll, T., J. Bolhàr-Nordenkampf, P. Kolbitsch, and H. Hofbauer. 2010. "Syngas and a separate nitrogen/argon stream via chemical looping reforming - A 140 kW pilot plant study." Fuel 89 (6):1249-1256. doi: 10.1016/j.fuel.2009.09.033.
Pröll, T., P. Kolbitsch, J. Bolhàr-Nordenkampf, and H. Hofbauer. 2011. "Chemical looping pilot plant results using a nickel-based oxygen carrier." Oil and Gas Science and Technology 66 (2):173-180. doi: 10.2516/ogst/2010036.
Pröll, Tobias, Hermann Hofbauer, Philipp Kolbitsch, and Johannes Bolhàr-Nordenkampf. The Dual Circulating Fluidized Bed (DCFB) Reactor System edited by Technology Transfer at Vienna University of Technology.
Riboldi, Luca, and Olav Bolland. 2017. "Overview on Pressure Swing Adsorption (PSA) as CO2 Capture Technology: State-of-the-Art, Limits and Potentials." Energy Procedia 114 (Supplement C):2390-2400. doi: https://doi.org/10.1016/j.egypro.2017.03.1385.
Richter, Horst J., and Karl F. Knoche. 1983. "REVERSIBILITY OF COMBUSTION PROCESSES." ACS Symposium Series:71-85.
Romano, Matteo C., Paolo Chiesa, and Giovanni Lozza. 2010. "Pre-combustion CO2 capture from natural gas power plants, with ATR and MDEA processes." International Journal of Greenhouse Gas Control 4 (5):785-797. doi: http://dx.doi.org/10.1016/j.ijggc.2010.04.015.
Rydén, M., M. Johansson, A. Lyngfelt, and T. Mattisson. 2009. "NiO supported on Mg-ZrO2 as oxygen carrier for chemical-looping combustion and chemical-looping reforming." Energy and Environmental Science 2 (9):970-981. doi: 10.1039/b904370e.
Rydén, M., A. Lyngfelt, and T. Mattisson. 2006. "Synthesis gas generation by chemical-looping reforming in a continuously operating laboratory reactor." Fuel 85 (12-13):1631-1641. doi: 10.1016/j.fuel.2006.02.004.
Rydén, M., A. Lyngfelt, and T. Mattisson. 2008. "Chemical-looping combustion and chemical-looping reforming in a circulating fluidized-bed reactor using Ni-based oxygen carriers." Energy and Fuels 22 (4):2585-2597. doi: 10.1021/ef800065m.
Rydén, M., A. Lyngfelt, T. Mattisson, D. Chen, A. Holmen, and E. Bjørgum. 2008. "Novel oxygen-carrier materials for chemical-looping combustion and chemical-looping reforming; LaxSr1-xFeyCo1-yO3-δ perovskites and mixed-metal oxides of NiO, Fe2O3
106
and Mn3O4." International Journal of Greenhouse Gas Control 2 (1):21-36. doi: 10.1016/S1750-5836(07)00107-7.
Schmid, J. C., C. Pfeifer, H. Kitzler, Tobias Proll, and Hermann Hofbauer. 2011. "A new dual fluidized bed gasifier design for improved in situ conversion of hydrocarbons." Proceedings International Conference on Polygeneration Strategies (ICPS).
Sircar, S., and T. C. Golden. 2000. "Purification of Hydrogen by Pressure Swing Adsorption." Separation Science and Technology 35 (5):667-687. doi: 10.1081/SS-100100183.
Spallina, V., D. Pandolfo, A. Battistella, M. C. Romano, M. Van Sint Annaland, and F. Gallucci. 2016. "Techno-economic assessment of membrane assisted fluidized bed reactors for pure H2 production with CO2 capture." Energy Conversion and Management 120:257-273. doi: http://dx.doi.org/10.1016/j.enconman.2016.04.073.
Spallina, Vincenzo, Fausto Gallucci, Matteo C. Romano, and Martin Van Sint Annaland. 2016. "Pre-combustion packed bed chemical looping (PCCL) technology for efficient H2-rich gas production processes." Chemical Engineering Journal 294:478-494. doi: http://dx.doi.org/10.1016/j.cej.2016.03.011.
Tang, M., L. Xu, and M. Fan. 2015. "Progress in oxygen carrier development of methane-based chemical-looping reforming: A review." Applied Energy 151. doi: 10.1016/j.apenergy.2015.04.017.
Thermoflow. 2017. Thermoflow Suite V26 User Guide. Thermoflow Inc., Southborough, MA, USA.
Thompson, Michael L., Hsiaotao Bi, and John R. Grace. 1999. "A generalized bubbling / turbulent fuidized-bed reactor model." Chemical Engineering Science 54:3-10.
Tong, A., L. Zeng, M. V. Kathe, D. Sridhar, and L. S. Fan. 2013. "Application of the moving-bed chemical looping process for high methane conversion." Energy and Fuels 27 (8):4119-4128. doi: 10.1021/ef3020475.
Wassie, Solomon A., Fausto Gallucci, Abdelghafour Zaabout, Schalk Cloete, Shahriar Amini, and Martin van Sint Annaland. 2017. "Hydrogen production with integrated CO2 capture in a novel gas switching reforming reactor: Proof-of-concept." International Journal of Hydrogen Energy 42 (21):14367-14379. doi: https://doi.org/10.1016/j.ijhydene.2017.04.227.
Wei, G., F. He, Z. Huang, K. Zhao, A. Zheng, and H. Li. 2014. "Chemical-looping reforming of methane using iron based oxygen carrier modified with low content nickel." Chinese Journal of Chemistry 32 (12):1271-1280. doi: 10.1002/cjoc.201400563.
WEO. 2016. World Energy Outlook 2016. International Energy Agency. Yahom, A., J. Powell, V. Pavarajarn, P. Onbhuddha, S. Charojrochkul, and S. Assabumrungrat.
2014. "Simulation and thermodynamic analysis of chemical looping reforming and CO2 enhanced chemical looping reforming." Chemical Engineering Research and Design 92 (11):2575-2583.
Young, D. J., J. Zhang, C. Geers, and M. Schütze. 2011. "Recent advances in understanding metal dusting: A review." Materials and Corrosion 62 (1):7-28. doi: 10.1002/maco.201005675.
Zafar, Q., T. Mattisson, and B. Gevert. 2005. "Integrated hydrogen and power production with CO2 capture using chemical-looping reforming-redox reactivity of particles of CuO, Mn 2O3, NiO, and Fe2O3 using SiO 2 as a support." Industrial and Engineering Chemistry Research 44 (10):3485-3496. doi: 10.1021/ie048978i.
Zhang, J. W., J. J. Huang, Y. T. Fang, Z. Q. Wang, and Z. L. Yu. 2014. "Partial oxidation reforming of methane to synthesis gas by chemical-looping using CeO2-modified Fe2O3 as oxygen carrier." Ranliao Huaxue Xuebao/Journal of Fuel Chemistry and Technology 42 (2):158-165.

107
Zhu, J. N., J. Bromly, and D. K. Zhang. 2005. "A new natural gas reforming concept: Chemical looping reforming." 5th Asia-Pacific Conference on Combustion, ASPACC 2005: Celebrating Prof. Bob Bilger's 70th Birthday.
Zohrabian, Angineh, Mohammad Mansouri Majoumerd, Mohammad Soltanieh, and Sourena Sattari. 2016. "Techno-economic evaluation of an integrated hydrogen and power co-generation system with CO2 capture." International Journal of Greenhouse Gas Control 44:94-103. doi: http://dx.doi.org/10.1016/j.ijggc.2015.11.004.

108
Appendix

Paper I
Nazir, S. M., Bolland, O., Amini, S., Full Plant Scale Analysis of Natural Gas Fired Power
Plants with Pre-Combustion CO2 Capture and Chemical Looping Reforming (CLR). Energy
Procedia 2017, 114, 2146-2155.

1876-6102 © 2017 The Authors. Published by Elsevier Ltd. This is an open access article under the CC BY-NC-ND license
(http://creativecommons.org/licenses/by-nc-nd/4.0/).
Peer-review under responsibility of the organizing committee of GHGT-13.
doi: 10.1016/j.egypro.2017.03.1350
Energy Procedia 114 ( 2017 ) 2146 – 2155
ScienceDirect
13th International Conference on Greenhouse Gas Control Technologies, GHGT-13, 14-18 November 2016, Lausanne, Switzerland
Full Plant Scale Analysis of Natural Gas Fired Power Plants with
Pre-Combustion CO2 Capture and Chemical Looping Reforming
(CLR)
Shareq Mohd Nazira,*, Olav Bolland
a, Shahriar Amini
a,b
aDepartment of Energy and Process Engineering, Norwegian University of Science and Technology, Trondheim 7491, NorwaybSINTEF Materials and Chemistry, Trondheim, Norway
Abstract
In this study, first of its kind complete plant scale integration of pre-combustion CO2 capture method with Chemical Looping
Reforming (CLR) of Natural Gas (NG), Water Gas Shift (WGS) process, CO2 capture and CO2 compression in a combined cycle
power plant has been presented. The CLR consisted of oxidation and fuel reactor. The oxidation reactor oxidizes the metal oxygen
carrier with compressed air and produces an oxygen depleted air stream (N2 stream) as by-product. The fuel reactor reforms the
NG with the metal oxide in presence of steam to produce syngas. The syngas is further subjected to WGS and CO2 capture using
a-MDEA, to prepare a H2-rich fuel, which is combusted in the Gas Turbine (GT) system. The heat from cooling of process streams
in the pre-combustion CO2 capture method, is used to prepare saturated low pressure steam, fraction of which is used in reboiler to
regenerate the amine for CO2 capture, and the remainder is expanded in Steam Turbine (ST) to generate power. The power plant is
a combined cycle with two GT, two Heat Recovery Steam Generators (HRSG) and one ST. 12% of air entering the GT is used in
the oxidation reactor of CLR, and equivalent amount of N2 stream is compressed and added as diluent in the GT. The overall
process was integrated and analysed at full load conditions. The current process has also been compared with Natural Gas Combined
Cycle (NGCC) plant without CO2 capture. The net electric efficiency of the power plant with pre-combustion CO2 capture in this
study is 43.1%, which is 15.3%-points less than the NGCC plant without capture. Major energy penalty in the process comes from
air compressor, the diluent N2 stream compressor and due to low degree of process integration to avoid complexity.
© 2017 The Authors. Published by Elsevier Ltd.
Peer-review under responsibility of the organizing committee of GHGT-13.
* Corresponding author. Tel.: +47-73593737;
E-mail address: [email protected]
Available online at www.sciencedirect.com
© 2017 The Authors. Published by Elsevier Ltd. This is an open access article under the CC BY-NC-ND license
(http://creativecommons.org/licenses/by-nc-nd/4.0/).
Peer-review under responsibility of the organizing committee of GHGT-13.
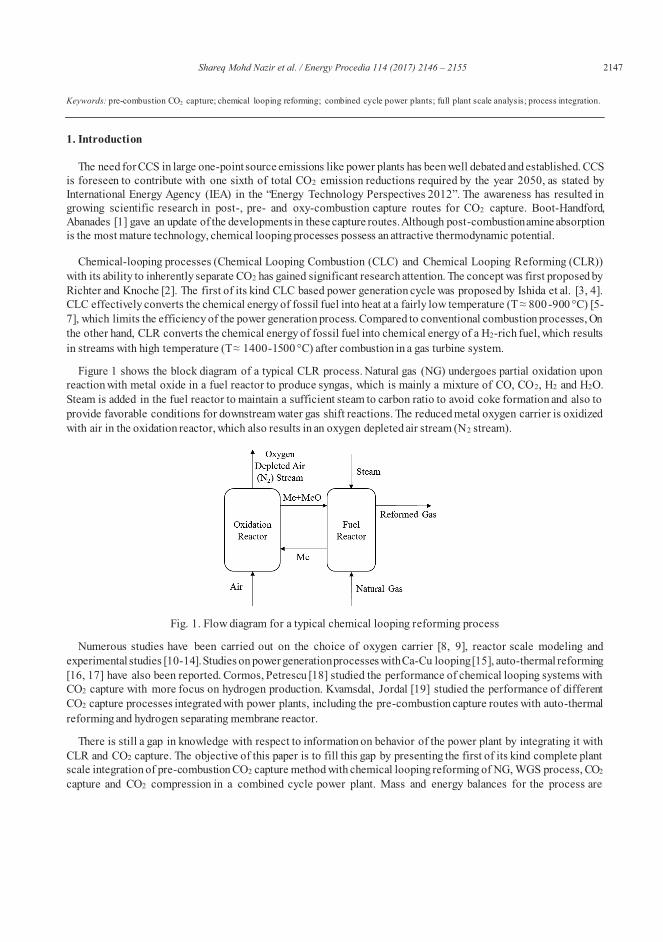
Shareq Mohd Nazir et al. / Energy Procedia 114 ( 2017 ) 2146 – 2155 2147
Keywords: pre-combustion CO2 capture; chemical looping reforming; combined cycle power plants; full plant scale analysis; process integration.
1. Introduction
The need for CCS in large one-point source emissions like power plants has been well debated and established. CCS
is foreseen to contribute with one sixth of total CO2 emission reductions required by the year 2050, as stated by
International Energy Agency (IEA) in the “Energy Technology Perspectives 2012”. The awareness has resulted in
growing scientific research in post-, pre- and oxy-combustion capture routes for CO2 capture. Boot-Handford,
Abanades [1] gave an update of the developments in these capture routes. Although post-combustion amine absorption
is the most mature technology, chemical looping processes possess an attractive thermodynamic potential.
Chemical-looping processes (Chemical Looping Combustion (CLC) and Chemical Looping Reforming (CLR))
with its ability to inherently separate CO2 has gained significant research attention. The concept was first proposed by
Richter and Knoche [2]. The first of its kind CLC based power generation cycle was proposed by Ishida et al. [3, 4].
CLC effectively converts the chemical energy of fossil fuel into heat at a fairly low temperature (T 800 -900 °C) [5-
7], which limits the efficiency of the power generation process. Compared to conventional combustion processes, On
the other hand, CLR converts the chemical energy of fossil fuel into chemical energy of a H2-rich fuel, which results
in streams with high temperature (T 1400-1500 °C) after combustion in a gas turbine system.
Figure 1 shows the block diagram of a typical CLR process. Natural gas (NG) undergoes partial oxidation upon
reaction with metal oxide in a fuel reactor to produce syngas, which is mainly a mixture of CO, CO2, H2 and H2O.
Steam is added in the fuel reactor to maintain a sufficient steam to carbon ratio to avoid coke formation and also to
provide favorable conditions for downstream water gas shift reactions. The reduced metal oxygen carrier is oxidized
with air in the oxidation reactor, which also results in an oxygen depleted air stream (N2 stream).
Fig. 1. Flow diagram for a typical chemical looping reforming process
Numerous studies have been carried out on the choice of oxygen carrier [8, 9], reactor scale modeling and
experimental studies [10-14]. Studies on power generation processes with Ca-Cu looping [15], auto-thermal reforming
[16, 17] have also been reported. Cormos, Petrescu [18] studied the performance of chemical looping systems with
CO2 capture with more focus on hydrogen production. Kvamsdal, Jordal [19] studied the performance of different
CO2 capture processes integrated with power plants, including the pre-combustion capture routes with auto-thermal
reforming and hydrogen separating membrane reactor.
There is still a gap in knowledge with respect to information on behavior of the power plant by integrating it with
CLR and CO2 capture. The objective of this paper is to fill this gap by presenting the first of its kind complete plant
scale integration of pre-combustion CO2 capture method with chemical looping reforming of NG, WGS process, CO2
capture and CO2 compression in a combined cycle power plant. Mass and energy balances for the process are
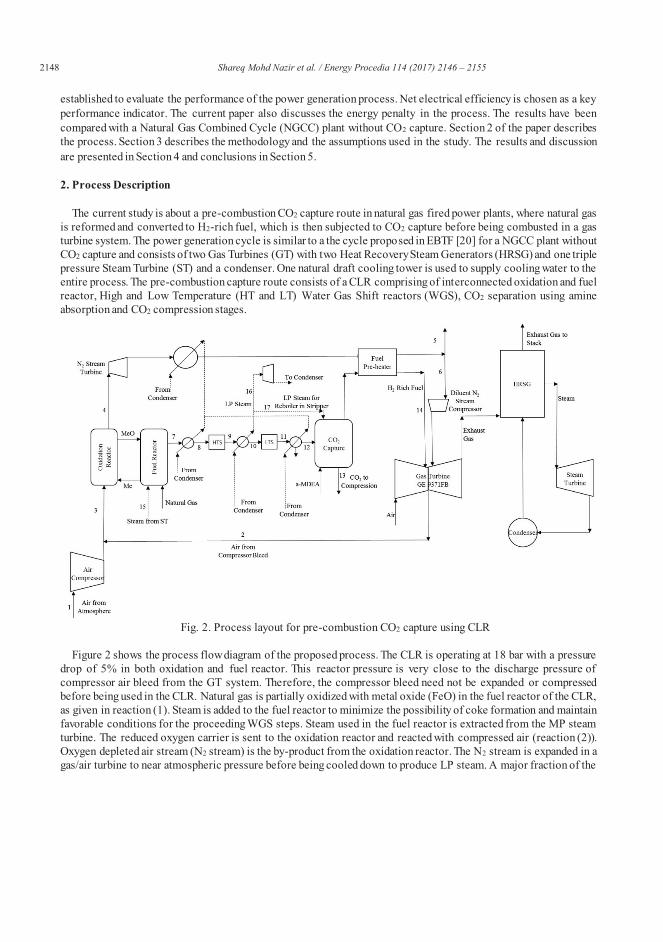
2148 Shareq Mohd Nazir et al. / Energy Procedia 114 ( 2017 ) 2146 – 2155
established to evaluate the performance of the power generation process. Net electrical efficiency is chosen as a key
performance indicator. The current paper also discusses the energy penalty in the process. The results have been
compared with a Natural Gas Combined Cycle (NGCC) plant without CO2 capture. Section 2 of the paper describes
the process. Section 3 describes the methodology and the assumptions used in the study. The results and discussion
are presented in Section 4 and conclusions in Section 5.
2. Process Description
The current study is about a pre-combustion CO2 capture route in natural gas fired power plants, where natural gas
is reformed and converted to H2-rich fuel, which is then subjected to CO2 capture before being combusted in a gas
turbine system. The power generation cycle is similar to a the cycle proposed in EBTF [20] for a NGCC plant without
CO2 capture and consists of two Gas Turbines (GT) with two Heat Recovery Steam Generators (HRSG) and one triple
pressure Steam Turbine (ST) and a condenser. One natural draft cooling tower is used to supply cooling water to the
entire process. The pre-combustion capture route consists of a CLR comprising of interconnected oxidation and fuel
reactor, High and Low Temperature (HT and LT) Water Gas Shift reactors (WGS), CO2 separation using amine
absorption and CO2 compression stages.
Fig. 2. Process layout for pre-combustion CO2 capture using CLR
Figure 2 shows the process flow diagram of the proposed process. The CLR is operating at 18 bar with a pressure
drop of 5% in both oxidation and fuel reactor. This reactor pressure is very close to the discharge pressure of
compressor air bleed from the GT system. Therefore, the compressor bleed need not be expanded or compressed
before being used in the CLR. Natural gas is partially oxidized with metal oxide (FeO) in the fuel reactor of the CLR,
as given in reaction (1). Steam is added to the fuel reactor to minimize the possibility of coke formation and maintain
favorable conditions for the proceeding WGS steps. Steam used in the fuel reactor is extracted from the MP steam
turbine. The reduced oxygen carrier is sent to the oxidation reactor and reacted with compressed air (reaction (2)).
Oxygen depleted air stream (N2 stream) is the by-product from the oxidation reactor. The N2 stream is expanded in a
gas/air turbine to near atmospheric pressure before being cooled down to produce LP steam. A major fraction of the
Shareq Mohd Nazir et al. / Energy Procedia 114 ( 2017 ) 2146 – 2155 2149
N2 stream (equal to the flowrate of compressor air bleed from GT) is sent to the GT system as diluent and the remainder
is vented out.
x y 2y
C H x MeO x CO H x Me H 0 kJ / mol2
(1)
2x
x Me O x MeO H 0 kJ / mol2
(2)
2 2 2CO H O CO H H 41 kJ / mol (3)
The syngas from the fuel reactor is cooled down and passed on to high and low temperature water gas shift reactors
in series. CO and H2O is converted to CO2 and H2 through a water gas shift reaction (3), which is exothermic. The
water gas shift reaction is driven catalytically in two stages to get higher conversion at lower steam requirements [21].
The resulting stream from the WGS section is cooled and subjected to CO2 capture through chemical absorption using
piperazine activated 45 wt% Methyl diethanolamine (a-MDEA). CO2 is absorbed into the solvent in the absorber
section and the solvent is regenerated in the stripper, where LP steam is used in the reboiler for regeneration. The
MDEA absorption technique serves well at moderate partial pressures of CO2 which is the case in this study [22]. The
choice of CO2 capture method is not in the scope of the current study. The captured CO2 is then compressed to 110
bar and is ready for transport and storage.
The H2-rich fuel after CO2 separation is compressed and combusted with air in the GE 9371FB gas turbine system
[20]. N2 stream from the oxidation reactor is used for dilution which not only compensates for the mass of compressor
bleed but also helps in reducing the peak flame temperatures and NOx formation when hydrogen is combusted [23].
The gas turbine exhaust passes through the HRSG to produce steam for the steam cycle before being released into the
atmosphere. The steam cycle is a three-pressure level with reheat at 166/37/3.8 bar for HP/MP/LP type of steam,
respectively. The water and steam mixture from the ST system is condensed in a condenser to prepare feed water for
the steam cycle. Natural draft cooling tower supplies the cooling water to the condenser.
The heat from N2 stream, syngas and WGS reaction is used to prepare saturated LP steam. The reboiler of the
stripper uses saturated LP steam to regenerate the amine. The remainder of the LP steam is used to produce work in a
separate steam turbine (additional LP steam turbine).
3. Methodology
Net electric efficiency ( ) on Lower Heating Value (LHV) basis of the fuel, is chosen as the parameter that defines
the performance of the power plant. It is defined as:
Net electricity produced
LHV of NG input to the process
The assumptions and methodology followed is shown for the three sections of the process (a) CLR (b) WGS, CO2
capture and compression (c) power plant.
3.1. CLR
The mass and heat balance calculations at equilibrium for air compressor and CLR were carried out in Aspen Plus V8.6, since it contains the property set for solids taking part in the reactions in CLR [14]. The Peng Robinson model was used to estimate the equilibrium conditions in the compressor and CLR at steady state [14]. The work in compressing air was estimated using the ASME Method in Aspen Plus, which uses polytropic efficiency. The Gibbs Reactor Module in Aspen Plus was used to simulate the adiabatic conditions in oxidation and fuel reactor. The stream
class was specified as MIXCISLD to accommodate for the presence of conventional solid metal particles without specifying the particle size distribution.
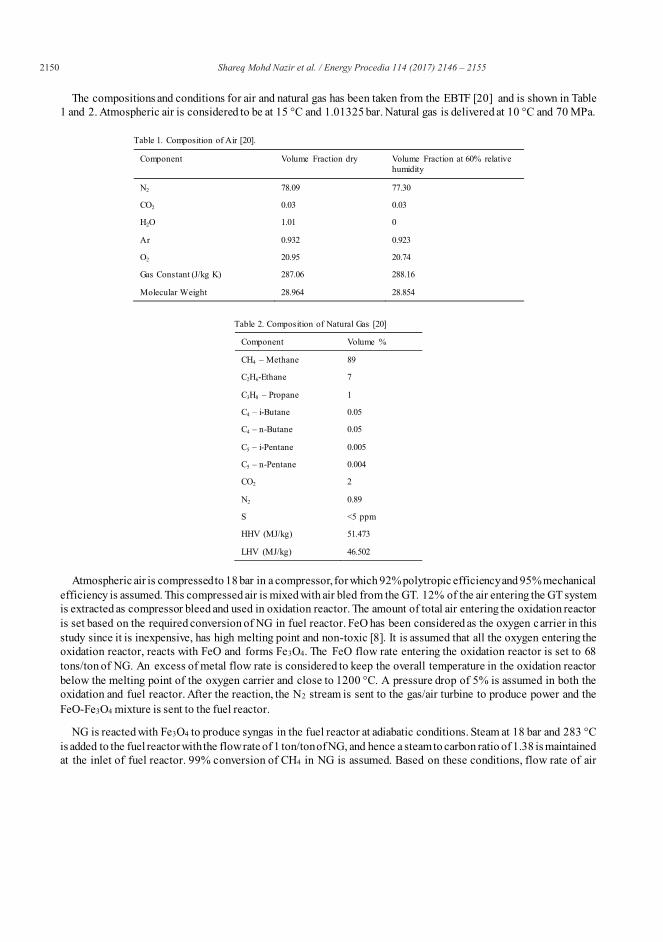
2150 Shareq Mohd Nazir et al. / Energy Procedia 114 ( 2017 ) 2146 – 2155
The compositions and conditions for air and natural gas has been taken from the EBTF [20] and is shown in Table
1 and 2. Atmospheric air is considered to be at 15 °C and 1.01325 bar. Natural gas is delivered at 10 °C and 70 MPa.
Table 1. Composition of Air [20].
Component Volume Fraction dry Volume Fraction at 60% relative humidity
N2 78.09 77.30
CO2 0.03 0.03
H2O 1.01 0
Ar 0.932 0.923
O2 20.95 20.74
Gas Constant (J/kg K) 287.06 288.16
Molecular Weight 28.964 28.854
Table 2. Composition of Natural Gas [20]
Component Volume %
CH4 – Methane 89
C2H6-Ethane 7
C3H8 – Propane 1
C4 – i-Butane 0.05
C4 – n-Butane 0.05
C5 – i-Pentane 0.005
C5 – n-Pentane 0.004
CO2 2
N2 0.89
S <5 ppm
HHV (MJ/kg) 51.473
LHV (MJ/kg) 46.502
Atmospheric air is compressed to 18 bar in a compressor, for which 92% polytropic efficiency and 95% mechanical
efficiency is assumed. This compressed air is mixed with air bled from the GT. 12% of the air entering the GT system
is extracted as compressor bleed and used in oxidation reactor. The amount of total air entering the oxidation reactor
is set based on the required conversion of NG in fuel reactor. FeO has been considered as the oxygen carrier in this
study since it is inexpensive, has high melting point and non-toxic [8]. It is assumed that all the oxygen entering the
oxidation reactor, reacts with FeO and forms Fe3O4. The FeO flow rate entering the oxidation reactor is set to 68
tons/ton of NG. An excess of metal flow rate is considered to keep the overall temperature in the oxidation reactor
below the melting point of the oxygen carrier and close to 1200 °C. A pressure drop of 5% is assumed in both the
oxidation and fuel reactor. After the reaction, the N2 stream is sent to the gas/air turbine to produce power and the
FeO-Fe3O4 mixture is sent to the fuel reactor.
NG is reacted with Fe3O4 to produce syngas in the fuel reactor at adiabatic conditions. Steam at 18 bar and 283 °C
is added to the fuel reactor with the flow rate of 1 ton/ton of NG, and hence a steam to carbon ratio of 1.38 is maintained
at the inlet of fuel reactor. 99% conversion of CH4 in NG is assumed. Based on these conditions, flow rate of air
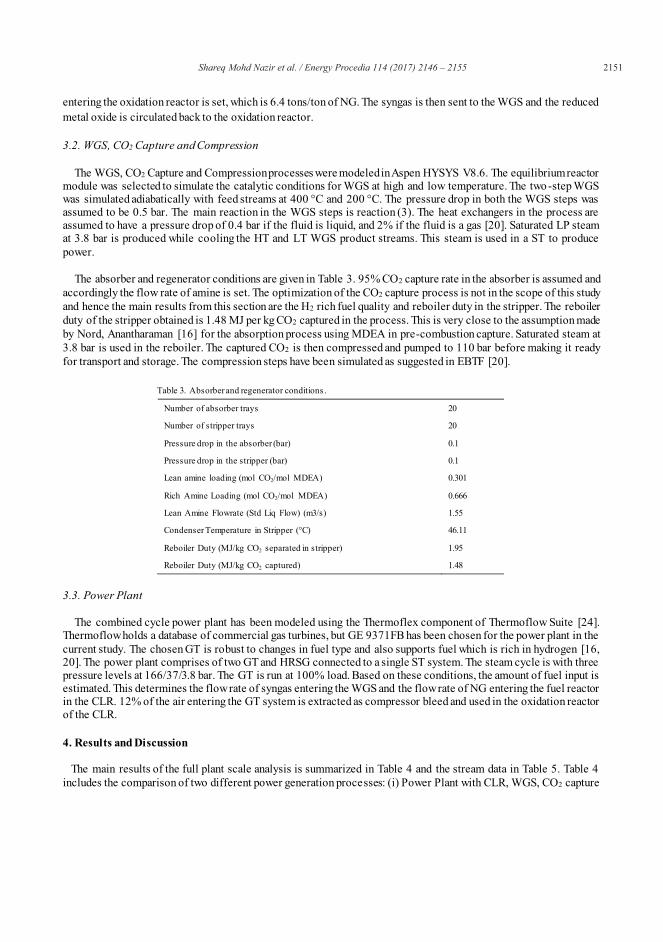
Shareq Mohd Nazir et al. / Energy Procedia 114 ( 2017 ) 2146 – 2155 2151
entering the oxidation reactor is set, which is 6.4 tons/ton of NG. The syngas is then sent to the WGS and the reduced
metal oxide is circulated back to the oxidation reactor.
3.2. WGS, CO2 Capture and Compression
The WGS, CO2 Capture and Compression processes were modeled in Aspen HYSYS V8.6. The equilibrium reactor module was selected to simulate the catalytic conditions for WGS at high and low temperature. The two-step WGS was simulated adiabatically with feed streams at 400 °C and 200 °C. The pressure drop in both the WGS steps was assumed to be 0.5 bar. The main reaction in the WGS steps is reaction (3). The heat exchangers in the process are assumed to have a pressure drop of 0.4 bar if the fluid is liquid, and 2% if the fluid is a gas [20]. Saturated LP steam at 3.8 bar is produced while cooling the HT and LT WGS product streams. This steam is used in a ST to produce
power.
The absorber and regenerator conditions are given in Table 3. 95% CO2 capture rate in the absorber is assumed and
accordingly the flow rate of amine is set. The optimization of the CO2 capture process is not in the scope of this study
and hence the main results from this section are the H2 rich fuel quality and reboiler duty in the stripper. The reboiler
duty of the stripper obtained is 1.48 MJ per kg CO2 captured in the process. This is very close to the assumption made
by Nord, Anantharaman [16] for the absorption process using MDEA in pre-combustion capture. Saturated steam at
3.8 bar is used in the reboiler. The captured CO2 is then compressed and pumped to 110 bar before making it ready
for transport and storage. The compression steps have been simulated as suggested in EBTF [20].
Table 3. Absorber and regenerator conditions .
Number of absorber trays 20
Number of stripper trays 20
Pressure drop in the absorber (bar) 0.1
Pressure drop in the stripper (bar) 0.1
Lean amine loading (mol CO2/mol MDEA) 0.301
Rich Amine Loading (mol CO2/mol MDEA) 0.666
Lean Amine Flowrate (Std Liq Flow) (m3/s) 1.55
Condenser Temperature in Stripper (°C) 46.11
Reboiler Duty (MJ/kg CO2 separated in stripper) 1.95
Reboiler Duty (MJ/kg CO2 captured) 1.48
3.3. Power Plant
The combined cycle power plant has been modeled using the Thermoflex component of Thermoflow Suite [24]. Thermoflow holds a database of commercial gas turbines, but GE 9371FB has been chosen for the power plant in the
current study. The chosen GT is robust to changes in fuel type and also supports fuel which is rich in hydrogen [16, 20]. The power plant comprises of two GT and HRSG connected to a single ST system. The steam cycle is with three pressure levels at 166/37/3.8 bar. The GT is run at 100% load. Based on these conditions, the amount of fuel input is estimated. This determines the flow rate of syngas entering the WGS and the flow rate of NG entering the fuel reactor in the CLR. 12% of the air entering the GT system is extracted as compressor bleed and used in the oxidation reactor of the CLR.
4. Results and Discussion
The main results of the full plant scale analysis is summarized in Table 4 and the stream data in Table 5. Table 4
includes the comparison of two different power generation processes: (i) Power Plant with CLR, WGS, CO2 capture
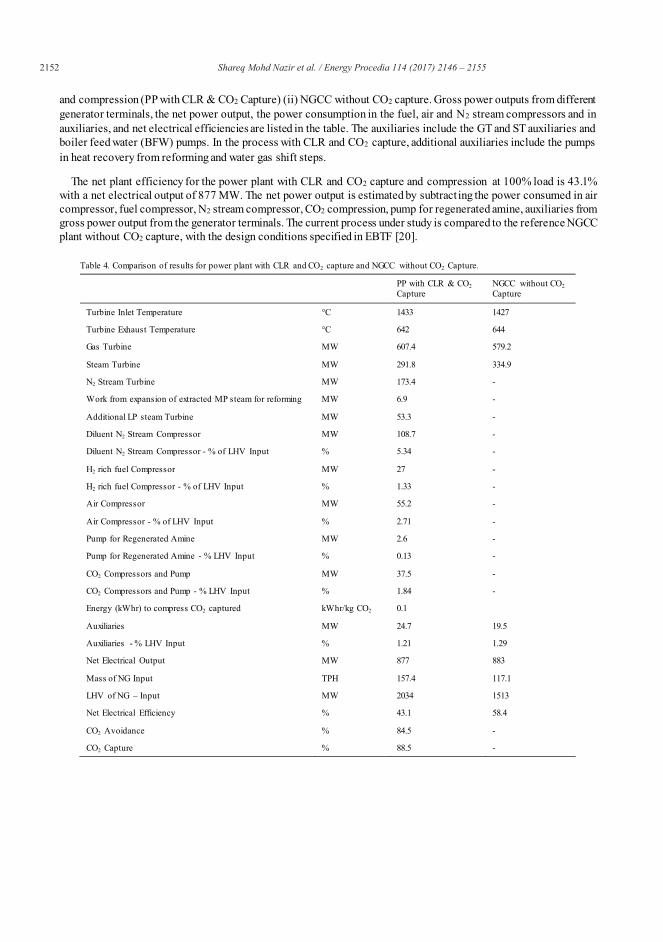
2152 Shareq Mohd Nazir et al. / Energy Procedia 114 ( 2017 ) 2146 – 2155
and compression (PP with CLR & CO2 Capture) (ii) NGCC without CO2 capture. Gross power outputs from different
generator terminals, the net power output, the power consumption in the fuel, air and N2 stream compressors and in
auxiliaries, and net electrical efficiencies are listed in the table. The auxiliaries include the GT and ST auxiliaries and
boiler feed water (BFW) pumps. In the process with CLR and CO2 capture, additional auxiliaries include the pumps
in heat recovery from reforming and water gas shift steps.
The net plant efficiency for the power plant with CLR and CO2 capture and compression at 100% load is 43.1%
with a net electrical output of 877 MW. The net power output is estimated by subtract ing the power consumed in air
compressor, fuel compressor, N2 stream compressor, CO2 compression, pump for regenerated amine, auxiliaries from
gross power output from the generator terminals. The current process under study is compared to the reference NGCC
plant without CO2 capture, with the design conditions specified in EBTF [20].
Table 4. Comparison of results for power plant with CLR and CO2 capture and NGCC without CO2 Capture.
PP with CLR & CO2
CaptureNGCC without CO2
Capture
Turbine Inlet Temperature °C 1433 1427
Turbine Exhaust Temperature °C 642 644
Gas Turbine MW 607.4 579.2
Steam Turbine MW 291.8 334.9
N2 Stream Turbine MW 173.4 -
Work from expansion of extracted MP steam for reforming MW 6.9 -
Additional LP steam Turbine MW 53.3 -
Diluent N2 Stream Compressor MW 108.7 -
Diluent N2 Stream Compressor - % of LHV Input % 5.34 -
H2 rich fuel Compressor MW 27 -
H2 rich fuel Compressor - % of LHV Input % 1.33 -
Air Compressor MW 55.2 -
Air Compressor - % of LHV Input % 2.71 -
Pump for Regenerated Amine MW 2.6 -
Pump for Regenerated Amine - % LHV Input % 0.13 -
CO2 Compressors and Pump MW 37.5 -
CO2 Compressors and Pump - % LHV Input % 1.84 -
Energy (kWhr) to compress CO2 captured kWhr/kg CO2 0.1
Auxiliaries MW 24.7 19.5
Auxiliaries - % LHV Input % 1.21 1.29
Net Electrical Output MW 877 883
Mass of NG Input TPH 157.4 117.1
LHV of NG – Input MW 2034 1513
Net Electrical Efficiency % 43.1 58.4
CO2 Avoidance % 84.5 -
CO2 Capture % 88.5 -
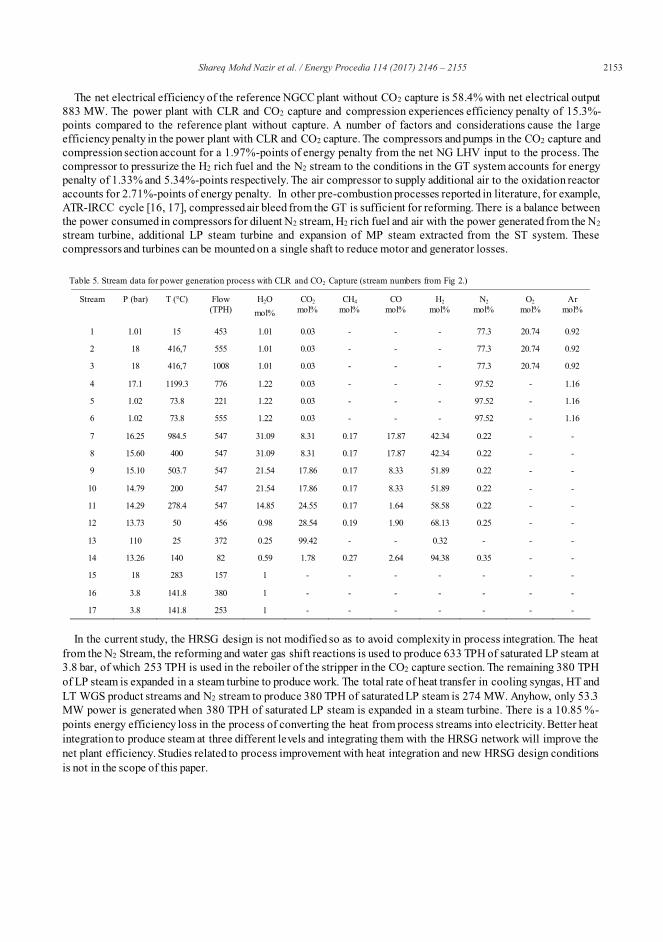
Shareq Mohd Nazir et al. / Energy Procedia 114 ( 2017 ) 2146 – 2155 2153
The net electrical efficiency of the reference NGCC plant without CO2 capture is 58.4% with net electrical output
883 MW. The power plant with CLR and CO2 capture and compression experiences efficiency penalty of 15.3%-
points compared to the reference plant without capture. A number of factors and considerations cause the l arge
efficiency penalty in the power plant with CLR and CO2 capture. The compressors and pumps in the CO2 capture and
compression section account for a 1.97%-points of energy penalty from the net NG LHV input to the process. The
compressor to pressurize the H2 rich fuel and the N2 stream to the conditions in the GT system accounts for energy
penalty of 1.33% and 5.34%-points respectively. The air compressor to supply additional air to the oxidation reactor
accounts for 2.71%-points of energy penalty. In other pre-combustion processes reported in literature, for example,
ATR-IRCC cycle [16, 17], compressed air bleed from the GT is sufficient for reforming. There is a balance between
the power consumed in compressors for diluent N2 stream, H2 rich fuel and air with the power generated from the N2
stream turbine, additional LP steam turbine and expansion of MP steam extracted from the ST system. These
compressors and turbines can be mounted on a single shaft to reduce motor and generator losses.
Table 5. Stream data for power generation process with CLR and CO2 Capture (stream numbers from Fig 2.)
Stream P (bar) T (°C) Flow (TPH)
H2O
mol%
CO2
mol%CH4
mol%CO
mol%H2
mol%N2
mol%O2
mol%Ar
mol%
1 1.01 15 453 1.01 0.03 - - - 77.3 20.74 0.92
2 18 416,7 555 1.01 0.03 - - - 77.3 20.74 0.92
3 18 416,7 1008 1.01 0.03 - - - 77.3 20.74 0.92
4 17.1 1199.3 776 1.22 0.03 - - - 97.52 - 1.16
5 1.02 73.8 221 1.22 0.03 - - - 97.52 - 1.16
6 1.02 73.8 555 1.22 0.03 - - - 97.52 - 1.16
7 16.25 984.5 547 31.09 8.31 0.17 17.87 42.34 0.22 - -
8 15.60 400 547 31.09 8.31 0.17 17.87 42.34 0.22 - -
9 15.10 503.7 547 21.54 17.86 0.17 8.33 51.89 0.22 - -
10 14.79 200 547 21.54 17.86 0.17 8.33 51.89 0.22 - -
11 14.29 278.4 547 14.85 24.55 0.17 1.64 58.58 0.22 - -
12 13.73 50 456 0.98 28.54 0.19 1.90 68.13 0.25 - -
13 110 25 372 0.25 99.42 - - 0.32 - - -
14 13.26 140 82 0.59 1.78 0.27 2.64 94.38 0.35 - -
15 18 283 157 1 - - - - - - -
16 3.8 141.8 380 1 - - - - - - -
17 3.8 141.8 253 1 - - - - - - -
In the current study, the HRSG design is not modified so as to avoid complexity in process integration. The heat
from the N2 Stream, the reforming and water gas shift reactions is used to produce 633 TPH of saturated LP steam at
3.8 bar, of which 253 TPH is used in the reboiler of the stripper in the CO2 capture section. The remaining 380 TPH
of LP steam is expanded in a steam turbine to produce work. The total rate of heat transfer in cooling syngas, HT and
LT WGS product streams and N2 stream to produce 380 TPH of saturated LP steam is 274 MW. Anyhow, only 53.3
MW power is generated when 380 TPH of saturated LP steam is expanded in a steam turbine. There is a 10.85 %-
points energy efficiency loss in the process of converting the heat from process streams into electricity. Better heat
integration to produce steam at three different levels and integrating them with the HRSG network will improve the
net plant efficiency. Studies related to process improvement with heat integration and new HRSG design conditions
is not in the scope of this paper.
2154 Shareq Mohd Nazir et al. / Energy Procedia 114 ( 2017 ) 2146 – 2155
NG used in the pre-combustion capture process is 34.4% more than the amount used in reference NGCC power
plant without capture. The excess NG in the CO2 capture route is because of the energy losses at various points in the
process apart from maintaining the full load conditions and similar LHV input at the GT inlet. The CO2 avoidance rate
is 84.5% and is defined as the ratio of CO2 avoided in the process and the CO2 emitted by the reference plant without
CO2 capture. The CO2 capture rate of the overall process is 88.5%. The CO2 capture rate is defined as the fraction of
CO2 formed which is captured and compressed for storage.
5. Conclusions
This paper investigates a natural gas based power plant with pre-combustion capture of CO2 through CLR, WGS and chemical absorption using a-MDEA. The mass and heat balances for the overall process was established, and the
net electrical efficiency was evaluated and compared to a reference NGCC plant without CO2 capture. The net electrical efficiency estimated for the current process is 43.1%, which is 15.3%-points less than the NGCC plant without capture. Efficiency losses between 8 and 16%-points have been reported in literature for pre-combustion capture processes in natural gas based power plants [16, 17, 25]. The major energy loss in the current process comes from the air compressor (2.71%), diluent N2 stream compressor (5.34%) and converting the heat from syngas, N2
stream, HT and LT WGS product streams into electricity.
A fairly low level of heat integration is present in the current process with pre-combustion capture of CO2, which is reflective through not changing the HRSG design, producing saturated LP steam from cooling of syngas, HT and LT WGS product streams and N2 stream, and using a separate steam turbine to generate power from saturated LP steam. Although the low degree of integration avoids complexity, it effects the overall efficiency of the process. The energy efficiency loss in producing saturated LP steam and producing power from it is 10.85%-points. Improvements
in heat integration and a modified HRSG design will improve the net plant efficiency.
Acknowledgments
The current work is part of EU-FP7 project “NanoSim” which deals with developing a multi-scale open source
modeling platform, which will enable the rationale design of second generation CCS processes. The authors would
like to thank the European Commission for funding this project.
References
[1] Boot-Handford, M.E., et al., Carbon capture and storage update. Energy and Environmental Science, 2014. 7(1): p. 130-189.
[2] Richter, H.J. and K.F. Knoche, REVERSIBILITY OF COMBUSTION PROCESSES. ACS Symposium Series, 1983: p. 71-85.
[3] Ishida, M. and H. Jin, A new advanced power-generation system using chemical-looping combustion. Energy, 1994. 19(4): p. 415-422.
[4] Ishida, M., D. Zheng, and T. Akehata, Evaluation of a chemical-looping-combustion power-generation system by graphic exergy analysis.
Energy, 1987. 12(2): p. 147-154.
[5] Consonni, S., et al., Chemical-looping combustion for combined cycles with CO2 capture. Journal of Engineering for Gas Turb ines and Power,
2006. 128(3): p. 525-534.
[6] Iloeje, C., Z. Zhao, and A.F. Ghoniem, Analysis of thermally coupled chemical looping combustion -based power plants with carbon capture.
International Journal of Greenhouse Gas Control, 2015. 35: p. 56-70.
[7] Naqvi, R. and O. Bolland, Multi-stage chemical looping combustion (CLC) for combined cycles with CO2 capture. International Journal of
Greenhouse Gas Control, 2007. 1(1): p. 19-30.
[8] Adanez, J., et al., Progress in chemical-looping combustion and reforming technologies. Progress in Energy and Combustion Science, 2012.
38(2): p. 215-282.
[9] Tang, M., L. Xu, and M. Fan, Progress in oxygen carrier development of methane-based chemical-looping reforming: A review. Applied
Energy, 2015. 151.
[10]Chiesa, P., et al., Three-reactors chemical looping process for hydrogen production. International Journal of Hydrogen Energy, 2008. 33(9): p.
2233-2245.
[11]Ortiz, M., et al., Hydrogen production by auto-thermal chemical-looping reforming in a pressurized fluidized bed reactor using Ni-based oxygen
carriers. International Journal of Hydrogen Energy, 2010. 35(1): p. 151-160.
[12]Pröll, T., et al., Syngas and a separate nitrogen/argon stream via chemical looping reforming - A 140 kW pilot plant study. Fuel, 2010. 89(6):
p. 1249-1256.
Shareq Mohd Nazir et al. / Energy Procedia 114 ( 2017 ) 2146 – 2155 2155
[13]Tong, A., et al., Application of the moving-bed chemical looping process for high methane conversion. Energy and Fuels, 2013. 27(8): p. 4119 -
4128.
[14]Yahom, A., et al., Simulation and thermodynamic analysis of chemical looping reforming and CO2 enhanced chemical looping reforming .
Chemical Engineering Research and Design, 2014. 92(11): p. 2575-2583.
[15]Martínez, I., et al., Integrated combined cycle from natural gas with CO2 capture using a Ca-Cu chemical loop. AIChE Journal, 2013. 59(8):
p. 2780-2794.
[16]Nord, L.O., R. Anantharaman, and O. Bolland, Design and off-design analyses of a pre-combustion CO2 capture process in a natural gas
combined cycle power plant. International Journal of Greenhouse Gas Control, 2009. 3(4): p. 385-392.
[17]Romano, M.C., P. Chiesa, and G. Lozza, Pre-combustion CO2 capture from natural gas power plants, with ATR and MDEA processes.
International Journal of Greenhouse Gas Control, 2010. 4(5): p. 785-797.
[18]Cormos, C.C., L. Petrescu, and A.M. Cormos, Assessment of hydrogen production systems based on natural gas conversion with carbon capture
and storage, in Computer Aided Chemical Engineering. 2014. p. 1081-1086.
[19]Kvamsdal, H.M., K. Jordal, and O. Bolland, A quantitative comparison of gas turbine cycles with capture. Energy, 2007. 32(1): p. 10-24.
[20]EBTF, European best practice guidelines for assessment of CO2 capture technologies. CESAR -project 7th FrameWork Programme.
Collaborative Project– GA No. 213569. 2011.
[21]Newsome, D.S., The Water-Gas Shift Reaction. Catalysis Reviews, 1980. 21(2): p. 275-318.
[22]Appl, M., Ammonia: Principles and Industrial Practice. 1999.
[23]Chiesa, P., G. Lozza, and L. Mazzocchi, Using Hydrogen as Gas Turbine Fuel. Journal of Engineering for Gas Turbines and Power , 2005.
127(1): p. 73-80.
[24]Riboldi, L., et al., Full-plant Analysis of a PSA CO2 Capture Unit Integrated In Coal-fired Power Plants: Post-and Pre-combustion Scenarios.
Energy Procedia, 2014. 63: p. 2289-2304.
[25]Jansen, D., et al., Pre-combustion CO2 capture. International Journal of Greenhouse Gas Control, 2015. 40: p. 167-187.

Paper II
Nazir, S., Bolland, O., Amini, S., Analysis of Combined Cycle Power Plants with Chemical
Looping Reforming of Natural Gas and Pre-Combustion CO2 Capture. Energies 2018, 11 (1),
147.

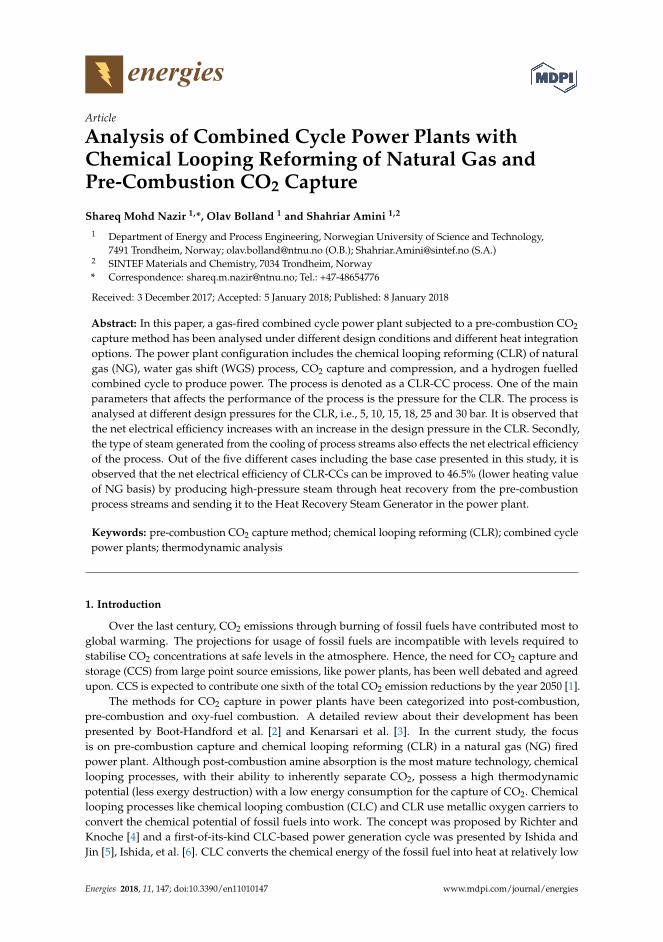
energiesArticle
Analysis of Combined Cycle Power Plants withChemical Looping Reforming of Natural Gas andPre-Combustion CO2 Capture
Shareq Mohd Nazir 1,*, Olav Bolland 1 and Shahriar Amini 1,2
1 Department of Energy and Process Engineering, Norwegian University of Science and Technology,7491 Trondheim, Norway; [email protected] (O.B.); [email protected] (S.A.)
2 SINTEF Materials and Chemistry, 7034 Trondheim, Norway* Correspondence: [email protected]; Tel.: +47-48654776
Received: 3 December 2017; Accepted: 5 January 2018; Published: 8 January 2018
Abstract: In this paper, a gas-fired combined cycle power plant subjected to a pre-combustion CO2
capture method has been analysed under different design conditions and different heat integrationoptions. The power plant configuration includes the chemical looping reforming (CLR) of naturalgas (NG), water gas shift (WGS) process, CO2 capture and compression, and a hydrogen fuelledcombined cycle to produce power. The process is denoted as a CLR-CC process. One of the mainparameters that affects the performance of the process is the pressure for the CLR. The process isanalysed at different design pressures for the CLR, i.e., 5, 10, 15, 18, 25 and 30 bar. It is observed thatthe net electrical efficiency increases with an increase in the design pressure in the CLR. Secondly,the type of steam generated from the cooling of process streams also effects the net electrical efficiencyof the process. Out of the five different cases including the base case presented in this study, it isobserved that the net electrical efficiency of CLR-CCs can be improved to 46.5% (lower heating valueof NG basis) by producing high-pressure steam through heat recovery from the pre-combustionprocess streams and sending it to the Heat Recovery Steam Generator in the power plant.
Keywords: pre-combustion CO2 capture method; chemical looping reforming (CLR); combined cyclepower plants; thermodynamic analysis
1. Introduction
Over the last century, CO2 emissions through burning of fossil fuels have contributed most toglobal warming. The projections for usage of fossil fuels are incompatible with levels required tostabilise CO2 concentrations at safe levels in the atmosphere. Hence, the need for CO2 capture andstorage (CCS) from large point source emissions, like power plants, has been well debated and agreedupon. CCS is expected to contribute one sixth of the total CO2 emission reductions by the year 2050 [1].
The methods for CO2 capture in power plants have been categorized into post-combustion,pre-combustion and oxy-fuel combustion. A detailed review about their development has beenpresented by Boot-Handford et al. [2] and Kenarsari et al. [3]. In the current study, the focusis on pre-combustion capture and chemical looping reforming (CLR) in a natural gas (NG) firedpower plant. Although post-combustion amine absorption is the most mature technology, chemicallooping processes, with their ability to inherently separate CO2, possess a high thermodynamicpotential (less exergy destruction) with a low energy consumption for the capture of CO2. Chemicallooping processes like chemical looping combustion (CLC) and CLR use metallic oxygen carriers toconvert the chemical potential of fossil fuels into work. The concept was proposed by Richter andKnoche [4] and a first-of-its-kind CLC-based power generation cycle was presented by Ishida andJin [5], Ishida, et al. [6]. CLC converts the chemical energy of the fossil fuel into heat at relatively low
Energies 2018, 11, 147; doi:10.3390/en11010147 www.mdpi.com/journal/energies
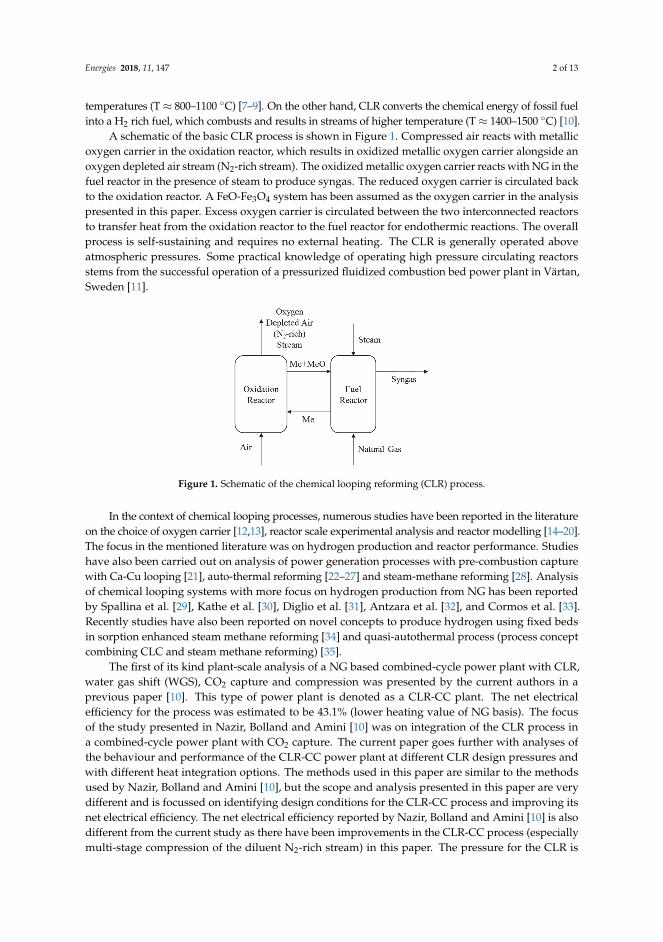
Energies 2018, 11, 147 2 of 13
temperatures (T ≈ 800–1100 ◦C) [7–9]. On the other hand, CLR converts the chemical energy of fossil fuelinto a H2 rich fuel, which combusts and results in streams of higher temperature (T ≈ 1400–1500 ◦C) [10].
A schematic of the basic CLR process is shown in Figure 1. Compressed air reacts with metallicoxygen carrier in the oxidation reactor, which results in oxidized metallic oxygen carrier alongside anoxygen depleted air stream (N2-rich stream). The oxidized metallic oxygen carrier reacts with NG in thefuel reactor in the presence of steam to produce syngas. The reduced oxygen carrier is circulated backto the oxidation reactor. A FeO-Fe3O4 system has been assumed as the oxygen carrier in the analysispresented in this paper. Excess oxygen carrier is circulated between the two interconnected reactorsto transfer heat from the oxidation reactor to the fuel reactor for endothermic reactions. The overallprocess is self-sustaining and requires no external heating. The CLR is generally operated aboveatmospheric pressures. Some practical knowledge of operating high pressure circulating reactorsstems from the successful operation of a pressurized fluidized combustion bed power plant in Värtan,Sweden [11].
Figure 1. Schematic of the chemical looping reforming (CLR) process.
In the context of chemical looping processes, numerous studies have been reported in the literatureon the choice of oxygen carrier [12,13], reactor scale experimental analysis and reactor modelling [14–20].The focus in the mentioned literature was on hydrogen production and reactor performance. Studieshave also been carried out on analysis of power generation processes with pre-combustion capturewith Ca-Cu looping [21], auto-thermal reforming [22–27] and steam-methane reforming [28]. Analysisof chemical looping systems with more focus on hydrogen production from NG has been reportedby Spallina et al. [29], Kathe et al. [30], Diglio et al. [31], Antzara et al. [32], and Cormos et al. [33].Recently studies have also been reported on novel concepts to produce hydrogen using fixed bedsin sorption enhanced steam methane reforming [34] and quasi-autothermal process (process conceptcombining CLC and steam methane reforming) [35].
The first of its kind plant-scale analysis of a NG based combined-cycle power plant with CLR,water gas shift (WGS), CO2 capture and compression was presented by the current authors in aprevious paper [10]. This type of power plant is denoted as a CLR-CC plant. The net electricalefficiency for the process was estimated to be 43.1% (lower heating value of NG basis). The focusof the study presented in Nazir, Bolland and Amini [10] was on integration of the CLR process ina combined-cycle power plant with CO2 capture. The current paper goes further with analyses ofthe behaviour and performance of the CLR-CC power plant at different CLR design pressures andwith different heat integration options. The methods used in this paper are similar to the methodsused by Nazir, Bolland and Amini [10], but the scope and analysis presented in this paper are verydifferent and is focussed on identifying design conditions for the CLR-CC process and improving itsnet electrical efficiency. The net electrical efficiency reported by Nazir, Bolland and Amini [10] is alsodifferent from the current study as there have been improvements in the CLR-CC process (especiallymulti-stage compression of the diluent N2-rich stream) in this paper. The pressure for the CLR is
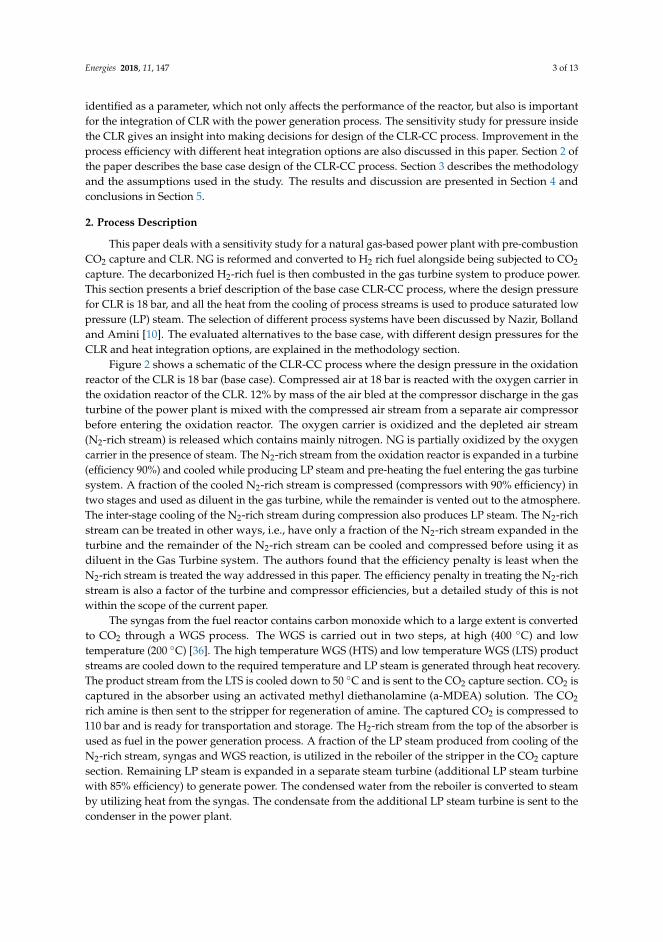
Energies 2018, 11, 147 3 of 13
identified as a parameter, which not only affects the performance of the reactor, but also is importantfor the integration of CLR with the power generation process. The sensitivity study for pressure insidethe CLR gives an insight into making decisions for design of the CLR-CC process. Improvement in theprocess efficiency with different heat integration options are also discussed in this paper. Section 2 ofthe paper describes the base case design of the CLR-CC process. Section 3 describes the methodologyand the assumptions used in the study. The results and discussion are presented in Section 4 andconclusions in Section 5.
2. Process Description
This paper deals with a sensitivity study for a natural gas-based power plant with pre-combustionCO2 capture and CLR. NG is reformed and converted to H2 rich fuel alongside being subjected to CO2
capture. The decarbonized H2-rich fuel is then combusted in the gas turbine system to produce power.This section presents a brief description of the base case CLR-CC process, where the design pressurefor CLR is 18 bar, and all the heat from the cooling of process streams is used to produce saturated lowpressure (LP) steam. The selection of different process systems have been discussed by Nazir, Bollandand Amini [10]. The evaluated alternatives to the base case, with different design pressures for theCLR and heat integration options, are explained in the methodology section.
Figure 2 shows a schematic of the CLR-CC process where the design pressure in the oxidationreactor of the CLR is 18 bar (base case). Compressed air at 18 bar is reacted with the oxygen carrier inthe oxidation reactor of the CLR. 12% by mass of the air bled at the compressor discharge in the gasturbine of the power plant is mixed with the compressed air stream from a separate air compressorbefore entering the oxidation reactor. The oxygen carrier is oxidized and the depleted air stream(N2-rich stream) is released which contains mainly nitrogen. NG is partially oxidized by the oxygencarrier in the presence of steam. The N2-rich stream from the oxidation reactor is expanded in a turbine(efficiency 90%) and cooled while producing LP steam and pre-heating the fuel entering the gas turbinesystem. A fraction of the cooled N2-rich stream is compressed (compressors with 90% efficiency) intwo stages and used as diluent in the gas turbine, while the remainder is vented out to the atmosphere.The inter-stage cooling of the N2-rich stream during compression also produces LP steam. The N2-richstream can be treated in other ways, i.e., have only a fraction of the N2-rich stream expanded in theturbine and the remainder of the N2-rich stream can be cooled and compressed before using it asdiluent in the Gas Turbine system. The authors found that the efficiency penalty is least when theN2-rich stream is treated the way addressed in this paper. The efficiency penalty in treating the N2-richstream is also a factor of the turbine and compressor efficiencies, but a detailed study of this is notwithin the scope of the current paper.
The syngas from the fuel reactor contains carbon monoxide which to a large extent is convertedto CO2 through a WGS process. The WGS is carried out in two steps, at high (400 ◦C) and lowtemperature (200 ◦C) [36]. The high temperature WGS (HTS) and low temperature WGS (LTS) productstreams are cooled down to the required temperature and LP steam is generated through heat recovery.The product stream from the LTS is cooled down to 50 ◦C and is sent to the CO2 capture section. CO2 iscaptured in the absorber using an activated methyl diethanolamine (a-MDEA) solution. The CO2
rich amine is then sent to the stripper for regeneration of amine. The captured CO2 is compressed to110 bar and is ready for transportation and storage. The H2-rich stream from the top of the absorber isused as fuel in the power generation process. A fraction of the LP steam produced from cooling of theN2-rich stream, syngas and WGS reaction, is utilized in the reboiler of the stripper in the CO2 capturesection. Remaining LP steam is expanded in a separate steam turbine (additional LP steam turbinewith 85% efficiency) to generate power. The condensed water from the reboiler is converted to steamby utilizing heat from the syngas. The condensate from the additional LP steam turbine is sent to thecondenser in the power plant.
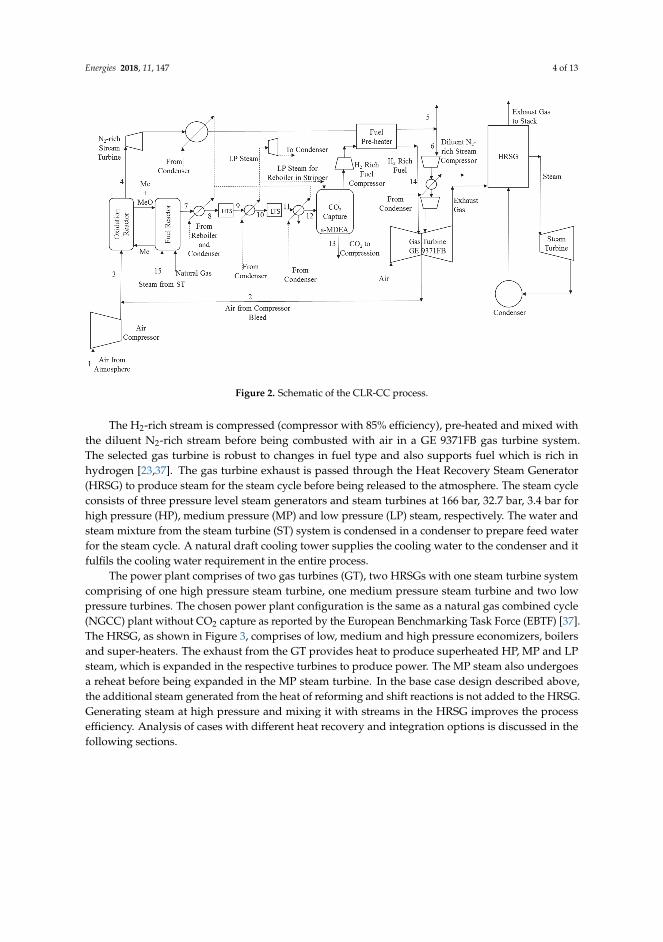
Energies 2018, 11, 147 4 of 13
Figure 2. Schematic of the CLR-CC process.
The H2-rich stream is compressed (compressor with 85% efficiency), pre-heated and mixed withthe diluent N2-rich stream before being combusted with air in a GE 9371FB gas turbine system.The selected gas turbine is robust to changes in fuel type and also supports fuel which is rich inhydrogen [23,37]. The gas turbine exhaust is passed through the Heat Recovery Steam Generator(HRSG) to produce steam for the steam cycle before being released to the atmosphere. The steam cycleconsists of three pressure level steam generators and steam turbines at 166 bar, 32.7 bar, 3.4 bar forhigh pressure (HP), medium pressure (MP) and low pressure (LP) steam, respectively. The water andsteam mixture from the steam turbine (ST) system is condensed in a condenser to prepare feed waterfor the steam cycle. A natural draft cooling tower supplies the cooling water to the condenser and itfulfils the cooling water requirement in the entire process.
The power plant comprises of two gas turbines (GT), two HRSGs with one steam turbine systemcomprising of one high pressure steam turbine, one medium pressure steam turbine and two lowpressure turbines. The chosen power plant configuration is the same as a natural gas combined cycle(NGCC) plant without CO2 capture as reported by the European Benchmarking Task Force (EBTF) [37].The HRSG, as shown in Figure 3, comprises of low, medium and high pressure economizers, boilersand super-heaters. The exhaust from the GT provides heat to produce superheated HP, MP and LPsteam, which is expanded in the respective turbines to produce power. The MP steam also undergoesa reheat before being expanded in the MP steam turbine. In the base case design described above,the additional steam generated from the heat of reforming and shift reactions is not added to the HRSG.Generating steam at high pressure and mixing it with streams in the HRSG improves the processefficiency. Analysis of cases with different heat recovery and integration options is discussed in thefollowing sections.
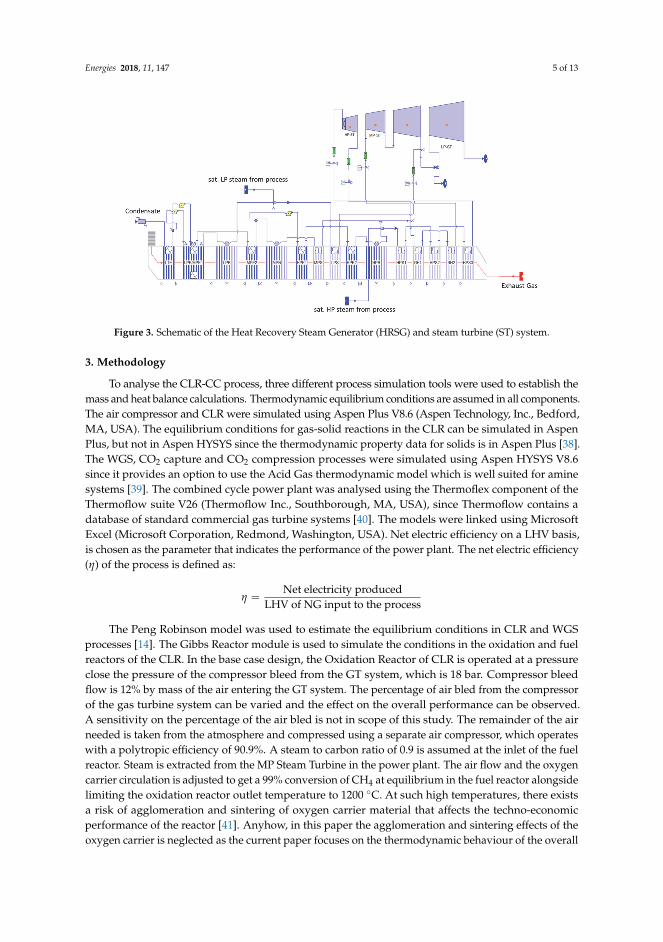
Energies 2018, 11, 147 5 of 13
Figure 3. Schematic of the Heat Recovery Steam Generator (HRSG) and steam turbine (ST) system.
3. Methodology
To analyse the CLR-CC process, three different process simulation tools were used to establish themass and heat balance calculations. Thermodynamic equilibrium conditions are assumed in all components.The air compressor and CLR were simulated using Aspen Plus V8.6 (Aspen Technology, Inc., Bedford,MA, USA). The equilibrium conditions for gas-solid reactions in the CLR can be simulated in AspenPlus, but not in Aspen HYSYS since the thermodynamic property data for solids is in Aspen Plus [38].The WGS, CO2 capture and CO2 compression processes were simulated using Aspen HYSYS V8.6since it provides an option to use the Acid Gas thermodynamic model which is well suited for aminesystems [39]. The combined cycle power plant was analysed using the Thermoflex component of theThermoflow suite V26 (Thermoflow Inc., Southborough, MA, USA), since Thermoflow contains adatabase of standard commercial gas turbine systems [40]. The models were linked using MicrosoftExcel (Microsoft Corporation, Redmond, Washington, USA). Net electric efficiency on a LHV basis,is chosen as the parameter that indicates the performance of the power plant. The net electric efficiency(η) of the process is defined as:
η =Net electricity produced
LHV of NG input to the process
The Peng Robinson model was used to estimate the equilibrium conditions in CLR and WGSprocesses [14]. The Gibbs Reactor module is used to simulate the conditions in the oxidation and fuelreactors of the CLR. In the base case design, the Oxidation Reactor of CLR is operated at a pressureclose the pressure of the compressor bleed from the GT system, which is 18 bar. Compressor bleedflow is 12% by mass of the air entering the GT system. The percentage of air bled from the compressorof the gas turbine system can be varied and the effect on the overall performance can be observed.A sensitivity on the percentage of the air bled is not in scope of this study. The remainder of the airneeded is taken from the atmosphere and compressed using a separate air compressor, which operateswith a polytropic efficiency of 90.9%. A steam to carbon ratio of 0.9 is assumed at the inlet of the fuelreactor. Steam is extracted from the MP Steam Turbine in the power plant. The air flow and the oxygencarrier circulation is adjusted to get a 99% conversion of CH4 at equilibrium in the fuel reactor alongsidelimiting the oxidation reactor outlet temperature to 1200 ◦C. At such high temperatures, there existsa risk of agglomeration and sintering of oxygen carrier material that affects the techno-economicperformance of the reactor [41]. Anyhow, in this paper the agglomeration and sintering effects of theoxygen carrier is neglected as the current paper focuses on the thermodynamic behaviour of the overall
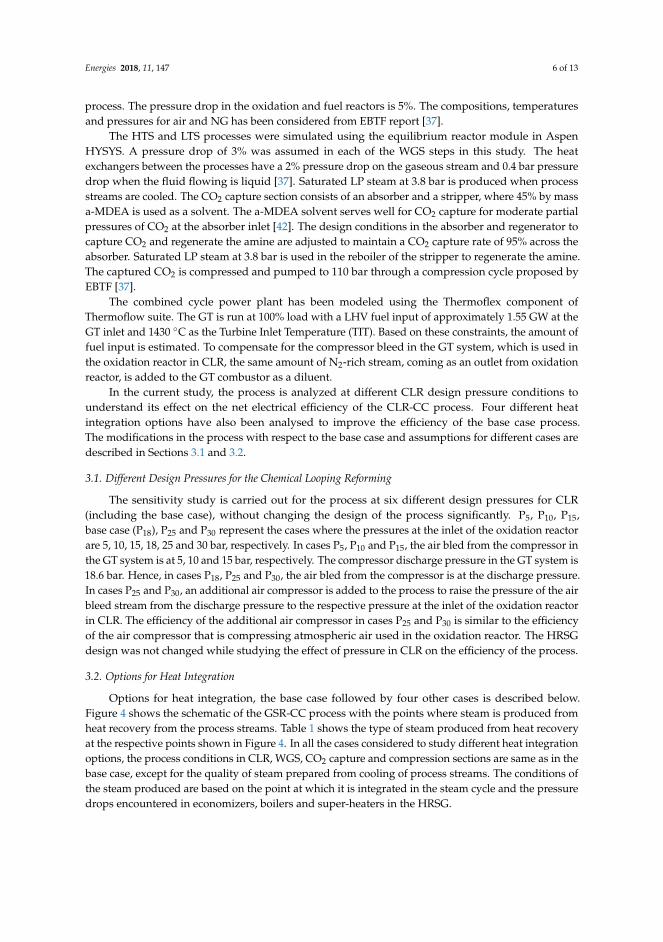
Energies 2018, 11, 147 6 of 13
process. The pressure drop in the oxidation and fuel reactors is 5%. The compositions, temperaturesand pressures for air and NG has been considered from EBTF report [37].
The HTS and LTS processes were simulated using the equilibrium reactor module in AspenHYSYS. A pressure drop of 3% was assumed in each of the WGS steps in this study. The heatexchangers between the processes have a 2% pressure drop on the gaseous stream and 0.4 bar pressuredrop when the fluid flowing is liquid [37]. Saturated LP steam at 3.8 bar is produced when processstreams are cooled. The CO2 capture section consists of an absorber and a stripper, where 45% by massa-MDEA is used as a solvent. The a-MDEA solvent serves well for CO2 capture for moderate partialpressures of CO2 at the absorber inlet [42]. The design conditions in the absorber and regenerator tocapture CO2 and regenerate the amine are adjusted to maintain a CO2 capture rate of 95% across theabsorber. Saturated LP steam at 3.8 bar is used in the reboiler of the stripper to regenerate the amine.The captured CO2 is compressed and pumped to 110 bar through a compression cycle proposed byEBTF [37].
The combined cycle power plant has been modeled using the Thermoflex component ofThermoflow suite. The GT is run at 100% load with a LHV fuel input of approximately 1.55 GW at theGT inlet and 1430 ◦C as the Turbine Inlet Temperature (TIT). Based on these constraints, the amount offuel input is estimated. To compensate for the compressor bleed in the GT system, which is used inthe oxidation reactor in CLR, the same amount of N2-rich stream, coming as an outlet from oxidationreactor, is added to the GT combustor as a diluent.
In the current study, the process is analyzed at different CLR design pressure conditions tounderstand its effect on the net electrical efficiency of the CLR-CC process. Four different heatintegration options have also been analysed to improve the efficiency of the base case process.The modifications in the process with respect to the base case and assumptions for different cases aredescribed in Sections 3.1 and 3.2.
3.1. Different Design Pressures for the Chemical Looping Reforming
The sensitivity study is carried out for the process at six different design pressures for CLR(including the base case), without changing the design of the process significantly. P5, P10, P15,base case (P18), P25 and P30 represent the cases where the pressures at the inlet of the oxidation reactorare 5, 10, 15, 18, 25 and 30 bar, respectively. In cases P5, P10 and P15, the air bled from the compressor inthe GT system is at 5, 10 and 15 bar, respectively. The compressor discharge pressure in the GT system is18.6 bar. Hence, in cases P18, P25 and P30, the air bled from the compressor is at the discharge pressure.In cases P25 and P30, an additional air compressor is added to the process to raise the pressure of the airbleed stream from the discharge pressure to the respective pressure at the inlet of the oxidation reactorin CLR. The efficiency of the additional air compressor in cases P25 and P30 is similar to the efficiencyof the air compressor that is compressing atmospheric air used in the oxidation reactor. The HRSGdesign was not changed while studying the effect of pressure in CLR on the efficiency of the process.
3.2. Options for Heat Integration
Options for heat integration, the base case followed by four other cases is described below.Figure 4 shows the schematic of the GSR-CC process with the points where steam is produced fromheat recovery from the process streams. Table 1 shows the type of steam produced from heat recoveryat the respective points shown in Figure 4. In all the cases considered to study different heat integrationoptions, the process conditions in CLR, WGS, CO2 capture and compression sections are same as in thebase case, except for the quality of steam prepared from cooling of process streams. The conditions ofthe steam produced are based on the point at which it is integrated in the steam cycle and the pressuredrops encountered in economizers, boilers and super-heaters in the HRSG.
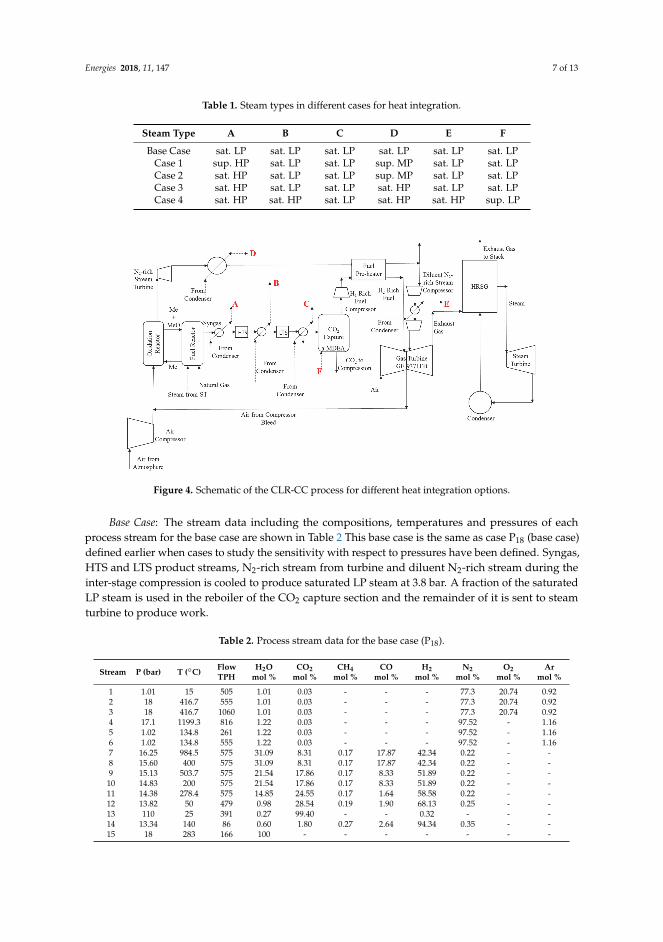
Energies 2018, 11, 147 7 of 13
Table 1. Steam types in different cases for heat integration.
Steam Type A B C D E F
Base Case sat. LP sat. LP sat. LP sat. LP sat. LP sat. LPCase 1 sup. HP sat. LP sat. LP sup. MP sat. LP sat. LPCase 2 sat. HP sat. LP sat. LP sup. MP sat. LP sat. LPCase 3 sat. HP sat. LP sat. LP sat. HP sat. LP sat. LPCase 4 sat. HP sat. HP sat. LP sat. HP sat. HP sup. LP
Figure 4. Schematic of the CLR-CC process for different heat integration options.
Base Case: The stream data including the compositions, temperatures and pressures of eachprocess stream for the base case are shown in Table 2 This base case is the same as case P18 (base case)defined earlier when cases to study the sensitivity with respect to pressures have been defined. Syngas,HTS and LTS product streams, N2-rich stream from turbine and diluent N2-rich stream during theinter-stage compression is cooled to produce saturated LP steam at 3.8 bar. A fraction of the saturatedLP steam is used in the reboiler of the CO2 capture section and the remainder of it is sent to steamturbine to produce work.
Table 2. Process stream data for the base case (P18).
Stream P (bar) T (◦C) FlowTPH
H2Omol %
CO2mol %
CH4mol %
COmol %
H2mol %
N2mol %
O2mol %
Armol %
1 1.01 15 505 1.01 0.03 - - - 77.3 20.74 0.922 18 416.7 555 1.01 0.03 - - - 77.3 20.74 0.923 18 416.7 1060 1.01 0.03 - - - 77.3 20.74 0.924 17.1 1199.3 816 1.22 0.03 - - - 97.52 - 1.165 1.02 134.8 261 1.22 0.03 - - - 97.52 - 1.166 1.02 134.8 555 1.22 0.03 - - - 97.52 - 1.167 16.25 984.5 575 31.09 8.31 0.17 17.87 42.34 0.22 - -8 15.60 400 575 31.09 8.31 0.17 17.87 42.34 0.22 - -9 15.13 503.7 575 21.54 17.86 0.17 8.33 51.89 0.22 - -10 14.83 200 575 21.54 17.86 0.17 8.33 51.89 0.22 - -11 14.38 278.4 575 14.85 24.55 0.17 1.64 58.58 0.22 - -12 13.82 50 479 0.98 28.54 0.19 1.90 68.13 0.25 - -13 110 25 391 0.27 99.40 - - 0.32 - - -14 13.34 140 86 0.60 1.80 0.27 2.64 94.34 0.35 - -15 18 283 166 100 - - - - - - -
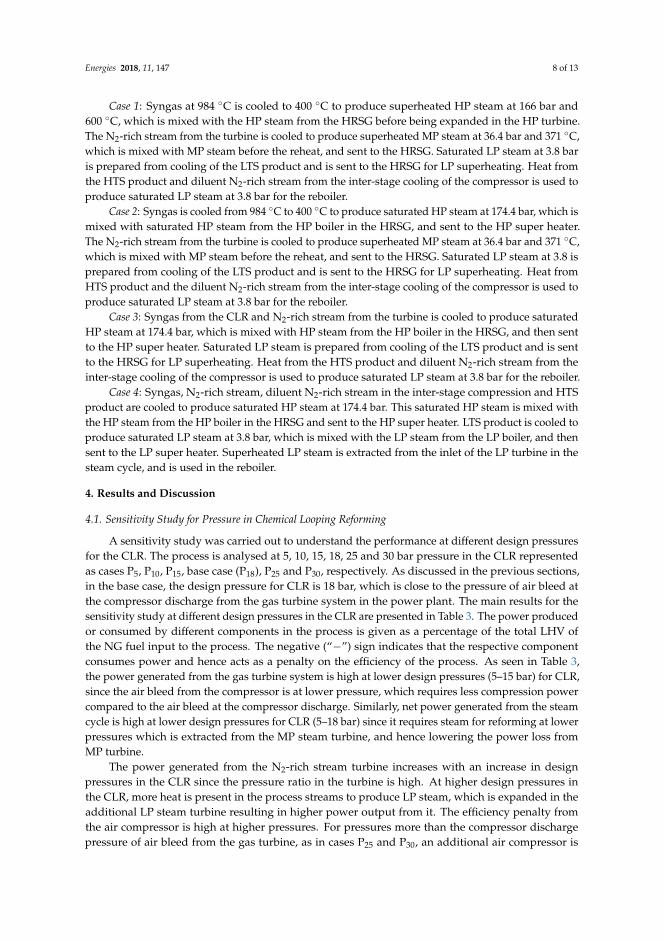
Energies 2018, 11, 147 8 of 13
Case 1: Syngas at 984 ◦C is cooled to 400 ◦C to produce superheated HP steam at 166 bar and600 ◦C, which is mixed with the HP steam from the HRSG before being expanded in the HP turbine.The N2-rich stream from the turbine is cooled to produce superheated MP steam at 36.4 bar and 371 ◦C,which is mixed with MP steam before the reheat, and sent to the HRSG. Saturated LP steam at 3.8 baris prepared from cooling of the LTS product and is sent to the HRSG for LP superheating. Heat fromthe HTS product and diluent N2-rich stream from the inter-stage cooling of the compressor is used toproduce saturated LP steam at 3.8 bar for the reboiler.
Case 2: Syngas is cooled from 984 ◦C to 400 ◦C to produce saturated HP steam at 174.4 bar, which ismixed with saturated HP steam from the HP boiler in the HRSG, and sent to the HP super heater.The N2-rich stream from the turbine is cooled to produce superheated MP steam at 36.4 bar and 371 ◦C,which is mixed with MP steam before the reheat, and sent to the HRSG. Saturated LP steam at 3.8 isprepared from cooling of the LTS product and is sent to the HRSG for LP superheating. Heat fromHTS product and the diluent N2-rich stream from the inter-stage cooling of the compressor is used toproduce saturated LP steam at 3.8 bar for the reboiler.
Case 3: Syngas from the CLR and N2-rich stream from the turbine is cooled to produce saturatedHP steam at 174.4 bar, which is mixed with HP steam from the HP boiler in the HRSG, and then sentto the HP super heater. Saturated LP steam is prepared from cooling of the LTS product and is sentto the HRSG for LP superheating. Heat from the HTS product and diluent N2-rich stream from theinter-stage cooling of the compressor is used to produce saturated LP steam at 3.8 bar for the reboiler.
Case 4: Syngas, N2-rich stream, diluent N2-rich stream in the inter-stage compression and HTSproduct are cooled to produce saturated HP steam at 174.4 bar. This saturated HP steam is mixed withthe HP steam from the HP boiler in the HRSG and sent to the HP super heater. LTS product is cooled toproduce saturated LP steam at 3.8 bar, which is mixed with the LP steam from the LP boiler, and thensent to the LP super heater. Superheated LP steam is extracted from the inlet of the LP turbine in thesteam cycle, and is used in the reboiler.
4. Results and Discussion
4.1. Sensitivity Study for Pressure in Chemical Looping Reforming
A sensitivity study was carried out to understand the performance at different design pressuresfor the CLR. The process is analysed at 5, 10, 15, 18, 25 and 30 bar pressure in the CLR representedas cases P5, P10, P15, base case (P18), P25 and P30, respectively. As discussed in the previous sections,in the base case, the design pressure for CLR is 18 bar, which is close to the pressure of air bleed atthe compressor discharge from the gas turbine system in the power plant. The main results for thesensitivity study at different design pressures in the CLR are presented in Table 3. The power producedor consumed by different components in the process is given as a percentage of the total LHV ofthe NG fuel input to the process. The negative (“−”) sign indicates that the respective componentconsumes power and hence acts as a penalty on the efficiency of the process. As seen in Table 3,the power generated from the gas turbine system is high at lower design pressures (5–15 bar) for CLR,since the air bleed from the compressor is at lower pressure, which requires less compression powercompared to the air bleed at the compressor discharge. Similarly, net power generated from the steamcycle is high at lower design pressures for CLR (5–18 bar) since it requires steam for reforming at lowerpressures which is extracted from the MP steam turbine, and hence lowering the power loss fromMP turbine.
The power generated from the N2-rich stream turbine increases with an increase in designpressures in the CLR since the pressure ratio in the turbine is high. At higher design pressures inthe CLR, more heat is present in the process streams to produce LP steam, which is expanded in theadditional LP steam turbine resulting in higher power output from it. The efficiency penalty fromthe air compressor is high at higher pressures. For pressures more than the compressor dischargepressure of air bleed from the gas turbine, as in cases P25 and P30, an additional air compressor is
Energies 2018, 11, 147 9 of 13
required to compress the air bleed from the discharge pressure to the required design pressure for theCLR. The efficiency penalty for the air compressor for cases P25 and P30 in Table 3 includes the penaltydue to the additional air compressor. The energy penalty due to the H2-rich fuel compressor is less athigher design pressures for the CLR, since the H2-rich fuel stream is coming out of the absorber inCO2 capture section at higher pressures. There is no significant difference in energy penalty due tothe N2-rich stream compressor, the CO2 compressors and pump, pump for regenerated amine andauxiliaries in the cases shown in Table 3.
All the components listed in Table 3, except the Gas Turbine, Steam Turbine and Auxiliaries,would be added to adapt a NGCC plant for pre-combustion capture of CO2. Another interestingpoint to notice is that at lower pressures (5–15 bar) for CLR, the sum of percentage of LHV of NGfuel for additional components is negative and hence a higher penalty on the efficiency of the process.At higher pressures (18–30 bar), the sum of the percentage of LHV of NG for additional components ispositive. Anyhow, the sum is very close to zero when the design pressure for CLR is 18 bar, which isvery close to the pressure of the air bleed from the compressor discharge in the GT. This is mainlybecause the power output from the N2-rich stream turbine and the additional LP steam turbine nullifiesthe penalty from compressors for the diluent N2-rich stream, H2-rich fuel, air and CO2 alongside pumpfor the amine and other auxiliaries. Although the efficiency of the compressors and turbines is goingto affect the outcome from each component, the efficiencies were assumed constant in all the casespresented in this paper. The net electrical efficiency of the CLR-CC process is high at higher designpressures for the CLR. Anyhow, for pressures more than 18 bar, an additional air compressor needs tobe included in the process to compress the air bleed from discharge pressure to the required pressurefor CLR.
Table 3. Results from analysis of CLR-CC at different design pressures in chemical looping reforming (CLR).
Pressure Case (bar) P5 P10 P15 Base Case (P18) P25 P30
Gas Turbine %—LHV input 30.3 29.4 28.9 28.5 28.6 28.7Steam Turbine %—LHV input 14.5 14.2 14.0 13.9 13.7 13.8
N2-rich Stream Turbine %—LHV input 5.3 7.2 8.1 8.5 9.2 9.5Additional LP steam Turbine %—LHV input 2.7 2.8 3.0 3.1 3.3 3.4
Diluent N2-rich Stream Compressor %—LHV input −4.8 −4.7 −4.7 −4.6 −4.5 −4.4H2 rich fuel Compressor %—LHV input −3.1 −1.9 −1.3 −1.0 −0.6 −0.4
Air Compressor %—LHV input −1.3 −2.1 −2.6 −2.9 −3.9 −4.5Pump for Regenerated Amine %—LHV input −0.1 −0.1 −0.1 −0.1 −0.2 −0.2
CO2 Compression %—LHV input −1.9 −1.9 −1.8 −1.8 −1.8 −1.8Auxiliaries %—LHV input −1.2 −1.2 −1.2 −1.2 −1.2 −1.2
LHV of NG—Input GW 2.11 2.14 2.14 2.14 2.14 2.13Net Electrical Efficiency % 40.6 41.8 42.3 42.5 42.7 42.9
CO2 Avoidance % 85.1 83.8 83.1 83.7 83.2 82.8CO2 Capture % 89.4 88.6 88.2 88.6 88.2 87.8
Energy to compress captured CO2 kWh/kg CO2 0.1 0.1 0.1 0.1 0.1 0.1
4.2. Heat Integration Options
Table 4 presents the main results from analysis of the performance of the power plant with CLRand CO2 capture for the five different cases of heat integration as discussed in the methodology section.The ‘+’ and ‘−’ signs in Table 4 relate to power production and consumption, respectively. The designpressure for the CLR is chosen to be 18 bar and is kept the same in all the five cases. The net electricalefficiency for the base case is 42.5%. The net electrical efficiencies and the net electrical output forall the other cases are higher than for the base case, since the heat from the process streams is usedto generate steam of higher quality to generate more power with the steam turbine. The amount ofsteam produced has an impact on the power consumed by auxiliaries, especially the work involved inpumping the condensate. The power output or the power consumed from the other sections in theprocess except the steam turbine and auxiliaries do not differ significantly across all the cases.
In Case 1, the net electrical efficiency for the power plant is 46.5%, where the heat is used togenerate superheated HP and MP steam for power production, alongside LP steam for the stripperreboiler. The net electrical efficiency in Case 2 is 44.4%, where the heat from the process streams is used
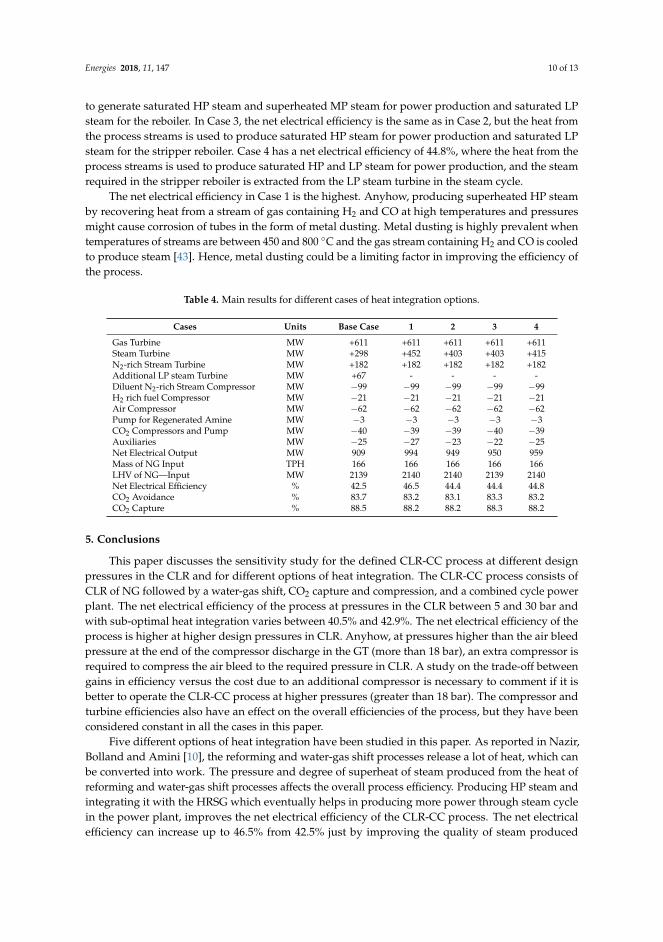
Energies 2018, 11, 147 10 of 13
to generate saturated HP steam and superheated MP steam for power production and saturated LPsteam for the reboiler. In Case 3, the net electrical efficiency is the same as in Case 2, but the heat fromthe process streams is used to produce saturated HP steam for power production and saturated LPsteam for the stripper reboiler. Case 4 has a net electrical efficiency of 44.8%, where the heat from theprocess streams is used to produce saturated HP and LP steam for power production, and the steamrequired in the stripper reboiler is extracted from the LP steam turbine in the steam cycle.
The net electrical efficiency in Case 1 is the highest. Anyhow, producing superheated HP steamby recovering heat from a stream of gas containing H2 and CO at high temperatures and pressuresmight cause corrosion of tubes in the form of metal dusting. Metal dusting is highly prevalent whentemperatures of streams are between 450 and 800 ◦C and the gas stream containing H2 and CO is cooledto produce steam [43]. Hence, metal dusting could be a limiting factor in improving the efficiency ofthe process.
Table 4. Main results for different cases of heat integration options.
Cases Units Base Case 1 2 3 4
Gas Turbine MW +611 +611 +611 +611 +611Steam Turbine MW +298 +452 +403 +403 +415N2-rich Stream Turbine MW +182 +182 +182 +182 +182Additional LP steam Turbine MW +67 - - - -Diluent N2-rich Stream Compressor MW −99 −99 −99 −99 −99H2 rich fuel Compressor MW −21 −21 −21 −21 −21Air Compressor MW −62 −62 −62 −62 −62Pump for Regenerated Amine MW −3 −3 −3 −3 −3CO2 Compressors and Pump MW −40 −39 −39 −40 −39Auxiliaries MW −25 −27 −23 −22 −25Net Electrical Output MW 909 994 949 950 959Mass of NG Input TPH 166 166 166 166 166LHV of NG—Input MW 2139 2140 2140 2139 2140Net Electrical Efficiency % 42.5 46.5 44.4 44.4 44.8CO2 Avoidance % 83.7 83.2 83.1 83.3 83.2CO2 Capture % 88.5 88.2 88.2 88.3 88.2
5. Conclusions
This paper discusses the sensitivity study for the defined CLR-CC process at different designpressures in the CLR and for different options of heat integration. The CLR-CC process consists ofCLR of NG followed by a water-gas shift, CO2 capture and compression, and a combined cycle powerplant. The net electrical efficiency of the process at pressures in the CLR between 5 and 30 bar andwith sub-optimal heat integration varies between 40.5% and 42.9%. The net electrical efficiency of theprocess is higher at higher design pressures in CLR. Anyhow, at pressures higher than the air bleedpressure at the end of the compressor discharge in the GT (more than 18 bar), an extra compressor isrequired to compress the air bleed to the required pressure in CLR. A study on the trade-off betweengains in efficiency versus the cost due to an additional compressor is necessary to comment if it isbetter to operate the CLR-CC process at higher pressures (greater than 18 bar). The compressor andturbine efficiencies also have an effect on the overall efficiencies of the process, but they have beenconsidered constant in all the cases in this paper.
Five different options of heat integration have been studied in this paper. As reported in Nazir,Bolland and Amini [10], the reforming and water-gas shift processes release a lot of heat, which canbe converted into work. The pressure and degree of superheat of steam produced from the heat ofreforming and water-gas shift processes affects the overall process efficiency. Producing HP steam andintegrating it with the HRSG which eventually helps in producing more power through steam cyclein the power plant, improves the net electrical efficiency of the CLR-CC process. The net electricalefficiency can increase up to 46.5% from 42.5% just by improving the quality of steam produced
Energies 2018, 11, 147 11 of 13
while cooling process streams. Anyhow, operation challenges like metal dusting might limit theimprovement in efficiency.
Acknowledgments: This publication forms a part of the EU-FP7 project titled “A Multiscale Simulation-BasedDesign Platform for Cost-Effective CO2 Capture Processes using Nano-Structured Materials (NanoSim)” andproject number 604656. The authors thank the European Commission for the funding. The authors wouldalso like to acknowledge the partners: SINTEF Materials and Chemistry, Universidade de Coimbra, ANDRITZEnergy & Environment GmbH, DCS Computing GmbH, Institut National Polytechnique de Toulouse (INPT),University College London, Technische Universitaet Graz for their support.
Author Contributions: Shareq Mohd Nazir has been responsible for process modeling and simulation, analysisof the results and writing the paper. Olav Bolland and Shahriar Amini have contributed to the paper throughrigorous technical discussions, suggestion and comments and reviewing the manuscripts.
Conflicts of Interest: The authors declare no conflict of interest.
References
1. Energy Technology Perspectives (ETP). Energy Technology Perspectives 2012; International Energy Agency:Paris, France, 2012.
2. Boot-Handford, M.E.; Abanades, J.C.; Anthony, E.J.; Blunt, M.J.; Brandani, S.; Mac Dowell, N.; Fernández, J.R.;Ferrari, M.C.; Gross, R.; Hallett, J.P.; et al. Carbon capture and storage update. Energy Environ. Sci. 2014, 7,130–189. [CrossRef]
3. Kenarsari, S.D.; Yang, D.; Jiang, G.; Zhang, S.; Wang, J.; Russell, A.G.; Wei, Q.; Fan, M. Review of recentadvances in carbon dioxide separation and capture. RSC Adv. 2013, 3, 22739–22773. [CrossRef]
4. Richter, H.J.; Knoche, K.F. Reversibility of Combustion Processes; ACS Symposium Series; ACS Publications:Washington, DC, USA, 1983; pp. 71–85.
5. Ishida, M.; Jin, H. A new advanced power-generation system using chemical-looping combustion. Energy1994, 19, 415–422. [CrossRef]
6. Ishida, M.; Zheng, D.; Akehata, T. Evaluation of a chemical-looping-combustion power-generation systemby graphic exergy analysis. Energy 1987, 12, 147–154. [CrossRef]
7. Consonni, S.; Lozza, G.; Pelliccia, G.; Rossini, S.; Saviano, F. Chemical-looping combustion for combinedcycles with CO2 capture. J. Eng. Gas Turbines Power 2006, 128, 525–534. [CrossRef]
8. Naqvi, R.; Bolland, O. Multi-stage chemical looping combustion (CLC) for combined cycles with CO2 capture.Int. J. Greenh. Gas Control 2007, 1, 19–30. [CrossRef]
9. Iloeje, C.; Zhao, Z.; Ghoniem, A.F. Analysis of thermally coupled chemical looping combustion-based powerplants with carbon capture. Int. J. Greenh. Gas Control 2015, 35, 56–70. [CrossRef]
10. Nazir, S.M.; Bolland, O.; Amini, S. Full plant scale analysis of natural gas fired power plants withpre-combustion CO2 capture and Chemical Looping Reforming (CLR). Energy Procedia 2017, 114, 2146–2155.[CrossRef]
11. Nag, P.K. Power Plant Engineering, 2nd ed.; Tata McGraw-Hill Publishing Company Limited: New York, NY,USA, 2001.
12. Tang, M.; Xu, L.; Fan, M. Progress in oxygen carrier development of methane-based chemical-loopingreforming: A review. Appl. Energy 2015, 151, 143–156. [CrossRef]
13. Adanez, J.; Abad, A.; Garcia-Labiano, F.; Gayan, P.; De Diego, L.F. Progress in chemical-looping combustionand reforming technologies. Prog. Energy Combust. Sci. 2012, 38, 215–282. [CrossRef]
14. Yahom, A.; Powell, J.; Pavarajarn, V.; Onbhuddha, P.; Charojrochkul, S.; Assabumrungrat, S. Simulation andthermodynamic analysis of chemical looping reforming and CO2 enhanced chemical looping reforming.Chem. Eng. Res. Des. 2014, 92, 2575–2583. [CrossRef]
15. Bischi, A.; Langørgen, Ø.; Morin, J.X.; Bakken, J.; Ghorbaniyan, M.; Bysveen, M.; Bolland, O. Hydrodynamicviability of chemical looping processes by means of cold flow model investigation. Appl. Energy 2012, 97,201–216. [CrossRef]
16. Pröll, T.; Kolbitsch, P.; Bolhàr-Nordenkampf, J.; Hofbauer, H. Chemical looping pilot plant results using anickel-based oxygen carrier. Oil Gas Sci. Technol. 2011, 66, 173–180. [CrossRef]
17. Pröll, T.; Bolhàr-Nordenkampf, J.; Kolbitsch, P.; Hofbauer, H. Syngas and a separate nitrogen/argon streamvia chemical looping reforming—A 140 kW pilot plant study. Fuel 2010, 89, 1249–1256. [CrossRef]
Energies 2018, 11, 147 12 of 13
18. Ortiz, M.; de Diego, L.F.; Abad, A.; García-Labiano, F.; Gayán, P.; Adánez, J. Hydrogen production byauto-thermal chemical-looping reforming in a pressurized fluidized bed reactor using Ni-based oxygencarriers. Int. J. Hydrog. Energy 2010, 35, 151–160. [CrossRef]
19. De Diego, L.F.; Ortiz, M.; García-Labiano, F.; Adánez, J.; Abad, A.; Gayán, P. Hydrogen productionby chemical-looping reforming in a circulating fluidized bed reactor using Ni-based oxygen carriers.J. Power Sources 2009, 192, 27–34. [CrossRef]
20. Rydén, M.; Lyngfelt, A.; Mattisson, T. Synthesis gas generation by chemical-looping reforming in acontinuously operating laboratory reactor. Fuel 2006, 85, 1631–1641. [CrossRef]
21. Martínez, I.; Murillo, R.; Grasa, G.; Fernández, J.R.; Abanades, J.C. Integrated combined cycle from naturalgas with CO2 capture using a Ca-Cu chemical loop. AIChE J. 2013, 59, 2780–2794. [CrossRef]
22. Romano, M.C.; Chiesa, P.; Lozza, G. Pre-combustion CO2 capture from natural gas power plants, with ATRand MDEA processes. Int. J. Greenh. Gas Control 2010, 4, 785–797. [CrossRef]
23. Nord, L.O.; Anantharaman, R.; Bolland, O. Design and off-design analyses of a pre-combustion CO2 captureprocess in a natural gas combined cycle power plant. Int. J. Greenh. Gas Control 2009, 3, 385–392. [CrossRef]
24. Ertesvåg, I.S.; Kvamsdal, H.M.; Bolland, O. Exergy analysis of a gas-turbine combined-cycle power plantwith precombustion CO2 capture. Energy 2005, 30, 5–39. [CrossRef]
25. Corradetti, A.; Desideri, U. Analysis of gas-steam combined cycles with natural gas reforming and CO2
capture. J. Eng. Gas Turbines Power 2005, 127, 545–552. [CrossRef]26. Lozza, G.; Chiesa, P. Natural gas decarbonization to reduce CO2 emission from combined cycles—Part I:
Partial oxidation. J. Eng. Gas Turbines Power 2000, 124, 82–88. [CrossRef]27. Zohrabian, A.; Mansouri Majoumerd, M.; Soltanieh, M.; Sattari, S. Techno-economic evaluation of an
integrated hydrogen and power co-generation system with CO2 capture. Int. J. Greenh. Gas Control 2016, 44,94–103. [CrossRef]
28. Lozza, G.; Chiesa, P. Natural gas decarbonization to reduce CO2 emission from combined cycles—Part II:Steam-Methane reforming. J. Eng. Gas Turbines Power 2000, 124, 89–95. [CrossRef]
29. Spallina, V.; Gallucci, F.; Romano, M.C.; Van Sint Annaland, M. Pre-combustion packed bed chemicallooping (PCCL) technology for efficient H2-rich gas production processes. Chem. Eng. J. 2016, 294, 478–494.[CrossRef]
30. Kathe, M.V.; Empfield, A.; Na, J.; Blair, E.; Fan, L.-S. Hydrogen production from natural gas usingan iron-based chemical looping technology: Thermodynamic simulations and process system analysis.Appl. Energy 2016, 165, 183–201. [CrossRef]
31. Diglio, G.; Bareschino, P.; Mancusi, E.; Pepe, F. Simulation of hydrogen production through chemical loopingreforming process in a packed-bed reactor. Chem. Eng. Res. Des. 2016, 105, 137–151. [CrossRef]
32. Antzara, A.; Heracleous, E.; Bukur, D.B.; Lemonidou, A.A. Thermodynamic analysis of hydrogen productionvia chemical looping steam methane reforming coupled with in situ CO2 capture. Int. J. Greenh. Gas Control2015, 32, 115–128. [CrossRef]
33. Cormos, C.C.; Petrescu, L.; Cormos, A.M. Assessment of hydrogen production systems based on natural gasconversion with carbon capture and storage. In Computer Aided Chemical Engineering; Elsevier: Amsterdam,The Netherlands, 2014; Volume 33, pp. 1081–1086.
34. Diglio, G.; Hanak, D.P.; Bareschino, P.; Mancusi, E.; Pepe, F.; Montagnaro, F.; Manovic, V. Techno-economicanalysis of sorption-enhanced steam methane reforming in a fixed bed reactor network integrated with fuelcell. J. Power Sources 2017, 364, 41–51. [CrossRef]
35. Diglio, G.; Bareschino, P.; Mancusi, E.; Pepe, F. Novel quasi-autothermal hydrogen production process in afixed-bed using a chemical looping approach: A numerical study. Int. J. Hydrog. Energy 2017, 42, 15010–15023.[CrossRef]
36. Newsome, D.S. The water-gas shift reaction. Catal. Rev. 1980, 21, 275–318. [CrossRef]37. EBTF (European Tenpin Bowling Federation). European Best Practice Guidelines for Assessment of CO2 Capture
Technologies; CESAR—Project 7th FrameWork Programme. Collaborative Project—GA No. 213569; EuropeanCommission: Brussels, Belgium, 2011.
38. AspenPlus. Aspen Plus V8.6 User Guide; Aspen Technology Inc.: Bedford, MA, USA, 2017.39. AspenHYSYS. Aspen HYSYS V8.6 User Guide; Aspen Technology Inc.: Bedford, MA, USA, 2017.40. Thermoflow. Thermoflow Suite V26 User Guide; Thermoflow Inc.: Southborough, MA, USA, 2017.

Energies 2018, 11, 147 13 of 13
41. Cho, W.C.; Kim, C.G.; Jeong, S.U.; Park, C.S.; Kang, K.S.; Lee, D.Y.; Kim, S.D. Activation and reactivity ofiron oxides as oxygen carriers for hydrogen production by chemical looping. Ind. Eng. Chem. Res. 2015, 54,3091–3100. [CrossRef]
42. Appl, M. Ammonia: Principles and Industrial Practice; WILEY-VCH Verlag GmbH: Weinheim, Germany, 1999.43. Young, D.J.; Zhang, J.; Geers, C.; Schütze, M. Recent advances in understanding metal dusting: A review.
Mater. Corros. 2011, 62, 7–28. [CrossRef]
© 2018 by the authors. Licensee MDPI, Basel, Switzerland. This article is an open accessarticle distributed under the terms and conditions of the Creative Commons Attribution(CC BY) license (http://creativecommons.org/licenses/by/4.0/).


Paper III
Nazir S.M., Morgado J.F., Bolland O., Quinta-Ferreira R., Amini S., Techno-economic
assessment of chemical looping reforming of Natural Gas for Hydrogen production and power
generation with integrated CO2 capture. International Journal of Greenhouse Gas Control
(2018). (Under Review).

Techno-economic assessment of chemical looping reforming of Natural Gas for Hydrogen production and power generation with integrated CO2 capture
Shareq Mohd Nazir1, Joana Francisco Morgado1,2, Olav Bolland1, Rosa Quinta-Ferreira2,
Shahriar Amini1,3*
1Department of Energy and Process Engineering, Norwegian University of Science and Technology, Trondheim, Norway
2Department of Chemical Engineering, University of Coimbra, Coimbra, Portugal 3SINTEF Materials and Chemistry, Trondheim, Norway
Abstract:
The current study presents the techno-economic analysis of the CLR-CC process. The CLR-CC
process comprises of chemical looping reforming (CLR) of Natural Gas, water gas shift, CO2
capture and compression, and combined cycle power plant. A 1-D phenomenological model
was developed using MATLAB and is used to study the performance of CLR, whereas the
remaining part of the process was analysed using commercial software tools like Aspen and
Thermoflow. The effect of design conditions in CLR, mainly the air flowrate to the oxidation
reactor, oxidation reactor outlet temperature and the steam flowrate to the fuel reactor of CLR,
on the overall techno-economic performance of the CLR-CC process is reported. The CH4
conversion in CLR, net electrical efficiency, CO2 avoidance rate and the Levelised Cost of
Electricity (LCOE) have been identified as techno-economic performance indicators. For the
sensitivity study carried out in this study through 12 cases, the net electrical efficiency of the
CLR-CC process varies between 40.0 and 43.4 %, whereas the LCOE varies between 75.3 and
144.8 $/MWh, which is highly dependent on the fuel cost and process contingency rates.
*Corresponding author Email: [email protected] Telephone: +47- 46639721 Address: S. P. Andersens veg 15 B, Trondheim, 7031
Keywords: Pre-combustion CO2 capture method; Chemical Looping Reforming; Combined
cycle power plants; Techno-economic analysis.
Nomenclature:
BEC Bare Erected Cost
CCS Carbon Capture and Sequestration
CLC Chemical Looping Combustion
CLR Chemical Looping Reforming
CF Capacity Factor
EPCC Engineering Procurement and Construction Cost
FC Fuel Cost
FCF Fixed Charge Factor
FOM Fixed Operating and Maintenance
GT Gas Turbine
HP High Pressure
HR Heat Rate
HRSG Heat Recovery Steam Generator
HTS High Temperature Shift
LCOE Levelised Cost of Electricity
LP Low Pressure
LTS Low Temperature Shift
MP Medium Pressure
NG Natural Gas
ST Steam Turbine
TCR Total Capital Requirement
TOC Total Overnight Cost
TPC Total Plant Cost
VOM Variable Operating and Maintenance
WGS Water Gas Shift
η Net Electrical Efficiency
1. Introduction
While the energy transition is taking momentum and a shift towards renewables is evidently
visible, oil, coal and natural gas still account for more than 80% of the world’s primary energy
demand (WEO 2016). There needs to be strike between satisfying the energy demands and the
control of CO2 levels in the atmosphere, as CO2 is the major contributor to the greenhouse gas
emissions. Carbon Capture and Sequestration (CCS) is one of the methods to mitigate
greenhouse gas emissions and is foreseen to reduce one sixth of the total CO2 emissions by
2050 (ETP 2012). Three main CO2 capture routes have been studied and presented in literature,
which are pre-, post- and oxy-combustion. A detailed review on the developments in the capture
methods have been presented by Boot-Handford et al. (2014). The focus of this paper is on a
pre-combustion capture method in Natural Gas (NG) based power plants with Chemical
Looping Reforming (CLR).
Chemical Looping (CL) processes with their ability to inherently separate air and CO2 have
attracted a lot of research attention. CL processes like Chemical Looping Combustion (CLC)
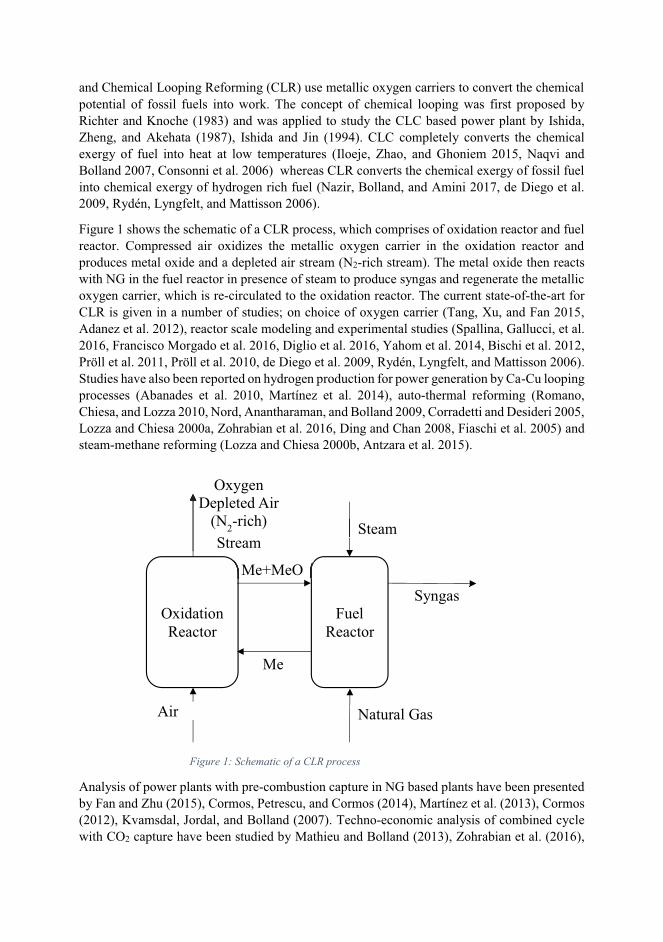
and Chemical Looping Reforming (CLR) use metallic oxygen carriers to convert the chemical
potential of fossil fuels into work. The concept of chemical looping was first proposed by
Richter and Knoche (1983) and was applied to study the CLC based power plant by Ishida,
Zheng, and Akehata (1987), Ishida and Jin (1994). CLC completely converts the chemical
exergy of fuel into heat at low temperatures (Iloeje, Zhao, and Ghoniem 2015, Naqvi and
Bolland 2007, Consonni et al. 2006) whereas CLR converts the chemical exergy of fossil fuel
into chemical exergy of hydrogen rich fuel (Nazir, Bolland, and Amini 2017, de Diego et al.
2009, Rydén, Lyngfelt, and Mattisson 2006).
Figure 1 shows the schematic of a CLR process, which comprises of oxidation reactor and fuel
reactor. Compressed air oxidizes the metallic oxygen carrier in the oxidation reactor and
produces metal oxide and a depleted air stream (N2-rich stream). The metal oxide then reacts
with NG in the fuel reactor in presence of steam to produce syngas and regenerate the metallic
oxygen carrier, which is re-circulated to the oxidation reactor. The current state-of-the-art for
CLR is given in a number of studies; on choice of oxygen carrier (Tang, Xu, and Fan 2015,
Adanez et al. 2012), reactor scale modeling and experimental studies (Spallina, Gallucci, et al.
2016, Francisco Morgado et al. 2016, Diglio et al. 2016, Yahom et al. 2014, Bischi et al. 2012,
Pröll et al. 2011, Pröll et al. 2010, de Diego et al. 2009, Rydén, Lyngfelt, and Mattisson 2006).
Studies have also been reported on hydrogen production for power generation by Ca-Cu looping
processes (Abanades et al. 2010, Martínez et al. 2014), auto-thermal reforming (Romano,
Chiesa, and Lozza 2010, Nord, Anantharaman, and Bolland 2009, Corradetti and Desideri 2005,
Lozza and Chiesa 2000a, Zohrabian et al. 2016, Ding and Chan 2008, Fiaschi et al. 2005) and
steam-methane reforming (Lozza and Chiesa 2000b, Antzara et al. 2015).
Analysis of power plants with pre-combustion capture in NG based plants have been presented
by Fan and Zhu (2015), Cormos, Petrescu, and Cormos (2014), Martínez et al. (2013), Cormos
(2012), Kvamsdal, Jordal, and Bolland (2007). Techno-economic analysis of combined cycle
with CO2 capture have been studied by Mathieu and Bolland (2013), Zohrabian et al. (2016),
Oxidation
Reactor
Fuel
Reactor
Me+MeO
Me
Syngas
Oxygen Depleted Air
(N2-rich)
Stream
Air Natural Gas
Steam
Figure 1: Schematic of a CLR process
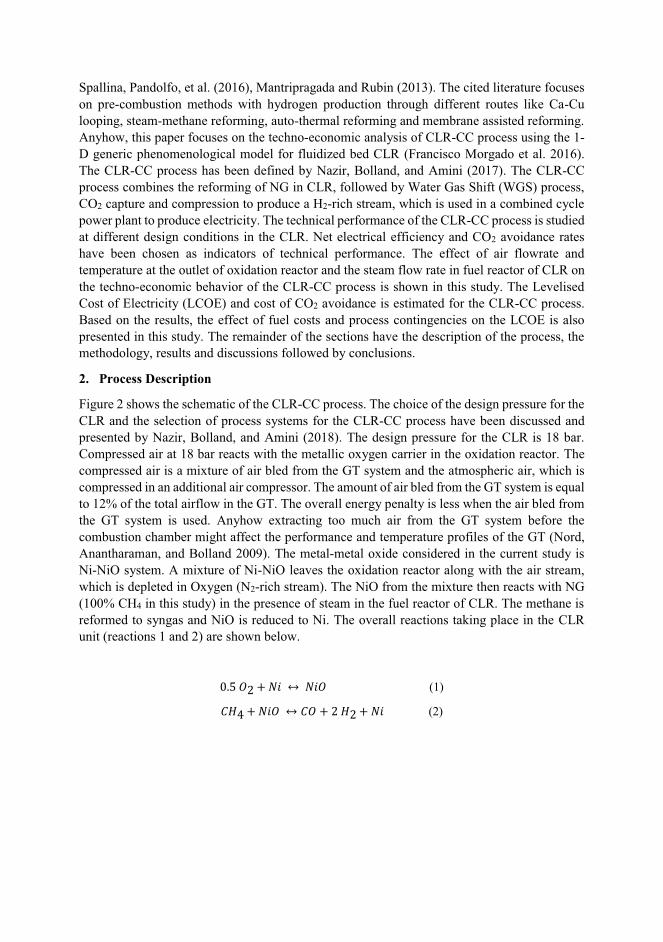
Spallina, Pandolfo, et al. (2016), Mantripragada and Rubin (2013). The cited literature focuses
on pre-combustion methods with hydrogen production through different routes like Ca-Cu
looping, steam-methane reforming, auto-thermal reforming and membrane assisted reforming.
Anyhow, this paper focuses on the techno-economic analysis of CLR-CC process using the 1-
D generic phenomenological model for fluidized bed CLR (Francisco Morgado et al. 2016).
The CLR-CC process has been defined by Nazir, Bolland, and Amini (2017). The CLR-CC
process combines the reforming of NG in CLR, followed by Water Gas Shift (WGS) process,
CO2 capture and compression to produce a H2-rich stream, which is used in a combined cycle
power plant to produce electricity. The technical performance of the CLR-CC process is studied
at different design conditions in the CLR. Net electrical efficiency and CO2 avoidance rates
have been chosen as indicators of technical performance. The effect of air flowrate and
temperature at the outlet of oxidation reactor and the steam flow rate in fuel reactor of CLR on
the techno-economic behavior of the CLR-CC process is shown in this study. The Levelised
Cost of Electricity (LCOE) and cost of CO2 avoidance is estimated for the CLR-CC process.
Based on the results, the effect of fuel costs and process contingencies on the LCOE is also
presented in this study. The remainder of the sections have the description of the process, the
methodology, results and discussions followed by conclusions.
2. Process Description
Figure 2 shows the schematic of the CLR-CC process. The choice of the design pressure for the
CLR and the selection of process systems for the CLR-CC process have been discussed and
presented by Nazir, Bolland, and Amini (2018). The design pressure for the CLR is 18 bar.
Compressed air at 18 bar reacts with the metallic oxygen carrier in the oxidation reactor. The
compressed air is a mixture of air bled from the GT system and the atmospheric air, which is
compressed in an additional air compressor. The amount of air bled from the GT system is equal
to 12% of the total airflow in the GT. The overall energy penalty is less when the air bled from
the GT system is used. Anyhow extracting too much air from the GT system before the
combustion chamber might affect the performance and temperature profiles of the GT (Nord,
Anantharaman, and Bolland 2009). The metal-metal oxide considered in the current study is
Ni-NiO system. A mixture of Ni-NiO leaves the oxidation reactor along with the air stream,
which is depleted in Oxygen (N2-rich stream). The NiO from the mixture then reacts with NG
(100% CH4 in this study) in the presence of steam in the fuel reactor of CLR. The methane is
reformed to syngas and NiO is reduced to Ni. The overall reactions taking place in the CLR
unit (reactions 1 and 2) are shown below.
+~���� � 0 � � �0 � (1)
��� � 0 �� � �� � ���� � 0 (2)
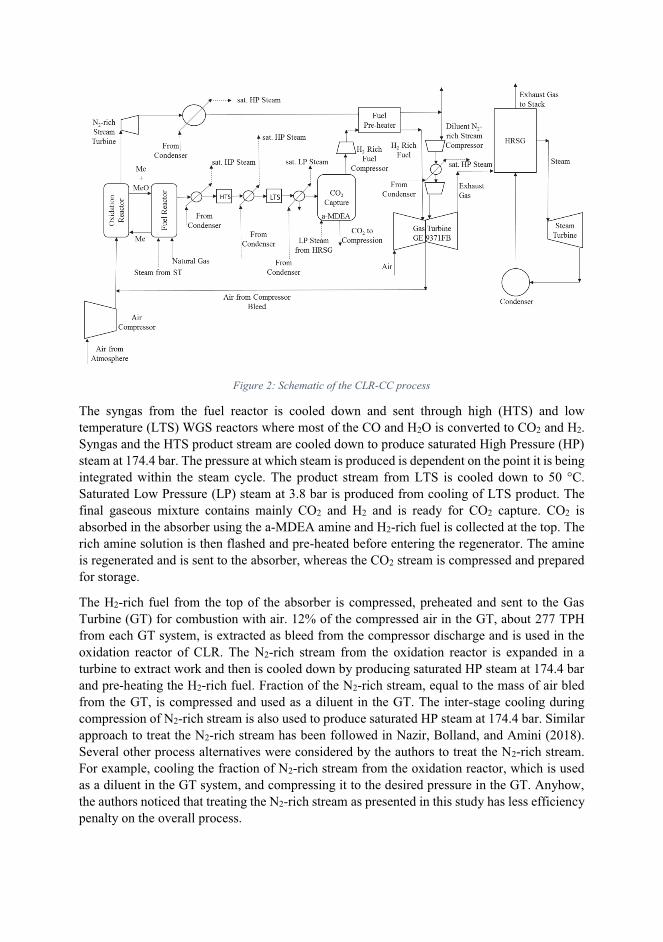
Figure 2: Schematic of the CLR-CC process
The syngas from the fuel reactor is cooled down and sent through high (HTS) and low
temperature (LTS) WGS reactors where most of the CO and H2O is converted to CO2 and H2.
Syngas and the HTS product stream are cooled down to produce saturated High Pressure (HP)
steam at 174.4 bar. The pressure at which steam is produced is dependent on the point it is being
integrated within the steam cycle. The product stream from LTS is cooled down to 50 °C.
Saturated Low Pressure (LP) steam at 3.8 bar is produced from cooling of LTS product. The
final gaseous mixture contains mainly CO2 and H2 and is ready for CO2 capture. CO2 is
absorbed in the absorber using the a-MDEA amine and H2-rich fuel is collected at the top. The
rich amine solution is then flashed and pre-heated before entering the regenerator. The amine
is regenerated and is sent to the absorber, whereas the CO2 stream is compressed and prepared
for storage.
The H2-rich fuel from the top of the absorber is compressed, preheated and sent to the Gas
Turbine (GT) for combustion with air. 12% of the compressed air in the GT, about 277 TPH
from each GT system, is extracted as bleed from the compressor discharge and is used in the
oxidation reactor of CLR. The N2-rich stream from the oxidation reactor is expanded in a
turbine to extract work and then is cooled down by producing saturated HP steam at 174.4 bar
and pre-heating the H2-rich fuel. Fraction of the N2-rich stream, equal to the mass of air bled
from the GT, is compressed and used as a diluent in the GT. The inter-stage cooling during
compression of N2-rich stream is also used to produce saturated HP steam at 174.4 bar. Similar
approach to treat the N2-rich stream has been followed in Nazir, Bolland, and Amini (2018).
Several other process alternatives were considered by the authors to treat the N2-rich stream.
For example, cooling the fraction of N2-rich stream from the oxidation reactor, which is used
as a diluent in the GT system, and compressing it to the desired pressure in the GT. Anyhow,
the authors noticed that treating the N2-rich stream as presented in this study has less efficiency
penalty on the overall process.
The power plant is a combined cycle with two gas turbines, two Heat Recovery Steam
Generators (HRSG) and one steam turbine (ST) system, as it is the same configuration used for
a NGCC plant without capture in EBTF (2011). The steam cycle is a three-pressure level with
reheat and comprises of one high pressure steam turbine, one medium pressure steam turbine
and two flow low pressure turbines. The low pressure (LP), medium pressure (MP) and high
pressure (HP) steam levels are maintained at 3.4, 32.7 and 166 bar, respectively. The water and
steam mixture from the ST is condensed in a water-cooled condenser before the water is
pumped and sent to HRSG. The cooling water requirements in the process is met by a natural
draft cooling tower. The saturated HP and LP steam generated from cooling of process streams
in the process is added to the HRSG at the inlet of respective HP and LP superheaters. The
assumptions made in the model are explained in the following section.
3. Methodology
The techno-economic assessment of the CLR-CC process was carried out using the process
models to assess different sections of the process, and the economic model as described by
GCCSI (2013). The description of the models and the respective assumptions alongside criteria
for technical assessment is briefed below.
3.1. 1-D Model for CLR
The 1-D model used in this work consists of a 1-D generic phenomenological model for
fluidized bed reactors applied to CLR (Morgado et al. 2016) developed using MATLAB. The
generic model formulation is based on the averaging probabilistic approach developed by
Thompson et al. (Thompson, Bi, and Grace 1999, Abba et al. 2003) and couples the three most
frequent fluidization regimes in industry (bubbling, turbulent and fast fluidization).
Furthermore, it relies on the two-phase theory that distinguishes between a low and high dense
phase, poor and highly concentrated in solids, respectively. The material and energy balances
as well as the empirical closure laws used to describe the hydrodynamics of the system under
different fluidization regimes are described by Morgado et al. (2016). The use of kinetic models
like this one helps in evaluating the process more accurately at different design conditions and
dynamics of the process. In this work the Dual Circulating Fluidized Bed (DCFB) configuration
proposed by (Pröll et al.) was considered. Therefore, both reactors operate under the same
fluidization regimes that is turbulent and/or fast fluidization (Schmid et al. 2011, Kolbitsch et
al. 2009).
Adiabatic conditions were assumed in both oxidation and fuel reactors. The temperature at the
outlet of the oxidation reactor was limited to 1200 ± 10 °C due to the thermal degradation of
the oxygen carrier and was used to estimate the oxygen carrier circulation rate between the
oxidation and fuel reactors. Adding on to it, the effect of changing the temperature at the outlet
of oxidation reactor to 1100 ± 10 °C is also presented in this paper. The air flowrate entering
the oxidation reactor was defined to meet higher conversion rates of methane in the fuel reactor.
The amount of steam flowrate fed to the fuel reactor was assumed based on the CO/H2O ratio
required for favorable conditions in WGS.
The dimensions of the reactors (height and diameter) were established in order to meet the
equilibrium conversions in the fuel reactor alongside maintaining the fluidization regimes as in
DCFB. Due to the excellent heat transfer properties of fluidized bed reactors, the temperature
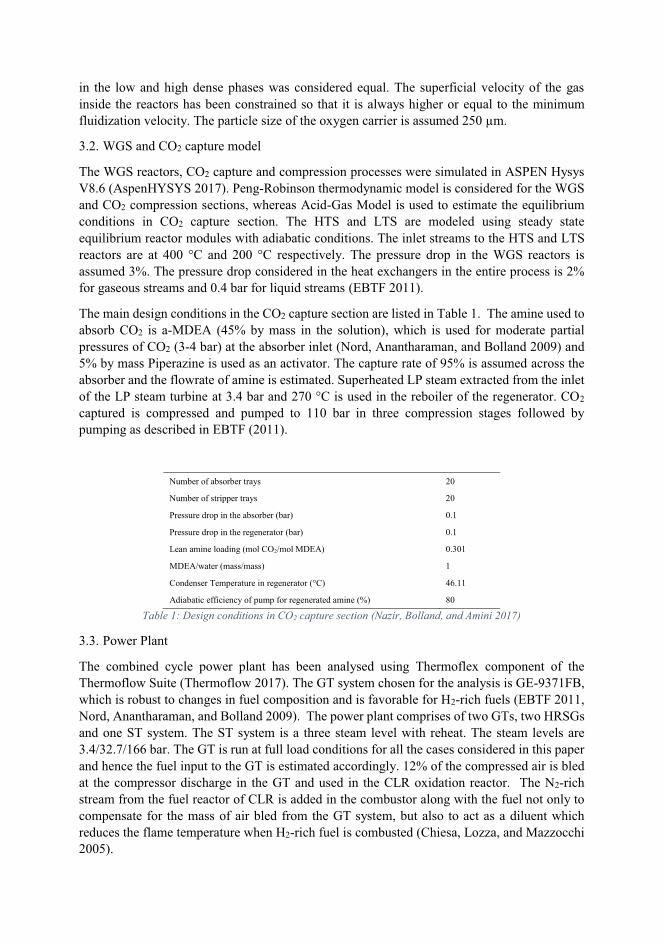
in the low and high dense phases was considered equal. The superficial velocity of the gas
inside the reactors has been constrained so that it is always higher or equal to the minimum
fluidization velocity. The particle size of the oxygen carrier is assumed 250 μm.
3.2. WGS and CO2 capture model
The WGS reactors, CO2 capture and compression processes were simulated in ASPEN Hysys
V8.6 (AspenHYSYS 2017). Peng-Robinson thermodynamic model is considered for the WGS
and CO2 compression sections, whereas Acid-Gas Model is used to estimate the equilibrium
conditions in CO2 capture section. The HTS and LTS are modeled using steady state
equilibrium reactor modules with adiabatic conditions. The inlet streams to the HTS and LTS
reactors are at 400 °C and 200 °C respectively. The pressure drop in the WGS reactors is
assumed 3%. The pressure drop considered in the heat exchangers in the entire process is 2%
for gaseous streams and 0.4 bar for liquid streams (EBTF 2011).
The main design conditions in the CO2 capture section are listed in Table 1. The amine used to
absorb CO2 is a-MDEA (45% by mass in the solution), which is used for moderate partial
pressures of CO2 (3-4 bar) at the absorber inlet (Nord, Anantharaman, and Bolland 2009) and
5% by mass Piperazine is used as an activator. The capture rate of 95% is assumed across the
absorber and the flowrate of amine is estimated. Superheated LP steam extracted from the inlet
of the LP steam turbine at 3.4 bar and 270 °C is used in the reboiler of the regenerator. CO2
captured is compressed and pumped to 110 bar in three compression stages followed by
pumping as described in EBTF (2011).
Number of absorber trays 20
Number of stripper trays 20
Pressure drop in the absorber (bar) 0.1
Pressure drop in the regenerator (bar) 0.1
Lean amine loading (mol CO2/mol MDEA) 0.301
MDEA/water (mass/mass) 1
Condenser Temperature in regenerator (°C) 46.11
Adiabatic efficiency of pump for regenerated amine (%) 80
Table 1: Design conditions in CO2 capture section (Nazir, Bolland, and Amini 2017)
3.3. Power Plant
The combined cycle power plant has been analysed using Thermoflex component of the
Thermoflow Suite (Thermoflow 2017). The GT system chosen for the analysis is GE-9371FB,
which is robust to changes in fuel composition and is favorable for H2-rich fuels (EBTF 2011,
Nord, Anantharaman, and Bolland 2009). The power plant comprises of two GTs, two HRSGs
and one ST system. The ST system is a three steam level with reheat. The steam levels are
3.4/32.7/166 bar. The GT is run at full load conditions for all the cases considered in this paper
and hence the fuel input to the GT is estimated accordingly. 12% of the compressed air is bled
at the compressor discharge in the GT and used in the CLR oxidation reactor. The N2-rich
stream from the fuel reactor of CLR is added in the combustor along with the fuel not only to
compensate for the mass of air bled from the GT system, but also to act as a diluent which
reduces the flame temperature when H2-rich fuel is combusted (Chiesa, Lozza, and Mazzocchi
2005).
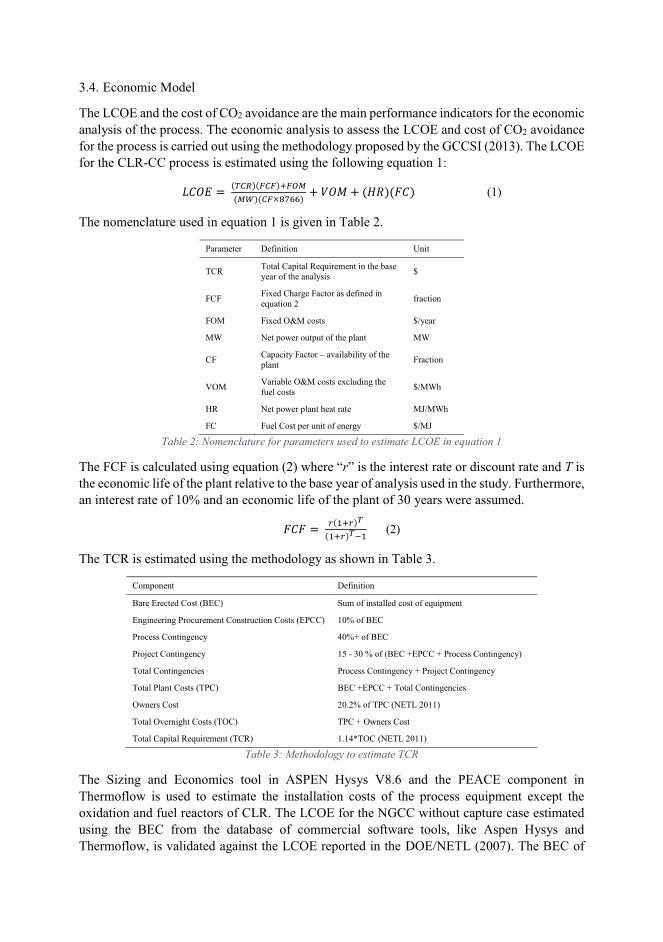
3.4. Economic Model
The LCOE and the cost of CO2 avoidance are the main performance indicators for the economic
analysis of the process. The economic analysis to assess the LCOE and cost of CO2 avoidance
for the process is carried out using the methodology proposed by the GCCSI (2013). The LCOE
for the CLR-CC process is estimated using the following equation 1:
M��� � � ,-&N/,O&O/POQR,RS/,&O*TUVV/ � ��� � ,�W/,X�/ (1)
The nomenclature used in equation 1 is given in Table 2.
Parameter Definition Unit
TCR Total Capital Requirement in the base year of the analysis
$
FCF Fixed Charge Factor as defined in equation 2
fraction
FOM Fixed O&M costs $/year
MW Net power output of the plant MW
CF Capacity Factor – availability of the plant
Fraction
VOM Variable O&M costs excluding the fuel costs
$/MWh
HR Net power plant heat rate MJ/MWh
FC Fuel Cost per unit of energy $/MJ
Table 2: Nomenclature for parameters used to estimate LCOE in equation 1
The FCF is calculated using equation (2) where “r” is the interest rate or discount rate and T is
the economic life of the plant relative to the base year of analysis used in the study. Furthermore,
an interest rate of 10% and an economic life of the plant of 30 years were assumed.
X�X �� @,9P@/-,9P@/-Y9 (2)
The TCR is estimated using the methodology as shown in Table 3.
Component Definition
Bare Erected Cost (BEC) Sum of installed cost of equipment
Engineering Procurement Construction Costs (EPCC) 10% of BEC
Process Contingency 40%+ of BEC
Project Contingency 15 - 30 % of (BEC +EPCC + Process Contingency)
Total Contingencies Process Contingency + Project Contingency
Total Plant Costs (TPC) BEC +EPCC + Total Contingencies
Owners Cost 20.2% of TPC (NETL 2011)
Total Overnight Costs (TOC) TPC + Owners Cost
Total Capital Requirement (TCR) 1.14*TOC (NETL 2011)
Table 3: Methodology to estimate TCR
The Sizing and Economics tool in ASPEN Hysys V8.6 and the PEACE component in
Thermoflow is used to estimate the installation costs of the process equipment except the
oxidation and fuel reactors of CLR. The LCOE for the NGCC without capture case estimated
using the BEC from the database of commercial software tools, like Aspen Hysys and
Thermoflow, is validated against the LCOE reported in the DOE/NETL (2007). The BEC of
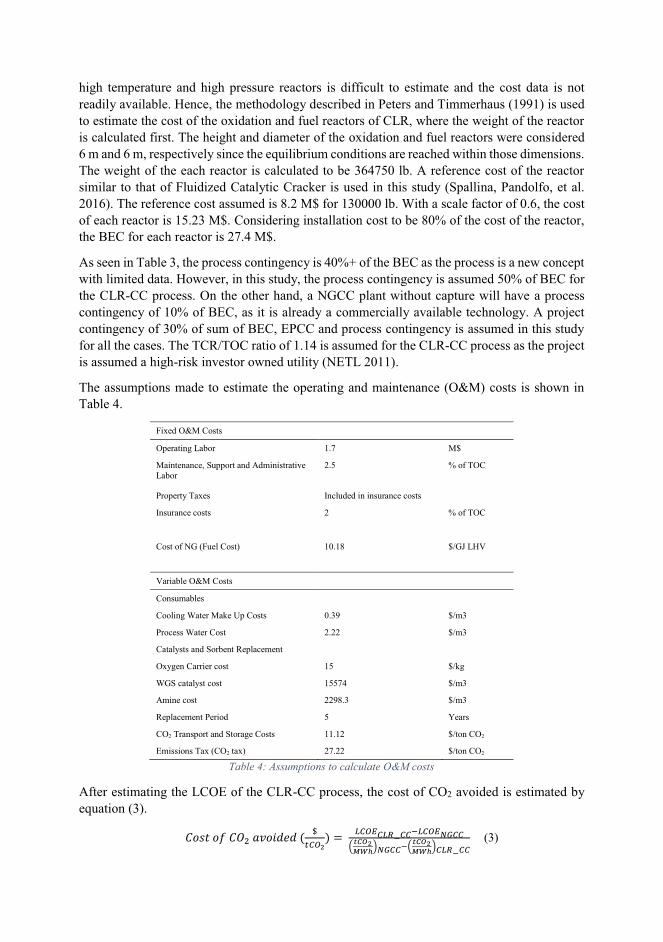
high temperature and high pressure reactors is difficult to estimate and the cost data is not
readily available. Hence, the methodology described in Peters and Timmerhaus (1991) is used
to estimate the cost of the oxidation and fuel reactors of CLR, where the weight of the reactor
is calculated first. The height and diameter of the oxidation and fuel reactors were considered
6 m and 6 m, respectively since the equilibrium conditions are reached within those dimensions.
The weight of the each reactor is calculated to be 364750 lb. A reference cost of the reactor
similar to that of Fluidized Catalytic Cracker is used in this study (Spallina, Pandolfo, et al.
2016). The reference cost assumed is 8.2 M$ for 130000 lb. With a scale factor of 0.6, the cost
of each reactor is 15.23 M$. Considering installation cost to be 80% of the cost of the reactor,
the BEC for each reactor is 27.4 M$.
As seen in Table 3, the process contingency is 40%+ of the BEC as the process is a new concept
with limited data. However, in this study, the process contingency is assumed 50% of BEC for
the CLR-CC process. On the other hand, a NGCC plant without capture will have a process
contingency of 10% of BEC, as it is already a commercially available technology. A project
contingency of 30% of sum of BEC, EPCC and process contingency is assumed in this study
for all the cases. The TCR/TOC ratio of 1.14 is assumed for the CLR-CC process as the project
is assumed a high-risk investor owned utility (NETL 2011).
The assumptions made to estimate the operating and maintenance (O&M) costs is shown in
Table 4.
Fixed O&M Costs
Operating Labor 1.7 M$
Maintenance, Support and Administrative Labor
2.5
% of TOC
Property Taxes Included in insurance costs
Insurance costs 2 % of TOC
Cost of NG (Fuel Cost) 10.18 $/GJ LHV
Variable O&M Costs
Consumables
Cooling Water Make Up Costs 0.39 $/m3
Process Water Cost 2.22 $/m3
Catalysts and Sorbent Replacement
Oxygen Carrier cost 15 $/kg
WGS catalyst cost 15574 $/m3
Amine cost 2298.3 $/m3
Replacement Period 5 Years
CO2 Transport and Storage Costs 11.12 $/ton CO2
Emissions Tax (CO2 tax) 27.22 $/ton CO2
Table 4: Assumptions to calculate O&M costs
After estimating the LCOE of the CLR-CC process, the cost of CO2 avoided is estimated by
equation (3).
���1��5���]�4z� {�{�, [=&Q\/ � � F&Q$&FNY&&YF&Q$;I&&#_`a\bcd);I&&Y#_`a\bcd)&FNY&& (3)
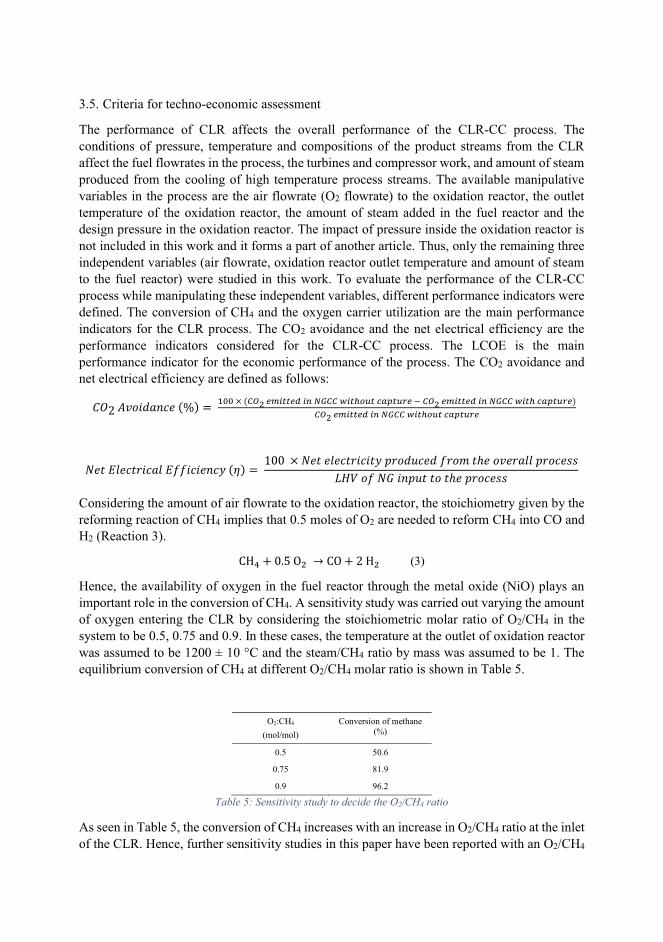
3.5. Criteria for techno-economic assessment
The performance of CLR affects the overall performance of the CLR-CC process. The
conditions of pressure, temperature and compositions of the product streams from the CLR
affect the fuel flowrates in the process, the turbines and compressor work, and amount of steam
produced from the cooling of high temperature process streams. The available manipulative
variables in the process are the air flowrate (O2 flowrate) to the oxidation reactor, the outlet
temperature of the oxidation reactor, the amount of steam added in the fuel reactor and the
design pressure in the oxidation reactor. The impact of pressure inside the oxidation reactor is
not included in this work and it forms a part of another article. Thus, only the remaining three
independent variables (air flowrate, oxidation reactor outlet temperature and amount of steam
to the fuel reactor) were studied in this work. To evaluate the performance of the CLR-CC
process while manipulating these independent variables, different performance indicators were
defined. The conversion of CH4 and the oxygen carrier utilization are the main performance
indicators for the CLR process. The CO2 avoidance and the net electrical efficiency are the
performance indicators considered for the CLR-CC process. The LCOE is the main
performance indicator for the economic performance of the process. The CO2 avoidance and
net electrical efficiency are defined as follows:
���������Zz� {462��,"/ � � 9::�*�,&Q]�<|A==<D�AJ�;I&&�}A=K.E=�?^C=E@<�Y�&Q]�<|A==<D�AJ�;I&&�}A=K�?^C=E@</&Q]�<|A==<D�AJ�;I&&�}A=K.E=�?^C=E@<
0�1����213 24���55 2 �627�,8/ � ��++� * 0�1����213 2 17��3�{�2�{�53���1����z�34����3�2���M����5�0�� 6��1�1��1����3�2���
Considering the amount of air flowrate to the oxidation reactor, the stoichiometry given by the
reforming reaction of CH4 implies that 0.5 moles of O2 are needed to reform CH4 into CO and
H2 (Reaction 3).
��( � +~���] �� �� � ���] (3)
Hence, the availability of oxygen in the fuel reactor through the metal oxide (NiO) plays an
important role in the conversion of CH4. A sensitivity study was carried out varying the amount
of oxygen entering the CLR by considering the stoichiometric molar ratio of O2/CH4 in the
system to be 0.5, 0.75 and 0.9. In these cases, the temperature at the outlet of oxidation reactor
was assumed to be 1200 ± 10 °C and the steam/CH4 ratio by mass was assumed to be 1. The
equilibrium conversion of CH4 at different O2/CH4 molar ratio is shown in Table 5.
O2:CH4
(mol/mol)
Conversion of methane (%)
0.5 50.6
0.75 81.9
0.9 96.2
Table 5: Sensitivity study to decide the O2/CH4 ratio
As seen in Table 5, the conversion of CH4 increases with an increase in O2/CH4 ratio at the inlet
of the CLR. Hence, further sensitivity studies in this paper have been reported with an O2/CH4
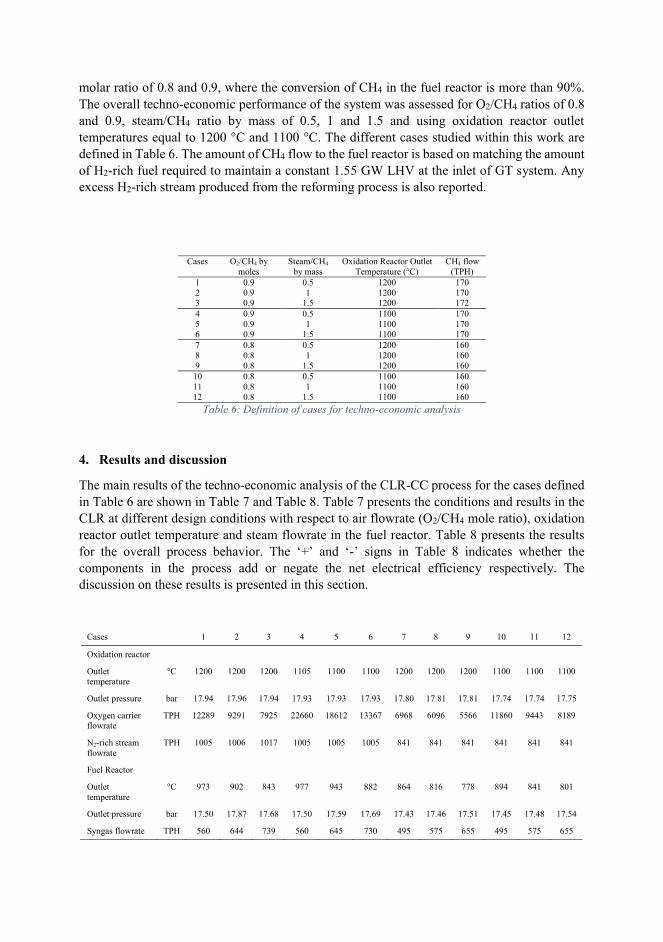
molar ratio of 0.8 and 0.9, where the conversion of CH4 in the fuel reactor is more than 90%.
The overall techno-economic performance of the system was assessed for O2/CH4 ratios of 0.8
and 0.9, steam/CH4 ratio by mass of 0.5, 1 and 1.5 and using oxidation reactor outlet
temperatures equal to 1200 °C and 1100 °C. The different cases studied within this work are
defined in Table 6. The amount of CH4 flow to the fuel reactor is based on matching the amount
of H2-rich fuel required to maintain a constant 1.55 GW LHV at the inlet of GT system. Any
excess H2-rich stream produced from the reforming process is also reported.
Cases O2/CH4 by moles
Steam/CH4 by mass
Oxidation Reactor Outlet Temperature (°C)
CH4 flow (TPH)
1 0.9 0.5 1200 170 2 0.9 1 1200 170 3 0.9 1.5 1200 172
4 0.9 0.5 1100 170 5 0.9 1 1100 170 6 0.9 1.5 1100 170
7 0.8 0.5 1200 160 8 0.8 1 1200 160 9 0.8 1.5 1200 160
10 0.8 0.5 1100 160 11 0.8 1 1100 160 12 0.8 1.5 1100 160
Table 6: Definition of cases for techno-economic analysis
4. Results and discussion
The main results of the techno-economic analysis of the CLR-CC process for the cases defined
in Table 6 are shown in Table 7 and Table 8. Table 7 presents the conditions and results in the
CLR at different design conditions with respect to air flowrate (O2/CH4 mole ratio), oxidation
reactor outlet temperature and steam flowrate in the fuel reactor. Table 8 presents the results
for the overall process behavior. The ‘+’ and ‘-’ signs in Table 8 indicates whether the
components in the process add or negate the net electrical efficiency respectively. The
discussion on these results is presented in this section.
Cases 1 2 3 4 5 6 7 8 9 10 11 12
Oxidation reactor
Outlet temperature
°C 1200 1200 1200 1105 1100 1100 1200 1200 1200 1100 1100 1100
Outlet pressure bar 17.94 17.96 17.94 17.93 17.93 17.93 17.80 17.81 17.81 17.74 17.74 17.75
Oxygen carrier flowrate
TPH 12289 9291 7925 22660 18612 13367 6968 6096 5566 11860 9443 8189
N2-rich stream flowrate
TPH 1005 1006 1017 1005 1005 1005 841 841 841 841 841 841
Fuel Reactor
Outlet temperature
°C 973 902 843 977 943 882 864 816 778 894 841 801
Outlet pressure bar 17.50 17.87 17.68 17.50 17.59 17.69 17.43 17.46 17.51 17.45 17.48 17.54
Syngas flowrate TPH 560 644 739 560 645 730 495 575 655 495 575 655

Methane conversion
% 98.9 96.6 95.3 98.9 98.8 97.5 91.0 88.3 85.9 94.0 91.5 89.2
Table 7: Design conditions and results from CLR
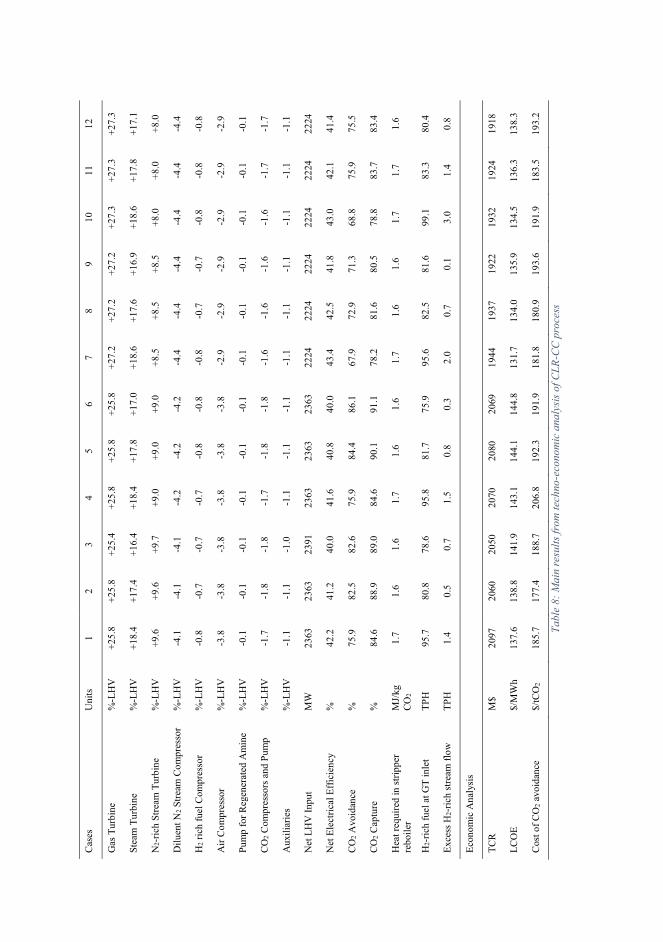
Cas
es
Un
its
1
2
3
4
5
6
7
8
9
10
11
12
Gas
Tu
rbin
e %
-LH
V
+2
5.8
+
25
.8
+2
5.4
+
25
.8
+2
5.8
+
25
.8
+2
7.2
+
27
.2
+2
7.2
+
27
.3
+2
7.3
+
27
.3
Ste
am T
urb
ine
%-L
HV
+
18
.4
+1
7.4
+
16
.4
+1
8.4
+
17
.8
+1
7.0
+
18
.6
+1
7.6
+
16
.9
+1
8.6
+
17
.8
+1
7.1
N2-r
ich
Str
eam
Tu
rbin
e %
-LH
V
+9
.6
+9
.6
+9
.7
+9
.0
+9
.0
+9
.0
+8
.5
+8
.5
+8
.5
+8
.0
+8
.0
+8
.0
Dil
uen
t N
2 S
trea
m C
om
pre
sso
r %
-LH
V
-4.1
-4
.1
-4.1
-4
.2
-4.2
-4
.2
-4.4
-4
.4
-4.4
-4
.4
-4.4
-4
.4
H2 r
ich
fu
el C
om
pre
sso
r %
-LH
V
-0.8
-0
.7
-0.7
-0
.7
-0.8
-0
.8
-0.8
-0
.7
-0.7
-0
.8
-0.8
-0
.8
Air
Co
mp
ress
or
%-L
HV
-3
.8
-3.8
-3
.8
-3.8
-3
.8
-3.8
-2
.9
-2.9
-2
.9
-2.9
-2
.9
-2.9
Pu
mp
fo
r R
egen
erat
ed A
min
e %
-LH
V
-0.1
-0
.1
-0.1
-0
.1
-0.1
-0
.1
-0.1
-0
.1
-0.1
-0
.1
-0.1
-0
.1
CO
2 C
om
pre
sso
rs a
nd
Pu
mp
%
-LH
V
-1.7
-1
.8
-1.8
-1
.7
-1.8
-1
.8
-1.6
-1
.6
-1.6
-1
.6
-1.7
-1
.7
Au
xil
iari
es
%-L
HV
-1
.1
-1.1
-1
.0
-1.1
-1
.1
-1.1
-1
.1
-1.1
-1
.1
-1.1
-1
.1
-1.1
Net
LH
V I
npu
t M
W
23
63
23
63
23
91
23
63
23
63
23
63
22
24
22
24
22
24
22
24
22
24
22
24
Net
Ele
ctri
cal
Eff
icie
ncy
%
4
2.2
4
1.2
4
0.0
4
1.6
4
0.8
4
0.0
4
3.4
4
2.5
4
1.8
4
3.0
4
2.1
4
1.4
CO
2 A
vo
idan
ce
%
75
.9
82
.5
82
.6
75
.9
84
.4
86
.1
67
.9
72
.9
71
.3
68
.8
75
.9
75
.5
CO
2 C
aptu
re
%
84
.6
88
.9
89
.0
84
.6
90
.1
91
.1
78
.2
81
.6
80
.5
78
.8
83
.7
83
.4
Hea
t re
qu
ired
in
str
ipp
er
reb
oil
er
MJ/
kg
CO
2
1.7
1
.6
1.6
1
.7
1.6
1
.6
1.7
1
.6
1.6
1
.7
1.7
1
.6
H2-r
ich
fu
el a
t G
T i
nle
t T
PH
9
5.7
8
0.8
7
8.6
9
5.8
8
1.7
7
5.9
9
5.6
8
2.5
8
1.6
9
9.1
8
3.3
8
0.4
Exce
ss H
2-r
ich
str
eam
flo
w
TP
H
1.4
0
.5
0.7
1
.5
0.8
0
.3
2.0
0
.7
0.1
3
.0
1.4
0
.8
Eco
no
mic
An
alysi
s
TC
R
M$
20
97
20
60
20
50
20
70
20
80
20
69
19
44
19
37
19
22
19
32
19
24
19
18
LC
OE
$
/MW
h
13
7.6
1
38.8
1
41.9
1
43.1
1
44.1
1
44.8
1
31.7
1
34.0
1
35.9
1
34.5
1
36.3
1
38.3
Co
st o
f C
O2 a
vo
idan
ce
$/t
CO
2
18
5.7
1
77.4
1
88.7
2
06.8
1
92.3
1
91.9
1
81.8
1
80.9
1
93.6
1
91.9
1
83.5
1
93.2
Tabl
e 8:
Mai
n re
sults
from
tech
no-e
cono
mic
ana
lysi
s of C
LR-C
C pr
oces
s
4.1.Behavior of the CLR
Figure 3 and Figure 4 show the main results for the performance of the CLR at different design
conditions described in Table 6. Figure 3 shows the conversion of CH4 in the fuel reactor, the
syngas temperature and the oxygen carrier flowrate in the oxidation reactor of the CLR. Figure
4 shows the composition of the syngas for the 12 cases defined in Table 6. The conversion of
CH4 in the fuel reactor of the CLR is a function of air flowrate (O2/CH4 mole ratio) in the
oxidation reactor, the syngas temperature and the steam flowrate (steam/CH4 mass ratio) in the
fuel reactor. The syngas temperature anyhow is mainly dependent on the steam flowrate
(steam/CH4 mass ratio). The CH4 conversion in the CLR is higher by 7-10% for the O2/CH4
mole ratio in the oxidation reactor as 0.9 when compared to 0.8. The CH4 conversion is 3-5%
higher when the steam/CH4 mass ratio in the fuel reactor is 0.5 and decreases when the ratio is
increased to 1 and 1.5. Higher steam flowrates in the fuel reactor lowers the overall fuel reactor
temperature (reflected in the syngas temperature) and hence lowering the CH4 conversion. No
significant change in CH4 conversion (~1%) is observed when the oxidation reactor outlet
temperature is changed from 1200 to 1100 °C. Anyhow, there is significant change in the
oxygen carrier usage in the CLR when the oxidation reactor outlet temperature is changed from
1200 to 1100 °C. Lower the oxidation reactor outlet temperature, higher is the oxygen carrier
circulation to maintain a steady process. The internal behavior of the oxidation and fuel reactor
of the CLR in terms of the average gas and solid axial velocities, average void fractions and
type of fluidization regimes is discussed further in the section.
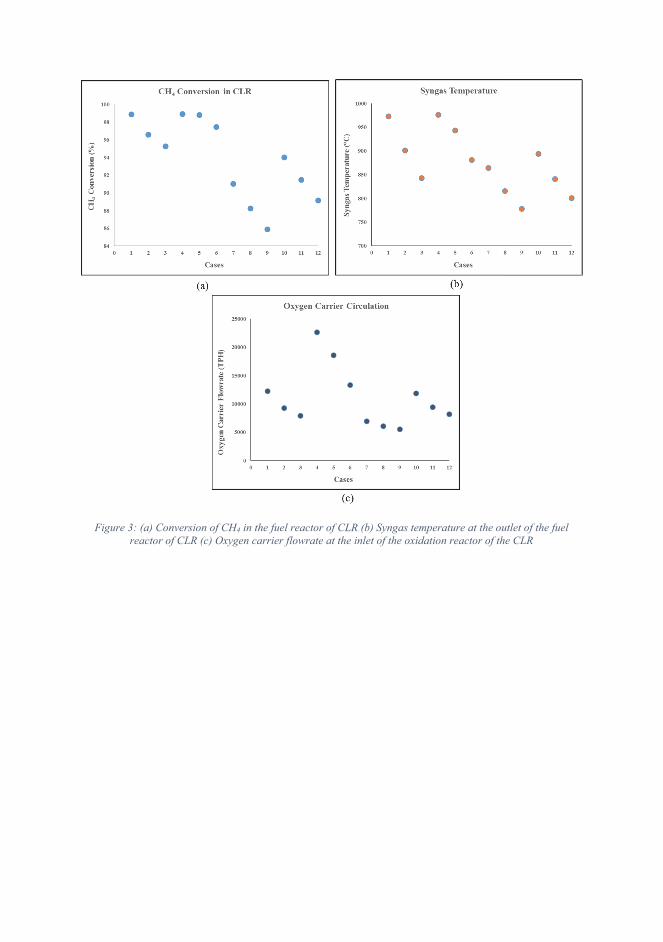
Figure 3: (a) Conversion of CH4 in the fuel reactor of CLR (b) Syngas temperature at the outlet of the fuel reactor of CLR (c) Oxygen carrier flowrate at the inlet of the oxidation reactor of the CLR
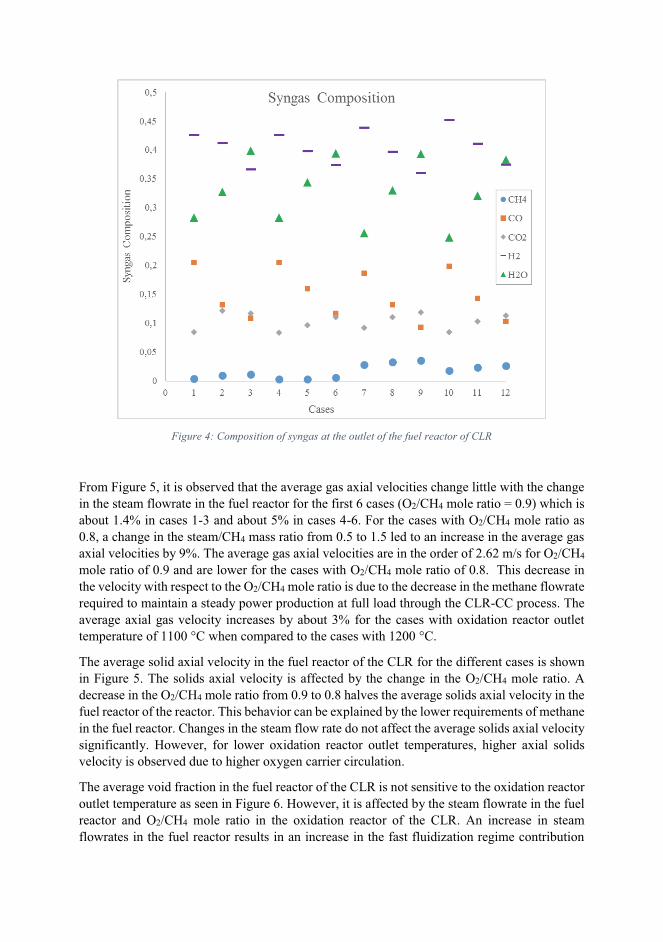
Figure 4: Composition of syngas at the outlet of the fuel reactor of CLR
From Figure 5, it is observed that the average gas axial velocities change little with the change
in the steam flowrate in the fuel reactor for the first 6 cases (O2/CH4 mole ratio = 0.9) which is
about 1.4% in cases 1-3 and about 5% in cases 4-6. For the cases with O2/CH4 mole ratio as
0.8, a change in the steam/CH4 mass ratio from 0.5 to 1.5 led to an increase in the average gas
axial velocities by 9%. The average gas axial velocities are in the order of 2.62 m/s for O2/CH4
mole ratio of 0.9 and are lower for the cases with O2/CH4 mole ratio of 0.8. This decrease in
the velocity with respect to the O2/CH4 mole ratio is due to the decrease in the methane flowrate
required to maintain a steady power production at full load through the CLR-CC process. The
average axial gas velocity increases by about 3% for the cases with oxidation reactor outlet
temperature of 1100 °C when compared to the cases with 1200 °C.
The average solid axial velocity in the fuel reactor of the CLR for the different cases is shown
in Figure 5. The solids axial velocity is affected by the change in the O2/CH4 mole ratio. A
decrease in the O2/CH4 mole ratio from 0.9 to 0.8 halves the average solids axial velocity in the
fuel reactor of the reactor. This behavior can be explained by the lower requirements of methane
in the fuel reactor. Changes in the steam flow rate do not affect the average solids axial velocity
significantly. However, for lower oxidation reactor outlet temperatures, higher axial solids
velocity is observed due to higher oxygen carrier circulation.
The average void fraction in the fuel reactor of the CLR is not sensitive to the oxidation reactor
outlet temperature as seen in Figure 6. However, it is affected by the steam flowrate in the fuel
reactor and O2/CH4 mole ratio in the oxidation reactor of the CLR. An increase in steam
flowrates in the fuel reactor results in an increase in the fast fluidization regime contribution
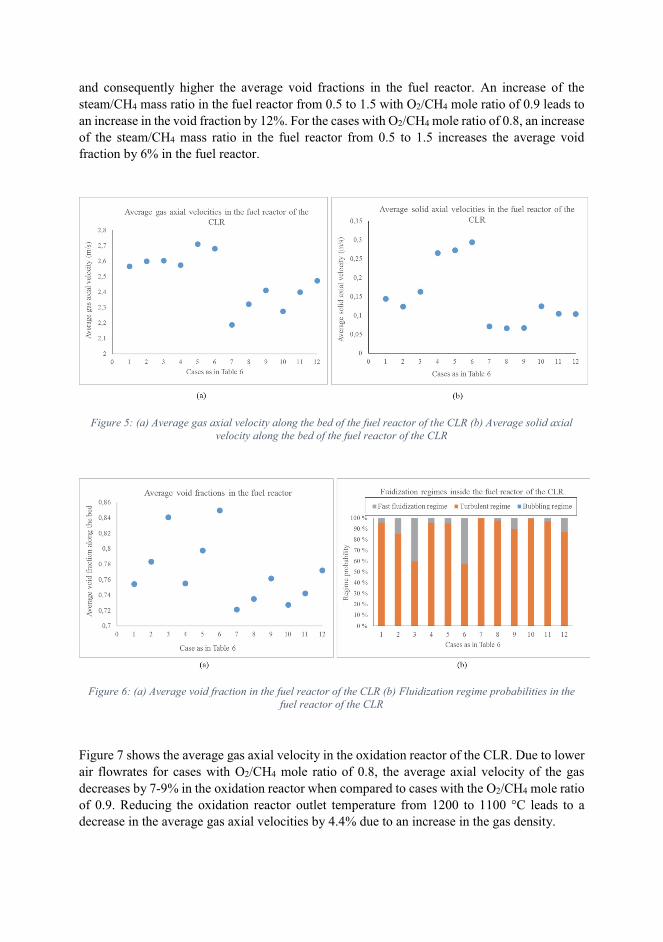
and consequently higher the average void fractions in the fuel reactor. An increase of the
steam/CH4 mass ratio in the fuel reactor from 0.5 to 1.5 with O2/CH4 mole ratio of 0.9 leads to
an increase in the void fraction by 12%. For the cases with O2/CH4 mole ratio of 0.8, an increase
of the steam/CH4 mass ratio in the fuel reactor from 0.5 to 1.5 increases the average void
fraction by 6% in the fuel reactor.
Figure 5: (a) Average gas axial velocity along the bed of the fuel reactor of the CLR (b) Average solid axial velocity along the bed of the fuel reactor of the CLR
Figure 6: (a) Average void fraction in the fuel reactor of the CLR (b) Fluidization regime probabilities in the fuel reactor of the CLR
Figure 7 shows the average gas axial velocity in the oxidation reactor of the CLR. Due to lower
air flowrates for cases with O2/CH4 mole ratio of 0.8, the average axial velocity of the gas
decreases by 7-9% in the oxidation reactor when compared to cases with the O2/CH4 mole ratio
of 0.9. Reducing the oxidation reactor outlet temperature from 1200 to 1100 °C leads to a
decrease in the average gas axial velocities by 4.4% due to an increase in the gas density.
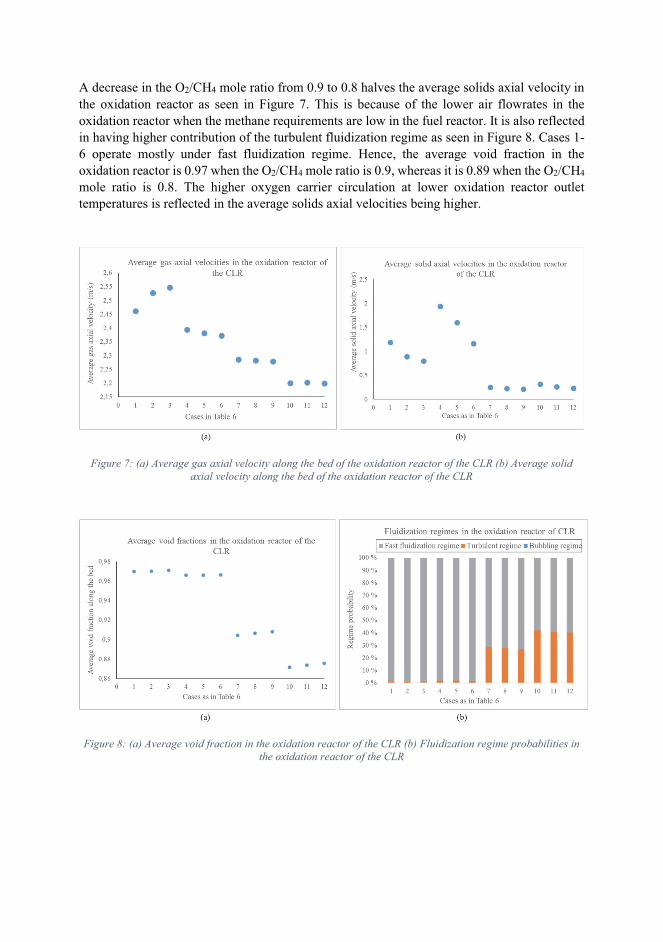
A decrease in the O2/CH4 mole ratio from 0.9 to 0.8 halves the average solids axial velocity in
the oxidation reactor as seen in Figure 7. This is because of the lower air flowrates in the
oxidation reactor when the methane requirements are low in the fuel reactor. It is also reflected
in having higher contribution of the turbulent fluidization regime as seen in Figure 8. Cases 1-
6 operate mostly under fast fluidization regime. Hence, the average void fraction in the
oxidation reactor is 0.97 when the O2/CH4 mole ratio is 0.9, whereas it is 0.89 when the O2/CH4
mole ratio is 0.8. The higher oxygen carrier circulation at lower oxidation reactor outlet
temperatures is reflected in the average solids axial velocities being higher.
Figure 7: (a) Average gas axial velocity along the bed of the oxidation reactor of the CLR (b) Average solid axial velocity along the bed of the oxidation reactor of the CLR
Figure 8: (a) Average void fraction in the oxidation reactor of the CLR (b) Fluidization regime probabilities in the oxidation reactor of the CLR
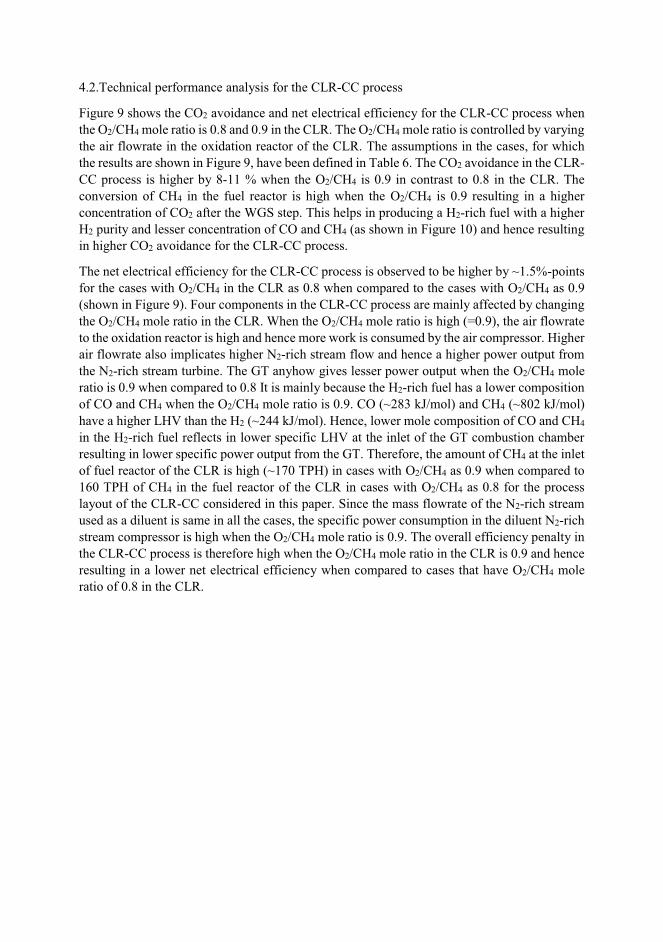
4.2.Technical performance analysis for the CLR-CC process
Figure 9 shows the CO2 avoidance and net electrical efficiency for the CLR-CC process when
the O2/CH4 mole ratio is 0.8 and 0.9 in the CLR. The O2/CH4 mole ratio is controlled by varying
the air flowrate in the oxidation reactor of the CLR. The assumptions in the cases, for which
the results are shown in Figure 9, have been defined in Table 6. The CO2 avoidance in the CLR-
CC process is higher by 8-11 % when the O2/CH4 is 0.9 in contrast to 0.8 in the CLR. The
conversion of CH4 in the fuel reactor is high when the O2/CH4 is 0.9 resulting in a higher
concentration of CO2 after the WGS step. This helps in producing a H2-rich fuel with a higher
H2 purity and lesser concentration of CO and CH4 (as shown in Figure 10) and hence resulting
in higher CO2 avoidance for the CLR-CC process.
The net electrical efficiency for the CLR-CC process is observed to be higher by ~1.5%-points
for the cases with O2/CH4 in the CLR as 0.8 when compared to the cases with O2/CH4 as 0.9
(shown in Figure 9). Four components in the CLR-CC process are mainly affected by changing
the O2/CH4 mole ratio in the CLR. When the O2/CH4 mole ratio is high (=0.9), the air flowrate
to the oxidation reactor is high and hence more work is consumed by the air compressor. Higher
air flowrate also implicates higher N2-rich stream flow and hence a higher power output from
the N2-rich stream turbine. The GT anyhow gives lesser power output when the O2/CH4 mole
ratio is 0.9 when compared to 0.8 It is mainly because the H2-rich fuel has a lower composition
of CO and CH4 when the O2/CH4 mole ratio is 0.9. CO (~283 kJ/mol) and CH4 (~802 kJ/mol)
have a higher LHV than the H2 (~244 kJ/mol). Hence, lower mole composition of CO and CH4
in the H2-rich fuel reflects in lower specific LHV at the inlet of the GT combustion chamber
resulting in lower specific power output from the GT. Therefore, the amount of CH4 at the inlet
of fuel reactor of the CLR is high (~170 TPH) in cases with O2/CH4 as 0.9 when compared to
160 TPH of CH4 in the fuel reactor of the CLR in cases with O2/CH4 as 0.8 for the process
layout of the CLR-CC considered in this paper. Since the mass flowrate of the N2-rich stream
used as a diluent is same in all the cases, the specific power consumption in the diluent N2-rich
stream compressor is high when the O2/CH4 mole ratio is 0.9. The overall efficiency penalty in
the CLR-CC process is therefore high when the O2/CH4 mole ratio in the CLR is 0.9 and hence
resulting in a lower net electrical efficiency when compared to cases that have O2/CH4 mole
ratio of 0.8 in the CLR.
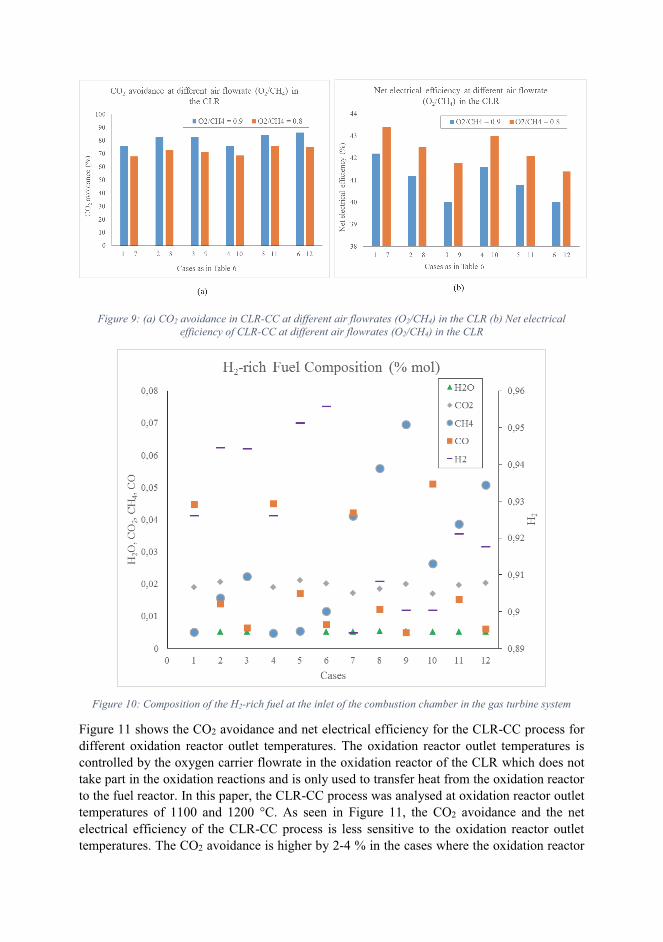
Figure 9: (a) CO2 avoidance in CLR-CC at different air flowrates (O2/CH4) in the CLR (b) Net electrical efficiency of CLR-CC at different air flowrates (O2/CH4) in the CLR
Figure 10: Composition of the H2-rich fuel at the inlet of the combustion chamber in the gas turbine system
Figure 11 shows the CO2 avoidance and net electrical efficiency for the CLR-CC process for
different oxidation reactor outlet temperatures. The oxidation reactor outlet temperatures is
controlled by the oxygen carrier flowrate in the oxidation reactor of the CLR which does not
take part in the oxidation reactions and is only used to transfer heat from the oxidation reactor
to the fuel reactor. In this paper, the CLR-CC process was analysed at oxidation reactor outlet
temperatures of 1100 and 1200 °C. As seen in Figure 11, the CO2 avoidance and the net
electrical efficiency of the CLR-CC process is less sensitive to the oxidation reactor outlet
temperatures. The CO2 avoidance is higher by 2-4 % in the cases where the oxidation reactor
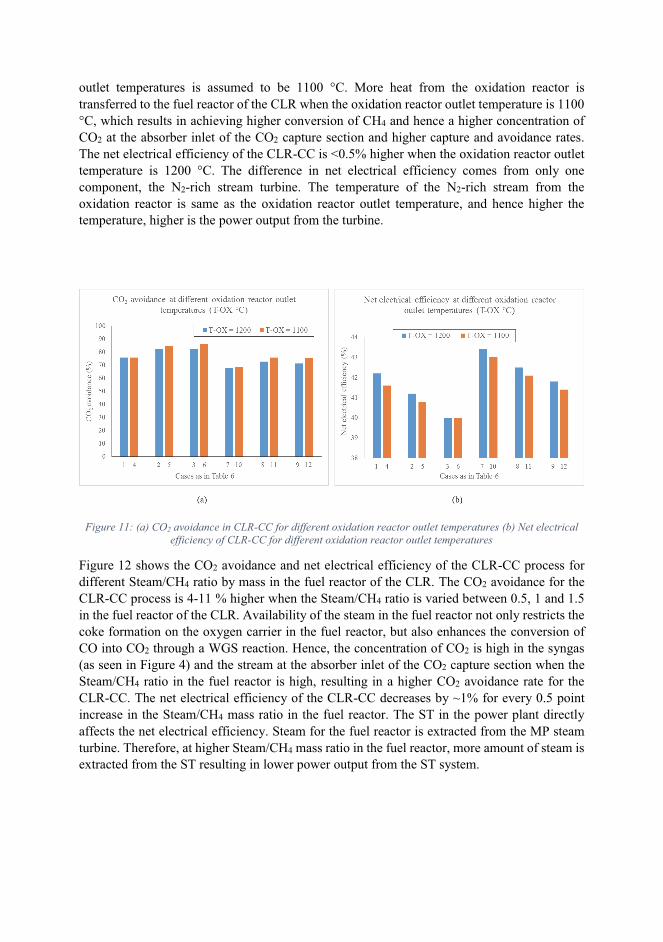
outlet temperatures is assumed to be 1100 °C. More heat from the oxidation reactor is
transferred to the fuel reactor of the CLR when the oxidation reactor outlet temperature is 1100
°C, which results in achieving higher conversion of CH4 and hence a higher concentration of
CO2 at the absorber inlet of the CO2 capture section and higher capture and avoidance rates.
The net electrical efficiency of the CLR-CC is <0.5% higher when the oxidation reactor outlet
temperature is 1200 °C. The difference in net electrical efficiency comes from only one
component, the N2-rich stream turbine. The temperature of the N2-rich stream from the
oxidation reactor is same as the oxidation reactor outlet temperature, and hence higher the
temperature, higher is the power output from the turbine.
Figure 11: (a) CO2 avoidance in CLR-CC for different oxidation reactor outlet temperatures (b) Net electrical efficiency of CLR-CC for different oxidation reactor outlet temperatures
Figure 12 shows the CO2 avoidance and net electrical efficiency of the CLR-CC process for
different Steam/CH4 ratio by mass in the fuel reactor of the CLR. The CO2 avoidance for the
CLR-CC process is 4-11 % higher when the Steam/CH4 ratio is varied between 0.5, 1 and 1.5
in the fuel reactor of the CLR. Availability of the steam in the fuel reactor not only restricts the
coke formation on the oxygen carrier in the fuel reactor, but also enhances the conversion of
CO into CO2 through a WGS reaction. Hence, the concentration of CO2 is high in the syngas
(as seen in Figure 4) and the stream at the absorber inlet of the CO2 capture section when the
Steam/CH4 ratio in the fuel reactor is high, resulting in a higher CO2 avoidance rate for the
CLR-CC. The net electrical efficiency of the CLR-CC decreases by ~1% for every 0.5 point
increase in the Steam/CH4 mass ratio in the fuel reactor. The ST in the power plant directly
affects the net electrical efficiency. Steam for the fuel reactor is extracted from the MP steam
turbine. Therefore, at higher Steam/CH4 mass ratio in the fuel reactor, more amount of steam is
extracted from the ST resulting in lower power output from the ST system.
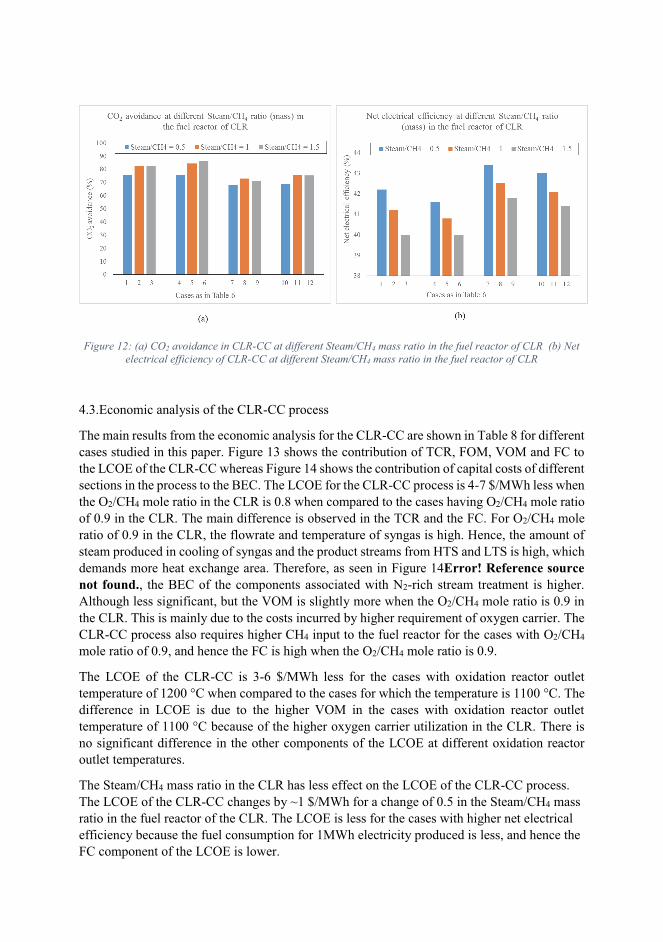
Figure 12: (a) CO2 avoidance in CLR-CC at different Steam/CH4 mass ratio in the fuel reactor of CLR (b) Net electrical efficiency of CLR-CC at different Steam/CH4 mass ratio in the fuel reactor of CLR
4.3.Economic analysis of the CLR-CC process
The main results from the economic analysis for the CLR-CC are shown in Table 8 for different
cases studied in this paper. Figure 13 shows the contribution of TCR, FOM, VOM and FC to
the LCOE of the CLR-CC whereas Figure 14 shows the contribution of capital costs of different
sections in the process to the BEC. The LCOE for the CLR-CC process is 4-7 $/MWh less when
the O2/CH4 mole ratio in the CLR is 0.8 when compared to the cases having O2/CH4 mole ratio
of 0.9 in the CLR. The main difference is observed in the TCR and the FC. For O2/CH4 mole
ratio of 0.9 in the CLR, the flowrate and temperature of syngas is high. Hence, the amount of
steam produced in cooling of syngas and the product streams from HTS and LTS is high, which
demands more heat exchange area. Therefore, as seen in Figure 14Error! Reference source not found., the BEC of the components associated with N2-rich stream treatment is higher.
Although less significant, but the VOM is slightly more when the O2/CH4 mole ratio is 0.9 in
the CLR. This is mainly due to the costs incurred by higher requirement of oxygen carrier. The
CLR-CC process also requires higher CH4 input to the fuel reactor for the cases with O2/CH4
mole ratio of 0.9, and hence the FC is high when the O2/CH4 mole ratio is 0.9.
The LCOE of the CLR-CC is 3-6 $/MWh less for the cases with oxidation reactor outlet
temperature of 1200 °C when compared to the cases for which the temperature is 1100 °C. The
difference in LCOE is due to the higher VOM in the cases with oxidation reactor outlet
temperature of 1100 °C because of the higher oxygen carrier utilization in the CLR. There is
no significant difference in the other components of the LCOE at different oxidation reactor
outlet temperatures.
The Steam/CH4 mass ratio in the CLR has less effect on the LCOE of the CLR-CC process.
The LCOE of the CLR-CC changes by ~1 $/MWh for a change of 0.5 in the Steam/CH4 mass
ratio in the fuel reactor of the CLR. The LCOE is less for the cases with higher net electrical
efficiency because the fuel consumption for 1MWh electricity produced is less, and hence the
FC component of the LCOE is lower.
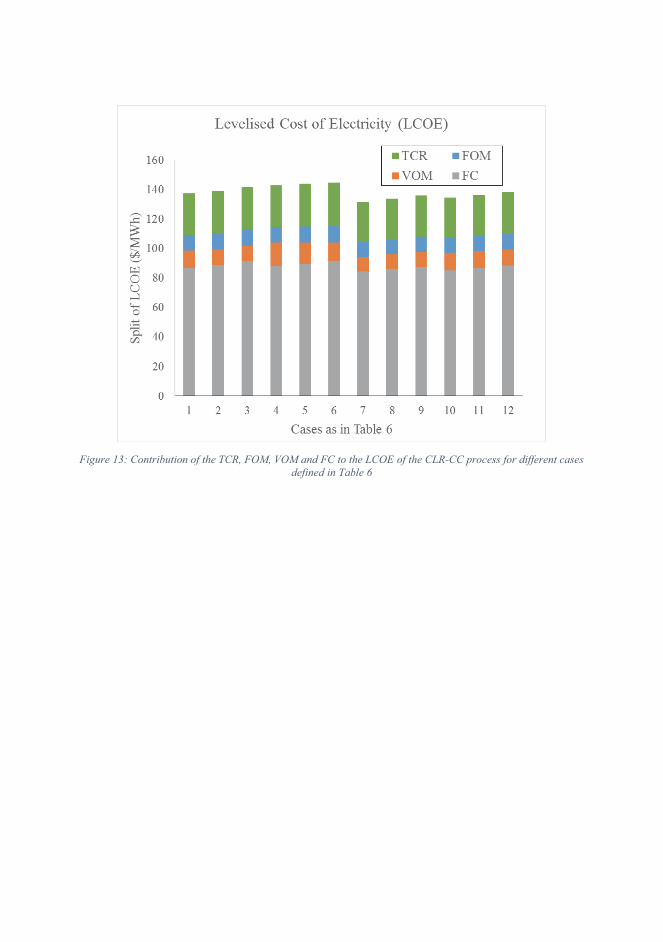
Figure 13: Contribution of the TCR, FOM, VOM and FC to the LCOE of the CLR-CC process for different cases defined in Table 6
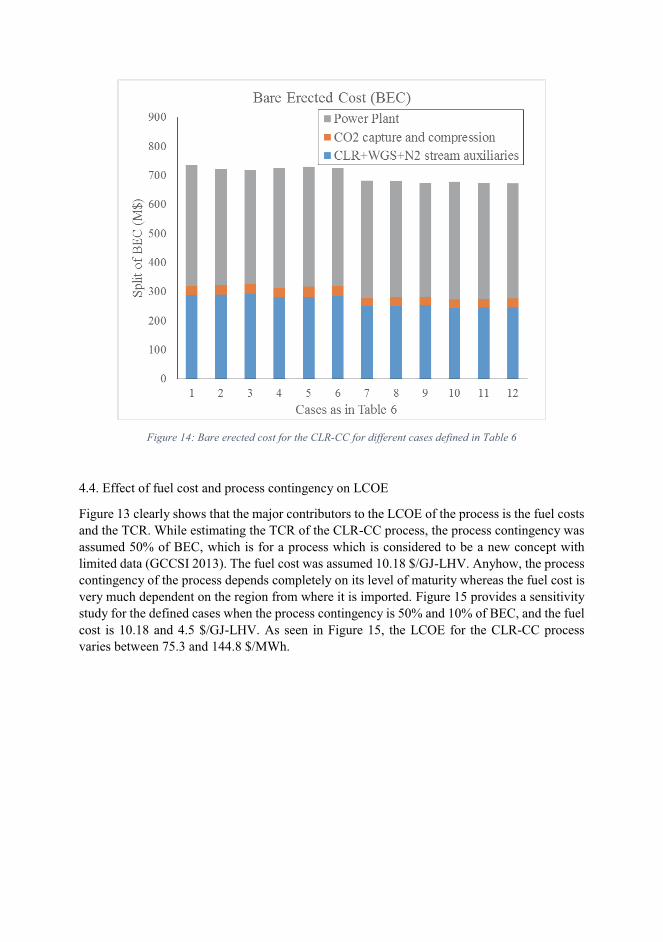
Figure 14: Bare erected cost for the CLR-CC for different cases defined in Table 6
4.4. Effect of fuel cost and process contingency on LCOE
Figure 13 clearly shows that the major contributors to the LCOE of the process is the fuel costs
and the TCR. While estimating the TCR of the CLR-CC process, the process contingency was
assumed 50% of BEC, which is for a process which is considered to be a new concept with
limited data (GCCSI 2013). The fuel cost was assumed 10.18 $/GJ-LHV. Anyhow, the process
contingency of the process depends completely on its level of maturity whereas the fuel cost is
very much dependent on the region from where it is imported. Figure 15 provides a sensitivity
study for the defined cases when the process contingency is 50% and 10% of BEC, and the fuel
cost is 10.18 and 4.5 $/GJ-LHV. As seen in Figure 15, the LCOE for the CLR-CC process
varies between 75.3 and 144.8 $/MWh.
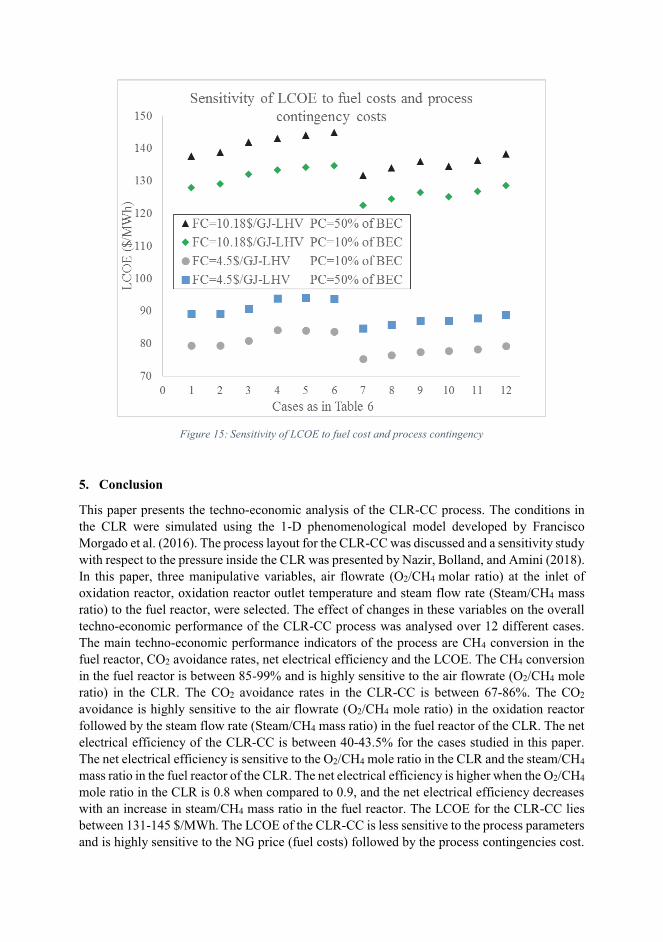
Figure 15: Sensitivity of LCOE to fuel cost and process contingency
5. Conclusion
This paper presents the techno-economic analysis of the CLR-CC process. The conditions in
the CLR were simulated using the 1-D phenomenological model developed by Francisco
Morgado et al. (2016). The process layout for the CLR-CC was discussed and a sensitivity study
with respect to the pressure inside the CLR was presented by Nazir, Bolland, and Amini (2018).
In this paper, three manipulative variables, air flowrate (O2/CH4 molar ratio) at the inlet of
oxidation reactor, oxidation reactor outlet temperature and steam flow rate (Steam/CH4 mass
ratio) to the fuel reactor, were selected. The effect of changes in these variables on the overall
techno-economic performance of the CLR-CC process was analysed over 12 different cases.
The main techno-economic performance indicators of the process are CH4 conversion in the
fuel reactor, CO2 avoidance rates, net electrical efficiency and the LCOE. The CH4 conversion
in the fuel reactor is between 85-99% and is highly sensitive to the air flowrate (O2/CH4 mole
ratio) in the CLR. The CO2 avoidance rates in the CLR-CC is between 67-86%. The CO2
avoidance is highly sensitive to the air flowrate (O2/CH4 mole ratio) in the oxidation reactor
followed by the steam flow rate (Steam/CH4 mass ratio) in the fuel reactor of the CLR. The net
electrical efficiency of the CLR-CC is between 40-43.5% for the cases studied in this paper.
The net electrical efficiency is sensitive to the O2/CH4 mole ratio in the CLR and the steam/CH4
mass ratio in the fuel reactor of the CLR. The net electrical efficiency is higher when the O2/CH4
mole ratio in the CLR is 0.8 when compared to 0.9, and the net electrical efficiency decreases
with an increase in steam/CH4 mass ratio in the fuel reactor. The LCOE for the CLR-CC lies
between 131-145 $/MWh. The LCOE of the CLR-CC is less sensitive to the process parameters
and is highly sensitive to the NG price (fuel costs) followed by the process contingencies cost.
The LCOE is reduced by 40% if the NG price is halved whereas if the process contingency is
reduced from 50% (for a new technology) to 10% (more mature and commercially available
technology), the LCOE reduces by ~10%.
The CO2 avoidance in the CLR-CC is on par with other pre- and post-combustion capture
methods. Anyhow, the net electrical efficiency of the CLR-CC for the conditions reported in
this paper is close to the net electrical efficiency of a combined cycle with steam-methane
reforming (~43.6%) but is less than that of combined cycles with auto-thermal reforming
(~46.9) and post-combustion capture methods involving chemical absorption (~49-50%).
Anyhow, one of the major benefits from the CLR-CC process when compared to the post-
combustion capture methods is the flexibility in operating the plant based on the needed output
which could be H2 or electric power. The current analysis helps in understanding the trends and
techno-economic behavior of the CLR-CC process for the chosen manipulated variables.
Improving efficiency of the process will help in reducing fuel consumption and hence reducing
the costs. Therefore, further optimization studies for the CLR-CC process is suggested. The
developed methods in this paper can also be applied to analyzing novel reactor concepts for
reforming like the gas-switching reforming (Wassie et al. 2017).
6. Acknowledgements
This publication forms a part of the EU-FP7 project titled “A Multiscale Simulation-Based
Design Platform for Cost-Effective CO2 Capture Processes using Nano-Structured Materials
(NanoSim)” and project number 604656. The authors thank the European Commission for the
funding. The authors would also like to acknowledge the partners: SINTEF Materials and
Chemistry, Universidade de Coimbra, ANDRITZ Energy & Environment GmbH, DCS
Computing GmbH, Institut National Polytechnique de Toulouse (INPT), University College
London, Technische Universitaet Graz for their support.
References
Abanades, J. C., R. Murillo, J. R. Fernandez, G. Grasa, and I. Martínez. 2010. "New CO2 capture process for hydrogen production combining Ca and Cu chemical loops." Environmental Science and Technology 44 (17):6901-6904. doi: 10.1021/es101707t.
Abba, I. a, J. R. Grace, H. T. Bi, and M. L. Thompson. 2003. "Spanning the flow regimes: Generic fluidized-bed reactor model." AIChE Journal 49:1838-1848. doi: 10.1002/aic.690490720.
Adanez, J., A. Abad, F. Garcia-Labiano, P. Gayan, and L. F. De Diego. 2012. "Progress in chemical-looping combustion and reforming technologies." Progress in Energy and Combustion Science 38 (2):215-282. doi: 10.1016/j.pecs.2011.09.001.
Antzara, A., E. Heracleous, D. B. Bukur, and A. A. Lemonidou. 2015. "Thermodynamic analysis of hydrogen production via chemical looping steam methane reforming coupled with in situ CO2 capture." International Journal of Greenhouse Gas Control 32 (0):115-128. doi: http://dx.doi.org/10.1016/j.ijggc.2014.11.010.
AspenHYSYS. 2017. Aspen HYSYS V8.6 User Guide. Aspen Technology Inc., Bedford, Massachusetts, USA.
Bischi, A., Ø Langørgen, J. X. Morin, J. Bakken, M. Ghorbaniyan, M. Bysveen, and O. Bolland. 2012. "Hydrodynamic viability of chemical looping processes by means of cold flow model investigation." Applied Energy 97:201-216. doi: 10.1016/j.apenergy.2011.12.051.
Boot-Handford, M. E., J. C. Abanades, E. J. Anthony, M. J. Blunt, S. Brandani, N. Mac Dowell, J. R. Fernández, M. C. Ferrari, R. Gross, J. P. Hallett, R. S. Haszeldine, P. Heptonstall, A. Lyngfelt, Z. Makuch, E. Mangano, R. T. J. Porter, M. Pourkashanian, G. T. Rochelle, N. Shah, J. G. Yao, and P. S. Fennell. 2014. "Carbon capture and storage update." Energy and Environmental Science 7 (1):130-189.
Chiesa, Paolo, Giovanni Lozza, and Luigi Mazzocchi. 2005. "Using Hydrogen as Gas Turbine Fuel." Journal of Engineering for Gas Turbines and Power 127 (1):73-80. doi: 10.1115/1.1787513.
Consonni, S., G. Lozza, G. Pelliccia, S. Rossini, and F. Saviano. 2006. "Chemical-looping combustion for combined cycles with CO2 capture." Journal of Engineering for Gas Turbines and Power 128 (3):525-534. doi: 10.1115/1.1850501.
Cormos, C. C. 2012. "Evaluation of syngas-based chemical looping applications for hydrogen and power co-generation with CCS." International Journal of Hydrogen Energy 37 (18):13371-13386. doi: 10.1016/j.ijhydene.2012.06.090.
Cormos, C. C., L. Petrescu, and A. M. Cormos. 2014. Assessment of hydrogen production systems based on natural gas conversion with carbon capture and storage. In Computer Aided Chemical Engineering.
Corradetti, Alessandro, and Umberto Desideri. 2005. "Analysis of Gas-Steam Combined Cycles With Natural Gas Reforming and CO2 Capture." Journal of Engineering for Gas Turbines and Power 127 (3):545-552. doi: 10.1115/1.1850941.
de Diego, L. F., M. Ortiz, F. García-Labiano, J. Adánez, A. Abad, and P. Gayán. 2009. "Hydrogen production by chemical-looping reforming in a circulating fluidized bed reactor using Ni-based oxygen carriers." Journal of Power Sources 192 (1):27-34. doi: 10.1016/j.jpowsour.2008.11.038.
Diglio, Giuseppe, Piero Bareschino, Erasmo Mancusi, and Francesco Pepe. 2016. "Simulation of hydrogen production through chemical looping reforming process in a packed-bed reactor." Chemical Engineering Research and Design 105:137-151. doi: http://dx.doi.org/10.1016/j.cherd.2015.11.013.
Ding, O. L., and S. H. Chan. 2008. "Autothermal reforming of methane gas—Modelling and experimental validation." International Journal of Hydrogen Energy 33 (2):633-643. doi: http://dx.doi.org/10.1016/j.ijhydene.2007.10.037.
DOE/NETL. 2007. Cost and Performance Baseline for Fossil Energy Plants. EBTF. 2011. European best practice guidelines for assessment of CO2 capture technologies.
CESAR -project 7th FrameWork Programme. Collaborative Project– GA No. 213569. ETP. 2012. Energy Technology Perspectives 2012. International Energy Agency. Fan, J., and L. Zhu. 2015. "Performance analysis of a feasible technology for power and high-
purity hydrogen production driven by methane fuel." Applied Thermal Engineering 75:103-114. doi: 10.1016/j.applthermaleng.2014.10.013.
Fiaschi, Daniele, Francesco Gamberi, Michael Bartlett, and Timothy Griffin. 2005. "The air membrane-ATR integrated gas turbine power cycle: A method for producing electricity with low CO2 emissions." Energy Conversion and Management 46 (15–16):2514-2529. doi: http://dx.doi.org/10.1016/j.enconman.2004.11.008.
Francisco Morgado, J., S. Cloete, J. Morud, T. Gurker, and S. Amini. 2016. "Modelling study of two chemical looping reforming reactor configurations: Looping vs. switching." Powder Technology. doi: 10.1016/j.powtec.2016.11.059.
GCCSI. 2013. Global CCS Institute - TOWARD A COMMON METHOD OF COST ESTIMATION FOR CO2 CAPTURE AND STORAGE AT FOSSIL FUEL POWER PLANTS.
Iloeje, C., Z. Zhao, and A. F. Ghoniem. 2015. "Analysis of thermally coupled chemical looping combustion-based power plants with carbon capture." International Journal of Greenhouse Gas Control 35:56-70. doi: 10.1016/j.ijggc.2015.01.013.
Ishida, M., D. Zheng, and T. Akehata. 1987. "Evaluation of a chemical-looping-combustion power-generation system by graphic exergy analysis." Energy 12 (2):147-154. doi: http://dx.doi.org/10.1016/0360-5442(87)90119-8.
Ishida, Masaru, and Hongguang Jin. 1994. "A new advanced power-generation system using chemical-looping combustion." Energy 19 (4):415-422. doi: http://dx.doi.org/10.1016/0360-5442(94)90120-1.
Kolbitsch, P., T. Pröll, J. Bolhar�Nordenkampf, and H. Hofbauer. 2009. "Design of a Chemical Looping Combustor using a Dual Circulating Fluidized Bed (DCFB) Reactor System." Chemical Engineering & Technology 32 (3):398-403. doi: 10.1002/ceat.200800378.
Kvamsdal, H. M., K. Jordal, and O. Bolland. 2007. "A quantitative comparison of gas turbine cycles with CO2 capture." Energy 32 (1):10-24. doi: 10.1016/j.energy.2006.02.006.
Lozza, G., and P. Chiesa. 2000a. "Natural Gas Decarbonization to Reduce CO2 Emission From Combined Cycles—Part I: Partial Oxidation." Journal of Engineering for Gas Turbines and Power 124 (1):82-88. doi: 10.1115/1.1395581.
Lozza, G., and P. Chiesa. 2000b. "Natural Gas Decarbonization to Reduce CO2 Emission From Combined Cycles—Part II: Steam-Methane Reforming." Journal of Engineering for Gas Turbines and Power 124 (1):89-95. doi: 10.1115/1.1395582.
Mantripragada, H. C., and E. S. Rubin. 2013. "Chemical looping for pre-combustion CO2 capture - Performance and cost analysis." Energy Procedia.
Martínez, I., R. Murillo, G. Grasa, J. R. Fernández, and J. C. Abanades. 2013. "Integrated combined cycle from natural gas with CO2 capture using a Ca-Cu chemical loop." AIChE Journal 59 (8):2780-2794. doi: 10.1002/aic.14054.
Martínez, I., M. C. Romano, J. R. Fernández, P. Chiesa, R. Murillo, and J. C. Abanades. 2014. "Process design of a hydrogen production plant from natural gas with CO2 capture based on a novel Ca/Cu chemical loop." Applied Energy 114 (0):192-208. doi: http://dx.doi.org/10.1016/j.apenergy.2013.09.026.
Mathieu, Philippe, and Olav Bolland. 2013. "Comparison of Costs for Natural gas Power Generation with CO2 Capture." Energy Procedia 37 (0):2406-2419. doi: http://dx.doi.org/10.1016/j.egypro.2013.06.122.
Morgado, Joana Francisco, Schalk Cloete, John Morud, Thomas Gurker, and Shahriar Amini. 2016. "Modelling study of two chemical looping reforming reactor configurations: Looping vs. switching." Powder Technology In Press. doi: http://dx.doi.org/10.1016/j.powtec.2016.11.059.
Naqvi, R., and O. Bolland. 2007. "Multi-stage chemical looping combustion (CLC) for combined cycles with CO2 capture." International Journal of Greenhouse Gas Control 1 (1):19-30. doi: 10.1016/S1750-5836(07)00012-6.
Nazir, Shareq, Olav Bolland, and Shahriar Amini. 2018. "Analysis of Combined Cycle Power Plants with Chemical Looping Reforming of Natural Gas and Pre-Combustion CO2 Capture." Energies 11 (1):147.
Nazir, Shareq Mohd, Olav Bolland, and Shahriar Amini. 2017. "Full Plant Scale Analysis of Natural Gas Fired Power Plants with Pre-Combustion CO2 Capture and Chemical Looping Reforming (CLR)." Energy Procedia 114:2146-2155. doi: http://dx.doi.org/10.1016/j.egypro.2017.03.1350.
NETL. 2011. Cost Estimation Methodology for NETL Assessments of Power Plant Performance.
Nord, Lars Olof, Rahul Anantharaman, and Olav Bolland. 2009. "Design and off-design analyses of a pre-combustion CO2 capture process in a natural gas combined cycle power plant." International Journal of Greenhouse Gas Control 3 (4):385-392. doi: http://dx.doi.org/10.1016/j.ijggc.2009.02.001.
Peters, Max S., and Klaus D. Timmerhaus. 1991. PLANT DESIGN AND ECONOMICS FOR CHEMICAL ENGINEERS. Fourth Edition ed: McGraw-Hill, Inc.
Pröll, T., J. Bolhàr-Nordenkampf, P. Kolbitsch, and H. Hofbauer. 2010. "Syngas and a separate nitrogen/argon stream via chemical looping reforming - A 140 kW pilot plant study." Fuel 89 (6):1249-1256. doi: 10.1016/j.fuel.2009.09.033.
Pröll, T., P. Kolbitsch, J. Bolhàr-Nordenkampf, and H. Hofbauer. 2011. "Chemical looping pilot plant results using a nickel-based oxygen carrier." Oil and Gas Science and Technology 66 (2):173-180. doi: 10.2516/ogst/2010036.
Pröll, Tobias, Hermann Hofbauer, Philipp Kolbitsch, and Johannes Bolhàr-Nordenkampf. The Dual Circulating Fluidized Bed (DCFB) Reactor System edited by Technology Transfer at Vienna University of Technology.
Richter, Horst J., and Karl F. Knoche. 1983. "REVERSIBILITY OF COMBUSTION PROCESSES." ACS Symposium Series:71-85.
Romano, Matteo C., Paolo Chiesa, and Giovanni Lozza. 2010. "Pre-combustion CO2 capture from natural gas power plants, with ATR and MDEA processes." International Journal of Greenhouse Gas Control 4 (5):785-797. doi: http://dx.doi.org/10.1016/j.ijggc.2010.04.015.
Rydén, M., A. Lyngfelt, and T. Mattisson. 2006. "Synthesis gas generation by chemical-looping reforming in a continuously operating laboratory reactor." Fuel 85 (12-13):1631-1641. doi: 10.1016/j.fuel.2006.02.004.
Schmid, J. C., C. Pfeifer, H. Kitzler, Tobias Proll, and Hermann Hofbauer. 2011. "A new dual fluidized bed gasifier design for improved in situ conversion of hydrocarbons." Proceedings International Conference on Polygeneration Strategies (ICPS).
Spallina, V., D. Pandolfo, A. Battistella, M. C. Romano, M. Van Sint Annaland, and F. Gallucci. 2016. "Techno-economic assessment of membrane assisted fluidized bed reactors for pure H2 production with CO2 capture." Energy Conversion and Management 120:257-273. doi: http://dx.doi.org/10.1016/j.enconman.2016.04.073.
Spallina, Vincenzo, Fausto Gallucci, Matteo C. Romano, and Martin Van Sint Annaland. 2016. "Pre-combustion packed bed chemical looping (PCCL) technology for efficient H2-rich gas production processes." Chemical Engineering Journal 294:478-494. doi: http://dx.doi.org/10.1016/j.cej.2016.03.011.
Tang, M., L. Xu, and M. Fan. 2015. "Progress in oxygen carrier development of methane-based chemical-looping reforming: A review." Applied Energy 151. doi: 10.1016/j.apenergy.2015.04.017.
Thermoflow. 2017. Thermoflow Suite V26 User Guide. Thermoflow Inc., Southborough, MA, USA.
Thompson, Michael L., Hsiaotao Bi, and John R. Grace. 1999. "A generalized bubbling / turbulent fuidized-bed reactor model." Chemical Engineering Science 54:3-10.
Wassie, Solomon A., Fausto Gallucci, Abdelghafour Zaabout, Schalk Cloete, Shahriar Amini, and Martin van Sint Annaland. 2017. "Hydrogen production with integrated CO2 capture in a novel gas switching reforming reactor: Proof-of-concept." International Journal of Hydrogen Energy 42 (21):14367-14379. doi: https://doi.org/10.1016/j.ijhydene.2017.04.227.
WEO. 2016. World Energy Outlook 2016. International Energy Agency.

Yahom, A., J. Powell, V. Pavarajarn, P. Onbhuddha, S. Charojrochkul, and S. Assabumrungrat. 2014. "Simulation and thermodynamic analysis of chemical looping reforming and CO2 enhanced chemical looping reforming." Chemical Engineering Research and Design 92 (11):2575-2583. doi: 10.1016/j.cherd.2014.04.002.
Zohrabian, Angineh, Mohammad Mansouri Majoumerd, Mohammad Soltanieh, and Sourena Sattari. 2016. "Techno-economic evaluation of an integrated hydrogen and power co-generation system with CO2 capture." International Journal of Greenhouse Gas Control 44:94-103. doi: http://dx.doi.org/10.1016/j.ijggc.2015.11.004.

Paper IV
Nazir S.M., Cloete S., Bolland O., Amini S., Techno-economic assessment of the novel Gas
Switching Reforming (GSR) concept for gas-fired power production with integrated CO2
capture. International Journal of Hydrogen Energy (2018). (Accepted for publication. Pre-
proofreading copy attached)

Techno-economic assessment of the novel Gas Switching Reforming (GSR)
concept for gas-fired power production with integrated CO2 capture
Shareq Mohd Nazira, Schalk Cloeteb, Olav Bollanda, Shahriar Aminia,b*
aDepartment of Energy and Process Engineering, Norwegian University of Science and
Technology, Trondheim, Norway
bSINTEF Materials and Chemistry, Trondheim, Norway
Abstract
The focus of this study is to carry out techno-economic analysis of a pre-combustion capture
method in Natural Gas based power plants with a novel reactor concept, Gas Switching
Reforming (GSR). This reactor concept enables auto thermal natural gas reforming with
integrated CO2 capture. The process analysed integrates GSR, Water Gas Shift (WGS), and
Pressure Swing Adsorption (PSA) into a Natural Gas based combined cycle power plant. The
overall process is defined as GSR-CC. Sensitivity studies have been carried out to understand
the performance of the GSR-CC process by changing the oxygen carrier utilization and
Steam/Carbon ratio in GSR. The net electrical efficiency of the GSR-CC lies between 45.1%
and 46.2% and the levelised cost of electricity lies between 124.4 and 128.1 $/MWh (at
European natural gas prices) for the parameter space assumed in this study. By eliminating the
WGS step from the process, the net electrical efficiency improves to 47.4% and the levelised
cost of electricity reduces to 120.7 $/MWh. Significant scope exists for further efficiency
improvements and cost reductions from the GSR-CC system. In addition, the GSR-CC process
achieves high CO2 avoidance rates (> 95%) and offers the possibility to produce pure H2 during
times of low electricity demands.
*Corresponding author Email: [email protected] Telephone: +47- 46639721 Address: S. P. Andersens veg 15 B, Trondheim, 7031, Norway
Keywords: pre-combustion CO2 capture; Gas Switching Reforming; Natural Gas Combined
Cycle power plants; Techno-economic analysis.
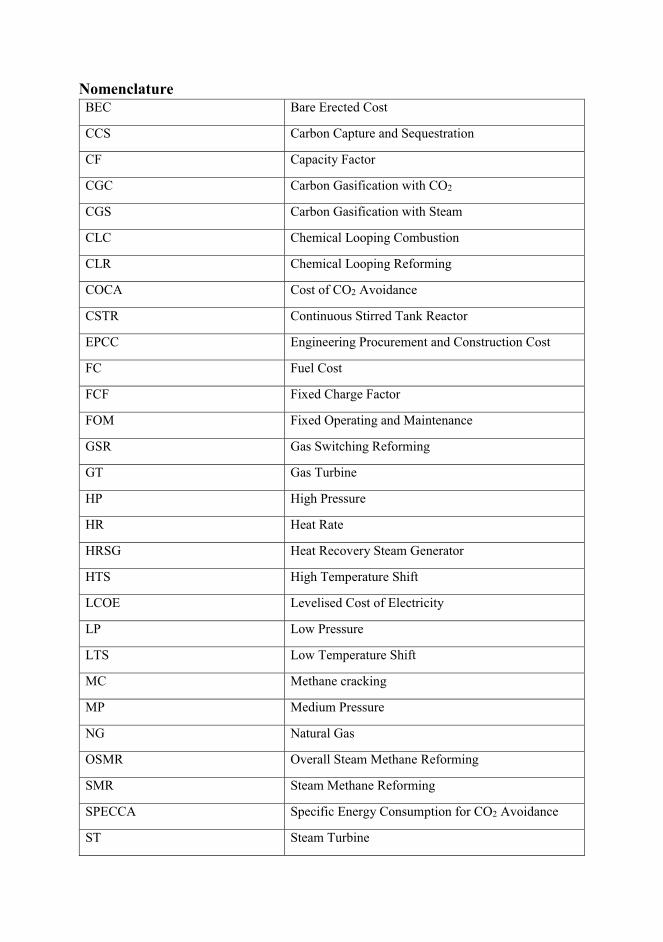
Nomenclature BEC Bare Erected Cost
CCS Carbon Capture and Sequestration
CF Capacity Factor
CGC Carbon Gasification with CO2
CGS Carbon Gasification with Steam
CLC Chemical Looping Combustion
CLR Chemical Looping Reforming
COCA Cost of CO2 Avoidance
CSTR Continuous Stirred Tank Reactor
EPCC Engineering Procurement and Construction Cost
FC Fuel Cost
FCF Fixed Charge Factor
FOM Fixed Operating and Maintenance
GSR Gas Switching Reforming
GT Gas Turbine
HP High Pressure
HR Heat Rate
HRSG Heat Recovery Steam Generator
HTS High Temperature Shift
LCOE Levelised Cost of Electricity
LP Low Pressure
LTS Low Temperature Shift
MC Methane cracking
MP Medium Pressure
NG Natural Gas
OSMR Overall Steam Methane Reforming
SMR Steam Methane Reforming
SPECCA Specific Energy Consumption for CO2 Avoidance
ST Steam Turbine
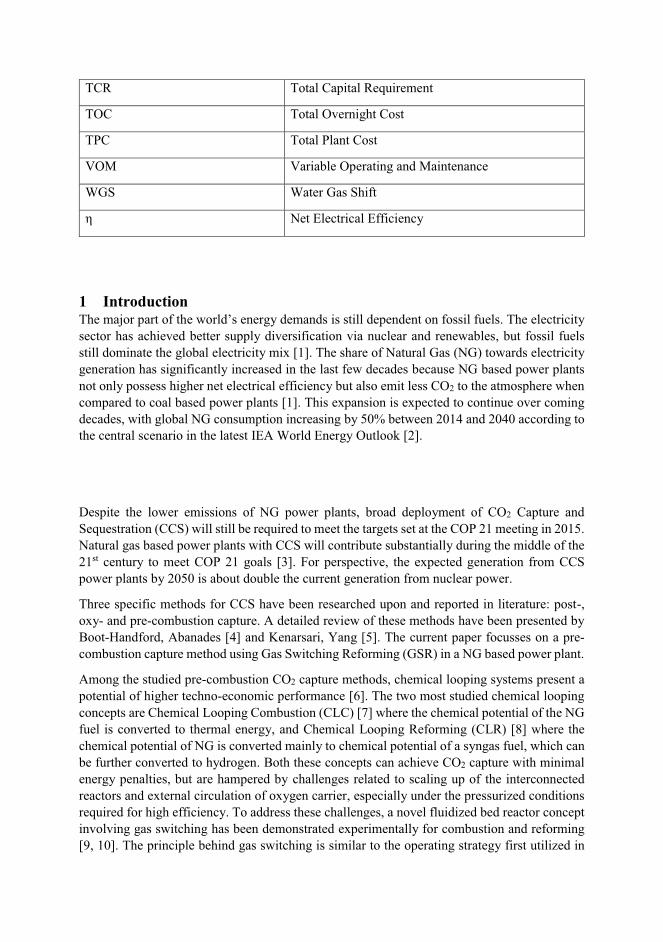
TCR Total Capital Requirement
TOC Total Overnight Cost
TPC Total Plant Cost
VOM Variable Operating and Maintenance
WGS Water Gas Shift
η Net Electrical Efficiency
1 Introduction The major part of the world’s energy demands is still dependent on fossil fuels. The electricity
sector has achieved better supply diversification via nuclear and renewables, but fossil fuels
still dominate the global electricity mix [1]. The share of Natural Gas (NG) towards electricity
generation has significantly increased in the last few decades because NG based power plants
not only possess higher net electrical efficiency but also emit less CO2 to the atmosphere when
compared to coal based power plants [1]. This expansion is expected to continue over coming
decades, with global NG consumption increasing by 50% between 2014 and 2040 according to
the central scenario in the latest IEA World Energy Outlook [2].
Despite the lower emissions of NG power plants, broad deployment of CO2 Capture and
Sequestration (CCS) will still be required to meet the targets set at the COP 21 meeting in 2015.
Natural gas based power plants with CCS will contribute substantially during the middle of the
21st century to meet COP 21 goals [3]. For perspective, the expected generation from CCS
power plants by 2050 is about double the current generation from nuclear power.
Three specific methods for CCS have been researched upon and reported in literature: post-,
oxy- and pre-combustion capture. A detailed review of these methods have been presented by
Boot-Handford, Abanades [4] and Kenarsari, Yang [5]. The current paper focusses on a pre-
combustion capture method using Gas Switching Reforming (GSR) in a NG based power plant.
Among the studied pre-combustion CO2 capture methods, chemical looping systems present a
potential of higher techno-economic performance [6]. The two most studied chemical looping
concepts are Chemical Looping Combustion (CLC) [7] where the chemical potential of the NG
fuel is converted to thermal energy, and Chemical Looping Reforming (CLR) [8] where the
chemical potential of NG is converted mainly to chemical potential of a syngas fuel, which can
be further converted to hydrogen. Both these concepts can achieve CO2 capture with minimal
energy penalties, but are hampered by challenges related to scaling up of the interconnected
reactors and external circulation of oxygen carrier, especially under the pressurized conditions
required for high efficiency. To address these challenges, a novel fluidized bed reactor concept
involving gas switching has been demonstrated experimentally for combustion and reforming
[9, 10]. The principle behind gas switching is similar to the operating strategy first utilized in
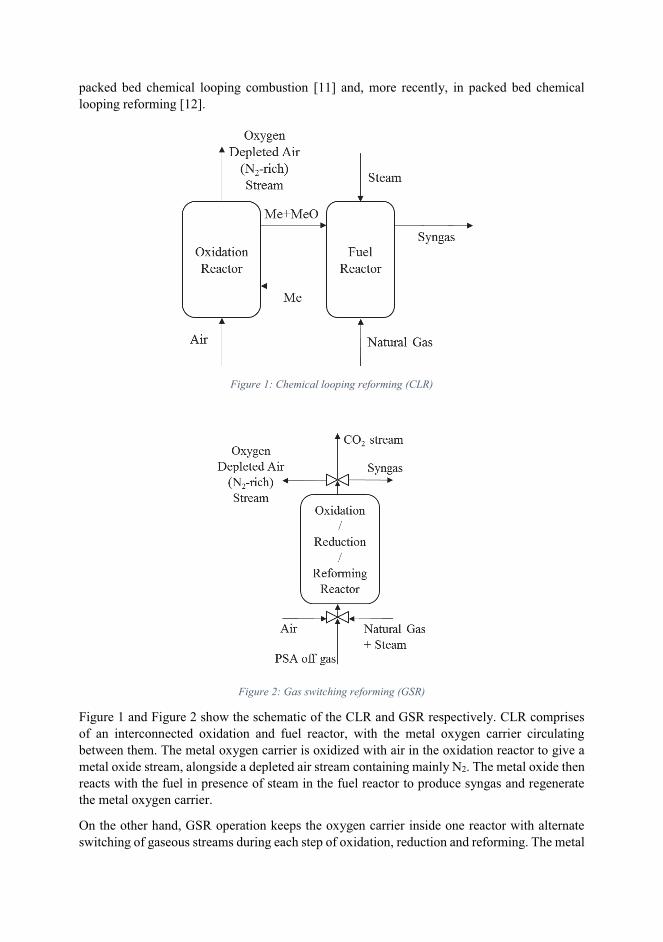
packed bed chemical looping combustion [11] and, more recently, in packed bed chemical
looping reforming [12].
Figure 1: Chemical looping reforming (CLR)
Figure 2: Gas switching reforming (GSR)
Figure 1 and Figure 2 show the schematic of the CLR and GSR respectively. CLR comprises
of an interconnected oxidation and fuel reactor, with the metal oxygen carrier circulating
between them. The metal oxygen carrier is oxidized with air in the oxidation reactor to give a
metal oxide stream, alongside a depleted air stream containing mainly N2. The metal oxide then
reacts with the fuel in presence of steam in the fuel reactor to produce syngas and regenerate
the metal oxygen carrier.
On the other hand, GSR operation keeps the oxygen carrier inside one reactor with alternate
switching of gaseous streams during each step of oxidation, reduction and reforming. The metal
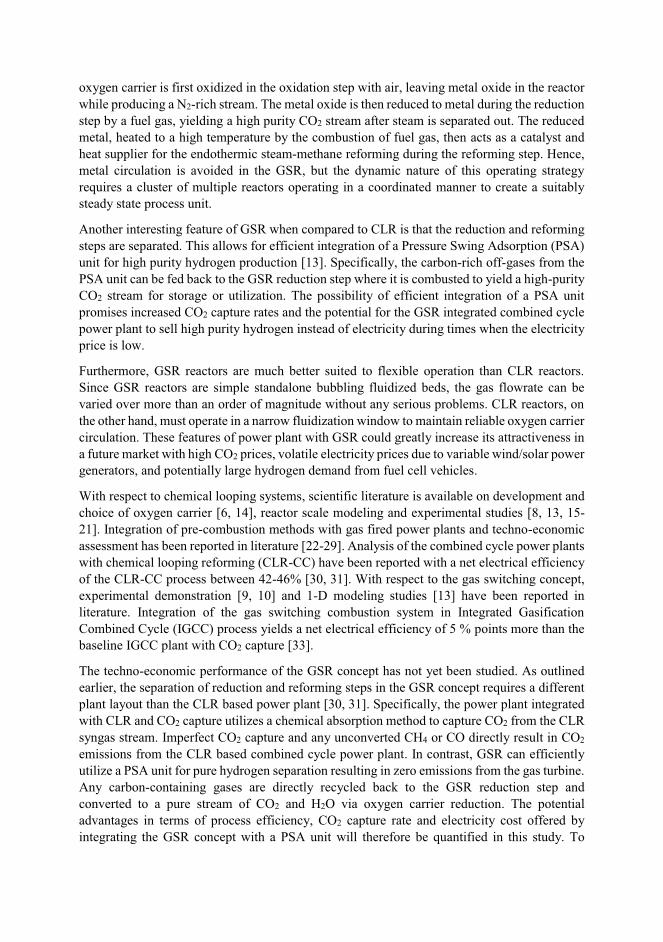
oxygen carrier is first oxidized in the oxidation step with air, leaving metal oxide in the reactor
while producing a N2-rich stream. The metal oxide is then reduced to metal during the reduction
step by a fuel gas, yielding a high purity CO2 stream after steam is separated out. The reduced
metal, heated to a high temperature by the combustion of fuel gas, then acts as a catalyst and
heat supplier for the endothermic steam-methane reforming during the reforming step. Hence,
metal circulation is avoided in the GSR, but the dynamic nature of this operating strategy
requires a cluster of multiple reactors operating in a coordinated manner to create a suitably
steady state process unit.
Another interesting feature of GSR when compared to CLR is that the reduction and reforming
steps are separated. This allows for efficient integration of a Pressure Swing Adsorption (PSA)
unit for high purity hydrogen production [13]. Specifically, the carbon-rich off-gases from the
PSA unit can be fed back to the GSR reduction step where it is combusted to yield a high-purity
CO2 stream for storage or utilization. The possibility of efficient integration of a PSA unit
promises increased CO2 capture rates and the potential for the GSR integrated combined cycle
power plant to sell high purity hydrogen instead of electricity during times when the electricity
price is low.
Furthermore, GSR reactors are much better suited to flexible operation than CLR reactors.
Since GSR reactors are simple standalone bubbling fluidized beds, the gas flowrate can be
varied over more than an order of magnitude without any serious problems. CLR reactors, on
the other hand, must operate in a narrow fluidization window to maintain reliable oxygen carrier
circulation. These features of power plant with GSR could greatly increase its attractiveness in
a future market with high CO2 prices, volatile electricity prices due to variable wind/solar power
generators, and potentially large hydrogen demand from fuel cell vehicles.
With respect to chemical looping systems, scientific literature is available on development and
choice of oxygen carrier [6, 14], reactor scale modeling and experimental studies [8, 13, 15-
21]. Integration of pre-combustion methods with gas fired power plants and techno-economic
assessment has been reported in literature [22-29]. Analysis of the combined cycle power plants
with chemical looping reforming (CLR-CC) have been reported with a net electrical efficiency
of the CLR-CC process between 42-46% [30, 31]. With respect to the gas switching concept,
experimental demonstration [9, 10] and 1-D modeling studies [13] have been reported in
literature. Integration of the gas switching combustion system in Integrated Gasification
Combined Cycle (IGCC) process yields a net electrical efficiency of 5 % points more than the
baseline IGCC plant with CO2 capture [33].
The techno-economic performance of the GSR concept has not yet been studied. As outlined
earlier, the separation of reduction and reforming steps in the GSR concept requires a different
plant layout than the CLR based power plant [30, 31]. Specifically, the power plant integrated
with CLR and CO2 capture utilizes a chemical absorption method to capture CO2 from the CLR
syngas stream. Imperfect CO2 capture and any unconverted CH4 or CO directly result in CO2
emissions from the CLR based combined cycle power plant. In contrast, GSR can efficiently
utilize a PSA unit for pure hydrogen separation resulting in zero emissions from the gas turbine.
Any carbon-containing gases are directly recycled back to the GSR reduction step and
converted to a pure stream of CO2 and H2O via oxygen carrier reduction. The potential
advantages in terms of process efficiency, CO2 capture rate and electricity cost offered by
integrating the GSR concept with a PSA unit will therefore be quantified in this study. To
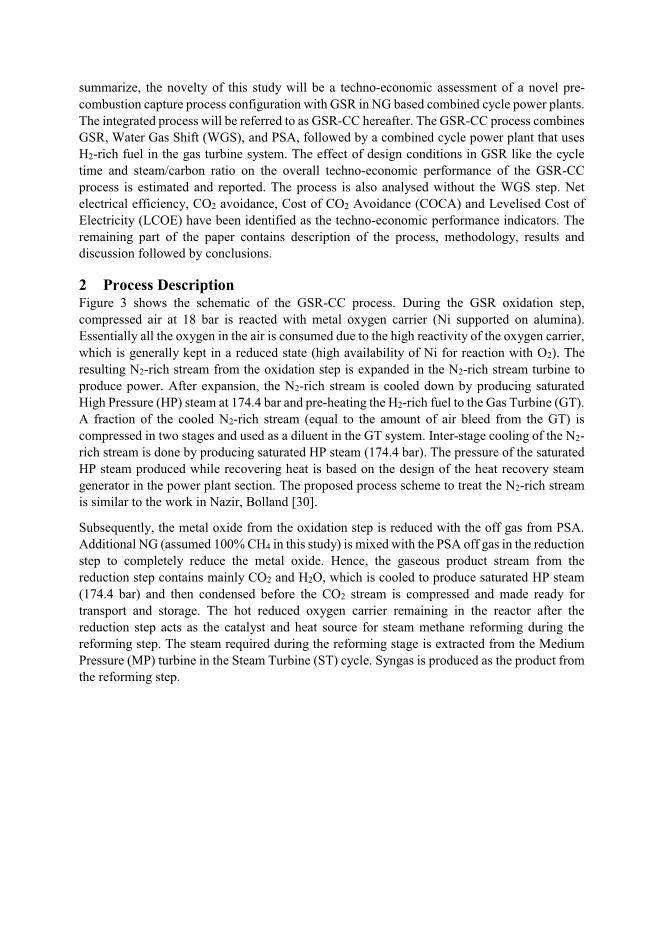
summarize, the novelty of this study will be a techno-economic assessment of a novel pre-
combustion capture process configuration with GSR in NG based combined cycle power plants.
The integrated process will be referred to as GSR-CC hereafter. The GSR-CC process combines
GSR, Water Gas Shift (WGS), and PSA, followed by a combined cycle power plant that uses
H2-rich fuel in the gas turbine system. The effect of design conditions in GSR like the cycle
time and steam/carbon ratio on the overall techno-economic performance of the GSR-CC
process is estimated and reported. The process is also analysed without the WGS step. Net
electrical efficiency, CO2 avoidance, Cost of CO2 Avoidance (COCA) and Levelised Cost of
Electricity (LCOE) have been identified as the techno-economic performance indicators. The
remaining part of the paper contains description of the process, methodology, results and
discussion followed by conclusions.
2 Process Description Figure 3 shows the schematic of the GSR-CC process. During the GSR oxidation step,
compressed air at 18 bar is reacted with metal oxygen carrier (Ni supported on alumina).
Essentially all the oxygen in the air is consumed due to the high reactivity of the oxygen carrier,
which is generally kept in a reduced state (high availability of Ni for reaction with O2). The
resulting N2-rich stream from the oxidation step is expanded in the N2-rich stream turbine to
produce power. After expansion, the N2-rich stream is cooled down by producing saturated
High Pressure (HP) steam at 174.4 bar and pre-heating the H2-rich fuel to the Gas Turbine (GT).
A fraction of the cooled N2-rich stream (equal to the amount of air bleed from the GT) is
compressed in two stages and used as a diluent in the GT system. Inter-stage cooling of the N2-
rich stream is done by producing saturated HP steam (174.4 bar). The pressure of the saturated
HP steam produced while recovering heat is based on the design of the heat recovery steam
generator in the power plant section. The proposed process scheme to treat the N2-rich stream
is similar to the work in Nazir, Bolland [30].
Subsequently, the metal oxide from the oxidation step is reduced with the off gas from PSA.
Additional NG (assumed 100% CH4 in this study) is mixed with the PSA off gas in the reduction
step to completely reduce the metal oxide. Hence, the gaseous product stream from the
reduction step contains mainly CO2 and H2O, which is cooled to produce saturated HP steam
(174.4 bar) and then condensed before the CO2 stream is compressed and made ready for
transport and storage. The hot reduced oxygen carrier remaining in the reactor after the
reduction step acts as the catalyst and heat source for steam methane reforming during the
reforming step. The steam required during the reforming stage is extracted from the Medium
Pressure (MP) turbine in the Steam Turbine (ST) cycle. Syngas is produced as the product from
the reforming step.
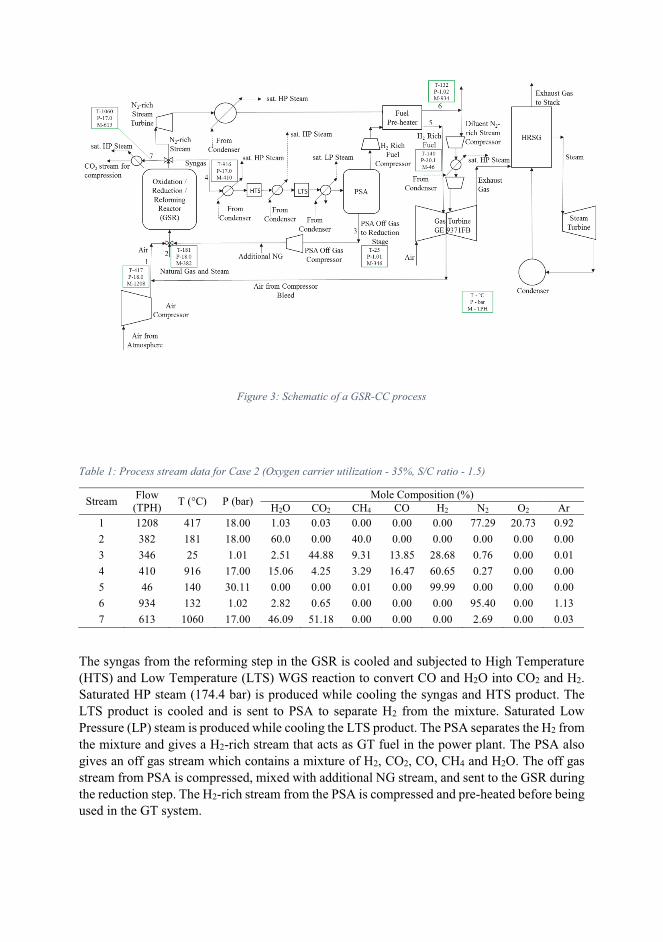
Figure 3: Schematic of a GSR-CC process
Table 1: Process stream data for Case 2 (Oxygen carrier utilization - 35%, S/C ratio - 1.5)
Stream Flow
(TPH) T (°C) P (bar)
Mole Composition (%)
H2O CO2 CH4 CO H2 N2 O2 Ar
1 1208 417 18.00 1.03 0.03 0.00 0.00 0.00 77.29 20.73 0.92
2 382 181 18.00 60.0 0.00 40.0 0.00 0.00 0.00 0.00 0.00
3 346 25 1.01 2.51 44.88 9.31 13.85 28.68 0.76 0.00 0.01
4 410 916 17.00 15.06 4.25 3.29 16.47 60.65 0.27 0.00 0.00
5 46 140 30.11 0.00 0.00 0.01 0.00 99.99 0.00 0.00 0.00
6 934 132 1.02 2.82 0.65 0.00 0.00 0.00 95.40 0.00 1.13
7 613 1060 17.00 46.09 51.18 0.00 0.00 0.00 2.69 0.00 0.03
The syngas from the reforming step in the GSR is cooled and subjected to High Temperature
(HTS) and Low Temperature (LTS) WGS reaction to convert CO and H2O into CO2 and H2.
Saturated HP steam (174.4 bar) is produced while cooling the syngas and HTS product. The
LTS product is cooled and is sent to PSA to separate H2 from the mixture. Saturated Low
Pressure (LP) steam is produced while cooling the LTS product. The PSA separates the H2 from
the mixture and gives a H2-rich stream that acts as GT fuel in the power plant. The PSA also
gives an off gas stream which contains a mixture of H2, CO2, CO, CH4 and H2O. The off gas
stream from PSA is compressed, mixed with additional NG stream, and sent to the GSR during
the reduction step. The H2-rich stream from the PSA is compressed and pre-heated before being
used in the GT system.
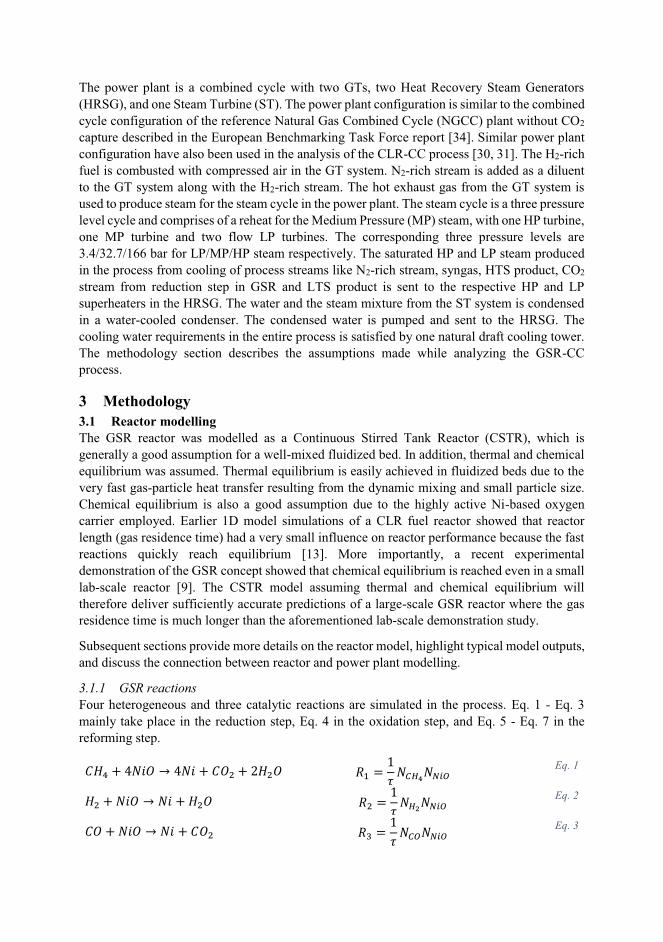
The power plant is a combined cycle with two GTs, two Heat Recovery Steam Generators
(HRSG), and one Steam Turbine (ST). The power plant configuration is similar to the combined
cycle configuration of the reference Natural Gas Combined Cycle (NGCC) plant without CO2
capture described in the European Benchmarking Task Force report [34]. Similar power plant
configuration have also been used in the analysis of the CLR-CC process [30, 31]. The H2-rich
fuel is combusted with compressed air in the GT system. N2-rich stream is added as a diluent
to the GT system along with the H2-rich stream. The hot exhaust gas from the GT system is
used to produce steam for the steam cycle in the power plant. The steam cycle is a three pressure
level cycle and comprises of a reheat for the Medium Pressure (MP) steam, with one HP turbine,
one MP turbine and two flow LP turbines. The corresponding three pressure levels are
3.4/32.7/166 bar for LP/MP/HP steam respectively. The saturated HP and LP steam produced
in the process from cooling of process streams like N2-rich stream, syngas, HTS product, CO2
stream from reduction step in GSR and LTS product is sent to the respective HP and LP
superheaters in the HRSG. The water and the steam mixture from the ST system is condensed
in a water-cooled condenser. The condensed water is pumped and sent to the HRSG. The
cooling water requirements in the entire process is satisfied by one natural draft cooling tower.
The methodology section describes the assumptions made while analyzing the GSR-CC
process.
3 Methodology 3.1 Reactor modelling The GSR reactor was modelled as a Continuous Stirred Tank Reactor (CSTR), which is
generally a good assumption for a well-mixed fluidized bed. In addition, thermal and chemical
equilibrium was assumed. Thermal equilibrium is easily achieved in fluidized beds due to the
very fast gas-particle heat transfer resulting from the dynamic mixing and small particle size.
Chemical equilibrium is also a good assumption due to the highly active Ni-based oxygen
carrier employed. Earlier 1D model simulations of a CLR fuel reactor showed that reactor
length (gas residence time) had a very small influence on reactor performance because the fast
reactions quickly reach equilibrium [13]. More importantly, a recent experimental
demonstration of the GSR concept showed that chemical equilibrium is reached even in a small
lab-scale reactor [9]. The CSTR model assuming thermal and chemical equilibrium will
therefore deliver sufficiently accurate predictions of a large-scale GSR reactor where the gas
residence time is much longer than the aforementioned lab-scale demonstration study.
Subsequent sections provide more details on the reactor model, highlight typical model outputs,
and discuss the connection between reactor and power plant modelling.
3.1.1 GSR reactions Four heterogeneous and three catalytic reactions are simulated in the process. Eq. 1 - Eq. 3
mainly take place in the reduction step, Eq. 4 in the oxidation step, and Eq. 5 - Eq. 7 in the
reforming step.
��( � �0 � � �0 � ��] � ��]� W9 � �� 0&'�0;AQ Eq. 1
�] � 0 � � 0 � �]� W] � �� 0'\0;AQ Eq. 2
�� � 0 � � 0 � ��] W� � �� 0&Q0;AQ Eq. 3
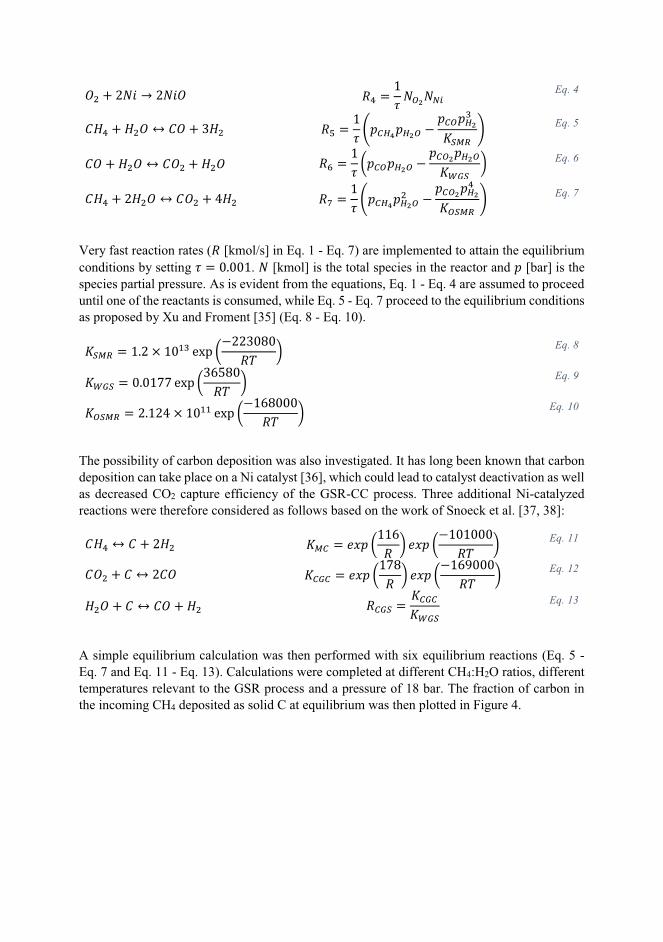
�] � �0 � �0 � W( � �� 0Q\0;A Eq. 4
��( � �]� � �� � ��] W� � �� ��&'��'\Q �&Q�'\���RN �
Eq. 5
�� � �]� � ��] � �]� WV � �� ��&Q�'\Q �&Q\�'\Q�SI� � Eq. 6
��( � ��]� � ��] � ��] WU � �� ��&'��'\Q] �&Q\�'\(�Q�RN �
Eq. 7
Very fast reaction rates (W [kmol/s] in Eq. 1 - Eq. 7) are implemented to attain the equilibrium
conditions by setting � � +~++�. 0 [kmol] is the total species in the reactor and � [bar] is the
species partial pressure. As is evident from the equations, Eq. 1 - Eq. 4 are assumed to proceed
until one of the reactants is consumed, while Eq. 5 - Eq. 7 proceed to the equilibrium conditions
as proposed by Xu and Froment [35] (Eq. 8 - Eq. 10).
��RN � �~� * �+9� ��� ����+ +W� � Eq. 8
�SI� � +~+��� ��� ���� +W� � Eq. 9
�Q�RN � �~��� * �+99 ��� ��� +++W� � Eq. 10
The possibility of carbon deposition was also investigated. It has long been known that carbon
deposition can take place on a Ni catalyst [36], which could lead to catalyst deactivation as well
as decreased CO2 capture efficiency of the GSR-CC process. Three additional Ni-catalyzed
reactions were therefore considered as follows based on the work of Snoeck et al. [37, 38]:
��( � � � ��] �R& � �!� ����W � �!� ��+�+++W� � Eq. 11
��] � � � ��� �&I& � �!� ��� W � �!� ����+++W� � Eq. 12
�]� � � � �� � �] W&I� � �&I&�SI� Eq. 13
A simple equilibrium calculation was then performed with six equilibrium reactions (Eq. 5 -
Eq. 7 and Eq. 11 - Eq. 13). Calculations were completed at different CH4:H2O ratios, different
temperatures relevant to the GSR process and a pressure of 18 bar. The fraction of carbon in
the incoming CH4 deposited as solid C at equilibrium was then plotted in Figure 4.
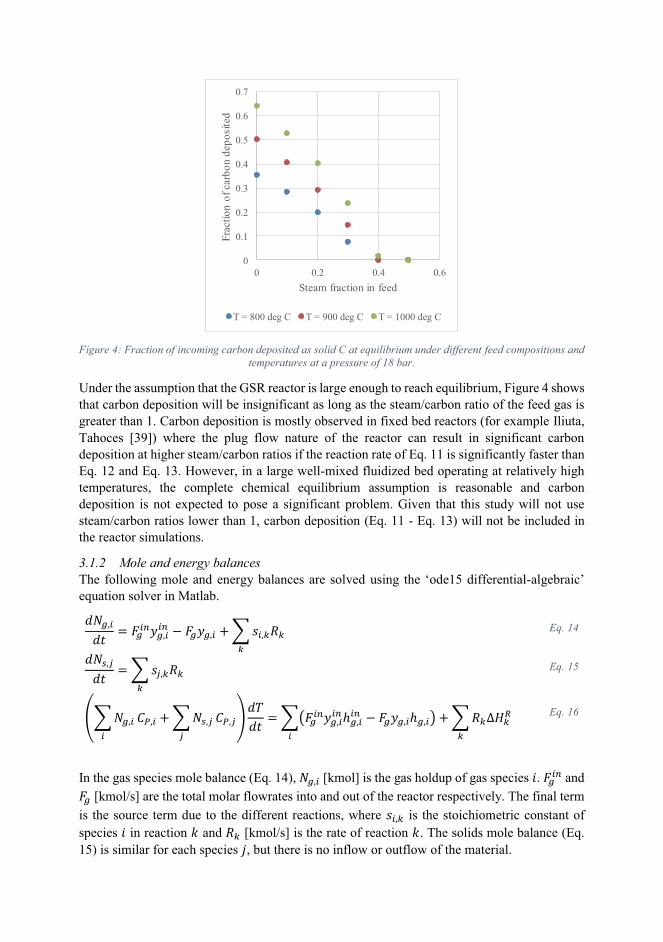
Figure 4: Fraction of incoming carbon deposited as solid C at equilibrium under different feed compositions and temperatures at a pressure of 18 bar.
Under the assumption that the GSR reactor is large enough to reach equilibrium, Figure 4 shows
that carbon deposition will be insignificant as long as the steam/carbon ratio of the feed gas is
greater than 1. Carbon deposition is mostly observed in fixed bed reactors (for example Iliuta,
Tahoces [39]) where the plug flow nature of the reactor can result in significant carbon
deposition at higher steam/carbon ratios if the reaction rate of Eq. 11 is significantly faster than
Eq. 12 and Eq. 13. However, in a large well-mixed fluidized bed operating at relatively high
temperatures, the complete chemical equilibrium assumption is reasonable and carbon
deposition is not expected to pose a significant problem. Given that this study will not use
steam/carbon ratios lower than 1, carbon deposition (Eq. 11 - Eq. 13) will not be included in
the reactor simulations.
3.1.2 Mole and energy balances The following mole and energy balances are solved using the ‘ode15 differential-algebraic’
equation solver in Matlab. {0� A{1 � X�AJ7� AAJ X�7� A � ¡ �A ¢W¢¢ Eq. 14
{0L £{1 � ¡ �£ ¢W¢¢ Eq. 15
¤¡ 0� AA �¥ A � ¡ 0L ££ �¥ £¦{�{1 � ¡§X�AJ7� AAJ�� AAJ X�7� A�� A¨A � ¡ W¢�¢N¢ Eq. 16
In the gas species mole balance (Eq. 14), 0� A [kmol] is the gas holdup of gas species . X�AJ and X� [kmol/s] are the total molar flowrates into and out of the reactor respectively. The final term
is the source term due to the different reactions, where �A ¢ is the stoichiometric constant of
species in reaction � and W¢ [kmol/s] is the rate of reaction �. The solids mole balance (Eq.
15) is similar for each species ©, but there is no inflow or outflow of the material.
0
0.1
0.2
0.3
0.4
0.5
0.6
0.7
0 0.2 0.4 0.6
Fra
ctio
n o
f ca
rbo
n d
epo
site
d
Steam fraction in feed
T = 800 deg C T = 900 deg C T = 1000 deg C
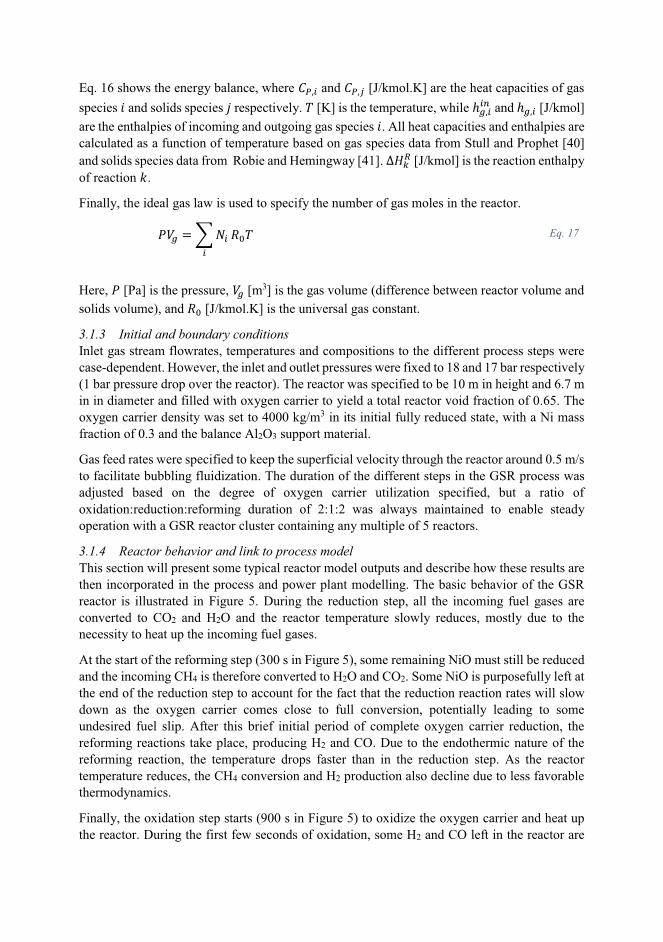
Eq. 16 shows the energy balance, where �¥ A and �¥ £ [J/kmol.K] are the heat capacities of gas
species and solids species © respectively. � [K] is the temperature, while �� AAJ and �� A [J/kmol]
are the enthalpies of incoming and outgoing gas species . All heat capacities and enthalpies are
calculated as a function of temperature based on gas species data from Stull and Prophet [40]
and solids species data from Robie and Hemingway [41]. �¢N [J/kmol] is the reaction enthalpy
of reaction �.
Finally, the ideal gas law is used to specify the number of gas moles in the reactor.
��� � ¡ 0AA W:� Eq. 17
Here, � [Pa] is the pressure, �� [m3] is the gas volume (difference between reactor volume and
solids volume), and W: [J/kmol.K] is the universal gas constant.
3.1.3 Initial and boundary conditions Inlet gas stream flowrates, temperatures and compositions to the different process steps were
case-dependent. However, the inlet and outlet pressures were fixed to 18 and 17 bar respectively
(1 bar pressure drop over the reactor). The reactor was specified to be 10 m in height and 6.7 m
in in diameter and filled with oxygen carrier to yield a total reactor void fraction of 0.65. The
oxygen carrier density was set to 4000 kg/m3 in its initial fully reduced state, with a Ni mass
fraction of 0.3 and the balance Al2O3 support material.
Gas feed rates were specified to keep the superficial velocity through the reactor around 0.5 m/s
to facilitate bubbling fluidization. The duration of the different steps in the GSR process was
adjusted based on the degree of oxygen carrier utilization specified, but a ratio of
oxidation:reduction:reforming duration of 2:1:2 was always maintained to enable steady
operation with a GSR reactor cluster containing any multiple of 5 reactors.
3.1.4 Reactor behavior and link to process model This section will present some typical reactor model outputs and describe how these results are
then incorporated in the process and power plant modelling. The basic behavior of the GSR
reactor is illustrated in Figure 5. During the reduction step, all the incoming fuel gases are
converted to CO2 and H2O and the reactor temperature slowly reduces, mostly due to the
necessity to heat up the incoming fuel gases.
At the start of the reforming step (300 s in Figure 5), some remaining NiO must still be reduced
and the incoming CH4 is therefore converted to H2O and CO2. Some NiO is purposefully left at
the end of the reduction step to account for the fact that the reduction reaction rates will slow
down as the oxygen carrier comes close to full conversion, potentially leading to some
undesired fuel slip. After this brief initial period of complete oxygen carrier reduction, the
reforming reactions take place, producing H2 and CO. Due to the endothermic nature of the
reforming reaction, the temperature drops faster than in the reduction step. As the reactor
temperature reduces, the CH4 conversion and H2 production also decline due to less favorable
thermodynamics.
Finally, the oxidation step starts (900 s in Figure 5) to oxidize the oxygen carrier and heat up
the reactor. During the first few seconds of oxidation, some H2 and CO left in the reactor are
converted to H2O and CO2. Following this brief period, the outlet gases comprise of almost
pure N2 as all the O2 in the air is consumed by the oxidation reaction.
Figure 5 also illustrates some undesired mixing between N2 and CO2 before and after the
oxidation step. This mixing is due to the CSTR assumption and will lower the CO2 capture rate
and CO2 purity achieved by the system. Nevertheless, the CO2 capture performance of the
system remains very high as will be described in the results and discussion section.
Figure 5: Reactor outlet gas species and temperature plot over one complete GSR cycle. The first 300 s of the cycle is reduction with PSA off-gas fuel, followed by 600 s of steam-methane reforming and 600 s of oxidation
with air.
For linking to the process model, the outlet gas composition and temperature from each step of
the reactor were averaged on the assumption that a cluster of GSR reactors will give a suitably
steady state stream. This assumption was previously evaluated in more detail for the gas
switching combustion (GSC) reactor concept [33], the combustion equivalent of GSR, showing
that transient mass and temperature variations were sufficiently small to allow for steady
operation of downstream equipment like a gas turbine. In the case of GSR, the reactor cluster
will need to consist of a multiple of five reactors, alternatively running reduction, reforming
and oxidation steps in a ratio of 1:2:2. The number of reactors should be determined by the
temperature variations that can be tolerated by downstream process equipment: more reactors
will yield steadier combined outlet streams. It should also be mentioned that the outlet streams
were averaged assuming an 8 s delay in the outlet valve switch relative to the inlet valve switch.
This practice increases the CO2 separation performance of the reactor (more details in Cloete,
Romano [33]).
The maximum reactor temperature was fixed at 1100 °C to protect the oxygen carrier material
from thermal damages. This means that a longer cycle will allow the reactor temperature to
drop to a lower level at the end of the reforming step, lowering the average outlet temperatures
from all three reactor steps. The most important effect of this lower temperature in the GSR
reactor is poorer CH4 conversion in the reforming step. On the other hand, a longer cycle will
also reduce the relative impact of the undesired mixing of N2 and CO2. This tradeoff between
fuel conversion and N2/CO2 separation efficiency could potentially be minimized by adding a
200
300
400
500
600
700
800
900
1000
1100
1200
0
0.1
0.2
0.3
0.4
0.5
0.6
0.7
0.8
0.9
1
0 300 600 900 1200 1500
Tem
per
atu
re (
°C)
Sp
ecie
s m
ole
fra
ctio
n
Time (s)
H2 CO CH4 H2O CO2 O2 N2 Ar T
steam purging step at the start and end of oxidation. Alternatively, the reactor could be designed
with additional thermal mass (such as vertical metal bars) to reduce the temperature variation
observed in Figure 5. In this case, however, it was found that such strategies were not required
to achieve good process performance.
The resulting averaged outlet stream data was passed to the process models for WGS, PSA and
the power plant. After this modification to the process model input, the off-gas stream from the
PSA being fed to the reduction step of the GSR process is also changed. Following this update,
the reactor model is run another time to give new output data to the process model for WGS,
PSA and power plant. 4-5 such iterations were required to converge the connection between the
reactor and process models.
3.2 Modeling Methodology and Assumptions The air compressor, WGS, PSA off gas compressor, reduction step product cooling and CO2
compression were modeled using Aspen Hysys V8.6 [42]. Peng-Robinson equation of state was
used to estimate the thermodynamic properties in the process model. The composition and
condition of atmospheric air is according to EBTF [34] report. The atmospheric air is
compressed to 18 bar in the air compressor before being mixed with the compressed air bleed
stream from the exit of the compressor in the GT system. The design pressure in the GSR unit,
which is 18 bar, was selected because it is close to the pressure of the air bleed from the
compressor discharge of the GT system. A design pressure of more than 18 bar will require an
additional air compressor in the process scheme [30, 31]. 12% by mass of the total air inlet to
the GT is bled at the compressor outlet of the GT and is used in the oxidation step in GSR. The
polytropic efficiency of the air compressor is 90.9%.
The equilibrium reactor module in Aspen Hysys V8.6 was used to model the conditions in HTS
and LTS. The inlet product streams to the HTS and LTS are at 400 °C and 200 °C respectively
[30, 31, 43]. The pressure drop in both the WGS reactors is assumed to be 3%. The heat
exchangers in the entire process have a pressure drop of 2% for gaseous streams, and 0.4 bar
for liquid streams.
The PSA unit in this study was modeled as a “black box”. The purity of H2 in the H2-rich stream
from the PSA unit is assumed 99.99% with 86% recovery of H2 [44, 45]. The component
balance around the PSA unit then leads to estimating the composition of the resulting outlet
streams. The pressure of the H2-rich fuel stream from the PSA unit is 0.2 bar less than the inlet
stream whereas the temperature is 43 °C. The temperature is similar to the H2-rich fuel
temperature considered in the analysis of CLR-CC by Nazir, Bolland [30]. The off gas from the
PSA is at atmospheric pressure and 25 °C. The PSA off gas is compressed to 18 bar before
being mixed with additional NG and sent to the GSR reduction step. The work done in
compressing the PSA off gas indirectly reflects the energy penalty in the PSA separation step.
The additional NG stream is heated up to the temperature of compressed PSA off gas stream
before it is mixed. The PSA off gas compressor has a polytropic efficiency of 90%. The flow
rate of additional CH4 to the reduction step in GSR is dependent on the amount of metal oxide
remaining to be reduced. The product stream from the reduction step contains mainly CO2 and
H2O. It is cooled and condensed before the CO2 stream is compressed to 110 bar and is ready
for transport and storage. The CO2 compression cycle is similar to the one presented in EBTF
[34]. The saturated HP steam produced while cooling syngas, HTS product, N2-rich stream and
reduction step product stream is at 174.4 bar. The saturated LP steam produced while cooling
LTS product stream is at 3.8 bar. The saturated steam pressures are based on the point at which
they are being mixed with the other steam lines in the HRSG.
The combined cycle power plant along with the N2-rich stream treatment has been modeled and
analysed using the Thermoflex component of the Thermoflow Suite V26 [46]. Themoflow suite
contains a database of the models of standard commercial GT systems. The N2-rich stream is
expanded in a N2-rich stream turbine and cooled. A fraction of the N2-rich stream, equivalent
to the amount of the compressor bleed flow rate from the GT system, is compressed in two
stages and used as diluent during the H2-rich fuel combustion in the combustor of the GT [47].
The polytropic efficiency of the compressors used for compressing N2-rich stream is 90%. The
GT system considered in this study is GE-9371FB model as it exhibits robustness to the fuel
types, especially to H2-rich fuels [34, 48]. The power plant comprises of two GTs, two HRSGs
and one ST system. The steam cycle consists of a three-pressure level with reheat before the
MP turbine. The GT is run at full load conditions and the Lower Heating Value (LHV) input at
the GT inlet is 1.55 GW in all the cases studied and presented in this paper. The net electrical
efficiency (η), the CO2 avoidance and the specific energy consumption for CO2 avoided
(SPECCA) are defined in Eq. 18, Eq. 19 and Eq. 20.
0�1����213 24���55 2 �627�,8/� ��++� * 0�1����213 2 17��3�{�2�{� 6���W����3�2���M����5�0�� 6��1�1��1����3�2��� Eq. 18
����Zz� {462��,"/� ��++� *� ,������ 11�{� 6�0���� ������� 11�{� 6���W��/������ 11�{� 6�0����
Eq. 19
�����Z � � �W �W3�5�#1������) #1������) 3�5��
Eq. 20
3.3 Economic analysis methodology and assumptions The LCOE and COCA are the main economic performance indicators for the GSR-CC process.
The methodology adopted to estimate the LCOE and COCA is proposed by GCCSI [49]. Eq.
21, Eq. 22 and Eq. 23 are used to calculate the LCOE and COCA. The definition of each term
used in the equations is given in Table 2.
M��� �� ,��W/,X�X/ � X��,��/,�X * ���/ � ��� � ,�W/,X�/�
Eq. 21
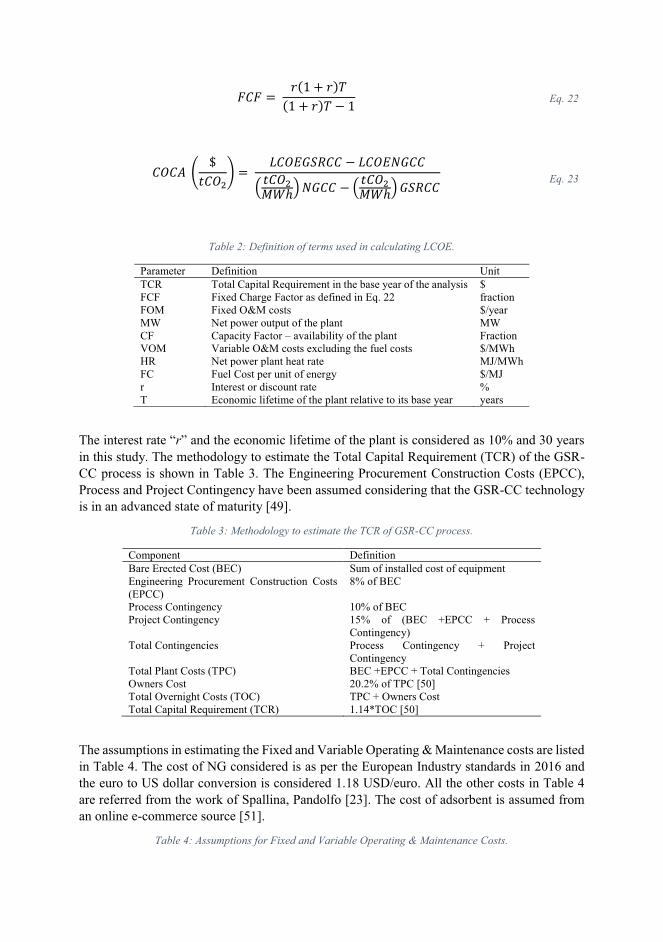
X�X � � 3,� � 3/�,� � 3/� ��
Eq. 22
���Z� � [1��]� � � M�����W�� M���0���#1��]���) 0��� #1��]���) ��W���
Eq. 23
Table 2: Definition of terms used in calculating LCOE.
Parameter Definition Unit
TCR Total Capital Requirement in the base year of the analysis $ FCF Fixed Charge Factor as defined in Eq. 22 fraction FOM Fixed O&M costs $/year MW Net power output of the plant MW CF Capacity Factor – availability of the plant Fraction VOM Variable O&M costs excluding the fuel costs $/MWh HR Net power plant heat rate MJ/MWh FC Fuel Cost per unit of energy $/MJ r Interest or discount rate % T Economic lifetime of the plant relative to its base year years
The interest rate “r” and the economic lifetime of the plant is considered as 10% and 30 years
in this study. The methodology to estimate the Total Capital Requirement (TCR) of the GSR-
CC process is shown in Table 3. The Engineering Procurement Construction Costs (EPCC),
Process and Project Contingency have been assumed considering that the GSR-CC technology
is in an advanced state of maturity [49].
Table 3: Methodology to estimate the TCR of GSR-CC process.
Component Definition
Bare Erected Cost (BEC) Sum of installed cost of equipment Engineering Procurement Construction Costs (EPCC)
8% of BEC
Process Contingency 10% of BEC Project Contingency 15% of (BEC +EPCC + Process
Contingency) Total Contingencies Process Contingency + Project
Contingency Total Plant Costs (TPC) BEC +EPCC + Total Contingencies Owners Cost 20.2% of TPC [50] Total Overnight Costs (TOC) TPC + Owners Cost Total Capital Requirement (TCR) 1.14*TOC [50]
The assumptions in estimating the Fixed and Variable Operating & Maintenance costs are listed
in Table 4. The cost of NG considered is as per the European Industry standards in 2016 and
the euro to US dollar conversion is considered 1.18 USD/euro. All the other costs in Table 4
are referred from the work of Spallina, Pandolfo [23]. The cost of adsorbent is assumed from
an online e-commerce source [51].
Table 4: Assumptions for Fixed and Variable Operating & Maintenance Costs.
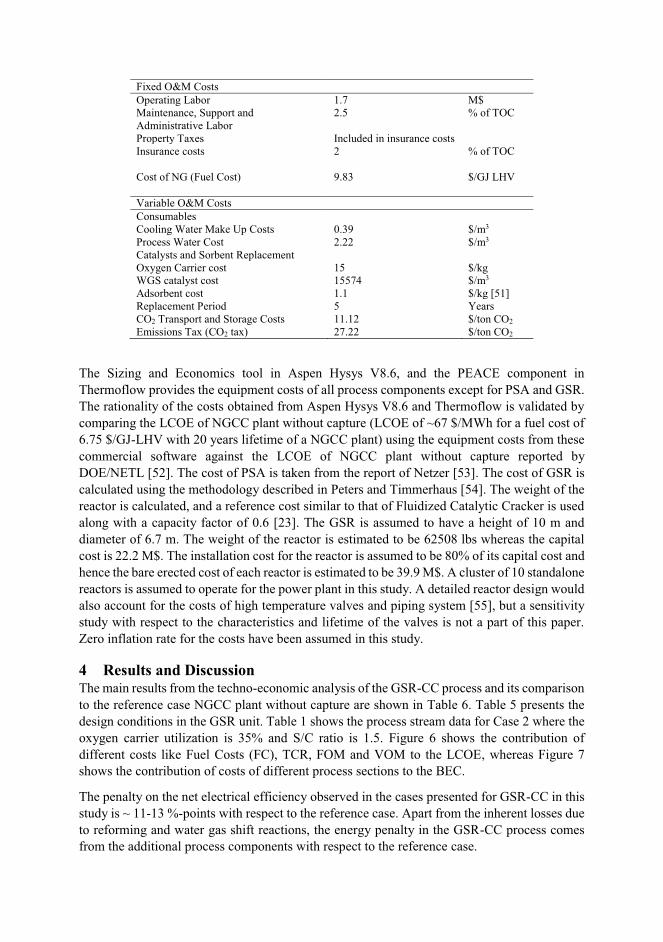
Fixed O&M Costs
Operating Labor 1.7 M$ Maintenance, Support and Administrative Labor
2.5
% of TOC
Property Taxes Included in insurance costs Insurance costs 2 % of TOC Cost of NG (Fuel Cost) 9.83 $/GJ LHV
Variable O&M Costs
Consumables Cooling Water Make Up Costs 0.39 $/m3 Process Water Cost 2.22 $/m3 Catalysts and Sorbent Replacement Oxygen Carrier cost 15 $/kg WGS catalyst cost 15574 $/m3 Adsorbent cost 1.1 $/kg [51] Replacement Period 5 Years CO2 Transport and Storage Costs 11.12 $/ton CO2 Emissions Tax (CO2 tax) 27.22 $/ton CO2
The Sizing and Economics tool in Aspen Hysys V8.6, and the PEACE component in
Thermoflow provides the equipment costs of all process components except for PSA and GSR.
The rationality of the costs obtained from Aspen Hysys V8.6 and Thermoflow is validated by
comparing the LCOE of NGCC plant without capture (LCOE of ~67 $/MWh for a fuel cost of
6.75 $/GJ-LHV with 20 years lifetime of a NGCC plant) using the equipment costs from these
commercial software against the LCOE of NGCC plant without capture reported by
DOE/NETL [52]. The cost of PSA is taken from the report of Netzer [53]. The cost of GSR is
calculated using the methodology described in Peters and Timmerhaus [54]. The weight of the
reactor is calculated, and a reference cost similar to that of Fluidized Catalytic Cracker is used
along with a capacity factor of 0.6 [23]. The GSR is assumed to have a height of 10 m and
diameter of 6.7 m. The weight of the reactor is estimated to be 62508 lbs whereas the capital
cost is 22.2 M$. The installation cost for the reactor is assumed to be 80% of its capital cost and
hence the bare erected cost of each reactor is estimated to be 39.9 M$. A cluster of 10 standalone
reactors is assumed to operate for the power plant in this study. A detailed reactor design would
also account for the costs of high temperature valves and piping system [55], but a sensitivity
study with respect to the characteristics and lifetime of the valves is not a part of this paper.
Zero inflation rate for the costs have been assumed in this study.
4 Results and Discussion The main results from the techno-economic analysis of the GSR-CC process and its comparison
to the reference case NGCC plant without capture are shown in Table 6. Table 5 presents the
design conditions in the GSR unit. Table 1 shows the process stream data for Case 2 where the
oxygen carrier utilization is 35% and S/C ratio is 1.5. Figure 6 shows the contribution of
different costs like Fuel Costs (FC), TCR, FOM and VOM to the LCOE, whereas Figure 7
shows the contribution of costs of different process sections to the BEC.
The penalty on the net electrical efficiency observed in the cases presented for GSR-CC in this
study is ~ 11-13 %-points with respect to the reference case. Apart from the inherent losses due
to reforming and water gas shift reactions, the energy penalty in the GSR-CC process comes
from the additional process components with respect to the reference case.
Gross power production from the turbomachinery in the GSR-CC plants is similar to the
reference case (around 59% of LHV input). At first glance, this is a counter-intuitive finding
because the thermal energy in the streams exiting the GSR reactors is converted to work at
lower temperatures than the reference case. For example, the CO2-rich gases exiting the
reduction step of the GSR reactors (stream 7 in Figure 3) are used to generate steam for
powering the steam turbine, whereas all of the process gases power the combined cycle in the
reference case. In addition, a significant amount of MP steam is extracted from the steam turbine
for feeding the reforming stage of the GSR reactors. However, the expansion work that is lost
through these mechanisms is compensated by additional energy input to the process streams
though the compressors for air, diluent N2-rich stream, PSA off gas, and H2-rich fuel, ultimately
creating a similar gross power output.
Another important energy penalty in the GSR-CC system is related to the practical requirements
of the primary gas turbine. Firstly, the compressor for the diluent N2-rich stream, required to
prevent excessive NOx formation when combusting the H2-rich fuel, consumes a significant
amount of power (4.4% of LHV input). To generate this compressed N2-rich stream at 30 bar,
the outlet gases from the air stage of the GSR reactors (stream 6 in Figure 3) must first be
expanded at a relatively low temperature (<1000 °C), resulting in less useful work compared to
the reference case where all gases enter the primary gas turbine at temperatures exceeding 1400
°C. In addition, the H2-rich fuel from the PSA unit must be further compressed for injection
into the combustion chamber at an additional electricity consumption equivalent to 0.8 % of
LHV input.
Ideally, no diluent would be added to the H2-rich fuel, and the hot N2-rich stream from the air
stage of the GSR reactors would be fed directly to the combustion chamber to be heated up
further before expansion. This arrangement would significantly increase efficiency and reduce
the number of process units, but is not feasible with currently available gas turbines.
Additional energy penalties arise from the PSA off-gas and CO2 compressors. As shown in
Table 6, the electricity consumption from the pressure swing separation of H2 amounts to 1.9
% of LHV input, whereas the further compression of the CO2-rich stream for transport and
storage imposes an additional 0.9 %-points in energy penalty.
The TCR for the GSR-CC process is 3 times more than the TCR of the reference case. As shown
in Figure 7, the GSR reactors represent the largest single capital cost increase, but significant
capital costs are also attributed to other plant components. In addition, the significant energy
penalty also enforces larger plant components for a given electricity output. The LCOE for the
GSR-CC process is higher than the reference case, since the GSR-CC encounters more fuel,
capital and operating and maintenance costs. The substantial increase in FOM is primarily
attributed to replacement costs of the GSR oxygen carrier. As a result of the significant increase
in LCOE, the GSR-CC plants assessed in this study impose a CO2 avoidance cost of 112-134
$/ton CO2 on top of the 27.22 $/ton CO2 emissions tax assumed.
To analyze the techno-economic performance of GSR-CC at different design conditions in
GSR, for cases 1, 2 and 3 in Table 5, the Steam/Carbon ratio in the reforming step is kept
constant whereas the cycle time in oxidation step is varied to result in oxidation of 25%, 35%
and 45% of the available Ni during the oxidation step of the GSR reactors. This independent
variable is henceforth called “oxygen carrier utilization”. In cases 2, 4 and 5, the oxygen carrier
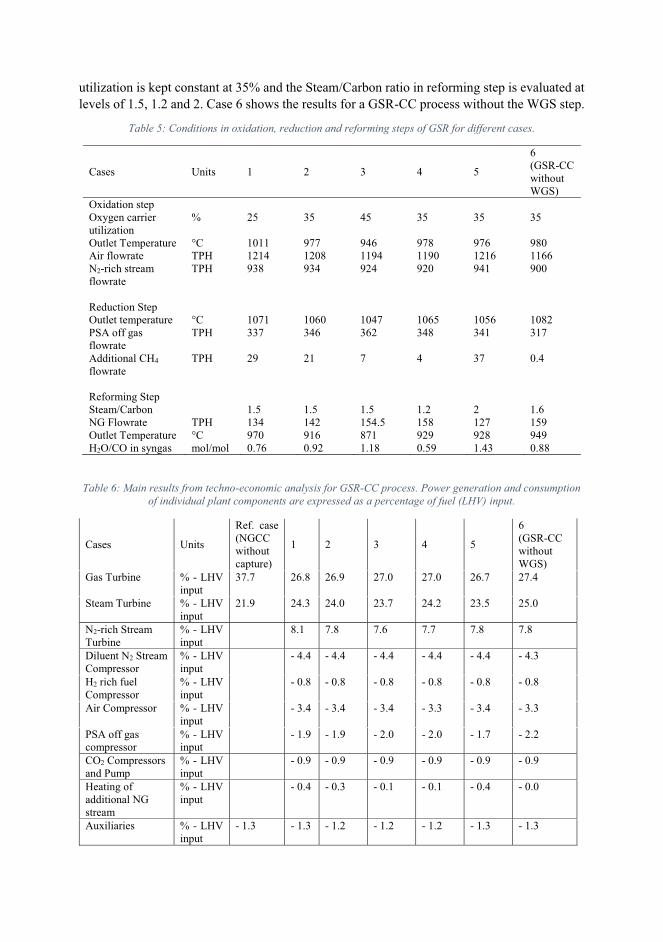
utilization is kept constant at 35% and the Steam/Carbon ratio in reforming step is evaluated at
levels of 1.5, 1.2 and 2. Case 6 shows the results for a GSR-CC process without the WGS step.
Table 5: Conditions in oxidation, reduction and reforming steps of GSR for different cases.
Cases Units 1 2 3 4 5
6 (GSR-CC without WGS)
Oxidation step Oxygen carrier utilization
% 25 35 45 35 35 35
Outlet Temperature °C 1011 977 946 978 976 980 Air flowrate TPH 1214 1208 1194 1190 1216 1166 N2-rich stream flowrate
TPH 938 934 924 920 941 900
Reduction Step Outlet temperature °C 1071 1060 1047 1065 1056 1082 PSA off gas flowrate
TPH 337 346 362 348 341 317
Additional CH4 flowrate
TPH 29 21 7 4 37 0.4
Reforming Step Steam/Carbon 1.5 1.5 1.5 1.2 2 1.6 NG Flowrate TPH 134 142 154.5 158 127 159 Outlet Temperature °C 970 916 871 929 928 949 H2O/CO in syngas mol/mol 0.76 0.92 1.18 0.59 1.43 0.88
Table 6: Main results from techno-economic analysis for GSR-CC process. Power generation and consumption of individual plant components are expressed as a percentage of fuel (LHV) input.
Cases Units
Ref. case (NGCC without capture)
1 2 3 4 5
6 (GSR-CC without WGS)
Gas Turbine % - LHV input
37.7 26.8 26.9 27.0 27.0 26.7 27.4
Steam Turbine % - LHV input
21.9 24.3 24.0 23.7 24.2 23.5 25.0
N2-rich Stream Turbine
% - LHV input
8.1 7.8 7.6 7.7 7.8 7.8
Diluent N2 Stream Compressor
% - LHV input
- 4.4 - 4.4 - 4.4 - 4.4 - 4.4 - 4.3
H2 rich fuel Compressor
% - LHV input
- 0.8 - 0.8 - 0.8 - 0.8 - 0.8 - 0.8
Air Compressor % - LHV input
- 3.4 - 3.4 - 3.4 - 3.3 - 3.4 - 3.3
PSA off gas compressor
% - LHV input
- 1.9 - 1.9 - 2.0 - 2.0 - 1.7 - 2.2
CO2 Compressors and Pump
% - LHV input
- 0.9 - 0.9 - 0.9 - 0.9 - 0.9 - 0.9
Heating of additional NG stream
% - LHV input
- 0.4 - 0.3 - 0.1 - 0.1 - 0.4 - 0.0
Auxiliaries % - LHV input
- 1.3 - 1.3 - 1.2 - 1.2 - 1.2 - 1.3 - 1.3
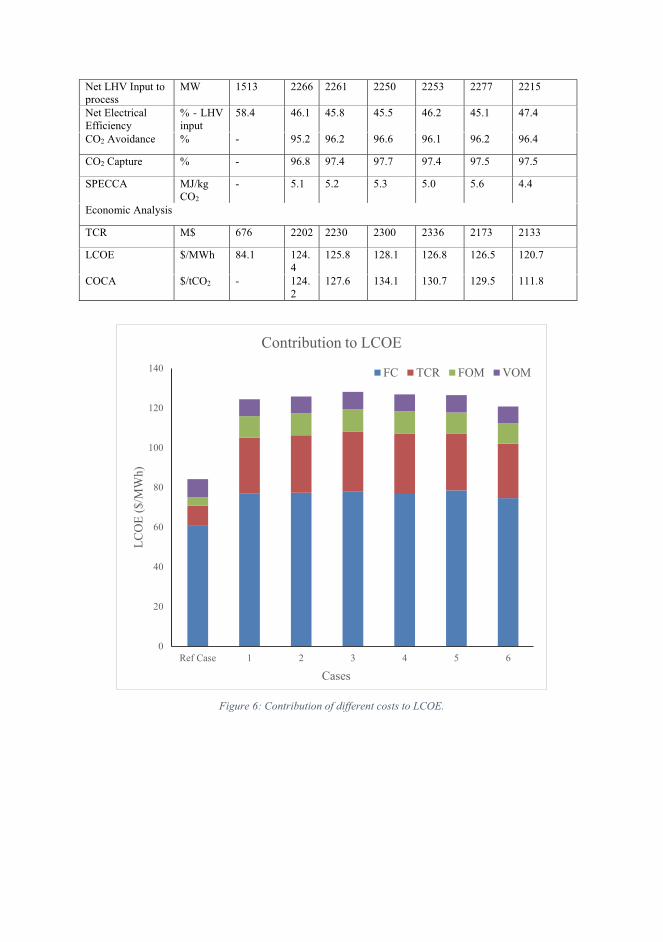
Net LHV Input to process
MW 1513 2266 2261 2250 2253 2277 2215
Net Electrical Efficiency
% - LHV input
58.4 46.1 45.8 45.5 46.2 45.1 47.4
CO2 Avoidance % - 95.2 96.2 96.6 96.1 96.2 96.4
CO2 Capture % - 96.8 97.4 97.7 97.4 97.5 97.5
SPECCA MJ/kg CO2
- 5.1 5.2 5.3 5.0 5.6 4.4
Economic Analysis
TCR M$ 676 2202 2230 2300 2336 2173 2133
LCOE $/MWh 84.1 124.4
125.8 128.1 126.8 126.5 120.7
COCA $/tCO2 - 124.2
127.6 134.1 130.7 129.5 111.8
Figure 6: Contribution of different costs to LCOE.
0
20
40
60
80
100
120
140
Ref Case 1 2 3 4 5 6
LC
OE
($
/MW
h)
Cases
Contribution to LCOE
FC TCR FOM VOM
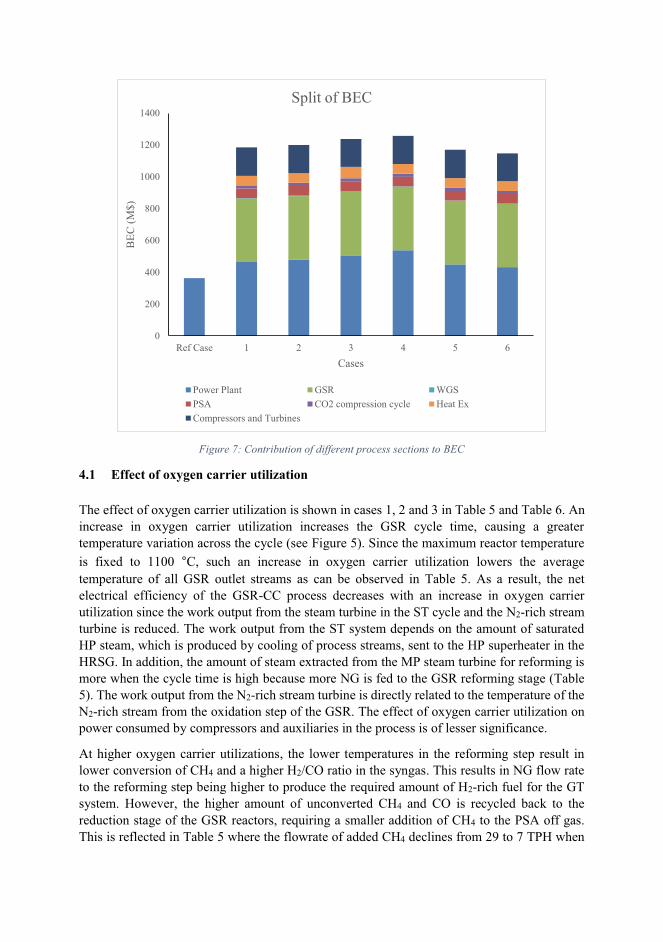
Figure 7: Contribution of different process sections to BEC
4.1 Effect of oxygen carrier utilization
The effect of oxygen carrier utilization is shown in cases 1, 2 and 3 in Table 5 and Table 6. An
increase in oxygen carrier utilization increases the GSR cycle time, causing a greater
temperature variation across the cycle (see Figure 5). Since the maximum reactor temperature
is fixed to 1100 °C, such an increase in oxygen carrier utilization lowers the average
temperature of all GSR outlet streams as can be observed in Table 5. As a result, the net
electrical efficiency of the GSR-CC process decreases with an increase in oxygen carrier
utilization since the work output from the steam turbine in the ST cycle and the N2-rich stream
turbine is reduced. The work output from the ST system depends on the amount of saturated
HP steam, which is produced by cooling of process streams, sent to the HP superheater in the
HRSG. In addition, the amount of steam extracted from the MP steam turbine for reforming is
more when the cycle time is high because more NG is fed to the GSR reforming stage (Table
5). The work output from the N2-rich stream turbine is directly related to the temperature of the
N2-rich stream from the oxidation step of the GSR. The effect of oxygen carrier utilization on
power consumed by compressors and auxiliaries in the process is of lesser significance.
At higher oxygen carrier utilizations, the lower temperatures in the reforming step result in
lower conversion of CH4 and a higher H2/CO ratio in the syngas. This results in NG flow rate
to the reforming step being higher to produce the required amount of H2-rich fuel for the GT
system. However, the higher amount of unconverted CH4 and CO is recycled back to the
reduction stage of the GSR reactors, requiring a smaller addition of CH4 to the PSA off gas.
This is reflected in Table 5 where the flowrate of added CH4 declines from 29 to 7 TPH when
0
200
400
600
800
1000
1200
1400
Ref Case 1 2 3 4 5 6
BE
C (
M$
)
Cases
Split of BEC
Power Plant GSR WGS
PSA CO2 compression cycle Heat Ex
Compressors and Turbines
the oxygen carrier utilization is increased from 25% to 45%. This also reduces the efficiency
penalty considered due to heating up the additional NG stream to the temperature of the
compressed PSA off gas.
The LCOE of the GSR-CC process increases with the degree of oxygen carrier utilization. This
is due the higher heat rate (lower net electric efficiency) and the higher total capital requirement
(TCR). As mentioned above, at higher oxygen carrier utilizations, the amount of saturated HP
steam prepared from cooling of different process streams is less due to the lower logarithmic
mean temperature difference (LMTD) between the process stream and the water stream that is
being converted to steam. Lower LMTD between streams results in higher heat exchange area
and costs (Figure 7). In addition, more saturated HP steam needs to be prepared from the HP
boiler in HRSG. This results in HRSG of higher size and costs as shown in Figure 7.
CO2 capture efficiency increases slightly with an increase in oxygen carrier utilization because
the constant amount of undesired gas mixing when switching between stages (see Figure 5)
becomes relatively smaller with longer cycle times. Despite this improvement, however, the
Cost of CO2 Avoidance (COCA) still increases with oxygen carrier utilization due the increase
in LCOE.
4.2 Effect of Steam/Carbon ratio Cases 2, 4 and 5 in Table 5 and Table 6 show the effect of Steam/Carbon ratio in the reforming
step on the overall techno-economic performance of the GSR-CC process. The oxygen carrier
utilization is kept constant at 35% for these cases and the Steam/Carbon molar ratio is assumed
1.5 in Case 2, 1.2 in Case 4, and 2 in Case 5. With different Steam/Carbon ratios in the
reforming step of GSR, the temperatures in the oxidation step, reduction and reforming steps in
the three cases do not vary much at a constant cycle time. However, the amount of NG reformed
in GSR to produce the H2-rich fuel for the GT system increases with Steam/Carbon ratio. This
results in lower flowrates of PSA off gas stream and higher additional CH4 flowrates when the
Steam/Carbon ratio is high. Hence, less power is consumed by the PSA off gas compressor, but
on the contrary, a higher efficiency penalty due to heating up of the additional NG stream.
The net electrical efficiency of the GSR-CC process is low when the Steam/Carbon ratio in the
reforming step of GSR is high. The main difference in net electrical efficiency is due to the
power produced from the ST cycle, power consumed by the PSA off gas compressor and the
penalty due to heating up of additional NG stream. The primary reason for the trend of reduced
steam turbine power output with increasing Steam/Carbon ratio is that it requires higher MP
steam extraction from the ST.
The TCR is low when the Steam/Carbon ratio is high. The main cost impact is due to the cost
of power plant section, which is low when the amount of saturated HP steam produced from
heat recovery from process streams is high (Table 6). When steam produced by heat recovery
from process streams is high, the size of the HP boiler in the HRSG system is low, and hence
lower the cost of HRSG. Although, the size of heat exchangers used for heat recovery from
process streams might increase, but it is also dependent on the LMTD in the heat exchanger.
The LCOE of the GSR-CC process does not differ much in cases 2, 4 and 5 as lower TCR at
high Steam/Carbon ratios is cancelled out by higher fuel costs (lower efficiency). Following
the LCOE, the COCA is also similar between these three cases given that CO2 avoidance was
not significantly affected by Steam/Carbon ratio.

4.3 Effect of excluding WGS The GSR-CC process was analysed without the WGS step, and the results are shown as Case 6
in Table 5 and Table 6. The oxygen carrier utilization is 35% and the Steam/Carbon ratio in the
reforming step of GSR is 1.6. Under these operating conditions, there is negligible additional
NG flowrate in the reduction step.
The net electrical efficiency for the GSR-CC process without a WGS step is high compared to
the other cases described in this paper, because the inherent efficiency penalty due to WGS
reactions does not exist. Hence, a higher conversion of the LHV input in GSR-CC to power
produced from GT and ST in power plant is observed. The flowrate of PSA off gas is high
which results in higher power consumption by the PSA off gas compressor. The PSA off gas
flow rate is high because, in the absence of WGS step, the CO and H2O in the syngas remain
unreacted.
The TCR for the GSR-CC without WGS is lower as the cost of WGS reactors and the heat
exchangers between the WGS steps is not included (Figure 7). The CO2 avoidance and capture
rate for GSR-CC without WGS is also more than 95% and 96% respectively. The LCOE for
the GSR-CC without WGS is least among the cases studied in this paper, since the contribution
of fuel costs and the TCR to the LCOE is less. Similarly, the COCA of Case 6 is the lowest for
GSR-CC without WGS when compared to the GSR-CC cases with WGS.
4.4 Sensitivity to NG price It is clear from Figure 6 that fuel cost is the major component of the LCOE. Hence, the LCOE
of the GSR-CC process is very sensitive to the NG price. The NG price considered for the
analysis above was 9.83 $/GJ-LHV which is the price in the European context (for the year
2014-2015), but there is a lot of variability of the price of NG around the world. Figure 8 shows
the effect of NG price on the LCOE and COCA for the GSR-CC process without WGS (case
6). Clearly, lower NG prices substantially improve the economics of the process.
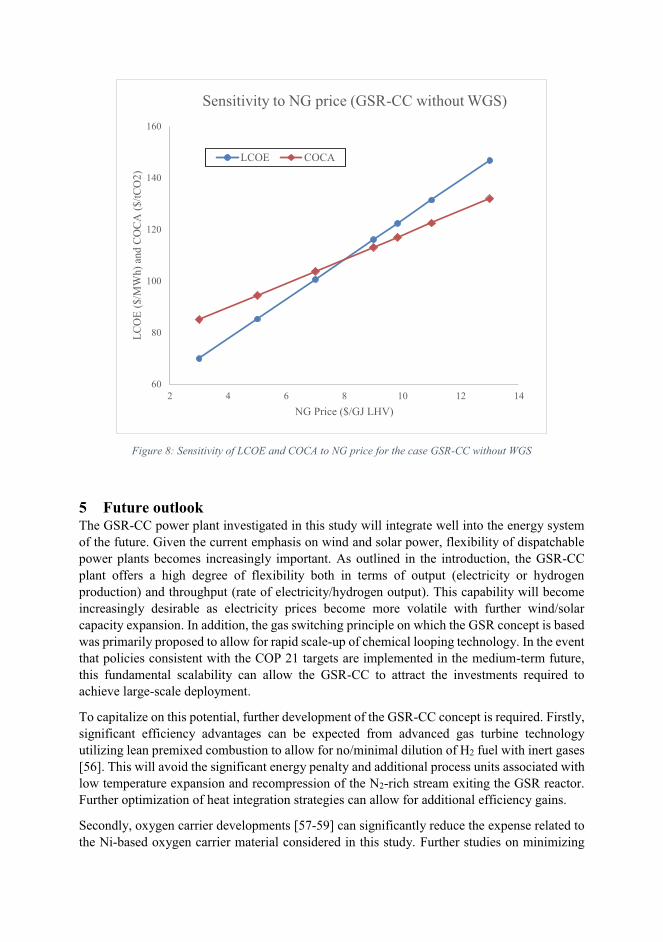
Figure 8: Sensitivity of LCOE and COCA to NG price for the case GSR-CC without WGS
5 Future outlook The GSR-CC power plant investigated in this study will integrate well into the energy system
of the future. Given the current emphasis on wind and solar power, flexibility of dispatchable
power plants becomes increasingly important. As outlined in the introduction, the GSR-CC
plant offers a high degree of flexibility both in terms of output (electricity or hydrogen
production) and throughput (rate of electricity/hydrogen output). This capability will become
increasingly desirable as electricity prices become more volatile with further wind/solar
capacity expansion. In addition, the gas switching principle on which the GSR concept is based
was primarily proposed to allow for rapid scale-up of chemical looping technology. In the event
that policies consistent with the COP 21 targets are implemented in the medium-term future,
this fundamental scalability can allow the GSR-CC to attract the investments required to
achieve large-scale deployment.
To capitalize on this potential, further development of the GSR-CC concept is required. Firstly,
significant efficiency advantages can be expected from advanced gas turbine technology
utilizing lean premixed combustion to allow for no/minimal dilution of H2 fuel with inert gases
[56]. This will avoid the significant energy penalty and additional process units associated with
low temperature expansion and recompression of the N2-rich stream exiting the GSR reactor.
Further optimization of heat integration strategies can allow for additional efficiency gains.
Secondly, oxygen carrier developments [57-59] can significantly reduce the expense related to
the Ni-based oxygen carrier material considered in this study. Further studies on minimizing
60
80
100
120
140
160
2 4 6 8 10 12 14
LC
OE
($
/MW
h)
and
CO
CA
($
/tC
O2
)
NG Price ($/GJ LHV)
Sensitivity to NG price (GSR-CC without WGS)
LCOE COCA
the cost of the reactor can also lead to capital cost reductions. The present study calculates
reactor costs based on an FCC benchmark, but it is possible that the standalone bubbling
fluidized bed reactors employed in the GSR concept can facilitate significantly lower costs due
to design simplicity and the use of cheaper refractory materials.
An important future challenge for the GSR technology is the requirement for high temperature
valves and filters downstream of the reactors. This equipment needs to operate reliably at
temperatures around 1000 °C, slightly above the upper limit of current market offerings. The
GSR reactors can be operated at lower temperatures to avoid the need for new developments in
downstream valves and filters, but this will result in lower fuel conversion in the reforming
stage. Given that the GSR process can afford a certain level of unconverted fuel because the
PSA off gas is efficiently utilized, the possibility of lower reactor temperatures to enable the
use of currently available valves and filters is an interesting topic for future study.
The ability of a cluster of dynamically operated GSR reactors to create a steady-state processing
unit also needs to be explicitly demonstrated. Given that several commercial processes in
operation today employ this principle (e.g. the PSA process), this step is expected to be
relatively straightforward.
In summary, the GSR-CC configuration introduced in this paper is 1) fundamentally suited to
a future energy system with high wind/solar penetration, H2 demand and CO2 prices, 2) capable
of achieving significant further cost reductions beyond the numbers reported in this study, 3)
fundamentally designed for rapid scale-up, and 4) not hindered by serious technical challenges.
6 Conclusions
This paper focused on the process integration and techno-economic analysis of a novel pre-
combustion CO2 capture method in gas fired power plants, which uses the gas switching
reforming (GSR) concept for efficient reforming of CH4 with integrated CO2 capture. The GSR
concept is integrated into a combined cycle power plant and is therefore called GSR-CC. The
GSR-CC process comprises of GSR, WGS, PSA for H2 separation, CO2 compression cycle and
a H2 fueled combined cycle power plant. The process has high flexibility with respect to the
output (electricity or pure hydrogen) and throughput (rate of NG input).
The net electrical efficiency of the GSR-CC process is similar or higher than other combined
cycle plants with pre-combustion capture like CLR-CC [30, 31] between 42-46 %, steam
methane reforming at 43.65% [60] and auto-thermal reforming at 46.9 % [29]. The CO2
avoidance observed in GSR-CC (>95%) is more than the other pre-combustion and post-
combustion capture methods (~88%) [29]. Sensitivity analyses showed a slight efficiency
increase (~1 %-point) when the oxygen carrier utilization and the S/C ratio are reduced. If WGS
was removed from the GSR-CC process, the net electrical efficiency was observed to be ~2 %-
points higher.
Although there exists advantages of GSR-CC over other capture methods especially with regard
to efficiency and CO2 avoidance, the TCR of GSR-CC is over 3 times the TCR of reference
NGCC plant without capture. The primary capital cost increase comes from the reactor cost that
is more than 30% of the total capital costs. Despite this large capital cost increase, fuel remains
the primary cost component when European NG prices are used (9.83 $/GJ-LHV). In this case,
the increase in LCOE of the GSR-CC with respect to the LCOE of reference plant comes from
the fuel cost (40% of the increase in LCOE), followed by the capital cost of the additional
process equipment in GSR-CC (35% of the increase in LCOE) and the larger size of the process
equipment due to efficiency penalty of the process (25% of the increase in LCOE). When the
price of the NG is halved, the capital cost of the additional process equipment in GSR-CC
becomes the primary cost increase (44% of the increase in LCOE), followed by costs due to
larger equipment size because of efficiency penalty of the process (31% of the increase in
LCOE) and fuel cost (25% of the increase in LCOE).
Given the large cost increase from fuel costs and larger sized process components caused by
lower net electric efficiency, further efficiency improvements are highly desirable.
Thermodynamic optimization was not in the scope of this study, but it is expected that the net
electrical efficiency of the GSR-CC process can be improved substantially by detailed energy
integration and optimization. Further work is recommended on this topic.
7 Acknowledgements The authors thank the European Commission for the funding through the EU-FP7 framework
for the project NanoSim (project number: 604656). The authors would also like to acknowledge
the partners in the NanoSim project for their support. The authors would also like to thank Dr
Luca Riboldi at NTNU for helping in the understanding of the PSA systems.
References
1. IEA, Key World Energy Statistics 2017. 2017. 2. WEO, World Energy Outlook 2016. 2016, International Energy Agency. 3. ETP, Energy Technology Perspectives. 2017, International Energy Agency. 4. Boot-Handford, M.E., et al., Carbon capture and storage update. Energy and
Environmental Science, 2014. 7(1): p. 130-189. 5. Kenarsari, S.D., et al., Review of recent advances in carbon dioxide separation and
capture. RSC Advances, 2013. 3(45): p. 22739-22773. 6. Adanez, J., et al., Progress in chemical-looping combustion and reforming
technologies. Progress in Energy and Combustion Science, 2012. 38(2): p. 215-282. 7. Ishida, M., D. Zheng, and T. Akehata, Evaluation of a chemical-looping-combustion
power-generation system by graphic exergy analysis. Energy, 1987. 12(2): p. 147-154. 8. Rydén, M., A. Lyngfelt, and T. Mattisson, Synthesis gas generation by chemical-
looping reforming in a continuously operating laboratory reactor. Fuel, 2006. 85(12-13): p. 1631-1641.
9. Wassie, S.A., et al., Hydrogen production with integrated CO2 capture in a novel gas switching reforming reactor: Proof-of-concept. International Journal of Hydrogen Energy, 2017. 42(21): p. 14367-14379.
10. Zaabout, A., et al., Experimental Demonstration of a Novel Gas Switching Combustion Reactor for Power Production with Integrated CO2 Capture. Industrial & Engineering Chemistry Research, 2013. 52(39): p. 14241-14250.
11. Noorman, S., M. van Sint Annaland, and Kuipers, Packed Bed Reactor Technology for Chemical-Looping Combustion. Industrial & Engineering Chemistry Research, 2007. 46(12): p. 4212-4220.
12. Spallina, V., et al., Chemical looping reforming in packed-bed reactors: Modelling, experimental validation and large-scale reactor design. Fuel Processing Technology, 2017. 156: p. 156-170.
13. Francisco Morgado, J., et al., Modelling study of two chemical looping reforming reactor configurations: Looping vs. switching. Powder Technology, 2016.
14. Tang, M., L. Xu, and M. Fan, Progress in oxygen carrier development of methane-based chemical-looping reforming: A review. Applied Energy, 2015. 151.
15. Spallina, V., et al., Pre-combustion packed bed chemical looping (PCCL) technology for efficient H2-rich gas production processes. Chemical Engineering Journal, 2016. 294: p. 478-494.
16. Diglio, G., et al., Simulation of hydrogen production through chemical looping reforming process in a packed-bed reactor. Chemical Engineering Research and Design, 2016. 105: p. 137-151.
17. Yahom, A., et al., Simulation and thermodynamic analysis of chemical looping reforming and CO2 enhanced chemical looping reforming. Chemical Engineering Research and Design, 2014. 92(11): p. 2575-2583.
18. Bischi, A., et al., Hydrodynamic viability of chemical looping processes by means of cold flow model investigation. Applied Energy, 2012. 97: p. 201-216.
19. Pröll, T., et al., Chemical looping pilot plant results using a nickel-based oxygen carrier. Oil and Gas Science and Technology, 2011. 66(2): p. 173-180.
20. Pröll, T., et al., Syngas and a separate nitrogen/argon stream via chemical looping reforming - A 140 kW pilot plant study. Fuel, 2010. 89(6): p. 1249-1256.
21. Ortiz, M., et al., Hydrogen production by auto-thermal chemical-looping reforming in a pressurized fluidized bed reactor using Ni-based oxygen carriers. International Journal of Hydrogen Energy, 2010. 35(1): p. 151-160.
22. Zohrabian, A., et al., Techno-economic evaluation of an integrated hydrogen and power co-generation system with CO2 capture. International Journal of Greenhouse Gas Control, 2016. 44: p. 94-103.
23. Spallina, V., et al., Techno-economic assessment of membrane assisted fluidized bed reactors for pure H2 production with CO2 capture. Energy Conversion and Management, 2016. 120: p. 257-273.
24. Fan, J. and L. Zhu, Performance analysis of a feasible technology for power and high-purity hydrogen production driven by methane fuel. Applied Thermal Engineering, 2015. 75: p. 103-114.
25. Cormos, C.C., L. Petrescu, and A.M. Cormos, Assessment of hydrogen production systems based on natural gas conversion with carbon capture and storage, in Computer Aided Chemical Engineering. 2014. p. 1081-1086.
26. Martínez, I., et al., Integrated combined cycle from natural gas with CO2 capture using a Ca-Cu chemical loop. AIChE Journal, 2013. 59(8): p. 2780-2794.
27. Mantripragada, H.C. and E.S. Rubin. Chemical looping for pre-combustion CO2 capture - Performance and cost analysis. in Energy Procedia. 2013.
28. Cormos, C.C., Evaluation of syngas-based chemical looping applications for hydrogen and power co-generation with CCS. International Journal of Hydrogen Energy, 2012. 37(18): p. 13371-13386.
29. Kvamsdal, H.M., K. Jordal, and O. Bolland, A quantitative comparison of gas turbine cycles with CO2 capture. Energy, 2007. 32(1): p. 10-24.
30. Nazir, S., O. Bolland, and S. Amini, Analysis of Combined Cycle Power Plants with Chemical Looping Reforming of Natural Gas and Pre-Combustion CO2 Capture. Energies, 2018. 11(1): p. 147.
31. Nazir, S.M., O. Bolland, and S. Amini, Full Plant Scale Analysis of Natural Gas Fired Power Plants with Pre-Combustion CO2 Capture and Chemical Looping Reforming (CLR). Energy Procedia, 2017. 114: p. 2146-2155.
32. Nazir, S.M., O. Bolland, and S. Amini, Full Plant Scale Analysis of Natural Gas Fired Power Plants with Pre-Combustion CO2 Capture and Chemical Looping Reforming (CLR). Energy Procedia, 2017.
33. Cloete, S., et al., Integration of a Gas Switching Combustion (GSC) system in integrated gasification combined cycles. International Journal of Greenhouse Gas Control, 2015. 42(Supplement C): p. 340-356.
34. EBTF, European best practice guidelines for assessment of CO2 capture technologies. CESAR -project 7th FrameWork Programme. Collaborative Project– GA No. 213569. 2011.
35. Xu, J. and G.F. Froment, Methane steam reforming, methanation and water-gas shift: I. Intrinsic kinetics. AIChE Journal, 1989. 35(1): p. 88-96.
36. Moayeri, M. and D.L. Trimm, Effect of carbon deposition on the activity of steam reforming catalysts. Journal of Applied Chemistry and Biotechnology, 1976. 26(1): p. 419-424.
37. Snoeck, J.W., G.F. Froment, and M. Fowles, Steam/CO2 Reforming of Methane. Carbon Filament Formation by the Boudouard Reaction and Gasification by CO2, by H2, and by Steam: Kinetic Study. Industrial & Engineering Chemistry Research, 2002. 41(17): p. 4252-4265.
38. Snoeck, J.W., G.F. Froment, and M. Fowles, Kinetic Study of the Carbon Filament Formation by Methane Cracking on a Nickel Catalyst. Journal of Catalysis, 1997. 169(1): p. 250-262.
39. Iliuta, I., et al., Chemical-looping combustion process: Kinetics and mathematical modeling. AIChE Journal, 2010. 56(4): p. 1063-1079.
40. Stull, D.R. and H. Prophet, JANAF Thermochemical Tables. 2nd Edition ed. 1971: National Bureau of Standards U.S.
41. Robie, R.A. and B.S. Hemingway, Thermodynamic properties of minerals and related substances at 298.15 K and 1 bar (10^5 pascals) pressure and at higher temperatures, in Bulletin. 1995.
42. AspenHYSYS, Aspen HYSYS V8.6 User Guide. 2017, Aspen Technology Inc., Bedford, Massachusetts, USA.
43. Newsome, D.S., The Water-Gas Shift Reaction. Catalysis Reviews, 1980. 21(2): p. 275-318.
44. Riboldi, L. and O. Bolland, Overview on Pressure Swing Adsorption (PSA) as CO2 Capture Technology: State-of-the-Art, Limits and Potentials. Energy Procedia, 2017. 114(Supplement C): p. 2390-2400.
45. Sircar, S. and T.C. Golden, Purification of Hydrogen by Pressure Swing Adsorption. Separation Science and Technology, 2000. 35(5): p. 667-687.
46. Thermoflow, Thermoflow Suite V26 User Guide. 2017, Thermoflow Inc., Southborough, MA, USA.
47. Chiesa, P., G. Lozza, and L. Mazzocchi, Using Hydrogen as Gas Turbine Fuel. Journal of Engineering for Gas Turbines and Power, 2005. 127(1): p. 73-80.
48. Nord, L.O., R. Anantharaman, and O. Bolland, Design and off-design analyses of a pre-combustion CO2 capture process in a natural gas combined cycle power plant. International Journal of Greenhouse Gas Control, 2009. 3(4): p. 385-392.
49. GCCSI, Global CCS Institute - TOWARD A COMMON METHOD OF COST ESTIMATION FOR CO2 CAPTURE AND STORAGE AT FOSSIL FUEL POWER PLANTS. 2013.
50. NETL, Cost Estimation Methodology for NETL Assessments of Power Plant Performance. 2011.
51. Alibaba. 2017 31 October 2017]; Available from: https://www.alibaba.com/. 52. DOE/NETL, Cost and Performance Baseline for Fossil Energy Plants. 2007. 53. Netzer, D., Alberta Bitumen Processing Integration Study: Final Report. 2006:
publisher not identified. 54. Peters, M.S. and K.D. Timmerhaus, PLANT DESIGN AND ECONOMICS FOR
CHEMICAL ENGINEERS. Fourth Edition ed. 1991: McGraw-Hill, Inc. 55. Diglio, G., et al., Techno-economic analysis of sorption-enhanced steam methane
reforming in a fixed bed reactor network integrated with fuel cell. Journal of Power Sources, 2017. 364(Supplement C): p. 41-51.
56. Gazzani, M., et al., Using Hydrogen as Gas Turbine Fuel: Premixed Versus Diffusive Flame Combustors. 2013(55133): p. V002T03A008.
57. Li, L., et al., A novel oxygen carrier for chemical looping reforming: LaNiO3 perovskite supported on montmorillonite. Energy, 2017. 131: p. 58-66.
58. Alirezaei, I., et al., Application of zirconium modified Cu-based oxygen carrier in chemical looping reforming. Journal of CO2 Utilization, 2016. 14: p. 112-121.
59. Wei, G., et al., Chemical-Looping Reforming of Methane Using Iron Based Oxygen Carrier Modified with Low Content Nickel. Chinese Journal of Chemistry, 2014. 32(12): p. 1271-1280.
60. Lozza, G. and P. Chiesa, Natural Gas Decarbonization to Reduce CO2 Emission From Combined Cycles—Part II: Steam-Methane Reforming. Journal of Engineering for Gas Turbines and Power, 2000. 124(1): p. 89-95.