preface - ntnu open
TRANSCRIPT

Preface
The work presented in this dissertation has been executed at the Department ofChemistry, the Norwegian University of Science and Technology in Trond-heim, from January 1999 to June 2002. Statoil ASA initiated this work, and Iwould like to thank them for letting me work on their project. Statoil and theNorwegian Research Council are gratefully acknowledged for their generousfinancial support.
I would like to express my most sincere gratitude to my supervisor, ProfessorJan M. Bakke, for his great enthusiasm and belief in me and my work.
I am deeply grateful to my friends and colleagues at the Department for manyhours of small-talk, fruitful discussions and valuable help during my studies.Particularly, I would particularly like to thank siv.ing. Ingrid Sletvold andsiv.ing. Bjart Frode Lutnæs for spending hours reading through this thesis. Allyour comments have been greatly appreciated. Dr.ing. Einar Skarstad Egelandwas very helpful in establishing the IUPAC names of many of my compounds,and he is gratefully acknowledged.
Finally, I would like to express my gratitude to my family for the many encour-aging phone calls during my many years of education. Lastly, I would like tothank my husband, Halvard, for his love and support, and for colourful ideasfor my work.
i

ii
Table of Contents
SUMMARY..........................................................VII
SYMBOLS & ABBREVIATIONS...................... IX
1 INTRODUCTION ...................................................11.1 H2S Scavenging..................................................... 1
1.2 Liquid Scavengers: "Triazine" .............................. 2
2 THEORY..................................................................52.1 Dihydrogen Sulfide ............................................... 5
2.1.1 Health Considerations .................................... 52.1.2 Chemical Properties ....................................... 5
2.2 1,3,5-Triazinanes................................................... 72.2.1 Preparation ..................................................... 72.2.2 Chemical Properties ....................................... 72.2.3 Spectroscopic Data......................................... 82.2.4 Triazinane 1 as H2S Scavenger ...................... 9
2.3 NMR Spectroscopy .............................................. 112.3.1 Dynamic NMR Spectroscopy ...................... 112.3.2 NOE Spectroscopy....................................... 12
3 THE HYDROLYSIS OF TRIAZINANE 1..........173.1 The Structures of the Products ............................ 17
3.1.1 Results and Discussion ................................ 17
3.2 The Rate of Hydrolysis ........................................ 183.2.1 Kinetic Equations......................................... 183.2.2 Results and Discussion ................................ 19
3.3 Conclusion .......................................................... 23
4 THE EQUIMOLAR REACTION BETWEEN TRIAZINANE 1 AND HS- ....................................254.1 NMR Analyses ..................................................... 27
4.1.1 1H NMR and 1H,1H COSY Spectra ............. 274.1.2 1D NOE spectra ........................................... 284.1.3 13C NMR and HETCOR Spectra ................. 294.1.4 Investigation of Possible Products ............... 304.1.5 Assignment of NMR Data ........................... 32
4.2 Separation and Isolation of the Products ........... 344.2.1 Liquid/Liquid Extraction ............................. 354.2.2 Gas Chromatography ................................... 354.2.3 Thin Layer and Column Chromatography... 36
4.3 Analyses of Thiadiazinane 2 ............................... 374.3.1 Mass Analysis .............................................. 374.3.2 Low Temperature 1H NMR Spectra............. 38
iii
4.3.3 IR Spectroscopy ........................................... 39
4.4 The pH-Dependence of the Reaction.................. 394.5 Conclusion.......................................................... 40
5 THE REACTION BETWEEN TRIAZINANE 1 AND EXCESS HS- ..........................................................415.1 Thiadiazinane 2 and NaHS................................. 41
5.2 Triazinane 1 and Two Equivalents of HS-........... 435.3 Separation and Isolation of the Product............. 43
5.3.1 Liquid/Liquid Extraction.............................. 435.3.2 Gas Chromatography ................................... 445.3.3 Short Path Distillation .................................. 44
5.4 Analysis of Dithiazinane 3.................................. 445.4.1 Mass Analysis .............................................. 445.4.2 Low-Temperature 1H NMR Spectra ............ 455.4.3 IR Spectroscopy ........................................... 47
5.5 Triazinane 1 and Large Excess of HS-................ 475.5.1 Triazinane 1 and Three Equivalents of HS- . 475.5.2 Triazinane 1 and Five Equivalents of HS-.... 475.5.3 Dithiazinane 3 and Four Equivalents of HS- 48
5.6 Triazinane 1 and Gaseous H2S........................... 49
5.7 Spent Scavenger Solution ................................... 505.8 Conclusion.......................................................... 50
6 .... THE RATE OF THE REACTION BETWEEN TRIAZINANE 1 AND H2S ...................................55
6.1 Kinetic Equations ............................................... 556.2 Method for Determination of Sulfide.................. 57
6.2.1 The First Attempt ......................................... 576.2.2 The Second Attempt..................................... 586.2.3 The Calibration of the Electrode .................. 596.2.4 Reproducibility Tests of Sulfide Electrode .. 596.2.5 Other Methods for Determination of Sulfide61
6.3 Method for Determination of Triazinane............ 616.3.1 The Reactivity of Triazinane 1..................... 626.3.2 Applicability of the Method......................... 64
6.4 Conclusion.......................................................... 64
7 STABILITY AND REACTIVITY OF OTHER
1,3,5-TRIAZINANES ............................................697.1 1,3,5-Triethyl-1,3,5-triazinane ........................... 70
7.1.1 Rate of Hydrolysis ....................................... 707.1.2 Reaction Products with H2S......................... 727.1.3 Rate of Reaction with H2S ........................... 75
iv
7.2 1,3,5-Trimethyl-1,3,5-triazinane ......................... 767.2.1 Rate of Hydrolysis ....................................... 767.2.2 Reaction Products with H2S......................... 78
7.2.3 Rate of Reaction with H2S........................... 80
7.3 2,4,6-Trimethyl-1,3,5-tris(2-hydroxyethyl)-1,3,5-triazinane ................................................... 81
7.4 Comparison of the Results .................................. 857.4.1 Stability ........................................................ 857.4.2 Reactivity with H2S ..................................... 86
7.5 Conclusion .......................................................... 87
8 STABILITY AND REACTIVITY OF TRIOXANES, TETROXANES AND AN OXOLANE ................918.1 1,3,5-Trioxane ..................................................... 918.2 2,4,6-Trimethyl-1,3,5-trioxane............................ 938.3 1,3,5,7-Tetroxane................................................. 948.4 1,3-Dioxolane...................................................... 978.5 Conclusion .......................................................... 98
9 EXPERIMENTAL...............................................1019.1 General .............................................................101
9.1.1 Chemicals................................................... 1019.1.2 Instrumentation .......................................... 101
9.2 The Synthesis of Triazinane 1 ...........................1039.3 The Hydrolysis of Triazinane 1 .........................103
9.3.1 The Structures of the Products ................... 1039.3.2 The Rate of Hydrolysis .............................. 104
9.4 The Equimolar Reaction between Triazinane 1
and HS-..............................................................1059.4.1 NMR Analyses........................................... 1059.4.2 Separation and Isolation of the Products ... 1079.4.3 Analyses of Thiadiazinane 2 ...................... 108
9.5 The Reaction between Triazinane 1 and Excess
HS-.....................................................................1099.5.1 Thiadiazine 2 and NaHS ............................ 1099.5.2 Triazinane 1 and Two Equivalents of HS- . 1099.5.3 Separation and Isolation of the Product ..... 1109.5.4 Analyses of Dithiazinane 3 ........................ 1109.5.5 Triazinane 1 and Large Excess of HS- ........1119.5.6 Triazinane 1 and Gaseous H2S................... 112
9.6 The Rate of the Reaction between Triazinane 1
and HS-.............................................................. 1139.6.1 Method for Determination of Sulfide ........ 1139.6.2 Method for Determination of Triazinane ... 114
v
9.7 Stability and Reactivity of Other 1,3,5-Triazinanes.....................................1159.7.1 1,3,5-Triethyl-1,3,5-triazinane ................... 1159.7.2 1,3,5-Trimethyl-1,3,5-triazinane ................ 1169.7.3 2,4,6-Trimethyl-1,3,5-tris(2-hydroxyethyl)-
1,3,5-triazinane........................................... 117
9.8 Stability and Reactivity of Trioxanes, Tetroxanes and an Oxolane ...............................1179.8.1 1,3,5-Trioxane ............................................ 1179.8.2 2,4,6-Trimethyl-1,3,5-trioxane................... 1189.8.3 1,3,5,7-Tetroxane ....................................... 1189.8.4 1,3-Dioxolane............................................. 119
REFERENCES ....................................................121
APPENDIX ANMR Data for Pure Compounds
APPENDIX BEquations for Calculations of Uncertainties
vi
Summary
Summary
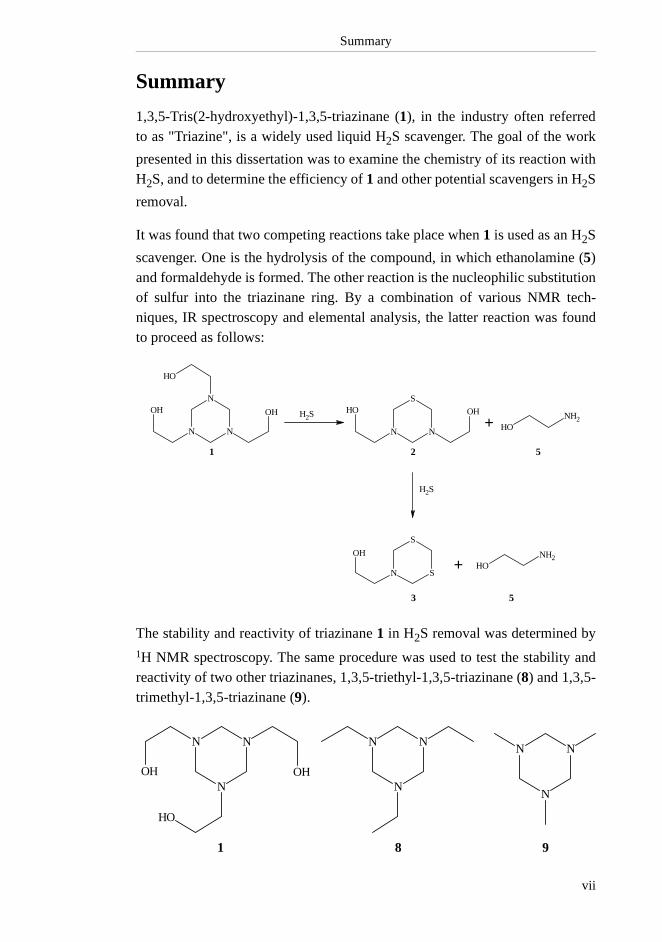
1,3,5-Tris(2-hydroxyethyl)-1,3,5-triazinane (1), in the industry often referredto as "Triazine", is a widely used liquid H2S scavenger. The goal of the work
presented in this dissertation was to examine the chemistry of its reaction withH2S, and to determine the efficiency of 1 and other potential scavengers in H2S
removal.
It was found that two competing reactions take place when 1 is used as an H2S
scavenger. One is the hydrolysis of the compound, in which ethanolamine (5)and formaldehyde is formed. The other reaction is the nucleophilic substitutionof sulfur into the triazinane ring. By a combination of various NMR tech-niques, IR spectroscopy and elemental analysis, the latter reaction was foundto proceed as follows:
The stability and reactivity of triazinane 1 in H2S removal was determined by1H NMR spectroscopy. The same procedure was used to test the stability andreactivity of two other triazinanes, 1,3,5-triethyl-1,3,5-triazinane (8) and 1,3,5-trimethyl-1,3,5-triazinane (9).
+
+
N
N
N
OH
OH OH
N
S
N
OH OH
SN
S
OH
OHNH2
OHNH2
SH2
SH2
1 2
3 5
5
N
N
NN
N
N
1 9
N
N
N
OHOH
OH
8
vii
Summary
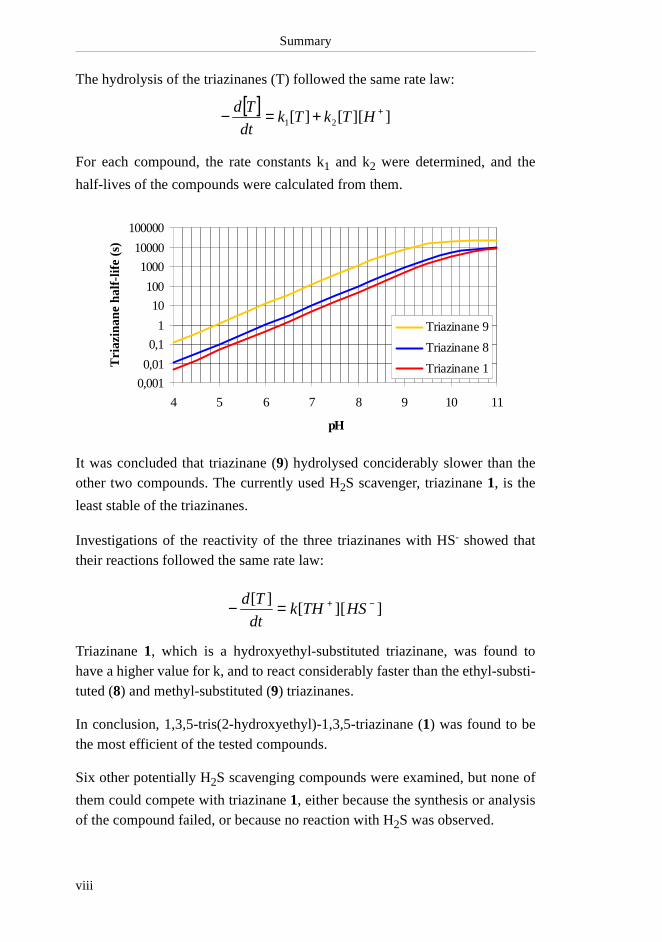
The hydrolysis of the triazinanes (T) followed the same rate law:
For each compound, the rate constants k1 and k2 were determined, and the
half-lives of the compounds were calculated from them.
It was concluded that triazinane (9) hydrolysed conciderably slower than theother two compounds. The currently used H2S scavenger, triazinane 1, is the
least stable of the triazinanes.
Investigations of the reactivity of the three triazinanes with HS- showed thattheir reactions followed the same rate law:
Triazinane 1, which is a hydroxyethyl-substituted triazinane, was found tohave a higher value for k, and to react considerably faster than the ethyl-substi-tuted (8) and methyl-substituted (9) triazinanes.
In conclusion, 1,3,5-tris(2-hydroxyethyl)-1,3,5-triazinane (1) was found to bethe most efficient of the tested compounds.
Six other potentially H2S scavenging compounds were examined, but none of
them could compete with triazinane 1, either because the synthesis or analysisof the compound failed, or because no reaction with H2S was observed.
[ ]]][[][ 21
++=− HTkTkdt
Td
0,001
0,01
0,1
1
10
100
1000
10000
100000
4 5 6 7 8 9 10 11
pH
Tri
azin
ane
half
-lif
e (s
)
Triazinane 9
Triazinane 8
Triazinane 1
]][[][ −+=− HSTHk
dt
Td
viii
Symbols & Abbreviations1D one-dimensional (NMR)
2D two-dimensional (NMR)
atm atmospheres (pressure unit)
Bu butyl
calcd calculated
CORR two-dimensional correlation spectroscopy (13C,1H)
COSY two-dimensional correlation spectroscopy (1H,1H)
d chemical shift in ppm from standard (NMR)
d doublet (NMR)
DMSO dimethyl sulfoxide
DNMR dynamic NMR spectroscopy
e.g. exempli gratia, for example
EIMS electron impact mass spectrometry
Et ethyl
EtOH hydroxyethyl or ethanol
g gram
GC gass chromatography
GC-MS gass chromatography combined with mass spectrometry
h hours
HETCOR heteronuclear correlation spectroscopy (13C,1H)
HRMS high resolution mass spectrometry
Hz Hertz
IR infrared
J coupling constant (NMR)
k rate constant
k1 first order rate constant
k1’ pseudo first order rate constant
k2 second order rate constant
k2’ pseudo second order rate constant
k3’ pseudo third order rate constant
Ka acid constant
kobs observed rate constant
M molar (mol/l)
m medium absorption (IR)
m multiplet (NMR)
Me methyl
MeOH methanol
MDEA methyldiethanolamine
MEA monoethanolamine
ix
MHz megahertz
min minute(s)
ml millilitre(s)
µl microlitre(s)
mmol millimole(s)
MS mass spectrometry
NMR nuclear magnetic resonance
NOE nuclear overhauser effect
NOESY two-dimensional nuclear overhauser effect spectroscopy
pH negative logarithm of [H+]
pKa negative logarithm of Ka
ppm parts per million
Pr propyl
q quartet (NMR)
rel.int. relative intensity (MS)
rt room temperature
s second(s)
s singlet (NMR)
s standard deviation (kinetics)
s strong absorption (IR)
SSE sum of squares of errors (linear regression)
t time (kinetics)
T triazinane (kinetics)
t triplet (NMR)
t½ half-life (time needed to reach half of original concentration)
Tc coalescence temperature (NMR)
TH+ triazinane with protonated nitrogen (kinetics)
THF tetrahydrofurane
TLC thin layer chromatography
UV ultra violet
vol% per cent by volume
w weak absorption (IR)
wt% per cent by weight
x
Chapter 1 - Introduction
1 Introduction
The production of natural gas in the North Sea is facing a growing problem:contamination of the natural gas with dihydrogen sulfide, H2S. As a gas reser-
voir is emptied, seawater containing sulfates is pumped into it, and the sulfatesare reduced to dihydrogen sulfide by sulfate-reducing bacteria. Dihydrogensulfide is then pumped up along with the oil, gas and water from the reservoir,causing severe corrosion of pipelines and contamination of the final natural gasproduct. Dihydrogen sulfide is extremely toxic, and in fields with especiallylarge concentrations of H2S this is a severe health risk for the platform work-
ers. Hence, it is desirable to remove the dihydrogen sulfide at the earliest stagepossible.
1.1 H2S Scavenging
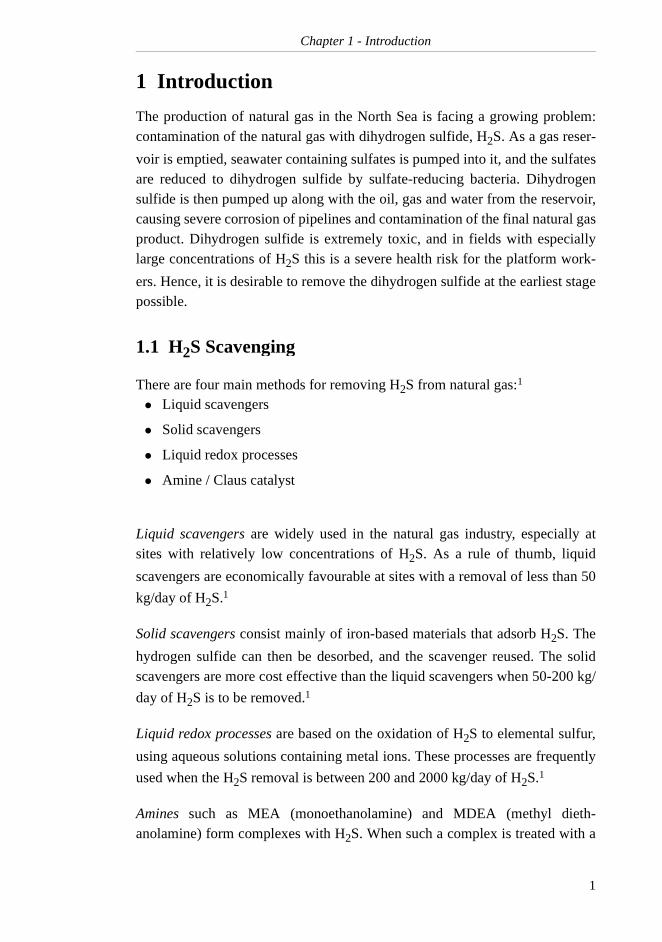
There are four main methods for removing H2S from natural gas:1
Liquid scavengers are widely used in the natural gas industry, especially atsites with relatively low concentrations of H2S. As a rule of thumb, liquid
scavengers are economically favourable at sites with a removal of less than 50
kg/day of H2S.1
Solid scavengers consist mainly of iron-based materials that adsorb H2S. The
hydrogen sulfide can then be desorbed, and the scavenger reused. The solidscavengers are more cost effective than the liquid scavengers when 50-200 kg/
day of H2S is to be removed.1
Liquid redox processes are based on the oxidation of H2S to elemental sulfur,
using aqueous solutions containing metal ions. These processes are frequently
used when the H2S removal is between 200 and 2000 kg/day of H2S.1
Amines such as MEA (monoethanolamine) and MDEA (methyl dieth-anolamine) form complexes with H2S. When such a complex is treated with a
• Liquid scavengers
• Solid scavengers
• Liquid redox processes
• Amine / Claus catalyst
1
Chapter 1 - Introduction
catalyst, H2S is oxidized to elemental sulfur. This process if often referred to as
a Claus process, and the relatively high cost related to the installation of such aunit makes the process economically unfavourable below 20 tons/day of H2S
removal.1
1.2 Liquid Scavengers: "Triazine"
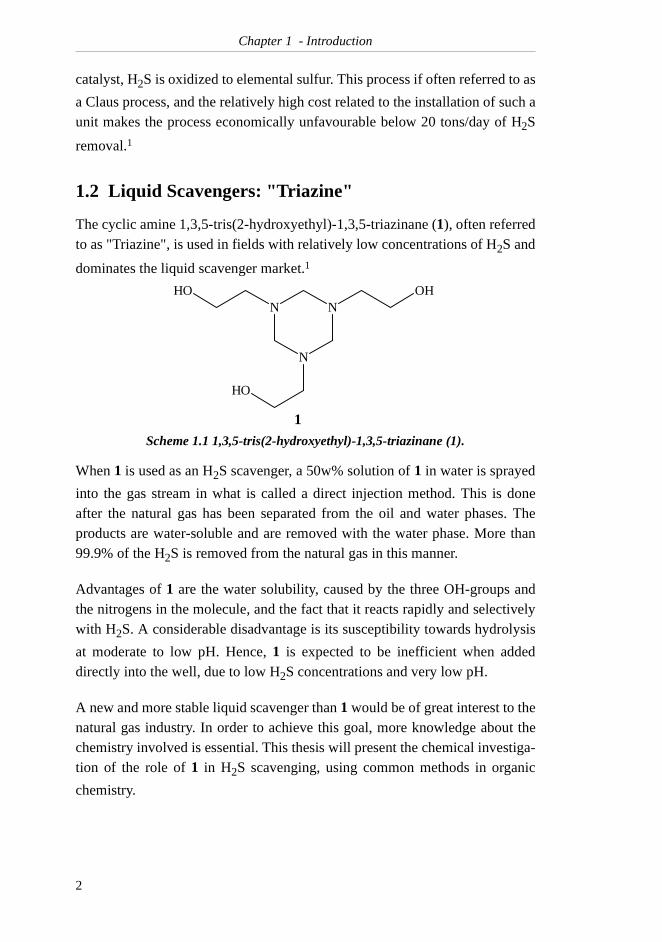
The cyclic amine 1,3,5-tris(2-hydroxyethyl)-1,3,5-triazinane (1), often referredto as "Triazine", is used in fields with relatively low concentrations of H2S and
dominates the liquid scavenger market.1
Scheme 1.1 1,3,5-tris(2-hydroxyethyl)-1,3,5-triazinane (1).
When 1 is used as an H2S scavenger, a 50w% solution of 1 in water is sprayed
into the gas stream in what is called a direct injection method. This is doneafter the natural gas has been separated from the oil and water phases. Theproducts are water-soluble and are removed with the water phase. More than99.9% of the H2S is removed from the natural gas in this manner.
Advantages of 1 are the water solubility, caused by the three OH-groups andthe nitrogens in the molecule, and the fact that it reacts rapidly and selectivelywith H2S. A considerable disadvantage is its susceptibility towards hydrolysis
at moderate to low pH. Hence, 1 is expected to be inefficient when addeddirectly into the well, due to low H2S concentrations and very low pH.
A new and more stable liquid scavenger than 1 would be of great interest to thenatural gas industry. In order to achieve this goal, more knowledge about thechemistry involved is essential. This thesis will present the chemical investiga-tion of the role of 1 in H2S scavenging, using common methods in organic
chemistry.
N
N
NOH OH
OH
1
2
Chapter 1 - Introduction
The work presented in this thesis is divided into three parts:
Part I Qualitative investigations of the reaction between triazinane 1and H2S (Chapters 3, 4 and 5).
Here the analysis of the reaction between 1 and H2S is examined.
The hydrolysis of 1 is investigated in Chapter 3, both qualitativelyand quantitatively. The products of the reaction between 1 andsulfide nucleophiles are identified in Chapters 4 and 5.
Part II Determination of the efficiency of triazinane 1 in H2S removal
(Chapter 6).
In Chapter 6, a method is developed for determining the effi-ciency of 1 in H2S removal, and the reaction kinetics for the reac-
tion between triazinane 1 and HS- is established.
Part III Suggestion, synthesis and testing of potential new H2S
scavengers (Chapters 7 and 8).
Using the method developed in Part II, the efficiency of othercompounds in H2S removal was tested. Investigations of other tri-
azinanes are presented in Chapter 7, whereas formaldehyde deriv-atives, such as trioxanes, tetroxanes and an oxolane, are discussedin Chapter 8.
Relevant theory for this thesis is presented in Chapter 2. All experimentaldetails are given in Chapter 9.
3

Chapter 1 - Introduction
4
Chapter 2 - Theory
2 Theory
2.1 Dihydrogen Sulfide
Dihydrogen sulfide, H2S, is a highly toxic and corrosive gas.2 It is one of the
principal compounds involved in the cycle of sulfur in the environment. Itoccurs naturally in volcanic gases, but it is also produced through bacterialaction during the decay of both plant and animal protein. Significant concen-trations of H2S can be found in many natural gas fields due to bacteria-assisted
direct reduction of sulfates.
2.1.1 Health Considerations
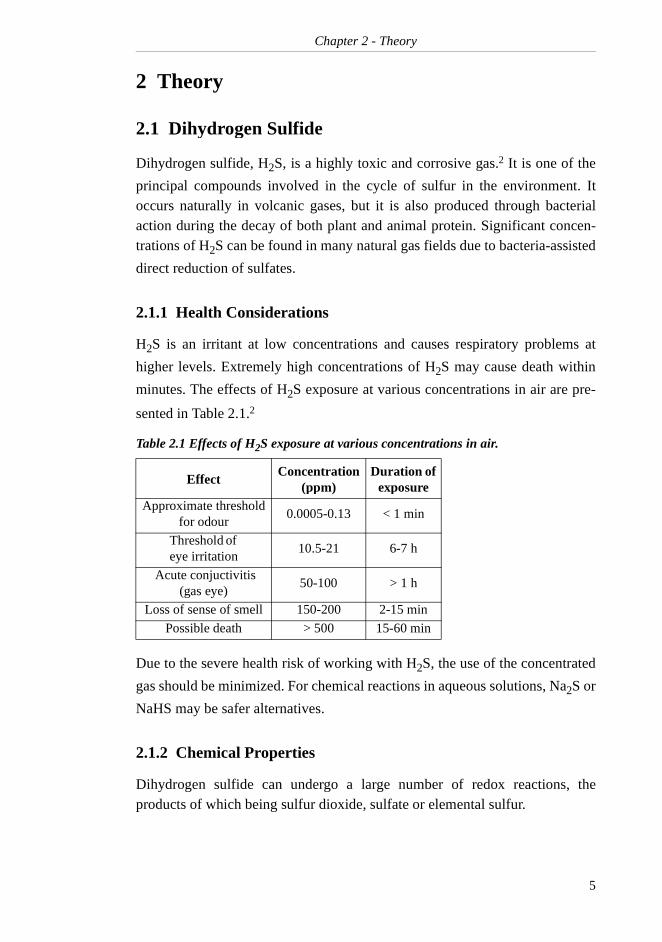
H2S is an irritant at low concentrations and causes respiratory problems at
higher levels. Extremely high concentrations of H2S may cause death within
minutes. The effects of H2S exposure at various concentrations in air are pre-
sented in Table 2.1.2
Due to the severe health risk of working with H2S, the use of the concentrated
gas should be minimized. For chemical reactions in aqueous solutions, Na2S or
NaHS may be safer alternatives.
2.1.2 Chemical Properties
Dihydrogen sulfide can undergo a large number of redox reactions, theproducts of which being sulfur dioxide, sulfate or elemental sulfur.
Table 2.1 Effects of H2S exposure at various concentrations in air.
EffectConcentration
(ppm)Duration of
exposureApproximate threshold
for odour0.0005-0.13 < 1 min
Threshold of eye irritation
10.5-21 6-7 h
Acute conjuctivitis (gas eye)
50-100 > 1 h
Loss of sense of smell 150-200 2-15 min
Possible death > 500 15-60 min
5
Chapter 2 - Theory
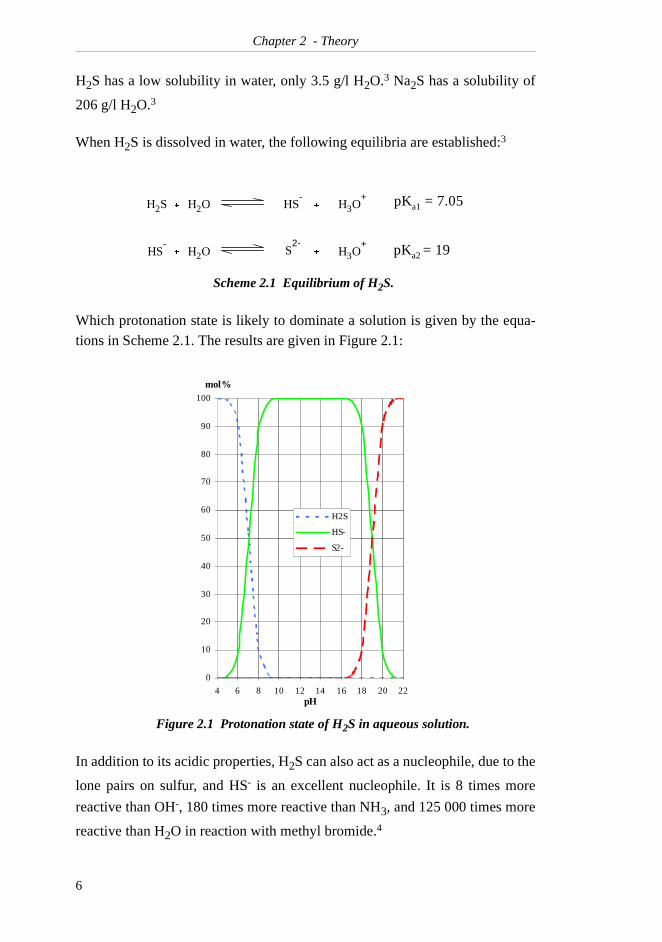
H2S has a low solubility in water, only 3.5 g/l H2O.3 Na2S has a solubility of
206 g/l H2O.3
When H2S is dissolved in water, the following equilibria are established:3
Which protonation state is likely to dominate a solution is given by the equa-tions in Scheme 2.1. The results are given in Figure 2.1:
In addition to its acidic properties, H2S can also act as a nucleophile, due to the
lone pairs on sulfur, and HS- is an excellent nucleophile. It is 8 times more
reactive than OH-, 180 times more reactive than NH3, and 125 000 times more
reactive than H2O in reaction with methyl bromide.4
Scheme 2.1 Equilibrium of H2S.
Figure 2.1 Protonation state of H2S in aqueous solution.
SH2 � OH2 SH-
OH3+
SH-
S2-
OH2 OH3+
�
��
pKa1 = 7.05
pKa2 = 19
0
10
20
30
40
50
60
70
80
90
100
4 6 8 10 12 14 16 18 20 22pH
mol%
H2S
HS-
S2-
6
Chapter 2 - Theory
2.2 1,3,5-Triazinanes
2.2.1 Preparation
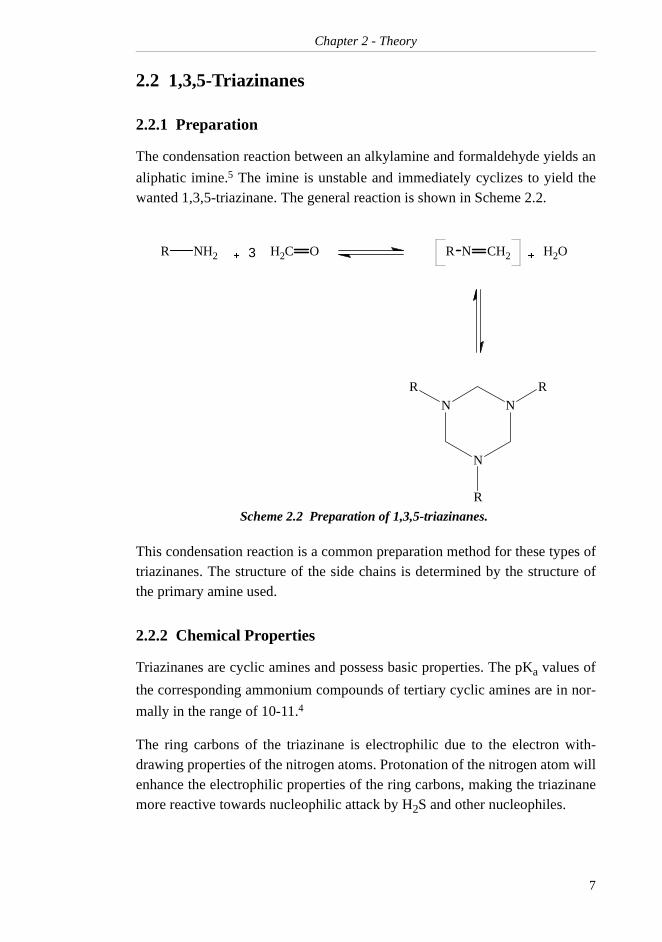
The condensation reaction between an alkylamine and formaldehyde yields an
aliphatic imine.5 The imine is unstable and immediately cyclizes to yield thewanted 1,3,5-triazinane. The general reaction is shown in Scheme 2.2.
This condensation reaction is a common preparation method for these types oftriazinanes. The structure of the side chains is determined by the structure ofthe primary amine used.
2.2.2 Chemical Properties
Triazinanes are cyclic amines and possess basic properties. The pKa values of
the corresponding ammonium compounds of tertiary cyclic amines are in nor-
mally in the range of 10-11.4
The ring carbons of the triazinane is electrophilic due to the electron with-drawing properties of the nitrogen atoms. Protonation of the nitrogen atom willenhance the electrophilic properties of the ring carbons, making the triazinanemore reactive towards nucleophilic attack by H2S and other nucleophiles.
Scheme 2.2 Preparation of 1,3,5-triazinanes.
R NH2 � 3 CH2 O N CH2R�
OH2
N
N
N
R R
R
7
Chapter 2 - Theory
2.2.3 Spectroscopic Data
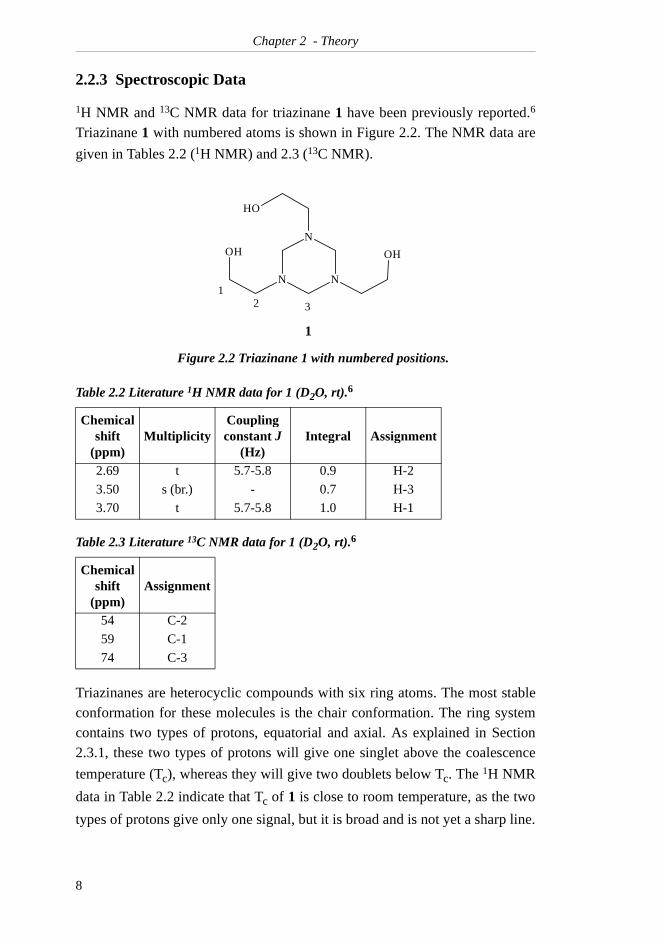
1H NMR and 13C NMR data for triazinane 1 have been previously reported.6
Triazinane 1 with numbered atoms is shown in Figure 2.2. The NMR data are
given in Tables 2.2 (1H NMR) and 2.3 (13C NMR).
Triazinanes are heterocyclic compounds with six ring atoms. The most stableconformation for these molecules is the chair conformation. The ring systemcontains two types of protons, equatorial and axial. As explained in Section2.3.1, these two types of protons will give one singlet above the coalescence
temperature (Tc), whereas they will give two doublets below Tc. The 1H NMR
data in Table 2.2 indicate that Tc of 1 is close to room temperature, as the two
types of protons give only one signal, but it is broad and is not yet a sharp line.
Figure 2.2 Triazinane 1 with numbered positions.
Table 2.2 Literature 1H NMR data for 1 (D2O, rt).6
Chemical shift
(ppm)Multiplicity
Coupling constant J
(Hz)Integral Assignment
2.69 t 5.7-5.8 0.9 H-2
3.50 s (br.) - 0.7 H-3
3.70 t 5.7-5.8 1.0 H-1
Table 2.3 Literature 13C NMR data for 1 (D2O, rt).6
Chemical shift
(ppm)Assignment
54 C-2
59 C-1
74 C-3
N
N
N
OH
OH OH
12 3
1
8
Chapter 2 - Theory
In the referred work, 1 was analysed by 1H NMR at -10 oC.6 The low tempera-
ture 1H NMR data are presented in Table 2.4.
At -10 oC, the broad singlet found at room temperature is split into two sharp
doublets. This temperature-dependent dynamic behaviour of the 1H NMR sig-nals strongly supports that 1 is a six-membered ring compound.
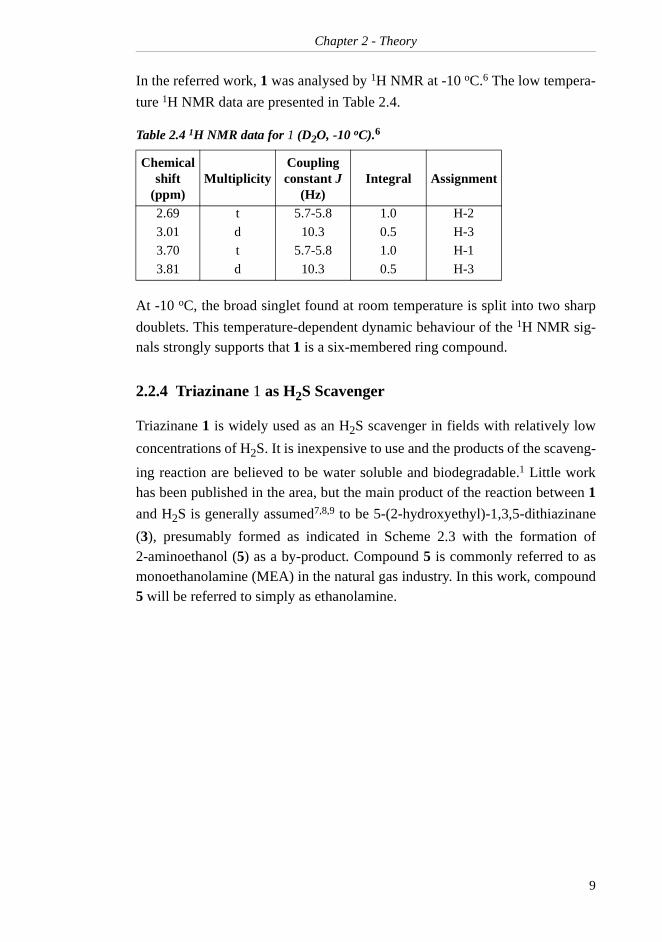
2.2.4 Triazinane 1 as H2S Scavenger
Triazinane 1 is widely used as an H2S scavenger in fields with relatively low
concentrations of H2S. It is inexpensive to use and the products of the scaveng-
ing reaction are believed to be water soluble and biodegradable.1 Little workhas been published in the area, but the main product of the reaction between 1
and H2S is generally assumed7,8,9 to be 5-(2-hydroxyethyl)-1,3,5-dithiazinane
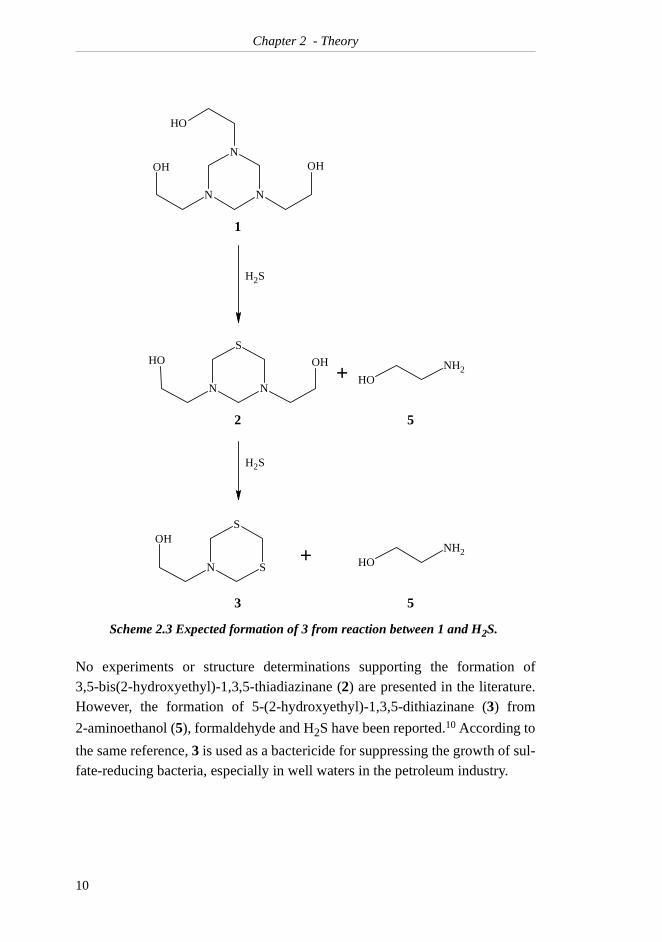
(3), presumably formed as indicated in Scheme 2.3 with the formation of2-aminoethanol (5) as a by-product. Compound 5 is commonly referred to asmonoethanolamine (MEA) in the natural gas industry. In this work, compound5 will be referred to simply as ethanolamine.
Table 2.4 1H NMR data for 1 (D2O, -10 oC).6
Chemical shift
(ppm)Multiplicity
Coupling constant J
(Hz)Integral Assignment
2.69 t 5.7-5.8 1.0 H-2
3.01 d 10.3 0.5 H-3
3.70 t 5.7-5.8 1.0 H-1
3.81 d 10.3 0.5 H-3
9
Chapter 2 - Theory
No experiments or structure determinations supporting the formation of3,5-bis(2-hydroxyethyl)-1,3,5-thiadiazinane (2) are presented in the literature.However, the formation of 5-(2-hydroxyethyl)-1,3,5-dithiazinane (3) from
2-aminoethanol (5), formaldehyde and H2S have been reported.10 According to
the same reference, 3 is used as a bactericide for suppressing the growth of sul-fate-reducing bacteria, especially in well waters in the petroleum industry.
Scheme 2.3 Expected formation of 3 from reaction between 1 and H2S.
+
+
1
5
N
N
N
OH
OH OH
N
S
N
OH OH
SN
SOH
OHNH2
OHNH2
SH2
SH2
3
2
5
10
Chapter 2 - Theory
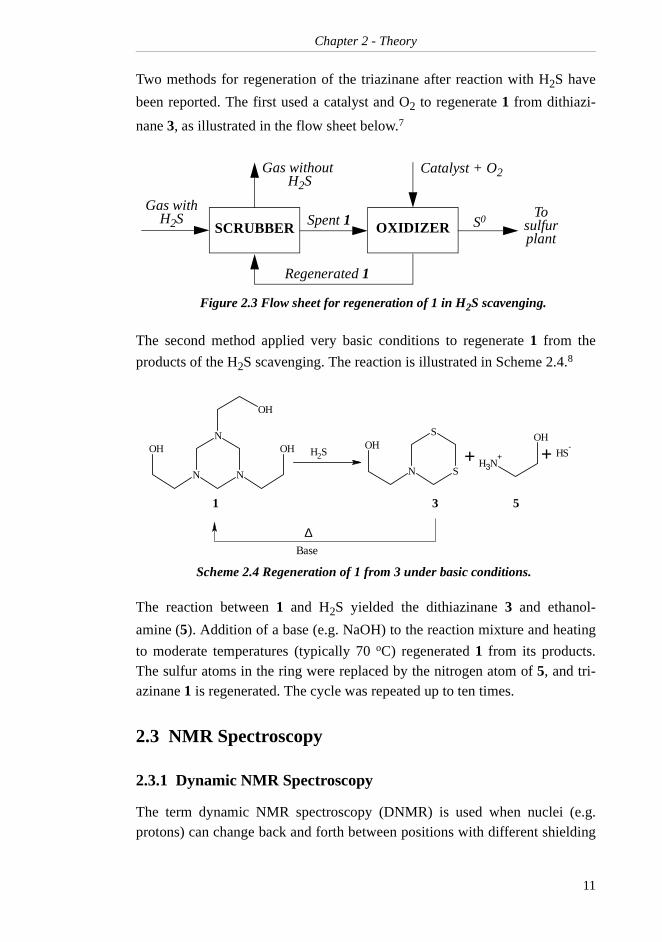
Two methods for regeneration of the triazinane after reaction with H2S have
been reported. The first used a catalyst and O2 to regenerate 1 from dithiazi-
nane 3, as illustrated in the flow sheet below.7
The second method applied very basic conditions to regenerate 1 from the
products of the H2S scavenging. The reaction is illustrated in Scheme 2.4.8
The reaction between 1 and H2S yielded the dithiazinane 3 and ethanol-
amine (5). Addition of a base (e.g. NaOH) to the reaction mixture and heating
to moderate temperatures (typically 70 oC) regenerated 1 from its products.The sulfur atoms in the ring were replaced by the nitrogen atom of 5, and tri-azinane 1 is regenerated. The cycle was repeated up to ten times.
2.3 NMR Spectroscopy
2.3.1 Dynamic NMR Spectroscopy
The term dynamic NMR spectroscopy (DNMR) is used when nuclei (e.g.protons) can change back and forth between positions with different shielding
Figure 2.3 Flow sheet for regeneration of 1 in H2S scavenging.
Scheme 2.4 Regeneration of 1 from 3 under basic conditions.
SCRUBBER
Gas with H2S
Gas withoutH2S
OXIDIZER
Catalyst + O2
S0To
sulfurplant
Spent 1
Regenerated 1
SH2
SN
SOH
+
Base
N
N
N
OHOH
OH
+ SH-
∆
1 3
OH
NH3+
5
11
Chapter 2 - Theory
values. These protons will be chemically and magnetically non-equivalent and
can be distinguished in 1H NMR spectroscopy at the right conditions.12
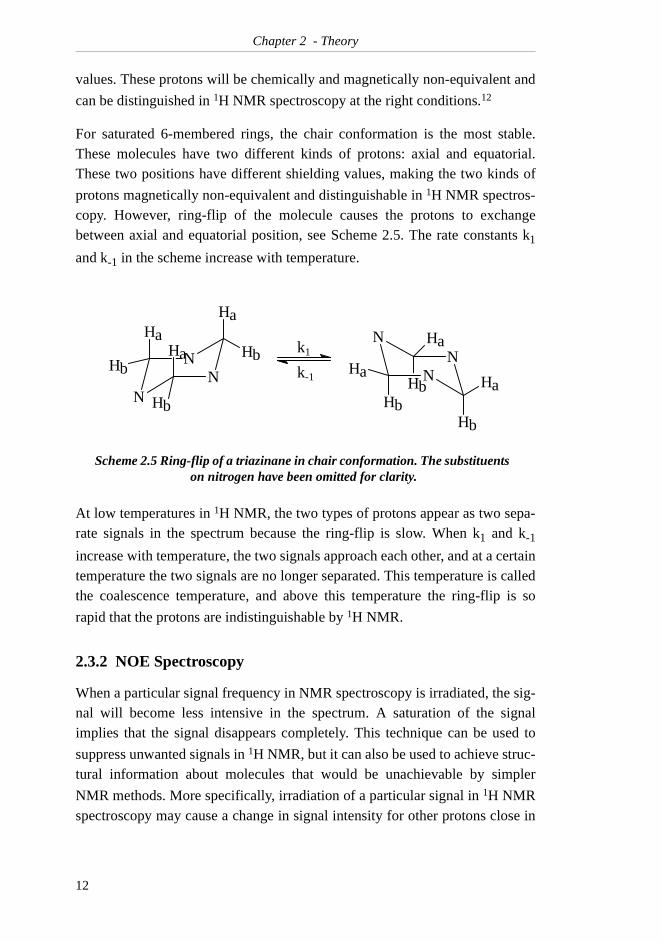
For saturated 6-membered rings, the chair conformation is the most stable.These molecules have two different kinds of protons: axial and equatorial.These two positions have different shielding values, making the two kinds of
protons magnetically non-equivalent and distinguishable in 1H NMR spectros-copy. However, ring-flip of the molecule causes the protons to exchangebetween axial and equatorial position, see Scheme 2.5. The rate constants k1
and k-1 in the scheme increase with temperature.
At low temperatures in 1H NMR, the two types of protons appear as two sepa-rate signals in the spectrum because the ring-flip is slow. When k1 and k-1
increase with temperature, the two signals approach each other, and at a certaintemperature the two signals are no longer separated. This temperature is calledthe coalescence temperature, and above this temperature the ring-flip is so
rapid that the protons are indistinguishable by 1H NMR.
2.3.2 NOE Spectroscopy
When a particular signal frequency in NMR spectroscopy is irradiated, the sig-nal will become less intensive in the spectrum. A saturation of the signalimplies that the signal disappears completely. This technique can be used to
suppress unwanted signals in 1H NMR, but it can also be used to achieve struc-tural information about molecules that would be unachievable by simpler
NMR methods. More specifically, irradiation of a particular signal in 1H NMRspectroscopy may cause a change in signal intensity for other protons close in
Scheme 2.5 Ring-flip of a triazinane in chair conformation. The substituents on nitrogen have been omitted for clarity.
NN
N
Ha
Hb
HaHa
Hb
Hb NN
N
Hb
HaHb
HbHa
Hak1
k-1
12
Chapter 2 - Theory
space (less than 3 Å)12 to the orignial protons, due to an effect referred to as theNuclear Overhauser Effect (NOE).
In 1H NMR spectroscopy, the NOE effect can give valuable structural informa-tion because an observable change in intensity of one signal as a consequenceof the irradiation of another signal shows that these protons are close to each
other. Experimentally, this is done by first recording a 1H NMR spectrum with-out irradiation. When the desired signal is irradiated, magnetization is trans-ferred between the irradiated nucleus and nuclei that are close to the irradiatednucleus in space. After a delay, a new spectrum is recorded. The two spectraare subtracted from each other, yielding a spectrum in which only changes insignal intensity are visible. The irradiated signal will appear as a strong nega-tive signal, whereas any proton close in space to the original one may give asmall positive or negative signal in the subtraction spectrum. NOE is usuallyreported as a percent change in signal intensity. The observed NOE may acci-dentally be zero, even though two protons are close to each other in space.However, an observable change in intensity of a signal due to the irradiation of
another signal in the 1H NMR spectrum strongly indicates that these two pro-tons are close to each other in space.
13

Chapter 2 - Theory
14
- Part I -
Qualitative Investigations of the Reaction between Triazinane 1 and H2S
The reaction between 1 and H2S was expected to be dominated by two com-
peting reactions:
1) Hydrolysis of 1
2) Nucleophilic attack of HS- on the electrophilic ring carbons in 1
Both reactions were assumed to need activation of the triazinane ring and totake place only below a certain pH (the pKa of 1). With the fulfilment of this
requirement, both reactions were expected to take place, but at different reac-tion rates. The products of the faster reaction would dominate the reaction mix-ture. However, since only the second reaction involved reaction with (andremoval of) H2S, the scavenging process would be most efficient at pHs where
the nucleophilic attack was favoured over the hydrolysis.
Therefore, it was desirable to examine the two reactions and determine whichone will dominate, given a set of reaction conditions - the most importantparameter being pH.
But first, attention had to be given to the qualitative prospects of the reactions.The identification of the products of the two reactions was necessary in orderto achieve a better understanding of the scavenging process. The products ofthe hydrolysis might still be able to react with H2S, and hence the hydrolysis
might not reduce the efficiency of 1 as much as anticipated. Also, one or moreof the reaction products might be toxic and should be treated accordingly.
The easiest way to examine the questions raised above was to investigate thetwo reactions separately. The hydrolysis reaction was examined using watersolutions of triazinane 1 alone, and the reaction initiated by the nucleophilicattack was examined by reacting 1 with Na2S or NaHS. The replacement of
H2S with Na2S or NaHS made it possible to run the reaction at a high pH
where the hydrolysis was slow enough to be neglected. It also made it easier tocontrol the reaction stoichiometrics and the amounts of products formed.
15
Finally, replacing gaseous H2S with the sodium salts gave a safer working
environment in the laboratory.
The hydrolysis of 1 will be discussed in Chapter 3 and its reaction with Na2S
and NaHS in Chapters 4 and 5.
16
Chapter 3 - The Hydrolysis of Triazinane 1
3 The Hydrolysis of Triazinane 1
The efficiency of 1 as an H2S scavenger is reduced by hydrolysis of the com-
pound at moderate to low pH. It was necessary to investigate this reaction indetail to determine the impact of this process on the overall H2S removal.
Studies on the rate of hydrolysis of 1 were initiated by Dr. Jaroslav Riha in1998. In this chapter, the structure of the hydrolysis products and the rate ofhydrolysis have been investigated by NMR spectroscopy. All experimentaldetails concerning the hydrolysis of 1 are given in Section 9.3. Spectroscopicdata of pure compounds are presented in Appendix A.
3.1 The Structures of the Products
3.1.1 Results and Discussion
Compound 1 was synthesized as described in Section 9.2. An aqueous solutionof 1 was acidified to pH 1.5 in order to hydrolyse the compound completely.
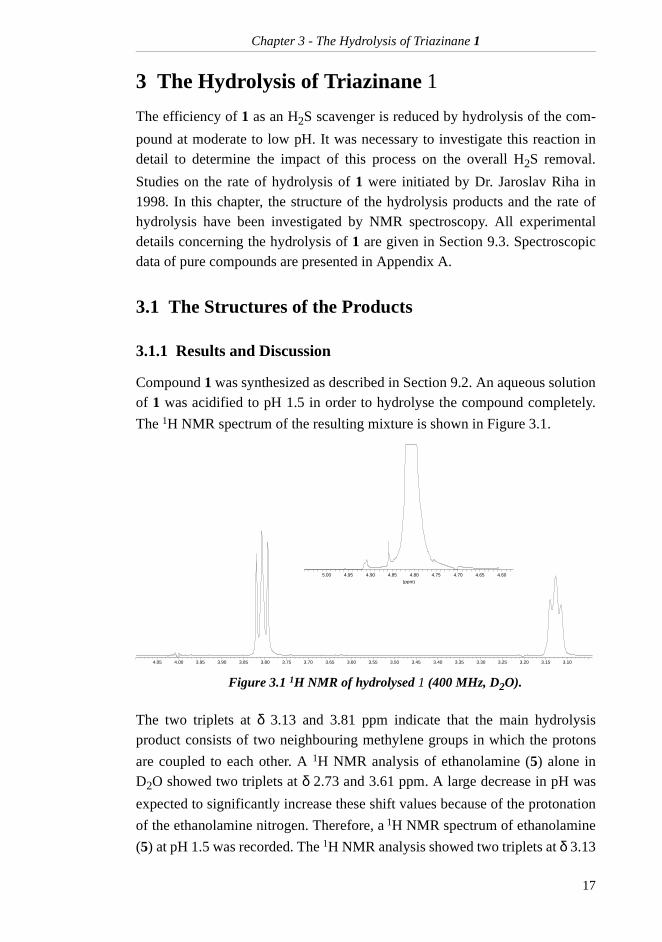
The 1H NMR spectrum of the resulting mixture is shown in Figure 3.1.
Figure 3.1 1H NMR of hydrolysed 1 (400 MHz, D2O).
The two triplets at δ 3.13 and 3.81 ppm indicate that the main hydrolysisproduct consists of two neighbouring methylene groups in which the protons
are coupled to each other. A 1H NMR analysis of ethanolamine (5) alone inD2O showed two triplets at δ 2.73 and 3.61 ppm. A large decrease in pH was
expected to significantly increase these shift values because of the protonation
of the ethanolamine nitrogen. Therefore, a 1H NMR spectrum of ethanolamine
(5) at pH 1.5 was recorded. The 1H NMR analysis showed two triplets at δ 3.13
3.103.153.203.253.303.353.403.453.503.553.603.653.703.753.803.853.903.954.004.05
(ppm)
4.604.654.704.754.804.854.904.955.00
17
Chapter 3 - The Hydrolysis of Triazinane 1
and 3.81 ppm. This indicated that one of the main products of the hydrolysiswas indeed ethanolamine (5).
Formaldehyde in aqueous solution is present in its hydrated form, CH2(OH)2,
and has a 1H NMR shift value of δ 4.83 ppm in D2O, but the large water signal
interferes with the formaldehyde singlet. At low concentrations the singlet can-not be observed at all. In Figure 3.1, a small signal is observed within the watersignal. The presence of this signal might indicate that hydrated formaldehydewas present in the solution, but such a conclusion could not be made without
further evidence. In 13C NMR there is no water signal interfering with othersignals, and the hydrated formaldehyde can be detected properly. Formaline
alone in D2O gave a signal at δ 84.6 ppm in 13C NMR. The hydrolysed 1 was
analysed by 13C NMR spectroscopy. The spectrum showed three signals at δ44.2, 60.6 and 84.7 ppm. The first signal is assigned to the H2N-CH2-group of
5. The second signal arises from the -CH2-OH carbon of 5. The third signal is
assigned to the CH2(OH)2 carbon of hydrated formaldehyde.
By these NMR experiments it is concluded that the products of the hydrolysisof 1 are ethanolamine (5) and hydrated formaldehyde.
3.2 The Rate of Hydrolysis
3.2.1 Kinetic Equations
The hydrolysis of a 1,3,5-triazinane (T) is assumed to have the following rateexpression:
For reactions run at constant pH, [H+] is constant, and Equation 3-1 is simpli-
fied to
with
(3-1)
(3-2)
(3-3)
[ ]]][[][ 21
++=− HTkTkdt
Td
[ ] [ ]Tkdt
Tdobs=−
][21++= Hkkkobs
18
Chapter 3 - The Hydrolysis of Triazinane 1
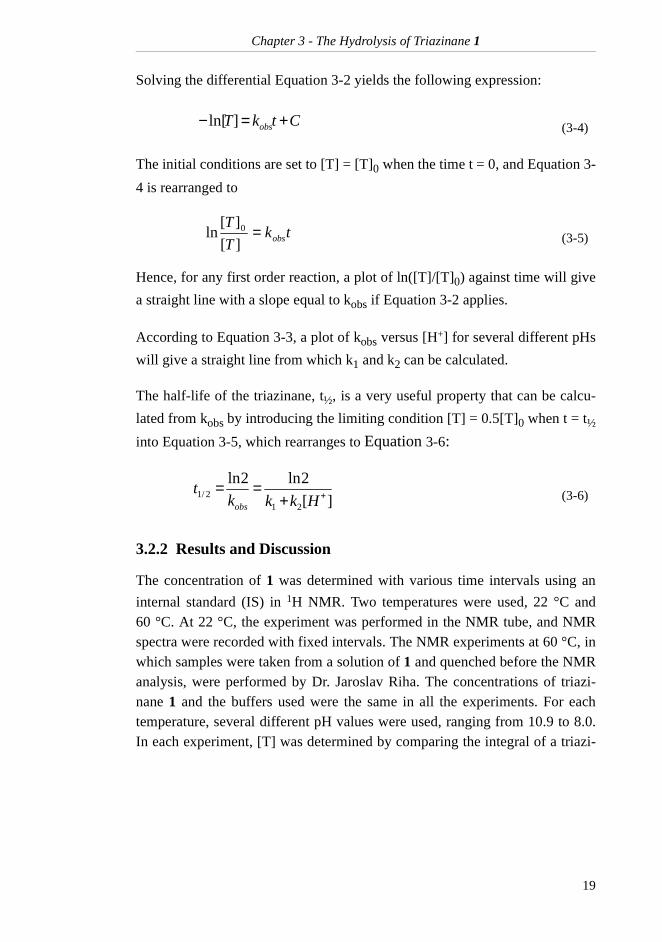
Solving the differential Equation 3-2 yields the following expression:
The initial conditions are set to [T] = [T]0 when the time t = 0, and Equation 3-
4 is rearranged to
Hence, for any first order reaction, a plot of ln([T]/[T]0) against time will give
a straight line with a slope equal to kobs if Equation 3-2 applies.
According to Equation 3-3, a plot of kobs versus [H+] for several different pHs
will give a straight line from which k1 and k2 can be calculated.
The half-life of the triazinane, t½, is a very useful property that can be calcu-
lated from kobs by introducing the limiting condition [T] = 0.5[T]0 when t = t½into Equation 3-5, which rearranges to Equation 3-6:
3.2.2 Results and Discussion
The concentration of 1 was determined with various time intervals using an
internal standard (IS) in 1H NMR. Two temperatures were used, 22 °C and60 °C. At 22 °C, the experiment was performed in the NMR tube, and NMRspectra were recorded with fixed intervals. The NMR experiments at 60 °C, inwhich samples were taken from a solution of 1 and quenched before the NMRanalysis, were performed by Dr. Jaroslav Riha. The concentrations of triazi-nane 1 and the buffers used were the same in all the experiments. For eachtemperature, several different pH values were used, ranging from 10.9 to 8.0.In each experiment, [T] was determined by comparing the integral of a triazi-
(3-4)
(3-5)
(3-6)
CtkT obs +=− ]ln[
tkT
Tobs=
][
][ln 0
][
2ln2ln
212/1 ++
==Hkkk
tobs
19
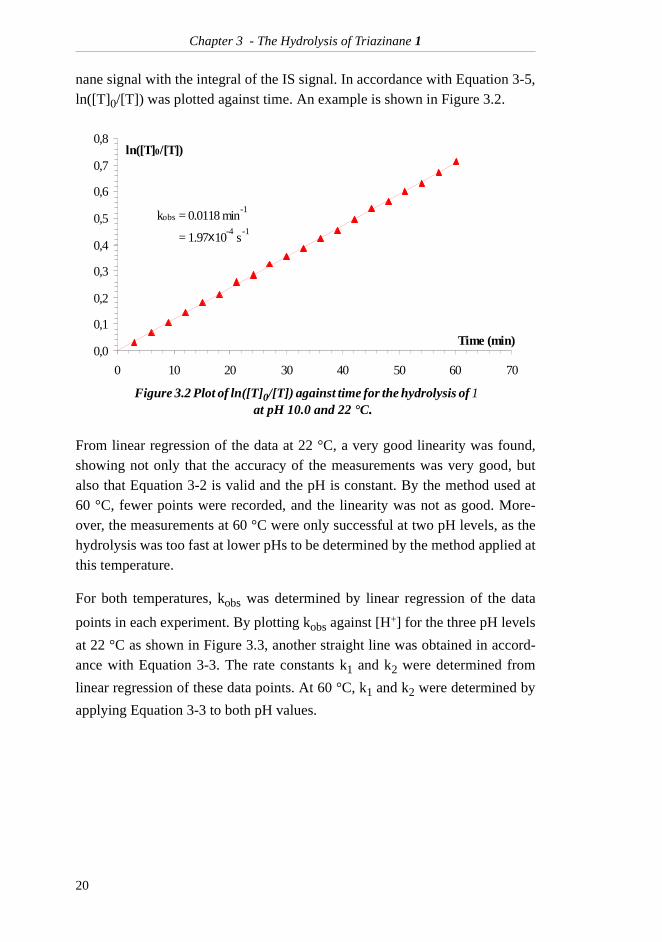
Chapter 3 - The Hydrolysis of Triazinane 1
nane signal with the integral of the IS signal. In accordance with Equation 3-5,ln([T]0/[T]) was plotted against time. An example is shown in Figure 3.2.
From linear regression of the data at 22 °C, a very good linearity was found,showing not only that the accuracy of the measurements was very good, butalso that Equation 3-2 is valid and the pH is constant. By the method used at60 °C, fewer points were recorded, and the linearity was not as good. More-over, the measurements at 60 °C were only successful at two pH levels, as thehydrolysis was too fast at lower pHs to be determined by the method applied atthis temperature.
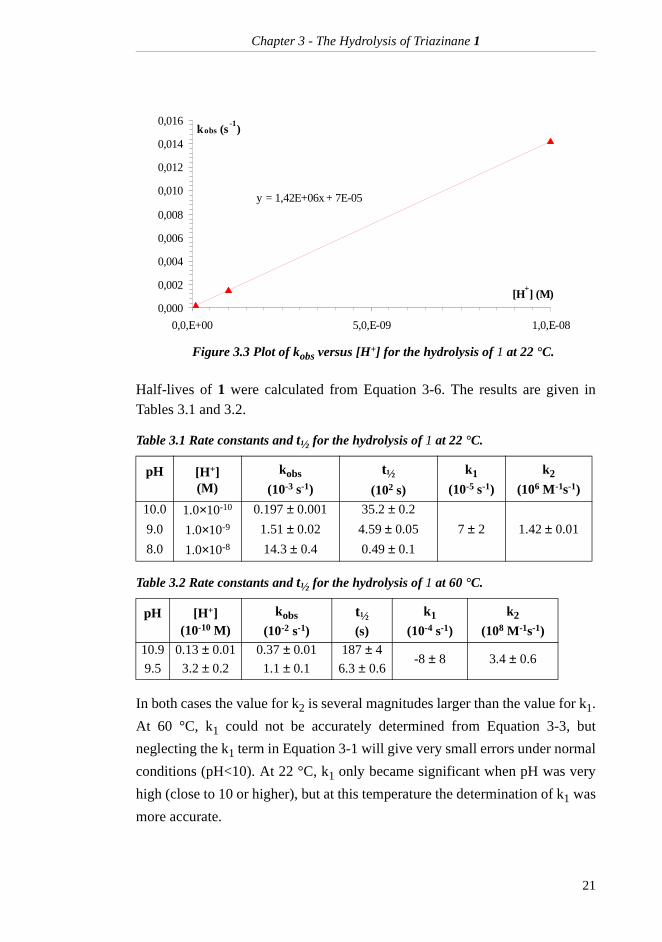
For both temperatures, kobs was determined by linear regression of the data
points in each experiment. By plotting kobs against [H+] for the three pH levels
at 22 °C as shown in Figure 3.3, another straight line was obtained in accord-ance with Equation 3-3. The rate constants k1 and k2 were determined from
linear regression of these data points. At 60 °C, k1 and k2 were determined by
applying Equation 3-3 to both pH values.
Figure 3.2 Plot of ln([T]0/[T]) against time for the hydrolysis of 1 at pH 10.0 and 22 °C.
kobs = 0.0118 min-1
= 1.97x10
-4 s
-1
0,0
0,1
0,2
0,3
0,4
0,5
0,6
0,7
0,8
0 10 20 30 40 50 60 70
Time (min)
ln([T]0/[T])
20
Chapter 3 - The Hydrolysis of Triazinane 1
Half-lives of 1 were calculated from Equation 3-6. The results are given inTables 3.1 and 3.2.
In both cases the value for k2 is several magnitudes larger than the value for k1.
At 60 °C, k1 could not be accurately determined from Equation 3-3, but
neglecting the k1 term in Equation 3-1 will give very small errors under normal
conditions (pH<10). At 22 °C, k1 only became significant when pH was very
high (close to 10 or higher), but at this temperature the determination of k1 was
more accurate.
Figure 3.3 Plot of kobs versus [H+] for the hydrolysis of 1 at 22 °C.
Table 3.1 Rate constants and t½ for the hydrolysis of 1 at 22 °C.
pH [H+](M)
kobs
(10-3 s-1)
t½
(102 s)
k1
(10-5 s-1)
k2
(106 M-1s-1)
10.0 1.0×10⁻¹⁰ 0.197 ± 0.001 35.2 ± 0.2
9.0 1.0×10⁻⁹ 1.51 ± 0.02 4.59 ± 0.05 7 ± 2 1.42 ± 0.01
8.0 1.0×10⁻⁸ 14.3 ± 0.4 0.49 ± 0.1
Table 3.2 Rate constants and t½ for the hydrolysis of 1 at 60 °C.
pH [H+](10-10 M)
kobs
(10-2 s-1)t½(s)
k1
(10-4 s-1)
k2
(108 M-1s-1)10.9 0.13 ± 0.01 0.37 ± 0.01 187 ± 4
-8 ± 8 3.4 ± 0.69.5 3.2 ± 0.2 1.1 ± 0.1 6.3 ± 0.6
y = 1,42E+06x + 7E-05
0,000
0,002
0,004
0,006
0,008
0,010
0,012
0,014
0,016
0,0,E+00 5,0,E-09 1,0,E-08
[H+] (M)
kobs (s-1
)
21
Chapter 3 - The Hydrolysis of Triazinane 1
Standard deviations in the regressions that gave kobs, k1 and k2 were obtained
from the regression tool in Microsoft Excel 1997, except for the calculation ofk1 and k2 at 60°C, for which Equation B-6 in Appendix B was used to deter-
mine the uncertainty. It was assumed that possible errors in the measuredvolumes, errors in the NMR integrals and errors in pH recordings were all ran-dom errors that would be reflected in the regression standard deviation. Theuncertainties in the observed rate constants were found to be up to 10 % for theexperiments at 60 °C, and up to 4 % for the experiments at 22 °C. At 60 °C, theuncertainties in k1 and k2 were found to be 100 % and 18 %, respectively. At
22 °C, the uncertainties were 29 % for k1 and less than 1 % for k2. The very
large margin of error in k1 is explained by the fact that k1 is found from the
intersection between the graph in Figure 3.3 and the y-axis. This value is veryclose to zero, and small changes in the data from which the graph is made willhave a much larger impact on the point of intersection than on the slope of theline, which determines k2. The uncertainties in the calculated half-lives were
determined from Equation B-6 in Appendix B and were found to be up to 10 %for the experiments at 60 °C, and up to 4 % for the experiments at 22 °C.
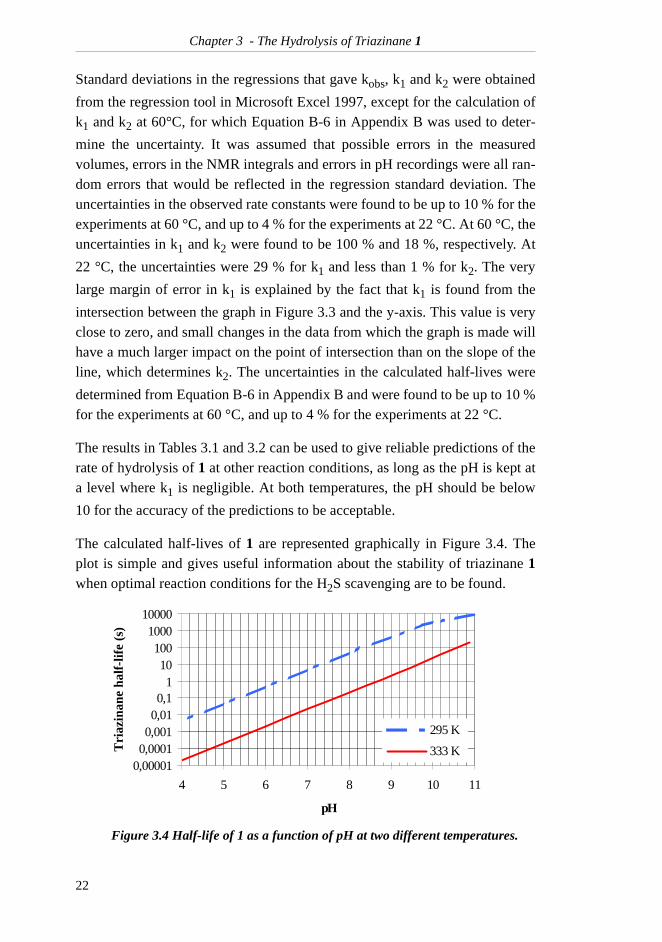
The results in Tables 3.1 and 3.2 can be used to give reliable predictions of therate of hydrolysis of 1 at other reaction conditions, as long as the pH is kept ata level where k1 is negligible. At both temperatures, the pH should be below
10 for the accuracy of the predictions to be acceptable.
The calculated half-lives of 1 are represented graphically in Figure 3.4. Theplot is simple and gives useful information about the stability of triazinane 1when optimal reaction conditions for the H2S scavenging are to be found.
Figure 3.4 Half-life of 1 as a function of pH at two different temperatures.
0,000010,00010,0010,010,1
110
1001000
10000
4 5 6 7 8 9 10 11
pH
Tri
azin
ane
half
-lif
e (s
)
295 K
333 K
22
Chapter 3 - The Hydrolysis of Triazinane 1
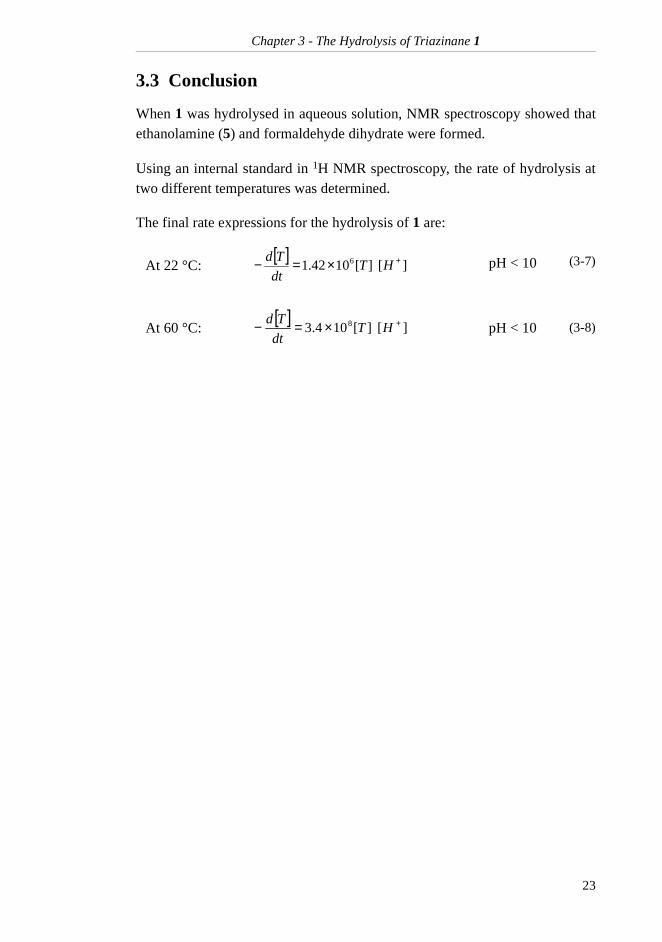
3.3 Conclusion
When 1 was hydrolysed in aqueous solution, NMR spectroscopy showed thatethanolamine (5) and formaldehyde dihydrate were formed.
Using an internal standard in 1H NMR spectroscopy, the rate of hydrolysis attwo different temperatures was determined.
The final rate expressions for the hydrolysis of 1 are:
At 22 °C: pH < 10 (3-7)
At 60 °C: pH < 10 (3-8)
[ ]][][1042.1 6 +×=− HT
dt
Td
[ ]][][104.3 8 +×=− HT
dt
Td
23

Chapter 3 - The Hydrolysis of Triazinane 1
24
Chapter 4 - The Equimolar Reaction between Triazinane 1 and HS-
4 The Equimolar Reaction between Triazinane 1 and HS-
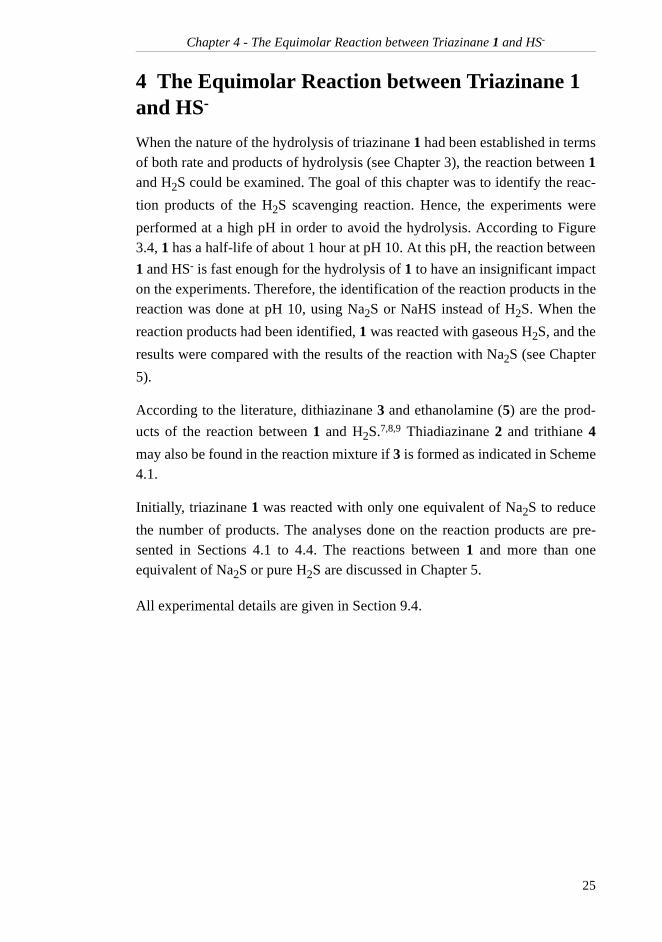
When the nature of the hydrolysis of triazinane 1 had been established in termsof both rate and products of hydrolysis (see Chapter 3), the reaction between 1and H2S could be examined. The goal of this chapter was to identify the reac-
tion products of the H2S scavenging reaction. Hence, the experiments were
performed at a high pH in order to avoid the hydrolysis. According to Figure3.4, 1 has a half-life of about 1 hour at pH 10. At this pH, the reaction between
1 and HS- is fast enough for the hydrolysis of 1 to have an insignificant impacton the experiments. Therefore, the identification of the reaction products in thereaction was done at pH 10, using Na2S or NaHS instead of H2S. When the
reaction products had been identified, 1 was reacted with gaseous H2S, and the
results were compared with the results of the reaction with Na2S (see Chapter
5).
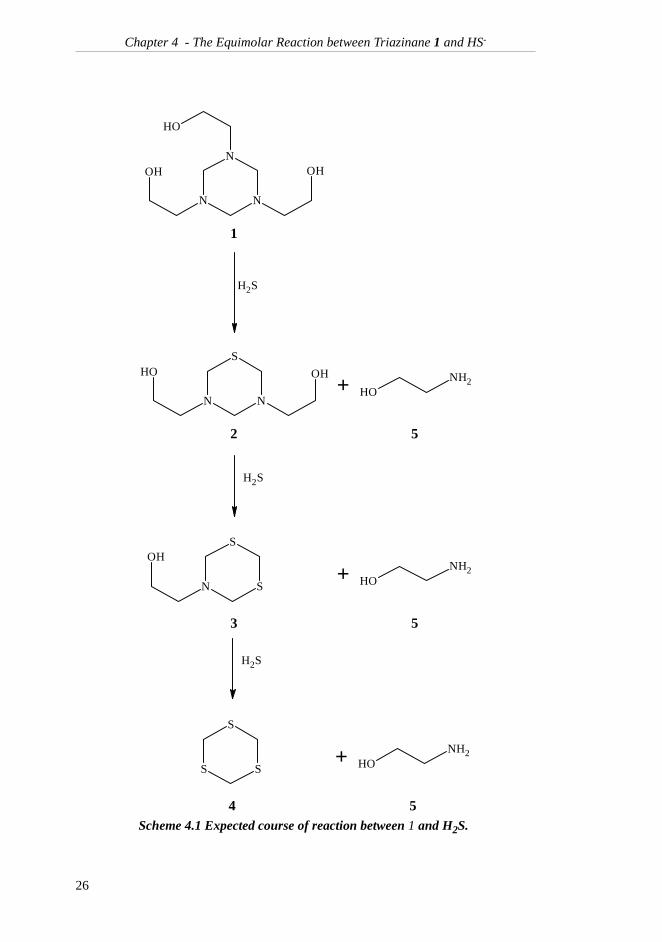
According to the literature, dithiazinane 3 and ethanolamine (5) are the prod-
ucts of the reaction between 1 and H2S.7,8,9 Thiadiazinane 2 and trithiane 4
may also be found in the reaction mixture if 3 is formed as indicated in Scheme4.1.
Initially, triazinane 1 was reacted with only one equivalent of Na2S to reduce
the number of products. The analyses done on the reaction products are pre-sented in Sections 4.1 to 4.4. The reactions between 1 and more than oneequivalent of Na2S or pure H2S are discussed in Chapter 5.
All experimental details are given in Section 9.4.
25
Chapter 4 - The Equimolar Reaction between Triazinane 1 and HS-
Scheme 4.1 Expected course of reaction between 1 and H2S.
+
+
1
5
N
N
N
OH
OH OH
N
S
N
OH OH
SN
SOH
OHNH2
OHNH2
SH2
SH2
3
2
5
+SS
S
OHNH2
SH2
4 5
26
Chapter 4 - The Equimolar Reaction between Triazinane 1 and HS-
4.1 NMR Analyses
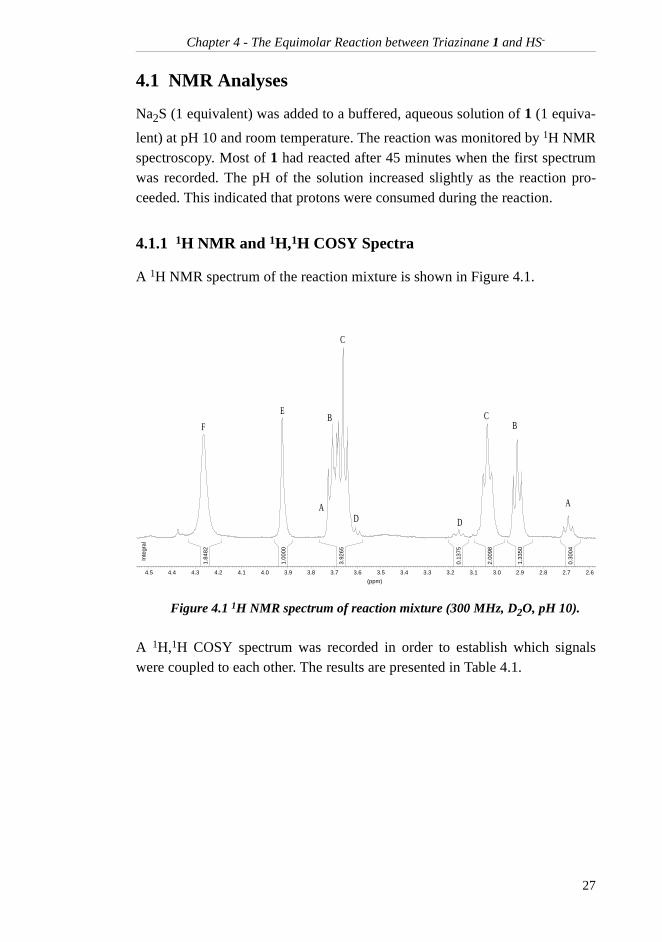
Na2S (1 equivalent) was added to a buffered, aqueous solution of 1 (1 equiva-
lent) at pH 10 and room temperature. The reaction was monitored by 1H NMRspectroscopy. Most of 1 had reacted after 45 minutes when the first spectrumwas recorded. The pH of the solution increased slightly as the reaction pro-ceeded. This indicated that protons were consumed during the reaction.
4.1.1 1H NMR and 1H,1H COSY Spectra
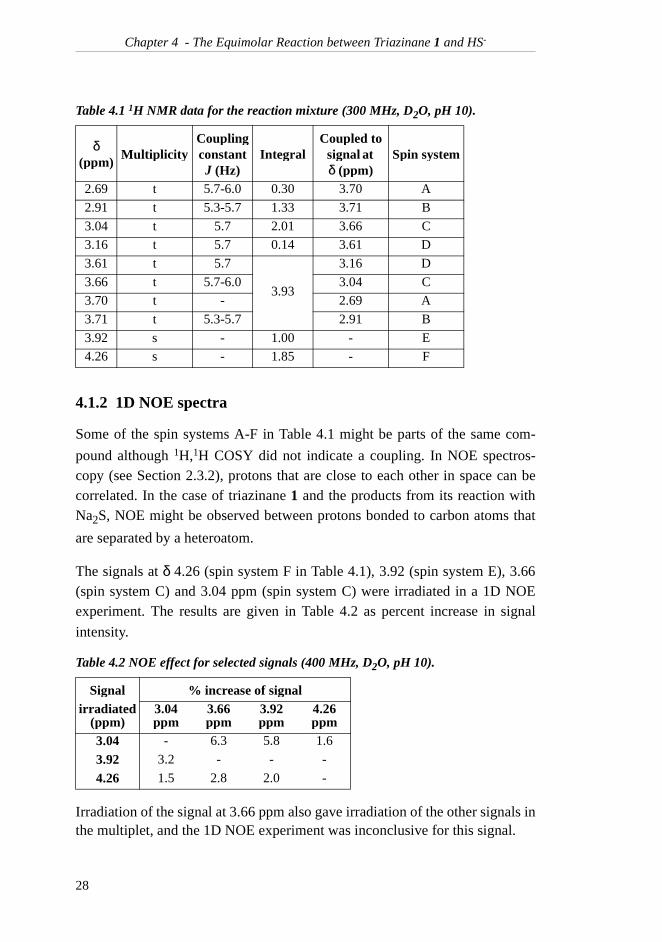
A 1H NMR spectrum of the reaction mixture is shown in Figure 4.1.
A 1H,1H COSY spectrum was recorded in order to establish which signalswere coupled to each other. The results are presented in Table 4.1.
Figure 4.1 1H NMR spectrum of reaction mixture (300 MHz, D2O, pH 10).
1.84
82
1.00
00
3.92
65
0.13
75
2.00
98
1.33
50
0.30
04
Inte
gral
(ppm)
2.62.72.82.93.03.13.23.33.43.53.63.73.83.94.04.14.24.34.44.5
AA
BB C
C
DD
E
F
27
Chapter 4 - The Equimolar Reaction between Triazinane 1 and HS-
4.1.2 1D NOE spectra
Some of the spin systems A-F in Table 4.1 might be parts of the same com-
pound although 1H,1H COSY did not indicate a coupling. In NOE spectros-copy (see Section 2.3.2), protons that are close to each other in space can becorrelated. In the case of triazinane 1 and the products from its reaction withNa2S, NOE might be observed between protons bonded to carbon atoms that
are separated by a heteroatom.
The signals at δ 4.26 (spin system F in Table 4.1), 3.92 (spin system E), 3.66(spin system C) and 3.04 ppm (spin system C) were irradiated in a 1D NOEexperiment. The results are given in Table 4.2 as percent increase in signal
intensity.
Irradiation of the signal at 3.66 ppm also gave irradiation of the other signals inthe multiplet, and the 1D NOE experiment was inconclusive for this signal.
Table 4.1 1H NMR data for the reaction mixture (300 MHz, D2O, pH 10).
δ(ppm)
MultiplicityCoupling constantJ (Hz)
IntegralCoupled to
signal at δ (ppm)
Spin system
2.69 t 5.7-6.0 0.30 3.70 A
2.91 t 5.3-5.7 1.33 3.71 B
3.04 t 5.7 2.01 3.66 C
3.16 t 5.7 0.14 3.61 D
3.61 t 5.7
3.93
3.16 D
3.66 t 5.7-6.0 3.04 C
3.70 t - 2.69 A
3.71 t 5.3-5.7 2.91 B
3.92 s - 1.00 - E
4.26 s - 1.85 - F
Table 4.2 NOE effect for selected signals (400 MHz, D2O, pH 10).
Signal % increase of signalirradiated
(ppm)3.04ppm
3.66ppm
3.92 ppm
4.26ppm
3.04 - 6.3 5.8 1.6
3.92 3.2 - - -
4.26 1.5 2.8 2.0 -
28
Chapter 4 - The Equimolar Reaction between Triazinane 1 and HS-
The results show that spin systems C, E and F, and accordingly the four signalsat δ 3.04, 3.66, 3.92, and 4.26 ppm, can all be assigned to the same compound,compound C. Spin systems A, B and D are the only spin systems in theirrespective compounds, henceforth referred to as compounds A, B and D.
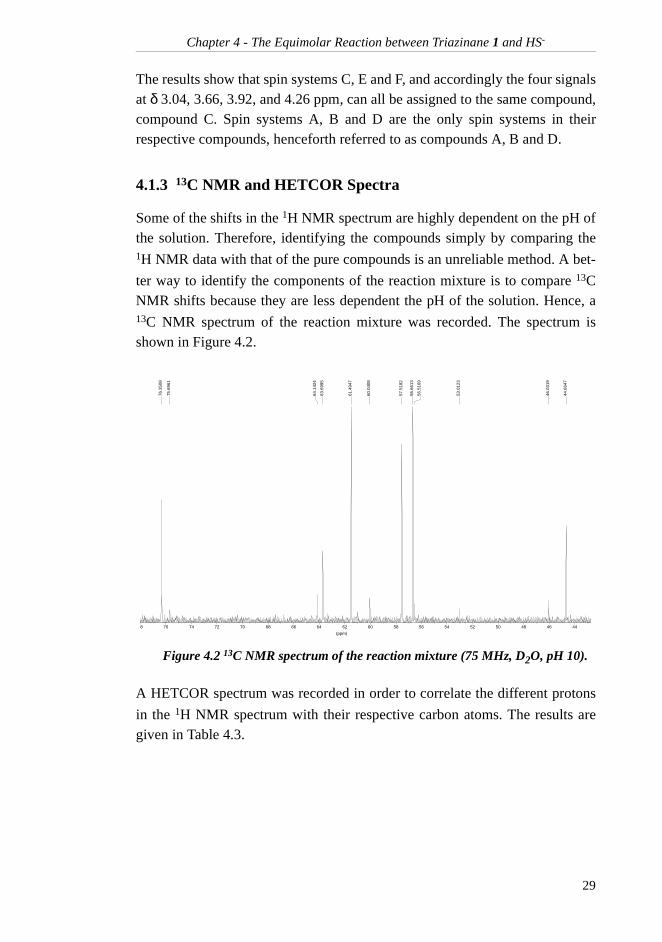
4.1.3 13C NMR and HETCOR Spectra
Some of the shifts in the 1H NMR spectrum are highly dependent on the pH ofthe solution. Therefore, identifying the compounds simply by comparing the1H NMR data with that of the pure compounds is an unreliable method. A bet-
ter way to identify the components of the reaction mixture is to compare 13CNMR shifts because they are less dependent the pH of the solution. Hence, a13C NMR spectrum of the reaction mixture was recorded. The spectrum isshown in Figure 4.2.
A HETCOR spectrum was recorded in order to correlate the different protons
in the 1H NMR spectrum with their respective carbon atoms. The results aregiven in Table 4.3.
Figure 4.2 13C NMR spectrum of the reaction mixture (75 MHz, D2O, pH 10).
76.3
508
75.6
961
64.1
424
63.6
995
61.4
947
60.0
408
57.5
182
56.6
613
56.5
169
53.0
123
46.0
319
44.6
647
(ppm)
44464850525456586062646668707274768
29
Chapter 4 - The Equimolar Reaction between Triazinane 1 and HS-
Some of the 13C signals were too weak to show 1H,13C coupling, but by com-
parison with 13C and 1H NMR spectra of the pure compounds (see AppendixB) and the method of elimination, they were given the compound assignmentsin parentheses.
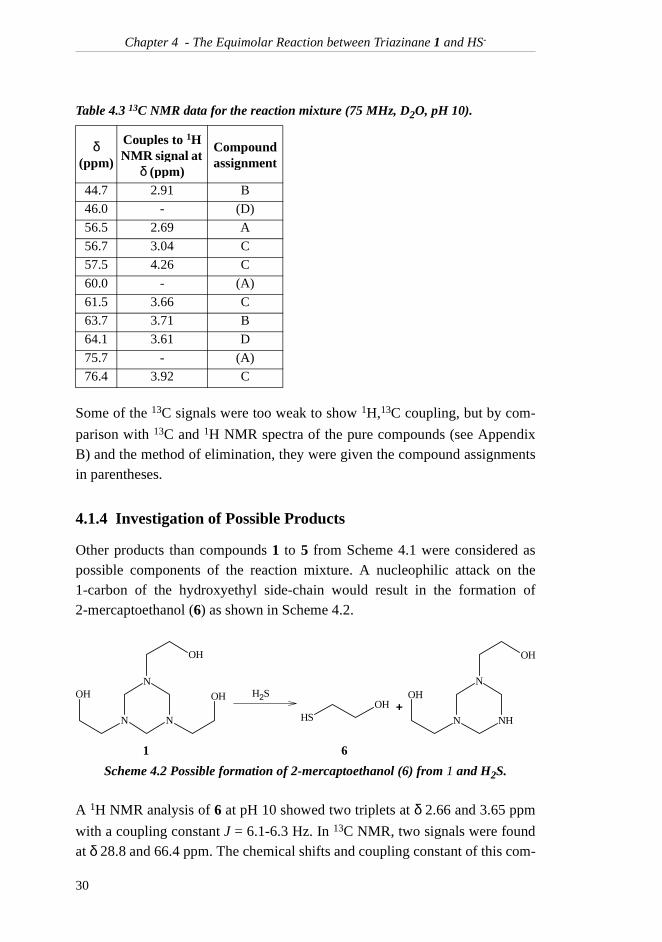
4.1.4 Investigation of Possible Products
Other products than compounds 1 to 5 from Scheme 4.1 were considered aspossible components of the reaction mixture. A nucleophilic attack on the1-carbon of the hydroxyethyl side-chain would result in the formation of2-mercaptoethanol (6) as shown in Scheme 4.2.
A 1H NMR analysis of 6 at pH 10 showed two triplets at δ 2.66 and 3.65 ppm
with a coupling constant J = 6.1-6.3 Hz. In 13C NMR, two signals were foundat δ 28.8 and 66.4 ppm. The chemical shifts and coupling constant of this com-
Table 4.3 13C NMR data for the reaction mixture (75 MHz, D2O, pH 10).
δ(ppm)
Couples to 1H NMR signal at
δ (ppm)
Compoundassignment
44.7 2.91 B
46.0 - (D)
56.5 2.69 A
56.7 3.04 C
57.5 4.26 C
60.0 - (A)
61.5 3.66 C
63.7 3.71 B
64.1 3.61 D
75.7 - (A)
76.4 3.92 C
Scheme 4.2 Possible formation of 2-mercaptoethanol (6) from 1 and H2S.
N
N
N
OHOH
OH
SHOH �
SH2
1 6
NH
N
N
OH
OH
30
Chapter 4 - The Equimolar Reaction between Triazinane 1 and HS-
pound did not match the experimental NMR data of Tables 4.1 and 4.3. It wasconcluded that 2-mercaptoethanol was not found in the reaction mixture, andthat nucleophilic attack on the hydroxyethyl side-chain of triazinane 1 did nottake place. This result was not surprising, as the ring carbons are clearly moreelectrophilic than the carbons of the side-chain.
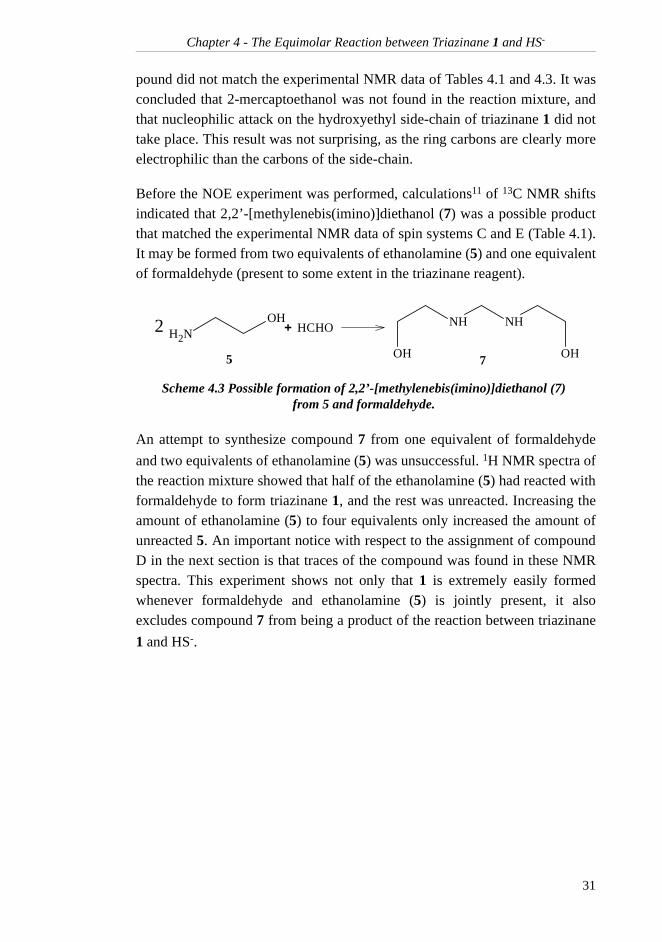
Before the NOE experiment was performed, calculations11 of 13C NMR shiftsindicated that 2,2’-[methylenebis(imino)]diethanol (7) was a possible productthat matched the experimental NMR data of spin systems C and E (Table 4.1).It may be formed from two equivalents of ethanolamine (5) and one equivalentof formaldehyde (present to some extent in the triazinane reagent).
An attempt to synthesize compound 7 from one equivalent of formaldehyde
and two equivalents of ethanolamine (5) was unsuccessful. 1H NMR spectra ofthe reaction mixture showed that half of the ethanolamine (5) had reacted withformaldehyde to form triazinane 1, and the rest was unreacted. Increasing theamount of ethanolamine (5) to four equivalents only increased the amount ofunreacted 5. An important notice with respect to the assignment of compoundD in the next section is that traces of the compound was found in these NMRspectra. This experiment shows not only that 1 is extremely easily formedwhenever formaldehyde and ethanolamine (5) is jointly present, it alsoexcludes compound 7 from being a product of the reaction between triazinane
1 and HS-.
Scheme 4.3 Possible formation of 2,2’-[methylenebis(imino)]diethanol (7) from 5 and formaldehyde.
NH2
OH�
5
NH
OH
NH
OH
2
7
HCHO
31
Chapter 4 - The Equimolar Reaction between Triazinane 1 and HS-
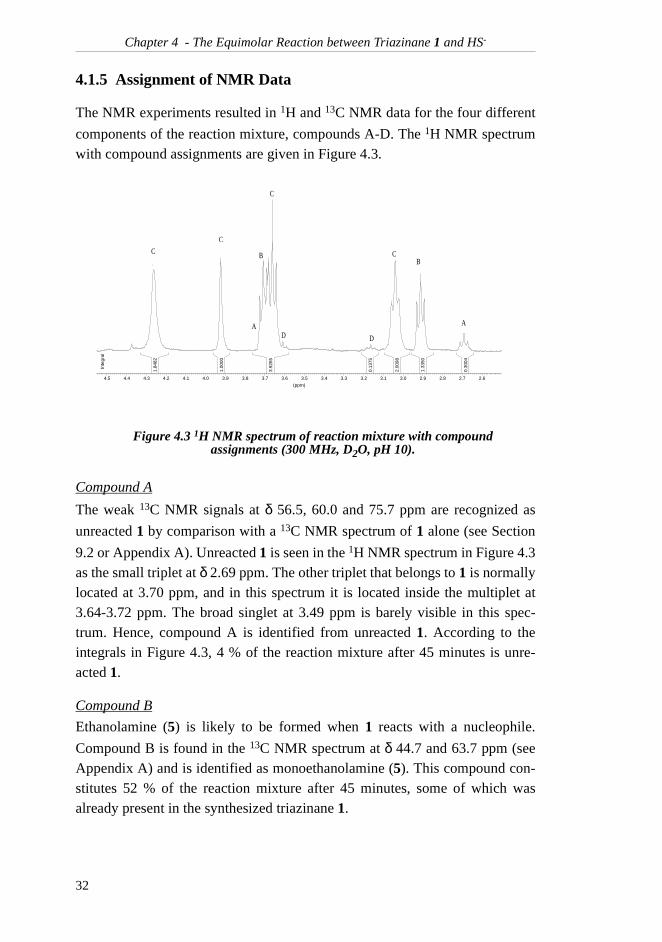
4.1.5 Assignment of NMR Data
The NMR experiments resulted in 1H and 13C NMR data for the four different
components of the reaction mixture, compounds A-D. The 1H NMR spectrumwith compound assignments are given in Figure 4.3.
Compound A
The weak 13C NMR signals at δ 56.5, 60.0 and 75.7 ppm are recognized as
unreacted 1 by comparison with a 13C NMR spectrum of 1 alone (see Section
9.2 or Appendix A). Unreacted 1 is seen in the 1H NMR spectrum in Figure 4.3as the small triplet at δ 2.69 ppm. The other triplet that belongs to 1 is normallylocated at 3.70 ppm, and in this spectrum it is located inside the multiplet at3.64-3.72 ppm. The broad singlet at 3.49 ppm is barely visible in this spec-trum. Hence, compound A is identified from unreacted 1. According to theintegrals in Figure 4.3, 4 % of the reaction mixture after 45 minutes is unre-acted 1.
Compound B
Ethanolamine (5) is likely to be formed when 1 reacts with a nucleophile.
Compound B is found in the 13C NMR spectrum at δ 44.7 and 63.7 ppm (seeAppendix A) and is identified as monoethanolamine (5). This compound con-stitutes 52 % of the reaction mixture after 45 minutes, some of which wasalready present in the synthesized triazinane 1.
Figure 4.3 1H NMR spectrum of reaction mixture with compound assignments (300 MHz, D2O, pH 10).
1.84
82
1.00
00
3.92
65
0.13
75
2.00
98
1.33
50
0.30
04
Inte
gral
(ppm)
2.62.72.82.93.03.13.23.33.43.53.63.73.83.94.04.14.24.34.44.5
AA
BB C
C
DD
E
F
C
C
32
Chapter 4 - The Equimolar Reaction between Triazinane 1 and HS-
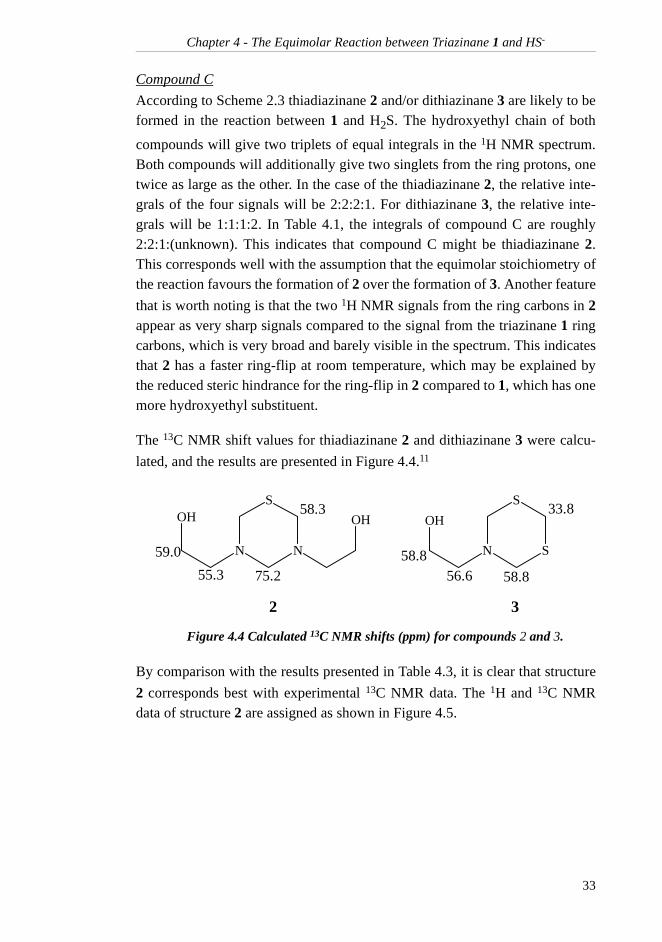
Compound C
According to Scheme 2.3 thiadiazinane 2 and/or dithiazinane 3 are likely to beformed in the reaction between 1 and H2S. The hydroxyethyl chain of both
compounds will give two triplets of equal integrals in the 1H NMR spectrum.Both compounds will additionally give two singlets from the ring protons, onetwice as large as the other. In the case of the thiadiazinane 2, the relative inte-grals of the four signals will be 2:2:2:1. For dithiazinane 3, the relative inte-grals will be 1:1:1:2. In Table 4.1, the integrals of compound C are roughly2:2:1:(unknown). This indicates that compound C might be thiadiazinane 2.This corresponds well with the assumption that the equimolar stoichiometry ofthe reaction favours the formation of 2 over the formation of 3. Another feature
that is worth noting is that the two 1H NMR signals from the ring carbons in 2appear as very sharp signals compared to the signal from the triazinane 1 ringcarbons, which is very broad and barely visible in the spectrum. This indicatesthat 2 has a faster ring-flip at room temperature, which may be explained bythe reduced steric hindrance for the ring-flip in 2 compared to 1, which has onemore hydroxyethyl substituent.
The 13C NMR shift values for thiadiazinane 2 and dithiazinane 3 were calcu-
lated, and the results are presented in Figure 4.4.11
By comparison with the results presented in Table 4.3, it is clear that structure
2 corresponds best with experimental 13C NMR data. The 1H and 13C NMRdata of structure 2 are assigned as shown in Figure 4.5.
Figure 4.4 Calculated 13C NMR shifts (ppm) for compounds 2 and 3.
2
N
S
N
OHOH
SN
S
OH
3
55.3
59.0
75.258.8
56.6 58.8
33.858.3
33
Chapter 4 - The Equimolar Reaction between Triazinane 1 and HS-
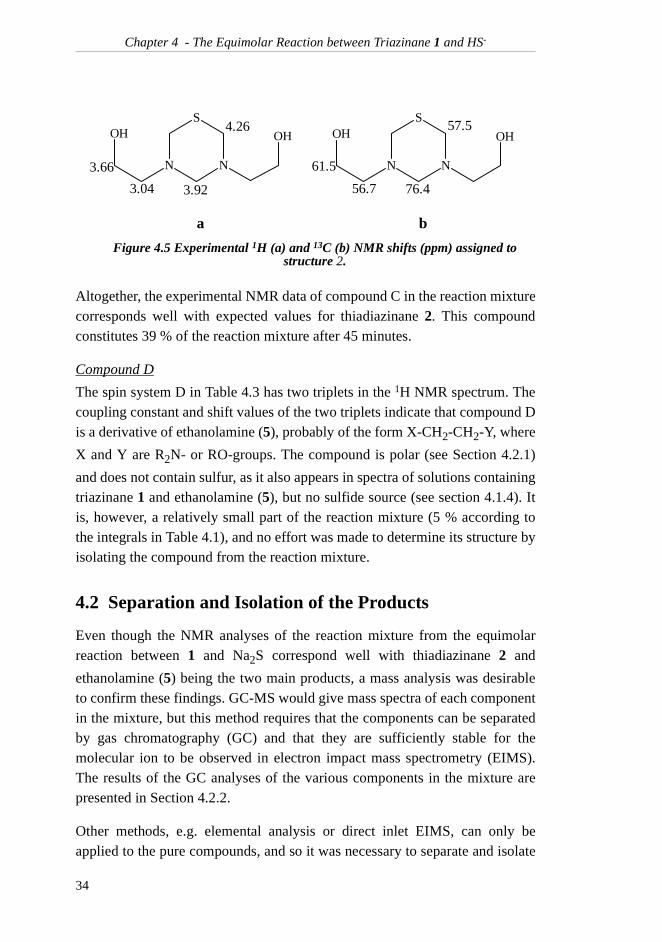
Altogether, the experimental NMR data of compound C in the reaction mixturecorresponds well with expected values for thiadiazinane 2. This compoundconstitutes 39 % of the reaction mixture after 45 minutes.
Compound D
The spin system D in Table 4.3 has two triplets in the 1H NMR spectrum. Thecoupling constant and shift values of the two triplets indicate that compound Dis a derivative of ethanolamine (5), probably of the form X-CH2-CH2-Y, where
X and Y are R2N- or RO-groups. The compound is polar (see Section 4.2.1)
and does not contain sulfur, as it also appears in spectra of solutions containingtriazinane 1 and ethanolamine (5), but no sulfide source (see section 4.1.4). Itis, however, a relatively small part of the reaction mixture (5 % according tothe integrals in Table 4.1), and no effort was made to determine its structure byisolating the compound from the reaction mixture.
4.2 Separation and Isolation of the Products
Even though the NMR analyses of the reaction mixture from the equimolarreaction between 1 and Na2S correspond well with thiadiazinane 2 and
ethanolamine (5) being the two main products, a mass analysis was desirableto confirm these findings. GC-MS would give mass spectra of each componentin the mixture, but this method requires that the components can be separatedby gas chromatography (GC) and that they are sufficiently stable for themolecular ion to be observed in electron impact mass spectrometry (EIMS).The results of the GC analyses of the various components in the mixture arepresented in Section 4.2.2.
Other methods, e.g. elemental analysis or direct inlet EIMS, can only beapplied to the pure compounds, and so it was necessary to separate and isolate
Figure 4.5 Experimental 1H (a) and 13C (b) NMR shifts (ppm) assigned to structure 2.
a
N
S
N
OHOH
56.7
61.5
76.4
57.5
b
N
S
N
OHOH
3.04
3.66
3.92
4.26
34
Chapter 4 - The Equimolar Reaction between Triazinane 1 and HS-
the main products. The attempts made to perform this isolation are described inSections 4.2.1 and 4.2.3. Yet another method, short path distillation, is dis-cussed in Section 5.3.3.
4.2.1 Liquid/Liquid Extraction
The reaction mixture from the equimolar reaction between 1 and Na2S was an
aqueous solution containing unreacted 1, ethanolamine (5), compound C andtraces of the unknown compound D. Compound C was the main product of thereaction, and the experimental NMR data corresponded best with the structureof thiadiazinane 2. There was a possibility that 2 could be separated from 1 andethanolamine by polarity, and the aqueous reaction mixture was extracted withdichloromethane. In this manner, thiadiazinane 2 and small amounts of anunknown compound later identified as dithiazinane 3 (see Section 5.4) wasseparated from the mixture. Compound 3 was not a part of the original mixtureand had been formed during the extraction. The fractions that contained both 2and 3 were purified by evaporating the dichloromethane, dissolving the result-ing yellow oil in water and performing extractions with smaller portions ofdichloromethane. The portions that contained only 2 were combined, and 2with a purity of 90 % was obtained after evaporation of the solvent. In laterexperiments, 2 was isolated by continuous extraction with dichloromethane.
Triazinane 1, ethanolamine (5) and compound D are more polar compoundsthan 2 and 3, and mainly remained in the water phase although traces of 5 wasfound in the last portions. The product, 2, was a yellow, viscous liquid, similarin appearance to triazinane 1. The synthesis and isolation of 2 have not yet
been reported in the literature.13 Obtained purities were typically between 70
and 85 % from 1H NMR spectroscopy, but by repeating the purification by
extraction, purities of up to 90 % for the isolated 2 was obtained. 1H NMRspectroscopy showed that dichloromethane, dithiazinane 3 and small traces oftriazinane 1 were the main impurities. The final traces of dichloromethanewere very difficult to evaporate off due to the high viscosity of the isolated liq-uid.
4.2.2 Gas Chromatography
Separation of the different components by gas chromatography would servetwo causes: the opportunity to follow the reaction between 1 and Na2S by GC
in addition to NMR, and the possibility that the products can be separated andanalysed by GC-MS. Both applications require that the starting materials as
35
Chapter 4 - The Equimolar Reaction between Triazinane 1 and HS-
well as the products can be analysed by GC. The various pure componentswere analysed separately to establish if GC was a suitable method for theanalysis of these compounds.
Amines are known to be difficult to analyse by gas chromatography.Triazinane 1 is also a very polar compound due to its three OH-groups. Severalattempts to get a solution of 1 in dichloromethane through a GC column (GCsystem number 1, Section 9.1.2) were unsuccessful. A column especiallydesigned for the analysis of amines was provided, and triazinane 1 in bothdichloromethane, methanol and water were attempted analysed by GC systemnumber 2 (Section 9.1.2). Again, no peaks were found in the chromatograms.
Ethanolamine (5) was also analysed on both systems, and the chromatogramsshowed a splitted peak at about 3.6 minutes. This is a shorter retention timethan expected for a such a polar compound, and the splitting of the peak wasvery surprising. No obvious explanation for this behaviour was found, but itwas concluded that ethanolamine (5) could not be satisfactorily analysed byGC.
Thiadiazinane 2 was isolated as described in Section 4.2.1. The pure com-pound in dichloromethane was injected into GC system number 2. No peakwas observed in the chromatogram. Apparently, both triazinane 1 andthiadiazinane 2 are too polar to go through the GC column.
Altogether, the attempts to analyse the reaction by GC were unsuccessful asnone of the main components could be satisfactorily analysed. Moreover, itwas concluded that the reaction between 1 and Na2S could not be followed by
GC. Hence, GC-MS could not be used to obtain mass spectra of the products.
The analysis of dithiazinane 3 by GC is discussed in Section 5.3.2.
4.2.3 Thin Layer and Column Chromatography
Thin layer chromatography (TLC) is the simplest of the chromatographicmethods. A TLC analysis of the reaction mixture from the reaction between 1
and HS- would be a simple way of finding out if the components in the reactionmixture can be separated based on polarity.
A reaction mixture from the equimolar reaction between 1 and Na2S in metha-
nol was applied to five TLC plates. Five different mobile phases wereemployed: methanol, methanol/ethyl acetate (1:4), ethyl acetate, acetonitrile
36
Chapter 4 - The Equimolar Reaction between Triazinane 1 and HS-
and hexane. Acetonitrile and ethyl acetate were selected as the best mobilephases for this separation, as one of the compounds was very well separatedfrom the others using these mobile phases, with ∆Rf = 0.56 for acetonitrile and
0.35 for ethyl acetate.
The TLC experiments indicated that at least one compound could be isolatedby column chromatography. A new experiment was performed, in which thereaction mixture of the equimolar reaction between 1 and Na2S was eluated
with ethyl acetate through a silica column. The fractions containing the single
spot from the TLC analyses were analysed by 1H NMR. The spectrum showeda product that was later identified as dithiazinane 3 (see Section 5.4). Thiscompound was not a part of the original reaction mixture but had been formedduring work-up.
4.3 Analyses of Thiadiazinane 2
4.3.1 Mass Analysis
In addition to the extensive NMR analyses presented in Section 4.1, the isola-tion of thiadiazinane 2 obtained by water/dichloromethane extraction made itpossible to achieve a mass analysis of the pure compound. However, heterocy-cles like 1 and 2 are assumed to be difficult to detect in EIMS, due to the manypossible fragmentations of the molecules. Elemental analysis was chosen asthe preferred method.
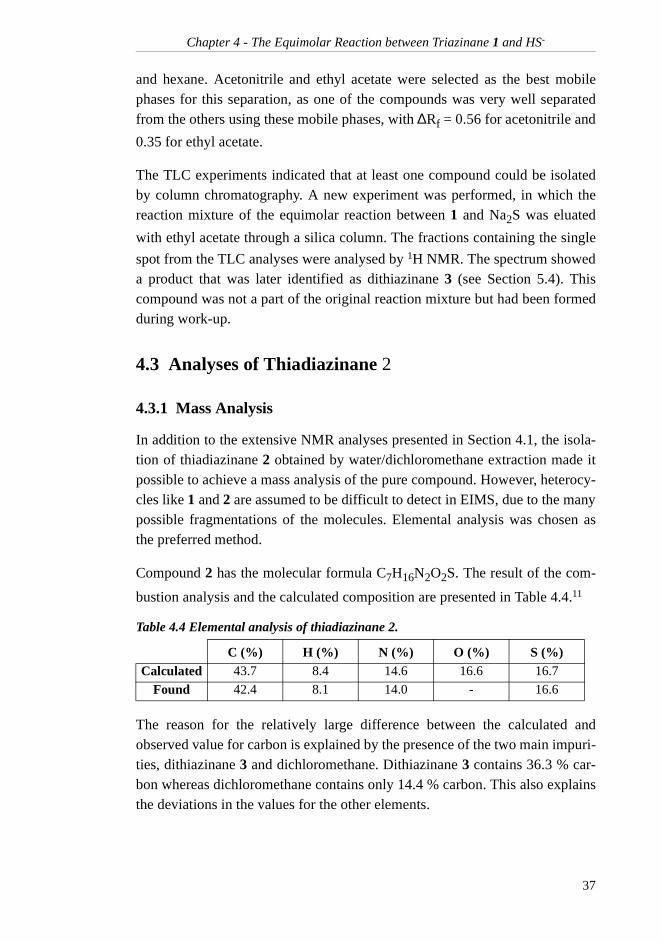
Compound 2 has the molecular formula C7H16N2O2S. The result of the com-
bustion analysis and the calculated composition are presented in Table 4.4.11
The reason for the relatively large difference between the calculated andobserved value for carbon is explained by the presence of the two main impuri-ties, dithiazinane 3 and dichloromethane. Dithiazinane 3 contains 36.3 % car-bon whereas dichloromethane contains only 14.4 % carbon. This also explainsthe deviations in the values for the other elements.
Table 4.4 Elemental analysis of thiadiazinane 2.
C (%) H (%) N (%) O (%) S (%)Calculated 43.7 8.4 14.6 16.6 16.7
Found 42.4 8.1 14.0 - 16.6
37
Chapter 4 - The Equimolar Reaction between Triazinane 1 and HS-
In conclusion, the findings from the elemental analysis supported the NMRresults. Thiadiazinane 2 was identified as one of the products of the equimolar
reaction between 1 and HS-.
4.3.2 Low Temperature 1H NMR Spectra
As described in Section 2.3.1, the ring protons of saturated six-membered rings
like triazinane 1 and its derivatives can show a different splitting pattern in 1HNMR spectroscopy when the temperature is lowered to the coalescence tem-perature, Tc. In fact, if singlets like the ones at δ 3.92 and 4.26 ppm in Figure
4.1 are splitted into two doublets at low temperatures, a reasonable explanationfor this behaviour would be that the signals arise from axial and equatorial pro-tons of a six-membered ring compound.
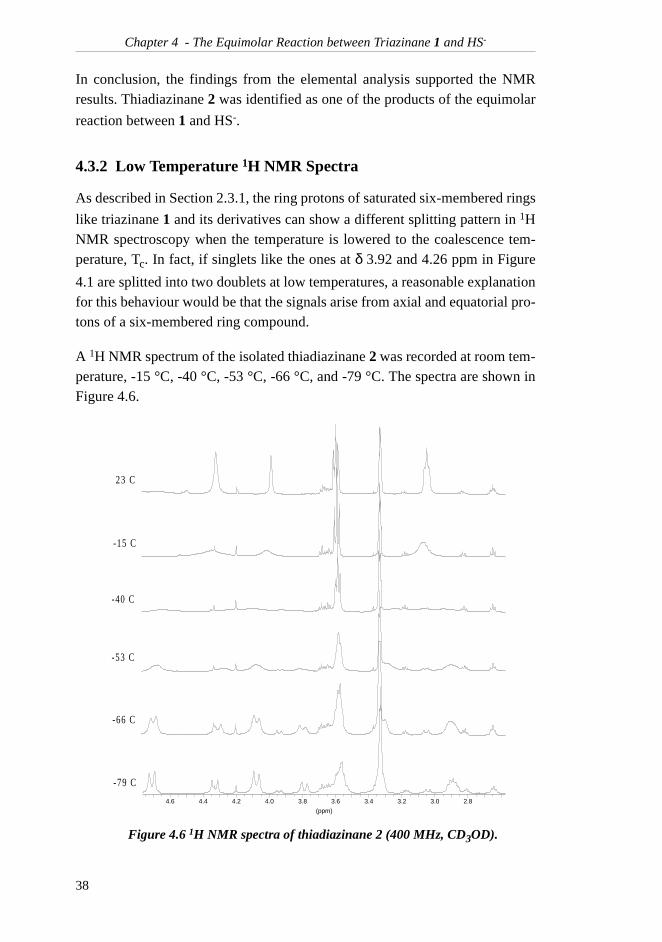
A 1H NMR spectrum of the isolated thiadiazinane 2 was recorded at room tem-perature, -15 °C, -40 °C, -53 °C, -66 °C, and -79 °C. The spectra are shown inFigure 4.6.
Figure 4.6 1H NMR spectra of thiadiazinane 2 (400 MHz, CD3OD).
(ppm)
2.83.03.23.43.63.84.04.24.44.6
-79 C
-66 C
23 C
-15 C
-40 C
-53 C
38
Chapter 4 - The Equimolar Reaction between Triazinane 1 and HS-
In addition to the signals from thiadiazinane 2, a large signal from methanol atδ 3.36 ppm as well as traces of triazinane 1 and ethanolamine (5) were found.From the spectrum at -79 °C, it is clear that the thiadiazinane singlet located atδ 3.92 ppm at room temperature has been splitted into two distinct doublets atδ 3.79 and 4.33 ppm with a coupling constant of 13.8 Hz, indicating a geminalcoupling. The same has happened to the singlet at δ 4.26 ppm, which is nowfound as two doublets at 4.08 and 4.71 ppm with a coupling constant of 12.8Hz. This NMR experiment confirms that the main product of the reaction hasthe six-membered ring intact. Another interesting observation is that the pro-tons of the side-chain methylene group in α-position to the nitrogen appear astwo multiplets (actually two doublets split into triplets) at low temperatures.The multiplets are found at δ 2.89 and 3.33 ppm, the latter one interfering withthe methanol signal. This behaviour is explained by the fact that the two pro-tons are prochiral and magnetically non-equivalent. Both these observationsare in accordance with thiadiazinane 2 being the main product.
4.3.3 IR Spectroscopy
The isolation of 2 also made it possible to achieve an IR spectrum of the pure
compound. In the spectrum, both a strong O-H stretch absorption (3378 cm-1)
and a strong C-O stretch absorption (1048 cm-1) were found, indicating that the
isolated compound is an alcohol.14 A weak C-N stretch absorption (1176 cm-1)
showed that the compound also contained an amine moiety.14 Finally, a C-S
stretch absorption (691 cm-1) indicated the presence of a sulfur moiety.14
In conclusion, the results from the IR analysis supported that thiadiazinane 2was the isolated product.
4.4 The pH-Dependence of the Reaction
Earlier work15 has established that the reaction between 1 and Na2S is faster at
lower pH levels. In this work, the specific correlation between the reaction rateand pH is treated in Chapter 6, and it is found that a decrease in pH dramati-cally increases the rate of reaction. This observation indicates that protonationis a rate-determining step in the reaction mechanism. It is assumed that thereaction is initiated by the protonation of the ring nitrogen of the triazinane 1,making the ring carbon more electrophilic and hence more reactive towards anucleophilic attack by the sulfide nucleophile.
39
Chapter 4 - The Equimolar Reaction between Triazinane 1 and HS-
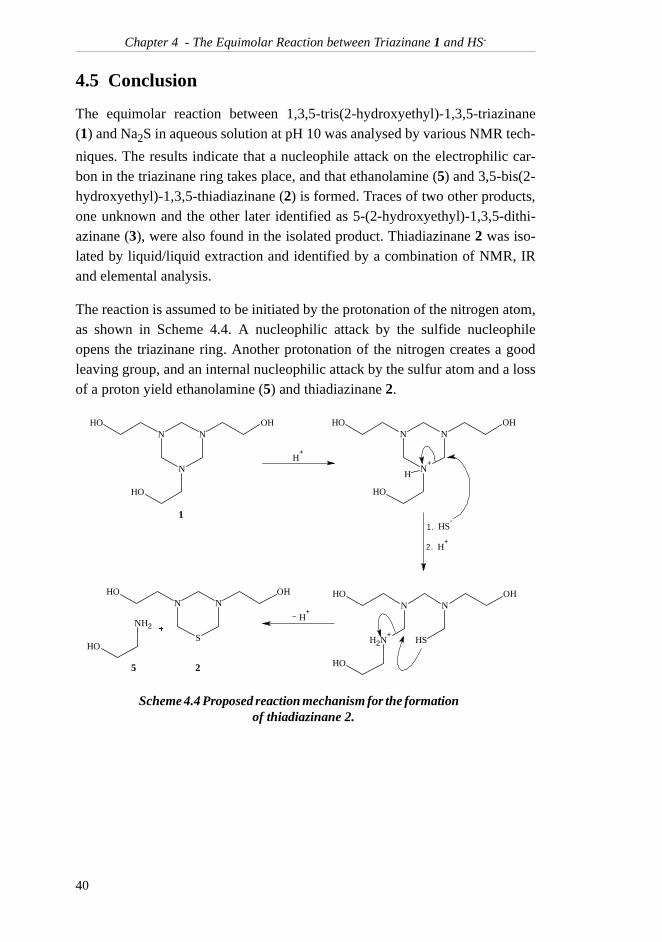
4.5 Conclusion
The equimolar reaction between 1,3,5-tris(2-hydroxyethyl)-1,3,5-triazinane(1) and Na2S in aqueous solution at pH 10 was analysed by various NMR tech-
niques. The results indicate that a nucleophile attack on the electrophilic car-bon in the triazinane ring takes place, and that ethanolamine (5) and 3,5-bis(2-hydroxyethyl)-1,3,5-thiadiazinane (2) is formed. Traces of two other products,one unknown and the other later identified as 5-(2-hydroxyethyl)-1,3,5-dithi-azinane (3), were also found in the isolated product. Thiadiazinane 2 was iso-lated by liquid/liquid extraction and identified by a combination of NMR, IRand elemental analysis.
The reaction is assumed to be initiated by the protonation of the nitrogen atom,as shown in Scheme 4.4. A nucleophilic attack by the sulfide nucleophileopens the triazinane ring. Another protonation of the nitrogen creates a goodleaving group, and an internal nucleophilic attack by the sulfur atom and a lossof a proton yield ethanolamine (5) and thiadiazinane 2.
Scheme 4.4 Proposed reaction mechanism for the formation of thiadiazinane 2.
N
N+
NOH OH
OH
H
SH-
N
NH2+
NOH OH
OH
SH
1.
2. H+
H+
-
N
S
NOHOH
�NH2
OH
5 2
1
N
N
NOH OH
OH
H+
40
Chapter 5 - The Reaction between Trizinane 1 and Excess HS-
5 The Reaction between Triazinane 1 and Excess HS-
In Chapter 4, it was established that when triazinane 1 reacts with one equiva-lent of Na2S at pH 10, thiadiazinane 2 and ethanolamine (5) were formed. It
seemed reasonable to assume that 2 can react with a sulfide nucleophile inmuch the same way as 1. However, the replacement of one ring nitrogen withsulfur should make at least two of the ring carbons less electrophilic, so 2 wasexpected to be less reactive than 1 towards nucleophilic substitution.
First, thiadiazinane 2 was reacted with one equivalent of NaHS. The productswere analysed and isolated by the same methods used in the equimolar reactionof Chapter 4. The results are discussed in Section 5.1.
Then, the reaction between triazinane 1 and two equivalents of NaHS wasanalysed, and the findings were compared to the ones achieved in Chapter 4.This is described in Section 5.2. The isolation of the product and the analysisof the pure compound are presented in Sections 5.3 and 5.4, respectively.
Triazinane 1 was then reacted with up to five equivalents of HS- in order to seeif 1,3,5-trithiane (4) was formed. The results are presented in Section 5.5.
Finally, triazinane 1 was reacted with H2S-gas and the findings were compared
both with the ones from Chapter 4, and with 1H NMR spectra from actual spentscavenger from a natural gas plant in the North Sea. These parts are treated inSections 5.6 and 5.7.
All experimental details are given in Section 9.5.
5.1 Thiadiazinane 2 and NaHS
Isolated thiadiazinane 2 with a purity of about 75 %, the rest being dichlo-romethane and traces of 5-(2-hydroxyethyl)-1,3,5-dithiazinane (3), was
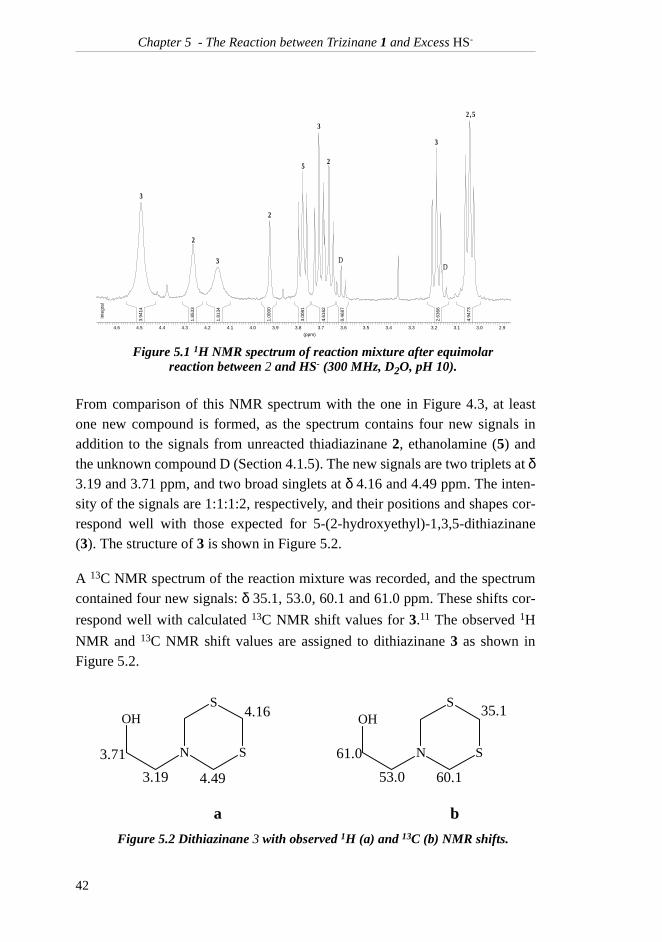
reacted with one equivalent of NaHS at pH 10 and room temperature. The 1HNMR spectra of the reaction mixture were recorded after 21 hours and againafter two days. The latter spectrum is given in Figure 5.1.
41
Chapter 5 - The Reaction between Trizinane 1 and Excess HS-
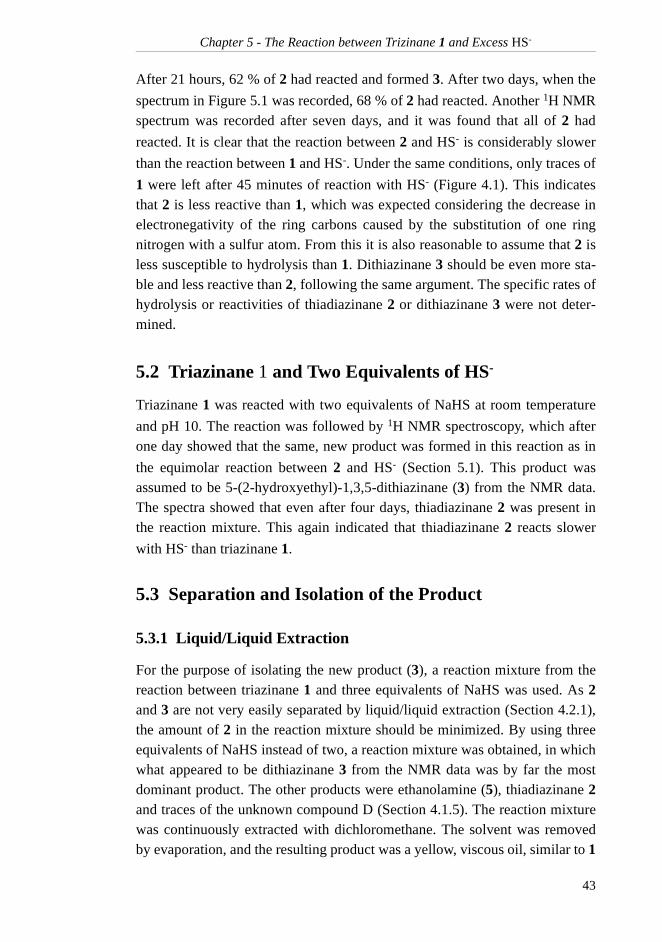
From comparison of this NMR spectrum with the one in Figure 4.3, at leastone new compound is formed, as the spectrum contains four new signals inaddition to the signals from unreacted thiadiazinane 2, ethanolamine (5) andthe unknown compound D (Section 4.1.5). The new signals are two triplets at δ3.19 and 3.71 ppm, and two broad singlets at δ 4.16 and 4.49 ppm. The inten-sity of the signals are 1:1:1:2, respectively, and their positions and shapes cor-respond well with those expected for 5-(2-hydroxyethyl)-1,3,5-dithiazinane(3). The structure of 3 is shown in Figure 5.2.
A 13C NMR spectrum of the reaction mixture was recorded, and the spectrumcontained four new signals: δ 35.1, 53.0, 60.1 and 61.0 ppm. These shifts cor-
respond well with calculated 13C NMR shift values for 3.11 The observed 1H
NMR and 13C NMR shift values are assigned to dithiazinane 3 as shown inFigure 5.2.
Figure 5.1 1H NMR spectrum of reaction mixture after equimolar reaction between 2 and HS- (300 MHz, D2O, pH 10).
Figure 5.2 Dithiazinane 3 with observed 1H (a) and 13C (b) NMR shifts.
3.94
14
1.85
33
1.81
34
1.00
00
3.00
81
4.61
62
0.46
87
2.63
66
4.94
73
Inte
gral
(ppm)
2.93.03.13.23.33.43.53.63.73.83.94.04.14.24.34.44.54.6
2 ,5
2
2
2
3
3
3
3
5
DD
a
53.0
61.0
60.1
35.1
b
S
S
N
OH
3.19
3.71
4.49
4.16
S
S
N
OH
42
Chapter 5 - The Reaction between Trizinane 1 and Excess HS-
After 21 hours, 62 % of 2 had reacted and formed 3. After two days, when the
spectrum in Figure 5.1 was recorded, 68 % of 2 had reacted. Another 1H NMRspectrum was recorded after seven days, and it was found that all of 2 had
reacted. It is clear that the reaction between 2 and HS- is considerably slower
than the reaction between 1 and HS-. Under the same conditions, only traces of
1 were left after 45 minutes of reaction with HS- (Figure 4.1). This indicatesthat 2 is less reactive than 1, which was expected considering the decrease inelectronegativity of the ring carbons caused by the substitution of one ringnitrogen with a sulfur atom. From this it is also reasonable to assume that 2 isless susceptible to hydrolysis than 1. Dithiazinane 3 should be even more sta-ble and less reactive than 2, following the same argument. The specific rates ofhydrolysis or reactivities of thiadiazinane 2 or dithiazinane 3 were not deter-mined.
5.2 Triazinane 1 and Two Equivalents of HS-
Triazinane 1 was reacted with two equivalents of NaHS at room temperature
and pH 10. The reaction was followed by 1H NMR spectroscopy, which afterone day showed that the same, new product was formed in this reaction as in
the equimolar reaction between 2 and HS- (Section 5.1). This product wasassumed to be 5-(2-hydroxyethyl)-1,3,5-dithiazinane (3) from the NMR data.The spectra showed that even after four days, thiadiazinane 2 was present inthe reaction mixture. This again indicated that thiadiazinane 2 reacts slower
with HS- than triazinane 1.
5.3 Separation and Isolation of the Product
5.3.1 Liquid/Liquid Extraction
For the purpose of isolating the new product (3), a reaction mixture from thereaction between triazinane 1 and three equivalents of NaHS was used. As 2and 3 are not very easily separated by liquid/liquid extraction (Section 4.2.1),the amount of 2 in the reaction mixture should be minimized. By using threeequivalents of NaHS instead of two, a reaction mixture was obtained, in whichwhat appeared to be dithiazinane 3 from the NMR data was by far the mostdominant product. The other products were ethanolamine (5), thiadiazinane 2and traces of the unknown compound D (Section 4.1.5). The reaction mixturewas continuously extracted with dichloromethane. The solvent was removedby evaporation, and the resulting product was a yellow, viscous oil, similar to 1
43
Chapter 5 - The Reaction between Trizinane 1 and Excess HS-
and 2 in physical appearance. A 1H NMR spectrum in CDCl3 showed that the
obtained purity of 3 was 98 %, the only contaminant being dichloromethane.
5.3.2 Gas Chromatography
Isolated dithiazinane 3 was analysed by GC system number 2 (see Section9.1.2). The result was a broad peak at 20.1 minutes in the chromatogram.Hence, 3 is the only compound that can be analysed by GC. However, as theother components of the reaction mixtures cannot be properly analysed by GC,this technique was not used to follow the reactions.
5.3.3 Short Path Distillation
As can be seen from Section 4.2.1, thiadiazinane 2 and dithiazinane 3 can beeasily separated from the rest of the reaction mixture by water/dichlorometh-ane extraction. However, if both compounds are present, separating them fromeach other by this method is slightly more difficult, as seen in Section 4.2.1.Short path distillation was attempted as another method of separating the twoproducts from each other. A mixture of 2 and 3, containing small amounts of 1and 5, was heated in the distillation apparatus. As the temperature was raised,the mixture gradually turned brown due to the decomposition of one or more ofthe components. No boiling was observed in the mixture at temperatures up to
200°C at 1.8×10⁻⁴ atm. A 1H NMR spectrum was recorded after the attempteddistillation, and apparently, most of the dithiazinane 3 was still intact. The sig-nals from triazinane 1 and thiadiazinane 2 were barely visible in the spectrumand had decomposed. The relative amount of ethanolamine (5) had increased,indicating that 5 was one of the products of the decomposition. Some other,new products were also formed in small amounts during the experiment.
It was concluded that short path distillation was not a successful method for thepurification of 2 and 3.
5.4 Analysis of Dithiazinane 3
5.4.1 Mass Analysis
The isolation of the new product, assumed to be 5-(2-hydroxyethyl)-1,3,5-dithiazinane (3) from NMR data, made it possible to perform an elemental
44
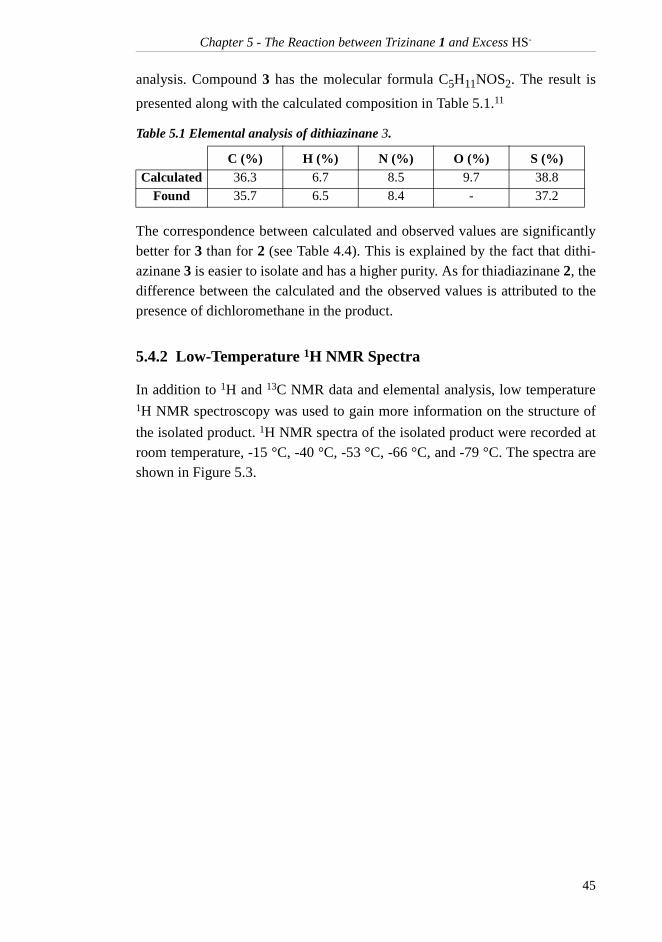
Chapter 5 - The Reaction between Trizinane 1 and Excess HS-
analysis. Compound 3 has the molecular formula C5H11NOS2. The result is
presented along with the calculated composition in Table 5.1.11
The correspondence between calculated and observed values are significantlybetter for 3 than for 2 (see Table 4.4). This is explained by the fact that dithi-azinane 3 is easier to isolate and has a higher purity. As for thiadiazinane 2, thedifference between the calculated and the observed values is attributed to thepresence of dichloromethane in the product.
5.4.2 Low-Temperature 1H NMR Spectra
In addition to 1H and 13C NMR data and elemental analysis, low temperature1H NMR spectroscopy was used to gain more information on the structure of
the isolated product. 1H NMR spectra of the isolated product were recorded atroom temperature, -15 °C, -40 °C, -53 °C, -66 °C, and -79 °C. The spectra areshown in Figure 5.3.
Table 5.1 Elemental analysis of dithiazinane 3.
C (%) H (%) N (%) O (%) S (%)Calculated 36.3 6.7 8.5 9.7 38.8
Found 35.7 6.5 8.4 - 37.2
45
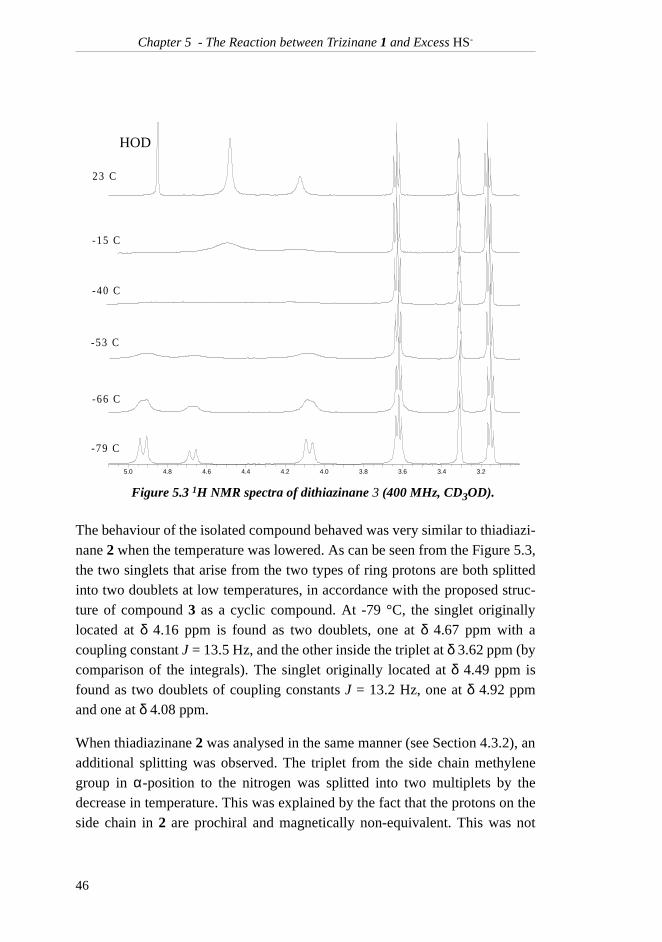
Chapter 5 - The Reaction between Trizinane 1 and Excess HS-
The behaviour of the isolated compound behaved was very similar to thiadiazi-nane 2 when the temperature was lowered. As can be seen from the Figure 5.3,the two singlets that arise from the two types of ring protons are both splittedinto two doublets at low temperatures, in accordance with the proposed struc-ture of compound 3 as a cyclic compound. At -79 °C, the singlet originallylocated at δ 4.16 ppm is found as two doublets, one at δ 4.67 ppm with acoupling constant J = 13.5 Hz, and the other inside the triplet at δ 3.62 ppm (bycomparison of the integrals). The singlet originally located at δ 4.49 ppm isfound as two doublets of coupling constants J = 13.2 Hz, one at δ 4.92 ppmand one at δ 4.08 ppm.
When thiadiazinane 2 was analysed in the same manner (see Section 4.3.2), anadditional splitting was observed. The triplet from the side chain methylenegroup in α-position to the nitrogen was splitted into two multiplets by thedecrease in temperature. This was explained by the fact that the protons on theside chain in 2 are prochiral and magnetically non-equivalent. This was not
Figure 5.3 1H NMR spectra of dithiazinane 3 (400 MHz, CD3OD).( )
3.23.43.63.84.04.24.44.64.85.0
2 3 C
-15 C
-40 C
-53 C
-66 C
-79 C
HOD
46
Chapter 5 - The Reaction between Trizinane 1 and Excess HS-
observed for 3, which can be explained by the symmetry of the achiral dithiazi-nane molecule.
In conclusion, the low temperature 1H NMR analyses strongly support theassignment of structure 3 as the isolated product.
5.4.3 IR Spectroscopy
Compound 3 was also analysed by IR spectroscopy. The characteristic absorp-
tions are assigned as follows:14 A strong O-H stretch absorption (3394 cm-1)
and a strong C-O stretch absorption (1059 cm-1) were found in the spectrum,indicating that the isolated compound is an alcohol. A weak C-N stretch
absorption (1195 cm-1) showed that the compound also contains an amine moi-
ety. Finally, a C-S stretch absorption (689 cm-1) indicated the presence of a sul-
fur moiety. The C-H absorptions were found at 2915 cm-1 (stretch), 1429 cm-1
(scissors) and 728 cm-1 (rock).
In conclusion, the results from the IR analysis support that dithiazinane 3 is theisolated product.
5.5 Triazinane 1 and Large Excess of HS-
The formation of thiadiazinane 2 from triazinane 1 and dithiazinane 3 fromthiadiazinane 2 indicate that 1,3,5-trithiane (4) might be formed from
dithiazinane 3 if enough HS- is added. It was desirable to find out if 4 reallycan be formed during H2S removal, mainly because 4 is likely to precipitate in
water and cause problems in the pipelines.
5.5.1 Triazinane 1 and Three Equivalents of HS-
Triazinane 1 was reacted with three equivalents of NaHS. After one week, onlytraces of the compounds 1 and 2 were found, and 3 and 5 were the mainproducts of the reaction, in addition to small amounts of the unknown com-pound D from Section 4.1.5. No solids was formed.
5.5.2 Triazinane 1 and Five Equivalents of HS-
The reaction between 1 and five equivalents of NaHS was performed, and the
reaction followed by 1H NMR. Again, no new products were observed in thespectrum, which after 2.5 hours contained thiadiazine 2, dithiazinane 3 and
47
Chapter 5 - The Reaction between Trizinane 1 and Excess HS-
ethanolamine (5). However, after seven weeks, small amounts of a white solid
had precipitated from the reaction mixture. A 1H NMR analysis showed onlythe signals from 3, 5 and the unknown compound D. The solid was insoluble inall the tried solvents (water, methanol, dichloromethane, DMSO and hexane),
so a acceptable 1H NMR spectrum of the compound(s) could not be obtained.IR analysis of the solid was not successful. The solid was put into an openflame, but the absence of the characteristic smell of SO2 indicated that the
white powder did not contain sulfur. The trithiane (4) is commercially availa-ble, and NMR analyses and melting point of the commercial compound aregiven in Appendix A. The white solid did not have a distinct melting point like4. A part of the solid apparently sublimed at 110 °C, and the rest graduallyturned brown as the temperature was raised, indicating that decompositiontook place.
In conclusion, the white solid formed in the reaction between 1 and five equiv-
alents of HS- was neither elemental sulfur nor 1,3,5-trithiane (4). The insolu-bility and the behaviour of the solid in the melting point apparatus indicatedthat the solid consisted of more than one polymer. The fact that the solid wasnot formed when 3 was mixed with excess Na2S (Section 5.5.3) may be due to
the lack of formaldehyde in this solution. As mentioned in Section 9.2, the syn-thesized 1 contains both water, ethanolamine (5) and formaldehyde. Formalde-hyde can react with sulfides to form (-CH2-S-)n type polymers, and sulfur-
containing polymers cannot be excluded as products based only on the SO2-
test.
5.5.3 Dithiazinane 3 and Four Equivalents of HS-
In order to see if new products were formed, dithiazinane 3 was reacted withtwo equivalents of Na2S in an aqueous buffer-solution of pH 8.0, containing an
internal standard. 1H NMR spectra after 1 hour and 20 hours showed that thesolution contained 3 only. Adjusting the pH to 6.0 for three hours, and to 2.0for another 24 hours with the addition of another two equivalents of Na2S
made no change in the reaction mixture. All of 3 was still intact, an no solidwas formed.
From these results, it was evident that dithiazinane 3 is a very stable com-pound. It does not react with Na2S, nor does it hydrolyse at pH levels down to
2.0.
48
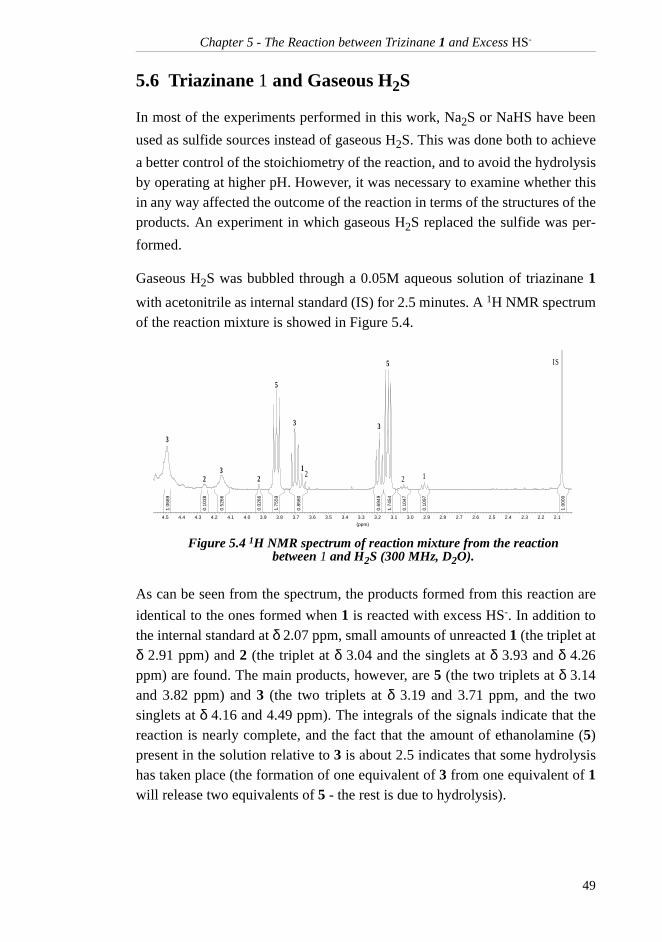
Chapter 5 - The Reaction between Trizinane 1 and Excess HS-
5.6 Triazinane 1 and Gaseous H2S
In most of the experiments performed in this work, Na2S or NaHS have been
used as sulfide sources instead of gaseous H2S. This was done both to achieve
a better control of the stoichiometry of the reaction, and to avoid the hydrolysisby operating at higher pH. However, it was necessary to examine whether thisin any way affected the outcome of the reaction in terms of the structures of theproducts. An experiment in which gaseous H2S replaced the sulfide was per-
formed.
Gaseous H2S was bubbled through a 0.05M aqueous solution of triazinane 1
with acetonitrile as internal standard (IS) for 2.5 minutes. A 1H NMR spectrumof the reaction mixture is showed in Figure 5.4.
As can be seen from the spectrum, the products formed from this reaction are
identical to the ones formed when 1 is reacted with excess HS-. In addition tothe internal standard at δ 2.07 ppm, small amounts of unreacted 1 (the triplet atδ 2.91 ppm) and 2 (the triplet at δ 3.04 and the singlets at δ 3.93 and δ 4.26ppm) are found. The main products, however, are 5 (the two triplets at δ 3.14and 3.82 ppm) and 3 (the two triplets at δ 3.19 and 3.71 ppm, and the twosinglets at δ 4.16 and 4.49 ppm). The integrals of the signals indicate that thereaction is nearly complete, and the fact that the amount of ethanolamine (5)present in the solution relative to 3 is about 2.5 indicates that some hydrolysishas taken place (the formation of one equivalent of 3 from one equivalent of 1will release two equivalents of 5 - the rest is due to hydrolysis).
Figure 5.4 1H NMR spectrum of reaction mixture from the reaction between 1 and H2S (300 MHz, D2O).
1.06
89
0.10
38
0.52
66
0.02
66
1.75
59
0.85
80
0.69
49
1.74
54
0.10
47
0.10
97
1.00
00
(ppm)
2.12.22.32.42.52.62.72.82.93.03.13.23.33.43.53.63.73.83.94.04.14.24.34.44.5
IS
5
22
3
3
33
5
12 12
49
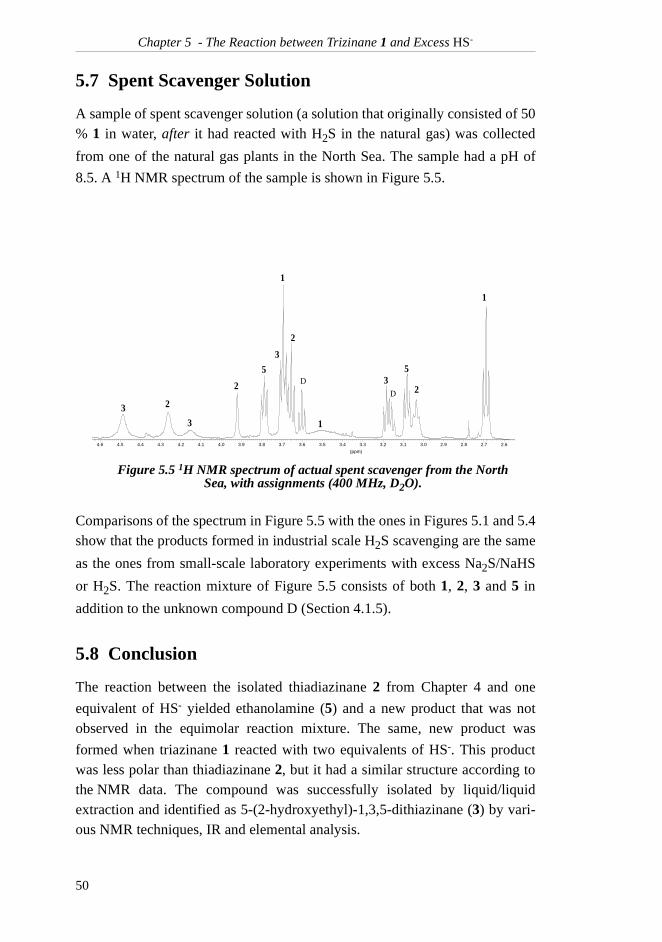
Chapter 5 - The Reaction between Trizinane 1 and Excess HS-
5.7 Spent Scavenger Solution
A sample of spent scavenger solution (a solution that originally consisted of 50% 1 in water, after it had reacted with H2S in the natural gas) was collected
from one of the natural gas plants in the North Sea. The sample had a pH of
8.5. A 1H NMR spectrum of the sample is shown in Figure 5.5.
Comparisons of the spectrum in Figure 5.5 with the ones in Figures 5.1 and 5.4show that the products formed in industrial scale H2S scavenging are the same
as the ones from small-scale laboratory experiments with excess Na2S/NaHS
or H2S. The reaction mixture of Figure 5.5 consists of both 1, 2, 3 and 5 in
addition to the unknown compound D (Section 4.1.5).
5.8 Conclusion
The reaction between the isolated thiadiazinane 2 from Chapter 4 and one
equivalent of HS- yielded ethanolamine (5) and a new product that was notobserved in the equimolar reaction mixture. The same, new product was
formed when triazinane 1 reacted with two equivalents of HS-. This productwas less polar than thiadiazinane 2, but it had a similar structure according tothe NMR data. The compound was successfully isolated by liquid/liquidextraction and identified as 5-(2-hydroxyethyl)-1,3,5-dithiazinane (3) by vari-ous NMR techniques, IR and elemental analysis.
Figure 5.5 1H NMR spectrum of actual spent scavenger from the North Sea, with assignments (400 MHz, D2O).
(ppm)
2.62.72.82.93.03.13.23.33.43.53.63.73.83.94.04.14.24.34.44.54.6
1
1
2
2 2
2
3
3
3
3
5 5
1
D
D
50
Chapter 5 - The Reaction between Trizinane 1 and Excess HS-
Dithiazinane 3 is presumably formed from thiadiazinane 2 via the same mech-anism that was proposed for the formation of 2 from triazinane 1, shown inScheme 4.4.
Upon addition of five equivalents of NaHS to 1, no 1,3,5-trithiane (4) wasformed, but the formation of 3 was complete. However, precipitation of asmall amount of a white solid was observed. Analysis of the solid showed thatit was not 1,3,5-trithiane (4). It was believed that the solid consisted of one ormore polymers of the type (-CH2-S-)n.
Addition of two and four equivalents of NaHS to the isolated dithiazinane 3
gave no new products from 1H NMR, and no formation of solids, even whenthe pH was lowered to 2.0. From this observation and the results of theattempted short path distillation of the products, it was concluded thatdithiazinane 3 was significantly more stable and less reactive than thiadiazi-nane 2 and triazinane 1. From the NMR results, it was also concluded that thi-adiazinane 2 is less reactive than triazinane 1, as most of 1 is converted intothiadiazinane 2 before any observable amount of dithiazinane 3 is formed.
When triazinane 1 was reacted with excess gaseous H2S, the products formed
were identical to the ones formed upon reaction between 1 and excess Na2S or
NaHS.
A 1H NMR analysis of a solution of 1 after it had been used to remove H2S
from a natural gas stream in the North Sea showed that the same products areformed in industrial scale H2S scavenging as in the laboratory experiments
performed in this work.
Altogether, the structures of the reaction products from the removal of H2S in
the North Sea by triazinane 1 are considered to be firmly established. Depend-ing on the relative concentrations of 1 and H2S in the solution or gas stream,
thiadiazinane 2, dithiazinane 3 and ethanolamine (5) are formed in various rel-ative amounts. The results are summarized in Scheme 5.1.
51
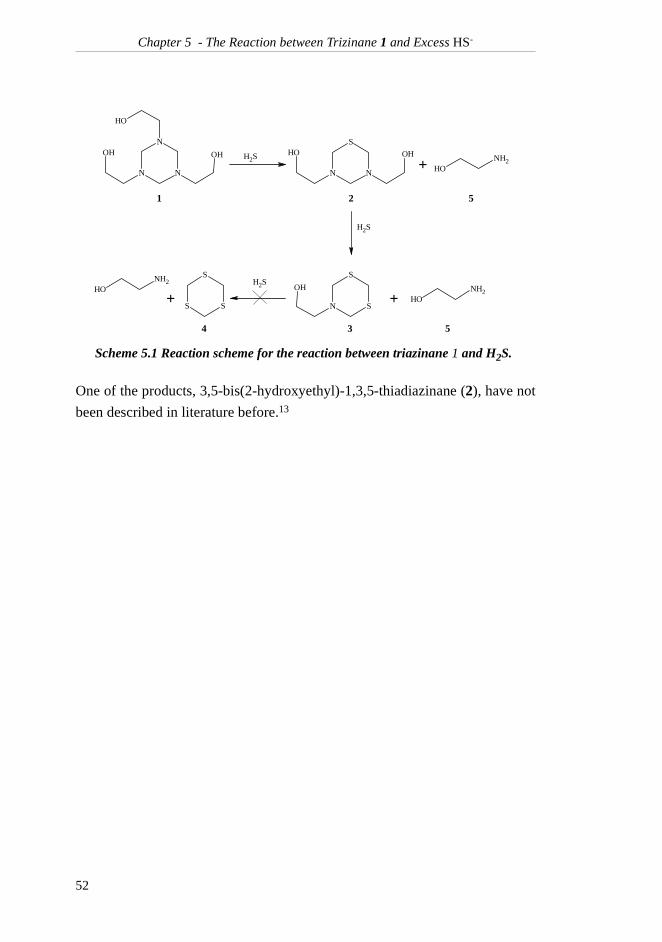
Chapter 5 - The Reaction between Trizinane 1 and Excess HS-
One of the products, 3,5-bis(2-hydroxyethyl)-1,3,5-thiadiazinane (2), have not
been described in literature before.13
Scheme 5.1 Reaction scheme for the reaction between triazinane 1 and H2S.
+
++
1
5
N
N
N
OH
OH OH
N
S
N
OH OH
SN
S
OH
S
S
S
OHNH2
OHNH2OH
NH2
SH2
SH2
SH2
4 3
2 5
52
- Part II -
Determination of the Efficiency of Triazinane 1 in H2S Removal
In the preceding chapters, the hydrolysis of triazinane 1 was investigated, bothin terms of hydrolysis products and the rate of the hydrolysis. The qualitativeaspect of the reaction between 1 and H2S have been investigated thoroughly,
and the main reaction products have been identified. A good understanding ofwhat happens when 1 and H2S react was achieved, and investigations of the
reactivity of triazinane 1 as an H2S scavenger could begin.
The overall chemical efficiency of 1 in H2S removal depends on both the reac-
tivity of 1 towards H2S and its reactivity in competing reactions. In part I it
was concluded that the hydrolysis of 1 was the only competing reaction of sig-nificance. Hence, to get a clear picture of the overall efficiency of triazinane 1in H2S removal, both the rate of hydrolysis of 1 and the rate of the reaction
between 1 and H2S had to be determined. The rate of hydrolysis was investi-
gated and determined in Section 3.2. In Chapter 6, a method for determiningthe rate of reaction between triazinane 1 and H2S is developed, and the reac-
tion kinetics will be established.
53

54
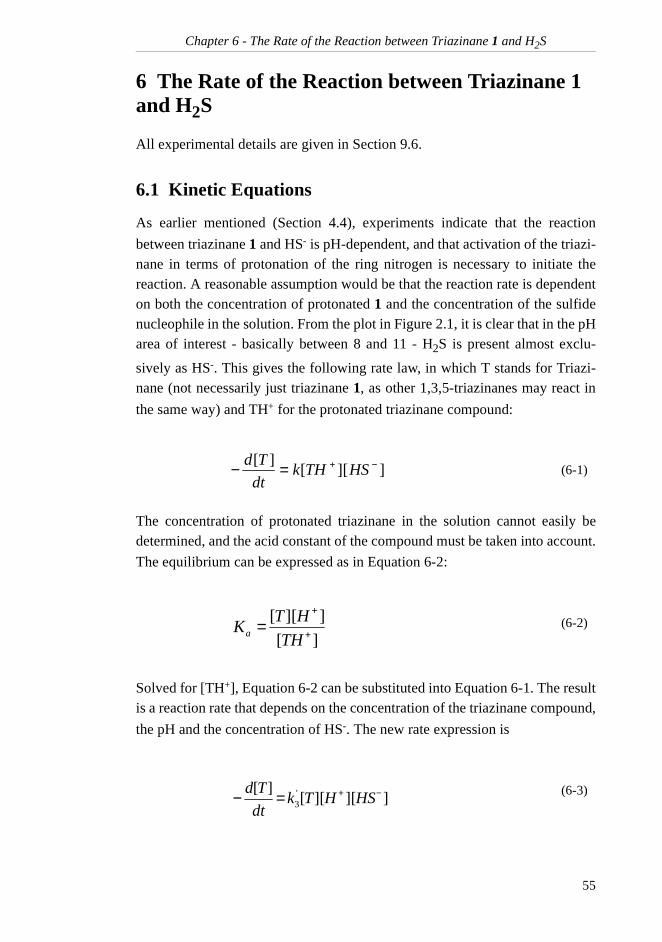
Chapter 6 - The Rate of the Reaction between Triazinane 1 and H2S
6 The Rate of the Reaction between Triazinane 1 and H2S
All experimental details are given in Section 9.6.
6.1 Kinetic Equations
As earlier mentioned (Section 4.4), experiments indicate that the reaction
between triazinane 1 and HS- is pH-dependent, and that activation of the triazi-nane in terms of protonation of the ring nitrogen is necessary to initiate thereaction. A reasonable assumption would be that the reaction rate is dependenton both the concentration of protonated 1 and the concentration of the sulfidenucleophile in the solution. From the plot in Figure 2.1, it is clear that in the pHarea of interest - basically between 8 and 11 - H2S is present almost exclu-
sively as HS-. This gives the following rate law, in which T stands for Triazi-nane (not necessarily just triazinane 1, as other 1,3,5-triazinanes may react in
the same way) and TH+ for the protonated triazinane compound:
The concentration of protonated triazinane in the solution cannot easily bedetermined, and the acid constant of the compound must be taken into account.
The equilibrium can be expressed as in Equation 6-2:
Solved for [TH+], Equation 6-2 can be substituted into Equation 6-1. The resultis a reaction rate that depends on the concentration of the triazinane compound,
the pH and the concentration of HS-. The new rate expression is
(6-1)
(6-2)
(6-3)
]][[][ −+=− HSTHk
dt
Td
][
]][[+
+
=TH
HTKa
]][][[][ '
3−+=− HSHTk
dt
Td
55
Chapter 6 - The Rate of the Reaction between Triazinane 1 and H2S
in which the new, apparent third order rate constant k3’ is
Following all three concentrations of Equation 6-3 would require a very exten-sive analysis, so in order to determine the rate constant, simplifications must bemade. If the reaction is run at constant pH, the concentration of protons is con-
stant, and the new rate expression becomes
where
The reaction rate now depends on the concentrations of both the triazinane andthe sulfide nucleophile. To further simplify the expression, one of the concen-trations must be kept constant. This can be achieved by running the reactionwith large excess of one of the reactants. In this way, the reaction will causeonly a negligible change in concentration of this reactant, and another constantis formed in the rate expression.
It had to be decided which of the concentrations should be followed during thereaction, and which should be used in large excess. For reasons described inthe next sections, the concentration of the triazinane was chosen as the one to
follow, and a large excess of HS- was used. In doing so, the reaction becomes a
pseudo first order reaction, and the rate expression becomes
(6-4)
(6-5)
(6-6)
(6-7)
1'3
−⋅= aKkk
]][[][ '
2−=− HSTk
dt
Td
]['3'2
+= Hkk
][][ '
1 Tkdt
Td =−
56
Chapter 6 - The Rate of the Reaction between Triazinane 1 and H2S
where
Integration of Equation 6-7 and insertion of the limiting condition that [T] =
[T]0 when t = 0 give
In other words, a plot of the left side of Equation 6-9 against time should pro-
duce a straight line with a slope equal to k1’ if the original rate law and its mod-
ifications are all valid.
6.2 Method for Determination of Sulfide
In Equation 6-5, it had to be decided which concentration to follow. The con-centration of sulfide would be a good choice for two reasons: The determina-tion of the reaction kinetics would be independent of the type of scavengerinvestigated, and the preferred tool for following the concentration of sulfide -a sulfide-sensitive electrode - is more applicable for fast reactions.
The sulfide-sensitive electrode used in this experiment is only sensitive
towards S2--ions. HS--ions and H2S are not detected. However, at a constant
pH, the relative ratio between these species is constant, and the rate of reaction
can be followed by measuring the concentration of S2-. When using the elec-trode, a calibration curve must be made, in which an exponential relationship is
found between [S2-] and the voltage registered by the electrode. The concentra-
tions of the S2--standards were determined either by iodometric titration16 or by
titration with Pb2+ and the electrode17.
6.2.1 The First Attempt
Initially, the reaction between a large excess (ten equivalents) of 1 relative toNa2S was followed by taking out samples and analysing them with the elec-
trode. The analysis was performed by first diluting the sample with specific
(6-8)
(6-9)
]['2'1
−= HSkk
tkT
T '1
0
][
][ln =
57
Chapter 6 - The Rate of the Reaction between Triazinane 1 and H2S
amounts of water and a buffered electrode stabilising solution17 that raised thepH of the sample to 14. According to the producers of the electrode, all the sul-
fur in the solution is found exclusively as S2- at this pH.17 From Figure 2.1, thisseems to be an erroneous assumption. Then, the voltage was recorded severaltimes for each sample, and the voltage at the time of the dilution was found by
extrapolation. The voltage was converted to [S2-] by the relationship from the
calibration curve. In this way, the concentration of S2- in the solution was fol-
lowed, and a plot of ln([S2-]0/[S2-]) against time gave a straight line with a
slope equal to the observed first order rate constant, k1’ = 8.7×10⁻³ s-1. The
experiment was reproduced, and the observed first order rate constant, k1’ =
1.3×10⁻² s-1.
With this procedure the uncertainties in the measurements were high, andmeasurements could not be performed as often as desired. Also, literature onthe subject indicates that the reaction between 1 and H2S was reversed at high
pH levels,8 making the use of the buffered electrode stabilising solution un-favourable.
In the two experiments performed, the pH decreased with half a unit as thereaction proceeded. Obviously, this seriously questions the reliability of thereadings. However, as the pH in the two solutions decreased with the samerate, the pH in the two experiments were equal at all times, and the resultscould be compared. The variance of 44 % in the obtained value for k1’ showed
that the reproducibility of this experiment was very poor. Another procedurehad to be used.
6.2.2 The Second Attempt
Because of the poor reproducibility obtained in Section 6.2.1, it would behighly beneficial to record the sulfide concentration with the electrode directlyin the reaction mixture. In this manner, many sources of error would be elimi-nated, e.g. the error in the volumes taken from the solution and the time thatpassed from the sample was taken out until the measurement was finished. The
buffered stabilizing solution was not used, as the reaction between 1 and HS-
would not occur in a solution of pH 14. This procedure enabled measuring thesulfide concentration as often as desired. The reaction had to be run at constant
pH in order to keep the ratio between [S2-] and [HS-] constant at all times.
Hence, following [S2-] would give a clear picture of the overall reaction kinet-ics. The reactions were still run in large excess of triazinane 1. The sulfide con-
58
Chapter 6 - The Rate of the Reaction between Triazinane 1 and H2S
centration was determined as the reaction proceeded, and plots were madeassuming that the reaction was a pseudo first order reaction with respect to thesulfide concentration.
Straight lines were obtained, and the observed first order rate constant was
found to be k1’ = 1.6×10⁻² s-1. The experiment was reproduced, giving a rate
constant k1’ = 1.6×10⁻² s-1. Obviously, the reproducibility was improved when
the electrode could be kept in the reaction mixture. However, without thestabilizing solution, the electrode might be more sensitive to small changes inthe reaction procedure. A third experiment was performed, in which Na2S sub-
stituted NaHS, which had been used in the previous two experiments as the
sulfide source. This time, the found rate constant was k1’ = 2.5×10⁻² s-1. Some
investigations were made in order to find the sources of error in these experi-ments, and they are presented in the next two sections.
6.2.3 The Calibration of the Electrode
During the work presented in the previous two sections, the electrode was
calibrated several times. This was done by making standard solutions of S2- inthe same solvents and at the same pH as in the reaction that was to be analysed.
The concentrations of the standards were verified by titration with I218 or with
Pb2+ and the electrode17. The standards were diluted in the same way as thesamples in the experiments, and their voltage was recorded. From this, acalibration curve was made by plotting voltage (on a linear scale) against con-centration (on a logarithmic scale), generating a straight line. The recordedvoltages from the experiments were converted to sulfide concentrations usingthe calibration curve. However, initial sulfide concentration in the experimentsoften exceeded the expected value by more than 50 %. Iodometric titrations ofsome of the samples gave concentrations that were close to the expected values(see Section 6.2.4). Apparently, good calibration curves for the electrode werevery difficult to obtain, and the reliability of the electrode had to be tested.
6.2.4 Reproducibility Tests of Sulfide Electrode
Based on the poor reproducibility of the previous experiments, it was desirable
to see if a solution of S2- in water would give stable readings over time. An
aqueous solution of S2- was analysed with the electrode directly in the solution,and the pH was held constant. No buffered stabilizing solution was used. Thesulfide concentration decreased with time, and after 40 minutes at pH 10.0,
59
Chapter 6 - The Rate of the Reaction between Triazinane 1 and H2S
only half of the original amount of sulfide was left. At this pH, the amount ofH2S present in the solution was very small (see Figure 2.1), so the loss of
sulfide as gaseous H2S did not account for the large reduction in sulfide con-
centration with time. During the experiment, five iodometric titrations showedthat the sulfide concentration was fairly constant. It was suspected that theelectrode itself was inaccurate or inapplicable for these measurements.
The reproducibility of the electrode was tested by making three solutions, inwhich identical amounts of Na2S were dissolved in identical volumes of the
same buffer of pH 10.0. This should give three solutions with identical sulfideconcentration. The three solutions were all analysed immediately after prepa-ration. The deviation in the recorded voltages was up to 4.9 mV. As a rule ofthumb, an increase in the voltage of 30 mV gives a ten-fold increase in concen-
tration.17 Hence, an increase of 5 mV corresponds to a 50 % increase in con-centration. Iodometric titration of the three samples showed that the solutionshad sulfide concentrations of 0.047, 0.047 and 0.048 M, respectively. Threedays later, a new solution was made with the same concentration. The recordedvoltage was up to 13.6 mV higher than the in other solutions. This correspondsto an increase of 100-200 % in concentration. Again, from iodometric titration,the solution had a sulfide concentration of 0.047 M. This illustrates not onlythe necessity to calibrate the electrode every day; the variations within therecordings done one a single day are also too large to comply with the need fora reliable and accurate determination of the sulfide concentration.
The unreliability of the measurements performed with the sulfide-sensitiveelectrode can be explained by the reactions being run mainly at pH 10.0. From
Figure 2.1 it is clear that at this pH, the amount of S2- is negligibly small com-
pared to the amount of HS-, which is the dominant species in the solution.
Hence, the electrode is measuring very small concentrations of S2- and theerror of the method may become significant. Another possibility is that the per-formance of the electrode is somehow influenced by one or more of the othercomponents in the mixture.
Because of the large uncertainty of the method in these experiments, it wasconcluded that the sulfide-sensitive electrode could not be used to examine the
reaction kinetics of the reaction between triazinanes and HS-.
60
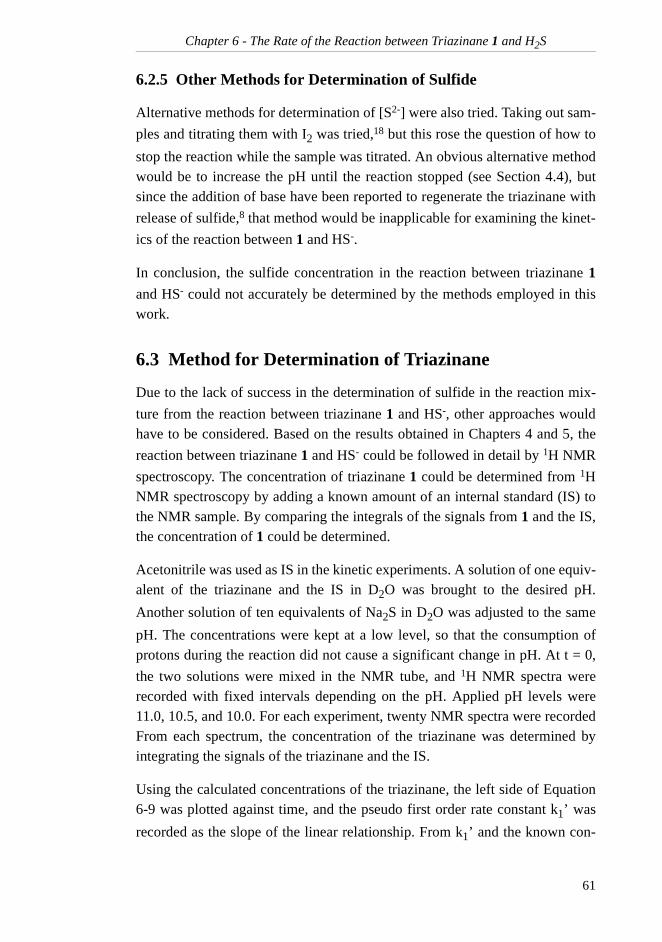
Chapter 6 - The Rate of the Reaction between Triazinane 1 and H2S
6.2.5 Other Methods for Determination of Sulfide
Alternative methods for determination of [S2-] were also tried. Taking out sam-
ples and titrating them with I2 was tried,18 but this rose the question of how to
stop the reaction while the sample was titrated. An obvious alternative methodwould be to increase the pH until the reaction stopped (see Section 4.4), butsince the addition of base have been reported to regenerate the triazinane with
release of sulfide,8 that method would be inapplicable for examining the kinet-
ics of the reaction between 1 and HS-.
In conclusion, the sulfide concentration in the reaction between triazinane 1
and HS- could not accurately be determined by the methods employed in thiswork.
6.3 Method for Determination of Triazinane
Due to the lack of success in the determination of sulfide in the reaction mix-
ture from the reaction between triazinane 1 and HS-, other approaches wouldhave to be considered. Based on the results obtained in Chapters 4 and 5, the
reaction between triazinane 1 and HS- could be followed in detail by 1H NMR
spectroscopy. The concentration of triazinane 1 could be determined from 1HNMR spectroscopy by adding a known amount of an internal standard (IS) tothe NMR sample. By comparing the integrals of the signals from 1 and the IS,the concentration of 1 could be determined.
Acetonitrile was used as IS in the kinetic experiments. A solution of one equiv-alent of the triazinane and the IS in D2O was brought to the desired pH.
Another solution of ten equivalents of Na2S in D2O was adjusted to the same
pH. The concentrations were kept at a low level, so that the consumption ofprotons during the reaction did not cause a significant change in pH. At t = 0,
the two solutions were mixed in the NMR tube, and 1H NMR spectra wererecorded with fixed intervals depending on the pH. Applied pH levels were11.0, 10.5, and 10.0. For each experiment, twenty NMR spectra were recordedFrom each spectrum, the concentration of the triazinane was determined byintegrating the signals of the triazinane and the IS.
Using the calculated concentrations of the triazinane, the left side of Equation6-9 was plotted against time, and the pseudo first order rate constant k1’ was
recorded as the slope of the linear relationship. From k1’ and the known con-
61
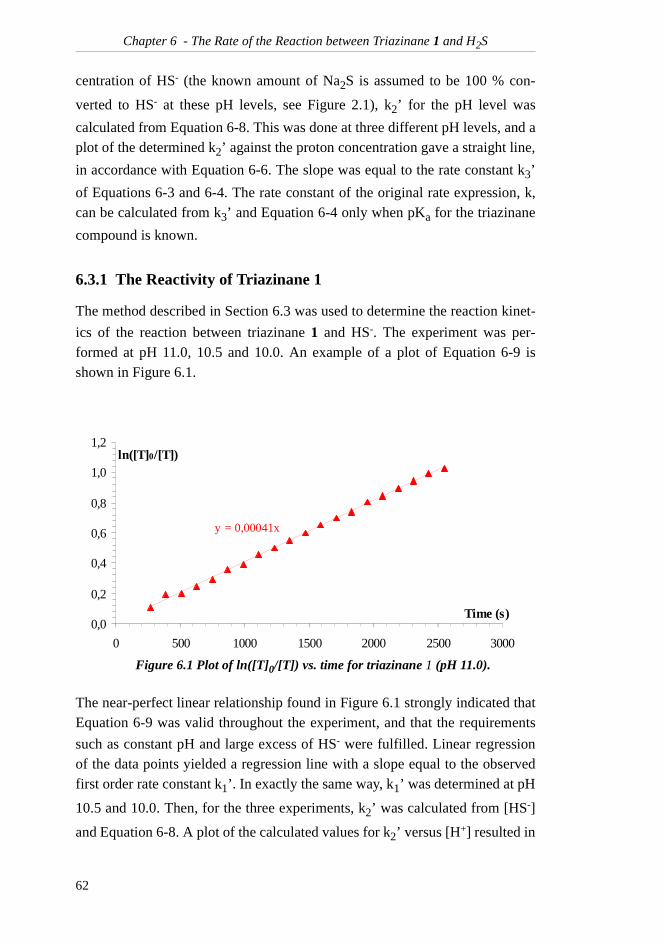
Chapter 6 - The Rate of the Reaction between Triazinane 1 and H2S
centration of HS- (the known amount of Na2S is assumed to be 100 % con-
verted to HS- at these pH levels, see Figure 2.1), k2’ for the pH level was
calculated from Equation 6-8. This was done at three different pH levels, and aplot of the determined k2’ against the proton concentration gave a straight line,
in accordance with Equation 6-6. The slope was equal to the rate constant k3’
of Equations 6-3 and 6-4. The rate constant of the original rate expression, k,can be calculated from k3’ and Equation 6-4 only when pKa for the triazinane
compound is known.
6.3.1 The Reactivity of Triazinane 1
The method described in Section 6.3 was used to determine the reaction kinet-
ics of the reaction between triazinane 1 and HS-. The experiment was per-formed at pH 11.0, 10.5 and 10.0. An example of a plot of Equation 6-9 isshown in Figure 6.1.
The near-perfect linear relationship found in Figure 6.1 strongly indicated thatEquation 6-9 was valid throughout the experiment, and that the requirements
such as constant pH and large excess of HS- were fulfilled. Linear regressionof the data points yielded a regression line with a slope equal to the observedfirst order rate constant k1’. In exactly the same way, k1’ was determined at pH
10.5 and 10.0. Then, for the three experiments, k2’ was calculated from [HS-]
and Equation 6-8. A plot of the calculated values for k2’ versus [H+] resulted in
Figure 6.1 Plot of ln([T]0/[T]) vs. time for triazinane 1 (pH 11.0).
y = 0,00041x
0,0
0,2
0,4
0,6
0,8
1,0
1,2
0 500 1000 1500 2000 2500 3000
Time (s)
ln([T]0/[T])
62
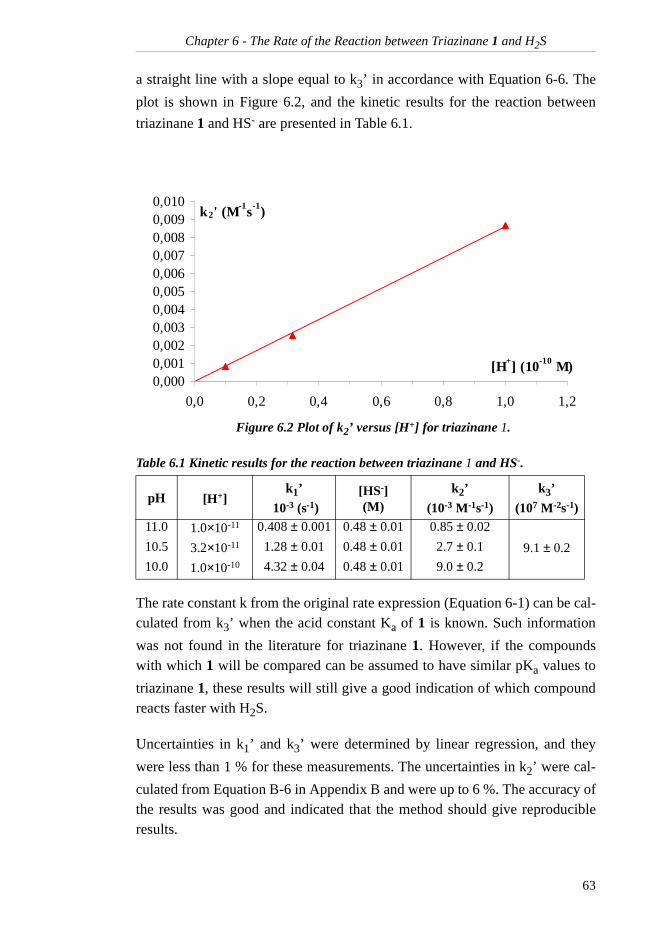
Chapter 6 - The Rate of the Reaction between Triazinane 1 and H2S
a straight line with a slope equal to k3’ in accordance with Equation 6-6. The
plot is shown in Figure 6.2, and the kinetic results for the reaction between
triazinane 1 and HS- are presented in Table 6.1.
The rate constant k from the original rate expression (Equation 6-1) can be cal-culated from k3’ when the acid constant Ka of 1 is known. Such information
was not found in the literature for triazinane 1. However, if the compoundswith which 1 will be compared can be assumed to have similar pKa values to
triazinane 1, these results will still give a good indication of which compoundreacts faster with H2S.
Uncertainties in k1’ and k3’ were determined by linear regression, and they
were less than 1 % for these measurements. The uncertainties in k2’ were cal-
culated from Equation B-6 in Appendix B and were up to 6 %. The accuracy ofthe results was good and indicated that the method should give reproducibleresults.
Figure 6.2 Plot of k2’ versus [H+] for triazinane 1.
Table 6.1 Kinetic results for the reaction between triazinane 1 and HS-.
pH [H+]k1’
10-3 (s-1)[HS-](M)
k2’
(10-3 M-1s-1)
k3’
(107 M-2s-1)11.0 1.0×10⁻¹¹ 0.408 ± 0.001 0.48 ± 0.01 0.85 ± 0.02
9.1 ± 0.210.5 3.2×10⁻¹¹ 1.28 ± 0.01 0.48 ± 0.01 2.7 ± 0.1
10.0 1.0×10⁻¹⁰ 4.32 ± 0.04 0.48 ± 0.01 9.0 ± 0.2
0,0000,0010,0020,0030,0040,0050,0060,0070,0080,0090,010
0,0 0,2 0,4 0,6 0,8 1,0 1,2
[H+] (10-10 M)
k2' (M-1s-1)
63
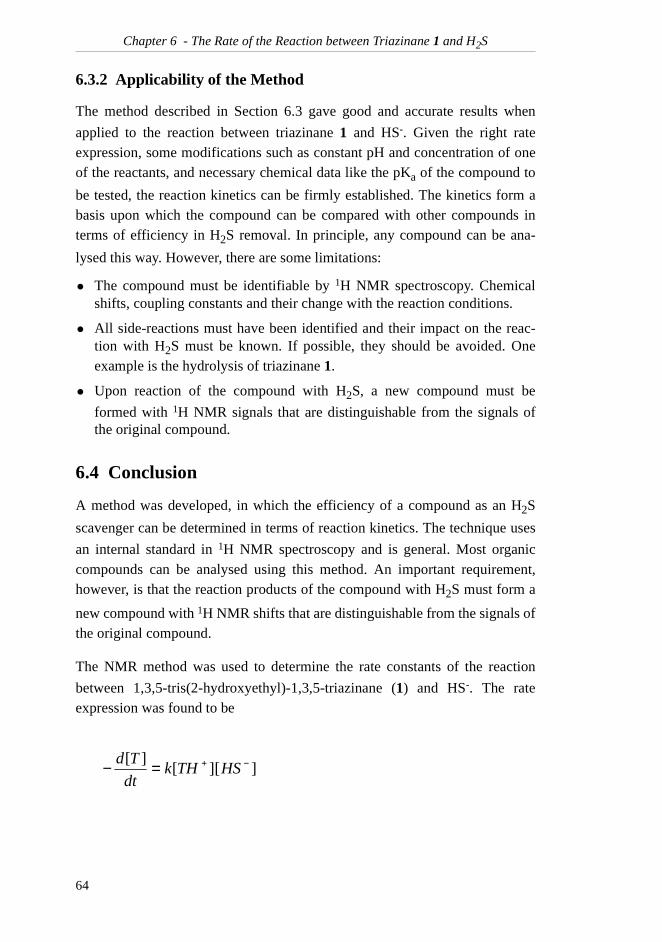
Chapter 6 - The Rate of the Reaction between Triazinane 1 and H2S
6.3.2 Applicability of the Method
The method described in Section 6.3 gave good and accurate results when
applied to the reaction between triazinane 1 and HS-. Given the right rateexpression, some modifications such as constant pH and concentration of oneof the reactants, and necessary chemical data like the pKa of the compound to
be tested, the reaction kinetics can be firmly established. The kinetics form abasis upon which the compound can be compared with other compounds interms of efficiency in H2S removal. In principle, any compound can be ana-
lysed this way. However, there are some limitations:
• The compound must be identifiable by 1H NMR spectroscopy. Chemicalshifts, coupling constants and their change with the reaction conditions.
• All side-reactions must have been identified and their impact on the reac-tion with H2S must be known. If possible, they should be avoided. Oneexample is the hydrolysis of triazinane 1.
• Upon reaction of the compound with H2S, a new compound must be
formed with 1H NMR signals that are distinguishable from the signals ofthe original compound.
6.4 Conclusion
A method was developed, in which the efficiency of a compound as an H2S
scavenger can be determined in terms of reaction kinetics. The technique uses
an internal standard in 1H NMR spectroscopy and is general. Most organiccompounds can be analysed using this method. An important requirement,however, is that the reaction products of the compound with H2S must form a
new compound with 1H NMR shifts that are distinguishable from the signals ofthe original compound.
The NMR method was used to determine the rate constants of the reaction
between 1,3,5-tris(2-hydroxyethyl)-1,3,5-triazinane (1) and HS-. The rateexpression was found to be
]][[][ −+=− HSTHk
dt
Td
64

Chapter 6 - The Rate of the Reaction between Triazinane 1 and H2S
and the rate constant
In sum, the use of internal standard in 1H NMR is a good method for determin-
ing the rate of the reaction between triazinane 1 and HS-. Other compounds canbe analysed in the same way, and the results can be compared to the results fortriazinane 1. Thus, this method was preferred as the method for comparing theefficiency of 1 with that of other potential scavengers.
127101.9 −−×⋅= sMKk a
65

Chapter 6 - The Rate of the Reaction between Triazinane 1 and H2S
66
- Part III -
Suggestion, Synthesis and Testing of Potential New H2S-Scavengers
With the method for testing the efficiency of various scavengers developed inPart II of this work, it was possible to determine the efficiency of other com-pounds in H2S removal. The potential scavengers to be tested had to fulfil all
requirements stated in Section 6.3.2. When the reaction kinetics had beenestablished, the results could be compared with the results obtained for triazi-nane 1 (Chapter 6).
As a first approach, compounds with structures and properties similar totriazinane 1 were tested. Other 1,3,5-triazinanes might be more reactivetowards H2S, or less susceptible to hydrolysis. In Chapter 7, other triazinanes
are suggested and tested.
Another class of compounds that has been considered as H2S scavengers is
formaldehyde and derivatives thereof. Formaldehyde itself is reactive towards
H2S and was used in H2S removal for many years.18 It has now been replaced
by other solutions, due to the toxic properties of formaldehyde. In this work, anoxolane and trimers and tetramers of formaldehyde have been analysed. Theresults are presented in Chapter 8.
67

68
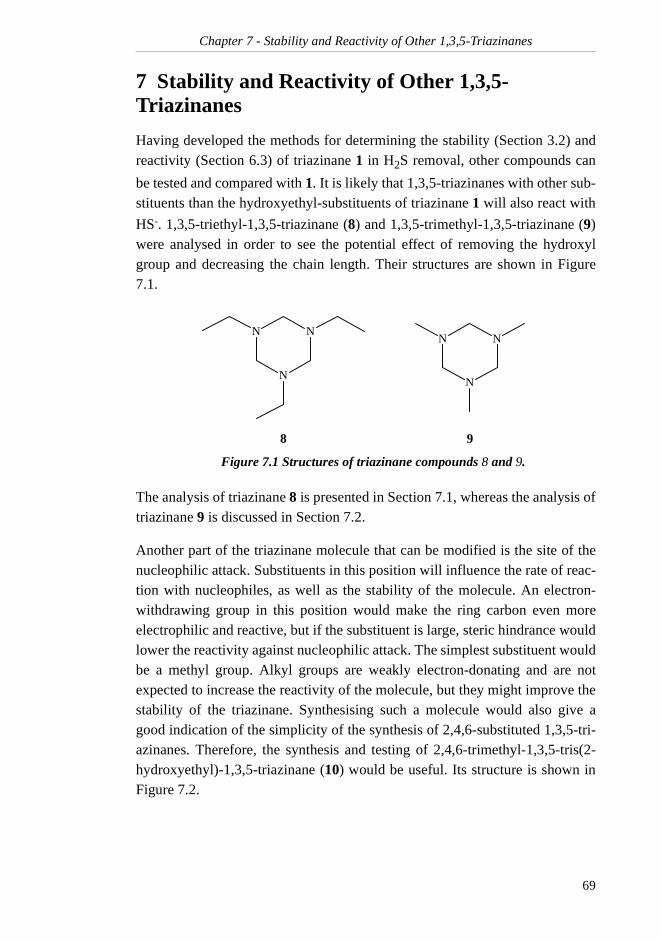
Chapter 7 - Stability and Reactivity of Other 1,3,5-Triazinanes
7 Stability and Reactivity of Other 1,3,5-Triazinanes
Having developed the methods for determining the stability (Section 3.2) andreactivity (Section 6.3) of triazinane 1 in H2S removal, other compounds can
be tested and compared with 1. It is likely that 1,3,5-triazinanes with other sub-stituents than the hydroxyethyl-substituents of triazinane 1 will also react with
HS-. 1,3,5-triethyl-1,3,5-triazinane (8) and 1,3,5-trimethyl-1,3,5-triazinane (9)were analysed in order to see the potential effect of removing the hydroxylgroup and decreasing the chain length. Their structures are shown in Figure7.1.
The analysis of triazinane 8 is presented in Section 7.1, whereas the analysis oftriazinane 9 is discussed in Section 7.2.
Another part of the triazinane molecule that can be modified is the site of thenucleophilic attack. Substituents in this position will influence the rate of reac-tion with nucleophiles, as well as the stability of the molecule. An electron-withdrawing group in this position would make the ring carbon even moreelectrophilic and reactive, but if the substituent is large, steric hindrance wouldlower the reactivity against nucleophilic attack. The simplest substituent wouldbe a methyl group. Alkyl groups are weakly electron-donating and are notexpected to increase the reactivity of the molecule, but they might improve thestability of the triazinane. Synthesising such a molecule would also give agood indication of the simplicity of the synthesis of 2,4,6-substituted 1,3,5-tri-azinanes. Therefore, the synthesis and testing of 2,4,6-trimethyl-1,3,5-tris(2-hydroxyethyl)-1,3,5-triazinane (10) would be useful. Its structure is shown inFigure 7.2.
Figure 7.1 Structures of triazinane compounds 8 and 9.
N
N
NN
N
N
8 9
69
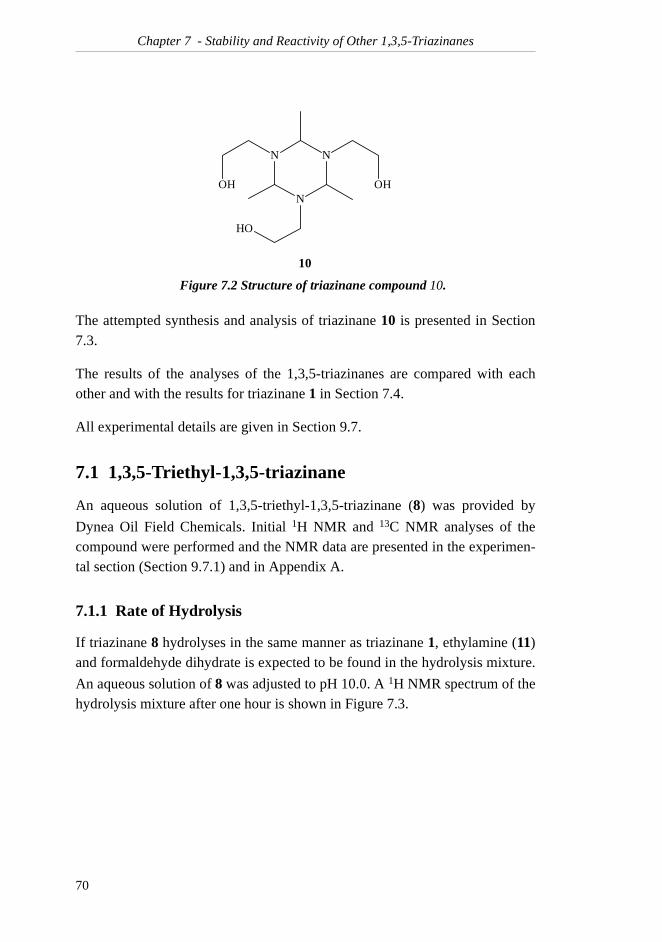
Chapter 7 - Stability and Reactivity of Other 1,3,5-Triazinanes
The attempted synthesis and analysis of triazinane 10 is presented in Section7.3.
The results of the analyses of the 1,3,5-triazinanes are compared with eachother and with the results for triazinane 1 in Section 7.4.
All experimental details are given in Section 9.7.
7.1 1,3,5-Triethyl-1,3,5-triazinane
An aqueous solution of 1,3,5-triethyl-1,3,5-triazinane (8) was provided by
Dynea Oil Field Chemicals. Initial 1H NMR and 13C NMR analyses of thecompound were performed and the NMR data are presented in the experimen-tal section (Section 9.7.1) and in Appendix A.
7.1.1 Rate of Hydrolysis
If triazinane 8 hydrolyses in the same manner as triazinane 1, ethylamine (11)and formaldehyde dihydrate is expected to be found in the hydrolysis mixture.
An aqueous solution of 8 was adjusted to pH 10.0. A 1H NMR spectrum of thehydrolysis mixture after one hour is shown in Figure 7.3.
Figure 7.2 Structure of triazinane compound 10.
N
N
N
OHOH
OH
10
70
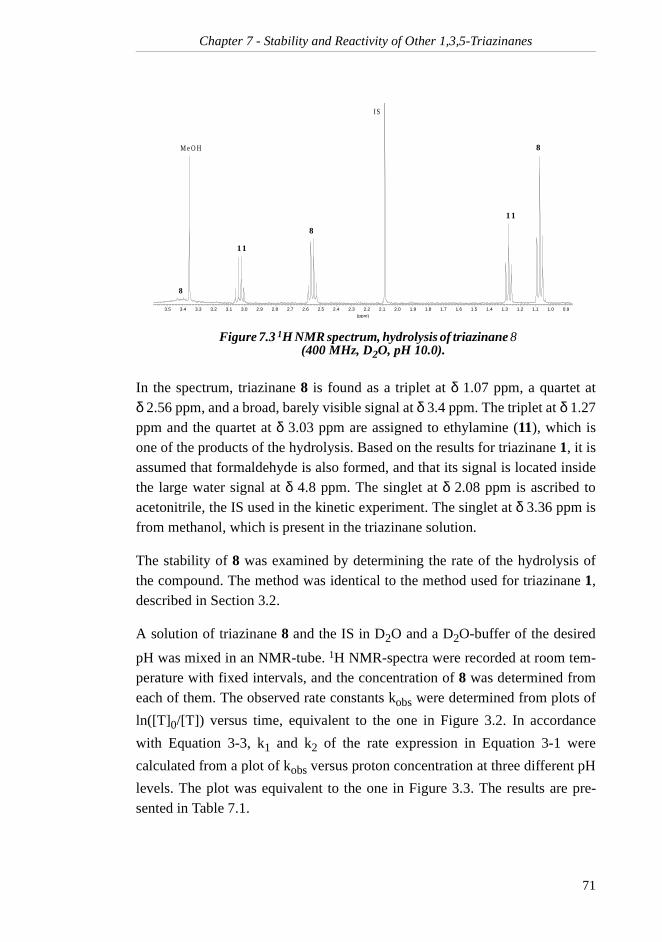
Chapter 7 - Stability and Reactivity of Other 1,3,5-Triazinanes
In the spectrum, triazinane 8 is found as a triplet at δ 1.07 ppm, a quartet atδ 2.56 ppm, and a broad, barely visible signal at δ 3.4 ppm. The triplet at δ 1.27ppm and the quartet at δ 3.03 ppm are assigned to ethylamine (11), which isone of the products of the hydrolysis. Based on the results for triazinane 1, it isassumed that formaldehyde is also formed, and that its signal is located insidethe large water signal at δ 4.8 ppm. The singlet at δ 2.08 ppm is ascribed toacetonitrile, the IS used in the kinetic experiment. The singlet at δ 3.36 ppm isfrom methanol, which is present in the triazinane solution.
The stability of 8 was examined by determining the rate of the hydrolysis ofthe compound. The method was identical to the method used for triazinane 1,described in Section 3.2.
A solution of triazinane 8 and the IS in D2O and a D2O-buffer of the desired
pH was mixed in an NMR-tube. 1H NMR-spectra were recorded at room tem-perature with fixed intervals, and the concentration of 8 was determined fromeach of them. The observed rate constants kobs were determined from plots of
ln([T]0/[T]) versus time, equivalent to the one in Figure 3.2. In accordance
with Equation 3-3, k1 and k2 of the rate expression in Equation 3-1 were
calculated from a plot of kobs versus proton concentration at three different pH
levels. The plot was equivalent to the one in Figure 3.3. The results are pre-sented in Table 7.1.
Figure 7.3 1H NMR spectrum, hydrolysis of triazinane 8 (400 MHz, D2O, pH 10.0).
(ppm)
0.91.01.11.21.31.41.51.61.71.81.92.02.12.22.32.42.52.62.72.82.93.03.13.23.33.43.5
8
8
11
1 1
8
M e O H
I S
71
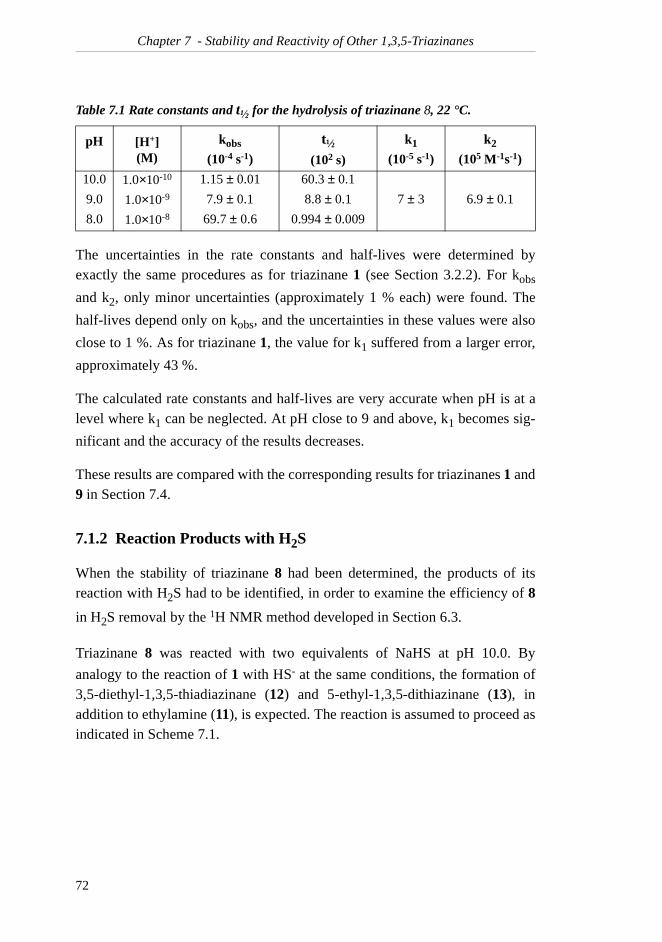
Chapter 7 - Stability and Reactivity of Other 1,3,5-Triazinanes
The uncertainties in the rate constants and half-lives were determined byexactly the same procedures as for triazinane 1 (see Section 3.2.2). For kobs
and k2, only minor uncertainties (approximately 1 % each) were found. The
half-lives depend only on kobs, and the uncertainties in these values were also
close to 1 %. As for triazinane 1, the value for k1 suffered from a larger error,
approximately 43 %.
The calculated rate constants and half-lives are very accurate when pH is at alevel where k1 can be neglected. At pH close to 9 and above, k1 becomes sig-
nificant and the accuracy of the results decreases.
These results are compared with the corresponding results for triazinanes 1 and9 in Section 7.4.
7.1.2 Reaction Products with H2S
When the stability of triazinane 8 had been determined, the products of itsreaction with H2S had to be identified, in order to examine the efficiency of 8
in H2S removal by the 1H NMR method developed in Section 6.3.
Triazinane 8 was reacted with two equivalents of NaHS at pH 10.0. By
analogy to the reaction of 1 with HS- at the same conditions, the formation of3,5-diethyl-1,3,5-thiadiazinane (12) and 5-ethyl-1,3,5-dithiazinane (13), inaddition to ethylamine (11), is expected. The reaction is assumed to proceed asindicated in Scheme 7.1.
Table 7.1 Rate constants and t½ for the hydrolysis of triazinane 8, 22 °C.
pH [H+](M)
kobs
(10-4 s-1)
t½
(102 s)
k1
(10-5 s-1)
k2
(105 M-1s-1)
10.0 1.0×10⁻¹⁰ 1.15 ± 0.01 60.3 ± 0.1
9.0 1.0×10⁻⁹ 7.9 ± 0.1 8.8 ± 0.1 7 ± 3 6.9 ± 0.1
8.0 1.0×10⁻⁸ 69.7 ± 0.6 0.994 ± 0.009
72
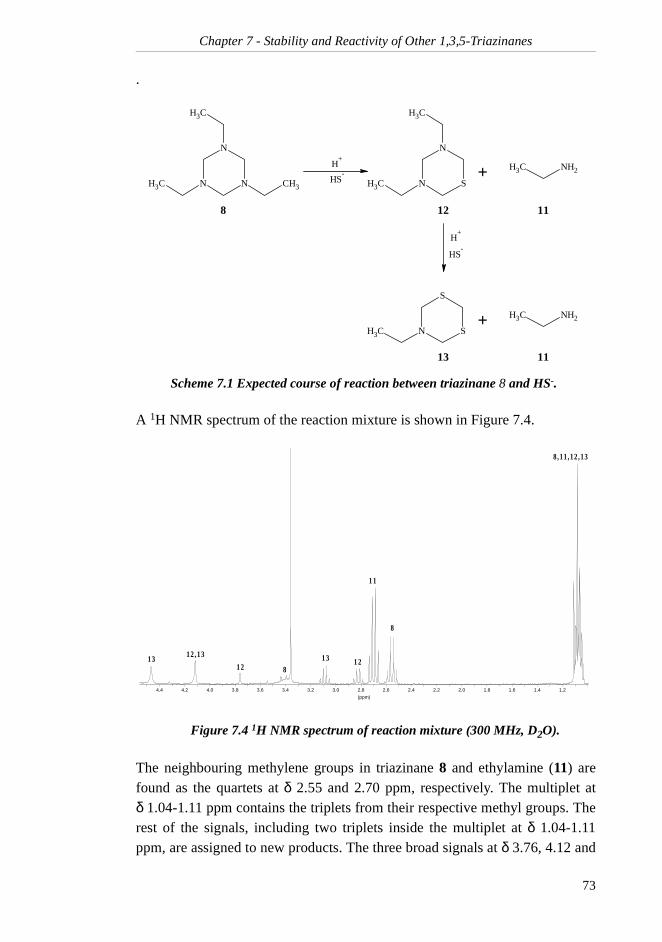
Chapter 7 - Stability and Reactivity of Other 1,3,5-Triazinanes
.
A 1H NMR spectrum of the reaction mixture is shown in Figure 7.4.
The neighbouring methylene groups in triazinane 8 and ethylamine (11) arefound as the quartets at δ 2.55 and 2.70 ppm, respectively. The multiplet atδ 1.04-1.11 ppm contains the triplets from their respective methyl groups. Therest of the signals, including two triplets inside the multiplet at δ 1.04-1.11ppm, are assigned to new products. The three broad signals at δ 3.76, 4.12 and
Scheme 7.1 Expected course of reaction between triazinane 8 and HS-.
Figure 7.4 1H NMR spectrum of reaction mixture (300 MHz, D2O).
+
+
8 12
N
N
NCH3 CH3
CH3
SN
S
CH3
CH3 NH2
CH3 NH2
SH-
SH-
13 11
11
S
N
NCH3
CH3
H+
H+
(ppm)
1.21.41.61.82.02.22.42.62.83.03.23.43.63.84.04.24.4
8
8
8 ,11 ,12 ,13
1 1
1 21 2
12 ,131 3 1 3
73
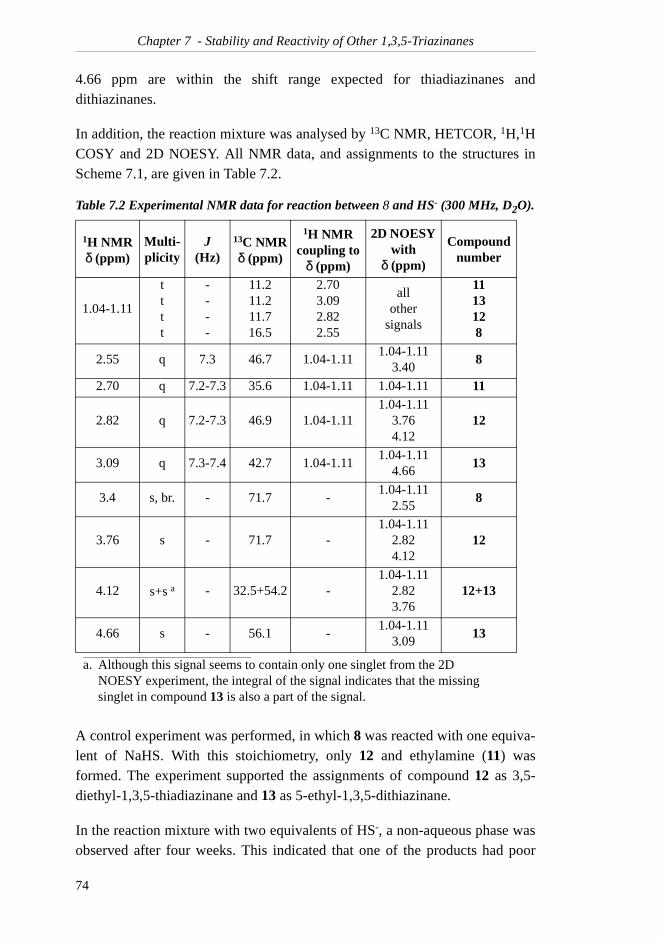
Chapter 7 - Stability and Reactivity of Other 1,3,5-Triazinanes
4.66 ppm are within the shift range expected for thiadiazinanes anddithiazinanes.
In addition, the reaction mixture was analysed by 13C NMR, HETCOR, 1H,1HCOSY and 2D NOESY. All NMR data, and assignments to the structures inScheme 7.1, are given in Table 7.2.
A control experiment was performed, in which 8 was reacted with one equiva-lent of NaHS. With this stoichiometry, only 12 and ethylamine (11) wasformed. The experiment supported the assignments of compound 12 as 3,5-diethyl-1,3,5-thiadiazinane and 13 as 5-ethyl-1,3,5-dithiazinane.
In the reaction mixture with two equivalents of HS-, a non-aqueous phase wasobserved after four weeks. This indicated that one of the products had poor
Table 7.2 Experimental NMR data for reaction between 8 and HS- (300 MHz, D2O).
1H NMRδ (ppm)
Multi-plicity
J(Hz)
13C NMRδ (ppm)
1H NMR coupling to
δ (ppm)
2D NOESY with
δ (ppm)
Compound number
1.04-1.11
tttt
----
11.211.211.716.5
2.703.092.822.55
allother
signals
1113128
2.55 q 7.3 46.7 1.04-1.111.04-1.11
3.408
2.70 q 7.2-7.3 35.6 1.04-1.11 1.04-1.11 11
2.82 q 7.2-7.3 46.9 1.04-1.111.04-1.11
3.764.12
12
3.09 q 7.3-7.4 42.7 1.04-1.111.04-1.11
4.6613
3.4 s, br. - 71.7 -1.04-1.11
2.558
3.76 s - 71.7 -1.04-1.11
2.824.12
12
4.12 s+s a
a. Although this signal seems to contain only one singlet from the 2D NOESY experiment, the integral of the signal indicates that the missing singlet in compound 13 is also a part of the signal.
- 32.5+54.2 -1.04-1.11
2.823.76
12+13
4.66 s - 56.1 -1.04-1.11
3.0913
74
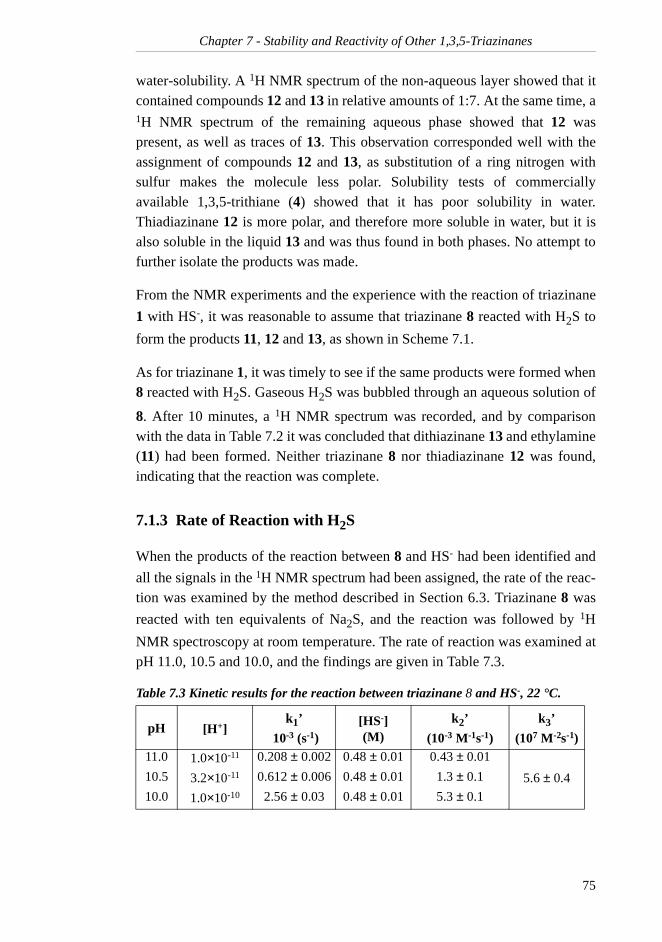
Chapter 7 - Stability and Reactivity of Other 1,3,5-Triazinanes
water-solubility. A 1H NMR spectrum of the non-aqueous layer showed that itcontained compounds 12 and 13 in relative amounts of 1:7. At the same time, a1H NMR spectrum of the remaining aqueous phase showed that 12 waspresent, as well as traces of 13. This observation corresponded well with theassignment of compounds 12 and 13, as substitution of a ring nitrogen withsulfur makes the molecule less polar. Solubility tests of commerciallyavailable 1,3,5-trithiane (4) showed that it has poor solubility in water.Thiadiazinane 12 is more polar, and therefore more soluble in water, but it isalso soluble in the liquid 13 and was thus found in both phases. No attempt tofurther isolate the products was made.
From the NMR experiments and the experience with the reaction of triazinane
1 with HS-, it was reasonable to assume that triazinane 8 reacted with H2S to
form the products 11, 12 and 13, as shown in Scheme 7.1.
As for triazinane 1, it was timely to see if the same products were formed when8 reacted with H2S. Gaseous H2S was bubbled through an aqueous solution of
8. After 10 minutes, a 1H NMR spectrum was recorded, and by comparisonwith the data in Table 7.2 it was concluded that dithiazinane 13 and ethylamine(11) had been formed. Neither triazinane 8 nor thiadiazinane 12 was found,indicating that the reaction was complete.
7.1.3 Rate of Reaction with H2S
When the products of the reaction between 8 and HS- had been identified and
all the signals in the 1H NMR spectrum had been assigned, the rate of the reac-tion was examined by the method described in Section 6.3. Triazinane 8 was
reacted with ten equivalents of Na2S, and the reaction was followed by 1H
NMR spectroscopy at room temperature. The rate of reaction was examined atpH 11.0, 10.5 and 10.0, and the findings are given in Table 7.3.
Table 7.3 Kinetic results for the reaction between triazinane 8 and HS-, 22 °C.
pH [H+]k1’
10-3 (s-1)[HS-](M)
k2’
(10-3 M-1s-1)
k3’
(107 M-2s-1)11.0 1.0×10⁻¹¹ 0.208 ± 0.002 0.48 ± 0.01 0.43 ± 0.01
5.6 ± 0.410.5 3.2×10⁻¹¹ 0.612 ± 0.006 0.48 ± 0.01 1.3 ± 0.1
10.0 1.0×10⁻¹⁰ 2.56 ± 0.03 0.48 ± 0.01 5.3 ± 0.1
75
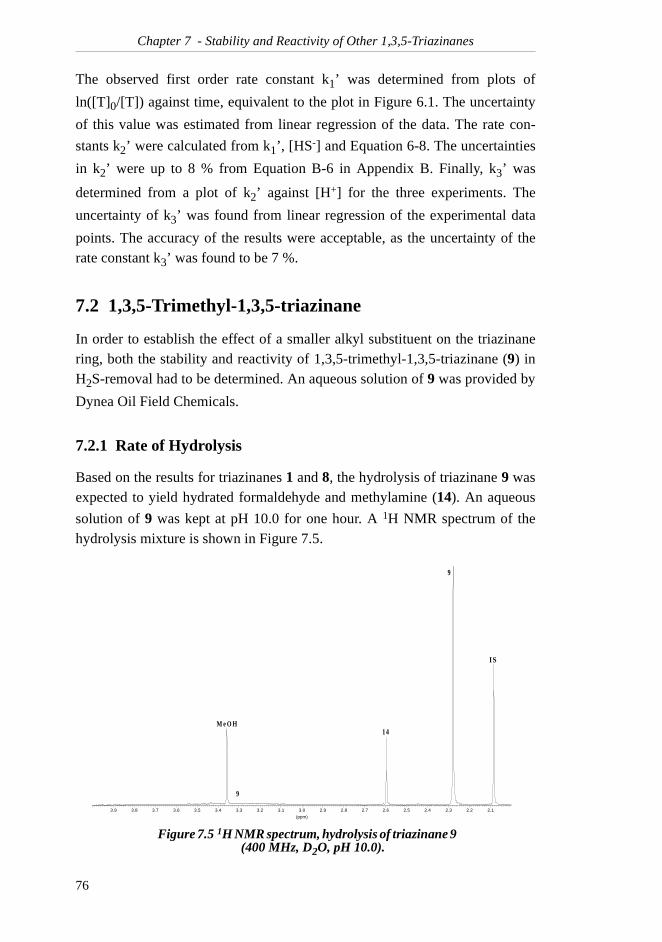
Chapter 7 - Stability and Reactivity of Other 1,3,5-Triazinanes
The observed first order rate constant k1’ was determined from plots of
ln([T]0/[T]) against time, equivalent to the plot in Figure 6.1. The uncertainty
of this value was estimated from linear regression of the data. The rate con-
stants k2’ were calculated from k1’, [HS-] and Equation 6-8. The uncertainties
in k2’ were up to 8 % from Equation B-6 in Appendix B. Finally, k3’ was
determined from a plot of k2’ against [H+] for the three experiments. The
uncertainty of k3’ was found from linear regression of the experimental data
points. The accuracy of the results were acceptable, as the uncertainty of therate constant k3’ was found to be 7 %.
7.2 1,3,5-Trimethyl-1,3,5-triazinane
In order to establish the effect of a smaller alkyl substituent on the triazinanering, both the stability and reactivity of 1,3,5-trimethyl-1,3,5-triazinane (9) inH2S-removal had to be determined. An aqueous solution of 9 was provided by
Dynea Oil Field Chemicals.
7.2.1 Rate of Hydrolysis
Based on the results for triazinanes 1 and 8, the hydrolysis of triazinane 9 wasexpected to yield hydrated formaldehyde and methylamine (14). An aqueous
solution of 9 was kept at pH 10.0 for one hour. A 1H NMR spectrum of thehydrolysis mixture is shown in Figure 7.5.
Figure 7.5 1H NMR spectrum, hydrolysis of triazinane 9 (400 MHz, D2O, pH 10.0).
(ppm)
2.12.22.32.42.52.62.72.82.93.03.13.23.33.43.53.63.73.83.9
9
9
IS
14M e O H
76
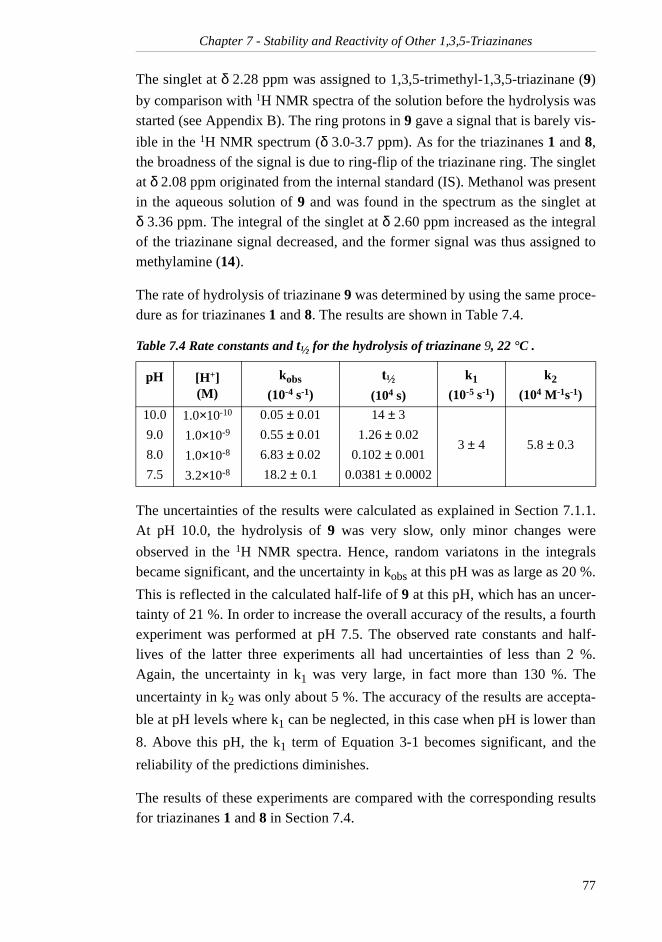
Chapter 7 - Stability and Reactivity of Other 1,3,5-Triazinanes
The singlet at δ 2.28 ppm was assigned to 1,3,5-trimethyl-1,3,5-triazinane (9)
by comparison with 1H NMR spectra of the solution before the hydrolysis wasstarted (see Appendix B). The ring protons in 9 gave a signal that is barely vis-
ible in the 1H NMR spectrum (δ 3.0-3.7 ppm). As for the triazinanes 1 and 8,the broadness of the signal is due to ring-flip of the triazinane ring. The singletat δ 2.08 ppm originated from the internal standard (IS). Methanol was presentin the aqueous solution of 9 and was found in the spectrum as the singlet atδ 3.36 ppm. The integral of the singlet at δ 2.60 ppm increased as the integralof the triazinane signal decreased, and the former signal was thus assigned tomethylamine (14).
The rate of hydrolysis of triazinane 9 was determined by using the same proce-dure as for triazinanes 1 and 8. The results are shown in Table 7.4.
The uncertainties of the results were calculated as explained in Section 7.1.1.At pH 10.0, the hydrolysis of 9 was very slow, only minor changes were
observed in the 1H NMR spectra. Hence, random variatons in the integralsbecame significant, and the uncertainty in kobs at this pH was as large as 20 %.
This is reflected in the calculated half-life of 9 at this pH, which has an uncer-tainty of 21 %. In order to increase the overall accuracy of the results, a fourthexperiment was performed at pH 7.5. The observed rate constants and half-lives of the latter three experiments all had uncertainties of less than 2 %.Again, the uncertainty in k1 was very large, in fact more than 130 %. The
uncertainty in k2 was only about 5 %. The accuracy of the results are accepta-
ble at pH levels where k1 can be neglected, in this case when pH is lower than
8. Above this pH, the k1 term of Equation 3-1 becomes significant, and the
reliability of the predictions diminishes.
The results of these experiments are compared with the corresponding resultsfor triazinanes 1 and 8 in Section 7.4.
Table 7.4 Rate constants and t½ for the hydrolysis of triazinane 9, 22 °C .
pH [H+](M)
kobs
(10-4 s-1)
t½
(104 s)
k1
(10-5 s-1)
k2
(104 M-1s-1)
10.0 1.0×10⁻¹⁰ 0.05 ± 0.01 14 ± 3
3 ± 4 5.8 ± 0.39.0 1.0×10⁻⁹ 0.55 ± 0.01 1.26 ± 0.02
8.0 1.0×10⁻⁸ 6.83 ± 0.02 0.102 ± 0.001
7.5 3.2×10⁻⁸ 18.2 ± 0.1 0.0381 ± 0.0002
77
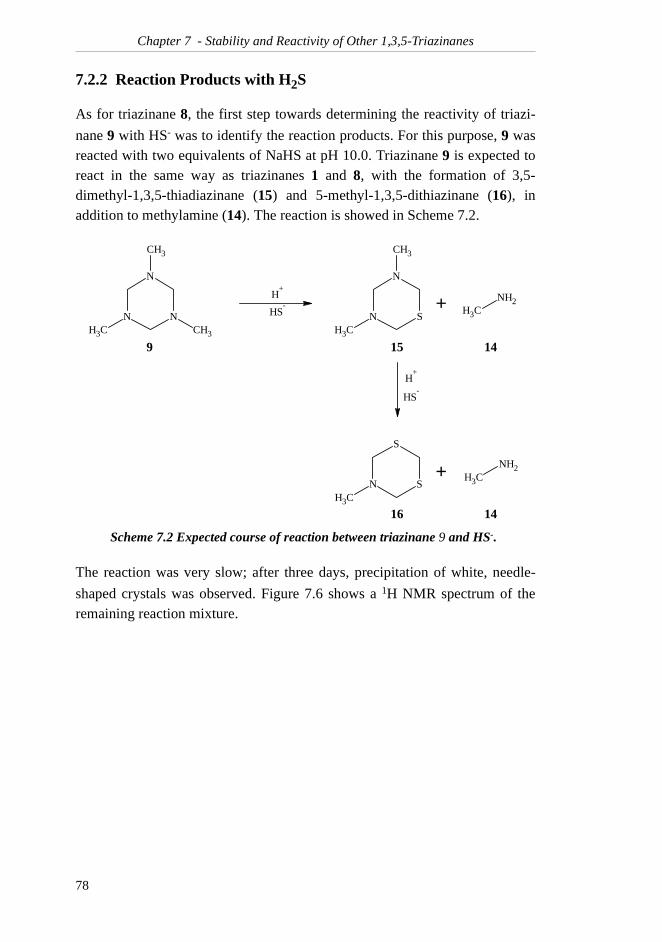
Chapter 7 - Stability and Reactivity of Other 1,3,5-Triazinanes
7.2.2 Reaction Products with H2S
As for triazinane 8, the first step towards determining the reactivity of triazi-
nane 9 with HS- was to identify the reaction products. For this purpose, 9 wasreacted with two equivalents of NaHS at pH 10.0. Triazinane 9 is expected toreact in the same way as triazinanes 1 and 8, with the formation of 3,5-dimethyl-1,3,5-thiadiazinane (15) and 5-methyl-1,3,5-dithiazinane (16), inaddition to methylamine (14). The reaction is showed in Scheme 7.2.
The reaction was very slow; after three days, precipitation of white, needle-
shaped crystals was observed. Figure 7.6 shows a 1H NMR spectrum of theremaining reaction mixture.
Scheme 7.2 Expected course of reaction between triazinane 9 and HS-.
+
+
9 15
N
N
NCH3 CH3
CH3
SN
S
CH3
CH3
NH2
CH3
NH2
SH-
SH-
16 14
14
S
N
NCH3
CH3
H+
H+
78
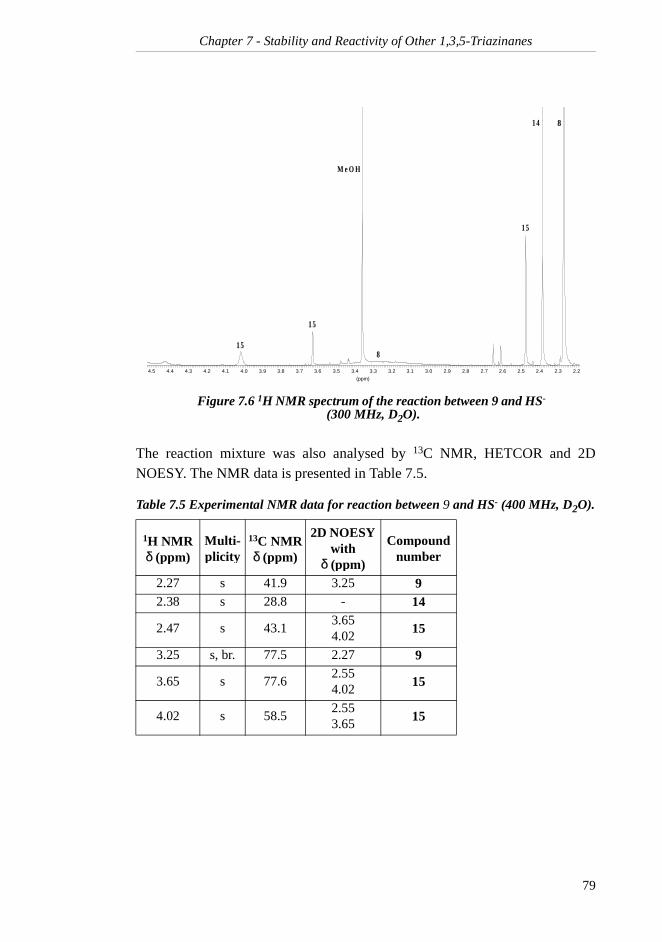
Chapter 7 - Stability and Reactivity of Other 1,3,5-Triazinanes
The reaction mixture was also analysed by 13C NMR, HETCOR and 2DNOESY. The NMR data is presented in Table 7.5.
Figure 7.6 1H NMR spectrum of the reaction between 9 and HS- (300 MHz, D2O).
Table 7.5 Experimental NMR data for reaction between 9 and HS- (400 MHz, D2O).
1H NMRδ (ppm)
Multi-plicity
13C NMRδ (ppm)
2D NOESY with
δ (ppm)
Compound number
2.27 s 41.9 3.25 92.38 s 28.8 - 14
2.47 s 43.13.654.02
15
3.25 s, br. 77.5 2.27 9
3.65 s 77.62.554.02
15
4.02 s 58.52.553.65
15
(ppm)
2.22.32.42.52.62.72.82.93.03.13.23.33.43.53.63.73.83.94.04.14.24.34.44.5
1 5
8
81 4
M e O H
1 5
1 5
79
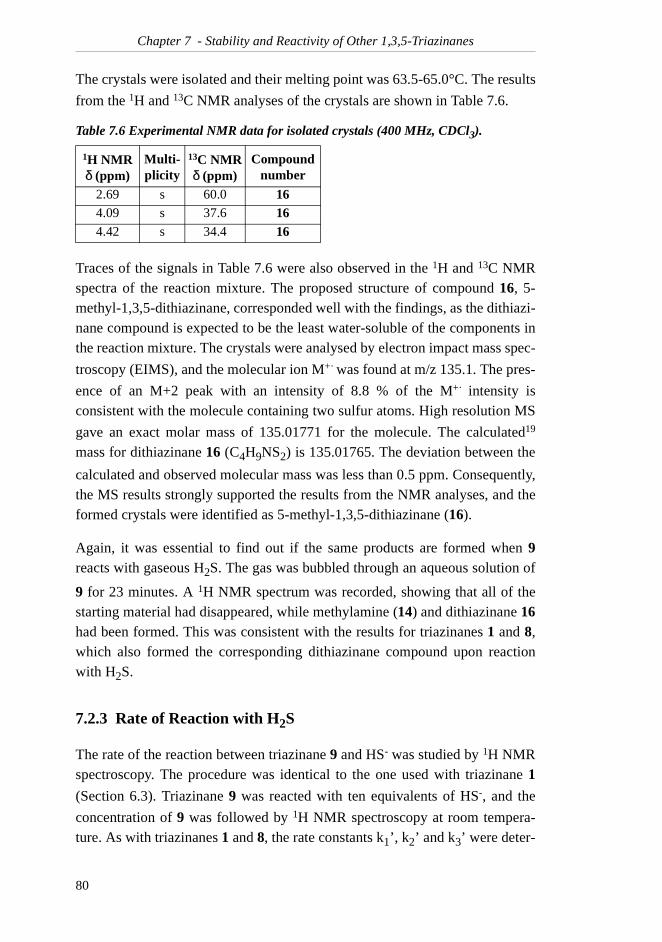
Chapter 7 - Stability and Reactivity of Other 1,3,5-Triazinanes
The crystals were isolated and their melting point was 63.5-65.0°C. The results
from the 1H and 13C NMR analyses of the crystals are shown in Table 7.6.
Traces of the signals in Table 7.6 were also observed in the 1H and 13C NMRspectra of the reaction mixture. The proposed structure of compound 16, 5-methyl-1,3,5-dithiazinane, corresponded well with the findings, as the dithiazi-nane compound is expected to be the least water-soluble of the components inthe reaction mixture. The crystals were analysed by electron impact mass spec-
troscopy (EIMS), and the molecular ion M+· was found at m/z 135.1. The pres-
ence of an M+2 peak with an intensity of 8.8 % of the M+· intensity isconsistent with the molecule containing two sulfur atoms. High resolution MS
gave an exact molar mass of 135.01771 for the molecule. The calculated19
mass for dithiazinane 16 (C4H9NS2) is 135.01765. The deviation between the
calculated and observed molecular mass was less than 0.5 ppm. Consequently,the MS results strongly supported the results from the NMR analyses, and theformed crystals were identified as 5-methyl-1,3,5-dithiazinane (16).
Again, it was essential to find out if the same products are formed when 9reacts with gaseous H2S. The gas was bubbled through an aqueous solution of
9 for 23 minutes. A 1H NMR spectrum was recorded, showing that all of thestarting material had disappeared, while methylamine (14) and dithiazinane 16had been formed. This was consistent with the results for triazinanes 1 and 8,which also formed the corresponding dithiazinane compound upon reactionwith H2S.
7.2.3 Rate of Reaction with H2S
The rate of the reaction between triazinane 9 and HS- was studied by 1H NMRspectroscopy. The procedure was identical to the one used with triazinane 1
(Section 6.3). Triazinane 9 was reacted with ten equivalents of HS-, and the
concentration of 9 was followed by 1H NMR spectroscopy at room tempera-ture. As with triazinanes 1 and 8, the rate constants k1’, k2’ and k3’ were deter-
Table 7.6 Experimental NMR data for isolated crystals (400 MHz, CDCl3).
1H NMRδ (ppm)
Multi-plicity
13C NMRδ (ppm)
Compound number
2.69 s 60.0 164.09 s 37.6 164.42 s 34.4 16
80
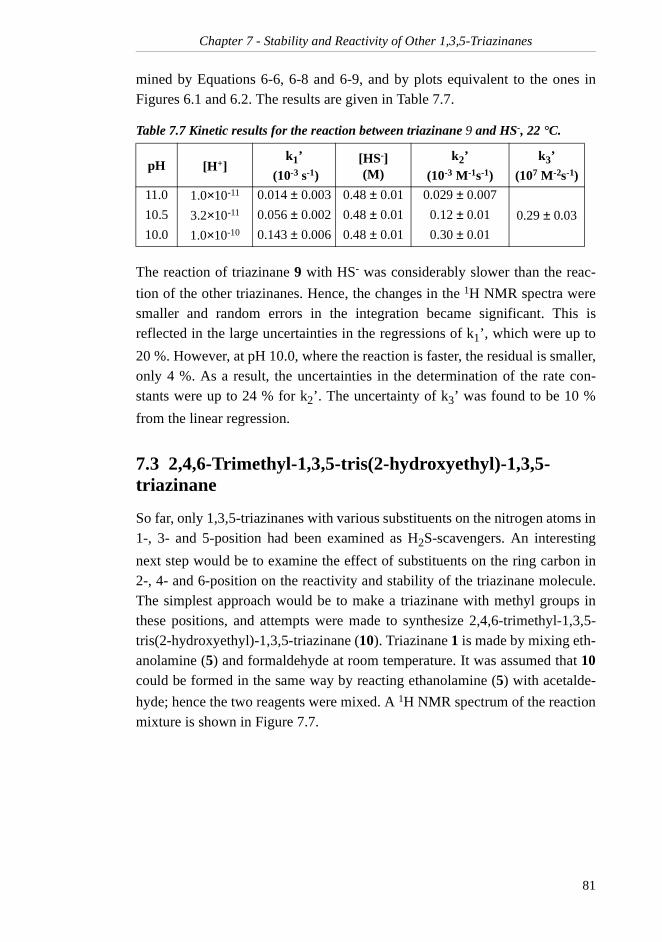
Chapter 7 - Stability and Reactivity of Other 1,3,5-Triazinanes
mined by Equations 6-6, 6-8 and 6-9, and by plots equivalent to the ones inFigures 6.1 and 6.2. The results are given in Table 7.7.
The reaction of triazinane 9 with HS- was considerably slower than the reac-
tion of the other triazinanes. Hence, the changes in the 1H NMR spectra weresmaller and random errors in the integration became significant. This isreflected in the large uncertainties in the regressions of k1’, which were up to
20 %. However, at pH 10.0, where the reaction is faster, the residual is smaller,only 4 %. As a result, the uncertainties in the determination of the rate con-stants were up to 24 % for k2’. The uncertainty of k3’ was found to be 10 %
from the linear regression.
7.3 2,4,6-Trimethyl-1,3,5-tris(2-hydroxyethyl)-1,3,5-triazinane
So far, only 1,3,5-triazinanes with various substituents on the nitrogen atoms in1-, 3- and 5-position had been examined as H2S-scavengers. An interesting
next step would be to examine the effect of substituents on the ring carbon in2-, 4- and 6-position on the reactivity and stability of the triazinane molecule.The simplest approach would be to make a triazinane with methyl groups inthese positions, and attempts were made to synthesize 2,4,6-trimethyl-1,3,5-tris(2-hydroxyethyl)-1,3,5-triazinane (10). Triazinane 1 is made by mixing eth-anolamine (5) and formaldehyde at room temperature. It was assumed that 10could be formed in the same way by reacting ethanolamine (5) with acetalde-
hyde; hence the two reagents were mixed. A 1H NMR spectrum of the reactionmixture is shown in Figure 7.7.
Table 7.7 Kinetic results for the reaction between triazinane 9 and HS-, 22 °C.
pH [H+]k1’
(10-3 s-1)[HS-](M)
k2’
(10-3 M-1s-1)
k3’
(107 M-2s-1)
11.0 1.0×10⁻¹¹ 0.014 ± 0.003 0.48 ± 0.01 0.029 ± 0.007
0.29 ± 0.0310.5 3.2×10⁻¹¹ 0.056 ± 0.002 0.48 ± 0.01 0.12 ± 0.01
10.0 1.0×10⁻¹⁰ 0.143 ± 0.006 0.48 ± 0.01 0.30 ± 0.01
81
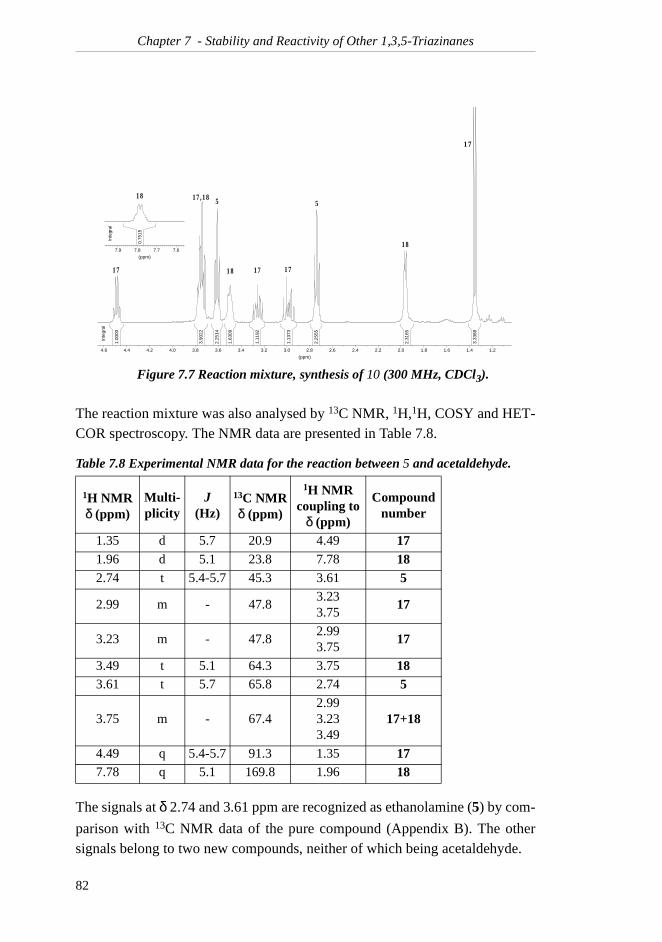
Chapter 7 - Stability and Reactivity of Other 1,3,5-Triazinanes
The reaction mixture was also analysed by 13C NMR, 1H,1H, COSY and HET-COR spectroscopy. The NMR data are presented in Table 7.8.
The signals at δ 2.74 and 3.61 ppm are recognized as ethanolamine (5) by com-
parison with 13C NMR data of the pure compound (Appendix B). The othersignals belong to two new compounds, neither of which being acetaldehyde.
Figure 7.7 Reaction mixture, synthesis of 10 (300 MHz, CDCl3).
Table 7.8 Experimental NMR data for the reaction between 5 and acetaldehyde.
1H NMRδ (ppm)
Multi-plicity
J(Hz)
13C NMRδ (ppm)
1H NMR coupling to
δ (ppm)
Compound number
1.35 d 5.7 20.9 4.49 171.96 d 5.1 23.8 7.78 182.74 t 5.4-5.7 45.3 3.61 5
2.99 m - 47.83.233.75
17
3.23 m - 47.82.993.75
17
3.49 t 5.1 64.3 3.75 183.61 t 5.7 65.8 2.74 5
3.75 m - 67.42.993.233.49
17+18
4.49 q 5.4-5.7 91.3 1.35 177.78 q 5.1 169.8 1.96 18
1.00
00
3.90
22
2.25
14
1.63
09
1.11
92
1.13
73
2.25
55
2.31
65
3.33
88
Inte
gral
(ppm)
1.21.41.61.82.02.22.42.62.83.03.23.43.63.84.04.24.44.6
0.75
15
Inte
gral
(ppm)
7.67.77.87.91 8
5
1 7
1 8 1 71 7
51 7 , 1 8
1 7
1 8
82
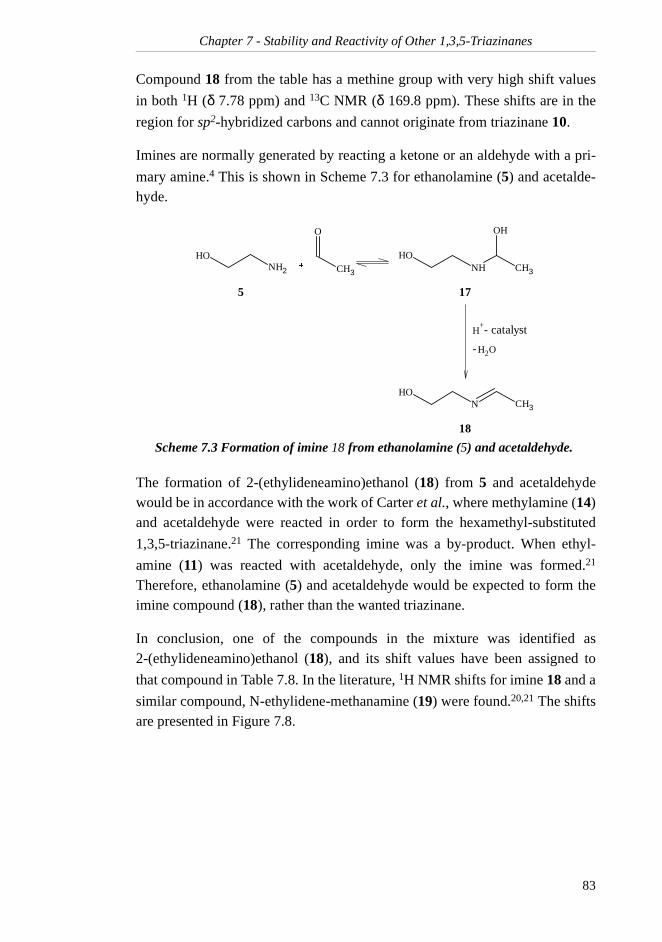
Chapter 7 - Stability and Reactivity of Other 1,3,5-Triazinanes
Compound 18 from the table has a methine group with very high shift values
in both 1H (δ 7.78 ppm) and 13C NMR (δ 169.8 ppm). These shifts are in the
region for sp2-hybridized carbons and cannot originate from triazinane 10.
Imines are normally generated by reacting a ketone or an aldehyde with a pri-
mary amine.4 This is shown in Scheme 7.3 for ethanolamine (5) and acetalde-hyde.
The formation of 2-(ethylideneamino)ethanol (18) from 5 and acetaldehydewould be in accordance with the work of Carter et al., where methylamine (14)and acetaldehyde were reacted in order to form the hexamethyl-substituted
1,3,5-triazinane.21 The corresponding imine was a by-product. When ethyl-
amine (11) was reacted with acetaldehyde, only the imine was formed.21
Therefore, ethanolamine (5) and acetaldehyde would be expected to form theimine compound (18), rather than the wanted triazinane.
In conclusion, one of the compounds in the mixture was identified as2-(ethylideneamino)ethanol (18), and its shift values have been assigned to
that compound in Table 7.8. In the literature, 1H NMR shifts for imine 18 and a
similar compound, N-ethylidene-methanamine (19) were found.20,21 The shiftsare presented in Figure 7.8.
Scheme 7.3 Formation of imine 18 from ethanolamine (5) and acetaldehyde.
OHNH2 CH3
O
�
OHNH CH3
OH
OHN CH3
OH2-
H+- catalyst
5 17
18
83
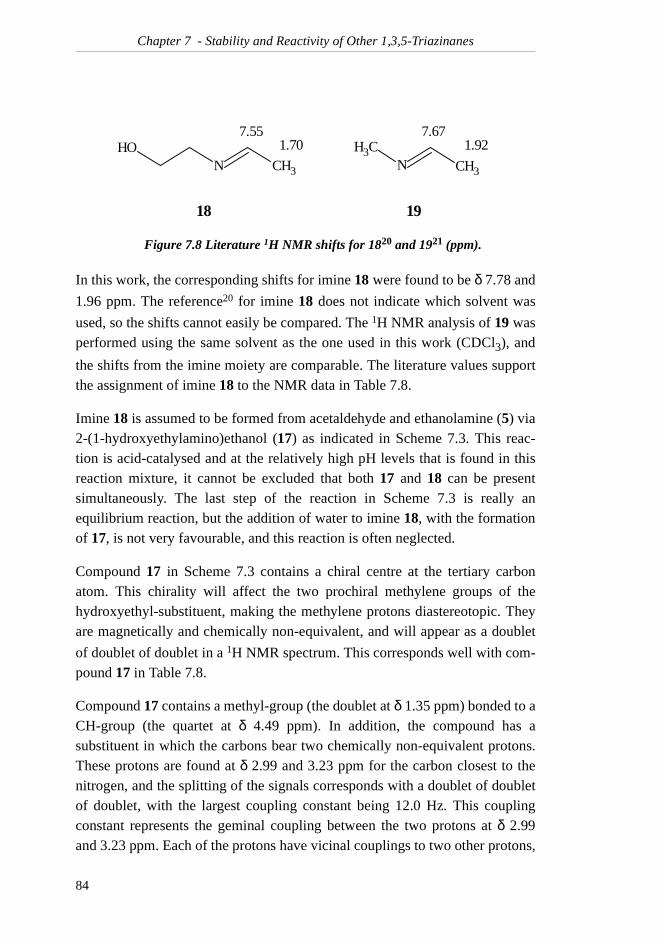
Chapter 7 - Stability and Reactivity of Other 1,3,5-Triazinanes
In this work, the corresponding shifts for imine 18 were found to be δ 7.78 and
1.96 ppm. The reference20 for imine 18 does not indicate which solvent was
used, so the shifts cannot easily be compared. The 1H NMR analysis of 19 wasperformed using the same solvent as the one used in this work (CDCl3), and
the shifts from the imine moiety are comparable. The literature values supportthe assignment of imine 18 to the NMR data in Table 7.8.
Imine 18 is assumed to be formed from acetaldehyde and ethanolamine (5) via2-(1-hydroxyethylamino)ethanol (17) as indicated in Scheme 7.3. This reac-tion is acid-catalysed and at the relatively high pH levels that is found in thisreaction mixture, it cannot be excluded that both 17 and 18 can be presentsimultaneously. The last step of the reaction in Scheme 7.3 is really anequilibrium reaction, but the addition of water to imine 18, with the formationof 17, is not very favourable, and this reaction is often neglected.
Compound 17 in Scheme 7.3 contains a chiral centre at the tertiary carbonatom. This chirality will affect the two prochiral methylene groups of thehydroxyethyl-substituent, making the methylene protons diastereotopic. Theyare magnetically and chemically non-equivalent, and will appear as a doublet
of doublet of doublet in a 1H NMR spectrum. This corresponds well with com-pound 17 in Table 7.8.
Compound 17 contains a methyl-group (the doublet at δ 1.35 ppm) bonded to aCH-group (the quartet at δ 4.49 ppm). In addition, the compound has asubstituent in which the carbons bear two chemically non-equivalent protons.These protons are found at δ 2.99 and 3.23 ppm for the carbon closest to thenitrogen, and the splitting of the signals corresponds with a doublet of doubletof doublet, with the largest coupling constant being 12.0 Hz. This couplingconstant represents the geminal coupling between the two protons at δ 2.99and 3.23 ppm. Each of the protons have vicinal couplings to two other protons,
Figure 7.8 Literature 1H NMR shifts for 1820 and 1921 (ppm).
OHN CH3
CH3N CH3
7.55
18 19
7.671.921.70
84
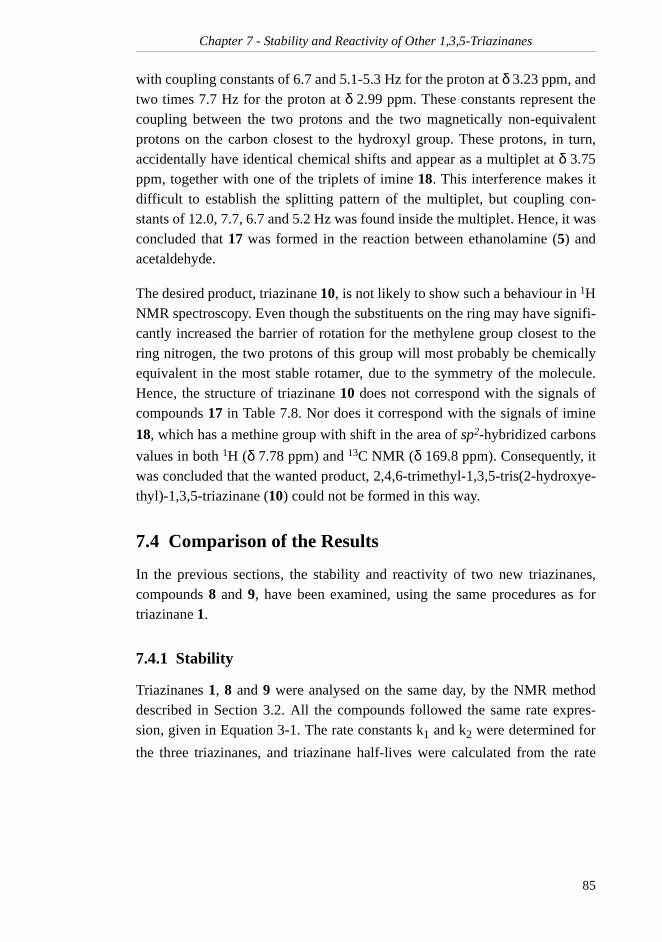
Chapter 7 - Stability and Reactivity of Other 1,3,5-Triazinanes
with coupling constants of 6.7 and 5.1-5.3 Hz for the proton at δ 3.23 ppm, andtwo times 7.7 Hz for the proton at δ 2.99 ppm. These constants represent thecoupling between the two protons and the two magnetically non-equivalentprotons on the carbon closest to the hydroxyl group. These protons, in turn,accidentally have identical chemical shifts and appear as a multiplet at δ 3.75ppm, together with one of the triplets of imine 18. This interference makes itdifficult to establish the splitting pattern of the multiplet, but coupling con-stants of 12.0, 7.7, 6.7 and 5.2 Hz was found inside the multiplet. Hence, it wasconcluded that 17 was formed in the reaction between ethanolamine (5) andacetaldehyde.
The desired product, triazinane 10, is not likely to show such a behaviour in 1HNMR spectroscopy. Even though the substituents on the ring may have signifi-cantly increased the barrier of rotation for the methylene group closest to thering nitrogen, the two protons of this group will most probably be chemicallyequivalent in the most stable rotamer, due to the symmetry of the molecule.Hence, the structure of triazinane 10 does not correspond with the signals ofcompounds 17 in Table 7.8. Nor does it correspond with the signals of imine
18, which has a methine group with shift in the area of sp2-hybridized carbons
values in both 1H (δ 7.78 ppm) and 13C NMR (δ 169.8 ppm). Consequently, itwas concluded that the wanted product, 2,4,6-trimethyl-1,3,5-tris(2-hydroxye-thyl)-1,3,5-triazinane (10) could not be formed in this way.
7.4 Comparison of the Results
In the previous sections, the stability and reactivity of two new triazinanes,compounds 8 and 9, have been examined, using the same procedures as fortriazinane 1.
7.4.1 Stability
Triazinanes 1, 8 and 9 were analysed on the same day, by the NMR methoddescribed in Section 3.2. All the compounds followed the same rate expres-sion, given in Equation 3-1. The rate constants k1 and k2 were determined for
the three triazinanes, and triazinane half-lives were calculated from the rate
85
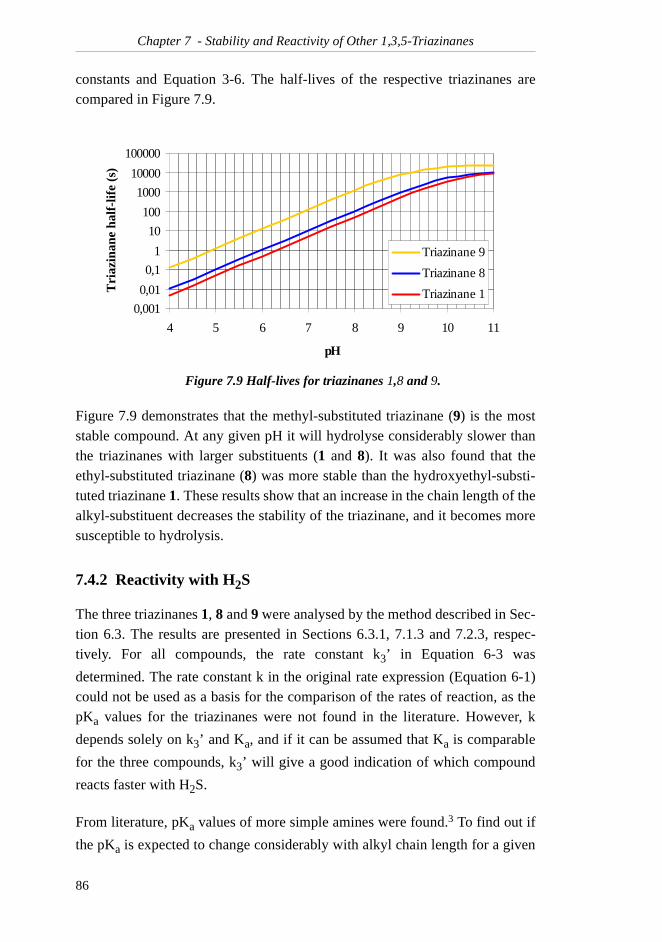
Chapter 7 - Stability and Reactivity of Other 1,3,5-Triazinanes
constants and Equation 3-6. The half-lives of the respective triazinanes arecompared in Figure 7.9.
Figure 7.9 demonstrates that the methyl-substituted triazinane (9) is the moststable compound. At any given pH it will hydrolyse considerably slower thanthe triazinanes with larger substituents (1 and 8). It was also found that theethyl-substituted triazinane (8) was more stable than the hydroxyethyl-substi-tuted triazinane 1. These results show that an increase in the chain length of thealkyl-substituent decreases the stability of the triazinane, and it becomes moresusceptible to hydrolysis.
7.4.2 Reactivity with H2S
The three triazinanes 1, 8 and 9 were analysed by the method described in Sec-tion 6.3. The results are presented in Sections 6.3.1, 7.1.3 and 7.2.3, respec-tively. For all compounds, the rate constant k3’ in Equation 6-3 was
determined. The rate constant k in the original rate expression (Equation 6-1)could not be used as a basis for the comparison of the rates of reaction, as thepKa values for the triazinanes were not found in the literature. However, k
depends solely on k3’ and Ka, and if it can be assumed that Ka is comparable
for the three compounds, k3’ will give a good indication of which compound
reacts faster with H2S.
From literature, pKa values of more simple amines were found.3 To find out if
the pKa is expected to change considerably with alkyl chain length for a given
Figure 7.9 Half-lives for triazinanes 1,8 and 9.
0,001
0,01
0,1
1
10
100
1000
10000
100000
4 5 6 7 8 9 10 11
pH
Tri
azin
ane
half
-lif
e (s
)
Triazinane 9
Triazinane 8
Triazinane 1
86
Chapter 7 - Stability and Reactivity of Other 1,3,5-Triazinanes
amine, pKa values of simple substituted amines were compared (see Table
7.9).
From Table 7.9 it was assumed that triazinane 1 will have a lower pKa value
(higher Ka) than triazinanes 8 and 9. However, no conclusions can be made
regarding the pKa values of 8 and 9 relative to each other, although the data
indicate that 8 will have a higher pKa than 9. Solving Equation 6-4 for k yields
For triazinane 1, k3’ was found to be 8.8×10⁷ M-2s-1. Likewise, k3’ was found to
be 5.5×10⁷ M-2s-1 for triazinane 8 and 1.4×10⁶ M-2s-1 for triazinane 9. Hence,triazinane 1 has larger values than the two others both in terms of k3’ and Ka.
Accordingly, it has a larger rate constant k and clearly reacts faster with HS-.
The reactivities of 8 and 9 cannot be distinguished from these results, since 8has a higher k3’, but may have a lower Ka than 9. Therefore, it remains unde-
termined which of the two triazinanes react faster with HS- at a given set ofreaction conditions.
7.5 Conclusion
The rates of hydrolysis of 1,3,5-triethyl-1,3,5-triazinane (8) and 1,3,5-trime-thyl-1,3,5-triazinane (9) were examined by the same method as that used for
triazinane 1, and the rate expression and rate constants were found to be:
where
Table 7.9 pKa values of simple substituted amines.3
R NH2R NHR2 NR3
Me 10.66 10.73 9.80
Et 10.65 10.84 10.75
Pr 10.54-10.63 11.05
Bu 10.56-10.68
EtOH 9.50 7.76
(7-1)aKkk ⋅= '3
[ ]]][[][ 21
++=− HTkTkdt
Td
87
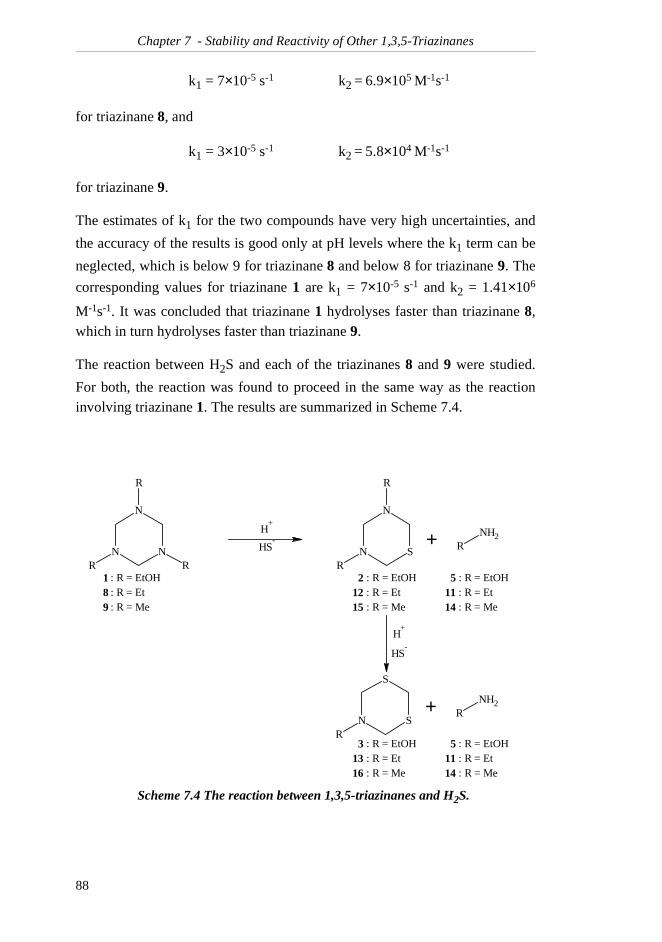
Chapter 7 - Stability and Reactivity of Other 1,3,5-Triazinanes
k1 = 7×10⁻⁵ s-1 k2 = 6.9×10⁵ M-1s-1
for triazinane 8, and
k1 = 3×10⁻⁵ s-1 k2 = 5.8×10⁴ M-1s-1
for triazinane 9.
The estimates of k1 for the two compounds have very high uncertainties, and
the accuracy of the results is good only at pH levels where the k1 term can be
neglected, which is below 9 for triazinane 8 and below 8 for triazinane 9. The
corresponding values for triazinane 1 are k1 = 7×10⁻⁵ s-1 and k2 = 1.41×10⁶
M-1s-1. It was concluded that triazinane 1 hydrolyses faster than triazinane 8,which in turn hydrolyses faster than triazinane 9.
The reaction between H2S and each of the triazinanes 8 and 9 were studied.
For both, the reaction was found to proceed in the same way as the reactioninvolving triazinane 1. The results are summarized in Scheme 7.4.
Scheme 7.4 The reaction between 1,3,5-triazinanes and H2S.
+
+
N
N
NR R
R
SN
S
R
RNH2
RNH2
SH-
SH-
S
N
NR
R
H+
H+
: R = EtOH: R = Et: R = Me
189
: R = EtOH: R = Et: R = Me
21215
: R = EtOH: R = Et: R = Me
31316
: R = EtOH: R = Et: R = Me
51114
: R = EtOH: R = Et: R = Me
51114
88
Chapter 7 - Stability and Reactivity of Other 1,3,5-Triazinanes
The reactivity of the two triazinanes with HS- were studied, and the rate
expression for both reactions was
in which k = Ka · k3’, and k3’ was found to be
k3’ = 5.5×10⁷ M-2s-1
for triazinane 8, and
k3’ = 1.4×10⁶ M-2s-1
for triazinane 9.
For triazinane 1, the corresponding value is k3’ = 8.8×10⁷ M-2s-1. It was con-
cluded that 1 also has a larger Ka and a larger rate constant k than the two other
compounds, making it the most reactive of the triazinanes in H2S removal.
From these experiments, it was concluded that triazinane 1 is the most reactiveof the compounds, but it is also easier hydrolysed. Triazinanes 8 and 9 werenot better suited as H2S-scavengers under the currently studied conditions, but
they may compete with triazinane 1 in situations where stability becomes moreimportant than the reactivity of the scavenger.
Attempts to synthesize another 1,3,5-triazinane, 1,3,5-tris(2-hydroxyethyl)-2,4,6-trimethyl-1,3,5-triazinane (10), from acetaldehyde and ethanolamine (5)were not successful.
]][[][ −+=− HSTHk
dt
Td
89

Chapter 7 - Stability and Reactivity of Other 1,3,5-Triazinanes
90
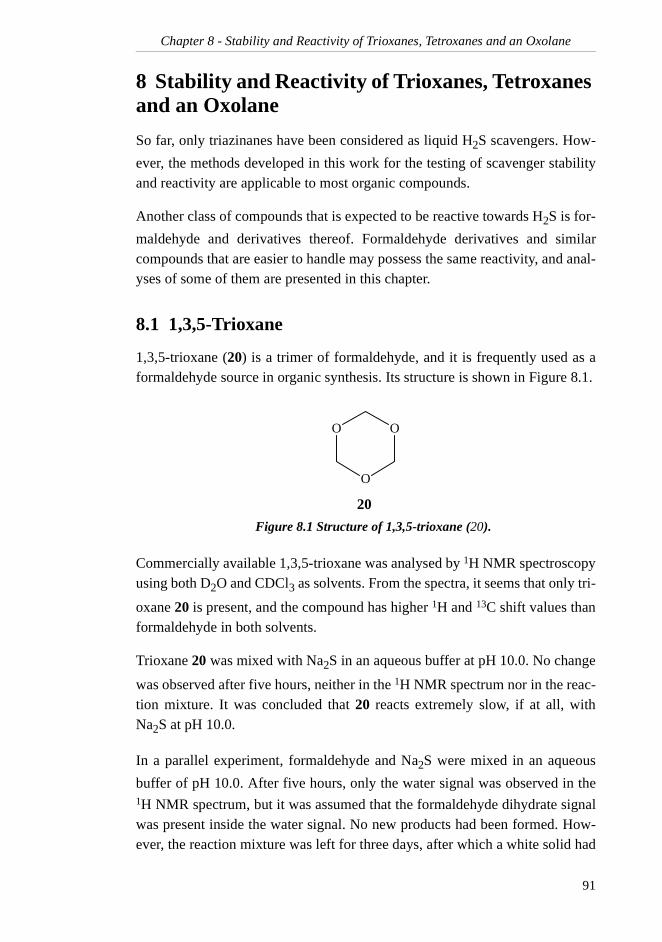
Chapter 8 - Stability and Reactivity of Trioxanes, Tetroxanes and an Oxolane
8 Stability and Reactivity of Trioxanes, Tetroxanes and an Oxolane
So far, only triazinanes have been considered as liquid H2S scavengers. How-
ever, the methods developed in this work for the testing of scavenger stabilityand reactivity are applicable to most organic compounds.
Another class of compounds that is expected to be reactive towards H2S is for-
maldehyde and derivatives thereof. Formaldehyde derivatives and similarcompounds that are easier to handle may possess the same reactivity, and anal-yses of some of them are presented in this chapter.
8.1 1,3,5-Trioxane
1,3,5-trioxane (20) is a trimer of formaldehyde, and it is frequently used as aformaldehyde source in organic synthesis. Its structure is shown in Figure 8.1.
Commercially available 1,3,5-trioxane was analysed by 1H NMR spectroscopyusing both D2O and CDCl3 as solvents. From the spectra, it seems that only tri-
oxane 20 is present, and the compound has higher 1H and 13C shift values thanformaldehyde in both solvents.
Trioxane 20 was mixed with Na2S in an aqueous buffer at pH 10.0. No change
was observed after five hours, neither in the 1H NMR spectrum nor in the reac-tion mixture. It was concluded that 20 reacts extremely slow, if at all, withNa2S at pH 10.0.
In a parallel experiment, formaldehyde and Na2S were mixed in an aqueous
buffer of pH 10.0. After five hours, only the water signal was observed in the1H NMR spectrum, but it was assumed that the formaldehyde dihydrate signalwas present inside the water signal. No new products had been formed. How-ever, the reaction mixture was left for three days, after which a white solid had
Figure 8.1 Structure of 1,3,5-trioxane (20).
O
O
O
20
91
Chapter 8 - Stability and Reactivity of Trioxanes, Tetroxanes and an Oxolane
precipitated from the solution. In the trioxane/Na2S mixture, no solids were
observed after three days. The white solid is assumed to be a polymer of thetype (-CH2-S-)n, but it was insoluble in six tested solvents, ranging from water
to hexane in polarity, and could not be analysed.
It was necessary to see if any reaction occurred between 1,3,5-trioxane (20)
and HS- at lower pH levels. The equimolar reaction between 20 and NaHS wasagain performed, but this time the pH was kept constant at 7.0. After six hours,
no reaction product was found in the 1H or 13C NMR spectra, but some whitesolid had precipitated from the solution.
The previous experiments raised the question whether trioxane 20 is present asthe trimer or as formaldehyde dihydrate in the aqueous solutions used. The sta-bility of 20 was analysed at pH 5.5, 2.5 and 1.5. The three samples had identi-
cal concentrations of 20 and the IS (acetonitrile), and a 1H NMR spectrum ofthe pH 5.5 solution was immediately recorded. The relative amounts of 20 andthe IS in this spectrum were used as a basis of comparison with the spectra of
the three solutions later recorded. After 25 hours, both 1H and 13C NMRspectra of the solutions were recorded. Trioxane 20 and the IS were still theonly compounds in the mixture, and the relative intensities of the signals from20 and the IS had not changed. Hence, 20 was considered to be stable even atvery low pH levels.
Finally, gaseous H2S was bubbled through an aqueous solution containing 20
and acetonitrile as an internal standard for 25 minutes, giving pH of 5 in the
solution. Two hours later a 1H NMR spectrum indicated that the relativeamounts of 20 and the IS were unchanged, and no products had been formed.No precipitation of any solids was observed.
From these experiments it was concluded that 1,3,5-trioxane (20) reacted very
slowly, if at all, with HS-. However, the results do not exclude the possibilitythat the trioxane coordinates to the sulfide and hence increases the uptake ofH2S in a solution. This effect would not be observable with the methods used
in the previous sections, but the experiments nevertheless indicate that 1,3,5-trioxane (20) cannot compete with 1,3,5-tris(2-hydroxyethyl)-1,3,5-triazinane(1) as an H2S scavenger.
92
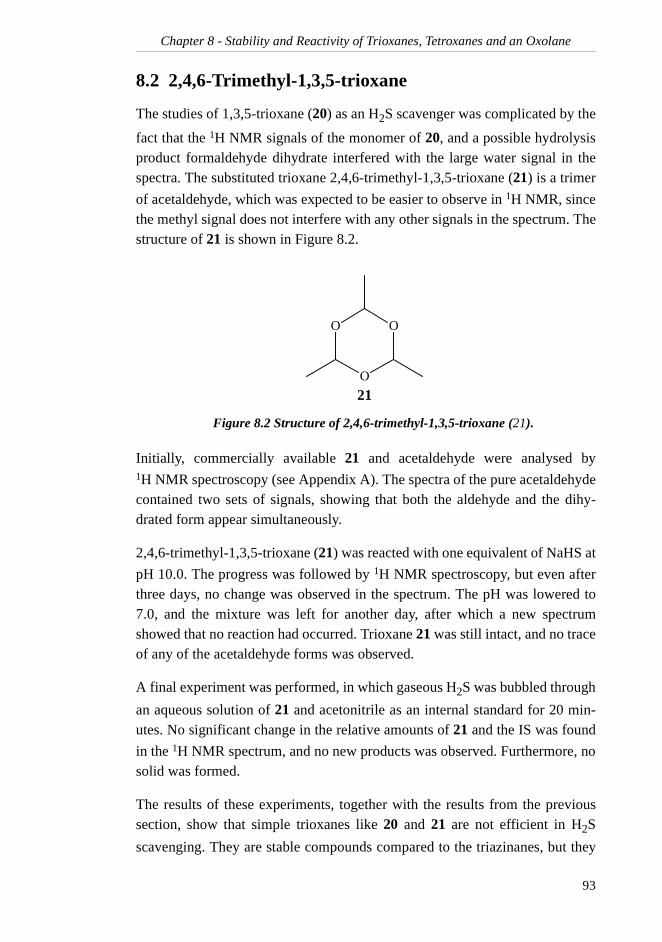
Chapter 8 - Stability and Reactivity of Trioxanes, Tetroxanes and an Oxolane
8.2 2,4,6-Trimethyl-1,3,5-trioxane
The studies of 1,3,5-trioxane (20) as an H2S scavenger was complicated by the
fact that the 1H NMR signals of the monomer of 20, and a possible hydrolysisproduct formaldehyde dihydrate interfered with the large water signal in thespectra. The substituted trioxane 2,4,6-trimethyl-1,3,5-trioxane (21) is a trimer
of acetaldehyde, which was expected to be easier to observe in 1H NMR, sincethe methyl signal does not interfere with any other signals in the spectrum. Thestructure of 21 is shown in Figure 8.2.
Initially, commercially available 21 and acetaldehyde were analysed by1H NMR spectroscopy (see Appendix A). The spectra of the pure acetaldehydecontained two sets of signals, showing that both the aldehyde and the dihy-drated form appear simultaneously.
2,4,6-trimethyl-1,3,5-trioxane (21) was reacted with one equivalent of NaHS at
pH 10.0. The progress was followed by 1H NMR spectroscopy, but even afterthree days, no change was observed in the spectrum. The pH was lowered to7.0, and the mixture was left for another day, after which a new spectrumshowed that no reaction had occurred. Trioxane 21 was still intact, and no traceof any of the acetaldehyde forms was observed.
A final experiment was performed, in which gaseous H2S was bubbled through
an aqueous solution of 21 and acetonitrile as an internal standard for 20 min-utes. No significant change in the relative amounts of 21 and the IS was found
in the 1H NMR spectrum, and no new products was observed. Furthermore, nosolid was formed.
The results of these experiments, together with the results from the previoussection, show that simple trioxanes like 20 and 21 are not efficient in H2S
scavenging. They are stable compounds compared to the triazinanes, but they
Figure 8.2 Structure of 2,4,6-trimethyl-1,3,5-trioxane (21).
O
O
O
21
93
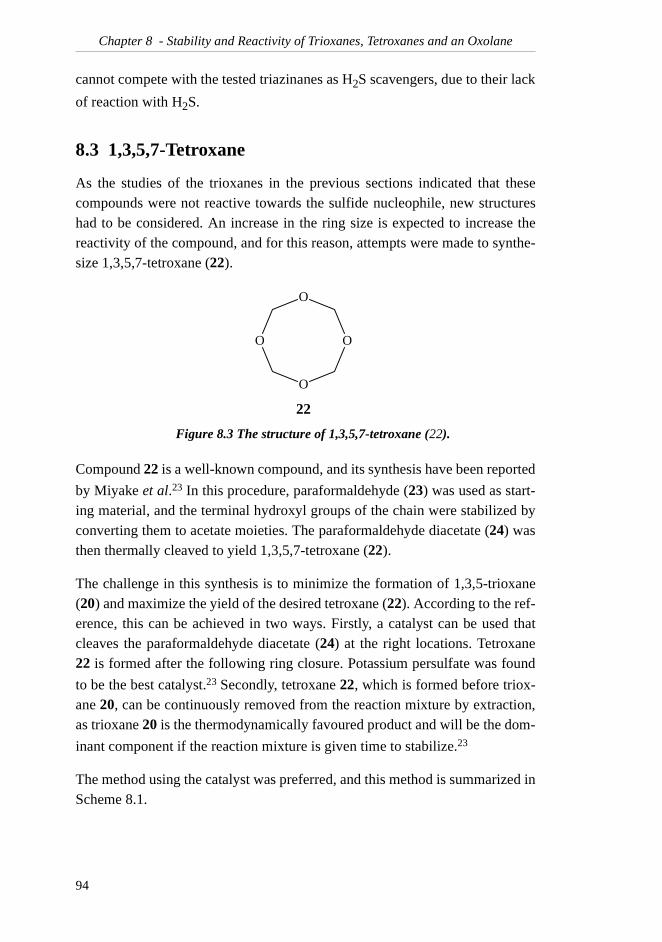
Chapter 8 - Stability and Reactivity of Trioxanes, Tetroxanes and an Oxolane
cannot compete with the tested triazinanes as H2S scavengers, due to their lack
of reaction with H2S.
8.3 1,3,5,7-Tetroxane
As the studies of the trioxanes in the previous sections indicated that thesecompounds were not reactive towards the sulfide nucleophile, new structureshad to be considered. An increase in the ring size is expected to increase thereactivity of the compound, and for this reason, attempts were made to synthe-size 1,3,5,7-tetroxane (22).
Compound 22 is a well-known compound, and its synthesis have been reported
by Miyake et al.23 In this procedure, paraformaldehyde (23) was used as start-ing material, and the terminal hydroxyl groups of the chain were stabilized byconverting them to acetate moieties. The paraformaldehyde diacetate (24) wasthen thermally cleaved to yield 1,3,5,7-tetroxane (22).
The challenge in this synthesis is to minimize the formation of 1,3,5-trioxane(20) and maximize the yield of the desired tetroxane (22). According to the ref-erence, this can be achieved in two ways. Firstly, a catalyst can be used thatcleaves the paraformaldehyde diacetate (24) at the right locations. Tetroxane22 is formed after the following ring closure. Potassium persulfate was found
to be the best catalyst.23 Secondly, tetroxane 22, which is formed before triox-ane 20, can be continuously removed from the reaction mixture by extraction,as trioxane 20 is the thermodynamically favoured product and will be the dom-
inant component if the reaction mixture is given time to stabilize.23
The method using the catalyst was preferred, and this method is summarized inScheme 8.1.
Figure 8.3 The structure of 1,3,5,7-tetroxane (22).
O
O
O
O
22
94
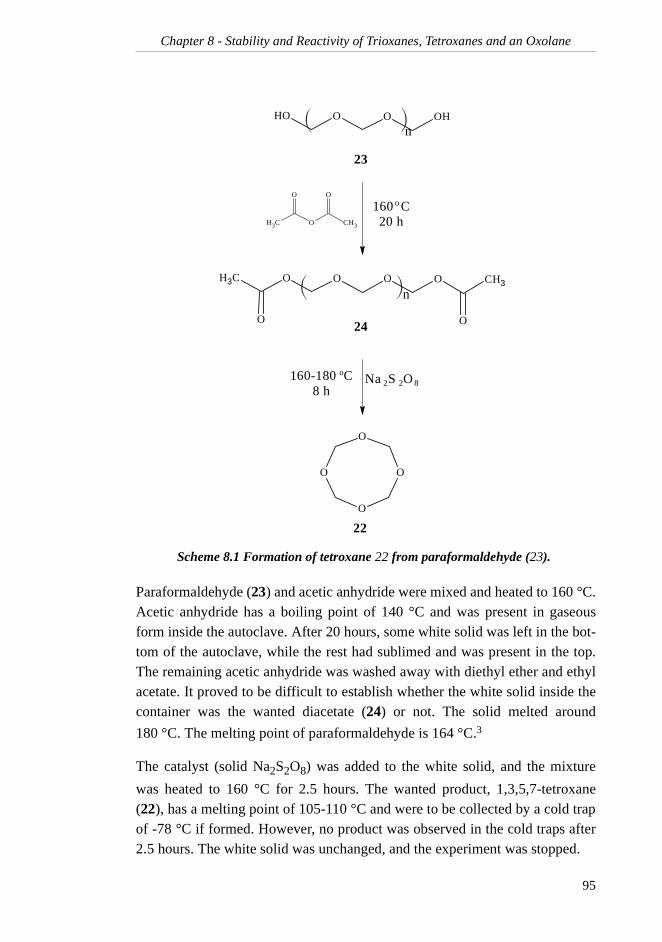
Chapter 8 - Stability and Reactivity of Trioxanes, Tetroxanes and an Oxolane
Paraformaldehyde (23) and acetic anhydride were mixed and heated to 160 °C.Acetic anhydride has a boiling point of 140 °C and was present in gaseousform inside the autoclave. After 20 hours, some white solid was left in the bot-tom of the autoclave, while the rest had sublimed and was present in the top.The remaining acetic anhydride was washed away with diethyl ether and ethylacetate. It proved to be difficult to establish whether the white solid inside thecontainer was the wanted diacetate (24) or not. The solid melted around
180 °C. The melting point of paraformaldehyde is 164 °C.3
The catalyst (solid Na2S2O8) was added to the white solid, and the mixture
was heated to 160 °C for 2.5 hours. The wanted product, 1,3,5,7-tetroxane(22), has a melting point of 105-110 °C and were to be collected by a cold trapof -78 °C if formed. However, no product was observed in the cold traps after2.5 hours. The white solid was unchanged, and the experiment was stopped.
Scheme 8.1 Formation of tetroxane 22 from paraformaldehyde (23).
O
O
O
O
OH O O OH
n
O O O OCH3
O
CH3
O
n
CH3 O CH3
O O
160-180 C8 h
oNa S O 2 2 8
160 C20 h
o
23
24
22
95
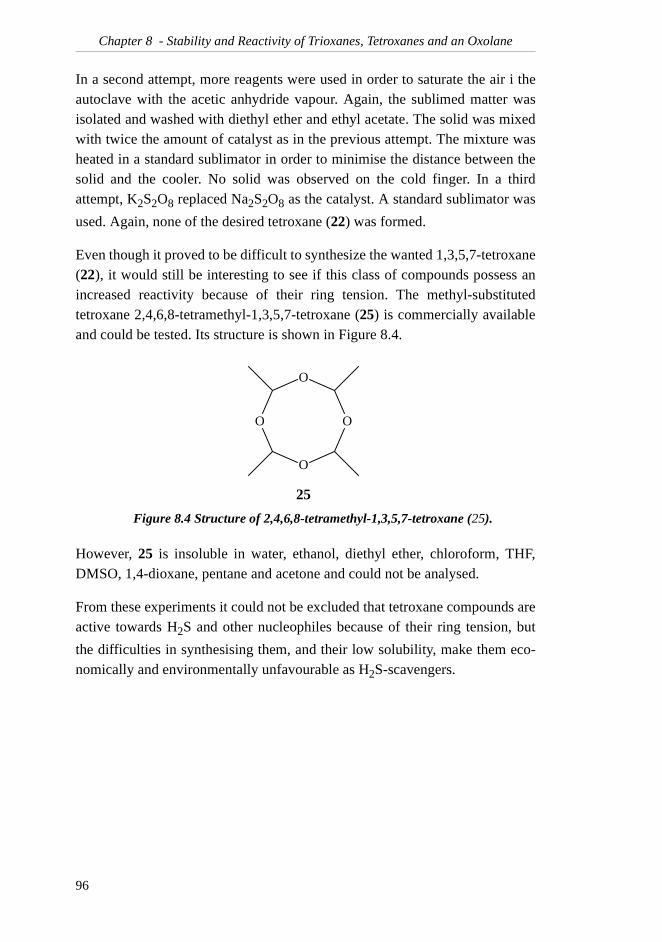
Chapter 8 - Stability and Reactivity of Trioxanes, Tetroxanes and an Oxolane
In a second attempt, more reagents were used in order to saturate the air i theautoclave with the acetic anhydride vapour. Again, the sublimed matter wasisolated and washed with diethyl ether and ethyl acetate. The solid was mixedwith twice the amount of catalyst as in the previous attempt. The mixture washeated in a standard sublimator in order to minimise the distance between thesolid and the cooler. No solid was observed on the cold finger. In a thirdattempt, K2S2O8 replaced Na2S2O8 as the catalyst. A standard sublimator was
used. Again, none of the desired tetroxane (22) was formed.
Even though it proved to be difficult to synthesize the wanted 1,3,5,7-tetroxane(22), it would still be interesting to see if this class of compounds possess anincreased reactivity because of their ring tension. The methyl-substitutedtetroxane 2,4,6,8-tetramethyl-1,3,5,7-tetroxane (25) is commercially availableand could be tested. Its structure is shown in Figure 8.4.
However, 25 is insoluble in water, ethanol, diethyl ether, chloroform, THF,DMSO, 1,4-dioxane, pentane and acetone and could not be analysed.
From these experiments it could not be excluded that tetroxane compounds areactive towards H2S and other nucleophiles because of their ring tension, but
the difficulties in synthesising them, and their low solubility, make them eco-nomically and environmentally unfavourable as H2S-scavengers.
Figure 8.4 Structure of 2,4,6,8-tetramethyl-1,3,5,7-tetroxane (25).
O
O
O
O
25
96
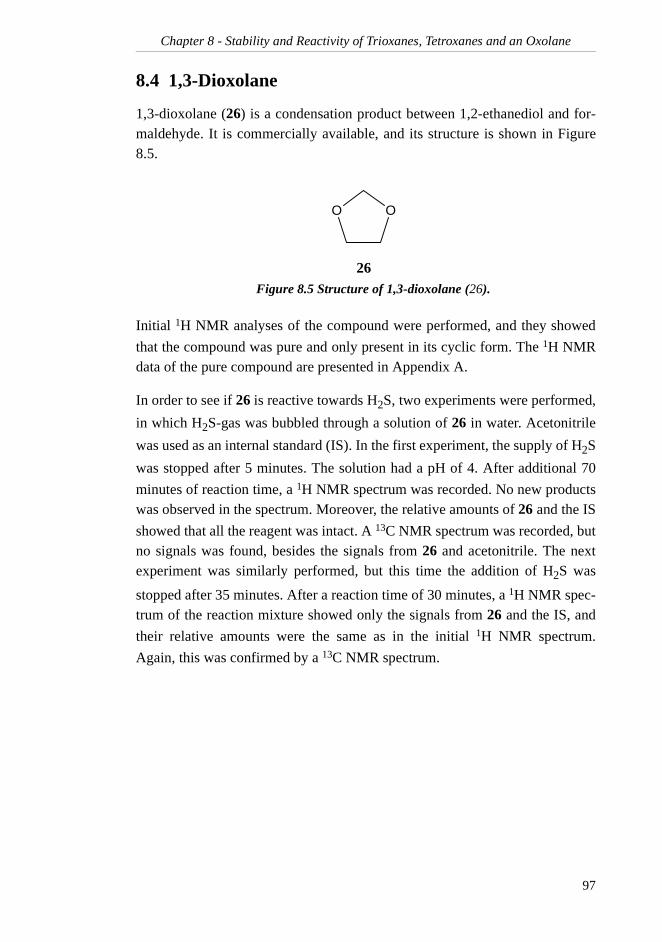
Chapter 8 - Stability and Reactivity of Trioxanes, Tetroxanes and an Oxolane
8.4 1,3-Dioxolane
1,3-dioxolane (26) is a condensation product between 1,2-ethanediol and for-maldehyde. It is commercially available, and its structure is shown in Figure8.5.
Initial 1H NMR analyses of the compound were performed, and they showed
that the compound was pure and only present in its cyclic form. The 1H NMRdata of the pure compound are presented in Appendix A.
In order to see if 26 is reactive towards H2S, two experiments were performed,
in which H2S-gas was bubbled through a solution of 26 in water. Acetonitrile
was used as an internal standard (IS). In the first experiment, the supply of H2S
was stopped after 5 minutes. The solution had a pH of 4. After additional 70
minutes of reaction time, a 1H NMR spectrum was recorded. No new productswas observed in the spectrum. Moreover, the relative amounts of 26 and the IS
showed that all the reagent was intact. A 13C NMR spectrum was recorded, butno signals was found, besides the signals from 26 and acetonitrile. The nextexperiment was similarly performed, but this time the addition of H2S was
stopped after 35 minutes. After a reaction time of 30 minutes, a 1H NMR spec-trum of the reaction mixture showed only the signals from 26 and the IS, and
their relative amounts were the same as in the initial 1H NMR spectrum.
Again, this was confirmed by a 13C NMR spectrum.
Figure 8.5 Structure of 1,3-dioxolane (26).
O O
26
97
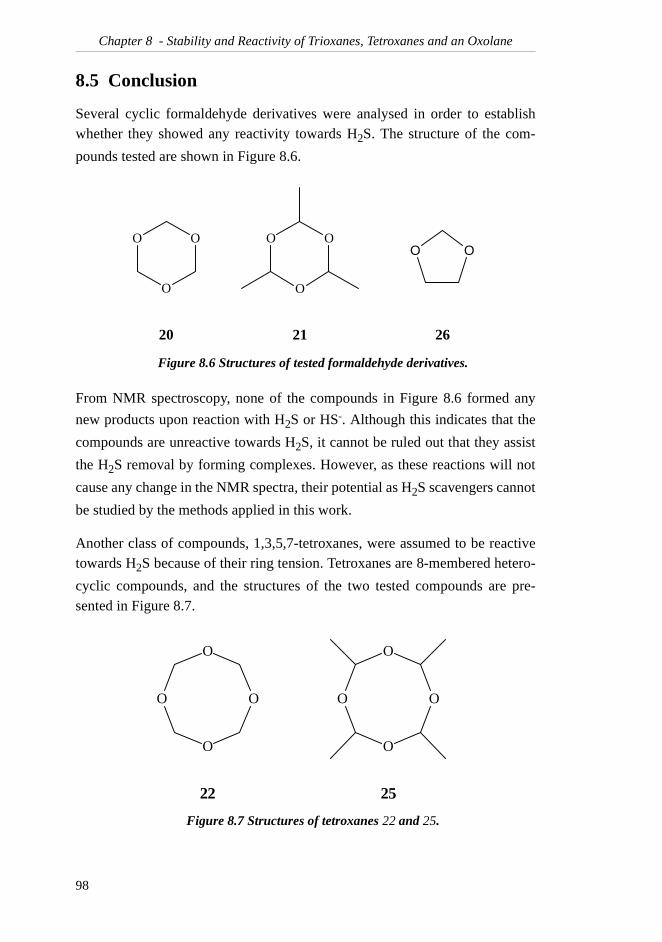
Chapter 8 - Stability and Reactivity of Trioxanes, Tetroxanes and an Oxolane
8.5 Conclusion
Several cyclic formaldehyde derivatives were analysed in order to establishwhether they showed any reactivity towards H2S. The structure of the com-
pounds tested are shown in Figure 8.6.
From NMR spectroscopy, none of the compounds in Figure 8.6 formed any
new products upon reaction with H2S or HS-. Although this indicates that the
compounds are unreactive towards H2S, it cannot be ruled out that they assist
the H2S removal by forming complexes. However, as these reactions will not
cause any change in the NMR spectra, their potential as H2S scavengers cannot
be studied by the methods applied in this work.
Another class of compounds, 1,3,5,7-tetroxanes, were assumed to be reactivetowards H2S because of their ring tension. Tetroxanes are 8-membered hetero-
cyclic compounds, and the structures of the two tested compounds are pre-sented in Figure 8.7.
Figure 8.6 Structures of tested formaldehyde derivatives.
Figure 8.7 Structures of tetroxanes 22 and 25.
O OO
O
O
20
O
O
O
21 26
O
O
O
OO
O
O
O
22 25
98
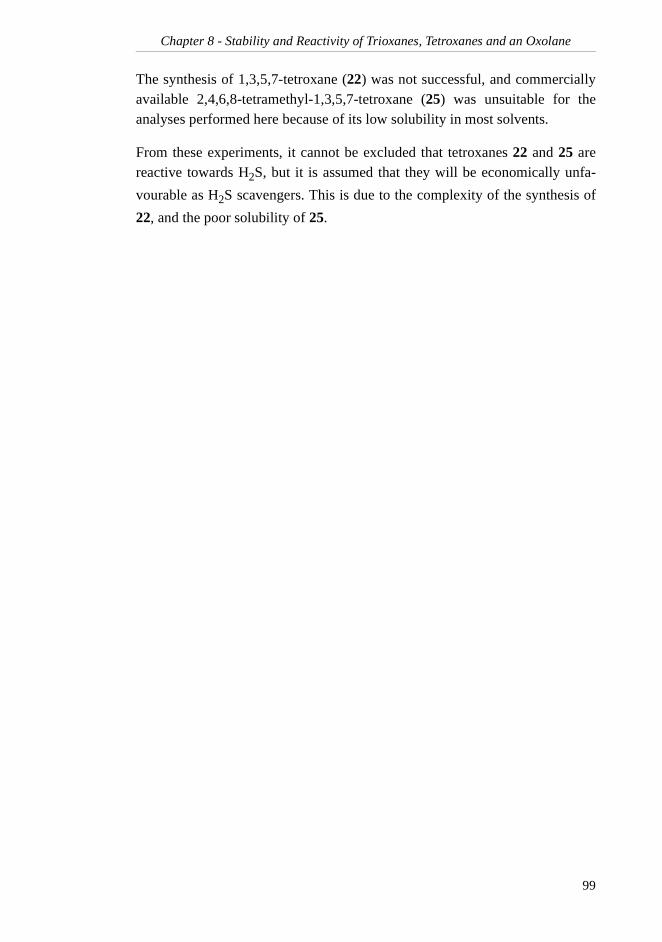
Chapter 8 - Stability and Reactivity of Trioxanes, Tetroxanes and an Oxolane
The synthesis of 1,3,5,7-tetroxane (22) was not successful, and commerciallyavailable 2,4,6,8-tetramethyl-1,3,5,7-tetroxane (25) was unsuitable for theanalyses performed here because of its low solubility in most solvents.
From these experiments, it cannot be excluded that tetroxanes 22 and 25 arereactive towards H2S, but it is assumed that they will be economically unfa-
vourable as H2S scavengers. This is due to the complexity of the synthesis of
22, and the poor solubility of 25.
99

Chapter 8 - Stability and Reactivity of Trioxanes, Tetroxanes and an Oxolane
100
Chapter 9 - Experimental
9 Experimental
9.1 General
9.1.1 Chemicals
All chemicals and solvents were of synthetic grade and were used without fur-ther purification. All water solutions were made with distilled water. Unlessotherwise indicated, all buffered solutions were made from a 0.50 M solutionof Na2HPO4, and all pH adjustments were performed with solid K2CO3, con-
centrated HCl or solid NaH2PO4. Solid Na2S and NaHS were used as sources
of HS-, and their purities were 60-62 % and 68-72 %, respectively, the restbeing crystal water.
9.1.2 Instrumentation
NMR Spectroscopy1H NMR and 13C NMR spectra were recorded on Bruker Avance DPX300 orDPX400 instruments. Chemical shifts are reported in ppm relative to tetrame-thylsilane (TMS, in CDCl3) or sodium 3-(trimethylsilyl)propionate-2,2,3,3-d4
(in D2O and CD3OD). In some experiments, a D2O-buffer was used as solvent.
The term "D2O-buffer" will refer to a 0.50 M solution of Na2HPO4 in D2O, in
which the pH had been adjusted to 10.0 with solid K2CO3.
All NMR spectra were recorded at room temperature with D2O as solvent
unless otherwise indicated.
Mass Spectrometry
The EIMS analysis and HRMS were performed on a Finnigan MAT 95 XLinstrument. The temperature was 20°C throughout the analysis.
IR Spectroscopy
Infrared spectra were recorded on a Nicolet 20SXC FT-IR Spectrometer.
Gas Chromatography
GC analyses were performed on two different GCs:
1. Chrompack 9000, Model 910/911 with split injection, flame ionisation detector, and a Shimadzu C-R5A integrator. The column used was CP-Sil5CB (25 m, ID 0.33 mm, Df 0.45 µm). The temperature program used
101
Chapter 9 - Experimental
linear gradients between the temperatures 80°C (0 min) - 180°C (12.5 min) - 250°C (16 min)- 180 °C (36 min).
2. Carlos Erba Instruments GC 6000 Vega Series 2 with on-column injection. The detectorand integrator were identical with the ones in GC system 1. The column was RTX-5 Amine (30 m, ID 0.25 mm, Df 0.5 µm). The tem-perature program used was 80°C (0 min)- 80 °C (3 min) - 250°C (11.5 min) - 250 °C (14.5 min).
All GC chromatograms were obtained by dissolving the pure component to beanalysed in dichloromethane (GC system 1) or methanol (GC system 2).
Thin Layer and Column Chromatography
TLC analyses were performed on Merck TLC aluminium sheets with Silica gel60 F254. The plates were developed with phosphomolybdic acid.
Silica 60 AC.C 40-63 µm was used as stationary phase in column chromato-graphy.
pH Measurements
Unless otherwise indicated, measurements of pH were performed with anOrion Ross Sure-Flow Combination electrode, model 8172, which can be usedwith sulfide-containing solutions. The electrode was connected to a constant-pH apparatus. This apparatus can keep a solution at a certain pH level by auto-matic titration. When pH rises above this level, an acidic solution is added witha Masterflex Easy-load pump (model 5718-00). Unless otherwise indicated, a5 % aqueous solution of HCl was used to keep the pH constant.
Sulfide Detection
Detection of sulfide was done with an Orion Sure-Flow Combination Silver/Sulfide Electrode, model 9616, connected to a Fluke 89IV True RMS Multi-meter.
Elemental Analysis
Elemental Analyses were performed by the Laboratory of Organic ElementalAnalysis, Prague Institute of Chemical Technology, Czech Republic.
Melting Points
All melting points are uncorrected and were measured on a Büchi oil bathmelting point apparatus.
102
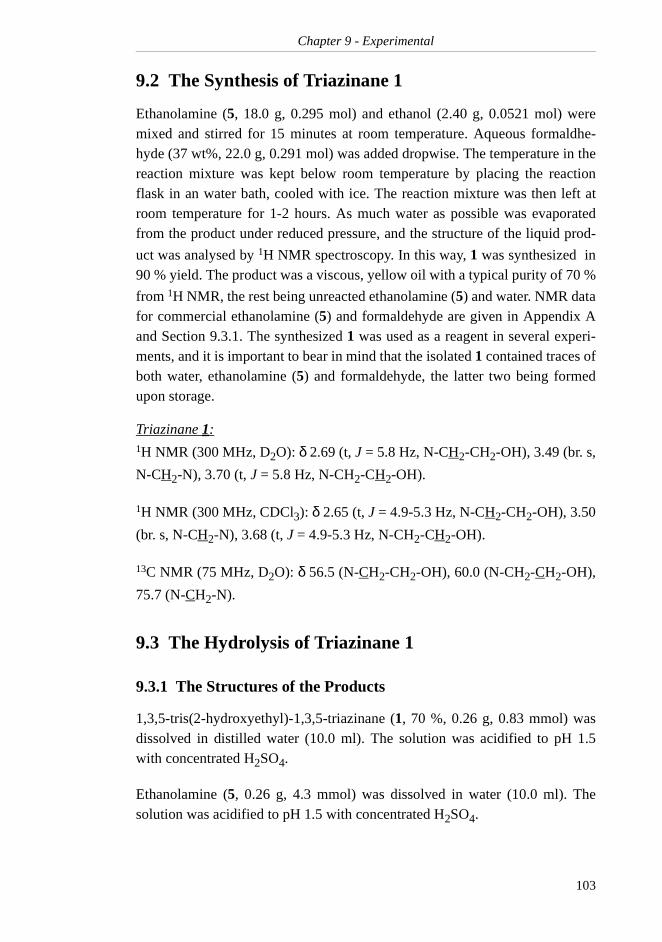
Chapter 9 - Experimental
9.2 The Synthesis of Triazinane 1
Ethanolamine (5, 18.0 g, 0.295 mol) and ethanol (2.40 g, 0.0521 mol) weremixed and stirred for 15 minutes at room temperature. Aqueous formaldhe-hyde (37 wt%, 22.0 g, 0.291 mol) was added dropwise. The temperature in thereaction mixture was kept below room temperature by placing the reactionflask in an water bath, cooled with ice. The reaction mixture was then left atroom temperature for 1-2 hours. As much water as possible was evaporatedfrom the product under reduced pressure, and the structure of the liquid prod-
uct was analysed by 1H NMR spectroscopy. In this way, 1 was synthesized in90 % yield. The product was a viscous, yellow oil with a typical purity of 70 %
from 1H NMR, the rest being unreacted ethanolamine (5) and water. NMR datafor commercial ethanolamine (5) and formaldehyde are given in Appendix Aand Section 9.3.1. The synthesized 1 was used as a reagent in several experi-ments, and it is important to bear in mind that the isolated 1 contained traces ofboth water, ethanolamine (5) and formaldehyde, the latter two being formedupon storage.
Triazinane 1:1H NMR (300 MHz, D2O): δ 2.69 (t, J = 5.8 Hz, N-CH2-CH2-OH), 3.49 (br. s,
N-CH2-N), 3.70 (t, J = 5.8 Hz, N-CH2-CH2-OH).
1H NMR (300 MHz, CDCl3): δ 2.65 (t, J = 4.9-5.3 Hz, N-CH2-CH2-OH), 3.50
(br. s, N-CH2-N), 3.68 (t, J = 4.9-5.3 Hz, N-CH2-CH2-OH).
13C NMR (75 MHz, D2O): δ 56.5 (N-CH2-CH2-OH), 60.0 (N-CH2-CH2-OH),
75.7 (N-CH2-N).
9.3 The Hydrolysis of Triazinane 1
9.3.1 The Structures of the Products
1,3,5-tris(2-hydroxyethyl)-1,3,5-triazinane (1, 70 %, 0.26 g, 0.83 mmol) wasdissolved in distilled water (10.0 ml). The solution was acidified to pH 1.5with concentrated H2SO4.
Ethanolamine (5, 0.26 g, 4.3 mmol) was dissolved in water (10.0 ml). Thesolution was acidified to pH 1.5 with concentrated H2SO4.
103
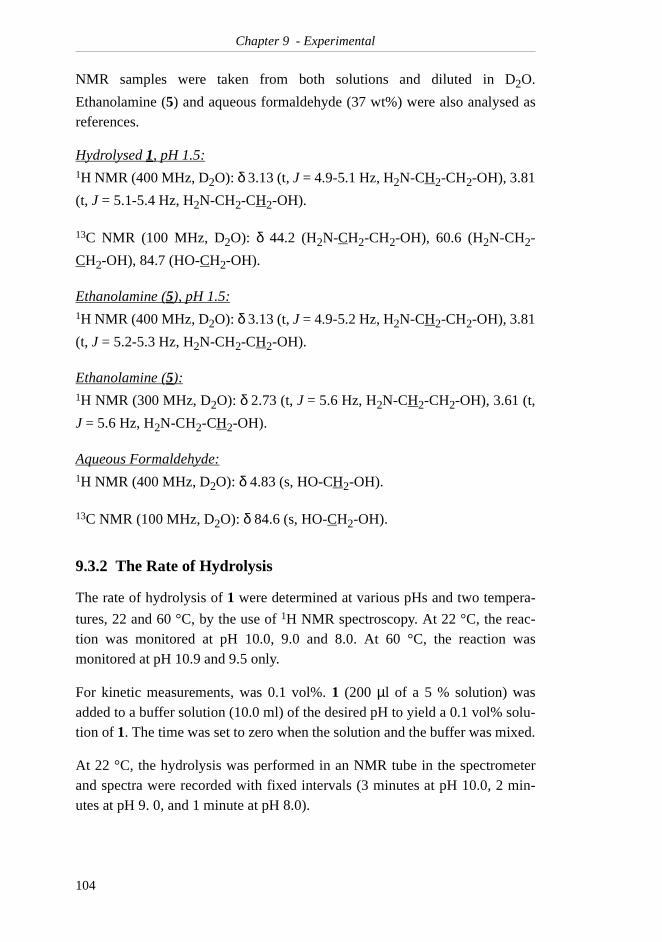
Chapter 9 - Experimental
NMR samples were taken from both solutions and diluted in D2O.
Ethanolamine (5) and aqueous formaldehyde (37 wt%) were also analysed asreferences.
Hydrolysed 1, pH 1.5:1H NMR (400 MHz, D2O): δ 3.13 (t, J = 4.9-5.1 Hz, H2N-CH2-CH2-OH), 3.81
(t, J = 5.1-5.4 Hz, H2N-CH2-CH2-OH).
13C NMR (100 MHz, D2O): δ 44.2 (H2N-CH2-CH2-OH), 60.6 (H2N-CH2-
CH2-OH), 84.7 (HO-CH2-OH).
Ethanolamine (5), pH 1.5:1H NMR (400 MHz, D2O): δ 3.13 (t, J = 4.9-5.2 Hz, H2N-CH2-CH2-OH), 3.81
(t, J = 5.2-5.3 Hz, H2N-CH2-CH2-OH).
Ethanolamine (5):1H NMR (300 MHz, D2O): δ 2.73 (t, J = 5.6 Hz, H2N-CH2-CH2-OH), 3.61 (t,
J = 5.6 Hz, H2N-CH2-CH2-OH).
Aqueous Formaldehyde:1H NMR (400 MHz, D2O): δ 4.83 (s, HO-CH2-OH).
13C NMR (100 MHz, D2O): δ 84.6 (s, HO-CH2-OH).
9.3.2 The Rate of Hydrolysis
The rate of hydrolysis of 1 were determined at various pHs and two tempera-
tures, 22 and 60 °C, by the use of 1H NMR spectroscopy. At 22 °C, the reac-tion was monitored at pH 10.0, 9.0 and 8.0. At 60 °C, the reaction wasmonitored at pH 10.9 and 9.5 only.
For kinetic measurements, was 0.1 vol%. 1 (200 µl of a 5 % solution) wasadded to a buffer solution (10.0 ml) of the desired pH to yield a 0.1 vol% solu-tion of 1. The time was set to zero when the solution and the buffer was mixed.
At 22 °C, the hydrolysis was performed in an NMR tube in the spectrometerand spectra were recorded with fixed intervals (3 minutes at pH 10.0, 2 min-utes at pH 9. 0, and 1 minute at pH 8.0).
104
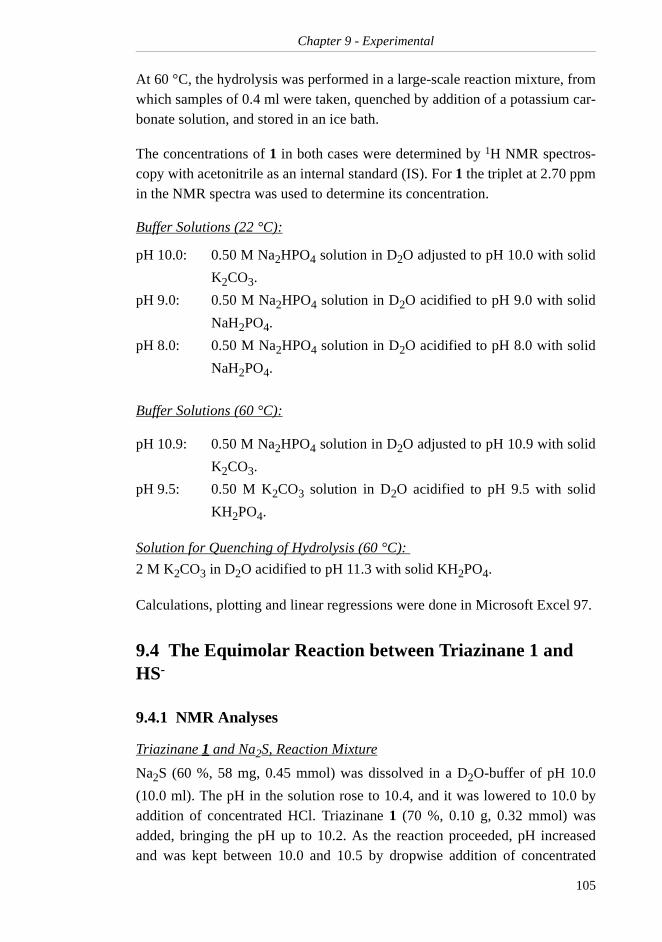
Chapter 9 - Experimental
At 60 °C, the hydrolysis was performed in a large-scale reaction mixture, fromwhich samples of 0.4 ml were taken, quenched by addition of a potassium car-bonate solution, and stored in an ice bath.
The concentrations of 1 in both cases were determined by 1H NMR spectros-copy with acetonitrile as an internal standard (IS). For 1 the triplet at 2.70 ppmin the NMR spectra was used to determine its concentration.
Buffer Solutions (22 °C):
pH 10.0: 0.50 M Na2HPO4 solution in D2O adjusted to pH 10.0 with solid
K2CO3.
pH 9.0: 0.50 M Na2HPO4 solution in D2O acidified to pH 9.0 with solid
NaH2PO4.
pH 8.0: 0.50 M Na2HPO4 solution in D2O acidified to pH 8.0 with solid
NaH2PO4.
Buffer Solutions (60 °C):
pH 10.9: 0.50 M Na2HPO4 solution in D2O adjusted to pH 10.9 with solid
K2CO3.
pH 9.5: 0.50 M K2CO3 solution in D2O acidified to pH 9.5 with solid
KH2PO4.
Solution for Quenching of Hydrolysis (60 °C):
2 M K2CO3 in D2O acidified to pH 11.3 with solid KH2PO4.
Calculations, plotting and linear regressions were done in Microsoft Excel 97.
9.4 The Equimolar Reaction between Triazinane 1 and HS-
9.4.1 NMR Analyses
Triazinane 1 and Na2S, Reaction Mixture
Na2S (60 %, 58 mg, 0.45 mmol) was dissolved in a D2O-buffer of pH 10.0
(10.0 ml). The pH in the solution rose to 10.4, and it was lowered to 10.0 byaddition of concentrated HCl. Triazinane 1 (70 %, 0.10 g, 0.32 mmol) wasadded, bringing the pH up to 10.2. As the reaction proceeded, pH increasedand was kept between 10.0 and 10.5 by dropwise addition of concentrated
105
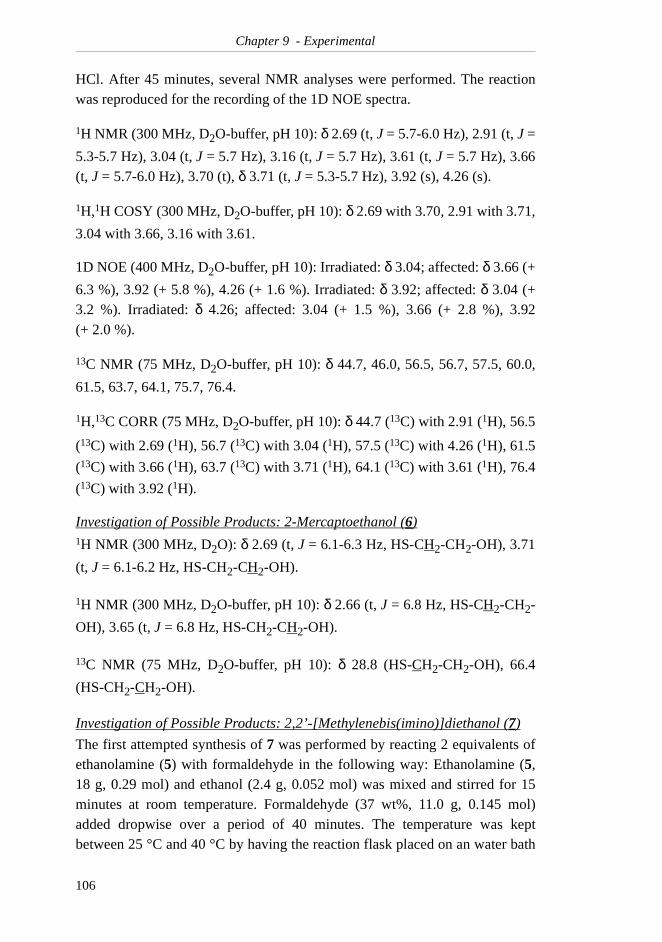
Chapter 9 - Experimental
HCl. After 45 minutes, several NMR analyses were performed. The reactionwas reproduced for the recording of the 1D NOE spectra.
1H NMR (300 MHz, D2O-buffer, pH 10): δ 2.69 (t, J = 5.7-6.0 Hz), 2.91 (t, J =
5.3-5.7 Hz), 3.04 (t, J = 5.7 Hz), 3.16 (t, J = 5.7 Hz), 3.61 (t, J = 5.7 Hz), 3.66(t, J = 5.7-6.0 Hz), 3.70 (t), δ 3.71 (t, J = 5.3-5.7 Hz), 3.92 (s), 4.26 (s).
1H,1H COSY (300 MHz, D2O-buffer, pH 10): δ 2.69 with 3.70, 2.91 with 3.71,
3.04 with 3.66, 3.16 with 3.61.
1D NOE (400 MHz, D2O-buffer, pH 10): Irradiated: δ 3.04; affected: δ 3.66 (+
6.3 %), 3.92 (+ 5.8 %), 4.26 (+ 1.6 %). Irradiated: δ 3.92; affected: δ 3.04 (+3.2 %). Irradiated: δ 4.26; affected: 3.04 (+ 1.5 %), 3.66 (+ 2.8 %), 3.92(+ 2.0 %).
13C NMR (75 MHz, D2O-buffer, pH 10): δ 44.7, 46.0, 56.5, 56.7, 57.5, 60.0,
61.5, 63.7, 64.1, 75.7, 76.4.
1H,13C CORR (75 MHz, D2O-buffer, pH 10): δ 44.7 (13C) with 2.91 (1H), 56.5
(13C) with 2.69 (1H), 56.7 (13C) with 3.04 (1H), 57.5 (13C) with 4.26 (1H), 61.5
(13C) with 3.66 (1H), 63.7 (13C) with 3.71 (1H), 64.1 (13C) with 3.61 (1H), 76.4
(13C) with 3.92 (1H).
Investigation of Possible Products: 2-Mercaptoethanol (6)1H NMR (300 MHz, D2O): δ 2.69 (t, J = 6.1-6.3 Hz, HS-CH2-CH2-OH), 3.71
(t, J = 6.1-6.2 Hz, HS-CH2-CH2-OH).
1H NMR (300 MHz, D2O-buffer, pH 10): δ 2.66 (t, J = 6.8 Hz, HS-CH2-CH2-
OH), 3.65 (t, J = 6.8 Hz, HS-CH2-CH2-OH).
13C NMR (75 MHz, D2O-buffer, pH 10): δ 28.8 (HS-CH2-CH2-OH), 66.4
(HS-CH2-CH2-OH).
Investigation of Possible Products: 2,2’-[Methylenebis(imino)]diethanol (7)
The first attempted synthesis of 7 was performed by reacting 2 equivalents ofethanolamine (5) with formaldehyde in the following way: Ethanolamine (5,18 g, 0.29 mol) and ethanol (2.4 g, 0.052 mol) was mixed and stirred for 15minutes at room temperature. Formaldehyde (37 wt%, 11.0 g, 0.145 mol)added dropwise over a period of 40 minutes. The temperature was keptbetween 25 °C and 40 °C by having the reaction flask placed on an water bath
106
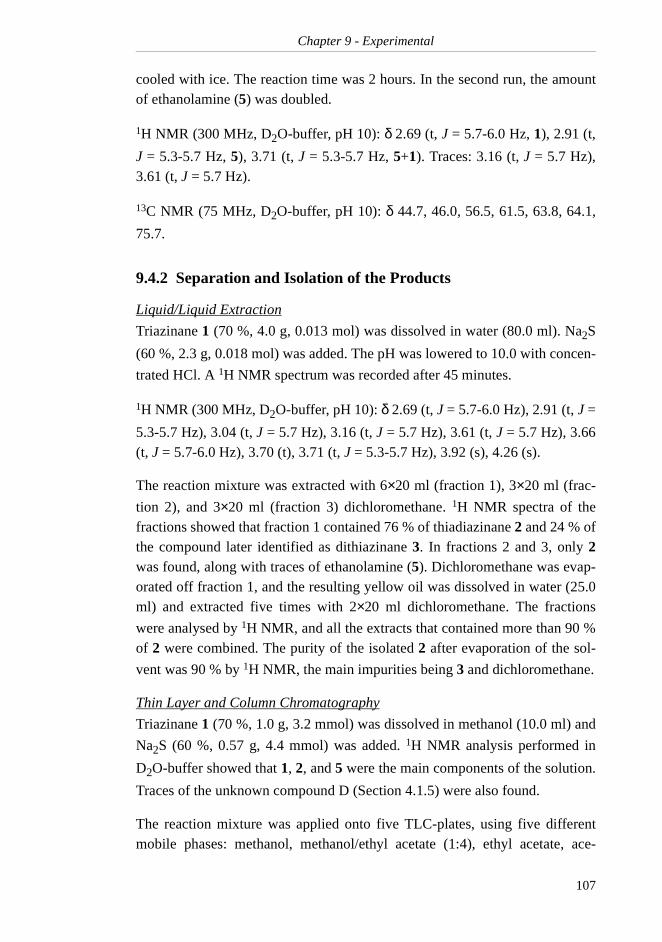
Chapter 9 - Experimental
cooled with ice. The reaction time was 2 hours. In the second run, the amountof ethanolamine (5) was doubled.
1H NMR (300 MHz, D2O-buffer, pH 10): δ 2.69 (t, J = 5.7-6.0 Hz, 1), 2.91 (t,
J = 5.3-5.7 Hz, 5), 3.71 (t, J = 5.3-5.7 Hz, 5+1). Traces: 3.16 (t, J = 5.7 Hz),3.61 (t, J = 5.7 Hz).
13C NMR (75 MHz, D2O-buffer, pH 10): δ 44.7, 46.0, 56.5, 61.5, 63.8, 64.1,
75.7.
9.4.2 Separation and Isolation of the Products
Liquid/Liquid Extraction
Triazinane 1 (70 %, 4.0 g, 0.013 mol) was dissolved in water (80.0 ml). Na2S
(60 %, 2.3 g, 0.018 mol) was added. The pH was lowered to 10.0 with concen-
trated HCl. A 1H NMR spectrum was recorded after 45 minutes.
1H NMR (300 MHz, D2O-buffer, pH 10): δ 2.69 (t, J = 5.7-6.0 Hz), 2.91 (t, J =
5.3-5.7 Hz), 3.04 (t, J = 5.7 Hz), 3.16 (t, J = 5.7 Hz), 3.61 (t, J = 5.7 Hz), 3.66(t, J = 5.7-6.0 Hz), 3.70 (t), 3.71 (t, J = 5.3-5.7 Hz), 3.92 (s), 4.26 (s).
The reaction mixture was extracted with 6×20 ml (fraction 1), 3×20 ml (frac-
tion 2), and 3×20 ml (fraction 3) dichloromethane. 1H NMR spectra of thefractions showed that fraction 1 contained 76 % of thiadiazinane 2 and 24 % ofthe compound later identified as dithiazinane 3. In fractions 2 and 3, only 2was found, along with traces of ethanolamine (5). Dichloromethane was evap-orated off fraction 1, and the resulting yellow oil was dissolved in water (25.0ml) and extracted five times with 2×20 ml dichloromethane. The fractions
were analysed by 1H NMR, and all the extracts that contained more than 90 %of 2 were combined. The purity of the isolated 2 after evaporation of the sol-
vent was 90 % by 1H NMR, the main impurities being 3 and dichloromethane.
Thin Layer and Column Chromatography
Triazinane 1 (70 %, 1.0 g, 3.2 mmol) was dissolved in methanol (10.0 ml) and
Na2S (60 %, 0.57 g, 4.4 mmol) was added. 1H NMR analysis performed in
D2O-buffer showed that 1, 2, and 5 were the main components of the solution.
Traces of the unknown compound D (Section 4.1.5) were also found.
The reaction mixture was applied onto five TLC-plates, using five differentmobile phases: methanol, methanol/ethyl acetate (1:4), ethyl acetate, ace-
107
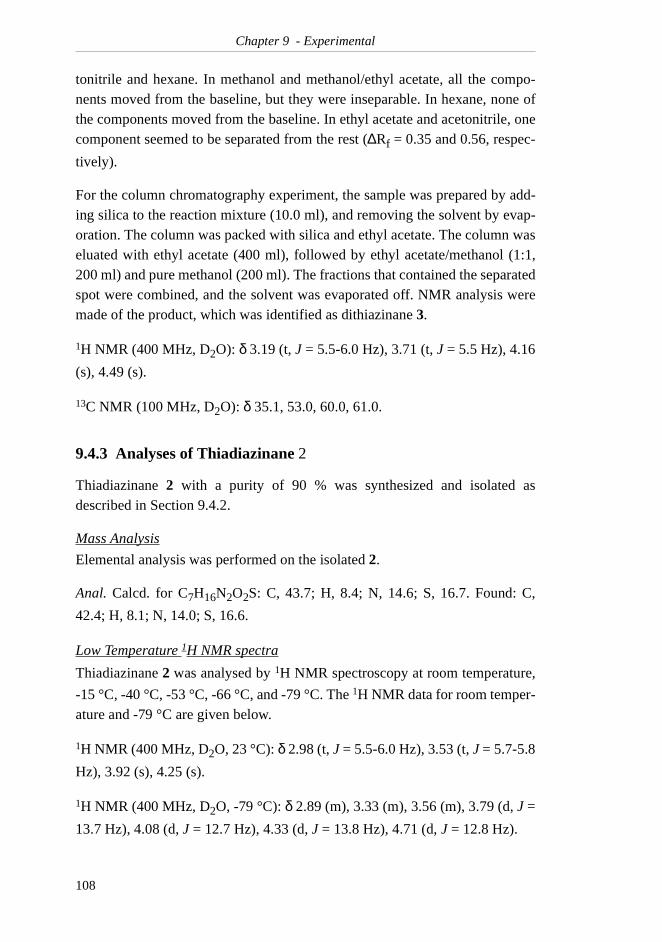
Chapter 9 - Experimental
tonitrile and hexane. In methanol and methanol/ethyl acetate, all the compo-nents moved from the baseline, but they were inseparable. In hexane, none ofthe components moved from the baseline. In ethyl acetate and acetonitrile, onecomponent seemed to be separated from the rest (∆Rf = 0.35 and 0.56, respec-
tively).
For the column chromatography experiment, the sample was prepared by add-ing silica to the reaction mixture (10.0 ml), and removing the solvent by evap-oration. The column was packed with silica and ethyl acetate. The column waseluated with ethyl acetate (400 ml), followed by ethyl acetate/methanol (1:1,200 ml) and pure methanol (200 ml). The fractions that contained the separatedspot were combined, and the solvent was evaporated off. NMR analysis weremade of the product, which was identified as dithiazinane 3.
1H NMR (400 MHz, D2O): δ 3.19 (t, J = 5.5-6.0 Hz), 3.71 (t, J = 5.5 Hz), 4.16
(s), 4.49 (s).
13C NMR (100 MHz, D2O): δ 35.1, 53.0, 60.0, 61.0.
9.4.3 Analyses of Thiadiazinane 2
Thiadiazinane 2 with a purity of 90 % was synthesized and isolated asdescribed in Section 9.4.2.
Mass Analysis
Elemental analysis was performed on the isolated 2.
Anal. Calcd. for C7H16N2O2S: C, 43.7; H, 8.4; N, 14.6; S, 16.7. Found: C,
42.4; H, 8.1; N, 14.0; S, 16.6.
Low Temperature 1H NMR spectra
Thiadiazinane 2 was analysed by 1H NMR spectroscopy at room temperature,
-15 °C, -40 °C, -53 °C, -66 °C, and -79 °C. The 1H NMR data for room temper-ature and -79 °C are given below.
1H NMR (400 MHz, D2O, 23 °C): δ 2.98 (t, J = 5.5-6.0 Hz), 3.53 (t, J = 5.7-5.8
Hz), 3.92 (s), 4.25 (s).
1H NMR (400 MHz, D2O, -79 °C): δ 2.89 (m), 3.33 (m), 3.56 (m), 3.79 (d, J =
13.7 Hz), 4.08 (d, J = 12.7 Hz), 4.33 (d, J = 13.8 Hz), 4.71 (d, J = 12.8 Hz).
108
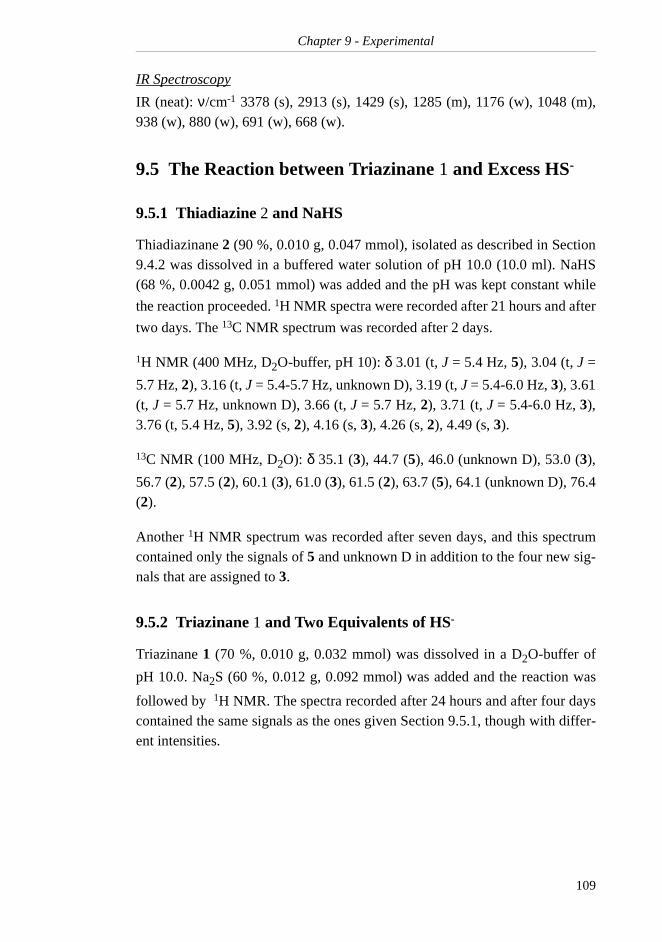
Chapter 9 - Experimental
IR Spectroscopy
IR (neat): ν/cm-1 3378 (s), 2913 (s), 1429 (s), 1285 (m), 1176 (w), 1048 (m),938 (w), 880 (w), 691 (w), 668 (w).
9.5 The Reaction between Triazinane 1 and Excess HS-
9.5.1 Thiadiazine 2 and NaHS
Thiadiazinane 2 (90 %, 0.010 g, 0.047 mmol), isolated as described in Section9.4.2 was dissolved in a buffered water solution of pH 10.0 (10.0 ml). NaHS(68 %, 0.0042 g, 0.051 mmol) was added and the pH was kept constant while
the reaction proceeded. 1H NMR spectra were recorded after 21 hours and after
two days. The 13C NMR spectrum was recorded after 2 days.
1H NMR (400 MHz, D2O-buffer, pH 10): δ 3.01 (t, J = 5.4 Hz, 5), 3.04 (t, J =
5.7 Hz, 2), 3.16 (t, J = 5.4-5.7 Hz, unknown D), 3.19 (t, J = 5.4-6.0 Hz, 3), 3.61(t, J = 5.7 Hz, unknown D), 3.66 (t, J = 5.7 Hz, 2), 3.71 (t, J = 5.4-6.0 Hz, 3),3.76 (t, 5.4 Hz, 5), 3.92 (s, 2), 4.16 (s, 3), 4.26 (s, 2), 4.49 (s, 3).
13C NMR (100 MHz, D2O): δ 35.1 (3), 44.7 (5), 46.0 (unknown D), 53.0 (3),
56.7 (2), 57.5 (2), 60.1 (3), 61.0 (3), 61.5 (2), 63.7 (5), 64.1 (unknown D), 76.4(2).
Another 1H NMR spectrum was recorded after seven days, and this spectrumcontained only the signals of 5 and unknown D in addition to the four new sig-nals that are assigned to 3.
9.5.2 Triazinane 1 and Two Equivalents of HS-
Triazinane 1 (70 %, 0.010 g, 0.032 mmol) was dissolved in a D2O-buffer of
pH 10.0. Na2S (60 %, 0.012 g, 0.092 mmol) was added and the reaction was
followed by 1H NMR. The spectra recorded after 24 hours and after four dayscontained the same signals as the ones given Section 9.5.1, though with differ-ent intensities.
109
Chapter 9 - Experimental
9.5.3 Separation and Isolation of the Product
Liquid/Liquid Extraction
Triazinane 1 (70 %, 1.0 g, 3.2 mmol) and Na2S (60 %, 1.2 g, 9.5 mmol) were
mixed in a buffered, aqueous solution of pH 10.0 (100 ml). The reaction mix-
ture was kept at a constant pH for five hours, when a 1H NMR spectrumshowed that thiadiazinane 2 was the dominant component in the solution, inaddition to 5. Another equivalent of Na2S (60 %, 0.58 g, 4.5 mmol) was added
to complete the reaction. After 24 hours, another 1H NMR spectrum showedthat the relative amounts of 2 and 3 were 1:1. The reaction mixture was kept at
a constant pH for another 24 hours, when 1H NMR spectrum showed that theamount of 3 in the solution was more than six times greater than the amount of2. 3 was continuously extracted from the reaction mixture with dichlorometh-
ane for one hour. 1H NMR of the aqueous phase showed that no 3 was left in
the reaction mixture. The solvent was evaporated from the organic phase. 1HNMR analysis (CDCl3) of the isolated product showed that the purity of 3 was
98 %, the only contaminant being dichloromethane.
Short Path Distillation
The short path distillation apparatus was evacuated. Solid carbon dioxide (dryice) was used to cool and condense any vapour formed in the experiments.
In the attempt to separate 2 and 3 by short path distillation, several mixtures ofpure 2 and 3 from the liquid-liquid extraction experiments (Section 4.2.1) werecombined in dichloromethane, which was then evaporated to yield a mixture
that from 1H NMR spectroscopy contained mainly 2 and 3, but also smallamounts of 1 and 5. The mixture was put in a short path distillation apparatus
which was evacuated to 1.8×10⁻⁴ atm. The temperature was increased fromroom temperature to 200°C. The mixture gradually turned brown, but no boil-
ing was observed. 1H NMR analysis after the experiment showed that 3 wasintact, whereas 1 and 2 had decomposed. The relative amount of 5 hadincreased. Some new signals with low intensity were also observed in the spec-trum.
9.5.4 Analyses of Dithiazinane 3
Dithiazinane 3 with a purity of 98 % was synthesized and isolated as describedin Section 9.5.3.
110
Chapter 9 - Experimental
Mass Analysis
Elemental analysis was performed on the isolated 3.
Anal. Calcd. for C5H11NOS2: C, 36.3; H, 6.7; N, 8.5; S, 38.8. Found: C, 35.7;
H, 6.5; N, 8.4; S, 37.2.
Low Temperature 1H NMR spectra
Dithazinane 3 was analysed by 1H NMR spectroscopy at room temperature,
-15 °C, -40 °C, -53 °C, -66 °C, and -79 °C. The 1H NMR data for room temper-ature and -79 °C are given below.
1H NMR (400 MHz, D2O, 23 °C): δ 3.16 (t, J = 5.7-5.8 Hz), 3.63 (t, J = 5.7-5.8
Hz), 4.12 (s), 4.48 (s).
1H NMR (400 MHz, D2O, -79 °C): δ 3.15 (t, J = 5.5-5.6 Hz), 3.62 (t, J = 5.5-
5.7 Hz), 3.62 (d), 4.08 (d, J = 13.1 Hz), 4.67 (d, J = 13.5 Hz), 4.92 (d, J = 13.3Hz).
IR Spectroscopy
IR (neat): ν/cm-1 3394 (s), 2915 (s), 1429 (s), 1283 (s), 1195 (m), 1059 (s), 941(m), 873 (m), 728 (m), 689 (m), 668 (w).
9.5.5 Triazinane 1 and Large Excess of HS-
Triazinane 1 and Three Equivalents of HS-
Triazinane 1 (70 %, 0.010 g, 0.032 mmol) was dissolved in a D2O-buffer of
pH 10 (10.0 ml), and NaHS (68 %, 0.011 g, 0.13 mmol) was added. After 22
hours, a 1H NMR spectrum was recorded, showing that the ratio between 2 and
3 was 1:0.9. The reaction was left for another six days, after which another 1HNMR analysis showed that the reaction mixture contained 3, 5, and theunknown compound D (Section 4.1.5). No new signals were found in the spec-trum, and no change was observed in the reaction mixture.
Triazinane 1 and Five Equivalents of HS-
Triazinane 1 (70 %, 0.10 g, 0.32 mmol) was dissolved in an aqueous, bufferedsolution of pH 10.0 (50.0 ml), and Na2S (60 %, 0.29 g, 2.2 mmol) was added.
The pH was lowered to 8.0 to get the reaction started. The pH increased stead-
ily as the reaction proceeded. The reaction was followed by 1H NMR spectros-copy. After 2.5 hours, the ratio between 2 and 3 was 1:1.3. The reaction wasleft for seven weeks for completion. The pH was adjusted to 10.0 with aqueous
111
Chapter 9 - Experimental
HCl three times during this period. After seven weeks, a white solid was
observed in the mixture. The 1H NMR spectrum now only contained the sig-nals from 3, 5, and unknown D. The solid was too fine to be separated from themixture by filtration, so centrifugation was used for the separation. The solidwas washed with water and dried.
Unsuccessful attempts were made to dissolve the solid in water, methanol,
dichloromethane, DMSO and hexane. Attempts were also made to record1H NMR spectra of the solid by dissolving it in deuterated water, chloroformand DMSO, but not enough matter was dissolved to get acceptable spectra.
The solid was also analysed by IR spectroscopy, but the quality of the spectrawere bad and indicated that the solid was not uniform.
Attempts to measure the melting point of the solid failed. A part of the solidsublimed at 110°C. The rest gradually turned brown as the temperature wasraised.
Dithiazinane 3 and Four Equivalents of HS-
Dithiazinane 3 (0.050 g, 0.30 mmol) was dissolved in an aqueous, bufferedsolution of pH 8.0 (10.0 ml), and Na2S (60 %, 0.076 g, 0.58 mmol) was added.1H NMR spectra recorded after one hour and after 20 hours contained only thesignals from 3. The pH was lowered to 6.0 by addition of aqueous HCl.Acetonitrile (0.012 g, 0.31 mmol) was added as an internal standard. After
three hours at pH 6.0, 1H NMR analysis showed that no change had occurredin the solution. The pH was lowered to 2.0 by addition of concentrated HCl.After another 20 hours no change or precipitation of solid was observed in thereaction mixture, and another two equivalents of Na2S (60 %, 0.076 g, 0.58
mmol) was added to the solution. Four hours later, a 1H NMR analysis showedthat the ratio between 3 and the IS was still 1:1.
9.5.6 Triazinane 1 and Gaseous H2S
Triazinane 1 (70 %, 0.55 g, 1.8 mmol) and acetonitrile (IS, 0.10 g, 2.5 mmol)was dissolved in water (50.0 ml). Gaseous H2S was bubbled through the solu-
tion for 2.5 minutes. A 1H NMR spectrum was recorded of the reaction mix-ture.
1H NMR (300 MHz, D2O): δ 2.07 (s, IS), 3.14 (t, J = 5.2-5.3 Hz, 5), 3.19 (t, J
= 5.6-5.8 Hz, 3), 3.71 (t, J = 5.5-5.8 Hz, 3), 3.82 (t, J = 5.2-5.3 Hz, 5), 4.16 (s,
112
Chapter 9 - Experimental
3), 4.49 (s, 3). Traces: δ 2.91 (t, J = 5.4-5.7 Hz, 1), 3.04 (t, J = 5.7-6.1 Hz, 2),3.61 (t, J = 5.9 Hz, unknown D), 3.92 (s, 2), 4.26 (s, 2).
9.6 The Rate of the Reaction between Triazinane 1 and HS-
9.6.1 Method for Determination of Sulfide
The First Attempt
Triazinane 1 (70 %, 1.0 g, 3.2 mmol) were dissolved in a buffer of pH 9.0(50.0 ml), and Na2S (60 %, 0.058 g, 0.45 mmol) was added. After the reactants
were dissolved, the pH was 9.98. During the reaction, the pH decreased andreached 9.50 after 13 minutes. Samples of 1.00 ml was taken from the reactionmixture every two minutes, diluted with water (4.00 ml) and the buffered stabi-lizing solution (5.00 ml). For each sample, the voltage was recorded 30 sec-onds after the dilution took place. Voltages were then recorded 60 seconds, 90seconds, and 120 seconds after the dilution. The recorded voltages increasedduring this time, and the values were extrapolated to give the voltage at thetime of the dilution. The sulfide concentration was found from the calibrationcurve that was made the same day.
The experiment described above was repeated. The decrease in pH was half aunit after 13 minutes. It was attempted to calibrate the electrode on the sameday, but very unstable readings were recorded, and the calibration curve fromthe previous experiment, made the previous day, was used.
The Second Attempt
Triazinane 1 (0.50 g, 1.6 mmol) was dissolved in a buffered water solution ofpH 9.8 (25.0 ml) and the pH was adjusted to 10.0 with solid K2CO3. NaHS (72
%, 0.0093 g, 0.23 mmol) was dissolved in the same buffer (25.0 ml) and thepH was adjusted to 9.96 with solid K2CO3. The two solutions were mixed and
after that the voltage were recorded every 30 seconds. The experiment wasreproduced.
In a third performance of the experiment, Na2S (60 %, 0.029 g, 0.22 mmol)
replaced NaHS, 1 was dissolved in 10.0 ml of the buffer, and Na2S was dis-
solved in 40.0 ml of the buffer. Otherwise, the experiment was performed inthe same way.
113
Chapter 9 - Experimental
Reproducibility Tests of Sulfide Electrode
Na2S (60 %, 0.029 g, 0.22 mmol) was dissolved in a buffered aqueous solution
of pH 10.0 (50.0 ml). The voltage was recorded every five minutes for 65 min-utes, and during that time, five iodometric titrations were performed. Thefound sulfide concentrations were 0.066 M (0 minutes), 0.066 M (5 minutes),0.065 M (20 minutes), 0.059 M (40 minutes) and 0.063 M (65 minutes).
Na2S (60 %, 0.029 g, 0.22 mmol) was dissolved in water (5.00 ml). This was
done three times, yielding three solutions. They were immediately analysedwith the sulfide-sensitive electrode in the same order as they were made. Thevoltages were 890.0, 887.5 and 885.1 mV for samples 1, 2 and 3, respectively.The samples were also titrated with I2, and the sulfide concentration was calcu-
lated to be 0.047, 0.047 and 0.048 M, respectively.
Three days later, a fourth sample was made in the same way as the other sam-ples. This sample had a voltage of 897.7 mV and a sulfide concentration of0.047 M from iodometric titration.
9.6.2 Method for Determination of Triazinane
The Reactivity of Triazinane 1
Three solutions were made as described below.
Solution 1: Triazinane 1 (70 %, 0.078 g, 0.25 mmol) and acetonitrile (IS,0.0103 g, 0.25 mmol) were dissolved in D2O (5.00 ml).
Solution 2: NaHS (68 %, 0.20 g, 2.4 mmol) was dissolved in D2O (5.00 ml).
Solution 3: A 0.50 M solution of Na2HPO4 in D2O.
The pH was adjusted to 11.0 in all three solutions. 0.10 ml of solution 1 and0.80 ml of solution 3 were transferred to an NMR-tube with a syringe. Thetime was started as 0.10 ml of solution 2 was added to the tube, which wasshaken and immediately put into the NMR instrument. After 1.5 minutes, a
two-minute 1H NMR spectrum was recorded. This spectrum gave the composi-tion of the reaction mixture after 2.5 minutes. After this, spectra were automat-ically recorded every two minutes (t = 4.5 minutes, 6.5 minutes etc.).
When all the spectra at pH 11.0 had been recorded, the pH was adjusted to 10.5in the same three solutions. The experiment was performed in the same way,
114
Chapter 9 - Experimental
but spectra were recorded every minute and the first one was recorded at t =3.5 minutes.
When all the spectra at pH 10.5 had been recorded, the pH was adjusted to 10.0in the three solutions. This experiment was performed in the same way as theprevious, and the first spectrum was recorded at t = 2.5 minutes.
9.7 Stability and Reactivity of Other 1,3,5-Triazinanes
9.7.1 1,3,5-Triethyl-1,3,5-triazinane
Rate of Hydrolysis
The experiment was performed as described in Section 9.3.2 for the experi-ment performed at 22 °C, with a 5 % solution of triazinane 8 as a stock solu-tion. The buffer solutions of pH 10.0, 9.0 and 8.0 were made and used in theexperiment.
Reaction Products with H2S:
NaHS (68 %, 0.80 g, 9.7 mmol) was mixed with 1,3,5-triethyl-1,3,5-triazinane(8, 39 wt%, 2.200 g, 5.00 mmol) and the mixture was diluted to 10.0 ml with0.50 M Na2HPO4. The pH was adjusted to 10.0.
In the control experiment, 8 (39 wt%, 0.22 g, 0.50 mmol) and Na2S (60 %,
0.063 g, 0.48 mmol) were dissolved in an aqueous buffer of pH 9.0. The pHwas adjusted to 10.0.
In another experiment, triazinane 8 (39 wt%, 1.100 g, 2.50 mmol) and ace-tonitrile (IS, 0.315 g, 7.67 mmol) were mixed and diluted to 50.0 ml withwater. H2S-gas was bubbled through the solution for 10 minutes.
Rate of Reaction with H2S:
The experiment was performed as described in Section 9.6.2, and the solutionsused were:
Solution 1: Triazinane 8 (39 wt%, 0.10 g, 0.25 mmol) and acetonitrile (IS,0.01 g, 0.26 mmol) was dissolved in D2O (5.00 ml).
Solution 2: Na2S (60 %, 0.314 g, 2.41 mmol) was dissolved in D2O (5.00 ml).
Solution 3: A 0.50 M solution of Na2HPO4 in D2O.
115
Chapter 9 - Experimental
The experiments were performed at pH 11.0, 10.5 and 10.0. The spectra wererecorded with intervals of two minutes.
9.7.2 1,3,5-Trimethyl-1,3,5-triazinane
Rate of Hydrolysis
The experiment was performed as described in Section 9.3.2 for the experi-ment performed at 22 °C, with a 5 % solution of triazinane 9 as a stock solu-tion. The buffer solutions of pH 10.0, 9.0 and 8.0 were made and used in theexperiment. An additional experiment was performed, using the same proce-dure and a buffer of pH 7.5 (0.50 M Na2HPO4 acidified to pH 7.5).
Reaction Products with H2S:
NaHS (68 %, 0.80 g, 9.7 mmol) was mixed with 1,3,5-trimethyl-1,3,5-triazi-nane (9, 38 wt%, 1.7 g, 5.0 mmol) and the mixture was diluted to 10.0 ml with0.50 M Na2HPO4. The pH was adjusted to 10.0. After three days, the formed
crystals were filtrated off and washed with water. The crystals were analysed
by 1H and 13C NMR, and EIMS and HRMS.
1H NMR (400 MHz, CDCl3): δ 2.69 (s, N-CH3), 4.09 (s, N-CH2-S), 4.42 (s, S-
CH2-S).
13C NMR (400 MHz, CDCl3): δ 60.0 (N-CH3), 37.6 (N-CH2-S), 34.4 (S-CH2-
S).
EIMS (70eV) m/z (rel.int.%): 137.1 (M+2, 1.4), 135.1 (M+, 16), 89.0 (9), 70.1(2), 57.1 (18), 46.0 (4), 45.0 (4), 44.0 (18), 43.0 (3), 42.0 (12), 41.0 (1).
HRMS (70eV) m/z: Observed 135.01765, calculated 135.01771.
In the same manner as for triazinane 8, triazinane 9 (38 wt%, 0.850 g, 2.50mmol) and acetonitrile (IS, 0.103 g, 2.50 mmol) were mixed and diluted to50.0 ml with water. H2S-gas was bubbled through the solution for 23 minutes.
Rate of Reaction with H2S:
The experiment was performed as described in Section 9.6.2, and the solutionsused were:
Solution 1: Triazinane 9 (38 wt%, 0.085 g, 0.25 mmol) and acetonitrile (IS,0.0103 g, 0.250 mmol) were dissolved in D2O (5.00 ml).
116
Chapter 9 - Experimental
Solution 2: Na2S (60 %, 0.314 g, 2.41 mmol) was dissolved in D2O (5.00 ml).
Solution 3: A 0.50 M solution of Na2HPO4 in D2O.
The experiments were performed at pH 11.0, 10.5 and 10.0. The spectra wererecorded with intervals of 2.5 minutes.
9.7.3 2,4,6-Trimethyl-1,3,5-tris(2-hydroxyethyl)-1,3,5-triazinane
Acetaldehyde (1.27 g, 0.030mol) was added to pure ethanolamine (5, 1.80 g,0.029 mol) over 5 minutes. The reaction mixture was kept in an ice bath.
9.8 Stability and Reactivity of Trioxanes, Tetroxanes and an Oxolane
9.8.1 1,3,5-Trioxane
In the reaction at pH 10.0, 1,3,5-trioxane (20, 0.23 g, 2.5 mmol) was dissolvedin a buffer (50.0 ml), and Na2S (60 %, 0.32 g, 2.5 mmol) was added. The pH
was adjusted to 10.0.
At the same time, formaldehyde dihydrate (37 %, 0.19 g, 2.5 mmol) was dis-solved in a buffer (50.0 ml), and Na2S (60 %, 0.32 g, 2.5 mmol) was added.
The pH was adjusted to 10.0.
In the experiment at pH 7.0, 20 (0.23 g, 2.5 mmol) was dissolved in water(25.0 ml), and NaHS (68 %, 0.20 g, 2.4 mmol) was added. The pH wasadjusted to 7.0.
The stability test was performed by dissolving trioxane 20 (0.015 g, 0.17mmol) in D2O (3.0 ml). The solution was measured into three containers of 1.0
ml each. Container 1 was left without adjusting the pH, which was 5.5 by pHpaper. In container 2, the pH was adjusted to 2.5, and in container 3 to 1.5.
Finally, trioxane 20 (0.23 g, 2.5 mmol) and acetonitrile (IS, 0.10 g, 2.5 mmol)were dissolved in water (50.0 ml) and gaseous H2S was bubbled through the
solution for 25 minutes. The pH in the solution was 5 by pH paper when thesupply of H2S was stopped.
117
Chapter 9 - Experimental
9.8.2 2,4,6-Trimethyl-1,3,5-trioxane
2,4,6-Trimethyl-1,3,5-trioxane (21, 0.33 g, 2.5 mmol) was dissolved in water(50.0 ml). NaHS (68 %, 0.20 g, 2.4 mmol) was added, and the pH was adjusted
to 10.0. 1H NMR spectra were recorded after three hours and after three days.
The pH was lowered to 7.0 and another 1H NMR spectrum was recorded oneday later.
Trioxane 21 was reacted with H2S by bubbling the gas through a solution of 21
(0.33 g, 2.5 mmol) and acetonitrile (IS, 0.10 g, 2.5 mmol) in water (50.0 ml)
for 20 minutes. 1H NMR spectra were recorded before the reaction and twohours after the gas supply was stopped.
9.8.3 1,3,5,7-Tetroxane
The attempt to synthesize the paraformaldehyde diacetate (24) was performedby mixing paraformaldehyde (23, 2.5 g) and acetic anhydride (0.85 g, 0.083mol) in an autoclave. The autoclave was closed, and a magnetic stirrer wasused as the temperature was raised to, and kept at, 160 °C for 23 hours. Thereactor was allowed to reach room temperature before it was opened. Some ofthe sublimed matter (1.5 g) was isolated and washed with diethyl ether (2x10ml) and ethyl acetate (10 ml).
The solid isolated in the previous experiment (1.01 g) was placed in a round-bottomed flask with sodium persulfate (Na2S2O8, 0.030 g, 0.25 mmol). The
flask was connected to a long glass tube, which in turn was connected to twocold traps at -78°C. The system was evacuated, and the flask was heated to160 °C. After 2.5 hours, no product was observed in the cold traps.
Another attempt was made to synthesize tetroxane (26). The paraformaldehyde(12.5 g) and the acetic anhydride (4.25 g, 0.042 mol) were placed in the auto-clave and heated to 160 °C for 21 hours. The sublimed matter (5.85 g) waswashed with diethyl ether (3x10 ml) and ethyl acetate (3x10 ml). In the nextstep, the solid (0.50 g) and the acid catalyst (Na2S2O8, 0.030 g, 0.25 mmol)
was mixed and crushed, and placed in a standard sublimator, in which the sub-limed product would only have to travel a short distance to the cold finger. Thecold finger was cooled to -10 °C. The bottom of the sublimator was heated to180 °C. No solid deposited on the cold finger after 7 hours.
118
Chapter 9 - Experimental
A third attempt was performed as described in the second attempt, but K2S2O8
(0.030 g, 0.11 mmol) replaced Na2S2O8 as the acid catalyst. Again, no solid
deposited on the cold finger.
9.8.4 1,3-Dioxolane
Gaseous H2S was bubbled through a solution of 1,3-dioxolane (26, 0.181 g,
2.44 mmol) and acetonitrile (IS, 0.109 g, 2.65 mmol) in water (50.0 ml). Theexperiment was stopped after five minutes, and the pH in the solution was 4 bypH paper.
In the second experiment, 26 (0.182 g, 2.46 mmol) and the IS (0.112 g, 2.73mmol) were dissolved in water (50.0 ml), and H2S was bubbled through the
solution for 35 minutes. No change was obsreved in the 1H NMR spectrum.
119

Chapter 9 - Experimental
120
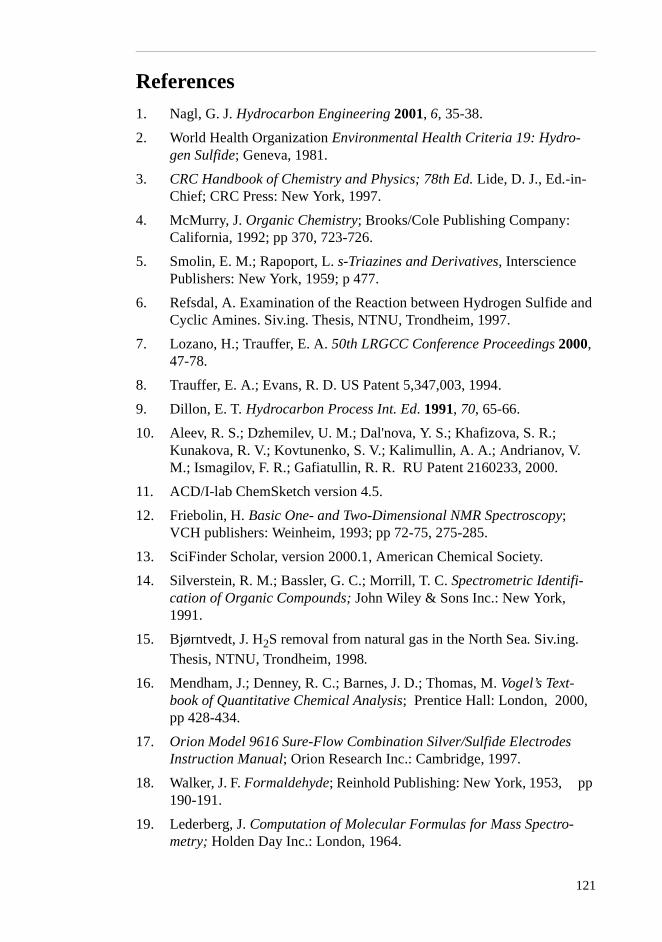
References1. Nagl, G. J. Hydrocarbon Engineering 2001, 6, 35-38.
2. World Health Organization Environmental Health Criteria 19: Hydro-gen Sulfide; Geneva, 1981.
3. CRC Handbook of Chemistry and Physics; 78th Ed. Lide, D. J., Ed.-in-Chief; CRC Press: New York, 1997.
4. McMurry, J. Organic Chemistry; Brooks/Cole Publishing Company: California, 1992; pp 370, 723-726.
5. Smolin, E. M.; Rapoport, L. s-Triazines and Derivatives, Interscience Publishers: New York, 1959; p 477.
6. Refsdal, A. Examination of the Reaction between Hydrogen Sulfide and Cyclic Amines. Siv.ing. Thesis, NTNU, Trondheim, 1997.
7. Lozano, H.; Trauffer, E. A. 50th LRGCC Conference Proceedings 2000, 47-78.
8. Trauffer, E. A.; Evans, R. D. US Patent 5,347,003, 1994.
9. Dillon, E. T. Hydrocarbon Process Int. Ed. 1991, 70, 65-66.
10. Aleev, R. S.; Dzhemilev, U. M.; Dal'nova, Y. S.; Khafizova, S. R.; Kunakova, R. V.; Kovtunenko, S. V.; Kalimullin, A. A.; Andrianov, V. M.; Ismagilov, F. R.; Gafiatullin, R. R. RU Patent 2160233, 2000.
11. ACD/I-lab ChemSketch version 4.5.
12. Friebolin, H. Basic One- and Two-Dimensional NMR Spectroscopy; VCH publishers: Weinheim, 1993; pp 72-75, 275-285.
13. SciFinder Scholar, version 2000.1, American Chemical Society.
14. Silverstein, R. M.; Bassler, G. C.; Morrill, T. C. Spectrometric Identifi-cation of Organic Compounds; John Wiley & Sons Inc.: New York, 1991.
15. Bjørntvedt, J. H2S removal from natural gas in the North Sea. Siv.ing. Thesis, NTNU, Trondheim, 1998.
16. Mendham, J.; Denney, R. C.; Barnes, J. D.; Thomas, M. Vogel’s Text-book of Quantitative Chemical Analysis; Prentice Hall: London, 2000, pp 428-434.
17. Orion Model 9616 Sure-Flow Combination Silver/Sulfide Electrodes Instruction Manual; Orion Research Inc.: Cambridge, 1997.
18. Walker, J. F. Formaldehyde; Reinhold Publishing: New York, 1953, pp 190-191.
19. Lederberg, J. Computation of Molecular Formulas for Mass Spectro-metry; Holden Day Inc.: London, 1964.
121
20. Alimukhamedov, M. G.; Tasanbaeva, N. E.; Magrupov, F. A.; Abdurashidov, T. P. Izv. Akad. Nauk Kaz. SSR, Ser. Khim. 1990, 2, 62-66.
21. Carter, G. B.; McIvor, M. C.; Miller, R. G. J. J. Chem. Soc., (C) 1968, 20, 2591-2592.
22. Patai, S., Ed. The chemistry of the amino group; Interscience Publishers: London, 1968; pp 367-373.
23. Miyake, Y.; Adachi, S.; Yamauchi, N.; Hayashi, T.; Akimoto, M. U.S. Patent 3,246,041, 1969.
24. Walpole, R. E.; Myers, R. H.; Myers, S. L.; Ye, K. Probability and Statis-tics for Engineers & Scientists Int. Ed.; Prentice Hall: New Jersey, 2002; pp 350-363.
25. Høy, M.; Anderssen, E.; Martens, H.; Steen, K. Beregning av usikkerhet i kjemisk måling; Kompendieforlaget, Trondheim, 2001.
122

APPENDIXES


Appendix A
NMR Data for Pure Compounds

Appendix A
Appendix A
1,3,5-Tris(2-hydroxyethyl)-1,3,5-triazinane (1):1H NMR (300 MHz, D2O): δ 2.69 (t, J = 5.8 Hz, N-CH2-CH2-OH), 3.49 (br. s,
N-CH2-N), 3.70 (t, J = 5.8 Hz, N-CH2-CH2-OH).
1H NMR (300 MHz, CDCl3): δ 2.65 (t, J = 4.9-5.3 Hz, N-CH2-CH2-OH), 3.50
(br. s, N-CH2-N), 3.68 (t, J = 4.9-5.3 Hz, N-CH2-CH2-OH).
13C NMR (75 MHz, D2O): δ 56.5 (N-CH2-CH2-OH), 60.0 (N-CH2-CH2-OH),
75.7 (N-CH2-N).
2-Aminoethanol/ethanolamine (5):1H NMR (300 MHz, D2O): δ 2.73 (t, J = 5.6 Hz, N-CH2-CH2-OH), 3.61 (t, J =
5.6 Hz, N-CH2-CH2-OH).
1H NMR (300 MHz, D2O-buffer, pH 10): δ 2.83 (t, J = 5.5 Hz, N-CH2-CH2-
OH), 3.67 (t, J = 5.4-5.6 Hz, N-CH2-CH2-OH).
13C NMR (75 MHz, D2O): δ 45.2 (N-CH2-CH2-OH), 65.2 (N-CH2-CH2-OH).
Aqueous formaldehyde:1H NMR (400 MHz, D2O): δ 4.83 (s, HO-CH2-OH).
13C NMR (100 MHz, D2O): δ 84.6 (s, HO-CH2-OH).
2-mercapto-ethanol (6):1H NMR (300 MHz, D2O): δ 2.69 (t, J = 6.1-6.3 Hz, HS-CH2-CH2-OH), 3.71
(t, J = 6.1-6.2 Hz, HS-CH2-CH2-OH).
1H NMR (300 MHz, D2O-buffer, pH 10): δ 2.66 (t, J = 6.8 Hz, HS-CH2-CH2-
OH), δ 3.65 (t, J = 6.8 Hz, HS-CH2-CH2-OH).
13C NMR (75 MHz, D2O-buffer, pH 10): δ 28.8, 66.4.
1,3,5-Trithiane (4):1H NMR (400 MHz, CDCl3): δ 4.33 (s).
Melting point: 215-216°C.
Appendix A
1,3,5-triethyl-1,3,5-triazinane (8):1H NMR (300 MHz, D2O): δ 1.07 (t, J = 7.2 Hz, N-CH2-CH3), 2.55 (q, J =
7.2-7.5 Hz, N-CH2-CH3), 3.38 (br. s, N-CH2-N).
13C NMR (100 MHz, D2O): δ 13.6 (N-CH2-CH3), 49.0 (N-CH2-CH3), 74.1
(N-CH2-N).
1,3,5-Trimethyl-1,3,5-triazinane (9):1H NMR (300 MHz, D2O): δ 2.27 (s, N-CH3). The signal from the ring protons
is barely visible at δ 3.4 ppm.
13C NMR (75 MHz, D2O): δ 41.8 (N-CH3), 77.5 (N-CH2-N).
1,3,5-Trioxane (19):1H NMR (300 MHz, CDCl3): δ 5.16 (s).
13C NMR (75 MHz, CDCl3): δ 93.6.
1H NMR (300 MHz, D2O): δ 5.24 (s).
13C NMR (75 MHz, D2O): δ 96.4.
2,4,6-Trimethyl-1,3,5-trioxane (20):1H NMR (300 MHz, CDCl3): δ 1.39 (d, J = 5.4 Hz, CH-CH3), 5.04 (q, J = 5.1
Hz, CH-CH3).
1H NMR (300 MHz, D2O): δ 1.36 (d, J = 5.1 Hz, CH-CH3), 5.27 (q, J = 5.1-
5.4 Hz, CH-CH3).
1H NMR (300 MHz, D2O, pH 10): δ 1.37 (d, J = 5.1 Hz, CH-CH3), 5.28 (q, J =
5.1-5.4 Hz, CH-CH3).
Acetaldehyde:1H NMR (300 MHz, D2O): δ 1.33 (d, J = 5.4 Hz, CH3-CH(OH)2), 2.24 (d, J =
3.0 Hz, CH3-CHO), 5.24 (q, J = 5.1-5.4 Hz, CH3-CH(OH)2), 9.67 (q, J = 3.0
Hz, CH3-CHO).
1,3-Dioxolane (25):1H NMR (400 MHz, CDCl3): δ 3.88 (s), 4.91 (s).

Appendix A
13C NMR (100 MHz, CDCl3): δ 64.6, 95.1.
1H NMR (400 MHz, D2O): δ 3.93 (s), 4.90 (s).
13C NMR (100 MHz, D2O): δ 67.1, 97.0.
Ethyleneglycol (26):13C NMR (75 MHz, D2O): δ 65.4.

Appendix A

Appendix B
Equations for Calculation of Uncertainties

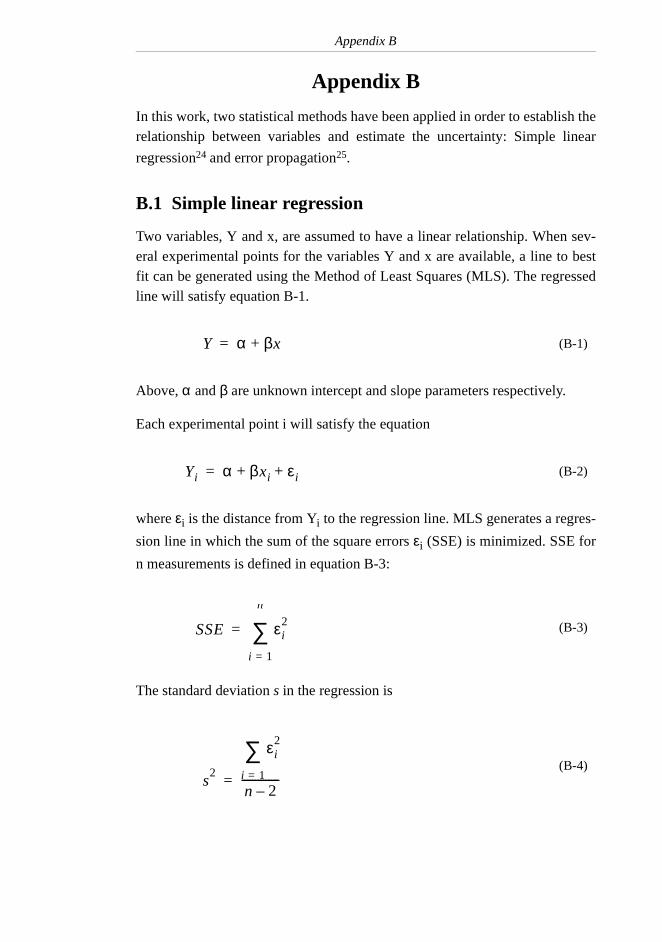
Appendix B
Appendix B
In this work, two statistical methods have been applied in order to establish therelationship between variables and estimate the uncertainty: Simple linear
regression24 and error propagation25.
B.1 Simple linear regression
Two variables, Y and x, are assumed to have a linear relationship. When sev-eral experimental points for the variables Y and x are available, a line to bestfit can be generated using the Method of Least Squares (MLS). The regressedline will satisfy equation B-1.
Above, α and β are unknown intercept and slope parameters respectively.
Each experimental point i will satisfy the equation
where εi is the distance from Yi to the regression line. MLS generates a regres-
sion line in which the sum of the square errors εi (SSE) is minimized. SSE for
n measurements is defined in equation B-3:
The standard deviation s in the regression is
(B-1)
(B-2)
(B-3)
(B-4)
Y α βx+=
Yi α βxi εi+ +=
SSE εi2
i 1=
n
∑=
s2
εi2
i 1=
∑n 2–--------------=
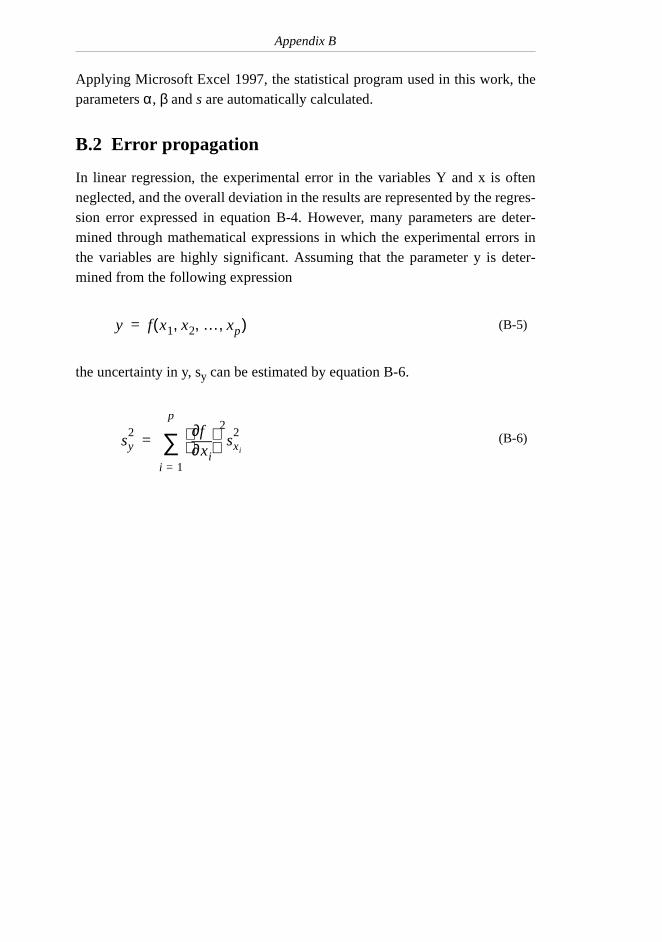
Appendix B
Applying Microsoft Excel 1997, the statistical program used in this work, theparameters α, β and s are automatically calculated.
B.2 Error propagation
In linear regression, the experimental error in the variables Y and x is oftenneglected, and the overall deviation in the results are represented by the regres-sion error expressed in equation B-4. However, many parameters are deter-mined through mathematical expressions in which the experimental errors inthe variables are highly significant. Assuming that the parameter y is deter-mined from the following expression
the uncertainty in y, sy can be estimated by equation B-6.
(B-5)
(B-6)
y f x1 x2 … xp, , ,( )=
sy2
xi∂∂f
2sxi
2
i 1=
p
∑=


