it in the european union: driving productivity divergence?
TRANSCRIPT

IT in the European Union: Driving Productivity Divergence? Research Memorandum GD-67 Marcel Timmer, Gerard Ypma and Bart van Ark
Groningen Growth and Development Centre October 2003

IT in the European Union: Driving Productivity Divergence?
Marcel P. Timmer, Gerard Ypma and Bart van Ark*
Groningen Growth and Development Centre University of Groningen
October 2003
Abstract This paper analyses the contributions of IT-capital deepening and total factor productivity growth (TFP) in IT-production on aggregate labour productivity growth patterns within the European Union in comparison with the US. We find that differences in the direct effects of IT almost fully explain the US lead in labour productivity growth over the EU aggregate over the period 1995-2001. However differences in the direct effects of IT are by no means the sole determinants of the widening of the “Atlantic Divide”, neither the main cause of divergent labour productivity growth patterns within Europe. Non-IT capital deepening and non-IT TFP growth were major contributors to continued or even accelerating growth in small economies such as Austria, Finland, Greece, Ireland, Portugal and Sweden. In Finland, Sweden and especially Ireland this was augmented by high contributions from IT, which were even higher than in the US. At the same time, decelerating labour productivity growth in major European countries such as France, Germany, Italy and the UK was mainly due to declining contributions of non-IT capital deepening and non-IT TFP growth compared to the period 1980-1995.
* The database used in this paper is an extension of previous work by van Ark, Melka, Mulder, Timmer and Ypma (2002). In addition to the people who helped in setting up the previous database, we would like to thank representatives from many statistical offices across the European Union for their indispensable help on identifying the appropriate sources for updating, and for providing guidance in interpreting the series.

2
1. Introduction Until recently, the explosive growth of investment in information and communication technology (ICT) has been at the centre of the “new economy” hype. The striking acceleration in productivity growth in US in the mid 1990s has been much discussed and a consensus has emerged that faster growth could be traced in large part to the production and adoption of IT-capital goods (Oliner and Sichel 2000, Jorgenson and Stiroh 2000). The ICT investment boom in turn was induced by the rapid decline in prices of IT goods driven by rapid and accelerating progress in semi-conductor manufacturing technology (Jorgenson 2001). The slowdown in GDP growth since 2001 has tempered the initial enthusiasm, and indeed ICT investment has somewhat slowed. But this does not alter the perspective that ICT has produced a fundamental change in the U.S. economy, leading to a permanent improvement in growth prospects. This optimistic conclusion is based on the fact that the decline in IT-prices will continue for some time (Jorgenson, Ho and Stiroh 2003). Moreover, as argued by David (1990), information technologies must be seen as pervasive, general-purpose technologies bound to spread in the economy and boost productivity growth, but with a lag. The bigger the costs of adjusting to a new technology, such as organisational changes, the longer the interval between its introduction and the visibility of the productivity-enhancing effects (Brynjolfsson and Hitt 2000). Following a period during which IT technology first mainly materialised as productivity growth in the IT-producing sectors, productivity growth in the IT-using sectors, such as retail trade, are expected to come about at least in the U.S. (Oliner and Sichel 2002, Baily and Lawrence 2001 and Foster, Haltiwanger and Krizan 2002). And indeed this pattern of productivity growth can be discerned for the US (Jorgenson, Ho and Stiroh 2002, Triplett and Bosworth forthcoming). In contrast to the case of the US, the impact of IT on European economic growth is still poorly understood. Macro-economic growth rates in Europe have not resurged as in the US, and especially the Atlantic gap in productivity levels widened since the mid 1990s. Whereas average annual labour productivity growth in the US accelerated from 1.4% during 1980-1995 to 1.8% during 1995-2001, EU growth declined from 2.3% to 1.4%. This deceleration in the EU hides considerable variation between EU member states. It is mainly caused by dismal performance in the larger economies: France, Germany, Italy, the UK and especially Spain (see Table 1). In contrast, smaller countries like Greece, Ireland, Austria and Sweden enjoyed growth accelerations of 0.8 % or more. Technological catch up may explain relative strong growth in countries like Greece, Portugal and to a lesser extent in Ireland, which in 1995 had labour productivity levels which were well below the US and the other EU countries. Growth accelerations and decelerations in other countries are less easily explained. Among other things (such as differences in openness and pressure for reforms) they might also be related to different responses to the opportunities provided by the IT revolution. The direct effects from IT on growth through IT-capital deepening and TFP growth in IT-goods production can be measured in a growth accounting framework.
[Table 1 about here]
IT growth accounting studies for groups of European countries are sparse, and as far as they exist, rely heavily on private data sources, such as those provided by the International Data Corporation (Schreyer 2000, Daveri 2002). These databases contain figures on expenditure on IT

3
goods which are used as a proxy for investment using rough conversion rates such as the share of investment in total expenditure in the US. Daveri (2002) concludes that there was catching up in IT investment of the EU as a whole with the US since 1999. As of 2001, the EU no longer appeared seriously to lag behind the US in terms of ICT adoption. 1 The contribution from IT capital goods to GDP growth varies within Europe and is still lagging behind the US. In most countries the contribution accelerated in the second half of the 1990s, but he found that in major countrie s like Spain, Germany and France it did not.
More recently Vijselaar and Albers (2002) and Colecchia and Schreyer (2001) make use of genuine investment series for a limited number of European countries. In contrast to Daveri (2002), Vijselaar and Albers (2002) conclude that for four European countries (France, Germany Italy and the Netherlands) contributions from IT capital did accelerate in the second half of the 1990s. Also Colecchia and Schreyer (2001) find an acceleration for their set of five European countries (Finland, France, Germany, Italy and the UK). They also find that these contributions are much lower than in the US. Both Daveri (2002) and Vijselaar and Albers (2002) stress that in most European countries there was no accompanying TFP acceleration as took place in the US. Several detailed country specific studies on Europe are also available but due to differences in methodologies, data sources and definitions, these studies are hard to compare (see van Ark 2002 for an overview).2 One clear conclusion from these studies was that in some countries the direct impact of IT seems almost to match the US experience, whereas in others it was severely lagging behind. This suggests that IT might not only be an important driver of divergence in the growth paths of the EU and the US, but also a driving force of disparate growth performance within the European Union. The main contribution of this paper is in analysing the impact of IT on growth paths of European countries and the US through two channels: IT investment and the production of IT goods. It develops genuine long term investment series of IT goods for 14 EU member countries3 and the US which are comparable by using a harmonised growth accounting approach. We update and extend our previous work (van Ark et al. 2002) by providing updates to 2001 and using revised data for most countries. Also Greece and Belgium have been added to the dataset. The new investment series are used in a growth accounting framework for the period 1980-2001, following Jorgenson’s (2001) study of the US. This allows for comparisons of the impact of IT investment on growth between the EU as a whole and the US, and between countries within the EU.
We also look at a second channel through which IT affects growth which has not been studied for Europe so far. Industries that produce IT-goods have experienced high TFP growth. This growth effect of IT production differs across countries depending on the relative importance of these industries in the economy. In the US it played an important role in acceleration of TFP growth in the latter half of the 1990s (Jorgenson, Ho and Stiroh 2002).
1 Daveri (2002, p. 346). 2 Individual country studies may differ in many respects including the definition of IT goods (narrow or broad, including other office machinery and different types of software), the boundaries of capital (in - or exclusion of public capital, residential capital, consumer durables, land and inventories), the use of hedonic deflators for IT investment and the definition of labour input (measures as hours worked or persons engaged and in- or excluding an adjustment for changes in labour quality). Even differences in the treatment of mundane issues such as the coverage of GDP (in-or exclusion of market services, housing rents and imputations for household durables) can be important for the final assessment of the importance of IT investment for productivity growth. 3 Luxembourg is excluded.

4
The remainder of the paper is organised as follows. In Section 2 data sources and methodology are discussed. Section 3 provides comparisons of IT investment, IT capital stock levels and IT service growth rates. We find almost all EU countries have been, and still are, seriously lagging behind the US in the share of IT investment in GDP. Consequently, IT capital stocks are much lower in the US. In contrast to the findings on the basis of expenditure data such as Daveri (2002), there is no sign of catching up. In Section 4 the importance of IT investment in driving GDP and labour productivity growth is analysed by means of growth accounting. It is shown that higher IT investment explains more than half of the US advantage in labour productivity growth over the EU during 1995-2001. However, divergent labour productivity growth paths within the EU cannot be explained by differences in IT capital intensity. Instead, differences in non-IT capital deepening and especially in TFP growth are the main sources of divergence. In Section 5 an attempt is made to measure the impact of IT-goods production on aggregate TFP growth. It is shown that a bigger production share of IT-goods explains the remainder of the US-EU growth difference. However, it did not appear to be an important driver for labour productivity growth differences within the EU. Section 6 summarises and concludes. It is argued that the reasons behind the deceleration of labour productivity growth in the EU warrant as much attention as the acceleration in the US. The former are not exclusively related to developments in information technology. 2. Data sources and methodology Sources for IT investment Although the situation is rapidly improving, official long term series on IT investment and capital stocks are not available on a comprehensive and sufficiently long term basis for many EU countries as yet. Most EU countries have started to collect data on these asset types only recently, and for many countries ICT investment series are still unpublished. As far as the published data are concerned, investment in office and computing machinery and communication equipment are mostly included with overall “machinery and equipment”. Fortunately, since the introduction of the European System of Accounts (ESA 1995) most countries now have separate estimates on software but mostly only for recent years. Van Ark et al. (2002) complemented the existing official series with their own estimates of IT investment based on a “commodity-flow” method for 12 EU countries. The database underlying the analysis in this paper builds upon this earlier work. We provide updates to 2001 and revisions for most countries as more data from national statistical offices have become available. Also Greece and Belgium have been added to the dataset. Estimates are now available for 14 EU member countries: Austria, Belgium, Denmark, Finland, France, Germany, Greece, Ireland, Italy, the Netherlands, Portugal, Spain, Sweden and the United Kingdom. Only data for Luxembourg is missing. The main characteristics of the database are discussed here, but for a more complete discussion the reader is referred to Van Ark et al. (2002).4
In contrast to many other studies, the definition of IT investment in van Ark et al. (2002) is relatively broad. Three IT asset types are distinguished: “computers”, which comprises the whole category of
4 EU totals are based on summation of country figures using the official national currency/euro exchange rates as of 1 January 1999. With this method price differences in output and capital inputs across EU countries are neglected. This omission is mainly due to lack of appropriate Purchasing Power Parities for IT assets.

5
office, accounting and computer equipment5, “communication equipment” which includes radio, TV and communication equipment6 and “software”, including pre-packaged, own account and customized software. This is in line with Triplett and Bosworth (2002) who argue in favour of a broad IT concept, as the electronic -driven technological change that is most characteristic of computer and communication equipment is also evident in, for example, photocopiers and related equipment. For many of the smaller EU countries there were no, or only short, investment series on office, accounting and computing equipment and communication equipment. Fortunately official series for a substantial length of time are available for the largest countries in the Union, including France, Germany, Italy, Spain and the United Kingdom. For countries and periods where no official series existed, the “commodity flow method” was used. This method traces commodities from their domestic production or importation to their final purchase, i.e. consumption or investment.7 First, using national accounts, production and trade statistics, final domestic purchases from the office and computer equipment, and communication equipment industries are derived. These are equal to domestic production plus imports minus exports. Second, investment shares in final domestic purchases are derived from benchmark input-output (I/O) tables. Finally, to obtain IT investment series these shares are applied to the annual figures on the production, exports and imports for separate industries as follows:
−+
−+=)(
)( ,,,, IOi
IOi
IOi
IOi
titititi EMQI
EMQI (1)
where iI is investment in asset i, iQ is domestic production, iE is exports and iM is imports.
Subscript t indicates time and the superscript IO indicates that the data is derived from benchmark I/O-tables.8
This method could not be used for software as software production, which partly takes place in-house in firms, is not registered as such in most input-output tables. For some countries software investment series are separately distinguished in the national accounts. For other countries, only data on total intangible investment was available. Software investment was then obtained by applying an estimated share of software in total intangible investment. In case no data on intangible or software investment was available, an estimated ratio of software to office and computer equipment investment was applied to the country-specific investments in office and computer equipment. The data source appendix provide detailed information for each country how the series have been derived. It must be kept in mind that investment series for software create the greatest problems in terms of international
5 It includes computers, peripheral equipment such as printers, etc., but also photocopiers and related equipment. This is equal to all products included in ISIC rev 3 industry 30 that is almost similar to U.S. SIC87 industry 357. 6 This is equal to products included in ISIC rev 3 industry 32 (U.S. SIC87 industry 366). 7 This supply side method resembles what many statistical offices in Europe in fact use to develop their investment numbers. An alternative estimation method that is used by some countries is a “demand-side” approach, in which capital expenditure data is collected directly from purchasers. 8 As supply and use tables with sufficient industry detail are mostly not available on an annual basis, the shares of investment in production and net imports were interpolated for intermediate years, and kept constant for years before (or after) the first (or the latest) year for which an I/O table was available.

6
comparability (Lequiller et al. 2003). Further effort is needed in this area to increase international standardisation. Harmonised IT deflation For deflating current investment series to constant price series, account must be taken of differences between the U.S. and most EU countries in measuring constant quality price indices for IT goods. The major source of difference in price indices for IT goods, which decline much more rapidly in the U.S. than in Europe, is of a methodological nature. For the U.S., IT deflators explicitly take account of quality changes by applying a hedonic price index for computers and peripheral equipment, pre-packaged software, telephone switching equipment and local area network (LAN) equipment. In most EU countries, however, price indexes for these goods are based on a matched model method, and the incidence of quality adjustments then differs highly between countries depending on the frequency of resampling and the actual quality adjustment method (Wyckoff 1995; Schreyer 2002). But whatever adjustments are made to matched model indices, in general the hedonic approach shows much stronger price declines. To put IT price deflators on a consistent basis across countries, we adopted the “price index harmonization” method that was proposed by Schreyer (2002), and applied it to develop country-specific deflators for IT assets. The harmonization method starts from the assumption that the U.S. hedonic price index for IT assets most adequately reflects “constant quality” price changes. Following Schreyer (2002), before applying the U.S. price index to other countries, we made an adjustment for differences in general inflation levels. When a separate domestic price index for non-IT capital goods is available, we applied the ratio of the U.S. price index for IT relative to non-IT capital goods to the price index for non-IT capital goods for each specific country. Otherwise, the U.S. ratio of the IT price index to the overall GDP deflator was applied to the GDP deflator for each specific country. 9 Capital stock and services Capital stocks are constructed for each asset type using the perpetual inventory method with a geometric depreciation rate:
TiiTit
tTit
iTi IKIK ,1,0
,, )1()1( +∂−=∂−= −
∞
=−∑ (2)
9 It should be noted that the harmonized deflation procedure applied here is not the perfect method to deflate IT investment in EU countries. First, it implicitly assumes that there is a global (U.S.) hedonic model on the basis of which the “predicted” price of a model can be estimated across the OECD. Second, as the U.S. price index for the group office and computer equipment is constructed from three detailed asset type indices by using U.S. weights, it does not allow for international differences in composition of investment within that asset group, and much the same can be said of the communication and software price indices. Third, a substantial part of IT investment goods in Europe is imported rather than domestically produced, and it is unknown whether the price indices of domestically produced investment goods and imported items develop in the same way. Schreyer (2002) provides a sensitivity analysis of various alternative procedures.
7
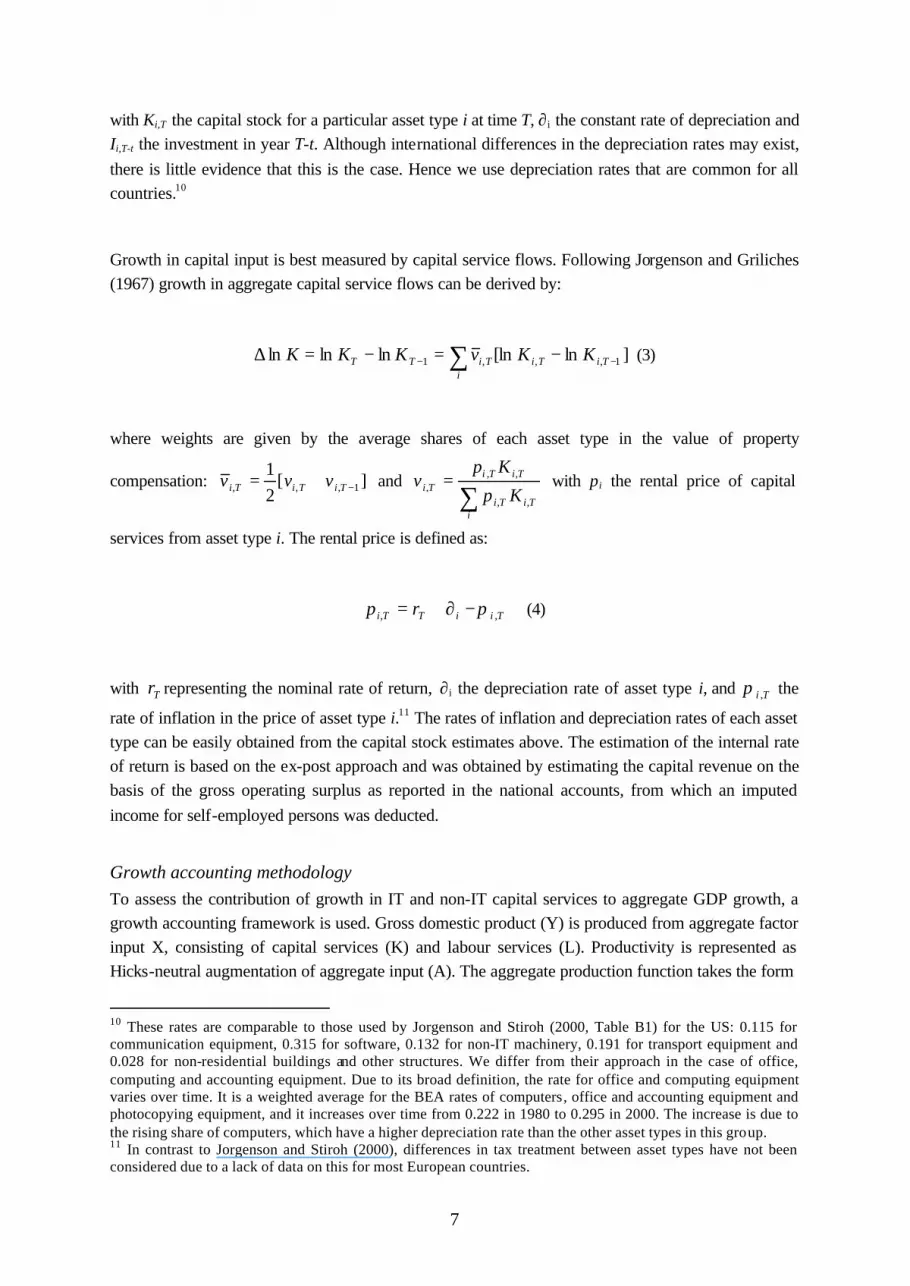
with Ki,T the capital stock for a particular asset type i at time T, ∂i the constant rate of depreciation and Ii,T-t the investment in year T-t. Although international differences in the depreciation rates may exist, there is little evidence that this is the case. Hence we use depreciation rates that are common for all countries.10
Growth in capital input is best measured by capital service flows. Following Jorgenson and Griliches (1967) growth in aggregate capital service flows can be derived by:
]ln[lnlnlnln 1,,,1 −− −=−=∆ ∑ TiTii
TiTT KKvKKK (3)
where weights are given by the average shares of each asset type in the value of property
compensation: ][21
1,,, −+= TiTiTi vvv and ∑
=
iTiTi
TiTiTi Kp
Kpv
,,
,,, with pi the rental price of capital
services from asset type i. The rental price is defined as:
TiiTTi rp ,, π−∂+= (4)
with Tr representing the nominal rate of return, ∂i the depreciation rate of asset type i, and Ti ,π the
rate of inflation in the price of asset type i.11 The rates of inflation and depreciation rates of each asset type can be easily obtained from the capital stock estimates above. The estimation of the internal rate of return is based on the ex-post approach and was obtained by estimating the capital revenue on the basis of the gross operating surplus as reported in the national accounts, from which an imputed income for self-employed persons was deducted.
Growth accounting methodology To assess the contribution of growth in IT and non-IT capital services to aggregate GDP growth, a growth accounting framework is used. Gross domestic product (Y) is produced from aggregate factor input X, consisting of capital services (K) and labour services (L). Productivity is represented as Hicks-neutral augmentation of aggregate input (A). The aggregate production function takes the form
10 These rates are comparable to those used by Jorgenson and Stiroh (2000, Table B1) for the US: 0.115 for communication equipment, 0.315 for software, 0.132 for non-IT machinery, 0.191 for transport equipment and 0.028 for non-residential buildings and other structures. We differ from their approach in the case of office, computing and accounting equipment. Due to its broad definition, the rate for office and computing equipment varies over time. It is a weighted average for the BEA rates of computers, office and accounting equipment and photocopying equipment, and it increases over time from 0.222 in 1980 to 0.295 in 2000. The increase is due to the rising share of computers, which have a higher depreciation rate than the other asset types in this group. 11 In contrast to Jorgenson and Stiroh (2000), differences in tax treatment between asset types have not been considered due to a lack of data on this for most European countries.
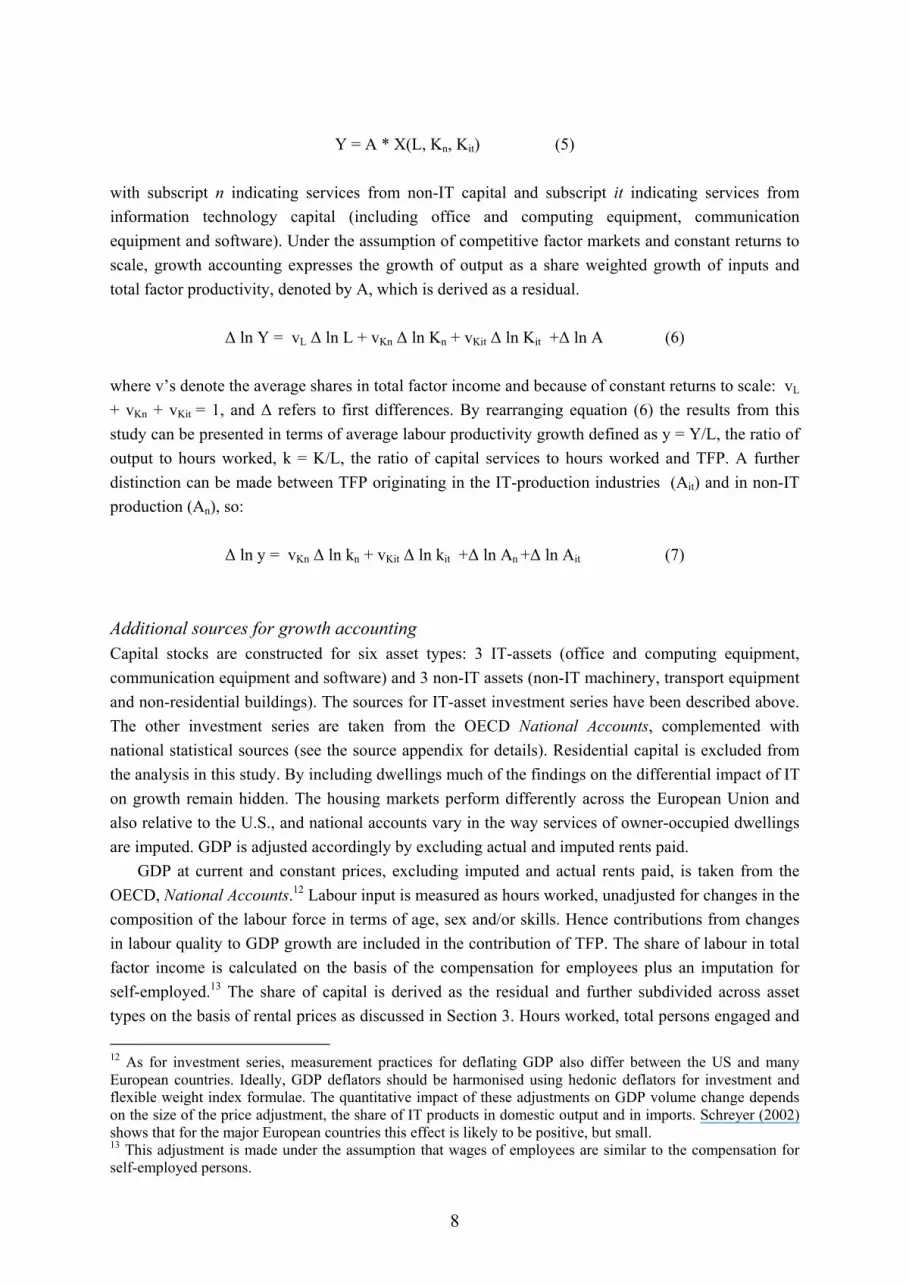
Y = A * X(L, Kn, Kit) (5)
with subscript n indicating services from non-IT capital and subscript it indicating services from information technology capital (including office and computing equipment, communication equipment and software). Under the assumption of competitive factor markets and constant returns to scale, growth accounting expresses the growth of output as a share weighted growth of inputs and total factor productivity, denoted by A, which is derived as a residual.
∆ ln Y = vL ∆ ln L + vKn ∆ ln Kn + vKit ∆ ln Kit +∆ ln A (6) where v’s denote the average shares in total factor income and because of constant returns to scale: vL + vKn + vKit = 1, and ∆ refers to first differences. By rearranging equation (6) the results from this study can be presented in terms of average labour productivity growth defined as y = Y/L, the ratio of output to hours worked, k = K/L, the ratio of capital services to hours worked and TFP. A further distinction can be made between TFP originating in the IT-production industries (Ait) and in non-IT production (An), so:
∆ ln y = vKn ∆ ln kn + vKit ∆ ln kit +∆ ln An +∆ ln Ait (7) Additional sources for growth accounting Capital stocks are constructed for six asset types: 3 IT-assets (office and computing equipment, communication equipment and software) and 3 non-IT assets (non-IT machinery, transport equipment and non-residential buildings). The sources for IT-asset investment series have been described above. The other investment series are taken from the OECD National Accounts, complemented with national statistical sources (see the source appendix for details). Residential capital is excluded from the analysis in this study. By including dwellings much of the findings on the differential impact of IT on growth remain hidden. The housing markets perform differently across the European Union and also relative to the U.S., and national accounts vary in the way services of owner-occupied dwellings are imputed. GDP is adjusted accordingly by excluding actual and imputed rents paid.
GDP at current and constant prices, excluding imputed and actual rents paid, is taken from the OECD, National Accounts.12 Labour input is measured as hours worked, unadjusted for changes in the composition of the labour force in terms of age, sex and/or skills. Hence contributions from changes in labour quality to GDP growth are included in the contribution of TFP. The share of labour in total factor income is calculated on the basis of the compensation for employees plus an imputation for self-employed.13 The share of capital is derived as the residual and further subdivided across asset types on the basis of rental prices as discussed in Section 3. Hours worked, total persons engaged and
12 As for investment series, measurement practices for deflating GDP also differ between the US and many European countries. Ideally, GDP deflators should be harmonised using hedonic deflators for investment and flexible weight index formulae. The quantitative impact of these adjustments on GDP volume change depends on the size of the price adjustment, the share of IT products in domestic output and in imports. Schreyer (2002) shows that for the major European countries this effect is likely to be positive, but small. 13 This adjustment is made under the assumption that wages of employees are similar to the compensation for self-employed persons.
8

9
number of employees are taken from the GGDC Total economy database, version February 2003.14 Compensation of employees is taken from OECD, National Accounts. IT-goods production shares have been derived from National accounts data and manufacturing census material. Source appendix 2 provides a detailed description of the sources used. 3. IT investment, stock and services Figure 1 provides a comparison of the share of IT investment in current price GDP in the EU and the US. In both regions there is a clear upward trend in the share of IT investment in the beginning of the 1980s and again in the latter half of the 1990s. However, the level of IT investment is much higher in the U.S. than in the EU and, importantly, the gap has not narrowed much. In contrast to what has been suggested on the basis of IT expenditure data (e.g. Daveri 2002), we find no significant catching-up in the share of IT in GDP in Europe relative to the U.S. Although in 2001 IT investment declined more severe in the US than in the EU, the investment rate in the European Union was still not higher than the rate in the U.S. in the beginning of the 1980s.15
[Fig 1 about here] In Table 2 a breakdown of IT-investment and non-IT investment is provided, expressed as shares of total non-residential gross fixed capital formation. The relative importance of the various IT assets varies over time. In the 1980s, office and computing equipment (O&CE) and communication equipment dominated IT investment, but their shares only slightly increased afterwards. Software is by far the most important IT-good in the 1990s, accounting for almost half of all IT-investment in 2001. The US is clearly leading the EU in investment in all IT goods. Although the gap in investment in O&CE has narrowed in 2001, investment shares in communication equipment and especially software were almost twice as high in the US.
[Table 2 about here] Within the EU a diverse IT-investment pattern is observed. In 2001, IT-investment shares varied between a low 1.9% of GDP in Ireland to a high 4.7 % in Sweden (Table 3). There is no clear cut division of countries into a group of slow adopters and fast adopters as suggested by Daveri on the basis of expenditure data, although the variance is high. In 2001, Ireland, Portugal, Spain and France had the lowest IT investment shares of 2.1% of GDP or lower.16 On the other hand Sweden and Finland even had a higher share of IT-spending in GDP than the US (4.7 and 4.3 % respectively). In general, the major EU countries are investing below the EU average. Only UK investment was above-average after 1995. These rankings have not been constant. Countries like Belgium, Italy and Germany had already relatively high shares in 1985, but these did not improve much afterwards. 14 Downloadable at http://www.ggdc.net/dseries/totecon.shtml#top. 15 In contrast, Daveri (2002) suggest that “Overall, as of 2001, the EU as a whole no longer appears seriously to lag behind the USA in terms of IT adoption”(p.346)

10
Other countries like Sweden, Finland and Greece, steadily increased IT-spending throughout the 1980s and 1990s.
[Table 3 about here] IT- investment composition differs as well across Europe (see Figure 2). Most of the Finnish IT-investment is in communication equipment, while Denmark and Sweden mainly spent on software. On the other hand Belgium had a high share of O&CE investment. The major EU countries do not differ much in terms of IT investment composition.
[Fig 2 about here] Investment series are deflated using the price index harmonisation method and converted into real stocks using the perpetual inventory method (see section 2). Table 4 provides a comparison of the IT capital stock in EU member countries and the US for the year 1995 and 2001 (see also Figure 3). The current price stock estimates of office and computing equipment, communication equipment and software have been summed for each country and converted to euros using the (official) euro exchange rates of 1999. By dividing through total hours worked an indicator of IT capital intensity is derived. In 2001, the European Union as a whole had IT-intensity levels which were still well below the US: 2.8 euro per hour worked compared to 5.2 in the US. In absolute terms the gap has increased over the period 1995-2001. While in 1995 the gap was 1.8 euro, it had increased to 2.4 euro in 2001. In Table 4 EU countries have been sorted on the basis of their IT-stock intensity in 2001. It shows that in 2001 all EU economies are still characterised by IT-intensity levels which are lower than in the US. Sweden, Finland, Belgium and Denmark rank high within the EU with levels ranging between of 4.2 and 4.8 euro per hour worked. Ireland, Greece, Spain and Portugal are at the bottom with intensity levels ranging between 1.1 and 2.2 euro.
[Table 4 about here] [Fig 3 about here]
How much did growth in IT-capital stocks contribute to capital service growth? These contributions are calculated using equation (3). Figure 4 shows the contributions of IT and non-IT capital to aggregate capital service growth for the periods 1980-1990, 1990-1995 and 1995-2001. The contribution of a particular asset type is calculated as the growth of its stock multiplied by its share in total capital compensation. Table 5 provides a more detailed breakdown of those contributions indicating shares in capital compensation, growth of stocks and %-point contribution to aggregate capital service growth.
Until 1995, capital service growth in the EU was fairly similar to growth in the US. The smaller contribution of IT-capital was (almost) fully compensated for by the higher contribution of non-IT assets, especially non-IT equipment in the 1980s and non-residential buildings and structures in the beginning of the 1990s. However, a big gap in capital service growth rates opened in the latter 16 The group of slow adopters of Daveri (2002, Table 1) includes Italy but excludes France. This suggests that

11
half of the 1990s. Capital service input growth in the U.S. accelerated from an annual average of 3.2 to 5.1 percent whereas growth was much slower in the EU, increasing from 3.2 to 3.7 percent. Similar to what was found by Jorgenson (2001), the U.S. acceleration was mainly due to increased service flows from IT-capital (contributing 1.0 percentage point to the acceleration).17 This was complemented by increasing contributions from non-IT assets, adding another 0.7 percentage point to the acceleration in the 1990s. In contrast, the contribution of non-IT assets in the EU stagnated. The increase in aggregate capital service flows in the EU was solely dependent on the increase in IT capital service flows, contributing 0.5 percentage points to the acceleration. The lower contribution of IT-capital in the EU is not due to slower growth rates of IT capital stocks. In fact, growth rates of all IT assets are high and of similar magnitude between the two regions (see middle panel in Table 5). But due to its much lower share in capital compensation, the contribution of IT capital to total capital service growth in the EU is much lower than in the U.S. This is a consequence of lagging levels of IT-investment in the EU as witnessed in Figure 1.
[Fig 4 about here] [Table 5 about here]
Contribution of IT and non-IT capital to aggregate capital service growth for the 14 EU countries for the period 1995-2001 are shown in Figure 5. Aggregate capital service growth rates vary from a low 2.2% in Finland to over 7.5% in Ireland. Together with Ireland, Portugal ranks highest in terms of capital service growth. But the IT-capital contribution is relatively minor as capital growth rates in these catching-up economies are dominated by growth in non-residential structures (3.4 and 3.0 percentage points respectively). In contrast, the rapid growth rates of Swedish capital services at 5.2 % is dominated by growth in IT-assets, which contribution is even higher than in the US. The UK also has growth rates of IT and non-IT capital services comparable to the US. High growth rates of almost 5% in Spain and Greece are mostly dominated by contributions from non-IT assets. Three major European countries, France, Italy and especially Germany, show the slowest growth rates in the EU region dragging down the EU average. They had IT contributions slightly below the EU average and are under performed only by Finland. Although investment growth rates in the latter country recovered from the slump in the beginning of the 1990s, non-IT equipment stocks were still shrinking.
[Fig 5 about here] 4. IT Capital Input as a Source of Growth
In this section capital service growth rates are combined with growth rates of hours worked to derive the contribution of each factor input to output growth. Total factor productivity growth (TFP) is derived as a residual. Table 6 and Figure 6 show input and TFP contributions to aggregate GDP growth for the periods 1980-1990, 1990-1995 and 1995-2001. Note that the latter period includes the
the consumption share of IT goods is rather high in France, and the opposite for Italy. 17 The estimated contribution of IT capital to total capital service input in the U.S. during the 1990s is somewhat larger in this study compared to Jorgenson (2001). Due to data limitations we do not consider capital services from land, inventories and residential buildings. We also do not impute services from consumer durables, part of which consists of IT-goods.

12
year 2001 in which GDP growth in both regions declined (from 4.2% annual average over the period 1995-2000 to 0.3% in 2001 in the US, and from 2.6% to 1.5% in the EU). Even including this latter year, the acceleration in GDP growth since 1995 is still clearly visible. In fact, the early 1990s are a period of slow GDP growth when compared with the 1980s and the post 1995 period. A comparison of the high growth periods, 1980-1990 with 1995-2001, shows that the sources of growth in the EU have changed a lot. This is not primarily due to changes in the contribution of capital services, despite increased IT investment. The big change is found in the contribution of labour. In the 1980s, labour input was almost zero, turning negative in the early 1990s, but increasing its contribution to GDP growth to 0.7 %-point in the late 1990s. In contrast the contribution of TFP in the European Union declined from 1.1 %-points during 1980-1995 to 0.5 %-points in the most recent period. This switch in the sources of growth from TFP to labour input is one of the outstanding characteristics of EU growth in the past two decades. Compared to Europe, the relative importance of the sources of growth in the US remained more stable. US growth resurgence in the most recent period is backed by increasing contributions from all sources. The contribution of labour input remained high, whereas the contribution of capital services slightly increased from both IT and non-IT, as did the contribution of TFP. In terms of GDP growth, the US has continuously led the EU since 1973 and the period 1995-2001 is not a special case from this perspective. Whereas in the earlier periods differences in labour input explained higher US growth, in the latest period all sources of growth show a higher contribution in the US than in the EU. The contribution of IT-capital has increased and is clearly higher in the US than in the EU. It explains 0.36 %-point of the 1.1 %-point GDP growth difference in the period 1995-2001. Differences in TFP growth explains 0.35 %-points and differences in labour input another 0.44%-points (see last rows in Table 6).
[Fig 6 about here] [Table 6 about here]
In terms of labour productivity growth the story is different. The EU has had higher labour productivity growth rates than the US ever since WW II, but this trend was reversed in the period 1995-2001. For the first time in five decades GDP per hour worked in the US grew faster than in the EU for a consecutive number of years, namely 1.9 % in the US annually versus 1.4 % in the EU (see Table 7). This difference is clearly related to the increase in labour input in the EU which is only partly matched by increased capital input. In the previous section it was shown that capital service growth in Europe only slightly increased between the period 1990-95 and 1995-2001. As a result, growth rates of non-IT capital input per hour worked declined rapidly. Whereas in the periods 1980-1990 and 1990-1995 it contributed 0.8 and 1.0 %-point to labour productivity growth, in the period 1995-2001 it was only 0.5 %-points. Increased levels of IT-capital per hour worked did not compensate for this decline. As for GDP growth, US labour productivity growth is fuelled by both input and productivity improvements. IT-capital deepening played a major role by adding 0.3 %-points to the acceleration of labour productivity growth in 1995-2001 compared to 1990-1995, non-IT deepening 0.1% and TFP another 0.2%. Hence whereas EU superior labour productivity performance in the earlier periods was primarily due to higher growth rates of (non-IT) capital deepening and higher TFP growth, falling behind in the period 1995-2001 is due to lower growth rates of IT-capital deepening and TFP than in the US.

13
[Table 7 about here] [Fig 7 about here]
Aggregate EU performance masks divergent growth paths of individual member states. In the period 1995-2001, GDP growth rates vary from 1.5% average annually in Germany and 1.9% in Italy, up to 4.5% in Finland and even 8.9 % in Ireland (see Table 8 and Figure 8). The importance of the various sources of growth differs as well. Increases in hours worked contributed 1.9 %-points or more to GDP growth in Ireland, Spain and the Netherlands, while it contributed negatively in Germany and Austria. IT capital had the biggest contribution in Sweden and Ireland. For Sweden it was the most important source of growth in this period. Non-IT capital contributed most in Ireland and Mediterranean countries like Spain, Portugal and Greece. TFP growth was high in Ireland, Finland and Greece but contributed negatively in Spain. Looking at the variance in the contribution of various sources across the EU countries it can be seen that differences in IT-capital investment play only a minor role in explaining different GDP growth rates (see last rows in Table 8). By far the most important drivers of divergence are labour input and TFP growth.
[Fig 8 about here] [Table 8 about here]
Contributions of labour input and TFP growth seem to be inversely related for most countries. With the exception of top-performers Ireland and Finland, countries with a high contribution of labour input (such as the Netherlands and Spain) have low contributions of TFP. And the other way around countries with low contributions of labour appear to have above average contributions from TFP growth (Austria, Germany and Belgium). In fact, this pattern is not only typical for the latest period. In Table 9 and figure 9 the percentage point contributions to GDP growth during the period 1980-1995 are given. Countries like Austria, the Netherlands and the UK were one of the few EU nations with positive labour growth during this period. This was coupled with below-average TFP growth rates (Table 7). On the other hand, countries like Finland, Spain and Germany had strong contributions from TFP growth while hours worked declined.
[Table 9 about here] [Fig 9 about here]
In Table 10 and Figure 10 the contributions of IT and non-IT capital deepening and TFP growth to labour productivity growth (GDP per hour worked) are given. Countries have been sorted on the basis of labour productivity growth in the period 1995-2001. Again a wide variation in the contributions of the various sources of growth is found. Whereas labour productivity grew rapidly at 3.0 % or more in Finland, Greece and Ireland, growth was slow in Italy and the Netherlands and even negative in Spain. Differences in IT and non-IT capital deepening are much smaller than in TFP and do not really matter in explaining variance in labour productivity growth rates across countries. This is shown by the variance of the various contributions shown in the last row in Table 10. Instead TFP drives divergent labour productivity growth rates in the EU. The five fastest growing countries in terms of labour productivity also were the five fastest growers in terms of TFP.

14
[Fig 10 about here]
[Table 10 about here] Table 11 and Figure 11 provide the decomposition of labour productivity growth rates for the period 1980-1995. Ireland, Finland, Germany and Spain top the list with growth rates of 2.8 % or higher. They were also the fastest TFP-growers (1.4% or higher). Austria, Sweden, the Netherlands and Greece had labour productivity growth of 1.7% or lower, driven by slow or even negative, TFP growth.
[Fig 11 about here] [Table 11 about here]
5. IT production and TFP growth
Various studies have shown that rapid technological development in the IT-producing industries play a major role in the revival of TFP growth in the U.S.18 On average, the GDP share of the IT producing industry is much smaller in Europe than in the United States, which may be an important reason for the much slower TFP growth in Europe in the period 1995-2001. Differences between EU countries may also be due to variance in the size of IT goods production. In this section we employ Domar’s aggregation model to assess the contribution of IT production to aggregate TFP growth and consider the contributions of three industries: office, accounting and computing equipment, communication equipment and electronic components.19
TFP estimates for IT-producing industries are difficult because they require capital service input measures at a detailed industry level and double deflated value added measures. Hence so far such estimates are not available for many European countries. To date there are various estimates of productivity growth in ICT producing industries in the US.20 We assume that TFP growth rates in U.S. IT industries also hold for the EU. Admittedly this is a strong assumption, but so far there is no indication that would suggest that these industries, for which performance is almost entirely technology-driven in highly competitive markets, would differ much in productivity growth across countries. In addition this assumption serves to focus ourselves on the sole effect of different output shares of IT-producing industries on aggregate growth differences between the EU and the U.S, and within EU member states.
18 Jorgenson (2001), Oliner and Sichel (2002) and Jorgenson, Ho and Stiroh (2002). 19 ISIC rev 3 industry numbers 30, 322 and 321 respectively. ISIC industry 321 corresponds closely to US SIC industry 367. Due to a lack of output data for most European countries, the computer services industry, including software, is left out of the analysis. Jorgenson, Ho and Stiroh (2002) show that the TFP contribution of this industry in the U.S. has been small. 20 These estimates differ in the growth accounting approach used (primal versus dual (or price) approach), the specific deflators used and in the weights of intermediate inputs, in particular semi -conductor input. The primal approach has been used by Jorgenson, Ho and Stiroh (2002) and the Bureau of Labour Statistics (Kask and Sieber, 2002). The dual approach has been used by Triplett (1996), Jorgenson (2001) and Oliner and Sichel (2002). For a discussion of the various results the reader is referred to Appendix B in van Ark et al. (2002). Triplett (1996) provides a good introduction to the problems in estimating IT industry TFP.

The most recent estimates of TFP growth rates in IT-production in a full input-output framework are provided in Jorgenson, Ho and Stiroh (2002, Table 18). Using primal growth accounting based on BLS data on output, prices, labour, capital and intermediate inputs they find TFP growth rates for computers and electronic components of about 15% annually over the period 1990-2000. These estimates are based on quality-adjusted price indices. Their finding of very rapid TFP growth is consistent with results from other studies. However, for communication equipment the TFP estimate from Jorgenson et al. appears to be much too low. TFP growth rates were only 3% for the period 1990-1995 and even negative for the period 1995-2000. The latter finding is due to two facts: firstly, semiconductor input into this industry is deflated with a quality adjusted price index, while the output price index of this industry is only partially quality-adjusted.21 Secondly, the price decline for semiconductor input into this industry is highly overstated as a distinction must be made between various types of semiconductors. Prices for chips used in communications equipment do not fall nearly as fast as prices for those chips used in computers (Aizcorbe, Flamm and Kurshid 2002). Hence an alternative estimate is needed. For this we will make use of recent work at the Federal Reserve Board which has led to a much better output price index for the communications industry based on hedonic methods for a larger number of products (Corrado 2003). This is combined with the work of Aizcorbe, Flamm and Kurshid (2002) on the semi-conductor input price into communication equipment in a price dual approach to growth accounting. In this approach, the rate of productivity growth in an industry (∆A) can be measured as the decline in the price of output, plus a weighted average of the growth rates of input prices with value shares of the inputs as weights (see for example Triplett 1996). Here we distinguish only two inputs: semiconductors (S) and other inputs (OI)
SSOISY PvPvPA ∆+∆−+∆−=∆ )1( (8)
where ∆PY stands for the price change of output, ∆PS and ∆POI, for the price change in semi-conductor and other inputs respectively, and vS denoting the input share of semiconductors in the value of gross output, with the bar representing averaging over periods t and t-1. The factor A, which represents industry productivity is conceptually analogous to the TFP concepts used above. In Table 12 the underlying data for TFP calculation are given for the periods 1990-1995 and 1995-2001. Depending on the low or high assumption of the share of semi-conductor input two estimates are derived. In the remainder of the paper we will use the high TFP estimate variant which indicates that TFP in the communication equipment industry has grown by more than 7% annually over the period 1995-2001.
[Table 12 about here] According to the Domar model, the contribution of a particular industry to aggregate TFP growth is obtained by weighting productivity growth for each industry by the ratio of gross output of that industry to aggregate GDP (Domar 1961). To derive the Domar-weights for IT industries in each country, gross output is calculated from a mix of national accounts and manufacturing census
21 In fact, in their study Jorgenson, Ho and Stiroh (2002) replace the unadjusted BLS index with the partially adjusted index from the BEA which shows a price decline of about 2% annually over the period 1990-2000.
15

16
statistics, adjusted for intra-industry deliveries using shares from input-output tables. The average weights for the EU and the U.S. in the periods 1990-1995 and 1995-2001 are given in the bottom rows of Table 13. It is shown that all three IT industries have greater gross output shares in the U.S. than in the EU, especially the electronic components industry which output mainly consists of semi-conductors. Only in communication equipment, the EU production equals the U.S. in the late 1990s. In Table 14 Domar weights for individual EU countries are given. The large IT production sectors in Ireland (mainly computers), and Finland and Sweden (mainly communication equipment) are striking, especially compared to countries like the Netherlands, Denmark and Greece with small IT goods producing sectors.
[Table 13 about here] [Table 14 about here]
By weighting the U.S. TFP growth rates in each industry by the country-specific Domar weights, the contribution of IT production to aggregate TFP growth is calculated. Table 13 shows that this contribution is higher in the U.S. than in the EU and that it has increased during the second half of the 1990s. For the period 1995-2001 about half of the gap of 0.34 percentage points in aggregate TFP growth between the EU and the U.S. is due to the U.S. lead in the production of IT (0.17 percentage points). This is almost solely due to production of electronic components (0.16 percentage points). So part of the better TFP performance in the US is due to its larger share of IT goods production. For some individual countries contributions of IT-production are actually much higher than in the US. In Ireland it contributed a whopping 3.6 %-points in 1995-2001, which is exactly equal to aggregate TFP growth. Also in Sweden and Finland, the contribution is high, adding 0.6 and 0.7 %-points to aggregate TFP growth respectively (See Figure 12). Of the larger EU countries the UK benefited most from IT-production (0.38 %-points), although less than the US (0.44 %-points). Clearly these estimates are still experimental, and await more detailed calculation of TFP growth in IT producing industries in individual countries before a definitive assessment can be made of the productivity impact of the presence of an IT-producing industry.
[Figure 12 about here] In Table 15 we summarise our findings concerning the impact of the IT-revolution on labour productivity growth in the EU member states in the US for the period 1995-2001. It decomposes labour productivity growth into the direct effects of IT and other sources. The direct effects of IT are the summation of the effect of capital deepening by IT investment and the growth effect from TFP growth in IT-goods production.
[Table 15 about here] Intra-EU differences in labour productivity growth can partially be explained by different impacts of IT investment and IT goods production. Ireland’s star performance is to a large extent due to its big IT-production sector. Countries like Sweden and Finland profited from both high IT capital investment and high shares of IT-goods production. In total 1.4 %-point of aggregate labour productivity growth in these two countries could be explained by these two direct effects of the IT-

17
revolution. But in the majority of EU countries growth benefits from IT were only limited, having contributions from IT of less than 0.65 %-points to labour productivity growth (see Table 15). In Spain it only contributed 0.32%-points. The UK is the only major European country in which IT contributed 1.0 %-points, which is below the US (1.2%). However, due to worse performance in TFP derived from non-IT production, labour productivity growth rates in the UK was not higher than in Germany and France (1.6 %-points). Italy suffered from both bad non-IT TFP performance and low contributions from IT, resulting in a low labour productivity growth (1.1%). 6. Summary and concluding remarks On the basis of updated and extended data on IT investment trends in 14 EU member states and the United States, the impact of the IT revolution on economic performance has been analysed for the period 1980-2001. Our main findings include the following. Since 1980 the EU as whole has been, and still is, lagging in IT investment compared to the US (2.6 versus 4.2 % of GDP in 2001). Consequently, in 2001 the IT capital stock per hour worked is almost two times higher in the US than in the EU. The growth advantage of the US over the EU of 0.50 percentage points per year during the period 1995-2001 is for more than half due to higher contributions from IT capital input (0.30 %-points, see Table 7). In addition, the difference in the size of the IT-goods producing sector is another important reason for EU’s falling behind. The bigger IT output share, especially of semi-conductors, adds another 0.17 %-point to the US labour productivity growth advantage (see Table 13). Hence differences in the direct contribution of IT explain virtually all of the US lead in labour productivity growth during 1995-2001.
Also within the European Union IT has been a major factor behind the observed disparities in growth performance. In the period 1995-2001, the direct contribution to GDP of IT investment and TFP growth in IT-production in Ireland, Finland, Sweden and the UK has been comparable to the contribution in the US, or even higher. In the rest of Europe, and especially in the major Continental countries, direct contributions have been half the contribution in the US, or even less. This is due to both smaller levels of IT capital stocks and smaller IT-goods producing industries (see Table 15).
However, this study also shows that the contributions from IT-investment and production are not the sole determinants of the widening of the “Atlantic Divide” in growth performance, neither the main cause of diverging labour productivity growth within Europe. ICT has been around for a long time, also in Europe, contributing to growth since the 1970s. Only recently it has become a dominant factor in economic growth, following a slow but steady increase. From a long-term growth perspective equally important issues in any explanation of European falling behind should be the decline in non-IT capital intensity and especially the decline in TFP growth (in non-IT goods producing sectors) in major European countries, compared to the acceleration in the US (see Tables 7, 10 and 11). In fact, the changes in the determinants of growth in the EU during the 1990s has been much more dramatic than in the US. Whereas US labour productivity growth in the second half of the 1990s accelerated through higher contributions of all sources of growth, EU growth declined by a full percentage point per year. The latter was due to declines in contributions from both non-IT capital deepening and non-IT TFP, notwithstanding increased contributions from IT-capital and TFP growth in IT-goods production.

18
Aggregate EU trends hide substantial variation in growth in individual European countries. In fact, the convergence pattern within the EU of the past decades has accelerated in the latter half of the 1990s. Labour productivity growth in leading countries slowed down, while growth in most lagging countries continued or even accelerated. Non-IT capital deepening and non-IT TFP were major contributors to growth in small economies such as Austria, Finland, Greece, Ireland, Portugal and Sweden. In Finland, Sweden and especially Ireland this was augmented by high direct contributions from IT. At the same time, decelerating labour productivity growth in the major European countries was due to declines in the contribution of non-IT. Compared to the period 1980-95, in Germany, Italy and the UK deceleration in labour productivity growth was mainly driven by slowing non-IT TFP growth. In France, the slowdown in non-IT capital intensification was most important. The Netherlands and especially Spain experienced large declines in both non-IT related sources of growth. The slowdown in the contribution of TFP to European growth, compared to increased contribution in the US, might be indirectly rela ted to the IT-revolution. Besides through IT-capital deepening and TFP growth in IT-goods production, there is a third channel through which IT can contribute to growth. The use of IT capital can boost TFP growth under the assumption that the use of IT provides significant spillover effects and stimulates disembodied technological progress. Industry-level studies of US growth such as Jorgenson, Ho and Stiroh (2002) find that the main contributing sectors to acceleration of TFP, together with IT-producing sectors, are the retailing and finance sectors, which are both highly intensive users of IT. On the basis of detailed industry-level comparisons of labour productivity growth in the US and 14 EU countries, Van Ark, Inklaar and McGuckin (2002) show that, in contrast to the US, European labour productivity growth acceleration in these sectors is only limited. Preliminary sectoral TFP growth estimates for four major European countries confirm this finding: compared to the US, Europe is especially lagging in TFP growth in those sectors which are intensive users of IT (Inklaar, O’Mahony and Timmer 2003).
The reasons for this slow reaction of TFP on IT investment in Europe can be multifold. First, the scale of IT investment might still be too small to have spillover effects. For example network externalities depend crucially on a critical mass of users of the new technology (e.g. Oulton 2002). In addition, stringent regulation might prohibit taking up the potential advantages in the use of IT (e.g. Bassanini and Scarpetta 2002, OECD 2003). And as argued by David (1990) productive use of a new technology takes time and productivity growth will follow investment only with a lag. Given the fact that EU IT investment is still way behind the US, a similar retardation might take place in the productivity enhancing effects.
A different set of explanations for Europe’s falling behind focus on issues which are not directly related to the effects of the IT revolution. It might be that the mid-1990s marked the end of the convergence process of the EU towards the US as (pre-IT) technological opportunities for catching up were exhausted. Realisation of this potential for growth drove post-WW II convergence in the OECD (Abramovitz 1989). As shown in Table 1, in 1995 relative labour productivity levels in the EU had almost caught up with the US indicating the diminished opportunities for further catch-up based growth. From this perspective, the EU productivity slowdown is nothing but a natural phenomenon of the catching up process. However the gradual exhaustion of catch up potential cannot account for the suddenness with which the EU labour productivity growth path was reversed in the 1990s.

19
Developments in labour markets also seem to play an important role. Our results suggest that countries, such as Spain and the Netherlands, with high employment growth rates tend to have much lower capital intensity and TFP growth rates, and vice versa. Austria, Belgium and Germany had relatively high TFP growth rates and low, or even negative, labour growth. This might be related to a change in the trade-off between productivity and employment induced by developments in labour markets (Bassanini and Scarpetta 2002, OECD 2003) and has little to do with the effects of the IT revolution. It suggests that in countries that have rapidly increased labour input, most of the employment generation has been in sectors with low TFP, or in low skilled, low productive, jobs. Further analysis of these hypotheses awaits more detailed data sets to estimate capital deepening and TFP growth at the sector level with a breakdown of hours worked by characteristics such as level of education.

20
References Abramovitz, M. (1989), Thinking About Growth, Cambridge: Cambridge University Press. Aizcorbe, A. K. Flamm & A. Kurshid (2002), The Role of Semiconductor Inputs in IT Hardware
Price Decline: Computers vs. Communications, mimeo, revised June 2002. Bassanini, A and S. Scarpetta (2002), “Growth, Technological Change and ICT Diffusion: Recent
Evidence from OECD Countries”, Oxford Review of Economic Policy, vol. 18(3), pp. 324-344.
Corrado, C. (2003), “Industrial Production and Capacity Utilization: The 2002 Historical and Annual Revision”, Federal Reserve Bulletin, Federal Reserve Bank, April 2003, pp. 151-176.
Baily, Martin N.; Lawrence, Robert Z. (2001) “Do we have a New E-conomy?”, NBER Working Paper, no. 8243, April 2001.
Brynjolfsson, E. and L. Hitt (2000), ‘Beyond Computation: Information Technology, Organizational Transformation and Business Performance’, Journal of Economic Perspectives, 14, p.23-48.
Colecchia, A. and P. Schreyer (2001), ‘ICT Investment and Economic Growth in the 1990s: Is the United States a Unique Case? A Comparative Study of Nine OECD Countries", STI Working Paper 2001/7, OECD, Paris.
Daveri, F. (2002), “The New Economy in Europe, 1992-2001”, Oxford Review of Economic Policy, vol. 18(3), pp. 345-362.
David, P. (1990), ‘The Dynamo and the Computer: An Historical Perspective on the Modern Productivity Paradox’, American Economic Review, 80 (2), pp. 355-61.
Domar, Evsey (1961) “On the Measurement of Technological Change.” Economic Journal, 71(284), pp. 709-29.
Foster, L, C. Haltiwanger and C.J. Krizan (2002), “ The Link Between Aggregate and Micro Productivity Growth: Evidence from Retail Trade”, NBER Working Papers 9120, National Bureau of Economic Research, August 2002
Inklaar, R., M. O’Mahony and M.P. Timmer (2003), The End of Catching-Up: An Industry Perspective on European Union and US Productivity Growth , mimeo, Groningen Growth and Development Centre, October 2003.
Jorgenson, D. W. (2001), ‘Information Technology and the US Economy’, American Economic Review, 91 (1), pp. 1-32.
Jorgenson, D. W. and Z. Griliches (1967), ‘The Explanation of Productivity Change’, Review of Economic Studies, 34, pp. 249-83.
Jorgenson, D.W. and K. Stiroh (2000), ‘Raising the Speed Limit: U.S. Economic Growth in the Information Age’, Brookings Papers on Economic Activity, 1, pp. 125-211.
Jorgenson, D.W., M.S. Ho, and K.J. Stiroh (2002), ‘Information Technology, Education, and the Sources of Economic Growth across US Industries’, mimeo, downloadable at http://post.economics.harvard.edu/faculty/jorgenson/papers/jhscriw.pdf
Jorgenson, D.W., M.S. Ho and K.J. Stiroh (2003), ‘Lessons for Europe from the US Growth Resurgence’, CESifo Economic Studies, No.1, pp. 27-48.
Kask, C. and E. Sieber (2002) "Productivity growth in 'high-tech' manufacturing industries," Monthly Labour Review, March 2002, pp. 16-31.

21
Lequiller, François; Ahmad, Nadim; Varjonen, Seppo; Cave, William and Ahn, Kil-Hyo (2003) “Report of the OECD Task Force on Software Measurement in The National Accounts”, OECD Statistics Directorate, STD/DOC (2003)1, OECD, Paris.
OECD (2003), The Sources of Economic Growth in OECD Countries, Paris: OECD Oliner, S. D. and D. E. Sichel, (2000), ‘The Resurgence of Growth in the Late 1990s: Is Information
Technology the Story?’, Journal of Economic Perspectives, 14 (4), pp. 3-22. Oliner, Stephen D.; Sichel, Daniel E. (2002), “Information Technology and Productivity: Where Are
We Now and Where Are We Going?”, Federal Reserve Bank of Atlanta Economic Review, 3rd Quarter 2002, 87(3), pp. 15-44
Oulton, N. (2002), “ICT and Productivity growth in the United Kingdom”, Oxford Review of Economic Policy, 18(3), pp. 363-379.
Schreyer, P. (2000), ‘The Contribution of Information and Communication Technology to Output Growth: A Study of the G7 Countries’, STI Working Papers 2000/2 , OECD, Paris.
Schreyer, P. (2002), ‘Computer Price Indices and International Growth and Productivity Comparisons’, Review of Income and Wealth, 48 (1), pp. 15-31, March.
Triplett, J. (1996), “High Tech Industry Productivity and Hedonic Price Indices,” in OECD, Industry Productivity. International Comparison and Measurement Issues, OECD Proceedings, Paris, pp. 119-142.
Triplett, J. E., and B. P. Bosworth. (forthcoming). “Baumol’s Disease Has Been Cured: IT and Multifactor Productivity in U.S. Services Industries.” In D. Jansen (ed.), The New Economy: How New? How Resilient?, Chicago: University of Chicago Press, forthcoming. Earlier version available at
http://www.brookings.edu/views/papers/triplett/20000112.pdf Van Ark, B. (2002), ‘Measuring the New Economy: An International Perspective’, Review of Income
and Wealth , 48 (1), pp.1-14. van Ark, Bart, Robert Inklaar and Robert McGuckin (2002), "Changing Gear" Productivity, ICT and
Services: Europe and the United States, GGDC Research Memorandum GD-60, Groningen Growth and Development Centre, December 2002.
Van Ark, B., J. Melka, N. Mulder, M.P. Timmer, and G. Ypma (2002), ‘ICT Investment and Growth Accounts for the European Union, 1980-2000’, GGDC Research Memorandum GD-56, Groningen Growth and Development Centre, December 2002, revised March 2003.
Vijselaar, F. and R. Albers (2002), New Technologies And Productivity Growth In The Euro Area , ECB Working Paper No. 122, February 2002.
Wykoff, Andrew W. (1995) “The Impact of Computer Prices on International Comparisons of Labour Productivity.” Economics of Innovation and New Technology, 1995, 3(3-4), pp. 277-93.

22
Sources Appendix
Source Appendix 1: Source description of gross fixed capital formation series Source Appendix 2: Other data sources

23
Source Appendix 1: Source description of gross fixed capital formation series A. Gross fixed capital formation in current prices Austria Office and computer equipment Sources: 1980-2001:Estimated series based on the I/(Q+M-E) share from the national 1995 I/O table from Statistik Austria and with production, import and export series from OECD STAN Database 2003, release 02, converted to national currency at the official Euro-exchange rate. Communication equipment Sources: 1980-2001: Estimated series based on the I/(Q+M-E) share from the national 1995 I/O table from Statistik Austria and production, import and export series from OECD STAN Database 2003, converted to national currency at the official Euro-exchange rate. Non-ICT equipment Sources: Derived from Total equipment, Office and computer equipment and communication equipment. Total equipment Sources: 1955-1959: trend of OECD National Account Statistics 1955-1964, trend based on 1960; 1965-1975: trend of OECD National Accounts, vol. 2, detailed tables 1960-1997, trend based on 1976; 1976-2001: OECD National Accounts, vol. 1, main aggregates 1970-2001 (2003). Notes: 1955-1975: derived from Machinery and Transport equipment with average shares of 1976 and 1977. Transport equipment Sources: 1955-1959: trend of OECD National Account Statistics 1955-1964, trend based on 1960; 1965-1975: trend of OECD National Accounts, vol. 2, detailed tables 1960-1997, trend based on 1976; 1976-2001: OECD National Accounts, vol. 1, main aggregates 1970-2001 (2003). Notes: 1955-1975: derived from Machinery and Transport equipment with average shares of 1976 and 1977. Non-residential structures Sources: 1955-1959: trend of OECD National Account Statistics 1955-1964, trend based on 1960; 1960-1975: trend of OECD National Accounts, vol. 2, detailed tables 1960-1997, trend based on 1976; 1976-2001: OECD National Accounts, vol. 1, main aggregates 1970-2001 (2003). Software Sources: Official series for investment in software 1976-2001 from Statistik Austria. Total GFCF

24
Sources: 1950-1954: trend from OECD National Accounts 1950-1978, vol. 1, main aggregates 1980, trend based on 1955; 1955-2001: summation of underlying categories. Belgium Office and computer equipment Sources: Official series for 1978-2001 from Federaal Planbureau België (FPB) Communication equipment Sources: Official series for 1978-2001 from Federaal Planbureau België (FPB) Non-ICT equipment Sources: Derived from Total equipment, Office and computer equipment and communication equipment. Total equipment Sources: 1955-1961: trend from OECD National Account Statistics 1955-1964, trend based on 1962; 1962-1974: trend from OECD National Accounts 1950-1978, vol. 1, main aggregates 1980, trend based on 1975; 1975-1994: trend from OECD National Accounts, vol. 2, detailed tables 1960-1997, trend based on 1995; 1995-1999: OECD National Accounts, vol. 1, main aggregates 1970-2001 (2003). Notes: 1955-1974: derived from Machinery and Transport equipment with average shares of 1975 and 1976. 2000 and 2001: derived from Total GFCF with average shares of 1998 and 1999. Transport equipment Sources: 1955-1961: trend from OECD National Account Statistics 1955-1964, trend based on 1962; 1962-1974: trend from OECD National Accounts 1950-1978, vol. 1, main aggregates 1980, trend based on 1975; 1975-1994: trend from OECD National Accounts, vol. 2, detailed tables 1960-1997, trend based on 1995; 1995-1999: OECD National Accounts, vol. 1, main aggregates 1970-2001 (2003). Notes: 1955-1974: derived from Machinery and Transport equipment with average shares of 1975 and 1976. 2000 and 2001: derived from Total GFCF with average shares of 1998 and 1999. Non-residential structures Sources: 1955-1961: trend from OECD National Account Statistics 1955-1964, trend based on 1962; 1962-1974: trend from OECD National Accounts 1950-1978, vol. 1, main aggregates 1980, trend based on 1975; 1975-1994: trend from OECD National Accounts, vol. 2, detailed tables 1960-1997, trend based on 1995; 1995-1999: OECD National Accounts, vol. 1, main aggregates 1970-2001 (2003). Notes: 2000 and 2001: derived from Total GFCF with average shares of 1998 and 1999. Software Sources: Estimations based on average ratio of software to office and computer equipment for France, Italy and the UK applied to investment in office and computer equipment for 1980-1995 and 2001, linked to official series for 1995-2000 from Federaal Planbureau België (FPB).

25
Total GFCF Sources: 1953-1954: trend from OECD National Accounts 1950-1978, vol. 1, main aggregates 1980, trend based on 1955; 1955-1999: summation of underlying categories. 2000-2001: trend from OECD National Accounts, vol. 1, main aggregates 1970-2001 (2003), linked in 1999. Denmark Office and computer equipment Sources: Official series for 1988-1999 from Statistik Danmark, extrapolated with estimated series based on I/(Q+M-E) shares from the OECD 1997 I/O Tables of 1993 and production, import and export series from the OECD STAN Database 2002, release 02. Communication equipment Sources: Official series for 1988-1999 from Statistik Danmark, extrapolated with estimated series based on I/(Q+M-E) shares from the national 1993 I/O table and the OECD I/O tables for 1972, 1977, 1980, 1985 and 1990 and production, import and export series from the OECD STAN Database 2002, release 02. Non-ICT equipment Sources: Derived from Total equipment, Office and computer equipment and communication equipment. Total equipment Sources: 1955-1962: trend of OECD National Account Statistics 1955-1964, trend based on 1963; 1963-1965: trend from OECD National Accounts 1950-1978, vol. 1, main aggregates 1980, trend based on 1966; 1966-1969: trend of OECD National Accounts, vol. 2, detailed tables 1960-1997, trend based on 1970; 1970-2001: OECD National Accounts, vol. 1, main aggregates 1970-2001 (2003). Notes: 1955-1965: derived from Machinery and Transport equipment with average shares of 1966 and 1967. 1963-1965 derived from Total GFCF with average shares of 1966 and 1967. Transport equipment Sources: 1955-1962: trend of OECD National Account Statistics 1955-1964, trend based on 1963; 1963-1965: trend from OECD National Accounts 1950-1978, vol. 1, main aggregates 1980, trend based on 1966; 1966-1969: trend of OECD National Accounts, vol. 2, detailed tables 1960-1997, trend based on 1970; 1970-2001: OECD National Accounts, vol. 1, main aggregates 1970-2001 (2003). Notes: 1955-1965: derived from Machinery and Transport equipment with average shares of 1966 and 1967. 1963-1965 derived from Total GFCF with average shares of 1966 and 1967. Non-residential structures Sources: 1955-1962: trend of OECD National Account Statistics 1955-1964, trend based on 1963; 1963-1965: trend from OECD National Accounts 1950-1978, vol. 1, main aggregates 1980, trend based on 1966; 1966-1969: trend of OECD National Accounts, vol. 2, detailed tables 1960-1997,

26
trend based on 1970; 1970-2001: OECD National Accounts, vol. 1, main aggregates 1970-2001 (2003). Notes: 1963-1965 derived from Total GFCF with average shares of 1966 and 1967. Software Sources: Official series for 1966-2001 from Danmarks Statistikbank. Total GFCF Sources: 1950-1954: trend from OECD National Accounts 1950-1978, vol. 1, main aggregates 1980, trend based on 1955; 1955-2001: summation of underlying categories. Finland Office and computer equipment Sources: Official series for 1995-1999 from Statistics Finland. Extrapolated with estimated series based on I/(Q+M-E) shares from the OECD 1995 I/O table and production, import and export series from the OECD STAN Database 2002, release 02, converted to national currency at the official Euro-exchange rate. Communication equipment Sources: Official series for 1995-1999 from Statistics Finland. Extrapolated with estimated series based on I/(Q+M-E) shares from the OECD 1995 I/O table and production, import and export series from the OECD STAN Database 2002, release 02, converted to national currency at the official Euro-exchange rate. Non-ICT equipment Sources: Derived from Total equipment, Office and computer equipment and communication equipment. Total equipment Sources: 1960-1969: Trend of OECD National Accounts, vol. 2, detailed tables 1960-1997, trend based on 1970; 1970-2001: OECD National Accounts, vol. 1, main aggregates 1970-2001 (2003). Transport equipment Sources: 1960-1969: Trend of OECD National Accounts, vol. 2, detailed tables 1960-1997, trend based on 1970; 1970-2001: OECD National Accounts, vol. 1, main aggregates 1970-2001 (2003). Non-residential structures Sources: 1960-1969: Trend of OECD National Accounts, vol. 2, detailed tables 1960-1997, trend based on 1970; 1970-2001: OECD National Accounts, vol. 1, main aggregates 1970-2001 (2003). Software Sources: Official series for 1975-2001 from Statistics Finland.

27
Total GFCF Sources: 1950-1959: trend from OECD National Accounts 1950-1978, vol. 1, main aggregates 1980, trend based on 1960; 1955-2001: summation of underlying categories. France: Office and computer equipment Sources: 1959-2000: Official series from INSEE. 2001 extrapolated with official trend in hardware from INSEE. Communication equipment Sources: 1959-2001: Official series from INSEE. Non-ICT equipment Sources: derived from Total equipment, Office and computer equipment and Communication equipment. Total equipment Sources: 1955-1959: trend of OECD National Account Statistics 1955-1964, trend based on 1960; 1960-1977: trend of OECD National Accounts, vol. 2, detailed tables 1960-1997, trend based on 1978; 1978-2001: OECD National Accounts, vol. 1, main aggregates 1970-2001 (2003). Notes: 1955-1975: derived from Machinery and Transport equipment with average shares of 1976 and 1977. Transport equipment Sources: 1955-1959: trend of OECD National Account Statistics 1955-1964, trend based on 1960; 1960-1977: trend of OECD National Accounts, vol. 2, detailed tables 1960-1997, trend based on 1978; 1978-2001: OECD National Accounts, vol. 1, main aggregates 1970-2001 (2003). Notes: 1955-1975: derived from Machinery and Transport equipment with average shares of 1976 and 1977. Non-residential structures Sources: 1955-1959: trend of OECD National Account Statistics 1955-1964, trend based on 1960; 1960-1977: trend of OECD National Accounts, vol. 2, detailed tables 1960-1997, trend based on 1978; 1978-2001: OECD National Accounts, vol. 1, main aggregates 1970-2001 (2003). Software Sources: 1959-2001: Official series from INSEE. Total GFCF Sources: 1950-1959: trend from OECD National Accounts 1950-1978, vol. 1, main aggregates 1980, trend based on 1960; 1955-2001: summation of underlying categories. Germany Office and computer equipment

28
Sources: Official series from German National Accounts for 1991-2001, extrapolated with official series for West Germany for 1970-1991. Communication equipment Sources: Offic ial series from German National Accounts for 1991-2001. 1980-1990 estimated series based on I/(Q+M-E) shares from OECD 1995 I/O table and production, import and export series from the OECD STAN Database 2002, release 02, converted to national currency at the official Euro-exchange rate (1991-2000) and West German trend from the OECD STAN Database 1995 (1976-1990). Non-ICT equipment Sources: Derived from Total equipment, Office and computer equipment and communication equipment. Total equipment Sources: 1955-1959: West German trend of OECD National Account Statistics 1955-1964, trend based on 1960; 1960-1969: West German trend of OECD National Accounts, vol. 2, detailed tables 1960-1997, trend based on 1970; 1970-2001: OECD National Accounts, vol. 1, main aggregates 1970-2001 (2003). Notes: 1955-1959: derived from Machinery and Transport equipment with average shares of 1960 and 1961. Transport equipment Sources: 1955-1959: West German trend of OECD National Account Statistics 1955-1964, trend based on 1960; 1960-1969: West German trend of OECD National Accounts, vol. 2, detailed tables 1960-1997, trend based on 1970; 1970-2001: OECD National Accounts, vol. 1, main aggregates 1970-2001 (2003). Notes: 1955-1959: derived from Machinery and Transport equipment with average shares of 1960 and 1961. Non-residential structures Sources: 1955-1959: West German trend of OECD National Account Statistics 1955-1964, trend based on 1960; 1960-1979: West German trend of OECD National Accounts, vol. 2, detailed tables 1960-1997, trend based on 1980; 1980-2001: OECD National Accounts, vol. 1, main aggregates 1970-2001 (2003). Software Sources: 1991-2001: Estimation based on average ratio of software to intangible investments from Finland, France, Italy and UK applied to official series of intangible investments from German National Accounts, extrapolated with ratio of software to office and computer equipment for other countries to investment in office and computer equipment for 1980-90. Total GFCF

29
Sources: 1950-1959: West-German trend from OECD National Accounts 1950-1978, vol. 1, main aggregates 1980, trend based on 1960; 1955-2001: summation of underlying categories. Greece Office and computer equipment Sources: Official series from Statistics Greece for 1988-2001, extrapolated for 1980-1987 with estimations based on I/Q+M-E shares from the OECD 1994 I/O table and production, import and export series from the OECD STAN Database 2003, release 02, converted to national currency at the official Euro-exchange rate. Communication equipment Sources: Official series from Statistics Greece for 1988-2001, extrapolated for 1980-1987 with estimations based on I/Q+M-E shares from the OECD 1994 I/O table and production, import and export series from the OECD STAN Database 2003, release 02, converted to national currency at the official Euro-exchange rate. Non-ICT equipment Sources: Derived from Total equipment, Office and computer equipment and communication equipment. Total equipment Sources: 1955-1959: trend of OECD National Account Statistics 1955-1964, trend based on 1960; 1960-1994: trend of OECD National Accounts, vol. 2, detailed tables 1960-1997, trend based on 1995; 1995-2001: OECD National Accounts, vol. 1, main aggregates 1970-2001 (2003). Notes: 1955-1959: derived from Machinery and Transport equipment with average shares of 1960 and 1961. Transport equipment Sources: 1955-1959: trend of OECD National Account Statistics 1955-1964, trend based on 1960; 1960-1994: trend of OECD National Accounts, vol. 2, detailed tables 1960-1997, trend based on 1995; 1995-2001: OECD National Accounts, vol. 1, main aggregates 1970-2001 (2003). Notes: 1955-1959: derived from Machinery and Transport equipment with average shares of 1960 and 1961. Non-residential structures Sources: 1955-1959: trend of OECD National Account Statistics 1955-1964, trend based on 1960; 1960-1994: trend of OECD National Accounts, vol. 2, detailed tables 1960-1997, trend based on 1995; 1995-2001: OECD National Accounts, vol. 1, main aggregates 1970-2001 (2003). Software Sources: Estimations based on average ratio of software to office and computer equipment for France, Italy and the UK applied to investment in office and computer equipment for 1980-2001. Total GFCF

30
Sources: 1950-1959: trend from OECD National Accounts 1950-1978, vol. 1, main aggregates 1980, trend based on 1960; 1955-2001: summation of underlying categories. Ireland Office and Computer Equipment Sources: 1980-2000 Estimated series based on I/(Q+M-E) shares from CSO National tables of 1985 and 1990 and production and import series from the Industrial Census of Production from CSO, converted to national currency with the official Euro-exchange rate. Notes: 2001 is estimated with the average share of Office and computer equipment in Total Equipment for 1999 and 2000. Communication equipment Sources: 1980-2000: Estimated series based on I/(Q+M-E) shares from CSO National tables of 1985 and 1990 and production, import and export series from the Industrial Census of Production, converted to national currency at official Euro-exchange rate. Notes: 2001 is estimated with the average share of communication equipment in Total Equipment for 1999 and 2000. Non-ICT equipment Sources: Derived from Total equipment, Office and computer equipment and communication equipment. Total equipment Sources: 1958-1959: trend from OECD National Account Statistics 1955-1964, trend based on 1960; 1960-1989: trend from OECD National Accounts, vol. 2, detailed tables 1960-1997, trend based on 1990; 1990-2001: OECD National Accounts, vol. 1, main aggregates 1970-2001 (2003). Notes: 1958-1985: derived from Machinery and Transport equipment with average shares of 1986 and 1987. Transport equipment Sources: 1958-1959: trend from OECD National Account Sta tistics 1955-1964, trend based on 1960; 1960-1989: trend from OECD National Accounts, vol. 2, detailed tables 1960-1997, trend based on 1990; 1990-2001: OECD National Accounts, vol. 1, main aggregates 1970-2001 (2003). Notes: 1958-1985: derived from Machinery and Transport equipment with average shares of 1986 and 1987. Non-residential structures Sources: 1958-1959: trend from OECD National Account Statistics 1955-1964, trend based on 1960; 1960-1989: trend from OECD National Accounts, vol. 2, detailed ta bles 1960-1997, trend based on 1990; 1990-2001: OECD National Accounts, vol. 1, main aggregates 1970-2001 (2003). Software

31
Sources: Official series from CSO for 1990-2000, extrapolated application of ratio of software to office and computer equipment for other countries to investment in office and computer equipment for 1981-89 and 2001. Total GFCF Sources: 1950-1959: trend from OECD National Accounts 1950-1978, vol. 1, main aggregates 1980, trend based on 1960; 1955-2001: summation of underlying categories. Italy Office and Computer Equipment Sources: 1982-2000: series from Istat Contabilità nazionale; 1980-1981 extrapolated with estimated series based on I/(Q+M-E) shares from the OECD 1985 I/O table and production, import and export series from the OECD STAN Database 2002, release 02, converted to national currency at official Euro-exchange rate, (1990-2000) and OECD STAN Database 1995 (1980-1990). Notes: 2001 estimated with average share of Office and Computer equipment in Total equipment for 1999 and 2000. Communication Equipment Sources: 1982-2000: series from Istat Contabilità nazionale; 1980-1981extrapolated with estimated series based on I/(Q+M-E) shares from the OECD 1985 I/O table and production, import and export series from the OECD STAN Database 2003, release 02, converted to national currency at official Euro-exchange rate (1990-2000) and OECD STAN Database 1995 (1980-1990). Notes: 2001 estimated with average share of Office and Computer equipment in Total equipment for 1999 and 2000. Non-ICT equipment Sources: Derived from Total equipment, Office and computer equipment and communication equipment. Total equipment Sources: 1955-1959: trend from OECD National Account Statistics 1955-1964, trend based on 1960; 1960-1969: trend from OECD National Accounts, vol. 2, detailed tables 1960-1997, trend based on 1970; 1970-2001: OECD National Accounts, vol. 1, main aggregates 1970-2001 (2003). Notes: 1955-1969: derived from Machinery and Transport equipment with average shares of 1970 and 1971. Transport equipment Sources: 1955-1959: trend from OECD National Account Statistics 1955-1964, trend based on 1960; 1960-1969: trend from OECD National Accounts, vol. 2, detailed tables 1960-1997, trend based on 1970; 1970-2001: OECD National Accounts, vol. 1, main aggregates 1970-2001 (2003). Notes: 1955-1969: derived from Machinery and Transport equipment with average shares of 1970 and 1971. Non-residential structures

32
Sources: 1955-1959: trend from OECD National Account Statistics 1955-1964, trend based on 1960; 1960-1979: trend from OECD National Accounts, vol. 2, detailed tables 1960-1997, trend based on 1980; 1980-2001: OECD National Accounts, vol. 1, main aggregates 1970-2001 (2003). Software Sources: 1982-2000: series from Istat Contabilità nazio nale, extrapolated with application of ratio of software to office and computer equipment for other countries to investment in office and computer equipment for 1980-1981. Total GFCF Sources: 1951-1959: trend from OECD National Accounts 1950-1978, vol. 1, main aggregates 1980, trend based on 1960; 1955-2001: summation of underlying categories. Netherlands Office and computer equipment Sources: Official series for 1987-2001 from CBS Statline; 1977-1986 extrapolated with an investment series in computer equipment from ECB (2001) Communication equipment Sources: 1980-2001: Estimated series based on the I/(Q+M-E) share from the OECD 1995 I/O table and production, import and export series from OECD STAN Database 2003, release 02, converted to national currency at the official Euro-exchange rate. Non-ICT equipment Sources: Derived from Total equipment, Office and computer equipment and communication equipment. Total equipment Sources: 1955-1959: trend from OECD National Account Statistics 1955-1964, trend based on 1960; 1960-1986: trend from OECD National Accounts, vol. 2, detailed tables 1960-1997, trend based on 1987; 1987-2001: OECD National Accounts, vol. 1, main aggregates 1970-2001 (2003). Notes: 1955-1976: derived from Machinery and Transport equipment with average shares of 1977 and 1978. Transport equipment Sources: 1955-1959: trend from OECD National Account Statistics 1955-1964, trend based on 1960; 1960-1986: trend from OECD National Accounts, vol. 2, detailed tables 1960-1997, trend based on 1987; 1987-2001: OECD National Accounts, vol. 1, main aggregates 1970-2001 (2003). Notes: 1955-1976: derived from Machinery and Transport equipment with average shares of 1977 and 1978. Non-residential structures

33
Sources: 1955-1959: trend from OECD National Account Statistics 1955-1964, trend based on 1960; 1960-1986: trend from OECD National Accounts, vol. 2, detailed tables 1960-1997, trend based on 1987; 1987-2001: OECD National Accounts, vol. 1, main aggregates 1970-2001 (2003). Software Sources: Official series for 1987-2001 from CBS Statline, extrapolated with series from ECB (2001) for 1977-1986. Total GFCF Sources: 1950-1959: trend from OECD National Accounts 1950-1978, vol. 1, main aggregates 1980, trend based on 1960; 1955-2001: summation of underlying categories. Portugal Office and computer equipment Sources: 1980-1999: Estimated series based on I/(Q+M-E) shares from the EUROSTAT 1995 I/O table and production, import and export series from the OECD STAN Database 2003, release 02. Notes: 2000-2001: derived from total equipment with average shares of 1998 and 1999. Communication equipment Sources: 1980-99: Estimated series based on I/(Q+M-E) shares from the EUROSTAT 1995 I/O table and production, import and export series from the OECD STAN Database 2003, release 02. Notes: 2000-2001: derived from total equipment with average shares of 1998 and 1999. Non-ICT equipment Sources: Derived from Total equipment, Office and computer equipment and communication equipment. Total equipment Sources: 1955-1961: trend from OECD National Account Statistics 1955-1964, trend based on 1962; 1962-1975: trend from OECD National Accounts 1950-1978, vol. 1, main aggregates 1980, trend based on 1976; 1976-1987: trend from OECD National Accounts, vol. 2, detailed tables 1960-1997, trend based on 1988; 1988-2001: OECD National Accounts, vol. 1, main aggregates 1970-2001 (2003). Notes: 1955-1961: derived from Machinery and Transport equipment with average shares of 1962 and 1963; 1976-1985: derived from Machinery and Transport equipment with average shares of 1986 and 1987. 1976 derived from Total GFCF with average shares of 1977 and 1978. Transport equipment Sources: 1955-1961: trend from OECD National Account Statistics 1955-1964, trend based on 1962; 1962-1975: trend from OECD National Accounts 1950-1978, vol. 1, main aggregates 1980, trend based on 1976; 1976-1987: trend from OECD National Accounts, vol. 2, detailed tables 1960-1997, trend based on 1988; 1988-2001: OECD National Accounts, vol. 1, main aggregates 1970-2001 (2003). Notes: 1976 derived from Total GFCF with average shares of 1977 and 1978.

34
Non-residential structures Sources: 1955-1961: trend from OECD National Account Statistics 1955-1964, trend based on 1962; 1962-1975: trend from OECD National Accounts 1950-1978, vol. 1, main aggregates 1980, trend based on 1976; 1976-1994: trend from OECD National Accounts, vol. 2, detailed tables 1960-1997, trend based on 1995; 1995-2001: OECD National Accounts, vol. 1, main aggregates 1970-2001 (2003). Notes: 1976 derived from Total GFCF with average shares of 1977 and 1978; 1994-2000 is derived from Non-residential + Residential with the average shares of 1994 and 1995. Software Sources: 1999: Official number from REIS. 1980-98 estimated with application of ratio of software to office and computer equipment for Finland, Italy, France and UK to investment in office and computer equipment. Notes: 2000-2001 are estimated with the average share of software in Total equipment of 1998 and 1999. Total GFCF Sources: 1953-1959: trend from OECD National Accounts 1950-1978, vol. 1, main aggregates 1980, trend based on 1960; 1955-2001: summation of underlying categories. Spain Office and computer equipment Sources: 1980-1997: Contabilidad Nacional de España; 1998-2000 extrapolated with estimated series based on I/(Q+M-E) shares from the OECD 1995 I/O tables and production, import and export series from the OECD STAN Database 2003, release 02, converted to national currency at official Euro-exchange rate. Notes: 2001 derived from total equipment with average share of 1999 and 2000. Communication equipment Sources: 1980-2000: Estimated series based on I/(Q+M-E) shares from the National I/O tables of 1991-1994 and the OECD 1995 I/O table and production, import and export series from the OECD STAN Database 2002, release 02, converted to national currency at official Euro-exchange rate. Notes: 2001 derived from total equipment with average shares of 1999 and 2000. Non-ICT equipment Sources: Derived from Total equipment, Office and computer equipment and communication equipment. Total equipment Sources: 1954-1957: trend from Uriel, E., M.L. Molto and V. Cucarella (2000): Contabilidad Nacional de España. Series Enlazadas 1954-97 (CNEe-86), Fundación BBV, Bilbao, based on 1958; 1958-1959: trend from OECD National Account Statistics 1955-1964, trend based on 1960; 1960-1994: trend from OECD National Accounts, vol. 2, detailed tables 1960-1997, trend based on 1995; 1995-2000: OECD National Accounts, vol. 1, main aggregates 1970-2001 (2003).

35
Notes: 1958-1979: derived from Machinery and Transport equipment with average shares of 1980 and 1981. Transport equipment Sources: 1954-1957: trend from Uriel, E., M.L. Molto and V. Cucarella (2000): Contabilidad Nacional de España. Series Enlazadas 1954-97 (CNEe-86), Fundación BBV, Bilbao, based on 1958; 1958-1959: trend from OECD National Account Statistics 1955-1964, trend based on 1960; 1960-1994: trend from OECD National Accounts, vol. 2, detailed tables 1960-1997, trend based on 1995; 1995-2000: OECD National Accounts, vol. 1, main aggregates 1970-2001 (2003). Notes: 1958-1979: derived from Machinery and Transport equipment with average shares of 1980 and 1981. Non-residential structures Sources: 1954-1957: trend from Uriel, E., M.L. Molto and V. Cucarella (2000): Contabilidad Nacional de España. Series Enlazadas 1954-97 (CNEe-86), Fundación BBV, Bilbao, based on 1958; 1958-1959: trend from OECD National Account Statistics 1955-1964, trend based on 1960; 1960-1994: trend from OECD National Accounts, vol. 2, detailed tables 1960-1997, trend based on 1995; 1995-2000: OECD National Accounts, vol. 1, main aggregates 1970-2001 (2003). Software Sources: estimated by application of average ratio of software to office and computer equipment for other countries to investment in office and computer equipment for 1980-1999. Notes: 2001 derived from total equipment with shares of 1999 and 2000. Total GFCF Sources: 1954-1959: trend from OECD National Accounts 1950-1978, vol. 1, main aggregates 1980, trend based on 1960; 1955-2001: summation of underlying categories. Notes: Sweden Office and computer equipment Sources: Official series from SCB National Accounts for 1993-2000, extrapolated with estimated series based on I/(Q+M-E) shares from the EUROSTAT 1995 I/O table and production, import and export series from the OECD STAN Database 2003, release 02. Notes: 2001 is estimated with the share of Office and Computer Equipment in Total equipment of 1999 and 2000. Communication equipment Sources: Official series from SCB National Accounts for 1993-2000, extrapolated with estimated series based on I/(Q+M-E) shares from the EUROSTAT 1995 I/O table and production, import and export series from the OECD STAN Database 2003, release 02. Notes: 2001 is estimated with the share of Office and Computer Equipment in Total equipment of 1999 and 2000.

36
Non-ICT equipment Sources: Derived from Total equipment, Office and computer equipment and communication equipment. Total equipment Sources: 1955-1961: trend from OECD National Account Statistics 1955-1964, trend based on 1962; 1962-1969: trend from OECD National Accounts 1950-1978, vol. 1, main aggregates 1980, trend based on 1970; 1970-1992: trend from OECD National Accounts, vol. 2, detailed tables 1960-1997, trend based on 1993; 1993-2001: OECD National Accounts, vol. 1, main aggregates 1970-2001 (2003). Notes: 1955-1961: derived from Machinery and Transport equipment with average shares of 1962 and 1963; 1962-1979 shares in Machinery and Transport are derived from OECD National Accounts 1950-1978, vol. 1, main aggregates 1980; 1980-1992: derived from Machinery and Transport equipment with average shares of 1978 and 1979. Transport equipment Sources: 1955-1961: trend from OECD National Account Statistics 1955-1964, trend based on 1962; 1962-1969: trend from OECD National Accounts 1950-1978, vol. 1, main aggregates 1980, trend based on 1970; 1970-1992: trend from OECD National Accounts, vol. 2, detailed tables 1960-1997, trend based on 1993; 1993-2001: OECD National Accounts, vol. 1, main aggregates 1970-2001 (2003). Notes: 1955-1961: derived from Machinery and Transport equipment with average shares of 1962 and 1963; 1962-1979 shares in Machinery and Transport are derived from OECD National Accounts 1950-1978, vol. 1, main aggregates 1980; 1980-1992: derived from Machinery and Transport equipment with average shares of 1978 and 1979. Non-residential structures Sources: 1955-1961: trend from OECD National Account Statistics 1955-1964, trend based on 1962; 1962-1969: trend from OECD National Accounts 1950-1978, vol. 1, main aggregates 1980, trend based on 1970; 1970-1979: trend from OECD National Accounts, vol. 2, detailed tables 1960-1997, trend based on 1980; 1980-2001: OECD National Accounts, vol. 1, main aggregates 1970-2001 (2003). Software Sources: 1994-2001: SCB National Accounts, extrapolated by application of ratio of software to office and computer equipment for other countries to investment in office and computer equipment for 1980-1993. Total GFCF Sources: 1950-1959: trend from OECD National Accounts 1950-1978, vol. 1, main aggregates 1980, trend based on 1960; 1955-2001: summation of underlying categories. UK Office and computer equipment

37
Sources: Official series for 1974, 1979, 1984 and 1989-1999, linearly interpolated for the missing years in between; 1972-1974 extrapolated with estimated series based on I/(Q+M-E) shares from the OECD 1968 and 1979 I/O tables and production, import and export series from the OECD STAN Database 1995. Notes: 2000 and 2001 are estimated with the average share of Office and Computer Equipment in Total equipment of 1998 and 1999. Communication equipment Sources: 1959-1999: Estimates from O’Mahony. Notes: 2000 and 2001 are estimated with the average share of communication equipment in Total equipment of 1998 and 1999. Non-ICT equipment Sources: Derived from Total equipment, Office and computer equipment and communication equipment. Total equipment Sources: 1955-1959: trend from OECD National Account Statistics 1955-1964, trend based on 1960; 1960-1969: trend from OECD National Accounts, vol. 2, detailed tables 1960-1997, trend based on 1970; 1970-2001: OECD National Accounts, vol. 1, main aggregates 1970-2001 (2003). Notes: 1955-1969: derived from Machinery and Transport equipment with average shares of 1970 and 1971. Transport equipment Sources: 1955-1959: trend from OECD National Account Statistics 1955-1964, trend based on 1960; 1960-1969: trend from OECD National Accounts, vol. 2, detailed ta bles 1960-1997, trend based on 1970; 1970-2001: OECD National Accounts, vol. 1, main aggregates 1970-2001 (2003). Notes: 1955-1969: derived from Machinery and Transport equipment with average shares of 1970 and 1971. Non-residential structures Sources: 1955-1959: trend from OECD National Account Statistics 1955-1964, trend based on 1960; 1960-1969: trend from OECD National Accounts, vol. 2, detailed tables 1960-1997, trend based on 1970; 1970-2001: OECD National Accounts, vol. 1, main aggregates 1970-2001 (2003). Software Sources: Estimates from O’Mahony. Notes: 2000 and 2001 are estimated with the average share of Office and Computer Equipment in Total equipment of 1998 and 1999. Total GFCF Sources: 1952-1959: trend from OECD National Accounts 1950-1978, vol. 1, main aggregates 1980, trend based on 1960; 1955-2001: summation of underlying categories.

38
USA Office and computer equipment Sources:1947-2001: Bureau of Economic Analysis (BEA), February 2003. Communication equipment Sources: 1947-2001: Bureau of Economic Analysis (BEA), February 2003. Non-ICT equipment Sources: 1947-2001: Bureau of Economic Analysis (BEA), February 2003. Total equipment Sources: 1947-2001: Bureau of Economic Analysis (BEA), February 2003. Transport equipment Sources: 1947-2001: Bureau of Economic Analysis (BEA), February 2003. Non-residential structures Sources: 1947-2001: Bureau of Economic Analysis (BEA), February 2003. Software Sources: 1947-2000: Bureau of Economic Analysis (BEA), February 2003. Total GFCF Sources: 1947-2000: summation of underlying categories. B. Gross fixed capital formation deflators Austria, Belgium, Denmark, Finland, Greece, Ireland, Netherlands, Portugal, Spain, Sweden and UK Office and computer equipment Sources: US IT deflator from Bureau of Economic Analysis (BEA) adjusted with difference in GDP deflator from OECD national accounts. Communication equipment Sources: US communication equipment deflator from Bureau of Economic Analysis (BEA) adjusted with difference in GDP defla tor from OECD national accounts. Non-ICT equipment Sources: See current.

39
Notes: Total equipment price deflator is used as an estimate of the non-ICT deflator. Total equipment Sources and Notes: See current. Transport equipment Sources and Notes: See current. Non-residential structures Sources and Notes: See current. Software Sources: US software deflator from Bureau of Economic Analysis (BEA) adjusted with difference in GDP deflator from OECD national accounts. France, Germany and Italy Office and computer equipment Sources: US IT deflator from Bureau of Economic Analysis (BEA) adjusted with difference in non-IT investment deflator from same source as current GFCF Communication equipment Sources: US communication equipment deflator from Bureau of Economic Analysis (BEA) adjusted with difference in non-IT investment deflator from same source as current GFCF Non-ICT equipment Sources: See current. Total equipment Sources and Notes: See current. Transport equipment Sources and Notes: See current. Non-residential structures Sources and Notes: See current. Software Sources: US software deflator from Bureau of Economic Analysis (BEA) adjusted with difference in GDP deflator from OECD national accounts.

40
USA All deflators from Bureau of Economic Analysis (BEA), October 2001.

41
Source Appendix 2: Other data sources Compensation of employees: For all countries: OECD National Accounts, vol. 1, 2002, release 04. For Portugal 1999-2001 is extrapolated with the trend of GDP. Total employment: GGDC Total Economy Database, February 2003; Netherlands from July 2003. Employees: GGDC Total Economy Database, February 2003 Hours: GGDC Total Economy Database, February 2003; Netherlands from July 2003. GDP (current and constant prices): 1950-1970: OECD National Accounts, various issues; 1970-2000 from OECD National Accounts, vol. 1, 2002, network version. Actual and imputed rents (current and constant prices):
Austria: 1950-1970: extrapolated with trend of GDP, linked to 1971; 1971-1975 from OECD National Accounts 1971-1983, linked to 1976; 1976-1979 from OECD National Accounts 1970-1997, linked to 1980; 1980-2000 from OECD National Accounts, vol. 2, 2002, release 02. 2001 extrapolated with trend of GDP. Belgium: 1950-1974: extrapolated with trend of GDP, linked to 1975; 1975-1994 from OECD National Accounts 1970-1997, linked to 1980; 1995-2000 from OECD National Accounts, vol. 2, 2002, release 02. 2001 extrapolated with trend of GDP. Denmark: 1950-1965: extrapolated with trend of GDP, linked to 1966; 1967-1969 from OECD National Accounts 1970-1997, linked to 1970; 1970-2001 from OECD National Accounts, vol. 2, 2002, release 02. Finland: 1950-1959: extrapolated with trend of GDP, linked to 1960; 1960-1974 from OECD National Accounts 1970-1997, linked to 1975; 1976-2000 from OECD National Accounts, vol. 2, 2002, release 02. 2001 extrapolated with trend of GDP. France: 1950-1969: extrapolated with trend of GDP, linked to 1970; 1971-1989 from OECD National Accounts 1970-1997, linked to 1990; 1990-2001 from OECD National Accounts, vol. 2, 2002, release 02. Germany:

42
1950-1959: extrapolated with trend of GDP, linked to 1960; 1960-1990 from OECD National Accounts 1970-1997, linked to 1991; 1991-2000 from OECD National Accounts, vol. 2, 2002, release 02. 2001 extrapolated with trend of GDP. Greece: 1950-1969: extrapolated with trend of GDP, linked to 1970; 1971-1994 from OECD National Accounts 1970-1997, linked to 1995; 1995-2000 from OECD National Accounts, vol. 2, 2002, release 02. 2001 extrapolated with trend of GDP.
Ireland: 1950-1970: extrapolated with trend of GDP, linked to 1971; 1971-1977 from OECD National Accounts 1971-1983, linked to 1978; 1978-1985 from OECD National Accounts 1978-1990, linked to 1986; 1986-1989 from OECD National Accounts 1970-1997, linked to 1990; 1990-2001 from OECD National Accounts, vol. 2, 2002, release 02. 2001 extrapolated with trend of GDP. Italy: 1950-1969: extrapolated with trend of GDP, linked to 1970; 1970-2001 from OECD National Accounts, vol. 2, 2002, release 02. Netherlands: 1950-1976: extrapolated with trend of GDP, linked to 1977; 1977 from OECD National Accounts 1971-1983, linked to 1978; 1978-1984 from OECD National Accounts 1978-1990, linked to 1985; 1985-1994 from OECD National Accounts 1970-1997, linked to 1995; 1995-1999 from OECD National Accounts, vol. 2, 2002, release 02. 2000-2001 extrapolated with trend of GDP. Portugal: 1950-1985: extrapolated with trend of GDP, linked to 1986; 1986-1987 from OECD National Accounts 1970-1997, linked to 1988; 1988-1998 from OECD National Accounts, vol. 2, 2002, release 02. 1999-2001 extrapolated with trend of GDP. Spain: 1950-1985: extrapolated with trend of GDP, linked to 1986; 1986-1994 from OECD National Accounts 1970-1997, linked to 1995; 1995-1999 from OECD National Accounts, vol. 2, 2002, release 02. 2000-2001 extrapolated with trend of GDP. Sweden: 1950-1979: extrapolated with trend of GDP, linked to 1980; 1980-1996 from OECD National Accounts 1970-1997, linked to 1997; 1997-2001 extrapolated with trend of GDP.
UK: 1950-1969: extrapolated with trend of GDP, linked to 1970; 1970-2000 from OECD National Accounts, vol. 2, 2002, release 02. 2001 extrapolated with trend of GDP. USA: 1950-1969: extrapolated with trend of GDP, linked to 1970; 1970-2000 from OECD National Accounts, vol. 2, 2002, release 02. 2001 extrapolated with trend of GDP. Exchange rates: For all countries: IMF International Financial Statistics, October 2001. Value added by industry: Greece and Portugal: OECD STAN Database 2003 All other countries: GGDC Sectoral Database, March 2003

43
US TFP Data: Jorgenson, Ho and Stiroh (2002), October 7, table 18 Gross final output: Office and computer equipment: Austria: 1995 from 1995 I-O Table from Statistik Austria, extrapolated with Production series from OECD STAN Database 2003, release 02. Belgium: 1980-1990: trend for Non-electrical Machinery from OECD STAN old, linked to 1991; 1991-1994 trend for Machinery and Equipment from OECD STAN Database 2003, linked to 1995; 1995 from 1995 Eurostat I-O Table, 1995-2000 extrapolated with Production series from OECD STAN Database 2003, release 02. 2001 Estimated with average growth rate of 1999 and 2000. Denmark: 1997 from 1997 OECD I-O Table, extrapolated with Production series from OECD STAN Database 2003, release 02. Finland: 1995 from 1995 OECD I-O Table, extrapolated with Production series from OECD STAN Database 2003, release 02. France: 1995 from 1995 OECD I-O Table, extrapolated with Production series from OECD STAN Database 2003, release 02. 2001 Estimated with average growth rate of 1999 and 2000. Germany: 1980-1990 West-German trend from OECD STAN old, linked to 1991; 1991-1994 and 1996-2001 from OECD STAN Database 2003, release 2, linked to 1995; 1995 from 1995 OECD I-O Table, extrapolated with Production series from OECD STAN Database 2003, release 02. 2001 estimated with average growth rate of 1999 and 2000. Greece: 1980-1992 trend of production series from OECD STAN Database for industrial Analysis 19976-1995; 1993 and 1994 interpolated between Production figures of 1992 and 1995; 1994 from 1994 OECD I-O Table; 1995-2001 Production series from OECD STAN Database 2003, release 02, extrapolated from 1995. Ireland: 1980-1990 from NSO Census of Industrial Production (NACE 70, nr. 33); 1991-1992 and 1994-1998 from NSO Census of Industrial Production; 1993 from 1993 I-O table from CSO; 1991-2001 extrapolated with trend of Exports from OECD International trade of commodities 1990-2000. Italy: 1992 from 1992 OECD I-O Table, extrapolated with Production series from OECD STAN Database 2003, release 02. 2001 estimated with average growth rate of 1999 and 2000. Netherlands: 1997 from 1997 OECD I-O Table, extrapolated with Production series from OECD STAN Database 2003, release 02. 2001 estimated with average growth rate of 1999 and 2000.
Portugal:

44
1995 from 1995 Eurostat I-O Table, extrapolated with Production series from OECD STAN Database 2003, release 02. Spain: 1995 from 1995 OECD I-O Table, extrapolated with Production series from OECD STAN Database 2003, release 02. 2001 estimated with average growth rate of 1999 and 2000. Sweden: 1995 from 1995 OECD I-O Table, extrapolated with Production series from OECD STAN Database 2003, release 02. 2001 estimated with average growth rate of 1999 and 2000. UK: 1998 from 1998 OECD I-O Table, extrapolated with Production series from OECD STAN Database 2003, release 02. 2001 estimated with average growth rate of 1999 and 2000. USA: 1997 from 1997 OECD I-O Table, extrapolated with Production series from OECD STAN Database 2003, release 02. Communication equipment: Austria: 1995 from 1995 I-O Table from Statistik Austria, extrapolated with Production series from OECD STAN Database 2003, release 02.
Belgium: 1980-1992: trend for Non-electrical Machinery from OECD STAN old, linked to 1991; 1993-1994 trend for Machinery and Equipment from OECD STAN Database 2003, linked to 1995; 1995 from 1995 Eurostat I-O Table, 1995-2000 extrapolated with Production series from OECD STAN Database 2003, release 02. 2001 Estimated with average growth rate of 1999 and 2000. Denmark: 1997 from 1997 OECD I-O Table, extrapolated with Production series from OECD STAN Database 2003, release 02. Finland: 1995 from 1995 OECD I-O Table, extrapolated with Production series from OECD STAN Database 2003, release 02. France: 1995 from 1995 OECD I-O Table, extrapolated with Production series from OECD STAN Database 2003, release 02. 2001 Estimated with average growth rate of 1999 and 2000. Germany: 1980-1990 West-German trend from OECD STAN old, linked to 1991; 1991-1994 and 1996-2001 from OECD STAN Database 2003, release 2, linked to 1995; 1995 from 1995 OECD I-O Table, extrapolated with Production series from OECD STAN Database 2003, release 02. 2001 estimated with average growth rate of 1999 and 2000. Greece: 1980-1992 trend of production series from OECD STAN Database for industrial Analysis 19976-1995; 1993 and 1994 interpolated between Production figures of 1992 and 1995; 1994 from 1994 OECD I-O Table; 1995-2001 Production series from OECD STAN Database 2003, release 02, extrapolated from 1995.
Ireland:

45
1980-1990 from NSO Census of Industrial Production (NACE 70, nr. 33); 1991-1992 and 1994-1998 from NSO Census of Industrial Production; 1993 from 1993 I-O table from CSO; 1991-2001 extrapolated with trend of Exports from OECD International trade of commodities 1990-2000. Italy: 1992 from 1992 OECD I-O Table, extrapolated with Production series from OECD STAN Database 2003, release 02. 2000-2001 are estimated with average growth rate of 1998-1999 and 1999-2000. Netherlands: 1997 from 1997 OECD I-O Table, extrapolated with Production series from OECD STAN Database 2003, release 02. 2001 estimated with average growth rate of 1999 and 2000. Portugal: 1995 from 1995 Eurostat I-O Table, extrapolated with Production series from OECD STAN Database 2003, release 02. Spain: 1995 from 1995 OECD I-O Table, extrapolated with Production series from OECD STAN Database 2003, release 02. 2001 estimated with average growth rate of 1999 and 2000. Sweden: 1995 from 1995 OECD I-O Table, extrapolated with Production series from OECD STAN Database 2003, release 02. 2000-2001 are estimated with average growth rate of 1998-1999 and 1999-2000. UK: 1998 from 1998 OECD I-O Table, extrapolated with Production series from OECD STAN Database 2003, release 02. 2001 estimated with average growth rate of 1999 and 2000. USA: 1997 from 1997 OECD I-O Table, extrapolated with Production series from OECD STAN Database 2003, release 02. Shares of 321 and 322 in Communication Equipment: Netherlands: 1997 from Panorama of European Business (1999) Other countries: OECD, Structural Statistics for Industry and Services, downloaded on August 13, 2002.

46
Table 1 GDP per hour worked, 1980-2001
1980 1995 20011980-1995
1995-2001
1995-2001 over 1980-
1995
Netherlands 30.2 39.3 41.4 1.8 0.8 -0.9France 26.2 37.5 41.4 2.4 1.7 -0.7Belgium 26.6 37.4 43.1 2.3 2.3 0.1Italy 26.4 36.0 38.3 2.1 1.0 -1.0Germany 22.9 35.1 39.0 2.8 1.8 -1.1Denmark 25.5 34.6 38.3 2.0 1.7 -0.4Austria 25.2 32.4 37.8 1.7 2.6 0.9Ireland 16.2 28.9 39.9 3.8 5.4 1.6Spain 19.2 28.8 28.0 2.7 -0.5 -3.2Finland 18.7 28.8 33.8 2.9 2.7 -0.2U.K. 20.3 28.6 31.4 2.3 1.5 -0.8Sweden 23.2 28.3 31.4 1.3 1.7 0.4Greece 16.7 19.1 23.0 0.9 3.1 2.2Portugal 12.9 18.2 20.5 2.3 2.0 -0.3
EU14 23.0 32.6 35.8 2.3 1.3 -1.0United States 27.9 34.1 37.8 1.3 1.7 0.4
Average annual growth ratesGDP per hour worked
(1999 EKS $)
Source: University of Groningen and The Conference Board, GGDC Total Economy Database, February 2003, www.ggdc.net Note: countries sorted in descending order of GDP per hour level in 1995. Table 2: Shares in Non-Residential Gross Fixed Capital Formation (GFCF)
1980 1985 1990 1995 2001Office and Computer Equipment
European Union 3.1 5.4 5.1 5.1 5.7United States 6.2 9.3 8.2 9.6 6.8
Communication EquipmentEuropean Union 2.9 3.7 3.6 4.1 4.4United States 6.6 7.3 7.1 6.7 7.0
SoftwareEuropean Union 1.2 3.0 3.9 5.3 7.1United States 2.7 4.7 7.5 9.3 13.9
Total ICT European Union 7.2 12.0 12.6 14.5 17.2United States 15.5 21.3 22.8 25.6 27.7
Non-ICT EquipmentEuropean Union 33.9 33.7 32.2 30.5 29.7United States 31.8 28.2 31.0 30.3 27.5
Transport EquipmentEuropean Union 11.3 11.5 11.8 11.7 13.3United States 10.8 10.7 8.9 12.4 10.7
Non-Residential BuildingsEuropean Union 47.6 42.8 43.4 43.3 39.7United States 41.9 39.8 37.3 31.7 34.1
Total Non-Residential GFCFEuropean Union 100.0 100.0 100.0 100.0 100.0United States 100.0 100.0 100.0 100.0 100.0
Source: See Appendix Tables Note: European Union average is a weighted average for all member countries, excluding Luxembourg. See Appendix Tables for figures by individual country.

47
Table 3: IT investment as % of GDP (current prices) 1980 1985 1990 1995 2001
Sweden 1.6 2.5 2.7 3.4 4.7 Finland 1.1 1.5 1.9 2.9 4.3 Belgium 1.7 2.9 3.1 2.6 3.6 Denmark 1.5 2.3 2.9 3.1 3.6 Greece 0.7 1.0 1.3 1.7 3.3 United Kingdom 0.8 1.6 2.3 2.8 3.0 Netherlands 1.6 1.9 2.4 2.1 2.9 Germany 1.3 2.2 2.4 2.0 2.5 Italy 1.5 1.9 2.3 2.0 2.5 Austria 1.3 1.6 1.9 1.7 2.4 Portugal 1.2 1.7 1.8 1.8 2.1 Spain 0.9 1.5 2.5 1.7 2.1 France 1.0 1.4 1.5 1.4 2.1 Ireland 0.9 1.6 1.2 1.9 1.9
European Union 1.2 1.9 2.2 2.1 2.6 United States 2.5 3.4 3.3 3.7 4.2 Source: See Appendix Tables Note: countries sorted in descending order of shares in 2001
Table 4 IT capital stock per hour worked (current euros)
1995 2001Sweden 3.1 4.8 Finland 2.1 4.6 Belgium 3.0 4.2 Denmark 3.1 4.2 Germany 2.7 3.3 Netherlands 2.4 3.3 Austria 2.4 3.3 United Kingdom 1.8 2.9 Italy 2.0 2.9 France 1.8 2.5 Ireland 1.1 2.2 Greece 0.8 1.5 Spain 1.4 1.5 Portugal 0.7 1.1
European Union 2.0 2.8 United States 3.8 5.2 Source: See Appendix Tables Note: converted into euros using 1999 official exchange rates. Countries sorted in descending order of level in 2001

48
Table 5 Capital Services, EU and US
EU US US - EU EU US US - EU EU US US - EU
Total capital services 4.0 4.2 0.2 3.2 3.2 0.0 3.7 5.1 1.4 Information technology capital services 1.2 2.1 1.0 0.8 1.6 0.7 1.3 2.6 1.3 Computers 0.7 1.3 0.5 0.4 0.7 0.3 0.7 1.2 0.5 Communication equipment 0.2 0.4 0.2 0.2 0.2 0.0 0.3 0.5 0.2 Software 0.3 0.4 0.2 0.3 0.6 0.4 0.4 1.0 0.6 Noninformation technology capital services 2.9 2.1 -0.7 2.4 1.7 -0.7 2.4 2.4 0.1 Non-IT equipment 0.9 0.6 -0.3 0.6 0.4 -0.2 0.8 0.8 0.1 Transport equipment 0.2 0.1 -0.1 0.1 0.3 0.2 0.3 0.5 0.2 Non-residential buildings and structures 1.8 1.5 -0.3 1.7 1.0 -0.7 1.3 1.1 -0.2
Total capital services 4.0 4.2 0.2 3.2 3.2 0.0 3.7 5.1 1.4 Information technology capital services 15.4 14.7 -0.6 8.8 9.0 0.1 13.7 14.3 0.6 Computers 20.2 19.0 -1.2 10.2 11.3 1.1 22.6 20.7 -1.9 Communication equipment 6.5 7.7 1.2 6.2 3.5 -2.7 8.1 8.5 0.4 Software 18.7 15.6 -3.1 9.8 12.5 2.8 10.8 13.8 3.0 Noninformation technology capital services 3.1 2.5 -0.6 2.7 2.0 -0.6 2.6 3.0 0.4 Non-IT equipment 3.0 2.2 -0.8 2.4 1.6 -0.8 3.1 3.2 0.2 Transport equipment 1.7 0.7 -1.0 1.1 3.7 2.7 3.9 5.6 1.7 Non-residential buildings and structures 3.4 3.0 -0.4 3.0 1.9 -1.1 2.2 2.3 0.1
Total capital services 100.0 100.0 0.0 100.0 100.0 0.0 100.0 100.0 0.0 Information technology capital services 7.5 14.3 6.8 9.5 17.4 7.9 9.7 18.4 8.7 Computers 3.5 6.6 3.1 3.8 6.6 2.7 3.1 5.7 2.6 Communication equipment 2.5 4.9 2.4 2.9 5.8 2.9 3.2 5.9 2.7 Software 1.5 2.8 1.3 2.7 5.0 2.3 3.4 6.9 3.5 Noninformation technology capital services 92.5 85.7 -6.8 90.5 82.6 -7.9 90.3 81.6 -8.7 Non-IT equipment 28.4 26.5 -1.9 25.8 25.1 -0.7 24.8 25.2 0.4 Transport equipment 9.4 8.8 -0.6 8.9 7.7 -1.2 8.6 9.0 0.4 Non-residential buildings and structures 54.6 50.4 -4.3 55.8 49.8 -6.0 56.9 47.3 -9.6
1990-1995 1995-20011980-90
Average share in capital compensation (%)
%-point contribution to total capital service growth
Capital services growth (%)
Source: see Appendix Tables. Note: contributions calculated as growth times share (see equation 3).

49
Table 6: Sources of Gross Domestic Product Growth, EU and US
1980-1990 1990-1995 1995-2001
1995-2001 over 1990-
1995
1995-2001 over 1980-
1990European UnionGross domestic product 2.38 1.58 2.42 0.84 0.04 Contribution of labor 0.05 -0.59 0.69 1.28 0.65 Contribution of capital services 1.21 1.03 1.26 0.23 0.05 Information technology capital services 0.35 0.27 0.46 0.19 0.11 Noninformation technology capital services 0.86 0.77 0.81 0.04 -0.05 Contribution of total factor productivity 1.12 1.14 0.46 -0.67 -0.66United StatesGross domestic product 3.19 2.42 3.52 1.10 0.33 Contribution of labor 1.22 0.86 1.15 0.29 -0.08 Contribution of capital services 1.21 0.96 1.57 0.61 0.36 Information technology capital services 0.59 0.46 0.82 0.35 0.22 Noninformation technology capital services 0.62 0.49 0.75 0.26 0.13 Contribution of total factor productivity 0.75 0.61 0.80 0.20 0.05US-EU differenceGross domestic product 0.81 0.84 1.10 0.26 0.29 Contribution of labor 1.18 1.45 0.46 -0.99 -0.72 Contribution of capital services 0.00 -0.08 0.30 0.38 0.30 Information technology capital services 0.25 0.20 0.36 0.16 0.12 Noninformation technology capital services -0.24 -0.27 -0.06 0.22 0.19 Contribution of total factor productivity -0.37 -0.53 0.34 0.87 0.71 Source: see Appendix Tables.
Note: Average annual percentage rates of growth. Contributions are defined in equation (6). The contribution of total factor productivity includes contribution of labour quality.

50
Table 7 Sources of Average Labour productivity growth, EU and US
1980-1990 1990-1995 1995-2001
1995-2001 over 1990-
1995
1995-2001 over 1980-
1990European UnionAverage labor productivity 2.28 2.43 1.37 -1.07 -0.92 Contribution of capital deepening 1.16 1.30 0.90 -0.40 -0.26 Information technology 0.34 0.29 0.42 0.13 0.08 Noninformation technology 0.82 1.01 0.48 -0.53 -0.34 Total factor productivity 1.12 1.14 0.46 -0.67 -0.66United StatesAverage labor productivity 1.46 1.19 1.85 0.66 0.39 Contribution of capital deepening 0.71 0.58 1.05 0.46 0.33 Information technology 0.52 0.40 0.72 0.33 0.20 Noninformation technology 0.19 0.19 0.32 0.13 0.13 Total factor productivity 0.75 0.61 0.80 0.20 0.05US-EU differenceAverage labor productivity -0.82 -1.24 0.48 1.73 1.30 Contribution of capital deepening -0.45 -0.71 0.14 0.86 0.60 Information technology 0.18 0.11 0.30 0.20 0.12 Noninformation technology -0.63 -0.82 -0.16 0.66 0.47 Total factor productivity -0.37 -0.53 0.34 0.87 0.71 Source: see Appendix Tables.
Note: Average annual percentage rates of growth. Contributions are defined in equation (7). The contribution of total factor productivity includes contribution of labour quality.

51
Table 8 Percentage contribution to GDP growth, 1995-2001.
LabourICT
Capital
Non-ICT
Capital TFPGDP
growthUnited States 1.1 0.8 0.8 0.8 3.5European Union 0.7 0.5 0.8 0.5 2.4
Ireland 1.9 0.8 2.6 3.6 8.9Finland 1.0 0.7 0.2 2.7 4.5Greece 0.3 0.5 1.2 1.7 3.6Spain 2.8 0.3 1.2 -0.6 3.7Portugal 0.9 0.4 1.6 0.5 3.4Netherlands 2.0 0.6 0.9 -0.1 3.3Sweden 0.6 0.8 0.7 0.7 2.8United Kingdom 0.8 0.7 0.9 0.5 2.8France 0.5 0.3 0.8 0.9 2.6Belgium 0.1 0.7 0.6 1.1 2.5Denmark 0.4 0.7 1.1 0.3 2.5Austria -0.2 0.4 0.9 1.3 2.4Italy 0.5 0.4 0.9 0.1 1.9Germany -0.1 0.4 0.4 0.9 1.5
unweighted average 0.82 0.53 1.00 0.97 3.32variance 0.69 0.03 0.31 1.13 2.93
In percentage points
Source: see Appendix Tables. Contributions as defined in equation (6). Note: countries ranked in descending order of GDP growth.
Table 9 Percentage contribution to GDP growth, 1980-1995
LabourICT
Capital
Non-ICT
Capital TFPGDP
growthUnited States 1.1 0.6 0.6 0.7 2.9European Union -0.2 0.3 0.8 1.1 2.1
Ireland 0.0 0.2 0.8 2.9 3.9Portugal 0.2 0.2 1.0 1.2 2.6Spain -0.3 0.3 0.9 1.6 2.5United Kingdom 0.0 0.4 0.8 1.3 2.4Austria 0.3 0.2 1.0 0.6 2.2Germany -0.5 0.3 0.6 1.7 2.1Netherlands 0.2 0.3 0.7 0.9 2.1France -0.4 0.2 1.1 0.9 1.9Sweden 0.1 0.4 0.8 0.5 1.8Belgium -0.4 0.6 0.8 0.8 1.8Denmark -0.1 0.4 0.6 0.8 1.8Italy -0.1 0.3 0.7 0.9 1.8Finland -0.8 0.3 0.8 1.4 1.6Greece 0.4 0.2 0.6 -0.5 0.7
unweighted average -0.09 0.32 0.80 1.06 2.09variance 0.11 0.01 0.02 0.52 0.46
In percentage points
Source: see Appendix Tables. Contributions as defined in equation (6). Note: countries ranked in descending order of GDP growth.

52
Table 10 Percentage contribution to labour productivity growth, 1995-2001.
ICT per hour
Non-ICT per
hour TFPGDP per
hourUnited States 0.7 0.3 0.8 1.8European Union 0.4 0.5 0.5 1.4
Ireland 0.7 1.2 3.6 5.5Greece 0.5 1.1 1.7 3.2Finland 0.7 -0.3 2.7 3.0Austria 0.4 1.0 1.3 2.7Belgium 0.7 0.5 1.1 2.3Portugal 0.3 1.2 0.5 2.1Sweden 0.8 0.5 0.7 1.9Denmark 0.6 0.9 0.3 1.8Germany 0.4 0.5 0.9 1.7France 0.3 0.5 0.9 1.7United Kingdom 0.6 0.6 0.5 1.7Italy 0.4 0.6 0.1 1.1Netherlands 0.4 -0.2 -0.1 0.1Spain 0.2 0.1 -0.6 -0.4
unweighted average 0.49 0.59 0.97 2.05variance 0.03 0.23 1.13 1.81
%-point contribution
Source: see Appendix Tables. Contributions as defined in equation (7). Note: countries ranked in descending order of GDP growth. Table 11 Percentage contribution to labour productivity growth, 1980-1995
ICT per hour
Non-ICT per
hour TFPGDP per
hourUnited States 0.5 0.2 0.7 1.4European Union 0.3 0.9 1.1 2.3
Ireland 0.2 0.7 2.9 3.9Spain 0.3 0.9 1.6 2.8Germany 0.4 0.8 1.7 2.8Finland 0.3 1.0 1.4 2.7France 0.3 1.2 0.9 2.4United Kingdom 0.4 0.8 1.3 2.4Belgium 0.7 0.9 0.8 2.3Portugal 0.2 0.8 1.2 2.2Italy 0.3 0.8 0.9 2.0Denmark 0.5 0.7 0.8 1.9Netherlands 0.3 0.5 0.9 1.7Austria 0.2 0.8 0.6 1.7Sweden 0.4 0.7 0.5 1.6Greece 0.2 0.4 -0.5 0.1
unweighted average 0.32 0.79 1.06 2.17variance 0.01 0.04 0.52 0.66
%-point contribution
Source: see Appendix Tables. Contributions as defined in equation (7). Note: countries ranked in descending order of GDP growth.

53
Table 12 Estimation of TFP growth in communication equipment manufacturing 1990-1995 1995-2001
(1) Semiconductor input price change (annual %) -5.9 -23.7(2a) Semiconductor input share in GVO (low estimate) 11% 11%(2b) Semiconductor input share in GVO (high estimate) 19% 19%(3) Communication equipment output price (annual %) -3.5 -7.8(4) US non-IT GDP deflator 2.9 2.3(5a) Estimated TFP (high estimate) 5.4 7.2(5b) Estimated TFP (low estimate) 4.7 5.1
Sources and notes: (1) from Aizcorbe, Flamm & Kurshid (2002) Table A2, assuming 1992-1995 representative for 1990-95, and 1995-99 for 1995-2001. (2) from ibid. Table A7 (3) from Corrado (2003, p.159). (4) value added deflator for non-IT industries from BEA, NIPA (5) derived from (1) to (4) using equation (8). Table 13 Sources of Total Factor Productivity Growth
EU US US-EU EU US US-EU
Aggregate TFP growth 1.14 0.61 -0.53 0.46 0.80 0.34
Information technology production 0.15 0.24 0.09 0.27 0.44 0.17 Computers 0.09 0.09 0.00 0.13 0.15 0.01 Electronic components 0.03 0.11 0.08 0.08 0.23 0.16 Communication equipment 0.02 0.03 0.01 0.06 0.06 0.00
Computers 11.9 11.9 16.8 16.8 Electronic components 10.6 10.6 18.0 18.0 Communication equipment 5.4 5.4 7.2 7.2
Information technology production 1.6 2.5 0.9 2.1 3.0 0.9 Computers 0.8 0.8 0.0 0.8 0.9 0.1 Electronic components 0.3 1.0 0.7 0.4 1.3 0.9 Communication equipment 0.5 0.6 0.2 0.8 0.8 -0.1
Total factor productivity growth (%)
Domar weights (%)
1990-1995 1995-2001
Contributions to aggregate TFP growth
Source: TFP for computers and electric components from Jorgenson, Ho and Stiroh (2002). TFP for communication equipment from Table 12. For Domar weights, see source appendix. Note: Contributions calculated as TFP times Domar weights.

54
Table 14 Contribution of ICT-Production to Average Annual TFP Growth, 1990-2001
1990-1995 1995-2001 1990-1995 1995-2001 1990-1995 1995-2001Ireland 12.91 22.55 1.36 3.62 2.93 3.61Finland 2.58 8.26 0.19 0.69 1.19 2.67Sweden 2.58 7.03 0.18 0.57 0.93 0.68United Kingdom 2.25 2.62 0.24 0.38 1.45 0.47Portugal 2.21 2.15 0.24 0.31 1.34 0.50France 2.08 2.34 0.20 0.31 0.03 0.86Germany 1.54 1.69 0.16 0.24 1.93 0.87Italy 1.90 1.75 0.15 0.21 1.04 0.14Austria 0.82 1.67 0.11 0.20 0.50 1.32Spain 1.06 1.09 0.10 0.15 0.87 -0.62Belgium 1.10 1.37 0.07 0.12 0.96 1.14Netherlands 0.64 0.77 0.06 0.11 0.46 0.37Denmark 0.60 0.81 0.06 0.10 1.48 0.29Greece 0.07 0.05 0.00 0.01 -0.22 1.67
European Union 1.56 2.07 0.15 0.27 1.14 0.46United States 2.46 2.96 0.24 0.44 0.61 0.80
Domar weights (gross final output over GDP
in %) TFP (percentage points)
Pro memoriaContribution of ICT
TFP growth (%)production to aggregate Aggregate
Source: see data appendix Note: Contribution calculated as Domar weights times TFP growth for three IT-goods (see Table 13). Countries ranked on contribution in 1995-2000.

55
Table 15 Decomposition of labour productivity growth, 1995-2001
GDP per hour Total
IT capital per hour
TFP from IT-production Total
Non-ICT per hour
Other TFP
(1) (2) (3) (4) (5) (6) (7)United States 1.85 1.16 0.72 0.44 0.69 0.32 0.36European Union 1.37 0.69 0.42 0.27 0.67 0.48 0.19
Ireland 5.48 4.27 0.66 3.62 1.21 1.22 -0.01Finland 3.00 1.35 0.66 0.69 1.65 -0.33 1.98Sweden 1.92 1.35 0.77 0.57 0.57 0.47 0.10United Kingdom 1.66 0.99 0.61 0.38 0.68 0.59 0.09Belgium 2.35 0.78 0.66 0.12 1.56 0.55 1.02Denmark 1.85 0.74 0.64 0.10 1.11 0.92 0.19Portugal 2.07 0.64 0.33 0.31 1.43 1.24 0.18France 1.72 0.64 0.33 0.31 1.08 0.53 0.55Germany 1.73 0.60 0.37 0.24 1.13 0.50 0.64Italy 1.12 0.60 0.39 0.21 0.52 0.59 -0.07Netherlands 0.83 0.57 0.47 0.11 0.25 -0.01 0.26Austria 2.72 0.57 0.37 0.20 2.15 1.03 1.12Greece 3.25 0.50 0.49 0.01 2.75 1.09 1.66Spain -0.36 0.32 0.17 0.15 -0.68 0.09 -0.77
Directly related to IT Not directly related to IT
Sources: Tables 10 and 14. Note: Columns (3), (4), (6) and (7) show contribution of various sources to labour productivity growth.
Column (1) = column (2) +column (5), Column (2) = column (3) +column (4) and Column (5) = column (6) +column (7). Countries are ranked on basis of contributions from IT.

56
Figure 1 Share of IT investment in GDP (%), EU and US
0.0
1.0
2.0
3.0
4.0
5.0
1980 1983 1986 1989 1992 1995 1998 2001
shar
e in
GD
P (%
)
EU US
Source: Table 3
Figure 2 Share of IT investment in GDP (%), EU countries, 2001
0.0 0.5 1.0 1.5 2.0 2.5 3.0 3.5 4.0 4.5 5.0
US
EU
Sweden
Finland
Belgium
Denmark
Greece
United Kingdom
Netherlands
Germany
Italy
Austria
Portugal
Spain
France
Ireland
Office & Computer Equipment Communication Equipment Software
Source: Table 3

57
Figure 3 IT capital stock per hour worked (current euros) in 2001
0.0 1.0 2.0 3.0 4.0 5.0 6.0
Portugal
Spain
Greece
Ireland
France
Italy
United Kingdom
Austria
Netherlands
Germany
Denmark
Belgium
Finland
Sweden
European Union
United States
Source: Table 4

58
Figure 4 Contribution to capital service growth by type of capital (in percentage points)
0 1 2 3 4 5 6
United States
European Union
1995-2001
United States
European Union
1990-1995
United States
European Union
1980-1990
Non-ICT Capital ICT Capital
Source: Table 5
Figure 5 Contribution to capital service growth by type of capital (in percentage points), EU countries, 1995-2001
0 1 2 3 4 5 6 7 8
USEU
Ireland
PortugalSweden
United KingdomDenmark
SpainGreece
BelgiumNetherlands
AustriaItaly
FranceGermany
Finland
Non-ICT Capital ICT Capital
Source: Appendix Tables

59
Figure 6 Contribution of labour, capital and TFP to GDP growth (in percentage points)
-1.0 0.0 1.0 2.0 3.0 4.0
United States
European Union
1995-2001
United States
European Union
1990-1995
United States
European Union
1980-1990
Labour ICT Capital Non-ICT Capital TFP Source: Table 6
Figure 7 Contribution of capital and TFP to labour productivity growth (in percentage points)
0.0 1.0 2.0 3.0
United States
European Union
1995-2001
United States
European Union
1990-1995
United States
European Union
1980-1990
IT per hour Non-IT per hour TFP Source: Table 7

60
Figure 8 Contribution of labour, capital and TFP to GDP growth (in percentage points), EU countries, 1995-2001
-1.0 0.0 1.0 2.0 3.0 4.0 5.0
United States
European Union
Ireland
Finland
GreeceSpain
Portugal
Netherlands
Sweden
United Kingdom
FranceBelgium
Denmark
Austria
Italy
Germany
Labour ICT Capital Non-ICT Capital TFP Source: Table 8
Figure 9 Contribution of labour, capital and TFP to GDP growth (in percentage points), EU countries, 1980-1995
-1.0 -0.5 0.0 0.5 1.0 1.5 2.0 2.5 3.0 3.5
United States
European Union
Ireland
Portugal
Spain
United Kingdom
Austria
Germany
Netherlands
France
Sweden
Belgium
Denmark
Italy
Finland
Greece
Labour ICT Capital Non-ICT Capital TFP Source: Table 9

61
Figure 10 Contribution of capital and TFP to labour productivity growth (in percentage points), EU countries, 1995-2001
-1.0 0.0 1.0 2.0 3.0 4.0
United StatesEuropean Union
Ireland
Greece
FinlandAustria
Belgium
Portugal
Sweden
United Kingdom
GermanyDenmark
France
Italy
Netherlands
Spain
IT per hour Non-IT per hour TFP
Source: Table 10
Figure 11 Contribution of capital and TFP to labour productivity growth (in percentage points), EU countries, 1980-1995
-0.5 0.0 0.5 1.0 1.5 2.0 2.5 3.0 3.5
United StatesEuropean Union
IrelandSpain
GermanyFinlandFrance
United KingdomBelgiumPortugal
ItalyDenmark
NetherlandsAustria
SwedenGreece
ICT per hour Non-ICT per hour TFP
Source: Table 11

62
Figure 12 Contribution of IT production to TFP growth, 1995-2001 (percentage points)
0.00 0.25 0.50 0.75 1.00
United StatesEuropean Union
IrelandFinlandSweden
United KingdomPortugal
FranceGermany
ItalyAustria
SpainBelgium
NetherlandsDenmark
Greece
Source: Table 14

63
Appendix Tables
Detailed country data on gross fixed capital formation in ICT and non-ICT assets, gross fixed capital stock, factor input compensation shares, growth in capital service input, growth in output and labour input and total factor productivity for 14 EU countries, EU-14 aggregate and the US for the period 1980-2001 can be downloaded at www.ggdc.net/dseries/growth-accounting.html.

64
Papers issued in the series of the Groningen Growth and Development Centre
Papers marked * are also available in pdf-format on the internet: http://www.ggdc.net/ 536 (GD-1) Maddison, Angus and Harry van Ooststroom, The International Comparison
of Value Added, Productivity and Purchasing Power Parities in Agriculture (1993)
537 (GD-2) Mulder, Nanno and Angus Maddison, The International Comparison of Performance in Distribution: Value Added, Labour Productivity and PPPs in Mexican and US Wholesale and Retail Trade 1975/7 (1993)
538 (GD-3) Szirmai, Adam, Comparative Performance in Indonesian Manufacturing, 1975-90 (1993)
549 (GD-4) de Jong, Herman J., Prices, Real Value Added and Productivity in Dutch Manufacturing, 1921-1960 (1993)
550 (GD-5) Beintema, Nienke and Bart van Ark, Comparative Productivity in East and West German Manufacturing before Reunification (1993)
567 (GD-6)* Maddison, Angus and Bart van Ark, The International Comparison of Real Product and Productivity (1994)
568 (GD-7) de Jong, Gjalt, An International Comparison of Real Output and Labour Productivity in Manufacturing in Ecuador and the United States, 1980 (1994)
569 (GD-8) van Ark, Bart and Angus Maddison, An International Comparison of Real Output, Purchasing Power and Labour Productivity in Manufacturing Industries: Brazil, Mexico and the USA in 1975 (1994) (second edition)
570 (GD-9) Maddison, Angus, Standardised Estimates of Fixed Capital Stock: A Six Country Comparison (1994)
571 (GD-10) van Ark, Bart and Remco D.J. Kouwenhoven, Productivity in French Manufacturing: An International Comparative Perspective (1994)
572 (GD-11) Gersbach, Hans and Bart van Ark, Micro Foundations for International Productivity Comparisons (1994)
573 (GD-12) Albers, Ronald, Adrian Clemens and Peter Groote, Can Growth Theory Contribute to Our Understanding of Nineteenth Century Economic Dynamics (1994)
574 (GD-13) de Jong, Herman J. and Ronald Albers, Industrial Output and Labour Produc-tivity in the Netherlands, 1913-1929: Some Neglected Issues (1994)
575 (GD-14) Mulder, Nanno, New Perspectives on Service Output and Productivity: A Comparison of French and US Productivity in Transport, Communications Wholesale and Retail Trade (1994)
576 (GD-15) Maddison, Angus, Economic Growth and Standards of Living in the Twentieth Century (1994)
577 (GD-16) Gales, Ben, In Foreign Parts: Free-Standing Companies in the Netherlands around the First World War (1994)
578 (GD-17) Mulder, Nanno, Output and Productivity in Brazilian Distribution: A Comparative View (1994)
579 (GD-18) Mulder, Nanno, Transport and Communication in Mexico and the United States: Value Added, Purchasing Power Parities and Productivity (1994)
580 (GD-19) Mulder, Nanno, Transport and Communications Output and Productivity in Brazil and the USA, 1950-1990 (1995)
581 (GD-20) Szirmai, Adam and Ren Ruoen, China's Manufacturing Performance in Comparative Perspective, 1980-1992 (1995)
GD-21 Fremdling, Rainer, Anglo-German Rivalry on Coal Markets in France, the Netherlands and Germany, 1850-1913 (December 1995)

65
GD-22 Tassenaar, Vincent, Regional Differences in Standard of Living in the Netherlands, 1800-1875. A Study Based on Anthropometric Data (December 1995)
GD-23 van Ark, Bart, Sectoral Growth Accounting and Structural Change in Postwar Europe (December 1995)
GD-24 Groote, Peter, Jan Jacobs and Jan Egbert Sturm, Output Responses to Infra-structure in the Netherlands, 1850-1913 (December 1995)
GD-25* Groote, Peter, Ronald Albers and Herman de Jong, A Standardised Time Series of the Stock of Fixed Capital in the Netherlands, 1900-1995 (May 1996)
GD-26 van Ark, Bart and Herman de Jong, Accounting for Economic Growth in the Netherlands since 1913 (May 1996)
GD-27* Maddison, Angus and D.S. Prasada Rao, A Generalized Approach to Internati-onal Comparisons of Agricultural Output and Productivity (May 1996)
GD-28 van Ark, Bart, Issues in Measurement and International Comparison of Productivity - An Overview (May 1996)
GD-29* Kouwenhoven, Remco, A Comparison of Soviet and US Industrial Perfor-mance, 1928-90 (May 1996)
GD-30 Fremdling, Rainer, Industrial Revolution and Scientific and Technological Progress (December 1996)
GD-31 Timmer, Marcel, On the Reliability of Unit Value Ratios in International Comparisons (December 1996)
GD-32 de Jong, Gjalt, Canada's Post-War Manufacturing Performance: A Comparison with the United States (December 1996)
GD-33 Lindlar, Ludger, “1968” and the German Economy (January 1997) GD-34 Albers, Ronald, Human Capital and Economic Growth: Operationalising
Growth Theory, with Special Reference to The Netherlands in the 19th Century (June 1997)
GD-35 Brinkman, Henk-Jan, J.W. Drukker and Brigitte Slot, GDP per Capita and the Biological Standard of Living in Contemporary Developing Countries (June 1997)
GD-36 de Jong, Herman, and Antoon Soete, Comparative Productivity and Structural Change in Belgian and Dutch Manufacturing, 1937-1987 (June 1997)
GD-37 Timmer, M.P., and A. Szirmai, Growth and Divergence in Manufacturing Performance in South and East Asia (June 1997)
GD-38* van Ark, B., and J. de Haan, The Delta-Model Revisited: Recent Trends in the Structural Performance of the Dutch Economy (December 1997)
GD-39* van der Eng, P., Economics Benefits from Colonial Assets: The Case of the Netherlands and Indonesia, 1870-1958 (June 1998)
GD-40* Timmer, Marcel P., Catch Up Patterns in Newly Industrializing Countries. An International Comparison of Manufacturing Productivity in Taiwan, 1961-1993 (July 1998)
GD-41* van Ark, Bart, Economic Growth and Labour Productivity in Europe: Half a Century of East-West Comparisons (October 1999)
GD-42* Smits, Jan Pieter, Herman de Jong and Bart van Ark, Three Phases of Dutch Economic Growth and Technological Change, 1815-1997 (October 1999)
GD-43* Fremdling, Rainer, Historical Precedents of Global Markets (October 1999) GD-44* van Ark, Bart, Lourens Broersma and Gjalt de Jong, Innovation in Services.
Overview of Data Sources and Analytical Structures (October 1999) GD-45* Broersma, Lourens and Robert McGuckin, The Impact of Computers on
Productivity in the Trade Sector: Explorations with Dutch Microdata (October 1999, Revised version June 2000)
GD-46* Sleifer, Jaap, Separated Unity: The East and West German Industrial Sector in 1936 (November 1999)
GD-47* Rao, D.S. Prasada and Marcel Timmer, Multilateralisation of Manufacturing Sector Comparisons: Issues, Methods and Empirical Results (July 2000)

66
GD-48* Vikström, Peter, Long term Patterns in Swedish Growth and Structural Change, 1870-1990 (July 2001)
GD-49* Wu, Harry X., Comparative labour productivity performance in Chinese manufacturing, 1952-1997: An ICOP PPP Approach (July 2001)
GD-50* Monnikhof, Erik and Bart van Ark, New Estimates of Labour Productivity in the Manufacturing Sectors of Czech Republic, Hungary and Poland, 1996 (January 2002)
GD-51* van Ark, Bart, Robert Inklaar and Marcel Timmer, The Canada-US Manufacturing Gap Revisited: New ICOP Results (January 2002)
GD-52* Mulder, Nanno, Sylvie Montout and Luis Peres Lopes, Brazil and Mexico's Manufacturing Performance in International Perspective, 1970-98 (January 2002)
GD-53* Szirmai, Adam, Francis Yamfwa and Chibwe Lwamba, Zambian Manufacturing Performance in Comparative Perspective (January 2002)
GD-54* Fremdling, Rainer, European Railways 1825-2001, an Overview (August 2002)
GD-55* Fremdling, Rainer, Foreign Trade-Transfer-Adaptation: The British Iron Making Technology on the Continent (Belgium and France) (August 2002)
GD-56* van Ark, Bart, Johanna Melka, Nanno Mulder, Marcel Timmer and Gerard Ypma, ICT Investments and Growth Accounts for the European Union 1980-2000 (September 2002)
GD-57* Sleifer, Jaap, A Benchmark Comparison of East and West German Industrial Labour Productivity in 1954 (October 2002)
GD-58* van Dijk, Michiel, South African Manufacturing Performance in International Perspective, 1970-1999 (November 2002)
GD-59* Szirmai, A., M. Prins and W. Schulte, Tanzanian Manufacturing Performance in Comparative Perspective (November 2002)
GD-60* van Ark, Bart, Robert Inklaar and Robert McGuckin, “Changing Gear” Productivity, ICT and Services: Europe and the United States (December 2002)
GD-61* Los, Bart and Timmer, Marcel, The ‘Appropriate Technology’ Explanation of Productivity Growth Differentials: An Empirical Approach (April 2003)
GD-62* Hill, Robert J., Constructing Price Indexes Across Space and Time: The Case of the European Union (May 2003)
GD-63* Stuivenwold, E. and M.P. Timmer, Manufacturing Performance in Indonesia, South Korea and Taiwan before and after the Crisis; An International Perspective, 1980-2000 (July 2003)
GD-64* Inklaar, Robert, Harry Wu and Bart van Ark, “Losing Ground”, Japanese Labour Productivity and Unit Labour Cost in Manufacturing in Comparison to the U.S. (July 2003)
GD-65* van Mulligen, Peter-Hein, Alternative Price Indices for Computers in the Netherlands using Scanner Data (July 2003)
GD-66* van Ark, Bart, The Productivity Problem of the Dutch Economy: Implications for Economic and Social Policies and Business Strategy (September 2003)

67
Groningen Growth and Development Centre Research Monographs:
Monographs marked * are also available in pdf-format on the internet No. 1* van Ark, Bart, International Comparisons of Output and Productivity:
Manufacturing Productivity Performance of Ten Countries from 1950 to 1990 (1993) (http://www.eco.rug.nl/GGDC/pub/Arkbook.shtml)
No. 2 Pilat, Dirk, The Economics of Catch-Up: The Experience of Japan and Korea (1993)
No. 3 Hofman, André, Latin American Economic Development. A Causal Analysis in Historical Perspective (1998)
No. 4 Mulder, Nanno, The Economic Performance of the Service Sector in Brazil, Mexico and the United States (1999)
No. 5* Smits, Jan-Pieter, Edwin Horlings and Jan Luiten van Zanden, Dutch GNP and Its Components, 1800-1913 (2000) (http://www.eco.rug.nl/GGDC/PUB/dutchgnp.pdf)
No. 6 Sleifer, Jaap, Falling Behind, the East German Economy in Comparison with West Germany from 1936 to 2002 (2003)