driving prosperity - volvo group
TRANSCRIPT
VOLVO GROUPANNUAL AND SUSTAINABILITY REPORT
2018
Driving prosperity
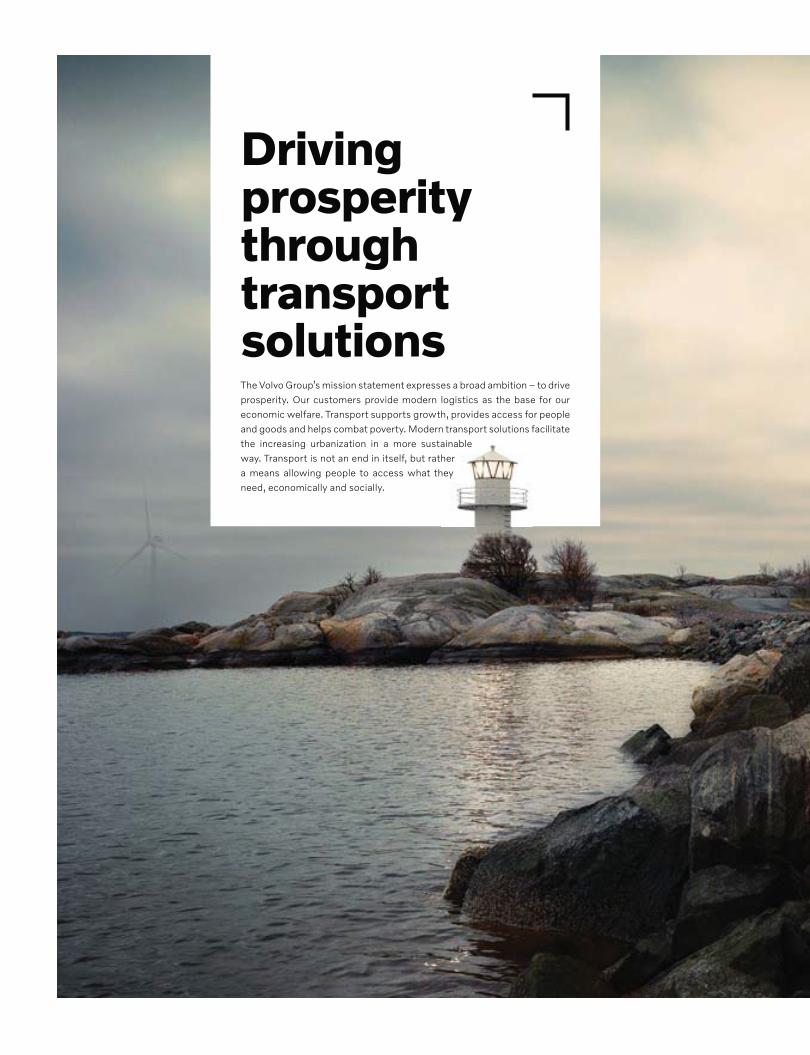
Driving prosperity through transport solutionsThe Volvo Group’s mission statement expresses a broad ambition – to drive prosperity. Our customers provide modern logistics as the base for our economic welfare. Transport supports growth, provides access for people and goods and helps combat poverty. Modern transport solutions facilitate the increasing urbanization in a more sustainable way. Transport is not an end in itself, but rather a means allowing people to access what they need, economically and socially.
ainableher
hey
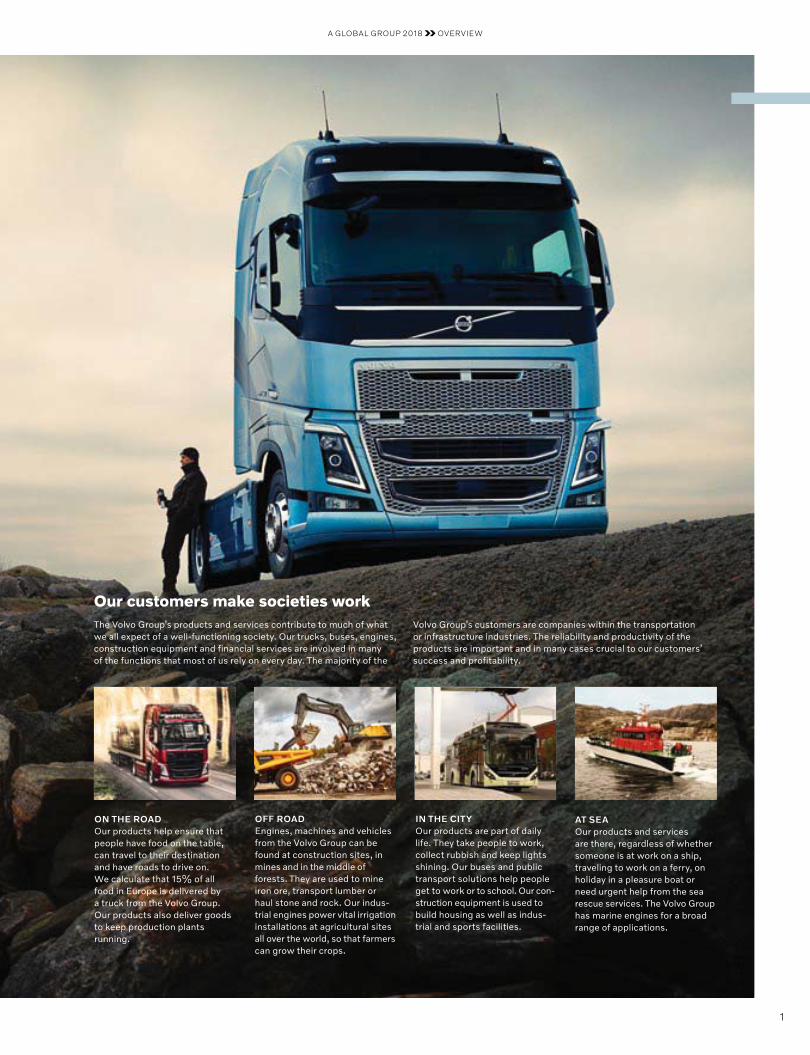
ON THE ROADOur products help ensure that people have food on the table, can travel to their destination and have roads to drive on. We calculate that 15% of all food in Europe is delivered by a truck from the Volvo Group. Our products also deliver goods to keep production plants running.
OFF ROADEngines, machines and vehiclesfrom the Volvo Group can be found at construction sites, in mines and in the middle of forests. They are used to mine iron ore, transport lumber or haul stone and rock. Our indus-trial engines power vital irrigation installations at agricultural sites all over the world, so that farmers can grow their crops.
IN THE CITYOur products are part of daily life. They take people to work, collect rubbish and keep lights shining. Our buses and public transport solutions help people get to work or to school. Our con-struction equipment is used to build housing as well as indus-trial and sports facilities.
AT SEAOur products and servicesare there, regardless of whether someone is at work on a ship, traveling to work on a ferry, on holiday in a pleasure boat or need urgent help from the sea rescue services. The Volvo Group has marine engines for a broad range of applications.
Our customers make societies workThe Volvo Group’s products and services contribute to much of what we all expect of a well-functioning society. Our trucks, buses, engines, construction equipment and financial services are involved in many of the functions that most of us rely on every day. The majority of the
Volvo Group’s customers are companies within the transportation or infrastructure industries. The reliability and productivity of the products are important and in many cases crucial to our customers’ success and profitability.
A GLOBAL GROUP 2018 OVERVIEW
1
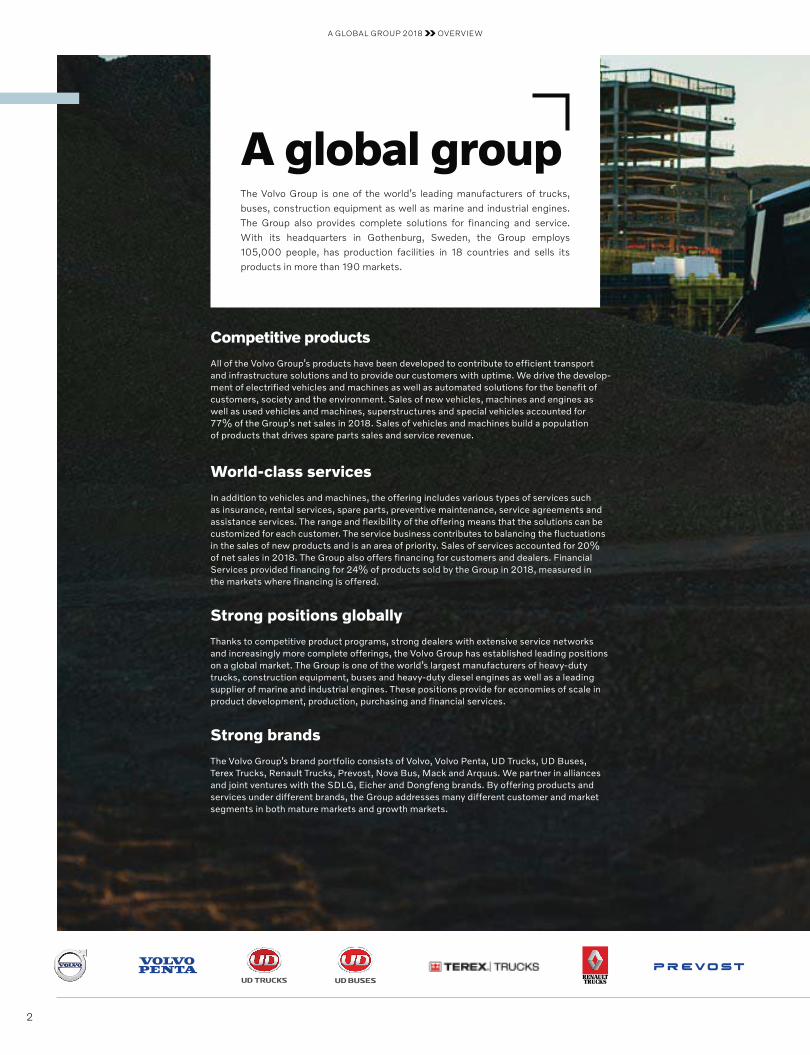
A global groupThe Volvo Group is one of the world’s leading manufacturers of trucks, buses, construction equipment as well as marine and industrial engines. The Group also provides complete solutions for financing and service. With its headquarters in Gothenburg, Sweden, the Group employs 105,000 people, has production facilities in 18 countries and sells its products in more than 190 markets.
Competitive products
All of the Volvo Group’s products have been developed to contri bute to efficient transport and infrastructure solutions and to provide our customers with uptime. We drive the develop-ment of electrified vehicles and machines as well as automated solutions for the benefit of customers, society and the environment. Sales of new vehicles, machines and engines as well as used vehicles and machines, superstructures and special vehicles accounted for 77% of the Group’s net sales in 2018. Sales of vehicles and machines build a population of products that drives spare parts sales and service revenue.
World-class services
In addition to vehicles and machines, the offering includes various types of services such as insurance, rental services, spare parts, preventive maintenance, service agreements and assistance services. The range and flexibility of the offering means that the solutions can be customized for each customer. The service business contributes to balancing the fluctuations in the sales of new products and is an area of priority. Sales of services accounted for 20% of net sales in 2018. The Group also offers financing for customers and dealers. Financial Services provided financing for 24% of products sold by the Group in 2018, measured in the markets where financing is offered.
Strong positions globally
Thanks to competitive product programs, strong dealers with extensive service networks and increasingly more complete offerings, the Volvo Group has established leading positions on a global market. The Group is one of the world’s largest manufacturers of heavy-duty trucks, construction equipment, buses and heavy-duty diesel engines as well as a leading supplier of marine and industrial engines. These positions provide for economies of scale in product development, production, purchasing and financial services.
Strong brands
The Volvo Group’s brand portfolio consists of Volvo, Volvo Penta, UD Trucks, UD Buses, Terex Trucks, Renault Trucks, Prevost, Nova Bus, Mack and Arquus. We partner in alliances and joint ventures with the SDLG, Eicher and Dongfeng brands. By offering products and services under different brands, the Group addresses many different customer and market segments in both mature markets and growth markets.
A GLOBAL GROUP 2018 OVERVIEW
2
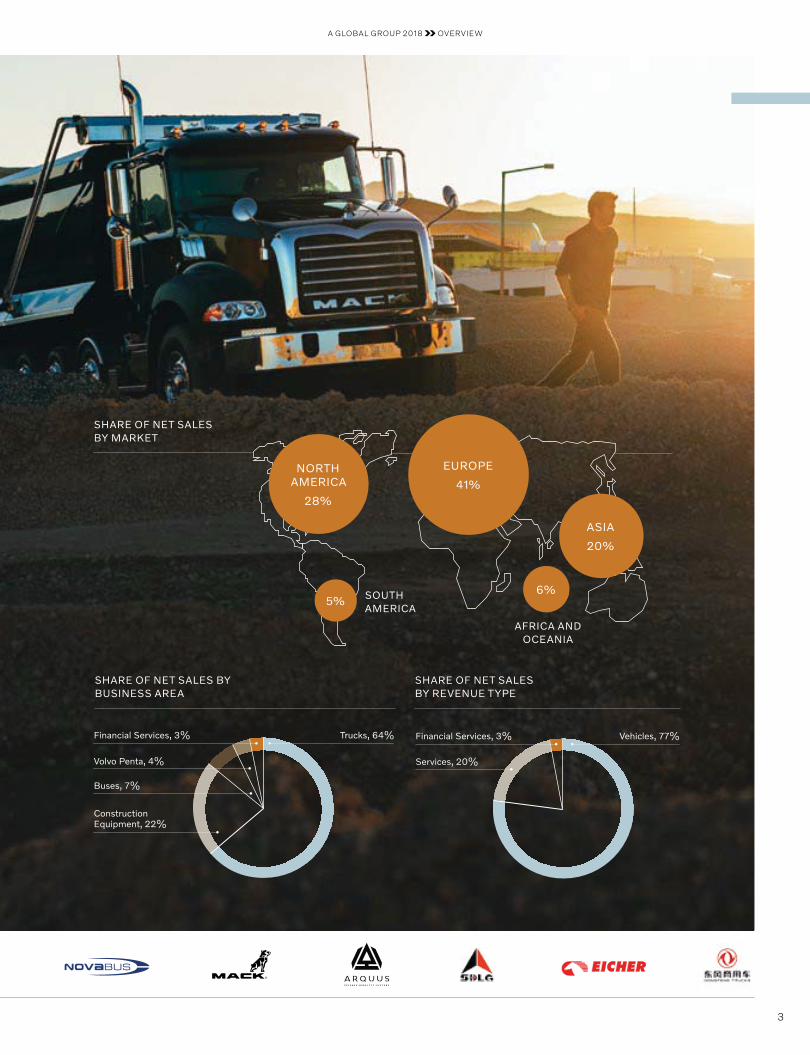
SHARE OF NET SALES BY BUSINESS AREA
Trucks, 64%Financial Services, 3%
Volvo Penta, 4%
Buses, 7%
ConstructionEquipment, 22%
SHARE OF NET SALES BY REVENUE TYPE
Financial Services, 3%
Services, 20%
Vehicles, 77%
SHARE OF NET SALES BY MARKET
SOUTH AMERICA
EUROPE
41%
ASIA
20%
NORTH AMERICA
28%
5%6%
AFRICA AND OCEANIA
A GLOBAL GROUP 2018 OVERVIEW
3
ContentA GLOBAL GROUP OVERVIEW This is the Volvo Group . . . . . . . . . . . . . . . . . 1 2018 in brief . . . . . . . . . . . . . . . . . . . . . . . 5 CEO comments. . . . . . . . . . . . . . . . . . . . . . 6
STRATEGY Balancing trends and challenges . . . . . . . . . . 10 Drive prosperity through transport solutions . . . . 12 Improving performance – the journey continues . 13 Strategic priorities . . . . . . . . . . . . . . . . . . . 14 Financial targets . . . . . . . . . . . . . . . . . . . . 17 Electrification . . . . . . . . . . . . . . . . . . . . . . 18 Automation . . . . . . . . . . . . . . . . . . . . . . . 22 Connectivity . . . . . . . . . . . . . . . . . . . . . . 26
BUSINESS MODEL
OUR ROLE IN SOCIETY . . . . . . . . . . . . . . . 30
VALUE CHAIN . . . . . . . . . . . . . . . . . . . . . 40 Customers . . . . . . . . . . . . . . . . . . . . . . 42 Product development . . . . . . . . . . . . . . . 48 Purchasing . . . . . . . . . . . . . . . . . . . . . . 58 Production & Logistics . . . . . . . . . . . . . . . 60 Retail & Service . . . . . . . . . . . . . . . . . . . 66 Reuse . . . . . . . . . . . . . . . . . . . . . . . . . 68
EMPLOYEES . . . . . . . . . . . . . . . . . . . . . . 70
GROUP PERFORMANCE BOARD OF DIRECTORS’ REPORT 2018 Global strength . . . . . . . . . . . . . . . . . . . . . 78 Significant events . . . . . . . . . . . . . . . . . . . 80 Financial performance . . . . . . . . . . . . . . . . . 82 Financial position . . . . . . . . . . . . . . . . . . . . 85 Cash flow statement . . . . . . . . . . . . . . . . . . 88 Trucks . . . . . . . . . . . . . . . . . . . . . . . . . . 90 Construction Equipment . . . . . . . . . . . . . . . 94 Buses . . . . . . . . . . . . . . . . . . . . . . . . . . 97 Volvo Penta . . . . . . . . . . . . . . . . . . . . . . . 99 Financial Services . . . . . . . . . . . . . . . . . . 101 Financial management . . . . . . . . . . . . . . . 103 Changes in consolidated shareholders’ equity . . 104 The share . . . . . . . . . . . . . . . . . . . . . . . 105 Risks and uncertainties . . . . . . . . . . . . . . . 108 Sustainability Reporting. . . . . . . . . . . . . . . 116
NOTES Notes to the financial statements . . . . . . . . . 121 Parent Company AB Volvo . . . . . . . . . . . . . 182
CORPORATE GOVERNANCE Corporate Governance Report 2018 . . . . . . . 192 Board of Directors . . . . . . . . . . . . . . . . . . 200 Group Executive Board . . . . . . . . . . . . . . . 206
OTHER INFORMATION Proposed remuneration policy . . . . . . . . . . . 210 Proposed disposition of unappropriated earnings . 211 Audit report for AB Volvo (publ) . . . . . . . . . . 212 Key Ratios . . . . . . . . . . . . . . . . . . . . . . . 215 Eleven-year summary . . . . . . . . . . . . . . . . 218 Reporting scope and boundaries . . . . . . . . . . 226 Annual General Meeting. . . . . . . . . . . . . . . 228 Preliminary publication dates . . . . . . . . . . . . 228
The Volvo Group’s formal financial reports are presented on pages 78–191, 210–211 and 215–217 and have been audited by the company’s auditors.
For information on which pages constitute the Volvo Group’s Sustainability Report, please see the Sustainability Reporting Index on page 116.
AUGMENTED REALITYDownload the app Volvo Group AR Stories. Use your mobile device to view the images marked with the AR symbol. Read more on page 229.
A GLOBAL GROUP 2018 OVERVIEW
4
The comparative financial information has been restated due to the implementation of IFRS 15 Revenue from Contracts with Customers. For more information, please see Note 31.
1 For more information on adjusted operating income, please see Key Ratios on page 215.
2 Proposed by the Board of Directors. SEK 5.00 per share in ordinary dividend and SEK 5.00 per share in extra dividend.
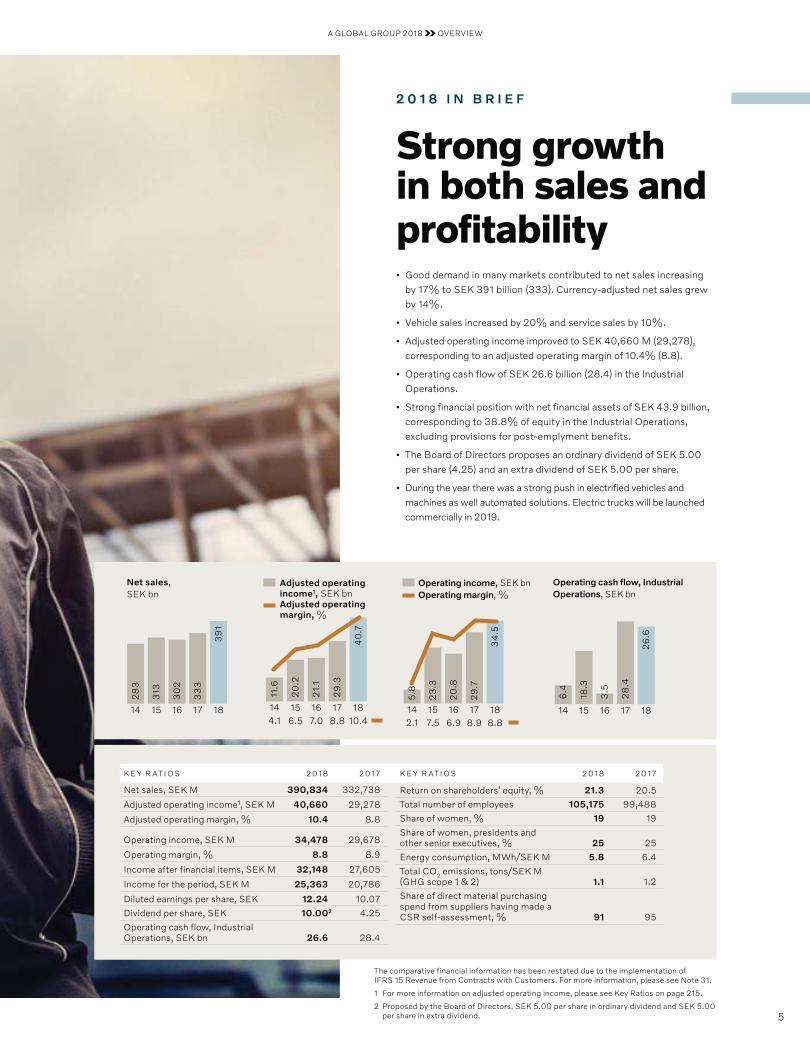
Net sales, SEK bn
16 171514 18
28
3
313
30
2
33
3
39
1
Adjusted operating income1, SEK bn
Adjusted operating margin, %
16 171514 18
11.6
20
.2
21.
1
29
.3
7.0 8.86.54.1 10.4
40
.7
Operating income, SEK bn Operating margin, %
16 171514 186.9 8.97.52.1 8.8
5.8
23
.3
20
.8
29
.7
34
.5
Operating cash flow, Industrial Operations, SEK bn
16 171514 18
6.4
18.3
3.5
28
.4
26
.6
K E Y R AT I O S 2018 2017
Return on shareholders’ equity, % 21.3 20.5
Total number of employees 105,175 99,488
Share of women, % 19 19
Share of women, presidents and other senior executives, % 25 25
Energy consumption, MWh/SEK M 5.8 6.4
Total CO2 emissions, tons/SEK M (GHG scope 1 & 2) 1.1 1.2
Share of direct material purchasing spend from suppliers having made a CSR self- assessment, % 91 95
K E Y R AT I O S 2018 2017
Net sales, SEK M 390,834 332,738
Adjusted operating income¹, SEK M 40,660 29,278
Adjusted operating margin, % 10.4 8.8
Operating income, SEK M 34,478 29,678
Operating margin, % 8.8 8.9
Income after financial items, SEK M 32,148 27,605
Income for the period, SEK M 25,363 20,786
Diluted earnings per share, SEK 12.24 10.07
Dividend per share, SEK 10.002 4.25
Operating cash flow, Industrial Operations, SEK bn 26.6 28.4
Strong growth in both sales and profitability• Good demand in many markets contributed to net sales increasing
by 17% to SEK 391 billion (333). Currency-adjusted net sales grew by 14%.
• Vehicle sales increased by 20% and service sales by 10%.
• Adjusted operating income improved to SEK 40,660 M (29,278), corresponding to an adjusted operating margin of 10.4% (8.8).
• Operating cash flow of SEK 26.6 billion (28.4) in the Industrial Operations.
• Strong financial position with net financial assets of SEK 43.9 billion, corresponding to 38.8% of equity in the Industrial Operations, excluding provisions for post-emplyment benefits.
• The Board of Directors proposes an ordinary dividend of SEK 5.00 per share (4.25) and an extra dividend of SEK 5.00 per share.
• During the year there was a strong push in electrified vehicles and machines as well automated solutions. Electric trucks will be launched commercially in 2019.
2 0 1 8 I N B R I E F
5
A GLOBAL GROUP 2018 OVERVIEW
C E O C O M M E N T S
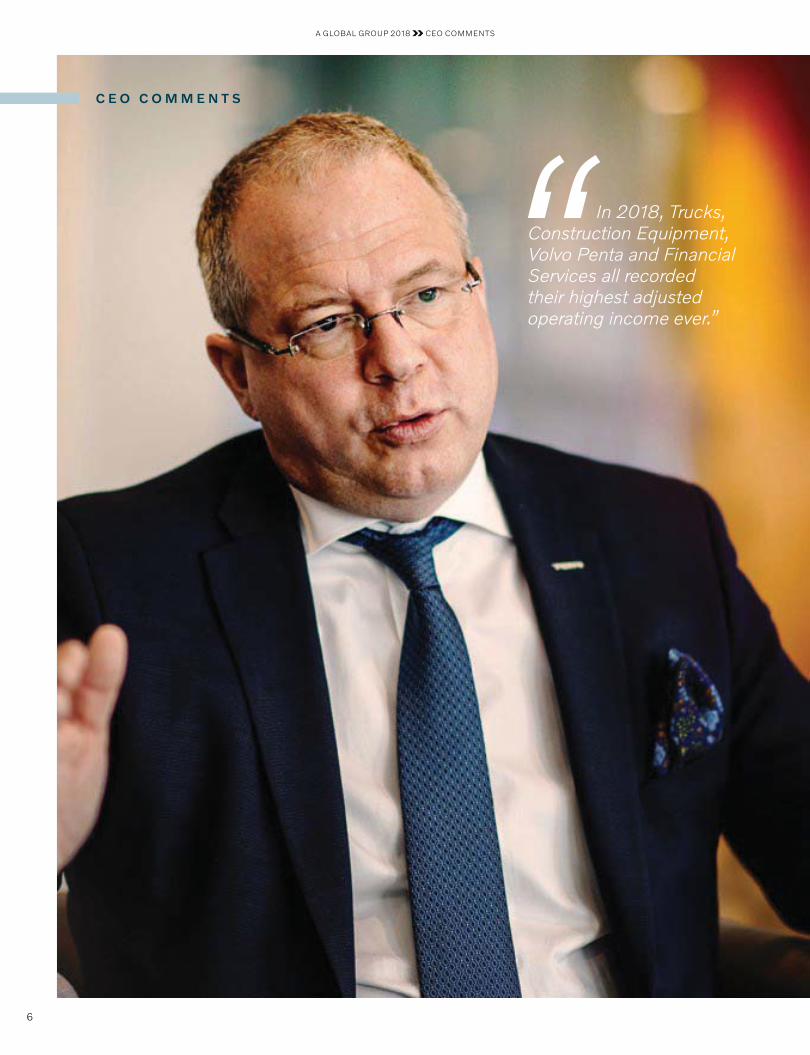
In 2018, Trucks, Construction Equipment, Volvo Penta and Financial Services all recorded their highest adjusted operating income ever.”
A GLOBAL GROUP 2018 CEO COMMENTS
6
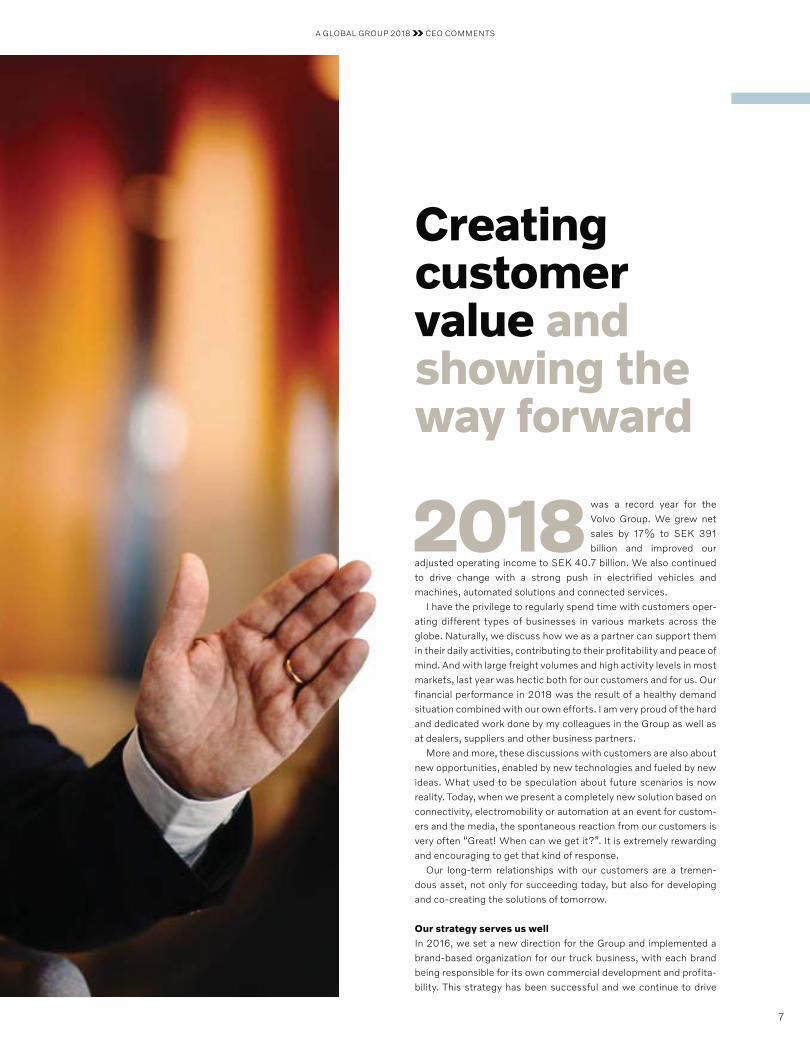
2018 was a record year for the Volvo Group. We grew net sales by 17% to SEK 391 billion and improved our
adjusted operating income to SEK 40.7 billion. We also continued to drive change with a strong push in electrified vehicles and machines, automated solutions and connected services.
I have the privilege to regularly spend time with customers oper-ating different types of businesses in various markets across the globe. Naturally, we discuss how we as a partner can support them in their daily activities, contributing to their profitability and peace of mind. And with large freight volumes and high activity levels in most markets, last year was hectic both for our customers and for us. Our financial performance in 2018 was the result of a healthy demand situation combined with our own efforts. I am very proud of the hard and dedicated work done by my colleagues in the Group as well as at dealers, suppliers and other business partners.
More and more, these discussions with customers are also about new opportunities, enabled by new technologies and fueled by new ideas. What used to be speculation about future scenarios is now reality. Today, when we present a completely new solution based on connectivity, electromobility or automation at an event for custom-ers and the media, the spontaneous reaction from our customers is very often “Great! When can we get it?”. It is extremely rewarding and encouraging to get that kind of response.
Our long-term relationships with our customers are a tremen-dous asset, not only for succeeding today, but also for developing and co-creating the solutions of tomorrow.
Our strategy serves us wellIn 2016, we set a new direction for the Group and implemented a brand-based organization for our truck business, with each brand being responsible for its own commercial development and profita-bility. This strategy has been successful and we continue to drive
Creating customer value and showing the way forward
A GLOBAL GROUP 2018 CEO COMMENTS
7
decentralization throughout the Group. Those closest to the cus-tomer should be empowered to make the decisions and also be accountable for the result. It is great to see this culture shift happen in practice. Individuals and teams are taking responsibility and driv-ing forward with the customer’s best interest in mind. There are still areas to address. As an organization, we can increase speed in deci-sion-making and improve how we collaborate internally, but we are on the right track and well on our way.
From a financial standpoint, our goal is to achieve a gradual and consistent earnings improvement with all business areas in the Volvo Group contributing. Since we operate in a cyclical industry, we aim to further reduce volatility in earnings and cash flow; for example, by continuing to focus on such areas as workshop performance, spare parts availability and higher service contract penetration. Finally, we are maintaining discipline when it comes to how we allocate capital and invest. This allows us to safeguard our room to maneuver also in times of lower demand and ensures that we have the strength to continue to innovate and invest in new technologies.
In 2018, Trucks, Construction Equipment, Volvo Penta and Financial Services all recorded their highest adjusted operating income ever. In addition, we continued to increase our financial strength and ended the year with a net cash position of SEK 43.9 billion in the Industrial Operations, excluding pension liabilities.
In line with the improved profitability and strengthened financial position, the Board has proposed an ordinary dividend of SEK 5.00 and an extra dividend of SEK 5.00 per share.
Strong demand and improved performance2018 saw high demand levels on basically all major truck markets. In Europe, healthy freight volumes and freight rates contributed to good customer profitability and demand for our trucks. Volvo Trucks performed well with market shares on historically high levels and Renault Trucks grew its market share slightly.
In North America, we concluded the introduction of the new product ranges from Volvo Trucks and Mack Trucks. The new offer-ing is one factor behind Volvo Trucks regaining market share in North America. The reception among customers has also been great on the Mack side, with the Mack Anthem being recognized as a means for attracting and retaining the best drivers. We continued to have a challenging situation with a stretched supply chain, but still managed to deliver 42% more trucks in North America year-on-year. Our dealers continued to invest in service capacity and the new service bays are literally filled from day one.
The truck market in Brazil continued to grow from low levels, while the situation in Japan was stable. Our truck joint ventures in China and India performed well, and it is great to see that VE Commercial Vehicles, already a strong player in the light and medium duty seg-ments in India, is also strengthening its position in heavy duty trucks.
In total, we grew Trucks’ net sales by 17% to SEK 250,358 M and improved the adjusted operating margin to 10.5%.
Demand for construction equipment in Europe and North America was at good levels. In North America, we saw growth in the segments for bigger machines. The Chinese market continued to develop along its long-term growth trajectory, albeit with slight stagnation at the end of the year.
For the full year, net sales for Construc tion Equipment amounted to SEK 84,238 M and the adjusted operating margin improved to 13.4%. The Construction Equipment organization responded favorably to the market upturn and increased deliveries by 29% year-on-year.
In early 2019, we announced that we will stop developing diesel- powered smaller compact equipment in favor of fully-electric machines with sales starting in 2020.
Our Buses business area operated under overall flat market con-ditions. Sales matched the year before at SEK 25,826 M, with a positive development in terms of order intake. The adjusted operat-ing margin was a low 3.0% and we see potential to improve our profitability in this area. In its biggest coach launch in 20 years, Volvo Buses introduced an all-new platform for long-distance coaches in Europe. Volvo Care – the new Volvo coach total offer of products, services and financing – was introduced, making it easier to buy, own and operate a Volvo coach. Volvo Buses also continued to showcase its leading position within electromobility by initiating tests involving high-capacity articulated full-electric buses.
Volvo Penta is perhaps best known for its strong heritage and game-changing innovations within marine applications. The Volvo Penta team continued this tradition by demonstrating an advanced system for self-docking, a solution for one of boating’s most stress-ful maneuvers, with a planned launch in 2020. For a number of years though, Volvo Penta has also successfully developed its industrial engine segment. Today, the industrial engine segment is an equally important part of the Volvo Penta business. In 2018, this develop-ment was further supported by a pre-buy effect in Europe on indus-trial engines. Full-year net sales for Volvo Penta increased 24% to SEK 13,741 M and the adjusted operating margin was 17.0%.
Our Financial Services business continued to perform well with low credit losses. Profitability improved and the underlying return on shareholders’ equity was 15.1%. Financial services are key in our work to deepen the relationship with customers and offer total solu-tions. There is still untapped potential for us to increase sales of financing and insurance packages for Group products. It is impor-tant to also drive innovation in this area. Financial Services recently received an innovative technology award for a new mobile app that helps to speed up the quoting and credit approval process.
A well-performing service business is a key driver for customer satisfaction, profitability and loyalty. Hard and focused work by all our business areas in 2018 resulted in a 10% growth of our service sales. Services are vital for supporting customer success, as well as for strengthening our resilience throughout the business cycle. Ser-vices are also a key part of our journey towards more advanced solutions.
Leading the transition into new technologies and business modelsOur products and services enable our customers to build roads, move goods, transport people to work and do numerous other things that make society work and modern life possible. And as the world population continues to grow, the need for sustainable trans-port and infrastructure solutions will increase. For the Volvo Group, sustainability encompasses economic, environmental and social dimensions, and we are working towards solutions that take these aspects into consideration. One example is our long-time support of the UN Global Compact. The Global Compact is a call to companies to align strategies and operations with universal principles on human rights, labor, environment and anti-corruption, and take actions that advance societal goals.
Efficient and sustainable transport is a precondition for economic growth, alleviating poverty and combating climate change. We believe that the shift towards sustainable transport provides great opportunities for our customers, for society and for the Volvo Group. To seize these opportunities, we work with customers and strategic partners in the ecosystem around new technologies. One concrete example is Volvo Buses’ participation in a research project whereby used electric bus batteries receive a second life as solar energy
A GLOBAL GROUP 2018 CEO COMMENTS
8
storage units. The aim is to evaluate how well the batteries perform in this application and gain insight into the possibility of reuse of our batteries.
In 2018, we added to our portfolio of sustainable transport solu-tions. Volvo Trucks unveiled two electric trucks: the 16 ton Volvo FL Electric and the Volvo FE Electric, designed for heavier city distribu-tion and refuse transport operations. Sales and series production of the new models will start in Europe this year. Renault Trucks pre-sented its second generation of fully electric vehicles with a complete range from 3.1 to 26 tons for use in cities. We also announced that Mack Trucks in 2019 will have a fully electric refuse truck in operation at the New York City Department of Sanitation. The electric trucks are based on the Group’s modular system and utilize knowledge we have gained from our well-established electric bus offering.
We are also pushing forward within automation. In January, UD Trucks participated in the world’s first public road demonstration of multi-brand truck platooning. In the US, we showcased platooning together with FedEx on a highway in North Carolina. Platooning can provide considerable savings for our customers by reducing fuel consumption.
Connectivity enables new ways to provide services that deepen the relationship with our customers. This is exemplified by our Mack Connect suite of services, which integrates intelligent software, predictive analytics and driver-assist technologies to help custom-ers boost productivity and profitability. The suite has helped us to cut diagnostic times by more than 70% and repair times by more than 20%. Another example is Volvo Connect, which enables cus-tomers to access the important services and information they need to run and develop their daily business – in one place.
And when we combine connectivity, electromobility and automa-tion, we are able to design completely new solutions.
Solutions that open up completely new possibilitiesDuring the year, Volvo Trucks presented Vera – a future transport vehicle that is autonomous, fully electric and connected. It can con-tribute to more efficient, safer and cleaner transportation in confined and hub-to-hub repetitive transport flows. The system is currently being developed together with customers and business partners.
We passed another milestone when Volvo Construction Equip-ment put the groundbreaking Electric Site solution to test at a quarry in Gothenburg, in cooperation with the customer Skanska. The results showed that Electric Site delivered significant reduc-tions in carbon emissions as well as operator costs. This represents the future of the industry.
New technologies enable us to offer complete solutions and implement new business models. The agreement between Volvo Trucks and Brønnøy Kalk AS in Norway is an example of both. In its first commercial autonomous transport solution, Volvo Trucks will use six autonomous Volvo FH trucks to transport limestone between two hubs. The customer pays per tons delivered.
Agreements like this constitute a long-term commitment by both parties. By providing complete systems and solutions, we are able to create more value and take more responsibility for our customers’ performance. In addition, our addressable market will grow significantly.
The paradigm shift is happening now and we are actively shaping the new landscape. We have a strong platform to grow from in terms of the Group’s technology and assets, our long-term cus-tomer relations and our skilled people with deep knowledge of our customers’ operations.
Once again I would like to thank all colleagues and partners for making 2018 the best year so far for the Volvo Group. Your commit-ment and passion make all the difference and together we will con-tinue to create value for our customers, our shareholders and soci-ety today and tomorrow.
Martin LundstedtPresident and CEO
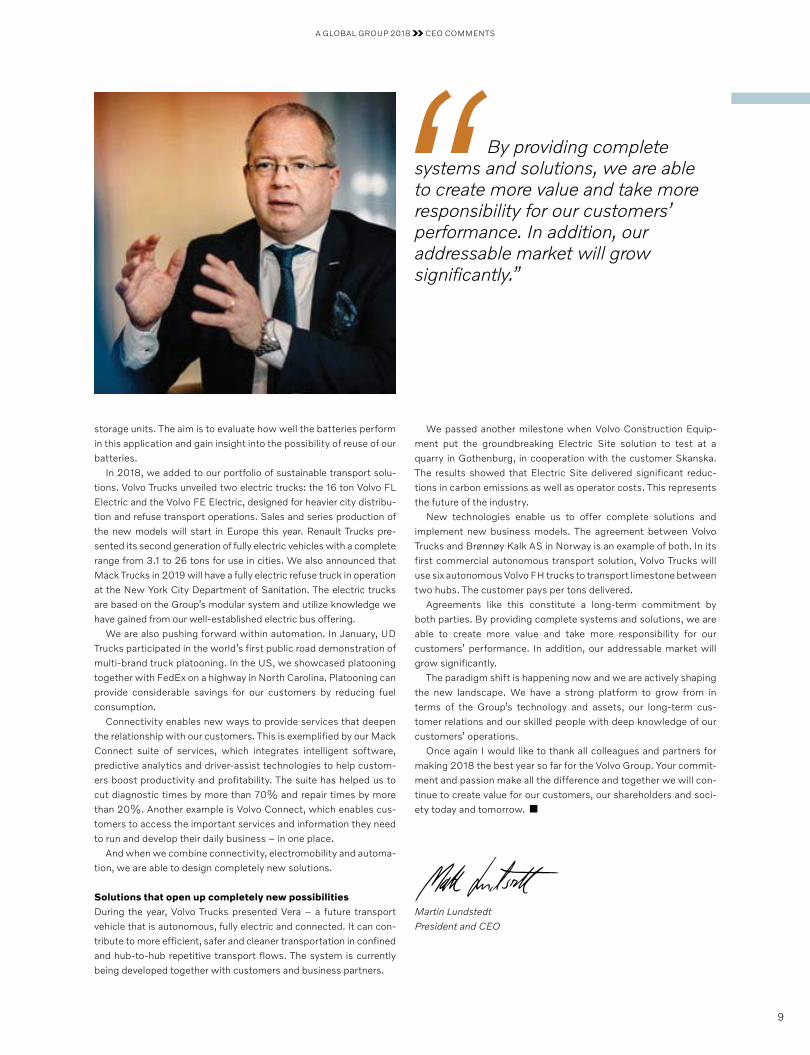
By providing complete systems and solutions, we are able to create more value and take more responsibility for our customers’ performance. In addition, our addressable market will grow significantly.”
A GLOBAL GROUP 2018 CEO COMMENTS
9
Global perspective
Driving prosperity, in all aspects of the word, means that the impact on environment and the usage of our society’s limited resources are considered in our activities.
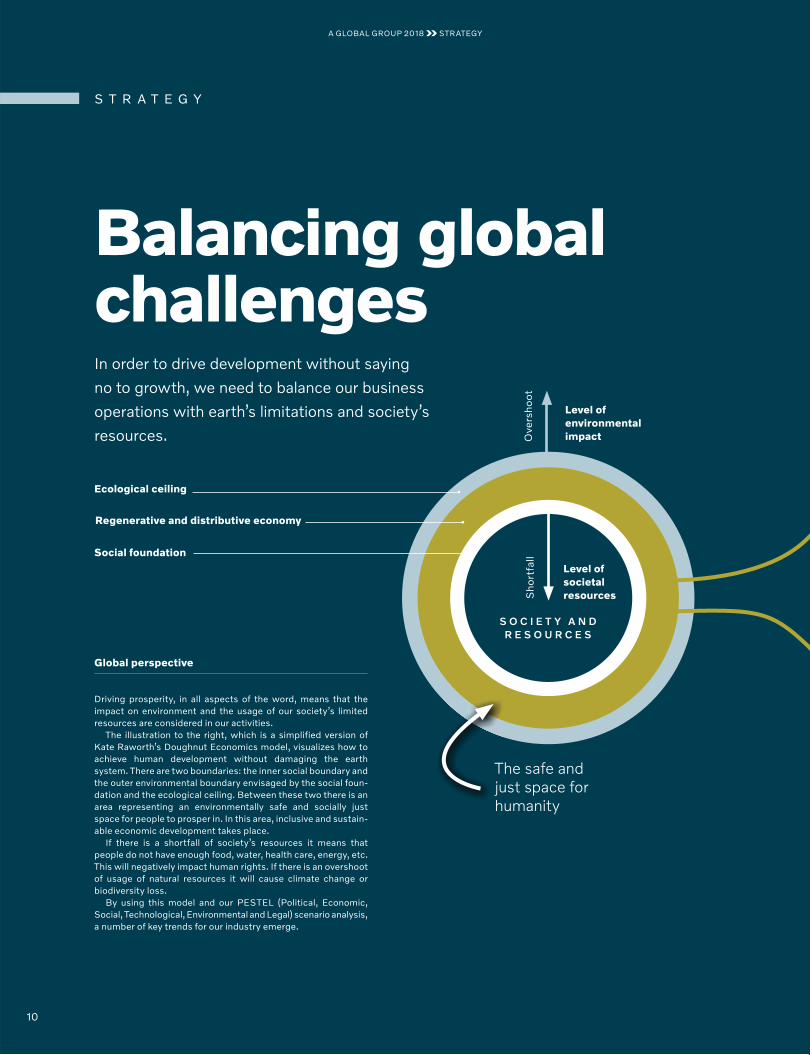
The illustration to the right, which is a simplified version of Kate Raworth’s Doughnut Economics model, visualizes how to achieve human development without damaging the earth system. There are two boundaries: the inner social boundary and the outer environmental boundary envisaged by the social foun-dation and the ecological ceiling. Between these two there is an area representing an environmentally safe and socially just space for people to prosper in. In this area, inclusive and sustain-able economic development takes place.
If there is a shortfall of society’s resources it means that people do not have enough food, water, health care, energy, etc. This will negatively impact human rights. If there is an overshoot of usage of natural resources it will cause climate change or biodiversity loss.
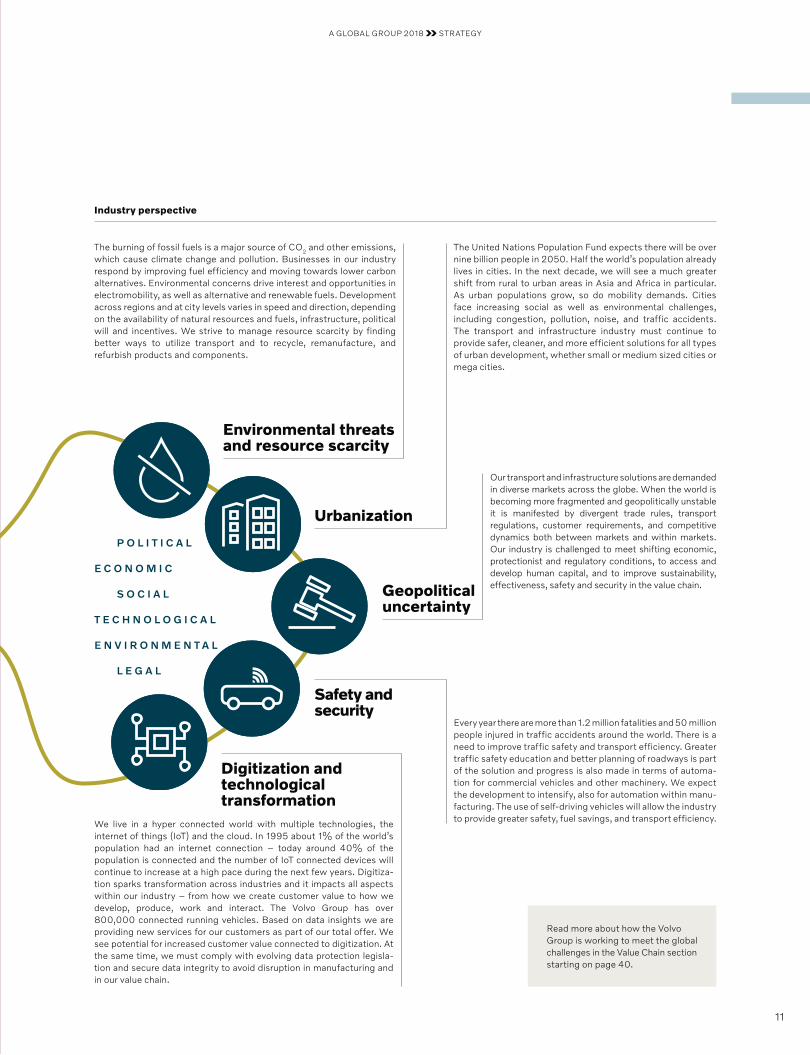
By using this model and our PESTEL (Political, Economic, Social, Technological, Environmental and Legal) scenario analysis, a number of key trends for our industry emerge.
S T R A T E G Y
Balancing global challengesIn order to drive development without saying
no to growth, we need to balance our business
operations with earth’s limitations and society’s
resources.
Regenerative and distributive economy
Ecological ceiling
Social foundation
Level of environmental impactO
vers
hoot
Level of societal resourcesS
hort
fall
The safe and just space for humanity
S O C I E T Y A N D R E S O U R C E S
Tju
10
A GLOBAL GROUP 2018 STRATEGY
L E G A L
S O C I A L
E C O N O M I C
T E C H N O L O G I C A L
E N V I R O N M E N T A L
P O L I T I C A L
Every year there are more than 1.2 million fatalities and 50 million people injured in traffic accidents around the world. There is a need to improve traffic safety and transport efficiency. Greater traffic safety education and better planning of roadways is part of the solution and progress is also made in terms of automa-tion for commercial vehicles and other machinery. We expect the development to intensify, also for automation within manu-facturing. The use of self-driving vehicles will allow the industry to provide greater safety, fuel savings, and transport efficiency.
Our transport and infrastructure solutions are demanded in diverse markets across the globe. When the world is becoming more fragmented and geopolitically unstable it is manifested by divergent trade rules, transport regulations, customer requirements, and competitive dynamics both between markets and within markets. Our industry is challenged to meet shifting economic, protectionist and regulatory conditions, to access and develop human capital, and to improve sustainability, effectiveness, safety and security in the value chain.
We live in a hyper connected world with multiple technologies, the internet of things (IoT) and the cloud. In 1995 about 1% of the world’s population had an internet connection – today around 40% of the population is connected and the number of IoT connected devices will continue to increase at a high pace during the next few years. Digitiza-tion sparks transformation across industries and it impacts all aspects within our industry – from how we create customer value to how we develop, produce, work and interact. The Volvo Group has over 800,000 connected running vehicles. Based on data insights we are providing new services for our customers as part of our total offer. We see potential for increased customer value connected to digitization. At the same time, we must comply with evolving data protection legisla-tion and secure data integrity to avoid disruption in manufacturing and in our value chain.
Urbanization
Safety and security
Geopolitical uncertainty
Industry perspective
The burning of fossil fuels is a major source of CO2 and other emissions, which cause climate change and pollution. Businesses in our industry respond by improving fuel efficiency and moving towards lower carbon alternatives. Environmental concerns drive interest and opportunities in electro mobility, as well as alternative and renewable fuels. Development across regions and at city levels varies in speed and direction, depending on the availability of natural resources and fuels, infrastructure, political will and incentives. We strive to manage resource scarcity by finding better ways to utilize transport and to recycle, remanufacture, and refurbish products and components.
The United Nations Population Fund expects there will be over nine billion people in 2050. Half the world’s population already lives in cities. In the next decade, we will see a much greater shift from rural to urban areas in Asia and Africa in particular. As urban populations grow, so do mobility demands. Cities face increasing social as well as environmental challenges, including congestion, pollution, noise, and traffic accidents. The transport and infrastructure industry must continue to provide safer, cleaner, and more efficient solutions for all types of urban development, whether small or medium sized cities or mega cities.
Digitization and technological transformation
Environmental threats and resource scarcity
Read more about how the Volvo Group is working to meet the global challenges in the Value Chain section starting on page 40.
A GLOBAL GROUP 2018 STRATEGY
11

Drive prosperity through transport solutions
Every company exists for a reason – it has a purpose. Our solutions to global challenges are driven by our mission to drive prosperity through transport solutions and our vision to be the most desired and successful transport
solution provider in the world.
MISSION
Driving prosperity through transport solutionsThe Volvo Group’s mission statement expresses a broad ambition – to drive prosperity. Our customers provide modern logistics as the base for our economic welfare. Transport supports growth, provides access for people and goods and helps combat poverty. Modern transport solutions facilitate the increasing urbanization in a sustain-able way. Transport is not an end in itself, but rather a means allow-ing people to access what they need, economically and socially.
VISION
Be the most desired and successful transport solution provider in the worldOur vision is to be the most desired and successful transport provider in the world. We are in a people business. Even though we operate in a business-to-business market, people make the decisions. Trust and relations are as important as the total offer. We have competitive products and services and it is with these and our people that we build lasting relations with our customers. In the end, by bringing together the best of everything from the offer to the relationship, we will become the customers’ preferred choice.
ASPIRATIONS
Guiding us on our journey• Have leading customer satis faction for all brands in their segments.
The only true measure of success is customer satisfaction.• Be the most admired employer in our industry. By being the most
admired employer we attract and retain the best people.• Have industry leading profit ability. Through strong performance
we are able to invest in products, services and people – and thereby own our own destiny.
VALUES
Building a performance cultureOur wanted culture is described by five values. They serve as a guide to our day to day behavior and they drive decisions on all levels of the organization. Customer success – We truly understand our custom-ers’ business. We listen to and talk with our customers about their needs, desires and challenges. We focus on transport solutions that make customers successful and create value for society. Trust – We are transparent and have respect for the individual. We trust other teams to do their best and we respect the decisions made. Passion – We are proud of the work and business we do. We are engaged and committed to meet our goals. Change – We are curious about the world around us. We are innovative and find ways to create new solutions and business. Performance – We expect a lot from our-selves and others, and walk the extra mile to do a great job. We see the big picture and know when to let go of an idea, a project or a plan.
CODE OF CONDUCT
Building trust with customers and societyOur Code of Conduct outlines how we do business in the Volvo Group; ethically and in compliance with the law. Doing business in line with the Code of Conduct builds trust with our customers as well as with society in general, which contributes to our commercial success. The Code of Conduct has been developed to be a practical tool which shall be used by everyone within the Group, see page 36.
This is an abbreviated version. The full version is available under About us at www.volvogroup.com
VALUES
CODE OF CONDUCT
VALUES
CODE OF CONDUCT
ASPIRATIONS
VISION
MISSION
ASPIRATIONS
VISION
MISSION
VOLVO GROUP
A GLOBAL GROUP 2018 STRATEGY
12

Improving performance – the journey continues
Following more than a decade of an active acquisition strat-egy to build the scale needed to be competitive in com-mercial vehicles and a subsequent restructuring period, the Volvo Group is currently in a phase focused on organic
growth, improved efficiency, increased profitability and getting even closer to custom ers.
During 1999 to 2011 the Volvo Group’s strategy was primarily tar-geted at growth, not least through acquisitions, while at the same time focusing the business on commercial vehicles. On the truck side, acquisitions include Renault Trucks, Mack Trucks and Nissan Diesel (now UD Trucks), the joint venture with Eicher Motors in India (VECV) and in 2015 the strategic alliance with Dongfeng Commer-cial Vehicles (DFCV) in China. Volvo Construction Equipment (Volvo CE) bought Samsung’s excavator business, a 70% ownership in the Chinese wheel loader manufacturer Lingong (SDLG), Ingersoll Rand Road Development and in 2014 the hauler business from Terex.
The acquisitions along with organic growth have enabled the Volvo Group to reach economies of scale in product development, produc-tion, purchasing and financial services. The streamlining to commer-cial vehicles has also involved divestment of non-core operations such as Volvo Aero, Volvo Rents, real estate and the external IT business.
During 2012 to 2015 the Volvo Group underwent a transforma-tion program aimed at reorganizing the company to take out over-laps, reduce structural costs and increase efficiency and profit-ability after the period of acquisition-driven growth. Among the activities in the program to reduce the Group’s structural cost levels were substantial reductions of white-collar employees and consult-ants, a reduction in research and development expenses, optimiza-tion of the sales and service channel and the industrial footprint as well as a consolidation and optimization of the spare parts distri-bution worldwide. In the current phase the focus is on organic growth and improved performance.
1999–2011 Acquisition-driven growth
Scale, synergies and geographical expansion.
2016–Improved performance
Customer focus, simplicity, speed, continuous improvements
and organic growth.
2012–2015 Transformation to close the gap
Product renewal, restructuring and cost efficiency.
Major acquisitions
2001 Renault Trucks and Mack Trucks
2006 Nissan Diesel (now UD Trucks)
2007 70% of Lingong (SDLG)
2007 Ingersoll Rand Road Development
2008 VECV (joint venture with Eicher)
A GLOBAL GROUP 2018 STRATEGY
13
A GLOBAL GROUP 2018 STRATEGY STRATEGIC PRIORITIES
S T R A T E G I C P R I O R I T I E S
Focus on creating customer value
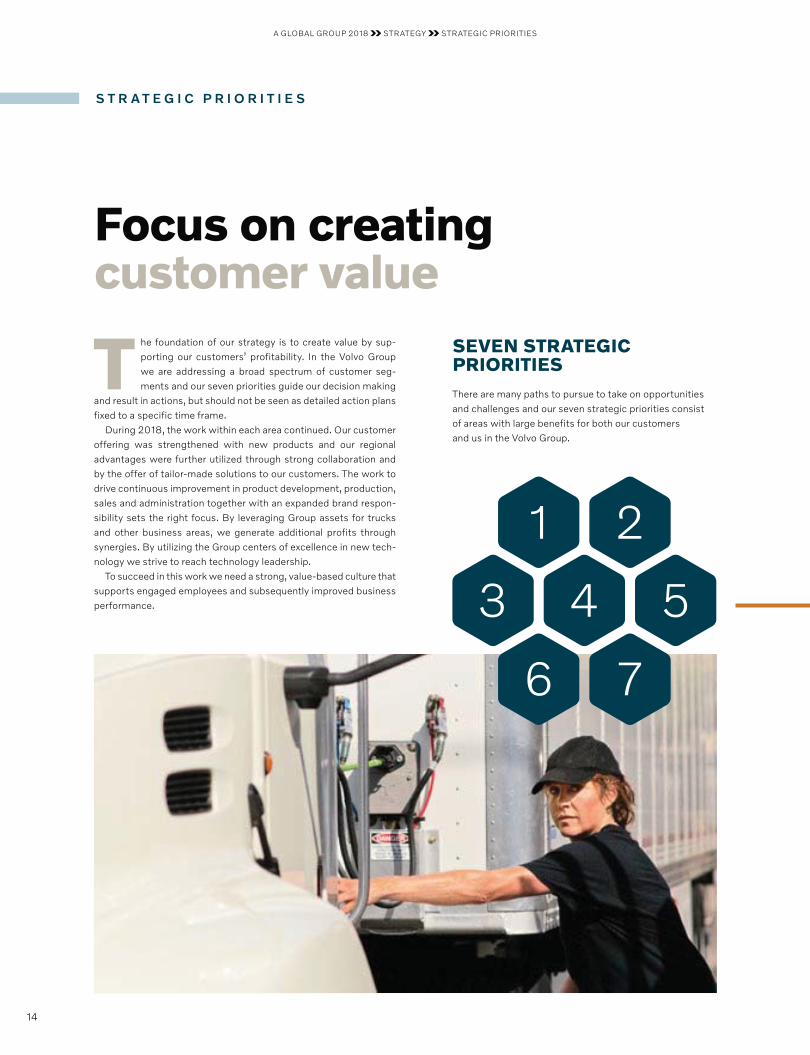
The foundation of our strategy is to create value by sup-porting our customers’ profitability. In the Volvo Group we are addressing a broad spectrum of customer seg-ments and our seven priorities guide our decision making
and result in actions, but should not be seen as detailed action plans fixed to a specific time frame.
During 2018, the work within each area continued. Our customer offering was strengthened with new products and our regional advantages were further utilized through strong collaboration and by the offer of tailor-made solutions to our customers. The work to drive continuous improvement in product development, production, sales and administration together with an expanded brand respon-sibility sets the right focus. By leveraging Group assets for trucks and other business areas, we generate additional profits through synergies. By utilizing the Group centers of excellence in new tech-nology we strive to reach technology leadership.
To succeed in this work we need a strong, value-based culture that supports engaged employees and subsequently improved business performance.
1
6
3
2
7
4 5
SEVEN STRATEGIC PRIORITIESThere are many paths to pursue to take on opportunities and challenges and our seven strategic priorities consist of areas with large benefits for both our customers and us in the Volvo Group.
14
A GLOBAL GROUP 2018 STRATEGY STRATEGIC PRIORITIES
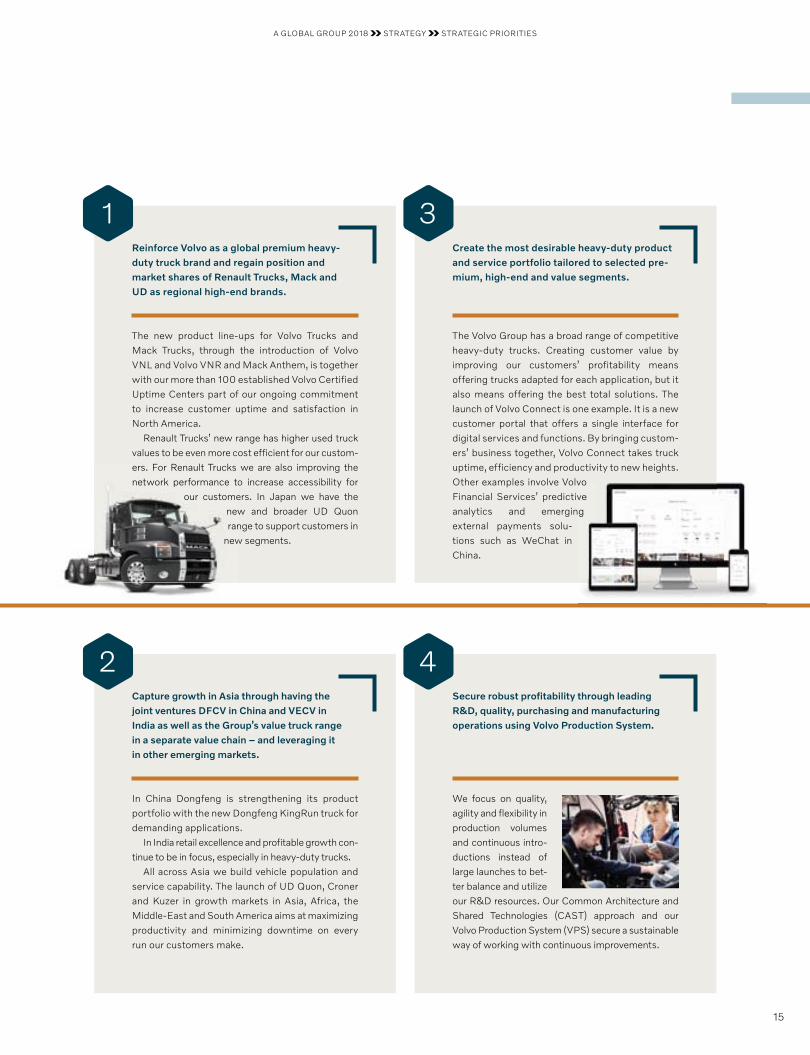
Capture growth in Asia through having the joint ventures DFCV in China and VECV in India as well as the Group’s value truck range in a separate value chain – and leveraging it in other emerging markets.
In China Dongfeng is strengthening its product portfolio with the new Dongfeng KingRun truck for demanding applications.
In India retail excellence and profitable growth con-tinue to be in focus, especially in heavy-duty trucks.
All across Asia we build vehicle population and service capability. The launch of UD Quon, Croner and Kuzer in growth markets in Asia, Africa, the Middle-East and South America aims at maximizing productivity and minimizing downtime on every run our customers make.
2
Reinforce Volvo as a global premium heavy-duty truck brand and regain position and market shares of Renault Trucks, Mack and UD as regional high-end brands.
The new product line-ups for Volvo Trucks and Mack Trucks, through the introduction of Volvo VNL and Volvo VNR and Mack Anthem, is together with our more than 100 established Volvo Certified Uptime Centers part of our ongoing commitment to increase customer uptime and satisfaction in North America.
Renault Trucks’ new range has higher used truck values to be even more cost efficient for our custom-ers. For Renault Trucks we are also improving the network performance to increase accessibility for
our customers. In Japan we have the new and broader UD Quon range to support customers in
new segments.
Create the most desirable heavy-duty product and service portfolio tailored to selected pre-mium, high-end and value segments.
The Volvo Group has a broad range of competitive heavy-duty trucks. Creating customer value by improving our customers’ profitability means offering trucks adapted for each application, but it also means offering the best total solutions. The launch of Volvo Connect is one example. It is a new customer portal that offers a single interface for digital services and functions. By bringing custom-ers’ business together, Volvo Connect takes truck uptime, efficiency and productivity to new heights. Other examples involve Volvo Financial Services’ predictive analytics and emerging external payments solu-tions such as WeChat in China.
ers. For Renault Trucks network performance to
our customenewran
new
vo ve g
1 3
Secure robust profit ability through leading R&D, quality, purchasing and manufacturing operations using Volvo Production System.
We focus on quality, agility and flexibility in production volumes and continuous intro-ductions instead of large launches to bet-ter balance and utilize our R&D resources. Our Common Architecture and Shared Technologies (CAST) approach and our Volvo Production System (VPS) secure a sustainable way of working with continuous improvements.
4
15
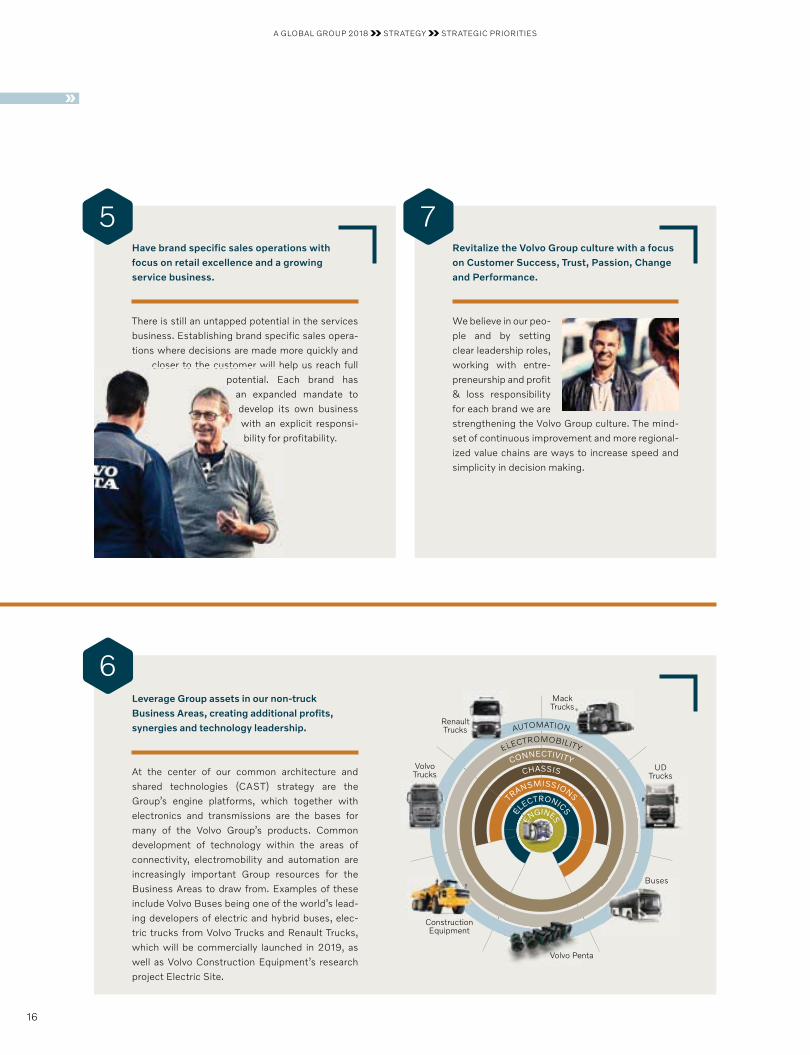
Have brand specific sales operations with focus on retail excellence and a growing service business.
There is still an untapped potential in the services business. Establishing brand specific sales opera-tions where decisions are made more quickly and
closer to the customer will help us reach full potential. Each brand has
an expanded mandate to develop its own business with an explicit responsi-bility for profitability.
Revitalize the Volvo Group culture with a focus on Customer Success, Trust, Passion, Change and Performance.
We believe in our peo-ple and by setting clear leadership roles, working with entre-preneurship and profit & loss responsibility for each brand we are strengthening the Volvo Group culture. The mind-set of continuous improve ment and more regional-ized value chains are ways to increase speed and simplicity in decision making.
Leverage Group assets in our non-truck Business Areas, creating additional profits, synergies and technology leadership.
At the center of our common architecture and shared technologies (CAST) strategy are the Group’s engine platforms, which together with electronics and transmissions are the bases for many of the Volvo Group’s products. Common development of technology within the areas of connectivity, electromobility and automation are increasingly important Group resources for the Business Areas to draw from. Examples of these include Volvo Buses being one of the world’s lead-ing developers of electric and hybrid buses, elec-tric trucks from Volvo Trucks and Renault Trucks, which will be commercially launched in 2019, as well as Volvo Construction Equipment’s research project Electric Site.
ELECTROMOBILITY
AUTOMATION
CONNECTIVITY
TRANSMISSIONS
ELECTRONICS
CHASSIS
ENGINESE
EEENGINES
EL
Renault Trucks
UD Trucks
MackTrucks
Volvo Penta
Construction Equipment
Volvo Trucks
Buses
A GLOBAL GROUP 2018 STRATEGY STRATEGIC PRIORITIES
6
75
closer to the customer will hpotential. E
an expanddevelop itwith an ebility for
16
A GLOBAL GROUP 2018 STRATEGY FINANCIAL TARGETS
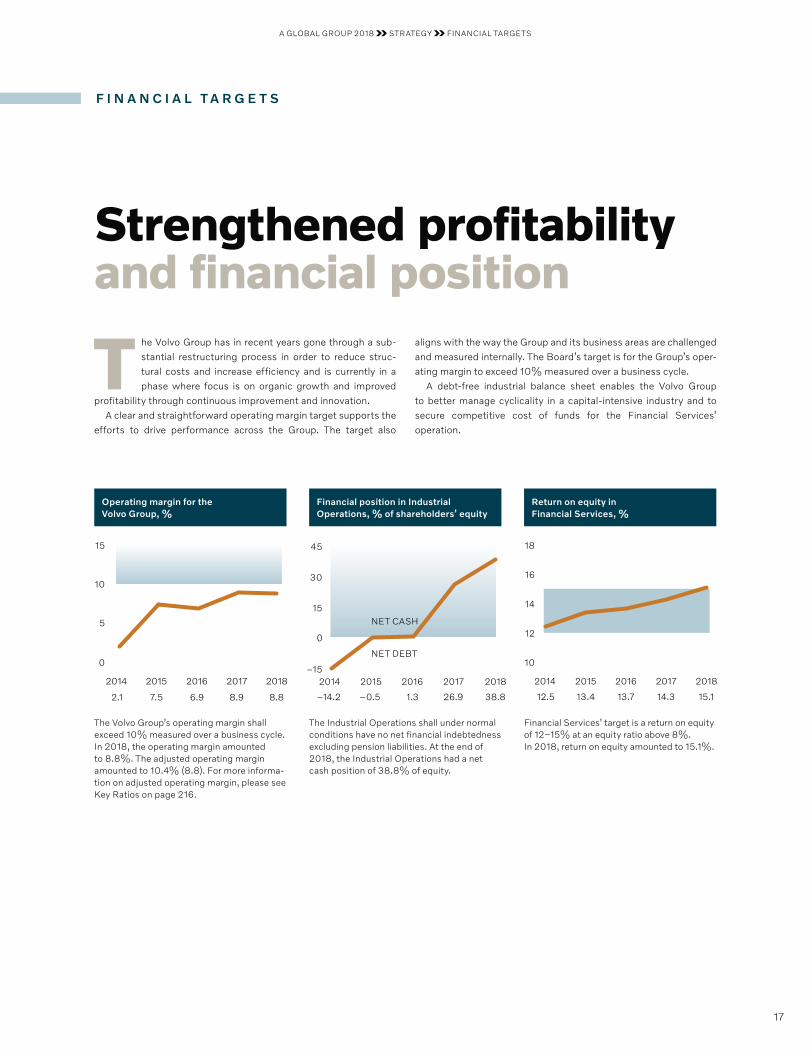
The Volvo Group’s operating margin shall exceed 10% measured over a business cycle. In 2018, the operating margin amounted to 8.8%. The adjusted operating margin amounted to 10.4% (8.8). For more informa-tion on adjusted operating margin, please see Key Ratios on page 216.
Operating margin for the Volvo Group, %
8.8
2018
0
5
15
10
7.5
2015
8.9
2017
6.9
2016
2.1
2014
Financial Services’ target is a return on equity of 12–15% at an equity ratio above 8%. In 2018, return on equity amounted to 15.1%.
Return on equity in Financial Services, %
15.1
2018
10
12
14
18
16
13.4
2015
14.3
2017
13.7
2016
12.5
2014
The Industrial Operations shall under normal conditions have no net financial indebtedness excluding pension liabilities. At the end of 2018, the Industrial Operations had a net cash position of 38.8% of equity.
Financial position in Industrial Operations, % of shareholders’ equity
38.8
2018
45
NET DEBT
NET CASH
–0.5
2015
26.9
2017
1.3
2016
–14.2
2014
0
–15
30
15
F I N A N C I A L T A R G E T S
Strengthened profitability and financial position
The Volvo Group has in recent years gone through a sub-stantial restructuring process in order to reduce struc-tural costs and increase efficiency and is currently in a phase where focus is on organic growth and improved
profita bility through continuous improvement and innovation.A clear and straightforward operating margin target supports the
efforts to drive performance across the Group. The target also
aligns with the way the Group and its business areas are challenged and measured internally. The Board’s target is for the Group’s oper-ating margin to exceed 10% measured over a business cycle.
A debt-free industrial balance sheet enables the Volvo Group to better manage cyclicality in a capital-intensive industry and to secure competitive cost of funds for the Financial Services’ operation.
17
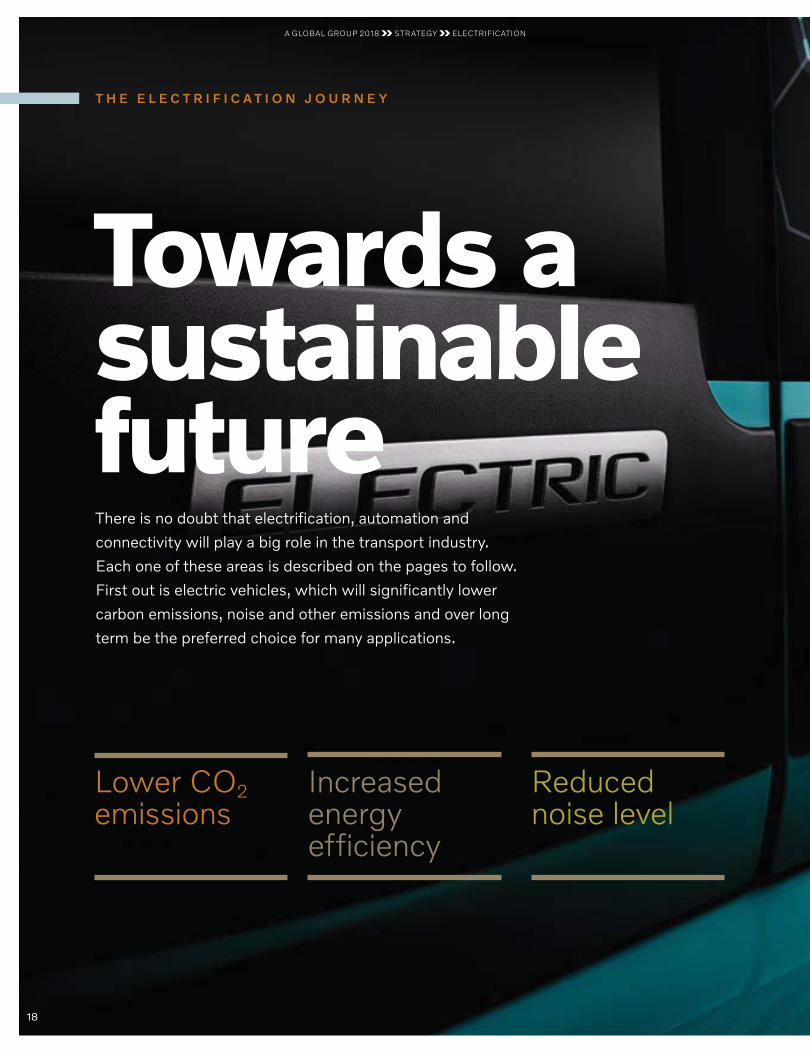
Towards a sustainable future
T H E E L E C T R I F I C A T I O N J O U R N E Y
Lower CO2 emissions
Increased energy efficiency
Reduced noise level
There is no doubt that electrification, automation and
connectivity will play a big role in the transport industry.
Each one of these areas is described on the pages to follow.
First out is electric vehicles, which will significantly lower
carbon emissions, noise and other emissions and over long
term be the preferred choice for many applications.
A GLOBAL GROUP 2018 STRATEGY ELECTRIFICATION
18
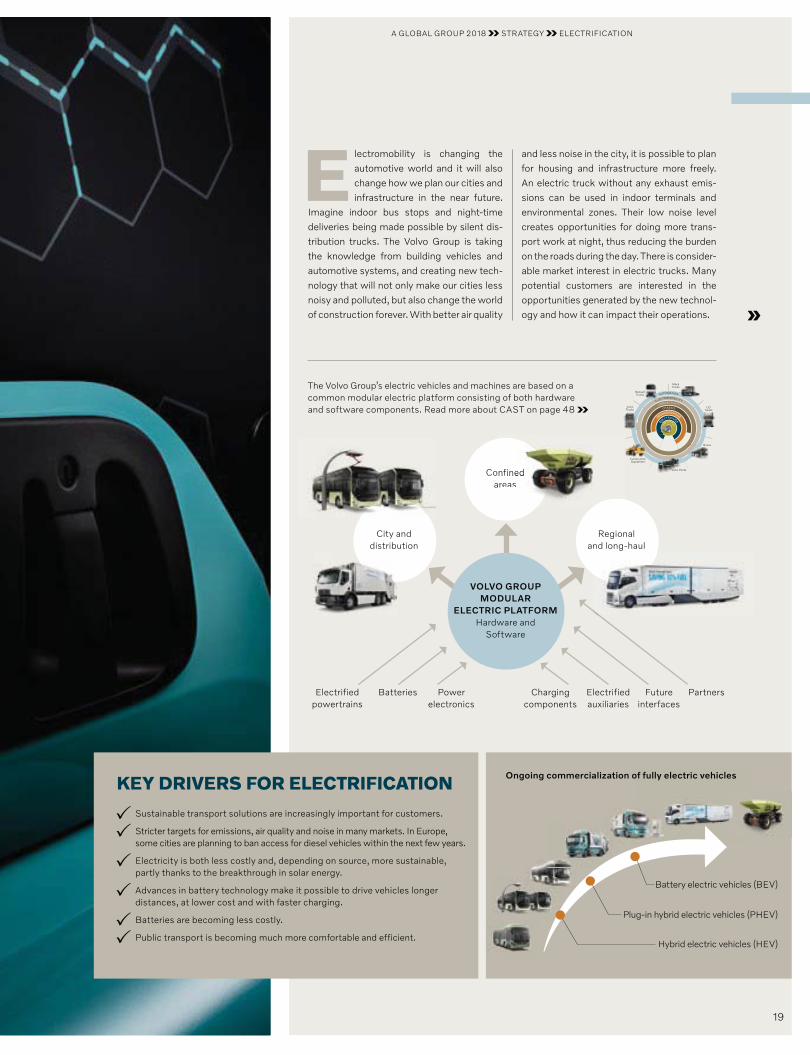
KEY DRIVERS FOR ELECTRIFICATION
Sustainable transport solutions are increasingly important for customers.
Stricter targets for emissions, air quality and noise in many markets. In Europe, some cities are planning to ban access for diesel vehicles within the next few years.
Electricity is both less costly and, depending on source, more sustain able, partly thanks to the breakthrough in solar energy.
Advances in battery technology make it possible to drive vehicles longer distances, at lower cost and with faster charging.
Batteries are becoming less costly.
Public transport is becoming much more comfortable and efficient.Hybrid electric vehicles (HEV)
Plug-in hybrid electric vehicles (PHEV)
Battery electric vehicles (BEV)
Ongoing commercialization of fully electric vehicles
Electromobility is changing the automotive world and it will also change how we plan our cities and infrastructure in the near future.
Imagine indoor bus stops and night-time deliveries being made possible by silent dis-tribution trucks. The Volvo Group is taking the knowledge from building vehicles and automotive systems, and creating new tech-nology that will not only make our cities less noisy and polluted, but also change the world of construction forever. With better air quality
and less noise in the city, it is possible to plan for housing and infrastructure more freely. An electric truck without any exhaust emis-sions can be used in indoor terminals and environmental zones. Their low noise level creates opportunities for doing more trans-port work at night, thus reducing the burden on the roads during the day. There is consider-able market interest in electric trucks. Many potential customers are interested in the opportunities generated by the new technol-ogy and how it can impact their operations.
The Volvo Group’s electric vehicles and machines are based on a common modular electric platform consisting of both hardware and software components. Read more about CAST on page 48
ELECTROMOBILITY
AUTOMATION
CONNECTIVITY
TRANSMISSIONS
ELECTRONICS
CHASSIS
ENGINESE
EEENGINES
EL
Renault Trucks
UD Trucks
MackTrucks
Volvo Penta
Construction Equipment
Volvo Trucks
Buses
City and distribution
Confined areas
Regional and long-haul
Electrified powertrains
Charging components
Batteries Electrified auxiliaries
Power electronics
Future interfaces
Partners
VOLVO GROUPMODULAR
ELECTRIC PLATFORMHardware and
Software
nfined reas
A GLOBAL GROUP 2018 STRATEGY ELECTRIFICATION
19
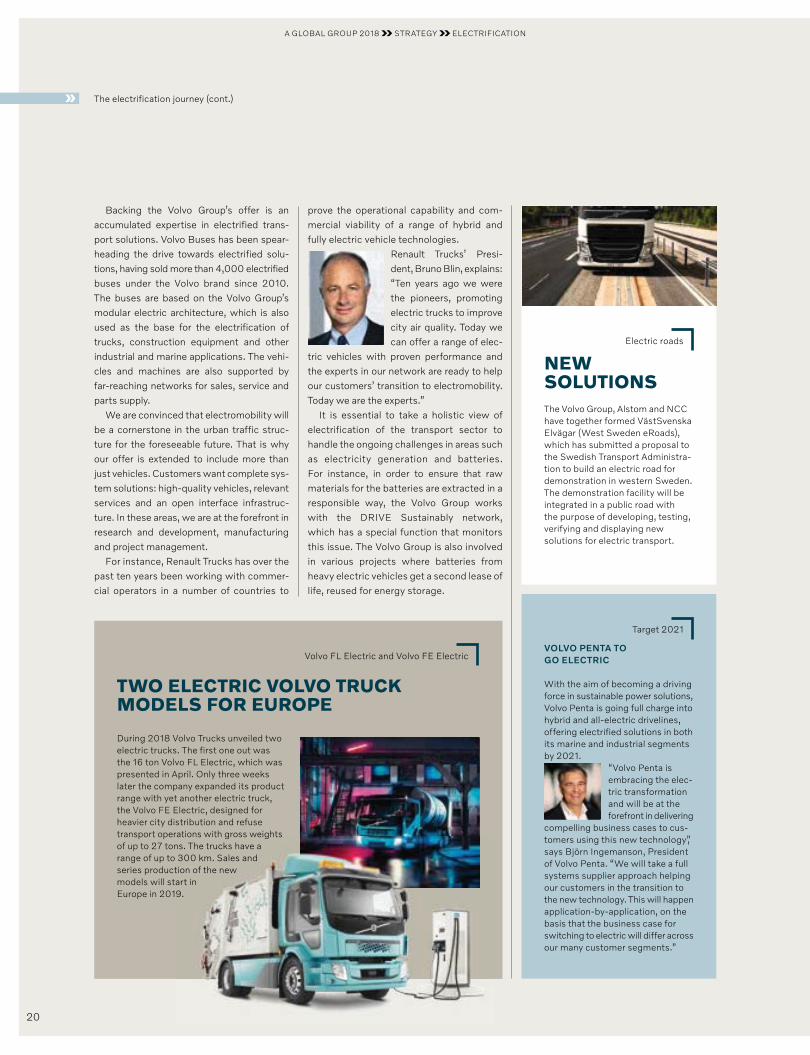
Volvo FL Electric and Volvo FE Electric
TWO ELECTRIC VOLVO TRUCK MODELS FOR EUROPE
During 2018 Volvo Trucks unveiled two electric trucks. The first one out was the 16 ton Volvo FL Electric, which was presented in April. Only three weeks later the company expanded its product range with yet another electric truck, the Volvo FE Electric, designed for heavier city distribution and refuse transport operations with gross weights of up to 27 tons. The trucks have a range of up to 300 km. Sales and series production of the new models will start in Europe in 2019.
Backing the Volvo Group’s offer is an accumulated expertise in electrified trans-port solutions. Volvo Buses has been spear-heading the drive towards electrified solu-tions, having sold more than 4,000 electrified buses under the Volvo brand since 2010. The buses are based on the Volvo Group’s modular electric architecture, which is also used as the base for the electrification of trucks, construction equipment and other industrial and marine applications. The vehi-cles and machines are also supported by far-reaching networks for sales, service and parts supply.
We are convinced that electromobility will be a cornerstone in the urban traffic struc-ture for the foreseeable future. That is why our offer is extended to include more than just vehicles. Customers want complete sys-tem solutions: high-quality vehicles, relevant services and an open interface infrastruc-ture. In these areas, we are at the forefront in research and development, manufacturing and project management.
For instance, Renault Trucks has over the past ten years been working with commer-cial operators in a number of countries to
prove the operational capability and com-mercial viability of a range of hybrid and fully electric vehicle technologies.
Renault Trucks’ Presi-dent, Bruno Blin, explains: “Ten years ago we were the pioneers, promoting electric trucks to improve city air quality. Today we can offer a range of elec-
tric vehicles with proven performance and the experts in our network are ready to help our customers’ transition to electromobility. Today we are the experts.”
It is essential to take a holistic view of electrification of the transport sector to handle the ongoing challenges in areas such as electricity generation and batteries. For instance, in order to ensure that raw materials for the batteries are extracted in a responsible way, the Volvo Group works with the DRIVE Sustainably network, which has a special function that monitors this issue. The Volvo Group is also involved in various projects where batteries from heavy electric vehicles get a second lease of life, reused for energy storage.
rations with gross weights ns. The trucks have a 300 km. Sales and tion of the new art in9.
Electric roads
NEW SOLUTIONSThe Volvo Group, Alstom and NCC have together formed VästSvenska Elvägar (West Sweden eRoads), which has submitted a proposal to the Swedish Transport Administra-tion to build an electric road for demonstration in western Sweden. The demonstration facility will be integrated in a public road with the purpose of developing, testing, verifying and displaying new solutions for electric transport.
Target 2021
VOLVO PENTA TO GO ELECTRIC
With the aim of becoming a driving force in sustainable power solutions, Volvo Penta is going full charge into hybrid and all-electric drivelines, offering electrified solutions in both its marine and industrial segments by 2021.
“Volvo Penta is embracing the elec-tric transformation and will be at the forefront in delivering
compel ling business cases to cus-tomers using this new technology ,” says Björn Ingemanson, President of Volvo Penta. “We will take a full sys tems supplier approach helping our customers in the transition to the new technology. This will happen appli cation-by-application, on the basis that the business case for switch ing to electric will differ across our many customer segments.”
The electrification journey (cont.)
A GLOBAL GROUP 2018 STRATEGY ELECTRIFICATION
20
Plans for commercialization
VOLVO TRUCKS TO INTRODUCE ALL-ELECTRIC TRUCKS IN NORTH AMERICA
In December Volvo Trucks announced that it plans to introduce all-electric Volvo VNR demonstrators in California in 2019, operating in distri-bution, regional-haul and drayage operations. Sales in North America is planned to begin in 2020.
“The Volvo VNR Electric leverages the versatility of the new Volvo VNR series with a proven fully-
electric powertrain. Cities prioritizing sustainable urban development can leverage electrified transport solu-tions to help improve air quality and reduce traffic noise. Cleaner, quieter, fully-electric commercial transport also creates opportunities for expanded morning and late-night operations, helping cut traffic conges tion during peak hours,” says Peter Voorhoeve, President of Volvo Trucks North America.
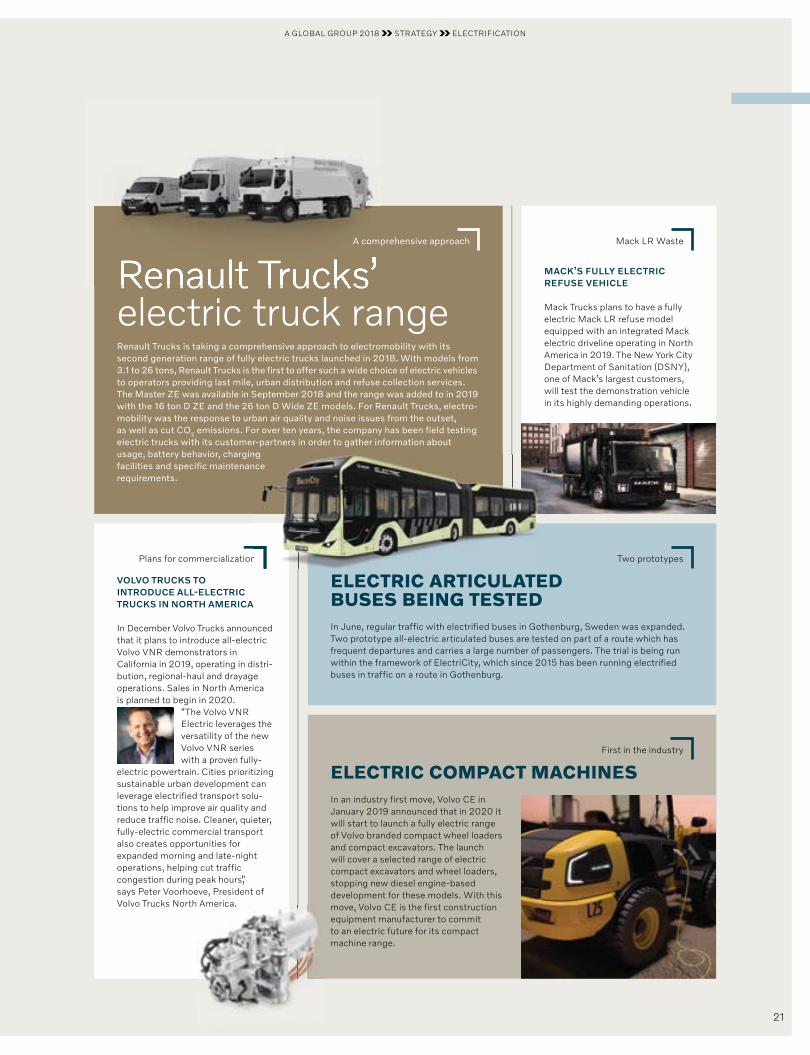
Mack LR Waste
MACK’S FULLY ELECTRIC REFUSE VEHICLE
Mack Trucks plans to have a fully electric Mack LR refuse model equipped with an integrated Mack electric driveline operating in North America in 2019. The New York City Department of Sanitation (DSNY), one of Mack’s largest customers, will test the demonstration vehicle in its highly demanding operations.
A comprehensive approach
Renault Trucks’ electric truck rangeRenault Trucks is taking a comprehensive approach to electromobility with its second generation range of fully electric trucks launched in 2018. With models from 3.1 to 26 tons, Renault Trucks is the first to offer such a wide choice of electric vehicles to operators providing last mile, urban distribution and refuse collection services. The Master ZE was available in September 2018 and the range was added to in 2019 with the 16 ton D ZE and the 26 ton D Wide ZE models. For Renault Trucks, electro-mobility was the response to urban air quality and noise issues from the outset, as well as cut CO2 emissions. For over ten years, the company has been field testing electric trucks with its customer-partners in order to gather information about usage, battery behavior, charging facilities and specific maintenance requirements.
First in the industry
ELECTRIC COMPACT MACHINES In an industry first move, Volvo CE in January 2019 announced that in 2020 it will start to launch a fully electric range of Volvo branded compact wheel loaders and compact excavators. The launch will cover a selected range of electric compact excavators and wheel loaders, stopping new diesel engine-based development for these models. With this move, Volvo CE is the first construction equipment manufacturer to commit to an electric future for its compact machine range.
Two prototypes
ELECTRIC ARTICULATED BUSES BEING TESTED In June, regular traffic with electrified buses in Gothenburg, Sweden was expanded. Two prototype all-electric articulated buses are tested on part of a route which has frequent departures and carries a large number of passengers. The trial is being run within the framework of ElectriCity, which since 2015 has been running electrified buses in traffic on a route in Gothenburg.
n
ng nce
A GLOBAL GROUP 2018 STRATEGY ELECTRIFICATION
A com
21
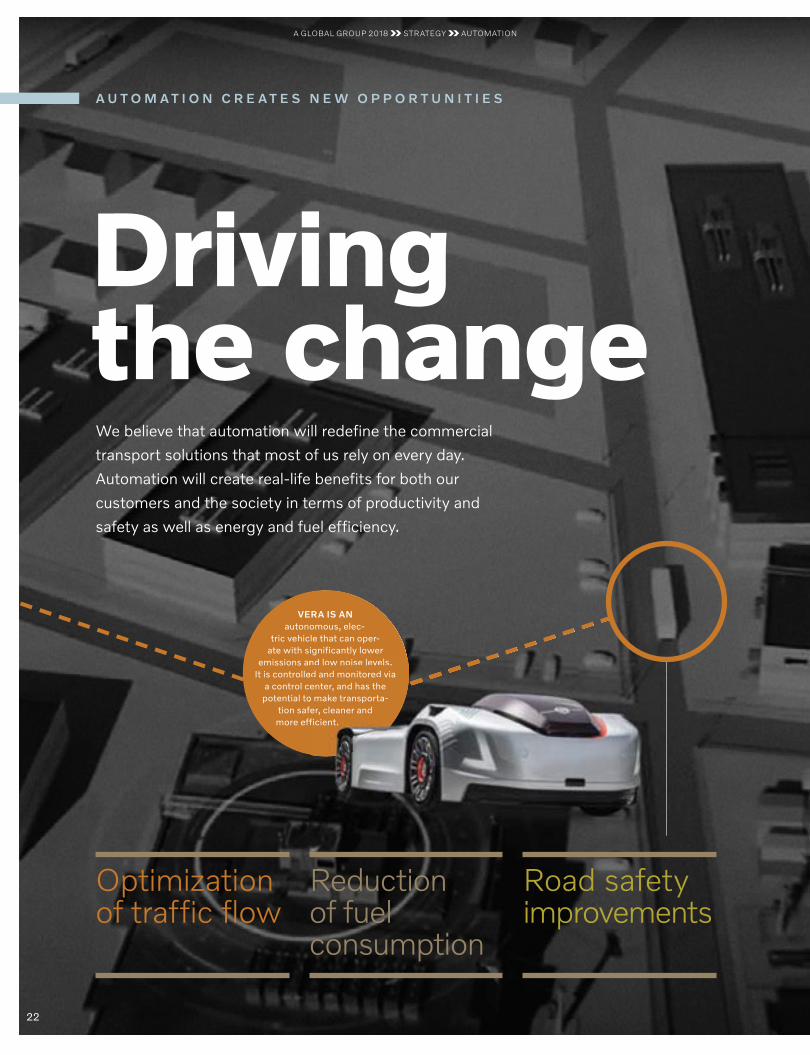
Driving the change
A U T O M A T I O N C R E A T E S N E W O P P O R T U N I T I E S
We believe that automation will redefine the commercial
transport solutions that most of us rely on every day.
Automation will create real-life benefits for both our
customers and the society in terms of productivity and
safety as well as energy and fuel efficiency.
VERA IS AN autonomous, elec-
tric vehicle that can oper-ate with significantly lower
emissions and low noise levels. It is controlled and monitored via
a control center, and has the potential to make transporta-
tion safer, cleaner and more efficient.
nd low noise levels.ed and monitored via enter, and has the
o make transporta-er, cleaner and ficient.
Reduction of fuel consumption
Road safety improvements
Optimization of traffic flow
A GLOBAL GROUP 2018 STRATEGY AUTOMATION
22
Since the ideal automation level is determined by its added value for customers and society, Volvo Group will introduce auto-
mated applications gradually over time.During 2018, the Volvo Group continued
its far-reaching drive to develop next- generation transport solutions. The latest examples include a concept system named Vera in which autonomous electric vehicles are coordinated to ensure as efficient, and safe goods transport as possible.
On September 12 the new goods trans-port solution was unveiled for the first time in connection with the Volvo Group’s Inno-vation Summit in Berlin. It consists of autonomous electric vehicles that are wire-lessly connected to a transport control center, which monitors parameters such as each vehicle’s location, load and battery charge. The data is used to ensure that the overall fleet logistics as well as goods and vehicle flow are as efficient as possible. The system is intended for use within areas characterized by short distances, large cargo volumes and high delivery precision, for example between logistic hubs.
“This is yet another result of the exciting and inno-vative solutions we are working on in the areas of automation, electromobil-ity and connectivity, says Lars Stenqvist, Chief
Technology Officer Volvo Group. ”It show-cases the Volvo Group’s immense range of expertise and our solid technological knowhow.”
“This puts us in a unique position for the develop- ment of next-generation transport solutions.
Scan the image to experi-ence the Vera system with autonomous, elec-tric vehicles.
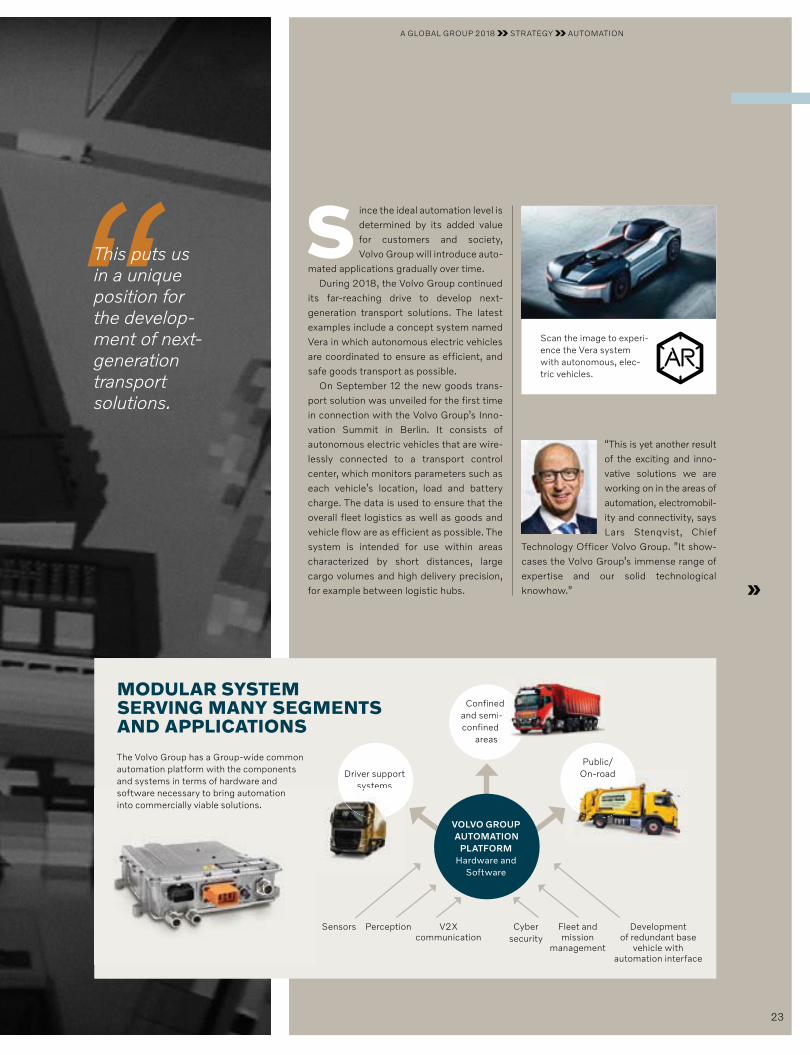
MODULAR SYSTEM SERVING MANY SEGMENTS AND APPLICATIONS
The Volvo Group has a Group-wide common automation platform with the components and systems in terms of hardware and software necessary to bring automation into commercially viable solutions.software necessary to bring automationinto commercially viable solutions.
Driver support systems
Confined and semi-confined
areas
Public/On-road
Sensors Cyber security
Perception Fleet and mission
management
V2X communication
Development of redundant base
vehicle with automation interface
VOLVO GROUP AUTOMATION
PLATFORMHardware and
Software
On-road
d -
systems
A GLOBAL GROUP 2018 STRATEGY AUTOMATION
23
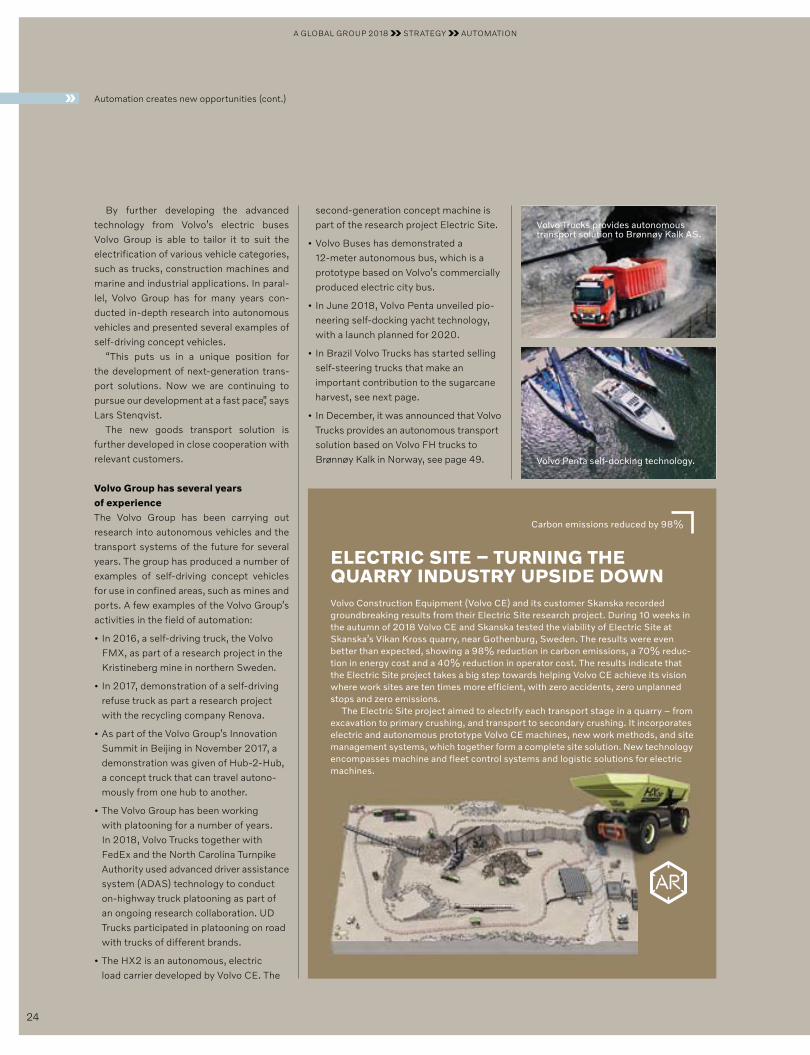
Carbon emissions reduced by 98%
ELECTRIC SITE – TURNING THE QUARRY INDUSTRY UPSIDE DOWNVolvo Construction Equipment (Volvo CE) and its customer Skanska recorded groundbreaking results from their Electric Site research project. During 10 weeks in the autumn of 2018 Volvo CE and Skanska tested the viability of Electric Site at Skanska’s Vikan Kross quarry, near Gothenburg, Sweden. The results were even better than expected, showing a 98% reduction in carbon emissions, a 70% reduc-tion in energy cost and a 40% reduction in operator cost. The results indicate that the Electric Site project takes a big step towards helping Volvo CE achieve its vision where work sites are ten times more efficient, with zero accidents, zero unplanned stops and zero emissions.
The Electric Site project aimed to electrify each transport stage in a quarry – from excavation to primary crushing, and transport to secondary crushing. It incorporates electric and autonomous prototype Volvo CE machines, new work methods, and site management systems, which together form a complete site solution. New technology encompasses machine and fleet control systems and logistic solutions for electric machines.
By further developing the advanced technology from Volvo’s electric buses Volvo Group is able to tailor it to suit the electrification of various vehicle categories, such as trucks, construction machines and marine and industrial applications. In paral-lel, Volvo Group has for many years con-ducted in-depth research into autonomous vehicles and presented several examples of self-driving concept vehicles.
“This puts us in a unique position for the development of next-generation trans-port solutions. Now we are continuing to pursue our development at a fast pace,” says Lars Stenqvist.
The new goods transport solution is further developed in close cooperation with relevant customers.
Volvo Group has several years of experienceThe Volvo Group has been carrying out research into autonomous vehicles and the transport systems of the future for several years. The group has produced a number of examples of self-driving concept vehicles for use in confined areas, such as mines and ports. A few examples of the Volvo Group’s activities in the field of automation:
• In 2016, a self-driving truck, the Volvo FMX, as part of a research project in the Kristineberg mine in northern Sweden.
• In 2017, demonstration of a self-driving refuse truck as part a research project with the recycling company Renova.
• As part of the Volvo Group’s Innovation Summit in Beijing in November 2017, a demonstration was given of Hub-2-Hub, a concept truck that can travel autono-mously from one hub to another.
• The Volvo Group has been working with platooning for a number of years. In 2018, Volvo Trucks together with FedEx and the North Carolina Turnpike Authority used advanced driver assistance system (ADAS) technology to conduct on-highway truck platooning as part of an ongoing research collaboration. UD Trucks participated in platooning on road with trucks of different brands.
• The HX2 is an autonomous, electric load carrier developed by Volvo CE. The
second-generation concept machine is part of the research project Electric Site.
• Volvo Buses has demonstrated a 12-meter autonomous bus, which is a prototype based on Volvo’s commercially produced electric city bus.
• In June 2018, Volvo Penta unveiled pio-neering self-docking yacht technology, with a launch planned for 2020.
• In Brazil Volvo Trucks has started selling self-steering trucks that make an important contribution to the sugarcane harvest, see next page.
• In December, it was announced that Volvo Trucks provides an autonomous transport solution based on Volvo FH trucks to Brønnøy Kalk in Norway, see page 49.
Automation creates new opportunities (cont.)
Volvo Penta self-docking technology.
Volvo Trucks provides autonomous transport solution to Brønnøy Kalk AS.
A GLOBAL GROUP 2018 STRATEGY AUTOMATION
24
INCREASING THE HARVEST Self-steering Volvo Truck
Volvo Trucks has developed a self-steering truck that can become a significant productiv-ity booster for Brazilian sugar-cane growers. The truck, which is used to transport newly har-vested sugarcane, is steered with great precision through the fields in order to avoid damag-
ing the young plants that will form the following year’s crop. With-out automated trucks about 4% of the crop is lost as young plants are run over and the soil is compacted by moving vehicles. This can translate into tens of thousands of US dollars in lost revenue per truck per season. Sugarcane is brought in from the fields using
harvesters and manually controlled trucks, which drive alongside each other at a low speed. When a truck is fully loaded and drives off to empty its load, the next one moves up next to the harvester and the procedure is repeated. The big challenge for the truck driver is to match the speed of the harvester and at the same time con-centrate fully on driving in its tracks, so as not to trample the nearby plants that will become the following year’s crop. Volvo Trucks has solved the problem with a driver assistance system that auto-mates steering. It ensures that the truck always maintains exactly the right course when it drives to, alongside and away from the harvester, so that the plants are not damaged by trampling. In September, Volvo Trucks sold seven automated trucks to sug-ar-and-ethanol group Usaçucar, the first commercial delivery of such a product.
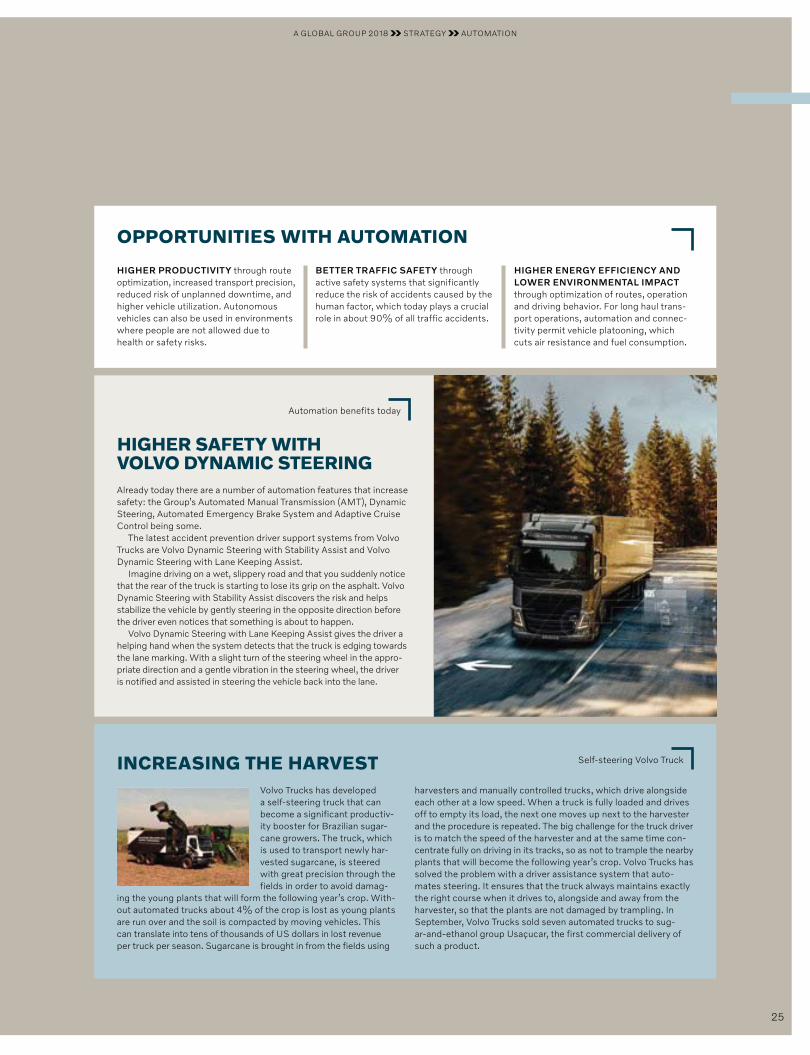
OPPORTUNITIES WITH AUTOMATION
HIGHER PRODUCTIVITY through route optimization, increased transport precision, reduced risk of unplanned downtime, and higher vehicle utilization. Autonomous vehicles can also be used in environments where people are not allowed due to health or safety risks.
BETTER TRAFFIC SAFETY through active safety systems that significantly reduce the risk of accidents caused by the human factor, which today plays a crucial role in about 90% of all traffic accidents.
HIGHER ENERGY EFFICIENCY AND LOWER ENVIRONMENTAL IMPACT through optimization of routes, operation and driving behavior. For long haul trans-port operations, automation and connec-tivity permit vehicle platooning, which cuts air resistance and fuel consumption.
Automation benefits today
HIGHER SAFETY WITH VOLVO DYNAMIC STEERINGAlready today there are a number of automation features that increase safety: the Group’s Automated Manual Transmission (AMT), Dynamic Steering, Automated Emergency Brake System and Adaptive Cruise Control being some.
The latest accident prevention driver support systems from Volvo Trucks are Volvo Dynamic Steering with Stability Assist and Volvo Dynamic Steering with Lane Keeping Assist.
Imagine driving on a wet, slippery road and that you suddenly notice that the rear of the truck is starting to lose its grip on the asphalt. Volvo Dynamic Steering with Stability Assist discovers the risk and helps stabilize the vehicle by gently steering in the opposite direction before the driver even notices that something is about to happen.
Volvo Dynamic Steering with Lane Keeping Assist gives the driver a helping hand when the system detects that the truck is edging towards the lane marking. With a slight turn of the steering wheel in the appro-priate direction and a gentle vibration in the steering wheel, the driver is notified and assisted in steering the vehicle back into the lane.
A GLOBAL GROUP 2018 STRATEGY AUTOMATION
25
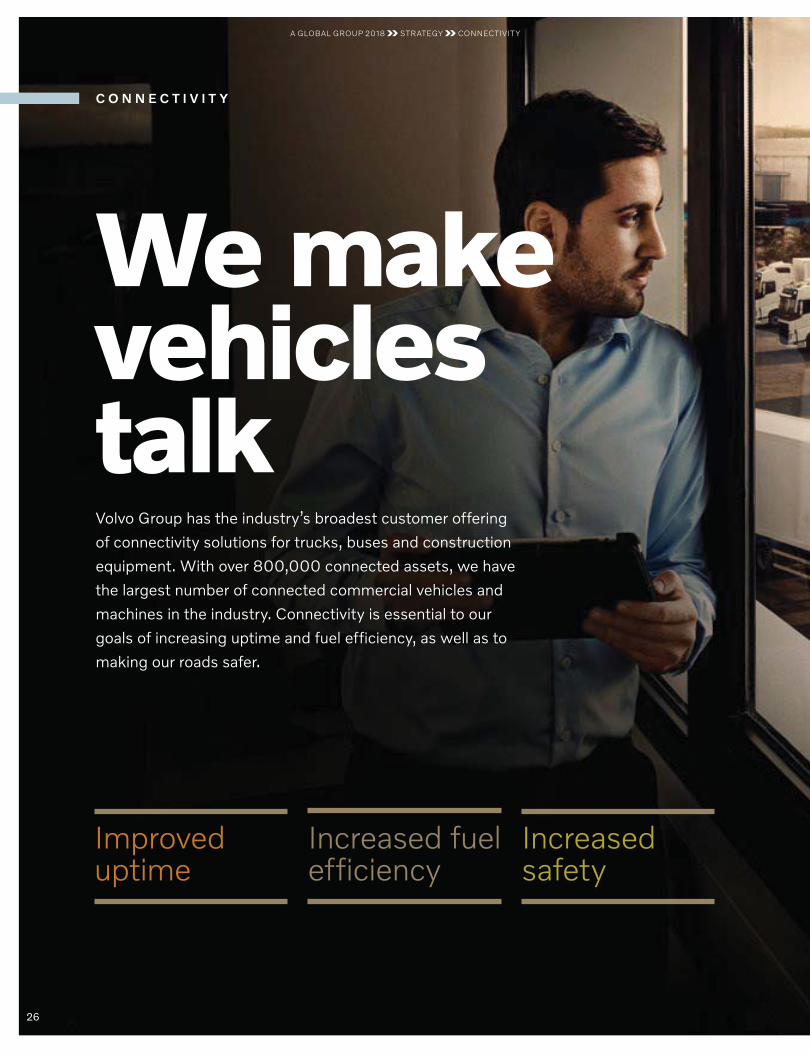
We make vehicles talk
C O N N E C T I V I T Y
Volvo Group has the industry’s broadest customer offering
of connectivity solutions for trucks, buses and construction
equipment. With over 800,000 connected assets, we have
the largest number of connected commercial vehicles and
machines in the industry. Connectivity is essential to our
goals of increasing uptime and fuel efficiency, as well as to
making our roads safer.
Improved uptime
Increased fuel efficiency
Increased safety
A GLOBAL GROUP 2018 STRATEGY CONNECTIVITY
26
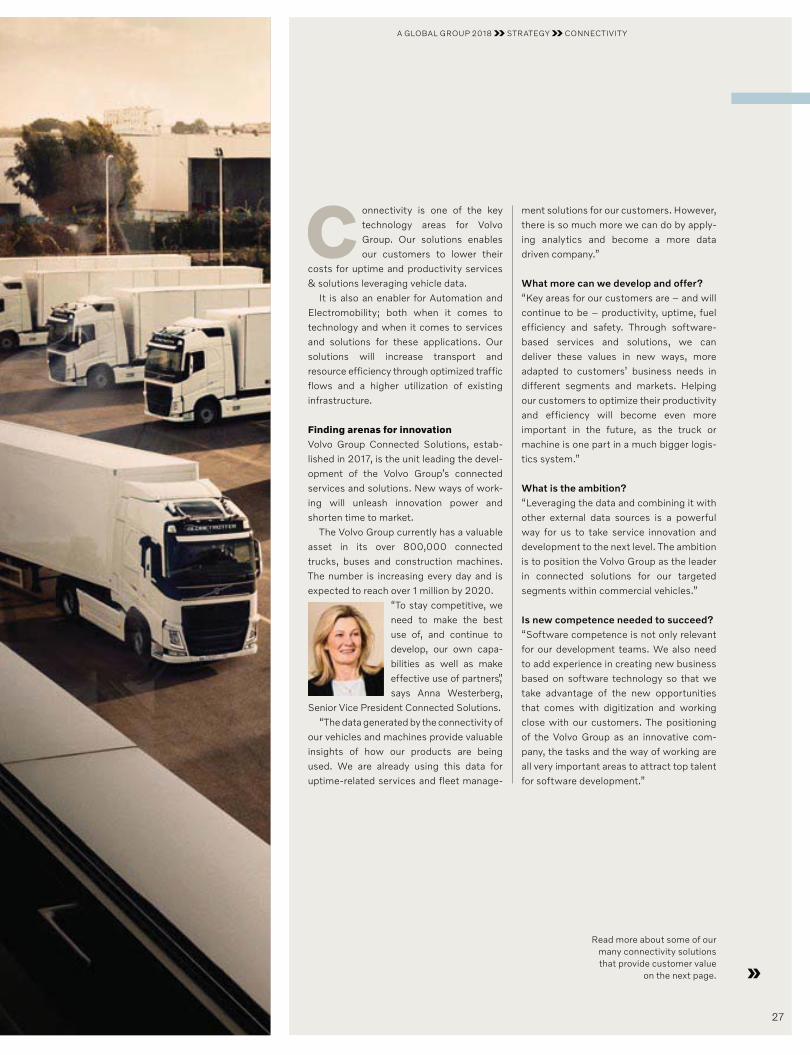
Connectivity is one of the key technology areas for Volvo Group. Our solutions enables our customers to lower their
costs for uptime and productivity services & solutions leveraging vehicle data.
It is also an enabler for Automation and Electromobility; both when it comes to technology and when it comes to services and solutions for these applications. Our solutions will increase transport and resource efficiency through optimized traffic flows and a higher utilization of existing infrastructure.
Finding arenas for innovationVolvo Group Connected Solutions, estab-lished in 2017, is the unit leading the devel-opment of the Volvo Group’s connected services and solutions. New ways of work-ing will unleash innovation power and shorten time to market.
The Volvo Group currently has a valuable asset in its over 800,000 connected trucks, buses and construction machines. The number is increasing every day and is expected to reach over 1 million by 2020.
“To stay competitive, we need to make the best use of, and continue to develop, our own capa-bilities as well as make effective use of partners,” says Anna Westerberg,
Senior Vice President Connected Solutions.“The data generated by the connectivity of
our vehicles and machines provide valuable insights of how our products are being used. We are already using this data for uptime- related services and fleet manage-
ment solutions for our customers. However, there is so much more we can do by apply-ing analytics and become a more data driven company.”
What more can we develop and offer?“Key areas for our customers are – and will continue to be – productivity, uptime, fuel efficiency and safety. Through software- based services and solutions, we can deliver these values in new ways, more adapted to customers’ business needs in different segments and markets. Helping our customers to optimize their productivity and efficiency will become even more important in the future, as the truck or machine is one part in a much bigger logis-tics system.”
What is the ambition?“Leveraging the data and combining it with other external data sources is a powerful way for us to take service innovation and development to the next level. The ambition is to position the Volvo Group as the leader in connected solutions for our targeted segments within commercial vehicles.”
Is new competence needed to succeed?“Software competence is not only relevant for our development teams. We also need to add experience in creating new business based on software technology so that we take advantage of the new opportunities that comes with digitization and working close with our customers. The positioning of the Volvo Group as an innovative com-pany, the tasks and the way of working are all very important areas to attract top talent for software development.”
Read more about some of our many connectivity solutions that provide customer value
on the next page.
A GLOBAL GROUP 2018 STRATEGY CONNECTIVITY
27
Connectivity (Cont.)
Real-time monitoring
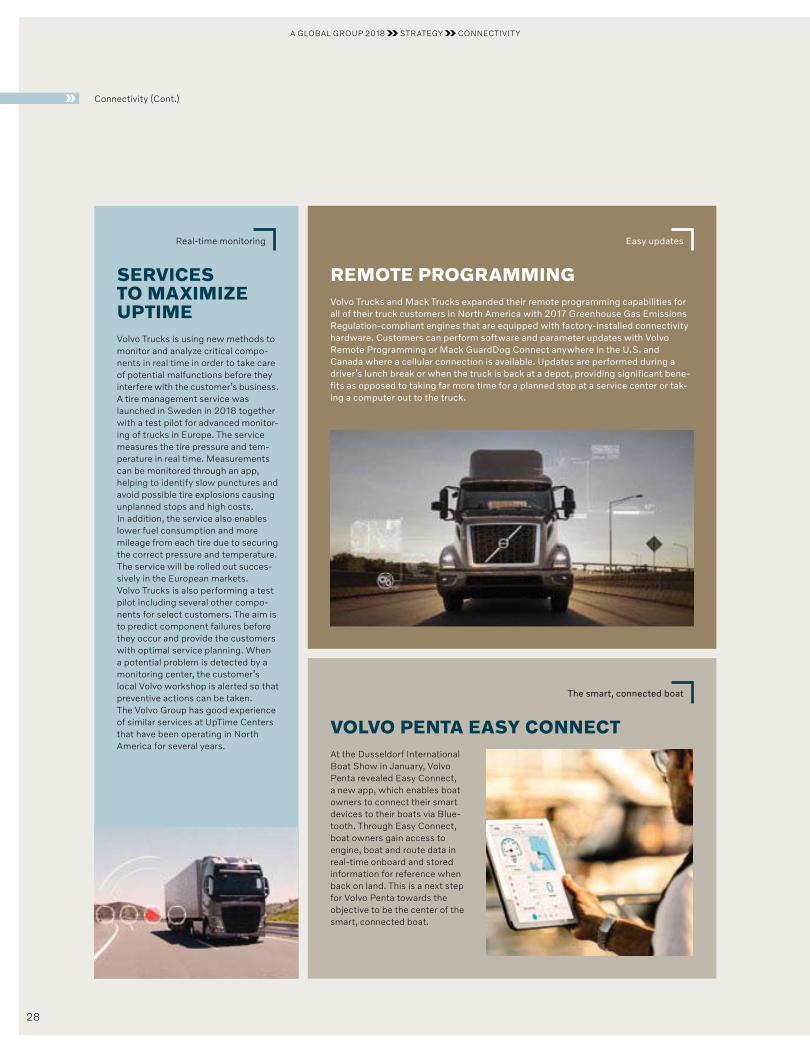
SERVICES TO MAXIMIZE UPTIMEVolvo Trucks is using new methods to monitor and analyze critical compo-nents in real time in order to take care of potential malfunctions before they interfere with the customer’s business. A tire management service was launched in Sweden in 2018 together with a test pilot for advanced monitor-ing of trucks in Europe. The service measures the tire pressure and tem-perature in real time. Measurements can be monitored through an app, helping to identify slow punctures and avoid possible tire explosions causing unplanned stops and high costs. In addition, the service also enables lower fuel consumption and more mileage from each tire due to securing the correct pressure and temperature. The service will be rolled out succes-sively in the European markets.Volvo Trucks is also performing a test pilot including several other compo-nents for select customers. The aim is to predict component failures before they occur and provide the customers with optimal service planning. When a potential problem is detected by a monitoring center, the customer’s local Volvo workshop is alerted so that preventive actions can be taken. The Volvo Group has good experience of similar services at UpTime Centers that have been operating in North America for several years.
Easy updates
REMOTE PROGRAMMINGVolvo Trucks and Mack Trucks expanded their remote programming capabilities for all of their truck customers in North America with 2017 Greenhouse Gas Emissions Regulation-compliant engines that are equipped with factory-installed connectivity hardware. Customers can perform software and parameter updates with Volvo Remote Programming or Mack GuardDog Connect anywhere in the U.S. and Canada where a cellular connection is available. Updates are performed during a driver’s lunch break or when the truck is back at a depot, providing significant bene-fits as opposed to taking far more time for a planned stop at a service center or tak-ing a computer out to the truck.
The smart, connected boat
VOLVO PENTA EASY CONNECTAt the Dusseldorf International Boat Show in January, Volvo Penta revealed Easy Connect, a new app, which enables boat owners to connect their smart devices to their boats via Blue-tooth. Through Easy Connect, boat owners gain access to engine, boat and route data in real-time onboard and stored information for reference when back on land. This is a next step for Volvo Penta towards the objective to be the center of the smart, connected boat.
A GLOBAL GROUP 2018 STRATEGY CONNECTIVITY
28

Volvo Group Venture Capital
WIRELESS CHARGINGIn January 2019, the Volvo Group invested in Momentum Dynamics Inc, a Philadelphia-based company developing and commercializing high power inductive charging for the auto-motive and transportation industries, especially suitable for commercial electric, autonomous and connected vehicles. Wireless electric charging allows any type of vehicle to auto-matically and without supervision connect to the electrical power grid without the use of wires or cables. Without the need for a driver to plug in their vehicle to a charging station, automatic and bi-directional “electric fueling” may occur frequently and opportunistically, resulting in efficient use of battery capacity, longer driving ranges and improved uptime. Momentum Dynamics is conducting pilots in Europe and North America with both fleets and vehicle manufacturers of cars, buses, trucks and trains.
Supporting customers’ business
VOLVO CONNECTDigitization is changing the way people live and work, and the transport industry is no exception. Truck owners and transport companies are increasingly using telematics and digital services to increase the productivity and efficiency of their businesses.
With the launch of Volvo Connect, a host of digital and con-nected services is combined into one user-friendly portal. Combining connectivity and data analytics is opening up for new opportunities to support our customers. However, this also means an increase in different systems and interfaces. Volvo Connect enables customers to access the important services and information needed to run and develop their daily business, in one place. Besides fleet management and maintenance planning, many more aspects of the operation will be supported, including help with administration and legal compliance.
Volvo Connect will also contain a marketplace where additional services can be subscribed to and activated. Users can adapt the interface so that the information and services most important to them are quickly and easily accessible.
As new functions and information are made available and new digital services developed, both by Volvo Trucks, industry partners and third-party developers, Volvo Connect will enable customers to access and use the services to their full potential.
However, this d interfaces.
he importantvelop theiragement andthe operationtration and
ce ooant
both artyers
A GLOBAL GROUP 2018 STRATEGY CONNECTIVITY
29
Embedding sustainability in business
O U R R O L E I N S O C I E T Y
Responsible business is an enabler for the
Volvo Group’s mission of driving prosperity.
Through our commitment to develop
sustainable transport solutions, we contribute
to the progress of a more resilient society.
By addressing responsible and sustainable
business behavior throughout our value
chain, we mitigate risk, find opportunities
and create long term value and trust.
VOLVO GROUP
VALUES
CODE OF CONDUCT
ASPIRATIONS
VISION
MISSION
Corporate Responsibility and Sustainability are embedded in our mission and visions and integrated in the organization, both on Volvo Group level and at business entities.
30
A GLOBAL GROUP 2018 BUSINESS MODEL OUR ROLE IN SOCIETY
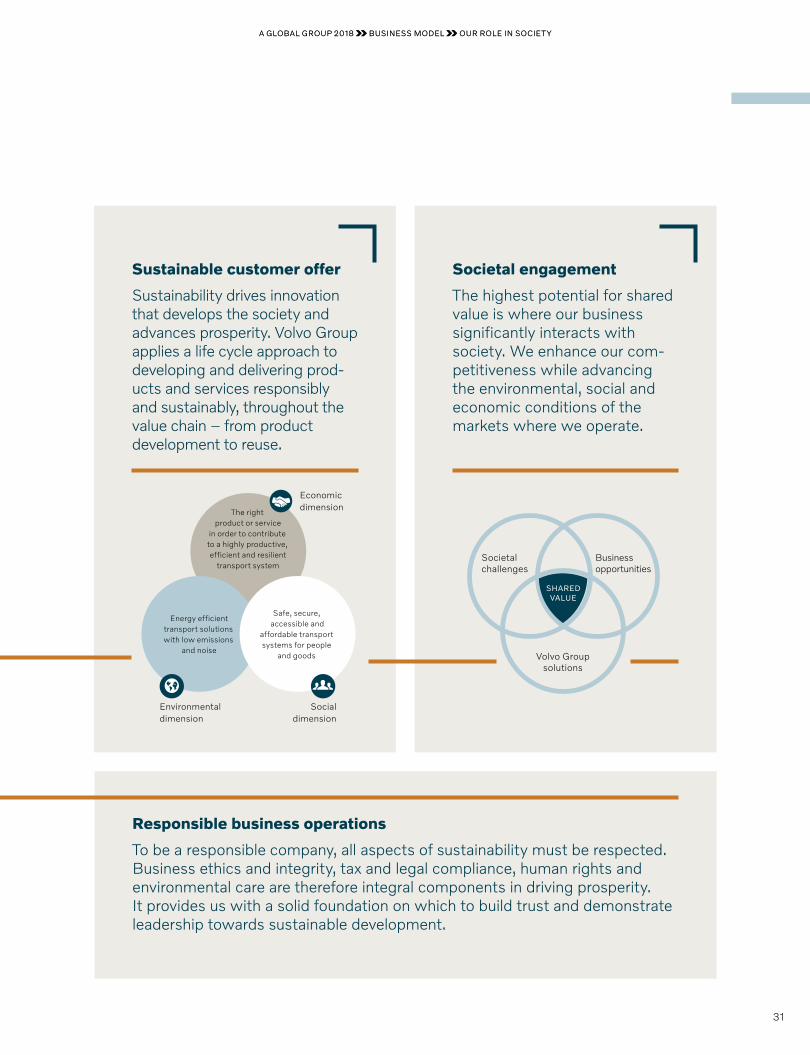
Responsible business operations
To be a responsible company, all aspects of sustainability must be respected. Business ethics and integrity, tax and legal compliance, human rights and environmental care are therefore integral components in driving prosperity. It provides us with a solid foundation on which to build trust and demonstrate leadership towards sustainable development.
Sustainable customer offer
Sustainability drives innovation that develops the society and advances prosperity. Volvo Group applies a life cycle approach to developing and delivering prod-ucts and services responsibly and sustainably, throughout the value chain – from product development to reuse.
Societal engagement
The highest potential for shared value is where our business signifi cantly interacts with society. We enhance our com-petitiveness while advancing the environmental, social and economic conditions of the markets where we operate.
The right product or service
in order to contribute to a highly productive, efficient and resilient
transport system
Energy efficient transport solutions with low emissions
and noise
Safe, secure, accessible and
affordable transport systems for people
and goods
Environmental dimension
Social dimension
Economic dimension
Societalchallenges
SHAREDVALUE
Volvo Group solutions
Business opportunities
A GLOBAL GROUP 2018 BUSINESS MODEL OUR ROLE IN SOCIETYA GLOBAL GROUP 2018 BUSINESS MODEL OUR ROLE IN SOCIETY
31
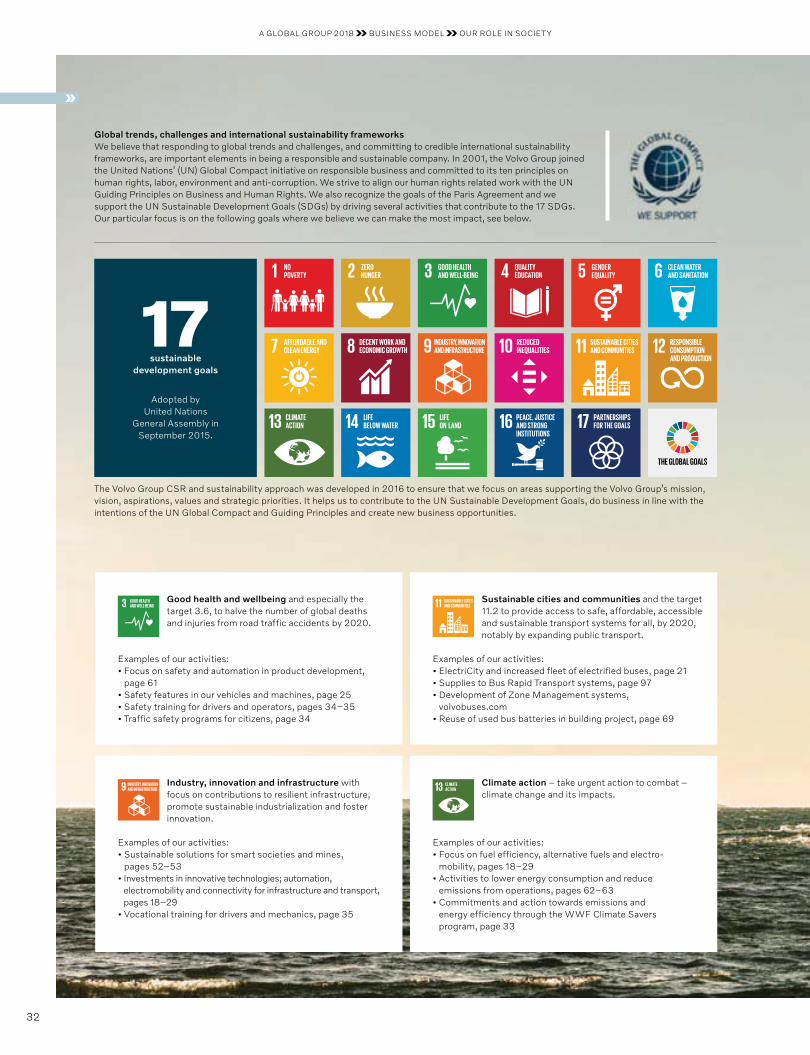
17 sust ainable
development goals
Adopted by United Nations
General Assembly in September 2015.
The Volvo Group CSR and sustainability approach was developed in 2016 to ensure that we focus on areas supporting the Volvo Group’s mission, vision, aspirations, values and strategic priorities. It helps us to contribute to the UN Sustainable Development Goals, do business in line with the intentions of the UN Global Compact and Guiding Principles and create new business opportunities.
Global trends, challenges and international sustainability frameworksWe believe that responding to global trends and challenges, and committing to credible international sustainability frameworks, are important elements in being a responsible and sustainable company. In 2001, the Volvo Group joined the United Nations’ (UN) Global Compact initiative on responsible business and committed to its ten principles on human rights, labor, environment and anti-corruption. We strive to align our human rights related work with the UN Guiding Principles on Business and Human Rights. We also recognize the goals of the Paris Agreement and we support the UN Sustainable Development Goals (SDGs) by driving several activities that contribute to the 17 SDGs. Our particular focus is on the following goals where we believe we can make the most impact, see below.
Industry, innovation and infrastructure with focus on contributions to resilient infrastructure, promote sustainable industrialization and foster innovation.
Examples of our activities:• Sustainable solutions for smart societies and mines,
pages 52–53• Investments in innovative technologies; automation,
electro mobility and connectivity for infrastructure and transport, pages 18–29
• Vocational training for drivers and mechanics, page 35
Good health and wellbeing and especially the target 3.6, to halve the number of global deaths and injuries from road traffic accidents by 2020.
Examples of our activities:• Focus on safety and automation in product development,
page 61• Safety features in our vehicles and machines, page 25• Safety training for drivers and operators, pages 34–35• Traffic safety programs for citizens, page 34
Climate action – take urgent action to combat –climate change and its impacts.
Examples of our activities:• Focus on fuel efficiency, alternative fuels and electro-
mobility, pages 18–29• Activities to lower energy consumption and reduce
emissions from operations, pages 62–63• Commitments and action towards emissions and
energy efficiency through the WWF Climate Savers program, page 33
Sustainable cities and communities and the target 11.2 to provide access to safe, affordable, accessible and sustainable transport systems for all, by 2020, notably by expanding public transport.
Examples of our activities:• ElectriCity and increased fleet of electrified buses, page 21• Supplies to Bus Rapid Transport systems, page 97• Development of Zone Management systems,
volvobuses.com• Reuse of used bus batteries in building project, page 69
A GLOBAL GROUP 2018 BUSINESS MODEL OUR ROLE IN SOCIETY
32
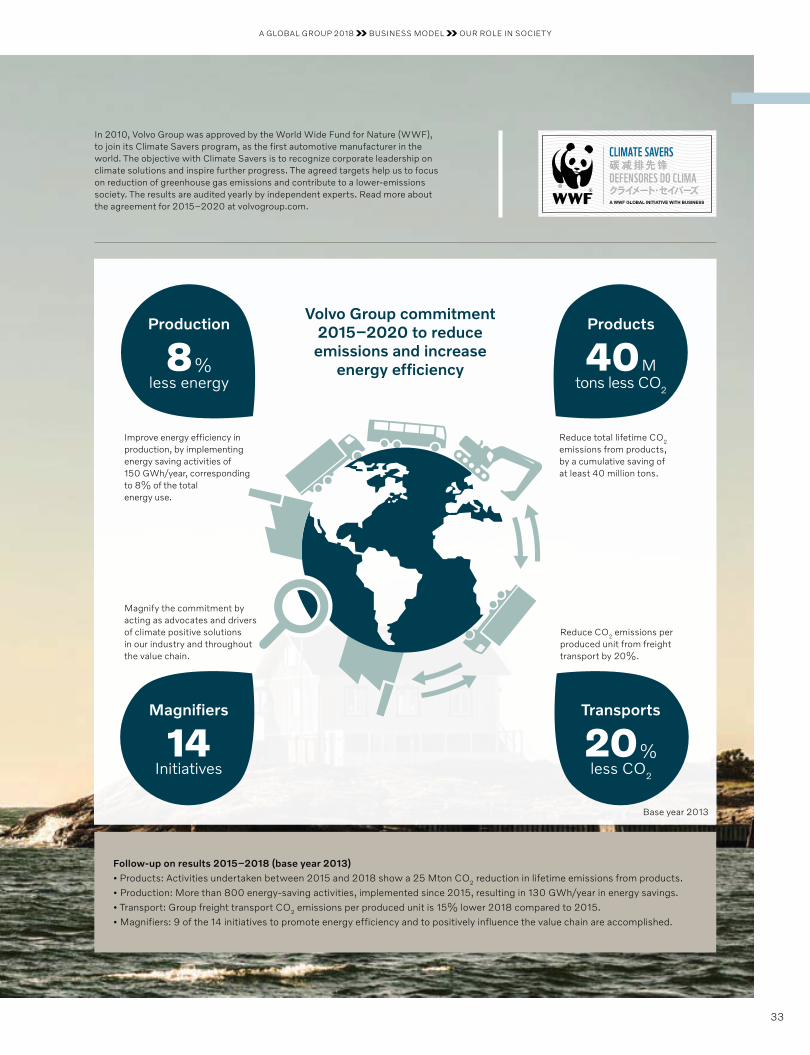
Follow-up on results 2015–2018 (base year 2013)• Products: Activities undertaken between 2015 and 2018 show a 25 Mton CO2 reduction in lifetime emissions from products.• Production: More than 800 energy-saving activities, implemented since 2015, resulting in 130 GWh/year in energy savings.• Transport: Group freight transport CO2 emissions per produced unit is 15% lower 2018 compared to 2015. • Magnifiers: 9 of the 14 initiatives to promote energy efficiency and to positively influence the value chain are accomplished.
In 2010, Volvo Group was approved by the World Wide Fund for Nature (WWF), to join its Climate Savers program, as the first automotive manufacturer in the world. The objective with Climate Savers is to recognize corporate leadership on climate solutions and inspire further progress. The agreed targets help us to focus on reduction of greenhouse gas emissions and contribute to a lower-emissions society. The results are audited yearly by independent experts. Read more about the agreement for 2015–2020 at volvogroup.com.
Magnifiers
14 Initiatives
Transports
20 %less CO2
Products
40 M tons less CO2
Production
8 %less energy
Improve energy efficiency in production, by implementing energy saving activities of 150 GWh/year, corresponding to 8% of the total energy use.
Reduce total lifetime CO2 emissions from products, by a cumulative saving of at least 40 million tons.
Magnify the commitment by acting as advocates and drivers of climate positive solutions in our industry and throughout the value chain.
Reduce CO2 emissions per produced unit from freight transport by 20%.
Base year 2013
Volvo Group commitment 2015–2020 to reduce emissions and increase
energy efficiency
A GLOBAL GROUP 2018 BUSINESS MODEL OUR ROLE IN SOCIETY
33
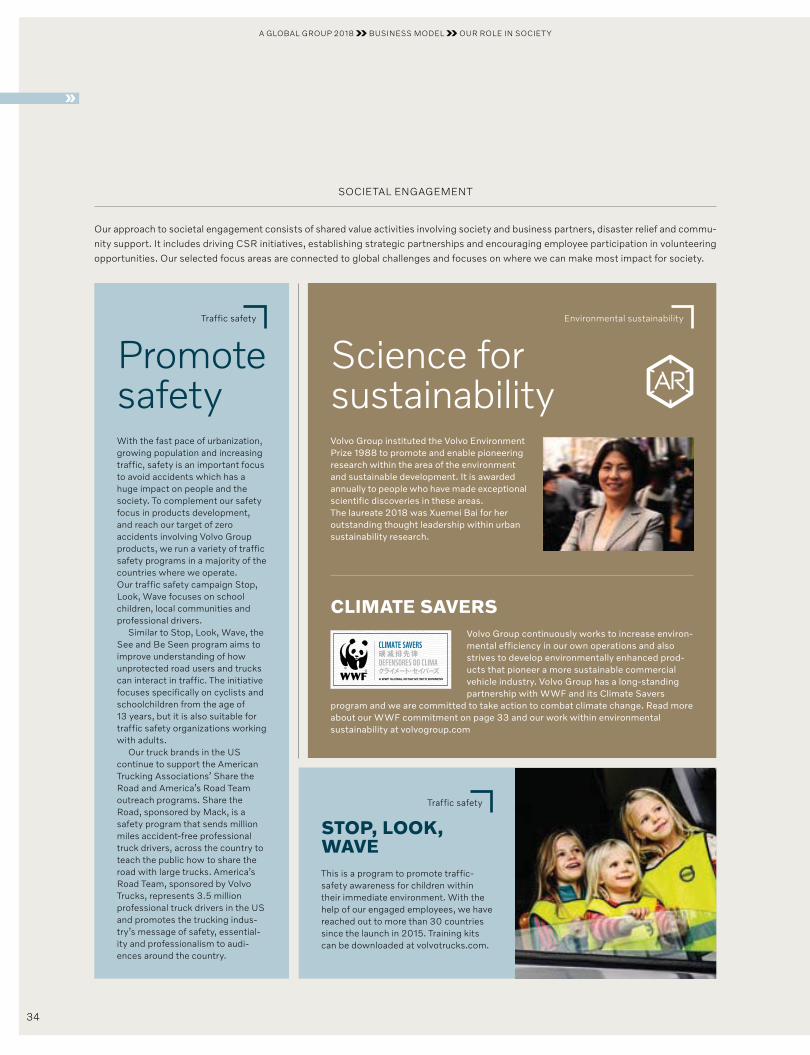
Our approach to societal engagement consists of shared value activities involving society and business partners, disaster relief and commu-nity support. It includes driving CSR initiatives, establishing strategic partnerships and encouraging em ployee participation in volunteering opportunities. Our selected focus areas are connected to global challenges and focuses on where we can make most impact for society.
SOCIETAL ENGAGEMENT
Traffic safety
STOP, LOOK, WAVEThis is a program to promote traffic- safety awareness for children within their immediate environment. With the help of our engaged employees, we have reached out to more than 30 countries since the launch in 2015. Training kits can be downloaded at volvotrucks.com.
Traffic safety
Promote safetyWith the fast pace of urbanization, growing population and increasing traffic, safety is an important focus to avoid accidents which has a huge impact on people and the society. To complement our safety focus in products development, and reach our target of zero accidents involving Volvo Group products, we run a variety of traffic safety programs in a majority of the countries where we operate. Our traffic safety campaign Stop, Look, Wave focuses on school children, local communities and professional drivers.
Similar to Stop, Look, Wave, the See and Be Seen program aims to improve understanding of how unprotected road users and trucks can interact in traffic. The initiative focuses specifically on cyclists and schoolchildren from the age of 13 years, but it is also suitable for traffic safety organizations working with adults.
Our truck brands in the US continue to support the American Trucking Associations’ Share the Road and America’s Road Team outreach programs. Share the Road, sponsored by Mack, is a safety program that sends million miles accident-free professional truck drivers, across the country to teach the public how to share the road with large trucks. America’s Road Team, sponsored by Volvo Trucks, represents 3.5 million profes sional truck drivers in the US and promotes the trucking indus-try’s message of safety, essential-ity and professionalism to audi-ences around the country.
Environmental sustainability
Science for sustainabilityVolvo Group instituted the Volvo Environment Prize 1988 to promote and enable pioneering research within the area of the environment and sustainable development. It is awarded annually to people who have made exceptional scientific discoveries in these areas. The laureate 2018 was Xuemei Bai for her outstanding thought leadership within urban sustainability research.
CLIMATE SAVERS Volvo Group continuously works to increase environ-mental efficiency in our own operations and also strives to develop environmentally enhanced prod-ucts that pioneer a more sustain able commercial vehicle industry. Volvo Group has a long-standing partnership with WWF and its Climate Savers
program and we are committed to take action to combat climate change. Read more about our WWF commitment on page 33 and our work within environmental sustain ability at volvogroup.com
A GLOBAL GROUP 2018 BUSINESS MODEL OUR ROLE IN SOCIETY
34

Disaster relief and donations
RESPOND TO LOCAL NEEDSThe Volvo Group Disaster Relief Fund is utilized to support efforts in response to disasters or catastrophes by providing products or funds to assist responding relief organizations. During 2018 Volvo Group made donations to support the victims of serious disasters caused by earth quakes and flood-ings in Indonesia, Japan and US. The Volvo Group Seasonal Gift 2018 amounted to SEK 5 M and will be distributed to 7 local societal projects in different countries to support development.
Education and skill development
Driving prosperityEducation is one of the most effective ways to alleviate poverty and develop countries. In many of our markets our customers and dealers suffer from a lack of skilled work-force, which is a threat to development and a prosperous society. Therefore we have a long-term plan to globally support and develop vocational training for mechanics, drivers and operators of trucks, buses and construction equipment. Since 2013, more than 1,050 students have participated in our vocational training schools in Ethiopia, Zambia and Morocco. In 2018, we established one driver training school in Ethiopia and one in Morocco, together with our partners.
VOCATIONAL SCHOOLSIn many countries development is held back by a shortage of skilled workers. At the same time many young people are unemployed. In Ethiopia, there is a shortage of trained tech-nicians that can service trucks and construction equipment. Volvo Group is driving vocational schools, together with our partners, that are playing a key role in training a new generation of technicians and drivers in the country.
HANNA NIGUSSIE was among the first to graduate from the school in Ethiopia 2015. Hanna initially worked at a truck dealership before returning to the school to teach. “I really like my job. It feels great to see the students grow and learn more and more,” she says.
VOLVO DRIVER TRAINING CENTER India crossed the milestone with 100,000 drivers trained in March 2018. Since the start in 1998, the center has been training both truck and bus drivers and is located in Hosakote, near Bengaluru, India. The right driving habits can save up to 10% of fuel and help drivers to avoid accidents.
Partnership
PARTNERSHIP FOR DEVELOP-MENTTo enhance societal engagement programs and make them most effective and sustainable on a long-term, it is key to collaborate with reliable organizations. Together with UNICEF we have an agreement that enable us to respond quickly to disasters and make sure help is coordinated to support people in need. Sida, UNIDO and USAid are key partners for developing our vocational schools. As a partner of the United Nation’s World Food Programme (WFP), Renault Trucks uses a mobile unit to train local WFP teams in Africa on truck main-tenance as well as fleet and work-shop management. Over five years, our employees have trained 200 WFP staff in twelve countries.
A GLOBAL GROUP 2018 BUSINESS MODEL OUR ROLE IN SOCIETY
35
ETHICAL AND COMPLIANT BUSINESS
B ehaving ethically and conducting business with integrity and in compliance with the law is a prerequisite for being a respon-sible company and build trust towards our business partners.
Trust is one of the Volvo Group’s most important values; therefore our Code of Conduct sets the framework for everything we do.
A new Code of ConductDuring autumn 2017 a new Volvo Group Code of Conduct was launched. It is a mandatory Group-wide policy that sets the require-ments on how to conduct business; ethically and in compliance with the law. The Code of Conduct states our minimum requirements on how we do business within the Volvo Group everywhere we operate and it focuses on the requirements on all employees.
The Code of Conduct is complemented by other policies that describe in more detail how we address its minimum standards. Both the Code of Conduct and the e-learning are available in 13 lan-guages. 92% of all white-collar employees have completed the e-learning. With regard to blue collar-employees, managers are required to lead mandatory training sessions. In 2019, further train-ing efforts will take place to promote the Code of Conduct, its val-ues and key principles. The Code of Conduct is publicly available on volvogroup.com.
Complying with legal regulationsLegal compliance forms the basis for everything we do in the VolvoGroup. It covers many different areas and involves a variety of employees with expertise and knowledge across the Group such as our work related to complying with emissions regulations. Two examples from the Code of Conduct are our commitments to com-ply with antitrust (competition) and anti-corruption laws in all juris-dictions where we conduct business. Our Code of Conduct states that we shall compete in a fair manner on the merits of our products and services and not participate in or endorse any corrupt practices. These principles of compliance are implemented through the Volvo Group Compliance Policy and dedicated compliance programs.
Across the Group we have programs consisting of a number of ele-ments, including policies and guidelines, a comprehensive range of e-learning and tailored face-to-face training, counselling and support, as well as auditing and review. The Volvo Group whistle-blower proce-dures also apply to our compliance programs. The process for anti-cor-ruption due diligence assessments of business partners aims to enhance the existing processes designed to prevent bribery by third parties carrying out business on behalf of the Volvo Group. The system includes the use of external tools, and applies to existing and new busi-ness partners. During 2018, both the competition and anti-corruption law compliance programs have been updated to clearly communicate legal requirements and to facilitate quick business decisions.
Responsible tax practicesGiven the role of taxes as a way to fund public welfare, we regard corporate tax compliance as a matter of responsible business behav-ior. The Volvo Group shall comply with the tax laws and regulations of each country where we operate. We do not engage in any aggres-
sive tax planning activities through structures in tax havens or other-wise. Where tax laws do not give clear guidance, prudence and transparency shall be the guiding principles. A fundamental objective of our tax policy is to ensure compliance with these principles throughout the Group, and at the same time ensure tax efficiency through tax-conscious management of our operations. The average corporate tax rate of the Volvo Group for the last five years is approx-imately 27%, whereof SEK 6 billion or 23% of current taxes relate to developing and emerging markets as defined by the IMF.
Monitoring adherenceAdherence to the Code of Conduct is monitored through management control systems, internal controls and the biennial employee survey. A whistle-blower policy encourages all employees to report suspected violations to their managers or other management representatives. If reporting to superiors is not feasible or possible, or is not taken seri-ously, employees have the possibility of escalating suspected viola-tions to Corporate Audit and the opportunity to remain anonymous where permitted by law. The Volvo Group does not tolerate retaliation against a person for making complaints in good faith of violations or suspected violations against the Code of Conduct.
In total, 102 reports were escalated to Corporate Audit in 2018, which exceeds the number of report in 2017 (57). This is due to the availability of the Volvo Group Whistle, our online platform for submit-ting whistle-blowing reports, and the reinforcement of the Code of Conduct. All cases have been addressed and subjected to investiga-tion. There are periodic reports on the whistle-blower and fraud inves-tigation activities provided to Audit Committee and AB Volvo Board of Directors. None of the reports in 2018 were considered to have a crit-ical impact on the Volvo Group. The most commonly reported catego-ries were workplace management (42) and business ethics and finan-cial practices (35). Read about Corporate Audit on page 202.
Whistle-blower cases escalated to Corporate Audit
Type of case 2018 2017
Workplace Management 42 41% 23 40%
Business Ethics and Financial Practices 35 34% 12 21%
Corruption and Conflict of Interest 13 13% 18 32%
Other incl. inquiries 12 12% 4 7%
Total 102 100% 57 100%
Data privacy within Volvo GroupData privacy is part of the Volvo Group’s Code of Conduct and a pri-oritized area across the Group. On 25 May 2018, the General Data Protection Regulation (GDPR) came into effect within the European Union. The purpose of this new regulation is to improve protection of individuals’ rights to personal integrity. A group-wide work has been done to adapt processes and applications in order to ensure data privacy and compliance with new regulatory requirements. In addi-tion, an e-learning was launched in February to white-collar employ-ees based in the EU and in Switzerland and Norway. The completion rate is 90% of all white-collar employees.
A GLOBAL GROUP 2018 BUSINESS MODEL OUR ROLE IN SOCIETY
36

VOLVO GROUP CODE OF CONDUCT• We respect one another• We earn business fairly and lawfully• We separate personal interests from business activities• We safeguard company information and assets• We communicate transparently and responsibly
A GLOBAL GROUP 2018 BUSINESS MODEL OUR ROLE IN SOCIETY
37
OUR HUMAN RIGHTS MANAGEMENT
O ur commitment to respect human rights covers not just our own operations and employees but also in our relation-ships with communities near our operations, suppliers and
other people potentially impacted by the use of our products.
Committed to respect human rightsVolvo Group is a truly global company with more than 105,000 employees, 51,000 suppliers, customers in about 190 countries, and is part of the community wherever we operate. We strive to align our human rights related work with the UN Guiding Principles on Busi-ness and Human Rights and the UN Global Compact’s ten principles including the principles on human rights and labor. In addition, we support and recognize international and regional human rights instruments such as the UN International Bill of Human Rights, the ILO’s eight fundamental conventions, the OECD’s Guidelines for Multinational Enterprises, and Children’s Rights and Business Prin-ciples by UNICEF and Save the Children. These instruments support us in our human rights work and serve as guidance especially in countries and regions with elevated human rights related concerns and where local regulations are insufficient or inadequately enforced.
The Volvo Group Code of Conduct, Supplier sustainability require-ments and various other Group-level policies and directives reflect our commitment to respect human rights. In these documents, we have emphasized our minimum requirements and standards relating to mutual respect, non-discrimination, safe and healthy workplace, freedom of association and collective bargaining, working hours and compensation, and that we do not tolerate any forms of modern slav-ery or child labor. Currently we consider these as the most relevant human rights issues for the Volvo Group and continue to identify other issues which may become more relevant. The Volvo Group also complies with human rights related reporting requirements under the EU’s non-financial reporting directive and the UK Modern Slavery Act. During the first half of 2018, we published Modern Slavery Statements for relevant companies within the Volvo Group.
Governance and management of human rights issuesGroup functions such as Corporate Responsibility, Legal and Compli-ance, and Human Resources together with our Group Truck divisions and Business areas monitor and assess risks in our operating environ-ment through human rights due diligence and enterprise risk manage-ment processes, dialogues with unions, industry collaboration and other benchmarks. During 2019 we will be reviewing our governance, including the use of the steering committee, which was established in 2017, consisting of certain Executive Board members, and our strategy for corporate responsibility areas including human rights.
Human rights due-diligence along the value chainVolvo Group’s human rights due-diligence efforts are focused on where we believe we have the highest risks of doing harm to people. This is based on country human rights risk levels, defined by indices from a global risk analytics service provider – purchase or sales segment risks and/or potential concerns brought to our attention by our employees or external stakeholders.
Human rights reviews in own operations Our human rights review process aims to identify actual impacts as well as potential risks on human rights of employees, consultants and onsite service providers. The review process involves desktop review of country and sector human rights risks, self-assessments and in-person workshops with the local management and human resources committees, in-person discussions with employees, ser-vice providers and their employees, union representatives, and also, if relevant, potential in-person discussions with other stakeholders. An important outcome of the human rights review process is the creation, implementation and follow-up of improvement actions with clear ownership and anchoring within the local management. We strive to ensure that our human rights review methodology is aligned with the UN Guiding Principles on Business and Human Rights while also taking into account Volvo Group’s global and local operating structures. We continued to improve and adjust the process in 2018 based on the pilot country level human rights reviews in India and Germany carried out in 2017.
In 2018, we performed a human rights review in South Africa, and initiated a human rights review in Mexico which is expected to be completed in 2019. We also performed a site visit to our opera-tions in India in 2018, following our pilot exercise there in 2017, to learn about their experience in implementing various improvement actions supported by the local management. In South Africa, we identified improvement actions regarding occupational health and safety, non-discrimination, fair and equal treatment of all employees, wider awareness and trust in our grievance processes. These improvement actions are anchored within the local management and we aim to regularly follow-up on the progress of their imple-mentation in an on-going manner.
Human rights in the supply chainOur sustainability requirements and aspirations expected from Volvo Group’s suppliers cover topics such as Human Rights and Working Conditions, Health and Safety, Business Ethics and Environmental Performance. We expect to launch a renewed Supplier Code of Conduct in 2019 and include it as part of supplier contracts.
In 2018, we performed an onsite review focusing on employment conditions of service providers working within certain of our premises in Malaysia. We identified a need for improvement actions in relation to some of our onsite service providers’ employment of foreign migrant workers. As a result, these service providers have proposed action plans, and we are also considering how to strengthen our inter-nal procedures in relation to this challenging issue, including by reviewing contractual terms, and undertaking further due-diligence in relation to foreign migrant workers in Malaysia. We also con tinued to perform supplier sustainability audits, and in 2018 these audits were performed in China, India and South Africa covering 35 suppliers. The main findings from these audits related to poor emergency prepared-ness, excessive working hours and insufficient rest times. Twenty Volvo Group employees became certified sustain ability auditors in 2018 and we trained approximately 100 suppliers in China, Hungary, Spain and Thailand on topics covering human rights, environmental
A GLOBAL GROUP 2018 BUSINESS MODEL OUR ROLE IN SOCIETY
38
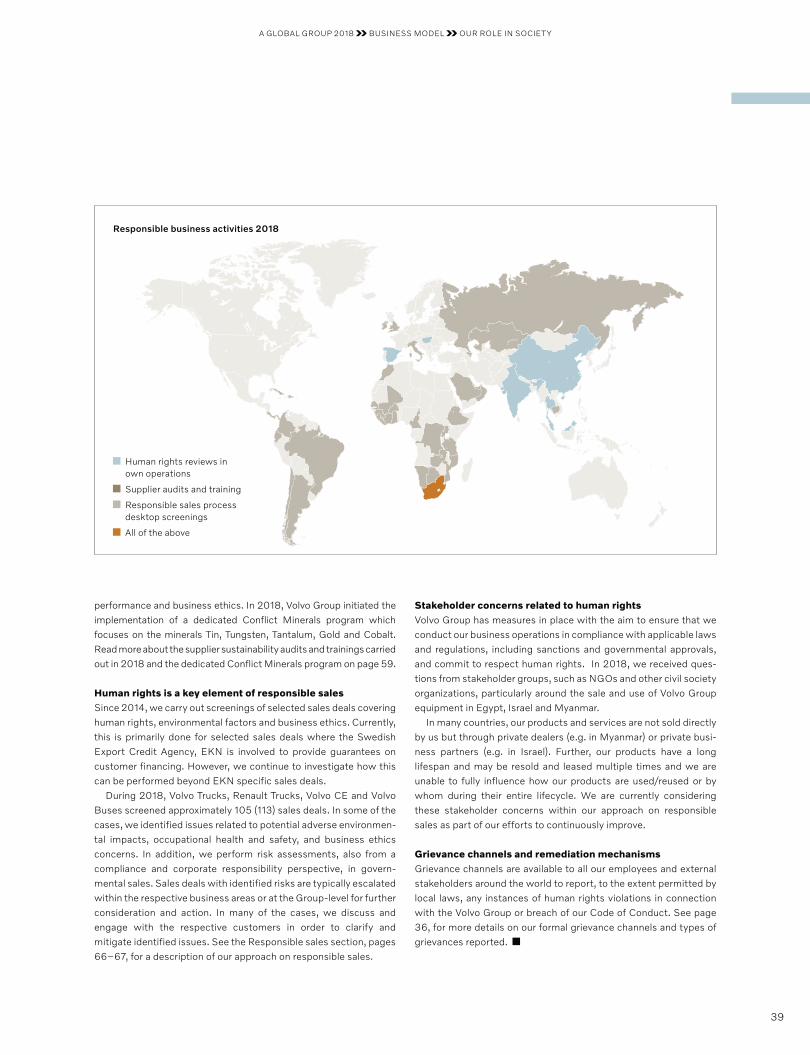
performance and business ethics. In 2018, Volvo Group initiated the implementation of a dedicated Conflict Minerals program which focuses on the minerals Tin, Tungsten, Tantalum, Gold and Cobalt. Read more about the supplier sustainability audits and trainings carried out in 2018 and the dedicated Conflict Minerals program on page 59.
Human rights is a key element of responsible salesSince 2014, we carry out screenings of selected sales deals covering human rights, environmental factors and business ethics. Currently, this is primarily done for selected sales deals where the Swedish Export Credit Agency, EKN is involved to provide guarantees on customer financing. However, we continue to investigate how this can be performed beyond EKN specific sales deals.
During 2018, Volvo Trucks, Renault Trucks, Volvo CE and Volvo Buses screened approximately 105 (113) sales deals. In some of the cases, we identified issues related to potential adverse environmen-tal impacts, occupational health and safety, and business ethics concerns. In addition, we perform risk assessments, also from a compliance and corporate responsibility perspective, in govern-mental sales. Sales deals with identified risks are typically escalated within the respective business areas or at the Group-level for further consideration and action. In many of the cases, we discuss and engage with the respective customers in order to clarify and mitigate identified issues. See the Responsible sales section, pages 66–67, for a description of our approach on responsible sales.
Stakeholder concerns related to human rightsVolvo Group has measures in place with the aim to ensure that we conduct our business operations in compliance with applicable laws and regulations, including sanctions and governmental approvals, and commit to respect human rights. In 2018, we received ques-tions from stakeholder groups, such as NGOs and other civil society organizations, particularly around the sale and use of Volvo Group equipment in Egypt, Israel and Myanmar.
In many countries, our products and services are not sold directly by us but through private dealers (e.g. in Myanmar) or private busi-ness partners (e.g. in Israel). Further, our products have a long lifespan and may be resold and leased multiple times and we are unable to fully influence how our products are used/reused or by whom during their entire lifecycle. We are currently considering these stakeholder concerns within our approach on responsible sales as part of our efforts to continuously improve.
Grievance channels and remediation mechanisms Grievance channels are available to all our employees and external stakeholders around the world to report, to the extent permitted by local laws, any instances of human rights violations in connection with the Volvo Group or breach of our Code of Conduct. See page 36, for more details on our formal grievance channels and types of grievances reported.
Responsible business activities 2018
Human rights reviews in own operations
Supplier audits and training
Responsible sales process desktop screenings
All of the above
A GLOBAL GROUP 2018 BUSINESS MODEL OUR ROLE IN SOCIETY
39
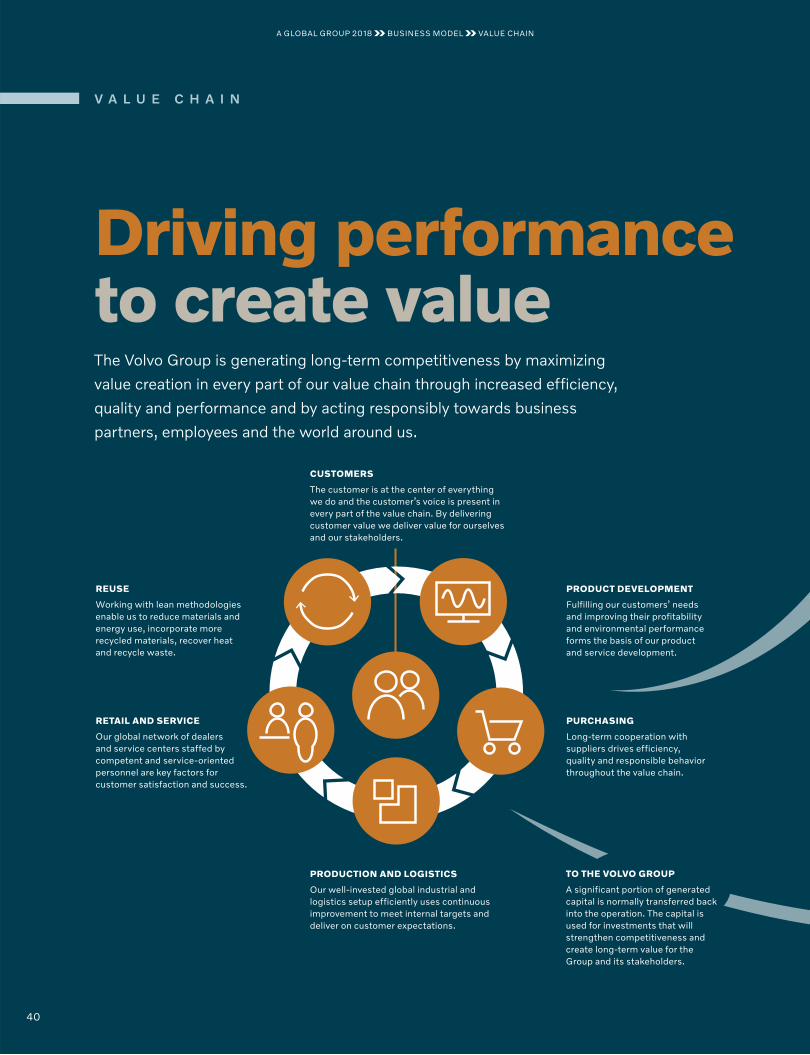
V A L U E C H A I N
Driving performance to create valueThe Volvo Group is generating long-term competitiveness by maximizing
value creation in every part of our value chain through increased efficiency,
quality and performance and by acting responsibly towards business
partners, employees and the world around us.
V A L U E C H A I N
CUSTOMERS
The customer is at the center of everything we do and the customer’s voice is present in every part of the value chain. By delivering customer value we deliver value for ourselves and our stakeholders.
REUSE
Working with lean methodologies enable us to reduce materials and energy use, incorporate more recycled materials, recover heat and recycle waste.
RETAIL AND SERVICE
Our global network of dealers and service centers staffed by competent and service- oriented personnel are key factors for customer satisfaction and success.
PRODUCTION AND LOGISTICS
Our well-invested global industrial and logistics setup efficiently uses continuous improvement to meet internal targets and deliver on customer expectations.
PRODUCT DEVELOPMENT
Fulfilling our customers’ needs and improving their profitability and environmental performance forms the basis of our product and service development.
PURCHASING
Long-term cooperation with suppliers drives efficiency, quality and responsible behavior throughout the value chain.
TO THE VOLVO GROUP
A significant portion of generated capital is normally transferred back into the operation. The capital is used for investments that will strengthen competitiveness and create long-term value for the Group and its stakeholders.
40
A GLOBAL GROUP 2018 BUSINESS MODEL VALUE CHAIN
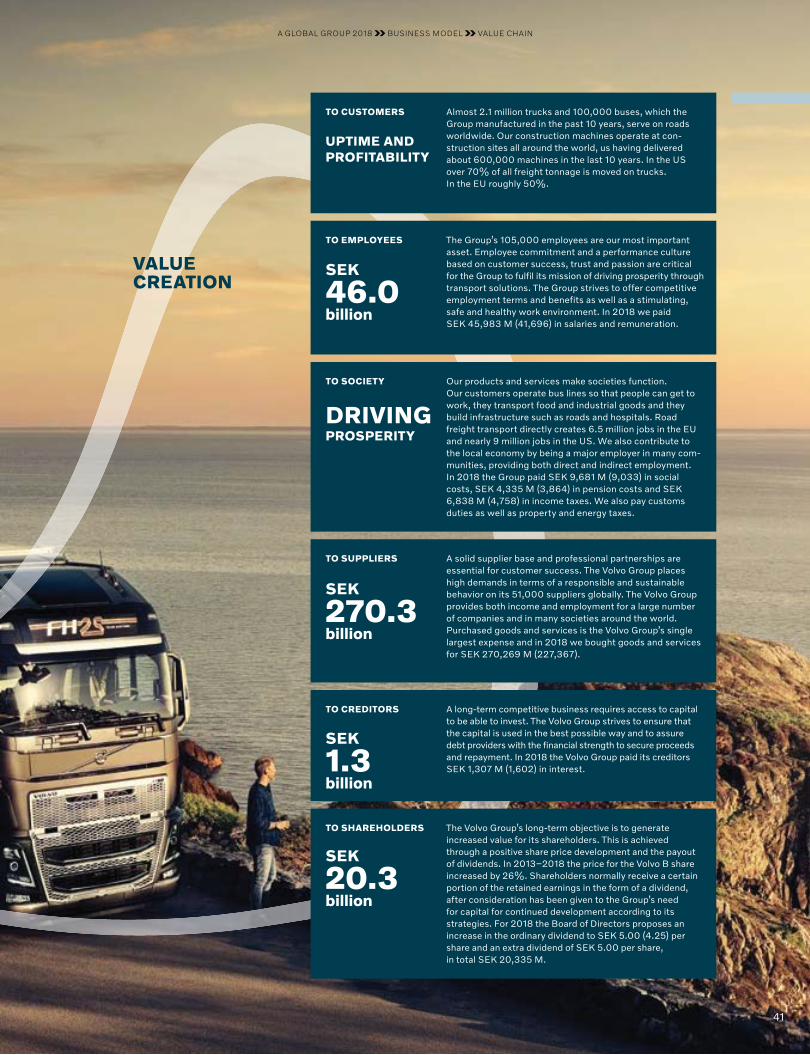
VALUE CREATION
TO CREDITORS
Our products and services make societies function. Our customers operate bus lines so that people can get to work, they transport food and industrial goods and they build infrastructure such as roads and hospitals. Road freight transport directly creates 6.5 million jobs in the EU and nearly 9 million jobs in the US. We also contribute to the local economy by being a major employer in many com-munities, providing both direct and indirect employment. In 2018 the Group paid SEK 9,681 M (9,033) in social costs, SEK 4,335 M (3,864) in pension costs and SEK 6,838 M (4,758) in income taxes. We also pay customs duties as well as property and energy taxes.
TO SOCIETY
DRIVINGPROSPERITY
The Group’s 105,000 employees are our most important asset. Employee commitment and a performance culture based on customer success, trust and passion are critical for the Group to fulfil its mission of driving prosperity through transport solutions. The Group strives to offer competitive employment terms and benefits as well as a stimulating, safe and healthy work environment. In 2018 we paid SEK 45,983 M (41,696) in salaries and remuner a tion.
TO EMPLOYEES
SEK
46.0 billion
Almost 2.1 million trucks and 100,000 buses, which the Group manufactured in the past 10 years, serve on roads worldwide. Our construction machines operate at con-struction sites all around the world, us having delivered about 600,000 machines in the last 10 years. In the US over 70% of all freight tonnage is moved on trucks. In the EU roughly 50%.
TO CUSTOMERS
UPTIME AND PROFITABILITY
A solid supplier base and profes sional partnerships are essential for customer success. The Volvo Group places high demands in terms of a responsible and sustainable behavior on its 51,000 suppliers globally. The Volvo Group provides both income and employment for a large number of companies and in many societies around the world. Purchased goods and services is the Volvo Group’s single largest expense and in 2018 we bought goods and services for SEK 270,269 M (227,367).
TO SUPPLIERS
SEK
270.3 billion
A long-term competitive business requires access to capital to be able to invest. The Volvo Group strives to ensure that the capital is used in the best possible way and to assure debt providers with the financial strength to secure proceeds and repayment. In 2018 the Volvo Group paid its creditors SEK 1,307 M (1,602) in interest.
TO CREDITORS
SEK
1.3 billion
The Volvo Group’s long-term objective is to generate increased value for its shareholders. This is achieved through a positive share price development and the payout of dividends. In 2013–2018 the price for the Volvo B share increased by 26%. Shareholders normally receive a certain portion of the retained earnings in the form of a dividend, after consideration has been given to the Group’s need for capital for continued development according to its strategies. For 2018 the Board of Directors proposes an increase in the ordinary dividend to SEK 5.00 (4.25) per share and an extra dividend of SEK 5.00 per share, in total SEK 20,335 M.
TO SHARE HOLDERS
SEK
20.3 billion
41
A GLOBAL GROUP 2018 BUSINESS MODEL VALUE CHAIN
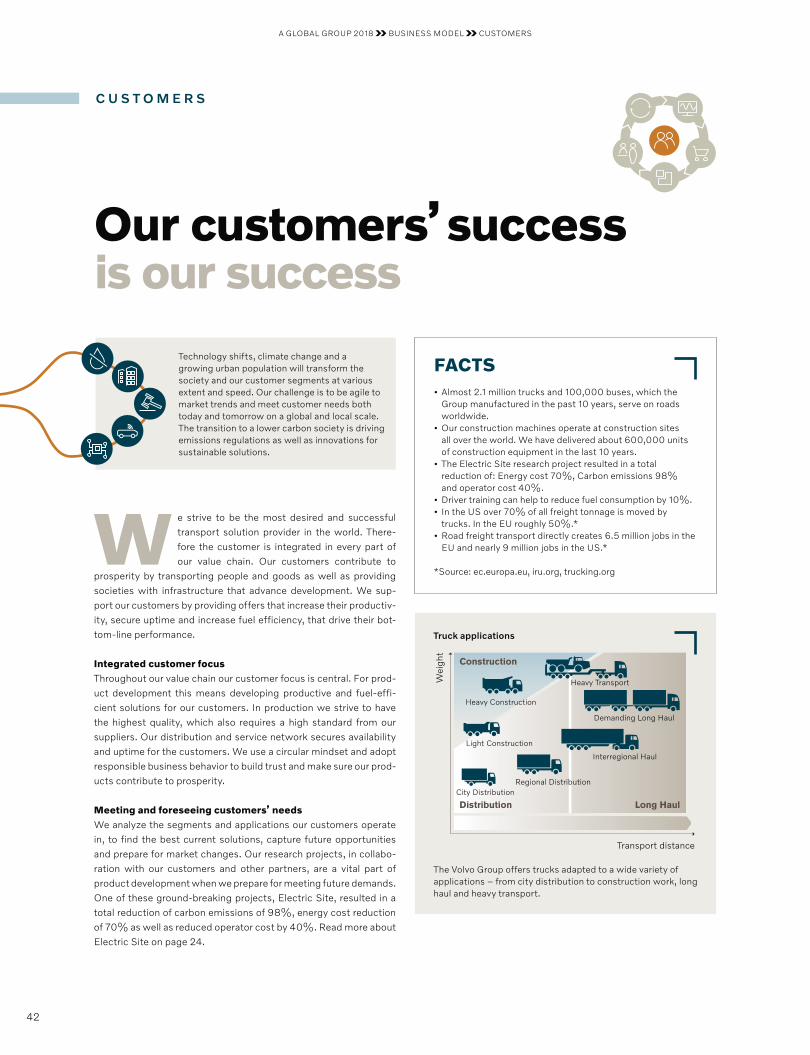
C U S T O M E R S
Our customers’ success is our success
We strive to be the most desired and successful transport solution provider in the world. There-fore the customer is integrated in every part of our value chain. Our customers contribute to
prosperity by transporting people and goods as well as providing societies with infrastructure that advance development. We sup-port our customers by providing offers that increase their productiv-ity, secure uptime and increase fuel efficiency, that drive their bot-tom-line performance.
Integrated customer focus Throughout our value chain our customer focus is central. For prod-uct development this means developing productive and fuel-effi-cient solutions for our customers. In production we strive to have the highest quality, which also requires a high standard from our suppliers. Our distribution and service network secures availability and uptime for the customers. We use a circular mindset and adopt responsible business behavior to build trust and make sure our prod-ucts contribute to prosperity.
Meeting and foreseeing customers’ needs We analyze the segments and applications our customers operate in, to find the best current solutions, capture future opportunities and prepare for market changes. Our research projects, in collabo-ration with our customers and other partners, are a vital part of product development when we prepare for meeting future demands. One of these ground-breaking projects, Electric Site, resulted in a total reduction of carbon emissions of 98%, energy cost reduction of 70% as well as reduced operator cost by 40%. Read more about Electric Site on page 24.
FACTS• Almost 2.1 million trucks and 100,000 buses, which the
Group manufactured in the past 10 years, serve on roads worldwide.
• Our construction machines operate at construction sites all over the world. We have delivered about 600,000 units of construction equipment in the last 10 years.
• The Electric Site research project resulted in a total reduction of: Energy cost 70%, Carbon emissions 98% and operator cost 40%.
• Driver training can help to reduce fuel consumption by 10%.• In the US over 70% of all freight tonnage is moved by
trucks. In the EU roughly 50%.*• Road freight transport directly creates 6.5 million jobs in the
EU and nearly 9 million jobs in the US.*
*Source: ec.europa.eu, iru.org, trucking.org
Wei
ght
Transport distance
Construction
Distribution Long Haul
Heavy Transport
Demanding Long Haul
Interregional Haul
Heavy Construction
Light Construction
Regional DistributionCity Distribution
Truck applications
The Volvo Group offers trucks adapted to a wide variety of applications – from city distribution to construction work, long haul and heavy transport.
Technology shifts, climate change and a growing urban population will transform the society and our customer segments at various extent and speed. Our challenge is to be agile to market trends and meet customer needs both today and tomorrow on a global and local scale. The transition to a lower carbon society is driving emissions regulations as well as innovations for sustainable solutions.
A GLOBAL GROUP 2018 BUSINESS MODEL CUSTOMERS
42
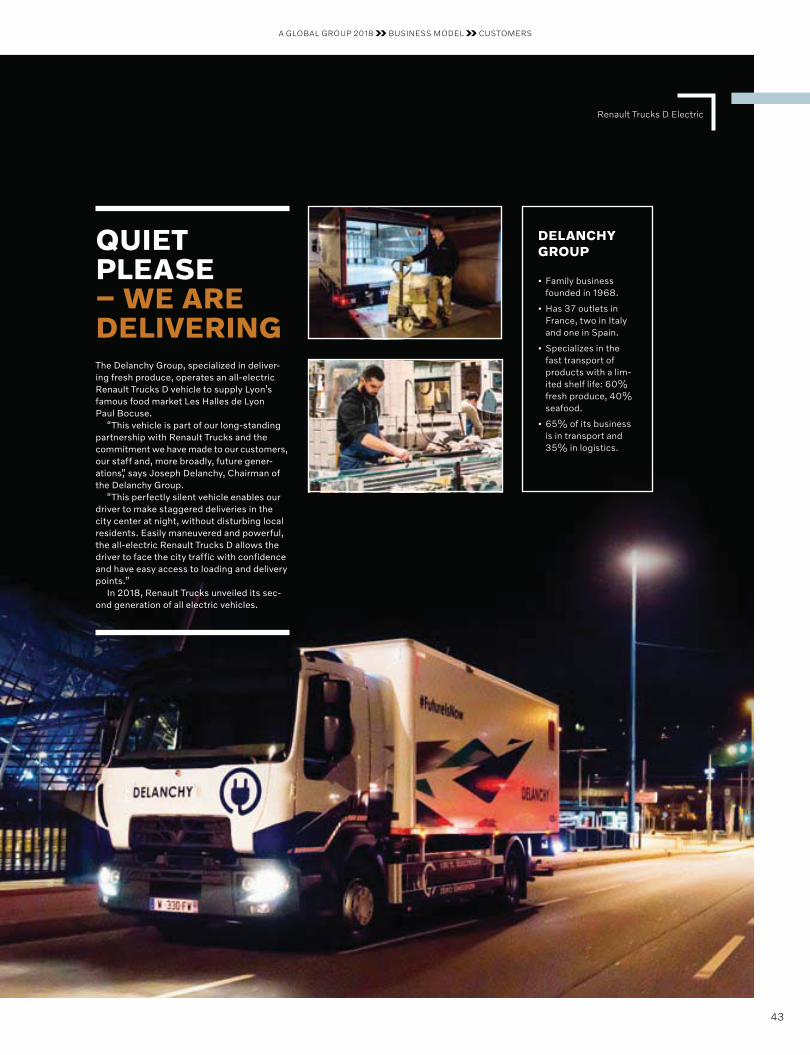
Renault Trucks D Electric
QUIET PLEASE – WE ARE DELIVERINGThe Delanchy Group, specialized in deliver-ing fresh produce, operates an all-electric Renault Trucks D vehicle to supply Lyon’s famous food market Les Halles de Lyon Paul Bocuse.
“This vehicle is part of our long-standing partnership with Renault Trucks and the commitment we have made to our customers, our staff and, more broadly, future gener-ations,” says Joseph Delanchy, Chairman of the Delanchy Group.
“This perfectly silent vehicle enables our driver to make staggered deliveries in the city center at night, without disturbing local residents. Easily maneuvered and powerful, the all-electric Renault Trucks D allows the driver to face the city traffic with confidence and have easy access to loading and delivery points.”
In 2018, Renault Trucks unveiled its sec-ond generation of all electric vehicles.
DELANCHY GROUP
• Family business founded in 1968.
• Has 37 outlets in France, two in Italy and one in Spain.
• Specializes in the fast transport of products with a lim-ited shelf life: 60% fresh produce, 40% seafood.
• 65% of its business is in transport and 35% in logistics.
A GLOBAL GROUP 2018 BUSINESS MODEL CUSTOMERS
43
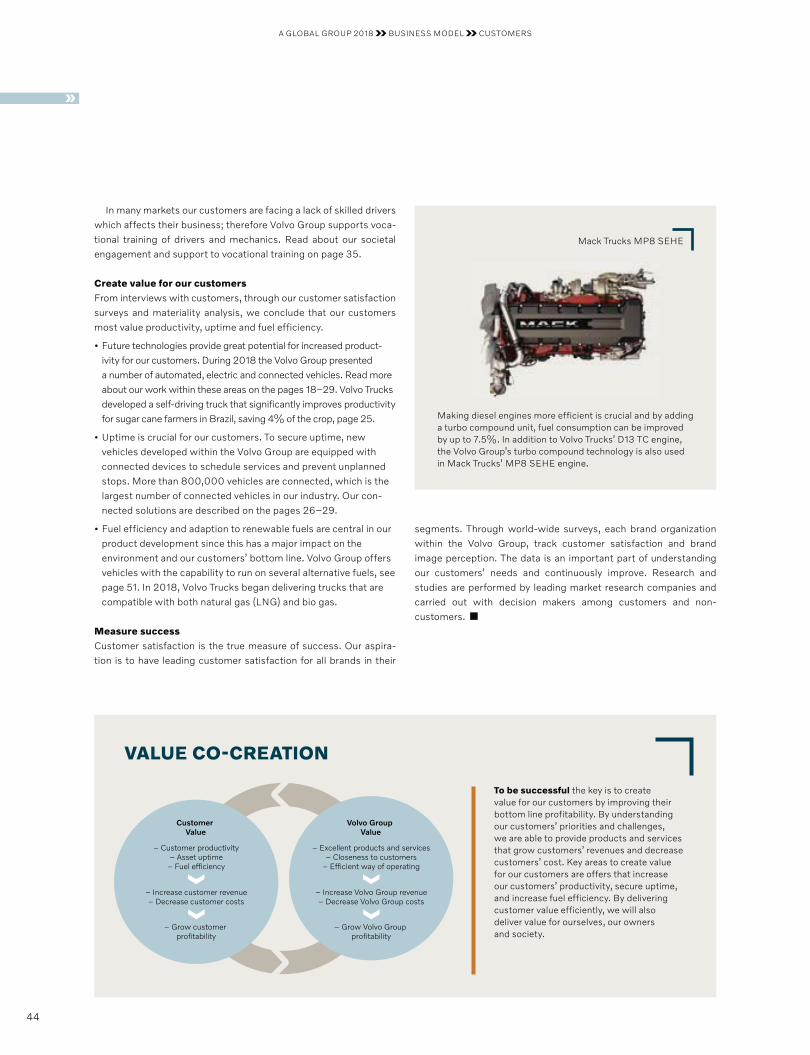
To be successful the key is to create value for our customers by improving their bottom line profitability. By understanding our customers’ priorities and challenges, we are able to provide products and services that grow customers’ revenues and decrease customers’ cost. Key areas to create value for our customers are offers that increase our customers’ productivity, secure uptime, and increase fuel efficiency. By delivering customer value efficiently, we will also deliver value for ourselves, our owners and society.
Customer Value
Volvo Group Value
– Customer productivity– Asset uptime
– Fuel efficiency
– Increase customer revenue– Decrease customer costs
– Grow customer profitability
– Excellent products and services– Closeness to customers
– Efficient way of operating
– Increase Volvo Group revenue– Decrease Volvo Group costs
– Grow Volvo Group profitability
VALUE CO-CREATION
In many markets our customers are facing a lack of skilled drivers which affects their business; therefore Volvo Group supports voca-tional training of drivers and mechanics. Read about our societal engagement and support to vocational training on page 35.
Create value for our customersFrom interviews with customers, through our customer satisfaction surveys and materiality analysis, we conclude that our customers most value productivity, uptime and fuel efficiency.
• Future technologies provide great potential for increased prod uct-ivity for our customers. During 2018 the Volvo Group presented a number of automated, electric and connected vehicles. Read more about our work within these areas on the pages 18–29. Volvo Trucks developed a self-driving truck that significantly improves productivity for sugar cane farmers in Brazil, saving 4% of the crop, page 25.
• Uptime is crucial for our customers. To secure uptime, new vehicles developed within the Volvo Group are equipped with connected devices to schedule services and prevent unplanned stops. More than 800,000 vehicles are connected, which is the largest number of connected vehicles in our industry. Our con-nected solutions are described on the pages 26–29.
• Fuel efficiency and adaption to renewable fuels are central in our product development since this has a major impact on the environ ment and our customers’ bottom line. Volvo Group offers vehicles with the capability to run on several alternative fuels, see page 51. In 2018, Volvo Trucks began delivering trucks that are compatible with both natural gas (LNG) and bio gas.
Measure successCustomer satisfaction is the true measure of success. Our aspira-tion is to have leading customer satisfaction for all brands in their
segments. Through world-wide surveys, each brand organization within the Volvo Group, track customer satisfaction and brand image perception. The data is an important part of understanding our customers’ needs and continuously improve. Research and studies are performed by leading market research companies and carried out with decision makers among customers and non- customers.
Mack Trucks MP8 SEHE
Making diesel engines more efficient is crucial and by adding a turbo compound unit, fuel consumption can be improved by up to 7.5%. In addition to Volvo Trucks’ D13 TC engine, the Volvo Group’s turbo compound technology is also used in Mack Trucks’ MP8 SEHE engine.
A GLOBAL GROUP 2018 BUSINESS MODEL CUSTOMERS
44
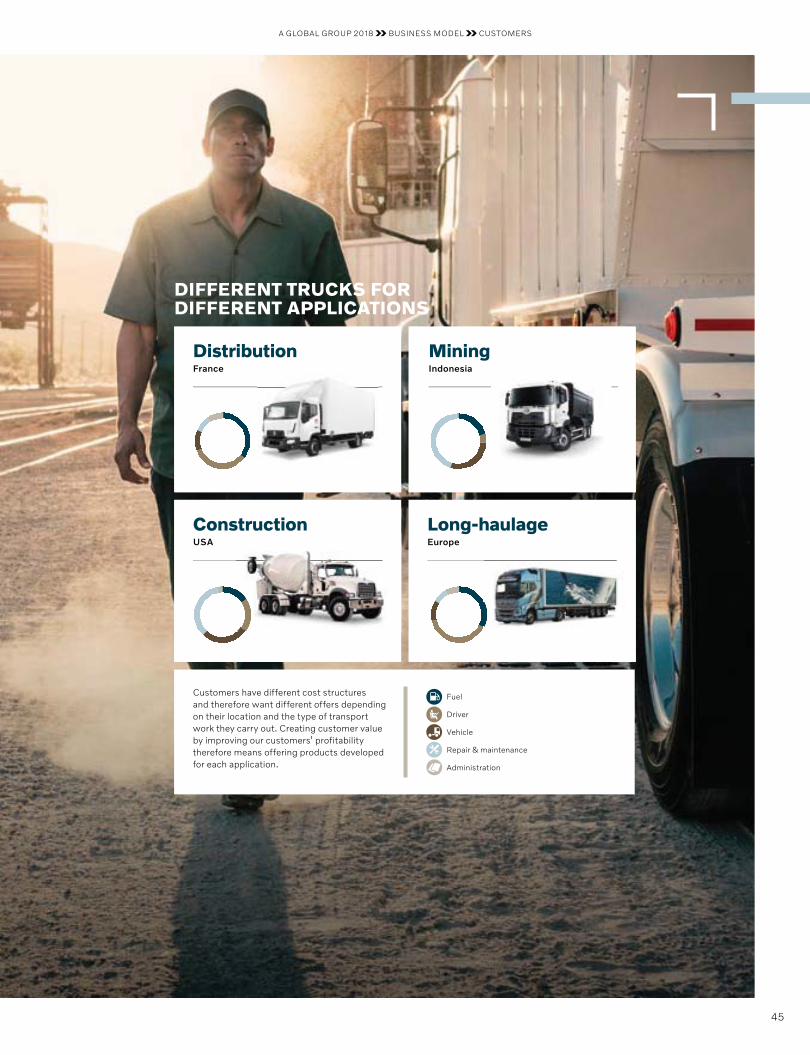
Customers have different cost structures and therefore want different offers depending on their location and the type of transport work they carry out. Creating customer value by improving our customers’ profitability therefore means offering products developed for each application.
Cost items:
Fuel
Driver
Vehicle
Repair & maintenance
Administration
Distribution France
Construction USA
Long-haulage Europe
Mining Indonesia
DIFFERENT TRUCKS FOR DIFFERENT APPLICATIONS
A GLOBAL GROUP 2018 BUSINESS MODEL CUSTOMERS
45
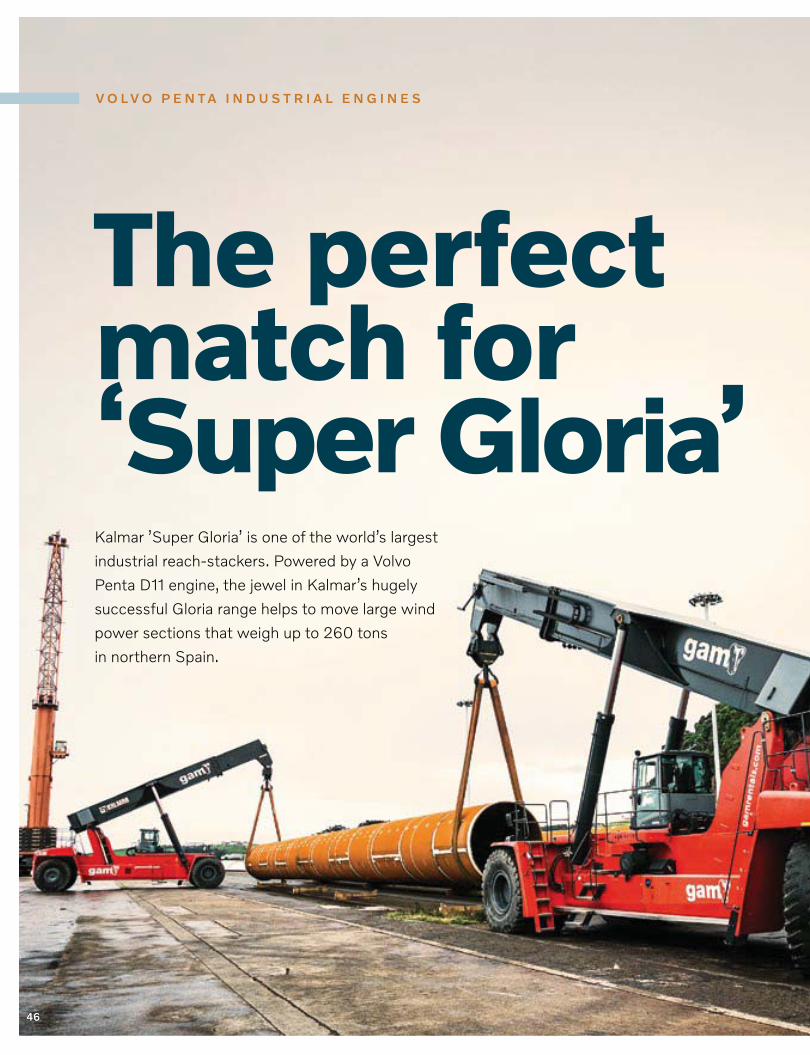
46
The perfect match for ‘Super Gloria’
V O L V O P E N T A I N D U S T R I A L E N G I N E S
Kalmar ’Super Gloria’ is one of the world’s largest industrial reach-stackers. Powered by a Volvo Penta D11 engine, the jewel in Kalmar’s hugely successful Gloria range helps to move large wind power sections that weigh up to 260 tons in northern Spain.
46
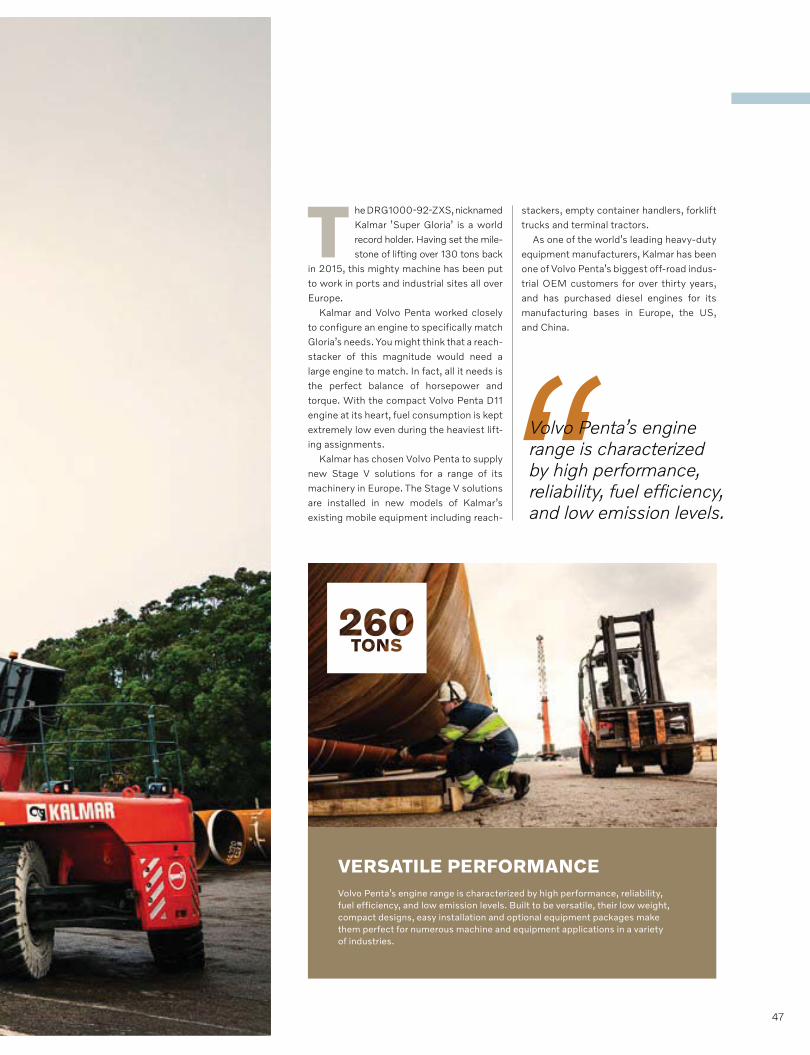
The DRG1000-92-ZXS, nicknamed Kalmar ’Super Gloria’ is a world record holder. Having set the mile-stone of lifting over 130 tons back
in 2015, this mighty machine has been put to work in ports and industrial sites all over Europe.
Kalmar and Volvo Penta worked closely to configure an engine to specifically match Gloria’s needs. You might think that a reach-stacker of this magnitude would need a large engine to match. In fact, all it needs is the perfect balance of horsepower and torque. With the compact Volvo Penta D11 engine at its heart, fuel consumption is kept extremely low even during the heaviest lift-ing assignments.
Kalmar has chosen Volvo Penta to supply new Stage V solutions for a range of its machinery in Europe. The Stage V solutions are installed in new models of Kalmar’s existing mobile equipment including reach-
stackers, empty container handlers, forklift trucks and terminal tractors.
As one of the world’s leading heavy-duty equipment manufacturers, Kalmar has been one of Volvo Penta’s biggest off-road indus-trial OEM customers for over thirty years, and has purchased diesel engines for its manufacturing bases in Europe, the US, and China.
VERSATILE PERFORMANCEVolvo Penta’s engine range is characterized by high performance, reliability, fuel efficiency, and low emission levels. Built to be versatile, their low weight, compact designs, easy installation and optional equipment packages make them perfect for numerous machine and equipment applications in a variety of industries.
“Volvo Penta’s engine range is characterized by high performance, reliability, fuel efficiency, and low emission levels.
47
FACTS • In 2018 investments in research and development amounted
to SEK 15.9 (16.1) billion, 4.1% (4.8) of Group net sales.• Around 95% of the environmental impact from a truck occurs
during the use phase. Therefore sustainable solutions are an integral focus for our product development.
• In 25 years the fuel consumption of a 40 ton total weight truck has been reduced by 19% and NOX emissions by 98%.
• The Volvo Group’s safety ambition is zero accidents involving our vehicles and equipment.
Global Development Centers
P R O D U C T D E V E L O P M E N T
Investing in the future
All our product development is based on the future needs of our customers. We will offer them products and services that help them support their customers with the most efficient transport solutions. The work-
ing environ ment for drivers and operators shall be pleasant and safe, and our products fuel-efficient with high productivity while fulfilling all requirements on emissions standards, safety standards, data protection and more.
New technology areas such as automated driving, electric vehicles and connectivity will reshape the industry and the society we live in. However, the speed of the transition is uncertain and we will therefore need to balance our product development investments between well-known and new technologies.
Automation, electromobility and connectivity have huge potential to raise productivity and safety and to reduce the environmental impact, but it will take time before we can fully utilize these opportuni-ties. Our engineers need to continue to innovate and develop the well-known technologies to make engines and transmissions more fuel- efficient with lower emissions, to further reduce the weight of the vehicles, and make them more aerodynamic, and to ensure that the cabs are further adapted to the needs and demands of drivers and operators. Innovative ideas are equally important in well-known tech-nologies and in new technologies. We firmly believe that there is still huge potential in well-known technologies. The Renault Trucks research and development project, Optifuel Lab 3, is one good example of the possibilities we see in well-known technologies (see page 53).
In parallel with developing well-known technologies, we have embarked on a journey toward increased automation, electromobil-ity and connectivity. Each of these technology areas has the poten-tial to impact the mobility of goods and people. When they con-verge, they will radically transform the transport industry. To ensure we remain on the frontline of these technology areas we have estab-lished three organizations focused on each of these areas.
Product development is influenced by custom-ers’ needs, legislation, changes in society and new technologies. There are strong trends such as automation, electromobility and connectivity that need to be balanced with investments in development of current technologies.
We also need to work more in partnerships with other compa-nies, universities and suppliers to find the best solutions for the future. One good example of this is our cooperation around future sustainable mining (see page 52). Furthermore, we need to work even more integrated with our customers to ensure that the features we develop are useful for them and that we can work together to develop the new business models needed. The Vera project is a good example of this way of working (see page 22).
Common Architecture and Shared TechnologyWith 12 different brands in different product segments, we strive to find synergies to reduce product and product development costs, while simultaneously securing brand-unique solutions. Volvo Group is now leveraging more than 15 years of work to create a modular system, and we have come a long way. We call the system CAST – Common Architecture and Shared Technology. The base engines we develop are shared by our trucks, construction equipment, buses and
A GLOBAL GROUP 2018 BUSINESS MODEL PRODUCT DEVELOPMENT
48
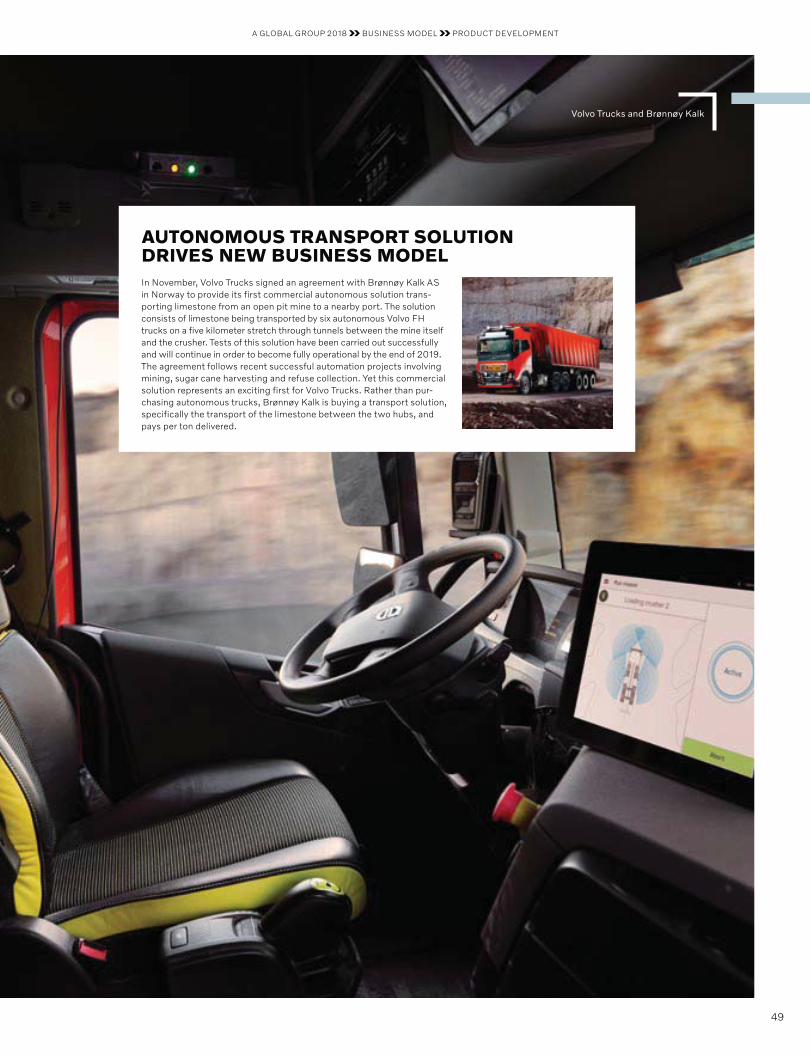
Volvo Trucks and Brønnøy Kalk
AUTO NOMOUS TRANSPORT SOLUTION DRIVES NEW BUSINESS MODELIn November, Volvo Trucks signed an agreement with Brønnøy Kalk AS in Norway to provide its first commercial autonomous solution trans-porting limestone from an open pit mine to a nearby port. The solution consists of limestone being transported by six autonomous Volvo FH trucks on a five kilometer stretch through tunnels between the mine itself and the crusher. Tests of this solution have been carried out successfully and will continue in order to become fully operational by the end of 2019. The agreement follows recent successful automation projects involving mining, sugar cane harvesting and refuse collection. Yet this commercial solution represents an exciting first for Volvo Trucks. Rather than pur-chasing autonomous trucks, Brønnøy Kalk is buying a transport solution, specifically the transport of the limestone between the two hubs, and pays per ton delivered.
A GLOBAL GROUP 2018 BUSINESS MODEL PRODUCT DEVELOPMENT
49

marine and industrial engines, while electric systems and transmis-sions are shared by most product segments and chassis compo-nents by all our truck brands, to give a few examples. We continue to build on this approach for the new technologies; automation, electromobility and connectivity. Instead of reinventing the wheel with every new product, we use as much common technology as possible, for the benefit of both our customers and the Volvo Group. The efficiency gains generated by our consistent work with com-monality are not confined to product development, they can also be seen in our supplier structure, industrial system, sales and, not least, service organization. At the same time, it is important to ensure that each product in the modular system is adapted to what customers expect from each brand and product segment, as well as local demands and requirements. Therefore we have a global product development system with engineering resources in different parts of the world, close to customers, to ensure that every product delivers the unique brand value that customers expect.
Increasing fuel efficiencyThe Volvo Group performed a fuel consumption and nitrogen oxide (NOX) emission test between two typical European long-haul tractors, a Volvo FH from 2016 and a Volvo F12 from 1991. Both trucks were simultaneously measured on an open road during normal traffic situations, pulling similar semi-trailers loaded to 40 tons total weight. The test route was driven four times during the same day. The measurements, from preparation to final evaluation,
ELECTROMOBILITY
AUTOMATION
CONNECTIVITY
TRANSMISSIONS
ELECTRONICS
CHASSIS
ENGINESE
EEEEEEEEEENGINES
EL
Renault Trucks
UD Trucks
MackTrucks
Volvo Penta
Construction Equipment
Volvo Trucks
Buses
Volvo Technology Award 2018 IMPROVED FUEL EFFICIENCY IN EXCAVATORS
A concept for a smart hydraulic hybrid excavator from Volvo Construction Equipment (Volvo CE) received the Volvo Technology Award 2018. The innovation, which is currently a concept and largely kept under wraps, delivers significant improvements in fuel efficiency and productivity, thanks to the use of an electronically-controlled hydraulics system, energy recovery system and pump optimization. Future plans for industrialization are under investigation.
The award recognizes outstanding technical advances made by employees who contribute to the enhancement of the Group’s high-tech competitiveness and technological expertise. The winners are Chunhan Lee, Dongsoo Kim, Sangmin Gwon, Taerang Jung, Gijun Yoon and Namgyu Kim from Volvo CE.
“Being a technology leader is crucial for us in our ambition to provide our customers with the best possible solutions,” says Lars Stenqvist, Volvo Group Chief Technology Officer. “The smart hydraulic hybrid excavator concept is a great example of how our engineers keep pushing the boundaries of what is possible today, leading to new levels of efficiency and productivity in future products.”
A GLOBAL GROUP 2018 BUSINESS MODEL PRODUCT DEVELOPMENT
50
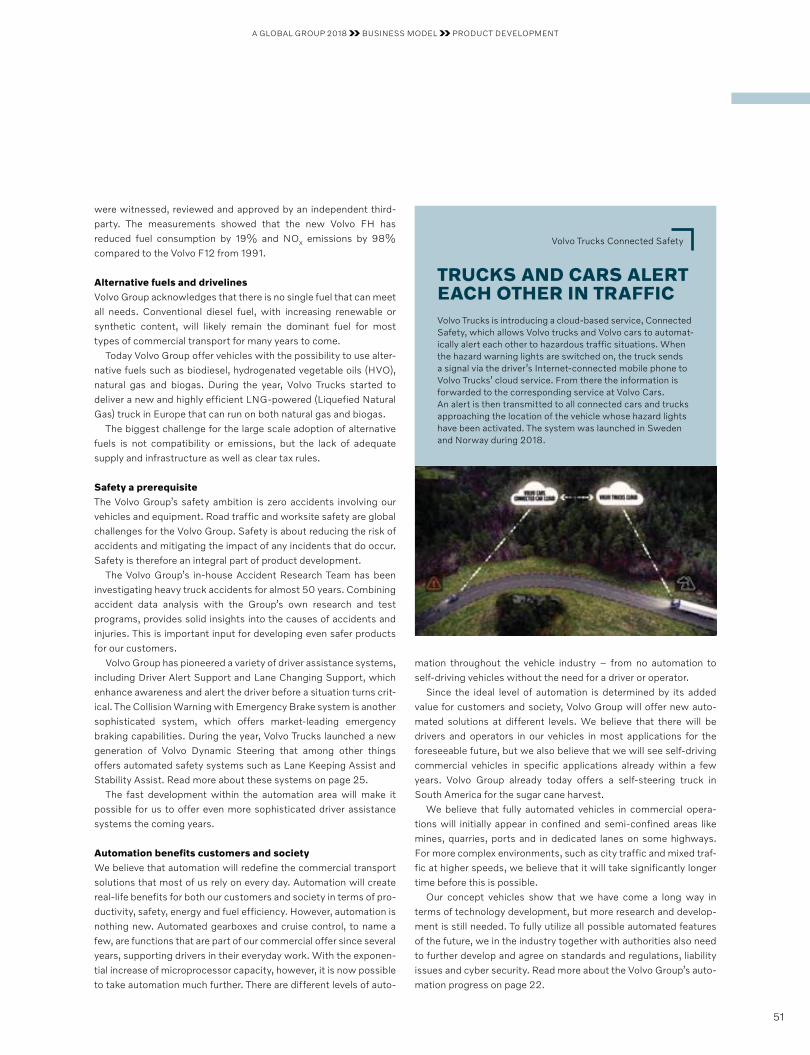
were witnessed, reviewed and approved by an independent third-party. The measurements showed that the new Volvo FH has reduced fuel consumption by 19% and NOX emissions by 98% compared to the Volvo F12 from 1991.
Alternative fuels and drivelinesVolvo Group acknowledges that there is no single fuel that can meet all needs. Conventional diesel fuel, with increasing renewable or synthetic content, will likely remain the dominant fuel for most types of commercial transport for many years to come.
Today Volvo Group offer vehicles with the possibility to use alter-native fuels such as biodiesel, hydrogenated vegetable oils (HVO), natural gas and biogas. During the year, Volvo Trucks started to deliver a new and highly efficient LNG-powered (Liquefied Natural Gas) truck in Europe that can run on both natural gas and biogas.
The biggest challenge for the large scale adoption of alternative fuels is not compatibility or emissions, but the lack of adequate supply and infrastructure as well as clear tax rules.
Safety a prerequisiteThe Volvo Group’s safety ambition is zero accidents involving our vehicles and equipment. Road traffic and worksite safety are global challenges for the Volvo Group. Safety is about reducing the risk of accidents and mitigating the impact of any incidents that do occur. Safety is therefore an integral part of product development.
The Volvo Group’s in-house Accident Research Team has been investigating heavy truck accidents for almost 50 years. Combining accident data analysis with the Group’s own research and test programs, provides solid insights into the causes of accidents and injuries. This is important input for developing even safer products for our customers.
Volvo Group has pioneered a variety of driver assistance systems, including Driver Alert Support and Lane Changing Support, which enhance awareness and alert the driver before a situation turns crit-ical. The Collision Warning with Emergency Brake system is another sophisticated system, which offers market-leading emergency braking capabilities. During the year, Volvo Trucks launched a new generation of Volvo Dynamic Steering that among other things offers automated safety systems such as Lane Keeping Assist and Stability Assist. Read more about these systems on page 25.
The fast development within the automation area will make it possible for us to offer even more sophisticated driver assist ance systems the coming years.
Automation benefits customers and societyWe believe that automation will redefine the commercial transport solutions that most of us rely on every day. Automation will create real-life benefits for both our customers and society in terms of pro-ductivity, safety, energy and fuel efficiency. However, automation is nothing new. Automated gearboxes and cruise control, to name a few, are functions that are part of our commercial offer since several years, supporting drivers in their everyday work. With the exponen-tial increase of microprocessor capacity, however, it is now possible to take automation much further. There are different levels of auto-
mation throughout the vehicle industry – from no automation to self-driving vehicles without the need for a driver or operator.
Since the ideal level of automation is determined by its added value for customers and society, Volvo Group will offer new auto-mated solutions at different levels. We believe that there will be drivers and operators in our vehicles in most applications for the foreseeable future, but we also believe that we will see self-driving commercial vehicles in specific applications already within a few years. Volvo Group already today offers a self-steering truck in South America for the sugar cane harvest.
We believe that fully automated vehicles in commercial opera-tions will initially appear in confined and semi-confined areas like mines, quarries, ports and in dedicated lanes on some highways. For more complex environments, such as city traffic and mixed traf-fic at higher speeds, we believe that it will take significantly longer time before this is possible.
Our concept vehicles show that we have come a long way in terms of technology development, but more research and develop-ment is still needed. To fully utilize all possible automated features of the future, we in the industry together with authorities also need to further develop and agree on standards and regulations, liability issues and cyber security. Read more about the Volvo Group’s auto-mation progress on page 22.
Volvo Trucks Connected Safety
TRUCKS AND CARS ALERT EACH OTHER IN TRAFFICVolvo Trucks is introducing a cloud-based service, Connected Safety, which allows Volvo trucks and Volvo cars to automat-ically alert each other to hazardous traffic situations. When the hazard warning lights are switched on, the truck sends a signal via the driver’s Internet-connected mobile phone to Volvo Trucks’ cloud service. From there the information is forwarded to the corresponding service at Volvo Cars. An alert is then transmitted to all connected cars and trucks approaching the location of the vehicle whose hazard lights have been activated. The system was launched in Sweden and Norway during 2018.
A GLOBAL GROUP 2018 BUSINESS MODEL PRODUCT DEVELOPMENT
51
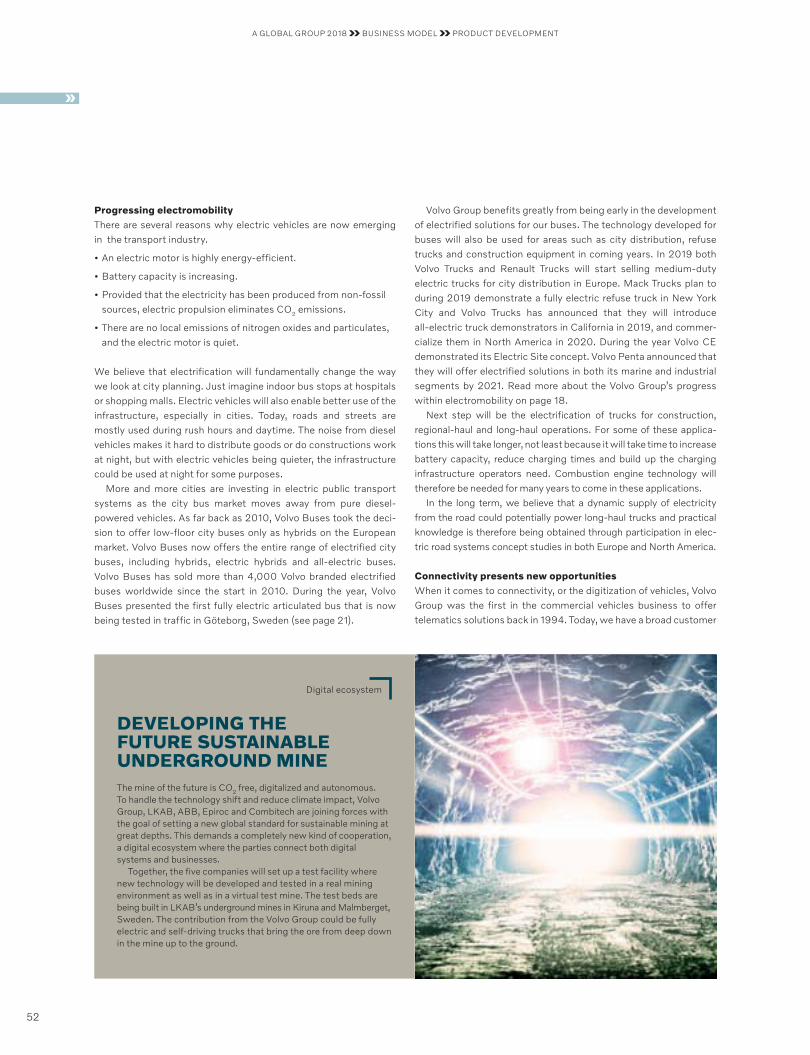
Progressing electromobilityThere are several reasons why electric vehicles are now emerging in the transport industry.
• An electric motor is highly energy-efficient.
• Battery capacity is increasing.
• Provided that the electricity has been produced from non-fossil sources, electric propulsion eliminates CO2 emissions.
• There are no local emissions of nitrogen oxides and particulates, and the electric motor is quiet.
We believe that electrification will fundamentally change the way we look at city planning. Just imagine indoor bus stops at hospitals or shopping malls. Electric vehicles will also enable better use of the infrastructure, especially in cities. Today, roads and streets are mostly used during rush hours and daytime. The noise from diesel vehicles makes it hard to distribute goods or do constructions work at night, but with electric vehicles being quieter, the infrastructure could be used at night for some purposes.
More and more cities are investing in electric public transport systems as the city bus market moves away from pure diesel- powered vehicles. As far back as 2010, Volvo Buses took the deci-sion to offer low-floor city buses only as hybrids on the European market. Volvo Buses now offers the entire range of electrified city buses, including hybrids, electric hybrids and all-electric buses. Volvo Buses has sold more than 4,000 Volvo branded electrified buses worldwide since the start in 2010. During the year, Volvo Buses presented the first fully electric articulated bus that is now being tested in traffic in Göteborg, Sweden (see page 21).
Digital ecosystem
DEVELOPING THE FUTURE SUSTAINABLE UNDERGROUND MINEThe mine of the future is CO2 free, digitalized and autonomous. To handle the technology shift and reduce climate impact, Volvo Group, LKAB, ABB, Epiroc and Combitech are joining forces with the goal of setting a new global standard for sustainable mining at great depths. This demands a completely new kind of cooperation, a digital ecosystem where the parties connect both digital systems and businesses.
Together, the five companies will set up a test facility where new technology will be developed and tested in a real mining environ ment as well as in a virtual test mine. The test beds are being built in LKAB’s underground mines in Kiruna and Malmberget, Sweden. The contribution from the Volvo Group could be fully electric and self- driving trucks that bring the ore from deep down in the mine up to the ground.
Volvo Group benefits greatly from being early in the development of electrified solutions for our buses. The technology developed for buses will also be used for areas such as city distribution, refuse trucks and construction equipment in coming years. In 2019 both Volvo Trucks and Renault Trucks will start selling medium-duty electric trucks for city distribution in Europe. Mack Trucks plan to during 2019 demonstrate a fully electric refuse truck in New York City and Volvo Trucks has announced that they will introduce all-electric truck demonstrators in California in 2019, and commer-cialize them in North America in 2020. During the year Volvo CE demonstrated its Electric Site concept. Volvo Penta announced that they will offer electrified solutions in both its marine and industrial segments by 2021. Read more about the Volvo Group’s progress within electromobility on page 18.
Next step will be the electrification of trucks for construction, regional-haul and long-haul operations. For some of these applica-tions this will take longer, not least because it will take time to increase battery capacity, reduce charging times and build up the charging infrastructure operators need. Combustion engine technology will therefore be needed for many years to come in these applications.
In the long term, we believe that a dynamic supply of electricity from the road could potentially power long-haul trucks and practical knowledge is therefore being obtained through participation in elec-tric road systems concept studies in both Europe and North America.
Connectivity presents new opportunitiesWhen it comes to connectivity, or the digitization of vehicles, Volvo Group was the first in the commercial vehicles business to offer telematics solutions back in 1994. Today, we have a broad customer
A GLOBAL GROUP 2018 BUSINESS MODEL PRODUCT DEVELOPMENT
52
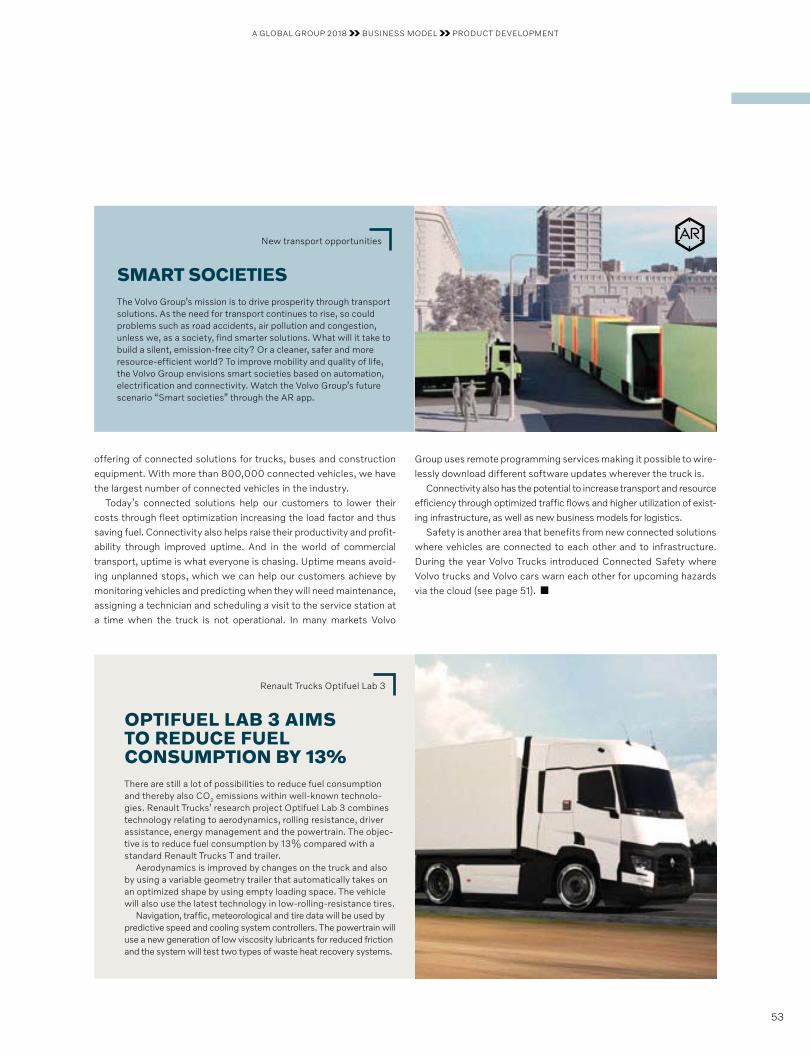
offering of connected solutions for trucks, buses and construction equipment. With more than 800,000 connected vehicles, we have the largest number of connected vehicles in the industry.
Today’s connected solutions help our customers to lower their costs through fleet optimization increasing the load factor and thus saving fuel. Connectivity also helps raise their productivity and profit-ability through improved uptime. And in the world of commercial transport, uptime is what everyone is chasing. Uptime means avoid-ing unplanned stops, which we can help our customers achieve by monitoring vehicles and predicting when they will need main tenance, assigning a technician and scheduling a visit to the service station at a time when the truck is not operational. In many markets Volvo
Group uses remote programming services making it possible to wire-lessly download different software updates wherever the truck is.
Connectivity also has the potential to increase transport and resource efficiency through optimized traffic flows and higher utilization of exist-ing infrastructure, as well as new business models for logistics.
Safety is another area that benefits from new connected solutions where vehicles are connected to each other and to infrastructure. During the year Volvo Trucks introduced Connected Safety where Volvo trucks and Volvo cars warn each other for upcoming hazards via the cloud (see page 51).
New transport opportunities
SMART SOCIETIESThe Volvo Group’s mission is to drive prosperity through transportsolutions. As the need for transport continues to rise, so could problems such as road accidents, air pollution and congestion, unless we, as a society, find smarter solutions. What will it take to build a silent, emission-free city? Or a cleaner, safer and more resource-efficient world? To improve mobility and quality of life, the Volvo Group envisions smart societies based on automation, electrification and connectivity. Watch the Volvo Group’s future scenario “Smart societies” through the AR app.
Renault Trucks Optifuel Lab 3
OPTIFUEL LAB 3 AIMS TO REDUCE FUEL CONSUMPTION BY 13%There are still a lot of possibilities to reduce fuel consumption and thereby also CO2 emissions within well-known technolo-gies. Renault Trucks’ research project Optifuel Lab 3 combines technology relating to aerodynamics, rolling resistance, driver assistance, energy management and the powertrain. The objec-tive is to reduce fuel consumption by 13% compared with a standard Renault Trucks T and trailer.
Aerodynamics is improved by changes on the truck and also by using a variable geometry trailer that automatically takes on an optimized shape by using empty loading space. The vehicle will also use the latest technology in low-rolling-resistance tires.
Navigation, traffic, meteorological and tire data will be used by predictive speed and cooling system controllers. The powertrain will use a new generation of low viscosity lubricants for reduced friction and the system will test two types of waste heat recovery systems.
A GLOBAL GROUP 2018 BUSINESS MODEL PRODUCT DEVELOPMENT
53
T he last decades, regulators in Europe, the US and Japan have progressively implemented stricter emissions standards for new heavy-duty engines for trucks and buses. China is also emerging with its new CN VI regulation for 2020 and 2023,
which is even surpassing the EU regulation in stringency, including demands on remote or telematics transmission of engine and nitrogen oxide (NOX) data. In spite of great progress, particularly related to lower levels of NOX and particulate matters (PM), problems with air pollution and climate change remain. A common focus for regulators going forward is the actual engine performance in use instead of a generic engine model in a test cell. The Volvo Group supports this direction. The Euro VI regulation implemented 2013 has clearly shown that testing with portable emissions measurement systems (PEMS) can be a very effective way to reduce real driving emissions during all conditions. The emissions regulation for passenger cars has now been updated in the same direction. We actively follow developments to ensure adherence by developing engines that meet all legal requirements.
EuropeIn 2016 a new regulation, Stage V, was published for non-road engines in EU. The main changes compared to Stage IV relate to particulate matters. The new requirements, valid from 2018/2019, are set at a perfor mance level achieved with particulate filters.
The emissions regulation for on-road vehicles was also updated with a Euro VI step D fully implemented in 2019. The main updates concern the in-service conformity testing with PEMS where the limits regarding payload and power have been changed to include low load duty cycles in a better way. A fifth update of the Euro VI regulation since the intro-duction, step E, is on its way to include cold start emissions and PM number measurements for the PEMS on-road measurements. As a first step in regulating carbon dioxide (CO2) emissions from heavy-duty vehicles, a declaration of CO2 emissions and fuel consumption for new heavy-duty trucks will start in the beginning of 2019. The regulation has been developed by the EU Commission with broad support from the Volvo Group and the industry via the European Automobile Manu-facturers’ Association (ACEA). The certified CO2 declaration is the most advanced in the world and is based on certified measurements of components and calculations of complete vehicle CO2 emissions. The system will give customers a possibility to, on an equal and fair basis, compare CO2 emissions of different product offerings and speci-fications. This will even further strengthen and support the market forces regarding CO2 and fuel consumption.
The second step is a CO2 reporting and monitoring regulation start-ing 2020, allowing the EU Commission to annually follow the progress of all new trucks and implement further actions if needed.
As a third step, a regulation setting CO2 emission performance standards for new heavy-duty vehicles was in February 2019 decided on by the EU Commission. According to the decision, the average annual CO2 emissions of the Union’s fleet of new heavy-duty vehicles is to be reduced by 15% year 2025 compared to the reference being the 2019 CO2 monitoring data. From 2030 onwards the reduction is to be at least 30% compared to 2019.
The CO2 regulation will drive the introduction of a broader scope of powertrain technologies and fuels, technologies that are not fully covered in the current Euro VI regulation. This will require an updated Euro VI regulation, to be aligned with the CO2 regulation. The Euro VI regulation has been updated three times since 2014 and each update requires a lot of testing and verification, resources that may be better used on one single, larger update. That would also allow the industry to get an appro priate lead time, similar to the four years that are stipulated in the US emission regulation.
USAIn the US, the EPA (Environmental Protection Agency) and NHTSA (National Highway Traffic Safety Administration) have decided the US Greenhouse Gas (GHG) regulation phase II final rule that will start 2021. It includes separate regulations for engines and vehicles, but also a new separate trailer regulation that started already 2018. One main difference from the current regulation is that the vehicle regulation in phase II includes the actual engine performance of the vehicle instead of a generic engine model. All limit values for engines and vehicles have been updated. The level of stringency will according to the EPA increase by up to 27% between year 2017 and 2027.
Regarding criteria pollutants, California Air Resources Board (CARB) has adopted optional low NOX certification standards for on-road heavy-duty engines. The emissions levels are reduced by up to 90% compared to the current federal NOX levels.
Local initiativesOn top of these regulations there are other local initiatives where cities around the world set more stringent regulations to improve air quality in cities. One example is the commitment from Paris, Mexico City, Madrid and Athens made at the C40 Mayors Summit to remove diesel vehicles from their cities by 2025. C40 is a network of the world’s megacities committed to addressing climate change.
Emissions regulations for heavy-duty vehicles
A GLOBAL GROUP 2018 BUSINESS MODEL PRODUCT DEVELOPMENT
54
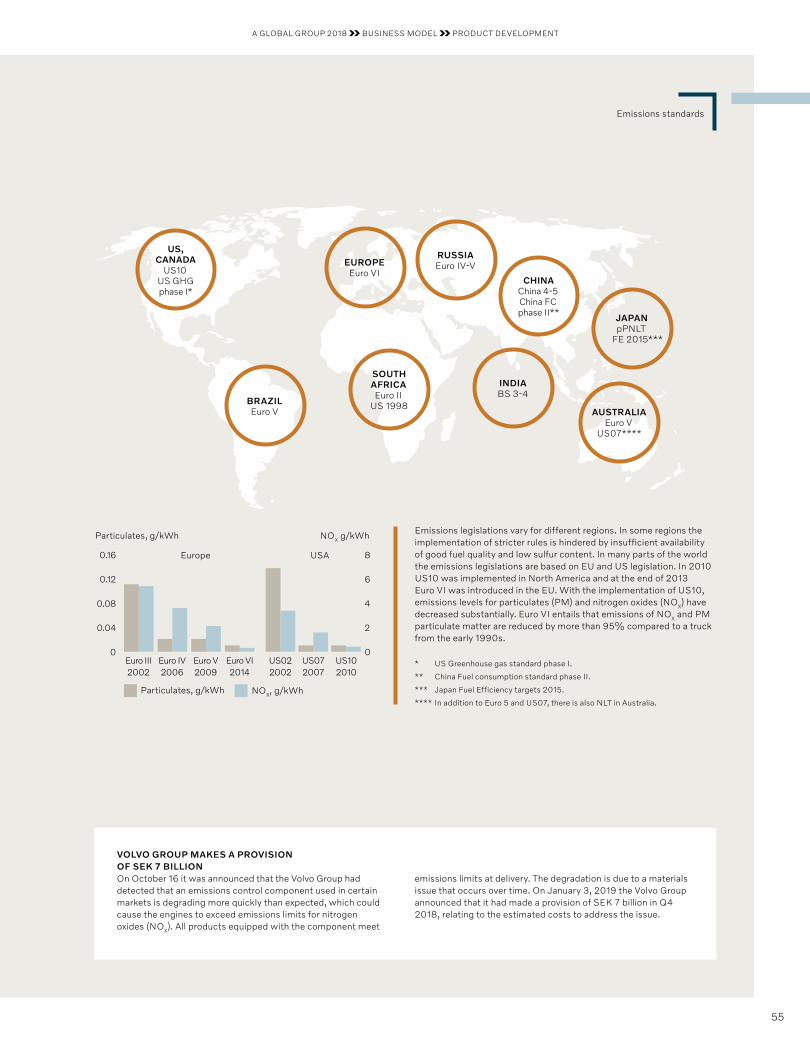
US, CANADA
US10US GHG phase I*
BRAZILEuro V
EUROPEEuro VI
RUSSIAEuro IV-V
SOUTH AFRICAEuro II
US 1998
CHINAChina 4-5China FC phase II**
INDIABS 3-4
JAPANpPNLT
FE 2015***
AUSTRALIAEuro V
US07****
Emissions standards
Euro IV2006
Euro V2009
US072007
US022002
Euro VI2014
US102010
Euro III2002
Particulates, g/kWh NOX, g/kWh
Europe USA0.16
0.12
0.08
0.04
Particulates, g/kWh
0
8
6
4
2
0
NOX g/kWh Emissions legislations vary for different regions. In some regions the implementation of stricter rules is hindered by insufficient availability of good fuel quality and low sulfur content. In many parts of the world the emissions legislations are based on EU and US legislation. In 2010 US10 was implemented in North America and at the end of 2013 Euro VI was introduced in the EU. With the implementation of US10, emissions levels for particulates (PM) and nitrogen oxides (NOX) have decreased substantially. Euro VI entails that emissions of NOX and PM partic ulate matter are reduced by more than 95% compared to a truck from the early 1990s.
* US Greenhouse gas standard phase I.
** China Fuel consumption standard phase II.
*** Japan Fuel Efficiency targets 2015.
**** In addition to Euro 5 and US07, there is also NLT in Australia.
VOLVO GROUP MAKES A PROVISION OF SEK 7 BILLION On October 16 it was announced that the Volvo Group had detected that an emissions control component used in certain markets is degrading more quickly than expected, which could cause the engines to exceed emissions limits for nitrogen oxides (NOX). All products equipped with the component meet
emissions limits at delivery. The degradation is due to a materials issue that occurs over time. On January 3, 2019 the Volvo Group announced that it had made a provision of SEK 7 billion in Q4 2018, relating to the estimated costs to address the issue.
A GLOBAL GROUP 2018 BUSINESS MODEL PRODUCT DEVELOPMENT
55
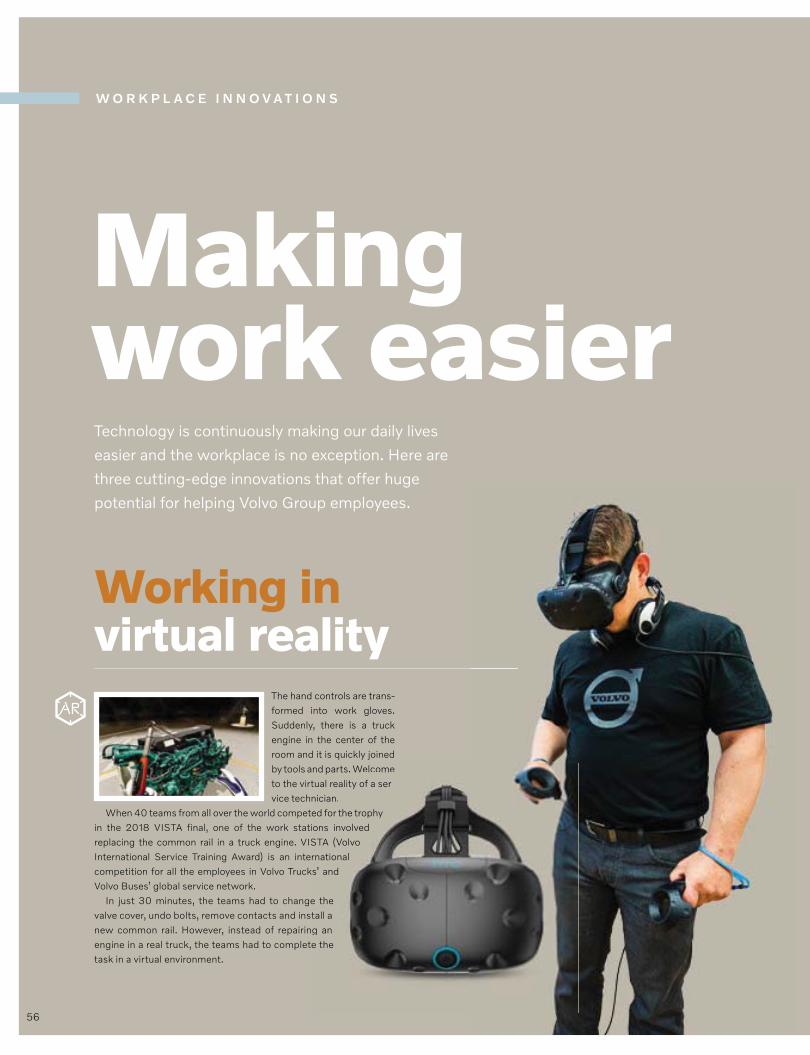
W O R K P L A C E I N N O V A T I O N S
Working in virtual reality
The hand controls are trans-formed into work gloves. Suddenly, there is a truck engine in the center of the room and it is quickly joined by tools and parts. Welcome to the virtual reality of a ser-vice technician.
When 40 teams from all over the world competed for the trophy in the 2018 VISTA final, one of the work stations involved replacing the common rail in a truck engine. VISTA (Volvo International Service Training Award) is an international competition for all the employees in Volvo Trucks’ and Volvo Buses’ global service network.
In just 30 minutes, the teams had to change the valve cover, undo bolts, remove contacts and install a new common rail. However, instead of repairing an engine in a real truck, the teams had to complete the task in a virtual environment.
Making work easierTechnology is continuously making our daily lives
easier and the workplace is no exception. Here are
three cutting-edge innovations that offer huge
potential for helping Volvo Group employees.
nd parts. Welcome tual reality of a ser-nician.ed for the trophy ons involvedSTA (Volvo rnational s’ and
e thetall a g an e the
56
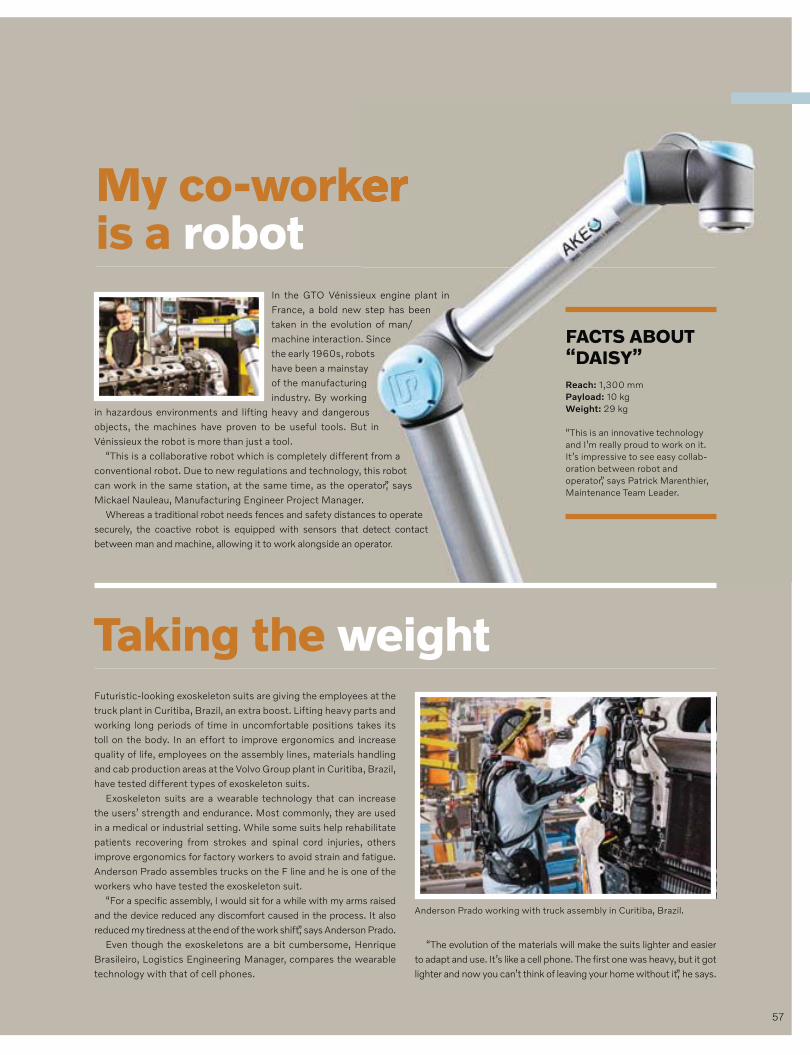
My co-worker is a robot
In the GTO Vénissieux engine plant in France, a bold new step has been taken in the evolution of man/machine interaction. Since the early 1960s, robots have been a mainstay of the manufacturing industry. By working
in hazardous environments and lifting heavy and dangerous objects, the machines have proven to be useful tools. But in Vénissieux the robot is more than just a tool.
“This is a collaborative robot which is completely different from a conventional robot. Due to new regulations and technology, this robot can work in the same station, at the same time, as the operator,” says Mickael Nauleau, Manufacturing Engineer Project Manager.
Whereas a traditional robot needs fences and safety distances to operate securely, the coactive robot is equipped with sensors that detect contact between man and machine, allowing it to work alongside an operator.
eux engine plant in step has been
on of man/. Since ots ay g g us t in
nt from a this robot
erator,” says .ces to operate detect contact
perator.
FACTS ABOUT “DAISY”Reach: 1,300 mmPayload: 10 kgWeight: 29 kg
“This is an innovative technology and I’m really proud to work on it. It’s impressive to see easy collab-oration between robot and operator,” says Patrick Marenthier, Maintenance Team Leader.
Taking the weightFuturistic-looking exoskeleton suits are giving the employees at the truck plant in Curitiba, Brazil, an extra boost. Lifting heavy parts and working long periods of time in uncomfortable positions takes its toll on the body. In an effort to improve ergonomics and increase quality of life, employees on the assembly lines, materials handling and cab production areas at the Volvo Group plant in Curitiba, Brazil, have tested different types of exoskeleton suits.
Exoskeleton suits are a wearable technology that can increase the users’ strength and endurance. Most commonly, they are used in a medical or industrial setting. While some suits help rehabilitate patients recovering from strokes and spinal cord injuries, others improve ergonomics for factory workers to avoid strain and fatigue. Anderson Prado assembles trucks on the F line and he is one of the workers who have tested the exoskeleton suit.
“For a specific assembly, I would sit for a while with my arms raised and the device reduced any discomfort caused in the process. It also reduced my tiredness at the end of the work shift,” says Anderson Prado.
Even though the exoskeletons are a bit cumbersome, Henrique Brasileiro, Logistics Engineering Manager, compares the wearable technology with that of cell phones.
Anderson Prado working with truck assembly in Curitiba, Brazil.
“The evolution of the materials will make the suits lighter and easier to adapt and use. It’s like a cell phone. The first one was heavy, but it got lighter and now you can’t think of leaving your home without it,” he says.
57
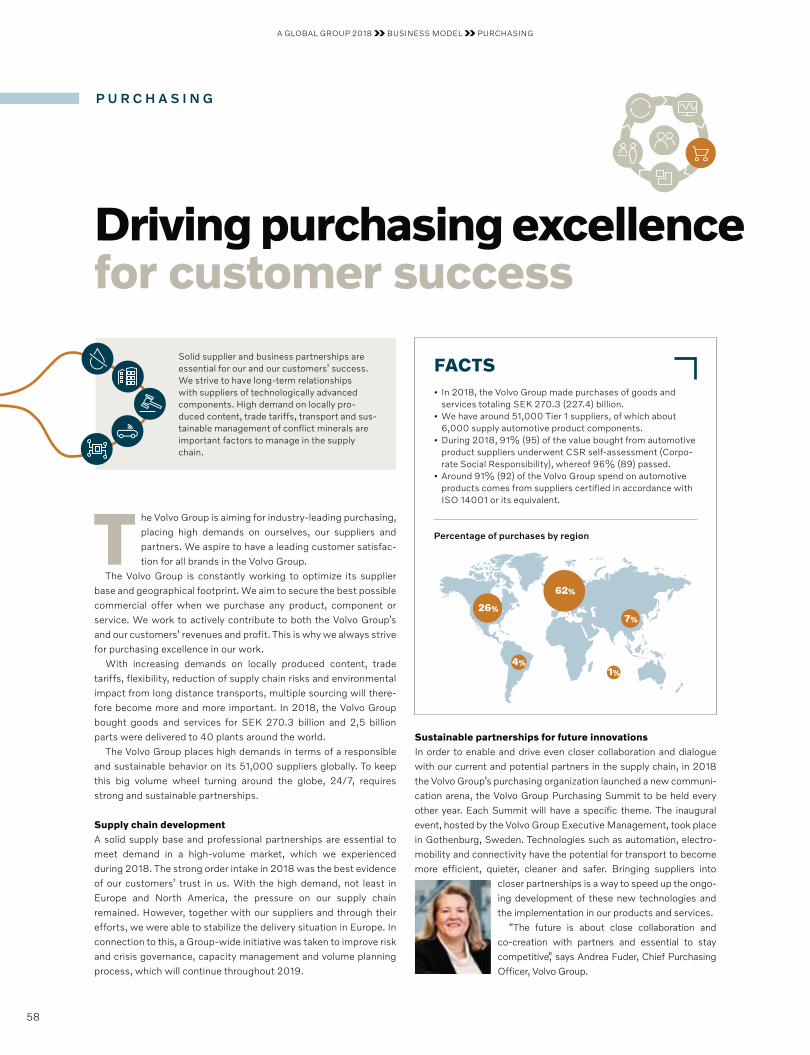
P U R C H A S I N G
Driving purchasing excellence for customer success
The Volvo Group is aiming for industry-leading purchasing, placing high demands on ourselves, our suppliers and partners. We aspire to have a leading customer satisfac-tion for all brands in the Volvo Group.
The Volvo Group is constantly working to optimize its supplier base and geographical footprint. We aim to secure the best possible commercial offer when we purchase any product, component or service. We work to actively contribute to both the Volvo Group’s and our customers’ revenues and profit. This is why we always strive for purchasing excellence in our work.
With increasing demands on locally produced content, trade tariffs, flexibility, reduction of supply chain risks and environmental impact from long distance transports, multiple sourcing will there-fore become more and more important. In 2018, the Volvo Group bought goods and services for SEK 270.3 billion and 2,5 billion parts were delivered to 40 plants around the world.
The Volvo Group places high demands in terms of a responsible and sustainable behavior on its 51,000 suppliers globally. To keep this big volume wheel turning around the globe, 24/7, requires strong and sustainable partnerships.
Supply chain developmentA solid supply base and professional partnerships are essential to meet demand in a high-volume market, which we experienced during 2018. The strong order intake in 2018 was the best evidence of our customers’ trust in us. With the high demand, not least in Europe and North America, the pressure on our supply chain remained. However, together with our suppliers and through their efforts, we were able to stabilize the delivery situation in Europe. In connection to this, a Group-wide initiative was taken to improve risk and crisis governance, capacity management and volume planning process, which will continue throughout 2019.
Sustainable partnerships for future innovationsIn order to enable and drive even closer collaboration and dialogue with our current and potential partners in the supply chain, in 2018 the Volvo Group’s purchasing organization launched a new communi-cation arena, the Volvo Group Purchasing Summit to be held every other year. Each Summit will have a specific theme. The inaugural event, hosted by the Volvo Group Executive Management, took place in Gothenburg, Sweden. Technologies such as automation, electro-mobility and connectivity have the potential for transport to become more efficient, quieter, cleaner and safer. Bringing suppliers into
closer partnerships is a way to speed up the ongo-ing development of these new technologies and the implementation in our products and services.
“The future is about close collaboration and co-creation with partners and essential to stay competitive,” says Andrea Fuder, Chief Purchasing Officer, Volvo Group.
Solid supplier and business partnerships are essential for our and our customers’ success. We strive to have long-term relationships with suppliers of technologically advanced components. High demand on locally pro-duced content, trade tariffs, transport and sus-tainable management of conflict minerals are important factors to manage in the supply chain.
FACTS• In 2018, the Volvo Group made purchases of goods and
services totaling SEK 270.3 (227.4) billion. • We have around 51,000 Tier 1 suppliers, of which about
6,000 supply automotive product components.• During 2018, 91% (95) of the value bought from automotive
product suppliers underwent CSR self-assessment (Corpo-rate Social Responsibility), whereof 96% (89) passed.
• Around 91% (92) of the Volvo Group spend on automotive products comes from suppliers certified in accordance with ISO 14001 or its equivalent.
Percentage of purchases by region
26%
4%
62%
7%
1%
A GLOBAL GROUP 2018 BUSINESS MODEL PURCHASING
58
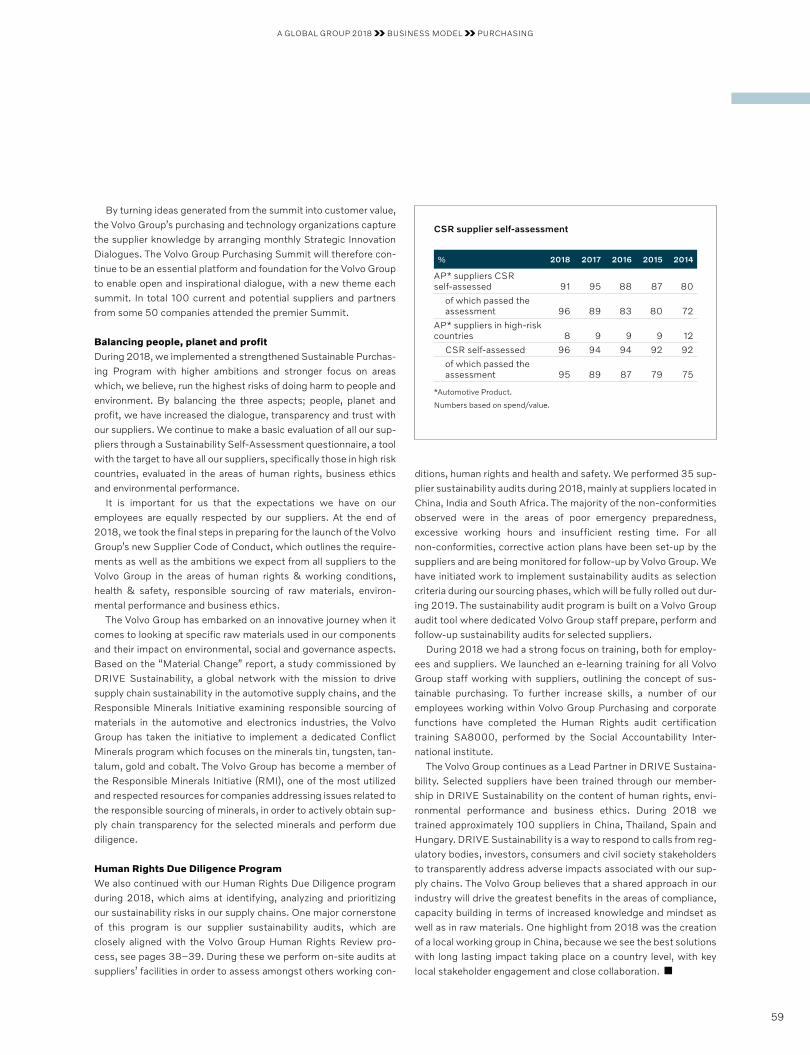
By turning ideas generated from the summit into customer value, the Volvo Group’s purchasing and technology organizations capture the supplier knowledge by arranging monthly Strategic Innovation Dialogues. The Volvo Group Purchasing Summit will therefore con-tinue to be an essential platform and foundation for the Volvo Group to enable open and inspirational dialogue, with a new theme each summit. In total 100 current and potential suppliers and partners from some 50 companies attended the premier Summit.
Balancing people, planet and profitDuring 2018, we implemented a strengthened Sustainable Purchas-ing Program with higher ambitions and stronger focus on areas which, we believe, run the highest risks of doing harm to people and environment. By balancing the three aspects; people, planet and profit, we have increased the dialogue, transparency and trust with our suppliers. We continue to make a basic evaluation of all our sup-pliers through a Sustainability Self-Assessment questionnaire, a tool with the target to have all our suppliers, specifically those in high risk countries, evaluated in the areas of human rights, business ethics and environmental performance.
It is important for us that the expectations we have on our employees are equally respected by our suppliers. At the end of 2018, we took the final steps in preparing for the launch of the Volvo Group’s new Supplier Code of Conduct, which outlines the require-ments as well as the ambitions we expect from all suppliers to the Volvo Group in the areas of human rights & working conditions, health & safety, responsible sourcing of raw materials, environ-mental performance and business ethics.
The Volvo Group has embarked on an innovative journey when it comes to looking at specific raw materials used in our components and their impact on environmental, social and governance aspects. Based on the “Material Change” report, a study commissioned by DRIVE Sustainability, a global network with the mission to drive supply chain sustainability in the automotive supply chains, and the Responsible Minerals Initiative examining responsible sourcing of materials in the automotive and electronics industries, the Volvo Group has taken the initiative to implement a dedicated Conflict Minerals program which focuses on the minerals tin, tungsten, tan-talum, gold and cobalt. The Volvo Group has become a member of the Responsible Minerals Initiative (RMI), one of the most utilized and respected resources for companies addressing issues related to the responsible sourcing of minerals, in order to actively obtain sup-ply chain transparency for the selected minerals and perform due diligence.
Human Rights Due Diligence ProgramWe also continued with our Human Rights Due Diligence program during 2018, which aims at identifying, analyzing and prioritizing our sustainability risks in our supply chains. One major cornerstone of this program is our supplier sustainability audits, which are closely aligned with the Volvo Group Human Rights Review pro-cess, see pages 38–39. During these we perform on-site audits at suppliers’ facilities in order to assess amongst others working con-
ditions, human rights and health and safety. We performed 35 sup-plier sustainability audits during 2018, mainly at suppliers located in China, India and South Africa. The majority of the non-conformities observed were in the areas of poor emergency preparedness, excessive working hours and insufficient resting time. For all non-conformities, corrective action plans have been set-up by the suppliers and are being monitored for follow-up by Volvo Group. We have initiated work to implement sustainability audits as selection criteria during our sourcing phases, which will be fully rolled out dur-ing 2019. The sustainability audit program is built on a Volvo Group audit tool where dedicated Volvo Group staff prepare, perform and follow-up sustainability audits for selected suppliers.
During 2018 we had a strong focus on training, both for employ-ees and suppliers. We launched an e-learning training for all Volvo Group staff working with suppliers, outlining the concept of sus-tainable purchasing. To further increase skills, a number of our employees working within Volvo Group Purchasing and corporate functions have completed the Human Rights audit certification training SA8000, performed by the Social Accountability Inter-national institute.
The Volvo Group continues as a Lead Partner in DRIVE Sustaina-bility. Selected suppliers have been trained through our member-ship in DRIVE Sustainability on the content of human rights, envi-ronmental performance and business ethics. During 2018 we trained approximately 100 suppliers in China, Thailand, Spain and Hungary. DRIVE Sustainability is a way to respond to calls from reg-ulatory bodies, investors, consumers and civil society stakeholders to transparently address adverse impacts associated with our sup-ply chains. The Volvo Group believes that a shared approach in our industry will drive the greatest benefits in the areas of compliance, capacity building in terms of increased knowledge and mindset as well as in raw materials. One highlight from 2018 was the creation of a local working group in China, because we see the best solutions with long lasting impact taking place on a country level, with key local stakeholder engagement and close collaboration.
CSR supplier self-assessment
% 2018 2017 2016 2015 2014
AP* suppliers CSR self-assessed 91 95 88 87 80
of which passed the assessment 96 89 83 80 72
AP* suppliers in high-risk countries 8 9 9 9 12
CSR self-assessed 96 94 94 92 92
of which passed the assessment 95 89 87 79 75
*Automotive Product.
Numbers based on spend/value.
A GLOBAL GROUP 2018 BUSINESS MODEL PURCHASING
59
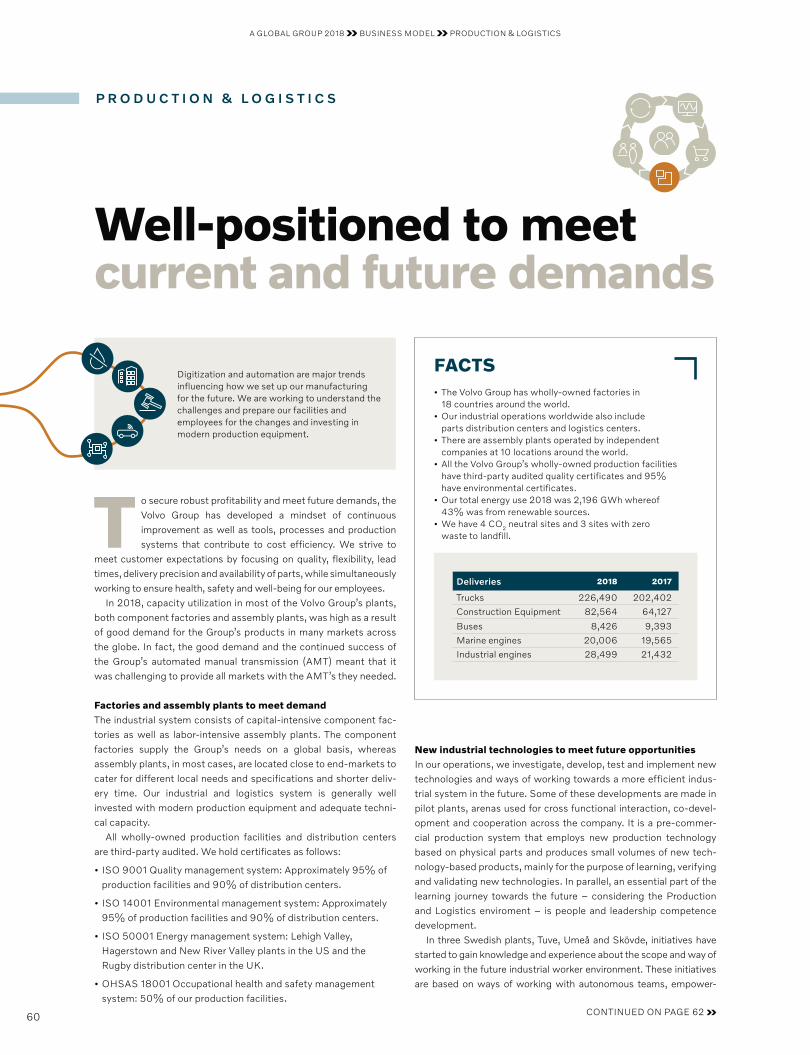
Well-positioned to meet current and future demands
To secure robust profitability and meet future demands, the Volvo Group has developed a mindset of continuous improvement as well as tools, processes and production systems that contribute to cost efficiency. We strive to
meet customer expectations by focusing on quality, flexibility, lead times, delivery precision and availability of parts, while simultaneously working to ensure health, safety and well-being for our employees.
In 2018, capacity utilization in most of the Volvo Group’s plants, both component factories and assembly plants, was high as a result of good demand for the Group’s products in many markets across the globe. In fact, the good demand and the continued success of the Group’s automated manual transmission (AMT) meant that it was challenging to provide all markets with the AMT’s they needed.
Factories and assembly plants to meet demand The industrial system consists of capital-intensive component fac-tories as well as labor-intensive assembly plants. The component factories supply the Group’s needs on a global basis, whereas assembly plants, in most cases, are located close to end-markets to cater for different local needs and specifications and shorter deliv-ery time. Our industrial and logistics system is generally well invested with modern production equipment and adequate techni-cal capacity.
All wholly-owned production facilities and distribution centers are third-party audited. We hold certificates as follows:
• ISO 9001 Quality management system: Approximately 95% of production facilities and 90% of distribution centers.
• ISO 14001 Environmental management system: Approximately 95% of production facilities and 90% of distribution centers.
• ISO 50001 Energy management system: Lehigh Valley, Hagerstown and New River Valley plants in the US and the Rugby distribution center in the UK.
• OHSAS 18001 Occupational health and safety management system: 50% of our production facilities.
FACTS• The Volvo Group has wholly-owned factories in
18 countries around the world.• Our industrial operations worldwide also include
parts distribution centers and logistics centers.• There are assembly plants operated by independent
companies at 10 locations around the world.• All the Volvo Group’s wholly-owned production facilities
have third-party audited quality certificates and 95% have environmental certificates.
• Our total energy use 2018 was 2,196 GWh whereof 43% was from renewable sources.
• We have 4 CO2 neutral sites and 3 sites with zero waste to landfill.
Deliveries 2018 2017
Trucks 226,490 202,402
Construction Equipment 82,564 64,127
Buses 8,426 9,393
Marine engines 20,006 19,565
Industrial engines 28,499 21,432
New industrial technologies to meet future opportunitiesIn our operations, we investigate, develop, test and implement new technologies and ways of working towards a more efficient indus-trial system in the future. Some of these developments are made in pilot plants, arenas used for cross functional interaction, co-devel-opment and cooperation across the company. It is a pre-commer-cial production system that employs new production technology based on physical parts and produces small volumes of new tech-nology-based products, mainly for the purpose of learning, verifying and validating new technologies. In parallel, an essential part of the learning journey towards the future – considering the Production and Logistics enviroment – is people and leadership competence development.
In three Swedish plants, Tuve, Umeå and Skövde, initiatives have started to gain knowledge and experience about the scope and way of working in the future industrial worker environment. These initiatives are based on ways of working with autonomous teams, empower-
Digitization and automation are major trends influencing how we set up our manufacturing for the future. We are working to understand the challenges and prepare our facilities and employees for the changes and investing in modern production equipment.
CONTINUED ON PAGE 62
P R O D U C T I O N & L O G I S T I C S
A GLOBAL GROUP 2018 BUSINESS MODEL PRODUCTION & LOGISTICS
60
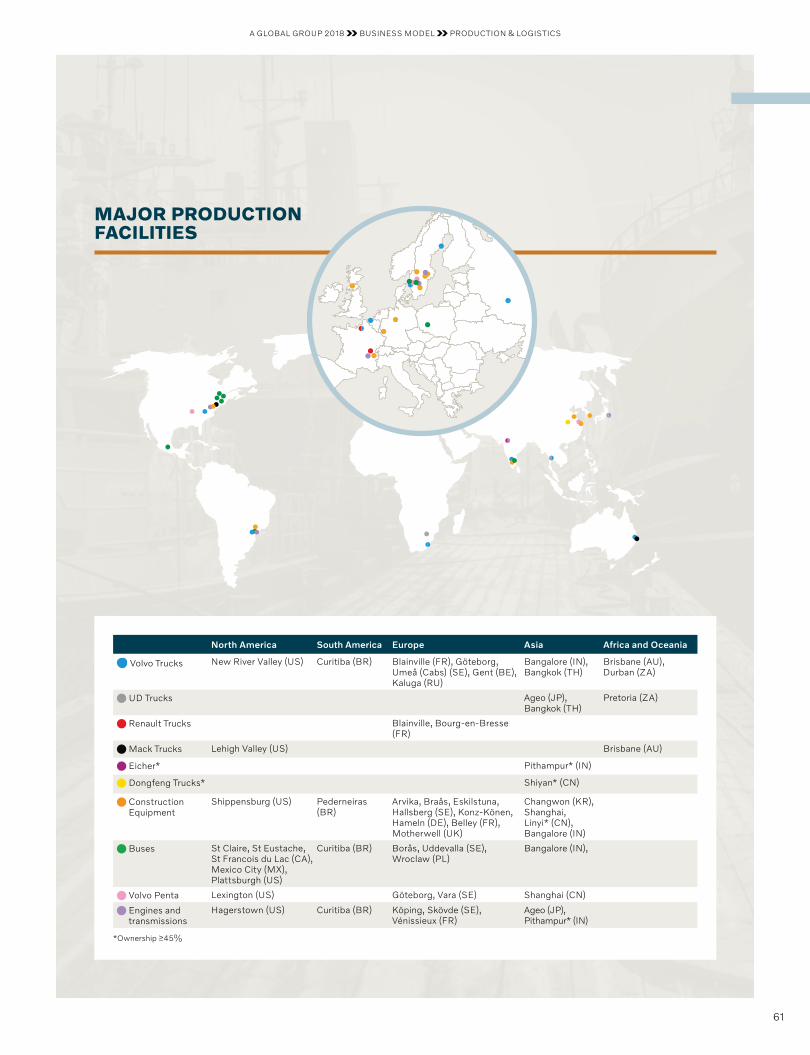
North America South America Europe Asia Africa and Oceania
Volvo Trucks New River Valley (US) Curitiba (BR) Blainville (FR), Göteborg, Umeå (Cabs) (SE), Gent (BE), Kaluga (RU)
Bangalore (IN), Bangkok (TH)
Brisbane (AU), Durban (ZA)
UD Trucks Ageo (JP), Bangkok (TH)
Pretoria (ZA)
Renault Trucks Blainville, Bourg-en-Bresse (FR)
Mack Trucks Lehigh Valley (US) Brisbane (AU)
Eicher* Pithampur* (IN)
Dongfeng Trucks* Shiyan* (CN)
Construction Equipment
Shippensburg (US) Pederneiras (BR)
Arvika, Braås, Eskilstuna, Hallsberg (SE), Konz-Könen, Hameln (DE), Belley (FR), Motherwell (UK)
Changwon (KR), Shanghai, Linyi* (CN), Bangalore (IN)
Buses St Claire, St Eustache, St Francois du Lac (CA), Mexico City (MX), Plattsburgh (US)
Curitiba (BR) Borås, Uddevalla (SE), Wroclaw (PL)
Bangalore (IN),
Volvo Penta Lexington (US) Göteborg, Vara (SE) Shanghai (CN)
Engines and transmissions
Hagerstown (US) Curitiba (BR) Köping, Skövde (SE), Vénissieux (FR)
Ageo (JP), Pithampur* (IN)
*Ownership ≥45%
MAJOR PRODUCTION FACILITIES
A GLOBAL GROUP 2018 BUSINESS MODEL PRODUCTION & LOGISTICS
61
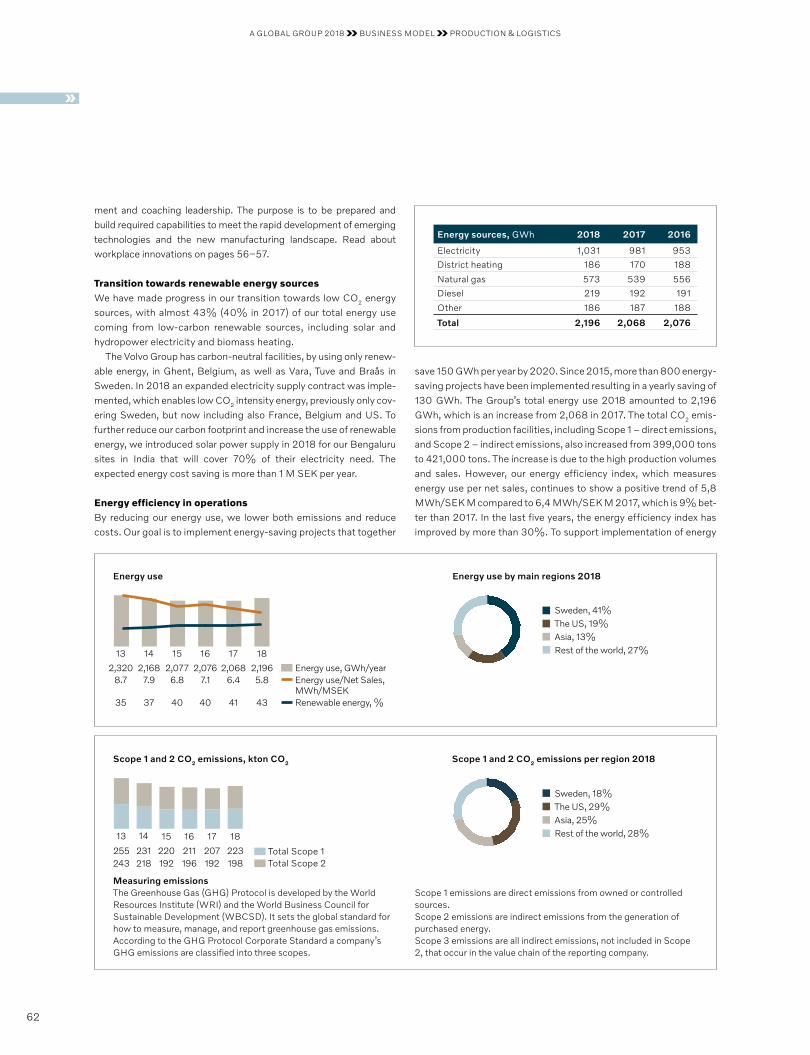
ment and coaching leadership. The purpose is to be prepared and build required capabilities to meet the rapid development of emerging technologies and the new manufacturing landscape. Read about workplace innovations on pages 56–57.
Transition towards renewable energy sourcesWe have made progress in our transition towards low CO2 energy sources, with almost 43% (40% in 2017) of our total energy use coming from low-carbon renewable sources, including solar and hydropower electricity and biomass heating.
The Volvo Group has carbon-neutral facilities, by using only renew-able energy, in Ghent, Belgium, as well as Vara, Tuve and Braås in Sweden. In 2018 an expanded electricity supply contract was imple-mented, which enables low CO2 intensity energy, previously only cov-ering Sweden, but now including also France, Belgium and US. To further reduce our carbon footprint and increase the use of renewable energy, we introduced solar power supply in 2018 for our Bengaluru sites in India that will cover 70% of their electricity need. The expected energy cost saving is more than 1 M SEK per year.
Energy efficiency in operationsBy reducing our energy use, we lower both emissions and reduce costs. Our goal is to implement energy-saving projects that together
save 150 GWh per year by 2020. Since 2015, more than 800 energy- saving projects have been implemented resulting in a yearly saving of 130 GWh. The Group’s total energy use 2018 amounted to 2,196 GWh, which is an increase from 2,068 in 2017. The total CO2 emis-sions from production facilities, including Scope 1 – direct emissions, and Scope 2 – indirect emissions, also increased from 399,000 tons to 421,000 tons. The increase is due to the high production volumes and sales. However, our energy efficiency index, which measures energy use per net sales, continues to show a positive trend of 5,8 MWh/SEK M compared to 6,4 MWh/SEK M 2017, which is 9% bet-ter than 2017. In the last five years, the energy efficiency index has improved by more than 30%. To support implementation of energy
Measuring emissionsThe Greenhouse Gas (GHG) Protocol is developed by the World Resources Institute (WRI) and the World Business Council for Sustain able Development (WBCSD). It sets the global standard for how to measure, manage, and report greenhouse gas emissions. According to the GHG Protocol Corporate Standard a company’s GHG emissions are classified into three scopes.
Scope 1 emissions are direct emissions from owned or controlled sources. Scope 2 emissions are indirect emissions from the generation of purchased energy. Scope 3 emissions are all indirect emissions, not included in Scope 2, that occur in the value chain of the reporting company.
Total Scope 1Total Scope 2
15
231218
16
220192
14
255243
13 17
211196
207192
18
223198
Scope 1 and 2 CO2 emissions, kton CO2
Sweden, 18%The US, 29%Asia, 25%Rest of the world, 28%
Scope 1 and 2 CO2 emissions per region 2018
Energy sources, GWh 2018 2017 2016
Electricity 1,031 981 953
District heating 186 170 188
Natural gas 573 539 556
Diesel 219 192 191
Other 186 187 188
Total 2,196 2,068 2,076
Energy use
Sweden, 41%The US, 19%Asia, 13%Rest of the world, 27%
Energy use by main regions 2018
14 1513 16
2,3208.7
35
2,1687.9
37
2,0776.8
40
2,0767.1
40
17
2,0686.4
41
18
2,1965.8
43
Energy use, GWh/yearEnergy use/Net Sales, MWh/MSEKRenewable energy, %
A GLOBAL GROUP 2018 BUSINESS MODEL PRODUCTION & LOGISTICS
62
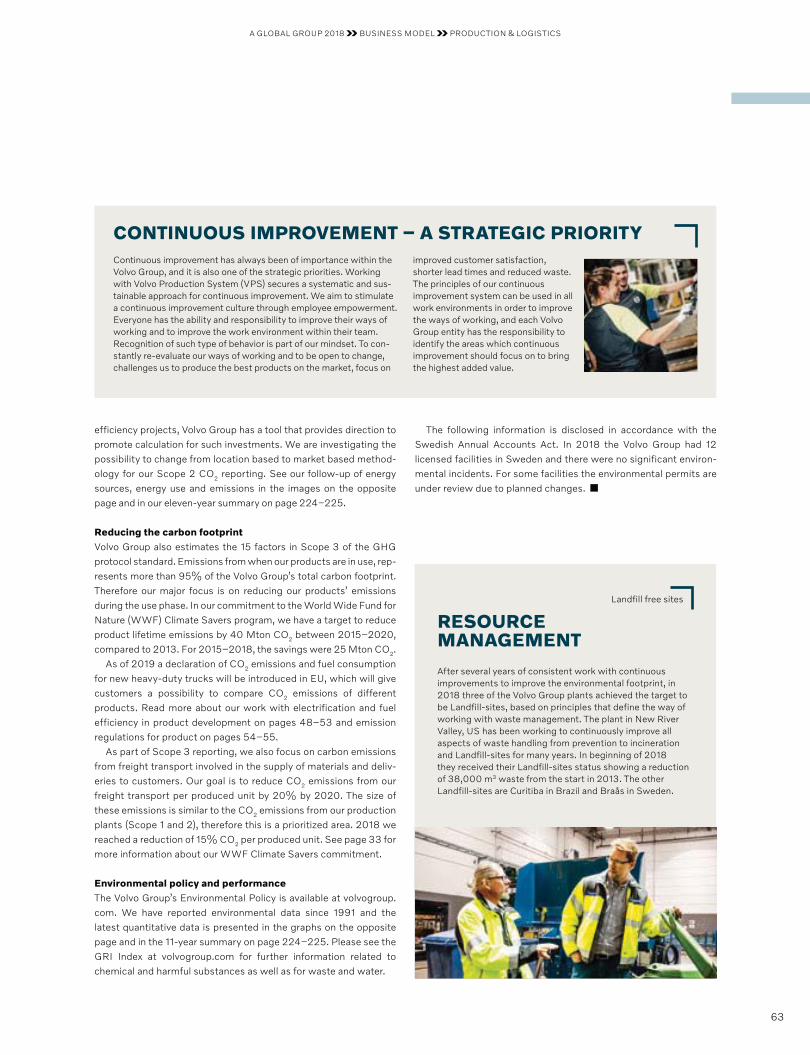
efficiency projects, Volvo Group has a tool that provides direction to promote calculation for such investments. We are investigating the possibility to change from location based to market based method-ology for our Scope 2 CO2 reporting. See our follow-up of energy sources, energy use and emissions in the images on the opposite page and in our eleven-year summary on page 224–225.
Reducing the carbon footprint Volvo Group also estimates the 15 factors in Scope 3 of the GHG protocol standard. Emissions from when our products are in use, rep-resents more than 95% of the Volvo Group’s total carbon footprint. Therefore our major focus is on reducing our products’ emissions during the use phase. In our commitment to the World Wide Fund for Nature (WWF) Climate Savers program, we have a target to reduce product lifetime emissions by 40 Mton CO2 between 2015–2020, compared to 2013. For 2015–2018, the savings were 25 Mton CO2.
As of 2019 a declaration of CO2 emissions and fuel consumption for new heavy-duty trucks will be introduced in EU, which will give customers a possibility to compare CO2 emissions of different products. Read more about our work with electrification and fuel efficiency in product development on pages 48–53 and emission regulations for product on pages 54–55.
As part of Scope 3 reporting, we also focus on carbon emissions from freight transport involved in the supply of materials and deliv-eries to customers. Our goal is to reduce CO2 emissions from our freight transport per produced unit by 20% by 2020. The size of these emissions is similar to the CO2 emissions from our production plants (Scope 1 and 2), therefore this is a prioritized area. 2018 we reached a reduction of 15% CO2 per produced unit. See page 33 for more information about our WWF Climate Savers commitment.
Environmental policy and performanceThe Volvo Group’s Environmental Policy is available at volvogroup.com. We have reported environmental data since 1991 and the latest quantitative data is presented in the graphs on the opposite page and in the 11-year summary on page 224–225. Please see the GRI Index at volvogroup.com for further information related to chemical and harmful substances as well as for waste and water.
The following information is disclosed in accordance with the Swedish Annual Accounts Act. In 2018 the Volvo Group had 12 licensed facilities in Sweden and there were no significant environ-mental incidents. For some facilities the environmental permits are under review due to planned changes.
CONTINUOUS IMPROVEMENT – A STRATEGIC PRIORITYContinuous improvement has always been of importance within the Volvo Group, and it is also one of the strategic priorities. Working with Volvo Production System (VPS) secures a systematic and sus-tainable approach for contin uous improvement. We aim to stimulate a continuous improvement culture through employee empowerment. Everyone has the ability and responsibility to improve their ways of working and to improve the work environment within their team. Recognition of such type of behavior is part of our mindset. To con-stantly re-evaluate our ways of working and to be open to change, challenges us to produce the best products on the market, focus on
improved customer satis faction, shorter lead times and reduced waste. The principles of our continuous improvement system can be used in all work environments in order to improve the ways of working, and each Volvo Group entity has the responsibility to identify the areas which contin uous improvement should focus on to bring the highest added value.
Landfill free sites
RESOURCE MANAGEMENT
After several years of consistent work with continuous improvements to improve the environmental footprint, in 2018 three of the Volvo Group plants achieved the target to be Landfill-sites, based on principles that define the way of working with waste management. The plant in New River Valley, US has been working to continuously improve all aspects of waste handling from prevention to incineration and Landfill-sites for many years. In beginning of 2018 they received their Landfill-sites status showing a reduction of 38,000 m3 waste from the start in 2013. The other Landfill-sites are Curitiba in Brazil and Braås in Sweden.
A GLOBAL GROUP 2018 BUSINESS MODEL PRODUCTION & LOGISTICS
63
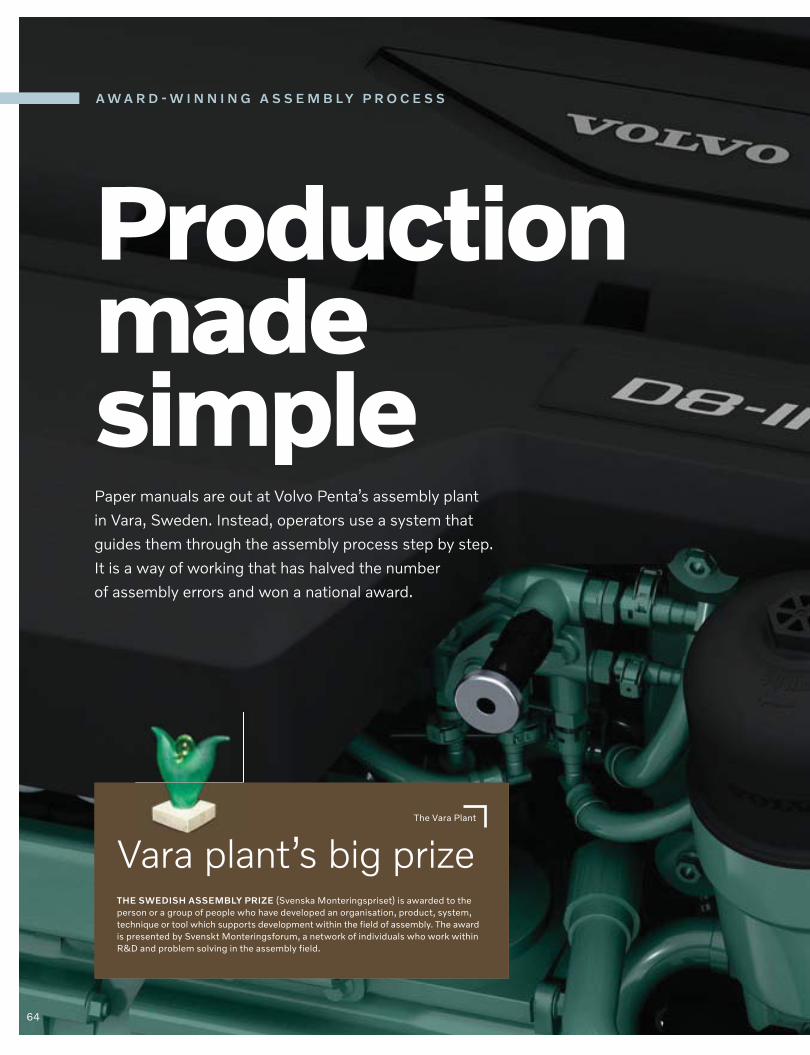
A W A R D - W I N N I N G A S S E M B L Y P R O C E S S
Production made simple
The Vara Plant
Vara plant’s big prize THE SWEDISH ASSEMBLY PRIZE (Svenska Monteringspriset) is awarded to the person or a group of people who have developed an organisation, product, system, technique or tool which supports development within the field of assembly. The award is presented by Svenskt Monteringsforum, a network of individuals who work within R&D and problem solving in the assembly field.
Paper manuals are out at Volvo Penta’s assembly plant
in Vara, Sweden. Instead, operators use a system that
guides them through the assembly process step by step.
It is a way of working that has halved the number
of assembly errors and won a national award.
64
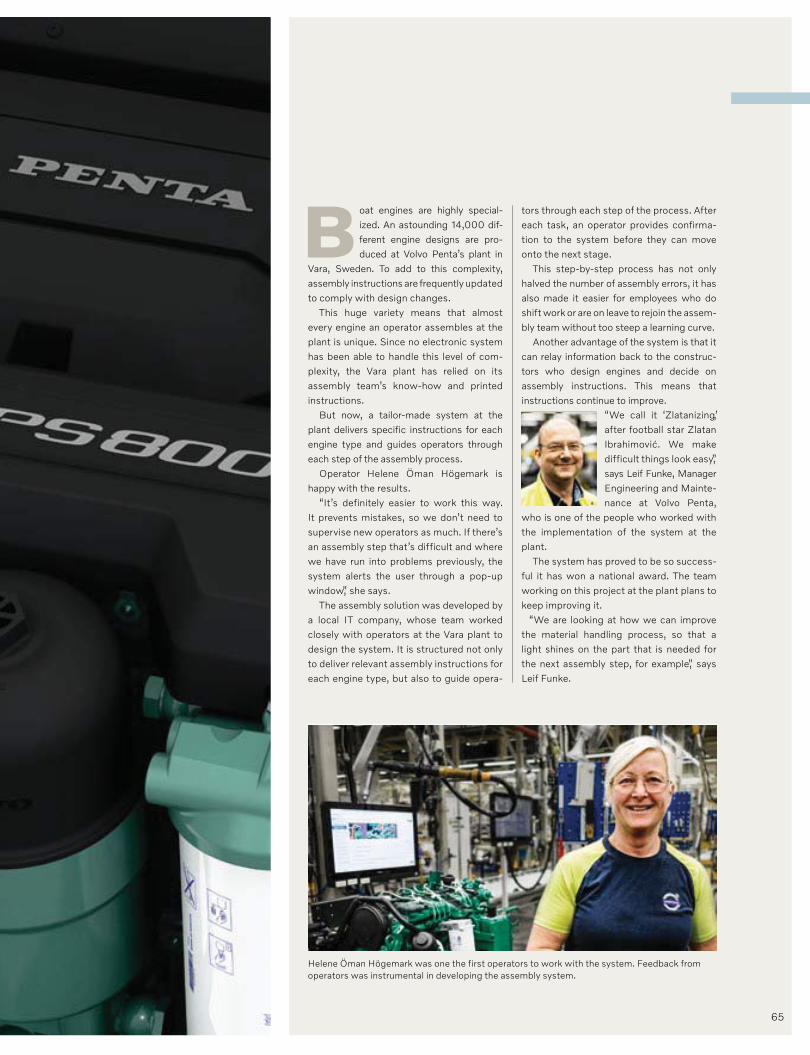
Boat engines are highly special-ized. An astounding 14,000 dif-ferent engine designs are pro-duced at Volvo Penta’s plant in
Vara, Sweden. To add to this complexity, assembly instructions are frequently updated to comply with design changes.
This huge variety means that almost every engine an operator assembles at the plant is unique. Since no electronic system has been able to handle this level of com-plexity, the Vara plant has relied on its assembly team’s know-how and printed instructions.
But now, a tailor-made system at the plant delivers specific instructions for each engine type and guides operators through each step of the assembly process.
Operator Helene Öman Högemark is happy with the results.
“It’s definitely easier to work this way. It prevents mistakes, so we don’t need to supervise new operators as much. If there’s an assembly step that’s difficult and where we have run into problems previously, the system alerts the user through a pop-up window,” she says.
The assembly solution was developed by a local IT company, whose team worked closely with operators at the Vara plant to design the system. It is structured not only to deliver relevant assembly instructions for each engine type, but also to guide opera-
tors through each step of the process. After each task, an operator provides confirma-tion to the system before they can move onto the next stage.
This step-by-step process has not only halved the number of assembly errors, it has also made it easier for employees who do shift work or are on leave to rejoin the assem-bly team without too steep a learning curve.
Another advantage of the system is that it can relay information back to the construc-tors who design engines and decide on assembly instructions. This means that instructions continue to improve.
“We call it ‘Zlatanizing’, after football star Zlatan Ibrahimović. We make difficult things look easy,” says Leif Funke, Manager Engineering and Mainte-nance at Volvo Penta,
who is one of the people who worked with the implementation of the system at the plant.
The system has proved to be so success-ful it has won a national award. The team working on this project at the plant plans to keep improving it.
“We are looking at how we can improve the material handling process, so that a light shines on the part that is needed for the next assembly step, for example,” says Leif Funke.
Helene Öman Högemark was one the first operators to work with the system. Feedback from operators was instrumental in developing the assembly system.
65
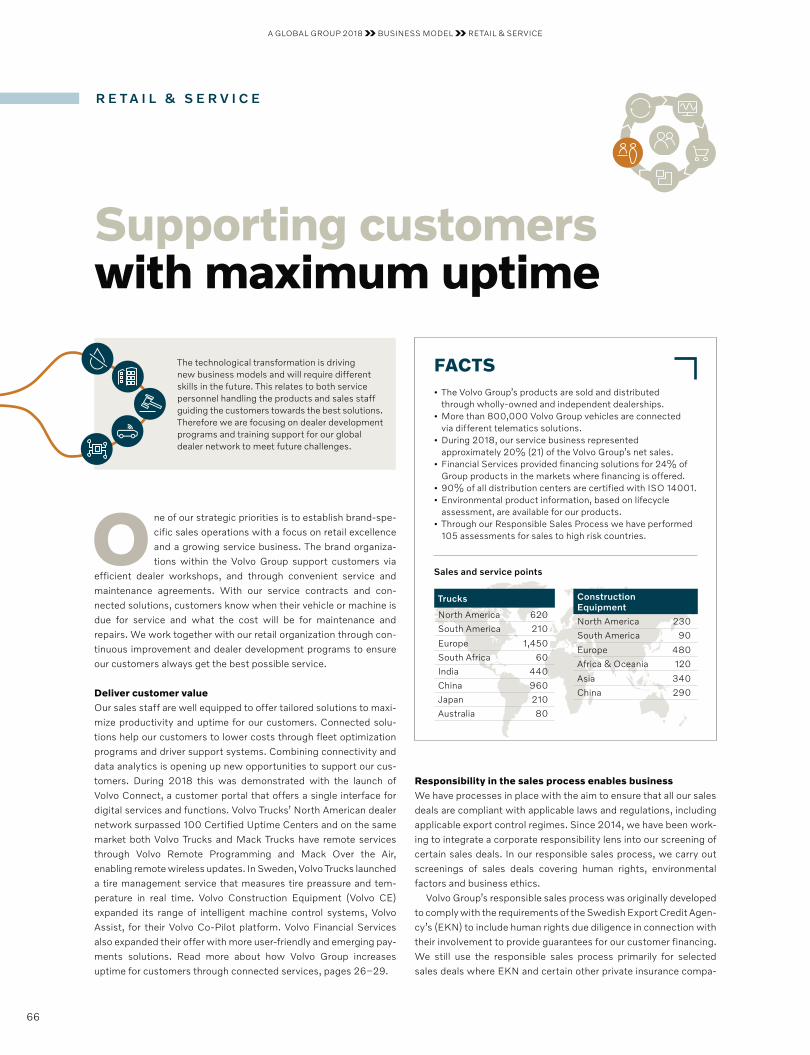
Supporting customers with maximum uptime
One of our strategic priorities is to establish brand-spe-cific sales operations with a focus on retail excellence and a growing service business. The brand organiza-tions within the Volvo Group support customers via
efficient dealer workshops, and through convenient service and maintenance agreements. With our service contracts and con-nected solutions, customers know when their vehicle or machine is due for service and what the cost will be for maintenance and repairs. We work together with our retail organization through con-tinuous improvement and dealer development programs to ensure our customers always get the best possible service.
Deliver customer value Our sales staff are well equipped to offer tailored solutions to maxi-mize productivity and uptime for our customers. Connected solu-tions help our customers to lower costs through fleet optimization programs and driver support systems. Combining connectivity and data analytics is opening up new opportunities to support our cus-tomers. During 2018 this was demonstrated with the launch of Volvo Connect, a customer portal that offers a single interface for digital services and functions. Volvo Trucks’ North American dealer network surpassed 100 Certified Uptime Centers and on the same market both Volvo Trucks and Mack Trucks have remote services through Volvo Remote Programming and Mack Over the Air, enabling remote wireless updates. In Sweden, Volvo Trucks launched a tire management service that measures tire preassure and tem-perature in real time. Volvo Construction Equipment (Volvo CE) expanded its range of intelligent machine control systems, Volvo Assist, for their Volvo Co-Pilot platform. Volvo Financial Services also expanded their offer with more user-friendly and emerging pay-ments solutions. Read more about how Volvo Group increases uptime for customers through connected services, pages 26–29.
Responsibility in the sales process enables businessWe have processes in place with the aim to ensure that all our sales deals are compliant with applicable laws and regulations, including applicable export control regimes. Since 2014, we have been work-ing to integrate a corporate responsibility lens into our screening of certain sales deals. In our responsible sales process, we carry out screenings of sales deals covering human rights, environmental factors and business ethics.
Volvo Group’s responsible sales process was originally developed to comply with the requirements of the Swedish Export Credit Agen-cy’s (EKN) to include human rights due diligence in connection with their involvement to provide guarantees for our customer financing. We still use the responsible sales process primarily for selected sales deals where EKN and certain other private insurance compa-
The technological transformation is driving new business models and will require different skills in the future. This relates to both service personnel handling the products and sales staff guiding the customers towards the best solutions. Therefore we are focusing on dealer development programs and training support for our global dealer network to meet future challenges.
R E T A I L & S E R V I C E
FACTS• The Volvo Group’s products are sold and distributed
through wholly-owned and independent dealerships. • More than 800,000 Volvo Group vehicles are connected
via different telematics solutions. • During 2018, our service business represented
approximately 20% (21) of the Volvo Group’s net sales.• Financial Services provided financing solutions for 24% of
Group products in the markets where financing is offered.• 90% of all distribution centers are certified with ISO 14001.• Environmental product information, based on life cycle
assessment, are available for our products.• Through our Responsible Sales Process we have performed
105 assessments for sales to high risk countries.
Sales and service points
Trucks
North America 620
South America 210
Europe 1,450
South Africa 60
India 440
China 960
Japan 210
Australia 80
Construction Equipment
North America 230
South America 90
Europe 480
Africa & Oceania 120
Asia 340
China 290
A GLOBAL GROUP 2018 BUSINESS MODEL RETAIL & SERVICE
66
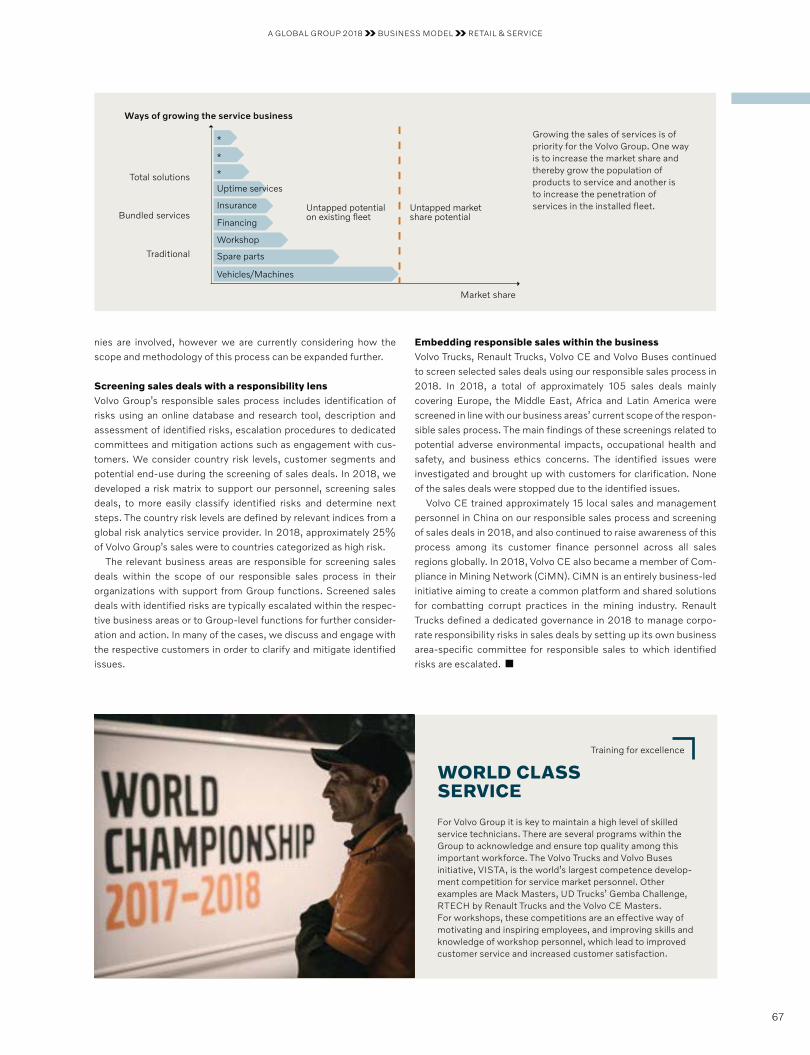
nies are involved, however we are currently considering how the scope and methodology of this process can be expanded further.
Screening sales deals with a responsibility lensVolvo Group’s responsible sales process includes identification of risks using an online database and research tool, description and assessment of identified risks, escalation procedures to dedicated committees and mitigation actions such as engagement with cus-tomers. We consider country risk levels, customer segments and potential end-use during the screening of sales deals. In 2018, we developed a risk matrix to support our personnel, screening sales deals, to more easily classify identified risks and determine next steps. The country risk levels are defined by relevant indices from a global risk analytics service provider. In 2018, approximately 25% of Volvo Group’s sales were to countries categorized as high risk.
The relevant business areas are responsible for screening sales deals within the scope of our responsible sales process in their organizations with support from Group functions. Screened sales deals with identified risks are typically escalated within the respec-tive business areas or to Group-level functions for further consider-ation and action. In many of the cases, we discuss and engage with the respective customers in order to clarify and mitigate identified issues.
Growing the sales of services is of priority for the Volvo Group. One way is to increase the market share and thereby grow the population of products to service and another is to increase the penetration of services in the installed fleet.
Traditional
Market share
Bundled services
Total solutions
Untapped marketshare potential
Untapped potentialon existing fleet
Vehicles/Machines
Spare parts
Workshop
Financing
Insurance
Uptime services
*
*
*
Ways of growing the service business
Embedding responsible sales within the businessVolvo Trucks, Renault Trucks, Volvo CE and Volvo Buses continued to screen selected sales deals using our responsible sales process in 2018. In 2018, a total of approximately 105 sales deals mainly covering Europe, the Middle East, Africa and Latin America were screened in line with our business areas’ current scope of the respon-sible sales process. The main findings of these screenings related to potential adverse environmental impacts, occupational health and safety, and business ethics concerns. The identified issues were investigated and brought up with customers for clarification. None of the sales deals were stopped due to the identified issues.
Volvo CE trained approximately 15 local sales and management personnel in China on our responsible sales process and screening of sales deals in 2018, and also continued to raise awareness of this process among its customer finance personnel across all sales regions globally. In 2018, Volvo CE also became a member of Com-pliance in Mining Network (CiMN). CiMN is an entirely business-led initiative aiming to create a common platform and shared solutions for combatting corrupt practices in the mining industry. Renault Trucks defined a dedicated governance in 2018 to manage corpo-rate responsibility risks in sales deals by setting up its own business area-specific committee for responsible sales to which identified risks are escalated.
Training for excellence
WORLD CLASS SERVICE
For Volvo Group it is key to maintain a high level of skilled service technicians. There are several programs within the Group to acknowledge and ensure top quality among this important workforce. The Volvo Trucks and Volvo Buses initiative, VISTA, is the world’s largest competence develop-ment competition for service market personnel. Other examples are Mack Masters, UD Trucks’ Gemba Challenge, RTECH by Renault Trucks and the Volvo CE Masters. For workshops, these competitions are an effective way of motivating and inspiring employees, and improving skills and knowledge of workshop personnel, which lead to improved customer service and increased customer satisfaction.
A GLOBAL GROUP 2018 BUSINESS MODEL RETAIL & SERVICE
67
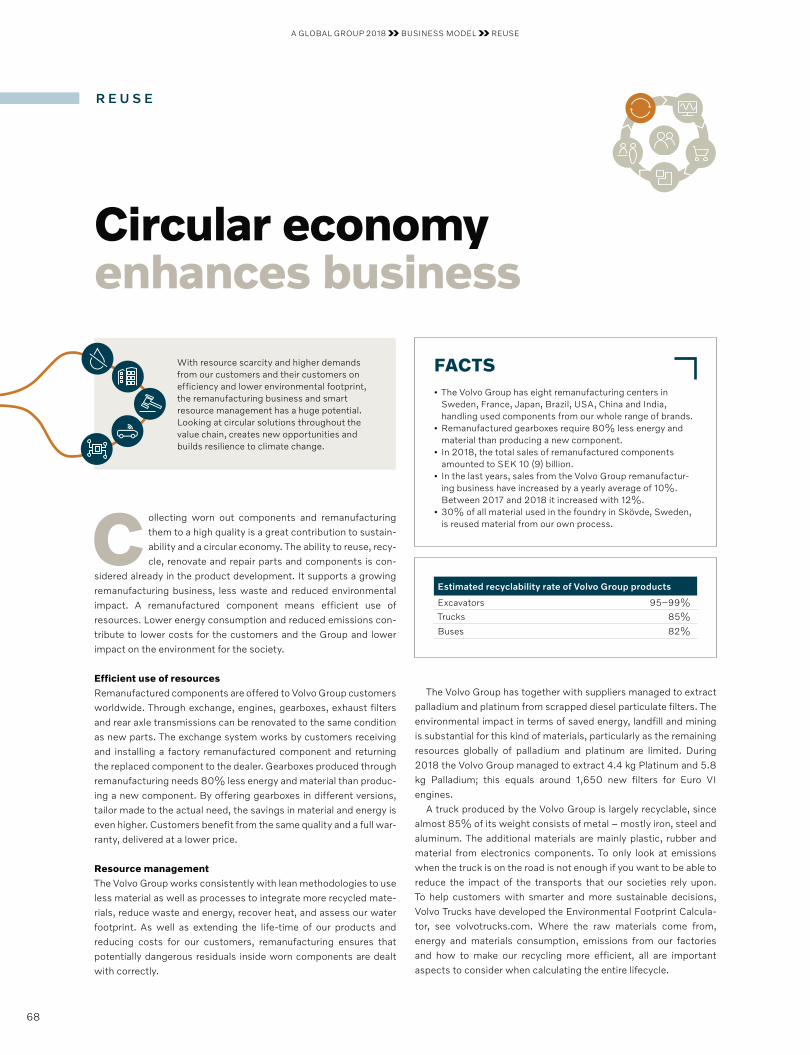
Circular economy enhances business
Collecting worn out components and remanufacturing them to a high quality is a great contribution to sustain-ability and a circular economy. The ability to reuse, recy-cle, renovate and repair parts and components is con-
sidered already in the product development. It supports a growing remanufacturing business, less waste and reduced environ mental impact. A remanufactured component means efficient use of resources. Lower energy consumption and reduced emissions con-tribute to lower costs for the customers and the Group and lower impact on the environment for the society.
Efficient use of resourcesRemanufactured components are offered to Volvo Group customers worldwide. Through exchange, engines, gearboxes, exhaust filters and rear axle transmissions can be renovated to the same condition as new parts. The exchange system works by customers receiving and installing a factory remanufactured component and returning the replaced component to the dealer. Gearboxes produced through remanufacturing needs 80% less energy and material than produc-ing a new component. By offering gearboxes in different versions, tailor made to the actual need, the savings in material and energy is even higher. Customers benefit from the same quality and a full war-ranty, delivered at a lower price.
Resource management The Volvo Group works consistently with lean methodologies to use less material as well as processes to integrate more recycled mate-rials, reduce waste and energy, recover heat, and assess our water footprint. As well as extending the life-time of our products and reducing costs for our customers, remanufacturing ensures that potentially dangerous residuals inside worn components are dealt with correctly.
FACTS• The Volvo Group has eight remanufacturing centers in
Sweden, France, Japan, Brazil, USA, China and India, handling used components from our whole range of brands.
• Remanufactured gearboxes require 80% less energy and material than producing a new component.
• In 2018, the total sales of remanufactured components amounted to SEK 10 (9) billion.
• In the last years, sales from the Volvo Group remanufactur-ing business have increased by a yearly average of 10%. Between 2017 and 2018 it increased with 12%.
• 30% of all material used in the foundry in Skövde, Sweden, is reused material from our own process.
The Volvo Group has together with suppliers managed to extract palladium and platinum from scrapped diesel particulate filters. The environmental impact in terms of saved energy, landfill and mining is substantial for this kind of materials, particularly as the remaining resources globally of palladium and platinum are limited. During 2018 the Volvo Group managed to extract 4.4 kg Platinum and 5.8 kg Palladium; this equals around 1,650 new filters for Euro VI engines.
A truck produced by the Volvo Group is largely recyclable, since almost 85% of its weight consists of metal – mostly iron, steel and aluminum. The additional materials are mainly plastic, rubber and material from electronics components. To only look at emissions when the truck is on the road is not enough if you want to be able to reduce the impact of the transports that our societies rely upon. To help customers with smarter and more sustainable decisions, Volvo Trucks have developed the Environmental Footprint Calcula-tor, see volvotrucks.com. Where the raw materials come from, energy and materials consumption, emissions from our factories and how to make our recycling more efficient, all are important aspects to consider when calculating the entire lifecycle.
With resource scarcity and higher demands from our customers and their customers on efficiency and lower environmental footprint, the remanufacturing business and smart resource management has a huge potential. Looking at circular solutions throughout the value chain, creates new opportunities and builds resilience to climate change.
R E U S E
Estimated recyclability rate of Volvo Group products
Excavators 95–99%
Trucks 85%
Buses 82%
A GLOBAL GROUP 2018 BUSINESS MODEL REUSE
68
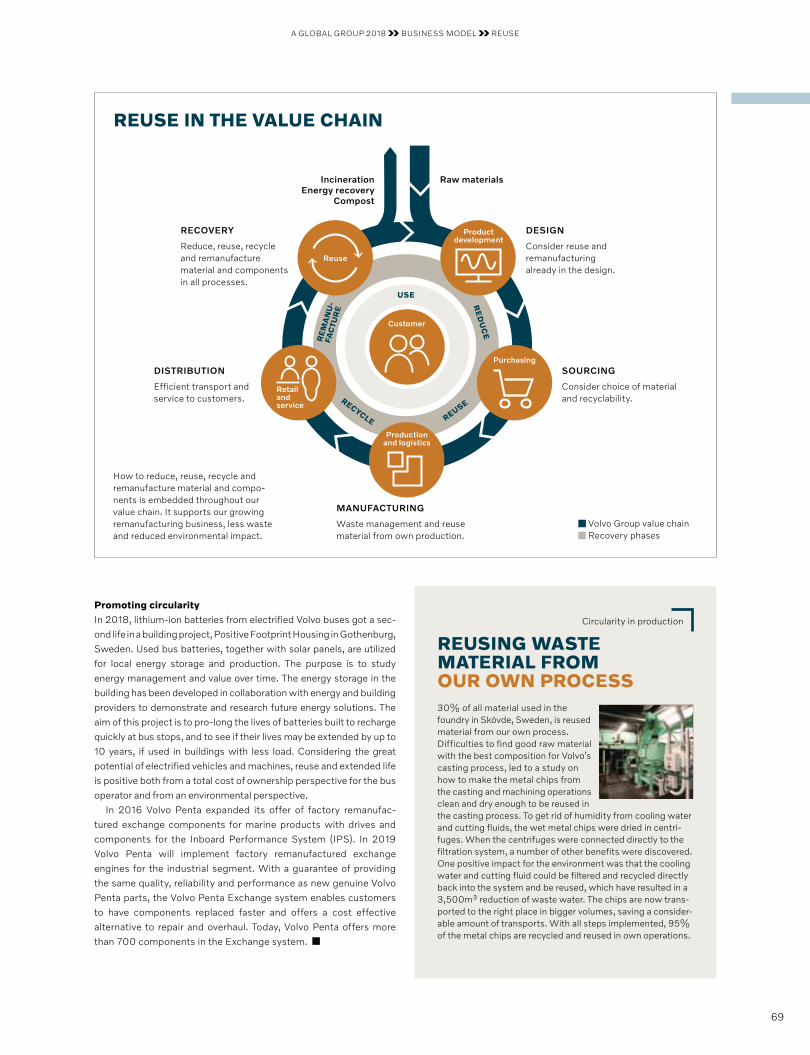
REUSE IN THE VALUE CHAIN
Promoting circularityIn 2018, lithium-ion batteries from electrified Volvo buses got a sec-ond life in a building project, Positive Footprint Housing in Gothenburg, Sweden. Used bus batteries, together with solar panels, are utilized for local energy storage and production. The purpose is to study energy management and value over time. The energy storage in the building has been developed in collaboration with energy and building providers to demonstrate and research future energy solutions. The aim of this project is to pro-long the lives of batteries built to recharge quickly at bus stops, and to see if their lives may be extended by up to 10 years, if used in buildings with less load. Consider ing the great potential of electrified vehicles and machines, reuse and extended life is positive both from a total cost of ownership perspective for the bus operator and from an environmental perspective.
In 2016 Volvo Penta expanded its offer of factory remanufac-tured exchange components for marine products with drives and components for the Inboard Performance System (IPS). In 2019 Volvo Penta will implement factory remanufactured exchange engines for the industrial segment. With a guarantee of providing the same quality, reliability and performance as new genuine Volvo Penta parts, the Volvo Penta Exchange system enables customers to have components replaced faster and offers a cost effective alternative to repair and overhaul. Today, Volvo Penta offers more than 700 components in the Exchange system.
Circularity in production
REUSING WASTE MATERIAL FROM OUR OWN PROCESS30% of all material used in the foundry in Skövde, Sweden, is reused material from our own process. Difficulties to find good raw material with the best composition for Volvo’s casting process, led to a study on how to make the metal chips from the casting and machining operations clean and dry enough to be reused in the casting process. To get rid of humidity from cooling water and cutting fluids, the wet metal chips were dried in centri-fuges. When the centrifuges were connected directly to the filtration system, a number of other benefits were discovered. One positive impact for the environ ment was that the cooling water and cutting fluid could be filtered and recycled directly back into the system and be reused, which have resulted in a 3,500m³ reduction of waste water. The chips are now trans-ported to the right place in bigger volumes, saving a consider-able amount of transports. With all steps implemented, 95% of the metal chips are recycled and reused in own operations.
How to reduce, reuse, recycle and remanufacture material and compo-nents is embedded throughout our value chain. It supports our growing remanufacturing business, less waste and reduced environmental impact.
RECOVERY
Reduce, reuse, recycle and remanufacture material and components in all processes.
DESIGN
Consider reuse and remanufacturing already in the design.
SOURCING
Consider choice of material and recyclability.
DISTRIBUTION
Efficient transport and service to customers.
MANUFACTURING
Waste management and reuse material from own production.
Raw materialsIncineration Energy recovery
Compost
Reuse
Productionand logistics
Retail andservice
Purchasing
Productdevelopment
Customer
Volvo Group value chain Recovery phases
USE
RE
DU
CE
REUSERECYCLE
RE
MA
NU
- FA
CTU
RE
A GLOBAL GROUP 2018 BUSINESS MODEL REUSE
69
Our people are our biggest asset
E M P L O Y E E S
All successful organizations have one thing in common – skilled
and engaged people. And in a world where talent is scarce, it
becomes ever more important for the Volvo Group to successfully
attract, retain and develop the right people and to shape a culture
that drives engagement and thus performance.
70
A GLOBAL GROUP 2018 BUSINESS MODEL EMPLOYEES
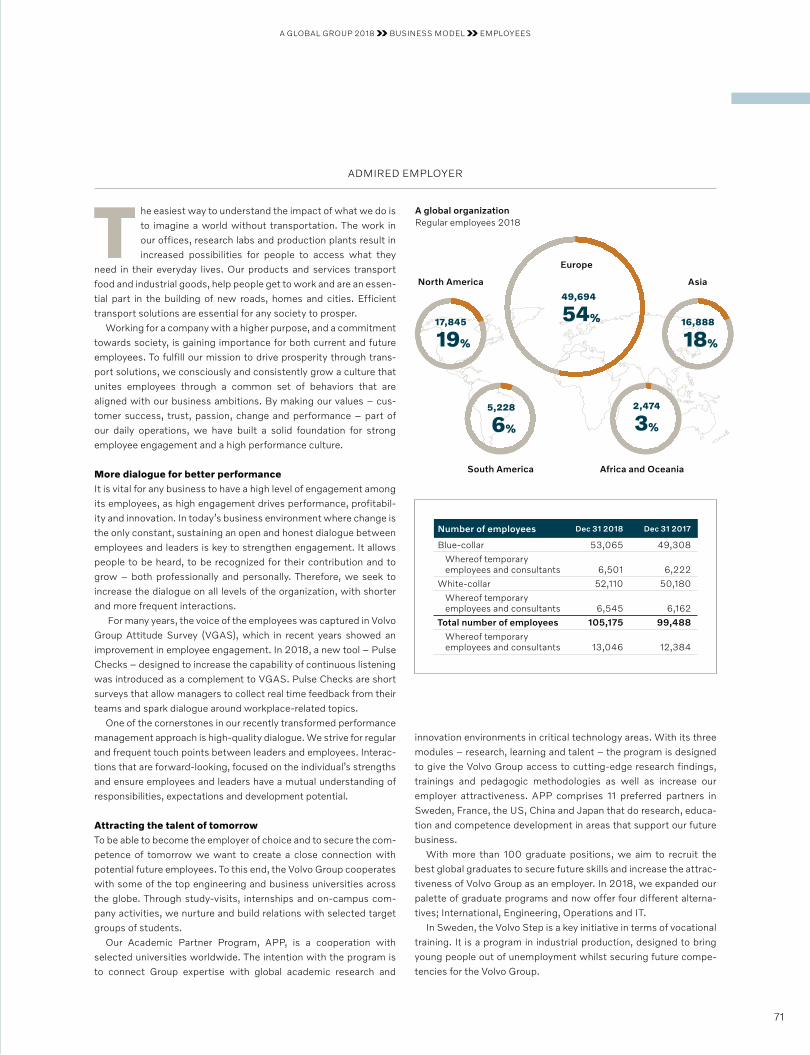
The easiest way to understand the impact of what we do is to imagine a world without transportation. The work in our offices, research labs and production plants result in increased possi bilities for people to access what they
need in their everyday lives. Our products and services transport food and industrial goods, help people get to work and are an essen-tial part in the building of new roads, homes and cities. Efficient transport solutions are essential for any society to prosper.
Working for a company with a higher purpose, and a commitment towards society, is gaining importance for both current and future employees. To fulfill our mission to drive prosperity through trans-port solutions, we consciously and consistently grow a culture that unites employees through a common set of behaviors that are aligned with our business ambitions. By making our values – cus-tomer success, trust, passion, change and performance – part of our daily operations, we have built a solid foundation for strong employee engagement and a high performance culture.
More dialogue for better performanceIt is vital for any business to have a high level of engagement among its employees, as high engagement drives performance, profitabil-ity and innovation. In today’s business environment where change is the only constant, sustaining an open and honest dialogue between employees and leaders is key to strengthen engagement. It allows people to be heard, to be recognized for their contribution and to grow – both professionally and personally. Therefore, we seek to increase the dialogue on all levels of the organization, with shorter and more frequent interactions.
For many years, the voice of the employees was captured in Volvo Group Attitude Survey (VGAS), which in recent years showed an improvement in employee engagement. In 2018, a new tool – Pulse Checks – designed to increase the capability of continuous listening was introduced as a complement to VGAS. Pulse Checks are short surveys that allow managers to collect real time feedback from their teams and spark dialogue around workplace-related topics.
One of the cornerstones in our recently transformed performance management approach is high-quality dialogue. We strive for regular and frequent touch points between leaders and employees. Interac-tions that are forward-looking, focused on the individual’s strengths and ensure employees and leaders have a mutual understanding of responsibilities, expectations and development potential.
Attracting the talent of tomorrowTo be able to become the employer of choice and to secure the com-petence of tomorrow we want to create a close connection with potential future employees. To this end, the Volvo Group cooperates with some of the top engineering and business universities across the globe. Through study-visits, internships and on-campus com-pany activities, we nurture and build relations with selected target groups of students.
Our Academic Partner Program, APP, is a cooperation with selected universities worldwide. The intention with the program is to connect Group expertise with global academic research and
ADMIRED EMPLOYER
Number of employees Dec 31 2018 Dec 31 2017
Blue-collar 53,065 49,308
Whereof temporary employees and consultants 6,501 6,222
White-collar 52,110 50,180
Whereof temporary employees and consultants 6,545 6,162
Total number of employees 105,175 99,488
Whereof temporary employees and consultants 13,046 12,384
innovation environments in critical technology areas. With its three modules – research, learning and talent – the program is designed to give the Volvo Group access to cutting-edge research findings, trainings and pedagogic methodologies as well as increase our employer attractiveness. APP comprises 11 preferred partners in Sweden, France, the US, China and Japan that do research, educa-tion and competence development in areas that support our future business.
With more than 100 graduate positions, we aim to recruit the best global graduates to secure future skills and increase the attrac-tiveness of Volvo Group as an employer. In 2018, we expanded our palette of graduate programs and now offer four different alterna-tives; International, Engineering, Operations and IT.
In Sweden, the Volvo Step is a key initiative in terms of vocational training. It is a program in industrial production, designed to bring young people out of unemployment whilst securing future compe-tencies for the Volvo Group.
A global organization Regular employees 2018
17,845
19%
North America
5,228
6%
South America
16,888
18%
Africa and Oceania
Asia
2,474
3%
49,694
54%
Europe
A GLOBAL GROUP 2018 BUSINESS MODEL EMPLOYEES
71

Education for everyoneTo give employees the opportunity to develop in their roles and learn new things, the Volvo Group has created its own corporate university. Volvo Group University (VGU) training programs are run through Navigator, a personalized and collaborative learning portal that accelerates competence development and makes employees engaged in their learning and sharing journey. One of the driving forces behind the decision to establish the VGU was our wish to ensure consistent, high quality development for all our employees. In close cooperation with the Group’s business areas, VGU devel-ops internal training that not only strengthens participants’ skills, but also matches the competence needs of the business. The train-ing stretches from classroom training to virtual learning and interac-tive games. During 2018, approximately 165,000 participants attended training through VGU. In 2018 the Volvo Group University won two international gold awards for its online team training pro-gram Meet the Customer. The categories were Best learning Game and Best Design, awarded by the Learning Technology Awards. Meet the customer is now being played by 285 teams around the world.
Developing the leaders of tomorrowIn the Volvo Group, we see talent as one of our most important assets – after all, it is people who create transport solutions and gen-erate value for both customers and the Group. Our talent review is a structured and formalized assessment of performance and potential, designed to know our people, secure a diverse leader pipeline and
Focus on employee experience
A WORKFORCE SPANNING OVER FIVE GENERATIONSFive generations sharing the same workplace demands an increased focus on the employee experience. With a workforce spanning from employees born before 1946 to Generation Z, the Volvo Group works actively to cater for the needs of these diverse groups to bring out the best in each individual. To be able to offer an attractive workplace for all employees, we focus on three areas; the physical work environ ment, the technical work environment and our culture. Simplicity, user friendliness and personalization are key elements. Our initiatives range from extensive onboarding programs and reverse mentoring to an intelligent digital workplace and a solution that makes the intranet accessible for all employees.
Health, safety and well-being are high on our agenda and the dedication to making it a natural part our day-to-day work is strong across all levels of the Volvo Group. Offering a safe and healthy work environment is essen-
tial, not only because we care for our employees, visitors, suppliers and customers, but also because it is reflected in the bottom line results. Well-being at work strengthens employee engagement, increases productivity and drives performance. A strong commit-ment to health and safety also makes us a more admired employer and allows us to attract and retain the talents we need, today and in the future.
In the Volvo Group, we have built our Health and Safety policy on the belief that accidents, near misses and work-related illness can be prevented. The Volvo Group works actively to minimize both the physical and psychological risks in the workplace and in 2018 we have implemented a new mental health toolbox as part of these efforts. The toolbox consists of a number of tools, workshops and assessments designed to prevent mental problems and promote well-being at work.
HEALTH, SAFETY AND WELL-BEING IN FOCUS
Health & Safety1
Lost Time Accident Rate2
Number of fatal accidents
151.38
161.06
141.59
17 18
0 031.00
31.22
3
1 The scope of employees included in the numbers have increased substantially over the past five years and in 2018 it covers 100%.
2 Number of recordable accidents with lost time × 200,000 hours / total number of worked hours for all employees and consultants.
stimulate mobility. Complemented by various leadership programs for different career levels, the talent review secures a solid succes-sion planning with talented people who lead in line with our values and have the ability to take our business to the next level.
A GLOBAL GROUP 2018 BUSINESS MODEL EMPLOYEES
72
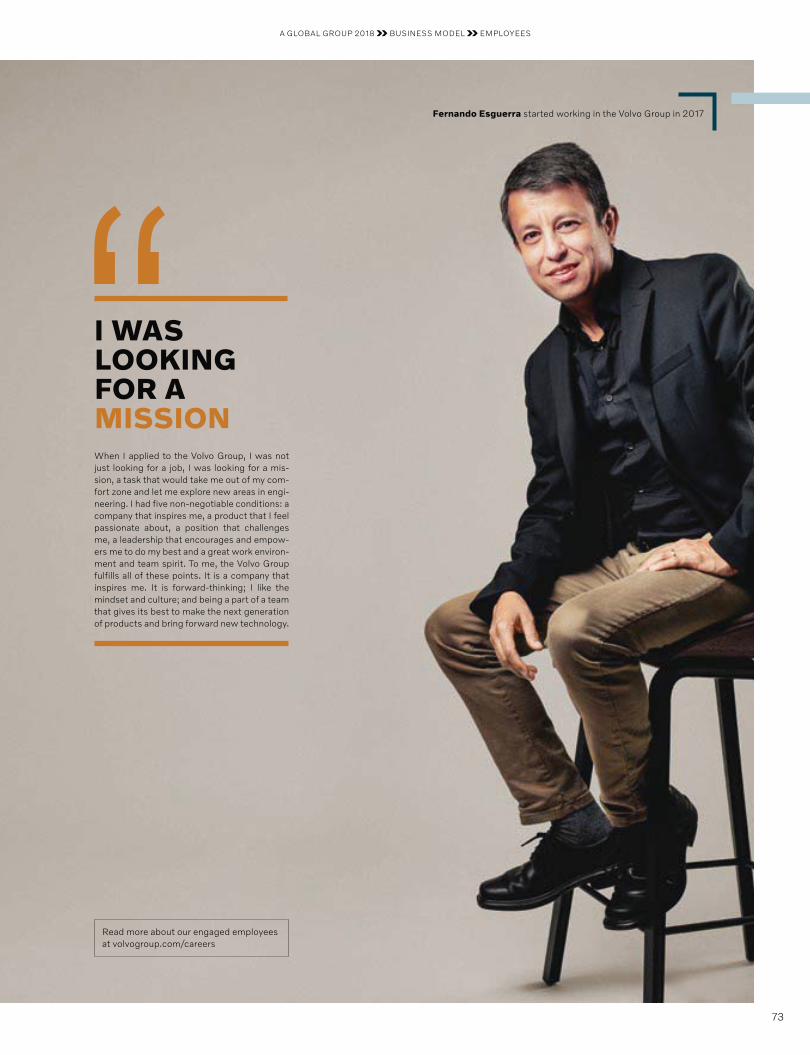
Fernando Esguerra started working in the Volvo Group in 2017
I WAS LOOKING FOR A MISSION When I applied to the Volvo Group, I was not just looking for a job, I was looking for a mis-sion, a task that would take me out of my com-fort zone and let me explore new areas in engi-neering. I had five non-negotiable conditions: a company that inspires me, a product that I feel passionate about, a position that challenges me, a leadership that encourages and empow-ers me to do my best and a great work environ-ment and team spirit. To me, the Volvo Group fulfills all of these points. It is a company that inspires me. It is forward-thinking; I like the mindset and culture; and being a part of a team that gives its best to make the next generation of products and bring forward new technology.
Read more about our engaged employees at volvogroup.com/careers
A GLOBAL GROUP 2018 BUSINESS MODEL EMPLOYEES
73
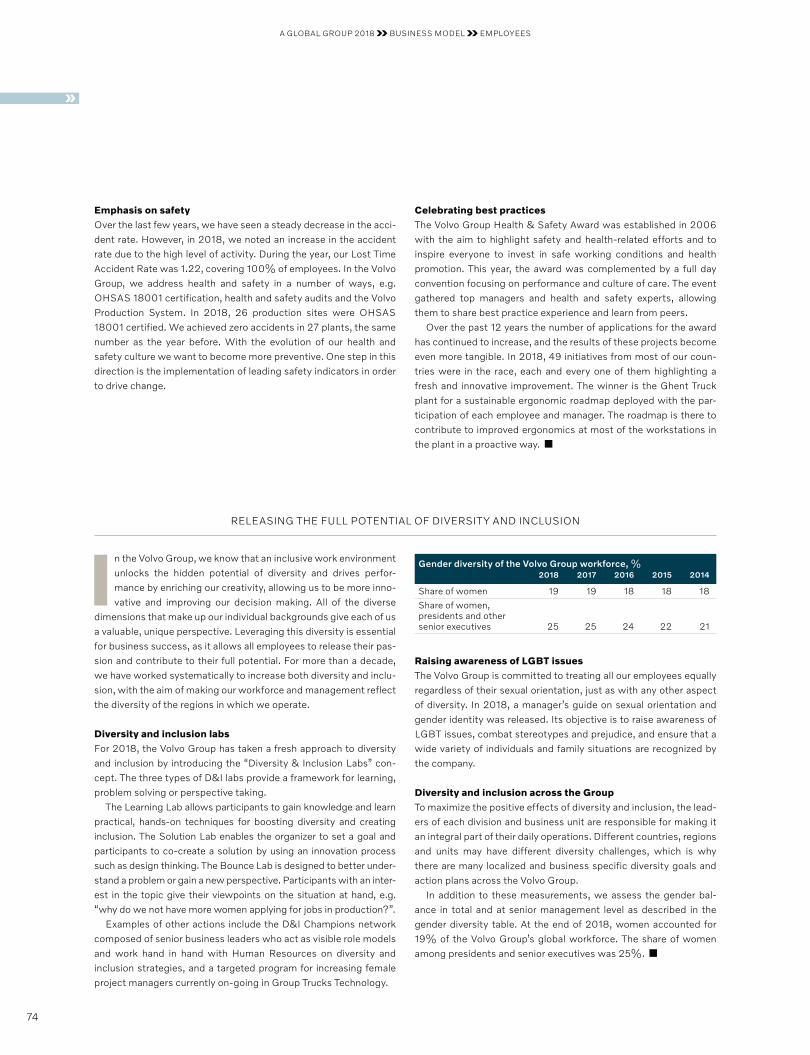
In the Volvo Group, we know that an inclusive work environment unlocks the hidden potential of diversity and drives perfor-mance by enriching our creativity, allowing us to be more inno-vative and improving our decision making. All of the diverse
dimensions that make up our individual backgrounds give each of us a valuable, unique perspective. Leveraging this diversity is essential for business success, as it allows all employees to release their pas-sion and contribute to their full potential. For more than a decade, we have worked systematically to increase both diversity and inclu-sion, with the aim of making our workforce and management reflect the diversity of the regions in which we operate.
Diversity and inclusion labsFor 2018, the Volvo Group has taken a fresh approach to diversity and inclusion by introducing the “Diversity & Inclusion Labs” con-cept. The three types of D&I labs provide a framework for learning, problem solving or perspective taking.
The Learning Lab allows participants to gain knowledge and learn practical, hands-on techniques for boosting diversity and creating inclusion. The Solution Lab enables the organizer to set a goal and participants to co-create a solution by using an innovation process such as design thinking. The Bounce Lab is designed to better under-stand a problem or gain a new perspective. Participants with an inter-est in the topic give their viewpoints on the situation at hand, e.g. “why do we not have more women applying for jobs in production?”.
Examples of other actions include the D&I Champions network composed of senior business leaders who act as visible role models and work hand in hand with Human Resources on diversity and inclusion strategies, and a targeted program for increasing female project managers currently on-going in Group Trucks Technology.
RELEASING THE FULL POTENTIAL OF DIVERSITY AND INCLUSION
Raising awareness of LGBT issuesThe Volvo Group is committed to treating all our employees equally regardless of their sexual orientation, just as with any other aspect of diversity. In 2018, a manager’s guide on sexual orientation and gender identity was released. Its objective is to raise awareness of LGBT issues, combat stereotypes and prejudice, and ensure that a wide variety of individuals and family situations are recognized by the company.
Diversity and inclusion across the GroupTo maximize the positive effects of diversity and inclusion, the lead-ers of each division and business unit are responsible for making it an integral part of their daily operations. Different countries, regions and units may have different diversity challenges, which is why there are many localized and business specific diversity goals and action plans across the Volvo Group.
In addition to these measurements, we assess the gender bal-ance in total and at senior management level as described in the gender diversity table. At the end of 2018, women accounted for 19% of the Volvo Group’s global workforce. The share of women among presidents and senior executives was 25%.
Emphasis on safety Over the last few years, we have seen a steady decrease in the acci-dent rate. However, in 2018, we noted an increase in the accident rate due to the high level of activity. During the year, our Lost Time Accident Rate was 1.22, covering 100% of employees. In the Volvo Group, we address health and safety in a number of ways, e.g. OHSAS 18001 certification, health and safety audits and the Volvo Production System. In 2018, 26 production sites were OHSAS 18001 certified. We achieved zero accidents in 27 plants, the same number as the year before. With the evolution of our health and safety culture we want to become more preventive. One step in this direction is the implementation of leading safety indicators in order to drive change.
Celebrating best practicesThe Volvo Group Health & Safety Award was established in 2006 with the aim to highlight safety and health-related efforts and to inspire everyone to invest in safe working conditions and health promotion. This year, the award was complemented by a full day convention focusing on performance and culture of care. The event gathered top managers and health and safety experts, allowing them to share best practice experience and learn from peers.
Over the past 12 years the number of applications for the award has continued to increase, and the results of these projects become even more tangible. In 2018, 49 initiatives from most of our coun-tries were in the race, each and every one of them highlighting a fresh and innovative improvement. The winner is the Ghent Truck plant for a sustainable ergonomic roadmap deployed with the par-ticipation of each employee and manager. The roadmap is there to contribute to improved ergonomics at most of the workstations in the plant in a proactive way.
Gender diversity of the Volvo Group workforce, %2018 2017 2016 2015 2014
Share of women 19 19 18 18 18
Share of women, presidents and other senior executives 25 25 24 22 21
A GLOBAL GROUP 2018 BUSINESS MODEL EMPLOYEES
74
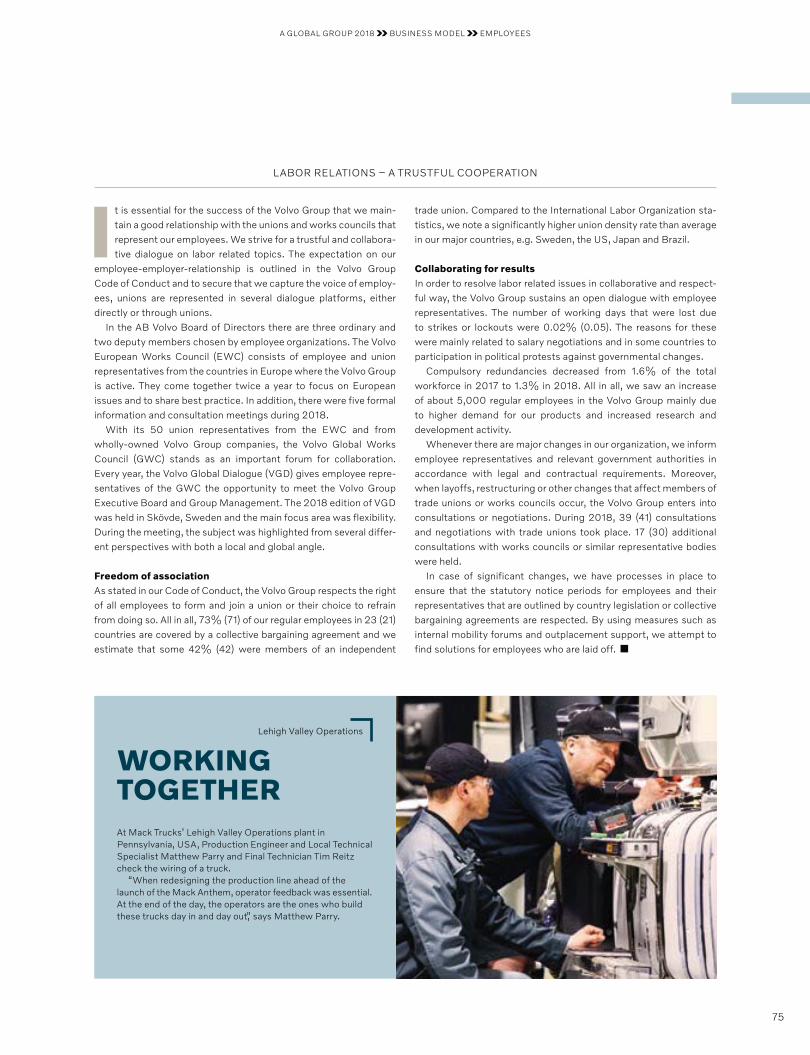
It is essential for the success of the Volvo Group that we main-tain a good relationship with the unions and works councils that represent our employees. We strive for a trustful and collabora-tive dialogue on labor related topics. The expectation on our
employee-employer-relationship is outlined in the Volvo Group Code of Conduct and to secure that we capture the voice of employ-ees, unions are represented in several dialogue platforms, either directly or through unions.
In the AB Volvo Board of Directors there are three ordinary and two deputy members chosen by employee organizations. The Volvo European Works Council (EWC) consists of employee and union representatives from the countries in Europe where the Volvo Group is active. They come together twice a year to focus on European issues and to share best practice. In addition, there were five formal information and consultation meetings during 2018.
With its 50 union representatives from the EWC and from wholly-owned Volvo Group companies, the Volvo Global Works Council (GWC) stands as an important forum for collaboration. Every year, the Volvo Global Dialogue (VGD) gives employee repre-sentatives of the GWC the opportunity to meet the Volvo Group Executive Board and Group Management. The 2018 edition of VGD was held in Skövde, Sweden and the main focus area was flexibility. During the meeting, the subject was highlighted from several differ-ent perspectives with both a local and global angle.
Freedom of association As stated in our Code of Conduct, the Volvo Group respects the right of all employees to form and join a union or their choice to refrain from doing so. All in all, 73% (71) of our regular employees in 23 (21) countries are covered by a collective bargaining agreement and we estimate that some 42% (42) were members of an independent
LABOR RELATIONS – A TRUSTFUL COOPERATION
trade union. Compared to the International Labor Organization sta-tistics, we note a significantly higher union density rate than average in our major countries, e.g. Sweden, the US, Japan and Brazil.
Collaborating for resultsIn order to resolve labor related issues in collaborative and respect-ful way, the Volvo Group sustains an open dialogue with employee representatives. The number of working days that were lost due to strikes or lockouts were 0.02% (0.05). The reasons for these were mainly related to salary negotiations and in some countries to participation in political protests against governmental changes.
Compulsory redundancies decreased from 1.6% of the total workforce in 2017 to 1.3% in 2018. All in all, we saw an increase of about 5,000 regular employees in the Volvo Group mainly due to higher demand for our products and increased research and development activity.
Whenever there are major changes in our organization, we inform employee representatives and relevant government authorities in accordance with legal and contractual requirements. Moreover, when layoffs, restructuring or other changes that affect members of trade unions or works councils occur, the Volvo Group enters into consultations or negotiations. During 2018, 39 (41) consultations and negotiations with trade unions took place. 17 (30) additional consultations with works councils or similar representative bodies were held.
In case of significant changes, we have processes in place to ensure that the statutory notice periods for employees and their representatives that are outlined by country legislation or collective bargaining agreements are respected. By using measures such as internal mobility forums and outplacement support, we attempt to find solutions for employees who are laid off.
Lehigh Valley Operations
WORKING TOGETHER At Mack Trucks’ Lehigh Valley Operations plant in Pennsyl vania, USA, Production Engineer and Local Technical Specialist Matthew Parry and Final Technician Tim Reitz check the wiring of a truck.
“When redesigning the production line ahead of the launch of the Mack Anthem, operator feedback was essential. At the end of the day, the operators are the ones who build these trucks day in and day out,” says Matthew Parry.
A GLOBAL GROUP 2018 BUSINESS MODEL EMPLOYEES
75
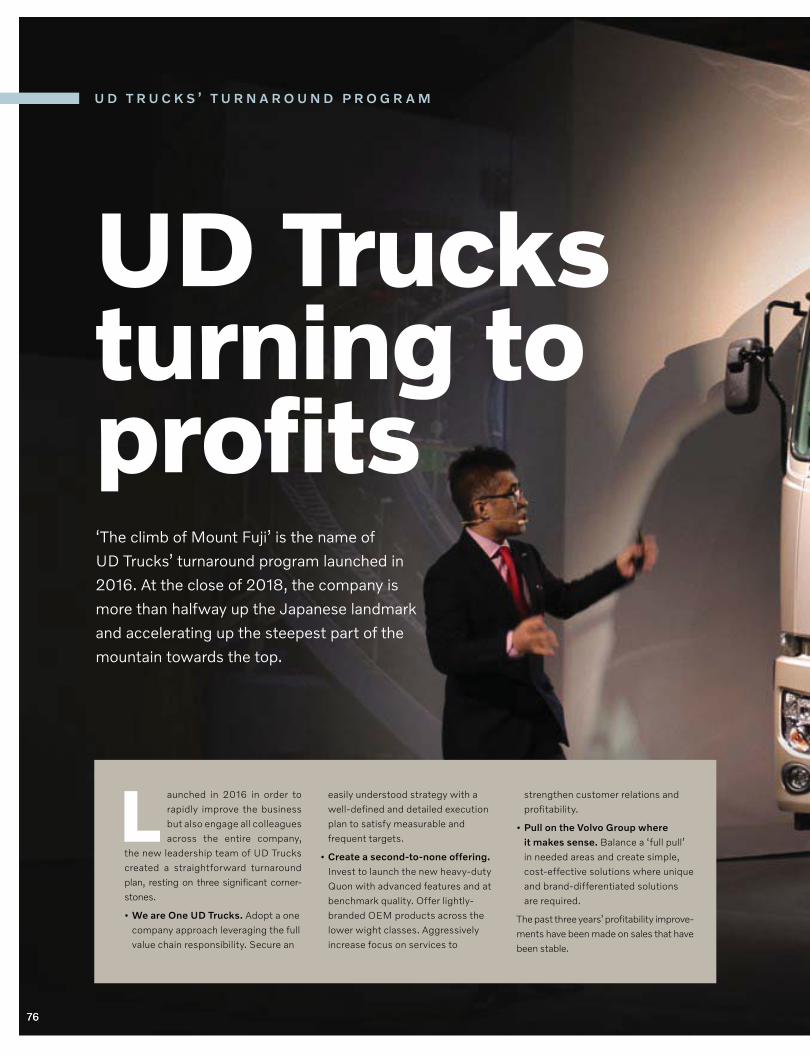
76
UD Trucks turning to profits
U D T R U C K S ’ T U R N A R O U N D P R O G R A M
‘The climb of Mount Fuji’ is the name of
UD Trucks’ turnaround program launched in
2016. At the close of 2018, the company is
more than halfway up the Japanese landmark
and accelerating up the steepest part of the
mountain towards the top.
Launched in 2016 in order to rapidly improve the business but also engage all colleagues across the entire company,
the new leadership team of UD Trucks created a straightforward turnaround plan, resting on three significant corner- stones.
• We are One UD Trucks. Adopt a one company approach leveraging the full value chain responsibility. Secure an
easily understood strategy with a well-defined and detailed execution plan to satisfy measurable and frequent targets.
• Create a second-to-none offering. Invest to launch the new heavy-duty Quon with advanced features and at benchmark quality. Offer lightly- branded OEM products across the lower wight classes. Aggressively increase focus on services to
strengthen customer relations and profitability.
• Pull on the Volvo Group where it makes sense. Balance a ‘full pull’ in needed areas and create simple, cost-effective solutions where unique and brand-differentiated solutions are required.
The past three years’ profitability improve-ments have been made on sales that have been stable.
76
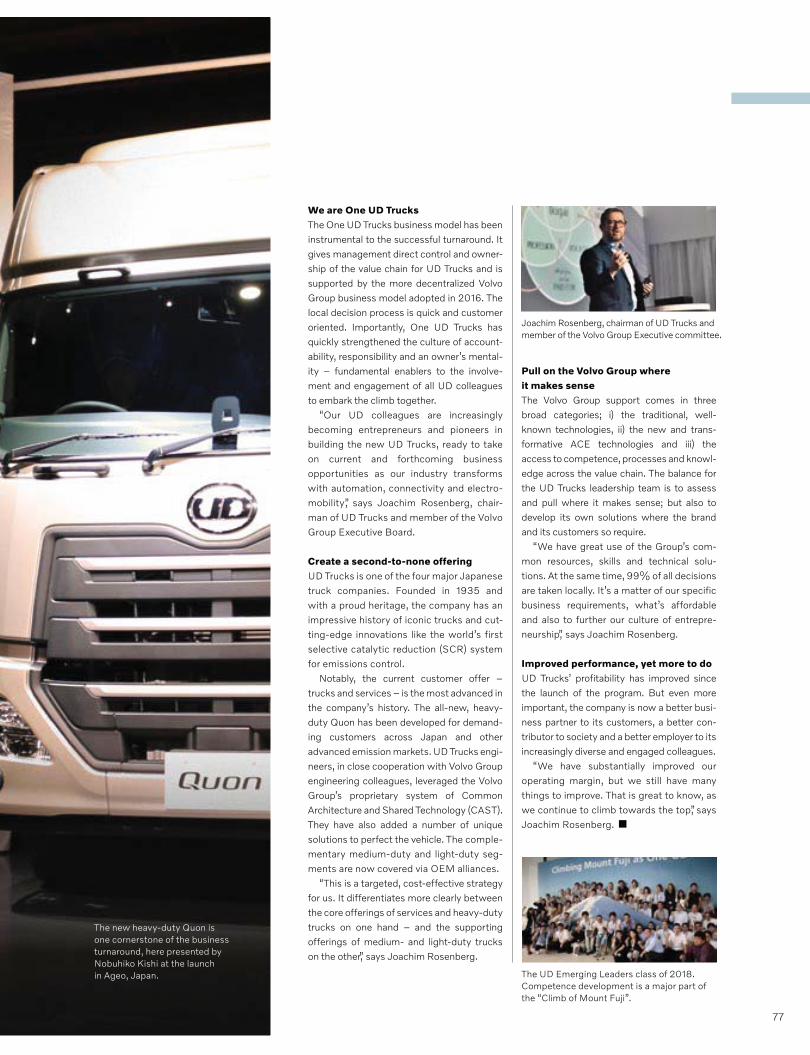
We are One UD TrucksThe One UD Trucks business model has been instrumental to the successful turnaround. It gives management direct control and owner-ship of the value chain for UD Trucks and is supported by the more decentralized Volvo Group business model adopted in 2016. The local decision process is quick and customer oriented. Importantly, One UD Trucks has quickly strengthened the culture of account-ability, responsibility and an owner’s mental-ity – fundamental enablers to the involve-ment and engagement of all UD colleagues to embark the climb together.
“Our UD colleagues are increasingly becoming entrepreneurs and pioneers in building the new UD Trucks, ready to take on current and forthcoming business opportunities as our industry transforms with automation, connectivity and electro-mobility”, says Joachim Rosenberg, chair-man of UD Trucks and member of the Volvo Group Executive Board.
Create a second-to-none offering UD Trucks is one of the four major Japanese truck companies. Founded in 1935 and with a proud heritage, the company has an impressive history of iconic trucks and cut-ting-edge innovations like the world’s first selective catalytic reduction (SCR) system for emissions control.
Notably, the current customer offer – trucks and services – is the most advanced in the company’s history. The all-new, heavy-duty Quon has been developed for demand-ing customers across Japan and other advanced emission markets. UD Trucks engi-neers, in close cooperation with Volvo Group engineering colleagues, leveraged the Volvo Group’s proprietary system of Common Architecture and Shared Technology (CAST). They have also added a number of unique solutions to perfect the vehicle. The comple-mentary medium-duty and light-duty seg-ments are now covered via OEM alliances.
“This is a targeted, cost-effective strategy for us. It differentiates more clearly between the core offerings of services and heavy-duty trucks on one hand – and the supporting offerings of medium- and light-duty trucks on the other,” says Joachim Rosenberg.
Pull on the Volvo Group where it makes sense The Volvo Group support comes in three broad categories; i) the traditional, well-known technologies, ii) the new and trans-formative ACE technologies and iii) the access to competence, processes and knowl-edge across the value chain. The balance for the UD Trucks leadership team is to assess and pull where it makes sense; but also to develop its own solutions where the brand and its customers so require.
“We have great use of the Group’s com-mon resources, skills and technical solu-tions. At the same time, 99% of all decisions are taken locally. It’s a matter of our specific business requirements, what’s affordable and also to further our culture of entrepre-neurship,” says Joachim Rosenberg.
Improved performance, yet more to doUD Trucks’ profitability has improved since the launch of the program. But even more important, the company is now a better busi-ness partner to its customers, a better con-tributor to society and a better employer to its increasingly diverse and engaged colleagues.
“We have substantially improved our operating margin, but we still have many things to improve. That is great to know, as we continue to climb towards the top”, says Joachim Rosenberg.
The UD Emerging Leaders class of 2018. Competence development is a major part of the “Climb of Mount Fuji”.
The new heavy-duty Quon is one cornerstone of the business turnaround, here presented by Nobuhiko Kishi at the launch in Ageo, Japan.
Joachim Rosenberg, chairman of UD Trucks and member of the Volvo Group Executive committee.
77
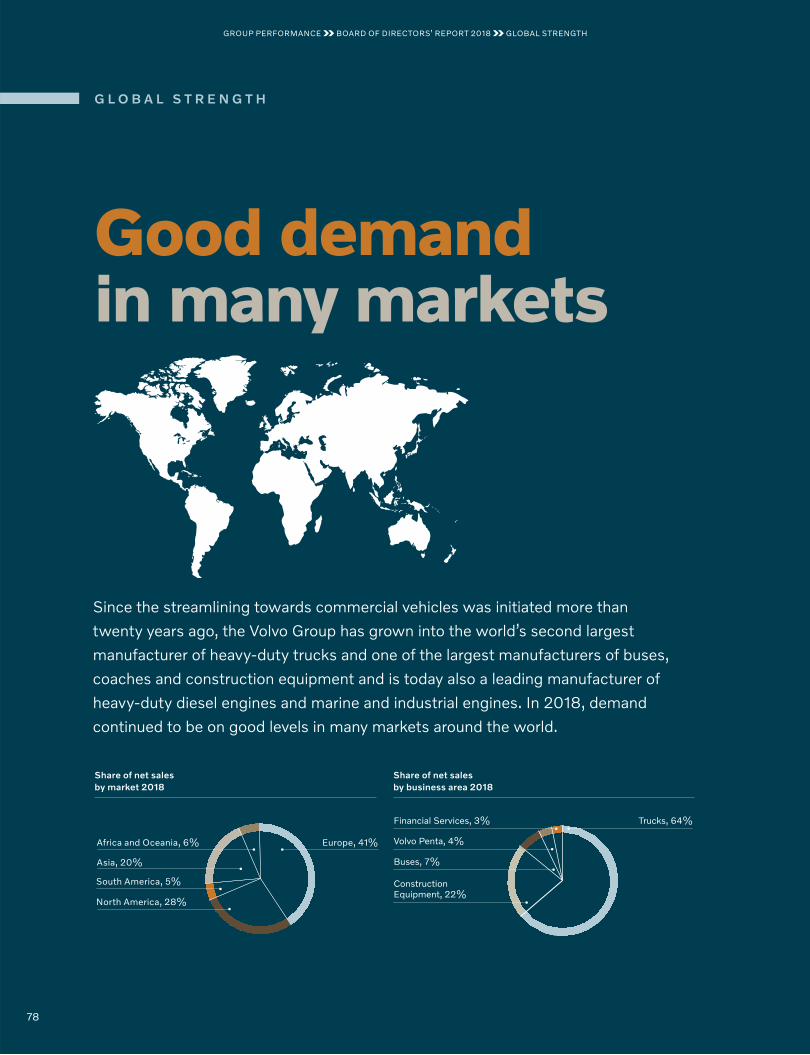
Good demandin many markets
G L O B A L S T R E N G T H
Since the streamlining towards commercial vehicles was initiated more than
twenty years ago, the Volvo Group has grown into the world’s second largest
manufacturer of heavy-duty trucks and one of the largest manufacturers of buses,
coaches and construction equipment and is today also a leading manufacturer of
heavy-duty diesel engines and marine and industrial engines. In 2018, demand
continued to be on good levels in many markets around the world.
Share of net sales by market 2018
Share of net sales by business area 2018
North America, 28%
Europe, 41%
South America, 5%
Asia, 20%
Africa and Oceania, 6%
Trucks, 64%Financial Services, 3%
Volvo Penta, 4%
Buses, 7%
Construction Equipment, 22%
78
GROUP PERFORMANCE BOARD OF DIRECTORS’ REPORT 2018 GLOBAL STRENGTH
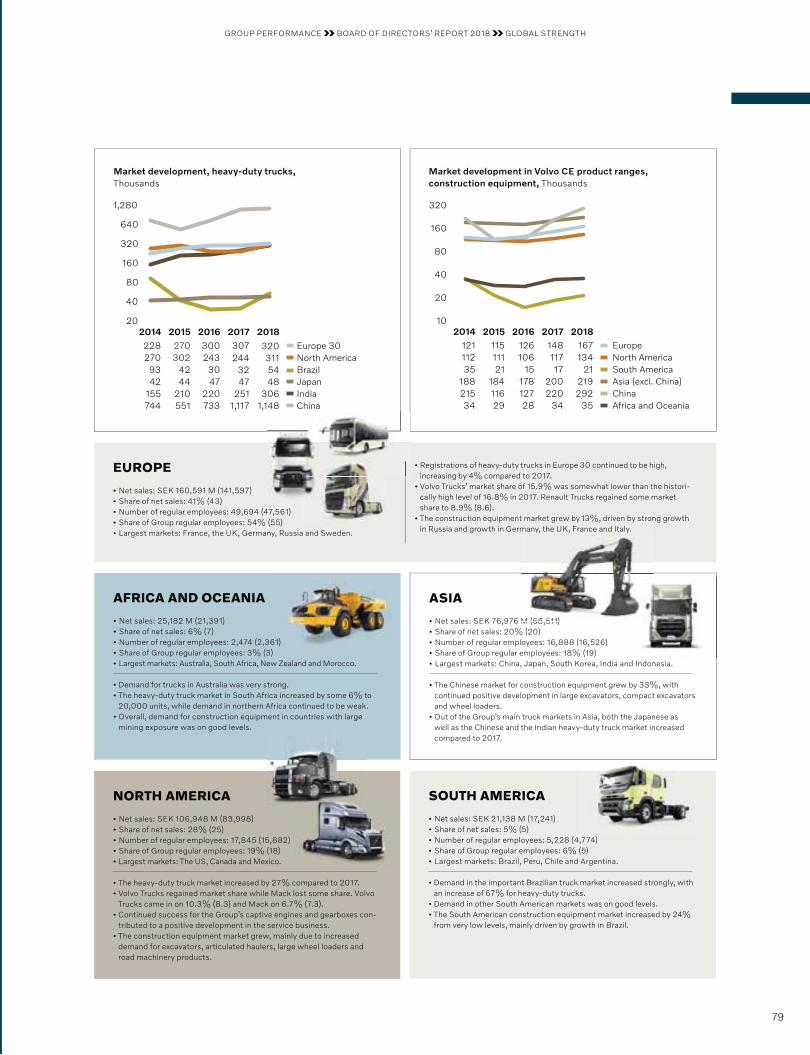
SOUTH AMERICA
• Net sales: SEK 21,138 M (17,241) • Share of net sales: 5% (5) • Number of regular employees: 5,228 (4,774) • Share of Group regular employees: 6% (5) • Largest markets: Brazil, Peru, Chile and Argentina.
• Demand in the important Brazilian truck market increased strongly, with an increase of 67% for heavy-duty trucks.
• Demand in other South American markets was on good levels. • The South American construction equipment market increased by 24%
from very low levels, mainly driven by growth in Brazil.
NORTH AMERICA
• Net sales: SEK 106,948 M (83,998) • Share of net sales: 28% (25) • Number of regular employees: 17,845 (15,882) • Share of Group regular employees: 19% (18) • Largest markets: The US, Canada and Mexico.
• The heavy-duty truck market increased by 27% compared to 2017.• Volvo Trucks regained market share while Mack lost some share. Volvo
Trucks came in on 10.3% (8.3) and Mack on 6.7% (7.3).• Continued success for the Group’s captive engines and gearboxes con-
tributed to a positive development in the service business. • The construction equipment market grew, mainly due to increased
demand for excavators, articulated haulers, large wheel loaders and road machinery products.
AFRICA AND OCEANIA
• Net sales: 25,182 M (21,391)• Share of net sales: 6% (7) • Number of regular employees: 2,474 (2,361) • Share of Group regular employees: 3% (3) • Largest markets: Australia, South Africa, New Zealand and Morocco.
• Demand for trucks in Australia was very strong.• The heavy-duty truck market in South Africa increased by some 6% to
20,000 units, while demand in northern Africa continued to be weak.• Overall, demand for construction equipment in countries with large
mining exposure was on good levels.
ASIA
• Net sales: SEK 76,976 M (68,511) • Share of net sales: 20% (20) • Number of regular employees: 16,888 (16,526) • Share of Group regular employees: 18% (19) • Largest markets: China, Japan, South Korea, India and Indonesia.
• The Chinese market for construction equipment grew by 33%, with continued positive development in large excavators, compact excavators and wheel loaders.
• Out of the Group’s main truck markets in Asia, both the Japanese as well as the Chinese and the Indian heavy-duty truck market increased compared to 2017.
40
20
10
80
160
320
EuropeNorth AmericaSouth AmericaAsia (excl. China)ChinaAfrica and Oceania
201412111235
18821534
201511511121
18411629
201714811717
200220
34
2018167134
21219292
35
2016126106
1517812728
Market development in Volvo CE product ranges, construction equipment, Thousands
40
20
80
160
320
640
1,280
2015270302
4244
210551
228270
9342
155744
2014
Europe 30North AmericaBrazilJapanIndiaChina
2016300243
3047
220733
2017307244
3247
2511,117
2018
3203115448
3061,148
Market development, heavy-duty trucks, Thousands
EUROPE
• Net sales: SEK 160,591 M (141,597) • Share of net sales: 41% (43) • Number of regular employees: 49,694 (47,561) • Share of Group regular employees: 54% (55) • Largest markets: France, the UK, Germany, Russia and Sweden.
• Registrations of heavy-duty trucks in Europe 30 continued to be high, increasing by 4% compared to 2017.
• Volvo Trucks’ market share of 15.9% was somewhat lower than the histori-cally high level of 16.8% in 2017. Renault Trucks regained some market share to 8.9% (8.6).
• The construction equipment market grew by 13%, driven by strong growth in Russia and growth in Germany, the UK, France and Italy.
61)
M (68 511)
many, the UK, France and Italy.
GROUP PERFORMANCE BOARD OF DIRECTORS’ REPORT 2018 GLOBAL STRENGTH
79
S I G N I F I C A N T E V E N T S
Significant events published in quarterly reports during 2018Electric trucks from Volvo Trucks and Renault TrucksIn January it was announced that both Volvo Trucks and Renault Trucks will start selling all-electric medium-duty trucks in Europe in 2019. The first units were put in operation together with a few selected reference customers already in 2018. Subsequently, Volvo Trucks for the first time showed the Volvo FL Electric and FE Electric for urban distribution and refuse operations, among other applica-tions. Renault Trucks presented an entire range of electric trucks.
Divestment of a subsidiary holding shares in NHLOn March 26 it was announced that Volvo Group had entered into an agreement to divest a Chinese subsidiary, which is holding 25.2% of the shares in the Chinese company Inner Mongolia North Hauler Joint Stock Co., Ltd (NHL). On May 11, 2018, the Volvo Group completed the divestment, which resulted in a capital gain of SEK 818 M.
Annual General Meeting of AB VolvoThe Annual General Meeting of AB Volvo, held on April 5, approved the Board of Directors’ proposal that a dividend of SEK 4.25 per share be paid to the company’s shareholders. Matti Alahuhta, Eckhard Cordes, James W. Griffith, Martin Lundstedt, Kathryn V. Marinello, Martina Merz, Hanne de Mora, Helena Stjernholm and Carl-Henric Svanberg were reelected as members of the Board. Eric
Elzvik was elected as new member of the Board. Carl-Henric Svanberg was reelected as Chairman of the Board. Bengt Kjell, rep-resenting AB Industrivärden, Yngve Slyngstad, representing Norges Bank Investment Management, Pär Boman, representing Svenska Handelsbanken, SHB Pension Fund, SHB Employee Fund, SHB Pensionskassa and Oktogonen, Ramsay Brufer, representing Alecta, and the Chairman of the Board were elected members of the Election Committee. A remuneration policy for senior executives was adopted in accordance with the Board of Directors’ proposal.
Change in Volvo’s Group Executive BoardOn June 19 it was announced that Volvo’s senior management team was to be strengthened to further intensify the rate of change at the Volvo Group and the development of new business models. Deputy CEO and CFO Jan Gurander continued his work as Deputy CEO with the task of leading Volvo’s strategic and operational activities together with President and CEO Martin Lundstedt. Jan Ytterberg was appointed CFO and new member of the Volvo Group Executive Board. Jan Ytterberg previous position was as the CFO of Swedish company Husqvarna Group and he has almost thirty years’ of previ-ous experience from the automotive industry from his various posi-tions at truck manufacturer Scania. In addition, it was announced that Executive Vice President Group Human Resources Kerstin Renard would step down from her role at the end of the year.
Volvo Group Press releases 2018
THE FIRST QUARTER T H E S E C O N D Q UA R T E R
1/10/2018 Correction: New number of votes in AB Volvo 1/11/2018 Volvo will bring autonomous electric buses to Singapore 1/15/2018 Save the date for Volvo Group Investor Day in New York 1/17/2018 Invitation to press and analyst confer-ence in Stockholm 1/23/2018 Volvo Trucks will start selling electric trucks 2019 1/31/2018 Volvo Group – the fourth quarter and full year 2017 1/31/2018 Renault Trucks will start selling electric trucks in 2019 1/31/2018 New number of votes in AB Volvo 2/23/2018 Eric Elzvik proposed as new Board member of AB Volvo 2/26/2018 AB Volvo’s Election Committee presents revised Board proposal 2/28/2018 New number of votes in AB Volvo 3/2/2018 Annual General Meeting of AB Volvo 3/13/2018 AB Volvo publishes Annual and Sustainability Report 2017 3/14/2018 Total sales of more than 4,000 electrified Volvo buses 3/23/2018 Invitation to Volvo Group Investor Day 2018 in New York 3/26/2018 Electric artic-ulated buses being tested in Gothenburg 3/26/2018 Volvo Group has entered into an agreement to divest a Chinese subsidiary holding shares in Inner Mongolia North Hauler Joint Stock 3/29/2018 New number of votes in AB Volvo
4/5/2018 Annual General Meeting of AB Volvo 4/10/2018 School for truck drivers to improve road safety in Morocco 4/12/2018 Premiere for Volvo Trucks’ first all-electric truck 4/12/2018 Invitation to press and analyst conference in Stockholm 4/24/2018 Volvo Group – the first quarter 2018 4/25/2018 Mack Trucks plans to have fully electric refuse vehicle in 2019 4/26/2018 Volvo scholarship for research on safe autonomous vehicles 4/30/2018 New number of votes in AB Volvo 5/7/2018 Trucks and cars alert each other in traffic – pioneering cooperation between Volvo Trucks and Volvo Cars 5/8/2018 Volvo Trucks presents second elec-tric truck model in three weeks 5/9/2018 Assar Gabrielsson award for increased awareness of cancer treatment 5/11/2018 Volvo Group has completed the sale of a Chinese subsidiary holding shares in Inner Mongolia North Hauler Joint Stock 5/29/2018 Volvo launches new program for long-distance coaches 5/31/2018 Volvo Group and Volvo Cars have decided to transfer ownership of the Volvo Ocean Race 6/1/2018 Volvo Ocean Race signals the start for electric articulated buses in Gothenburg 6/13/2018 Innovation and sustainability – the Volvo Group’s theme when the Volvo Ocean Race arrives in Gothenburg 6/15/2018 Technology award
80
GROUP PERFORMANCE BOARD OF DIRECTORS’ REPORT 2018 SIGNIFICANT EVENTS
Testing of Electric SiteOn August 29 it was announced that Volvo Construction Equipment and the customer Skanska began testing the viability of its Electric Site concept. The system, which incorporates connected, electric and autonomous Volvo machines, would run in a real production environment for 10 weeks, and was anticipated to deliver a substan-tial reduction in carbon emissions and total cost of operations. On November 21, it was announced that Volvo Construction Equip-ment and Skanska had recorded groundbreaking results from the research project – including a 98% reduction in carbon emissions, a 70% reduction in energy cost and a 40% reduction in operator cost.
Ground-breaking innovations for future autonomous and electric transport solutionsIn connection with the Volvo Group’s Innovation Summit in Berlin, on September 12, a new goods transport solution was unveiled. The solution, named Vera, consists of autonomous electric vehicles that are wirelessly connected to a transport control center. Vera is intended for use within areas characterized by short distances, large cargo volumes and high delivery precision, for example between logistic hubs. The new goods transport solution will be further developed in close cooperation with relevant customers.
Volvo Trucks to introduce all-electric trucks in North AmericaOn September 27 it was announced that the California Air Resources Board (CARB) had preliminarily awarded USD 44.8 mil-lion to California’s South Coast Air Quality Management District (SCAQMD) for the Volvo LIGHTS (Low Impact Green Heavy Trans-port Solutions) project. The Volvo LIGHTS project is a part of an innovative partnership between the Volvo Group, SCAQMD and industry leaders in transportation and electrical charging infrastruc-ture. As part of the project, Volvo Trucks plans to introduce all-elec-tric truck demonstrators in California in 2019, and commercialize them in North America in 2020.
Volvo Group makes a provision of SEK 7 billion On October 16 it was announced that the Volvo Group had detected that an emissions control component used in certain markets is degrading more quickly than expected, which could cause the engines to exceed emissions limits for nitrogen oxides (NOX). All products equipped with the component meet emissions limits at delivery. The degradation is due to a materials issue that occurs over time. On January 3, 2019 the Volvo Group announced that it had made a provision of SEK 7 billion in Q4 2018, relating to the esti-mated costs to address the issue.
Volvo Trucks delivers autonomous transport solution to Brønnøy Kalk On November 20, it was announced that Volvo Trucks had signed an agreement with Brønnøy Kalk AS in Norway to provide its first commercial autonomous solution transporting limestone from an open pit mine to a nearby port.
Changes in Volvo’s management On December 12, it was announced that Roger Alm had been appointed as a new member of Volvo’s Group Executive Board and President Volvo Trucks, replacing Claes Nilsson, who retired. In par-allel, Diana Niu was appointed as a member of the Group Executive Board and Executive Vice President Group Human Resources for Volvo Group. Roger Alm and Diana Niu took up their new positions on January 1, 2019.
Volvo Group divests majority stake in WirelessCar On December 19, it was announced that the Volvo Group had signed an agreement to divest 75.1% of the shares in its wholly-owned sub-sidiary WirelessCar to the Volkswagen Group. The sales price amounts to SEK 1.1 billion. The divestment will, at the time of closing of the transaction, result in a positive impact on operating income of approximately SEK 1.5 billion and a positive cash flow effect of SEK 1.1 billion. Closing of the transaction is expected during the first half of 2019, subject to customary authority approvals.
T H E T H I R D Q UA R T E R
T H E FO U R T H Q UA R T E R
7/3/2018 Volvo receives Sweden’s largest order ever for electric buses 7/5/2018 Invitation to press and analyst conference in Stockholm 7/5/2018 How to protect cyclists and pedestrians in city traffic 7/19/2018 Volvo Group - the second quarter 2018 8/29/2018 Testing begins at world’s first ‘emission-free’ quarry 8/31/2018 New number of votes in AB Volvo 9/5/2018 Smart societies in focus at the next Volvo Group Innovation Summit 9/12/2018 Ground-breaking innovations for future autonomous and electric transport solutions 9/27/2018 Volvo Trucks to introduce all-electric trucks in North America
10/5/2018 Invitation to press and analyst conference in Stockholm 10/16/2018 Volvo Group has detected premature degradation of emissions control component 10/19/2018 Volvo Group – the third quarter 2018 10/29/2018 Sustainability will be won or lost in cities 10/31/2018 New number of votes in AB Volvo 11/5/2018 Volvo to deliver 700 city buses to Bogotá, Colombia 11/6/2018 Volvo Financial Services launches iLabX – an innovation Lab for Technology Entrepreneurs 11/15/2018 Martin Lundstedt is the Leader of the year 2018 11/20/2018 Volvo Trucks provides autonomous transport solution to Brønnøy Kalk AS 11/21/2018 Carbon emissions reduced by 98% at Volvo Construction Equipment and Skanska’s Electric Site 11/28/2018 Save the date for the Volvo Group Capital Market Day 2019 12/12/2018 Changes in Volvo’s management 12/19/2018 Volvo Group divests majority stake in WirelessCar 12/28/2018 New number of votes in AB Volvo
recognizes concept that improves fuel efficiency in excavators 6/16/2018 Volvo Penta unveils pioneering self-docking yacht technology 6/19/2018 Change in Volvo’s Group Executive Board 6/27/2018 Volvo Penta unveils hybrid marine propul-sion concept 6/27/2018 Renault Trucks unveils its second generation of electric trucks 6/28/2018 Volvo Trucks and FedEx demonstrate Truck Platooning 6/29/2018 New number of votes in AB Volvo
81
GROUP PERFORMANCE BOARD OF DIRECTORS’ REPORT 2018 SIGNIFICANT EVENTS

F I N A N C I A L P E R F O R M A N C E
INCOME STATEMENTS VOLVO GROUP
Industrial Operations Financial Services Eliminations Volvo Group
SEK M 2018 2017 2018 2017 2018 2017 2018 2017
Net sales Note 6, 7 378,320 321,799 13,070 11,812 –555 –873 390,834 332,738
Cost of sales –296,109 –247,021 –7,924 –7,072 555 873 –303,478 –253,220
Gross income 82,210 74,778 5,146 4,740 – – 87,357 79,518
Research and development expenses –15,899 –16,098 – – – – –15,899 –16,098
Selling expenses –28,642 –26,495 –2,248 –2,086 – – –30,890 –28,582
Administrative expenses –5,756 –5,602 –43 –40 – – –5,798 –5,642
Other operating income and expenses Note 8 –1,828 –640 –445 –421 – – –2,273 –1,061
Income from investments in joint ventures and associated companies Note 5, 6 1,948 1,408 – – – – 1,948 1,407
Income/loss from other investments 33 135 0 0 – – 33 135
Operating income 32,067 27,485 2,411 2,192 – – 34,478 29,678
Interest income and similar credits 199 164 – – 0 – 199 164
Interest expenses and similar charges –1,658 –1,852 0 0 0 – –1,658 –1,852
Other financial income and expenses Note 9 –870 –385 – – – – –870 –385
Income after financial items 29,738 25,412 2,411 2,192 – – 32,148 27,605
Income taxes Note 10 –6,172 –7,066 –613 248 – – –6,785 –6,818
Income for the period 23,566 18,346 1,798 2,440 – – 25,363 20,786
Attributable to:
Equity holders of the parent company 24,897 20,484
Minority interests 466 302
25,363 20,786
Basic earnings per share, SEK Note 19 12.25 10.08
Diluted earnings per share, SEK Note 19 12.24 10.07
OTHER COMPREHENSIVE INCOME
SEK M 2018 2017
Income for the period 25,363 20,786
Items that will not be reclassified to income statement:
Remeasurements of defined benefit pension plans –579 –827
Items that may be reclassified subsequently to income statement:
Exchange differences on translation of foreign operations 2,350 –2,546
Share of OCI related to joint ventures and associated companies 0 25
Accumulated translation difference reversed to income –94 –112
Available-for-sale investments Note 19 14 –10
Change in cash flow hedge reserve Note 19 – –20
Other comprehensive income, net of income taxes 1,691 –3,490
Total comprehensive income for the period 27,054 17,296
Attributable to:
Equity holders of the parent company 26,536 17,048
Minority interests 518 248
27,054 17,296
For the Volvo Group 2018 was a year with improved profitability and high volumes.
Improved profitability
GROUP PERFORMANCE BOARD OF DIRECTORS’ REPORT 2018 FINANCIAL PERFORMANCE
82
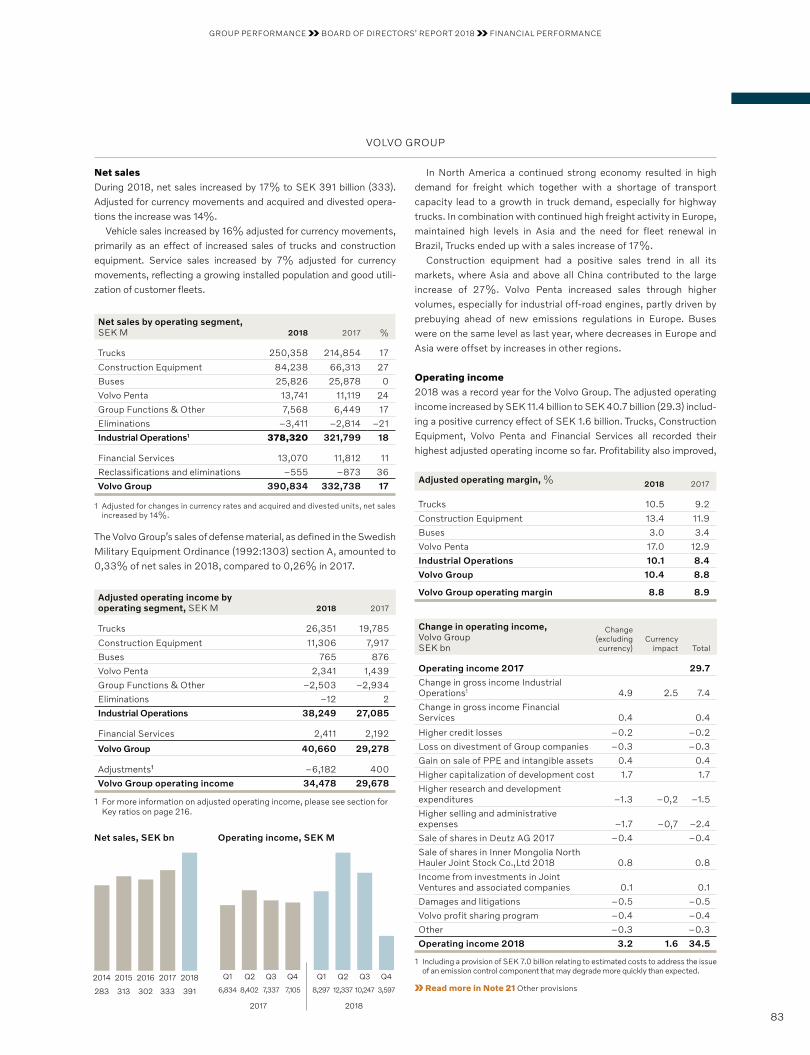
Net salesDuring 2018, net sales increased by 17% to SEK 391 billion (333). Adjusted for currency movements and acquired and divested opera-tions the increase was 14%.
Vehicle sales increased by 16% adjusted for currency movements, primarily as an effect of increased sales of trucks and construction equipment. Service sales increased by 7% adjusted for currency movements, reflecting a growing installed population and good utili-zation of customer fleets.
In North America a continued strong economy resulted in high demand for freight which together with a shortage of transport capacity lead to a growth in truck demand, especially for highway trucks. In combination with continued high freight activity in Europe, maintained high levels in Asia and the need for fleet renewal in Brazil, Trucks ended up with a sales increase of 17%.
Construction equipment had a positive sales trend in all its markets, where Asia and above all China contributed to the large increase of 27%. Volvo Penta increased sales through higher volumes, especially for industrial off-road engines, partly driven by prebuying ahead of new emissions regulations in Europe. Buses were on the same level as last year, where decreases in Europe and Asia were offset by increases in other regions.
Operating income 2018 was a record year for the Volvo Group. The adjusted operating income increased by SEK 11.4 billion to SEK 40.7 billion (29.3) includ-ing a positive currency effect of SEK 1.6 billion. Trucks, Construction Equipment, Volvo Penta and Financial Services all recorded their highest adjusted operating income so far. Profitability also improved,
Net sales by operating segment, SEK M 2018 2017 %
Trucks 250,358 214,854 17
Construction Equipment 84,238 66,313 27
Buses 25,826 25,878 0
Volvo Penta 13,741 11,119 24
Group Functions & Other 7,568 6,449 17
Eliminations –3,411 –2,814 –21
Industrial Operations1 378,320 321,799 18
Financial Services 13,070 11,812 11
Reclassifications and eliminations –555 –873 36
Volvo Group 390,834 332,738 17
1 Adjusted for changes in currency rates and acquired and divested units, net sales increased by 14%.
The Volvo Group’s sales of defense material, as defined in the Swedish Military Equipment Ordinance (1992:1303) section A, amounted to 0,33% of net sales in 2018, compared to 0,26% in 2017.
Adjusted operating income by operating segment, SEK M 2018 2017
Trucks 26,351 19,785
Construction Equipment 11,306 7,917
Buses 765 876
Volvo Penta 2,341 1,439
Group Functions & Other –2,503 –2,934
Eliminations –12 2
Industrial Operations 38,249 27,085
Financial Services 2,411 2,192
Volvo Group 40,660 29,278
Adjustments¹ –6,182 400
Volvo Group operating income 34,478 29,678
1 For more information on adjusted operating income, please see section for Key ratios on page 216.
Change in operating income, Volvo GroupSEK bn
Change (excluding currency)
Currency impact Total
Operating income 2017 29.7
Change in gross income Industrial Operations1 4.9 2.5 7.4
Change in gross income Financial Services 0.4 0.4
Higher credit losses –0.2 –0.2
Loss on divestment of Group companies –0.3 –0.3
Gain on sale of PPE and intangible assets 0.4 0.4
Higher capitalization of development cost 1.7 1.7
Higher research and development expenditures –1.3 –0,2 –1.5
Higher selling and administrative expenses –1.7 –0,7 –2.4
Sale of shares in Deutz AG 2017 –0.4 –0.4
Sale of shares in Inner Mongolia North Hauler Joint Stock Co.,Ltd 2018 0.8 0.8
Income from investments in Joint Ventures and associated companies 0.1 0.1
Damages and litigations –0.5 –0.5
Volvo profit sharing program –0.4 –0.4
Other –0.3 –0.3
Operating income 2018 3.2 1.6 34.5
1 Including a provision of SEK 7.0 billion relating to estimated costs to address the issue of an emission control component that may degrade more quickly than expected.
Read more in Note 21 Other provisions
Adjusted operating margin, % 2018 2017
Trucks 10.5 9.2
Construction Equipment 13.4 11.9
Buses 3.0 3.4
Volvo Penta 17.0 12.9
Industrial Operations 10.1 8.4
Volvo Group 10.4 8.8
Volvo Group operating margin 8.8 8.9
VOLVO GROUP
2014
283
2015
313
2016
302
2017
333
2018
391
Net sales, SEK bn
Q3Q2Q1 Q4 Q3 Q4
7,337 7,105
Q2
8,402
Q1
6,834 10,247 3,59712,3378,297
20182017
Operating income, SEK M
GROUP PERFORMANCE BOARD OF DIRECTORS’ REPORT 2018 FINANCIAL PERFORMANCE
83
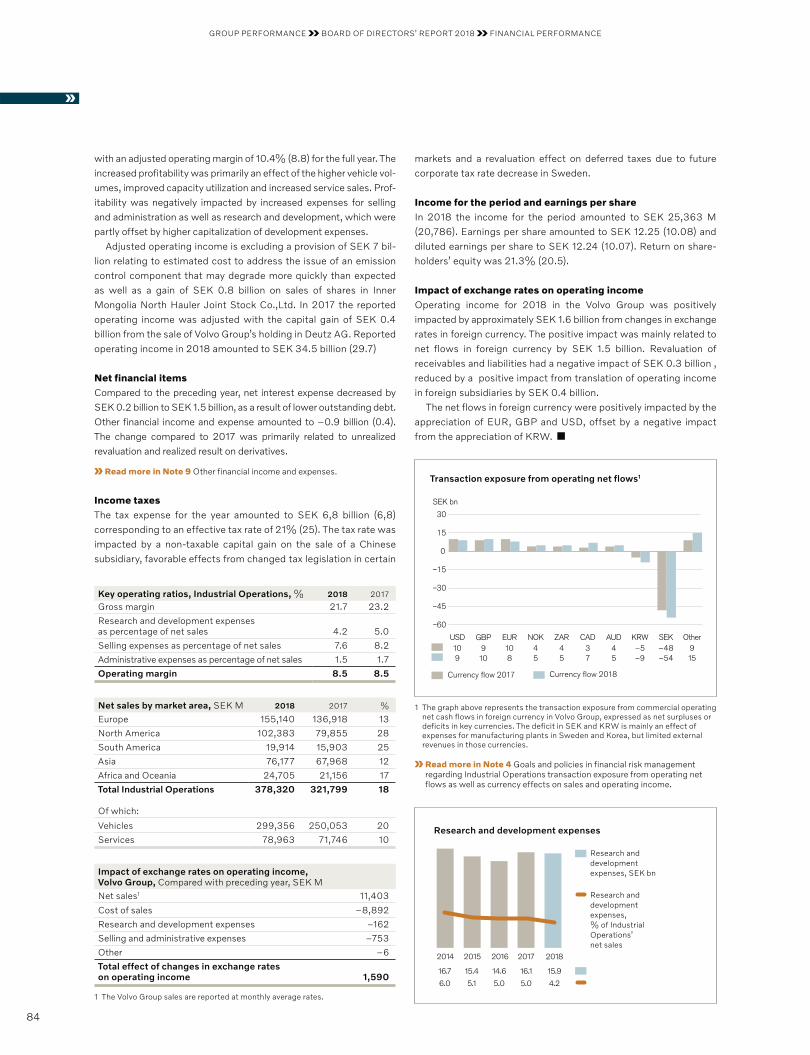
with an adjusted operating margin of 10.4% (8.8) for the full year. The increased profitability was primarily an effect of the higher vehicle vol-umes, improved capacity utilization and increased service sales. Prof-itability was negatively impacted by increased expenses for selling and administration as well as research and development, which were partly offset by higher capitalization of development expenses.
Adjusted operating income is excluding a provision of SEK 7 bil-lion relating to estimated cost to address the issue of an emission control component that may degrade more quickly than expected as well as a gain of SEK 0.8 billion on sales of shares in Inner Mongolia North Hauler Joint Stock Co.,Ltd. In 2017 the reported operating income was adjusted with the capital gain of SEK 0.4 billion from the sale of Volvo Group’s holding in Deutz AG. Reported operating income in 2018 amounted to SEK 34.5 billion (29.7)
Net financial items Compared to the preceding year, net interest expense decreased by SEK 0.2 billion to SEK 1.5 billion, as a result of lower outstanding debt. Other financial income and expense amounted to –0.9 billion (0.4). The change compared to 2017 was primarily related to unrealized revaluation and realized result on derivatives.
Read more in Note 9 Other financial income and expenses.
Income taxes The tax expense for the year amounted to SEK 6,8 billion (6,8) corre sponding to an effective tax rate of 21% (25). The tax rate was impacted by a non-taxable capital gain on the sale of a Chinese subsidiary, favorable effects from changed tax legislation in certain
markets and a revaluation effect on deferred taxes due to future corpo rate tax rate decrease in Sweden.
Income for the period and earnings per share In 2018 the income for the period amounted to SEK 25,363 M (20,786). Earnings per share amounted to SEK 12.25 (10.08) and diluted earnings per share to SEK 12.24 (10.07). Return on share-holders’ equity was 21.3% (20.5).
Impact of exchange rates on operating incomeOperating income for 2018 in the Volvo Group was positively impacted by approximately SEK 1.6 billion from changes in exchange rates in foreign currency. The positive impact was mainly related to net flows in foreign currency by SEK 1.5 billion. Revaluation of receivables and liabilities had a negative impact of SEK 0.3 billion , reduced by a positive impact from translation of operating income in foreign subsidiaries by SEK 0.4 billion.
The net flows in foreign currency were positively impacted by the appreciation of EUR, GBP and USD, offset by a negative impact from the appreciation of KRW.
Key operating ratios, Industrial Operations, % 2018 2017
Gross margin 21.7 23.2
Research and development expenses as percentage of net sales 4.2 5.0
Selling expenses as percentage of net sales 7.6 8.2
Administrative expenses as percentage of net sales 1.5 1.7
Operating margin 8.5 8.5
Net sales by market area, SEK M 2018 2017 %
Europe 155,140 136,918 13
North America 102,383 79,855 28
South America 19,914 15,903 25
Asia 76,177 67,968 12
Africa and Oceania 24,705 21,156 17
Total Industrial Operations 378,320 321,799 18
Of which:
Vehicles 299,356 250,053 20
Services 78,963 71,746 10
Impact of exchange rates on operating income, Volvo Group, Compared with preceding year, SEK MNet sales1 11,403
Cost of sales –8,892
Research and development expenses –162
Selling and administrative expenses –753
Other –6
Total effect of changes in exchange rates on operating income 1,590
1 The Volvo Group sales are reported at monthly average rates.
Transaction exposure from operating net flows1
–60
–45
–30
–15
0
15
30
SEKKRWAUDCADNOKEURGBP ZARUSD
SEK bn
Other
Currency flow 2017 Currency flow 2018
15–54–95758109 59–48–543410910 4
1 The graph above represents the transaction exposure from commercial operating net cash flows in foreign currency in Volvo Group, expressed as net surpluses or deficits in key currencies. The deficit in SEK and KRW is mainly an effect of expenses for manufacturing plants in Sweden and Korea, but limited external revenues in those currencies.
Read more in Note 4 Goals and policies in financial risk management regarding Industrial Operations transaction exposure from operating net flows as well as currency effects on sales and operating income.
Research and development expenses
2014 2017
14.6
5.0
2018
15.9
4.2
16.1
5.0
2015
16.7
6.0
2016
15.4
5.1
Research and development expenses, SEK bn
Research and development expenses, % of Industrial Operations’ net sales
GROUP PERFORMANCE BOARD OF DIRECTORS’ REPORT 2018 FINANCIAL PERFORMANCE
84
Net financial positionDuring 2018, net financial assets in the Volvo Group’s Industrial Operations, excluding provisions for post-employment benefits, improved by SEK 17.6 billion resulting in a net financial asset position of SEK 43.9 billion on December 31, 2018. This equals 38.8% of shareholders’ equity.
Including provisions for post-employment benefits, the Industrial Operations’ net financial assets amounted to SEK 29.1 billion which equals 25.7% of shareholders’ equity. The change during the year was mainly explained by a positive operating cash flow of SEK 26.6 billion, divestment of a company holding shares in Inner Mongolia North Hauler Joint Stock Co., Ltd (NHL) by SEK 0.8 billion reduced by the dividend paid to AB Volvo shareholders of SEK 8.6 billion. During 2018, remeasurements of the defined benefit pension obligations had a negative impact of SEK 0.5 billion and currency fluctuations had a negative effect of SEK 1.2 billion.
Read more in Note 5 Investments in joint ventures, associated companies and other shares and participations regarding the divestment of a company holding shares in Inner Mongolia North Hauler Joint Stock Co., Ltd (NHL).
Read more in Note 20 Provisions for post- employment benefits.
The Volvo Group´s cash and cash equivalents amounted to SEK 46.9 billion on December 31, 2018, an increase of SEK 10.8 billion as an effect of the positive operating cash flow. In addition to this, granted but unutilized credit facilities amounted to SEK 44.0 (45.4) billion. Cash and cash equivalents as of December 31, 2018 include SEK 1.9 (1.3) billion that is not available to use by the Volvo Group and SEK 5.6 (5.0) billion where other limitations exist, mainly in countries where exchange controls or other legal restrictions apply.
Read more in Note 18 Marketable securities and liquid funds.
Read more in Note 22 Liabilities regarding the maturity structure on Volvo Group’s credit facilities.
Balance sheetTotal assets in the Volvo Group amounted to SEK 474.7 billion as of December 31, 2018, an increase of SEK 55.7 billion since Decem-ber 31, 2017. The increase is mainly in cash and cash equivalents, inventory and customer-financing receivables. Customer-financing receivables have increased by SEK 17.5 billion as an effect of higher new business volume in Financial Services. Inventory levels have increased by SEK 13.1 billion as an effect of higher demand mainly in Trucks and Construction Equipment. Currency effects had a positive impact on total assets in an amount of SEK 14.8 billion.
Read more in Note 15 Customer-financing receivables.
Read more in Note 17 Inventories.
Assets and liabilities held for sale increased by SEK 0.2 billion during the year. The increase is mainly due to planned property divestments.
Read more in Note 3 Acquisitions and divestments of shares in subsidaries regarding assets and liabilities held for sale.
Investments in joint ventures and associated companies decreased by SEK 0.8 billion during the year, mainly driven by the divestment of shares in Inner Mongolia North Hauler Joint Stock Co., Ltd (NHL).
Read more in Note 5 Investments in joint ventures, associated companies and other shares and participations.
The net value of assets and liabilities related to pensions and similar obligations amounted to a liability of SEK 14.9 billion as of December 31, 2018, an increase of SEK 0.7 billion compared to year-end 2017.
Read more in Note 20 Provisions for post- employment benefits.
On December 31, 2018 the shareholders’ equity for the Volvo Group amounted to SEK 125.8 billion compared to SEK 107.8 billion at year-end 2017. The equity ratio was 26.5% (25.7) on December 2018. On the same date the equity ratio in the Industrial operations amounted to 31.9% (31.1).
F I N A N C I A L P O S I T I O N
Continued strengthened financial position
GROUP PERFORMANCE BOARD OF DIRECTORS’ REPORT 2018 FINANCIAL POSITION
85
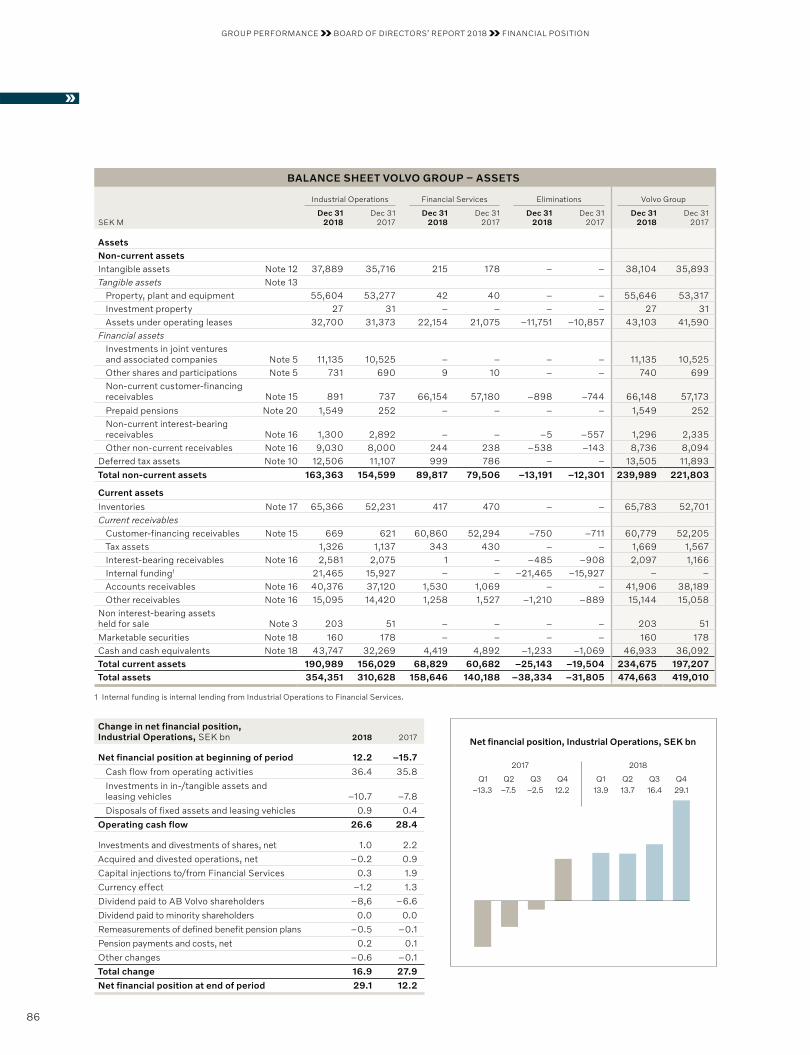
Change in net financial position, Industrial Operations, SEK bn 2018 2017
Net financial position at beginning of period 12.2 –15.7
Cash flow from operating activities 36.4 35.8
Investments in in-/tangible assets and leasing vehicles –10.7 –7.8
Disposals of fixed assets and leasing vehicles 0.9 0.4
Operating cash flow 26.6 28.4
Investments and divestments of shares, net 1.0 2.2
Acquired and divested operations, net –0.2 0.9
Capital injections to/from Financial Services 0.3 1.9
Currency effect –1.2 1.3
Dividend paid to AB Volvo shareholders –8,6 –6.6
Dividend paid to minority shareholders 0.0 0.0
Remeasurements of defined benefit pension plans –0.5 –0.1
Pension payments and costs, net 0.2 0.1
Other changes –0.6 –0.1
Total change 16.9 27.9
Net financial position at end of period 29.1 12.2
BALANCE SHEET VOLVO GROUP – ASSETS
Industrial Operations Financial Services Eliminations Volvo Group
SEK MDec 31
2018Dec 31
2017Dec 31
2018Dec 31
2017Dec 31
2018Dec 31
2017Dec 31
2018Dec 31
2017
Assets Non-current assets Intangible assets Note 12 37,889 35,716 215 178 – – 38,104 35,893Tangible assets Note 13
Property, plant and equipment 55,604 53,277 42 40 – – 55,646 53,317Investment property 27 31 – – – – 27 31Assets under operating leases 32,700 31,373 22,154 21,075 –11,751 –10,857 43,103 41,590
Financial assetsInvestments in joint ventures and associated companies Note 5 11,135 10,525 – – – – 11,135 10,525Other shares and participations Note 5 731 690 9 10 – – 740 699Non-current customer-financing receivables Note 15 891 737 66,154 57,180 –898 –744 66,148 57,173Prepaid pensions Note 20 1,549 252 – – – – 1,549 252Non-current interest-bearing receivables Note 16 1,300 2,892 – – –5 –557 1,296 2,335Other non-current receivables Note 16 9,030 8,000 244 238 –538 –143 8,736 8,094
Deferred tax assets Note 10 12,506 11,107 999 786 – – 13,505 11,893Total non-current assets 163,363 154,599 89,817 79,506 –13,191 –12,301 239,989 221,803
Current assets
Inventories Note 17 65,366 52,231 417 470 – – 65,783 52,701Current receivables
Customer-financing receivables Note 15 669 621 60,860 52,294 –750 –711 60,779 52,205Tax assets 1,326 1,137 343 430 – – 1,669 1,567Interest-bearing receivables Note 16 2,581 2,075 1 – –485 –908 2,097 1,166Internal funding1 21,465 15,927 – – –21,465 –15,927 – –Accounts receivables Note 16 40,376 37,120 1,530 1,069 – – 41,906 38,189Other receivables Note 16 15,095 14,420 1,258 1,527 –1,210 –889 15,144 15,058
Non interest-bearing assets held for sale Note 3 203 51 – – – – 203 51Marketable securities Note 18 160 178 – – – – 160 178Cash and cash equivalents Note 18 43,747 32,269 4,419 4,892 –1,233 –1,069 46,933 36,092Total current assets 190,989 156,029 68,829 60,682 –25,143 –19,504 234,675 197,207Total assets 354,351 310,628 158,646 140,188 –38,334 –31,805 474,663 419,010
1 Internal funding is internal lending from Industrial Operations to Financial Services.
Net financial position, Industrial Operations, SEK bn
2017 2018
Q4Q3Q2Q1Q4Q3Q2Q129.116.413.713.912.2–2.5–7.5–13.3
GROUP PERFORMANCE BOARD OF DIRECTORS’ REPORT 2018 FINANCIAL POSITION
86
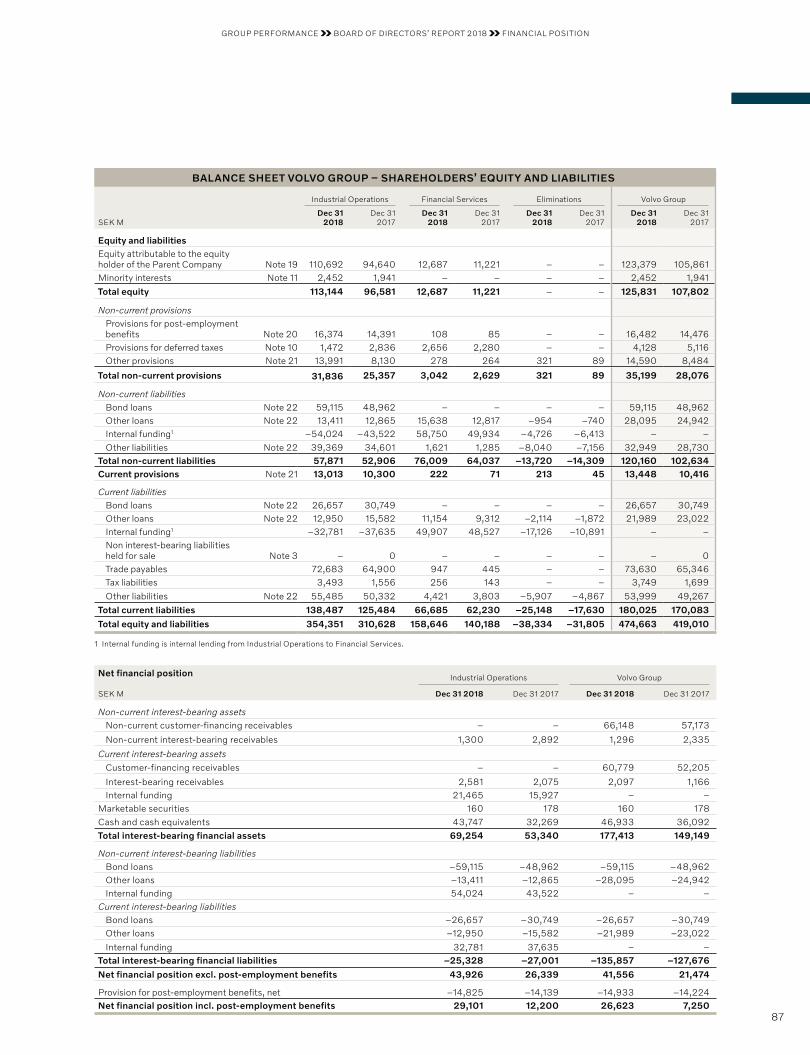
Net financial position Industrial Operations Volvo Group
SEK M Dec 31 2018 Dec 31 2017 Dec 31 2018 Dec 31 2017
Non-current interest-bearing assets Non-current customer-financing receivables – – 66,148 57,173
Non-current interest-bearing receivables 1,300 2,892 1,296 2,335
Current interest-bearing assetsCustomer-financing receivables – – 60,779 52,205
Interest-bearing receivables 2,581 2,075 2,097 1,166Internal funding 21,465 15,927 – –
Marketable securities 160 178 160 178Cash and cash equivalents 43,747 32,269 46,933 36,092Total interest-bearing financial assets 69,254 53,340 177,413 149,149
Non-current interest-bearing liabilitiesBond loans –59,115 –48,962 –59,115 –48,962Other loans –13,411 –12,865 –28,095 –24,942Internal funding 54,024 43,522 – –
Current interest-bearing liabilitiesBond loans –26,657 –30,749 –26,657 –30,749Other loans –12,950 –15,582 –21,989 –23,022
Internal funding 32,781 37,635 – –Total interest-bearing financial liabilities –25,328 –27,001 –135,857 –127,676
Net financial position excl. post- employment benefits 43,926 26,339 41,556 21,474
Provision for post-employment benefits, net –14,825 –14,139 –14,933 –14,224Net financial position incl. post- employment benefits 29,101 12,200 26,623 7,250
BALANCE SHEET VOLVO GROUP – SHAREHOLDERS’ EQUITY AND LIABILITIES
Industrial Operations Financial Services Eliminations Volvo Group
SEK MDec 31
2018Dec 31
2017Dec 31
2018Dec 31
2017Dec 31
2018Dec 31
2017Dec 31
2018Dec 31
2017
Equity and liabilitiesEquity attributable to the equity holder of the Parent Company Note 19 110,692 94,640 12,687 11,221 – – 123,379 105,861Minority interests Note 11 2,452 1,941 – – – – 2,452 1,941Total equity 113,144 96,581 12,687 11,221 – – 125,831 107,802
Non-current provisionsProvisions for post- employment benefits Note 20 16,374 14,391 108 85 – – 16,482 14,476Provisions for deferred taxes Note 10 1,472 2,836 2,656 2,280 – – 4,128 5,116Other provisions Note 21 13,991 8,130 278 264 321 89 14,590 8,484
Total non-current provisions 31,836 25,357 3,042 2,629 321 89 35,199 28,076
Non-current liabilitiesBond loans Note 22 59,115 48,962 – – – – 59,115 48,962Other loans Note 22 13,411 12,865 15,638 12,817 –954 –740 28,095 24,942Internal funding1 –54,024 –43,522 58,750 49,934 –4,726 –6,413 – –Other liabilities Note 22 39,369 34,601 1,621 1,285 –8,040 –7,156 32,949 28,730
Total non-current liabilities 57,871 52,906 76,009 64,037 –13,720 –14,309 120,160 102,634Current provisions Note 21 13,013 10,300 222 71 213 45 13,448 10,416
Current liabilitiesBond loans Note 22 26,657 30,749 – – – – 26,657 30,749Other loans Note 22 12,950 15,582 11,154 9,312 –2,114 –1,872 21,989 23,022Internal funding1 –32,781 –37,635 49,907 48,527 –17,126 –10,891 – –Non interest-bearing liabilities held for sale Note 3 – 0 – – – – – 0Trade payables 72,683 64,900 947 445 – – 73,630 65,346Tax liabilities 3,493 1,556 256 143 – – 3,749 1,699Other liabilities Note 22 55,485 50,332 4,421 3,803 –5,907 –4,867 53,999 49,267
Total current liabilities 138,487 125,484 66,685 62,230 –25,148 –17,630 180,025 170,083
Total equity and liabilities 354,351 310,628 158,646 140,188 –38,334 –31,805 474,663 419,010
1 Internal funding is internal lending from Industrial Operations to Financial Services.
GROUP PERFORMANCE BOARD OF DIRECTORS’ REPORT 2018 FINANCIAL POSITION
87
During 2018 operating cash flow in the Industrial Opera-tions amounted to SEK 26.6 billion (28.4).
The strong operating cash flow within Industrial Operations is primarily related to the improved operat-
ing income of SEK 32.1 billion reduced by higher level of working capital. During the year operating income was negatively impacted by a provision of SEK 7.0 billion relating to estimated costs to address the issue of a degrading emission control. Negative cash flow effects from these activities will start in 2019 with a ramp up during the coming years. The provision of SEK 7 billion is recorded in Other non-cash items. The increase in operating capital is primarily related to inventory and accounts receivables counterbalanced by an increase in trade payables. The higher inventory levels is mainly an effect of higher demand in Trucks and Construction Equipment. The increase in trade payables is primarily due to higher production volumes as an effect of higher sales.
Income taxes paid in the Industrial Oper ations increased by SEK 2.5 billion.
Operating cash flow within Financial Services was negative in an amount of SEK 10.4 billion (4.2), mainly due to an increase in the customer-financing receivables and an increase in investments in assets under operating lease as an effect of a strong level of new business volume in the credit portfolio.
Read more in Note 10 Income taxes.
Read more in Note 21 Other provisions.
Investments and disposalsThe Industrial Operations’ investments in fixed assets and capitalized development costs during 2018 amounted to SEK 10.7 billion (7.7).
Group Trucks investments in fixed assets and capitalized develop-ment costs amounted to SEK 7.7 billion (5.3). The major investments related to industrial efficiency measures in the plants continued, with replacement of the E-coat process in Umeå, Sweden. Replace-ments and upgrades in the US plants as well as in Europe were also seen. Capital expenditures were also related to new products, the development of electric trucks, emission upgrades with both product development activities and required adaptations in the plants.
The investments in dealer networks and workshops were mainly done in Japan and Europe primarily for upgrade and replacements.
Investments in Construction Equipment amounted to SEK 0.9 billion (0.8). The major investments in the plants were related to new products and replacements mainly in Asia but also Europe. The product related investments during the year were mainly related to continued investments in tooling and required adaptations in the plants for excavators and wheel loaders.
The investments in Buses were SEK 0.4 billion (0.3), and in Volvo Penta SEK 0.6 billion (0.3).
The investment level for property, plant and equipment during 2018 was above the preceding year. During 2019, investments in property, plant and equipment are expected to continue to increase compared to 2018. Optimization of the industrial footprint, product- related tooling, replacements and dealer investments will continue to be the main areas.
Investments and divestments of sharesDuring the year the Volvo Group divested a subsidiary with holding of shares in Inner Mongolia North Hauler Joint Stock Co. Ltd (NHL). The divestment resulted in a positive effect on cash flow of SEK 1.0 billion. In total, investments and divestments of shares in 2018 had a positive impact on cash flow of SEK 1.0 billion (2.2), mainly as a consequence of the divestment of NHL.
Read more in Note 5 Investments in joint venture, associated companies and other shares and participations.
Acquired and divested operationsIn total acquired and divested operations in 2018 had a negative impact on cash flow of SEK 0.2 billion (0.9).
Read more in Note 3 Acquisitions and divestments of shares in subsidiaries.
Financing and dividendNet borrowings increased cash and cash equivalents by SEK 1.9 billion during 2018. In 2017 the corresponding item decreased cash and cash equivalents by SEK 9.0 billion.
Read more in Note 29 Cash flow regarding change in loans during 2018.
During the year dividend of SEK 8.6 billion, corresponding to SEK 4.25 per share, was paid to the shareholders of AB Volvo.
Change in cash and cash equivalentsThe Volvo Group’s cash and cash equivalents increased by SEK 10.8 billion during the year due to the strong operating cash flow and amounted to SEK 46.9 billion at December 31, 2018.
Read more in Note 29 Cash flow regarding principles for preparing the cash flow statement.
Read more in Note 18 Marketable securities and liquid funds regarding the accounting policy.
C A S H F L O W S T A T E M E N T
Continued strong operating cash flow
GROUP PERFORMANCE BOARD OF DIRECTORS’ REPORT 2018 CASH FLOW STATEMENT
88
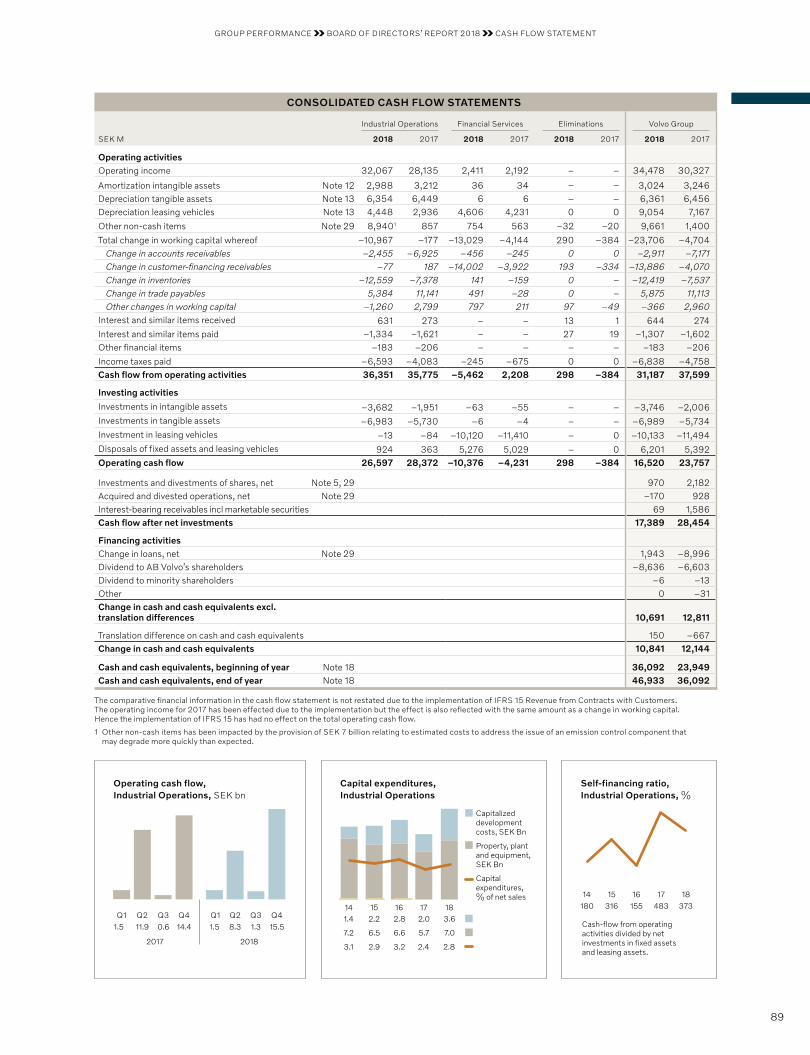
CONSOLIDATED CASH FLOW STATEMENTS
Industrial Operations Financial Services Eliminations Volvo Group
SEK M 2018 2017 2018 2017 2018 2017 2018 2017
Operating activities Operating income 32,067 28,135 2,411 2,192 – – 34,478 30,327
Amortization intangible assets Note 12 2,988 3,212 36 34 – – 3,024 3,246Depreciation tangible assets Note 13 6,354 6,449 6 6 – – 6,361 6,456Depreciation leasing vehicles Note 13 4,448 2,936 4,606 4,231 0 0 9,054 7,167
Other non-cash items Note 29 8,9401 857 754 563 –32 –20 9,661 1,400
Total change in working capital whereof –10,967 –177 –13,029 –4,144 290 –384 –23,706 –4,704Change in accounts receivables –2,455 –6,925 –456 –245 0 0 –2,911 –7,171Change in customer-financing receivables –77 187 –14,002 –3,922 193 –334 –13,886 –4,070Change in inventories –12,559 –7,378 141 –159 0 – –12,419 –7,537Change in trade payables 5,384 11,141 491 –28 0 – 5,875 11,113Other changes in working capital –1,260 2,799 797 211 97 –49 –366 2,960
Interest and similar items received 631 273 – – 13 1 644 274Interest and similar items paid –1,334 –1,621 – – 27 19 –1,307 –1,602Other financial items –183 –206 – – – – –183 –206
Income taxes paid –6,593 –4,083 –245 –675 0 0 –6,838 –4,758Cash flow from operating activities 36,351 35,775 –5,462 2,208 298 –384 31,187 37,599
Investing activities
Investments in intangible assets –3,682 –1,951 –63 –55 – – –3,746 –2,006Investments in tangible assets –6,983 –5,730 –6 –4 – – –6,989 –5,734Investment in leasing vehicles –13 –84 –10,120 –11,410 – 0 –10,133 –11,494Disposals of fixed assets and leasing vehicles 924 363 5,276 5,029 – 0 6,201 5,392Operating cash flow 26,597 28,372 –10,376 –4,231 298 –384 16,520 23,757
Investments and divestments of shares, net Note 5, 29 970 2,182Acquired and divested operations, net Note 29 –170 928Interest-bearing receivables incl marketable securities 69 1,586Cash flow after net investments 17,389 28,454
Financing activities Change in loans, net Note 29 1,943 –8,996Dividend to AB Volvo’s shareholders –8,636 –6,603Dividend to minority shareholders –6 –13Other 0 –31Change in cash and cash equivalents excl. translation differences 10,691 12,811
Translation difference on cash and cash equivalents 150 –667Change in cash and cash equivalents 10,841 12,144
Cash and cash equivalents, beginning of year Note 18 36,092 23,949Cash and cash equivalents, end of year Note 18 46,933 36,092
The comparative financial information in the cash flow statement is not restated due to the implementation of IFRS 15 Revenue from Contracts with Customers. The operating income for 2017 has been effected due to the implementation but the effect is also reflected with the same amount as a change in working capital. Hence the implementation of IFRS 15 has had no effect on the total operating cash flow.
1 Other non-cash items has been impacted by the provision of SEK 7 billion relating to estimated costs to address the issue of an emission control component that may degrade more quickly than expected.
Operating cash flow, Industrial Operations, SEK bn
Capital expenditures, Industrial Operations
Self-financing ratio, Industrial Operations, %
20182017
Q415.5
Q31.3
Q28.3
Q11.5
Q4Q3Q2Q114.40.611.91.5
Capital expenditures, % of net sales
Property, plant and equipment, SEK Bn
Capitalized development costs, SEK Bn
1514 16 17 18
2.4
5.7
2.0
2.8
7.0
3.6
3.1
7.2
1.4
2.9
6.5
2.2
3.2
6.6
2.8
1514180
16316 155
17483
18373
Cash-flow from operating activities divided by net investments in fixed assets and leasing assets.
GROUP PERFORMANCE BOARD OF DIRECTORS’ REPORT 2018 CASH FLOW STATEMENT
89
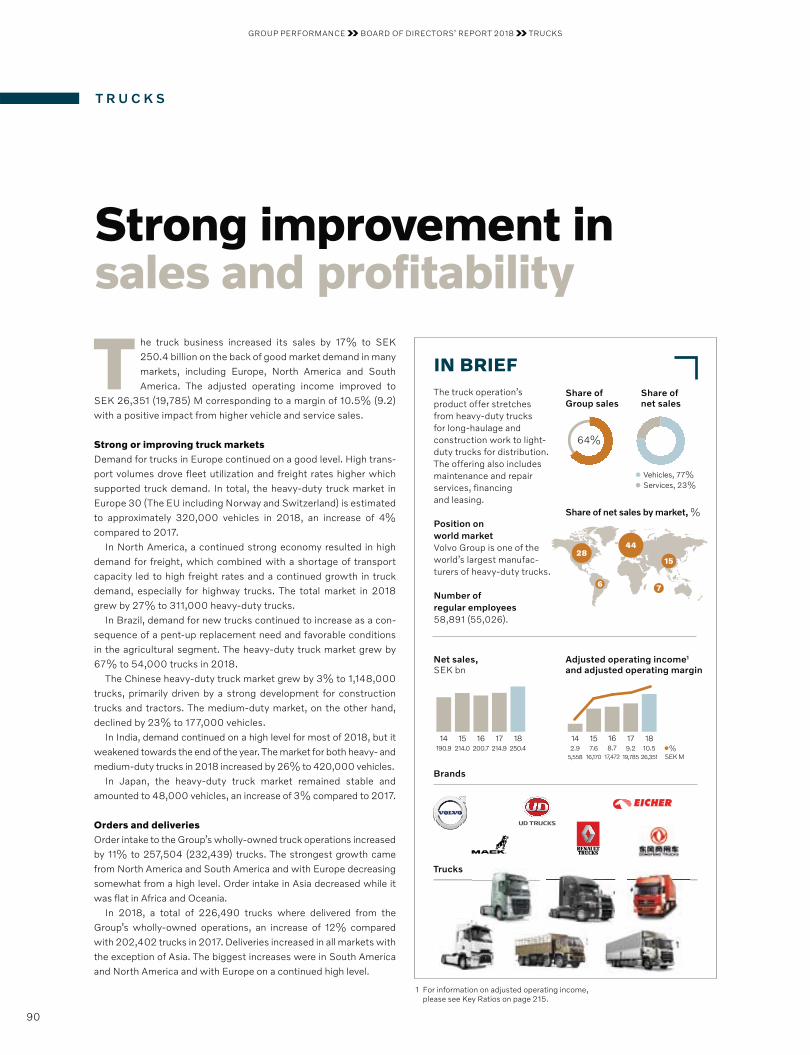
T R U C K S
Strong improvement in sales and profitability
The truck business increased its sales by 17% to SEK 250.4 billion on the back of good market demand in many markets, including Europe, North America and South America. The adjusted operating income improved to
SEK 26,351 (19,785) M corresponding to a margin of 10.5% (9.2) with a positive impact from higher vehicle and service sales.
Strong or improving truck marketsDemand for trucks in Europe continued on a good level. High trans-port volumes drove fleet utilization and freight rates higher which supported truck demand. In total, the heavy-duty truck market in Europe 30 (The EU including Norway and Switzerland) is estimated to approximately 320,000 vehicles in 2018, an increase of 4% compared to 2017.
In North America, a continued strong economy resulted in high demand for freight, which combined with a shortage of transport capacity led to high freight rates and a continued growth in truck demand, especially for highway trucks. The total market in 2018 grew by 27% to 311,000 heavy-duty trucks.
In Brazil, demand for new trucks continued to increase as a con-sequence of a pent-up replacement need and favorable conditions in the agricultural segment. The heavy-duty truck market grew by 67% to 54,000 trucks in 2018.
The Chinese heavy-duty truck market grew by 3% to 1,148,000 trucks, primarily driven by a strong development for construction trucks and tractors. The medium-duty market, on the other hand, declined by 23% to 177,000 vehicles.
In India, demand continued on a high level for most of 2018, but it weakened towards the end of the year. The market for both heavy- and medium-duty trucks in 2018 increased by 26% to 420,000 vehicles.
In Japan, the heavy-duty truck market remained stable and amounted to 48,000 vehicles, an increase of 3% compared to 2017.
Orders and deliveriesOrder intake to the Group’s wholly-owned truck operations increased by 11% to 257,504 (232,439) trucks. The strongest growth came from North America and South America and with Europe decreasing somewhat from a high level. Order intake in Asia decreased while it was flat in Africa and Oceania.
In 2018, a total of 226,490 trucks where delivered from the Group’s wholly-owned operations, an increase of 12% compared with 202,402 trucks in 2017. Deliveries increased in all markets with the exception of Asia. The biggest increases were in South America and North America and with Europe on a continued high level.
Share of Group sales
64%
IN BRIEFThe truck operation’s product offer stretches from heavy-duty trucks for long-haulage and construc tion work to light-duty trucks for distri bution. The offering also includes maintenance and repair services, financing and leasing.
Position on world market Volvo Group is one of the world’s largest manufac-turers of heavy-duty trucks.
Number of regular employees 58,891 (55,026).
1 For information on adjusted operating income, please see Key Ratios on page 215.
17161514190.9 214.0 200.7 214.9 250.4
18
Net sales, SEK bn
171615142.9 7.6 8.7 9.2
5,558 16,170 17,472 19,78510.5
26,351
18
SEK M%
Adjusted operating income1 and adjusted operating margin
Share of net sales
Vehicles, 77%Services, 23%
Brands
Trucks
Share of net sales by market, %
4428
6 7
15
GROUP PERFORMANCE BOARD OF DIRECTORS’ REPORT 2018 TRUCKS
90
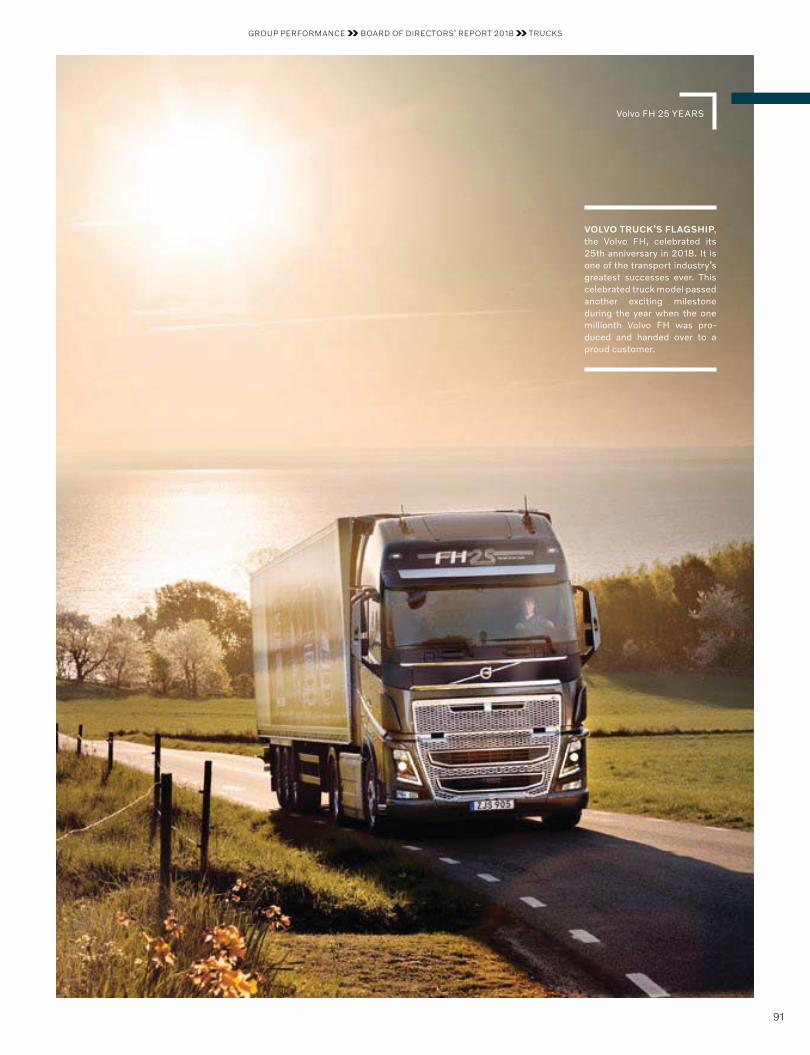
Volvo FH 25 YEARS
VOLVO TRUCK’S FLAGSHIP, the Volvo FH, celebrated its 25th anniversary in 2018. It is one of the transport industry’s greatest successes ever. This celebrated truck model passed another exciting milestone during the year when the one millionth Volvo FH was pro-duced and handed over to a proud customer.
GROUP PERFORMANCE BOARD OF DIRECTORS’ REPORT 2018 TRUCKS
91
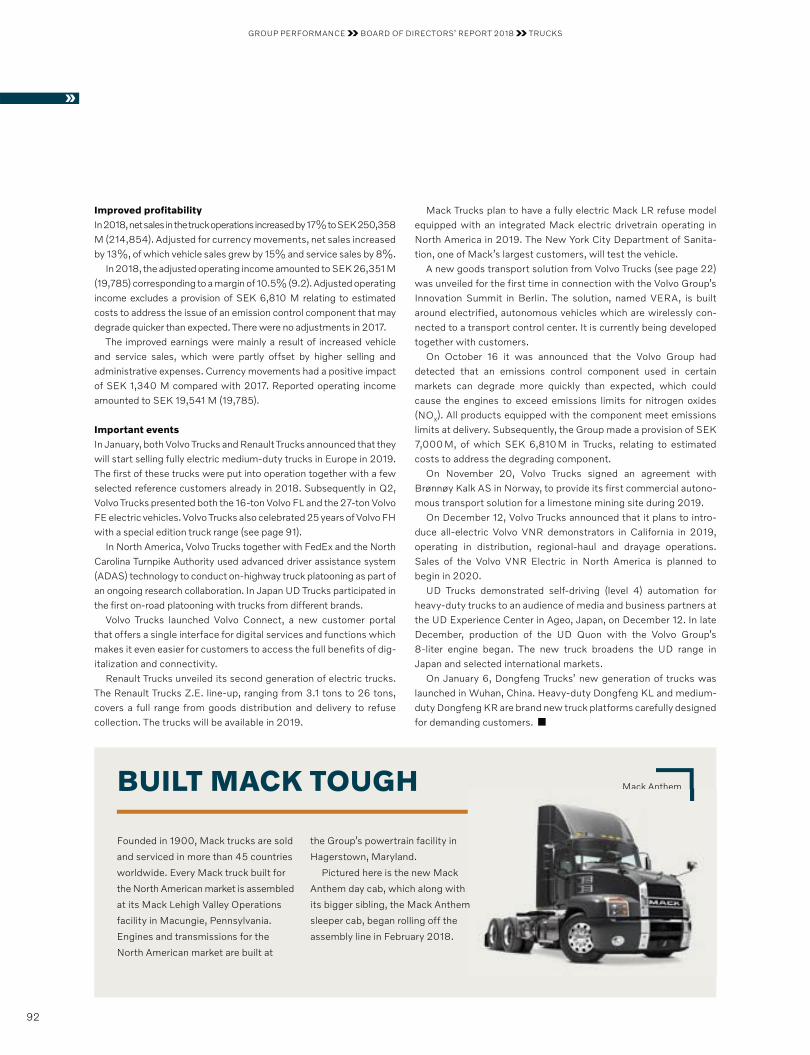
Improved profitabilityIn 2018, net sales in the truck operations increased by 17% to SEK 250,358 M (214,854). Adjusted for currency movements, net sales increased by 13%, of which vehicle sales grew by 15% and service sales by 8%.
In 2018, the adjusted operating income amounted to SEK 26,351 M (19,785) corresponding to a margin of 10.5% (9.2). Adjusted operating income excludes a provision of SEK 6,810 M relating to estimated costs to address the issue of an emission control component that may degrade quicker than expected. There were no adjustments in 2017.
The improved earnings were mainly a result of increased vehicle and service sales, which were partly offset by higher selling and administrative expenses. Currency movements had a positive impact of SEK 1,340 M compared with 2017. Reported operating income amounted to SEK 19,541 M (19,785).
Important eventsIn January, both Volvo Trucks and Renault Trucks announced that they will start selling fully electric medium-duty trucks in Europe in 2019. The first of these trucks were put into operation together with a few selected reference customers already in 2018. Subsequently in Q2, Volvo Trucks presented both the 16-ton Volvo FL and the 27-ton Volvo FE electric vehicles. Volvo Trucks also celebrated 25 years of Volvo FH with a special edition truck range (see page 91).
In North America, Volvo Trucks together with FedEx and the North Carolina Turnpike Authority used advanced driver assistance system (ADAS) technology to conduct on-highway truck platooning as part of an ongoing research collaboration. In Japan UD Trucks participated in the first on-road platooning with trucks from different brands.
Volvo Trucks launched Volvo Connect, a new customer portal that offers a single interface for digital services and functions which makes it even easier for customers to access the full benefits of dig-italization and connectivity.
Renault Trucks unveiled its second generation of electric trucks. The Renault Trucks Z.E. line-up, ranging from 3.1 tons to 26 tons, covers a full range from goods distribution and delivery to refuse collection. The trucks will be available in 2019.
Mack Trucks plan to have a fully electric Mack LR refuse model equipped with an integrated Mack electric drivetrain operating in North America in 2019. The New York City Department of Sanita-tion, one of Mack’s largest customers, will test the vehicle.
A new goods transport solution from Volvo Trucks (see page 22) was unveiled for the first time in connection with the Volvo Group’s Innovation Summit in Berlin. The solution, named VERA, is built around electrified, autonomous vehicles which are wirelessly con-nected to a transport control center. It is currently being developed together with customers.
On October 16 it was announced that the Volvo Group had detected that an emissions control component used in certain markets can degrade more quickly than expected, which could cause the engines to exceed emissions limits for nitrogen oxides (NOX). All products equipped with the component meet emissions limits at delivery. Subsequently, the Group made a provision of SEK 7,000 M, of which SEK 6,810 M in Trucks, relating to estimated costs to address the degrading component.
On November 20, Volvo Trucks signed an agreement with Brønnøy Kalk AS in Norway, to provide its first commercial autono-mous transport solution for a limestone mining site during 2019.
On December 12, Volvo Trucks announced that it plans to intro-duce all-electric Volvo VNR demonstrators in California in 2019, operating in distribution, regional-haul and drayage operations. Sales of the Volvo VNR Electric in North America is planned to begin in 2020.
UD Trucks demonstrated self-driving (level 4) automation for heavy-duty trucks to an audience of media and business partners at the UD Experience Center in Ageo, Japan, on December 12. In late December, production of the UD Quon with the Volvo Group’s 8-liter engine began. The new truck broadens the UD range in Japan and selected international markets.
On January 6, Dongfeng Trucks’ new generation of trucks was launched in Wuhan, China. Heavy-duty Dongfeng KL and medium- duty Dongfeng KR are brand new truck platforms carefully designed for demanding customers.
BUILT MACK TOUGH
Founded in 1900, Mack trucks are sold
and serviced in more than 45 countries
worldwide. Every Mack truck built for
the North American market is assembled
at its Mack Lehigh Valley Operations
facility in Macungie, Pennsylvania.
Engines and transmissions for the
North American market are built at
the Group’s powertrain facility in
Hagerstown, Maryland.
Pictured here is the new Mack
Anthem day cab, which along with
its bigger sibling, the Mack Anthem
sleeper cab, began rolling off the
assembly line in February 2018.
Mack Anthem
m
Mack Anthem
GROUP PERFORMANCE BOARD OF DIRECTORS’ REPORT 2018 TRUCKS
92
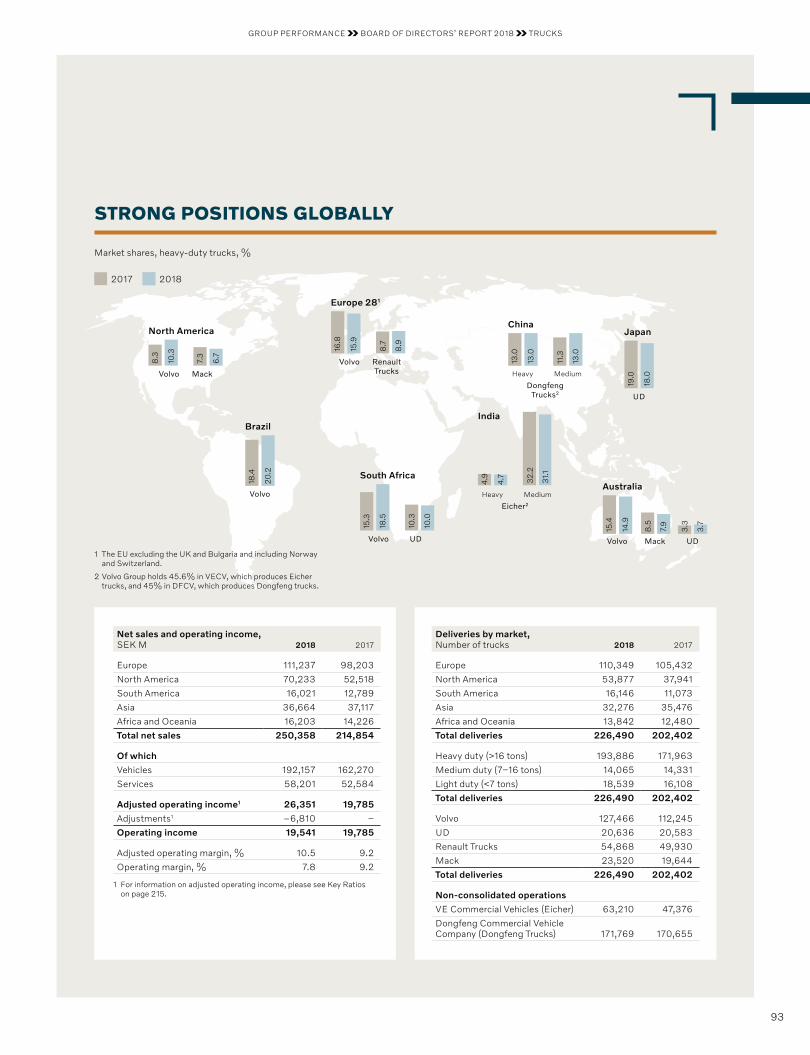
Net sales and operating income, SEK M 2018 2017
Europe 111,237 98,203
North America 70,233 52,518
South America 16,021 12,789
Asia 36,664 37,117
Africa and Oceania 16,203 14,226
Total net sales 250,358 214,854
Of which
Vehicles 192,157 162,270
Services 58,201 52,584
Adjusted operating income1 26,351 19,785
Adjustments1 –6,810 −
Operating income 19,541 19,785
Adjusted operating margin, % 10.5 9.2
Operating margin, % 7.8 9.2
1 For information on adjusted operating income, please see Key Ratios on page 215.
Deliveries by market, Number of trucks 2018 2017
Europe 110,349 105,432
North America 53,877 37,941
South America 16,146 11,073
Asia 32,276 35,476
Africa and Oceania 13,842 12,480
Total deliveries 226,490 202,402
Heavy duty (>16 tons) 193,886 171,963
Medium duty (7–16 tons) 14,065 14,331
Light duty (<7 tons) 18,539 16,108
Total deliveries 226,490 202,402
Volvo 127,466 112,245
UD 20,636 20,583
Renault Trucks 54,868 49,930
Mack 23,520 19,644
Total deliveries 226,490 202,402
Non-consolidated operations
VE Commercial Vehicles (Eicher) 63,210 47,376
Dongfeng Commercial Vehicle Company (Dongfeng Trucks) 171,769 170,655
STRONG POSITIONS GLOBALLY
Market shares, heavy-duty trucks, %
China
13.0
13.0
11.3
13.0
Heavy Medium
Dongfeng Trucks2
Brazil
18.4
20.2
Volvo
North America
8.3
10.3
7.3
6.7
Volvo Mack
Australia
15.4
14.9
8.5
7.9
3.3
3.7
Volvo Mack UD
Japan
19.0
18.0
UD
South Africa
15.3
18.5
10.3
10.0
Volvo UD
Heavy Medium
Eicher2
4.9
4.7 32
.2
31.1
India
2017 2018
16.8
15.9
8.7
8.9
Volvo Renault Trucks
Europe 281
1 The EU excluding the UK and Bulgaria and including Norway and Switzerland.
2 Volvo Group holds 45.6% in VECV, which produces Eicher trucks, and 45% in DFCV, which produces Dongfeng trucks.
GROUP PERFORMANCE BOARD OF DIRECTORS’ REPORT 2018 TRUCKS
93
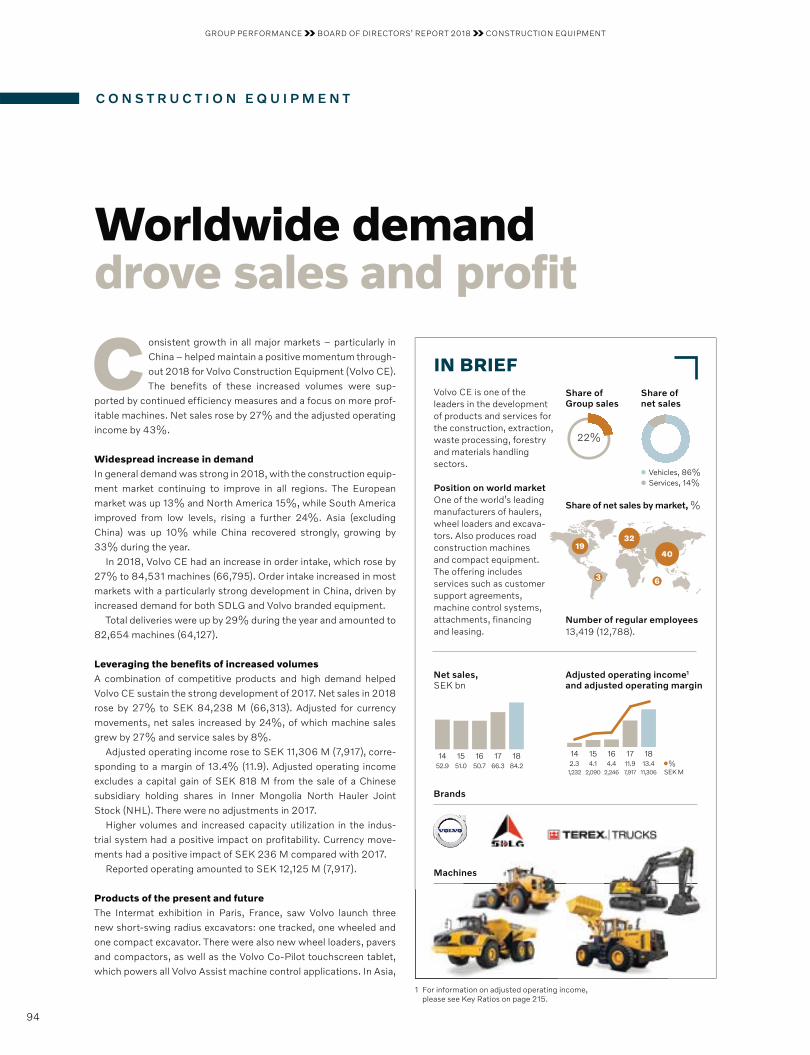
C O N S T R U C T I O N E Q U I P M E N T
Worldwide demand drove sales and profit
Consistent growth in all major markets – particularly in China – helped maintain a positive momentum through-out 2018 for Volvo Construction Equipment (Volvo CE). The benefits of these increased volumes were sup-
ported by continued efficiency measures and a focus on more prof-itable machines. Net sales rose by 27% and the adjusted operating income by 43%.
Widespread increase in demandIn general demand was strong in 2018, with the construction equip-ment market continuing to improve in all regions. The European market was up 13% and North America 15%, while South America improved from low levels, rising a further 24%. Asia (excluding China) was up 10% while China recovered strongly, growing by 33% during the year.
In 2018, Volvo CE had an increase in order intake, which rose by 27% to 84,531 machines (66,795). Order intake increased in most markets with a particularly strong development in China, driven by increased demand for both SDLG and Volvo branded equipment.
Total deliveries were up by 29% during the year and amounted to 82,654 machines (64,127).
Leveraging the benefits of increased volumesA combination of competitive products and high demand helped Volvo CE sustain the strong development of 2017. Net sales in 2018 rose by 27% to SEK 84,238 M (66,313). Adjusted for currency movements, net sales increased by 24%, of which machine sales grew by 27% and service sales by 8%.
Adjusted operating income rose to SEK 11,306 M (7,917), corre-sponding to a margin of 13.4% (11.9). Adjusted operating income excludes a capital gain of SEK 818 M from the sale of a Chinese subsidiary holding shares in Inner Mongolia North Hauler Joint Stock (NHL). There were no adjustments in 2017.
Higher volumes and increased capacity utilization in the indus-trial system had a positive impact on profitability. Currency move-ments had a positive impact of SEK 236 M compared with 2017.
Reported operating amounted to SEK 12,125 M (7,917).
Products of the present and futureThe Intermat exhibition in Paris, France, saw Volvo launch three new short-swing radius excavators: one tracked, one wheeled and one compact excavator. There were also new wheel loaders, pavers and compactors, as well as the Volvo Co-Pilot touchscreen tablet, which powers all Volvo Assist machine control applications. In Asia,
IN BRIEFVolvo CE is one of the leaders in the development of products and services for the construction, extraction, waste processing, forestry and materials handling sectors.
Position on world market One of the world’s leading manufacturers of haulers, wheel loaders and excava-tors. Also produces road construc tion machines and compact equipment. The offering includes services such as customer support agreements, machine control systems, attachments, financing and leasing.
1 For information on adjusted operating income, please see Key Ratios on page 215.
Number of regular employees 13,419 (12,788).
Brands
Machines
Share of net sales by market, %
Share of Group sales
22%
Share of net sales
Vehicles, 86%Services, 14%
1716151452.9 51.0 50.7 66.3 84.2
18
Net sales, SEK bn
171615142.3 4.1 4.4 11.9
1,232 2,090 2,246 7,91713.4
11,306
18
SEK M%
Adjusted operating income1 and adjusted operating margin
3219
3 6
40
nes
94
GROUP PERFORMANCE BOARD OF DIRECTORS’ REPORT 2018 CONSTRUCTION EQUIPMENT
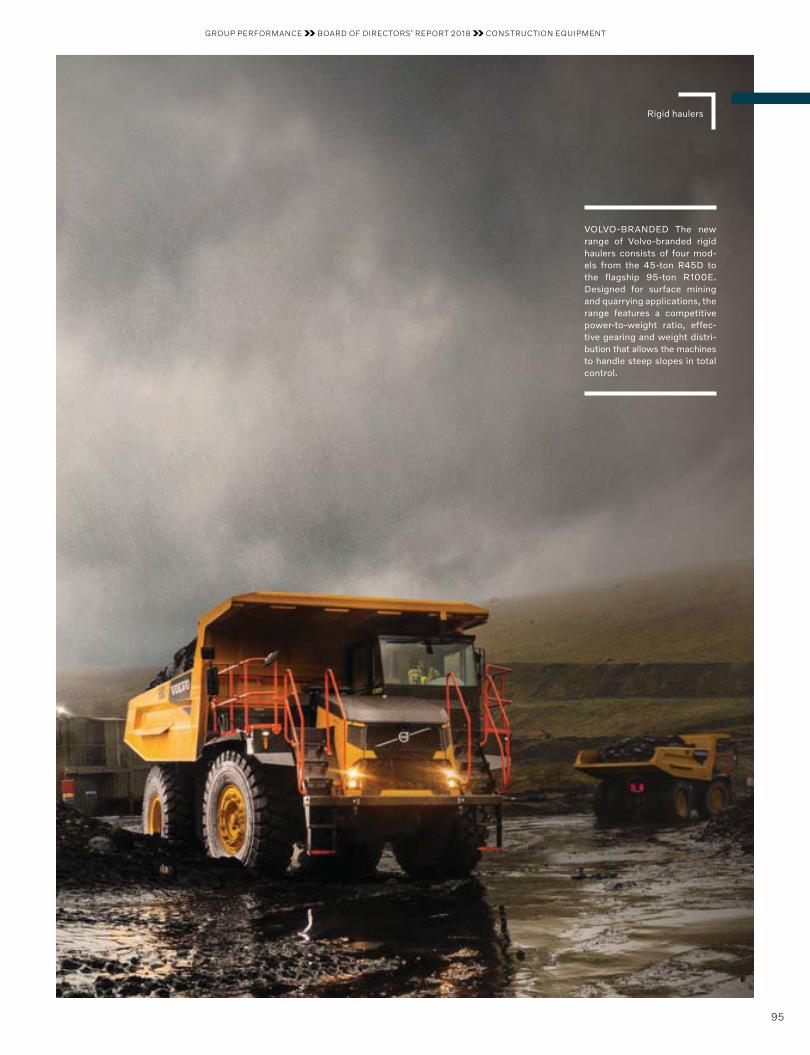
Rigid haulers
VOLVO-BRANDED The new range of Volvo-branded rigid haulers consists of four mod-els from the 45-ton R45D to the flagship 95-ton R100E. Designed for surface mining and quarrying applications, the range features a competitive power-to-weight ratio, effec-tive gearing and weight distri-bution that allows the machines to handle steep slopes in total control.
95
GROUP PERFORMANCE BOARD OF DIRECTORS’ REPORT 2018 CONSTRUCTION EQUIPMENT
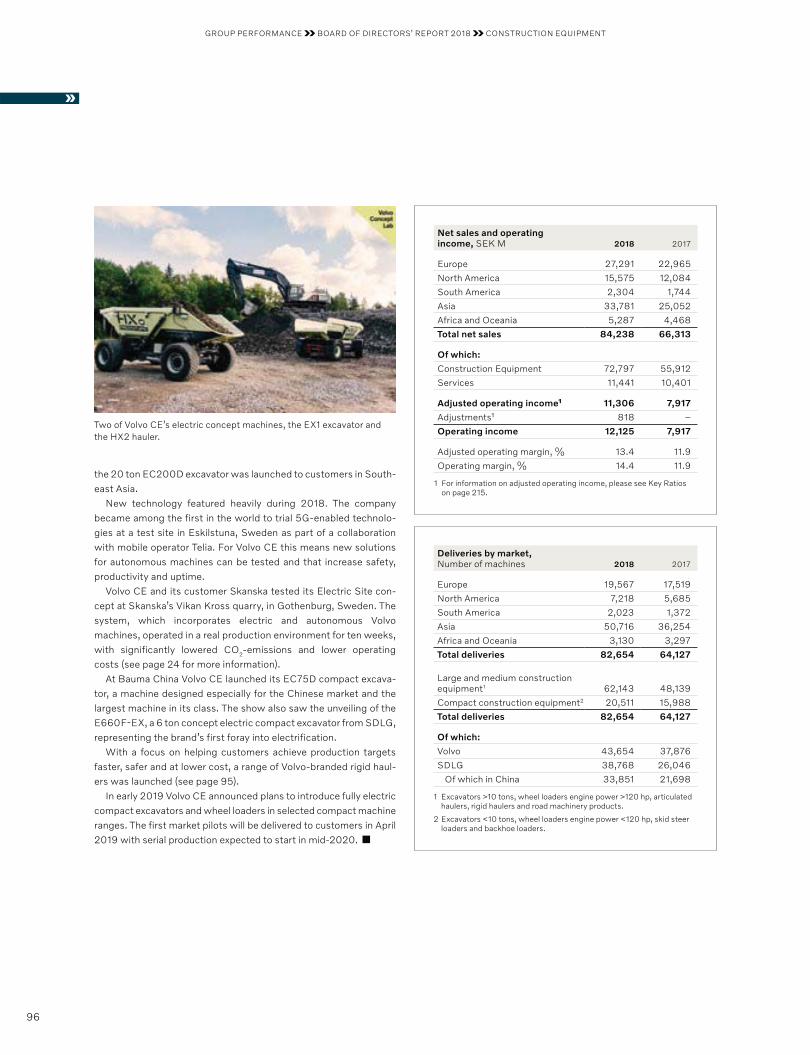
the 20 ton EC200D excavator was launched to customers in South-east Asia.
New technology featured heavily during 2018. The company became among the first in the world to trial 5G-enabled technolo-gies at a test site in Eskilstuna, Sweden as part of a collaboration with mobile operator Telia. For Volvo CE this means new solutions for autonomous machines can be tested and that increase safety, productivity and uptime.
Volvo CE and its customer Skanska tested its Electric Site con-cept at Skanska’s Vikan Kross quarry, in Gothenburg, Sweden. The system, which incorporates electric and autonomous Volvo machines, operated in a real production environment for ten weeks, with significantly lowered CO2-emissions and lower operating costs (see page 24 for more information).
At Bauma China Volvo CE launched its EC75D compact excava-tor, a machine designed especially for the Chinese market and the largest machine in its class. The show also saw the unveiling of the E660F-EX, a 6 ton concept electric compact excavator from SDLG, representing the brand’s first foray into electrification.
With a focus on helping customers achieve production targets faster, safer and at lower cost, a range of Volvo-branded rigid haul-ers was launched (see page 95).
In early 2019 Volvo CE announced plans to introduce fully electric compact excavators and wheel loaders in selected compact machine ranges. The first market pilots will be delivered to customers in April 2019 with serial production expected to start in mid-2020.
Net sales and operating income, SEK M 2018 2017
Europe 27,291 22,965
North America 15,575 12,084
South America 2,304 1,744
Asia 33,781 25,052
Africa and Oceania 5,287 4,468
Total net sales 84,238 66,313
Of which:
Construction Equipment 72,797 55,912
Services 11,441 10,401
Adjusted operating income¹ 11,306 7,917
Adjustments¹ 818 –
Operating income 12,125 7,917
Adjusted operating margin, % 13.4 11.9
Operating margin, % 14.4 11.9
1 For information on adjusted operating income, please see Key Ratios on page 215.
Deliveries by market, Number of machines 2018 2017
Europe 19,567 17,519
North America 7,218 5,685
South America 2,023 1,372
Asia 50,716 36,254
Africa and Oceania 3,130 3,297
Total deliveries 82,654 64,127
Large and medium construction equipment1 62,143 48,139
Compact construction equipment2 20,511 15,988
Total deliveries 82,654 64,127
Of which:
Volvo 43,654 37,876
SDLG 38,768 26,046
Of which in China 33,851 21,698
1 Excavators >10 tons, wheel loaders engine power >120 hp, articulated haulers, rigid haulers and road machinery products.
2 Excavators <10 tons, wheel loaders engine power <120 hp, skid steer loaders and backhoe loaders.
Two of Volvo CE’s electric concept machines, the EX1 excavator and the HX2 hauler.
96
GROUP PERFORMANCE BOARD OF DIRECTORS’ REPORT 2018 CONSTRUCTION EQUIPMENT
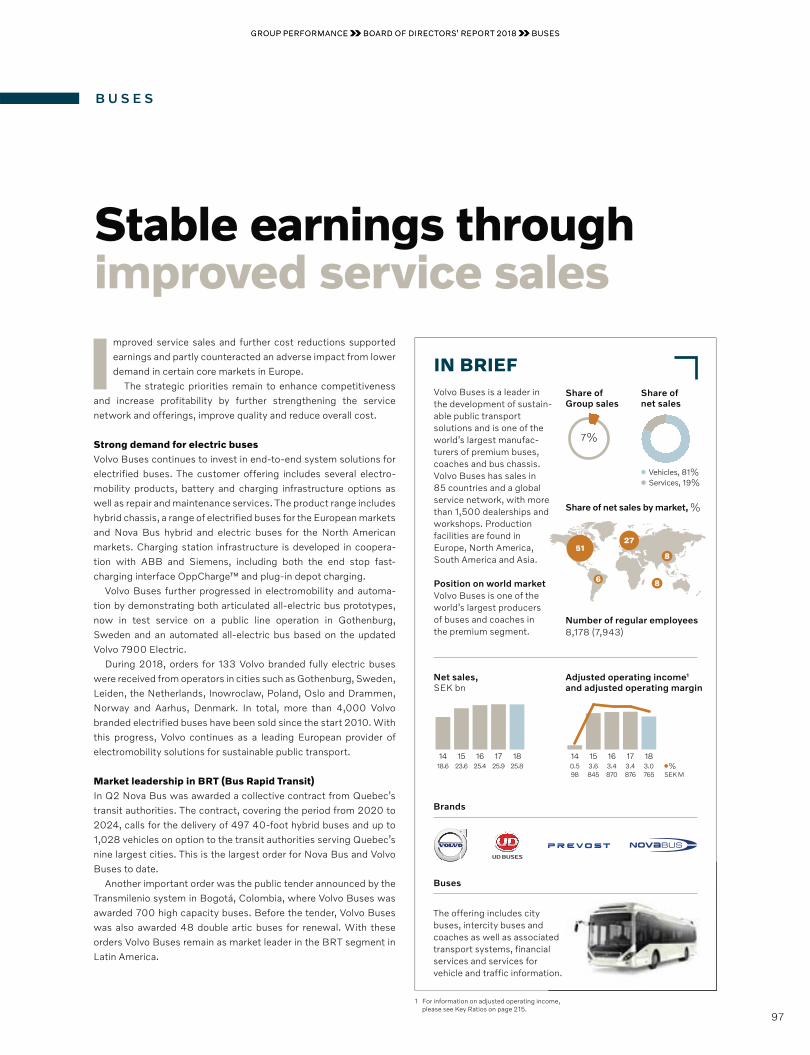
B U S E S
Stable earnings through improved service sales
Improved service sales and further cost reductions supported earnings and partly counteracted an adverse impact from lower demand in certain core markets in Europe.
The strategic priorities remain to enhance competitiveness and increase profitability by further strengthening the service network and offerings, improve quality and reduce overall cost.
Strong demand for electric busesVolvo Buses continues to invest in end-to-end system solutions for electrified buses. The customer offering includes several electro-mobility products, battery and charging infrastructure options as well as repair and maintenance services. The product range includes hybrid chassis, a range of electrified buses for the European markets and Nova Bus hybrid and electric buses for the North American markets. Charging station infrastructure is developed in coopera-tion with ABB and Siemens, including both the end stop fast- charging interface OppCharge™ and plug-in depot charging.
Volvo Buses further progressed in electromobility and automa-tion by demonstrating both articulated all-electric bus prototypes, now in test service on a public line operation in Gothenburg, Sweden and an automated all-electric bus based on the updated Volvo 7900 Electric.
During 2018, orders for 133 Volvo branded fully electric buses were received from operators in cities such as Gothenburg, Sweden, Leiden, the Netherlands, Inowroclaw, Poland, Oslo and Drammen, Norway and Aarhus, Denmark. In total, more than 4,000 Volvo branded electrified buses have been sold since the start 2010. With this progress, Volvo continues as a leading European provider of electromobility solutions for sustainable public transport.
Market leadership in BRT (Bus Rapid Transit) In Q2 Nova Bus was awarded a collective contract from Quebec’s transit authorities. The contract, covering the period from 2020 to 2024, calls for the delivery of 497 40-foot hybrid buses and up to 1,028 vehicles on option to the transit authorities serving Quebec’s nine largest cities. This is the largest order for Nova Bus and Volvo Buses to date.
Another important order was the public tender announced by the Transmilenio system in Bogotá, Colombia, where Volvo Buses was awarded 700 high capacity buses. Before the tender, Volvo Buses was also awarded 48 double artic buses for renewal. With these orders Volvo Buses remain as market leader in the BRT segment in Latin America.
GROUP PERFORMANCE BOARD OF DIRECTORS’ REPORT 2018 BUSES
IN BRIEFVolvo Buses is a leader in the development of sustain-able public transport solutions and is one of the world’s largest manu fac-turers of premium buses, coaches and bus chassis. Volvo Buses has sales in 85 countries and a global service network, with more than 1,500 dealerships and workshops. Production facilities are found in Europe, North America, South America and Asia.
Position on world market Volvo Buses is one of the world’s largest producers of buses and coaches in the premium segment.
1 For information on adjusted operating income, please see Key Ratios on page 215.
1716151418.6 23.6 25.4 25.9 25.8
18
Net sales, SEK bn
171615140.5 3.6 3.4 3.498 845 870 876
3.0765
18
SEK M%
Adjusted operating income1 and adjusted operating margin
ome,
Buses
The offering includes city buses, intercity buses and coaches as well as associated transport systems, financial services and services for vehicle and traffic information.
Number of regular employees 8,178 (7,943)
Share of net sales by market, %
Share of Group sales
7%
Share of net sales
Vehicles, 81%Services, 19%
2751
6 8
8
Brands
GROUP PERFORMANCE BOARD OF DIRECTORS’ REPORT 2018 BUSES
97
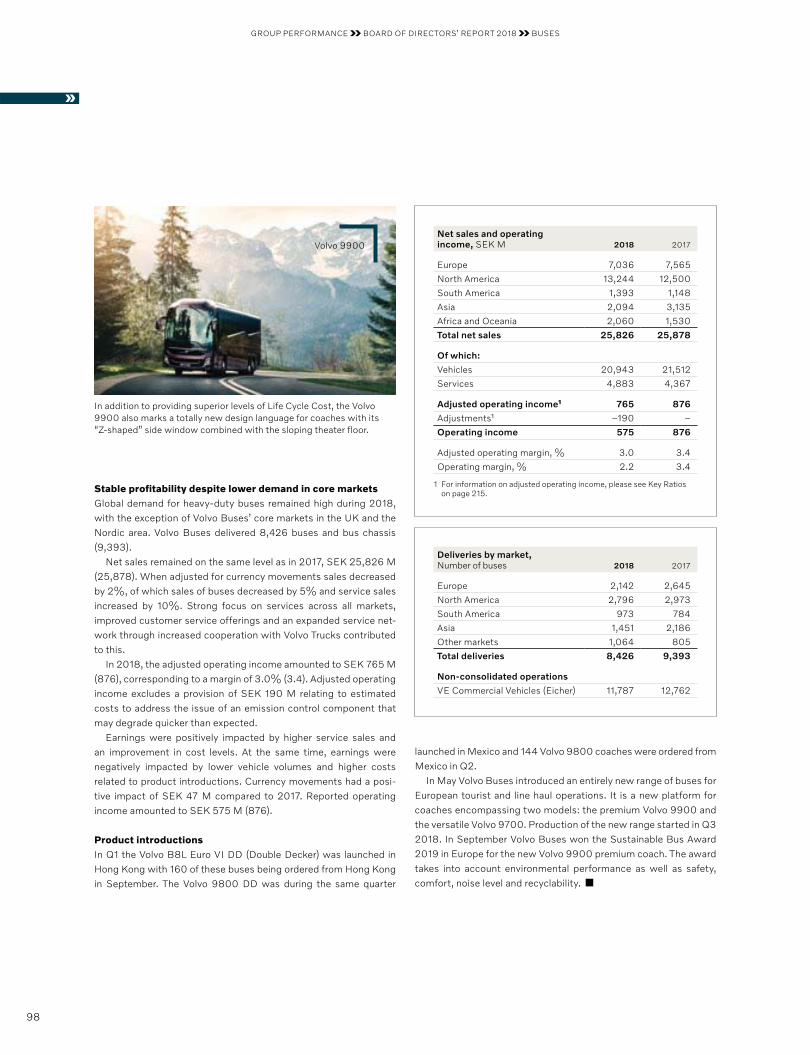
Stable profitability despite lower demand in core marketsGlobal demand for heavy-duty buses remained high during 2018, with the exception of Volvo Buses’ core markets in the UK and the Nordic area. Volvo Buses delivered 8,426 buses and bus chassis (9,393).
Net sales remained on the same level as in 2017, SEK 25,826 M (25,878). When adjusted for currency movements sales decreased by 2%, of which sales of buses decreased by 5% and service sales increased by 10%. Strong focus on services across all markets, improved customer service offerings and an expanded service net-work through increased cooperation with Volvo Trucks contributed to this.
In 2018, the adjusted operating income amounted to SEK 765 M (876), corresponding to a margin of 3.0% (3.4). Adjusted operating income excludes a provision of SEK 190 M relating to estimated costs to address the issue of an emission control component that may degrade quicker than expected.
Earnings were positively impacted by higher service sales and an improvement in cost levels. At the same time, earnings were nega tively impacted by lower vehicle volumes and higher costs related to product introductions. Currency movements had a posi-tive impact of SEK 47 M compared to 2017. Reported operating income amounted to SEK 575 M (876).
Product introductionsIn Q1 the Volvo B8L Euro VI DD (Double Decker) was launched in Hong Kong with 160 of these buses being ordered from Hong Kong in September. The Volvo 9800 DD was during the same quarter
launched in Mexico and 144 Volvo 9800 coaches were ordered from Mexico in Q2.
In May Volvo Buses introduced an entirely new range of buses for European tourist and line haul operations. It is a new platform for coaches encompassing two models: the premium Volvo 9900 and the versatile Volvo 9700. Production of the new range started in Q3 2018. In September Volvo Buses won the Sustainable Bus Award 2019 in Europe for the new Volvo 9900 premium coach. The award takes into account environmental performance as well as safety, comfort, noise level and recyclability.
Deliveries by market, Number of buses 2018 2017
Europe 2,142 2,645
North America 2,796 2,973
South America 973 784
Asia 1,451 2,186
Other markets 1,064 805
Total deliveries 8,426 9,393
Non-consolidated operations
VE Commercial Vehicles (Eicher) 11,787 12,762
Net sales and operating income, SEK M 2018 2017
Europe 7,036 7,565
North America 13,244 12,500
South America 1,393 1,148
Asia 2,094 3,135
Africa and Oceania 2,060 1,530
Total net sales 25,826 25,878
Of which:
Vehicles 20,943 21,512
Services 4,883 4,367
Adjusted operating income¹ 765 876
Adjustments¹ –190 –
Operating income 575 876
Adjusted operating margin, % 3.0 3.4
Operating margin, % 2.2 3.4
1 For information on adjusted operating income, please see Key Ratios on page 215.
Volvo 9900
In addition to providing superior levels of Life Cycle Cost, the Volvo 9900 also marks a totally new design language for coaches with its “Z-shaped” side window combined with the sloping theater floor.
GROUP PERFORMANCE BOARD OF DIRECTORS’ REPORT 2018 BUSES
98
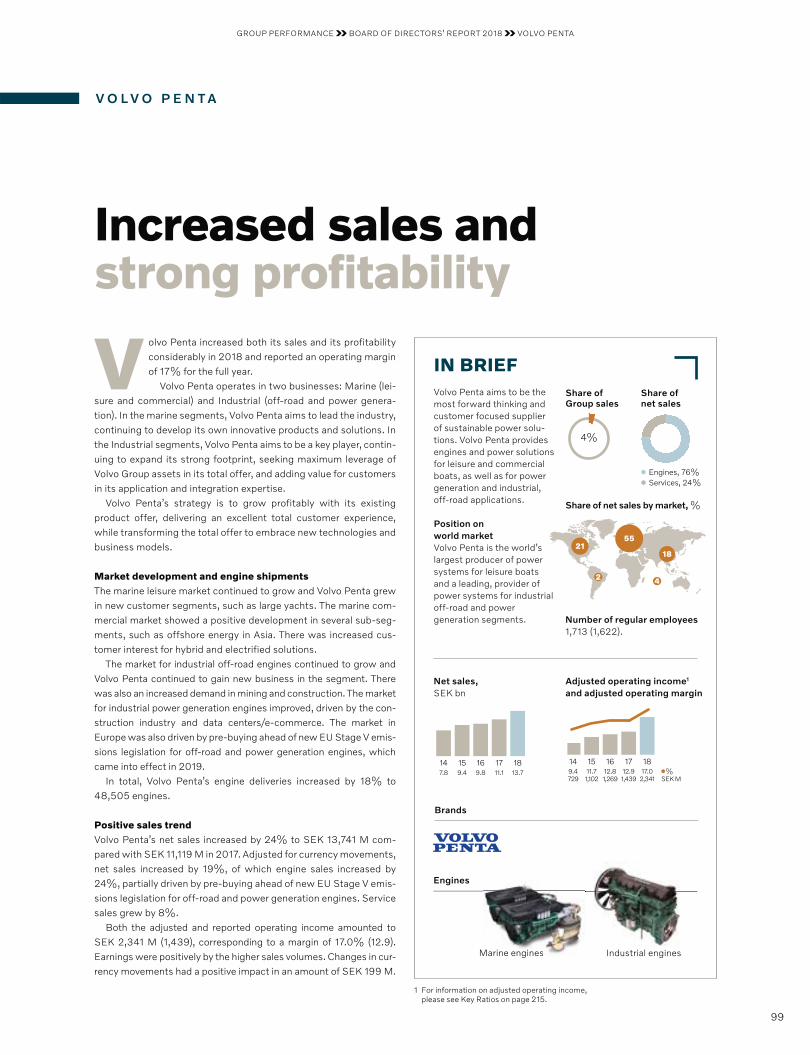
V O L V O P E N T A
Increased sales and strong profitability
Volvo Penta increased both its sales and its profitability considerably in 2018 and reported an operating margin of 17% for the full year.
Volvo Penta operates in two businesses: Marine (lei-sure and commercial) and Industrial (off-road and power genera-tion). In the marine segments, Volvo Penta aims to lead the industry, continuing to develop its own innovative products and solutions. In the Industrial segments, Volvo Penta aims to be a key player, contin-uing to expand its strong footprint, seeking maximum leverage of Volvo Group assets in its total offer, and adding value for customers in its application and integration expertise.
Volvo Penta’s strategy is to grow profitably with its existing product offer, delivering an excellent total customer experience, while transforming the total offer to embrace new technologies and business models.
Market development and engine shipmentsThe marine leisure market continued to grow and Volvo Penta grew in new customer segments, such as large yachts. The marine com-mercial market showed a positive development in several sub-seg-ments, such as offshore energy in Asia. There was increased cus-tomer interest for hybrid and electrified solutions.
The market for industrial off-road engines continued to grow and Volvo Penta continued to gain new business in the segment. There was also an increased demand in mining and construction. The market for industrial power generation engines improved, driven by the con-struction industry and data centers/e-commerce. The market in Europe was also driven by pre-buying ahead of new EU Stage V emis-sions legislation for off-road and power generation engines, which came into effect in 2019.
In total, Volvo Penta’s engine deliveries increased by 18% to 48,505 engines.
Positive sales trendVolvo Penta’s net sales increased by 24% to SEK 13,741 M com-pared with SEK 11,119 M in 2017. Adjusted for currency movements, net sales increased by 19%, of which engine sales increased by 24%, partially driven by pre-buying ahead of new EU Stage V emis-sions legislation for off-road and power generation engines. Service sales grew by 8%.
Both the adjusted and reported operating income amounted to SEK 2,341 M (1,439), corresponding to a margin of 17.0% (12.9). Earnings were positively by the higher sales volumes. Changes in cur-rency movements had a positive impact in an amount of SEK 199 M.
Brands
IN BRIEFVolvo Penta aims to be the most forward thinking and customer focused supplier of sustainable power solu-tions. Volvo Penta provides engines and power solutions for leisure and commercial boats, as well as for power generation and industrial, off-road applications.
Position on world market Volvo Penta is the world’s largest producer of power systems for leisure boats and a leading, provider of power systems for industrial off-road and power generation segments.
1 For information on adjusted operating income, please see Key Ratios on page 215.
171615147.8 9.4 9.8 11.1 13.7
18
Net sales, SEK bn
171615149.4 11.7 12.8 12.9729 1,102 1,269 1,439
17.02,341
18
SEK M%
Adjusted operating income1 and adjusted operating margin
Engines
Marine enginesMarine engines Industrial enginesI d t i l i
Number of regular employees 1,713 (1,622).
Share of net sales by market, %
Share of Group sales
4%
Share of net sales
Engines, 76%Services, 24%
5521
2 4
18
GROUP PERFORMANCE BOARD OF DIRECTORS’ REPORT 2018 VOLVO PENTA
99
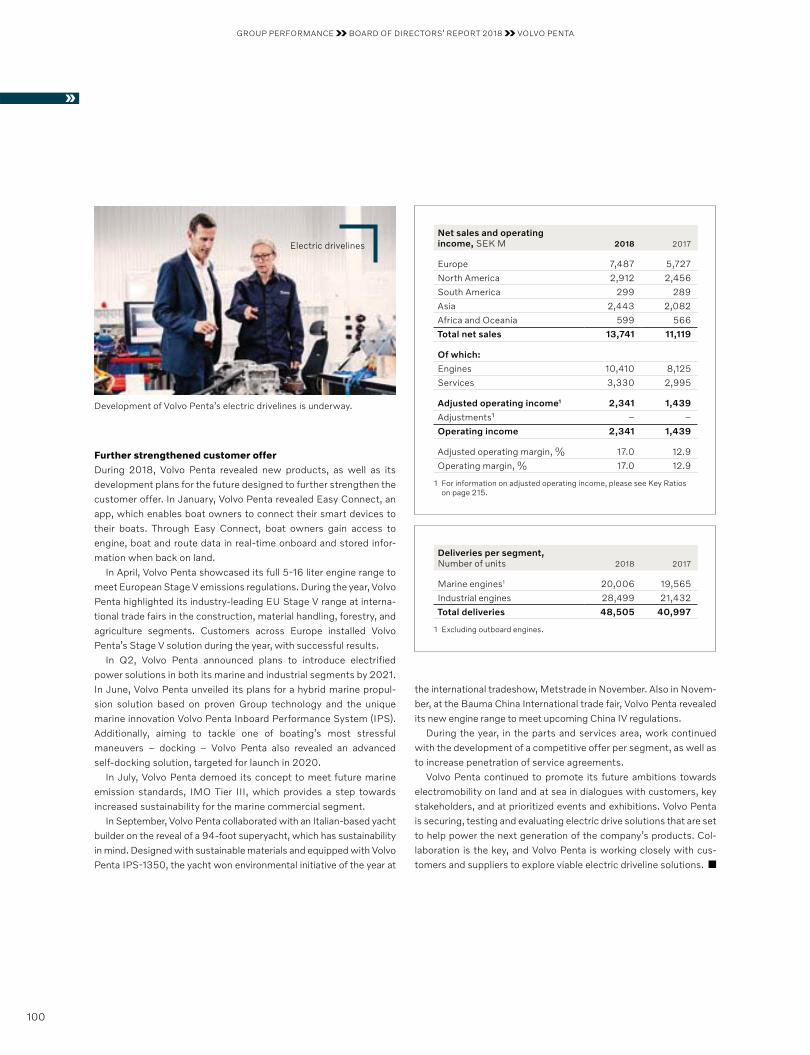
Further strengthened customer offerDuring 2018, Volvo Penta revealed new products, as well as its development plans for the future designed to further strengthen the customer offer. In January, Volvo Penta revealed Easy Connect, an app, which enables boat owners to connect their smart devices to their boats. Through Easy Connect, boat owners gain access to engine, boat and route data in real-time onboard and stored infor-mation when back on land.
In April, Volvo Penta showcased its full 5-16 liter engine range to meet European Stage V emissions regulations. During the year, Volvo Penta highlighted its industry-leading EU Stage V range at interna-tional trade fairs in the construction, material handling, forestry, and agriculture segments. Customers across Europe installed Volvo Penta’s Stage V solution during the year, with success ful results.
In Q2, Volvo Penta announced plans to introduce electrified power solutions in both its marine and industrial segments by 2021. In June, Volvo Penta unveiled its plans for a hybrid marine propul-sion solution based on proven Group technology and the unique marine innovation Volvo Penta Inboard Performance System (IPS). Additionally, aiming to tackle one of boating’s most stressful maneuvers – docking – Volvo Penta also revealed an advanced self-docking solution, targeted for launch in 2020.
In July, Volvo Penta demoed its concept to meet future marine emission standards, IMO Tier III, which provides a step towards increased sustainability for the marine commercial segment.
In September, Volvo Penta collaborated with an Italian-based yacht builder on the reveal of a 94-foot superyacht, which has sustainability in mind. Designed with sustainable materials and equipped with Volvo Penta IPS-1350, the yacht won environmental initiative of the year at
Deliveries per segment, Number of units 2018 2017
Marine engines1 20,006 19,565
Industrial engines 28,499 21,432
Total deliveries 48,505 40,997
1 Excluding outboard engines.
Net sales and operating income, SEK M 2018 2017
Europe 7,487 5,727
North America 2,912 2,456
South America 299 289
Asia 2,443 2,082
Africa and Oceania 599 566
Total net sales 13,741 11,119
Of which:
Engines 10,410 8,125
Services 3,330 2,995
Adjusted operating income1 2,341 1,439
Adjustments¹ – –
Operating income 2,341 1,439
Adjusted operating margin, % 17.0 12.9
Operating margin, % 17.0 12.9
1 For information on adjusted operating income, please see Key Ratios on page 215.
the international tradeshow, Metstrade in November. Also in Novem-ber, at the Bauma China International trade fair, Volvo Penta revealed its new engine range to meet upcoming China IV regulations.
During the year, in the parts and services area, work continued with the development of a competitive offer per segment, as well as to increase penetration of service agreements.
Volvo Penta continued to promote its future ambitions towards electromobility on land and at sea in dialogues with customers, key stakeholders, and at prioritized events and exhibitions. Volvo Penta is securing, testing and evaluating electric drive solutions that are set to help power the next generation of the company’s products. Col-laboration is the key, and Volvo Penta is working closely with cus-tomers and suppliers to explore viable electric driveline solutions.
Electric drivelines
Development of Volvo Penta’s electric drivelines is underway.
GROUP PERFORMANCE BOARD OF DIRECTORS’ REPORT 2018 VOLVO PENTA
100
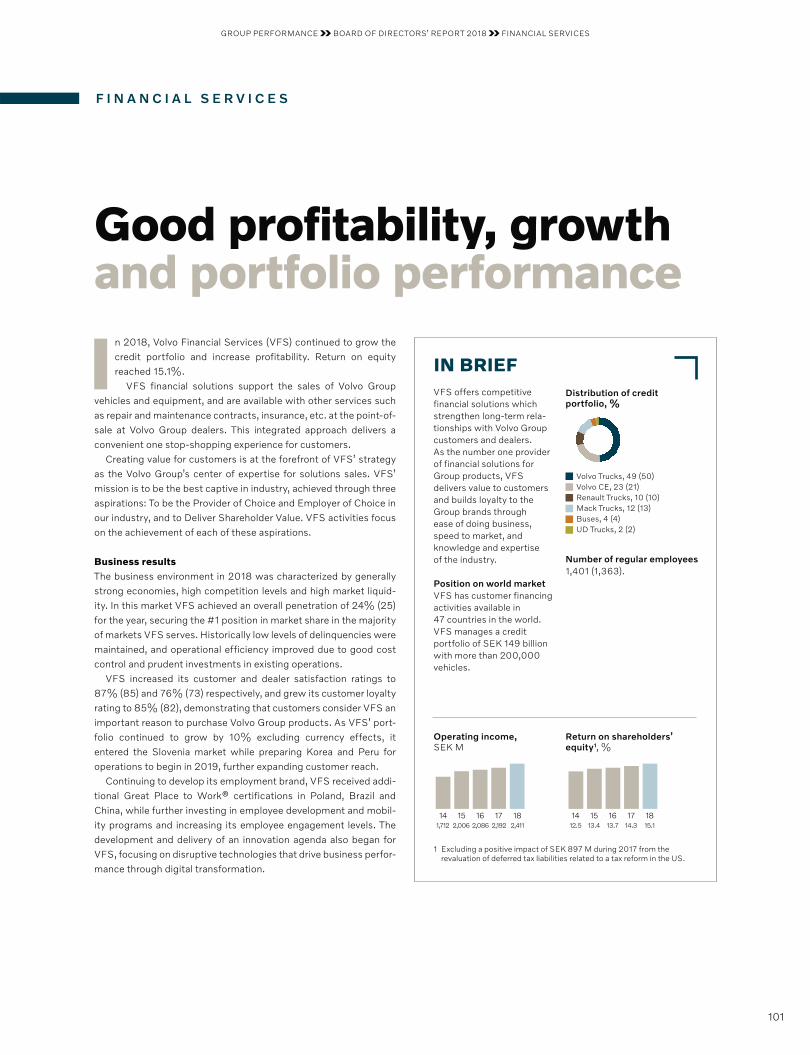
F I N A N C I A L S E R V I C E S
Good profitability, growth and portfolio performance
In 2018, Volvo Financial Services (VFS) continued to grow the credit portfolio and increase profitability. Return on equity reached 15.1%.
VFS financial solutions support the sales of Volvo Group vehicles and equipment, and are available with other services such as repair and maintenance contracts, insurance, etc. at the point-of-sale at Volvo Group dealers. This integrated approach delivers a convenient one stop-shopping experience for customers.
Creating value for customers is at the forefront of VFS’ strategy as the Volvo Group’s center of expertise for solutions sales. VFS’ mission is to be the best captive in industry, achieved through three aspirations: To be the Provider of Choice and Employer of Choice in our industry, and to Deliver Shareholder Value. VFS activities focus on the achievement of each of these aspirations.
Business resultsThe business environment in 2018 was characterized by generally strong economies, high competition levels and high market liquid-ity. In this market VFS achieved an overall penetration of 24% (25) for the year, securing the #1 position in market share in the majority of markets VFS serves. Historically low levels of delinquencies were maintained, and operational efficiency improved due to good cost control and prudent investments in existing operations.
VFS increased its customer and dealer satisfaction ratings to 87% (85) and 76% (73) respectively, and grew its customer loyalty rating to 85% (82), demonstrating that customers consider VFS an important reason to purchase Volvo Group products. As VFS’ port-folio continued to grow by 10% excluding currency effects, it entered the Slovenia market while preparing Korea and Peru for operations to begin in 2019, further expanding customer reach.
Continuing to develop its employment brand, VFS received addi-tional Great Place to Work® certifications in Poland, Brazil and China, while further investing in employee development and mobil-ity programs and increasing its employee engagement levels. The development and delivery of an innovation agenda also began for VFS, focusing on disruptive technologies that drive business perfor-mance through digital transformation.
Distribution of credit portfolio, %
IN BRIEFVFS offers competitive financial solutions which strengthen long-term rela-tionships with Volvo Group customers and dealers. As the number one provider of financial solutions for Group products, VFS delivers value to customers and builds loyalty to the Group brands through ease of doing business, speed to market, and knowledge and expertise of the industry.
Position on world market VFS has customer financing activities available in 47 countries in the world. VFS manages a credit port folio of SEK 149 billion with more than 200,000 vehicles.
1 Excluding a positive impact of SEK 897 M during 2017 from the revaluation of deferred tax liabilities related to a tax reform in the US.
1716151412.5 13.4 13.7 14.3 15.1
18
Return on shareholders’ equity1, %
171615141,712 2,006 2,086 2,192 2,411
18
Operating income, SEK M
Number of regular employees 1,401 (1,363).
Volvo Trucks, 49 (50)Volvo CE, 23 (21)Renault Trucks, 10 (10)Mack Trucks, 12 (13)Buses, 4 (4)UD Trucks, 2 (2)
GROUP PERFORMANCE BOARD OF DIRECTORS’ REPORT 2018 FINANCIAL SERVICES
101
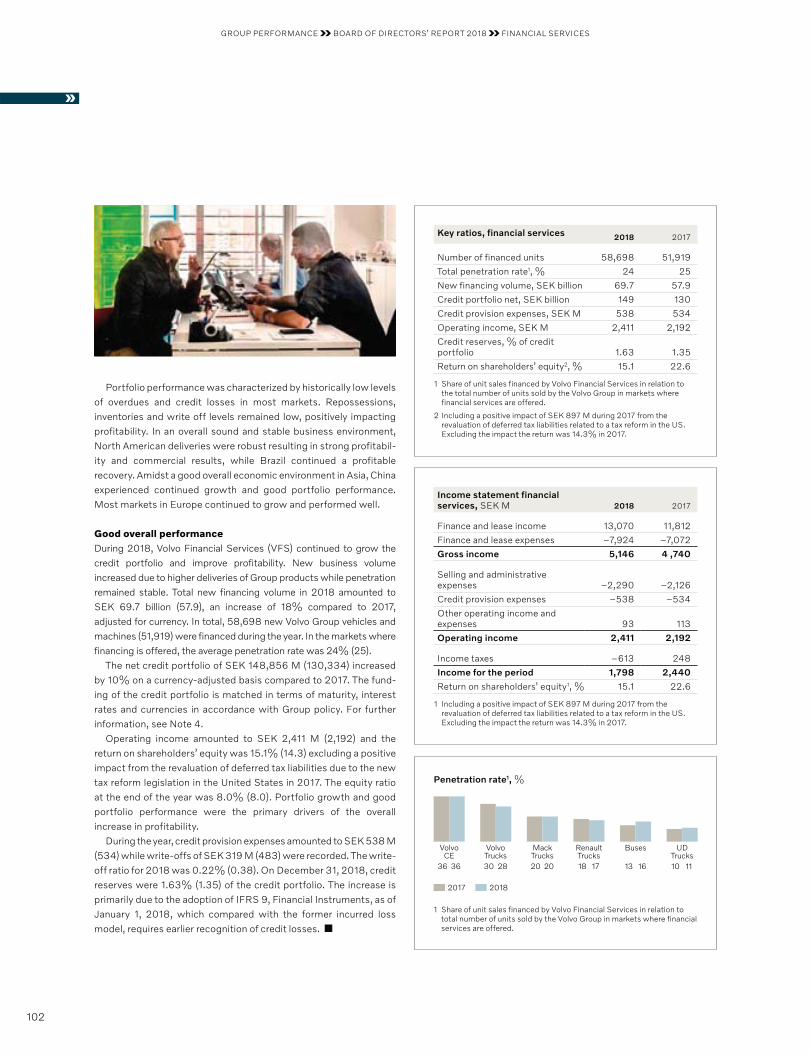
Key ratios, financial services 2018 2017
Number of financed units 58,698 51,919
Total penetration rate1, % 24 25
New financing volume, SEK billion 69.7 57.9
Credit portfolio net, SEK billion 149 130
Credit provision expenses, SEK M 538 534
Operating income, SEK M 2,411 2,192
Credit reserves, % of credit portfolio 1.63 1.35
Return on shareholders’ equity2, % 15.1 22.6
1 Share of unit sales financed by Volvo Financial Services in relation to the total number of units sold by the Volvo Group in markets where financial services are offered.
2 Including a positive impact of SEK 897 M during 2017 from the revaluation of deferred tax liabilities related to a tax reform in the US. Excluding the impact the return was 14.3% in 2017.
Income statement financial services, SEK M 2018 2017
Finance and lease income 13,070 11,812
Finance and lease expenses –7,924 –7,072
Gross income 5,146 4 ,740
Selling and administrative expenses –2,290 –2,126
Credit provision expenses –538 –534
Other operating income and expenses 93 113
Operating income 2,411 2,192
Income taxes –613 248
Income for the period 1,798 2,440
Return on shareholders’ equity1, % 15.1 22.6
1 Including a positive impact of SEK 897 M during 2017 from the revaluation of deferred tax liabilities related to a tax reform in the US. Excluding the impact the return was 14.3% in 2017.
Portfolio performance was characterized by historically low levels of overdues and credit losses in most markets. Repossessions, inventories and write off levels remained low, positively impacting profitability. In an overall sound and stable business environment, North American deliveries were robust resulting in strong profitabil-ity and commercial results, while Brazil continued a profitable recovery. Amidst a good overall economic environment in Asia, China experienced continued growth and good portfolio performance. Most markets in Europe continued to grow and performed well.
Good overall performanceDuring 2018, Volvo Financial Services (VFS) continued to grow the credit portfolio and improve profitability. New business volume increased due to higher deliveries of Group products while pene tration remained stable. Total new financing volume in 2018 amounted to SEK 69.7 billion (57.9), an increase of 18% compared to 2017, adjusted for currency. In total, 58,698 new Volvo Group vehicles and machines (51,919) were financed during the year. In the markets where financing is offered, the average penetration rate was 24% (25).
The net credit portfolio of SEK 148,856 M (130,334) increased by 10% on a currency-adjusted basis compared to 2017. The fund-ing of the credit portfolio is matched in terms of maturity, interest rates and currencies in accordance with Group policy. For further information, see Note 4.
Operating income amounted to SEK 2,411 M (2,192) and the return on shareholders’ equity was 15.1% (14.3) excluding a positive impact from the revaluation of deferred tax liabilities due to the new tax reform legislation in the United States in 2017. The equity ratio at the end of the year was 8.0% (8.0). Portfolio growth and good portfolio performance were the primary drivers of the overall increase in profitability.
During the year, credit provision expenses amounted to SEK 538 M (534) while write-offs of SEK 319 M (483) were recorded. The write-off ratio for 2018 was 0.22% (0.38). On December 31, 2018, credit reserves were 1.63% (1.35) of the credit portfolio. The increase is primarily due to the adoption of IFRS 9, Financial Instruments, as of January 1, 2018, which compared with the former incurred loss model, requires earlier recognition of credit losses.
Penetration rate1, %
VolvoTrucks
28303636
VolvoCE
17182020 1613 1110
RenaultTrucks
MackTrucks
Buses UDTrucks
2017 2018
1 Share of unit sales financed by Volvo Financial Services in relation to total number of units sold by the Volvo Group in markets where financial services are offered.
GROUP PERFORMANCE BOARD OF DIRECTORS’ REPORT 2018 FINANCIAL SERVICES
102
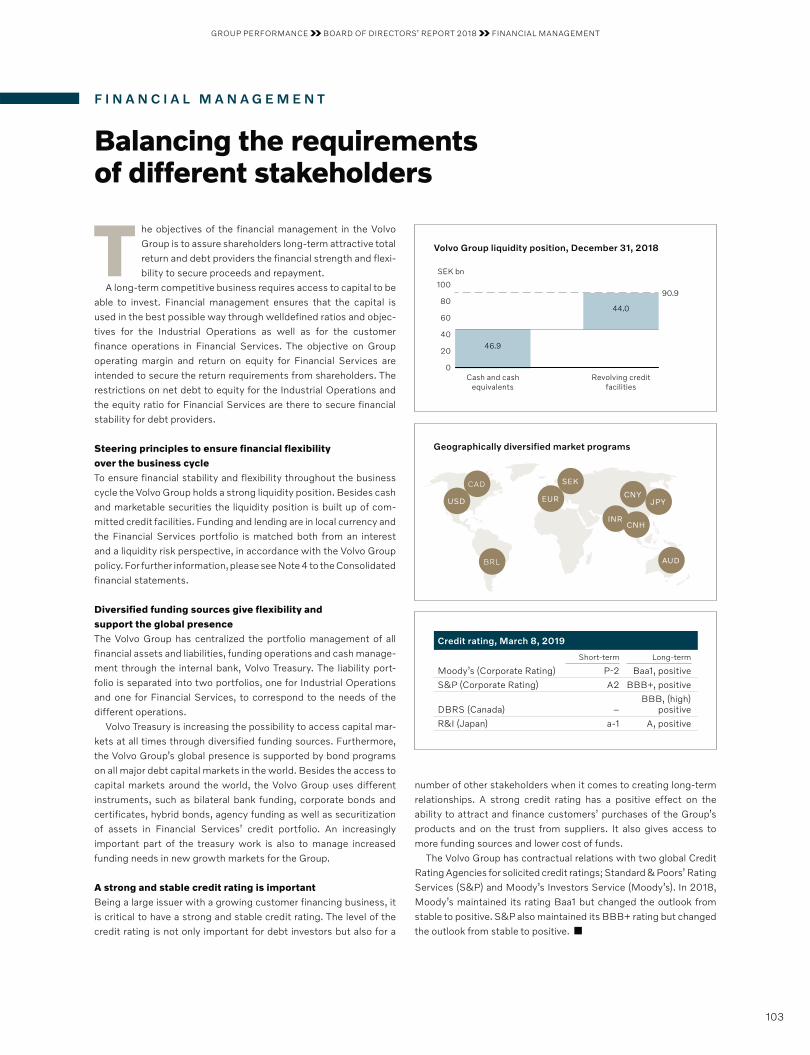
F I N A N C I A L M A N A G E M E N T
Balancing the requirements of different stakeholders
The objectives of the financial management in the Volvo Group is to assure shareholders long-term attractive total return and debt providers the financial strength and flexi-bility to secure proceeds and repayment.
A long-term competitive business requires access to capital to be able to invest. Financial management ensures that the capital is used in the best possible way through welldefined ratios and objec-tives for the Industrial Operations as well as for the customer finance operations in Financial Services. The objective on Group operating margin and return on equity for Financial Services are intended to secure the return requirements from shareholders. The restrictions on net debt to equity for the Industrial Operations and the equity ratio for Financial Services are there to secure fi nancial stability for debt providers.
Steering principles to ensure financial flexibility over the business cycleTo ensure financial stability and flexibility throughout the business cycle the Volvo Group holds a strong liquidity position. Besides cash and marketable securities the liquidity position is built up of com-mitted credit facilities. Funding and lending are in local currency and the Financial Services portfolio is matched both from an interest and a liquidity risk perspective, in accordance with the Volvo Group policy. For further information, please see Note 4 to the Consolidated financial statements.
Diversified funding sources give flexibility and support the global presenceThe Volvo Group has centralized the portfolio man agement of all financial assets and liabilities, funding operations and cash manage-ment through the internal bank, Volvo Treasury. The liability port-folio is separated into two portfolios, one for Industrial Operations and one for Financial Services, to correspond to the needs of the different operations.
Volvo Treasury is increasing the possibility to access capital mar-kets at all times through diversified funding sources. Furthermore, the Volvo Group’s global presence is supported by bond programs on all major debt capital markets in the world. Besides the access to capital markets around the world, the Volvo Group uses different instruments, such as bilateral bank funding, corpor ate bonds and certificates, hybrid bonds, agency funding as well as securitization of assets in Financial Services’ credit portfolio. An increasingly import ant part of the treasury work is also to manage increased funding needs in new growth markets for the Group.
A strong and stable credit rating is importantBeing a large issuer with a growing customer financing business, it is critical to have a strong and stable credit rating. The level of the credit rating is not only important for debt investors but also for a
number of other stakeholders when it comes to creating long-term relationships. A strong credit rating has a positive effect on the ability to attract and finance customers’ purchases of the Group’s products and on the trust from suppliers. It also gives access to more funding sources and lower cost of funds.
The Volvo Group has contractual relations with two global Credit Rating Agencies for solicited credit ratings; Standard & Poors’ Rating Services (S&P) and Moody’s Investors Service (Moody’s). In 2018, Moody’s maintained its rating Baa1 but changed the outlook from stable to positive. S&P also maintained its BBB+ rating but changed the outlook from stable to positive.
Credit rating, March 8, 2019
Short-term Long-term
Moody’s (Corporate Rating) P-2 Baa1, positive
S&P (Corporate Rating) A2 BBB+, positive
DBRS (Canada) –BBB, (high)
positive
R&I (Japan) a-1 A, positive
Geographically diversified market programs
CNY
SEK
JPY
AUD
EUR
CAD
USD
BRL
INRCNH
Volvo Group liquidity position, December 31, 2018
Cash and cashequivalents
Revolving creditfacilities
0
20
80
40
100
6044.0
90.9
46.9
SEK bn
GROUP PERFORMANCE BOARD OF DIRECTORS’ REPORT 2018 FINANCIAL MANAGEMENT
103
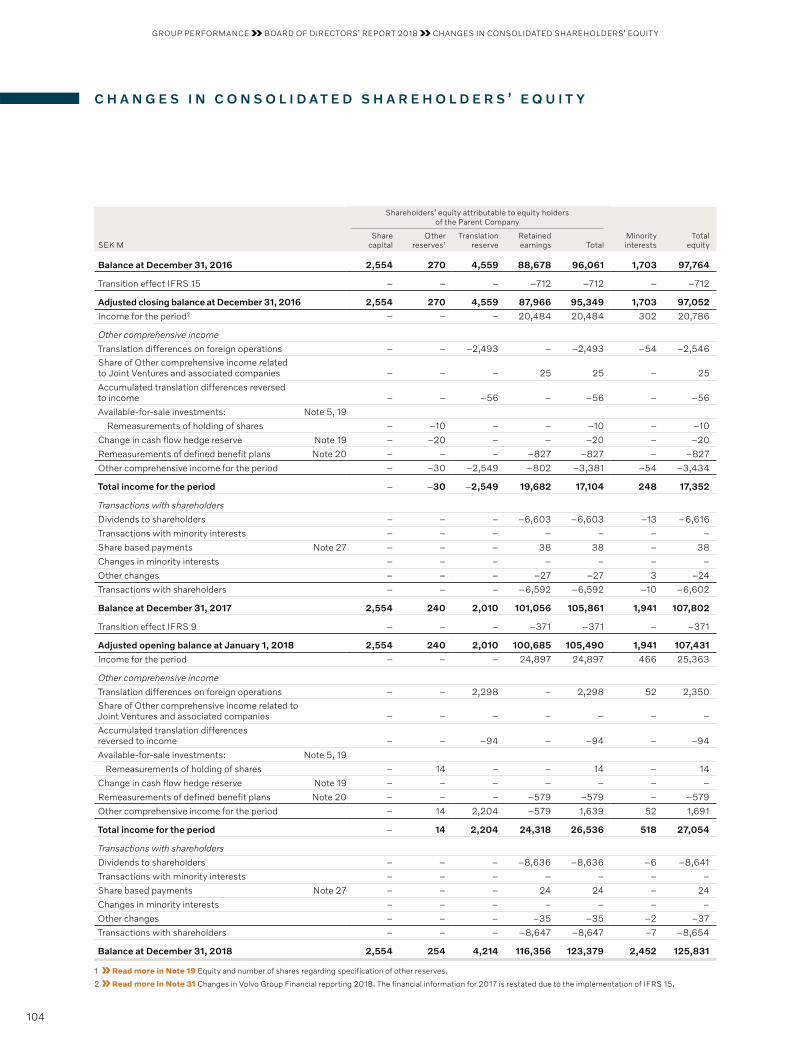
C H A N G E S I N C O N S O L I D A T E D S H A R E H O L D E R S ’ E Q U I T Y
Shareholders’ equity attributable to equity holders of the Parent Company
SEK MShare
capitalOther
reserves 1Translation
reserveRetainedearnings Total
Minorityinterests
Totalequity
Balance at December 31, 2016 2,554 270 4,559 88,678 96,061 1,703 97,764
Transition effect IFRS 15 – – – –712 –712 – –712
Adjusted closing balance at December 31, 2016 2,554 270 4,559 87,966 95,349 1,703 97,052
Income for the period2 – – – 20,484 20,484 302 20,786
Other comprehensive income
Translation differences on foreign operations – – –2,493 – –2,493 –54 –2,546Share of Other comprehensive income related to Joint Ventures and associated companies – – – 25 25 – 25
Accumulated translation differences reversed to income – – –56 – –56 – –56
Available-for-sale investments: Note 5, 19
Remeasurements of holding of shares – –10 – – –10 – –10
Change in cash flow hedge reserve Note 19 – –20 – – –20 – –20
Remeasurements of defined benefit plans Note 20 – – – –827 –827 – –827
Other comprehensive income for the period – –30 –2,549 –802 –3,381 –54 –3,434
Total income for the period – –30 –2,549 19,682 17,104 248 17,352
Transactions with shareholders
Dividends to shareholders – – – –6,603 –6,603 –13 –6,616
Transactions with minority interests – – – – – – –
Share based payments Note 27 – – – 38 38 – 38
Changes in minority interests – – – – – – –
Other changes – – – –27 –27 3 –24
Transactions with shareholders – – – –6,592 –6,592 –10 –6,602
Balance at December 31, 2017 2,554 240 2,010 101,056 105,861 1,941 107,802
Transition effect IFRS 9 – – – –371 –371 – –371
Adjusted opening balance at January 1, 2018 2,554 240 2,010 100,685 105,490 1,941 107,431
Income for the period – – – 24,897 24,897 466 25,363
Other comprehensive income
Translation differences on foreign operations – – 2,298 – 2,298 52 2,350Share of Other comprehensive income related to Joint Ventures and associated companies – – – – – – –
Accumulated translation differences reversed to income – – –94 – –94 – –94
Available-for-sale investments: Note 5, 19
Remeasurements of holding of shares – 14 – – 14 – 14
Change in cash flow hedge reserve Note 19 – – – – – – –
Remeasurements of defined benefit plans Note 20 – – – –579 –579 – –579
Other comprehensive income for the period – 14 2,204 –579 1,639 52 1,691
Total income for the period – 14 2,204 24,318 26,536 518 27,054
Transactions with shareholders
Dividends to shareholders – – – –8,636 –8,636 –6 –8,641
Transactions with minority interests – – – – – – –
Share based payments Note 27 – – – 24 24 – 24
Changes in minority interests – – – – – – –
Other changes – – – –35 –35 –2 –37
Transactions with shareholders – – – –8,647 –8,647 –7 –8,654
Balance at December 31, 2018 2,554 254 4,214 116,356 123,379 2,452 125,831
1 Read more in Note 19 Equity and number of shares regarding specification of other reserves.
2 Read more in Note 31 Changes in Volvo Group Financial reporting 2018. The financial information for 2017 is restated due to the implementation of IFRS 15.
104
GROUP PERFORMANCE BOARD OF DIRECTORS’ REPORT 2018 CHANGES IN CONSOLIDATED SHAREHOLDERS’ EQUITY
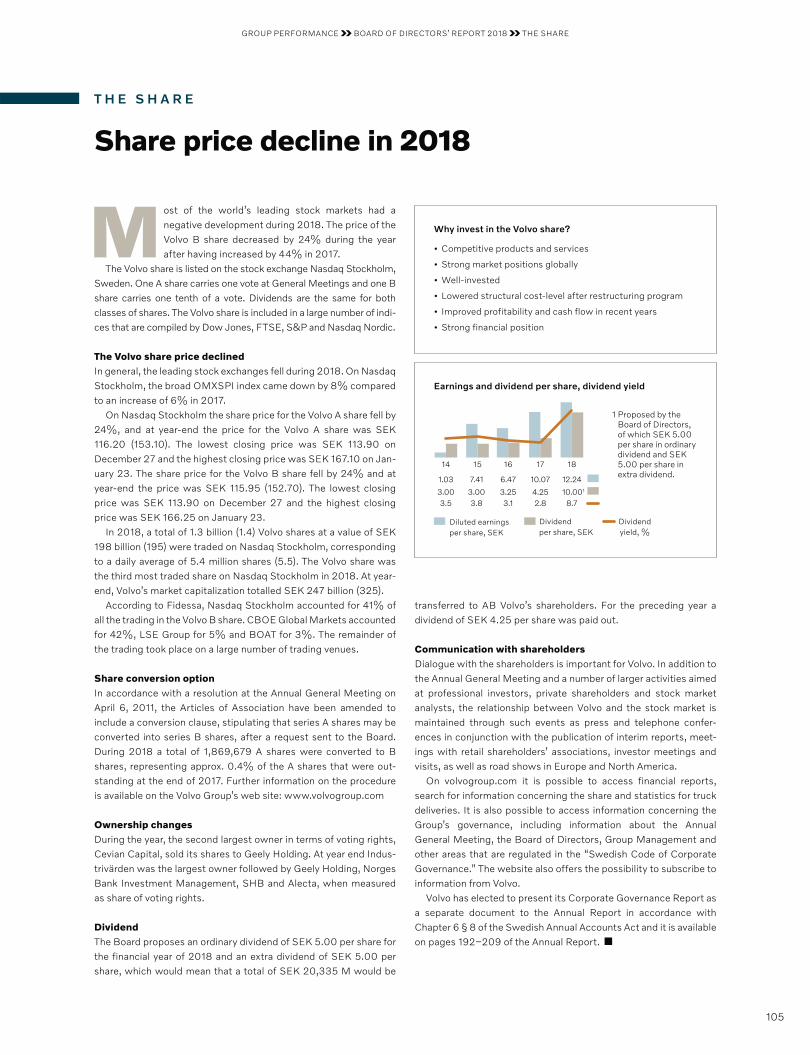
Most of the world’s leading stock markets had a negative development during 2018. The price of the Volvo B share decreased by 24% during the year after having increased by 44% in 2017.
The Volvo share is listed on the stock exchange Nasdaq Stockholm, Sweden. One A share carries one vote at General Meetings and one B share carries one tenth of a vote. Dividends are the same for both classes of shares. The Volvo share is included in a large number of indi-ces that are compiled by Dow Jones, FTSE, S&P and Nasdaq Nordic.
The Volvo share price declinedIn general, the leading stock exchanges fell during 2018. On Nasdaq Stockholm, the broad OMXSPI index came down by 8% compared to an increase of 6% in 2017.
On Nasdaq Stockholm the share price for the Volvo A share fell by 24%, and at year-end the price for the Volvo A share was SEK 116.20 (153.10). The lowest closing price was SEK 113.90 on December 27 and the highest closing price was SEK 167.10 on Jan-uary 23. The share price for the Volvo B share fell by 24% and at year-end the price was SEK 115.95 (152.70). The lowest closing price was SEK 113.90 on December 27 and the highest closing price was SEK 166.25 on January 23.
In 2018, a total of 1.3 billion (1.4) Volvo shares at a value of SEK 198 billion (195) were traded on Nasdaq Stockholm, corresponding to a daily average of 5.4 million shares (5.5). The Volvo share was the third most traded share on Nasdaq Stockholm in 2018. At year-end, Volvo’s market capitalization totalled SEK 247 billion (325).
According to Fidessa, Nasdaq Stockholm accounted for 41% of all the trading in the Volvo B share. CBOE Global Markets accounted for 42%, LSE Group for 5% and BOAT for 3%. The remainder of the trading took place on a large number of trading venues.
Share conversion optionIn accordance with a resolution at the Annual General Meeting on April 6, 2011, the Articles of Association have been amended to include a conversion clause, stipulating that series A shares may be converted into series B shares, after a request sent to the Board. During 2018 a total of 1,869,679 A shares were converted to B shares, representing approx. 0.4% of the A shares that were out-standing at the end of 2017. Further information on the procedure is available on the Volvo Group’s web site: www.volvogroup.com
Ownership changesDuring the year, the second largest owner in terms of voting rights, Cevian Capital, sold its shares to Geely Holding. At year end Indus-trivärden was the largest owner followed by Geely Holding, Norges Bank Investment Management, SHB and Alecta, when measured as share of voting rights.
DividendThe Board proposes an ordinary dividend of SEK 5.00 per share for the financial year of 2018 and an extra dividend of SEK 5.00 per share, which would mean that a total of SEK 20,335 M would be
transferred to AB Volvo’s shareholders. For the preceding year a dividend of SEK 4.25 per share was paid out.
Communication with shareholdersDialogue with the shareholders is important for Volvo. In addition to the Annual General Meeting and a number of larger activities aimed at professional investors, private shareholders and stock market analysts, the relationship between Volvo and the stock market is maintained through such events as press and telephone confer-ences in conjunction with the publication of interim reports, meet-ings with retail shareholders’ associations, investor meetings and visits, as well as road shows in Europe and North America.
On volvogroup.com it is possible to access financial reports, search for information concerning the share and statistics for truck deliveries. It is also possible to access information concerning the Group’s governance, including information about the Annual General Meeting, the Board of Directors, Group Management and other areas that are regulated in the “Swedish Code of Corporate Governance.” The website also offers the possibility to subscribe to information from Volvo.
Volvo has elected to present its Corporate Governance Report as a separate document to the Annual Report in accordance with Chapter 6 § 8 of the Swedish Annual Accounts Act and it is available on pages 192–209 of the Annual Report.
Why invest in the Volvo share?
• Competitive products and services
• Strong market positions globally
• Well-invested
• Lowered structural cost-level after restructuring program
• Improved profitability and cash flow in recent years
• Strong financial position
T H E S H A R E
Share price decline in 2018
Earnings and dividend per share, dividend yield
Diluted earnings per share, SEK
Dividend per share, SEK
Dividend yield, %
14 15 16 17 18
10.001
8.7
12.24
4.252.8
10.07
3.003.5
1.03
3.253.1
6.47
3.003.8
7.41
1 Proposed by the Board of Directors, of which SEK 5.00 per share in ordinary dividend and SEK 5.00 per share in extra dividend.
105
GROUP PERFORMANCE BOARD OF DIRECTORS’ REPORT 2018 THE SHARE
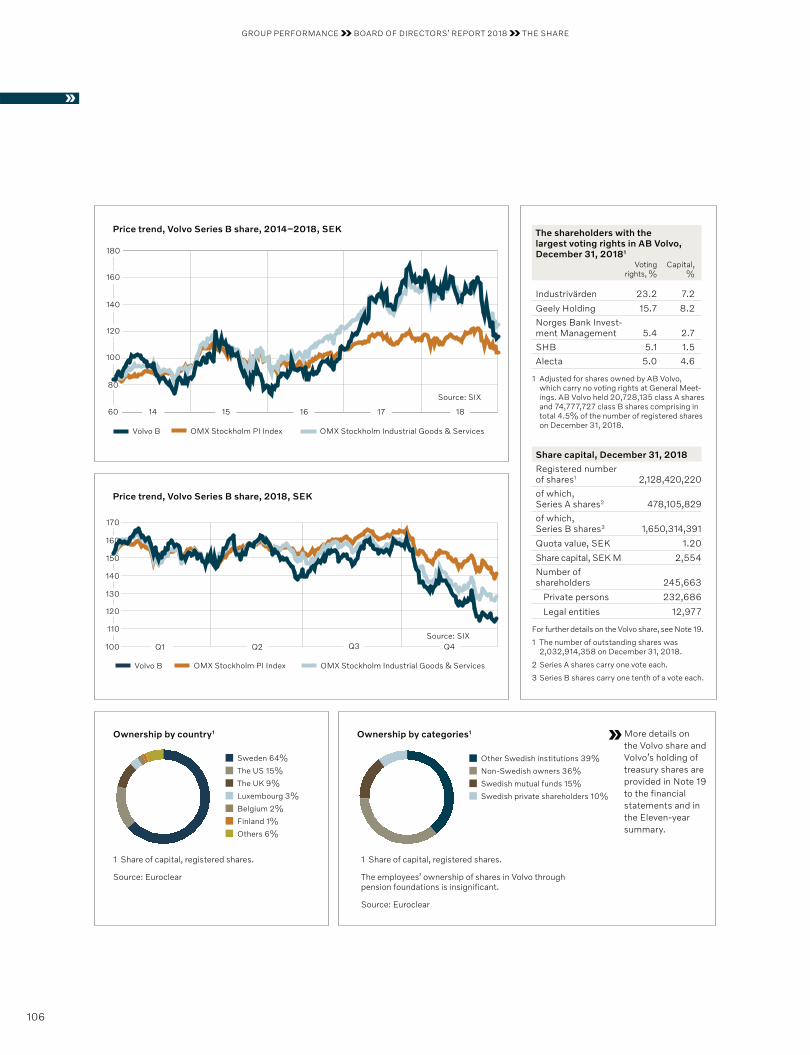
The shareholders with the largest voting rights in AB Volvo, December 31, 20181
Voting rights, %
Capital, %
Industrivärden 23.2 7.2
Geely Holding 15.7 8.2
Norges Bank Invest-ment Management 5.4 2.7
SHB 5.1 1.5
Alecta 5.0 4.6
1 Adjusted for shares owned by AB Volvo, which carry no voting rights at General Meet-ings. AB Volvo held 20,728,135 class A shares and 74,777,727 class B shares comprising in total 4.5% of the number of registered shares on December 31, 2018.
Share capital, December 31, 2018
Registered number of shares1 2,128,420,220
of which, Series A shares2 478,105,829
of which, Series B shares3 1,650,314,391
Quota value, SEK 1.20
Share capital, SEK M 2,554
Number of shareholders 245,663
Private persons 232,686
Legal entities 12,977
For further details on the Volvo share, see Note 19.
1 The number of outstanding shares was 2,032,914,358 on December 31, 2018.
2 Series A shares carry one vote each.
3 Series B shares carry one tenth of a vote each.
Ownership by country1
Sweden 64%
The US 15%
The UK 9%
Luxembourg 3%
Belgium 2%
Finland 1%
Others 6%
Ownership by categories1
Other Swedish institutions 39%
Non-Swedish owners 36%
Swedish mutual funds 15%
Swedish private shareholders 10%
More details on the Volvo share and Volvo’s holding of treasury shares are provided in Note 19 to the financial statements and in the Eleven-year summary.
Price trend, Volvo Series B share, 2014–2018, SEK
Source: SIX
OMX Stockholm PI Index Volvo B OMX Stockholm Industrial Goods & Services
14 15 16 17 1860
80
100
180
160
140
120
Price trend, Volvo Series B share, 2018, SEK
Source: SIX
OMX Stockholm PI Index Volvo B OMX Stockholm Industrial Goods & Services
Q2 Q3 Q4100 Q1
150
160
170
120
110
130
140
1 Share of capital, registered shares.
Source: Euroclear
1 Share of capital, registered shares.
The employees’ ownership of shares in Volvo through pension foundations is insignificant.
Source: Euroclear
106
GROUP PERFORMANCE BOARD OF DIRECTORS’ REPORT 2018 THE SHARE
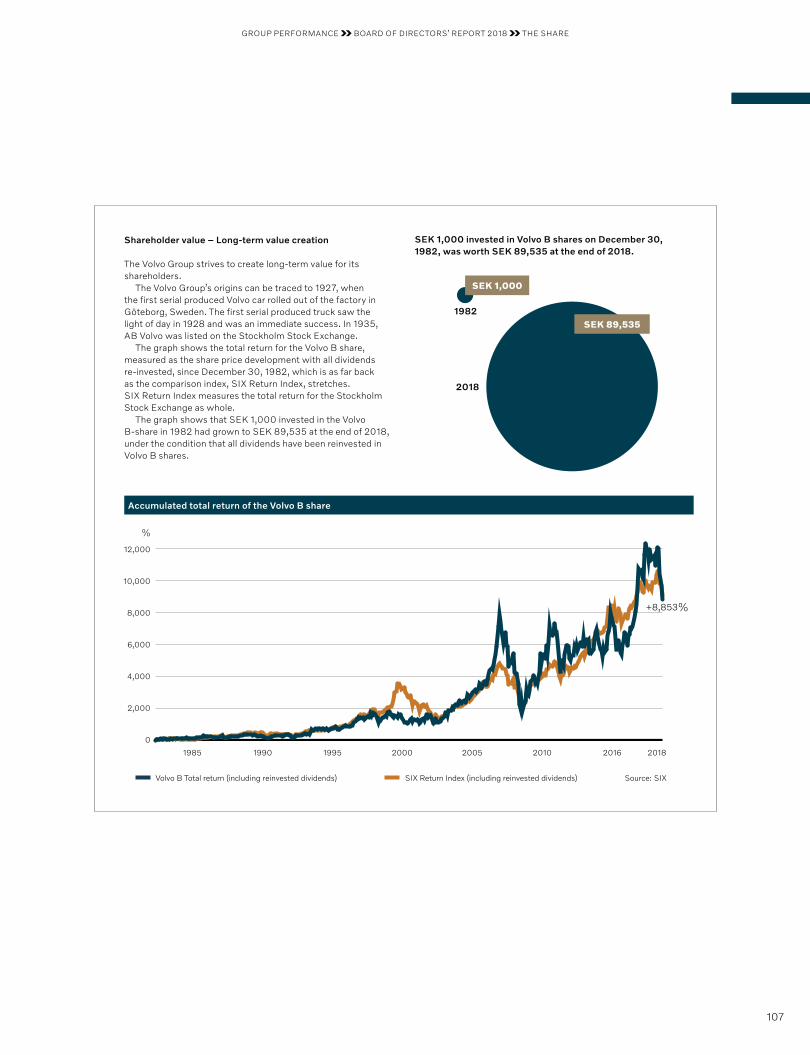
SEK 1,000 invested in Volvo B shares on December 30, 1982, was worth SEK 89,535 at the end of 2018.
1982
2018
SEK 89,535
SEK 1,000
Shareholder value – Long-term value creation
The Volvo Group strives to create long-term value for its shareholders.
The Volvo Group’s origins can be traced to 1927, when the first serial produced Volvo car rolled out of the factory in Göteborg, Sweden. The first serial produced truck saw the light of day in 1928 and was an immediate success. In 1935, AB Volvo was listed on the Stockholm Stock Exchange.
The graph shows the total return for the Volvo B share, measured as the share price development with all dividends re- invested, since December 30, 1982, which is as far back as the comparison index, SIX Return Index, stretches. SIX Return Index measures the total return for the Stockholm Stock Exchange as whole.
The graph shows that SEK 1,000 invested in the Volvo B-share in 1982 had grown to SEK 89,535 at the end of 2018, under the condition that all dividends have been reinvested in Volvo B shares.
Accumulated total return of the Volvo B share
Volvo B Total return (including reinvested dividends) SIX Return Index (including reinvested dividends) Source: SIX
1985 1990 1995 2000 2005 2010 20182016
12,000
%
8,000
6,000
10,000
4,000
2,000
0
+8,853%
107
GROUP PERFORMANCE BOARD OF DIRECTORS’ REPORT 2018 THE SHARE
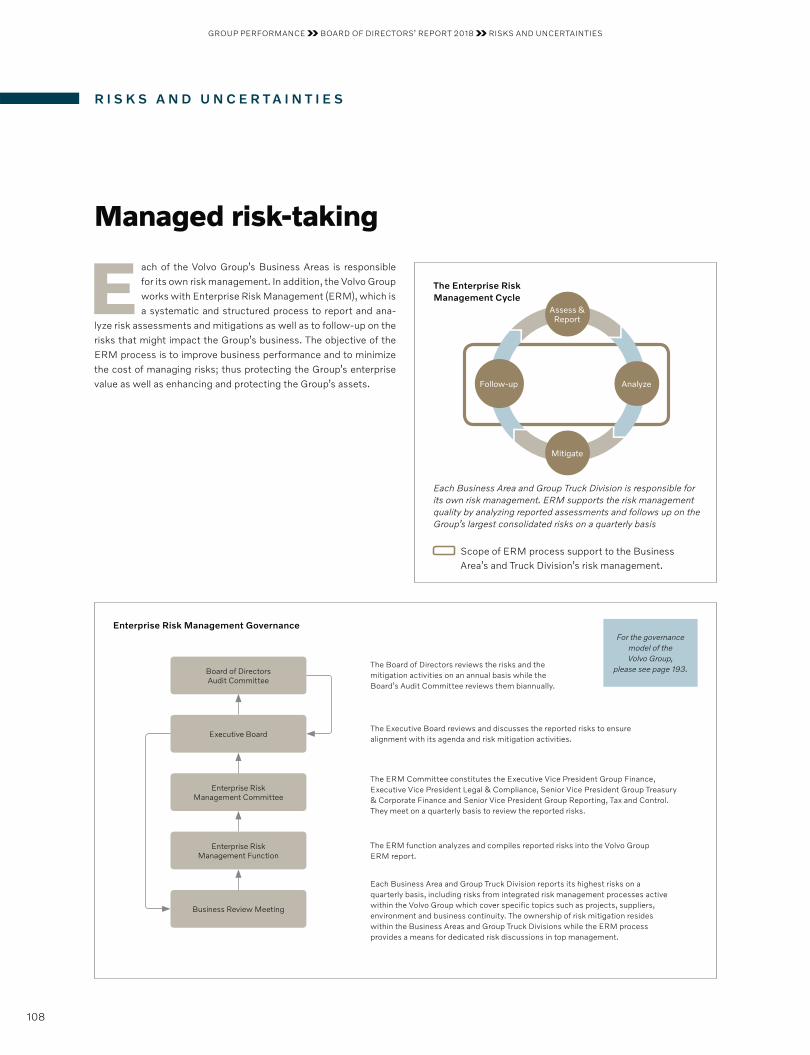
Each of the Volvo Group’s Business Areas is responsible for its own risk management. In addition, the Volvo Group works with Enterprise Risk Management (ERM), which is a systematic and structured process to report and ana-
lyze risk assessments and mitigations as well as to follow-up on the risks that might impact the Group’s business. The objective of the ERM process is to improve business performance and to minimize the cost of managing risks; thus protecting the Group’s enterprise value as well as enhancing and protecting the Group’s assets.
R I S K S A N D U N C E R T A I N T I E S
Managed risk-taking
Scope of ERM process support to the Business Area’s and Truck Division’s risk management.
AnalyzeFollow-up
Assess &Report
Mitigate
The Enterprise Risk Management Cycle
Each Business Area and Group Truck Division is responsible for its own risk management. ERM supports the risk management quality by analyzing reported assessments and follows up on the Group’s largest consolidated risks on a quarterly basis
Enterprise Risk Management GovernanceFor the governance
model of the Volvo Group,
please see page 193.
The Executive Board reviews and discusses the reported risks to ensure alignment with its agenda and risk mitigation activities.
The Board of Directors reviews the risks and the mitigation activities on an annual basis while the Board’s Audit Committee reviews them biannually.
The ERM Committee constitutes the Executive Vice President Group Finance, Executive Vice President Legal & Compliance, Senior Vice President Group Treasury & Corporate Finance and Senior Vice President Group Reporting, Tax and Control. They meet on a quarterly basis to review the reported risks.
The ERM function analyzes and compiles reported risks into the Volvo Group ERM report.
Each Business Area and Group Truck Division reports its highest risks on a quarterly basis, including risks from integrated risk management processes active within the Volvo Group which cover specific topics such as projects, suppliers, environment and business continuity. The ownership of risk mitigation resides within the Business Areas and Group Truck Divisions while the ERM process provides a means for dedicated risk discussions in top management.
Board of Directors Audit Committee
Executive Board
Enterprise Risk Management Committee
Enterprise Risk Management Function
Business Review Meeting
108
GROUP PERFORMANCE BOARD OF DIRECTORS’ REPORT 2018 RISKS AND UNCERTAINTIES
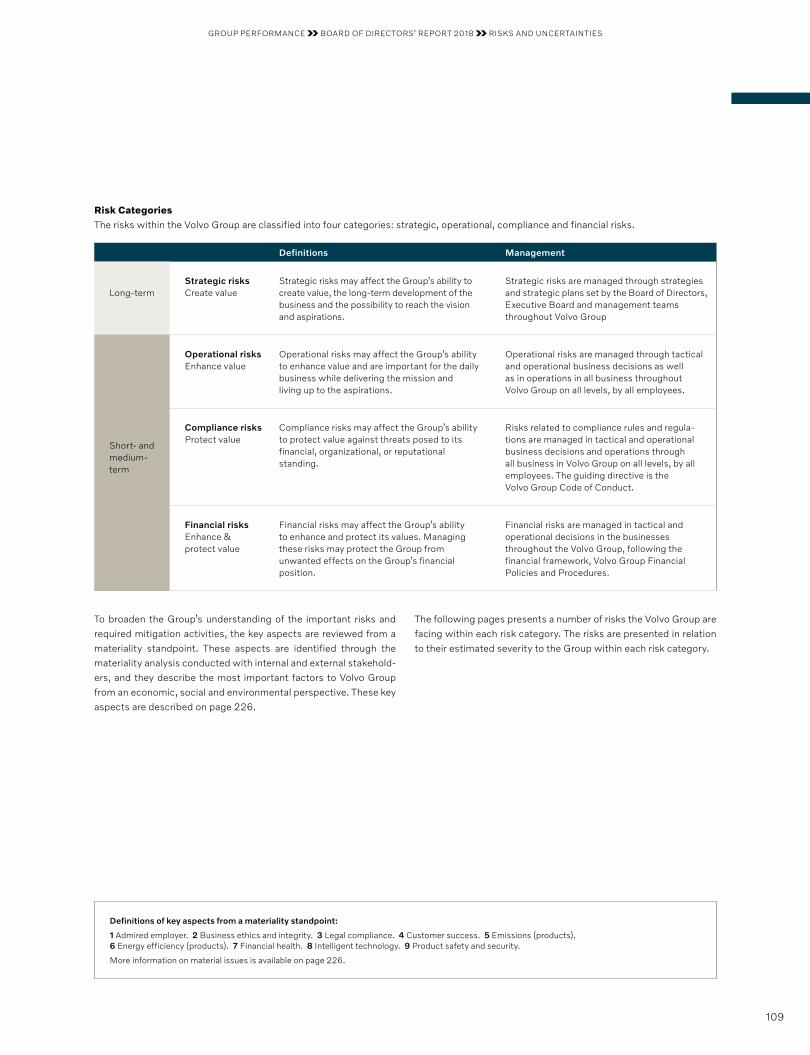
Definitions Management
Long-termStrategic risksCreate value
Strategic risks may affect the Group’s ability to create value, the long-term development of the business and the possibility to reach the vision and aspirations.
Strategic risks are managed through strategies and strategic plans set by the Board of Directors, Executive Board and management teams throughout Volvo Group
Short- and medium- term
Operational risksEnhance value
Operational risks may affect the Group’s ability to enhance value and are important for the daily business while delivering the mission and living up to the aspirations.
Operational risks are managed through tactical and operational business decisions as well as in operations in all business throughout Volvo Group on all levels, by all employees.
Compliance risksProtect value
Compliance risks may affect the Group’s ability to protect value against threats posed to its financial, organizational, or reputational standing.
Risks related to compliance rules and regula-tions are managed in tactical and operational business decisions and operations through all business in Volvo Group on all levels, by all employees. The guiding directive is the Volvo Group Code of Conduct.
Financial risksEnhance & protect value
Financial risks may affect the Group’s ability to enhance and protect its values. Managing these risks may protect the Group from unwanted effects on the Group’s financial position.
Financial risks are managed in tactical and operational decisions in the businesses throughout the Volvo Group, following the financial framework, Volvo Group Financial Policies and Procedures.
Risk CategoriesThe risks within the Volvo Group are classified into four categories: strategic, operational, compliance and financial risks.
To broaden the Group’s understanding of the important risks and required mitigation activities, the key aspects are reviewed from a materiality standpoint. These aspects are identified through the materiality analysis conducted with internal and external stakehold-ers, and they describe the most important factors to Volvo Group from an economic, social and environmental perspective. These key aspects are described on page 226.
The following pages presents a number of risks the Volvo Group are facing within each risk category. The risks are presented in relation to their estimated severity to the Group within each risk category.
Definitions of key aspects from a materiality standpoint:
1 Admired employer. 2 Business ethics and integrity. 3 Legal compliance. 4 Customer success. 5 Emissions (products). 6 Energy efficiency (products). 7 Financial health. 8 Intelligent technology. 9 Product safety and security.
More information on material issues is available on page 226.
109
GROUP PERFORMANCE BOARD OF DIRECTORS’ REPORT 2018 RISKS AND UNCERTAINTIES
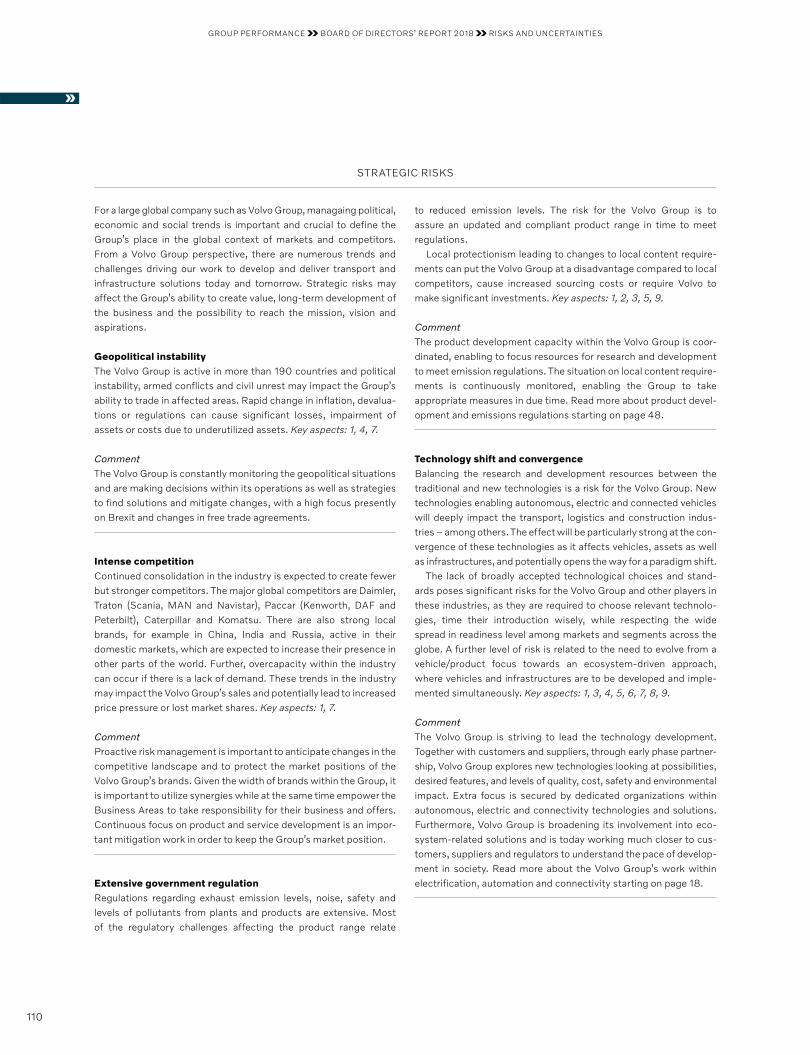
STRATEGIC RISKS
to reduced emission levels. The risk for the Volvo Group is to assure an updated and compliant product range in time to meet regulations.
Local protectionism leading to changes to local content require-ments can put the Volvo Group at a disadvantage compared to local competitors, cause increased sourcing costs or require Volvo to make significant investments. Key aspects: 1, 2, 3, 5, 9.
CommentThe product development capacity within the Volvo Group is coor-dinated, enabling to focus resources for research and development to meet emission regulations. The situation on local content require-ments is continuously monitored, enabling the Group to take appropriate measures in due time. Read more about product devel-opment and emissions regulations starting on page 48.
Technology shift and convergenceBalancing the research and development resources between the tradi tional and new technologies is a risk for the Volvo Group. New technologies enabling autonomous, electric and connected vehicles will deeply impact the transport, logistics and construction indus-tries – among others. The effect will be particularly strong at the con-vergence of these technologies as it affects vehicles, assets as well as infrastructures, and potentially opens the way for a paradigm shift.
The lack of broadly accepted technological choices and stand-ards poses significant risks for the Volvo Group and other players in these industries, as they are required to choose relevant technolo-gies, time their introduction wisely, while respecting the wide spread in readiness level among markets and segments across the globe. A further level of risk is related to the need to evolve from a vehicle/product focus towards an ecosystem-driven approach, where vehicles and infrastructures are to be developed and imple-mented simultaneously. Key aspects: 1, 3, 4, 5, 6, 7, 8, 9.
CommentThe Volvo Group is striving to lead the technology development. Together with customers and suppliers, through early phase partner-ship, Volvo Group explores new technologies looking at possibilities, desired features, and levels of quality, cost, safety and environmental impact. Extra focus is secured by dedicated organizations within autonomous, electric and connectivity technologies and solutions. Furthermore, Volvo Group is broadening its involvement into eco-system-related solutions and is today working much closer to cus-tomers, suppliers and regulators to understand the pace of develop-ment in society. Read more about the Volvo Group’s work within electrification, automation and connectivity starting on page 18.
For a large global company such as Volvo Group, managaing political, economic and social trends is important and crucial to define the Group’s place in the global context of markets and competitors. From a Volvo Group perspective, there are numerous trends and challenges driving our work to develop and deliver transport and infrastructure solutions today and tomorrow. Strategic risks may affect the Group’s ability to create value, long-term development of the business and the possibility to reach the mission, vision and aspirations.
Geopolitical instabilityThe Volvo Group is active in more than 190 countries and political instability, armed conflicts and civil unrest may impact the Group’s ability to trade in affected areas. Rapid change in inflation, devalua-tions or regulations can cause significant losses, impairment of assets or costs due to underutilized assets. Key aspects: 1, 4, 7.
CommentThe Volvo Group is constantly monitoring the geopolitical situations and are making decisions within its operations as well as strategies to find solutions and mitigate changes, with a high focus presently on Brexit and changes in free trade agreements.
Intense competitionContinued consolidation in the industry is expected to create fewer but stronger competitors. The major global competitors are Daimler, Traton (Scania, MAN and Navistar), Paccar (Kenworth, DAF and Peterbilt), Caterpillar and Komatsu. There are also strong local brands, for example in China, India and Russia, active in their domestic markets, which are expected to increase their presence in other parts of the world. Further, overcapacity within the industry can occur if there is a lack of demand. These trends in the industry may impact the Volvo Group’s sales and potentially lead to increased price pressure or lost market shares. Key aspects: 1, 7.
CommentProactive risk management is important to anticipate changes in the competitive landscape and to protect the market positions of the Volvo Group’s brands. Given the width of brands within the Group, it is important to utilize synergies while at the same time empower the Business Areas to take responsibility for their business and offers. Continuous focus on product and service development is an impor-tant mitigation work in order to keep the Group’s market position.
Extensive government regulationRegulations regarding exhaust emission levels, noise, safety and levels of pollutants from plants and products are extensive. Most of the regulatory challenges affecting the product range relate
110
GROUP PERFORMANCE BOARD OF DIRECTORS’ REPORT 2018 RISKS AND UNCERTAINTIES
OPERATIONAL RISKS
For Volvo Group, steering the tactical and operational work is crucial to reach the aspirations in terms of customer satisfaction, admired employer and leading profitability. To enhance business value, all decisions and operations are based on knowledge regarding short and medium term operational risks. These risks are actively man-aged throughout the Volvo Group in accordance with the govern-ance model. Operational risks may affect the Group’s ability to enhance value, which means knowledge of these risks are impor-tant for the daily business.
Customer satisfactionTop priority for the Volvo Group is to support the customers’ business and profitability in order for them to succeed, regardless of segment, brand, product or service. Customer satisfaction is reliant on the expectations in relation to the actual delivery or user experience of the total offer. The satisfaction, and thereby the Group’s sale, is at risk if the total experience is not at the expected level or price point. Key aspects: 1, 2, 3, 4, 5, 6, 7, 8, 9.
CommentThe Volvo Group strives for a culture where customer success is at the heart of everything. Regardless of where in the value chain, the Group engages in understanding the customers’ business and focus efforts on things that create value from the customer’s perspective.
The Volvo Group also puts a lot of effort on market research and customer interviews to secure knowledge of the customer needs. For the product development, the Group has implemented a project gate model and a governance structure where risks regarding project and product quality, cost, project lead time and product features are constantly monitored.
Staff at retailers and workshops are continuously trained and provided with instructions or guidelines on how to interact with their customers. Web pages are aligned, positioned and developed towards the brand’s targeted customers. Read more on page 42.
Cyclical commercial vehicles industry The Volvo Group’s customers operate all over the world, some within a single state, and others across borders. A multitude of global and regional economic, regulatory, digital, technological and environ-mental factors create strategic as well as operational challenges for the industry. Like many capital goods industries, the commercial vehicle industry generally has been cyclical, with a strong correlation to GDP and corresponding change in transport demand, the need to replace aging vehicles and machines, as well as changing laws and regulations. Although there is a continued shift in focus in the com-mercial vehicle industry from product to service, the cyclicality in sales and profitability remains. The changing business landscape as well as the divergence between emerging and developed markets, influences demand for customers’ services and customers’ success. The fluctuating demand for the Group’s products and services
makes the financial result of the operations dependent on the Group’s ability to react quickly to market changes. Key aspect: 7.
CommentThe Volvo Group strives to continuously balance production levels and operating expenses, as well as enhance business agility in ful-filling demands for new services.
Reliance on suppliers and scarce materialsThe Volvo Group purchases raw materials and components from numerous external suppliers. Suppliers and business partners come from all around the world, thus sustainable solutions and close col-laboration with suppliers are key for the success of the Group’s cus-tomers. The purchase cost can vary significantly over a business cycle due to changes in world market prices for raw materials and currency impact. Growth in major markets is positive from a Group perspective, however simultaneous growth of sales in major markets can create extraordinary capacity constraints in the supply chain. High demand as well as suppliers’ financial instability could also result in delivery disturbances.
Possible effects of delivery disturbances vary depending on the components’ lead time and complexity as well as on the availability of alternative suppliers and transport providers. Some components are standard throughout the industry, other are Volvo Group unique. Key aspects: 1, 2, 3, 4, 7, 9.
CommentProactive efforts are put forth in establishing a robust and flexible supply chain for the Volvo Group. To manage the high volatility in the commercial vehicle market, capacity management is a focus area, as well as social responsibility management in close cooperation with suppliers and business partners. Read more about how we work with suppliers on page 58 and reuse on page 68.
Industrial operations The industrial system is vital for the Volvo Group in order to provide products to customers with the right quality and on time. Compo-nents as well as complete vehicles and machines are produced, and material supplied to customers and factories in a sustainable and resource-efficient way. The risk of interruptions, inefficiencies in the system, operational hazards or unwanted impact on the external environment may have a large negative impact on the Volvo Group. Key aspects: 1, 3, 4, 7, 8.
CommentThe organization is continuously working on improvements and to manage risks such as volume variations, supplier disruptions, legal deviations, operational hazards, and external environmental impacts. The contributions to environmental care include improving efficiency in the use of natural resources like water, energy and chemicals, reducing the dependency on hazardous substances,
111
GROUP PERFORMANCE BOARD OF DIRECTORS’ REPORT 2018 RISKS AND UNCERTAINTIES
preventing adverse impacts from emissions to land, water and air, and strategically working to increase renewable energy use and reduce CO2 emissions.
Volvo Production System, VPS, is a method focusing on contin-uous improvement used to achieve excellence, providing the logic and methods to reduce and mitigate the threat of undesired future consequences. Read more about production, logistics and VPS starting on page 60.
Human capital The expectations from employees and other stakeholders are changing rapidly. To meet them requires a strong focus on areas such as leadership, empowerment, employee engagement, human rights, company culture and values. Failure to do the right things according the Group’s company values, risks a negative impact on the Volvo Group reputation, as well as on the image as an employer and on the ability of employees to develop the knowledge and skills necessary to ensure customer success. Key aspects: 1, 2, 3, 7, 8.
CommentThis risk is managed by the Volvo Group continuously monitors chang-ing legislation to ensure compliance, leveraging the full diversity of the workforce to ensure business success on a global arena. The Volvo Group Attitude Survey (VGAS) has been complemented by other tools and processes designed to increase dialogue, which allows the Group to capture the voice of employees and strengthen engage-ment. Uniting employees through a common set of behaviors that are in line with the business ambitions, the Group consciously grows an inclusive culture and a value-based leadership.
Human rightsPeople are at the core of what the Volvo Group does. In the updated Code of Conduct human rights issues are emphasized, for example mutual respect, non-discrimination, safe and healthy workplace, freedom of association and collective bargaining, working hours and compensation, as well as modern slavery and child labor. These are currently considered as most relevant, however the Volvo Group continuously investigates other issues that might become more rel-evant. Violation of human rights may potentially materialize not only in the own organization, but also through the business relationships and in the value chain. The Group is aware that conducting business in certain parts of the world constitutes higher risks for potential human rights violation, and have identified 17 countries where the Volvo Group has a substantial number of employees and/or close business partners which is considered high risk countries in this respect. The Group is also aware that potential linkage through the supply chain as well as Group products and services to segments such as the electronics industry, mining industry and heavy
infrastructure projects constitutes higher risks for human rights violations. Key aspects: 1, 2, 3, 4, 7.
CommentThe consequences of human rights risks for the Volvo Group depend on if the Group is seen as causing, contributing to or having a linkage to the harm done, and could be anything from legal liability to reputa-tional and brand damage, depending also on the severity of its nature. Read more on how the Group manages human rights on page 38–39.
Residual value commitments A customer can purchase a vehicle in different ways from the Volvo Group. A sale without any further commitments is the most common way but there are also different types of transactions, for instance when the Volvo Group is offering the customer a residual value com-mitment. It means that the customer can return the asset at the agreed date and to the agreed price. A commitment is a potential risk for the Group because predicting the future development of used vehicle prices can be challenging. A lot of parameters will influ-ence the future price (transport demand, model changes, technol-ogy steps, changed legislation and standards, etc.). A commitment can also become a future used vehicle inventory risk, affecting the cash flow negatively. Key aspects: 4, 7.
CommentIn order to minimize the risk and the impact on the future profitability, the Volvo Group has established processes and procedures within each Business Area, where each Business Area assumes the responsibility for establishing and maintaining a residual value matrix to reflect fair future market values, proactive planning and management of expiring contracts as well as portfolio evaluation.
Natural disasters, malicious intent or accidents risksWith activities in more than 190 countries, the Volvo Group’s global operations are exposed to a number of risks that could impact peo-ple, products, information and assets. These risks range from inter alia political and social instability, criminality, loss of sensitive data, and cyber disruptions to natural disasters. These risks, if they occur, could have an adverse effect on the Volvo Group’s reputation and financial health. Key aspects: 1, 2, 3, 4, 7, 8, 9.
CommentThe Volvo Group strives to identify and monitor vulnerabilities and implement appropriate measures to mitigate identified risks to avoid, prevent, reduce or transfer the impact. This is a recurring process that adapts to changes in the risk and operational environment.
112
GROUP PERFORMANCE BOARD OF DIRECTORS’ REPORT 2018 RISKS AND UNCERTAINTIES
Corruption and non-compliance with competition lawCorruption risks are primarily linked to the activities of the Volvo Group’s business partners (distributors and sales agents), for which the Group may be responsible, as well as to the behaviors of employ-ees in sales situations in relation to public officials and other customer representatives. The overall risk level is also affected by the fact that Volvo pursues business operations in many markets that are considered high-risk from a corruption perspective. Poten-tial risks for non-compliance with competition law (e.g. price fixing, market sharing, unlawful information exchange, abuse of market power) are primarily linked to behavior of employees when inter-acting with competitors and other external stakeholders in various situa tions. Corruption as well as competition law infringements may involve severe negative impacts for the business operations, including reputational damage, fines and imprisonment of employees. Key aspects: 1, 2, 3, 4.
CommentCorruption related risks are managed via the Volvo Group’s Anti-Corruption Compliance Program, which consists of different mitigating activities including anti-corruption due diligence of business partners. This is to ensure that the Group selects the right business partners to prevent corrupt practices in connection with the sale of products and services. As regards employees and con-tractors, it is clearly stated in the Code of Conduct that Volvo employees and contractors may not participate in or endorse any corrupt practices. Further, the Code of Conduct states that the Group competes on the merit of products and services and do not take actions that are illegal under the competition laws, such as collud ing with competitors. Also, regular anti-corruption training is provided. Read more about the Anti-Corruption Compliance Program on page 36.
In the operations the Group is obliged to follow a number of laws and regulations and comply with certain global standards. Compli-ance risks may affect the ability to protect value through threats posed to the Group’s reputation or financial position.
On a global level, there is an increased activity by authorities to monitor compliance with different laws and regulations that apply to Volvo Group operations. This covers areas such as emission reg-ulations, data privacy requirements, competition law and sanction regulations. As a consequence, there is now more focus on and resources needed for internal activities to measure and be prepared to verify compliance to concerned authorities. Having compliance programs for key areas of the business is an important prerequisite to be able to promote compliance.
Non-compliance with data privacy laws One area that is currently in focus is compliance with data privacy laws, with focus on the new General Data Protection Regulation (GDPR) that applies within the EU. The Volvo Group has imple-mented a group wide data privacy compliance program. The new GDPR legislation has recently been implemented and there are uncertainties regarding interpretation and level of enforcement by authorities. Such uncertainties are also relevant for other regions, where corresponding laws and regulations are coming into force. Key aspects: 1, 2, 3, 4.
CommentThe data privacy area is closely monitored to identify potential problems that may have a negative impact on the Volvo Group. Read more on page 36.
Intangible assets The Volvo Group owns or otherwise has rights to patents, trade-marks, designs and copyrights that relate to the products and services that the Group manufactures and markets. These rights have been developed or acquired over a number of years and are valuable to the operations of the Volvo Group. Further, in order to safeguard investments in R&D, the Volvo Group has an intellectual property plan defining the creation and use of its intellectual prop-erty rights. AB Volvo and Volvo Car Corporation jointly own the Volvo brand and trademarks through Volvo Trademark Holding AB. AB Volvo has the exclusive right to use the Volvo name and trade-mark for its products and services and according to a license agree-ment. Similarly, Volvo Car Corporation has the exclusive right to use the Volvo name and trademark for its products and services. The Volvo Group’s rights to use the Renault brand and trademarks are related to the truck operations only and are regulated by a license from Renault s.a.s., which owns the Renault brand and trademarks. In addition, the Volvo Group owns several other trademarks relating to its business. Use in possible conflict with third-party intellectual property rights may have significant business impact on the Group. Key aspects: 2, 3, 7, 8.
CommentUse in possible conflict with third-party intellectual property rights may have significant business impact on the Group. Therefore, the Volvo Group is continuously assessing intellectual property rights of third parties as well as possible infringements by third parties of the Group’s intellectual property rights.
COMPLIANCE RISKS
113
GROUP PERFORMANCE BOARD OF DIRECTORS’ REPORT 2018 RISKS AND UNCERTAINTIES
CommentTo mitigate risk and impact in the environmental regulatory area, the Volvo Group invests substantial resources to adhere to different leg-islation throughout the entire value chain. Examples of this are:
• Monitoring of upcoming environmental regulations and initiatives which could have an impact on the business
• Governance structure to address upcoming environmental requirements
• Prioritizations and investment decisions in regular operational processes.
Read more about how the Group manages environmental risks in the Value Chain section starting on page 40.
Contractual conditions related to takeover bidsProvisions stipulating that an agreement can be changed or termi-nated if the control of the company is changed, so called control clauses, are included in some of the agreements whereby Renault Trucks has been given the right to sell Renault s.a.s. and Nissan Motor Co. Ltd’s light-duty trucks as well as in some of the Group’s purchasing agreements.
Some of Volvo Group’s long-term loan agreements contain condi-tions stipulating the right for a bondholder to request repayment in advance under certain conditions following a change of the control of the company. These clauses are not unusual in loan agreements. In AB Volvo’s opinion it has been necessary to accept those condi-tions in order to receive financing on otherwise acceptable terms. Key aspects: 2, 7.
FINANCIAL RISKS
For the Volvo Group, steering and monitoring financial risk is impor-tant, both from an operational and compliance perspective. Group-wide policies, Volvo Group Financial Policies and Procedures, are updated and decided upon annually, and form the basis for the Group company’s management of these risks. The financial risks may affect the Group’s ability to enhance and protect the Group’s financial position.
Interest rate risk Volvo Group’s debt structure is connected to the aspiration to have industry-leading profitability. Movements in interest-rate levels may impact the Group’s net income and cash flow or the value of financial assets and liabilities. Key aspect: 7.
CommentThe Industrial Operations’ interest rate fixing is kept short, i.e. below six months, to leverage on the countercyclical relationship of short-term interest rates. Financial Services funding and lending shall be matched to mitigate undesired volatility in profitability due to interest-rate risk.
Currency riskThe Volvo Group’s global presence means that business is con-ducted in many different regions. More than 95% of the net sales of the Volvo Group are generated in countries other than Sweden. A majority of the Group’s costs also stem from countries other than Sweden. As such, the Volvo Group’s cash flow and profitability are impacted by uncertainties in foreign exchange rates which impact
Complaints and legal actionsThe Volvo Group may be the target of complaints and legal actions initiated by customers, employees and other third parties alleging health, environmental, safety or business-related issues, or failure to comply with applicable legislation and regulations. Information about legal proceedings involving entities within the Volvo Group are found in Note 21 Other Provisions and in Note 24 Contingent Liabilities. Even if such disputes are resolved successfully, without having adverse consequences financially or on the values, they could negatively impact the Group’s reputation and take up resources that could be used for other purposes. Key aspects: 1, 2, 3, 4, 5, 6, 7, 9.
CommentThe Volvo Group has well-established structures and processes in place to evaluate and handle complaints and legal proceedings with the purpose of mitigating legal risks for the Group.
Environmental regulationsInternational agreements on limiting the CO2 emissions, such as the Paris Agreement, together with related national and regional initia-tives lead to an increase in policies and influence regulatory devel-opment. Environmental legislation is developing in for instance vehicle regulations on CO2 and on emission standards as well as chemical substance regulations. These developments increase the need for monitoring and adaption to new requirements. Even if challenges in these areas are resolved and handled, they could have a negative impact on Group reputation and usage of resources. Key aspects: 1, 2, 3, 4, 5, 6, 7.
114
GROUP PERFORMANCE BOARD OF DIRECTORS’ REPORT 2018 RISKS AND UNCERTAINTIES
the Volvo Group’s operating income, balance sheet and cash flow, as well as an indirect impact over time on Volvo’s competitiveness. Key aspects: 4, 7.
CommentThe Volvo Group strives to have sourcing and manufacturing located in the major markets which offsets structural currency exposures, and actively manages currency flows and translation risk to reduce the impact on profitability and cash flow.
Liquidity riskThe Volvo Group needs to ensure that it has adequate payment capa-bilities over time, in order to capture both business opportunities and expectations from external stakeholders. Sudden changes in the business cycle, or unforeseen events within the financial markets can affect the Volvo Group both in a direct or indirect way. The customers can experience difficulties in financing products bought from the Volvo Group, the suppliers can face challenges in assuring their deliv-ery of components to the Volvo Group production, and the Volvo Group can face challenges in delivering according to expectations. Key aspect: 7.
CommentThe Volvo Group ensures sound financial preparedness by always keeping a certain percent of its sales in liquid assets. A sound balance between short and long-term debt maturities as well as long-term committed credit facilities and cash, are intended to secure liquidity preparedness and thus the Volvo Group’s payment capability.
Credit riskCredit risk is the risk of loss resulting from either a customer’s or a borrower’s failure to meet their contractual obligations resulting in lost principal and/or interest, disruption to cash flows, and increased collection costs. Within its Industrial Operations the Group sells products with open credits to customers and issue credit guaran-tees for customers’ commercial vehicles and equipment. The cus-tomer financing activity in Volvo Financial Services manages a sig-nificant credit portfolio, equivalent to SEK 149 billion at year-end 2018. Another part of the Group’s credit risk is related to the invest-ment of the financial assets of the Group. Key aspects: 4, 7.
CommentThe Volvo Group has set clear principles for how to manage external customer relationship, including customer assessment, how to manage and measure exposure and mitigate risks, financing solu-tions, collection procedures and performance follow-up structure.
In order to mitigate this risk, the company has through the Finan-cial Services operation implemented strong portfolio management processes based on prudent credit approvals, active monitoring of
individual loan performance, utilization of in-house and external col-lections, portfolio segmentation and risk diversification analysis and on-going monitoring of the economic, political and industry condi-tions in each market. In addition, further credit enhancements such as down payments, personal guarantees, credit insurance, liens on other property owned by the borrower, etc. may be required at the time of origination or when there are signs of impairment.
Investment of financial assets consists primarily of short-term deposits with banks. The company only deals with major banks and credit ratings are followed closely. The credit risk exposure is actively monitored. A Credit Limit Frame stipulates the maximum financial credit risk limit allowed for any counterparty.
Market risk from investments in shares or similar instrumentsThe Volvo Group has investments in listed shares with a direct expo-sure to the capital markets. Please see Note 5 for further informa-tion. Furthermore, the Volvo Group is indirectly exposed to market risks from shares and other similar instruments as a result of assets being managed in independent pension plans with exposure to these types of instruments. Please see Note 20 for further information. Key aspects: 1, 7.
CommentThe direct exposures are continuously evaluated from strategic and financial perspectives. Holdings which no longer are deemed stra-tegic will be evaluated for potential divestment. The indirect expo-sure is controlled in the short run by ensuring strict adherence to each plans’ investment policy and by proactively implementing portfolio de-risking strategies when deemed necessary.
ImpairmentThe Volvo Group verifies annually, or more frequently if necessary, the goodwill value and other intangible assets. The size of the surplus value differs between the business areas and they are, to a varying degree, sensitive to changes in the business environment. Instability in the business recovery and volatility in interest and currency rates may lead to indications of impairment. Key aspects: 3, 7.
CommentGoodwill is evaluated yearly or at any indication of impairment. Other intangible assets are evaluated in case of indication of impair-ment. For further information on intangible assets, see Note 12.
115
GROUP PERFORMANCE BOARD OF DIRECTORS’ REPORT 2018 RISKS AND UNCERTAINTIES
The Volvo Group’s mission is to drive prosperity through transport solutions, hence sustainability and responsible business behavior are integrated into our overall strategy and business model. We have an integrated Annual and
Sustainability Report where non-financial reporting requirements are included as an integral part of our financial and operational statements.
Our sustainability reporting is prepared in accordance with the Global Reporting Initiative (GRI) Standards Core, which is a volun-tary framework that sets out principles and indicators for measuring and reporting economic, environmental and social performance. Volvo Group’s GRI index can be found at volvogroup.com.
During 2018 we have conducted a gap analysis and stakeholder dialogues with internal and external stakeholders to identify and include disclosures relevant according the Taskforce on Climate- related Financial Disclosures (TCFD). Since 2010 we have made environmental commitments within the World Wide Fund for Nature (WWF) Climate Savers program, see page 33. Together with the WWF we are also estimating science based targets for heavy duty vehicles based on the Paris agreement. We participate in a number of global independent sustainability rankings on a yearly basis.
Volvo Group is a signatory of the UN Global Compact since 2001 and supports the UN Guiding Principles on business and human rights. We strive to align with the UN Sustainable Development Goals that are the most relevant for our business operations by driving various initiatives that support progress, page 32.
Non-financial reporting in accordance with the Swedish Annual Accounts ActVolvo’s Business ModelWith business operations in more than 190 countries whereof many are classified as high risk countries from an environmental, human rights and/or corruption perspective, we need to secure that we pursue our business operations in a responsible manner. Sustaina-bility aspects and responsible business behavior are integrated into Volvo’s business model and also incorporated into Volvo’s policies and processes. In line with our decentralized business model each business area is responsible to ensure compliance with Volvo’s minimum standards relating to responsible business behavior. Volvo’s strategy, business model and value chain is further described on pages 10–69.
S U S T A I N A B I L I T Y R E P O R T I N G
Integrated Sustainability Reporting
Volvo Group Policies The Volvo Group Code of Conduct is a Group-wide policy that sets the standards on how we conduct business; ethically and in compli-ance with applicable laws and regulations. It applies everywhere we operate, for our employees and everyone else who works on our behalf. The Code of Conduct is complemented by other policies that describe in more detail how we address its minimum standards. The Volvo Group has a number of policies which sets out the Volvo Group’s minimum requirements and standards relating to the envi-ronment, employees, social factors, human rights and anti-corrup-tion (see the sustainability reporting index on the opposite side).Such minimum requirements and standards apply for all our busi-ness operations in all parts of the world. Our policies are in some areas complemented with mandatory compliance programs to ensure compliance with legal requirements and policy commit-ments, see page 36. In line with our decentralized business model our various business areas are free to complement existing policies and compliance programs with more stringent requirements on environmental sustainability, social sustainability and responsible business behavior for their respective business area.
Risks and mitigationsThe Volvo Group works with Enterprise Risk Management (ERM) which is a system atic and structured process to assess, report, analyze and follow-up the risks that might impact the Volvo Group’s business operations. Hence, many of Volvo’s sustainability and responsible business related risks and mitigations are reported as part of Volvo’s general risk analysis, see pages 108–115. The sus-tainability reporting index, on the opposite side, includes a more detailed overview on essential risks and mitigations relating to the environment, employees, social factors, human rights and corrup-tion in line with the non-financial reporting requirements under the Swedish Annual Accounts Act. We do not believe that we have any other non-financial factors that are material for our business operations.
Key Performance IndicatorsIn line with our integrated sustainability reporting, KPI’s in relation to the environment, employees, social factors, human rights and corruption are integrated into our overall report, see further the sustain ability reporting index on the opposite side and our GRI Index at volvogroup.com.
116
GROUP PERFORMANCE BOARD OF DIRECTORS’ REPORT 2018 SUSTAINABILITY REPORTING
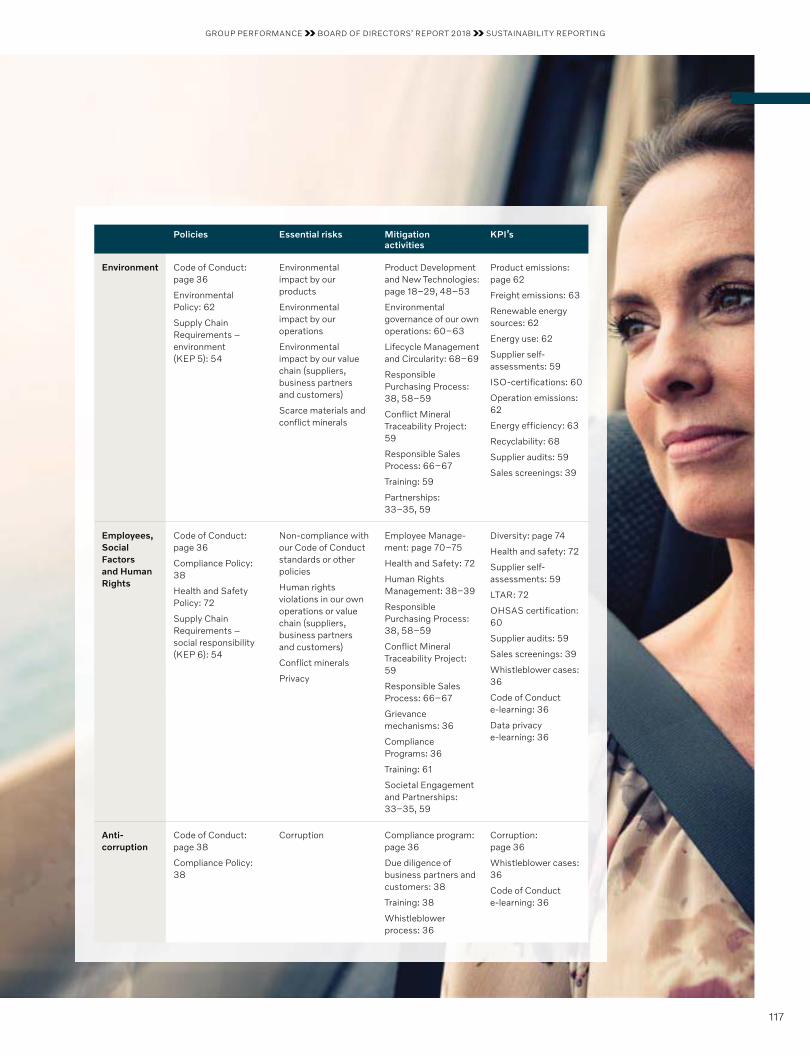
Policies Essential risks Mitigation activities
KPI’s
Environment Code of Conduct: page 36
Environmental Policy: 62
Supply Chain Requirements – environment (KEP 5): 54
Environmental impact by our products
Environmental impact by our operations
Environmental impact by our value chain (suppliers, business partners and customers)
Scarce materials and conflict minerals
Product Development and New Technologies: page 18–29, 48–53
Environmental governance of our own operations: 60–63
Lifecycle Management and Circularity: 68–69
Responsible Purchasing Process: 38, 58–59
Conflict Mineral Trace ability Project: 59
Responsible Sales Process: 66–67
Training: 59
Partnerships: 33–35, 59
Product emissions: page 62
Freight emissions: 63
Renewable energy sources: 62
Energy use: 62
Supplier self- assess ments: 59
ISO-certifications: 60
Operation emissions: 62
Energy efficiency: 63
Recyclability: 68
Supplier audits: 59
Sales screenings: 39
Employees, Social Factors and Human Rights
Code of Conduct: page 36
Compliance Policy: 38
Health and Safety Policy: 72
Supply Chain Requirements – social responsibility (KEP 6): 54
Non-compliance with our Code of Conduct standards or other policies
Human rights violations in our own operations or value chain (suppliers, business partners and customers)
Conflict minerals
Privacy
Employee Manage-ment: page 70–75
Health and Safety: 72
Human Rights Management: 38–39
Responsible Purchasing Process: 38, 58–59
Conflict Mineral Traceability Project: 59
Responsible Sales Process: 66–67
Grievance mechanisms: 36
Compliance Programs: 36
Training: 61
Societal Engagement and Partnerships: 33–35, 59
Diversity: page 74
Health and safety: 72
Supplier self- assessments: 59
LTAR: 72
OHSAS certification: 60
Supplier audits: 59
Sales screenings: 39
Whistleblower cases: 36
Code of Conduct e-learning: 36
Data privacy e-learning: 36
Anti- corruption
Code of Conduct: page 38
Compliance Policy: 38
Corruption Compliance program: page 36
Due diligence of business partners and customers: 38
Training: 38
Whistleblower process: 36
Corruption: page 36
Whistleblower cases: 36
Code of Conduct e-learning: 36
117
GROUP PERFORMANCE BOARD OF DIRECTORS’ REPORT 2018 SUSTAINABILITY REPORTING
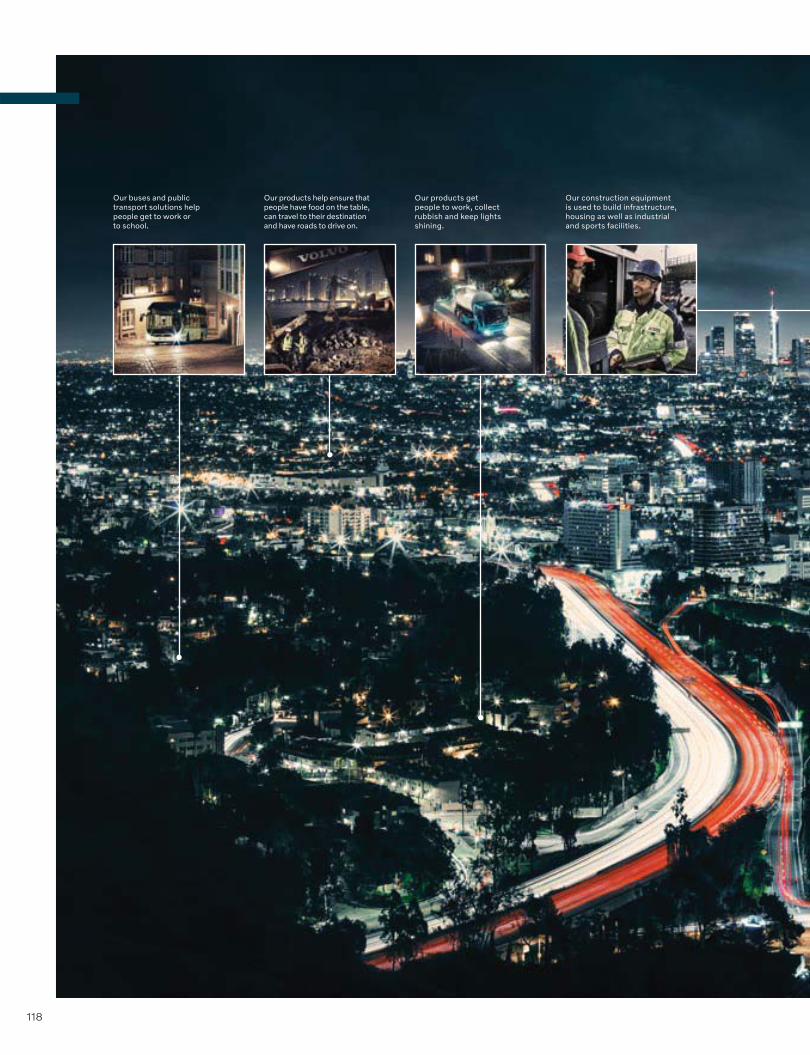
Our buses and public transport solutions help people get to work or to school.
Our products help ensure that people have food on the table, can travel to their destination and have roads to drive on.
Our products get people to work, collect rubbish and keep lights shining.
Our construction equipment is used to build infrastructure, housing as well as industrial and sports facilities.
118
Our products are part of daily life
OUR CUSTOMERS MAKE SOCIETIES WORKThe Volvo Group’s products and services contribute to much of what we all expect of a well-functioning society. Our trucks, buses, engines, construction equipment and financial services are involved in many of the functions that most of us rely on every day. The majority of the Volvo Group’s customers are companies within the transportation or infrastructure industries. The reliability and pro-ductivity of the products are important and in many cases crucial to our customers’ success and profitability.
119
Group performance 2018
PAGENotes to financial statements 121Parent Company AB Volvo 182Proposed policy for remuneration to senior executives
210
Proposed disposition of unappropriated earnings 211Audit report for AB Volvo 212Key ratios 215Eleven-year summary 218
NOTE THE VOLVO GROUP PAGE1 Accounting policies 1212 Key sources of estimation uncertainty 1233 Acquisitions and divestments of
shares in subsidiaries124
4 Goals and policies in financial risk management
126
5 Investments in joint ventures, associated companies and other shares and participations
132
6 Segment reporting 1357 Revenue 1378 Other operating income and expenses 1399 Other financial income and expenses 139
10 Income taxes 14011 Minority interests 14112 Intangible assets 14213 Tangible assets 14414 Leasing 14615 Customer-financing receivables 14716 Receivables 14917 Inventories 15118 Marketable securities and liquid funds 15119 Equity and number of shares 15220 Provisions for post-employment benefits 15321 Other provisions 15822 Liabilities 16023 Assets pledged 16124 Contingent liabilities 16225 Transactions with related parties 16326 Government grants 16327 Personnel 16428 Fees to the auditors 16829 Cash flow 16830 Financial instruments 17031 Changes in Volvo Group
Financial Reporting 2018174
32 Changes in Volvo Group Financial Reporting 2019
178
NOTE PARENT COMPANY PAGE1 Accounting policies 1862 Revenue and intra-group transactions 1863 Administrative expenses 1864 Other operating income and expenses 1865 Income from investments
in Group companies187
6 Income from investments in joint ventures and associated companies
187
7 Income from other investments 1878 Interest expenses 1879 Other financial income and expenses 187
10 Allocations 18711 Income taxes 18712 Intangible and tangible assets 18813 Investments in shares and participations 18814 Other receivables 19015 Untaxed reserves 19016 Provisions for post- employment benefits 19017 Non-current liabilities 19118 Other liabilities 19119 Contingent liabilities 19120 Cash flow 191
N O T E S
FINANCIAL STATEMENTS
Income statements Page 82
Balance sheet Page 85
Income statements Balance sheetB
Changes in consolidated shareholders’ equity
Page 104
Cash flow statement Page 88
120
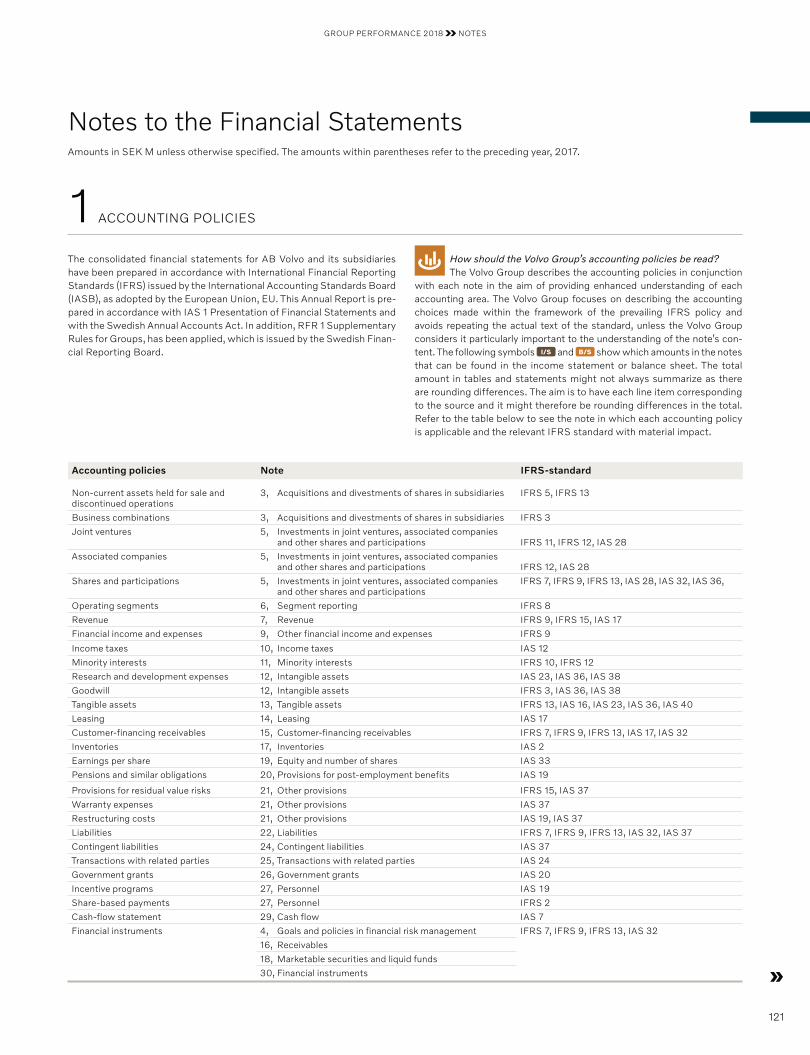
GROUP PERFORMANCE 2018 NOTES
Notes to the Financial StatementsAmounts in SEK M unless otherwise specified. The amounts within parentheses refer to the preceding year, 2017.
The consolidated financial statements for AB Volvo and its subsidiaries have been prepared in accordance with International Financial Reporting Standards (IFRS) issued by the International Accounting Standards Board (IASB), as adopted by the European Union, EU. This Annual Report is pre-pared in accordance with IAS 1 Presentation of Financial Statements and with the Swedish Annual Accounts Act. In addition, RFR 1 Supplementary Rules for Groups, has been applied, which is issued by the Swe dish Finan-cial Reporting Board.
How should the Volvo Group’s accounting policies be read?The Volvo Group describes the accounting policies in conjunction
with each note in the aim of providing enhanced understanding of each accounting area. The Volvo Group focuses on describing the accounting choices made within the framework of the prevailing IFRS policy and avoids repeating the actual text of the standard, unless the Volvo Group considers it particularly important to the understanding of the note’s con-tent. The following symbols I/S and B/S show which amounts in the notes that can be found in the income statement or balance sheet. The total amount in tables and statements might not always summarize as there are rounding differences. The aim is to have each line item corresponding to the source and it might therefore be rounding differences in the total. Refer to the table below to see the note in which each accounting policy is applicable and the relevant IFRS standard with material impact.
Accounting policies Note IFRS-standard
Non-current assets held for sale and discontinued operations
3, Acquisitions and divestments of shares in subsidiaries IFRS 5, IFRS 13
Business combinations 3, Acquisitions and divestments of shares in subsidiaries IFRS 3
Joint ventures 5, Investments in joint ventures, associated companies and other shares and participations IFRS 11, IFRS 12, IAS 28
Associated companies 5, Investments in joint ventures, associated companies and other shares and participations IFRS 12, IAS 28
Shares and participations 5, Investments in joint ventures, associated companies and other shares and participations
IFRS 7, IFRS 9, IFRS 13, IAS 28, IAS 32, IAS 36,
Operating segments 6, Segment reporting IFRS 8
Revenue 7, Revenue IFRS 9, IFRS 15, IAS 17
Financial income and expenses 9, Other financial income and expenses IFRS 9
Income taxes 10, Income taxes IAS 12
Minority interests 11, Minority interests IFRS 10, IFRS 12
Research and development expenses 12, Intangible assets IAS 23, IAS 36, IAS 38
Goodwill 12, Intangible assets IFRS 3, IAS 36, IAS 38
Tangible assets 13, Tangible assets IFRS 13, IAS 16, IAS 23, IAS 36, IAS 40
Leasing 14, Leasing IAS 17
Customer-financing receivables 15, Customer-financing receivables IFRS 7, IFRS 9, IFRS 13, IAS 17, IAS 32
Inventories 17, Inventories IAS 2
Earnings per share 19, Equity and number of shares IAS 33
Pensions and similar obligations 20, Provisions for post-employment benefits IAS 19
Provisions for residual value risks 21, Other provisions IFRS 15, IAS 37
Warranty expenses 21, Other provisions IAS 37
Restructuring costs 21, Other provisions IAS 19, IAS 37
Liabilities 22, Liabilities IFRS 7, IFRS 9, IFRS 13, IAS 32, IAS 37
Contingent liabilities 24, Contingent liabilities IAS 37
Transactions with related parties 25, Transactions with related parties IAS 24
Government grants 26, Government grants IAS 20
Incentive programs 27, Personnel IAS 19
Share-based payments 27, Personnel IFRS 2
Cash-flow statement 29, Cash flow IAS 7
Financial instruments 4, Goals and policies in financial risk management IFRS 7, IFRS 9, IFRS 13, IAS 32
16, Receivables
18, Marketable securities and liquid funds
30, Financial instruments
1 ACCOUNTING POLICIES
121
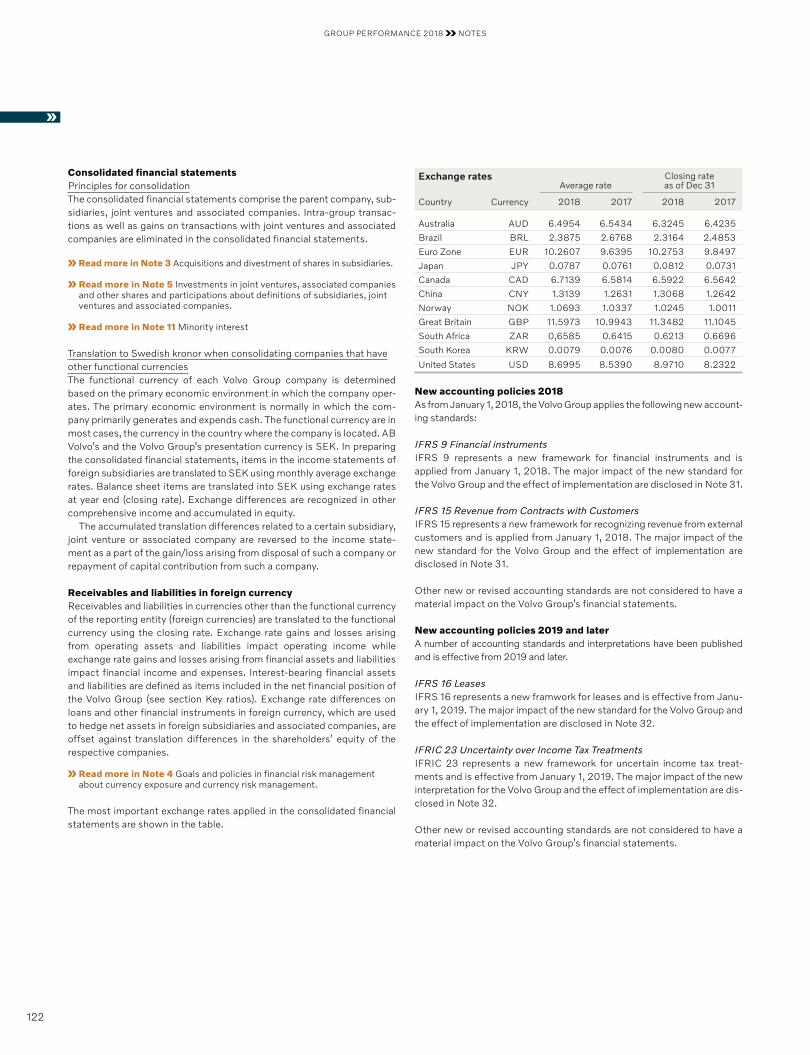
GROUP PERFORMANCE 2018 NOTES
Consolidated financial statementsPrinciples for consolidationThe consolidated financial statements comprise the parent company, sub-sidiaries, joint ventures and associated companies. Intra-group transac-tions as well as gains on transactions with joint ventures and associated companies are eliminated in the consolidated financial statements.
Read more in Note 3 Acquisitions and divestment of shares in subsidiaries.
Read more in Note 5 Investments in joint ventures, associated companies and other shares and participations about definitions of subsidiaries, joint ventures and associated companies.
Read more in Note 11 Minority interest
Translation to Swedish kronor when consolidating companies that haveother functional currenciesThe functional currency of each Volvo Group company is determined based on the primary economic environment in which the company oper-ates. The primary economic environment is normally in which the com-pany primarily generates and expends cash. The functional currency are in most cases, the currency in the country where the company is located. AB Volvo’s and the Volvo Group’s presentation currency is SEK. In preparing the consolidated financial statements, items in the income statements of foreign subsidiaries are translated to SEK using monthly average exchange rates. Balance sheet items are translated into SEK using exchange rates at year end (closing rate). Exchange differences are recognized in other comprehensive income and accumulated in equity.
The accumulated translation differences related to a certain subsidiary, joint venture or associated company are reversed to the income state-ment as a part of the gain/loss arising from disposal of such a company or repayment of capital contribution from such a company.
Receivables and liabilities in foreign currencyReceivables and liabilities in currencies other than the functional currency of the reporting entity (foreign currencies) are translated to the functional currency using the closing rate. Exchange rate gains and losses arising from operating assets and liabilities impact operating income while exchange rate gains and losses arising from financial assets and liabilities impact financial income and expenses. Interest-bearing financial assets and liabilities are defined as items included in the net financial position of the Volvo Group (see section Key ratios). Exchange rate differences on loans and other financial instruments in foreign currency, which are used to hedge net assets in foreign subsidiaries and associated companies, are offset against translation differences in the shareholders’ equity of the respective companies.
Read more in Note 4 Goals and policies in financial risk management about currency exposure and currency risk management.
The most important exchange rates applied in the consolidated financial statements are shown in the table.
Exchange ratesAverage rate
Closing rate as of Dec 31
Country Currency 2018 2017 2018 2017
Australia AUD 6.4954 6.5434 6.3245 6.4235
Brazil BRL 2.3875 2.6768 2.3164 2.4853
Euro Zone EUR 10.2607 9.6395 10.2753 9.8497
Japan JPY 0.0787 0.0761 0.0812 0.0731
Canada CAD 6.7139 6.5814 6.5922 6.5642
China CNY 1.3139 1.2631 1.3068 1.2642
Norway NOK 1.0693 1.0337 1.0245 1.0011
Great Britain GBP 11.5973 10.9943 11.3482 11.1045
South Africa ZAR 0,6585 0.6415 0.6213 0.6696
South Korea KRW 0.0079 0.0076 0.0080 0.0077
United States USD 8.6995 8.5390 8.9710 8.2322
New accounting policies 2018As from January 1, 2018, the Volvo Group applies the following new account-ing standards:
IFRS 9 Financial instrumentsIFRS 9 represents a new framework for financial instruments and is applied from January 1, 2018. The major impact of the new standard for the Volvo Group and the effect of implementation are disclosed in Note 31.
IFRS 15 Revenue from Contracts with CustomersIFRS 15 represents a new framework for recognizing revenue from external customers and is applied from January 1, 2018. The major impact of the new standard for the Volvo Group and the effect of implementation are disclosed in Note 31.
Other new or revised accounting standards are not considered to have a material impact on the Volvo Group’s financial statements.
New accounting policies 2019 and later A number of accounting standards and interpretations have been published and is effective from 2019 and later.
IFRS 16 LeasesIFRS 16 represents a new framwork for leases and is effective from Janu-ary 1, 2019. The major impact of the new standard for the Volvo Group and the effect of implementation are disclosed in Note 32.
IFRIC 23 Uncertainty over Income Tax TreatmentsIFRIC 23 represents a new framework for uncertain income tax treat-ments and is effective from January 1, 2019. The major impact of the new interpretation for the Volvo Group and the effect of implementation are dis-closed in Note 32.
Other new or revised accounting standards are not considered to have a material impact on the Volvo Group’s financial statements.
122
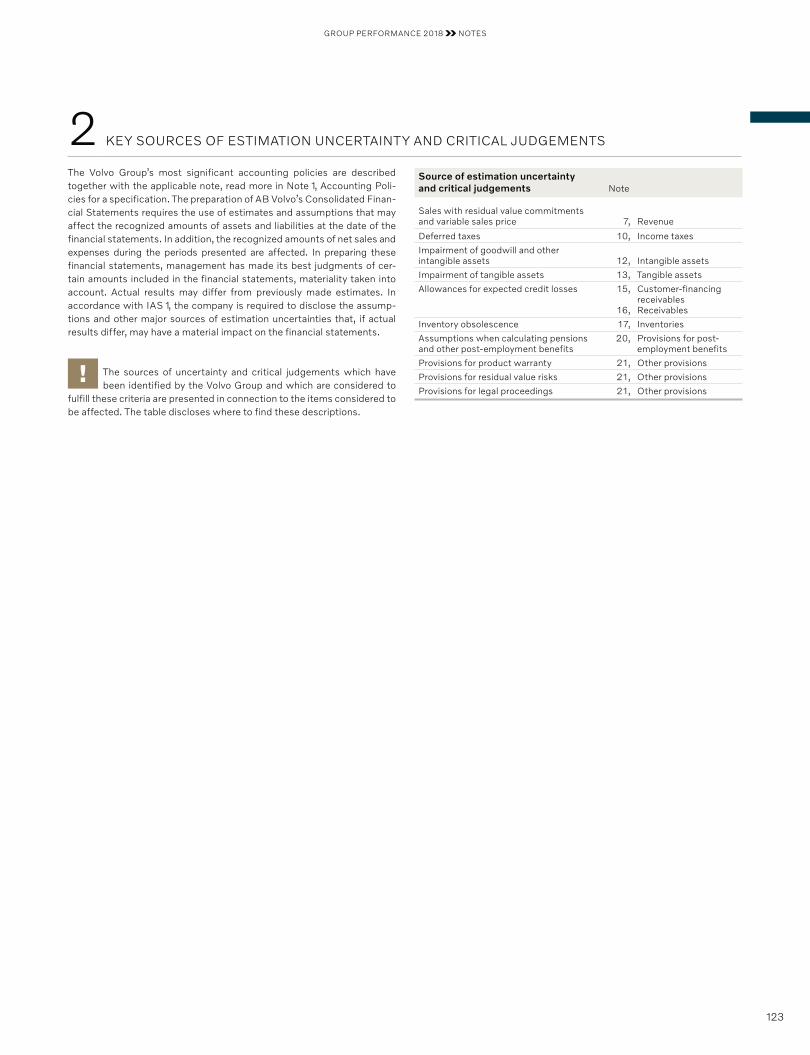
GROUP PERFORMANCE 2018 NOTES
The Volvo Group’s most significant accounting policies are described together with the applicable note, read more in Note 1, Accounting Poli-cies for a specification. The preparation of AB Volvo’s Consolidated Finan-cial Statements requires the use of estimates and assumptions that may affect the recognized amounts of assets and liabilities at the date of the financial statements. In addition, the recognized amounts of net sales and expenses during the periods presented are affected. In preparing these financial statements, management has made its best judgments of cer-tain amounts included in the financial statements, materiality taken into account. Actual results may differ from previously made estimates. In accordance with IAS 1, the company is required to disclose the assump-tions and other major sources of estimation uncertainties that, if actual results differ, may have a material impact on the financial statements.
The sources of uncertainty and critical judgements which have been identified by the Volvo Group and which are considered to
fulfill these criteria are presented in connection to the items considered to be affected. The table discloses where to find these descriptions.
Source of estimation uncertainty and critical judgements Note
Sales with residual value commitments and variable sales price 7, Revenue
Deferred taxes 10, Income taxes
Impairment of goodwill and other intangible assets 12, Intangible assets
Impairment of tangible assets 13, Tangible assets
Allowances for expected credit losses 15,
16,
Customer-financing receivablesReceivables
Inventory obsolescence 17, Inventories
Assumptions when calculating pensions and other post-employment benefits
20, Provisions for post- employment benefits
Provisions for product warranty 21, Other provisions
Provisions for residual value risks 21, Other provisions
Provisions for legal proceedings 21, Other provisions
2 KEY SOURCES OF ESTIMATION UNCERTAINTY AND CRITICAL JUDGEMENTS
123

GROUP PERFORMANCE 2018 NOTES
ACCOUNTING POLICY
Recognition of business combinationsAll business combinations are recognized in accordance with the acquisi-tion method. Volvo Group measures acquired identifiable assets, tangible and intangible, and liabilities at fair value. Any surplus amount from the purchase price, possible minority interests and fair value of previously held equity interests at the acquisition date compared to the Volvo Group’s share of acquired net assets is recognized as goodwill. Any deficit amount, known as gain from a bargain purchase, is recognized in the income statement.
In step acquisitions, a business combination occurs only on the date control is achieved, which is also the time when goodwill is calculated. Transactions with the minority are recognized as equity as long as control of the subsidiary is retained. For each business combination, the Volvo Group decides whether the minority interest shall be valued at fair value or at the minority interest’s proportionate share of the net assets of the acquiree. All acquisition-related costs are expensed. Companies acquired during the year are consolidated as of the date of acquisition. Companies that have been divested are included in the consolidated financial state-ments up to and including the date of the divestment. Divestment of oper-ations with the main purpose to dispose fixed assets is treated as disposal of fixed assets.
Non-current assets held for sale and discontinued operationsIn a global group like the Volvo Group, processes are continuously ongoing regarding the sale of assets or groups of assets at minor values. When the criteria for being classified as a non-current asset held for sale are fulfilled and the asset or group of assets are of significant value, the asset or group of assets, both current and non-current, and the related liabilities are recog nized on a separate line in the balance sheet. The asset or group of assets are measured at the lower of its carrying amount and fair value after deductions for selling expenses. The balance sheet items and the potential income effect resulting from the revaluation to fair value less selling expenses are normally recognized in the segment Group functions & Other, until the sale is completed and the result is distributed to the relevant segments.
AB Volvo’s holding of shares in subsidiaries as of December 31, 2018 is disclosed in Note 13 for the Parent Company. Significant acquisitions, formations and divestments within the Volvo Group are listed below.
Business combinations during the periodThe Volvo Group has not made any acquisitions of subsidiaries during 2017 and 2018, which solely or jointly have had a significant impact on the Volvo Group’s financial statements.
3 ACQUISITIONS AND DIVESTMENTS OF SHARES IN SUBSIDIARIES
124
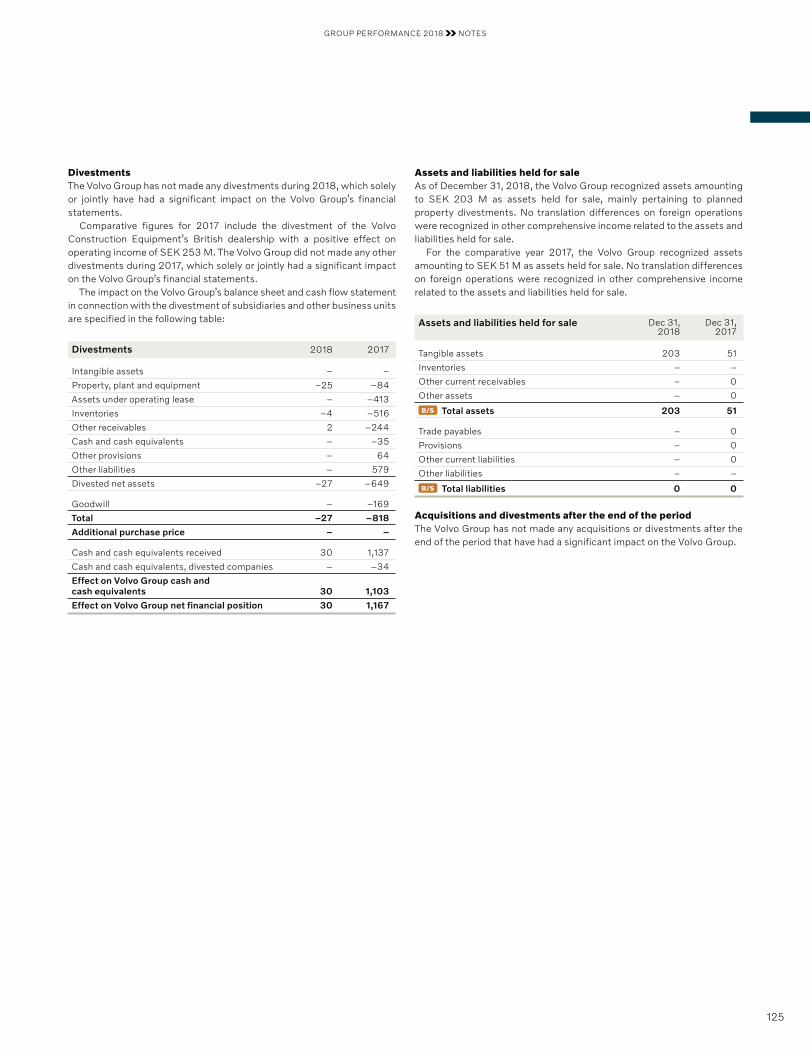
GROUP PERFORMANCE 2018 NOTES
DivestmentsThe Volvo Group has not made any divestments during 2018, which solely or jointly have had a significant impact on the Volvo Group’s financial statements.
Comparative figures for 2017 include the divestment of the Volvo Construction Equipment’s British dealership with a positive effect on operating income of SEK 253 M. The Volvo Group did not made any other divestments during 2017, which solely or jointly had a significant impact on the Volvo Group’s financial statements.
The impact on the Volvo Group’s balance sheet and cash flow statement in connection with the divestment of subsidiaries and other business units are specified in the following table:
Divestments 2018 2017
Intangible assets – –
Property, plant and equipment –25 –84
Assets under operating lease – –413
Inventories –4 –516
Other receivables 2 –244
Cash and cash equivalents – –35
Other provisions – 64
Other liabilities – 579
Divested net assets –27 –649
Goodwill – –169
Total –27 –818
Additional purchase price – –
Cash and cash equivalents received 30 1,137
Cash and cash equivalents, divested companies – –34
Effect on Volvo Group cash and cash equivalents 30 1,103
Effect on Volvo Group net financial position 30 1,167
Assets and liabilities held for saleAs of December 31, 2018, the Volvo Group recognized assets amounting to SEK 203 M as assets held for sale, mainly pertaining to planned property divestments. No translation differences on foreign operations were recognized in other comprehensive income related to the assets and liabilities held for sale.
For the comparative year 2017, the Volvo Group recognized assets amounting to SEK 51 M as assets held for sale. No translation differences on foreign operations were recognized in other comprehensive income related to the assets and liabilities held for sale.
Assets and liabilities held for sale Dec 31,2018
Dec 31, 2017
Tangible assets 203 51
Inventories – –
Other current receivables – 0
Other assets – 0
B/S Total assets 203 51
Trade payables – 0
Provisions – 0
Other current liabilities – 0
Other liabilities – –
B/S Total liabilities 0 0 Acquisitions and divestments after the end of the periodThe Volvo Group has not made any acquisitions or divestments after the end of the period that have had a significant impact on the Volvo Group.
125
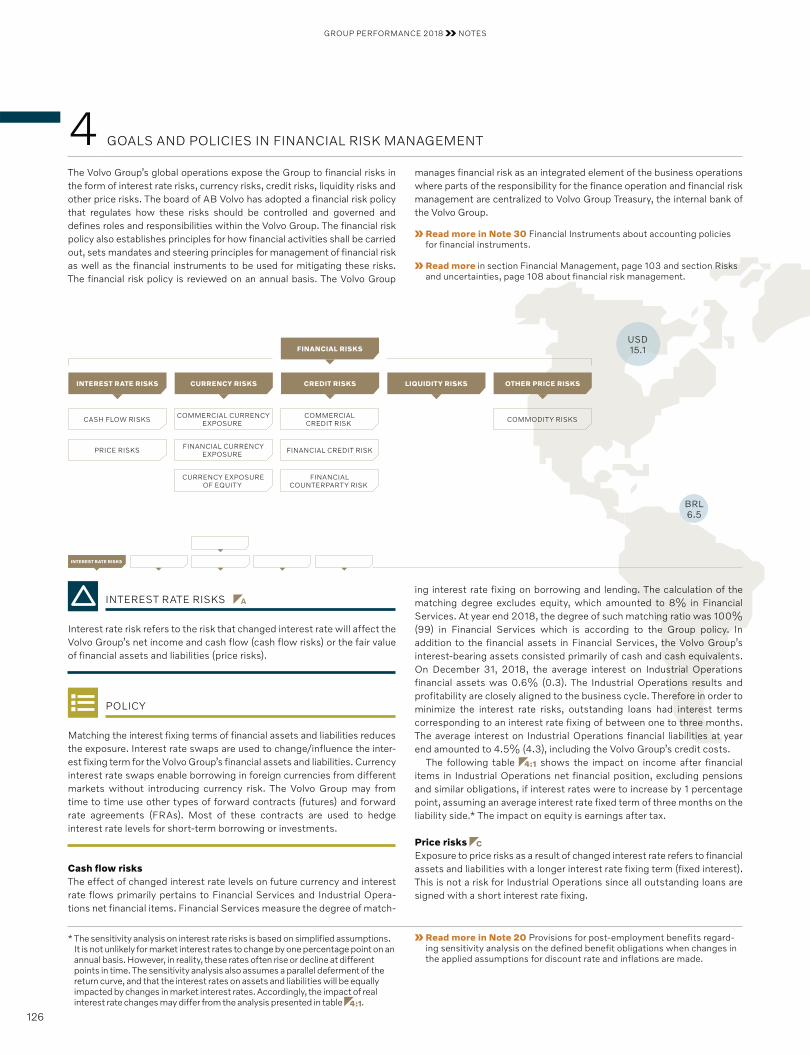
GROUP PERFORMANCE 2018 NOTES
BRL 6.5
USD 15.1
The Volvo Group’s global operations expose the Group to financial risks in the form of interest rate risks, currency risks, credit risks, liquidity risks and other price risks. The board of AB Volvo has adopted a financial risk policy that regulates how these risks should be controlled and governed and defines roles and responsibilities within the Volvo Group. The financial risk policy also establishes principles for how financial activities shall be carried out, sets mandates and steering principles for management of financial risk as well as the financial instruments to be used for mitigating these risks. The financial risk policy is reviewed on an annual basis. The Volvo Group
* The sensitivity analysis on interest rate risks is based on simplified assumptions. It is not unlikely for market interest rates to change by one percentage point on an annual basis. However, in reality, these rates often rise or decline at different points in time. The sensitivity analysis also assumes a parallel deferment of the return curve, and that the interest rates on assets and liabilities will be equally impacted by changes in market interest rates. Accordingly, the impact of real interest rate changes may differ from the analysis presented in table 4:1.
Read more in Note 20 Provisions for post-employment benefits regard-ing sensitivity analysis on the defined benefit obligations when changes in the applied assumptions for discount rate and inflations are made.
INTEREST RATE RISKS
CASH FLOW RISKS
PRICE RISKS FINANCIAL CURRENCY EXPOSURE
CURRENCY EXPOSURE OF EQUITY
COMMERCIAL CURRENCY EXPOSURE
COMMERCIAL CREDIT RISK COMMODITY RISKS
FINANCIAL CREDIT RISK
FINANCIAL COUNTERPARTY RISK
INTEREST RATE RISKS CURRENCY RISKS CREDIT RISKS
FINANCIAL RISKS
OTHER PRICE RISKSLIQUIDITY RISKS
INTEREST RATE RISKS A
Interest rate risk refers to the risk that changed interest rate will affect the Volvo Group’s net income and cash flow (cash flow risks) or the fair value of financial assets and liabilities (price risks).
POLICY
Matching the interest fixing terms of financial assets and liabilities reduces the exposure. Interest rate swaps are used to change/influence the inter-est fixing term for the Volvo Group’s financial assets and liabilities. Currency interest rate swaps enable borrowing in foreign currencies from different markets without introducing currency risk. The Volvo Group may from time to time use other types of forward contracts (futures) and forward rate agreements (FRAs). Most of these contracts are used to hedge interest rate levels for short-term borrowing or investments.
Cash flow risksThe effect of changed interest rate levels on future currency and interest rate flows primarily pertains to Financial Services and Industrial Opera-tions net financial items. Financial Services measure the degree of match-
ing interest rate fixing on borrowing and lending. The calculation of the matching degree excludes equity, which amounted to 8% in Financial Services. At year end 2018, the degree of such matching ratio was 100% (99) in Financial Services which is according to the Group policy. In addition to the financial assets in Financial Services, the Volvo Group’s interest-bearing assets consisted primarily of cash and cash equivalents. On December 31, 2018, the average interest on Industrial Operations financial assets was 0.6% (0.3). The Industrial Operations results and profitability are closely aligned to the business cycle. Therefore in order to minimize the interest rate risks, outstanding loans had interest terms corresponding to an interest rate fixing of between one to three months. The average interest on Industrial Operations financial liabilities at year end amounted to 4.5% (4.3), including the Volvo Group’s credit costs.
The following table 4:1 shows the impact on income after financial items in Industrial Operations net financial position, excluding pensions and similar obligations, if interest rates were to increase by 1 percentage point, assuming an average interest rate fixed term of three months on the liability side.* The impact on equity is earnings after tax.
Price risks C
Exposure to price risks as a result of changed interest rate refers to financial assets and liabilities with a longer interest rate fixing term (fixed interest). This is not a risk for Industrial Operations since all outstanding loans are signed with a short interest rate fixing.
4 GOALS AND POLICIES IN FINANCIAL RISK MANAGEMENT
manages financial risk as an integrated element of the business operations where parts of the responsibility for the finance operation and financial risk management are centralized to Volvo Group Treasury, the internal bank of the Volvo Group.
Read more in Note 30 Financial Instruments about accounting policies for financial instruments.
Read more in section Financial Management, page 103 and section Risks and uncertainties, page 108 about financial risk management.
126
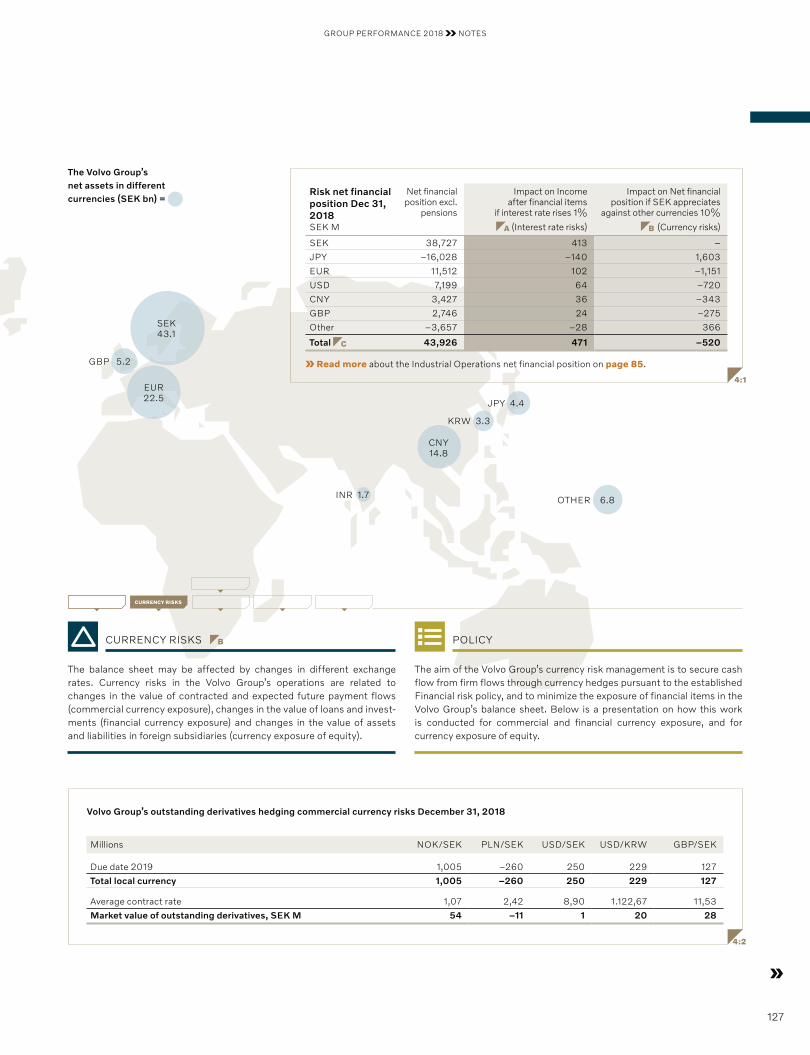
GROUP PERFORMANCE 2018 NOTES
SEK 43.1
GBP 5.2
CNY14.8
INR 1.7
EUR 22.5
KRW 3.3
OTHER 6.8
JPY 4.4
The Volvo Group’s net assets in different currencies (SEK bn) =
CURRENCY RISKS B
The balance sheet may be affected by changes in different exchange rates. Currency risks in the Volvo Group’s operations are related to changes in the value of contracted and expected future payment flows (commercial currency exposure), changes in the value of loans and invest-ments (financial currency exposure) and changes in the value of assets and liabilities in foreign subsidiaries (currency exposure of equity).
POLICY
The aim of the Volvo Group’s currency risk management is to secure cash flow from firm flows through currency hedges pursuant to the established Financial risk policy, and to minimize the exposure of financial items in the Volvo Group’s balance sheet. Below is a presentation on how this work is conducted for commercial and financial currency exposure, and for currency exposure of equity.
CURRENCY RISKS
Millions NOK/SEK PLN/SEK USD/SEK USD/KRW GBP/SEK
Due date 2019 1,005 –260 250 229 127
Total local currency 1,005 –260 250 229 127
Average contract rate 1,07 2,42 8,90 1.122,67 11,53
Market value of outstanding derivatives, SEK M 54 –11 1 20 28
Volvo Group’s outstanding derivatives hedging commercial currency risks December 31, 2018
4:2
Risk net financial position Dec 31, 2018
Net financial position excl.
pensions
Impact on Income after financial items
if interest rate rises 1%
A (Interest rate risks)
Impact on Net financial position if SEK appreciates
against other currencies 10%
B (Currency risks) SEK M
SEK 38,727 413 –
JPY –16,028 –140 1,603
EUR 11,512 102 –1,151
USD 7,199 64 –720
CNY 3,427 36 –343
GBP 2,746 24 –275
Other –3,657 –28 366
Total C 43,926 471 –520
Read more about the Industrial Operations net financial position on page 85.
4:1
127
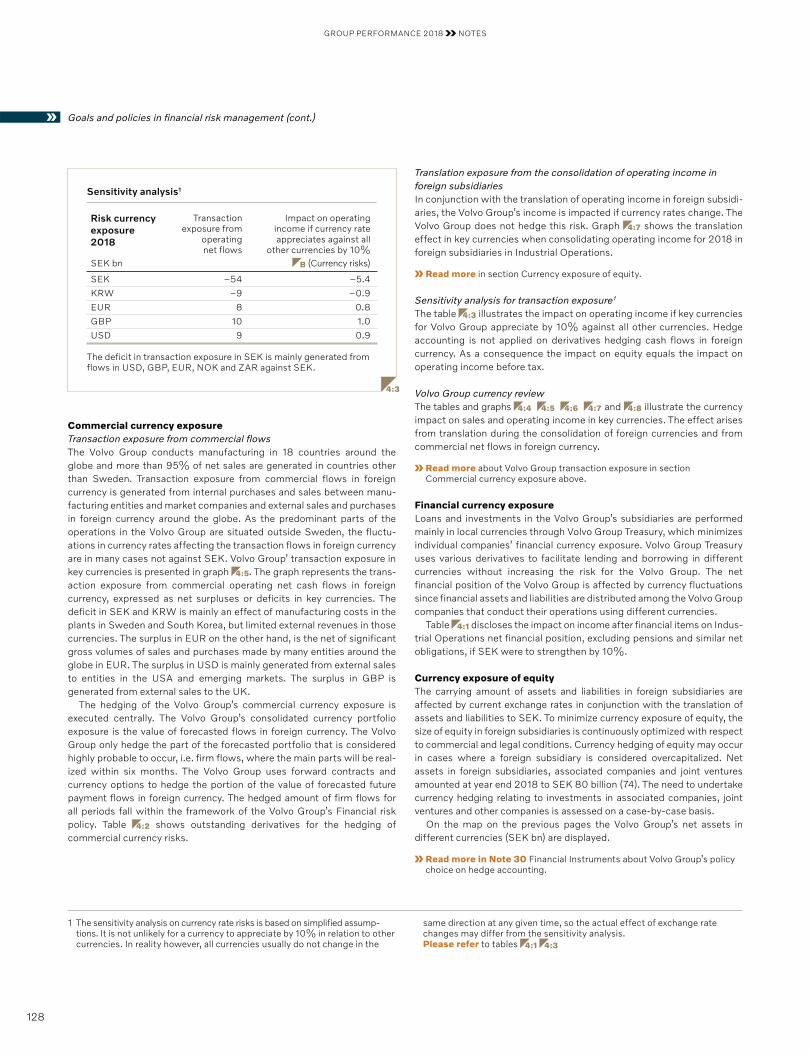
GROUP PERFORMANCE 2018 NOTES
Commercial currency exposureTransaction exposure from commercial flowsThe Volvo Group conducts manufacturing in 18 countries around the globe and more than 95% of net sales are generated in countries other than Sweden. Transaction exposure from commercial flows in foreign currency is generated from internal purchases and sales between manu-facturing entities and market companies and external sales and purchases in foreign currency around the globe. As the predominant parts of the operations in the Volvo Group are situated outside Sweden, the fluctu-ations in currency rates affecting the transaction flows in foreign currency are in many cases not against SEK. Volvo Group’ transaction exposure in key currencies is presented in graph 4:5. The graph represents the trans-action exposure from commercial operating net cash flows in foreign currency, expressed as net surpluses or deficits in key currencies. The deficit in SEK and KRW is mainly an effect of manufacturing costs in the plants in Sweden and South Korea, but limited external revenues in those currencies. The surplus in EUR on the other hand, is the net of significant gross volumes of sales and purchases made by many entities around the globe in EUR. The surplus in USD is mainly generated from external sales to entities in the USA and emerging markets. The surplus in GBP is generated from external sales to the UK.
The hedging of the Volvo Group’s commercial currency exposure is executed centrally. The Volvo Group’s consolidated currency portfolio exposure is the value of forecasted flows in foreign currency. The Volvo Group only hedge the part of the forecasted portfolio that is considered highly probable to occur, i.e. firm flows, where the main parts will be real-ized within six months. The Volvo Group uses forward contracts and currency options to hedge the portion of the value of forecasted future payment flows in foreign currency. The hedged amount of firm flows for all periods fall within the framework of the Volvo Group’s Financial risk policy. Table 4:2 shows outstanding derivatives for the hedging of commercial currency risks.
Translation exposure from the consolidation of operating income in foreign subsidiariesIn conjunction with the translation of operating income in foreign subsidi-aries, the Volvo Group’s income is impacted if currency rates change. The Volvo Group does not hedge this risk. Graph 4:7 shows the translation effect in key currencies when consolidating operating income for 2018 in foreign subsidiaries in Industrial Operations.
Read more in section Currency exposure of equity.
Sensitivity analysis for transaction exposure 1 The table 4:3 illustrates the impact on operating income if key currencies for Volvo Group appreciate by 10% against all other currencies. Hedge accounting is not applied on derivatives hedging cash flows in foreign currency. As a consequence the impact on equity equals the impact on operating income before tax.
Volvo Group currency review The tables and graphs 4:4 4:5 4:6 4:7 and 4:8 illustrate the currency impact on sales and operating income in key currencies. The effect arises from translation during the consolidation of foreign currencies and from commercial net flows in foreign currency.
Read more about Volvo Group transaction exposure in section Commercial currency exposure above.
Financial currency exposureLoans and investments in the Volvo Group’s subsidiaries are performed mainly in local currencies through Volvo Group Treasury, which minimizes individual companies’ financial currency exposure. Volvo Group Treasury uses various derivatives to facilitate lending and borrowing in different currencies without increasing the risk for the Volvo Group. The net financial position of the Volvo Group is affected by currency fluctuations since financial assets and liabilities are distributed among the Volvo Group companies that conduct their operations using different currencies.
Table 4:1 discloses the impact on income after financial items on Indus-trial Operations net financial position, excluding pensions and similar net obligations, if SEK were to strengthen by 10%.
Currency exposure of equityThe carrying amount of assets and liabilities in foreign subsidiaries are affected by current exchange rates in conjunction with the translation of assets and liabilities to SEK. To minimize currency exposure of equity, the size of equity in foreign subsidiaries is continuously optimized with respect to commercial and legal conditions. Currency hedging of equity may occur in cases where a foreign subsidiary is considered overcapitalized. Net assets in foreign subsidiaries, associated companies and joint ventures amounted at year end 2018 to SEK 80 billion (74). The need to undertake currency hedging relating to investments in associated companies, joint ventures and other companies is assessed on a case-by-case basis.
On the map on the previous pages the Volvo Group’s net assets in different currencies (SEK bn) are displayed.
Read more in Note 30 Financial Instruments about Volvo Group’s policy choice on hedge accounting.
1 The sensitivity analysis on currency rate risks is based on simplified assump-tions. It is not unlikely for a currency to appreciate by 10% in relation to other currencies. In reality however, all currencies usually do not change in the
same direction at any given time, so the actual effect of exchange rate changes may differ from the sensitivity analysis. Please refer to tables 4:1 4:3
Goals and policies in financial risk management (cont.)
Sensitivity analysis1
Risk currency exposure 2018
Transaction exposure from
operating net flows
Impact on operating income if currency rate appreciates against all
other currencies by 10% B (Currency risks)SEK bn
SEK –54 –5.4
KRW –9 –0.9
EUR 8 0.8
GBP 10 1.0
USD 9 0.9
The deficit in transaction exposure in SEK is mainly generated from flows in USD, GBP, EUR, NOK and ZAR against SEK.
4:3
128
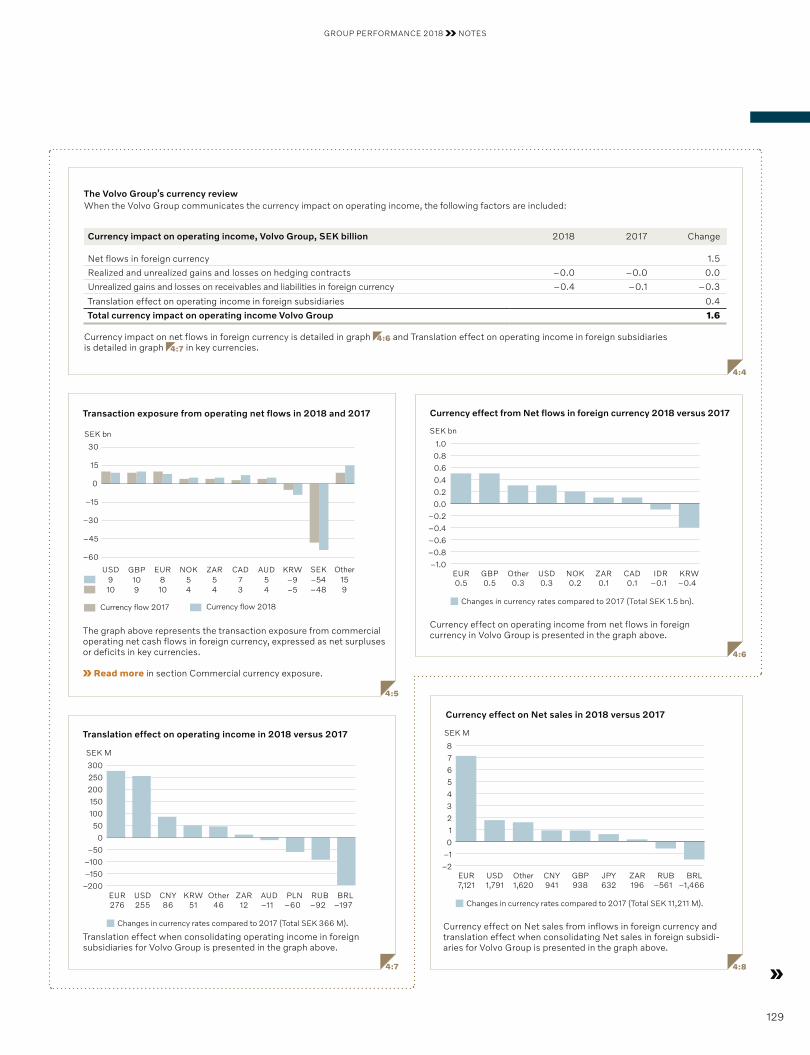
GROUP PERFORMANCE 2018 NOTES
4:5
Transaction exposure from operating net flows in 2018 and 2017
–60
–45
–30
–15
0
15
30
SEK bn
Currency flow 2017 Currency flow 2018
SEKKRWAUDCADNOKEURGBP ZARUSD Other
9–48–543410910 415–54–95758109 5
The graph above represents the transaction exposure from commercial operating net cash flows in foreign currency, expressed as net surpluses or deficits in key currencies.
Read more in section Commercial currency exposure.
4:7
Translation effect on operating income in 2018 versus 2017
EUR276
KRW51
ZAR12
AUD–11
USD255
RUB–92
BRL–197
Other46
CNY86
PLN–60
Changes in currency rates compared to 2017 (Total SEK 366 M).
SEK M
–100
–150
–200
–50
0
50
100
150
200
250
300
Translation effect when consolidating operating income in foreign subsidiaries for Volvo Group is presented in the graph above.
4:6
Currency effect from Net flows in foreign currency 2018 versus 2017
EUR0.5
USD0.3
ZAR0.1
CAD0.1
GBP0.5
KRW–0.4
NOK0.2
Other0.3
IDR–0.1
Changes in currency rates compared to 2017 (Total SEK 1.5 bn).
SEK bn
–1.0
–0.8
–0.6
–0.4
–0.2
0.0
0.2
0.4
0.6
0.8
1.0
Currency effect on operating income from net flows in foreign currency in Volvo Group is presented in the graph above.
4:8
Currency effect on Net sales in 2018 versus 2017
EUR7,121
CNY941
JPY632
ZAR196
USD1,791
BRL–1,466
GBP938
Other1,620
RUB–561
Changes in currency rates compared to 2017 (Total SEK 11,211 M).
SEK M
–2
–1
0
1
2
3
4
5
6
7
8
Currency effect on Net sales from inflows in foreign currency and translation effect when consolidating Net sales in foreign subsidi-aries for Volvo Group is presented in the graph above.
4:4
Currency impact on operating income, Volvo Group, SEK billion 2018 2017 Change
Net flows in foreign currency 1.5
Realized and unrealized gains and losses on hedging contracts –0.0 –0.0 0.0
Unrealized gains and losses on receivables and liabilities in foreign currency –0.4 –0.1 –0.3
Translation effect on operating income in foreign subsidiaries 0.4
Total currency impact on operating income Volvo Group 1.6
Currency impact on net flows in foreign currency is detailed in graph 4:6 and Translation effect on operating income in foreign subsidiaries is detailed in graph 4:7 in key currencies.
The Volvo Group’s currency review When the Volvo Group communicates the currency impact on operating income, the following factors are included:
129
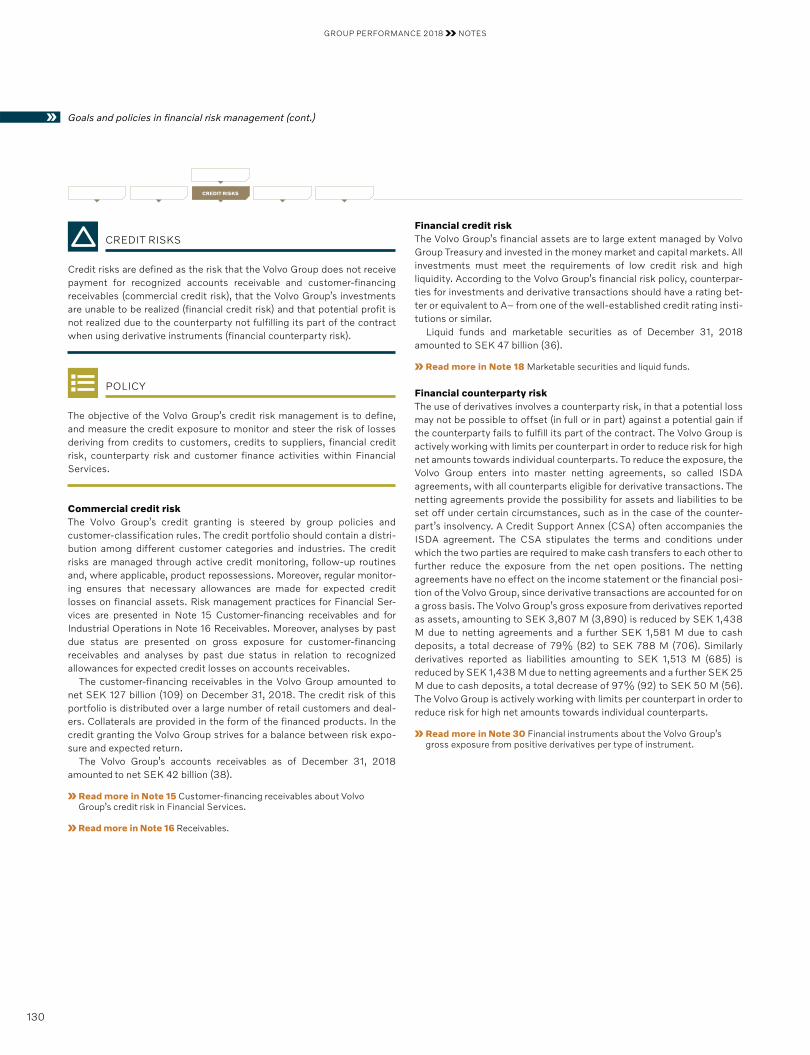
GROUP PERFORMANCE 2018 NOTES
CREDIT RISKS
Credit risks are defined as the risk that the Volvo Group does not receive payment for recognized accounts receivable and customer-financing receivables (commercial credit risk), that the Volvo Group’s investments are unable to be realized (financial credit risk) and that potential profit is not realized due to the counterparty not fulfilling its part of the contract when using derivative instruments (financial counterparty risk).
POLICY
The objective of the Volvo Group’s credit risk management is to define, and measure the credit exposure to monitor and steer the risk of losses deriving from credits to customers, credits to suppliers, financial credit risk, counterparty risk and customer finance activities within Financial Services.
Commercial credit riskThe Volvo Group’s credit granting is steered by group policies and customer-classification rules. The credit portfolio should contain a distri-bution among different customer categories and industries. The credit risks are managed through active credit monitoring, follow-up routines and, where applicable, product repossessions. Moreover, regular monitor-ing ensures that necessary allowances are made for expected credit losses on financial assets. Risk management practices for Financial Ser-vices are presented in Note 15 Customer-financing receivables and for Industrial Operations in Note 16 Receivables. Moreover, analyses by past due status are presented on gross exposure for customer-financing receivables and analyses by past due status in relation to recognized allowances for expected credit losses on accounts receivables.
The customer-financing receivables in the Volvo Group amounted to net SEK 127 billion (109) on December 31, 2018. The credit risk of this portfolio is distributed over a large number of retail customers and deal-ers. Collaterals are provided in the form of the financed products. In the credit granting the Volvo Group strives for a balance between risk expo-sure and expected return.
The Volvo Group’s accounts receivables as of December 31, 2018 amounted to net SEK 42 billion (38).
Read more in Note 15 Customer-financing receivables about Volvo Group’s credit risk in Financial Services.
Read more in Note 16 Receivables.
Financial credit riskThe Volvo Group’s financial assets are to large extent managed by Volvo Group Treasury and invested in the money market and capital markets. All investments must meet the requirements of low credit risk and high liquid ity. According to the Volvo Group’s financial risk policy, counterpar-ties for investments and derivative transactions should have a rating bet-ter or equivalent to A– from one of the well-established credit rating insti-tutions or similar.
Liquid funds and marketable securities as of December 31, 2018 amounted to SEK 47 billion (36).
Read more in Note 18 Marketable securities and liquid funds.
Financial counterparty riskThe use of derivatives involves a counterparty risk, in that a potential loss may not be possible to offset (in full or in part) against a potential gain if the counterparty fails to fulfill its part of the contract. The Volvo Group is actively working with limits per counterpart in order to reduce risk for high net amounts towards individual counterparts. To reduce the expos ure, the Volvo Group enters into master netting agreements, so called ISDA agreements, with all counterparts eligible for derivative transactions. The netting agreements provide the possibility for assets and liabilities to be set off under certain circumstances, such as in the case of the counter-part’s insolvency. A Credit Support Annex (CSA) often accompanies the ISDA agreement. The CSA stipulates the terms and conditions under which the two parties are required to make cash transfers to each other to further reduce the exposure from the net open positions. The netting agreements have no effect on the income statement or the financial posi-tion of the Volvo Group, since derivative transactions are accounted for on a gross basis. The Volvo Group’s gross exposure from derivatives reported as assets, amount ing to SEK 3,807 M (3,890) is reduced by SEK 1,438 M due to netting agreements and a further SEK 1,581 M due to cash deposits, a total decrease of 79% (82) to SEK 788 M (706). Similarly derivatives reported as liabilities amounting to SEK 1,513 M (685) is reduced by SEK 1,438 M due to netting agreements and a further SEK 25 M due to cash deposits, a total decrease of 97% (92) to SEK 50 M (56). The Volvo Group is actively working with limits per counterpart in order to reduce risk for high net amounts towards individual counterparts.
Read more in Note 30 Financial instruments about the Volvo Group’s gross exposure from positive derivatives per type of instrument.
Goals and policies in financial risk management (cont.)
CREDIT RISKS
130
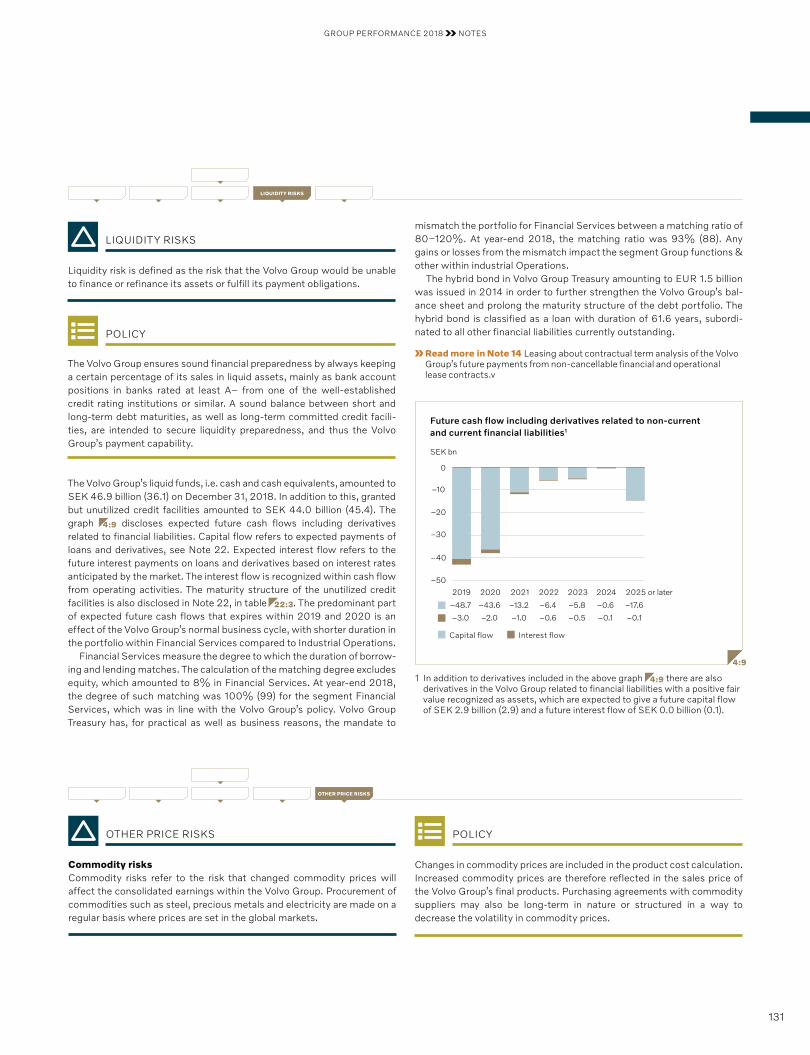
GROUP PERFORMANCE 2018 NOTES
LIQUIDITY RISKS
Liquidity risk is defined as the risk that the Volvo Group would be unable to finance or refinance its assets or fulfill its payment obligations.
POLICY
The Volvo Group ensures sound financial preparedness by always keeping a certain percentage of its sales in liquid assets, mainly as bank account positions in banks rated at least A– from one of the well-established credit rating institutions or similar. A sound balance between short and long-term debt maturities, as well as long-term committed credit facili-ties, are intended to secure liquidity preparedness, and thus the Volvo Group’s payment capability.
The Volvo Group’s liquid funds, i.e. cash and cash equivalents, amounted to SEK 46.9 billion (36.1) on December 31, 2018. In addition to this, granted but unutilized credit facilities amounted to SEK 44.0 billion (45.4). The graph 4:9 discloses expected future cash flows including derivatives related to financial liabilities. Capital flow refers to expected payments of loans and derivatives, see Note 22. Expected interest flow refers to the future interest payments on loans and derivatives based on interest rates anticipated by the market. The interest flow is recognized within cash flow from operating activities. The maturity structure of the unutilized credit facilities is also disclosed in Note 22, in table 22:3. The predominant part of expected future cash flows that expires within 2019 and 2020 is an effect of the Volvo Group’s normal business cycle, with shorter duration in the portfolio within Financial Services compared to Industrial Operations.
Financial Services measure the degree to which the duration of borrow-ing and lending matches. The calculation of the matching degree excludes equity, which amounted to 8% in Financial Services. At year-end 2018, the degree of such matching was 100% (99) for the segment Financial Services, which was in line with the Volvo Group’s policy. Volvo Group Treasury has, for practical as well as business reasons, the mandate to
POLICY
Changes in commodity prices are included in the product cost calculation. Increased commodity prices are therefore reflected in the sales price of the Volvo Group’s final products. Purchasing agreements with commodity suppliers may also be long-term in nature or structured in a way to decrease the volatility in commodity prices.
OTHER PRICE RISKS
Commodity risksCommodity risks refer to the risk that changed commodity prices will affect the consolidated earnings within the Volvo Group. Procurement of commodities such as steel, precious metals and electricity are made on a regular basis where prices are set in the global markets.
mismatch the portfolio for Financial Services between a matching ratio of 80–120%. At year-end 2018, the matching ratio was 93% (88). Any gains or losses from the mismatch impact the segment Group functions & other within industrial Operations.
The hybrid bond in Volvo Group Treasury amounting to EUR 1.5 billion was issued in 2014 in order to further strengthen the Volvo Group’s bal-ance sheet and prolong the maturity structure of the debt portfolio. The hybrid bond is classified as a loan with duration of 61.6 years, subordi-nated to all other financial liabilities currently outstanding.
Read more in Note 14 Leasing about contractual term analysis of the Volvo Group’s future payments from non-cancellable financial and operational lease contracts.v
4:9
Future cash flow including derivatives related to non-current and current financial liabilities1
–50
–40
0
–30
–20
–10
Capital flow Interest flow
SEK bn
2020
–43.6
–2.0
2021
–13.2
–1.0
2022
–6.4
–0.6
2019
–48.7
–3.0
2023
–5.8
–0.5
2025 or later2024
–0.6
–0.1
–17.6
–0.1
LIQUIDITY RISKS
OTHER PRICE RISKS
1 In addition to derivatives included in the above graph 4:9 there are also derivatives in the Volvo Group related to financial liabilities with a positive fair value recognized as assets, which are expected to give a future capital flow of SEK 2.9 billion (2.9) and a future interest flow of SEK 0.0 billion (0.1).
131
GROUP PERFORMANCE 2018 NOTES
ACCOUNTING POLICY
SubsidiariesThe Volvo Group has production facilities in 18 countries and sales of products in more than 190 markets, which means that the Volvo Group has subsidiaries in many parts of the world. A subsidiary is defined as an entity controlled by the Volvo Group. A subsidiary is controlled by a parent company when the parent has power over the investee, exposure to, or hold rights to variable returns from its involvement with the investee and has the ability to use its power over the investee to affect the amount of the investor’s return. Most of the Volvo Group’s subsidiaries are 100% owned by the Volvo Group and are therefore considered to be controlled by the Volvo Group. For some subsidiaries there are restrictions on the Volvo Group’s ability to access or use cash or cash equivalents from these subsidiaries.
Read more in Note 11 Minority interests.
Read more in Note 13 Investments in shares and participations in the Parent company about the composition of the Volvo Group.
Read more in Note 18 Marketable securities and liquid funds about cash that is not available for use, or where other limitations exists.
Joint venturesJoint ventures are companies over which the Volvo Group has controlling influence together with one or more external parties. Joint ventures are recognized by applying equity method accounting. The investment in VE Commercial Vehicles, Ltd., (VECV) is of a business related nature and aims at strengthening the Volvo Group’s position in India. VECV is included in the Trucks segment.
Associated companies Associated companies are companies in which the Volvo Group has a sig-nificant influence. A strong indication of such influence is when the Group’s holdings is at least 20% but less than 50% of the voting rights. Holdings in associated companies are recognized in accordance with the equity method accounting. The ownership in the Chinese automotive manufacturer Dongfeng Commercial Vehicles Co., Ltd (DFCV) is classi-fied as an associated company and is included in the Trucks segment.
Equity methodThe Volvo Group’s share of income in companies recognized according to the equity method is included in the consolidated income statement under Income/loss from investments in joint ventures and associated compa-nies, less, where appropriate, depreciation of surplus values and the effect of applying different accounting policies. Income from companies recog-nized in accordance with the equity method is included in operating income since the Volvo Group’s investments are business related in nature. For practical reasons, some of the associated companies are included in the
consolidated financial statements with a certain time lag, normally up to one quarter. Dividends from joint ventures and associated companies are not included in the consolidated income. In the consolidated balance sheet, investments in joint ventures and associated companies are affected by the Volvo Group’s share of the company’s net income, less depreciation of surplus values and dividends received. Investments in joint ventures and associated companies are also affected by the Volvo Group’s share of the company’s other comprehensive income and by the translation differ-ence from translating the company’s equity in the Volvo Group.
When applying the equity method, including recognizing the associates' or joint ventures' losses, additional impairment losses might be recog-nized given any indication of impairment. For instance a significant or pro-longed decline in the fair value of the shares is an indication of impairment. Investments accounted for in accordance with the equity method cannot be of a negative carrying value and therefore losses are not provided for if the holding is of a negative amount. Additional losses are provided for to the extent that the Volvo Group has incurred legal or constructive obligations or made payments on behalf of the joint venture or the associ-ated company.
Other shares and participationsOther shares and participations recognizes holding of shares in which the Volvo Group does not hold a significant influence. This generally means that the Volvo Group’s holding of shares corresponds to less than 20% of the voting rights. Listed shares are recognized at fair value through other comprehensive income since the shares are not held for trading. Unlisted shares and participations, for which a fair value cannot reasonably be determined, are measured at amortized cost.
Earned or paid interest attributable to these assets is recognized in the income statement as part of net financial items, in accordance with the effective interest method. Dividends received attributable to these assets are recognized in the income statement as Income from other invest-ments included in operating income.
Read more in Note 30 Financial Instruments, regarding classification and valuation of financial instruments.
Joint ventures The Volvo Group’s investments in joint ventures are listed below.
Shares in joint ventures Dec 31, 2018 Dec 31, 2017
Holding percentage
Holding percentage
VE Commercial Vehicles, Ltd., India1 45.6 45.6
1 VE Commercial Vehicles, Ltd., is considered to be a joint venture as the Volvo Group and Eicher Motors Ltd. have signed an agreement which states that common agreement is needed for important matters related to the governance of VECV.
5 INVESTMENTS IN JOINT VENTURES, ASSOCIATED COMPANIES AND OTHER SHARES AND PARTICIPATIONS
132
GROUP PERFORMANCE 2018 NOTES
The following tables present summarized financial information for the Volvo Group’s joint venture:
Summarized income statements 2018 2017
VE Commercial Vehicles, Ltd.
VE Commercial Vehicles, Ltd.
Net sales 14,764 12,370
Operating income 1 851 668
Interest income and similar credits 106 68
Interest expense and similar charges –24 –19
Other financial income and expenses –1 0
Income taxes –301 –199
Income for the period2 631 518
Other comprehensive income3 0 5
Total comprehensive income 631 523
1 Depreciation and amortization of SEK 423 M (363) are included within operating income. 2 Income for the period in joint ventures includes depreciation of surplus values. 3 Including the Volvo Group’s share of OCI related to joint ventures. Translation differences from translating joint ventures’ equity in the Volvo Group are excluded.
Summarized balance sheets Dec 31, 2018 Dec 31, 2017
VE Commercial Vehicles, Ltd.
VE Commercial Vehicles, Ltd.
Non-current assets 5,314 4,880
Marketable securities, cash and cash equivalents 1,229 1,695
Other current assets 6,133 4,691
Total assets 12,676 11,266
Equity1 5,948 5,492
Non-current financial liabilities 13 12
Other non-current liabilities 466 309
Current financial liabilities 3,795 3,530
Other current liabilities 2,454 1,923
Total equity and liabilities 12,676 11,266
1 Including the translation differences from translating joint ventures’ equity in the Volvo Group.
Investments in joint ventures Percentage holding
Dec 31, 2018 Carrying value
Dec 31, 2017Carrying value
VE Commercial Vehicles, Ltd., India 45.6 2,715 2,504
Investments in joint ventures 2,715 2,504
Net financial position for the joint ventures (excluding post-employment benefits) amounted to SEK 888 M (1,352) as of December 31, 2018.As of December 31, 2018, the Volvo Group’s share of contingent liabilities in its joint ventures amounted to SEK 143 M (146). Dividend received
from VECV amounted to SEK 70 M (59).
133
GROUP PERFORMANCE 2018 NOTES
Other shares and participationsThe carrying amount of the Volvo Group’s holding of shares and participa-tions in other companies as of December 31, 2018, is disclosed in the table below.
Read more in Note 30 Financial Instruments, regarding classification and valuation of financial instruments.
Holding of shares in listed and non-listed companies
Dec 31, 2018Carrying value
Dec 31, 2017Carrying value
Holdings in Japanese companies 495 461
Holdings in other listed companies 0 1
Holding of shares in listed companies1 496 462
Holding of shares in non-listed companies 244 237
B/S Other shares and participations 740 699 1 Changes in fair value is measured through other comprehensive income and
amounts to SEK 34 M (37).
Income/loss from investments in joint ventures and associated companies 2018 2017
Income/loss joint ventures
VECV 286 236
Subtotal 286 236
Income/loss associated companies
DFCV1 840 720
Deutz AG – 28
Other companies 1 24
Subtotal 842 771
Revaluation, write-down and gain on divestment of shares associated companies
Deutz AG2 – 400
Other companies3 821 0
Subtotal 821 400
I/S Income/loss from investments in joint ventures and associated companies4 1,948 1,407
1 Income/loss includes an internal profit elimination of net SEK 0 M (15).
Associated companiesThe following tables present summarized financial information for the Volvo Group’s associated companies:
Summarized income statements 2018 2017
DFCV Deutz AGOther associated
companies Total DFCV Deutz AGOther associated
companies Total
Net sales 53,261 – 3,993 57,254 49,641 9,937 4,056 63,634
Operating income 2,367 – 114 2,481 1,575 234 110 1,919
Income for the period1 1,867 – 109 1,976 1,600 113 267 1,980
Other comprehensive income2 0 – 0 0 –27 –3 – –30
Total comprehensive income 1,867 – 109 1,976 1,573 110 267 1,950
1 Income for the period in associated companies includes depreciation of surplus values and internal transactions.2 Including the Volvo Group’s share of Other comprehensive income related to associated companies. Translation differences from translating the associated
companies’ equity in the Volvo Group are excluded.
Summarized balance sheets Dec 31, 2018 Dec 31, 2017
DFCV1 Deutz AG2Other associated
companies Total DFCV1 Deutz AG2Other associated
companies Total
Non-current assets 18,173 – 1,668 19,841 17,709 – 1,645 19,354
Current assets 36,540 – 3,807 40,347 37,407 – 3,213 40,620
Total assets 54,713 – 5,475 60,188 55,116 – 4,858 59,974
Equity 17,997 – 2,199 20,196 16,313 – 2,009 18,322
Non-current liabilities 2,367 – 491 2,858 2,554 – 603 3,157
Current liabilities 34,350 – 2,784 37,134 36,249 – 2,246 38,495
Total equity and liabilities 54,713 – 5,475 60,188 55,116 – 4,858 59,974
1 Dividend of SEK 336 M (–) was received from DFCV during financial year 2018.2 The Volvo Group divested the share of ownership in Deutz AG during 2017.
Investments in associated companies Percentageholding
Dec 31, 2018Carrying value
Dec 31, 2017Carrying value
Dongfeng Commercial Vehicles Co., Ltd (DFCV) China 45.0 7,973 7,341
Deutz AG, Germany – – –
Other holdings in associated companies1 447 680
Investments in associated companies 8,420 8,021
1 Other holdings include the investment in two dealers in Japan and Blue Chip Jet.
2 During 2017, the Volvo Group divested the share of ownership in Deutz AG with a gain of SEK 400 M.
3 During 2018, the Volvo Group divested a Chinese subsidiary holding shares in NHL with a gain of SEK 818 M.
4 Income/loss from investments in joint ventures include the Volvo Group’s share of depreciation of surplus values of SEK 12 M (20) and associated companies include depreciation of surplus values of SEK 39 M (46).
134
GROUP PERFORMANCE 2018 NOTES
Operating segments are reported in a manner consistent with the internal reporting provided to the chief operating decision-maker. The chief oper-ating decision-maker, who is responsible for allocating resources and assessing performance of the operating segments, has been identified as the Group Executive Board that makes strategic decisions.
The Volvo Group comprises ten business areas: Volvo Trucks, UD Trucks, Mack Trucks, Renault Trucks, Group Trucks Asia & JVs, Volvo Construction Equipment, Volvo Buses, Volvo Penta, Arquus and Volvo Financial Services.
Each business area, except for the truck brands and Arquus, is seen as a separate segment. Arquus is part of the segment Group functions & Other.
The truck brands are seen as one segment since the operations are highly integrated and the assessment of the performance is done for the truck brands in total.
The Volvo Group has shared operations in both the Trucks segment and in the segment Group functions & Other. Shared operations for produc-tion, development and logistics for powertrain and parts are included in the Trucks segment. Volvo Group IT and Volvo Group Real Estate are seen as business support functions and are part of Group functions & Other. The cost of these operations is shared between the different business areas based on utilization according to principles set by the Volvo Group.
6 SEGMENT REPORTING
2018 Trucks
Con-struction
Equipment BusesVolvo Penta
Group func-tions & Other
incl. elim.Industrial
OperationsFinancial Services
Elimina-tions
Volvo Group
Net sales, external customers 249,815 84,061 24,941 13,267 5,945 378,030 12,804 – 390,834
Net sales, internal 542 176 885 474 –1,788 289 266 –555 –
I/S Net sales 250,358 84,238 25,826 13,741 4,157 378,320 13,070 –555 390,834
Expenses –231,944 –72,935 –25,250 –11,401 –6,671 –348,201 –10,659 555 –358,305
I/S Income from investments in joint ventures and associated companies 1,128 821 –1 2 –1 1,948 – – 1,948
I/S Operating income 19,541 12,125 575 2,341 –2,515 32,067 2,411 – 34,478
I/S Interest income and similar credits 199 – – 199
I/S Interest expense and similar charges –1,658 0 – –1,658
I/S Other financial income and expense –870 – – –870
I/S Income after financial items 29,738 2,411 – 32,148
Other segment information
Depreciation, amortization and impairment –12,840 –1,858 –505 –250 1,662 –13,792 –4,648 – –18,440
Restructuring costs 1 10 0 0 0 11 –41 – –29
Gains/losses from divestments 4 0 0 0 2 6 0 – 6
Investments in fixed assets 8,006 832 347 527 1,021 10,733 10,184 – 20,916
B/S Investments in joint ventures and associated companies 10,966 0 60 32 77 11,135 – – 11,135
B/S Assets held for sale 203 – – 203
B/S Liabilities held for sale – – – –
135

GROUP PERFORMANCE 2018 NOTES
Reporting by market Net sales Non-current assets2
2018 20171 2018 20171
Europe 160,591 141,597 70,953 65,273
of which Sweden 9,866 8,936 25,665 19,501
of which France 31,195 26,994 12,111 13,610
of which the UK 18,598 18,650 5,441 6,240
North America 106,948 83,998 19,689 20,140
of which USA 84,639 66,608 17,966 18,607
South America 21,138 17,241 2,710 2,792
of which Brazil 12,582 8,846 2,264 2,395
Asia 76,976 68,511 17,215 17,803
of which China 27,214 17,663 1,888 1,845
of which Japan 18,227 17,397 10,782 11,204
Other markets 25,182 21,391 2,178 2,042
I/S B/S Total 390,834 332,738 112,745 108,051
2 Non-current assets include tangible and intangible assets excluding goodwill.
The reporting of net sales by market is based on where the delivery of the goods or services took place.
2017 TrucksCon struction
Equipment BusesVolvo Penta
Group functions & Other
incl. elim.Industrial
OperationsFinancial Services
Elimina-tions
Volvo Group
Net sales, external customers1 214,168 66,114 25,094 10,743 5,266 321,387 11,351 – 332,738
Net sales, internal 685 199 783 376 –1,632 412 461 –873 –
I/S Net sales 214,854 66,313 25,878 11,119 3,634 321,799 11,812 –873 332,738
Expenses 1 –196,030 –58,406 –25,006 –9,681 –6,596 –295,720 –9,619 873 –304,467
I/S Income from investments in joint ventures and associated companies 961 10 5 2 430 1,407 – – 1,407
I/S Operating income 19,785 7,917 876 1,439 –2,532 27,485 2,192 – 29,678
I/S Interest income and similar credits 164 – – 164
I/S Interest expense and similar charges –1,852 0 – –1,852
I/S Other financial income and expense –385 – – –385
I/S Income after financial items 25,413 2,192 – 27,605
Other segment information
Depreciation, amortization and impairment1 –11,619 –2,134 –503 –243 1,319 –13,181 –4,272 – –17,452
Restructuring costs 41 –105 – 0 38 –26 – – –26
Gains/losses from divestments 66 250 – – 4 320 0 – 320
Investments in fixed assets 5,490 811 327 348 956 7,932 11,469 – 19,401
B/S Investments in joint ventures and associated companies 10,098 255 64 31 78 10,525 – – 10,525
B/S Assets held for sale 51 – – 51
B/S Liabilities held for sale 0 – – 0
1 Read more in Note 31 Changes in Volvo Group financial reporting 2018. The financial information for 2017 is restated due to the implementation of IFRS 15.
136
GROUP PERFORMANCE 2018 NOTES
7 REVENUE
ACCOUNTING POLICY
The recognized net sales in Industrial Operations pertain to revenues from sales of vehicles and services. Revenue from vehicles and services are rec-ognized when control has been transferred from Volvo Group to the cus-tomer. Control refers to the customers’ ability to use vehicles or services in its operations and to obtain the associated cash flow. Vehicles and ser-vices may be sold separately or as a combined offer. In combined offers where the vehicle and services are separable from each other and the cus-tomer can benefit from the vehicle and the service independently, the transaction price is allocated between vehicles and services based on stand-alone selling price according to price lists.
The recognized net sales in Financial Services pertain to interest income related to finance leases and installment credits and income from operating lease contracts. Interest income are recognized during the underlying contract period and income from operating leasing is recog-nized over the leasing period.
The below table includes a description of vehicles and services in terms of nature, timing of recognizing revenue and payment terms.
Read more in Note 6 Segment reporting regarding net sales by segment and market.
SOURCE OF ESTIMATION UNCERTAINTY AND CRITICAL JUDGEMENTS
Sales with residual value commitments and variable sales priceWhen the Volvo Group enters into sales transactions of vehicles with various residual value commitments (buybacks and tradebacks) the judgement whether control has been transferred from Volvo Group to the customer and at what point in time revenue shall be recognized is critical. The criterion of transferring control is based on if the customer has a signifi-cant economic incentive to exercise the residual value commitment or not. If the repurchase price is higher than the assessed fair market value i.e. net realizable value at the end of the residual value commitment period, or if the average historical return rates indicate that it is probable that the customer will return the vehicle at the end of the commitment period, a significant eco-nomic incentive exist. Thus, the control has not been transferred and revenue is recognized over the commitment period as an operating lease. If it is assessed that the customer does not have a significant economic incentive to return the vehicle, the sales contract is accounted for in accordance with the right of return model. The assessment of transfer of control is performed at the inception of the contract and requires judgments. Other critical judge-ments relates to estimating the fair market value at the end of the contract and assessing variable sales price such as residual value guarantees. In assessing the variable sales price, the expected value method is used and revenue is recognized when it is highly probable that a reversal will not occur.
Read more in Note 21 Other provisions for a description of residual value risks and the assessment of fair market value.
VEHICLES SERVICES
Vehicles include sales of new vehicles, machinery and engines as well as sales of used vehicles, machines, trailers, superstructures and special vehicles. A standard contractual warranty is included as part of the sales, read more in Note 21 Other provisions. The customer can pay for the vehicle at the point of sale or defer the payment by entering into agree-ments such as installment credits and finance lease.
Revenue is recognized when the control of the vehicle has been trans-ferred to the customer, normally when the vehicle has been delivered to the customer. The value of rebates, returns and variable sales price have been considered as part of the revenue recognition. The variable sales price such as residual value guarantees is assessed at contract inception with continuous reassessment at each reporting period.
If the sale of the vehicle is combined with residual value commitment and there is a significant economic incentive for the customer to exercise the option, the control has not been transferred to the customer. The reve-nue and expense are recognized over the residual value commitment period in accordance with the rules for operating lease transactions. An asset, a Residual value liability, and a Deferred lease income are recognized in the balance sheet. The asset is depreciated over the contract period and the Deferred lease income is decreasing in the balance sheet during the con-tract period. The Residual value liability amount remains unchanged until the end of the contract period. During 2018, revenue from these operating lease transactions has been recognized with SEK 5,278 M.
If the customer is not considered to have a significant economic incentive to exercise the residual value commitment to return the vehicle, the revenue is recognized in accordance with the right of return model. Revenue corresponding to the sales amount less the buyback amount is recognized at the initial sale, as well as a proportionate share of cost of goods sold. The remaining revenue is recognized as a Refund liability and the remaining cost of goods sold as a Right of return asset during the commitment period. If the vehicle is not returned the Refund liability is recognized as revenue and the Right of return asset is recognized as cost of goods sold at the end of the commitment period.
Services include sale of spare parts, maintenance services, extended coverage and other aftermarket products. Revenue is recognized when the control of the service has been transferred to the customer, which is when the Volvo Group incurs the associated cost to deliver the service and the customer can benefit from the use of the delivered services. For spare parts, revenue is recognized when it is delivered to the customer. For maintenance services and other after market products, revenue is recognized during the contract period. When payment for maintenance contracts is received in advance, the payment is recognized as a con-tract liability.
Services also includes sales in Financial Services related to finance lease, installment credits and operating leases. During 2018, revenue from Financial Services operations amounted to SEK 13,070 M.
7:1
137
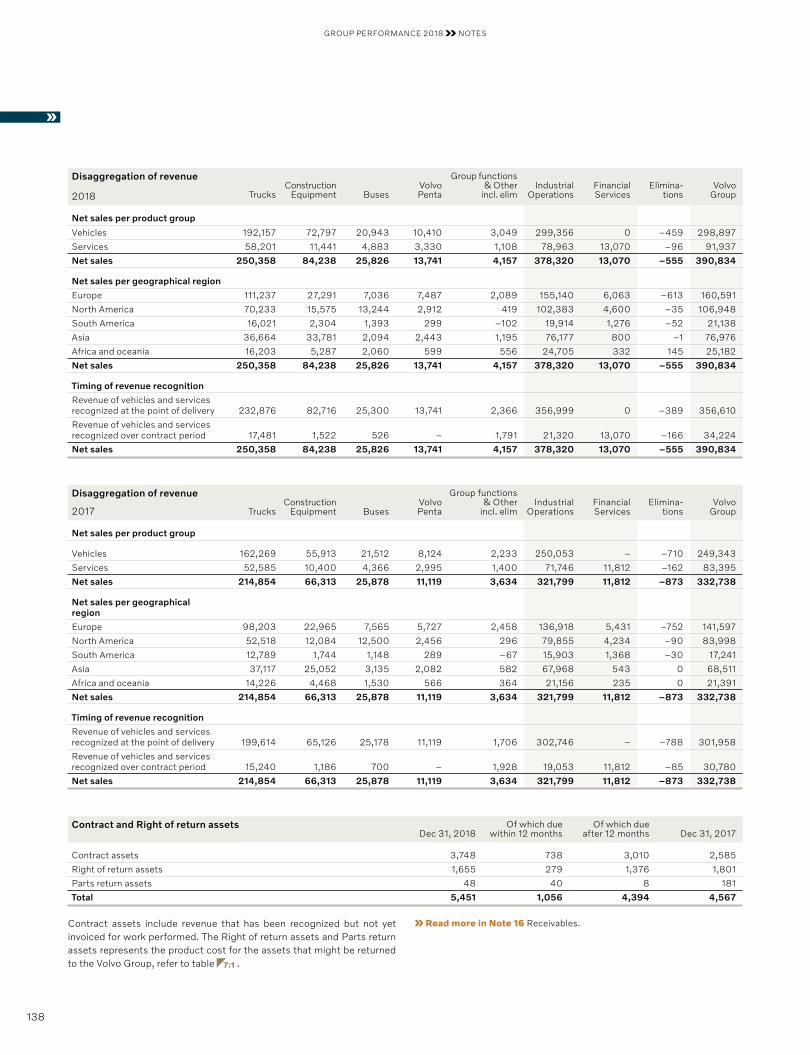
GROUP PERFORMANCE 2018 NOTES
Disaggregation of revenue
TrucksConstruction
Equipment BusesVolvo Penta
Group functions & Other
incl. elimIndustrial
OperationsFinancial Services
Elimina-tions
Volvo Group2018
Net sales per product group
Vehicles 192,157 72,797 20,943 10,410 3,049 299,356 0 –459 298,897
Services 58,201 11,441 4,883 3,330 1,108 78,963 13,070 –96 91,937
Net sales 250,358 84,238 25,826 13,741 4,157 378,320 13,070 –555 390,834
Net sales per geographical region
Europe 111,237 27,291 7,036 7,487 2,089 155,140 6,063 –613 160,591
North America 70,233 15,575 13,244 2,912 419 102,383 4,600 –35 106,948
South America 16,021 2,304 1,393 299 –102 19,914 1,276 –52 21,138
Asia 36,664 33,781 2,094 2,443 1,195 76,177 800 –1 76,976
Africa and oceania 16,203 5,287 2,060 599 556 24,705 332 145 25,182
Net sales 250,358 84,238 25,826 13,741 4,157 378,320 13,070 –555 390,834
Timing of revenue recognition
Revenue of vehicles and services recognized at the point of delivery 232,876 82,716 25,300 13,741 2,366 356,999 0 –389 356,610
Revenue of vehicles and services recognized over contract period 17,481 1,522 526 – 1,791 21,320 13,070 –166 34,224
Net sales 250,358 84,238 25,826 13,741 4,157 378,320 13,070 –555 390,834
Disaggregation of revenue
TrucksConstruction
Equipment BusesVolvo Penta
Group functions & Other
incl. elimIndustrial
OperationsFinancial Services
Elimina-tions
Volvo Group2017
Net sales per product group
Vehicles 162,269 55,913 21,512 8,124 2,233 250,053 – –710 249,343
Services 52,585 10,400 4,366 2,995 1,400 71,746 11,812 –162 83,395
Net sales 214,854 66,313 25,878 11,119 3,634 321,799 11,812 –873 332,738
Net sales per geographical region
Europe 98,203 22,965 7,565 5,727 2,458 136,918 5,431 –752 141,597
North America 52,518 12,084 12,500 2,456 296 79,855 4,234 –90 83,998
South America 12,789 1,744 1,148 289 –67 15,903 1,368 –30 17,241
Asia 37,117 25,052 3,135 2,082 582 67,968 543 0 68,511
Africa and oceania 14,226 4,468 1,530 566 364 21,156 235 0 21,391
Net sales 214,854 66,313 25,878 11,119 3,634 321,799 11,812 –873 332,738
Timing of revenue recognition
Revenue of vehicles and services recognized at the point of delivery 199,614 65,126 25,178 11,119 1,706 302,746 – –788 301,958
Revenue of vehicles and services recognized over contract period 15,240 1,186 700 – 1,928 19,053 11,812 –85 30,780
Net sales 214,854 66,313 25,878 11,119 3,634 321,799 11,812 –873 332,738
Contract and Right of return assetsDec 31, 2018
Of which due within 12 months
Of which due after 12 months Dec 31, 2017
Contract assets 3,748 738 3,010 2,585
Right of return assets 1,655 279 1,376 1,801
Parts return assets 48 40 8 181
Total 5,451 1,056 4,394 4,567
Contract assets include revenue that has been recognized but not yet invoiced for work performed. The Right of return assets and Parts return assets represents the product cost for the assets that might be returned to the Volvo Group, refer to table 7:1 .
Read more in Note 16 Receivables.
138
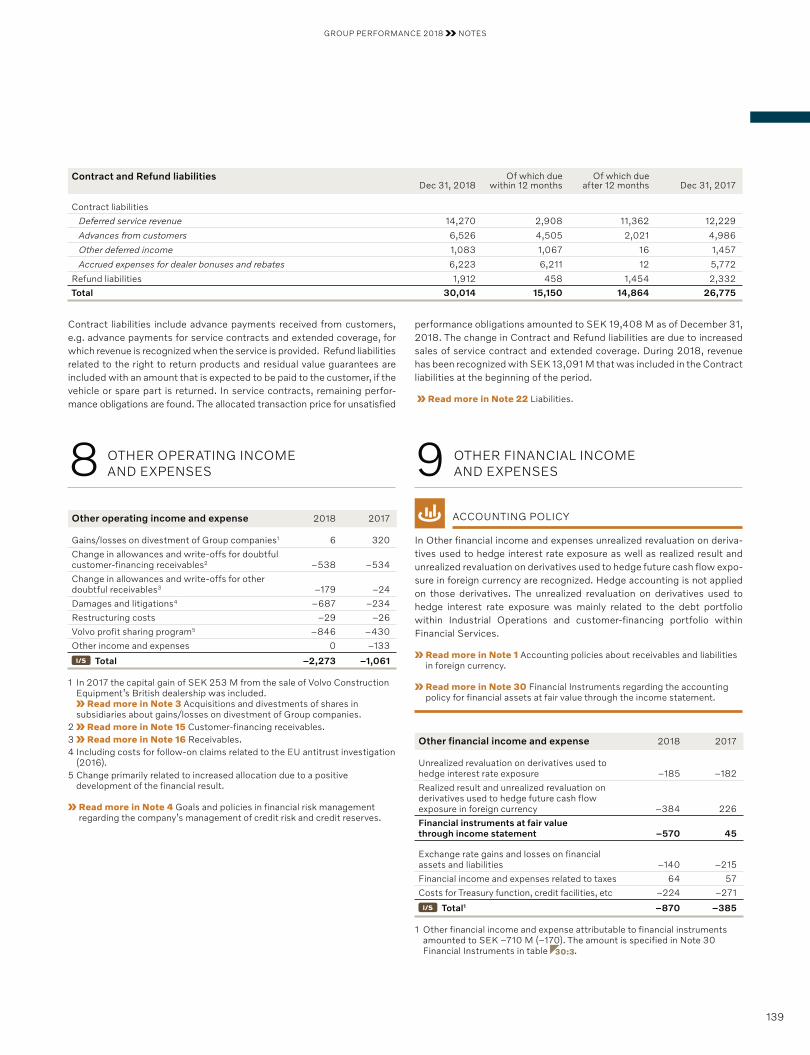
GROUP PERFORMANCE 2018 NOTES
9 OTHER FINANCIAL INCOME AND EXPENSES
ACCOUNTING POLICY
In Other financial income and expenses unrealized revaluation on deriva-tives used to hedge interest rate exposure as well as realized result and unrealized revaluation on derivatives used to hedge future cash flow expo-sure in foreign currency are recognized. Hedge accounting is not applied on those derivatives. The unrealized revaluation on derivatives used to hedge interest rate exposure was mainly related to the debt portfolio within Industrial Operations and customer-financing portfolio within Financial Services.
Read more in Note 1 Accounting policies about receivables and liabilities in foreign currency.
Read more in Note 30 Financial Instruments regarding the accounting policy for financial assets at fair value through the income statement.
Other financial income and expense 2018 2017
Unrealized revaluation on derivatives used to hedge interest rate exposure –185 –182
Realized result and unrealized revaluation on derivatives used to hedge future cash flow exposure in foreign currency –384 226
Financial instruments at fair value through income statement –570 45
Exchange rate gains and losses on financial assets and liabilities –140 –215
Financial income and expenses related to taxes 64 57
Costs for Treasury function, credit facilities, etc –224 –271
I/S Total1 –870 –385
1 Other financial income and expense attributable to financial instruments amounted to SEK –710 M (–170). The amount is specified in Note 30 Financial Instruments in table 30:3.
Contract and Refund liabilitiesDec 31, 2018
Of which due within 12 months
Of which due after 12 months Dec 31, 2017
Contract liabilities
Deferred service revenue 14,270 2,908 11,362 12,229
Advances from customers 6,526 4,505 2,021 4,986
Other deferred income 1,083 1,067 16 1,457
Accrued expenses for dealer bonuses and rebates 6,223 6,211 12 5,772
Refund liabilities 1,912 458 1,454 2,332
Total 30,014 15,150 14,864 26,775
8 OTHER OPERATING INCOME AND EXPENSES
Other operating income and expense 2018 2017
Gains/losses on divestment of Group companies1 6 320
Change in allowances and write-offs for doubtful customer-financing receivables2 –538 –534
Change in allowances and write-offs for other doubtful receivables3 –179 –24
Damages and litigations4 –687 –234
Restructuring costs –29 –26
Volvo profit sharing program5 –846 –430
Other income and expenses 0 –133
I/S Total –2,273 –1,061
1 In 2017 the capital gain of SEK 253 M from the sale of Volvo Construction Equipment’s British dealership was included.
Read more in Note 3 Acquisitions and divestments of shares in subsidiaries about gains/losses on divestment of Group companies.
2 Read more in Note 15 Customer-financing receivables.3 Read more in Note 16 Receivables.4 Including costs for follow-on claims related to the EU antitrust investigation
(2016).5 Change primarily related to increased allocation due to a positive
development of the financial result.
Read more in Note 4 Goals and policies in financial risk management regarding the company’s management of credit risk and credit reserves.
Contract liabilities include advance payments received from customers, e.g. advance payments for service contracts and extended coverage, for which revenue is recognized when the service is provided. Refund liabilities related to the right to return products and residual value guarantees are included with an amount that is expected to be paid to the customer, if the vehicle or spare part is returned. In service contracts, remaining perfor-mance obligations are found. The allocated transaction price for unsatisfied
performance obligations amounted to SEK 19,408 M as of December 31, 2018. The change in Contract and Refund liabilities are due to increased sales of service contract and extended coverage. During 2018, revenue has been recognized with SEK 13,091 M that was included in the Contract liabilities at the beginning of the period.
Read more in Note 22 Liabilities.
139
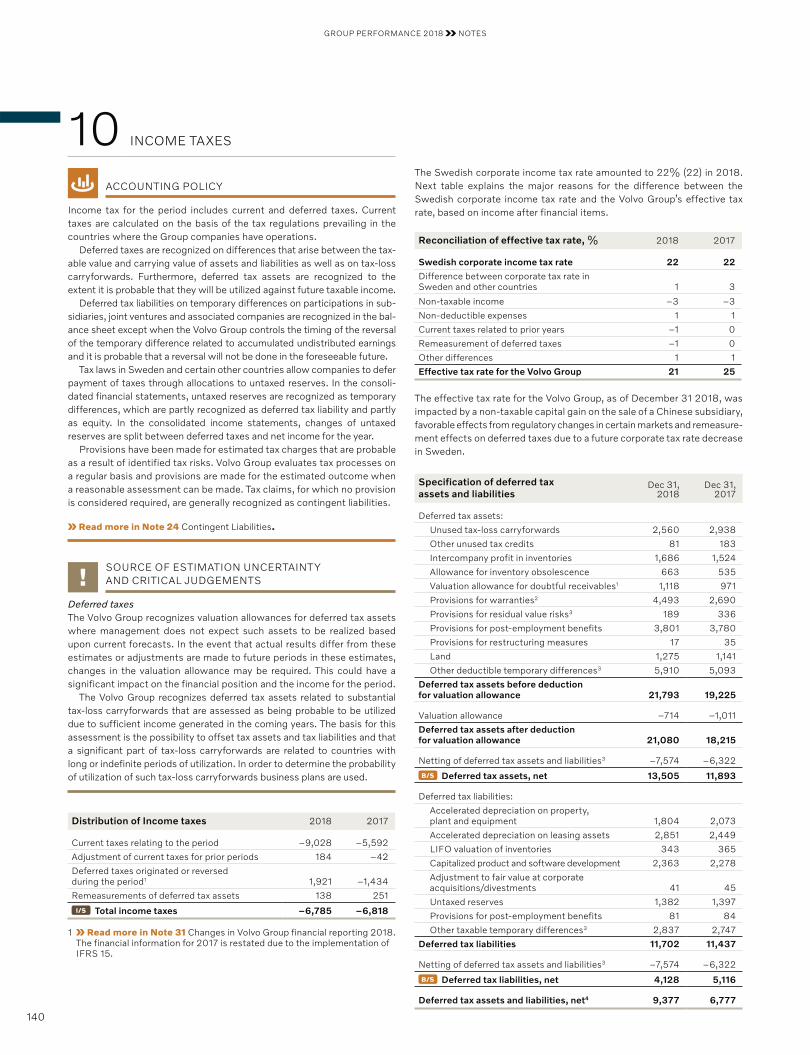
GROUP PERFORMANCE 2018 NOTES
The Swedish corporate income tax rate amounted to 22% (22) in 2018. Next table explains the major reasons for the difference between the Swedish corporate income tax rate and the Volvo Group’s effective tax rate, based on income after financial items.
Reconciliation of effective tax rate, % 2018 2017
Swedish corporate income tax rate 22 22
Difference between corporate tax rate in Sweden and other countries 1 3
Non-taxable income –3 –3
Non-deductible expenses 1 1
Current taxes related to prior years –1 0
Remeasurement of deferred taxes –1 0
Other differences 1 1
Effective tax rate for the Volvo Group 21 25
The effective tax rate for the Volvo Group, as of December 31 2018, was impacted by a non-taxable capital gain on the sale of a Chinese subsidiary, favorable effects from regulatory changes in certain markets and remeasure-ment effects on deferred taxes due to a future corporate tax rate decrease in Sweden.
Specification of deferred tax assets and liabilities
Dec 31,2018
Dec 31,2017
Deferred tax assets:
Unused tax-loss carryforwards 2,560 2,938
Other unused tax credits 81 183
Intercompany profit in inventories 1,686 1,524
Allowance for inventory obsolescence 663 535
Valuation allowance for doubtful receivables1 1,118 971
Provisions for warranties2 4,493 2,690
Provisions for residual value risks3 189 336
Provisions for post-employment benefits 3,801 3,780
Provisions for restructuring measures 17 35
Land 1,275 1,141
Other deductible temporary differences3 5,910 5,093
Deferred tax assets before deduction for valuation allowance 21,793 19,225
Valuation allowance –714 –1,011
Deferred tax assets after deduction for valuation allowance 21,080 18,215
Netting of deferred tax assets and liabilities3 –7,574 –6,322
B/S Deferred tax assets, net 13,505 11,893
Deferred tax liabilities:
Accelerated depreciation on property, plant and equipment 1,804 2,073
Accelerated depreciation on leasing assets 2,851 2,449
LIFO valuation of inventories 343 365
Capitalized product and software development 2,363 2,278
Adjustment to fair value at corporate acquisitions/divestments 41 45
Untaxed reserves 1,382 1,397
Provisions for post-employment benefits 81 84
Other taxable temporary differences3 2,837 2,747
Deferred tax liabilities 11,702 11,437
Netting of deferred tax assets and liabilities3 –7,574 –6,322
B/S Deferred tax liabilities, net 4,128 5,116
Deferred tax assets and liabilities, net4 9,377 6,777
10 INCOME TAXES
ACCOUNTING POLICY
Income tax for the period includes current and deferred taxes. Current taxes are calculated on the basis of the tax regulations prevailing in the countries where the Group companies have operations.
Deferred taxes are recognized on differences that arise between the tax-able value and carrying value of assets and liabilities as well as on tax-loss carryforwards. Furthermore, deferred tax assets are recognized to the extent it is probable that they will be utilized against future taxable income.
Deferred tax liabilities on temporary differences on participations in sub-sidiaries, joint ventures and associated companies are recognized in the bal-ance sheet except when the Volvo Group controls the timing of the reversal of the temporary difference related to accumulated undistributed earnings and it is probable that a reversal will not be done in the foreseeable future.
Tax laws in Sweden and certain other countries allow companies to defer payment of taxes through allocations to untaxed reserves. In the consoli-dated financial statements, untaxed reserves are recognized as temporary differences, which are partly recognized as deferred tax liability and partly as equity. In the consolidated income statements, changes of untaxed reserves are split between deferred taxes and net income for the year.
Provisions have been made for estimated tax charges that are probable as a result of identified tax risks. Volvo Group evaluates tax processes on a regular basis and provisions are made for the estimated outcome when a reasonable assessment can be made. Tax claims, for which no provision is considered required, are generally recognized as contingent liabilities.
Read more in Note 24 Contingent Liabilities.
SOURCE OF ESTIMATION UNCERTAINTY AND CRITICAL JUDGEMENTS
Deferred taxesThe Volvo Group recognizes valuation allowances for deferred tax assets where management does not expect such assets to be realized based upon current forecasts. In the event that actual results differ from these estimates or adjustments are made to future periods in these estimates, changes in the valuation allowance may be required. This could have a significant impact on the financial position and the income for the period.
The Volvo Group recognizes deferred tax assets related to substantial tax-loss carryforwards that are assessed as being probable to be utilized due to sufficient income generated in the coming years. The basis for this assessment is the possibility to offset tax assets and tax liabilities and that a significant part of tax-loss carryforwards are related to countries with long or indefinite periods of utilization. In order to determine the probability of utilization of such tax-loss carryforwards business plans are used.
Distribution of Income taxes 2018 2017
Current taxes relating to the period –9,028 –5,592
Adjustment of current taxes for prior periods 184 –42
Deferred taxes originated or reversed during the period1 1,921 –1,434
Remeasurements of deferred tax assets 138 251
I/S Total income taxes –6,785 –6,818
1 Read more in Note 31 Changes in Volvo Group financial reporting 2018. The financial information for 2017 is restated due to the implementation of IFRS 15.
140
GROUP PERFORMANCE 2018 NOTES
1 Read more in Note 31 Changes in Volvo Group financial reporting 2018. The opening balance for 2018 is restated due to the implementation of IFRS 9.
2 Includes the tax impact of a provision made in 2018 of SEK 7 billion for estimated costs to address the issue of an emission control component.
Read more in Note 21 Other provisions. 3 Read more in Note 31 Changes in Volvo Group financial reporting 2018.
The financial information for 2017 is restated due to the implementation of IFRS 15.
4 The deferred tax assets and liabilities are recognized in the balance sheet partially on a net basis after taking into account offsetting possibilities. Deferred tax assets and liabilities have been measured at the tax rates that are expected to be applied during the period when the asset is realized or the liability is settled, according to the tax rates and tax regulations that have been resolved or enacted at the balance sheet date.
The total valuation allowance for deferred tax assets amounted to SEK 714 M (1,011) as of December 31, 2018. Most of the reserve, SEK 583 M (953), consisted of valuation allowance for unused tax-loss carry forwards, mainly related to Japan.
As of December 31, 2018, the Volvo Group’s gross unused tax-loss carry forwards amounted to SEK 9,088 M (10,418) pertaining to deferred tax assets of SEK 2,560 M (2,938) recognized in the balance sheet. After deduction for valuation allowance, deferred tax assets attributable to unused tax-loss carry forwards amounted to SEK 1,977 M (1,985) of which SEK 934 M (978) pertains to France and SEK 491 M (433) to Japan.
The gross unused tax-loss carryforwards expire according to the following table:
Due date, unused tax-loss carryforwards gross
Dec 31,2018
Dec 31,2017
after 1 year 365 875
after 2 years 1,677 328
after 3 years 394 1,900
after 4 years 450 617
after 5 years 328 337
after 6 years or more 1 5,874 6,360
Total 9,088 10,418
1 Tax-loss carryforwards with long or indefinite periods of utilization were mainly related to France. Tax-loss carryforwards with indefinite periods of utilization amounted to SEK 5,368 M (5,633) which corresponds to 59% (54) of the total unused tax-losses carryforward.
Changes in deferred tax assets and liabilities, net 2018 2017
Deferred tax assets and liabilities, net, opening balance1 6,777 9,323
Transition effect IFRS 92 129 –
Opening balance 6,906 9,323
Recognized in Income statement1 2,059 –1,183
Recognized in Other comprehensive income, whereof:
Remeasurements of defined-benefit pension plans3 –47 –678
Cash flow hedge reserve – 6
Available-for-sale reserve 6 –16
Translation differences and other changes 453 –675
Deferred tax assets and liabilities, net, as of December 31 9,377 6,777
1 Read more in Note 31 Changes in Volvo Group financial reporting 2018. The financial information for 2017 is restated due to the implementation of IFRS 15.
2 Read more in Note 31 Changes in Volvo Group financial reporting 2018. The opening balance for 2018 is restated due to the implementation of IFRS 9.
3 Due to the new tax reform legislation in the USA deferred tax assets related to provisions for post-employment benefits were revaluated for 2017. The reval-uation was mainly recognized in Other comprehensive income, SEK 449 M.
The cumulative amount of undistributed earnings in foreign subsidiaries, which the Volvo Group currently intends to indefinitely reinvest outside of Sweden and which no deferred income tax have been accounted for, amounted to SEK 29 billion (27) at year end. Undistributed earnings pertaining to countries where the dividends are not taxable are excluded.
Read more in Note 4 Goals and policies in financial risk management about how the Volvo Group handles equity currency risk.
11 MINORITY INTERESTS
ACCOUNTING POLICY
Minority interests are interest attributable to non-controlling sharehold-ers. Minority interests are assigned to the minority shareholders portion of the equity of the subsidiary. The minority’s share of the equity is presented separately from the parent company’s equity. As part of an acquisition, minority interests are valued either at fair value or to a proportionate share of the acquired company’s net assets. Ownership changes in minority interest, not resulting in a loss of control is recognized within equity.
The Volvo Group has a few non-wholly owned subsidiaries, of which one of the subsidiaries is considered to be a significant minority interest. Shandong Lingong Construction Machinery Co. (Lingong), in China,has a minority interest holding of 30% of the shares and voting rights, this is considered significant for the Volvo Group. During 2018, the profit allo-cated to the minority interest in Lingong amounted to SEK 464 M (294). The accumulated amount allocated to the minority interest within equity of Lingong amounts to SEK 2,400 M (1,884).
The following table presents summarized financial information for Shandong Lingong Construction Machinery Co.:
Summarized income statement 2018 2017
Net sales 17,107 10,539
Operating income 1,738 1,116
Income for the period 1,548 981
Other comprehensive income1 196 –193
Total comprehensive income1 1,744 788
Dividends paid to minority interest – –
Summarized balance sheet Dec 31, 2018
Dec 31, 2017
Non-current assets 2,978 2,129
Marketable securities, cash and cash equivalents 3,648 2,603
Current assets 11,328 8,692
Total assets 17,953 13,424
Non-current liabilities 153 144
Current liabilities 9,798 6,999
Total liabilities 9,952 7,143
Equity attributable to the Volvo Group’s shareholders 5,601 4,397
Minority interests1 2,400 1,884
1 Includes translation differences from translating equity in foreign subsidiaries in the Volvo Group.
141
GROUP PERFORMANCE 2018 NOTES
ACCOUNTING POLICY
Volvo Group applies the cost method for recognition of intangible assets. Borrowing costs are included in the cost of assets that are expected to take more than twelve months to complete for their intended use or sale.
When participating in industrial projects in partnership with other com-panies the Volvo Group in certain cases pays an entrance fee to partici-pate. These entrance fees are capitalized as intangible assets.
Research and development expensesExpenditures for the development of new products and software are recog-nized as intangible assets if such expenditures, with a high degree of cer-tainty, will result in future financial benefits for the company. The cost for such intangible assets is amortized over the estimated useful life of the assets.
The rules require stringent criteria to be met for these development expenditures to be recognized as assets. For example, it must be possible to prove the technical functionality of a new product or software prior to its development expenditure being recognized as an asset. In normal cases, this means that expenditures are capitalized only during the industrializa-tion phase of a product development project. Other research and develop-ment expenses are recognized in the income statement as incurred.
The Volvo Group has developed a process for conducting product development projects, which has six phases focused on separate parts of the project. Every phase starts and ends with a reconciliation point, known as a gate, for which the criteria must be met for the project’s deci-sion making committee to allow the project to progress to the next phase. During the industrialization phase, the industrial system is prepared for serial production and the product is launched. A corresponding process is developed for software development.
GoodwillGoodwill is recognized as an intangible asset with indefinite useful life. For non-depreciable assets such as goodwill, impairment tests are per-formed annually, as well as if there are indications of impairments during the year, by calculating the asset’s recoverable amount. If the calculated recoverable amount is less than the carrying amount, the asset is written down to its recoverable amount.
The Volvo Group’s valuation model is based on a discounted cash flow model, with a forecast period of four years. Valuation is performed on cash generating units, identified as the Volvo Group’s operating segments. Each operating segment is fully integrated ensuring maximum synergy, hence no independent cash flows exists on a lower level.
Goodwill is allocated to these cash generating units based on expected future benefit. The valuation is based on a business plan which is an integral part of the Volvo Group’s financial planning process and represents manage-ment’s best estimate of the development of the Group’s operations. Assumption of 2% (2) long-term market growth beyond the forecast period and the Group’s expected performance in this environment is a basis for the valuation. In the model, the Volvo Group is expected to maintain stable cap-ital efficiency over time. Other parameters considered in the calculation are operating income, mix of products and services, expenses and level of capi-tal expenditures. Measurements are based on nominal values and a general rate of inflation applicable for the main markets where the Volvo Group oper-ates. The Volvo Group uses a discount rate at 12% (12) before tax for 2018.
In 2018, the calculated value of Volvo Group’s operations exceeded the carrying amount for all operating segments, thus no impairment was recognized. The Volvo Group has also analyzed whether a negative adjust-ment of one percentage point to the aforementioned parameters would result in impairment for any goodwill value, however none of the operating segments would be impaired as a result of this test. The operating param-eters applied in the valuation are based on management’s strategy and
could indicate higher value than historical performance for each operating segment. Furthermore the Volvo Group is operating in a cyclical industry why performance could vary over time.
The surplus values differ between the operating segments why they are sensitive to changes in the assumptions described above to a varying degree. Therefore, the Volvo Group continuously follows the performance of the operating segments whose surplus value is dependent on the fulfill-ment of the Volvo Group’s assessments. Instability in the recovery of the market and volatility in interest and currency rates may lead to indications of a need for impairment. The most important factors for the future oper-ations of the Volvo Group are described in the Volvo Group operating seg-ment section, as well as in the Risk management section.
Amortization and impairmentAmortization is made on a straight line basis based on the cost of the assets, adjusted in appropriate cases by impairments, and estimated use-ful lives. Amortization is recognized in the respective function to which it belongs, meaning that amortization of product development is part of the research and development expenses in the income statement. Impair-ment tests for amortizable assets are performed if there are indications of impairment at the balance sheet date. In addition, for capitalized develop-ment cost for products and software not yet in use, impairment tests are performed annually.
Amortization periods
Trademarks 20 years
Distribution networks 10 years
Product and software development 3 to 8 years
SOURCE OF ESTIMATION UNCERTAINTY AND CRITICAL JUDGEMENTS
Impairment of goodwill and other intangible assetsIntangible assets other than goodwill are amortized over their useful lives. Useful lives are based on estimates of the period in which the assets will generate revenue. If, at the date of the financial statements, any indication exists that an intangible non-current asset has been impaired, the recovera-ble amount of the asset is calculated. The recoverable amount is the higher of the asset’s net selling price and its value in use, estimated with reference to management’s projections of future cash flows. If the recoverable amount of the asset is less than the carrying amount, an impairment is recognized and the carrying amount of the asset is reduced to the recoverable amount. Determination of the recoverable amount is based upon management’s pro-jections of future cash flows, which are generally based on internal business plans or forecasts. While management believes that estimates of future cash flows are reasonable, different assumptions regarding such cash flows could materially affect valuations. The need for impairment of goodwill is determined on an annual basis, or more frequently if re quired through calcu-lation of the value of the asset. Such an impairment review will require man-agement to determine the recoverable amount of the Volvo Group’s cash generating units, on the basis of projected cash flows and internal business plans and forecasts. Surplus values differ between the operating segments and they are, to a varying degree, sensitive to changes in assumptions and the business environment. The Volvo Group has performed similar impair-ment reviews since 2002. No impairment was recognized for the period 2002 until 2018. The goodwill related to planned divestments has been revaluated in accordance with IFRS 5.
Read more in Note 3 Acquisitions and divestments of shares in subsidiaries.
12 INTANGIBLE ASSETS
142

GROUP PERFORMANCE 2018 NOTES
Intangible assets, acquisition costsGoodwill
Capitalized product and software development
Other intangible assets1
Total intangible assets
Opening balance 2017 23,438 44,382 8,180 75,999
Investments2 – 2,017 19 2,036
Sales/scrapping – –29 –12 –41
Acquired and divested operations –33 – 63 30
Translation differences –568 –1,072 –185 –1,826
Reclassification at divestment 17 3 1 20
Reclassifications and other 0 –34 44 10
Acquisition cost as of Dec 31, 2017 22,853 45,266 8,109 76,228
Investments2 0 3,732 13 3,745
Sales/scrapping 0 –327 –43 –370
Acquired and divested operations 114 0 0 114
Translation differences 1,240 475 424 2,139
Reclassification at divestment – – – –
Reclassifications and other –72 –24 8 –88
Acquisition cost as of Dec 31, 2018 24,135 49,122 8,511 81,768
Intangible assets, accumulated amortization and impairment Goodwill
Capitalized product and software development
Other intangible assets1
Total intangible assets
Opening balance 2017 71 32,217 5,794 38,083
Amortization – 2,840 320 3,160
Impairment – – 86 86
Sales/scrapping – –21 –12 –33
Acquired and divested operations – 0 1 1
Translation differences – –851 –100 –951
Reclassification at divestment – 0 0 0
Reclassifications and other – –35 24 –11
Accumulated amortization and impairment as of Dec 31, 2017 71 34,150 6,113 40,334
Amortization – 2,739 285 3,024
Impairment – 0 0 0
Sales/scrapping – –323 –43 –366
Acquired and divested operations – – – –
Translation differences – 475 264 739
Reclassification at divestment – – – –
Reclassifications and other –71 –2 6 –67
Accumulated amortization and impairment as of Dec 31, 2018 0 37,039 6,625 43,664
B/S Net value in balance sheet as of December 31, 20173 22,781 11,116 1,996 35,893
B/S Net value in balance sheet as of December 31, 20183 24,135 12,083 1,886 38,104
1 Other intangible assets mainly consist of entrance fees in industrial programs, trademarks and distribution networks.2 Including capitalized borrowing costs of SEK 0 M (30).3 Acquisition costs less accumulated amortization and impairments.
Read more in Note 3 Acquisitions and divestments of shares in subsidiaries, for a description of acquired and divested operations.
Goodwill per Operating Segment Dec 31,2018 Dec 31,2017
Trucks 13,301 12,496
Construction Equipment 8,988 8,514
Buses 1,044 1,042
Other operating segments 802 729
Total goodwill value 24,135 22,781
143
GROUP PERFORMANCE 2018 NOTES
ACCOUNTING POLICY
The Volvo Group applies the cost method for measurement of tangible assets. Borrowing costs are included in the acquisition value of assets that are expected to take more than 12 months to complete for their intended use or sale.
Investment properties are properties owned for the purpose of obtaining rental income and appreciation in value. Investment properties are recog-nized at cost. For disclosure purposes, information regarding the estimated fair value of investment properties is based on an internal discounted cash flow projection. The required return is based on current property market con-ditions for comparable properties in comparable locations. The applied valu-ation method is classified as level 3 as per the fair value hierarchy in IFRS 13 and there have not been any changes in valuation method during the year.
Investment properties are classified as buildings. Land contains land and land improvements. Machinery is machinery, type-bound tools and other equipment. Construction in progress are assets under construction and advanced payments. Operating leases are assets owned by the Volvo Group, which are subject of operating lease agreements with customers. Rental fleet is assets used in a fleet for rental business. Sales with residual value commitment are accounted for as an operating lease transaction.
Read more in Note 7 Revenue about sales with residual value commitments.
Read more in Note 14 Leasing about rental fleet.
Depreciation and impairmentTangible assets are depreciated over their useful lives. Useful lives are based on estimates of the period over which the assets will generate rev-enue. Land is not depreciated.
Depreciation is recognized on a straight-line basis based on the cost of the assets, adjusted by residual value when applicable and estimated use-ful lives. Depreciation is recognized in the respective function to which it belongs. Impairment tests are performed if there are indications of impair-ment at the balance-sheet date.
Tangible assets, Acquisition cost
Property, plant, equipment and investment property
Assets under operating leases
Buildings Land Machinery1Construction
in progressOperating
leases Rental fleet
Sales w. residual value
commitments2,3
Total tangible
assets
Opening balance 2017 36,652 12,062 80,068 4,902 28,127 4,198 22,677 188,686
Investments 316 78 1,643 3,831 11,496 – – 17,364
Sales/scrapping –390 –62 –2,268 –15 –8,547 – – –11,281
Acquired and divested operations –80 –8 –78 0 0 –9 –108 –283
Translation differences –916 –338 –1,526 –239 –672 –56 28 –3,719
Reclassified at divestment 46 –13 5 0 – 343 – 382
Reclassifications and other 1,329 53 2,827 –4,399 –316 794 2,252 2,541
Acquisition costs as of Dec 31, 2017 36,957 11,772 80,672 4,081 30,087 5,271 24,850 193,690
Investments 434 239 1,927 4,443 10,133 – 1 17,177
Sales/scrapping –282 –246 –1,507 –7 –9,545 0 0 –11,587
Acquired and divested operations –26 –10 4 – – – – –32
Translation differences 1,653 807 2,575 76 1,406 165 1,076 7,758
Reclassified at divestment –58 –120 0 – – – – –178
Reclassifications and other 745 72 1,920 –2,792 –249 660 –694 –338
Acquisition costs as of Dec 31, 2018 39,423 12,514 85,591 5,801 31,832 6,096 25,233 206,490
Depreciation periods
Type-bound tools 3 to 8 years
Operating leases, Rental fleet 3 to 5 years
Sales with residual value commitments 3 to 5 years
Machinery 5 to 20 years
Buildings and investment properties 20 to 50 years
Land improvements 20 years
SOURCE OF ESTIMATION UNCERTAINTY AND CRITICAL JUDGEMENTS
Impairment of tangible assets If, at the balance-sheet date, there is any indication that a tangible asset has been impaired, the recoverable amount of the asset should be esti-mated. The recoverable amount is the higher of the asset’s net selling price and its value in use, estimated with reference to management’s pro-jections of future cash flows. If the recoverable amount of the asset is less than the carrying amount, an impairment loss is recognized and the carry-ing amount of the asset is reduced to the recoverable amount. To deter-mine the recoverable amount, management’s projections of future cash flows are used, which are generally based upon internal business plans or forecasts. While management believes that estimates of future cash flows are reasonable, different assumptions regarding such cash flows could materially affect valuations.
13 TANGIBLE ASSETS
144
GROUP PERFORMANCE 2018 NOTES
Tangible assets, Accumulated depreciation and impairments
Property, plant, equipment and investment property
Assets under operating leases
Buildings Land Machinery1Construction
in progressOperating
leases Rental fleet
Sales w. residual value
commitments2,3
Total tangible
assets
Opening balance 2017 18,227 1,221 58,351 11 8,217 1,085 7,010 94,122
Depreciation 1,313 88 5,063 – 4,311 759 2,556 14,090
Impairment 0 0 –13 4 – 0 125 116
Sales/scrapping –304 –37 –2,133 – –3,419 – – –5,893
Acquired and divested operations –43 –1 –53 – – –1 –36 –135
Translation differences –478 –19 –1,114 – –181 –5 –35 –1,832
Reclassified at divestment 36 16 4 – – 81 – 138
Reclassifications and other 8 –3 –8 – –164 –448 –1,238 –1,853
Accumulated depreciation and impairments as of Dec 31, 2017 18,759 1,265 60,097 15 8,765 1,471 8,381 98,753
Transition effect IFRS 94 – – – – –77 – – –77
Depreciation 1,378 98 4,865 – 4,704 839 2,977 14,861
Impairment – 24 –4 – – 0 535 555
Sales/scrapping –212 –52 –1,392 – –4,158 0 – –5,814
Acquired and divested operations –12 0 –7 – 0 – – –19
Translation differences 941 57 1,997 – 444 44 401 3,884
Reclassified at divestment –36 0 0 – – – – –36
Reclassifications and other –13 –2 –110 – –35 –624 –3,610 –4,394
Accumulated depreciation and impairments as of Dec 31, 2018 20,805 1,390 65,446 15 9,643 1,730 8,685 107,714
B/S Net value in balance sheet as of Dec 31, 20175,6 18,198 10,507 20,575 4,066 21,322 3,800 16,468 94,937
B/S Net value in balance sheet as of Dec 31, 20185,6 18,618 11,124 20,145 5,786 22,189 4,366 16,548 98,776
1 Machinery and equipment pertains mainly to production related assets.2 Read more in Note 7 Revenue about sales with residual value commitments3 Read more in Note 31 Changes in Volvo Group Financial reporting 2018. The financial information for 2017 is restated due to the implementation of IFRS 15.4 Read more in Note 31 Changes in Volvo Group Financial reporting 2018. The opening balance for 2018 is restated due to the implementation of IFRS 9.5 Acquisition costs less accumulated depreciation and impairments.6 Of which investment property SEK 27 M (31) and PPE as well as Construction in progress SEK 55,646 M (53,317).
Read more in Note 3 Acquisitions and divestments of shares in subsidiaries, for a description of acquired and divested operations.
ReclassificationsReclassifications and other presented in the table above mainly consist ofassets related to sales with residual value commitments (e.g. buyback or tradebacks), rental fleet and construction in progress. For sales with residual value commitments and rental fleet, reclassifications occurs when the vehicle is sold or rented out to customers by transferring the vehicle from Inventory to Assets under operating leases. If the vehicle is returned by the end of the residual value commitment period or the leas-ing period, the vehicle is reclassified back to Inventory.
Read more in Note 7 Revenue about sales with residual value commitments.
Read more in Note 14 Leasing about rental fleet.
For construction in progress, reclassification occurs when the asset is available for use by transferring the assets to the respectivecategory within Property, plant and equipment.
Investment propertiesThe acquisition value of investment properties at year-end amounted to SEK 70 M (72). Reclassifications amounted to SEK 0 M (–1). Accumu-lated depreciation amounted to SEK 43 M (41) at year-end, of which SEK 2 M (2) refers to 2018. The estimated fair value of investment properties amounted to SEK 63 M (62) at year-end and 98% (98) of the area avail-able for lease was leased out during the year. Operating income was affected by rental income from investment properties that amounted to SEK 7 M (6) and direct costs that amounted to SEK 1 M (1).
145
GROUP PERFORMANCE 2018 NOTES
ACCOUNTING POLICY
Volvo Group as the lessorLeasing contracts are defined in two categories, operating and finance leases, depending on the contract’s financial implications. Operating lease contracts are recognized as non-current assets in Assets under operating leases. Income recognized from operating lease is equally distributed over the leasing period. Straight-line depreciation is applied to these assets in accordance with the terms of the undertaking and the depreciation amount is adjusted to correspond to the estimated realizable value when the undertaking expires. Assessed impairments are charged to the income statement directly. The product’s assessed realizable value at expir ation of the undertaking is reviewed continuously on an individual basis.
Finance lease contracts are recognized as either non-current or current receivables in Financial Services. Payments from finance lease contracts are distributed between interest income and amortization of the receiva-ble in Financial Services.
Volvo Group as the lesseeAs for lessors, leases are divided into operating and finance leases. Finance leases are those cases when risks and rewards related to owner-ship are substantially held by the Volvo Group. Volvo Group recognizes the asset and related obligation in the balance sheet at the lower of the leased asset’s fair value or the present value of minimum lease payments. Future lease fee commitments are recognized as obligations. The lease asset is depreciated in accordance with the Volvo Group’s policy for the respective tangible asset. The lease payments made are allocated between amorti-zation and interest expenses. If the lease contract is considered to be an operating lease, lease payments are recognized as operating expenses in the income statement over the lease contract period.
Volvo Group as the lessorAs of December 31, 2018, future rental income from non-cancellable finance and operating leases (minimum lease fees excluding sales with residual value commitments) amounted to SEK 75,833 M (66,210).
Future rental income Finance leases
Operating leases
2019 19,982 9,469
2020–2023 31,272 13,949
2024 or later 920 239
Total 52,175 23,658
Allowance for uncollectible future rental income –958
Unearned rental income –3,420
Present value of future rental income related to non-cancellable leases 47,797
Read more in Note 15 Customer-financing receivables about finance leases.
Volvo Group as a lesseeAs of December 31, 2018, future rental payments (minimum leasing fees) related to non-cancellable leases amounted to SEK 9,185 M (6,736).
Future rental payments Finance leases
Operating leases
2019 229 2,241
2020–2023 652 4,133
2024 or later 311 1,619
Total 1,192 7,993
Rental expenses 2018 2017
Finance leases:
Contingent rents –8 –7
Operating leases:
Contingent rents –32 –33
Rental payments –2,102 –1,840
Sublease payments 42 14
Total –2,100 –1,866
Carrying amount of assets subject to financial leases
Dec 31, 2018
Dec 31, 2017
Acquisition value:
Buildings 715 732
Land 78 81
Machinery 501 811
Assets under operating lease and rental fleet1 397 370
Total 1,691 1,995
Accumulated depreciation:
Buildings –219 –174
Land –10 –7
Machinery –279 –475
Assets under operating lease and rental fleet1 –136 –148
Total –644 –805
Carrying amount in the balance sheet:
Buildings 495 557
Land 68 74
Machinery 222 336
Assets under operating lease and rental fleet1 261 222
Total 1,047 1,189
1 Refer to assets leased by the Volvo Group as finance lease which are later leased to customers as operating lease.
14 LEASING
146
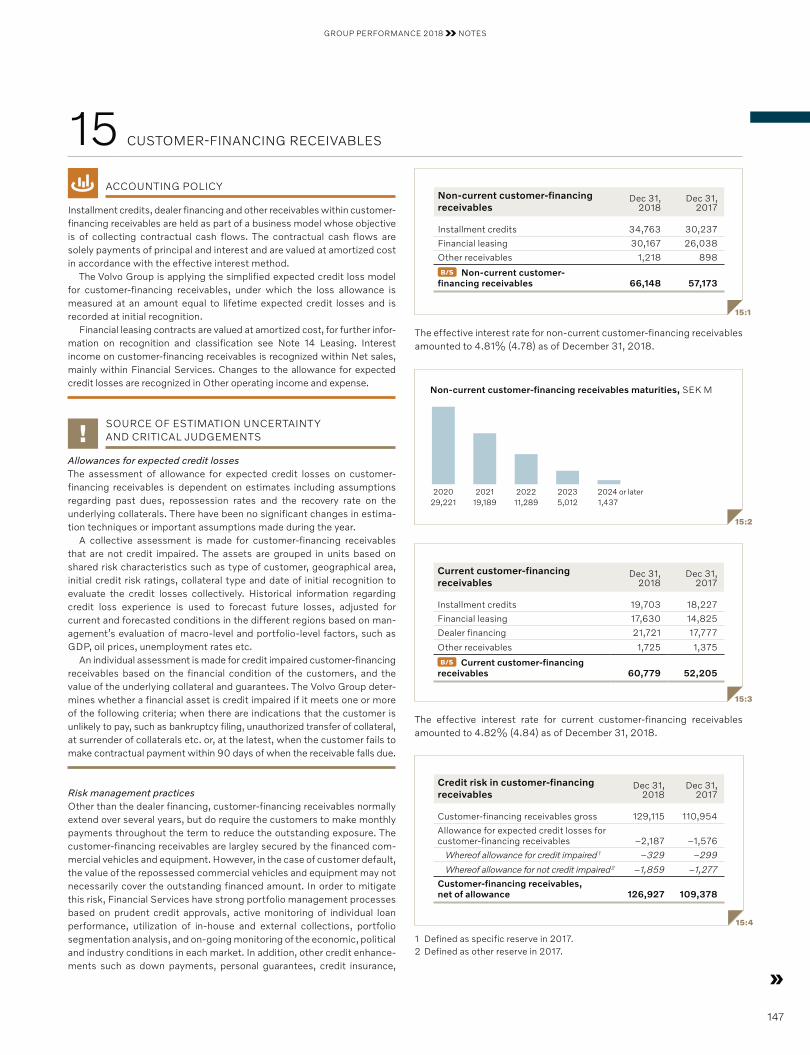
GROUP PERFORMANCE 2018 NOTES
ACCOUNTING POLICY
Installment credits, dealer financing and other receivables within customer- financing receivables are held as part of a business model whose objective is of collecting contractual cash flows. The contractual cash flows are solely payments of principal and interest and are valued at amortized cost in accordance with the effective interest method.
The Volvo Group is applying the simplified expected credit loss model for customer-financing receivables, under which the loss allowance is measured at an amount equal to lifetime expected credit losses and is recorded at initial recognition.
Financial leasing contracts are valued at amortized cost, for further infor-mation on recognition and classification see Note 14 Leasing. Interest income on customer-financing receivables is recognized within Net sales, mainly within Financial Services. Changes to the allowance for expected credit losses are recognized in Other operating income and expense.
SOURCE OF ESTIMATION UNCERTAINTY AND CRITICAL JUDGEMENTS
Allowances for expected credit losses The assessment of allowance for expected credit losses on customer- financing receivables is dependent on estimates including assumptions regarding past dues, repossession rates and the recovery rate on the underlying collaterals. There have been no significant changes in estima-tion techniques or important assumptions made during the year.
A collective assessment is made for customer-financing receivables that are not credit impaired. The assets are grouped in units based on shared risk characteristics such as type of customer, geographical area, initial credit risk ratings, collateral type and date of initial recognition to evaluate the credit losses collectively. Historical information regarding credit loss experience is used to forecast future losses, adjusted for current and forecasted conditions in the different regions based on man-agement’s evaluation of macro-level and portfolio-level factors, such as GDP, oil prices, unemployment rates etc.
An individual assessment is made for credit impaired customer-financing receivables based on the financial condition of the customers, and the value of the underlying collateral and guarantees. The Volvo Group deter-mines whether a financial asset is credit impaired if it meets one or more of the following criteria; when there are indications that the customer is unlikely to pay, such as bankruptcy filing, unauthorized transfer of collateral, at surrender of collaterals etc. or, at the latest, when the customer fails to make contractual payment within 90 days of when the receivable falls due.
Risk management practicesOther than the dealer financing, customer-financing receivables normally extend over several years, but do require the customers to make monthly payments throughout the term to reduce the outstanding exposure. The customer-financing receivables are largley secured by the financed com-mercial vehicles and equipment. However, in the case of customer default, the value of the repossessed commercial vehicles and equipment may not necessarily cover the outstanding financed amount. In order to mitigate this risk, Financial Services have strong portfolio management processes based on prudent credit approvals, active monitoring of individual loan performance, utilization of in-house and external collections, portfolio segmentation analysis, and on-going monitoring of the economic, political and industry conditions in each market. In addition, other credit enhance-ments such as down payments, personal guarantees, credit insurance,
Non-current customer-financing receivables
Dec 31, 2018
Dec 31, 2017
Installment credits 34,763 30,237
Financial leasing 30,167 26,038
Other receivables 1,218 898
B/S Non-current customer- financing receivables 66,148 57,173
15:1
The effective interest rate for non-current customer-financing receivables amounted to 4.81% (4.78) as of December 31, 2018.
Current customer-financing receivables
Dec 31, 2018
Dec 31, 2017
Installment credits 19,703 18,227
Financial leasing 17,630 14,825
Dealer financing 21,721 17,777
Other receivables 1,725 1,375
B/S Current customer-financing receivables 60,779 52,205
15:3
The effective interest rate for current customer-financing receivables amounted to 4.82% (4.84) as of December 31, 2018.
Credit risk in customer-financing receivables
Dec 31, 2018
Dec 31, 2017
Customer-financing receivables gross 129,115 110,954
Allowance for expected credit losses for customer-financing receivables –2,187 –1,576
Whereof allowance for credit impaired 1 –329 –299
Whereof allowance for not credit impaired 2 –1,859 –1,277
Customer-financing receivables, net of allowance 126,927 109,378
15:4
1 Defined as specific reserve in 2017.2 Defined as other reserve in 2017.
15 CUSTOMER-FINANCING RECEIVABLES
15:2
Non-current customer- financing receivables maturities, SEK M
202119,189
202211,289
20235,012
202029,221
2024 or later1,437
147
GROUP PERFORMANCE 2018 NOTES
Table 15:6 represents the gross credit exposure within the Volvo Group per age interval. For the Volvo Group the lifetime expected credit loss allowances for customer-financing receivables not credit impaired amounted to SEK 1,859 M and allowances for customer-financing receiv-ables credit impaired amounted to SEK 329 M, included in table 15:4. The remaining exposure was secured by liens of the financed commercial vehicles and equipment and in certain circumstances other credit enhancements such as personal guarantees, credit insurance, liens on other property owned by the borrower etc. Collaterals taken in possession that meet the criteria for recognition in the balance sheet amounted to SEK 147 M (230) as of December 31, 2018.
Customer-financing receivables Gross exposure
Dec 31, 2018 Dec 31, 2017
Not due 1–30 31–90 >90 Total Not due 1–30 31–90 >90 Total
Customer-financing receivables total 118,172 7,390 2,241 1,312 129,115 96,545 12,770 1,458 181 110,954
Whereof not credit impaired 117,955 6,632 1,713 531 126,831
Whereof credit impaired 217 758 528 781 2,284
15:6
liens on other property owned by the borrower etc. may be required at the time of origination or when there are signs of impairment. When customer- financ ing receivables exceed 90 days of overdue collateral repossession is initiated, although there may be circumstances where repossession is initiated earlier. When the collateral is repossessed, the net realizable value is established and transferred to inventory and the expected loss on the customer-financing receivable is written off. If repossession has not occurred on customer-financing receivables exceeding 180 days of over-due the expected loss on the receivable is written off. Financial Services continues to engage in enforcement activity on all customer financing- receivables written of during the year to attempt to recover the contrac-tual amount not previously received from the customer.
During 2018 certain financial assets have been renegotiated in situa-tions where the customer’s default was due to a temporary or correctible situation but this has not had any significant impact on either the credit risk or the income statement. Renegotiated assets continue to be moni-tored closely for on-going payment performance and signs of impairment.
As of December 31, 2018, the total allowances for expected credit losses in Financial Services amounted to 1.63% (1.35) of the total credit portfolio in Financial Services. This reserve ratio is used as an important measure for Financial Services and includes operating leases and inventory.
Read more in Note 4 Goals and policies in financial risk management for a description of the credit risk, interest and currency risks.
Read more in Note 30 Financial Instruments for further information regarding customer-financing receivables.
As an effect of the implementation of the new accounting standard for Financial Instruments as of January 1, 2018 the allowances for expected credit losses for customer-financing receivables increased due to earlier recognition of credit losses. In total, allowances for expected credit losses for customer-financing receivables has increased since the beginning of the year from SEK 1,973 M to SEK 2,187 M primarily due to the overall increase in the customer-financing portfolio. During the year, economic conditions in certain segments have continued to show improvement, having a slightly offsetting effect on the overall allowance level.
Read more in Note 30 Financial instruments for information on the gain or loss recognized in the operating income arising from derecognition of customer-financing receivables in table 30:3.
Change of allowance for expected credit losses for customer- financing receivables
2018
Not credit
impairedCredit
impaired 2017
Closing balance previous year 1,277 299 1,689
Transition effect IFRS 91 397 – –
Opening balance 1,674 299 1,689
New valuation allowance charged to income 522 150 568
Reversal of valuation allowance charged to income –45 –62 –98
Utilization of valuation allowance related to actual losses – –331 –438
Movements between not credit impaired/credit impaired –257 257 –
Translation differences 38 16 –79
Syndication transactions and other –73 –1 –65
Allowance for expected credit losses for customer- financing receivables as of December 31 1,859 329 1,576
15:5
1 Read more in Note 31 Changes in Volvo Group Financial reporting 2018. The opening balance for 2018 is restated due to the implementation of IFRS 9.
148
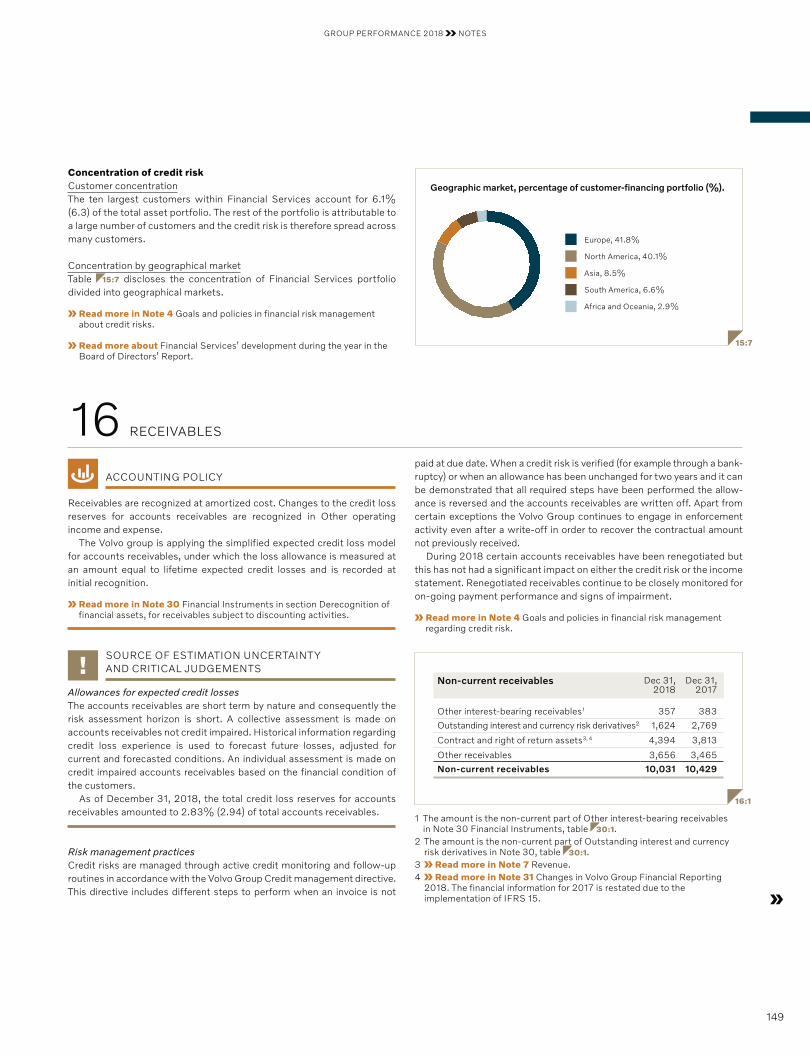
GROUP PERFORMANCE 2018 NOTES
Geographic market, percentage of customer-financing portfolio (%).
15:7
Europe, 41.8%
North America, 40.1%
Asia, 8.5%
South America, 6.6%
Africa and Oceania, 2.9%
ACCOUNTING POLICY
Receivables are recognized at amortized cost. Changes to the credit loss reserves for accounts receivables are recognized in Other operating income and expense.
The Volvo group is applying the simplified expected credit loss model for accounts receivables, under which the loss allowance is measured at an amount equal to lifetime expected credit losses and is recorded at initial recognition.
Read more in Note 30 Financial Instruments in section Derecognition of financial assets, for receivables subject to discounting activities.
SOURCE OF ESTIMATION UNCERTAINTY AND CRITICAL JUDGEMENTS
Allowances for expected credit lossesThe accounts receivables are short term by nature and consequently the risk assessment horizon is short. A collective assessment is made on accounts receivables not credit impaired. Historical information regarding credit loss experience is used to forecast future losses, adjusted for current and forecasted conditions. An individual assessment is made on credit impaired accounts receivables based on the financial condition of the customers.
As of December 31, 2018, the total credit loss reserves for accounts receivables amounted to 2.83% (2.94) of total accounts receivables.
Risk management practices Credit risks are managed through active credit monitoring and follow-up routines in accordance with the Volvo Group Credit management directive. This directive includes different steps to perform when an invoice is not
16 RECEIVABLES
Concentration of credit riskCustomer concentration The ten largest customers within Financial Services account for 6.1% (6.3) of the total asset portfolio. The rest of the portfolio is attributable to a large number of customers and the credit risk is therefore spread across many customers.
Concentration by geographical marketTable 15:7 discloses the concentration of Financial Services portfolio divided into geographical markets.
Read more in Note 4 Goals and policies in financial risk management about credit risks.
Read more about Financial Services’ development during the year in the Board of Directors’ Report.
paid at due date. When a credit risk is verified (for example through a bank-ruptcy) or when an allowance has been unchanged for two years and it can be demonstrated that all required steps have been performed the allow-ance is reversed and the accounts receivables are written off. Apart from certain exceptions the Volvo Group continues to engage in enforcement activity even after a write-off in order to recover the contractual amount not previously received.
During 2018 certain accounts receivables have been renegotiated but this has not had a significant impact on either the credit risk or the income statement. Renegotiated receivables continue to be closely monitored for on-going payment performance and signs of impairment.
Read more in Note 4 Goals and policies in financial risk management regarding credit risk.
16:1
Non-current receivables Dec 31, 2018
Dec 31, 2017
Other interest-bearing receivables 1 357 383
Outstanding interest and currency risk derivatives 2 1,624 2,769
Contract and right of return assets3, 4 4,394 3,813
Other receivables 3,656 3,465
Non-current receivables 10,031 10,429
1 The amount is the non-current part of Other interest-bearing receivables in Note 30 Financial Instruments, table 30:1.
2 The amount is the non-current part of Outstanding interest and currency risk derivatives in Note 30, table 30:1.
3 Read more in Note 7 Revenue.4 Read more in Note 31 Changes in Volvo Group Financial Reporting
2018. The financial information for 2017 is restated due to the implementation of IFRS 15.
149
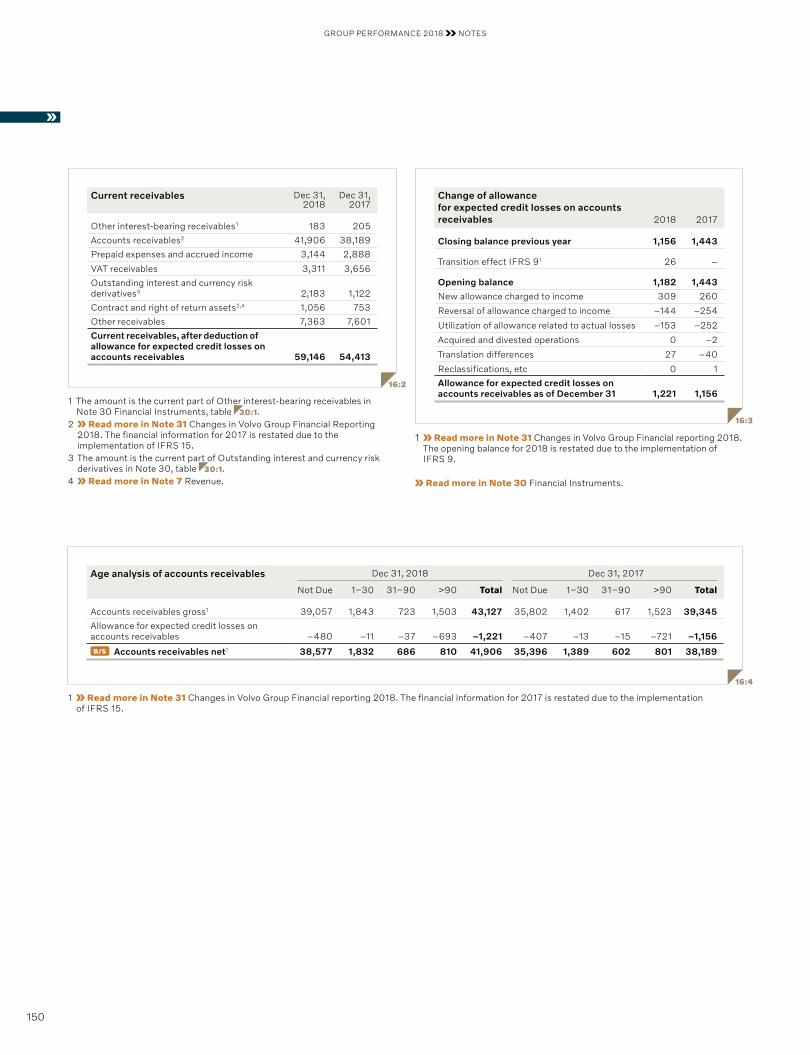
GROUP PERFORMANCE 2018 NOTES
1 Read more in Note 31 Changes in Volvo Group Financial reporting 2018. The opening balance for 2018 is restated due to the implementation of IFRS 9.
Read more in Note 30 Financial Instruments.
Change of allowance for expected credit losses on accounts receivables 2018 2017
Closing balance previous year 1,156 1,443
Transition effect IFRS 91 26 –
Opening balance 1,182 1,443
New allowance charged to income 309 260
Reversal of allowance charged to income –144 –254
Utilization of allowance related to actual losses –153 –252
Acquired and divested operations 0 –2
Translation differences 27 –40
Reclassifications, etc 0 1
Allowance for expected credit losses on accounts receivables as of December 31 1,221 1,156
16:3
Current receivables Dec 31, 2018
Dec 31, 2017
Other interest-bearing receivables 1 183 205
Accounts receivables2 41,906 38,189
Prepaid expenses and accrued income 3,144 2,888
VAT receivables 3,311 3,656
Outstanding interest and currency risk derivatives3 2,183 1,122
Contract and right of return assets2,4 1,056 753
Other receivables 7,363 7,601
Current receivables, after deduction of allowance for expected credit losses on accounts receivable s 59,146 54,413
16:2
1 The amount is the current part of Other interest-bearing receivables in Note 30 Financial Instruments, table 30:1.
2 Read more in Note 31 Changes in Volvo Group Financial Reporting 2018. The financial information for 2017 is restated due to the implementation of IFRS 15.
3 The amount is the current part of Outstanding interest and currency risk derivatives in Note 30, table 30:1.
4 Read more in Note 7 Revenue.
16:4
Age analysis of accounts receivables Dec 31, 2018 Dec 31, 2017
Not Due 1–30 31–90 >90 Total Not Due 1–30 31–90 >90 Total
Accounts receivables gross1 39,057 1,843 723 1,503 43,127 35,802 1,402 617 1,523 39,345
Allowance for expected credit losses on accounts receivables –480 –11 –37 –693 –1,221 –407 –13 –15 –721 –1,156
B/S Accounts receivables net1 38,577 1,832 686 810 41,906 35,396 1,389 602 801 38,189
1 Read more in Note 31 Changes in Volvo Group Financial reporting 2018. The financial information for 2017 is restated due to the implementation of IFRS 15.
150
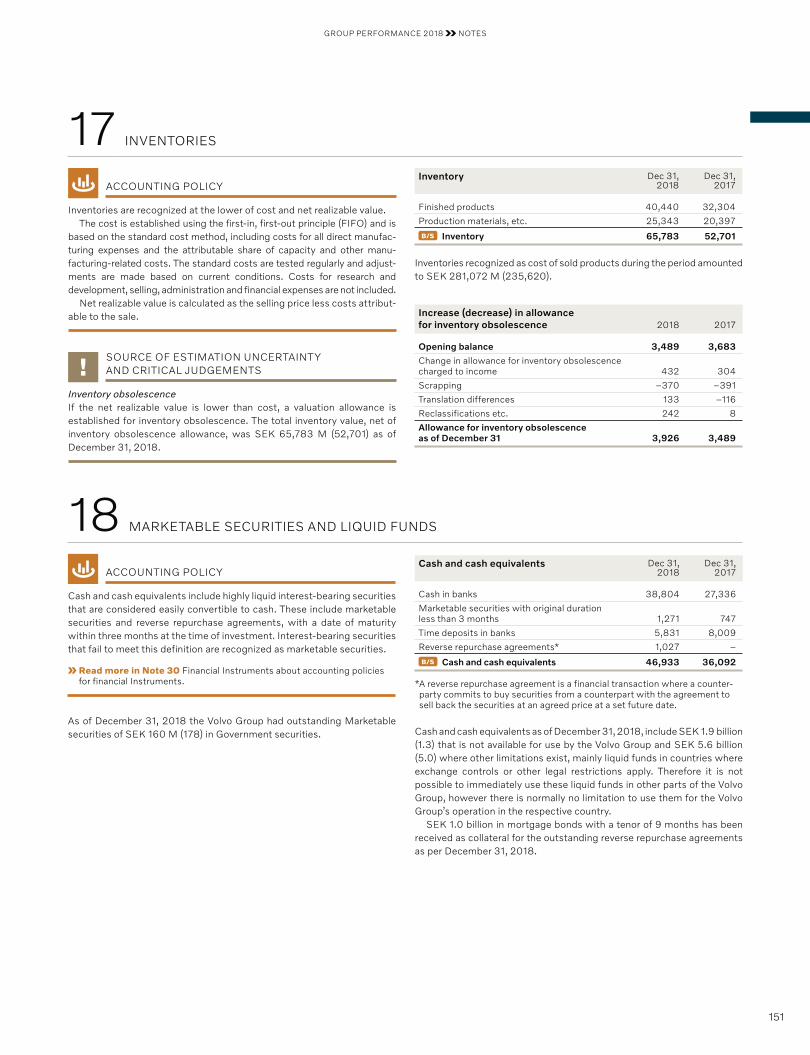
GROUP PERFORMANCE 2018 NOTES
ACCOUNTING POLICY
Cash and cash equivalents include highly liquid interest-bearing securities that are considered easily convertible to cash. These include market able securities and reverse repurchase agreements, with a date of maturity within three months at the time of investment. Interest-bearing securities that fail to meet this definition are recognized as marketable securities.
Read more in Note 30 Financial Instruments about accounting policies for financial Instruments.
As of December 31, 2018 the Volvo Group had outstanding Marketable securities of SEK 160 M (178) in Government securities.
Cash and cash equivalents Dec 31,2018
Dec 31,2017
Cash in banks 38,804 27,336
Marketable securities with original duration less than 3 months 1,271 747
Time deposits in banks 5,831 8,009
Reverse repurchase agreements* 1,027 –
B/S Cash and cash equivalents 46,933 36,092
* A reverse repurchase agreement is a financial transaction where a counter-party commits to buy securities from a counterpart with the agreement to sell back the securities at an agreed price at a set future date.
Cash and cash equivalents as of December 31, 2018, include SEK 1.9 billion (1.3) that is not available for use by the Volvo Group and SEK 5.6 billion (5.0) where other limitations exist, mainly liquid funds in countries where exchange controls or other legal restrictions apply. Therefore it is not possible to immediately use these liquid funds in other parts of the Volvo Group, however there is normally no limitation to use them for the Volvo Group’s operation in the respective country.
SEK 1.0 billion in mortgage bonds with a tenor of 9 months has been received as collateral for the outstanding reverse repurchase agreements as per December 31, 2018.
18 MARKETABLE SECURITIES AND LIQUID FUNDS
Inventory Dec 31, 2018
Dec 31,2017
Finished products 40,440 32,304
Production materials, etc. 25,343 20,397
B/S Inventory 65,783 52,701
Inventories recognized as cost of sold products during the period amounted to SEK 281,072 M (235,620).
Increase (decrease) in allowance for inventory obsolescence 2018 2017
Opening balance 3,489 3,683
Change in allowance for inventory obsolescence charged to income 432 304
Scrapping –370 –391
Translation differences 133 –116
Reclassifications etc. 242 8
Allowance for inventory obsolescence as of December 31 3,926 3,489
17 INVENTORIES
ACCOUNTING POLICY
Inventories are recognized at the lower of cost and net realizable value.The cost is established using the first-in, first-out principle (FIFO) and is
based on the standard cost method, including costs for all direct manufac-turing expenses and the attributable share of capacity and other manu-facturing-related costs. The standard costs are tested regularly and adjust-ments are made based on current conditions. Costs for research and development, selling, administration and financial expenses are not in cluded.
Net realizable value is calculated as the selling price less costs attribut-able to the sale.
SOURCE OF ESTIMATION UNCERTAINTY AND CRITICAL JUDGEMENTS
Inventory obsolescenceIf the net realizable value is lower than cost, a valuation allowance is established for inventory obsolescence. The total inventory value, net of inventory obsolescence allowance, was SEK 65,783 M (52,701) as of December 31, 2018.
151
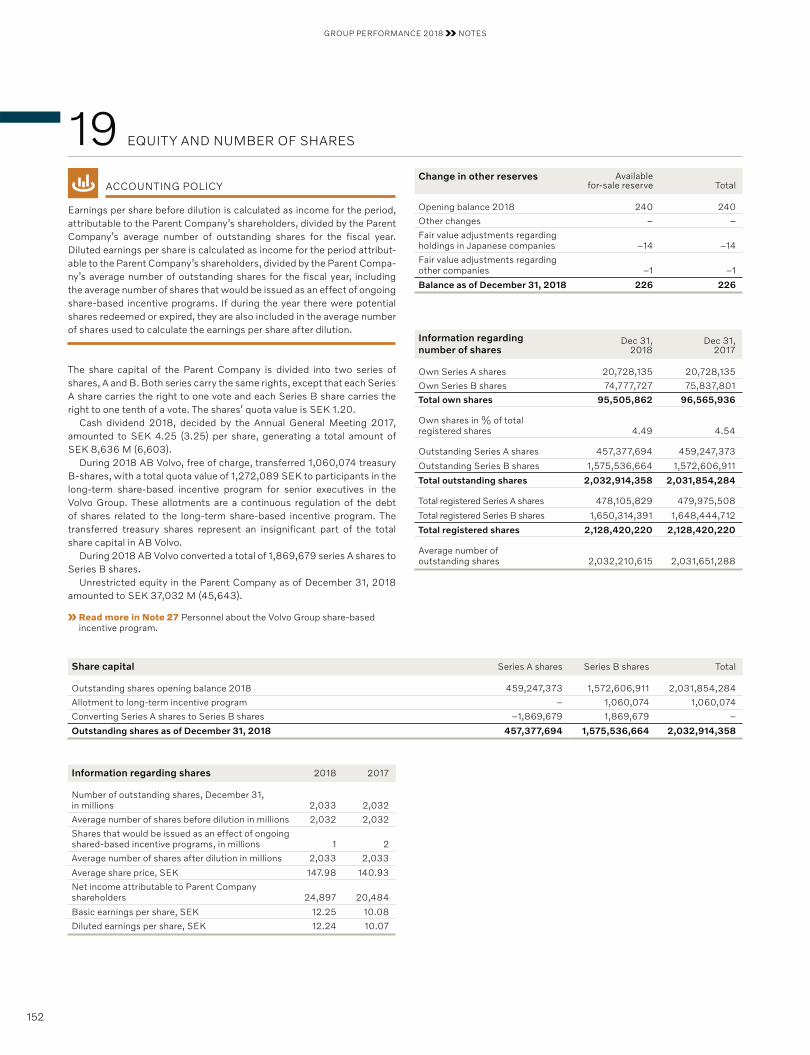
GROUP PERFORMANCE 2018 NOTES
Change in other reserves Available for-sale reserve Total
Opening balance 2018 240 240
Other changes – –
Fair value adjustments regarding holdings in Japanese companies –14 –14
Fair value adjustments regarding other companies –1 –1
Balance as of December 31, 2018 226 226
Information regarding shares 2018 2017
Number of outstanding shares, December 31, in millions 2,033 2,032
Average number of shares before dilution in millions 2,032 2,032
Shares that would be issued as an effect of ongoing shared-based incentive programs, in millions 1 2
Average number of shares after dilution in millions 2,033 2,033
Average share price, SEK 147.98 140.93
Net income attributable to Parent Company shareholders 24,897 20,484
Basic earnings per share, SEK 12.25 10.08
Diluted earnings per share, SEK 12.24 10.07
Share capital Series A shares Series B shares Total
Outstanding shares opening balance 2018 459,247,373 1,572,606,911 2,031,854,284
Allotment to long-term incentive program – 1,060,074 1,060,074
Converting Series A shares to Series B shares –1,869,679 1,869,679 –
Outstanding shares as of December 31, 2018 457,377,694 1,575,536,664 2,032,914,358
ACCOUNTING POLICY
Earnings per share before dilution is calculated as income for the period, attributable to the Parent Company’s shareholders, divided by the Parent Company’s average number of outstanding shares for the fiscal year. Diluted earnings per share is calculated as income for the period attribut-able to the Parent Company’s shareholders, divided by the Parent Compa-ny’s average number of outstanding shares for the fiscal year, including the average number of shares that would be issued as an effect of ongoing share-based incentive programs. If during the year there were potential shares redeemed or expired, they are also included in the average number of shares used to calculate the earnings per share after dilution.
The share capital of the Parent Company is divided into two series of shares, A and B. Both series carry the same rights, except that each Series A share carries the right to one vote and each Series B share carries the right to one tenth of a vote. The shares’ quota value is SEK 1.20.
Cash dividend 2018, decided by the Annual General Meeting 2017, amounted to SEK 4.25 (3.25) per share, generating a total amount of SEK 8,636 M (6,603).
During 2018 AB Volvo, free of charge, transferred 1,060,074 treasury B-shares, with a total quota value of 1,272,089 SEK to participants in the long-term share-based incentive program for senior executives in the Volvo Group. These allotments are a continuous regulation of the debt of shares related to the long-term share-based incentive program. The transferred treasury shares represent an insignificant part of the total share capital in AB Volvo.
During 2018 AB Volvo converted a total of 1,869,679 series A shares to Series B shares.
Unrestricted equity in the Parent Company as of December 31, 2018 amounted to SEK 37,032 M (45,643).
Read more in Note 27 Personnel about the Volvo Group share-based incentive program.
Information regarding number of shares
Dec 31,2018
Dec 31,2017
Own Series A shares 20,728,135 20,728,135
Own Series B shares 74,777,727 75,837,801
Total own shares 95,505,862 96,565,936
Own shares in % of total registered shares 4.49 4.54
Outstanding Series A shares 457,377,694 459,247,373
Outstanding Series B shares 1,575,536,664 1,572,606,911
Total outstanding shares 2,032,914,358 2,031,854,284
Total registered Series A shares 478,105,829 479,975,508
Total registered Series B shares 1,650,314,391 1,648,444,712
Total registered shares 2,128,420,220 2,128,420,220
Average number of outstanding shares 2,032,210,615 2,031,651,288
19 EQUITY AND NUMBER OF SHARES
152
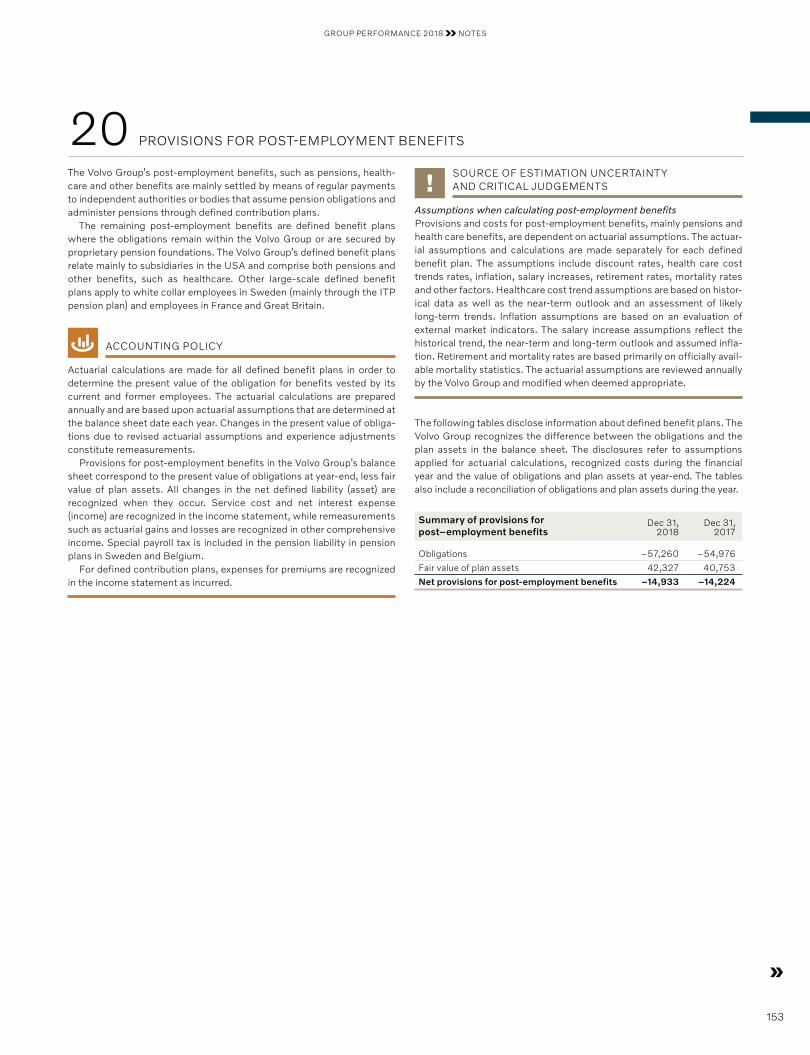
GROUP PERFORMANCE 2018 NOTES
SOURCE OF ESTIMATION UNCERTAINTY AND CRITICAL JUDGEMENTS
Assumptions when calculating post-employment benefits Provisions and costs for post-employment benefits, mainly pensions and health care benefits, are dependent on actuarial assumptions. The actuar-ial assumptions and calculations are made separately for each defined benefit plan. The assumptions include discount rates, health care cost trends rates, inflation, salary increases, retirement rates, mortality rates and other factors. Healthcare cost trend assumptions are based on histor-ical data as well as the near-term outlook and an assessment of likely long-term trends. Inflation assumptions are based on an evaluation of external market indicators. The salary increase assumptions reflect the historical trend, the near-term and long-term outlook and assumed infla-tion. Retirement and mortality rates are based primarily on officially avail-able mortality statistics. The actuarial assumptions are reviewed annually by the Volvo Group and modified when deemed appropriate.
The following tables disclose information about defined benefit plans. The Volvo Group recognizes the difference between the obligations and the plan assets in the balance sheet. The disclosures refer to assumptions applied for actuarial calculations, recognized costs during the financial year and the value of obligations and plan assets at year-end. The tables also include a reconciliation of obligations and plan assets during the year.
Summary of provisions for post–employment benefits
Dec 31, 2018
Dec 31, 2017
Obligations –57,260 –54,976
Fair value of plan assets 42,327 40,753
Net provisions for post-employment benefits –14,933 –14,224
The Volvo Group’s post-employment benefits, such as pensions, health-care and other benefits are mainly settled by means of regular payments to independent authorities or bodies that assume pension obligations and administer pensions through defined contribution plans.
The remaining post-employment benefits are defined benefit plans where the obligations remain within the Volvo Group or are secured by proprietary pension foundations. The Volvo Group’s defined benefit plans relate mainly to subsidiaries in the USA and comprise both pensions and other benefits, such as healthcare. Other large-scale defined benefit plans apply to white collar employees in Sweden (mainly through the ITP pension plan) and employees in France and Great Britain.
ACCOUNTING POLICY
Actuarial calculations are made for all defined benefit plans in order to determine the present value of the obligation for benefits vested by its current and former employees. The actuarial calculations are prepared annually and are based upon actuarial assumptions that are determined at the balance sheet date each year. Changes in the present value of obliga-tions due to revised actuarial assumptions and experience adjustments constitute remeasurements.
Provisions for post-employment benefits in the Volvo Group’s balance sheet correspond to the present value of obligations at year-end, less fair value of plan assets. All changes in the net defined liability (asset) are recognized when they occur. Service cost and net interest expense (income) are recognized in the income statement, while remeasurements such as actuarial gains and losses are recognized in other comprehensive income. Special payroll tax is included in the pension liability in pension plans in Sweden and Belgium.
For defined contribution plans, expenses for premiums are recognized in the income statement as incurred.
20 PROVISIONS FOR POST-EMPLOYMENT BENEFITS
153
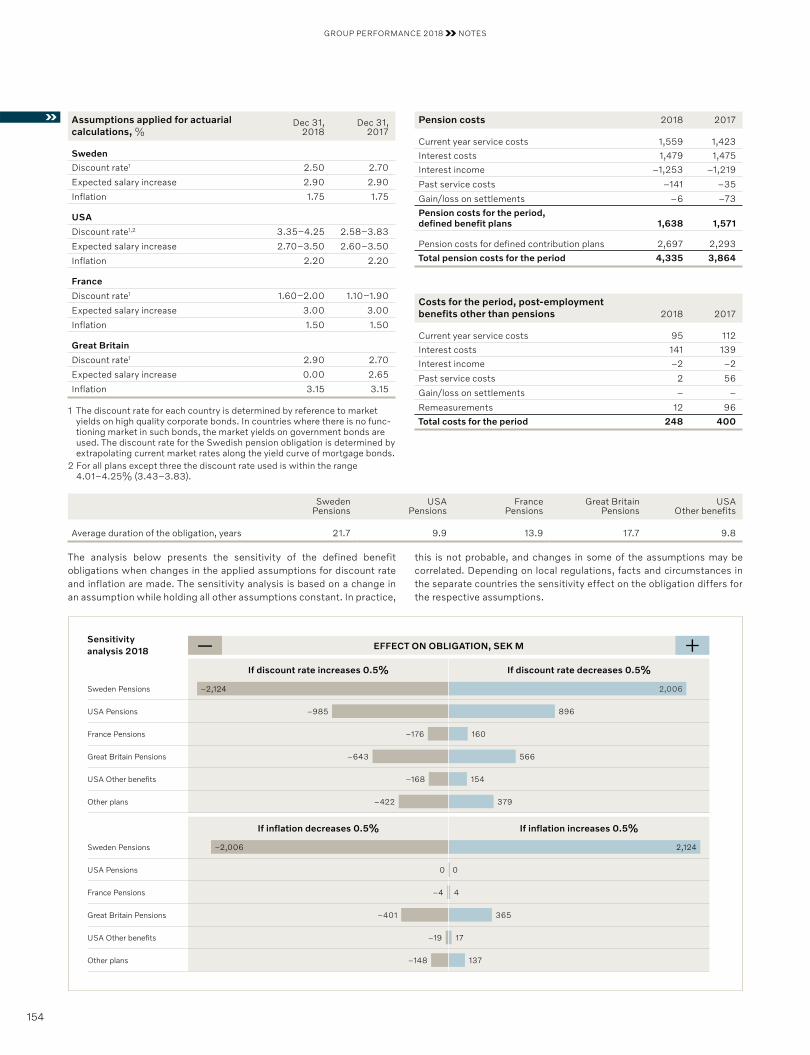
GROUP PERFORMANCE 2018 NOTES
Assumptions applied for actuarial calculations, %
Dec 31,2018
Dec 31,2017
Sweden
Discount rate1 2.50 2.70
Expected salary increase 2.90 2.90
Inflation 1.75 1.75
USA
Discount rate1,2 3.35–4.25 2.58–3.83
Expected salary increase 2.70–3.50 2.60–3.50
Inflation 2.20 2.20
France
Discount rate1 1.60–2.00 1.10–1.90
Expected salary increase 3.00 3.00
Inflation 1.50 1.50
Great Britain
Discount rate1 2.90 2.70
Expected salary increase 0.00 2.65
Inflation 3.15 3.15
1 The discount rate for each country is determined by reference to market yields on high quality corporate bonds. In countries where there is no func-tioning market in such bonds, the market yields on government bonds are used. The discount rate for the Swedish pension obligation is determined by extra polating current market rates along the yield curve of mortgage bonds.
2 For all plans except three the discount rate used is within the range 4.01–4.25% (3.43–3.83).
Pension costs 2018 2017
Current year service costs 1,559 1,423
Interest costs 1,479 1,475
Interest income –1,253 –1,219
Past service costs –141 –35
Gain/loss on settlements –6 –73
Pension costs for the period, defined benefit plans 1,638 1,571
Pension costs for defined contribution plans 2,697 2,293
Total pension costs for the period 4,335 3,864
Costs for the period, post-employment benefits other than pensions 2018 2017
Current year service costs 95 112
Interest costs 141 139
Interest income –2 –2
Past service costs 2 56
Gain/loss on settlements – –
Remeasurements 12 96
Total costs for the period 248 400
SwedenPensions
USAPensions
FrancePensions
Great BritainPensions
USA Other benefits
Average duration of the obligation, years 21.7 9.9 13.9 17.7 9.8
The analysis below presents the sensitivity of the defined benefit obligations when changes in the applied assumptions for discount rate and inflation are made. The sensitivity analysis is based on a change in an assump tion while holding all other assumptions constant. In practice,
this is not probable, and changes in some of the assumptions may be correlated. Depending on local regulations, facts and circumstances in the separate countries the sensitivity effect on the obligation differs for the respective assumptions.
Sensitivity analysis 2018 − +EFFECT ON OBLIGATION, SEK M
If discount rate increases 0.5% If discount rate decreases 0.5%
Sweden Pensions
USA Pensions
USA Other benefits
Other plans
France Pensions
Great Britain Pensions
If inflation decreases 0.5% If inflation increases 0.5%
–2,124
–985
–176
2,006
896
160
–643
–168
566
154
–422 379
–2,006 2,124
0
–4
0
4
–401
–19 17
–148 137
365
Sweden Pensions
USA Pensions
USA Other benefits
Other plans
France Pensions
Great Britain Pensions
154
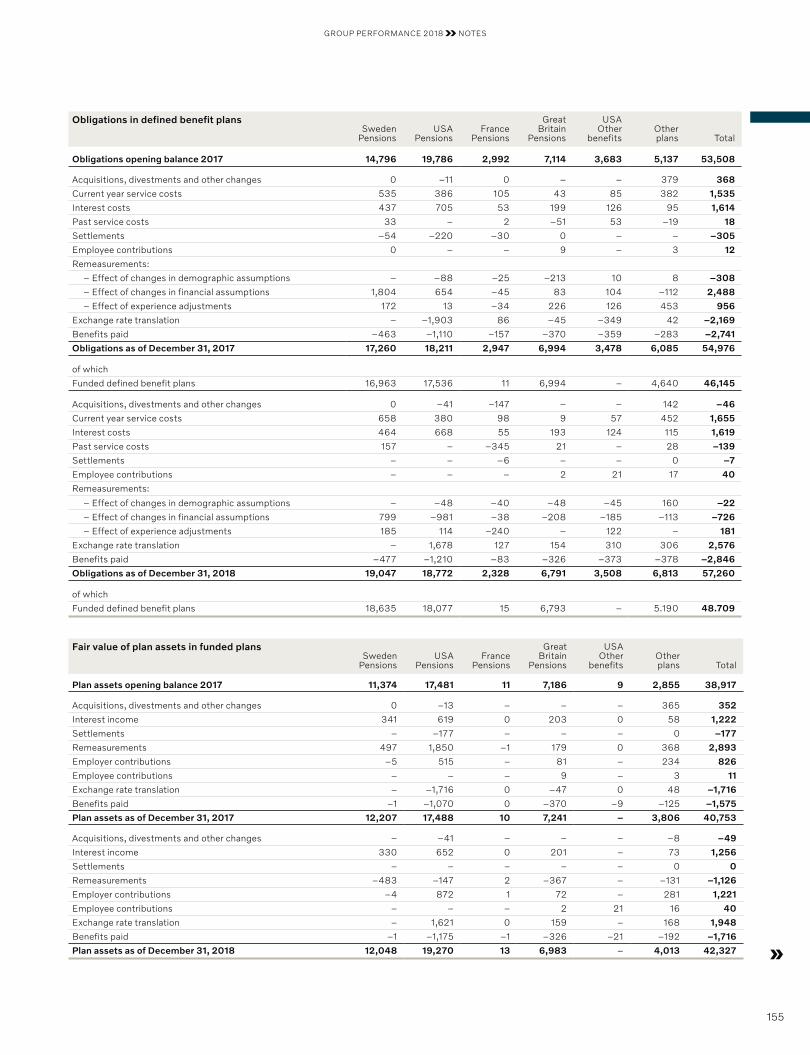
GROUP PERFORMANCE 2018 NOTES
Obligations in defined benefit plansSweden
PensionsUSA
PensionsFrance
Pensions
GreatBritain
Pensions
USA Other
benefitsOtherplans Total
Obligations opening balance 2017 14,796 19,786 2,992 7,114 3,683 5,137 53,508
Acquisitions, divestments and other changes 0 –11 0 – – 379 368
Current year service costs 535 386 105 43 85 382 1,535
Interest costs 437 705 53 199 126 95 1,614
Past service costs 33 – 2 –51 53 –19 18
Settlements –54 –220 –30 0 – – –305
Employee contributions 0 – – 9 – 3 12
Remeasurements:
– Effect of changes in demographic assumptions – –88 –25 –213 10 8 –308
– Effect of changes in financial assumptions 1,804 654 –45 83 104 –112 2,488
– Effect of experience adjustments 172 13 –34 226 126 453 956
Exchange rate translation – –1,903 86 –45 –349 42 –2,169
Benefits paid –463 –1,110 –157 –370 –359 –283 –2,741
Obligations as of December 31, 2017 17,260 18,211 2,947 6,994 3,478 6,085 54,976
of which
Funded defined benefit plans 16,963 17,536 11 6,994 – 4,640 46,145
Acquisitions, divestments and other changes 0 –41 –147 – – 142 –46
Current year service costs 658 380 98 9 57 452 1,655
Interest costs 464 668 55 193 124 115 1,619
Past service costs 157 – –345 21 – 28 –139
Settlements – – –6 – – 0 –7
Employee contributions – – – 2 21 17 40
Remeasurements:
– Effect of changes in demographic assumptions – –48 –40 –48 –45 160 –22
– Effect of changes in financial assumptions 799 –981 –38 –208 –185 –113 –726
– Effect of experience adjustments 185 114 –240 – 122 – 181
Exchange rate translation – 1,678 127 154 310 306 2,576
Benefits paid –477 –1,210 –83 –326 –373 –378 –2,846
Obligations as of December 31, 2018 19,047 18,772 2,328 6,791 3,508 6,813 57,260
of which
Funded defined benefit plans 18,635 18,077 15 6,793 – 5.190 48.709
Fair value of plan assets in funded plansSweden
PensionsUSA
PensionsFrance
Pensions
GreatBritain
Pensions
USA Other
benefitsOtherplans Total
Plan assets opening balance 2017 11,374 17,481 11 7,186 9 2,855 38,917
Acquisitions, divestments and other changes 0 –13 – – – 365 352
Interest income 341 619 0 203 0 58 1,222
Settlements – –177 – – – 0 –177
Remeasurements 497 1,850 –1 179 0 368 2,893
Employer contributions –5 515 – 81 – 234 826
Employee contributions – – – 9 – 3 11
Exchange rate translation – –1,716 0 –47 0 48 –1,716
Benefits paid –1 –1,070 0 –370 –9 –125 –1,575
Plan assets as of December 31, 2017 12,207 17,488 10 7,241 – 3,806 40,753
Acquisitions, divestments and other changes – –41 – – – –8 –49
Interest income 330 652 0 201 – 73 1,256
Settlements – – – – – 0 0
Remeasurements –483 –147 2 –367 – –131 –1,126
Employer contributions –4 872 1 72 – 281 1,221
Employee contributions – – – 2 21 16 40
Exchange rate translation – 1,621 0 159 – 168 1,948
Benefits paid –1 –1,175 –1 –326 –21 –192 –1,716
Plan assets as of December 31, 2018 12,048 19,270 13 6,983 – 4,013 42,327
155
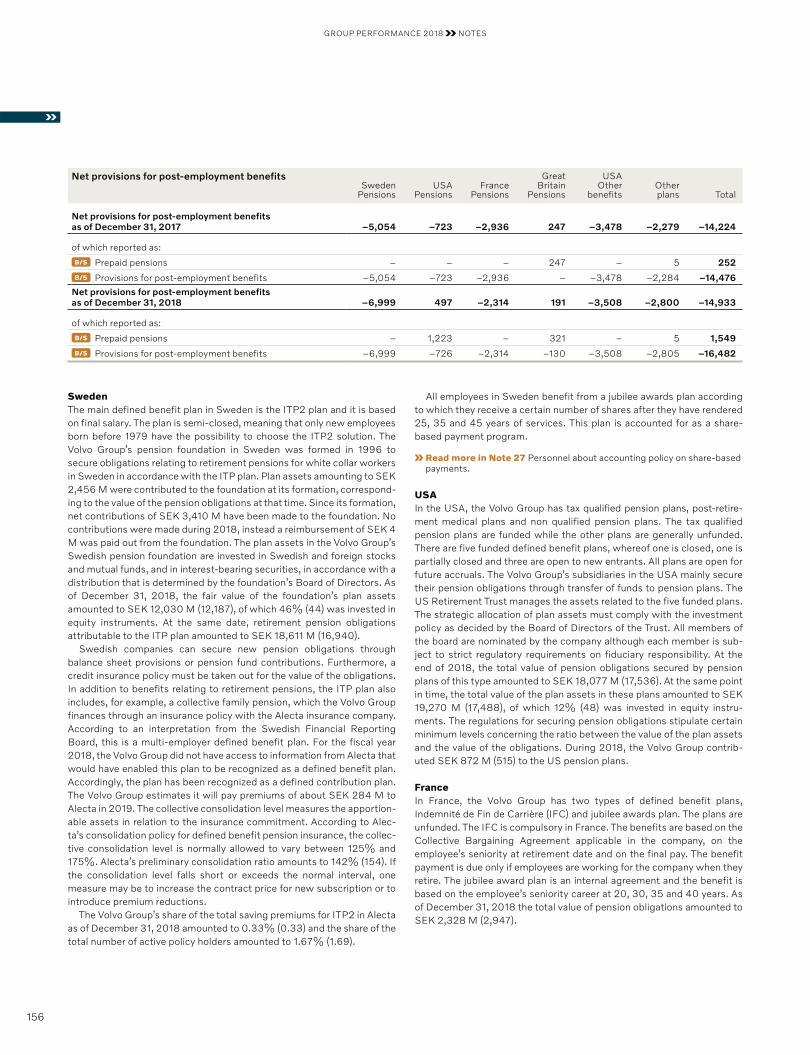
GROUP PERFORMANCE 2018 NOTES
Net provisions for post-employment benefitsSweden
PensionsUSA
PensionsFrance
Pensions
GreatBritain
Pensions
USA Other
benefitsOtherplans Total
Net provisions for post-employment benefits as of December 31, 2017 –5,054 –723 –2,936 247 –3,478 –2,279 –14,224
of which reported as:
B/S Prepaid pensions – – – 247 – 5 252
B/S Provisions for post-employment benefits –5,054 –723 –2,936 – –3,478 –2,284 –14,476
Net provisions for post-employment benefits as of December 31, 2018 –6,999 497 –2,314 191 –3,508 –2,800 –14,933
of which reported as:
B/S Prepaid pensions – 1,223 – 321 – 5 1,549
B/S Provisions for post-employment benefits –6,999 –726 –2,314 –130 –3,508 –2,805 –16,482
All employees in Sweden benefit from a jubilee awards plan according to which they receive a certain number of shares after they have rendered 25, 35 and 45 years of services. This plan is accounted for as a share-based payment program.
Read more in Note 27 Personnel about accounting policy on share-based payments.
USA In the USA, the Volvo Group has tax qualified pension plans, post-retire-ment medical plans and non qualified pension plans. The tax qualified pension plans are funded while the other plans are generally unfunded. There are five funded defined benefit plans, whereof one is closed, one is partially closed and three are open to new entrants. All plans are open for future accruals. The Volvo Group’s subsidiaries in the USA mainly secure their pension obligations through transfer of funds to pension plans. The US Retirement Trust manages the assets related to the five funded plans. The strategic allocation of plan assets must comply with the investment policy as decided by the Board of Directors of the Trust. All members of the board are nominated by the company although each member is sub-ject to strict regulatory requirements on fiduciary responsibility. At the end of 2018, the total value of pension obligations secured by pension plans of this type amounted to SEK 18,077 M (17,536). At the same point in time, the total value of the plan assets in these plans amounted to SEK 19,270 M (17,488), of which 12% (48) was invested in equity instru-ments. The regulations for securing pension obligations stipulate certain minimum levels concerning the ratio between the value of the plan assets and the value of the obligations. During 2018, the Volvo Group contrib-uted SEK 872 M (515) to the US pension plans.
France In France, the Volvo Group has two types of defined benefit plans, Indemnité de Fin de Carrière (IFC) and jubilee awards plan. The plans are unfunded. The IFC is compulsory in France. The benefits are based on the Collective Bargaining Agreement applicable in the company, on the employee’s seniority at retirement date and on the final pay. The benefit payment is due only if employees are working for the company when they retire. The jubilee award plan is an internal agreement and the benefit is based on the employee’s seniority career at 20, 30, 35 and 40 years. As of December 31, 2018 the total value of pension obligations amounted to SEK 2,328 M (2,947).
SwedenThe main defined benefit plan in Sweden is the ITP2 plan and it is based on final salary. The plan is semi-closed, meaning that only new employees born before 1979 have the possibility to choose the ITP2 solution. The Volvo Group’s pension foundation in Sweden was formed in 1996 to secure obligations relating to retirement pensions for white collar workers in Sweden in accordance with the ITP plan. Plan assets amounting to SEK 2,456 M were contributed to the foundation at its formation, correspond-ing to the value of the pension obligations at that time. Since its formation, net contributions of SEK 3,410 M have been made to the foundation. No contributions were made during 2018, instead a reimbursement of SEK 4 M was paid out from the foundation. The plan assets in the Volvo Group’s Swedish pension foundation are invested in Swedish and foreign stocks and mutual funds, and in interest-bearing securities, in accordance with a distribution that is determined by the foundation’s Board of Directors. As of December 31, 2018, the fair value of the foundation’s plan assets amounted to SEK 12,030 M (12,187), of which 46% (44) was invested in equity instruments. At the same date, retirement pension obligations attributable to the ITP plan amounted to SEK 18,611 M (16,940).
Swedish companies can secure new pension obligations through balance sheet provisions or pension fund contributions. Furthermore, a credit insurance policy must be taken out for the value of the obligations. In addition to benefits relating to retirement pensions, the ITP plan also includes, for example, a collective family pension, which the Volvo Group finances through an insurance policy with the Alecta insurance company. According to an interpretation from the Swedish Financial Reporting Board, this is a multi-employer defined benefit plan. For the fiscal year 2018, the Volvo Group did not have access to information from Alecta that would have enabled this plan to be recognized as a defined benefit plan. Accordingly, the plan has been recognized as a defined contribution plan. The Volvo Group estimates it will pay premiums of about SEK 284 M to Alecta in 2019. The collective consolidation level measures the apportion-able assets in relation to the insurance commitment. According to Alec-ta’s consolidation policy for defined benefit pension insurance, the collec-tive consolidation level is normally allowed to vary between 125% and 175%. Alecta’s preliminary consolidation ratio amounts to 142% (154). If the consolidation level falls short or exceeds the normal interval, one measure may be to increase the contract price for new subscription or to introduce premium reductions.
The Volvo Group’s share of the total saving premiums for ITP2 in Alecta as of December 31, 2018 amounted to 0.33% (0.33) and the share of the total number of active policy holders amounted to 1.67% (1.69).
156
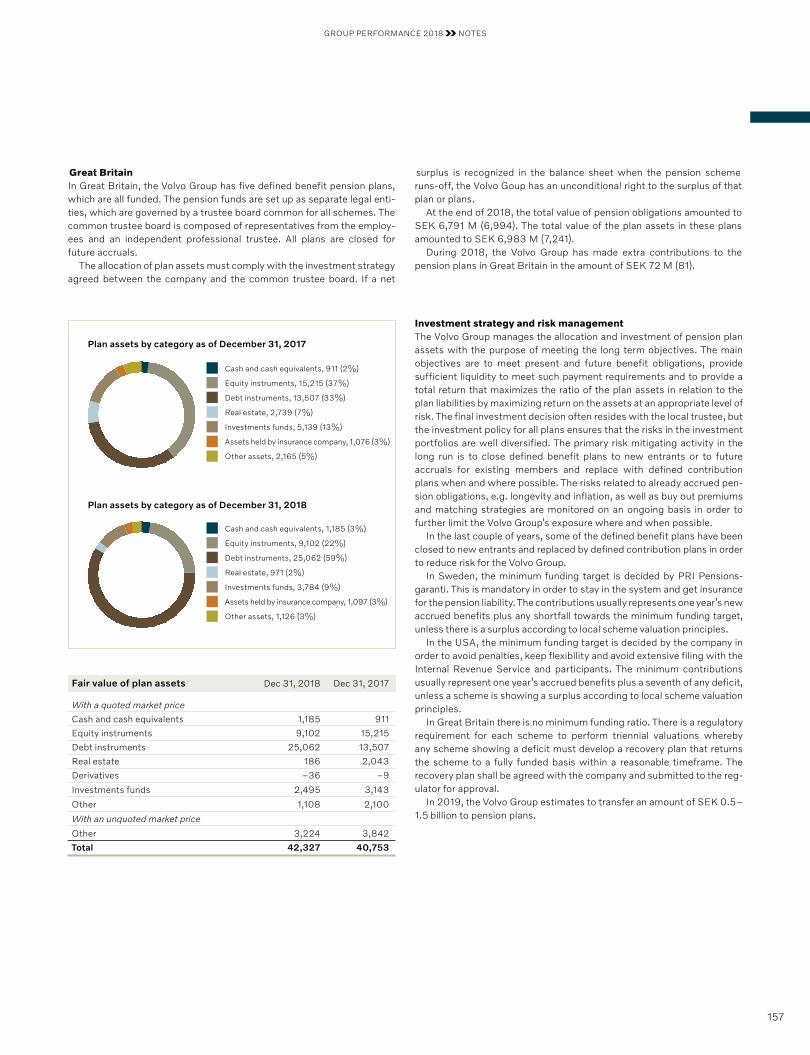
GROUP PERFORMANCE 2018 NOTES
Fair value of plan assets Dec 31, 2018 Dec 31, 2017
With a quoted market price
Cash and cash equivalents 1,185 911
Equity instruments 9,102 15,215
Debt instruments 25,062 13,507
Real estate 186 2,043
Derivatives –36 –9
Investments funds 2,495 3,143
Other 1,108 2,100
With an unquoted market price
Other 3,224 3,842
Total 42,327 40,753
Cash and cash equivalents, 1,185 (3%)
Equity instruments, 9,102 (22%)
Debt instruments, 25,062 (59%)
Real estate, 971 (2%)
Investments funds, 3,784 (9%)
Assets held by insurance company, 1,097 (3%)
Other assets, 1,126 (3%)
Plan assets by category as of December 31, 2017
Plan assets by category as of December 31, 2018
Cash and cash equivalents, 911 (2%)
Equity instruments, 15,215 (37%)
Debt instruments, 13,507 (33%)
Real estate, 2,739 (7%)
Investments funds, 5,139 (13%)
Assets held by insurance company, 1,076 (3%)
Other assets, 2,165 (5%)
Investment strategy and risk managementThe Volvo Group manages the allocation and investment of pension plan assets with the purpose of meeting the long term objectives. The main objectives are to meet present and future benefit obligations, provide sufficient liquidity to meet such payment requirements and to provide a total return that maximizes the ratio of the plan assets in relation to the plan liabilities by maximizing return on the assets at an appropriate level of risk. The final investment decision often resides with the local trustee, but the investment policy for all plans ensures that the risks in the investment portfolios are well diversified. The primary risk mitigating activity in the long run is to close defined benefit plans to new entrants or to future accruals for existing members and replace with defined contribution plans when and where possible. The risks related to already accrued pen-sion obligations, e.g. longevity and inflation, as well as buy out premiums and matching strategies are monitored on an ongoing basis in order to further limit the Volvo Group’s exposure where and when possible.
In the last couple of years, some of the defined benefit plans have been closed to new entrants and replaced by defined contribution plans in order to reduce risk for the Volvo Group.
In Sweden, the minimum funding target is decided by PRI Pensions-garanti. This is mandatory in order to stay in the system and get insurance for the pension liability. The contributions usually represents one year’s new accrued benefits plus any shortfall towards the minimum funding target, unless there is a surplus according to local scheme valuation principles.
In the USA, the minimum funding target is decided by the company in order to avoid penalties, keep flexibility and avoid extensive filing with the Internal Revenue Service and participants. The minimum contributions usually represent one year’s accrued benefits plus a seventh of any deficit, unless a scheme is showing a surplus according to local scheme valuation principles.
In Great Britain there is no minimum funding ratio. There is a regulatory requirement for each scheme to perform triennial valuations whereby any scheme showing a deficit must develop a recovery plan that returns the scheme to a fully funded basis within a reasonable timeframe. The recovery plan shall be agreed with the company and submitted to the reg-ulator for approval.
In 2019, the Volvo Group estimates to transfer an amount of SEK 0.5–1.5 billion to pension plans.
Great Britain In Great Britain, the Volvo Group has five defined benefit pension plans, which are all funded. The pension funds are set up as separate legal enti-ties, which are governed by a trustee board common for all schemes. The common trustee board is composed of representatives from the employ-ees and an independent professional trustee. All plans are closed for future accruals.
The allocation of plan assets must comply with the investment strategy agreed between the company and the common trustee board. If a net
surplus is recognized in the balance sheet when the pension scheme runs-off, the Volvo Goup has an unconditional right to the surplus of that plan or plans.
At the end of 2018, the total value of pension obligations amounted to SEK 6,791 M (6,994). The total value of the plan assets in these plans amounted to SEK 6,983 M (7,241).
During 2018, the Volvo Group has made extra contributions to the pension plans in Great Britain in the amount of SEK 72 M (81).
157
GROUP PERFORMANCE 2018 NOTES
ACCOUNTING POLICY
Provisions are recognized when a legal or constructive obligation exists as a result of a past event and it is probable that an outflow of resources will be required to settle the obligation and the amount can be reliably estimated.
Provisions for product warranty Estimated provisions for product warranties are recognized when the prod-ucts are sold as Cost of sales. The provision includes both expected con-tractual warranties and so called technical goodwill warranties (warranty cover in excess of contractual warranty or campaigns which is accepted as a matter of policy or normal practice in order to maintain a good busi-ness relation with the customer) and is determined based on historical sta-tistics considering known quality improvements, costs for remedy of defaults etc. Provision for campaigns in connection with specific quality problems are recognized when the campaign is decided.
Provisions for extended coverageAn extended coverage is a product insurance sold to a customer to cover a product according to specific conditions for an agreed period as an addi-tional insurance to the factory contractual warranty. The provision is intended to cover the risk that the expected cost of providing services under the contract exceed the expected revenue.
Provisions in insurance operationsVolvo Group has a captive insurance company and the provisions in insur-ance operations are related to third party claims addressed to companies within the Volvo Group. The claims reserve also includes a provision for unreported losses based on past experience. The unearned premium reserve is reported as an accrued expense within other current liabilities.
Provisions for restructuring costs A provision for decided restructuring measures is recognized when a detailed plan for the implementation of the measures is complete and when this plan is communicated to those who are affected. A provision and costs for termination benefits as a result of a voluntary termination program is recognized when the employee accepts the offer. Normally restructuring costs are included in other operating income and expenses.
Read more in Note 8 Other operating income and expenses about restructuring costs.
Provisions for residual value risks In the course of its operations, the Volvo Group is exposed to residual value risks through operating lease contracts and sales transactions with various residual value commitments (buybacks and tradebacks). Residual value commitments amounted to SEK 30,020 M (28,282) as of Decem-ber 31, 2018. Residual value risks are the risks that the Volvo Group in the future would have to dispose used products at a loss if the price develop-ment of these products is worse than what was expected when the contracts were entered. Residual value risks are reflected in differ ent ways in the Volvo Group’s consolidated financial statements.
When Industrial Operations enters into an operating lease contract or a sale with a residual value commitment where the vehicle is expected to be returned, the products are recognized in the balance sheet as Assets under operating leases. The residual value commitment agreed with the customer is recognized as current and non-current Residual value liabili-ties. Depreciation of Assets under operating leases is recognized on a straight-line basis over the commitment period. During the period, the depreciable amount is adjusted through the income statement to corre-
spond to estimated net realizable value to reflect any residual value risks at the end of the commitment period.
When Industrial Operations enters into a sales contract with a residual value commitment where the vehicle is not expected to be returned, the sale is recognized in accordance with the right of return model. In the balance sheet, a Right of return asset is recognized and refers to the right to recover the vehicle. A Refund liability is recognized as current and non-current liabilities and corresponds to the residual value commitment agreed with the customer. The Right of return asset is adjusted through the income statement to reflect any residual value risk at the end of the commitment period associated to the vehicle that might be returned.
For operating lease contracts which have been financed by Financial Services, the residual value liability towards the customer is being elimi-nated on Group level and instead recognized as a residual value provision. The provision represents the residual value risk for the Volvo Group for vehi-cles recognized as Assets under operating leases in Financial Services.
If the residual value risk commitment is independent from the sale transaction, the asset is not recognized in the balance sheet. Instead, the risk that the Volvo Group would have to dispose the used vehicles at a loss is reported as a residual value provision. To the extent the residual value exposure does not meet the definition of a provision, the gross exposure is reported as a contingent liability.
Read more in Note 7 Revenue.
Read more in Note 22 Liabilities about residual value liabilities.
Read more in Note 24 Contingent liabilities.
Provisions for service contractsService contracts offer the customer preventive maintenance according to an agreed service plan. The provision is intended to cover the risk that the expected cost of providing services and repairs under the contract exceeds the expected revenue.
SOURCE OF ESTIMATION UNCERTAINTY AND CRITICAL JUDGEMENTS
The uncertainties about the amount or timing of outflows vary for different kind of provisions. Regarding provisions for warranty, residual value risks, extended coverage and service contracts, the provisions are based on his-torical statistics and estimated future costs, why the provided amount has a high correlation with the outflow of resources. Regarding provisions for disputes, like tax and legal disputes, the uncertainty is higher.
Provisions for product warrantyWarranty provisions are estimated with consideration of historical statis-tics with regard to known changes in warranty claims, warranty periods, the average time-lag between faults occurring until claims are received by the company and anticipated changes in quality indexes. Differences between actual and estimated warranty cost affect the recognized expense and provisions in future periods. Re funds from suppliers, that decrease the Volvo Group’s warranty costs, are recognized to the extent these are considered to be certain.
Provisions for residual value risksThe assessment of residual value risks is based upon a continuing estima-tion of the used vehicles’ future net realizable values (fair market value). The estimated future net realizable value of the products at the end of the commitment period is monitored individually on a continuing basis. A
21 OTHER PROVISIONS
158
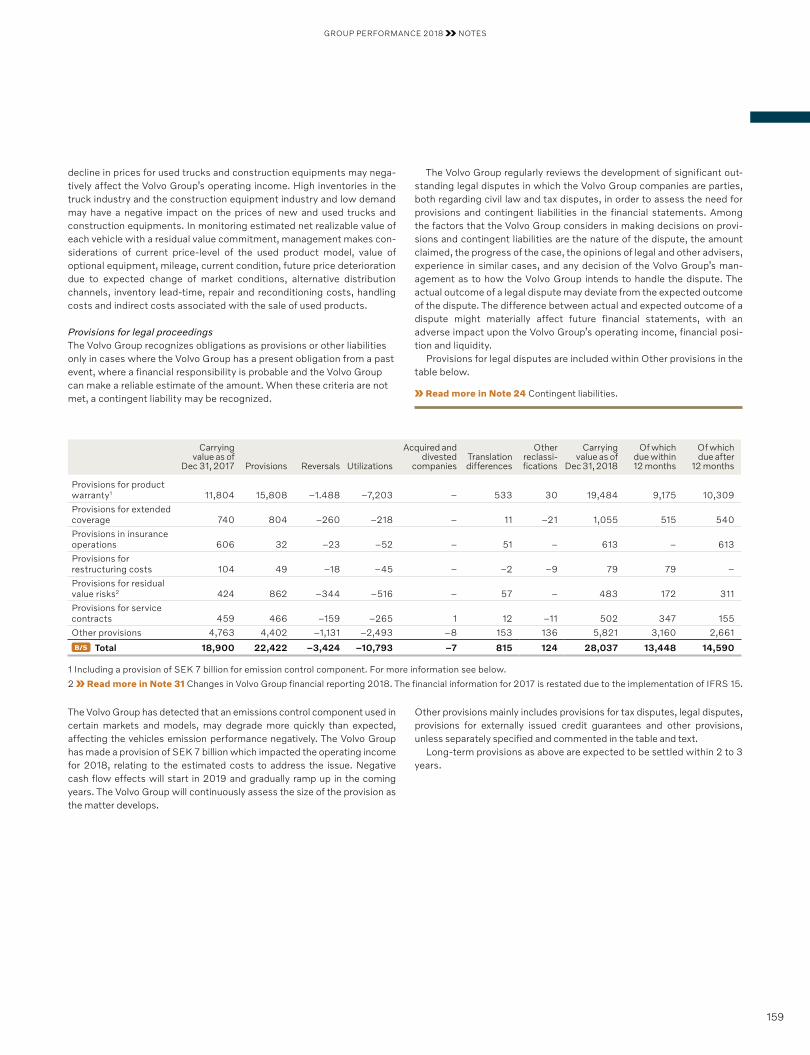
GROUP PERFORMANCE 2018 NOTES
decline in prices for used trucks and construction equipments may nega-tively affect the Volvo Group’s operating in come. High inventories in the truck industry and the construction equipment industry and low demand may have a negative impact on the prices of new and used trucks and construction equipments. In monitoring estimated net realizable value of each vehicle with a residual value commitment, management makes con-siderations of current price-level of the used product model, value of optional equipment, mileage, current condition, future price deterioration due to expected change of market conditions, alternative distribution channels, inventory lead-time, repair and reconditioning costs, handling costs and indirect costs associated with the sale of used products.
Provisions for legal proceedingsThe Volvo Group recognizes obligations as provisions or other liabilities only in cases where the Volvo Group has a present obligation from a past event, where a financial responsibility is probable and the Volvo Group can make a reliable estimate of the amount. When these criteria are not met, a contingent liability may be recognized.
The Volvo Group regularly reviews the development of significant out-standing legal disputes in which the Volvo Group companies are parties, both regarding civil law and tax disputes, in order to assess the need for provisions and contingent liabilities in the financial statements. Among the factors that the Volvo Group considers in making decisions on provi-sions and contingent liabilities are the nature of the dispute, the amount claimed, the progress of the case, the opinions of legal and other advisers, experience in similar cases, and any decision of the Volvo Group’s man-agement as to how the Volvo Group intends to handle the dispute. The actual outcome of a legal dispute may deviate from the expected outcome of the dispute. The difference between actual and expected outcome of a dispute might materially affect future financial statements, with an adverse impact upon the Volvo Group’s operating income, financial posi-tion and liquidity.
Provisions for legal disputes are included within Other provisions in the table below.
Read more in Note 24 Contingent liabilities.
Carryingvalue as of
Dec 31, 2017 Provisions Reversals Utilizations
Acquired and divested
companiesTrans lation differences
Other reclassi-fications
Carryingvalue as of
Dec 31, 2018
Of which due within 12 months
Of which due after
12 months
Provisions for product warranty1 11,804 15,808 –1.488 –7,203 – 533 30 19,484 9,175 10,309
Provisions for extended coverage 740 804 –260 –218 – 11 –21 1,055 515 540
Provisions in insurance operations 606 32 –23 –52 – 51 – 613 – 613
Provisions for restructuring costs 104 49 –18 –45 – –2 –9 79 79 –
Provisions for residual value risks2 424 862 –344 –516 – 57 – 483 172 311
Provisions for service contracts 459 466 –159 –265 1 12 –11 502 347 155
Other provisions 4,763 4,402 –1,131 –2,493 –8 153 136 5,821 3,160 2,661
B/S Total 18,900 22,422 –3,424 –10,793 –7 815 124 28,037 13,448 14,590
1 Including a provision of SEK 7 billion for emission control component. For more information see below.
2 Read more in Note 31 Changes in Volvo Group financial reporting 2018. The financial information for 2017 is restated due to the implementation of IFRS 15.
The Volvo Group has detected that an emissions control component used in certain markets and models, may degrade more quickly than expected, affecting the vehicles emission performance negatively. The Volvo Group has made a provision of SEK 7 billion which impacted the operating income for 2018, relating to the estimated costs to address the issue. Negative cash flow effects will start in 2019 and gradually ramp up in the coming years. The Volvo Group will continuously assess the size of the provision as the matter develops.
Other provisions mainly includes provisions for tax disputes, legal disputes, provisions for externally issued credit guarantees and other provisions, unless separately specified and commented in the table and text.
Long-term provisions as above are expected to be settled within 2 to 3 years.
159
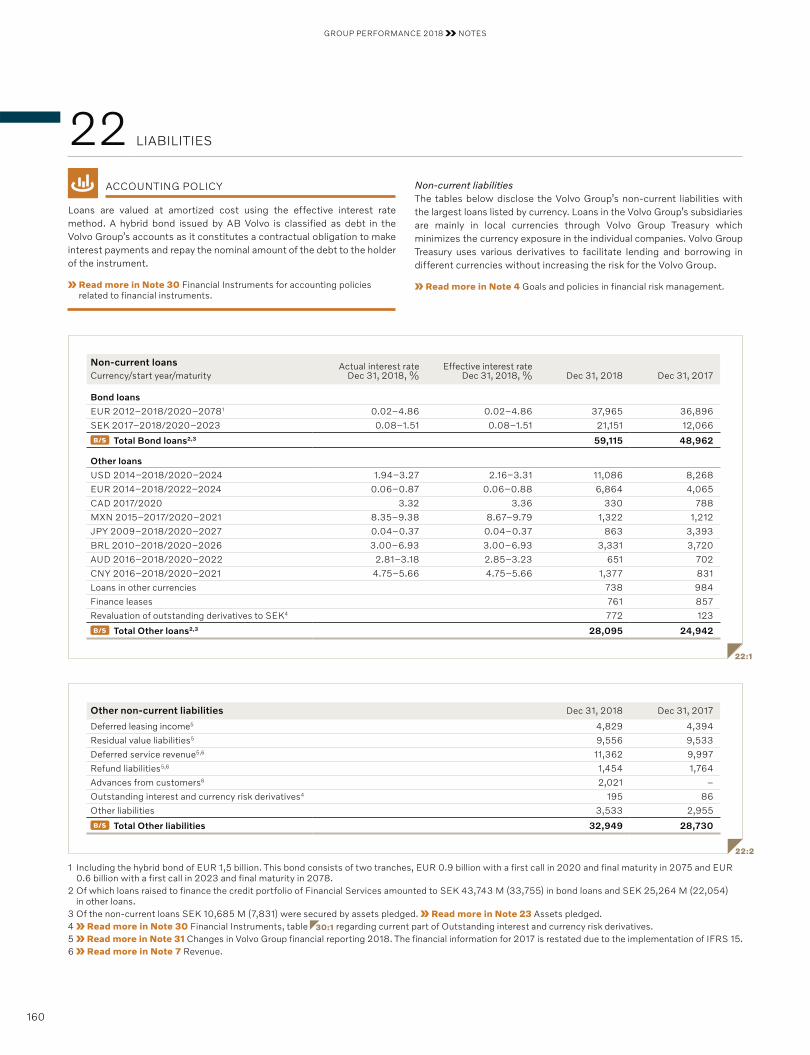
GROUP PERFORMANCE 2018 NOTES
ACCOUNTING POLICY
Loans are valued at amortized cost using the effective interest rate method. A hybrid bond issued by AB Volvo is classified as debt in the Volvo Group’s accounts as it constitutes a contractual obligation to make interest payments and repay the nominal amount of the debt to the holder of the instrument.
Read more in Note 30 Financial Instruments for accounting policies related to financial instruments.
Non-current liabilitiesThe tables below disclose the Volvo Group’s non-current liabilities with the largest loans listed by currency. Loans in the Volvo Group’s subsidiaries are mainly in local currencies through Volvo Group Treasury which minimizes the currency exposure in the individual companies. Volvo Group Treasury uses various derivatives to facilitate lending and borrowing in different currencies without increasing the risk for the Volvo Group.
Read more in Note 4 Goals and policies in financial risk management.
22:1
22:2
1 Including the hybrid bond of EUR 1,5 billion. This bond consists of two tranches, EUR 0.9 billion with a first call in 2020 and final maturity in 2075 and EUR 0.6 billion with a first call in 2023 and final maturity in 2078.
2 Of which loans raised to finance the credit portfolio of Financial Services amounted to SEK 43,743 M (33,755) in bond loans and SEK 25,264 M (22,054) in other loans.
3 Of the non-current loans SEK 10,685 M (7,831) were secured by assets pledged. Read more in Note 23 Assets pledged.4 Read more in Note 30 Financial Instruments, table 30:1 regarding current part of Outstanding interest and currency risk derivatives. 5 Read more in Note 31 Changes in Volvo Group financial reporting 2018. The financial information for 2017 is restated due to the implementation of IFRS 15.6 Read more in Note 7 Revenue.
22 LIABILITIES
Non-current loansCurrency/start year/maturity
Actual interest rate Dec 31, 2018, %
Effective interest rate Dec 31, 2018, % Dec 31, 2018 Dec 31, 2017
Bond loans
EUR 2012–2018/2020–20781 0.02–4.86 0.02–4.86 37,965 36,896
SEK 2017–2018/2020–2023 0.08–1.51 0.08–1.51 21,151 12,066
B/S Total Bond loans2,3 59,115 48,962
Other loans
USD 2014–2018/2020–2024 1.94–3.27 2.16–3.31 11,086 8,268
EUR 2014–2018/2022–2024 0.06–0.87 0.06–0.88 6,864 4,065
CAD 2017/2020 3.32 3.36 330 788
MXN 2015–2017/2020–2021 8.35–9.38 8.67–9.79 1,322 1,212
JPY 2009–2018/2020–2027 0.04–0.37 0.04–0.37 863 3,393
BRL 2010–2018/2020–2026 3.00–6.93 3.00–6.93 3,331 3,720
AUD 2016–2018/2020–2022 2.81–3.18 2.85–3.23 651 702
CNY 2016–2018/2020–2021 4.75–5.66 4.75–5.66 1,377 831
Loans in other currencies 738 984
Finance leases 761 857
Revaluation of outstanding derivatives to SEK4 772 123
B/S Total Other loans2,3 28,095 24,942
Other non-current liabilities Dec 31, 2018 Dec 31, 2017
Deferred leasing income5 4,829 4,394
Residual value liabilities5 9,556 9,533
Deferred service revenue5,6 11,362 9,997
Refund liabilities5,6 1,454 1,764
Advances from customers6 2,021 –
Outstanding interest and currency risk derivatives4 195 86
Other liabilities 3,533 2,955
B/S Total Other liabilities 32,949 28,730
160
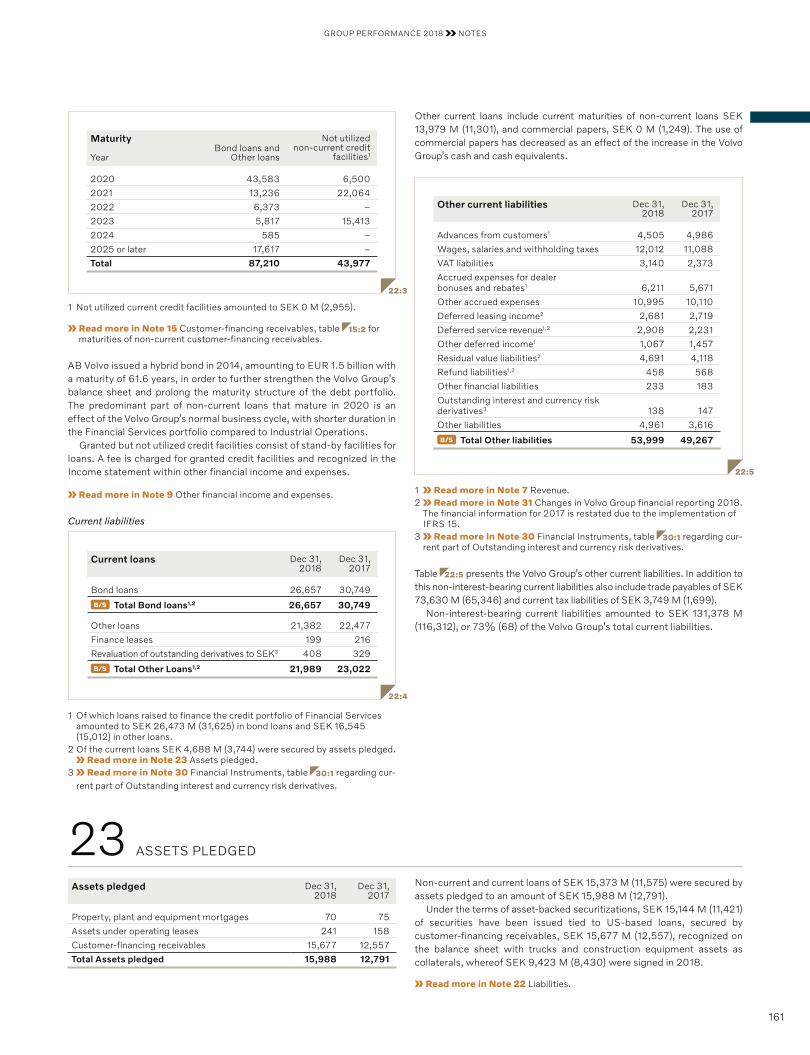
GROUP PERFORMANCE 2018 NOTES
22:3
Maturity
YearBond loans and
Other loans
Not utilized non-current credit
facilities1
2020 43,583 6,500
2021 13,236 22,064
2022 6,373 –
2023 5,817 15,413
2024 585 –
2025 or later 17,617 –
Total 87,210 43,977
1 Not utilized current credit facilities amounted to SEK 0 M (2,955).
Read more in Note 15 Customer-financing receivables, table 15:2 for maturities of non-current customer-financing receivables.
AB Volvo issued a hybrid bond in 2014, amounting to EUR 1.5 billion with a maturity of 61.6 years, in order to further strengthen the Volvo Group’s balance sheet and prolong the maturity structure of the debt portfolio. The predominant part of non-current loans that mature in 2020 is an effect of the Volvo Group’s normal business cycle, with shorter duration in the Financial Services portfolio compared to Industrial Operations.
Granted but not utilized credit facilities consist of stand-by facilities for loans. A fee is charged for granted credit facilities and recognized in the Income statement within other financial income and expenses.
Read more in Note 9 Other financial income and expenses.
Current liabilities
22:4
Current loans Dec 31,2018
Dec 31,2017
Bond loans 26,657 30,749
B/S Total Bond loans1,2 26,657 30,749
Other loans 21,382 22,477
Finance leases 199 216
Revaluation of outstanding derivatives to SEK3 408 329
B/S Total Other Loans1,2 21,989 23,022
1 Of which loans raised to finance the credit portfolio of Financial Services amounted to SEK 26,473 M (31,625) in bond loans and SEK 16,545 (15,012) in other loans.
2 Of the current loans SEK 4,688 M (3,744) were secured by assets pledged. Read more in Note 23 Assets pledged.
3 Read more in Note 30 Financial Instruments, table 30:1 regarding cur-rent part of Outstanding interest and currency risk derivatives.
Other current loans include current maturities of non-current loans SEK 13,979 M (11,301), and commercial papers, SEK 0 M (1,249). The use of commercial papers has decreased as an effect of the increase in the Volvo Group’s cash and cash equivalents.
22:5
Other current liabilities Dec 31,2018
Dec 31,2017
Advances from customers1 4,505 4,986
Wages, salaries and withholding taxes 12,012 11,088
VAT liabilities 3,140 2,373
Accrued expenses for dealer bonuses and rebates1 6,211 5,671
Other accrued expenses 10,995 10,110
Deferred leasing income2 2,681 2,719
Deferred service revenue1,2 2,908 2,231
Other deferred income1 1,067 1,457
Residual value liabilities2 4,691 4,118
Refund liabilities1,2 458 568
Other financial liabilities 233 183
Outstanding interest and currency risk derivatives 3 138 147
Other liabilities 4,961 3,616
B/S Total Other liabilities 53,999 49,267
1 Read more in Note 7 Revenue. 2 Read more in Note 31 Changes in Volvo Group financial reporting 2018.
The financial information for 2017 is restated due to the implementation of IFRS 15.
3 Read more in Note 30 Financial Instruments, table 30:1 regarding cur-rent part of Outstanding interest and currency risk derivatives.
Table 22:5 presents the Volvo Group’s other current liabilities. In addition to this non-interest-bearing current liabilities also include trade payables of SEK 73,630 M (65,346) and current tax liabilities of SEK 3,749 M (1,699).
Non-interest-bearing current liabilities amounted to SEK 131,378 M (116,312), or 73% (68) of the Volvo Group’s total current liabilities.
Assets pledged Dec 31,2018
Dec 31,2017
Property, plant and equipment mortgages 70 75
Assets under operating leases 241 158
Customer-financing receivables 15,677 12,557
Total Assets pledged 15,988 12,791
Non-current and current loans of SEK 15,373 M (11,575) were secured by assets pledged to an amount of SEK 15,988 M (12,791).
Under the terms of asset-backed securitizations, SEK 15,144 M (11,421) of securities have been issued tied to US-based loans, secured by customer-financing receivables, SEK 15,677 M (12,557), recognized on the balance sheet with trucks and construction equipment assets as collaterals, whereof SEK 9,423 M (8,430) were signed in 2018.
Read more in Note 22 Liabilities.
23 ASSETS PLEDGED
161
GROUP PERFORMANCE 2018 NOTES
ACCOUNTING POLICY
Contingent liabilities A contingent liability is recognized for a possible obligation, for which it is not yet confirmed that a present obligation exists that could lead to an outflow of resources. Alternatively, there is a present obligation that does not meet the definitions of a provision or a liability as it is not probable that an outflow of resources will be required to settle the obligation or when a sufficiently reliable estimate of the amount cannot be made.
Contingent liabilities Dec 31,2018
Dec 31,2017
Credit guarantees issued for customers and others 2,435 1,352
Tax claims 4,929 5,159
Residual value commitments1 1,766 2,267
Other contingent liabilities 5,117 4,376
Total contingent liabilities 14,247 13,154
1 Read more in Note 31 Changes in Volvo Group financial reporting 2018. The financial information for 2017 is restated due to the implementation of IFRS 15.
Total contingent liabilities at December 31, 2018, amounted to net SEK 14,247M (13,154) and included no contingent assets.
Credit guarantees issued amounted to SEK 2,435 M (1,352). The recog-nized amount for credit guarantees corresponds to the gross exposure and has not been reduced by the value of counter guarantees received or other collaterals such as the right to repossess the products in cases where a legal offsetting right does not exist. The value of counter guarantees and other collaterals reducing the exposure is dependent on the development of used products prices and on the possibility to repossess the products.
A major part of the credit guarantees pertains to the credit guarantees related to Chinese dealers and retail customers within Construction Equipment. The increase compared to last year is an effect of higher sales in Construction Equipment in China. The risk exposure related to credit guarantees for construction equipment sold in China prior to 2016 is no longer considered to be material.
Tax claims amounted to SEK 4,929 M (5,159) and pertained to charges against the Volvo Group for which the criteria for recognizing a provision were not met. Global companies such as the Volvo Group are occasionally involved in tax processes of varying scope and in various stages. Volvo
Group regularly assesses these tax processes. When it is probable that additional taxes must be paid and the outcome can be reasonably estimated, the required provision is made. Out of total tax claims, SEK 1.8 billion (2.1) is related to a transfer price audit in Brazil and SEK 1.1 billion (1.1) to a custom duties audit in India.
Residual value commitments amounted to SEK 1,766 M (2,267) and were attributable to sales transactions with residual value commitments (buy-backs and tradebacks). The recognized amount corresponds to the gross exposure and has not been reduced by the estimated net selling price of used products taken as collaterals. To the extent the used products per-taining to those transactions are expected to be disposed at a loss, a pro-vision for residual value risk is recognized.
Read more in Note 21 Other provisions about provisions for residual value risks.
Other contingent liabilities amounted to SEK 5,117 M (4,376) and included for example bid and performance clauses and legal proceedings.
Legal proceedings In January 2011, the Volvo Group and a number of other companies in the truck industry became part of an investigation by the European Commis-sion regarding a possible violation of EU antitrust rules. The Volvo Group co-operated fully with the European Commission in the investigation. In July 2016, the Volvo Group reached a settlement with the European Com-mission in the investigation. Following the adoption of the European Commission’s settlement decision, the Volvo Group has received and will be defending itself against numerous private damages claims brought by customers and other third parties alleging that they suffered loss by rea-son of the conduct covered in the decision. The claims are being brought in various countries by claimants either acting individually or as part of a wider group or class of claimants. Further claims are likely to be com-menced. At this stage, it is not possible to make a reliable estimate of the amount of any liability that could arise from any such proceedings.
The Volvo Group is also involved in a number of legal proceedings other than those described above. The Volvo Group’s assessment is that such other legal proceedings in aggregate are not likely to entail any risk of having a material effect on the Volvo Group’s financial position.
Detected premature degradation of emissions control componentThe Volvo Group has detected that an emissions control component used in certain markets and models, may degrade more quickly than expected, affecting the vehicles emission performance negatively. The Volvo Group has made a provision that will be continuously assessed as the matter develops.
Read more in Note 21 Other provisions
24 CONTINGENT LIABILITIES
162
GROUP PERFORMANCE 2018 NOTES
Transactions between AB Volvo and its subsidiaries, which are related parties to AB Volvo, have been eliminated in the Group and are not disclosed in this note.
Sales of goods, services and other income
Purchases of goods, services and other expense
2018 2017 2018 2017
Associated companies 1,544 1,426 100 1,354
Joint ventures 1,695 2,059 1,023 901
Other related companies 96 22 853 590
Receivables Payables
Dec 31, 2018 Dec 31, 2017 Dec 31, 2018 Dec 31, 2017
Associated companies 290 369 33 93
Joint ventures 353 419 166 63
Other related companies 80 16 252 243
The Volvo Group engages in transactions with some of its associated companies. The transactions consist mainly of sales of vehicles and parts to dealers and importers as well as purchases mainly consisting of parts.
The Volvo Group engages in transactions with its joint ventures. The transactions consist mainly of sales of vehicles, parts and services as well as purchases consisting mainly of engines.
ACCOUNTING POLICY
Government grants are financial grants from governmental or supra-national bodies received by the Volvo Group in exchange for fulfillment of certain conditions.
Government grants related to assets are presented in the balance sheet by deducting the grants from the carrying amount of the asset. Government grants related to income are reported as a deferred income in the balance sheet and recognized in the income statement over the periods to match the related costs. If the costs incur before the grants have been received, but there is an agreement that grants will be received, grants are recognized in the income statement to match the related costs.
In 2018, government grants of SEK 649 M (661) were received, and SEK 636 M (706) were recognized in the income statement. The amount includes tax credits of SEK 371 M (313) related to product development, which were primarily received in France and in the United States. Other grants were mainly received from Swedish, Chinese and US governmen-tal organizations and from the European Commission.
25 TRANSACTIONS WITH RELATED PARTIES
26 GOVERNMENT GRANTS
The Volvo Group engages in transactions with other related companies, which mainly consist of sales of machines and purchases of vehicles for resale.
Commercial terms and market prices apply for all related party trans-actions.
Read more in Note 5 Investments in joint ventures, associated companies and other shares and participations.
163
GROUP PERFORMANCE 2018 NOTES
Fees paid to the Board of DirectorsAccording to a resolution adopted at the Annual General Meeting 2018, the fee to the Board of Directors appointed at the Annual General Meeting for the period until the close of the Annual General Meeting 2019 shall be paid as follows: The Chairman of the Board should be awarded SEK 3,500,000 and each of the other members SEK 1,030,000 with excep-tion of the President and CEO of AB Volvo, who does not receive a direc-tor’s fee. In addition, SEK 360,000 should be awarded to the Chairman of the Audit Committee and SEK 165,000 to each of the other members of the Audit Committee, and SEK 150,000 to the Chairman of the Remu-neration Committee and SEK 110,000 to each of the other members of the Remuneration Committee. Finally, SEK 180,000 should be awared to the Chairman of the Business Area Committee and to the other members of the Business Area Committee SEK 155,000 each.
Terms of employment and remuneration to the CEOFixed salary, short-term and long-term incentivesThe President and CEO is entitled to a remuneration consisting of a fixed annual salary and short-term and long-term incentives. During the finan-cial year 2018, the short-term and long-term incentives are based on EBIT and cash flow for the Volvo Group. The short-term and long-term incentives, each, amounts to a maximum of 100% of the annual base salary.
For the financial year 2018, Martin Lundstedt received a fixed salary including vacation payment of SEK 14,578,361 and a short-term incen-tive of SEK 12,471,729. The short-term incentive was 87.7% of the annual base salary. Other benefits, mainly pertaining to car and housing, amounted to SEK 300,184 in 2018. Martin Lundstedt was also partici-pating in the long-term incentive program decided by the Board of Direc-tors. During the financial year the outcome of the long-term incentive pro-gram amounted to SEK 10,018,624, which was 70.5% of the base salary. The full net amount shall be invested in Volvo B shares. There is to be no pay-out of the amount if the Annual Meeting held in 2019 decides not to distribute any dividends to the shareholders for 2018.
PensionsThe President and CEO is covered both by pension benefits provided under collective bargain agreements and by the Volvo Management Pension (VMP) and Volvo Executive Pension (VEP) plans. Both VMP and VEP are defined contribution plans. The pensionable salary consists of the annual salary, vacation payment and a calculated short-term variable pay. The premium for the VMP is SEK 30,000 per year plus 20% of pension-able salary over 30 income base amounts and the premium for VEP is 10% of pensionable salary. There are no commitments other than the pay-ment of the premiums. In addition to the collective bargain agreement (ITP), the disability pension is 25% of pensionable salary between 7,5 price base amounts and 20 income base amounts, 37.5% of pensionable salary between 20–30 income base amounts and 50% of pensionable salary between 30–50 income base amounts. The right to disability pen-sion is conditional to employment and will cease upon termination of employment.
The President and CEO is also covered by Volvo Företags pension, a defined contribution plan for additional retirement benefit. The premium is negotiated each year. For 2018, the premium amounted to SEK 8,016 for the full year.
Total pension premiums for Martin Lundstedt amounted to SEK 6,084,607 in 2018.
ACCOUNTING POLICY
Incentive programsThe Volvo Group has a long-term incentive program that is accounted for in accordance with IAS 19 Employee benefits. During the vesting period, the incentive program is recognized as an expense and as a short-term liability.
The Volvo Group also has a share-based incentive program for the years 2014 to 2015. The fair value of the equity-settled payments is determined at the grant date, recognized as an expense during the vesting period and offset in equity. The fair value is based on the share price reduced by divi-dends connected with the share during the vesting period.
The cash-settled payment is revalued at each balance sheet date and is recognized as an expense during the vesting period and as a short-term liability.
Remuneration policy decided at the Annual General Meeting in 2018The Annual General Meeting of 2018 decided upon a policy on remunera-tion and other employment terms for the members of the Volvo Group Executive Board. The decided principles are summarized as follows:
The remuneration and the other terms of employment of the Executives shall be competitive so that the Volvo Group can attract and retain com-petent Executives. The total remuneration to Executives consists of fixed salary, short-term and long-term incentives, pension and other benefits. Short-term and long-term incentives shall be linked to predetermined and measurable criteria relating to EBIT and cash flow targets for the Volvo Group, devised to promote the long-term value creation of the Volvo Group and strengthen the link between achieved performance targets and rewards. The criteria for short-term and long-term incentives shall be determined by the Board annually.
Short-term incentive may, as regards the President & CEO, amount to a maximum of 100% of the fixed salary and, as regards other Executives, a maximum of 80% of the fixed salary.
Long-term incentive may, as regards the President & CEO, amount to a maximum of 100% of the fixed salary and, as regards other Executives, a maximum of 80% of the fixed salary. The long-term incentive program for the Volvo Group’s top executives, including the Executives, is cash-based. Awards under the program, based on how well the performance targets are achieved, are disbursed in cash to the participants on the condition that they invest the net award in AB Volvo shares and that they retain the shares for at least three years.
Any new share-based incentive program, will, where applicable, be resolved by the General Meeting, but no such program is currently proposed.
For Executives resident in Sweden, the notice period upon termination by the company shall not exceed 12 months and the notice period upon termination by the Executive shall not exceed 6 months. In addition, in the event of termination by the company, the Executive may be entitled to a maximum of 12 months’ severance pay.
Executives resident outside Sweden or resident in Sweden but having a material connection to or having been resident in a country other than Sweden may be offered notice periods for termination and severance pay-ment that are competitive in the country where the Executives are or have been resident or to which the Executives have a material connection, prefer ably solutions comparable to the solutions applied to Executives resident in Sweden.
The Board of Directors may deviate from this policy if there are special reasons to do so in an individual case.
27 PERSONNEL
164
GROUP PERFORMANCE 2018 NOTES
Severance paymentsMartin Lundstedt has a 12 months notice period upon termination by AB Volvo and a 6 months notice period upon termination on his own initiative. If terminated by the company, Martin Lundstedt is entitled to a severance payment equivalent to 12 months’ salary. In the event of new employment during the severance period, the severance pay is reduced with an amount equal to 100% of the income from the new employment.
Remuneration to the Group Executive Board Fixed salary, short-term and long-term incentivesMembers of the Group Executive Board receive short-term and long-term incentives in addition to fixed salaries. During the financial year 2018, the short-term and long-term incentives are based on EBIT and cash flow for the Volvo Group. In 2018, short-term and long-term incentives, for Group Executive Board members excluding the CEO, could each amount to a maximum of 80% of the annual base salary.
For the financial year 2018, fixed salaries amounted to SEK 73,510,127 and a sign-on bonus amounted to SEK 4,590,000. Short-term incentive amounted to SEK 49,954,990 for Group Executive Board members excluding the CEO. The short-term incentive was in average 69.3% of the annual base salary. The Group Executive Board comprised, excluding the CEO, of 12 members at the beginning and 13 at the end of the year. Other benefits, mainly pertaining to car and housing, amounted to SEK 12,575,800 in 2018.
Group Executive Board members participate in the long-term share-based incentive programs decided by the Annual General Meeting 2014. During 2018, 132,808 shares granted under the 2014 and 2015 pro-grams corresponding to a taxable value of SEK 20,295,124 have been allotted to Group Executive Board members.
The Group Executive Board also participate in the long-term incentive program decided by the Board of Directors in 2018. During the financial year the outcome of the long-term incentive program, for the Group Exec-utive Board members, excluding the CEO, amounted to SEK 40,610,751 of which the full net amount shall be invested in Volvo B shares. The long-term incentive was 56.4% of the annual base salaries. There is to be no pay-out of the amount if the Annual Meeting held in 2019 decides not to distribute any dividends to the shareholders for 2018.
PensionsGroup Executive Board members enrolled in the Swedish pension plan are also covered by a defined contribution plan, Volvo Executive Pension plan (VEP) with pension premium payments at the longest to the age of 65 years. The premium is 10% of pensionable salary. As a complement to the collective bargain agreement regarding occupational pension, members of the Group Executive Board enrolled in the Swedish pensions plan and who are born before 1979 are also covered by a defined contribution pen-sion plan, Volvo Management Pension (VMP). The premium is SEK 30,000 per year plus 20% of pensionable salary over 30 income base amounts. The pensionable salary consists of the annual salary, vacation payment and a calculated short-term variable pay. Pension premiums for the Group Executive Board, excluding the CEO, amounted to SEK 24,857,202 in 2018.
Severance payments The employment contracts for Group Executive Board members contain rules governing severance payments when the company terminates the employment. For Executives resident in Sweden, the notice period upon termination by the company shall not exceed 12 months and the notice period upon termination by the Executive shall not exceed 6 months. In addition, in the event of termination by the company, the Executive is entitled to a maximum of 12 months’ severance pay.
Executives resident outside Sweden or resident in Sweden but having a material connection to or having been resident in a country other than Sweden may be offered notice periods for termination and severance pay-ment that are competitive in the country where the Executives are or have been resident or to which the Executives have a material connection, prefer ably solutions comparable to the solutions applied to Executives resident in Sweden.
Volvo Group’s total costs for remuneration and benefits to the Group Executive Board The total costs for remuneration and benefits to the Group Executive Board amounted to SEK 313 M (333) and pertained to fixed salary, short-term and long-term incentives, other benefits and pensions. It also included social fees on salaries and benefits, special payroll tax and addi-tional costs for other benefits. The cost related to the long-term share-based incentive program is reflected over the vesting period and amounted to SEK 1 M (13) for 2018. The remuneration model of the Volvo Group is to a main part designed to follow changes in the profit ability of the Volvo Group.
Long-term incentive programs Long-term share-based incentive program 2014–2015The Annual General Meeting held in 2014 approved a long-term share-based incentive program for up to 300 Group and Senior Executives and comprising the years 2014 to 2016. In 2016 the Board of Director’s approved this program to be replaced by a new program as from 2016 with the effect of terminating current program one year in advance. During 2018, all of the shares granted under the programs during 2014 have been allotted and the majority of the 2015 programs’ shares have been allotted to the participants. Allotments of all remaining shares and the termination of the program is expected during the upcoming fiscal year. Long-term incentive program valid from 2016The Board of Directors have in 2016 approved a long-term cash-based incentive program comprising the top 300 Executives in the Volvo Group. This program replaces the previous long-term share-based incentive program approved in 2014. A prerequisite for participation in the program is that the participants shall undertake to invest the annual net (after tax) payout amounts under the plan in Volvo B-shares and to hold those shares for at least three years.
Long-term incentive may, as regards the President & CEO, amount to a maximum of 100% of the fixed salary and, as regards other Executives, a maximum of 80% of the fixed salary. There will however be no payout under the long-term incentive program if the Annual General Meeting that is held in the year following the performance year, decides not to distribute any dividends to the shareholders.
165
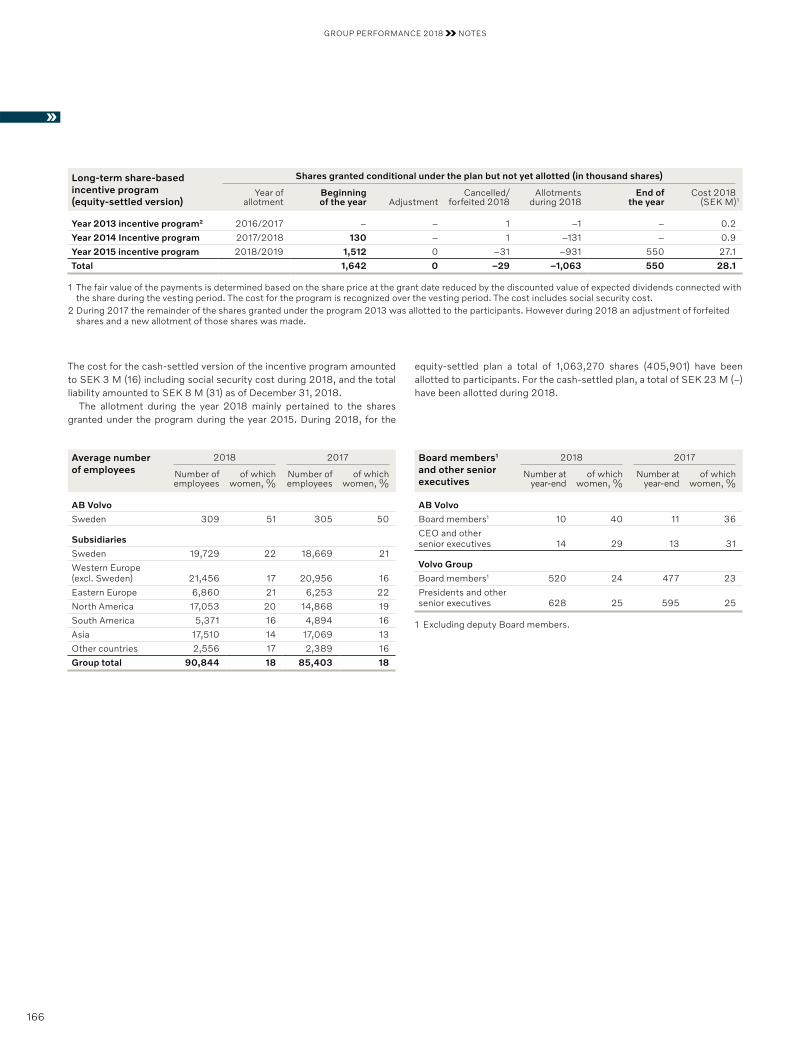
GROUP PERFORMANCE 2018 NOTES
Long-term share-based incentive program (equity-settled version)
Shares granted conditional under the plan but not yet allotted (in thousand shares)
Year of allotment
Beginning of the year Adjustment
Cancelled/ forfeited 2018
Allotments during 2018
End of the year
Cost 2018(SEK M)1
Year 2013 incentive program2 2016/2017 – – 1 –1 – 0.2
Year 2014 Incentive program 2017/2018 130 – 1 –131 – 0.9
Year 2015 incentive program 2018/2019 1,512 0 –31 –931 550 27.1
Total 1,642 0 –29 –1,063 550 28.1
1 The fair value of the payments is determined based on the share price at the grant date reduced by the discounted value of expected dividends connected with the share during the vesting period. The cost for the program is recognized over the vesting period. The cost includes social security cost.
2 During 2017 the remainder of the shares granted under the program 2013 was allotted to the participants. However during 2018 an adjustment of forfeited shares and a new allotment of those shares was made.
Average numberof employees
2018 2017
Number ofemployees
of whichwomen, %
Number ofemployees
of whichwomen, %
AB Volvo
Sweden 309 51 305 50
Subsidiaries
Sweden 19,729 22 18,669 21
Western Europe (excl. Sweden) 21,456 17 20,956 16
Eastern Europe 6,860 21 6,253 22
North America 17,053 20 14,868 19
South America 5,371 16 4,894 16
Asia 17,510 14 17,069 13
Other countries 2,556 17 2,389 16
Group total 90,844 18 85,403 18
Board members1
and other senior executives
2018 2017
Number at year-end
of whichwomen, %
Number at year-end
of whichwomen, %
AB Volvo
Board members1 10 40 11 36
CEO and other senior executives 14 29 13 31
Volvo Group
Board members1 520 24 477 23
Presidents and other senior executives 628 25 595 25
1 Excluding deputy Board members.
The cost for the cash-settled version of the incentive program amounted to SEK 3 M (16) including social security cost during 2018, and the total liability amounted to SEK 8 M (31) as of December 31, 2018.
The allotment during the year 2018 mainly pertained to the shares granted under the program during the year 2015. During 2018, for the
equity-settled plan a total of 1,063,270 shares (405,901) have been allotted to participants. For the cash-settled plan, a total of SEK 23 M (–) have been allotted during 2018.
166
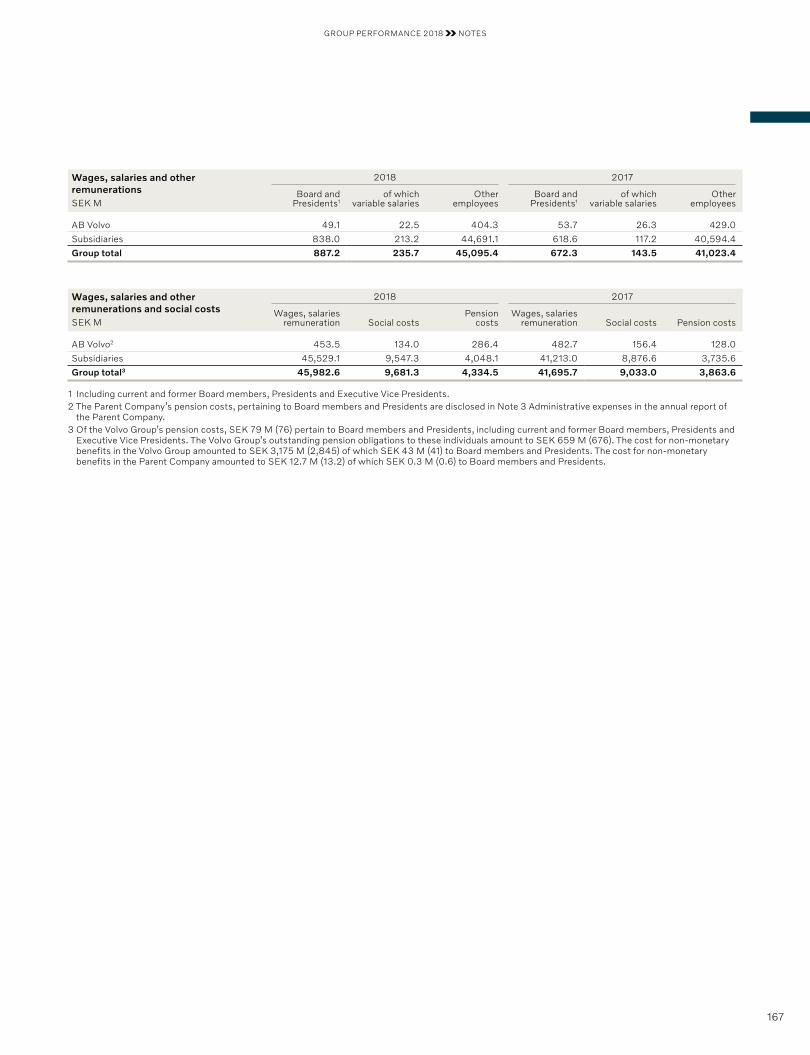
GROUP PERFORMANCE 2018 NOTES
Wages, salaries and other remunerationsSEK M
2018 2017
Board and Presidents1
of which variable salaries
Otheremployees
Board and Presidents1
of which variable salaries
Otheremployees
AB Volvo 49.1 22.5 404.3 53.7 26.3 429.0
Subsidiaries 838.0 213.2 44,691.1 618.6 117.2 40,594.4
Group total 887.2 235.7 45,095.4 672.3 143.5 41,023.4
Wages, salaries and other remunerations and social costsSEK M
2018 2017
Wages, salaries remuneration Social costs
Pensioncosts
Wages, salaries remuneration Social costs Pension costs
AB Volvo2 453.5 134.0 286.4 482.7 156.4 128.0
Subsidiaries 45,529.1 9,547.3 4,048.1 41,213.0 8,876.6 3,735.6
Group total3 45,982.6 9,681.3 4,334.5 41,695.7 9,033.0 3,863.6
1 Including current and former Board members, Presidents and Executive Vice Presidents.2 The Parent Company’s pension costs, pertaining to Board members and Presidents are disclosed in Note 3 Administrative expenses in the annual report of
the Parent Company.3 Of the Volvo Group’s pension costs, SEK 79 M (76) pertain to Board members and Presidents, including current and former Board members, Presidents and
Executive Vice Presidents. The Volvo Group’s outstanding pension obligations to these individuals amount to SEK 659 M (676). The cost for non-monetary benefits in the Volvo Group amounted to SEK 3,175 M (2,845) of which SEK 43 M (41) to Board members and Presidents. The cost for non-monetary benefits in the Parent Company amounted to SEK 12.7 M (13.2) of which SEK 0.3 M (0.6) to Board members and Presidents.
167
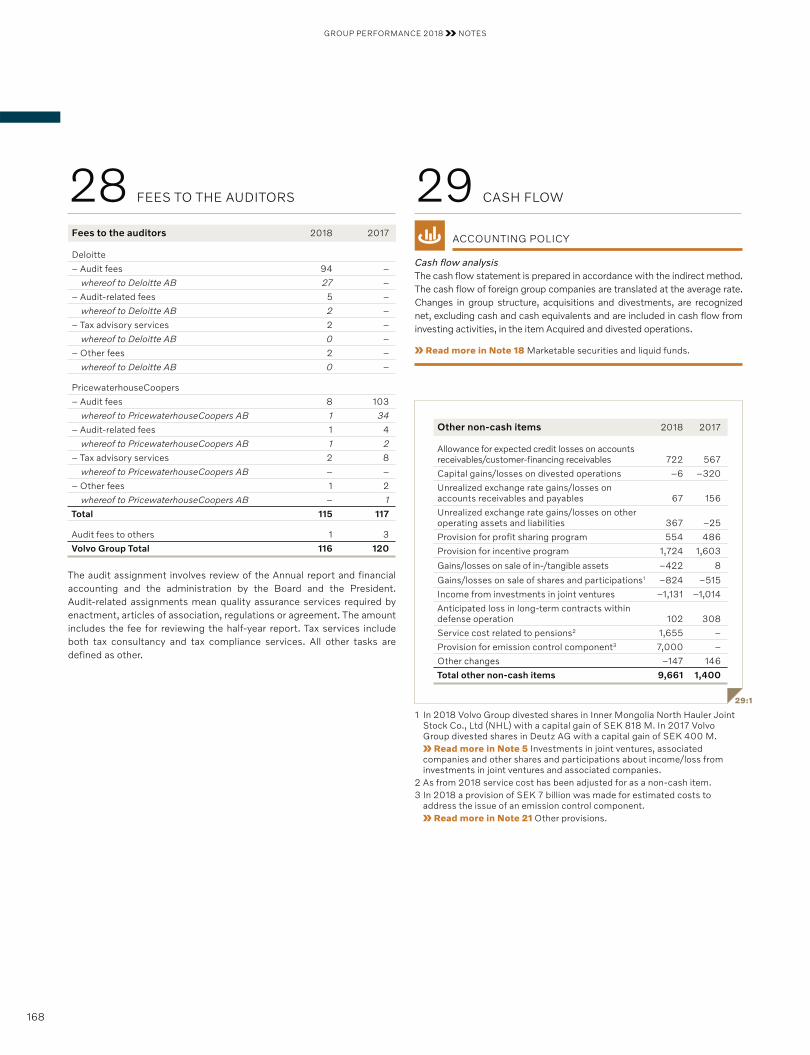
GROUP PERFORMANCE 2018 NOTES
ACCOUNTING POLICY
Cash flow analysis The cash flow statement is prepared in accordance with the indirect method. The cash flow of foreign group companies are translated at the average rate. Changes in group structure, acquisitions and divestments, are recognized net, excluding cash and cash equivalents and are included in cash flow from investing activities, in the item Acquired and divested operations.
Read more in Note 18 Marketable securities and liquid funds.
1 In 2018 Volvo Group divested shares in Inner Mongolia North Hauler Joint Stock Co., Ltd (NHL) with a capital gain of SEK 818 M. In 2017 Volvo Group divested shares in Deutz AG with a capital gain of SEK 400 M.
Read more in Note 5 Investments in joint ventures, associated companies and other shares and participations about income/loss from investments in joint ventures and associated companies.
2 As from 2018 service cost has been adjusted for as a non-cash item.3 In 2018 a provision of SEK 7 billion was made for estimated costs to
address the issue of an emission control component. Read more in Note 21 Other provisions.
29 CASH FLOW
Fees to the auditors 2018 2017
Deloitte
– Audit fees 94 –
whereof to Deloitte AB 27 –
– Audit-related fees 5 –
whereof to Deloitte AB 2 –
– Tax advisory services 2 –
whereof to Deloitte AB 0 –
– Other fees 2 –
whereof to Deloitte AB 0 –
PricewaterhouseCoopers
– Audit fees 8 103
whereof to PricewaterhouseCoopers AB 1 34
– Audit-related fees 1 4
whereof to PricewaterhouseCoopers AB 1 2
– Tax advisory services 2 8
whereof to PricewaterhouseCoopers AB – –
– Other fees 1 2
whereof to PricewaterhouseCoopers AB – 1
Total 115 117
Audit fees to others 1 3
Volvo Group Total 116 120
The audit assignment involves review of the Annual report and financial accounting and the administration by the Board and the President. Audit-related assignments mean quality assurance services required by enactment, articles of association, regulations or agreement. The amount includes the fee for reviewing the half-year report. Tax services include both tax consultancy and tax compliance services. All other tasks are defined as other.
28 FEES TO THE AUDITORS
29:1
Other non-cash items 2018 2017
Allowance for expected credit losses on accounts receivables/customer-financing receivables 722 567
Capital gains/losses on divested operations –6 –320
Unrealized exchange rate gains/losses on accounts receivables and payables 67 156
Unrealized exchange rate gains/losses on other operating assets and liabilities 367 –25
Provision for profit sharing program 554 486
Provision for incentive program 1,724 1,603
Gains/losses on sale of in-/tangible assets –422 8
Gains/losses on sale of shares and participations1 –824 –515
Income from investments in joint ventures –1,131 –1,014
Anticipated loss in long-term contracts within defense operation 102 308
Service cost related to pensions2 1,655 –
Provision for emission control component3 7,000 –
Other changes –147 146
Total other non-cash items 9,661 1,400
168

GROUP PERFORMANCE 2018 NOTES
Net borrowings increased by SEK 1.9 billion (–9.0) mainly as an effect of higher new business volume in Financial Services.
Syndications were performed in Financial Services to an amount of SEK 7.5 billion (6.2). All syndications impacted cash flow this year.
Read more in Note 22 Liabilities regarding Current loans and Non-current loans.
Read more in Group performance about Cash flow statement and Financial position.
29:4
29:2
Investments and divestments of shares, net 2018 2017
New issue of shares –2 –1
Capital contribution –1 92
Acquisitions –7 –18
Divestments 1,018 2,102
Other –38 7
Total cash flow from investments and divestments of shares, net 970 2,182
In 2018 Volvo Group divested shares in Inner Mongolia North Hauler Joint Stock Co., Ltd (NHL) which generated a positive cash flow of SEK 1 billion.
In 2017 Volvo Group divested shares in Deutz AG which generated a positive cash flow of SEK 1.9 billion.
Read more in Note 5 Investments in joint ventures, associated companies and other shares and participations about divested shares in Inner Mongolia North Hauler Joint Stock Co., Ltd (NHL).
29:3
Acquired and divested operations, net 2018 2017
Acquired subsidiaries and other business units –200 –175
Divested subsidiaries and other business units 30 1,103
Total cash flow from acquired and divested operations, net –170 928
In 2017 Volvo Group divested Volvo Construction Equipment’s dealer busi-ness in the UK. The sale generated a positive cash flow of SEK 0.9 billion.
Read more in Note 3 Acquisitions and divestments of shares in subsidiaries about the effect on net financial position from the acquisitions and divestments.
Change in loans 2018 Cash flows Non-cash items
December 31, 2017
New borrowings
Amorti-zations
Reclass i-fications
Unrealized currency effects
Currency translation
December 31, 2018
Current loans 53,771 60,340 –98,181 30,834 –739 2,621 48,646
Non-current loans 73,904 47,367 –6,635 –30,834 649 2,759 87,210
Interest and currency risk derivatives –2,957 – – – –9 – –2,966
Realized derivatives – – –624 – – – –
Other – – –324 – – – –
Cash flows impact from change in loans 107,707 –105,764 –
Change in loans 2017 Cash flows Non-cash items
December 31, 2016
New borrowings
Amorti-zations
Reclass i-fications
Unrealized currency effects
Currency translation
December 31, 2017
Current loans 56,497 78,896 –115,746 35,735 2,070 –3,681 53,771
Non-current loans 84,551 35,013 –7,119 –35,735 –283 –2,523 73,904
Interest and currency risk derivatives –1,247 – – – –1,710 – –2,957
Realized derivatives – – 87 – – – –
Other – – –127 – – – –
Cash flows impact from change in loans 113,909 –122,905 –
169
GROUP PERFORMANCE 2018 NOTES
ACCOUNTING POLICY
Purchases and sales of financial assets and liabilities are recognized on the transaction date. Transaction expenses are included in the assets’ fair value, except in cases in which the change in value is recognized in the income statement. The transaction costs that arise in conjunction with the admission of financial liabilities are amortized over the term of the loan as financial cost.
A financial asset is derecognized from the balance sheet when all significant risks and benefits related to the asset have been transferred to a third party.
The fair value of assets is determined based on valid market prices, when available. If market prices are unavailable, the fair value is deter-mined for each asset through the use of various measurement techniques.
Financial instruments are classified based on the degree that market values have been utilized when measuring fair value. The majority of finan-cial instruments measured at fair value held by Volvo Group are classified as level 2. The valuation of level 2 instruments is based on market condi-tions using quoted market data existing at each balance sheet date. The basis for the interest is the zero-coupon-curve in each currency which is used to calculate the present value of all the estimated future cash flows. For forward exchange contracts the basis is the forward premium based on current spot rate for each currency and future date. The fair value is then discounted based on the forward rates as per the balance sheet date.
Shares and participations are classified as level 1 for listed shares and level 3 for non-listed shares. Call options are classified as level 3 and are based on the Black & Scholes option pricing formula.
Financial assets measured at amortized costCustomer-financing receivables are held as part of a business model whose objective is of collecting contractual cash flows. The contractual cash flows are solely payments of principal and interest and are valued at amortized cost in accordance with the effective interest method. In this category Volvo Group also includes accounts receivables and holding of shares in non-listed companies for which a fair value cannot reasonably be determined.
Read more in Note 5 Investments in joint ventures, associated companies and other shares and participations.
Read more in Note 15 Customer-financing receivables.
Read more in Note 16 Receivables.
Financial assets measured at fair value through other comprehensive incomeIn this category Volvo Group includes holding of shares in listed companies. The shares are not held for trading. Changes in fair value was measured through other comprehensive income and amounted to SEK 34 M (37).
Read more in Note 5 Investments in joint ventures, associated companies and other shares and participations.
Financial assets at fair value through the income statementThe majority of the Volvo Group’s financial assets are held for trading and are recognized at fair value through the income statement. As presented in table 30:1, these instruments are derivatives, used for hedging interest and currency risks and marketable securities (further presented in note 18).
Derivatives used for hedging interest rate exposure in the customer- financing portfolio within Financial Services as well as the debt portfolio in Industrial Operations are included in this section. Unrealized gains and losses from fluctuations in the fair value of the financial instruments are recognized in Other financial income and expenses. The Volvo Group intends to hold these derivatives to maturity, which is why, over time, the market valuation will be offset by the interest-rate fixing on borrowing and lending in Financial Services, and thus not affect Net income or cash flow.
Financial instruments used for hedging currency risks arising from future firm commercial cash flows are also recognized in this section. Realized result and unrealized revaluation of derivatives are recognized in Other financial income and expenses to be able to net all internal flows before entering into external derivatives to hedge future currency risk. When hedging future cash flows for specific orders the classification in the income statement is decided on a case by case basis. In 2018, gains and losses from derivatives hedging currency risks for specific orders of SEK –6 M (–9) have been recognized in Operating income and SEK –42 M (27) in Other financial income and expenses.
Read more in Note 9 Other financial income and expenses.
Hedge Accounting is not applied by the Volvo Group.
Information regarding carrying amounts and fair valuesIn table 30:1, carrying amounts are compared with fair values for all of the Volvo Group’s financial instruments. The part of the table attributable to 2017 is in accordance with IAS 39, valid until December 31, 2017, and the part of the table attributable to 2018 is in accordance with IFRS 9, valid as from January 1, 2018. The classification of accounts receivables, customer-financing receivables and other interest bearing receivables has changed from category loans and receivables to financial assets at amor-tized cost. The classification of holding of shares in listed companies has changed from category assets available for sale to financial assets at fair value through other comprehensive income. The changes have not had any impact on the carrying amounts for the Volvo Group.
30 FINANCIAL INSTRUMENTS
170
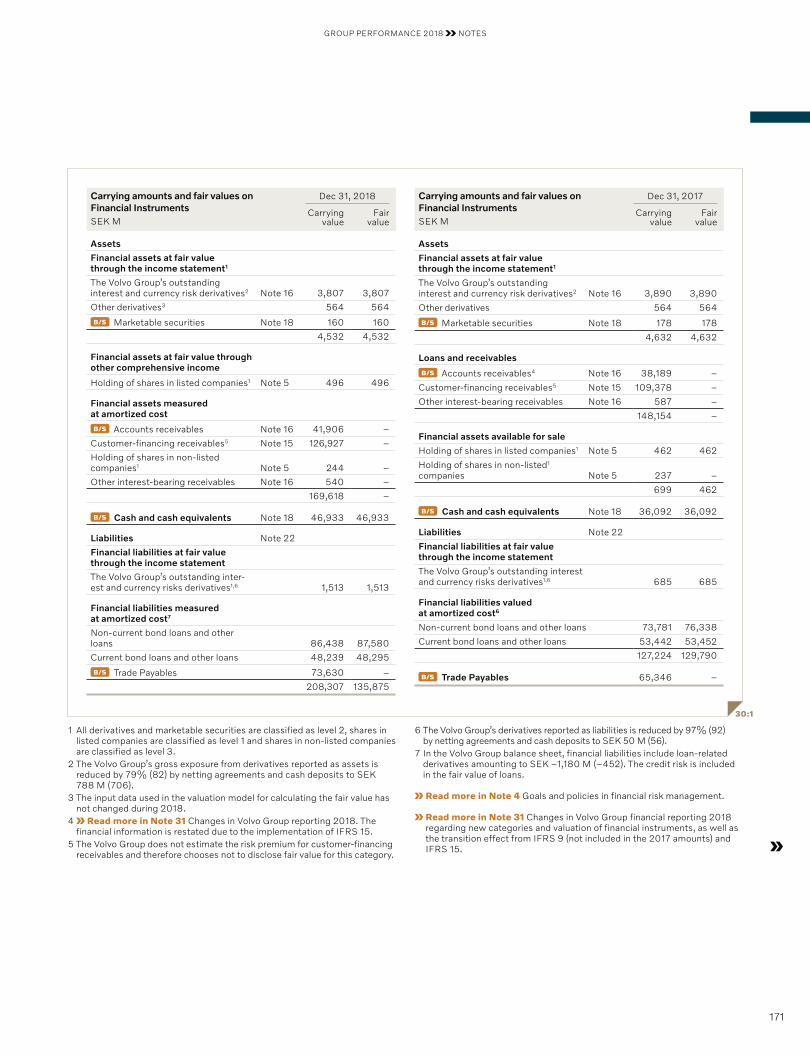
GROUP PERFORMANCE 2018 NOTES
30:1
1 All derivatives and marketable securities are classified as level 2, shares in listed companies are classified as level 1 and shares in non-listed companies are classified as level 3.
2 The Volvo Group’s gross exposure from derivatives reported as assets is reduced by 79% (82) by netting agreements and cash deposits to SEK 788 M (706).
3 The input data used in the valuation model for calculating the fair value has not changed during 2018.
4 Read more in Note 31 Changes in Volvo Group reporting 2018. The financial information is restated due to the implementation of IFRS 15.
5 The Volvo Group does not estimate the risk premium for customer-financing receivables and therefore chooses not to disclose fair value for this category.
6 The Volvo Group’s derivatives reported as liabilities is reduced by 97% (92) by netting agreements and cash deposits to SEK 50 M (56).
7 In the Volvo Group balance sheet, financial liabilities include loan-related derivatives amounting to SEK –1,180 M (–452). The credit risk is included in the fair value of loans.
Read more in Note 4 Goals and policies in financial risk management.
Read more in Note 31 Changes in Volvo Group financial reporting 2018 regarding new categories and valuation of financial instruments, as well as the transition effect from IFRS 9 (not included in the 2017 amounts) and IFRS 15.
Carrying amounts and fair values on Financial InstrumentsSEK M
Dec 31, 2017
Carrying value
Fairvalue
Assets
Financial assets at fair value through the income statement1
The Volvo Group’s outstanding interest and currency risk derivatives2 Note 16 3,890 3,890
Other derivatives 564 564
B/S Marketable securities Note 18 178 178
4,632 4,632
Loans and receivables
B/S Accounts receivables4 Note 16 38,189 –
Customer-financing receivables5 Note 15 109,378 –
Other interest-bearing receivables Note 16 587 –
148,154 –
Financial assets available for sale
Holding of shares in listed companies1 Note 5 462 462
Holding of shares in non-listed1 companies Note 5 237 –
699 462
B/S Cash and cash equivalents Note 18 36,092 36,092
Liabilities Note 22
Financial liabilities at fair value through the income statement
The Volvo Group’s outstanding interest and currency risks derivatives1,6 685 685
Financial liabilities valued at amortized cost6
Non-current bond loans and other loans 73,781 76,338
Current bond loans and other loans 53,442 53,452
127,224 129,790
B/S Trade Payables 65,346 –
Carrying amounts and fair values on Financial InstrumentsSEK M
Dec 31, 2018
Carrying value
Fairvalue
Assets
Financial assets at fair value through the income statement1
The Volvo Group’s outstanding interest and currency risk derivatives2 Note 16 3,807 3,807
Other derivatives3 564 564
B/S Marketable securities Note 18 160 160
4,532 4,532
Financial assets at fair value through other comprehensive income
Holding of shares in listed companies1 Note 5 496 496
Financial assets measured at amortized cost
B/S Accounts receivables Note 16 41,906 –
Customer-financing receivables5 Note 15 126,927 –
Holding of shares in non-listed companies1 Note 5 244 –
Other interest-bearing receivables Note 16 540 –
169,618 –
B/S Cash and cash equivalents Note 18 46,933 46,933
Liabilities Note 22
Financial liabilities at fair value through the income statement
The Volvo Group’s outstanding inter-est and currency risks derivatives1,6 1,513 1,513
Financial liabilities measured at amortized cost7
Non-current bond loans and other loans 86,438 87,580
Current bond loans and other loans 48,239 48,295
B/S Trade Payables 73,630 –
208,307 135,875
171
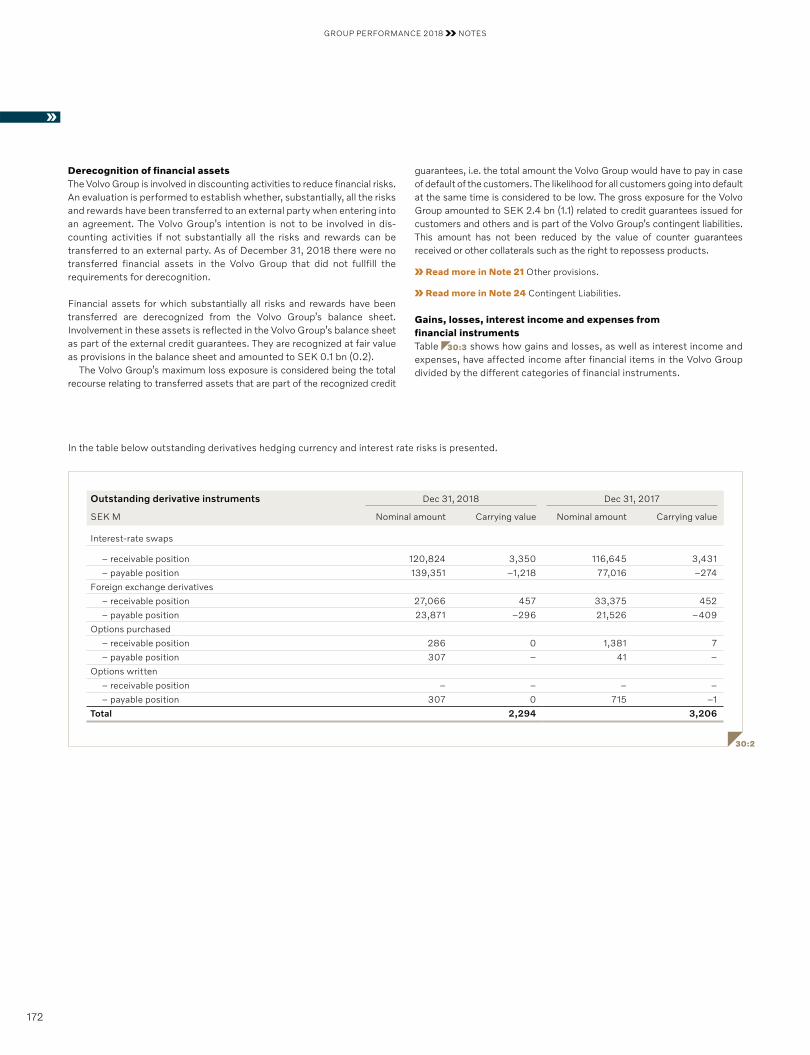
GROUP PERFORMANCE 2018 NOTES
Derecognition of financial assetsThe Volvo Group is involved in discounting activities to reduce financial risks. An evaluation is performed to establish whether, substantially, all the risks and rewards have been transferred to an external party when entering into an agreement. The Volvo Group’s intention is not to be involved in dis-counting activities if not substantially all the risks and rewards can be transferred to an external party. As of December 31, 2018 there were no transferred financial assets in the Volvo Group that did not fullfill the requirements for derecognition.
Financial assets for which substantially all risks and rewards have been transferred are derecognized from the Volvo Group’s balance sheet. Involvement in these assets is reflected in the Volvo Group’s balance sheet as part of the external credit guarantees. They are recognized at fair value as provisions in the balance sheet and amounted to SEK 0.1 bn (0.2).
The Volvo Group’s maximum loss exposure is considered being the total recourse relating to transferred assets that are part of the recognized credit
guarantees, i.e. the total amount the Volvo Group would have to pay in case of default of the customers. The likelihood for all customers going into default at the same time is considered to be low. The gross exposure for the Volvo Group amounted to SEK 2.4 bn (1.1) related to credit guarantees issued for customers and others and is part of the Volvo Group’s contingent liabilities. This amount has not been reduced by the value of counter guarantees received or other collaterals such as the right to repossess products.
Read more in Note 21 Other provisions.
Read more in Note 24 Contingent Liabilities.
Gains, losses, interest income and expenses from financial instrumentsTable 30:3 shows how gains and losses, as well as interest income and expenses, have affected income after financial items in the Volvo Group divided by the different categories of financial instruments.
In the table below outstanding derivatives hedging currency and interest rate risks is presented.
Outstanding derivative instruments Dec 31, 2018 Dec 31, 2017
SEK M Nominal amount Carrying value Nominal amount Carrying value
Interest-rate swaps
– receivable position 120,824 3,350 116,645 3,431
– payable position 139,351 –1,218 77,016 –274
Foreign exchange derivatives
– receivable position 27,066 457 33,375 452
– payable position 23,871 –296 21,526 –409
Options purchased
– receivable position 286 0 1,381 7
– payable position 307 – 41 –
Options written
– receivable position – – – –
– payable position 307 0 715 –1
Total 2,294 3,206
30:2
172
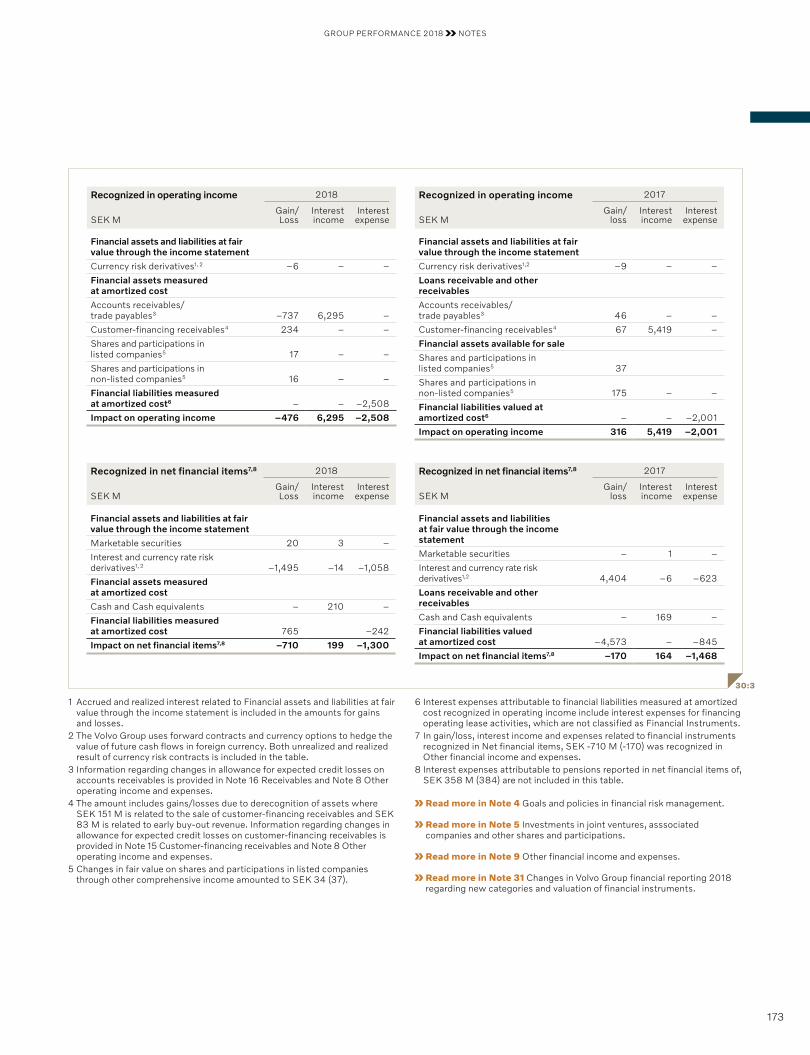
GROUP PERFORMANCE 2018 NOTES
1 Accrued and realized interest related to Financial assets and liabilities at fair value through the income statement is included in the amounts for gains and losses.
2 The Volvo Group uses forward contracts and currency options to hedge the value of future cash flows in foreign currency. Both unrealized and realized result of currency risk contracts is included in the table.
3 Information regarding changes in allowance for expected credit losses on accounts receivables is provided in Note 16 Receivables and Note 8 Other operating income and expenses.
4 The amount includes gains/losses due to derecognition of assets where SEK 151 M is related to the sale of customer-financing receivables and SEK 83 M is related to early buy-out revenue. Information regarding changes in allowance for expected credit losses on customer-financing receivables is provided in Note 15 Customer-financing receivables and Note 8 Other operating income and expenses.
5 Changes in fair value on shares and participations in listed companies through other comprehensive income amounted to SEK 34 (37).
30:3
Recognized in operating income 2018
SEK MGain/Loss
Interest income
Interest expense
Financial assets and liabilities at fair value through the income statement
Currency risk derivatives1, 2 –6 – –
Financial assets measured at amortized cost
Accounts receivables/trade payables3 –737 6,295 –
Customer-financing receivables4 234 – –
Shares and participations in listed companies5 17 – –
Shares and participations in non-listed companies5 16 – –
Financial liabilities measured at amortized cost6 – – –2,508
Impact on operating income –476 6,295 –2,508
Recognized in operating income 2017
SEK MGain/
lossInterest income
Interest expense
Financial assets and liabilities at fair value through the income statement
Currency risk derivatives1,2 –9 – –
Loans receivable and other receivables
Accounts receivables/trade payables3 46 – –
Customer-financing receivables4 67 5,419 –
Financial assets available for sale
Shares and participations in listed companies5 37
Shares and participations in non-listed companies5 175 – –
Financial liabilities valued at amortized cost6 – – –2,001
Impact on operating income 316 5,419 –2,001
6 Interest expenses attributable to financial liabilities measured at amortized cost recognized in operating income include interest expenses for financing operating lease activities, which are not classified as Financial Instruments.
7 In gain/loss, interest income and expenses related to financial instruments recognized in Net financial items, SEK -710 M (-170) was recognized in Other financial income and expenses.
8 Interest expenses attributable to pensions reported in net financial items of, SEK 358 M (384) are not included in this table.
Read more in Note 4 Goals and policies in financial risk management.
Read more in Note 5 Investments in joint ventures, asssociated companies and other shares and participations.
Read more in Note 9 Other financial income and expenses.
Read more in Note 31 Changes in Volvo Group financial reporting 2018 regarding new categories and valuation of financial instruments.
Recognized in net financial items7,8 2018
SEK MGain/Loss
Interest income
Interest expense
Financial assets and liabilities at fair value through the income statement
Marketable securities 20 3 –
Interest and currency rate risk derivatives1, 2 –1,495 –14 –1,058
Financial assets measured at amortized cost
Cash and Cash equivalents – 210 –
Financial liabilities measured at amortized cost 765 –242
Impact on net financial items7,8 –710 199 –1,300
Recognized in net financial items7,8 2017
SEK MGain/
lossInterest income
Interest expense
Financial assets and liabilities at fair value through the income statement
Marketable securities – 1 –
Interest and currency rate risk derivatives1,2 4,404 –6 –623
Loans receivable and other receivables
Cash and Cash equivalents – 169 –
Financial liabilities valued at amortized cost –4,573 – –845
Impact on net financial items7,8 –170 164 –1,468
173
GROUP PERFORMANCE 2018 NOTES
Implementation of new accounting standardsAs from January 1, 2018 Volvo Group applies IFRS 9 Financial instru-ments and IFRS 15 Revenue from Contracts with Customers. These standards have been applied retrospectively but with a difference in rela-tion to presenting comparative financial information for 2017.
Opening balance 2017For IFRS 15, the opening balance for 2017 was adjusted in accordance with the new standard and the transition effect was recognized as a decrease in equity with SEK 712 M. The reported financial information for 2017 was restated accordingly for comparison purposes. For IFRS 9, the opening balance for 2017 has not been restated.
IFRS 9 Financial instrumentsIFRS 9 is divided in three parts: Classification and Measurement, Impair-ment and Hedge Accounting, and replaced IAS 39 Financial Instruments: recognition and measurement. All financial instruments within the Volvo Group are classified and valued at amortized cost, except marketable securities and derivatives, which are classified and valued at fair value through the income statement. Holding of shares in listed companies are classified and valued at fair value through other comprehensive income. The new rules regarding valuation have no impact on the Volvo Group. The new hedge accounting rules are not affecting the Volvo Group as no hedge accounting is applied.
The impact of the new standard is related to impairment and the new expected credit loss model. The Volvo Group applies the simplified approach to measure lifetime expected credit losses. Compared with the former applied incurred loss model, the new requirements imply an earlier recognition of credit losses. Historical information is used regarding credit loss experience to forecast future credit losses. In addition, current and forward-looking information is used to reflect current and future conditions.
The new model increased loss allowance by SEK 500 M mainly affecting customer-financing receivables negatively within Financial Services with a corresponding decrease in equity amounting to SEK 371 M (net of tax) as of January 1, 2018.
Read more in Note 30 Financial instruments regarding accounting policy for 2018
The effect from the transition to IFRS 9 is presented on page 177–178 in the restated balance sheet and net financial position as of January 1, 2018.
IFRS 15 Revenue from Contracts with CustomersIFRS 15 replaced IAS 11 Construction contracts, IAS 18 Revenue and the related interpretations IFRIC 13, 15, 18 and SIC-31. IFRS 15 represents a new framework for recognizing revenue from contracts with customers, with additional disclosure requirements.
The major impact of implementing IFRS 15 is related to sales trans-actions of vehicles with various residual value commitments (buybacks and tradebacks) and the assessment whether control has been transferred from Volvo Group to the customer.
The criterion of transferring control is based on if the customer has a significant economic incentive to exercise the residual value commitment or not. If the customer is considered to have a significant economic incen-tive to exercise the residual value commitment to return the vehicle, revenue is recognized over the residual value commitment period as an operating lease transaction in accordance with IAS 17.
Various factors are assessed when considering if significant economic incentives exist, such as repurchase price in relation to the expected market value at the date of the repurchase and historical return rates. These are new criteria compared with the former revenue recognition model, where the residual value was compared with the sales price. The accounting model has not changed, however the criteria for when to apply the model are different.
If the customer is not considered to have a significant economic incen-tive to exercise the residual value commitment to return the vehicle, the revenue is recognized in accordance with the right of return model. Hence, a major portion of revenue and margin is recognized at inception of the contract. A refund liability and an asset related to the right to recover the vehicle from the customer on settling the refund liability are recognized in the balance sheet. If the vehicle is not returned the refund liability is recog-nized as revenue and the asset is expensed. This is a change compared to the former model, where full revenue was recognized at the inception of the contract with a contingent liability.
The effect of the two new models is a later recognition of revenue. As of December 31, 2017, assets increased with SEK 6,516 M mainly related to assets under operating lease and right of return assets. Liabilities increased with SEK 7,725 M mainly related to deferred leasing income and residual value liabilities. The corresponding effect was a net decrease in equity with SEK 1,209 M (net of tax) consisting of opening balance effect of SEK 712 M and a decrease of Income for the period for 2017 with SEK 497 M, whereof SEK 650 M affected Operating income for 2017.
Read more in Note 7 Revenue regarding accounting policy for 2018.
The effect from the transition to IFRS 15 is presented on page 175–177 with restatements of income statement for the full year 2017, opening balance as of January 1, 2017 and closing balance as of December 31, 2017.
31 CHANGES IN VOLVO GROUP FINANCIAL REPORTING 2018
174
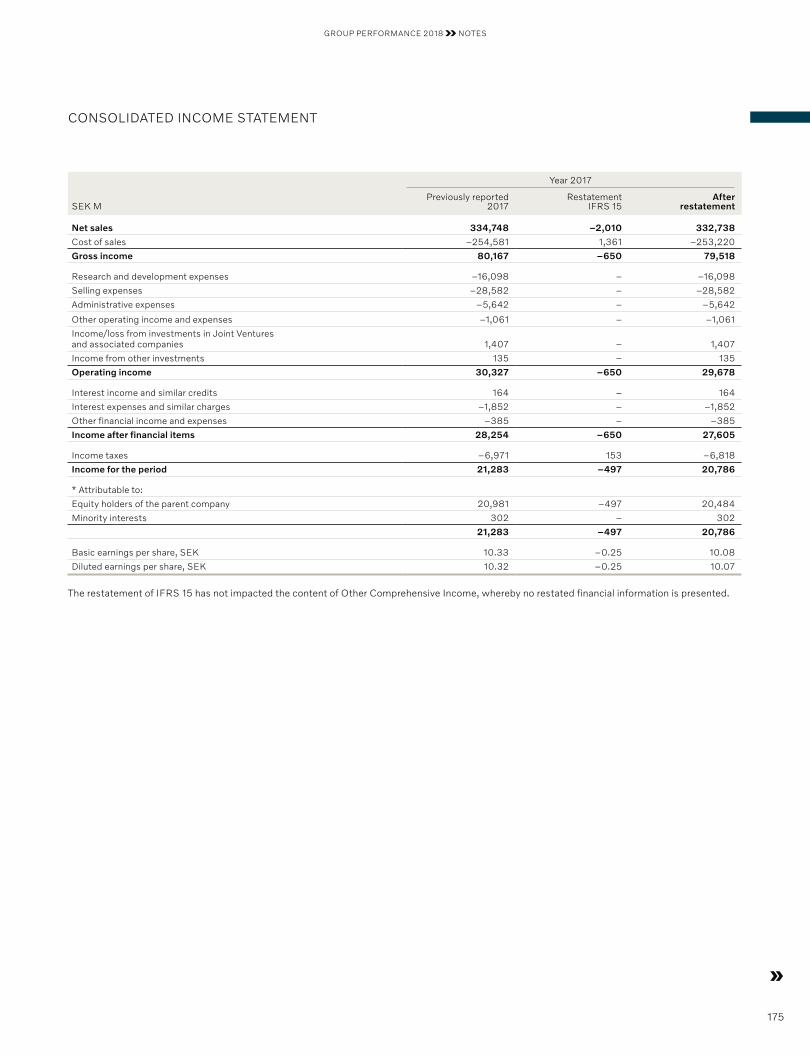
GROUP PERFORMANCE 2018 NOTES
CONSOLIDATED INCOME STATEMENT
Year 2017
SEK MPreviously reported
2017Restatement
IFRS 15After
restatement
Net sales 334,748 –2,010 332,738
Cost of sales –254,581 1,361 –253,220
Gross income 80,167 –650 79,518
Research and development expenses –16,098 – –16,098
Selling expenses –28,582 – –28,582
Administrative expenses –5,642 – –5,642
Other operating income and expenses –1,061 – –1,061
Income/loss from investments in Joint Ventures and associated companies 1,407 – 1,407
Income from other investments 135 – 135
Operating income 30,327 –650 29,678
Interest income and similar credits 164 – 164
Interest expenses and similar charges –1,852 – –1,852
Other financial income and expenses –385 – –385
Income after financial items 28,254 –650 27,605
Income taxes –6,971 153 –6,818
Income for the period 21,283 –497 20,786
* Attributable to:
Equity holders of the parent company 20,981 –497 20,484
Minority interests 302 – 302
21,283 –497 20,786
Basic earnings per share, SEK 10.33 –0.25 10.08
Diluted earnings per share, SEK 10.32 –0.25 10.07
The restatement of IFRS 15 has not impacted the content of Other Comprehensive Income, whereby no restated financial information is presented.
175
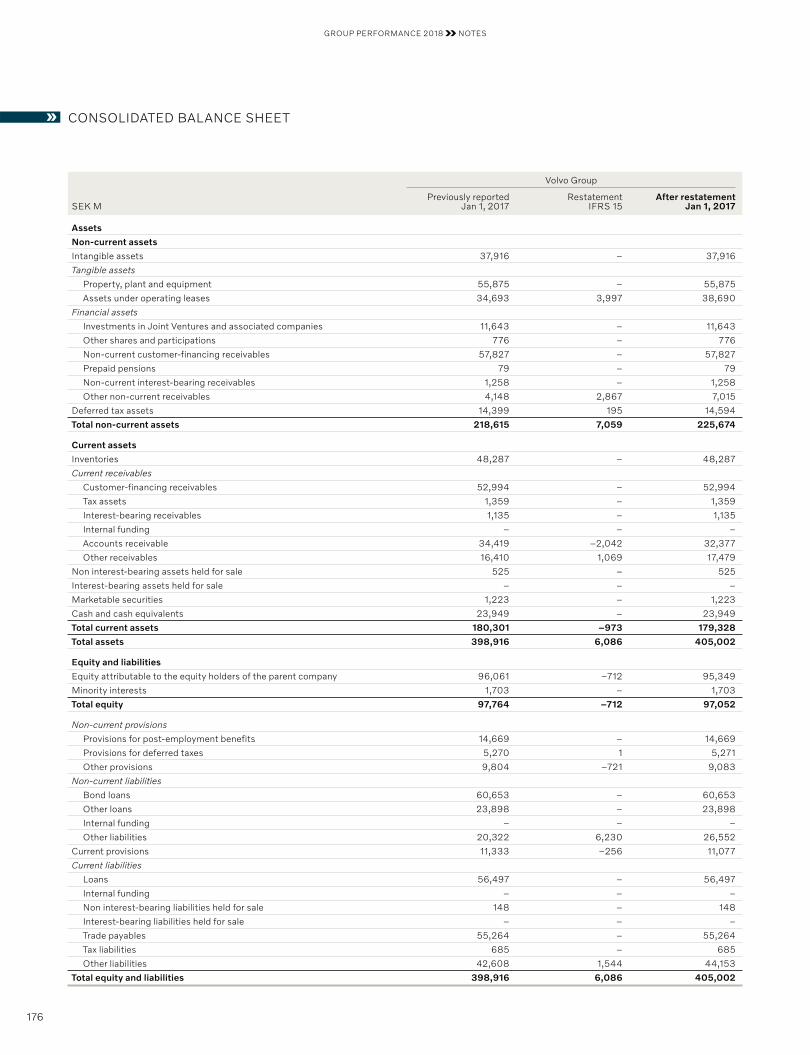
GROUP PERFORMANCE 2018 NOTES
CONSOLIDATED BALANCE SHEET
Volvo Group
SEK MPreviously reported
Jan 1, 2017Restatement
IFRS 15After restatement
Jan 1, 2017
Assets
Non-current assets
Intangible assets 37,916 – 37,916
Tangible assets
Property, plant and equipment 55,875 – 55,875
Assets under operating leases 34,693 3,997 38,690
Financial assets
Investments in Joint Ventures and associated companies 11,643 – 11,643
Other shares and participations 776 – 776
Non-current customer-financing receivables 57,827 – 57,827
Prepaid pensions 79 – 79
Non-current interest-bearing receivables 1,258 – 1,258
Other non-current receivables 4,148 2,867 7,015
Deferred tax assets 14,399 195 14,594
Total non-current assets 218,615 7,059 225,674
Current assets
Inventories 48,287 – 48,287
Current receivables
Customer-financing receivables 52,994 – 52,994
Tax assets 1,359 – 1,359
Interest-bearing receivables 1,135 – 1,135
Internal funding – – –
Accounts receivable 34,419 –2,042 32,377
Other receivables 16,410 1,069 17,479
Non interest-bearing assets held for sale 525 – 525
Interest-bearing assets held for sale – – –
Marketable securities 1,223 – 1,223
Cash and cash equivalents 23,949 – 23,949
Total current assets 180,301 –973 179,328
Total assets 398,916 6,086 405,002
Equity and liabilities
Equity attributable to the equity holders of the parent company 96,061 –712 95,349
Minority interests 1,703 – 1,703
Total equity 97,764 –712 97,052
Non-current provisions
Provisions for post-employment benefits 14,669 – 14,669
Provisions for deferred taxes 5,270 1 5,271
Other provisions 9,804 –721 9,083
Non-current liabilities
Bond loans 60,653 – 60,653
Other loans 23,898 – 23,898
Internal funding – – –
Other liabilities 20,322 6,230 26,552
Current provisions 11,333 –256 11,077
Current liabilities
Loans 56,497 – 56,497
Internal funding – – –
Non interest-bearing liabilities held for sale 148 – 148
Interest-bearing liabilities held for sale – – –
Trade payables 55,264 – 55,264
Tax liabilities 685 – 685
Other liabilities 42,608 1,544 44,153
Total equity and liabilities 398,916 6,086 405,002
176
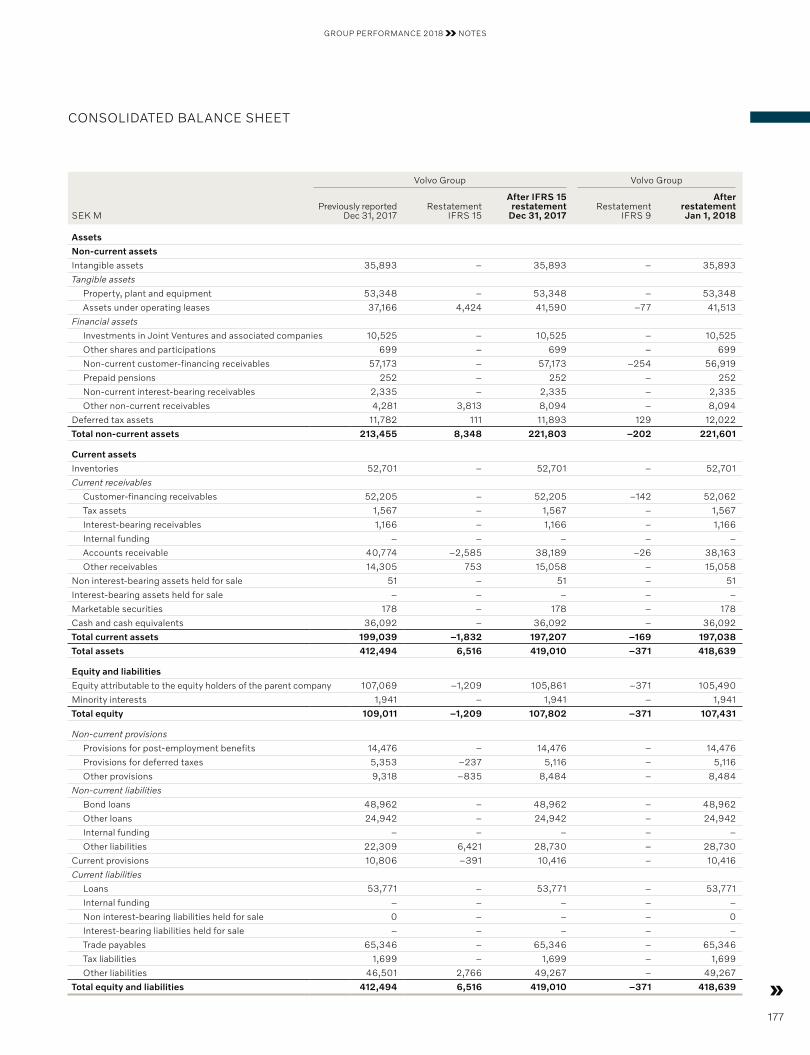
GROUP PERFORMANCE 2018 NOTES
CONSOLIDATED BALANCE SHEET
Volvo Group Volvo Group
SEK MPreviously reported
Dec 31, 2017Restatement
IFRS 15
After IFRS 15 restatement
Dec 31, 2017 Restatement
IFRS 9
After restatement Jan 1, 2018
Assets
Non-current assets
Intangible assets 35,893 – 35,893 – 35,893
Tangible assets
Property, plant and equipment 53,348 – 53,348 – 53,348
Assets under operating leases 37,166 4,424 41,590 –77 41,513
Financial assets
Investments in Joint Ventures and associated companies 10,525 – 10,525 – 10,525
Other shares and participations 699 – 699 – 699
Non-current customer-financing receivables 57,173 – 57,173 –254 56,919
Prepaid pensions 252 – 252 – 252
Non-current interest-bearing receivables 2,335 – 2,335 – 2,335
Other non-current receivables 4,281 3,813 8,094 – 8,094
Deferred tax assets 11,782 111 11,893 129 12,022
Total non-current assets 213,455 8,348 221,803 –202 221,601
Current assets
Inventories 52,701 – 52,701 – 52,701
Current receivables
Customer-financing receivables 52,205 – 52,205 –142 52,062
Tax assets 1,567 – 1,567 – 1,567
Interest-bearing receivables 1,166 – 1,166 – 1,166
Internal funding – – – – –
Accounts receivable 40,774 –2,585 38,189 –26 38,163
Other receivables 14,305 753 15,058 – 15,058
Non interest-bearing assets held for sale 51 – 51 – 51
Interest-bearing assets held for sale – – – – –
Marketable securities 178 – 178 – 178
Cash and cash equivalents 36,092 – 36,092 – 36,092
Total current assets 199,039 –1,832 197,207 –169 197,038
Total assets 412,494 6,516 419,010 –371 418,639
Equity and liabilities
Equity attributable to the equity holders of the parent company 107,069 –1,209 105,861 –371 105,490
Minority interests 1,941 – 1,941 – 1,941
Total equity 109,011 –1,209 107,802 –371 107,431
Non-current provisions
Provisions for post-employment benefits 14,476 – 14,476 – 14,476
Provisions for deferred taxes 5,353 –237 5,116 – 5,116
Other provisions 9,318 –835 8,484 – 8,484
Non-current liabilities
Bond loans 48,962 – 48,962 – 48,962
Other loans 24,942 – 24,942 – 24,942
Internal funding – – – – –
Other liabilities 22,309 6,421 28,730 – 28,730
Current provisions 10,806 –391 10,416 – 10,416
Current liabilities
Loans 53,771 – 53,771 – 53,771
Internal funding – – – – –
Non interest-bearing liabilities held for sale 0 – – – 0
Interest-bearing liabilities held for sale – – – – –
Trade payables 65,346 – 65,346 – 65,346
Tax liabilities 1,699 – 1,699 – 1,699
Other liabilities 46,501 2,766 49,267 – 49,267
Total equity and liabilities 412,494 6,516 419,010 –371 418,639
177
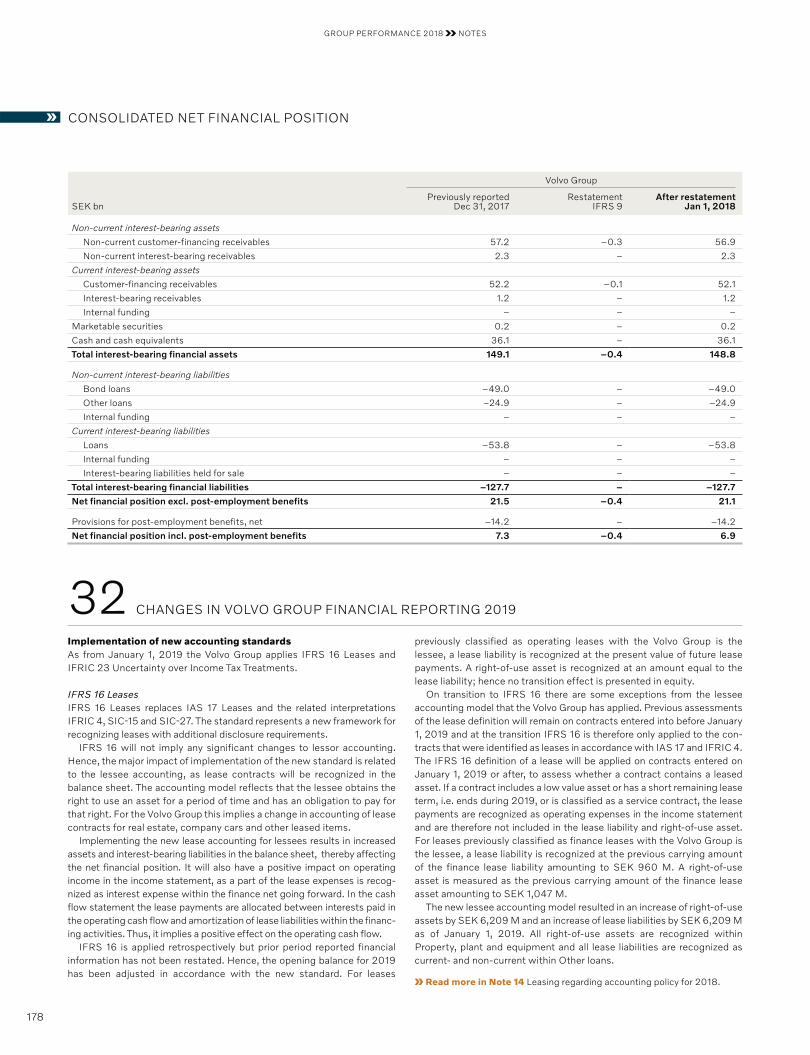
GROUP PERFORMANCE 2018 NOTES
CONSOLIDATED NET FINANCIAL POSITION
Volvo Group
SEK bnPreviously reported
Dec 31, 2017Restatement
IFRS 9After restatement
Jan 1, 2018
Non-current interest-bearing assets
Non-current customer-financing receivables 57.2 –0.3 56.9
Non-current interest-bearing receivables 2.3 – 2.3
Current interest-bearing assets
Customer-financing receivables 52.2 –0.1 52.1
Interest-bearing receivables 1.2 – 1.2
Internal funding – – –
Marketable securities 0.2 – 0.2
Cash and cash equivalents 36.1 – 36.1
Total interest-bearing financial assets 149.1 –0.4 148.8
Non-current interest-bearing liabilities
Bond loans –49.0 – –49.0
Other loans –24.9 – –24.9
Internal funding – – –
Current interest-bearing liabilities
Loans –53.8 – –53.8
Internal funding – – –
Interest-bearing liabilities held for sale – – –
Total interest-bearing financial liabilities –127.7 – –127.7
Net financial position excl. post-employment benefits 21.5 –0.4 21.1
Provisions for post-employment benefits, net –14.2 – –14.2
Net financial position incl. post-employment benefits 7.3 –0.4 6.9
Implementation of new accounting standardsAs from January 1, 2019 the Volvo Group applies IFRS 16 Leases and IFRIC 23 Uncertainty over Income Tax Treatments.
IFRS 16 LeasesIFRS 16 Leases replaces IAS 17 Leases and the related interpretations IFRIC 4, SIC-15 and SIC-27. The standard represents a new framework for recognizing leases with additional disclosure requirements.
IFRS 16 will not imply any significant changes to lessor accounting. Hence, the major impact of implementation of the new standard is related to the lessee accounting, as lease contracts will be recognized in the balance sheet. The accounting model reflects that the lessee obtains the right to use an asset for a period of time and has an obligation to pay for that right. For the Volvo Group this implies a change in accounting of lease contracts for real estate, company cars and other leased items.
Implementing the new lease accounting for lessees results in increased assets and interest-bearing liabilities in the balance sheet, thereby affecting the net financial position. It will also have a positive impact on operating income in the income statement, as a part of the lease expenses is recog-nized as interest expense within the finance net going forward. In the cash flow statement the lease payments are allocated between interests paid in the operating cash flow and amortization of lease liabilities within the financ-ing activities. Thus, it implies a positive effect on the operating cash flow.
IFRS 16 is applied retrospectively but prior period reported financial information has not been restated. Hence, the opening balance for 2019 has been adjusted in accordance with the new standard. For leases
previously classified as operating leases with the Volvo Group is the lessee, a lease liability is recognized at the present value of future lease payments. A right-of-use asset is recognized at an amount equal to the lease liability; hence no transition effect is presented in equity.
On transition to IFRS 16 there are some exceptions from the lessee accounting model that the Volvo Group has applied. Previous assessments of the lease definition will remain on contracts entered into before January 1, 2019 and at the transition IFRS 16 is therefore only applied to the con-tracts that were identified as leases in accordance with IAS 17 and IFRIC 4. The IFRS 16 definition of a lease will be applied on contracts entered on January 1, 2019 or after, to assess whether a contract contains a leased asset. If a contract includes a low value asset or has a short remaining lease term, i.e. ends during 2019, or is classified as a service contract, the lease payments are recognized as operating expenses in the income statement and are therefore not included in the lease liability and right-of-use asset. For leases previously classified as finance leases with the Volvo Group is the lessee, a lease liability is recognized at the previous carrying amount of the finance lease liability amounting to SEK 960 M. A right-of-use asset is measured as the previous carrying amount of the finance lease asset amounting to SEK 1,047 M.
The new lessee accounting model resulted in an increase of right-of-use assets by SEK 6,209 M and an increase of lease liabilities by SEK 6,209 M as of January 1, 2019. All right-of-use assets are recognized within Property, plant and equipment and all lease liabilities are recognized as current- and non-current within Other loans.
Read more in Note 14 Leasing regarding accounting policy for 2018.
32 CHANGES IN VOLVO GROUP FINANCIAL REPORTING 2019
178
GROUP PERFORMANCE 2018 NOTES
The effect from the transition to IFRS 16 is presented on page 180–181 in the restated balance sheet and net financial position as of January 1, 2019. Accounting policy for leases as from January 1, 2019
Leases (Note 14)
ACCOUNTING POLICY
The Volvo Group as the lesseeThe Volvo Group recognizes a right-of-use asset in the balance sheet as well as a lease liability by the present value of future lease payments. The leased asset is depreciated over the lease term on a straight-line basis or over its useful life of the underlying asset if it is assessed to be reasonably certain that the Volvo Group will obtain ownership at the end of the lease term. The leasing cost is recognized as depreciation within operating income and interest expense within finance net. If the lease contract is considered to include a low value asset or has a lease term that is less than 12 months, or includes service components, these lease payments are recognized as operating expenses in the income statement over the lease contract period.
IFRIC 23 Uncertainty over Income Tax TreatmentIFRIC 23 is a new interpretation of uncertain income tax treatments within the scope of IAS 12 Income Taxes. An assessment shall be made whether it is probable that the tax authority or court will accept the tax treatment in the income tax return, otherwise, the effect of uncertainty should be estimated and recognized in the financial statements as tax liability.
For the Volvo Group, the implementation of IFRIC 23 implies a changed classification for identified income tax-related risks that have previously been recognized as a provision for tax charges that are probable to regu-late the obligation. Going forward, uncertain income tax treatments are reported as tax liabilities. IFRIC 23 is applied retrospectively but prior period reported financial information has not been restated. Hence, the opening balance for 2019 has been adjusted in accordance with the new interpretation. Income tax risks previously recognized as current and non-current provisions has been reclassified to tax liabilities with an amount of SEK 295 M as of January 1, 2019. Thus no transition effect is presented in equity.
Read more in Note 10 Income taxes regarding accounting policy for 2018.
The effect from the transition to IFRIC 23 is presented on page 180 in the restated balance sheet as of January 1, 2019.
Accounting policy for uncertain income tax treatments as from January 1, 2019
Income taxes (Note 10)
ACCOUNTING POLICY
Adjustments of tax liability are made for estimated tax charges that are probable, as a result of identified tax risks. The Volvo Group evaluates tax processes on a regular basis and adjustments of the tax liability are made for the estimated outcome when a reasonable assessment can be made. Tax claims, for which no adjustments of the tax liability are considered required, are generally recognized as contingent liabilities.
179
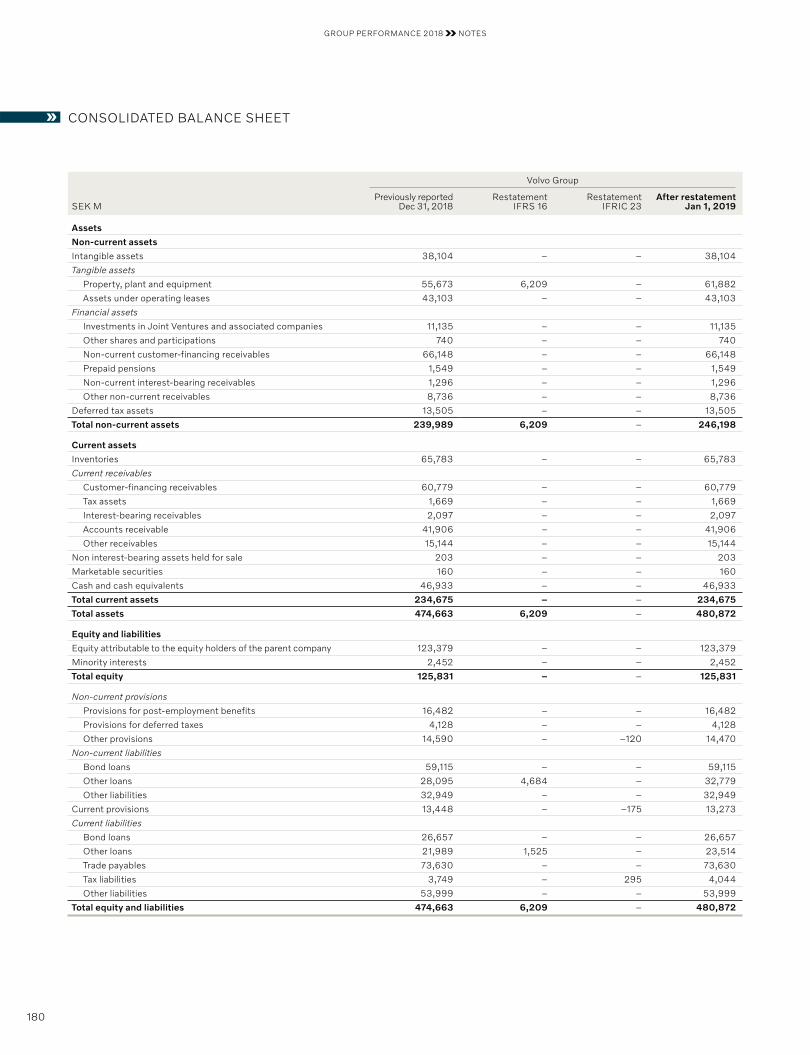
GROUP PERFORMANCE 2018 NOTES
CONSOLIDATED BALANCE SHEET
Volvo Group
SEK MPreviously reported
Dec 31, 2018Restatement
IFRS 16Restatement
IFRIC 23After restatement
Jan 1, 2019
Assets
Non-current assets
Intangible assets 38,104 – – 38,104
Tangible assets
Property, plant and equipment 55,673 6,209 – 61,882
Assets under operating leases 43,103 – – 43,103
Financial assets
Investments in Joint Ventures and associated companies 11,135 – – 11,135
Other shares and participations 740 – – 740
Non-current customer-financing receivables 66,148 – – 66,148
Prepaid pensions 1,549 – – 1,549
Non-current interest-bearing receivables 1,296 – – 1,296
Other non-current receivables 8,736 – – 8,736
Deferred tax assets 13,505 – – 13,505
Total non-current assets 239,989 6,209 – 246,198
Current assets
Inventories 65,783 – – 65,783
Current receivables
Customer-financing receivables 60,779 – – 60,779
Tax assets 1,669 – – 1,669
Interest-bearing receivables 2,097 – – 2,097
Accounts receivable 41,906 – – 41,906
Other receivables 15,144 – – 15,144
Non interest-bearing assets held for sale 203 – – 203
Marketable securities 160 – – 160
Cash and cash equivalents 46,933 – – 46,933
Total current assets 234,675 – – 234,675
Total assets 474,663 6,209 – 480,872
Equity and liabilities
Equity attributable to the equity holders of the parent company 123,379 – – 123,379
Minority interests 2,452 – – 2,452
Total equity 125,831 – – 125,831
Non-current provisions
Provisions for post-employment benefits 16,482 – – 16,482
Provisions for deferred taxes 4,128 – – 4,128
Other provisions 14,590 – –120 14,470
Non-current liabilities
Bond loans 59,115 – – 59,115
Other loans 28,095 4,684 – 32,779
Other liabilities 32,949 – – 32,949
Current provisions 13,448 – –175 13,273
Current liabilities
Bond loans 26,657 – – 26,657
Other loans 21,989 1,525 – 23,514
Trade payables 73,630 – – 73,630
Tax liabilities 3,749 – 295 4,044
Other liabilities 53,999 – – 53,999
Total equity and liabilities 474,663 6,209 – 480,872
180
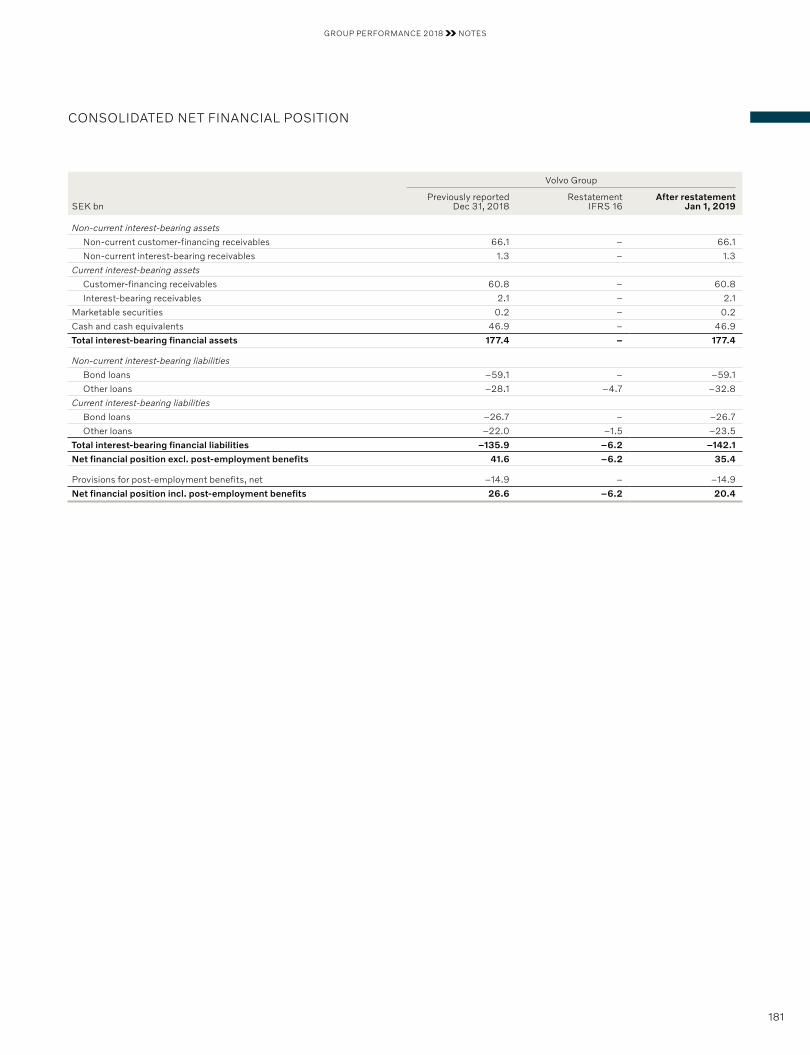
GROUP PERFORMANCE 2018 NOTES
CONSOLIDATED NET FINANCIAL POSITION
Volvo Group
SEK bnPreviously reported
Dec 31, 2018Restatement
IFRS 16After restatement
Jan 1, 2019
Non-current interest-bearing assets
Non-current customer-financing receivables 66.1 – 66.1
Non-current interest-bearing receivables 1.3 – 1.3
Current interest-bearing assets
Customer-financing receivables 60.8 – 60.8
Interest-bearing receivables 2.1 – 2.1
Marketable securities 0.2 – 0.2
Cash and cash equivalents 46.9 – 46.9
Total interest-bearing financial assets 177.4 – 177.4
Non-current interest-bearing liabilities
Bond loans –59.1 – –59.1
Other loans –28.1 –4.7 –32.8
Current interest-bearing liabilities
Bond loans –26.7 – –26.7
Other loans –22.0 –1.5 –23.5
Total interest-bearing financial liabilities –135.9 –6.2 –142.1
Net financial position excl. post-employment benefits 41.6 –6.2 35.4
Provisions for post-employment benefits, net –14.9 – –14.9
Net financial position incl. post-employment benefits 26.6 –6.2 20.4
181
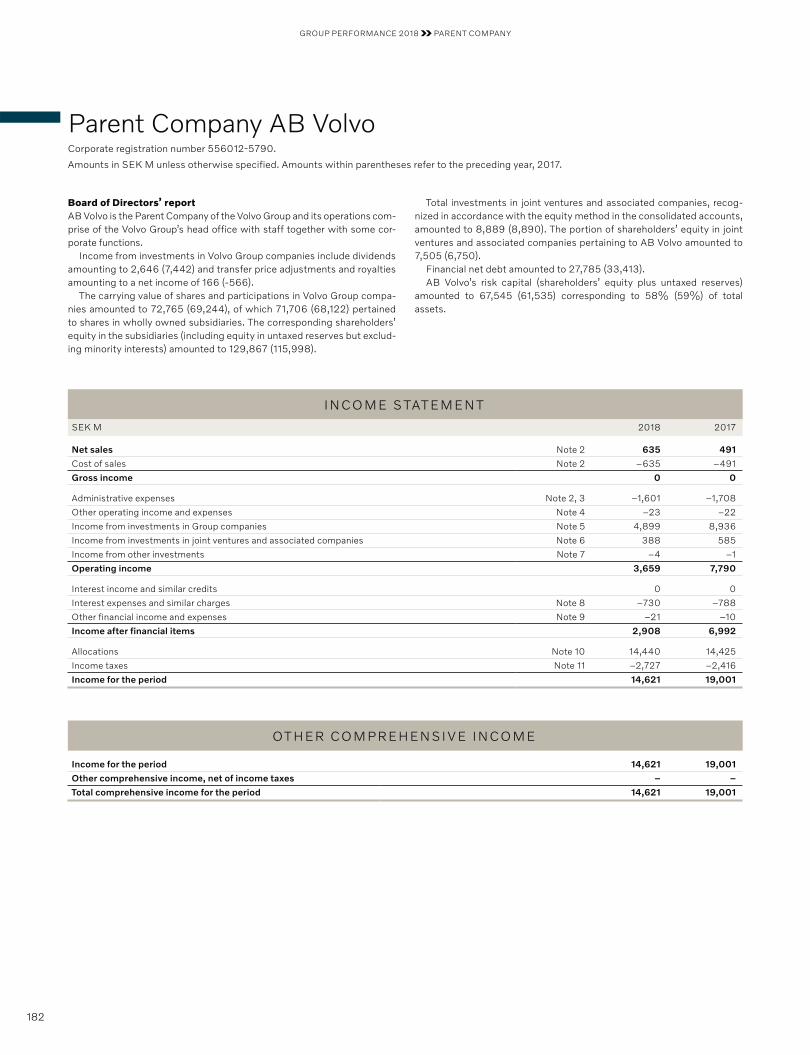
GROUP PERFORMANCE 2018 PARENT COMPANY
Parent Company AB Volvo Corporate registration number 556012-5790.
Amounts in SEK M unless otherwise specified. Amounts within parentheses refer to the preceding year, 2017.
Board of Directors’ reportAB Volvo is the Parent Company of the Volvo Group and its operations com-prise of the Volvo Group’s head office with staff together with some cor-porate functions.
Income from investments in Volvo Group companies include dividends amounting to 2,646 (7,442) and transfer price adjustments and royalties amounting to a net income of 166 (-566).
The carrying value of shares and participations in Volvo Group compa-nies amounted to 72,765 (69,244), of which 71,706 (68,122) pertained to shares in wholly owned subsidiaries. The corresponding shareholders’ equity in the subsidiaries (including equity in untaxed reserves but exclud-ing minority interests) amounted to 129,867 (115,998).
Total investments in joint ventures and associated companies, recog-nized in accordance with the equity method in the consolidated accounts, amounted to 8,889 (8,890). The portion of shareholders’ equity in joint ventures and associated companies pertaining to AB Volvo amounted to 7,505 (6,750).
Financial net debt amounted to 27,785 (33,413). AB Volvo’s risk capital (shareholders’ equity plus untaxed reserves)
amounted to 67,545 (61,535) corresponding to 58% (59%) of total assets.
INC OME S TAT EMEN T
SEK M 2018 2017
Net sales Note 2 635 491
Cost of sales Note 2 –635 –491
Gross income 0 0
Administrative expenses Note 2, 3 –1,601 –1,708
Other operating income and expenses Note 4 –23 –22
Income from investments in Group companies Note 5 4,899 8,936
Income from investments in joint ventures and associated companies Note 6 388 585
Income from other investments Note 7 –4 –1
Operating income 3,659 7,790
Interest income and similar credits 0 0
Interest expenses and similar charges Note 8 –730 –788
Other financial income and expenses Note 9 –21 –10
Income after financial items 2,908 6,992
Allocations Note 10 14,440 14,425
Income taxes Note 11 –2,727 –2,416
Income for the period 14,621 19,001
OT HER C OMP REHENSI V E INC OME
Income for the period 14,621 19,001
Other comprehensive income, net of income taxes – –
Total comprehensive income for the period 14,621 19,001
182
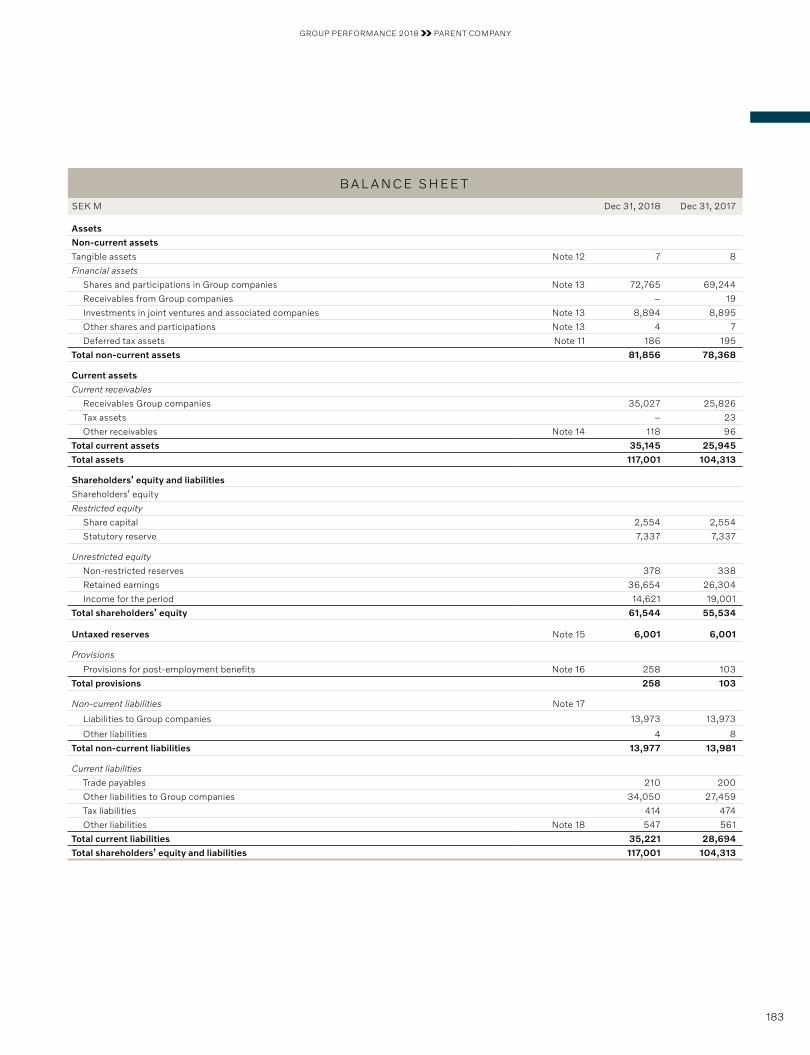
GROUP PERFORMANCE 2018 PARENT COMPANY
B A L A NCE SHEE T
SEK M Dec 31, 2018 Dec 31, 2017
Assets
Non-current assets
Tangible assets Note 12 7 8
Financial assets
Shares and participations in Group companies Note 13 72,765 69,244
Receivables from Group companies – 19
Investments in joint ventures and associated companies Note 13 8,894 8,895
Other shares and participations Note 13 4 7
Deferred tax assets Note 11 186 195
Total non-current assets 81,856 78,368
Current assets
Current receivables
Receivables Group companies 35,027 25,826
Tax assets – 23
Other receivables Note 14 118 96
Total current assets 35,145 25,945
Total assets 117,001 104,313
Shareholders’ equity and liabilities
Shareholders’ equity
Restricted equity
Share capital 2,554 2,554
Statutory reserve 7,337 7,337
Unrestricted equity
Non-restricted reserves 378 338
Retained earnings 36,654 26,304
Income for the period 14,621 19,001
Total shareholders’ equity 61,544 55,534
Untaxed reserves Note 15 6,001 6,001
Provisions
Provisions for post-employment benefits Note 16 258 103
Total provisions 258 103
Non-current liabilities Note 17
Liabilities to Group companies 13,973 13,973
Other liabilities 4 8
Total non-current liabilities 13,977 13,981
Current liabilities
Trade payables 210 200
Other liabilities to Group companies 34,050 27,459
Tax liabilities 414 474
Other liabilities Note 18 547 561
Total current liabilities 35,221 28,694
Total shareholders’ equity and liabilities 117,001 104,313
183
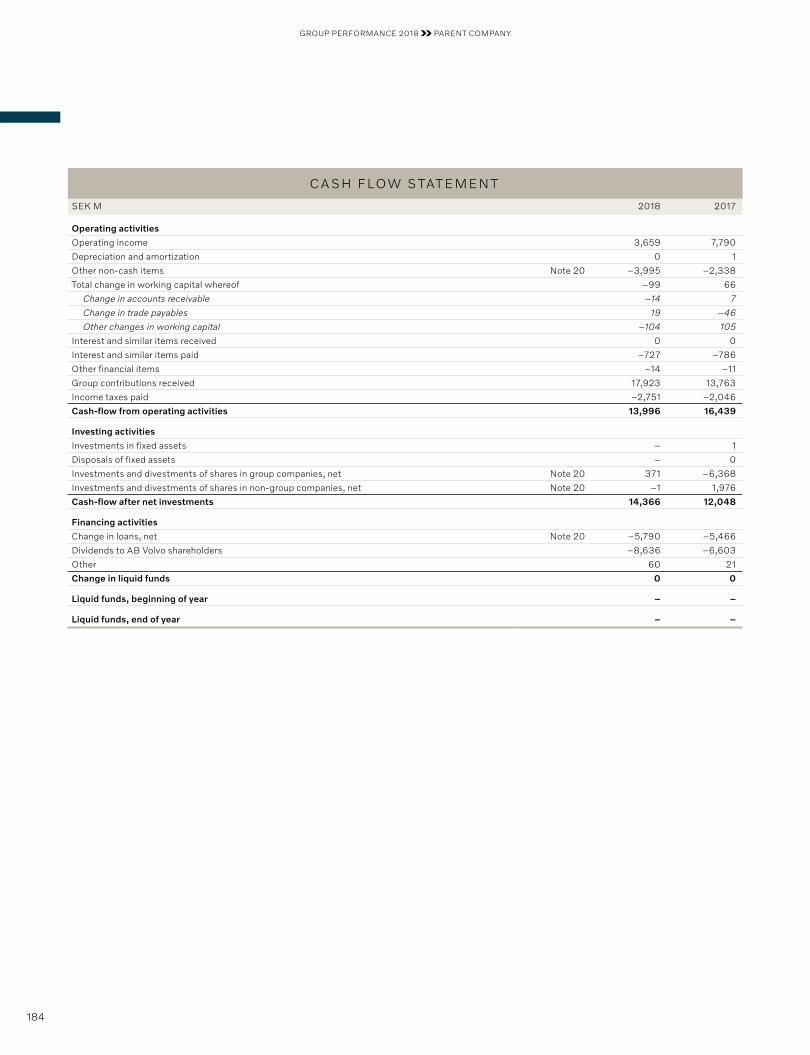
GROUP PERFORMANCE 2018 PARENT COMPANY
C A SH FLOW S TAT EMEN T
SEK M 2018 2017
Operating activities
Operating income 3,659 7,790
Depreciation and amortization 0 1
Other non-cash items Note 20 –3,995 –2,338
Total change in working capital whereof –99 66
Change in accounts receivable –14 7
Change in trade payables 19 –46
Other changes in working capital –104 105
Interest and similar items received 0 0
Interest and similar items paid –727 –786
Other financial items –14 –11
Group contributions received 17,923 13,763
Income taxes paid –2,751 –2,046
Cash-flow from operating activities 13,996 16,439
Investing activities
Investments in fixed assets – 1
Disposals of fixed assets – 0
Investments and divestments of shares in group companies, net Note 20 371 –6,368
Investments and divestments of shares in non-group companies, net Note 20 –1 1,976
Cash-flow after net investments 14,366 12,048
Financing activities
Change in loans, net Note 20 –5,790 –5,466
Dividends to AB Volvo shareholders –8,636 –6,603
Other 60 21
Change in liquid funds 0 0
Liquid funds, beginning of year – –
Liquid funds, end of year – –
184
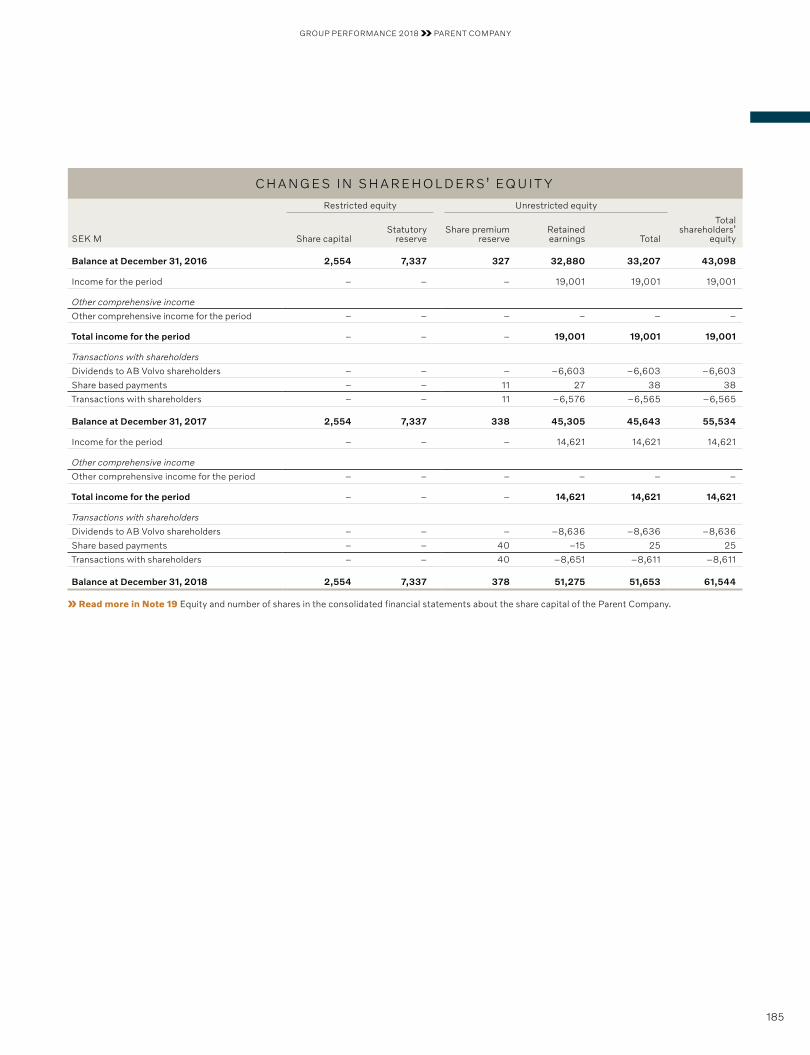
GROUP PERFORMANCE 2018 PARENT COMPANY
CH A NGES IN SH A REHOL DERS’ EQ UI T Y
Restricted equity Unrestricted equity
SEK M Share capitalStatutory
reserveShare premium
reserveRetained earnings Total
Total shareholders’
equity
Balance at December 31, 2016 2,554 7,337 327 32,880 33,207 43,098
Income for the period – – – 19,001 19,001 19,001
Other comprehensive income
Other comprehensive income for the period – – – – – –
Total income for the period – – – 19,001 19,001 19,001
Transactions with shareholders
Dividends to AB Volvo shareholders – – – –6,603 –6,603 –6,603
Share based payments – – 11 27 38 38
Transactions with shareholders – – 11 –6,576 –6,565 –6,565
Balance at December 31, 2017 2,554 7,337 338 45,305 45,643 55,534
Income for the period – – – 14,621 14,621 14,621
Other comprehensive income
Other comprehensive income for the period – – – – – –
Total income for the period – – – 14,621 14,621 14,621
Transactions with shareholders
Dividends to AB Volvo shareholders – – – –8,636 –8,636 –8,636
Share based payments – – 40 –15 25 25
Transactions with shareholders – – 40 –8,651 –8,611 –8,611
Balance at December 31, 2018 2,554 7,337 378 51,275 51,653 61,544
Read more in Note 19 Equity and number of shares in the consolidated financial statements about the share capital of the Parent Company.
185
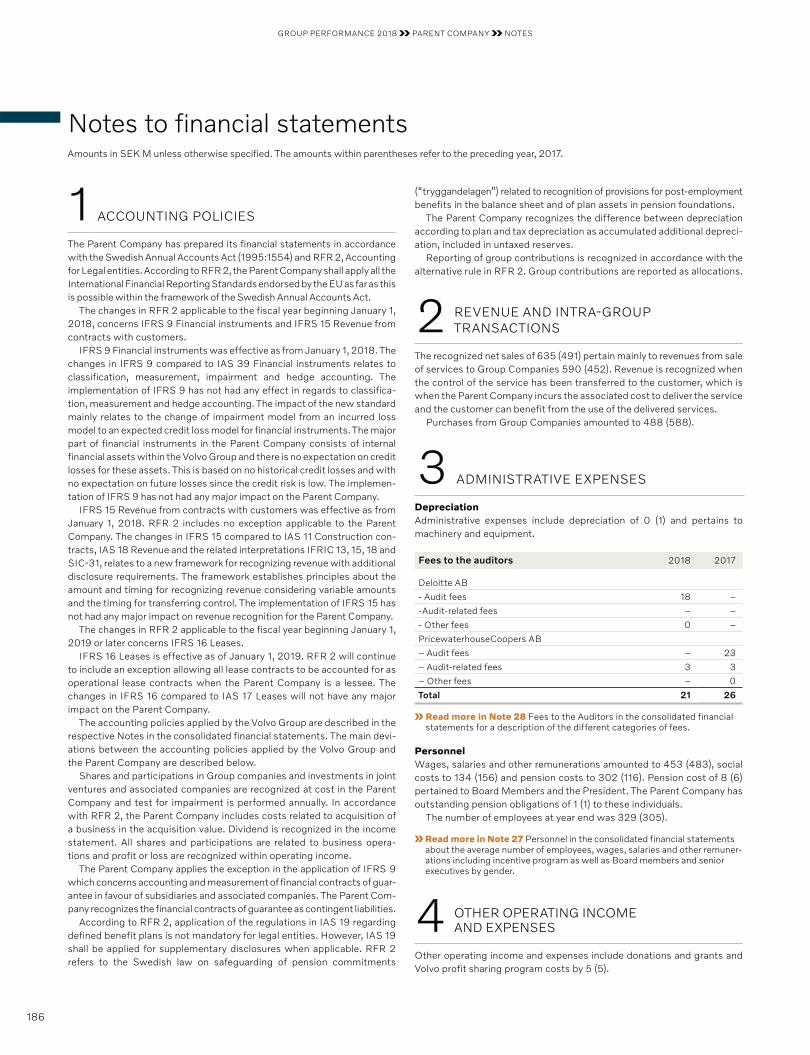
GROUP PERFORMANCE 2018 PARENT COMPANY NOTES
Amounts in SEK M unless otherwise specified. The amounts within parentheses refer to the preceding year, 2017.
1 ACCOUNTING POLICIES
The Parent Company has prepared its financial statements in accordance with the Swedish Annual Accounts Act (1995:1554) and RFR 2, Accounting for Legal entities. According to RFR 2, the Parent Company shall apply all the International Financial Reporting Standards endorsed by the EU as far as this is possible within the framework of the Swedish Annual Accounts Act.
The changes in RFR 2 applicable to the fiscal year beginning January 1, 2018, concerns IFRS 9 Financial instruments and IFRS 15 Revenue from contracts with customers.
IFRS 9 Financial instruments was effective as from January 1, 2018. The changes in IFRS 9 compared to IAS 39 Financial instruments relates to classification, measurement, impairment and hedge accounting. The implementation of IFRS 9 has not had any effect in regards to classifica-tion, measurement and hedge accounting. The impact of the new standard mainly relates to the change of impairment model from an incurred loss model to an expected credit loss model for financial instruments. The major part of financial instruments in the Parent Company consists of internal financial assets within the Volvo Group and there is no expectation on credit losses for these assets. This is based on no historical credit losses and with no expectation on future losses since the credit risk is low. The implemen-tation of IFRS 9 has not had any major impact on the Parent Company.
IFRS 15 Revenue from contracts with customers was effective as from January 1, 2018. RFR 2 includes no exception applicable to the Parent Company. The changes in IFRS 15 compared to IAS 11 Construction con-tracts, IAS 18 Revenue and the related interpretations IFRIC 13, 15, 18 and SIC-31, relates to a new framework for recognizing revenue with additional disclosure requirements. The framework establishes principles about the amount and timing for recognizing revenue considering variable amounts and the timing for transferring control. The implementation of IFRS 15 has not had any major impact on revenue recognition for the Parent Company.
The changes in RFR 2 applicable to the fiscal year beginning January 1, 2019 or later concerns IFRS 16 Leases.
IFRS 16 Leases is effective as of January 1, 2019. RFR 2 will continue to include an exception allowing all lease contracts to be accounted for as operational lease contracts when the Parent Company is a lessee. The changes in IFRS 16 compared to IAS 17 Leases will not have any major impact on the Parent Company.
The accounting policies applied by the Volvo Group are described in the respective Notes in the consolidated financial statements. The main devi-ations between the accounting policies applied by the Volvo Group and the Parent Company are described below.
Shares and participations in Group companies and investments in joint ventures and associated companies are recognized at cost in the Parent Company and test for impairment is performed annually. In accordance with RFR 2, the Parent Company includes costs related to acquisition of a business in the acquisition value. Dividend is recognized in the income statement. All shares and participations are related to business opera-tions and profit or loss are recognized within operating income.
The Parent Company applies the exception in the application of IFRS 9 which concerns accounting and measurement of financial contracts of guar-antee in favour of subsidiaries and associated companies. The Parent Com-pany recognizes the financial contracts of guarantee as contingent liabilities.
According to RFR 2, application of the regulations in IAS 19 regarding defined benefit plans is not mandatory for legal entities. However, IAS 19 shall be applied for supplementary disclosures when applicable. RFR 2 refers to the Swedish law on safeguarding of pension commitments
Notes to financial statements
(“tryggandelagen”) related to recognition of provisions for post-employment benefits in the balance sheet and of plan assets in pension foundations.
The Parent Company recognizes the difference between depreciation according to plan and tax depreciation as accumulated additional depreci-ation, included in untaxed reserves.
Reporting of group contributions is recognized in accordance with the alternative rule in RFR 2. Group contributions are reported as allocations.
2 REVENUE AND INTRA-GROUP TRANSACTIONS
The recognized net sales of 635 (491) pertain mainly to revenues from sale of services to Group Companies 590 (452). Revenue is recognized when the control of the service has been transferred to the customer, which is when the Parent Company incurs the associated cost to deliver the service and the customer can benefit from the use of the delivered services.
Purchases from Group Companies amounted to 488 (588).
3 ADMINISTRATIVE EXPENSES
DepreciationAdministrative expenses include depreciation of 0 (1) and pertains to machinery and equipment.
Fees to the auditors 2018 2017
Deloitte AB
- Audit fees 18 –
-Audit-related fees – –
- Other fees 0 –
PricewaterhouseCoopers AB
– Audit fees – 23
– Audit-related fees 3 3
– Other fees – 0
Total 21 26
Read more in Note 28 Fees to the Auditors in the consolidated financial statements for a description of the different categories of fees.
PersonnelWages, salaries and other remunerations amounted to 453 (483), social costs to 134 (156) and pension costs to 302 (116). Pension cost of 8 (6) pertained to Board Members and the President. The Parent Company has outstanding pension obligations of 1 (1) to these individuals.
The number of employees at year end was 329 (305).
Read more in Note 27 Personnel in the consolidated financial statements about the average number of employees, wages, salaries and other remuner-ations including incentive program as well as Board members and senior executives by gender.
4 OTHER OPERATING INCOME AND EXPENSES
Other operating income and expenses include donations and grants and Volvo profit sharing program costs by 5 (5).
186
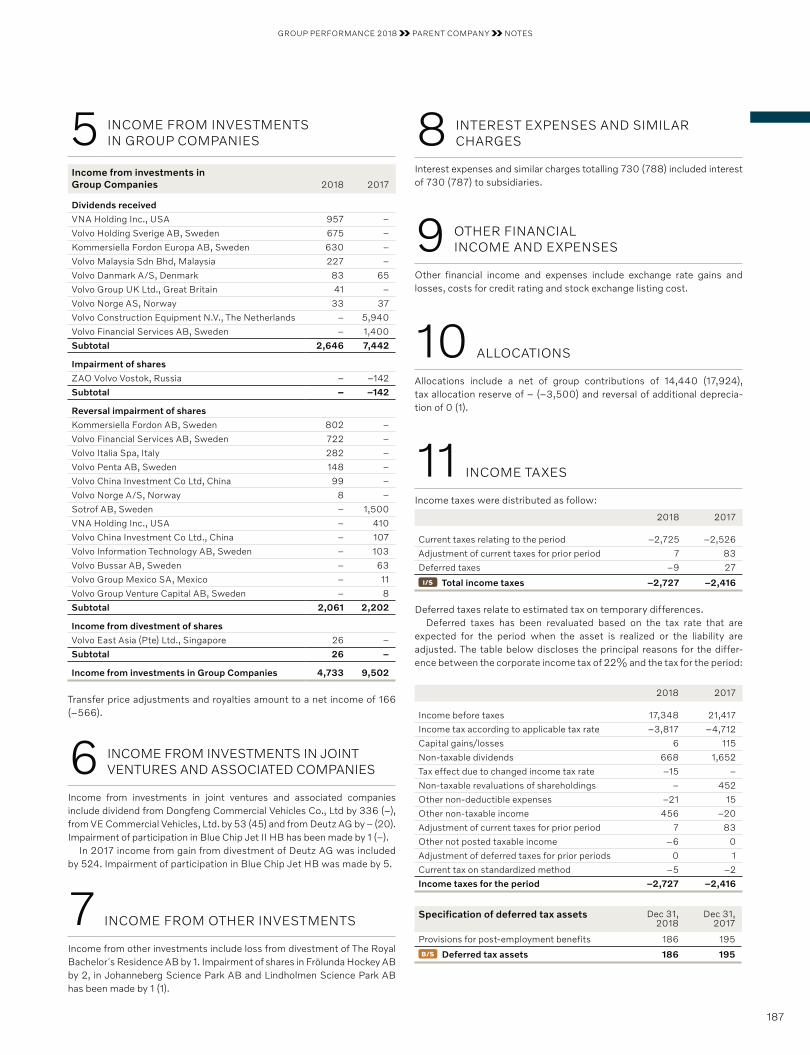
GROUP PERFORMANCE 2018 PARENT COMPANY NOTES
5 INCOME FROM INVESTMENTS IN GROUP COMPANIES
Income from investments in Group Companies 2018 2017
Dividends received
VNA Holding Inc., USA 957 –
Volvo Holding Sverige AB, Sweden 675 –
Kommersiella Fordon Europa AB, Sweden 630 –
Volvo Malaysia Sdn Bhd, Malaysia 227 –
Volvo Danmark A/S, Denmark 83 65
Volvo Group UK Ltd., Great Britain 41 –
Volvo Norge AS, Norway 33 37
Volvo Construction Equipment N.V., The Netherlands – 5,940
Volvo Financial Services AB, Sweden – 1,400
Subtotal 2,646 7,442
Impairment of shares
ZAO Volvo Vostok, Russia – –142
Subtotal – –142
Reversal impairment of shares
Kommersiella Fordon AB, Sweden 802 –
Volvo Financial Services AB, Sweden 722 –
Volvo Italia Spa, Italy 282 –
Volvo Penta AB, Sweden 148 –
Volvo China Investment Co Ltd, China 99 –
Volvo Norge A/S, Norway 8 –
Sotrof AB, Sweden – 1,500
VNA Holding Inc., USA – 410
Volvo China Investment Co Ltd., China – 107
Volvo Information Technology AB, Sweden – 103
Volvo Bussar AB, Sweden – 63
Volvo Group Mexico SA, Mexico – 11
Volvo Group Venture Capital AB, Sweden – 8
Subtotal 2,061 2,202
Income from divestment of shares
Volvo East Asia (Pte) Ltd., Singapore 26 –
Subtotal 26 –
Income from investments in Group Companies 4,733 9,502
Transfer price adjustments and royalties amount to a net income of 166 (–566).
6 INCOME FROM INVESTMENTS IN JOINT VENTURES AND ASSOCIATED COMPANIES
Income from investments in joint ventures and associated companies include dividend from Dongfeng Commercial Vehicles Co., Ltd by 336 (–), from VE Commercial Vehicles, Ltd. by 53 (45) and from Deutz AG by – (20). Impairment of participation in Blue Chip Jet II HB has been made by 1 (–).
In 2017 income from gain from divestment of Deutz AG was included by 524. Impairment of participation in Blue Chip Jet HB was made by 5.
7 INCOME FROM OTHER INVESTMENTS
Income from other investments include loss from divestment of The Royal Bachelor´s Residence AB by 1. Impairment of shares in Frölunda Hockey AB by 2, in Johanneberg Science Park AB and Lindholmen Science Park AB has been made by 1 (1).
8 INTEREST EXPENSES AND SIMILAR CHARGES
Interest expenses and similar charges totalling 730 (788) included interest of 730 (787) to subsidiaries.
9 OTHER FINANCIAL INCOME AND EXPENSES
Other financial income and expenses include exchange rate gains and losses, costs for credit rating and stock exchange listing cost.
10 ALLOCATIONS
Allocations include a net of group contributions of 14,440 (17,924), tax allocation reserve of – (–3,500) and reversal of additional deprecia-tion of 0 (1).
11 INCOME TAXES
Income taxes were distributed as follow:
2018 2017
Current taxes relating to the period –2,725 –2,526
Adjustment of current taxes for prior period 7 83
Deferred taxes –9 27
I/S Total income taxes –2,727 –2,416
Deferred taxes relate to estimated tax on temporary differences. Deferred taxes has been revaluated based on the tax rate that are
expected for the period when the asset is realized or the liability are adjusted. The table below discloses the principal reasons for the differ-ence between the corporate income tax of 22% and the tax for the period:
2018 2017
Income before taxes 17,348 21,417
Income tax according to applicable tax rate –3,817 –4,712
Capital gains/losses 6 115
Non-taxable dividends 668 1,652
Tax effect due to changed income tax rate –15 –
Non-taxable revaluations of shareholdings – 452
Other non-deductible expenses –21 15
Other non-taxable income 456 –20
Adjustment of current taxes for prior period 7 83
Other not posted taxable income –6 0
Adjustment of deferred taxes for prior periods 0 1
Current tax on standardized method –5 –2
Income taxes for the period –2,727 –2,416
Specification of deferred tax assets Dec 31, 2018
Dec 31, 2017
Provisions for post-employment benefits 186 195
B/S Deferred tax assets 186 195
187
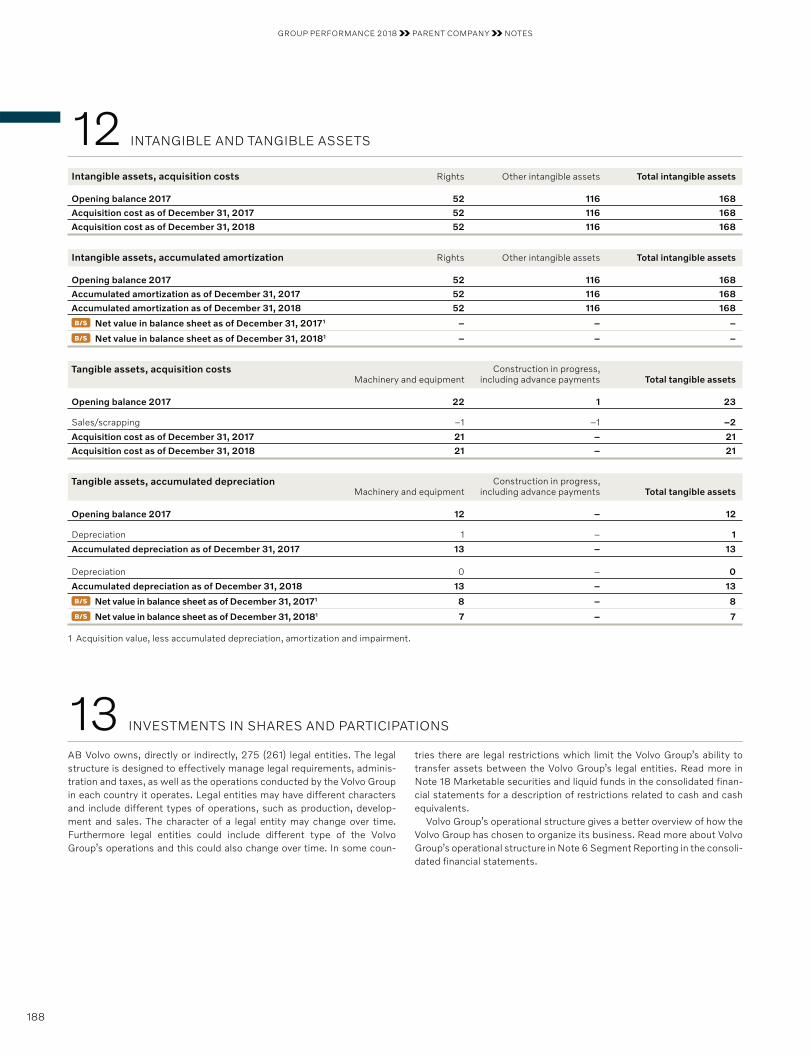
GROUP PERFORMANCE 2018 PARENT COMPANY NOTES
Intangible assets, acquisition costs Rights Other intangible assets Total intangible assets
Opening balance 2017 52 116 168
Acquisition cost as of December 31, 2017 52 116 168
Acquisition cost as of December 31, 2018 52 116 168
Intangible assets, accumulated amortization Rights Other intangible assets Total intangible assets
Opening balance 2017 52 116 168
Accumulated amortization as of December 31, 2017 52 116 168
Accumulated amortization as of December 31, 2018 52 116 168
B/S Net value in balance sheet as of December 31, 20171 – – –
B/S Net value in balance sheet as of December 31, 20181 – – –
Tangible assets, acquisition costsMachinery and equipment
Construction in progress, including advance payments Total tangible assets
Opening balance 2017 22 1 23
Sales/scrapping –1 –1 –2
Acquisition cost as of December 31, 2017 21 – 21
Acquisition cost as of December 31, 2018 21 – 21
Tangible assets, accumulated depreciationMachinery and equipment
Construction in progress, including advance payments Total tangible assets
Opening balance 2017 12 – 12
Depreciation 1 – 1
Accumulated depreciation as of December 31, 2017 13 – 13
Depreciation 0 – 0
Accumulated depreciation as of December 31, 2018 13 – 13
B/S Net value in balance sheet as of December 31, 20171 8 – 8
B/S Net value in balance sheet as of December 31, 20181 7 – 7
1 Acquisition value, less accumulated depreciation, amortization and impairment.
AB Volvo owns, directly or indirectly, 275 (261) legal entities. The legal structure is designed to effectively manage legal requirements, adminis-tration and taxes, as well as the operations conducted by the Volvo Group in each country it operates. Legal entities may have different characters and include different types of operations, such as production, develop-ment and sales. The character of a legal entity may change over time. Furthermore legal entities could include different type of the Volvo Group’s operations and this could also change over time. In some coun-
tries there are legal restrictions which limit the Volvo Group’s ability to transfer assets between the Volvo Group’s legal entities. Read more in Note 18 Marketable securities and liquid funds in the consolidated finan-cial statements for a description of restrictions related to cash and cash equivalents.
Volvo Group’s operational structure gives a better overview of how the Volvo Group has chosen to organize its business. Read more about Volvo Group’s operational structure in Note 6 Segment Reporting in the consoli-dated financial statements.
12 INTANGIBLE AND TANGIBLE ASSETS
13 INVESTMENTS IN SHARES AND PARTICIPATIONS
188
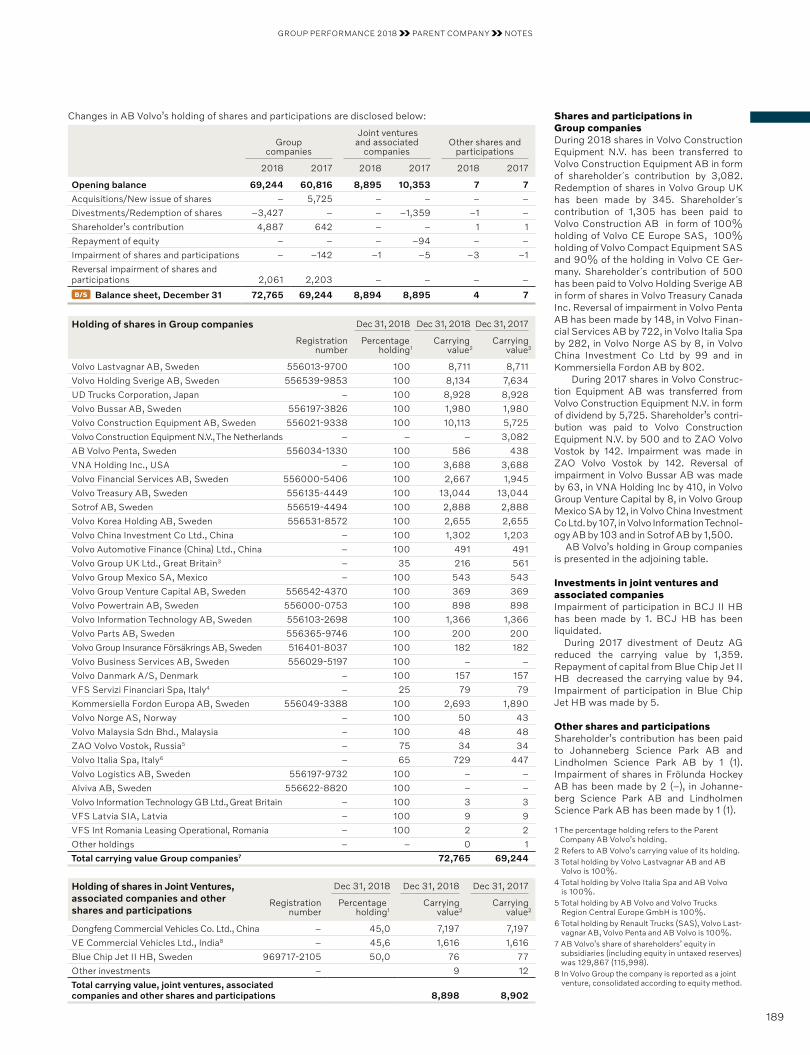
GROUP PERFORMANCE 2018 PARENT COMPANY NOTES
Changes in AB Volvo’s holding of shares and participations are disclosed below:
Group companies
Joint ventures and associated
companiesOther shares and
participations
2018 2017 2018 2017 2018 2017
Opening balance 69,244 60,816 8,895 10,353 7 7
Acquisitions/New issue of shares – 5,725 – – – –
Divestments/Redemption of shares –3,427 – – –1,359 –1 –
Shareholder’s contribution 4,887 642 – – 1 1
Repayment of equity – – – –94 – –
Impairment of shares and participations – –142 –1 –5 –3 –1
Reversal impairment of shares and participations 2,061 2,203 – – – –
B/S Balance sheet, December 31 72,765 69,244 8,894 8,895 4 7
Holding of shares in Group companies Dec 31, 2018 Dec 31, 2018 Dec 31, 2017
Registration number
Percentageholding1
Carryingvalue2
Carryingvalue2
Volvo Lastvagnar AB, Sweden 556013-9700 100 8,711 8,711
Volvo Holding Sverige AB, Sweden 556539-9853 100 8,134 7,634
UD Trucks Corporation, Japan – 100 8,928 8,928
Volvo Bussar AB, Sweden 556197-3826 100 1,980 1,980
Volvo Construction Equipment AB, Sweden 556021-9338 100 10,113 5,725
Volvo Construction Equipment N.V., The Netherlands – – – 3,082
AB Volvo Penta, Sweden 556034-1330 100 586 438
VNA Holding Inc., USA – 100 3,688 3,688
Volvo Financial Services AB, Sweden 556000-5406 100 2,667 1,945
Volvo Treasury AB, Sweden 556135-4449 100 13,044 13,044
Sotrof AB, Sweden 556519-4494 100 2,888 2,888
Volvo Korea Holding AB, Sweden 556531-8572 100 2,655 2,655
Volvo China Investment Co Ltd., China – 100 1,302 1,203
Volvo Automotive Finance (China) Ltd., China – 100 491 491
Volvo Group UK Ltd., Great Britain3 – 35 216 561
Volvo Group Mexico SA, Mexico – 100 543 543
Volvo Group Venture Capital AB, Sweden 556542-4370 100 369 369
Volvo Powertrain AB, Sweden 556000-0753 100 898 898
Volvo Information Technology AB, Sweden 556103-2698 100 1,366 1,366
Volvo Parts AB, Sweden 556365-9746 100 200 200
Volvo Group Insurance Försäkrings AB, Sweden 516401-8037 100 182 182
Volvo Business Services AB, Sweden 556029-5197 100 – –
Volvo Danmark A/S, Denmark – 100 157 157
VFS Servizi Financiari Spa, Italy4 – 25 79 79
Kommersiella Fordon Europa AB, Sweden 556049-3388 100 2,693 1,890
Volvo Norge AS, Norway – 100 50 43
Volvo Malaysia Sdn Bhd., Malaysia – 100 48 48
ZAO Volvo Vostok, Russia5 – 75 34 34
Volvo Italia Spa, Italy6 – 65 729 447
Volvo Logistics AB, Sweden 556197-9732 100 – –
Alviva AB, Sweden 556622-8820 100 – –
Volvo Information Technology GB Ltd., Great Britain – 100 3 3
VFS Latvia SIA, Latvia – 100 9 9
VFS Int Romania Leasing Operational, Romania – 100 2 2
Other holdings – – 0 1
Total carrying value Group companies7 72,765 69,244
Holding of shares in Joint Ventures, associated companies and other shares and participations
Dec 31, 2018 Dec 31, 2018 Dec 31, 2017
Registration number
Percentageholding1
Carryingvalue2
Carrying value2
Dongfeng Commercial Vehicles Co. Ltd., China – 45,0 7,197 7,197
VE Commercial Vehicles Ltd., India8 – 45,6 1,616 1,616
Blue Chip Jet II HB, Sweden 969717-2105 50,0 76 77
Other investments – 9 12
Total carrying value, joint ventures, associated companies and other shares and participations 8,898 8,902
Shares and participations in Group companies During 2018 shares in Volvo Construction Equipment N.V. has been transferred to Volvo Construction Equipment AB in form of shareholder´s contribution by 3,082. Redemption of shares in Volvo Group UK has been made by 345. Shareholder´s contribution of 1,305 has been paid to Volvo Construction AB in form of 100% holding of Volvo CE Europe SAS, 100% holding of Volvo Compact Equipment SAS and 90% of the holding in Volvo CE Ger-many. Shareholder´s contribution of 500 has been paid to Volvo Holding Sverige AB in form of shares in Volvo Treasury Canada Inc. Reversal of impairment in Volvo Penta AB has been made by 148, in Volvo Finan-cial Services AB by 722, in Volvo Italia Spa by 282, in Volvo Norge AS by 8, in Volvo China Investment Co Ltd by 99 and in Kommersiella Fordon AB by 802.
During 2017 shares in Volvo Construc-tion Equipment AB was transferred from Volvo Construction Equipment N.V. in form of dividend by 5,725. Shareholder’s contri-bution was paid to Volvo Construction Equipment N.V. by 500 and to ZAO Volvo Vostok by 142. Impairment was made in ZAO Volvo Vostok by 142. Reversal of impairment in Volvo Bussar AB was made by 63, in VNA Holding Inc by 410, in Volvo Group Venture Capital by 8, in Volvo Group Mexico SA by 12, in Volvo China Investment Co Ltd. by 107, in Volvo Information Technol-ogy AB by 103 and in Sotrof AB by 1,500.
AB Volvo’s holding in Group companies is presented in the adjoining table.
Investments in joint ventures and associated companiesImpairment of participation in BCJ II HB has been made by 1. BCJ HB has been liqui dated. During 2017 divestment of Deutz AG reduced the carrying value by 1,359. Repayment of capital from Blue Chip Jet II HB decreased the carrying value by 94. Impairment of participation in Blue Chip Jet HB was made by 5.
Other shares and participationsShareholder’s contribution has been paid to Johanneberg Science Park AB and Lindholmen Science Park AB by 1 (1). Impairment of shares in Frölunda Hockey AB has been made by 2 (–), in Johanne-berg Science Park AB and Lindholmen Science Park AB has been made by 1 (1).
1 The percentage holding refers to the Parent Company AB Volvo’s holding.
2 Refers to AB Volvo’s carrying value of its holding.3 Total holding by Volvo Lastvagnar AB and AB
Volvo is 100%.4 Total holding by Volvo Italia Spa and AB Volvo
is 100%.5 Total holding by AB Volvo and Volvo Trucks
Region Central Europe GmbH is 100%.6 Total holding by Renault Trucks (SAS), Volvo Last-
vagnar AB, Volvo Penta and AB Volvo is 100%.7 AB Volvo’s share of shareholders’ equity in
subsidiaries (including equity in untaxed reserves) was 129,867 (115,998).
8 In Volvo Group the company is reported as a joint venture, consolidated according to equity method.
189
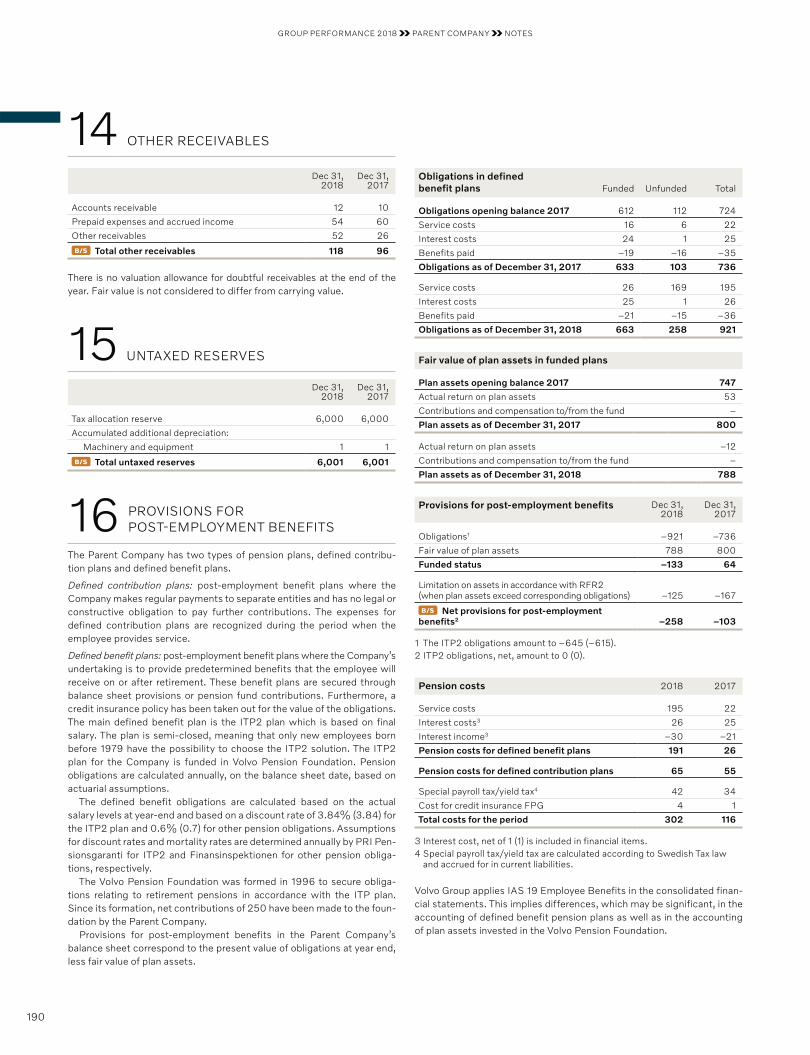
GROUP PERFORMANCE 2018 PARENT COMPANY NOTES
14 OTHER RECEIVABLES
Dec 31, 2018
Dec 31, 2017
Accounts receivable 12 10
Prepaid expenses and accrued income 54 60
Other receivables 52 26
B/S Total other receivables 118 96
There is no valuation allowance for doubtful receivables at the end of the year. Fair value is not considered to differ from carrying value.
15 UNTAXED RESERVES
Dec 31, 2018
Dec 31, 2017
Tax allocation reserve 6,000 6,000
Accumulated additional depreciation:
Machinery and equipment 1 1
B/S Total untaxed reserves 6,001 6,001
16 PROVISIONS FOR POST-EMPLOYMENT BENEFITS
The Parent Company has two types of pension plans, defined contribu-tion plans and defined benefit plans.
Defined contribution plans: post-employment benefit plans where the Company makes regular payments to separate entities and has no legal or constructive obligation to pay further contributions. The expenses for defined contribution plans are recognized during the period when the employee provides service.
Defined benefit plans: post-employment benefit plans where the Company’s undertaking is to provide predetermined benefits that the employee will receive on or after retirement. These benefit plans are secured through balance sheet provisions or pension fund contributions. Furthermore, a credit insurance policy has been taken out for the value of the obligations. The main defined benefit plan is the ITP2 plan which is based on final salary. The plan is semi-closed, meaning that only new employees born before 1979 have the possibility to choose the ITP2 solution. The ITP2 plan for the Company is funded in Volvo Pension Foundation. Pension obligations are calculated annually, on the balance sheet date, based on actuarial assumptions.
The defined benefit obligations are calculated based on the actual salary levels at year-end and based on a discount rate of 3.84% (3.84) for the ITP2 plan and 0.6% (0.7) for other pension obligations. Assumptions for discount rates and mortality rates are determined annually by PRI Pen-sionsgaranti for ITP2 and Finansinspektionen for other pension obliga-tions, respectively.
The Volvo Pension Foundation was formed in 1996 to secure obliga-tions relating to retirement pensions in accordance with the ITP plan. Since its formation, net contributions of 250 have been made to the foun-dation by the Parent Company.
Provisions for post-employment benefits in the Parent Company’s balance sheet correspond to the present value of obligations at year end, less fair value of plan assets.
Obligations in defined benefit plans Funded Unfunded Total
Obligations opening balance 2017 612 112 724
Service costs 16 6 22
Interest costs 24 1 25
Benefits paid –19 –16 –35
Obligations as of December 31, 2017 633 103 736
Service costs 26 169 195
Interest costs 25 1 26
Benefits paid –21 –15 –36
Obligations as of December 31, 2018 663 258 921
Fair value of plan assets in funded plans
Plan assets opening balance 2017 747
Actual return on plan assets 53
Contributions and compensation to/from the fund –
Plan assets as of December 31, 2017 800
Actual return on plan assets –12
Contributions and compensation to/from the fund –
Plan assets as of December 31, 2018 788
Provisions for post-employment benefits Dec 31, 2018
Dec 31, 2017
Obligations1 –921 –736
Fair value of plan assets 788 800
Funded status –133 64
Limitation on assets in accordance with RFR2 (when plan assets exceed corresponding obligations) –125 –167
B/S Net provisions for post-employment benefits2 –258 –103
1 The ITP2 obligations amount to –645 (–615).2 ITP2 obligations, net, amount to 0 (0).
Pension costs 2018 2017
Service costs 195 22
Interest costs3 26 25
Interest income3 –30 –21
Pension costs for defined benefit plans 191 26
Pension costs for defined contribution plans 65 55
Special payroll tax/yield tax4 42 34
Cost for credit insurance FPG 4 1
Total costs for the period 302 116
3 Interest cost, net of 1 (1) is included in financial items.4 Special payroll tax/yield tax are calculated according to Swedish Tax law
and accrued for in current liabilities.
Volvo Group applies IAS 19 Employee Benefits in the consolidated finan-cial statements. This implies differences, which may be significant, in the accounting of defined benefit pension plans as well as in the accounting of plan assets invested in the Volvo Pension Foundation.
190

GROUP PERFORMANCE 2018 PARENT COMPANY NOTES
The accounting principles for defined benefit plans differ from IAS19 mainly relating to:
• Pension liability calculated according to Swedish accounting principles does not take into account future salary increases.
• The discount rate used in the calculations is set by PRI Pensions garanti and Finansinspektionen, respectively.
• Changes in the discount rate, actual return on plan assets and other actuarial assumptions are recognized directly in the income statement and in the balance sheet.
• Deficit must be either immediately settled in cash or recognized as a liability in the balance sheet.
• Surplus cannot be recognized as an asset, but may in some cases be refunded to the Company to offset pension costs.
17 NON-CURRENT LIABILITIES
Non-current debt matures as follows:
2020–2024 13,975
2025 or later 2
B/S Total non-current liabilities 13,977
18 OTHER LIABILITIES
Dec 31, 2018
Dec 31, 2017
Wages, salaries and withholding taxes 302 320
Accrued expenses and prepaid income 239 237
Other liabilities 6 4
B/S Total other liabilities 547 561
No collateral is provided for current liabilities.
19 CONTINGENT LIABILITIES
Contingent liabilities as of December 31, 2018, amounted to 296,380 (274,646 ) of which 296,166 (274,445) pertained to Group companies.
Credit guarantees are included to an amount corresponding to the credit limits. Credit guarantees amounted to 277,018 (260,355). The total amount pertained to Group companies.
20 CASH-FLOW
Other non-cash items 2018 2017
Revaluation of shareholdings –2,056 –2,054
Dividend in form of shares/Gains on sale of shares –1,831 –524
Transfer price adjustments, net –178 28
Other changes 70 212
Total Other items not affecting cash flow –3,995 –2,338
Further information is provided in Note 5 Income from investments in Group companies, Note 6 Income from investments in joint ventures and associated companies and Note 7 Income from other investments.
Acquired and divested shares in Group companies, net 2018 2017
Acquisitions – –6,368
Divestments 371 –
Total cash flow from acquired and divested shares in Group companies, net 371 –6,368
Acquisitions and divestments of participations in Group companies are shown in Note 13 Investments in shares and participations.
Acquired and divested shares in non-Group companies, net 2018 2017
Acquisitions –1 –1
Divestments – 1,977
Total cash flow from acquired and divested shares in non-Group companies, net –1 1,976
Acquisitions and divestments of participations in non-Group companies are presented in Note 13 Investments in shares and participations.
Change in loans, net Non-current liabilities to
Group companies
Loan Volvo Treasury AB
Current liabilities to
Group companies
Cashpool Treasury AB
December 31, 2016 13,973 24,806
Cash flows – –5,466
Other – –3
December 31, 2017 13,973 19,337
Cash flows – –5,790
Other – 7
December 31, 2018 13,973 13,554
191
CORPORATE GOVERNANCE CORPORATE GOVERNANCE REPORT 2018
192
The Swedish Corporate Governance Code
AB Volvo’s shares are admitted to trading on the stock exchange Nasdaq Stockholm’s main market. As a listed company, Volvo applies the Swedish Corporate Governance Code (the Code), which is available at www.corporategovernanceboard.se.
This Corporate Governance Report has been prepared in accordance with the Swedish Annual Accounts Act and the Code, and is separate from the Annual Report. The report has been reviewed by Volvo’s auditors and includes a report from the auditors.
Corporate Governance Model
At the General Meetings of AB Volvo, which is the Parent Company of the Volvo Group, the shareholders exercise their voting rights with regard to for example the composition of the Board of Directors of AB Volvo and the election of auditors.
An Election Committee, appointed by the Annual General Meeting of AB Volvo, submits proposals to the upcoming Annual General Meeting concerning the election of Board members and Board Chairman as well as proposals for resolutions concerning remuneration of the Board. When applicable, the Election Committee also submits proposals for the election of external auditors and for resolutions concerning fees to the auditors.
The Board is ultimately responsible for Volvo’s organization and the management of its operations.
In addition, the Board appoints the President and CEO of AB Volvo. The CEO is in charge of the daily management of the Group in accordance with the guidelines provided by the Board.
Corporate governance report 2018
C O R P O R A T E G O V E R N A N C E
The Volvo Group appreciates the value of sound corporate governance
as a fundamental base in achieving a trusting relation with shareholders
and other key parties. The Swedish Corporate Governance Code, which is
applied by the Volvo Group, aims at creating a sound balance of power
between shareholders, the board of directors and the senior management.
Sound corporate governance, characterized by high standards when it
comes to transparency, reliability and ethical values, has always been a
well-established guiding principle within the Volvo Group’s operations.
CORPORATE GOVERNANCE CORPORATE GOVERNANCE REPORT 2018
192
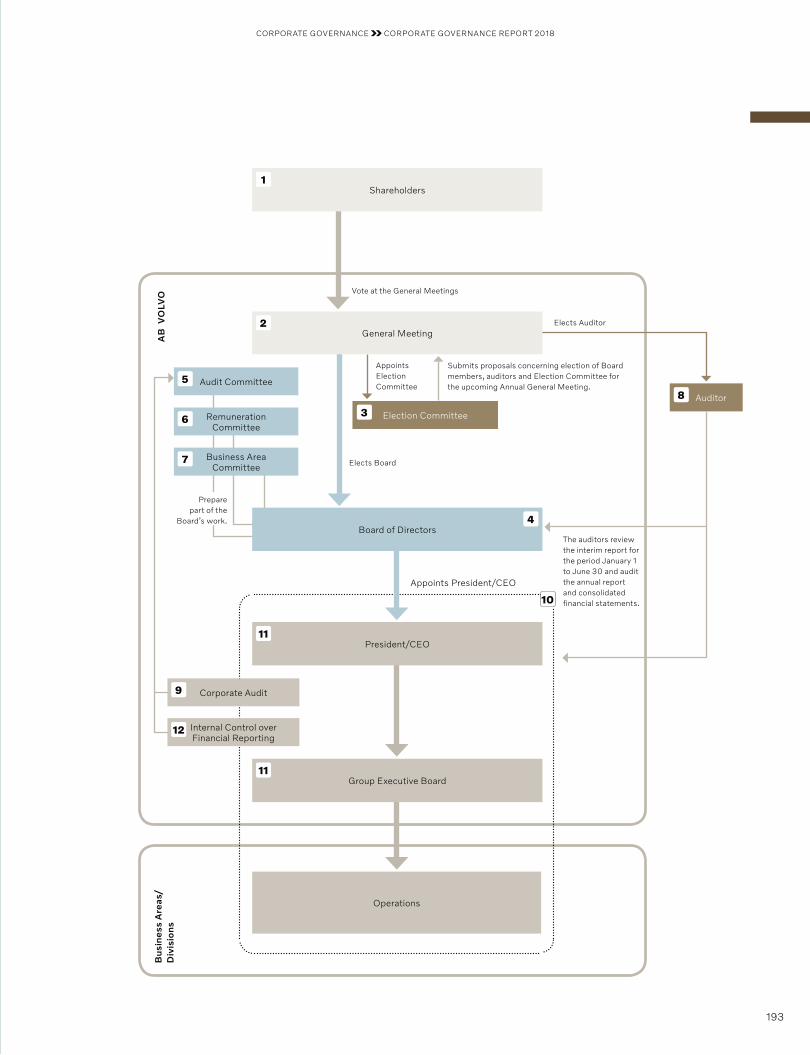
CORPORATE GOVERNANCE CORPORATE GOVERNANCE REPORT 2018
193
Audit Committee
Election Committee
Auditor
AB
VO
LVO
Bu
sin
ess
Are
as/
Div
isio
ns
Vote at the General Meetings
Elects Board
Prepare part of the
Board’s work.
Elects Auditor
Appoints Election Committee
The auditors review the interim report for the period January 1 to June 30 and audit the annual report and consolidated financial statements.
Appoints President/CEO
Shareholders
Business Area Committee
General Meeting
1
2
5
Remuneration Committee
6
7
3
8
President/CEO
Operations
Board of Directors
Submits proposals concerning election of Board members, auditors and Election Committee for the upcoming Annual General Meeting.
4
10
11
Group Executive Board11
Corporate Audit
Internal Control over Financial Reporting
9
12
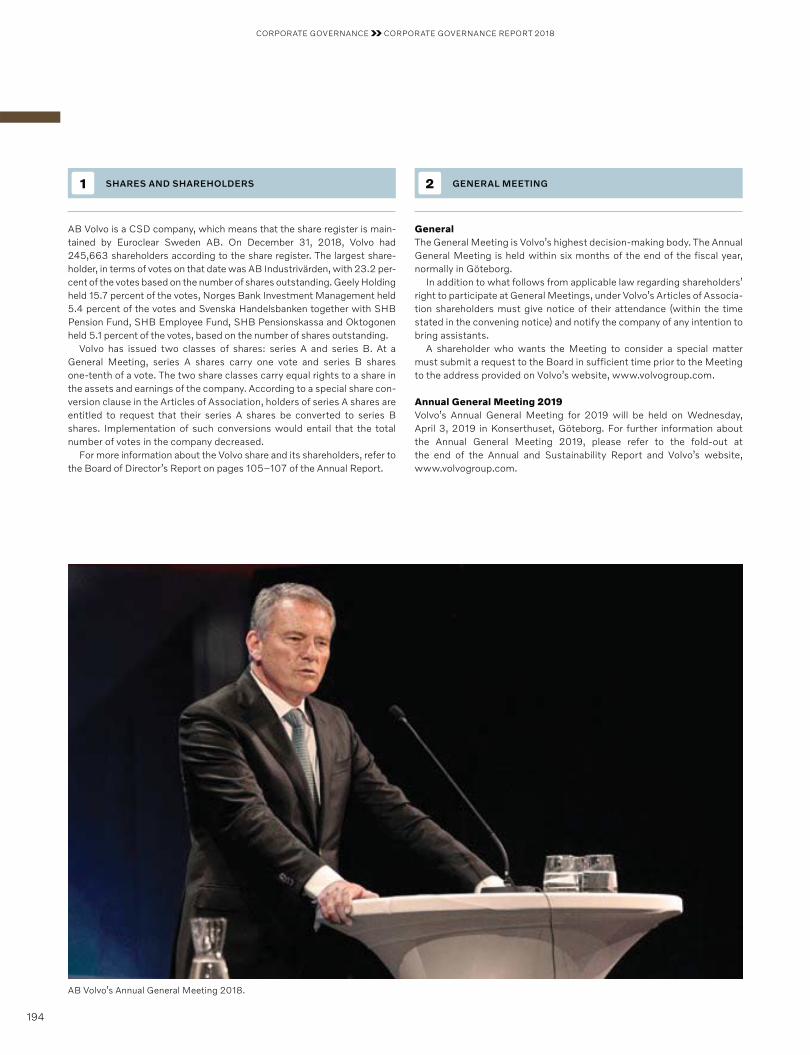
CORPORATE GOVERNANCE CORPORATE GOVERNANCE REPORT 2018
194
AB Volvo is a CSD company, which means that the share register is main-tained by Euroclear Sweden AB. On December 31, 2018, Volvo had 245,663 shareholders according to the share register. The largest share-holder, in terms of votes on that date was AB Industrivärden, with 23.2 per-cent of the votes based on the number of shares outstanding. Geely Holding held 15.7 percent of the votes, Norges Bank Investment Management held 5.4 percent of the votes and Svenska Handelsbanken together with SHB Pension Fund, SHB Employee Fund, SHB Pensionskassa and Oktogonen held 5.1 percent of the votes, based on the number of shares outstanding.
Volvo has issued two classes of shares: series A and series B. At a General Meeting, series A shares carry one vote and series B shares one-tenth of a vote. The two share classes carry equal rights to a share in the assets and earnings of the company. According to a special share con-version clause in the Articles of Association, holders of series A shares are entitled to request that their series A shares be converted to series B shares. Implementation of such conversions would entail that the total number of votes in the company decreased.
For more information about the Volvo share and its shareholders, refer to the Board of Director’s Report on pages 105–107 of the Annual Report.
SHARES AND SHAREHOLDERS1
GeneralThe General Meeting is Volvo’s highest decision-making body. The Annual General Meeting is held within six months of the end of the fiscal year, normally in Göteborg.
In addition to what follows from applicable law regarding shareholders’ right to participate at General Meetings, under Volvo’s Articles of Associa-tion shareholders must give notice of their attendance (within the time stated in the convening notice) and notify the company of any intention to bring assistants.
A shareholder who wants the Meeting to consider a special matter must submit a request to the Board in sufficient time prior to the Meeting to the address provided on Volvo’s website, www.volvogroup.com.
Annual General Meeting 2019Volvo’s Annual General Meeting for 2019 will be held on Wednesday, April 3, 2019 in Konserthuset, Göteborg. For further information about the Annual General Meeting 2019, please refer to the fold-out at the end of the Annual and Sustainability Report and Volvo’s website, www.volvogroup.com.
GENERAL MEETING2
AB Volvo’s Annual General Meeting 2018.

CORPORATE GOVERNANCE CORPORATE GOVERNANCE REPORT 2018
195
DutiesThe Election Committee shall perform the tasks that are incumbent upon the Election Committee according to the Code. The main task is to prepare and present proposals to the Annual General Meeting on behalf of the shareholders for the election of Board members, the Chairman and Board remuneration and, when applicable, proposals for auditors and fees to the auditors.
In addition, the Election Committee, in accordance with prevailing instructions for Volvo’s Election Committee, presents proposals for members of the Election Committee for the following year.
CompositionIn accordance with the instructions for Volvo’s Election Committee adopted by the 2017 Annual General Meeting, the Annual General Meet-ing shall elect five members to serve on the Election Committee, of whom four shall represent the largest shareholders in the company, in terms of votes who have expressed their willingness to participate on the Election Committee. In addition, one of the members shall be the Chairman of the AB Volvo Board. In accordance with its instructions, Volvo’s Annual General Meeting 2018 resolved to appoint the following individuals as members of the Election Committee:• Pär Boman, Svenska Handelsbanken, SHB Pension Fund,
SHB Employee Fund, SHB Pensionskassa and Oktogonen,• Ramsay Brufer, Alecta, • Bengt Kjell, AB Industrivärden,• Yngve Slyngstad, Norges Bank Investment Management, and• Carl-Henric Svanberg, Chairman of the Board.
The Election Committee appointed Bengt Kjell as Chairman of the Election Committee.
ELECTION COMMITTEE3 BOARD OF DIRECTORS4
DutiesThe Board of Directors is ultimately responsible for Volvo’s organization and management of the company’s operations. The Board is responsible for the Group’s long-term development and strategy, for regularly control-ling and evaluating the Group’s operations and for the other duties set forth in the Swedish Companies Act.
Composition During the period January 1, 2018 to April 5, 2018, AB Volvo’s Board con-sisted of eleven members elected by the Annual General Meeting and three members and two deputy members appointed by employee organi-zations. According to the Articles of Association, the Board shall consist of not less than six and not more than twelve members elected by the General Meeting.
The Annual General Meeting 2018 re-elected Matti Alahuhta, Eckhard Cordes, James W. Griffith, Martin Lundstedt, Kathryn V. Marinello, Martina Merz, Hanne de Mora, Helena Stjernholm and Carl- Henric Svanberg as Board members and Eric Elzvik was elected as new Board member and the Annual General Meeting re-elected Carl-Henric Svanberg as Chairman of the Board. An account of each Board member’s age, principal education, professional experience, assignments in the company, other significant assignments, their own and related parties’ ownership of shares in Volvo as of March 8, 2019, and the year they were elected to the Volvo Board, is presented in the “Board of Directors” section on pages 200–201.
Prior to the 2018 Annual General Meeting, the Election Committee announced that it had applied the provisions of rule 4.1 of the Code as board diversity policy. The aim is that the Board as a collective should possess the required mix in terms of background and knowledge, whereby an even gender distribution is taken into particular account. The result of the Election Committee’s application of the diversity policy is a Board that represents a mix of both professional experience and knowledge as well as geographical and cultural backgrounds. 40 percent of the Board members elected at the Annual General Meeting are women.
Independence requirements The Board of Directors of AB Volvo is subject to the independence require-ments prescribed in the Code.
Prior to the 2018 Annual General Meeting, the Nomination Committee presented the following assessment of the independence of Board members elected at the 2018 Annual General Meeting.
Carl-Henric Svanberg, Matti Alahuhta, Eckhard Cordes, Eric Elzvik, James W. Griffith, Kathryn V. Marinello, Martina Merz and Hanne de Mora were all considered independent of the company and company management, as well as the company’s major shareholders.
Martin Lundstedt, as President of AB Volvo and CEO of the Volvo Group, was considered independent of the company’s major shareholders but not of the company and company management.
Helena Stjernholm was considered independent of the company and company management. Since AB Industrivärden, prior to the Annual General Meeting 2018, controlled more than 10 percent of the votes in the company, Helena Stjernholm, due to her capacity as President and CEO of AB Industri värden, was not considered independent in relation to one of the company’s major shareholders.
CORPORATE GOVERNANCE CORPORATE GOVERNANCE REPORT 2018
196
Work procedures Every year, the Board adopts work procedures for the Board’s work.
The work procedures outline how the Board’s duties should be distrib-uted, including the specific role and duties of the Chairman, instructions for the division of duties between the Board and the President and for the reporting of financial information to the Board. The Board has also adopted specific instructions for the Board’s committees, which are linked to the work procedures.
The Board’s work in 2018The Board’s work is mainly performed within the framework of formal Board meetings and through meetings in the respective committees of the Board. In addition, regular contact is maintained between the Chair-man of the Board and the CEO in order to discuss ongoing business and to ensure that the Board’s decisions are executed.
In 2018, there were nine regular Board meetings and one statutory Board meeting. The attendance of Board members at these meetings is presented in the table on page 199. The Company’s auditor attended one Board meeting during the year.
In 2018, business cycle management has been high on the Board’s agenda. In addition, the Board continued to focus on measures to increase the Group’s profitability and to strengthen the balance sheet. In May 2018, the Volvo Group divested a Chinese subsidiary holding shares in Inner Mongolia North Hauler Joint Stock Co., Ltd, resulting in a capital gain of approximately SEK 0.8 billion. Furthermore, in December 2018, the Volvo Group signed an agreement to divest 75.1 percent of the shares in its wholly-owned subsidiary WirelessCar. The divestment will, at the time of closing of the transaction, result in a positive impact on operating income of approximately SEK 1.5 billion and a positive cash flow effect of SEK 1.1 billion. The completion of the transaction is subject to customary authority approvals.
Another focus area for the Board has been New Technologies and throughout the year, the Board has paid particular attention to the Group’s strategic focus on disruptive technology trends and initiatives within the areas of digitalization, electrification and automation.
The Board also decided on an overall financial plan and investment framework for the Group’s operations. In addition, the Board regularly monitors the Group’s earnings and financial position and maintains con-tinuous focus on risk related issues such as overall risk management and ongoing legal disputes and investigations. Throughout the year, the Board has devoted considerable time to talent review and succession planning and on the review and follow-up of the Company’s quality work.
By allocating time to business reviews of the Group’s various truck divi-sions and business areas the Board remains continuously up-to-date on the status and development of the Group’s operations. In June 2018, the Board visited the Company’s operations in Ghent in Belgium. Additionally, the Board has focused on the Group’s strategy regarding its operations and joint ventures in Asia and as part of this the Board, in October 2018, visited the Group’s operations in India.
In 2017, a Volvo CE Committee was established with a specific focus on monitoring and evaluating Volvo CE’s operations. Following the improved financial and operational performance of Volvo CE, the Volvo
CE Committee was renamed the Business Area Committee in April 2018. Following this change, the main purpose of the committee is for the Board to allocate time for deep-dives and additional follow-ups of specific busi-ness areas.
Evaluation of the Board’s workIn 2018, the Board performed its yearly evaluation of the Board’s work. The purpose of the evaluation is to further develop the Board’s efficiency and working procedures and to determine the main focus of the Board’s coming work. In addition, the evaluation serves as a tool for determining the competence required by the Board and for analyzing the competence that already exists in the current Board. By that, the evaluation also serves as input for the Election Committee’s work with proposing Board members.
As part of the yearly evaluation, Board members were asked to com-plete a questionnaire and assess various areas related to the Board’s work from their own perspective. The areas evaluated for 2018 included the Board’s composition, the management and focus of Board meetings, Board support and how the Board addresses issues related to strategy, potential risks and succession planning. The areas covered by the evalua-tion may differ from one year to another to reflect the development of the Board’s work and the Volvo Group.
Separate evaluations were conducted of the Board as a collective, of the Chairman of the Board, the Audit Committee, the Remuneration Com-mittee and the Business Area Committee. The results of the evaluations of the Board as a collective and of the Chairman were discussed by the Board. The results of the evaluations of the committees were, or will be, discussed by the relevant committee. In addition, the results of the evalu-ations of the Board as a collective and of the Chairman are shared with the Election Committee.
Remuneration of Board Members The Annual General Meeting resolves on fees to be paid to the Board mem-bers elected by the Annual General Meeting. For information about Board remuneration, as adopted by the Annual General Meeting 2018, please refer to Note 27 Personnel in the Group’s notes in the Annual Report.
Remuneration of Board members, 2018 (from AGM on April 5, 2018) SEK
Chairman of the Board 3,500,000
Board member 1,030,000
Chairman of the Audit Committee 360,000
Member of the Audit Committee 165,000
Chairman of the Remuneration Committee 150,000
Member of the Remuneration Committee 110,000
Chairman of the Business Area Committee1 180,000
Member of the Business Area Committee1 155,000
1 Previously named Volvo CE Committee.
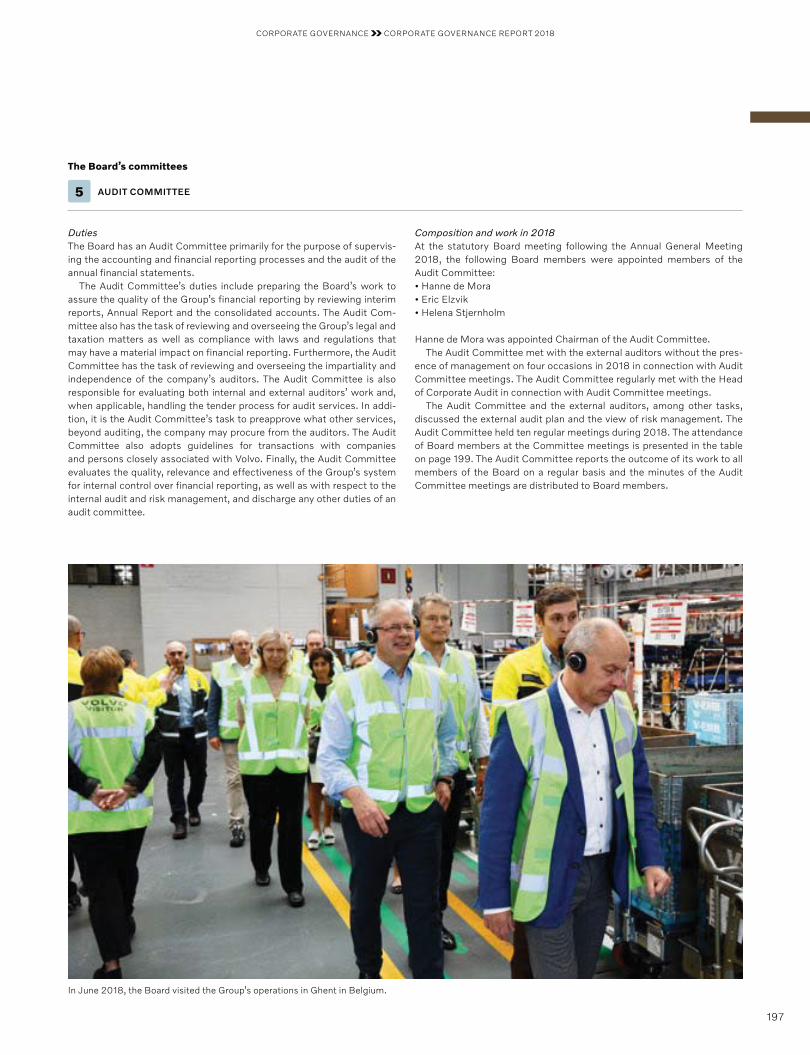
CORPORATE GOVERNANCE CORPORATE GOVERNANCE REPORT 2018
197
In June 2018, the Board visited the Group’s operations in Ghent in Belgium.
DutiesThe Board has an Audit Committee primarily for the purpose of supervis-ing the accounting and financial reporting processes and the audit of the annual financial statements.
The Audit Committee’s duties include preparing the Board’s work to assure the quality of the Group’s financial reporting by reviewing interim reports, Annual Report and the consolidated accounts. The Audit Com-mittee also has the task of reviewing and overseeing the Group’s legal and taxation matters as well as compliance with laws and regulations that may have a material impact on financial reporting. Furthermore, the Audit Committee has the task of reviewing and overseeing the impartiality and independence of the company’s auditors. The Audit Committee is also responsible for evaluating both internal and external auditors’ work and, when applicable, handling the tender process for audit services. In addi-tion, it is the Audit Committee’s task to preapprove what other services, beyond auditing, the company may procure from the auditors. The Audit Committee also adopts guidelines for transactions with companies and persons closely associated with Volvo. Finally, the Audit Committee evaluates the quality, relevance and effectiveness of the Group’s system for internal control over financial reporting, as well as with respect to the internal audit and risk management, and discharge any other duties of an audit committee.
The Board’s committees
5 AUDIT COMMITTEE
Composition and work in 2018At the statutory Board meeting following the Annual General Meeting 2018, the following Board members were appointed members of the Audit Committee:• Hanne de Mora• Eric Elzvik• Helena Stjernholm
Hanne de Mora was appointed Chairman of the Audit Committee.The Audit Committee met with the external auditors without the pres-
ence of management on four occasions in 2018 in connection with Audit Committee meetings. The Audit Committee regularly met with the Head of Corporate Audit in connection with Audit Committee meetings.
The Audit Committee and the external auditors, among other tasks, discussed the external audit plan and the view of risk management. The Audit Committee held ten regular meetings during 2018. The attendance of Board members at the Committee meetings is presented in the table on page 199. The Audit Committee reports the outcome of its work to all members of the Board on a regular basis and the minutes of the Audit Committee meetings are distributed to Board members.
CORPORATE GOVERNANCE CORPORATE GOVERNANCE REPORT 2018
198
7 BUSINESS AREA COMMITTEE
DutiesIn connection with the 2017 Annual General Meeting the Board estab-lished a Volvo CE committee, during 2018 the committee changed name to Business Area Committee. The main purpose of the committee is to review and evaluate the development of Volvo Group Business Areas.
Composition and work in 2018At the statutory Board meeting following the Annual General Meeting 2018, the following Board members were appointed members of the Business Area Committee:• Carl-Henric Svanberg• Matti Alahuhta• Lars Ask• Eckhard Cordes• James W. Griffith• Mari Larsson• Helena Stjernholm
Carl-Henric Svanberg was appointed Chairman of the Business Area Committee.
The Business Area Committee held three meetings in 2018. The attend-ance of Board members at Committee meetings is presented in the table on page 199. The Business Area Committee reports the outcome of its work to all members of the Board on a regular basis.
Board of Directors (cont.)
6 REMUNERATION COMMITTEE
DutiesThe Board has a Remuneration Committee for the purpose of preparing and deciding on issues relating to the remuneration of senior executives in the Group. The duties of the Committee include making recommenda-tions to the Board on the Board’s decisions regarding terms of employ-ment and remuneration of the CEO and the deputy CEO of AB Volvo, principles for the remuneration, including pensions and severance payments, of other members of the Group Executive Board and principles for variable salary systems, sharebased incentive programs and for pension and severance payment structures for other senior executives in the Group.
The Remuneration Committee shall monitor and evaluate ongoing programs and programs concluded during the year for the variable remune-ration of senior executives, application of the guidelines for the remunera-tion of senior executives on which the Annual General Meeting shall decide, and the current remuneration structures and levels in the Group.
The Board shall, no later than three weeks prior to the Annual General Meeting, present the results of the Remuneration Committee’s evaluation on the company’s website.
Composition and work in 2018At the statutory Board meeting following the Annual General Meeting 2018, the following Board members were appointed members of the Remuneration Committee:• Carl-Henric Svanberg• Matti Alahuhta• James W. Griffith• Mikael Sällström
Carl-Henric Svanberg was appointed Chairman of the Remuneration Committee.
The Code sets the requirement that members of the Remuneration Committee, with the exception of the Board Chairman if being a member of the Remuneration Committee, shall be independent of the company and company management. The Election Committee’s assessment of independence prior to the 2018 Annual General Meeting is presented under “Independence requirements” on page 195.
The Remuneration Committee held six meetings in 2018. The attend-ance of Board members at Committee meetings is presented in the table on page 199. The Remuneration Committee reports the outcome of its work to all members of the Board on a regular basis.
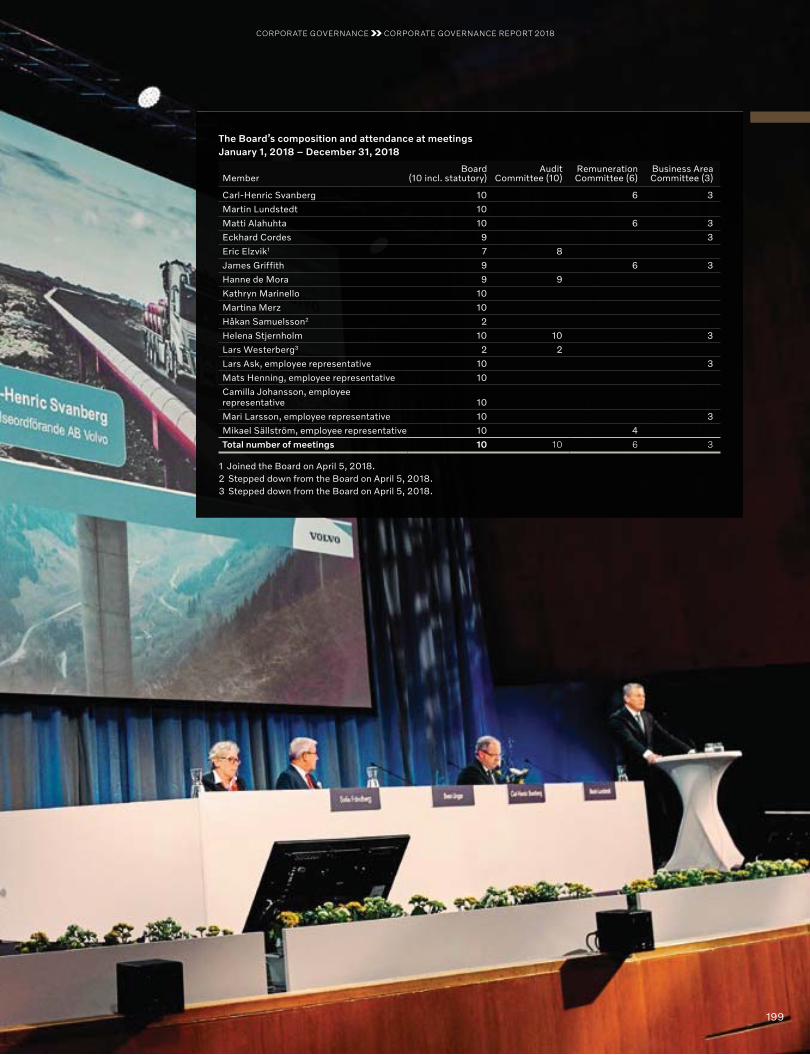
199
The Board’s composition and attendance at meetings January 1, 2018 – December 31, 2018
MemberBoard
(10 incl. statutory)Audit
Committee (10)RemunerationCommittee (6)
Business Area Committee (3)
Carl-Henric Svanberg 10 6 3
Martin Lundstedt 10
Matti Alahuhta 10 6 3
Eckhard Cordes 9 3
Eric Elzvik1 7 8
James Griffith 9 6 3
Hanne de Mora 9 9
Kathryn Marinello 10
Martina Merz 10
Håkan Samuelsson2 2
Helena Stjernholm 10 10 3
Lars Westerberg3 2 2
Lars Ask, employee representative 10 3
Mats Henning, employee representative 10
Camilla Johansson, employee representative 10
Mari Larsson, employee representative 10 3
Mikael Sällström, employee representative 10 4
Total number of meetings 10 10 6 3
1 Joined the Board on April 5, 2018.2 Stepped down from the Board on April 5, 2018.3 Stepped down from the Board on April 5, 2018.
CORPORATE GOVERNANCE CORPORATE GOVERNANCE REPORT 2018
199

CORPORATE GOVERNANCE CORPORATE GOVERNANCE REPORT 2018
200
Board of Directors
BOARD MEMBERS ELECTED BY THE ANNUAL GENERAL MEETING
Carl-Henric SvanbergChairman of the Board, Chairman of the Remuneration Committee, Chairman of the Business Area Committee
Matti AlahuhtaMember of the Remuneration Committee, Member of the Business Area Committee
Eckhard Cordes Member of the Business Area Committee
Eric Elzvik Member of the Audit Committee
James W. Griffith Member of the Remuneration Committee, Member of the Business Area Committee
Education MSc in Applied Physics, Linköping Institute of Tech-nology, BSc Business Admin-istration, University of Uppsala.
MSc, Dr Sc. Doctor of Science, Helsinki University of Technology.
MBA and PhD, University of Hamburg.
MSc Business Administra-tion, Stockholm School of Economics.
BSc Industrial Engineering, MBA from Stanford University.
Born 1952 1952 1950 1960 1954
Member of the Volvo Board
Chairman of the Volvo Board since April 4, 2012.
Since April 2, 2014. Since April 1, 2015. Since April 5, 2018. Since April 2, 2014.
Position and Board memberships
Chairman of the Academy: The Royal Swedish Academy of Engineering Sciences (IVA) and Chairman of the European Round Table of Industrialists.
Board Chairman: DevCo Partners Oy and Outotec Corporation. Board member: Kone Corporation, and ABB Ltd.
Partner in Cevian Capital and EMERAM Capital Partners.Board Chairman: Bilfinger SE. Member of the Executive Committee of Eastern European Economic Relations of German Industry.
Board member: Telefon-aktiebolaget LM Ericsson, Landis+Gyr Group AG, Fenix Marine Services and VFS Global.
Board member: Illinois Tool Works Inc.
Principal work experience
Has held various positions at Asea Brown Boveri (ABB) and Securitas AB, President and CEO of Assa Abloy AB, President and CEO of Telefon-aktiebolaget LM Ericsson, member of the External Advisory Board of the Earth Institute at Columbia University, the Advisory Board of Harvard Kennedy School and Board Chairman of BP plc.
Has held several manage-ment positions in the Nokia Group – President of Nokia Telecommunications, Presi-dent of Nokia Mobile Phones and Chief Strategy Officer of the Nokia Group, President of Kone Corporation between 2005–2014 and between 2006–2014 also CEO.
Started with Daimler Benz AG, where he has held several manage ment positions, such as Head of the trucks and buses business, Head of Group Controlling, Corporate Development and M&A in AEG AG and CEO of Mercedes Car Group. Previously CEO of Metro AG, senior advisor at EQT and Board member of Air Berlin, SKF, Carl Zeiss and Rhein-metall AG. Since 2012 partner in Cevian Capital and EMERAM Capital Partners respectively.
Joined ABB in 1984 and has held several management positions in the Finance function at ABB in Sweden, Singa pore and Switzerland – most recently as Group CFO between 2013 and 2017 and previously as CFO for the Divisions Discrete Automa-tion & Motion and Automa-tion Products and a position as Head of Mergers & Acqui-sitions and New Ventures and also as Head of Corporate Development. Industrial advisor to private equity.
Began his career at The Timken Company in 1984, where he has held several management positions, such as responsible for Timken’s bearing business activities in Asia, the Pacific and Latin America and for the company’s automotive business in North America. Until 2014 President and CEO at Timken Company.
Holdings in Volvo, own and related parties
1,500,000 Series B shares. 146,100 Series B shares. None. 7,475 B Series B shares. 40,000 Series B shares.
BOARD MEMBERS APPOINTED BY THE EMPLOYEE ORGANISATIONS
Lars AskEmployee representative, ordinary member Member of the Business Area Committee
Mats HenningEmployee representative, ordinary member
Mikael SällströmEmployee representative, ordinary member Member of the Remuneration Committee
Born 1959 1961 1959
Member of the Volvo Board
Ordinary member since April 6, 2016. Deputy member from June 16, 2009–2016.
Since May 9, 2014. Since September 7, 2009.
Background within Volvo With Volvo since 1982. With Volvo since 1982. With Volvo 1980–1999 and since 2009.
Holdings in Volvo, own and related parties
None. 293 Series A shares, 500 Series B shares. 293 Series A shares.
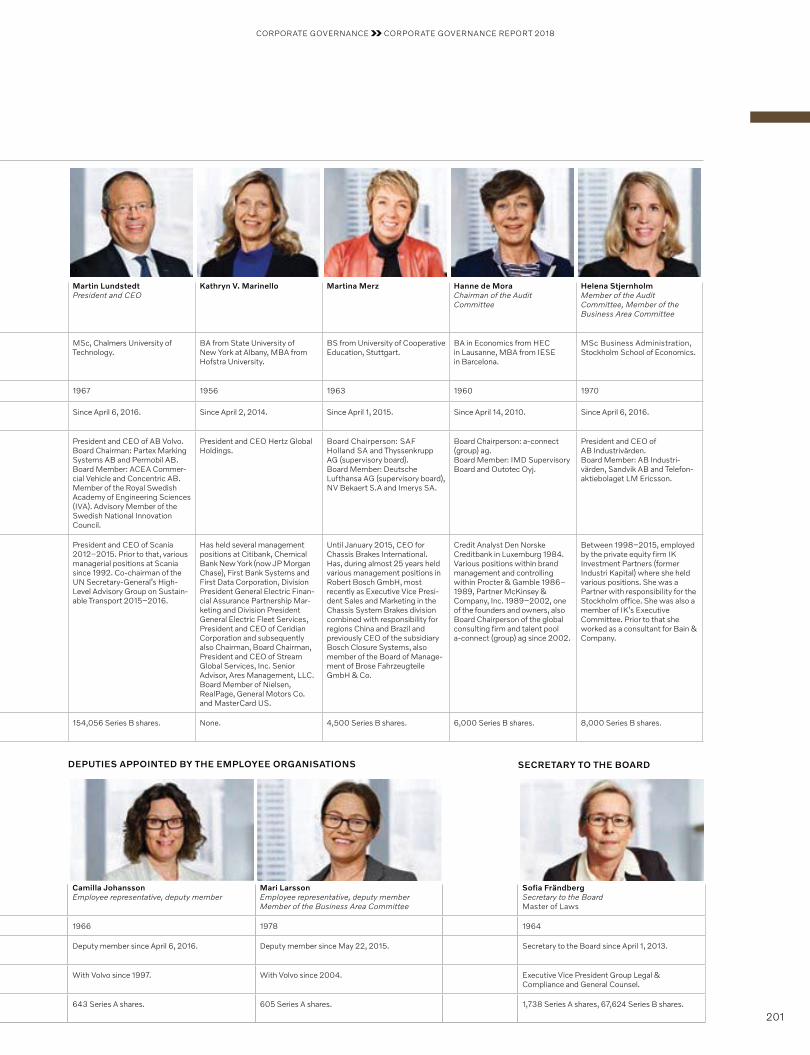
CORPORATE GOVERNANCE CORPORATE GOVERNANCE REPORT 2018
201
Martin Lundstedt President and CEO
Kathryn V. Marinello Martina Merz Hanne de Mora Chairman of the Audit Committee
Helena StjernholmMember of the Audit Committee, Member of the Business Area Committee
MSc, Chalmers University of Technology.
BA from State University of New York at Albany, MBA from Hofstra University.
BS from University of Cooperative Education, Stuttgart.
BA in Economics from HEC in Lausanne, MBA from IESE in Barcelona.
MSc Business Administration, Stockholm School of Economics.
1967 1956 1963 1960 1970
Since April 6, 2016. Since April 2, 2014. Since April 1, 2015. Since April 14, 2010. Since April 6, 2016.
President and CEO of AB Volvo.Board Chairman: Partex Marking Systems AB and Permobil AB. Board Member: ACEA Commer-cial Vehicle and Concentric AB. Member of the Royal Swedish Academy of Engineering Sciences (IVA). Advisory Member of the Swedish National Innovation Council.
President and CEO Hertz Global Holdings.
Board Chairperson: SAF Holland SA and Thyssenkrupp AG (supervisory board).Board Member: Deutsche Lufthansa AG (supervisory board), NV Bekaert S.A and Imerys SA.
Board Chairperson: a-connect (group) ag.Board Member: IMD Super visory Board and Outotec Oyj.
President and CEO of AB Industri värden.Board Member: AB Industri-värden, Sandvik AB and Telefon -aktie bolaget LM Ericsson.
President and CEO of Scania 2012–2015. Prior to that, various managerial positions at Scania since 1992. Co-chairman of the UN Secretary- General’s High-Level Advisory Group on Sustain-able Transport 2015–2016.
Has held several management positions at Citibank, Chemical Bank New York (now JP Morgan Chase), First Bank Systems and First Data Corporation, Division President General Electric Finan-cial Assurance Partnership Mar-keting and Division President General Electric Fleet Services, President and CEO of Ceridian Corporation and subsequently also Chairman, Board Chairman, President and CEO of Stream Global Services, Inc. Senior Advisor, Ares Management, LLC. Board Member of Nielsen, RealPage, General Motors Co. and MasterCard US.
Until January 2015, CEO for Chassis Brakes International. Has, during almost 25 years held various management positions in Robert Bosch GmbH, most recently as Executive Vice Presi-dent Sales and Marketing in the Chassis System Brakes division combined with responsibility for regions China and Brazil and previously CEO of the subsidiary Bosch Closure Systems, also member of the Board of Manage-ment of Brose Fahrzeugteile GmbH & Co.
Credit Analyst Den Norske Credit bank in Luxemburg 1984. Various positions within brand management and controlling within Procter & Gamble 1986–1989, Partner McKinsey & Company, Inc. 1989–2002, one of the founders and owners, also Board Chairperson of the global consulting firm and talent pool a-connect (group) ag since 2002.
Between 1998–2015, employed by the private equity firm IK Investment Partners (former Industri Kapital) where she held various positions. She was a Partner with responsibility for the Stockholm office. She was also a member of IK’s Executive Committee. Prior to that she worked as a consultant for Bain & Company.
154,056 Series B shares. None. 4,500 Series B shares. 6,000 Series B shares. 8,000 Series B shares.
DEPUTIES APPOINTED BY THE EMPLOYEE ORGANISATIONS SECRETARY TO THE BOARD
Camilla JohanssonEmployee representative, deputy member
Mari LarssonEmployee representative, deputy member Member of the Business Area Committee
Sofia FrändbergSecretary to the Board Master of Laws
1966 1978 1964
Deputy member since April 6, 2016. Deputy member since May 22, 2015. Secretary to the Board since April 1, 2013.
With Volvo since 1997. With Volvo since 2004. Executive Vice President Group Legal & Compliance and General Counsel.
643 Series A shares. 605 Series A shares. 1,738 Series A shares, 67,624 Series B shares.
CORPORATE GOVERNANCE CORPORATE GOVERNANCE REPORT 2018
202
Volvo’s auditors are elected by the Annual General Meeting. The auditors perform a review of the interim financial information and audit the annual financial statements and consolidated accounts. The auditors report the results of their audit of the annual financial statements and consolidated accounts and their review of the Corporate Governance Report in the Audit Report and in an opinion on the Corporate Governance Report, as well as an opinion to the Annual General Meeting regarding whether the guidelines for remuneration to senior executives have been complied with, which they present to the Annual General Meeting.
The current auditor Deloitte AB (Deloitte), was elected at the 2018 Annual General Meeting for a period of four years. Jan Nilsson is respon-sible for the audit of Volvo and Auditor-in-Charge.
For information about Volvo’s remuneration of the auditors, refer to Note 28 “Fees to the auditors” in the Group’s notes in the Annual Report.
EXTERNAL AUDITING8
Volvo’s internal audit function, Corporate Audit, supports Volvo in enhancing and protecting organizational value by providing risk-based, independent and objective assurance, advice and insight. Corporate Audit helps the organization to accomplish its objectives by bringing a system-atic, disciplined approach to evaluate and to improve the effectiveness of risk management, control and governance processes.
Corporate Audit performs internal audits in selected focus areas, iden-tified through an independent risk assessment process and approved by the Audit Committee. In addition, special assignments requested by man-agement and the Audit Committee are performed. The audits cover, among other things, assessments on the adequacy and effectiveness of the organization’s processes for controlling its activities and managing its risks and evaluation of compliance with policies and directives.
Corporate Audit also assists in investigations of suspected breaches of the Code of Conduct and of suspected fraudulent activities within the organization and coordinates and provides oversight of other control and monitoring functions.
The head of Corporate Audit reports directly to the CEO, the Group’s General Counsel and the Board’s Audit Committee.
For additional information on internal control over financial reporting, see pages 208–209.
CORPORATE AUDIT9
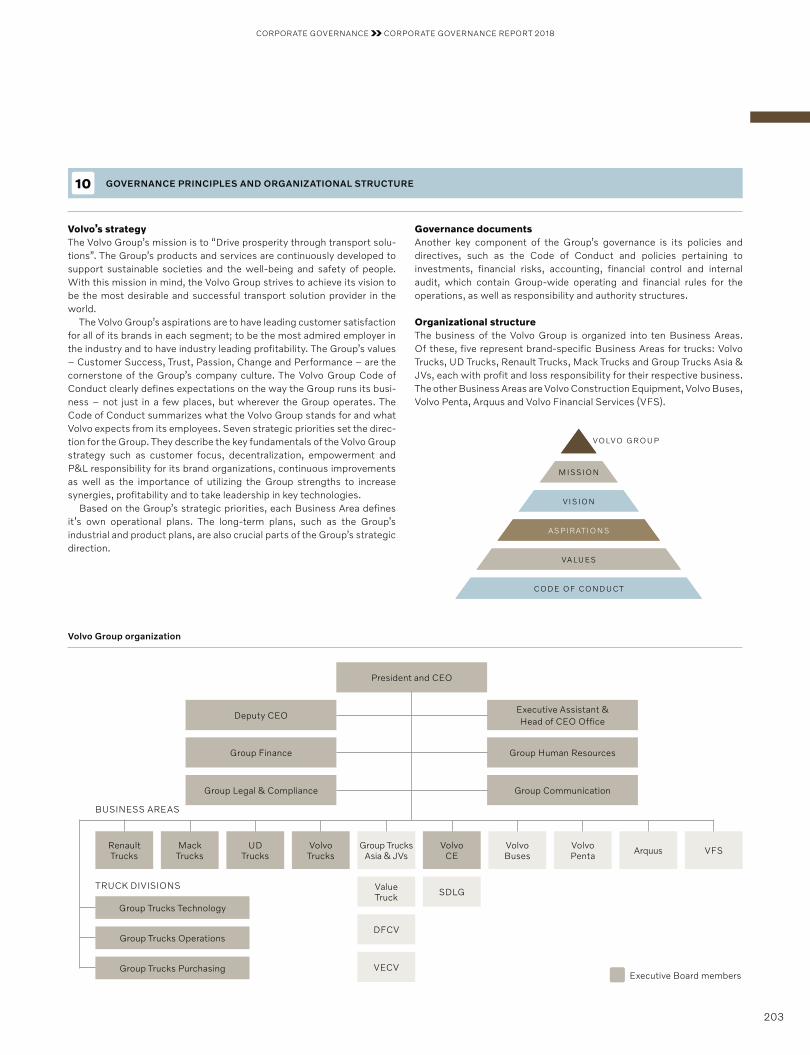
CORPORATE GOVERNANCE CORPORATE GOVERNANCE REPORT 2018
203
GOVERNANCE PRINCIPLES AND ORGANIZATIONAL STRUCTURE10
Volvo Group organization
President and CEO
Group Human Resources
Executive Assistant & Head of CEO Office
Group Communication
Group Finance
Deputy CEO
Group Legal & Compliance
RenaultTrucks
Group TrucksAsia & JVs
UDTrucks
VolvoBuses ArquusMack
TrucksVolvo
CEVolvoTrucks
VolvoPenta VFS
Value Truck SDLG
DFCV
VECV
Group Trucks Technology
Group Trucks Operations
Group Trucks Purchasing
BUSINESS AREAS
TRUCK DIVISIONS
Executive Board members
Volvo’s strategyThe Volvo Group’s mission is to “Drive prosperity through transport solu-tions”. The Group’s products and services are continuously developed to support sustainable societies and the well-being and safety of people. With this mission in mind, the Volvo Group strives to achieve its vision to be the most desirable and successful transport solution provider in the world.
The Volvo Group’s aspirations are to have leading customer satisfaction for all of its brands in each segment; to be the most admired employer in the industry and to have industry leading profitability. The Group’s values – Customer Success, Trust, Passion, Change and Performance – are the cornerstone of the Group’s company culture. The Volvo Group Code of Conduct clearly defines expectations on the way the Group runs its busi-ness – not just in a few places, but wherever the Group operates. The Code of Conduct summarizes what the Volvo Group stands for and what Volvo expects from its employees. Seven strategic priorities set the direc-tion for the Group. They describe the key funda mentals of the Volvo Group strategy such as customer focus, decentralization, empowerment and P&L responsibility for its brand organizations, continuous improvements as well as the importance of utiliz ing the Group strengths to increase synergies, profitability and to take leadership in key technologies.
Based on the Group’s strategic priorities, each Business Area defines it’s own operational plans. The long-term plans, such as the Group’s industrial and product plans, are also crucial parts of the Group’s strategic direction.
Governance documents Another key component of the Group’s governance is its policies and directives, such as the Code of Conduct and policies pertaining to investments, financial risks, accounting, financial control and internal audit, which contain Group-wide operating and financial rules for the operations, as well as responsibility and authority structures. Organizational structureThe business of the Volvo Group is organized into ten Business Areas. Of these, five represent brand-specific Business Areas for trucks: Volvo Trucks, UD Trucks, Renault Trucks, Mack Trucks and Group Trucks Asia & JVs, each with profit and loss responsibility for their respective business. The other Business Areas are Volvo Construction Equipment, Volvo Buses, Volvo Penta, Arquus and Volvo Financial Services (VFS).
VALUES
CODE OF CONDUCT
VALUES
CODE OF CONDUCT
ASPIRATIONS
VISION
MISSION
ASPIRATIONS
VISION
MISSION
VOLVO GROUP
CORPORATE GOVERNANCE CORPORATE GOVERNANCE REPORT 2018
204
The Group Executive Board comprises 14 members. In addition to the CEO and the deputy CEO, the Group Executive Board
comprises the Executive Vice Presidents of the three Group Truck Divi-sions, the Executive Vice Presidents of the five Business Areas Renault Trucks, Mack Trucks, UD Trucks, Volvo Trucks and Volvo Construction Equipment, and the Executive Vice Presidents of the four Group Functions. The members of the Group Executive Board report directly to the CEO.
The Presidents of the Business Areas Group Trucks Asia & JVs, Volvo Buses, Volvo Penta, Arquus and VFS also report directly to the CEO and are part of an extended Group Management Team together with the members of the Group Executive Board.
The CEO is responsible for managing the day-to-day operations of the Volvo Group and is authorized to make decisions on matters that do not require Board approval. The CEO leads the operations of the Group mainly through the Group Executive Board and the extended Group Management Team.
Key decisions related to the Group’s offering and technology portfolio are made by the Product Board.
Quality-related matters are addressed in the Quality Board in order to support fast decision-making and customer focus in this area.
At special meetings for Sales & Operations Planning (S&OP), decisions are made regarding a production plan aimed at optimizing the Volvo Group’s overall profitability. The purpose of the meetings is to balance demand with supply chain capabilities, drive capacity management and provide directions for the Group’s sales and operations activities.
All of the above bodies affect control and monitoring of the Group’s financial development, strategies and targets, and make decisions regard-ing investments and other matters.
GROUP MANAGEMENT11
The Trucks Business is further organized into three divisions: Group Trucks Technology (GTT), Group Trucks Operations (GTO) and Group Trucks Purchasing (GTP).
GTT is responsible for product development of engines, transmissions and trucks. GTO is responsible for the production of trucks and the Group’s engines and transmissions, as well as for the Group’s spare parts supply and logistics operation. GTP has overall responsibility for purchas-ing for the Group’s trucks, engines and transmissions operations as well as for the Group’s purchase of indirect products and services.
In addition, there are four Group Functions: Group Human Resources, Group Finance, Group Communication and Group Legal & Compliance, tasked with supporting the CEO and the Group Executive Board with expertise within each Group Function area and with developing standards for the entire organization through policies, directives and guidelines. In addition, there are Group Functions that provide services and/or products for the entire Group, such as Group IT and Accounting & Company Control.
With this governance model, Volvo can utilize the synergies of having global organizations for manufacturing, product development and pur-chasing, while maintaining clear leadership and responsibility for each truck brand to make sure that customer needs are met. The aim of the governance model is that all Business Areas are driven according to the same distinct business principles, whereby each Business Area can follow and optimize its own earnings performance in the long and short term.
Governance principles and organizational structure (cont.)
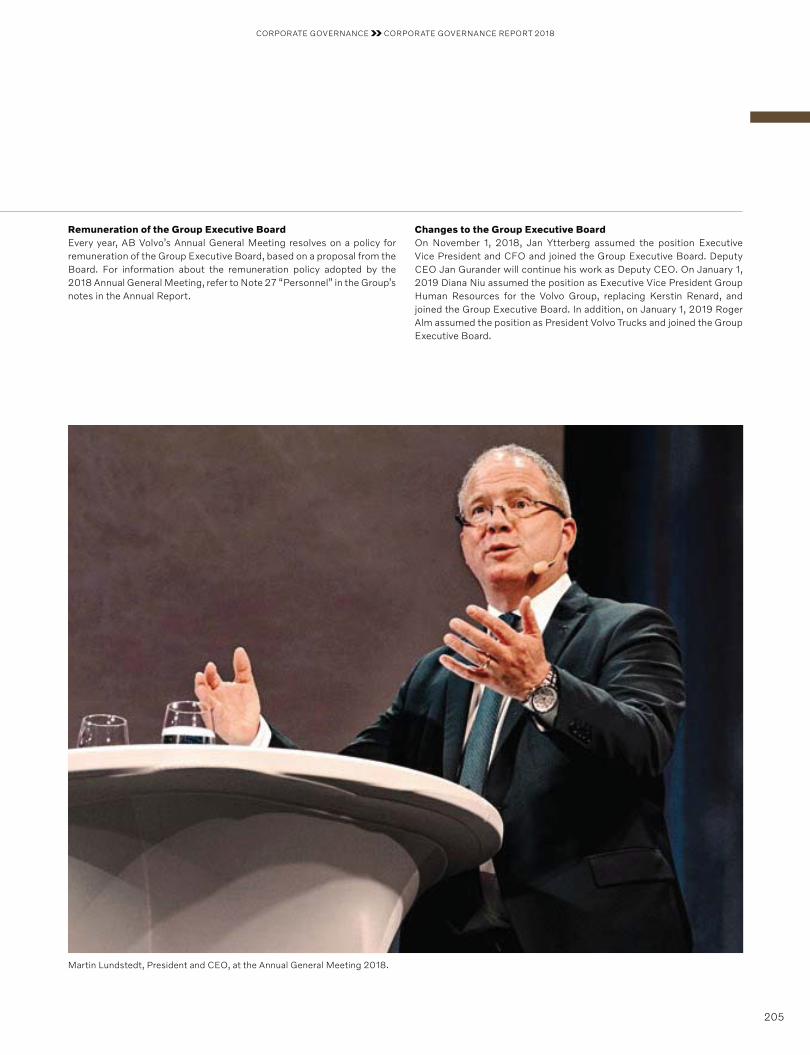
CORPORATE GOVERNANCE CORPORATE GOVERNANCE REPORT 2018
205
Martin Lundstedt, President and CEO, at the Annual General Meeting 2018.
Changes to the Group Executive BoardOn November 1, 2018, Jan Ytterberg assumed the position Executive Vice President and CFO and joined the Group Executive Board. Deputy CEO Jan Gurander will continue his work as Deputy CEO. On January 1, 2019 Diana Niu assumed the position as Executive Vice President Group Human Resources for the Volvo Group, replacing Kerstin Renard, and joined the Group Executive Board. In addition, on January 1, 2019 Roger Alm assumed the position as President Volvo Trucks and joined the Group Executive Board.
Remuneration of the Group Executive BoardEvery year, AB Volvo’s Annual General Meeting resolves on a policy for remuneration of the Group Executive Board, based on a proposal from the Board. For information about the remuneration policy adopted by the 2018 Annual General Meeting, refer to Note 27 “Personnel” in the Group’s notes in the Annual Report.
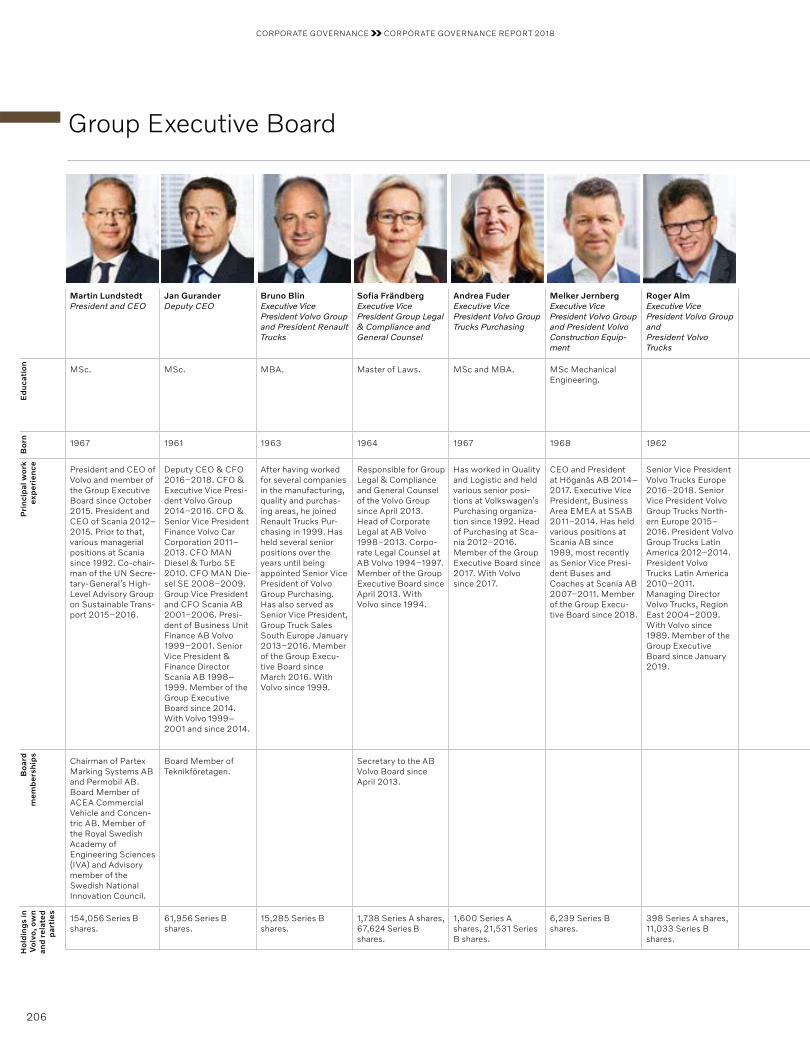
CORPORATE GOVERNANCE CORPORATE GOVERNANCE REPORT 2018
206
Group Executive Board
Martin LundstedtPresident and CEO
Jan GuranderDeputy CEO
Bruno BlinExecutive Vice President Volvo Group and President Renault Trucks
Sofia FrändbergExecutive Vice President Group Legal & Compliance and General Counsel
Andrea Fuder Executive Vice President Volvo Group Trucks Purchasing
Melker JernbergExecutive Vice President Volvo Group and President Volvo Construction Equip-ment
Roger AlmExecutive Vice President Volvo Group and President Volvo Trucks
MSc. MSc. MBA. Master of Laws. MSc and MBA. MSc Mechanical Engineering.
1967 1961 1963 1964 1967 1968 1962
President and CEO of Volvo and member of the Group Executive Board since October 2015. President and CEO of Scania 2012– 2015. Prior to that, various managerial positions at Scania since 1992. Co-chair-man of the UN Secre-tary-General’s High-Level Advisory Group on Sustainable Trans-port 2015–2016.
Deputy CEO & CFO 2016–2018. CFO & Executive Vice Presi-dent Volvo Group 2014–2016. CFO & Senior Vice President Finance Volvo Car Corporation 2011–2013. CFO MAN Diesel & Turbo SE 2010. CFO MAN Die-sel SE 2008–2009. Group Vice President and CFO Scania AB 2001–2006. Presi-dent of Business Unit Finance AB Volvo 1999–2001. Senior Vice President & Finance Director Scania AB 1998–1999. Member of the Group Executive Board since 2014. With Volvo 1999–2001 and since 2014.
After having worked for several companies in the manufacturing, quality and purchas-ing areas, he joined Renault Trucks Pur-chasing in 1999. Has held several senior positions over the years until being appointed Senior Vice President of Volvo Group Purchasing. Has also served as Senior Vice President, Group Truck Sales South Europe January 2013–2016. Member of the Group Execu-tive Board since March 2016. With Volvo since 1999.
Responsible for Group Legal & Compliance and General Counsel of the Volvo Group since April 2013. Head of Corporate Legal at AB Volvo 1998–2013. Corpo-rate Legal Counsel at AB Volvo 1994–1997. Member of the Group Executive Board since April 2013. With Volvo since 1994.
Has worked in Quality and Logistic and held various senior posi-tions at Volkswagen’s Purchasing organiza-tion since 1992. Head of Purchasing at Sca-nia 2012–2016. Member of the Group Executive Board since 2017. With Volvo since 2017.
CEO and President at Höganäs AB 2014–2017. Executive Vice President, Business Area EMEA at SSAB 2011–2014. Has held various positions at Scania AB since 1989, most recently as Senior Vice Presi-dent Buses and Coaches at Scania AB 2007–2011. Member of the Group Execu-tive Board since 2018.
Senior Vice President Volvo Trucks Europe 2016–2018. Senior Vice President Volvo Group Trucks North-ern Europe 2015–2016. President Volvo Group Trucks Latin America 2012–2014. President Volvo Trucks Latin America 2010–2011. Managing Director Volvo Trucks, Region East 2004–2009. With Volvo since 1989. Member of the Group Executive Board since January 2019.
Chairman of Partex Marking Systems AB and Permobil AB. Board Member of ACEA Commercial Vehicle and Concen-tric AB. Member of the Royal Swedish Academy of Engineering Sciences (IVA) and Advisory member of the S wedish National Innovation Council.
Board Member of Teknikföretagen.
Secretary to the AB Volvo Board since April 2013.
154,056 Series B shares.
61,956 Series B shares.
15,285 Series B shares.
1,738 Series A shares, 67,624 Series B shares.
1,600 Series A shares, 21,531 Series B shares.
6,239 Series B shares.
398 Series A shares, 11,033 Series B shares.
Ed
uca
tio
nB
orn
Pri
nci
pal
wo
rk
exp
erie
nce
Bo
ard
m
emb
ersh
ips
Ho
ldin
gs
in
Vo
lvo
, ow
n an
d r
elat
ed
par
ties
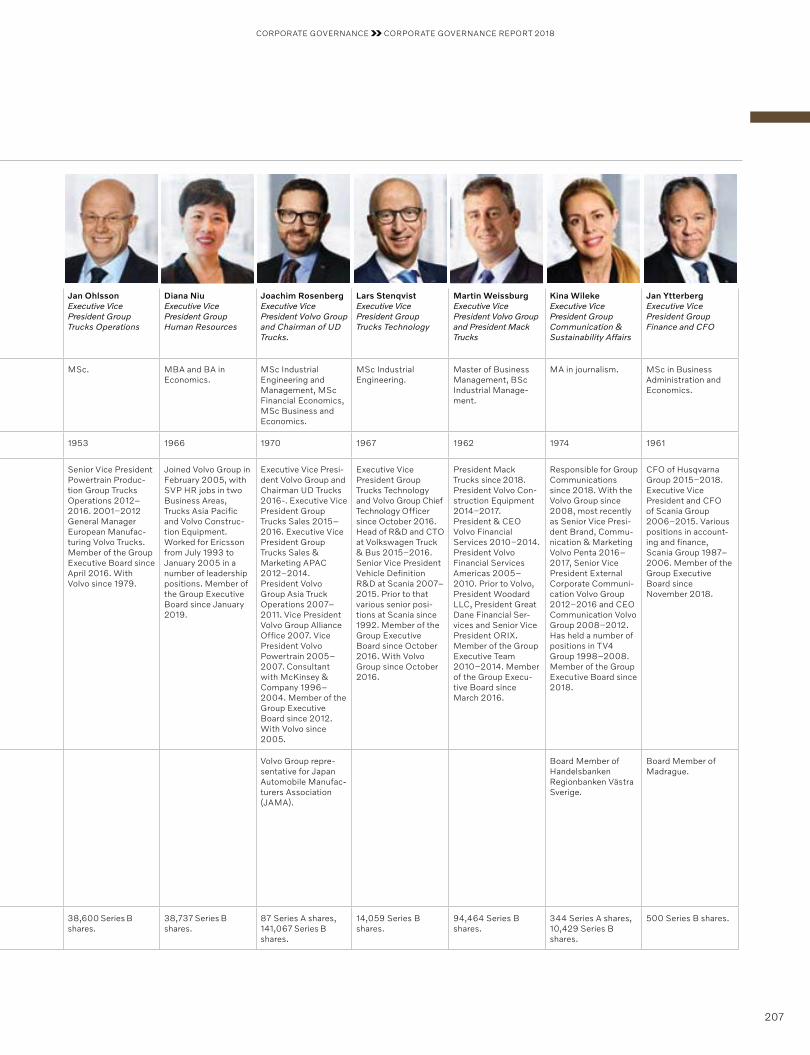
CORPORATE GOVERNANCE CORPORATE GOVERNANCE REPORT 2018
207
Jan OhlssonExecutive Vice President Group Trucks Operations
Diana NiuExecutive Vice President Group Human Resources
Joachim RosenbergExecutive Vice President Volvo Group and Chairman of UD Trucks.
Lars StenqvistExecutive Vice President Group Trucks Technology
Martin WeissburgExecutive Vice President Volvo Group and President Mack Trucks
Kina Wileke Executive Vice President Group Communication & Sustainability Affairs
Jan YtterbergExecutive Vice President Group Finance and CFO
MSc. MBA and BA in Economics.
MSc Industrial Engineering and Management, MSc Financial Economics, MSc Business and Economics.
MSc Industrial Engineering.
Master of Business Management, BSc Industrial Manage-ment.
MA in journalism. MSc in Business Administration and Economics.
1953 1966 1970 1967 1962 1974 1961
Senior Vice President Powertrain Produc-tion Group Trucks Operations 2012–2016. 2001–2012 General Manager European Manufac-turing Volvo Trucks. Member of the Group Executive Board since April 2016. With Volvo since 1979.
Joined Volvo Group in February 2005, with SVP HR jobs in two Business Areas, Trucks Asia Pacific and Volvo Construc-tion Equipment. Worked for Ericsson from July 1993 to January 2005 in a number of leadership positions. Member of the Group Executive Board since January 2019.
Executive Vice Presi-dent Volvo Group and Chairman UD Trucks 2016-. Executive Vice President Group Trucks Sales 2015–2016. Executive Vice President Group Trucks Sales & Marketing APAC 2012–2014.President Volvo Group Asia Truck Operations 2007–2011. Vice President Volvo Group Alliance Office 2007. Vice President VolvoPowertrain 2005–2007. Consultant with McKinsey & Company 1996–2004. Member of the Group Executive Board since 2012. With Volvo since 2005.
Executive Vice President Group Trucks Technology and Volvo Group Chief Technology Officer since October 2016. Head of R&D and CTO at Volkswagen Truck & Bus 2015–2016. Senior Vice President Vehicle Definition R&D at Scania 2007–2015. Prior to that various senior posi-tions at Scania since 1992. Member of the Group Executive Board since October 2016. With Volvo Group since October 2016.
President Mack Trucks since 2018. President Volvo Con-struction Equipment 2014–2017. President & CEO Volvo Financial Services 2010–2014. President Volvo Financial Services Americas 2005–2010. Prior to Volvo, President Woodard LLC, President Great Dane Financial Ser-vices and Senior Vice President ORIX. Member of the Group Executive Team 2010–2014. Member of the Group Execu-tive Board since March 2016.
Responsible for Group Communications since 2018. With the Volvo Group since 2008, most recently as Senior Vice Presi-dent Brand, Commu-nication & Marketing Volvo Penta 2016–2017, Senior Vice President External Corporate Communi-cation Volvo Group 2012–2016 and CEO Communication Volvo Group 2008–2012. Has held a number of positions in TV4 Group 1998–2008. Member of the Group Executive Board since 2018.
CFO of Husqvarna Group 2015–2018. Executive Vice President and CFO of Scania Group 2006–2015. Various positions in account-ing and finance, Scania Group 1987–2006. Member of the Group Executive Board since November 2018.
Volvo Group repre-sentative for Japan Auto mobile Manufac-turers Association (JAMA).
Board Member of Handelsbanken Regionbanken Västra Sverige.
Board Member of Madrague.
38,600 Series B shares.
38,737 Series B shares.
87 Series A shares, 141,067 Series B shares.
14,059 Series B shares.
94,464 Series B shares.
344 Series A shares, 10,429 Series B shares.
500 Series B shares.
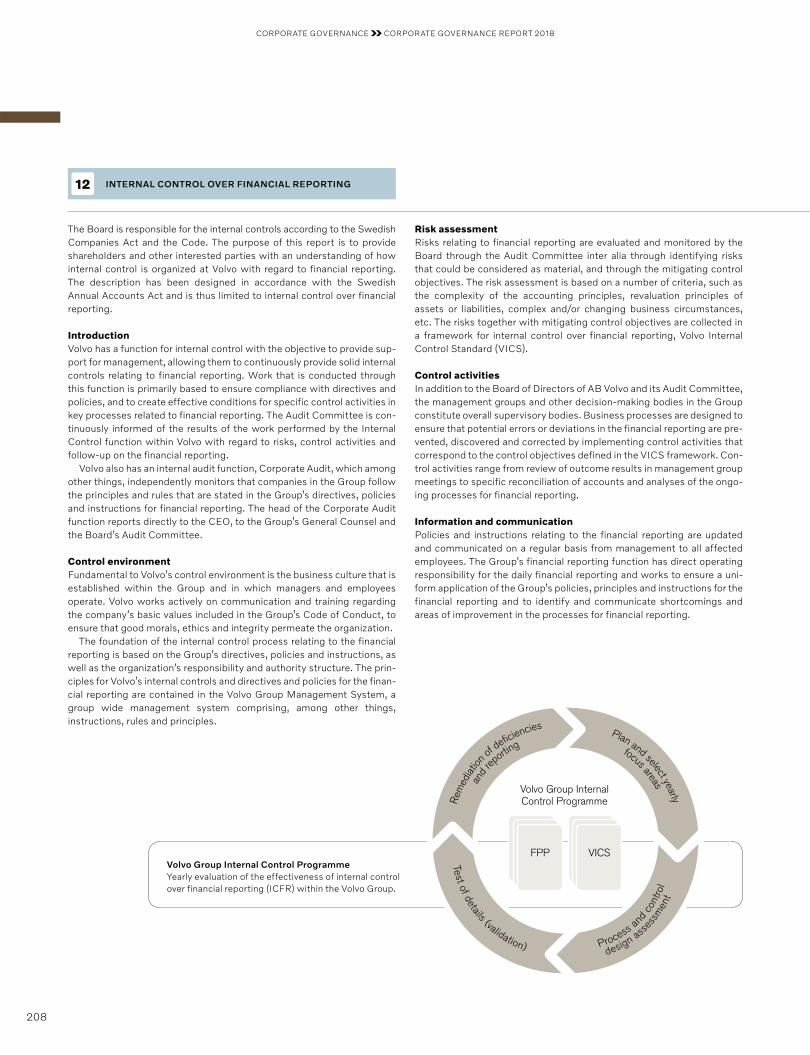
CORPORATE GOVERNANCE CORPORATE GOVERNANCE REPORT 2018
208
The Board is responsible for the internal controls according to the Swedish Companies Act and the Code. The purpose of this report is to provide shareholders and other interested parties with an understanding of how internal control is organized at Volvo with regard to financial reporting. The description has been designed in accordance with the Swedish Annual Accounts Act and is thus limited to internal control over financial reporting.
IntroductionVolvo has a function for internal control with the objective to provide sup-port for management, allowing them to continuously provide solid internal controls relating to financial reporting. Work that is conducted through this function is primarily based to ensure compliance with directives and policies, and to create effective conditions for specific control activities in key processes related to financial reporting. The Audit Committee is con-tinuously informed of the results of the work performed by the Internal Control function within Volvo with regard to risks, control activities and follow-up on the financial reporting.
Volvo also has an internal audit function, Corporate Audit, which among other things, independently monitors that companies in the Group follow the principles and rules that are stated in the Group’s directives, policies and instructions for financial reporting. The head of the Corporate Audit function reports directly to the CEO, to the Group’s General Counsel and the Board’s Audit Committee.
Control environmentFundamental to Volvo’s control environment is the business culture that is established within the Group and in which managers and employees operate. Volvo works actively on communication and training regarding the company’s basic values included in the Group’s Code of Conduct, to ensure that good morals, ethics and integrity permeate the organization.
The foundation of the internal control process relating to the financial reporting is based on the Group’s directives, policies and instructions, as well as the organization’s responsibility and authority structure. The prin-ciples for Volvo’s internal controls and directives and policies for the finan-cial reporting are contained in the Volvo Group Management System, a group wide management system comprising, among other things, instructions, rules and principles.
Risk assessmentRisks relating to financial reporting are evaluated and monitored by the Board through the Audit Committee inter alia through identifying risks that could be considered as material, and through the mitigating control objectives. The risk assessment is based on a number of criteria, such as the complexity of the accounting principles, revaluation principles of assets or liabilities, complex and/or changing business circumstances, etc. The risks together with mitigating control objectives are collected in a framework for internal control over financial reporting, Volvo Internal Control Standard (VICS).
Control activitiesIn addition to the Board of Directors of AB Volvo and its Audit Committee, the management groups and other decision-making bodies in the Group constitute overall supervisory bodies. Business processes are designed to ensure that potential errors or deviations in the financial reporting are pre-vented, discovered and corrected by implementing control activities that correspond to the control objectives defined in the VICS framework. Con-trol activities range from review of outcome results in management group meetings to specific reconciliation of accounts and analyses of the ongo-ing processes for financial reporting.
Information and communicationPolicies and instructions relating to the financial reporting are updated and communicated on a regular basis from management to all affected employees. The Group’s financial reporting function has direct operating responsibility for the daily financial reporting and works to ensure a uni-form application of the Group’s policies, principles and instructions for the financial reporting and to identify and communicate shortcomings and areas of improvement in the processes for financial reporting.
Volvo Group Internal Control ProgrammeYearly evaluation of the effectiveness of internal control over financial reporting (ICFR) within the Volvo Group.
INTERNAL CONTROL OVER FINANCIAL REPORTING12
Rem
edia
tion
of deficiencies
and
repo
rting
Plan and select yearly
focus areas
Test o
f details (validation)
FPP VICS
Volvo Group Internal Control Programme
Process a
nd c
ontr
ol
design ass
essm
ent
CORPORATE GOVERNANCE CORPORATE GOVERNANCE REPORT 2018
209
To the Annual General Meeting of the shareholders of AB Volvo, corporate identity number 556012-5790
Engagement and responsibilityThe Board of Directors is responsible for that the corporate governance statement on pages 192–209 has been prepared in accordance with the Annual Accounts Act.
The scope of the auditOur examination of the corporate governance statement is conducted in accordance with FAR’s auditing standard RevU 16 The auditor’s examina-tion of the corporate governance statement. This means that our examina-tion of the corporate governance statement is different and substantially less in scope than an audit conducted in accordance with International Standards on Auditing and generally accepted auditing standards in Sweden. We believe that the examination has provided us with sufficient basis for our opinions.
OpinionA corporate governance statement has been prepared. Disclosures in accordance with chapter 6 section 6 the second paragraph points 2–6 of the Annual Accounts Act and chapter 7 section 31 the second paragraph the same law are consistent with the other parts of the annual accounts and consolidated accounts and are in accordance with the Annual Accounts Act.
Göteborg, March 8, 2019
Deloitte AB
Jan NilssonAuthorized Public Accountant
AUDITOR’S REPORT ON THE CORPORATE GOVERNANCE STATEMENT
Follow-upOngoing responsibility for follow-up rests with the Group’s financial reporting function. In addition, the Corporate Audit and the Internal Control function conduct review and follow-up activities in accordance with what is described in the introduction of this report. More specifically, the Internal Control function runs and coordinates evaluation activities through the “Volvo Group Internal Control Programme,” with the purpose of systematically evaluating the quality of the internal control over financial reporting on an annual basis. An annual evaluation plan is established and presented to the Audit Committee. This evaluation program comprises three main areas:
1. Group-wide controls: Self-assessment procedure carried out by manage ment teams at business area, Group Function and company levels. The main areas evaluated are compliance with the Group’s financial directives and policies and the Group’s Code of Conduct.
2. Process controls at transaction level: Processes related to the financial reporting are evaluated by testing procedures/controls based on the framework for internal control over financial reporting, Volvo Internal Control Standards (VICS).
3. General IT controls: Processes for maintenance, development and access management of financial applications are evaluated by testing procedures and controls.
The results of the evaluation activities are reported to Group management and the Audit Committee. During 2018, the Internal Control function reported three times to the Audit Committee regarding the annual evalu-ation plan, status on outstanding issues and final assessment of the control environment.
Göteborg, March 8, 2019
AB Volvo (publ)The Board of Directors
OTHER INFORMATION 2018
210
Proposal by the Board of Directors to the Annual General Meeting 2019This policy concerns the remuneration and other terms of employment for the members of the Volvo Group Executive Board (“Executives”).
The remuneration and the other terms of employment of the Executives shall be competitive so that the Volvo Group can attract and retain com-petent Executives. The total remuneration to Executives consists of fixed salary, short-term and long-term incentives, pension and other benefits. Short-term and long-term incentives shall be linked to predetermined and measurable criteria relating to EBIT and cash flow targets for the Volvo Group, devised to promote the long-term value creation of the Volvo Group and strengthen the link between achieved performance targets and reward. The criteria for short-term and long-term incentives shall be determined by the Board annually.
Short-term incentive may, as regards the President & CEO, amount to a maximum of 100% of the fixed salary and, as regards other Executives, a maximum of 80% of the fixed salary.
Long-term incentive may, as regards the President & CEO, amount to a maximum of 100% of the fixed salary and, as regards other Executives, a maximum of 80% of the fixed salary. The long-term incentive program for the Group’s top executives, including the Executives, is cash-based. Awards under the program, based on how well the performance targets are achieved, are disbursed in cash to the participants on the condition that they invest the net award in AB Volvo shares and that they retain the shares for at least three years. In addition, the Executives should be required to accrue (if they do not already have such a holding) and retain a holding of AB Volvo shares with a market value of at least one year’s pre-tax fixed salary (two years’ for the President and CEO), subject to a right for the Board of Directors to grant such exceptions as the Board
deems appropriate. For the avoidance of doubt, Executives shall not be under any obligation to purchase additional shares, other than those pur-chased in connection with the long-term incentive program, to satisfy the accrual and retention requirement.
Any new share-based incentive program will, where applicable, be resolved by the General Meeting, but no such program is currently proposed.
For Executives resident in Sweden, the notice period upon termination by the company shall not exceed 12 months and the notice period upon termination by the Executive shall not exceed 6 months. In addition, in the event of termination by the company, the Executive may be entitled to a maximum of 12 months’ severance pay.
Executives resident outside Sweden or resident in Sweden but having a material connection to or having been resident in a country other than Sweden may be offered notice periods for termination and severance payment that are competitive in the country where the Executives are or have been resident or to which the Executives have a material connection, preferably solutions comparable to the solutions applied to Executives resident in Sweden.
Authority to decide on deviations from this policyThe Board of Directors may deviate from this policy if there are special reasons to do so in an individual case.
Additional informationExecutive compensation, which has been decided but which has not yet become due for payment by the time of the 2019 Annual General Meeting, falls within the scope of this policy. Additional information regarding remuneration is available in the Volvo Group Annual Report for 2018.
Proposed policy for remuneration to senior executives
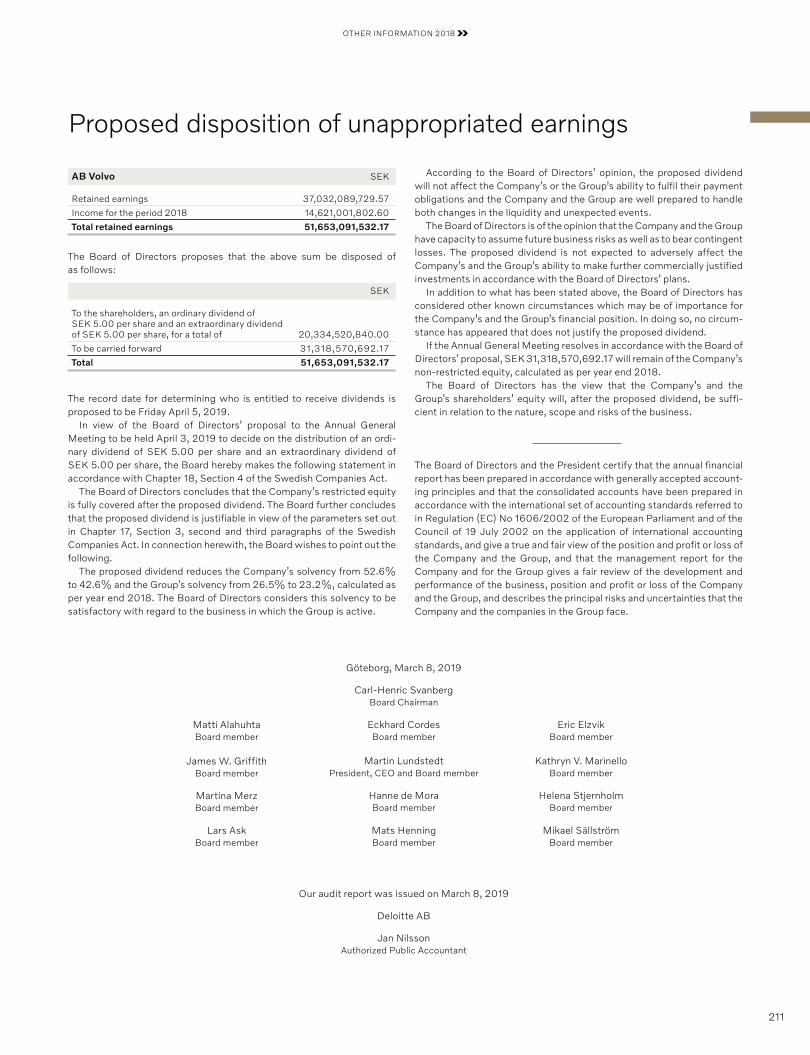
OTHER INFORMATION 2018
211
Proposed disposition of unappropriated earnings
According to the Board of Directors’ opinion, the proposed dividend will not affect the Company’s or the Group’s ability to fulfil their payment obligations and the Company and the Group are well prepared to handle both changes in the liquidity and unexpected events.
The Board of Directors is of the opinion that the Company and the Group have capacity to assume future business risks as well as to bear contingent losses. The proposed dividend is not expected to adversely affect the Company’s and the Group’s ability to make further commercially justified investments in accordance with the Board of Directors’ plans.
In addition to what has been stated above, the Board of Directors has considered other known circumstances which may be of importance for the Company’s and the Group’s financial position. In doing so, no circum-stance has appeared that does not justify the proposed dividend.
If the Annual General Meeting resolves in accordance with the Board of Directors’ proposal, SEK 31,318,570,692.17 will remain of the Company’s non-restricted equity, calculated as per year end 2018.
The Board of Directors has the view that the Company’s and the Group’s shareholders’ equity will, after the proposed dividend, be suffi-cient in relation to the nature, scope and risks of the business.
The Board of Directors and the President certify that the annual financial report has been prepared in accordance with generally accepted account-ing principles and that the consolidated accounts have been prepared in accordance with the international set of accounting standards referred to in Regulation (EC) No 1606/2002 of the European Parliament and of the Council of 19 July 2002 on the application of international accounting standards, and give a true and fair view of the position and profit or loss of the Company and the Group, and that the management report for the Company and for the Group gives a fair review of the development and performance of the business, position and profit or loss of the Company and the Group, and describes the principal risks and uncertainties that the Company and the companies in the Group face.
AB Volvo SEK
Retained earnings 37,032,089,729.57
Income for the period 2018 14,621,001,802.60
Total retained earnings 51,653,091,532.17
The Board of Directors proposes that the above sum be disposed of as follows:
SEK
To the shareholders, an ordinary dividend of SEK 5.00 per share and an extraordinary dividend of SEK 5.00 per share, for a total of 20,334,520,840.00
To be carried forward 31,318,570,692.17
Total 51,653,091,532.17
The record date for determining who is entitled to receive dividends is proposed to be Friday April 5, 2019.
In view of the Board of Directors’ proposal to the Annual General Meeting to be held April 3, 2019 to decide on the distribution of an ordi-nary dividend of SEK 5.00 per share and an extraordinary dividend of SEK 5.00 per share, the Board hereby makes the following statement in accordance with Chapter 18, Section 4 of the Swedish Companies Act.
The Board of Directors concludes that the Company’s restricted equity is fully covered after the proposed dividend. The Board further concludes that the proposed dividend is justifiable in view of the parameters set out in Chapter 17, Section 3, second and third paragraphs of the Swedish Companies Act. In connection herewith, the Board wishes to point out the following.
The proposed dividend reduces the Company’s solvency from 52.6% to 42.6% and the Group’s solvency from 26.5% to 23.2%, calculated as per year end 2018. The Board of Directors considers this solvency to be satisfactory with regard to the business in which the Group is active.
Göteborg, March 8, 2019
Carl-Henric SvanbergBoard Chairman
Matti Alahuhta Board member
Eckhard CordesBoard member
Eric ElzvikBoard member
James W. GriffithBoard member
Martin LundstedtPresident, CEO and Board member
Kathryn V. MarinelloBoard member
Martina MerzBoard member
Hanne de MoraBoard member
Helena StjernholmBoard member
Lars AskBoard member
Mats HenningBoard member
Mikael SällströmBoard member
Our audit report was issued on March 8, 2019
Deloitte AB
Jan NilssonAuthorized Public Accountant
212
Audit report for AB Volvo (publ)
OTHER INFORMATION 2018 AUDIT REPORT
To the general meeting of the shareholders of AB Volvo (publ)corporate identity number 556012-5790
Report on the annual accounts and consolidated accounts
OpinionsWe have audited the annual accounts and consolidated accounts of AB Volvo (publ) for the financial year 2018-01-01–2018-12-31 except for the sustainability report on pages 116–117. The annual accounts and consoli-dated accounts of the company are included on pages 78–191, 210–211 and 215–217 in this document.
In our opinion, the annual accounts have been prepared in accordance with the Annual Accounts Act and present fairly, in all material respects, the financial position of the parent company as of 31 December 2018 and its financial performance and cash flow for the year then ended in accord-ance with the Annual Accounts Act. The consolidated accounts have been prepared in accordance with the Annual Accounts Act and present fairly, in all material respects, the financial position of the group as of 31 December 2018 and its financial performance and cash flow for the year then ended in accordance with the International Financial Reporting Standards (IFRS), as adopted by the EU, and the Annual Accounts Act. The statutory admin-istration report is consistent with the other parts of the annual accounts.
We therefore recommend that the general meeting of shareholders adopts the income statement and balance sheet for the parent company and the group.
Our opinions in this report regarding the annual accounts and consoli-dated accounts are consistent with the content of the additional report that has been submitted to the parent company and group audit commit-tee in accordance with the Auditors Ordinance (537/2014) Article 11.
Basis for OpinionsWe conducted our audit in accordance with International Standards on Auditing (ISA) and generally accepted auditing standards in Sweden. Our responsibilities under those standards are further described in the Audi-tor’s Responsibilities section. We are independent of the parent company and the group in accordance with professional ethics for accountants in Sweden and have otherwise fulfilled our ethical responsibilities in accord-ance with these requirements. Based on our knowledge, no forbidden services included in the Auditors Ordinance (537/2014) article 5.1 has been provided in the audited company, its’ parent company or audited companies in EU.
We believe that the audit evidence we have obtained is sufficient and appropriate to provide a basis for our opinions.
Other informationThe audit of the annual accounts for the fiscal year 2017-01-01 – 2017-12-31 was performed by another auditor who signed the audit report March 6th 2018 without exceptions in the Annual Report.
Key Audit Matters Key audit matters of the audit are those matters that, in our professional judgment, were of most significance in our audit of the annual accounts and consolidated accounts of the current period. These matters were addressed in the context of our audit of, and in forming our opinion thereon, the annual accounts and consolidated accounts as a whole, but we do not provide a separate opinion on these matters.
Revenue recognition
Volvo Group’s recognized net sales relate mainly to revenues from the sale of vehicles, services and aftermarket parts.
The accounting principles for revenue is further described in note 7 to the annual report. The Company records its revenue from sales the day
control has been transferred to the customer, which usually occurs on delivery of goods and sales of services over a defined period of time when the service can be utilized.
There are certain transactions entered into by the Company that carry increased levels of complexity, such as transactions with customers that involve buy-back agreements or residual value guarantees. In these trans-actions management need to assess whether or not control has been transferred to customer or not to ensure that revenue is recognized at the correct amount and in the correct period.
Audit procedures Our audit procedures included, but were not limited to:
• assessing the revenue recognition policies with respect to IFRS 15 to determine the Company designed appropriate revenue recognition policies to recognize revenue in the correct period to correct amounts;
• evaluating the design and testing operational effectiveness of key internal controls used for revenue recognition;
• inspecting a sample of sales agreements and evaluating if the Company applied the correct accounting treatment for the type of sale;
• inspection of a several sales transaction to conclude on how the revenue was recorded accurately and in the correct period;
• examining a sample of contract liabilities to determine if revenue was recorded accurately and in the correct period
Provision for product warranty
Volvo Group grants certain product warranties to their end customers, which are contractual warranties covering certain defects in material and workmanship of Volvo products sold or services rendered over a defined period of time. Estimated warranty costs include contractual warranty and goodwill warranty. The accounting principles for warranty is further described in note 21 to the annual report.
Estimated provisions for product warranties are recognized when the Company’s products are sold. The provision includes both expected con-tractual warranties and goodwill warranties. The provision is determined based on certain management estimates, including key components such as historical statistics considering known quality improvements and costs for remedy of defaults.
Provisions for campaigns in connection with specific quality problems are recognized when the campaign is decided.
During 2018, the Volvo Group detected an emissions control compo-nent used in certain markets is degrading more quickly than expected, which could cause the engines to exceed emissions limits for nitrogen oxides (NOX). The provision for this campaign includes a high degree of judgment and estimation, including performing statistical analysis and assessing corrective actions.
Audit procedures Our audit procedures included, but were not limited to:
• assessing the warranty provision recognition policies with respect to IAS 37 to determine the Company designed appropriate policies;
• evaluating the design and testing operational effectiveness of key inter-nal controls used within the warranty review process;
• selecting a sample of product warranty provisions:
– evaluating the process to determine the provision
– testing the completeness and accuracy of provision input assumptions
– assessing the reasonableness of the Company’s calculations for warranty provisions
213
OTHER INFORMATION 2018 AUDIT REPORT
• reviewing internal Company documents to identify the completeness of recorded campaign warranty provisions
• assessment of the Company’s process for larger warranty campaigns, evaluating the provision for NOX by reviewing the Company’s assess-ment of relevant government demands, testing calculations, testing the input assumptions, and assessing the results of their statistical analysis and corrective action determinations
Provisions for losses from claims from customers and other third parties – EC Antitrust Settlement In July 2016, the European Commission and Volvo Group reached a set-tlement with regards to antitrust allegations made by the European Com-mission in relation to Volvo Group and other companies in the truck man-ufacturing industry. Following the adoption of the European Commission’s settlement decision, the Company has received and may continue to receive numerous third party damages claims from customers and other third parties alleging that they suffered loss by reason of the conduct cov-ered in the decision. The accounting principles for provisions for legal dis-putes is further described in note 21 to the annual report.
The recognition and measurement of any provisions recorded for such legal disputes is complicated, requires the involvement of legal and accounting experts, and depends upon the future outcomes of the private damages claims which is uncertain. Due to these complexities, the valua-tion of any such provisions is significantly impacted by management’s ultimate judgments and best estimates. At this time, the Company has not been able to make a reliable estimate of the amount of any liability that could arise from these claims, if any. Further information is disclosed in note 24 to the annual report.
Audit procedures Our audit procedures included, but were not limited to:
• holding discussions and audit the documentation and conclude how the board evaluated the claims.
• holding discussions with internal legal department and with Volvo Group’s external legal advisors and attorneys in order to obtain an understanding of the facts of the cases, new developments, and assessments
• reviewing internal minutes and documentation as well as reports from the external legal advisors to corroborate the consistency of information received
• evaluating the appropriateness of the Company’s final conclusions
• assessing the adequacy of the disclosures around the legal proceedings
Other Information than the annual accounts and consolidated accounts This document also contains other information than the annual accounts and consolidated accounts and is found on pages 1–77, 218–228. The Board of Directors and the President are responsible for this other information. Our opinion on the annual accounts and consolidated accounts does not cover this other information and we do not express any form of assurance conclusion regarding this other information.
In connection with our audit of the annual accounts and consolidated accounts, our responsibility is to read the information identified above and consider whether the information is materially inconsistent with the annual accounts and consolidated accounts. In this procedure we also take into account our knowledge otherwise obtained in the audit and assess whether the information otherwise appears to be materially misstated.
If we, based on the work performed concerning this information, con-clude that there is a material misstatement of this other information, we are required to report that fact. We have nothing to report in this regard.
Responsibilities of the Board of Directors and the PresidentThe Board of Directors and the President are responsible for the preparation of the annual accounts and that they give a fair presentation in accordance with the Annual Accounts Act and, concerning the consolidated accounts, in accordance with IFRS as adopted by the EU. The Board of Directors and the President are also responsible for such internal control as they determine is necessary to enable the preparation of annual accounts and consolidated accounts that are free from material misstatement, whether due to fraud or error.
In preparing the annual accounts and consolidated accounts, The Board of Directors and the President are responsible for the assessment of the company’s and the group’s ability to continue as a going concern. They disclose, as applicable, matters related to going concern and using the going concern basis of accounting. The going concern basis of accounting is however not applied if the Board of Directors and the President intends to liquidate the company, to cease operations, or has no realistic alterna-tive but to do so.
The Audit Committee shall, without prejudice to the Board of Director’s responsibilities and tasks in general among other things oversee the com-pany’s financial reporting process.
Auditor’s responsibilityOur objectives are to obtain reasonable assurance about whether the annual accounts and consolidated accounts as a whole are free from material misstatement, whether due to fraud or error, and to issue an audi-tor’s report that includes our opinions. Reasonable assurance is a high level of assurance, but is not a guarantee that an audit conducted in accordance with ISAs and generally accepted auditing standards in Swe-den will always detect a material misstatement when it exists. Misstate-ments can arise from fraud or error and are considered material if, individ-ually or in the aggregate, they could reasonably be expected to influence the economic decisions of users taken on the basis of these annual accounts and consolidated accounts.
Further information about our responsibility in the audit of the annual report and the consolidated report can be found on the webpage of Swedish incorporate of Auditors: www.revisorsinspektionen.se/revisornsansvar.
Report on other legal and regulatory requirements
OpinionsIn addition to our audit of the annual accounts and consolidated accounts, we have also audited the administration of the Board of Directors and the President of AB Volvo (publ) for the financial year 2018-01-01–2018-12-31 and the proposed appropriations of the company’s profit or loss.
We recommend to the general meeting of shareholders that the profit to be appropriated in accordance with the proposal in the statutory administration report and that the members of the Board of Directors and the President be discharged from liability for the financial year.
Basis for OpinionsWe conducted the audit in accordance with generally accepted auditing standards in Sweden. Our responsibilities under those standards are further described in the Auditor’s Responsibilities section. We are independent of the parent company and the group in accordance with professional ethics for accountants in Sweden and have otherwise fulfilled our ethical respon-sibilities in accordance with these requirements.
We believe that the audit evidence we have obtained is sufficient and appropriate to provide a basis for our opinions.
214
OTHER INFORMATION 2018 AUDIT REPORT
Göteborg, March 8, 2019
Deloitte AB
Jan NilssonAuthorized Public Accountant
Responsibilities of the Board of Directors and the PresidentThe Board of Directors is responsible for the proposal for appropriations of the company’s profit or loss. At the proposal of a dividend, this includes an assessment of whether the dividend is justifiable considering the require-ments which the company’s and the group’s type of operations, size and risks place on the size of the parent company’s and the group’s equity, consolidation requirements, liquidity and position in general.
The Board of Directors is responsible for the company’s organization and the administration of the company’s affairs. This includes among other things continuous assessment of the company’s financial situation and ensuring that the company’s organization is designed so that the accounting, management of assets and the company’s financial affairs otherwise are controlled in a reassuring manner. The President shall manage the ongoing administration according to the Board of Directors’ guidelines and instructions and among other matters take measures that are necessary to fulfill the company’s accounting in accordance with law and handle the management of assets in a reassuring manner.
Auditor’s responsibilityOur objective concerning the audit of the administration, and thereby our opinion about discharge from liability, is to obtain audit evidence to assess with a reasonable degree of assurance whether any member of the Board of Directors or the President in any material respect:
• has undertaken any action or been guilty of any omission which can give rise to liability to the company, or
• in any other way has acted in contravention of the Companies Act, the Annual Accounts Act or the Articles of Association.
Our objective concerning the audit of the proposed appropriations of the company’s profit or loss, and thereby our opinion about this, is to assess with reasonable degree of assurance whether the proposal is in accordance with the Companies Act.
Reasonable assurance is a high level of assurance, but is not a guarantee that an audit conducted in accordance with generally accepted auditing standards in Sweden will always detect actions or omissions that can give rise to liability to the company, or that the proposed appropriations of the company’s profit or loss are not in accordance with the Companies Act.
Further information about our responsibility in the audit can be found on the webpage of Swedish incorporate of Auditors: www.revisorsinspek-tionen.se/revisornsansvar.
The auditor´s opinion regarding the statutory sustainability report The Board of Directors is responsible for the statutory sustainability report on pages 116-117 and that it is prepared in accordance with the Annual Accounts Act.
Our examination has been conducted in accordance with FAR:s audit-ing standard RevR 12 The auditor´s opinion regarding the statutory sus-tainability report.
This means that our examination of the statutory sustainability report is different and substantially less in scope than an audit conducted in accordance with International Standards on Auditing and generally accepted auditing standards in Sweden. We believe that the examination has provided us with sufficient basis for our opinion.
A statutory sustainability report has been prepared. Deloitte AB, was appointed auditor of AB Volvo (publ by the general
meeting of the shareholders on April 5, 2018 and has been the company’s auditor since April 5, 2018.
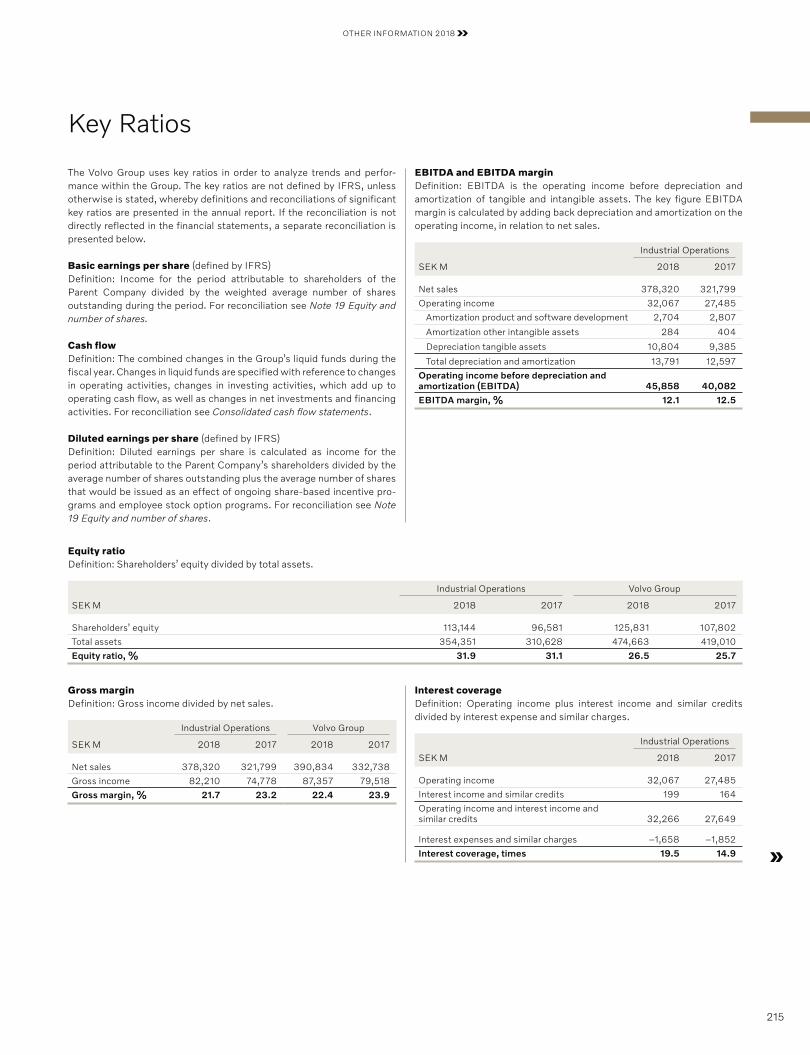
OTHER INFORMATION 2018
Key Ratios
The Volvo Group uses key ratios in order to analyze trends and perfor-mance within the Group. The key ratios are not defined by IFRS, unless otherwise is stated, whereby definitions and reconciliations of significant key ratios are presented in the annual report. If the reconciliation is not directly reflected in the financial statements, a separate reconciliation is presented below.
Basic earnings per share (defined by IFRS)Definition: Income for the period attributable to shareholders of the Parent Company divided by the weighted average number of shares outstanding during the period. For reconciliation see Note 19 Equity and number of shares.
Cash flowDefinition: The combined changes in the Group’s liquid funds during the fiscal year. Changes in liquid funds are specified with reference to changes in operating activities, changes in investing activities, which add up to operating cash flow, as well as changes in net investments and financing activities. For reconciliation see Consolidated cash flow statements.
Diluted earnings per share (defined by IFRS)Definition: Diluted earnings per share is calculated as income for the period attributable to the Parent Company’s shareholders divided by the average number of shares outstanding plus the average number of shares that would be issued as an effect of ongoing share-based incentive pro-grams and employee stock option programs. For reconciliation see Note 19 Equity and number of shares.
EBITDA and EBITDA margin Definition: EBITDA is the operating income before depreciation and amortization of tangible and intangible assets. The key figure EBITDA margin is calculated by adding back depreciation and amortization on the operating income, in relation to net sales.
Industrial Operations
SEK M 2018 2017
Net sales 378,320 321,799
Operating income 32,067 27,485
Amortization product and software development 2,704 2,807
Amortization other intangible assets 284 404
Depreciation tangible assets 10,804 9,385
Total depreciation and amortization 13,791 12,597
Operating income before depreciation and amortization (EBITDA) 45,858 40,082
EBITDA margin, % 12.1 12.5
Equity ratio Definition: Shareholders’ equity divided by total assets.
Industrial Operations Volvo Group
SEK M 2018 2017 2018 2017
Shareholders’ equity 113,144 96,581 125,831 107,802
Total assets 354,351 310,628 474,663 419,010
Equity ratio, % 31.9 31.1 26.5 25.7
Gross margin Definition: Gross income divided by net sales.
Industrial Operations Volvo Group
SEK M 2018 2017 2018 2017
Net sales 378,320 321,799 390,834 332,738
Gross income 82,210 74,778 87,357 79,518
Gross margin, % 21.7 23.2 22.4 23.9
Interest coverageDefinition: Operating income plus interest income and similar credits divided by interest expense and similar charges.
Industrial Operations
SEK M 2018 2017
Operating income 32,067 27,485
Interest income and similar credits 199 164
Operating income and interest income and similar credits 32,266 27,649
Interest expenses and similar charges –1,658 –1,852
Interest coverage, times 19.5 14.9
215
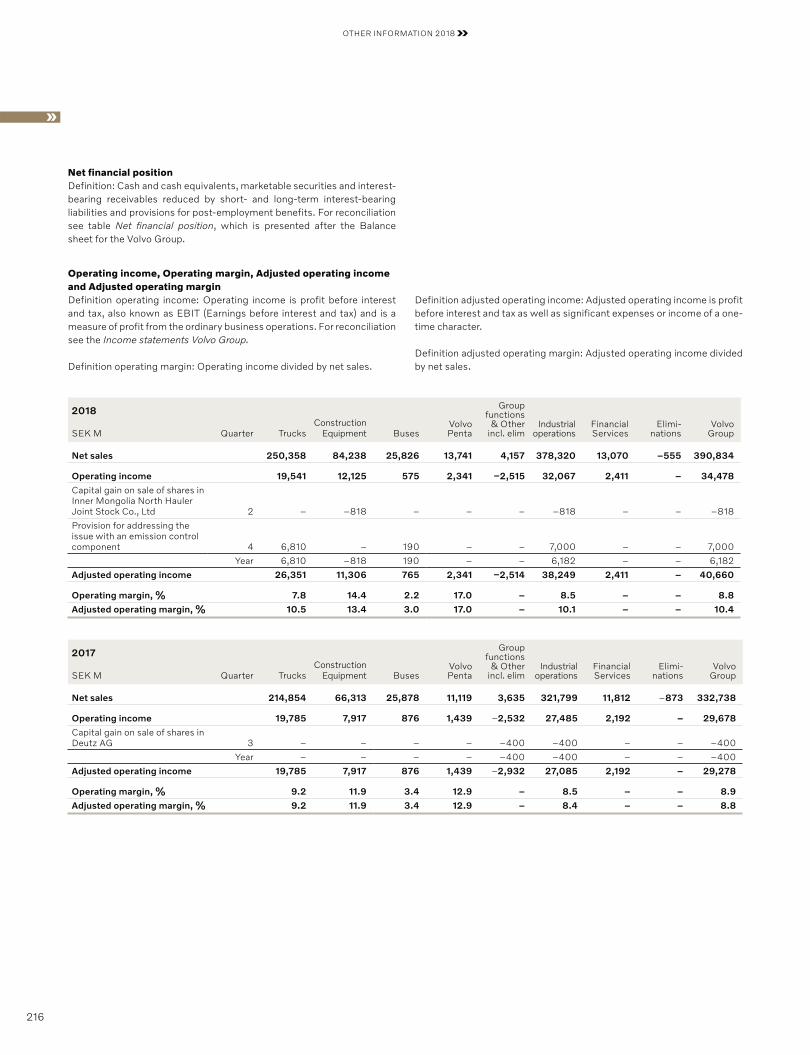
OTHER INFORMATION 2018
Net financial positionDefinition: Cash and cash equivalents, marketable securities and interest-bearing receivables reduced by short- and long-term interest-bearing liabili ties and provisions for post-employment benefits. For reconciliation see table Net financial position, which is presented after the Balance sheet for the Volvo Group.
Operating income, Operating margin, Adjusted operating income and Adjusted operating marginDefinition operating income: Operating income is profit before interest and tax, also known as EBIT (Earnings before interest and tax) and is a measure of profit from the ordinary business operations. For reconciliation see the Income statements Volvo Group.
Definition operating margin: Operating income divided by net sales.
Definition adjusted operating income: Adjusted operating income is profit before interest and tax as well as significant expenses or income of a one-time character.
Definition adjusted operating margin: Adjusted operating income divided by net sales.
2018
Quarter TrucksConstruction
Equipment BusesVolvo Penta
Group functions
& Other incl. elim
Industrial operations
Financial Services
Elimi-nations
Volvo GroupSEK M
Net sales 250,358 84,238 25,826 13,741 4,157 378,320 13,070 –555 390,834
Operating income 19,541 12,125 575 2,341 –2,515 32,067 2,411 – 34,478
Capital gain on sale of shares in Inner Mongolia North Hauler Joint Stock Co., Ltd 2 – –818 – – – –818 – – –818
Provision for addressing the issue with an emission control component 4 6,810 – 190 – – 7,000 – – 7,000
Year 6,810 –818 190 – – 6,182 – – 6,182
Adjusted operating income 26,351 11,306 765 2,341 –2,514 38,249 2,411 – 40,660
Operating margin, % 7.8 14.4 2.2 17.0 – 8.5 – – 8.8
Adjusted operating margin, % 10.5 13.4 3.0 17.0 – 10.1 – – 10.4
2017
Quarter TrucksConstruction
Equipment BusesVolvo Penta
Group functions
& Other incl. elim
Industrial operations
Financial Services
Elimi-nations
Volvo GroupSEK M
Net sales 214,854 66,313 25,878 11,119 3,635 321,799 11,812 –873 332,738
Operating income 19,785 7,917 876 1,439 –2,532 27,485 2,192 – 29,678
Capital gain on sale of shares in Deutz AG 3 – – – – –400 –400 – – –400
Year – – – – –400 –400 – – –400
Adjusted operating income 19,785 7,917 876 1,439 –2,932 27,085 2,192 – 29,278
Operating margin, % 9.2 11.9 3.4 12.9 – 8.5 – – 8.9
Adjusted operating margin, % 9.2 11.9 3.4 12.9 – 8.4 – – 8.8
216
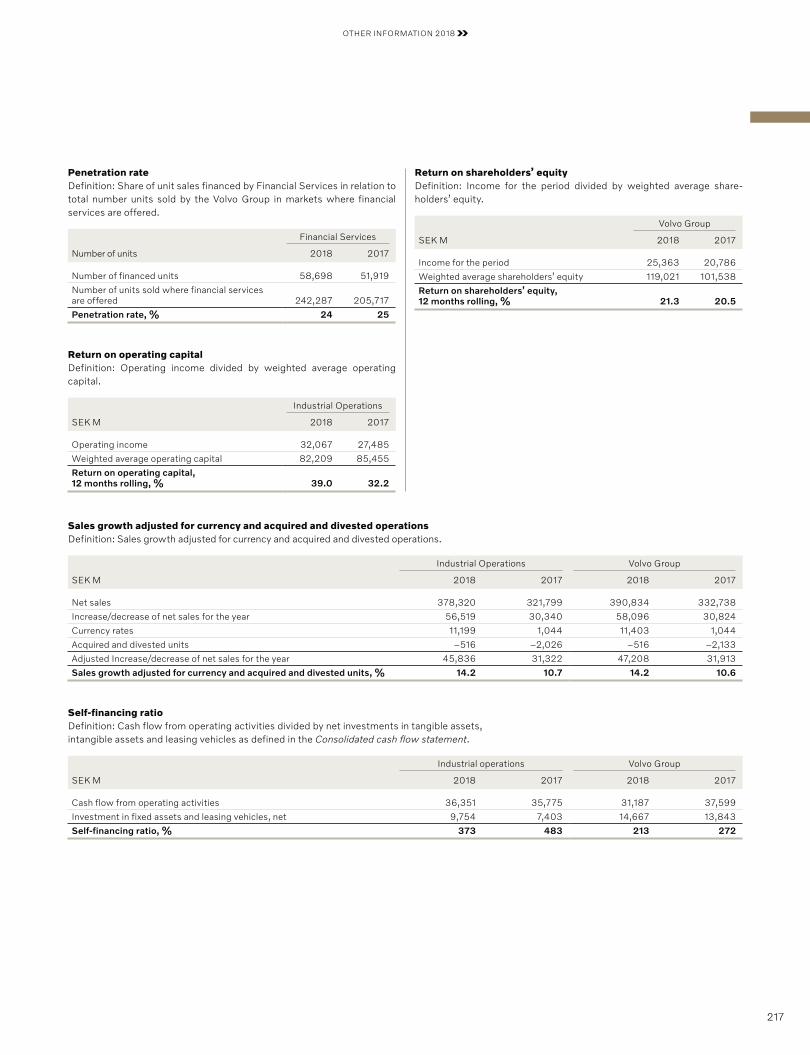
OTHER INFORMATION 2018
Penetration rateDefinition: Share of unit sales financed by Financial Services in relation to total number units sold by the Volvo Group in markets where financial services are offered.
Financial Services
Number of units 2018 2017
Number of financed units 58,698 51,919
Number of units sold where financial services are offered 242,287 205,717
Penetration rate, % 24 25
Return on operating capital Definition: Operating income divided by weighted average operating capital.
Industrial Operations
SEK M 2018 2017
Operating income 32,067 27,485
Weighted average operating capital 82,209 85,455
Return on operating capital, 12 months rolling, % 39.0 32.2
Return on shareholders’ equity Definition: Income for the period divided by weighted average share-holders’ equity.
Volvo Group
SEK M 2018 2017
Income for the period 25,363 20,786
Weighted average shareholders’ equity 119,021 101,538
Return on shareholders’ equity, 12 months rolling, % 21.3 20.5
Sales growth adjusted for currency and acquired and divested operationsDefinition: Sales growth adjusted for currency and acquired and divested operations.
Industrial Operations Volvo Group
SEK M 2018 2017 2018 2017
Net sales 378,320 321,799 390,834 332,738
Increase/decrease of net sales for the year 56,519 30,340 58,096 30,824
Currency rates 11,199 1,044 11,403 1,044
Acquired and divested units –516 –2,026 –516 –2,133
Adjusted Increase/decrease of net sales for the year 45,836 31,322 47,208 31,913
Sales growth adjusted for currency and acquired and divested units, % 14.2 10.7 14.2 10.6
Self-financing ratioDefinition: Cash flow from operating activities divided by net investments in tangible assets, intangible assets and leasing vehicles as defined in the Consolidated cash flow statement.
Industrial operations Volvo Group
SEK M 2018 2017 2018 2017
Cash flow from operating activities 36,351 35,775 31,187 37,599
Investment in fixed assets and leasing vehicles, net 9,754 7,403 14,667 13,843
Self-financing ratio, % 373 483 213 272
217
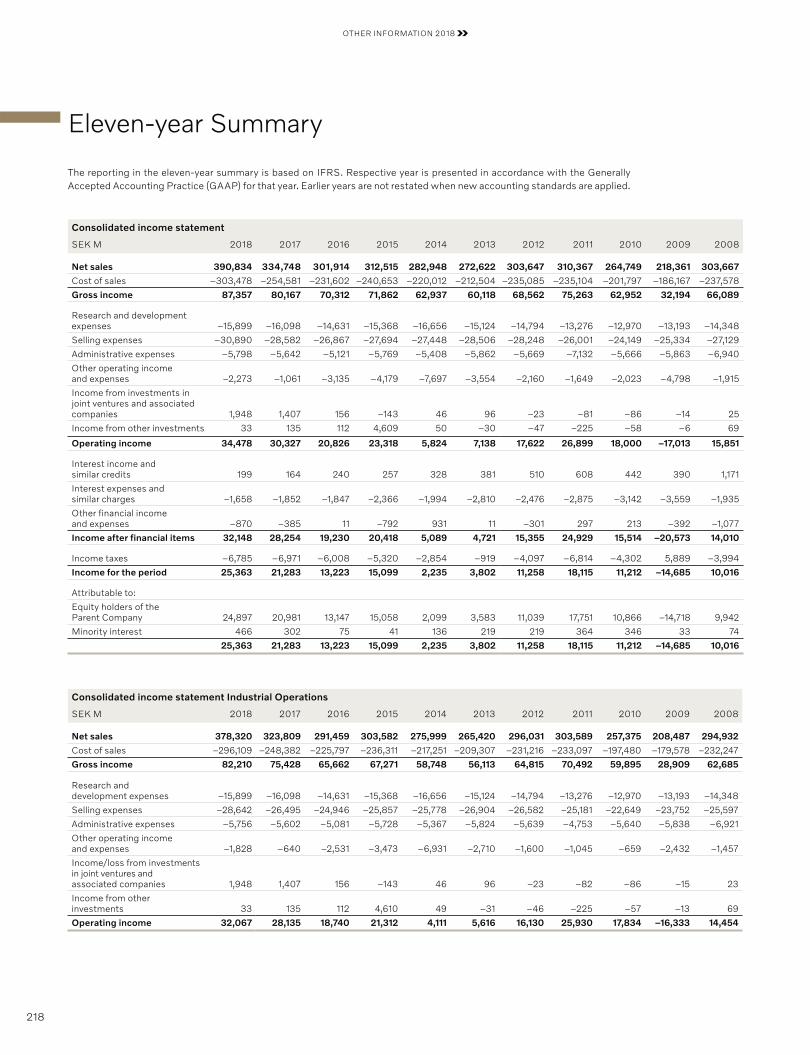
OTHER INFORMATION 2018
Eleven-year Summary
The reporting in the eleven-year summary is based on IFRS. Respective year is presented in accordance with the Generally Accepted Accounting Practice (GAAP) for that year. Earlier years are not restated when new accounting standards are applied.
Consolidated income statement
SEK M 2018 2017 2016 2015 2014 2013 2012 2011 2010 2009 2008
Net sales 390,834 334,748 301,914 312,515 282,948 272,622 303,647 310,367 264,749 218,361 303,667
Cost of sales –303,478 –254,581 –231,602 –240,653 –220,012 –212,504 –235,085 –235,104 –201,797 –186,167 –237,578
Gross income 87,357 80,167 70,312 71,862 62,937 60,118 68,562 75,263 62,952 32,194 66,089
Research and development expenses –15,899 –16,098 –14,631 –15,368 –16,656 –15,124 –14,794 –13,276 –12,970 –13,193 –14,348
Selling expenses –30,890 –28,582 –26,867 –27,694 –27,448 –28,506 –28,248 –26,001 –24,149 –25,334 –27,129
Administrative expenses –5,798 –5,642 –5,121 –5,769 –5,408 –5,862 –5,669 –7,132 –5,666 –5,863 –6,940
Other operating income and expenses –2,273 –1,061 –3,135 –4,179 –7,697 –3,554 –2,160 –1,649 –2,023 –4,798 –1,915
Income from investments in joint ventures and associated companies 1,948 1,407 156 –143 46 96 –23 –81 –86 –14 25
Income from other investments 33 135 112 4,609 50 –30 –47 –225 –58 –6 69
Operating income 34,478 30,327 20,826 23,318 5,824 7,138 17,622 26,899 18,000 –17,013 15,851
Interest income and similar credits 199 164 240 257 328 381 510 608 442 390 1,171
Interest expenses and similar charges –1,658 –1,852 –1,847 –2,366 –1,994 –2,810 –2,476 –2,875 –3,142 –3,559 –1,935
Other financial income and expenses –870 –385 11 –792 931 11 –301 297 213 –392 –1,077
Income after financial items 32,148 28,254 19,230 20,418 5,089 4,721 15,355 24,929 15,514 –20,573 14,010
Income taxes –6,785 –6,971 –6,008 –5,320 –2,854 –919 –4,097 –6,814 –4,302 5,889 –3,994
Income for the period 25,363 21,283 13,223 15,099 2,235 3,802 11,258 18,115 11,212 –14,685 10,016
Attributable to:
Equity holders of the Parent Company 24,897 20,981 13,147 15,058 2,099 3,583 11,039 17,751 10,866 –14,718 9,942
Minority interest 466 302 75 41 136 219 219 364 346 33 74
25,363 21,283 13,223 15,099 2,235 3,802 11,258 18,115 11,212 –14,685 10,016
Consolidated income statement Industrial Operations
SEK M 2018 2017 2016 2015 2014 2013 2012 2011 2010 2009 2008
Net sales 378,320 323,809 291,459 303,582 275,999 265,420 296,031 303,589 257,375 208,487 294,932
Cost of sales –296,109 –248,382 –225,797 –236,311 –217,251 –209,307 –231,216 –233,097 –197,480 –179,578 –232,247
Gross income 82,210 75,428 65,662 67,271 58,748 56,113 64,815 70,492 59,895 28,909 62,685
Research and development expenses –15,899 –16,098 –14,631 –15,368 –16,656 –15,124 –14,794 –13,276 –12,970 –13,193 –14,348
Selling expenses –28,642 –26,495 –24,946 –25,857 –25,778 –26,904 –26,582 –25,181 –22,649 –23,752 –25,597
Administrative expenses –5,756 –5,602 –5,081 –5,728 –5,367 –5,824 –5,639 –4,753 –5,640 –5,838 –6,921
Other operating income and expenses –1,828 –640 –2,531 –3,473 –6,931 –2,710 –1,600 –1,045 –659 –2,432 –1,457
Income/loss from investments in joint ventures and associated companies 1,948 1,407 156 –143 46 96 –23 –82 –86 –15 23
Income from other investments 33 135 112 4,610 49 –31 –46 –225 –57 –13 69
Operating income 32,067 28,135 18,740 21,312 4,111 5,616 16,130 25,930 17,834 –16,333 14,454
218
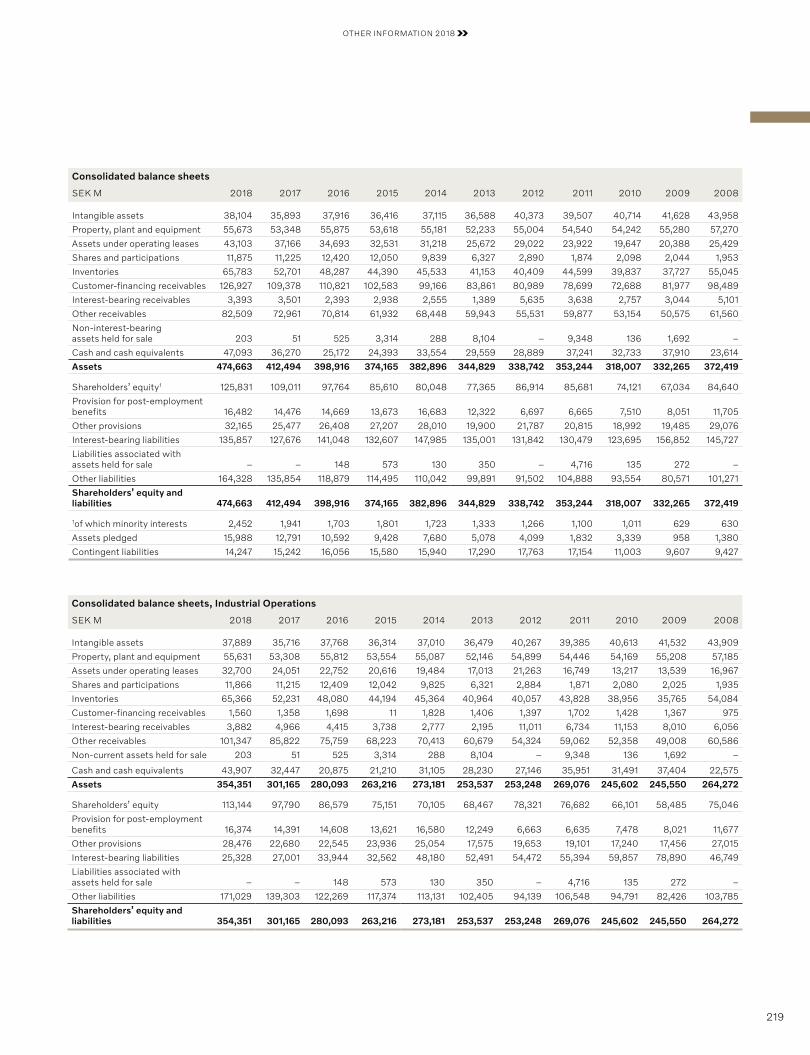
OTHER INFORMATION 2018
Consolidated balance sheets
SEK M 2018 2017 2016 2015 2014 2013 2012 2011 2010 2009 2008
Intangible assets 38,104 35,893 37,916 36,416 37,115 36,588 40,373 39,507 40,714 41,628 43,958
Property, plant and equipment 55,673 53,348 55,875 53,618 55,181 52,233 55,004 54,540 54,242 55,280 57,270
Assets under operating leases 43,103 37,166 34,693 32,531 31,218 25,672 29,022 23,922 19,647 20,388 25,429
Shares and participations 11,875 11,225 12,420 12,050 9,839 6,327 2,890 1,874 2,098 2,044 1,953
Inventories 65,783 52,701 48,287 44,390 45,533 41,153 40,409 44,599 39,837 37,727 55,045
Customer-financing receivables 126,927 109,378 110,821 102,583 99,166 83,861 80,989 78,699 72,688 81,977 98,489
Interest-bearing receivables 3,393 3,501 2,393 2,938 2,555 1,389 5,635 3,638 2,757 3,044 5,101
Other receivables 82,509 72,961 70,814 61,932 68,448 59,943 55,531 59,877 53,154 50,575 61,560
Non-interest-bearing assets held for sale 203 51 525 3,314 288 8,104 – 9,348 136 1,692 –
Cash and cash equivalents 47,093 36,270 25,172 24,393 33,554 29,559 28,889 37,241 32,733 37,910 23,614
Assets 474,663 412,494 398,916 374,165 382,896 344,829 338,742 353,244 318,007 332,265 372,419
Shareholders’ equity1 125,831 109,011 97,764 85,610 80,048 77,365 86,914 85,681 74,121 67,034 84,640
Provision for post-employment benefits 16,482 14,476 14,669 13,673 16,683 12,322 6,697 6,665 7,510 8,051 11,705
Other provisions 32,165 25,477 26,408 27,207 28,010 19,900 21,787 20,815 18,992 19,485 29,076
Interest-bearing liabilities 135,857 127,676 141,048 132,607 147,985 135,001 131,842 130,479 123,695 156,852 145,727
Liabilities associated with assets held for sale – – 148 573 130 350 – 4,716 135 272 –
Other liabilities 164,328 135,854 118,879 114,495 110,042 99,891 91,502 104,888 93,554 80,571 101,271
Shareholders’ equity and liabilities 474,663 412,494 398,916 374,165 382,896 344,829 338,742 353,244 318,007 332,265 372,419
1of which minority interests 2,452 1,941 1,703 1,801 1,723 1,333 1,266 1,100 1,011 629 630
Assets pledged 15,988 12,791 10,592 9,428 7,680 5,078 4,099 1,832 3,339 958 1,380
Contingent liabilities 14,247 15,242 16,056 15,580 15,940 17,290 17,763 17,154 11,003 9,607 9,427
Consolidated balance sheets, Industrial Operations
SEK M 2018 2017 2016 2015 2014 2013 2012 2011 2010 2009 2008
Intangible assets 37,889 35,716 37,768 36,314 37,010 36,479 40,267 39,385 40,613 41,532 43,909
Property, plant and equipment 55,631 53,308 55,812 53,554 55,087 52,146 54,899 54,446 54,169 55,208 57,185
Assets under operating leases 32,700 24,051 22,752 20,616 19,484 17,013 21,263 16,749 13,217 13,539 16,967
Shares and participations 11,866 11,215 12,409 12,042 9,825 6,321 2,884 1,871 2,080 2,025 1,935
Inventories 65,366 52,231 48,080 44,194 45,364 40,964 40,057 43,828 38,956 35,765 54,084
Customer-financing receivables 1,560 1,358 1,698 11 1,828 1,406 1,397 1,702 1,428 1,367 975
Interest-bearing receivables 3,882 4,966 4,415 3,738 2,777 2,195 11,011 6,734 11,153 8,010 6,056
Other receivables 101,347 85,822 75,759 68,223 70,413 60,679 54,324 59,062 52,358 49,008 60,586
Non-current assets held for sale 203 51 525 3,314 288 8,104 – 9,348 136 1,692 –
Cash and cash equivalents 43,907 32,447 20,875 21,210 31,105 28,230 27,146 35,951 31,491 37,404 22,575
Assets 354,351 301,165 280,093 263,216 273,181 253,537 253,248 269,076 245,602 245,550 264,272
Shareholders’ equity 113,144 97,790 86,579 75,151 70,105 68,467 78,321 76,682 66,101 58,485 75,046
Provision for post-employment benefits 16,374 14,391 14,608 13,621 16,580 12,249 6,663 6,635 7,478 8,021 11,677
Other provisions 28,476 22,680 22,545 23,936 25,054 17,575 19,653 19,101 17,240 17,456 27,015
Interest-bearing liabilities 25,328 27,001 33,944 32,562 48,180 52,491 54,472 55,394 59,857 78,890 46,749
Liabilities associated with assets held for sale – – 148 573 130 350 – 4,716 135 272 –
Other liabilities 171,029 139,303 122,269 117,374 113,131 102,405 94,139 106,548 94,791 82,426 103,785
Shareholders’ equity and liabilities 354,351 301,165 280,093 263,216 273,181 253,537 253,248 269,076 245,602 245,550 264,272
219
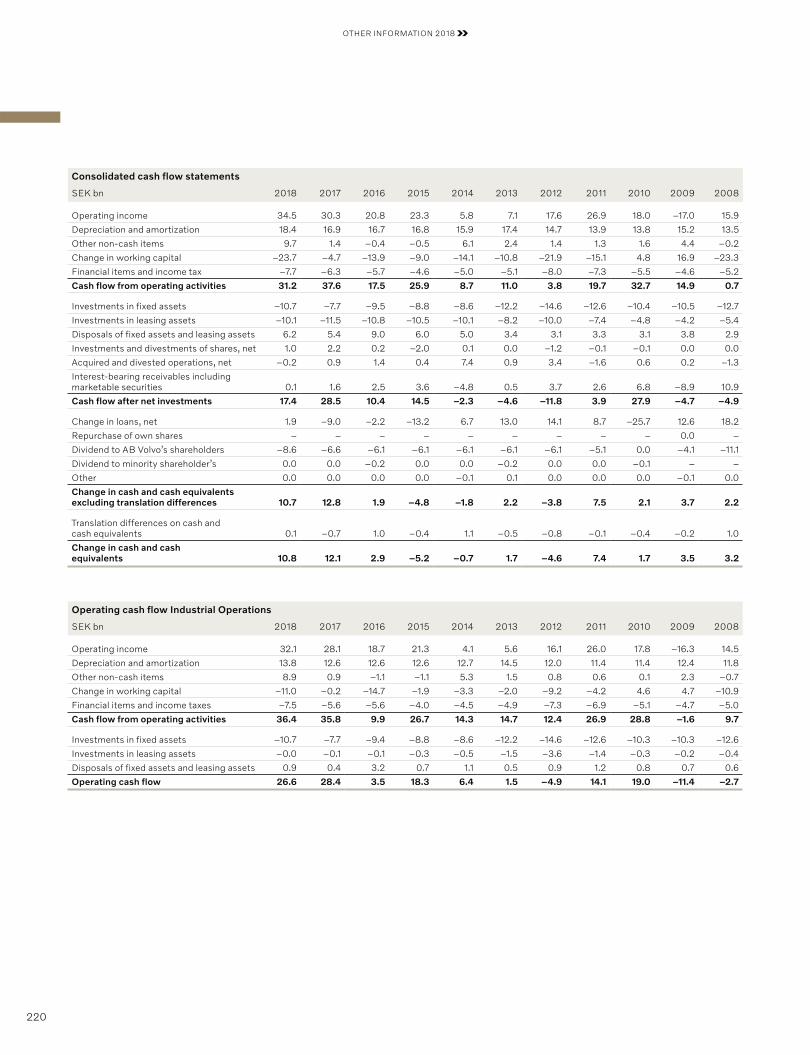
OTHER INFORMATION 2018
Consolidated cash flow statements
SEK bn 2018 2017 2016 2015 2014 2013 2012 2011 2010 2009 2008
Operating income 34.5 30.3 20.8 23.3 5.8 7.1 17.6 26.9 18.0 –17.0 15.9
Depreciation and amortization 18.4 16.9 16.7 16.8 15.9 17.4 14.7 13.9 13.8 15.2 13.5
Other non-cash items 9.7 1.4 –0.4 –0.5 6.1 2.4 1.4 1.3 1.6 4.4 –0.2
Change in working capital –23.7 –4.7 –13.9 –9.0 –14.1 –10.8 –21.9 –15.1 4.8 16.9 –23.3
Financial items and income tax –7.7 –6.3 –5.7 –4.6 –5.0 –5.1 –8.0 –7.3 –5.5 –4.6 –5.2
Cash flow from operating activities 31.2 37.6 17.5 25.9 8.7 11.0 3.8 19.7 32.7 14.9 0.7
Investments in fixed assets –10.7 –7.7 –9.5 –8.8 –8.6 –12.2 –14.6 –12.6 –10.4 –10.5 –12.7
Investments in leasing assets –10.1 –11.5 –10.8 –10.5 –10.1 –8.2 –10.0 –7.4 –4.8 –4.2 –5.4
Disposals of fixed assets and leasing assets 6.2 5.4 9.0 6.0 5.0 3.4 3.1 3.3 3.1 3.8 2.9
Investments and divestments of shares, net 1.0 2.2 0.2 –2.0 0.1 0.0 –1.2 –0.1 –0.1 0.0 0.0
Acquired and divested operations, net –0.2 0.9 1.4 0.4 7.4 0.9 3.4 –1.6 0.6 0.2 –1.3
Interest-bearing receivables including marketable securities 0.1 1.6 2.5 3.6 –4.8 0.5 3.7 2.6 6.8 –8.9 10.9
Cash flow after net investments 17.4 28.5 10.4 14.5 –2.3 –4.6 –11.8 3.9 27.9 –4.7 –4.9
Change in loans, net 1.9 –9.0 –2.2 –13.2 6.7 13.0 14.1 8.7 –25.7 12.6 18.2
Repurchase of own shares – – – – – – – – – 0.0 –
Dividend to AB Volvo’s shareholders –8.6 –6.6 –6.1 –6.1 –6.1 –6.1 –6.1 –5.1 0.0 –4.1 –11.1
Dividend to minority shareholder’s 0.0 0.0 –0.2 0.0 0.0 –0.2 0.0 0.0 –0.1 – –
Other 0.0 0.0 0.0 0.0 –0.1 0.1 0.0 0.0 0.0 –0.1 0.0
Change in cash and cash equivalents excluding translation differences 10.7 12.8 1.9 –4.8 –1.8 2.2 –3.8 7.5 2.1 3.7 2.2
Translation differences on cash and cash equivalents 0.1 –0.7 1.0 –0.4 1.1 –0.5 –0.8 –0.1 –0.4 –0.2 1.0
Change in cash and cash equivalents 10.8 12.1 2.9 –5.2 –0.7 1.7 –4.6 7.4 1.7 3.5 3.2
Operating cash flow Industrial Operations
SEK bn 2018 2017 2016 2015 2014 2013 2012 2011 2010 2009 2008
Operating income 32.1 28.1 18.7 21.3 4.1 5.6 16.1 26.0 17.8 –16.3 14.5
Depreciation and amortization 13.8 12.6 12.6 12.6 12.7 14.5 12.0 11.4 11.4 12.4 11.8
Other non-cash items 8.9 0.9 –1.1 –1.1 5.3 1.5 0.8 0.6 0.1 2.3 –0.7
Change in working capital –11.0 –0.2 –14.7 –1.9 –3.3 –2.0 –9.2 –4.2 4.6 4.7 –10.9
Financial items and income taxes –7.5 –5.6 –5.6 –4.0 –4.5 –4.9 –7.3 –6.9 –5.1 –4.7 –5.0
Cash flow from operating activities 36.4 35.8 9.9 26.7 14.3 14.7 12.4 26.9 28.8 –1.6 9.7
Investments in fixed assets –10.7 –7.7 –9.4 –8.8 –8.6 –12.2 –14.6 –12.6 –10.3 –10.3 –12.6
Investments in leasing assets –0.0 –0.1 –0.1 –0.3 –0.5 –1.5 –3.6 –1.4 –0.3 –0.2 –0.4
Disposals of fixed assets and leasing assets 0.9 0.4 3.2 0.7 1.1 0.5 0.9 1.2 0.8 0.7 0.6
Operating cash flow 26.6 28.4 3.5 18.3 6.4 1.5 –4.9 14.1 19.0 –11.4 –2.7
220
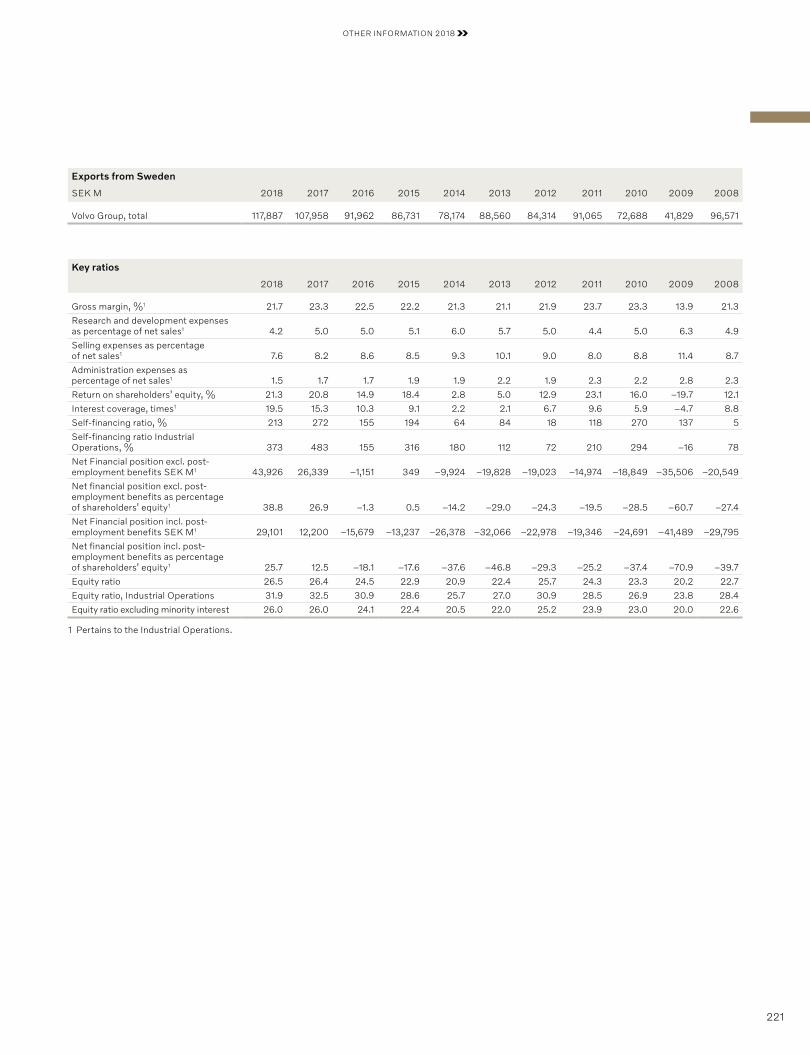
OTHER INFORMATION 2018
Key ratios
2018 2017 2016 2015 2014 2013 2012 2011 2010 2009 2008
Gross margin, %1 21.7 23.3 22.5 22.2 21.3 21.1 21.9 23.7 23.3 13.9 21.3
Research and development expenses as percentage of net sales1 4.2 5.0 5.0 5.1 6.0 5.7 5.0 4.4 5.0 6.3 4.9
Selling expenses as percentage of net sales1 7.6 8.2 8.6 8.5 9.3 10.1 9.0 8.0 8.8 11.4 8.7
Administration expenses as percentage of net sales1 1.5 1.7 1.7 1.9 1.9 2.2 1.9 2.3 2.2 2.8 2.3
Return on shareholders’ equity, % 21.3 20.8 14.9 18.4 2.8 5.0 12.9 23.1 16.0 –19.7 12.1
Interest coverage, times1 19.5 15.3 10.3 9.1 2.2 2.1 6.7 9.6 5.9 –4.7 8.8
Self-financing ratio, % 213 272 155 194 64 84 18 118 270 137 5
Self-financing ratio Industrial Operations, % 373 483 155 316 180 112 72 210 294 –16 78
Net Financial position excl. post -employment benefits SEK M1 43,926 26,339 –1,151 349 –9,924 –19,828 –19,023 –14,974 –18,849 –35,506 –20,549
Net financial position excl. post- employment benefits as percentage of shareholders’ equity1 38.8 26.9 –1.3 0.5 –14.2 –29.0 –24.3 –19.5 –28.5 –60.7 –27.4
Net Financial position incl. post -employment benefits SEK M1 29,101 12,200 –15,679 –13,237 –26,378 –32,066 –22,978 –19,346 –24,691 –41,489 –29,795
Net financial position incl. post- employment benefits as percentage of shareholders’ equity1 25.7 12.5 –18.1 –17.6 –37.6 –46.8 –29.3 –25.2 –37.4 –70.9 –39.7
Equity ratio 26.5 26.4 24.5 22.9 20.9 22.4 25.7 24.3 23.3 20.2 22.7
Equity ratio, Industrial Operations 31.9 32.5 30.9 28.6 25.7 27.0 30.9 28.5 26.9 23.8 28.4
Equity ratio excluding minority interest 26.0 26.0 24.1 22.4 20.5 22.0 25.2 23.9 23.0 20.0 22.6
1 Pertains to the Industrial Operations.
Exports from Sweden
SEK M 2018 2017 2016 2015 2014 2013 2012 2011 2010 2009 2008
Volvo Group, total 117,887 107,958 91,962 86,731 78,174 88,560 84,314 91,065 72,688 41,829 96,571
221
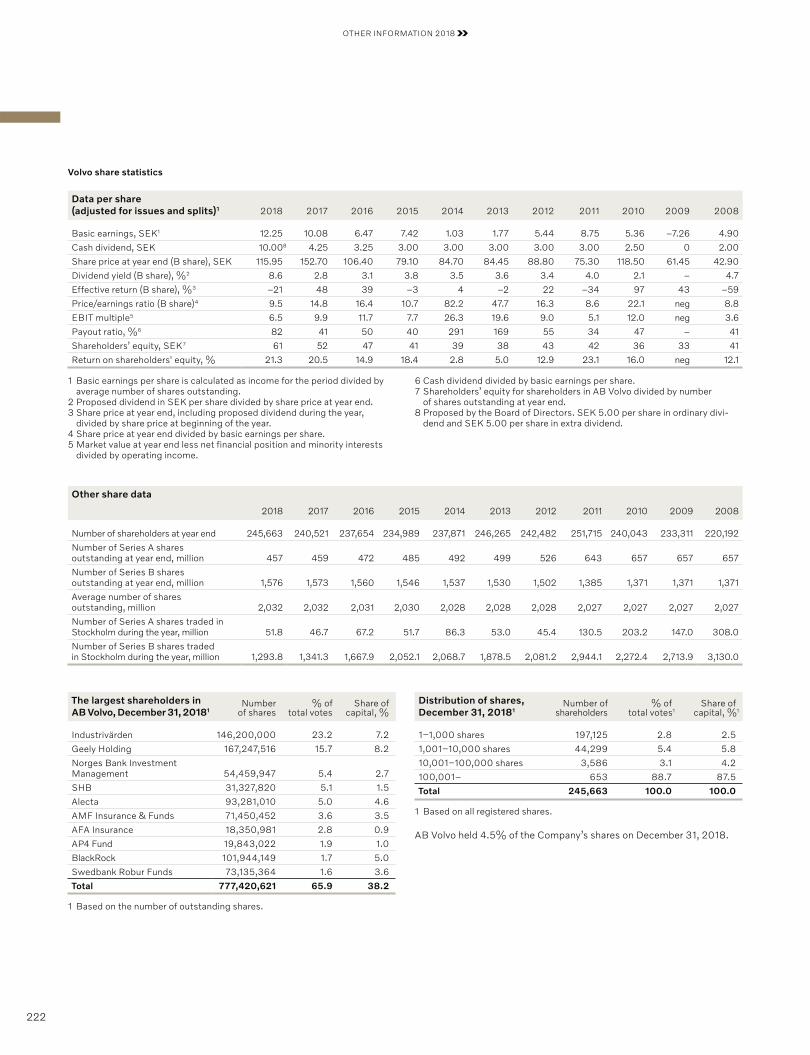
OTHER INFORMATION 2018
Volvo share statistics
Data per share (adjusted for issues and splits)1 2018 2017 2016 2015 2014 2013 2012 2011 2010 2009 2008
Basic earnings, SEK1 12.25 10.08 6.47 7.42 1.03 1.77 5.44 8.75 5.36 –7.26 4.90
Cash dividend, SEK 10.008 4.25 3.25 3.00 3.00 3.00 3.00 3.00 2.50 0 2.00
Share price at year end (B share), SEK 115.95 152.70 106.40 79.10 84.70 84.45 88.80 75.30 118.50 61.45 42.90
Dividend yield (B share), %2 8.6 2.8 3.1 3.8 3.5 3.6 3.4 4.0 2.1 – 4.7
Effective return (B share), %3 –21 48 39 –3 4 –2 22 –34 97 43 –59
Price/earnings ratio (B share)4 9.5 14.8 16.4 10.7 82.2 47.7 16.3 8.6 22.1 neg 8.8
EBIT multiple5 6.5 9.9 11.7 7.7 26.3 19.6 9.0 5.1 12.0 neg 3.6
Payout ratio, %6 82 41 50 40 291 169 55 34 47 – 41
Shareholders’ equity, SEK7 61 52 47 41 39 38 43 42 36 33 41
Return on shareholders' equity, % 21.3 20.5 14.9 18.4 2.8 5.0 12.9 23.1 16.0 neg 12.1
Other share data
2018 2017 2016 2015 2014 2013 2012 2011 2010 2009 2008
Number of shareholders at year end 245,663 240,521 237,654 234,989 237,871 246,265 242,482 251,715 240,043 233,311 220,192
Number of Series A shares outstanding at year end, million 457 459 472 485 492 499 526 643 657 657 657
Number of Series B shares outstanding at year end, million 1,576 1,573 1,560 1,546 1,537 1,530 1,502 1,385 1,371 1,371 1,371
Average number of shares outstanding, million 2,032 2,032 2,031 2,030 2,028 2,028 2,028 2,027 2,027 2,027 2,027
Number of Series A shares traded in Stockholm during the year, million 51.8 46.7 67.2 51.7 86.3 53.0 45.4 130.5 203.2 147.0 308.0
Number of Series B shares traded in Stockholm during the year, million 1,293.8 1,341.3 1,667.9 2,052.1 2,068.7 1,878.5 2,081.2 2,944.1 2,272.4 2,713.9 3,130.0
1 Basic earnings per share is calculated as income for the period divided by average number of shares outstanding.
2 Proposed dividend in SEK per share divided by share price at year end.3 Share price at year end, including proposed dividend during the year,
divided by share price at beginning of the year.4 Share price at year end divided by basic earnings per share. 5 Market value at year end less net financial position and minority interests
divided by operating income.
6 Cash dividend divided by basic earnings per share. 7 Shareholders’ equity for shareholders in AB Volvo divided by number
of shares outstanding at year end. 8 Proposed by the Board of Directors. SEK 5.00 per share in ordinary divi-
dend and SEK 5.00 per share in extra dividend.
The largest shareholders in AB Volvo, December 31, 20181
Number of shares
% of total votes
Share of capital, %
Industrivärden 146,200,000 23.2 7.2
Geely Holding 167,247,516 15.7 8.2
Norges Bank Investment Management 54,459,947 5.4 2.7
SHB 31,327,820 5.1 1.5
Alecta 93,281,010 5.0 4.6
AMF Insurance & Funds 71,450,452 3.6 3.5
AFA Insurance 18,350,981 2.8 0.9
AP4 Fund 19,843,022 1.9 1.0
BlackRock 101,944,149 1.7 5.0
Swedbank Robur Funds 73,135,364 1.6 3.6
Total 777,420,621 65.9 38.2
1 Based on the number of outstanding shares.
Distribution of shares, December 31, 20181
Number of shareholders
% oftotal votes1
Share ofcapital, %1
1–1,000 shares 197,125 2.8 2.5
1,001–10,000 shares 44,299 5.4 5.8
10,001–100,000 shares 3,586 3.1 4.2
100,001– 653 88.7 87.5
Total 245,663 100.0 100.0
1 Based on all registered shares.
AB Volvo held 4.5% of the Company’s shares on December 31, 2018.
222
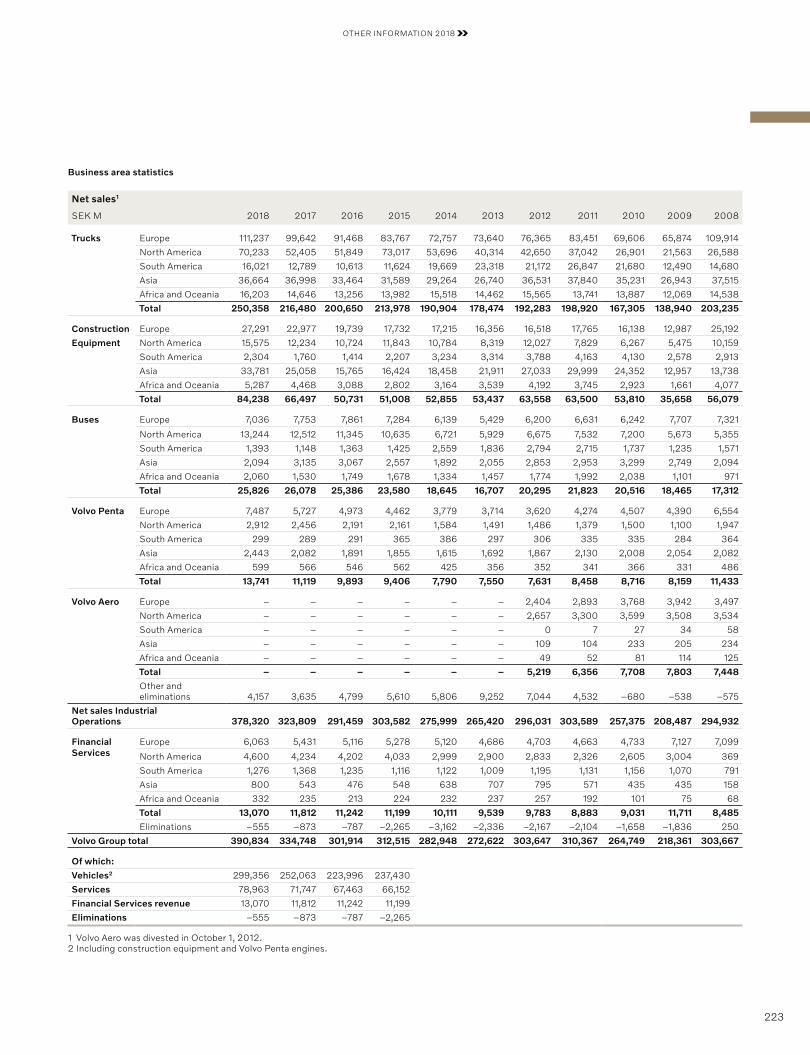
OTHER INFORMATION 2018
Business area statistics
Net sales1
SEK M 2018 2017 2016 2015 2014 2013 2012 2011 2010 2009 2008
Trucks Europe 111,237 99,642 91,468 83,767 72,757 73,640 76,365 83,451 69,606 65,874 109,914
North America 70,233 52,405 51,849 73,017 53,696 40,314 42,650 37,042 26,901 21,563 26,588
South America 16,021 12,789 10,613 11,624 19,669 23,318 21,172 26,847 21,680 12,490 14,680
Asia 36,664 36,998 33,464 31,589 29,264 26,740 36,531 37,840 35,231 26,943 37,515
Africa and Oceania 16,203 14,646 13,256 13,982 15,518 14,462 15,565 13,741 13,887 12,069 14,538
Total 250,358 216,480 200,650 213,978 190,904 178,474 192,283 198,920 167,305 138,940 203,235
Construction Europe 27,291 22,977 19,739 17,732 17,215 16,356 16,518 17,765 16,138 12,987 25,192
Equipment North America 15,575 12,234 10,724 11,843 10,784 8,319 12,027 7,829 6,267 5,475 10,159
South America 2,304 1,760 1,414 2,207 3,234 3,314 3,788 4,163 4,130 2,578 2,913
Asia 33,781 25,058 15,765 16,424 18,458 21,911 27,033 29,999 24,352 12,957 13,738
Africa and Oceania 5,287 4,468 3,088 2,802 3,164 3,539 4,192 3,745 2,923 1,661 4,077
Total 84,238 66,497 50,731 51,008 52,855 53,437 63,558 63,500 53,810 35,658 56,079
Buses Europe 7,036 7,753 7,861 7,284 6,139 5,429 6,200 6,631 6,242 7,707 7,321 North America 13,244 12,512 11,345 10,635 6,721 5,929 6,675 7,532 7,200 5,673 5,355
South America 1,393 1,148 1,363 1,425 2,559 1,836 2,794 2,715 1,737 1,235 1,571
Asia 2,094 3,135 3,067 2,557 1,892 2,055 2,853 2,953 3,299 2,749 2,094
Africa and Oceania 2,060 1,530 1,749 1,678 1,334 1,457 1,774 1,992 2,038 1,101 971
Total 25,826 26,078 25,386 23,580 18,645 16,707 20,295 21,823 20,516 18,465 17,312
Volvo Penta Europe 7,487 5,727 4,973 4,462 3,779 3,714 3,620 4,274 4,507 4,390 6,554
North America 2,912 2,456 2,191 2,161 1,584 1,491 1,486 1,379 1,500 1,100 1,947
South America 299 289 291 365 386 297 306 335 335 284 364
Asia 2,443 2,082 1,891 1,855 1,615 1,692 1,867 2,130 2,008 2,054 2,082
Africa and Oceania 599 566 546 562 425 356 352 341 366 331 486
Total 13,741 11,119 9,893 9,406 7,790 7,550 7,631 8,458 8,716 8,159 11,433
Volvo Aero Europe – – – – – – 2,404 2,893 3,768 3,942 3,497
North America – – – – – – 2,657 3,300 3,599 3,508 3,534
South America – – – – – – 0 7 27 34 58
Asia – – – – – – 109 104 233 205 234
Africa and Oceania – – – – – – 49 52 81 114 125
Total – – – – – – 5,219 6,356 7,708 7,803 7,448
Other and eliminations 4,157 3,635 4,799 5,610 5,806 9,252 7,044 4,532 –680 –538 –575
Net sales Industrial Operations 378,320 323,809 291,459 303,582 275,999 265,420 296,031 303,589 257,375 208,487 294,932
Financial Europe 6,063 5,431 5,116 5,278 5,120 4,686 4,703 4,663 4,733 7,127 7,099Services North America 4,600 4,234 4,202 4,033 2,999 2,900 2,833 2,326 2,605 3,004 369
South America 1,276 1,368 1,235 1,116 1,122 1,009 1,195 1,131 1,156 1,070 791
Asia 800 543 476 548 638 707 795 571 435 435 158
Africa and Oceania 332 235 213 224 232 237 257 192 101 75 68
Total 13,070 11,812 11,242 11,199 10,111 9,539 9,783 8,883 9,031 11,711 8,485
Eliminations –555 –873 –787 –2,265 –3,162 –2,336 –2,167 –2,104 –1,658 –1,836 250
Volvo Group total 390,834 334,748 301,914 312,515 282,948 272,622 303,647 310,367 264,749 218,361 303,667
Of which:
Vehicles2 299,356 252,063 223,996 237,430
Services 78,963 71,747 67,463 66,152
Financial Services revenue 13,070 11,812 11,242 11,199
Eliminations –555 –873 –787 –2,265
1 Volvo Aero was divested in October 1, 2012.2 Including construction equipment and Volvo Penta engines.
223
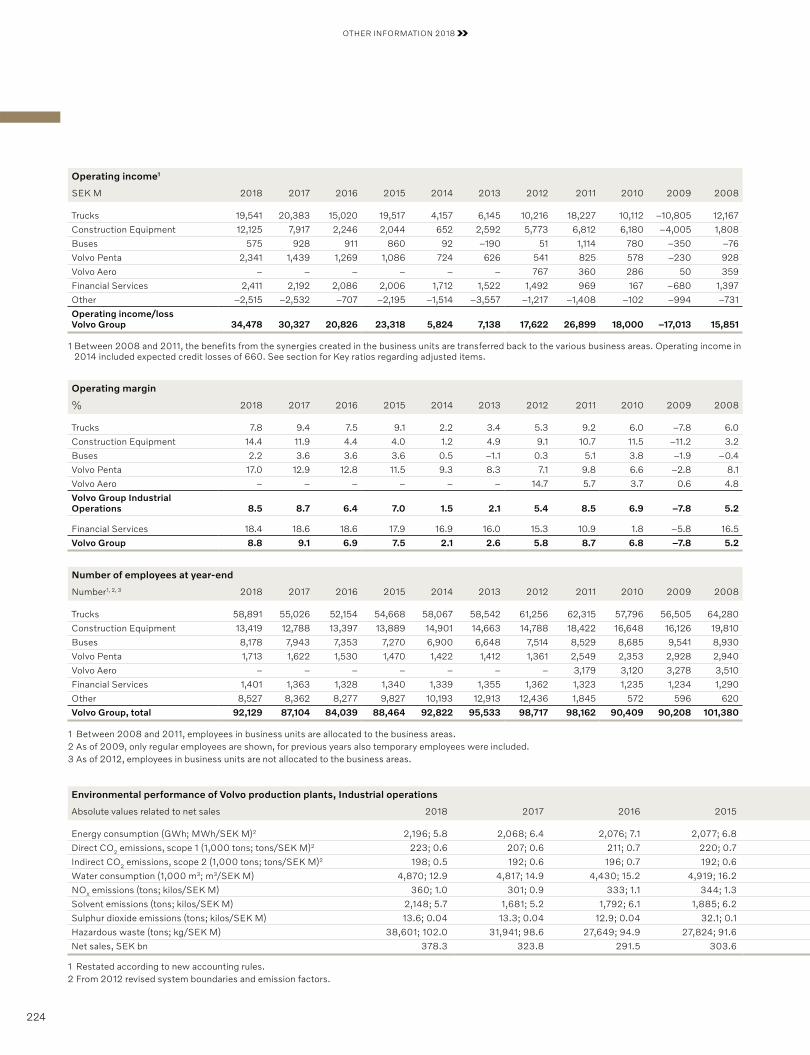
OTHER INFORMATION 2018
Operating margin
% 2018 2017 2016 2015 2014 2013 2012 2011 2010 2009 2008
Trucks 7.8 9.4 7.5 9.1 2.2 3.4 5.3 9.2 6.0 –7.8 6.0
Construction Equipment 14.4 11.9 4.4 4.0 1.2 4.9 9.1 10.7 11.5 –11.2 3.2
Buses 2.2 3.6 3.6 3.6 0.5 –1.1 0.3 5.1 3.8 –1.9 –0.4
Volvo Penta 17.0 12.9 12.8 11.5 9.3 8.3 7.1 9.8 6.6 –2.8 8.1
Volvo Aero – – – – – – 14.7 5.7 3.7 0.6 4.8
Volvo Group Industrial Operations 8.5 8.7 6.4 7.0 1.5 2.1 5.4 8.5 6.9 –7.8 5.2
Financial Services 18.4 18.6 18.6 17.9 16.9 16.0 15.3 10.9 1.8 –5.8 16.5
Volvo Group 8.8 9.1 6.9 7.5 2.1 2.6 5.8 8.7 6.8 –7.8 5.2
Operating income1
SEK M 2018 2017 2016 2015 2014 2013 2012 2011 2010 2009 2008
Trucks 19,541 20,383 15,020 19,517 4,157 6,145 10,216 18,227 10,112 –10,805 12,167
Construction Equipment 12,125 7,917 2,246 2,044 652 2,592 5,773 6,812 6,180 –4,005 1,808
Buses 575 928 911 860 92 –190 51 1,114 780 –350 –76
Volvo Penta 2,341 1,439 1,269 1,086 724 626 541 825 578 –230 928
Volvo Aero – – – – – – 767 360 286 50 359
Financial Services 2,411 2,192 2,086 2,006 1,712 1,522 1,492 969 167 –680 1,397
Other –2,515 –2,532 –707 –2,195 –1,514 –3,557 –1,217 –1,408 –102 –994 –731
Operating income/loss Volvo Group 34,478 30,327 20,826 23,318 5,824 7,138 17,622 26,899 18,000 –17,013 15,851
1 Between 2008 and 2011, the benefits from the synergies created in the business units are transferred back to the various business areas. Operating income in 2014 included expected credit losses of 660. See section for Key ratios regarding adjusted items.
Number of employees at year-end
Number1, 2, 3 2018 2017 2016 2015 2014 2013 2012 2011 2010 2009 2008
Trucks 58,891 55,026 52,154 54,668 58,067 58,542 61,256 62,315 57,796 56,505 64,280
Construction Equipment 13,419 12,788 13,397 13,889 14,901 14,663 14,788 18,422 16,648 16,126 19,810
Buses 8,178 7,943 7,353 7,270 6,900 6,648 7,514 8,529 8,685 9,541 8,930
Volvo Penta 1,713 1,622 1,530 1,470 1,422 1,412 1,361 2,549 2,353 2,928 2,940
Volvo Aero – – – – – – – 3,179 3,120 3,278 3,510
Financial Services 1,401 1,363 1,328 1,340 1,339 1,355 1,362 1,323 1,235 1,234 1,290
Other 8,527 8,362 8,277 9,827 10,193 12,913 12,436 1,845 572 596 620
Volvo Group, total 92,129 87,104 84,039 88,464 92,822 95,533 98,717 98,162 90,409 90,208 101,380
1 Between 2008 and 2011, employees in business units are allocated to the business areas.2 As of 2009, only regular employees are shown, for previous years also temporary employees were included. 3 As of 2012, employees in business units are not allocated to the business areas.
Environmental performance of Volvo production plants, Industrial operations
Absolute values related to net sales 2018 2017 2016 2015
Energy consumption (GWh; MWh/SEK M)2 2,196; 5.8 2,068; 6.4 2,076; 7.1 2,077; 6.8
Direct CO2 emissions, scope 1 (1,000 tons; tons/SEK M)2 223; 0.6 207; 0.6 211; 0.7 220; 0.7
Indirect CO2 emissions, scope 2 (1,000 tons; tons/SEK M)2 198; 0.5 192; 0.6 196; 0.7 192; 0.6
Water consumption (1,000 m3; m3/SEK M) 4,870; 12.9 4,817; 14.9 4,430; 15.2 4,919; 16.2
NOX emissions (tons; kilos/SEK M) 360; 1.0 301; 0.9 333; 1.1 344; 1.3
Solvent emissions (tons; kilos/SEK M) 2,148; 5.7 1,681; 5.2 1,792; 6.1 1,885; 6.2
Sulphur dioxide emissions (tons; kilos/SEK M) 13.6; 0.04 13.3; 0.04 12.9; 0.04 32.1; 0.1
Hazardous waste (tons; kg/SEK M) 38,601; 102.0 31,941; 98.6 27,649; 94.9 27,824; 91.6
Net sales, SEK bn 378.3 323.8 291.5 303.6
1 Restated according to new accounting rules.2 From 2012 revised system boundaries and emission factors.
224
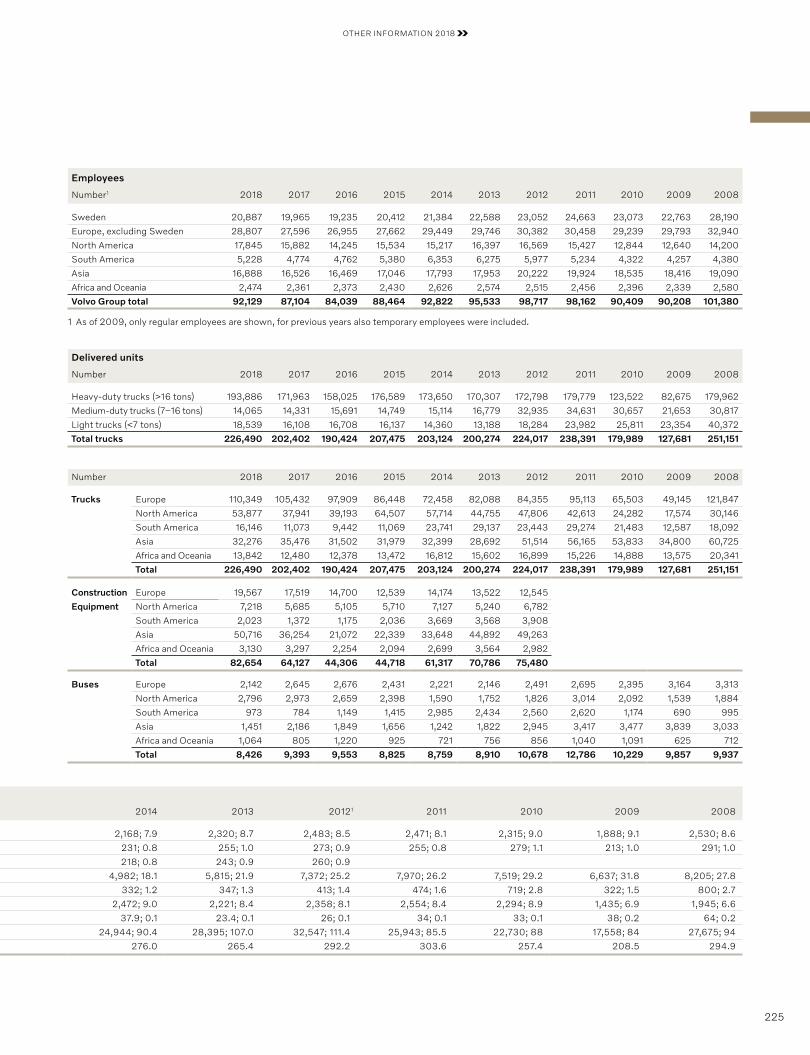
OTHER INFORMATION 2018
2014 2013 20121 2011 2010 2009 2008
2,168; 7.9 2,320; 8.7 2,483; 8.5 2,471; 8.1 2,315; 9.0 1,888; 9.1 2,530; 8.6
231; 0.8 255; 1.0 273; 0.9 255; 0.8 279; 1.1 213; 1.0 291; 1.0
218; 0.8 243; 0.9 260; 0.9
4,982; 18.1 5,815; 21.9 7,372; 25.2 7,970; 26.2 7,519; 29.2 6,637; 31.8 8,205; 27.8
332; 1.2 347; 1.3 413; 1.4 474; 1.6 719; 2.8 322; 1.5 800; 2.7
2,472; 9.0 2,221; 8.4 2,358; 8.1 2,554; 8.4 2,294; 8.9 1,435; 6.9 1,945; 6.6
37.9; 0.1 23.4; 0.1 26; 0.1 34; 0.1 33; 0.1 38; 0.2 64; 0.2
24,944; 90.4 28,395; 107.0 32,547; 111.4 25,943; 85.5 22,730; 88 17,558; 84 27,675; 94
276.0 265.4 292.2 303.6 257.4 208.5 294.9
Employees
Number1 2018 2017 2016 2015 2014 2013 2012 2011 2010 2009 2008
Sweden 20,887 19,965 19,235 20,412 21,384 22,588 23,052 24,663 23,073 22,763 28,190
Europe, excluding Sweden 28,807 27,596 26,955 27,662 29,449 29,746 30,382 30,458 29,239 29,793 32,940
North America 17,845 15,882 14,245 15,534 15,217 16,397 16,569 15,427 12,844 12,640 14,200
South America 5,228 4,774 4,762 5,380 6,353 6,275 5,977 5,234 4,322 4,257 4,380
Asia 16,888 16,526 16,469 17,046 17,793 17,953 20,222 19,924 18,535 18,416 19,090
Africa and Oceania 2,474 2,361 2,373 2,430 2,626 2,574 2,515 2,456 2,396 2,339 2,580
Volvo Group total 92,129 87,104 84,039 88,464 92,822 95,533 98,717 98,162 90,409 90,208 101,380
1 As of 2009, only regular employees are shown, for previous years also temporary employees were included.
Delivered units
Number 2018 2017 2016 2015 2014 2013 2012 2011 2010 2009 2008
Heavy-duty trucks (>16 tons) 193,886 171,963 158,025 176,589 173,650 170,307 172,798 179,779 123,522 82,675 179,962
Medium-duty trucks (7–16 tons) 14,065 14,331 15,691 14,749 15,114 16,779 32,935 34,631 30,657 21,653 30,817
Light trucks (<7 tons) 18,539 16,108 16,708 16,137 14,360 13,188 18,284 23,982 25,811 23,354 40,372
Total trucks 226,490 202,402 190,424 207,475 203,124 200,274 224,017 238,391 179,989 127,681 251,151
Number 2018 2017 2016 2015 2014 2013 2012 2011 2010 2009 2008
Trucks Europe 110,349 105,432 97,909 86,448 72,458 82,088 84,355 95,113 65,503 49,145 121,847
North America 53,877 37,941 39,193 64,507 57,714 44,755 47,806 42,613 24,282 17,574 30,146
South America 16,146 11,073 9,442 11,069 23,741 29,137 23,443 29,274 21,483 12,587 18,092
Asia 32,276 35,476 31,502 31,979 32,399 28,692 51,514 56,165 53,833 34,800 60,725
Africa and Oceania 13,842 12,480 12,378 13,472 16,812 15,602 16,899 15,226 14,888 13,575 20,341
Total 226,490 202,402 190,424 207,475 203,124 200,274 224,017 238,391 179,989 127,681 251,151
Construction Europe 19,567 17,519 14,700 12,539 14,174 13,522 12,545
Equipment North America 7,218 5,685 5,105 5,710 7,127 5,240 6,782
South America 2,023 1,372 1,175 2,036 3,669 3,568 3,908
Asia 50,716 36,254 21,072 22,339 33,648 44,892 49,263
Africa and Oceania 3,130 3,297 2,254 2,094 2,699 3,564 2,982
Total 82,654 64,127 44,306 44,718 61,317 70,786 75,480
Buses Europe 2,142 2,645 2,676 2,431 2,221 2,146 2,491 2,695 2,395 3,164 3,313
North America 2,796 2,973 2,659 2,398 1,590 1,752 1,826 3,014 2,092 1,539 1,884
South America 973 784 1,149 1,415 2,985 2,434 2,560 2,620 1,174 690 995
Asia 1,451 2,186 1,849 1,656 1,242 1,822 2,945 3,417 3,477 3,839 3,033
Africa and Oceania 1,064 805 1,220 925 721 756 856 1,040 1,091 625 712
Total 8,426 9,393 9,553 8,825 8,759 8,910 10,678 12,786 10,229 9,857 9,937
225
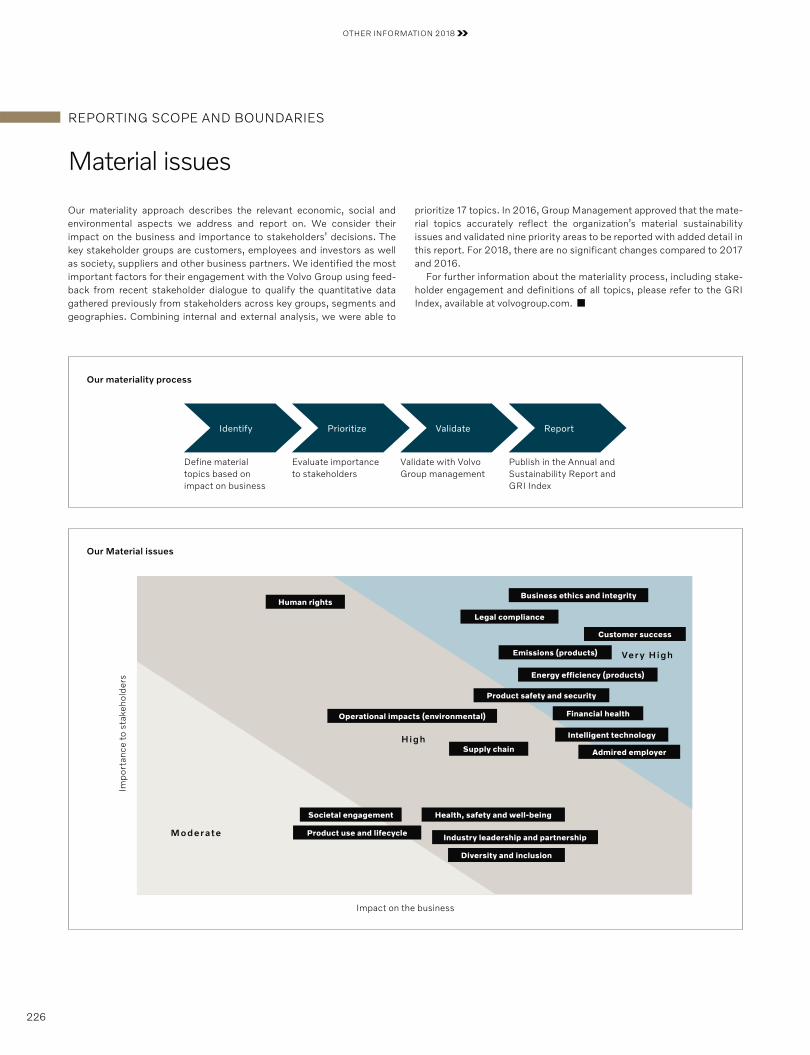
OTHER INFORMATION 2018
Our materiality approach describes the relevant economic, social and environmental aspects we address and report on. We consider their impact on the business and importance to stakeholders’ decisions. The key stakeholder groups are customers, employees and investors as well as society, suppliers and other business partners. We identified the most important factors for their engagement with the Volvo Group using feed-back from recent stakeholder dialogue to qualify the quantitative data gathered previously from stakeholders across key groups, segments and geographies. Combining internal and external analysis, we were able to
prioritize 17 topics. In 2016, Group Management approved that the mate-rial topics accurately reflect the organization’s material sustainability issues and validated nine priority areas to be reported with added detail in this report. For 2018, there are no significant changes compared to 2017 and 2016.
For further information about the materiality process, including stake-holder engagement and definitions of all topics, please refer to the GRI Index, available at volvogroup.com.
Identify
Define material topics based on impact on business
Evaluate importance to stakeholders
Prioritize
Validate with Volvo Group management
Validate
Publish in the Annual and Sustainability Report and GRI Index
Report
Our materiality process
Impact on the business
Impo
rtan
ce t
o st
akeh
olde
rs
Moder ate
High
Ver y High
Energy efficiency (products)
Product safety and security
Industry leadership and partnershipProduct use and lifecycle
Health, safety and well-being
Diversity and inclusion
Societal engagement
Operational impacts (environmental)
Emissions (products)
Business ethics and integrity
Legal compliance
Human rights
Supply chain
Financial health
Customer success
Admired employer
Intelligent technology
Our Material issues
Material issues
REPORTING SCOPE AND BOUNDARIES
226
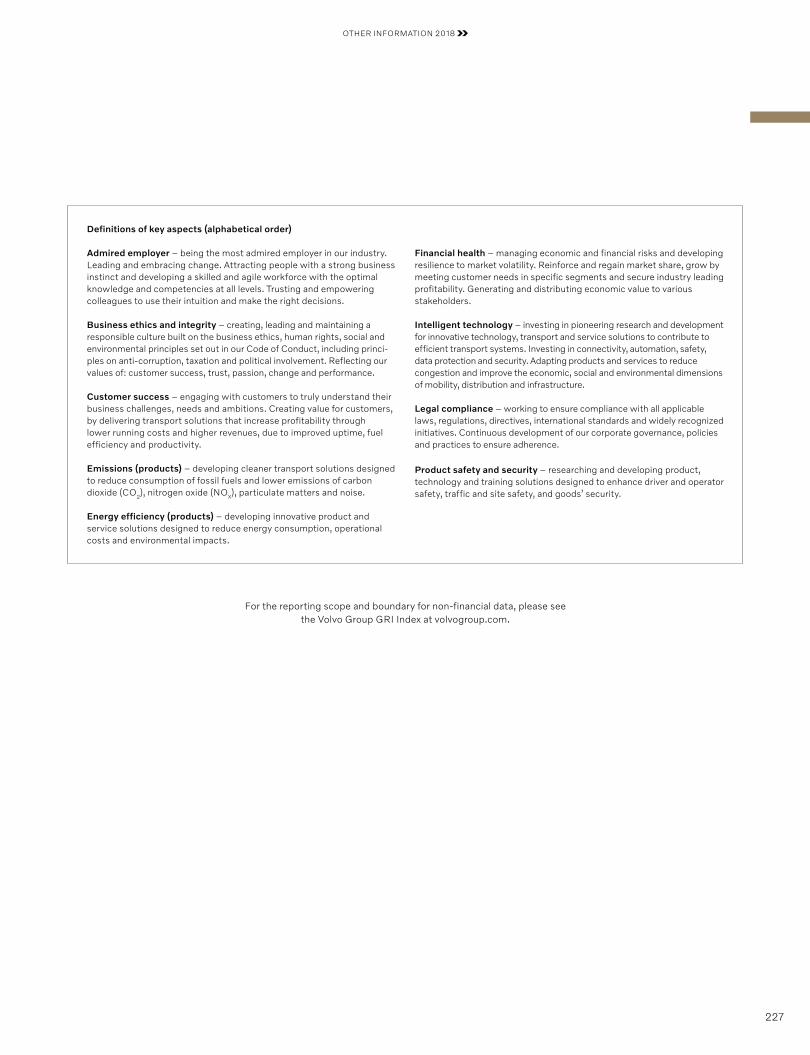
OTHER INFORMATION 2018
For the reporting scope and boundary for non-financial data, please see the Volvo Group GRI Index at volvogroup.com.
Definitions of key aspects (alphabetical order)
Admired employer – being the most admired employer in our industry. Leading and embracing change. Attracting people with a strong business instinct and developing a skilled and agile workforce with the optimal knowledge and competencies at all levels. Trusting and empowering colleagues to use their intuition and make the right decisions.
Business ethics and integrity – creating, leading and maintaining a responsible culture built on the business ethics, human rights, social and environmental principles set out in our Code of Conduct, including princi-ples on anti-corruption, taxation and political involvement. Reflecting our values of: customer success, trust, passion, change and performance.
Customer success – engaging with customers to truly understand their business challenges, needs and ambitions. Creating value for customers, by delivering transport solutions that increase profitability through lower running costs and higher revenues, due to improved uptime, fuel efficiency and productivity.
Emissions (products) – developing cleaner transport solutions designed to reduce consumption of fossil fuels and lower emissions of carbon dioxide (CO2), nitrogen oxide (NOX), particulate matters and noise.
Energy efficiency (products) – developing innovative product and service solutions designed to reduce energy consumption, operational costs and environmental impacts.
Financial health – managing economic and financial risks and developing resilience to market volatility. Reinforce and regain market share, grow by meeting customer needs in specific segments and secure industry leading profitability. Generating and distributing economic value to various stakeholders.
Intelligent technology – investing in pioneering research and development for innovative technology, transport and service solutions to contribute to efficient transport systems. Investing in connectivity, automation, safety, data protection and security. Adapting products and services to reduce congestion and improve the economic, social and environmental dimensions of mobility, distribution and infrastructure.
Legal compliance – working to ensure compliance with all applicable laws, regulations, directives, international standards and widely recognized initiatives. Continuous development of our corporate governance, policies and practices to ensure adherence.
Product safety and security – researching and developing product, technology and training solutions designed to enhance driver and operator safety, traffic and site safety, and goods’ security.
227
OTHER INFORMATION 2018
ANNUAL GENERAL MEETING, APRIL 3, 2019
The Annual General Meeting of AB Volvo will be held in Göteborg in Konserthuset, Götaplatsen, Wednesday, April 3, 2019.
NoticeThose who wish to participate must be recorded as shareholders in the share register maintained by Euroclear Sweden AB on March 28, 2019 and give notice of intention to attend the meeting no later than March 28, 2019:
• by telephone, +46 8 402 90 76, notice of intention to attend the meeting could be given by telephone no later than 4.00 p.m. on March 28, 2019
• by mail addressed to AB Volvo (publ), “AGM”, c/o Euroclear Sweden, P.O. Box 191, SE-101 23 Stockholm, Sweden
• on AB Volvo’s website www.volvogroup.com or volvogroup.se
When giving notice, shareholders should state their:
• name
• personal registration number (corporate registration number)
• address and telephone number
• name and personal number of the proxy, if any
• number of any accompanying assistant(s) (maximum two)
To be entitled to participate in the annual general meeting, shareholders having their shares registered in the name of a nominee must request the nominee to enter the shareholder into the share register. Such registration, which can be temporary, must have been effected by March 28, 2019 and should therefore be requested well in advance of March 28, 2019.
VOLVO’S ELECTION COMMITTEE
The following persons are members of Volvo’s Election Committee:
Bengt Kjell Chairman of the Election Committee, AB Industrivärden
Pär Boman Svenska Handelsbanken, SHB Pension Fund, SHB Pensionskassa, SHB Employee Fund and Oktogonen
Ramsay Brufer Alecta
Yngve Slyngstad Norges Bank Investment Management
Carl-Henric Svanberg Chairman of the AB Volvo Board
Among other duties, the Election Committee is responsible for submitting to the Annual General Meeting proposals for candidates to serve as members of the Board of Directors, Chairman of the Board and proposal for auditors if applicable. The Election Committee also proposes the amount of the fees to be paid to the Board of Directors.
PRELIMINARY PUBLICATION DATES
Annual General Meeting 2019 April 3, 2019
Report on the first quarter 2019 April 24, 2019
Report on the second quarter 2019 July 18, 2019
Report on the third quarter 2019 October 18, 2019
The reports are available on www.volvogroup.com and www.volvogroup.se on date of publication and are also sent electronically to shareholders who have advised Volvo that they wish to receive financial information.
Historical and current time series reflecting the Volvo Group’s market information are published regularly on www.volvogroup.com and on www.volvogroup.se.
CONTACTS
Investor Relations: Christer Johansson +46 739 02 25 22Johan Bartler +46 739 02 21 93 Anders Christensson +46 765 53 59 66 E-mail: [email protected]
Corporate Responsibility:Martina Klaus +46 31 323 45 64E-mail: [email protected]
Aktiebolaget Volvo (publ) 556012-5790Investor Relations, VGHQ SE-405 08 Göteborg Sweden
Tel +46 31 66 00 00
www.volvogroup.com
228
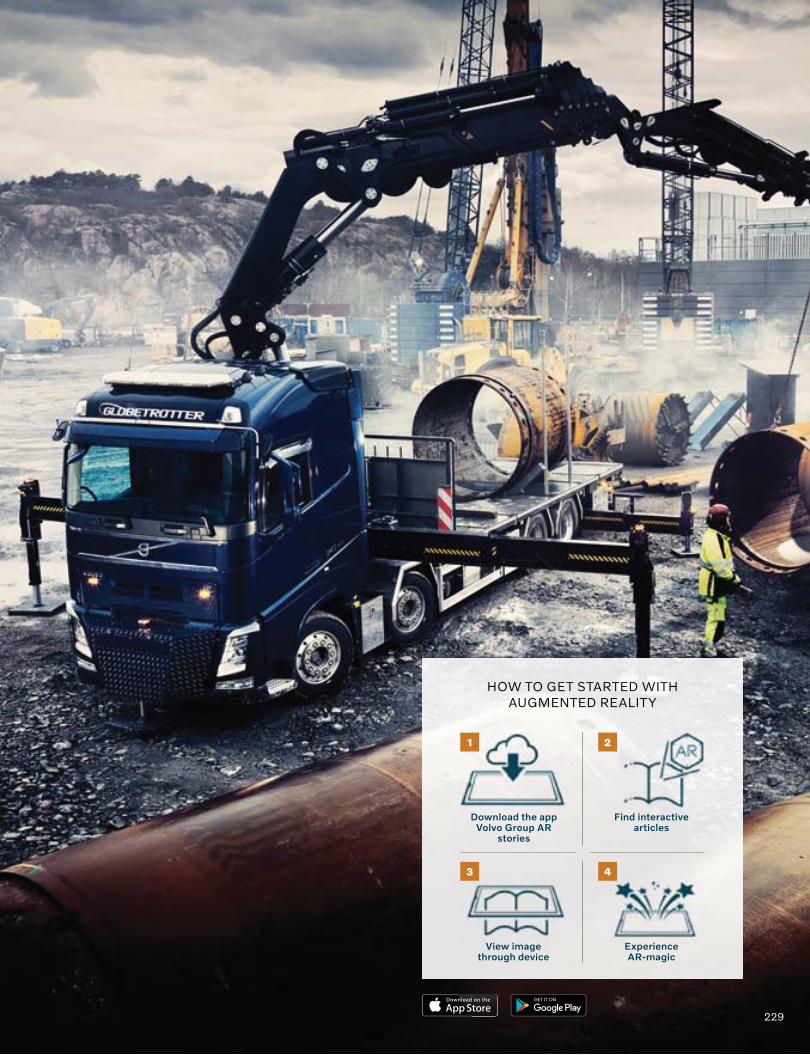
HOW TO GET STARTED WITH AUGMENTED REALITY
Download the app Volvo Group AR
stories
1
View image through device
3
Find interactive articles
2
Experience AR-magic
4
229
AB Volvo (publ)SE-40508 Göteborg, SwedenTelephone +46 31 66 00 00www.volvogroup.com
The Volvo Group is one of the world’s leading manufacturers of trucks, buses, construction equipment and marine and industrial engines. The Group also provides complete solutions for financing and service. The Volvo Group, which employs 105,000 people, has production facilities in 18 countries and sells its products in more than 190 markets. In 2018 the Volvo Group’s sales amounted to SEK 391 billion. The Volvo Group is a publicly-held company headquartered in Göteborg, Sweden. Volvo shares are listed on Nasdaq Stockholm.
AB
Vol
vo, I
nves
tor
Rel
atio
ns a
nd G
roup
Acc
ount
ing