driving licenses in india
TRANSCRIPT
Obtaining a Driving License in India: An Experimental Approach to Studying Corruption
Marianne Bertrand University of Chicago Graduate School of Business, NBER, CEPR and IZA
Simeon Djankov
International Finance Corporation
Rema Hanna New York University Wagner School of Public Service
Sendhil Mullainathan1
Harvard University, and NBER
November 2006
Abstract We conduct two experiments to understand the process of obtaining a driver’s license in India. In the first experiment, we randomly assign license candidates to one of three groups: bonus (offered a financial reward if they could obtain their license fast), lesson (offered free driving lessons upfront), and control. The control group alone illustrates bureaucratic failures: 71% of the license getters in that group avoided the mandated driving test and 62% failed a surprise driving test. The system responds to private needs— there are more license getters in the bonus group—but at a social cost: there are more license getters who cannot drive in the bonus group. The system however also appears to respond to social considerations, as there are more license getters in the lesson group. Large extra-legal payments are made by license getters: those in the control group pay 2.5 times the official fee. More of these extra-legal payments take place in the bonus group. Surprisingly, these extra-legal payments are not direct bribes to bureaucrats but instead payments to agents. In the second experiment, we perform an audit study to better understand the role of agents. The audit shows that agents can provide licenses to individuals even if they cannot drive; but the audit also shows that agents cannot as easily circumvent all other rules. We argue that our findings are most consistent with agents being the channel for corruption in this system. We also report some suggestive evidence that bureaucrats create red tape, possibly to induce more license candidates to use agents.
1 This project was conducted and funded by the International Finance Corporation. We thank Anup Kumar Roy for outstanding research assistance. We are grateful to Lawrence Katz (the editor), three anonymous referees, Abhijit Banerjee, Gary Becker, Ryan Bubb, Anne Case, Angus Deaton, Luis Garicano, Ben Olken, Sam Peltzman, Andrei Shleifer, Jakob Svensson and to seminar participants at Harvard, MIT, Princeton, University of California at Berkeley, University of Chicago GSB, LSE, Yale University, NYU, Ohio State University, University of Florida, University of Toronto, the World Bank and the ASSA 2006 meeting for helpful comments.
Introduction Public service provision in many developing countries is rife with corruption. Some argue that this
corruption is socially beneficial (see Leff, 1964; Huntington, 1968; Lui 1985). For example, Huntington
(1968) remarked that “[I]n terms of economic growth, the only thing worse than a society with a rigid,
overcentralized, dishonest bureaucracy is one with a rigid, overcentralized, and honest bureaucracy.” Others
argue that corruption harms society (see Myrdal 1968; Rose-Ackerman, 1978; Klitgaard, 1991; Shleifer and
Vishny, 1993; Djankov et al., 2002). This disagreement arises from differing views about which aspects of
regulation corrupt bureaucrats circumvent. Under the first (“grease-the-wheels”) view, corrupt bureaucrats
circumvent privately noxious but socially unimportant pieces of the regulatory process. For example, “speed
money” payments to bureaucrats may enable citizens with the highest willingness-to-pay to jump the
bureaucratic queue. Under the second view, corrupt bureaucrats also circumvent socially important
components of the regulatory process when catering to private benefits. At the extreme, corrupt bureaucrats
may ignore all regulation and exclusively rely on bribes to decide who will be granted a service or license.
These two views differ on how a bureaucratic system responds to private willingness-to-pay and social
considerations.2 In this paper, we use detailed survey data and experimental evidence to explore how one
particular bureaucratic system responds to these factors.
Specifically, we focus on the provision of driving licenses in Delhi (India), and examine how
bureaucrats allocate driving licenses to those with higher private incentives to acquire a license, as well as to
those with better driving skills. Between October 2004 and April 2005, the International Finance Corporation
(IFC) followed 822 individuals through the application process, collecting data on whether a license was
obtained, as well as detailed micro data on the specific procedures, time and expenditures involved.3
Afterwards, the IFC administered an independent, surprise road test (matching the test that is supposed to be
given by the bureaucrats) to determine whether individuals who were granted a license could drive. The IFC
also randomly allocated participants into one of three groups: “bonus,” “lesson” and control. Specifically,
2 Other considerations may also be important. Alternatives to corruption may create enough distortion that even if corruption has negative consequences, it may still be a second-best (e.g. Tirole 1997 or Acemoglu and Verdier 2000). 3 Other noteworthy micro-empirical approaches to documenting and measuring corruption are Di Tella and Schargrodsky (2003), Fisman and Wei (2004) and Olken (2005).
1
participants in the “bonus group” were offered a large financial bonus if they were able to obtain a license in
32 days (two days longer than the statutory minimum time of 30 days). The “lesson group” was offered free
driving lessons, to be taken up immediately after recruitment into the survey.4 These treatments allow us to
distinguish a “grease-the-wheels” view from an inefficiency view of corruption. The “bonus” treatment tests
whether higher private benefits increases the number of license getters (as in the "grease-the-wheels” view),
but also whether it decreases the quality of the license getters (as in the "inefficiency" view). The “lesson”
treatment tests whether the allocation of licenses is at all responsive to driving ability.
The control group’s experiences already provide a rich set of facts on the licensing process.
First, the process fails to implement the social goals it was intended for. Thirty-four percent of the
individuals in the control group obtained a license without taking the legally required licensing exam; given
that only 48% of individuals obtained a license, this implies that close to 71% of the license getters did not
take the licensing exam. This does not necessarily imply that bad drivers obtain licenses: perhaps bureaucrats
are efficiently only testing marginal drivers. But the independent driving test shows that bad drivers are
indeed obtaining licenses. Close to 30% of the control group obtained a license and automatically failed an
independent driving test, where failing means that the individual knew so little about the workings of the car
that the test-giver refused to take him on the road. This implies that 62% of the license getters are unqualified
to drive at the time they obtain a license. Second, getting a license involves extra-legal payments. The control
group pays well above the legislated fees to get a license. Specifically, the average license getter in the
control group paid Rs 1,120, or about 2.5 times the official fee of Rs 450, to obtain his driving license.
This suggests a distorted process, one in which bureaucrats do not enforce a key element of the
regulation and individuals face extra-legal costs. Yet, causality is hard to assign. Do these distortions result
from bureaucrats sacrificing social benefits in order to cater to individuals’ private willingness to pay? Do
these distortions imply that bureaucrats ignore social considerations? The bonus group was designed to
answer the first of these questions and the lesson group the second. We find that the system responds to
private needs: the bonus group is 24 percentage points more likely to obtain a license than the control group.
4 To ensure no social costs to the study, participants in the control and bonus groups were offered free driving lessons upon completion of the final survey and driving test.
2
However, this response comes at a social cost: the bonus group is 18 percentage points more likely to both
obtain a license and fail the independent driving test.5 Moreover, we find that individuals in the bonus group
are 13 percentage points more likely than the control group to obtain a license while also not taking the
legally required driving exam. In other words, the bonus group is better able to complete the process, but at a
social cost. We also find that the bonus group pays on average Rs 178 more in extra-legal fees. The
bureaucratic system also appears to respond to driving ability, as the lesson group is 12 percentage points
more likely to obtain a license than the control group.6 On the other hand, the lesson group does not pay less
than the control for their license, despite their superior driving ability, suggesting that extra-legal payments
might be an essential part of getting a license.
Surprisingly, we find almost no evidence of direct bribes to bureaucrats in any of the groups. Instead,
the extra-legal payments are payments to “agents,” professionals who “assist” individuals in the process of
obtaining their driving license. We present multiple pieces of evidence suggesting that agents are the channel
for corruption in this bureaucracy, and not simply the providers of legal time-saving services. First, we report
descriptive statistics contrasting the process of getting a license with and without an agent. Tellingly, we
show that while 94% of those who did not hire an agent took the legally required driving test at least once,
only 12% of those who used an agent took that test. Second, we design an experiment aimed exclusively at
finding how agents can affect the licensing process. Specifically, trained actors were sent to agents in order
to elicit the feasibility of and prices for obtaining a license under different pretexts, which corresponded to
bending various official rules of the process. We find that agents were able to procure a license despite
someone’s lack of driving skills: agents offered to procure licenses for 100% of actors who said they did not
have the time to learn how to drive. We show that agents provide other services that imply a deviation from
the formal legal requirements attached to obtaining a license, but they cannot bend all rules: rules which
leave a documentary trail (such as place-of-residence restrictions) appear harder for agents to circumvent.
5 The average license getter in the bonus group is more likely to fail the independent test, suggesting that the bonus group’s failure rate is higher than one would estimate if one simply added more license-getters (but with the same failure rate) to the control group. 6 We cannot rule out the possibility that simply being offered lessons also raised the lesson group’s desire to get a license, and, therefore, the effort they were willing to exert to obtain a license. The lesson group may thus also have a higher private willingness to pay for the license.
3
Motivated by the still large extra-legal payments made by the better drivers in the lesson group, we
examine the experiences of those who use the formal (i.e. non-agent) channel for getting a license. Though
not as easy to interpret as the experimental work, these data suggest that bureaucrats may be creating “red
tape.” Specifically, it appears that bureaucrats use the driving test not to screen unsafe from safe drivers, but
to arbitrarily fail some people. Examining the subset of participants who begin the process by taking the
driving test once, we find that a substantial percentage of them (about 35%) fail and must resort to retaking
the test or hiring an agent. This percentage is unrelated to the actual ability to drive: it is constant across the
lesson, bonus and control groups, and it also constant across scores on the ex-post driving test.7 The findings
here support one strand of the theoretical literature that has emphasized that many bureaucratic rigidities are
the result of rent-seeking activities by bureaucrats (for example, Myrdal, 1968; Shleifer and Vishny, 1993;
Banerjee, 1997; and Svensson, 2005). In these theories of “endogeneous red tape,” bureaucrats introduce
socially unnecessary hurdles in order to extract bribes from citizens.
These results support an inefficiency view of corruption, with catering to private benefits coming at a
social cost. There are two paths to obtaining a driving license in New Delhi: the official path and the agent
path. While following the agent path involves substantial extra costs, it ensures one of getting a license even
without knowing how to drive, most likely because agents make payments to bureaucrats to bend the rules.
While it is possible to obtain a license without hiring an agent, it also appears that bureaucrats may create
hurdles (“red tape”) to encourage the use of agents.
Could these results be explained without corruption? We examine two alternative hypotheses. First,
we consider the possibility of an incompetent bureaucracy, combined with a confusing process and the need
for agents to stream-line it with legal time-saving services. This explanation doesn’t fit several findings in
our analysis. Second, we consider the possibility that bureaucrats enjoy private benefits through reduced
effort, but without any monetary kick-backs. This explanation is harder to rule out since we do not observe
direct bribe payments. Yet, we report on qualitative and quantitative evidence which suggests this is unlikely
to be the whole story.
7 This finding is interesting because red tape here is a public good. Every bureaucrat benefits from another bureaucrat’s willingness to fail applicants at random. This suggests some form of collusion or other-regarding preferences. The potential for collusion or other-regarding preferences is implicit in previous empirical work on corruption (Wade, 1982).
4
The rest of the paper proceeds as follows. Section I discusses the process of obtaining a driving
license in India, while Section II describes the data collection and lays out the design of the first experiment
(comparative experiences of control, “bonus” and “lesson” groups). These experimental findings are
presented in Section III. Section IV explores the process of getting a license with an agent, relying both on
non-experimental data but also on the findings of the second experiment (audit study of agents); we also
investigate the possibility of “red tape” in the formal process. Section V discusses alternative interpretations.
Section VI concludes.
I. Getting a Driver’s License in Delhi, India
The Motor Vehicle Act of 1988 and its subsequent amendments stipulate the official licensing process in
India. State governments are responsible for administering this act. In Delhi, the setting for this project,
licenses are issued at nine Regional Transport Offices (RTOs). The jurisdiction of each office coincides with
the corresponding police district, and individuals can only obtain a license from their particular RTO. In
2002, the Delhi Motor Vehicle Department authorized 313,690 licenses.
To be eligible for a license, an individual must be at least 18 years of age. He or she must first obtain
a temporary license, which grants the right to practice driving under the supervision of a licensed individual.
To obtain the temporary license, proof of residence, proof of age, a passport size photo and a medical
certificate must be submitted to the RTO along with the application form. There is an application fee of Rs
360 ($8). Then, the applicant must take a color blindness test and a written exam with 20 multiple choice
questions on road signs, traffic rules, and traffic regulations. Upon passing these, the temporary license is
processed on the same day. If the applicant fails the exam, he or she can reapply after a 7-day waiting period.
After 30 days (and within 180 days) of the issuance of the temporary license, the individual may
apply for a permanent license. The applicant must submit proof of age, proof of residence, a recent passport
size photo, and his or her temporary license. The applicant must also pass a driving road test at the RTO. A
Rs 90 fee ($2) is charged for the photograph and lamination of the license. If the applicant fails the road test,
he or she can reapply after a 7-day waiting period.
5
II. Design of the First Field Experiment
In the first experiment, the IFC recruited and observed individuals through the application process of a four-
wheeler license. Survey participants were randomly allocated to one of three experimental groups. One
group was offered a bonus for getting the license as fast as is legally possible in order to create exogenous
variation in the willingness to pay for a license. The IFC offered a second group free driving lessons to
improve their driving ability. The remaining group was simply asked to obtain a license. The three main
project phases—recruitment, randomization and follow-up—are described below (see also Figure 1).
Recruitment
Recruitment began in June 2004, and continued through November 2004. Recruiting occurred on a two-
week cycle. During each cycle, recruiters intercepted individuals who were entering one of the following
four Regional Transport Offices (RTOs) in Delhi: Southwest, Northwest, South or New Delhi. The IFC gave
recruiters strict guidelines regarding the type of person to approach for the project. First, to reduce attrition,
recruiters were instructed to approach only men (in a pilot study, 60% of men remained in the project, while
100% of the women dropped out). Second, they were asked to identify individuals that had not previously
had a license, but wanted one. Finally, to comply with government regulations, only individuals over age 18
were allowed to participate.
The recruiters provided each potential participant with a short explanation of the project, offered an
information sheet outlining the time frame and payment structure for the project, and invited interested
individuals to attend an information session to learn more about the project. Over the course of each two
week cycle, the recruiters collectively spoke to about 150 potential participants.
Initial Session and Randomization
An initial survey session was held at the end of each two-week recruiting cycle, near the RTO from which
the subjects were recruited. On average, 36 individuals participated in each of the 23 sessions, for a total of
6
822 project participants (see Figure 2). Participation was restricted to individuals who had been officially
recruited and up to one of their friends.8
To begin, the survey team administered an introduction survey to each participant. The first section
of the survey collected participants’ demographic information while the second section detailed their
previous driving experiences. The third section focused on their previous experiences in obtaining
government services, and the fourth section documented their beliefs on the necessary procedures and costs
to obtain a driving license. The survey concluded with a series of questions regarding driving laws and
practices; these questions were drawn from a sample of practice test questions published by the Delhi RTO.9
After the survey, each individual was given one of three possible letters. The letters randomly
allocated him to one of three groups: a comparison group, a bonus group and a lesson group. Individuals in
the comparison group were simply asked to return for a second survey—documenting their experiences—
upon acquiring a permanent license. As an inducement to return, each subject was offered Rs 800 (roughly
$17) upon completion of the final survey.10
The IFC gave individuals in the bonus group the same set of instructions as those in the comparison
group. However, in order to generate a higher incentive for obtaining a license, the IFC also offered a bonus
of Rs 2,000 (on top of Rs 800 for completing the surveys) if the individuals could obtain their permanent
license within 32 days of obtaining their temporary license (two days over the official minimum wait time).
Rs 2,000 was chosen to ensure a large enough treatment effect. The monthly gross salary for the 380
employed individuals in our sample is Rs 5,446, and so the bonus is roughly equivalent to one-third of an
individual's monthly income. The goal of this treatment was to raise private willingness to pay rather than
alleviate credit constraints, so individuals in the bonus group were not given more cash upfront.
Finally, in addition to being given the same set of instructions as the comparison group, individuals
in the lesson group were offered free driving lessons, to be taken immediately. Accredited driving schools 8 To further limit attrition, the project team undertook several steps: first, they rejected any individual whose phone number could not be verified prior to the session; second, they required formal identification (student identification, ration card, etc); third, they turned away several individuals who were rude to surveyors during the session. 9 For example: You are driving in heavy rain. Your steering suddenly becomes very light. You should: (1) Steer towards the side of the road, (2) Brake firmly to reduce speed, (3) Apply gentle acceleration, (4) Ease off the acceleration, (5) Do not know. 10 Since all subjects received a cash payment, their behavior may not be representative of how the population as a whole would behave. This does not compromise the internal validity of the differences between treatment and control groups.
7
were hired to provide up to 15 lessons. Individuals in this group were also promised a payment of Rs 800
upon completion of the surveys.
At the end of this initial session, the project team paid all participants Rs 200 ($4.25). This was done
to help alleviate possible credit constraints in acquiring a license. This upfront payment was also made in
order to increase the credibility of the final payment. Behavioral studies of this type are not typical in India
and participants in the pilot (who did not receive this upfront payment) harbored suspicions about whether
the final payment would be made.
While the project team tried to isolate the three groups from each other, we cannot rule out the
possibility that individuals in different groups communicated with each other during this process. To
increase transparency, each of them was informed that several groups existed in the study, and that some
participants were randomly chosen to win additional payments.
Follow-up
It may take as little as 30 days or as many as 180 days to obtain a license. During this period, the project
team kept in close contact with each participant to remind them about the project and maintain the credibility
of the final payments. Extensive phone calls were made (and logged) to ensure that people understood the
instructions and payments schemes, to arrange lessons for subjects in the lesson group, and to remind
subjects in the bonus group about the bonus scheme and deadlines.
As shown in Figure 2 (and, in more detail, in Appendix Table 1), 497 (60%) individuals obtained a
temporary license. The survey team administered a phone survey to these individuals regarding the subject’s
experiences in the bureaucratic process so far: number of trips made to the RTO, breakdown of the payments
made so far, questions regarding the written exam, etc. The project team also attempted to administer a
phone survey to the 325 individuals who failed to obtain a temporary license in order to understand the
reasons why. Ninety individuals could not be contacted. Since we are unsure whether they obtained any type
of license, we exclude them from the rest of the analysis.
Upon earning a permanent license, each subject was invited to a final session. Half of the original
set of participants both obtained a final license and returned for the final survey. At this session, the survey
8
team questioned each individual on his experiences in the process, tested his driving skills, gave the final
payment and, for those in the comparison and bonus groups, offered free driving lessons.11
Under the supervision of the project team, an accredited driving school administered a surprise,
practical driving test. The exam was designed to test the skills required to obtain a license. To preserve the
integrity of the test, the test-givers were not from one of the schools that provided the instruction to the
lesson group and did not know which experimental group a given test-taker belonged to. The driving exam
consisted of two parts. First, the test-giver administered an oral exam to judge whether a subject could
operate a car.12 If a subject was unable to answer all of these questions correctly, he was deemed incapable
of taking the practical driving test and failed. If the subject adequately answered all questions, the test-giver
administered a road test. The test-giver awarded subjects a series of points for satisfactorily illustrating that
they could properly start a car, change gears, use indicators, complete turns, and park. The key feature of this
test is that it mirrors exactly what the RTO itself is supposed to be testing.
The project team offered Rs 500 to the 71 individuals who obtained a temporary license, but did not
obtain a final license, to also attend a final session. At this session, the project team administered a survey to
understand why they did not obtain a license and administered the surprise driving exam. Twenty-three
individuals attended this session (Figure 2).
For the rest of the paper, an individual is considered an attritor if he could not be tracked during the
study (90 individuals) or if he did not complete the requested final survey (65 individuals); this leaves 667
individuals. Appendix Table 2 studies the differences between attritors and non-attritors in terms of socio-
economic characteristics, driving experiences, past bribing experience and beliefs regarding procedures (as
collected in the initial survey). A few characteristics (mainly age, marital status, and having driven a 4
wheeler at one time in the past) are not balanced between attritors and non-attritors. All the empirical
specifications in this paper control for these characteristics.
11 Upon earning a permanent license, an individual is required to relinquish his temporary license back to the RTO. As proof of date, subjects in the bonus group were required to bring a photocopy of their temporary license. We cannot rule out that this “proof” might be faked, i.e. it took 40 days for the participant to obtain a license, but he paid the bureaucrat extra to make it appear as if it took 30 days. 12 This oral exam was not a test of technical terms. Instead it tested basic knowledge needed to operate a motor vehicle. For example, individuals were asked “which pedal would you use to speed up?”, “how would you start the car?” etc.
9
Survey Participants’ Characteristics
Table 1 describes the main characteristics of the 667 individuals in the study whom we were able to track and
who completed the requested final survey. Besides providing background on the average participant's
characteristics, the table also reports whether any systematic differences exist across participants in the three
experimental groups and serves as a check of the randomization design. Column 1 presents means for the
full sample, while columns 2 through 4 present means at the group-level. The stars indicate whether a given
group’s mean is significantly different from the two other groups’, after controlling for session fixed effects.
All standard errors are robust.
Panel A and B document the participants’ socioeconomic background and their past driving
experience. Individuals tend to be young (24 years of age) and many are high school or college students
(49%). Seventy-seven percent are Hindu, while 20% are Muslim; 35% have minority status (Other Backward
Castes, Scheduled Caste, or Scheduled Tribe). Many have driven a two-wheeler at least once (88%), yet
only 3% report having a two-wheeler license. Close to a quarter report having driven a four-wheeler at least
once in the past. As Delhi is India’s capital, it is unsurprising that 43% have at least one family member
(usually a parent) employed by the government.
The characteristics summarized in Panel A and B appear balanced across the three groups. There are
no significant differences across groups in age, education levels (as measured by percentage of people with
less than a primary school education), employment status, wealth (as measured by owning a home or owning
a car), income, or likelihood to have a two-wheeler license. There are some exceptions. First, individuals in
the control group are more likely to be Hindu. Second, a larger fraction of those in the bonus group and a
lower fraction of those in the control group report having driven a two-wheeler at least once in the past.
Third, a larger fraction of those in the bonus group and a smaller fraction of those in the lesson group report
having driven a four wheeler before. However, conditional on having driven a four-wheeler, there are no
systematic differences across groups in the tenure of driving a four-wheeler.
Survey participants talk openly about bribes and agent usage. First, to capture attitudes towards
bribing, the project team posed the following hypothetical scenario to individuals: “You are driving without a
10
license, and are pulled over by a policeman. The policeman offers you a choice of paying a Rs 500 fine or a
Rs 300 bribe.” Sixty-one percent of the sample indicates that they would pay the bribe, and there are no
significant differences in the propensity to bribe across the three groups (Panel C). Participants have some
distaste for paying bribes, as evidenced by the fact that when the cost of the fine relative to the bribe
increases, more individuals are willing to pay the bribe (for example, 81% of the sample stated that they
would pay the bribe if the fine was Rs 3,000 and the bribe remained Rs 300). Second, the project team
asked individuals whether they had paid a bribe at least once in the past (Panel D). Conditional on having
obtained a service, 20% of individuals paid a bribe and 21% report having hired an illegal agent to help
obtain a service (these are not mutually exclusive groups).13 There are no systematic differences in past
bribing behavior or agent usage across the three groups.
The final panel reports the participants’ beliefs regarding the process. Participants think that the
entire process will take on average 6.9 trips. As we will see, this is more trips than what it will take the
average participant in practice. There are no systematic differences in beliefs across the three groups.
In summary, while the pre-characteristics are fairly well-balanced across the three groups, there are
some systematic differences. In the analysis that follows, we directly control for those characteristics.
III. Empirical Results From First Experiment
How does this bureaucratic system respond to variation in individuals’ willingness-to-pay for a driving
license (“bonus” treatment)? How does it respond to variation in individuals’ deservingness of a driving
license (“lesson” treatment)? Before examining the experiment designed to address these questions, we first
describe some interesting facts that emerge from a simple description of outcomes and experiences for
individuals in the control group. These are reported in Table 2.
Panel A includes all individuals in the control group that could be tracked by the survey team and
completed the requested surveys, as described in Section II. Only 48 percent were able to obtain their
permanent driving license and only 15 percent were able to obtain it within 32 days of obtaining their
13 The list of services covered in the initial survey was: ration card, passport, land title, building permit, electricity, water, voter’s card, personal account number (which is equivalent to a social security number). The highest likelihood of bribe payment was with regard to ration cards, followed by land titles and building permits.
11
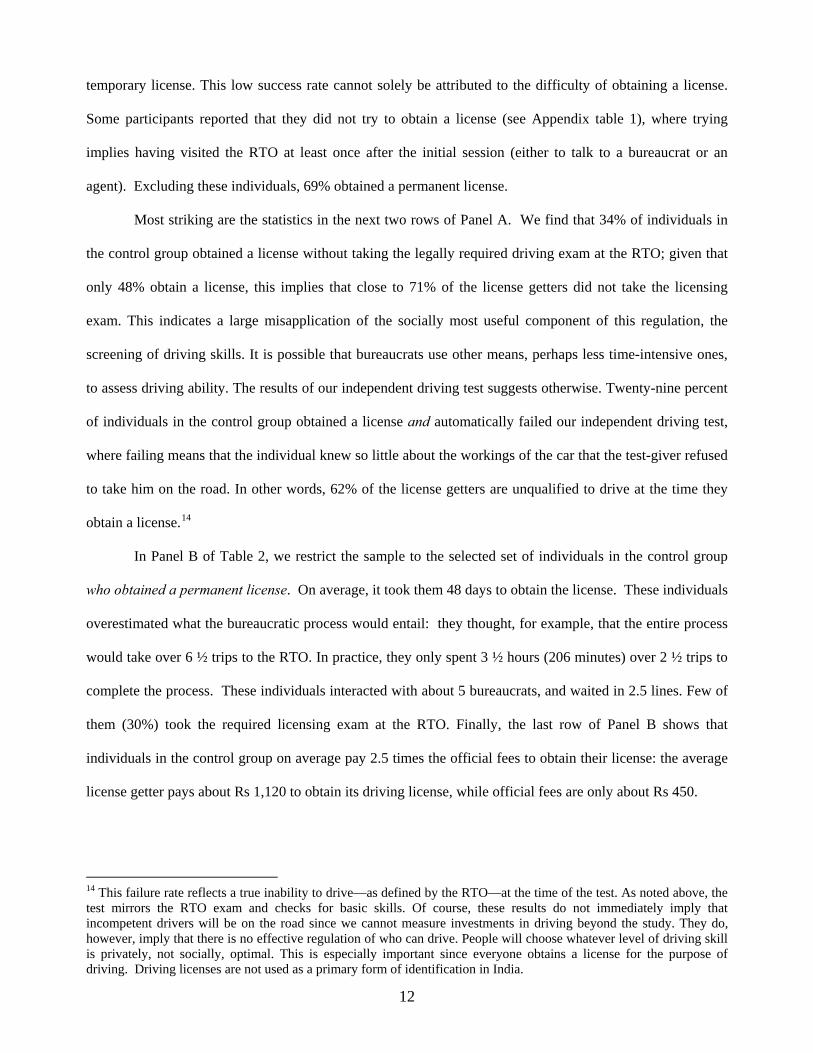
temporary license. This low success rate cannot solely be attributed to the difficulty of obtaining a license.
Some participants reported that they did not try to obtain a license (see Appendix table 1), where trying
implies having visited the RTO at least once after the initial session (either to talk to a bureaucrat or an
agent). Excluding these individuals, 69% obtained a permanent license.
Most striking are the statistics in the next two rows of Panel A. We find that 34% of individuals in
the control group obtained a license without taking the legally required driving exam at the RTO; given that
only 48% obtain a license, this implies that close to 71% of the license getters did not take the licensing
exam. This indicates a large misapplication of the socially most useful component of this regulation, the
screening of driving skills. It is possible that bureaucrats use other means, perhaps less time-intensive ones,
to assess driving ability. The results of our independent driving test suggests otherwise. Twenty-nine percent
of individuals in the control group obtained a license and automatically failed our independent driving test,
where failing means that the individual knew so little about the workings of the car that the test-giver refused
to take him on the road. In other words, 62% of the license getters are unqualified to drive at the time they
obtain a license.14
In Panel B of Table 2, we restrict the sample to the selected set of individuals in the control group
who obtained a permanent license. On average, it took them 48 days to obtain the license. These individuals
overestimated what the bureaucratic process would entail: they thought, for example, that the entire process
would take over 6 ½ trips to the RTO. In practice, they only spent 3 ½ hours (206 minutes) over 2 ½ trips to
complete the process. These individuals interacted with about 5 bureaucrats, and waited in 2.5 lines. Few of
them (30%) took the required licensing exam at the RTO. Finally, the last row of Panel B shows that
individuals in the control group on average pay 2.5 times the official fees to obtain their license: the average
license getter pays about Rs 1,120 to obtain its driving license, while official fees are only about Rs 450.
14 This failure rate reflects a true inability to drive—as defined by the RTO—at the time of the test. As noted above, the test mirrors the RTO exam and checks for basic skills. Of course, these results do not immediately imply that incompetent drivers will be on the road since we cannot measure investments in driving beyond the study. They do, however, imply that there is no effective regulation of who can drive. People will choose whatever level of driving skill is privately, not socially, optimal. This is especially important since everyone obtains a license for the purpose of driving. Driving licenses are not used as a primary form of identification in India.
12
In summary, the experience of the control group shows distortions in the system, with many
individuals obtaining a license without being screened for driving ability and many paying well above
official fees. However, this evidence does not tell us about the causal forces that generate these outcomes for
the control group. Do these distortions result from bureaucrats sacrificing social benefits in order to cater to
individuals’ private willingness to pay? Do these distortions imply that this system does not respond to social
considerations (e.g. ability to drive)? The experimental results shed light on these questions.
Experimental Results
Our main experimental results are presented in Tables 3 and 4. Each column reports, for the dependent
variable listed in that column, the coefficient estimates on dummy variables for “bonus” and “lesson” groups
from a regression of the form:
Outcomei=β0 + β1Bonus i+ β2Lesson i+ β3Session i +β4X i+ ei
Indicator variables for the initial session the individual attended (Sessioni) are included to absorb the
unobserved heterogeneity in the procedural outcome across the initial sessions. This is important for two
reasons. First, the IFC ended the study three months after the last initial session. Thus, individuals who
attended the first session in July 2004 had more time to obtain a license than those who attended the last
session in November 2004. Second, because we recruited geographically for each session, all individuals at a
given initial session were required to obtain a license from the same RTO. Controlling for initial session
fixed effects therefore also nets out any differences in procedures across RTOs. Demographic variables—
age, marital status, religion fixed effects, a dummy variable for having driven a four-wheeler prior to the
experiment, and a dummy variable for having driven a two-wheeler prior to the experiment —are used to
control for differences in pre-experimental characteristics and differential attrition in the main sample (see
Table 1 and Appendix Table 2).15 Robust standard errors are reported in parentheses under each estimated
coefficient. Below the coefficient estimates, we list the F-statistic and p-value for the joint significance of β1
15 The results do not differ significantly if we control for the additional socioeconomic variables from the Introduction Survey.
13
and β2. For ease of interpretation, we also report the mean of the dependent variable for the comparison
group in the first row of each column.
Table 3 focuses on experimental outcomes related to whether or not a given individual obtained a
license; Table 4 considers payment and process-related outcomes. For ease of exposition, within each table,
we first discuss our findings regarding the “bonus” group and subsequently move to our findings regarding
the “lesson” group.
Obtaining a License: The Bonus Group
The first outcome we consider in Table 3 is whether or not a given individual was able to obtain a license.
“Obtained license” is a dummy variable that equals 1 if a given individual obtained a permanent driving
license, and 0 otherwise. We can define this variable for two different samples of the data. In Column 1, the
sample consists of the 731 individuals for whom we know whether or not they obtained a final license (i.e.
the 90 individuals who could not be tracked were dropped).16 Column 2 presents the same analysis, where
we additionally drop the 65 individuals who indicated their final licensing status to the project team over the
phone, but refused to attend the final session to take the survey and driving exam. The sample in column 2
will be used for the analysis of all other experimental outcomes in Table 3 as the only information we have
about these 65 individuals is whether or not they obtained a license. We obtain similar results in the two
samples. Specifically, column 1 shows that individuals in the bonus group are 24 percentage points more
likely to obtain a final license, a difference that is significant at the 1% level; this difference is 25 percentage
points and also significant at the 1% level in the sample of people who completed all the requested surveys
(column 2).17
16 In the bonus group, the individuals we could not track were more likely to be students and to have known how to drive for a longer period of time (conditional on knowing how to drive), relative to the control group. In the lesson group, the individuals we could not track were more likely to be older, married, employed and know someone in the government, relative to the control group. 17 Since the bonus group has a lower attrition rate (4.4%) than the control (13.4%), one wonders whether selective attrition by the control could generate an apparent difference in success rates even if none existed. This would happen if the drop-outs from the control group are disproportionately license getters. To quantify the magnitude of this concern, assume conservatively that the license-getting rate amongst those we cannot track in the control group is the same as the license getting rate among those we can track in the bonus group. Then, assume further that none of those we cannot
14
We also consider in column 3 a dummy variable that equals 1 if the individual was able to obtain his
permanent license within 32 days of obtaining his temporary license (the maximum amount of time allowed
to receive the financial bonus), 0 otherwise; we assign a value of 0 for this variable for those individuals who
did not obtain a permanent license. Column 3 shows that individuals in the bonus group are 42 percentage
points more likely to get their permanent license within 32 days or less. Hence, these first findings suggest
that this system is responsive to private needs, in that individuals who have a greater need to get a license
quickly are able to achieve their objective.
Our next findings show that this increased propensity to get a license comes at a social cost: more
bad drivers. The dependent variable in column 4 is a dummy variable that equals 1 if the individual obtained
a driving license without taking the legally required RTO driving exam, 0 otherwise. As one can see in
column 4, increasing the willingness to pay for a driving license not only increases the number of people who
manage to obtain a license, it also increases the number of people who manage to obtain a license without
taking the legally required RTO exam. Columns 5 to 8 of Table 3 show that this lack of testing is
accompanied by an increase in the number of licensed drivers with poor driving skills. Columns 5 and 6
consider inputs into learning how to drive. We find that individuals in the bonus group are 29 percentage
points more likely to obtain a license without having anyone teach them how to drive (column 5) and are not
more likely to have attended a driving school (column 6). They are also much worse drivers than the control:
they are 18 percentage points more likely to be licensed drivers who automatically fail the independent
driving test (column 7); they are 22 percentage points more likely to be licensed drivers who score below
average on the independent test (column 8).18 The interesting finding here is not that the marginal person
trying to get a license is of low quality: it is that the bureaucracy allows them to get a license despite their
low quality. In this regard, it is useful to benchmark how bad the marginal driver actually is. The failure rate
track in the bonus group obtained a license. This would imply a license getting rate of 48% in the control group, compared to a license getting rate of 65% in the bonus group. This suggests that the attrition is not quantitatively large enough to affect this result. 18 The score is comprised of the individuals’ score on the 5 oral questions and on 23 aspects of driving. Thus, the highest possible score is 28.
15

on the independent exam is .60 (.29/.48; see Table 2) amongst the licensed drivers in the control group, while
it is .75 (=.18/.25) amongst the marginally new licensed drivers in the bonus group.
In summary, the evidence reported so far in Table 3 suggests a bureaucratic system where a higher
willingness to pay for a license translates not only in an increase in the number of license getters (a socially
efficient component of the bureaucratic response), but also an increase in the number of license getters that
do not know how to drive (a socially inefficient component of the bureaucratic response).
Obtaining a License: The Lesson Group
The motivation for including a “lesson treatment” in our experimental design is to test whether the
bureaucrats are responsive to the main social consideration in the allocation of licenses: one’s ability to drive.
Under an extreme view of a corrupt bureaucracy, one might expect the allocation of licenses to be driven
only by willingness to pay. This is not the case. Our findings in the first two columns of Table 3 suggest that
randomly helping individuals acquire better driving skills increases the number of license getters among
these individuals. Specifically, columns 1 and 2 show that individuals in the lesson group are between 12 and
15 percentage points more likely than the control group to obtain a permanent license.
These findings are however difficult to interpret because we cannot rule out the possibility that
offering free driving lessons to these individuals altered their willingness to pay for a license. There is a sunk
cost argument, where trying harder to get a license becomes a justification for the time spent learning how to
drive. Moreover, it could also be that having learned how to drive raises the private value of getting a license
since it can now be used. In support of these points, we found that individuals in the lesson group were about
12 percentage points more likely to “try” to obtain a license compared to the control group.19
The remaining columns of Table 3 show that individuals in the lesson group are not more likely than
the comparison group to obtain a license without taking the exam (column 4). Thus, while the lesson group
has more license getters, it does not have more untested license getters. This suggests that models in which
19 In comparison, we found that individuals in the bonus group were about 19 percentage points more likely to “try” than individuals in the control group.
16

bureaucrats test a fixed fraction of license getters do not fit the data. Instead, it appears that whether one is
tested depends on both willingness to pay for license and driving skills. The lesson group is also more likely
to obtain their license while having had someone taught them how to drive (column 5) and especially also
having attended a driving school (column 6). These findings are, of course, unsurprising given the nature of
the treatment for this group. More generally, 60% of the individuals in the lesson group who obtained a
license took the free driving lessons; also, conditional on take-up, they attended 12 classes on average.
Columns 7 and 8 suggest that these classes did turn these individuals into better drivers.20 For example,
column 8 shows that individuals in the lesson group are 22 percentage points less likely to have obtained a
license and also automatically failed our independent driving test.21
In summary, giving a random subset of individuals access to driving lessons did raise their driving
skills and also increased the likelihood that they obtained a driving license. While this is consistent with the
view that bureaucrats do not completely ignore driving ability in the allocation of licenses, this conclusion is
somewhat tempered by the fact that giving free access to driving lessons also raised individuals’ likelihood
of trying to get a license, and might thus also have increased their private need for a license.
Payments and Process
Our findings so far show distortions in the application of this regulation, and that the magnitudes of these
distortions respond to the private willingness to pay for a license. This leads us to question whether
bureaucrats receive bribes from misapplying the rules. In Table 4, we study a set of experimental outcomes
related to licensing payments and the process of obtaining a license. In all regressions, the sample is the set
of individuals who could be tracked by the survey team and completed the requested surveys.
Payments and Process: The Bonus Group
20 Could this be the result of “teaching to the test”? Could the lesson group not be better drivers but merely have been better taught how to take the driving test? The nature of the test, as noted before, makes this an unlikely possibility. Given that general skills are tested, the test likely provides a good approximation of what constitutes a good driver. 21 We also tested driving ability among the set of participants that had only obtained a temporary license, but agreed to come back for a final survey. As expected, even in that group, driving ability was higher in the lesson group than in the control and bonus groups. Only 26% of the lesson group automatically failed the test, compared to 40% and 50% in the control and bonus groups, respectively.
17
The dependent variable in column 1 of Table 4 is the amount paid by an individual above the official fees in
the process of obtaining a license.22 The mean of this variable in the control group is Rs 338, indicating that
the control group already incurs substantial payments above the official fees. Column 1 shows that the bonus
group makes more of these extra-legal payments.
In columns 2 through 5, we study the exact nature of these extra payments. While our intuition ex-
ante was that these extra payments were direct bribes paid to bureaucrats, column 2 shows that this intuition
was wrong. The dependent variable in column 2 is a dummy variable that equals 1 if an individual reported
offering to bribe any bureaucrat or being asked for a bribe, 0 otherwise. First, one can see that the mean of
this variable in the control group is low, with only 5 percent of individuals in that group having tried to bribe
or having been asked for a bribe; this implies that bribes to bureaucrats were only used by 11% of the license
getters in the control group. More importantly, we do not find a significant (neither economically nor
statistically) increase in the use of bribes in the bonus group.
What are these extra payments? Columns 3 to 5 show that most of these payments are payments to
agents. Agents are professionals who, for a fee, help individuals through the process of obtaining various
services.23 While illegal, agents are a common institution in India. We find that about 40 percent of
individuals in the control group hired an agent at some point in the process of getting a license (column 3).
Nearly as many hired an agent and also obtained a license (column 4), indicating that hiring an agent pretty
much guarantees obtaining a license. As column 5 shows, the average payment to agents by individuals in
the control group (Rs 313) is about the same as the total average payment above official fees (Rs 338,
column 1); in other words, payments to agents are the bulk of the non-official fees paid in the process of
getting a license.
Individuals in the bonus group report being about 20 percentage points more likely to use an agent
(columns 3 and 4) and spend about Rs 142 more on agent fees (column 5) than the control group; hence,
22 Individuals were asked to break down their expenditures for the license. If an individual did not separate their official and non-official costs, the formal fees of Rs 450 were subtracted from their fees. Note that information on informal fees paid was collected even if the individual did not obtain a license. 23 The existence of agents has been documented before. Rosenn (1984) describes the role of facilitators ("despachantes") in obtaining various public services in Brazil. Fisman, Moustakerski, and Wei (2005) find agents in the arena of international trade in Hong Kong.
18
most of the bonus group’s additional payments are agent fees. One conjecture that emerges from the bonus
group’s experiences is that agents are the channels of corruption in this bureaucratic system, and not simply
the providers of standard “agency” services (such as standing in line for people). This conjecture is based on
the fact that a positive shock to the willingness to pay for a license increases both the number of people that
pay for an agent (Table 4) as well as the number of people that obtain a license despite being unqualified to
drive (Table 3). However, further evidence will clearly be needed to strengthen this conjecture.
Payments and Process: The Lesson Group
The findings in Table 4 suggest that the lesson group does not differ much from the control group when it
comes to average extra-payments in the process of getting a license or reliance on agents. In a model where
the extra-legal payments were routine payments made by all individuals, one would have expected the lesson
group, which gets the license at a higher rate, to also pay more. The fact that they do not pay more suggests
that the informal payments are part of an alternative mechanism for acquiring a license. The fact that the
lesson group, which knows how to drive, relies less on this alternative mechanism, suggests that this
mechanism is used more by those who are attempting to circumvent the driving test.
The same insight is true with regard to agent usage: it is interesting that the lesson group is not more
likely to use an agent, despite getting more licenses. Specifically, about 35 percent of the individuals in the
lesson group hired an agent, compared to 39 percent in the control group (this difference is not statistically
significant); the average payment above official fees paid to agents is virtually identical in the control group
and in the lesson group.
One should also importantly note, though, that many individuals in the lesson group continue to use
agents and hence make extra-legal payments. One interpretation is that not everyone in the lesson group
knows how to drive. Another interpretation is that the agent route might be attractive even for able drivers,
possibly because of the many hassles associated with getting a license without an agent. The last column of
Table 4 gives some credence to the second interpretation. We use as a dependent variable a dummy that
equals 1 if an individual obtained a license but also had to make more than 3 trips in the process of getting
that license. This variable may proxy for the hassle in getting a license; indeed, a smooth process through the
19

RTO would imply exactly 3 visits to the RTO office: one visit to obtain the necessary forms, one visit to
obtain a temporary license, and a final visit to take the licensing exam. Needing more than 3 visits implies
that either the individual had to go back to pick up additional documents or had to go back to take an
additional exam. We find that individuals in the lesson group are more likely to make more than 3 trips to the
RTO to obtain their license. In other words, it is possible that the formal route involves extra-legal hurdles so
that even some of those who know how to drive may choose to hire agents. We return to this possibility in
the next section.
IV. The Process of Getting a License: Agents and Red Tape
Our experimental findings regarding the bonus group are consistent with a bureaucratic system that shows
both “good flexibility” (ability for people that want a license fast to get it) and “bad flexibility” (ability for
people that want a license fast to get it without knowing how to drive). However, we cannot conclude that
corruption plays a role in these findings because there is virtually no direct bribing, even among the bonus
group. The large extra-payments are made to agents. This requires further understanding of the role of agents
and their relationship to the bureaucrats. This is what we do in the first part of this section, combining non-
experimental descriptive analyses, new experimental data from an audit study, and anecdotal evidence from
interviews. In the second part, we investigate further the possibility that even good drivers may decide to hire
agents because of the hurdles, or “red tape,” bureaucrats are imposing on those individuals who attempt to
complete the licensing process without an agent.
Agents: Non-Experimental Analysis
Individuals in the bonus group are about 20 percentage points more likely to use an agent at some point in
the process of obtaining a driving license. However, agent usage is not limited to the bonus group. In fact,
more than 70% of the participants who obtained a license hired an agent. From the initial survey, we learned
that agent usage is quite prevalent in the procurement of many government services in India. For example,
of the 155 participants who obtained a ration card, 54% reported being helped by an agent. Similarly, 47%
of the 47 individuals who obtained a land title, 15% of the 104 who obtained a passport, and 20% of the 58
20
who obtained a personal account number reported hiring an agent. For driving licenses, it was quite easy for
participants to find an agent. The survey data indicate that agents approached 86% of the participants who
eventually obtained a license and that, on average, individuals were approached by 2.7 agents.
Our experimental evidence has shown that the higher usage of agents in the bonus group went hand-
in-hand with a higher number of licenses being issued to individuals that had not taken the legally required
driving exam at the RTO and did not pass our independent driving test. We conjectured that these patterns
were a symptom of agents being the providers of corruption services, since no other extra-legal payments
were made by individuals in the bonus group. We now more systematically examine processes and
outcomes for agent users versus non-agent users in the control group. Specifically, we report the means of a
set of outcome and process-related variables for individuals in the control group that obtained a license
without using an agent, and the difference in means for those who obtained a license using an agent. The
results are reported in Table 5.
We find that hiring an agent is associated with a much shorter process. Those that did not use an
agent spent on average 306 minutes at the RTO, took more than 3 trips to the RTO and spoke with close to 8
bureaucrats (columns 5, 2, and 3, respectively). Agent users spent 130 minutes less time at the RTO, took
one fewer trip, and spoke to only 4 bureaucrats.
Hiring an agent is also very strongly related to the level of testing at the RTO. While 94% of those
who did not hire an agent took the legally required RTO practical test at least once, only 12% of those who
hired an agent took that test (column 6). This is consistent with the hypothesis that hiring an agent is the main
channel through which bad drivers can end up with a license, but it is also theoretically possible that only the
best drivers, for which testing would be inessential, hire agents. This hypothesis is rejected in columns 8 and
9 of Table 5. Individuals who hire an agent to get their license are about 38 percentage points more likely to
fail the surprise driving test.
As we had already learned from our experimental results in Table 4, fees paid to agents are pretty
much the only source of excess payments in this bureaucratic process. Specifically, in column 7, we
compare the average expenditures to obtain a license for those that hired agents and those that did not. For
21
those without agents, the total expenditures were Rs 580. In contrast, those hiring an agent paid about Rs 720
more to obtain their license.
In summary, the correlation analysis suggests that the role of agents in this process appears to be
more than simply “standing in line” for their client. Instead, there is a strong correlation between using an
agent and being able to skip the legally required driving exam; there is also very strong correlation between
using an agent and having unsafe drivers obtain licenses.24 This reinforces our experimental results in Tables
3 and 4. However, the evidence in Table 5 is purely correlational. In the next subsection, we move to some
new experimental evidence that rules out a non-causal interpretation of these correlations.
Agents: Experimental Evidence
In January 2006, the IFC performed an audit study of agents involved in the provision of driving licenses in
Delhi. Trained actors were sent to agents under different scripted pretexts. The actor would record whether
the agent said a license could be obtained under this pretext and if so, at what price. The actors were college-
aged, Hindu men. They were of similar height and weight, and wore similar clothes. In total, 6 actors had
224 interactions with agents. Appendix A offers more details on the audit design.
Each day, the actors were randomly given one of six scripted pretexts. In the main script of interest,
actors stated that they wanted to get a license but did not know how to drive and did not have the time to
learn how to drive (“Cannot Drive Script”). The five other scripts (in addition to the “Cannot Drive” script)
were as follows. First, the actor had to learn what the agent could do for him if he had all the right paperwork
and could drive (comparison group). We also focused on what would happen if the actors were missing
either residential proof or age proof, two of the required documents to obtain a license. Another script
focused on what would happen if the agent could not come back to the RTO to obtain a license. Finally, the
last script focused on what would happen if the actor needed a license in less than 30 days, in other words
less than the officially required time between the temporary license and the final license.
24 The New Delhi RTO illustrates the correlation between agents and ability to obtain a license. This RTO is situated near the main Federal Buildings. As such, the government has made a special attempt to remove agents from this area, and bureaucrats are more heavily monitored. We find both a lower rate of agent usage, a lower rate of license getting, and a higher quality of driving skills among those who received their license at the New Delhi RTO. All results in this paper are robust to the exclusion of the New Delhi RTO.
22
After each visit, the actors were asked to fill out a survey describing their experiences with each
agent. A series of questions on the work practices of the agents and their relationship with the RTO
bureaucrats were also included in that survey. The actors were trained to bring up as many of these questions
as possible in casual conversation with the agents (see Appendix A for details).
The results of the audit study are reported in Table 6. The dependent variable in columns 1 and 2 is
a dummy variable that equals 1 if the agent says he can procure a license to the actor in a given interaction, 0
otherwise. Column 1 corresponds to a single regression of this “agent can procure license” dummy on the
various pretext dummies; reported in each cell is the estimated coefficient on the pretext in that row, with
robust standard errors in parentheses. In column 2, we replicate the regression in column 1 but further control
for actor fixed effects, to net out possible differences across actors in their ability to obtain the service.
Columns 3 and 4 follow the same structure as columns 1 and 2, respectively, but focus on the final price
quoted by the agent if the agent was able to procure the service.
Several interesting findings emerge. To start, the prices quoted by the agents were of similar
magnitude to those in the survey data discussed before (see Table 5). Second, our finding regarding the
“Cannot Drive” script confirms the relationship between agent usage and ability to get a license despite
lacking driving skills. Agents saw no problem in helping actors who stated they did not know how to drive
and did not have time to learn how to drive. One hundred percent of actors that approached an agent with a
“cannot drive” pretext were told that the agents could help them in getting their license. This confirms that
the correlation between agent usage and poor driving ability observed in Table 5 does not simply reflect an
omitted third factor. In addition, in cases where the actors manage to ask a few additional questions to the
agents in “casual conversation,” the agents openly said that they could get the actor out of the formal driving
exam at the RTO. Strikingly, the prices quoted under that script were not statistically different from those
quoted to the comparison group.
The remaining rows of Table 6 indicate that there are other services that agents can provide even
though these services also imply a deviation from the formal legal requirements. However, not all such
services are as easy to provide for the agents as getting a license to someone that cannot drive. For example,
only 50% of agents reported that they could procure a license if the actor lacked residential proof (row 3) and
23

80% if the actor lacked age proof (row 4). Also, in the cases of missing residential proof or age proof, the
prices quoted by the agents conditional on being able to help were statistically significantly larger than in the
comparison group. However, only 5% of agents could procure a license if the actor stated that he could not
come back to hand in forms and take the picture at the RTO (row 5). Finally, only 9% of agents said they
could assist someone that needed a license in less than the official minimum time, and conditional on being
to assist, quoted a much higher price for rendering this service.
How can we explain these findings? Why is assisting someone in getting a driving license despite
not knowing how to drive easier than assisting someone with some missing pieces of paperwork? One
conjecture is that verifiability is an important determinant of which rules can be bent.25 While it might be
easy for the bureaucrat’s superiors to cross-check whether a valid proof of age and proof of residence were
submitted by a license candidate, and to monitor the dates at which these documents were submitted, it is
harder to cross-check whether the candidate took a road test and how well he did on it. Under this view, the
audit study suggests that the social inefficiency results would generalize most readily to other contexts where
the socially useful part of the regulation is non-verifiable by the bureaucrats’ principals. At the same time,
the audit findings lead to many more questions. First, is it possible that even verifiable elements of a
regulation could be overcome through collusion between the principals and the bureaucrats? While we do
not have a direct measure of the extent of collusion between the bureaucrats and higher-up officials, the audit
results suggest that there was not complete collusion in this particular setting. Second, would bureaucrats
still ignore the non-verifiable, but socially useful parts of regulation if the costs to society of breaking the
rules were much higher? Our first experiment suggests that bureaucrats may not entirely ignore social
considerations, and therefore, this is possible.
Red Tape
25 Reinikka and Svensson (2005) illustrate this in the context of Uganda, where a newspaper campaign aimed at reducing corruption in schools by providing parents with information to monitor local officials was highly successful.
24
Even the better drivers in our study rely infrequently on the formal channel, which is associated with
virtually no extra-legal payments. What are the hurdles faced in this channel? The non-experimental data
provide some clues.
In particular, our data allow us to examine bureaucrats’ behavior when it comes to deciding whether
someone has passed or failed the official driving test. Consider an individual entering the RTO and being
asked to take the test. What affects the likelihood that this individual will succeed and be awarded a license?
One clear determinant of success ought to be that individual’s driving ability. However, bureaucrats may
strategically manipulate the passing rule in order to extract higher bribe payments, e.g. forcing more
individuals to go through an agent to obtain their license. At the extreme, bureaucrats may fail all test takers
independently of how well they perform on the test, thereby forcing them to pay extra to obtain their license.
The fact that a fraction of the participants in our study did manage to obtain their license without hiring an
agent already indicates that such extreme behavior is not taking place. However, the bureaucrats may still be
able to manipulate the passing rule in a way that might discourage even some of the good drivers from
attempting to get their license without an agent. This is the possibility we consider in Table 7.
In order to test this “red tape” hypothesis, we would ideally like to randomly send to the RTO
individuals with better and worse driving ability, get them to take the RTO driving test, and see how their
driving ability affects their success in getting a license. Unfortunately, we do not have such a controlled
experiment here and will have to rely on more selected samples. The evidence in Table 7 should, therefore,
be interpreted with much more caution than the previous experimental findings in this paper.
Given the apparent ability of agents to circumvent the exam (Tables 5 and 6), we focus on all
participants who begin the process without an agent and actually take the exam at least once. This is the
closest our data allow us to get to the hypothetical set of individuals described above. For this set of
individuals, we can define a “success” variable that equals 1 if the individual managed to obtain a license
without ending up hiring an agent and without taking the RTO exam twice. This roughly corresponds to
individuals that went to the RTO, took the test and successfully got their license. Of course, our objective is
to contrast performance on that test based on driving ability. We consider two approaches to identify
heterogeneity in driving ability in the selected sample of interest. First, we can rely on the result of our
25
independent driving test and contrast the mean of this “success” variable for individuals that automatically
failed the independent exam and those that passed that exam (Panel A of Table 7). Alternatively, we can go
back to our 3 experimental groups and compare mean “success” for these selected sets of individuals, relying
on the fact that individuals in the lesson group are better drivers due to the free lessons they were offered
(Panel B).
“Success,” as defined above, does not appear to systematically vary with driving ability. Looking at
the 133 individuals who started the process without an agent and took at least one exam at the RTO (Column
1), we find a (statistically insignificant) higher success rate among those individuals that we found to be
unqualified to drive (74% compared to 62%). The same surprising patterns hold when we contrast among
those individuals across the three groups (Panel B).
With the caveat of a clearly selected sample, this evidence is consistent with the idea that bureaucrats
may introduce additional randomness in the application process, or additional “red tape,” for individuals who
use the formal channel, maybe to induce them to use agents. Interestingly, about 25% of those who started
the process at the RTO by taking the driving test eventually resorted to hiring an agent to obtain their license
(Column 2). Similarly, statistics computed in the full sample of license getters also suggest that many of the
license getters who used an agent did not start the process with an agent, but eventually switched to hiring
one. Column 3 of Table 7 reports the fraction of license getters who used an agent from the start, while
column 4 reports the fraction of license getters who ended up using an agent. Worse drivers (“failed exam”
group; row 2) and drivers in a hurry (bonus group; row 4) are more likely to have used agents from the start.
But interestingly, all drivers (good and bad) who start without an agent are likely to end with one. For
example, we find that while only about 35% of the individuals in the control group who obtained a license
started the process with an agent, 78% of these individuals used an agent in the end.
V. Interpretation
To summarize, there are two main tracks to procuring a driving license in Delhi. The formal track involves
directly applying through the RTO and no bribing. Some of our results, however, suggest that this track
might be fraught with extra-legal hurdles: amongst those who get tested at the RTO, passage of the exam is
26
unrelated to ex post measured ability to drive. The informal channel, on the other hand, is operated by agents,
who account for nearly all the extra-legal payments in our sample. These agents not only help to secure a
license—which they do at nearly a 100% success rate—they also help to circumvent the testing requirement
at no extra cost.
This bureaucratic system responds to private needs, but at a social cost. The bonus group gets
licenses by paying extra-legal fees when using agents and not taking the driving test, resulting in unqualified
(yet licensed) drivers. The system does respond to social needs as well. The lesson group gets more licenses
without paying more as they rely more on the formal channel, where they get tested but possibly also face
extra-legal hurdles. The result is a system that fails to regulate the quality of drivers and forces many
individuals to make extra-legal payments to acquire a license.
While this system is clearly dysfunctional, should we think of it as corruption? A dominant
alternative interpretation is one we call the “overloaded bureaucrat” model. Under this interpretation, the
RTO is unable to test all drivers due to lack of resources. Instead, it only tests sporadically and many people
slip through the cracks, hence the high rates of bad drivers with licenses. At the same time, the under-
staffing also leads to long lines, confusion and complexity. This generates a demand for agents who provide
legal time-saving services, such as waiting in lines and help navigating a confusing system.
What this interpretation fails to fully explain is the apparent ability of agents to bend certain
legislated rules. Specifically, if agents are simply offering time-saving devices, why does the audit study
reveal that they can so easily bypass the RTO exam (in fact, at no extra cost)? In fact, the cross-sectional data
in the first experiment suggests a strong relationship between agent usage and test-taking at the RTO. In
other words, while an “overloaded bureaucrat” model with “normal” agency services could explain the
sporadic testing, it struggles to explain the sharp difference in testing between agent users and non-users.
This suggests that the dysfunctional system is not from lack of resources alone. Instead, some form
of bureaucratic misbehavior is needed. There are two plausible forms of misbehavior. The first is what we
call corruption, where the bureaucrats receive bribes (from agents) in order to both speed up the process, but
also skip the test (or ignore the test results). The other form of misbehavior could be lack of effort. Instead of
enjoying monetary benefits, the “lazy” bureaucrat could be enjoying non-monetary private benefits by
27
simply not making an effort to test individuals. In this world, agents have knowledge of when to go to the
RTO and who to approach at the RTO to both speed up the process and avoid testing (e.g. knowledge of who
the rubber-stamping bureaucrats are).
These two explanations are clearly hard to disentangle without direct data on bribing. With this in
mind, we attempted to collect more qualitative data from both bureaucrats and agents. First, and as already
indicated above, actors involved in the audit study were instructed to engage whenever possible into casual
conversations with the agents. When this happened, the agents openly discussed the need for bribing
bureaucrats. Of the 208 actor-agent interactions where the actor was able to engage in casual conversation,
the agents stated that they would need to pay bribes to the RTO in 81% of the cases. Second, though it is
normally difficult to talk to bureaucrats about these issues, the IFC research assistants managed to informally
interview 3 officials in Delhi and one in Chennai. The bureaucrats stated that the agents made payments to
them. They described weekly to bi-weekly meetings with agents. At these meetings, the agents paid a fixed
fee for each of the agents’ clients the bureaucrat granted a license. The bureaucrats also indicated that the fee
does not vary much based on the individual’s driving ability. These interviews also reinforced the audit
findings that some rules can be broken and some cannot. When asked which rules he could break, one
bureaucrat stated that it was easy to get around the rule that everyone must be tested for driving; however, he
stated that he could not easily get around the residency rule, since the copy of the residency requirement was
checked by at least two superiors.
Beyond these qualitative interviews, our main finding in Table 7 also raises doubts about the “lazy
bureaucrat” interpretation. Once a person is being tested, the additional “effort” required to appropriately
administer the test is minimal. The bureaucrat is already sitting in the car, and even a small amount of
attention to the test-taker would allow far greater differentiation of good and bad drivers than we are finding
in Table 7. Thus, while the lazy bureaucrat view could explain the low testing rates, it is harder to
understand under this explanation why the testing that does take place is so poor.
Finally, the prices charged by agents can also be informative since the agent sector appears quite
competitive. During the audit, we found at least six agents at each RTO to secure a price from, each vying
for business. Their prices should therefore be somewhat commensurate with their input costs. Our data
28
suggest that an agent saves about two hours of time for the applicants. Assuming agents’ opportunity cost of
time is about Rs 40 per hour, this would suggest that the marginal cost of assisting an individual in getting a
license is only about Rs 80. This is an order of magnitude less than the average agent fee we observe in our
data, which is about Rs 700.
As a whole, these qualitative and quantitative considerations lead us to favor a view in which at least
some of the failures of this system are generated by corrupt bureaucrats working in collaboration with agents.
VI. Conclusion
Corruption in this study appears to undercut the very rationale for regulation: keeping bad drivers from
getting licenses. Agents appear to play a key role in the informal channel, as intermediaries between
bureaucrats and applicants. The agent system allows bureaucrats to avoid direct bribery, and the bureaucrats
may apply arbitrary failures on the driving exam to entice individuals to use agents. One interpretation of the
audit results is that the verifiability of a particular regulatory requirement determines the ease with which
corruption can overcome it. This suggests that the social inefficiency results would generalize most readily
to other contexts where the socially useful part of the regulation is non-verifiable by the bureaucrats’
principals.
The study illustrates two main points for future research in the corruption literature. First, greater
efforts to collect micro data are needed to penetrate the black box of corruption. Had we ran a survey
simply asking individuals who had obtained a license whether they paid bribes, we may have concluded that
there was no corruption in this bureaucratic system. Instead, the detailed questions on payments and the
process of obtaining a license allowed us to isolate the central role agents play in this system. Second, this
industrial organization of corruption (e.g. around the agent system) is intriguing and has been largely ignored
by the theoretical literature. How do agents manage to develop their contacts with the bureaucrats? How do
bureaucrats maintain their relationship with agents? Why is the provision of agents apparently so plentiful,
rather than having their numbers be restricted? Does the agent system limit the ability of the bureaucrat to
more finely price discriminate between time-rushed and non-rushed individuals, as seems to be the case
here? These are some of the questions we plan to explore in future work.
29
References Acemoglu, Daron and Thierry Verdier (2000). “The Choice Between Market Failures and Corruption,” American Economic Review, 90 pp.194-211. Banerjee, Abhijit (1997). “A Theory of Misgovernance,” Quarterly Journal of Economics, 112, pp. 1289-1332. Di Tella, Rafael and Ernesto Schargrodsky (2003). “The Role of Wages and Auditing During a Crackdown on Corruption in the City of Buenos Aires,” Journal of Law and Economics, 46. Djankov, Simeon, Rafael La Porta, Florencio Lopez-de-Silanes, and Andrei Shleifer (2002). “The Regulation of Entry,” Quarterly Journal of Economics, 117(1), 1-37. Fisman, Ray and Shang-jin Wei (2004), “Tax Rates and Tax Evasion: Evidence from ‘Missing’ Imports in China,” Journal of Political Economy. Fisman, Ray, Peter Moustakerski, and Shang-jin We (2005), “Off-shoring Tax Evasion: Evidence from Hong Kong as Entrepôt Trader,” Mimeo. Huntington, S.P. (1968). “Modernization and Corruption.” Political Order in Changing Societies, (New Haven: Yale University Press), 59-71. Reprinted in A. Heidenheimer, M.Johnston and V. LeVine, Political Corruption - A Handbook, (New Brunswick: Transaction Publishers), 1989. Klitgaard, Robert (1991). “Gifts and Bribes,” in Richard Zeckhauser, ed., Strategy and Choice, MIT Press, Cambridge, MA. Leff, N.H. (1964). “Economic Development Through Bureaucratic Corruption.” American Behavioral Scientist, VIII (3), 8-14. Reprinted in A. Heidenheimer, M. Johnston and V. LeVine, Political Corruption - A Handbook, (New Brunswick: Transaction Publishers), 1989. Lui, Francis (1985). “An Equilibrium Queuing Model of Bribery,” Journal of Political Economy, 93, pp. 760-781. Mauro, Paolo (1995). “Corruption and Growth,” Quarterly Journal of Economics, 110(3), 681-712. Myrdal, Gunnar (1968). Asian Drama. Vol. II., (New York: Random House). Olken, Benjamin (2005). “Monitoring Corruption: Evidence from a Field Experiment in Indonesia,” mimeo, MIT. Reinikka, Ritva and Jakob Svensson (2005). “Fighting Corruption to Improve Schooling: Evidence from a Newspaper Campaign in Uganda,” Journal of the European Economic Association, 3(2-3), 259-267. Rose-Ackerman, Susan (1978). Corruption: A Study in Political Economy. New York: Academic Press. Rosenn, Keith (1984). “Brazil’s Legal Culture: The Jeito Revisited,” Florida International Law Journal, 1(1), 1-43.
30
Shleifer, Andrei and Robert Vishny (1992). “Pervasive Shortages under Socialism,” Rand Journal of Economics, 23(2), 237-246. Shleifer, Andrei and Robert Vishny (1993). “Corruption,” Quarterly Journal of Economics, 108(3), 599-617. Svensson, Jakob (2003). “Who Must Pay Bribes and How Much? Evidence from a Cross Section of Firms,” Quarterly Journal of Economics, 118(1), 207-230. Svensson, Jakob (2005). “Eight Questions about Corruption,” Journal of Economic Perspectives, 19(3), 19-42. Tirole, Jean (1992). “Collusion and the theory of organizations.” In J.-J. Laffont (ed.), Advances in Economic Theory. Sixth World Congress. Cambridge University Press. Wade, R. (1982). “The System of Administrative and Political Corruption: Canal Irrigation in South India.” Journal of Development Studies, 18(3):287–327.
31
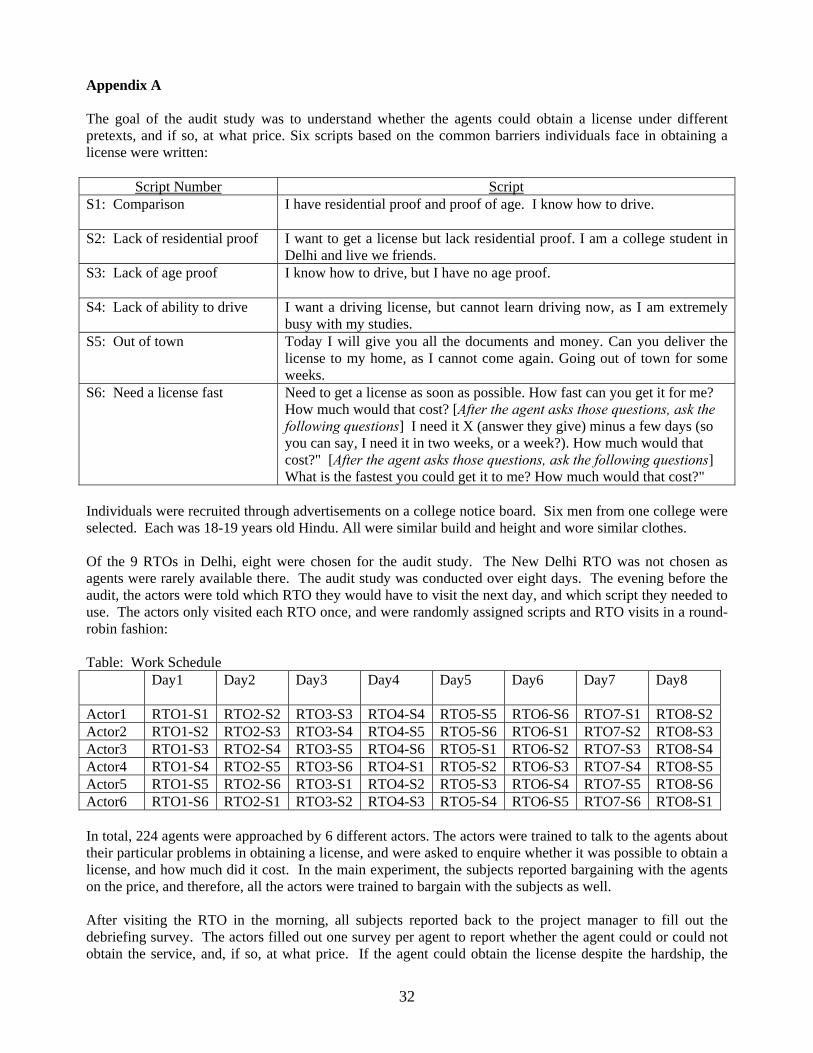
Appendix A The goal of the audit study was to understand whether the agents could obtain a license under different pretexts, and if so, at what price. Six scripts based on the common barriers individuals face in obtaining a license were written:
Script Number ScriptS1: Comparison
I have residential proof and proof of age. I know how to drive.
S2: Lack of residential proof
I want to get a license but lack residential proof. I am a college student in Delhi and live we friends.
S3: Lack of age proof
I know how to drive, but I have no age proof.
S4: Lack of ability to drive
I want a driving license, but cannot learn driving now, as I am extremely busy with my studies.
S5: Out of town Today I will give you all the documents and money. Can you deliver the license to my home, as I cannot come again. Going out of town for some weeks.
S6: Need a license fast
Need to get a license as soon as possible. How fast can you get it for me? How much would that cost? [After the agent asks those questions, ask the following questions] I need it X (answer they give) minus a few days (so you can say, I need it in two weeks, or a week?). How much would that cost?" [After the agent asks those questions, ask the following questions] What is the fastest you could get it to me? How much would that cost?"
Individuals were recruited through advertisements on a college notice board. Six men from one college were selected. Each was 18-19 years old Hindu. All were similar build and height and wore similar clothes. Of the 9 RTOs in Delhi, eight were chosen for the audit study. The New Delhi RTO was not chosen as agents were rarely available there. The audit study was conducted over eight days. The evening before the audit, the actors were told which RTO they would have to visit the next day, and which script they needed to use. The actors only visited each RTO once, and were randomly assigned scripts and RTO visits in a round-robin fashion: Table: Work Schedule
Day1 Day2 Day3 Day4 Day5 Day6 Day7 Day8
Actor1 RTO1-S1 RTO2-S2 RTO3-S3 RTO4-S4 RTO5-S5 RTO6-S6 RTO7-S1 RTO8-S2 Actor2 RTO1-S2 RTO2-S3 RTO3-S4 RTO4-S5 RTO5-S6 RTO6-S1 RTO7-S2 RTO8-S3 Actor3 RTO1-S3 RTO2-S4 RTO3-S5 RTO4-S6 RTO5-S1 RTO6-S2 RTO7-S3 RTO8-S4 Actor4 RTO1-S4 RTO2-S5 RTO3-S6 RTO4-S1 RTO5-S2 RTO6-S3 RTO7-S4 RTO8-S5 Actor5 RTO1-S5 RTO2-S6 RTO3-S1 RTO4-S2 RTO5-S3 RTO6-S4 RTO7-S5 RTO8-S6 Actor6 RTO1-S6 RTO2-S1 RTO3-S2 RTO4-S3 RTO5-S4 RTO6-S5 RTO7-S6 RTO8-S1 In total, 224 agents were approached by 6 different actors. The actors were trained to talk to the agents about their particular problems in obtaining a license, and were asked to enquire whether it was possible to obtain a license, and how much did it cost. In the main experiment, the subjects reported bargaining with the agents on the price, and therefore, all the actors were trained to bargain with the subjects as well. After visiting the RTO in the morning, all subjects reported back to the project manager to fill out the debriefing survey. The actors filled out one survey per agent to report whether the agent could or could not obtain the service, and, if so, at what price. If the agent could obtain the license despite the hardship, the
32
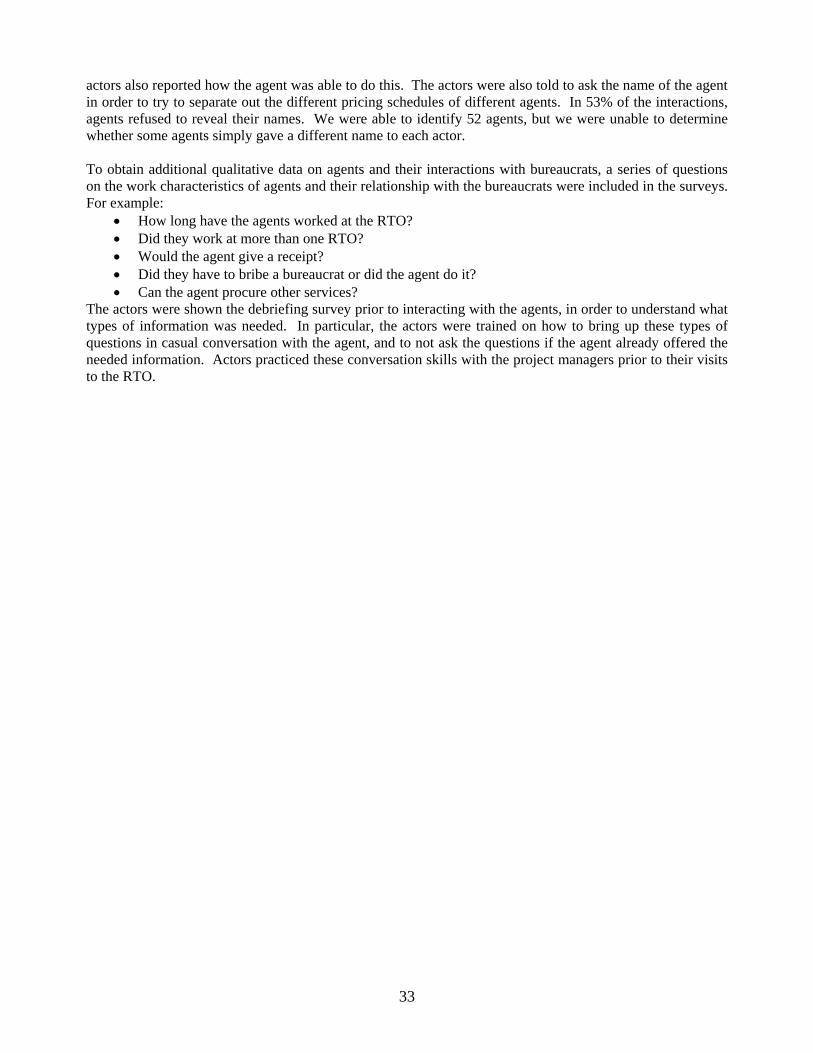
actors also reported how the agent was able to do this. The actors were also told to ask the name of the agent in order to try to separate out the different pricing schedules of different agents. In 53% of the interactions, agents refused to reveal their names. We were able to identify 52 agents, but we were unable to determine whether some agents simply gave a different name to each actor. To obtain additional qualitative data on agents and their interactions with bureaucrats, a series of questions on the work characteristics of agents and their relationship with the bureaucrats were included in the surveys. For example:
• How long have the agents worked at the RTO? • Did they work at more than one RTO? • Would the agent give a receipt? • Did they have to bribe a bureaucrat or did the agent do it? • Can the agent procure other services?
The actors were shown the debriefing survey prior to interacting with the agents, in order to understand what types of information was needed. In particular, the actors were trained on how to bring up these types of questions in casual conversation with the agent, and to not ask the questions if the agent already offered the needed information. Actors practiced these conversation skills with the project managers prior to their visits to the RTO.
33
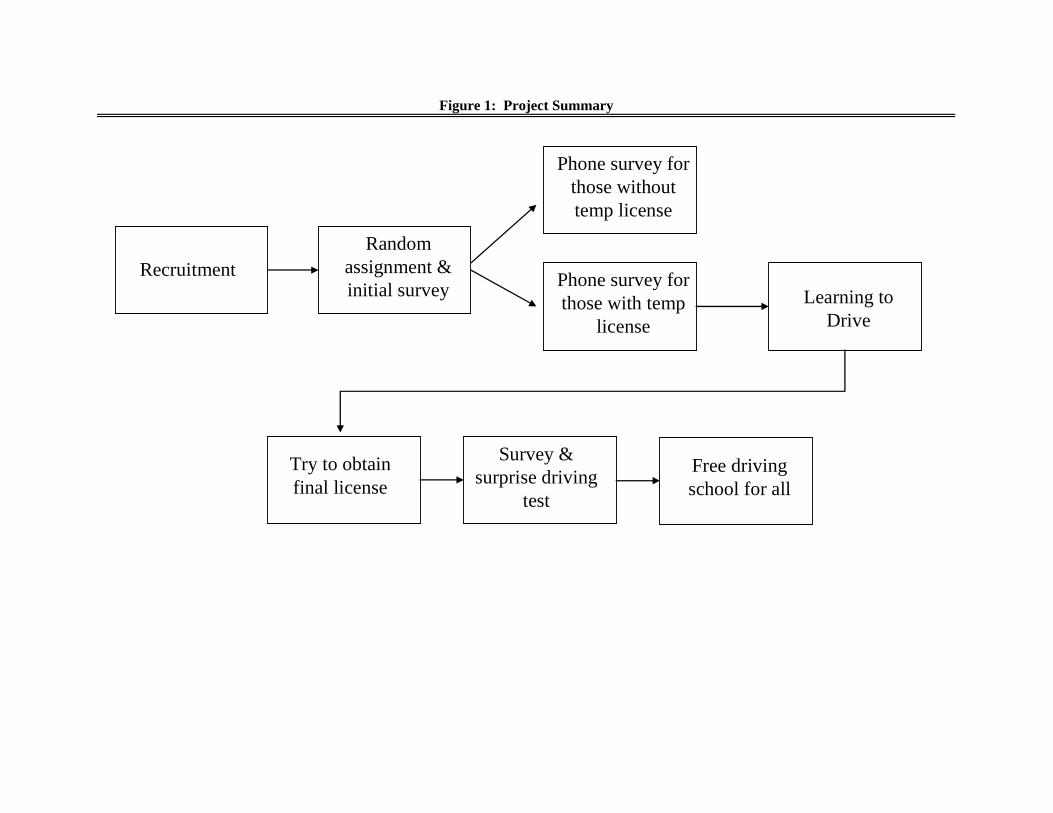
Figure 1: Project Summary
RecruitmentRandom
assignment &initial survey Learning to
Drive
Try to obtain final license
Survey & surprise driving
test
Free driving school for all
Phone survey for those without temp license
Phone survey for those with temp
license
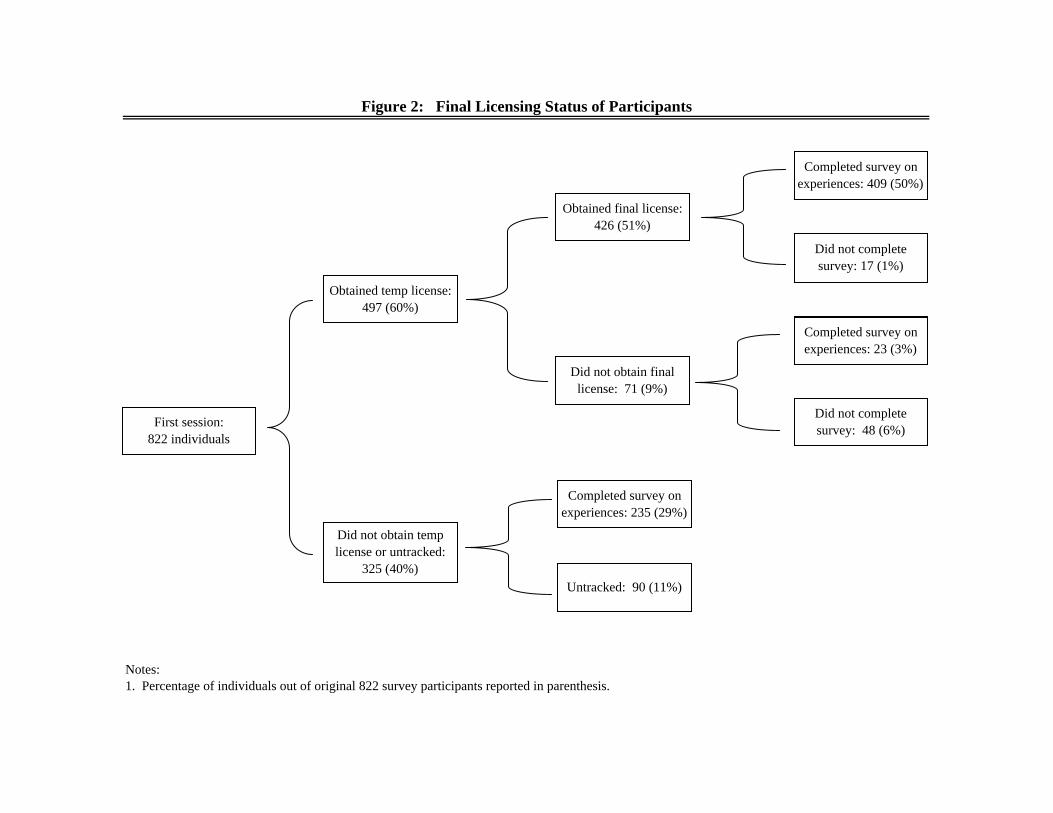
Notes: 1. Percentage of individuals out of original 822 survey participants reported in parenthesis.
Figure 2: Final Licensing Status of Participants
Completed survey on experiences: 409 (50%)
Did not complete survey: 48 (6%)
Completed survey on experiences: 235 (29%)
Untracked: 90 (11%)
Obtained final license: 426 (51%)
Did not obtain final license: 71 (9%)
Obtained temp license: 497 (60%)
Did not obtain temp license or untracked:
325 (40%)
First session:822 individuals
Completed survey on experiences: 23 (3%)
Did not complete survey: 17 (1%)
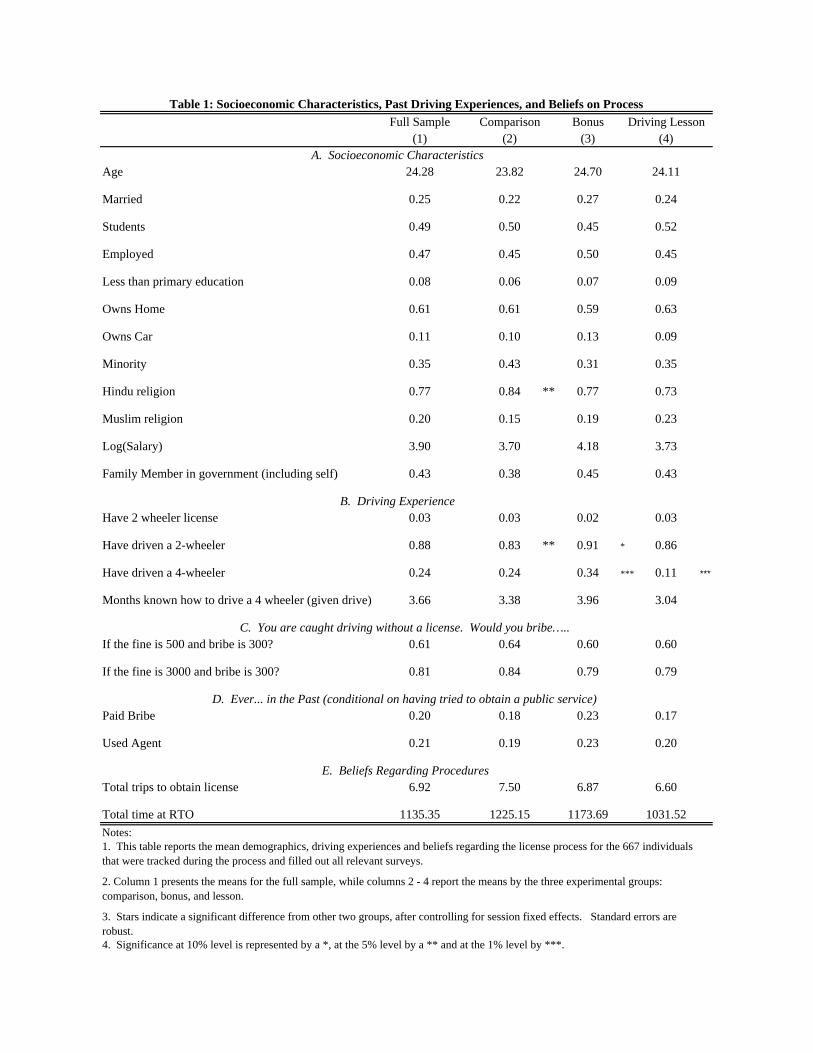
Full Sample Comparison Bonus Driving Lesson(1) (2) (3) (4)
Age 24.28 23.82 24.70 24.11
Married 0.25 0.22 0.27 0.24
Students 0.49 0.50 0.45 0.52
Employed 0.47 0.45 0.50 0.45
Less than primary education 0.08 0.06 0.07 0.09
Owns Home 0.61 0.61 0.59 0.63
Owns Car 0.11 0.10 0.13 0.09
Minority 0.35 0.43 0.31 0.35
Hindu religion 0.77 0.84 ** 0.77 0.73
Muslim religion 0.20 0.15 0.19 0.23
Log(Salary) 3.90 3.70 4.18 3.73
Family Member in government (including self) 0.43 0.38 0.45 0.43
Have 2 wheeler license 0.03 0.03 0.02 0.03
Have driven a 2-wheeler 0.88 0.83 ** 0.91 * 0.86
Have driven a 4-wheeler 0.24 0.24 0.34 *** 0.11 ***
Months known how to drive a 4 wheeler (given drive) 3.66 3.38 3.96 3.04
If the fine is 500 and bribe is 300? 0.61 0.64 0.60 0.60
If the fine is 3000 and bribe is 300? 0.81 0.84 0.79 0.79
Paid Bribe 0.20 0.18 0.23 0.17
Used Agent 0.21 0.19 0.23 0.20
Total trips to obtain license 6.92 7.50 6.87 6.60
Total time at RTO 1135.35 1225.15 1173.69 1031.52
Table 1: Socioeconomic Characteristics, Past Driving Experiences, and Beliefs on Process
A. Socioeconomic Characteristics
B. Driving Experience
C. You are caught driving without a license. Would you bribe…..
2. Column 1 presents the means for the full sample, while columns 2 - 4 report the means by the three experimental groups: comparison, bonus, and lesson.
3. Stars indicate a significant difference from other two groups, after controlling for session fixed effects. Standard errors are robust.4. Significance at 10% level is represented by a *, at the 5% level by a ** and at the 1% level by ***.
D. Ever... in the Past (conditional on having tried to obtain a public service)
E. Beliefs Regarding Procedures
Notes: 1. This table reports the mean demographics, driving experiences and beliefs regarding the license process for the 667 individuals that were tracked during the process and filled out all relevant surveys.
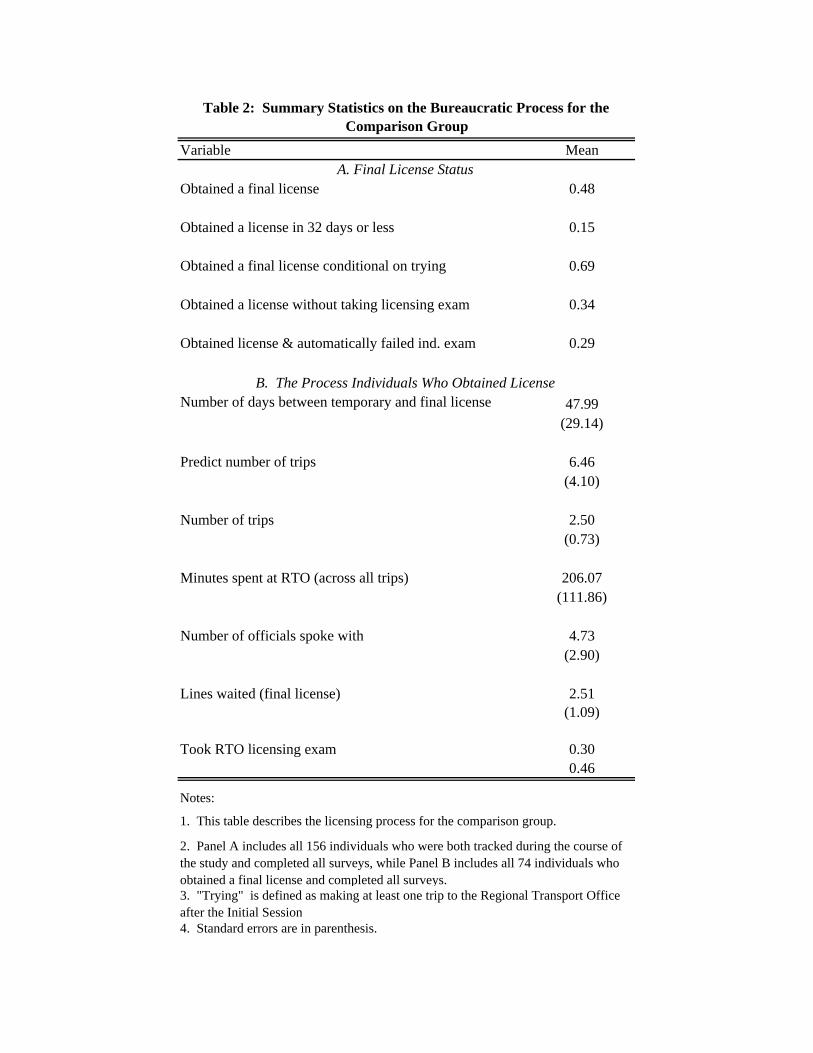
Variable Mean
Obtained a final license 0.48
Obtained a license in 32 days or less 0.15
Obtained a final license conditional on trying 0.69
Obtained a license without taking licensing exam 0.34
Obtained license & automatically failed ind. exam 0.29
Number of days between temporary and final license 47.99(29.14)
Predict number of trips 6.46(4.10)
Number of trips 2.50(0.73)
Minutes spent at RTO (across all trips) 206.07(111.86)
Number of officials spoke with 4.73(2.90)
Lines waited (final license) 2.51(1.09)
Took RTO licensing exam 0.300.46
Table 2: Summary Statistics on the Bureaucratic Process for the Comparison Group
A. Final License Status
B. The Process Individuals Who Obtained License
Notes:
1. This table describes the licensing process for the comparison group.
2. Panel A includes all 156 individuals who were both tracked during the course of the study and completed all surveys, while Panel B includes all 74 individuals who obtained a final license and completed all surveys.
4. Standard errors are in parenthesis.
3. "Trying" is defined as making at least one trip to the Regional Transport Office after the Initial Session
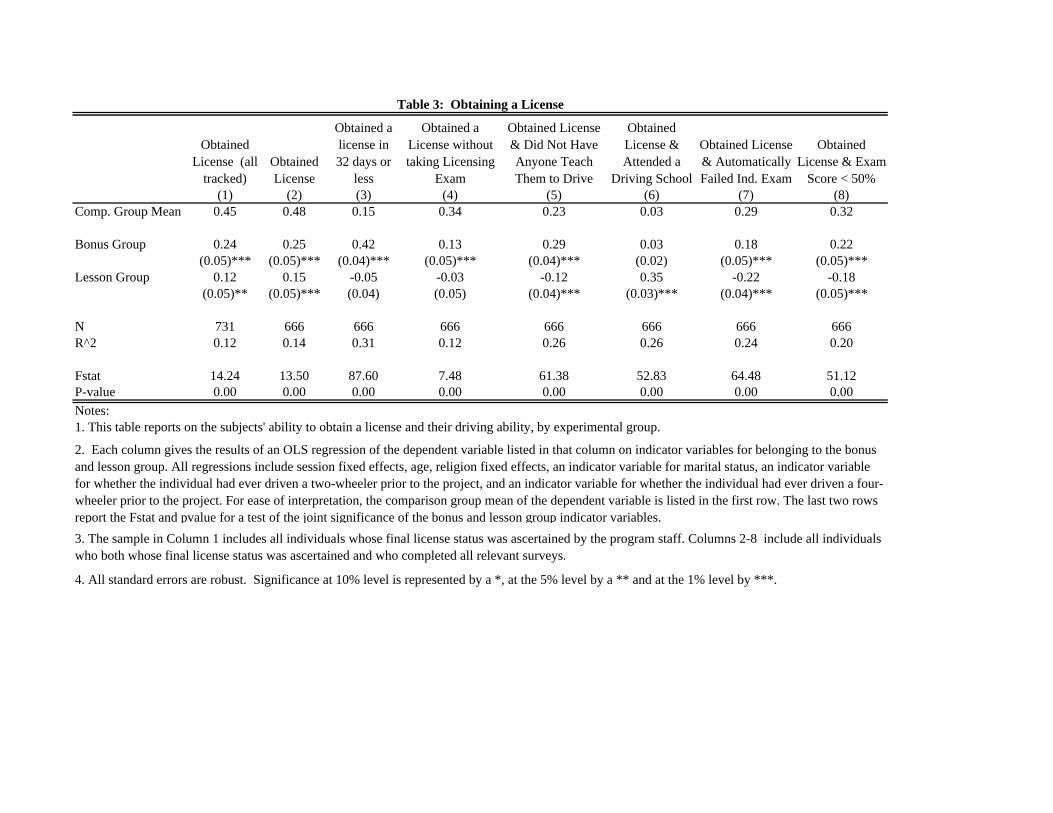
Obtained License (all
tracked)Obtained License
Obtained a license in 32 days or
less
Obtained a License without taking Licensing
Exam
Obtained License & Did Not Have Anyone Teach Them to Drive
Obtained License & Attended a
Driving School
Obtained License & Automatically Failed Ind. Exam
Obtained License & Exam
Score < 50%(1) (2) (3) (4) (5) (6) (7) (8)
Comp. Group Mean 0.45 0.48 0.15 0.34 0.23 0.03 0.29 0.32
Bonus Group 0.24 0.25 0.42 0.13 0.29 0.03 0.18 0.22(0.05)*** (0.05)*** (0.04)*** (0.05)*** (0.04)*** (0.02) (0.05)*** (0.05)***
Lesson Group 0.12 0.15 -0.05 -0.03 -0.12 0.35 -0.22 -0.18(0.05)** (0.05)*** (0.04) (0.05) (0.04)*** (0.03)*** (0.04)*** (0.05)***
N 731 666 666 666 666 666 666 666R^2 0.12 0.14 0.31 0.12 0.26 0.26 0.24 0.20
Fstat 14.24 13.50 87.60 7.48 61.38 52.83 64.48 51.12P-value 0.00 0.00 0.00 0.00 0.00 0.00 0.00 0.00Notes:1. This table reports on the subjects' ability to obtain a license and their driving ability, by experimental group.
4. All standard errors are robust. Significance at 10% level is represented by a *, at the 5% level by a ** and at the 1% level by ***.
Table 3: Obtaining a License
2. Each column gives the results of an OLS regression of the dependent variable listed in that column on indicator variables for belonging to the bonus and lesson group. All regressions include session fixed effects, age, religion fixed effects, an indicator variable for marital status, an indicator variable for whether the individual had ever driven a two-wheeler prior to the project, and an indicator variable for whether the individual had ever driven a four-wheeler prior to the project. For ease of interpretation, the comparison group mean of the dependent variable is listed in the first row. The last two rows report the Fstat and pvalue for a test of the joint significance of the bonus and lesson group indicator variables.3. The sample in Column 1 includes all individuals whose final license status was ascertained by the program staff. Columns 2-8 include all individuals who both whose final license status was ascertained and who completed all relevant surveys.
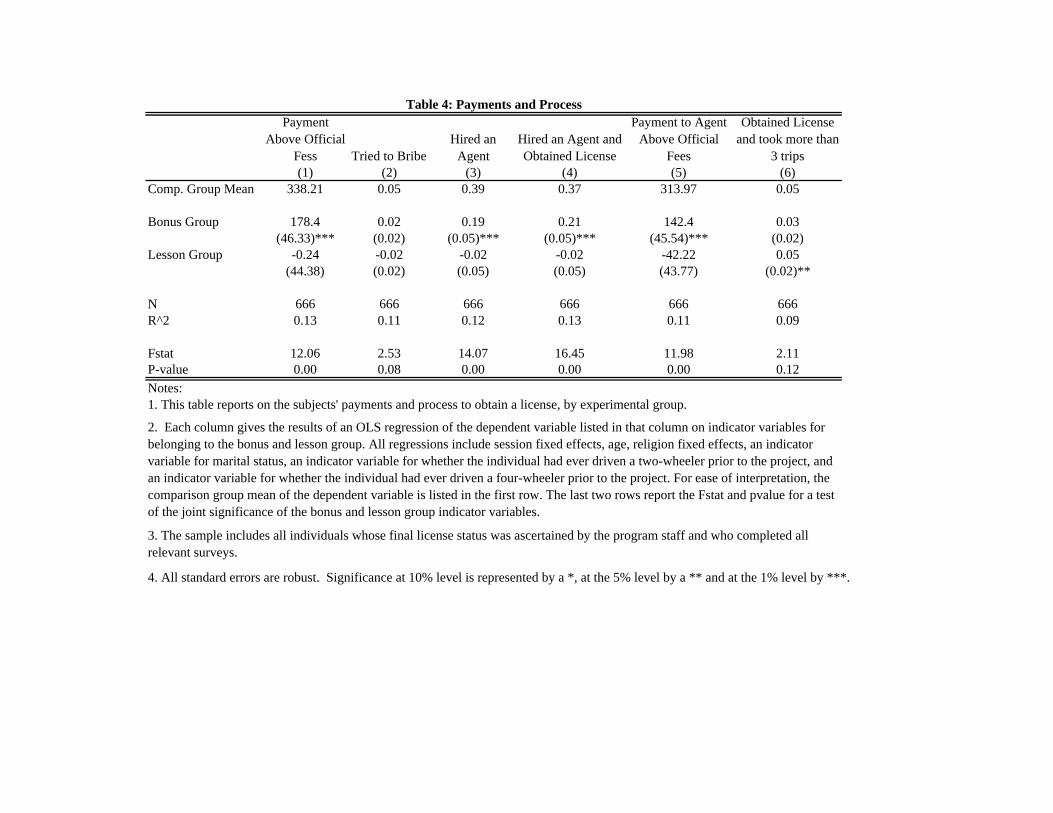
Payment Above Official
Fess Tried to BribeHired an
AgentHired an Agent and Obtained License
Payment to Agent Above Official
Fees
Obtained License and took more than
3 trips(1) (2) (3) (4) (5) (6)
Comp. Group Mean 338.21 0.05 0.39 0.37 313.97 0.05
Bonus Group 178.4 0.02 0.19 0.21 142.4 0.03(46.33)*** (0.02) (0.05)*** (0.05)*** (45.54)*** (0.02)
Lesson Group -0.24 -0.02 -0.02 -0.02 -42.22 0.05(44.38) (0.02) (0.05) (0.05) (43.77) (0.02)**
N 666 666 666 666 666 666R^2 0.13 0.11 0.12 0.13 0.11 0.09
Fstat 12.06 2.53 14.07 16.45 11.98 2.11P-value 0.00 0.08 0.00 0.00 0.00 0.12Notes:1. This table reports on the subjects' payments and process to obtain a license, by experimental group.
4. All standard errors are robust. Significance at 10% level is represented by a *, at the 5% level by a ** and at the 1% level by ***.
Table 4: Payments and Process
2. Each column gives the results of an OLS regression of the dependent variable listed in that column on indicator variables for belonging to the bonus and lesson group. All regressions include session fixed effects, age, religion fixed effects, an indicator variable for marital status, an indicator variable for whether the individual had ever driven a two-wheeler prior to the project, and an indicator variable for whether the individual had ever driven a four-wheeler prior to the project. For ease of interpretation, the comparison group mean of the dependent variable is listed in the first row. The last two rows report the Fstat and pvalue for a test of the joint significance of the bonus and lesson group indicator variables.
3. The sample includes all individuals whose final license status was ascertained by the program staff and who completed all relevant surveys.
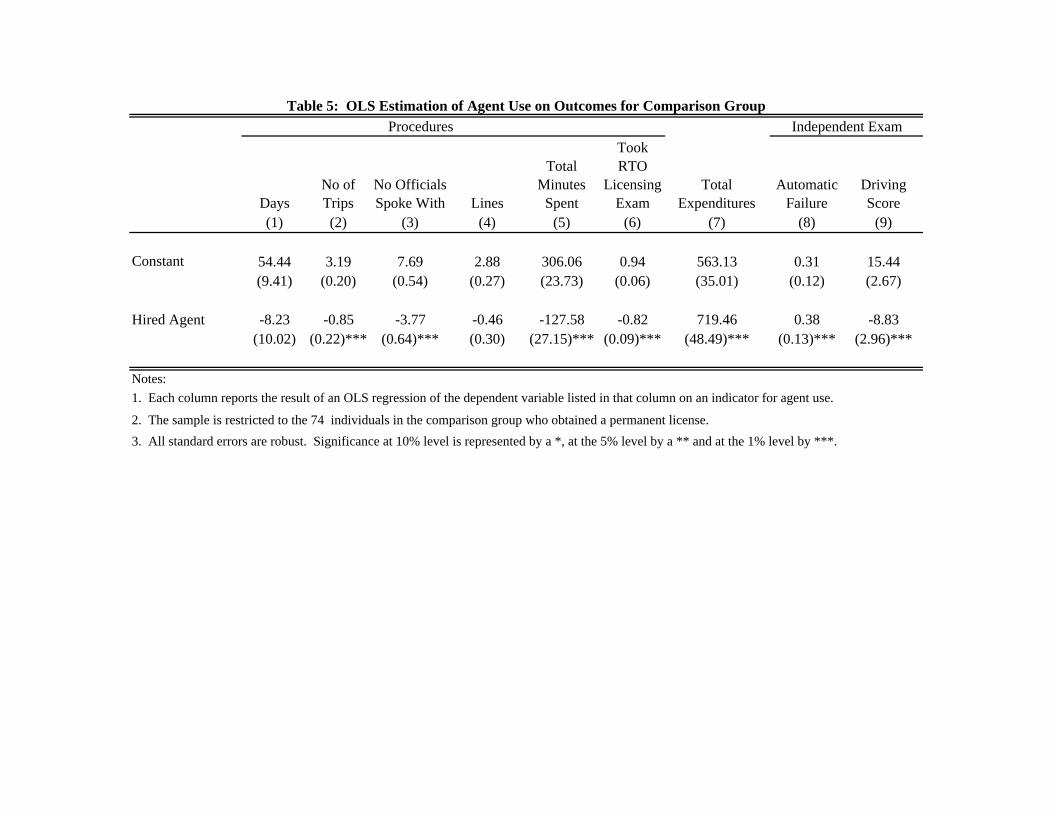
DaysNo of Trips
No Officials Spoke With Lines
Total Minutes
Spent
Took RTO
Licensing Exam
Total Expenditures
Automatic Failure
Driving Score
(1) (2) (3) (4) (5) (6) (7) (8) (9)
Constant 54.44 3.19 7.69 2.88 306.06 0.94 563.13 0.31 15.44(9.41) (0.20) (0.54) (0.27) (23.73) (0.06) (35.01) (0.12) (2.67)
Hired Agent -8.23 -0.85 -3.77 -0.46 -127.58 -0.82 719.46 0.38 -8.83(10.02) (0.22)*** (0.64)*** (0.30) (27.15)*** (0.09)*** (48.49)*** (0.13)*** (2.96)***
1. Each column reports the result of an OLS regression of the dependent variable listed in that column on an indicator for agent use.
2. The sample is restricted to the 74 individuals in the comparison group who obtained a permanent license.3. All standard errors are robust. Significance at 10% level is represented by a *, at the 5% level by a ** and at the 1% level by ***.
Table 5: OLS Estimation of Agent Use on Outcomes for Comparison GroupProcedures Independent Exam
Notes:
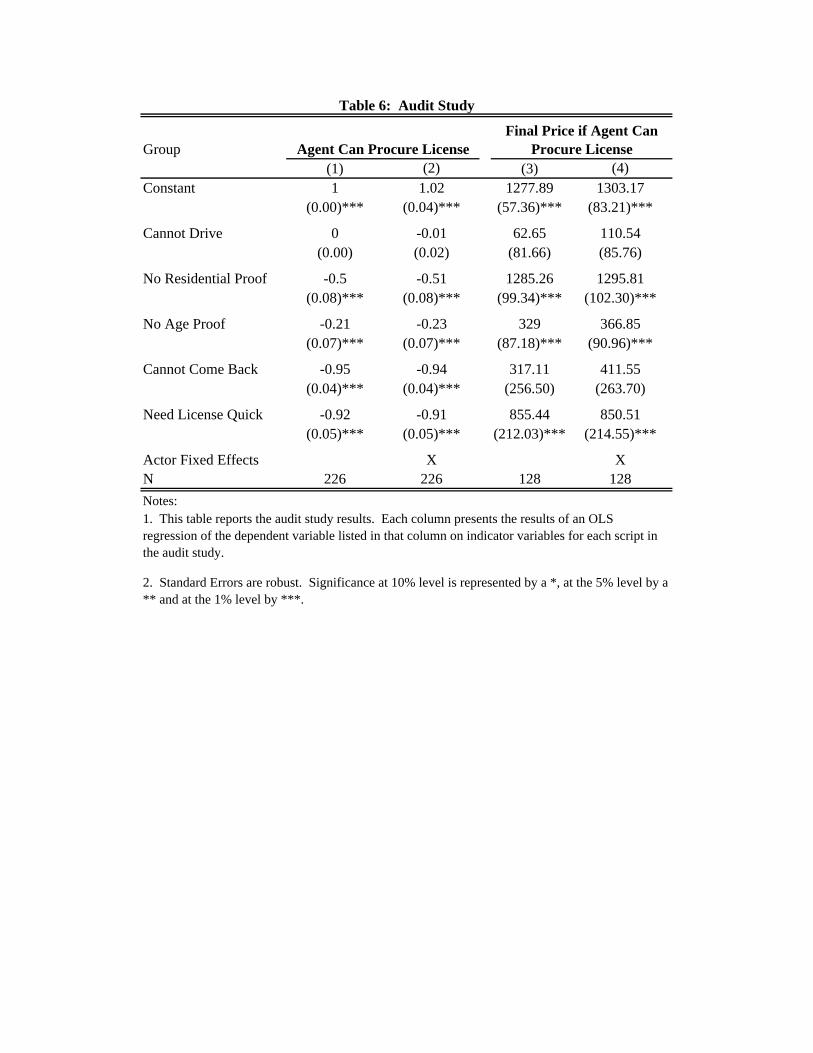
Group(1) (2) (3) (4)
Constant 1 1.02 1277.89 1303.17(0.00)*** (0.04)*** (57.36)*** (83.21)***
Cannot Drive 0 -0.01 62.65 110.54(0.00) (0.02) (81.66) (85.76)
No Residential Proof -0.5 -0.51 1285.26 1295.81(0.08)*** (0.08)*** (99.34)*** (102.30)***
No Age Proof -0.21 -0.23 329 366.85(0.07)*** (0.07)*** (87.18)*** (90.96)***
Cannot Come Back -0.95 -0.94 317.11 411.55(0.04)*** (0.04)*** (256.50) (263.70)
Need License Quick -0.92 -0.91 855.44 850.51(0.05)*** (0.05)*** (212.03)*** (214.55)***
Actor Fixed Effects X XN 226 226 128 128Notes:
2. Standard Errors are robust. Significance at 10% level is represented by a *, at the 5% level by a ** and at the 1% level by ***.
1. This table reports the audit study results. Each column presents the results of an OLS regression of the dependent variable listed in that column on indicator variables for each script in the audit study.
Agent Can Procure License
Table 6: Audit Study
Final Price if Agent Can Procure License
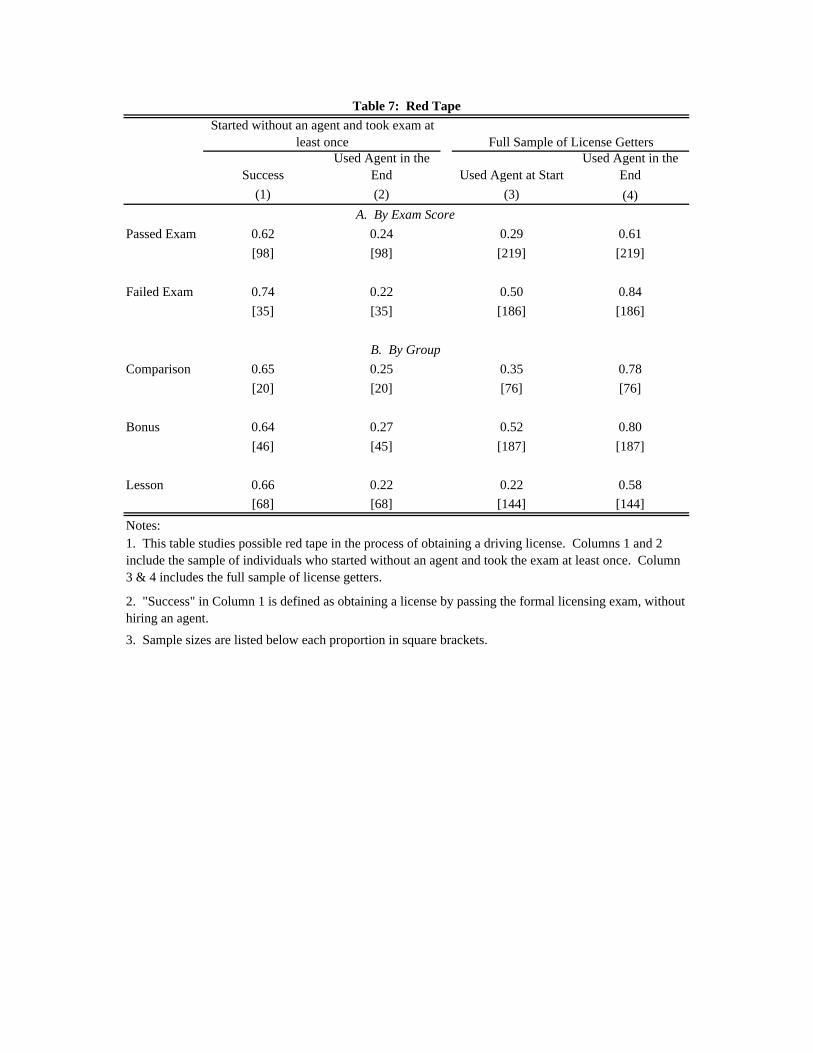
SuccessUsed Agent in the
End Used Agent at StartUsed Agent in the
End(1) (2) (3) (4)
Passed Exam 0.62 0.24 0.29 0.61[98] [98] [219] [219]
Failed Exam 0.74 0.22 0.50 0.84[35] [35] [186] [186]
Comparison 0.65 0.25 0.35 0.78[20] [20] [76] [76]
Bonus 0.64 0.27 0.52 0.80[46] [45] [187] [187]
Lesson 0.66 0.22 0.22 0.58[68] [68] [144] [144]
Notes:1. This table studies possible red tape in the process of obtaining a driving license. Columns 1 and 2 include the sample of individuals who started without an agent and took the exam at least once. Column 3 & 4 includes the full sample of license getters.
2. "Success" in Column 1 is defined as obtaining a license by passing the formal licensing exam, without hiring an agent.3. Sample sizes are listed below each proportion in square brackets.
Table 7: Red Tape
A. By Exam Score
B. By Group
Started without an agent and took exam at least once Full Sample of License Getters
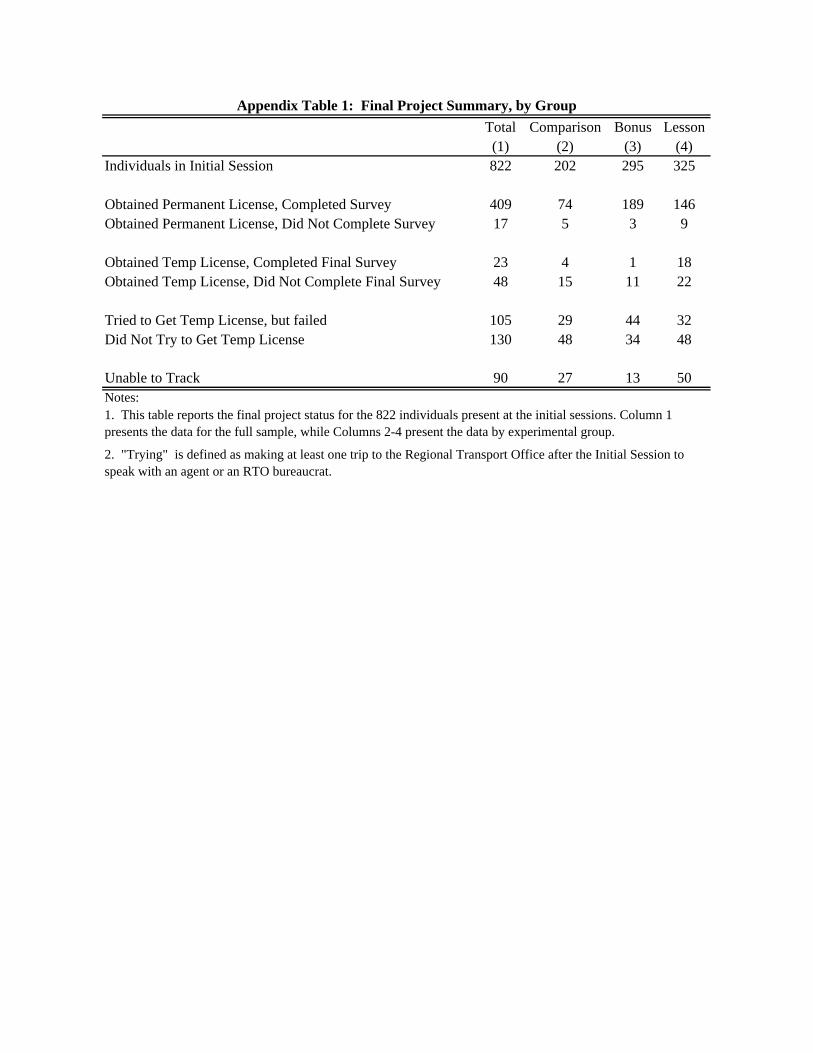
Total Comparison Bonus Lesson(1) (2) (3) (4)
Individuals in Initial Session 822 202 295 325
Obtained Permanent License, Completed Survey 409 74 189 146Obtained Permanent License, Did Not Complete Survey 17 5 3 9
Obtained Temp License, Completed Final Survey 23 4 1 18Obtained Temp License, Did Not Complete Final Survey 48 15 11 22
Tried to Get Temp License, but failed 105 29 44 32Did Not Try to Get Temp License 130 48 34 48
Unable to Track 90 27 13 50Notes:
Appendix Table 1: Final Project Summary, by Group
1. This table reports the final project status for the 822 individuals present at the initial sessions. Column 1 presents the data for the full sample, while Columns 2-4 present the data by experimental group.
2. "Trying" is defined as making at least one trip to the Regional Transport Office after the Initial Session to speak with an agent or an RTO bureaucrat.
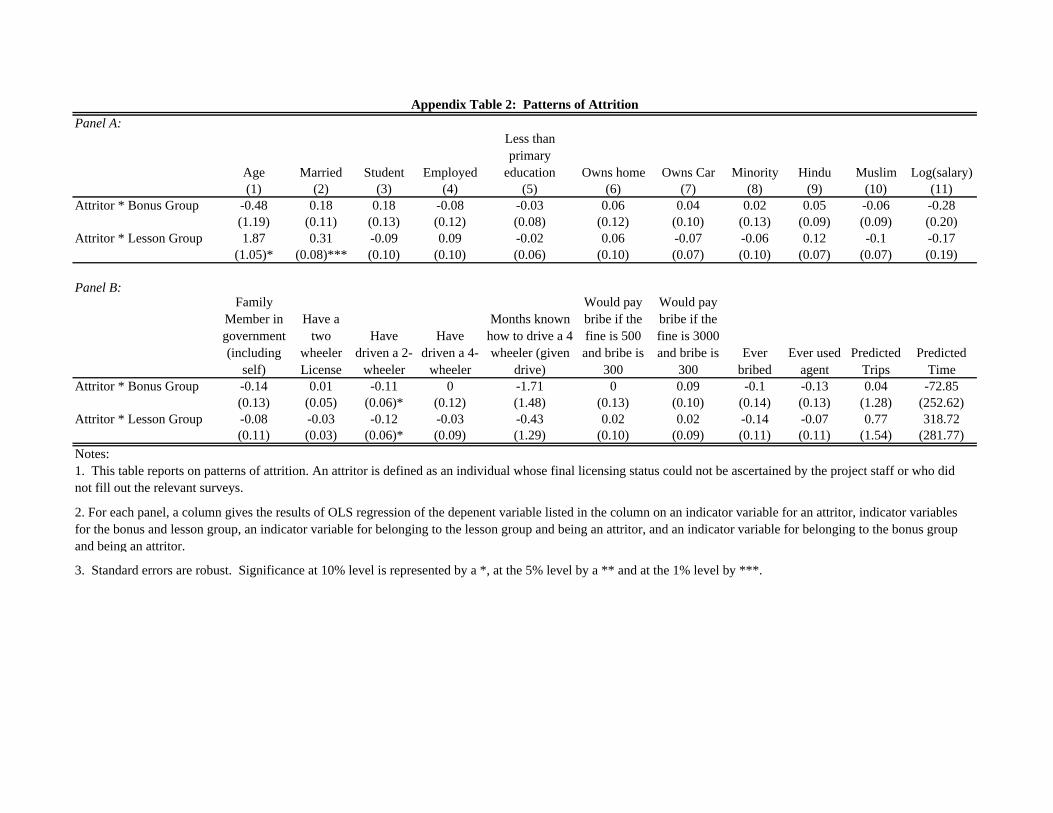
Panel A:
Age Married Student Employed
Less than primary
education Owns home Owns Car Minority Hindu Muslim Log(salary)(1) (2) (3) (4) (5) (6) (7) (8) (9) (10) (11)
Attritor * Bonus Group -0.48 0.18 0.18 -0.08 -0.03 0.06 0.04 0.02 0.05 -0.06 -0.28(1.19) (0.11) (0.13) (0.12) (0.08) (0.12) (0.10) (0.13) (0.09) (0.09) (0.20)
Attritor * Lesson Group 1.87 0.31 -0.09 0.09 -0.02 0.06 -0.07 -0.06 0.12 -0.1 -0.17(1.05)* (0.08)*** (0.10) (0.10) (0.06) (0.10) (0.07) (0.10) (0.07) (0.07) (0.19)
Panel B:Family
Member in government (including
self)
Have a two
wheeler License
Have driven a 2-
wheeler
Have driven a 4-
wheeler
Months known how to drive a 4 wheeler (given
drive)
Would pay bribe if the fine is 500 and bribe is
300
Would pay bribe if the fine is 3000 and bribe is
300Ever
bribedEver used
agentPredicted
TripsPredicted
TimeAttritor * Bonus Group -0.14 0.01 -0.11 0 -1.71 0 0.09 -0.1 -0.13 0.04 -72.85
(0.13) (0.05) (0.06)* (0.12) (1.48) (0.13) (0.10) (0.14) (0.13) (1.28) (252.62)Attritor * Lesson Group -0.08 -0.03 -0.12 -0.03 -0.43 0.02 0.02 -0.14 -0.07 0.77 318.72
(0.11) (0.03) (0.06)* (0.09) (1.29) (0.10) (0.09) (0.11) (0.11) (1.54) (281.77)Notes:
3. Standard errors are robust. Significance at 10% level is represented by a *, at the 5% level by a ** and at the 1% level by ***.
Appendix Table 2: Patterns of Attrition
1. This table reports on patterns of attrition. An attritor is defined as an individual whose final licensing status could not be ascertained by the project staff or who did not fill out the relevant surveys.
2. For each panel, a column gives the results of OLS regression of the depenent variable listed in the column on an indicator variable for an attritor, indicator variables for the bonus and lesson group, an indicator variable for belonging to the lesson group and being an attritor, and an indicator variable for belonging to the bonus group and being an attritor.