international journal of current research in
TRANSCRIPT
Int. J. Curr. Res. Biosci. Plant Biol. 2015, 2(3): 19-28
R. Efendi et al. (2015) / Int. J. Curr. Res. Biosci. Plant Biol. 2015, 2(3): 19-28 19
Original Research Article
Selection of Homozygosity and Genetic Diversity of Maize Inbred using Simple
Sequence Repeats (SSRs) Marker
Roy Efendi1*, Sri Sunarti
1, Yunus Musa
2, M. Farid Bdr
2, M. Danial Rahim
2
and M. Azrai1
1Indonesian Cereal Research Institute, Jl. Dr. Ratulangi 274, Maros, South Sulawesi, Indonesia
2 Hasanuddin University, Faculty of Agriculture, Jl. Perintis kemerdekaan, Makassar, South Sulawesi,
Indonesia
*Corresponding author.
A b s t r a c t K e y w o r d s
The level of homozygosity and genetic diversity are accurately detected by
codominant SSRs markers. The research aimed to select homozygosity and
analyze genetic diversity of 51 maize inbreds using 36 SSRs markers. The
research was aimed to select among 51 maize inbreds with high homozygosity
and to investigate the genetic diversity using 36 SSRs markers. The result
shows that there were 30 inbreds indicating homozygosity level of more than
80%. The diversity of those inbreds was moderately high, with genetic
similarity of between 0.22 and 0.87 distributed within six heterotic groups. The
farthest genetic distance of 0.87 was detected on inbred pair 1044_3 vs
Nei9008. Meanwhile the closest genetic distance of 0.22 was showed by
inbred pair G20133077 vs G2013627. Inbred pairs with genetic distance of
more than 0.7 were potentially generating high heterotic parental
combinations.
Genetic diversity
Homozygosity
Inbred maize
Introduction Inbred lines are extracted from population or varieties
through self cross (selfing) for 5 to 6 selfing
generations which generates homozygous plants.
Through self crossing, heterozygous loci are
segregating to which increases the frequency of
homozygous loci and decreases heterozygous loci
(Singh et al., 1987). High frequency of homozygosity
affects plant performance by decreasing plant vigor
and productivity due to inbreeding depression.
Extraction of maize inbreds as parental lines supports
the development of hybrid and synthetic maize.
Breeding program to develop hybrid and synthetic
maize requires high level of homozygosity and genetic
diversity. Liu et al. (2003) stated that high genetic
diversity of inbred lines distributed equally among
heterotic group is useful in guiding breeders to select
parental candidates for crossing program. Further, the
diversity information enable breeders to select parental
International Journal of Current Research in
Biosciences and Plant Biology ISSN: 2349-8080 Volume 2 Number 3 (March-2015) pp. 19-28
www.ijcrbp.com
Int. J. Curr. Res. Biosci. Plant Biol. 2015, 2(3): 19-28
R. Efendi et al. (2015) / Int. J. Curr. Res. Biosci. Plant Biol. 2015, 2(3): 19-28 20
lines to develop hybrid and synthetic maize (Legesse
et al., 2007; Pabendon et al., 2008).
Detection of homozygosity level and genetic diversity
can be performed conventionally based on the
uniformity of morphological characters or plant color.
Morphological data which refer to Union Pour la
Protection des Obtention Vegetales (UPOV) has long
been used as descriptive parameter to identify and
distinguish varieties or inbreds (Gunjaca et al., 2007).
However, morphological character poorly describes
the genetic relationship due to the existence of genetic
by environment interaction and also unknown genetic
control. Therefore, selection of homozygosity level
and genetic diversity based on the plant morphology is
less accurate.
The advent of molecular marker as selection tool has
extensively been utilized on plants and produces more
accurate result compared to morphological data.
Molecular marker selection is merely based on the
genetic character of the plant and thus not affected by
environment condition. Simple Sequence Repeats
(SSRs) is one of molecular markers which have been
used comprehensively on maize. Detection of this
marker is based on polymerase chain reaction (PCR)
using nucleotide sequence as primer (Gupta et al.,
1996). The feasibility of SSRs markers for breeding
program is proven, because it is abundantly and
equally distributed throughout the genome with high
variability (Powell et al., 1996), highly
reproducible(Smith et al., 1997; Mingsheng et al.,
2010), feasible for genetic diversity study (Li et al.,
2002; Legesse et al., 2007; Shehata et al., 2009; Yang
et al., 2011), and accurately detect the level of
homozygosity and genetic purity of inbred lines
(Mingsheng et al., 2010; Daniel et al., 2012; Hipi et
al., 2012; Semagn et al., 2012; Mulsanti et al., 2013).
The level of homozygosity and genetic purity is
important key in developing novel hybrid and
synthetic maize varieties (Gunjaca et al., 2008;
Heckenberger et al., 2002). The research was aimed to
select among 51 maize inbreds with high
homozygosity and to investigate the genetic diversity.
Materials and methods
Selection of 51 maize inbred lines using SSRs markers
was conducted at Molecular Biology Laboratory of
Indonesian Cereal Research Institute (ICERI), Maros
from April to June 2013. The research was aimed to
select 51 maize inbred lines with homozygosity level
of more than 80% and to investigate their genetic
diversity. Genetic material used in this research
consisted of 20 inbred lines tolerance to low N
fertilizer and was introduced from CIMMYT; and 31
inbred lines collection of ICERI for high yielding and
drought tolerance breeding program.
Fifteen seeds of each line were sown on a plant pot
with diameter of 17 cm and height of 14 cm. The plot
was filled with mix of soil and manure with ratio of
1:1 (v/v). Leave sample was collected at10 days after
planting from 10 plants for each line, by cutting fully
expanded leaves into small cutting. Leaves of 20
plants were mixed and sample was taken from the
mixture as much as 0.4 gram /sample.
DNA extraction was performed based on George et al.
(2004). DNA pellet was extracted through
centrifugation, rinsing, drying and dilution of the DNA
using TE buffer, and finally incubation at 60°C for 15
min.
DNA was amplified by Polymerase Chain Reaction
(PCR) based on the markers used for the analysis.
There were 36 markers equally distributed throughout
maize genom were used. Those markers were
seleceted based on their equal distribution on ten
maize chromosoms and their elaborate utilization on
maize (Warburton et al., 2002; George et al., 2004;
Pabendon et al., 2007). PCR cocktail of 88 μl
consisted of 1 μl DNA, 6,25 μl TaqDNA polymerase,
0.5 μl primer, 2.25 μl ddH2O. PCR process was
consist of denaturation (1 min at 94°C), followed by
touch down of 2 cycles for 1 min at 94°C, 1 min at
65°C and 2 min at 72°C. Annealing temperature was
lowered down from 1°C every two cycles and finished
as annealing temperature was reached. The cycle was
repeated for 29 times.
PCR product was separated using vertical
electrophoretic Triple Mini-vertical Electrophoresis
System, and acrylamid gel with composition of 100 ml
8% acylamid, 100 μl Temed, and 1000 μl 10%APS.
Electrophoretic was performed in 1×TBE buffer at 100
volt for 45–60 min. Silver staining was used to
visualize DNA band according to Promega Silver
Sequence protocol. The gel was soaked for 5 min in
silver solution (1 g silver/l), then rinsed with aquades
for 30 seconds, soaked in mixture solution of NaOH
(20 g/l) and formaldehyde 3000 μl until DNA bands
Int. J. Curr. Res. Biosci. Plant Biol. 2015, 2(3): 19-28
R. Efendi et al. (2015) / Int. J. Curr. Res. Biosci. Plant Biol. 2015, 2(3): 19-28 21
were visualized. DNA bands were then labeled based
on relative position of the base pair to marker
fragments, which was φX174/Hin f I. The DNA band
was scored based on the binary data with criteria of
score 1: present of DNA band, score 0: absent of DNA
band and 9: missing DNA band.
Level of polymorphism was analyzed based on the
value of polymorphic information content (PIC) which
shows level of genetic diversity (Weir, 1996). A locus
with high number of alleles indicates high PIC value
(Smith et al., 1997). PIC value was calculated using
formula,
where was ith allele frequency. Cophenetic
correlation coefficient was calculated using NTSYS
program.
Level of hetezygosity was analized based on the
number of DNA band that present as more than one
bands per locus. This analysis helped to eliminate
genotypes with high heterozygosity which was not
detected on phenotypic selection. Formula to calculate
level of heterozygosity was
In order to generate an accurate data analysis, inbred
lines with heterozygosity of more than 20% were
eliminated at inital stage, and thus produced only
parental lines with homozygosity of more than
80%.Level of genetic similarity was estimated by
Jaccard coefficient (Rohlf, 2000) with formula,
where m was number of DNA band at the same
position, n was total number of DNA (alleles) and u
was number of DNA band at different position.
Genetic similarity analysis was performed using
NTSYS version 2.1based on Unweighted Pair Group
Method Using Arithmetic Averages (UPGMA).
Genetic distance matrix was calculated from genetic
similarity analysis using formula S = 1 – GS, in which
S was genetic distance and GS was genetic similarity.
Boot Strapping analysis was performed to reveal the
goodness of fit of clustering using Winboot program.
Results and discussion
Characteristic of SSRs markers on 51 maize inbred
lines
Based on DNA band visualization of each marker,
score 0 and 9 represent absent of the band and missing
data respectively, while score 1 represents the present
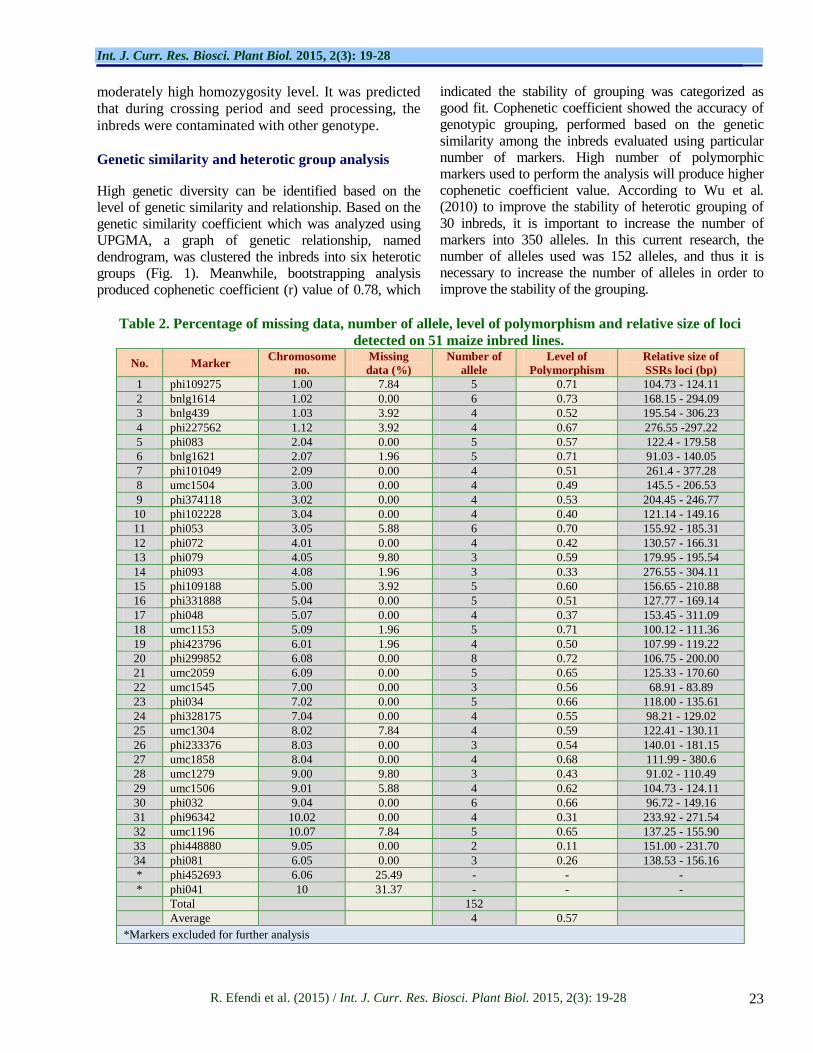
of DNA band. In order to produce valid data, markers
with missing data of more than 15% were excluded
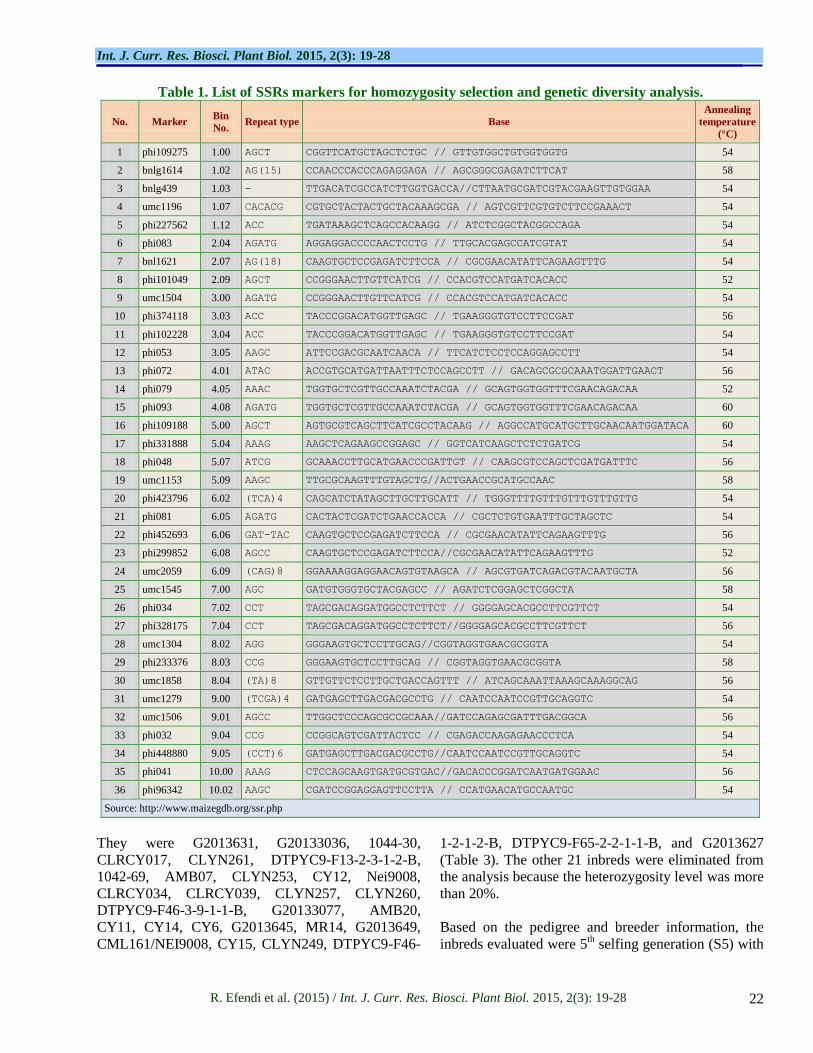
from the analysis (CIMMYT, 2005). The total markers
initially used for the analysis were 36 SSRs markers.
However, among these markers were phi041 with
missing data of 25.49% and phi45269 with missing
data of 31.37%. Therefore, further heterozygosity and
genetic diversity analysis was performed using 34
SSRs markers (Table 1).
The number of identified alleles from 30 inbred lines
using 34 SSRs markers was 152. Meanwhile, the
variation of allele number/inbred/marker was range
from 2 to 8, with average of 4.28 alleles. The level of
polymorphism was detected from 0.11 to 0.73, with
the lowest level showed by marker phi448880 and the
highest by marker bnlg1614. According to Buckler et
al. (2006), the phenotypic variation in particular plant
species is controlled by polymorphism of several
genes. The high average of polymorphism level
indicates high genetic variation among inbred lines.
Homozygosity selection
Level of homozygosity of certain genotype is
identified using SSRs marker which based on the
number of DNA band. Heterozygous locus will appear
as more than one DNA bands /allele per marker per
genotype, while homozygous locus is represented by
one DNA band. The tolerable level of heterozygosity
of maize inbred is 20%, with the assumption of
homozygosity of more than 80% (CIMMYT,
2005).With the help of SSRs marker, genotypes with
more than 20% of heterozygosity can be eliminated in
the early stage of breeding program, which is difficult
to be detected via phenotypic observation due to
environmental effect.
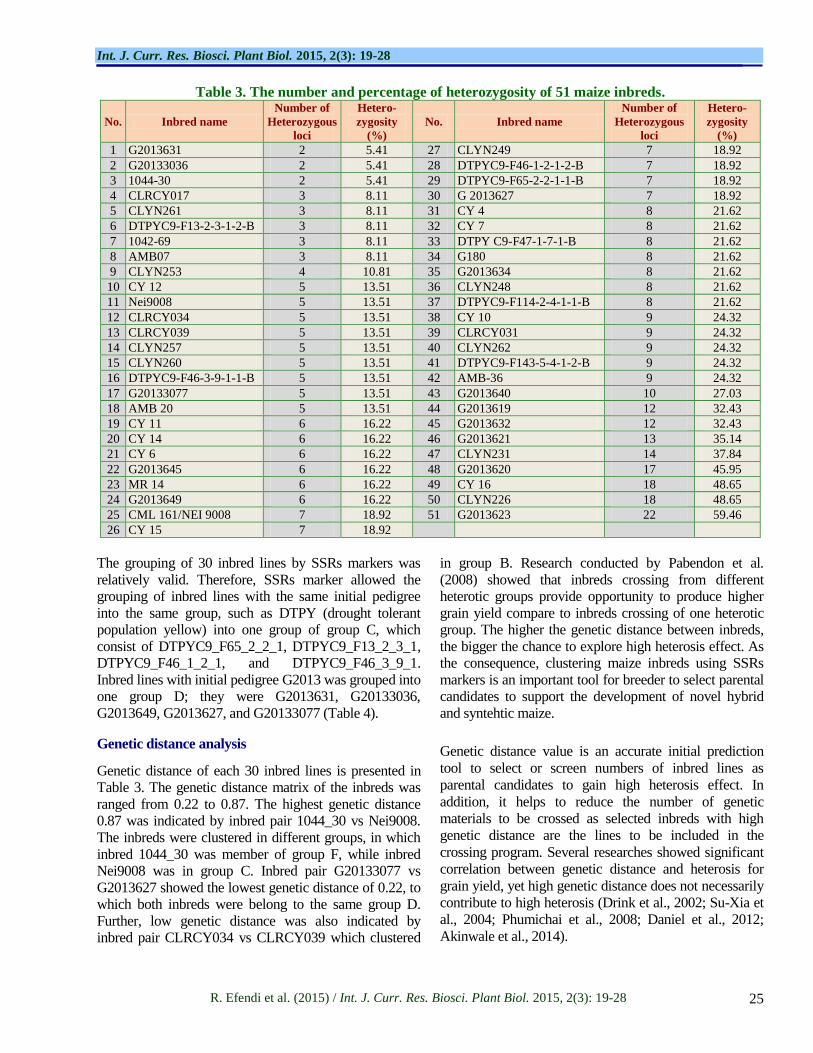
The level of heterozygosity of 51 maize inbreds was
ranged from 5.41% to 59.64% (Table 2). Among those
inbreds, 30 genotypes were indicating level of
heterozygosity of more than 20%, with the assumption
of homozygosity percentage of more than 80%.
Int. J. Curr. Res. Biosci. Plant Biol. 2015, 2(3): 19-28
R. Efendi et al. (2015) / Int. J. Curr. Res. Biosci. Plant Biol. 2015, 2(3): 19-28 22
Table 1. List of SSRs markers for homozygosity selection and genetic diversity analysis.
No. Marker Bin
No. Repeat type Base
Annealing
temperature
(°C)
1 phi109275 1.00 AGCT CGGTTCATGCTAGCTCTGC // GTTGTGGCTGTGGTGGTG 54
2 bnlg1614 1.02 AG(15) CCAACCCACCCAGAGGAGA // AGCGGGCGAGATCTTCAT 58
3 bnlg439 1.03 - TTGACATCGCCATCTTGGTGACCA//CTTAATGCGATCGTACGAAGTTGTGGAA 54
4 umc1196 1.07 CACACG CGTGCTACTACTGCTACAAAGCGA // AGTCGTTCGTGTCTTCCGAAACT 54
5 phi227562 1.12 ACC TGATAAAGCTCAGCCACAAGG // ATCTCGGCTACGGCCAGA 54
6 phi083 2.04 AGATG AGGAGGACCCCAACTCCTG // TTGCACGAGCCATCGTAT 54
7 bnl1621 2.07 AG(18) CAAGTGCTCCGAGATCTTCCA // CGCGAACATATTCAGAAGTTTG 54
8 phi101049 2.09 AGCT CCGGGAACTTGTTCATCG // CCACGTCCATGATCACACC 52
9 umc1504 3.00 AGATG CCGGGAACTTGTTCATCG // CCACGTCCATGATCACACC 54
10 phi374118 3.03 ACC TACCCGGACATGGTTGAGC // TGAAGGGTGTCCTTCCGAT 56
11 phi102228 3.04 ACC TACCCGGACATGGTTGAGC // TGAAGGGTGTCCTTCCGAT 54
12 phi053 3.05 AAGC ATTCCGACGCAATCAACA // TTCATCTCCTCCAGGAGCCTT 54
13 phi072 4.01 ATAC ACCGTGCATGATTAATTTCTCCAGCCTT // GACAGCGCGCAAATGGATTGAACT 56
14 phi079 4.05 AAAC TGGTGCTCGTTGCCAAATCTACGA // GCAGTGGTGGTTTCGAACAGACAA 52
15 phi093 4.08 AGATG TGGTGCTCGTTGCCAAATCTACGA // GCAGTGGTGGTTTCGAACAGACAA 60
16 phi109188 5.00 AGCT AGTGCGTCAGCTTCATCGCCTACAAG // AGGCCATGCATGCTTGCAACAATGGATACA 60
17 phi331888 5.04 AAAG AAGCTCAGAAGCCGGAGC // GGTCATCAAGCTCTCTGATCG 54
18 phi048 5.07 ATCG GCAAACCTTGCATGAACCCGATTGT // CAAGCGTCCAGCTCGATGATTTC 56
19 umc1153 5.09 AAGC TTGCGCAAGTTTGTAGCTG//ACTGAACCGCATGCCAAC 58
20 phi423796 6.02 (TCA)4 CAGCATCTATAGCTTGCTTGCATT // TGGGTTTTGTTTGTTTGTTTGTTG 54
21 phi081 6.05 AGATG CACTACTCGATCTGAACCACCA // CGCTCTGTGAATTTGCTAGCTC 54
22 phi452693 6.06 GAT-TAC CAAGTGCTCCGAGATCTTCCA // CGCGAACATATTCAGAAGTTTG 56
23 phi299852 6.08 AGCC CAAGTGCTCCGAGATCTTCCA//CGCGAACATATTCAGAAGTTTG 52
24 umc2059 6.09 (CAG)8 GGAAAAGGAGGAACAGTGTAAGCA // AGCGTGATCAGACGTACAATGCTA 56
25 umc1545 7.00 AGC GATGTGGGTGCTACGAGCC // AGATCTCGGAGCTCGGCTA 58
26 phi034 7.02 CCT TAGCGACAGGATGGCCTCTTCT // GGGGAGCACGCCTTCGTTCT 54
27 phi328175 7.04 CCT TAGCGACAGGATGGCCTCTTCT//GGGGAGCACGCCTTCGTTCT 56
28 umc1304 8.02 AGG GGGAAGTGCTCCTTGCAG//CGGTAGGTGAACGCGGTA 54
29 phi233376 8.03 CCG GGGAAGTGCTCCTTGCAG // CGGTAGGTGAACGCGGTA 58
30 umc1858 8.04 (TA)8 GTTGTTCTCCTTGCTGACCAGTTT // ATCAGCAAATTAAAGCAAAGGCAG 56
31 umc1279 9.00 (TCGA)4 GATGAGCTTGACGACGCCTG // CAATCCAATCCGTTGCAGGTC 54
32 umc1506 9.01 AGCC TTGGCTCCCAGCGCCGCAAA//GATCCAGAGCGATTTGACGGCA 56
33 phi032 9.04 CCG CCGGCAGTCGATTACTCC // CGAGACCAAGAGAACCCTCA 54
34 phi448880 9.05 (CCT)6 GATGAGCTTGACGACGCCTG//CAATCCAATCCGTTGCAGGTC 54
35 phi041 10.00 AAAG CTCCAGCAAGTGATGCGTGAC//GACACCCGGATCAATGATGGAAC 56
36 phi96342 10.02 AAGC CGATCCGGAGGAGTTCCTTA // CCATGAACATGCCAATGC 54
Source: http://www.maizegdb.org/ssr.php
They were G2013631, G20133036, 1044-30,
CLRCY017, CLYN261, DTPYC9-F13-2-3-1-2-B,
1042-69, AMB07, CLYN253, CY12, Nei9008,
CLRCY034, CLRCY039, CLYN257, CLYN260,
DTPYC9-F46-3-9-1-1-B, G20133077, AMB20,
CY11, CY14, CY6, G2013645, MR14, G2013649,
CML161/NEI9008, CY15, CLYN249, DTPYC9-F46-
1-2-1-2-B, DTPYC9-F65-2-2-1-1-B, and G2013627
(Table 3). The other 21 inbreds were eliminated from
the analysis because the heterozygosity level was more
than 20%.
Based on the pedigree and breeder information, the
inbreds evaluated were 5th selfing generation (S5) with
Int. J. Curr. Res. Biosci. Plant Biol. 2015, 2(3): 19-28
R. Efendi et al. (2015) / Int. J. Curr. Res. Biosci. Plant Biol. 2015, 2(3): 19-28 23
moderately high homozygosity level. It was predicted
that during crossing period and seed processing, the
inbreds were contaminated with other genotype.
Genetic similarity and heterotic group analysis
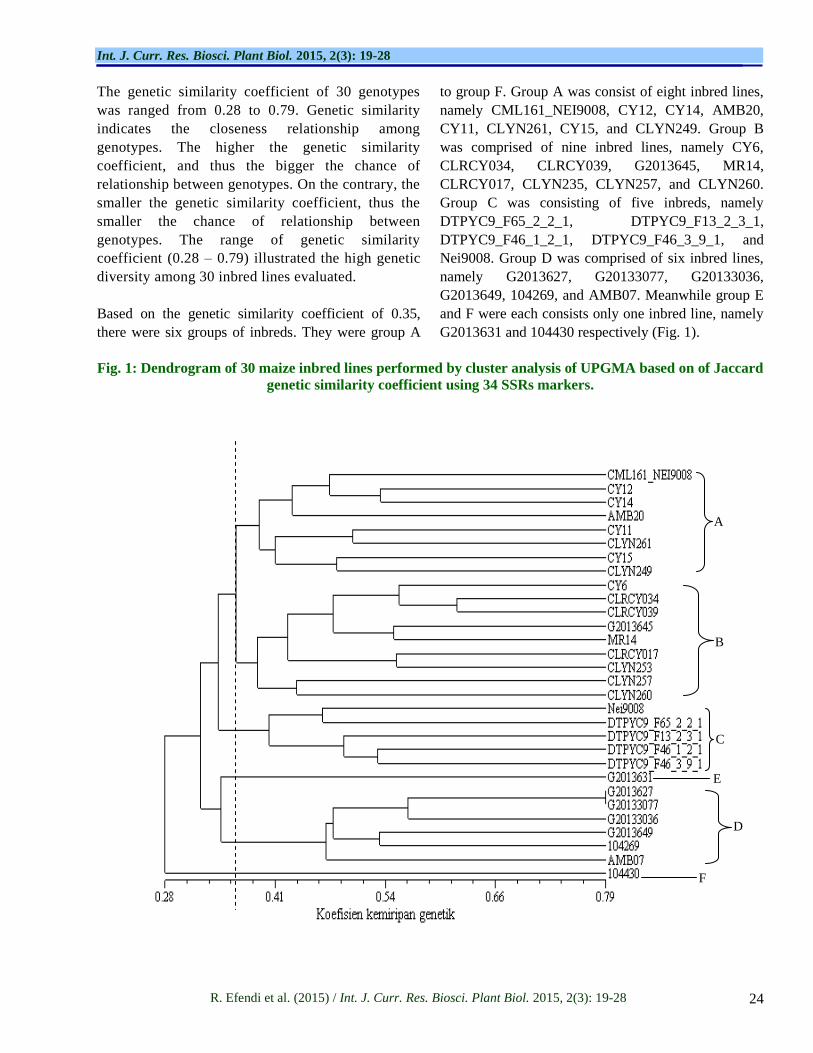
High genetic diversity can be identified based on the level of genetic similarity and relationship. Based on the genetic similarity coefficient which was analyzed using UPGMA, a graph of genetic relationship, named dendrogram, was clustered the inbreds into six heterotic groups (Fig. 1). Meanwhile, bootstrapping analysis produced cophenetic coefficient (r) value of 0.78, which
indicated the stability of grouping was categorized as good fit. Cophenetic coefficient showed the accuracy of genotypic grouping, performed based on the genetic similarity among the inbreds evaluated using particular number of markers. High number of polymorphic markers used to perform the analysis will produce higher cophenetic coefficient value. According to Wu et al. (2010) to improve the stability of heterotic grouping of 30 inbreds, it is important to increase the number of markers into 350 alleles. In this current research, the number of alleles used was 152 alleles, and thus it is necessary to increase the number of alleles in order to improve the stability of the grouping.
Table 2. Percentage of missing data, number of allele, level of polymorphism and relative size of loci
detected on 51 maize inbred lines.
No. Marker Chromosome
no.
Missing
data (%)
Number of
allele
Level of
Polymorphism
Relative size of
SSRs loci (bp)
1 phi109275 1.00 7.84 5 0.71 104.73 - 124.11
2 bnlg1614 1.02 0.00 6 0.73 168.15 - 294.09
3 bnlg439 1.03 3.92 4 0.52 195.54 - 306.23
4 phi227562 1.12 3.92 4 0.67 276.55 -297.22
5 phi083 2.04 0.00 5 0.57 122.4 - 179.58
6 bnlg1621 2.07 1.96 5 0.71 91.03 - 140.05
7 phi101049 2.09 0.00 4 0.51 261.4 - 377.28
8 umc1504 3.00 0.00 4 0.49 145.5 - 206.53
9 phi374118 3.02 0.00 4 0.53 204.45 - 246.77
10 phi102228 3.04 0.00 4 0.40 121.14 - 149.16
11 phi053 3.05 5.88 6 0.70 155.92 - 185.31
12 phi072 4.01 0.00 4 0.42 130.57 - 166.31
13 phi079 4.05 9.80 3 0.59 179.95 - 195.54
14 phi093 4.08 1.96 3 0.33 276.55 - 304.11
15 phi109188 5.00 3.92 5 0.60 156.65 - 210.88
16 phi331888 5.04 0.00 5 0.51 127.77 - 169.14
17 phi048 5.07 0.00 4 0.37 153.45 - 311.09
18 umc1153 5.09 1.96 5 0.71 100.12 - 111.36
19 phi423796 6.01 1.96 4 0.50 107.99 - 119.22
20 phi299852 6.08 0.00 8 0.72 106.75 - 200.00
21 umc2059 6.09 0.00 5 0.65 125.33 - 170.60
22 umc1545 7.00 0.00 3 0.56 68.91 - 83.89
23 phi034 7.02 0.00 5 0.66 118.00 - 135.61
24 phi328175 7.04 0.00 4 0.55 98.21 - 129.02
25 umc1304 8.02 7.84 4 0.59 122.41 - 130.11
26 phi233376 8.03 0.00 3 0.54 140.01 - 181.15
27 umc1858 8.04 0.00 4 0.68 111.99 - 380.6
28 umc1279 9.00 9.80 3 0.43 91.02 - 110.49
29 umc1506 9.01 5.88 4 0.62 104.73 - 124.11
30 phi032 9.04 0.00 6 0.66 96.72 - 149.16
31 phi96342 10.02 0.00 4 0.31 233.92 - 271.54
32 umc1196 10.07 7.84 5 0.65 137.25 - 155.90
33 phi448880 9.05 0.00 2 0.11 151.00 - 231.70
34 phi081 6.05 0.00 3 0.26 138.53 - 156.16
* phi452693 6.06 25.49 - - -
* phi041 10 31.37 - - -
Total
152
Average
4 0.57
*Markers excluded for further analysis
Int. J. Curr. Res. Biosci. Plant Biol. 2015, 2(3): 19-28
R. Efendi et al. (2015) / Int. J. Curr. Res. Biosci. Plant Biol. 2015, 2(3): 19-28 24
The genetic similarity coefficient of 30 genotypes
was ranged from 0.28 to 0.79. Genetic similarity
indicates the closeness relationship among
genotypes. The higher the genetic similarity
coefficient, and thus the bigger the chance of
relationship between genotypes. On the contrary, the
smaller the genetic similarity coefficient, thus the
smaller the chance of relationship between
genotypes. The range of genetic similarity
coefficient (0.28 – 0.79) illustrated the high genetic
diversity among 30 inbred lines evaluated.
Based on the genetic similarity coefficient of 0.35,
there were six groups of inbreds. They were group A
to group F. Group A was consist of eight inbred lines,
namely CML161_NEI9008, CY12, CY14, AMB20,
CY11, CLYN261, CY15, and CLYN249. Group B
was comprised of nine inbred lines, namely CY6,
CLRCY034, CLRCY039, G2013645, MR14,
CLRCY017, CLYN235, CLYN257, and CLYN260.
Group C was consisting of five inbreds, namely
DTPYC9_F65_2_2_1, DTPYC9_F13_2_3_1,
DTPYC9_F46_1_2_1, DTPYC9_F46_3_9_1, and
Nei9008. Group D was comprised of six inbred lines,
namely G2013627, G20133077, G20133036,
G2013649, 104269, and AMB07. Meanwhile group E
and F were each consists only one inbred line, namely
G2013631 and 104430 respectively (Fig. 1).
Fig. 1: Dendrogram of 30 maize inbred lines performed by cluster analysis of UPGMA based on of Jaccard
genetic similarity coefficient using 34 SSRs markers.
D
E
A
B
C
F
E
D
C
Int. J. Curr. Res. Biosci. Plant Biol. 2015, 2(3): 19-28
R. Efendi et al. (2015) / Int. J. Curr. Res. Biosci. Plant Biol. 2015, 2(3): 19-28 25
Table 3. The number and percentage of heterozygosity of 51 maize inbreds.
No. Inbred name
Number of
Heterozygous
loci
Hetero-
zygosity
(%)
No. Inbred name
Number of
Heterozygous
loci
Hetero-
zygosity
(%)
1 G2013631 2 5.41 27 CLYN249 7 18.92
2 G20133036 2 5.41 28 DTPYC9-F46-1-2-1-2-B 7 18.92
3 1044-30 2 5.41 29 DTPYC9-F65-2-2-1-1-B 7 18.92
4 CLRCY017 3 8.11 30 G 2013627 7 18.92
5 CLYN261 3 8.11 31 CY 4 8 21.62
6 DTPYC9-F13-2-3-1-2-B 3 8.11 32 CY 7 8 21.62
7 1042-69 3 8.11 33 DTPY C9-F47-1-7-1-B 8 21.62
8 AMB07 3 8.11 34 G180 8 21.62
9 CLYN253 4 10.81 35 G2013634 8 21.62
10 CY 12 5 13.51 36 CLYN248 8 21.62
11 Nei9008 5 13.51 37 DTPYC9-F114-2-4-1-1-B 8 21.62
12 CLRCY034 5 13.51 38 CY 10 9 24.32
13 CLRCY039 5 13.51 39 CLRCY031 9 24.32
14 CLYN257 5 13.51 40 CLYN262 9 24.32
15 CLYN260 5 13.51 41 DTPYC9-F143-5-4-1-2-B 9 24.32
16 DTPYC9-F46-3-9-1-1-B 5 13.51 42 AMB-36 9 24.32
17 G20133077 5 13.51 43 G2013640 10 27.03
18 AMB 20 5 13.51 44 G2013619 12 32.43
19 CY 11 6 16.22 45 G2013632 12 32.43
20 CY 14 6 16.22 46 G2013621 13 35.14
21 CY 6 6 16.22 47 CLYN231 14 37.84
22 G2013645 6 16.22 48 G2013620 17 45.95
23 MR 14 6 16.22 49 CY 16 18 48.65
24 G2013649 6 16.22 50 CLYN226 18 48.65
25 CML 161/NEI 9008 7 18.92 51 G2013623 22 59.46
26 CY 15 7 18.92
The grouping of 30 inbred lines by SSRs markers was
relatively valid. Therefore, SSRs marker allowed the grouping of inbred lines with the same initial pedigree
into the same group, such as DTPY (drought tolerant population yellow) into one group of group C, which
consist of DTPYC9_F65_2_2_1, DTPYC9_F13_2_3_1, DTPYC9_F46_1_2_1, and DTPYC9_F46_3_9_1.
Inbred lines with initial pedigree G2013 was grouped into one group D; they were G2013631, G20133036,
G2013649, G2013627, and G20133077 (Table 4).
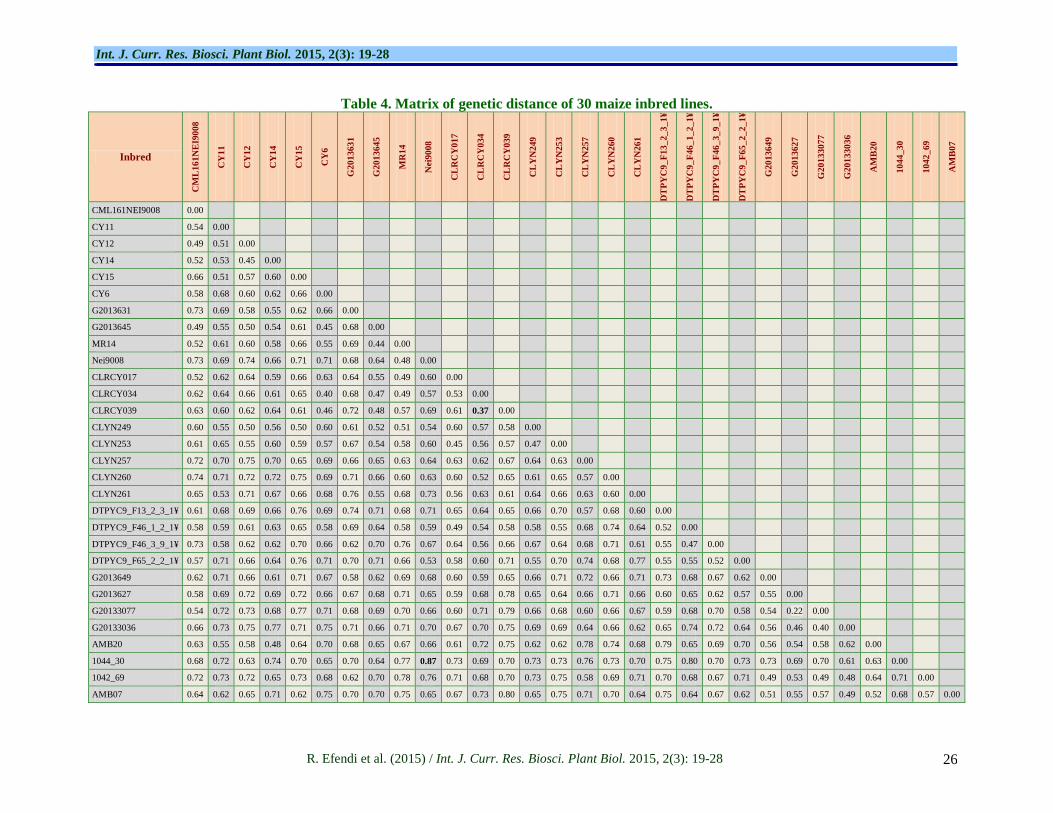
Genetic distance analysis
Genetic distance of each 30 inbred lines is presented in Table 3. The genetic distance matrix of the inbreds was
ranged from 0.22 to 0.87. The highest genetic distance 0.87 was indicated by inbred pair 1044_30 vs Nei9008.
The inbreds were clustered in different groups, in which
inbred 1044_30 was member of group F, while inbred Nei9008 was in group C. Inbred pair G20133077 vs
G2013627 showed the lowest genetic distance of 0.22, to which both inbreds were belong to the same group D.
Further, low genetic distance was also indicated by inbred pair CLRCY034 vs CLRCY039 which clustered
in group B. Research conducted by Pabendon et al.
(2008) showed that inbreds crossing from different heterotic groups provide opportunity to produce higher
grain yield compare to inbreds crossing of one heterotic group. The higher the genetic distance between inbreds,
the bigger the chance to explore high heterosis effect. As the consequence, clustering maize inbreds using SSRs
markers is an important tool for breeder to select parental candidates to support the development of novel hybrid
and syntehtic maize.
Genetic distance value is an accurate initial prediction
tool to select or screen numbers of inbred lines as
parental candidates to gain high heterosis effect. In
addition, it helps to reduce the number of genetic
materials to be crossed as selected inbreds with high
genetic distance are the lines to be included in the
crossing program. Several researches showed significant
correlation between genetic distance and heterosis for
grain yield, yet high genetic distance does not necessarily
contribute to high heterosis (Drink et al., 2002; Su-Xia et
al., 2004; Phumichai et al., 2008; Daniel et al., 2012;
Akinwale et al., 2014).
Int. J. Curr. Res. Biosci. Plant Biol. 2015, 2(3): 19-28
R. Efendi et al. (2015) / Int. J. Curr. Res. Biosci. Plant Biol. 2015, 2(3): 19-28 26
Table 4. Matrix of genetic distance of 30 maize inbred lines.
Inbred
CM
L1
61
NE
I9008
CY
11
CY
12
CY
14
CY
15
CY
6
G2
01
36
31
G2
01
36
45
MR
14
Nei9
00
8
CL
RC
Y0
17
CL
RC
Y0
34
CL
RC
Y0
39
CL
YN
24
9
CL
YN
25
3
CL
YN
25
7
CL
YN
26
0
CL
YN
26
1
DT
PY
C9
_F
13
_2
_3_1¥
DT
PY
C9
_F
46
_1
_2_1¥
DT
PY
C9
_F
46
_3
_9_1¥
DT
PY
C9
_F
65
_2
_2_1¥
G2
01
36
49
G2
01
36
27
G2
01
33
07
7
G2
01
33
03
6
AM
B2
0
10
44
_3
0
10
42
_6
9
AM
B0
7
CML161NEI9008 0.00
CY11 0.54 0.00
CY12 0.49 0.51 0.00
CY14 0.52 0.53 0.45 0.00
CY15 0.66 0.51 0.57 0.60 0.00
CY6 0.58 0.68 0.60 0.62 0.66 0.00
G2013631 0.73 0.69 0.58 0.55 0.62 0.66 0.00
G2013645 0.49 0.55 0.50 0.54 0.61 0.45 0.68 0.00
MR14 0.52 0.61 0.60 0.58 0.66 0.55 0.69 0.44 0.00
Nei9008 0.73 0.69 0.74 0.66 0.71 0.71 0.68 0.64 0.48 0.00
CLRCY017 0.52 0.62 0.64 0.59 0.66 0.63 0.64 0.55 0.49 0.60 0.00
CLRCY034 0.62 0.64 0.66 0.61 0.65 0.40 0.68 0.47 0.49 0.57 0.53 0.00
CLRCY039 0.63 0.60 0.62 0.64 0.61 0.46 0.72 0.48 0.57 0.69 0.61 0.37 0.00
CLYN249 0.60 0.55 0.50 0.56 0.50 0.60 0.61 0.52 0.51 0.54 0.60 0.57 0.58 0.00
CLYN253 0.61 0.65 0.55 0.60 0.59 0.57 0.67 0.54 0.58 0.60 0.45 0.56 0.57 0.47 0.00
CLYN257 0.72 0.70 0.75 0.70 0.65 0.69 0.66 0.65 0.63 0.64 0.63 0.62 0.67 0.64 0.63 0.00
CLYN260 0.74 0.71 0.72 0.72 0.75 0.69 0.71 0.66 0.60 0.63 0.60 0.52 0.65 0.61 0.65 0.57 0.00
CLYN261 0.65 0.53 0.71 0.67 0.66 0.68 0.76 0.55 0.68 0.73 0.56 0.63 0.61 0.64 0.66 0.63 0.60 0.00
DTPYC9_F13_2_3_1¥ 0.61 0.68 0.69 0.66 0.76 0.69 0.74 0.71 0.68 0.71 0.65 0.64 0.65 0.66 0.70 0.57 0.68 0.60 0.00
DTPYC9_F46_1_2_1¥ 0.58 0.59 0.61 0.63 0.65 0.58 0.69 0.64 0.58 0.59 0.49 0.54 0.58 0.58 0.55 0.68 0.74 0.64 0.52 0.00
DTPYC9_F46_3_9_1¥ 0.73 0.58 0.62 0.62 0.70 0.66 0.62 0.70 0.76 0.67 0.64 0.56 0.66 0.67 0.64 0.68 0.71 0.61 0.55 0.47 0.00
DTPYC9_F65_2_2_1¥ 0.57 0.71 0.66 0.64 0.76 0.71 0.70 0.71 0.66 0.53 0.58 0.60 0.71 0.55 0.70 0.74 0.68 0.77 0.55 0.55 0.52 0.00
G2013649 0.62 0.71 0.66 0.61 0.71 0.67 0.58 0.62 0.69 0.68 0.60 0.59 0.65 0.66 0.71 0.72 0.66 0.71 0.73 0.68 0.67 0.62 0.00
G2013627 0.58 0.69 0.72 0.69 0.72 0.66 0.67 0.68 0.71 0.65 0.59 0.68 0.78 0.65 0.64 0.66 0.71 0.66 0.60 0.65 0.62 0.57 0.55 0.00
G20133077 0.54 0.72 0.73 0.68 0.77 0.71 0.68 0.69 0.70 0.66 0.60 0.71 0.79 0.66 0.68 0.60 0.66 0.67 0.59 0.68 0.70 0.58 0.54 0.22 0.00
G20133036 0.66 0.73 0.75 0.77 0.71 0.75 0.71 0.66 0.71 0.70 0.67 0.70 0.75 0.69 0.69 0.64 0.66 0.62 0.65 0.74 0.72 0.64 0.56 0.46 0.40 0.00
AMB20 0.63 0.55 0.58 0.48 0.64 0.70 0.68 0.65 0.67 0.66 0.61 0.72 0.75 0.62 0.62 0.78 0.74 0.68 0.79 0.65 0.69 0.70 0.56 0.54 0.58 0.62 0.00
1044_30 0.68 0.72 0.63 0.74 0.70 0.65 0.70 0.64 0.77 0.87 0.73 0.69 0.70 0.73 0.73 0.76 0.73 0.70 0.75 0.80 0.70 0.73 0.73 0.69 0.70 0.61 0.63 0.00
1042_69 0.72 0.73 0.72 0.65 0.73 0.68 0.62 0.70 0.78 0.76 0.71 0.68 0.70 0.73 0.75 0.58 0.69 0.71 0.70 0.68 0.67 0.71 0.49 0.53 0.49 0.48 0.64 0.71 0.00
AMB07 0.64 0.62 0.65 0.71 0.62 0.75 0.70 0.70 0.75 0.65 0.67 0.73 0.80 0.65 0.75 0.71 0.70 0.64 0.75 0.64 0.67 0.62 0.51 0.55 0.57 0.49 0.52 0.68 0.57 0.00
Int. J. Curr. Res. Biosci. Plant Biol. 2015, 2(3): 19-28
R. Efendi et al. (2015) / Int. J. Curr. Res. Biosci. Plant Biol. 2015, 2(3): 19-28 27
Pabendon et al. (2010) stated that parental pair with
maximum genetic distance does not necessarily to be
crossing pair with the highest heterosis effect;
nevertheless it can be generated from parental pair
with moderate difference of genetic distance value of
more than 0.7. Xu et al. (2004) explained the reason of
inconsistence prediction of hybrid heterosis using
SSRs markers were (a) hybrid heterosis performance is
strongly affected by environment. Productivity of
maize will vary when it is cultivated in different agro-
ecological condition, such as climate, fertility and
pathogenesis present in that particular environment.
On the contrary, SSRs markers are not influenced by
environmental condition. (b) SSRs loci are equally
distributed throughout the whole genome and thus
SSRs data (SSRs allele) might not necessarily related
to hybrid heterosis.
Conclusion
Homozygosity selection of 51 maize inbreds using
SSRs markers has selected 30 maize inbred lines with
homozygosity level of more than 80%. Genetic
diversity of 30 inbred lines was relatively high with
genetic similarity coefficient ranged from 0.22-0.87
and distributed in six heterotic groups. The highest
genetic distance of 0.87 were indicated by inbred pair
1044_30 vs Nei9008, while the lowest genetic distance
of 0.22 was displayed by inbred pair G20133077 vs
G2013627.Inbred pairs with genetic distance of more
than 0.7 are potential to generate high heterosis.
References
Akinwale, R.O., Badu-Apraku, B., Fakorede, M.A.B.,
Vroh-Bi, I., 2014. Heterotic grouping of tropical
early-maturing maize inbred lines based on
combining ability in Striga-infested and Striga-
free environments and the use of SSR markers for
genotyping. Field Crop Res. 156, 48-62.
Buckler, E.S., Gaut, B.S., McMullen, M.D., 2006.
Molecular and functional diversity of maize.
Curr. Opinion Plant Biol. 9, 172-176.
CIMMYT, 2005. Laboratory Protocols: CIMMYT
Applied Molecular Genetics Laboratory. Mexico,
D.F.: CIMMYT, Mexico, D.F.: CIMMYT. p.
102.
Daniel, I.O., Adetumbi, J.A., Oyelakin, O.O.,
Olakojo, S.A., Ajala, M.O., Onagbesan, S.O.,
2012. Application of SSR markers for genetic
purity analysis of parental inbred lines and some
commercial hybrid maize (Zea mays L.). Am. J.
Expt. Agric. 2, 597-606.
Drink, S.M., Trifunovk, S., Drink, G., Konstantinov,
K., 2002. Genetic divergence and its correlation
to heterosis in maize as revealed by SSR-based
markers. Maydica 47, 1-8.
George, M.L., Regalado, E., Warburton, M., Vasal,
S., Hoisington, D., 2004. Genetic diversity of
maize inbred lines in relation to downy mildew.
Euphytica 135, 145-155.
Gunjaca, J., Buhinicek, I., Jukic, M., Sarcevic, H.,
Vragolovic, A., Kozic, Z., Jambrovic, A., Pejic,
I., 2007. Discriminating maize inbred lines using
molecular and DUS data. Euphytica 161, 165-
172.
Gunjaca, J., Buhinicek, I., Jukic, M., Sarcevic, H.,
Vragolovic, A., Kozic, Z., Jambrovic, A., Pejic,
I., 2008. Discriminating maize inbred lines using
molecular and DUS data. Euphytica 161, 165-
172.
Gupta, P.K., Balyan, H.S., Sharma, P.C., Ramesh, B.,
1996. Microsatellites in plants: A new class of
molecular markers. Curr. Sci. 7(1), 45-54.
Heckenberger, M., Bohn, M., Ziegle, J.S., Joe, L.K.,
Hauser, J.D., Hutton, M., Melchinger, A.E.,
2002. Variation of DNA fingerprints among
accessions within maize inbred lines and
implications for identification of essentially
derived varieties. I. Genetic and technical sources
of variation in SSR data. Mol. Breed. 10, 181–
191.
Hipi, A., Surahman, M., Ilyas, S., Giyanto., 2012.
Seed genetic purity assessment of hybrid maize
using microsatellite markers (SSR). Proceedings
of International Maize Conference, Gorontalo.
Legesse, B.W., Myburg, A.A., Pixley, K.V., Botha,
A.M., 2007. Genetic diversity of African maize
inbred lines revealed by SSR markers. Hereditas
144, 10-17.
Li, Y., Du, J., Wang, T., Shi, Y., Song, Y., Jia, J.,
2002. Genetic diversity and relationships among
Chinese maize inbred lines revealed by SSR
markers. Maydica 47 93-101.
Liu, K., Goodman, M., Muse, S., Smith, J.S.,
Buckler, E., Doebley, J., 2003. Genetic structure
and diversity among maize inbred lines as
inferred from DNA microsatellites. Genet. 165,
2117-2128.
Mingsheng, W., Jia, X., Tian, L., Baochun, L., 2010.
Rapid and reliable purity identification of F1
Int. J. Curr. Res. Biosci. Plant Biol. 2015, 2(3): 19-28
R. Efendi et al. (2015) / Int. J. Curr. Res. Biosci. Plant Biol. 2015, 2(3): 19-28 28
hybrids of maize (Zea may L.) using SSR
markers. Maize Genom. Genet. 1(1), 1-4.
Mulsanti, I.W., Surahman, M., Wahyuni, S., Utami,
D.W., 2013. Identification of specific SSR
marker to identify hybrid rice parental lines and
their utilization for seed purity assessment.
Penelitian Pertanian Tanaman Pangan 32(1), 1-8.
Pabendon, M.B., Azrai, M., Mejaya, M.J., Sutrisno.,
2008. Genetic diversity of QPM and normal
maize inbreds as revealed by SSR markers and its
relationship with the hybrid performance. J.
AgroBiogen 4(2), 77-82.
Pabendon, M.B., Mejaya, M.J., Koswara, J.,
Aswidinnoor, H., 2010. Correlation between
genetic distances based on microsatellite marker
in maize inbred with seed weight of F1.
Penelitian Pertanian Tanaman Pangan 29(1), 11-
17.
Phumichai, C., Doungchan, W., Puddhanon, P.,
Jampatong, S., Grudloyma, P., Kirdsri, C.,
Chunwongse, J., Pulam, T., 2008. SSR-based and
grain yield-based diversity of hybrid maize in
Thailand. Field Crop Res. 108, 157-162.
Powell, W., Machray, G.C., Provan, J., 1996.
Polymorphism revealed by simple sequence
repeats. Trends in Plant Science 1, 215-222.
Rohlf, F.J., 2000. NTSYSpc Numerical Taxonomy
and Multivariate Analysis System Version 2.1.
Applied Biostatistics Inc.
Semagn, K., Beyene, Y., Makumbi, D., Mugo, S.,
Prasanna, B.M., Magorokosho, C., Atlin, G.,
2012. Quality control genotyping for assessment
of genetic identity and purity in diverse tropical
maize inbred lines. Theor. Appl. Genet. 125,
1487-1501.
Shehata, A.I., Al-Ghethar, H.A., Al-Homaidan, A.A.,
2009. Application of simple sequence repeat
(SSR) markers for molecular diversity and
heterozygosity analysis in maize inbred lines.
Saudi J. Biol. Sci. 16, 57-62.
Singh, J., Chaudhri, M.Y., Tahir, W.M., 1987. Field
manual of maize breeding procedures. Food and
Agriculture Organization of The United Nations,
Rome.
Smith, J.S.C., Chin, E.C.L., Shu, H., Smith, O.S.,
Wall, S.J., Senior, M.L., Mitchell, S.E., Kresovich,
S., Ziegle, J., 1997. An evaluation of the utility of
SSR loci as molecular markers in maize (Zea mays
L.): comparisons with data from RFLPS and
pedigree. Theor. Appl. Genet. 95, 163-173.
Su-Xia, X., Jie, L., Gong-She, L., 2004. The use of
SSRs for predicting the hybrid yield and yield
heterosis in 15 key inbred lines of Chinese maize.
Hereditas 141, 207-215.
Weir, B.S., 1996. Genetic Data Analysis II. Sinauer
Associates. Inc., Sunderland.
Wu, C., Li, S., Dong, B., Zhang, Q., Zhang, C., 2010.
Determination of the number of SSR alleles
necessary for the analysis of genetic relationships
between maize inbred lines. Agric. Sci. China 9,
1713-1725.
Xu, S.X., Liu, J., Liu, G.S., 2004. The use of SSRs
for predicting the hybrid yield and yield heterosis
in 15 key inbred lines of Chinese maize.
Hereditas 141, 207-215.
Yang, X., Xu, Y., Shah, T., Li, H., Han, Z., Li, J.,
Yan, J., 2011. Comparison of SSRs and SNPs in
assessment of genetic relatedness in maize.
Genet. 139, 1045-1054.