hydra: a personalized and context-aware multi-modal
TRANSCRIPT

Hydra: A Personalized and Context-AwareMulti-Modal Transportation Recommendation SystemHao Liu1, Yongxin Tong2, Panpan Zhang1, Xinjiang Lu1, Jianguo Duan1, Hui Xiong1,3⇤
1The Business Intelligence Lab, Baidu Research,National Engineering Laboratory of Deep Learning Technology and Application, Beijing, China,
2SKLSDE Lab, Beihang University, Beijing, China, 3Rutgers University1{liuhao30, zhangpanpan04, luxinjiang, duanjianguo}@baidu.com,
[email protected], [email protected]
ABSTRACTTransportation recommendation is one important map service innavigation applications. Previous transportation recommendationsolutions fail to deliver satisfactory user experience because theirrecommendations only consider routes in one transportation mode(uni-modal, e.g., taxi, bus, cycle) and largely overlook situationalcontext. In this work, we proposeHydra, a recommendation systemthat o�ers multi-modal transportation planning and is adaptiveto various situational context (e.g., nearby point-of-interest (POI)distribution and weather). We leverage the availability of existingrouting engines and big urban data, and design a novel two-levelframework that integrates uni-modal and multi-modal (e.g., taxi-bus, bus-cycle) routes as well as heterogeneous urban data forintelligentmulti-modal transportation recommendation. In additionto urban context features constructed frommulti-source urban data,we learn the latent representations of users, origin-destination (OD)pairs and transportation modes based on user implicit feedbacks,which captures the collaborative transportation mode preferencesof users and OD pairs. A gradient boosting tree based model isthen introduced to recommend the proper route among variousuni-modal and multi-modal transportation routes. We also optimizethe framework to support real-time, large-scale route query andrecommendation. We deploy Hydra on Baidu Maps, one of theworld’s largest map services. Real-world urban-scale experimentsdemonstrate the e�ectiveness and e�ciency of our proposed system.Since its deployment in August 2018, Hydra has answered over ahundred million route recommendation queries made by over tenmillion distinct users with 82.8% relative improvement of user clickratio.
KEYWORDSTransportation recommendation; context-aware; personalized; fea-ture engineering; deployment
⇤Corresponding author.
Permission to make digital or hard copies of all or part of this work for personal orclassroom use is granted without fee provided that copies are not made or distributedfor pro�t or commercial advantage and that copies bear this notice and the full citationon the �rst page. Copyrights for components of this work owned by others than ACMmust be honored. Abstracting with credit is permitted. To copy otherwise, or republish,to post on servers or to redistribute to lists, requires prior speci�c permission and/or afee. Request permissions from [email protected] ’19, August 4–8, 2019, Anchorage, AK, USA© 2019 Association for Computing Machinery.ACM ISBN 978-1-4503-6201-6/19/08. . . $15.00https://doi.org/10.1145/3292500.3330660
ACM Reference Format:Hao Liu, Yongxin Tong, Panpan Zhang, Xinjiang Lu, Jianguo Duan, andHui Xiong. 2019. Hydra: A Personalized and Context-Aware Multi-ModalTransportation Recommendation System. In The 25th ACM SIGKDD Con-ference on Knowledge Discovery & Data Mining (KDD’19), August 4–8, 2019,Anchorage, AK, USA. ACM, NY, NY, USA, 9 pages. https://doi.org/10.1145/3292500.33306601 INTRODUCTIONTransportation recommendation is a core component in variousmap services and has deeply penetrated into the everyday life ofcitizens. Transportation recommendation refers to a set of routesrecommended to users given the speci�c OD pair input by users.Online map services such as Baidu Maps answer over a hundredmillion transportation recommendation queries made by over tenmillion distinct users in China per day.
Despite its popularity and frequent usage, existing transporta-tion recommendation solutions still fail to deliver satisfactory userexperience. According to Baidu Maps, over 15% of the users tendto request transportation recommendations on di�erent uni-modalrouting engines (e.g., taxi and bus), indicating the requirement ofinter-modal transportation comparison. Furthermore, 89.1% rout-ing queries from users are answered with feasible transportationrecommendations but over 58.5% of the transportation recommen-dation list has no user clicks (see Table 1), indicating none of therecommended transportation plans are satisfactory.
The above observations indicate two limitations of current trans-portation recommendation solutions. (i) Ignorance of situationalcontext. For instance, when a big concert lets out, it is di�cult tocall a taxi. A better solution may consider supplement of multiplealternative transportation modes (as illustrated in Figure 1) andrecommend the most e�cient one. (ii) Uni-modal transportationrecommendation. For example, imagine the following scenario thatthe distance of the OD pair is relatively large, and the trip purposeis in no emergency. In this case, a cost-e�ective transportationrecommendation that including multiple transport modes, e.g., taxi-bus, maybe more attractive (as illustrated in Figure 1(b)). Hence,the transportation recommendation should adapt to the situationalcontext e.g., whether there is a concert, and provides more �exiblerecommendations, e.g., combining buses and taxis.
To address these limitations, we propose Hydra, a personalizedand context-aware multi-modal transportation recommendationsystem. Inspired by the availability of existing routing enginesand big urban data, we design a novel framework that integratesroute plans in di�erent transportation modes (including both uni-modal and multi-modal transportation plans) and heterogeneous
Applied Data Science Track Paper KDD ’19, August 4–8, 2019, Anchorage, AK, USA
2314

%DLGX�7HFKQRORJ\�3DUN
7KH�&KLQD�:RUOG�7UDGH�&HQWHU
=KL[LQJ 7D[L 'ULYH %XV :DON &\FOH
7UDQVSRUWDWLRQ 6HWWLQJ
,QWHOOLJHQW 5HFRPPHQGDWLRQ
7D[L�%XV ӝ�� �K��PLQ
6XEZD\ /LQH ��
7D[L�WR�+DLGLDQ�+XDQJ]KXDQJ�6XEZD\�6WDWLRQ z �� VWRSVz :DON ��� P z 7D[L ���� NP� ӝ��
'ULYH���� NP z ��� NP +LJK 7UDIILF z � 7UDIILF OLJKWV
��PLQ
ӝ��� ��PLQ7D[L���� NP z :DLW IRU SLFN�XS � PLQ z ���PLQ�RI�WUDYHO
%XV
6XEZD\ /LQH ��%XV ��� 6XEZD\ /LQH ��
�� VWRSV z :DON ��� NP z *HW RQ DW +RXFKDQJFXQ 6WDWLRQ
ӝ� �K��PLQ
(a) Recommendation list.
7D[L�WR�+DLGLDQ�+XDQJ]KXDQJ�6XEZD\�6WDWLRQ z �� ŏ
7D[L*HW RQ DW WKH %DLGX7HFKQRORJ\ 3DUN
+DLGLDQ +XDQJ]KXDQJ6XEZD\ /LQH ��
7KH�&KLQD�:RUOG�7UDGH�&HQWHU
(b) Details of the �rst route.
Figure 1: An example of user interfaces of Hydra on BaiduMaps. The left �gure shows the list of plans in various trans-portation modes ordered by our recommendation model.The right �gure shows the details of the top-1 recommenda-tion, which is a multi-modal transportation plan (i.e., �rsttake taxi and then bus). The �rst recommended plan is 26.3%faster than the pure bus plan and 61.2% cheaper than thepure taxi plan.
urban data. Hydra not only extracts features from multi-sourceurban data, but also learns the latent representations of users, ODpairs and transportation modes based on user clicks to capturethe collaborative transportation mode preferences of users andOD pairs. It then applies a gradient boosting tree based model torecommend the proper transportation plan among various uni-modal and multi-modal transportation routes.
In web-scale recommendation, the service scalability and onlinerecommendation latency is also curial for user experience [22]. Toaddress the service e�ciency concern, we build a distributed o�inedata pipeline as well as an RPC based online web service framework.Besides, we propose a dedicated region index structure in onlinefeature processing to reduce the online recommendation latency.
Our main contributions can be summarized as follows.
• We proposeHydra, a multi-modal transportation recommen-dation system. To the best of our knowledge, this is the �rstproduct level intelligent routing engine that integrates vari-ous transportation modes in a uni�ed service.
• We design a novel recommendation model that is adaptiveto the situational context. We extract a rich set of featuresfrom multi-source urban data to sense the context variationand adopt a graph embedding based algorithm to capturethe transportation preferences of users and OD pairs.
• We propose a series of optimization techniques to improvethe time e�ciency of the recommendation system and dis-cuss several deployment issues in a hundred million userlevel online map service.
• Extensive real-world urban-scale experiments on real datasetsshow that our proposed framework outperforms six baseline
Table 1: Statistics of datasets.Data description B������ S�������
User behavior data# of queries 5,956,596 5,628,921# of displays 5,308,127 4,993,350# of clicks 2,205,091 1,980,870
Geographical data# of POIs 900,669 1,061,399
# of road segments 812,195 768,336# of bus stations 44,830 45,052
Meteorological data # of weather records 34,944 32,760User pro�le data # of distinct users 1,199,399 1,217,140
algorithms in four metrics. The online recommendation ser-vice achieves less than 250ms latency in average and scalewell in the production environment.
In the rest of this paper, we �rst describe the details of the real-world large datasets used in our study in Section 2, and elaborate onthe detailed methodologies of our transportation recommendationsystem in Section 3. We next introduce our deployment details ande�ciency optimization techniques in Section 4. Evaluations on twolarge-scale industrial datasets are presented in Section 5. Finallywe review related work in Section 6 and conclude in Section 7.
2 DATA DESCRIPTION AND ANALYSISThis section introduces the datasets that will be used in the follow-ing sections, with a preliminary data analysis. The datasets includeuser behavior data, geographical data, meteorological data and userpro�le data collected from B������ and S�������, twometropolisesin China. Table 1 summarizes the statistics of the datasets.
2.1 User Behavior DataUser behavior data captures the user interactions with navigationapplications. Our user behavior data are collected from Baidu Maps,a large-scale navigation app, from September 2018 to November2018. According to a user interaction loop, the user behavior datacan be further categorized into query records, display records andclick records. In short, a query record represents one route searchfrom a user on Baidu Maps; a display record is the routes rec-ommended by Baidu Maps shown to the user; and a click recordindicates the user feedback of di�erent recommendations (i.e., auser may click on speci�c routes displayed to him/her for details, asin Figure 1). Please refer Appendix A for detailed data description.
We brie�y explain the distributions of our user behavior datasetin B������ below (see Figure 2(a)-Figure 2(e)). Note that similarobservations held in S�������, which we omit due to the pagelimit. Figure 2(a) and Figure 2(b) depict the spatial distributions oforigins and destinations in the query records. Most origins and des-tinations are within the 6th ring road, i.e., the central area of Beijing.The distribution of destinations is more concentrated than that oforigins, indicating that most queries are about speci�c POIs suchas transport stations and city landmarks. The spatial distributionpatterns of origins and destinations motivate us to use geographi-cal data to capture the spatial dependency for transportation routerecommendation. Figure 2(c) plots the temporal distributions ofquery, display and click records (i.e., numbers per day). The tem-poral distributions exhibit strong periodicity, where peaks oftencorrespond to weekends and holidays. For example, the peaks onthe 22nd and 31st days correspond to the mid-autumn festival and
Applied Data Science Track Paper KDD ’19, August 4–8, 2019, Anchorage, AK, USA
2315

(a) Spatial distribution of origins. (b) Spatial distribution of destinations.
0 10 20 30 40 50 60 70 80 90Day
0
20,000
40,000
60,000
80,000
100,000
Counts
querydisplayclick
(c) Temporal distribution.
0 5 10 15 20 25 30 35 40 45 50Distance(km)
0.00
0.02
0.04
0.06
0.08
0.10
0.12
Nor
mal
ized
per
cent
age
0.0
0.2
0.4
0.6
0.8
1.0
Cum
ulat
ive
norm
aliz
ed p
erce
ntag
e
Cumulative normalized percentageNormalized percentage
(d) Distance distribution.
Bus Drive Walk Bus-cycle Cycle Taxi Taxi-bus0
0.1
0.2
0.3
0.4
Percentage
Mode
(e) Transport mode distribution.
< 18 18-24 25-34 35-44 45-54 55-64 ≥ 650
0.1
0.2
0.3
0.4
Per
cent
age
Age
(f) User age distribution.
Figure 2: Distributions of the B������ dataset: (a) the spatial distribution of query origins; (b) the spatial distribution of querydestinations; (c) the temporal distribution of user query behavior in three successive months; (d) the distribution of traveldistances; (e) the distribution of clicks on transport modes; (f) the distribution of user ages.
the National day, two public holidays in China. Figure 2(d) showsthe distribution of trip distance from the queries. Here the tripdistance is measured by the spherical distance on earth [10]. Over60% trips are within 10 Kms and 80% trips are within 20 Kms. Thisindicates short-distance and mid-distance trips are the major querydemand on online navigation applications. Figure 2(e) shows the dis-tribution of clicks on di�erent recommended routes. Above 54.64%clicks involve buses (i.e., bus and bus-bicycle) and 25.12% clicks aredrive or taxi, indicating public and car-based transportation aremore preferable.
2.2 Geographical DataIntuitively, geographical characteristics of origins and destinationspartially re�ect the situational context, and thus a�ect user prefer-ences on transportation modes. Accordingly, we use a large-scalegeographical dataset collected from (i) professional surveyors em-ployed by Baidu Maps (ii) the crowdsourcing platform in Baidu,which include POI data, road network data and transportation sta-tion data in B������ and S�������. All data are updated daily. Wepresent a detailed data description in Appendix A.
2.3 Meteorological DataMeteorological data tend to re�ect the temporal dynamics of thesituational context when planning trips, and thus may also a�ectthe user preference on transportation modes. For example, the de-mand for taxis may be higher in the case of snow, rain and severeair pollution. We collect the meteorological data from an onlinemeteorology website of the Chinese government over three monthsfrom September 1st to November 30th. Each record of meteorolog-ical data consists of an administrative district, a time stamp, theweather, the temperature, the wind strength, the wind directionand the Air Quality Index (AQI). The weather is categorized as
sunny, cloudy, rainy and overcast. The AQI is an integer of the airpollution level.
2.4 User Pro�le DataUser pro�le attributes re�ect individual preference on transporta-tion modes. For instance, subways are more cost-e�ective thantaxis for most urban commuters, and driving is likely to be the�rst choice for car owners. We collect user pro�le attributes frommultiple Baidu applications including Baidu search, Baidu App andBaidu Maps. The B������ dataset contains 1, 199, 399 distinct userrecords and the S������� dataset contains 1, 217, 140 distinct userrecords. Each record consists of a user’s demographic attributesincluding the age, the gender, and social attributes such as the indus-try, the educational level, and whether the user is a car owner. Alluser pro�le records are anonymized and cannot be associated withsensitive personal information such as names and phone numbers.Figure 2(f) plots the age distribution of B������ dataset. Most BaiduMaps users are between 18 and 54 years old.
3 HYDRA FRAMEWORKThis section presents the framework of Hydra in detail.
3.1 OverviewFigure 3 shows an overview of Hydra. It consists of four majorcomponents, Route generation, Feature construction, Transport modepreference representation and Transportation recommendation. TheRoute generation module leverages existing uni-modal routing en-gines to generate feasible routes in di�erent transport modes. There-after, the Feature construction module extracts features from var-ious urban datasets. Meanwhile, the Transport mode preferencerepresentation module captures high-order user (resp. OD pair)
Applied Data Science Track Paper KDD ’19, August 4–8, 2019, Anchorage, AK, USA
2316

�!(���'���#!&%� ��� �� �$
������'���#��!��� ��%�!
�&�%��$!&#���&#�� ���%�$�%$
�$�#�����'�!#���%�
�&�#*�#��!#�
��$"��*�#��!#�
������#��!#�
��!�#�"��������%�
�
�!��� �%(!#�
�%�%�!
��%�!#!�!��������%��$�#�"#!�������%�
���%&#���! $%#&�%�!
���"!#������%&#�$
��%�!#!�!���������%&#�$
�"�%�������%&#�$
��� ����%&#�$
�$�#����%&#�$
���!��� ��%�! ��!���
���� ��"#!��$$� � �� ��"#!��$$� �
����! �� ��)��%�!#!�!������
$�#'���
�$�#�� %�#��%�!
�� �����%&#���! $%#&�%�!
�� ����%��#�%#��'��
��!�#�"������*��&"����%����!���
�!����� ���%���� %�#��
�!����� ��%���� %�#��
�!����� ��%���� %�#�� …
Drive Bus Cycle Walk Bus + Taxi
- …
�!���"#���#� ���#�"#�$� %�%�!
Data integration
Route generation
Logging
Modelupdate
Route generation
Figure 3: Hydra Overview.
transport mode preference representation through a graph em-bedding method. Finally, the Transportation recommendation mod-ule integrates handcrafted features and embedding features tomake recommendation. In this paper, we consider seven transportmodes {dri�e, taxi,bus, c�cle,walk, taxi-bus,bus-c�cle}. In partic-ular, the �rst �ve modes are uni-modal transport modes whereastaxi-bus and bus-c�cle are multi-modal transport modes. Accord-ing to log analysis, taxi-bus and bus-c�cle are top multi-modaltravel demands and are already well supported in Baidu Maps. Notethat we treat each uni-modal and multi-modal transport mode asdistinct transport modes, which makes our model extendable forother potential transport modes.
3.2 Route GenerationWe adopt existing low level routing engines to generate feasibleroutes for each transport mode. In online processing, the routeis searched in real-time in parallel. Speci�cally, when a query isreceived, a station binding process is �rst applied to bind origin anddestination locations to validate start and end points. For example,the location is bound to road segments for drive and taxi, and totransport stations for bus. After that, a bidirectional shortest-pathsearch [12] is applied on each transportation network. For eachuni-modal transport mode, a contraction hierarchy (CH) [11] ispre-constructed on the transportation network to reduce searchlatency. A set of valid routes is generated by various criteria, e.g.,fastest, distance shortest and least transfer. For multi-modal trans-portation, the search strategy is slightly di�erent. We build a multi-modal transportation network [6] and restrict the number of modal-transfer to guarantee the utility [5] of searched routes. Finally, aninternal rule based ranking model is applied in each transport modeto �lter out routes with high segment overlap and decide the or-der of routes. For ease of cross-mode comparison, only one routeof each transport mode will appear in the �nal display. In o�ineprocessing, the route is directly retrieved from user behavior data.In the production environment, a query understanding componentwill be invoked before route generation to bind fuzzy search key-words with concrete POIs. We omit further discussions since theyare out of the scope of transportation recommendation.
Figure 4: An illustrative example of region partition base onroad network connectivity in B������. Di�erent colors indi-cate di�erent region functionality derived by TF-IDF basedon the POI distribution.
3.3 Feature ConstructionWe introduce the process of constructing, transforming and aug-menting feature vectors below. Appendix B lists features we con-struct based on each dataset with a detailed description.
3.3.1 Plan Features. Cost of a plan such as Price and ETA are part ofconsiderations for user preferences. For each plan, we extract Roadnetwork distance, Route distance, ETA, Price, Transfer count, Transfermodel count from display records. The Road network distance is thereal travel distance on the road network. For walking and cycling,Price is set to zero.
3.3.2 Spatial Features. We �rst extract District and POI categoryfeatures of the origins and destinations. As shown in Figure 5(a),the transportation mode choices of di�erent destination POI cate-gories vary. For example, the demand for buses to Sports and TouristAttraction POIs is higher than average. In contrast, the demand forbuses to Beauty, Life Service and Food POIs is lower than average.Then we calculate the Spherical distance of OD pairs. Figure 5(b)shows the relation between trip distance and the percentage ofdi�erent transport modes. We observe a strong correlation betweenSpherical distance and transport mode choice. Walk and cycle arethe major choices for trips shorter than 5 Km whereas bus anddrive are the major choices for trips longer than 10 Km. The peakof demand for taxi appears when the trip distance is near 5 Km.Since the road connectivity and transport stations in a region are�xed, the transport availability of adjacent OD pairs is similar. Toincorporate such regional dependency, we partitioned the city intoa set of non-overlapping regions through the road network [34].Figure 4 gives an illustrative example of partitioned regions of B�������. For each origin region, we further compute the POI count ofeach POI category as Regional POI distribution, transport facilitycount (i.e., road segment, road intersection, bus station and busline) as Regional transport facility distribution and transport modeclick count as Regional historical mode distribution. We also extractsimilar features for destination regions and OD region pairs.
3.3.3 Temporal Features. We exploit Hour, Minute, Day of week,Day of month and Workday as the temporal features. As shown inFigure 5(c), distributions of transportation mode choices di�er indi�erent time periods. The demand for walk and cycle is mainly indaytime whereas the demand for taxi and taxi-bus is still high at
Applied Data Science Track Paper KDD ’19, August 4–8, 2019, Anchorage, AK, USA
2317

P01P02P03P04P05P06P07P08P09P10P11P12P13P14P15P16P17P180
0.2
0.4
0.6
0.8
1
Percentage
POI-Categary
BusBus-cycleCycleDriveTaxiTaxi-buswalk
(a) POI-mode distribution.Distance(km)
0-1 2-5 6-10 11-20 21-30 31-40 41-50 51-60 61-70 71-80 81-90 91-100
0.0
0.2
0.4
0.6
0.8
1.0
Cum
ulat
ive
norm
aliz
ed p
erce
ntag
e
BusBus-cycleCycleDriveTaxiTexi-busWalk
(b) Distance-mode distribution.
1 3 5 7 9 11 13 15 17 19 21 23
0.01
0.02
0.03
0.04
0.05
0.06
0.07
0.08
Percentage
Hour
BusBus-cycleCycleDriveTaxiTaxi-busWalk
(c) Hour-mode distribution.
1 3 5 7 9 11 13 15 17 19 21 230.000.01
0.02
0.03
0.04
0.05
0.06
0.07
Percentage
Hour
weekendworkday
(d) Workday & weekend-mode distribution (Drive).
Cloudy Overcast Rain Sunny
walk
Bus
Bus-cycle
Cycle
Drive
Taxi
Taxi-bus
walk
Bus
Bus-cycle
Cycle
Drive
Taxi
Taxi-bus
walk
Bus
Bus-cycle
Cycle
Drive
Taxi
Taxi-bus
walk
Bus
Bus-cycle
Cycle
Drive
Taxi
Taxi-bus
00.1
0.2
0.3
0.4
0.5
0.6
Percentage
(e) Weather-mode distribution.
< 18 18-24 25-34 35-44 45-54 55-64 ≥ 650
0.2
0.4
0.6
0.8
1
Per
cent
age
Age
BusBus-cycleCycleDriveTaxiTaxi-busWalk
(f) Age-mode distribution.
Figure 5: Feature distributions of the B������ dataset.
night. As illustrated in Figure 5(d), the transport mode preferencesduring di�erent time periods on weekdays and weekends also di�er.For drive, there are two peak hours in a day. However, the peak onweekday mornings is earlier than that on weekend mornings andthe peak on weekday evenings is later. Conversely, peak hours atweekends are closer and the demand is more evenly distributed inthe daytime.
3.3.4 Meteorological Features. We adopt Weather, Temperature,AQI, Wind speed and Wind direction as the meteorology features.Figure 5(e) depicts the correlation between weather and transportmode preference distributions. The demand for drive is higher onovercast and rainy days whereas the demand for bus on overcastdays is lower.
3.3.5 User Features. We construct user features based on users’Demographic attribute, Social attribute and User historical mode dis-tribution, as shown in Table 5. Figure 5(f) depicts the correlationbetween the age of users and the transport mode choices. We ob-serve that older people have higher demand for drive and taxi,whereas younger people prefer walk and bus more.
3.4 Transport Mode Preference RepresentationTransport mode preference representation aims to learn high ordercollaborative relationship among users, OD pairs, and transportmodes. The intuition is, users travelling similar OD pairs via similartransport modes have similar transport mode preference. Inspiredby the recent success of embedding methods [13, 18] on preservinglocal network structures, we construct a heterogeneous graph G =(V, E) of user nodes U, OD pair nodes OD and transport modenodesM based on the user behavior data (Figure 6). The target is toproject each node � 2 G into a low dimensional vector in the latentspace, each of which re�ects the neighborhood relationship (a.k.a.the second-order proximity) inG . We analogize random walks withthe constructed click events, where a click event is de�ned as a user
u clicked on a route in transport modem over a speci�c OD pairod . We adopt Trans2vec [15] and skip-gram [17] on G. Speci�cally,given a click event, the latent vectors of �u 2 U, �od 2 OD and�m
2 M, denoted as uu , uod , and um , are learned by maximizingthe following conditional log probability:
Ot =’t 2T
’�i 2V t
’ntj 2Nt (�i )
logp(ntj |�i ), (1)
where T = {u,od,m} is the type of nodes in G, and ntj 2 N
t(�i )
is the type aware context node of �i ever co-occurred in a clickevent. That is, only heterogeneous neighbour nodes are consideredas valid context nodes. For example, for �i 2 U, we have N t
(�i ) ✓{OD,M}. p(ntj |�i ) is the conditional probability of observing typeaware neighborhood ntj 2 G conditioned on the presence of �i :
p(ntj |�i ) =
eu0j
|·ui
Õ |V t |k=1 e
u0k|·ui, (2)
where u0j is the context representation vector of�j as a context nodeand |V
t| is the number of nodes with type t in graph G. To reduce
the computation complexity, we employ negative sampling [17] fore�cient learning. The objective function becomes:
Ot = log� (u0j|· ui ) +
K’i=1
E� tn⇠Un (� t )[log� (�utn|· ui )], (3)
where � is the sigmoid function. The �rst term models observededges in click events whereas the second term draws K negativeedges from a uniform distribution. In this way, the distance betweenthe learned user (resp. OD) embedding and each transportationmode embedding re�ects the preference of a user (resp. OD) toeach transport mode. That is, those users (resp. ODs) having similartransportation mode preference should be close to each other inthe latent embedding space.
Applied Data Science Track Paper KDD ’19, August 4–8, 2019, Anchorage, AK, USA
2318

Drive
Bus
Bike
Walk
Bus + taxi-
…… …
!"#
!$#
!%#
!&#
!"'(
!$'(
!%'(
!)'(
Figure 6: An illustrative example of the heterogeneous trans-portation graph. Each edge indicates the frequency of a user�ui (resp. OD pair �odj ) clicking on a route of a speci�c trans-port mode.
3.5 Transportation RecommendationWe model the transport mode recommendation as a multi-classclassi�cation problem. Once the embedding vectors are learned,the proper transport mode can be derived by calculating the in-ner product of embedding vectors (as in [15]). In the productionenvironment, however, the embedding method su�ers from thecold-start problem. That is, 62.9% queries are from new users (i.e.,users migrate from other routing engines and new users of BaiduMaps) or target to new OD pairs (i.e., OD pairs which have not beenqueried by users). To handle such cases, we concatenate the learnedembedding vector of the user and the OD pair with the handcraftedfeatures (as in Section 3.3) into a d dimensional feature vector.
Given a preprocessed dataset of n instances,m transport modesand d feature dimensions, we transform the raw data into a 2Dmatrix D = {xi ,�i } where |D| = n, xi 2 R
d is the feature vectorand �i 2 R
M is the i-th transport mode. We employ the gradientboosting tree [8] as our recommendation model because gradientboosting tree based algorithms [3] are suited for data mining withsparse and high dimensional features. Speci�cally, we sequentiallygenerate a set of tree classi�ers F (·) = { f1(·), f2(·), . . . , fk (·)} andensemble the result of each classi�er to generate the overall predic-tive result.
�̂i = F (xi ) =k’j=1
fj (xi ), fj 2 F , (4)
where �̂i is the estimated transport mode of i-th instance, f (·) is asoftmax regressor for multi-class classi�cation:
f (xi ) =ew|q xi
Õ |M |
p=1 ew|p xi, (5)
where wq is the parameter vector of the q-th class. The learningobjective is to minimize
O =
n’i=i
l(�i , �̂i ) +�12
k’j
kwjk1 +�22
k’j
kwjk2, (6)
where l(·) is is the cross-entropy loss, �1 and �2 are hyper-parametersfor L1 and L2 regularizations, respectively.
The gradient of the tree function is derived much harder thantraditional optimization tasks. Since we train classi�ers sequen-tially, we approximate the gradient based on the previous step. The
objective at the t-th iteration becomes
eOi =n’i=1
(�i ft (xi )+12hi f
2t (xi ))+
�12
k’j
kwjk1+�22
k’j
kwjk2, (7)
where �i = @�̂t�1il(�i , �̂t�1i ) and hi = @2�̂t�1i
l(�i , �̂t�1i ) are the �rstorder and second order gradient statistics of l(·). The detailed de-duction can be found in [7].
4 DEPLOYMENTHydra has been deployed on Baidu Maps. In this section, we de-scribe the implementation and deployment details.
4.1 O�line ProcessingDue to the complex data dependency, we propose an automaticpipeline for data integration and feature engineering. We employBig�ow1 as the o�ine data pipeline platform. Big�ow is an opensource programming abstraction that allows for programming andprocessing data on various distributed computing engines (e.g.,Hadoop Tez [19] and Spark [35]). In Big�ow, a set of data wranglingoperators such asmap, f ilter and join is well supported and thelower level distributed operations are transparent to users.
4.1.1 Data pipeline. There are two components, data preprocessingand feature construction, in the data pipeline. In the data prepro-cessing phase, the user behavior data is appended on daily basis,the geographical data and user social data are updated on monthlybasis and the meteorological data is collected per hour. In the mid-night, each dataset is extracted from the log system of Baidu Mapsand related databases. All datasets are integrated as described inAppendix D. The integrated dataset is stored as a large fact table.In the feature construction phase, features are extracted from thefact table. For numerical features, we replace missing values witheither default values or the average value. Then we remove outliersand apply min-max normalization to scale the values into [0, 1].For categorical features, we consolidate the rare categories into the"Other" category and then apply one-hot encoding to each cate-gorical feature. Finally, all features and labels are combined intoa two dimensional array and all side information, such as columnmin-max values and feature dimensions, is stored in a meta-data�le.
4.1.2 Model Training. We use the XGBoost library2 to train therecommendation model. The recommendation model is updated ondaily basis to take new data into consideration. To exclude seasonalchanges, we de�ne a three-month sliding time window for trainingdata selection. Once the data pipeline is �nished, the model updatescript is triggered to update the model.
4.2 Online ProcessingBaiduMaps answers billions of queries in each day. Thus, it is crucialto o�er e�ective and scalable online service to users. To this end,we build e�cient region index and scalable web service frameworkto enable low latency and high throughput online service.
1http://big�ow.baidu.com2https://xgboost.readthedocs.io/en/latest/
Applied Data Science Track Paper KDD ’19, August 4–8, 2019, Anchorage, AK, USA
2319

4.2.1 Region Index. For online feature processing, a batch of sta-tistical features is required to be mapped from coordinates to re-gions (e.g., join the origin coordinates of a query with the regionalPOI distribution). Traditional spatial index, such as R-tree, requiresO(logn) search time, which is time consuming for cities with alarge number of regions. We proposed a dedicated region index tospeed up such mapping process. Speci�cally, we divide the city into�ne-grained grids based on coordinates with a unique grid id. Wethen allocate regions to the corresponding grids. Note that eachregion is an irregular polygon, therefore, a grid may be intersectedwith one or multiple regions. For example, the minimum boundingrectangle (MBR) [(116.30, 40.05), (116.31, 40.06)] is partitioned togrid �1, with id 11630_4005. If there are two regions r1 and r2 inter-sect with �1, the index in the database is stored as a key-value pair(11630_4005, [r1, r2]), where the value is a list of regions. Internally,the grid-regions pair is stored as a hash table in Redis. Since theregion is partitioned based on the road network, most grids areonly associated with one or a few regions. In practice, the averagetime cost of the mapping process is much lower than that of R-tree.
4.2.2 Web Service Framework. We build the web service based onBRPC (https://github.com/brpc/brpc), a scalable RPC frameworkused throughout Baidu. The model is duplicated in four data centersdistributed over China to reduce network latency of the service.Speci�cally, the online service contains three components. First,retrieve geographical information, meteorological data, user pro�ledata in parallel and integrate them with raw route plans. Second,execute the online feature engineering process by leveraging themetadata generated in the o�ine data pipeline. Third, feed theprocessed feature vector into the model, sort each mode by modelscore and return the transport mode with the highest score to theuser. About 6% of transport modes with the highest score haveno corresponding plan. Instead, we recommend the next transportmode that has a feasible plan.
5 EXPERIMENTS5.1 Experimental SetupWe conduct experiments on the datasets described in Section 2. Wemainly focus on (1) the overall performance of our approach, (2)each feature contribution and (3) the robustness of our approach.We also present the user satisfaction analysis and the e�ciencyand scalability of our system. We split data from September 1 toNovember 20 as training set and the remaining as testing set.
Metrics.We adopt the overall NDCG [29], weighted precision,recall and F1 metrics to evaluate the performance. The NDCG met-ric takes all transport modes into consideration whereas the restmetrics only care about the top-1 recommendation.
Baselines. We compare our approach with two statistical rec-ommendation methods and four learning based methods.
• UHP recommends the transportation mode of route usingthe fraction of user historical preference. The most commontransport mode choice of the user will be recommended.
• ODHP recommends the transportation mode of route usingthe fraction of OD historical preference. The most populartransport mode between the OD pair will be recommended.
Table 2: Overall recommendation performance.
B������
Algorithm N��� P��� R�� F1UHP 0.29 0.159 0.207 0.18ODHP 0.343 0.478 0.229 0.31LR 0.802 0.255 0.681 0.371RF 0.754 0.329 0.448 0.379LTR 0.798 0.258 0.673 0.373
Trans2vec 0.462 0.26 0.282 0.271Hydra 0.815 0.271 0.72 0.396
S�������
UHP 0.288 0.162 0.188 0.174ODHP 0.367 0.454 0.253 0.325LR 0.789 0.262 0.652 0.374RF 0.747 0.336 0.423 0.37LTR 0.794 0.265 0.653 0.377
Trans2vec 0.46 0.266 0.258 0.262Hydra 0.819 0.274 0.685 0.391
Table 3: Top-10 features ranked by information gain.
Rank Feature name Relative gain1 Walk ETA 12 Bus-cycle ETA 0.8033 Bus ETA 0.5774 Taxi-bus ETA 0.4515 User walk percentage 0.2956 Consumption level 0.2137 Origin station count 0.1628 Primary POI category 0.0969 Hour 0.09210 Spherical distance 0.051
• LR recommends the transportation mode of route via thewell-known logistic regression model. The input feature issame with our method as described in Section 3.3.
• RF recommends the transportation mode of route usingRandom Forest. The input feature is same to our method asdescribed in Section 3.3.
• LTR is a popular LambdaMart [2] learning to rank method,where the pairwise loss is minimized.We use the plan featuredescribed in Section 3.3 as input.
• Trans2vec is the state-of-the-art transportation mode rec-ommendation method [15] based on graph embedding. Itmakes recommendation based on the inner product of uservector and transportation mode vector and the inner productof OD pair vector and transportation mode vector.
5.2 Overall Recommendation ResultTable 2 depicts the overall results of our method and all the com-pared baselines with respect to four evaluation metrics. We canmake the following observations. (i) Hydra achieves better perfor-mance than six baselines over all metrics except P���. Althoughthe P��� of Hydra is worse than ODHP and RF, Hydra achievesbetter balance between P��� and R��, which is evaluated by F1. (ii)The performance of LR is only slightly worse compared withHydraand is competitive with LTR, which matches our expectation thatsituational context information and tailored feature engineering iscurial for multi-modal transportation recommendation. (iii) Theperformance of solely Trans2vec is not well on the dataset with
Applied Data Science Track Paper KDD ’19, August 4–8, 2019, Anchorage, AK, USA
2320

(a) Group by users (b) Group by OD pairs
Figure 7: Robustness check on the B������ dataset.
large proportion of cold-start users (resp. OD pairs). Overall, incor-porating handcrafted features and high-order embedding featureswith a gradient boosting tree model outperforms all other baselines.
5.3 Feature Importance AnalysisTo evaluate the e�ectiveness of feature construction, we rank fea-tures by information gain [16]. The higher information gain in-dicates higher frequency the feature used to split nodes in eachindividual tree. Table 3 reports top-10 features and their relative in-formation gain. The top 4 features are all plan ETA of correspondingmodes, which meets our expectation that travel time is the majorconsideration in the transport mode choice. Besides, we observeuser attributes especially user social attributes such as historicalmode preferences (walk preference in rank 5) and consumptionlevel (rank 6) also make signi�cant contribution for transport modeprediction. Features from rank 7 to rank 10 are spatial features andtemporal features, which validates our intuition that the spatial andtemporal dependency in�uences the transport mode choice.
5.4 Robustness CheckA robust algorithm should perform evenly on di�erent subgroupsof queries. We group queries from two perspectives: 1) user pro�leperspective, and 2) OD pro�le perspective. For 1), we segment usersthrough gender and age, i.e., women and age lower than 35, menand age lower than 35, women and age older than 35, men andage older than 35. For 2), we segment OD pairs based on regionfunctionality (i.e., we use the POI distribution of correspondingregions), classical K-means is applied to cluster OD pairs into fourdisjoint groups. Figure 7 illustrates the performance of our methodon di�erent subgroups on B������, the results on S������� aresimilar. For di�erent groups of users, the results are strongly stableon four metrics, which validates the robustness of our method fordi�erent users. For di�erent OD pairs, the results are also stable onfour metrics expect the third group (e.g., for R��, the di�erence isover 10%). This result indicates the variation from the OD pro�leperspective is more signi�cant, further optimization on the thirdgroup can be applied in future to improve the overall performance.
5.5 User InterviewThe model has been deployed on Baidu Maps since mid 2018. Inpast months, the model has answered over a hundred million routeplanning requests and served over ten million distinct users. Toassess the user satisfaction of model recommendations, we pub-lished survey questionnaires to frequent Baidu Maps users. Overall,
�������
������
����
����
�����
(a) User satisfaction (b) Latency
Figure 8: Results of the online service.
738 valid questionnaires are collected. In the questionnaire, we set�ve level satisfaction categories, G+,G, S,B,B+, where G standsfor good, S stands for same as before, B stands for bad. As shownin Figure 8(a), over 86.7% users think the recommendation resultis better than before, and only 1.6% users think the recommen-dation result becomes worse. That is, our method provides betterrecommendations in terms of user experience.
5.6 E�ciency and ScalabilityWe further evaluate the query response latency of our frameworkin the production environment. The query response latency is com-posed of two parts, low level routing cost and high level recommen-dation cost. As reported in Figure 8(b), when we vary the queryper second (QPS) from 1 to 10, 000, the low level routing latencyincreased from 220ms to 671ms, whereas the high level recommen-dation latency increased from 5ms to 274ms. Overall, the low levelrouting is the major bottleneck and can be further optimized. Notethat the peak QPS of the online service is less than 1, 000, the onlineworkload thus can be well handled by our system.
6 RELATEDWORKRoute recommendation. Route recommendation has attractedmuch attention from both the academia (e.g., [1, 28]) and industries(e.g., Google Maps and Baidu Maps). A common routine of routerecommendation is to apply the algorithms of shortest distancequeries [9] with prede�ned cost functions [21]. As another impor-tant direction, the quality of recommended routes can be improvedby leveraging large-scale historical trajectories [36]. Speci�cally,T-Drive [33] captures the intelligence of taxi drivers via a landmarkgraph. Dai et al. [4] recommends routes by considering personalpreference (e.g., time e�ciency or fuel e�ciency) for each individ-ual driver. Zhou et al. [37] proposes a “semi-lazy" approach for pathprediction. Recently, the route recommendation for shared mobil-ity also attracted research interest to improve e�ciency [27] andrevenue [24–26]. However, all of them consider uni-modal route rec-ommendations and thus cannot be directly applied for multi-modalroute recommendation. Trans2vec [15] considers multi-modal rec-ommendation by learning embedding of users, OD pairs and trans-port modes. But it su�ers from the cold-start problem and requiresextra models or strategies to handle new instances.
Urban computing. With the development of city urbanization,various data generated from GPS, sensors, buildings and humanshas been applied to tackle various urban issues. For example, Yiet al. [31] and Yu et al. [32] predict urban safety by considering
Applied Data Science Track Paper KDD ’19, August 4–8, 2019, Anchorage, AK, USA
2321

multiple spatial and temporal factors. Moreover, Tong et al. [23] andXia et al. [30] predicts taxi demands based on multi-sourced urbandata. Sun et al. [20] mines the urban region-of-interest throughmap search queries. As another example, Zhu et al. [38] capturesuser preferences for mobile recommendation. Motivated by abovestudies, we integrate multiple urban datasets to improve the perfor-mance of route recommendation among various transport modes.To the best of our knowledge, it is the �rst work that integratesmultiple sources of urban data for route recommendation amongvarious transport modes in a data-driven way at urban-scale.
7 CONCLUSIONIn this paper, we presented Hydra, a personalized and context-aware multi-modal transportation recommendation system. It is atwo-level system that adaptively recommends uni-modal and multi-modal transportation routes according to the user preferences andthe situational context. We �rst extracted a rich set of features fromuser behavior data and several urban data collected from othersources. Next, we learnt embedding features via the heterogeneoustransportation graph to enhance the recommendation performance.Moreover, a gradient boosting tree based model was devised formulti-modal transportation recommendation. Finally, we discussedseveral deployment issues to optimize Hydra to be scalable, includ-ing o�ine data pipelines, high performance spatial index, as well asthe construction of web service framework. Extensive evaluationson real-world datasets validate the e�ectiveness and e�ciency ofHydra. More importantly, Hydra has been deployed to Baidu Maps,one of the largest online map services, and has answered over ahundred million route recommendation queries made by over tenmillion distinct users.
ACKNOWLEDGMENTSWe would like to thank the Zhixing team of Baidu Maps for theirvaluable help and collaboration in the deployment process. YongxinTong’s work is partially supported by National Science Foundationof China (NSFC) under Grant No. 61822201.
REFERENCES[1] Hannah Bast, Daniel Delling, Andrew Goldberg, Matthias Müller-Hannemann,
Thomas Pajor, Peter Sanders, Dorothea Wagner, and Renato F Werneck. 2016.Route planning in transportation networks. In Algorithm engineering. Springer,19–80.
[2] Chris J.C. Burges. 2010. From RankNet to LambdaRank to LambdaMART: AnOverview. Technical Report.
[3] Tianqi Chen and Carlos Guestrin. 2016. Xgboost: A scalable tree boosting system.In SIGKDD. ACM, 785–794.
[4] Jian Dai, Bin Yang, Chenjuan Guo, and Zhiming Ding. 2015. Personalized routerecommendation using big trajectory data. In ICDE. 543–554.
[5] Daniel Delling, Julian Dibbelt, Thomas Pajor, Dorothea Wagner, and Renato FWerneck. 2012. Computing and evaluating multimodal journeys. KIT, Fakultät fürInformatik.
[6] Julian Dibbelt et al. 2016. Engineering Algorithms for Route Planning in Multi-modal Transportation Networks. Transportation (2016).
[7] Jerome Friedman, Trevor Hastie, Robert Tibshirani, et al. 2000. Additive logisticregression: a statistical view of boosting. The annals of statistics 28, 2 (2000),337–407.
[8] Jerome H Friedman. 2002. Stochastic gradient boosting. Computational Statistics& Data Analysis 38, 4 (2002), 367–378.
[9] Liping Fu, D Sun, and Laurence R Rilett. 2006. Heuristic shortest path algorithmsfor transportation applications: state of the art. Computers & Operations Research33, 11 (2006), 3324–3343.
[10] Kenneth Gade. 2010. A non-singular horizontal position representation. Thejournal of navigation 63, 3 (2010), 395–417.
[11] Robert Geisberger, Peter Sanders, Dominik Schultes, and Daniel Delling. 2008.Contraction hierarchies: Faster and simpler hierarchical routing in road networks.In International Workshop on Experimental and E�cient Algorithms. 319–333.
[12] Andrew V Goldberg and Chris Harrelson. 2005. Computing the shortest path:A search meets graph theory. In Proceedings of the sixteenth annual ACM-SIAMsymposium on Discrete algorithms. 156–165.
[13] Aditya Grover and Jure Leskovec. 2016. node2vec: Scalable Feature Learning forNetworks. In SIGKDD.
[14] Yuxuan Liang, Songyu Ke, Junbo Zhang, Xiuwen Yi, and Yu Zheng. 2018. Geo-MAN: Multi-level Attention Networks for Geo-sensory Time Series Prediction..In IJCAI. 3428–3434.
[15] Hao Liu, Ting Li, Renjun Hu, Yanjie Fu, Jingjing Gu, and Hui Xiong. 2019. JointRepresentation Learning for Multi-Modal Transportation Recommendation. InAAAI.
[16] Gilles Louppe, Louis Wehenkel, Antonio Sutera, and Pierre Geurts. 2013. Un-derstanding variable importances in forests of randomized trees. In Advances inneural information processing systems. 431–439.
[17] Tomas Mikolov, Ilya Sutskever, Kai Chen, Greg S Corrado, and Je� Dean. 2013.Distributed representations of words and phrases and their compositionality. InAdvances in neural information processing systems. 3111–3119.
[18] Bryan Perozzi, Rami Al-Rfou, and Steven Skiena. 2014. DeepWalk: online learningof social representations. In SIGKDD.
[19] Bikas Saha, Hitesh Shah, Siddharth Seth, Gopal Vijayaraghavan, Arun Murthy,and Carlo Curino. 2015. Apache tez: A unifying framework for modeling andbuilding data processing applications. In SIGMOD. ACM, 1357–1369.
[20] Ying Sun, Hengshu Zhu, Fuzhen Zhuang, Jingjing Gu, and Qing He. 2018. Ex-ploring the urban region-of-interest through the analysis of online map searchqueries. In SIGKDD. ACM, 2269–2278.
[21] Robert J Szczerba, Peggy Galkowski, Ira S Glicktein, and Noah Ternullo. 2000.Robust algorithm for real-time route planning. IEEE Trans. Aerospace Electron.Systems 36, 3 (2000), 869–878.
[22] Niraj Tolia, David G Andersen, and Mahadev Satyanarayanan. 2006. Quantifyinginteractive user experience on thin clients. Computer 3 (2006), 46–52.
[23] Yongxin Tong, Yuqiang Chen, Zimu Zhou, Lei Chen, Jie Wang, Qiang Yang,Jieping Ye, and Weifeng Lv. 2017. The Simpler The Better: A Uni�ed Approachto Predicting Original Taxi Demands based on Large-Scale Online Platforms. InSIGKDD. 1653–1662.
[24] Yongxin Tong, Jieying She, Bolin Ding, Libin Wang, and Lei Chen. 2016. Onlinemobile Micro-Task Allocation in spatial crowdsourcing. In ICDE. 49–60.
[25] Yongxin Tong, Libin Wang, Zimu Zhou, Lei Chen, Bowen Du, and Jieping Ye.2018. Dynamic Pricing in Spatial Crowdsourcing: A Matching-Based Approach.In SIGMOD. 773–788.
[26] Yongxin Tong, Libin Wang, Zimu Zhou, Bolin Ding, Lei Chen, Jieping Ye, and KeXu. 2017. Flexible Online Task Assignment in Real-Time Spatial Data. PVLDB 10,11 (2017), 1334–1345.
[27] Yongxin Tong, Yuxiang Zeng, Zimu Zhou, Lei Chen, Jieping Ye, and Ke Xu. 2018.A Uni�ed Approach to Route Planning for Shared Mobility. PVLDB 11, 11 (2018),1633–1646.
[28] Sibo Wang, Wenqing Lin, Yi Yang, Xiaokui Xiao, and Shuigeng Zhou. 2015.E�cient route planning on public transportation networks: A labelling approach.In SIGMOD. 967–982.
[29] Yining Wang, Liwei Wang, Yuanzhi Li, and Di He. 2013. A theoretical analysis ofNDCG ranking measures. In COLT.
[30] Yuan Xia, Jingbo Zhou, Jingjia Cao, Yanyan Li, Fei Gao, Kun Liu, Haishan Wu,and Hui Xiong. 2018. Intent-Aware Audience Targeting for Ride-Hailing Service.In ECML. Springer, 136–151.
[31] Fei Yi, Zhiwen Yu, Fuzhen Zhuang, Xiao Zhang, and Hui Xiong. 2018. AnIntegrated Model for Crime Prediction Using Temporal and Spatial Factors. InICDM. 1386–1391.
[32] Zhiwen Yu, Fei Yi, Qin Lv, and Bin Guo. 2018. Identifying on-site users for socialevents: Mobility, content, and social relationship. IEEE Transactions on MobileComputing 17, 9 (2018), 2055–2068.
[33] Jing Yuan, Yu Zheng, Chengyang Zhang, Wenlei Xie, Xing Xie, Guangzhong Sun,and Yan Huang. 2010. T-drive: driving directions based on taxi trajectories. InSIGSPATIAL. ACM, 99–108.
[34] Nicholas Jing Yuan, Yu Zheng, and Xing Xie. 2012. Segmentation of urban areasusing road networks. MSR-TR-2012–65, Tech. Rep. (2012).
[35] Matei Zaharia, Mosharaf Chowdhury, Tathagata Das, Ankur Dave, Justin Ma,Murphy McCauley, Michael J Franklin, Scott Shenker, and Ion Stoica. 2012. Re-silient distributed datasets: A fault-tolerant abstraction for in-memory clustercomputing. In NSDI. USENIX Association, 2–2.
[36] Yu Zheng. 2015. Trajectory data mining: an overview. TIST 6, 3 (2015), 29.[37] Jingbo Zhou, Anthony KH Tung, Wei Wu, and Wee Siong Ng. 2013. A “semi-lazy”
approach to probabilistic path prediction in dynamic environments. In SIGKDD.ACM, 748–756.
[38] Hengshu Zhu, Enhong Chen, Hui Xiong, Kuifei Yu, Huanhuan Cao, and JileiTian. 2015. Mining mobile user preferences for personalized context-awarerecommendation. TIST 5, 4 (2015), 58.
Applied Data Science Track Paper KDD ’19, August 4–8, 2019, Anchorage, AK, USA
2322
A EXTENDED DATA DESCRIPTIONWe �rst introduce three kinds of user behavior data in detail, includequery record, display record and click record.
• Query record. A query record consists of a session ID, ananonymized user ID, a time stamp, the coordinates and thePOIs of the origin o and the destination d , and the operatingsystem of the device. For example, [si ,ui , “2018� 09� 01 15 :15 : 36”, (116.30, 40.05), (116.353, 39.99), “Baidu Buildin�”,“Beihan�Uni�ersit�”, “IOS”]means a userui makes a queryon a trip from Baidu Building to Beihang University in theafternoon of September 1st, 2018.
• Display record.A display record consists of a session ID, ananonymized user ID, a time stamp and a list of routes. Eachroute consists of the transport mode, the estimated routedistance, the estimated time of arrival (ETA), the estimatedprice and the rank in the display list. The number of displayedroutes varies across queries, and there can be no feasibleroutes for certain queries.
• Click record. A click record consists of a session ID, ananonymized user ID, a time stamp, and a list of clicked routesin the route list. There can be none or multiple clicks on aroute.We only record the �rst click on each route and removerepeated clicks.
Then we present three kinds of geographical data in detail, in-clude POI data, road network data and transportation station data.
• POI data. Semantics in POIs indicate the travel intentionand have been applied for various urban computing tasks[14]. Our POI dataset contains 1, 204, 344 distinct POIs inB������ and 1, 594, 684 distinct POIs in S�������. Each POIrecord has a POI ID, an ascendant POI ID, coordinates ofthe location, the POI name and a two-level category. Theascendant POI is the higher level POI of the current POI.For example, "Baidu building" is the ascendant of "Baidubuilding tower 2". To enrich the POI semantics, we mapuninformative POI categories such as "Entrance" and "DoorAddress" to the ascendant POI categories. The two-levelcategory has a primary category and a secondary category.For example, "Education" is a primary category whereas"University" is one of its secondary categories. There are 18primary categories and 189 secondary categories in the POIdataset.
• Road network data. Road network data help to capture re-gional tra�c capability. Each record of road network consistsof a unique road segment ID, the start location coordinates,the end location coordinates, the road length and the levelof the road segment. There are eight levels of road segments.For instance, the national highway is with the highest leveland the pedestrian path is with the lowest level.
• Transportation station data. The distribution of trans-portation stations also in�uences user preferences on trans-portation modes. For regions with few bus stations, taxismight be preferred. Each record of transportation stationdata consists of a unique station ID, coordinates of the sta-tion location, a list of bus lines across the station and thecorresponding city code.
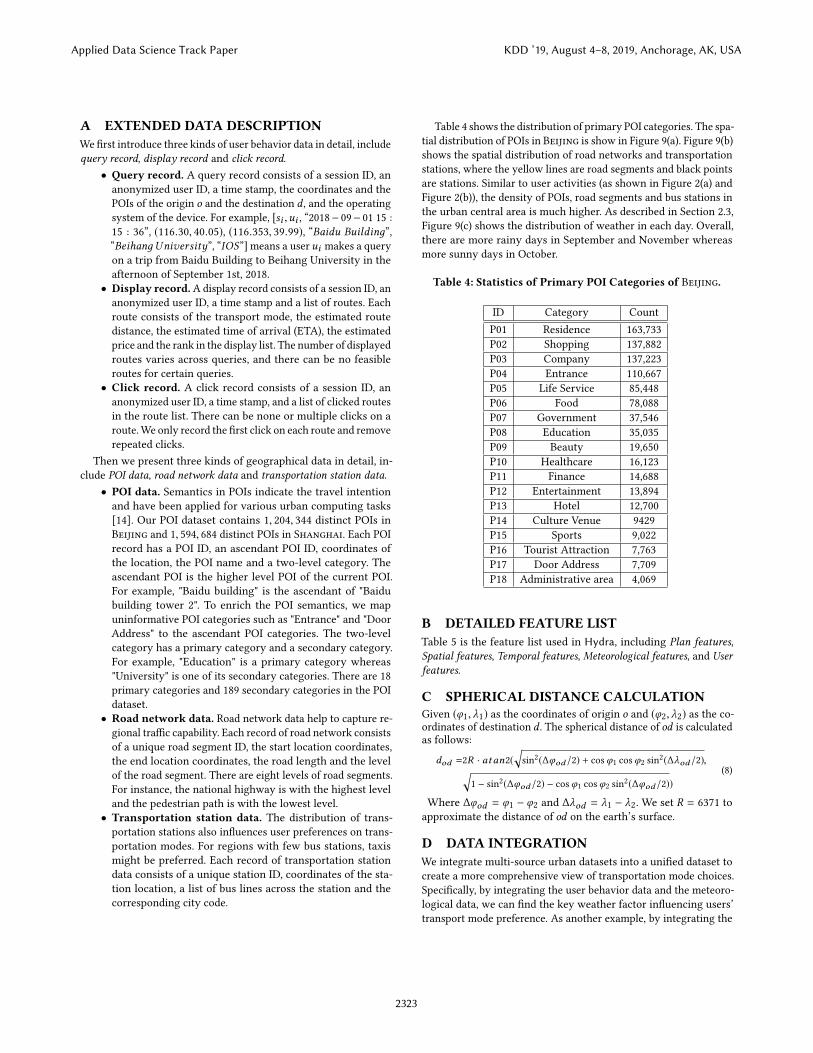
Table 4 shows the distribution of primary POI categories. The spa-tial distribution of POIs in B������ is show in Figure 9(a). Figure 9(b)shows the spatial distribution of road networks and transportationstations, where the yellow lines are road segments and black pointsare stations. Similar to user activities (as shown in Figure 2(a) andFigure 2(b)), the density of POIs, road segments and bus stations inthe urban central area is much higher. As described in Section 2.3,Figure 9(c) shows the distribution of weather in each day. Overall,there are more rainy days in September and November whereasmore sunny days in October.
Table 4: Statistics of Primary POI Categories of B������.
ID Category CountP01 Residence 163,733P02 Shopping 137,882P03 Company 137,223P04 Entrance 110,667P05 Life Service 85,448P06 Food 78,088P07 Government 37,546P08 Education 35,035P09 Beauty 19,650P10 Healthcare 16,123P11 Finance 14,688P12 Entertainment 13,894P13 Hotel 12,700P14 Culture Venue 9429P15 Sports 9,022P16 Tourist Attraction 7,763P17 Door Address 7,709P18 Administrative area 4,069
B DETAILED FEATURE LISTTable 5 is the feature list used in Hydra, including Plan features,Spatial features, Temporal features, Meteorological features, and Userfeatures.
C SPHERICAL DISTANCE CALCULATIONGiven (�1, �1) as the coordinates of origin o and (�2, �2) as the co-ordinates of destination d . The spherical distance of od is calculatedas follows:
dod =2R · atan2(qsin2(��od /2) + cos�1 cos�2 sin2(��od /2),q
1 � sin2(��od /2) � cos�1 cos�2 sin2(��od /2))(8)
Where ��od = �1 � �2 and ��od = �1 � �2. We set R = 6371 toapproximate the distance of od on the earth’s surface.
D DATA INTEGRATIONWe integrate multi-source urban datasets into a uni�ed dataset tocreate a more comprehensive view of transportation mode choices.Speci�cally, by integrating the user behavior data and the meteoro-logical data, we can �nd the key weather factor in�uencing users’transport mode preference. As another example, by integrating the
Applied Data Science Track Paper KDD ’19, August 4–8, 2019, Anchorage, AK, USA
2323

(a) POI distribution. (b) Road network and station distribution. (c) Weather distribution.
Figure 9:More distributions of theB������ dataset: (a) the distribution of POIs; (b) the distribution of roadnetworks and stations;(c) the distribution of weather
Table 5: The Description of features.
Feature Type Feature Description
Plan
Road network distance The length of the planned route on the road networkPrice The total cost of the planETA The estimated time of arrival (ETA) of the planTransfer count The number of transfers of the planTransport mode count The number of transport modes used in the plan
Spatial
District The administrative district which the origin and destination belongs toPOI category The primary and secondary category of the POISpherical distance The spherical distance between the OD pairStation distance Spherical distances of top-k nearest bus stations from the O/D locationStation count The number of bus stations in the O/D regionRegional POI distribution The distribution of two level POI category of corresponding O/D regionRegional road network distribution The number of road segment and road intersection in the O/D regionRegional bus line count The number of bus line cross the O/D regionRegional historical mode distribution The mode preference distribution of O/D/OD region
Temporal
Hour The corresponding time period in a dayMinute The corresponding minute binDay of week The ordinal number of the day in a weekDay of month The ordinal number of the day in a monthWorkday Whether the day is a workday
Meteorological
Weather The weather in current time periodTemperature The temperature and statistics (i.e., highest/lowest temperature) in current dayAQI The AQI and AQI statistics (i.e., highest/lowest AQI) in current dayWind speed The wind speed in current time periodWind direction The wind direction in current time period
UserDemographic attribute The age, gender of the user and OS in useSocial attribute The education level, industry type, car type and consumption levelUser historical mode The mode preference distribution of the user
user behavior data and POI data, we can analyze the relationshipbetween transport modes and travel intention.
We use the �OIN operator to integrate all datasets together. We�rst join user queries, display and click records on the session ID.Since each query contains an origin and a destination, we furtherjoin the origin and the destination with the POI data through loca-tion coordinates and POI names. Note that in map search queries,91% origins are "current locations", which do not have explicit POI
names. For such origins, we associate the coordinates with thenearest POI. Besides, the meteorological data is in district level.Therefore, we join the origin and the destination with the mete-orological record if the coordinates located in the correspondingdistrict. We crawl the polygon of each district as a preprocessingstep and then join the original and destination with the meteorolog-ical record if the coordinates located in the corresponding district.Finally, we join the above data with user pro�le data through userIDs.
Applied Data Science Track Paper KDD ’19, August 4–8, 2019, Anchorage, AK, USA
2324