robust g2 pausing of adult stem cells in hydra
TRANSCRIPT
Hydra stem cells Buzgariu et al. Differentiation (2014)
1
Robust G2 pausing of adult stem cells in Hydra Wanda BUZGARIU1, Marco CRESCENZI2 and Brigitte GALLIOT1 * 1 Department of Genetics and Evolution, University of Geneva, Sciences III, 30 Quai Ernest Ansermet, CH-1211 Geneva 4, Switzerland. 2 Health Institute, Roma, Italy. * corresponding author: tel: 41 22 379 67 74; e-mail: [email protected] http://dx.doi.org/10.1016/j.diff.2014.03.001
Key words: flow cytometry method, epithelial stem cells, interstitial stem cells, G2 pausing, cell cycling, AEP_cnnos1 and AEP_Icy1 transgenic Hydra
Abbreviations ASCs: Adult Stem Cells; BLI: BrdU-labeling index; BrdU: 5-bromo-2’-deoxyuridine; CV: coefficient of variation; DM: Dissociation Medium; eGFP: enhanced Green Fluorescent Protein; ESCs: Embryonic Stem Cells; FC: Flow Cytometry; FSC: forward scatter; HS: Heat-shock; IPs: Interstitial Progenitors; ISCs: Interstitial Stem Cells; MECs: Myoepithelial Cells; NDZ: nocodazole; PI: Propidium Iodide; SCs: Stem Cells; SSC: side scatter
ABSTRACT Hydra is a freshwater hydrozoan polyp that constantly renews its two tissue layers thanks to three distinct stem cell populations that cannot replace each other, epithelial ectodermal, epithelial endodermal, and multipotent interstitial. These adult stem cells, located in the central body column, exhibit different cycling paces, slow for the epithelial, fast for the interstitial. To monitor the changes in cell cycling in Hydra, we established a fast and efficient flow cytometry procedure, which we validated by confirming previous findings, as the Nocodazole-induced reversible arrest of cell cycling in G2/M, and the mitogenic signal provided by feeding. Then to dissect the cycling and differentiation behaviors of the interstitial stem cells, we used the AEP_cnnos1 and AEP_Icy1 transgenic lines that constitutively express GFP in this lineage. For the epithelial lineages we used the sf-1 strain that rapidly eliminates the fast cycling cells upon heat-shock and progressively becomes epithelial. This study evidences similar cycling patterns for the interstitial and epithelial stem cells, which all alternate between the G2 and S-phases traversing a minimal G1-phase. We also found interstitial progenitors with a shorter G2 that pause in G1/G0. At the animal extremities, most cells no longer cycle, the epithelial cells terminally differentiate in G2 and the interstitial progenitors in G1/G0. At the apical pole ~80% cells are post-mitotic differentiated cells, reflecting the higher density of neurons and nematocytes in this region. We discuss how the robust G2 pausing of stem cells, maintained over weeks of starvation, may contribute to regeneration.
INTRODUCTION The freshwater Hydra polyp, which belongs to Cnidaria, is characterized by a highly dynamic growth state and an amazing regenerative potential, providing a classical model system to study the maintenance of a dynamic homeostasis and the regulation of regeneration (Steele, 2002; Bosch, 2007; Galliot and Ghila, 2010). Hydra has a relatively simple anatomy, basically a tube, with at the apical pole a more complex structure named head, formed by the mouth/anus opening surrounded by a dome (the hypostome) and a ring of tentacles that capture the food and defend against preys (Fig.1A). At the other extremity, the basal disc secretes some mucus that allows the polyps to attach to surfaces. Two epithelial layers, the ectoderm and the endoderm separated by an extracellular matrix called mesoglea compose the animal’s wall. All cell types in Hydra derive from three distinct adult stem cell (ASC) populations (Fig.1B), ectodermal epithelial, endodermal epithelial and interstitial, located along the central body column where they continuously self-renew (David and Plotnick, 1980; Bosch, 2009; David, 2012; Hobmayer et al., 2012). However the epithelial cells are quite unusual as they self-renew as differentiated myo-epithelial cells (MECs), whereas the interstitial stem cells (ISCs) appear as classical undifferentiated multipotent cells, producing germ cells (Nishimiya-Fujisawa and Kobayashi, 2012), but also progenitors for a variety of
somatic cells as gland cells, neurons, mechano-sensory cells named nematocytes (or cnidocytes) (David and Murphy, 1977; Holstein and David, 1990b; Bode, 1996; David, 2012).
A large fraction of the interstitial progenitors migrate towards the extremities where they differentiate, while MECs get passively displaced and stop cycling when reaching the apical and basal poles. As a consequence the tentacles and the basal disc exclusively contain terminally differentiated cells, in G2 for the epithelial cells (Dubel et al., 1987; Dubel and Schaller, 1990), in G0 for the neurons, nematocytes and gland cells (Holstein, 1986; Holstein and David, 1990a; Technau and Holstein, 1996; Hager and David, 1997). The MECs cycle every three or four days with 25% cells in S-phase, whereas the ISCs cycle faster, roughly everyday (from 16 to 27 hours) with 50% cells in S-phase (David and Campbell, 1972; Campbell and David, 1974). Upon regular feeding, these ASCs produce an excess of cells that support budding, an asexual reproduction process whereby a new polyp grows from the parental body.
The classical methods applied to monitor the cycling behavior of Hydra MECs revealed some typical mitosis (90 minutes), a 12-15 hours S-phase, but also some unusual features as a very short G1-phase (60 minutes) and a rather long G2-phase, from 24 up to 72 hours (David and Campbell, 1972; Campbell and David, 1974).
Hydra stem cells Buzgariu et al. Differentiation (2014)
2
This last feature is quite uncommon for adult animal cells, where G2 duration is usually fixed and very short, and it was proposed that in Hydra the G2 interval would replace the G1 period (David and Campbell, 1972). Similarly the ISCs display a usual mitosis phase, but an unusual short G1-phase followed by a nine to 13 hour S-phase and a highly variable G2-phase, from six to 22 hours (Campbell and David, 1974; Holstein and David, 1990a). These data were deduced from determination of 3H-thymidine incorporation after gastric injection(s), evaluation of DNA content by microfluorimetry and counting of mitotic nuclei (Campbell and David, 1974; David and Gierer, 1974; Holstein and David, 1990a). Subsequently BrdU-labeling of cycling cells replaced these methods, offering the possibility to soak live animals either continuously or in a pulse-chase manner, and then detect proliferation patterns on whole mounts (Plickert and Kroiher, 1988; Holstein et al., 1991). Anti-BrdU immunostaining can also be performed on macerated tissues, facilitating the measurement of BrdU-labeling index (BLI) for any given cell type, possibly combined to mRNA in situ hybridization or additional immunodetection (Alexandrova et al., 2003; Gauchat et al., 2004; Lindgens et al., 2004; Miljkovic-Licina et al., 2007; Chera et al., 2009). However, BLI
measurements that rely on the manual counting of each cell type, are laborious and time-consuming.
By contrast, flow cytometry (FC) analysis of DNA-labeled cells offers an easier and faster alternative for investigating cell cycling, as this methodology allows the estimation of the different phases of the cell cycle, G0/G1, S, G2/M, based on their respective DNA content. Hence the cell cycle profiles are directly obtained from the measurements of the DNA content after stoechiometric labeling with propidium-iodide (PI). This method was applied to mammalian cells, in culture or in tumors (Ormerod, 2005), but also to invertebrate tissues as in daphnia (Gomez et al., 2001), mussel (Bihari et al., 2003), fly (Shcherbata et al., 2004), planaria (Hayashi et al., 2006; Kang and Sanchez Alvarado, 2009), or to non-animal cells as algae (Kadono et al., 2004), Dictyostelium (Kim et al., 2005) and plants (Leblanc et al., 2002). Here we applied flow cytometry (FC) to investigate the cycling behavior of Hydra stem cells.
A previous FC study had successfully monitored cell cycle modulations in Hydra (Ulrich and Tarnok, 2005). However this procedure relies on a tissue dissociating technique that is not optimized for low amount of tissue. Therefore
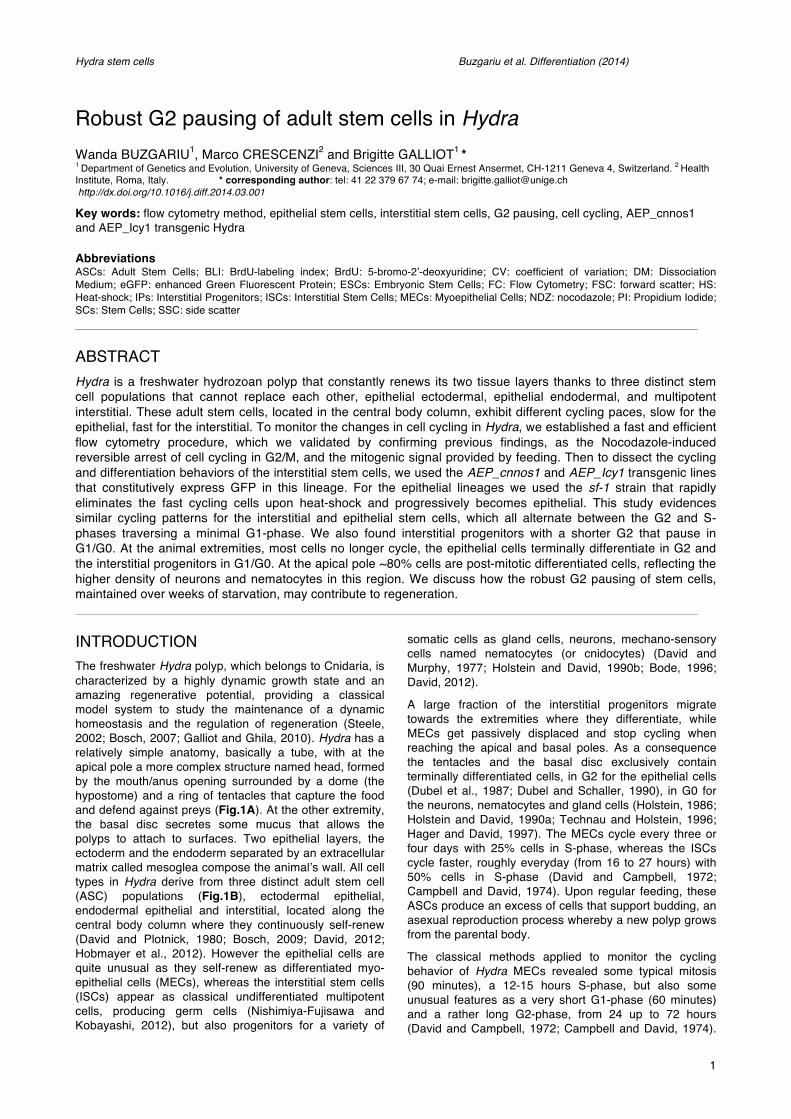
Figure 1: Flow Cytometry (FC) procedure to measure DNA content in Hydra cells A) Anatomy of the Hydra polyp. The bisection levels used in this study to compare the apical, gastric and basal regions are indicated. B) Scheme depicting the three Hydra stem cell populations and corresponding cell lineages. Reproduced with permission from Galliot et al. Sem Cell Dev Biol 2006. C) Broken cells and nuclei obtained after tissue dissociation. The Hoechst (blue) and Mitotracker (red) stainings evidence the remaining cytoplasm attached to the nuclei. Large nuclei belong to epithelial cells (ep), small nuclei to nematoblasts (nb), moon shape nuclei frequently associated with the nematocyst capsule to nematocytes (nc). D) FC analysis of the cell cycle profile in Hm_sf-1 maintained at 18°C after the elimination of debris and cell clumps by gating the events based on their size (FSC versus SSC), and the elimination of the doublets located outside the marked R1 region. The cell cycle profile of the R1-gated events are shown in the third panel. E) Proportion of cell debris when FC analysis is performed on 1, 5, 10 or 50 Hydra.
Hydra stem cells Buzgariu et al. Differentiation (2014)
3
we first optimized a procedure that provides reliable results from limited amounts of tissue. Then we used a variety of Hydra strains to monitor the cycling activity of one or the other cell lineage, namely the AEP_Icy1 and AEP_cnnos1 transgenic strains that constitutively expresses eGFP in their interstitial cells (Khalturin et al., 2007; Hemmrich et al., 2012), and the thermosensitive sf-1 strain that becomes epithelial upon heat-shock (Sugiyama and Fujisawa, 1978; Marcum et al., 1980). Thanks to this FC procedure, we were able to monitor along the Hydra body axis the cell cycle modulations induced by physiological or pharmacological agents as starvation, feeding or nocodazole (NDZ) exposure, and deduce the DNA profiles of MECs, ISCs, but also interstitial progenitors (IPs), and terminally differentiated cells.
MATERIALS and METHODS Hydra culture, manipulations and drug treatments: H. vulgaris (Hv), H. magnipapillata (Hm), H. AEP (AEP) and H. oligactis (Ho) (Kawaida et al., 2010; Martinez et al., 2010) were used in this study from the following strains: Hv Basel, Hv Jussy (Geneva canton, unpublished), Hm-105, Hm_sf-1 (sf-1) (Sugiyama and Fujisawa, 1978), AEP wild-type, and two transgenic strains AEP_Icy1 and AEP_cnnos1 (Khalturin et al., 2007; Hemmrich et al., 2012). Hydra were mass-cultured at 18°C in Hydra Medium (HM: NaCl 1 mM, CaCl2 1 mM, KCl 0.1 mM, MgSO4 0.1 mM, Tris pH 7.6 1 mM) and fed five times a week. To induce depletion of interstitial cells, sf-1 polyps were heat-shocked for 48 hours at 28°C and returned to 18°C. To map cycling cells along the body axis, Hydra were transected at 80% and 35% providing the apical, gastric and basal regions (Fig.1A), which were immediately collected and processed. For Nocodazole
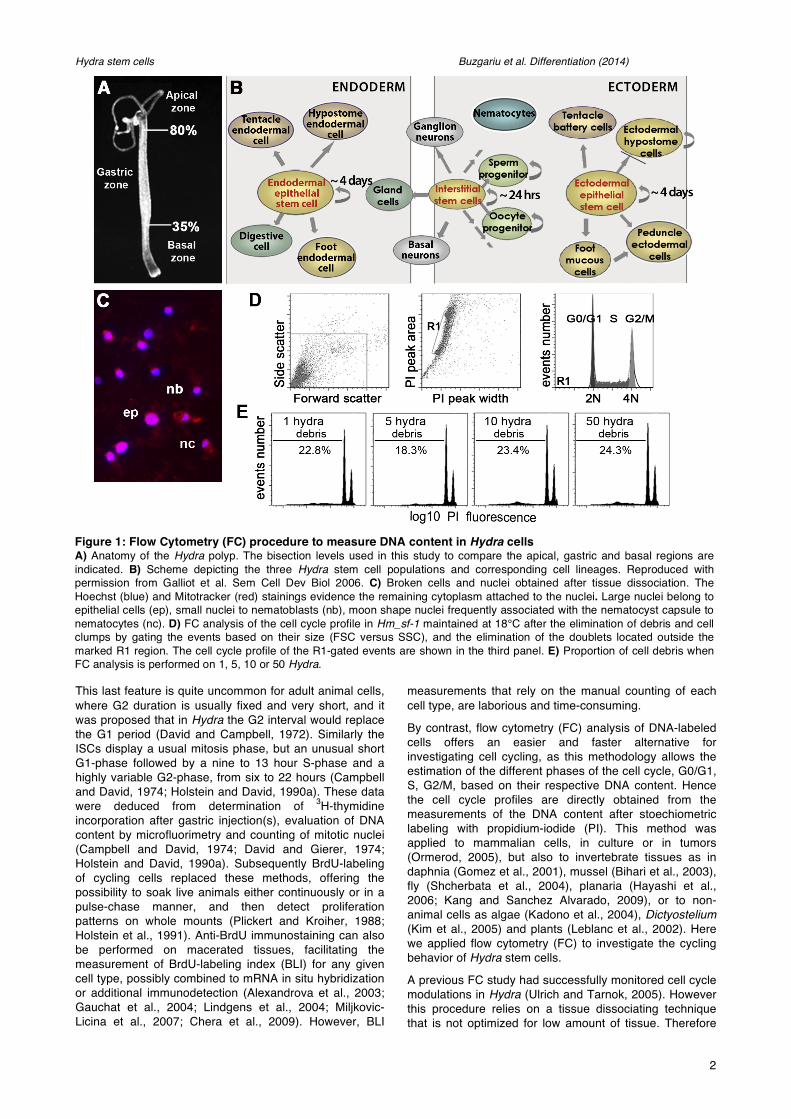
Figure 2: Regional differences of DNA profiles in starving Hydra A) Anatomy of the Hydra polyps used in this study: Hydra vulgaris (Hv) from Europe: Basel (Hv Basel, HvB), Geneva (Hv Jussy, HvJ), from Japan: H. magnipapillata (Hm) represented here by Hm-105 and the thermosensitive Hm_sf-1, from North America: AEP strain, and finally a distinct species, Hydra oligactis (Ho), characterized by a typical stalk morphology of the peduncle. Scale bar = 1 mm. B) DNA profiles in Ho, Hv and Hm animals maintained at 18°C, fed four times a week and starved for 32 hours. C) Prolonged starvation does not modify the overall DNA profiles, recorded here in Hv Jussy polyps (see also Fig.6C). D) DNA profiles recorded along the body axis of daily fed polyps from four distinct strains. For each condition four animals in quadruplicate were transected at 80% and 35% body length 32 hours after the last feeding, and the apical, basal and gastric regions were immediately collected for FC analysis. The mean values (± SD) were deduced from three independent experiments. Note the striking predominance of G0/G1 cells (~70%) in the apical region. E) DNA profiles along the body axis of Hv Jussy polyps starved up to 16 days.

Hydra stem cells Buzgariu et al. Differentiation (2014)
4
treatment (NDZ, Sigma, stock solution 1 mg/ml in DMSO), animals were exposed for 24 or 33 hours, washed in HM and processed as indicated. Live animals were photographed with an Olympus SZX10 stereomicroscope. Flow cytometry (FC) on propidium iodide (PI) stained nuclei: The conditions for cell disruption and nuclear labeling were optimized as in supplement S1. Animals or body fragments from one to five large budless polyps were digested in 50 µl trypsin-EDTA 0.05%, Hanks balanced buffer solution 150 mM for 5-7 min at 37°C. After transfer on ice, trypsin was inactivated by adding 20 µl fetal calf serum and, the cell suspension was adjusted to 5x 10⁵ cells/ml (maximum) by adding 430 µl hypertonic NP-40 buffer (PI 40 µg/ml, RNAse A 200 µg/ml, 0.5% NP-40 in PBS), cells were then stained for 30 min. The emitted fluorescence was measured on a FACSCalibur II System (Becton-Dickinson) using an argon-ion laser at 488 nm, together with the forward scattered (FSC) and side scattered (SSC) parameters. The emitted PI fluorescence was collected by a 585-nm bandpass filter in the FL2 channel. Typically data from 10’000 to 20’000 events per sample were collected using the CellQuest software, and analyzed with the FlowJo software (TreeStar Inc) after excluding debris, clumps (FSC versus SSC) and doublets (signal area FL2-A versus signal width FL2-W). A special gating is applied for the apical or whole Hydra samples (see Fig.S1C). The mathematical model applied to estimate the cell percentages in each phase of the cell cycle is based on the Watson model (Watson et al., 1987). Four to five replicates were done for each condition and each experiment was repeated at least twice. All the statistical analyses were done using the unpaired Student T-Test. FACS sorting of live GFP cells and PI staining: 80 transected body columns from AEP_wt or AEP_cnnos1 polyps were completely dissociated with 8 mg/ml pronase E (Sigma) in Dissociation Medium (DM: KCl 3.6 mM, CaCl2 6 mM, MgSO4 1.2 mM, sodium citrate 6 mM, sodium pyruvate 6 mM, glucose 6 mM, TES 12.5 mM) at 18°C with gentle agitation to provide a live cell suspension (Greber et al., 1992). Cells were then centrifuged at 100 g (5 min 4°C) and the supernatant was re-centrifuged at 300 g. After one wash in DM, the pellet was resuspended in DM and the cells sorted on a FACSAria flow cytometer based on their GFP fluorescence intensity. Sorted cells were centrifuged at 1’000 g, resuspended in NP-40 buffer, PI stained on ice for 30 min and analyzed on a FACSCalibur flow cytometer as above. FC on Draq5 stained live cells: Cells obtained from 20 intact polyps or transected body parts from AEP_wt or AEP_Icy1 strains after pronase dissociation were washed once in DM, resuspended in DM at 5x 10⁵ cells/ml, stained with Draq5 (Biostatus Limited, 20 µM final) for 30 min at room temperature, and analyzed on FACSCalibur II System. The GFP and Draq5 fluorescences were collected in the FL1 and FL3 channels (green filter 530 nm and red filter 670 nm filters respectively). At least 60’000 events per sample were analyzed as above. The DNA profiles of cells from region R1 and R2 were analyzed and represented after exclusion of doublets and debris. All tested FC procedures are summarized in supplement 2. Immunodetection: Cells obtained from Hydra macerated in acidic conditions (David, 1973), were fixed in PFA 4% 60 min, immunostained with anti-α-tubulin (1:1000, Sigma) or anti-GFP (1:400, Novus Biological) and counterstained with DAPI. The cell type distribution was deduced from counting at least 500 cells per sample on
an automatized Axioplan 2 (Zeiss). GFP-immunostained samples were analyzed on a LSM 700 Zeiss confocal microscope. For BrdU-detection (Chera et al., 2011), animals were incubated in 5 mM BrdU for 2 hours, fixed for 4 hrs in 4% PFA at RT, transferred in methanol and kept at -20°C ON, then serially rehydrated, denatured for 30 min in 2N HCl, blocked with 2% BSA, incubated overnight with the anti-BrdU antibody (Roche kit III, 1:20) and imaged on an Axioplan 2 Zeiss microscope. For anti-GFP (1:400, Novus Biological) immunodetection whole mount AEP_cnnos1 polyps were treated as above, but the HCl treatment was omitted. Nuclear DNA content measurement using DAPI fluorescence: Macerated tissues from AEP_Cnnos1 Hydra were immunostained for GFP and counterstained for DAPI as above. The nuclear fluorescence was then measured with a Zeiss AXIO Imager Z1m microscope equipped with an Axiocam MRm camera. The images were acquired with a 100x objective, deconvoluted with Volocity 6.3 software (Perkin Elmer) and the fluorescence was measured with Image J (http://rsb.info.nih.gov/ij/). The fluorescence intensity of nerve cells was used as standard for the diploid (2N) content.
RESULTS Conditions for high quality and accurate FC analysis in Hydra The FC procedure previously reported to measure DNA profiles in Hydra cells (Ulrich and Tarnok, 2005) relies on a rather complicated tissue disruption procedure and requires a high number of animals. To improve this procedure, we tested a series of tissue dissociating conditions and different methods of DNA labeling (Fig.S1). We found that the enzymatic digestion by trypsin-EDTA allows a complete dissociation of the tissue (Fig.1C), including the syncitial nematoblast clusters of 4, 8, 16 or 32 cells,. To measure the DNA content, the nuclei were PI stained (Krishan, 1975) in a hypertonic solution containing 0.5% NP40 detergent that disrupts the cell membranes as evidenced by the high proportion of isolated nuclei or broken cells (Fig.1C), and the very low proportion of cell clusters (Fig.1D, middle panel). Therefore, filtration after enzymatic digestion was not necessary before FC analysis.
The quality of DNA histograms was measured by the coefficient of variation (CV) across the G1 peak (Ormerod, 2005). Doublets and clumps were excluded by gating the acquired events in a cytogram that measured the width and the area of the PI signal (Fig.1D) after elimination of the debris. By combining trypsin dissociation with hypertonic-detergent PI staining, we obtained CV values lower than four, an acceptable value considering the multiple cell types present in the tested tissue. Next, we tested whether the number of cells in a given sample modifies the accuracy of the FC analysis. To address that question a variable number of Hydra was dissociated, from one up to 50, and the amount of cell debris was quantified. The fraction of cell debris did not vary significantly, representing less than 25% from the acquired events whatever the number of analyzed animals (Fig.1E). Therefore we considered that trypsin digestion combined to hypertonic PI staining provides a reliable method to measure with accuracy the cell cycle profiles in small fragments of tissue.
Hydra stem cells Buzgariu et al. Differentiation (2014)
5
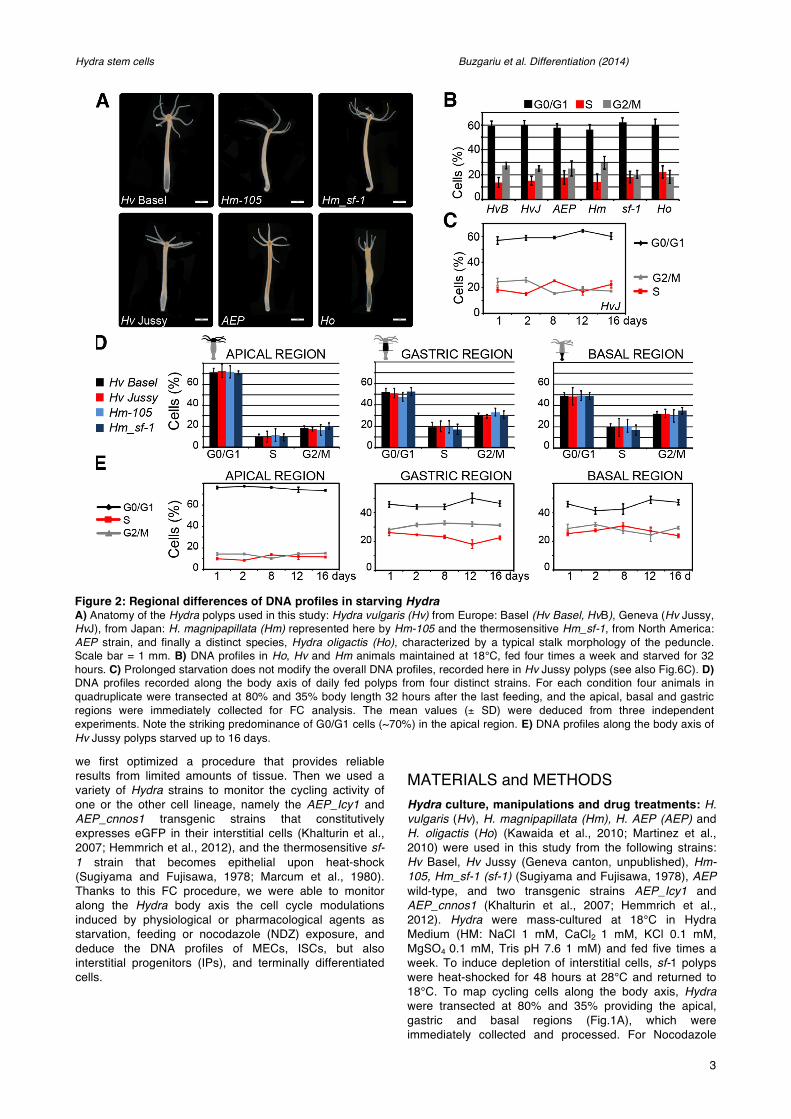
Figure 3: Nocodazole (NDZ) induces a reversible G2/M arrest in the cells of the Hydra body column A, A’) Toxicity of NDZ tested in Hm-105 polyps exposed for 24 (A) and 33 (A’) hours. Note the dose-dependent alterations, with shortening of the tentacles already visible after a 2 nM NDZ exposure, not detected in polyps exposed to 1.4 nM for 33 hours. Scale = 1 mm. B) DNA profiles of whole Hm_105 polyps exposed to NDZ at increasing concentrations for 12 or 24 hours. C-E) Cell cycle profiles in the apical (C), basal (D) or gastric (E) regions of Hm-105 polyps exposed for 24, 36 or 48 hours to NDZ. These regions were dissected immediately at the end of the treatment. Note the dramatic increase in G2/M cells in the gastric and basal regions already after 24 hours NDZ exposure. F) Cellular composition of Hydra body columns during and after a 33 hours NDZ treatment. Polyps were decapitated just before maceration, and three distinct categories of interstitial cells were counted: i) ISCs (black bars), ii) nematoblasts (Nb, red bars) as interstitial progenitors, and iii) gland cells (Gl), nerve cells (Nv) and nematocytes (Nc) as differentiated cells (grey bars). Each category was normalized on the total number of MECs. G) Detection of cell proliferation after two hours BrdU-labeling in control animals (left) or animals exposed to 1.4 nM NDZ for 33 hours. BrdU-labeling was performed either immediately after treatment (0-2 hrs, middle), or 6 hours later (6-8 hrs, right). H) Cycling profiles of gastric cells from Hm-105 polyps exposed to NDZ 1.4 nM for 33 hours and analyzed over six days after drug removal (see untreated condition in Fig. S3).
Hydra stem cells Buzgariu et al. Differentiation (2014)
6
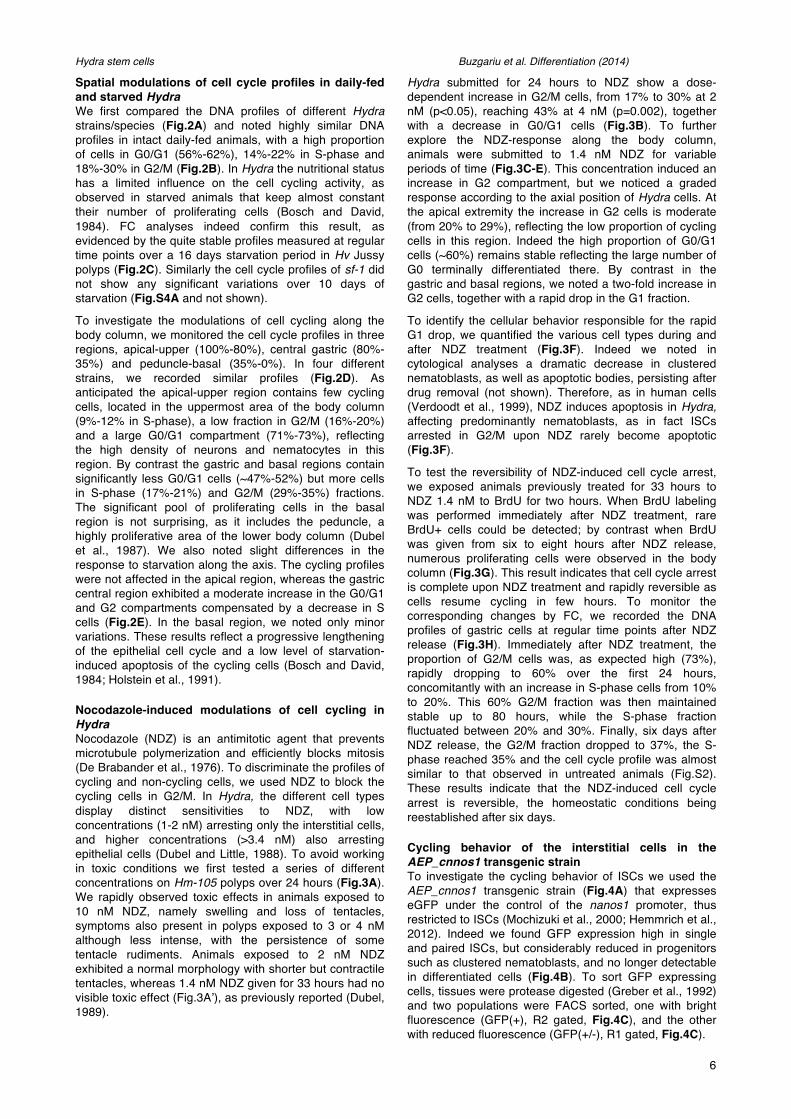
Spatial modulations of cell cycle profiles in daily-fed and starved Hydra We first compared the DNA profiles of different Hydra strains/species (Fig.2A) and noted highly similar DNA profiles in intact daily-fed animals, with a high proportion of cells in G0/G1 (56%-62%), 14%-22% in S-phase and 18%-30% in G2/M (Fig.2B). In Hydra the nutritional status has a limited influence on the cell cycling activity, as observed in starved animals that keep almost constant their number of proliferating cells (Bosch and David, 1984). FC analyses indeed confirm this result, as evidenced by the quite stable profiles measured at regular time points over a 16 days starvation period in Hv Jussy polyps (Fig.2C). Similarly the cell cycle profiles of sf-1 did not show any significant variations over 10 days of starvation (Fig.S4A and not shown).
To investigate the modulations of cell cycling along the body column, we monitored the cell cycle profiles in three regions, apical-upper (100%-80%), central gastric (80%-35%) and peduncle-basal (35%-0%). In four different strains, we recorded similar profiles (Fig.2D). As anticipated the apical-upper region contains few cycling cells, located in the uppermost area of the body column (9%-12% in S-phase), a low fraction in G2/M (16%-20%) and a large G0/G1 compartment (71%-73%), reflecting the high density of neurons and nematocytes in this region. By contrast the gastric and basal regions contain significantly less G0/G1 cells (~47%-52%) but more cells in S-phase (17%-21%) and G2/M (29%-35%) fractions. The significant pool of proliferating cells in the basal region is not surprising, as it includes the peduncle, a highly proliferative area of the lower body column (Dubel et al., 1987). We also noted slight differences in the response to starvation along the axis. The cycling profiles were not affected in the apical region, whereas the gastric central region exhibited a moderate increase in the G0/G1 and G2 compartments compensated by a decrease in S cells (Fig.2E). In the basal region, we noted only minor variations. These results reflect a progressive lengthening of the epithelial cell cycle and a low level of starvation-induced apoptosis of the cycling cells (Bosch and David, 1984; Holstein et al., 1991).
Nocodazole-induced modulations of cell cycling in Hydra Nocodazole (NDZ) is an antimitotic agent that prevents microtubule polymerization and efficiently blocks mitosis (De Brabander et al., 1976). To discriminate the profiles of cycling and non-cycling cells, we used NDZ to block the cycling cells in G2/M. In Hydra, the different cell types display distinct sensitivities to NDZ, with low concentrations (1-2 nM) arresting only the interstitial cells, and higher concentrations (>3.4 nM) also arresting epithelial cells (Dubel and Little, 1988). To avoid working in toxic conditions we first tested a series of different concentrations on Hm-105 polyps over 24 hours (Fig.3A). We rapidly observed toxic effects in animals exposed to 10 nM NDZ, namely swelling and loss of tentacles, symptoms also present in polyps exposed to 3 or 4 nM although less intense, with the persistence of some tentacle rudiments. Animals exposed to 2 nM NDZ exhibited a normal morphology with shorter but contractile tentacles, whereas 1.4 nM NDZ given for 33 hours had no visible toxic effect (Fig.3A’), as previously reported (Dubel, 1989).
Hydra submitted for 24 hours to NDZ show a dose-dependent increase in G2/M cells, from 17% to 30% at 2 nM (p<0.05), reaching 43% at 4 nM (p=0.002), together with a decrease in G0/G1 cells (Fig.3B). To further explore the NDZ-response along the body column, animals were submitted to 1.4 nM NDZ for variable periods of time (Fig.3C-E). This concentration induced an increase in G2 compartment, but we noticed a graded response according to the axial position of Hydra cells. At the apical extremity the increase in G2 cells is moderate (from 20% to 29%), reflecting the low proportion of cycling cells in this region. Indeed the high proportion of G0/G1 cells (~60%) remains stable reflecting the large number of G0 terminally differentiated there. By contrast in the gastric and basal regions, we noted a two-fold increase in G2 cells, together with a rapid drop in the G1 fraction.
To identify the cellular behavior responsible for the rapid G1 drop, we quantified the various cell types during and after NDZ treatment (Fig.3F). Indeed we noted in cytological analyses a dramatic decrease in clustered nematoblasts, as well as apoptotic bodies, persisting after drug removal (not shown). Therefore, as in human cells (Verdoodt et al., 1999), NDZ induces apoptosis in Hydra, affecting predominantly nematoblasts, as in fact ISCs arrested in G2/M upon NDZ rarely become apoptotic (Fig.3F).
To test the reversibility of NDZ-induced cell cycle arrest, we exposed animals previously treated for 33 hours to NDZ 1.4 nM to BrdU for two hours. When BrdU labeling was performed immediately after NDZ treatment, rare BrdU+ cells could be detected; by contrast when BrdU was given from six to eight hours after NDZ release, numerous proliferating cells were observed in the body column (Fig.3G). This result indicates that cell cycle arrest is complete upon NDZ treatment and rapidly reversible as cells resume cycling in few hours. To monitor the corresponding changes by FC, we recorded the DNA profiles of gastric cells at regular time points after NDZ release (Fig.3H). Immediately after NDZ treatment, the proportion of G2/M cells was, as expected high (73%), rapidly dropping to 60% over the first 24 hours, concomitantly with an increase in S-phase cells from 10% to 20%. This 60% G2/M fraction was then maintained stable up to 80 hours, while the S-phase fraction fluctuated between 20% and 30%. Finally, six days after NDZ release, the G2/M fraction dropped to 37%, the S-phase reached 35% and the cell cycle profile was almost similar to that observed in untreated animals (Fig.S2). These results indicate that the NDZ-induced cell cycle arrest is reversible, the homeostatic conditions being reestablished after six days.
Cycling behavior of the interstitial cells in the AEP_cnnos1 transgenic strain To investigate the cycling behavior of ISCs we used the AEP_cnnos1 transgenic strain (Fig.4A) that expresses eGFP under the control of the nanos1 promoter, thus restricted to ISCs (Mochizuki et al., 2000; Hemmrich et al., 2012). Indeed we found GFP expression high in single and paired ISCs, but considerably reduced in progenitors such as clustered nematoblasts, and no longer detectable in differentiated cells (Fig.4B). To sort GFP expressing cells, tissues were protease digested (Greber et al., 1992) and two populations were FACS sorted, one with bright fluorescence (GFP(+), R2 gated, Fig.4C), and the other with reduced fluorescence (GFP(+/-), R1 gated, Fig.4C).

Hydra stem cells Buzgariu et al. Differentiation (2014)
7
Figure 4: Cell cycle profiles of the interstitial cell lineage derivatives in the transgenic AEP_cnnos1 strain A) GFP immunodetection in transgenic AEP_cnnos1 polyps that express nanos::eGFP exclusively in interstitial stem cells (ISCs) (Hemmrich et al., 2012). Note the absence of fluorescence at the apical and basal extremities. B) Scheme depicting the differentiation pathway of the ectodermal interstitial derivatives and their level of GFP expression in AEP_cnnos1 polyps: high in single (1s) and paired (2s) ISCs (green background) and low (light-green background) in progenitors (PGs) and in synchronously dividing nematoblasts, represented by clusters of 4, 8 and 16 cells (4s, 8s, 16s). GFP is undetectable in post-mitotic differentiated cells as nerve cells or nematocytes. Nematocytes that can differentiate from clusters of any size are not depicted here. C) Flow cytometry sorting of the nanos::eGFP(+) and nanos::eGFP(+/-) cell populations gated in R2 and R1 respectively. Note the absence of the R2 and R1 gated populations in AEP-wt polyps. D, F) GFP fluorescence of the R2 (D) and R1 (F) sorted cells. Scale bar: 10 μm. E, G) Cell cycle profiles of the R2 (E) and R1 (G) cells. Note the high proportion of G2/M cells among the GFP(+) population (60%) compared to the GFP(+/-) one (32%). H, I) DNA content of the nanos::eGFP(+) and nanos::eGFP(+/-) cells measured on macerated tissues immunostained for GFP and DAPI labeled. DAPI fluorescence was measured and normalized over the DNA content of nerve cells that is 2N (G0). The cells with high GFP fluorescence include only 1s and 2s cells (H, left panel), whereas cells with low GFP fluorescence include 1s, 2s cells (H, middel panel) and clusters of nematoblasts (I). n: number of cells counted for each condition. Percentages are estimated values of the number of cells in G1, S and G2 in each panel. Note the difference in the G1 fraction size between the high GFP and the low GFP 1s + 2s cells.
Hydra stem cells Buzgariu et al. Differentiation (2014)
8
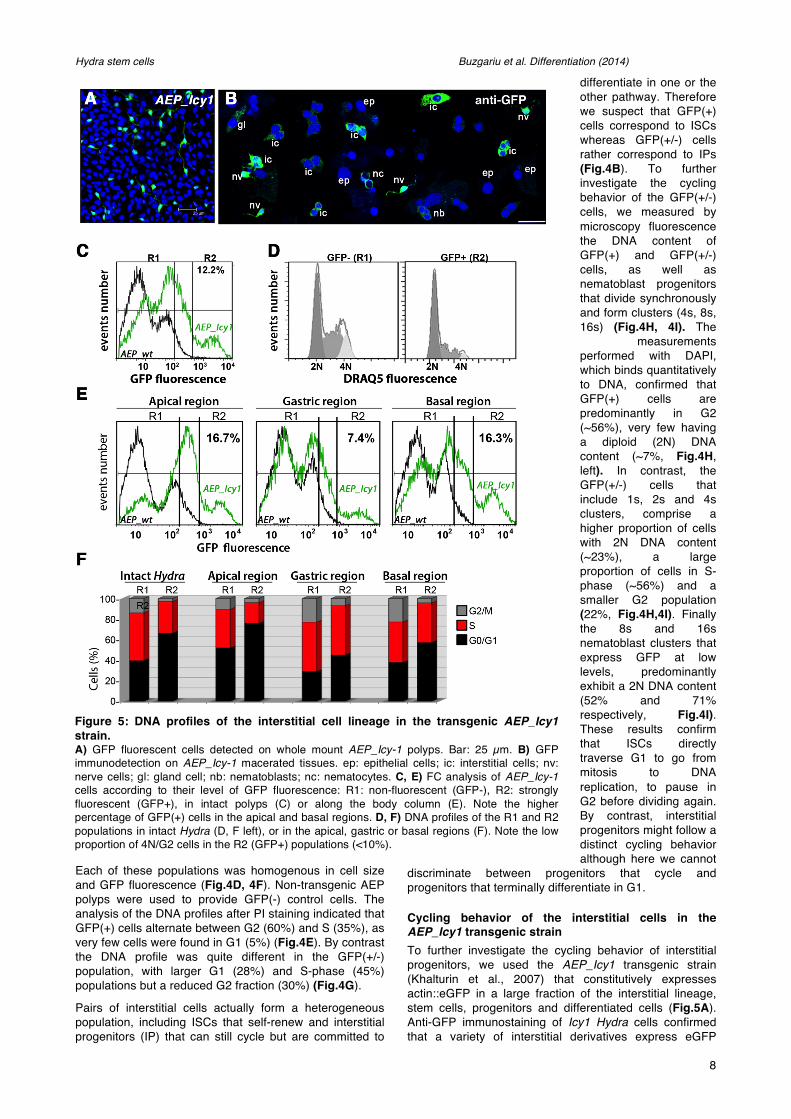
Each of these populations was homogenous in cell size and GFP fluorescence (Fig.4D, 4F). Non-transgenic AEP polyps were used to provide GFP(-) control cells. The analysis of the DNA profiles after PI staining indicated that GFP(+) cells alternate between G2 (60%) and S (35%), as very few cells were found in G1 (5%) (Fig.4E). By contrast the DNA profile was quite different in the GFP(+/-) population, with larger G1 (28%) and S-phase (45%) populations but a reduced G2 fraction (30%) (Fig.4G).
Pairs of interstitial cells actually form a heterogeneous population, including ISCs that self-renew and interstitial progenitors (IP) that can still cycle but are committed to
differentiate in one or the other pathway. Therefore we suspect that GFP(+) cells correspond to ISCs whereas GFP(+/-) cells rather correspond to IPs (Fig.4B). To further investigate the cycling behavior of the GFP(+/-) cells, we measured by microscopy fluorescence the DNA content of GFP(+) and GFP(+/-) cells, as well as nematoblast progenitors that divide synchronously and form clusters (4s, 8s, 16s) (Fig.4H, 4I). The
measurements performed with DAPI, which binds quantitatively to DNA, confirmed that GFP(+) cells are predominantly in G2 (~56%), very few having a diploid (2N) DNA content (~7%, Fig.4H, left). In contrast, the GFP(+/-) cells that include 1s, 2s and 4s clusters, comprise a higher proportion of cells with 2N DNA content (~23%), a large proportion of cells in S-phase (~56%) and a smaller G2 population (22%, Fig.4H,4I). Finally the 8s and 16s nematoblast clusters that express GFP at low levels, predominantly exhibit a 2N DNA content (52% and 71% respectively, Fig.4I). These results confirm that ISCs directly traverse G1 to go from mitosis to DNA replication, to pause in G2 before dividing again. By contrast, interstitial progenitors might follow a distinct cycling behavior although here we cannot
discriminate between progenitors that cycle and progenitors that terminally differentiate in G1.
Cycling behavior of the interstitial cells in the AEP_Icy1 transgenic strain To further investigate the cycling behavior of interstitial progenitors, we used the AEP_Icy1 transgenic strain (Khalturin et al., 2007) that constitutively expresses actin::eGFP in a large fraction of the interstitial lineage, stem cells, progenitors and differentiated cells (Fig.5A). Anti-GFP immunostaining of Icy1 Hydra cells confirmed that a variety of interstitial derivatives express eGFP
Figure 5: DNA profiles of the interstitial cell lineage in the transgenic AEP_Icy1 strain. A) GFP fluorescent cells detected on whole mount AEP_Icy-1 polyps. Bar: 25 µm. B) GFP immunodetection on AEP_Icy-1 macerated tissues. ep: epithelial cells; ic: interstitial cells; nv: nerve cells; gl: gland cell; nb: nematoblasts; nc: nematocytes. C, E) FC analysis of AEP_Icy-1 cells according to their level of GFP fluorescence: R1: non-fluorescent (GFP-), R2: strongly fluorescent (GFP+), in intact polyps (C) or along the body column (E). Note the higher percentage of GFP(+) cells in the apical and basal regions. D, F) DNA profiles of the R1 and R2 populations in intact Hydra (D, F left), or in the apical, gastric or basal regions (F). Note the low proportion of 4N/G2 cells in the R2 (GFP+) populations (<10%).

Hydra stem cells Buzgariu et al. Differentiation (2014)
9
although with different intensities (Fig.5B). Based on GFP fluorescence intensity, we gated two distinct populations in the AEP_Icy1 cells: the R1 GFP(-) population, similar to the control non-transgenic AEP-wt cells, and the R2 GFP(+) population detected exclusively in AEP_Icy1 polyps, representing about 13% of all cells (Fig.5C). The GFP(+) R2 cells are twice more abundant at the extremities than in the gastric region (16% versus 7%, Fig.5E), in agreement with the identification of a large proportion of AEP_Icy1 GFP(+) cells as nematocytes and nerve cells (Khalturin et al., 2007).
To characterize the AEP_Icy1 GFP(+) DNA profiles, we used the cell-permeable Draq5 DNA probe that generates cell cycle profiles similar to those observed in PI-stained cells, except a slight decrease in the G2/M fraction and a proportional increase in G0/G1 (not shown). When this profiling was performed on whole animals, we found most R2 GFP(+) cells in G0/G1 (>60%), ~27% in S-phase, and very few in G2/M (Fig.5D, Fig.S3). When profiling was performed on the apical region, we recorded among the R2 GFP(+) cells an even larger G0/G1 population (73%), 20% in S-phase and again very few in G2/M (4%) (Fig.5F). In the basal region, twice more R2 GFP(+) cells are replicating (39% S-phase), 57% are in G0/G1 and very few in G2/M (4%). Finally the R2 GFP(+) cells show the highest proliferative activity in the gastric region with 48% cells in S-phase, a similar proportion in G0/G1
(45%), and as in the other regions a very low G2/M fraction (7%). Hence in all three regions the R2 GFP(+) cells are rarely in G2, seemingly cycling between G1 and S phases. In summary, the comparative analysis of cell cycle profiles in the AEP_cnnos1 and AEP_Icy1 strains indicate that the multipotent ISCs and the interstitial progenitors follow quite distinct cycling regulations: The ISCs located in the gastric region alternate between the S and G2-phases without pausing in G1, whereas the interstitial cycling progenitors committed for one or the other pathway (predominantly nematoblasts) no longer rest in G2, and finally get arrested in G0/G1 when they terminally differentiate as observed in the apical region.
Rapid enrichment in epithelial cells in heat-shocked (HS) sf-1 Hydra To investigate the cycling behavior of epithelial cells, we used the thermosensitive sf-1 strain (Sugiyama and Fujisawa, 1978; Marcum et al., 1980), which upon a 48 hours HS gets rid of all fast cycling cells (interstitial) through apoptosis, while the slower cycling cells (epithelial) are not significantly affected (Fig.6A). The microscopic quantification of the various cell types from animals macerated after HS confirmed the enrichment in epithelial cells, with only 6% ISCs and IPs identified after a two days HS, while most differentiated cells (nematocytes, neurons, gland cells) are still preserved
Figure 6: Epithelial cell cycle profiles in heat-shocked (HS) Hm_sf-1 polyps A) Microscopic view of cells immunodetected with α-tubulin and DAPI stained, from Hm_sf-1 polyps either maintained unfed at 18°C and macerated after 11 days (upper panel), or HS at 28°C for two days (day-2 to day 0) and macerated eight days later (lower panel). ec: ectodermal, en:endodermal cells, other abbreviations as in Fig.5B. Scale bar: 50 µm. B) Quantification of the various cell types before and after HS. Note the immediate loss of fast cycling cells, ISCs and nematoblasts, together with the relative increase in MECs immediately after HS and the sustained persistence of nematocytes, neurons and gland cells. C) DNA profiles in whole Hm_sf-1 polyps maintained at 18°C (upper) or HS as in A (lower). Note the G0/G1 decrease and concomitant increase in S plus G2/M after HS. D) Distinct modulations of DNA profiles in the apical, gastric and basal regions of Hm_sf-1 polyps upon HS. The apical, basal and gastric region of HS animals treated as in A were analyzed by FC. Note the immediate decrease in G0/G1 nuclei in the gastric and basal regions, compensated by an increase in G2/M nuclei in the gastric region (up to 60% at day 8), and an increase in S nuclei in the basal region (already 40% post-HS). By contrast modulations in the apical region are delayed for at least four days.

Hydra stem cells Buzgariu et al. Differentiation (2014)
10
eight days later (Fig.6B). In agreement with this analysis, FC analyses detected stable DNA profiles on sf-1 whole polyps maintained at 18°C (Fig.6C, upper), but an immediate sharp decline in the G0/G1 population (from 65% to 54% p<0.05) in HS polyps, followed by a slower decrease to reach 38% after eight days (Fig.6C, lower). Concomitantly we noted a marked enrichment in the S and G2 populations, 1.6x (p<0.005) and 2x fold (p<0.0005) respectively. These results indicate that the cycling activity recorded eight days after HS is restricted to the MECs.
As anticipated we found striking different responses to HS along the body column (Fig.6D). In the apical region, the G0/G1 population gradually decreases from 80% to 50%, while the G2/M compartment significantly increases from 10% to 30% (p<0.0005), the S-phase fraction remaining low (10%-15%). These results indicate that the HS-induced elimination of the interstitial cells progressively uncovers the 4N DNA content of the apical epithelial cells. These cells exit the cell cycle in G2 to terminally differentiate in apical-specific cells (battery or hypostomal cells) when they reach the apical region (Dubel et al., 1987; Dubel and Schaller, 1990). By contrast the gastric
region reacts much faster to HS (Fig.6D), with an immediate two-fold reduction in G0/G1 cells (from 57% to 26%), associated to a rapid increase in G2 cells (from 22% to 43%) and a rather stable S-phase fraction, except a transient accumulation during HS (from 22% to 31%, p<0.005). These changes reflect the rapid loss of the fast cycling cells in this region, while the Hydra tissue becomes epithelial. In fact up to 60% gastric cells have a 4N DNA content eight days after HS, in agreement with previous microfluorimetry analyses (David and Campbell, 1972; Holstein and David, 1990a). Similarly the basal region exhibits an immediate drastic drop of the G0/G1 compartment (from 52% to 33%). However in contrast to the gastric region, this drop is associated with a marked but transient increase in S-phase cells (from 22% to 41%), while the G2 compartment continuously increases (from 25% to 39% at day-8).
Analysis of the R2-gated cells to deduce the epithelial cycling behavior in sf-1 Hydra To refine this analysis, we measured the FSC and SSC parameters that estimate the size and granularity of each cell type respectively (Fig.7A). The different Hydra cell types roughly distribute in four classes according to their nuclear
diameter: above 12 µm for the epithelial cells, between 8 and 11 µm for the large interstitial cells and the gland cells, between 5 and 8 µm for the small interstitial and the mucous cells, below 5 µm for the neurons (Lentz, 1966). Based on these properties, we estimate that the different nuclei distribute in three distinct areas on the FSC/SSC cytogram (Fig.7A): the R1 area that contains the smallest nuclei, from neurons and nematoblasts; the R2 area with the largest nuclei, from epithelial cells, large interstitial cells and gland cells, and the R3 area that contains mixed large nuclei and cell fragments with the highest SSC values, corresponding almost exclusively to apical cells, either the large battery epithelial ectodermal cells that populate the tentacles, or nematocytes that keep their capsules attached to the nuclei (see Fig.1B). Next we analyzed for each gated population the HS-induced variations of their relative abundance (Fig.7A), and of their DNA profiles (Fig. 7B, Table-S2) along the body column.
As anticipated from the HS-induced enrichment in epithelial cells, we noted a two-fold increase in large R2-gated cells in all three regions, reaching ~66% cells in the gastric and basal regions, 35% in the apical region
Figure 7: DNA profiles of HS sensitive and HS insensitive cells in Hm_sf-1 Hydra. A) Forward scatter/ side scatter (FSC/SSC) cytograms in the apical, gastric and basal regions of Hm_sf-1 polyps heat-shocked for two days and analyzed eight days later. Note the relative decrease in R1-gated nuclei from the basal and gastric regions, and in R3-gated nuclei from the apical region after HS. The parallel increase in the three regions in R2-gated nuclei reflects the enrichment in epithelial cells. B) HS-induced modulations of the DNA profiles. Note the low HS sensitivity of the R1-gated nuclei that are predominantly in G0/G1 whatever the region, and the HS-induced increase in G2/M of the R2-gated nuclei in the gastric region.
Hydra stem cells Buzgariu et al. Differentiation (2014)
11
(Fig.7A). A large fraction of the gastric R2-gated cells are cycling in permissive conditions (>35% S-phase), a proportion reduced to 10% eight days after HS, while most cells actually pause in G2/M (87%, Fig.7B). Given the complete depletion of cycling interstitial cells upon HS, these results indicate a dramatic enrichment in MECs in the gastric region. The 3.4x fold reduction in S-phase MECs can be explained by a lengthening of the epithelial cell cycle, and/or by a cell cycle exit in G2. By contrast in the apical and basal regions a higher proportion of R2-gated cells keep cycling (27%, 30% respectively), the basal cells maintaining a typical epithelial DNA profile (~30% S-phase, ~65% G2).
By contrast, the small R1-gated cells do not modify their DNA profile upon HS, predominantly in G0/G1 (>82%), as expected from interstitial derivatives (Fig.7B). However their proportion is affected upon HS, with R1 apical cells becoming relatively more abundant (31% to 45%) as expected from the survival of apical neurons and differentiating nematoblasts, while the R1 gastric and basal cells are two-fold reduced (Fig.7A). Finally the mixed R3-gated cells are dramatically depleted in the apical region (from 51% to 20%), likely corresponding to the progressive elimination of discharged nematocytes no longer replaced after the elimination of ISCs and progenitors. By contrast the R3 contingent remain stable in the gastric and basal regions (10% and 7% respectively). These R3 cells are mostly in G0/G1 (≥90%) at the apex, and exhibit a typical epithelial profile in the gastric region after HS (~22% S-phase, ~75% G2).
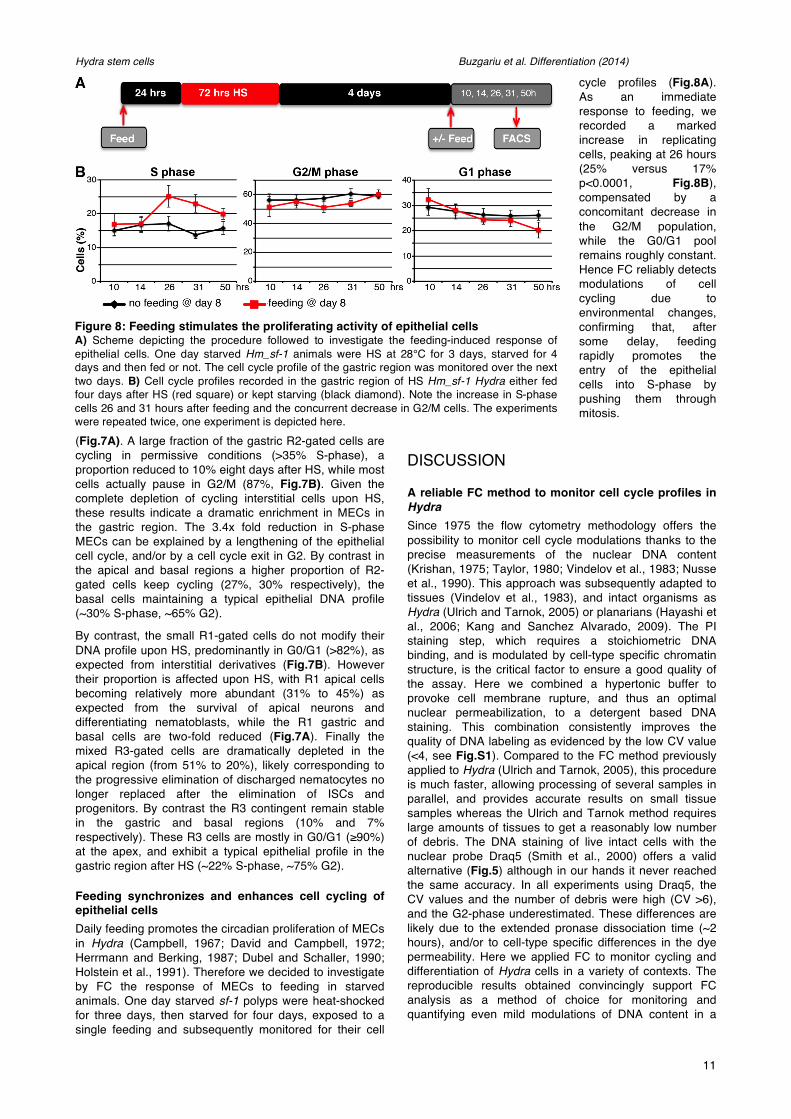
Feeding synchronizes and enhances cell cycling of epithelial cells Daily feeding promotes the circadian proliferation of MECs in Hydra (Campbell, 1967; David and Campbell, 1972; Herrmann and Berking, 1987; Dubel and Schaller, 1990; Holstein et al., 1991). Therefore we decided to investigate by FC the response of MECs to feeding in starved animals. One day starved sf-1 polyps were heat-shocked for three days, then starved for four days, exposed to a single feeding and subsequently monitored for their cell
cycle profiles (Fig.8A). As an immediate response to feeding, we recorded a marked increase in replicating cells, peaking at 26 hours (25% versus 17% p<0.0001, Fig.8B), compensated by a concomitant decrease in the G2/M population, while the G0/G1 pool remains roughly constant. Hence FC reliably detects modulations of cell cycling due to environmental changes, confirming that, after some delay, feeding rapidly promotes the entry of the epithelial cells into S-phase by pushing them through mitosis.
DISCUSSION
A reliable FC method to monitor cell cycle profiles in Hydra Since 1975 the flow cytometry methodology offers the possibility to monitor cell cycle modulations thanks to the precise measurements of the nuclear DNA content (Krishan, 1975; Taylor, 1980; Vindelov et al., 1983; Nusse et al., 1990). This approach was subsequently adapted to tissues (Vindelov et al., 1983), and intact organisms as Hydra (Ulrich and Tarnok, 2005) or planarians (Hayashi et al., 2006; Kang and Sanchez Alvarado, 2009). The PI staining step, which requires a stoichiometric DNA binding, and is modulated by cell-type specific chromatin structure, is the critical factor to ensure a good quality of the assay. Here we combined a hypertonic buffer to provoke cell membrane rupture, and thus an optimal nuclear permeabilization, to a detergent based DNA staining. This combination consistently improves the quality of DNA labeling as evidenced by the low CV value (<4, see Fig.S1). Compared to the FC method previously applied to Hydra (Ulrich and Tarnok, 2005), this procedure is much faster, allowing processing of several samples in parallel, and provides accurate results on small tissue samples whereas the Ulrich and Tarnok method requires large amounts of tissues to get a reasonably low number of debris. The DNA staining of live intact cells with the nuclear probe Draq5 (Smith et al., 2000) offers a valid alternative (Fig.5) although in our hands it never reached the same accuracy. In all experiments using Draq5, the CV values and the number of debris were high (CV >6), and the G2-phase underestimated. These differences are likely due to the extended pronase dissociation time (~2 hours), and/or to cell-type specific differences in the dye permeability. Here we applied FC to monitor cycling and differentiation of Hydra cells in a variety of contexts. The reproducible results obtained convincingly support FC analysis as a method of choice for monitoring and quantifying even mild modulations of DNA content in a
Figure 8: Feeding stimulates the proliferating activity of epithelial cells A) Scheme depicting the procedure followed to investigate the feeding-induced response of epithelial cells. One day starved Hm_sf-1 animals were HS at 28°C for 3 days, starved for 4 days and then fed or not. The cell cycle profile of the gastric region was monitored over the next two days. B) Cell cycle profiles recorded in the gastric region of HS Hm_sf-1 Hydra either fed four days after HS (red square) or kept starving (black diamond). Note the increase in S-phase cells 26 and 31 hours after feeding and the concurrent decrease in G2/M cells. The experiments were repeated twice, one experiment is depicted here.
Hydra stem cells Buzgariu et al. Differentiation (2014)
12
complex and highly dynamic tissue. In fact FC on Hydra tissues is easily amenable, reliable and sensitive.
Starvation, feeding and cell cycling in Hydra Previous microscopic studies showed that starvation in Hydra only moderately modifies the cycling activity (Otto and Campbell, 1977; Bosch and David, 1984), since animals starved for weeks maintain a sustained cycling activity, even though the epithelial cells progressively lengthen their cell cycle by extending G2. Indeed the present FC analysis identified similar DNA profiles in both starved and daily-fed animals (Fig.2C), confirming thus that starvation does not affect the overall cell cycling activities in Hydra. This is no surprise since Hydra polyps are quite resistant to food depletion, able to survive for weeks without nutrients, adapting to unfavorable condition by rapidly arresting budding, inducing autophagy and progressively decreasing their size (Otto and Campbell, 1977; Galliot and Ghila, 2010).
Cell cycling is also regulated by feeding in Hydra. In fact feeding transiently inhibits mitosis of MECs, preventing their entry into S-phase for about six hours, then cells synchronously divide and immediately enter S-phase (Campbell, 1967; David and Campbell, 1972; Herrmann and Berking, 1987; Dubel and Schaller, 1990; Holstein et al., 1991). This scenario was deduced from the analysis of the post-feeding replicative activity, either by [3H]-thymidine incorporation in intact Hydra (Herrmann and Berking, 1987; Dubel and Schaller, 1990), or by BrdU labeling in epithelial heat-shocked sf-1 Hydra (Holstein et al., 1991). In both contexts the percentage of S-phase cells drops six hours after feeding (from ~27% to 5% in intact Ho, from 15% to ~6% in epithelial sf-1 Hydra), but rapidly increases to reach a plateau value about 15-20 hours after feeding, remaining stable until the next feeding induces a new drop. Indeed the counting of mitotic figures detected a peak about 12 hours post-feeding (Campbell, 1967). Hence a daily feeding suffices to synchronize and sustain the epithelial cell cycling activity, whereas under starvation conditions this feeding-induced circadian rhythm rapidly disappears (Dubel and Schaller, 1990).
The FC analysis reported here confirms this scenario, showing that, in the absence of interstitial cells, a large fraction of the epithelial cells re-enter the cell cycle about 26 hours after feeding (Fig.8B). This is ~10 hours later than previously reported, likely as a result of the extended starvation period that precedes this unique feeding and slows down their cycling activity. Hence the epithelial cells are highly sensitive to environmental cues as nutrients and starvation that trigger fast and slow responses respectively. As the cycling interstitial cells are twice more abundant than the cycling MECs (40-50% versus 20%), the starvation/feeding induced modulations appear subtle in whole animals but well visible when the ISCs and interstitial progenitors are eliminated.
Similarly to feeding, NDZ, an antimitotic agent that prevents microtubule polymerization, efficiently blocks mitosis in Hydra and leads to cell synchronization. This study actually evidences a dose-dependent accumulation of G2/M cells, together with the rapid death of nematoblasts, whereas differentiated cells and stem cells are not affected (Fig.3F). The G2/M pausing induced by NDZ at low concentration is reversible, cells resume cycling and the interstitial cells progressively repopulate
the gastric tissue with proliferating progenitors and differentiating cells, to reach the homeostatic condition after five days. This FC analysis indicates that low doses of NDZ suffices to disturb tissue homeostasis, by two distinct mechanisms, i) by transiently forcing the cells to pause in G2/M, and ii) by eliminating the G1 cells highly sensitive to NDZ pro-apoptotic activity.
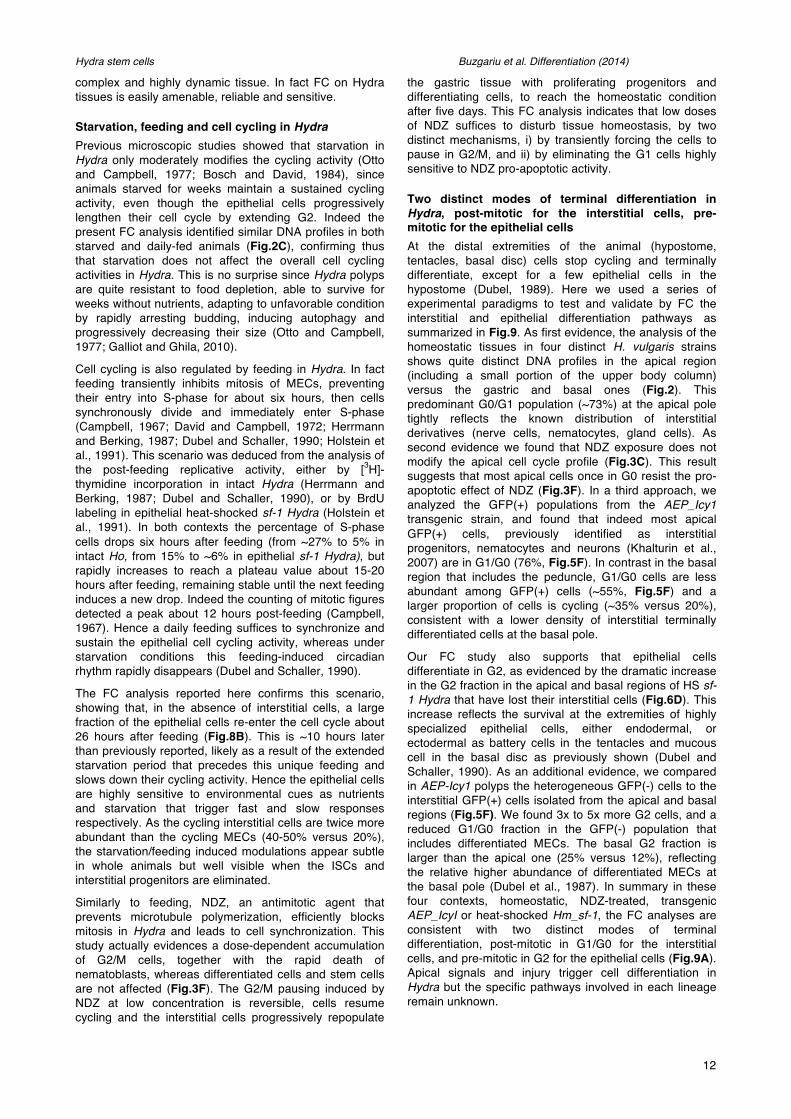
Two distinct modes of terminal differentiation in Hydra, post-mitotic for the interstitial cells, pre-mitotic for the epithelial cells At the distal extremities of the animal (hypostome, tentacles, basal disc) cells stop cycling and terminally differentiate, except for a few epithelial cells in the hypostome (Dubel, 1989). Here we used a series of experimental paradigms to test and validate by FC the interstitial and epithelial differentiation pathways as summarized in Fig.9. As first evidence, the analysis of the homeostatic tissues in four distinct H. vulgaris strains shows quite distinct DNA profiles in the apical region (including a small portion of the upper body column) versus the gastric and basal ones (Fig.2). This predominant G0/G1 population (~73%) at the apical pole tightly reflects the known distribution of interstitial derivatives (nerve cells, nematocytes, gland cells). As second evidence we found that NDZ exposure does not modify the apical cell cycle profile (Fig.3C). This result suggests that most apical cells once in G0 resist the pro-apoptotic effect of NDZ (Fig.3F). In a third approach, we analyzed the GFP(+) populations from the AEP_Icy1 transgenic strain, and found that indeed most apical GFP(+) cells, previously identified as interstitial progenitors, nematocytes and neurons (Khalturin et al., 2007) are in G1/G0 (76%, Fig.5F). In contrast in the basal region that includes the peduncle, G1/G0 cells are less abundant among GFP(+) cells (~55%, Fig.5F) and a larger proportion of cells is cycling (~35% versus 20%), consistent with a lower density of interstitial terminally differentiated cells at the basal pole.
Our FC study also supports that epithelial cells differentiate in G2, as evidenced by the dramatic increase in the G2 fraction in the apical and basal regions of HS sf-1 Hydra that have lost their interstitial cells (Fig.6D). This increase reflects the survival at the extremities of highly specialized epithelial cells, either endodermal, or ectodermal as battery cells in the tentacles and mucous cell in the basal disc as previously shown (Dubel and Schaller, 1990). As an additional evidence, we compared in AEP-Icy1 polyps the heterogeneous GFP(-) cells to the interstitial GFP(+) cells isolated from the apical and basal regions (Fig.5F). We found 3x to 5x more G2 cells, and a reduced G1/G0 fraction in the GFP(-) population that includes differentiated MECs. The basal G2 fraction is larger than the apical one (25% versus 12%), reflecting the relative higher abundance of differentiated MECs at the basal pole (Dubel et al., 1987). In summary in these four contexts, homeostatic, NDZ-treated, transgenic AEP_IcyI or heat-shocked Hm_sf-1, the FC analyses are consistent with two distinct modes of terminal differentiation, post-mitotic in G1/G0 for the interstitial cells, and pre-mitotic in G2 for the epithelial cells (Fig.9A). Apical signals and injury trigger cell differentiation in Hydra but the specific pathways involved in each lineage remain unknown.

Hydra stem cells Buzgariu et al. Differentiation (2014)
13
G2 pausing and a very short G1 characterize Hydra stem cells Previous studies reported a very short or even absent G1-phase in Hydra cycling cells (Campbell, 1967; David and Campbell, 1972; Campbell and David, 1974). This finding is supported by the present study, which confirms from the DNA profiles measured in gastric epithelial cells surviving HS in sf-1 Hydra that indeed all epithelial cells pause in G2 and briefly transit through G1 (Fig.6D, 7B). Additional FC analyses performed on transgenic strains expressing GFP in epithelial cell lineages indeed confirmed this unusual cycling pattern with 70% epithelial cells in G2 and 25% in S-phase (WB, unpublished). In the thermosensitive strain sf-1, we found eight days after HS
87% epithelial cells in G2 (Fig.7B, R2-gated gastric cells) but only 10% in S-phase. This 2.5x reduction in the S-phase fraction indicates that after HS the MECs continue to proliferate but at a reduced pace, pausing in G2 as previously shown (Holstein et al., 1991). Alternatively some MECs may also stop cycling.
As to the ISCs, we could confirm that the multipotent ISCs alternate between G2 and S without pausing in G1 (Fig.4C), as deduced from the FC analysis performed on the transgenic AEP_cnnos1 strain. Hence the unipotent MECs and the multipotent ISCs exhibit a similar regulation of their cell cycle (except some cycling endodermal epithelial cells located in the hypostome that according to (Dubel, 1989) pause in G1 - not tested here -). However in
Figure 9: Stem cells and cell cycle regulation along the Hydra body axis A) Typical DNA profiles of the Hydra stem cell populations, MECs and ISCs, of the interstitial progenitors ready to exit the cell cycle, and of terminally differentiated cells. B) Apico-basal modulations of the cell cycle profiles along the Hydra body axis as deduced from the FC analyses performed on animals maintained in homeostatic conditions, on animals exposed to NDZ, and on AEP_cnnos1, AEP_Icy-1, Hm_sf-1 polyps. The Hydra scheme is reproduced with permission and after modifications from Lenhoff and Lenhoff (1988). The black bar on the left indicates the region along the body where cells are mitotically active. No cell cycling is taking place at the extremities of the animal, except few MECs in the hypostome. For each cell type at apical, gastric or basal position along the body column, the bars represent the relative proportions of cells at a given phase of the cell cycle: G1/G0 (purple), S (red) and G2/M (green).
Hydra stem cells Buzgariu et al. Differentiation (2014)
14
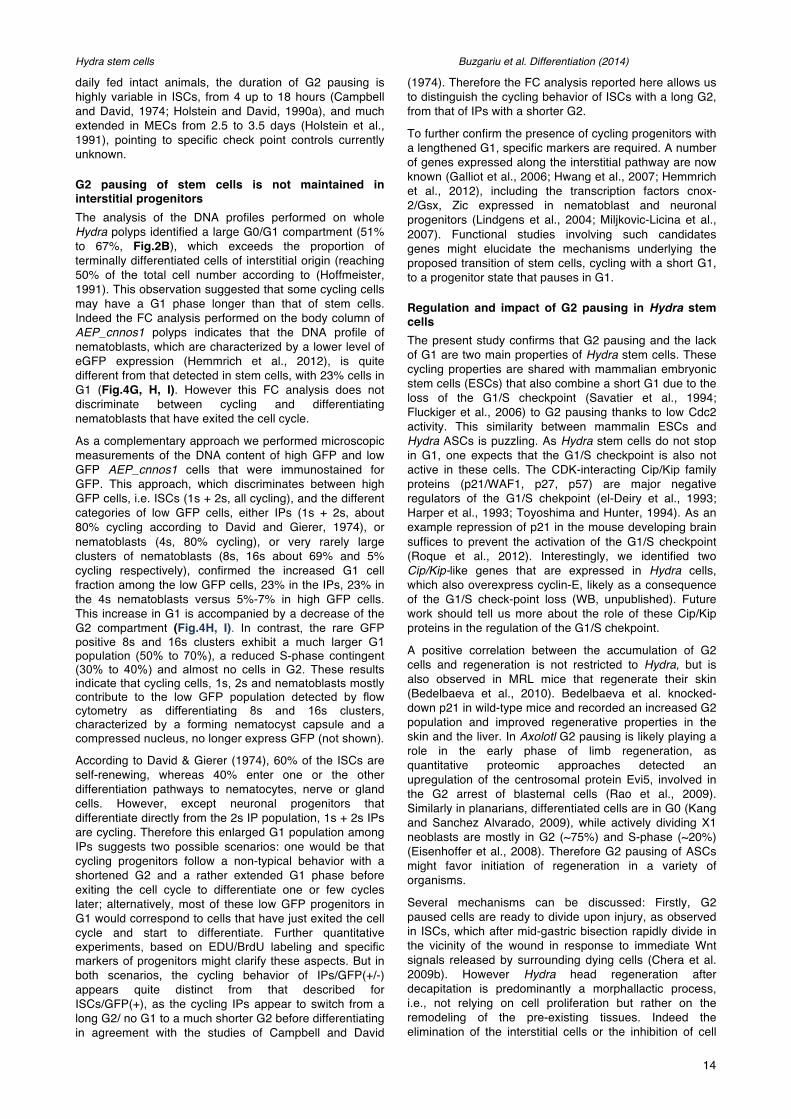
daily fed intact animals, the duration of G2 pausing is highly variable in ISCs, from 4 up to 18 hours (Campbell and David, 1974; Holstein and David, 1990a), and much extended in MECs from 2.5 to 3.5 days (Holstein et al., 1991), pointing to specific check point controls currently unknown.
G2 pausing of stem cells is not maintained in interstitial progenitors The analysis of the DNA profiles performed on whole Hydra polyps identified a large G0/G1 compartment (51% to 67%, Fig.2B), which exceeds the proportion of terminally differentiated cells of interstitial origin (reaching 50% of the total cell number according to (Hoffmeister, 1991). This observation suggested that some cycling cells may have a G1 phase longer than that of stem cells. Indeed the FC analysis performed on the body column of AEP_cnnos1 polyps indicates that the DNA profile of nematoblasts, which are characterized by a lower level of eGFP expression (Hemmrich et al., 2012), is quite different from that detected in stem cells, with 23% cells in G1 (Fig.4G, H, I). However this FC analysis does not discriminate between cycling and differentiating nematoblasts that have exited the cell cycle.
As a complementary approach we performed microscopic measurements of the DNA content of high GFP and low GFP AEP_cnnos1 cells that were immunostained for GFP. This approach, which discriminates between high GFP cells, i.e. ISCs (1s + 2s, all cycling), and the different categories of low GFP cells, either IPs (1s + 2s, about 80% cycling according to David and Gierer, 1974), or nematoblasts (4s, 80% cycling), or very rarely large clusters of nematoblasts (8s, 16s about 69% and 5% cycling respectively), confirmed the increased G1 cell fraction among the low GFP cells, 23% in the IPs, 23% in the 4s nematoblasts versus 5%-7% in high GFP cells. This increase in G1 is accompanied by a decrease of the G2 compartment (Fig.4H, I). In contrast, the rare GFP positive 8s and 16s clusters exhibit a much larger G1 population (50% to 70%), a reduced S-phase contingent (30% to 40%) and almost no cells in G2. These results indicate that cycling cells, 1s, 2s and nematoblasts mostly contribute to the low GFP population detected by flow cytometry as differentiating 8s and 16s clusters, characterized by a forming nematocyst capsule and a compressed nucleus, no longer express GFP (not shown).
According to David & Gierer (1974), 60% of the ISCs are self-renewing, whereas 40% enter one or the other differentiation pathways to nematocytes, nerve or gland cells. However, except neuronal progenitors that differentiate directly from the 2s IP population, 1s + 2s IPs are cycling. Therefore this enlarged G1 population among IPs suggests two possible scenarios: one would be that cycling progenitors follow a non-typical behavior with a shortened G2 and a rather extended G1 phase before exiting the cell cycle to differentiate one or few cycles later; alternatively, most of these low GFP progenitors in G1 would correspond to cells that have just exited the cell cycle and start to differentiate. Further quantitative experiments, based on EDU/BrdU labeling and specific markers of progenitors might clarify these aspects. But in both scenarios, the cycling behavior of IPs/GFP(+/-) appears quite distinct from that described for ISCs/GFP(+), as the cycling IPs appear to switch from a long G2/ no G1 to a much shorter G2 before differentiating in agreement with the studies of Campbell and David
(1974). Therefore the FC analysis reported here allows us to distinguish the cycling behavior of ISCs with a long G2, from that of IPs with a shorter G2.
To further confirm the presence of cycling progenitors with a lengthened G1, specific markers are required. A number of genes expressed along the interstitial pathway are now known (Galliot et al., 2006; Hwang et al., 2007; Hemmrich et al., 2012), including the transcription factors cnox-2/Gsx, Zic expressed in nematoblast and neuronal progenitors (Lindgens et al., 2004; Miljkovic-Licina et al., 2007). Functional studies involving such candidates genes might elucidate the mechanisms underlying the proposed transition of stem cells, cycling with a short G1, to a progenitor state that pauses in G1.
Regulation and impact of G2 pausing in Hydra stem cells The present study confirms that G2 pausing and the lack of G1 are two main properties of Hydra stem cells. These cycling properties are shared with mammalian embryonic stem cells (ESCs) that also combine a short G1 due to the loss of the G1/S checkpoint (Savatier et al., 1994; Fluckiger et al., 2006) to G2 pausing thanks to low Cdc2 activity. This similarity between mammalin ESCs and Hydra ASCs is puzzling. As Hydra stem cells do not stop in G1, one expects that the G1/S checkpoint is also not active in these cells. The CDK-interacting Cip/Kip family proteins (p21/WAF1, p27, p57) are major negative regulators of the G1/S chekpoint (el-Deiry et al., 1993; Harper et al., 1993; Toyoshima and Hunter, 1994). As an example repression of p21 in the mouse developing brain suffices to prevent the activation of the G1/S checkpoint (Roque et al., 2012). Interestingly, we identified two Cip/Kip-like genes that are expressed in Hydra cells, which also overexpress cyclin-E, likely as a consequence of the G1/S check-point loss (WB, unpublished). Future work should tell us more about the role of these Cip/Kip proteins in the regulation of the G1/S chekpoint.
A positive correlation between the accumulation of G2 cells and regeneration is not restricted to Hydra, but is also observed in MRL mice that regenerate their skin (Bedelbaeva et al., 2010). Bedelbaeva et al. knocked-down p21 in wild-type mice and recorded an increased G2 population and improved regenerative properties in the skin and the liver. In Axolotl G2 pausing is likely playing a role in the early phase of limb regeneration, as quantitative proteomic approaches detected an upregulation of the centrosomal protein Evi5, involved in the G2 arrest of blastemal cells (Rao et al., 2009). Similarly in planarians, differentiated cells are in G0 (Kang and Sanchez Alvarado, 2009), while actively dividing X1 neoblasts are mostly in G2 (~75%) and S-phase (~20%) (Eisenhoffer et al., 2008). Therefore G2 pausing of ASCs might favor initiation of regeneration in a variety of organisms.
Several mechanisms can be discussed: Firstly, G2 paused cells are ready to divide upon injury, as observed in ISCs, which after mid-gastric bisection rapidly divide in the vicinity of the wound in response to immediate Wnt signals released by surrounding dying cells (Chera et al. 2009b). However Hydra head regeneration after decapitation is predominantly a morphallactic process, i.e., not relying on cell proliferation but rather on the remodeling of the pre-existing tissues. Indeed the elimination of the interstitial cells or the inhibition of cell
Hydra stem cells Buzgariu et al. Differentiation (2014)
15
cycling affect head regeneration, but do not abolish it (see in (Galliot, 2013). Therefore, as a second mechanism, G2 pausing can facilitate injury-induced differentiation of the epithelial cells, in the absence of any mitotic event (Dubel and Schaller, 1990). Endodermal MECs from the regenerating tip actually develop in few hours after bisection an organizer activity, characterized by the propensity to induce a secondary axis when grafted on a polyp host, and which requires a series of signals involving the Wnt pathway (Lengfeld et al., 2009).
Thirdly, we assume that, beside immediate cell division and differentiation, G2 pausing might confer some additional selective advantage as for example a strong resistance to cell death. Indeed cycling progenitors, which are predominantly in G1 or S-phases, rapidly undergo cell death in response to a variety of pro-apoptotic agents, while most G2 cells resist to these agents (Reiter et al., 2012); this study; WB, unpublished). This is reminiscent of mammalian epithelial stem cells that resist cell death in G2 thanks to high levels of G2 check-point proteins, CHK1, CHK2 (Harper et al., 2010). Fourthly, an extended G2 phase might enhance the DNA repair program, as homologous recombination, one of the well conserved mechanisms involved in the repair of double strand DNA is activated during late S-phase and G2 (Takata et al., 1998; Rothkamm et al., 2003; Ferreira and Cooper, 2004). In Hydra CHK1, CHK2, as well as some components of the DNA repair pathway like BRCA1, Rad51 and the Swi2/Snf2 helicase protein Rad54 that protect cells in S or G2 against damage inducing apoptosis (Rousseau et al., 2012), are highly conserved (Wenger and Galliot, 2013). Hence Hydra provides a suitable framework to test the impact of G2 pausing on regenerative competence.
Acknowledgements The authors are very grateful to Thomas Bosch for kindly providing the AEP_Icy1 and AEP_cnnos1 transgenic strains, Thanos Halazonetis for critical reading of the paper, Dominique Wohlwend and Jean-Pierre Aubry for support at the FACS platform (Geneva University Medical Center), Yvan Wenger for fruitful discussions, Alessandra Strom for technical advices, Julien Candrian, Lisbeth Muster and Denis Benoni for technical help. This work was supported by the Swiss National Foundation, the NCCR Frontiers in Genetics Stem Cells & Regeneration project, the Canton of Geneva, the Claraz Donation and the Academic Society of Geneva.
REFERENCES Alexandrova, O., Solovei, I., Cremer, T., David, C.N., 2003.
Replication labeling patterns and chromosome territories typical of mammalian nuclei are conserved in the early metazoan Hydra. Chromosoma. 112, 190-200.
Bedelbaeva, K., Snyder, A., Gourevitch, D., Clark, L., Zhang, X.M., Leferovich, J., Cheverud, J.M., Lieberman, P., Heber-Katz, E., 2010. Lack of p21 expression links cell cycle control and appendage regeneration in mice. Proc Natl Acad Sci U S A. 107, 5845-5850.
Bihari, N., Micic, M., Batel, R., Zahn, R.K., 2003. Flow cytometric detection of DNA cell cycle alterations in hemocytes of mussels (Mytilus galloprovincialis) off the Adriatic coast, Croatia. Aquat Toxicol. 64, 121-129.
Bode, H.R., 1996. The interstitial cell lineage of hydra: a stem cell system that arose early in evolution. J Cell Sci. 109 ( Pt 6), 1155-1164.
Bosch, T.C., 2007. Why polyps regenerate and we don't: towards a cellular and molecular framework for Hydra regeneration. Dev. Biol. 303, 421-433.
Bosch, T.C., 2009. Hydra and the evolution of stem cells. Bioessays. 31, 478-486.
Bosch, T.C., David, C.N., 1984. Growth regulation in Hydra: relationship between epithelial cell cycle length and growth rate. Dev. Biol. 104, 161-171.
Campbell, R.D., 1967. Tissue dynamics of steady state growth in Hydra littoralis. I. Patterns of cell division. Dev. Biol. 15, 487-502.
Campbell, R.D., David, C.N., 1974. Cell cycle kinetics and development of Hydra attenuata. II. Interstitial cells. J Cell Sci. 16, 349-358.
Chera, S., Ghila, L., Dobretz, K., Wenger, Y., Bauer, C., Buzgariu, W., Martinou, J.C., Galliot, B., 2009. Apoptotic cells provide an unexpected source of Wnt3 signaling to drive hydra head regeneration. Dev. Cell. 17, 279-289.
Chera, S., Ghila, L., Wenger, Y., Galliot, B., 2011. Injury-induced activation of the MAPK/CREB pathway triggers apoptosis-induced compensatory proliferation in hydra head regeneration. Dev Growth Differ. 53, 186-201.
David, C.N., 1973. A quantitative method for maceration of Hydra tissue. Wilhelm Roux's Arch. Dev. Biol. 171, 259-268.
David, C.N., 2012. Interstitial stem cells in Hydra: multipotency and decision-making. Int J Dev Biol. 56, 489-497.
David, C.N., Campbell, R.D., 1972. Cell cycle kinetics and development of Hydra attenuata. I. Epithelial cells. J Cell Sci. 11, 557-568.
David, C.N., Gierer, A., 1974. Cell cycle kinetics and development of Hydra attenuata. III. Nerve and nematocyte differentiation. J Cell Sci. 16, 359-375.
David, C.N., Murphy, S., 1977. Characterization of interstitial stem cells in hydra by cloning. Dev. Biol. 58, 372-383.
David, C.N., Plotnick, I., 1980. Distribution of interstitial stem cells in Hydra. Dev. Biol. 76, 175-184.
De Brabander, M.J., Van de Veire, R.M., Aerts, F.E., Borgers, M., Janssen, P.A., 1976. The effects of methyl (5-(2-thienylcarbonyl)-1H-benzimidazol-2-yl) carbamate, (R 17934; NSC 238159), a new synthetic antitumoral drug interfering with microtubules, on mammalian cells cultured in vitro. Cancer Res. 36, 905-916.
Dubel, S., 1989. Cell differentiation in the head of hydra. Differentiation. 41, 99-109.
Dubel, S., Hoffmeister, S.A., Schaller, H., 1987. Differentiation pathways of ectodermal epithelial cells in hydra. Differentiation. 35, 181-189.
Dubel, S., Little, M., 1988. Microtubule-dependent cell cycle regulation is implicated in the G2 phase of Hydra cells. J Cell Sci. 91 ( Pt 3), 347-359.
Dubel, S., Schaller, H.C., 1990. Terminal differentiation of ectodermal epithelial stem cells of Hydra can occur in G2 without requiring mitosis or S phase. J Cell Biol. 110, 939-945.
Eisenhoffer, G.T., Kang, H., Sanchez Alvarado, A., 2008. Molecular analysis of stem cells and their descendants during cell turnover and regeneration in the planarian Schmidtea mediterranea. Cell Stem Cell. 3, 327-339.
el-Deiry, W.S., et al., 1993. WAF1, a potential mediator of p53 tumor suppression. Cell. 75, 817-825.
Ferreira, M.G., Cooper, J.P., 2004. Two modes of DNA double-strand break repair are reciprocally regulated through the fission yeast cell cycle. Genes Dev. 18, 2249-2254.
Fluckiger, A.C., Marcy, G., Marchand, M., Negre, D., Cosset, F.L., Mitalipov, S., Wolf, D., Savatier, P., Dehay, C., 2006. Cell cycle features of primate embryonic stem cells. Stem Cells. 24, 547-556.
Galliot, B. 2013. Regeneration in Hydra, eLS, 3rd edition ed. John Wiley & Sons Ltd: Chichester, London.
Hydra stem cells Buzgariu et al. Differentiation (2014)
16
Galliot, B., Ghila, L., 2010. Cell plasticity in homeostasis and regeneration. Mol Reprod Dev. 77, 837-855.
Galliot, B., Miljkovic-Licina, M., de Rosa, R., Chera, S., 2006. Hydra, a niche for cell and developmental plasticity. Semin Cell Dev Biol. 17, 492-502.
Gauchat, D., Escriva, H., Miljkovic-Licina, M., Chera, S., Langlois, M.C., Begue, A., Laudet, V., Galliot, B., 2004. The orphan COUP-TF nuclear receptors are markers for neurogenesis from cnidarians to vertebrates. Dev. Biol. 275, 104-123.
Gomez, M., Mayo, I., Torres, S., 2001. Flow cytometry of cell proliferation through the incorporation of bromodeoxyuridine as an index of growth rate in the water flea, Daphnia magna (Crustacea, Cladocera). Cytometry. 44, 264-271.
Greber, M.J., David, C.N., Holstein, T.W., 1992. A quantitative method for separation of living Hydra cells. Roux's Arch Dev Biol. 201, 296-300.
Hager, G., David, C.N., 1997. Pattern of differentiated nerve cells in hydra is determined by precursor migration. Development. 124, 569-576.
Harper, J.W., Adami, G.R., Wei, N., Keyomarsi, K., Elledge, S.J., 1993. The p21 Cdk-interacting protein Cip1 is a potent inhibitor of G1 cyclin-dependent kinases. Cell. 75, 805-816.
Harper, L.J., Costea, D.E., Gammon, L., Fazil, B., Biddle, A., Mackenzie, I.C., 2010. Normal and malignant epithelial cells with stem-like properties have an extended G2 cell cycle phase that is associated with apoptotic resistance. BMC Cancer. 10, 166.
Hayashi, T., Asami, M., Higuchi, S., Shibata, N., Agata, K., 2006. Isolation of planarian X-ray-sensitive stem cells by fluorescence-activated cell sorting. Dev Growth Differ. 48, 371-380.
Hemmrich, G., et al., 2012. Molecular Signatures of the Three Stem Cell Lineages in Hydra and the Emergence of Stem Cell Function at the Base of Multicellularity. Mol Biol Evol 10.1093/molbev/mss134.
Herrmann, K., Berking, S., 1987. The length of S-phase and G2-phase of epithelial cells is regulated during growth and morphogenesis in Hydra attenuata. Development. 99, 33-39.
Hobmayer, B., Jenewein, M., Eder, D., Eder, M., Glasauer, S., Gufler, S., Hartl, M., Salvenmoser, W., 2012. Stemness in Hydra - a current perspective. Int J Dev Biol. (in press).
Hoffmeister, S.A., 1991. Analysis of a foot regeneration deficient strain of Hydra oligactis. Mech Dev. 35, 181-192.
Holstein, T., David C.N., , 1986. The properties of nerve cell precursors in hydra. Dev. Biol. 115, 18-26.
Holstein, T.W., David, C.N., 1990a. Cell cycle length, cell size, and proliferation rate in hydra stem cells. Dev. Biol. 142, 392-400.
Holstein, T.W., David, C.N., 1990b. Putative intermediates in the nerve cell differentiation pathway in hydra have properties of multipotent stem cells. Dev. Biol. 142, 401-405.
Holstein, T.W., Hobmayer, E., David, C.N., 1991. Pattern of epithelial cell cycling in hydra. Dev. Biol. 148, 602-611.
Hwang, J.S., Ohyanagi, H., Hayakawa, S., Osato, N., Nishimiya-Fujisawa, C., Ikeo, K., David, C.N., Fujisawa, T., Gojobori, T., 2007. The evolutionary emergence of cell type-specific genes inferred from the gene expression analysis of Hydra. Proc Natl Acad Sci U S A. 104, 14735-14740.
Kadono, T., Kawano, T., Hosoya, H., Kosaka, T., 2004. Flow cytometric studies of the host-regulated cell cycle in algae symbiotic with green paramecium. Protoplasma. 223, 133-141.
Kang, H., Sanchez Alvarado, A., 2009. Flow cytometry methods for the study of cell-cycle parameters of planarian stem cells. Dev. Dyn. 238, 1111-1117.
Kawaida, H., Shimizu, H., Fujisawa, T., Tachida, H., Kobayakawa, Y., 2010. Molecular phylogenetic study in genus Hydra. Gene. 468, 30-40.
Khalturin, K., Anton-Erxleben, F., Milde, S., Plotz, C., Wittlieb, J., Hemmrich, G., Bosch, T.C., 2007. Transgenic stem cells in
Hydra reveal an early evolutionary origin for key elements controlling self-renewal and differentiation. Dev. Biol. 309, 32-44.
Kim, B.J., Choi, C.H., Lee, C.H., Jeong, S.Y., Kim, J.S., Kim, B.Y., Yim, H.S., Kang, S.O., 2005. Glutathione is required for growth and prespore cell differentiation in Dictyostelium. Dev. Biol. 284, 387-398.
Krishan, A., 1975. Rapid flow cytofluorometric analysis of mammalian cell cycle by propidium iodide staining. J Cell Biol. 66, 188-193.
Leblanc, O., Pointe, C., Hernandez, M., 2002. Cell cycle progression during endosperm development in Zea mays depends on parental dosage effects. Plant J. 32, 1057-1066.
Lengfeld, T., et al., 2009. Multiple Wnts are involved in Hydra organizer formation and regeneration. Dev. Biol. 330, 186-199.
Lentz, T.L. 1966. The Cell Biology of Hydra. North-Holland Publishing company, Amsterdam.
Lindgens, D., Holstein, T.W., Technau, U., 2004. Hyzic, the Hydra homolog of the zic/odd-paired gene, is involved in the early specification of the sensory nematocytes. Development. 131, 191-201.
Marcum, B.A., Fujisawa, T., Sugiyama, T. 1980. A mutant hydra strain (sf-1) containing temperature-sensitive interstitial cells, in: Tardent P., Tardent R. (Eds.), Developmental and Cellular Biology of Coelenterates. Elsevier/North Holland, Amsterdam, pp. 429-434.
Martinez, D.E., Iniguez, A.R., Percell, K.M., Willner, J.B., Signorovitch, J., Campbell, R.D., 2010. Phylogeny and biogeography of Hydra (Cnidaria: Hydridae) using mitochondrial and nuclear DNA sequences. Mol Phylogenet Evol. 57, 403-410.
Miljkovic-Licina, M., Chera, S., Ghila, L., Galliot, B., 2007. Head regeneration in wild-type hydra requires de novo neurogenesis. Development. 134, 1191-1201.
Mochizuki, K., Sano, H., Kobayashi, S., Nishimiya-Fujisawa, C., Fujisawa, T., 2000. Expression and evolutionary conservation of nanos-related genes in Hydra. Dev. Genes Evol. 210, 591-602.
Nishimiya-Fujisawa, C., Kobayashi, S., 2012. Germline stem cells and sex determination in Hydra. Int J Dev Biol. 56, 499-508.
Nusse, M., Beisker, W., Hoffmann, C., Tarnok, A., 1990. Flow cytometric analysis of G1- and G2/M-phase subpopulations in mammalian cell nuclei using side scatter and DNA content measurements. Cytometry. 11, 813-821.
Ormerod, M.G. 2005. Flow Cytometry. 3rd edition ed. Oxford University Press Inc., New York.
Otto, J.J., Campbell, R.D., 1977. Tissue economics of hydra: regulation of cell cycle, animal size and development by controlled feeding rates. J Cell Sci. 28, 117-132.
Plickert, G., Kroiher, M., 1988. Proliferation kinetics and cell lineages can be studied in whole mounts and macerates by means of BrdU/anti-BrdU technique. Development. 103, 791-794.
Rao, N., et al., 2009. Proteomic analysis of blastema formation in regenerating axolotl limbs. BMC Biol. 7, 83.
Reiter, S., Galliot, B., Buzgariu, W., 2012. Hydra, a versatile model to study the homeostatic and developmental functions of cell death. Int J Dev Biol. 56, 593-604.
Roque, T., Haton, C., Etienne, O., Chicheportiche, A., Rousseau, L., Martin, L., Mouthon, M.A., Boussin, F.D., 2012. Lack of a p21waf1/cip -dependent G1/S checkpoint in neural stem and progenitor cells after DNA damage in vivo. Stem Cells. 30, 537-547.
Rothkamm, K., Kruger, I., Thompson, L.H., Lobrich, M., 2003. Pathways of DNA double-strand break repair during the mammalian cell cycle. Mol Cell Biol. 23, 5706-5715.
Rousseau, L., et al., 2012. In vivo importance of homologous recombination DNA repair for mouse neural stem and progenitor cells. PLoS ONE. 7, e37194.

Hydra stem cells Buzgariu et al. Differentiation (2014)
17
Savatier, P., Huang, S., Szekely, L., Wiman, K.G., Samarut, J., 1994. Contrasting patterns of retinoblastoma protein expression in mouse embryonic stem cells and embryonic fibroblasts. Oncogene. 9, 809-818.
Shcherbata, H.R., Althauser, C., Findley, S.D., Ruohola-Baker, H., 2004. The mitotic-to-endocycle switch in Drosophila follicle cells is executed by Notch-dependent regulation of G1/S, G2/M and M/G1 cell-cycle transitions. Development. 131, 3169-3181.
Smith, P.J., et al., 2000. Characteristics of a novel deep red/infrared fluorescent cell-permeant DNA probe, DRAQ5, in intact human cells analyzed by flow cytometry, confocal and multiphoton microscopy. Cytometry. 40, 280-291.
Steele, R.E., 2002. Developmental signaling in Hydra: what does it take to build a "simple" animal? Dev. Biol. 248, 199-219.
Sugiyama, T., Fujisawa, T., 1978. Genetic analysis of developmental mechanisms in Hydra. II. Isolation and characterization of an interstitial cell-deficient strain. J Cell Sci. 29, 35-52.
Takata, M., Sasaki, M.S., Sonoda, E., Morrison, C., Hashimoto, M., Utsumi, H., Yamaguchi-Iwai, Y., Shinohara, A., Takeda, S., 1998. Homologous recombination and non-homologous end-joining pathways of DNA double-strand break repair have overlapping roles in the maintenance of chromosomal integrity in vertebrate cells. EMBO J. 17, 5497-5508.
Taylor, I.W., 1980. A rapid single step staining technique for DNA analysis by flow microfluorimetry. J Histochem Cytochem. 28, 1021-1024.
Technau, U., Holstein, T.W., 1996. Phenotypic maturation of neurons and continuous precursor migration in the formation of the peduncle nerve net in Hydra. Dev. Biol. 177, 599-615.
Toyoshima, H., Hunter, T., 1994. p27, a novel inhibitor of G1 cyclin-Cdk protein kinase activity, is related to p21. Cell. 78, 67-74.
Ulrich, H., Tarnok, A., 2005. Quantification of cell-cycle distribution and mitotic index in Hydra by flow cytometry. Cell Prolif. 38, 63-75.
Verdoodt, B., Decordier, I., Geleyns, K., Cunha, M., Cundari, E., Kirsch-Volders, M., 1999. Induction of polyploidy and apoptosis after exposure to high concentrations of the spindle poison nocodazole. Mutagenesis. 14, 513-520.
Vindelov, L.L., Christensen, I.J., Nissen, N.I., 1983. A detergent-trypsin method for the preparation of nuclei for flow cytometric DNA analysis. Cytometry. 3, 323-327.
Watson, J.V., Chamber, S.H., Smith, P.G., 1987. A pragmatic approach to the analysis of DNA histograms with a definable G1 peak. Cytometry. 8, 1-8.
Wenger, Y., Galliot, B., 2013. RNAseq versus genome-predicted transcriptomes: a large population of novel transcripts identified in an Illumina-454 Hydra transcriptome. BMC Genomics. 14.

Hydra stem cells Buzgariu et al. Differentiation (2014)
1
Robust G2 pausing of adult stem cells in Hydra Wanda BUZGARIU1, Marco CRESCENZI2 and Brigitte GALLIOT1 * 1 Department of Genetics and Evolution, University of Geneva, Sciences III, 30 Quai Ernest Ansermet, CH-1211 Geneva 4, Switzerland. 2 Health Institute, Roma, Italy. * corresponding author: tel: 41 22 379 67 74; e-mail: [email protected] http://dx.doi.org/10.1016/j.diff.2014.03.001
Published by Elsevier for the International Society of Differentiation
SUPPLEMENTAL DATA:
Supplement 1. Optimization of the procedure for measuring DNA content in Hydra ...................................... 2 Supplement 2: Table listing the different FC procedures used in this study to monitor cell cycle profiles ...... 2 FIGURE S1: Optimization of the procedure measuring the DNA content in Hydra cells. ............................... 3 FIGURE S2: Stable DNA profiles of gastric cells of Hm-105 polyps starved over seven days ....................... 4 FIGURE S3: Flow cytometry analysis of DNA profiles in the transgenic AEP_Icy1 strain. ............................. 4 FIGURE S4: A. DNA profiles of Hm_sf-1 thermo-sensitive polyps maintained at 18°C, and of heat-shocked Hm-105 thermo-insensitive polyps ................................................................................................................. 5 TABLE-S1: CV values according to the methods used for tissue dissociation and DNA staining. ................. 6 TABLE-S2: Heat-shocked induced modulations of the cell cycling profiles in the apical, gastric and basal regions of sf-1 Hydra. ..................................................................................................................................... 6
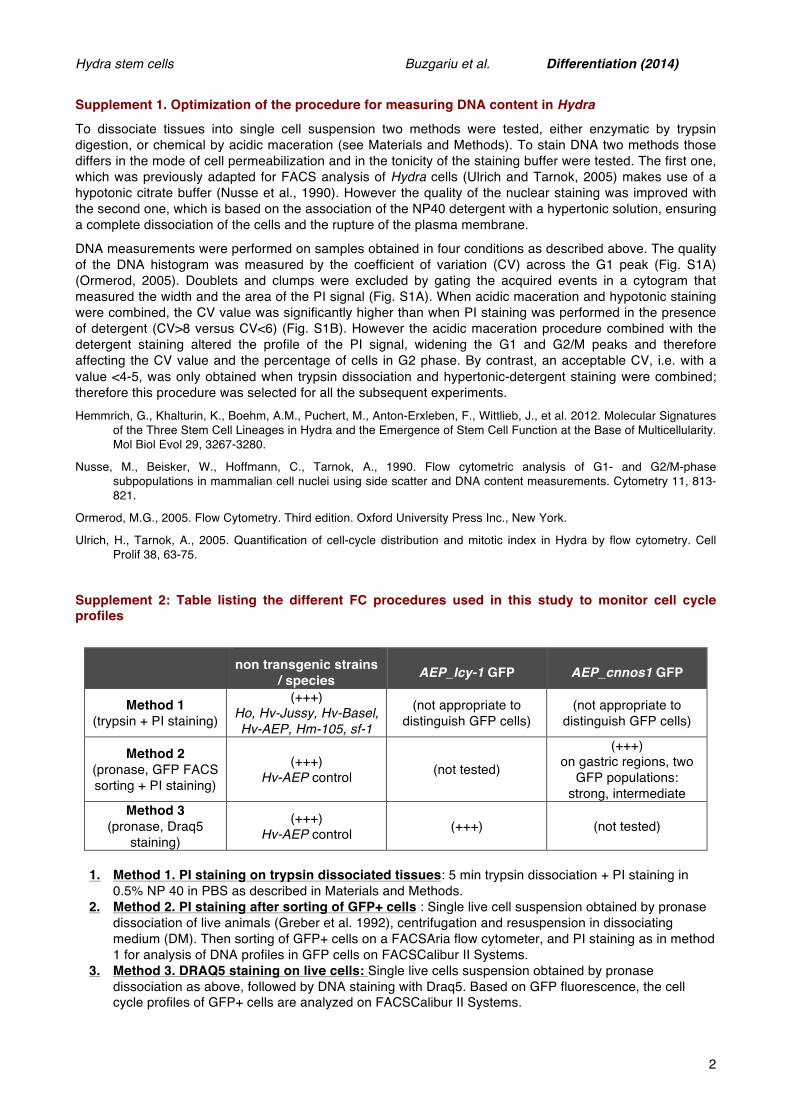
Hydra stem cells Buzgariu et al. Differentiation (2014)
2
Supplement 1. Optimization of the procedure for measuring DNA content in Hydra
To dissociate tissues into single cell suspension two methods were tested, either enzymatic by trypsin digestion, or chemical by acidic maceration (see Materials and Methods). To stain DNA two methods those differs in the mode of cell permeabilization and in the tonicity of the staining buffer were tested. The first one, which was previously adapted for FACS analysis of Hydra cells (Ulrich and Tarnok, 2005) makes use of a hypotonic citrate buffer (Nusse et al., 1990). However the quality of the nuclear staining was improved with the second one, which is based on the association of the NP40 detergent with a hypertonic solution, ensuring a complete dissociation of the cells and the rupture of the plasma membrane.
DNA measurements were performed on samples obtained in four conditions as described above. The quality of the DNA histogram was measured by the coefficient of variation (CV) across the G1 peak (Fig. S1A) (Ormerod, 2005). Doublets and clumps were excluded by gating the acquired events in a cytogram that measured the width and the area of the PI signal (Fig. S1A). When acidic maceration and hypotonic staining were combined, the CV value was significantly higher than when PI staining was performed in the presence of detergent (CV>8 versus CV<6) (Fig. S1B). However the acidic maceration procedure combined with the detergent staining altered the profile of the PI signal, widening the G1 and G2/M peaks and therefore affecting the CV value and the percentage of cells in G2 phase. By contrast, an acceptable CV, i.e. with a value <4-5, was only obtained when trypsin dissociation and hypertonic-detergent staining were combined; therefore this procedure was selected for all the subsequent experiments. Hemmrich, G., Khalturin, K., Boehm, A.M., Puchert, M., Anton-Erxleben, F., Wittlieb, J., et al. 2012. Molecular Signatures
of the Three Stem Cell Lineages in Hydra and the Emergence of Stem Cell Function at the Base of Multicellularity. Mol Biol Evol 29, 3267-3280.
Nusse, M., Beisker, W., Hoffmann, C., Tarnok, A., 1990. Flow cytometric analysis of G1- and G2/M-phase subpopulations in mammalian cell nuclei using side scatter and DNA content measurements. Cytometry 11, 813-821.
Ormerod, M.G., 2005. Flow Cytometry. Third edition. Oxford University Press Inc., New York.
Ulrich, H., Tarnok, A., 2005. Quantification of cell-cycle distribution and mitotic index in Hydra by flow cytometry. Cell Prolif 38, 63-75.
Supplement 2: Table listing the different FC procedures used in this study to monitor cell cycle profiles
non transgenic strains / species AEP_Icy-1 GFP AEP_cnnos1 GFP
Method 1 (trypsin + PI staining)
(+++) Ho, Hv-Jussy, Hv-Basel, Hv-AEP, Hm-105, sf-1
(not appropriate to distinguish GFP cells)
(not appropriate to distinguish GFP cells)
Method 2 (pronase, GFP FACS sorting + PI staining)
(+++) Hv-AEP control (not tested)
(+++) on gastric regions, two
GFP populations: strong, intermediate
Method 3 (pronase, Draq5
staining)
(+++) Hv-AEP control (+++) (not tested)
1. Method 1. PI staining on trypsin dissociated tissues: 5 min trypsin dissociation + PI staining in
0.5% NP 40 in PBS as described in Materials and Methods. 2. Method 2. PI staining after sorting of GFP+ cells : Single live cell suspension obtained by pronase
dissociation of live animals (Greber et al. 1992), centrifugation and resuspension in dissociating medium (DM). Then sorting of GFP+ cells on a FACSAria flow cytometer, and PI staining as in method 1 for analysis of DNA profiles in GFP cells on FACSCalibur II Systems.
3. Method 3. DRAQ5 staining on live cells: Single live cells suspension obtained by pronase dissociation as above, followed by DNA staining with Draq5. Based on GFP fluorescence, the cell cycle profiles of GFP+ cells are analyzed on FACSCalibur II Systems.

Hydra stem cells Buzgariu et al. Differentiation (2014)
3
FIGURE S1: Optimization of the procedure measuring the DNA content in Hydra cells.
A) Effects of two different dissociation methods on the shape and width of G1 and G2/M peaks. The clumped cells were excluded by gating the single cells found in region 1 (R1). The number of clusters of clumped cells, located outside the marked R1 region, markedly increased when Hydra were macerated (lower panels, right) but remained low when Hydra were dissociated by trypsin digestion (lower panels, left). The cell cycle profiles of the R1-gated events are represented in the lower panels.
B) Variations of the CV value according to the methods used for tissue dissociation and DNA staining. Enzymatic dissociation provided a lower CV when compared to the maceration procedure. The lowest CV value (< 4) was obtained when trypsin dissociation and PI detergent staining were combined. See numerical values in Tabel-S1.
C) In the case of apical region or whole hydra, a double peak corresponding to two different cell population in G0 or G1 was observed and impaired the correct analysis of the cell cycle distribution. Therefore, after the selection based on the nuclear size (gate G1) and doublets discrimination (gate R1), the two G0/G1 population were separated based on their differences in size in 2 gates (R2 and R3) and the cell cycle profiles were measured separately. The cell cycle distribution for the analyzed tissue was obtained by summing up the results obtained for the R2 and R3 cells. Sorting of the nuclei from the R3 population revealed that most of the cells having a 2N DNA content with a slightly higher fluorescence value are actually terminally differentiated nematocytes that are arrested in G0 (data not shown).

Hydra stem cells Buzgariu et al. Differentiation (2014)
4
FIGURE S2: Stable DNA profiles of gastric cells of Hm-105 polyps starved over seven days For comparison see the Nocodazole-induced changes of DNA profiles as shown in Fig.3I.
FIGURE S3: Flow cytometry analysis of DNA profiles in the transgenic AEP_Icy1 strain.
Live cells from either whole AEP_Icy1 polyps, or apical, gastric and basal regions were first sorted according to their GFP expression level. Then the DNA profiles were measured after Draq5 DNA staining. Only cells with intact DNA content were considered for these analyses. The DNA profiles of cells from region R1 (non fluorescencent, GFP -) and R2 (strongly fluorescencent, GFP +) were analyzed (See Fig.5) and represented after doublets (signal area FL3-A versus signal width FL3-W) and debris exclusion. Cell cycling profiles of the Icy1 Hydra cells vary according to their level of GFP expression and their location along the body axis. The cells that strongly express eGFP (R2) are predominantly found in the G0/G1 and S phases but rarely in G2 compared to the R1 cells at similar position along the axis. See also Figure 5.

Hydra stem cells Buzgariu et al. Differentiation (2014)
5
FIGURE S4: A. DNA profiles of Hm_sf-1 thermo-sensitive polyps maintained at 18°C, and of heat-shocked Hm-105 thermo-insensitive polyps
A) Sf-1 polyps maintained at 18°C were bisected to separate the apical, gastric and basal regions that were immediately processed for flow cytometry analysis. Except the slight mnodulations observed in the gastric region, the cycling patterns remain stable over 10 days. Compare to the heat-shock induced modulations shown in Fig.6D. B) DNA profiles of Hm-105 polyps before and immediately after heat-shock. Note the similar cell cycle profiles before and after HS, in contrast with the thermosensitive Hm sf-1 polyp (Fig. 6D)
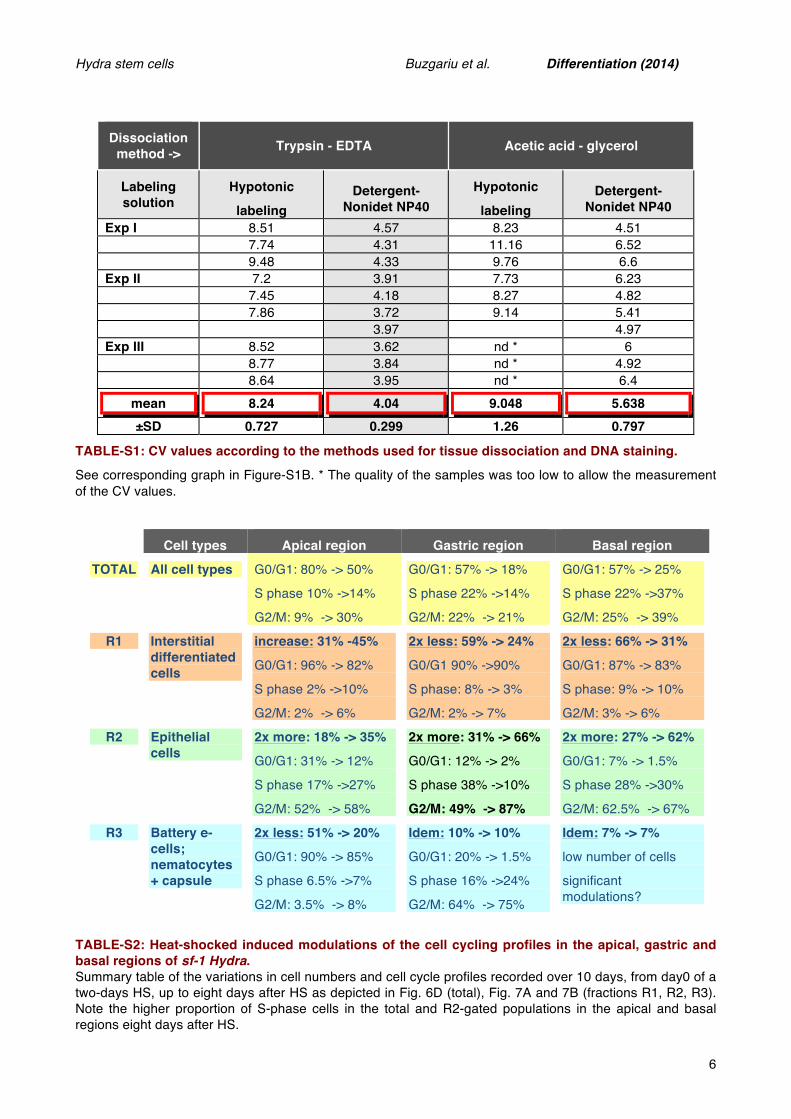
Hydra stem cells Buzgariu et al. Differentiation (2014)
6
Dissociation method -> Trypsin - EDTA Acetic acid - glycerol
Labeling solution
Hypotonic
labeling Detergent-
Nonidet NP40 Hypotonic
labeling Detergent-
Nonidet NP40 Exp I 8.51 4.57 8.23 4.51 7.74 4.31 11.16 6.52 9.48 4.33 9.76 6.6 Exp II 7.2 3.91 7.73 6.23 7.45 4.18 8.27 4.82 7.86 3.72 9.14 5.41 3.97 4.97 Exp III 8.52 3.62 nd * 6 8.77 3.84 nd * 4.92 8.64 3.95 nd * 6.4
mean 8.24 4.04 9.048 5.638 ±SD 0.727 0.299 1.26 0.797
TABLE-S1: CV values according to the methods used for tissue dissociation and DNA staining.
See corresponding graph in Figure-S1B. * The quality of the samples was too low to allow the measurement of the CV values.
Cell types Apical region Gastric region Basal region
TOTAL All cell types G0/G1: 80% -> 50%
S phase 10% ->14%
G2/M: 9% -> 30%
G0/G1: 57% -> 18%
S phase 22% ->14%
G2/M: 22% -> 21%
G0/G1: 57% -> 25%
S phase 22% ->37%
G2/M: 25% -> 39%
R1 Interstitial differentiated cells
increase: 31% -45%
G0/G1: 96% -> 82%
S phase 2% ->10%
G2/M: 2% -> 6%
2x less: 59% -> 24%
G0/G1 90% ->90%
S phase: 8% -> 3%
G2/M: 2% -> 7%
2x less: 66% -> 31%
G0/G1: 87% -> 83%
S phase: 9% -> 10%
G2/M: 3% -> 6%
R2 Epithelial cells
2x more: 18% -> 35%
G0/G1: 31% -> 12%
S phase 17% ->27%
G2/M: 52% -> 58%
2x more: 31% -> 66%
G0/G1: 12% -> 2%
S phase 38% ->10%
G2/M: 49% -> 87%
2x more: 27% -> 62%
G0/G1: 7% -> 1.5%
S phase 28% ->30%
G2/M: 62.5% -> 67%
R3 Battery e-cells; nematocytes + capsule
2x less: 51% -> 20%
G0/G1: 90% -> 85%
S phase 6.5% ->7%
G2/M: 3.5% -> 8%
Idem: 10% -> 10%
G0/G1: 20% -> 1.5%
S phase 16% ->24%
G2/M: 64% -> 75%
Idem: 7% -> 7%
low number of cells
significant modulations?
TABLE-S2: Heat-shocked induced modulations of the cell cycling profiles in the apical, gastric and basal regions of sf-1 Hydra. Summary table of the variations in cell numbers and cell cycle profiles recorded over 10 days, from day0 of a two-days HS, up to eight days after HS as depicted in Fig. 6D (total), Fig. 7A and 7B (fractions R1, R2, R3). Note the higher proportion of S-phase cells in the total and R2-gated populations in the apical and basal regions eight days after HS.