hurricane risk index abstract 1. introduction
TRANSCRIPT
1
Methodologies and tools of Risk Management: Hurricane Risk Index 𝑯𝑹𝒊 M.L. Hernández1, M.L. Carreño2, L. Castillo (†)3 ______________________________________ Abstract Mexico is recognized worldwide for the extension of its coastlines and its tourist exploitation. Quintana Roo is one of the Mexican states, which has a shoreline of approximately 800 km, known as the Mexican Caribbean. The hurricanes that form in the Atlantic Ocean are the main natural hazard to which this region is exposed. In this article, hurricane risk is evaluated for coastal cities through the definition of a system of indicators. Based on this indicators system, the Hurricane Risk Index 𝐻𝑅𝑖 is calculated. This system allows the construction of vulnerability indices for different dimensions: physical, environmental, social, economic, cultural and institutional. The obtained results can contribute to the definition of public prevention policies and actions to reduce the levels of vulnerability and increase the resilience of these communities. This indicators model is applied to two coastal cities of the Mexican Caribbean; Mahahual, obtaining an 𝐻𝑅𝑖 of 82.13%, and Chetumal obtaining an 𝐻𝑅𝑖 of 69.31%, corresponding to the impact of Hurricane Dean in 2007. The proposed indicators system can be replicated for different hazards. Keywords Risk evaluation, vulnerability, hurricanes, risk management, indicators.
1. Introduction
Disaster risk is defined as the expected probability of harmful consequences or losses resulting from interactions between natural or anthropogenic hazards and vulnerable conditions (Birkman et al., 2013). It is the potential occurrence of physical, social, economic, and environmental consequences or losses, in a given area and over a period of time, resulting from the vulnerability conditions of a socio-ecological system exposed to hazards (UNDP, 2004). It is common for risk to be estimated only in physical terms since social vulnerability is difficult to assess in quantitative terms. Many of the discrepancies in the meanings of vulnerability arise from different epistemological orientations and subsequent methodological practices (Cutter, 1996). There is a potential for loss derived from the interaction of society with biophysical conditions that in turn affect the resilience of the environment to respond to the hazard or disaster as well as influencing the adaptation of society to such changing conditions (Cutter, 1996). However, it is possible to assess vulnerability in a relative way or through "relative risk" indicators, which also allow decisions and can define prevention and mitigation priorities (Cardona et al., 2003).
1 M.L. Hernández, [email protected]. Centro de Información Geográfica. Universidad de Quintana Roo, Campus Chetumal, México. Boulevard Bahía s/n Esq. Ignacio Comonfort, Col. Del Bosque Chetumal, Quintana Roo, México C.P. 77019 Tel. (+52 983) 8350300 ext. 174 & 143 2 M. L. Carreño, [email protected]. Centre Internacional de Mètodes Numèrics en Enginyeria (CIMNE), Universitat Politècnica de Catalunya, Campus Norte UPC C/Gran Capitán S/N, 08034 Barcelona, España. 3 L. Castillo (†). (R.I.P) División de Ciencias e Ingeniería. Universidad de Quintana Roo, Campus Chetumal, México.
2
Coastal areas constitute geographic spaces of extraordinary importance for human beings, from the natural, social and economic point of view. In the Atlantic tropical cyclone basin, which includes the Atlantic Ocean, the Caribbean Sea, and the Gulf of Mexico, hurricanes originate mostly in the northern Atlantic and to a lesser degree in the Caribbean. The areas most at risk are the Caribbean island countries north of Trinidad, Mexico and the southeastern United States (OAS, 1991). The state of Quintana Roo is located southeast of the Mexican Republic, on the Caribbean Sea, commonly called "Mexican Caribbean". The coast of Quintana Roo covers 865.2 km, the most extensive of the Atlantic coast, being one of the coastal states with greater pressure for the tourist development known as "sun and beach" of the country (Moreno-Casasola et al., 2014). The official hurricane season in the Greater Caribbean region begins 1 June and lasts through November 30, with 84 percent of all hurricanes occurring during August and September (OEA, 1991). Hurricanes affected the southern territory of Quintana Roo; some can be mentioned: Carmen, 1974; Gert, 1993; Opal and Roxanne, 1995; Chantal, 1998. Some of the most remembered: Hurricane Mitch, 1998, whose threat lasted about fifteen days; Hurricane Wilma, 2005, the most intense recorded in the Atlantic and the 10th most intense recorded worldwide in category 5; Hurricane Dean, 2007. Karl, 2010; Ernesto, 2012; Franklin, 2017; Harvey, 2017 and Nate, 2017, have been other hurricanes that have affected the territory to a lower degree. The tourism industry suffered the greatest damage. For example, during the 1988 Atlantic hurricane season, the tourist areas of the state of Quintana Roo suffered US$100 million in direct damage and lost an estimated US$90 million in revenues. The Inter-American Development Bank, after evaluating the damage to infrastructure in this sector, lent US$41.5 million for reconstruction (OEA, 1991). Population centers and economic activities in the region are highly vulnerable to disruption and damage from the effects of extreme weather. They are largely concentrated in coastal plains and low-lying areas subject to storm surges and land-borne flooding. High demands placed on existing lifeline infrastructure, combined with inadequate funds for the expansion and maintenance of these vital systems, have increased their susceptibility to breakdowns. Hurricane activity varies over different time cycles, and the reasons for this variability are not all well-understood. The Atlantic hurricane season of 2017 was an extremely active season. Hurricanes Harvey, Irma, and Maria combined to produce over a quarter trillion dollars in damage in the U.S.A. Three Category 4 hurricanes made landfall in the United States following twelve years without a major hurricane landfall. Irma and Harvey left major floods in Houston and Miami, as well as great destruction in Puerto Rico, the islands of Antigua and Barbuda, San Bartolome, San Martin, the British Virgin Islands, the Dominican Republic, Haiti, the Bahamas, and Cuba. The great economic losses activated the financial relief funds for the region. Each hurricane generates different problems: Harvey brought massive flooding, Irma deadly storm surges, and Maria catastrophic high winds. Despite all this activity, during the 2017 season, Mexico did not suffer direct impact from a hurricane. Although there are significant advances in improving their disaster risk management capabilities with early warnings in the state, coastal locations remain the most vulnerable areas. From the above, the following research question arises: How can we identify the levels of hurricane risk and vulnerability of coastal zones to which they are exposed year after year? Therefore, the main objective of this article is to propose a conceptual framework, a system of
3
indicators and the Hurricane Risk index 𝐻𝑅𝑖 to assess hurricanes risk and vulnerability in coastal areas of the Mexican Caribbean, taking as case study two coastal areas: Chetumal and Mahahual, facing the natural hazard of the hurricane Dean (2007).
2. Key concepts and methodologies
The research on natural hazards was focused primarily on studies of the physical phenomena (White, 1945; Tricart and Kilian, 1982) leaving aside the human causes (Ribas and Saurí, 2006). It was in the 1940s, with the pioneering work of Gilbert White, where the argument is set: “in the generation of risk both physical factors and human factors intervene”. White (1945), gives perhaps one of the most revealing phrases of his study, “(…) floods are “acts of God”, but flood losses are largely acts of man (…)” (p.2). This explains clearly that the action of nature is not the one that generates the risks, but the lack of planning and little vision of the future on the part of societies and their rulers. In the assessment of disaster risk, contributions of the natural sciences, applied sciences, and social sciences have been developed and gradually incorporated into more complex and holistic models and concepts.
The unplanned and untidy growth increase the risk in cities, resulting in human losses when disaster strikes. In developing countries, such as those in Latin America, including Mexico, there is a lack of territorial and urban planning involving disaster risk management. Measuring risk means taking into account not only the expected physical damage, the victims or equivalent economic losses but also social, organizational and institutional factors (Carreño, 2006; Carreño et al., 2007a; 2007b; 2012; 2014a; 2014b; 2017; 2018; Jaramillo et al. 2016). Martínez (2009) indicates the necessity to use different methodological procedures to carry out a disaster risk evaluation. It mentions that first, it is necessary to use an empirical - analytical approach, with the purpose of knowing each of the hazardous phenomena that are part of a global system. Secondly, a systemic approach, which studies the interrelationships and processes between the natural hazard origin and the vulnerability. Third, an approach interested in examining differences, between the probability of exposure to biophysical risk and social vulnerability or combination of both. 2.1. Hazard, vulnerability, and risk
United Nations Disaster Relief Organization (UNDRO) together with United Nations Educational, Scientific and Cultural Organization (UNESCO) in 1979 promoted a meeting of experts to unify the concepts of risk, hazard, and vulnerability, resulting in the report: Natural Disasters and Vulnerability Analysis. Report Expert Group (9-12 July; UNDRO, 1980). Among other concepts, this report includes the following: Hazard or Danger 𝐻 , Vulnerability 𝑉 , Specific risk 𝑅𝑠 , Elements at risk 𝐸 , Total risk 𝑅𝑡 . Based on the above, the following equation to assess risk was proposed:
𝑅𝑡 𝐸 ∗ 𝑅𝑠 𝐸 ∗ 𝐻 ∗ 𝑉 (1)
Cardona, in 1985, proposed, removed the variable Exposure (𝐸), since it is involved in the Vulnerability (𝑉), without this modifying the original conception (Cardona, 1993). In this equation the hazard is associated with the natural phenomenon: a hurricane, a flood, an eruption, for example; and vulnerability is associated with the critical physical and social factors
4
that lead to a greater impact of the natural phenomenon: poorly constructed housing, extreme poverty, lack of preparedness measures, and so on. Under this definition it must be conceived that a city at risk is one that is likely to be affected or is prone to a natural hazard, and that its society does not have adequate measures to minimize the impact of the phenomenon (UNDRO, 1980; Cardona, 1993; Mansilla, 2000; Soldano, 2009). For this article, and according to Birkmann et al. (2013), hazard is defined as the potentiality of a damaging event, phenomenon or human activity that may have a negative impact on cultural, economic, environmental, institutional, physical or social assets in a given area and over a given period of time. A hazard is characterized by its location, magnitude, and frequency or probability. The natural hazard is a latent threat caused by natural processes or phenomena occurring in the biosphere. Hydro-meteorological hazards are natural processes or phenomena of atmospheric, hydrological or oceanographic nature. Hydro-meteorological hazards include floods, debris and mud floods; tropical cyclones, storm surges, thunder/hailstorms, rain and wind storms, blizzards and other severe storms; drought, desertification, wildland fires, temperature extremes, sand or dust storms; permafrost and snow or ice avalanches. The risk is defined as the potential occurrence of harmful consequences or losses resulting from interactions between natural or anthropogenic hazards and vulnerable conditions. The composite or synthetic indicators, which summarize the information contained in the indicator systems, have acquired a growing interest as a powerful tool that contributes to the measurement, evaluation, formulation, and analysis of public policies in the disaster risk reduction (Schuschny and Soto, 2009). Several proposals have been developed around the world (BID, 2010; Cardona, 2008; Cardona et al., 2005; Carreño, 2006; Carreño, et al., 2007b; Castillo, 2009; Herrera-Moreno y Betancourt, 2001; Cutter, et al., 2003; UNDP, 2004; Peduzzi, et al., 2009; Rodríguez y Bozada, 2010; SINAPROC-CENAPRED, 2006, Khazai et al, 2015; Burton, 2015), these methodologies are the basis of the proposed indicators system. Masure and Lutoff (2002) proposed the methodology "Urban System Exposure (USE)". It characterizes the city as a system of seven components: population, urban space, urban functions, urban activities, urban government, identity, culture and external image. The methodology analyzes the exposed elements in a city after a catastrophic event and before returning to its normal dynamics without taking into account the physical factors of the hazards. The present article defined the main components of hurricanes (wind, waves, storm surge and rain) and vulnerability from a broader perspective, considering the construction of the city, environmental, social, economic, cultural and institutional dimensions.
2.2. Dimensions of vulnerability
Blaikie et al. (1996) define vulnerability as the characteristics of a person or group of people related to the capacity to anticipate, cope, resist and recover from the impact of natural hazards. However, Birkmann (2006) defines vulnerability as an intrinsic predisposition to be affected or susceptible to physical, economic, social or political damages, as a consequence of an event of natural or anthropogenic origin. The vulnerability has to be studied in its multifaceted nature (Bohle, 2002, cit. Birkmann, 2006), but the different definitions and approaches show that it is not clear exactly what “vulnerability” represents as a scientific concept.
5
This article takes into account the several aspects of vulnerability based on the proposals from different authors. Wilches-Chaux (1993) proposed ten different dimensions of vulnerability (physical, economic, social, educational, political, institutional, cultural, environmental and ideological) that are closely interconnected with each other. Cardona (2001) proposes the vulnerability is generated by three factors (exposure, social fragility and lack of resilience). The European research project Methods for the Improvement of Vulnerability Assessment in Europe, MOVE, (Birkmann et al. 2013) defines six dimensions of vulnerability (physical, ecological, social, economic, cultural and institutional). The MOVE conceptual framework stresses the fact that many interactions that shape vulnerability are dynamic (change over time) and characterized by nonlinearity and place-specific factors. Thus, the application of the framework has to consider the place-specific characteristics that influence vulnerability and its components as well as the coupling processes between social and environmental systems (Birkmann et al. 2013). The present article bases its approach on the three mentioned proposals.
3. Model for hurricanes risk evaluation
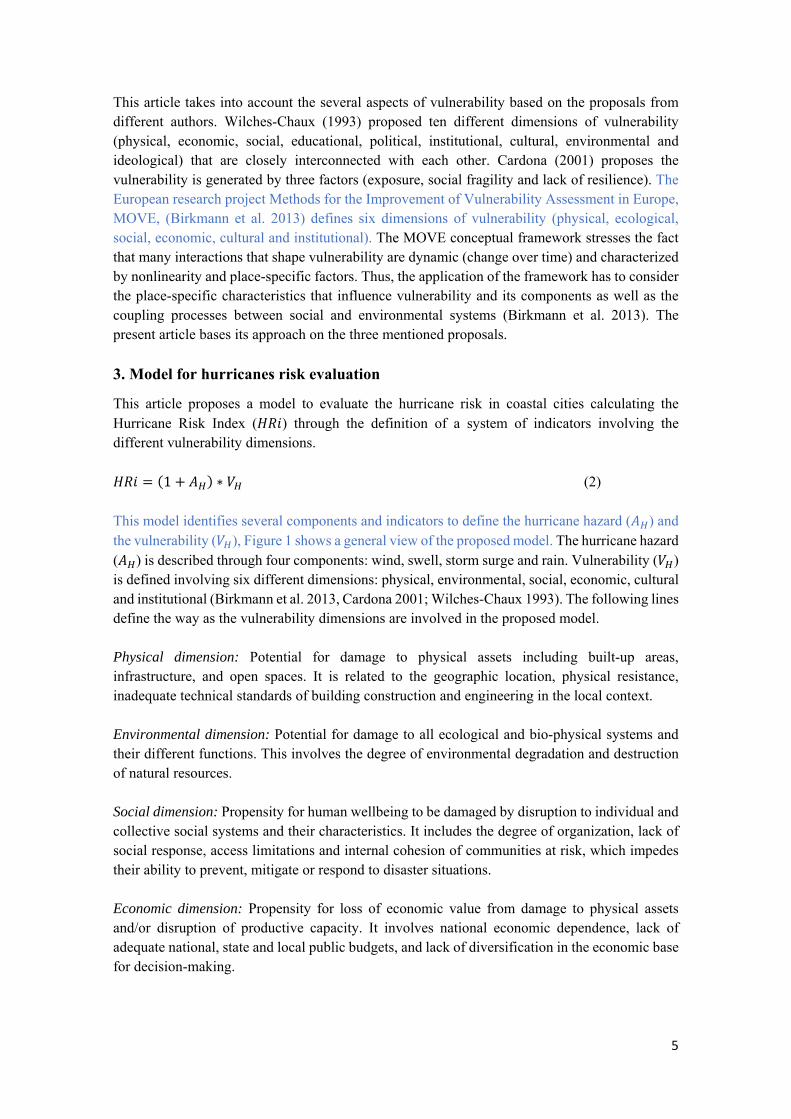
This article proposes a model to evaluate the hurricane risk in coastal cities calculating the Hurricane Risk Index (𝐻𝑅𝑖) through the definition of a system of indicators involving the different vulnerability dimensions. 𝐻𝑅𝑖 1 𝐴 ∗ 𝑉 (2) This model identifies several components and indicators to define the hurricane hazard (𝐴 ) and the vulnerability (𝑉 ), Figure 1 shows a general view of the proposed model. The hurricane hazard (𝐴 ) is described through four components: wind, swell, storm surge and rain. Vulnerability (𝑉 ) is defined involving six different dimensions: physical, environmental, social, economic, cultural and institutional (Birkmann et al. 2013, Cardona 2001; Wilches-Chaux 1993). The following lines define the way as the vulnerability dimensions are involved in the proposed model. Physical dimension: Potential for damage to physical assets including built-up areas, infrastructure, and open spaces. It is related to the geographic location, physical resistance, inadequate technical standards of building construction and engineering in the local context. Environmental dimension: Potential for damage to all ecological and bio-physical systems and their different functions. This involves the degree of environmental degradation and destruction of natural resources. Social dimension: Propensity for human wellbeing to be damaged by disruption to individual and collective social systems and their characteristics. It includes the degree of organization, lack of social response, access limitations and internal cohesion of communities at risk, which impedes their ability to prevent, mitigate or respond to disaster situations. Economic dimension: Propensity for loss of economic value from damage to physical assets and/or disruption of productive capacity. It involves national economic dependence, lack of adequate national, state and local public budgets, and lack of diversification in the economic base for decision-making.
6
Cultural dimension: Potential for damage to intangible values including meanings placed on artifacts, customs, habitual practices and natural or urban landscapes. It involves the hazard and risk perception, language problems, and the influence of disaster prevention in educational plans and programs to create a culture of safety and resilience. Institutional dimension: Potential for damage to governance systems, organizational form, and function as well as guiding formal/legal and informal/customary rules. It involves the structural problems of institutions, especially the political system: local decision-making, mitigation actions and programs, degrees of centralization in decision-making and governmental organization.
Figure 1. Model of Risk and Vulnerability to Hurricanes
4. System of indicators
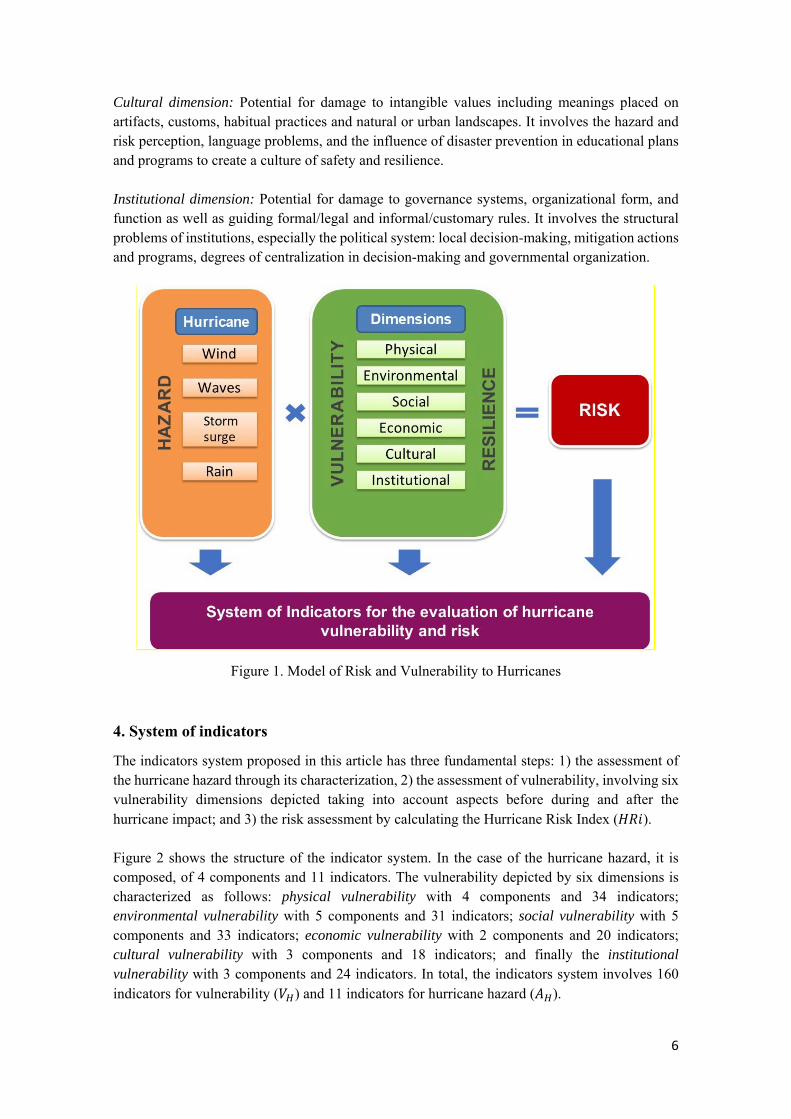
The indicators system proposed in this article has three fundamental steps: 1) the assessment of the hurricane hazard through its characterization, 2) the assessment of vulnerability, involving six vulnerability dimensions depicted taking into account aspects before during and after the hurricane impact; and 3) the risk assessment by calculating the Hurricane Risk Index (𝐻𝑅𝑖). Figure 2 shows the structure of the indicator system. In the case of the hurricane hazard, it is composed, of 4 components and 11 indicators. The vulnerability depicted by six dimensions is characterized as follows: physical vulnerability with 4 components and 34 indicators; environmental vulnerability with 5 components and 31 indicators; social vulnerability with 5 components and 33 indicators; economic vulnerability with 2 components and 20 indicators; cultural vulnerability with 3 components and 18 indicators; and finally the institutional vulnerability with 3 components and 24 indicators. In total, the indicators system involves 160 indicators for vulnerability (𝑉 ) and 11 indicators for hurricane hazard (𝐴 ).
7
𝐴 Hazard X
𝑉 Vulnerability = 𝐻𝑅𝑖
Figure 2. System of indicators Starting from the “Model for hurricane risk and vulnerability evaluation in coastal areas” (Figure 1), the Hurricane Risk index 𝐻𝑅𝑖 is expressed by equation 2
𝐻𝑅𝑖 1 𝐴 ∗ 𝑉
The hurricane hazard, 𝐴 , is calculated as the weighted sum of the components 𝐴 ,
𝐴 ∑ 𝑊𝐴 ∗ 𝐴 (3)
Such components, 𝐴 , are also obtained as the weighted sum of their corresponding normalized indicators in each case.
𝐴 ∑ 𝐴 ∗ 𝑊𝐴 (4)
Were, 𝑁 is the total number of indicators involved in the component 𝑖 of the hazard, 𝐴 is the
normalized indicator 𝑗 within component 𝑖 of the hazard, 𝑊𝐴 is the weight assigned to the
𝐴 : Wind 𝑊𝐴 𝐴 Hurricane category 𝑊𝐴
𝐴 Wind speed 𝑊𝐴
𝐴 Central pressure 𝑊𝐴
𝐴 : Waves 𝑊𝐴 𝐴 Amplitude 𝑊𝐴
𝐴 Height 𝑊𝐴
𝐴 Wavelength 𝑊𝐴
𝐴 : Storm surge 𝑊𝐴 𝐴 Storm surge 𝑊𝐴
𝐴 : Rain 𝑊𝐴 𝐴 Intensity 𝑊𝐴
𝐴 Duration 𝑊𝐴
𝐴 Depth 𝑊𝐴
𝐴 Frequency 𝑊𝐴
𝑉 : Physical Vulnerability 𝑊𝑉 𝑉 Population 𝑊𝑉
𝑉 Space occupied 𝑊𝑉
𝑉 Urban infrastructure 𝑊𝑉
𝑉 Urban activities 𝑊𝑉
𝑉 : Environmental Vulnerability 𝑊𝑉 𝑉 Protected natural areas 𝑊𝑉
𝑉 Bodies of water 𝑊𝑉
𝑉 Rivers 𝑊𝑉
𝑉 Solid urban waste 𝑊𝑉
𝑉 Land use changes 𝑊𝑉
𝑉 : Social Vulnerability 𝑊𝑉 𝑉 Population 𝑊𝑉
𝑉 Housing 𝑊𝑉
𝑉 Basic services 𝑊𝑉
𝑉 Education 𝑊𝑉
𝑉 Emergency resources 𝑊𝑉
𝑉 : Economic Vulnerability 𝑊𝑉 𝑉 Population 𝑊𝑉
𝑉 Economic activities 𝑊𝑉
𝑉 : Cultural Vulnerability 𝑊𝑉 𝑉 Risk perception 𝑊𝑉
𝑉 Language 𝑊𝑉
𝑉 Plans and study programs 𝑊𝑉
𝑉 : Institutional Vulnerability 𝑊𝑉 𝑉 Local decision 𝑊𝑉
𝑉 Plans and programs 𝑊𝑉
𝑉 Financial protection 𝑊𝑉
34 indicators
31 indicators
33 indicators
20 indicators
18 indicators
24 indicators
8
component 𝑖 of the hazard, and 𝑊𝐴 is the weight assigned to the normalized indicator 𝑗 within
the component 𝑖.
In the same way, the vulnerability, 𝑉 , is calculated as the weighted sum of the six dimensions
identified,
𝑉 ∑ 𝑊𝑉 ∗ 𝑉 (5)
were 𝑊𝑉 is the weight assigned to each dimension. The vulnerability index for each dimension,
𝑉 is also calculated as the weighted sum of the corresponding components 𝑉 ,
𝑉 ∑ 𝑊𝑉 ∗ 𝑉 (6)
were 𝑊 is the weight assigned, through expert opinion, to each component in the dimension 𝑖.
The vulnerability index for each component, 𝑉 , corresponds to the weighted sum of the
corresponding normalized indicators involved in each case 𝑉 ,
𝑉 ∑ 𝑊𝑉 ∗ 𝑉 (7)
were 𝑊𝑉 is the weight assigned to each indicator.
Composite indicators are based on sub-indicators that have no common meaningful unit of
measurement, and there is no obvious way of weighting these sub-indicators. A commonly used
method is the assignment of weights to sub-indicators based on personal judgment (participatory
method). Budget allocation is a participatory method in which experts are given a "budget" of N
points, to be distributed over a number of sub-indicators, "paying" more for those sub-indicators
whose importance they want to stress.
The proposed methodology used the consensus of local experts' opinion. Experts from the state
and municipal civil protection as well as academic experts were interviewed. It was also applied
to the selection of the minimum and maximum values of the indicators used to normalize their
values.
The simple indicators involved in each component are classified as positive or negative, and then
normalized, to take values in the range from 0 to 1 in case of hazard; and in the range, 0 to 100 in
case of vulnerability, to guarantee the comparability of the data. The simple indicators are
normalized in a relative way by using default minimum and maximum values.
The hazard indicators are normalized using the following
𝐴 (8)
9
The vulnerability indicators can increase or reduce vulnerability, and they are normalized
according to this condition. In the case of a higher value of the indicator means greater
vulnerability (+), the indicator is normalized as follows:
𝑉 ∗ 100 (9)
In the opposite case, when a higher value of the indicator means a lower vulnerability (-), the
normalization is applied as follows:
𝑉 ∗ 100 (10)
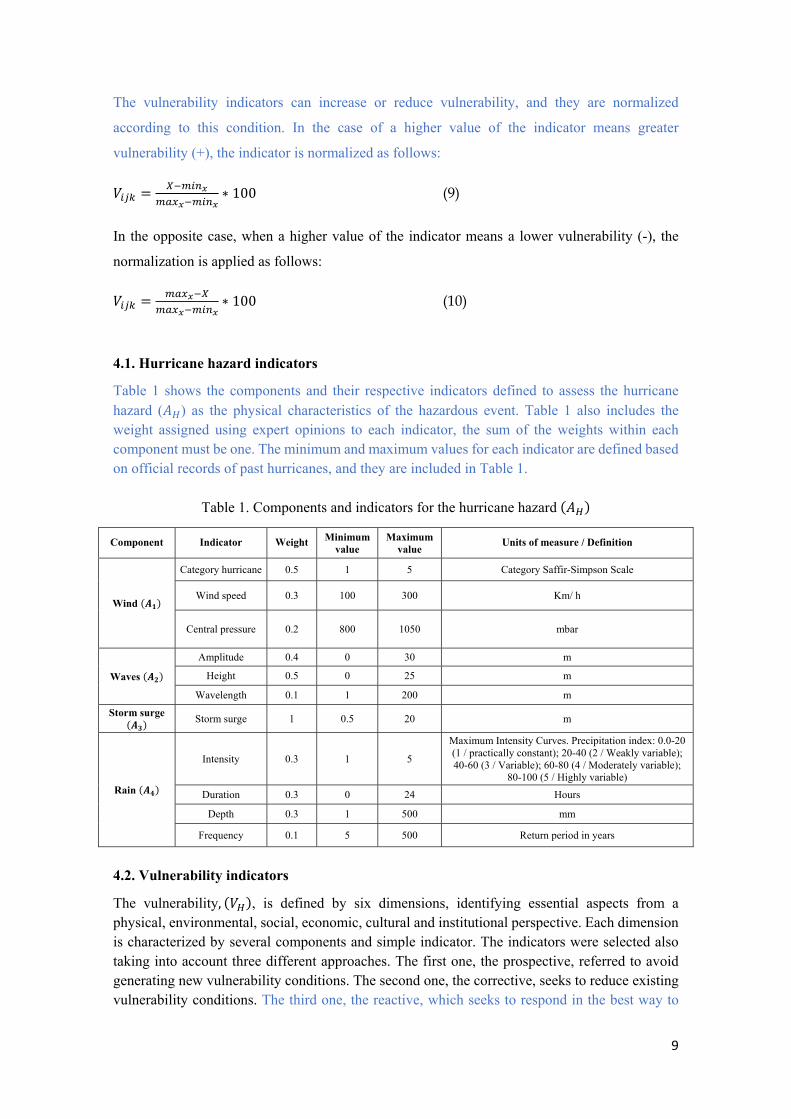
4.1. Hurricane hazard indicators
Table 1 shows the components and their respective indicators defined to assess the hurricane hazard (𝐴 ) as the physical characteristics of the hazardous event. Table 1 also includes the weight assigned using expert opinions to each indicator, the sum of the weights within each component must be one. The minimum and maximum values for each indicator are defined based on official records of past hurricanes, and they are included in Table 1.
Table 1. Components and indicators for the hurricane hazard 𝐴
Component Indicator Weight Minimum value
Maximum value
Units of measure / Definition
Wind 𝑨𝟏
Category hurricane 0.5 1 5 Category Saffir-Simpson Scale
Wind speed 0.3 100 300 Km/ h
Central pressure 0.2 800 1050 mbar
Waves 𝑨𝟐
Amplitude 0.4 0 30 m
Height 0.5 0 25 m
Wavelength 0.1 1 200 m
Storm surge 𝑨𝟑
Storm surge 1 0.5 20 m
Rain 𝑨𝟒
Intensity 0.3 1 5
Maximum Intensity Curves. Precipitation index: 0.0-20 (1 / practically constant); 20-40 (2 / Weakly variable); 40-60 (3 / Variable); 60-80 (4 / Moderately variable);
80-100 (5 / Highly variable)
Duration 0.3 0 24 Hours
Depth 0.3 1 500 mm
Frequency 0.1 5 500 Return period in years
4.2. Vulnerability indicators
The vulnerability, 𝑉 , is defined by six dimensions, identifying essential aspects from a physical, environmental, social, economic, cultural and institutional perspective. Each dimension is characterized by several components and simple indicator. The indicators were selected also taking into account three different approaches. The first one, the prospective, referred to avoid generating new vulnerability conditions. The second one, the corrective, seeks to reduce existing vulnerability conditions. The third one, the reactive, which seeks to respond in the best way to
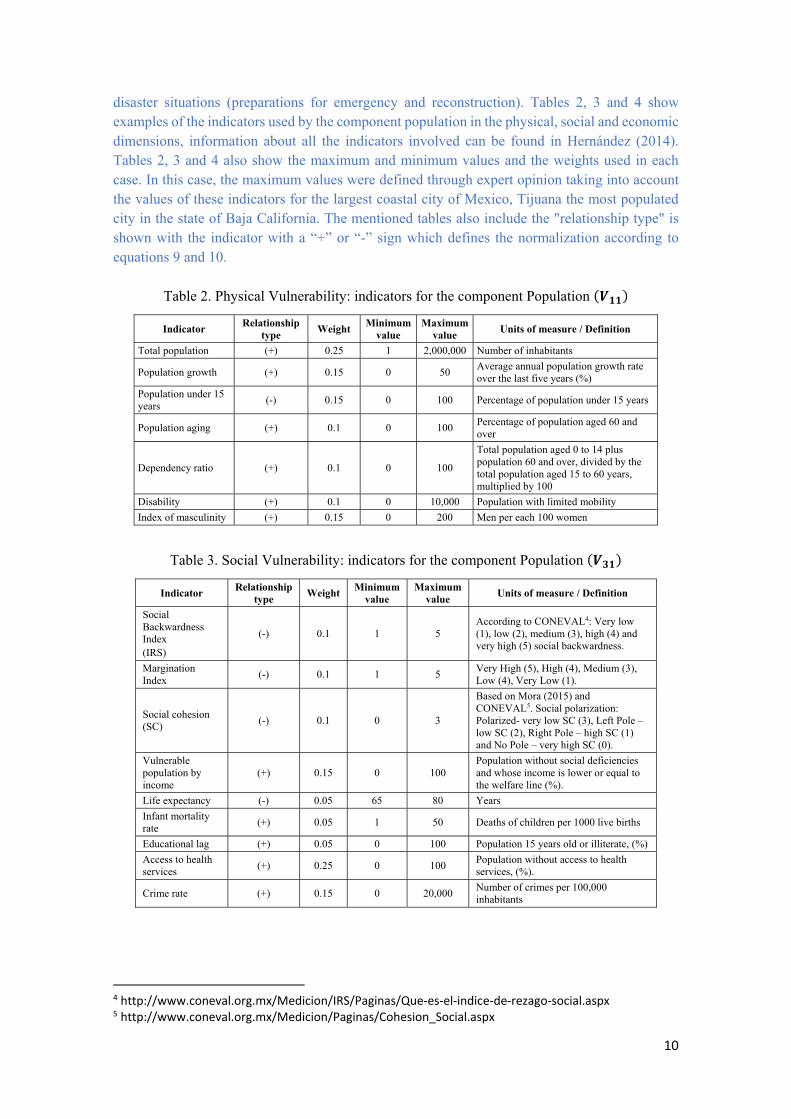
10
disaster situations (preparations for emergency and reconstruction). Tables 2, 3 and 4 show examples of the indicators used by the component population in the physical, social and economic dimensions, information about all the indicators involved can be found in Hernández (2014). Tables 2, 3 and 4 also show the maximum and minimum values and the weights used in each case. In this case, the maximum values were defined through expert opinion taking into account the values of these indicators for the largest coastal city of Mexico, Tijuana the most populated city in the state of Baja California. The mentioned tables also include the "relationship type" is shown with the indicator with a “+” or “-” sign which defines the normalization according to equations 9 and 10.
Table 2. Physical Vulnerability: indicators for the component Population 𝑽𝟏𝟏
Indicator Relationship
type Weight
Minimum value
Maximum value
Units of measure / Definition
Total population (+) 0.25 1 2,000,000 Number of inhabitants
Population growth (+) 0.15 0 50 Average annual population growth rate over the last five years (%)
Population under 15 years
(-) 0.15 0 100 Percentage of population under 15 years
Population aging (+) 0.1 0 100 Percentage of population aged 60 and over
Dependency ratio (+) 0.1 0 100
Total population aged 0 to 14 plus population 60 and over, divided by the total population aged 15 to 60 years, multiplied by 100
Disability (+) 0.1 0 10,000 Population with limited mobility
Index of masculinity (+) 0.15 0 200 Men per each 100 women
Table 3. Social Vulnerability: indicators for the component Population 𝑽𝟑𝟏
Indicator Relationship
type Weight
Minimum value
Maximum value
Units of measure / Definition
Social Backwardness Index (IRS)
(-) 0.1 1 5 According to CONEVAL4: Very low (1), low (2), medium (3), high (4) and very high (5) social backwardness.
Margination Index
(-) 0.1 1 5 Very High (5), High (4), Medium (3), Low (4), Very Low (1).
Social cohesion (SC)
(-) 0.1 0 3
Based on Mora (2015) and CONEVAL5. Social polarization: Polarized- very low SC (3), Left Pole – low SC (2), Right Pole – high SC (1) and No Pole – very high SC (0).
Vulnerable population by income
(+) 0.15 0 100 Population without social deficiencies and whose income is lower or equal to the welfare line (%).
Life expectancy (-) 0.05 65 80 Years
Infant mortality rate
(+) 0.05 1 50 Deaths of children per 1000 live births
Educational lag (+) 0.05 0 100 Population 15 years old or illiterate, (%)
Access to health services
(+) 0.25 0 100 Population without access to health services, (%).
Crime rate (+) 0.15 0 20,000 Number of crimes per 100,000 inhabitants
4 http://www.coneval.org.mx/Medicion/IRS/Paginas/Que‐es‐el‐indice‐de‐rezago‐social.aspx 5 http://www.coneval.org.mx/Medicion/Paginas/Cohesion_Social.aspx
11
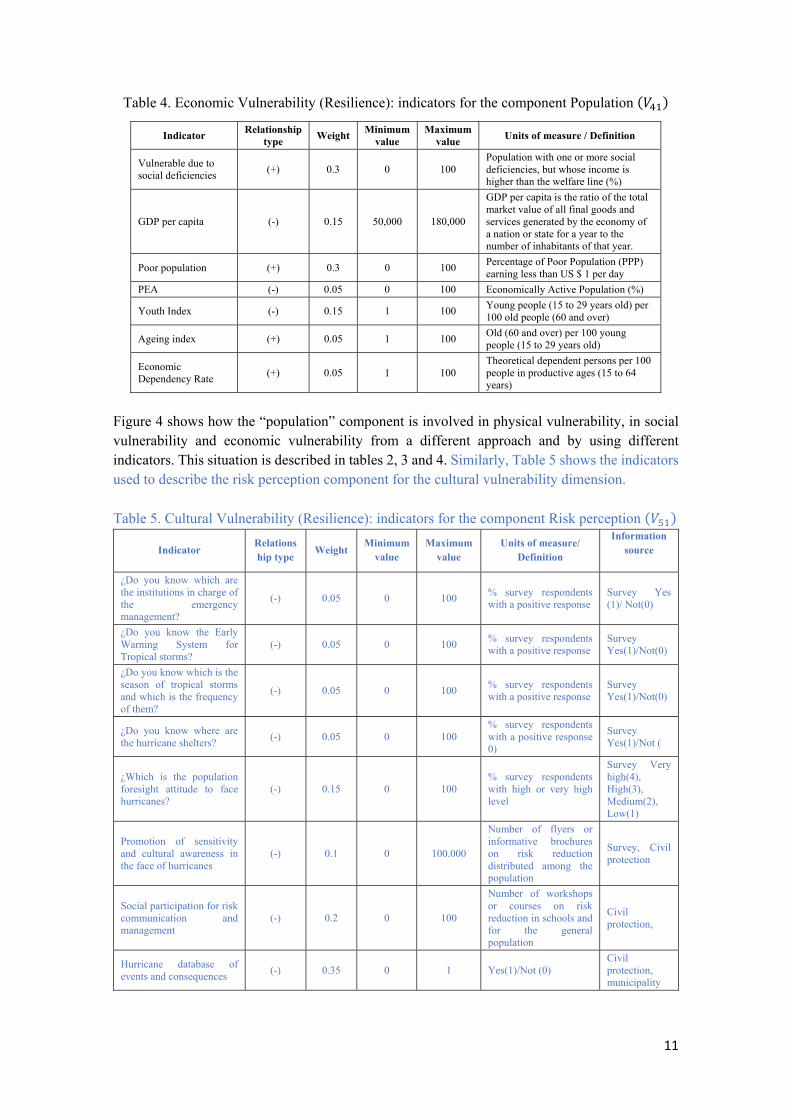
Table 4. Economic Vulnerability (Resilience): indicators for the component Population 𝑉
Indicator Relationship
type Weight
Minimum value
Maximum value
Units of measure / Definition
Vulnerable due to social deficiencies
(+) 0.3 0 100 Population with one or more social deficiencies, but whose income is higher than the welfare line (%)
GDP per capita (-) 0.15 50,000 180,000
GDP per capita is the ratio of the total market value of all final goods and services generated by the economy of a nation or state for a year to the number of inhabitants of that year.
Poor population (+) 0.3 0 100 Percentage of Poor Population (PPP) earning less than US $ 1 per day
PEA (-) 0.05 0 100 Economically Active Population (%)
Youth Index (-) 0.15 1 100 Young people (15 to 29 years old) per 100 old people (60 and over)
Ageing index (+) 0.05 1 100 Old (60 and over) per 100 young people (15 to 29 years old)
Economic Dependency Rate
(+) 0.05 1 100 Theoretical dependent persons per 100 people in productive ages (15 to 64 years)
Figure 4 shows how the “population” component is involved in physical vulnerability, in social vulnerability and economic vulnerability from a different approach and by using different indicators. This situation is described in tables 2, 3 and 4. Similarly, Table 5 shows the indicators used to describe the risk perception component for the cultural vulnerability dimension. Table 5. Cultural Vulnerability (Resilience): indicators for the component Risk perception 𝑉
Indicator Relationship type
Weight Minimum
value Maximum
value Units of measure/
Definition
Information source
¿Do you know which are the institutions in charge of the emergency management?
(-) 0.05 0 100 % survey respondents with a positive response
Survey Yes (1)/ Not(0)
¿Do you know the Early Warning System for Tropical storms?
(-) 0.05 0 100 % survey respondents with a positive response
Survey Yes(1)/Not(0)
¿Do you know which is the season of tropical storms and which is the frequency of them?
(-) 0.05 0 100 % survey respondents with a positive response
Survey Yes(1)/Not(0)
¿Do you know where are the hurricane shelters?
(-) 0.05 0 100 % survey respondents with a positive response 0)
Survey Yes(1)/Not (
¿Which is the population foresight attitude to face hurricanes?
(-) 0.15 0 100 % survey respondents with high or very high level
Survey Very high(4), High(3), Medium(2), Low(1)
Promotion of sensitivity and cultural awareness in the face of hurricanes
(-) 0.1 0 100.000
Number of flyers or informative brochures on risk reduction distributed among the population
Survey, Civil protection
Social participation for risk communication and management
(-) 0.2 0 100
Number of workshops or courses on risk reduction in schools and for the general population
Civil protection,
Hurricane database of events and consequences
(-) 0.35 0 1 Yes(1)/Not (0) Civil protection, municipality
12
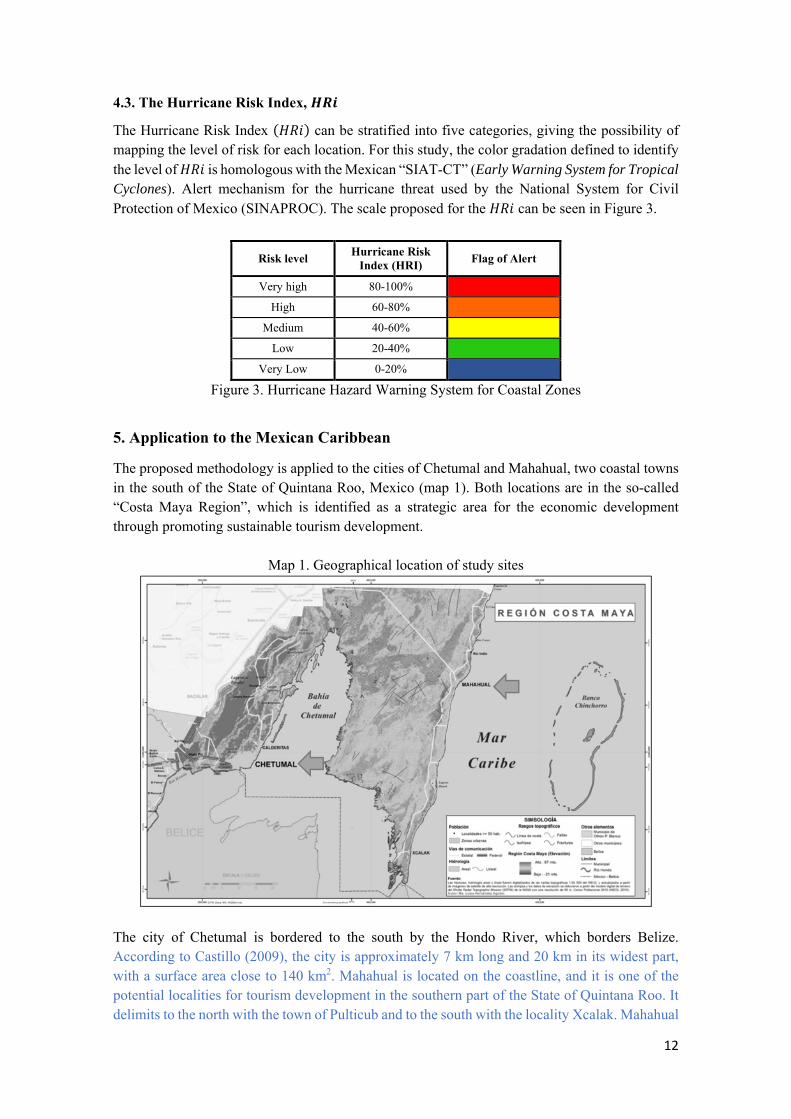
4.3. The Hurricane Risk Index, 𝑯𝑹𝒊
The Hurricane Risk Index 𝐻𝑅𝑖 can be stratified into five categories, giving the possibility of mapping the level of risk for each location. For this study, the color gradation defined to identify the level of 𝐻𝑅𝑖 is homologous with the Mexican “SIAT-CT” (Early Warning System for Tropical Cyclones). Alert mechanism for the hurricane threat used by the National System for Civil Protection of Mexico (SINAPROC). The scale proposed for the 𝐻𝑅𝑖 can be seen in Figure 3.
Risk level Hurricane Risk
Index (HRI) Flag of Alert
Very high 80-100%
High 60-80%
Medium 40-60%
Low 20-40%
Very Low 0-20%
Figure 3. Hurricane Hazard Warning System for Coastal Zones
5. Application to the Mexican Caribbean
The proposed methodology is applied to the cities of Chetumal and Mahahual, two coastal towns in the south of the State of Quintana Roo, Mexico (map 1). Both locations are in the so-called “Costa Maya Region”, which is identified as a strategic area for the economic development through promoting sustainable tourism development.
Map 1. Geographical location of study sites
The city of Chetumal is bordered to the south by the Hondo River, which borders Belize. According to Castillo (2009), the city is approximately 7 km long and 20 km in its widest part, with a surface area close to 140 km2. Mahahual is located on the coastline, and it is one of the potential localities for tourism development in the southern part of the State of Quintana Roo. It delimits to the north with the town of Pulticub and to the south with the locality Xcalak. Mahahual
13
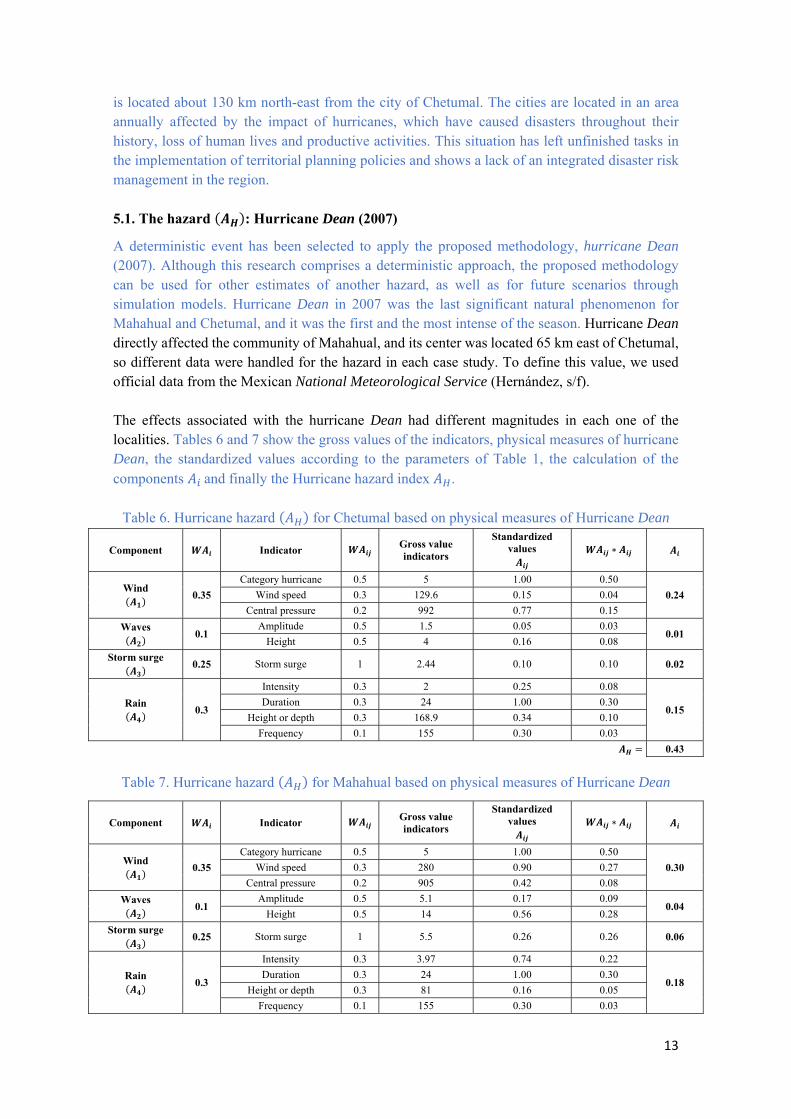
is located about 130 km north-east from the city of Chetumal. The cities are located in an area annually affected by the impact of hurricanes, which have caused disasters throughout their history, loss of human lives and productive activities. This situation has left unfinished tasks in the implementation of territorial planning policies and shows a lack of an integrated disaster risk management in the region. 5.1. The hazard 𝑨𝑯 : Hurricane Dean (2007)
A deterministic event has been selected to apply the proposed methodology, hurricane Dean (2007). Although this research comprises a deterministic approach, the proposed methodology can be used for other estimates of another hazard, as well as for future scenarios through simulation models. Hurricane Dean in 2007 was the last significant natural phenomenon for Mahahual and Chetumal, and it was the first and the most intense of the season. Hurricane Dean directly affected the community of Mahahual, and its center was located 65 km east of Chetumal, so different data were handled for the hazard in each case study. To define this value, we used official data from the Mexican National Meteorological Service (Hernández, s/f). The effects associated with the hurricane Dean had different magnitudes in each one of the localities. Tables 6 and 7 show the gross values of the indicators, physical measures of hurricane Dean, the standardized values according to the parameters of Table 1, the calculation of the components 𝐴 and finally the Hurricane hazard index 𝐴 .
Table 6. Hurricane hazard 𝐴 for Chetumal based on physical measures of Hurricane Dean
Component 𝑾𝑨𝒊 Indicator 𝑾𝑨𝒊𝒋 Gross value indicators
Standardized values
𝑨𝒊𝒋 𝑾𝑨𝒊𝒋 ∗ 𝑨𝒊𝒋 𝑨𝒊
Wind 𝑨𝟏
0.35
Category hurricane 0.5 5 1.00 0.50
0.24 Wind speed 0.3 129.6 0.15 0.04
Central pressure 0.2 992 0.77 0.15
Waves 𝑨𝟐
0.1 Amplitude 0.5 1.5 0.05 0.03
0.01 Height 0.5 4 0.16 0.08
Storm surge 𝑨𝟑
0.25 Storm surge 1 2.44 0.10 0.10 0.02
Rain 𝑨𝟒
0.3
Intensity 0.3 2 0.25 0.08
0.15 Duration 0.3 24 1.00 0.30
Height or depth 0.3 168.9 0.34 0.10
Frequency 0.1 155 0.30 0.03
𝑨𝑯 0.43
Table 7. Hurricane hazard 𝐴 for Mahahual based on physical measures of Hurricane Dean
Component 𝑾𝑨𝒊 Indicator 𝑾𝑨𝒊𝒋 Gross value indicators
Standardized values
𝑨𝒊𝒋 𝑾𝑨𝒊𝒋 ∗ 𝑨𝒊𝒋 𝑨𝒊
Wind 𝑨𝟏
0.35
Category hurricane 0.5 5 1.00 0.50
0.30 Wind speed 0.3 280 0.90 0.27
Central pressure 0.2 905 0.42 0.08
Waves 𝑨𝟐
0.1 Amplitude 0.5 5.1 0.17 0.09
0.04 Height 0.5 14 0.56 0.28
Storm surge 𝑨𝟑
0.25 Storm surge 1 5.5 0.26 0.26 0.06
Rain 𝑨𝟒
0.3
Intensity 0.3 3.97 0.74 0.22
0.18 Duration 0.3 24 1.00 0.30
Height or depth 0.3 81 0.16 0.05
Frequency 0.1 155 0.30 0.03
14
𝑨𝑯 0.58
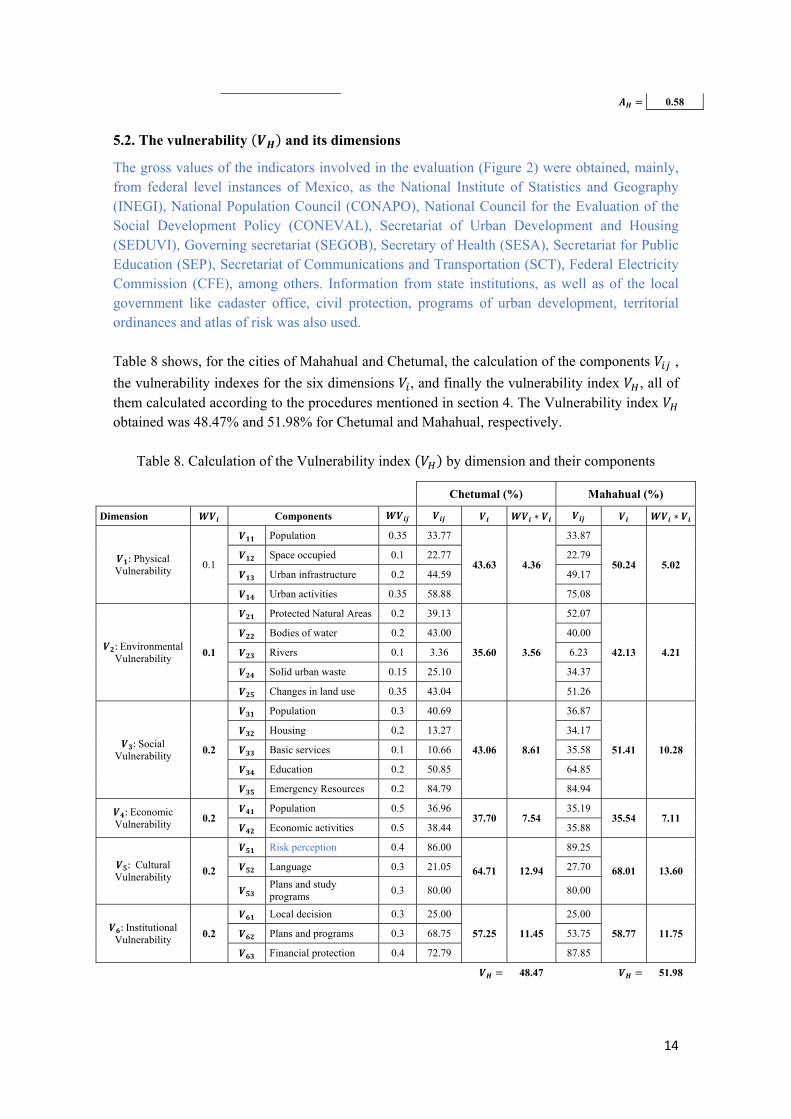
5.2. The vulnerability 𝑽𝑯 and its dimensions
The gross values of the indicators involved in the evaluation (Figure 2) were obtained, mainly, from federal level instances of Mexico, as the National Institute of Statistics and Geography (INEGI), National Population Council (CONAPO), National Council for the Evaluation of the Social Development Policy (CONEVAL), Secretariat of Urban Development and Housing (SEDUVI), Governing secretariat (SEGOB), Secretary of Health (SESA), Secretariat for Public Education (SEP), Secretariat of Communications and Transportation (SCT), Federal Electricity Commission (CFE), among others. Information from state institutions, as well as of the local government like cadaster office, civil protection, programs of urban development, territorial ordinances and atlas of risk was also used. Table 8 shows, for the cities of Mahahual and Chetumal, the calculation of the components 𝑉 ,
the vulnerability indexes for the six dimensions 𝑉 , and finally the vulnerability index 𝑉 , all of them calculated according to the procedures mentioned in section 4. The Vulnerability index 𝑉 obtained was 48.47% and 51.98% for Chetumal and Mahahual, respectively.
Table 8. Calculation of the Vulnerability index 𝑉 by dimension and their components
Chetumal (%) Mahahual (%)
Dimension 𝑾𝑽𝒊 Components 𝑾𝑽𝒊𝒋 𝑽𝒊𝒋 𝑽𝒊 𝑾𝑽𝒊 ∗ 𝑽𝒊 𝑽𝒊𝒋 𝑽𝒊 𝑾𝑽𝒊 ∗ 𝑽𝒊
𝑽𝟏: Physical Vulnerability
0.1
𝑽𝟏𝟏 Population 0.35 33.77
43.63 4.36
33.87
50.24 5.02 𝑽𝟏𝟐 Space occupied 0.1 22.77 22.79
𝑽𝟏𝟑 Urban infrastructure 0.2 44.59 49.17
𝑽𝟏𝟒 Urban activities 0.35 58.88 75.08
𝑽𝟐: Environmental Vulnerability
0.1
𝑽𝟐𝟏 Protected Natural Areas 0.2 39.13
35.60 3.56
52.07
42.13 4.21
𝑽𝟐𝟐 Bodies of water 0.2 43.00 40.00
𝑽𝟐𝟑 Rivers 0.1 3.36 6.23
𝑽𝟐𝟒 Solid urban waste 0.15 25.10 34.37
𝑽𝟐𝟓 Changes in land use 0.35 43.04 51.26
𝑽𝟑: Social Vulnerability
0.2
𝑽𝟑𝟏 Population 0.3 40.69
43.06 8.61
36.87
51.41 10.28
𝑽𝟑𝟐 Housing 0.2 13.27 34.17
𝑽𝟑𝟑 Basic services 0.1 10.66 35.58
𝑽𝟑𝟒 Education 0.2 50.85 64.85
𝑽𝟑𝟓 Emergency Resources 0.2 84.79 84.94
𝑽𝟒: Economic Vulnerability
0.2 𝑽𝟒𝟏 Population 0.5 36.96
37.70 7.54 35.19
35.54 7.11 𝑽𝟒𝟐 Economic activities 0.5 38.44 35.88
𝑽𝟓: Cultural Vulnerability
0.2
𝑽𝟓𝟏 Risk perception 0.4 86.00
64.71 12.94
89.25
68.01 13.60 𝑽𝟓𝟐 Language 0.3 21.05 27.70
𝑽𝟓𝟑 Plans and study programs
0.3 80.00 80.00
𝑽𝟔: Institutional Vulnerability
0.2
𝑽𝟔𝟏 Local decision 0.3 25.00
57.25 11.45
25.00
58.77 11.75 𝑽𝟔𝟐 Plans and programs 0.3 68.75 53.75
𝑽𝟔𝟑 Financial protection 0.4 72.79 87.85
𝑽𝑯 48.47 𝑽𝑯 51.98
15
Comparing the obtained results for the six vulnerability dimensions involved in the evaluation, it can be highlight some similarities and also differences among both cities. Chetumal and Mahaual show similar levels of economic, cultural and institutional vulnerability, but some differences are recognized as referring to social, physical and environmental vulnerability. Mahahual shows a higher physical vulnerability than Chetumal, 50.24%, and 43.63%, respectively. This difference is possible related to the rates of population growth and urban growth. Mahahual has a growing tourism sector; and Chetumal, capital of the Quintana Roo State, is a city of services where the powers of government found. The water consumption per capita can be increased between three and ten times due to the growing tourism in Mahahual; this can create conflicts due to the dwindling water resources. Some of the indicators involved in the economic vulnerability are available only at the municipal level, in consequence, the values are the same for both cities, and the obtained results are similar (37.70% and 35.54%). However, beyond the problem of income, economic vulnerability refers, sometimes correlated, to the problem of national economic dependence, the absence of adequate budgets, national, regional and local publics, and a lack of diversification of the economic base. In the same way, the institutional vulnerability shows similar values for both localities (57.25% and 58.77%), there is a high degree of centralization in decision-making and governmental organization, and there is a weakness in the levels of institutional autonomy. In particular, in social vulnerability dimension, the components related to housing and basic services show important differences. The component urban activities as part of the physical vulnerability also reflect differences between the cities; this component involves aspects such as the flood-prone areas by storm surge, electric service coverage, street lighting and cartography of the drinking water distribution network, educative centers, private and public schools; and public and private hospitals. In the case of cultural vulnerability for the cities of Chetumal and Mahahual, the component risk perception only takes into account the following indicators: Promotion of sensitivity and cultural awareness in the face of hurricanes, Social participation for risk communication and management, and Hurricane database of events and consequences. The other indicators mentioned in Table 5 are results from surveys that, at present, are in development as part of new research projects. Institutional vulnerability dimension shows globally similar results for both cities. The local decision gives the same result for both cities; it involves the decentralization degree, community participation, transparency and accountability, integration of local agencies and institutions and Legal Framework for disaster risk reduction. The second component, plans, and programs, shows a better situation in Chetumal than in Mahahual; it involves the inclusion of disaster risk analysis into the urban and territorial planning, disaster recovery plans, training plans on disaster risk reduction, relocation of population living in disaster-prone areas and post-disaster plans for rehabilitation of coastal ecosystems. The third component, financial protection, shows a better situation in Mahahual than in Chetumal, it involves the income of the local government, budget allocation to disaster risk reduction, insurance of public and private assets, inclusion of disaster risk as criteria to funding infrastructure projects, and the contribution of the Trust Fund for Natural Disasters (FONDEN) in case of disaster.
16
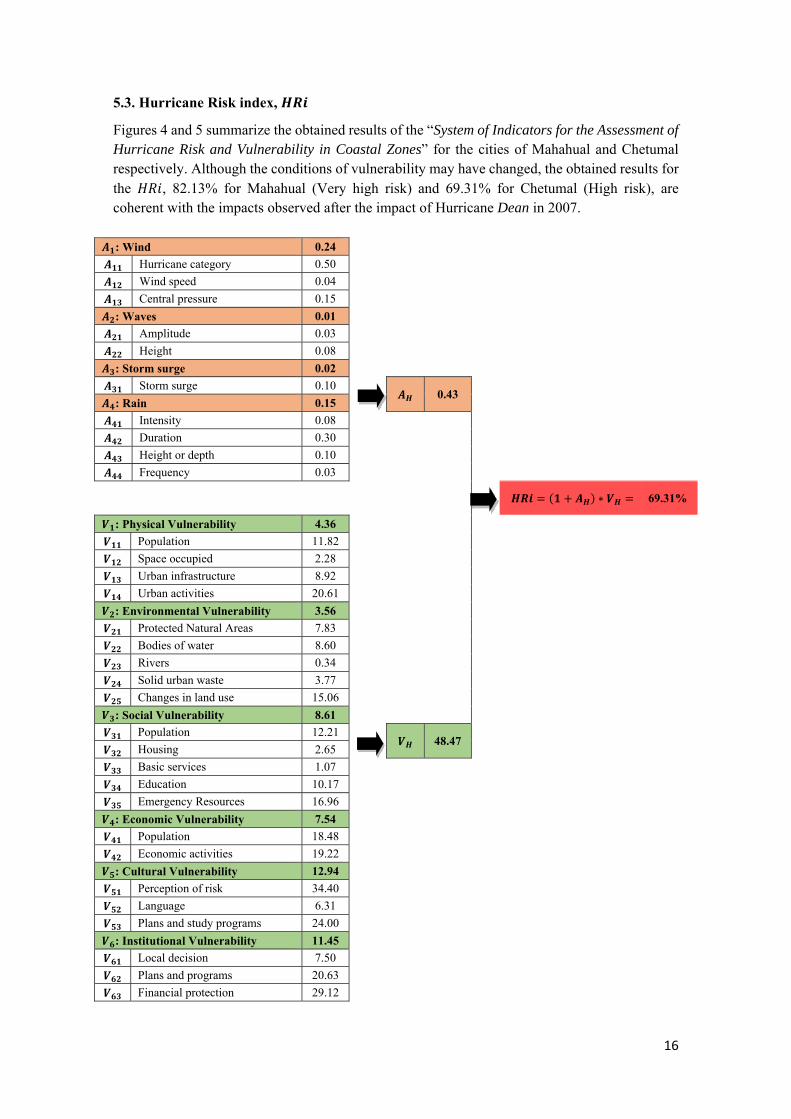
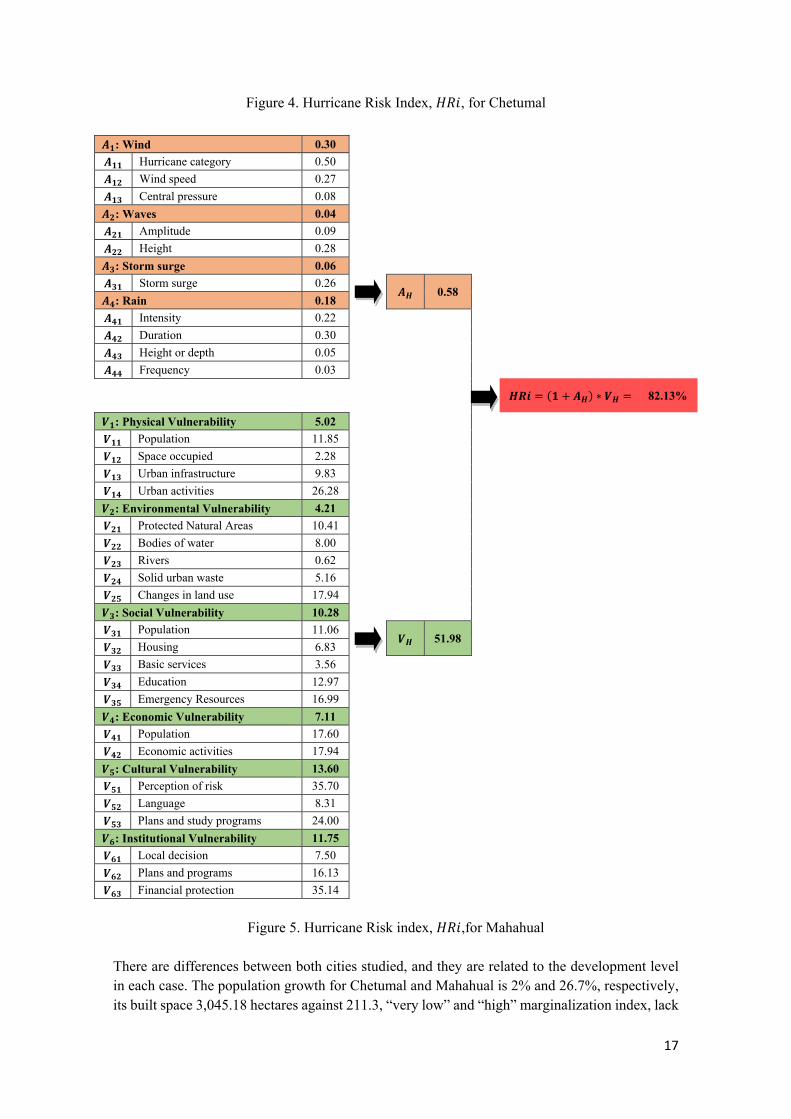
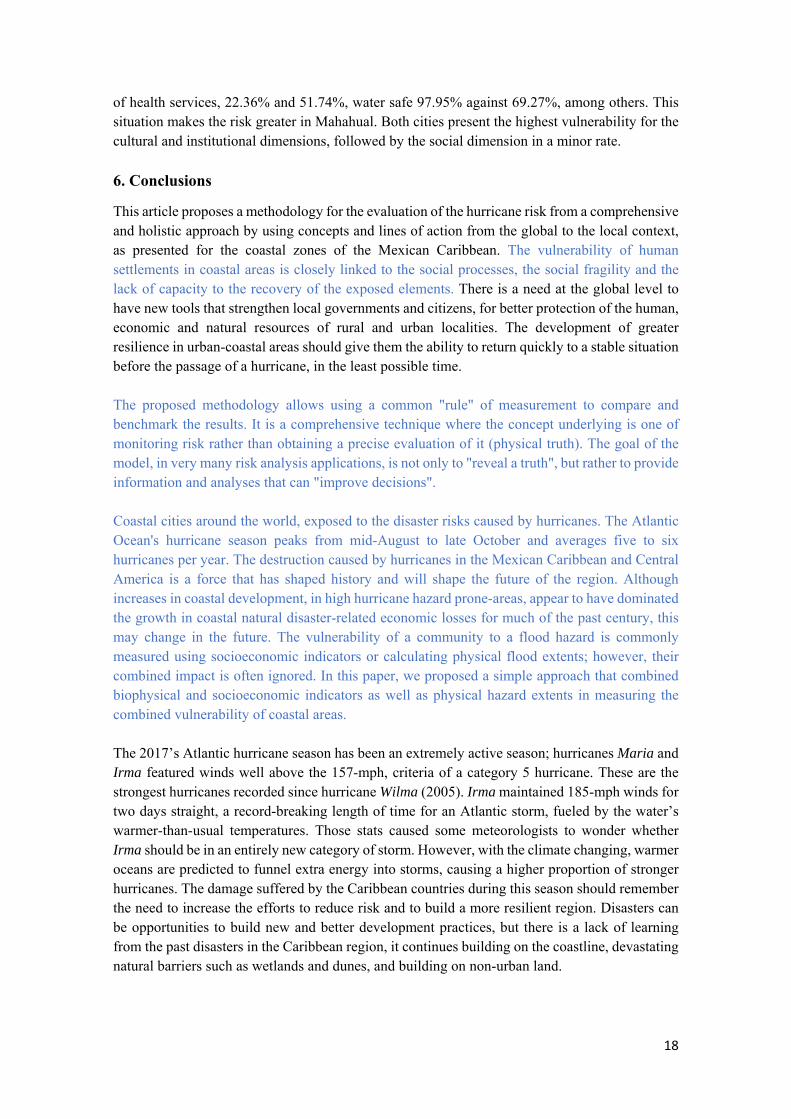
5.3. Hurricane Risk index, 𝑯𝑹𝒊
Figures 4 and 5 summarize the obtained results of the “System of Indicators for the Assessment of Hurricane Risk and Vulnerability in Coastal Zones” for the cities of Mahahual and Chetumal respectively. Although the conditions of vulnerability may have changed, the obtained results for the 𝐻𝑅𝑖, 82.13% for Mahahual (Very high risk) and 69.31% for Chetumal (High risk), are coherent with the impacts observed after the impact of Hurricane Dean in 2007.
𝑨𝟏: Wind 0.24
𝑨𝟏𝟏 Hurricane category 0.50
𝑨𝟏𝟐 Wind speed 0.04
𝑨𝟏𝟑 Central pressure 0.15
𝑨𝟐: Waves 0.01
𝑨𝟐𝟏 Amplitude 0.03
𝑨𝟐𝟐 Height 0.08
𝑨𝟑: Storm surge 0.02
𝑨𝟑𝟏 Storm surge 0.10 𝑨𝑯 0.43
𝑨𝟒: Rain 0.15
𝑨𝟒𝟏 Intensity 0.08
𝑨𝟒𝟐 Duration 0.30
𝑨𝟒𝟑 Height or depth 0.10
𝑨𝟒𝟒 Frequency 0.03
𝑯𝑹𝒊 𝟏 𝑨𝑯 ∗ 𝑽𝑯 69.31%
𝑽𝟏: Physical Vulnerability 4.36
𝑽𝟏𝟏 Population 11.82
𝑽𝟏𝟐 Space occupied 2.28
𝑽𝟏𝟑 Urban infrastructure 8.92
𝑽𝟏𝟒 Urban activities 20.61
𝑽𝟐: Environmental Vulnerability 3.56
𝑽𝟐𝟏 Protected Natural Areas 7.83
𝑽𝟐𝟐 Bodies of water 8.60
𝑽𝟐𝟑 Rivers 0.34
𝑽𝟐𝟒 Solid urban waste 3.77
𝑽𝟐𝟓 Changes in land use 15.06
𝑽𝟑: Social Vulnerability 8.61
𝑽𝟑𝟏 Population 12.21 𝑽𝑯 48.47
𝑽𝟑𝟐 Housing 2.65
𝑽𝟑𝟑 Basic services 1.07
𝑽𝟑𝟒 Education 10.17
𝑽𝟑𝟓 Emergency Resources 16.96
𝑽𝟒: Economic Vulnerability 7.54
𝑽𝟒𝟏 Population 18.48
𝑽𝟒𝟐 Economic activities 19.22
𝑽𝟓: Cultural Vulnerability 12.94
𝑽𝟓𝟏 Perception of risk 34.40
𝑽𝟓𝟐 Language 6.31
𝑽𝟓𝟑 Plans and study programs 24.00
𝑽𝟔: Institutional Vulnerability 11.45
𝑽𝟔𝟏 Local decision 7.50
𝑽𝟔𝟐 Plans and programs 20.63
𝑽𝟔𝟑 Financial protection 29.12
17
Figure 4. Hurricane Risk Index, 𝐻𝑅𝑖, for Chetumal
𝑨𝟏: Wind 0.30
𝑨𝟏𝟏 Hurricane category 0.50
𝑨𝟏𝟐 Wind speed 0.27
𝑨𝟏𝟑 Central pressure 0.08
𝑨𝟐: Waves 0.04
𝑨𝟐𝟏 Amplitude 0.09
𝑨𝟐𝟐 Height 0.28
𝑨𝟑: Storm surge 0.06
𝑨𝟑𝟏 Storm surge 0.26 𝑨𝑯 0.58
𝑨𝟒: Rain 0.18
𝑨𝟒𝟏 Intensity 0.22
𝑨𝟒𝟐 Duration 0.30
𝑨𝟒𝟑 Height or depth 0.05
𝑨𝟒𝟒 Frequency 0.03
𝑯𝑹𝒊 𝟏 𝑨𝑯 ∗ 𝑽𝑯 82.13%
𝑽𝟏: Physical Vulnerability 5.02
𝑽𝟏𝟏 Population 11.85
𝑽𝟏𝟐 Space occupied 2.28
𝑽𝟏𝟑 Urban infrastructure 9.83
𝑽𝟏𝟒 Urban activities 26.28
𝑽𝟐: Environmental Vulnerability 4.21
𝑽𝟐𝟏 Protected Natural Areas 10.41
𝑽𝟐𝟐 Bodies of water 8.00
𝑽𝟐𝟑 Rivers 0.62
𝑽𝟐𝟒 Solid urban waste 5.16
𝑽𝟐𝟓 Changes in land use 17.94
𝑽𝟑: Social Vulnerability 10.28
𝑽𝟑𝟏 Population 11.06 𝑽𝑯 51.98
𝑽𝟑𝟐 Housing 6.83
𝑽𝟑𝟑 Basic services 3.56
𝑽𝟑𝟒 Education 12.97
𝑽𝟑𝟓 Emergency Resources 16.99
𝑽𝟒: Economic Vulnerability 7.11
𝑽𝟒𝟏 Population 17.60
𝑽𝟒𝟐 Economic activities 17.94
𝑽𝟓: Cultural Vulnerability 13.60
𝑽𝟓𝟏 Perception of risk 35.70
𝑽𝟓𝟐 Language 8.31
𝑽𝟓𝟑 Plans and study programs 24.00
𝑽𝟔: Institutional Vulnerability 11.75
𝑽𝟔𝟏 Local decision 7.50
𝑽𝟔𝟐 Plans and programs 16.13
𝑽𝟔𝟑 Financial protection 35.14
Figure 5. Hurricane Risk index, 𝐻𝑅𝑖,for Mahahual
There are differences between both cities studied, and they are related to the development level in each case. The population growth for Chetumal and Mahahual is 2% and 26.7%, respectively, its built space 3,045.18 hectares against 211.3, “very low” and “high” marginalization index, lack
18
of health services, 22.36% and 51.74%, water safe 97.95% against 69.27%, among others. This situation makes the risk greater in Mahahual. Both cities present the highest vulnerability for the cultural and institutional dimensions, followed by the social dimension in a minor rate.
6. Conclusions
This article proposes a methodology for the evaluation of the hurricane risk from a comprehensive and holistic approach by using concepts and lines of action from the global to the local context, as presented for the coastal zones of the Mexican Caribbean. The vulnerability of human settlements in coastal areas is closely linked to the social processes, the social fragility and the lack of capacity to the recovery of the exposed elements. There is a need at the global level to have new tools that strengthen local governments and citizens, for better protection of the human, economic and natural resources of rural and urban localities. The development of greater resilience in urban-coastal areas should give them the ability to return quickly to a stable situation before the passage of a hurricane, in the least possible time. The proposed methodology allows using a common "rule" of measurement to compare and benchmark the results. It is a comprehensive technique where the concept underlying is one of monitoring risk rather than obtaining a precise evaluation of it (physical truth). The goal of the model, in very many risk analysis applications, is not only to "reveal a truth", but rather to provide information and analyses that can "improve decisions". Coastal cities around the world, exposed to the disaster risks caused by hurricanes. The Atlantic Ocean's hurricane season peaks from mid-August to late October and averages five to six hurricanes per year. The destruction caused by hurricanes in the Mexican Caribbean and Central America is a force that has shaped history and will shape the future of the region. Although increases in coastal development, in high hurricane hazard prone-areas, appear to have dominated the growth in coastal natural disaster-related economic losses for much of the past century, this may change in the future. The vulnerability of a community to a flood hazard is commonly measured using socioeconomic indicators or calculating physical flood extents; however, their combined impact is often ignored. In this paper, we proposed a simple approach that combined biophysical and socioeconomic indicators as well as physical hazard extents in measuring the combined vulnerability of coastal areas. The 2017’s Atlantic hurricane season has been an extremely active season; hurricanes Maria and Irma featured winds well above the 157-mph, criteria of a category 5 hurricane. These are the strongest hurricanes recorded since hurricane Wilma (2005). Irma maintained 185-mph winds for two days straight, a record-breaking length of time for an Atlantic storm, fueled by the water’s warmer-than-usual temperatures. Those stats caused some meteorologists to wonder whether Irma should be in an entirely new category of storm. However, with the climate changing, warmer oceans are predicted to funnel extra energy into storms, causing a higher proportion of stronger hurricanes. The damage suffered by the Caribbean countries during this season should remember the need to increase the efforts to reduce risk and to build a more resilient region. Disasters can be opportunities to build new and better development practices, but there is a lack of learning from the past disasters in the Caribbean region, it continues building on the coastline, devastating natural barriers such as wetlands and dunes, and building on non-urban land.
19
There are early warning systems established for hurricanes in the Mexican Caribbean, and they are well known by the population in the region. The proposed methodology looks for a comprehensive hurricane risk evaluation thought the design of an indicators system and the calculation of the Hurricane Risk Index 𝐻𝑅𝑖 . This evaluation can help to identify the weaknesses of the exposed population to support the decision making to construct a more resilient community. The inclusion of topics related to Disaster Risk Reduction within the curricula at different education levels could increase the resilience of the population in Mexico. The proposed methodology can be automated, to create a kind of early warning system involving different dimensions of the population vulnerability. The proposed methodology can help to define priorities to carry out risk reduction actions in the coastal zones; the obtained results can be used to promote education plans to make the population aware of the hurricane risk and reduce the vulnerability in its different dimensions. This evaluation can be performed periodically to monitor the evolution of each vulnerability dimension and in consequence, the government policies related. It permits the follow-up of the risk situation, and the effectiveness of the prevention and mitigation measures can be easily achieved. Results can be verified, and the mitigation priorities can be established as regards the prevention and planning actions to modify those conditions having a greater influence on risk in the city. It is easy to identify the most relevant aspects, with no need for further analysis and interpretation of results. The number of indicators used in the hurricane risk assessment was limited to the information available for that period. The evaluation of another location can be performed in a similar way taking into account the singularities of each place and the limitation of the available information. The indicators used in the current evaluation can be a starting point to look for information in another location, but it is not a limitation. The indicators can be selected based on the indicators used globally and internationally by different urban observers and international indicators databases. The weight assigned to the indicators involved in the evaluation can change according to the particularities of each case study. To support the decision making through the prioritizing of needs, the authors prefer the use of relative weights based on the opinions of local experts. To improve to proposed methodology new efforts are in progress: Surveys to complete information referring the population knowledge on hurricane hazard and risk, after this it is necessary to perform a correlation analysis of the indicators involved in this methodology to define in a better way their relevance. Finally, the proposed methodology can also be adapted to take into account other natural hazards or take as a starting point a probabilistic hurricane risk assessment instead of a deterministic event. The development and integration of natural hazard and social indicators will improve our disaster risk assessments and justify the selective targeting of communities.
Acknowledgments
Postmortem gratitude to the memory Lourdes Castillo Villanueva, research professor in the University of Quintana Roo, Mexico. Died on December 14th, 2016. Ph.D. in Geography, the authors thanks her advisor, the example of excellence as a researcher, mentor, instructor, and role model.
20
The authors express their gratitude for the support of the University of Quintana Roo, Mexico and Doctoral Program in Geography of the Division of Sciences and Engineering. The authors express their gratitude for the support of the Ministery of Economy, Industry, and Competitiveness of Spain “Evaluación de la Vulnerabilidad y el Riesgo de Zonas Urbanas Expuestas a Amenazas Naturales y Antrópicas” (BIA2016-78544-R).
Finally, the authors would like to thank the anonymous reviewers whose comments helped to improve the original version of the manuscript
References
Ayala-Carcedo, F., Olcina J. (2002). Riesgos Naturales. Conceptos Fundamentales y Clasificación. En Ayala-Carcedo and Olcina, J. (Coords.) Riesgos Naturales. Primera Edición. Barcelona, España: Ariel.
BID/IDEA. (2010). Indicadores de Riesgo de Desastre y de Gestión de Riesgos. Programa para América Latina y el Caribe. México. Banco Interamericano para el Desarrollo (BID).
Birkmann, J., Cardona, O.D., Carreño, M.L., Barbat, A.H., Pelling, M., Schneiderbauer, S., Welle, T. (2013). Framing vulnerability, risk and societal responses: the MOVE framework. Natural Hazards, 67(2), 193–211. doi: 10.1007/s11069-013-0558-5. Available from: https://link.springer.com/content/pdf/10.1007%2Fs11069-013-0558-5.pdf
Birkmann, J. (2006). Measuring Vulnerability to Natural Hazards. (J. Birkmann, Ed.). Hong Kong: UNU-Press.
Blaikie, P., Cannon, T., Davis, I., Wisner, B. (1996). Vulnerabilidad. El entorno social, político y económico de los desastres. (1st edition., p. 374). Colombia: LA RED. Available from: http://www.desenredando.org/public/libros/1996/vesped/
Bohle, H.G. (2002). Editorial: The Geography of Vulnerable Food Systems. Die Erde, 133(4):341-344.
Burton, C.G. (2015). A Validation of Metrics for Community Resilience to Natural Hazards and Disasters using the Recovery from Hurricane Katrina as a Case Study. Annals of the Association of American Geographers, 150 (1): 67–86.
Cardona, O. (2008). Indicators of disaster risk and risk management: Program for Latin America and the Caribbean: summary report = Indicadores de riesgo de desastre y gestión de riesgos: Programa para América Latina y el Caribe: informe resumido / Omar D. Cardona. 2nd ed. (Series of economic and sector studies; INE-08-002) ISBN: 9789584402196. Available from: http://idea.unalmzl.edu.co/documentos/IndicatorsINE28marzo2008Espanol.pdf
Cardona, O.D., Hurtado, J., Duque, G., Moreno, A., Chardon A., Velásquez, L., Prieto, S. (2005). Indicators of disaster risk and risk management—main technical report. English and Spanish edition, National University of Colombia/Manizales, Institute of Environmental Studies/IDEA, Inter-American Development Bank, Washington, DC. Available from: http://idea.bid.manizales.unal.edu.co/
Cardona, O., Hurtado, J., Duque, G., Moreno, A., Chardon A., Velásquez, L., Prieto, S. (2003). Indicators for Risk Measurement. Fundamentals for a Methodological Approach. Information and Indicators Program for Disaster Risk Management. Inter-American Development Bank, Washington, DC/Universidad Nacional de Colombia Sede
21
Manizales/Instituto de Estudios Ambientales – IDEA. Manizales, Colombia. September 2003. Available from: http://idea.bid.manizales.unal.edu.co/
Cardona, O.D. (2001). Estimación Holística del Riesgo Sísmico utilizando Sistemas Dinámicos Complejos. Tesis de Doctorado - Universidad Politécnica de Cataluña, UPC, Barcelona, [On line] Available from: http://www.tesisenred.net/handle/10803/6219.
Cardona, O.D. (1993). “Evaluación de la Amenaza, la Vulnerabilidad y el Riesgo”. En los Desastres No son Naturales, A. Maskrey (Compilador), LA RED, Tercer Mundo Editores, Bogotá, Colombia. Available from: http://www.desenredando.org/public/libros/1993/ldnsn/html/cap3.htm
Carreño, M.L.; Lantada, N.; Jaramillo, N. (2018). Fuzzy inference system for muti-hazard physical risk assessment in urban areas. Revista Internacional de Métodos Numéricos para Cálculo y Diseño en Ingeniería 34(1). DOI 10.23967/j.rimni.2017.7.001 URL https://www.scipedia.com/public/Carreno_et_al_2017a
Carreño, M.L., Cardona, O.D., Barbat A.H., Suarez D.C., Perez M.P., Narvaez L. (2017). Holistic Disaster Risk Evaluation for the Urban Risk Management Plan of Manizales, Colombia. International Journal of Disaster Risk Science 8(3): 258-269. DOI 10.1007/s13753-017-0136-7. Available from: https://link.springer.com/content/pdf/10.1007%2Fs13753-017-0136-7.pdf
Carreño, M.L., Barbat, A.H., Cardona O.D. (2014a). Numerical method for the holistic evaluation of the seismic risk based on the fuzzy sets theory. Revista Internacional de Métodos Numéricos para Calculo y Diseño en Ingeniería 30(1): 25–34 (in Spanish). Available from: https://www.scipedia.com/public/Carreno_et_al_2013a#
Carreño, M.L., Barbat A.H., Cardona O.D., Marulanda M.C (2014b). Holistic Evaluation of Seismic Risk in Barcelona. In Assessment of vulnerability to natural hazards: A European perspective, ed. D. Alexander, J. Birkmann, and S. Kienberger, 21–52. Oxford: Elsevier. Available from: https://www.sciencedirect.com/science/article/pii/B9780124105287000023.
Carreño, M.L., Cardona O.D., Barbat A.H. (2012). New methodology for urban seismic risk assessment from a holistic perspective. Bulletin of earthquake engineering 10(2): 547–565. Available from: https://link.springer.com/article/10.1007/s10518-011-9302-2.
Carreño, M.L., Cardona, O.D., Barbat, A.H. (2007a). A disaster risk management performance index. Natural Hazards 41(1):1-20, DOI: 10.1007/s11069-006-9008-y, ISBN 0921-030X (Print) 1573-0840 (Online), Springer Netherlands. Available from: https://link.springer.com/article/10.1007/s11069-006-9008-y.
Carreño, M.L., Cardona, O.D. Barbat A.H. (2007b). Urban seismic risk evaluation: A holistic approach. Natural Hazards 40(1): 137–172, DOI 10.1007/s11069-006-0008-8. ISBN 0921-030X (Print) 1573-0840 (Online), Springer Netherlands. Available from: https://link.springer.com/article/10.1007/s11069-006-0008-8.
Carreño, M.L. (2006). Técnicas innovadoras para la evaluación del riesgo sísmico y su gestión en centros urbanos: Acciones ex ante y ex post. Doctoral Thesis. Universitat Politècnica de Catalunya. Departament d'Enginyeria del Terreny, Cartogràfica i Geofísica, Barcelona, Spain. Available from: http://www.tesisenred.net/handle/10803/6241.
Castillo, L. (2009). Urbanización, problemas ambientales y calidad de vida urbana. México: Plaza y Valdés: Universidad de Quintana Roo, 2009. 239 P., IL.; 23 cm. ISBN 9786074021325.
22
Cutter, S., Boruff, B., Shirley, W.L. (2003). Social Vulnerability to Environmental Hazards. Social Science Quarterly. 84. 242-261. 10.1111/1540-6237.8402002.
Cutter, S. L. (1996). Vulnerability to environmental hazards. Progress in Human Geography 20, 529–539.
Hernández, A. (s/f). Reseña del Huracán “Dean” del Océano Atlántico. Subdirección General Técnica. Servicio Meteorológico Nacional. Subgerencia de Pronóstico Meteorológico. Comisión Nacional del Agua (CONAGUA). Secretaría de Medioambiente y Recursos Naturales (SEMARNAT). México. Available from: http://smn.cna.gob.mx/tools/DATA/Ciclones%20Tropicales/Ciclones/2007-Dean.pdf.
Hernández, M.L. (2014). Evaluación del riesgo y vulnerabilidad ante la amenaza de huracanes en zonas costeras del Caribe Mexicano: Chetumal y Mahahual. Doctoral Thesis. University of Quintana Roo. Doctoral Program in Geography of the Division of Sciences and Engineering. Chetumal, Quintana Roo, México. Available from: http://192.100.164.54/janium-bin/detalle.pl?Id=20180206133947
Herrera-Moreno, A., Betancourt, L. (2001). Escenarios climáticos, vulnerabilidad y adaptación de la zona costera de la República Dominicana. Proyecto PNUD/ FMAM/ SEMARENA Habilitando a República Dominicana en las preparaciones iniciales en respuesta a sus compromisos con la Convención Marco de las Naciones Unidas para el Cambio Climático, 43. pp. Available from: http://programaecomar.com/index.htm#cambioclimatico.
Jaramillo, N.; Carreño, M.L.; Lantada N. (2016). Evaluation of social context integrated into the study of seismic risk for urban areas. International Journal of Disaster Risk Reduction 17: 185–198. ISSN: 2212-4209. Available from: https://www.sciencedirect.com/science/article/pii/S2212420916300218.
B. Khazai, F. Benimerad, O.D. Cardona, M.-L. Carreño, A.H. Barbat, C.G. Burton, J. Abelinde, J. Constantino, A. Dalena, I. Padao, H.J. Pasimio. (Eds.), A Guide to Measuring Urban Risk Resilience: Principles, Tools and Practice of Urban Indicators, 1st ed, Earthquakes and Megacities Initiative (EMI), Quezon City, Philippines, 2015.
Mansilla, E. (2000). Riesgo y Ciudad. Doctoral Thesis. División de estudios de posgrado. Facultad de Arquitectura. Doctorado en Urbanismo. Universidad Nacional Autónoma de México. Available from: http://132.248.9.195/pd2000/287437/Index.html.
Martínez, M. (2009). Los geógrafos y la teoría de riesgos y desastres ambientales. Perspectiva Geográfica, 14, 241-263. Bogotá, Colombia. Available from: http://revistas.uptc.edu.co/index.php/perspectiva/article/view/1724.
Masure P., Lutoff C. (2002). Handbook on urban system exposure (USE). Assessment to natural disasters. RISK-UE Project.
Moreno-Casasola, P., Infante-Mata D., Espejel, I., Jiménez-Orocio, O., Martínez, M.L., Rodríguez-Revelo, N., y Monroy, R. (2014). Quintana Roo. In Diagnóstico de las dunas costeras de México. Martínez, M.L., Moreno-Casasola, P., Espejel, I., Jiménez-Orocio, O., Infante-Mata D., Rodríguez-Revelo, N. Eds. CONAFOR. México D.F. 253-264. ISBN 978-607-8383-17-7.
OAS (1991). Primer on Natural Hazard Management in Integrated Regional Development Planning. Department of Regional Development and Environment Executive Secretariat for Economic and Social Affairs Organization of American States with support from the Office

23
of Foreign Disaster Assistance United States Agency for International Development. Washington, D.C. 1991. Available at: https://www.preventionweb.net/go/1088
Peduzzi, P., Dao, H., Herold, C., Mouton, F. (2009). Assessing global exposure and vulnerability towards natural hazards: The Disaster Risk Index. Natural Hazards and Earth System Science, 9(4), 1149-1159. Available from: https://www.nat-hazards-earth-syst-sci.net/9/1149/2009/nhess-9-1149-2009.pdf
Ribas, A., Sauri, D. (2006). “De las Geografías de los riesgos a las geografías de la vulnerabilidad”, en: Joan Nogué y Joan Romero (Eds.), Las otras geografías, Valencia, Tirant Lo Blanch, pp.285-299.
Rodríguez P.H., Bozada L.M. (2010). Vulnerabilidad social al cambio climático en las costas del Golfo de México: un estudio exploratorio. In Vulnerabilidad de las zonas costeras mexicanas ante el cambio climático, Botello, A.V., S. Villanueva-Fragoso, J. Gutiérrez, y J.L. Rojas Galaviz (eds.). (pp. 427-467). Gobierno del Estado de Tabasco. SEMARNAT-INE, UNAM-ICMyL, Universidad Autónoma de Campeche.
SINAPROC/CENAPRED (2006). Evaluación de la vulnerabilidad Física y Social. Atlas Nacional de Riesgos. SEGOB, CENAPRED. Available from: http://www.cenapred.gob.mx/es/Publicaciones/archivos/57.pdf
Soldano, Á. (2009). Conceptos sobre Riesgo. Foro Virtual de la RIMD creado para la Capacitación en Teledetección Aplicada a la Reducción del Riesgo por Inundaciones (pp. 1-5). Falda del Carmen, Córdoba, Argentina. Available from: http://www.rimd.org/advf/documentos/4921a2bfbe57f2.37678682.pdf
Schuschny, A., Soto, H. (2009). Guía metodológica. Diseño de indicadores compuestos de desarrollo sostenible. Sociedad Alemana de Cooperación Técnica (GTZ) y la Comisión Económica para América Latina y el Caribe (CEPAL). Santiago de Chile. Available from: https://www.cepal.org/es/publicaciones/3661-guia-metodologica-diseno-indicadores-compuestos-desarrollo-sostenible
Tricart, J., Kilian, J. (1982). La ecogeografía y la ordenación del medio natural. Barcelona: Anagrama. Available from: http://www.raco.cat/index.php/DocumentsAnalisi/article/view/41315/52149
UNDP. (2004). Reducing Disaster Risk: A Challenge for Development. A Global Report. United Nations Development Program (UNDP), Geneva. Available from: http:// http://www.undp.org/content/undp/en/home/librarypage/crisis-prevention-and-recovery/reducing-disaster-risk--a-challenge-for-development.html
UNDRO. (1980). Natural Disasters and Vulnerability Analysis (Department of Humanitarian Affairs/United Nations Disaster Relief Office, 1979, 53 p.). Available from: https://archive.org/details/naturaldisasters00offi
White, G. F. (1945). Human Adjustment to Floods. Department of Geography Research Paper No. 29. Chicago: The University of Chicago. Available from: https://biotech.law.lsu.edu/climate/docs/Human_Adj_Floods_White.pdf
Wilches-Chaux G. (1993). La vulnerabilidad global. En Los desastres no son naturales, Maskrey A. (Comp.) Primera Ed. Perú: Red de Estudios Sociales en Prevención de Desastres en América Latina - LA RED. Available from: http://www.desenredando.org/public/libros/1993/ldnsn/LosDesastresNoSonNaturales-1.0.0.pdf

24