histone acetylation regulates intracellular ph
TRANSCRIPT

Molecular Cell
Article
Histone Acetylation Regulates Intracellular pHMatthew A. McBrian,1,2,7 Iman Saramipoor Behbahan,1,7 Roberto Ferrari,1 Trent Su,1,3 Ta-Wei Huang,1 Kunwu Li,1
Candice S. Hong,4 Heather R. Christofk,4 Maria Vogelauer,1 David B. Seligson,5 and Siavash K. Kurdistani1,2,5,6,*1Department of Biological Chemistry2Molecular Biology Institute3Division of Oral Biology and Medicine, School of Dentistry4Department of Molecular and Medical Pharmacology5Department of Pathology and Laboratory Medicine6Eli and Edythe Broad Center of Regenerative Medicine and Stem Cell ResearchDavid Geffen School of Medicine, University of California, Los Angeles, Los Angeles, CA 90095, USA7These authors contributed equally to this work
*Correspondence: [email protected]
http://dx.doi.org/10.1016/j.molcel.2012.10.025
SUMMARY
Differences in global levels of histone acetylationoccur in normal and cancer cells, although the reasonwhy cells regulate these levels has been unclear.Here we demonstrate a role for histone acetylationin regulating intracellular pH (pHi). As pHi decreases,histones are globally deacetylated by histonedeacetylases (HDACs), and the released acetateanions are coexported with protons out of the cellbymonocarboxylate transporters (MCTs), preventingfurther reductions in pHi. Conversely, global histoneacetylation increases as pHi rises, such as whenresting cells are induced to proliferate. Inhibition ofHDACs or MCTs decreases acetate export andlowers pHi, particularly compromising pHi mainte-nance in acidic environments. Global deacetylationat lowpH is reflected at a genomic level by decreasedabundance and extensive redistribution of acetyla-tion throughout the genome. Thus, acetylation ofchromatin functions as a rheostat to regulate pHi
with important implications for mechanism of actionand therapeutic use of HDAC inhibitors.
INTRODUCTION
Targeted acetylation of lysine residues of histone proteins at
distinct genomic loci is linked to regulation of essentially all
DNA-templated processes, including transcription, replication,
repair, recombination, and the formation of specialized chro-
matin structures such as heterochromatin (Kouzarides,
2007). For example, alterations in histone acetylation at select
gene promoters—via recruitment of histone acetyltransferases
(HATs) and histone deacetylases (HDACs) by sequence-specific
DNA-binding transcription factors—regulate the transcriptional
activity of the targeted genes (Ferrari et al., 2012). Histone acet-
ylation regulates such DNA-templated processes by influencing
the local chromatin structure and by regulating the binding or
exclusion of bromo-domain-containing proteins to and from
310 Molecular Cell 49, 310–321, January 24, 2013 ª2013 Elsevier Inc
the chromatin (Shogren-Knaak et al., 2006; Taverna et al.,
2007). The role of histone acetylation has largely been inter-
preted in this local, site-specific context (Margueron et al.,
2005; Zhou et al., 2011). However, histone acetylation levels
also differ at a cellular or global level (Horwitz et al., 2008; Voge-
lauer et al., 2000). Examination of acetylation by methods that
assess total histone content—such as western blotting (WB) or
immunohistochemistry (IHC)—has revealed heterogeneity in
the levels of global histone acetylation in different tissues and
cell types (Ferrari et al., 2012; Iwabata et al., 2005; Suzuki
et al., 2009). IHC studies on a variety of primary cancer tissues
have shown that an increased prevalence of cells with lower
cellular levels of histone acetylation is associated with more
aggressive cancers and poorer clinical outcome such as
increased risk of tumor recurrence or decreased survival rates
(Elsheikh et al., 2009; Fraga et al., 2005; Manuyakorn et al.,
2010; Seligson et al., 2005, 2009). Such associations under-
score the biological relevance of global differences in histone
acetylation levels. However, very little is known about what
function(s) the changes in global levels of histone acetylation
serve for the cell. While a few studies have shown the necessity
for a pool of acetyl coenzyme A (ac-CoA) to maintain global
histone acetylation (Friis et al., 2009; Takahashi et al., 2006;
Wellen et al., 2009), the biological factor(s) in response to
which global histone acetylation levels change and what cellular
processes are affected by this outcome have remained unknown
(Friis and Schultz, 2009).
Cycles of histone acetylation and deacetylation occur contin-
uously and rapidly throughout the genome, consuming ac-CoA
and generating negatively charged acetate anions in the pro-
cess. Since ac-CoA and acetate anions participate in many
metabolic processes, we hypothesized that histone acetylation
may be linked to certain metabolic or physiologic cues. We
therefore systematically studied how global levels of histone
acetylation change in response to alterations of various compo-
nents of the standard tissue culture medium (Dulbecco’s
modified Eagle’s medium, DMEM). Strikingly, we found that as
intracellular pH (pHi) is decreased, histones become globally
hypoacetylated in an HDAC-dependent manner. The resulting
free acetate anions are transported with protons by the proton
(H+)-coupled monocarboxylate transporters (MCTs) to the
.

Figure 1. Minimal Levels of G, Q, or P Maintain Global Levels of Histone Acetylation
(A) WBs of histone acetylation in HeLa cells cultured for 16 hr in DMEM salts and vitamins with the indicated ac-CoA sources. The bar graph shows average
values ± SD from 15 independent experiments and p value derived from the Student’s t test.
(B) WBs of acetylation in normal IMR90 fibroblasts cultured as in (A).
(C) WBs of tubulin and histone H4 acetylation in HeLa cells under conditions of G, Q, and P deprivation.
(D) WBs of acetylation in HeLa cells cultured at the indicated concentrations of G or Q.
(E) WBs showing the effects of varying concentrations of Ca2+ and phosphate on histone acetylation in HeLa cells. Lane 1 in each panel (A–E) is the reference
condition, the values of which are set to 1. See also Figure S1.
Molecular Cell
Chromatin as a Rheostatic Regulator of pHi
extracellular environment, thereby reducing the intracellular H+
load and resisting further reductions in pHi. As pHi increases,
the flow of acetate and protons is favored toward the inside of
the cell leading to global histone hyperacetylation. Our data
reveal that chromatin, through the basic chemistry of histone
acetylation and deacetylation, coupled with MCTs, function as
a system for rheostatic regulation of pHi.
RESULTS
Glucose, Glutamine, or Pyruvate Is Required toMaintainGlobal Histone AcetylationThe metabolites in standard DMEM that are required to maintain
a pool of ac-CoA for histone acetylation have not been system-
atically identified. Thus, we began by asking if any or all of the
ac-CoA producing sources in DMEM are required to maintain
steady-state levels of histones H3 and H4 acetylation. These
sources potentially include glucose (G), glutamine (Q), pyruvate
(P) and the 14 other amino acids (aa) present in DMEM. HeLa
Mo
and MDA-MB-231 (231) cells were cultured for 16 hr in complete
medium or in medium lacking all or one of the potential ac-CoA
sources. Simultaneous removal of GQP and aa led to significant
(�40%–99%) reduction in the acetylation of multiple lysine resi-
dues on histones H3 and H4 (Figures 1A and S1A, lane 2, avail-
able online). Elimination of G, Q, P, or aa individually had little or
no effect on histone acetylation. These results suggest that the
pool of ac-CoA that is used for histone acetylation derives
from one or more of these carbon sources.
To determine which of these carbon sources are necessary to
maintain histone acetylation, HeLa, 231, and IMR90 normal
primary lung fibroblasts were cultured for 16 hr in medium with
all ac-CoA sources, none, or a single ac-CoA source. Cells that
were cultured in only G, Q, or P maintained normal levels of
histone acetylation in cancer cells and substantial amounts in
IMR90 fibroblasts (Figures 1A, 1B, and S1A). However, histone
acetylation was significantly reduced in the presence of all
other aa. We conclude that G, Q, or P—but not the remaining
aa present in DMEM—are sufficient to maintain normal levels
lecular Cell 49, 310–321, January 24, 2013 ª2013 Elsevier Inc. 311

Molecular Cell
Chromatin as a Rheostatic Regulator of pHi
of histone acetylation. It is interesting that, in the absence of
GQP and aa, although histone acetylation was significantly
decreased, we observed up to an 8-fold increase in tubulin acet-
ylation (Figures 1C and S1B). Higher tubulin acetylation suggests
that cellular pools of ac-CoA are not completely depleted when
GQP are removed. Therefore, the loss of histone acetylation
may be partly due to selective allocation of ac-CoA to other
molecular processes under GQP starvation.
Minimal Amounts of G or Q Are Required to MaintainNormal Levels of Histone AcetylationWe next tested whether global levels of histone acetylation
change with varying concentrations of G or Q as the sole
ac-CoA source. As expected, at zero concentration of G or Q,
histone acetylation was significantly reduced after 16 hr of
culture (Figures 1D and S1C, lanes 6 and 12). It is surprising
however, that global levels of histone acetylation remained
largely unchanged over a 45-fold range of G concentration
(0.1–4.5 g/l) and a 20-fold range of Q concentration (0.1–2 mM)
(Figures 1D and S1C), which include concentrations insufficient
to maintain cell growth and replication. These data indicate
that global levels of histone acetylation do not change dose-
dependently in response to variation in G and Q concentrations
within the range tested.
Vitamins, Calcium, and Phosphate Do Not Affectthe Global Levels of Histone AcetylationWe next asked whether global levels of acetylation change in
response to the vitamins, cofactors, or salts present in DMEM
(see Supplemental Experimental Procedures). Culturing HeLa
cells for 16 hr in media with varying amounts of vitamins and
cofactors in the presence or absence of carbon sources did
not significantly affect the global levels of histone acetylation
(Figure S1D). Calcium (Ca2+) can enhance the permeability of
the mitochondrial membrane to ac-CoA in the presence of phos-
phate (Benjamin et al., 1983). However, reducing the amount of
Ca2+ in the presence or absence of phosphate did not lead to
significant changes in the global levels of histone acetylation in
HeLa or 231 cells after 16 hr of culture (Figures 1E and Fig-
ure S1E). We conclude that global levels of histone acetylation
do not change significantly in the absence of vitamins and
cofactors or Ca2+ and phosphate.
Global Levels of Histone Acetylation Changein Response to pHFinally, we asked whether the buffering component and the re-
sulting pH of the medium could affect histone acetylation.
Changes in pHe are known to induce corresponding changes
in pHi (Fellenz and Gerweck, 1988; Mizuno et al., 2002). We
measured pHi in our cell lines at different bicarbonate concentra-
tions (i.e., different pHe levels) using the pH-sensitive dye
BCECF-AM (see Experimental Procedures). Consistent with
previous reports (Wong et al., 2002), we found that decreasing
pHe led to decreasing pHi, with the range of pHi changes (6.3–
7.3) being more restricted than that of pHe changes (5.9–7.6)
(see top graphs in Figures 2A and S2A). Varying bicarbonate
concentration from 45 mM to 10 mM resulted in pHe values
that led to slight changes in pHi and histone acetylation (Figures
312 Molecular Cell 49, 310–321, January 24, 2013 ª2013 Elsevier Inc
2A and S2A, lanes 1–3). However, decreasing bicarbonate from
10 mM down to 1 mM resulted in pHe values that resulted in
pronounced effects on pHi and significant reductions in histone
acetylation as assessed by WB (Figures 2A and S2A, lanes
3–5) and immunofluorescence (Figure 2B). Acetylation of the
cytoplasmic pool of histones was affected by pH in a similar
manner (Figures 2C and S2B). The effect of pHe on histone acet-
ylation was not limited to cancer cells but was also observed in
H1 human embryonic stem cells, IMR90 normal primary lung
fibroblasts, and even in Saccharomyces cerevisiae, suggesting
that changes in histone acetylation in response to varying pH
is a fundamentally conserved process (Figure S2C). It is impor-
tant to note that acetylation in yeast was reduced at levels of
pHe (�pH 4.0) that have the most pronounced effects on pHi
(Valli et al., 2005).
Histone acetylation was also significantly reduced at low pH
when the culture medium was buffered with HEPES instead of
bicarbonate (Figures 2D and S2D). This suggests the reduction
in acetylation at low pH was in fact due to changes in pH and
not to a reduction in bicarbonate concentration. The reduction
in acetylation was also not due to changes in acetyl-CoA
concentration (Figures 2E and S2E) but was dependent on the
activity of class I and II HDACs. Treatment of cells with HDAC
inhibitors Trichostatin A (TSA) and sodium butyrate, but not
nicotinamide, prior to lowering the pHe blocked the effects of
pH on acetylation (Figures 2F and S2F). In addition, deletion of
the major HDACs, RPD3 and HDA1, in yeast also greatly dimin-
ished the pH-induced hypoacetylation, confirming the require-
ment for HDAC activity (Figure S2C, lanes 13 and 14). In all
pH-related experiments, histone methylation levels at multiple
sites were largely unaffected, suggesting that the effect of pH
on histone acetylation is not due to general impairment of the
cellular posttranslational machinery (Figure 2G). It is interesting
that tubulin acetylation was only minimally affected as pHi
decreased, indicating some degree of specificity for histone
acetylation (Figures 2H and S2G). We conclude that global levels
of histone acetylation change in response to pHi, with increased
deacetylation of histones occurring at lower values of pHi.
The pH-Induced Changes in Histone Acetylation LevelsDo Not Require Specific Carbon Sources or SaltsLowering pHe in the presence of only G, Q, or P resulted in reduc-
tion of histone acetylation (Figures 3A and S3A), indicating that
the effect of pH on histone acetylation is independent of the
source of ac-CoA. Next, we asked if specific salts are required
for hypoacetylation of histones at low pH. Cells were cultured
at normal and low pHe in the presence and absence of sodium
(Na+) or chloride (Cl�), using Q as the ac-CoA source. We found
that global histone acetylation decreased in low pHi regardless
of the presence of either ion (Figures 3B, 3C, S3B, S3C). Ca2+
and phosphate were also not required for pH-mediated changes
of histone acetylation levels, regardless of whether the cells were
deprived of these salts for several days prior to lowering the pH
(Figures 3D and S3D) or deprived at the same time the pH was
decreased (Figure S3E). We conclude that the alteration of
histone acetylation levels in response to pH does not depend
on a specific carbon source or extracellular Na+, Cl�, Ca2+ or
phosphate.
.

B pHe 7.4 6.5 6.1
H4ac
CAH4K5ac
cytoplasm 1.00 0.72H3
pHe 7.4 6.5
H4ac1.00 0.59 0.16 0.07
HEPES (mM) 90 45 15 5pHe 6.8 6.57.0D 6.3
7.5
7.0
DAPIH4K5acnucleus 1.00 0.62
H3cytoplasm 1.00 1.15
Coomassienucleus
H4K12ac1.00 0.45 0.02 0.01
H4K16ac1.00 0.37 0.15 0.07
H3K18ac1.00 0.96 0.50 0.35
pHi
6.0
6.5
pHe 7.5 7.0 6.5 6.08.0 5.5
H4K12ac
DAPI
A] 1.5E
1.00 0.99
Lane 1 2Coomassie
1.00 1.00 1.01 1.02
Lane 1 2 3 4
1 12 4 9 3 7 0 497 9pH 7.0 pH 6.3
Bicarb (mM) 45 25 10 3 1
H4ac0.96 1.00 0.98 0.44 0.36
H4K12ac1.01 1.00 0.94 0.37 0.27
pHe 7.7 7.4 6.9 6.4 5.9
DAPI
H3K18ac
Rel
ativ
e [a
c-C
oA
0
0.5
1.01e-12 4e-9 3e-7 0.497e-91.2
0.8
0.4
vera
ge s
igna
l
1.01 1.00 0.94 0.37 0.27
H4K16ac0.98 1.00 1.06 0.24 0.05
H3K18ac1.08 1.00 1.16 0.58 0.44
Coomassie
pHe 7.0 6.3G
pHe
7.4 6.50
Butyrate7.4 6.5
TSA7.4 6.5 7.4 6.5
NAMpHe 7.4 6.5
F ---HDACi
0
Av
Lane 1 2 3 4 5
0.98 1.00 1.08 1.04 1.03
2e-6 9e-5 3e-5 1e-3 0.101.2
pH 7.4 pH 6.5
K3K4me21.00 1.10
K3K9me21.00 1.09
H3K27me31.00 0.91
H
tubulin1.00 1.20
ac-tubulin1.00 1.39
pHe 7.4 6.51.00 0.94
1.00 0.93
1.00 0.98
1.00 1.00
1.00 0.87
1.00 0.94
1.00 0.25
1.00 0.12
1.00 0.23
H4ac
H4K12ac
H4K16ac
1.00 0.43
1.00 0.20
1.00 0.47
0.8
0.4erag
e si
gnal
H3K36me21.00 1.10
Coomassie1.00 1.03
Lane 1 2
H4ac1.00 0.50
Coomassie1.00 0.94
Lane 1 23 4
1.00 1.02
1.00 1.00
5 6
1.00 0.89
1.00 1.05
7 8
1.00 0.60
1.00 1.02
H3K18ac
Coomassie
Lane 1 2
1.00 0.67
1.00 0.990
Av
Figure 2. Global Levels of Histone Acetylation Decrease when pHi Decreases
(A) Measurements of pHi (mean ± SD) as a function of pHe and effects on histone acetylation in HeLa cells cultured at the indicated pHe for 16 hr in complete
DMEM as assessed by WB. The reference condition is set to 25 mM bicarbonate (lane 2), which approximates the normal physiological concentration. The bar
graph shows average values ± SD from seven independent experiments and p value derived from the Student’s t test.
(B) Immunofluorescent analysis of histone acetylation of HeLa cells cultured as in (A).
(C) WB analysis of H4K5ac in HeLa cells in the indicated histone fractions and pH.
(D) WBs of histone acetylation in HeLa cells cultured in media buffered with HEPES. The bar graph shows average values ± SD from 17 independent experiments
and p value derived from the Student’s t test.
(E) Acetyl-CoA measurements (mean ± SD) in HeLa cells treated for 4 hr at the indicated pHe.
(F)WBs of histone acetylation in HeLa cells that were treated with or without 5mM sodium butyrate, 500 nMTSA, or 2mMnicotinamide (NAM) for 6 hr in complete
DMEM at pHe 7.4, followed by incubation at the indicated pHe for 4 hr.
(G) WBs of histone methylation in HeLa cells cultured at the indicated pH.
(H) WBs of tubulin and histone H4 acetylation in HeLa cells treated for 16 hr at the indicated pH values. See also Figure S2.
Molecular Cell
Chromatin as a Rheostatic Regulator of pHi
Acetylation of H4K16 Is Decreased and DrasticallyRedistributed at Low pHTo determine how the pH-induced changes in global levels of
acetylation map to specific genomic loci, we treated HeLa cells
for 4 hr at pHe 7.4 or pH 6.5 and then performed chromatin immu-
noprecipitation sequencing (ChIP-seq) analysis of H4K16ac. (For
each pH treatment, both input and immunoprecipitated DNA
were sequenced.) Consistent with the global decrease in
H4K16ac levels, there were significant reductions in both the
number of base pairs covered as well as the total number of
genomic loci significantly associated with H4K16ac at low pH
Mo
(Figure 4A). Clustering of the significant peaks of H4K16ac re-
vealed drastic redistribution and decreased overall intensity of
this acetylation site at low pH. Figure 4B shows the clusters of
H4K16ac peaks (heat maps), the average value of each cluster
(line graphs), and the genomic distribution of the peaks (pie
charts) with associated gene ontology. Cluster 1 contained
2,751 peaks of H4K16ac in high pH, which were essentially fully
deacetylated at low pH. These peaks are mostly near transcrip-
tion start sites (TSS) and introns of genes whose gene ontology
(GO) terms include in protein synthesis and cell cycle control.
Cluster 2 contained 595 peaks that were present at both pH
lecular Cell 49, 310–321, January 24, 2013 ª2013 Elsevier Inc. 313

Figure 3. Changes in Histone Acetylation Levels in Response to pH Do Not Require Specific Carbon Sources or Salts
(A–D) WBs of histone acetylation in HeLa cells cultured for 16 hr in DMEM salts at pHe 7.0 or 6.3 either (A) including the indicated carbon source or including Q but
lacking (B) Na+, (C) Cl�, and (D) Ca2+ and phosphate. In (D), cells were starved of Ca2+ and phosphate for 3 days prior to pHe treatment. See also Figure S3.
Molecular Cell
Chromatin as a Rheostatic Regulator of pHi
values but with much decreased intensity at low pH. More than
90% of cluster 2 peaks occur at TSS and introns of genes
enriched in GO terms encoding ribonucleoproteins including
mitochondrial and cellular ribosomal protein genes as well as,
interestingly, the NuA4 HAT complex that acetylates histone
H4 (Arnold et al., 2011). Cluster 3 contained 1,971 new peaks
of H4K16ac at low pH, which are mostly in regions away from
TSS and are associated with GO terms including spindle organi-
zation and replicative senescence.
We also performed mRNA sequencing (mRNA-seq) under the
same conditions to correlate the redistribution of H4K16ac to
changes in gene expression. Compared to high pH, 740 genes
were upregulated greater than 2-fold at low pH, including histone
genes and genes involved in regulation of transcription,
signaling, and metabolism (Table S1). A total of 888 genes
were downregulated greater than 2-fold at low pH with functions
in plasma membrane and extracellular matrix biology (Table S1).
It was surprising that there were no significant changes in the
average expression of genes in the three acetylation clusters
(Figure 4C). We conclude that treatment at low pH results in elim-
ination of most H4K16ac peaks and re-establishment of less
than half as many peaks with lower intensity at new genomic
locations predominantly away from TSS regions. This redistribu-
tion does not significantly correlate with gene expression after
4 hr of treatment at low pH.
Changes in Histone Acetylation in Response to NutrientAvailability and pH Occur via Different MechanismsWe next performed kinetic experiments to compare the histone
acetylation changes that occur in response to the acidification
of the intracellular milieu to those resulting from changes in
nutrient availability. First, we performed time course experiments
to examine the kinetics of the decrease in acetylation upon each
type of treatment. HeLa and 231 cells were cultured for 1, 2, 4, 8,
and 16 hr at normal or low pH in the presence or absence of GQP
(Figures 5A and S4A). Removal of GQP at normal pH resulted in
a gradual decrease in histone acetylation over 16 hr (compare
solid and dashed green lines). In contrast, acidification of the
medium in the presence of GQP resulted in an abrupt decrease
in acetylation at 1 hr, which then remained relatively constant
314 Molecular Cell 49, 310–321, January 24, 2013 ª2013 Elsevier Inc
over time (compare solid green and orange lines). In addition,
removal of GQP in the low pH medium resulted in a sharp
decrease in acetylation during the first hour, followedby a gradual
declineover16hr (comparesolid anddashedorange lines). These
data indicate that the kinetics of hypoacetylation in response to
acidic pHi and to GQP deprivation are markedly different.
Second, we performed time course experiments to investigate
the kinetics of the recovery of histone acetylation in cells that
were returned to steady-state culture conditions after being
treated at low pH or being deprived GQP. HeLa and 231 cells
were cultured for 16 hr at pHe 7.4 or 6.5. A cohort group of cells
were cultured for 16 hr inmediumwith or without GQP at pHe 7.4.
In each case, the cells were then returned to normal culture
conditions for various amounts of time as shown in Figures 5B
and S4B. The recovery of acetylation upon returning GQP was
gradual and required �24 hr to return to steady-state levels
(compare purple and green lines). The recovery of acetylation
upon return to a normal pHe was much faster (compare purple
and orange lines). These data show that the kinetics of acetyla-
tion recovery are also different for cells treated at low pH versus
those that have been GQP starved. Together with the differential
effects on tubulin acetylation, we conclude that medium acidifi-
cation and nutrient deprivation affect histone acetylation by
distinct mechanisms.
Decreased pHResults in an HDAC-Dependent Excretionof Acetate and Protons by MCTsSince the levels of acetylation were regulated in response to pH,
we hypothesized that histone acetylation may impact cellular
control of pHi. While deacetylation of lysines in and of itself has
no net effect on pHi, export of free, negatively charged acetate
anions, which are membrane impermeable (Walter and Gut-
knecht, 1984), through the H+-coupled MCTs would buffer
against further acidification of pHi by decreasing the intracellular
H+ load. As obligate H+ symporters, MCTs 1–4 bidirectionally
cotransport acetate and other small organic anions—such as
lactate—with a H+, thereby participating in pHi regulation (Boron
et al., 1988; Halestrap and Meredith, 2004).
To determine if HDAC-derived acetate anion is excreted in-
creasingly as pH decreases, we incubated cells with 3H-acetate
.

7.4 6.5
Num
ber o
f sig
.en
riche
d lo
ci
pHe
12000
8000
4000
0
A
7.4 6.5pHe
Cov
erag
e (k
b) 300
200
100
0 34
41
25
TSS (+3 kb) Introns Intergenic
49 43
8
B pH 7.4 pH 6.5
-log P 8
0
Clu
ster
1 (2
751)
-1.5 0 1.5 -1.5 0 1.5
Avg
. val
ue
(-lo
g P
) 1 2 3 4 5 6
1 2 3 4 5 6
2
Clu
ster
2 (5
95)
4
8
6
-1.5 0 1.5
2
4
8
6
-1.5 0 1.5
Distance from peak center (kb)
Distance from peak center (kb)
Clu
ster
3 (1
971)
-1.5 0 1.5 -1.5 0 1.5 1 2 3 4 5 6
1 2 3 4 5 6
17
40 44
Cluster 3 GO Term P-val spindle organization 2.0E-07
decreased bone volume 1.0E-06 abnormal cellular replicative
senescence 7.9E-06
early cellular replicative senescence 4.9E-05
Cluster 2 GO Term P-val ribonucleoprotein complex 3.5E-36
nuclear speck 6.5E-09
decreased cell proliferation 1.3E-04 NuA4 histone
acetyltransferase complex 1.9E-03
Cluster 1 GO Term P-val ribosome 1.8E-08
tumor regression 3.8E-06 mitotic cell cycle damage
checkpoint 6.6E-06
cell cycle checkpoint 1.1E-05
Avg
. val
ue
(-lo
g P
) A
vg. v
alue
(-
log
P)
Cluster 1 Cluster 2 Cluster 3
pH 6.5 pH 7.4
Exp
ress
ion
(ln(R
PK
M))
-6 -4 -2 0 2 4 6
C
Figure 4. Low pH Causes Global Decrease and Redistribution of H4K16ac throughout the Genome
The distribution of H4K16ac in HeLa cells treated for 4 hr at pH 7.4 or 6.5 was determined by ChIP-seq.
(A) Number of DNA base pairs covered by significant (p < 10�4) peaks of H4K16ac and number of genomic regions (25 bp windows) associated with significant
H4K16ac peaks.
(B) Heat maps showing the distribution of H4K16ac peaks at the indicated pH values as the�log p value of enrichment in ±1.5 kb region from the center of each
peak. All peaks were clustered in three groups based on their combinatorial presence in each pH condition. The number of peaks in each cluster is indicated. The
average value of enrichment as�log p value for each cluster is shown as a line chart below each heat map. The distribution of peaks in each cluster is shown as
a pie chart. The gene ontology (GO) of genes associated with the peaks of H4K16ac in each cluster is shown. The GO terms include biological process, cellular
component, molecular function, and mouse phenotypes of homologous gene knockout.
(C) Box plots showing the distribution of expression of genes associated with the H4K16ac peaks in each cluster under the indicated pH conditions. See
also Table S1.
Molecular Cell
Chromatin as a Rheostatic Regulator of pHi
in complete medium for 1 hr in order to label histone acetyl
groups (Carmen et al., 1996). Following a 30 min chase, HeLa
and 231 cells were treated in media of varying pH, which was as-
sayed for released tritium (3H) at the indicated time points in Fig-
ure 6A. (Note that at each time point, the entire volume of
medium was removed for liquid scintillation counting and fresh
medium was added.) Incubation in decreasing pHe resulted in
immediate, dose-dependent increases in the appearance of 3H
for up to 30 min, which we attribute to acetate anion released
from the cell (Figure 6A). The fast nature of the response is
consistent with other regulators of pHi (Hulikova et al., 2011).
To determine if global histone acetylation is affected in a similarly
short time period, we performed kinetic studies analogous to
Mo
those done in Figure 5 but on a shorter time scale. Loss of global
acetylation at most sites examined was detected by WB at
30min after lowering pHe (Figure S5A). It is possible that histones
are deacetylated at earlier time points but at levels below the
sensitivity of the antibodies used in this study. Indeed, we
detected recovery of acetylation as early as 5 min after return
to normal pHe (Figure S5B). We conclude that global deacetyla-
tion of histones in response to pH is associated with increased
excretion of acetate anion from cells.
The appearance of 3H in the media at both normal and low
pH was significantly decreased by treating cells for 30 min
with the MCT1/MCT4 inhibitor a-cyano-4-hydroxycinnamate
(CNCn) after the labeling step but before addition of medium at
lecular Cell 49, 310–321, January 24, 2013 ª2013 Elsevier Inc. 315

H4ac H4K12ac HistonesH3K18acH4K16acel
ativ
e si
gnal 1.
51.
00.
5A
pH 7.4 + GQPpH 7.4 - GQPpH 6.5 + GQPpH 6.5 - GQP
1 2 4 8 16
pH 7.4 + GQP
pH 7.4 - GQP
Time (hr)
Re
0.0
618421618421 618421618421
p
pH 6.5 + GQP
pH 6.5 - GQP
5 H4ac H4K12ac HistonesH3K18acH4K16ac
Control
GQP recovery
pH recovery
Rel
ativ
e si
gnal 1.
51.
00.
50
B
Control
GQP recovery
pH recovery
Time (hr)
R
0.0
1 2 4 8 240 1 2 4 8 240 1 2 4 8 240 1 2 4 8 240 1 2 4 8 240
pH recovery
Figure 5. Nutrient Availability and pH Alter Histone Acetylation Differently
(A and B) WBs of histone acetylation in HeLa cells cultured in DMEM salts (A) for the indicated amount of time and pHe in the presence (+) and absence (�) of GQP
and (B) at pHe 7.4 with GQP (control), pHe 7.4 without GQP (for GQP recovery), or pHe 6.5 with GQP (for pH recovery) for 16 hr followed by treatment for the
indicated amount of time in medium at pHe 7.4 with GQP. Membrane images were cropped in order to place them below the graph at the corresponding time
points. See also Figure S4.
Molecular Cell
Chromatin as a Rheostatic Regulator of pHi
normal or low pH (Figure 6B). In addition, the class I HDAC inhib-
itor TSA inhibited the increase in the appearance of 3H in the
media at low pHe (Figure 6C). These data suggest that histones
are globally deacetylated at low pH in an HDAC-dependent
manner with subsequent excretion of acetate anion and protons
from the cell through the MCTs.
The potential of HDAC-dependent, H+-coupled acetate excre-
tion to regulate pHi depends upon sufficient rates of acetate
excretion. To determine the rate of acetate excretion from cells,
we used an enzyme-based assay to measure the amount of
acetate in culture media from 231 cells incubated in DMEM
of varying pHe for 30 min. Assuming an average cell volume of
500 fl (Kim et al., 2007), we found that, as the pHe was decreased
in a stepwise manner, the rate of acetate anion excretion
increased from �0.43 mM/min at pHe 7.4 to �0.74 mM/min at
pHe 6.7, reaching a rate of �0.96 mM/min at pHe 6.1 (Figure 6D).
This rate of acetate and H+ secretion is within the range of other
known regulators of pHi such as NHE1, which, for example,
secretes protons from acid-loaded (pHi of 6.8) HeLa and
316 Molecular Cell 49, 310–321, January 24, 2013 ª2013 Elsevier Inc
MDA-MB-468 cells at a rate �0.5 mM/min and �2.0 mM/min,
respectively, at a pHe of 6.8 (Hulikova et al., 2011). Since MCT-
dependent efflux of acetate anions and protons has a 1:1 stoichi-
ometry, theacetate efflux rate could significantly contribute to pHi
regulation by enabling efflux of protons at the same rate. It is
important to note that levels of acetylation were increased in
231 cells that were treated with TSA after they had been cultured
at low pHe (Figure 6E). This suggests that HAT activity is main-
tained at low pH, thereby ensuring a steady supply of acetate
anions.
Inhibition of HDACs or MCTs Decreases pHi
Our data predict that HDAC inhibition should decrease pHi by
preventing the release of acetate from histones, thereby
reducing the ability of MCTs to couple H+ efflux to acetate anion
efflux. Treatment with increasing concentrations of TSA in
complete medium at normal pHe resulted in a dose-dependent
decrease of pHi in both HeLa and 231 cells (Figures 7A and
S6A, left panel). This effect was not due to passive acidification
.
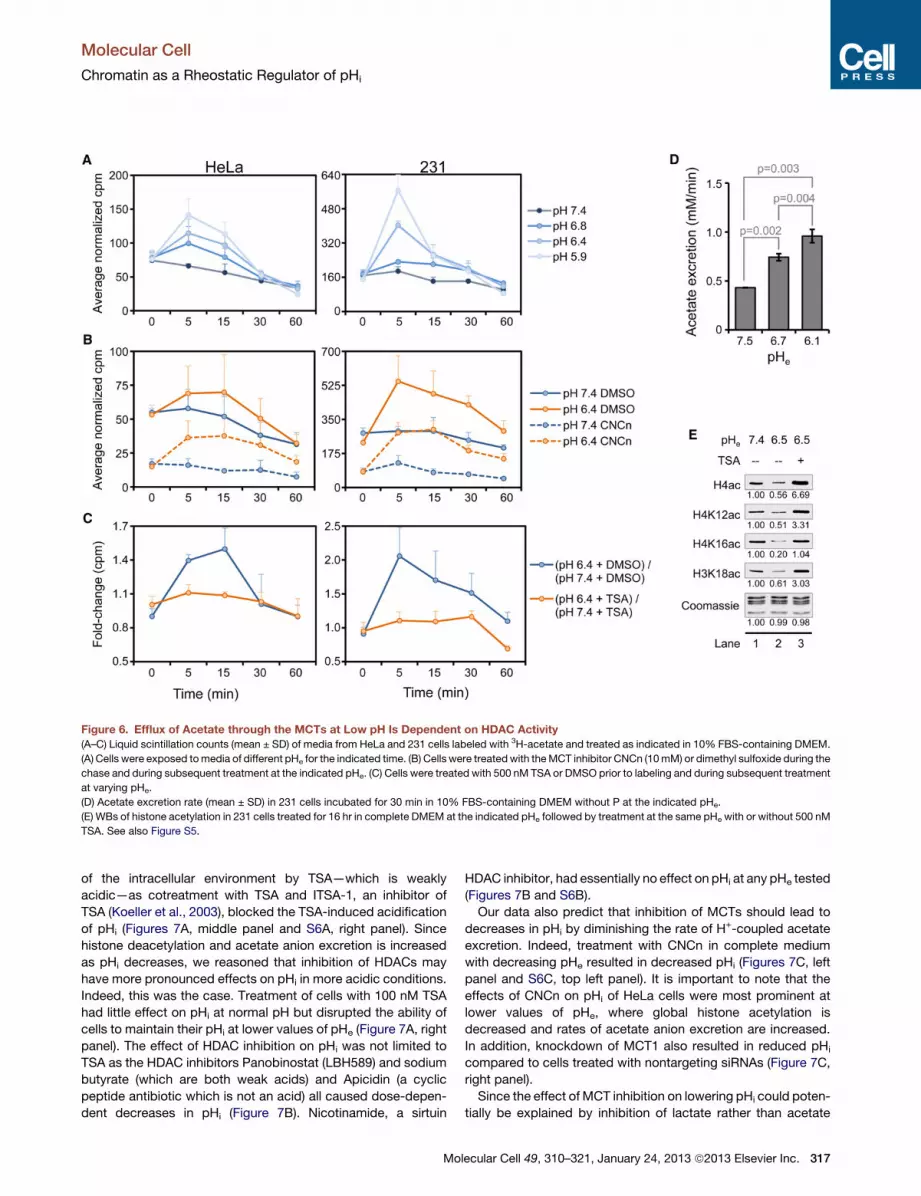
Figure 6. Efflux of Acetate through the MCTs at Low pH Is Dependent on HDAC Activity
(A–C) Liquid scintillation counts (mean ± SD) of media from HeLa and 231 cells labeled with 3H-acetate and treated as indicated in 10% FBS-containing DMEM.
(A) Cells were exposed tomedia of different pHe for the indicated time. (B) Cells were treatedwith theMCT inhibitor CNCn (10mM) or dimethyl sulfoxide during the
chase and during subsequent treatment at the indicated pHe. (C) Cells were treated with 500 nM TSA or DMSO prior to labeling and during subsequent treatment
at varying pHe.
(D) Acetate excretion rate (mean ± SD) in 231 cells incubated for 30 min in 10% FBS-containing DMEM without P at the indicated pHe.
(E) WBs of histone acetylation in 231 cells treated for 16 hr in complete DMEM at the indicated pHe followed by treatment at the same pHe with or without 500 nM
TSA. See also Figure S5.
Molecular Cell
Chromatin as a Rheostatic Regulator of pHi
of the intracellular environment by TSA—which is weakly
acidic—as cotreatment with TSA and ITSA-1, an inhibitor of
TSA (Koeller et al., 2003), blocked the TSA-induced acidification
of pHi (Figures 7A, middle panel and S6A, right panel). Since
histone deacetylation and acetate anion excretion is increased
as pHi decreases, we reasoned that inhibition of HDACs may
have more pronounced effects on pHi in more acidic conditions.
Indeed, this was the case. Treatment of cells with 100 nM TSA
had little effect on pHi at normal pH but disrupted the ability of
cells to maintain their pHi at lower values of pHe (Figure 7A, right
panel). The effect of HDAC inhibition on pHi was not limited to
TSA as the HDAC inhibitors Panobinostat (LBH589) and sodium
butyrate (which are both weak acids) and Apicidin (a cyclic
peptide antibiotic which is not an acid) all caused dose-depen-
dent decreases in pHi (Figure 7B). Nicotinamide, a sirtuin
Mo
HDAC inhibitor, had essentially no effect on pHi at any pHe tested
(Figures 7B and S6B).
Our data also predict that inhibition of MCTs should lead to
decreases in pHi by diminishing the rate of H+-coupled acetate
excretion. Indeed, treatment with CNCn in complete medium
with decreasing pHe resulted in decreased pHi (Figures 7C, left
panel and S6C, top left panel). It is important to note that the
effects of CNCn on pHi of HeLa cells were most prominent at
lower values of pHe, where global histone acetylation is
decreased and rates of acetate anion excretion are increased.
In addition, knockdown of MCT1 also resulted in reduced pHi
compared to cells treated with nontargeting siRNAs (Figure 7C,
right panel).
Since the effect of MCT inhibition on lowering pHi could poten-
tially be explained by inhibition of lactate rather than acetate
lecular Cell 49, 310–321, January 24, 2013 ª2013 Elsevier Inc. 317

Figure 7. HDACs, MCTs, and Cellular Proliferation Affect pHi and Global Histone Acetylation Levels(A and B) pHi of HeLa cells treated in standard DMEMovernight with (A) the indicated concentration of TSA (left panel); 250 nMTSA, 50 mM ITSA-1, or both (middle
panel); 100 nM TSA followed by 6 hr of culture at the pHe indicated (right panel); or (B) the listed HDAC inhibitors at the indicated concentrations (NAM = 2 mM
nicotinamide).
(C) pHi of HeLa cells in which MCT function was inhibited by treatment for 1 hr with 10 mMCNCn (left panel) or by siRNA-mediated knockdown of MCT1 for 96 hr
(right panel) followed by treatment for 30 min at the pHe shown.
(D) Rates of lactate excretion in HeLa cells after 30 min of treatment in DMEMwithout G and P at the indicated pHe (left panel); pHi measurements under identical
conditions with 10 mM CNCn or DMSO (right panel).
(E) T cells were stimulated to proliferate by CD3/CD28-coated dynabeads and interleukin-2 treatment for 48 hr. EdU incorporation was determined by flow
cytometry, and cell number was counted with and without 48 hr stimulation.
(F) pHe and pHi values, as well as histone acetylation, of resting and activated T cells after 48 hr. Note that pHi changes independently of pHe. All data (A–F) are
presented as mean ± SD. See also Figure S6.
Molecular Cell
Chromatin as a Rheostatic Regulator of pHi
excretion, we examined the rates of lactate excretion at varying
pHe. We found that, as pHe was decreased, the rate of lactate
excretion was drastically reduced in both HeLa and 231 cells
(Figures 7D and S6C, lower left panel) and became even slower
than that of acetate excretion at lower values of pHe in
G-deprived 231 cells (Figure S6C, lower right panel). It is impor-
tant to note that MCT inhibition under G-deprived conditions still
resulted in decreased pHi (Figures 7D, right panel and S6C, top
right panel). It is interesting that MCT inhibition by CNCn did not
affect pH-induced histone hypoacetylation, indicating that
histone deacetylation is not dependent on acetate excretion
318 Molecular Cell 49, 310–321, January 24, 2013 ª2013 Elsevier Inc
(Figure S6D). Taken together, these results indicate that
decreasing acetate release from histones by HDAC inhibition
or efflux from the cell by MCT inhibition results in lower pHi.
Rapid Cell Proliferation Is Associatedwith Increased pHi
and Histone HyperacetylationAlthough our pH experiments were all done at pHe values that are
known to occur in certain cancer tissue (Zhang et al., 2010), we
wished to investigate a system in which pHi changes indepen-
dently of pHe. Considering that rapidly dividing cells have higher
pHi than nondividing cells (Reshkin et al., 2000), our data predict
.

Molecular Cell
Chromatin as a Rheostatic Regulator of pHi
that changes in proliferation are associated with changes in
histone acetylation. To test this prediction, we used an in vitro
system that mimics the physiological stimulation of T cells to
proliferate by antigen-presenting cells (Trickett and Kwan,
2003). Stimulation of proliferation of normal, primary peripheral
blood T cells—as evidenced by the incorporation of 5-ethynyl-
20-deoxyuridine (EdU)—led to an increase in overall cell number
after 48 hr (Figure 7E). In agreement with previous reports (Bental
and Deutsch, 1994), the activation of T cells was associated with
an increase in pHi independent of changes in pHe. As predicted,
increased pHi was associated with an increase in global histone
acetylation (Figure 7F). These data indicate that in physiological
conditions in which pHi is affected independently of pHe, global
histone acetylation levels change correspondingly.
DISCUSSION
Cells have developed multiple mechanisms to maintain and
regulate pHi in response to changes in pHe or increased acid
production within the cell (Casey et al., 2010; Parks et al.,
2011). These mechanisms include Na+/H+ and Cl�/bicarbonateexchangers, H+ pump ATPases, and bidirectional transport of
organic acids by H+-coupled MCTs (Cardone et al., 2005; Wahl
et al., 2002). Notably, the MCTs contribute to pHi regulation
particularly at low pHe values (Cardone et al., 2005) in tissues
such as muscle during exercise (Messonnier et al., 2007) and
in certain cancer cells (Wahl et al., 2002). Our data now reveal
that the dynamic acetylation and deacetylation of histones
together with flux of acetate anions and protons in and out of
the cell through the MCTs provides an additional mechanism
for cells to modulate their pHi. Deacetylation of histones releases
acetic acid from chromatin. Owing to its pKa of 4.74, acetic acid
immediately releases a proton that is readily accepted by the
ε-amino group (pKa 10.5) of the deprotonated lysine within phys-
iologically relevant pH range. The impermeability of the acetate
anion to the plasma membrane necessitates a transporter for
the movement of acetate in and out of the cell. This need is
met in part by the proton-coupled MCTs, imparting chromatin
with the capability to serve as a buffer of pHi. Whether the
acetate molecules serve additional functions once excreted
from the cell remains to be determined.
The mechanism(s) by which pH affects global histone acetyla-
tion levels remains to be determined, but our data suggest that
HAT activity is not compromised and that the activity of HDACs
is required. It is possible that, at low pHi levels, the balance of
histone acetylation and deacetylation is shifted toward the latter,
resulting in continual generation of free acetate anions for H+
transport by MCTs. This would result in the appearance of
globally hypoacetylated histones but increased production of
acetate anions due to continued activity of HATs (see Graphical
Abstract). Different sites of histone acetylation may also respond
differently to changes in pH. We consistently observed more
reduction in global levels of histone H4 than H3K18ac, suggest-
ing that some fraction of H3K18ac may be protected against or
unresponsive to pH alterations.
At a molecular level, global hypoacetylation of H4K16 at
low pH is associated with elimination of 82% of peaks that are
normally present at high pH and with decreased intensity of
Mo
the remaining 18% of the peaks. Conversely, novel peaks of
H4K16ac are established at low pH, covering less than half as
many regions of the genome as in a high pH condition. It is inter-
esting that many more peaks of H4K16ac are associated with
promoter regions at high pH compared to low pH. Despite the
widespread decrease and redistribution of H4K16ac, there was
essentially no correlation with the gene expression changes
that occurred at low pH in the same time frame. It is possible
that redistribution of H4K16ac precedes corresponding changes
in gene expression that may occur at a later time point or that
other sites of histone acetylation correlate better with transcrip-
tional changes. Nonetheless, our data suggest that rapid
changes in gene expression are decoupled from hypoacetylation
and redistribution of H4K16ac in response to low pH.
Participation of histone acetylation in pH regulation is consis-
tent with the long-standing phenomenon that acetyl groups
of histones have a rapid turnover rate, on the order of a few
minutes (Waterborg, 2002). Such rapid turnover would be
required for cells to respond swiftly to pH fluctuations. Our
data may also be of particular relevance to cancers with low
levels of histone acetylation that display a poor clinical outcome
(Manuyakorn et al., 2010; Seligson et al., 2009; Suzuki et al.,
2009). Cancer tissues displaying low levels of histone acetylation
may have enhanced acetate and proton efflux, thereby contrib-
uting to an alkaline pHi and an acidic pHe. Tumor microenviron-
ments are commonly found to be acidic, and some with pH
values below 6.5 have been reported (Zhang et al., 2010). In
addition, tumors with an alkaline pHi and/or acidic microenviron-
ment exhibit more aggressive phenotypes (Harguindey et al.,
2005; Lora-Michiels et al., 2006; Moellering et al., 2008; Perona
and Serrano, 1988; Reshkin et al., 2000; Rofstad et al., 2006).
Our data also suggest that the use of HDAC inhibitors as thera-
peutic agents in cancer treatment should also be considered
from the additional perspective that HDAC inhibition may
disrupt the pHi-buffering capacity of cells. Indeed, HDAC
inhibitors other than those used in this study also lower pHi
(Chung et al., 2008), suggesting an alternative mechanism of
action for this class of drugs. Altogether, our findings uncover
chromatin as an essential component of an alternative pHi regu-
latory system involving histone acetylation and deacetylation
and MCTs.
EXPERIMENTAL PROCEDURES
Cell Culture
HeLa, 231, and IMR90 cells were maintained in DMEM supplemented with G,
Q, P, sodium bicarbonate, antibiotics, and 5% dialyzed fetal bovine serum
(FBS). Experiments were performed in the absence of serum, unless otherwise
noted. H1 cells were maintained in mTeSR1 medium (STEMCELL Technolo-
gies #05850) on Matrigel. T cells were purchased from AllCells (PB009-1F)
and were maintained in RPMI-1640 (ATCC #30-2001) with 10% FBS (Hyclone
#SV3001403) that was heat inactivated by treatment at 56�C for 1 hr.
WB Analysis
WBs were performed using the LI-COR Odyssey system. Blots were per-
formed on acid-extracted histones from isolated nuclei or on whole-cell
lysates in the case of tubulin, cytoplasmic histones, and MCT1. A representa-
tive blot of three ormore independent biological replicates is shown. Statistical
analysis was performed in cases where at least seven replicate data points
were obtained.
lecular Cell 49, 310–321, January 24, 2013 ª2013 Elsevier Inc. 319

Molecular Cell
Chromatin as a Rheostatic Regulator of pHi
Immunofluorescence
Cells were plated on chambered slides (Fisher #12-565-110N) in control
medium and then treated for 16 hr at the indicated pH. Cells were fixed in
methanol and stained with the indicated antibodies at 1:200 dilutions in
PBS-Tween with 5% bovine serum albumin. Alexa Fluor 488 goat anti-rabbit
secondary antibody was used at 1:1,000 dilution. Images were taken using
an inverted fluorescent microscope and processed using Slidebook.
Measurements of ac-CoA
Cells grown on 10 cm dishes were treated for 4 hr in DMEM at pH 7.4 or 6.5.
The plates containing cells were then directly submerged in liquid nitrogen
and shipped on dry ice to the University of Michigan Metabolomics Resource
Core for mass spectrometry measurements (Lorenz et al., 2011).
ChIP-Seq and mRNA-Seq
Cells were cultured for 4 hr at the indicated pH in complete DMEM. DNA
and RNA were subjected to standard ChIP-seq and mRNA-seq as previously
described (Ferrari et al., 2012). Briefly, sequenced reads were aligned to
the human genome (Hg19), and only those that matched a unique location
with up to two sequencemismatcheswere retained. To define peaks of enrich-
ment, we segmented the human genome into 25 bp windows and compared
the ChIP and normalized input DNA read counts in each window. Using the
Poisson distribution, we calculated p values for the enrichment of ChIP reads
in each window. A cutoff p value <10�4 was used to maintain a false discovery
rate <1%. Significant peaks were defined as those with a p value <10�4 and
with significant windows at the same p value in the two neighboring windows.
Total RNA was extracted from cells using QIAGEN RNeasy Mini kit and
treated with Ambion’s Turbo DNase. Two micrograms of total RNA was
used to start the library preparation according to the manufacturer’s instruc-
tions (Illumina TruSeq RNA Sample Preparation Kit). Libraries were sequenced
using Illumina HiSeq system to obtain 50 bp-long reads. Alignment of
mRNA-seq reads to Human genome (Hg19) was performed using default
parameters of Tophat (Trapnell et al., 2009). SAMMate software (Xu et al.,
2011) was used to determine the transcript RPKM (reads per kilobase of
exon per million of reads).
Acetate and Lactate Excretion Assays
Cells grown in 10 cm dishes were incubated in 5 ml of medium at the indicated
pHe for 30 min. Acetate was measured using the K-ACET kit, and lactate was
measured using the K-LATE kit (Megazyme) according to manufacturer’s
instructions. We confirmed the compatibility of all reagents used in experi-
ments with this kit using the provided standards. Note that an unknown
compound in HeLa cell culture medium interfered with the reactions of the
K-ACET kit, precluding direct acetate measurement.
pHi Measurements
Adherent cells were grown on 35 mM poly-lysine-coated glass bottom dishes
in the presence or absence of pharmacological inhibitors or siRNA. Cells were
loaded with 5 nmol/ml of the pH-sensitive dye BCECF-AM in EBSS for 25 min.
We then determined pHi by obtaining the ratio of emission at 535 nm
wavelength for excitation wavelengths of 495 nm and 440 nm. The pHi of non-
adherent T cells was obtained by flow cytometry. Cells were resuspended
in Earle’s balanced salt solution (EBSS) and loaded with 5 nmol/ml of the
pH-sensitive dye SNARF-1 for 30 min. The pHi was determined by obtaining
the ratio of emission wavelength of 580 and 640 nm for excitation wavelength
of 488 nm. Ratios were converted to pH using in situ calibration curves as
described elsewhere (Nehrke, 2006).
T Cell Stimulation
T cells were stimulated to proliferate using recombinant human IL-2 (Invitrogen
#CTP0021) and CD3/CD28-coated Dynabeads (Invitrogen #111.31D) accord-
ing to manufacturer’s instructions. 5-ethynyl-20-deoxyuridine (Invitrogen
#C35002) incorporation was assessed by flow cytometry according to manu-
facturer’s instructions.
Additional details are available in the Supplemental Experimental
Procedures.
320 Molecular Cell 49, 310–321, January 24, 2013 ª2013 Elsevier Inc
ACCESSION NUMBERS
ChIP-seq and mRNA-seq data are available for download at the NCBI Gene
Expression Omnibus under accession number GSE40114.
SUPPLEMENTAL INFORMATION
Supplemental Information includes six figures, one table, and Supplemental
Experimental Procedures and can be found with this article online at http://
dx.doi.org/10.1016/j.molcel.2012.10.025.
ACKNOWLEDGMENTS
We thank Klara Olofsdotter Otis and Kelsey Martin for the use of their fluores-
cent microscope; Yasutada Akiba and Jonathan Kaunitz for initial help with pHi
measurement; and Steven Clarke, Sohail Tavazoie, and Saeed Tavazoie for
discussions. M.A.M. was supported in part by a University of California, Los
Angeles, Genetics Training Grant fellowship. This work was supported by
grants from the California Institute for Regenerative Medicine and the Amer-
ican Cancer Society and by Beckman Young Investigator, Howard Hughes
Medical Institute Early Career, and National Institutes of Health Director’s
Innovator awards to S.K.K.
Received: March 27, 2012
Revised: August 7, 2012
Accepted: October 25, 2012
Published online: November 29, 2012
REFERENCES
Arnold, K.M., Lee, S., and Denu, J.M. (2011). Processing mechanism and
substrate selectivity of the core NuA4 histone acetyltransferase complex.
Biochemistry 50, 727–737.
Benjamin, A.M., Murthy, C.R., and Quastel, J.H. (1983). Calcium-dependent
release of acetyl-coenzyme A from liver mitochondria. Can. J. Physiol.
Pharmacol. 61, 154–158.
Bental, M., and Deutsch, C. (1994). 19F-NMR study of primary human T
lymphocyte activation: effects of mitogen on intracellular pH. Am. J. Physiol.
266, C541–C551.
Boron, W.F., Siebens, A.W., and Nakhoul, N.L. (1988). Role of monocarboxy-
late transport in the regulation of intracellular pH of renal proximal tubule cells.
Ciba Found. Symp. 139, 91–105.
Cardone, R.A., Casavola, V., and Reshkin, S.J. (2005). The role of disturbed pH
dynamics and the Na+/H+ exchanger in metastasis. Nat. Rev. Cancer 5,
786–795.
Carmen, A.A., Rundlett, S.E., and Grunstein, M. (1996). HDA1 and HDA3 are
components of a yeast histone deacetylase (HDA) complex. J. Biol. Chem.
271, 15837–15844.
Casey, J.R., Grinstein, S., and Orlowski, J. (2010). Sensors and regulators of
intracellular pH. Nat. Rev. Mol. Cell Biol. 11, 50–61.
Chung, Y.L., Troy, H., Kristeleit, R., Aherne, W., Jackson, L.E., Atadja, P.,
Griffiths, J.R., Judson, I.R., Workman, P., Leach, M.O., and Beloueche-
Babari, M. (2008). Noninvasive magnetic resonance spectroscopic pharmaco-
dynamic markers of a novel histone deacetylase inhibitor, LAQ824, in human
colon carcinoma cells and xenografts. Neoplasia 10, 303–313.
Elsheikh, S.E., Green, A.R., Rakha, E.A., Powe, D.G., Ahmed, R.A., Collins,
H.M., Soria, D., Garibaldi, J.M., Paish, C.E., Ammar, A.A., et al. (2009).
Global histone modifications in breast cancer correlate with tumor pheno-
types, prognostic factors, and patient outcome. Cancer Res. 69, 3802–3809.
Fellenz, M.P., and Gerweck, L.E. (1988). Influence of extracellular pH on intra-
cellular pH and cell energy status: relationship to hyperthermic sensitivity.
Radiat. Res. 116, 305–312.
Ferrari, R., Su, T., Li, B., Bonora, G., Oberai, A., Chan, Y., Sasidharan, R., Berk,
A.J., Pellegrini, M., and Kurdistani, S.K. (2012). Reorganization of the host
epigenome by a viral oncogene. Genome Res. 22, 1212–1221.
.

Molecular Cell
Chromatin as a Rheostatic Regulator of pHi
Fraga, M.F., Ballestar, E., Villar-Garea, A., Boix-Chornet, M., Espada, J.,
Schotta, G., Bonaldi, T., Haydon, C., Ropero, S., Petrie, K., et al. (2005).
Loss of acetylation at Lys16 and trimethylation at Lys20 of histone H4 is
a common hallmark of human cancer. Nat. Genet. 37, 391–400.
Friis, R.M., and Schultz, M.C. (2009). Untargeted tail acetylation of histones in
chromatin: lessons from yeast. Biochem. Cell Biol. 87, 107–116.
Friis, R.M., Wu, B.P., Reinke, S.N., Hockman, D.J., Sykes, B.D., and Schultz,
M.C. (2009). A glycolytic burst drives glucose induction of global histone
acetylation by picNuA4 and SAGA. Nucleic Acids Res. 37, 3969–3980.
Halestrap, A.P., and Meredith, D. (2004). The SLC16 gene family-from mono-
carboxylate transporters (MCTs) to aromatic amino acid transporters and
beyond. Pflugers Arch. 447, 619–628.
Harguindey, S., Orive, G., Luis Pedraz, J., Paradiso, A., and Reshkin, S.J.
(2005). The role of pH dynamics and the Na+/H+ antiporter in the etiopatho-
genesis and treatment of cancer. Two faces of the same coin—one single
nature. Biochim. Biophys. Acta 1756, 1–24.
Horwitz, G.A., Zhang, K., McBrian, M.A., Grunstein, M., Kurdistani, S.K., and
Berk, A.J. (2008). Adenovirus small e1a alters global patterns of histone
modification. Science 321, 1084–1085.
Hulikova, A., Vaughan-Jones, R.D., and Swietach, P. (2011). Dual role of CO2/
HCO3(-) buffer in the regulation of intracellular pH of three-dimensional tumor
growths. J. Biol. Chem. 286, 13815–13826.
Iwabata, H., Yoshida, M., and Komatsu, Y. (2005). Proteomic analysis of
organ-specific post-translational lysine-acetylation and -methylation in mice
by use of anti-acetyllysine and -methyllysine mouse monoclonal antibodies.
Proteomics 5, 4653–4664.
Kim, U., Shu, C.W., Dane, K.Y., Daugherty, P.S., Wang, J.Y., and Soh, H.T.
(2007). Selection of mammalian cells based on their cell-cycle phase using di-
electrophoresis. Proc. Natl. Acad. Sci. USA 104, 20708–20712.
Koeller, K.M., Haggarty, S.J., Perkins, B.D., Leykin, I., Wong, J.C., Kao, M.C.,
and Schreiber, S.L. (2003). Chemical genetic modifier screens: small molecule
trichostatin suppressors as probes of intracellular histone and tubulin acetyla-
tion. Chem. Biol. 10, 397–410.
Kouzarides, T. (2007). Chromatin modifications and their function. Cell 128,
693–705.
Lora-Michiels, M., Yu, D., Sanders, L., Poulson, J.M., Azuma, C., Case, B.,
Vujaskovic, Z., Thrall, D.E., Charles, H.C., and Dewhirst, M.W. (2006).
Extracellular pH and P-31 magnetic resonance spectroscopic variables are
related to outcome in canine soft tissue sarcomas treated with thermoradio-
therapy. Clin. Cancer Res. 12, 5733–5740.
Lorenz, M.A., Burant, C.F., and Kennedy, R.T. (2011). Reducing time and
increasing sensitivity in sample preparation for adherent mammalian cell
metabolomics. Anal. Chem. 83, 3406–3414.
Manuyakorn, A., Paulus, R., Farrell, J., Dawson, N.A., Tze, S., Cheung-Lau, G.,
Hines, O.J., Reber, H., Seligson, D.B., Horvath, S., et al. (2010). Cellular histone
modification patterns predict prognosis and treatment response in resectable
pancreatic adenocarcinoma: results from RTOG 9704. J. Clin. Oncol. 28,
1358–1365.
Margueron, R., Trojer, P., and Reinberg, D. (2005). The key to development:
interpreting the histone code? Curr. Opin. Genet. Dev. 15, 163–176.
Messonnier, L., Kristensen, M., Juel, C., and Denis, C. (2007). Importance of
pH regulation and lactate/H+ transport capacity for work production during
supramaximal exercise in humans. J. Appl. Physiol. 102, 1936–1944.
Mizuno, S., Demura, Y., Ameshima, S., Okamura, S., Miyamori, I., and Ishizaki,
T. (2002). Alkalosis stimulates endothelial nitric oxide synthase in cultured
human pulmonary arterial endothelial cells. Am. J. Physiol. Lung Cell. Mol.
Physiol. 283, L113–L119.
Moellering, R.E., Black, K.C., Krishnamurty, C., Baggett, B.K., Stafford, P.,
Rain, M., Gatenby, R.A., and Gillies, R.J. (2008). Acid treatment of melanoma
cells selects for invasive phenotypes. Clin. Exp. Metastasis 25, 411–425.
Nehrke, K. (2006). Intracellular pH measurements in vivo using green fluores-
cent protein variants. Methods Mol. Biol. 351, 223–239.
Mo
Parks, S.K., Chiche, J., and Pouyssegur, J. (2011). pH control mechanisms of
tumor survival and growth. J. Cell. Physiol. 226, 299–308.
Perona, R., and Serrano, R. (1988). Increased pH and tumorigenicity of
fibroblasts expressing a yeast proton pump. Nature 334, 438–440.
Reshkin, S.J., Bellizzi, A., Caldeira, S., Albarani, V., Malanchi, I., Poignee, M.,
Alunni-Fabbroni, M., Casavola, V., and Tommasino, M. (2000). Na+/H+
exchanger-dependent intracellular alkalinization is an early event in malignant
transformation and plays an essential role in the development of subsequent
transformation-associated phenotypes. FASEB J. 14, 2185–2197.
Rofstad, E.K., Mathiesen, B., Kindem, K., and Galappathi, K. (2006). Acidic
extracellular pH promotes experimental metastasis of human melanoma cells
in athymic nude mice. Cancer Res. 66, 6699–6707.
Seligson, D.B., Horvath, S., Shi, T., Yu, H., Tze, S., Grunstein, M., and
Kurdistani, S.K. (2005). Global histone modification patterns predict risk of
prostate cancer recurrence. Nature 435, 1262–1266.
Seligson, D.B., Horvath, S., McBrian, M.A., Mah, V., Yu, H., Tze, S., Wang, Q.,
Chia, D., Goodglick, L., and Kurdistani, S.K. (2009). Global levels of histone
modifications predict prognosis in different cancers. Am. J. Pathol. 174,
1619–1628.
Shogren-Knaak, M., Ishii, H., Sun, J.M., Pazin, M.J., Davie, J.R., and Peterson,
C.L. (2006). Histone H4-K16 acetylation controls chromatin structure and
protein interactions. Science 311, 844–847.
Suzuki, J., Chen, Y.Y., Scott, G.K., Devries, S., Chin, K., Benz, C.C., Waldman,
F.M., and Hwang, E.S. (2009). Protein acetylation and histone deacetylase
expression associated with malignant breast cancer progression. Clin.
Cancer Res. 15, 3163–3171.
Takahashi, H., McCaffery, J.M., Irizarry, R.A., and Boeke, J.D. (2006).
Nucleocytosolic acetyl-coenzyme a synthetase is required for histone acetyla-
tion and global transcription. Mol. Cell 23, 207–217.
Taverna, S.D., Li, H., Ruthenburg, A.J., Allis, C.D., and Patel, D.J. (2007). How
chromatin-binding modules interpret histone modifications: lessons from
professional pocket pickers. Nat. Struct. Mol. Biol. 14, 1025–1040.
Trapnell, C., Pachter, L., and Salzberg, S.L. (2009). TopHat: discovering splice
junctions with RNA-Seq. Bioinformatics 25, 1105–1111.
Trickett, A., and Kwan, Y.L. (2003). T cell stimulation and expansion using anti-
CD3/CD28 beads. J. Immunol. Methods 275, 251–255.
Valli, M., Sauer, M., Branduardi, P., Borth, N., Porro, D., and Mattanovich, D.
(2005). Intracellular pH distribution in Saccharomyces cerevisiae cell popula-
tions, analyzed by flow cytometry. Appl. Environ. Microbiol. 71, 1515–1521.
Vogelauer, M., Wu, J., Suka, N., and Grunstein, M. (2000). Global histone
acetylation and deacetylation in yeast. Nature 408, 495–498.
Wahl, M.L., Owen, J.A., Burd, R., Herlands, R.A., Nogami, S.S., Rodeck, U.,
Berd, D., Leeper, D.B., and Owen, C.S. (2002). Regulation of intracellular pH
in human melanoma: potential therapeutic implications. Mol. Cancer Ther. 1,
617–628.
Walter, A., and Gutknecht, J. (1984). Monocarboxylic acid permeation through
lipid bilayer membranes. J. Membr. Biol. 77, 255–264.
Waterborg, J.H. (2002). Dynamics of histone acetylation in vivo. A function for
acetylation turnover? Biochem. Cell Biol. 80, 363–378.
Wellen, K.E., Hatzivassiliou, G., Sachdeva, U.M., Bui, T.V., Cross, J.R., and
Thompson, C.B. (2009). ATP-citrate lyase links cellular metabolism to histone
acetylation. Science 324, 1076–1080.
Wong,P.,Kleemann,H.W., andTannock, I.F. (2002).Cytostaticpotential ofnovel
agents that inhibit the regulation of intracellular pH. Br. J. Cancer 87, 238–245.
Xu, G., Deng, N., Zhao, Z., Judeh, T., Flemington, E., and Zhu, D. (2011).
SAMMate: a GUI tool for processing short read alignments in SAM/BAM
format. Source Code Biol. Med. 6, 2.
Zhang, X., Lin, Y., and Gillies, R.J. (2010). Tumor pH and its measurement.
J. Nucl. Med. 51, 1167–1170.
Zhou, V.W., Goren, A., and Bernstein, B.E. (2011). Charting histone modifica-
tions and the functional organization ofmammalian genomes. Nat. Rev. Genet.
12, 7–18.
lecular Cell 49, 310–321, January 24, 2013 ª2013 Elsevier Inc. 321