alcohol exposure decreases creb binding protein expression and histone acetylation in the developing...
TRANSCRIPT
Alcohol Exposure Decreases CREB Binding ProteinExpression and Histone Acetylation in the DevelopingCerebellumWeixiang Guo, Erin L. Crossey, Li Zhang, Stefano Zucca, Olivia L. George, C. Fernando Valenzuela*,
Xinyu Zhao*
Department of Neurosciences, University of New Mexico School of Medicine, Albuquerque, New Mexico, United States of America
Abstract
Background: Fetal alcohol exposure affects 1 in 100 children making it the leading cause of mental retardation in the US. Ithas long been known that alcohol affects cerebellum development and function. However, the underlying molecularmechanism is unclear.
Methodology/Principal Findings: We demonstrate that CREB binding protein (CBP) is widely expressed in granule andPurkinje neurons of the developing cerebellar cortex of naıve rats. We also show that exposure to ethanol during the 3rd
trimester-equivalent of human pregnancy reduces CBP levels. CBP is a histone acetyltransferase, a component of theepigenetic mechanism controlling neuronal gene expression. We further demonstrate that the acetylation of both histoneH3 and H4 is reduced in the cerebellum of ethanol- treated rats.
Conclusions/Significance: These findings indicate that ethanol exposure decreases the expression and function of CBP inthe developing cerebellum. This effect of ethanol may be responsible for the motor coordination deficits that characterizefetal alcohol spectrum disorders.
Citation: Guo W, Crossey EL, Zhang L, Zucca S, George OL, et al. (2011) Alcohol Exposure Decreases CREB Binding Protein Expression and Histone Acetylation inthe Developing Cerebellum. PLoS ONE 6(5): e19351. doi:10.1371/journal.pone.0019351
Editor: Huaibin Cai, National Institutes of Health, United States of America
Received September 3, 2010; Accepted April 3, 2011; Published May 31, 2011
Copyright: � 2011 Guo et al. This is an open-access article distributed under the terms of the Creative Commons Attribution License, which permits unrestricteduse, distribution, and reproduction in any medium, provided the original author and source are credited.
Funding: This work was supported by NIH grants P20 AA017068 to X.Z. and C.F.V, MH078972 and MH080434 to X.Z, and AA14973 and AA15614 to C.F.V. Thefunders had no role in study design, data collection and analysis, decision to publish, or preparation of the manuscript.
Competing Interests: The authors have declared that no competing interests exist.
* E-mail: [email protected] (XZ); [email protected] (FV)
Introduction
Fetal Alcohol Spectrum Disorder (FASD) is associated with
persistent deficits in motor coordination and balance that are likely
caused, in part, by alterations in the normal trajectory of cerebellar
development [1,2,3]. Studies with rodents suggest that long-lasting
cerebellar damage can occur after exposure during any stage of
pregnancy, including the period equivalent to the human 3rd
trimester of pregnancy which corresponds to approximately the
first 10–12 days of life in these animals [4]. Exposure to high
(400 mg/dL = 87 mM) blood alcohol levels (BALs) during a
portion of this period (postnatal days 4–7) was shown to
significantly decrease Purkinje and granule cell numbers [5].
Electrophysiological alterations in the function of the Purkinje
neurons that survive ethanol exposure during this period were
demonstrated by Backman et al [6], who found a decrease in
Purkinje neuron complex spike frequency that could be detected
during adulthood. Moreover, exposure of rats to ethanol (330 mg/
dL = 72 mM) during postnatal days 4–9 produced deficits in eye-
blink conditioning, a behavioral paradigm that assesses the
integrity of cerebellar-brain stem circuitry [4,7]. Although the
mechanisms responsible for these structural and functional
cerebellar abnormalities are not fully understood, studies suggest
that they involve alterations in the function of retinoic acid [8],
growth factors [9,10,11,12], ion channels [13,14,15], neurotrans-
mitter systems [16], Ca2+ and cyclic nucleotide signaling pathways
[17], cell cycle proteins [18], antioxidant protective mechanisms
[19,20] and cell adhesion molecules [21,22]. The widespread
effects of ethanol suggest that regulatory factors that impact
multiple cellular pathways might be affected. However, such
factors have not been identified.
A mechanism that could underlie the actions of ethanol on the
developing cerebellum is disruption of epigenetic mechanisms
mediated by DNA methylation, histone modification, and
noncoding RNAs [23]. Epigenetic mechanisms can translate
environmental influences into changes in the expression of genes
that are known to have a significant role in brain development, as
well as the pathophysiology of neurodevelopmental disorders
[24,25,26,27]. Importantly, studies suggest that DNA methylation
and noncoding RNAs are altered in animal models of FASD [28].
For example, [29] observed evidence consistent with DNA
hypomethylation and decreased nuclear methylase activity in
samples isolated from whole day-11 embryos that were exposed to
ethanol in utero during gestational days 9–11. [30] reported that
exposure of whole mouse cultured embryos to a high concentra-
tion of ethanol (404 mg/dl = 88 mM) increased DNA methylation
of genes located on chromosomes 7, 10, and X, including genes
involved in growth, cell cycle and programmed cell death. [31]
PLoS ONE | www.plosone.org 1 May 2011 | Volume 6 | Issue 5 | e19351

demonstrated that ethanol (322 mg/dl = 70 mM) exposure de-
creased expression of four noncoding microRNAs (miR-21, -335, -
9, and -153) in cultured neurospheres from fetal mouse cerebral
cortex, leading to cell cycle induction and stem cell maturation.
However, whether alterations in histone modification play a role
in the pathophysiology of FASD remains an open question.
The nucleosome is the fundamental unit of chromatin and is
composed of DNA wrapped around an octameric protein core
containing 4 different types of histones (H2A, H2B, H3 and H4)
[24]. The N-terminal domains of these histones contain amino
acid residues that can be enzymatically modified (for example,
acetylated, phosphorylated, methylated, ubiquitinated and sumoy-
lated) and this can have a powerful effect on chromatin
structure[32]. In the nervous system, the best characterized
histone modification is acetylation of N-terminal lysine residues,
which typically shifts the conformation of chromatin into a relaxed
state, leading to upregulation of gene transcription [33]. Histone
acetylation levels are determined by the balance of the activities of
two families of enzymes: histone acetyl transferases (HATs) and
histone deacetylases (HDACs). At least four families of HATs have
been identified based on sequence homology [34]. Among these,
one of the best characterized is the CREB binding protein (CBP or
CREBBP) family of HATs. CBP was originally identified as a co-
activator for CREB and was later discovered to be a cofactor for
many transcription factors, facilitating induction of the genes
targeted by these factors. CBP can act both as a scaffolding protein
for the transcription complex by recruiting components of the
transcriptional machinery and via its intrinsic HAT activity, which
ultimately causes chromatin relaxation. Therefore, CBP links
classic gene regulatory mechanisms with epigenetic mechanisms.
Both CREB and CBP are regulated by neuronal activity and their
interaction is critical for activation of neuronal genes that are
involved in brain development. Heterozygotic deficiency of CBP
(and a related HAT, p300) causes the Rubinstein-Taybi
Syndrome, a dominant mental retardation syndrome that is also
characterized by growth deficits and distinct facial features[35].
Genetic mouse models with CBP mutations have been generated.
Homozygote mutant mice are embryonically lethal, while
heterozygote mice with about 50% reduction in CBP levels have
impaired late-phase hippocampal long-term potentiation and
learning deficits [36]. Deletion of CBP in the brain leads to
reduced histone acetylation and learning deficits [37].
In addition to being crucial for normal hippocampal function-
ing, a number of studies suggest that CBP plays a central role in
cerebellar development. First, cerebellar developmental abnor-
malities were observed in knockout mice for steroid receptor
coactivator-1 (SRC-1), which possesses intrinsic HAT enzymatic
activity as well as motifs that bind CBP/p300 and a number of
nuclear receptors, including those for thyroid hormone, glucocor-
ticoids, progesterone, estrogen and retinoic acid (reviewed in [38]).
SRC-1 2/2 mice display delayed Purkinje cell development and
persistent motor alterations that could be a consequence of
impaired responsiveness to steroid hormones [39]. Second, CBP
expression and H4 acetylation have been shown to be reduced in a
transgenic mouse model of spinocerebellar ataxia [40]. Finally,
p300 has been shown to be a co-factor for RORa, an orphan
nuclear receptor that is involved in Purkinje cell differentiation
[41]. However, whether CBP is involved in ethanol-induced
neurodevelopmental deficits is unknown. In light of these studies,
we hypothesized that CBP might be a target of ethanol during
cerebellar development. To test this hypothesis, we exposed rats to
moderate levels of ethanol during the 3rd trimester equivalent of
human pregnancy and assessed the effect of ethanol exposure on
CBP and acetylated histone levels in the developing cerebellum
using western immunoblotting and immunohistochemical tech-
niques. Our data unveil a novel target of ethanol in the developing
brain and demonstrate a central role of epigenetic mechanisms in
ethanol-induced neurodevelopmental deficits.
Results
CBP is expressed widely in neurons of developingcerebellum
To determine whether CBP is involved in cerebellar develop-
ment, we first investigated which neuronal populations express
CBP in the developing cerebellum from postnatal day 8 (P8) rats,
by using immunohistochemical studies. At this age, the cerebellar
cortex consists of four layers: external granule layer (EGL),
molecular layer (ML), Purkinje cell layer (PCL), and the internal
granule layer (IGL) [42,43]. The EGL is mainly composed of
immature proliferating granule cells. The ML contains Purkinje
cell dendrites and migrating molecular layer interneurons. The
Purkinje layer contains the cell bodies of these neurons, which are
arranged in multiple layers at this developmental stage. The IGL
consists of more mature granule cells, Golgi cells and mossy fibers.
At P8, immature granule cells in the EGL are migrating (passing
through ML and PCL) to become more mature granule neurons at
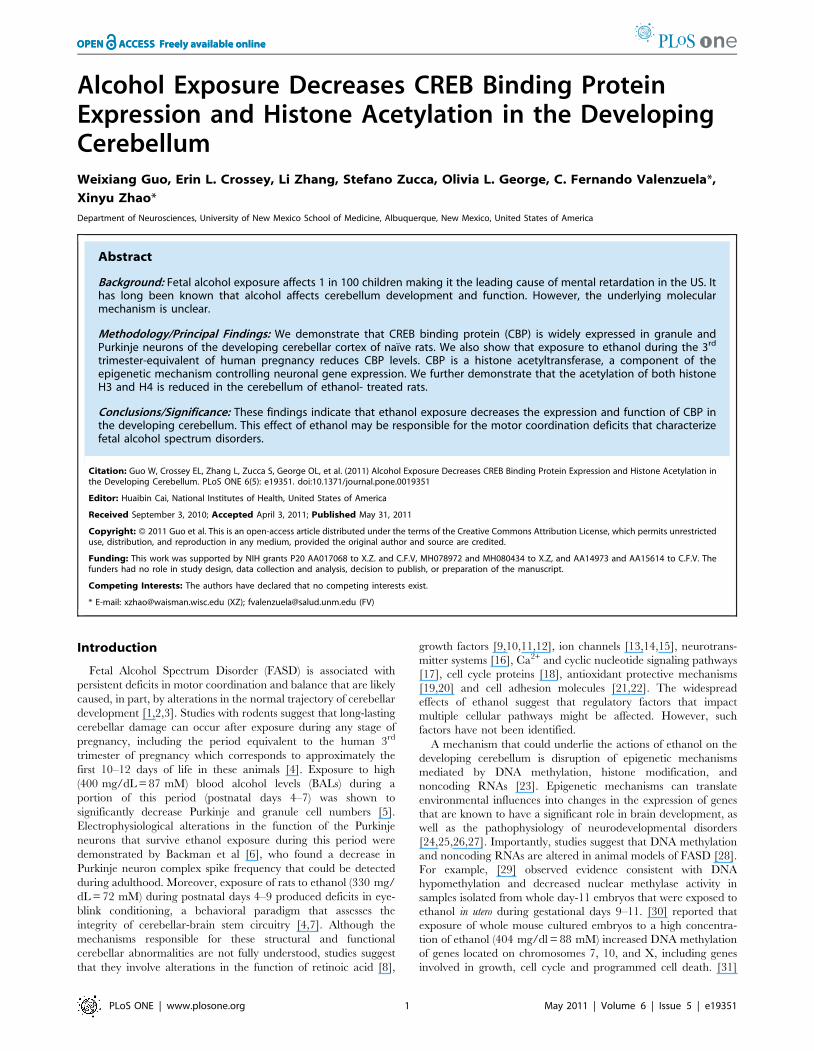
IGL. As shown in Figure 1, CBP expression was nearly
undetectable in the nestin+ EGL cells (Fig. 1A, 1C, and 1F),
and low in doublecortin-positive (DCX+) ML neurons (Fig. 1B,
1D, and 1F), but high in PCL and IGL neurons (Fig. 1A, 1B, and
1F). We found that the young Purkinje cells also express nestin
(Fig. 1), a finding that is consistent with the literature[44] and the
Allan Brain Atlas (http://www.brain-map.org/). Interestingly,
while CBP is located in granule neuron nuclei at IGL, it is both
in the nucleus and cysotol of Purkinje cells in PCL (Fig. 1E). Using
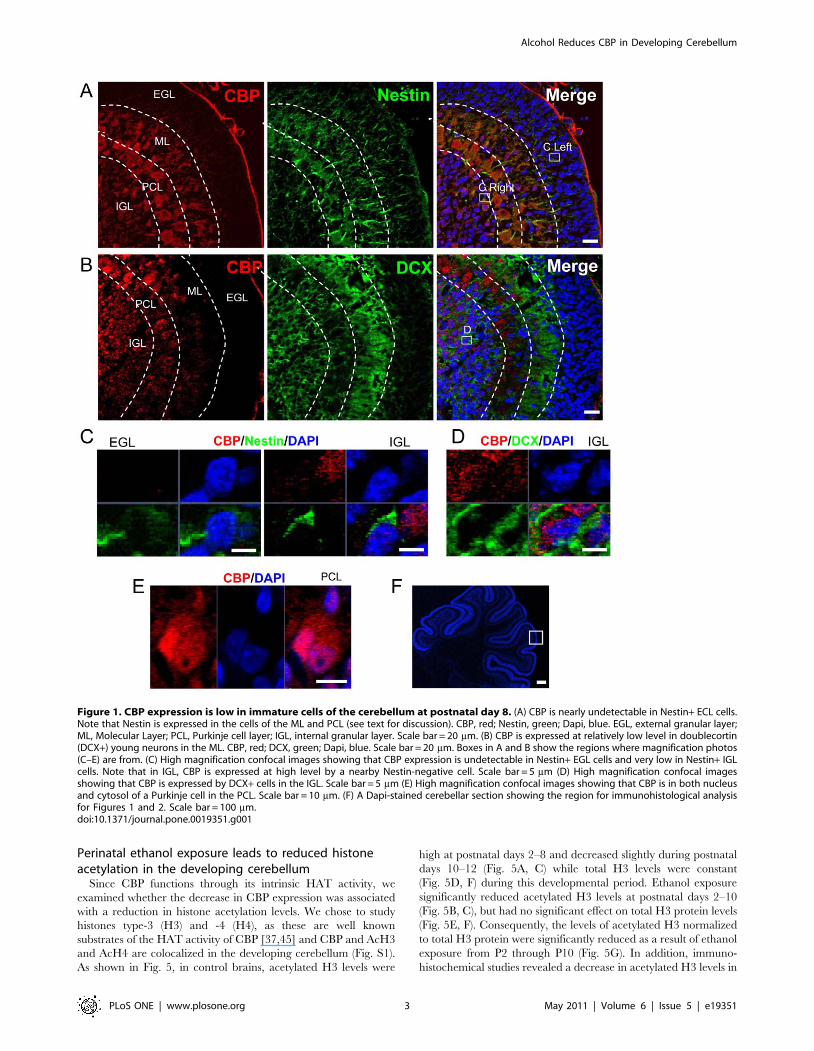
a mature neuronal marker, NeuN, we found that CBP was
predominantly expressed in relatively more mature, non-migrating
neurons, located in the IGL and PCL (Fig. 2A and D). A
subpopulation of GFAP astroctyes also expressed CBP (Fig. 2B
and E). In addition, CBP expression was detected in MBP+ myelin
fibers (Fig. 2C and F), suggesting its expression in oligodendro-
cytes. In summary, CBP is expressed at high levels in neurons and
also glial cells of the developing cerebellar cortex.
Perinatal ethanol exposure leads to reduced CBPexpression in the developing cerebellum
We next tested the effect of ethanol exposure on cerebellar CBP
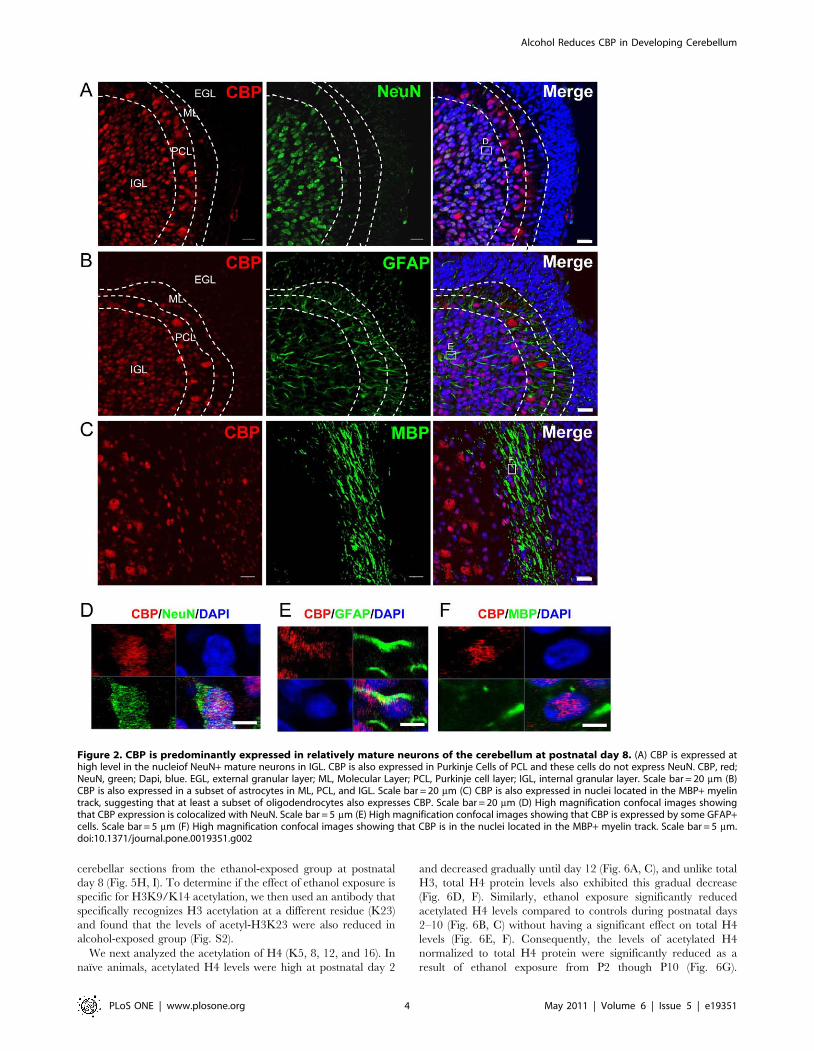
expression. Exposure to ethanol vapor resulted in serum ethanol
concentrations in the pups that were similar across postnatal days
(overall average = 5464 mM; n = 48; Fig. 3A; for comparison,
80 mg/dl = 17.4 mM). Furthermore, pup weight gain was similar
in the air and ethanol groups (Fig. 3B). There was only one case of
neonatal mortality and it occurred in a litter exposed to air. In
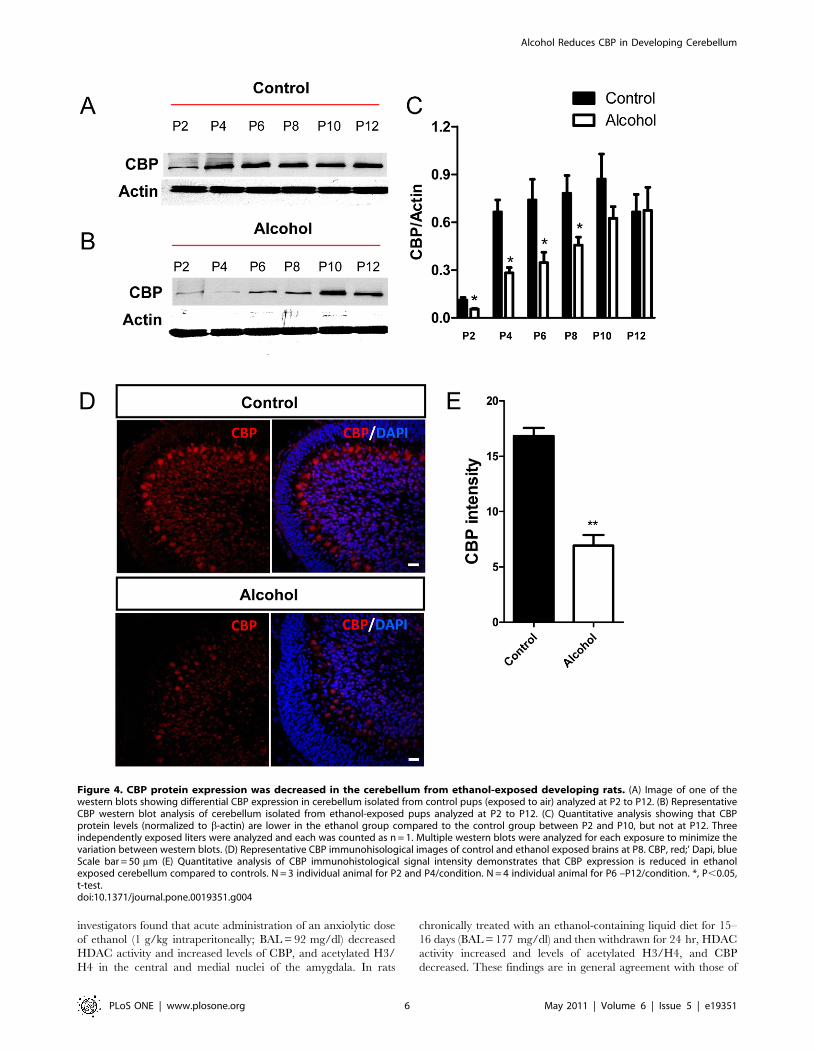
cerebellar homogenates from air-exposed animals, CBP expression
increased approximately 4-fold between postnatal day 2 and
postnatal day 4, and then remained relatively stable until postnatal
day 12, the last day of our analysis (Fig. 4A, C). In cerebellar
homogenates from ethanol-exposed animals, CBP levels were
significantly lower compared to control pups between postnatal
days 2 and 10 (Fig. 4B, C). Although both control and ethanol
groups had similar CBP expression levels at postnatal day 12
(Fig. 4A–C), the developmental stage-dependent upregulation of
CBP was much delayed in ethanol-exposed animals compared to
control animals. Immunohistochemical experiments also detected
a decrease in CBP levels in IGC and PCL at postnatal day 8
(Fig. 4D, E). Therefore, 3rd trimester equivalent ethanol exposure
led to reduced CBP expression in the developing cerebellum.
Alcohol Reduces CBP in Developing Cerebellum
PLoS ONE | www.plosone.org 2 May 2011 | Volume 6 | Issue 5 | e19351
Perinatal ethanol exposure leads to reduced histoneacetylation in the developing cerebellum
Since CBP functions through its intrinsic HAT activity, we
examined whether the decrease in CBP expression was associated
with a reduction in histone acetylation levels. We chose to study
histones type-3 (H3) and -4 (H4), as these are well known
substrates of the HAT activity of CBP [37,45] and CBP and AcH3
and AcH4 are colocalized in the developing cerebellum (Fig. S1).
As shown in Fig. 5, in control brains, acetylated H3 levels were
high at postnatal days 2–8 and decreased slightly during postnatal
days 10–12 (Fig. 5A, C) while total H3 levels were constant
(Fig. 5D, F) during this developmental period. Ethanol exposure
significantly reduced acetylated H3 levels at postnatal days 2–10
(Fig. 5B, C), but had no significant effect on total H3 protein levels
(Fig. 5E, F). Consequently, the levels of acetylated H3 normalized
to total H3 protein were significantly reduced as a result of ethanol
exposure from P2 through P10 (Fig. 5G). In addition, immuno-
histochemical studies revealed a decrease in acetylated H3 levels in
Figure 1. CBP expression is low in immature cells of the cerebellum at postnatal day 8. (A) CBP is nearly undetectable in Nestin+ ECL cells.Note that Nestin is expressed in the cells of the ML and PCL (see text for discussion). CBP, red; Nestin, green; Dapi, blue. EGL, external granular layer;ML, Molecular Layer; PCL, Purkinje cell layer; IGL, internal granular layer. Scale bar = 20 mm. (B) CBP is expressed at relatively low level in doublecortin(DCX+) young neurons in the ML. CBP, red; DCX, green; Dapi, blue. Scale bar = 20 mm. Boxes in A and B show the regions where magnification photos(C–E) are from. (C) High magnification confocal images showing that CBP expression is undetectable in Nestin+ EGL cells and very low in Nestin+ IGLcells. Note that in IGL, CBP is expressed at high level by a nearby Nestin-negative cell. Scale bar = 5 mm (D) High magnification confocal imagesshowing that CBP is expressed by DCX+ cells in the IGL. Scale bar = 5 mm (E) High magnification confocal images showing that CBP is in both nucleusand cytosol of a Purkinje cell in the PCL. Scale bar = 10 mm. (F) A Dapi-stained cerebellar section showing the region for immunohistological analysisfor Figures 1 and 2. Scale bar = 100 mm.doi:10.1371/journal.pone.0019351.g001
Alcohol Reduces CBP in Developing Cerebellum
PLoS ONE | www.plosone.org 3 May 2011 | Volume 6 | Issue 5 | e19351
cerebellar sections from the ethanol-exposed group at postnatal
day 8 (Fig. 5H, I). To determine if the effect of ethanol exposure is
specific for H3K9/K14 acetylation, we then used an antibody that
specifically recognizes H3 acetylation at a different residue (K23)
and found that the levels of acetyl-H3K23 were also reduced in
alcohol-exposed group (Fig. S2).
We next analyzed the acetylation of H4 (K5, 8, 12, and 16). In
naıve animals, acetylated H4 levels were high at postnatal day 2
and decreased gradually until day 12 (Fig. 6A, C), and unlike total
H3, total H4 protein levels also exhibited this gradual decrease
(Fig. 6D, F). Similarly, ethanol exposure significantly reduced
acetylated H4 levels compared to controls during postnatal days
2–10 (Fig. 6B, C) without having a significant effect on total H4
levels (Fig. 6E, F). Consequently, the levels of acetylated H4
normalized to total H4 protein were significantly reduced as a
result of ethanol exposure from P2 though P10 (Fig. 6G).
Figure 2. CBP is predominantly expressed in relatively mature neurons of the cerebellum at postnatal day 8. (A) CBP is expressed athigh level in the nucleiof NeuN+ mature neurons in IGL. CBP is also expressed in Purkinje Cells of PCL and these cells do not express NeuN. CBP, red;NeuN, green; Dapi, blue. EGL, external granular layer; ML, Molecular Layer; PCL, Purkinje cell layer; IGL, internal granular layer. Scale bar = 20 mm (B)CBP is also expressed in a subset of astrocytes in ML, PCL, and IGL. Scale bar = 20 mm (C) CBP is also expressed in nuclei located in the MBP+ myelintrack, suggesting that at least a subset of oligodendrocytes also expresses CBP. Scale bar = 20 mm (D) High magnification confocal images showingthat CBP expression is colocalized with NeuN. Scale bar = 5 mm (E) High magnification confocal images showing that CBP is expressed by some GFAP+cells. Scale bar = 5 mm (F) High magnification confocal images showing that CBP is in the nuclei located in the MBP+ myelin track. Scale bar = 5 mm.doi:10.1371/journal.pone.0019351.g002
Alcohol Reduces CBP in Developing Cerebellum
PLoS ONE | www.plosone.org 4 May 2011 | Volume 6 | Issue 5 | e19351
Immunohistochemical studies also revealed a decrease in acety-
lated H4 levels in cerebellar sections from the ethanol-exposed
group at postnatal day 8 (Fig. 6H, I). Therefore, 3rd trimester
equivalent ethanol exposure led to reduced histone H3 and H4
acetylation, without affecting total histone H3 and H4 protein
expression in the developing cerebellum.
Discussion
In this study, we demonstrate that CBP is highly expressed in
developing cerebellar neurons and ethanol exposure leads to nearly
a 50% reduction of CBP levels as well as a reduction in histone
acetylation. Given the important functions of CBP in many cellular
pathways and the fact that heterozygote CBP gene mutation with
50% reduction of CBP protein levels results in human mental
retardation, our discovery unveils a novel target of ethanol which
may shed light on understanding the molecular mechanism
underlying alcohol-induced neurodevelopmental deficits.
CBP is expressed in the forebrain of both developing and adult
rodents [46–47] and CBP expression has been shown in the adult
rat cerebellum [47]. In addition, CBP is also expressed in cultured
cerebellar granule neurons isolated from developing brains
[48,49]. Furthermore, in situ hybridization data suggest that CBP
mRNA is expressed in the developing cerebellum (Allan Brain
Atlas). However, the presence of CBP protein and cell type-specific
expression patterns of CBP in developing cerebellum have not
been reported. Here, we show that CBP is predominantly
expressed in neurons and, in particular, relatively mature neurons
in the PCL and IGL. In addition, CBP expression increases as
development progresses, with a particular sharp increase at P2–4,
suggesting a critical role of this protein in neuronal maturation
during cerebellar development. Although CBP expression patterns
spatially match that of acetylated histones in the P8 brains, H3 and
H4 acetylation, however, does not sharply increase from P2–4,
suggesting that either other acetyltransferases might be more
dominant at P2, or stronger HDAC activity might be present
between P2–4. This is consistent with the fact that while ethanol
leads to a nearly 50% reduction of CBP levels, it only reduces H3
and H4 acetylation levels by 20%. In addition, a reduction in CBP
expression may lead to decreased acetyl histone binding to specific
gene loci in addition to the global changes of histone acetylation.
Future chromatin immunoprecipitation studies coupled to genome
wide analysis will further unveil the impact of CBP reduction on
specific gene expression and function in FASD models.
We found that ethanol exposure decreased CBP and acetylated
levels for H3 and H4 in the developing cerebellum. These effects
could be detected even after a single 4 hr ethanol exposure episode
at P2. At P12, CBP and histone acetylation levels were not
significantly different between the control and ethanol groups,
consistent with the literature indicating that the developing
cerebellum is particularly vulnerable to the actions of ethanol
during the first 10 days of life [4]. During this period, rapid growth
of axons and dendrites takes place in granule cells; Purkinje cells,
Golgi cells and molecular layer interneurons, and synapses among
these neurons are actively generated and refined. It will be
interesting to directly establish whether these processes are, in part,
mediated by CBP-dependent modulation of changes in gene
expression. The decrease in CBP expression should impair gene
expression driven by CREB; this effect may be enhanced by a
parallel inhibitory effect of ethanol on phosphorylated CREB levels
caused by dysregulation of [Ca2+]i, as demonstrated by Gruol et al
in acutely dissociated Purkinje neurons from neonatal rats [50]. In
developing Purkinje neurons, it is well established that progesterone
and estradiol promote dendritic growth, generation of spines and
synaptogenesis and these effects may be mediated by brain-derived
neurotrophic factor (reviewed in [51]). The thyroid hormone is also
important for these processes and is also essential for granule cell
maturation and for myelination of cerebellar axonal tracts (reviewed
in [52]). Glucocorticoids inhibit granule cell division and prolifer-
ation in the external granule cell layer, leading to a reduction in
granule cell numbers in the internal granule layer [53]. Exposure to
high levels of retinoic acid leads to the loss of a subpopulation of
proliferating granule cells [54]. As mentioned above, SRC-1 is an
important cofactor for the actions of these agents and CBP/p300
are required for the normal functioning of SRC-1 (reviewed in [38]).
Therefore, it is possible that ethanol exposure during the 3rd
trimester equivalent alters cerebellar cortical development by
blunting the trophic actions of the above-mentioned agents via a
disruption in the facilitator actions of CBP/SRC-1.
To the best of our knowledge, this is the first study of the effect
of ethanol exposure on CBP and histone acetylation levels in the
developing brain. The effects of acute and chronic ethanol
exposure on CBP and histone acetylation levels were previously
characterized in male adult rats by Pandey et al[55]. These
Figure 3. Moderate perinatal ethanol exposure does not affectpup weight. (A) Pup serum alcohol during the course of ethanolexposure between postnatal day 2 and day 12 (n = 6). (B) Ethanolexposure did not affect the weight of pups as assessed during postnatalday 2 to day 12. Control, solid triangles; ethanol, open squares; n = 9litters per group.doi:10.1371/journal.pone.0019351.g003
Alcohol Reduces CBP in Developing Cerebellum
PLoS ONE | www.plosone.org 5 May 2011 | Volume 6 | Issue 5 | e19351
investigators found that acute administration of an anxiolytic dose
of ethanol (1 g/kg intraperitoneally; BAL = 92 mg/dl) decreased
HDAC activity and increased levels of CBP, and acetylated H3/
H4 in the central and medial nuclei of the amygdala. In rats
chronically treated with an ethanol-containing liquid diet for 15–
16 days (BAL = 177 mg/dl) and then withdrawn for 24 hr, HDAC
activity increased and levels of acetylated H3/H4, and CBP
decreased. These findings are in general agreement with those of
Figure 4. CBP protein expression was decreased in the cerebellum from ethanol-exposed developing rats. (A) Image of one of thewestern blots showing differential CBP expression in cerebellum isolated from control pups (exposed to air) analyzed at P2 to P12. (B) RepresentativeCBP western blot analysis of cerebellum isolated from ethanol-exposed pups analyzed at P2 to P12. (C) Quantitative analysis showing that CBPprotein levels (normalized to b-actin) are lower in the ethanol group compared to the control group between P2 and P10, but not at P12. Threeindependently exposed liters were analyzed and each was counted as n = 1. Multiple western blots were analyzed for each exposure to minimize thevariation between western blots. (D) Representative CBP immunohisological images of control and ethanol exposed brains at P8. CBP, red;’ Dapi, blueScale bar = 50 mm (E) Quantitative analysis of CBP immunohistological signal intensity demonstrates that CBP expression is reduced in ethanolexposed cerebellum compared to controls. N = 3 individual animal for P2 and P4/condition. N = 4 individual animal for P6 –P12/condition. *, P,0.05,t-test.doi:10.1371/journal.pone.0019351.g004
Alcohol Reduces CBP in Developing Cerebellum
PLoS ONE | www.plosone.org 6 May 2011 | Volume 6 | Issue 5 | e19351
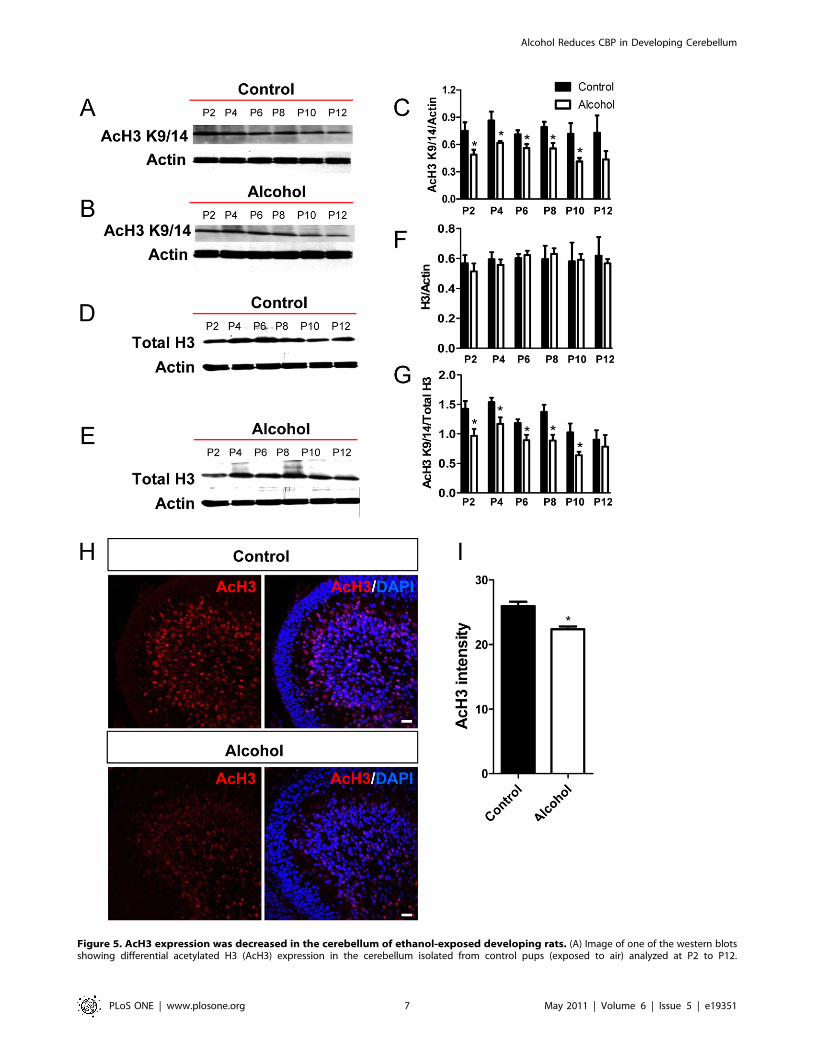
Figure 5. AcH3 expression was decreased in the cerebellum of ethanol-exposed developing rats. (A) Image of one of the western blotsshowing differential acetylated H3 (AcH3) expression in the cerebellum isolated from control pups (exposed to air) analyzed at P2 to P12.
Alcohol Reduces CBP in Developing Cerebellum
PLoS ONE | www.plosone.org 7 May 2011 | Volume 6 | Issue 5 | e19351
the present study, suggesting that CBP is an important target of
ethanol both in developing and mature animals. Moreover, these
findings support the possibility that ethanol affects CBP expression
in multiple brain regions and this should be assessed in the future.
Since a 50% reduction of CBP levels results in human Rubinstein-
Taybi Syndrome, a dominant disorder that shares mental
retardation, growth deficits, and certain facial features with fetal
alcohol syndrome[35], our findings may shed light on a common
pathway between genetic-based and toxin-induced mental retar-
dation disorders.
The mechanisms responsible for the ethanol-induced decreases in
CBP expression remain to be elucidated. Although pathways that
regulate CBP activity (for instance, phosphorylation pathways) have
been identified [56,57,58], the literature on factors that control
expression of CBP is scarce. Interestingly, it was demonstrated that
activation of apoptotic pathways triggered degradation of CBP and
histone deacetylation in cultured cerebellar granule neurons from
postnatal day 7 mice that were maintained in culture for 6 days.
CBP degradation was mediated by caspase-6 and calpain [48].
Exposure to high doses of ethanol (,300–500 mg/dl for at least
8 hr) during the 3rd trimester-equivalent has been shown to activate
apoptotic pathways in the developing rat cerebellum [59,60].
Calpain activation has also been demonstrated in the cerebral
cortex in rats exposed to high doses of ethanol during postnatal days
4–10 [61]. Therefore, it is important to determine whether ethanol
induces degradation of CBP via a caspase/calpain-dependent
mechanism and if this can occur at moderate doses of ethanol or
can only be observed in response to high dose ethanol exposure. It
should be noted that ethanol exposure decreases CBP mRNA
expression (Zhao and Valenzuela, unpublished observation),
suggesting that ethanol could act at the transcriptional level and
we are currently actively investigating this possibility.
In conclusion, our findings demonstrate that ethanol exposure
during the 3rd trimester-equivalent of human pregnancy decreases
CBP and acetylated histone levels in the developing cerebellum.
Future studies should determine whether this effect can occur in
other regions of the brain and other organ systems. It should also
be investigated if exposure during other stages of pregnancy can
also reduce CBP expression. Ongoing studies in our laboratories
are exploring the impact of these effects of ethanol on expression
of genes that are controlled by this key transcriptional regulator/
integrator. In light of the findings of Pandey et al[55] indicating
that HDAC inhibitors could be useful in the treatment of alcohol
withdrawal-induced anxiety, it is also important to investigate the
potential value of these agents in the treatment of FASD.
Methods
Ethics StatementAnimal procedures were approved by the Institutional Animal
Care and Use Committee of the University of New Mexico Health
Sciences Center and conformed to National Institutes of Health
guidelines. The Animal Protocol approved for this study is
#08UNM012 (PI, C. Fernando Valenzuela).
Exposure of neonatal rats to ethanol vapor andpreparation of brain samples
Animal procedures were approved by the Institutional Animal
Care and Use Committee of the University of New Mexico Health
Sciences Center and conformed to National Institutes of Health
guidelines. Timed-pregnant Long-Evans rats were ordered from
Harlan (Indianapolis, IN) and housed individually with ad libitum
access to chow and water under a 12 hr light:dark cycle (lights on at 6
am). Male and female neonatal rat pups and their respective mothers
were exposed to ethanol for 4 hr/day between postnatal days 2 to 12
in inhalation chambers (La Jolla Research Inc, La Jolla, CA), as
previously described [62]. Litters were culled to 8–12 pups and
exposed to air or air plus ethanol. This paradigm models repeated
daily maternal drinking sessions during the third trimester-equivalent
of human pregnancy. An advantage of this paradigm is that it
produces low blood ethanol levels in the dams and does not disrupt
grooming and nursing behavior [62]. This paradigm produced serum
ethanol concentrations that are approximately twice the legal
intoxication limit and does not affect pup weight gain (Fig. 3).
Within 1 hr of the end of the 4 hr ethanol exposure, pups were
euthanized by decapitation under ketamine (250 mg/kg) anesthesia
and trunk blood collected. The concentrations of ethanol in pup
serum were then determined using a standard alcohol dehydroge-
nase-based assay [62]. For Western blotting studies, cerebella were
dissected, flash frozen in liquid nitrogen and stored at -80uC. For
immunohistochemical studies, cerebella were fixed in 4% parafor-
maldehyde for 24 hours at 4uC, rinsed in phosphate-buffered saline
(PBS; pH 7.4) and then cryoprotected in 30% sucrose (wt/v) in PBS
for 48 hours. Brains were quickly frozen in Optimal Cutting
Temperature reagent (Sakura Finetek, Torrance, CA) and coronal
sections (14–18 mm) were collected on Superfrost-plus slides.
Sections were air dried at room temperature and stored at 280uC.
Western blotWestern blotting analyses were performed as previously
described[63,64]. Cerebellar tissues were dissected from postnatal
rat pups and frozen immediately in liquid nitrogen until use.
Tissues were homogenized in RIPA buffer (50 mM Tris HCl
pH 8, 150 mM NaCl, 1% NP-40, 0.5% sodium deoxycholate,
0.1% SDS) or RIPA buffer with 2% SDS (for Figure S1) and total
protein concentration was measured by using Bio-Rad protein
assay kit (#500-0006; Bio-Rad, Hercules, CA). Twenty-mg of each
protein sample was separated on SDS-PAGE gels and transferred
to PVDF membranes (Millipore, Billerica, MA). After primary and
secondary antibody incubation, specific protein signals were
visualized by processing membranes using enhanced chemilumi-
nescence (GE Healthcare, Piscataway, NJ). The following primary
antibodies were used at the concentrations recommended by the
manufacturers: rabbit anti-CBP (1:200, #SC-369, Santa Cruz
(B) Representative AcH3 western blot analysis of cerebellum isolated from ethanol-exposed pups analyzed at P2 to P12. (C) Quantitative analysisshowing that AcH3 protein levels (normalized to b-actin) are lower in the ethanol group compared to the control group between P2 and P10, but notat P12. Three independently exposed liters were analyzed and each was counted as an n = 1. Multiple western blots were analyzed for each exposureto minimize the variation between western blots. (D) Representative total H3 (Total H3) western blot analysis of cerebellum isolated from controlpups (exposed to air) analyzed at P2 to P12. (E) Representative total H3 western blot analysis of cerebellum isolated from ethanol-exposed pupsanalyzed at P2 to P12. (F) Quantitative analysis showing that total H3 protein levels (normalized to b-actin) are not changed in the ethanol groupcompared to the control group. (G) Quantitative analysis showing that the ratio of AcH3 compared to total H3 protein levels are lower in the ethanolgroup compared to the control group between P2 and P10, but not at P12. (H) Representative AcH3 immunohistological images of control andethanol exposed cerebella at P8. AcH3, red; Dapi, blue. Scale bar = 50 mm. (I) Quantitative analysis of AcH3 immunohistological signal intensitydemonstrates that AcH3 expression is reduced in the cerebellum of ethanol exposed rats compared to controls. N = 4 individual animal/condition.P,0.05 t-test.doi:10.1371/journal.pone.0019351.g005
Alcohol Reduces CBP in Developing Cerebellum
PLoS ONE | www.plosone.org 8 May 2011 | Volume 6 | Issue 5 | e19351
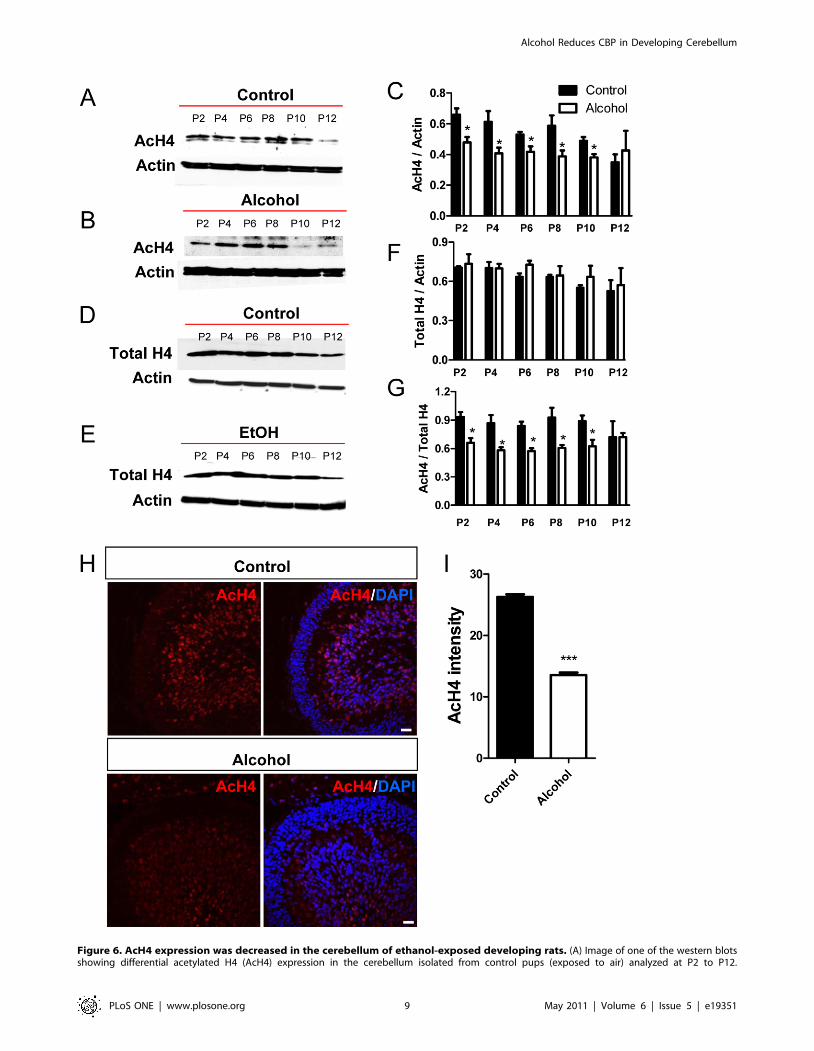
Figure 6. AcH4 expression was decreased in the cerebellum of ethanol-exposed developing rats. (A) Image of one of the western blotsshowing differential acetylated H4 (AcH4) expression in the cerebellum isolated from control pups (exposed to air) analyzed at P2 to P12.
Alcohol Reduces CBP in Developing Cerebellum
PLoS ONE | www.plosone.org 9 May 2011 | Volume 6 | Issue 5 | e19351
Biotechnology, Santa Cruz, CA), rabbit anti-Histone H3 (1:1000,
#06-755, Millipore, Billerica, MA), rabbit anti-Histone H4 (1:1000,
#07-108, Millipore, Billerica, MA), rabbit anti-acetyl-Histone H3
(1:1000, #06-599, Millipore, Billerica, MA), rabbit anti-acetyl-
Histone H3 (K23) (1:1000, #9674, Cell Signaling, Danvers, MA),
rabbit anti-acetyl-Histone H4 (1:1000, #06-866, Millipore, Bill-
erica, MA), and mouse anti-b-Actin (1:1000, #A2228, Sigma-
Aldrich, St. Louis, MO). HRP-conjugated secondary antibodies
were purchased from Thermo Fisher Scientific (Rockford, IL). For
loading controls, membranes were stripped and reprobed with the
antibody against b-Actin. Chemiluminescence was captured on X-
ray films which were scanned and the intensities of the bands of
interest were quantified via ImageJ software version 1.43 (NIH).
The relative quantity of the proteins of interest were obtained by
normalizing to the expression levels of b-Actin or, in some cases,
total histone H3 or H4 levels.
Immunohistology and quantificationImmunohistological staining and confocal imagings were per-
formed as previously described[63,64]. Briefly, frozen brain sections
were stained with following primary antibodies: rabbit anti-CBP
(1:200, #SC-369, Santa Cruz Biotechnology, Santa Cruz, CA),
mouse anti-CBP (1:100, #LS-C88255, Lifespan Bioscience, Seattle
WA), mouse anti-NeuN (1:1000, #MAB377, Millipore, Billerica,
MA), mouse anti-MBP (1:1000, Millipore, 05-675, Billerica, MA),
chicken anti-Nestin (1:1000, #mNES, Aves Lab, Inc, Tigard,
Oregon), goat anti-Doublecortin (1:200, #SC-8066, Santa Cruz,
Santa Cruz, CA), anti-acetyl-Histone H3 (1:1000, #06-599,
Millipore, Billerica, MA), rabbit anti-acetyl-Histone H4 (1:1000,
#06-866, Millipore, Billerica, MA). Fluorescent secondary anti-
bodies were used at 1:250 dilutions (donkey from Jackson
ImmunoResearch, West Grove, PA or goat from Invitrogen,
Carlsbad, CA). After staining, sections were mounted, coverslipped,
and maintained at 4uC in the dark until analysis. Confocal images
were acquired at 406 by using LSM 510 Image Examiner (Carl
Zeiss, Thornwood, NY) and imported into ImageJ. Signal intensities
of AcH3 and AcH4 were quantified using ImageJ software version
1.43 (NIH). Ten individual cells were picked randomly from brain
sections of each animal and measured for signal intensities. The
average intensity from each animal (10 cells) was count as n = 1 for
statistics. Samples from three individual animals each from a
different litter per experimental condition were analyzed (n = 3).
Statistical AnalysisUnless specified, statistical analysis was performed using
ANOVA and Student t-test, with the aid of SPSS v.17. All data
are shown as mean with standard error of mean (mean6SEM).
p,0.05 was considered significant.
Supporting Information
Figure S1 Colocalization of CBP and acetylated histonesin the developing cerebellum. (A, B) Confocal images
showing collocalization of CBP and AcH3 in the developing
cerebellum. AcH3 (green), CBP (red), DAPI (blue). (C, D)
Confocal images showing collocalization of CBP and AcH3 in
the developing cerebellum. AcH3 (green), CBP (red), DAPI (blue).
Scale bar in A and C = 20 mm; scale bar in B and D = 10 mm.
(PDF)
Figure S2 AcH3K23 expression was decreased in thecerebellum of ethanol-exposed developing rats. (A) Image
of one of the western blots showing acetylated H3K23 (AcH3K23)
expression in the cerebellum isolated from control pups (exposed
to air) analyzed at p2 to p12. (B) Image of one of the western blots
showing AcH3 expression in the cerebellum isolated from ethanol-
exposed pups analyzed at p2 to p12. (C) Quantitative analysis
showing that AcH3 protein levels (normalized to b-actin) are lower
in the ethanol group compared to the control group between P2
and P10, but not at P12. (D) Quantitative analysis showing that
total H3 protein levels (normalized to b-actin) are not changed in
the ethanol group compared to the control group. (E) Quantitative
analysis showing that the ratio of AcH3K23 compared to total H3
protein levels are lower in the ethanol group compared to the
control group between P2 and P12. Three independently exposed
liters (n = 3) were analyzed and each was counted as one replicate.
Multiple western blots were analyzed for each exposure to
minimize the variation between western blots. For P2 and P10,
only two independent liters were analyzed therefore no statistic
analysis was done on the data for these two time points.
(PDF)
Acknowledgments
We thank Dr Kevin Caldwell for critical reading of the manuscript, and
Camilo Gamboa and Aya Wadleigh for technical support. Images in this
paper were generated in the University of New Mexico Cancer Center
Fluorescence Microscopy Facility, supported as detailed on the webpage
(http://hsc.unm.edu/crtc/microscopy/facility.html). We also thank, Julie
Everett and Yamhilette Licon-Munoz for assistance with alcohol vapor
exposure.
Author Contributions
Conceived and designed the experiments: CFV XZ. Performed the
experiments: WG ELC LZ SZ OLG. Analyzed the data: WG ELC CFV
XZ. Wrote the paper: CFV XZ. Finalized figures for publication: WG XZ
CFV.
References
1. Connor PD, Sampson PD, Streissguth AP, Bookstein FL, Barr HM (2006)
Effects of prenatal alcohol exposure on fine motor coordination and balance: A
study of two adult samples. Neuropsychologia 44: 744–751.
2. Jacobson SW, Stanton ME, Molteno CD, Burden MJ, Fuller DS, et al. (2008)
Impaired eyeblink conditioning in children with fetal alcohol syndrome. Alcohol
Clin Exp Res 32: 365–372.
(B) Representative AcH4 western blot analysis of cerebellum isolated from ethanol-exposed pups analyzed at p2 to p12. (C) Quantitative analysisshowing that AcH4 protein levels (normalized to b-actin) are lower in the ethanol group compared to the control group between P2 and P10, but notat P12. Three independently exposed liters were analyzed and each was counted as n = 1. Multiple western blots were analyzed for each exposure tominimize the variation between western blots. (D) Representative total H4 (Total H4) western blot analysis of cerebellum isolated from control pups(exposed to air) analyzed at P2 to P12. (E) Representative Total H4 western blot analysis of cerebellum isolated from ethanol-exposed pups analyzedat P2 to P12. (F) Quantitative analysis showing that total H4 protein levels (normalized to b-actin) are not changed in the ethanol group compared tothe control group. (G) Quantitative analysis showing that the ratio of AcH4 compared to total H4 protein levels are lower in the ethanol groupcompared to the control group between P2 and P10, but not at P12. (H) Representative AcH4 immunohistological images of control and ethanol-exposed cerebella at P8. AcH4, red; Dapi, blue. Scale bar = 50 mm. (I) Quantitative analysis of AcH4 immunohistological signal intensity demonstratesthat AcH4 expression is reduced in the cerebellum of ethanol exposed rats compared to controls. N = 4 individual animal/condition. P,0.05 t-test.doi:10.1371/journal.pone.0019351.g006
Alcohol Reduces CBP in Developing Cerebellum
PLoS ONE | www.plosone.org 10 May 2011 | Volume 6 | Issue 5 | e19351
3. Norman AL, Crocker N, Mattson SN, Riley EP (2009) Neuroimaging and fetal
alcohol spectrum disorders. Dev Disabil Res Rev 15: 209–217.4. Green JT (2004) The effects of ethanol on the developing cerebellum and
eyeblink classical conditioning. Cerebellum 3: 178–187.
5. Hamre KM, West JR (1993) The effects of the timing of ethanol exposure duringthe brain growth spurt on the number of cerebellar Purkinje and granule cell
nuclear profiles. Alcohol Clin Exp Res 17: 610–622.6. Backman C, West JR, Mahoney JC, Palmer MR (1998) Electrophysiological
characterization of cerebellar neurons from adult rats exposed to ethanol during
development. Alcohol Clin Exp Res 22: 1137–1145.7. Stanton ME, Goodlett CR (1998) Neonatal ethanol exposure impairs eyeblink
conditioning in weanling rats. Alcohol Clin Exp Res 22: 270–275.8. Kumar A, Singh CK, DiPette DD, Singh US (2010) Ethanol impairs activation
of retinoic acid receptors in cerebellar granule cells in a rodent model of fetalalcohol spectrum disorders. Alcohol Clin Exp Res 34: 928–937.
9. Dohrman DP, West JR, Pantazis NJ (1997) Ethanol reduces expression of the
nerve growth factor receptor, but not nerve growth factor protein levels in theneonatal rat cerebellum. Alcohol Clin Exp Res 21: 882–893.
10. Light KE, Brown DP, Newton BW, Belcher SM, Kane CJ (2002) Ethanol-induced alterations of neurotrophin receptor expression on Purkinje cells in the
neonatal rat cerebellum. Brain Res 924: 71–81.
11. Moore DB, Madorsky I, Paiva M, Barrow Heaton M (2004) Ethanol exposurealters neurotrophin receptor expression in the rat central nervous system: Effects
of neonatal exposure. J Neurobiol 60: 114–126.12. Soscia SJ, Tong M, Xu XJ, Cohen AC, Chu J, et al. (2006) Chronic gestational
exposure to ethanol causes insulin and IGF resistance and impairs acetylcholinehomeostasis in the brain. Cell Mol Life Sci 63: 2039–2056.
13. Gruol DL, Parsons KL (1994) Chronic exposure to alcohol during development
alters the calcium currents of cultured cerebellar Purkinje neurons. Brain Res634: 283–290.
14. Lefebvre T, Gonzalez BJ, Vaudry D, Desrues L, Falluel-Morel A, et al. (2009)Paradoxical effect of ethanol on potassium channel currents and cell survival in
cerebellar granule neurons. J Neurochem 110: 976–989.
15. Ramadoss J, Lunde ER, Ouyang N, Chen WJ, Cudd TA (2008) Acid-sensitivechannel inhibition prevents fetal alcohol spectrum disorders cerebellar Purkinje
cell loss. Am J Physiol Regul Integr Comp Physiol 295: R596–603.16. Lewis B, Wellmann KA, Barron S (2007) Agmatine reduces balance deficits in a
rat model of third trimester binge-like ethanol exposure. Pharmacol BiochemBehav 88: 114–121.
17. Kumada T, Jiang Y, Cameron DB, Komuro H (2007) How does alcohol impair
neuronal migration? J Neurosci Res 85: 465–470.18. Li Z, Miller MW, Luo J (2002) Effects of prenatal exposure to ethanol on the
cyclin-dependent kinase system in the developing rat cerebellum. Brain Res DevBrain Res 139: 237–245.
19. Chu J, Tong M, de la Monte SM (2007) Chronic ethanol exposure causes
mitochondrial dysfunction and oxidative stress in immature central nervoussystem neurons. Acta Neuropathol 113: 659–673.
20. Siler-Marsiglio KI, Pan Q, Paiva M, Madorsky I, Khurana NC, et al. (2005)Mitochondrially targeted vitamin E and vitamin E mitigate ethanol-mediated effects
on cerebellar granule cell antioxidant defense systems. Brain Res 1052: 202–211.21. Ramanathan R, Wilkemeyer MF, Mittal B, Perides G, Charness ME (1996)
Alcohol inhibits cell-cell adhesion mediated by human L1. J Cell Biol 133:
381–390.22. Tang N, He M, O’Riordan MA, Farkas C, Buck K, et al. (2006) Ethanol inhibits
L1 cell adhesion molecule activation of mitogen-activated protein kinases.J Neurochem 96: 1480–1490.
23. Bernstein BE, Meissner A, Lander ES (2007) The mammalian epigenome. Cell
128: 669–681.24. MacDonald JL, Roskams AJ (2009) Epigenetic regulation of nervous system
development by DNA methylation and histone deacetylation. Prog Neurobiol88: 170–183.
25. Urdinguio RG, Sanchez-Mut JV, Esteller M (2009) Epigenetic mechanisms in
neurological diseases: genes, syndromes, and therapies. Lancet Neurol 8:1056–1072.
26. Moretti P, Zoghbi HY (2006) MeCP2 dysfunction in Rett syndrome and relateddisorders. Curr Opin Genet Dev 16: 276–281.
27. Zhao X, Pak C, Smrt RD, Jin P (2007) Epigenetics and Neural developmentaldisorders: Washington DC, September 18 and 19, 2006. Epigenetics 2: 126–134.
28. Haycock PC (2009) Fetal alcohol spectrum disorders: the epigenetic perspective.
Biol Reprod 81: 607–617.29. Garro AJ, McBeth DL, Lima V, Lieber CS (1991) Ethanol consumption inhibits
fetal DNA methylation in mice: implications for the fetal alcohol syndrome.Alcohol Clin Exp Res 15: 395–398.
30. Liu Y, Balaraman Y, Wang G, Nephew KP, Zhou FC (2009) Alcohol exposure
alters DNA methylation profiles in mouse embryos at early neurulation.Epigenetics 4: 500–511.
31. Sathyan P, Golden HB, Miranda RC (2007) Competing interactions betweenmicro-RNAs determine neural progenitor survival and proliferation after
ethanol exposure: evidence from an ex vivo model of the fetal cerebral corticalneuroepithelium. J Neurosci 27: 8546–8557.
32. Roth TL, Sweatt JD (2009) Regulation of chromatin structure in memory
formation. Curr Opin Neurobiol 19: 336–342.33. Renthal W, Nestler EJ (2009) Histone acetylation in drug addiction. Semin Cell
Dev Biol 20: 387–394.
34. Dekker FJ, Haisma HJ (2009) Histone acetyl transferases as emerging drugtargets. Drug Discov Today 14: 942–948.
35. Hennekam RC (2006) Rubinstein-Taybi syndrome. Eur J Hum Genet 14:
981–985.
36. Alarcon JM, Malleret G, Touzani K, Vronskaya S, Ishii S, et al. (2004)
Chromatin acetylation, memory, and LTP are impaired in CBP+/- mice: amodel for the cognitive deficit in Rubinstein-Taybi syndrome and its
amelioration. Neuron 42: 947–959.
37. Valor LM, Pulopulos MM, Jimenez-Minchan M, Olivares R, Lutz B, et al.
(2011) Ablation of CBP in forebrain principal neurons causes modest memoryand transcriptional defects and a dramatic reduction of histone acetylation but
does not affect cell viability. J Neurosci 31: 1652–1663.
38. Nishihara E (2008) An overview of nuclear receptor coregulators involved in
cerebellar development. Cerebellum 7: 48–59.
39. Nishihara E, Yoshida-Komiya H, Chan CS, Liao L, Davis RL, et al. (2003)SRC-1 null mice exhibit moderate motor dysfunction and delayed development
of cerebellar Purkinje cells. J Neurosci 23: 213–222.
40. Tsirigotis M, Tang MY, Beyers M, Zhang M, Woulfe J, et al. (2006) Delayed
spinocerebellar ataxia in transgenic mice expressing mutant ubiquitin.Neuropathol Appl Neurobiol 32: 26–39.
41. Gold DA, Baek SH, Schork NJ, Rose DW, Larsen DD, et al. (2003) RORalpha
coordinates reciprocal signaling in cerebellar development through sonic
hedgehog and calcium-dependent pathways. Neuron 40: 1119–1131.
42. Chedotal A (2010) Should I stay or should I go? Becoming a granule cell. TrendsNeurosci 33: 163–172.
43. Sotelo C, Dusart I (2009) Intrinsic versus extrinsic determinants during thedevelopment of Purkinje cell dendrites. Neuroscience 162: 589–600.
44. Morte B, Manzano J, Scanlan TS, Vennstrom B, Bernal J (2004) Aberrant
maturation of astrocytes in thyroid hormone receptor alpha 1 knockout mice
reveals an interplay between thyroid hormone receptor isoforms. Endocrinology145: 1386–1391.
45. Ogryzko VV, Schiltz RL, Russanova V, Howard BH, Nakatani Y (1996) The
transcriptional coactivators p300 and CBP are histone acetyltransferases. Cell87: 953–959.
46. Auger AP, Perrot-Sinal TS, Auger CJ, Ekas LA, Tetel MJ, et al. (2002)Expression of the nuclear receptor coactivator, cAMP response element-binding
protein, is sexually dimorphic and modulates sexual differentiation of neonatalrat brain. Endocrinology 143: 3009–3016.
47. Stromberg H, Svensson SP, Hermanson O (1999) Distribution of CREB-bindingprotein immunoreactivity in the adult rat brain. Brain Res 818: 510–514.
48. Rouaux C, Jokic N, Mbebi C, Boutillier S, Loeffler JP, et al. (2003) Critical loss
of CBP/p300 histone acetylase activity by caspase-6 during neurodegeneration.
Embo J 22: 6537–6549.
49. Yalcin A, Koulich E, Mohamed S, Liu L, D’Mello SR (2003) Apoptosis incerebellar granule neurons is associated with reduced interaction between
CREB-binding protein and NF-kappaB. J Neurochem 84: 397–408.
50. Gruol DL, Quina LA, Netzeband JG, Nguyen D, Gullette CE (2006)
Developmental changes in Ca2+-regulated functions of early postnatal Purkinjeneurons. J Neurosci Res 83: 1381–1392.
51. Tsutsui K (2008) Neurosteroids in the Purkinje cell: biosynthesis, mode of action
and functional significance. Mol Neurobiol 37: 116–125.
52. Koibuchi N (2008) The role of thyroid hormone on cerebellar development.
Cerebellum 7: 530–533.
53. Holmes MC, Seckl JR (2006) The role of 11beta-hydroxysteroid dehydrogenases
in the brain. Mol Cell Endocrinol 248: 9–14.
54. Yamamoto M, Ullman D, Drager UC, McCaffery P (1999) Postnatal effects ofretinoic acid on cerebellar development. Neurotoxicol Teratol 21: 141–146.
55. Pandey SC, Ugale R, Zhang H, Tang L, Prakash A (2008) Brain chromatin
remodeling: a novel mechanism of alcoholism. J Neurosci 28: 3729–3737.
56. Chan HM, La Thangue NB (2001) p300/CBP proteins: HATs for transcrip-
tional bridges and scaffolds. J Cell Sci 114: 2363–2373.
57. Vo N, Goodman RH (2001) CREB-binding protein and p300 in transcriptional
regulation. J Biol Chem 276: 13505–13508.
58. Wang J, Weaver IC, Gauthier-Fisher A, Wang H, He L, et al. (2010) CBPhistone acetyltransferase activity regulates embryonic neural differentiation in
the normal and Rubinstein-Taybi syndrome brain. Dev Cell 18: 114–125.
59. Dikranian K, Qin YQ, Labruyere J, Nemmers B, Olney JW (2005) Ethanol-
induced neuroapoptosis in the developing rodent cerebellum and related brainstem structures. Brain Res Dev Brain Res 155: 1–13.
60. Ikonomidou C, Bittigau P, Ishimaru MJ, Wozniak DF, Koch C, et al. (2000)Ethanol-induced apoptotic neurodegeneration and fetal alcohol syndrome.
Science 287: 1056–1060.
61. Carloni S, Mazzoni E, Balduini W (2004) Caspase-3 and calpain activities afteracute and repeated ethanol administration during the rat brain growth spurt.
J Neurochem 89: 197–203.
62. Galindo R, Valenzuela CF (2006) Immature hippocampal neuronal networks do
not develop tolerance to the excitatory actions of ethanol. Alcohol 40: 111–118.
63. Liu C, Teng ZQ, Santistevan NJ, Szulwach KE, Guo W, et al. (2010) Epigenetic
regulation of miR-184 by MBD1 governs neural stem cell proliferation anddifferentiation. Cell Stem Cell 6: 433–444.
64. Luo Y, Shan G, Guo W, Smrt RD, Johnson EB, et al. (2010) Fragile x mental
retardation protein regulates proliferation and differentiation of adult neural
stem/progenitor cells. PLoS Genet 6: e1000898.
Alcohol Reduces CBP in Developing Cerebellum
PLoS ONE | www.plosone.org 11 May 2011 | Volume 6 | Issue 5 | e19351