surface acetylation of bacterial cellulose
TRANSCRIPT
Surface acetylation of bacterial celluloseN
Dae-Young Kim1, Yoshiharu Nishiyama2 and Shigenori Kuga2,*1Department of Forest Resources, College of Life Resources Science, Dongguk University, Pill-dong,Chung-gu, Seoul, Korea 100-715; 2Department of Biomaterials Science, Graduate School of Agricultural andLife Sciences, The University of Tokyo, Yayoi 1-1-1, Bunkyo-ku, Tokyo 113-8657, Japan; *Author forcorrespondence (e-mail: [email protected]; phone: +81-3-5841-5241; fax: +81-3-5684-0299)
Received 18 October 2001; accepted in revised form 6 March 2002
Key words: Bacterial cellulose (BC), Surface acetylation
Abstract
Bacterial cellulose was partially acetylated by the fibrous acetylation method to modify its physical properties,while preserving the microfibrillar morphology. The overall degree of substitution was varied from 0.04 to 2.77by changing the amount of acetic anhydride added. X-ray diffraction of the partially acetylated samples showedthe crystalline pattern of unmodified cellulose I up to moderate degrees of acetylation, and the change in peakwidths indicated that acetylation proceeded from the surface of microfibrils, leaving the core portion unreacted.Scanning electron microscopy revealed that even low levels of acetylation were effective to maintain the originalmicrofibrillar morphology of bacterial cellulose on direct drying from water.
Introduction
Cellulose acetate is widely used for production of ar-tificial fibers, films, varnishes, and plastics (Borganand Brewer 1989). Acetylation of cellulose by the fi-brous methods, which avoid dissolution of acetylatedproducts into the medium, employs acetic anhydride–acetic acid mixtures to fibrous cellulose soaked in anonaqueous solvent with the aid of catalyst such asperchloric acid (Tanghe et al. 1963). Various productsare marketed with degrees of substitution rangingfrom 2.2 to 3.0 (Smart and Zellner 1971).
The fibrous conversion method also provides par-tially acetylated cellulosic materials. Herdle andGriggs (1965) prepared a paper with improved wetstrength and dimensional stability from partiallyacetylated cellulose fibers. Sassi and Chanzy (1995)studied the features of fibrous acetylation of crystal-line cellulose and found that the conversion pro-ceeded from the surface to internal regions. Since theacetylated surface is expected to provide improved
adhesion with hydrophobic matrices, use of partialacetylation of cellulosic fibers has been intensivelystudied as reinforcing elements for composite materi-als (Cavaillé et al. 1997; Glasser et al. 1999; Mat-sumura et al. 2000a, b; Seavey and Glasser 2001).While these publications mainly use pulp fibers andregenerated cellulose fibers as fibrous components,we here attempted to apply surface acetylation tohighly crystalline microfibrils of bacterial celluloseand studied the features of the reaction and its prod-ucts by X-ray diffraction, infrared spectroscopy andelectron microscopy.
Methods
Bacterial cellulose (BC)
The cellulose samples used were produced by Aceto-bacter xylinum (JCM10150). The sample was ob-tained from standing culture at 28 °C in a mixture of4% sucrose and 4% corn steep liquor for about aweek. The resulting gel-like pellicle was washed withdistilled water and treated with 1% sodium hydroxideat 80 °C for 1 h, followed by rinsing with water.
N Presented at the 8th Annual Meeting of theCellulose Society of Japan which was held on July12–13, 2001.
361Cellulose 9: 361–367, 2002.© 2002 Kluwer Academic Publishers. Printed in the Netherlands.
Acetylation
The wet bacterial cellulose pellicle, cut into about 10cm × 10 cm × 1 cm thick pieces, was squeezed byhand in a polyethylene cloth and soaked in anhydrousacetic acid. The squeezing–soaking with acetic acidwas repeated three times for complete removal of wa-ter. The sample was then placed in a stoppered glassbottle containing a mixture of 20 mL of acetic acid,25 mL of toluene, and 0.1 mL of 60% perchloric acid.The mixture was shaken vigorously for about 1 min.Then a desired amount of acetic anhydride wasadded, and the mixture was shaken vigorously forabout 1 min. The mixture was allowed to stand for 1h at room temperature. After the reaction the BC sam-ple piece, maintaining its original appearance and in-tegrity, was squeezed and washed thoroughly withmethanol, then with water.
Determination of degrees of acetylation
A piece of water-wet sample containing about 100 mgdry cellulose was dried for 2 h at 105 °C, weighedaccurately, and put into 40 mL of 75% ethanol in aglass bottle. The bottle, loosely stoppered, was heatedto 50–60 °C for 30 min for better swelling of the ma-terial. Then 40 mL of 0.5 N NaOH solution, accu-rately measured, was added to the sample and themixture was heated to 50–60 °C for 15 min. Then thebottle was stoppered tightly and allowed to stand atroom temperature for about 48 h. The excess alkaliwas then titrated with 0.5 N HCl using phenolphtha-lein as an indicator.
Fourier transform infrared spectroscopy
Thin film of partially acetylated BC sample, 5–20 mmthick, was prepared by delaminating the gel-like spec-imen in water followed by drying on a Teflon plate at60 °C. The infrared spectrum of the film was recordedon a Nicolet magna 860 infrared spectrophotometer.All the spectra were obtained by accumulation of 64scans, with resolution of 4 cm−1, at 400–4000 cm−1.For this measurement, the partially acetylated cellu-lose samples were annealed at 200 °C for 1 h for bet-ter resolution of the spectra.
X-ray diffraction analysis
X-ray diffraction diagrams were recorded using a ro-tating-anode X-ray generator Rigaku RU 200BH
equipped with a flat-plate vacuum camera. Nickel-fil-tered Cu-Ka radiation (� = 0.15418 nm) generated at50 kV and 100 mA was collimated by two pinholesof 0.3 mm diameter. The sample-to-plate distance was43 mm. The diffraction patterns were recorded onimaging plates that were then scanned by an imagingplate reader (R-AXIS imaging plate reader system) at50 �m resolution.
The sample films were cut into 1 mm wide stripsand diffraction was recorded for two modes, i.e. withthe X-ray beam perpendicular (through view) andparallel (edge view) to the film surface. The diffrac-tion profiles were obtained by integrating the inten-sity of the diffraction pattern along a concentric circlearound the center spot. The 200 °C–1 h annealed sam-ples were used for diffraction, for better resolution ofcrystalline patterns of cellulose triacetate.
Scanning electron microscopy (SEM)
Partially acetylated cellulose samples were dried fromwater at 80 °C for 1 day, coated with platinum by anion sputter coater, and observed with a field-emissionscanning electron microscope (Hitachi S4000).
Nitrogen adsorption
The nitrogen adsorption isotherms of the acetylatedBC samples were obtained at liquid nitrogen temper-ature (i.e. 77 K) using a Coulter Omnisorp 100CX.This automatic instrument uses a static volumetrictechnique. Before the measurement all samples wereoutgassed for 2 h at 120 °C under vacuum to removethe moisture and other containments. The specific sur-face areas of the acetylated samples were obtained bymeans of the standard method of Brunauer, Emmettand Teller (the BET method) applied in a relativepressure range from 0.01 to 0.15 (Brunauer et al.1938).
Results and discussion
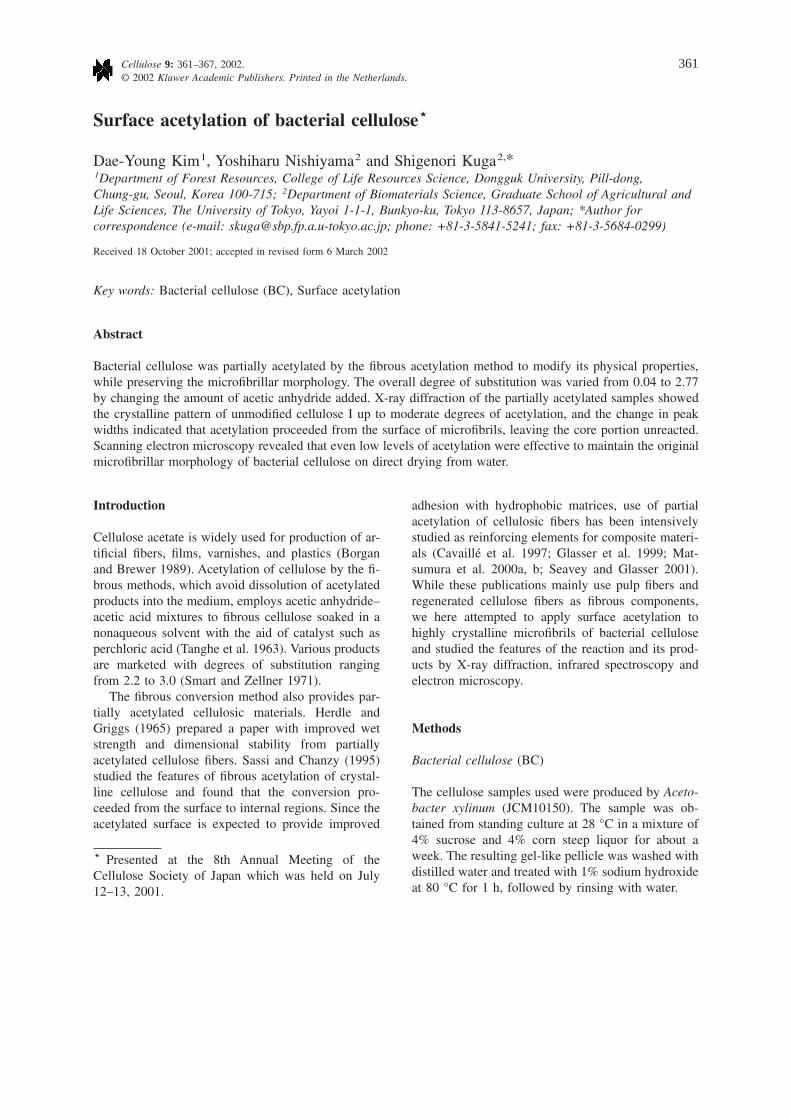
Figure 1 shows the degree of substitution (DS) ofacetylated BC samples determined by titration, plot-ted against the amount of acetic anhydride (Ac2O)added to the cellulose specimen containing about 150mg of dry cellulose. The maximum DS obtained byaddition of excess Ac2O was 2.77. Low levels ofacetylation were achieved by decreasing the amountof acetic anhydride added. The graph shows a steep
362
rise in DS as the amount of reagent increases; the DScould be controlled at low levels by changing theamount of Ac2O added. The observed nonlinearitymay have been caused by trace water in the reactionmixture originating from the addition of aqueous per-chloric acid and possible incompleteness of solventexchange of the BC sample.
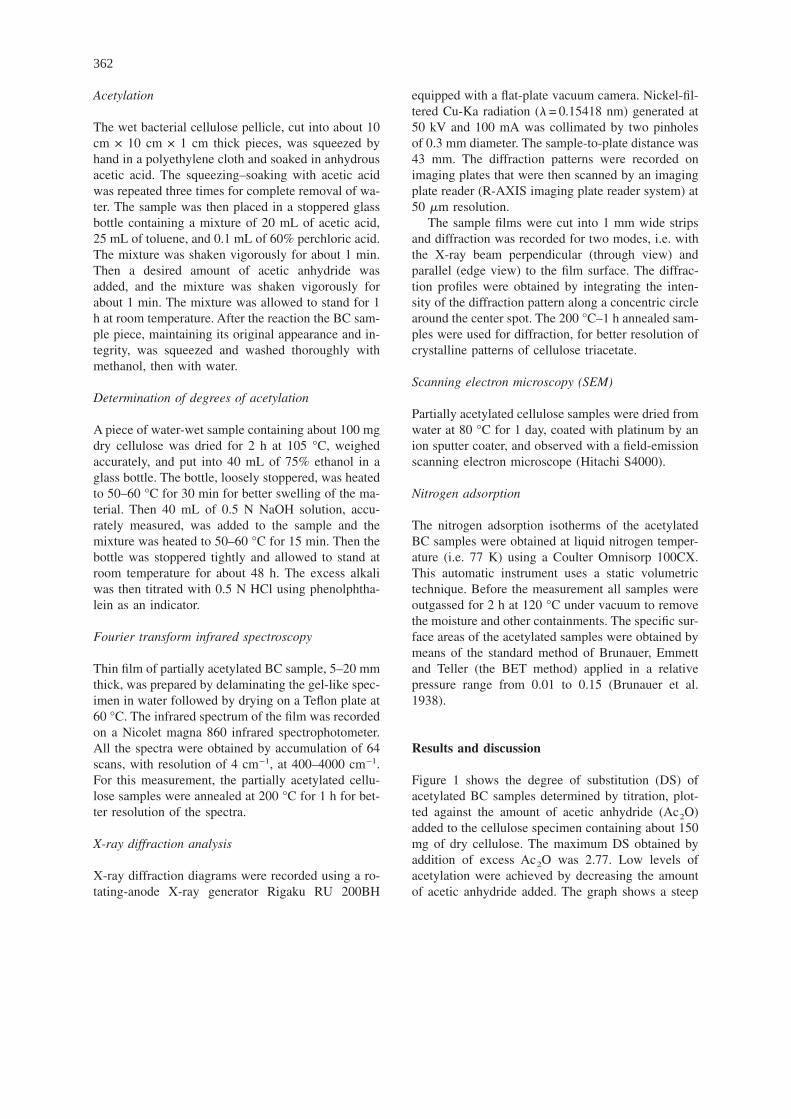
The IR spectra of a series of acetylated BC (Fig-ure 2), corresponding to the increase in DS, showed amonotonous decrease in the O-H band (3350 cm−1)and increases in three major bands of cellulose triac-etate, i.e. the C=O band (1750 cm−1), the C-O band(1240 cm−1) and the C-CH3 band (1375 cm−1) (Hur-tubise 1962). Though quantitative analysis of IR spec-tra is not possible because of variation in film thick-ness, the overall change in absorption band intensitiesis in good accord with the DS values from titration.
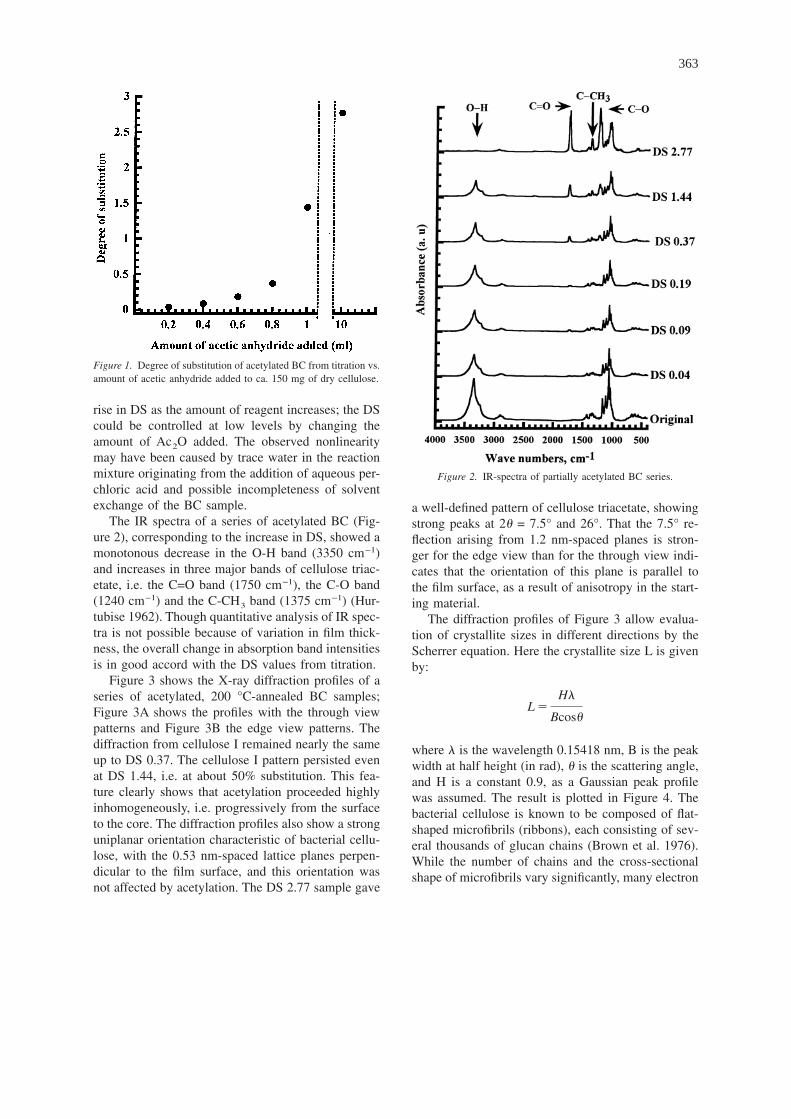
Figure 3 shows the X-ray diffraction profiles of aseries of acetylated, 200 °C-annealed BC samples;Figure 3A shows the profiles with the through viewpatterns and Figure 3B the edge view patterns. Thediffraction from cellulose I remained nearly the sameup to DS 0.37. The cellulose I pattern persisted evenat DS 1.44, i.e. at about 50% substitution. This fea-ture clearly shows that acetylation proceeded highlyinhomogeneously, i.e. progressively from the surfaceto the core. The diffraction profiles also show a stronguniplanar orientation characteristic of bacterial cellu-lose, with the 0.53 nm-spaced lattice planes perpen-dicular to the film surface, and this orientation wasnot affected by acetylation. The DS 2.77 sample gave
a well-defined pattern of cellulose triacetate, showingstrong peaks at 2� = 7.5° and 26°. That the 7.5° re-flection arising from 1.2 nm-spaced planes is stron-ger for the edge view than for the through view indi-cates that the orientation of this plane is parallel tothe film surface, as a result of anisotropy in the start-ing material.
The diffraction profiles of Figure 3 allow evalua-tion of crystallite sizes in different directions by theScherrer equation. Here the crystallite size L is givenby:
L �H�
Bcos�
where � is the wavelength 0.15418 nm, B is the peakwidth at half height (in rad), � is the scattering angle,and H is a constant 0.9, as a Gaussian peak profilewas assumed. The result is plotted in Figure 4. Thebacterial cellulose is known to be composed of flat-shaped microfibrils (ribbons), each consisting of sev-eral thousands of glucan chains (Brown et al. 1976).While the number of chains and the cross-sectionalshape of microfibrils vary significantly, many electron
Figure 1. Degree of substitution of acetylated BC from titration vs.amount of acetic anhydride added to ca. 150 mg of dry cellulose.
Figure 2. IR-spectra of partially acetylated BC series.
363
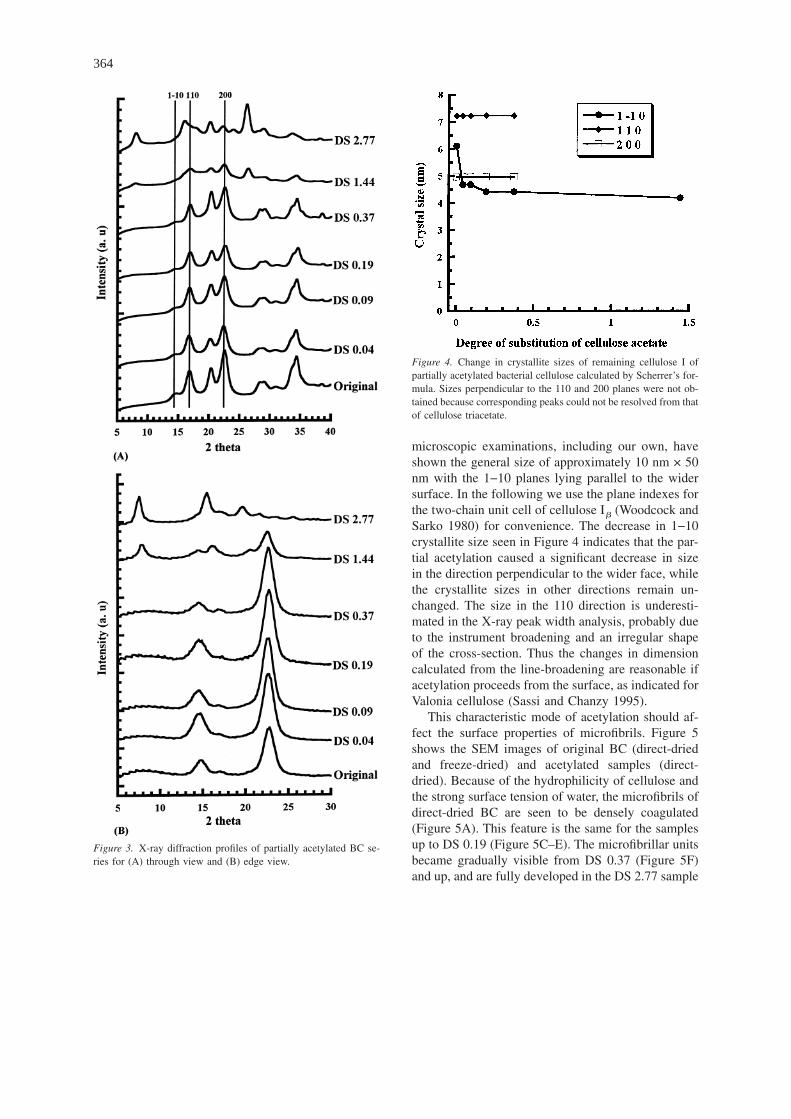
microscopic examinations, including our own, haveshown the general size of approximately 10 nm × 50nm with the 1−10 planes lying parallel to the widersurface. In the following we use the plane indexes forthe two-chain unit cell of cellulose I� (Woodcock andSarko 1980) for convenience. The decrease in 1−10crystallite size seen in Figure 4 indicates that the par-tial acetylation caused a significant decrease in sizein the direction perpendicular to the wider face, whilethe crystallite sizes in other directions remain un-changed. The size in the 110 direction is underesti-mated in the X-ray peak width analysis, probably dueto the instrument broadening and an irregular shapeof the cross-section. Thus the changes in dimensioncalculated from the line-broadening are reasonable ifacetylation proceeds from the surface, as indicated forValonia cellulose (Sassi and Chanzy 1995).
This characteristic mode of acetylation should af-fect the surface properties of microfibrils. Figure 5shows the SEM images of original BC (direct-driedand freeze-dried) and acetylated samples (direct-dried). Because of the hydrophilicity of cellulose andthe strong surface tension of water, the microfibrils ofdirect-dried BC are seen to be densely coagulated(Figure 5A). This feature is the same for the samplesup to DS 0.19 (Figure 5C–E). The microfibrillar unitsbecame gradually visible from DS 0.37 (Figure 5F)and up, and are fully developed in the DS 2.77 sample
Figure 3. X-ray diffraction profiles of partially acetylated BC se-ries for (A) through view and (B) edge view.
Figure 4. Change in crystallite sizes of remaining cellulose I ofpartially acetylated bacterial cellulose calculated by Scherrer’s for-mula. Sizes perpendicular to the 110 and 200 planes were not ob-tained because corresponding peaks could not be resolved from thatof cellulose triacetate.
364
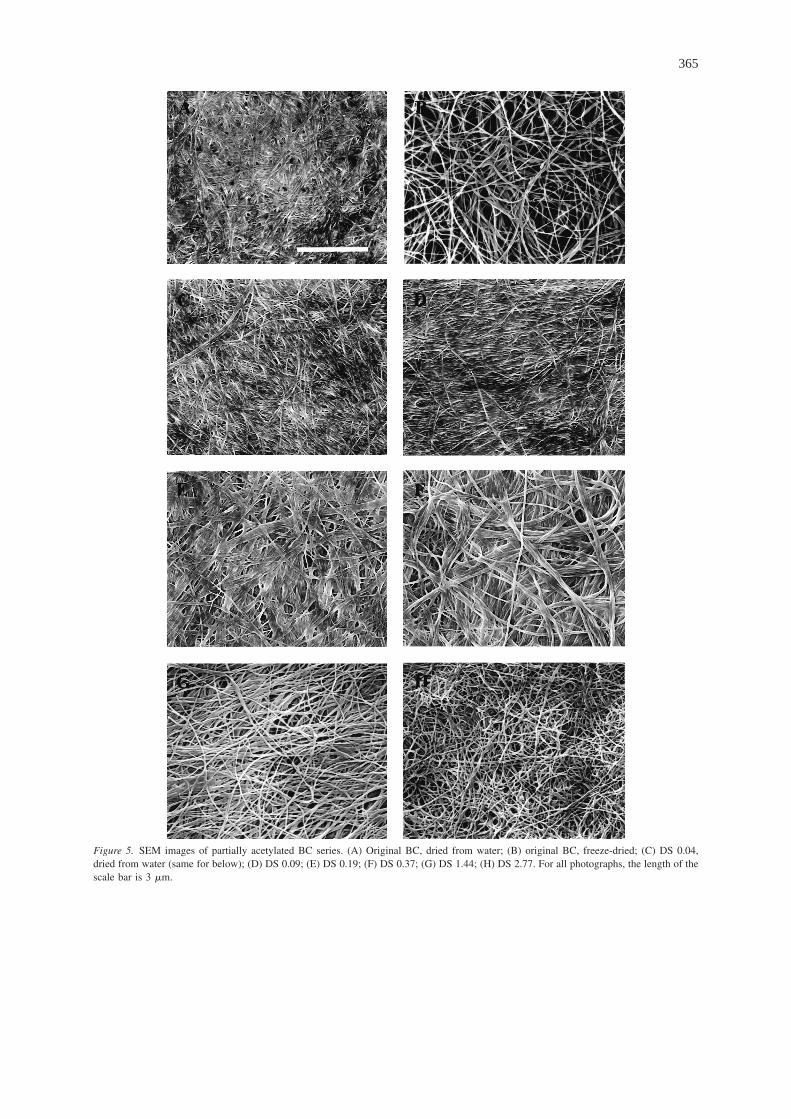
Figure 5. SEM images of partially acetylated BC series. (A) Original BC, dried from water; (B) original BC, freeze-dried; (C) DS 0.04,dried from water (same for below); (D) DS 0.09; (E) DS 0.19; (F) DS 0.37; (G) DS 1.44; (H) DS 2.77. For all photographs, the length of thescale bar is 3 �m.
365
(Figure 5H). This change is considered to result fromincreased hydrophobicity of the acetylated surfaces.
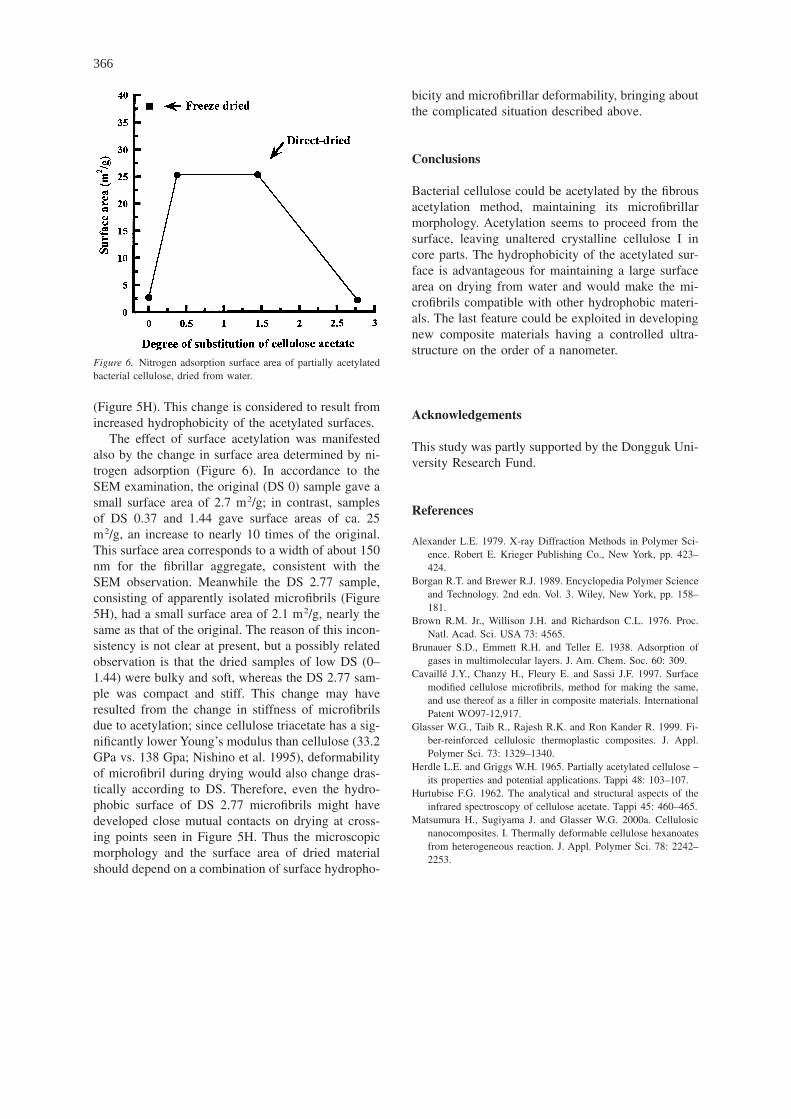
The effect of surface acetylation was manifestedalso by the change in surface area determined by ni-trogen adsorption (Figure 6). In accordance to theSEM examination, the original (DS 0) sample gave asmall surface area of 2.7 m2/g; in contrast, samplesof DS 0.37 and 1.44 gave surface areas of ca. 25m2/g, an increase to nearly 10 times of the original.This surface area corresponds to a width of about 150nm for the fibrillar aggregate, consistent with theSEM observation. Meanwhile the DS 2.77 sample,consisting of apparently isolated microfibrils (Figure5H), had a small surface area of 2.1 m2/g, nearly thesame as that of the original. The reason of this incon-sistency is not clear at present, but a possibly relatedobservation is that the dried samples of low DS (0–1.44) were bulky and soft, whereas the DS 2.77 sam-ple was compact and stiff. This change may haveresulted from the change in stiffness of microfibrilsdue to acetylation; since cellulose triacetate has a sig-nificantly lower Young’s modulus than cellulose (33.2GPa vs. 138 Gpa; Nishino et al. 1995), deformabilityof microfibril during drying would also change dras-tically according to DS. Therefore, even the hydro-phobic surface of DS 2.77 microfibrils might havedeveloped close mutual contacts on drying at cross-ing points seen in Figure 5H. Thus the microscopicmorphology and the surface area of dried materialshould depend on a combination of surface hydropho-
bicity and microfibrillar deformability, bringing aboutthe complicated situation described above.
Conclusions
Bacterial cellulose could be acetylated by the fibrousacetylation method, maintaining its microfibrillarmorphology. Acetylation seems to proceed from thesurface, leaving unaltered crystalline cellulose I incore parts. The hydrophobicity of the acetylated sur-face is advantageous for maintaining a large surfacearea on drying from water and would make the mi-crofibrils compatible with other hydrophobic materi-als. The last feature could be exploited in developingnew composite materials having a controlled ultra-structure on the order of a nanometer.
Acknowledgements
This study was partly supported by the Dongguk Uni-versity Research Fund.
References
Alexander L.E. 1979. X-ray Diffraction Methods in Polymer Sci-ence. Robert E. Krieger Publishing Co., New York, pp. 423–424.
Borgan R.T. and Brewer R.J. 1989. Encyclopedia Polymer Scienceand Technology. 2nd edn. Vol. 3. Wiley, New York, pp. 158–181.
Brown R.M. Jr., Willison J.H. and Richardson C.L. 1976. Proc.Natl. Acad. Sci. USA 73: 4565.
Brunauer S.D., Emmett R.H. and Teller E. 1938. Adsorption ofgases in multimolecular layers. J. Am. Chem. Soc. 60: 309.
Cavaillé J.Y., Chanzy H., Fleury E. and Sassi J.F. 1997. Surfacemodified cellulose microfibrils, method for making the same,and use thereof as a filler in composite materials. InternationalPatent WO97-12,917.
Glasser W.G., Taib R., Rajesh R.K. and Ron Kander R. 1999. Fi-ber-reinforced cellulosic thermoplastic composites. J. Appl.Polymer Sci. 73: 1329–1340.
Herdle L.E. and Griggs W.H. 1965. Partially acetylated cellulose –its properties and potential applications. Tappi 48: 103–107.
Hurtubise F.G. 1962. The analytical and structural aspects of theinfrared spectroscopy of cellulose acetate. Tappi 45: 460–465.
Matsumura H., Sugiyama J. and Glasser W.G. 2000a. Cellulosicnanocomposites. I. Thermally deformable cellulose hexanoatesfrom heterogeneous reaction. J. Appl. Polymer Sci. 78: 2242–2253.
Figure 6. Nitrogen adsorption surface area of partially acetylatedbacterial cellulose, dried from water.
366
Matsumura H. and Glasser W.G. 2000b. Cellulosic nanocompos-ites. II. Studies by atomic force microscopy. J. Appl. PolymerSci. 78: 2254–2261.
Nishino T., Takano K. and Nakamae K. 1995. Elastic modulus ofthe crystalline regions of cellulose polymorphs. J. Polym. Sci.,Part B: Polym. Phys. 33: 1647–1651.
Sassi J.-F. and Chanzy H. 1995. Ultrastructural aspects of theacetylation of cellulose. Cellulose 2: 111–127.
Seavey K.C. and Glasser W.G. 2001. Continuous cellulose fiber-reinforced cellulose ester composites. II. Fiber surface modifi-cation and consolidation conditions. Cellulose 8: 161–169.
Smart C.L. and Zellner C.N. 1971. Cellulose triacetate fibers. In:Bikales N.M. and Segal L. (eds), Cellulose and Cellulose De-rivatives. Vol. 5. Wiley-Interscience, New York, pp. 1151–1167.
Tanghe L.J., Genung L.B. and Mendh J.W. 1963. Cellulose acetate,acetylation of cellulose. In: Whistler R.L., Green J.W., BemillerJ.N. and Wolfrom L. (eds), Methods in Carbohydrate Chemis-try, Volume III: Cellulose. Academic Press, New York, pp. 193–212.
Woodcock C. and Sarko A. 1980. Packing analysis of carbohy-drates and polysaccharides. 11. Molecular and crystal structureof native ramie cellulose. Macromolecules 13: 1183–1187.
367
