geochemical truths in large data sets. i: geochemical screening data
TRANSCRIPT

~ Pergamon Org. Geochem. Vol. 29, No. 1 3, pp. 519 530, 1998
© 1998 Elsevier Science Ltd. All rights reserved Printed in Great Britain PII: S0146-6380(98)00189-2 0146-6380/98/$- see front matter
Geochemical truths in large data sets. I: Geochemical screening data
C H R I S C O R N F O R D * , PHILIP G A R D N E R and C H R I S B U R G E S S
Integrated Geochemical Interpretation Limited, Hallsannery, Bideford, Devon EX39 5HE, U.K.
Abstract~Organic geochemistry, especially when undertaken on a well by well or outcrop by outcrop basis, arguably lacks statistically significant numbers of analyses to establish reliable trends. Can a re- liable vitrinite reflectance vs. depth trend be established from (say) 12 analysed samples? When the number of analysed samples are in the hundreds or even thousands, much clearer general trends are established and anomalous measurements more readily recognised. Interpretation of anomalies is itself highly instructive, but forms another paper. In this paper, a global data set of some 5000 source rock samples is assembled from the open literature and released data (e.g. open file reports) and the results discussed to produce practical oil-industry interpretations from basic screening data. A complex con- clusion can be extracted from simple data sets and are supported by mass balance and kinetic theory. It is concluded that interpretation always falls back on a comparison of new data with pre-existing knowledge in the form of tables and plots. Total organic carbon (TOC) values are generally log-nor- mally distributed so that using mean + standard deviation values will under-estimate the upside poten- tial when fed into risked (probabilistic) hydrocarbon charge prediction models. Kerogen type is initially best-determined using plots of Rock-Eval $2 vs. TOC rather than the hydrogen index (HI = S2/TOC) vs. oxygen index (OI = S3/TOC) or "pseudo-van Krevelen" plot. The intercept of the $2 vs. TOC plot predicts the average dead carbon (inertinite) content of the source rock set, with the slope correspond- ing to the hydrogen index of the labile component (HIE). Maturity trends of the hydrogen index (vs. Tma× or %Ro) show reversals at high maturities as supported by the kinetics of the thermal breakdown of the three standard kerogen types. At elevated maturities, Type III kerogens have higher hydrogen in- dices than Types I and II kerogens, a feature that must be taken into account when correcting mature kerogens to their original HI values (Hlo). The reduction in hydrogen index is a measure of generation with the corresponding increase in production index (PI = Sl/[Sl +$2]) being effectively a measure of hydrocarbon retention. A cross-plot of HI vs. PI can be interpreted in terms of expulsion efficiencies (expelled = generated minus retained hydrocarbon). Measured data support a pore saturation and/or generation pressure-driven process for expulsion and indicate a limiting pore saturation equivalent to a production index of 0.6 for rich (>2%TOC) source rocks. © 1998 Elsevier Science Ltd. All rights reserved
Key words geochemical interpretation, pyrolysis, screening geochemistry, organic petrography, kerogen type, hydrocarbon generation, expulsion efficiency
INTRODUCTION
This paper is not about the geochemistry of a single sample, well, stratigraphic unit or basin, but about large merged global data sets. The focus of the paper is to help an interested but non-specialist geoscientist (e.g. a petroleum geologist) to address the geochemical aspects of prospect generation or basin evaluation (Cornford, 1998). The important point is that once merged, the data in the form of graphs and tables may be simply grouped or ident- ified by symbol or colour in terms of geography, litho-, bio- or chrono-stratigraphy, lithology, depth, sample type, laboratory, date, well, etc. and the original data sets re-formed if desired.
With the ever-increasing size of corporate data- bases, the petroleum explorationist has access to and may manipulate large numbers of source rock and hydrocarbon analyses. These large data sets
*To whom correspondence should be addressed. E-mail: [email protected].
provide a firm basis for the use of "r isking" in exploration. Risking requires the knowledge of the spread of possible values (e.g. source rock yield in kg hydrocarbon per tonne of rock) in order to use Monte Carlo techniques to give probabilistic esti- mates of hydrocarbon volumes and properties char- ging traps (Cornford, 1993, 1998).
Petroleum geochemistry generally deals with ana- lytical data from both source rocks and migrated hydrocarbons, with a general interpretation requir- ing an opinion on kerogen type, maturity, gener- ation, migration and alteration, together with oil and source rock correlations. This paper restricts its discussion to source rock screening analyses such as TOC, Rock-Eval parameters (Horsfield, 1984; Peters, 1986), vitrinite reflectance and visual kero- gen type and spore colour index (SCI) values. These data were organised and interpreted using the Integrated Geochemical Interpretation geochemical software package, p:IGI. Simple nomograms are discussed below to address aspects of hydrocarbon
519
520 Chris Cornford et al.
genesis based on commonly available screening data.
This geochemical interpretation package allows graphical presentation of data with discrimination of samples by depth, stratigraphy, lithology, sample type or any numeric variable such as TOC content, hydrogen index, etc. This discrimination is achieved by using both colour and symbol palettes, in ad- dition to grouping data by sample sets (e.g. "all Palaeozoic samples from North America with < 30% liptinite and TOC values > 5%"). Such an approach allows the user to interrogate the raw data and define significant trends. Samples either following or falling away from these trends can be grouped and their geochemical or geological signifi- cance investigated. This ultimately leads to an understanding of the underlying variable(s) control- ling the data variability, and hence an ability to predict source rock or oil properties away from sampled locations. A number of trends relating to hydrocarbon source rock properties are considered in this paper.
PHILOSOPHY
While developing a geochemical interpretation software package capable of handling large diverse data sets, the practices adopted by petroleum geo-
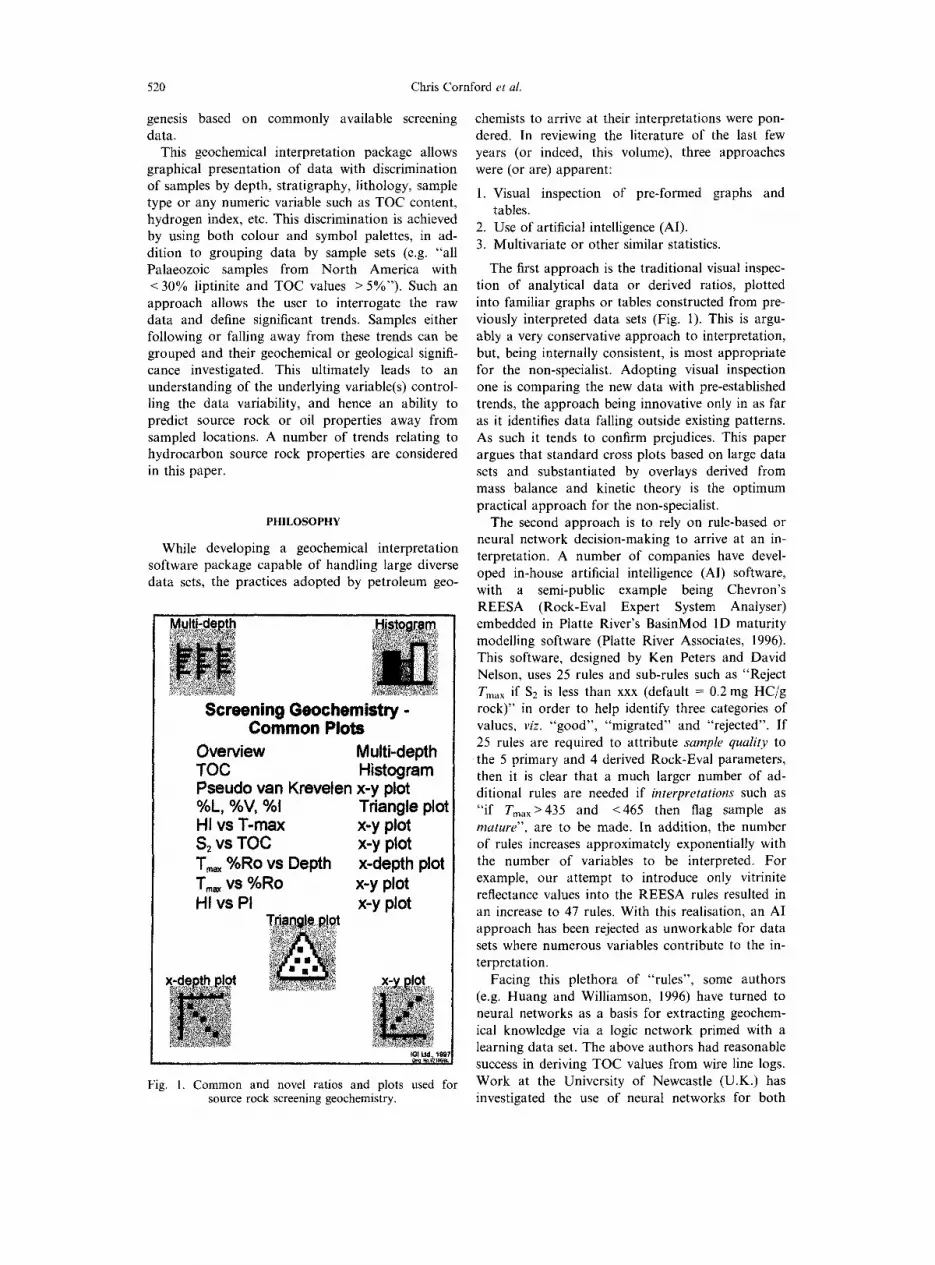
Screening Geochemistry. Common Plots
Overview Multi-depth TOC Histogram Pseudo van Krevelen x-y plot %k, %V, %1 Triangle plot HI vs T-max x-y plot $2 vs TOC x-y plot T~,x %Ro vs Depth x-depth plot T~,x vs %Ro x-y plot HI vs PI x-y plot
x-de~th ~lot
{GI Ltd., 1991 No 07 I ~ k
Fig. 1. Common and novel ratios and plots used for source rock screening geochemistry.
chemists to arrive at their interpretations were pon- dered. In reviewing the literature of the last few years (or indeed, this volume), three approaches were (or are) apparent:
1. Visual inspection of pre-formed graphs and tables.
2. Use of artificial intelligence (AI). 3. Multivariate or other similar statistics.
The first approach is the traditional visual inspec- tion of analytical data or derived ratios, plotted into familiar graphs or tables constructed from pre- viously interpreted data sets (Fig. 1). This is argu- ably a very conservative approach to interpretation, but, being internally consistent, is most appropriate for the non-specialist. Adopting visual inspection one is comparing the new data with pre-established trends, the approach being innovative only in as far as it identifies data falling outside existing patterns. As such it tends to confirm prejudices. This paper argues that standard cross plots based on large data sets and substantiated by overlays derived from mass balance and kinetic theory is the optimum practical approach for the non-specialist.
The second approach is to rely on rule-based or neural network decision-making to arrive at an in- terpretation. A number of companies have devel- oped in-house artificial intelligence (AI) software, with a semi-public example being Chevron's REESA (Rock-Eval Expert System Analyser) embedded in Platte River's BasinMod 1D maturity modelling software (Platte River Associates, 1996). This software, designed by Ken Peters and David Nelson, uses 25 rules and sub-rules such as "Reject Tmax if $2 is less than xxx (default = 0.2 mg HC/g rock)" in order to help identify three categories of values, viz. "good", "migrated" and "rejected". If 25 rules are required to attribute sample quality to the 5 primary and 4 derived Rock-Eval parameters, then it is clear that a much larger number of ad- ditional rules are needed if interpretations such as "if Tm~x>435 and <465 then flag sample as mature", are to be made. In addition, the number of rules increases approximately exponentially with the number of variables to be interpreted. For example, our attempt to introduce only vitrinite reflectance values into the REESA rules resulted in an increase to 47 rules. With this realisation, an AI approach has been rejected as unworkable for data sets where numerous variables contribute to the in- terpretation.
Facing this plethora of "rules", some authors (e.g. Huang and Williamson, 1996) have turned to neural networks as a basis for extracting geochem- ical knowledge via a logic network primed with a learning data set. The above authors had reasonable success in deriving TOC values from wire line logs. Work at the University of Newcastle (U.K.) has investigated the use of neural networks for both


522 Chris Cornford et al.
Hydrogen Index (HI) = S2/TOC l Oxygen Index (01) = S ~ I ' O C
I Production Index (PI) = $1/($1 + $2) Transformation Index (TI) = S1/TOC Potential Yield (PY) = S~ + S 2
80 - 550°C @ 25°C/min
' F He L
ROCK EVAL I PYROLYSIS
'a
TCD
$2 Tmax (calculated
~ nfrOm time and eating rate)
n Time
S 3
m Time FID = Flame Ionization Detector; TCD = Thermal Conductivity Detector 97127:
Fig. 3. Cartoon of the Rock-Eval pyrolysis apparatus, measured parameters and derived ratios (FID = flame ionisation detector; TCD = thermal conductivity detector).
(Py = pyrolysate; %TOC = TOC expressed as weight percent of whole rock).
The gradient on the plot thus reflects kerogen quality as defined by hydrogen indices. Since HI values diminish with increasing maturity, samples should ideally be immature or early mature for this interpretation to be valid, though as shown by the maturity arrow in Fig. 5 the HI trend rotates about its intercept on the TOC axis with maturity. The
1000
800
6 0 0 g 1O _= ~, 40o
'1-
2OO
Rock-Eval Source Hydrccarbor Kerogen Types 0 r_ga,is_m sr~_.p o~n_fi_al_ _
,,0ae ' . . . . . -t(plankton)~ . . . .
I ~ P " I | Oil- ~ L - _ ~ . . . . . . . . ~ . . . . . . =-- prone - • I iBacterially I ~ _ _ ~ degraded
f.-,~I':':::t I m~x=res i Resn, I and
~ , ~ ' ~ - . . . . . . y- cuticle, ~ 'oondensate -:.j'~:IP/" j ~ * p o r e s J prone l . r . . . . . . . . . . . . . . .
- - - . ~ - - - - - ~ - 1 - ugno- ~__ Gal- a ~[~.=1 ~ . cellulosic A r prone---
tissue,
• " " - I . . . . . . . . , wg~ I No ootenUal
50 100 150 Oxygen Index (mg/g TOC)
Changes with maturation
Fig. 4. Typical pseudo-van Krevelen diagram illustrating the confusion of kerogen type end members, mixes and
maturity effects with respect to hydrocarbon potential.
intercept on the TOC axis is thus essentially inde- pendent of sample maturity.
Most sets of immature-early mature samples gen- erally produce S2/TOC trends that do not pass through the origin of the plot (Fig. 6), the trend projecting to a positive TOC value for zero $2 yield (Fig. 5, solid line). This intercept has been inter- preted by Langford and Blanc-Valleron (1990) as the absorptive capacity of the mineral matter. However, in our data sets we note a strong corre- lation of the intercept TOC value with visual esti- mates of inertinite content taken as an area % of the microscope slide. This suggests that the inter- cept TOC value largely reflects the wt% dead car- bon (DC), Here dead carbon is defined as organic matter that contributes nothing to the $2 pyrolysate yield and equates to Inertinite (from microscopy) or Type IV kerogen (from Rock-Eval pyrolysis). A re- calculated dead carbon-free or labile hydrogen index (Hit.) may then be defined:
Hi t = S2/(TOC - DC )
Eliminating the effects of dead carbon on hydrogen index thus allows an improved discrimination of kerogen type compared with the conventional pseudo-van Krevelen plot (Fig. 4).
As an example, a suite of rocks apparently con- taining Type II kerogen with a mean TOC of 5% and HI value of 500 mg/g TOC is shown to contain 0.3 fraction by weight of dead carbon from the TOC intercept (i.e. 30% of the total organic carbon comprises dead carbon, DC). Eliminating the 1.5%

Geochemical truths 523
4 0 1 ISLOPE = SJ(TOC-DC) = HI' = 585 (mgSJgAC) l
, . 3 0 1 . . . . . . . _T_,__. ~'~..~ ~ ~ l l " I Note Slope decreases with I
/ o~;':o"o~am%'=; ~-'PJ'-~,~'" I maturati°n'butocvalue I J . ~ . I remains constant I
20 4 .. '7 = - " / "H, = assi "1 " ........... "'".'-° / . ~ ~ Reworked carbon or
u~ 10 J ...'~" ' ~ ~ ~ 7 2"~'5 ! ~ inertinite rich / ... j l ~ .- ~ m - , l .Y ~ [ , INB: TOC = A C T I V E C A R B O N (AC)I
0 • .
0 2 4 6 8 10
TOC (wt %)
Fig. 5. A more detailed determination of kerogen type in immature and early mature kerogens using Rock Eval $2 vs. TOC plot to determine the amount of dead carbon, as a basis for calculating a dead
carbon-free hydrogen index values (HIL).
DC (0.3x5%TOC), produces a HIL value of 710 mg/g TOC. It is now clear that these rocks ap- proximate to a mix of Type I and Type IV kerogen (algal + inertinitic kerogen) and represent a differ- ent organo-facies than that implied by a Type II kerogen (bacterially degraded algal or exinitic kero- gen).
Having eliminated the dead carbon (DC), the HIE value can be displayed as a line on a triangular plot of Type I, Type II and Type III kerogen based on end-member hydrogen indices (Fig. 7 upper). As presented, this plot is only valid for immature and early mature kerogens: an approach for more mature kerogens is discussed below.
The combination of kerogen types will decide exactly where on the HIE line the kerogen mix lies (i.e. pure Type II or a mix of Types I and III kero- gens). This distinction may be best determined from the ratio of amorphous to particulate liptinites (from microscopy) or from pyrolysis gas-chroma- tography fingerprints (Burwood et al., 1995; Horsfield, 1984). Only organic petrography is routi- nely available as screening analyses (Fig. 7 lower), particularly in historical data sets. The equivalence of pyrolysis kerogen type and optical kerogen ter- minology inferred from a comparison of the upper and lower tri-plots in Fig. 7 is discussed in Cornford (1998).
MATURITY EFFECTS
Hydrogen index (HI) vs. Rock-Eval Tmax plots (Fig. 8) may be used to demonstrate kerogen type if maturity is known, or maturity if kerogen type is known. In practice, the trend of values reflects the residual hydrocarbon potential in terms of a
decrease in HI with increasing maturity. The decrease in hydrogen index values with increasing maturity thus reflects the generation of hydrocarbon in terms of the conversion of the $2 pyrolysate yield to the Sl free hydrocarbon yield plus expelled oil.
As shown in Fig. 8, Types I and II kerogen start with high hydrogen indices (e.g. 900 and 600 mg/g TOC, respectively) compared with Type III kero- gens (e.g. HI = 180 mg/g TOC), but by late matur- ity (e.g. Tma×>460°C), the situation is strongly reversed. The exhausted Type II kerogen now has hydrogen indices of 50 mg/g TOC while the Type III kerogen with stronger bonds retains its hydro- gen indices at about 100 mg/g TOC. This reversal is exactly what is expected based on the differences in activation energy (Ea) distributions. The higher Ea values of Type III kerogen predict the retention of higher hydrogen indices at elevated levels of matur- ity. A singular kerogen type is likely to require its own Tmax calibration: for example generation from a sulphur-rich Type IS (Sinninghe-Damste et al., 1993) or IIS kerogen (Orr, 1986) produces a re- duction in hydrogen index at anomalously low maturity levels. An interpretational overlay to Fig. 8 may thus be derived from transformation ratios cal- culated from activation energy distributions and fre- quency factors via the Arrhenius equation (Cornford, 1998). Applying this overlay to the HI VS. Tma x plot containing the world-data set pro- duces envelopes consistent with the cross-over of the Type I and II and Type III trends (Fig. 9).
Standard LLNL kerogen kinetics (activation energies and frequency factors), used in Platte Rivers BasinMod software (Platte River Associates, 1996; Waples and Marzi, 1998), can be used to cal- culate transformation ratios for the three kerogen

524 Chris Cornford et al.
e 0
@ e e • e
• o~ e ~ o
I I I I 1 ~
++ • • • O 0 +
O
®o
@ 0
0
O
8
0
e ~
e Q
0
O
~n
0
k:,~/'
T 8 8 _ e , = = ' ~
m e e O 0
'~,;
n~
® O ®
o
® O
O
0 0
0
0
0 0 0
o
IM
,I.-=
bb
0
;>
©
0 I,,,-,
0
LT.,
(U5:4) zS

Geochemical truths 525
'N RPRETING I DEAD C A R B O N FREE I l o / ~.9o
3ol \7o , o'o ~,"~ 4o 60 ¢-
10 20 30 40 50 60 70 80 90 % TYPE II
I PRESENTING I TYPE DATA
ORGANIC PETF
10 20 30 40 50 60 70 80 90 % I N E R T I N I T E
Fig. 7. Triangular plots of kerogen type based on pyrolysis HI values of immature-early mature end members with iso-HI lines (upper) and visual estimates of area % of kerogen particles from organic petrography (lower). An average HIL value represents a line on the upper plot, whilst most kerogens
plot as mixtures which can be related to survival during deposition (lower plot).
types at a burial/heating rate of approximately 2°C/ m.y. (Table 1). This is a geologically common heat- ing rate, equating, for example, to a geothermal gradient of 40°C/m.y. and sedimentation rate of 50 m/na.y. The maturity-related increase in trans- formation ratios and hence theoretical decrease in predicted hydrogen indices are shown in Fig. 10. These trends form the basis for the three kerogen- type trends in Figs 8 and 9 and again confirm the reversal of HI for kerogen types at higher levels of maturity.
Thus when using Rock-Eval data from late- and post-mature samples as a basis for estimating the
original kerogen type, it must be borne in mind that the highest hydrogen indices represent the orig- inally least oil-prone kerogens. The triangular plot shown for low maturity kerogens in Fig. 7 can be modified to that shown in Fig. 11 for late mature kerogens (Tmax=465°C). The HI values for the apices of the triangle for any maturity level may be taken from Table 1. At high maturity levels, the variation of HI values for the kerogen end-members is small, and hence the sensitivity of the diagram is restricted. In this case, organic petrography descrip- tions may be of even greater assistance in establish- ing the original organic input since microscopy can

526 Chris Cornford et al.
Rock-Eval Hydrogen Index (mg Py/g TOC) 0 100 2 0 0 3 0 0 4 0 0 5 0 0 6 0 0 7 0 0
4 0 0 Ict at ~15°C ~peratures
4 2 0
O 9... 440
E I-- ¢o 4 6 0 > v ' o o 4 8 0 rY
500
520
Hydrogen Indices reversed 1 at high maturities J
a r e r T.,=
)~erature)
Fig. 8. Hydrogen index (HI) vs. T,,,x trends demonstrating kerogen type if maturity is known or matur- ity if kerogen type is known. Note the reversal of HI for kerogen types at higher levels of maturity.
define particle form and hence original type even at high levels of maturation.
E X P U L S I O N EFFICIENCY F R O M PYROLYSIS DATA
If, in a data set covering a range of maturities and with an homogenous kerogen type, the re- duction in hydrogen index (S2/TOC) is a measure of generation and the corresponding increase in production index (St/Si + $2) is a measure of hydro- carbon retention, then a cross-plot of HI vs. PI can be interpreted in terms of expulsion efficiencies
(expelled = generated minus retained).
Generation = (HIinit - HIobs) x TOC kg/tonne,
Retention = (Sl(obs))
= Plobs x S2(obs))(l -- Plobs) kg/ tonne
Consider an initial production index (PIinit) of 0.05 for an immature kerogen with 6% TOC and initial
hydrogen index (HIinit) of 900 mg Py/g TOC. In a closed system this source rock will produce an $2 value of 54kg Py/tonne (900x0.06) and as the hydrogen index decreases with maturation will
0
400
420 i c ~
440
480 - O ~O
500 o
©
520
I H~ (mg/gTOC) I 100 200 300 400 500 600
I I r i I I J J I I ~ I I
T pe,,, e o . .
o i o _o x . -~u.o~O /,lees '
oo
o o - ? @ ,%o% o
700 800 900 [ = I J
T y p e I /
$ 2 (kg/tonne)
• 0.0 - 10.0
• lO.O- 2o.o • 2o.o-3o.o O 30.0 - 40.0
40.0 - 50.0
Fig. 9. Large data set differentiated by kerogen type on a Hydrogen Index (HI) vs. Tin,× plot. The kerogen type overlay derived from kerogen kinetics.
Geochemical truths 527
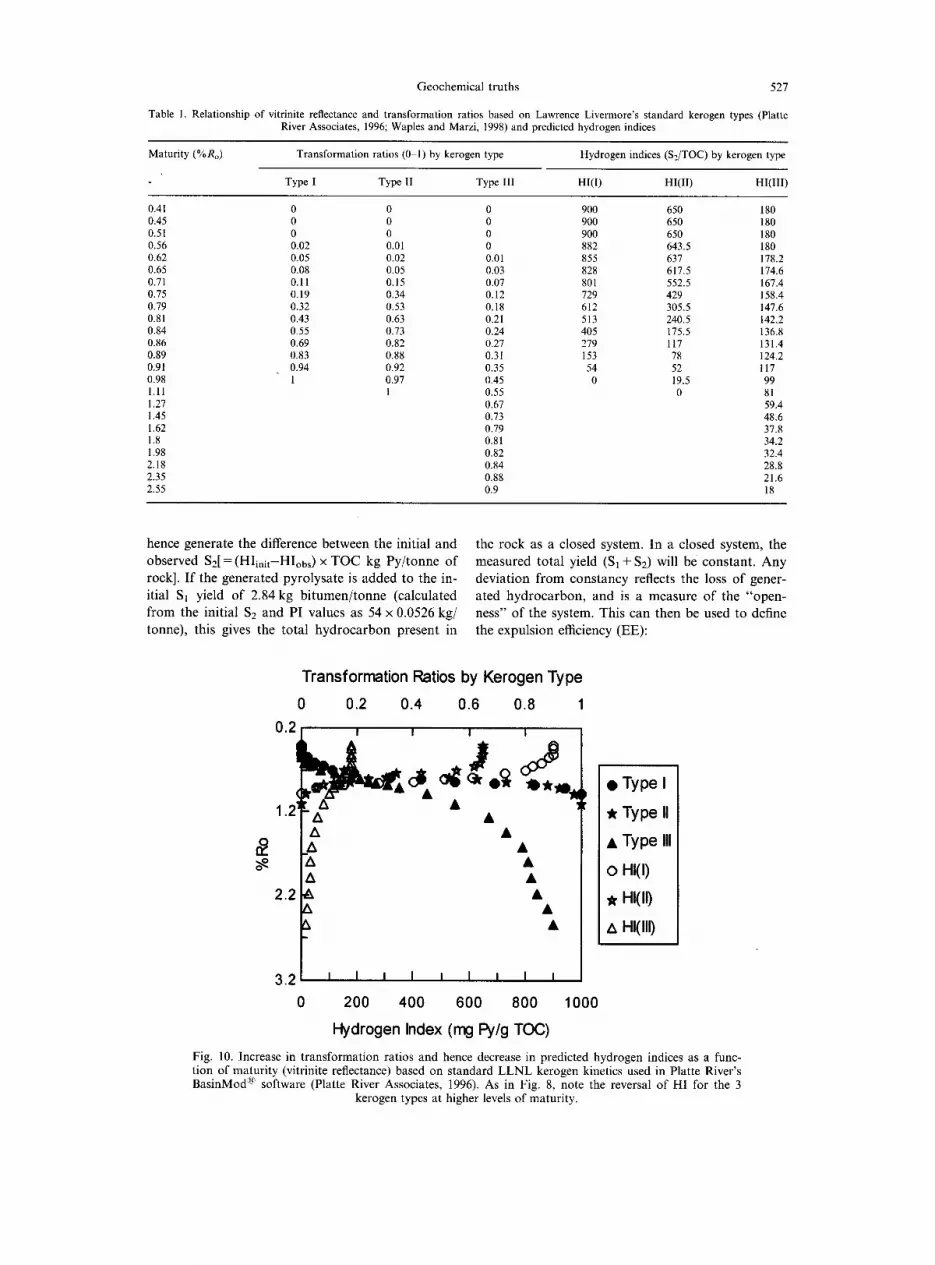
Table 1. Relationship of vitrinite reflectance and transformation ratios based on Lawrence Livermore's standard kerogen types (Platte River Associates, 1996; Waples and Marzi, 1998) and predicted hydrogen indices
Maturity (%Ro) Transformation ratios (0 1) by kerogen type Hydrogen indices (S2/TOC) by kerogen type
Type I Type I1 Type III HI(I) HI(II) HI(Ill)
0.41 0 0 0 900 650 180 0.45 0 0 0 900 650 180 0.51 0 0 0 900 650 180 0.56 0.02 0.01 0 882 643.5 180 0.62 0.05 0.02 0.01 855 637 178.2 0.65 0.08 0.05 0.03 828 617.5 174.6 0.71 0.11 0.15 0.07 801 552.5 167.4 0.75 0.19 0.34 0.12 729 429 158.4 0.79 0.32 0.53 0.18 612 305.5 147.6 0.81 0.43 0.63 0.21 513 240.5 142.2 0.84 0.55 0.73 0.24 405 175.5 136.8 0.86 0.69 0.82 0.27 279 117 131.4 0.89 0.83 0.88 0.31 153 78 124.2 0.91 0.94 0.92 0.35 54 52 117 0.98 1 0.97 0.45 0 19.5 99 1.11 1 0.55 0 81 1.27 0.67 59.4 1.45 0.73 48.6 1.62 0.79 37.8 1.8 0.81 34.2 1.98 0.82 32.4 2.18 0.84 28.8 2.35 0.88 21.6 2.55 0.9 18
hence g e n e r a t e the d i f ference b e t w e e n the ini t ial a n d
o b s e r v e d $2[= ( H I i n i t - H I o b s ) x T O C kg P y / t o n n e o f
rock]. I f t he g e n e r a t e d p y r o l y s a t e is a d d e d to t he in-
itial Sl yield o f 2.84 kg b i t u m e n / t o n n e ( ca l cu la t ed
f r o m the ini t ia l $2 a n d PI va l ue s as 54 x 0 .0526 kg /
t onne ) , th is g ives the to ta l h y d r o c a r b o n p r e s e n t in
the rock as a c losed sy s t em. In a c losed s y s t e m , the
m e a s u r e d to t a l yield (SI + $2) will be c o n s t a n t . A n y
d e v i a t i o n f r o m c o n s t a n c y reflects the loss o f gene r -
a t ed h y d r o c a r b o n , a n d is a m e a s u r e o f the " o p e n -
n e s s " o f the sy s t em. T h i s c a n t h e n be u s e d to def ine
the e x p u l s i o n efficiency (EE):
1.2 - A A
-n A
2.2 ,A Z~ Lx
Transformation Ratios by Kerogen Type
0 0.2 0.4 0.6 0.8 1 0.2
I I I I I I I I I 3.2 0 200 400 600 800 1000
Hydrogen Index (mg Py/g TOC)
• Type I
, Type II
• Type III
o HI(I)
HI(II)
A HI(Ill)
Fig. 10. Increase in t ransformation ratios and hence decrease in predicted hydrogen indices as a func- tion of maturi ty (vitrinite reflectance) based on standard L L N L kerogen kinetics used in Platte River's BasinMod ~" software (Platte River Associates, 1996). As in Fig. 8, note the reversal of HI for the 3
kerogen types at higher levels of maturity.
528 Chris Cornford et al.
ESTIMATING ORIGINAL HYDROGEN INDEX AND
HENCE PYROLSIS YIELD / ~ FROM POST-MATURE l O / ~9o
KEROGEN 20 ~ -, \ 80 7 \- INe: rmax..48s'Cl
30.7. N..zo , , ,~ / ~ a n \ k , Rtcv 40 60 "z- o/
...k,o
~ xf I I I I I E r ~ ,o 20 30 40% #OE 1160 70 80 90 ~rt'o=*UUl I
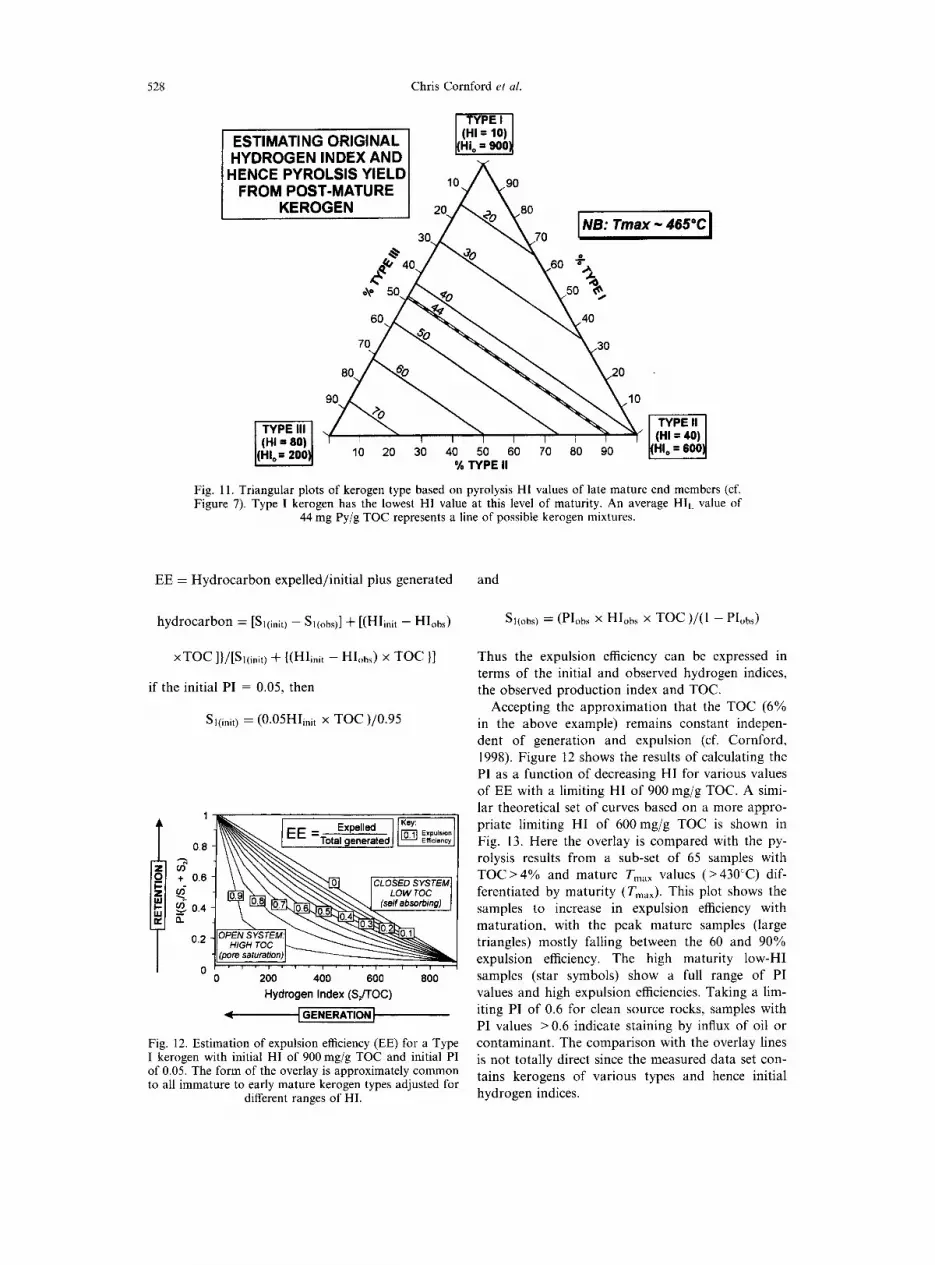
Fig. 11. Triangular plots of kerogen type based on pyrolysis HI values of late mature end members (cf. Figure 7). Type I kerogen has the lowest HI value at this level of maturity. An average HIL value of
44 mg Py/g TOC represents a line of possible kerogen mixtures.
EE = Hydrocarbon expelled/initial plus generated
hydrocarbon = [Sl<init) - Sl(obs)] Jr- [ (HI in i t - H l o b s )
xTOC ]}/[Sl( ini t) -{- { (Hl in i t - Hlob~) x TOC }]
if the initial PI = 0.05, then
Sl(init) = ( 0 . 0 5 H I i n i t x T O C )/0.95
I EE = Expelled o g,°,r=ed, , - - E O,o0y,
+ o, \ \ \ \ ~ " { . O j l eLOSEO svsrEul I ~ ; ~ _ \ ~ ~ I LOW TOO I
HIGH TOC ~ ~ ~ . - , , , . ~ " ~ (pore saturation)l ~ ~
200 400 600 800
Hydrogen Index (SJTOC)
I GENERATION}
Fig. 12. Estimation of expulsion efficiency (EE) for a Type I kerogen with initial HI of 900 mg/g TOC and initial PI of 0.05. The form of the overlay is approximately common to all immature to early mature kerogen types adjusted for
different ranges of HI.
and
Sl(obs) = (Plobs × HIobs × TOC )/(1 - Plobs)
Thus the expulsion efficiency can be expressed in terms of the initial and observed hydrogen indices, the observed production index and TOC.
Accepting the approximation that the TOC (6% in the above example) remains constant indepen- dent of generation and expulsion (cf. Cornford, 1998). Figure 12 shows the results of calculating the PI as a function of decreasing HI for various values of EE with a limiting HI of 900 mg/g TOC. A simi- lar theoretical set of curves based on a more appro- priate limiting HI of 600 mg/g TOC is shown in Fig. 13. Here the overlay is compared with the py- rolysis results from a sub-set of 65 samples with TOC > 4% and mature Tma x values (> 430°C) dif- ferentiated by maturity (Tm,,x). This plot shows the samples to increase in expulsion efficiency with maturation, with the peak mature samples (large triangles) mostly falling between the 60 and 90% expulsion efficiency. The high maturity low-HI samples (star symbols) show a full range of PI values and high expulsion efficiencies. Taking a lim- iting PI of 0.6 for clean source rocks, samples with PI values > 0.6 indicate staining by influx of oil or contaminant. The comparison with the overlay lines is not totally direct since the measured data set con- tains kerogens of various types and hence initial hydrogen indices.

Geochemical truths 529
1.o-
0 . 8
~" 0.6-
~- 0.4
0.2-
0.0-
o
Oil-stained
200 400 600 HI (mg/gTOC)
EE : 20%
EE : 40%
EE = 60%
EE : 80%
EE : 90%
T-max (°C) • 430- 435 • 435-44O • 44o-445 • 445-450
I 450-455 800 ~5.4eo
-~. >460"C
Fig. 13. Plot of production index (PI) as a function of decreasing hydrogen index (HI) for 65 samples. This data set suggests EE values of 60 90% for fully mature samples with reference to the set of theor-
etical curves.
The combination of the theory of Fig. 12 and the observed data for Fig. 13 provides confirmatory evi- dence for a pore saturation or generation pressure driven model for oil expulsion from clastic source rocks (Mann et al., 1997; Cornford, 1998).
SUMMARY AND CONCLUSIONS
Complex conclusions can be extracted fi'om simple data sets and supported by theoretical con- siderations. In practice, interpretation always falls back on a comparison of new data with pre-existing knowledge (tables and plots of raw data and ratios). A global data set of published screening geochemis- try from some 5000 source rock samples was used to establish general interpretation plots. The follow- ing conclusions were drawn:
• TOC values are generally log-normally distribu- ted so that using mean+s tandard deviation under-estimates the upside potential when fed into risked (probabilistic) hydrocarbon charge prediction models.
• Kerogen type is best determined using plots of $2 vs. TOC rather than the HI vs. OI (pseudo-van Krevelen) plot. The intercept of the plot predicts the average dead carbon (inertinite) content of source rocks, with the slope the labile hydrogen index (HIL).
• Maturity trends of hydrogen index (vs. Tmax or %Ro) for Types I, II and III kerogens cross over at high maturities as supported by LLNL kin- etics. At elevated maturities, Type III kerogens have higher hydrogen indices than Types I and II kerogens, a feature that must be taken into
account when estimating the original HI values (Hit) for mature kerogens
• The reduction in hydrogen index (S2/TOC) is a measure of generation and the corresponding increase in production index (S]/[SI+S2]) a measure of hydrocarbon retention in a source rock. A cross-plot of HI vs. PI can be interpreted in terms of expulsion efficiencies (expelled = gen- erated minus retained). Measured data supports a rock pore saturation and/or pressure-driven pro- cess for expulsion and indicates a limiting pore saturation equivalent to a production index of 0.6.
Finally, it can be concluded that there is a vast amount of simple screening data in the literature that has barely been touched in terms of inter-pub- lication interpretation.
REFERENCES
Barth, T., Seim, M., Christy, A. A. and Kvalheim, O. M. (1995) Maturity trends in asphaltenes from pyro- lysed source rocks and natural coals: multivariate mod- elling of diffuse reflectance Fourier-transform infrared spectra. Organic Geochemistry 23, 139-159.
Burwood, R., De Witte, S. M., Mycke, B. and Paulet, J. (1995) Petroleum geochemical characterisation of the Lower Congo coastal basin Bucomazi Formation. In Petroleum Source Rocks, ed. B. J. Katz. Springer Verlag, Berlin, pp. 235-263.
Christie, O. H. J., Cornford, C., Endresen, U., Auxi6tre, J.-L., Pittion, J.-L. and Noyau, A. (1993) Prediction of North Sea source rock burial depth and oil generation depth, and a migration distance modelling technique based on sterane and triterpane data. In Extended Abstracts, 16th International Meeting on Organic Geochemistry, Stavanger, ed. K. Oygard. pp. 212-216.

530 Chris Cornford et al.
Cornford, C. (1993) Risked basin efficiency calculations for the Central Graben, North Sea. In Extended Abstracts, 16th International Meeting on Organic Geochemistry, Stavanger, ed. K. Oygard. pp. 80-86.
Cornford, C. (1998) Source rocks and hydrocarbons of the North Sea. In Introduction to the Petroleum Geology of the North Sea, 4th edn, ed. K. W. Glennie. Blackwell, Oxford, pp. 376-462.
Horsfield, B. (1984) Pyrolysis studies and petroleum exploration. In Advances in Petroleum Geochemistry, eds. J. Brooks and D. H. Welte, Vol. 1. Academic Press, London, pp. 247 298.
Huang, Z. and Williamson, M. A. (1996) Artificial neural network modelling as an aid to source rock characteriz- ation. Marine and Petroleum Geology 13, 277-290.
Irwin, H. and Meyer, T. (1990) Lacustrine organic facies. A biomarker study using multivariate statistical analy- sis. Organic Geochemistry 16, 197 210.
Langford, F. F. and Blanc-Valleron, M.-M. (1990) Interpreting Rock-Eval pyrolysis data using graphs of pyrolyzable hydrocarbons vs. total organic carbon. American Association o[' Petroleum Geology Bulletin 74, 799 804.
Larter, S., Aplin, A., Macleod, G., Yang, Y., Bennett, B., Bowler, B. and Carruthers, D. (1998) Constraints and calculations in basin modelling. Abstract from Geoscience '98 Meeting, University of Keele, U.K., 14- 18 April, p. 55.
Mann, U., Hantschel, T., Schaefer, R. G., Kroos, B., Leythaeuser, D., Littke, R. and Sachsenhofer, R. F.
(1997) Petroleum migration: mechanisms, pathways, effi- ciencies, and numerical simulations. In Petroleum and Basin Evolution, eds. D. H. Welte, B. Horsfield and D. R. Baker. Springer Verlag, Berlin, pp. 403-489.
Orr, W. L. (1986) Kerogen/asphaltene/sulfur relationships in sulfur-rich Monterey oils. Organic' Geochemistry 10, 499-516.
Peters, K. E. (1986) Guidelines for evaluating petroleum source rock using programmed pyrolysis. American Association of Petroleum Geology Bulletin 70, 318-329.
Platte River Associates (1996) BasinMod I D .for Windows: Basin Modelling System. Commercial Sqftware Manual. Platte River Associates, Boulder, Co, U.S.A.
Sinninghe-Damste, J. S., de las Heras, F. X., van Bergen, P. F. and de Leeuw, J. W. (1993) Characterization of Tertiary Catalan lacustrine oil shales: discovery of extre- mely organic sulphur-rich Type 1 kerogens. Geochimica et Cosmochimica Acta 57, 389 415.
Telnaes, N. and Dahl, B. (1986) Oil oil correlation using multivariate techniques. Organic Geochemistry 10, 425- 432.
Waples, D. W. and Marzi, R. W. (1998) The universality of the relationship between vitrinite reflectance and transformation ratio. Organic Geochemistry 28, 383-388.
Zumberge, J. E. (1987) Prediction of source rock charac- teristics based on terpane biomarkers in crude oils: a multivariate statistical approach. Geochimica Cosmochimica Acta 51, 1625-1637.