53. data report: geochemical results from wireline logs at sites 761, 762, and 7641
TRANSCRIPT

von Rad, U., Haq, B. U., et al., 1992Proceedings of the Ocean Drilling Program, Scientific Results, Vol. 122
53. DATA REPORT: GEOCHEMICAL RESULTS FROM WIRELINE LOGSAT SITES 761, 762, AND 7641
Elizabeth Lewis Pratson,2 Xenia Golovchenko,2 Cristina Broglia2
ABSTRACT
Geochemical well logs were obtained at Sites 761, 762, and 764 of Leg 122 on the Exmouth Plateau. Thepreliminary log measurements which were presented in the Initial Reports have been corrected for borehole size,borehole fluids, and logging speed variations. The corrected logs are used to calculate percentages of the naturallyradioactive elements and oxides of the formation. The CaCO3 logs agree well with core-derived carbonatemeasurements from Holes 762C and 764B, and agree less with measurements from Hole 761C. The geochemical logsare found to be useful in refining major lithologic changes in each of the three wells.
INTRODUCTION
Leg 122 was drilled on the Exmouth Plateau, in an oldsediment-starved margin off the northwest coast of Australia.The sites on Leg 122 of the Ocean Drilling Program (ODP)were drilled along two transects: Sites 759, 760, 761 and 764were drilled to study the Triassic to Cenozoic evolution of theWombat Plateau, a small sub-plateau of the northern ExmouthPlateau; Sites 762 and 763 were drilled to study the Cretaceousto Cenozoic passive-margin evolution of the south-centralExmouth Plateau.
Logging was carried out at all six of the sites drilled. Due totime constraints, however, only three of these sites werelogged with the geochemical tool string: Sites 761 and 764 onthe Wombat Plateau and Site 762 on the Exmouth Plateau.Geochemical logs provide continuous measurements of all themajor rock-forming elements. These measurements are usedto derive the weight fraction of the major oxides present in theformation.
This paper will discuss the logging conditions at each of thesites logged with the geochemical tool and review the basicprinciples and modes of operation of the geochemical toolsand the data processing techniques. The results of the post-cruise analysis of the geochemical log data from Sites 761,762, and 764 will then be presented along with carbonate coremeasurements. A brief discussion of how the logs compare tolithologic core descriptions will follow.
DATA ACQUISITIONTo prepare for logging, a wiper trip was made in each of the
logged holes. While weather conditions were favorable, bore-hole instabilities (Site 761) and problems with the hydraulic bitrelease (Site 764) forced logging through pipe with thegeochemical tool. Although electrical and acoustical logs donot work through pipe, nuclear logs can be recorded, as theneutrons from the source and the gamma rays from the forma-tion can penetrate the pipe. The amount of data from theformation gathered by the tool is reduced and the signal-to-noiselevel decreases. Site 762, on the other hand, was logged openhole; therefore, logs at this site provide the most reliable data.
'von Rad, U., Haq, B. U., et al., 1992. Proc. ODP, Sci. Results, 122:College Station, TX (Ocean Drilling Program).
2Lamont-Doherty Geological Observatory of Columbia University, Pali-sades, NY 10964, U.S.A.
In Hole 761C the seismic-stratigraphic tool string was runopen hole. However, a bridge at 260 meters below seafloor(mbsf) prevented logging of the lower portion with this toolstring. Because of the bridge formation in this hole, pipe waslowered to the bottom of the well and the geochemical tool stringwas run through pipe, recording logs from 424 to 58.2 mbsf.
In Hole 762C, a complete pass of all three electrical,acoustical, and nuclear tool strings was run in the followingorder: (1) seismic-stratigraphic tool string, (2) geochemicaltool string, and (3) lithodensity tool string. All three loggingstrings were run successfully in open hole without any prob-lems in the hole.
The hydraulic bit release failed at Hole 764B, preventing anyopen-hole logging. Two logging passes were completed throughpipe-the geochemical logging string and the lithodensity toolstring-both from 265 mbsf to 10 m above the mud line.
GEOCHEMICAL TOOL STRINGThe geochemical logging tool (GLT) string consists of four
separate logging tools: the natural gamma ray tool (NGT), thecompensated neutron tool (CNT), the aluminum activationclay tool, (AACT), and the gamma-ray spectrometry tool(GST; Fig. 1) (GLT, NGT, CNT, AACT, and GST aretrademarks of Schlumberger). The NGT tool is located at thetop of the tool string so that it can measure the naturallyoccurring radionuclides-thorium, uranium, and potassium—before the formation is activated by the nuclear sourcesmounted on other following tools. The compensated neutrontool located below the NGT carries a low-energy neutroncalifornium (Cf252) source which activates the aluminum atomsin the formation. The aluminum activation clay tool, a modi-fied natural gamma-ray tool which follows the Cf252 source,measures the activated gamma rays in the formation. Bycombining this measurement with the previous NGT measure-ment, background radiation is subtracted out and a reading offormation aluminum (Al) is obtained (Scott and Smith, 1973).Finally, the gamma-ray spectrometry tool, located at thebottom of the tool string, uses a pulsed neutron generator tobombard the borehole, and a detector to measure the spec-trum of capture gamma rays generated by neutron capturereactions. Because each of the elements in the formation ischaracterized by a unique spectral signature, it is possible toderive the contribution (or yield) of the major elements silicon(Si), iron (Fe), calcium (Ca), titanium (Ti), sulfur (S), gadolin-ium (Gd), and potassium (K) from the measured spectrum.The gamma-ray spectrometry tool also measures hydrogen
861

DATA REPORT
TCCB
NGT
CNT-G
AACT
GST
D
DD
DD
D
D
Telemetry Cartridge
Natural Gamma Ray Tool: measures naturally radioactiveelements thorium, uranium, and potassium
Dual-Porosity Compensated Neutron Tool: Measuresneutron porosity in the thermal and epithermal energy ranges
Thermal detectors
Californium 252 source
Epithermal detectors
Aluminum Activation Clay Tool: Measures aluminumactivation and natural count rates as it passes the formationactivated by Californium 252
Gamma Ray Spectrometry Tool: Measuresconcentration of calcium, silicon, iron, sulfur,gadolinium, titanium, hydrogen, chlorine, andformation capture cross section
Neutron accelerator
Figure 1. The geochemical tool string as it is run for ODP and the elements measured by each tool.
(H) and chlorine (Cl), but these elements are not used indetermining the rock geochemistry.
The only major elements not measured by the geochemicaltool string are magnesium (Mg) and sodium (Na). The neu-tron-capture cross-sections of these elements are too small tobe detected by the gamma-ray spectrometry tool. An estimateof their abundances can be made using the photoelectric factor(PEF) from the lithodensity tool when it is run open hole.
PROCESSING OF GEOCHEMICAL LOG DATAThe well log data from the Schlumberger tools are trans-
mitted digitally up a wireline, and are recorded and processedaboard the JOIDES Resolution in the Schlumberger CyberService Unit (CSU). The results from the CSU are made
available as "field logs" for initial interpretation while at sea.Subsequent reprocessing is necessary to further correct thedata for hole size changes, the effects of fluids added to thewell, and variations in logging speed. Processing of thespectrometry data is required in order to transform the rela-tive elemental yields into oxide weight fractions.
The processing is done using a set of log interpretationprograms written by Schlumberger. The processing steps aresummarized below.
1. Reconstruction of 10 relative elemental yields from recordedspectral data.
The first program uses a least-squares method to comparethe measured spectra from the geochemical spectrometry tool
862
DATA REPORT
with a series of standard spectra to determine the relativecontribution (or yield) of each element. Whereas only sixelemental standards are used to produce the yields at sea,during processing at Lamont-Doherty three additional stan-dards (Ti, Gd, K) are utilized. Although these three elementsoften occur in very low concentrations in the formation, theycan make a large contribution to the measured spectra becauseof their large neutron-capture cross-sections. The capture cross-section of Gd, for instance, is 49,000 barns (lO~^m2); that of Siis 0.16 barns (Hertzog et al., 1987). Therefore, Gd, althoughoccurring in very small abundances in the formation, must beincluded when calculating a best fit between the measured andthe standard spectra. This best-fit analysis gives Si, Ca, Fe, Ti,Gd, S, H, Cl, and K as final yields. Before any further manipu-lation of the yields is done, a 10-point smoothing filter is appliedto reduce the amplitude of noise in the data. The iron yield is alsocorrected for effects of the steel in the drill pipe and thebottom-hole assembly (BHA) by applying an appropriate offset(see the logging section of the Initial Reports, Haq, von Rad,O'Connell, etal., 1990).
2. Calculation of total radioactivity and Th, U, and Kconcentration.
The second routine estimates the total gamma radiation,along with the concentrations of Th, U, and K, using thecounts in five spectral windows from the natural gamma-raytool (Lock and Hoyer, 1971). Again, this is very similar toshipboard processing. One of the main differences, however,is the use of a caliper curve to correct for borehole sizechanges. A second difference is the complexity of filtering.Because statistical errors in the logs often create erroneousnegative readings and anti-correlations (especially between Thand U), a Kalman-type filter (Ruckenbusch, 1983) is applied toreduce these effects. A slightly more sophisticated version ofthe Kalman filter is available for shore-based processing. Theshore-based program also allows for an estimate of potassiumfrom the drilling mud in the hole to be calculated and cor-rected for. This K correction is particularly useful in ODPwells where KC1 is typically added to the drilling mud. Theoutputs of this program are K (wet weight percent, or wt%), U(ppm), and Th (ppm), along with a total gamma-ray curve anda computed gamma-ray curve (Th + K).
3. Calculation ofAl concentration.
The third routine calculates Al using four energy windowsfrom the aluminum activation clay tool, while simultaneouslycorrecting for borehole fluid neutron-capture cross-section, for-mation neutron-capture cross-section, formation slowing-downlength, and borehole size. Porosity and density curves wereinput from core data from Holes 761C and 764B, and from thelithodensity string in Hole 762C; these curves are used to convertAl and K to dry wt%. A correction is also made for the Si in theformation, which can become activated by the Cf252 source,causing a reaction which produces the aluminum isotope Al28.Because this silicon reaction creates a direct interference withthe aluminum calculation (Hertzog et al., 1987), the programuses the silicon yield from the gamma-ray spectrometry tool todetermine the silicon background correction. The program out-puts dry weight percent (wt%) of Al and K, which are used in thenormalization process for calculating the remaining elements.
4. Photoelectric factor corrections.
In the fourth routine, a photoelectric factor (PEF) curve,which is used in the calculation of Mg + Na, is corrected fortool standoff from the borehole wall and then converted to adry wt% reading. This was done for Hole 762C, the only wellin which the lithodensity tool (which gives PEF) was run
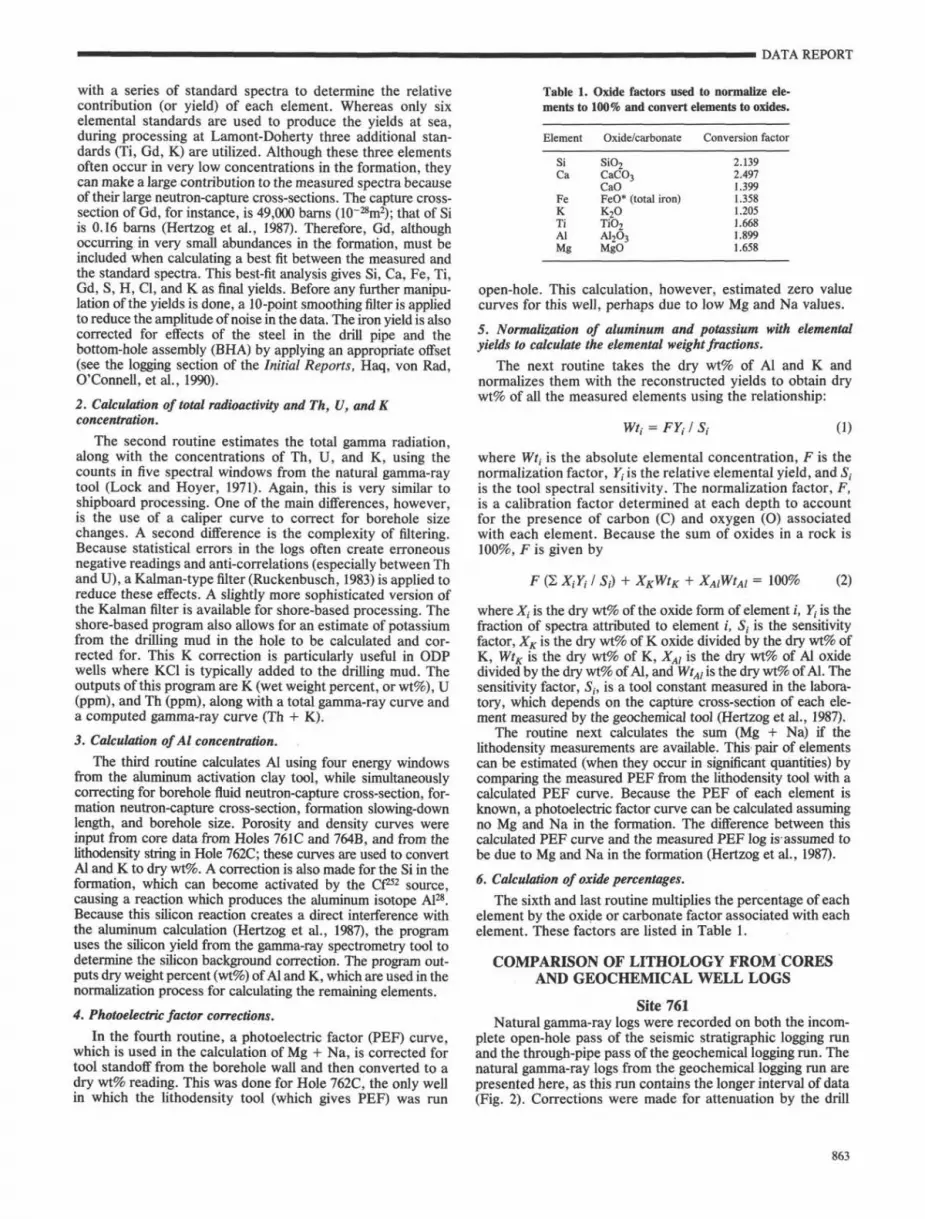
Table 1. Oxide factors used to normalize ele-ments to 100% and convert elements to oxides.
Element
SiCa
FeKTiAlMg
Oxide/carbonate
SiO2
CaCO 3
CaOFeO* (total iron)K2OTiO 2
A12O3
MgO
Conversion factor
2.1392.497
.399
.358
.205
.668
.899
.658
open-hole. This calculation, however, estimated zero valuecurves for this well, perhaps due to low Mg and Na values.
5. Normalization of aluminum and potassium with elementalyields to calculate the elemental weight fractions.
The next routine takes the dry wt% of Al and K andnormalizes them with the reconstructed yields to obtain drywt% of all the measured elements using the relationship:
= FYi I (1)
where Wtt is the absolute elemental concentration, F is thenormalization factor, Y{ is the relative elemental yield, and 5,is the tool spectral sensitivity. The normalization factor, F,is a calibration factor determined at each depth to accountfor the presence of carbon (C) and oxygen (O) associatedwith each element. Because the sum of oxides in a rock is100%, F is given by
F (Σ XtYt I Si) + XKWtK + XAlWtAl = 100% (2)
where Z, is the dry wt% of the oxide form of element i, Yt is thefraction of spectra attributed to element i, 5, is the sensitivityfactor, XK is the dry wt% of K oxide divided by the dry wt% ofK, WtK is the dry wt% of K, XAl is the dry wt% of Al oxidedivided by the dry wt% of Al, and WtA, is the dry wt% of Al. Thesensitivity factor, 5, , is a tool constant measured in the labora-tory, which depends on the capture cross-section of each ele-ment measured by the geochemical tool (Hertzog et al., 1987).
The routine next calculates the sum (Mg + Na) if thelithodensity measurements are available. This pair of elementscan be estimated (when they occur in significant quantities) bycomparing the measured PEF from the lithodensity tool with acalculated PEF curve. Because the PEF of each element isknown, a photoelectric factor curve can be calculated assumingno Mg and Na in the formation. The difference between thiscalculated PEF curve and the measured PEF log is assumed tobe due to Mg and Na in the formation (Hertzog et al., 1987).
6. Calculation of oxide percentages.
The sixth and last routine multiplies the percentage of eachelement by the oxide or carbonate factor associated with eachelement. These factors are listed in Table 1.
COMPARISON OF LITHOLOGY FROM CORESAND GEOCHEMICAL WELL LOGS
Site 761Natural gamma-ray logs were recorded on both the incom-
plete open-hole pass of the seismic stratigraphic logging runand the through-pipe pass of the geochemical logging run. Thenatural gamma-ray logs from the geochemical logging run arepresented here, as this run contains the longer interval of data(Fig. 2). Corrections were made for attenuation by the drill
863

Figure 2. Processed natural gamma-ray curves from Holes 76IB and 761C. Legend of lithologic units: Unit IB—nannofossil ooze;Unit IC—nannofossil ooze with foraminifers and chert; Unit ID—nannofossil chalk with foraminifers; Unit IIA—nannofossil chalk;Unit HB—nannofossil chalk with foraminifers; Unit HC—nannofossil chalk with bentonite/smectite layers; Unit III—sandstone; UnitIV—limestone; Unit VA—limestone and calcareous claystone; Unit VB—claystone and limestone.
DATA REPORT -

DATA REPORT
_ SPECTRAL GAMMA RAY
2 c I COMPUTED
to § I O~ ~ " ~ APi"un7ts 1~θb I
S J C2Q a. 0
TOTAL
API units 100 0
POTASSIUM
wt.% 2 0
THORIUM
ppm 10 0
URANIUM
ppm 5
Δ zE 3
2 * %
88 5
÷T
11
12
13
14
15
16
17
βmm
2450-
-250IIC
Figure 2 (continued).
pipe and the BHA on the natural gamma-ray curves. The BHAsection from 292 to 410 mbsf is not presented due to theextremely poor quality of the data in this section.
The computed oxide weight fraction and calcium carbonatelogs are displayed in Figure 3. Corrections were applied to theiron yield to account for iron in the pipe and BHA. Calciumcarbonate analyses of core data are displayed alongside thelog-derived calcium carbonate curve. The two measurementsshow an overall correlation; however, the log values are lowerand have a higher variability. A few major discrepancies existbetween the log and core measurements where discrete sam-ples of chert (Samples 122-761B-11X-1, 80-83 cm, and 122-761B-23X-4, 73-75 cm), sandstone (Samples 122-761C-9R-1,145-147 cm, and 122-761C-10R-2, 37-39 cm), and claystone(Samples 122-761C-9R-2, 8-10 cm, and 122-761C-30R-2, 98-100 cm) were analyzed from units that otherwise had highcalcium carbonate concentrations. The logs were unable todetect these anomalous lithologies (1 to 10 cm thick) becauseof the low vertical resolution (50 cm) of the geochemicallogging tools.
Lithologic descriptions divide the sediments into fivemajor units (Haq, von Rad, O'Connell, et al., 1990). Units Iand II are not distinguished on the logs due to the similarchemical nature of oozes and chalks. Unit III (255-259.5mbsf), consisting of silty claystone and sandstone, is atransition zone on the logs, varying from relatively high SiO2
and intermediate CaCO3 wt% at the top of the interval, tolow SiO2 and high CaCO3 at the base of the unit. Thesandstone and claystone of Unit III, which were not wellrecovered in the core, appear from the log data to be moreextensive than the core data indicate (Fig. 2). High thoriumand potassium values are observed from 246 to 260 mbsf.Thorium indicates the presence of heavy minerals, whereaspotassium is associated with feldspar and mica, which oftenoccur as detrital material in sandstone. Unit IV (259.5-338.3mbsf) is predominantly white limestone (with minor amountsof grainstone) and mudstone. Even though Unit IV waspoorly recovered, the limestone and interbedded grainstonecan be readily differentiated on the geochemical logs, par-
ticularly using the CaCO3 curve (Fig. 3). Unit V (338.3-411.0 mbsf) is a sequence of interbedded carbonate mud-stone to grainstone and calcareous claystone to silty clay-stone. The boundary between lithologic Units IV and V isquite distinct on the calcium carbonate and aluminum oxidelogs (Fig. 3), and marks a change in the log character fromlittle variation within the limestone interval above, to highvariation in Unit V below.
Site 762
Natural gamma-ray logs were recorded on each of the threelogging passes. The recomputed natural gamma-ray logs dis-played in Figure 4 are derived from the seismic stratigraphiclogging run, as this pass contained the longest open-holelogging run (902-192 mbsf).
Geochemical logs were recorded open-hole between 502and 906 mbsf. The calculated oxide and carbonate measure-ments for Site 762 are displayed in Figure 5. The calciumcarbonate concentration from core analysis and the calculatedcalcium carbonate curve correlate well. The one noteworthyexception is at approximately 865 mbsf (Sample 122-762C-82X-2, 78-103 cm), where the CaCO3 analysis was made on a25-cm-thick limestone bed interstratified with the silty clay-stones that dominate the lithology of Unit VI.
The natural gamma-ray logs recorded over lithologic UnitsII and III (192.0-554.8 mbsf) show only small amplitudevariation in the nannofossil chalks (Fig. 4). Potassium andthorium values increase near the bottom of Unit III, indicatingan increase in detrital material. Both radioactive elementsdecrease abruptly at the base of Subunit IIIB (Cretaceous/Tertiary boundary). Within Unit IV (554.8-838.5 mbsf), thegamma-ray log values are low except in Subunits IVD andIVE, where the gradual increase in thorium and potassiumindicates a greater component of clay and detrital material inthe nannofossil chalk. This is supported by core analysis,which indicates that calcium carbonate concentration drops aslow as 51% in some of the darker beds. The top of Unit V(835.5-848.5 mbsf) is quite distinct on both the natural gam-ma-ray (Fig. 4) and oxide curves (Fig. 5), marking the change
865

DATA REPORT
IW OCtf QO Lüu 52
I tS3I— LL
ë i |0 % 50|0
2250-
SKX Al-O2 ^ 3% 30
FeO* CaCO- TiO. K000 % 1510 % 100 10 % 2.5 Fθ
2300
2350-
2400-
> DATA RECX5RDED
THRCXIGH PIPE
1
>
-100
-150
-200
HA
IIB
Figure 3. Oxide weight fractions and calcium carbonate at Holes 76IB and 761C. Results of calcium carbonate analyses on coresamples are shown as diamonds.
866

Figure 3 (continued).

DATA REPORT
20
_ SPECTRAL GAMMA RAY
LU (->
Q £E
1550
1600
1650π
1700-
DATA RECORDED
OPENHOLE
e h-
0
0
COMPUTED
API units
TOTAL
API units
100
100 0
POTASSIUM
wt.% 2 0
THORIUM
ppm 12 0
URANIUM
ppm 12
-200
-250
-300
IMA
Figure 4. Processed natural gamma-ray curves from Hole 762C. Legend of lithologic units: Unit IIIB—nannofossil chalk; UnitIVA—nannofossil chalk and clayey nannofossil chalk; Unit IVB—nannofossil chalk with foraminifers and nannofossil claystone;Unit IVD—nannofossil chalk with foraminifers and clayey nannofossil chalk; Unit IVE—nannofossil calcareous chalk and clayeynannofossil chalk; Unit V—calcareous claystone; Unit VI—silty claystone and clayey siltstone.
868

Figure 4 (continued).

Figure 4 (continued).

Figure 4 (continued).

DATA REPORT
IISPECTRAL GAMMA RAY
0
0
COMPUTEDAPI units
TOTALAPI units
100
100 0
POTASSIUM
wt.% 2 0
THORIUMppm 12 0
URANIUMppm 12
2 ^ ^
2250-
-900
VI
Figure 4 (continued).
from siliciclastic sediments in Unit V to pelagic carbonates inSubunit IVE. The change from Unit V (calcareous claystone)to Unit VI (848.5-902.0 mbsf; silty claystone and clayeysiltstone) is seen as a strong baseline shift on the naturalgamma-ray curves (Fig. 4) and a somewhat lesser shift on thealuminum and iron oxide curves (Fig. 5).
Site 764All log data at this site were recorded through pipe, and
therefore the signal from the formation is more attenuatedcompared to the open-hole logs of Site 762. The naturalgamma-ray logs presented (Fig. 6) come from the geochemicallogging run. Corrections have been made to account for pipeattenuation in the natural gamma-ray logs; however, there aresome zones in which the pipe became irradiated (marked withasterisks on the logs) due to pipe movement.
The computed oxides along with carbonate core measure-ments are displayed in Figure 7. Corrections were made to theiron yield to account for iron in the pipe and the BHA.Excellent agreement is seen between the carbonate measure-ments from core and logs despite the adverse logging condi-tions in this hole.
Units I, II, and III, consisting of nannofossil oozes andchalks, cannot be differentiated on either the geochemical ornatural gamma-ray logs (Fig. 6 and 7). The top of Unit IV(49.6-55.9 mbsf) is marked by a sharp uranium peak and aminor increase in thorium, indicating a thin clay bed at the topof the unit. Core recovery within this interval was approxi-mately 30%. The lithologies recovered range from carbonatemudstone, wackestone, and skeletal packstone to grainstone.The top of Unit V (55.9-72.5 mbsf) appears on the logs atapproximately 61.5 mbsf as a pronounced increase on thepotassium, thorium, and aluminum oxide curves. The in-creased clay component in the lithology of Unit V, whichconsists of calcareous claystones and clayey limestones, isconfirmed by these logs.
Unit VI (72.5-280.0 mbsf) is predominantly composed oflimestone, with minor amounts of mudstones, laminated clay-stones, and dolomitic mudstones. Because core recovery wasless than 10% in this interval, subunits of this interval were notidentified. Log analysis, however, shows that this unit canpossibly be subdivided into three intervals on the basis of log
character. The top subunit (84-118 mbsf) is characterized byhigh Th and FeO* (Fe2O3 + FeO) values and low SiO2 andA12O3 values. This suggests that clays are absent and that thehigh gamma-ray signal is probably due to a heavy mineralconcentration. The second subunit (118-200 mbsf) is charac-terized by a higher aluminum concentration throughout thesubunit, and a very low concentration of potassium anduranium in the upper section, gradually increasing toward thebottom of the subunit. The third subunit (200-252 mbsf) ischaracterized by low clay content (low gamma ray and A12O3)and high calcium carbonate (Fig. 6 and 7). However, thechange in log character at this point is questionable due to theincrease in pipe thickness in the BHA at this depth.
CONCLUSIONSThe reprocessing of geochemical logs described above
improves the usefulness of the measurements made in the fieldby providing quantitative measurements which can be com-pared to core. When core data is missing, the reprocessed welllogs are an invaluable data set from which a representativelithologic column can be derived and geology interpreted.
REFERENCES
Haq, B. U., von Rad, U., 0'Connell, S., et al., 1990. Proc. ODP, Init.Repts., 122: College Station, TX (Ocean Drilling Program).
Hertzog, R., Colson, L., Seeman, B., O'Brien, M., Scott, H.,McKeon, D., Wraight, P., Grau, J., Schweitzer, J., and Herron,M., 1987. Geochemical Logging With Spectrometry Tools: Soc.Pet. Eng. Pap., 18:792.
Lock, G. A., and Hoyer, W. A., 1971. Natural gamma-ray spectrallogging. Log Analyst, 12:3-9.
Ruckenbusch, G., 1983. A Kalman filtering approach to naturalgamma-ray spectroscopy in well logging. IEEE Trans. Auto.Control, 28:372-380.
Scott, H. D., and Smith, M. P., 1973. The aluminum activation log.Log Analyst, 14:3-12.
Date of initial receipt: 2 May 1990Date of acceptance: 16 November 1990Ms 122B-188
872

DATA REPORT
ifP
| 5§
40
53
0
SiO 2
% 100 0
AI2O
%3
60 0
FθO*
% 15 0
CaCOg
% 100 0
TiO2
% 5 0
K 2 O
% 7
1900 -
1950-
2000-
§in!α. <
-550
-600
-650
1MB
IVA
IVB
Figure 5. Oxide weight fractions and calcium carbonate at Hole 762C. Results of calcium carbonate analyses on core samples areshown as diamonds.
873
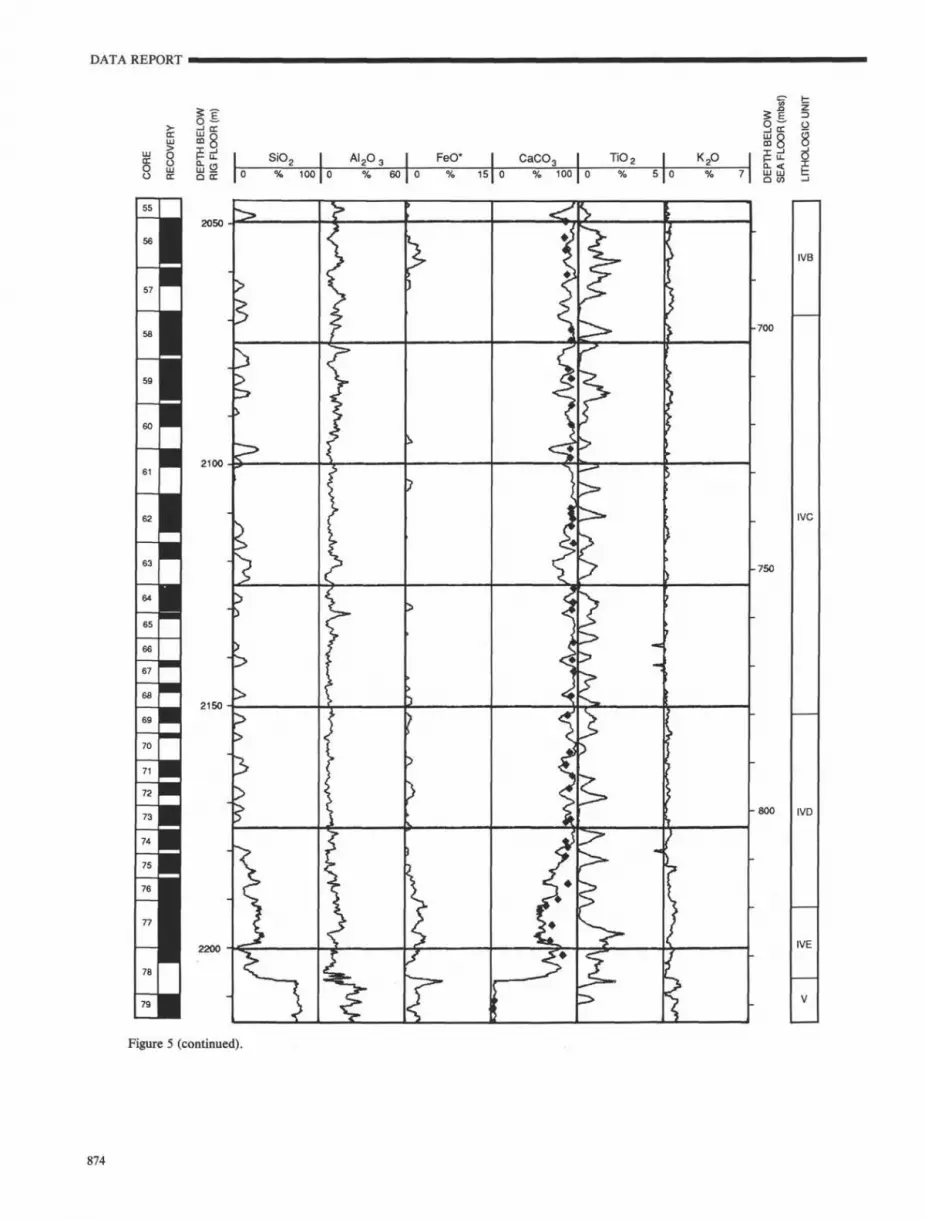
Figure 5 (continued).

DATA REPORT
§ 1
IE>- —i t r
1 li
f z
2 ^ §
SiO, ALO. FeO* CaCO, TiO. K->O
0 % 100 0 % 60 I 0 % 15T0 % 100 0 % 5 0 7 U U J =I Q CΛ -1
88
2250
Figure 5 (continued).
-850
-900
VI
875

DATA REPORT
£5h- U-
Q OC
SPECTRAL GAMMA RAY
COMPUTED0 API units 100
TOTAL0 API units 100 0
POTASSIUMwt.%
Is|o
THORIUMppm 20 0
URANIUMppm 10
0- <LU LUQ «5
2750
-100
-150
VI
Figure 6. Processed natural gamma-ray curves at Holes 764A and 764B. The log peaks at 24.0-30.5 mbsf and 100-106 mbsf(indicated by asterisks) are due to pipe movement and are therefore invalid. Legend of lithologic units: Unit I—foraminifernannofossil ooze; Unit II—nannofossil ooze with clay and foraminifer nannofossil ooze with clay; Unit III—nannofossil chalk andforaminifer nannofossil chalk; Unit IV—fossiliferous wackestone, packstone, and grainstone; Unit V—limestone and calcareousclay stone; Unit VI—boundstone, grainstone, dolomitic clay stone, and rudstone.
876

DATA REPORT
_ SPECTRAL GAMMA RAY
COMPUTED
~APf units 100U* I
uj m δ I IΛ I —I
LU O
o a Sisü QC Q IT
TOTAL0 API units 100 0
POTASSIUMwt.% 5 0
THORIUMppm 20 0
URANIUMppm 10
27
2900-
2950-
S
-200
^250
VI
Figure 6 (continued).
877

DATA REPORT
8 £
rigSiO, AloO. FθO* CaCO< TiO KoO
1
2
3
4
2
3
4
5
6
7
8
9
10
11
12
13
14
15
16
17
18
19
• •
2750
2800
2850
-50
DATA RECORDEDTHROUGH PIPE > < T
-100
-150
VI
Figure 7. Oxide weight fractions at Holes 764A and 764B. Results of calcium carbonate analyses on core samples are shown asdiamonds.
878

Figure 7 (continued).