physical, geochemical and microbial
TRANSCRIPT

PHYSICAL, GEOCHEMICAL AND
MICROBIAL PARAMETERS DRIVING THE
IMPROVEMENT OF WATER QUALITY IN
MANAGED AQUIFER RECHARGE
Ph.D. Thesis
Carme Barba Ferrer
Advisors: Dr. Albert Folch Sancho
Dr. Xavier Sanchez-Vila


UNIVERSITAT POLITÈCNICA DE CATALUNYA
Department of Civil and Environmental Engineering
Hydrogeology Group (UPC-CSIC)
Physical, geochemical and microbial parameters
driving the improvement of water quality in
Managed Aquifer Recharge
by
Carme Barba Ferrer
Advised by Dr. Albert Folch Sancho and Dr. Xavier Sanchez-Vila
External Reviewers:
1. Dr. Daniele Pedretti (Geological Survey of Finland)
2. Dr. Fulvio Boano (Politecnico di Torino)
September 2018

This thesis has been financially supported by Generalitat de
Catalunya via FI scholarship program (FI-DGR 2014), the
European Union project MARSOL grant agreement no. 619120,
FP7-ENV-2013-WATER-INNO-DEMO, the Spanish Government
and EU (project ACWAPUR PCIN-2015-239), and the Spanish
Government project REMEDIATION (CGL2014-57215-C4-2-R).
Carme Barba Ferrer
Physical, geochemical and microbial parameters driving the improvement of
water quality in Managed Aquifer Recharge
Ph.D. Thesis, September 2018
Reviewers: Dr. Daniele Pedretti and Dr. Fulvio Boano
Advisors: Dr. Albert Folch Sancho and Dr. Xavier Sanchez-Vila
Universitat Politècnica de Catalunya
Hydrogeology Group (UPC-CSIC)
Department of Civil and Environmental Engineering
C/Jordi Girona 1-3, Edifici D2, despatx 005
08034 Barcelona

v
Summary
Water demand around the world has been continuously increasing over time, mainly
due to population growth and development. In addition, climate change is causing a
significant alteration of the periodicity and intensity of precipitation and climate-
related events. All this implies significant challenges in water management,
especially in arid and semi-arid regions (the Mediterranean amongst others), where
the integral management of water (including both surface water and groundwater)
is crucial to ensure water supply. The management of quality and quantity aspects
are essential, not only for the prevention of threats to those resources but also to
ensure a sustainable exploitation. In this context of management, the work
undertaken in this thesis is framed in the management of groundwater resources
due to the possibility of exploitation of those during surface water scarcity periods.
Therefore, Managed Aquifer Recharge (MAR) represents a feasible solution to deal
with future water management challenges promoting the storage of available water
in aquifers improving the recharged water quality.
The present dissertation is focused on the study of microbial, biogeochemical and
physical processes related to MAR ponds, regarding both quantity and quality
aspects. The knowledge about these processes has allowed identifying key issues
affecting the correct operation of infiltration ponds, laying the foundations for the
optimization of quantity and quality targets.
Two different sites in the Llobregat River Basin were chosen as a frame for the
investigations.
The first part of this thesis was developed in Sant Vicenç MAR system (Barcelona),
where an innovative treatment for emerging contaminants had been proved
successfully. A reactive layer was put in the bottom of the infiltration pond,
promoting different redox conditions below the pond and enhancing the removal of
dissolved organic matter as well as emergent organic contaminants. In this thesis,
further work has been carried out, by investigating the role of the microbial
community in this removal, by means of a microbial fingerprinting study between
two different scenarios. Which were (1) when no-recharge was present and (2) during
a long recharge period. The microbial fingerprinting study confirmed that microbial
diversity during recharge period fitted in Intermediate Disturbance Hypothesis
approach. Furthermore, sequencing of prominent bands evidenced the presence of

vi
principally degradative-like microorganisms during recharge. A multivariate
statistical analysis including hydrochemical, soil grain-size distribution, operational
and microbial variables was also performed. Most relevant variables affecting
microbial populations were identified. Likewise, the correlations between some
microbial prints in the system revealed the presence of some classes and species
involved in denitrification as well as methanotrophic pathways.
The second investigation was focused on the study of redox processes from the
infiltration pond to the aquifer, passing through the vadose zone. The study was
placed in Castellbisbal MAR system (Barcelona). This facility has a conventional
surface infiltration pond without the effect of the reactive layer. The infiltration path
was widely monitored and four sampling campaigns were carried out in four
different moments along a one-year study. Results from in situ redox potential
measurements, temperature evolution, operating conditions (water levels, flow rate,
and infiltration rate), characterization of the organic matter and hydrochemical
composition of water were collected and analyzed. Especially, operating conditions
and redox potential, where it was observed that evolution in the first meter of the
infiltration profile had been related to clogging development in the pond bottom.
Finally, results from monitoring tasks were used as the basis to construct a flow and
heat transport model simulating the recharge process. The flow model included the
decrease of hydraulic conductivity caused by clogging periods. In addition, a heat
transport model was capable to calculate the modifications of hydraulic conductivity
due to temporal temperature evolution. Taking into account the results of heat
transport model, two batch-type biogeochemical models were suggested to explain
redox processes in winter and summer scenarios. Furthermore, models were capable
to explain the fate of different fractions of dissolved organic matter, i.e. labile,
recalcitrant and immobile, and the corresponding change of degradation rates due
to temperature changes amongst different scenarios.

vii
Resum
La demanda d’aigua arreu del món es preveu que continuarà augmentant a causa
de l’increment de la població i el seu desenvolupament. El canvi climàtic, a més,
suposarà un agreujant d’aquesta problemàtica, ja que es preveu que alterarà la
periodicitat i intensitat de les precipitacions arreu. La gestió de l’aigua s’enfronta,
doncs, a grans reptes, especialment a les regions àrides i semiàrides (la mediterrània
d’entre altres), on caldrà gestionar de manera integrada aigües superficials i
subterrànies. La bona qualitat de les masses d’aigua, tant a nivell quantitatiu com
qualitatiu, serà clau per afrontar els reptes de futur i per garantir que es faci un
aprofitament sostenible d’aquest recurs. En aquest context de gestió, el paper de
l’aigua subterrània és, doncs, clau, ja que permet ser explotada fins i tot en moments
d’escassetat hídrica.
Partint d’aquest marc, la recàrrega artificial d’aqüífers representa una solució vàlida
per afrontar els reptes de futur que presenta la gestió de l’aigua. La recàrrega
induïda promou l’emmagatzematge d’aigua en el subsol millorant-ne la qualitat.
La present tesi doctoral té com a objectiu l’estudi de processos microbiològics,
biogeoquímics i físics relacionats amb les basses de recàrrega. Tot aquest
coneixement ha permès detectar molts dels aspectes que afecten el correcte
funcionament d’aquestes infraestructures, construint les bases per a poder
optimitzar-ne el funcionament.
Per poder abordar els objectius plantejats, s’han dut a terme diferents investigacions
a dos emplaçaments de la conca del riu Llobregat destinats a recarregar el seu
aqüífer.
El primer estudi de la present tesi ha estat desenvolupat al sistema de recàrrega de
Sant Vicenç (Barcelona). Aquest sistema contenia un tractament innovador basat en
una barrera reactiva permeable instal·lada al llit de la bassa. La barrera, amb un
alt contingut de matèria orgànica, promovia diferents condicions redox sota la bassa
i millorava la degradació de matèria orgànica dissolta així com també de
contaminants orgànics emergents.
En aquesta tesi s’ha volgut anar un pas més enllà, i s’ha investigat el paper de les
comunitats microbianes mitjançant un estudi de patrons microbiològics comparant
dos escenaris diferents. S’ha avaluat la contribució de les comunitats microbianes

viii
sota els efectes prolongats de la recàrrega i amb la bassa parada. Aquest estudi
confirma que els efectes de la recàrrega sobre la diversitat microbiana es podrien
assimilar als predits per la Hipòtesi de la Pertorbació Intermèdia. Així mateix, la
seqüenciació de les bandes més prominents ha revelat que les espècies principals de
microorganismes que es trobaven sota els efectes de la recàrrega tenien capacitats
degradatives.
A continuació s’ha efectuat un estudi estadístic multivariant, englobant variables de
tipus hidroquímic, de mida i distribució de gra en sòls, de tipus operacional i
microbiològiques. S’han identificat doncs, les variables més rellevants que afecten
les poblacions microbianes. A més, s’han detectat correlacions entre algunes
variables hidroquímiques i espècies com ara desnitrificants o metanòtrofes.
La segona part de la tesi ha estat emmarcada en el sistema de recàrrega de
Castellbisbal (Barcelona). Aquest sistema inclou també una bassa d’infiltració, però
sense l’efecte d’una capa reactiva. A Castellbisbal s’han estudiat els processos redox
en tot el perfil d’infiltració, des de l’aigua d’infiltració fins a la zona saturada de sota
la bassa, passant per la zona no saturada. Tot aquest perfil es va monitoritzar i es
van dur a terme quatre campanyes de mostreig durant l’any sencer que ha durat
l’estudi. La monitorització ha permès obtenir resultats d’evolució de potencial redox
a diferents profunditats, de la temperatura i de tots els paràmetres d’operació
(nivells, cabals i taxa d’infiltració). Les campanyes de mostreig han permès
caracteritzar hidroquímicament les mostres així com també caracteritzar l’origen de
la matèria orgànica present. La integració de tots aquests resultats, especialment
pel que fa a la monitorització del potencial redox en el primer metre de sòl ha permès
evidenciar la relació que tenen tots ells amb la colmatació al llit de la bassa.
Finalment, la monitorització efectuada a la bassa ha servit per establir les bases per
a construir un model de flux i transport de calor simulant l’acció de la recàrrega. El
model inclou l’efecte de la colmatació sobre el descens de la conductivitat hidràulica.
De la mateixa manera, el model de transport de calor pot calcular les modificacions
en la conductivitat hidràulica que venen donades per les variacions temporals de la
temperatura. El model evidencia la importància de la temperatura en els paràmetres
hidràulics. Partint d’aquesta base, s’han desenvolupat dos models biogeoquímics de
tipus batch amb l’objectiu d’explicar els processos redox en dos escenaris estiu-
hivern. Els models, a més, inclouen diferents fraccions de matèria orgànica dissolta:
de caràcter làbil, recalcitrant i una tercera, d’immòbil. S’avaluen, doncs, els canvis

ix
en les taxes de degradació de la matèria orgànica a causa de les variacions de
temperatura entre escenaris.

x

xi
Resumen
A nivel mundial se prevé que la demanda de agua siga creciendo a causa del aumento
de población y su desarrollo. El cambio climático, además, va a suponer un agravante
a esta problemática, ya que se prevé que alterará la periodicidad e intensidad de las
precipitaciones. La gestión del agua se enfrenta pues a grandes retos, especialmente
en las regiones áridas y semiáridas (como por ejemplo la mediterránea), donde será
necesaria una gestión integral de las aguas superficiales y subterráneas. La buena
calidad de las masas de agua, tanto a lo que a cantidad y calidad se refiere, será clave
para afrontar los retos de futuro y para garantizar un aprovechamiento sostenible
de este recurso. En este contexto de gestión, el papel del agua subterránea es clave,
ya que permite ser explotada incluso en periodos de escasez hídrica.
Partiendo de este contexto, la recarga artificial de acuíferos representa una solución
válida para afrontar los retos de futuro que presenta la gestión del agua. La recarga
artificial de acuíferos promueve el almacenamiento de agua en el subsuelo y mejora
su calidad.
La presente tesis doctoral tiene como principal objetivo estudiar los procesos
microbiológicos, biogeoquímicos y físicos relacionados con las balsas de recarga. Todo
este conocimiento ha permitido detectar muchos aspectos que afectan el correcto
funcionamiento de estas infraestructuras, sentado la base para poder optimizar su
funcionamiento.
Para abordar los objetivos planteados, se han llevado a cabo diferentes
investigaciones en dos emplazamientos de la cuenca del río Llobregat destinados a
recargar su acuífero.
El primer estudio de la presente tesis ha sido desarrollado en el sistema de recarga
de Sant Vicenç (Barcleona). Este sistema contenía un tratamiento innovador basado
en una barrera reactiva permeable instalada en el lecho de la balsa. La barrera, con
un alto contenido en materia orgánica, promovía diferentes condiciones redox debajo
de la balsa y mejoraba la degradación de materia orgánica disuelta, así como también
de contaminantes orgánicos emergentes.
En esta tesis se ha querido ir un paso más allá, y se ha investigado el papel de las
comunidades microbianas mediante un estudio de patrones microbianos comparando
diferentes escenarios. Se ha evaluado la contribución de las comunidades

xii
microbianas bajo los efectos prolongados de la recarga y con la balsa parada. Este
estudio confirma que los efectos de la recarga sobre la diversidad microbiana se
podrían asimilar a los predichos por la Hipótesis de la Perturbación Intermedia.
Asimismo, la secuenciación de las bandas más prominentes ha revelado que las
especies principales de microorganismos que se encontraban bajo los efectos de la
recarga tenían capacidades de degradación.
A continuación, se ha efectuado un estudio estadístico multivariante, englobando
variables de tipo hidroquímico, de tamaño y distribución de grano en suelos, de tipo
operacional y microbiológicas. Se han identificado, pues, las variables más relevantes
que afectan a las poblaciones microbianas. Además, se han detectado correlaciones
entre algunas variables hidroquímicas y especies desnitrificantes y metanótrofas (de
entre otras).
La segunda parte de la tesis ha sido enmarcada en el sistema de recarga de
Castellbisbal (Barcelona). Este sistema incluye también una balsa de infiltración,
pero sin el efecto de una barrera reactiva. En Castellbisbal se han estudiado procesos
redox en el perfil de infiltración, desde el agua de infiltración hasta la zona saturada,
pasando por la zona no saturada. Todo este perfil se monitorizó y se llevaron a cabo
cuatro campañas de muestreo durante un año. La monitorización ha permitido
obtener resultados sobre la evolución del potencial redox en diferentes
profundidades, de la temperatura y de todos los parámetros de operación (niveles,
caudales y tasa de infiltración). Las campañas de muestreo han permitido
caracterizar hidroquímicamente las muestras, así como también caracterizar el
origen de la materia orgánica presente. La integración de todos estos resultados,
especialmente los relacionados con la monitorización del potencial redox en el primer
metro de suelo, ha permitido evidenciar la relación que tienen todos ellos con la
colmatación en el lecho de la balsa.
Finalmente, la monitorización efectuada en la balsa ha servido para establecer las
bases de construcción de un modelo de flujo y transporte de calor simulando la acción
de la recarga. El modelo incluye el efecto de la colmatación sobre el descenso de la
conductividad hidráulica. Asimismo, el modelo de transporte de calor puede calcular
las modificaciones en la conductividad hidráulica que vienen dadas por las
variaciones temporales de la temperatura. El modelo pone de relieve la importancia
de la temperatura en los parámetros hidráulicos. Partiendo de esta base, se han
desarrollado dos modeles biogeoquímicos de tipo batch, con el objetivo de explicar los

xiii
procesos redox en dos escenarios verano-invierno. Los modelos, además, incluyen
diferentes fracciones de materia orgánica disuelta: de carácter lábil, recalcitrante y
una tercera, inmóvil. Se evalúan, pues, cambios en las tasas de degradación de la
materia orgánica a causa de variaciones de temperatura entre escenarios.

xiv

xv
Acknowledgements
Malgrat sembli un tòpic, puc estar ben segura que aquesta tesi és del tot
inconcebible sense el suport i participació d’una llarga llista de persones.
En primer lloc, he d’agrair al Xavier Sanchez i a l’Albert Folch l’oportunitat que
m’han donat de fer la tesi al Grup d’Hidrologia Subterrània. Penso que la seva
complementarietat com a directors ha estat clau en el resultat final d’aquest treball.
Xavi, gràcies per donar-me l’oportunitat d’entrar a la gran família del GHS, on m’hi
he sentit com si fos casa meva. Absolutament sempre m’has donat carta blanca a
totes les iniciatives que he proposat. Per altra banda, és una evidència que la
redacció de la tesi no tindria la mateixa qualitat sense la teva ajuda. Albert, gràcies
per obrir-me les portes del món de la hidrogeologia i per la oportunitat que em vas
donar de començar la tesi, per la infinita paciència que has tingut amb mi i el meu
caràcter, per haver respectat sempre la meva estranya logística i els meus ritmes de
treball, pel teu optimisme contagiós i per tota l’ajuda i suport que m’has donat durant
tots aquests anys.
De tot cor, moltes gràcies a tots dos!
En segon lloc vull agrair molt especialment a la Núria Gaju, la Maira
Martínez, el Rafa Marcé i la Paula Rodríguez la seva gran contribució en
aquest treball. Tractant-se d’una tesi multidisciplinària, hagués estat
impossible d’acabar amb èxit sense la seva expertesa i coneixements.
També agrair a tots els professors del Grup d’Hidrologia Subterrània que al
llarg d’aquests anys m’han deixat “colar” a les seves classes. Al Maarten, el
Jesús, l’Enric, la Nieves, el Carlos A i l’Ester T. Molt especialment he d’agrair
al Dani la seva predisposició, ajuda i, després de tant de temps, també
amistat.
I ja se sap que lo meu són les famílies grans, de manera que moltes gràcies a
la família GHS, als de l’IDAEA i molt especialment als meus amics i
companys d’aquí dalt l’UPC. Primer de tot a la Tere, per ajudar-me sempre
amb els tiquets, factures, maldecaps amb la furgo, i tota la paperassa: Tere,
tens solucions per a tot! També vull tenir un record especial per tots els que
ja no hi són i en algun moment han estat al meu costat -el Joel, el Genís, la

xvi
Sona, l’Albert, la Carlota i la Perujo- ja sigui discutint resultats, fent voltes a
la poma, fent intercanvis lingüístics o parlant dels fills i les aventures de ser
pares. I també gràcies als que compartim el dia a dia, -l’Arnau, el Carni, el
David, el Guillem, la Gumbi, el Jordi, la Jou, la Laura, la Lurdes, la Miki, la
Mireia, l’Uri i el Yufei- i tots els integrants dels Esmorzars UPC, que sense
vosaltres els àpats no serien ni de bon tros tan apassionants (ni llargs!). Vull
agrair especialment tot el suport dels integrants del “Grup de Paddle”, no pas
per la nostra regularitat en el joc, sinó per tota l’ajuda durant aquests anys:
gràcies perquè m’heu fet riure cada dia, m’heu animat en els moments difícils
i heu fet que aquí m’hi senti com a casa. Gràcies pels acudits sense gràcia,
pels poemes trobadorescos, pels detalls de tofu que tant m’agraden, per les
calçotades a Can Sanchez, per les barbacoes a Can Fernàndez, pels bodorrios,
per les teràpies, per les Juanis, per les bitlles, pels piti-breaks, pels sopars
estiuencs, per les jornades padelsurferes a l’estiu, per deixar-me ser creativa
als aniversaris. I el més important, moltes gràcies perquè tots, absolutament
tots, m’heu ajudat d’alguna o altra manera amb la tesi. Especialment, gràcies
a tots els qui m’heu ajudat al camp, ja sigui per la vostra generositat innata
o per no haver d’aguantar els meus rotllos i xantatges. Amb Dockers, bikini,
traje de pesca o chándal, és innegable que us hi heu deixat la pell
(literalment). I parlant de camp, seria impossible no pensar en el Jordi
Massana, l’Enric Queralt i molt especialment la Vinyet Solà que des de la
CUADLL i la CUACSA sempre m’han facilitat la feina i m’han donat
l’oportunitat de treballar a Sant Vicenç i Castellbisbal. També gràcies al Jordi
Bellés, la Sara Insa i la Carmen Guitérrez per tota l’ajuda amb l’anàlisi de
mostres i al laboratori. I a l’Alba Grau, la Giulia i l’Álvaro per la seva
col·laboració al camp i en la interpretació de les dades.
I no puc acabar els agraïments sense esmentar la Nuri, la meva companya de
viatge científic des de fa 11 anys (!!), per tants moments que hem compartit (i
compartirem!), per ser-hi sempre i ajudar-me al camp, al despatx, amb els
nens, i amb tot!

xvii
Per últim, vull donar les gràcies a la meva família i amics per tot el suport
(directe o indirectament) que m’han donat. Als meus pares, germans i sogres
especialment. Per cuidar els nens, pels tuppers, per tants “Tu pots!!”.
I com no, res hagués estat possible sense el Miguel, l’Aina, l’Helena i el
Miquel. Malgrat es podria pensar el contrari, els meus fills m’han facilitat el
camí fins aquí; em donen llum els dies negres, em fan espavilar fins i tot els
dies que no en tinc ganes, i m’omplen d’optimisme i ganes de viure tantes
vegades. I gràcies al Miguel, per suplir les meves hores de mare absent, per
compartir els èxits i aguantar estoicament els mals moments. No hi ha
paraules d’agraïment suficients per explicar el que això representa per a mi.

xviii

xix
Contents
CHAPTER 1: INTRODUCTION .......................................................................... 1
Managed Aquifer Recharge as a component in the integrated water
resources management ............................................................................................. 4
Types of MAR techniques .............................................................................. 4
Quality targets of MAR: microbial community role in water quality
improvement ............................................................................................................. 5
Motivation and objectives .............................................................................. 7
Managed Aquifer Recharge in Llobregat River Basin: study sites .............. 9
1.5.1. Background .................................................................................................... 9
1.5.2. Study site 1: Sant Vicenç MAR system ....................................................... 10
1.5.3. Study site 2: Castellbisbal MAR system: site description and previous
studies ..................................................................................................................... 12
Outline of the thesis .................................................................................... 14
CHAPTER 2: PARAMETERS AFFECTING MICROBIAL COMMUNITY
COMPOSITION IN SURFACE INFILTRATION PONDS ...................................... 17
2.1. Introduction ................................................................................................. 19
2.2. Methodology ................................................................................................ 20
2.2.1. Monitoring network and hydrochemistry sampling surveys ...................... 21
2.2.2. Microbial community characterization ....................................................... 22
2.2.3. Physical characterization of soil .................................................................. 24
2.3. Results ......................................................................................................... 24
2.3.1. Clustering of recharge influenced zones according to temperature and
conductivity changes ............................................................................................... 24
2.3.2. Fitting groundwater microbial communities in the conceptual flow model
………………………………………………………………………………………..27
2.3.3. Spatial and temporal variations in microbial diversity indices in
groundwater ............................................................................................................ 30

xx
2.3.4. Role of MAR activities for the microbial community structure .................. 32
2.3.5. Microbial community indicators of MAR in soil and surface water ........... 34
2.4. Discussion .................................................................................................... 35
2.4.1. Matching groundwater model, ecological disturbance principle and
microbial community composition .......................................................................... 35
2.4.2. Role of microbial populations in soil and surface water ............................. 38
2.4.3. Transferability of results ............................................................................. 40
2.5. Conclusions .................................................................................................. 40
CHAPTER 3: THE ROLE OF WATER QUALITY AND SOIL
CHARACTERISTICS IN SOME DOMINANT MICROBIAL SUB-SURFACE
POPULATIONS ……………………………………………………………………………43
3.1. Introduction ................................................................................................. 45
3.2. Methodology ................................................................................................. 47
3.2.1. Input data for the multivariate statistical approach .................................. 47
3.2.2. Rationale for the multivariate statistical approach: requirements for PCA
………………………………………………………………………………………..49
3.2.3. Selecting variables for the statistical analysis of water samples ............... 49
3.2.4. Selecting variables for the statistical analysis of soil samples ................... 51
3.2.5. PCA for microbial print in water and soil samples ..................................... 51
3.3. Results ......................................................................................................... 52
3.3.1. Key parameters influencing microbial classes in surface water and
groundwater ............................................................................................................ 52
3.3.2. Key parameters influencing microbial species in water samples ............... 55
3.3.3. Key parameters influencing microbial classes in MAR soils ...................... 57
3.3.4. Key parameters influencing microbial species in MAR soils ...................... 59
3.3.5. Interclass and interspecies relationships.................................................... 60
3.4. Discussion .................................................................................................... 63
3.5. Conclusions .................................................................................................. 66

xxi
CHAPTER 4: MONITORING OF REDOX PROCESSES TO IMPROVE MAR
MANAGEMENT ……………………………………………………………………………69
4.1. Introduction ................................................................................................. 71
4.2. Objectives ..................................................................................................... 73
4.3. Methodology ................................................................................................. 73
4.3.1. Monitoring operational conditions in the system ....................................... 74
4.3.2. Sampling surveys ........................................................................................ 75
4.3.3. Redox potential and temperature continuous monitoring .......................... 78
4.4. Results and discussion................................................................................. 79
4.4.1. Monitoring and field data ............................................................................ 79
4.5. Conclusions .................................................................................................. 97
CHAPTER 5: MODELING FLOW, TEMPERATURE AND
BIOGEOCHEMICAL PROCESSES IN A SURFACE INFILTRATION SYSTEM.. 99
5.1. Introduction ............................................................................................... 101
5.2. Methodology ............................................................................................... 103
5.2.1. Flow and heat transport models ............................................................... 103
5.2.2. Biogeochemical model: organic matter fate during managed aquifer
recharge ................................................................................................................. 107
5.3. Results and discussion............................................................................... 116
5.3.1. Flow and heat transport model: annual temperature and hydraulic
conductivity evolution ........................................................................................... 116
5.3.2. Biogeochemical models for winter and summer scenarios ....................... 122
5.4. Conclusions ................................................................................................ 126
CHAPTER 6: CONCLUSIONS ........................................................................ 127
APPENDICES ………………………………………………………………………….157
APPENDIX A: HYDROCHEMICAL DATA IN SANT VICENÇ MAR SYSTEM .. 159
APPENDIX B ………………………………………………………………………….165

xxii

xxiii
List of Figures
Chapter 1
Figure 1.1 Geographical location of the Sant Vicenç MAR system and piezometers’
network ...................................................................................................................... 11
Figure 1.2 Geographical location and disposition of the Castellbisbal surface
infiltration system ..................................................................................................... 13
Chapter 2
Figure 2.1 Transect section studied with piezometers and sampling depths. ......... 21
Figure 2.2 Temperature distribution at the local scale ............................................ 25
Figure 2.3 Electrical Conductivity distribution at the local scale ............................ 26
Figure 2.4 Non-metric Multidimensional Scaling clustering for all groundwater
samples ...................................................................................................................... 28
Figure 2.5 DGGE band patterns of bacterial 16S rRNA gene fragments and UPGMA
cluster analysis for fingerprints ................................................................................ 29
Figure 2.6 Average of Shannon Indices in piezometer samples under wet conditions.
................................................................................................................................... 30
Figure 2.7 Bacterial community structure of groundwater samples ....................... 33
Figure 2.8 Bacterial community structure of soil samples from pre-sedimentation
and infiltration basins ............................................................................................... 34
Figure 2.9 Bacterial community structure from water samples of pre-sedimentation
and infiltration basins. .............................................................................................. 35
Chapter 3
Figure 3.1 Cross-section of Sant Vicenç MAR system .............................................. 48
Figure 3.2 PCA1 analysis .......................................................................................... 54
Figure 3.3 PCA2 analysis .......................................................................................... 55
Figure 3.4 PCA3.analysis .......................................................................................... 56
Figure 3.5 PCA4 analysis .......................................................................................... 57
Figure 3.6 PCA5 analysis .......................................................................................... 58

xxiv
Figure 3.7 PCA6 analysis .......................................................................................... 59
Figure 3.8 PCA7 analysis .......................................................................................... 60
Figure 3.9 PCA8 analysis .......................................................................................... 60
Figure 3.10 PCA9 analysis ........................................................................................ 61
Figure 3.11 PCA10 analysis ....................................................................................... 62
Figure 3.12 PCA11 analysis ....................................................................................... 63
Chapter 4
Figure 4.1 Electron acceptor sequence according to organic matter biodegradation
process ....................................................................................................................... 72
Figure 4.2 Instrumentation installed in the infiltration pond in the Castellbisbal
MAR system. ............................................................................................................. 75
Figure 4.3 Evolution of concentrations of TOC, nitrate, nitrite, ammonium and
values of turbidity, flow rate and precipitation in the Llobregat River water. ....... 80
Figure 4.4 Evolution of flow rate, infiltration rate and water table in Castellbisbal
MAR system .............................................................................................................. 83
Figure 4.5 Evolution of groundwater level in PJ and water table in infiltration pond
................................................................................................................................... 84
Figure 4.6 Evolution of TOC, DOC, CO2, BOD, O2, nitrate, nitrite and ammonium
concentrations in four sampling campaigns performed in the Castellbisbal MAR
system ........................................................................................................................ 86
Figure 4.7 Evolution of Oxidation Reduction Potential (ORP), sulfate, iron,
manganese concentrations, alkalinity and pH in four sampling campaigns performed
in the Castellbisbal MAR system .............................................................................. 87
Figure 4.8 Relative contribution of the protein-like peak and humic-like peak
intensities for Infiltration Pond, vadose zone and groundwater water samples .... 88
Figure 4.9 Evolution of fluorescence indices of water samples in the Castellbisbal
MAR system for four different sampling campaigns ................................................ 89
Figure 4.10 Evolution of the carbon content in the sediment of the Castellbisbal MAR
infiltration pond ........................................................................................................ 90

xxv
Figure 4.11 Difference between redox soil probes measurements and YSI
Professional Plus values for the redox potential electrode in three sampling surveys.
................................................................................................................................... 91
Figure 4.12 Redox potential measurements in the infiltration pond water, in the 20
cm layer, and in the 50 cm layer ............................................................................... 93
Figure 4.13 Redox potential measurements at 62 cm, 70 cm depth and in PJ ........ 94
Figure 4.14 Temperature records in infiltration pond, 55 cm depth and PJ .......... 96
Chapter 5
Figure 5.1 Conceptual biogeochemical model of DOM transformation and
degradation via different paths............................................................................... 108
Figure 5.2 Piper diagram showing the relative position of infiltration water samples
of the four sampling campaigns performed in the Castellbisbal MAR system ...... 113
Figure 5.3 Results of the HYDRUS flow model of recharge in the infiltration pond of
the Castellbisbal MAR system ................................................................................ 118
Figure 5.4 Summary of input parameters and calibrated parameters for the flow
model ....................................................................................................................... 119
Figure 5.5 Results from the heat transport model at 55 cm depth ........................ 120
Figure 5.6 Spatial and temporal evolution of simulated temperature in the vadose
zone and saturated zone below the infiltration pond of the Castellbisbal MAR system
................................................................................................................................. 121
Figure 5.7 Spatial and temporal evolution of effective hydraulic conductivity in the
vadose zone and saturated zone below the infiltration pond ................................. 121
Figure 5.8 Five-days batch simulation of biodegradation of DOClab, DOMrec, and
DOMimm species in winter ....................................................................................... 124
Figure 5.9 Five-days batch simulation of biodegradation of DOClab, DOMrec and
DOMimm species in summer ..................................................................................... 125

xxvi

xxvii
List of Tables
Chapter 2
Table 2.1 Summary of Diversity Indices at the Llobregat MAR site in the different
scenarios ................................................................................................................ - 31 -
Chapter 3
Table 3.1Relation to main correlations among variables obtained by PCA analysis
................................................................................................................................... 53
Chapter 4
Table 4.1 Duration and characteristics of the five management periods stablished
................................................................................................................................... 74
Chapter 5
Table 5.1 Soil hydraulic parameters and geometry of the model ........................... 106
Table 5.2 Time periods for the model...................................................................... 106
Table 5.3 Heat transport parameters for a sandy material ................................... 107
Table 5.4 Processes involved in DOM transformation and consumption in a shallow
part of saturated soil ............................................................................................... 110
Table 5.5 Summary of parameters used in biogeochemical batch models ............. 112
Table 5.6 Input solutions defined in PHREEQC batch models .............................. 115

xxviii

xxix
Abbreviations
BIX: Biological Index
BOD: Biological Oxygen Demand
CC: Coefficient of Curvature
CU: Uniformity Coefficient
DGGE: Denaturing Gradient Gel Electrophoresis
DOC: Dissolved Organic Carbon
DOClab: Labile Dissolved Organic Carbon
DOM: Dissolved Organic Matter
DOMimm: Immobile Dissolved Organic Matter
DOMrec: Recalcitrant Dissolved Organic Matter
EEM: Excitation-Emission Matrix
FI: Fluorescence Index
EOC: Emerging Organic Contaminant
HIX: Humification Index
IDH: Intermediate Disturbance Hypothesis
ORP: Oxidation Reduction Potential
PCA: Principal Component Analysis
PCR: Polymerase Chain Reaction
POC: Particulate Organic Carbon
SUVA: Ultra-Violet Absorbance
TOC: Total Organic Carbon
TIC: Total Inorganic Carbon

xxx

1
_____________________________________________________
CHAPTER 1: INTRODUCTION
_____________________________________________________

2

_______________________________________________CHAPTER 1_ INTRODUCTION
3
owadays, increasing water demand and the progressive pollution of water
resources are some of the most alarming issues for human development.
Furthermore, the context of climate change represents an additional
problem in the management of hydric resources. In fact, anthropogenic pollution, i.e.
the increase of greenhouse gas emissions, has a direct affection to climate global
patterns. Concretely, the increase of average planet temperature (linked mainly to
such emissions) is expected to significantly affect the hydrological cycle, changing
the intensity and the patterns of precipitation events, the widespread melting of
snow and ice, and the increase of evaporation and atmospheric water vapor.
Therefore, changes in soil moisture and runoff are consequently induced. All these
effects, directly or indirectly, affect the availability of water resources. Hence, arid
and semi-arid zones (such as the Mediterranean Basin), which are exposed to a
recurrent risk of scarcity, might be quite vulnerable to climate change effects.
Furthermore, if the tendency in the increase of water withdrawals is maintained,
the impact of droughts will be exacerbated. The gravity of the situation was
exemplified by Turner et al. (1991) stating that withdrawals of water from natural
circulation has been multiplied for almost 40 times in the past 300 years.
Indeed, the challenge of getting a sustainable exploitation of freshwater and other
Earth resources are and will be a key factor for the development and well-being of
future generations. The sustainable management should be capable to deal with the
uncertain effects of climate change plus future scenarios of water demand.
Considering the available water resources, one can see that 97.5% of the water on
Earth is salty. The 70% of the rest, i.e. freshwater, is frozen mostly in Antarctica and
Greenland and almost the rest is not available remaining in soil moisture or
inaccessible aquifers. Only less than 1% of freshwater is available for human uses,
that is, water from lakes, rivers, reservoirs and accessible aquifers (Shiklomanov,
1997). A global assessment of water resources confirms that freshwater resources
have been under high human pressure, both for the rising of demand as well as the
negative impacts of pollution.
Despite patterns are changing, water had been traditionally used for waste disposal.
Even now, water bodies suffer lots of impacts devaluating their quality. Major
pollution problems include:
Microbial pollution (bacteria, protozoa and viruses) from the pouring of
untreated water or without an adequate treatment of freshwater bodies.
N

_______________________________________________CHAPTER 1_ INTRODUCTION
4
Accelerate growth of algae in surface waters due to the high amounts of
nitrogen and phosphorous present in many discharges.
Presence of nitrates in groundwater from fertilizers.
Release of heavy metals in soils and water by the industry and mining.
Distribution of thousands of synthetized chemical compounds into the
environment: fertilizers, personal care products, drugs, or pharmaceutical
compounds among others, can reach the environment and become
transported by rivers and be accountable of pollution of aquifers, coastal
waters, and oceans. Furthermore, most of them and/or their by-products are
toxic and highly persistent (recalcitrant) in the environment.
All of these pollution loads are causing worldwide public health problems, limiting
economic and agricultural development, and harming a number of ecosystems.
Therefore, it is necessary to increase the amount of water resources, not only by
finding complementary resources but also by improving the quality of available
freshwater.
Managed Aquifer Recharge as a component in the integrated water
resources management
Water resources should be managed and used efficiently in order to ensure the long-
term human population development. Managed Aquifer Recharge (MAR) was born
as a solution to increase the availability of water in groundwater reservoirs. MAR is
conceived as a local strategic management tool since it can use opportunistic water
(e.g. wastewater, river water, or runoff waters among others) to replenish aquifers
(San-Sebastián-Sauto et al., 2018). In this way, groundwater resources represent an
advantage with respect to surface ones, since the larger residence time of water
within the aquifers allows to consider them as reservoirs. Then, such reservoirs could
be exploited in times of water shortages. Furthermore, the replenishment of aquifers
helps to ensure the supply of water necessities of different sectors by means of a wide
display of sources. So, MAR fits with the concept of integrated water resources
management, adequately responding to a claim for the conjunctive use of surface
water and groundwater.
Types of MAR techniques
MAR includes the group of all programmed techniques that induce the entrance of
water into aquifers. In this way, both the availability and quality of water resources

_______________________________________________CHAPTER 1_ INTRODUCTION
5
can be increased. MAR facilities are divided into two main groups: filtration from
the surface or direct injection into the aquifer. The first group is basically used in
unconfined aquifers, whereas deep injection is mostly applied to semi-confined and
confined aquifers. Taking into account both groups, Dillon (2005) describes the
following MAR types:
Aquifer storage and recovery (ASR): injection of water into a well and then
extraction from the same well.
Aquifer storage transfer and recovery (ASTR): injection of water into a well
and then extraction from a different well to provide an additional treatment
based on transport through the aquifer.
Bank-filtration: extraction of groundwater to induce infiltration from the
surface water body, therefore improving the quality of water.
Dune filtration: infiltration of water from ponds constructed in dunes and
recovery of water with higher quality downstream.
Infiltration ponds: diverting of surface water that infiltrates into the aquifer
through the vadose zone.
Percolation tanks: water is detained and infiltrates through the base in
ephemeral waddies. Water is then extracted down-valley to supply towns.
Rainwater harvesting: use of runoff water from roofs to replenish wells or
caissons filled with sand or gravel.
Soil aquifer treatment (SAT): use of infiltration ponds to remove nutrients
and pathogens during the passage through the vadose zone.
Sand dams: accumulation of sand that traps sediment during flow, and
accumulates water in successive floods that can be exploited in dry seasons.
Underground dams: construction of trenches in the streambed of ephemeral
streams to help the retaining flood flows.
Recharge releases: construction of dams in ephemeral streams to retain
flooding water and slow release water into the streambed downstream.
Quality targets of MAR: microbial community role in water quality
improvement
Human impacts can affect water bodies. Pollutants can be removed from water; yet,
eliminating some substances can be technically difficult and economically expensive.
In this way, MAR is a quite common technique to take advantage of the potential of
the soil as a biogeochemical reactor to enhance the quality of water infiltrating

_______________________________________________CHAPTER 1_ INTRODUCTION
6
through the vadose zone, especially in surface replenishment systems (Drewes et al.,
2003; Nadav et al., 2012). In fact, MAR has been proven effective to remove
pathogens (Bekele et al., 2011; Betancourt et al., 2014), dissolved organic carbon
(DOC) (Maeng et al., 2011; Mermillod-Blondin et al., 2015), nitrate (Grau-Martínez
et al., 2018), as well as some organic persistent contaminants (Hamann et al., 2016;
Regnery et al., 2015; Valhondo et al., 2018). The feasibility of MAR as a water
treatment technique is based on the capability of microorganisms to degrade water
contaminants. The potentiality attenuation effect of microorganisms has been
applied for example in landfill leakage affections (Röling et al., 2001; Staats et al.,
2011), contaminant spills (Fahrenfeld et al., 2014; Haack et al., 2004; Martínez-
Pascual et al., 2010; Nijenhuis and Kuntze, 2016) or nitrate polluted aquifers (Bellini
et al., 2018, 2013).
Microbial growth and activity is conditioned by several environmental parameters
such as DOC availability, dissolved oxygen content, redox conditions, temperature,
nutrient concentrations or soil moisture (Alidina et al., 2015; Bekele et al., 2011;
Dutta et al., 2015; Goren et al., 2014; Greskowiak et al., 2006, 2005b; Hellauer et al.,
2017; Laws et al., 2011; Rezanezhad et al., 2014). All these parameters have a crucial
role in the metabolic path of microorganisms and, consequently, in the removal
efficiency of the targeted pollutants.
Studies testing the link between water quality and microbial communities in real
MAR facilities are few, dealing with recharge wells (Ginige et al., 2013), riverbank
areas (Schütz et al., 2009), or surface infiltration ponds (Reed et al., 2008; Regnery
et al., 2016). However, there are no microbial fingerprinting studies that integrate
results from infiltrating water, soil and groundwater samples comparing different
operational periods in surface recharge systems. Furthermore, what species are
favored under recharge conditions is not well known either.
On the other hand, intrinsic properties of the porous media (e.g., porosity and pore
size distribution) determine the spatial and temporal distribution of microorganisms
in soils (Chau et al., 2011). Physical and hydraulic characteristics of soils condition
the availability of pore space and the access to nutrients, thus affecting in a distinct
way the growth and activity of microorganisms (Perujo et al., 2018, 2017).
Subsequently, determining how much and to what extent physical, geochemical,
biological and operational parameters influence the system functioning is useful for
managing purposes (Dutta et al., 2015; Grau-Martínez et al., 2018; Hellauer et al.,

_______________________________________________CHAPTER 1_ INTRODUCTION
7
2017; Pedretti et al., 2012b; Rodríguez-Escales et al., 2017). Despite that, it is
difficult to find multidisciplinary research dealing with integrated approaches to
improve the understanding of MAR problems.
Motivation and objectives
The present dissertation is contextualized in the frame of the EU project MARSOL
(Demonstrating Managed Aquifer Recharge as a Solution to Water Scarcity and
Drought). The consortium involved different European partners, including the
Universitat Politècnica de Catalunya in charge of the Sant Vicenç site, as well as
managing a work package in water quality. The site involves a sedimentation pond
followed by an infiltration pond. The latter included an innovative treatment based
on a reactive layer placed at the bottom to enhance degradation of emerging organic
contaminants (EOCs). The investigations performed there, allowed concluding that
redox conditions occurring below the infiltration pond induced the depletion of some
EOCs. Then, it was demonstrated that the existence of a reactive layer enhanced
some contaminant attenuation processes. But several questions remained
unanswered: Which were the microbial populations driving such quality processes?
What are the dominant microbial populations and their dynamics under recharge
and non-recharge scenarios? Which is the ecological behavior of MAR microbial
communities? Are they diverse? Are there some microbial key-species?
Very little is known about the sensitivity of microbial populations to MAR-linked
environmental (external) factors that affect water quality, such as hydrochemical
composition, temperature, redox potential, organic matter, and nutrients
concentration.
In order to monitor and study processes related to water quality improvement under
“natural” conditions, the Castellbisbal MAR system (again surface ponding) allowed
to analyze them without the influence of the reactive layer. Biodegradation processes
are highly dependent on redox conditions (Burke et al., 2014; Regnery et al., 2017;
Rodríguez-Escales et al., 2017), and both, in turn, are very influenced by
temperature (Henzler et al., 2016; Prommer and Stuyfzand, 2005).
Temperature also can modify water intrinsic properties, mainly viscosity. This may
have important implications in the saturated hydraulic conductivity, especially in
MAR surface systems with drastic seasonal climatic situations (Braga et al., 2007;
Lin et al., 2003; Vandenbohede and Van Houtte, 2012). However, temperature not

_______________________________________________CHAPTER 1_ INTRODUCTION
8
only affects water properties; bio-mediated processes will be also influenced (Maeng
et al., 2011; D Or et al., 2007; Zhang et al., 2015). The extent in which temperature
changes may affect the infiltration rate and in turn biodegradation rates is an
unknown issue related to MAR ponds management.
The principal aim of this thesis is:
To accomplish this objective, a number of studies were carried out in two different
recharge ponds in the Llobregat alluvial aquifer, targeting specific goals:
Perform a microbial fingerprinting study between two opposite scenarios of
recharge.
Identify key microbial species linked to the recharge process.
Evaluate the ecological implications of MAR.
Associate microbial community distribution tendencies related to changes in
hydrochemistry, management, and soil properties.
Monitor biological activity through the infiltration system (infiltration water,
vadose zone, and aquifer) with annual redox potential evolution.
Determine the role of redox potential in the carbon cycle through the
infiltration system.
Quantify the effect of temperature in redox reactions rates.
Quantify variations in hydraulic saturated conductivity due to seasonal
temperature fluctuations.
Plan management measures in order to optimize both quantity and quality
targets pursued by recharge.
To understand and characterize in detail the biogeochemical process occurring
during MAR in infiltration ponds, as well as the dynamic of local microbial
populations under different recharge conditions

_______________________________________________CHAPTER 1_ INTRODUCTION
9
Managed Aquifer Recharge in Llobregat River Basin: study sites
1.5.1. Background
Barcelona Conurbation encompasses a population over 3.5 million inhabitants. The
water supply for this area is mainly based on surface water resources, from rivers
Ter and Llobregat. Only a small portion for human supply is covered by groundwater
withdrawals, mainly from the Llobregat Lower Valley and Delta. However, there are
some industrial and agricultural zones supplied mainly by groundwater, resulting
in 11% of the total supply on average. There is thus, a management in an integrated
way considering both surface and sub-surface as a unique water body unit. In fact,
the strategies performed in the Llobregat River were pioneers in the Spanish water
management system; noticeably the Water User’s Community created in 1981, as a
union of different water users.
In the context of the Barcelona Conurbation, aquifers are considered strategic
reservoirs to be exploited in high shortage periods, capable of partially supplying the
population living in the area. Scarcity periods are quite frequent in the context of
Mediterranean climate conditions. Furthermore, the climate change perspective and
the effects of population growth that are forecasted in the area increase the risk of a
future lack of water, so that groundwater should be properly managed within an
integrated framework.
The sedimentary basin of the Llobregat River is formed by two detritic levels,
separated by an intercalation of silty materials that lose continuity towards the
valley and boundaries. The upper part of the aquifer is formed by sands of a delta
front, about 15 m thick. The deep aquifer is formed by a combination of sands and
gravels. This, is considered the main aquifer with values of transmissivity in the
range between 1000 to 5000 m2/day. A silty wedge acts hydrogeologically as a
semiconfining unit.
Several groundwater models have been developed in the area, the last one performed
by the Hydrogeology Group (UPC-CSIC) in 2006. The model confirmed the clear
deficit of groundwater in the area, claiming the need for induced recharge actions,
to be distributed all along the lower course of the River. Accordingly, managed
aquifer recharge practices were recommended in the delta region and in the lower
valley. In short, it was established that a sustainable exploitation could not be
guaranteed only due natural recharge, especially during drought events.

_______________________________________________CHAPTER 1_ INTRODUCTION
10
For this reason, the Water Catalan Agency (ACA) and the water supply operator
(Aigües de Barcelona –Agbar) have been promoting strategies to recover the aquifer
in the lower course of Llobregat. These consist of:
Riverbed scarification in the Lower Valley: consists on removing the fine
materials settled in the riverbed. This activity has been performed since the
1950s, contributing in an infiltration rate that has been estimated in 40000
m3/d, although this figure is questioned.
Deep injection: this technique has been intermittently applied since 1969,
taking advantage of drinking water quality excess production at some
periods. It was the first deep recharge system built in Spain and it is
composed of 12 wells that allow decreasing the regional head gradient. The
recharge capacity of this technique has been calculated in 75000 m3/d, but it
is used only intermittently.
Seawater positive barrier in Llobregat Delta: seawater intrusion in the deep
delta aquifer has progressively deteriorated the groundwater quality since
the 1960s. For this reason, in 2007 a seawater positive barrier was put into
operation. Water for injection is tertiary-treated water (UV-disinfected, ultra-
filtered and treated with reverse osmosis). Wells are located 1 km inland from
the coast, displaying a line parallel to the coast about 6 km long. The total
injected flow was 15000 m3/d during operation, that was discontinued in 2010
due to financial problems of the funding agency.
More information about recharge practices in the Llobregat Basin can be found in
Sanchez-Vila et al. (2012) and in Deliverable 6.1 of MARSOL project
(www.marsol.eu).
1.5.2. Study site 1: Sant Vicenç MAR system
The Sant Vicenç MAR system is located 15 km inland from the Mediterranean Sea,
close to Barcelona city (Figure 1.1). It feeds the Lower Valley Aquifer, with 10-15 m
of thickness in the vicinity. The aquifer presents alternate sands and gravels with
non-continuous fine-grained sediments (Pedretti et al., 2012b). The water supplied
to the system is diverted from upstream the river to a pre-sedimentation basin. After
2-4 days of residence time, it is diverted to an infiltration basin of 6500 m2. The

_______________________________________________CHAPTER 1_ INTRODUCTION
11
infiltration capacity has been estimated at 1 m3m−2d−1 on average, and the local
transmissivity of the aquifer is estimated as 14000 m2d−1 (unpublished).
Figure 1.1 Geographical location of the Sant Vicenç MAR System and piezometers’ network
Since the construction of the ponds in 2009, many studies have been carried out in
the Sant Vicenç MAR System. The two first projects emplaced there were
GABARDINE (2005-2008) and RASA (2008-2010). Thanks to the RASA project, the
site was instrumented, a network of piezometers was constructed, pumping and
tracer tests performed, and a hydrologic model was developed. In 2010, the EU
project LIFE-ENSAT started, including the installation of a reactive layer at the
bottom of the infiltration pond to enhance the removal of emergent organic
contaminants. The idea of the reactive layer was to increase the organic load of the
infiltration water, promoting biological processes through the soil and the vadose
zone. The barrier was composed of organic compost (50% in volume) mixed with local
sand and gravel. Small amounts of clay and iron oxides were added to foster
adsorption and ion exchange, respectively.
Finally, the MARSOL project funded by the UE, dealing with quality and risk issues
related to artificial recharge, took place during 2014-2017.

_______________________________________________CHAPTER 1_ INTRODUCTION
12
Several Ph.D. thesis were developed based partially on these four projects: Barbieri
(2011), Pedretti (2012), Barahona-Palomo (2014), Valhondo (2016) and Grau-
Martínez (2018). Barbieri (2011) studied the potential effect of redox conditions on
the biodegradation of some selected micropollutants. Batch experiments were
performed with reactive barrier material from the site, simulating the conditions
during recharge. Results showed removal rates similar to those of conventional
wastewater treatments for ideal redox conditions. It was concluded that infiltration
ponds can be a suitable complement to traditional wastewater treatments.
Pedretti (2012) focused on the development of tools to map recharge affected by the
heterogeneity of the topsoil porous media. The combination of satellite imaging with
field data allowed modeling the spatial variability of infiltration capacity in the site.
The model considered the development of the clogging process in a probabilistic risk
assessment framework during recharge events.
Barahona-Palomo (2014) studied the effect of temperature fluctuations in the
vertical hydraulic conductivity behavior below the pond. Field data were compared
with a 1D model results.
The Ph.D. dissertations of Valhondo (2016) and Grau Martínez (2018) dealt with
quality aspects related to MAR. The former analyzed the efficiency of the reactive
layer to remove selected EOCs. A local reactive transport model explaining the
behavior of pond recharge was also presented. On the other hand, the latter focused
on denitrification processes occurring below the pond.
Overall, the published work provides a good hydrogeological characterization of the
site. Additionally, the four mentioned projects resulted in site equipment and a
significant monitoring network. So, it represents an excellent starting point to
develop the objectives introduced before.
1.5.3. Study site 2: Castellbisbal MAR system: site description and previous
studies
The Castellbisbal MAR system is located NW of the Barcelona Metropolitan Area
(Figure 1.2) The pond feeds the Cubeta de Sant Andreu’s aquifer that is constituted
by Quaternary detritic materials associated to the evolution of the Llobregat River.
The aquifer is composed of different levels of stepped alluvial terraces. The study
zone is located in a river meander, on a terrace sitting on Cenozoic red mudstones
(Martín and López, 2001). The aquifer depth under the pond is around 10 m. The

_______________________________________________CHAPTER 1_ INTRODUCTION
13
lithology under the pond is composed by gravels in a sand matrix. The associated
transmissivity in the vicinity is estimated around 4100 m2/d while the porosity was
estimated in 0.2-0.3 (Martín and López, 2001). Groundwater from the Cubeta de
Sant Andreu supplies the cities of Sant Andreu de la Barca, Castellbisbal and
Corbera, as well as industrial and agricultural activities in the area.
Figure 1.2 Geographical location and disposition of the Castellbisbal surface infiltration system
The MAR system exists since the 1980’s. However, it was fully reconstructed in 2007
after a complete damage due to flooding in 1998. Water for recharge purposes is
collected from the Llobregat River some 300 m upstream the study zone. Firstly,
water passes through a permanent-regime wetland (14500 m2), with a residence time
of about 3 days. Then, water is diverted to the infiltration pond (1400 m2). In
principle, recharge is continuous over the year, closing the interconnection between
ponds when the turbidity in the Llobregat River reaches 150 NTUs. Maintenance
operations (scrapping) in the infiltration is carried out approximately once a year.

_______________________________________________CHAPTER 1_ INTRODUCTION
14
Compared to the Sant Vicenç MAR site, the recharge system of Castellbisbal has
been much less studied, with no reactive layer installed. The work of Rodríguez
Vicente (2013) evaluated the availability of MAR at this location in terms of
Llobregat River average flow rate and water quality. Sendrós Brea-Iglesias (2016)
in his dissertation proposed geophysical prospection as a non-invasive technique to
characterize the infiltrating medium. The main monitoring point is a piezometer
drilled inside the infiltration pond, crossing the vadose zone and penetrating the
aquifer (PJ) (Sendrós Brea-Iglesias, 2016).
Outline of the thesis
This dissertation is organized into six main chapters.
Apart from this introduction (Chapter 1), Chapter 2 and Chapter 3 correspond to the
investigations carried out in the Sant Vicenç MAR system. Chapter 2 shows a
microbial fingerprinting comparing recharge and non-recharge scenarios. The goal
of this chapter is to link the conceptual flow model -mapping different groundwater
zones according to the influence of recharge- with microbial community behavior in
both scenarios. Chapter 2 also provides a wide discussion about ecological
implications of MAR ponds related to these two operation extremes.
In Chapter 3, all the data obtained in the latter study is compiled and subjected to a
statistical analysis. Compilation of microbial community composition data for soil
and water samples, diversity indices, the hydrochemical composition of water at
different depths, and grain-size distribution of soil samples allowed treating the
variables by means of PCA analysis. The objective of this chapter is to bring forth
strong correlations about non-biological and biological variables. Likewise, all
analyses have been framed in the two scenarios studied in the previous chapter.
Chapter 4 and Chapter 5 have been carried out in the context of the Castellbisbal
MAR system, where the reactive layer is not present.
In Chapter 4, several sampling surveys with analytical methods distributed along
one year are presented; this allowed to characterize redox species, the origin of
organic matter in water samples, and to quantify the amount of carbon in sediments
of the infiltration pond bed. Results from continuous monitoring of the hydrological
regime (water table in the infiltration pond, infiltration flow rate, and groundwater
level below the pond); temperature and redox potential in infiltration water, soil and
groundwater are also presented. The aim of this chapter is to understand clogging

_______________________________________________CHAPTER 1_ INTRODUCTION
15
development and redox processes induced by infiltration to improve MAR
management.
Chapter 5 focuses on modeling flow and heat transport of the Castellbisbal MAR
system in order to know and quantify (1) reduction of hydraulic conductivity caused
by clogging, (2) changes in hydraulic conductivity due to temperature fluctuations in
space and time. Furthermore, two reactive biogeochemical models are implemented
in order to test the impact of temperature on redox processes, i.e. on degradation
rates. The last section of this chapter presents some suggestions in order to couple
reactive transport with flow and heat transport.
Finally, Chapter 6 presents the conclusions of the overall performed research along
the Ph.D. dissertation.
The Appendix includes two parts. The first one provides some hydrochemical data
obtained in the Sant Vicenç MAR sampling campaigns; the second includes two
scientific papers, one with a content similar to Chapter 2, and another one is a paper
that I coauthor dealing with denitrification processes occurring in the Sant Vicenç
MAR system.

_______________________________________________CHAPTER 1_ INTRODUCTION
16

17
_____________________________________________________
CHAPTER 2: PARAMETERS AFFECTING
MICROBIAL COMMUNITY COMPOSITION IN
SURFACE INFILTRATION PONDS
_____________________________________________________

18

_______________________CHAPTER 2_ PARAMETERS AFFECTING MICROBIAL
COMMUNITY COMPOSITION IN SURFACE INFILTRATION PONDS
19
2.1. Introduction
As the Intergovernmental Panel on Climate Change has stated for years, climate
change is affecting and will continue to affect the availability and quality of
freshwater resources, with severe consequences to humans and ecosystems. In
particular, the Mediterranean Basin is expected to become warmer and drier (Bates
et al., 2008). Therefore, among other actions, claiming a secure water supply should
increase groundwater storage of quality water as a strategic management tool in
times of scarcity. Managed Aquifer Recharge (MAR) is a globally used, worldwide
extended technology based on refilling aquifers with water from different sources
(e.g., river, reclaimed, or opportunity water). MAR facilities are usually intended to
recover groundwater levels, to become water reservoirs or as a means for improving
water quality during infiltration (Drewes et al., 2003; Nadav et al., 2012).
The Llobregat River (Catalonia, NE Spain) is fed by about a hundred Waste Water
Treatment Plants. While nitrogen, phosphorous and organic matter (DOC) are
eliminated below the legal limits before treated wastewater is discharged to the
river, emerging organic contaminants (EOCs) are not fully removed (Loos et al.,
2013). Consequently, significant concentrations of many EOCs have been detected
in the Llobregat River (López-Serna et al., 2012) and its associated groundwater
bodies (Jurado et al., 2012).
Biodegradation of EOCs strongly depends on redox conditions (Barbieri et al., 2011;
Maeng et al., 2010). In this regard, it has been shown that MAR is a feasible
technique capable of partially degrading some of these contaminants (Hellauer et
al., 2017; Massmann et al., 2008), particularly when bioprocesses are enhanced
(Grau-Martínez et al., 2018; Schaffer et al., 2015). Infiltration through the soil
intrinsically leads to two main consequences in groundwater recharge:
1. Development of different vertical and temporal redox zonations responding to
organic matter availability as electron acceptors are consumed (Greskowiak et al.,
2006).
2. Development of microbial communities according to the flow paths. Fingering
below the surface of the recharge systems and preferential flow paths in the
saturated zone can create anaerobic microsites Bridgham et al. (2013) in which
oxygen is consumed faster than it can be diffused from oxic zones.

_______________________CHAPTER 2_ PARAMETERS AFFECTING MICROBIAL
COMMUNITY COMPOSITION IN SURFACE INFILTRATION PONDS
20
Indeed, MAR implies groundwater quality modifications when compared to natural
flow conditions. This includes several parameters such as organic matter, dissolved
oxygen content, temperature, pH, electrical conductivity, and nutrients (Rivett et al.,
2008; Zhang et al., 2016). Such disturbances have ecological implications, as all these
parameters affect the growth and activity of microorganisms and the corresponding
degradation of emerging contaminants (Barbieri et al., 2012; Regnery et al., 2017;
Valhondo et al., 2018).
Microbial studies linked to MAR practices involve mostly laboratory experiments
(Alidina et al., 2014c; Freixa et al., 2015; Li et al., 2013; Rubol et al., 2014). As for
microbial MAR field studies, most relevant research is limited to well injection
systems (Ginige et al., 2013; Reed et al., 2008; Zhang et al., 2016) or riverbank
filtration conditions (Huang et al., 2015). Onesios-Barry et al. (2014) compared
results from a column experiment and soil samples in a MAR site in the US, focusing
on the microbial populations linked to pharmaceutical and personal care products
removal, and concluded that microbial composition and structure of both systems
were comparable. Regnery et al. (2016) went one step further by relating the relative
abundance of functional genes involved in xenobiotic pathways with attenuation of
some trace organic chemicals and their byproducts in a combination of laboratory
experiments and a full-scale MAR facility. However, in our knowledge, there are no
microbial fingerprinting studies of MAR surface infiltration basins, that integrate
results from surface water, groundwater, and soil samples and comparing them in
two different operational periods.
The main goal of this chapter is to determine how MAR activities induce changes in
the microbial communities in Sant Vicenç recharge system. Here, changes on
diversity indices are evaluated and we incorporate results of the DNA sequence
analysis of excised DGGE band patterns for samples taken from different
environments and locations within the site and under conditions of recharge and
non-recharge. Additionally, results are linked with ecological principles and
potential biogeochemical processes (i.e. pollutants degradation) occurring due to
MAR activities.
2.2. Methodology
This second chapter is framed in Sant Vicenç MAR facility (see Chapter 1, section
2.3.1.).

_______________________CHAPTER 2_ PARAMETERS AFFECTING MICROBIAL
COMMUNITY COMPOSITION IN SURFACE INFILTRATION PONDS
21
2.2.1. Monitoring network and hydrochemistry sampling surveys
Two recharge situations were compared to evaluate the effect of MAR on
groundwater chemical signature. After six months of continuous recharge operation,
a sampling campaign took place in July 2014 (wet campaign). Samples were collected
from surface water in both basins and in the existing piezometers at different depths
(from -5 to 3 masl, see Figure 1.1 and Figure 2.1).
Figure 2.1 Transect section studied with piezometers (P1 and P2 are projected) and displaying sampling
depths (red diamonds). Water from piezometer P1 represents background conditions (not affected by
recharge. The blue line shows the groundwater level in July 2014 (active recharge scenario) and March
2015 (non-recharge scenario)
A second sampling campaign was performed in March 2015 after recharge had been
discontinued for four months. In this case, groundwater was also sampled. Water
was analyzed for cations, anions (Cl-, NO3-, SO4
-2, HCO3-), DOC and TOC. Samples
for Cl-, NO3-, SO4
-2, and HCO3- analysis were filtered through 0.2-μm nylon filters,
stored at 4⁰C and analyzed using high-performance liquid chromatography (HPLC)
with a WATERS 515 HPLC pump, IC-PAC anion columns, and a WATERS 432
detector. Samples for the determination of cations were filtered through a 0.2-μm
filter, acidified in the field with 1% HNO3- and stored at 4⁰C. Cations were analyzed
using inductively coupled plasma-optical emission spectrometry (ICP-OES, Perkin-
Elmer Optima 3200 RL). Samples for DOC analysis were filtered through a 0.45-μm
nylon filter and collected in muffled (450⁰C, 4.30 h) glass bottles, acidified and stored

_______________________CHAPTER 2_ PARAMETERS AFFECTING MICROBIAL
COMMUNITY COMPOSITION IN SURFACE INFILTRATION PONDS
22
at 4⁰C. In addition, water for TOC determination was sampled and stored at 4⁰C.
TOC and DOC were analyzed with an infrared detector using the NPOC method
(Shimadzu TOC-Vcsh).
In both campaigns, temperature and electrical conductivity vertical profiles were
mapped along the transect from data obtained at 50 cm intervals (MPS-D8, SEBA
Hydrometrie).
2.2.2. Microbial community characterization
Water samples were extracted from the pre-sedimentation and infiltration basins at
three locations (entrance, middle, and end) during recharge conditions (from now on,
wet scenario). On the contrary, 3 soil samples were extracted at the same locations
in the infiltration basin under non-recharge conditions (termed dry scenario). Soil
samples were obtained from around 10 to 50 cm in depth. The sampling procedure
for soil was done taking into account Lombard et al. (2011) recommendations,
especially regarding the variability of microbial communities along a field transect.
Soil samples were taken by means of cores, individually disassembled and kept in a
sterile bag. Groundwater samples were taken from -5 to 3 masl depending on the
piezometers (10 samples for wet scenario and 7 for dry). All soil and groundwater
samples were taken in duplicate, kept in sterile conditions, and preserved in dark at
4⁰C until being taken to the laboratory for molecular analyses.
Liquid samples were filtered through 0.22-μm GV Durapore® membrane filters
(Merck 14 Millipore, USA) and stored at -80ºC. Soil samples were centrifuged at
14.000 rpm and the liquid fraction was discarded before pellets were cold-stored at
-80ºC. Total DNA extraction was conducted using PowerWater® and PowerSoil®
DNA Isolation Kits (MoBio Laboratories, USA) for water (100 mL) and soil (200 mg)
samples, respectively. For bacterial analyses, a 550-bp DNA fragment in the 16S
region of the small-subunit ribosomal RNA gene was amplified using the primer set
341f/907r (Muyzer et al., 1993) a with a GC clamp added at the 5’ end of the forward
primer. Final concentrations of the PCR reactions consisted of 1x PCR buffer, 2 mM
of MgCl2, 200 μM of each deoxynucleoside triphosphate, 500 nM of each primer, 2.5
U of Taq DNA polymerase (Invitrogen, ThermoFisher Scientific, USA) and 10 ng of
template DNA. The amplification protocol consisted of 94ºC for 5 min; 20 cycles of
94ºC for 1 min, 65ºC for 1 min (-0.5ºC/cycle), 72ºC for 3 min; 15 cycles of 94ºC for 1
min, 55ºC for 1 min, 72ºC for 3 min; and a single final extension of 72ºC for 7 min.

_______________________CHAPTER 2_ PARAMETERS AFFECTING MICROBIAL
COMMUNITY COMPOSITION IN SURFACE INFILTRATION PONDS
23
Denaturing gradient gel electrophoresis (DGGE) was performed using the Dcode
Universal Mutation Detection System (Bio-Rad, Spain). First, 900 ng of DNA from
PCR products were loaded onto 6% (w/v) polyacrylamide gels (acrylamide/bis
solution 37.5:1) containing linear chemical gradients of 30-70% denaturant. The
100% denaturing solution contained 7 M urea and 40% (v/v) deionized formamide.
Gels were run in 1X Tris acetate-EDTA (TAE) for 16 h at 75 V and 60ºC, stained
with 1 μg/mL ethidium bromide solution for 25 min, washed with deionized water
for 25 min and photographed with Universal Hood II (Bio-Rad, Spain). DGGE images
were analyzed using InfoQuest™ FP software. Dice’s coefficient and the unweighted
pair group method with arithmetic averages (UPGMA) were employed for the
clustering of DGGE gel profiles. Non-metric Multidimensional Scaling (NMD) was
performed using the Vegan package (Oksanen et al., 2017). Prominent bands from
the DGGE were excised, re-amplified and sequenced by Macrogen (South Korea).
The obtained sequences were trimmed with FinchTV software and checked for
chimeras using the UCHIME algorithm (Edgar et al., 2011) integrated into Mothur
version 1.38 (Schloss et al., 2009). Each 16S rRNA sequence was assigned to its
closest neighbor according to the Basic Local Alignment Search Tool (BLAST) results
(Altschul et al., 1997). Curated sequences were deposited in the National Center for
Biotechnology Information (NCBI) GenBank database under accession numbers
MF471641-MF471667.
Once the main microbial communities were characterized, three diversity indices
were calculated. The first one is Richness (S), defined as the proportional number of
microbial species present in a sample, i.e., equal to the total number of bands; the
other two, Shannon (H), and Evenness (E), were calculated for each sample as
follows:
(2.1.)
(2.2)
𝐻 = −∑𝑝𝑖
𝑆
𝑖=1
· 𝑙𝑛(𝑝𝑖)
𝐸 =𝐻
𝐻𝑚𝑎𝑥
; with𝐻𝑚𝑎𝑥=ln S

_______________________CHAPTER 2_ PARAMETERS AFFECTING MICROBIAL
COMMUNITY COMPOSITION IN SURFACE INFILTRATION PONDS
24
where Hmax=lnS and pi is the relative intensity of each band of the sample. Values
reported correspond to the average of the two replicas.
2.2.3. Physical characterization of soil
To complement the soil microbial community’s characterization, particle size
measurements of soil samples were taken according to the ASTM guidelines. The
soil was sampled in the pre-sedimentation basin and at the entrance, middle, and
end of infiltration basin. Soil sampling was performed close to the location where
samples were taken for microbial analyses.
2.3. Results
2.3.1. Clustering of recharge influenced zones according to temperature
and conductivity changes
Understanding the flow pattern in MAR basins is essential to explain microbial
community dynamics. In this regard, 2D transects of temperature and conductivity
alterations obtained at the time of the sampling campaigns (Figure 2.2 and Figure
2.3) based on vertical profiles indicate that: 1) the vertical flow gradient pushes the
existing groundwater downwards and forms a shallow front that travels
approximately 120 m downstream, eventually mixing with the background water; 2)
the background water is mostly found near the recharge pond and at the deepest
sampling points below the pond.

_______________________CHAPTER 2_ PARAMETERS AFFECTING MICROBIAL
COMMUNITY COMPOSITION IN SURFACE INFILTRATION PONDS
25
Figure 2.2 Temperature distribution at the local scale in (a) July 2014 (wet), and (b) March 2015 (dry).
Red diamonds indicate sampling points for microbial and water analysis in each campaign

_______________________CHAPTER 2_ PARAMETERS AFFECTING MICROBIAL
COMMUNITY COMPOSITION IN SURFACE INFILTRATION PONDS
26
Figure 2.3 Electrical Conductivity distribution at the local scale in (a) July 2014 (wet), and (b) March
2015 (dry)

_______________________CHAPTER 2_ PARAMETERS AFFECTING MICROBIAL
COMMUNITY COMPOSITION IN SURFACE INFILTRATION PONDS
27
From this conceptual model, four main groups of groundwater can be defined under
recharge conditions:
Type I water represents the background environment of the aquifer,
unaffected by MAR activities. Water sampled in P1 is an example of this type.
Type II water is the infiltrating one (best observed in P8 at both sampling
depths). It flows vertically through the vadose zone to the aquifer, creating a
small water mound that pushes down the Type I water.
Type III water, characteristic of points P2(3), P5(2.3) and P5(-2.2), is a
mixture between Types I and II waters, with a high proportion of the latter.
Type IV is again a mixture but with a lower proportion of Type II water. It is
present in piezometers P3(0.8), P3(-4.2), P2(-5) and P10(-1).
Apart from temperature and conductivity, major ions composition does not
show any significant trend related with groundwater zonation below the pond
(see Table A1.1 in Appendix A). The role of nitrate and DOC in microbial
community patterns is discussed further below.
2.3.2. Fitting groundwater microbial communities in the conceptual flow
model
To characterize differences in microbial communities due to recharge, groundwater
samples were subjected to molecular analysis. Post-processing of DGGE gels allowed
for Non-Metric Multidimensional Scaling (NMDS), showing similarities among band
patterns (Figure 2.4) and strong clustering of microbial communities. Samples from
both scenarios were completely separated; blue squares (dry) and triangles (wet)
represent groundwater samples and are clearly clustered in top and bottom halves
of the plot, respectively. Moreover, samples from the wet scenario grouped according
to water types. Types I and II are displayed on opposite sides; Types III and IV
(mixed) are displayed in between. The two green triangles in the center of the plot
correspond to groundwater samples from P10.

_______________________CHAPTER 2_ PARAMETERS AFFECTING MICROBIAL
COMMUNITY COMPOSITION IN SURFACE INFILTRATION PONDS
28
Figure 2.4 Non-metric Multidimensional Scaling clustering for all groundwater samples. Blue squares
and triangles represent samples in dry and wet scenarios, respectively. Colors in triangles represent
water types. Black circles correspond to band migration numbers in DGGE gels that were sequenced
(phylogenetic affiliation corresponding to each black circle). Non-sequenced bands are also portrayed
(empty circles). Discrete bands are also portrayed (circles), allowing linkage of the bands’ contribution
to sample assemblages. Filled circles report the class and genus of the sequenced bands, whereas empty
circles symbolize non-sequenced bands

_______________________CHAPTER 2_ PARAMETERS AFFECTING MICROBIAL
COMMUNITY COMPOSITION IN SURFACE INFILTRATION PONDS
29
Figure 2.5 DGGE band patterns of bacterial 16S rRNA gene fragments and UPGMA cluster analysis
for fingerprints obtained from wet (July 2014) (a) and dry (March 2015) (b) periods. Bar indicates 9%
divergence. Each sample is defined by a code indicating piezometer number and sampling depth (see
table 1). Black triangles indicate the position of bands recovered and sequenced, and numbers
correspond to their phylogenetic affiliation (see table A1.2 in Annex A)
Figure 2.5 shows DGGE profiles and UPGMA clustering analysis of groundwater
samples. The genetic fingerprints revealed high dissimilarities in the bacterial
assemblage of about 70% and 80% during the active recharge period and the dry
campaign, respectively (Figure 2.5). Moreover, most replicas grouped together,
indicating sampling quality. Under active recharge (wet) conditions (Figure 2.5a),
the dendrogram reproduces quite well the water types postulated by the conceptual
flow model: in the first group, we can include four out of the five samples that were

_______________________CHAPTER 2_ PARAMETERS AFFECTING MICROBIAL
COMMUNITY COMPOSITION IN SURFACE INFILTRATION PONDS
30
strongly influenced by recharge (P5(-2.2), P5(2.3), P8(1) and P8(-3)); while in the
second group, P2(3), P3(-4.2) and P3(0.8) clustered together with P1 (non-affected by
recharge). In the dry campaign (Figure 2.5b), although no infiltration occurred, P8
appears separated from the other piezometers, indicating the still marked influence
of the water infiltrated during the wet period, which occurred over four months
earlier.
2.3.3. Spatial and temporal variations in microbial diversity indices in
groundwater
The structure and processes of ecosystems change when a disturbance occurs
(Grimm, 1994). Such changes in microbial communities have been quantified and
described by means of diversity indices. Such indices, grouped according to water
types during wet conditions, were ordered along an imaginary line from low to highly
perturbed as a consequence of water infiltration (
Figure 2.6). The lowest diversity indices were obtained for the recharging water
(Type II), indicating low species richness and a highly dissimilar proportion. In
contrast, Type IV water, only slightly affected by water infiltration, displayed higher
Shannon and Evenness indices, similar to Type I (unaffected by recharge).
Figure 2.6 Average of Shannon Indices in piezometer samples
under wet conditions. Standard deviation is shown in error bars.
Horizontal axis reflects the degree of perturbation of original
groundwater due to recharge

_________________________CHAPTER 2_ PARAMETERS AFFECTING MICROBIAL COMMUNITY COMPOSITION IN SURFACE
INFILTRATION PONDS
- 31 -
* Numbers in parenthesis after each index value indicate standard deviation, not reported whenever when the replica was damaged
Table 2.1 Summary of Diversity Indices at the Llobregat MAR site in the different scenarios
Environment
Sampling location
(depth-masl-)
Shannon (SD)* Richness (SD)* Evenness (SD)*
WET DRY WET DRY WET DRY
Groundwater
T.I P1-BG (-0.6) 2.57(0.04)
2.73
22 (4.1) 19 0.61(0.01)
0.64
T.II P8 (1) 1.43(0.05)
1.73
10 (2.0) 11 0.34(0.01)
0.41
P8 (-3) 1.69(0.20)
2.03(0.14)
11 10 (2.0) 0.40(0.05)
0.48(0.03)
T.III
P2 (3) 2.29(0.13) 18.5 (7.2) 0.54(0.03)
P2 (-2) 2.67(0.13)
18 (2.0) 0.63(0.03)
P5 (2.3) 1.91(0.01)
2.41
14.5 (1.0) 14 0.45(1·10-3)
0.56
P5 (-2.2) 2.22(0.01)
12.5 (1.0) 0.52(2·10-3)
T.IV
P3 (0.8) 2.65(0.09)
2.01(0.28)
21 10.5 (3.07) 0.63(0.02)
0.48(0.07)
P3 (-4.2) 2.65(0.13)
20 0.63(0.03)
P2 (-5) 2.80(0.12)
23 (4.1) 0.66(0.03)
P10 (-1) 2.51(0.20)
2.49(0.09)
17 16 (4.1) 0.59(0.01)
0.59(0.02)
Water of basins
Pre-sedimentation
dddzzzsedimentation
2.93(0.28)
29 (14.3) 0.69(0.07)
Infiltration entrance 2.78(0.53)
28.5 (17.4) 0.66(0.12)
Infiltration midfield 2.66(0.14)
25.5 (3.1) 0.63(0.03)
Infiltration end 2.58(0.08)
24 (2.0) 0.61(0.02)
Soil of basins
Pre-sedimentation 2.89(0.16)
25.5 (7.2) 0.68(0.04)
Infiltration entrance 3.22(0.09)
2.93(0.21)
35.5 (1.0) 25 (7.6) 0.76(0.02)
0.69(0.08)
Infiltration midfield 3.36(0.14)
2.90(0.05)
2
30.5 (3.1) 21 0.79(0.03)
0.68(0.01)
Infiltration end 3.29(0.05)
2.40(0.07)
34 (2.0) 16 0.78(0.01)
0.57(0.02)

_______________________CHAPTER 2_ PARAMETERS AFFECTING MICROBIAL
COMMUNITY COMPOSITION IN SURFACE INFILTRATION PONDS
32
2.3.4. Role of MAR activities for the microbial community structure
Prominent bands were recovered from the DGGE gels (Figure 2.5) and sequenced.
Table A1.2 (Appendix A) shows the sequenced bands, their similarity values
compared to the closest related GenBank sequences, and their phylogenetic
affiliations. Overall, sequences fell into nine different bacterial phyla and eleven
classes: Proteobacteria (Alphaproteobacteria, Betaproteobacteria, and
Gammaproteobacteria), Cyanobacteria, Chloroflexi (Dehalococcoidia), Chlorobi
(Chlorobia), Nitrospirae (Nitrospira), Acidobacteria, Actinobacteria, Firmicutes
(Bacilli) and Bacteroidetes (Cytophagia) (Figure 2.7). The group designated as
“Others” includes unclassified and non-sequenced fine bands.
The two main classes displaying the largest differences between the two scenarios
are Betaproteobacteria and Dehalococcoidia, which were favored under recharge
conditions. In particular, Dehalococcoidia is present in medium- and low-influenced
waters, and it is absent from the high recharge-influenced groundwater (P8(1) and
P8(-3)). This phylotype was identified at the genus level as Dehalogenimonas sp
(Table A1.2). Similar behavior was found in the Nitrospira class, appearing in low-
influenced groundwater in the wet scenario.
Patterns in the structure of microbial populations correlated with water types. For
Type I, differences in the bacterial assemblage between both campaigns were
attributed to seasonal changes (Table A1.2). Dehalococcoidia and Chlorobia were
only detected in the wet scenario, while Cytophagia and Nitrospira could only be
detected under dry conditions.

_______________________CHAPTER 2_ PARAMETERS AFFECTING MICROBIAL
COMMUNITY COMPOSITION IN SURFACE INFILTRATION PONDS
33
Figure 2.7 Bacterial community structure of groundwater samples. Class relative abundances
calculated for wet (a) and dry (b) scenarios
During the active recharge period and for Type IV water, Dehalococcoidia was found
in three out of four sampling points and was the most abundant phylotype. For Type
III water, significant differences were observed among in the samples analyzed.
Populations with the highest relative abundance in P5 (2.3) were Betaproteobacteria
and Bacilli. The former was also prominent in P5(–2.2), together with Cytophagia,
while Dehalococcoidia were dominant in P2(3). Finally, in the case of groundwater
Type II (recharge water), the bacterial assemblage was dominated by members of
the Betaproteobacteria class. During the dry period, no clear distribution patterns
in the bacterial relative abundances at the phylum and class level were observed, in
part due to the DGGE profiles, mainly composed by fine bands (Figure 2.5); these
were difficult to recover and purify, and thus could not be characterized. However, it

_______________________CHAPTER 2_ PARAMETERS AFFECTING MICROBIAL
COMMUNITY COMPOSITION IN SURFACE INFILTRATION PONDS
34
should be mentioned that Betaproteobacteria were dominant in both P8 samples,
contributing more than 50% to the relative abundance.
2.3.5. Microbial community indicators of MAR in soil and surface water
To study the impact of MAR on microbial community structure, recharge water from
pre-sedimentation and infiltration basins, as well as soils, were analyzed. Figure 2.8
and Figure 2.9 show the relative abundance of bacterial phylotypes at the
taxonomical level of classes for surface water and soil samples. The results are
displayed according to the distance to the recharge basin inlet. Microbial richness in
soil samples was controlled by water content. Non-recharge conditions had a
primarily negative effect on the populations of Dehalococcoidia, Acidobacteria, and
Chlorobia, but favored the presence of Nitrospira, Cytophagia and Actinobacteria
(Figure 2.8). Shannon and Evenness indices demonstrated that soils were more
diverse under wet conditions than under dry ones (Table 2.1).
Figure 2.8 Bacterial community structure of soil samples from pre-sedimentation and infiltration
basins. Class relative abundances calculated for wet (a) and dry (b) scenarios
For surface water samples (Figure 2.9), there was a decreasing gradient in
community complexity along the ponds. Acidobacteria, Betaproteobacteria, and
Cyanobacteria were the main phylotypes present.

_______________________CHAPTER 2_ PARAMETERS AFFECTING MICROBIAL
COMMUNITY COMPOSITION IN SURFACE INFILTRATION PONDS
35
Figure 2.9 Bacterial community structure from water samples of pre-sedimentation and infiltration
basins. Class relative abundance calculated for wet scenario
2.4. Discussion
2.4.1. Matching groundwater model, ecological disturbance principle and
microbial community composition
Groundwater is a quite stable aquatic environment (Griebler and Lueders, 2009) as
it is shown by the low variability in the hydrochemical data (Table A1.1). One could
expect that microbial communities in groundwater should also display low
variability that could be reflected in the diversity indices. In this way, piezometer
P1, which is unaffected by recharge, showed stable diversity indices regardless of the
sampling campaign. However, disturbances produced by recharge, evidenced by
temperature and conductivity gradients below the pond (Figure 2.2 and Figure 2.3),
favor the highest Shannon values for the intermediate-disturbed samples. As a

_______________________CHAPTER 2_ PARAMETERS AFFECTING MICROBIAL
COMMUNITY COMPOSITION IN SURFACE INFILTRATION PONDS
36
result, the average of diversity indices remains constant between both scenarios but
with higher standard deviation during the wet scenario. These two facts combined,
suggest that perturbations caused by recharge influence much more the composition
of microbial communities in groundwater than the natural variability of the
background aquifer water between scenarios.
MAR is a passive treatment technique that can provide simultaneously oxic and
anoxic conditions (Maeng et al., 2011). This has wide implications for the potential
biological removal of selected emerging contaminants, as each micropollutant is most
efficiently removed under specific redox conditions (Schmidt et al., 2007). Some can
even be degraded by co-metabolism, involving different redox states in the process
(Rodriguez-Escales and Sanchez-Vila, 2016). In this sense, MAR is an efficient
remediation system. In addition, many sequenced phylotypes, such as Nitrospira sp,
Stenotrophomonas sp, and Methylobacterium sp have been associated with
degradation capabilities (Cycoń et al., 2017; Daims et al., 2001; Wang et al., 2015).
In short, the MAR microbial ecosystem studied in this work presents many more
phylotypes than previous studies reported in groundwater systems (Logue et al.,
2015), and thus, MAR can be considered an efficient remediation system.
We further tested the Intermediate Disturbance Hypothesis (IDH) for microbial
communities in groundwater (Figure 2.4) related to MAR activities. IDH was
originally proposed for tropical rainforests and coral reefs (Connell, 1978) and
supports the idea that small perturbations create new access to resources for species
which have overlapping niches, allowing their coexistence. This mechanism, known
as a competition-colonization trade-off, can explain IDH in local communities,
leading to an increase in diversity. However, when the degree of disturbance rises,
only eurytolerant populations can survive and grow. Thus, an inverse correlation
between diversity and the degree of disturbance (reflected in the temperature and
conductivity profiles) was expected (see Table 2.1). Such correlations have also been
reported in recharge wells and snowmelt-influenced aquifers (Ginige et al., 2013;
Zhou et al., 2012).
In Sant Vicenç MAR system, the initial diversity in the microbial community
increased with perturbation caused by recharge (

_______________________CHAPTER 2_ PARAMETERS AFFECTING MICROBIAL
COMMUNITY COMPOSITION IN SURFACE INFILTRATION PONDS
37
Figure 2.6), with maximum diversity associated with Type IV water, and lowest for
the most disturbed water (Type II). In ecological terms, Type III and Type IV waters
represent different proportions of perturbation.
In the most altered groundwater zone (represented by P8 samples),
Betaproteobacteria grew above 50% of the relative abundance (Figure 2.7). The main
phylogenetic affiliation of this phylotype at the genus level is Vogesella. Strains of
this genus are able to catabolize monosaccharides under aerobic conditions, but not
under low-oxygen conditions. Furthermore, all Vogesella strains are denitrifiers
(Grimes et al., 1997). Indeed, P8, located below the pond, receives oxygen-rich water
during the recharge process, driven by fingering in the vadose zone. Although
dissolved oxygen was not measured in the present study, data from other campaigns
confirm this behavior for oxygen in P8 samples (data not shown). Moreover, nitrate
concentration in the surface water was low (Table A1.1), and thus most
denitrification is expected to occur under the pond. Grau-Martínez et al. (2018)
recently confirmed that nitrate was consumed via denitrification pathway under the
infiltration pond in Sant Vicenç MAR system, supporting the idea that Vogesella sp
could be one of the genera involved in nitrate consumption. Likely, depending on the
oxygen content, Vogesella sp will adapt its metabolic function in favor of aerobic
oxidation of organic matter or by means of denitrification, thus becoming a good
indicator of highly-disturbed MAR environments.
For Type III and Type IV waters, Dehalogenimonas sp, within the Dehalococcoidia
class, is characteristic of medium-disturbance groundwater (Figure 2.4 and Figure
2.7). Dehalogenimonas sp has been studied in recent years because some strains are
associated with dechlorination in contaminated sites. This genus is strictly anaerobic
and mesophilic, and some species can reductively dehalogenate polychlorinated
aliphatic alkanes (Martín-González et al., 2015; Moe et al., 2009). As a result,
recharge creates reducing conditions, likely indicating the existence of microzones or
microsites (Bridgham et al., 2013; Hamersley and Howes, 2002), defined as local
anoxic areas that coexist with fast-traveling oxygen-rich paths. Thus, microbial
analysis can be used to unmask the apparent mishap of water samples that are oxic
and display some typical anaerobic species. Moreover, some species of
Dehalogenimonas can dechlorinate some Trichloroethane isomers (Dillehay et al.,
2014), a pollutant reported in the Llobregat Lower Valley at levels as high as 300µg/L

_______________________CHAPTER 2_ PARAMETERS AFFECTING MICROBIAL
COMMUNITY COMPOSITION IN SURFACE INFILTRATION PONDS
38
(Valhondo et al., 2014), thus opening the door for the development of enhanced
remediation activities.
The Evenness index is an indicator of the equity of a community and can be quite
informative for observing perturbations to microbial communities. In the wet
scenario, the lowest values of E were obtained for the samples most affected by
recharge (Table 2.1), indicating that some species developed into predominant
members of the microbial assemblage. Groundwater samples displayed the highest
evenness values in the area less affected by recharge and in the dry scenario. In the
latter case, values indicate the recovery of microbial communities from the
disruption caused by recharge. In fact, P8(1) samples in the dry scenario were not
fully consistent with this conceptual model, with low evenness index and very low
nitrate concentration. Furthermore, the presence of Methylotenera mobilis
(Betaproteobacteria class) in both P8 sampling points was more than 40%, on
average, of the relative abundance. Methylotenera mobilis is a methylotroph species
with denitrification abilities (Chistoserdova, 2011). These results suggest that P8
denitrification processes occur below the basin even when it is empty, indicating that
four months is not enough time to revert back to natural conditions at this sampling
point. This assumption is consistent with nitrate isotopic data presented in Grau-
Martínez et al. (2018) and is also in agreement with the study of Rodriguez-Escales
et al. (2016) in which biomass decay acted as an endogenous carbon source for
respiration once the input carbon was reduced, maintaining denitrification rates.
2.4.2. Role of microbial populations in soil and surface water
We analyzed the heterogeneity of the microbial community structure in soil and
surface water in terms of the distance to the infiltration basin entry point (Figure
2.8 and Figure 2.9) Patterns in surface water microbial composition are linked to
sequential sedimentation processes as revealed by granulometric analyses of soil
samples (Table A1.3 in Appendix 1). The result was that surface water became
poorer in terms of the presence of microbial communities between the pre-
sedimentation basin and the end of the infiltration basin. The main reason could be
the decrease in solids suspended throughout the system due to the sequential
decantation of particles and their attached biomass. Furthermore, surface water
displays relatively higher values of Cyanobacteria and Acidobacteria classes
compared to groundwater. Cyanobacteria constitute the largest, most diverse, and
most widely distributed group of photosynthetic prokaryotes, which are capable of

_______________________CHAPTER 2_ PARAMETERS AFFECTING MICROBIAL
COMMUNITY COMPOSITION IN SURFACE INFILTRATION PONDS
39
conducting N fixation (Stanier and Cohen-Bazire, 1977). However, members of the
phylum Acidobacteria are physiologically diverse and ubiquitous in soils, degrade a
wide range of carbon sources (from substances with a wide range of complexity), and
are capable of reducing nitrates and nitrites (Kielak et al., 2016). This heterogeneous
effect with distance to the entry point of the basin is also observed in the diversity
indices, which lose diversity with distance and are inversely correlated to the
proportion of fine particles. Similar behavior for richness correlated to soil texture
was reported elsewhere (Chau et al., 2011).
Differences in the microbial communities in soils between the two basins were
concentrated in the large organic matter content provided by the reactive barrier
present in the latter, being a source for the growth of bacterial communities and
enhanced diversity under recharge conditions. The role of the humidity on microbial
diversity is also significant, as was previously reported in horizontal subsurface
constructed wetlands (Nurk et al., 2005). Furthermore, phylotypes distribution
changes among scenarios. Whereas Dehaloccocoidia and Chlorobia classes appear in
wet soils, Nitrospira, Cytophagia, and Actinobacteria are favored under dry
conditions.
The role of the reactive layer at the infiltration pond could be extrapolated as a
system fed with a considerable organic carbon load. Laboratory experiments and
constructed wetlands demonstrate that concentration of microbial activity and TOC
degradation is concentrated in the first centimeters of the filter material (Ragusa et
al., 2004; Sleytr et al., 2007; Tietz et al., 2007) in response to oxygen concentration
vertical distribution. Although rapid oxygen depletion and consequent
denitrification conditions have been evidenced in lab-scale MAR experiments
(Alidina et al., 2014a; Dutta et al., 2015), this effect may not happen rapidly under
real infiltration conditions, where entrapped gas (Heilweil et al., 2004) or fingering
processes (Kung, 1990) may provide higher oxygen concentrations than in lower
dimension systems (e.g., columns). Lab-experiments are doubtlessly useful to
elucidate the behavior of microbial communities under controlled conditions.
However, sometimes it could exist a difficulty of transferring conclusions obtained
from lab samples to real sites.

_______________________CHAPTER 2_ PARAMETERS AFFECTING MICROBIAL
COMMUNITY COMPOSITION IN SURFACE INFILTRATION PONDS
40
2.4.3. Transferability of results
The results of the present work are from a field experiment. This intrinsically means
that is not performed under controlled conditions. Field studies are indeed realistic,
but their transferability to other areas becomes challenging. However, some
microbial and ecological approaches are comparable between experimental studies.
In this way, the diversity indices are common calculations performed to assess the
ecological state of a microbial community which allows comparing different
communities (samples under different operational conditions in our case). Following
an ecological argument, this study evidences that Intermediate Disturbance
Hypothesis has been accomplished in Sant Vicenç MAR site. Therefore, we could
expect the same behavior in other impacted areas under similar recharge conditions.
Another information that could be useful for other scientific works is the role of some
microbial species in the organic matter degradation and denitrification processes,
such as the role of Vogesella sp and other key species discussed previously. The
sequences of all species found were deposited into GenBank, so it represents a
contribution to the genetic database and to the overall scientific knowledge.
2.5. Conclusions
This study aims at integrating different fields such as hydrogeology, ecology and
microbiology applied to a real MAR facility, relating flow (infiltration) conditions,
physicochemical water parameters, and microbial changes induced by managed
recharge along the vertical transect. We observed that infiltration ponds modify the
hydrochemistry and ecology of the groundwater environment, especially in terms of
microbial communities. Comparing recharge and non-recharge scenarios, we found
that microbial diversity indices (Shannon) correlate inversely with the degree of
perturbation caused by the induced recharge, substantiating an Intermediate
Disturbance Hypothesis distribution. In fact, MAR (surface) basins operation can
promote different levels of disturbance at the same time, and microbial community
structures change accordingly. From the microbial fingerprinting analysis, we
observed the boosting of Betaproteobacteria and Dehalococcoidia classes correlate to
recharge practices. Furthermore, genera such as Dehalogenimonas, Nitrospira,
Stenotrophomonas, Methylobacterium were also detected, indicating a wide
spectrum of biodegradation capabilities. Likewise, sequencing tasks revealed
characteristic phylotypes from each water type, particularly Vogesella sp for highly
perturbed water or Dehalogenimonas sp for medium-perturbed water. Microbial

_______________________CHAPTER 2_ PARAMETERS AFFECTING MICROBIAL
COMMUNITY COMPOSITION IN SURFACE INFILTRATION PONDS
41
populations in the soil are quite diverse when comparing wet with dry scenarios. Soil
moisture and sediment grain size appear to be the key factors explaining diversity
patterns. Furthermore, variation in recharge conditions does not translate
immediately to changes in communities. All these results combined confirm the
difficulty of extending laboratory experiment results to the field scale.

_______________________CHAPTER 2_ PARAMETERS AFFECTING MICROBIAL
COMMUNITY COMPOSITION IN SURFACE INFILTRATION PONDS
42

43
_____________________________________________________
CHAPTER 3: THE ROLE OF WATER QUALITY
AND SOIL CHARACTERISTICS IN SOME
DOMINANT MICROBIAL SUB-SURFACE
POPULATIONS
_____________________________________________________

44

CHAPTER 3_ THE ROLE OF WATER QUALITY AND SOIL CHARACTERISTICS
IN SOME DOMINANT MICROBIAL SUB-SRUFACE POPULATIONS
45
3.1. Introduction
Groundwater systems are perceived as relatively stable environments as compared
to most aquatic ecosystems (Zhou et al., 2012). Despite that, investigations have
shown that soil-aquifer systems support a wide diversity of organisms (e.g. Griebler
and Lueders, 2009). Actually, the unsaturated zone, and more specifically the topsoil,
supports the highest microbial activity and biomass of all compartments within the
subsurface environment (Lapworth et al., 2012). Likewise, microorganisms are
responsible of most biological processes in aquifers (Stein et al., 2010).
Several studies evidence microbial adaptation to groundwater extreme
environments (thermal or hypersaline) (e.g. Rothschild and Mancinelli, 2001) or
disturbed by human activities (Meckenstock et al., 2015). Human activities have
caused disruption in aquifer dynamics to some extent (Griebler and Lueders, 2009;
Zhu et al., 2017), with biological implications as indigenous microorganisms can
acclimate (Pett-Ridge and Firestone, 2005) or even take advantage (Rezanezhad et
al., 2014) to these environmental disturbances.
In fact, the water treatment industry has taken advantage of the adaptability and
metabolic capabilities of microorganisms to maximize the improvement of water
quality. Several laboratory studies and engineering applications have tested the
effectiveness of microbial engineered techniques for water reclaim purposes.
Laboratory experiments have been conducted aiming at (1) describing specific
targets, such as metabolic rates and degradation pathways of specific pollutants, and
quantifying degradation rates (Greskowiak et al., 2017; Regnery et al., 2015;
Rodriguez-Escales and Sanchez-Vila, 2016), (2) determining the physical and
hydrochemical conditions that can govern the behavior of specific microbial groups
(Alidina et al., 2014b; Drewes et al., 2014; Freixa et al., 2015; Kolehmainen et al.,
2008; Perujo et al., 2017) or (3) understanding the role of organic matter (i.e.,
dissolved organic carbon -DOC- or micropollutants), on the growth of microbial
communities (Li et al., 2013, 2012). Regarding the engineered applications of
microbial ecology designed to improve the quality of reclaimed water, some examples
are constructed wetlands (Faulwetter et al., 2009; Truu et al., 2009; Zhang et al.,
2018) and sand filters (D’Alessio et al., 2015).
Natural and induced microbial attenuation have been studied and applied at the
field scale concerning groundwater related environmental issues. This includes, e.g.,

CHAPTER 3_ THE ROLE OF WATER QUALITY AND SOIL CHARACTERISTICS
IN SOME DOMINANT MICROBIAL SUB-SRUFACE POPULATIONS
46
landfill leakage affections (Röling et al., 2001; Staats et al., 2011), contaminant spills
(Fahrenfeld et al., 2014; Haack et al., 2004; Martínez-Pascual et al., 2010; Nijenhuis
and Kuntze, 2016), or nitrate polluted aquifers (Bellini et al., 2018, 2013).
In the recent years, soil aquifer treatment (SAT) facilities are increasing in number
worldwide. These MAR techniques combine the replenishment of groundwater
bodies with the treatment of water during infiltration, by taking advantage of the
potential of the subsurface microbial communities degradation potential (Bouwer,
2002). Studies testing the link between water quality and microbial communities in
MAR systems can be separated depending on the system type, whether recharge
wells (Ginige et al., 2013), riverbank areas (Schütz et al., 2009), or surface
infiltration ponds (Reed et al., 2008; Regnery et al., 2016). Infiltration ponds are low-
cost, low-tech, passive facilities compared to advanced water treatment methods
(Drewes et al., 2003; San-Sebastián-Sauto et al., 2018); for these reasons, they are
widely implemented, mostly in arid or semi-arid environments (Goren et al., 2014;
Greskowiak et al., 2006; Rodríguez-Escales et al., 2018).
Biodegradation processes linked to surface infiltration ponds include aerobic
oxidation of DOC (Maeng et al., 2011; Mermillod-Blondin et al., 2015), denitrification
(Grau-Martínez et al., 2018), and fate of selected emerging organic contaminants
(Hamann et al., 2016; Valhondo et al., 2015). Parameters modifying bioprocesses,
such as DOC availability, dissolved oxygen content, redox conditions, temperature,
nutrient concentrations, or soil moisture have been widely studied (Alidina et al.,
2015; Bekele et al., 2011; Dutta et al., 2015; Goren et al., 2014; Greskowiak et al.,
2005a; Hellauer et al., 2017; Laws et al., 2011; Massmann et al., 2006; Rezanezhad
et al., 2014). Apart from environmental parameters, intrinsic properties of the
porous media (e.g., porosity and pore size distribution), determine the spatial and
temporal distributions of microorganisms in soils (Chau et al., 2011). Physical and
hydraulic characteristics of soils condition the availability of pore space and the
access to nutrients, thus affecting in a distinct way the growth and activity of
microorganisms (Perujo et al., 2018, 2017).
Subsequently, determining how much and to what extent physical, geochemical,
biological and operational parameters influence the system functioning is useful for
managing purposes (Dutta et al., 2015; Grau-Martínez et al., 2018; Hellauer et al.,
2017; Pedretti et al., 2012a; Rodríguez-Escales et al., 2017). Despite of that, it is
difficult to find multidisciplinary research dealing with integrated approaches to

CHAPTER 3_ THE ROLE OF WATER QUALITY AND SOIL CHARACTERISTICS
IN SOME DOMINANT MICROBIAL SUB-SRUFACE POPULATIONS
47
improve understanding of infiltration problems. We contend that a full analysis of
processes occurring at the surface recharge system should involve the simultaneous
use of physical, hydraulic, geochemical, microbial structure, and metabolic potential;
therefore, the problem involves the simultaneous analysis of continuous, discrete
and categorical data, with different resolution windows. A rigorous analysis to
combine datasets with different variable types and various available data for each
individual variable involves the use of multivariate statistical techniques. Such
techniques have been widely used in hydrogeology to understand and to accompany
stochastic numeric and conceptual groundwater models (e.g. El Alfy et al., 2017;
Menció et al., 2012). In the case of microbial ecology, the development of molecular
analyses allowed the generation of large data sets that are best treated using
multivariate (MV) statistical techniques. As an example, Paliy and Shankar (2016)
reviewed the different existing applications and provided some examples of the use
of MV techniques in microbial ecology.
In this work, we aim at combining both the ecological and hydrological approaches
to understand sub-surface microbial community distribution under the recharge
changing conditions of Sant Vicenç MAR system. For this purpose, we compiled a
physical-bio-geochemical dataset (data from Chapter 2). We then applied Principal
Component Analysis (PCA), aiming at statistically discriminate the relationships
among microbial community structure and geochemical variables, grain size
distribution of soil samples, or operational conditions (recharge/no recharge). The
specific objectives were to provide the most relevant microbial indicators present in
the system and to correlate them with soil and groundwater local characteristics.
Furthermore, the existing data between microbial clades both in water and soil were
also analyzed separately to obtain further relevant inter-clade correlations.
3.2. Methodology
The present chapter is built on the dataset provided in Chapter 2. Therefore, the
methodology to obtain raw data for the statistical analysis is also explained in
section 2.2 of Chapter 2. In this section is provided only the essential information to
contextualize the statistical analysis.
3.2.1. Input data for the multivariate statistical approach
As presented in the previous chapter, water and soil samples were taken in two
different periods, July 2014 and March 2015, representing different recharge

CHAPTER 3_ THE ROLE OF WATER QUALITY AND SOIL CHARACTERISTICS
IN SOME DOMINANT MICROBIAL SUB-SRUFACE POPULATIONS
48
operation conditions. Figure 3.1 shows again the conformation of the piezometric
network and adding P9 and soil samples location with respect to the previous study.
Figure 3.1 Cross-section of Sant Vicenç MAR system. Triangle and circles represent the location of soil
samples. Diamond and squares represent those of water and groundwater samples, respectively. Blue
symbols indicate samples taken in July 2014, after six months of continuous uninterrupted recharge.
Orange samples were taken after recharge was discontinued for 4 months in March 2015
In total, 21 water samples (20 for groundwater and 1 for recharge water) and 10 soil
samples were subjected to molecular analyses, in duplicate (only average values are
presented in this work). Furthermore, water samples were hydrochemically
characterized, while granulometric curves were obtained for the soil samples. The
sampling and analysis methodologies for chemistry, granulometry, DNA extraction,
PCR, DGGE, diversity indices and relative abundances of the microbial clades, are
reported in Chapter 2.
The statistical analyses performed in this chapter, grouped samples according to
their nature and their associated variables. Soil as in water samples is studied
separately, as different variables are included in each case. In the case of the water
samples, the statistical analysis took into account (1) microbial diversity indexes, (2)
relative microbial abundances at the taxonomical rank level of class and species, and
(3) hydrochemical characterization of samples (major, minor and trace elements).
While statistical analyses of soil samples contained (1) microbial diversity indexes,
(2) relative microbial abundances at the taxonomical rank level of class and species,
(3) grain-size distribution representative parameters, (4) depth, and (5) an
operational binary variable indicating the sampling campaign. Finally, a general
statistical analysis was performed for all soil and water samples (31 in total) and

CHAPTER 3_ THE ROLE OF WATER QUALITY AND SOIL CHARACTERISTICS
IN SOME DOMINANT MICROBIAL SUB-SRUFACE POPULATIONS
49
their variables in common, that is, (1) microbial diversity indexes, (2) relative
microbial abundances at the taxonomical rank level of class and species and (3) a
binary variable indicating the nature of the sample (soil or water).
3.2.2. Rationale for the multivariate statistical approach: requirements for
PCA
Multivariate statistics is a useful technique to treat large datasets involving
different types of variables, from quantitative to categorical. In short, PCA
transforms a set of data values of variables that in principle are correlated into a set
of values of linearly uncorrelated variables called principal components. Principal
components are defined such that the first one accounts for as much of the variability
in the data as possible, and each succeeding component, in turn, has the highest
variance possible under the constraint that it is orthogonal to the preceding
components. Thus, a multidimensional system in terms of variables is projected into
a low dimensional map of components. Solutions were subjected to a varimax
rotation. This implies the rotation of the original system corresponding to the
directions of the largest variance in the dataset. Statistical analysis was done using
software SPSS (IBM SPSS Statistics 24).
3.2.3. Selecting variables for the statistical analysis of water samples
Statistical parametric methods perform best when data follows a unimodal
symmetric distribution (Paliy and Shankar, 2016). For this reason, some variables
from the initial dataset were eliminated, grouped and/or transformed in order to
conform better to the assumptions of PCA analysis.
For example, hydrochemical variables with most values below the detection limit
were eliminated (this is the case of Al, B, Cd, Co, Fe, Pb, and P). Also, Ba
concentration values were rejected for data inconsistency. Second, non-Gaussian
hydrochemical variables were transformed to log concentrations (Cu, DOC, Ni, S,
and V). Contrarily, depth, electrical conductivity (EC), temperature, and the
concentrations of HCO3, Ca, Cl, Li, Mg, Mn, Na, NO3, pH, Si, SO4, and Zn were added
to the analysis as raw data without any transformation.
With reference to variables of microbial abundances, they were all transformed into
new variables. For ecological data, displaying a large number of zero values,
(Legendre and Gallagher, 2001) recommend applying either the Chord or the

CHAPTER 3_ THE ROLE OF WATER QUALITY AND SOIL CHARACTERISTICS
IN SOME DOMINANT MICROBIAL SUB-SRUFACE POPULATIONS
50
Hellinger transformations to data values. In our case, we applied the latter one,
because, after some preliminary analyses, the transformed variables presented
higher correlation coefficients (r2) than the non-transformed ones. Hellinger
transformation (𝑥′𝑖𝑗) of a datum 𝑥𝑖𝑗 pertaining to the 𝑖 -class and 𝑗 -object, is:
𝑥′𝑖𝑗 =√𝑥𝑖𝑗
∑𝑥𝑖+ (3.1)
where i+ denotes all i’s.
Finally, in the case of microbial diversity indices, the input data for the PCA were
directly the Shannon, Richness and Evenness index values for each sample.
Once established the variables for the analysis, the next step was to perform a
bivariate correlation analysis with all variables taken two by two, including
hydrochemical variables (both raw and log-transformed; actually this was the way
of selecting whether the log-transformation was finally applied or not) and Hellinger-
transformed microbial variables in order to select the ones that would be used in the
final analysis. Since the aim of the statistical analysis was to emphasize the
correlations with the microbial data, most redundant geochemical variables, as well
as those which displayed very low values of the r2 coefficient to the biological ones,
were removed. This was the case of As, HCO3, Ca, Li, Mg, Mn, Si, Zn, and also depth,
pH, and temperature. In the case of microbial phylotypes, some of them were
eliminated because they did not show significant correlations with other variables;
this is the case of Bacilli, Acidobacteria, Actinobacteria, Chlorobia, Nitrospira,
Gammaproteobacteria, Alphaproteobacteria, Subgroup3 sp (Acidobacteria),
Stenotrophomonas sp, Chryseomicrobium sp, Nitrospira1 sp, Methylobacterium sp,
and Nitrospira2 sp.
The selected variables could not be incorporated all together in a single PCA because
the total variance was too high to allow proper discrimination of components. Then,
different PCAs (each one involving a different subset of parameters) were performed,
trying to maximize the amount of explained information. We performed two PCAs
for microbial abundances at the class level and two more at the species level; each of
these four included all the variables that were (even if mildly) correlated. The most
informative set of variables were selected as the subset that maximized the measure
of sampling adequacy reported by Kaiser-Meyer-Olkin test (KMO); the variables
included in each analysis are provided in Table 3.1.

CHAPTER 3_ THE ROLE OF WATER QUALITY AND SOIL CHARACTERISTICS
IN SOME DOMINANT MICROBIAL SUB-SRUFACE POPULATIONS
51
3.2.4. Selecting variables for the statistical analysis of soil samples
Soil samples described in the previous chapter were subjected to sieve analysis,
obtaining grain-size distribution curves. For each sample, the uniformity coefficient
(CU) and the coefficient of curvature (CC) were calculated as Terzaghi et al. (1996):
CU= 𝐷60
𝐷10, CC=
(𝐷30)2
𝐷60·𝐷10, where D60, D30 and D10 are the diameters so that 60%, 30% and
10% of the material (in weight) pass the corresponding sieve. 𝐷10 has also been used
as one of the variables in the statistical analysis. Another variable incorporated in
the analysis was the proportion (in weight) of fine material (<0.074 mm) for each
sample. Soil samples depth and sampling campaign (operation) were also included.
The same procedure as that performed for the water samples followed, stated with
the bivariate correlation analyses. However, here Hellinger transformation was not
applied to relative abundances of microbial species, because correlations were high
already for the raw relative abundances. Some microbial variables were removed for
the final analyses, based on the low bivariate r2 coefficients obtained (this was the
case of Cyanobacteria, Nitrospira, Gammaproteobacteria, Alphaproteobacteria,
Stenotrophomonas sp, Chryseomicrobium sp, and Nitrospira1 sp).
Here, the optimization between the number of PCAs, the measurement of sampling
adequacy (KMO) and the number of considered variables was done following the
same criteria as indicated in the statistical analysis of the water samples.
3.2.5. PCA for microbial print in water and soil samples
Taking advantage of the shared variables by water and soil samples, a third
statistical analysis was performed, now including all 31 samples (soil and water)
together. Microbial classes and microbial species were treated separately and were
Hellinger transformed. In addition to microbial data, the type of sample was also
included as a binary variable. From the bivariate correlation analysis, some
variables were removed from the final statistical analysis: Cyanobacteria,
Gammaproteobacteria, Alphaproteobacteria, Methylotenera mobilis, Vogesella
indigofera, Stenotrophomonas sp, Chryseomicrobium sp, Methylobacterium sp, and
Nitrospira2 sp. The optimization criteria were the same as indicated in the two
previous sections.

CHAPTER 3_ THE ROLE OF WATER QUALITY AND SOIL CHARACTERISTICS
IN SOME DOMINANT MICROBIAL SUB-SRUFACE POPULATIONS
52
3.3. Results
As a consequence of the preliminary analysis, PCAs of water samples considered 10
hydrochemical variables, 2 diversity indices and 10 microbial variables (5 classes
and 5 species). PCAs of soil samples took into account 1 operational variable, depth,
4 grain-size soil parameters, 3 diversity indices and 14 microbial variables (7 classes
and 7 species). Finally, the statistical approach for the total of 31 samples (soil and
water) included 3 diversity indices, the type of sample and 13 microbial variables (9
classes and 4 species).
We present firstly global results of the eleven PCAs performed (Table 3.1). We
indicate, in the same table and for each statistical analysis performed, the extracted
components with their variables and the proportion of variance represented for each
component. Also, the measure of sampling adequacy (KMO test value) is reported
for each analysis.
3.3.1. Key parameters influencing microbial classes in surface water and
groundwater
Two PCAs were developed; the first one (PCA1 in Table 3.1) included Shannon and
Richness indices, Cl, EC, Na, the log transformations of S, Cu, and V, as well as
BetaproteobacteriaH, DehalococcoidiaH, NitrospiraH, and OthersH classes. The group
“Others” includes microbial classes that could not be classified. Results of this PCA
show that these twelve variables could be well explained with only two principal
components (that combined explained 74% of the total variance). The strength of the
analysis is supported by a value of 0.744 in the KMO test. Results of a 2D
representation of varifactors and components (Figure 3.2) show the significance of
hydrochemistry beyond microbial variables. All the chemical variables included in
the analysis are grouped in the first component, showing a high correlation amongst
them; Na, Cl, EC and Cu-log (“-log” indicates log-transformed) are positively
correlated, whereas V-log and S-log are situated in the opposite side of the plot
(negative correlation).

______________________________________________CHAPTER 3_ THE ROLE OF WATER QUALITY AND SOIL CHARACTERISTICS IN
SOME DOMINANT MICROBIAL SUB-SRUFACE POPULATIONS
53
Table 3.1 Relation to main correlations among variables obtained by PCA analysis (inverse correlations in bold). Subscript “H” in microbial variables
indicates that Hellinger transformation was applied to the data. –log in geochemical variables indicates that log transformation was performed
Type of
sample
Microbial
clade
data
treated
PCAs
performed
PCA
number Extracted components
% of
variance
KMO Test
value
Water
Classes 2
PCA1 C1: V-log, Cu-log, Cl, EC, S-log, Na, OthersH 46.9
0.744 C2: Shannon, BetaproteobacteriaH, DehalococcoidiaH, Richness 27.2
PCA2 C1: CyanobacteriaH, EC, Cl, Cu-log, Ni-log 52.6
0.701 C2: CytophagiaH, Richness 24.4
Species 2
PCA3 C1: Methylotenera_mobilisH, NO3, SO4, DOC-log 61.5
0.797 C2: Nitrospira_sp2H, EC, Na, V-log, Cu-log, Cl 15.4
PCA4 C1: Pontibacter_spH, Dehalogenimonas_spH, Richness 52.9
0.635 C2: Vogesella_indigoferaH, Shannon, DOC-log 24.3
Soil
Classes 2
PCA5
C1: BetaproteobacteriaH, ActinobacteriaH, Dryness, Depth,
CytophagiaH 62.5
0.750
C2: CU, % Fine, AcidobacteriaH 22.1
PCA6 C1: Richness, DehalococcoidiaH, ChlorobiaH 75.5
0.727 C2: Shannon, Evenness, ActinobacteriaH, BacilliH 12.3
Species 2
PCA7 C1: Nitrospira_2sp, Dryness, Shannon, Pontibacter_sp, 64.6
0.758 C2: % Fine, Subgroup3_sp, CU 27.6
PCA8 C1: CC, D10, Methylotenera_mobilis, Methylobacterium sp, 59.5
0.640 C2: % Fine, CU, Dehalogenimonas_sp, Vogesella indigofera 23.9
Water
and
soil
Classes 2
PCA9
C1: Shannon, Richness, ActinobacteriaH, Type, Evenness 53.8
0.692 C2: OthersH, BetaproteobacteiraH 16.4
C3: BacilliH 12.5
PCA10
C1: Shannon, Evenness, Richness 44.0
0.696 C2: DehalococcoidesH, CytophagiaH, AcidobacteriaH 26.4
C3: NitrospiraH, ChlorobiaH 14.4
Species 1 PCA11 C1: Shannon, Richness, Evenness, Type, Nitrospira_sp1H 48.8
0.705 C2: Pontibacter_spH, Dehalogenimonas_spH, Subgroup3_spH 25.5

CHAPTER 3_ THE ROLE OF WATER QUALITY AND SOIL CHARACTERISTICS
IN SOME DOMINANT MICROBIAL SUB-SRUFACE POPULATIONS
54
Figure 3.2 PCA1 analysis including diversity indices, microbial classes and hydrochemical data from
groundwater samples (squares) and one infiltration water sample (diamond) during the recharge period
(blue) and no-recharge period (orange). The position of samples is scaled in VF1 and VF2 axes for
visualization purposes. Red arrows represent the contribution of each variable projected into the
varifactor plane. Samples are labeled corresponding to the sampling point and the height (meters above
sea level, or masl) indicated in brackets. The symbols assignment follows the same criteria in all PCA
plots.
The second component relates inversely the presence of BetaproteobacteriaH to the
Shannon and Richness indices. Furthermore, BetaproteobacteriaH has a particular
importance in the samples most affected by recharge (piezometer P8, located directly
below the infiltration pond). Finally, the projection of sample data in the plane
composed of the two varifactors (VF1, VF2) clearly separate data according to the
operational period (recharge/no-recharge). Moreover, the sample not affected by
recharge (P1, placed upstream) is displayed in between the samples corresponding
to the no-recharge and recharge periods.
The second PCA (Figure 3.3, PCA2 in Table 3.1) also separates data corresponding
to operational periods in the VF1-VF2 plane. Furthermore, two groups of variables
can be distinguished. The first one relates CyanobacteriaH, Cl, EC, Cu-log, and Ni-
log. Apart from hydrochemical differences that force the separation of samples
between operational periods, Cyanobacteria are more abundant in the groundwater

CHAPTER 3_ THE ROLE OF WATER QUALITY AND SOIL CHARACTERISTICS
IN SOME DOMINANT MICROBIAL SUB-SRUFACE POPULATIONS
55
samples in the recharge period. Component 2 shows an inverse correlation between
Richness and CytophagiaH.
Figure 3.3 PCA2 analysis with microbial classes and hydrochemical data from groundwater samples
(squares) and the infiltration water sample (diamond) during the recharge period (blue) and during the
no-recharge period (orange). The position of samples is scaled in VF1 and VF2 axes. Red arrows
represent the contribution of each variable in both Varifactors
3.3.2. Key parameters influencing microbial species in water samples
PCA3 analysis (Table 3.1) included variables EC, Na, Cl, V-log, Cu-log, NO3, SO4,
DOC-log, and two microbial species (as opposed to microbial classes, that were the
objective of PCA1 and PCA2): Methylotenera mobilisH and Nitrospira sp2H. From the
projection on the varifactor plane (Figure 3.4), samples corresponding to operational
conditions clearly display on different areas within the plot. Furthermore, samples
taken during active operation display a disturbance degree caused by recharge
(indicated in qualitative terms by the blue arrow). On the other hand, the sample
representing background conditions (P1) is located separated from the rest,
indicating that in no recharge periods the areas that were recharged kept some
memory of the events, i.e., the microbial communities did not go back to the pre-
recharge conditions.

CHAPTER 3_ THE ROLE OF WATER QUALITY AND SOIL CHARACTERISTICS
IN SOME DOMINANT MICROBIAL SUB-SRUFACE POPULATIONS
56
Figure 3.4 PCA3 analysis including diversity indices, microbial species and hydrochemical data from
groundwater samples (squares) and one infiltration water sample (diamond). The discontinuous blue
arrow indicates disturbance degree caused by recharge.
Figure 3.4 also shows the main relations amongst variables. The first component
groups mainly SO4, NO3 and DOC-log (inversely) with Methylotenera mobilisH. The
behavior of Nitrospira sp2H and its high correlation with conductivity were explained
by the second component.
PCA4 indicated a relationship between Dehalogenimonas sp.H, Pontibacter sp.H and
Vogesella indigoferaH with some hydrochemical and biological indicators (Figure
3.5). Dehalogenimonas sp.H appears to be a key contributor to Richness and Diversity
indices and in turn, is inversely correlated with Pontibacter sp.H. However, Vogesella
indigoferaH is correlated with DOC-log (Figure 3.5), placed in the vicinity of the P8
samples projection, indicating the effect of recharge on both variables.

CHAPTER 3_ THE ROLE OF WATER QUALITY AND SOIL CHARACTERISTICS
IN SOME DOMINANT MICROBIAL SUB-SRUFACE POPULATIONS
57
Figure 3.5 PCA4 analysis with microbial species and hydrochemical data from groundwater samples
(squares) and the infiltration water sample (diamond) during the recharge period (blue) and during the
no-recharge period (orange). The position of samples is scaled in VF1 and VF2 axes. Red arrows
represent the contribution of each variable in both Varifactors
3.3.3. Key parameters influencing microbial classes in MAR soils
PCA5 to PCA8 provide statistical analyses for samples taken from soils. Here, the
parameters extracted from the grain-size distribution curves are included, together
with microbial variables, depth, and the operational variable. In all cases, the
position of samples is scaled in VF1 and VF2 axes. Red arrows represent the
contribution of each variable projected into the plane defined by the two varifactors.
PCA5 involved microbial soil classes (AcidobacteriaH, BetaproteobacteriaH,
ActinobacteriaH, CytophagiaH), Uniformity Coefficient (CU), fine material content (%
Fine), Dryness (operation condition dry-wet) and Depth (Table 3.1). From Figure 3.6,
BetaproteobacteriaH displays oppositely to Depth, ActinobacteriaH, CytophagiaH, and
Dryness, suggesting that BetaproteobacteriaH is more favorable to live in wet and
shallow soils, while ActinobacteriaH and CytophagiaH are preferably found in dry
and deep soils. It should also be noted that when projected over the first two
varifactors plane, wet samples (blue circles) are clustered, whereas dry samples
(orange circles) are more scattered in space, indicating that they are affected by

CHAPTER 3_ THE ROLE OF WATER QUALITY AND SOIL CHARACTERISTICS
IN SOME DOMINANT MICROBIAL SUB-SRUFACE POPULATIONS
58
depth gradients. Finally, AcidobacteriaH is correlated positively with CU and the
proportion of fines, well represented by the sample taken in the sedimentation pond
(blue triangle).
Figure 3.6 PCA5 analysis including microbial classes, grain-size distribution curve parameters and
depth from soil samples during the recharge period (blue) and no-recharge period (orange). Circles are
related to the infiltration pond samples (E-Entrance, M-Midfield, and F-Final stretch). Numbers
indicate the depth the sample was taken (in m below surface). Triangle corresponds to the
sedimentation pond sample. Symbols follow the same criteria in the following PCA charts
PCA6 clusters microbial classes with diversity indices (Shannon, Richness, and
Evenness), ActinobacteriaH, DehalococcoidiaH, ChlorobiaH, BacilliH and OthersH
(Figure 3.7). Whereas BacilliH behavior is explained basically by the second
component, Shannon, Evenness, and ActinobacteriaH are partially included in both
components. Same as shown in a previous analysis, ActinobacteriaH is negatively
correlated with Shannon and Evenness indices. ChlorobiaH and DehalococoidiaH are
explained by the first component and contribute visibly to the microbial print of the
wet soil samples.

CHAPTER 3_ THE ROLE OF WATER QUALITY AND SOIL CHARACTERISTICS
IN SOME DOMINANT MICROBIAL SUB-SRUFACE POPULATIONS
59
Figure 3.7 PCA6 analysis with microbial class data from soil samples during the recharge period (blue)
and during the no-recharge period (orange). Circles are related to the infiltration pond samples
(Entrance, Midfield and Final stretch according to the capital letter close to each symbol). Triangle is
referred to the sedimentation pond sample. The position of samples is scaled in VF1 and VF2 axes. Red
arrows represent the contribution of each variable in both Varifactors scaled by components
3.3.4. Key parameters influencing microbial species in MAR soils
In PCA7 (Figure 3.8 and Table 3.1), the first two components explain 92% of the total
variance. Projection of samples on varifactor space provides a clear separation of
samples according to the operational period (during recharge and no-recharge
periods), while the sample from the sedimentation pond remains separated. This last
sample (SD in Figure 3.8) is explained mainly by the proportion of fines, CU and
notably, the presence of Subgroup_3 Acidobacteria. Moreover, Shannon Index and
Dryness are displayed in opposite sides of the plot, while the latter is placed in the
same side as Pontibacter sp and Nitrospira sp2, highlighting that both species have
a high affinity to dry conditions.
PCA8 indicates the affinity of Vogesella indigofera to silty soils (Figure 3.9). Despite
Dehalogenimonas sp. behavior is explained by the second component, this species
does not show correlation with V. indigofera or CU. However, the bivariate
correlations matrix (not showed) revealed the correlation of Dehalogenimonas sp.
with fine particles proportion. On the other hand, both Methylotenera mobilis and
Methylobacterium sp. are correlated positively with two other soil characteristics,
CC and D10.
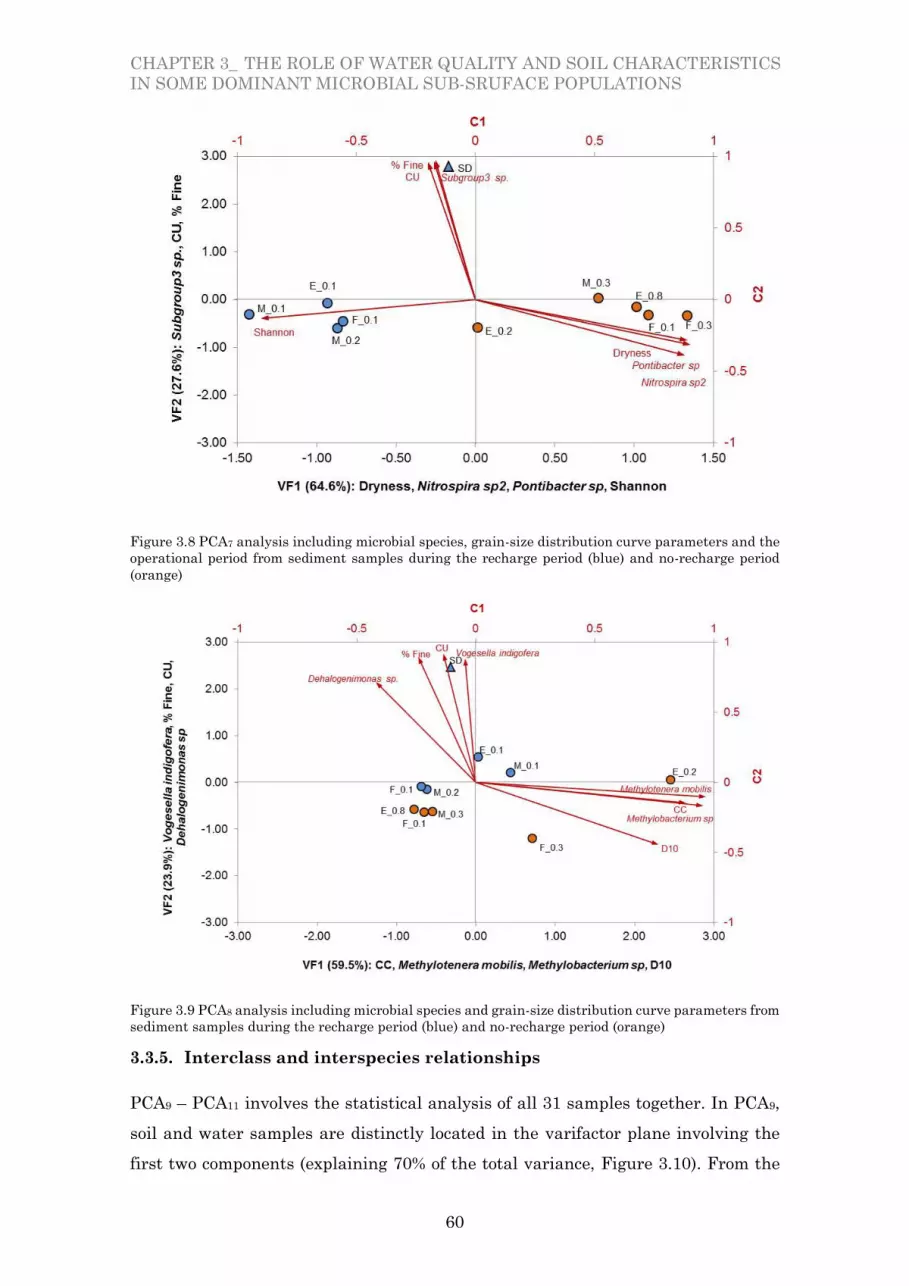
CHAPTER 3_ THE ROLE OF WATER QUALITY AND SOIL CHARACTERISTICS
IN SOME DOMINANT MICROBIAL SUB-SRUFACE POPULATIONS
60
Figure 3.8 PCA7 analysis including microbial species, grain-size distribution curve parameters and the
operational period from sediment samples during the recharge period (blue) and no-recharge period
(orange)
Figure 3.9 PCA8 analysis including microbial species and grain-size distribution curve parameters from
sediment samples during the recharge period (blue) and no-recharge period (orange)
3.3.5. Interclass and interspecies relationships
PCA9 – PCA11 involves the statistical analysis of all 31 samples together. In PCA9,
soil and water samples are distinctly located in the varifactor plane involving the
first two components (explaining 70% of the total variance, Figure 3.10). From the

CHAPTER 3_ THE ROLE OF WATER QUALITY AND SOIL CHARACTERISTICS
IN SOME DOMINANT MICROBIAL SUB-SRUFACE POPULATIONS
61
analysis, soil samples are the most diverse, equally-distributed and rich
environments sustaining microbial growth. On the other hand, BetaproteobacteriaH
shows higher affinity for water samples. BacilliH becomes an independent third
component explaining 13% of the total variance (Table 3.1).
Figure 3.10 PCA9 analysis including diversity indices, microbial classes and sample type from soil and
water samples during the recharge period (blue) and no-recharge period (orange)
PCA10 was performed to analyze the intra-relationships among microbial classes.
Three components were needed to explain 85% of the total variance. The first one
clusters the three microbial diversity indices. The second one explains the positive
correlation between DehalococcoidiaH and AcidobacteriaH and the negative one with
CytophagiaH. Finally, the third component showed a negative correlation between
NitrospiraH and ChlorobiaH. Samples distribution in VF axes did not show any
relevant association among samples (Figure 3.11).
Finally, PCA11 emphasizes microbial species. Similar to PCA10, the first component
groups all three diversity indices, and is representative of soil samples in the
varifactor plane (Figure 3.12). Nitrospira sp1H was also positively correlated with
Shannon and Evenness indices. Regarding the second component, Pontibacter sp.H
is inversely correlated with Dehalogenimonas sp.H and in turn, the latter correlated

CHAPTER 3_ THE ROLE OF WATER QUALITY AND SOIL CHARACTERISTICS
IN SOME DOMINANT MICROBIAL SUB-SRUFACE POPULATIONS
62
positively with Subgroup3 spH, pointing out that these two species seem to be more
associated to water and groundwater samples during active recharge period.
Figure 3.11 PCA10 analysis including diversity indices and microbial classes from soil and water
samples during the recharge period (blue) and no-recharge period (orange)

CHAPTER 3_ THE ROLE OF WATER QUALITY AND SOIL CHARACTERISTICS
IN SOME DOMINANT MICROBIAL SUB-SRUFACE POPULATIONS
63
Figure 3.12 PCA11 analysis including diversity indices, microbial species, and type of sample from
sediment and water samples during the recharge period (blue) and no-recharge period (orange)
3.4. Discussion
The most significant result from the statistical analysis is that the projection of
samples on the planes defined by the principal components shows a clear influence
of the operational conditions. This implies that recharge operation drives significant
changes in microbial communities. Recharge results in shifts in the microbial
community structure, in terms of abundance and composition of dominant taxonomic
groups.
Cyanobacteria, the only diazotrophs that produce oxygen as a by-product of the
photosynthetic process, were found most abundantly in the surface water, and the
measured concentrations correlated with several hydrogeochemical variables (EC,
Cl, Cu-log, and Ni-log) (recall Figure 3.3). Correlations among EC and cyanobacteria
abundance were already reported, for example, in a Neotropical urban lake (Frau et
al., 2018) or in a eutrophicated reservoir in Brazil (Chellappa and Mederios Costa,
2003). Cu-log is positively correlated with cyanobacteria; this follows Dwivedi et al.
(2006), who associated the presence of cyanobacteria with some metals (including
copper) in river water samples enriched by fly-ash originated in a coal thermal power

CHAPTER 3_ THE ROLE OF WATER QUALITY AND SOIL CHARACTERISTICS
IN SOME DOMINANT MICROBIAL SUB-SRUFACE POPULATIONS
64
station. Indeed, some cyanobacterial species have the ability to immobilize metals,
thus used in some water treatment industries (de-Bashan and Bashan, 2010).
The highest relative abundance of Betaproteobacteria was found in the groundwater
samples most affected by recharge, e.g., P8, located directly below the infiltration
pond. The fact that this microbial group correlates inversely with Richness and
Shannon indices (recall Figure 3.2) suggests that members of the Betaproteobacteria
class could have an opportunistic behavior, displacing other microbial populations
when recharge is active, and becoming the leading microorganisms degrading
organic matter using different electron acceptors such as nitrate.
We also evaluated the role of DOC, nitrate, and sulfate on the abundance of
Methylotenera mobilis in surface and subsurface water environments (see PCA3). M.
mobilis may carry out heterotrophic denitrification by using different substrates,
such as methanol (Kalyuhznaya et al., 2009; Sun et al., 2016) or methylamine
(Kalyuzhnaya et al., 2006) in an aerobic environment. In fact, M. mobilis is the first
methylotroph using nitrate as an electron acceptor, thus being a potential
explanation of the positive correlation observed between M. mobilis abundance with
nitrate concentration in water. Denitrification is an anaerobic process but in some
cases occurs in the presence of oxygen. In these situations, anoxic
microenvironments (called microsites) would be created, and denitrification could
take place (Knowles, 2005; Modin et al., 2007).
On the other hand, it is not surprising that abundance of M. mobilis correlates with
Methylobacterium sp. presence in the soil environment (see PCA8) since they belong
to different proteobacterial classes, they are both obligate methylotrophs
(Kumaresan et al., 2018). Indeed, correlations between both species of methylotrophs
have been reported by Wright et al. (2017) in a groundwater dichloromethane
contaminated site in the United States. Unlike M. mobilis, Methylobacterium sp. is
a dichloromethane degrader (Gisi et al., 1998; Vuilleumier et al., 2009), capable to
dechlorinate in aerobic conditions. Following Wright et al. (2017), this suggests that
M. mobilis could take advantage by using the byproducts of dichloromethane
degradation carried out by Methylobacterium sp. However, methane has not been
measured at the site, so we are not assuming its presence via dichloromethane
degradation.

CHAPTER 3_ THE ROLE OF WATER QUALITY AND SOIL CHARACTERISTICS
IN SOME DOMINANT MICROBIAL SUB-SRUFACE POPULATIONS
65
In any case, it is not clear whether M. mobilis abundance correlates with some redox
species; on one hand, the bivariate correlation coefficients with DOC-log and SO4
were not significant (data not shown), but on the other hand, M. mobilis grouped in
the same component with NO3 and SO4. Regarding this last point, there is no
evidence that SO4 might be part of the metabolic pathway of M. mobilis.
Vogesella indigofera positively correlates with DOC-log (PCA5). Members of this
genus are important denitrifiers in groundwater systems (Bellini et al., 2018),
capable of oxidizing few monosaccharides in low-oxygen concentration conditions
(Grimes et al., 1997). Contrarily, DOC-log was negatively correlated with NO3
concentration (PCA3). In fact, the isotopic study performed by Grau-Martínez et al.
(2018) at the same facility and on the same dates confirmed that recharge induced
denitrification.
Dryness (a binary dry = 0 / wet = 1 variable) is the most significant one controlling
the distribution of microbial communities in soils. Similar to what was observed in
water samples, soil samples during recharge periods displayed the largest diversity
and highest Betaproteobacteria abundance. Recharge of river water ensured the
continuous supply of nutrients and DOC to the system, favoring Betaproteobacteria
growth, as it is one of the main bacterial groups biodegrading DOC (Li et al., 2013).
In fact, in the work of Li et al. (2012), carried out in column models,
Betaproteobacterias were found mainly close to the inlet, in response to the high
DOC concentrations fed. On the other hand, they also found that water content
(saturated and unsaturated, in our case equivalent to wet/dry) is also a key factor
for the microbial community structure in soils. Therefore, we could expect that
recharge conditions contribute to microbial diversity in soils. In this regard,
decreasing proportions of Betaproteobacteria were found in dried soils respect to the
wet ones in an experiment performed with streambed fresh sediments (Pohlon et al.,
2013).
Distribution of microbial populations in soils is also strongly affected by
granulometry (PCA8). M. mobilis and Methylobacterium sp. correlated with CC and
𝐷10. There is not much literature on this subject. The work performed by Madhaiyan
et al. (2007) associated the variability in the distribution of pink-pigmented
facultative metylotrophs, such as Methylobacterium sp, with soil type and moisture
among other environmental variables. In fact, soil texture conditions is of paramount
importance for nutrient transference into flooded soils (Perujo et al., 2017), also

CHAPTER 3_ THE ROLE OF WATER QUALITY AND SOIL CHARACTERISTICS
IN SOME DOMINANT MICROBIAL SUB-SRUFACE POPULATIONS
66
influence methane consumption rates (Jäckel et al., 2001). In the same way, the
presence of Vogesella indigofera and Subgroup3 sp (Acidobacteria) in soils is linked
to CU (an indicator of grain-size heterogeneity) and proportion of fine particles,
resulting in these two populations being most abundant in sandy-clay soils.
Members of the phylum Acidobacteria, such as Subgroup 3 sp are widespread
abundant in soils and sediments, and capable to tolerate moisture fluctuations
(Ward et al., 2009). This tolerance can be related to the capability to form biofilms,
highly hydrated structures (Kielak et al., 2016), which allows them to survive under
stressful dryness conditions (Ward et al., 2009); this could be the reason to find it
regardless the operational period. Moreover, it is also important to know the
interactions of this group with other microbial classes present in the soil. In this
regard, we found a significant statistical positive correlation between Subgroup3 sp
(Acidobacteria) and Dehalogenimonas sp (Dehalococcoidia class); both groups are
environmentally important as they are involved in different contaminant
degradation processes (Chen et al., 2018; Song et al., 2016), and this could be the
reason of the correlation observed.
In the soil samples, the concentration of Actinobacteria was directly correlated with
dry conditions (PCA5), similar to the observations already reported by Pohlon et al.
(2013). Different members of this phylum have the ability to grow developing mycelia
structures and forming spores (Bhatti et al., 2017), providing them an advantage in
the colonization of soil with limited water availability. Moreover, the combined
analysis of soil and water samples showed the widespread presence of this phylum,
especially abundant in soil samples, and could be associated to their important role
in the cycling of organic matter due to their decomposition capabilities (Bhatti et al.,
2017; Polkade et al., 2016). This behavior is consistent with results observed in our
system (PCA9), where Actinobacteria is linked to microbial diversity indexes and
dryness conditions. These last results are not surprising since soils probably are one
of the most diverse and rich environments supporting microbial life in the world
(Curtis et al., 2002; Dani Or et al., 2007; Torsvik et al., 2002; Young and Crawford,
2004).
3.5. Conclusions
Managed Aquifer Recharge influences significantly microbial communities in soil,
surface and subsurface water. Therefore, they can be used to assess the area of the

CHAPTER 3_ THE ROLE OF WATER QUALITY AND SOIL CHARACTERISTICS
IN SOME DOMINANT MICROBIAL SUB-SRUFACE POPULATIONS
67
soil and the volume of the aquifer influenced by recharge. Microbial communities are
directly influenced by a combination of physical, chemical and biological processes.
Aquifer recharge via infiltration ponds has a significant importance in carbon and
nitrogen cycles in the topsoil since most of the species detected in this study have a
role in the aerobic degradation of organic matter and/linked to denitrification. In this
way, the statistical analysis has shown the correlation between hydrochemical
compounds and some microbial communities not only in the soil but also in
groundwater; an example is the correlation between Vogesella indigofera with DOC
and Methylotenera mobilis with NO3.
The analysis of both groundwater and soil samples clearly discriminate operational
conditions. Recharge drives several distinct populations to become dominant
(Betaproteobacteria, Dehalococcoidia, and Nitrospira), reducing ecological diversity;
once recharge is discontinued, other communities take over, with none becoming
dominant; that is, increasing diversity (measured by entropy indices). In any case,
when the operation is discontinued, the system does not go back to the initial non-
perturbed conditions.
In the case of soil samples, there are two most significant variables affecting the
distribution of communities. On one hand, microbial communities are affected by the
grain-size distribution (Vogesella indigofera and Subgroup3 sp (Acidobacteria)),
indicating that these microorganisms are preferentially found in the most
heterogeneous clayey sediments. However, the most important factor is operation
conditions in which wet soils contain more microbial diversity than dry ones.
However, there are some classes (e.g., Acidobacteria) that are less affected by
recharge conditions. In the future, this could provide ideas for the affection of the
climate change consequences in stream-flows, wetlands, and other drought-
vulnerable aquatic systems.
Multivariate statistical analysis indicates that DOC was a determinant factor
shaping microbial community structure. Among them, members of
Betaproteobacteria, Dehalococcoidia and Acidobacteria are involved in pollutant
bioremediation and can be considered as potential bioindicators for recharge
monitoring.

CHAPTER 3_ THE ROLE OF WATER QUALITY AND SOIL CHARACTERISTICS
IN SOME DOMINANT MICROBIAL SUB-SRUFACE POPULATIONS
68

69
_____________________________________________________
CHAPTER 4: MONITORING OF REDOX
PROCESSES TO IMPROVE MAR
MANAGEMENT
_____________________________________________________

70
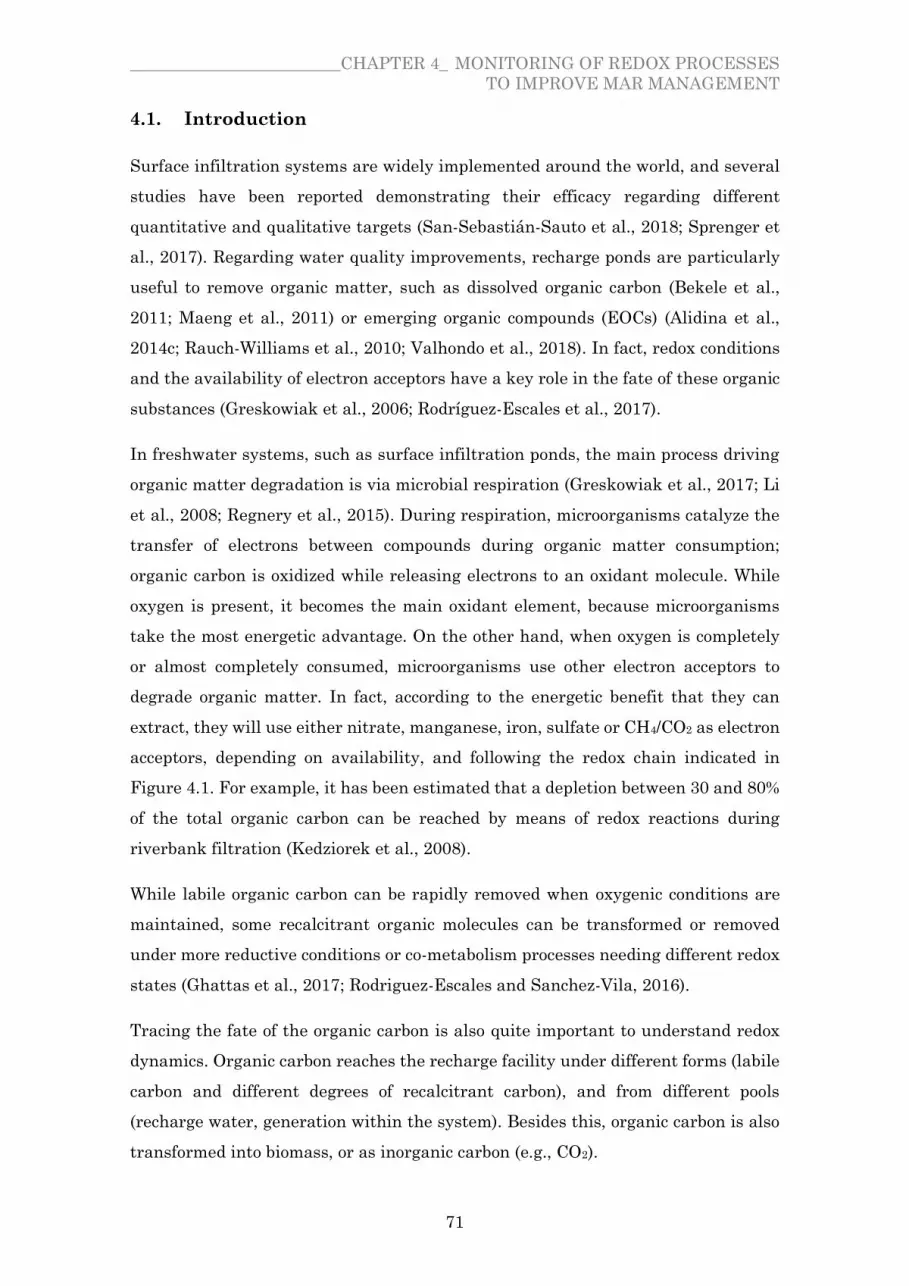
_________________________CHAPTER 4_ MONITORING OF REDOX PROCESSES
TO IMPROVE MAR MANAGEMENT
71
4.1. Introduction
Surface infiltration systems are widely implemented around the world, and several
studies have been reported demonstrating their efficacy regarding different
quantitative and qualitative targets (San-Sebastián-Sauto et al., 2018; Sprenger et
al., 2017). Regarding water quality improvements, recharge ponds are particularly
useful to remove organic matter, such as dissolved organic carbon (Bekele et al.,
2011; Maeng et al., 2011) or emerging organic compounds (EOCs) (Alidina et al.,
2014c; Rauch-Williams et al., 2010; Valhondo et al., 2018). In fact, redox conditions
and the availability of electron acceptors have a key role in the fate of these organic
substances (Greskowiak et al., 2006; Rodríguez-Escales et al., 2017).
In freshwater systems, such as surface infiltration ponds, the main process driving
organic matter degradation is via microbial respiration (Greskowiak et al., 2017; Li
et al., 2008; Regnery et al., 2015). During respiration, microorganisms catalyze the
transfer of electrons between compounds during organic matter consumption;
organic carbon is oxidized while releasing electrons to an oxidant molecule. While
oxygen is present, it becomes the main oxidant element, because microorganisms
take the most energetic advantage. On the other hand, when oxygen is completely
or almost completely consumed, microorganisms use other electron acceptors to
degrade organic matter. In fact, according to the energetic benefit that they can
extract, they will use either nitrate, manganese, iron, sulfate or CH4/CO2 as electron
acceptors, depending on availability, and following the redox chain indicated in
Figure 4.1. For example, it has been estimated that a depletion between 30 and 80%
of the total organic carbon can be reached by means of redox reactions during
riverbank filtration (Kedziorek et al., 2008).
While labile organic carbon can be rapidly removed when oxygenic conditions are
maintained, some recalcitrant organic molecules can be transformed or removed
under more reductive conditions or co-metabolism processes needing different redox
states (Ghattas et al., 2017; Rodriguez-Escales and Sanchez-Vila, 2016).
Tracing the fate of the organic carbon is also quite important to understand redox
dynamics. Organic carbon reaches the recharge facility under different forms (labile
carbon and different degrees of recalcitrant carbon), and from different pools
(recharge water, generation within the system). Besides this, organic carbon is also
transformed into biomass, or as inorganic carbon (e.g., CO2).

_________________________CHAPTER 4_ MONITORING OF REDOX PROCESSES
TO IMPROVE MAR MANAGEMENT
72
Figure 4.1 Electron acceptor sequence according to organic matter biodegradation process. Values of
Free Gibbs Energy were provided by Faulwetter et al. (2009)
Although redox reactions govern microbial dynamics, redox monitoring has been
traditionally a problem since most of the current instruments only provide discrete
information, lumped at the scale of the instrument. Nevertheless, redox processes
are quite dynamic both in time and in space (Alewell et al., 2008; Meckenstock et al.,
2015). Furthermore, redox samples are quite sensitive to the presence of oxygen in
the atmosphere, so monitoring should be done under strictly anaerobic conditions
and/or with a flow cell.
Redox potential, thus, is an indicator of biological activity. Apart from bio-mediating
several degradation processes, microorganisms have a key role in bioclogging
development (Baveye et al., 1998; Hand et al., 2008). The polymeric structures and
biological communities conforming biofilms have great implications on infiltration
systems management (Baveye et al., 1998; Rubol et al., 2014). Characterizing the
evolution of bioclogging might be a useful tool to optimize both the infiltration rate
and to improve water quality. This bioclogging characterization can be carried out
by means of e.g., redox potential monitoring, determination of organic carbon
amount in the infiltration pond bed, characterizing redox species or characterizing
dissolved organic matter origin by means of their fluorescence properties.
Clogging involves a combination of physical, chemical and biological processes
(Pedretti et al., 2012a). Traditionally, processes affecting clogging are not
differentiated, and so the usual approach is to (1) control it by means of a rotation of
drying-wetting cycles, so that desiccation of the clogging layer would result in surface
cracking; (2) in case this method would not work (infiltration rate were not restored),
ploughing and/or mechanical removal of the topsoil would be carried out (Bouwer,

_________________________CHAPTER 4_ MONITORING OF REDOX PROCESSES
TO IMPROVE MAR MANAGEMENT
73
2002). The impacts of clogging imply changes in infiltration rate by the colonization
of pores and throats resulting in changes in hydraulic conductivity and dispersivity
(Carles Brangarí et al., 2017; Hand et al., 2008; Thullner et al., 2002). In a feedback
process, changes in interstitial fluxes and redox potential also influence microbial
dynamics in the subsurface (Perujo et al., 2017). Moreover, temperature plays a role
in microorganism growth (Zhang et al., 2015). Altogether, understanding the
microorganisms dynamics will facilitate the optimal management of the infiltration
facilities.
4.2. Objectives
The objective of this chapter is to better understanding biogeochemical processes,
occurring naturally in a MAR system, in order to suggest practices to optimize MAR
facilities involving surface infiltration ponds. To reach this global objective, different
specific objectives are included:
Understanding the evolution of the infiltration rate linked to operating
conditions in a real MAR facility.
Evaluating temporal and spatial changes on redox potential using an
intensive in situ monitoring network
Linking redox potential evolution with:
Δ Dissolved organic carbon and electron acceptors dynamics
Δ Organic matter characterization due to their fluorescence properties
Δ Biological clogging formation
4.3. Methodology
The study was framed in the Castellbisbal recharge system (see section 1.5.3. in
Chapter 1). The period considered is of one year, from 25/10/2016 to 24/10/2017.
During that period, continuous monitoring in addition to four sampling campaigns
was carried out. According to the different criteria of recharge management, this
period was divided into five sub-periods - Period I to Period V- (Table 4.1).

_________________________CHAPTER 4_ MONITORING OF REDOX PROCESSES
TO IMPROVE MAR MANAGEMENT
74
4.3.1. Monitoring operational conditions in the system
During the 365 days conforming the study, different information about the hydraulic
regime in the system and in the vicinity was acquired from the network of pressure,
temperature and redox sensors installed (Figure 4.2).
First of all, flow rate, turbidity, Total Organic Carbon (TOC), nitrate, nitrite, and
ammonium were measured at the Llobregat River on a daily basis by the Water
Supply Company (Aigües Ter-Llobregat - ATLL). These parameters were measured
10 km upstream from the facility. Precipitation was registered in the Castellbisbal
meteorological station (UTM coordinates, X: 414461.00, Y: 4592431.00, located at a
distance of 1.5 km from the facility), and it was available from RuralCat
(www.ruralcat.gencat.cat).
Table 4.1 Duration and characteristics of the five management periods
stablished between 25th October 2016 and 24th October 2017
Starting date Duration
(d) Characteristics
PERIOD I 24th October 2016 64 Period after scrapping
Maximum infiltration rate
PERIOD II 27th December 2016 83 Intermediate infiltration rate
Period ends with a heavy rainfall event
PERIOD
III 20th March 2017 75
Low infiltration rate
Physical and biological clogging
PERIOD
IV 3rd June 2017 27
Period after scrapping
High infiltration rate
PERIOD V 30th June 2017 116
Fluctuation of infiltration rate
Vacation period (stop) in the middle of
the period

_________________________CHAPTER 4_ MONITORING OF REDOX PROCESSES
TO IMPROVE MAR MANAGEMENT
75
Figure 4.2 Instrumentation installed in the infiltration pond in the Castellbisbal MAR system.
On the other hand, the flow rate was measured daily at the interconnection between
the wetland and infiltration ponds. This data was provided by the water user’s
community managers (CUACSA). Daily infiltration rate was calculated by balancing
the inflow water entering the pond minus the storage accumulation in the pond
(measured by the water level variation); evaporation is negligible compared to
infiltration volumes.
The water table in the infiltration pond and groundwater level in the piezometer
located in the center of infiltration pond (PJ) were monitored at time intervals of 30
minutes with pressure transducers (CTD Diver, Schlumberger). Transducers also
provided measurements of temperature and electrical conductivity at the same level
of temporal discretization. Barometric pressure was also measured (Baro-Diver,
Schlumberger) in order to compensate water level measurements. Values of pressure
were then daily averaged.
4.3.2. Sampling surveys
Apart from continuous monitoring, four sampling campaigns were performed during
the one-year duration of the study. Campaigns were carried out taking into account
different seasons and different operating conditions. The first campaign was in
winter 2016 (12/12/16) with the lowest temperatures of the study period. The second

_________________________CHAPTER 4_ MONITORING OF REDOX PROCESSES
TO IMPROVE MAR MANAGEMENT
76
campaign was in April 2017 (20/04/17), when the pond was being dried because of
clogging. The third sampling period took place in summer, after scrapping the
bottom of the pond (22/06/17). Finally, the last sampling date was in July 2017
(21/07/17).
Water samples were taken at different locations: Infiltration pond, Vadose Zone at
20, 50 and 90cm and the aquifer just below the pond (PJ) (Figure 4.2). Vadose zone
samples were extracted with a vacuum pump connected to three plastic fine
sampling ports inserted at 20, 50 and 90 cm, respectively, and separated one meter
and a half from each other. Groundwater samples were taken with a pump into PJ,
purging since stable conditions were reached.
Dissolved oxygen, electrical conductivity, temperature, Oxidation Reduction
Potential (ORP) and pH were measured in situ with a multiparameter meter (YSI
Professional Plus). These field parameters were measured into a flow cell in the
vadose zone and groundwater (PJ) in order to preserve the pressurization of the
sample during the measurements. The CO2 partial pressure in water samples was
also measured in the field with an infrared gas analyzer (EGM-4, PP-Systems, USA)
coupled to a membrane contactor (MiniModule, Liqui-Cel, USA). The measurement
accuracy of the EGM-4/contactor system is estimated to be within 1% over the
calibrated CO2 range. For measurements, the water samples were circulated
through the membrane contactor by gravity at a rate of 300 mL/min, while the
internal pump of the EGM-4 recirculated a small volume of air between the contactor
and the analyzer. The flow of water was kept constant until full gas equilibration
with the recirculated air, which typically happened in less than 2 minutes.
After measuring field parameters, water samples were taken in order to analyze
Biological Oxygen Demand (BOD), Total Organic Carbon (TOC), Dissolved Organic
Carbon (DOC), Dissolved Organic Matter (DOM), major cations and anions,
nutrients and metals.
Water samples for DOC determination were filtered in the field through pre-
combusted and pre-rinsed 0.7 m glass fiber filters (GF/F; Whatman, UK). DOC and
TOC concentrations were analyzed by high-temperature catalytic oxidation on a
Shimadzu TOC-V CSH analyzer (Shimadzu Corporation, Japan). Samples for DOM
characterization were filtered in situ in a similar way as those for DOC
determination. DOM characterization was performed by absorbance-fluorescence

_________________________CHAPTER 4_ MONITORING OF REDOX PROCESSES
TO IMPROVE MAR MANAGEMENT
77
spectroscopy (AFS, Casas-Ruiz et al., 2016). AFS provides an Excitation-Emission
Matrix (EEM) with fluorescence signals for each sample. EEM matrix allows
identifying fluorophores by visual peak picking. The most common identified
fluorophores are peaks A, C, M, T and B. Peaks A, C and M appear at the longer
emissions and reflect humic-like compounds. A and C are considered to be
terrestrially-derived (Hudson et al., 2007). Peak M has been related to humic-like
compounds derived from microbial activity, and have a lower aromatic character
(Romera-Castillo et al., 2010). On the contrary, peaks T (related to tryptophan) and
B (related to tyrosine) correspond to the protein-like fraction of DOM, appearing at
lower emission wavelengths (Yamashita and Tanoue, 2003).
Thanks to EEM, protein-like peaks (B and T) and humic-like peaks (C, A, and M)
were determined for each sample in the four sampling surveys. Apart from
fluorescence peaks, some optical indices were calculated as:
SUVA =𝐴𝑏𝑠254×𝑙𝑛(10)
𝑙×
1
[𝐷𝑂𝐶] (4.1)
HIX ="H"range
"L"range=
Abs{λex254,λem235−480}
Abs{λex254,λem330−345} (4.2)
BIX =Abs{λex310,λem380}
Abs{λex310,λem430} (4.3)
FI =Abs{λex370,λem470}
Abs{λex370,λem520} (4.4)
Specific Ultra-Violet Absorbance (SUVA) is a measurement of bulk DOM aromacity
and the formulation was calculated according to Weishaar et al. (2003) (equation
4.1). Abs254 is the absorbance at 254 nm, l corresponds to the cuvette path length and
[DOC] is the concentration of DOC.
The Humification Index (HIX, Zsolnay et al., 1999) was introduced in order to
estimate the maturity of soil DOM. It is calculated as a ratio (equation 4.2)
Abs{λex254,λem_(235-480) } corresponds to the sum of the emission signals between
325 and 480 nm for the excitation at 254 nm. Abs{λex254,λem_(330-345)}
corresponds to the sum of the emission signals between 330 and 345 nm for the
excitation at 254 nm.
The Biological Index (BIX) is calculated also as a ratio (Huguet et al., 2009) and
defined in equation 4.3. In this case, the ratio is between Abs{λex310,λem380} and

_________________________CHAPTER 4_ MONITORING OF REDOX PROCESSES
TO IMPROVE MAR MANAGEMENT
78
Abs{λex310,λem430}, that is the points in EEM defined by the emission signal of 380
and 430 nm respectively, at 310 nm of emission. BIX is proportional to the recently
produced organic matter.
Finally, Fluorescence Index (FI) (Cory et al., 2010; McKnight et al., 2001) is
presented in equation 4.4. FI is defined by the ratio between Abs{λex370,λem470}
and Abs{λex370,λem520} values in the EEM. FI is an indicator of DOC quality. That
is, high values indicate that DOC is mainly composed of microbial-derived
substances, while low values are representative of terrestrial-derived substances
(McKnight et al., 2001).
Water for the determination of BOD5, ammonia, phosphate, nitrate, nitrite, major
anions and major cations was sampled and kept in dark at 4ºC until analysis.
Samples were filtered, treated and analyzed directly in the laboratory in less than
24h. BOD5 of water samples was determined using the respirometric method (WTW
BOD OxiTop® OC 100). Nitrate, nitrite, major anions, and major cations were
determined by liquid phase ionic chromatography (IC5000, Dionex, Thermo Fisher
Scientific, USA). Phosphate was determined by spectrophotometry (Smartchem 140,
AMS Alliance, Italy).
Samples for metal determination were filtered in the field through 0.2 µm nylon
filters (Whatman, UK) and acidified with nitric acid since reaching a pH 2-3. They
were preserved in dark at 4ºC. Samples were analyzed in the laboratory within 72 h
by ICP- OES using a Perkin Elmer Optima 3200DV.
Finally, the organic carbon content in the surface of the sediments of the infiltration
pond was estimated by measuring the Ash-Free-Dry Mass (AFDM) of a sample of
sediment. A small plastic corer (volume=1mL) was used to sample the first two
centimeters of the sediment, and the content transferred to a pre-combusted glass
vial. Five replicates were collected at the pond during each sampling, randomly
selecting the sediment locations in the infiltration pond. AFDM was calculated as
the difference between the weight of the samples dried at 50ºC in an oven for 48h
and after combustion of the samples at 450ºC for 4h.
4.3.3. Redox potential and temperature continuous monitoring
Three multilevel and four simple redox potential probes (Hypnos III, MVH Consult,
The Netherlands) were installed from the infiltration pond water, along the first

_________________________CHAPTER 4_ MONITORING OF REDOX PROCESSES
TO IMPROVE MAR MANAGEMENT
79
meter of the vadose zone profile, to the groundwater below the pond (PJ) (Figure
4.2). The simple probes (one sensor per probe) monitored redox potential in the
infiltration pond water (probe 1), at 17 cm (probe 5), at 70 cm (probe 6) and inside
PJ (probe 7). The three multilevel probes measured redox potential at 22 and 62 cm
(probe 2), 25 and 56 cm (probe 3) and at 23 and 53 cm (probe 4). Hypnos provided
information of redox potential at the nine sensors of the seven different probes.
Redox data was recorded every 12 minutes. Furthermore, two temperature sensors
integrated into the redox probes allowed monitoring temperature in the water pond
and at 55 cm depth of soil.
In order to calibrate redox probe measurements, values from the ORP probe (YSI
Professional Plus) measured in each campaign were compared with the
corresponding values of redox probes. Furthermore, ORP values from
multiparametric meter were converted to the standard hydrogen electrode values
(Eh). In this way, the resulting Eh corresponds to:
Eh(mV) = ORPYSI + 220 + Ehprobe (4.5)
4.4. Results and discussion
4.4.1. Monitoring and field data
The present section presents the results of the monitoring network and the four
sampling campaigns carried out in Castellbisbal MAR system during the period
between October 2016 and October 2017. The study period includes different hydric
regimes in the system as well as physical and biological clogging events, influencing
in a different manner infiltration rates. In this way, sampling surveys allowed to go
deeply into the characterization of the system under different seasonal and
operational conditions.
Meteorological data and quality parameters of Llobregat River water
Thanks to Aigües Ter-Llobregat, it was possible to get a daily register of some quality
parameters of the Llobregat River water, 10 km upstream of the recharge system
location. Figure 4.3 displays the evolution of flow rate, Total Organic Carbon (TOC),
concentrations of nitrate, nitrite, and ammonium, as well as turbidity monitored in
the river water. Also, daily accumulated precipitation is showed.

_________________________CHAPTER 4_ MONITORING OF REDOX PROCESSES
TO IMPROVE MAR MANAGEMENT
80
Monitoring of quality parameters in the Llobregat River reflected a sinusoidal
tendency of nitrate concentration, presenting higher concentrations in winter and
spring and lower in summer and autumn (Figure 4.3a). In general, nitrate as well
as TOC, ammonium, and nitrite, remained in low concentrations according to the
legal constraints for the disposal of effluents from wastewater treatment plant to the
natural media (rivers).
Actually, a correlation is visible between the three extreme rainfall events, flow rate
and turbidity (Figure 4.3b). Moreover, the event occurred by the end of March
generated flooding of the Llobregat River above the ponds. It is expected thus, an
inevitable peak of turbidity in the infiltration water, resulting in enhanced clogging.
Figure 4.3 (a) Evolution of concentrations of TOC, nitrate, nitrite, ammonium and (b) values of
turbidity, flow rate and precipitation in the Llobregat River water, measured 10 km upstream of the
Castellbisbal MAR System.
Operating conditions in the Castellbisbal MAR system: flow rate, water
table, infiltration rate, and groundwater table
The Castellbisbal MAR system is composed by an infiltration pond (1400 m2)
preceded by a natural wetland that acts as a sedimentation pond. The wetland
receives water from the Llobregat River permanently, except during rainfall events,
linked with high turbidity in the inlet water, when the sluice is closed. A floodgate

_________________________CHAPTER 4_ MONITORING OF REDOX PROCESSES
TO IMPROVE MAR MANAGEMENT
81
towards the river ensures the permanent movement of flow in the wetland.
Furthermore, the wetland is connected with the infiltration pond through a pipe,
where a flowmeter records daily the inflow rate.
The present study started in October 2016, after the infiltration pond had been
emptied for the three previous months. Furthermore, during that period, the bottom
of the infiltration pond was scrapped in order to remove the fine particles that settled
during the previous operation. Therefore, the infiltration rate during Period I was
the maximum (Figure 4.4). The flow rate and the water table level were not constant
during this period since technical problems with the flowmeter and rain forecasts at
different times forced often technical stops.
During Period II, it can be appreciated that the water table did not follow the same
trend in infiltration rate as in the previous one, indicating that some kind of clogging
was occurring. This tendency is even more evident in Period III, where the
infiltration rate reduced drastically and the water table was maintained almost
constant over the days, despite no water was flowing into the infiltration pond. Field
observations evidenced that both biological (algae growing) and physical clogging
were present during that period. Actually, Period III started after the flooding event
that occurred at the end of March, probably causing the entrance of suspended solids
from the river. At the end of Period III, the pond was totally dried and the surface
was scrapped. In Period IV the infiltration capacity was recovered, confirmed by the
high correlation between infiltration rates and water level in the pond. However, at
the starting of July, this correlation was not observed anymore. During this period,
physical clogging is discarded, since there was not any turbidity peak in the water
sampled at the Llobregat River. High temperatures registered and the growth of
bloom algae may indicate that bioclogging could occur. During August, the facility
was stopped due to holidays period. After that, the water table rose slightly, while
infiltration rate fluctuated drastically. This behavior was difficult to interpret,
however, it could be a data monitoring problem, where flowmeter or pressure
transducers malfunctioned due to the high temperatures.
Apart from the data obtained in the recharge ponds, the groundwater level was
monitored just below the infiltration pond (Figure 4.2, piezometer PJ). In general,
one would expect a local perturbation in the groundwater level due to the effect of
enhanced recharge. In this particular case, the high transmissivities in the area
(estimated in 4100 m2/d from hydraulic tests(Martín and López, 2001)) buffer the

_________________________CHAPTER 4_ MONITORING OF REDOX PROCESSES
TO IMPROVE MAR MANAGEMENT
82
effect of mounding below the infiltration pond. The highest rising of aquifer phreatic
level occurred by the end of March 2017 (beginning of Period III) during the
mentioned flooding event, where the saturated zone reached the surface (Figure 4.5).
In fact, groundwater level grew almost 4 meters in few hours, accordingly to the
regional behavior of the whole aquifer levels (data not shown).
Comparing the water table in the pond and groundwater table during this flooding
event, it can be seen that a vertical gradient existed through the profile. Since the
groundwater level was above the surface and below the water table, it can be
confirmed that clogging was present and acted as a semiconfining layer (Figure 4.4).
According to such vertical gradient, infiltration occurred at low rates.
It should also be noted that the groundwater level remained almost constant during
few months, just below the surface. Four months after the heavy rainfall at the end
of March, groundwater level had dropt one meter. The scrapping of the pond surface
(between Period III and IV) allowed the reestablishment of the initial infiltration
rate.

_______________________________________CHAPTER 4_ MONITORING OF REDOX PROCESSES TO IMPROVE MAR MANAGEMENT
83
Figure 4.4 Evolution of flow rate (orange), infiltration rate (green) and water table (blue) in Castellbisbal MAR system from October 2016 to October 2017. Operational
periods are emphasized according to infiltration rate variations

_________________________CHAPTER 4_ MONITORING OF REDOX PROCESSES
TO IMPROVE MAR MANAGEMENT
84
Figure 4.5 Evolution of groundwater level in PJ and water table in infiltration pond between October
2016 and October 2017
Discrete characterization: sampling surveys
Four sampling surveys were performed in the Castellbisbal recharge system. Water
samples were taken in order to define physical, hydrochemical and organic matter
composition characterization. For each campaign, samples were taken from the
infiltration pond, vadose zone (at 20, 50 and 90 cm), and piezometer PJ. Sediment
samples at the infiltration pond topsoil were taken to determine the amount of
organic carbon.
a) Hydrochemistry
Hydrochemical characterization was made in order to understand redox reactions
taking place through the system. Water samples of the infiltration pond, vadose zone
(at three different depths) and groundwater just below the pond (PJ) were analyzed
(Figure 4.6 and Figure 4.7). In general, there is a consistency between organic matter
depletion and electron acceptors present in the water samples regardless of the
sampling campaign. For example, the December campaign shows more stable
concentrations of DOC and nitrate through the profile. Likewise, manganese and
iron were not found in any of the two sampling points analyzed. BOD and O2
concentrations in December were consistent with redox species behavior, overall
evidencing lower activity of microorganisms in December compared to the rest of
campaigns.

_________________________CHAPTER 4_ MONITORING OF REDOX PROCESSES
TO IMPROVE MAR MANAGEMENT
85
In fact, the April, June and July campaigns demonstrated highest variations in
hydrochemistry. In general, O2 depletion occurred in depth, while the partial
pressure of CO2 showed the opposite behavior, indicating the consumption of oxygen
via microbial respiration and the consequent production of CO2. ORP and manganese
and iron concentrations were consistent with this assumption, indicating that both
manganese and iron reduction were occurring, at least in the vadose zone (green
area in the plots). The role of nitrate is not clear, as their concentration during the
different surveys was very low in the three campaigns in all sampled points.
Comparing TOC and DOC concentration (first row in Figure 4.6), it seems that all
the organic carbon in the system in the four campaigns was in dissolved form.
However, samples were filtered by laboratory technicians in order to avoid the TOC
analyzer damage. Consequently, Particulate Organic Carbon (POC) most probably
was underestimated.
Despite in the April, June and July campaigns, there were evidence of redox
processes in Castellbisbal MAR system according to major ions hydrochemistry,
DOC concentrations were almost stable in time and space. The releasing of DOC via
algae hydrolysis (or other POC sources) may be the reason why DOC concentrations
remain constant despite biodegradation reactions occurring.

_______________________________________CHAPTER 4_ MONITORING OF REDOX PROCESSES TO IMPROVE MAR MANAGEMENT
86
Figure 4.6 Evolution of TOC, DOC, CO2, BOD, O2, nitrate, nitrite and ammonium concentrations in four sampling campaigns performed in the Castellbisbal MAR system.
Hydrochemical characterization of infiltration water (purple), vadose zone at three different depths (green) and saturated zone (blue) is represented. Missing values were
samples that could not be measured/analyzed

_______________________________________CHAPTER 4_ MONITORING OF REDOX PROCESSES TO IMPROVE MAR MANAGEMENT
87
Figure 4.7 Evolution of Oxidation Reduction Potential (ORP), sulfate, iron, manganese concentrations, alkalinity and pH in four sampling campaigns performed in the
Castellbisbal MAR system. Hydrochemical characterization of infiltration water (purple), vadose zone at three different depths (green) and saturated zone (blue) is
represented. Missing values were samples that could not be measured/analyzed

_________________________CHAPTER 4_ MONITORING OF REDOX PROCESSES
TO IMPROVE MAR MANAGEMENT
88
b) Organic matter characterization in water, sediments, and stones
The origin of organic matter in water samples was determined by fluorescence. On
the one hand, protein-like peaks (B and T) and humic-like peaks (C, A, and M) were
determined (Figure 4.8). Protein-like peaks are indicators of organic matter that has
been created recently, for example by means of photosynthesis. Humic-like peaks are
typical of terrestrial organic matter, that is, organic matter not recently synthetized.
On the other hand, SUVA, HIX, BIX and FI indices were calculated following
Equations 4.1 to 4.4 (Figure 4.9). Comparing the results of the four sampling
campaigns, infiltration pond water samples (IP, purple dots in Figure 4.9) showed
the higher protein-like proportion, might indicating higher phototrophic activity
with respect to other samples. However, December 2016 IP sample raised their
proportion of humic-like peak compared with the rest of campaigns. A hypothesis of
this behavior may be the drop of phototrophic processes in winter.
Figure 4.8 Relative contribution of the protein-like peak (B+T) and humic-like peak (A+C+M)
intensities for Infiltration Pond (IP), vadose zone at three different depths (VZ – depth) and
groundwater (PJ) water samples in the December 2016. April 2017, June 2017 and July 2017 sampling
campaigns

_________________________CHAPTER 4_ MONITORING OF REDOX PROCESSES
TO IMPROVE MAR MANAGEMENT
89
IP sample in June (purple dot) showed the highest protein-like proportion of all data
(55%). Despite bioclogging had been recently removed in June 2016, the protein-like
proportion in the IP sample indicates probably the period with the highest primary
production.
Figure 4.9 Evolution of fluorescence indices (SUVA, BIX, HIX, and FI) of water samples in the
Castellbisbal MAR system for four different sampling campaigns
Samples taken at the vadose zone (green dots) had similar behavior between
campaigns. The proportion of protein-like organic matter was relatively low for the
three depths in December and April. Then, these proportions grew in June and
decreased a little bit again in July. The main feature for these samples is the highest
values of protein-like organic matter in June (see the IP sample). The difference
between IP and vadose zone protein-peaks might give an idea about the proportion
of labile DOM that has been oxidized by microorganisms in depth.
The PJ sample (blue dots) shows the opposite behavior of that of IP. In all campaigns,
except that of December 2016, the former displayed higher humic-like organic
matter proportion than the latter, indicating that higher consumption of labile DOM
has been achieved. In the same way, values of TOC and DOC were almost always
less in PJ than in the rest of the system, also suggesting that organic matter
oxidation occurs into the soil profile before reaching PJ.

_________________________CHAPTER 4_ MONITORING OF REDOX PROCESSES
TO IMPROVE MAR MANAGEMENT
90
The evolution of fluorescence indices was apparently less informative than the
proportion of humic and protein-like peaks. Concretely, Fluorescence Index (FI, red
line) and Biological Index (BIX, blue line) remained constant in almost all campaigns
and sampling points. Specific Ultra-Violet Absorbance index (SUVA, violet line)
showed the most variability in time and space. SUVA in June 2017 was especially
higher for the samples taken at 50 cm and PJ, indicating highest degree of
aromaticity. Also, Humification Index (HIX, green line) was the highest for the PJ
sample in June 2017; actually HIX in general raised in depth, indicating that organic
matter maturity was proportional to travel time.
Organic matter amount in the infiltration pond sediment is presented in Figure 4.10.
Results show for each campaign the average of the weight of carbon per surface unit
for the five sediment samples analyzed. Also, error bars related to standard deviation
are reported.
Figure 4.10 Evolution of the carbon content in the sediment of the Castellbisbal MAR infiltration pond
The evolution of carbon content per unit surface in the four sampling campaigns
follows a tendency according to management practices. The highest rising of carbon
content in the sediment took place between December 16 and April 17, coinciding
with physical and biological clogging episode. The pronounced decreasing between
April 17 and June 17 fits with the fact that the infiltration pond bottom was scrapped
less than one month before the June campaign. The removal of infiltration pond
sediment gives the reason for the losses of sediment carbon. After that, summer
temperatures and the continuous operation of the MAR facility may be the reasons
for the rising of carbon content in sediment in July 17.

_________________________CHAPTER 4_ MONITORING OF REDOX PROCESSES
TO IMPROVE MAR MANAGEMENT
91
Despite the general trend of organic carbon in sediment makes sense, the relatively
high amounts of carbon in December are surprising since that campaign was
performed one month and a half after scrapping. Likewise, hydrochemical data
suggested that microbial activity in winter seemed not to be too high.
c) Continuous Redox potential measurements
In order to calibrate values from redox potential probes, ORP values (converted to
Eh values) from sampling surveys were compared with redox fixed probes. ORP
values of December campaign were not considered because electrode was damaged.
Figure 4.11 shows the difference between campaigns values and soil redox probes.
Values from infiltration water were not compared because the fixed sensor was
collocated 30 cm above the bottom and in many campaigns was dry (infiltration pond
had been dried in order to make possible the sampling). In all campaigns, the
difference between both sensors was averaged in 320mV. Even groundwater
sampled, representing a volume of water much greater than that surrounding the
probe installed in the piezometer, give the same difference between both methods
except in April.
Figure 4.11 Difference between redox soil probes measurements and YSI Professional Plus values for
the redox potential electrode in three sampling surveys. The averaged difference for all values is 320
mV (SD=32.2 mV)
Taking into account these differences, measurements of redox potential probes were
corrected according to equation 4.6 and represented for the whole time studied
(Figure 4.12 and Figure 4.13).
The redox potential of the infiltration water ranged between 0 and 1000 mV (Figure
4.12). However, the highest values and fluctuations are considered noise, because

_________________________CHAPTER 4_ MONITORING OF REDOX PROCESSES
TO IMPROVE MAR MANAGEMENT
92
correspond to measurements when the pond was empty, and the sensor was
unstable. The temporal series of infiltration water redox potential shows oxic
conditions over the whole year, showing the minimum values during the time period
that groundwater reached the pond surface due to the flooding event at the end of
March 2017 (beginning of Period III).

_______________________________________CHAPTER 4_ MONITORING OF REDOX PROCESSES TO IMPROVE MAR MANAGEMENT
93
Figure 4.12 Redox potential measurements in the infiltration pond water (purple), in the 20 cm layer (brown ranges), and in the 50 cm layer (green ranges) between the
October 24, 2016 and October 25, 2017. Groundwater level (black dots) is represented in reference to the surface level

_______________________________________CHAPTER 4_ MONITORING OF REDOX PROCESSES TO IMPROVE MAR MANAGEMENT
94
Figure 4.13 Redox potential measurements at 62 cm (orange) and 70 cm (brown) depths and in PJ (blue) at 4m depth below the surface. Groundwater level is represented
in black dots

______________________________________CHAPTER 4_ MONITORING OF REDOX
PROCESSES TO IMPROVE MAR MANAGEMENT
95
In general, all redox probes show very oxic conditions since the middle of the Period
II, i.e. during the winter season. From the middle of Period II to the flooding event
(beginning of Period III), soil redox potential was decreasing globally despite a large
presence of fluctuations. However, redox potential in groundwater remained
constant and highly oxic. The rising of groundwater level in March 2017 above the
surface, caused the same behavior in all redox probes, from the infiltration pond to
the aquifer, with a drastic fall in redox potentials, reaching almost 0 mV in all
sensors. After the flooding event, redox potentials in all sensors of 20 cm layer and
at 53 cm were rising at the same time that the groundwater level was falling.
However, sensors at 55 cm, 62 cm, and 70 cm did not recover oxic conditions until
Period V.
The variations in the groundwater level had in fact, a lot of consequences in the
behavior of redox potential. During Periods III and IV, the groundwater level
remained between the pond surface and 1m in depth. The redox potential was then
negatively correlated with the depth of the sensors, becoming more oxidant in the
shallow sensors. As the groundwater level was falling down, the shallow sensors
were registering highest redox potentials. This also indicates that oxidant
infiltration water was reaching the shallower sensors without the impact of
groundwater.
Scrapping the bottom of the infiltration pond (by the end of Period III) had
presumably some effects on all redox potentials measured by the sensors. It can be
seen that oxic conditions, especially present in the shallow layers, were drastically
altered in the Period III and IV transition, corresponding to the recovery of
significant infiltration rates after scrapping.
In general, clogging episodes are related with more reductive conditions, while in
periods with high infiltration rates (after scrapping and after summer stop), the
redox potential raised.
Results from sampling campaigns are correlated with redox potentials measured in
the field. Whereas redox conditions in winter (December sampling campaign) were
oxidant (no nitrate depletion, nor iron and manganese presence), in the rest of
sampling campaigns iron reduction conditions should had been reached (according
to Figure 4.1 thresholds).

______________________________________CHAPTER 4_ MONITORING OF REDOX
PROCESSES TO IMPROVE MAR MANAGEMENT
96
Finally, results of redox monitoring in PJ presented some drastic fluctuations. In
many cases, the punctual extraction of sensors for monitoring purposes and pumping
in some cases generated some unstable conditions, visible in Figure 4.13.
d) Evolution of temperature
Temperature sensors were installed to monitor infiltration water (30 cm above de
bottom of the infiltration pond), at 55 cm, and inside PJ (Figure 4.14). Temperature
measurements were daily averaged.
The evolution of temperature at three depths was almost the same during Period I
and II (autumn and winter seasons). After the great flooding event (transition of
Period II to III) and coinciding with the beginning of spring, the temperature of
infiltration water and at 55 cm grew over the groundwater temperature. In fact, the
temperature difference was about 10-15°C until the beginning of September. At the
end of Period V, temperatures were linked again to the same behavior at the
beginning of the study.
Figure 4.14 Temperature records in infiltration pond (in purple), 55 cm depth (green) and PJ (6 m below
the surface) (blue) from October 2016 to October 2017 in Castellbisbal MAR system
Temporal evolution of redox potential and results for the four sampling campaigns
performed suggest that temperature could be a determinant factor on biodegradation
processes. Since microbial respiration has a strong temperature dependence (Or et
al., 2007; Zhang et al., 2015), it is reasonable to think that microbial activity might
be lower in cold periods than in the wet ones.

______________________________________CHAPTER 4_ MONITORING OF REDOX
PROCESSES TO IMPROVE MAR MANAGEMENT
97
4.5. Conclusions
According to the wide monitoring control carried out in the Castellbisbal MAR
system, different conclusions can be highlighted in order to improve the MAR system
management:
It is important to monitor the system in order to know and control processes
occurring, i.e. monitoring groundwater levels just below the pond to avoid the
excessive rise.
Scrapping is a useful technique to revert the infiltration capacity of the
system in terms of bioclogging and physical clogging removal.
Physical clogging may accelerate bioclogging formation. The increase of
residence time of water in an infiltration pond promotes photosynthetic
activity, boosting particulate organic carbon for growth and respiration of
organisms.
Clogging processes are closed loops that can be interrupted and reverted with
proper managing actions.
Desiccation of the infiltration pond during the summer period had a favorable
impact to mitigate bioclogging. Establishing drying-wetting hydric regimes
might be a useful practice to avoid bioclogging effects, especially in the
warmest periods.
Data from sampling surveys and continuous monitoring support the idea that
temperature is a key factor for redox processes and bioclogging development.
MAR surface ponds can reach many different redox conditions in time and
depth. This might have many consequences in order to improve water
pollutants degradation.

______________________________________CHAPTER 4_ MONITORING OF REDOX
PROCESSES TO IMPROVE MAR MANAGEMENT
98

99
_____________________________________________________
CHAPTER 5: MODELING FLOW,
TEMPERATURE AND BIOGEOCHEMICAL
PROCESSES IN A SURFACE INFILTRATION
SYSTEM
_____________________________________________________

100

CHAPTER 5_ MODELING FLOW, TEMPERATURE AND BIOGEOCHEMICAL
PROCESSES IN A SURFACE INFILTRATION SYSTEM
101
5.1. Introduction
Surface infiltration ponds are MAR facilities aimed at increasing groundwater
resources, to store water and/or to improve the quality of water during the
infiltration process (Bouwer, 2002).
Issues related to the operation of surface ponds are widely reported in the literature.
Design aspects (Bouwer, 2002; Eusuff and Lansey, 2004; Hellauer et al., 2017),
impacts on groundwater geochemistry (Goren et al., 2014), risk assessment (Pedretti
et al., 2012a; Rodríguez-Escales et al., 2018); clogging issues and effects (Baveye et
al., 1998; Dutta et al., 2015; Pedretti et al., 2012b); redox processes (Grau-Martínez
et al., 2018; Greskowiak et al., 2006; Massmann et al., 2006; Rezanezhad et al., 2014;
Schmidt et al., 2007); behavior of organic matter and pollutants (Alidina et al.,
2014a; Regnery et al., 2015; Valhondo et al., 2018) and microbial community
description (Alidina et al., 2014b; Li et al., 2013). Chapter 2 shows some examples of
works concerning surface infiltration ponds. Most of these issues are dependent on
temperature, and its role in infiltration facilities is often omitted. The temperature
in the feeding water oscillates daily (Goren et al., 2014; Ronan et al., 1998) and
seasonally (Braga et al., 2007; Greskowiak et al., 2006; Massmann et al., 2006);
consequently, all the processes mentioned before are affected by it.
Temperature variations in the surface water of the Castellbisbal MAR system are
not an exception; it shows a sinusoidal trend during the year (see Figure 4.14 in
Chapter 4). The annual temperature cycle is characterized by a Mediterranean
climate with moderate-low temperatures in winter (from 5ºC to 15ºC), tempered
temperatures in autumn and spring (from 15ºC to 25ºC) and high temperatures at
the end of spring and summer (from 25ºC to 45ºC). The maximum difference in
environmental temperature registered in the facility between seasons was 46°C.
Temperature variations have consequences for recharge facilities operation and
management (Vandenbohede and Van Houtte, 2012). First, a large amount of
intrinsic properties of fluids (mainly viscosity, density, and surface tension) are
directly affected by temperature changes, thus, also changing hydraulic conductivity
through:
𝑓 =𝜌𝑤𝑔
𝜂=
𝑔
𝜂′ (5.1)

CHAPTER 5_ MODELING FLOW, TEMPERATURE AND BIOGEOCHEMICAL
PROCESSES IN A SURFACE INFILTRATION SYSTEM
102
where f is the fluidity of water [L-1T-1], 𝜌𝑤 is water density [ML-3], g is gravitational
acceleration [LT-2], 𝜂 is viscosity [ML-2T-1] and 𝜂′ is kinematic viscosity [L2T-1]. Lin et
al. (2003) and Braga et al. (2007) estimated in 40% and 56% respectively the change
of infiltration rate between the summer and winter months due to viscosity changes.
The latter also predicted a cyclical pattern of high and low infiltration rates occurring
across the year.
Another intrinsic property of water is surface tension at the air-water interface,
decreasing with increasing temperature. However, its influence upon hydraulic
conductivity is mild (Constantz, 1982; Lin et al., 2003; Ronan et al., 1998), and it is
mostly neglected in experiments and studies evaluating infiltration yields (Lin et al.,
2003).
Temperature also influences indirectly water quality in MAR systems, since it is one
of the main factors catalyzing chemical reactions. As a consequence, microbial
degradation rates depend on temperature evolution (Maeng et al., 2011). This fact is
especially demonstrated in many field investigations, beyond laboratory studies
(Greskowiak et al., 2017). For example, temperature affects pyrite oxidation
(Prommer and Stuyfzand, 2005), aerobic oxidation of organic matter (Massmann et
al., 2006), nitrogen reduction (Carrera et al., 2003; David et al., 1997; Massmann et
al., 2006), and manganese reduction (Massmann et al., 2006). Many of these works
are accompanied by biogeochemical models explaining the fate of redox-sensitive
species in surface infiltration systems.
Taking into account the effect of temperature in reaction rates during MAR activities
implies: 1) understanding multiphase flows in the unsaturated zone; 2) coupling
temperature dynamics to flow models; and 3) coupling temperature dynamics and
geochemical processes to multiphase systems. A model including temperature
affections and their implication on redox reactions will help to improve the design,
managing and operating MAR systems. With this information, both the infiltration
rate and the quality of the recharged water could be optimized through, for example,
a decision tool. Although some works have coupled all these processes (e.g.
Greskowiak et al. 2006), to our knowledge, there is no work coupling flow in
unsaturated and saturated media, heat transport, biogeochemical reactions, and
managing actions (scraping, non-recharge periods, etc.).

CHAPTER 5_ MODELING FLOW, TEMPERATURE AND BIOGEOCHEMICAL
PROCESSES IN A SURFACE INFILTRATION SYSTEM
103
Then, the main aim of this chapter is to assess and quantify with a numerical model
the temperature impact on hydraulic conductivity and to evaluate its role in
biodegradation processes (microbial degradation rates), in a real surface infiltration
system during a year of operation. Improving knowledge about the influence of
seasonal temperature changes on the infiltration rate would allow achieving optimal
operation and maximum recharge efficiency in surface infiltration systems.
To achieve this goal, the first step was to develop a flow and heat transport model of
the Castellbisbal recharge facility considering the temperature variations during one
year and using the experimental information described in Chapter 4. After that, in
order to test the impact of the temperature on the biogeochemistry of the system, a
batch biogeochemical model was developed to:
Test the role of temperature in biological clogging;
Test the impacts of organic matter origin in redox processes; and
Evaluate the effect of temperature on the redox processes occurring in the
top-soil of the Castellbisbal infiltration pond.
This batch geochemical model was developed as an initial tool to quantify the relative
importance of temperature in the system. It was done in order to set up the main
biogeochemical processes involved in recharge and to evaluate the influence of
temperature.
5.2. Methodology
A one-dimension flow and heat transport model of the Castellbisbal MAR system has
been constructed. Two different biogeochemical scenarios were evaluated with batch
simulations. The model was based on the field site of Castellbisbal (see section 1.5.3)
and we used the experimental information collected during the period between
October 2016 and October 2017, which is described in Chapter 4.
5.2.1. Flow and heat transport models
Governing equations
The flow between infiltration pond and groundwater was simulated with the
software HYDRUS version 4.16.0110 (Jacques and Simunek, 2005). The code solves
the Richards equation for water movement in a partially-saturated porous medium:

CHAPTER 5_ MODELING FLOW, TEMPERATURE AND BIOGEOCHEMICAL
PROCESSES IN A SURFACE INFILTRATION SYSTEM
104
𝜕𝜃
𝜕𝑡=
𝜕
𝜕𝑥[𝐾 (
𝜕ℎ
𝜕𝑥+ cos𝛼)] − 𝑆 (5.2.)
where h is the water pressure head [L], θ is the volumetric water content [L3 L-3], t
is time [T], x is the spatial coordinate [L] (positive upward), S is the sink term [L3 L-
3T-1], α is the angle between the flow direction and the vertical axis (α = 0 for vertical
flow), and K(h) is the unsaturated hydraulic conductivity [LT-1] given by
𝐾(ℎ, 𝑥) = 𝐾𝑠(𝑥)𝐾𝑟(ℎ, 𝑥) (5.3.)
where Kr is the relative hydraulic conductivity [-] and Ks the saturated hydraulic
conductivity [LT-1].
A single porosity model was assumed based on the analytical solution of Van
Genuchten (1980) (Eq 5.4 and 5.5) to estimate unsaturated hydraulic properties:
𝜃(ℎ) = {
𝜃𝑠−𝜃𝑟[1+|𝛼ℎ|𝑛]𝑚
ℎ < 0𝜃𝑠ℎ ≥ 0
(5.4.)
𝐾(ℎ) = 𝐾𝑠𝑆𝑒𝑙 [1 − (1 − 𝑆𝑒
𝑙
𝑚)
𝑚
]
2
(5.5.)
where θs is the saturated water content [-], θr is the residual water content [-], α, m,
n are empirical parameters [1/L], [-], [-], and Se is the effective water content[-].
Van Genuchten (1980) used the statistical pore-size distribution model of Mualem
(1976) to obtain a predictive equation for the unsaturated hydraulic conductivity
function in terms of soil water retention parameters.
Heat transport across the profile was considered following the solution described
with a convection-dispersion equation of the form:
𝜕𝐶𝑝(𝜃)𝑇
𝜕𝑡=
𝜕
𝜕𝑥[𝜆(𝜃)
𝜕𝑇
𝜕𝑥] − 𝐶𝑤
𝜕𝑞𝑇
𝜕𝑥− 𝐶𝑤𝑆𝑇 (5.6.)
where λ(θ) is the coefficient of the apparent thermal conductivity of the soil [MLT-
3K-1] and Cp(θ) and Cw are the volumetric heat capacities [ML-1T-2K-1] of the porous
medium and the liquid phase, respectively. The temperature for the inlet water
(infiltration pond water) and outlet water (PJ) were set as thermal boundary
conditions.

CHAPTER 5_ MODELING FLOW, TEMPERATURE AND BIOGEOCHEMICAL
PROCESSES IN A SURFACE INFILTRATION SYSTEM
105
The definition of thermal conductivity proposed by Chung and Horton (1987) was
used:
𝜆0(𝜃) = 𝑏1 + 𝑏2𝜃 + 𝑏3𝜃0.5 (5.7)
where b1, b2, and b3 are empirical parameters [MLT-3K-1] for a sandy material.
Since temperature may affect hydraulic parameters (mainly water viscosity), Ks
changes as a function of temperature variations were calculated following the
expression proposed by Constantz (1982):
𝐾𝑇(𝜃) =𝜇𝑟𝑒𝑓
𝜇𝑇
𝜌𝑇
𝜌𝑟𝑒𝑓𝐾𝑟𝑒𝑓(𝜃) (5.8)
where Kref and KT denote hydraulic conductivities at the reference temperature Tref
and soil temperature T, respectively; μref and μT (ρref and ρT) represent the dynamic
viscosity [ML-1T-1] (density of soil water [ML-3]) at Tref and T, respectively.
Model construction
A one-dimension model was constructed for the study zone of Castellbisbal. The
model took into account the vertical profile constituted by the infiltration pond, the
vadose zone, and the saturated zone. The total length of the model was 6 m. The
domain was discretized with a regular mesh of 100 nodes (each one 6 cm long). Two
layers were defined in the vadose zone (of lengths 20 cm and 580 cm) to consider the
topsoil clogging effect as well as the corresponding maintenance practices of the
infiltration pond along the modeled year (see Chapter 4).
In order to change hydraulic conductivity for the upper layer to simulate observed
clogging, the whole model was divided into five different sub-models according to the
periods presented in Chapter 4 and in Table 5.2. The lower layer (580 cm) was
considered not affected by clogging and its hydraulic conductivity was assumed
constant along the all modeled period. Soil hydraulic parameters for the sandy
material of the two layers are presented in Table 5.1 and were set through
pedotransfer functions provided by HYDRUS.
The total modeled time was 365 days and it was regularly discretized using a time
step of 1 day. Both spatial and temporal discretizations were selected according to
Péclet and Courant criteria in order to avoid numerical oscillations.

CHAPTER 5_ MODELING FLOW, TEMPERATURE AND BIOGEOCHEMICAL
PROCESSES IN A SURFACE INFILTRATION SYSTEM
106
Qr Residual soil water content; Qs Saturated soil water content; α, n Parameters in the soil water
retention curve; l Tortuosity factor in the conductivity function; Ks Saturated hydraulic conductivity
The water table of the pond and the groundwater pressure at 6 m depth (location of
the pressure transducer in the piezometer) were set as upper and lower Dirichlet
boundary conditions respectively during the modeling time of one year.
The initial conditions of the model were -20 cm of pressure head at the upper node
linearly growing until node number 58 (depth 358 cm), where the groundwater level
was set. From node 58 to the lower boundary (600 cm), saturated conditions were set
at h=0 cm. The temperature was established for the upper node (19°C, infiltration
water) and the lower node (20°C, aquifer). Values between both nodes were linearly
interpolated.
Saturated hydraulic conductivity (Ks) was the calibrated parameter for both layers.
Porosity (Qs) value was defined according to different local studies (section 1.5.3 in
Chapter 1). Calculated infiltration flow was compared to the real one, which was
measured daily during the whole modeled period (see Chapter 4). The model was
divided into five different sub-models considering the different periods. The outputs
from each model were used as inputs for the subsequent one.
After flow model calibration, the heat transport model was carried out. Heat
transport parameters were set to default values following the determination of
Chung and Horton (1987) for a sandy material (Table 5.3). The temperature of the
Table 5.1 Soil hydraulic parameters and geometry of the model
Layer Layer 1 Layer 2
Depth [cm] 20 580
Qr [-] 0.045
Qs [-] 0.28
α [1/cm] 0.145
n [-] 2.68
l [-] 0.5
Ks [cm/d] calibrated calibrated
Table 5.2 Time periods for the model
Number of period I II III IV V
Duration [d] 64 83 75 27 116

CHAPTER 5_ MODELING FLOW, TEMPERATURE AND BIOGEOCHEMICAL
PROCESSES IN A SURFACE INFILTRATION SYSTEM
107
infiltration water and at the aquifer were prescribed daily as upper and lower
boundary conditions, respectively.
S Volume fraction of solid phase; DT Longitudinal thermal dispersivity [cm]; b1 Coefficient b1 in the
expression for the thermal conductivity function; b2 Coefficient b2 in the expression for the thermal
conductivity function; b3 Coefficient b3 in the expression for the thermal conductivity function; Cn
Volumetric heat capacity of the solid phase; Cw Volumetric heat capacity of the liquid phase.
The validity of the heat transport model was done comparing the fitting of
temperature calculated at a depth of 55 cm with the data provided by the
temperature sensor (Figure 4.14, Chapter 4).
5.2.2. Biogeochemical model: organic matter fate during managed aquifer
recharge
The basis for the biogeochemical model: winter vs summer scenarios
The biogeochemical model at batch scale was developed using Phreeqc code (version
2.18.00) (Parkhurst and Appelo, 2013). In this model, the main processes of organic
matter oxidation concerning the carbon and the nitrogen flow were considered. These
are summarized in Figure 5.1.
Table 5.3 Heat transport parameters for a sandy material according to
Chung and Horton (1987)
S [-] DT [cm] b1
[kg·cm/d3·⁰
C]
b2
[kg·cm/d3·⁰
C]
b3
[kg·cm/d3·⁰
C]
Cn
[kg·cm/d2·⁰
C]
Cw
[kg·cm/d2·⁰
C]
0.72 5 1.47054·1016 -1.5518·1017 3.16617·1017 1.43327·1014 3.12035·1014

CHAPTER 5_ MODELING FLOW, TEMPERATURE AND BIOGEOCHEMICAL
PROCESSES IN A SURFACE INFILTRATION SYSTEM
108
Figure 5.1 Conceptual biogeochemical model of DOM transformation and degradation via different
paths (discontinuous arrows 1 to 5). DOM coming from infiltration water composition comprises a
source of ammonium, DOMrec (as the recalcitrant fraction of DOM), and DOClab (labile fraction of DOM).
DOMimm is the immobile form of DOM, as an endogenous source of organic matter synthetized in situ.
This model assumes that a fraction of dissolved organic matter (DOM) present in the
soil profile comes from the infiltration water. DOM is divided into two different pools:
recalcitrant organic matter and labile dissolved organic carbon (DOClab).
Recalcitrant DOC can be converted to DOClab and ammonium (processes 2 and 4).
The model also incorporates the carbon produced due to photosynthetic growth, it is
called endogenous organic matter (DOMimm). This endogenic production is
assimilated as organic matter provided by bioclogging layer or settled algae on the
bottom of the pond. DOMimm can be also converted to labile DOC (process 1). DOClab
is considered the unique species oxidized to CO2 by microorganisms (process 3). This
oxidation process takes into account the microbial use of different electron acceptors.
Oxygen, nitrate, manganese, iron or sulfate will be used as electron acceptors
according to their availability and their respective energy yield (Bethke et al., 2011;
Ghattas et al., 2017).
The production of DOClab via demobilization of DOMimm and hydrolysis of DOMrec
implies the release of ammonium (process 4), as a simplification of Dissolved Organic
Nitrogen. If oxygen is present, ammonium is converted to nitrate through
nitrification (process 5) and this can be reduced to nitrogen gas via denitrification
path if anaerobic conditions are reached. Note that denitrification is also part of
organic carbon oxidation (process 3).

CHAPTER 5_ MODELING FLOW, TEMPERATURE AND BIOGEOCHEMICAL
PROCESSES IN A SURFACE INFILTRATION SYSTEM
109
Considering that nitrite was not significantly detected (Figure 4.6, Chapter 4), and
in order to simplify the model, it was neglected. Besides, the model neither considers
the growth nor the decay of biomass. Neither CO2 autotrophic fixation by algae and
cyanobacteria were considered in the model; they were assumed as part of
bioclogging and as immobile DOM, setting an initial concentration. Photochemical
and biological degradation of recalcitrant DOM was also omitted, considering that
rates are much lower than those of oxidation of labile DOC.
Modeled reactions and governing equations
In Castellbisbal MAR system, aerobic, denitrifying, manganese and iron-reducing
conditions were reached at different locations according to the results of Chapter 4.
The simulation of labile organic matter described by the conceptual biogeochemical
model described was carried out considering DOClab represented by the chemical
formula CH2O. The corresponding redox reactions for DOClab degradation are:
Aerobic respiration: 𝐶𝐻2𝑂 +𝑂2 → 𝐻𝐶𝑂3− +𝐻+
Denitrification: 𝐶𝐻2𝑂 + 0.8𝑁𝑂3− + 0.8𝐻+ → 𝐻𝐶𝑂3
− + 0.4𝑁2 +𝐻+ + 0.4𝐻2𝑂
Manganese reduction: 2𝐶𝐻2𝑂 + 4𝑀𝑛𝑂2 + 6𝐻+ → 2𝐻𝐶𝑂3− + 4𝑀𝑛2+ + 4𝐻2𝑂
Iron reduction: 𝐶𝐻2𝑂 + 4𝐹𝑒(𝑂𝐻) + 7𝐻+ → 𝐻𝐶𝑂3− + 4𝐹𝑒2+ + 6𝐻2𝑂
Sulfate reduction: 2𝐶𝐻2𝑂 + 𝑆𝑂4−2 → 2𝐻𝐶𝑂3
− +𝐻𝑆− +𝐻+
All these reactions were modeled grouped into the rates defined in Equation 5.11 in
Table 5.4. In turn, DOClab comes from immobile and recalcitrant DOM, following 1:1
stoichiometry in the depletion of DOM in favor of the appearance of DOClab. The
transformation of DOMimm and DOMrec into DOClab is modeled following rate
definitions in equations 5.9 and 5.10 respectively in Table 5.4.

CHAPTER 5_ MODELING FLOW, TEMPERATURE AND BIOGEOCHEMICAL
PROCESSES IN A SURFACE INFILTRATION SYSTEM
110
Kimm [T-1]is the first-order rate for the release of immobile DOM; F(T) [-] is the function of the
temperature dependence of DOM transformation and mineralization; F(Topt) [-] is the maximum value
of F(T); Krec[T-1] is the first-order rate for the hydrolysis of recalcitrant DOM; n is the number of the
terminal electron acceptors; 𝑘𝑖 [M·M-3·T-1] is the maximum rate for the DOClab degradation using i
species as electron acceptor; Ci [M·M-3] is the concentration of the corresponding electron acceptor in
the oxidation of DOClab; 𝐾𝑖 [M·M-3] is the half-saturation constant of the corresponding electron acceptor
in the oxidation of DOClab; Cj,i [M·M-3] is the concentration of j inhibitor above the i species in the
oxidation of DOClab; 𝐾𝑖𝑛ℎ,𝑗,𝑖 [M·M-3] is the inhibition coefficient of the j inhibitor above the i species in
the oxidation of DOClab; 𝑘𝐴𝑚𝑚 [M·M-3·T-1] is the maximum nitrification rate; and 𝐾𝑂2 is the half-
saturation constant for O2 in nitrification; 𝐾𝐴𝑚𝑚 is the half-saturation constant for ammonium in
nitrification.
The release of ammonium (process 4, Table 4) during DOMimm and DOMrec
transformations followed the equations 5.12 and 5.13 in Table 5.4. The stoichiometry
of this transformation was set in 1:0.15 for the relation DOM:Ammonium. Finally,
nitrification (process 5) was unified in order to group nitritation and nitratation in a
single-step:
Nitritation: 2𝑁𝐻4+ + 3𝑂2 → 2𝑁𝑂2
− +4𝐻+ + 2𝐻2𝑂
Nitratation: 2𝑁𝑂2− + 𝑂2 → 2𝑁𝑂3
−
Table 5.4 Processes involved in DOM transformation and consumption in
a shallow part of saturated soil
Number of
process Process Rate definition
Release of
immobile DOM
dDOClab
dt= Kimm ×
F(T)
F(Topt)× [DOMimm] (5.9)
Hydrolysis of
recalcitrant DOM
dDOClab
dt= Krec ×
F(T)
F(Topt)× [DOMrec] (5.10)
Microbial
oxidation of labile
DOC
dDOClab
dt=
F(T)
F(Topt)× [DOClab] ×
∑ (−kiCi
Ci+Ki∏
Cj,i+𝐾𝑖𝑛ℎ,𝑗,𝑖
𝐾𝑖𝑛ℎ,𝑗,𝑖
mj=1 )n
i=1 (5.11)
Release of
ammonium
dNH4+
dt= kimm ×
F(T)
F(Topt)× [DOMimm] (5.12)
dNH4+
dt= krec ×
F(T)
F(Topt)× [DOMrec] (5.13)
Nitrification 𝐝𝐍𝐇𝟒
+
𝐝𝐭= −
𝐅(𝐓)
𝐅(𝐓𝐨𝐩𝐭)× 𝐤𝐀𝐦𝐦 ×
[𝐎𝟐]
𝐊𝐎𝟐+[𝐎𝟐]
×[𝐍𝐇𝟒
+]
𝐊𝐀𝐦𝐦+[𝐍𝐇𝟒+]
(5.14)

CHAPTER 5_ MODELING FLOW, TEMPERATURE AND BIOGEOCHEMICAL
PROCESSES IN A SURFACE INFILTRATION SYSTEM
111
Nitrification: 2𝑁𝐻4+ + 4𝑂2 → 2𝑁𝑂3
− +4𝐻+ +2𝐻2𝑂
Equation 5.14 defines the nitrification rate for the reduced organic nitrogen
(ammonium) to the most oxidized form (nitrate). The stoichiometry of the reaction
was set in 1:1 for ammonium:nitrate as it is shown in nitrification equation above.
All values and sources of kinetic constants are summarized in Table 5.5.
The influence of temperature, F(T), in all defined processes is modeled according to
Greskowiak et al. (2006), Kirschbaum (1995) and O’Connell (1990):
𝐹(𝑇) = 𝑒𝑥𝑝 [𝛼 + 𝛽𝑇 (1 − 0.5𝑇
𝑇𝑜𝑝𝑡)] (5.15)
where α [-] and β [-] are fitting parameters and Topt [Celsius] is the optimal
temperature for the decomposition and transformation rates.

CHAPTER 5_ MODELING FLOW, TEMPERATURE AND BIOGEOCHEMICAL
PROCESSES IN A SURFACE INFILTRATION SYSTEM
112
a Rodríguez-Escales et al. (2017); b Rolle et al. (2008); c Brun and Engesgaard (2002); d Greskowiak et
al. (2006); e Mayer et al. (2001); f Prommer et al. (2002); g Prommer et al. (2006); h Kirschbaum (1995);
i Kirschbaum (2000); j O’Connell (1990)
Model implementation in PHREEQC: input data
To compare the effect of temperature, the model was run using two different
solutions representing water recharged in the facility of Castellbisbal: one
Table 5.5 Summary of parameters used in biogeochemical batch models: first order
rates (Kimm and Krec); maximum degradation rates (K); half-saturation constants (k);
and inhibition constants (kinh); Topt and F(Topt)
Parameter Units Used value Source Values in literature
Kimm d-1 1 assumed
Krec d-1 0.01 assumed
𝑘𝑂2 d-1 0.15 a, b 0.08b, 0.01c
𝑘𝑁𝑂3− d-1 0.12 a, b 0.01b, 0.001c
𝑘𝑀𝑛2+ d-1 0.1 a, b 0.011b, 0.0002c
𝑘𝐹𝑒2+ d-1 0.11 a, b 0.008b
𝑘𝑆𝑂42− d-1 0.09 a, b 0.12b, 0.01c
𝐾𝑂2 M 1.56e-05 a, b 1e-05d, 3.1e-06e, 2e-03f; 2.94e-04g
𝐾𝑁𝑂3− M 8.06e-06 a, b 1e-05d, 3.1e-06e, 2e-03f, 2.94e-04g
𝐾𝑀𝑛2+ M 5.62e-06 a 8.93e-06b
𝐾𝐹𝑒2+ M 5.75e-06 a 9.09e-06b, 2.4e-04e, 1e-04g
𝐾𝑆𝑂42− M 5.21e-06 a, b 1.6e-04e, 1e-05f,
𝐾𝑖𝑛ℎ,𝑂2 M 3.13e-07 a, b 1e-05d, 3.1e-5e
𝐾𝑖𝑛ℎ,𝑁𝑂3− M 1.61e-07 a, b 1.6e-5e
𝐾𝑖𝑛ℎ,𝑀𝑛2+ M 1.12e-07 a 1.79e-07b
𝐾𝑖𝑛ℎ,𝐹𝑒2+ M 1.15e-07 a 1.82e-07b
Kamm M 5e-05 assumed
kamm M· d-1 12.26 assumed
Topt °C 35.0 d 36.9h,i,33.1j,33.8j
F(Topt) - 5.20698 d
α - -1.50 d -3.432h,-3.764h, -1.16j, -2.26j
β - 0.18 d 0.19h, 0.20h, 0.21j, 0.26j, 0.15i

CHAPTER 5_ MODELING FLOW, TEMPERATURE AND BIOGEOCHEMICAL
PROCESSES IN A SURFACE INFILTRATION SYSTEM
113
representative of winter and the other one representative of summer chemical
signatures. The water of the infiltration pond and organic carbon in the sediment of
December 2016 (winter scenario) and July 2017 (summer scenario) sampling surveys
were taken as reference data for the two models.
In order to lay the hydrochemistry for the two models and considering the small
differences between surveys, a typeset water was defined for the concentrations of
sulfate, sodium, Total Inorganic Carbon (TIC), potassium, calcium, and chloride.
Considering the four sampling campaigns (December 2016, April 2017, June 2017
and July 2017, see Chapter 4), the typeset water was established averaging the
mentioned parameters of the infiltration water. Piper diagram was constructed to
ensure the representability of the typeset water as an average of the four campaigns
(Figure 5.2). Considering the same composition for both models allow also a better
understanding of the organic carbon behavior and the corresponding redox processes
involved.
Figure 5.2 Piper diagram showing the relative position of infiltration water samples of the four
sampling campaigns performed in the Castellbisbal MAR system. Red triangle represents the average
values of water parameters for the four campaigns.
CHAPTER 5_ MODELING FLOW, TEMPERATURE AND BIOGEOCHEMICAL
PROCESSES IN A SURFACE INFILTRATION SYSTEM
114
Nitrate, temperature, pH and dissolved oxygen in winter and summer models were
set to the measurements in the infiltration water measured in December 2016 and
July 2017, respectively. Value of pe was not specified.
These two sampling campaigns were the reference for DOC inputs as well.
Recalcitrant DOM and labile DOC were determined using DOC concentration in
infiltration water weighing the contribution of humic-like and protein-like peaks in
each sample. These peaks were obtained from DOM fluorescence analysis (see
section 4.4.1 in Chapter 4).
Organic carbon amount in the sediment was used as an indicator of immobile DOM.
The maximum amount was observed in April 2017, because the pond was clogged,
and field observations confirmed high algae growth and organic matter
accumulation on the bottom of the pond. It was transformed to DOMimm
concentration considering a value of 10 mmol/kgw. This value is a reasonable
concentration of immobile DOM (between 1 and 2 orders of magnitude above TOC
annual concentration in the Llobregat River, Figure 4.3) for the most bioclogged
period. Then, values of DOMimm for summer and winter scenarios were predicted
according to the amount of carbon in the sediment in July 2017 and December 16,
respectively. DOMimm species was considered immobile in PHREEQC.
Manganese and iron were considered in equilibrium with their mineral forms,
pyrolusite and goethite, respectively. Equilibrium with both minerals allowed to
ensure the availability of manganese and iron as electron acceptors in organic matter
degradation. Values of initial concentrations of Mn4+ and Fe3+ as immobile species
coming from pyrolusite and goethite minerals respectively were set comparing the
experimental concentrations of their soluble forms (Mn+2 and Fe+2) with model
results.
The initial concentrations of all the components considered in solutions are
summarized in Table 5.6.

CHAPTER 5_ MODELING FLOW, TEMPERATURE AND BIOGEOCHEMICAL
PROCESSES IN A SURFACE INFILTRATION SYSTEM
115
* The proportion of humic-like DOM and protein-like DOM was respectively 0.62 and 0.38 in winter
and 0.57 and 0.43 in summer, according to December and July sampling campaigns. These proportions
were applied to the infiltration water DOC, which was analyzed in the two mentioned campaigns. As a
result, DOClab and DOMrec were set. ** Total Inorganic Carbon (TIC) was set calculating the speciation
with field alkalinity in the typeset water. ***Chloride was the species used to compensate ionic charges
in the solution **** Mn4+ and Fe3+ were added as immobile species in their mineral form (goethite and
pyrolusite)
Table 5.6 Input solutions defined in PHREEQC batch models for winter
and summer scenarios
Parameter Units Winter Summer
Temperature °C
9.5 24.9
pH 8.27 8.49
DOClab* mmol/kgw 0.18 0.18
DOMrec* mmol/kgw 0.30 0.24
DOMimm mmol/kgw 2.56 4.90
O2 mmol/kgw 0.32 0.20
NO3- mmol/kgw 0.14 0.06
SO42- mmol/kgw 1.34 1.34
TIC** mmol/kgw 4.12 4.12
Na+ mmol/kgw 5.01 5.01
K+ mmol/kgw 0.64 0.64
Ca2+ mmol/kgw 2.19 2.19
Cl-** mmol/kgw 5.96 5.96
Mn4+**** mmol/kgw 0.0164 0.0164
Fe3+**** mmol/kgw 0.0429 0.0429

CHAPTER 5_ MODELING FLOW, TEMPERATURE AND BIOGEOCHEMICAL
PROCESSES IN A SURFACE INFILTRATION SYSTEM
116
5.3. Results and discussion
5.3.1. Flow and heat transport model: annual temperature and hydraulic
conductivity evolution
The results of the flow model in the vertical profile of the infiltration pond of the
Castellbisbal MAR system are presented in Figure 5.3. Calibration of hydraulic
conductivity was carried out for the two set layers in the five modeling periods
(Figure 5.4). Aquifer vertical hydraulic conductivity (5.80 m lower layer) was set in
600 cm/d for the whole year, while in the upper layer (20 cm) changed by periods.
The calibration results for the upper layer explained quite well the development of
clogging in the infiltration pond and maintenance practices. While Period IV
recovered the hydraulic conductivity set for the aquifer layer because the topsoil was
scrapped and removed, the rest of the periods showed values between 5 and 30 cm/d.
Note that the hydraulic conductivity evolution follows the same dynamic as organic
carbon in sediments presented in Chapter 4 (Figure 4.10). This indicates that
hydraulic conductivity and organic carbon content are correlated parameters and
indicate the presence of biological clogging. The model evidenced that clogging
reduced between 95 and 99% the saturated hydraulic conductivity. Likewise, this
reduction presented a drastic decrease only one month after scrapping (see Figure
5.4, values of hydraulic conductivity between Period IV and Period V).
Heat transport was added to the flow model showing a good fitting between the
temperature simulated at 55 cm depth and the experimental one (Figure 5.5). The
simulation of temperatures along the profile (600 cm) from October 2016 to October
2017 (Figure 5.5) showed that (1) the seasonal variations of temperature followed
the climate behavior, and (2) the distribution of temperature was homogenously
distributed in depth, showing similar temperatures for the infiltration water and
that at 600 cm below the surface. The temperature dynamics shows that transit time
in the non-saturated zone is relatively short because of both the model and the
experimental results evidence that environmental temperature has an important
influence on groundwater. However, during summertime, the aquifer temperature
was about 10 degrees lower than that of the infiltration water. These differences are
produced due to the static position of the pressure-temperature sensor as in summer,
after the increase of levels of the spring, there are 3 m of saturated thickness above
the sensor, then limiting the thermal effect of the infiltrated water.

CHAPTER 5_ MODELING FLOW, TEMPERATURE AND BIOGEOCHEMICAL
PROCESSES IN A SURFACE INFILTRATION SYSTEM
117
Heat transport model revealed that apart from clogging, warmer temperatures in
summer resulted in a reduction in hydraulic conductivity (from 600 to 480 cm/d) in
the saturated zone, while colder temperatures in winter raised effective hydraulic
conductivity (from 600 to 810 cm/d) (Figure 5.6 and Figure 5.7).
The distribution of hydraulic conductivity showed smaller values for the vadose zone,
reflecting quite well the limit of the groundwater table. Saturated conditions
resulted in 4.5 times the hydraulic conductivity of the unsaturated zone in the first
150 d of the simulation.

____________________________________________________CHAPTER 5_ MODELING FLOW, TEMPERATURE AND BIOGEOCHEMICAL
PROCESSES IN A SURFACE INFILTRATION SYSTEM
118
Figure 5.3 Results of the HYDRUS flow model of recharge in the infiltration pond of the Castellbisbal MAR system during the period from October 2016 to October 2017.
Real daily infiltration flux (empty black circles) is compared with flux calculated by HYDRUS (blue line)

____________________________________________________CHAPTER 5_ MODELING FLOW, TEMPERATURE AND BIOGEOCHEMICAL
PROCESSES IN A SURFACE INFILTRATION SYSTEM
119
Figure 5.4 Summary of input parameters and calibrated parameters for the flow model. The 365 days-model was divided into 5 periods. Long-time non-recharge periods
are displayed in orange (infiltration pond scrapping) and purple (vacation period). Time-boundary conditions are represented by a blue line (pond water table) and a black
line (groundwater table). Calibrated parameters are showed for the upper and lower layers, fixed in 5 to 30 cm/d (green range) and 600 cm/d (blue pattern)

____________________________________________________CHAPTER 5_ MODELING FLOW, TEMPERATURE AND BIOGEOCHEMICAL
PROCESSES IN A SURFACE INFILTRATION SYSTEM
120
Figure 5.5 Results from the heat transport model at 55 cm depth. Empty black circles were the average of daily temperature measurements at 55 cm, while the red line
shows the simulated temperature for the node at the same depth

CHAPTER 5_ MODELING FLOW, TEMPERATURE AND BIOGEOCHEMICAL
PROCESSES IN A SURFACE INFILTRATION SYSTEM
121
Figure 5.6 Spatial and temporal evolution of simulated temperature in the vadose zone and saturated
zone below the infiltration pond of the Castellbisbal MAR system. Operational periods are delimited by
discontinuous lines.
Figure 5.7 Spatial and temporal evolution of effective hydraulic conductivity in the vadose zone and
saturated zone below the infiltration pond of the Castellbisbal MAR system. Operational periods are
delimited by discontinuous lines.

CHAPTER 5_ MODELING FLOW, TEMPERATURE AND BIOGEOCHEMICAL
PROCESSES IN A SURFACE INFILTRATION SYSTEM
122
In saturated conditions, the reduction of the hydraulic conductivity for thermal
reasons was at most 35% in the coldest days and depths. On the contrary, for warmer
periods, hydraulic conductivity reached more than 800 cm/d in some depths. This
represents about 20% more than it was set in soil hydraulic parameters defined. The
color map shows clearly that recharge would be more effective in warmer periods,
that is, especially, in summer due to higher hydraulic conductivity during this
period.
5.3.2. Biogeochemical models for winter and summer scenarios
Two batch models were constructed in order to test the role of temperature in the
organic matter biodegradation during five days. The two basic differences between
models were temperature and the amount of immobile organic matter. Whereas the
winter model was at 9.5°C and had a DOMimm concentration of 2.56 mmol/kgw, the
summer model was at 24.9°C and DOMimm was 4.90 mmol/kgw.
The first model explains the behavior of organic matter species in winter (Figure
5.8). Denitrification conditions were reached at the end of the second day when
oxygen was totally consumed. As a consequence, pe dropped from 13.8 to 12.2.
Despite the change in redox conditions, nitrate did not show many variations along
the modeled period; thus, neither pyrolusite nor goethite were consumed. DOM
dynamics were in accordance to the redox conditions. The concentration of DOClab
was rising at the same time that DOMimm concentration was decreasing. Little
difference in the slope of both tendencies is explained by the slight amount of DOClab
degraded via aerobic oxidation.
In the second batch plot (Figure 5.9), summer conditions were reproduced. Unlike
during the winter model, denitrification conditions were reached in few hours, and
then from the second day to the fifth, manganese reduction conditions were present.
Electron acceptors consumption, pe, and pyrolusite concentration were consistent
with the redox conditions. DOMimm and DOClab showed again the opposite behavior
but not in the same magnitude as in winter, with the highest slopes in this second
case. Biodegradation of labile DOC and hydrolysis of immobile DOM in summer were
in fact, higher than in winter. Most concretely, and according to plots, both rates
were about 2.5 times faster in summer than in winter. The amount of labile DOC
was higher due to the faster transformation of immobile DOM, and also the rates
were higher.

CHAPTER 5_ MODELING FLOW, TEMPERATURE AND BIOGEOCHEMICAL
PROCESSES IN A SURFACE INFILTRATION SYSTEM
123
The role of DOCrec in the two scenarios was almost inappreciable, especially for the
winter scenario. Despite the behavior of DOCrec would be the expected, calibration of
Krec might be considered.
The fitting between pe in the model and pe in the field was compared taking values
of Eh provided by the redox probe installed in the infiltration pond (see Chapter 4).
Pe was calculated from the measurements recorded just before the sampling
campaign. Those pe values were compared with an initial range of pe simulated in
the model. For the winter model, calculated pe was 13.7 while the real pe according
to redox probe was 14.2. In the summer model, calculated pe was 12.0 and the
observed value was 11.7.

__________________________________________________CHAPTER 5_ MODELING FLOW, TEMPERATURE AND BIOGEOCHEMICAL
PROCESSES IN A SURFACE INFILTRATION SYSTEM
124
Figure 5.8 Five-days batch simulation of biodegradation of DOClab (blue dots), DOMrec (green dots) and DOMimm (red dots) species in winter. Electron acceptors consumed
total or partially are represented with triangles, oxygen (grey) and nitrate (violet). Goethite (orange) and pyrolusite (black) consumption are represented by single lines.
Secondary axis shows the evolution of pH (orange crosses) and pe (turquoise crosses)

__________________________________________________CHAPTER 5_ MODELING FLOW, TEMPERATURE AND BIOGEOCHEMICAL
PROCESSES IN A SURFACE INFILTRATION SYSTEM
125
Figure 5.9 Five-days batch simulation of biodegradation of DOClab (blue dots), DOMrec (green dots) and DOMimm (red dots) species in summer. Electron acceptors consumed
total or partially are represented with triangles, oxygen (grey), nitrate (violet) and manganese (purple). Goethite (orange) and pyrolusite (black) consumption are
represented by single lines. Secondary axis shows the evolution of pH (orange crosses) and pe (turquoise crosses)

CHAPTER 5_ MODELING FLOW, TEMPERATURE AND BIOGEOCHEMICAL
PROCESSES IN A SURFACE INFILTRATION SYSTEM
126
5.4. Conclusions
A flow and heat transport model has been constructed to simulate infiltration
processes below a surface pond. Good fitting between simulated flux and
temperature with the observed ones demonstrated the importance of the quality of
data to construct the model. Therefore, the monitoring network of pressure
transducers, temperature sensors, and data from the flow meter was crucial to
construct a representative model of real infiltration conditions.
Heat transport model allowed predicting changes in hydraulic conductivity taking
into account temperature fluctuations as well as unsaturated conditions. Carrying
out recharge during summer would be more favorable than in winter since effective
hydraulic conductivity is 20% higher than the theoretical one. The model, however,
only predicts changes in hydraulic conductivity caused by viscosity modifications.
Other indirect effects of temperature are not considered (isothermal vapor flux,
changes in surface tension or in diffuse double-layer thickness). These other causes
would underestimate the effects of temperature in hydraulic conductivity, and
consequently, in infiltration rate.
Biogeochemical models evidenced that warmer conditions (25°C) increased
degradation rates about 2.5 times compared with conditions in winter (10°C).
Furthermore, production of labile DOC, as well as their consumption, were higher in
the summer model.
Thus, the optimal scenario would be probably in autumn or spring, where
intermediate temperatures would not allow too much clogging development, while
microorganisms would still be active enough to remove DOM coming from the river
while maintaining a good infiltration rate. Furthermore, lower temperatures would
increase the infiltration rate with respect to the summer scenario. Thus, the
optimization of the amount of water infiltrated and the improvement of its quality
could be achieved.
Modeling temperature implications in infiltration ponds is and will be a powerful
tool, especially important on the climate change context and their consequent
alterations in temperature pattern behaviors.

127
_____________________________________________________
CHAPTER 6: CONCLUSIONS
_____________________________________________________

128

_______________________________________________ CHAPTER 6_ CONCLUSIONS
129
his thesis is aimed at improving our understanding of the operation and
management of MAR systems. All the investigations carried out: field work,
data analysis, and numerical model development, aimed at contributing to
the sustainable management of water resources. In fact, the main novelty of this
work is the integration of different interdisciplinary methodologies (microbial
fingerprinting, multivariate statistical analysis, hydrochemical characterization,
and numerical modeling) as well as monitoring tools (redox potential and hydrologic
features) to better understanding processes in infiltration ponds.
The two first chapters of this work highlight the importance of microbial
communities in the aquifer’s water quality improvement during infiltration
practices. Some denitrifiers, carbon fixators, and methanotrophs, among others,
have been found associated with recharge practices. Recharge processes lead to the
perturbation of the existing groundwater chemical signature, stimulating microbial
activity and diversity. This tendency follows the Intermediate Disturbance
Hypothesis, and it is evidenced in the Sant Vicenç site, as an example of MAR surface
infiltration system. The increase of biological diversity due to intermediate
disturbances implies the colonization of wide biological niches by microbial
populations during MAR.
The relationship between microbial community composition, recharge operational
conditions (whether recharge is active or discontinued), hydrochemistry (in water
samples) and grain-size distribution properties (in soil samples) was further
analyzed by means of Principal Component Analysis. This multivariate statistical
analysis from data of the Sant Vicenç MAR system allowed distinguishing relevant
variables for the development of microbial communities in different environments.
For example, the presence of Cyanobacteria populations (mainly in surface water)
might be linked to metals immobilization capability. Also, PCA allowed identifying
in statistical terms key species related to biodegradation processes. For instance, the
populations of Methylotenera mobilis and Vogesella indigofera can be used as
denitrifying indicators in MAR environments, showing correlations with DOC (log)
concentrations. The statistical analysis also highlighted (1) the importance of the
grain-size distribution of soils in the development of microbial communities; and (2)
moisture as a key parameter for the microbial diversity in soils. One could expect
that these conclusions should be maintained when studying other MAR sites or
freshwater environments.
T
_______________________________________________ CHAPTER 6_ CONCLUSIONS
130
Another innovative result of this thesis is the in situ continuous monitoring of redox
potential in the infiltration water, the vadose zone, and in the aquifer. This allows
studying the dynamics of redox processes in MAR systems, as an exponent of
potential water quality improvement and bioclogging development, and could
potentially have many implications for MAR ponds management.
Sampling surveys characterizing hydrochemistry and organic matter origin, as well
as two biochemical reactive models, were also performed in order to complement the
understanding of redox processes at the field scale. Redox potential measurements
are relevant in several ways: (1) they give an idea of the redox state of the system;
(2) they are indicative of the main redox processes that are occurring at each period
(and their spatiotemporal evolution in depth). Indeed, there is an inverse
relationship between water depth and redox potential, indicating that the
thermodynamic chain in the consumption of electron acceptors is followed along the
infiltration through the non-saturated zone. Furthermore, it was confirmed that
redox potential measurements are indicators of clogging appearance. Comparing
periods with clogging development with those after scrapping, we observed that oxic
conditions recovered when recharge was restarted after clogging removal.
Measured redox potentials and biological activity indicators (partial pressure of CO2,
Biological Oxygen Demand -BOD- and Oxidation Reduction Potential -ORP-) suggest
low biological activity during the cold months, when denitrification is not occurring.
Oppositely, during the warm months at least iron reduction takes place. Last,
dissolved organic matter, analyzed by fluorescence, was demonstrated as a useful
tool to characterize the origin of the organic matter and the changes in
concentrations along the year.
These results highlight that redox potential is dynamic during MAR activities, and
therefore, potential bioclogging and/or biodegradation of pollutants/nutrients.
Furthermore, it changes along the seasons and according to external managing
measures (scrapping), with significant implications for the proper management and
planning of MAR aims (quality and quantity). Developing a biogeochemical model
and comparing two opposite scenarios (summer and winter) allowed making a first
approximation of optimal practices. For example, during cold months
microorganisms’ activity is significantly low, so that it would not be reasonable to
prioritize quality issues, especially those biodegradation processes needing redox
reductive conditions.

_______________________________________________ CHAPTER 6_ CONCLUSIONS
131
The flow and heat transport models also showed that temperature changes during
MAR activities have wide implications for the dynamics of hydraulic conductivity,
which in turn might affect both water quality and quantity during recharge. Changes
in viscosity in winter might involve a reduction of 35% of the hydraulic conductivity
initially set in the model. Recharge in terms of quantity would be optimal during
summer, with an increase of 20% in hydraulic conductivity.
Management of bioclogging takes special importance in the warm months, because
it can directly affect the infiltration rate. Avoiding bioclogging in the summertime
will result in the maximization of infiltration rate and the achievement of the target
biogeochemical redox reactions occurring during recharge.
This dissertation has contributed to understanding the biogeochemical processes
occurring in MAR infiltration ponds. It is expected that the results will help to
improve their management according to the different targets of quantity and quality,
but also according to the environmental conditions and MAR ponds design.
Future work
Finally, some more future work can be undertaken in order to improve the
knowledge of processes involved in ponds functioning.
The microbial fingerprinting study performed in Sant Vicenç MAR system was the
first approximation to determine if there were relevant microbial community
differences between recharge and no-recharge operation conditions and at different
locations along the flow path. Once these differences have been exposed, we target a
broader study taking benefit of the advances in throughput sequencing; this
technique allows getting a complete characterization of microbial communities,
which can be applied under recharge and no-recharge conditions. This way, the less
abundant populations could be classified and so, biological functions for the whole
microbial community would be discriminated. Furthermore, a more detailed study,
considering a wider area not affected by MAR, could be used to determine the
relative importance of climate cycles in subsurface microbial ecosystems.
Regarding the statistical analysis of data from the Sant Vicenç MAR system, PCA
allowed discriminating among relevant correlations between variables. However,
soil and water samples had to be treated in separated analyses, since some of their

_______________________________________________ CHAPTER 6_ CONCLUSIONS
132
variables did not coincide. Therefore, performing a Redundancy Analysis would be
useful to verify to which extent both environments are related.
Chapter 4 could be also extended, since sampling campaigns in the Castellbisbal
system included more points than the ones shown in this work (Llobregat River,
inflow and outflow of the wetland, one piezometer upstream and two piezometers
downstream). It should be interesting to perform an organic carbon balance across
and through the recharge system and taking into account its terrestrial or
endogenous origin. Fluorescence data would be very helpful in order to distinguish
the origin fractions of dissolved organic matter.
Regarding the modeling tasks, biogeochemical reactions should be implemented in
flow and heat models for the whole year, in order to make it realistic. This could be
done by means of reactive models HYDRUS-HPx (a model combining PHREEQC and
HYDRUS). In this way, it would be possible to link temperature outputs from heat
transport model with defined rates, which depend in turn to temperature by means
of the function F(T) (Equation 5.15). Some improvements to the model could be
performed, making an extended review about constant rates for the hydrolysis of
DOMimm and the release of DOClab from DOMrec, linked to algae growth, a recurrent
phenomenon observed in the Castellbisbal MAR system.
It is also predictable that photosynthesis may occur as a general rule in similar
infiltration systems. It would be very interesting and also useful for management
proposes, to study and quantify algae and cyanobacteria growth in the infiltration
pond water, related to temperature changes. Likewise, organic matter conforming
photosynthetic organisms could be analyzed in order to know their nature (degree of
lability). All these information would be very interesting to include in the global
biogeochemical model. It would be more realistic than our first approach of treating
immobile DOM as a mineral with a hydrolysis rate.
Completing the flow and heat transport model with reactive transport for DOM
degradation would allow testing the effect of temperature in an integrated way and
would also be very useful for management purposes. Furthermore, some more
simulations of different scenarios could be done, as a decisions benchmark, e.g,
deciding the best moment to remove clogging, when to establish a drying period,
finding the best moment to optimize both quantity and quality targets, etc.

133
Bibliography
Alewell, C., Paul, S., Lischeid, G., Storck, F.R., 2008. Co-regulation of redox
processes in freshwater wetlands as a function of organic matter availability?
Sci. Total Environ. 404, 335–342. https://doi.org/10.1016/j.scitotenv.2007.11.001
Alidina, M., Hoppe-Jones, C., Yoon, M., Hamadeh, A.F., Li, D., Drewes, J.E., 2014a.
The occurrence of emerging trace organic chemicals in wastewater effluents in
Saudi Arabia. Sci. Total Environ. 478, 152–62.
https://doi.org/10.1016/j.scitotenv.2014.01.093
Alidina, M., Li, D., Drewes, J.E., 2014b. Investigating the role for adaptation of the
microbial community to transform trace organic chemicals during managed
aquifer recharge. Water Res. 56, 172–180.
https://doi.org/http://dx.doi.org/10.1016/j.watres.2014.02.046
Alidina, M., Li, D., Ouf, M., Drewes, J.E., 2014c. Role of primary substrate
composition and concentration on attenuation of trace organic chemicals in
managed aquifer recharge systems. J. Environ. Manage. 144, 58–66.
https://doi.org/10.1016/j.jenvman.2014.04.032
Alidina, M., Shewchuk, J., Drewes, J.E., 2015. Effect of temperature on removal of
trace organic chemicals in managed aquifer recharge systems. Chemosphere
122, 23–31. https://doi.org/10.1016/j.chemosphere.2014.10.064
Altschul, S., Madden, T., Schaffer; AA, Zhang, J., Zhang, Z., Miller, W., Lipman, D.,
1997. Gapped BLAST and PSI-BLAST: a new generation of protein database
search programs. Nucleic Acids Res. 25, 3389–3402.
https://doi.org/10.1093/nar/25.17.3389
Barahona-Palomo, M., 2014. Estimation of aquifers hydraulic parameters by three
different tecniques: geostatistics, correlation and modeling. Universitat
Politècnica de Catalunya.
Barbieri, M., 2011. Effect of redox conditions on the fate of emerging organic
micropollutants during artificial recharge of groundwater: batch experiments.
Universitat Politècnica de Catalunya.
Barbieri, M., Carrera, J., Ayora, C., Sanchez-Vila, X., Licha, T., Nodler, K., Osorio,

____________________________________________________________ BIBLIOGRAPHY
134
V., Perez, S., Kock-Schulmeyer, M., Lopez de Alda, M., Barcelo, D., 2012.
Formation of diclofenac and sulfamethoxazole reversible transformation
products in aquifer material under denitrifying conditions: batch experiments.
Sci Total Env. 426, 256–263. https://doi.org/10.1016/j.scitotenv.2012.02.058
Barbieri, M., Carrera, J., Sanchez-Vila, X., Ayora, C., Cama, J., Köck-Schulmeyer,
M., López de Alda, M., Barceló, D., Tobella Brunet, J., Hernández García, M.,
2011. Microcosm experiments to control anaerobic redox conditions when
studying the fate of organic micropollutants in aquifer material. J. Contam.
Hydrol. 126, 330–345.
https://doi.org/http://dx.doi.org/10.1016/j.jconhyd.2011.09.003
Bates, B.C., Z.W. Kundzewicz, S.Wu, J.P. Palutikof, 2008. Climate Change and
Water. Technical Paper if the Intergovernmental Panel on Climate Change.
Geneva.
Baveye, P., Vandevivere, P., Hoyle, B.L., DeLeo, P.C., Sanchez de Lozada, D., 1998.
Environmental impact and mechanisms of the biological clogging of saturated
soils and aquifer materials. Crit. Rev. Environ. Sci. Technol. 28, 123.
Bekele, E., Toze, S., Patterson, B., Higginson, S., 2011. Managed aquifer recharge of
treated wastewater: Water quality changes resulting from infiltration through
the vadose zone. Water Res. 45, 5764–5772.
https://doi.org/10.1016/j.watres.2011.08.058
Bellini, M.I., Gutiérrez, L., Tarlera, S., Scavino, A.F., 2013. Isolation and functional
analysis of denitrifiers in an aquifer with high potential for denitrification. Syst.
Appl. Microbiol. 36, 505–16. https://doi.org/10.1016/j.syapm.2013.07.001
Bellini, M.I., Kumaresan, D., Tarlera, S., Murrell, J.C., Fernández-Scavino, A., 2018.
Identification of active denitrifiers by DNA-stable isotope probing and amplicon
sequencing reveals Betaproteobacteria as responsible for attenuation of nitrate
contamination in a low impacted aquifer. FEMS Microbiol. Ecol. 94, fix181-
fix181.
Betancourt, W.Q., Kitajima, M., Wing, A.D., Regnery, J., Drewes, J.E., Pepper, I.L.,
Gerba, C.P., 2014. Assessment of virus removal by managed aquifer recharge
at three full-scale operations. J. Environ. Sci. Heal. Part A 49, 1685–1692.
https://doi.org/10.1080/10934529.2014.951233

____________________________________________________________ BIBLIOGRAPHY
135
Bethke, C.M., Sanford, R.A., Kirk, M.F., Jin, Q., Flynn, T.M., 2011. The
thermodynamic ladder in geomicrobiology. Am. J. Sci. 311, 183–210.
https://doi.org/10.2475/03.2011.01
Bhatti, A.A., Haq, S., Bhat, R.A., 2017. Actinomycetes benefaction role in soil and
plant health. Microb. Pathog. https://doi.org/10.1016/j.micpath.2017.09.036
Bouwer, H., 2002. Artificial recharge of groundwater: hydrogeology and engineering.
Hydrogeol. J. 10, 121–142. https://doi.org/10.1007/s10040-001-0182-4
Braga, A., Horst, M., Traver, R.G., 2007. Temperature Effects on the Infiltration
Rate through an Infiltration Basin BMP. J. Irrig. Drain. Eng. 133, 593–601.
https://doi.org/10.1061/(ASCE)0733-9437(2007)133:6(593)
Bridgham, S.D., Cadillo-Quiroz, H., Keller, J.K., Zhuang, Q., 2013. Methane
emissions from wetlands: biogeochemical, microbial, and modeling perspectives
from local to global scales. Glob. Chang. Biol. 19, 1325–1346.
https://doi.org/10.1111/gcb.12131
Brun, A., Engesgaard, P., 2002. Modelling of transport and biogeochemical processes
in pollution plumes: literature review and model development. J. Hydrol. 256,
211–227. https://doi.org/10.1016/S0022-1694(01)00547-9
Burke, V., Greskowiak, J., Asmuß, T., Bremermann, R., Taute, T., Massmann, G.,
2014. Temperature dependent redox zonation and attenuation of wastewater-
derived organic micropollutants in the hyporheic zone. Sci. Total Environ. 482–
483, 53–61. https://doi.org/10.1016/j.scitotenv.2014.02.098
Carles Brangarí, A., Sanchez-Vila, X., Freixa, A., M. Romaní, A., Rubol, S.,
Fernàndez-Garcia, D., 2017. A mechanistic model (BCC-PSSICO) to predict
changes in the hydraulic properties for bio-amended variably saturated soils.
Water Resour. Res. 53, 93–109. https://doi.org/10.1002/2015WR018517
Carrera, J., Vicent, T., Lafuente, F.J., 2003. Influence of temperature on
denitrification of an industrial high-strength nitrogen wastewater in a two-
sludge system. Water SA 29, 11–16. https://doi.org/10.4314/wsa.v29i1.4939
Casas-Ruiz, J.P., Tittel, J., von Schiller, D., Catalán, N., Obrador, B., Gómez-Gener,
L., Zwirnmann, E., Sabater, S., Marcé, R., 2016. Drought-induced
discontinuities in the source and degradation of dissolved organic matter in a
Mediterranean river. Biogeochemistry 127, 125–139.

____________________________________________________________ BIBLIOGRAPHY
136
https://doi.org/10.1007/s10533-015-0173-5
Chau, J., Bagtzoglou, A., Willig, M., 2011. The effect of soil texture on richness and
diversity of bacterial communities. Environ. Forensics 12, 333–341.
https://doi.org/10.1080/15275922.2011.622348
Chellappa, N.T., Mederios Costa, M.A., 2003. Dominant and co-existing species of
Cyanobacteria from a Eutrophicated reservoir of Rio Grande do Norte State,
Brazil, in: Acta Oecologica. Elsevier Masson, pp. S3–S10.
https://doi.org/10.1016/S1146-609X(03)00005-5
Chen, J., Wang, P.-F., Wang, C., Liu, J.-J., Gao, H., Wang, X., 2018. Spatial
distribution and diversity of organohalide-respiring bacteria and their
relationships with polybrominated diphenyl ether concentration in Taihu Lake
sediments. Environ. Pollut. 232, 200–211.
https://doi.org/10.1016/J.ENVPOL.2017.08.124
Chistoserdova, L., 2011. Methylotrophy in a lake: From metagenomics to single-
organism physiology. Appl. Environ. Microbiol.
https://doi.org/10.1128/AEM.00314-11
Chung, S. ‐O, Horton, R., 1987. Soil heat and water flow with a partial surface mulch.
Water Resour. Res. 23, 2175–2186. https://doi.org/10.1029/WR023i012p02175
Connell, J.H., 1978. Diversity in Tropical Rain Forests and Coral Reefs. Science (80-
. ). 199, 1302–1310. https://doi.org/10.1126/science.199.4335.1302
Constantz, J., 1982. Temperature dependence of unsaturated hydraulic conductivity
of two soils. Soil Sci. Soc. Am. J. 46, 466–470.
https://doi.org/10.2136/sssaj1982.03615995004600030005x
Cory, R.M., Miller, M.P., McKnight, D.M., Guerard, J.J., Miller, P.L., 2010. Effect of
instrument-specific response on the analysis of fulvic acid fluorescence spectra.
Limnol. Oceanogr. Methods 8, 67–78. https://doi.org/10.4319/lom.2010.8.67
Curtis, T.P., Sloan, W.T., Scannell, J.W., 2002. Estimating prokaryotic diversity and
its limits. Proc. Natl. Acad. Sci. 99, 10494–10499.
https://doi.org/10.1073/pnas.142680199
Cycoń, M., Mrozik, A., Piotrowska-Seget, Z., 2017. Bioaugmentation as a strategy for
the remediation of pesticide-polluted soil: A review. Chemosphere.

____________________________________________________________ BIBLIOGRAPHY
137
https://doi.org/10.1016/j.chemosphere.2016.12.129
D’Alessio, M., Yoneyama, B., Kirs, M., Kisand, V., Ray, C., 2015. Pharmaceutically
active compounds: Their removal during slow sand filtration and their impact
on slow sand filtration bacterial removal. Sci. Total Environ. 524–525, 124–135.
https://doi.org/10.1016/j.scitotenv.2015.04.014
Daims, H., Nielsen, J.L., Nielsen, P.H., Schleifer, K.-H., Wagner, M., 2001. In Situ
Characterization of Nitrospira-Like Nitrite-Oxidizing Bacteria Active in
Wastewater Treatment Plants. Appl. Environ. Microbiol. 67, 5273–5284.
https://doi.org/10.1128/AEM.67.11.5273-5284.2001
David, M.B., Gentry, L.E., Smith, K.M., Kovacic, D.A., 1997. Carbon, Plant, and
Temperature Control of Nitrate Removal from Wetland Mesocosms. Trans.
Illinois State Acad. Sci. 90, 103–112.
de-Bashan, L.E., Bashan, Y., 2010. Immobilized microalgae for removing pollutants:
Review of practical aspects. Bioresour. Technol. 101, 1611–1627.
https://doi.org/10.1016/j.biortech.2009.09.043
Dillehay, J.L., Bowman, K.S., Yan, J., Rainey, F.A., Moe, W.M., 2014. Substrate
interactions in dehalogenation of 1,2-dichloroethane, 1,2-dichloropropane, and
1,1,2-trichloroethane mixtures by Dehalogenimonas spp. Biodegradation 25,
301–312. https://doi.org/10.1007/s10532-013-9661-2
Dillon, P., 2005. Future management of aquifer recharge. Hydrogeol. J. 13, 313–316.
https://doi.org/10.1007/s10040-004-0413-6
Drewes, J.E., Li, D., Regnery, J., Alidina, M., Wing, A., Hoppe-Jones, C., 2014.
Tuning the performance of a natural treatment process using metagenomics for
improved trace organic chemical attenuation. Water Sci. Technol. 69, 628–633.
https://doi.org/10.2166/wst.2013.750
Drewes, J.E., Reinhard, M., Fox, P., 2003. Comparing microfiltration-reverse
osmosis and soil-aquifer treatment for indirect potable reuse of water. Water
Res. 37, 3612–3621. https://doi.org/10.1016/S0043-1354(03)00230-6
Dutta, T., Carles-Brangarí, A., Fernàndez-Garcia, D., Rubol, S., Tirado-Conde, J.,
Sanchez-Vila, X., 2015. Vadose zone oxygen (O2) dynamics during drying and
wetting cycles: An artificial recharge laboratory experiment. J. Hydrol. 527,
151–159. https://doi.org/10.1016/j.jhydrol.2015.04.048

____________________________________________________________ BIBLIOGRAPHY
138
Dwivedi, S., Tripathi, R.D., Rai, U.N., Srivastava, S., Mishra, S., Shukla, M.K.,
Gupta, A.K., Sinha, S., Baghel, V.S., Gupta, D.K., 2006. Dominance of algae in
ganga water polluted through fly-ash leaching: Metal bioaccumulation potential
of selected algal species. Bull. Environ. Contam. Toxicol. 77, 427–436.
https://doi.org/10.1007/s00128-006-1083-y
Edgar, R.C., Haas, B.J., Clemente, J.C., Quince, C., Knight, R., 2011. UCHIME
improves sensitivity and speed of chimera detection. Bioinformatics 27, 2194–
2200.
El Alfy, M., Lashin, A., Abdalla, F., Al-Bassam, A., 2017. Assessing the
hydrogeochemical processes affecting groundwater pollution in arid areas using
an integration of geochemical equilibrium and multivariate statistical
techniques. Environ. Pollut. 229, 760–770.
https://doi.org/10.1016/j.envpol.2017.05.052
Eusuff, M.M., Lansey, K.E., 2004. Optimal operation of artificial groundwater
recharge systems considering water quality transformations. Water Resour.
Manag. 18, 379–405. https://doi.org/10.1023/B:WARM.0000048486.46046.ee
Fahrenfeld, N., Cozzarelli, I.M., Bailey, Z., Pruden, A., 2014. Insights into
Biodegradation Through Depth-Resolved Microbial Community Functional and
Structural Profiling of a Crude-Oil Contaminant Plume. Microb. Ecol. 68, 453–
462. https://doi.org/10.1007/s00248-014-0421-6
Faulwetter, J.L., Gagnon, V., Sundberg, C., Chazarenc, F., Burr, M.D., Brisson, J.,
Camper, A.K., Stein, O.R., 2009. Microbial processes influencing performance
of treatment wetlands: A review. Ecol. Eng. 35, 987–1004.
https://doi.org/10.1016/j.ecoleng.2008.12.030
Frau, D., Pinto, P.D.T., Mayora, G., 2018. Are cyanobacteria total, specific and trait
abundance regulated by the same environmental variables? Ann. Limnol. 54, 3.
https://doi.org/10.1051/limn/2017030
Freixa, A., Rubol, S., Carles-Brangarí, A., Fernàndez-Garcia, D., Butturini, A.,
Sanchez-Vila, X., Romaní, A.M., 2015. The effects of sediment depth and oxygen
concentration on the use of organic matter: An experimental study using an
infiltration sediment tank. Sci. Total Environ. 540, 20–31.
https://doi.org/10.1016/j.scitotenv.2015.04.007

____________________________________________________________ BIBLIOGRAPHY
139
Ghattas, A.-K., Fischer, F., Wick, A., Ternes, T.A., 2017. Anaerobic biodegradation
of (emerging) organic contaminants in the aquatic environment. Water Res.
116, 268–295. https://doi.org/https://doi.org/10.1016/j.watres.2017.02.001
Ginige, M.P., Kaksonen, A.H., Morris, C., Shackelton, M., Patterson, B.M., 2013.
Bacterial community and groundwater quality changes in an anaerobic aquifer
during groundwater recharge with aerobic recycled water. FEMS Microbiol.
Ecol. 85, 553–567. https://doi.org/10.1111/1574-6941.12137
Gisi, D., Willi, L., Traber, H., Leisinger, T., Vuilleumier, S., 1998. Effects of bacterial
host and dichloromethane dehalogenase on the competitiveness of
methylotrophic bacteria growing with dichloromethane. Appl. Environ.
Microbiol. 64, 1194–1202.
Goren, O., Burg, A., Gavrieli, I., Negev, I., Guttman, J., Kraitzer, T., Kloppmann,
W., Lazar, B., 2014. Biogeochemical processes in infiltration basins and their
impact on the recharging effluent, the soil aquifer treatment (SAT) system of
the Shafdan plant, Israel. Appl. Geochemistry 48, 58–69.
https://doi.org/http://dx.doi.org/10.1016/j.apgeochem.2014.06.017
Grau-Martínez, A., Folch, A., Torrentó, C., Valhondo, C., Barba, C., Domènech, C.,
Soler, A., Otero, N., 2018. Monitoring induced denitrification during managed
aquifer recharge in an infiltration pond. J. Hydrol. 561, 123–135.
https://doi.org/10.1016/j.jhydrol.2018.03.044
Grau Martínez, A., 2018. Induced attenuation of nitrate pollution: multi-isotopic
study at laboratory and field scale. Universitat de Barcelona.
Greskowiak, J., Hamann, E., Burke, V., Massmann, G., 2017. The uncertainty of
biodegradation rate constants of emerging organic compounds in soil and
groundwater – A compilation of literature values for 82 substances. Water Res.
126, 122–133. https://doi.org/10.1016/j.watres.2017.09.017
Greskowiak, J., Prommer, H., Massmann, G., Johnston, C.D., Nützmann, G.,
Pekdeger, A., 2005a. The impact of variably saturated conditions on
hydrogeochemical changes during artificial recharge of groundwater. Appl.
Geochemistry 20, 1409–1426.
https://doi.org/http://dx.doi.org/10.1016/j.apgeochem.2005.03.002
Greskowiak, J., Prommer, H., Massmann, G., Nützmann, G., 2006. Modeling

____________________________________________________________ BIBLIOGRAPHY
140
Seasonal Redox Dynamics and the Corresponding Fate of the Pharmaceutical
Residue Phenazone During Artificial Recharge of Groundwater. Environ. Sci.
Technol. 40, 6615–6621. https://doi.org/10.1021/es052506t
Greskowiak, J., Prommer, H., Vanderzalm, J., Pavelic, P., Dillon, P., 2005b.
Modeling of carbon cycling and biogeochemical changes during injection and
recovery of reclaimed water at Bolivar, South Australia. Water Resour. Res. 41.
https://doi.org/10.1029/2005WR004095
Griebler, C., Lueders, T., 2009. Microbial biodiversity in groundwater ecosystems.
Freshw. Biol. 54, 649–677. https://doi.org/10.1111/j.1365-2427.2008.02013.x
Grimes, D.J., Woese, C.R., MacDonell, M.T., Colwell, R.R., 1997. Systematic study
of the genus Vogesella gen. nov. and its type species, Vogesella indigofera comb.
nov. Int. J. Syst. Bacteriol. 47, 19–27. https://doi.org/10.1099/00207713-47-1-19
Grimm, N.B., 1994. Disturbance, succession, and ecosystem processes in streams: a
case study from the desert, in: P.S. Giller, A.G. Hildrew, and D.G.R. (Ed.), Joint
Symposium of the British Ecological Society and the American Society of
Lirrmologyand Oceanography. Blackwell Scientific, Oxford, pp. 93–112.
Haack, S.K., Fogarty, L.R., West, T.G., Alm, E.W., McGuire, J.T., Long, D.T.,
Hyndman, D.W., Forney, L.J., 2004. Spatial and temporal changes in microbial
community structure associated with recharge-influenced chemical gradients in
a contaminated aquifer. Env. Microbiol 6, 438–448.
https://doi.org/10.1111/j.1462-2920.2003.00563.x
Hamann, E., Stuyfzand, P.J., Greskowiak, J., Timmer, H., Massmann, G., 2016. The
fate of organic micropollutants during long-term/long-distance river bank
filtration. Sci. Total Environ. 545–546, 629–640.
https://doi.org/10.1016/j.scitotenv.2015.12.057
Hamersley, M.R., Howes, B.L., 2002. Control of denitrification in a septage-treating
artificial wetland: The dual role of particulate organic carbon. Water Res. 36,
4415–4427. https://doi.org/10.1016/S0043-1354(02)00134-3
Hand, V.L., Lloyd, J.R., Vaughan, D.J., Wilkins, M.J., Boult, S., 2008. Experimental
studies of the influence of grain size, oxygen availability and organic carbon
availability on bioclogging in porous media. Env. Sci Technol 42, 1485–1491.
Heilweil, V.M., Solomon, D.K., Perkins, K.S., Ellett, K.M., 2004. Gas-partitioning

____________________________________________________________ BIBLIOGRAPHY
141
tracer test to quantify trapped gas during recharge. Ground Water 42, 589–600.
Hellauer, K., Karakurt, S., Sperlich, A., Burke, V., Massmann, G., Hübner, U.,
Drewes, J.E., 2017. Establishing sequential managed aquifer recharge
technology (SMART) for enhanced removal of trace organic chemicals:
Experiences from field studies in Berlin, Germany. J. Hydrol.
https://doi.org/10.1016/j.jhydrol.2017.09.044
Henzler, A.F., Greskowiak, J., Massmann, G., 2016. Seasonality of temperatures and
redox zonations during bank filtration - A modeling approach. J. Hydrol. 535,
282–292. https://doi.org/10.1016/j.jhydrol.2016.01.044
Huang, G., Liu, F., Yang, Y., Deng, W., Li, S., Huang, Y., Kong, X., 2015. Removal of
ammonium-nitrogen from groundwater using a fully passive permeable reactive
barrier with oxygen-releasing compound and clinoptilolite. J. Environ. Manage.
154, 1–7. https://doi.org/http://dx.doi.org/10.1016/j.jenvman.2015.02.012
Hudson, N., Baker, A., Reynolds, D., 2007. Fluorescence analysis of dissolved organic
matter in natural, waste and polluted waters—a review. River Res. Appl. 23,
631–649. https://doi.org/10.1002/rra.1005
Huguet, A., Vacher, L., Relexans, S., Saubusse, S., Froidefond, J.M., Parlanti, E.,
2009. Properties of fluorescent dissolved organic matter in the Gironde Estuary.
Org. Geochem. 40, 706–719. https://doi.org/10.1016/j.orggeochem.2009.03.002
Jäckel, U., Schnell, S., Conrad, R., 2001. Effect of moisture, texture and aggregate
size of paddy soil on production and consumption of CH4. Soil Biol. Biochem.
33, 965–971. https://doi.org/10.1016/S0038-0717(00)00248-0
Jacques, D., Simunek, J., 2005. User Manual of the Multicomponent Variably-
Saturated Flow and Transport Model HP1, Univ. Calif.
Jurado, A., Vàzquez-Suñé, E., Carrera, J., López de Alda, M., Pujades, E., 2012.
Emerging organic contaminants in groundwater in Spain: A review of sources,
recent occurrence and fate in a European context. Sci. Total Environ. 440, 82–
94. https://doi.org/10.1016/j.scitotenv.2012.08.029
Kalyuhznaya, M.G., Martens-Habbena, W., Wang, T., Hackett, M., Stolyar, S.M.,
Stahl, D.A., Lidstrom, M.E., Chistoserdova, L., 2009. Methylophilaceae link
methanol oxidation to denitrification in freshwater lake sediment as suggested
by stable isotope probing and pure culture analysis. Environ. Microbiol. Rep. 1,

____________________________________________________________ BIBLIOGRAPHY
142
385–392. https://doi.org/10.1111/j.1758-2229.2009.00046.x
Kalyuzhnaya, M.G., Bowerman, S., Lara, J.C., Lidstrom, M.E., Chistoserdova, L.,
2006. Methylotenera mobilis gen. nov., sp. nov., an obligately methelamine-
utilizing bacterium within the family Methylophilaceae. Int. J. Syst. Evol.
Microbiol. 56, 2819–2823. https://doi.org/10.1099/ijs.0.64191-0
Kedziorek, M.A.M., Geoffriau, S., Bourg, A.C.M., 2008. Organic matter and modeling
redox reactions during river bank filtration in an alluvial aquifer of the Lot
River, France. Environ. Sci. Technol. 42, 2793–2798.
https://doi.org/10.1021/es702411t
Kielak, A.M., Barreto, C.C., Kowalchuk, G.A., van Veen, J.A., Kuramae, E.E., 2016.
The ecology of Acidobacteria: Moving beyond genes and genomes. Front.
Microbiol. https://doi.org/10.3389/fmicb.2016.00744
Kirschbaum, M.U.F., 2000. Will changes in soil organic carbon act as a positive or
negative feedback on global warming? Biogeochemistry 48, 21–51.
https://doi.org/10.1023/A:1006238902976
Kirschbaum, M.U.F., 1995. The temperature dependence of soil organic matter
decomposition, and the effect of global warming on soil organic C storage. Soil
Biol. Biochem. 27, 753–760. https://doi.org/10.1016/0038-0717(94)00242-S
Knowles, R., 2005. Denitrifiers associated with methanotrophs and their potential
impact on the nitrogen cycle. Ecol. Eng. 24, 441–446.
https://doi.org/10.1016/J.ECOLENG.2005.01.001
Kolehmainen, R.E., Tiirola, M., Puhakka, J.A., 2008. Spatial and temporal changes
in Actinobacterial dominance in experimental artificial groundwater recharge.
Water Res. 42, 4525–4537. https://doi.org/10.1016/j.watres.2008.07.039
Kumaresan, D., Stephenson, J., Doxey, A.C., Bandukwala, H., Brooks, E.,
Hillebrand-Voiculescu, A., Whiteley, A.S., Murrell, J.C., 2018. Aerobic
proteobacterial methylotrophs in Movile Cave: genomic and metagenomic
analyses. Microbiome 6, 1. https://doi.org/10.1186/s40168-017-0383-2
Kung, K.-J.S., 1990. Preferential flow in a sandy vadose zone: 1. Field observation.
Geoderma 46, 51–58. https://doi.org/10.1016/0016-7061(90)90006-U
Lapworth, D.J., Baran, N., Stuart, M.E., Ward, R.S., 2012. Emerging organic

____________________________________________________________ BIBLIOGRAPHY
143
contaminants in groundwater: A review of sources, fate and occurrence.
Environ. Pollut. https://doi.org/10.1016/j.envpol.2011.12.034
Laws, B. V, Dickenson, E.R. V, Johnson, T.A., Snyder, S.A., Drewes, J.E., 2011.
Attenuation of contaminants of emerging concern during surface-spreading
aquifer recharge. Sci. Total Environ. 409, 1087–1094.
https://doi.org/https://doi.org/10.1016/j.scitotenv.2010.11.021
Legendre, P., Gallagher, E.D., 2001. Ecologically meaningful transformations for
ordination of species data. Oecologia 129, 271–280.
https://doi.org/10.1007/s004420100716
Li, D., Alidina, M., Ouf, M., Sharp, J.O., Saikaly, P., Drewes, J.E., 2013. Microbial
community evolution during simulated managed aquifer recharge in response
to different biodegradable dissolved organic carbon (BDOC) concentrations.
Water Res 47, 2421–2430. https://doi.org/10.1016/j.watres.2013.02.012
Li, D., Sharp, J.O., Saikaly, P.E., Ali, S., Alidina, M., Alarawi, M.S., Keller, S.,
Hoppe-Jones, C., Drewes, J.E., 2012. Dissolved organic carbon influences
microbial community composition and diversity in managed aquifer recharge
systems. Appl Env. Microbiol 78, 6819–6828.
https://doi.org/10.1128/aem.01223-12
Li, J., Wen, Y., Zhou, Q., Xingjie, Z., Li, X., Yang, S., Lin, T., 2008. Influence of
vegetation and substrate on the removal and transformation of dissolved
organic matter in horizontal subsurface-flow constructed wetlands. Bioresour.
Technol. 99, 4990–6. https://doi.org/10.1016/j.biortech.2007.09.012
Lin, C., Greenwald, D., Banin, A., 2003. Temperature dependence of infiltration rate
during large scale water recharge into soils. Soil Sci. Soc. Am. J. 487–493.
Logue, J.B., Stedmon, C. a, Kellerman, A.M., Nielsen, N.J., Andersson, A.F., Laudon,
H., Lindström, E.S., Kritzberg, E.S., 2015. Experimental insights into the
importance of aquatic bacterial community composition to the degradation of
dissolved organic matter. ISME J. 1–13.
Loos, R., Carvalho, R., António, D.C., Comero, S., Locoro, G., Tavazzi, S., Paracchini,
B., Ghiani, M., Lettieri, T., Blaha, L., Jarosova, B., Voorspoels, S., Servaes, K.,
Haglund, P., Fick, J., Lindberg, R.H., Schwesig, D., Gawlik, B.M., 2013. EU-
wide monitoring survey on emerging polar organic contaminants in wastewater

____________________________________________________________ BIBLIOGRAPHY
144
treatment plant effluents. Water Res. 47, 6475–6487.
https://doi.org/10.1016/j.watres.2013.08.024
López-Serna, R., Postigo, C., Blanco, J., Pérez, S., Ginebreda, A., López De Alda, M.,
Petrović, M., Munné, A., Barceló, D., Ginebreda, A., De Alda, M.L., Petrović, :
M, Barceló, D., Petrović, M., Munné, A., 2012. Assessing the effects of tertiary
treated wastewater reuse on the presence emerging contaminants in a
Mediterranean river (Llobregat, NE Spain). Env. Sci Pollut Res 19, 1000–1012.
https://doi.org/10.1007/s11356-011-0596-z
Madhaiyan, M., Poonguzhali, S., Sa, T., 2007. Influence of plant species and
environmental conditions on epiphytic and endophytic pink-pigmented
facultative methylotrophic bacterial populations associated with field-grown
rice cultivars. J. Microbiol. Biotechnol. 17, 1645–1654.
Maeng, S.K., Ameda, E., Sharma, S.K., Grützmacher, G., Amy, G.L., 2010. Organic
micropollutant removal from wastewater effluent-impacted drinking water
sources during bank filtration and artificial recharge. Water Res. 44, 4003–
4014. https://doi.org/http://dx.doi.org/10.1016/j.watres.2010.03.035
Maeng, S.K., Sharma, S.K., Lekkerkerker-Teunissen, K., Amy, G.L., 2011.
Occurrence and fate of bulk organic matter and pharmaceutically active
compounds in managed aquifer recharge: A review. Water Res. 45, 3015–3033.
https://doi.org/http://dx.doi.org/10.1016/j.watres.2011.02.017
Martín-González, L., Hatijah Mortan, S., Rosell, M., Parladé, E., Martínez-Alonso,
M., Gaju, N., Caminal, G., Adrian, L., Marco-Urrea, E., 2015. Stable Carbon
Isotope Fractionation During 1,2-Dichloropropane-to-Propene Transformation
by an Enrichment Culture Containing Dehalogenimonas Strains and a dcpA
Gene. Environ. Sci. Technol. 49, 8666–8674.
https://doi.org/10.1021/acs.est.5b00929
Martín, S., López, N., 2001. Actualización hidrogeológica de la Cubeta de Sant
Andreu (Martorell-Pallejà) (No. 35). Barcelona.
Martínez-Pascual, E., Jiménez, N., Vidal-Gavilan, G., Vinas, M., Solanas, A.M.,
2010. Chemical and microbial community analysis during aerobic
biostimulation assays of non-sulfonated alkyl-benzene-contaminated
groundwater. Appl. Microbiol. Biotechnol. 88, 985–995.

____________________________________________________________ BIBLIOGRAPHY
145
https://doi.org/10.1007/s00253-010-2816-8
Massmann, G., Dünnbier, U., Heberer, T., Taute, T., 2008. Behaviour and redox
sensitivity of antimicrobial residues during bank filtration– Investigation of
residues of phenazone-type analgesics. Chemosphere 71, 1476–1485.
https://doi.org/10.1016/j.chemosphere.2008.06.056
Massmann, G., Greskowiak, J., Dünnbier, U., Zuehlke, S., Knappe, A., Pekdeger, A.,
2006. The impact of variable temperatures on the redox conditions and the
behaviour of pharmaceutical residues during artificial recharge. J. Hydrol. 328,
141–156. https://doi.org/http://dx.doi.org/10.1016/j.jhydrol.2005.12.009
Mayer, K.U., Benner, S.G., Frind, E.O., Thornton, S.F., Lerner, D.N., 2001. Reactive
transport modeling of processes controlling the distribution and natural
attenuation of phenolic compounds in a deep sandstone aquifer. J. Contam.
Hydrol. 53, 341–68.
McKnight, D.M., Boyer, E.W., Westerhoff, P.K., Doran, P.T., Kulbe, T., Andersen,
D.T., 2001. Spectrofluorometric characterization of dissolved organic matter for
indication of precursor organic material and aromaticity. Limnol. Oceanogr. 46,
38–48. https://doi.org/10.4319/lo.2001.46.1.0038
Meckenstock, R.U., Elsner, M., Griebler, C., Lueders, T., Stumpp, C., Aamand, J.,
Agathos, S.N., Albrechtsen, H.J., Bastiaens, L., Bjerg, P.L., Boon, N., Dejonghe,
W., Huang, W.E., Schmidt, S.I., Smolders, E., Sørensen, S.R., Springael, D., Van
Breukelen, B.M., 2015. Biodegradation: Updating the Concepts of Control for
Microbial Cleanup in Contaminated Aquifers. Environ. Sci. Technol. 49, 7073–
7081. https://doi.org/10.1021/acs.est.5b00715
Menció, A., Folch, A., Mas-Pla, J., 2012. Identifying key parameters to differentiate
groundwater flow systems using multifactorial analysis. J. Hydrol. 472–473,
301–313. https://doi.org/10.1016/j.jhydrol.2012.09.030
Mermillod-Blondin, F., Simon, L., Maazouzi, C., Foulquier, A., Delolme, C.,
Marmonier, P., 2015. Dynamics of dissolved organic carbon (DOC) through
stormwater basins designed for groundwater recharge in urban area:
Assessment of retention efficiency. Water Res. 81, 27–37.
https://doi.org/10.1016/j.watres.2015.05.031
Modin, O., Fukushi, K., Yamamoto, K., 2007. Denitrification with methane as

____________________________________________________________ BIBLIOGRAPHY
146
external carbon source. Water Res. 41, 2726–2738.
https://doi.org/10.1016/j.watres.2007.02.053
Moe, W.M., Yan, J., Nobre, M.F., da Costa, M.S., Rainey, F.A., 2009.
Dehalogenimonas lykanthroporepellens gen. nov., sp. nov., a reductively
dehalogenating bacterium isolated from chlorinated solvent-contaminated
groundwater. Int. J. Syst. Evol. Microbiol. 59, 2692–2697.
Mualem, Y., 1976. A new model for predicting the hydraulic conductivity of
unsaturated porous media. Water Resour. Res. 12, 513–522.
https://doi.org/10.1029/WR012i003p00513
Muyzer, G., De Waal, E.C., Uitterlinden, A.G., 1993. Profiling of complex microbial
populations by denaturing gradient gel electrophoresis analysis of polymerase
chain reaction-amplified genes coding for 16S rRNA. Appl. Environ. Microbiol.
59, 695–700. https://doi.org/0099-2240/93/030695-06$02.00/0
Nadav, I., Arye, G., Tarchitzky, J., Chen, Y., 2012. Enhanced infiltration regime for
treated-wastewater purification in soil aquifer treatment (SAT). J. Hydrol. 420,
275–283. https://doi.org/10.1016/j.jhydrol.2011.12.013
Nijenhuis, I., Kuntze, K., 2016. Anaerobic microbial dehalogenation of
organohalides—state of the art and remediation strategies. Curr. Opin.
Biotechnol. 38, 33–38. https://doi.org/10.1016/j.copbio.2015.11.009
Nurk, K., Truu, J., Truu, M., Mander, Ü., 2005. Microbial Characteristics and
Nitrogen Transformation in Planted Soil Filter for Domestic Wastewater
Treatment. J. Environ. Sci. Heal. Part A 40, 1201–1214.
https://doi.org/10.1081/ESE-200055659
O’Connell, A.M., 1990. Microbial decomposition (respiration) of litter in eucalypt
forests of South-Western Australia: An empirical model based on laboratory
incubations. Soil Biol. Biochem. 22, 153–160.
https://doi.org/https://doi.org/10.1016/0038-0717(90)90080-J
Oksanen, J., Blanchet, F., Kindt, R., Legendre, P., Minchin, P., O’Hara, R., Simpson,
G., Solymos, P., Stevens, M., Wagner, H., 2017. Vegan: Community Ecology
Package. R package version 2.4–3. The R Project for Statistical Computing,
Vienna, Austria.
Onesios-Barry, K.M., Berry, D., Proescher, J.B., Ashok Sivakumar, I.K., Bouwer,

____________________________________________________________ BIBLIOGRAPHY
147
E.J., 2014. Removal of pharmaceuticals and personal care products during
water recycling: Microbial community structure and effects of substrate
concentration. Appl. Environ. Microbiol. 80, 2440–2450.
https://doi.org/10.1128/AEM.03693-13
Or, D., Phutane, S., Dechesne, A., 2007. Extracellular Polymeric Substances
Affecting Pore-Scale Hydrologic Conditions for Bacterial Activity in
Unsaturated Soils All rights reserved. No part of this periodical may be
reproduced or transmitted in any form or by any means, electronic or
mechanica. Vadose Zo. J. 298–305.
Or, D., Smets, B.F., Wraith, J.M., Dechesne, A., Friedman, S.P., 2007. Physical
constraints affecting bacterial habitats and activity in unsaturated porous
media – a review. Adv. Water Resour. 30, 1505–1527.
https://doi.org/http://dx.doi.org/10.1016/j.advwatres.2006.05.025
Paliy, O., Shankar, V., 2016. Application of multivariate statistical techniques in
microbial ecology. Mol. Ecol. https://doi.org/10.1111/mec.13536
Parkhurst, D.L., Appelo, C.A.J., 2013. Description of Input and Examples for
PHREEQC Version 3—A Computer Program for Speciation, Batch-Reaction,
One-Dimensional Transport, and Inverse Geochemical Calculations. Chapter
43 of Section A. Groundwater Book 6, Modeling Techniques.
Pedretti, D., 2012. Tools and analysis of spatio-temporal dynamics in heterogeneous
aquifers : Applications to artificial recharge and forced-gradient solute
transport by. Universitat Politècnica de Catalunya.
Pedretti, D., Barahona-Palomo, M., Bolster, D., Fernàndez-Garcia, D., Sanchez-Vila,
X., Tartakovsky, D.M., 2012a. Probabilistic analysis of maintenance and
operation of artificial recharge ponds. Adv. Water Resour. 36, 23–35.
https://doi.org/http://dx.doi.org/10.1016/j.advwatres.2011.07.008
Pedretti, D., Barahona-Palomo, M., Bolster, D., Sanchez-Vila, X., Fernàndez-Garcia,
D., 2012b. A quick and inexpensive method to quantify spatially variable
infiltration capacity for artificial recharge ponds using photographic images. J.
Hydrol. 430–431, 118–126.
https://doi.org/http://dx.doi.org/10.1016/j.jhydrol.2012.02.008
Perujo, N., Romaní, A.M., Sanchez-Vila, X., 2018. Bilayer Infiltration System

____________________________________________________________ BIBLIOGRAPHY
148
Combines Benefits from Both Coarse and Fine Sands Promoting Nutrient
Accumulation in Sediments and Increasing Removal Rates. Environ. Sci.
Technol. 52, 5734–5743. https://doi.org/10.1021/acs.est.8b00771
Perujo, N., Sanchez-Vila, X., Proia, L., Romaní, A.M., 2017. Interaction between
Physical Heterogeneity and Microbial Processes in Subsurface Sediments: A
Laboratory-Scale Column Experiment. Environ. Sci. Technol. 51, 6110–6119.
https://doi.org/10.1021/acs.est.6b06506
Pett-Ridge, J., Firestone, M.K., 2005. Redox fluctuation structures microbial
communities in a wet tropical soil. Appl. Environ. Microbiol. 71, 6998–7007.
https://doi.org/10.1128/AEM.71.11.6998-7007.2005
Pohlon, E., Fandino, A.O., Marxsen, J., 2013. Bacterial community composition and
extracellular enzyme activity in temperate streambed sediment during drying
and rewetting. PLoS One 8, e83365.
https://doi.org/10.1371/journal.pone.0083365
Polkade, A. V, Mantri, S.S., Patwekar, U.J., Jangid, K., 2016. Quorum sensing: An
under-explored phenomenon in the phylum Actinobacteria. Front. Microbiol.
https://doi.org/10.3389/fmicb.2016.00131
Prommer, H., Barry, D.., Davis, G.., 2002. Modelling of physical and reactive
processes during biodegradation of a hydrocarbon plume under transient
groundwater flow conditions. J. Contam. Hydrol. 59, 113–131.
https://doi.org/10.1016/S0169-7722(02)00078-5
Prommer, H., Stuyfzand, P.J., 2005. Identification of Temperature-Dependent Water
Quality Changes during a Deep Well Injection Experiment in a Pyritic Aquifer.
Environ. Sci. Technol. 39, 2200–2209. https://doi.org/10.1021/es0486768
Prommer, H., Tuxen, N., Bjerg, P.L., 2006. Fringe-controlled natural attenuation of
phenoxy acids in a landfill plume: Integration of field-scale processes by reactive
transport modeling. Environ. Sci. Technol. 40, 4732–4738.
https://doi.org/10.1021/es0603002
Ragusa, S.R., McNevin, D., Qasem, S., Mitchell, C., 2004. Indicators of biofilm
development and activity in constructed wetlands microcosms. Water Res. 38,
2865–2873. https://doi.org/10.1016/j.watres.2004.03.039
Rauch-Williams, T., Hoppe-Jones, C., Drewes, J.E., 2010. The role of organic matter

____________________________________________________________ BIBLIOGRAPHY
149
in the removal of emerging trace organic chemicals during managed aquifer
recharge. Water Res. 44, 449–460.
https://doi.org/10.1016/J.WATRES.2009.08.027
Reed, D.A., Toze, S., Chang, B., 2008. Spatial and temporal changes in sulphate-
reducing groundwater bacterial community structure in response to Managed
Aquifer Recharge. Water Sci. Technol. 57, 789.
https://doi.org/10.2166/wst.2008.172
Regnery, J., Lee, J., Drumheller, Z.W., Drewes, J.E., Illangasekare, T.H., Kitanidis,
P.K., McCray, J.E., Smits, K.M., 2017. Trace organic chemical attenuation
during managed aquifer recharge: Insights from a variably saturated 2D tank
experiment. J. Hydrol. 548, 641–651.
https://doi.org/10.1016/j.jhydrol.2017.03.038
Regnery, J., Li, D., Roberts, S., Higgins, C., Sharp, J.O., Drewes, J.E., 2016. Linking
Trace Organic Chemical Attenuation to Microbiome metabolic Capabilities:
Insights from Laboratory- and Full-scale Managed Aquifer Recharge Systems,
in: ACS Symposium Series. pp. 163–187. https://doi.org/10.1021/bk-2016-
1241.ch011
Regnery, J., Wing, A.D., Alidina, M., Drewes, J.E., 2015. Biotransformation of trace
organic chemicals during groundwater recharge: How useful are first-order rate
constants? J. Contam. Hydrol. 179, 65–75.
https://doi.org/10.1016/j.jconhyd.2015.05.008
Rezanezhad, F., Couture, R.M., Kovac, R., O’Connell, D., Van Cappellen, P., 2014.
Water table fluctuations and soil biogeochemistry: An experimental approach
using an automated soil column system. J. Hydrol. 509, 245–256.
https://doi.org/10.1016/j.jhydrol.2013.11.036
Rivett, M.O., Buss, S.R., Morgan, P., Smith, J.W.N., Bemment, C.D., 2008. Nitrate
attenuation in groundwater: A review of biogeochemical controlling processes.
Water Res. 42, 4215–4232. https://doi.org/10.1016/j.watres.2008.07.020
Rodríguez-Escales, P., Canelles, A., Sanchez-Vila, X., Folch, A., Kurtzman, D.,
Rossetto, R., Fernández-Escalante, E., Lobo-Ferreira, J.-P., Sapiano, M., San-
Sebastián, J., Schüth, C., 2018. A risk assessment methodology to evaluate the
risk failure of managed aquifer recharge in the Mediterranean Basin. Hydrol.

____________________________________________________________ BIBLIOGRAPHY
150
Earth Syst. Sci. 22, 3213–3227. https://doi.org/10.5194/hess-22-3213-2018
Rodríguez-Escales, P., Fernàndez-Garcia, D., Drechsel, J., Folch, A., Sanchez-Vila,
X., 2017. Improving degradation of emerging organic compounds by applying
chaotic advection in Managed Aquifer Recharge in randomly heterogeneous
porous media. Water Resour. Res. 53, 4376–4392.
https://doi.org/10.1002/2016WR020333
Rodriguez-Escales, P., Folch, A., van Breukelen, B.M., Vidal-Gavilan, G., Sanchez-
Vila, X., 2016. Modeling long term Enhanced in situ Biodenitrification and
induced heterogeneity in column experiments under different feeding
strategies. J. Hydrol. 538, 127–137.
https://doi.org/10.1016/j.jhydrol.2016.04.012
Rodriguez-Escales, P., Sanchez-Vila, X., 2016. Fate of sulfamethoxazole in
groundwater: Conceptualizing and modeling metabolite formation under
different redox conditions. Water Res. 105, 540–550.
https://doi.org/10.1016/j.watres.2016.09.034
Rodríguez Vicente, D., 2013. Análisis de la técnica de recarga artificial en la Cubeta
de Sant Andreu de la Barca (Barcelona). Escuela Técnica Superior de Ingenieros
de Minas.
Röling, W.F., van Breukelen, B.M., Braster, M., Lin, B., van Verseveld, H.W., 2001.
Relationships between microbial community structure and hydrochemistry in a
landfill leachate-polluted aquifer. Appl. Environ. Microbiol. 67, 4619–29.
Rolle, M., Clement, T.P., Sethi, R., Di Molfetta, A., 2008. A kinetic approach for
simulating redox-controlled fringe and core biodegradation processes in
groundwater: model development and application to a landfill site in Piedmont,
Italy. Hydrol. Process. 22, 4905–4921. https://doi.org/10.1002/hyp.7113
Romera-Castillo, C., Sarmento, H., Álvarez-Salgado, X.A., Gasol, J.M., Marrasé, C.,
2010. Erratum: Production of chromophoric dissolved organic matter by marine
phytoplankton. Limnol. Oceanogr. 55, 1466–1466.
https://doi.org/10.4319/lo.2010.55.3.1466
Ronan, A.D., Prudic, D.E., Thodal, C.E., Constantz, J., 1998. Field study and
simulation of diurnal temperature effects on infiltration and variably saturated
flow beneath an ephemeral stream. Water Resour. Res. 34, 2137–2153.

____________________________________________________________ BIBLIOGRAPHY
151
https://doi.org/10.1029/98WR01572
Rothschild, L.J., Mancinelli, R.L., 2001. Life in extreme environments (nature).PDF.
Nature 409, 1092–1101. https://doi.org/10.1038/35059215
Rubol, S., Freixa, A., Carles-Brangarí, A., Fernàndez-Garcia, D., Romaní, A.M.,
Sanchez-Vila, X., 2014. Connecting bacterial colonization to physical and
biochemical changes in a sand box infiltration experiment. J. Hydrol. 517, 317–
327. https://doi.org/http://dx.doi.org/10.1016/j.jhydrol.2014.05.041
San-Sebastián-Sauto, J., Fernández-Escalante, E., Calero-Gil, R., Carvalho, T.,
Rodríguez-Escales, P., 2018. Characterization and benchmarking of seven
managed aquifer recharge systems in south-western Europe. Sustain. Water
Resour. Manag. 1–23. https://doi.org/10.1007/s40899-018-0232-x
Sanchez-Vila, X., Armenter, J.-L., Ortuño, F., Queralt, E., Fernàndez-Garcia, D.,
2012. Managed Artificial Recharge in the Llobregat Aquifers: Quantitative
Versus Qualitative Aspects, in: Sabater, S., Ginebreda, A., Barceló, D. (Eds.),
The Llobregat. Springer Berlin Heidelberg, pp. 51–68.
https://doi.org/10.1007/698_2012_154
Schaffer, M., Kröger, K.F., Nödler, K., Ayora, C., Carrera, J., Hernández, M., Licha,
T., 2015. Influence of a compost layer on the attenuation of 28 selected organic
micropollutants under realistic soil aquifer treatment conditions: Insights from
a large scale column experiment. Water Res. 74, 110–121.
https://doi.org/10.1016/j.watres.2015.02.010
Schloss, P.D., Westcott, S.L., Ryabin, T., Hall, J.R., Hartmann, M., Hollister, E.B.,
Lesniewski, R.A., Oakley, B.B., Parks, D.H., Robinson, C.J., Sahl, J.W., Stres,
B., Thallinger, G.G., Van Horn, D.J., Weber, C.F., 2009. Introducing mothur:
open-source, platform-independent, community-supported software for
describing and comparing microbial communities. Appl. Environ. Microbiol. 75,
7537–41. https://doi.org/10.1128/AEM.01541-09
Schmidt, C.K., Lange, F.T., Brauch, H.-J., 2007. Characteristics and evaluation of
natural attenuation processes for organic micropollutant removal during
riverbank filtration. Water Sci. Technol. Water Supply 7.
Schütz, K., Nagel, P., Vetter, W., Kandeler, E., Ruess, L., 2009. Flooding forested
groundwater recharge areas modifies microbial communities from top soil to

____________________________________________________________ BIBLIOGRAPHY
152
groundwater table. FEMS Microbiol. Ecol. 67, 171–182.
https://doi.org/10.1111/j.1574-6941.2008.00608.x
Sendrós Brea-Iglesias, A., 2016. Using geophisical techniques in planning and
management of groundwater resources. Application in Mediterranean aquifers.
Institut de Recerca de l’Aigua. Universitat de Barcelona.
Shiklomanov, I.A., 1997. Comprehensive assessment of the freshwater resources of
the World. World Meteorol. Organ. 88.
Sleytr, K., Tietz, A., Langergraber, G., Haberl, R., 2007. Investigation of bacterial
removal during the filtration process in constructed wetlands. Sci. Total
Environ. 380, 173–180. https://doi.org/10.1016/j.scitotenv.2007.03.001
Song, M., Jiang, L., Zhang, D., Luo, C., Wang, Y., Yu, Z., Yin, H., Zhang, G., 2016.
Bacteria capable of degrading anthracene, phenanthrene, and fluoranthene as
revealed by DNA based stable-isotope probing in a forest soil. J. Hazard. Mater.
308, 50–57. https://doi.org/10.1016/J.JHAZMAT.2016.01.009
Sprenger, C., Hartog, N., Hernández, M., Vilanova, E., Grützmacher, G., Scheibler,
F., Hannappel, S., 2017. Inventory of managed aquifer recharge sites in Europe:
historical development, current situation and perspectives. Hydrogeol. J. 25,
1909–1922. https://doi.org/10.1007/s10040-017-1554-8
Staats, M., Braster, M., Röling, W.F.M., 2011. Molecular diversity and distribution
of aromatic hydrocarbon-degrading anaerobes across a landfill leachate plume.
Environ. Microbiol. 13, 1216–1227. https://doi.org/10.1111/j.1462-
2920.2010.02421.x
Stanier, R., Cohen-Bazire, G., 1977. Phototrophic prokaryotes: The cyanobacteria.
Ann Rev Micriobiol. https://doi.org/10.1146/annurev.mi.31.100177.001301
Stein, H., Kellermann, C., Schmidt, S.I., Brielmann, H., Steube, C., Berkhoff, S.E.,
Fuchs, A., Hahn, H.J., Thulin, B., Griebler, C., 2010. The potential use of fauna
and bacteria as ecological indicators for the assessment of groundwater quality.
J. Environ. Monit. 12, 242–254. https://doi.org/10.1039/B913484K
Sun, Y., Shen, D., Zhou, X., Shi, N., Tian, Y., 2016. Microbial diversity and
community structure of denitrifying biological filters operated with different
carbon sources. Springerplus 5, 1752. https://doi.org/10.1186/s40064-016-3451-
3

____________________________________________________________ BIBLIOGRAPHY
153
Terzaghi, K., Peck, R.B., Mesri, G., 1996. Soil mechanics in engineering practice,
Third ed. ed. Wiley-Interscience.
Thullner, M., Zeyer, J., Kinzelbach, W., 2002. Influence of Microbial Growth on
Hydraulic Properties of Pore Networks. Transp. Porous Media 49, 99–122.
https://doi.org/10.1023/A:1016030112089
Tietz, A., Kirschner, A., Langergraber, G., Sleytr, K., Haberl, R., 2007.
Characterisation of microbial biocoenosis in vertical subsurface flow
constructed wetlands. Sci. Total Environ. 380, 163–172.
https://doi.org/10.1016/j.scitotenv.2006.11.034
Torsvik, V., Øvreås, L., Thingstad, T.F., 2002. Prokaryotic diversity - Magnitude,
dynamics, and controlling factors. Science (80-. ).
https://doi.org/10.1126/science.1071698
Truu, M., Juhanson, J., Truu, J., 2009. Microbial biomass, activity and community
composition in constructed wetlands. Sci. Total Environ. 407, 3958–3971.
https://doi.org/http://dx.doi.org/10.1016/j.scitotenv.2008.11.036
Turner, B.I., Clark, W., Kates, R., Richards, J., Mathews, J., Meyer, W., 1991. The
Earth as Transformed by Human Action: Global and Regional Changes in the
Biosphere over the Past 300 Years.
Valhondo, C., 2016. A reactive barrier to enhance the removal of emerging organic
compounds during artificial recharge of aquifers through infiltration basins.
Universitat Politècnica de Catalunya.
Valhondo, C., Carrera, J., Ayora, C., Barbieri, M., Nödler, K., Licha, T., Huerta, M.,
2014. Behavior of nine selected emerging trace organic contaminants in an
artificial recharge system supplemented with a reactive barrier. Environ. Sci.
Pollut. Res. 21, 11832–11843.
Valhondo, C., Carrera, J., Ayora, C., Tubau, I., Martinez-Landa, L., Nödler, K.,
Licha, T., 2015. Characterizing redox conditions and monitoring attenuation of
selected pharmaceuticals during artificial recharge through a reactive layer.
Sci. Total Environ. 512–513, 240–50.
https://doi.org/10.1016/j.scitotenv.2015.01.030
Valhondo, C., Martinez-Landa, L., Carrera, J., Ayora, C., Nödler, K., Licha, T., 2018.
Evaluation of EOC removal processes during artificial recharge through a
____________________________________________________________ BIBLIOGRAPHY
154
reactive barrier. Sci. Total Environ. 612, 985–994.
https://doi.org/10.1016/j.scitotenv.2017.08.054
Van Genuchten, M.T., 1980. A closed-form equation for predicting the hydraulic
conductivity of unsaturated soils. Soil Sci. Soc. Am. J. 44, 892–898.
Vandenbohede, A., Van Houtte, E., 2012. Heat transport and temperature
distribution during managed artificial recharge with surface ponds. J. Hydrol.
472–473, 77–89. https://doi.org/10.1016/j.jhydrol.2012.09.028
Vuilleumier, S., Chistoserdova, L., Lee, M.C., Bringel, F., Lajus, A., Yang, Z.,
Gourion, B., Barbe, V., Chang, J., Cruveiller, S., Dossat, C., Gillett, W., Gruffaz,
C., Haugen, E., Hourcade, E., Levy, R., Mangenot, S., Muller, E., Nadalig, T.,
Pagni, M., Penny, C., Peyraud, R., Robinson, D.G., Roche, D., Rouy, Z.,
Saenempechek, C., Salvignol, G., Vallenet, D., Zaining, W., Marx, C.J., Vorholt,
J.A., Olson, M. V, Kaul, R., Weissenbach, J., Médigue, C., Lidstrom, M.E., 2009.
Methylobacterium genome sequences: A reference blueprint to investigate
microbial metabolism of C1 compounds from natural and industrial sources.
PLoS One 4. https://doi.org/10.1371/journal.pone.0005584
Wang, Z., Dai, Y., Zhao, Q., Li, N., Zhou, Q., Xie, S., 2015. Nonylphenol
biodegradation, functional gene abundance and bacterial community in
bioaugmented sediment: effect of external carbon source. Environ. Sci. Pollut.
Res. 22, 12083–12091. https://doi.org/10.1007/s11356-015-4509-4
Ward, N.L., Challacombe, J.F., Janssen, P.H., Henrissat, B., Coutinho, P.M., Wu,
M., Xie, G., Haft, D.H., Sait, M., Badger, J., Barabote, R.D., Bradley, B., Brettin,
T.S., Brinkac, L.M., Bruce, D., Creasy, T., Daugherty, S.C., Davidsen, T.M.,
DeBoy, R.T., Detter, J.C., Dodson, R.J., Durkin, A.S., Ganapathy, A., Gwinn-
Giglio, M., Han, C.S., Khouri, H., Kiss, H., Kothari, S.P., Madupu, R., Nelson,
K.E., Nelson, W.C., Paulsen, I., Penn, K., Ren, Q., Rosovitz, M.J., Selengut, J.D.,
Shrivastava, S., Sullivan, S.A., Tapia, R., Thompson, S., Watkins, K.L., Yang,
Q., Yu, C., Zafar, N., Zhou, L., Kuske, C.R., 2009. Three genomes from the
phylum Acidobacteria provide insight into the lifestyles of these
microorganisms in soils. Appl. Environ. Microbiol. 75, 2046–2056.
https://doi.org/10.1128/AEM.02294-08
Weishaar, J.L., Aiken, G.R., Bergamaschi, B.A., Fram, M.S., Fujii, R., Mopper, K.,
2003. Evaluation of Specific Ultraviolet Absorbance as an Indicator of the

____________________________________________________________ BIBLIOGRAPHY
155
Chemical Composition and Reactivity of Dissolved Organic Carbon. Environ.
Sci. Technol. 37, 4702–4708. https://doi.org/10.1021/es030360x
Wright, J., Kirchner, V., Bernard, W., Ulrich, N., McLimans, C., Campa, M.F.,
Hazen, T., Macbeth, T., Marabello, D., McDermott, J., Mackelprang, R., Roth,
K., Lamendella, R., 2017. Bacterial Community Dynamics in Dichloromethane-
Contaminated Groundwater Undergoing Natural Attenuation. Front.
Microbiol.
Yamashita, Y., Tanoue, E., 2003. Chemical characterization of protein-like
fluorophores in DOM in relation to aromatic amino acids. Mar. Chem. 82, 255–
271. https://doi.org/10.1016/S0304-4203(03)00073-2
Young, I.M., Crawford, J.W., 2004. Interactions and self-organization in the soil-
microbe complex. Science (80-. ). https://doi.org/10.1126/science.1097394
Zhang, Q., Katul, G., Oren, R., Daly, E., Manzoni, S., Yang, D., 2015. The hysteresis
response of soil CO2 concentration and soil respiration to soil temperature. J.
Geophys. Res. Biogeosciences 120, 1–14.
https://doi.org/10.1002/2015JG003047.Received
Zhang, W., Huan, Y., Liu, D., Wang, H., Jiao, X., Wu, X., Du, S., 2016. Influences of
microbial communities on groundwater component concentrations during
managed artificial recharge. Environ. Earth Sci. 75, 1–8.
https://doi.org/10.1007/s12665-015-4959-5
Zhang, Y., Sun, R., Zhou, A., Zhang, J., Luan, Y., Jia, J., Yue, X., Zhang, J., 2018.
Microbial community response reveals underlying mechanism of industrial-
scale manganese sand biofilters used for the simultaneous removal of iron,
manganese and ammonia from groundwater. AMB Express 8, 2.
https://doi.org/10.1186/s13568-017-0534-7
Zhou, Y., Kellermann, C., Griebler, C., 2012. Spatio-temporal patterns of microbial
communities in a hydrologically dynamic pristine aquifer. FEMS Microbiol.
Ecol. 81, 230–242. https://doi.org/10.1111/j.1574-6941.2012.01371.x
Zhu, B., Wang, X., Rioual, P., 2017. Multivariate indications between environment
and ground water recharge in a sedimentary drainage basin in northwestern
China. J. Hydrol. 549, 92–113. https://doi.org/10.1016/j.jhydrol.2017.03.058
Zsolnay, A., Baigar, E., Jimenez, M., Steinweg, B., Saccomandi, F., 1999.

____________________________________________________________ BIBLIOGRAPHY
156
Differentiating with fluorescence spectroscopy the sources of dissolved organic
matter in soils subjected to drying. Chemosphere 38, 45–50.
https://doi.org/10.1016/S0045-6535(98)00166-0

157
_____________________________________________________
APPENDICES
_____________________________________________________

158

159
_____________________________________________________
APPENDIX A: HYDROCHEMICAL DATA IN
SANT VICENÇ MAR SYSTEM
_____________________________________________________

160

_______________________________________________________________ APPENDIX A
161

_______________________________________________________________ APPENDIX A
162
Table A1.2. Sequence information corresponding to the DGGE
bands obtained from bacterial populations’ fingerprints in Sant
Vicenç MAR system
Phylotype Phylogenetic affiliation
Band
codea
Accession
number
Taxonomic lineage (Phylum, Class, Order,
Family, Genus)b
Closest match
(accession no.)c
Similarity
(%)d
B1 MF47164
Firmicutes(100); Bacilli(100); Bacillales(100);
Planococcaceae(100)
Chryseomicrobium
sp. (KX889925)
98
B2 MF47164
Proteobacteria(100); Betaproteobacteria(100);
Neisseriales(94); Neisseriaceae(94)
Vogesella indigofera
(KF951043)
100
B3 MF47164
Firmicutes(100); Bacilli(100); Bacillales(100);
Planococcaceae(100)
Chryseomicrobium
sp. (KX889925)
99
B4 MF47164
Proteobacteria(94); Betaproteobacteria(87); TRA3-
20(54); TRA3-20_fa(54)
Uncultured beta
proteobacterium
(KF182906)
94
B5 MF47164
Chloroflexi(100); Dehalococcoidia(100);
vadinBA26(61); vadinBA26_fa(61)
Dehalogenimonas
alkenigignens
(JQ994267)
100
B6 MF47164
Proteobacteria(100); Gammaproteobacteria(100);
Xanthomonadales(100); Xanthomonadaceae(100);
Stenotrophomonas(98)
Stenotrophomonas
sp. (LC136883)
97
B7 MF47164
Nitrospirae(100); Nitrospira(100); Nitrospirales(100);
Nitrospiraceae(100); Nitrospira(100)
Uncultured
bacterium
(HM445209)
97
B8 MF47164
Chloroflexi(100); Dehalococcoidia(100);
vadinBA26(52); vadinBA26_fa(52)
Dehalogenimonas
alkenigignens
(JQ994267)
100
B9 MF47164
Firmicutes(100); Bacilli(100); Bacillales(100);
Planococcaceae(100)
Chryseomicrobium
sp. (KX889925)
99
B10 MF47165
Cyanobacteria(100); Cyanobacteria(100);
SubsectionI(100); FamilyI(100)
Uncultured
cyanobacterium
(FJ916292)
99

_______________________________________________________________ APPENDIX A
163
B11 MF47165
Cyanobacteria(100); Cyanobacteria(100);
SubsectionI(100); FamilyI(100)
Uncultured
cyanobacterium
(FJ916292)
97
B12 MF47165
Proteobacteria(97); Betaproteobacteria(86);
Nitrosomonadales(38); Nitrosomonadaceae(34)
Uncultured
Burkholderiaceae
(AM935619)
94
B13 MF47165
Proteobacteria(100); Betaproteobacteria(100);
Nitrosomonadales(89); Nitrosomonadaceae(89);
uncultured(88)
Uncultured
Burkholderiaceae
(AM935619)
97
B14 MF47165
Proteobacteria(100); Betaproteobacteria(100); TRA3-
20(100); TRA3-20_fa(100); TRA3-20_ge(100)
Uncultured beta
proteobacterium
(EU979071)
99
B15 MF47165
Proteobacteria(99); Betaproteobacteria(94);
Hydrogenophilales(47); Hydrogenophilaceae(47)
Uncultured beta
proteobacterium
(JN868168)
92
B16 MF47165
Proteobacteria(82); Betaproteobacteria(56);
Nitrosomonadales(20); Nitrosomonadaceae(20)
Uncultured beta
proteobacterium
(AM935274)
88
B17 MF47165
Nitrospirae(100); Nitrospira(100); Nitrospirales(100);
Nitrospiraceae(100); Nitrospira(100)
Uncultured
Nitrospiraceae
(EU298577)
97
B18 MF47165
Bacteroidetes(100); Cytophagia(100);
Cytophagales(100); Cytophagaceae(85);
Pontibacter(84)
Uncultured
Bacteroidetes
(HF564274)
99
B19 MF47165
Chlorobi(80); Chlorobia(80); Chlorobiales(80);
OPB56(80); OPB56_ge(80)
Uncultured
bacterium
(KC666711)
99
B20 MF47166
Actinobacteria(99); Actinobacteria(99); Frankiales(99);
Sporichthyaceae(99); Sporichthyaceae_ge(99)
Uncultured
actinobacterium
(LC018957)
99
B21 MF47166
Actinobacteria(93); Actinobacteria(93);
Micrococcales(86); Microbacteriaceae(77)
Uncultured
actinobacterium
(LC018957)
96
B22 MF47166
Acidobacteria(91); Solibacteres(91); Solibacterales(91);
Solibacteraceae_(Subgroup_3)(91)
Uncultured
Acidobacteria
(KM016273)
97
B23 MF47166
Proteobacteria(100); Betaproteobacteria(100);
Burkholderiales(99); Comamonadaceae(99)
Uncultured
bacterium
(EU465081)
95

_______________________________________________________________ APPENDIX A
164
B24 MF47166
Proteobacteria(100); Betaproteobacteria(100);
Burkholderiales(94); Comamonadaceae(79)
Uncultured
Comamonadaceae
(LT679549)
94
B25 MF47166
Proteobacteria(96); Alphaproteobacteria(90);
Rhizobiales(75); Rhizobiales_Incertae_Sedis(25)
Uncultured alpha
proteobacterium
(HF584680)
98
B26 MF47166
Proteobacteria(100); Betaproteobacteria(100);
Burkholderiales(100); Comamonadaceae(100);
Aquabacterium(100)
Uncultured
bacterium
(KF065163)
99
B27 MF47166
Bacteria(100); Proteobacteria(100);
Betaproteobacteria(100); Methylophilales(100);
Methylophilaceae(100); Methylophilus(100)
Methylotenera
mobilis (AB698738)
99
a band numbers correspond to those presented in Figure 2.4
b taxonomic string with bootstrap values (in parentheses), generated in mothur using SILVA database reference file
release 119
c closest relative according to INSA (International Nucleotide Sequence Database)
d percentage sequence similarity with closest INSA using BLAST tool
Table A1.3 Granulometric composition of sediments in Llobregat MAR
site
Sampling location >12.7
mm
2-12.7
mm
0.3-2
mm
0.056-0.3
mm <0.056 mm
Pre-sed End 39.48 6.68 20.66 28.10 5.07
Inf. pon
Entrance 54.05 25.43 12.93 6.91 0.68
Midfield 40.35 30.36 20.90 7.62 0.76
End 15.36 40.26 31.54 11.47 1.37

165
_____________________________________________________
APPENDIX B
_____________________________________________________

166

Microbial community changes induced by Managed AquiferRecharge activities: Linking hydrogeological and biologicalprocessesCarme Barba1,2, Albert Folch1,2, Núria Gaju3, Xavier Sanchez-Vila1,2, Marc Carrasquilla3,Alba Grau-Martínez4, and Maira Martínez-Alonso3
1Department of Civil and Environmental Engineering, Universitat Politècnica de Catalunya (UPC), C/Jordi Girona 1-3, 08034Barcelona, Spain2Associated Unit: Hydrogeology Group (UPC-CSIC)3Department of Genetics and Microbiology, Universitat Autònoma de Barcelona (UAB), 08193 Bellaterra, Spain4Grup de Mineralogia Aplicada i Geoquímica de Fluids, Departament de Mineralogia, Petrologia i Geologia Aplicada,Facultat de Ciències de la Terra, Universitat de Barcelona (UB), C/Martí i Franquès s/n, 08028 Barcelona, Spain
Correspondence: Carme Barba ([email protected])
Abstract. Managed Aquifer Recharge (MAR) is a worldwide used technique to increase the availability of water resources.
We study how MAR modifies microbial ecosystems, and its implications for enhancing biodegradation processes to eventually
improve groundwater quality. We compare soil and groundwater samples taken from a MAR facility located in NE Spain
during recharge (with the facility operating continuously for several months) and after four months of no recharge. The study
demonstrates a strong correlation between soil and water microbial prints with respect to sampling location along the mapped5
infiltration path. In particular, managed recharge practices disrupt groundwater ecosystems by modifying diversity indices and
the composition of microbial communities, indicating that infiltration favors the growth of certain populations. Analysis of
the genetic profiles showed the presence of nine different bacterial phyla in the facility, revealing high biological diversity at
the highest taxonomic range. In fact, the microbial population patterns under recharge conditions agree with the Intermediate
Disturbance Hypothesis. Moreover, DNA sequence analysis of excised DGGE band patterns revealed the existence of indicator10
species linked to MAR, most notably Dehalogenimonas sp, Nitrospira sp and Vogesella sp. Our real facility multidisciplinary
study (hydrological, geochemical and microbial), involving soil and groundwater samples, support that MAR is a naturally-
based, passive, and efficient technique with broad implications for the biodegradation of pollutants dissolved in water.
Copyright statement. TEXT
1 Introduction15
As the Intergovernmental Panel on Climate Change has stated for years, climate change is affecting and will continue to affect
the availability and quality of freshwater resources, with severe consequences to humans and ecosystems. In particular, the
1
Hydrol. Earth Syst. Sci. Discuss., https://doi.org/10.5194/hess-2018-174Manuscript under review for journal Hydrol. Earth Syst. Sci.Discussion started: 17 April 2018c© Author(s) 2018. CC BY 4.0 License.

Mediterranean Basin is expected to become warmer and drier (Bates et al., 2008). Therefore, among other actions, claiming a
secure water supply should increase groundwater storage of quality water as a strategic management tool in times of scarcity.
Managed Aquifer Recharge (MAR) is a globally used, worldwide extended technology based on refilling aquifers with water
from different sources (e.g., river, reclaimed, or opportunity water). MAR facilities are usually intended to recover ground-
water levels or to become water reservoirs, but other objectives can be targeted. It is quite common to take advantage of the5
potential of soil as a biogeochemical reactor to enhance the quality of water infiltrating the vadose zone, especially in surface
replenishment systems (Drewes et al., 2003; Nadav et al., 2012).
The Llobregat River (Catalonia, NE Spain) is fed by about a hundred Waste Water Treatment Plants. While nitrogen, phos-
phorous and organic matter (COD) are eliminated below the legal limits before treated wastewater is discharged to the river,
emerging organic contaminants (EOCs) are not fully removed (Loos et al., 2013). Consequently, significant concentrations of10
many EOCs have been detected in the Llobregat River (López-Serna et al., 2012) and its associated groundwater bodies (Jurado
et al., 2012).
Biodegradation of EOCs strongly depends on redox conditions (Barbieri et al., 2011; Maeng et al., 2010). In this regard, it
has been shown that MAR is a feasible technique capable of partially degrading some of these contaminants (Hellauer et al.,
2017; Massmann et al., 2008), particularly when bioprocesses are enhanced (Grau-Martínez et al., 2018; Schaffer et al., 2015).15
Infiltration through the soil intrinsically leads to two main consequences in groundwater recharge:
1. Development of different vertical and temporal redox zonations responding to organic matter availability as electron
acceptors are consumed (Greskowiak et al., 2006).
2. Development of microbial communities according to the flow paths. Fingering below the surface of the recharge systems
and preferential flow paths in the saturated zone can create anaerobic microsites (e.g. Bridgham et al., 2013) in which20
oxygen is consumed faster than it can be diffused from oxic zones.
Indeed, MAR implies groundwater quality modifications when compared to natural flow conditions. This includes several pa-
rameters such as organic matter, dissolved oxygen content, temperature, pH, electrical conductivity, and nutrients (Rivett et al.,
2008; Zhang et al., 2016). Such disturbances have ecological implications, as all these parameters affect the growth and activity
of microorganisms and the corresponding degradation of emerging contaminants (Barbieri et al., 2012; Regnery et al., 2017;25
Valhondo et al., 2018).
Microbial studies linked to MAR practices involve mostly laboratory experiments (Alidina et al., 2014b; Freixa et al., 2015; Li
et al., 2013; Rubol et al., 2014). As for microbial MAR field studies, most relevant research is limited to well injection systems
(Ginige et al., 2013; Reed et al., 2008; Zhang et al., 2016) or riverbank filtration conditions (Huang et al., 2015). Onesios-Barry
et al. (2014) compared results from a column experiment and soil samples in a MAR site in the US, focusing on the micro-30
bial populations linked to pharmaceutical and personal care products removal, and concluded that microbial composition and
structure of both systems were comparable. Regnery et al. (2016) went one step further by relating the relative abundance of
functional genes involved in xenobiotic pathways with attenuation of some trace organic chemicals and their byproducts in a
combination of laboratory experiments and a full-scale MAR facility. However, in our knowledge, there are no microbial fin-
2
Hydrol. Earth Syst. Sci. Discuss., https://doi.org/10.5194/hess-2018-174Manuscript under review for journal Hydrol. Earth Syst. Sci.Discussion started: 17 April 2018c© Author(s) 2018. CC BY 4.0 License.

gerprinting studies of MAR surface infiltration basins, that integrate results from surface water, groundwater and soil samples
and comparing them in two different operational periods.
The main goal of this study is to determine how MAR activities induce changes in the microbial communities in a real facility
composed of a settling and infiltration pond adjacent to the Llobregat River. We evaluate changes on diversity indices and
we incorporate results of the DNA sequence analysis of excised DGGE band patterns for samples taken from different envi-5
ronments and locations within the site and under conditions of recharge and non-recharge. Additionally, we link our results
with ecological principles and potential biogeochemical processes (i.e. pollutants degradation) occurring due to MAR activities.
2 Material and Methods
2.1 The Llobregat MAR site10
The Llobregat MAR system is located 15 km inland from the Mediterranean Sea, close to Barcelona city (Figure 1). The
aquifer thickness in the vicinity is 10-15 m, with alternating sands and gravels. Non-continuous fine-grained sediments are
widely present (Pedretti et al., 2012). The distance from the bottom of the pond to the water table oscillated from 9 m (July
2014) to 7 m (March 2015) in the period under study.
Water enters is diverted from upstream the river to a pre-sedimentation basin. After 2-4 days of residence time, it is diverted15
to an infiltration basin of 6500 m2. The infiltration capacity has been estimated at 1 m3m−2d−1 on average, and the local
transmissivity of the aquifer is estimated as 14000 m2d−1 (unpublished).
In 2011, a reactive barrier was installed at the bottom of the infiltration basin to increase the organic load of the infiltration wa-
ter, and thus promote biological processes through the soil and the vadose zone. The barrier was composed of organic compost
(50% in volume) mixed with sand and gravel. Small amounts of clay and iron oxides were added to foster adsorption and ion20
exchange. Previous studies demonstrated that the reactive barrier enhanced the removal of some emergent contaminants, such
as sulfamethoxazole or caffeine (Valhondo et al., 2014). More information about the site and the performance of the reactive
barrier can be found in Valhondo et al. (2014).
There are six piezometers distributed in a 500 m transect across the study area (Figure 1). P1, P3, P2, P5 and P10 are fully
screened. P8 is a multilevel piezometer drilled at three different depths. Water from piezometer P1 represents background con-25
ditions (not affected by recharge).
2.2 Hydrochemistry sampling surveys
Two recharge situations were compared to evaluate the effect of MAR on groundwater chemical signature. After six months
of continuous recharge operation, a sampling campaign took place in July 2014 (wet campaign). Samples were collected from30
surface water in both basins and in the existing piezometers at different depths (from -5 to 3 masl, see diamonds in Figure 1).
3
Hydrol. Earth Syst. Sci. Discuss., https://doi.org/10.5194/hess-2018-174Manuscript under review for journal Hydrol. Earth Syst. Sci.Discussion started: 17 April 2018c© Author(s) 2018. CC BY 4.0 License.

The second sampling campaign was performed in March 2015 after recharge had been discontinued for four months. In this
case, groundwater was also sampled.
Water was analyzed for cations, anions (Cl−, NO−3 , SO−24 , HCO−3 ), DOC and TOC. Analytical procedures are widely de-
scribed in Supplementary Material section.
In both campaigns, temperature and electrical conductivity vertical profiles were mapped along the transect from data obtained5
at 50-cm intervals (MPS-D8, SEBA Hydrometrie).
2.3 Microbial community characterization
Water samples were extracted from the pre-sedimentation and infiltration basins at three locations (entrance, middle, and end)
during recharge conditions (from now on, wet scenario). On the contrary, 3 soil samples were extracted at the same locations10
in the infiltration basin under non-recharge conditions (termed dry scenario). Soil samples were obtained from around 10
to 50cm in dept. The sampling procedure for soil was done taking into account Lombard et al. (2011) recommendations,
especially regarding the variability of microbial communities along a field transect. Soil samples were taken by means of
cores, individually disassembled and kept in a sterile bag. Groundwater samples were taken from -5 to 3 masl depending on
the piezometers (10 samples for wet scenario and 7 for dry). All soil and groundwater samples were taken in duplicate, kept in15
sterile conditions, and preserved in dark at −4◦C until being taken to the laboratory for molecular analyses.
Protocols for molecular analyses of liquid and soil samples are thoroughly described in the Supplementary Material.
Once the main microbial communities were characterized, three diversity indices were calculated. The first one is Richness
(S), defined as the proportional number of microbial species present in a sample, i.e., equal to the total number of bands; the
other two, Shannon (H), and Evenness (E), were calculated for each sample as follows:20
H =S∑
i=1
piln(pi) (1)
E =H
Hmax; with Hmax = lnS (2)
where pi is the relative intensity of each band of the sample. Values reported correspond to the average of the two replicas.25
2.4 Soil characterization
To complement the soil microbial community’s characterization, particle size measurements of soil samples were taken ac-
cording to the ASTM guidelines. The soil was sampled in the pre-sedimentation basin and at the entrance, middle, and end of
infiltration basin. Soil sampling was performed close to the location where samples were taken for microbial analyses.30
4
Hydrol. Earth Syst. Sci. Discuss., https://doi.org/10.5194/hess-2018-174Manuscript under review for journal Hydrol. Earth Syst. Sci.Discussion started: 17 April 2018c© Author(s) 2018. CC BY 4.0 License.

3 Results
3.1 Microbial differences in groundwater linked to recharge conditions
3.1.1 Closing the conceptual flow model
Understanding the flow pattern in MAR basins is essential to explain microbial community dynamics. In this regard, 2D
transects of temperature and conductivity alterations obtained at the time of the sampling campaigns (Figure 2a and Figure 3a)5
based on vertical profiles indicate that: 1) the vertical flow gradient pushes the existing groundwater downwards and forms a
shallow front that travels approximately 120 m downstream, eventually mixing with the background water; 2) the background
water is mostly found near the recharge pond and at the deepest sampling points below the pond.
From this conceptual model, four main groups of groundwater can be defined under recharge conditions:
– Type I water represents the background environment of the aquifer, unaffected by MAR activities. Water sampled in P110
is an example of this type.
– Type II water, is the infiltrating one (best observed in P8 at both sampling depths). It flows vertically through the vadose
zone to the aquifer, creating a small water mound that pushes down the Type I water.
– Type III water, characteristic of points P2(3), P5(2.3) and P5(-2.2), is a mixture between Types I and II waters, with a
high proportion of the latter.15
– Type IV water is again a mixture, but with a lower proportion of Type II water. It is present in piezometers P3(0.8),
P3(-4.2), P2(-5) and P10(-1).
Apart from temperature and conductivity, major ions composition does not show any significant trend related with groundwa-
ter zonation below the pond (see Table S1 in Supplementary Material). The role of nitrate and DOC in microbial community
patterns is discussed further below.20
3.1.2 Clustering groundwater microbial communities according to presence and abundance
To characterize differences in microbial communities due the recharge, groundwater samples were subjected to molecular
analysis. Post-processing of DGGE gels allowed for Non-Metric Multidimensional Scaling (NMDS), showing similarities
among band patterns (Figure 4) and strong clustering of microbial communities. Samples from both scenarios were completely25
separated; blue squares (dry) and triangles (wet) represent groundwater samples, and are clearly clustered in top and bottom
halves of the plot, respectively. Moreover, samples from the wet scenario grouped according to water types. Types I and II are
displayed on opposite sides; Types III and IV (mixed) display in between. The two green triangles in the center of the plot
correspond to groundwater samples from P10.
Discrete bands are also portrayed (circles), allowing linkage of the bands’ contribution to sample assemblages. Filled circles30
5
Hydrol. Earth Syst. Sci. Discuss., https://doi.org/10.5194/hess-2018-174Manuscript under review for journal Hydrol. Earth Syst. Sci.Discussion started: 17 April 2018c© Author(s) 2018. CC BY 4.0 License.

report the class and genus of the sequenced bands, whereas empty circles symbolize non-sequenced bands.
Figure 5 shows DGGE profiles and UPGMA clustering analysis of groundwater samples. The genetic fingerprints revealed
high dissimilarities in the bacterial assemblage of about 70% and 80% during the active recharge period and the dry campaign,
respectively (Figure 5). Moreover, most replicas grouped together, indicating sampling quality. Under active recharge (wet)
conditions (Figure 5a), the dendrogram reproduces quite well the water types postulated by the conceptual flow model: in the5
first group, we can include four out of the five samples that were strongly influenced by recharge (P5(-2.2), P5(2.3), P8(1) and
P8(-3)); while in the second group, P2(3), P3(-4.2) and P3(0.8) clustered together with P1 (non-affected by recharge). In the
dry campaign (Figure 5b), although no infiltration occurred, P8 appears separated from the other piezometers, indicating the
still marked influence of the water infiltrated during the wet period, which occurred over four months earlier.
10
3.1.3 Variations in microbial diversity indices in groundwater
The structure and processes of ecosystems change when a disturbance occurs (Grimm, 1994). Such changes in microbial com-
munities have been quantified and described by means of diversity indices (Table 1). Such indices, grouped according to water
types during wet conditions, were ordered along an imaginary line from low to highly perturbed as a consequence of water
infiltration (Figure 6). The lowest diversity indices were obtained for the recharging water (Type II), indicating low species15
richness and a highly dissimilar proportion. In contrast, Type IV water, only slightly affected by water infiltration, displayed
higher Shannon and Evenness indices, similar to Type I (unaffected by recharge).
3.1.4 Role of MAR activities for the microbial community structure
Prominent bands were recovered from the DGGE gels (Figure 5) and sequenced. Table S2 (Supplementary Material) shows20
the sequenced bands, their similarity values compared to the closest related GenBanK sequences, and their phylogenetic af-
filiations. Overall, sequences fell into nine different bacterial phyla and eleven classes: Proteobacteria (Alphaproteobacteria,
Betaproteobacteria and Gammaproteobacteria), Cyanobacteria, Chloroflexi (Dehalococcoidia), Chlorobi (Chlorobia), Nitro-
spirae (Nitrospira), Acidobacteria, Actinobacteria, Firmicutes (Bacilli) and Bacteroidetes (Cytophagia) (Figure 7). The group
designated as “Others” includes unclassified and non-sequenced fine bands.25
The two main classes displaying the largest differences between the two scenarios are Betaproteobacteria and Dehalococcoidia,
which were favored under recharge conditions. In particular, Dehalococcoidia is present in medium- and low-influenced waters,
and it is absent in the high recharge-influenced groundwater (P8(1) and P8(-3)). This phylotype was identified at the genus level
as Dehalogenimonas sp (Table S2). Similar behavior was found in the Nitrospira class, appearing in low-influenced ground-
water in the wet scenario.30
Patterns in the structure of microbial populations correlated with water types. For Type I, differences in the bacterial assemblage
between both campaigns were attributed to seasonal changes (Table S1). Dehalococcoidia and Chlorobia were only detected
in the wet scenario, while Cytophagia and Nitrospira could only be detected under dry conditions.
6
Hydrol. Earth Syst. Sci. Discuss., https://doi.org/10.5194/hess-2018-174Manuscript under review for journal Hydrol. Earth Syst. Sci.Discussion started: 17 April 2018c© Author(s) 2018. CC BY 4.0 License.

During the active recharge period and for Type IV water, Dehalococcoidia was found in three out of four sampling points and
was the most abundant phylotype. For Type III water, significant differences were observed among in the samples analyzed.
Populations with the highest relative abundance in P5 (2.3) were Betaproteobacteria and Bacilli. The former was also promi-
nent in P5(–2.2), together with Cytophagia, while Dehalococcoidia were dominant in P2(3). Finally, in the case of groundwater
Type II (recharge water), the bacterial assemblage was dominated by members of the Betaproteobacteria class. During the dry5
period, no clear distribution patterns in the bacterial relative abundances at the phylum and class level were observed, in part
due to the DGGE profiles, mainly composed by fine bands (Figure 5); these were difficult to recover and purify, and thus could
not be characterized. However, it should be mentioned that Betaproteobacteria were dominant in both P8 samples, contributing
more than 50% to the relative abundance.
10
3.2 Microbial community indicators of MAR in soil and surface water
To study the impact of MAR on microbial community structure, recharge water from pre-sedimentation and infiltration basins,
as well as soils, were analyzed. Figures 8 and 9 show the relative abundance of bacterial phylotypes at the taxonomical level
of classes for surface water and soil samples. The results are displayed according to the distance to the recharge basin inlet.
Microbial richness in soil samples was controlled by water content. Non-recharge conditions had a primarily negative effect15
on the populations of Dehalococcoidia, Acidobacteria and Chlorobia, but favored the presence of Nitrospira, Cytophagia and
Actinobacteria (Figure 8). Shannon and Evenness indices demonstrated that soils were more diverse under wet conditions than
under dry ones (Table 1).
For surface water samples (Figure 9), there was a decreasing gradient in community complexity along the ponds. Acidobacte-
ria, Betaproteobacteria and Cyanobacteria were the main phylotypes present.20
4 Discussion
We contend that interdisciplinary analysis of geochemical characterization, recharge evaluation, and microbial fingerprinting,
can provide relevant information about the fate of microbial ecosystems in soil and groundwater.
25
4.1 Matching groundwater model, ecological disturbance principle and microbial communities
Groundwater is a quite stable aquatic environment (Griebler and Lueders, 2009). One could expect that microbial communities
in groundwater should also display low variability that could be reflected in the diversity indices. An example of this is P1,
which is unaffected by recharge; the diversity indices remain constant regardless of the sampling campaign.
30
7
Hydrol. Earth Syst. Sci. Discuss., https://doi.org/10.5194/hess-2018-174Manuscript under review for journal Hydrol. Earth Syst. Sci.Discussion started: 17 April 2018c© Author(s) 2018. CC BY 4.0 License.

MAR is a passive treatment technique that can provide simultaneously oxic and anoxic conditions (Maeng et al., 2011). This
has wide implications for the potential biological removal of selected emerging contaminants, as each micropollutant is most
efficiently removed under specific redox conditions (Schmidt et al., 2007). Some can even be degraded by co-metabolism,
involving different redox states in the process (Rodriguez-Escales and Sanchez-Vila, 2016). In this sense, MAR is an efficient
remediation system. In addition, many sequenced phylotypes, such as Nitrospira sp, Stenotrophomonas sp and Methylobac-5
terium sp have been associated with degradation capabilities (Cycon et al., 2017; Daims et al., 2001; Wang et al., 2015). In
short, the MAR microbial ecosystem studied in this work presents many more phylotypes than previous studies reported in
groundwater systems (Logue et al., 2015), and thus, MAR can be considered an efficient remediation system.
We further tested the Intermediate Disturbance Hypothesis (IDH) for microbial communities in groundwater (Figure 6) related
to MAR activities. IDH was originally proposed for tropical rain forests and coral reefs (Connell, 1978) and supports the idea10
that small perturbations create new access to resources for species which have overlapping niches, allowing their coexistence.
This mechanism, known as a competition-colonization trade-off, can explain IDH in local communities, leading to an increase
in diversity. However, when the degree of disturbance rises, only eurytolerant populations can survive and grow. Thus, an
inverse correlation between diversity and the degree of disturbance (reflected in the temperature and conductivity profiles) was
expected (see Table 1). Such correlations have also been reported in recharge wells and snowmelt-influenced aquifers (Ginige15
et al., 2013; Zhou et al., 2012).
In the Llobregat MAR system, the initial diversity in the microbial community increased with perturbation caused by recharge
(Figure 6), with maximum diversity associated with Type IV water, and lowest for the most disturbed water (Type II). In eco-
logical terms, Type III and Type IV waters represent different proportions of perturbation.
In the most altered groundwater zone (represented by P8 samples), Betaproteobacteria grew above 50% of the relative abun-20
dance (Figure 7). The main phylogenetic affiliation of this phylotype at the genus level is Vogesella. Strains of this genus are
able to catabolize monosaccharides under aerobic conditions, but not under low-oxygen conditions. Furthermore, all Vogesella
strains are denitrifiers (Grimes et al., 1997). Indeed, P8, located below the pond, receives oxygen-rich water during the recharge
process, driven by fingering in the vadose zone. Although dissolved oxygen was not measured in the present study, data from
other campaigns confirm this behavior for oxygen in P8 samples (data not shown). Moreover, nitrate concentration in the sur-25
face water was low (Table S1), and thus most denitrification is expected to occur under the pond. Grau-Martínez et al. (2018)
recently confirmed that nitrate was consumed via denitrification pathway under the infiltration pond in the Llobregat MAR
system, supporting the idea that Vogesella sp could be one of the genera involved in nitrate consumption. Likely, depending on
the oxygen content, Vogesella sp will adapt its metabolic function in favor of aerobic oxidation of organic matter or by means
of denitrification, thus becoming a good indicator of highly-disturbed MAR environments.30
For Type III and Type IV waters, Dehalogenimonas sp, within the Dehalococcoidia class, is characteristic of medium-disturance
groundwater (Figure 4 and Figure 7). Dehalogenimonas sp has been studied in recent years because some strains are associated
with dechlorination in contaminated sites. This genus is strictly anaerobic and mesophilic, and some species can reductively
dehalogenate polychlorinated aliphatic alkanes (Martín-González et al., 2015; Moe et al., 2009). As a result, recharge creates
reducing conditions, likely indicating the existence of microzones or microsites (Bridgham et al., 2013; Hamersley and Howes,35
8
Hydrol. Earth Syst. Sci. Discuss., https://doi.org/10.5194/hess-2018-174Manuscript under review for journal Hydrol. Earth Syst. Sci.Discussion started: 17 April 2018c© Author(s) 2018. CC BY 4.0 License.

2002), defined as local anoxic areas that coexist with fast-travelling oxygen-rich paths. Thus, microbial analysis can be used
to unmask the apparent mishap of water samples that are oxic and display some typical anaerobic species. Moreover, some
species of Dehalogenimonas can dechlorinate some Trichloroethane isomers (Dillehay et al., 2014), a pollutant reported in the
Llobregat Lower Valley at levels as high as 300 µg/L (Valhondo et al., 2014), thus opening the door for the development of
enhanced remediation activities.5
The Evenness index is an indicator of the equity of a community, and can be quite informative for observing perturbations to
microbial communities. In the wet scenario, the lowest values of E were obtained for the samples most affected by recharge
(Table 1), indicating that some species developed into predominant members of the microbial assemblage. Groundwater sam-
ples displayed the highest evenness values in the area less affected by recharge and in the dry scenario. in the latter case, values
indicate the recovery of microbial communities from the disruption caused by recharge. In fact, P8(1) samples in dry scenario10
were not fully consistent with this conceptual model, with low evenness index and very low nitrate concentration. Furthermore,
the presence of Methylotenera mobilis (Betaproteobacteria class) in both P8 sampling points was more than 40%, on average,
of the relative abundance. Methylotenera mobilis is a methylotroph specie with denitrification abilities (Chistoserdova, 2011).
These results suggest that P8 denitrification processes occur below the basin even when it is empty, indicating that four months
is not enough time to revert back to natural conditions at this sampling point. This assumption is consistent with nitrate isotopic15
data presented in Grau-Martínez et al. (2018), and is also in agreement with the study of Rodriguez-Escales et al. (2016) in
which biomass decay acted as an endogenous carbon source for respiration once the input carbon was reduced, maintaining
denitrification rates.
4.2 Microbial community structure in soils and surface waters20
We analyzed the heterogeneity of the microbial community structure in soil and surface water in terms of the distance to the
infiltration basin entry point (Figure 9 and Table 1). Patterns in surface water microbial composition are linked to sequential
sedimentation processes as revealed by granulometric analyses of soil samples (Table S3). The result was that surface water
became poorer in terms of the presence of microbial communities between the pre-sedimentation basin and the end of the
infiltration basin. The main reason could be the decrease in solids suspended throughout the system due to the sequential25
decantation of particles and their attached biomass. Furthermore, surface water displays relatively higher values of Cyanobac-
teria and Acidobacteria classes compared to groundwater. Cyanobacteria constitute the largest, most diverse, and most widely
distributed group of photosynthetic prokaryotes, which are capable of conducting N fixation (Stanier and Bazine, 1977). How-
ever, members of the phylum Acidobacteria are physiologically diverse and ubiquitous in soils, degrade a wide range of carbon
sources (from substances with a wide range of complexity), and are capable of reducing nitrates and nitrites (Kielak et al.,30
2016). This heterogeneous effect with distance to the entry point of the basin is also observed in the diversity indices, which
lose diversity with distance and are inversely correlated to the proportion of fine particles. Similar behavior for richness corre-
lated to soil texture was reported elsewhere (Chau et al., 2011).
Differences in the microbial communities in soils between the two basins were concentrated in the large organic matter content
9
Hydrol. Earth Syst. Sci. Discuss., https://doi.org/10.5194/hess-2018-174Manuscript under review for journal Hydrol. Earth Syst. Sci.Discussion started: 17 April 2018c© Author(s) 2018. CC BY 4.0 License.

provided by the reactive barrier present in the latter, being a source for the growth of bacterial communities and enhanced
diversity under recharge conditions. The role of the humidity on microbial diversity is also significant, as was previously re-
ported in horizontal subsurface constructed wetlands (Nurk et al., 2005). Furthermore, phylotypes distribution changes among
scenarios. Whereas Dehaloccocoidia and Chlorobia classes appear in wet soils, Nitrospira, Cytophagia and Actinobacteria are
favored under dry conditions.5
The role of the reactive layer at the infiltration pond could be extrapolated as a system fed with a considerable organic carbon
load. Laboratory experiments and constructed wetlands demonstrate that concentration of microbial activity and TOC degra-
dation is concentrated in the first centimeters of the filter material (Ragusa et al., 2004; Sleytr et al., 2007; Tietz et al., 2007) in
response to oxygen concentration vertical distribution. Although rapid oxygen depletion and consequent denitrification condi-
tions have been evidenced in lab-scale MAR experiments (Alidina et al., 2014a; Dutta et al., 2015), this effect may not happen10
rapidly under real infiltration conditions, where entrapped gas (Heilweil et al., 2004) or fingering processes (Kung, 1990) may
provide higher oxygen concentrations than in lower dimension systems (e.g., columns). Lab-experiments are doubtlessly useful
to elucidate the behavior of microbial communities under controlled conditions. However, sometimes it could exist a difficulty
of transferring conclusions obtained from lab samples to real sites.
15
5 Conclusions
This study aims at integrating different fields such as hydrogeology, ecology and microbiology applied to a real MAR facility,
relating flow (infiltration) conditions, physicochemical water parameters, and microbial changes induced by managed recharge
along vertical transect. We observed that infiltration ponds modify the hydrochemistry and ecology of the groundwater environ-
ment, especially in terms of microbial communities. Comparing recharge and non-recharge scenarios, we found that microbial20
diversity indices (Shannon) correlate inversely with the degree of perturbation caused by the induced recharge, substantiating
an Intermediate Disturbance Hypothesis distribution. In fact, MAR (surface) basins operation can promote different levels of
disturbance at the same time, and microbial community structures change accordingly. From microbial fingerprinting analy-
sis, we observed the boosting of Betaproteobacteria and Dehalococcoidia classes correlate to recharge practices. Furthermore,
genera such as Dehalogenimonas, Nitrospira, Stenotrophomonas, Methylobacterium were also detected, indicating a wide25
spectrum of biodegradation capabilities. Likewise, sequencing tasks revealed characteristic phylotypes from each water type,
particularly Vogesella sp for highly perturbed water or Dehalogenimonas sp for medium-perturbed water. Microbial popula-
tions in soil are quite diverse when comparing wet with dry scenarios. Soil moisture and sediment grain size appear to be the
key factors explaining diversity patterns. Furthermore, variation in recharge conditions do not translate immediately to changes
in communities. All these results combined confirm the difficulty of extending laboratory experiment results to the field scale.30
10
Hydrol. Earth Syst. Sci. Discuss., https://doi.org/10.5194/hess-2018-174Manuscript under review for journal Hydrol. Earth Syst. Sci.Discussion started: 17 April 2018c© Author(s) 2018. CC BY 4.0 License.

Competing interests. The authors declare that they have no conflict of interest.
Acknowledgements. This investigation was financially supported by the European Union project MARSOL grant agreement no. 619120,
FP7-ENV-2013-WATER-INNO-DEMO, Generalitat de Catalunya via FI scholarship program (FI-DGR 2014) and the Spanish Government
and EU (project ACWAPUR PCIN-2015-239). The authors would like to acknowledge Marc Vives for his help and Comunitat d’Usuaris
d’Aigües de la Vall Baixa i del Delta del Riu Llobregat (CUADLL) for their cooperation.5
11
Hydrol. Earth Syst. Sci. Discuss., https://doi.org/10.5194/hess-2018-174Manuscript under review for journal Hydrol. Earth Syst. Sci.Discussion started: 17 April 2018c© Author(s) 2018. CC BY 4.0 License.

References
Alidina, M., Hoppe-Jones, C., Yoon, M., Hamadeh, A. F., Li, D., and Drewes, J. E.: The occurrence of emerging trace organic chemicals in
wastewater effluents in Saudi Arabia., The Science of the total environment, 478, 152–62, https://doi.org/10.1016/j.scitotenv.2014.01.093,
http://www.sciencedirect.com/science/article/pii/S0048969714001211, 2014a.
Alidina, M., Li, D., Ouf, M., and Drewes, J. E.: Role of primary substrate composition and concentration on attenua-5
tion of trace organic chemicals in managed aquifer recharge systems., Journal of environmental management, 144, 58–66,
https://doi.org/10.1016/j.jenvman.2014.04.032, http://www.sciencedirect.com/science/article/pii/S0301479714002552, 2014b.
Barbieri, M., Carrera, J., Sanchez-Vila, X., Ayora, C., Cama, J., Köck-Schulmeyer, M., López de Alda, M., Barceló, D., Tobella Brunet, J., and
Hernández García, M.: Microcosm experiments to control anaerobic redox conditions when studying the fate of organic micropollutants
in aquifer material, Journal of Contaminant Hydrology, 126, 330–345, https://doi.org/http://dx.doi.org/10.1016/j.jconhyd.2011.09.003,10
http://www.sciencedirect.com/science/article/pii/S0169772211000957, 2011.
Barbieri, M., Carrera, J., Ayora, C., Sanchez-Vila, X., Licha, T., Nodler, K., Osorio, V., Perez, S., Kock-Schulmeyer, M., Lopez de Alda, M.,
and Barcelo, D.: Formation of diclofenac and sulfamethoxazole reversible transformation products in aquifer material under denitrifying
conditions: batch experiments, Sci Total Environ, 426, 256–263, https://doi.org/10.1016/j.scitotenv.2012.02.058, 2012.
Bates, B., Z.W. Kundzewicz, S.Wu, and J.P. Palutikof: Climate Change and Water. Technical Paper if the Intergov-15
ernmental Panel on Climate Change, Tech. rep., IPCC Secretariat, Geneva, https://www.ipcc.ch/publications{_}and{_}data/
publications{_}and{_}data{_}technical{_}papers.shtml, 2008.
Bridgham, S. D., Cadillo-Quiroz, H., Keller, J. K., and Zhuang, Q.: Methane emissions from wetlands: biogeochemical, microbial, and
modeling perspectives from local to global scales, Global Change Biology, 19, 1325–1346, https://doi.org/10.1111/gcb.12131, http://dx.
doi.org/10.1111/gcb.12131, 2013.20
Chau, J., Bagtzoglou, A., and Willig, M.: The effect of soil texture on richness and diversity of bacterial communities, Environmental Foren-
sics, 12, 333–341, https://doi.org/10.1080/15275922.2011.622348, http://www.tandfonline.com/doi/abs/10.1080/15275922.2011.622348,
2011.
Chistoserdova, L.: Methylotrophy in a lake: From metagenomics to single-organism physiology, https://doi.org/10.1128/AEM.00314-11,
http://www.ncbi.nlm.nih.gov/pubmed/21622781http://www.pubmedcentral.nih.gov/articlerender.fcgi?artid=PMC3147377, 2011.25
Connell, J. H.: Diversity in Tropical Rain Forests and Coral Reefs, Science, 199, 1302–1310, https://doi.org/10.1126/science.199.4335.1302,
http://www.sciencemag.org/cgi/doi/10.1126/science.199.4335.1302, 1978.
Cycon, M., Mrozik, A., and Piotrowska-Seget, Z.: Bioaugmentation as a strategy for the remediation of pesticide-polluted soil: A
review, https://doi.org/10.1016/j.chemosphere.2016.12.129, http://www.sciencedirect.com.recursos.biblioteca.upc.edu/science/article/pii/
S0045653516318720, 2017.30
Daims, H., Nielsen, J. L., Nielsen, P. H., Schleifer, K.-H., and Wagner, M.: In Situ Characterization of Nitrospira-Like
Nitrite-Oxidizing Bacteria Active in Wastewater Treatment Plants, Applied and Environmental Microbiology, 67, 5273–5284,
https://doi.org/10.1128/AEM.67.11.5273-5284.2001, http://www.ncbi.nlm.nih.gov/pmc/articles/PMC93301/, 2001.
Dillehay, J. L., Bowman, K. S., Yan, J., Rainey, F. A., and Moe, W. M.: Substrate interactions in dehalogenation
of 1,2-dichloroethane, 1,2-dichloropropane, and 1,1,2-trichloroethane mixtures by Dehalogenimonas spp., Biodegradation, 25,35
301–312, https://doi.org/10.1007/s10532-013-9661-2, http://www.ncbi.nlm.nih.gov/pubmed/23990262http://link.springer.com/10.1007/
s10532-013-9661-2, 2014.
12
Hydrol. Earth Syst. Sci. Discuss., https://doi.org/10.5194/hess-2018-174Manuscript under review for journal Hydrol. Earth Syst. Sci.Discussion started: 17 April 2018c© Author(s) 2018. CC BY 4.0 License.

Drewes, J. E., Reinhard, M., and Fox, P.: Comparing microfiltration-reverse osmosis and soil-aquifer treatment for indirect potable reuse of
water, Water Research, 37, 3612–3621, https://doi.org/10.1016/S0043-1354(03)00230-6, 2003.
Dutta, T., Carles-Brangarí, A., Fernàndez-Garcia, D., Rubol, S., Tirado-Conde, J., and Sanchez-Vila, X.: Vadose zone oxygen (O2)
dynamics during drying and wetting cycles: An artificial recharge laboratory experiment, Journal of Hydrology, 527, 151–159,
https://doi.org/10.1016/j.jhydrol.2015.04.048, http://www.sciencedirect.com/science/article/pii/S0022169415003078, 2015.5
Freixa, A., Rubol, S., Carles-Brangarí, A., Fernàndez-Garcia, D., Butturini, A., Sanchez-Vila, X., and Romaní, A. M.: The effects of sediment
depth and oxygen concentration on the use of organic matter: An experimental study using an infiltration sediment tank, Science of
the Total Environment, 540, 20–31, https://doi.org/10.1016/j.scitotenv.2015.04.007, http://www.ncbi.nlm.nih.gov/pubmed/25900223http:
//linkinghub.elsevier.com/retrieve/pii/S004896971500443X, 2015.
Ginige, M. P., Kaksonen, A. H., Morris, C., Shackelton, M., and Patterson, B. M.: Bacterial community and groundwater quality10
changes in an anaerobic aquifer during groundwater recharge with aerobic recycled water, FEMS Microbiology Ecology, 85, 553–567,
https://doi.org/10.1111/1574-6941.12137, 2013.
Grau-Martínez, A., Folch, A., Torrentó, C., Valhondo, C., Barba, C., Domènech, C., Otero, N., and Soler, A.: Monitoring induced deni-
trification during managed aquifer recharge in an infiltration pond, Journal of Hydrology, https://doi.org/10.1016/j.jhydrol.2018.03.044,
http://linkinghub.elsevier.com/retrieve/pii/S0022169418302105, 2018.15
Greskowiak, J., Prommer, H., Massmann, G., and Nützmann, G.: Modeling Seasonal Redox Dynamics and the Corresponding Fate of the
Pharmaceutical Residue Phenazone During Artificial Recharge of Groundwater, Environmental Science & Technology, 40, 6615–6621,
https://doi.org/10.1021/es052506t, http://pubs.acs.org/doi/abs/10.1021/es052506t, 2006.
Griebler, C. and Lueders, T.: Microbial biodiversity in groundwater ecosystems, Freshwater Biology, 54, 649–677,
https://doi.org/10.1111/j.1365-2427.2008.02013.x, http://doi.wiley.com/10.1111/j.1365-2427.2008.02013.x, 2009.20
Grimes, D. J., Woese, C. R., MacDonell, M. T., and Colwell, R. R.: Systematic study of the genus Vogesella gen. nov. and its type species,
Vogesella indigofera comb. nov., International journal of systematic bacteriology, 47, 19–27, https://doi.org/10.1099/00207713-
47-1-19, http://ijs.microbiologyresearch.org/content/view.action?itemId=http{%}3A{%}2F{%}2Fsgm.metastore.
ingenta.com{%}2Fcontent{%}2Fjournal{%}2Fijsem{%}2F10.1099{%}2F00207713-47-1-19{&}view={&}itemType=
http{%}3A{%}2F{%}2Fpub2web.metastore.ingenta.com{%}2Fns{%}2FArticle, 1997.25
Grimm, N. B.: Disturbance, succession, and ecosystem processes in streams: a case study from the desert, in: Joint Symposium of the British
Ecological Society and the American Society of Lirrmologyand Oceanography, edited by P.S. Giller, A.G. Hildrew and Raffaeli, D., pp.
93–112, Blackwell Scientific, Oxford, 1994.
Hamersley, M. R. and Howes, B. L.: Control of denitrification in a septage-treating artificial wetland: The dual role of particulate organic
carbon, Water Research, 36, 4415–4427, https://doi.org/10.1016/S0043-1354(02)00134-3, 2002.30
Heilweil, V. M., Solomon, D. K., Perkins, K. S., and Ellett, K. M.: Gas-partitioning tracer test to quantify trapped gas during recharge.,
Ground water, 42, 589–600, http://www.ncbi.nlm.nih.gov/pubmed/15318781, 2004.
Hellauer, K., Karakurt, S., Sperlich, A., Burke, V., Massmann, G., Hübner, U., and Drewes, J. E.: Establishing sequential managed aquifer
recharge technology (SMART) for enhanced removal of trace organic chemicals: Experiences from field studies in Berlin, Germany,
https://doi.org/10.1016/j.jhydrol.2017.09.044, https://www.sciencedirect.com/science/article/pii/S0022169417306480, 2017.35
Huang, G., Liu, F., Yang, Y., Deng, W., Li, S., Huang, Y., and Kong, X.: Removal of ammonium-nitrogen from groundwa-
ter using a fully passive permeable reactive barrier with oxygen-releasing compound and clinoptilolite, Journal of Environmen-
13
Hydrol. Earth Syst. Sci. Discuss., https://doi.org/10.5194/hess-2018-174Manuscript under review for journal Hydrol. Earth Syst. Sci.Discussion started: 17 April 2018c© Author(s) 2018. CC BY 4.0 License.

tal Management, 154, 1–7, https://doi.org/http://dx.doi.org/10.1016/j.jenvman.2015.02.012, http://www.sciencedirect.com/science/article/
pii/S0301479715000808, 2015.
Jurado, A., Vàzquez-Suñé, E., Carrera, J., López de Alda, M., and Pujades, E.: Emerging organic contaminants in groundwater in
Spain: A review of sources, recent occurrence and fate in a European context, Science of The Total Environment, 440, 82–94,
https://doi.org/10.1016/j.scitotenv.2012.08.029, 2012.5
Kielak, A. M., Barreto, C. C., Kowalchuk, G. A., van Veen, J. A., and Kuramae, E. E.: The ecology of Acidobacteria: Moving beyond genes
and genomes, https://doi.org/10.3389/fmicb.2016.00744, http://journal.frontiersin.org/Article/10.3389/fmicb.2016.00744/abstract, 2016.
Kung, K.-J.: Preferential flow in a sandy vadose zone: 1. Field observation, Geoderma, 46, 51–58, https://doi.org/10.1016/0016-
7061(90)90006-U, http://linkinghub.elsevier.com/retrieve/pii/001670619090006U, 1990.
Li, D., Alidina, M., Ouf, M., Sharp, J. O., Saikaly, P., and Drewes, J. E.: Microbial community evolution during simulated managed10
aquifer recharge in response to different biodegradable dissolved organic carbon (BDOC) concentrations, Water Res, 47, 2421–2430,
https://doi.org/10.1016/j.watres.2013.02.012, 2013.
Logue, J. B., Stedmon, C. a., Kellerman, A. M., Nielsen, N. J., Andersson, A. F., Laudon, H., Lindström, E. S., and Kritzberg, E. S.:
Experimental insights into the importance of aquatic bacterial community composition to the degradation of dissolved organic matter, The
ISME Journal, pp. 1–13, http://www.nature.com/doifinder/10.1038/ismej.2015.131, 2015.15
Lombard, N., Prestat, E., van Elsas, J. D., and Simonet, P.: Soil-specific limitations for access and analysis of soil microbial communities by
metagenomics, https://doi.org/10.1111/j.1574-6941.2011.01140.x, http://www.ncbi.nlm.nih.gov/pubmed/21631545https://academic.oup.
com/femsec/article-lookup/doi/10.1111/j.1574-6941.2011.01140.x, 2011.
Loos, R., Carvalho, R., António, D. C., Comero, S., Locoro, G., Tavazzi, S., Paracchini, B., Ghiani, M., Lettieri, T., Blaha, L.,
Jarosova, B., Voorspoels, S., Servaes, K., Haglund, P., Fick, J., Lindberg, R. H., Schwesig, D., and Gawlik, B. M.: EU-wide mon-20
itoring survey on emerging polar organic contaminants in wastewater treatment plant effluents, Water Research, 47, 6475–6487,
https://doi.org/10.1016/j.watres.2013.08.024, 2013.
López-Serna, R., Postigo, C., Blanco, J., Pérez, S., Ginebreda, A., López De Alda, M., Petrovic, M., Munné, A., Barceló, D., Ginebreda,
A., De Alda, M. L., Petrovic, . M., Barceló, D., Petrovic, M., and Munné, A.: Assessing the effects of tertiary treated wastewater
reuse on the presence emerging contaminants in a Mediterranean river (Llobregat, NE Spain), Environ Sci Pollut Res, 19, 1000–1012,25
https://doi.org/10.1007/s11356-011-0596-z, 2012.
Maeng, S. K., Ameda, E., Sharma, S. K., Grützmacher, G., and Amy, G. L.: Organic micropollutant removal from wastewa-
ter effluent-impacted drinking water sources during bank filtration and artificial recharge, Water Research, 44, 4003–4014,
https://doi.org/http://dx.doi.org/10.1016/j.watres.2010.03.035, http://www.sciencedirect.com/science/article/pii/S004313541000223X,
2010.30
Maeng, S. K., Sharma, S. K., Lekkerkerker-Teunissen, K., and Amy, G. L.: Occurrence and fate of bulk organic mat-
ter and pharmaceutically active compounds in managed aquifer recharge: A review, Water Research, 45, 3015–3033,
https://doi.org/http://dx.doi.org/10.1016/j.watres.2011.02.017, http://www.sciencedirect.com/science/article/pii/S004313541100073X,
2011.
Martín-González, L., Hatijah Mortan, S., Rosell, M., Parladé, E., Martínez-Alonso, M., Gaju, N., Caminal, G., Adrian, L., and35
Marco-Urrea, E.: Stable Carbon Isotope Fractionation During 1,2-Dichloropropane-to-Propene Transformation by an Enrich-
ment Culture Containing Dehalogenimonas Strains and a dcpA Gene, Environmental Science & Technology, 49, 8666–8674,
https://doi.org/10.1021/acs.est.5b00929, http://www.ncbi.nlm.nih.gov/pubmed/26111261, 2015.
14
Hydrol. Earth Syst. Sci. Discuss., https://doi.org/10.5194/hess-2018-174Manuscript under review for journal Hydrol. Earth Syst. Sci.Discussion started: 17 April 2018c© Author(s) 2018. CC BY 4.0 License.

Massmann, G., Dünnbier, U., Heberer, T., and Taute, T.: Behaviour and redox sensitivity of antimicrobial residues during bank filtration– In-
vestigation of residues of phenazone-type analgesics, Chemosphere, 71, 1476–1485, https://doi.org/10.1016/j.chemosphere.2008.06.056,
2008.
Moe, W. M., Yan, J., Nobre, M. F., da Costa, M. S., and Rainey, F. A.: Dehalogenimonas lykanthroporepellens gen. nov., sp. nov., a re-
ductively dehalogenating bacterium isolated from chlorinated solvent-contaminated groundwater, International Journal of Systematic and5
Evolutionary Microbiology, 59, 2692–2697, 2009.
Nadav, I., Arye, G., Tarchitzky, J., and Chen, Y.: Enhanced infiltration regime for treated-wastewater purification in soil aquifer treatment
(SAT), Journal of Hydrology, 420, 275–283, https://doi.org/10.1016/j.jhydrol.2011.12.013, 2012.
Nurk, K., Truu, J., Truu, M., and Mander, Ü.: Microbial Characteristics and Nitrogen Transformation in Planted Soil Filter for Domestic
Wastewater Treatment, Journal of Environmental Science and Health, Part A, 40, 1201–1214, https://doi.org/10.1081/ESE-200055659,10
http://www.tandfonline.com/doi/abs/10.1081/ESE-200055659{#}.V39pvVGAcWQ.mendeley, 2005.
Onesios-Barry, K. M., Berry, D., Proescher, J. B., Ashok Sivakumar, I. K., and Bouwer, E. J.: Removal of pharmaceuticals and per-
sonal care products during water recycling: Microbial community structure and effects of substrate concentration, Applied and Envi-
ronmental Microbiology, 80, 2440–2450, https://doi.org/10.1128/AEM.03693-13, http://www.ncbi.nlm.nih.gov/pubmed/24509919http:
//www.pubmedcentral.nih.gov/articlerender.fcgi?artid=PMC3993184, 2014.15
Pedretti, D., Barahona-Palomo, M., Bolster, D., Sanchez-Vila, X., and Fernàndez-Garcia, D.: A quick and inexpensive method
to quantify spatially variable infiltration capacity for artificial recharge ponds using photographic images, Journal of Hydrol-
ogy, 430–431, 118–126, https://doi.org/http://dx.doi.org/10.1016/j.jhydrol.2012.02.008, http://www.sciencedirect.com/science/article/pii/
S0022169412001060, 2012.
Ragusa, S. R., McNevin, D., Qasem, S., and Mitchell, C.: Indicators of biofilm development and activity in constructed wetlands20
microcosms, Water Research, 38, 2865–2873, https://doi.org/10.1016/j.watres.2004.03.039, http://linkinghub.elsevier.com/retrieve/pii/
S0043135404001757, 2004.
Reed, D. A., Toze, S., and Chang, B.: Spatial and temporal changes in sulphate-reducing groundwater bacterial community structure in re-
sponse to Managed Aquifer Recharge, Water Science & Technology, 57, 789, https://doi.org/10.2166/wst.2008.172, http://wst.iwaponline.
com/cgi/doi/10.2166/wst.2008.172, 2008.25
Regnery, J., Li, D., Roberts, S., Higgins, C., Sharp, J. O., and Drewes, J. E.: Linking Trace Organic Chemical Attenuation to Microbiome
metabolic Capabilities: Insights from Laboratory- and Full-scale Managed Aquifer Recharge Systems, in: ACS Symposium Series, vol. 1,
chap. 2, pp. 163–187, https://doi.org/10.1021/bk-2016-1241.ch011, http://pubs.acs.org/doi/abs/10.1021/bk-2016-1241.ch011, 2016.
Regnery, J., Lee, J., Drumheller, Z. W., Drewes, J. E., Illangasekare, T. H., Kitanidis, P. K., McCray, J. E., and Smits, K. M.: Trace organic
chemical attenuation during managed aquifer recharge: Insights from a variably saturated 2D tank experiment, Journal of Hydrology, 548,30
641–651, https://doi.org/10.1016/j.jhydrol.2017.03.038, 2017.
Rivett, M. O., Buss, S. R., Morgan, P., Smith, J. W. N., and Bemment, C. D.: Nitrate attenuation in groundwater: A review of biogeochemical
controlling processes, Water Research, 42, 4215–4232, https://doi.org/10.1016/j.watres.2008.07.020, 2008.
Rodriguez-Escales, P. and Sanchez-Vila, X.: Fate of sulfamethoxazole in groundwater: Conceptualizing and modeling metabolite formation
under different redox conditions, Water Research, 105, 540–550, https://doi.org/10.1016/j.watres.2016.09.034, 2016.35
Rodriguez-Escales, P., Folch, A., van Breukelen, B. M., Vidal-Gavilan, G., and Sanchez-Vila, X.: Modeling long term Enhanced in situ
Biodenitrification and induced heterogeneity in column experiments under different feeding strategies, Journal of Hydrology, 538, 127–
137, https://doi.org/10.1016/j.jhydrol.2016.04.012, http://linkinghub.elsevier.com/retrieve/pii/S0022169416301937, 2016.
15
Hydrol. Earth Syst. Sci. Discuss., https://doi.org/10.5194/hess-2018-174Manuscript under review for journal Hydrol. Earth Syst. Sci.Discussion started: 17 April 2018c© Author(s) 2018. CC BY 4.0 License.

Rubol, S., Freixa, A., Carles-Brangarí, A., Fernàndez-Garcia, D., Romaní, A. M., and Sanchez-Vila, X.: Connecting bacterial
colonization to physical and biochemical changes in a sand box infiltration experiment, Journal of Hydrology, 517, 317–327,
https://doi.org/http://dx.doi.org/10.1016/j.jhydrol.2014.05.041, http://www.sciencedirect.com/science/article/pii/S0022169414004053,
2014.
Schaffer, M., Kröger, K. F., Nödler, K., Ayora, C., Carrera, J., Hernández, M., and Licha, T.: Influence of a compost layer on the attenuation5
of 28 selected organic micropollutants under realistic soil aquifer treatment conditions: Insights from a large scale column experiment,
Water Research, 74, 110–121, https://doi.org/10.1016/j.watres.2015.02.010, 2015.
Schmidt, C. K., Lange, F. T., and Brauch, H. J.: Characteristics and evaluation of natural attenuation processes for organic micropollutant
removal during riverbank filtration, in: Water Science and Technology: Water Supply, vol. 7, pp. 1–7, https://doi.org/10.2166/ws.2007.060,
2007.10
Sleytr, K., Tietz, A., Langergraber, G., and Haberl, R.: Investigation of bacterial removal during the filtration process in constructed wetlands,
Science of the Total Environment, 380, 173–180, https://doi.org/10.1016/j.scitotenv.2007.03.001, http://linkinghub.elsevier.com/retrieve/
pii/S0048969707003002, 2007.
Stanier, R. Y. and Bazine, G. C.: Phototrophic Prokaryotes: The Cyanobacteria, Annual Review of Microbiology, 31, 225–274,
https://doi.org/10.1146/annurev.mi.31.100177.001301, http://www.annualreviews.org/doi/10.1146/annurev.mi.31.100177.001301, 1977.15
Tietz, A., Kirschner, A., Langergraber, G., Sleytr, K., and Haberl, R.: Characterisation of microbial biocoenosis in vertical subsurface flow
constructed wetlands, Science of the Total Environment, 380, 163–172, https://doi.org/10.1016/j.scitotenv.2006.11.034, http://linkinghub.
elsevier.com/retrieve/pii/S0048969706009107, 2007.
Valhondo, C., Carrera, J., Ayora, C., Barbieri, M., Nödler, K., Licha, T., and Huerta, M.: Behavior of nine selected emerging trace organic
contaminants in an artificial recharge system supplemented with a reactive barrier, Environmental Science and Pollution Research, 21,20
11 832–11 843, 2014.
Valhondo, C., Martinez-Landa, L., Carrera, J., Ayora, C., Nödler, K., and Licha, T.: Evaluation of EOC removal processes during artificial
recharge through a reactive barrier, Science of the Total Environment, 612, 985–994, https://doi.org/10.1016/j.scitotenv.2017.08.054,
http://www.sciencedirect.com.recursos.biblioteca.upc.edu/science/article/pii/S0048969717320521, 2018.
Wang, Z., Dai, Y., Zhao, Q., Li, N., Zhou, Q., and Xie, S.: Nonylphenol biodegradation, functional gene abundance and bacte-25
rial community in bioaugmented sediment: effect of external carbon source, Environmental Science and Pollution Research, 22,
12 083–12 091, https://doi.org/10.1007/s11356-015-4509-4, http://www.ncbi.nlm.nih.gov/pubmed/25874439http://link.springer.com/10.
1007/s11356-015-4509-4, 2015.
Zhang, W., Huan, Y., Liu, D., Wang, H., Jiao, X., Wu, X., and Du, S.: Influences of microbial communities on groundwater component
concentrations during managed artificial recharge, Environmental Earth Sciences, 75, 1–8, https://doi.org/10.1007/s12665-015-4959-5,30
http://link.springer.com/10.1007/s12665-015-4959-5, 2016.
Zhou, Y., Kellermann, C., and Griebler, C.: Spatio-temporal patterns of microbial communities in a hydrologically dynamic pristine aquifer,
FEMS Microbiology Ecology, 81, 230–242, https://doi.org/10.1111/j.1574-6941.2012.01371.x, http://dx.doi.org/10.1111/j.1574-6941.
2012.01371.x, 2012.
16
Hydrol. Earth Syst. Sci. Discuss., https://doi.org/10.5194/hess-2018-174Manuscript under review for journal Hydrol. Earth Syst. Sci.Discussion started: 17 April 2018c© Author(s) 2018. CC BY 4.0 License.

Figure 1. Geographical location of the Llobregat MAR system and location of the established transect (a) Transect section with piezometers
(P1 and P2 are projected) and displaying sampling depths (red diamonds). (b) Blue line shows groundwater level in July 2014 (wet scenario
- recharge) and March 2015 (dry scenario – non-recharge)
17
Hydrol. Earth Syst. Sci. Discuss., https://doi.org/10.5194/hess-2018-174Manuscript under review for journal Hydrol. Earth Syst. Sci.Discussion started: 17 April 2018c© Author(s) 2018. CC BY 4.0 License.

Figure 2. Temperature distribution at the local scale in (a) July 2014 (wet), and (b) March 2015 (dry). Red diamonds indicate sampling points
for microbial and water analysis in each campaign
18
Hydrol. Earth Syst. Sci. Discuss., https://doi.org/10.5194/hess-2018-174Manuscript under review for journal Hydrol. Earth Syst. Sci.Discussion started: 17 April 2018c© Author(s) 2018. CC BY 4.0 License.

Figure 3. Electrical Conductivity distribution at the local scale in (a) July 2014 (wet), and (b) March 2015 (dry)
19
Hydrol. Earth Syst. Sci. Discuss., https://doi.org/10.5194/hess-2018-174Manuscript under review for journal Hydrol. Earth Syst. Sci.Discussion started: 17 April 2018c© Author(s) 2018. CC BY 4.0 License.

Figure 4. Non-metric Multidimensional Scaling clustering for all groundwater samples. Blue squares and triangles represent samples in dry
and wet scenarios, respectively. Colors in triangles represent water types. Black circles correspond to band migration numbers in DGGE gels
that were sequenced (phylogenetic affiliation corresponding to each black circle). Non-sequenced bands are also portrayed (empty circles)
20
Hydrol. Earth Syst. Sci. Discuss., https://doi.org/10.5194/hess-2018-174Manuscript under review for journal Hydrol. Earth Syst. Sci.Discussion started: 17 April 2018c© Author(s) 2018. CC BY 4.0 License.

Figure 5. Average of Shannon Indices in piezometer samples under wet conditions. Standard deviation is shown in error bars. Horizontal
axis reflects the degree of perturbation of original groundwater due to recharge
21
Hydrol. Earth Syst. Sci. Discuss., https://doi.org/10.5194/hess-2018-174Manuscript under review for journal Hydrol. Earth Syst. Sci.Discussion started: 17 April 2018c© Author(s) 2018. CC BY 4.0 License.

Figure 6. DGGE band patterns of bacterial 16S rRNA gene fragments and UPGMA cluster analysis for fingerprints obtained from wet
(July 2014) (a) and dry (March 2015) (b) periods. Bar indicates 9% divergence. Each sample is defined by a code indicating piezometer
number and sampling depth (see table 1). Black triangles indicate position of bands recovered and sequenced, and numbers correspond to
their phylogenetic affiliation (see table S2 supplementary material)
22
Hydrol. Earth Syst. Sci. Discuss., https://doi.org/10.5194/hess-2018-174Manuscript under review for journal Hydrol. Earth Syst. Sci.Discussion started: 17 April 2018c© Author(s) 2018. CC BY 4.0 License.

Figure 7. Bacterial community structure of groundwater samples. Class relative abundances calculated for wet (a) and dry (b) scenarios
23
Hydrol. Earth Syst. Sci. Discuss., https://doi.org/10.5194/hess-2018-174Manuscript under review for journal Hydrol. Earth Syst. Sci.Discussion started: 17 April 2018c© Author(s) 2018. CC BY 4.0 License.

Figure 8. Bacterial community structure of soil samples from pre-sedimentation and infiltration basins. Class relative abundances calculated
for wet (a) and dry (b) scenarios
24
Hydrol. Earth Syst. Sci. Discuss., https://doi.org/10.5194/hess-2018-174Manuscript under review for journal Hydrol. Earth Syst. Sci.Discussion started: 17 April 2018c© Author(s) 2018. CC BY 4.0 License.

Figure 9. Bacterial community structure from water samples of pre-sedimentation and infiltration basins. Class relative abundance calculated
for wet scenario
25
Hydrol. Earth Syst. Sci. Discuss., https://doi.org/10.5194/hess-2018-174Manuscript under review for journal Hydrol. Earth Syst. Sci.Discussion started: 17 April 2018c© Author(s) 2018. CC BY 4.0 License.

Table 1. Summary of values of Shannon, Richness and Evenness indices at the Llobregat MAR site in different scenarios
EnvironmentSampling location Shannnon (SD)* Richness (SD)* E (SD)*
(depth -masl-) WET DRY WET DRY WET DRY
Groundwater
T.I P1(-0.6) 2.57 (0.04) 2.73 22 (4.1) 19 0.61 (0.01) 0.64
T.IIP8(1) 1.43 (0.05) 1.73 10 (2.0) 11 0.34 (0.01) 0.41
P8(-3) 1.69 (0.20) 2.03 (0.14) 11 10 (2.0) 0.40 (0.05) 0.48 (0.03)
T.III
P2(3) 2.29 (0.13) 18.5 (7.2) 0.54 (0.03)
P2(-2) 2.67 (0.13) 18 (2.0) 0.63 (0.03)
P5(2.3) 1.91 (0.01) 2.41 14.5 (1.0) 14 0.45 (1× 10⁻³) 0.56
P5(-2.2) 2.22 (0.01) 12.5 (1.0) 0.52 (2× 10⁻³)
T.IV
P3(0.8) 2.65 (0.09) 2.01 (0.28) 21 10.5 (3.07) 0.63 (0.02) 0.48 (0.07)
P3(-4.2) 2.65 (0.13) 20 0.63 (0.03)
P2(-5) 2.80 (0.12) 23 (4.1) 0.66 (0.12)
P10(-1) 2.51 (0.20) 2.49 (0.09) 17 16 (4.1) 0.59 (0.01) 0.59 (0.02)
Water of basins
Pre-sedimentation 2.93 (0.28) 29 (14.3) 0.69 (0.07)
Infiltration entrance 2.78 (0.53) 28.5 (17.4) 0.66 (0.12)
Infiltration midfield 2.66 (0.14) 25.5 (3.1) 0.63 (0.03)
Infiltration end 2.58 (0.08) 24 (2.0) 0.61 (0.02)
Soil of basins
Pre-sedimentation 2.89 (0.16) 25.5 (7.2) 0.68 (0.04)
Infiltration entrance 3.22 (0.09) 2.93 (0.21) 35.5 (1.0) 25 (7.6) 0.76 (0.02) 0.69 (0.08)
Infiltration midfield 3.36 (0.14) 2.90 (0.05) 30.5 (3.1) 21 0.79 (0.03) 0.68 (0.01)
Infiltration end 3.29 (0.05) 2.40 (0.07) 34 (2.0) 16 0.78 (0.01) 0.57 (0.02)
* Numbers in parenthesis after each index value indicate standard deviation, not reported whenever one replica was damaged.
26
Hydrol. Earth Syst. Sci. Discuss., https://doi.org/10.5194/hess-2018-174Manuscript under review for journal Hydrol. Earth Syst. Sci.Discussion started: 17 April 2018c© Author(s) 2018. CC BY 4.0 License.

Research papers
Monitoring induced denitrification during managed aquifer recharge inan infiltration pond
Alba Grau-Martínez a,⇑, Albert Folch b,c, Clara Torrentó a,d, Cristina Valhondo c,e, Carme Barba b,c,Cristina Domènech a, Albert Soler a, Neus Otero a,f
aGrup de Mineralogia Aplicada i Geoquímica de Fluids, Departament de Mineralogia, Petrologia i Geologia Aplicada, SIMGEO UB-CSIC, Facultat de Ciències de la Terra, Universitatde Barcelona (UB), C/Martí i Franquès, s/n – 08028 Barcelona, SpainbDepartment of Civil and Environmental Engineering (DECA), Universitat Politècnica de Catalunya (UPC), c/Jordi Girona 1-3, 08034 Barcelona, SpaincAssociated Unit: Hydrogeology Group (UPC-CSIC), SpaindCentre for Hydrogeology and Geothermics, University of Neuchâtel, Rue Emile-Argand 11, 2000 Neuchâtel, Switzerlande Institute of Environmental Assessment and Water Research (IDAEA), CSIC, c/Jordi Girona 18, 08034 Barcelona, Spainf Serra Hunter Fellow, Generalitat de Catalunya, Spain
a r t i c l e i n f o
Article history:Received 27 July 2017Received in revised form 16 March 2018Accepted 17 March 2018Available online 28 March 2018This manuscript was handled by ‘‘CorradoCorradini Editor-in-Chief, with theassistance of Jiin-Shuh Jean, Associate Editor
Keywords:Nitrate reductionMulti-isotope analysisReactive layerMixing zoneArtificial rechargeField and laboratory experiments
a b s t r a c t
Managed aquifer recharge (MAR) is a well-known technique for improving water quality and increasinggroundwater resources. Denitrification (i.e. removal of nitrate) can be enhanced during MAR by couplingan artificial recharge pond with a permeable reactive layer (PRL). In this study, we examined the suitabil-ity of a multi-isotope approach for assessing the long-term effectiveness of enhancing denitrification in aPRL containing vegetal compost. Batch laboratory experiments confirmed that the PRL was still able toenhance denitrification two years after its installation in the infiltration pond. At the field scale, changesin redox indicators along a flow path and below the MAR-PRL system were monitored over 21 monthsduring recharge and non-recharge periods. Results showed that the PRL was still releasing non-purgeable dissolved organic carbon five years after its installation. Nitrate concentration coupled withisotopic data collected from the piezometer network at the MAR system indicated that denitrificationwas occurring in the saturated zone immediately beneath the infiltration pond, where recharged waterand native groundwater mix. Furthermore, longer operational periods of the MAR-PRL system increaseddenitrification extent. Multi-isotope analyses are therefore proved to be useful tools in identifying andquantifying denitrification in MAR-PRL systems.
� 2018 Elsevier B.V. All rights reserved.
1. Introduction
Increasing water demands with growing world population andpotential water shortages require flexible management strategiesto replenish aquifers. The artificial recharge of groundwater, com-monly known as managed aquifer recharge (MAR), is becomingincreasingly important all over the world as a sustainable way ofprotecting the quality and quantity of groundwater supplies(Bouwer, 2002; Dillon, 2004; Sprenger et al., 2017). Rechargeponds are one of the most commonly used approaches for MAR.This approach involves surface infiltration through spreading
basins or ponds to introduce surface water into the subsurfaceenvironment (Bouwer, 2002; Miller et al., 2006).
Common sources of water for MAR in recharge ponds includewastewater effluents (after different stages of treatment) andeffluent-receiving rivers (Díaz-Cruz and Barceló, 2008; Maenget al., 2011), as well as river water and storm water runoff. Thesesources of water, mainly those from wastewater treatment plants(WWTPs), might contain high levels of ammonium (NH4
+), whereasthose resulting from agricultural activity might have high concen-trations of nitrate (NO3
–) (Schmidt et al., 2011). Furthermore, oxicconditions promote ammonium nitrification, transforming it tonitrate.
The chemical composition of the infiltrating water in MARchanges due to a combination of physical and biogeochemical pro-cesses as the water passes from unsaturated to saturated zones,where it mixes with native groundwater. In some circumstances,these changes can lead to an overall improvement in groundwater
https://doi.org/10.1016/j.jhydrol.2018.03.0440022-1694/� 2018 Elsevier B.V. All rights reserved.
⇑ Corresponding author.E-mail addresses: [email protected] (A. Grau-Martínez), albert.folch.sancho@upc.
edu (A. Folch), [email protected], [email protected] (C. Torrentó),[email protected] (C. Valhondo), [email protected] (C. Barba),[email protected] (C. Domènech), [email protected] (A. Soler),[email protected] (N. Otero).
Journal of Hydrology 561 (2018) 123–135
Contents lists available at ScienceDirect
Journal of Hydrology
journal homepage: www.elsevier .com/ locate / jhydrol

quality (Bouwer, 2002; Fox et al., 2006). Several studies havedemonstrated that artificial recharge reduces the concentrationof nutrients (Bekele et al., 2011), organic matter (Bekele et al.,2011; Vanderzalm et al., 2006), metals (Dillon et al., 2006; Bekeleet al., 2011), pathogens (Dillon et al., 2006), organic contaminants(Dillon et al., 2006; Patterson et al., 2011) and pharmaceuticallyactive compounds (PhACs) (Heberer et al. (2004); Valhondo et al.,2014, 2015). Massmann et al. (2006), investigated changes in redoxconditions below an artificial recharge pond in Berlin, and foundthat the level of PhACs in groundwater was controlled by the tran-sient hydraulic and hydrochemical conditions during artificialrecharge. Thus, to increase the quality of recharge water andgroundwater, the infiltration pond can be coupled to a permeablereactive layer (PRL), an organic reactive layer at the bottom ofthe pond (Valhondo et al., 2014, 2015, 2016) that promotes diverseredox conditions along the recharge path to enhance the degrada-tion of pollutants.
NO3– is one of the most abundant pollutants in groundwater
(Menció et al., 2016). Denitrification, a microbe-mediated processin which NO3
– is converted into dinitrogen gas (N2), is the main nat-urally occurring process that decreases NO3
– concentration ingroundwater. Dilution and dispersion also decrease groundwaternitrate concentration, but in contrast to denitrification, they donot lead to mass reduction of the contaminant within an aquifer.Denitrification is carried out by bacteria that use NO3
– as the termi-nal electron acceptor when dissolved oxygen (DO), which is ener-getically more favorable, is unavailable (Knowles, 1982).Denitrification can be heterotrophic or autotrophic, depending onwhether the substrate is organic or inorganic, respectively (Eqs.(1) and (2)).
5CH2Oþ 4NO�3 þ 4Hþ ! 2N2 þ 5CO2 þ 7H2O ð1Þ
5FeS2 þ 14NO�3 þ 4Hþ ! 7N2 þ 10SO2�
4 þ 5Fe2þ þ 2H2O ð2ÞDenitrification can be enhanced in MAR-PRL pond systems,
since adequate residence time and the presence of easily degrad-able organic carbon promote the activity of heterotrophic denitri-fying bacteria. Recent laboratory studies (Grau-Martínez et al.,2017; Gibert et al., 2008) have suggested that low-cost carbon-releasing materials like organic compost, palm tree leaves andwood by-products could induce denitrification. Promoting denitri-fication by using a reactive layer in a recharge pond requires con-trol mechanisms to test the efficacy of the implemented materialsat the field scale.
Multi-isotope analysis, coupled with chemical data, is useful foridentifying and even quantifying denitrification processes in aqui-fers (Mariotti et al., 1988; Aravena and Robertson, 1998; Pauwelset al., 2000; among others). Denitrification affects the isotope com-position of the residual nitrate, resulting in increased levels of theheavy isotopes 15N and 18O (Mariotti et al., 1988; Aravena andRobertson, 1998; Fukada et al., 2003; Kendall et al., 2007). Thischange in isotope composition, or isotope fractionation (e), distin-guishes denitrification at the field scale from other processes suchas dilution, which can also decrease NO3
– concentration, but with-out changing its isotopic value (Clark and Fritz, 1997; Kendallet al., 2007).
Isotopic studies coupled with chemical data are an effective toolto identify and describe denitrification (Aravena and Robertson,1998; Pauwels et al., 1998, 2000, 2010; Kendall et al., 2007;Otero et al., 2009; among others). Furthermore, multi-isotopicstudies of the solutes involved in denitrification reactions, suchas d34S and d18O of dissolved sulfate and d13C of dissolved inorganiccarbon, can help determining whether denitrification is promotedby heterotrophic or autotrophic bacteria and identifying the occur-rence of secondary processes such as SO4
2- reduction (Mariotti et al.,
1988). Schmidt et al. (2011), Schmidt et al. (2012) used nitrate iso-tope ratios to demonstrate the occurrence of denitrification in theinfiltrating water during its passage through the first meter of thesoil beneath the base of a MAR pond in central coastal California.
In the present work, we monitored denitrification processes in aMAR-PRL system located at Sant Vicenç dels Horts, Barcelona,Spain (Valhondo et al., 2014, 2015, 2016, 2018), which has a layerof vegetal compost at the bottom of the infiltration pond. The aimof the present study is to test the usefulness of a combined isotopeanalysis and depth specific hydrochemical data to: (i) assess thelong-term effectiveness of the reactive layer in promoting denitri-fication 5 years after its installation; (ii) identify the denitrificationprocesses occurring at different aquifer depths and locations alongthe saturated zone below the infiltration pond (including the mix-ing zone between recharge and native groundwater). The methodstested here can be applied in other sites to assess the efficacy ofMAR ponds coupled to reactive layer PRL in promotingdenitrification.
2. Materials and methods
2.1. Study site description
The field site studied is located 15 km inland from the Mediter-ranean coast, in the lower valley of the Llobregat Delta (Catalonia,NE Spain). This area is characterized by a Mediterranean climate,with average annual precipitation around 590 mm. Precipitationis scarce in winter and summer (monthly average of 37 mm) andmore frequent during spring (monthly average of 41 mm) andespecially autumn (monthly average 77 mm). The aquifer consistsof Quaternary alluvial sediments, mainly coarse gravel and sandwith small clay lenses (Iribar et al., 1997). The minerals presentinclude quartz, calcite and dolomite, and the solid phase fractionof organic carbon is less than 0.002 (gOC/gsoil) (Barbieri et al.,2011). At this location, the aquifer extends to a depth of 23 to27 m underground (Valhondo et al., 2014) and is located between5 and 10 m below the Llobregat river bed, the river and aquiferthus being hydraulically disconnected (Vàzquez-Suñé et al.,2007). The regional groundwater flow direction is from NNW toSSE (Quevauviller et al., 2009), with a natural hydraulic gradientof 2.3‰. Previous pumping tests determined the hydraulic param-eters to be 1.4 � 104 m2 day�1 for transmissivity and 0.03 for stor-age coefficient (Barahona-Palomo et al., 2011).
Groundwater is artificially recharged by infiltrating water fromthe Llobregat River via a system of pipes and ponds. The riverwater is collected approximately 2 km upstream of the MAR sys-tem (Molins de Rei inlet) and flows by gravity through a concretepipe to a decantation pond (�4000 m2). By the time the riverreaches the capture point, it has received treated water from morethan 50 wastewater treatment plants (Köck-Schulmeyer et al.,2011). In the decantation pond, the sediments are allowed to settlefor approximately 2–4 days before the water is transferred by aconcrete pipe to an infiltration pond (�5000 m2) (Fig. 1). The infil-tration rate in the infiltration pond ranges from 0.5 to 2 m d�1,whereas insignificant water infiltration occurs in the decantationpond (Valhondo et al., 2014).
A reactive layer was installed at the bottom of the infiltrationpond in 2011 to create favorable conditions for the biodegradationof the contaminants present in the infiltration water. The reactivelayer (�65 cm thick) consists of aquifer sand (49.5% in volume),vegetal compost from gardens and scrap wood (49.5%), clay(�1%) and iron oxide dust (�0.1%). The components were mixedon site with an excavator until homogeneity was visually evident.The layer was covered with approximately 5 cm of sand to preventthe woody material from floating away. The compost in the
124 A. Grau-Martínez et al. / Journal of Hydrology 561 (2018) 123–135

reactive layer was added to promote microbial growth and redoxconditions by providing organic matter to the infiltration water.The sand was added to provide structural integrity to the layerand guarantee high hydraulic conductivity. Finally, iron oxidesand clay, consisting mainly of illite (33 wt%), smectite (16 wt%)and chlorite (9 wt%), were present to provide extra sorption capac-ity for cationic and anionic contaminants (Valhondo et al., 2014).
The MAR pond undergoes two main operational periods: (1)recharge periods (RPs), with continuous flow from the river tothe pond (infiltration water is mainly river water with less than1.5% contribution from precipitation on average) and (2) non-recharge periods (NRPs), when the pond is dried for operationalredevelopment and/or when the infiltration is stopped becausethe quality of the river water is low. During recharge periods, total
saturation conditions are not obtained (Valhondo et al., 2015,2016).
NRPs are implemented when the control parameters of the infil-tration water are exceeded, such as when NH4
+ concentrations arehigher than 1.5 mg L�1, electrical conductivity (EC) is higher than2000 lS cm�1, river turbidity is greater than 100 NTU and inputwater turbidity exceeds 25 NTU. NRPs are also implemented whenthe clogged layer needs to be removed or the upper layer of sandhas to be cleaned. During NRPs, the groundwater table declinesand the bottom of the pond is exposed to the atmosphere.
A piezometric network consisting of seven piezometers wasinstalled around the recharge MAR system (Fig. 1). Piezometer P1(screened from 6 to 24 m) is located upstream of the infiltrationpond and was used to monitor background groundwater. P3
Decantationpond
P1
P3
P8 P2
P5
P9P10
N
0 100 500 m
A
A’
A A’
0 500 mD e c a n t a t i o n p o n d I n f i l t r a t i o n p o n d
7
4
-2.3
1.8
3.1
-1.8
-4.9
6.7
2.2 2.5
G r o u n d w a t e r f l o w
-0.4
-3.6 -3.0
0123456
4
-0.8
-2.1
3.4
-2.1
-6.1
-1.1
Gravels and some pebbles with siltysandly matrix
Red clay (aquitard)
Polygenic gravel with coarse sandy matrix Bedrock
P1 P3 P8 P2 P5 P9 P10
Depth (masl)
-1-2-3-4-5-6-7-8-9
7.8
-5.1
Fig. 1. Upper panel: Schematic location and plan view of the Sant Vicenç dels Horts recharge system. Lower panel: Cross-section of the transect A–A’. The red diamonds showthe sampling depths. (For interpretation of the references to colour in this figure legend, the reader is referred to the web version of this article.)
A. Grau-Martínez et al. / Journal of Hydrology 561 (2018) 123–135 125

(screened from 5 to 23 m) is located upstream of the infiltrationpond, between the decantation and infiltration ponds, while P8 islocated in the middle of the infiltration pond and is composed ofthree piezometers screened at different depths (P8.1 from 13 to15 m, P8.2 from 10 to 12 m and P8.3 from 7 to 9 m). P8.3 was usedto evaluate the behavior of the infiltration water through thevadose zone, while P8.1 was used to monitor the recharge at thedeepest point of the saturated zone. P2 (completely screened from6 to 24 m) and P5 (screened from 5 to 21 m) are situated down-stream, at the edge of the infiltration pond. Additionally, P9(screened from 9 to 24 m) and P10 (screened from 6 to 20 m) arelocated 190 m and 200 m downstream of the infiltration pond,respectively. Therefore, all the monitoring points, except P1 (nativegroundwater) and P8.3 (infiltration water just after crossing thevadose zone), represent different ratios of recharge water to nativegroundwater in the aquifer at different travel times. Travel time ofthe infiltration water from the pond to the piezometers is around18 to 24 h for P8.3, nearly 2 days for P2 and P5, 10 days for P10and P8.1, and more than 20 days for P9 (Valhondo et al., 2014,2016).
2.2. Sampling surveys
To assess the long-term effectiveness of the PRL, four samplingcampaigns were performed using the seven piezometers (Fig. 1) toevaluate nitrate removal under different operational conditions inJune 2013, September 2013, July 2014 and March 2015. The mon-itored period started 5 years after the installation of the PRL. TheJune 2013 and July 2014 campaigns were performed during RPs,and the other two during NRPs. Fig. 2 shows the distribution alongtime of the operational periods and the sampling campaigns. Thesystem was under RPs for a total of 222 days in 2013 and 213 daysin 2014. In 2015, before the March 2015 campaign, the system wasunder NRPs for almost four months, whereas only two months ofnon-recharge had occurred before the September 2013 campaign.
Sampling was carried out using depth-specific samplers (bail-ers). Bailers are considered suitable for measuring groundwaternitrate concentration (Lasagna and De Luca, 2016). Each piezome-ter was sampled at three different depths (Fig. 1), which wereselected according to the stratigraphic profiles. A layer with hightransmissivity was identified in the middle depth of all the
piezometers. This layer is composed of polygenic gravel andlarge-sized gravel with medium fine sandy matrix. Although somesampling protocols (ENSAT, 2012) do not deem it necessary topurge piezometers in aquifers with high transmissivity such as thatof Sant Vicenç dels Horts (1.4 � 104 m2 day�1), we still purged thepiezometers prior to sampling by removing well water three timesat each specific depth. During the four sampling campaigns, sam-ples from the Llobregat River were also collected, sometimes morethan once on the same day.
Physicochemical parameters (pH, temperature (T) and EC) weremeasured in situ, using a Multi 3410 multi-parameter (WTW,Weil-heim, Germany). Samples for measuring major cations were fil-tered through 0.2-mm Millipore� filters, preserved by theaddition of 1% HNO3
– and stored in polyethylene bottles at 4 �C untilanalysis. Samples for the analysis of major anions (Cl-, NO3
–, NO2–
and SO42�) and isotope ratios (d15NNO3, d18ONO3, d34SSO4, d18OSO4
and d13CHCO3) were filtered through 0.2-mm Millipore� filters andstored in polyethylene bottles. Samples for measuring NO3
– iso-topes were kept frozen until analysis, while those for d18OH2O
and d2HH2O measurements were collected in glass flasks and fil-tered through 0.45-mm Millipore� filters. For isotope analyses,samples were taken only from the middle depth of each piezome-ter. Samples for the analysis of non-purgeable dissolved organiccarbon (NPDOC) were collected in muffled (450 �C, 4.5 h) glass bot-tles, filtered through 0.45-mm Millipore� filters, acidified to pH 3with hydrochloric acid and stored at 4 �C until analysis. To measuredissolved inorganic carbon (DIC), samples were collected in glassbottles, filtered through 0.45-mm Millipore� filters and analyzedwithin a day.
2.3. Laboratory experiments
Batch experiments were performed with material extracted in2013 from the PRL of the MAR pond system. The substrate wasused within a few hours after extraction without any pre-treatment. Experiments were performed in triplicate, using 20 gof the PRL material and 400 mL of groundwater from the Llobregataquifer (from P2) spiked with 0.80 mM of NO3
– to evaluate the den-itrification potential of the vegetal compost. The experiments wererun in sterilized 500-mL glass bottles previously purged with N2
for 15 min in a glove box in an argon atmosphere to minimize
Fig. 2. Operational periods of the Sant Vicenç dels Horts MAR-PRL system between January 2013 and May 2015: recharge periods (RPs, blue) and non-recharge periods (NRPs,grey). The four sampling campaigns are also shown (red bars). (For interpretation of the references to colour in this figure legend, the reader is referred to the web version ofthis article.)
126 A. Grau-Martínez et al. / Journal of Hydrology 561 (2018) 123–135

the O2 level. Experimental oxygen partial pressure in the glove boxwas maintained between 0.1 and 0.3% O2 and continuously moni-tored using an oxygen partial pressure detector (Sensotran, Gasvi-sor 6) with an accuracy of ±0.1% O2. Batch experiments weremanually shaken once a day and aqueous samples (5 mL) were col-lected daily using sterilized syringes. A ratio of solution/solid mate-rial at 90% of the initial value was maintained.
The experiments were performed to check the reactivity of theextracted material and also to estimate the isotopic fractionation(Ɛ) of N and O.
The NO3– pseudo-first order degradation rate constants (k’) were
calculated using Eq. (3), where C0 and Ct are the initial NO3– concen-
tration and the NO3– concentration at time t, respectively.
Ct ¼ C0e�kt ð3ÞIsotopic fractionation during denitrification can be expressed as
a Rayleigh distillation process Eq. (4), from which the isotopic frac-tionation factor (a) can be obtained (Mariotti et al., 1988; Aravenaand Robertson, 1998).
lnRt
R0
� �¼ ða� 1Þln Ct
C0
� �ð4Þ
where C0 and Ct are the initial and residual NO3– concentration,
respectively (mmol L�1), and Ro and Rt denote the ratios of heavyto light isotopes at the initial time and time t, respectively, whichare calculated according to Eq. (5).
R ¼ d1000
� �þ 1
� �ð5Þ
where d is the isotopic composition of d15Ν and d18O (‰). The term(a -1) was calculated from the slope of the regression line in thedouble-logarithmic plots [ln(Rt/R0)] vs. [ln(Ct/C0)], according to Eq.(5), and converted into isotope fractionation (eN and eO) followingEq. (6).
e ¼ 1000� ða� 1Þ ð6ÞThe Rayleigh equation applies to closed system conditions;
therefore, isotopic fractionation is commonly calculated in labora-tory experiments where conditions are wells constrained, no othersinks affect the NO3
– pool and the concentration and isotopic com-position of NO3
– can be considered exclusively determined by NO3–
reduction.
2.4. Analytical methods
Concentrations of major anions (Cl-, NO2–, NO3
–, and SO42�) were
determined by high performance liquid chromatography (HPLC)using a WATERS 515 HPLC pump, an IC-PAC anions column and aWATERS 432 detector. Cation concentrations were determined byinductively coupled plasma-optical emission spectrometry (ICP-OES, Perkin-Elmer Optima 3200 RL). NPDOC was measured byorganic matter combustion using a MULTI N/C 3100 Analytik Jenacarbon analyzer. DIC concentrations were analyzed by titration(METROHM 702 SM Titrino). Chemical analyses were conductedat the ‘‘Centres Científics i Tecnològics” of the University of Barce-lona (CCiT-UB).
The d15N and d18O of dissolved NO3– weremeasured using amod-
ified cadmium reduction method of McIlvin and Altabet (2005) andRyabenko et al. (2009). Briefly, NO3
– was converted into nitritethrough a spongy cadmium reduction and then to nitrous oxideusing sodium azide in an acetic acid buffer. Simultaneous d15Nand d18O analysis of the N2O produced was carried out with aPreCon system (Thermo Scientific) coupled to a FinniganMAT-253 Isotope Ratio Mass Spectrometer (IRMS, Thermo Scien-tific). For d34S and d18O analyses, dissolved SO4
2� was precipitated
as BaSO4 by adding BaCl2 after acidifying the sample with HCl andboiling it to prevent BaCO3 precipitation, following standardmethods (Dogramaci et al., 2001). d34S was analyzed with a CarloErba elemental analyzer (EA)-Finnigan Delta C IRMS, while d18Owas analyzed in duplicate with a ThermoQuest high temperatureconversion EA (TC/EA) coupled in continuous flow with a FinniganMAT Delta C IRMS. For d13CDIC analysis, carbonates were precipi-tated by adding a NaOH-BaCl2 solution and isotope ratio was mea-sured on a Gas-Bench II-MAT-253 IRMS (Thermo Scientific). d2HH2O
and d18OH2O were analyzed by Wavelength-Scanned Cavity Ring-down Spectroscopy (WS-CRDS) using L2120-i Picarro�. Total C,total N, d15N and d13C from the PRL material were measured usingCarbo Erba EA-Finnigan Delta C IRMS. Isotope ratios were calcu-lated using both international and internal laboratory standards.Notation was expressed in terms of d relative to the internationalstandards (V-SMOW for d18O and d2H, atmospheric N2 for d15N,V-CDT for d34S and V-PDB for d13C). The reproducibility of the sam-ples was ±1‰ for the d15N of NO3, ±1.5‰ for the d18O of NO3
–, ±0.2‰for the d34S of SO4
2-, ±0.5‰ for the d18O of SO42-, ±0.2‰ for the d13C of
DIC, ±0.2‰ for the d18O of H2O and ±1‰ for the d2H of H2O. Samplesfor isotopic analyses were prepared at the ‘‘Mineralogia Aplicada iGeoquímica de Fluids” laboratory and analyzed at CCiT-UB, exceptwater isotopes, which were analyzed at the University of Málaga.
3. Results and discussion
3.1. Laboratory experiments
Total N and C content as well as the d15N and d13C of the reac-tive layer material are shown in the Supplementary Material(Table S1). Results of the chemical and isotopic characterizationof the batch experiments are detailed in the Supplementary Mate-rial (Table S2).
Complete NO3– reduction was achieved within eleven days in the
batch experiments (Fig. 3), with a slight transient increase in NO2–
concentration (up to 0.07 mM). Nitrate reduction in previous batchexperiments performed with fresh commercial compost wasaccompanied by a significant initial release of NO3
– (up to 2.5mM) and transient NO2
– production (up to 0.12 mM) (Grau-Martínez et al., 2017). By comparison, the compost used in the pre-sent batch experiments, extracted from the PRL two years after itsinstallation, did not release NO3
– and produced a lower increase inNO2
– concentration.Denitrification in both sets of batch experiments followed
pseudo-first-order kinetics and an initial lag phase of 6–7 dayswith a lower degradation rate was observed. The observed k’ val-ues were 0.21 ± 0.01 and 0.83 ± 0.06 d�1 with the PRL materialand 0.17 ± 0.02 and 0.67 ± 0.01 d�1 with the fresh compost forthe lag and main phases, respectively. Although highly similar,degradation rates were slightly higher for the PRL material thanfor the fresh compost. These results demonstrated that the com-post from the PRL still had denitrification potential two years afterits installation.
The isotopic fractionations obtained were �10.4‰ for eN and�13.8‰ for eO, with a eN/eO ratio of 0.75 (Fig. 4a and b). The eNand eO values obtained in this studywere similar to those from pre-vious laboratory experiments using fresh commercial compost (eN= �10.8‰ and eO = �9.0‰ Grau-Martínez et al., 2017), also fallingwithin the range of laboratory values for heterotrophic denitrifica-tion reported in the literature (from-8.6‰ to -16.2‰ foreNand from�4‰ to �13.8‰ for eO (Knöller et al., 2011; Carrey et al., 2013)).
The obtained C and N isotope fractionations associated withdenitrification induced by the two-year-old PRL material enablesa more accurate quantification of the enhanced reduction in NO3
–
levels in the aquifer.
A. Grau-Martínez et al. / Journal of Hydrology 561 (2018) 123–135 127

3.2. Field study
3.2.1. Hydrochemical characterisationResults of the chemical characterization of the field samples are
detailed in the Supplementary Material (Table S3). For all theanalyzed samples, pH values ranged between 6.98 and 7.60,HCO3
– concentrations between 223 and 408 mg L�1 and EC from991 to 1653 lS cm�1. There were no significant differences in theconcentrations of major cations between the piezometers amongthe four sampling campaigns.
Groundwater underneath the infiltration pond can be consid-ered a mixture of recharge water and native groundwater. Samplesclustered in the HCO3-Cl-Ca-Na hydrochemical facies, withnegligible differences among the sampling campaigns (Fig. S1).
3.2.2. Sources of groundwater rechargeResults of the isotopic characterization of the field samples are
detailed in the Supplementary Material (Table S4). d2H and d18O
values of the infiltration water (river water) and groundwater sam-pled during RPs (June 2013 and July 2014) mostly plotted along theLocal Meteoric Water Line (LMWL) (Fig. 5). The LMWL was calcu-lated with data from the Global Network of Isotopes in Precipita-tion (GNIP) obtained from stations 0,818,001 and 0,818,002 inBarcelona (IAEA/WMO, 2017). Isotope ratios are lower than theweighted mean long-term isotopic composition of precipitationin Barcelona (d2H = �31.16‰, d18O = �5.3‰), but in agreementwith the values obtained with the surface water of the Lowerend of the Llobregat River (Otero et al., 2008) and samples fromthe Llobregat aquifer (Solà, 2009). The results confirmed that riverwater is the main source of recharge in the aquifer and indicatethat evaporation is not an important process in the pond and/orthe unsaturated zone. Lastly, the range of d2H and d18O valuesshowed that only one recharge flow system is involved in the aqui-fer recharge. Accordingly, Valhondo et al. (2015) using electricalconductivity and 1,1,2-trichloroethane content as tracers, esti-mated the contribution of the infiltration water on the monitoring
A
B
Fig. 3. Changes in NO3– (A) and NO2
– (B) concentrations over time in the batch experiments with compost extracted from the PRL (two-year-old reactive layer). Results ofprevious batch experiments with fresh commercial compost (Grau-Martínez et al., 2017) are also shown for comparison. Values and error bars represent the mean andstandard deviation, respectively, for the experiments performed in triplicate.
128 A. Grau-Martínez et al. / Journal of Hydrology 561 (2018) 123–135

points and showed that samples collected in P2, P5, P8.3 and P10comprised primarily infiltrated water, whereas wells P8.2, P8.1and P9 displayed a mixture of infiltration water and local ground-water (P1), although the concentrations were closer to the infiltra-tion water composition.
3.3. Changes in redox sensitive indicators
The evolution of the concentration of NO3– and NPDOC in the
saturated zone along the flow path, during both RPs and NRPs, isshown in Fig.6. The results of major anions (Cl�, SO4
2�, HCO3–) are
shown in the Supplementary Material (Fig. S2).For assessing the effect of MAR, the chemical composition of
groundwater collected upstream of the infiltration pond (P1, whichrepresents native groundwater not affected by the recharge) wascompared to that of the piezometers affected by recharge water.The concentrations of major anions in P1 samples remained almostconstantwithdepth and time (Fig. S2). The influenceof riverwater isclearly observed in the piezometers located closer to the infiltrationpond (P8, P2 and P5) during RP and to a lesser extent during NRPs.Piezometers located furthest from the infiltration pond (P9 andP10) are less influenced by river water chemistry. Overall, no signif-icant changes with depth were observed during both RP and NRPs.
NPDOC concentrations at the piezometers downstream of theinfiltration pond generally ranged between those for nativegroundwater and those for river water (Fig.6) during both RP andNRP, being generally lower during NRPs. Higher NPDOC concentra-tions were detected in some samples (e.g. P2 in July 2014, P3 andP8 in September 2013, P8 in March 2015). These results suggestthat the reactive layer was still releasing NPDOC five years afterinstallation. Average higher NPDOC concentration was detectedin September 2013 (two months of non-recharge before sampling)than in March 2015 (four months of non-recharge before sam-pling), indicating that the duration of recharge conditions had asignificant effect.
NO3– concentration (measured as mg of NO3
– L�1) in nativegroundwater (P1) ranged from 4.2 to 9.8 mg L�1 with a medianvalue of 5.6 (Table S3). Additional river water data show NO3
– con-tents between 4.5 and 17.4 mg L�1 (Table S5). It should be notedthat NO3
– and NH4+ concentrations vary considerably in rivers with
effluents from WWTPs, even among samples collected on the sameday. During the RPs a significant decrease in NO3
– concentrationwas observed in the piezometers located close to the infiltrationpond (P2 and P5), especially in the June 2013 sampling, whichshowed complete NO3
– reduction at some depths highlighting theability of the MAR-PRL system to enhance nitrate reduction(Fig. 6). During the July 2014 RP, a decrease in NO3
– concentrationwas also observed downstream of the pond but to a lesser extent.During NRPs, NO3
– concentrations at the downstream piezometerswere generally within native groundwater and river water sam-ples, although slightly lower NO3
– concentrations were seldomdetected suggesting that NO3
– reduction was maintained to someextent.
Fe concentrations in samples downstream of the infiltrationpond were generally lower than that in the native groundwater(P1) (Table S3). No significant variations between the samplingcampaigns were observed (values ranged from 0.2 to 1.0 mM),except for an important increase at P5 during the June 2013 RP(up to 3.7 mM) probably arising from more reducing conditionsoccurring. The solubility of Fe(III)-oxyhydroxides, which usuallyaffects Fe concentration in groundwater, increases under morereducing conditions, thereby increasing aqueous Fe concentration.
Overall, the observed changes in redox indicators suggestedthat the PRL installed in 2011 was still releasing organic matterand promoting reducing conditions to varying extents below theinfiltration pond.
εΟ (Grau-Martínez et al., 2017) = -9.0‰R² = 0.88
εΟ (this study) = -13.8‰R² = 0.96
-0.01
0.01
0.03
0.04
0.06
-5.0 -4.0 -3.0 -2.0 -1.0 0.0
Ln(R
t/R0)
Ln(Ct/C0)
δ18Ο-NO3 CCC (Grau-Martínez et al., 2017)
δ18O-NO3 CCB (Grau-Martínez et al., 2017)
δ18Ο-NO3 (this study)
δ18ONO3
δ18ONO3
δ18ONO3
A
B
εΝ (Grau-Martínez et al., 2017) = -10.8‰R² = 0.76
εΝ (this study)= -10.4‰ R² = 0.98
-0.01
0.01
0.03
0.04
0.06
-5.0 -4.0 -3.0 -2.0 -1.0 0.0
Ln(R
t/R0)
Ln(Ct/C0)
δ15N-NO3 CCC (Grau-Martínez et al. ,2017)
δ15N-NO3 CCB (Grau-Martínez et al., 2017)
δ15N-NO3 (this study)
δ15NNO3
δ15NNO3
δ15NNO3
Fig. 4. N (A) and O (B) isotope results of the batch experiments performed with thetwo-year-old PRL material. Slopes of the regression lines represent (a-1) for N andO. Results of previous batch experiments with fresh commercial compost (Grau-Martínez et al., 2017) are also shown for comparison.
-70
-60
-50
-40
-30
-20
-10-10 -8 -6 -4 -2
δ2 H-H
2O (‰
)
δ18O-H2O (‰)
River June2013River July2014Mixed GWJune 2013Mixed GWJuly 2014Native GWJune 2013Native GWJuly 2014LMWLWMPLlobregataquifer GWLB 98-99
Fig. 5. d18O-H2O vs. d2H-H2O of samples collected in June 2013 (RP) and July 2014(RP) from the Llobregat River, native groundwater (P1) and mixed groundwater (allthe piezometers, except P1). The Local Meteoric Water Line (LMWL) and weightedmean precipitation (WMP) are also shown, as well as the groundwater samplesfrom the Llobregat aquifer collected in an area close to the MAR pond (‘‘Llobregataquifer”, Solà, 2009) and Llobregat river samples collected in 1998–1999 (‘‘LB”,Otero et al., 2008).
A. Grau-Martínez et al. / Journal of Hydrology 561 (2018) 123–135 129

3.4. Denitrification during artificial recharge
Nitrate isotope composition was measured in a subset of thesesamples based on NO3
– concentrations (Table S4). Fig. 7 shows thed15NNO3 and d18ONO3 values of dissolved nitrate at the piezometers,as well as the isotope composition of the main potential sources ofnitrate: nitrate fertilizers, ammonium fertilizers, soil nitrate andanimal manure or sewage (Vitòria et al., 2004; Kendall et al.,2007; Xue et al., 2009). The range of d18O of NO3
– for ammoniumfertilizers, soil nitrogen and manure/sewage plotted in Fig. 7(+1.93‰ to + 3.13‰) was estimated according to Eq. (7)(Anderson and Hooper, 1983; Kendall et al., 2007), whered18OH2O corresponds to the range measured in Sant Vicenç delsHorts groundwater samples and d18OO2 to atmospheric O2
(+23.5‰ Horibe et al., 1973).
d18ONO3 ¼ 23ðd18OH2OÞ þ 1
3ðd18OO2Þ ð7Þ
Native groundwater (P1) showed d15N and d18O values rangingfrom +13.0 to +17.5‰ and from +2.8 to +9.7‰, respectively. Thenitrate isotope ratios of the samples from the piezometers locateddownstream of the pond ranged from +9.5 to +26.7‰ (averaging+18.4‰) for d15N and from +3.5 to +16.6‰ (averaging + 9.5‰) ford18O (Table S4). All samples presented isotope ratios compatiblewith those for soil organic nitrogen and sewage/manure.The mixed groundwater samples showed a positive correlation
(r2 = 0.55) between d15NNO3 and d18ONO3 and were aligned follow-ing a eN/eO ratio of 1.5 (Fig. 7), which is consistent with denitrifi-cation (Kendall et al., 2007). The eN/eO ratio reported in theliterature for denitrification in groundwater ranges from 1.3 to2.1 (Böttcher et al., 1990; Cey et al., 1999; Mengis et al., 1999;DeVito et al., 2000; Lehmann et al., 2003; Fukada et al., 2003).
Most samples collected during the RPs followed the denitrifica-tion trend, with higher d15NNO3 and d18ONO3 during the July 2014sampling. During NRPs also a different behavior was observed inthe two surveys, with lower isotopic values in March 2015 andhigh values in the September 2013 sampling. However, it shouldbe noted that in both September 2013 and July 2014 samplings,high d15N and d18O values were also measured in river water.The high variability of NO3
– contents in river water samples evenon the same day (Table S5) could explain the particularly high iso-tope ratios measured in September 2013 and July 2014. Accord-ingly, Sine (2017) reported that NO3
– isotopes values in a highlyimpacted river are not conservative, even when NO3
– contents donot change. These authors studied the Grand River (south westernOntario, Canada), which receives high NO3
– loading from point(urban WWTPs) and non-point sources (agricultural manure andfertilizer) and suggested that river metabolism influences rapidisotopic changes.
eN and eO values allow quantifying at field scale NO3– losses due
to denitrification independently of dilution effects on NO3– concen-
trations (Mariotti et al., 1981; Böttcher et al., 1990; Fukada et al.,
-200 -100 0 100 200 300-30
-25
-20
-15
-10
-5
0
-200 -100 0 100 200 300
Dep
th (m
)
June 2013 RP
NPDOC (mg/L) NO3 (mg/L)
-30
-25
-20
-15
-10
-5
0
-200 -100 0 100 200 300
Dep
th (m
)
July 2014 RP
-200 -100 0 100 200 300
Distance (m)
March 2015 NRP
September 2013 NRP
A B
C D
Distance (m)
P1 P3 P8 P2 P5 P9 P10
river
P1 P3 P8 P2 P5 P9 P10
river
P1 P3 P8 P2 P5 P9 P10
river
P1 P3 P8 P2 P5 P9 P10
river
Fig. 6. Changes in the concentration of NPDOC and NO3– in depth-specific groundwater samples along the flow path under both RPs (a, c) and NRPs (b, d). Values for the
Llobregat river samples are also shown. The size of the symbols is proportional to the corresponding concentration value. Concentrations ranged from 0.11 to 8.6 mg L�1 forNPDOC and from 0.01 to 19.4 mg L�1 for NO3
–. Concentration values are given in the Supplementary Material (Table S3).
130 A. Grau-Martínez et al. / Journal of Hydrology 561 (2018) 123–135

2003; Otero et al., 2009; Torrentó et al., 2011). With the e valuesobtained in laboratory experiments, the percentage of denitrifica-tion at the field scale can be calculated according to Eq. (8) usingeither eN or eO, or both.
DENð%Þ ¼ 1� ½NO3�residual½NO3�initial
� �� 100 ¼ 1� eð
dðresidualÞ�dðinitialÞe Þ
� �� 100
ð8ÞThe extent of denitrification enhanced by the MAR-PRL system
was estimated for each sampling campaign. The isotope composi-tion of the native groundwater (P1) for each campaign was usedas the initial value, and the e values were obtained from the batchexperiments with the two-year-old PRL material (�10.4‰ for eNand �13.8‰ for eO, with an eN/eO ratio of 0.75) (Fig. 8).
This approximation shows that during both RPs, the NO3– reduc-
tion percentage was similar with a maximum value around 30% -40%. Complete denitrification at some depths of P2 and P5 wasobserved in samples collected in June 2013 (Fig. 6), but isotopicvalues were not determined due to the low NO3
– concentration.Denitrification was enhanced in the piezometers located closer tothe infiltration pond (P2). In all campaigns, the isotope composi-tion of P8.2 was very similar to that of P1, indicating that denitri-fication was not occurring. Since isotopes in samples at differentdepths were not determined, the cause of variations in NO3
– con-centration along depth at P8 could be either due to denitrificationor other process (e.g., mixing). Comparing the two RP samplingcampaigns, the June 2013 samples presented a slightly higher levelof denitrification, most probably because the system was underalmost continuous operation since January 2012 (except for 30days in August 2012, 24 days in February-March 2013 and 5 daysin April 2013). The MAR system was stopped from 22nd June to1st July, 10 days before the July 2014 sampling campaign. Thelonger operational period before the June 2013 campaign couldhave induced a well-developed denitrifying microbial community,with the bacteria being more concentrated in the areas receivingmore recharge water, such as P2 and P5. Li et al. (2013), simulatingthe infiltration zone of a MAR system, showed that microbial com-munities reached stability after 3–4 months of operation.
During NRPs, the percentage of denitrificationwas very low (lessthan 20%) in all the samples, except those from P2 (30–60%), whichwas one of the piezometers most affected by recharge water(Valhondo et al., 2014) (Fig. 8). All the samples collected in March2015, including P2, showed the lowest percentage of denitrificationamong all the sampling campaigns. The September 2013 campaignwas performed after a year of almost continuous recharge (Fig. 2)followed by less than two months of non-recharge, whereas theMarch 2015 campaign was undertaken after almost four monthsof non-recharge. Differences in the percentage of denitrificationamong the P2 samples collected from both NRPs indicate that thebacteria grow during RPs were still denitrifying even when theMAR pond was under non-recharge, but became less active withtime in the absence of a carbon source (Rodríguez-Escales et al.,2016a,b).
Results indicate that time of operation is a key issue to enhancedenitrification in the MAR-PRL system. However, in practical termsit is difficult to accomplish due to day by day management issues(low quality river water, maintenance, etc.). In this regard, chaoticadvection could be a good technology to keep high denitrificationrates as well as other pollutant degradation in both RPs and NRPsas stated in Rodríguez-Escales et al. (2017).
3.5. Additional isotope data
On the one hand, the redox conditions induced in a MAR-PRLsystem determine the degradation of different contaminants. Inthe case of mixtures of emerging organic contaminants, for exam-ple, increasing the variability of redox conditions is crucial sincethe individual degradation of these compounds depends on speci-fic redox conditions (e.g. Barbieri et al., 2011; Liu et al., 2013).Characterizing the redox conditions achieved in the studiedMAR-PRL system is thus critical.
Monitoring the redox sensitive indicators and the nitrate iso-tope data suggested that the organic matter released by the PRLwas promoting reducing conditions to varying extents, at least tonitrate reduction conditions, and probably iron reductions condi-tions occasionally in P5. The isotope composition of SO4
2- (d34SSO4and d18OSO4) was analyzed to assess the occurrence of sulfate-
P2
P8 P5
P9 P10
P2
P5
P8 P9P10P8
P2
P10
P9
P2
P5
P8
P10P1 July
P1 Sept
P1 March
P1 June
River Sept
River June
River July
River March
εN/εO = 1.50R² = 0.55
0
2
4
6
8
10
12
14
16
18
20
22
24
-2 2 6 10 14 18 22 26 30 34
δ81O
3O
N)
‰(
δ15NNO3 (‰)
Manure or Sewage Ammoniumm fertilizersNitrate fertilizers Soil nitrateNRP Sep13 NRP March15RP June13 RP July14Native GW Llobregat River
Fig. 7. d15NNO3 and d18ONO3 of dissolved NO3– in the collected samples, as well as the isotope composition of the main nitrate sources: fertilizers, soil nitrate and animal
manure or sewage (Vitòria et al., 2004; Kendall et al., 2007; Xue et al., 2009).
A. Grau-Martínez et al. / Journal of Hydrology 561 (2018) 123–135 131

reducing conditions. Sulfate reduction should produce a decreasein the SO4
2- concentration an increase in the d34SSO4 values of thedissolved SO4
2-. The isotope composition of the dissolved SO42- in
mixed groundwater samples was only analyzed for the June 2013and September 2013 campaigns. Values ranged from +6.7 to+10.6‰ for d34S and from +9.0 to +11.1‰ for d18O (Fig. 9). Similarvalues were obtained for the river water and native groundwatersamples. Most of the mixed groundwater samples gave valueswithin the range obtained for sewage (Otero et al., 2008) (Fig. 9),indicating that the vast majority of SO4
2- came from sewage, whichis consistent with the conclusions drawn from the NO3
– isotoperesults regarding potential NO3
– sources.The narrow range of the d34SSO4 and d18OSO4 values obtained
suggests a lack of SO42- reduction. It can thus be concluded that
the NPDOC released by the reactive layer produces variable redoxconditions in the saturated zone along the flow path, leadingmainly to the reduction of NO3
–, as well as iron under certainconditions, but not of SO4
2-. Results indicate that time of operationis a key issue to modify redox conditions as well as pollutantdegradation in the MAR-PRL system.
On the other hand, the isotopic composition of dissolvedinorganic carbon d13CHCO3 can provide information about thedenitrification reaction (Aravena and Robertson, 1998). However,in the studied site, due to the aquifer lithology, groundwater
contained high concentrations of bicarbonate (median value of325 ± 25 mg L�1 in P1 for the four sampling campaigns) that couldbuffer any change in the d13CHCO3 isotope ratio linked to denitrifi-cation. The d13CHCO3 values in P1 samples (native groundwater)averaged�13.2 ± 1‰, which is in agreement with the known rangeof d13CHCO3 for groundwater (�16‰ to �11‰ Vogel and Ehhalt,1963). Mixed groundwater samples displayed d13CHCO3 valuesclose to that of P1 samples (between �13.8 and �12.0‰, with amedian value of �12.7‰), except three samples collected in theJune 2013 campaign (RP) (that had values ranging from �11.1 to�9.9‰) (Fig. 10). As expected, the role of organic matter oxidationin the observed denitrification processes was not evident from thed13CHCO3 data due to the buffering effect of the bicarbonate.
4. Conclusions
We evaluated the feasibility of a multi-isotope approach forassessing the efficacy of the MAR-PRL system of Sant Vicenç delsHorts in promoting denitrification in the groundwater below theinfiltration pond. Similarities in the hydrochemical data (exceptfor NO3
– contents, which decreased during recharge periods inmixed groundwater) of river water, native groundwater and mixedgroundwater demonstrated a unique recharge flow system.
P8P2
P10
P950%
40%
30%20%
10%
0
5
10
15
20
25
30
0 5 10 15 20 25 30 35
δ81O
3O
N)
‰(
June 2013
Manure or Sewage Ammoniumm fertilizersNitrate fertilizers Soil nitrateRP June13 % DENLlobregat River Native GW
A
P2
P5P8
P9P10
50%
40%30%
20%10%
0 5 10 15 20 25 30 35
September 2013
Manure or Sewage Ammoniumm fertilizersNitrate fertilizers Soil nitrateNRP Sept 13 % DENLlobregat River Native GW
B
P2
P5
P8
P10
50%
40%
30%
20%10%
0
5
10
15
20
25
30
0 5 10 15 20 25 30 35
δ81O
3O
N)
‰(
δ15NNO3 (‰)
July 2014
Manure or Sewage Ammoniumm fertilizersNitrate fertilizers Soil nitrateRP July 14 %DENLlobregat River Native GW
C
P2
P5
P8P9
P10
50%
40%
30%
20%10%
0 5 10 15 20 25 30 35
δ15NNO3 (‰)
March 2015
Manure or Sewage Ammoniumm fertilizersNitrate fertilizers Soil nitrateNRP March 15 % DENLlobregat River Native GW
D
Fig. 8. Estimation of the extent of NO3– attenuation in all the sampling campaigns, using e values obtained from the batch experiments with two-year-old PRL material. The
isotope composition of the native groundwater was used as the initial value.
132 A. Grau-Martínez et al. / Journal of Hydrology 561 (2018) 123–135

Changes in the redox indicators with depth and along the flow pathduring recharge and non-recharge periods confirmed that thereactive layer was still releasing NPDOC five years after installa-tion. NO3
– concentrations decreased during recharge periodsespecially in the piezometers closest to the infiltration pond, whileaqueous Fe concentrations increased in the piezometers withlower NO3
– concentrations, however, SO42- reduction was not
observed.Isotope data revealed that denitrification mainly occurred in the
area under the infiltration pond. The piezometers closest to theMAR-PRL, P2 and P5, showed higher levels of denitrification thanthe other piezometers. Importantly, denitrification was enhancedby a more continuous recharge of the MAR-PRL system, probablybecause microbial communities become stable after 3–4 monthsof continuous operation. Although a more detailed field samplingsurvey is needed to determine the real extent of denitrification atthe field scale, the results of this study show the usefulness of a
multi-isotope approach in identifying denitrification in MAR-PRLsystems.
Acknowledgements
This study was funded by the projects REMEDIATION [ref.CGL2014-57215-C4-1-R] and ISOTEC [CGL2017-87216-C4-1-R],financed by the Spanish Ministry of Economy (Agencia Estatal deInvestigación/Fondo Europeo de Desarrollo Regional/Unión Euro-pea, AEI/FEDER, EU), the project MAG [Catalan Government, ref.2014SGR-1456] and the European Union projects WADIS-MAR[European Commission, ref. ENPI/2011/280-008] and MARSOL[European Commission, FP7-ENV-2013-WATER-INNO-DEMO]. Wethank the editor and three anonymous reviewers for commentsthat improved the quality of the manuscript.
Appendix A. Supplementary data
Supplementary data associated with this article can be found, inthe online version, at https://doi.org/10.1016/j.jhydrol.2018.03.044.
References
Anderson, K.K., Hooper, A.B., 1983. O2 and H2O are each the source of O in NO2
produced from NH3 by Nitrosomas 15N-NMR evidence. FEBS Lett. 64, 236–240.Aravena, R., Robertson, W.D., 1998. Use of multiple isotope tracers to evaluate
denitrification in ground water: study of nitrate from a large-flux septic systemplume. Ground Water 36, 975–982.
Barahona-Palomo, M., Barbieri, M., Fernàndez-Garcia, D., Pedretti, D., Sanchez-Vila,X., Valhondo, C., Queralt, E., Massana, J., Hernández, M., Tobella, J., 2011.Caracterització del Sistema de Recàrrega de Sant Vicenç dels Horts: ProjecteRASA, Informe Fase 2. CUADLL, Barcelona.
Barbieri, M., Carrera, J., Sanchez-Vila, X., Ayora, C., Cama, J., Köck-Schulmeyer, M.,López de Alda, M., Barceló, D., Tobella Brunet, J., Hernández García, M., 2011.Microcosm experiments to control anaerobic redox conditions when studyingthe fate of organic micropollutants in aquifer material. J. Contam. Hydrol. 126(3–4), 330–345.
Bekele, E., Toze, S., Patterson, B., Higginson, S., 2011. Managed aquifer recharge oftreated wastewater: water quality changes resulting from infiltration throughthe vadose zone. Water Res. 45 (17), 5764–5772.
Mine tailings
Sulphideoxidation
Fertilizers
Sewage
2
4
6
8
10
12
14
16
18
-15 -10 -5 0 5 10 15 20 25 30
δ81O
-OS
4(0 /
00)
δ34S-SO4(0/00)
RP June13NRP Sep13Native GW June13Native GW Sep13River JuneRiver September
Gypsum
Pig manure
Soil Sulfate
Fig. 9. d18OSO4 vs d34SSO4 for river, native groundwater and mixed groundwater samples collected in June 2013 and September 2013. The isotope composition of potential SO42-
sources is also shown. Values for SO42- derived from sulfide oxidation are from Pierre et al. (1994) for disseminated pyrite in anoxic Tertiary marls that outcrop in the Llobregat
River basin. Values for pig manure are taken from Otero et al. (2008) and Cravotta (1997). Soil SO42- data are from Krouse and Mayer (2000) and fertilizer data from Vitòria
et al. (2004). Gypsum values correspond to local gypsum outcrops (Utrilla et al., 1992). Sewage data are from the Igualada sewage plant (Otero et al., 2008).
P2
P5
P8P9
P10
P2
P5P8P9 P10P2
P5
P8
P9
P10
-15
-14
-13
-12
-11
-10
-9
-8200 250 300 350 400 450
δ31C
3O
HC
)‰(
HCO3- (mg L-1)
Mixed groundwater June 2013 Mixed groundwater Sept 2013Mixed groundwater Juy 2014 Native groundwater
Fig. 10. d13CHCO3 vs HCO3– concentration for native and mixed groundwater samples
collected in June 2013, September 2013 and July 2014. The dotted lines representthe range of the d13CHCO3 values for the native groundwater samples.
A. Grau-Martínez et al. / Journal of Hydrology 561 (2018) 123–135 133

Böttcher, J., Strebel, O., Voerkelius, S., Schmidt, H.L., 1990. Using isotopefractionation of nitrate-nitrogen and nitrate-oxigen for evaluation ofmicrobial denitrification in sandy aquifer. J. Hydrol. 114, 413–424.
Bouwer, H., 2002. Artificial recharge of groundwater: hydrogeology andengineering. Hydrogeol. J. 10, 121–142.
Carrey, R., Otero, N., Soler, A., Gomez-Alday, J.J., Ayora, C., 2013. The role of LowerCretaceous sediments in groundwater nitrate attenuation in central Spain:column experiments. Appl. Geochem. 32, 142–152.
Cey, E.E., Rudolph, D.L., Aravena, R., Parkin, G., 1999. Role of the riparian zone incontrollingthe distribution and fate of agricultural nitrogen near a small streamin southern Ontario. J. Contam. Hydrol. 37, 45–67.
Clark, I.D., Fritz, P., 1997. Environmental Isotopes in Hydrogeology. LewisPublishers, New York, pp. 352.
Cravotta, C.A., (1997). Use of stable isotopes of carbon, nitrogen and Sulphur toidentify sources of nitrogen in surface waters in the lower Susquehanna RiverBasin, Pennsylvania. U.S. Geological Survey Water-Supply Paper. 2497.
Devito, K.J., Fitzgerald, D., Hill, A.R., Aravena, R., 2000. Nitrate dynamics in relationto lithology and hydrologic flow path in a river riparian zone. J. Environ. Qual.29, 1075–1084.
Díaz-Cruz, M.S., Barceló, D., 2008. Trace organic chemicals contamination in groundwater recharge. Chemosphere 72 (3), 333–342.
Dillon, P.J., 2004. Future management of aquifer recharge. Hydro. Geol. J. 13 (1),313–316.
Dillon, P., Pavelic, P., Toze, S., Rinck-Pfeiffer, S., Martin, R., Knapton, A., Pidsley, D.,2006. Role of aquifer storage in water reuse. Desalination 188 (1–3), 123–134.
Dogramaci, S.S., Herczeg, A.L., Schi, S.L., Bone, Y., 2001. Controls on d34S and d18O ofdissolved sulfate in aquifers of the Murray Basin, Australia and their use asindicators of flow processes. Appl. Geochem. 16, 475–488.
ENSAT (Enhancement of Soil Aquifer Treatment), 2012. Modelo hidrogeológico:Modelo conceptual de flujo en el sistema de recarga de Sant Vicenç dels Horts.ENSAT, Barcelona.
Fox, P. et al., 2006. Advances in Soil Aquifer Treatment Research for SustainableWater Reuse. Denver, Awwa Research Foundation, p. 200.
Fukada, T., Hiscock, K., Dennis, P.F., Grischek, T., 2003. A dual isotope approach toidentify denitrifaction in groundwater at river-bank infiltration site. Water Res.37, 3070–3078.
Gibert, O., Pomierny, S., Rowe, I., Kalin, R.M., 2008. Selection of organic substrates aspotential reactive materials for use in a denitrification permeable reactivebarrier (PRB). Bioresour. Technol. 99, 7587–7596.
Grau-Martínez, A., Torrentó, C., Carrey, R., Rodríguez-Escales, P., Domènech, C.,Ghiglieri, G., Soler, A., Otero, N., 2017. Feasibility of two low-cost organicsubstrates for inducing denitrification in artificial recharge ponds: batch andflow-through experiments. J. Contam. Hydrol. 198, 48–58.
Heberer, T., Mechlinski, A., Franck, B., Knappe, A., Massmann, G., Pekdeger, A., Fritz,B., 2004. Field studies on the fate and transport of pharmaceutical residues inbank filtration. Ground Water Monit. Remediat. 24 (2), 70–77.
Horibe, Y., Shigehara, K., Takakuwa, Y., 1973. Isotope separation factors of carbondioxide water system and isotopic composition of atmospheric oxygen. J.Geophys. Res. 78, 2625–2629.
IAEA/WMO (2017). Global Network of Isotopes in Precipitation. The GNIP Database.Accessible at: http://www.iaea.org/water
Iribar, V., Carrera, J., Custodio, E., Medina, A., 1997. Inverse modelling of seawaterintrusion in the Llobregat delta deep aquifer. J. Hydrol. 198 (1–4), 226–244.
Kendall, C., Elliott, E.M., Wankel, S.D., 2007. Tracing anthropogenic inputs ofnitrogen to ecosystems Chapter 12. In: Michener, R.H., Lajtha, K. (Eds.), Stableisotopes in Ecology and Environmental Science. second ed. BlackwellPublishing, pp. 375–449.
Knöller, K., Vogt, C., Haupt, M., Feisthauer, S., Richnow, H.H., 2011. Experimentalinvestigation of nitrogen and oxygen isotope fractionation in nitrate and nitriteduring denitrification. Biogeochemistry 103, 371–384.
Knowles, R., 1982. Denitrification. Microbiol. Rev. 46, 43–70.Köck-Schulmeyer, M., Ginebreda, A., Postigo, C., López-Serna, R., Pérez, S., Brix, R.,
Llorca, M., Alda, MLd, Petrovic, M., Munné, A., Tirapu, L., Barceló, D., 2011.Wastewater reuse in Mediterranean semi-arid areas: the impact of dischargesof tertiary treated sewage on the load of polar micro pollutants in the LlobregatRiver (NE Spain). Chemosphere 82 (5), 670–678.
Krouse, H.R., Mayer, B., 2000. Sulphur and oxygen isotopes in sulphate. In: Cook, P.G., Hercseg, A.L. (Eds.), Environmnetal Tracers in Subsurface Hydrology. KluwerAcademic Press, Boston, pp. 195–231.
Lasagna, M., De Luca, D.A., 2016. The use of multilevel sampling techniques fordetermining shallow aquifer nitrate profiles. Environ. Sci. Pollut. Res. 23 (20),20431–20448.
Lehmann, M.F., Reichert, P., Bernasconi, S.M., Barbieri, A., McKenzie, J.A., 2003.Modelling nitrogen and oxygen isotope fractionation during denitrification in alacustrine redox-transition zone. Geochim. Cosmochim. Acta 67, 2529–2542.
Li, D., Alidina, M., Ouf, M., Sharp, J.O., Saikaly, P., Drewes, J.E., 2013. Microbialcommunity evolution during simulated managed aquifer recharge in responseto different biodegradable dissolved organic carbon (BDOC) concentrations.Water Res. 47 (7), 2421–2430.
Liu, Y.-S., Ying, G.-G., Shareef, A., Kookana, R.S., 2013. Biodegradation of threeselected benzotriazoles in aquifer materials under aerobic and anaerobicconditions. J. Contam. Hydrol. 151, 131–139.
Maeng, S.K., Sharma, S.K., Lekkerkerker-Teunissen, K., Amy, G.L., 2011. Occurrenceand fate of bulk organic matter and pharmaceutically active compounds inmanaged aquifer recharge: a review. Water Res. 45 (10), 3015–3033.
Mariotti, A., Germon, J.C., Hubert, P., Kaiser, P., Letolle, R., Tardieux, P., 1981.Experimental determination of nitrogen kinetic isotope fractionation: someprinciples, illustration for the denitrification and nitrification processes. PlantSoil 62, 413–430.
Mariotti, A., Landreau, A., Simon, B., 1988. 15N isotope biogeochemistry and naturaldenitrification process in groundwater application to the chalk aquifer ofnorthern France. Geochim. Cosmochim. Acta 52, 1869–1878.
Massmann, G., Greskowiak, J., Dunnbier, U., Zuehlke, S., Knappe, A., Pekdeger, A.,2006. The impact of variable temperatures on the redox conditions and thebehaviour of pharmaceutical residues during artificial recharge. J. Hydrol. 328(1–2), 141–156.
McIlvin, M.R., Altabet, M.A., 2005. Chemical conversion of nitrate and nitrite tonitrous oxide for nitrogen and oxygen isotopic analysis in freshwater andseawater. Anal. Chem. 77, 5589–5595.
Menció, A., Mas-Pla, J., Soler, A., Regàs, O., Boy-Roure, M., Puig, R., Bach, J.,Domènech, C., Folch, A., Zamarona, M., Brusi, D., 2016. Nitrate pollution ofgroundwater; all right, but nothing else? Sci. Total Environ. 539C, 241–251.
Mengis, M., Schif, S.L., Harris, M., English, M.C., Aravena, R., Elgood, R.J., MacLean, A.,1999. Multiple geochemical and isotopic approaches for assessing ground waterNO3 elimination in a riparian zone. Ground Water 37, 448–457.
Miller, J.H., Ela, W.P., Lansey, K.E., Chipello, P.L., Arnold, R.G., 2006. Nitrogentransformations during soil-aquifer treatment of wastewater effluent-oxygeneffects in field studies. J. Environ. Eng. Asce 132 (10), 1298–1306.
Otero, N., Soler, A., Canals, A., 2008. Controls of d34S and d18O in dissolvedsulphate: learning from a detailed survey in the Llobregat River (Spain). Appl.Geochm. 23, 1166–1185.
Otero, N., Torrentó, C., Soler, A., Menció, A., Mas-Pla, J., 2009. Monitoringgroundwater nitrate attenuation in a regional system coupling hydrogeologywith multi-isotopic methods: the case of Plana de Vic (Osona, Spain). Agric.Ecosyst. Environ. 133 (1–2), 103–113.
Pauwels, H., Foucher, J.C., Kloppmann, W., 2000. Denitrification and mixing in aschist aquifer: influence on water chemistry and isotopes. Chem. Geol. 168,307–324.
Pauwels, H., Ayraud-Vergnaud, V., Aquilina, L., Molénat, J., 2010. The fate of nitrogenand sulfur in hard-rock aquifers as shown by sulfate-isotope tracing. Appl.Geochem. 25, 105–115.
Pauwels, H., Kloppmann, W., Foucher, J.C., Martelat, A., Fritsche, V., 1998. Fieldtracer test for denitrification in a pyrite-bearing schist aquifer. Appl. Geochem.13, 284–292.
Patterson, B., Shackleton, M., Furness, A., Bekele, E., Pearce, J., Linge, K., Busetti, F.,Spadek, T., Toze, S., 2011. Behaviour and fate on nine recycled water traceorganics during managed aquifer recharge in aerobic aquifer. J. Contam. Hydrol.122 (1–4), 53–62.
Pierre, C., Taberner, C., Urquiola, M.M., Pueyo, J.J., 1994. Sulphur and oxygen isotopecomposition of sulphates in hypersaline environments, as markers of redoxdepositional versus diagenetic changes. Mineral Mag. 58, 724–725.
Quevauviller, P.P., Fouillac, A.M., Grath, J., Ward, R., 2009. Groundwater Monitoring.Wiley, New York.
Rodríguez-Escales, P., Folch, A., van Breukelen, B.M., Vidal-Gavilan, G., Sanchez-Vila,X., 2016a. Modeling long term enhanced in situ biodenitrification and inducedheterogeneity in column experiments under different feeding strategies. J.Hydrol. 538, 127–137.
Rodríguez-Escales, P., Folch, A., Vidal-Gavilan, G., van Breukelen, B.M., 2016b.Modeling biogeochemical processes and isotope fractionation of enhancedin situ biodenitrification in a fractured aquifer. Chem. Geol. 425, 52–64.
Rodríguez-Escales, P., Fernàndez-Garcia, D., Drechsel, J., Folch, A., Sanchez-Vila, X.,2017. Improving degradation of emerging organic compounds by applyingchaotic advection in Managed Aquifer Recharge in randomly heterogeneousporous media. Water Resour. Res. 53 (5), 4376–4392.
Ryabenko, E., Altabet, M.A., Wallace, D.W.R., 2009. Effect of chloride on the chemicalconversion of nitrate to nitrous oxide for d15N analysis. Limnol. Oceanogr. 7,545–552.
Schmidt, C.M., Fisher, A.T., Racz, A., Wheat, C.G., Los Huertos, M., Lockwood, B., 2012.Rapid nutrient load reduction during infiltration of managed aquifer recharge inan agricultural groundwater basin: Pajaro Valley, California. Hydrol. Process. 26,2235–2247.
Schmidt, C.S., Richardson, D.J., Baggs, E.M., 2011. Constraining the conditionsconducive to dissimilatory nitrate reduction to ammonium in temperate arablesoils. Soil Biol. Biochem. 43, 1607–1611.
Sine S.E., (2017) Paradigm shift: does river metabolism mask the isotopic signal ofnitrate sources? MSc. Thesis. University of Waterloo. pp. 118.
Solà, V., (2009). Actualització hidroquímica I isotòpica dels aqüífers del BaixLlobregat per a la determinació de la intrusió marina, amb consideració de laisotopia del sulfat. Tesi de Màster en Hidrologia Subterrània.
Sprenger, C., Hartog, N., Hernández, M., Vilanova, E., Grützmacher, G., Scheibler, F.,Hannappel, S., 2017. Inventory of managed aquifer recharge sites in Europe:historical development, current situation and perspectives. Hydrogeol. J. 25,1909–1922.
Torrentó, C., Urmeneta, J., Otero, N., Soler, A., Viñas, M., Cama, J., 2011. Enhanceddenitrification in groundwater and sediments from a nitrate-contaminatedaquifer after addition of pyrite. Chem. Geol. 287, 90–101.
Utrilla, R., Pierre, C., Orti, F., Pueyo, J.J., 1992. Oxygen and sulphur isotopecompositions as indicators of the origin of Mesozoic and Cenozoic evaporitesfrom Spain. Chem. Geol. Isot. Geosci. 102, 229–244.
Valhondo, C., Carrera, J., Ayora, C., Barbieri, M., Noedler, K., Licha, T., Huerta, M.,2014. Behavior of nine selected emerging trace organic contaminants in an
134 A. Grau-Martínez et al. / Journal of Hydrology 561 (2018) 123–135

artificial recharge system supplemented with a reactive barrier. Environ. Sci.Pollut. R. 21, 11832–11843.
Valhondo, C., Carrera, J., Ayora, Tubau, I., Martinez-Landa, L., Nödler, K., Licha, T.,2015. Characterizing redox conditions and monitoring attenuation of selectedpharmaceuticals during artificial recharge through a reactive layer. Sci. TotalEnviron. 512–513, 240–250.
Valhondo, C., Martinez-Landa, L., Carrera, J., Hidalgo, J.J., Tubau, I., De Pourcq, K.,Grau-Martínez, A., Ayora, C., 2016. Tracer test modeling for local scale residencetime distribution characterization in an artificial recharge site. Hydrol. EarthSyst. Sci. 20, 4209–4221.
Valhondo, C., Martinez-Landa, L., Carrera, J., Ayora, c., Nödler, K., Licha, T., 2018.Evaluation of EOC removal processes during artificial recharge through areactive barrier. Sci. Total Environ. 612, 985–994.
Vanderzalm, J., Salle, C.L.G.L., Dillon, P., 2006. Fate of organic matter during aquiferstorage and recovery (ASR) of reclaimed water in a carbonate aquifer. Appl.Geochem. 21 (7), 1204–1215.
Vàzquez-Suñé, E., Capino, B., Abarca, E., Carrera, J., 2007. Estimation of rechargefrom floods in disconnected stream-aquifer systems. GroundWater 45 (5), 579–589.
Vitòria, L., Otero, N., Canals, A., Soler, A., 2004. Fertilizer characterization: isotopicdata (N, S, O, C and Sr). Environ. Sci. Technol. 38, 3254–3262.
Vogel, J.C., Ehhalt, D.H., 1963. The use of carbon isotopes in groundwater studies. In:Radioisotopes in Hydrology. International Atomic Energy Agency, Vienna, pp.338–396.
Xue, D., Botte, J., De Baets, B., Accoe, F., Nestler, A., Taylor, P., Van Cleemput, O.,Berglund, M., Boeckkx, P., 2009. Present limitations and future prospects ofstable isotopes methods for nitrate source identification in surface andgroundwater. Water Res. 43, 1159–1170.
A. Grau-Martínez et al. / Journal of Hydrology 561 (2018) 123–135 135