mobility of arsenic in a bangladesh aquifer: inferences from geochemical profiles, leaching data,...
TRANSCRIPT
Pergamon
Geochimica et Cosmochimica Acta, Vol. 68, No. 22, pp. 4539-4557, 2004Copyright © 2004 Elsevier Ltd
Printed in the USA. All rights reserved
doi:10.1016/j.gca.2004.04.020
Mobility of arsenic in a Bangladesh aquifer: Inferences from geochemical profiles, leachingdata, and mineralogical characterization
CHRISTOPHER H. SWARTZ,1,* NICOLE KEON BLUTE,1,† BORHAN BADRUZZMAN,2 ASHRAF ALI,2 DANIEL BRABANDER,1,‡ JENNY JAY,1,§
JAMES BESANCON,4 SHAFIQUL ISLAM,3 HAROLD F. HEMOND,1 and CHARLES F. HARVEY1
1Ralph M. Parsons Laboratory, Civil and Environmental Engineering, MIT, 15 Vassar Street, Cambridge, MA, USA2Dept. of Civil Engineering, Bangladesh University of Engineering and Technology, Dhaka-1000, Bangladesh
3Dept. of Civil and Environmental Engineering, University of Cincinnati, Cincinnati, OH, USA4Geosciences Dept., Wellesley College, 106 Central Street, Wellesley, MA, USA
(Received November 12, 2002; accepted in revised form April 30, 2004)
Abstract—Aquifer geochemistry was characterized at a field site in the Munshiganj district of Bangladeshwhere the groundwater is severely contaminated by As. Vertical profiles of aqueous and solid phaseparameters were measured in a sandy deep aquifer (depth �150 m) below a thick confining clay (119 to150 m), a sandy upper aquifer (3.5 to 119 m) above this confining layer, and a surficial clay layer (�3.5 m).In the deep aquifer and near the top of the upper aquifer, aqueous As levels are low (�10 �g/L), but aqueousAs approaches a maximum of 640 �g/L at a depth of 30 to 40 m and falls to 58 �g/L near the base (107 m)of the upper aquifer. In contrast, solid phase As concentrations are uniformly low, rarely exceeding 2 �g/g inthe two sandy aquifers and never exceeding 10 �g/g in the clay layers. Solid phase As is also similarlydistributed among a variety of reservoirs in the deep and upper aquifer, including adsorbed As, Ascoprecipitated in solids leachable by mild acids and reductants, and As incorporated in silicates and other morerecalcitrant phases. One notable difference among depths is that sorbed As loads, considered with respect tosolid phase Fe extractable with 1 N HCl, 0.2 M oxalic acid, and a 0.5 M Ti(III)-citrate-EDTA solution, appearto be at capacity at depths where aqueous As is highest; this suggests that sorption limitations may, in part,explain the aqueous As depth profile at this site. Competition for sorption sites by silicate, phosphate, andcarbonate oxyanions appear to sustain elevated aqueous As levels in the upper aquifer. Furthermore,geochemical profiles are consistent with the hypothesis that past or ongoing reductive dissolution of Fe(III)oxyhydroxides acts synergistically with competitive sorption to maintain elevated dissolved As levels in theupper aquifer. Microprobe data indicate substantial spatial comapping between As and Fe in both the upperand deep aquifer sediments, and microscopic observations reveal ubiquitous Fe coatings on most solid phases,including quartz, feldspars, and aluminosilicates. Extraction results and XRD analysis of density/magneticseparates suggest that these coatings may comprise predominantly Fe(II) and mixed valence Fe solids,although the presence of Fe(III) oxyhydroxides can not be ruled out. These data suggest As release maycontinue to be linked to dissolution processes targeting Fe, or Fe-rich, phases in these aquifers. Copyright
0016-7037/04 $30.00 � .00
© 2004 Elsevier Ltd
1. INTRODUCTION
Arsenic contamination in the groundwaters of Bangladesh iswidespread and poses a significant health risk to the millionswho depend on this water (Chowdhury et al., 2000; Karim etal., 2000). Beginning in the 1960s, shallow (10–75 m) wells, ortubewells, were drilled throughout Bangladesh to providedrinking water. Surface water consumption had been a primarysource of waterborne disease in Bangladesh, and groundwaterwas thought to be a safe alternative. Unfortunately, much of thewater extracted from the alluvial aquifers contains naturallyoccurring As from the alluvium deposited on the Ganges,Brahmaputra, and Megna river floodplains during the Holocene(BGS & DPHE, 2001). The high concentrations of As in well
* Author to whom correspondence should be addressed, at StockholmEnvironment Institute/Tellus Institute, 11 Arlington Street, Boston,MA 02116, USA ([email protected]).† Present address: McGuire Environmental Consultants, 119 SantaMonica Blvd., Suite 200, Santa Monica, CA, USA.‡ Present address: Wellesley College, Wellesley, MA, USA.§
Present address: Dept. of Civil and Environmental Engineering,University of California, Los Angeles, CA, USA.4539
water came to public attention in 1993, when the BangladeshDepartment of Public Health Engineering tested wells in west-ern Bangladesh after extensive As contamination was discov-ered in West Bengal nearly a decade before (Chadha and Ray,1999; BGS & DPHE, 2001). Since then, high levels of As havealso been found in northwestern Bangladesh (Badruzzaman etal., 1998) and in many of the wells in central and southernBangladesh (BGS & DPHE, 2001). In a national survey of3534 wells less than 150 m deep, As concentrations exceededthe Bangladesh standard of 50 �g/L in 27% of the wells, andAs concentrations greater than 1000 �g/L were found in some(BGS & DPHE, 2001). It is unclear what proportion of thepopulation (�120 million) will eventually suffer health effectsas a result of exposure (Anawar et al., 2002), but the implica-tion of existing dose-response data (Mazumder et al., 1998) isthat the prevalence of arsenocosis will be more than one millionpeople (Yu et al., 2003).
Observations of low oxidation/reduction potential, high lev-els of aqueous Fe and bicarbonate, and low levels of sulfate,have led researchers to hypothesize that microbially mediatedreduction of Fe(III) oxyhydroxides has been the primary mech-
anism mobilizing As from these shallow sediments (Bhatta-
4540 C. H. Swartz et al.
charya et al., 1997; Nickson et al., 1998, 2000; BGS & DPHE,2001; Harvey et al., 2002). Although release of As throughoxidation of pyrite has also been advanced as a mobilizationmechanism (Chowdhury et al., 1999), regional (Nickson et al.,2000; BGS & DPHE, 2001) and local geochemical surveys(Harvey et al., 2002) indicate an inverse relationship typicallyexists between dissolved sulfate and As in the pore waters ofthe Holocene aquifers, inconsistent with patterns expected fromdissolution of arsenical pyrite. In addition, acid volatile sulfideshave been detected in sediments cored throughout the depthrange of peak aqueous As concentrations at one site within ahighly impacted area south of Dhaka (Harvey et al., 2002),suggesting that formation, rather than oxidative dissolution, ofsulfides is more likely in these deposits.
While country-wide surveys have mapped the extent ofdissolved As contamination in tubewells, only a few studieshave been devoted to the analysis and characterization of thesediments to elucidate what role solid phases play in As mo-bility in these aquifers (Foster et al., 2000; Nickson et al., 2000;BGS & DPHE, 2001; Breit et al., 2001). Nickson et al. (2000)extracted “diagenetically available” metals from late Pleisto-cene-Holocene sediments taken from two shallow cores col-lected from the Gopalganj district using hot concentrated HCland found Fe and As in these extracts to be correlated. BGS &DPHE (2001) analyzed sediments taken from up to 150 m indepth in several districts of Bangladesh. In addition to miner-alogical characterization by scanning electron microscopy andX-ray diffraction, they used selective dissolution with ammo-nium oxalate to liberate solid phase As. They found ammoniumoxalate-extractable As and Fe to be highly correlated. Extrac-tion methods used by Nickson et al. (2000) and BGS & DPHE(2001) did not differentiate sorbed versus coprecipitated As.Breit et al. (2001) and Foster et al. (2000) analyzed shallow(�50 m) sediments using X-ray absorption spectroscopy, find-ing evidence for As associated with aluminum hydroxides andthe weathered, Fe-rich edges of phyllosilicates in gray, reducedsediments of the Holocene aquifer.
Data characterizing deeper aquifer materials are particularlysparse, and little work has been done with the orange-brownPleistocene sediments typically underlying a confining claylayer present at up to 50 m in thickness in some areas ofBangladesh. The pore water extracted from wells deeper than150 m typically has much lower As concentrations (van Geenet al., 2003a), with only 5% of wells sampled in the nationalsurvey exceeding 10 ug/L (BGS & DPHE, 2001). For thisreason, deeper wells, some penetrating the Pleistocene sedi-ments below the confining clay layer, are currently being in-stalled in some villages as a presumably safe alternative to theAs-contaminated shallower wells (van Geen et al., 2003b; Yuet al., 2003). These installation programs are in addition to thedeep well installations that have occurred in past years in thecoastal areas to remedy saline intrusion. However, it is notknown whether these deeper wells will remain free of As onceextraction of water from the wells commences. Deeper wells,especially those completed where a confining unit is absent,might become contaminated with time if As moves downwardfrom the shallower aquifer, induced by deep well pumping(BGS & DPHE, 2001). Shifts in geochemical conditions result-ing from pumping may also facilitate As mobilization to pore
water. To our knowledge, no analyses of the deeper aquiferbelow this clay confining layer have been conducted to deter-mine at what concentrations, and in what forms, As is presentin these sediments. These issues need to be addressed beforefuture water use from the deeper aquifer can be planned.
The objectives of the present study are therefore to contrib-ute to understanding the geochemical mechanisms that controlpartitioning of naturally occurring As between aquifer solidsand groundwater in the aquifers of Bangladesh. We provide adetailed geochemical characterization of aqueous and solidphases along a depth profile extending to 165 m below groundsurface at a site in a village within the Munshiganj district southof Dhaka, Bangladesh. Our investigation also includes one ofthe first analyses of sediments taken from the deeper aquiferunderlying the clay aquiclude. These data complement an ear-lier presentation of aqueous and solid phase profiles from thissite by Harvey et al. (2002), who showed that aqueous Ca andNH4
� closely follow the profile of aqueous As throughout theupper aquifer, which peaks at a depth range of 30 to 40 m, andaqueous inorganic carbon and organic carbon (DOC) also in-crease with increasing As up to the peak depth. They inferredfrom these observations that microbial respiration and associ-ated ammonification of organic matter resulted in the reductivedissolution of Fe(III) oxyhydroxides and possibly dissolutionof calcite as well, the former being a likely cause of theelevated aqueous As levels in the upper aquifer (Harvey et al.,2002). Furthermore, they demonstrated the susceptibility ofupper aquifer sediments to further release of As to pore waterafter introduction of labile organic matter to stimulate micro-bial respiration (Harvey et al., 2002), suggesting that some Asmay yet be associated with solid phases susceptible to reductivedissolution.
In this paper, we provide additional analyses of dissolvedconstituents from this site as well as characterization of solidphase As. We use sequential extraction techniques to differ-entiate between adsorbed and coprecipitated As in the sed-iments and to quantify readily extractable Fe versus Feincorporated in more recalcitrant phases such as silicateminerals and pyrite. Although the utility of extraction meth-ods can be limited by nonselectivity (Ryan and Gschwend,1991) and readsorption of target elements (Gruebel et al.,1988; Ostergren et al., 1999), their application can aid incharacterizing relative leachability of elements from sedi-ment matrices. We also use spectroscopic methods to eluci-date spatial associations between As and Fe in sedimentmatrices. In addition, we perform geochemical equilibriummodeling, with input parameters provided from the aqueousand solid phase analyses, to explore whether amorphousFe(III) oxyhydroxide, even as only a relatively small amountof the total pool of readily extractable Fe, could explaindissolved and solid phase levels of As in the upper aquifer,as suggested by the in-situ mobilization experiments con-ducted by Harvey et al. (2002). We use a depth whereaqueous As is highest as an example for this exercise. Withthe intent to inform more reliable evaluation of alternativewater supply options for Bangladesh, these analytical meth-ods are used in an effort to understand the mobility of As insediments in the upper and lower aquifers and, in particular,what types of geochemical alterations, possibly induced bypumping, may further mobilize any As present in these
aquifers.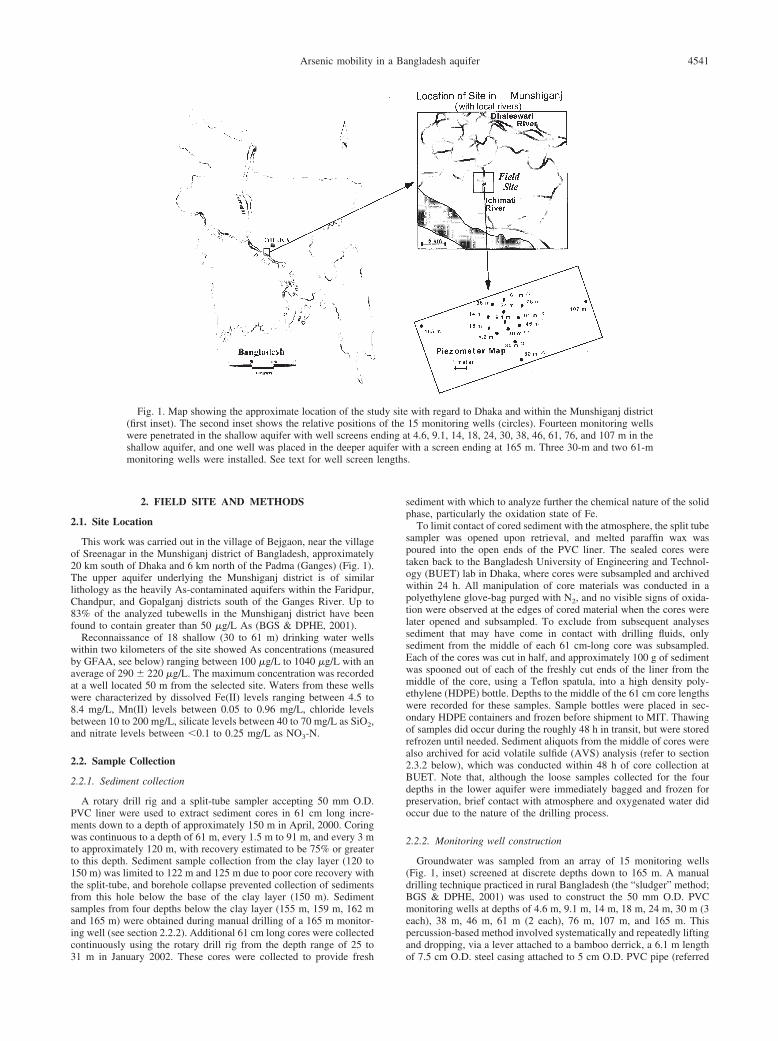
uifer wlengths
4541Arsenic mobility in a Bangladesh aquifer
2. FIELD SITE AND METHODS
2.1. Site Location
This work was carried out in the village of Bejgaon, near the villageof Sreenagar in the Munshiganj district of Bangladesh, approximately20 km south of Dhaka and 6 km north of the Padma (Ganges) (Fig. 1).The upper aquifer underlying the Munshiganj district is of similarlithology as the heavily As-contaminated aquifers within the Faridpur,Chandpur, and Gopalganj districts south of the Ganges River. Up to83% of the analyzed tubewells in the Munshiganj district have beenfound to contain greater than 50 �g/L As (BGS & DPHE, 2001).
Reconnaissance of 18 shallow (30 to 61 m) drinking water wellswithin two kilometers of the site showed As concentrations (measuredby GFAA, see below) ranging between 100 �g/L to 1040 �g/L with anaverage of 290 � 220 �g/L. The maximum concentration was recordedat a well located 50 m from the selected site. Waters from these wellswere characterized by dissolved Fe(II) levels ranging between 4.5 to8.4 mg/L, Mn(II) levels between 0.05 to 0.96 mg/L, chloride levelsbetween 10 to 200 mg/L, silicate levels between 40 to 70 mg/L as SiO2,and nitrate levels between �0.1 to 0.25 mg/L as NO3-N.
2.2. Sample Collection
2.2.1. Sediment collection
A rotary drill rig and a split-tube sampler accepting 50 mm O.D.PVC liner were used to extract sediment cores in 61 cm long incre-ments down to a depth of approximately 150 m in April, 2000. Coringwas continuous to a depth of 61 m, every 1.5 m to 91 m, and every 3 mto approximately 120 m, with recovery estimated to be 75% or greaterto this depth. Sediment sample collection from the clay layer (120 to150 m) was limited to 122 m and 125 m due to poor core recovery withthe split-tube, and borehole collapse prevented collection of sedimentsfrom this hole below the base of the clay layer (150 m). Sedimentsamples from four depths below the clay layer (155 m, 159 m, 162 mand 165 m) were obtained during manual drilling of a 165 m monitor-ing well (see section 2.2.2). Additional 61 cm long cores were collected
Fig. 1. Map showing the approximate location of the st(first inset). The second inset shows the relative positionswere penetrated in the shallow aquifer with well screens eshallow aquifer, and one well was placed in the deeper aqmonitoring wells were installed. See text for well screen
continuously using the rotary drill rig from the depth range of 25 to31 m in January 2002. These cores were collected to provide fresh
sediment with which to analyze further the chemical nature of the solidphase, particularly the oxidation state of Fe.
To limit contact of cored sediment with the atmosphere, the split tubesampler was opened upon retrieval, and melted paraffin wax waspoured into the open ends of the PVC liner. The sealed cores weretaken back to the Bangladesh University of Engineering and Technol-ogy (BUET) lab in Dhaka, where cores were subsampled and archivedwithin 24 h. All manipulation of core materials was conducted in apolyethylene glove-bag purged with N2, and no visible signs of oxida-tion were observed at the edges of cored material when the cores werelater opened and subsampled. To exclude from subsequent analysessediment that may have come in contact with drilling fluids, onlysediment from the middle of each 61 cm-long core was subsampled.Each of the cores was cut in half, and approximately 100 g of sedimentwas spooned out of each of the freshly cut ends of the liner from themiddle of the core, using a Teflon spatula, into a high density poly-ethylene (HDPE) bottle. Depths to the middle of the 61 cm core lengthswere recorded for these samples. Sample bottles were placed in sec-ondary HDPE containers and frozen before shipment to MIT. Thawingof samples did occur during the roughly 48 h in transit, but were storedrefrozen until needed. Sediment aliquots from the middle of cores werealso archived for acid volatile sulfide (AVS) analysis (refer to section2.3.2 below), which was conducted within 48 h of core collection atBUET. Note that, although the loose samples collected for the fourdepths in the lower aquifer were immediately bagged and frozen forpreservation, brief contact with atmosphere and oxygenated water didoccur due to the nature of the drilling process.
2.2.2. Monitoring well construction
Groundwater was sampled from an array of 15 monitoring wells(Fig. 1, inset) screened at discrete depths down to 165 m. A manualdrilling technique practiced in rural Bangladesh (the “sludger” method;BGS & DPHE, 2001) was used to construct the 50 mm O.D. PVCmonitoring wells at depths of 4.6 m, 9.1 m, 14 m, 18 m, 24 m, 30 m (3each), 38 m, 46 m, 61 m (2 each), 76 m, 107 m, and 165 m. Thispercussion-based method involved systematically and repeatedly lifting
with regard to Dhaka and within the Munshiganj district15 monitoring wells (circles). Fourteen monitoring wellst 4.6, 9.1, 14, 18, 24, 30, 38, 46, 61, 76, and 107 m in theith a screen ending at 165 m. Three 30-m and two 61-m.
udy siteof the
nding a
and dropping, via a lever attached to a bamboo derrick, a 6.1 m lengthof 7.5 cm O.D. steel casing attached to 5 cm O.D. PVC pipe (referred
4542 C. H. Swartz et al.
to below as the percussion tool). The deepening hole was flushed withwater to create a slurry at its base. As the casing was lifted, an operatorpositioned at the top of the derrick placed his hand over the open endof the percussion tool to create suction. As the percussion tool wasdropped down the hole, the operator raised his hand from the end of thepercussion tool, allowing the slurry at the base of the hole to be drivenup and out through the pipe. As the hole deepened, more PVC pipeextensions were added to the percussion tool.
When the desired depth was reached, the percussion tool was liftedout of the hole and the permanent well screen and casing, constructedof 3 m lengths of 50 mm O.D. PVC, were lowered down the hole. Thewell screen lengths for wells shallower than 30 m, between 30 and107 m in depth, and the 165 m deep well were 1.5 m, 3 m, and 6.1 mlong, respectively. The PVC pipes for each well were joined by firstsoftening one end with a flame, then inserting another pipe to create aseamless joint that would easily slide down the well bore. Sand waspoured down the annulus between the casing and the hole to backfill thescreened interval. The sand was followed with quick-setting cement,which was used to fill the annulus up to ground surface to preventshort-circuiting of flow between various depths.
2.2.3. Water sampling
Wells were sampled by peristaltic pump (Cole Parmer) with 6 mmO.D. HDPE tubing lowered to the depth of the middle of the wellscreen. Inflatable packers were used to isolate the screened interval inall wells shallower than 46 m. Because of pressure limitations for thepackers, deeper wells were pumped without packers installed. How-ever, no drawdown of the water level in the wells (approximately 2 mbelow ground surface) was observed during pumping, indicating thatpumped water was drawn from the aquifer and not the well bore.Before sampling, all wells were pumped at a flow rate of 6 L/min forat least 1 h to allow the discharge to clarify (turbidity was not mea-sured) and to develop the wells.
Samples were collected at a flow rate of approximately 200 mL/minand water quality measurements were made in a manner to excludecontact with the atmosphere. A multi-probe flow cell (Geotech Envi-ronmental Equipment, Denver, CO) fitted with calibrated pH, platinumredox, conductivity, and dissolved oxygen electrodes was placed in thesampling line. Electrode parameters were recorded after readings sta-bilized (e.g., remained unchanged for at least 4 L of discharge).
A 147 mm diameter polycarbonate filter cartridge (Geotech Envi-ronmental Equipment, Denver, CO) containing a 200 nm polycarbonatefilter membrane (Osmotics) was then placed in the sample line. Down-stream of this cartridge, a 125 mL HDPE bottle was also added to thesample line. Two 3-way stopcocks fitted to the bottle lid allowedexchange of the bottle, once filled, without contact with the atmo-sphere. Downstream of this collection point was another 147 mmdiameter polycarbonate filter cartridge containing a 50 nm polycarbon-ate filter membrane, followed by another sampling point. We collectedseveral 125 mL volumes of 200 nm and 50 nm filtrate. Immediatelyfollowing collection, both 200 nm and 50 nm filtered samples wereplaced in a N2-purged polyethylene glove-bag at the field site, andsample aliquots were separated out either for analysis on-site or ar-chived for future laboratory analyses (see section 2.3.1). Samples ofunfiltered water were also collected for total metals and dissolvedorganic carbon analyses.
2.3. Analytical Methods
2.3.1. Aqueous analyses
2.3.1.1. Field. Aliquots of the 200 nm filtrate were analyzedimmediately on-site using Chemets (Chemetrics, VA) for the followingdissolved constituents: Fe(II), total Fe, Mn(II), total sulfide, NH4
�-N,NO3
�-N, and total phosphate. These measurements were conductedinitially in a glove-bag filled with N2, but replication of sample anal-yses outside of the glove-bag showed identical results to those con-ducted inside the glove-bag. All subsequent Chemets analyses wereconducted outside the glove-bag. Additional aliquots of 200 nm filtratewere saved for ion chromatography and measurement of alkalinity,
total metals and dissolved CO2 (by filling a gas-tight syringe withsample) at MIT.Aliquots of the 50 nm filtrate from each well depth were immediatelysubjected to a technique to separate the As(III) (arsenite) and As(V)(arsenate) species (Edwards et al., 1998). These separations wereconducted in the glove-bag and performed in duplicate for each welldepth except 4.6 m. 50 mL aliquots of sample were passed through acartridge containing approximately 2 g of moist Biorad resin, whichtraps the As(V) species, at a flow rate of approximately 5 mL/min.Samples were not first acidified to pH 2.5–3.0 with sulfuric acid asspecified by Edwards et al. (1998) due to lack of ultra-pure reagent.Failure to acidify samples before separation may result in underesti-mation of the fraction As(III) due to trapping of a portion of As(III)onto the resin (Edwards et al., 1998), particularly at the ambientcircumneutral pH of our samples. Recovery experiments were per-formed later with standard solutions to estimate the extent of As(III)underestimation due to not acidifying samples (see section 3.2.2).Effluent from the columns was collected for analysis of As (assumedAs(III) species) content. The resin was then emptied out of the cartridgeinto a 50 mL centrifuge tube, to which 10 mL of 1 mol/L HCl wasadded to elute As trapped on the resin. The tube was shaken for 5 min,the resin allowed to settle, and aliquots of the supernatant were sampledfor later analysis of As (assumed As(V) species) content.
2.3.1.2. Laboratory. All measurements were performed at MITunless noted otherwise. Concentrations of As in the Biorad resin filtrateand eluent, the unfiltered samples, and the 200 nm and 50 nm filtrateswere measured by graphite furnace atomic absorption spectrophotom-etry (GFAA) (Perkin Elmer, 4100ZL) with a detection limit of 5 �g/Lor by hydride generation-fluorescence spectrophotometry (HGFS)(PSA Excalibur) with a detection limit of 150 ng/L. Matrix modifiersused in the GFAA analyses comprised 250 mg/L palladium (as palla-dium chloride) and 150 mg/L magnesium nitrate. The 200 nm filtrateswere also analyzed for aluminum and silicon (by GFAA), molybdate-reactive silica (Standard Methods for the Examination of Water andWastewater, 1992), the major cations Na, K, Ca, and Mg (by flameatomic absorption spectrophotometry, Perkin Elmer AAnalyst100), andchloride and sulfate (by ion chromatography, Dionex model 16 with aself-regenerating anion suppressor column). Bicarbonate was calcu-lated from alkalinity, measured in the 200 nm fitrates by Gran titrationto pH 3 with 1 mM HCl, after correcting for other measured contrib-utors to alkalinity. Dissolved CO2 was measured by GC analysis(Hewlett Packard fitted with a CarboSieve column) of a N2 headspaceequilibrated with 200 nm filtrate in a 50 mL gas-tight syringe preservedin the field. Nonpurgeable dissolved organic carbon was measured inunfiltered samples, after acidification to pH 3 and purging with N2, bycombustion and infrared detection of CO2 (TOC-5000, Shimadzu)standardized with potassium hydrogen phthalate.
2.3.2. Sediment analyses
2.3.2.1. Bulk chemical analysis. Aliquots of sediment from thearchived core samples were analyzed for a variety of elements, includ-ing As, Fe, and S using polarized energy dispersive X-ray fluorescence(EDXRF) with an X-Lab2000 (Spectro Analytical) and Turboquantdata analysis routines (for methodologic details, see Rogers et al.,2002). Solid phase C was determined with a model 2400 CHN analyzer(Perkin Elmer).
2.3.2.2. Extractions. Extractions to indicate the presence of acidvolatile sulfide (AVS) in the sediment samples were performed at theBUET lab within 48 h after recovery of the cores. 40 mL of 1 mol/LHCl was added to each previously archived 2.5 g moist sedimentsample in 50 mL centrifuge tubes (see section 2.2.1). The suspensionwas purged by bubbling with N2 at approximately 40 mL/min, and thegas was carried via Teflon tubing to 250 mL Sepcor bottles containing0.3 mol/L zinc acetate and 0.12 mol/L sodium acetate to trap hydrogensulfide as zinc sulfide. Sulfide was measured spectrophotometricallyusing the methylene blue method (Hach DR 4000U UVSpectrophotometer).
Sequential extraction (Keon et al., 2001) was performed at MIT todifferentiate pools of solid phase As within 1 yr of sample collection.
This method targets weakly adsorbed As (1 mol/L MgCl2, pH 8),strongly adsorbed As (1 mol/L NaH2PO4, pH 4–5), As coprecipitated
4543Arsenic mobility in a Bangladesh aquifer
with carbonates, acid volatile sulfides, amorphous metal oxides andmagnetite (1 mol/L HCl followed by 0.2 mol/L oxalic acid, pH 3), Ascoprecipitated with crystalline Fe oxides and amorphous sulfides (0.5mol/L titanium(III)chloride-sodium citrate-tetrasodium EDTA-bicar-bonate, pH 7), As coprecipitated with silicate minerals or As2O3 (10mol/L hydrofluoric acid), and As incorporated in pyritic phases (con-centrated nitric acid). A final hot concentrated nitric acid and hydrogenperoxide digest (EPA method 3050B) of the residue targets As incor-porated in crystalline sulfides such as orpiment, and other recalcitrantphases (Keon et al., 2001). These extraction steps are referred tohereafter as MG, PHOS, HCl, OX, TiCEB, HF, NIT, and HOT NIT,respectively.
Sediment samples were thawed, then manipulated in a glove-boxpurged with N2. All extractant solutions were made up in deoxygenated18 MOhm water (with less than 1 �M O2, as measured by Chemets).Thirty mL of each extractant was added to 2.5 g of moist sediment ina 50 mL Sepcor centrifuge tube. Suspensions were shaken for theprescribed amount of time, centrifuged at 23,000 g for 30 min, and thesupernatant decanted. The next extractant was added and the procedurewas repeated. Levels of As in the extracts were measured by eitherGFAA or HGFS, with standards prepared in the appropriate matrices.Fe liberated in each of the extraction steps was measured by GFAA.
Aliquots of the HCl extracts were also analyzed with the ferrozinemethod (Gibbs, 1979; Lovley and Phillips, 1986) to determine theamount of liberated Fe(II), and after reduction via addition of hydrox-ylamine hydrochloride (Gibbs, 1979), total Fe. These latter analyseswere performed mostly on core samples obtained in January 2002,within 8 weeks of sample collection. Samples from a few matchingdepths from the older core (April 2000) were concurrently analyzed todetermine whether oxidation of this material had occurred in storagesince collection (approximately 2 yr). No attempt was made to speciateFe liberated by the OX extractant due to the difficulty in preserving theoxidation state of Fe in this extractant. Oxalate degrades rapidly in lightand promotes reduction of Fe(III) (Cornell and Schindler, 1987; Paniaset al., 1996).
A separate one-step extraction was performed on aliquots from thesame sample depths to quantify adsorbed phosphate and silicate; phos-phate could not be quantified in the PHOS leaches due to interferencefrom the extractant. 2.5 g of moist sediment was placed in a centrifugetube and 30 mL of deoxygenated water, acidified to pH 2.0 with HCl,was added. The suspension was shaken for 4 h, centrifuged, anddecanted. Phosphate was measured by the stannous chloride-molybdatemethod (Standard Methods for the Examination of Water and Waste-water, 1992) and silicate was inferred from GFAA analysis for silicon.As liberated by the pH 2 extractant was quantified by HGFS forcomparison with levels determined from the MG and PHOS leachesperformed in the parallel sequential extraction procedure.
2.3.2.3. Density and magnetic separations. Density separa-tions were conducted on air-dried samples from four depths (9.6, 27.7,74.7, and 165 m) to quantify As associations as a function of densityclass. Bromoform (Geoliquids, Inc.) was used to separate grains withdensities greater than and less than 2.85 g/cm3. The �2.85 g/cm3
fraction was separated by running a hand magnet over the samples, andthe hand-magnetic fraction was collected. The portion of the sample notcollected by the hand magnet was further separated with a Franzisomagnetic analyzer into 0.5 and 1.5 amp fractions. The remainderwas classified as nonmagnetic. Cumulative recoveries for the densityand magnetic separations were always greater than 85%.
2.3.2.4. NAA, XRD, SEM and X-ray microprobe analyses.Sediment fractions separated by density and magnetic properties wereplaced in the 5.0 MW M.I.T research reactor and subjected to thermalneutron flux of 8 � 1012 n/cm2/s. Irradiations lasted between 30 s to 6 hdepending on the half-life of the elements of interest. Germanium-based gamma ray detectors coupled with the Genie 2000 neutronactivation analysis program were used to calculate the concentration oftrace elements with ng/gm detection limits for many of the elements ofinterest. The standardization process used two NIST standards, one runas a sample with every batch of samples, i.e., every 6 to 10 samples.
Aliquots of the density and magnetic separates were also handground and mounted on glass slides as slurry. X-ray diffraction mea-
surements used CuK� radiation and a graphite monochrometer on aPhilips vertical diffractometer, stepped at 6 s/0.02°, from 4° to 100° 2�.Iterative identification of minerals in the samples used Jade software(Materials Data Incorporated) with Search/Match of the FIZ/ICSDminerals database using calculated powder patterns, and Rietveldwhole pattern fitting options. Initial full physics model refinements ofobvious major phase(s) left a residual pattern that was iterativelyrematched with the database and refined until no additional likelyphases resulted. Atom coordinates including occupancies were notrefined as the complexity of the mixtures together with pattern qualitydid not justify these steps. The final refinement gave unit cell andapproximate abundance of each mineral (based on the formula of thedatabase match and calculated density and not taking into accountpossible microabsorption), normalized to 100%. This procedure doesnot include possible undiscovered minor phases or amorphousfractions.
Observation and characterization of elemental composition of min-eral grains was conducted with scanning electron microscopy (SEM)and energy dispersive spectroscopy (EDS) using a variable pressureLEO-433VP instrument (LEO Instruments). Quantitative analysis wasperformed with an IXRF 10 mm2 active over Si (Li) detector.
X-ray microprobe analyses were also conducted to elucidate spatialassociations between As and Fe in sediment samples. Sediment aliquotsfrom depths of 29.5 m and 165 m were analyzed by X-ray microprobeat undulator beamline 13-ID-C of the Advanced Photon Source (APS),Argonne National Laboratory. Samples used in this analysis wereparafilm-sealed and stored frozen at �30°C during the 9 month periodbetween arrival at MIT and beamtime availability. In a N2-purgedglove-box at the APS, an aliquot from the center of each bottle wasremoved with a Teflon spatula, and a thin layer of sediment was appliedto a piece of 8 �m thick Kapton tape attached to a cardboard slidemount. Fluorescence data for As and Fe were collected using a solid-state, energy-dispersive, multi-channel Ge detector. A 5 �m step sizewas used for elemental mapping of 400 � 340 �m scan areas. Becauseof low As concentrations in the samples and a temporarily compro-mised detector, we were only able to map elemental distributions butnot collect adequate absorption spectra to determine solid phase Asspeciation and binding mechanisms.
2.3.2.5. Aqueous and adsorption modeling. MINEQL (ver-sion 4.0�) was used to test hypothesized mechanisms of As sorption inthe upper aquifer. The modeled sorbent was amorphous Fe(III) oxy-hydroxide, and the Two Layer Model (TLM) for hydrous ferric oxide(HFO) within MINEQL was used. The central component of the TLMis the Diffuse Layer Model (DLM) (Dzombak and Morel, 1990).Ligand sorption was considered to occur at a single surface site type,with a density of 0.2 mol/mol Fe (Dzombak and Morel, 1990). Equi-librium sorption constants for arsenite, arsenate, and phosphate specieson HFO were used from the MINEQL thermodynamic database (Table1). Equilibrium constants needed to model three sorbed silicate species,�FeH3SiO4
0, �FeH2SiO4�, and �FeHSiO4
2�, on HFO were taken asthe weighted average intrinsic adsorption constants from Swedlund andWebster (1999) (Table 1). Equilibrium constants describing adsorptionof two carbonate species (�FeOCO2
�, and �FeOCO2H) onto HFOwere taken from Appelo et al. (2002). Carbonate ion concentrationswere calculated from alkalinity and pH.
Total As concentrations for the one well depth (30 m) used insimulations were derived by adding the measured dissolved As con-centration to the averaged sum (from at least two depths within the wellscreen depth interval being considered) of adsorbed As leached by thepH 2 extractants, corrected to aqueous molar quantities using an as-sumed porosity of 0.30 and a solids density of 2.6 g/cm3 (Table 1).Total phosphate and silicate concentrations were calculated similarly(Table 1). Total Fe(III) concentrations (allowed to precipitate as HFOin the simulations) were derived by assuming that a fraction of Feleached by the OX extractant was liberated from amorphous Fe(III)oxyhydroxides (with surface properties identical to HFO). The quantityof Fe liberated by the HCl extracts was added to aqueous Fe(II) todetermine total Fe(II) for these simulations. In additional simulations,amorphous silica (GL), siderite [FeCO3], and vivianite [Fe3(PO4)2]
were also allowed to precipitate.Because the speciation of As in the pH 2 extractant was not deter-
le Fe ated com
4544 C. H. Swartz et al.
mined, initial simulations were run for the 30 m depth (Table 1) toascertain whether the model would predict dominance of arsenate orarsenite in the adsorbed As pool. Total As, phosphate, silicate, carbon-ate, Fe(II), and Fe(III) (all in Table 1), as well as pH and major ionconcentrations (Table 2), were held constant while the percentage ofAs(III) was varied from a lower bound of 20% of total As (obtained ifarsenite existed only in the aqueous phase, and not in the adsorbedpool, at 30 m; see Table 1) to 90%. Only HFO was allowed toprecipitate, and OX-extractable Fe was taken as total Fe(III) in thesesimulations.
3. RESULTS
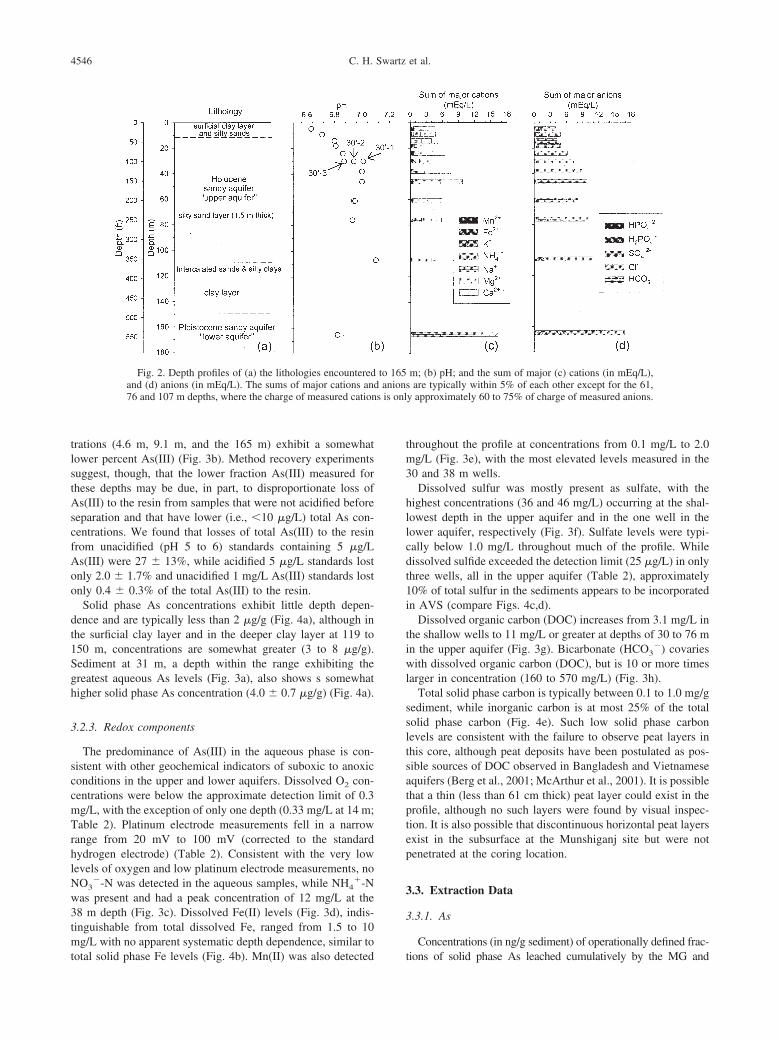
3.1. Lithology
The site is overlain by a 3.5 m thick gray clay layer unsat-urated to a depth of approximately 2 m, the maximum draw-down of the water table during dry season irrigation, at the timeof sediment collection (Fig. 2a). Below this layer, intercalatedfine sands and silty sands, gray in color, were observed to adepth of approximately 12 m. A sequence of fine to mediumsands, grayish-green in color, was collected from 12 to 110 m,interrupted by a 10 cm thick silty-clay layer observed at 42.5 mand a silty-fine sand layer, approximately 1.5 m thick, at 76 m.Intercalated fine sands and silty clays were observed from110 m to 119 m, below which a greenish clay was encounteredto a depth of 150 m (Fig. 2a). Fine to medium sands wereencountered at depths from 150 to 165 m. These sands werelight brown to orange in color, contrasting with the grayish-green sands in the upper aquifer. For this study, the sedimentslocated above the 30 m thick clay layer will be referred to as the“upper” aquifer and are presumed to be Holocene deposits.Sediments beneath the clay layer will be referred to as the
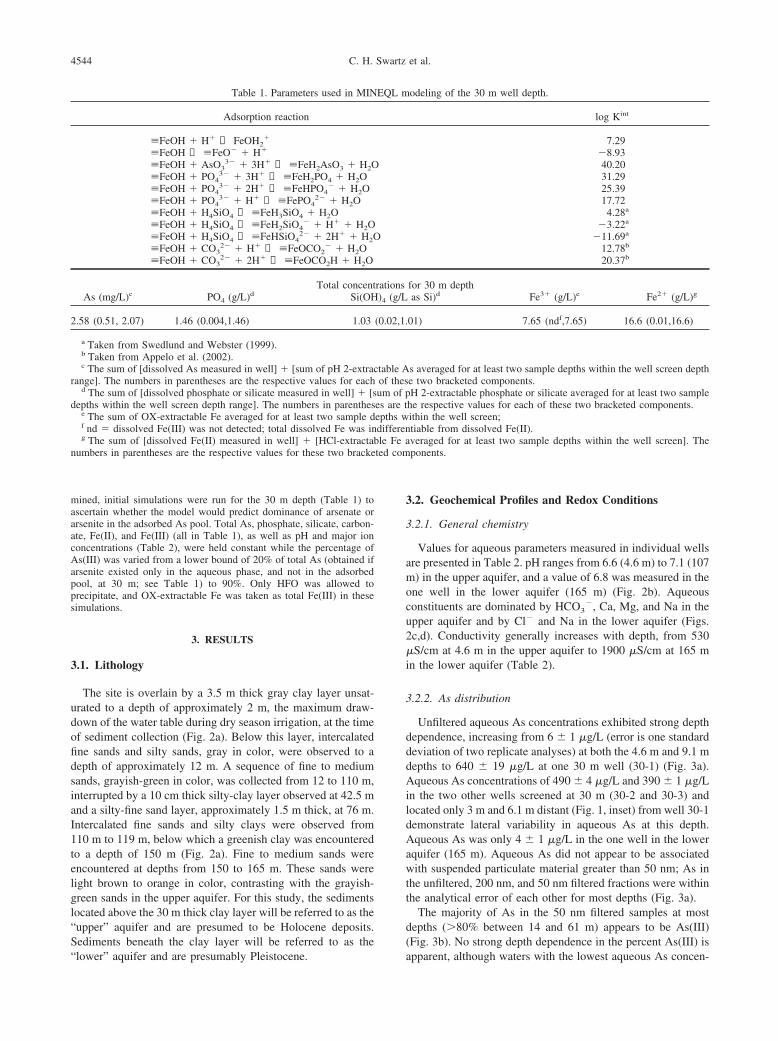
Table 1. Parameters used in MIN
Adsorption reaction
�FeOH � H� ↔ FeOH2�
�FeOH ↔ �FeO� � H�
�FeOH � AsO33� � 3H� ↔ �FeH2AsO3 � H2O
�FeOH � PO43� � 3H� ↔ �FeH2PO4 � H2O
�FeOH � PO43� � 2H� ↔ �FeHPO4
� � H2O�FeOH � PO4
3� � H� ↔ �FePO42� � H2O
�FeOH � H4SiO4 ↔ �FeH3SiO4 � H2O�FeOH � H4SiO4 ↔ �FeH2SiO4
� � H� � H2O�FeOH � H4SiO4 ↔ �FeHSiO4
2� � 2H� � H2O�FeOH � CO3
2� � H� ↔ �FeOCO2� � H2O
�FeOH � CO32� � 2H� ↔ �FeOCO2H � H2O
As (mg/L)c PO4 (g/L)dTotal concent
Si(OH
2.58 (0.51, 2.07) 1.46 (0.004,1.46) 1.03
a Taken from Swedlund and Webster (1999).b Taken from Appelo et al. (2002).c The sum of [dissolved As measured in well] � [sum of pH 2-extrac
range]. The numbers in parentheses are the respective values for eachd The sum of [dissolved phosphate or silicate measured in well] � [s
depths within the well screen depth range]. The numbers in parenthese The sum of OX-extractable Fe averaged for at least two sample df nd � dissolved Fe(III) was not detected; total dissolved Fe was ing The sum of [dissolved Fe(II) measured in well] � [HCl-extractab
numbers in parentheses are the respective values for these two bracke
“lower” aquifer and are presumably Pleistocene.
3.2. Geochemical Profiles and Redox Conditions
3.2.1. General chemistry
Values for aqueous parameters measured in individual wellsare presented in Table 2. pH ranges from 6.6 (4.6 m) to 7.1 (107m) in the upper aquifer, and a value of 6.8 was measured in theone well in the lower aquifer (165 m) (Fig. 2b). Aqueousconstituents are dominated by HCO3
�, Ca, Mg, and Na in theupper aquifer and by Cl� and Na in the lower aquifer (Figs.2c,d). Conductivity generally increases with depth, from 530�S/cm at 4.6 m in the upper aquifer to 1900 �S/cm at 165 min the lower aquifer (Table 2).
3.2.2. As distribution
Unfiltered aqueous As concentrations exhibited strong depthdependence, increasing from 6 � 1 �g/L (error is one standarddeviation of two replicate analyses) at both the 4.6 m and 9.1 mdepths to 640 � 19 �g/L at one 30 m well (30-1) (Fig. 3a).Aqueous As concentrations of 490 � 4 �g/L and 390 � 1 �g/Lin the two other wells screened at 30 m (30-2 and 30-3) andlocated only 3 m and 6.1 m distant (Fig. 1, inset) from well 30-1demonstrate lateral variability in aqueous As at this depth.Aqueous As was only 4 � 1 �g/L in the one well in the loweraquifer (165 m). Aqueous As did not appear to be associatedwith suspended particulate material greater than 50 nm; As inthe unfiltered, 200 nm, and 50 nm filtered fractions were withinthe analytical error of each other for most depths (Fig. 3a).
The majority of As in the 50 nm filtered samples at mostdepths (�80% between 14 and 61 m) appears to be As(III)(Fig. 3b). No strong depth dependence in the percent As(III) is
odeling of the 30 m well depth.
log Kint
7.29�8.9340.2031.2925.3917.724.28a
�3.22a
�11.69a
12.78b
20.37b
for 30 m depthas Si)d Fe3� (g/L)e Fe2� (g/L)g
01) 7.65 (ndf,7.65) 16.6 (0.01,16.6)
s averaged for at least two sample depths within the well screen depthe two bracketed components.H 2-extractable phosphate or silicate averaged for at least two sample
he respective values for each of these two bracketed components.ithin the well screen;tiable from dissolved Fe(II).veraged for at least two sample depths within the well screen]. Theponents.
EQL m
rations)4 (g/L
(0.02,1.
table Aof thesum of pes are tepths wdifferen
apparent, although waters with the lowest aqueous As concen-
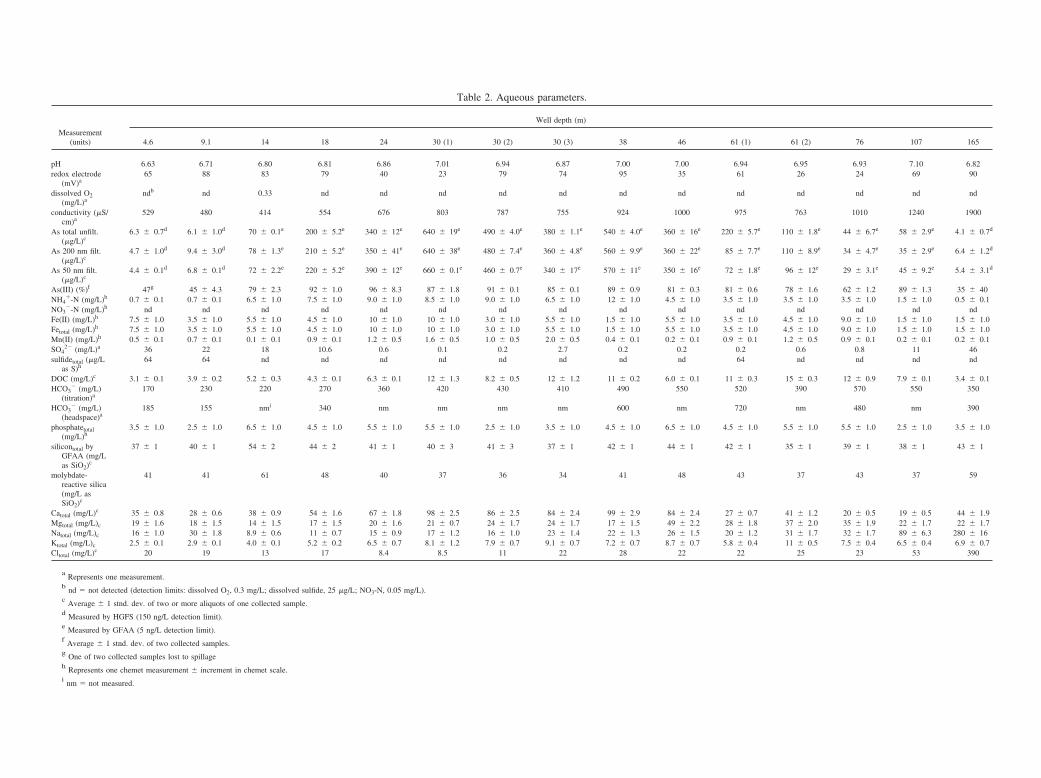
Table 2. Aqueous parameters.
Measurement(units)
Well depth (m)
4.6 9.1 14 18 24 30 (1) 30 (2) 30 (3) 38 46 61 (1) 61 (2) 76 107 165
pH 6.63 6.71 6.80 6.81 6.86 7.01 6.94 6.87 7.00 7.00 6.94 6.95 6.93 7.10 6.82redox electrode
(mV)a65 88 83 79 40 23 79 74 95 35 61 26 24 69 90
dissolved O2(mg/L)a
ndb nd 0.33 nd nd nd nd nd nd nd nd nd nd nd nd
conductivity (�S/cm)a
529 480 414 554 676 803 787 755 924 1000 975 763 1010 1240 1900
As total unfilt.(�g/L)c
6.3 � 0.7d 6.1 � 1.0d 70 � 0.1e 200 � 5.2e 340 � 12e 640 � 19e 490 � 4.0e 380 � 1.1e 540 � 4.0e 360 � 16e 220 � 5.7e 110 � 1.8e 44 � 6.7e 58 � 2.9e 4.1 � 0.7d
As 200 nm filt.(�g/L)c
4.7 � 1.0d 9.4 � 3.0d 78 � 1.3e 210 � 5.2e 350 � 41e 640 � 38e 480 � 7.4e 360 � 4.8e 560 � 9.9e 360 � 22e 85 � 7.7e 110 � 8.9e 34 � 4.7e 35 � 2.9e 6.4 � 1.2d
As 50 nm filt.(�g/L)c
4.4 � 0.1d 6.8 � 0.1d 72 � 2.2e 220 � 5.2e 390 � 12e 660 � 0.1e 460 � 0.7e 340 � 17e 570 � 11e 350 � 16e 72 � 1.8e 96 � 12e 29 � 3.1e 45 � 9.2e 5.4 � 3.1d
As(III) (%)f 47g 45 � 4.3 79 � 2.3 92 � 1.0 96 � 8.3 87 � 1.8 91 � 0.1 85 � 0.1 89 � 0.9 81 � 0.3 81 � 0.6 78 � 1.6 62 � 1.2 89 � 1.3 35 � 40NH4
�-N (mg/L)h 0.7 � 0.1 0.7 � 0.1 6.5 � 1.0 7.5 � 1.0 9.0 � 1.0 8.5 � 1.0 9.0 � 1.0 6.5 � 1.0 12 � 1.0 4.5 � 1.0 3.5 � 1.0 3.5 � 1.0 3.5 � 1.0 1.5 � 1.0 0.5 � 0.1NO3
�-N (mg/L)h nd nd nd nd nd nd nd nd nd nd nd nd nd nd ndFe(II) (mg/L)h 7.5 � 1.0 3.5 � 1.0 5.5 � 1.0 4.5 � 1.0 10 � 1.0 10 � 1.0 3.0 � 1.0 5.5 � 1.0 1.5 � 1.0 5.5 � 1.0 3.5 � 1.0 4.5 � 1.0 9.0 � 1.0 1.5 � 1.0 1.5 � 1.0Fetotal (mg/L)h 7.5 � 1.0 3.5 � 1.0 5.5 � 1.0 4.5 � 1.0 10 � 1.0 10 � 1.0 3.0 � 1.0 5.5 � 1.0 1.5 � 1.0 5.5 � 1.0 3.5 � 1.0 4.5 � 1.0 9.0 � 1.0 1.5 � 1.0 1.5 � 1.0Mn(II) (mg/L)h 0.5 � 0.1 0.7 � 0.1 0.1 � 0.1 0.9 � 0.1 1.2 � 0.5 1.6 � 0.5 1.0 � 0.5 2.0 � 0.5 0.4 � 0.1 0.2 � 0.1 0.9 � 0.1 1.2 � 0.5 0.9 � 0.1 0.2 � 0.1 0.2 � 0.1SO4
2� (mg/L)a 36 22 18 10.6 0.6 0.1 0.2 2.7 0.2 0.2 0.2 0.6 0.8 11 46sulfidetotal (�g/L
as S)h64 64 nd nd nd nd nd nd nd nd 64 nd nd nd nd
DOC (mg/L)c 3.1 � 0.1 3.9 � 0.2 5.2 � 0.3 4.3 � 0.1 6.3 � 0.1 12 � 1.3 8.2 � 0.5 12 � 1.2 11 � 0.2 6.0 � 0.1 11 � 0.3 15 � 0.3 12 � 0.9 7.9 � 0.1 3.4 � 0.1HCO3
� (mg/L)(titration)a
170 230 220 270 360 420 430 410 490 550 520 390 570 550 350
HCO3� (mg/L)
(headspace)a185 155 nmi 340 nm nm nm nm 600 nm 720 nm 480 nm 390
phosphatetotal(mg/L)h
3.5 � 1.0 2.5 � 1.0 6.5 � 1.0 4.5 � 1.0 5.5 � 1.0 5.5 � 1.0 2.5 � 1.0 3.5 � 1.0 4.5 � 1.0 6.5 � 1.0 4.5 � 1.0 5.5 � 1.0 5.5 � 1.0 2.5 � 1.0 3.5 � 1.0
silicontotal byGFAA (mg/Las SiO2)c
37 � 1 40 � 1 54 � 2 44 � 2 41 � 1 40 � 3 41 � 3 37 � 1 42 � 1 44 � 1 42 � 1 35 � 1 39 � 1 38 � 1 43 � 1
molybdate-reactive silica(mg/L asSiO2)c
41 41 61 48 40 37 36 34 41 48 43 37 43 37 59
Catotal (mg/L)c 35 � 0.8 28 � 0.6 38 � 0.9 54 � 1.6 67 � 1.8 98 � 2.5 86 � 2.5 84 � 2.4 99 � 2.9 84 � 2.4 27 � 0.7 41 � 1.2 20 � 0.5 19 � 0.5 44 � 1.9Mgtotal (mg/L)c 19 � 1.6 18 � 1.5 14 � 1.5 17 � 1.5 20 � 1.6 21 � 0.7 24 � 1.7 24 � 1.7 17 � 1.5 49 � 2.2 28 � 1.8 37 � 2.0 35 � 1.9 22 � 1.7 22 � 1.7Natotal (mg/L)c 16 � 1.0 30 � 1.8 8.9 � 0.6 11 � 0.7 15 � 0.9 17 � 1.2 16 � 1.0 23 � 1.4 22 � 1.3 26 � 1.5 20 � 1.2 31 � 1.7 32 � 1.7 89 � 6.3 280 � 16Ktotal (mg/L)c 2.5 � 0.1 2.9 � 0.1 4.0 � 0.1 5.2 � 0.2 6.5 � 0.7 8.1 � 1.2 7.9 � 0.7 9.1 � 0.7 7.2 � 0.7 8.7 � 0.7 5.8 � 0.4 11 � 0.5 7.5 � 0.4 6.5 � 0.4 6.9 � 0.7Cltotal (mg/L)c 20 19 13 17 8.4 8.5 11 22 28 22 22 25 23 53 390
a Represents one measurement.b nd � not detected (detection limits: dissolved O2, 0.3 mg/L; dissolved sulfide, 25 �g/L; NO3-N, 0.05 mg/L).c Average � 1 stnd. dev. of two or more aliquots of one collected sample.d Measured by HGFS (150 ng/L detection limit).e Measured by GFAA (5 ng/L detection limit).f Average � 1 stnd. dev. of two collected samples.g One of two collected samples lost to spillageh Represents one chemet measurement � increment in chemet scale.i nm � not measured.
d anions is onl
4546 C. H. Swartz et al.
trations (4.6 m, 9.1 m, and the 165 m) exhibit a somewhatlower percent As(III) (Fig. 3b). Method recovery experimentssuggest, though, that the lower fraction As(III) measured forthese depths may be due, in part, to disproportionate loss ofAs(III) to the resin from samples that were not acidified beforeseparation and that have lower (i.e., �10 �g/L) total As con-centrations. We found that losses of total As(III) to the resinfrom unacidified (pH 5 to 6) standards containing 5 �g/LAs(III) were 27 � 13%, while acidified 5 �g/L standards lostonly 2.0 � 1.7% and unacidified 1 mg/L As(III) standards lostonly 0.4 � 0.3% of the total As(III) to the resin.
Solid phase As concentrations exhibit little depth depen-dence and are typically less than 2 �g/g (Fig. 4a), although inthe surficial clay layer and in the deeper clay layer at 119 to150 m, concentrations are somewhat greater (3 to 8 �g/g).Sediment at 31 m, a depth within the range exhibiting thegreatest aqueous As levels (Fig. 3a), also shows s somewhathigher solid phase As concentration (4.0 � 0.7 �g/g) (Fig. 4a).
3.2.3. Redox components
The predominance of As(III) in the aqueous phase is con-sistent with other geochemical indicators of suboxic to anoxicconditions in the upper and lower aquifers. Dissolved O2 con-centrations were below the approximate detection limit of 0.3mg/L, with the exception of only one depth (0.33 mg/L at 14 m;Table 2). Platinum electrode measurements fell in a narrowrange from 20 mV to 100 mV (corrected to the standardhydrogen electrode) (Table 2). Consistent with the very lowlevels of oxygen and low platinum electrode measurements, noNO3
�-N was detected in the aqueous samples, while NH4�-N
was present and had a peak concentration of 12 mg/L at the38 m depth (Fig. 3c). Dissolved Fe(II) levels (Fig. 3d), indis-tinguishable from total dissolved Fe, ranged from 1.5 to 10mg/L with no apparent systematic depth dependence, similar to
Fig. 2. Depth profiles of (a) the lithologies encounteredand (d) anions (in mEq/L). The sums of major cations an76 and 107 m depths, where the charge of measured cation
total solid phase Fe levels (Fig. 4b). Mn(II) was also detected
throughout the profile at concentrations from 0.1 mg/L to 2.0mg/L (Fig. 3e), with the most elevated levels measured in the30 and 38 m wells.
Dissolved sulfur was mostly present as sulfate, with thehighest concentrations (36 and 46 mg/L) occurring at the shal-lowest depth in the upper aquifer and in the one well in thelower aquifer, respectively (Fig. 3f). Sulfate levels were typi-cally below 1.0 mg/L throughout much of the profile. Whiledissolved sulfide exceeded the detection limit (25 �g/L) in onlythree wells, all in the upper aquifer (Table 2), approximately10% of total sulfur in the sediments appears to be incorporatedin AVS (compare Figs. 4c,d).
Dissolved organic carbon (DOC) increases from 3.1 mg/L inthe shallow wells to 11 mg/L or greater at depths of 30 to 76 min the upper aquifer (Fig. 3g). Bicarbonate (HCO3
�) covarieswith dissolved organic carbon (DOC), but is 10 or more timeslarger in concentration (160 to 570 mg/L) (Fig. 3h).
Total solid phase carbon is typically between 0.1 to 1.0 mg/gsediment, while inorganic carbon is at most 25% of the totalsolid phase carbon (Fig. 4e). Such low solid phase carbonlevels are consistent with the failure to observe peat layers inthis core, although peat deposits have been postulated as pos-sible sources of DOC observed in Bangladesh and Vietnameseaquifers (Berg et al., 2001; McArthur et al., 2001). It is possiblethat a thin (less than 61 cm thick) peat layer could exist in theprofile, although no such layers were found by visual inspec-tion. It is also possible that discontinuous horizontal peat layersexist in the subsurface at the Munshiganj site but were notpenetrated at the coring location.
3.3. Extraction Data
3.3.1. As
Concentrations (in ng/g sediment) of operationally defined frac-
m; (b) pH; and the sum of major (c) cations (in mEq/L),s are typically within 5% of each other except for the 61,y approximately 60 to 75% of charge of measured anions.
to 165
tions of solid phase As leached cumulatively by the MG and
bars ar
4547Arsenic mobility in a Bangladesh aquifer
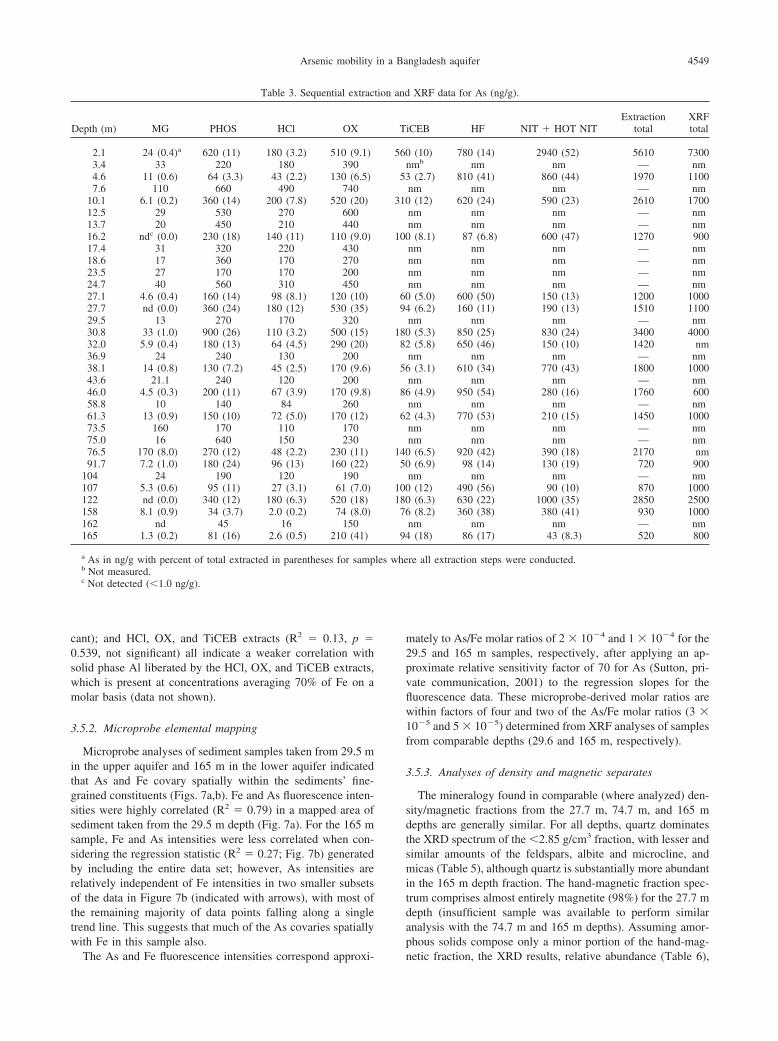
PHOS extractants (interpreted as adsorbed) and the HCl and OXextractants (interpreted as coprecipitated in solids, possibly AVS,carbonates, phosphates, mixed valence and amorphous oxides)covary with depth, although the range in concentrations for eitherpool generally spans less than one order of magnitude (Fig. 5; seeTable 3 for concentrations of As in each pool). As extracted by thepH 2 solution (also interpreted as adsorbed) is presented also inFigure 5 for comparison with the sum of As in the MG and PHOSextracts; As extracted by the pH 2 extractant was 80 � 37% of thesum of As in the MG and PHOS extracts (see Table A1 in theAppendix for pH 2 extraction data). Note that the amounts of Asin these pools of As, relatively mobile under reducing conditions,are similar throughout the depth profile, being only a factor of 2 to
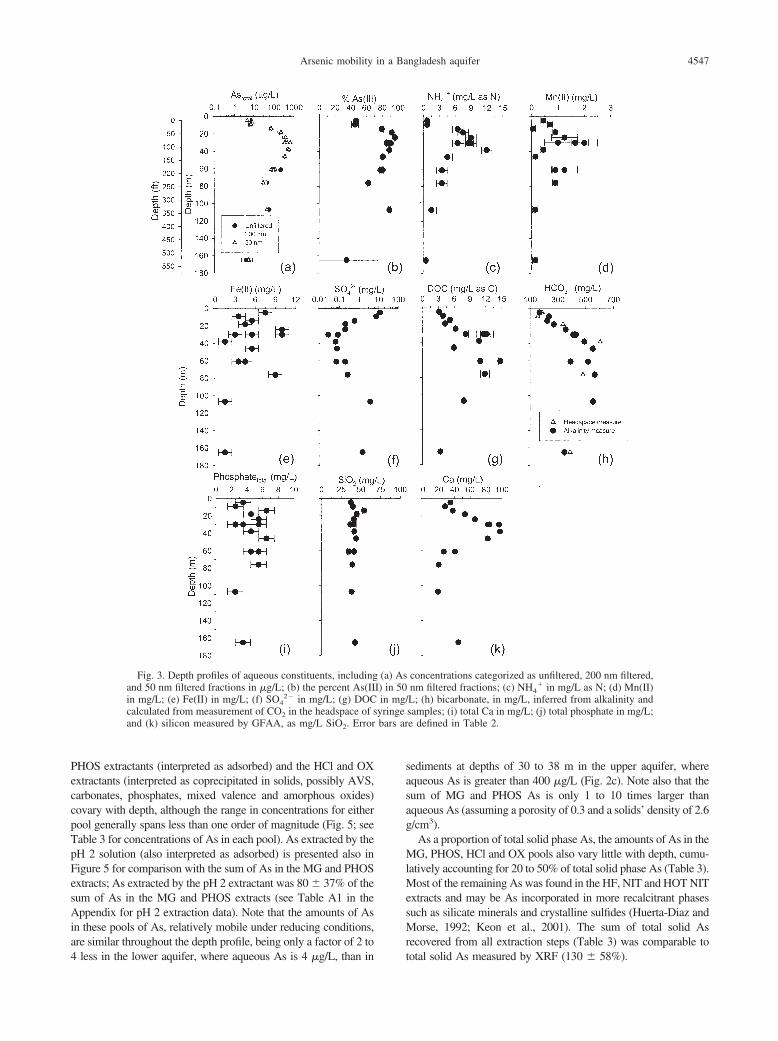
Fig. 3. Depth profiles of aqueous constituents, includingand 50 nm filtered fractions in �g/L; (b) the percent As(IIin mg/L; (e) Fe(II) in mg/L; (f) SO4
2� in mg/L; (g) DOCcalculated from measurement of CO2 in the headspace of sand (k) silicon measured by GFAA, as mg/L SiO2. Error
4 less in the lower aquifer, where aqueous As is 4 �g/L, than in
sediments at depths of 30 to 38 m in the upper aquifer, whereaqueous As is greater than 400 �g/L (Fig. 2c). Note also that thesum of MG and PHOS As is only 1 to 10 times larger thanaqueous As (assuming a porosity of 0.3 and a solids’ density of 2.6g/cm3).
As a proportion of total solid phase As, the amounts of As in theMG, PHOS, HCl and OX pools also vary little with depth, cumu-latively accounting for 20 to 50% of total solid phase As (Table 3).Most of the remaining As was found in the HF, NIT and HOT NITextracts and may be As incorporated in more recalcitrant phasessuch as silicate minerals and crystalline sulfides (Huerta-Diaz andMorse, 1992; Keon et al., 2001). The sum of total solid Asrecovered from all extraction steps (Table 3) was comparable to
concentrations categorized as unfiltered, 200 nm filtered,nm filtered fractions; (c) NH4
� in mg/L as N; (d) Mn(II)L; (h) bicarbonate, in mg/L, inferred from alkalinity andsamples; (i) total Ca in mg/L; (j) total phosphate in mg/L;e defined in Table 2.
(a) AsI) in 50in mg/
yringe
total solid As measured by XRF (130 � 58%).
d devia
4548 C. H. Swartz et al.
3.3.2. Fe
The proportions of solid phase Fe extracted in the HCl andOX steps are fairly constant with depth, each constitutingapproximately 5 to 10% of total solid phase Fe (Table 4). Theoxidation state(s) of the Fe liberated in the HCl step wasdetermined in sediments from depths of 24.7, 25.9, 29.0, and30.2 m taken from the core obtained in January 2002; essen-tially all of the HCl-extractable Fe was Fe(II) (106 � 3%, data
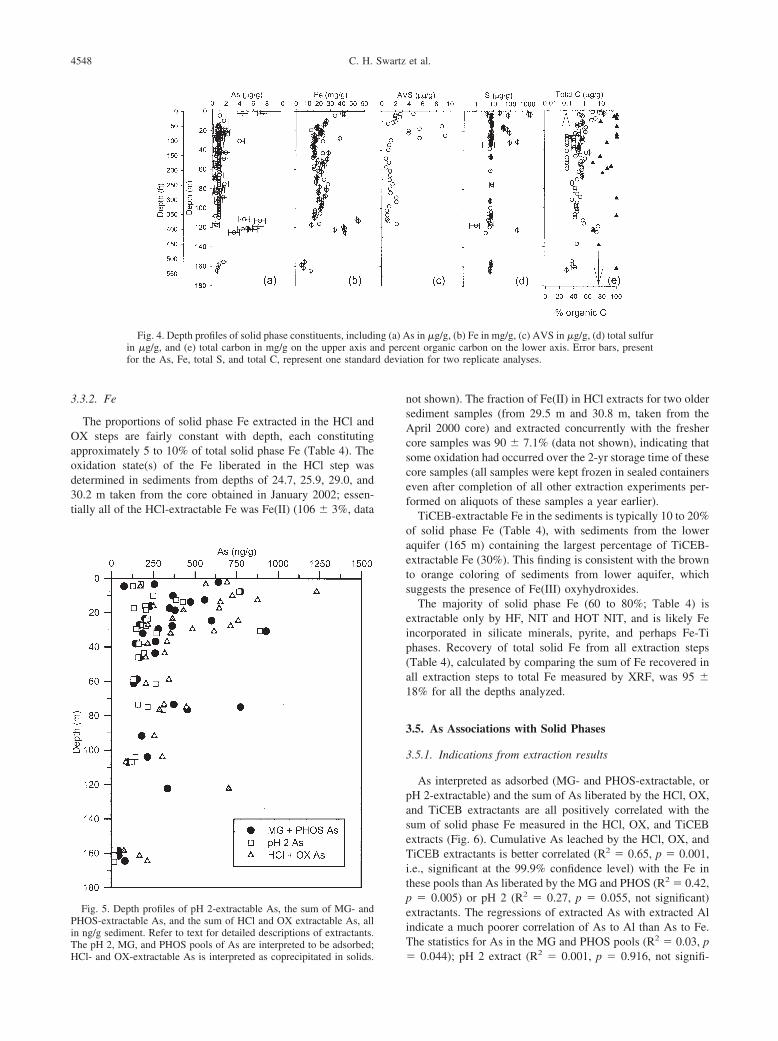
Fig. 4. Depth profiles of solid phase constituents, includiin �g/g, and (e) total carbon in mg/g on the upper axis afor the As, Fe, total S, and total C, represent one standar
Fig. 5. Depth profiles of pH 2-extractable As, the sum of MG- andPHOS-extractable As, and the sum of HCl and OX extractable As, allin ng/g sediment. Refer to text for detailed descriptions of extractants.
The pH 2, MG, and PHOS pools of As are interpreted to be adsorbed;HCl- and OX-extractable As is interpreted as coprecipitated in solids.not shown). The fraction of Fe(II) in HCl extracts for two oldersediment samples (from 29.5 m and 30.8 m, taken from theApril 2000 core) and extracted concurrently with the freshercore samples was 90 � 7.1% (data not shown), indicating thatsome oxidation had occurred over the 2-yr storage time of thesecore samples (all samples were kept frozen in sealed containerseven after completion of all other extraction experiments per-formed on aliquots of these samples a year earlier).
TiCEB-extractable Fe in the sediments is typically 10 to 20%of solid phase Fe (Table 4), with sediments from the loweraquifer (165 m) containing the largest percentage of TiCEB-extractable Fe (30%). This finding is consistent with the brownto orange coloring of sediments from lower aquifer, whichsuggests the presence of Fe(III) oxyhydroxides.
The majority of solid phase Fe (60 to 80%; Table 4) isextractable only by HF, NIT and HOT NIT, and is likely Feincorporated in silicate minerals, pyrite, and perhaps Fe-Tiphases. Recovery of total solid Fe from all extraction steps(Table 4), calculated by comparing the sum of Fe recovered inall extraction steps to total Fe measured by XRF, was 95 �18% for all the depths analyzed.
3.5. As Associations with Solid Phases
3.5.1. Indications from extraction results
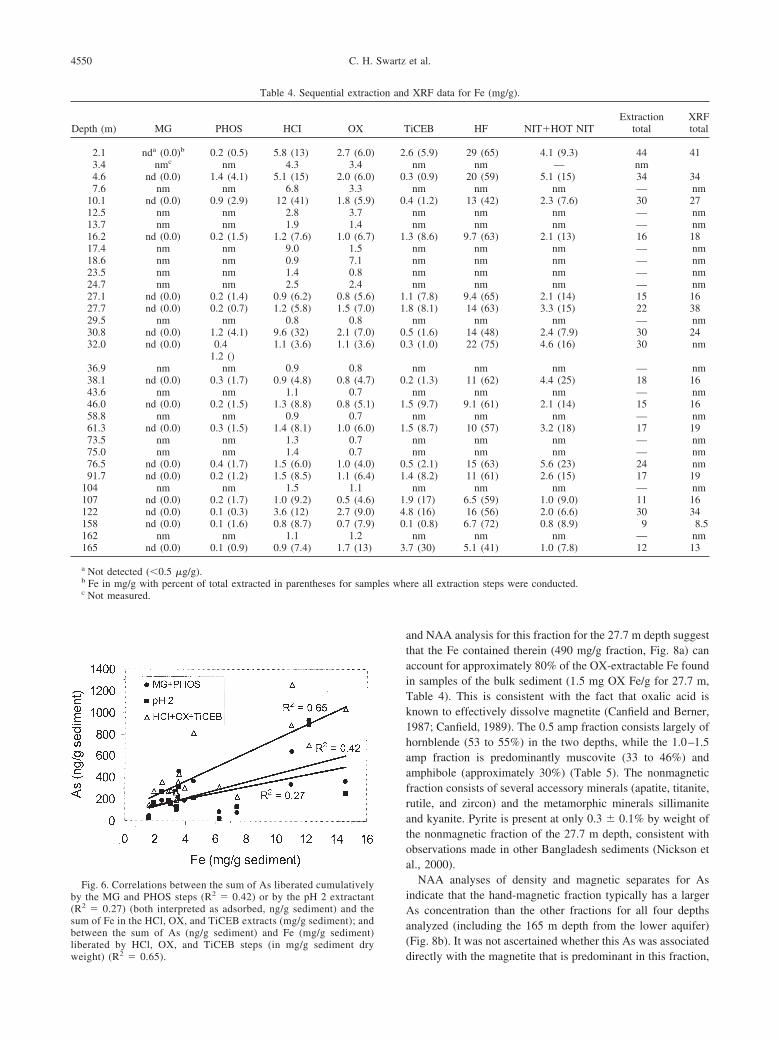
As interpreted as adsorbed (MG- and PHOS-extractable, orpH 2-extractable) and the sum of As liberated by the HCl, OX,and TiCEB extractants are all positively correlated with thesum of solid phase Fe measured in the HCl, OX, and TiCEBextracts (Fig. 6). Cumulative As leached by the HCl, OX, andTiCEB extractants is better correlated (R2 � 0.65, p � 0.001,i.e., significant at the 99.9% confidence level) with the Fe inthese pools than As liberated by the MG and PHOS (R2 � 0.42,p � 0.005) or pH 2 (R2 � 0.27, p � 0.055, not significant)extractants. The regressions of extracted As with extracted Alindicate a much poorer correlation of As to Al than As to Fe.The statistics for As in the MG and PHOS pools (R2 � 0.03, p
s in �g/g, (b) Fe in mg/g, (c) AVS in �g/g, (d) total sulfurent organic carbon on the lower axis. Error bars, presenttion for two replicate analyses.
ng (a) And perc
� 0.044); pH 2 extract (R2 � 0.001, p � 0.916, not signifi-
4549Arsenic mobility in a Bangladesh aquifer
cant); and HCl, OX, and TiCEB extracts (R2 � 0.13, p �0.539, not significant) all indicate a weaker correlation withsolid phase Al liberated by the HCl, OX, and TiCEB extracts,which is present at concentrations averaging 70% of Fe on amolar basis (data not shown).
3.5.2. Microprobe elemental mapping
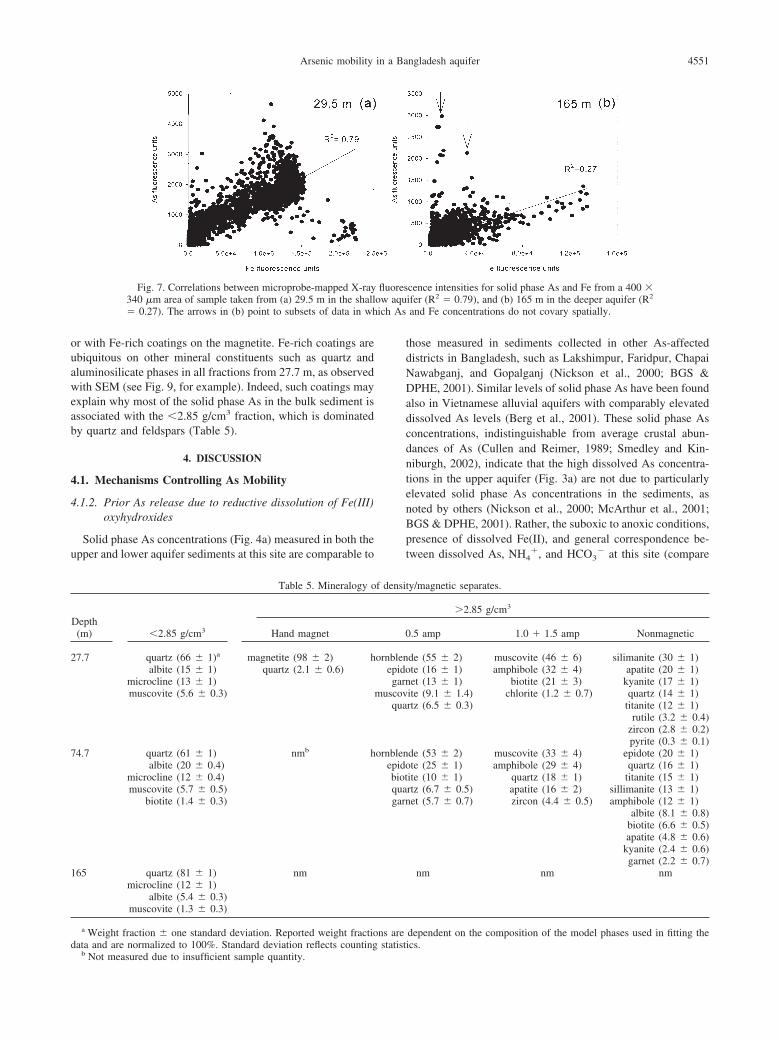
Microprobe analyses of sediment samples taken from 29.5 min the upper aquifer and 165 m in the lower aquifer indicatedthat As and Fe covary spatially within the sediments’ fine-grained constituents (Figs. 7a,b). Fe and As fluorescence inten-sities were highly correlated (R2 � 0.79) in a mapped area ofsediment taken from the 29.5 m depth (Fig. 7a). For the 165 msample, Fe and As intensities were less correlated when con-sidering the regression statistic (R2 � 0.27; Fig. 7b) generatedby including the entire data set; however, As intensities arerelatively independent of Fe intensities in two smaller subsetsof the data in Figure 7b (indicated with arrows), with most ofthe remaining majority of data points falling along a singletrend line. This suggests that much of the As covaries spatiallywith Fe in this sample also.
Table 3. Sequential extrac
Depth (m) MG PHOS HCl OX
2.1 24 (0.4)a 620 (11) 180 (3.2) 510 (9.1)3.4 33 220 180 3904.6 11 (0.6) 64 (3.3) 43 (2.2) 130 (6.5)7.6 110 660 490 740
10.1 6.1 (0.2) 360 (14) 200 (7.8) 520 (20)12.5 29 530 270 60013.7 20 450 210 44016.2 ndc (0.0) 230 (18) 140 (11) 110 (9.0)17.4 31 320 220 43018.6 17 360 170 27023.5 27 170 170 20024.7 40 560 310 45027.1 4.6 (0.4) 160 (14) 98 (8.1) 120 (10)27.7 nd (0.0) 360 (24) 180 (12) 530 (35)29.5 13 270 170 32030.8 33 (1.0) 900 (26) 110 (3.2) 500 (15)32.0 5.9 (0.4) 180 (13) 64 (4.5) 290 (20)36.9 24 240 130 20038.1 14 (0.8) 130 (7.2) 45 (2.5) 170 (9.6)43.6 21.1 240 120 20046.0 4.5 (0.3) 200 (11) 67 (3.9) 170 (9.8)58.8 10 140 84 26061.3 13 (0.9) 150 (10) 72 (5.0) 170 (12)73.5 160 170 110 17075.0 16 640 150 23076.5 170 (8.0) 270 (12) 48 (2.2) 230 (11)91.7 7.2 (1.0) 180 (24) 96 (13) 160 (22)
104 24 190 120 190107 5.3 (0.6) 95 (11) 27 (3.1) 61 (7.0)122 nd (0.0) 340 (12) 180 (6.3) 520 (18)158 8.1 (0.9) 34 (3.7) 2.0 (0.2) 74 (8.0)162 nd 45 16 150165 1.3 (0.2) 81 (16) 2.6 (0.5) 210 (41)
a As in ng/g with percent of total extracted in parentheses for sampb Not measured.c Not detected (�1.0 ng/g).
The As and Fe fluorescence intensities correspond approxi-
mately to As/Fe molar ratios of 2 � 10�4 and 1 � 10�4 for the29.5 and 165 m samples, respectively, after applying an ap-proximate relative sensitivity factor of 70 for As (Sutton, pri-vate communication, 2001) to the regression slopes for thefluorescence data. These microprobe-derived molar ratios arewithin factors of four and two of the As/Fe molar ratios (3 �10�5 and 5 � 10�5) determined from XRF analyses of samplesfrom comparable depths (29.6 and 165 m, respectively).
3.5.3. Analyses of density and magnetic separates
The mineralogy found in comparable (where analyzed) den-sity/magnetic fractions from the 27.7 m, 74.7 m, and 165 mdepths are generally similar. For all depths, quartz dominatesthe XRD spectrum of the �2.85 g/cm3 fraction, with lesser andsimilar amounts of the feldspars, albite and microcline, andmicas (Table 5), although quartz is substantially more abundantin the 165 m depth fraction. The hand-magnetic fraction spec-trum comprises almost entirely magnetite (98%) for the 27.7 mdepth (insufficient sample was available to perform similaranalysis with the 74.7 m and 165 m depths). Assuming amor-phous solids compose only a minor portion of the hand-mag-
XRF data for As (ng/g).
iCEB HF NIT � HOT NITExtraction
totalXRFtotal
(10) 780 (14) 2940 (52) 5610 7300nmb nm nm — nm
(2.7) 810 (41) 860 (44) 1970 1100nm nm nm — nm
(12) 620 (24) 590 (23) 2610 1700nm nm nm — nmnm nm nm — nm
(8.1) 87 (6.8) 600 (47) 1270 900nm nm nm — nmnm nm nm — nmnm nm nm — nmnm nm nm — nm
(5.0) 600 (50) 150 (13) 1200 1000(6.2) 160 (11) 190 (13) 1510 1100
nm nm nm — nm(5.3) 850 (25) 830 (24) 3400 4000(5.8) 650 (46) 150 (10) 1420 nm
nm nm nm — nm(3.1) 610 (34) 770 (43) 1800 1000
nm nm nm — nm(4.9) 950 (54) 280 (16) 1760 600
nm nm nm — nm(4.3) 770 (53) 210 (15) 1450 1000
nm nm nm — nmnm nm nm — nm
(6.5) 920 (42) 390 (18) 2170 nm(6.9) 98 (14) 130 (19) 720 900
nm nm nm — nm(12) 490 (56) 90 (10) 870 1000(6.3) 630 (22) 1000 (35) 2850 2500(8.2) 360 (38) 380 (41) 930 1000
nm nm nm — nm(18) 86 (17) 43 (8.3) 520 800
re all extraction steps were conducted.
tion and
T
560
53
310
100
6094
18082
56
86
62
14050
10018076
94
les whe
netic fraction, the XRD results, relative abundance (Table 6),
c Not measured.
liberated by HCl, OX, and TiCEB steps (in mg/g sediment dryweight) (R2 � 0.65).
4550 C. H. Swartz et al.
and NAA analysis for this fraction for the 27.7 m depth suggestthat the Fe contained therein (490 mg/g fraction, Fig. 8a) canaccount for approximately 80% of the OX-extractable Fe foundin samples of the bulk sediment (1.5 mg OX Fe/g for 27.7 m,Table 4). This is consistent with the fact that oxalic acid isknown to effectively dissolve magnetite (Canfield and Berner,1987; Canfield, 1989). The 0.5 amp fraction consists largely ofhornblende (53 to 55%) in the two depths, while the 1.0–1.5amp fraction is predominantly muscovite (33 to 46%) andamphibole (approximately 30%) (Table 5). The nonmagneticfraction consists of several accessory minerals (apatite, titanite,rutile, and zircon) and the metamorphic minerals sillimaniteand kyanite. Pyrite is present at only 0.3 � 0.1% by weight ofthe nonmagnetic fraction of the 27.7 m depth, consistent withobservations made in other Bangladesh sediments (Nickson etal., 2000).
NAA analyses of density and magnetic separates for Asindicate that the hand-magnetic fraction typically has a largerAs concentration than the other fractions for all four depthsanalyzed (including the 165 m depth from the lower aquifer)(Fig. 8b). It was not ascertained whether this As was associated
XRF data for Fe (mg/g).
iCEB HF NIT�HOT NITExtraction
totalXRFtotal
6 (5.9) 29 (65) 4.1 (9.3) 44 41nm nm — nm
3 (0.9) 20 (59) 5.1 (15) 34 34nm nm nm — nm
4 (1.2) 13 (42) 2.3 (7.6) 30 27nm nm nm — nmnm nm nm — nm
3 (8.6) 9.7 (63) 2.1 (13) 16 18nm nm nm — nmnm nm nm — nmnm nm nm — nmnm nm nm — nm
1 (7.8) 9.4 (65) 2.1 (14) 15 168 (8.1) 14 (63) 3.3 (15) 22 38nm nm nm — nm
5 (1.6) 14 (48) 2.4 (7.9) 30 243 (1.0) 22 (75) 4.6 (16) 30 nm
nm nm nm — nm2 (1.3) 11 (62) 4.4 (25) 18 16nm nm nm — nm
5 (9.7) 9.1 (61) 2.1 (14) 15 16nm nm nm — nm
5 (8.7) 10 (57) 3.2 (18) 17 19nm nm nm — nmnm nm nm — nm
5 (2.1) 15 (63) 5.6 (23) 24 nm4 (8.2) 11 (61) 2.6 (15) 17 19nm nm nm — nm
9 (17) 6.5 (59) 1.0 (9.0) 11 168 (16) 16 (56) 2.0 (6.6) 30 341 (0.8) 6.7 (72) 0.8 (8.9) 9 8.5nm nm nm — nm
7 (30) 5.1 (41) 1.0 (7.8) 12 13
ere all extraction steps were conducted.
Table 4. Sequential extraction and
Depth (m) MG PHOS HCI OX T
2.1 nda (0.0)b 0.2 (0.5) 5.8 (13) 2.7 (6.0) 2.3.4 nmc nm 4.3 3.44.6 nd (0.0) 1.4 (4.1) 5.1 (15) 2.0 (6.0) 0.7.6 nm nm 6.8 3.3
10.1 nd (0.0) 0.9 (2.9) 12 (41) 1.8 (5.9) 0.12.5 nm nm 2.8 3.713.7 nm nm 1.9 1.416.2 nd (0.0) 0.2 (1.5) 1.2 (7.6) 1.0 (6.7) 1.17.4 nm nm 9.0 1.518.6 nm nm 0.9 7.123.5 nm nm 1.4 0.824.7 nm nm 2.5 2.427.1 nd (0.0) 0.2 (1.4) 0.9 (6.2) 0.8 (5.6) 1.27.7 nd (0.0) 0.2 (0.7) 1.2 (5.8) 1.5 (7.0) 1.29.5 nm nm 0.8 0.830.8 nd (0.0) 1.2 (4.1) 9.6 (32) 2.1 (7.0) 0.32.0 nd (0.0) 0.4
1.2 ()1.1 (3.6) 1.1 (3.6) 0.
36.9 nm nm 0.9 0.838.1 nd (0.0) 0.3 (1.7) 0.9 (4.8) 0.8 (4.7) 0.43.6 nm nm 1.1 0.746.0 nd (0.0) 0.2 (1.5) 1.3 (8.8) 0.8 (5.1) 1.58.8 nm nm 0.9 0.761.3 nd (0.0) 0.3 (1.5) 1.4 (8.1) 1.0 (6.0) 1.73.5 nm nm 1.3 0.775.0 nm nm 1.4 0.776.5 nd (0.0) 0.4 (1.7) 1.5 (6.0) 1.0 (4.0) 0.91.7 nd (0.0) 0.2 (1.2) 1.5 (8.5) 1.1 (6.4) 1.
104 nm nm 1.5 1.1107 nd (0.0) 0.2 (1.7) 1.0 (9.2) 0.5 (4.6) 1.122 nd (0.0) 0.1 (0.3) 3.6 (12) 2.7 (9.0) 4.158 nd (0.0) 0.1 (1.6) 0.8 (8.7) 0.7 (7.9) 0.162 nm nm 1.1 1.2165 nd (0.0) 0.1 (0.9) 0.9 (7.4) 1.7 (13) 3.
a Not detected (�0.5 �g/g).b Fe in mg/g with percent of total extracted in parentheses for samples wh
Fig. 6. Correlations between the sum of As liberated cumulativelyby the MG and PHOS steps (R2 � 0.42) or by the pH 2 extractant(R2 � 0.27) (both interpreted as adsorbed, ng/g sediment) and thesum of Fe in the HCl, OX, and TiCEB extracts (mg/g sediment); andbetween the sum of As (ng/g sediment) and Fe (mg/g sediment)
directly with the magnetite that is predominant in this fraction,
ich As
4551Arsenic mobility in a Bangladesh aquifer
or with Fe-rich coatings on the magnetite. Fe-rich coatings areubiquitous on other mineral constituents such as quartz andaluminosilicate phases in all fractions from 27.7 m, as observedwith SEM (see Fig. 9, for example). Indeed, such coatings mayexplain why most of the solid phase As in the bulk sediment isassociated with the �2.85 g/cm3 fraction, which is dominatedby quartz and feldspars (Table 5).
4. DISCUSSION
4.1. Mechanisms Controlling As Mobility
4.1.2. Prior As release due to reductive dissolution of Fe(III)oxyhydroxides
Solid phase As concentrations (Fig. 4a) measured in both theupper and lower aquifer sediments at this site are comparable to
Fig. 7. Correlations between microprobe-mapped X-ray340 �m area of sample taken from (a) 29.5 m in the shall� 0.27). The arrows in (b) point to subsets of data in wh
Table 5. Mineralogy o
Depth(m) �2.85 g/cm3 Hand magnet
27.7 quartz (66 � 1)a magnetite (98 � 2) halbite (15 � 1) quartz (2.1 � 0.6)
microcline (13 � 1)muscovite (5.6 � 0.3)
74.7 quartz (61 � 1) nmb halbite (20 � 0.4)
microcline (12 � 0.4)muscovite (5.7 � 0.5)
biotite (1.4 � 0.3)
165 quartz (81 � 1) nmmicrocline (12 � 1)
albite (5.4 � 0.3)muscovite (1.3 � 0.3)
a Weight fraction � one standard deviation. Reported weight fractio
data and are normalized to 100%. Standard deviation reflects counting statistb Not measured due to insufficient sample quantity.
those measured in sediments collected in other As-affecteddistricts in Bangladesh, such as Lakshimpur, Faridpur, ChapaiNawabganj, and Gopalganj (Nickson et al., 2000; BGS &DPHE, 2001). Similar levels of solid phase As have been foundalso in Vietnamese alluvial aquifers with comparably elevateddissolved As levels (Berg et al., 2001). These solid phase Asconcentrations, indistinguishable from average crustal abun-dances of As (Cullen and Reimer, 1989; Smedley and Kin-niburgh, 2002), indicate that the high dissolved As concentra-tions in the upper aquifer (Fig. 3a) are not due to particularlyelevated solid phase As concentrations in the sediments, asnoted by others (Nickson et al., 2000; McArthur et al., 2001;BGS & DPHE, 2001). Rather, the suboxic to anoxic conditions,presence of dissolved Fe(II), and general correspondence be-tween dissolved As, NH4
�, and HCO3� at this site (compare
cence intensities for solid phase As and Fe from a 400 �ifer (R2 � 0.79), and (b) 165 m in the deeper aquifer (R2
and Fe concentrations do not covary spatially.
ty/magnetic separates.
�2.85 g/cm3
.5 amp 1.0 � 1.5 amp Nonmagnetic
de (55 � 2) muscovite (46 � 6) silimanite (30 � 1)te (16 � 1) amphibole (32 � 4) apatite (20 � 1)et (13 � 1) biotite (21 � 3) kyanite (17 � 1)
ite (9.1 � 1.4) chlorite (1.2 � 0.7) quartz (14 � 1)rtz (6.5 � 0.3) titanite (12 � 1)
rutile (3.2 � 0.4)zircon (2.8 � 0.2)pyrite (0.3 � 0.1)
de (53 � 2) muscovite (33 � 4) epidote (20 � 1)te (25 � 1) amphibole (29 � 4) quartz (16 � 1)
ite (10 � 1) quartz (18 � 1) titanite (15 � 1)rtz (6.7 � 0.5) apatite (16 � 2) sillimanite (13 � 1)et (5.7 � 0.7) zircon (4.4 � 0.5) amphibole (12 � 1)
albite (8.1 � 0.8)biotite (6.6 � 0.5)apatite (4.8 � 0.6)
kyanite (2.4 � 0.6)garnet (2.2 � 0.7)
nm nm nm
dependent on the composition of the model phases used in fitting the
fluoresow aqu
f densi
0
ornblenepidogarn
muscovqua
ornblenepidobiotquagarn
ns are
ics.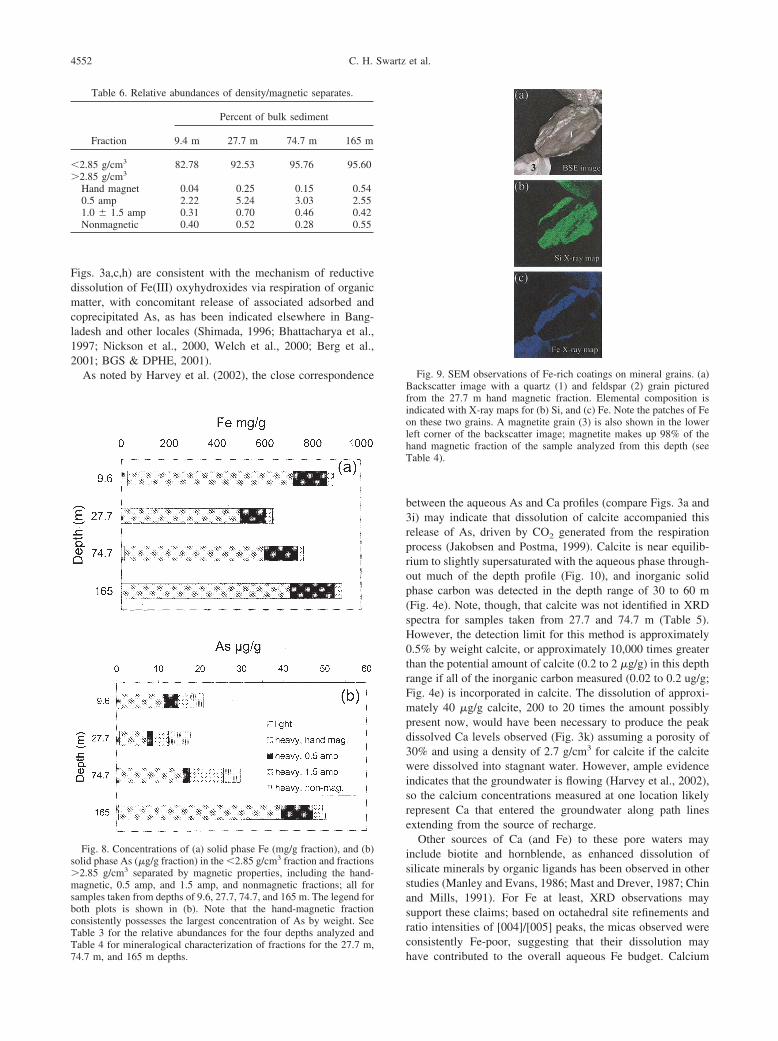
4552 C. H. Swartz et al.
Figs. 3a,c,h) are consistent with the mechanism of reductivedissolution of Fe(III) oxyhydroxides via respiration of organicmatter, with concomitant release of associated adsorbed andcoprecipitated As, as has been indicated elsewhere in Bang-ladesh and other locales (Shimada, 1996; Bhattacharya et al.,1997; Nickson et al., 2000, Welch et al., 2000; Berg et al.,2001; BGS & DPHE, 2001).
As noted by Harvey et al. (2002), the close correspondence
Table 6. Relative abundances of density/magnetic separates.
Fraction
Percent of bulk sediment
9.4 m 27.7 m 74.7 m 165 m
�2.85 g/cm3 82.78 92.53 95.76 95.60�2.85 g/cm3
Hand magnet 0.04 0.25 0.15 0.540.5 amp 2.22 5.24 3.03 2.551.0 � 1.5 amp 0.31 0.70 0.46 0.42Nonmagnetic 0.40 0.52 0.28 0.55
Fig. 8. Concentrations of (a) solid phase Fe (mg/g fraction), and (b)solid phase As (�g/g fraction) in the �2.85 g/cm3 fraction and fractions�2.85 g/cm3 separated by magnetic properties, including the hand-magnetic, 0.5 amp, and 1.5 amp, and nonmagnetic fractions; all forsamples taken from depths of 9.6, 27.7, 74.7, and 165 m. The legend forboth plots is shown in (b). Note that the hand-magnetic fractionconsistently possesses the largest concentration of As by weight. SeeTable 3 for the relative abundances for the four depths analyzed and
Table 4 for mineralogical characterization of fractions for the 27.7 m,74.7 m, and 165 m depths.between the aqueous As and Ca profiles (compare Figs. 3a and3i) may indicate that dissolution of calcite accompanied thisrelease of As, driven by CO2 generated from the respirationprocess (Jakobsen and Postma, 1999). Calcite is near equilib-rium to slightly supersaturated with the aqueous phase through-out much of the depth profile (Fig. 10), and inorganic solidphase carbon was detected in the depth range of 30 to 60 m(Fig. 4e). Note, though, that calcite was not identified in XRDspectra for samples taken from 27.7 and 74.7 m (Table 5).However, the detection limit for this method is approximately0.5% by weight calcite, or approximately 10,000 times greaterthan the potential amount of calcite (0.2 to 2 �g/g) in this depthrange if all of the inorganic carbon measured (0.02 to 0.2 ug/g;Fig. 4e) is incorporated in calcite. The dissolution of approxi-mately 40 �g/g calcite, 200 to 20 times the amount possiblypresent now, would have been necessary to produce the peakdissolved Ca levels observed (Fig. 3k) assuming a porosity of30% and using a density of 2.7 g/cm3 for calcite if the calcitewere dissolved into stagnant water. However, ample evidenceindicates that the groundwater is flowing (Harvey et al., 2002),so the calcium concentrations measured at one location likelyrepresent Ca that entered the groundwater along path linesextending from the source of recharge.
Other sources of Ca (and Fe) to these pore waters mayinclude biotite and hornblende, as enhanced dissolution ofsilicate minerals by organic ligands has been observed in otherstudies (Manley and Evans, 1986; Mast and Drever, 1987; Chinand Mills, 1991). For Fe at least, XRD observations maysupport these claims; based on octahedral site refinements andratio intensities of [004]/[005] peaks, the micas observed wereconsistently Fe-poor, suggesting that their dissolution may
Fig. 9. SEM observations of Fe-rich coatings on mineral grains. (a)Backscatter image with a quartz (1) and feldspar (2) grain picturedfrom the 27.7 m hand magnetic fraction. Elemental composition isindicated with X-ray maps for (b) Si, and (c) Fe. Note the patches of Feon these two grains. A magnetite grain (3) is also shown in the lowerleft corner of the backscatter image; magnetite makes up 98% of thehand magnetic fraction of the sample analyzed from this depth (seeTable 4).
have contributed to the overall aqueous Fe budget. Calcium
4553Arsenic mobility in a Bangladesh aquifer
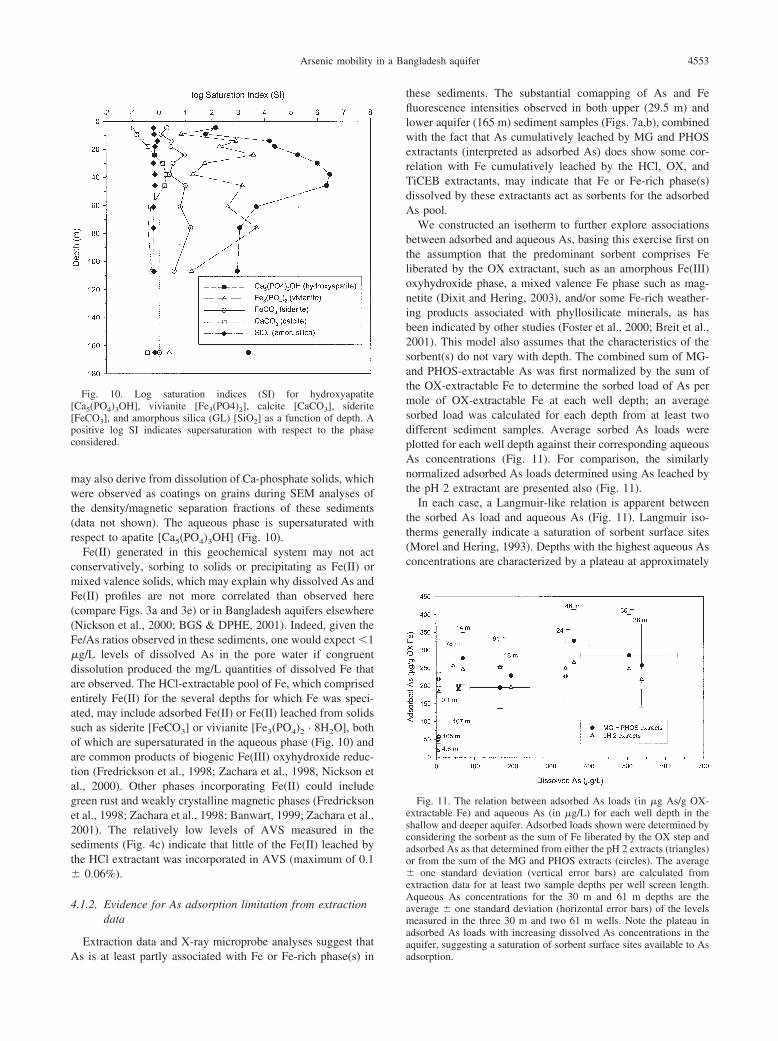
may also derive from dissolution of Ca-phosphate solids, whichwere observed as coatings on grains during SEM analyses ofthe density/magnetic separation fractions of these sediments(data not shown). The aqueous phase is supersaturated withrespect to apatite [Ca5(PO4)3OH] (Fig. 10).
Fe(II) generated in this geochemical system may not actconservatively, sorbing to solids or precipitating as Fe(II) ormixed valence solids, which may explain why dissolved As andFe(II) profiles are not more correlated than observed here(compare Figs. 3a and 3e) or in Bangladesh aquifers elsewhere(Nickson et al., 2000; BGS & DPHE, 2001). Indeed, given theFe/As ratios observed in these sediments, one would expect �1�g/L levels of dissolved As in the pore water if congruentdissolution produced the mg/L quantities of dissolved Fe thatare observed. The HCl-extractable pool of Fe, which comprisedentirely Fe(II) for the several depths for which Fe was speci-ated, may include adsorbed Fe(II) or Fe(II) leached from solidssuch as siderite [FeCO3] or vivianite [Fe3(PO4)2 · 8H2O], bothof which are supersaturated in the aqueous phase (Fig. 10) andare common products of biogenic Fe(III) oxyhydroxide reduc-tion (Fredrickson et al., 1998; Zachara et al., 1998, Nickson etal., 2000). Other phases incorporating Fe(II) could includegreen rust and weakly crystalline magnetic phases (Fredricksonet al., 1998; Zachara et al., 1998; Banwart, 1999; Zachara et al.,2001). The relatively low levels of AVS measured in thesediments (Fig. 4c) indicate that little of the Fe(II) leached bythe HCl extractant was incorporated in AVS (maximum of 0.1� 0.06%).
4.1.2. Evidence for As adsorption limitation from extractiondata
Extraction data and X-ray microprobe analyses suggest that
Fig. 10. Log saturation indices (SI) for hydroxyapatite[Ca5(PO4)3OH], vivianite [Fe3(PO4)2], calcite [CaCO3], siderite[FeCO3], and amorphous silica (GL) [SiO2] as a function of depth. Apositive log SI indicates supersaturation with respect to the phaseconsidered.
As is at least partly associated with Fe or Fe-rich phase(s) in
these sediments. The substantial comapping of As and Fefluorescence intensities observed in both upper (29.5 m) andlower aquifer (165 m) sediment samples (Figs. 7a,b), combinedwith the fact that As cumulatively leached by MG and PHOSextractants (interpreted as adsorbed As) does show some cor-relation with Fe cumulatively leached by the HCl, OX, andTiCEB extractants, may indicate that Fe or Fe-rich phase(s)dissolved by these extractants act as sorbents for the adsorbedAs pool.
We constructed an isotherm to further explore associationsbetween adsorbed and aqueous As, basing this exercise first onthe assumption that the predominant sorbent comprises Feliberated by the OX extractant, such as an amorphous Fe(III)oxyhydroxide phase, a mixed valence Fe phase such as mag-netite (Dixit and Hering, 2003), and/or some Fe-rich weather-ing products associated with phyllosilicate minerals, as hasbeen indicated by other studies (Foster et al., 2000; Breit et al.,2001). This model also assumes that the characteristics of thesorbent(s) do not vary with depth. The combined sum of MG-and PHOS-extractable As was first normalized by the sum ofthe OX-extractable Fe to determine the sorbed load of As permole of OX-extractable Fe at each well depth; an averagesorbed load was calculated for each depth from at least twodifferent sediment samples. Average sorbed As loads wereplotted for each well depth against their corresponding aqueousAs concentrations (Fig. 11). For comparison, the similarlynormalized adsorbed As loads determined using As leached bythe pH 2 extractant are presented also (Fig. 11).
In each case, a Langmuir-like relation is apparent betweenthe sorbed As load and aqueous As (Fig. 11). Langmuir iso-therms generally indicate a saturation of sorbent surface sites(Morel and Hering, 1993). Depths with the highest aqueous Asconcentrations are characterized by a plateau at approximately
Fig. 11. The relation between adsorbed As loads (in �g As/g OX-extractable Fe) and aqueous As (in �g/L) for each well depth in theshallow and deeper aquifer. Adsorbed loads shown were determined byconsidering the sorbent as the sum of Fe liberated by the OX step andadsorbed As as that determined from either the pH 2 extracts (triangles)or from the sum of the MG and PHOS extracts (circles). The average� one standard deviation (vertical error bars) are calculated fromextraction data for at least two sample depths per well screen length.Aqueous As concentrations for the 30 m and 61 m depths are theaverage � one standard deviation (horizontal error bars) of the levelsmeasured in the three 30 m and two 61 m wells. Note the plateau inadsorbed As loads with increasing dissolved As concentrations in the
aquifer, suggesting a saturation of sorbent surface sites available to Asadsorption.
4554 C. H. Swartz et al.
250 �g adsorbed As/g OX Fe, while levels of adsorbed As (in�g As/g OX-extractable Fe) fall below this plateau for welldepths with low aqueous As concentrations, i.e., 4.6 and 165 m.It should be noted that even if the HCl-extractable pool of Fe,a quantity of Fe comparable to that leached by the OX step, andthe relatively smaller pool of TiCEB-extractable Fe are con-sidered cumulatively with the OX Fe in determining the Asloads, a similar pattern between sorbed and aqueous As results,albeit with a lower plateau value (approximately 80 �g As/g[HCl � OX � TiCEB]-extractable Fe, data not shown). Thisrelation between adsorbed loads and aqueous As suggests thatone factor influencing the aqueous As depth profile at this siteis a limited capacity to further sorb As at depths from 18 to107 m, where aqueous As levels are greatest. Limited sorptionresults in part because As must compete with relatively higherlevels of other oxyanions for available sorption sites, includingbicarbonate (Fig. 3h), phosphate (Fig. 3j), and silicate (Fig. 3k),the latter quantified by measuring both aqueous silicon andmolybdate-reactive silica concentrations, which are typicallyundifferentiable (Fig. 3k and Table 2).
The Langmuir-like relation between sorbed and dissolved Asconcentrations suggests some important characteristics of Asmobility and transport in this aquifer. Because the sedimentappears to have limited capacity to sorb additional As wheredissolved As concentrations are above approximately 100�g/L, As may be readily transported through regions wheredissolved concentrations are high. Furthermore, As concentra-tions may be subject to more rapid change in these regionsbecause any additional input of As, either by transport into theregion or by mobilization from the local solid phase, willremain largely in the dissolved phase. These characteristicswere confirmed in a large-scale injection-withdrawal experi-ment (Harvey et al., 2002) where high-As groundwater wasdisplaced from approximately 32 m3 of sediment by injectionof low-As groundwater. The increase in As concentrations asthis water was withdrawn was modeled with a rate-limitedLangmuir isotherm coupled with an advective-dispersivemodel for transport from and to the well. They found that thedata could not be reproduced with a linear isotherm (i.e.,unlimited sites for sorption), but were closely reproduced by aLangmuir model very similar to that described here. Thus, thislarge-scale field experiment corroborates our finding that thesediment has little additional capacity to sorb As where con-centrations are high.
4.1.3. Potential for ongoing influence of Fe(III)oxyhydroxides on As mobility
An important question to consider regarding the potential forongoing As mobilization in the upper aquifer is whether Fe(III)oxyhydroxides remain a sorbent and coprecipitating phase forAs in these sediments. If so, continued release of As throughmicrobially mediated reductive dissolution of Fe(III) solidsmay be expected in the upper aquifer. Similarly, future eleva-tions in dissolved As levels may result in the lower aquifer ifreducing conditions intensify there, dissolving Fe(III) oxyhy-droxides that are likely present, as suggested by the sedimentcoloring and relatively greater amounts of TiCEB-extractableFe.
Harvey et al. (2002) also demonstrated in situ the potential
for additional As release from the upper aquifer solids (at adepth of 105 m) after injecting groundwater amended withlabile organic carbon (molasses) at concentrations similar to thetotal carbon concentration at the As peak in an effort to stim-ulate microbial respiration. Levels of As in water pumped fromthe injection depth rose within hours after injection of theamended groundwater, indicating the propensity of the aquifersolids for further As release (Harvey et al., 2002). The sensi-tivity of these aquifer solids to geochemical perturbations thatrelease As to the pore water may be related to the fact that 10to 20% of the total As measured in sediments from both theupper (and lower aquifer) is adsorbed (MG- and PHOS-extract-able fractions, Table 3) and an additional 10 to 20% of As iscoprecipitated in solids that are readily leachable with mildacids and reductants (HCl and OX extractants, respectively).
While the predominance of Fe(II) in the HCl-extractablepool of Fe in upper aquifer sediments suggests that geochemi-cal conditions are not conducive to amorphous Fe(III) oxyhy-droxide stability, amorphous Fe(III) oxyhydroxide could nev-ertheless exist, possibly associated with magnetite, quartz,feldspar and aluminosilicate grains as coatings, which wereobserved on the silicate minerals using SEM. The coexistenceof Fe(II)and mixed valence solids such as magnetite, and pos-sibly crystalline Fe(III) oxides, may indicate the absence ofadequate reductant for complete reduction of the entire pool ofavailable Fe(III).
We employed MINEQLTM to explore how much of theOX-extractable Fe would have to comprise amorphous Fe(III)oxyhydroxide (HFO) to adequately predict the observed aque-ous and adsorbed levels of key constituents (As, carbonate,phosphate, and silicate) in the upper aquifer. Here we used the30 m well depth (a depth within the aqueous As peak) as anexample. The objective was to compare the simulated quantityof HFO to measured levels of other sorbents, particularlymagnetite, which makes up approximately 80% of the OX-extractable Fe at 27.7 m. Magnetite has recently been demon-strated to possess an intrinsic affinity for As(III) sorption sim-ilar to that of amorphous Fe(III) oxyhydroxide and goethite,although it has an approximately 10-fold lower sorption densitythan the former (Dixit and Hering, 2003).
Carbonate, phosphate, and silicate species were selected foranalysis in the model because the aqueous levels of theseconstituents are substantial throughout the depth profile (Figs.3h, j, and k) and there is evidence that each competes with Asoxyanions for sorption sites on Fe(III) oxyhydroxides (Man-ning and Goldberg, 1996; Swedlund and Webster, 1999; Ap-pelo et al., 2002). All simulations were run assuming total Ascomprised only As(III), as As(III) dominates the aqueous phaseat 30 m (Fig. 3b) and initial simulations indicated As(III)species would overwhelmingly dominant the sorbed As poolalso.
The modeled distribution of As between sorbed and aqueouspools was, as expected, highly sensitive to the amount of totalFe(III) present. Additionally, although observed aqueous Asconcentrations could be reproduced with the model by manip-ulating the amount of Fe(III) available for sorption, we foundthat aqueous silicate, phosphate, and Fe(II) species were con-sistently over-predicted.
Thus, additional simulations were conducted in which vivi-
anite, siderite, and amorphous SiO2 were allowed to precipitate
4555Arsenic mobility in a Bangladesh aquifer
in addition to HFO. Note that the amount of phosphate in thepH 2 extractant, used to determine total phosphate in thesesimulations (Tables 1 and A1), may include some phosphatedissolved from solids such as vivianite in addition to adsorbedphosphate, especially if these solids have an amorphous nature.Similarly, silicon liberated by the pH 2 extractant (Tables 1 andA1) may comprise adsorbed silicate oxyanion and polymericsilica closely associated with surfaces. When we allowed pre-cipitation of the additional phases, we were able to predictlevels of dissolved As (460 �g/L), phosphate (3.8 mg/L),silicate (27.0 mg/L as Si), and Fe(II) (0.7 mg/L) reasonablyclose to average concentrations measured in the three 30 mwells (502 �g/L, 3.8 mg/L, 16.7 mg/L as Si, and 6.1 mg/L,respectively) using total Fe(III) equivalent to 2.5% (190 mg/L)of OX-extractable Fe.
Eliminating sorption of carbonate species to HFO in themodel decreased dissolved As concentrations only slightly, to375 �g/L. We found that silicate species were the dominantsorbate predicted in these simulations, with sorbed silicateconcentrations approximately two, five, and ten times greaterthan sorbed carbonate species, phosphate and arsenite, respec-tively.
Although there are indications that surface complexationmodels may not be able to fully represent competitive adsorp-tion effects (Ali and Dzombak, 1996), and natural sedimentsare often a complex mixture of multiple sorbents that may notpossess the sorption properties of model laboratory-synthesizedphases (Stollenwerk, 2003), the modeling results describedabove allow one to consider the relatively minor amount ofamorphous Fe(III) oxyhydroxide, as a component of the labilepool of solid phase Fe (2.5% of OX-extractable Fe), that wouldbe required to reproduce observed solute concentrations. Thisamount of an amorphous Fe(III) oxyhydroxide would be diffi-cult to distinguish either wet-chemically or spectroscopically.
Given the considerably larger abundances of magnetite andaluminosilicate minerals, as well as possible Fe(II) solidswhose presence is suggested by the HCl extracts, it may be thatone or more of these constituents is the predominant sorbent forAs in these sediments. Additional research is needed to (1)further characterize Fe-bearing solid phases and the Fe-richcoatings observed on mineral grains in these sediments; and (2)to determine specifically which phase(s) As is adsorbed to andcoprecipitated with to better explain As mobility in these aqui-fers.
5. CONCLUSIONS
At the field site in Munshiganj, aqueous As levels in theupper aquifer are as high as 640 �g/L and are strongly depth-dependent. This pattern is explained neither by total solid phaseAs levels (which approximate crustal averages), nor by theproportions of total solid phase As distributed among variousextractant pools. Adsorbed As appears to be at capacity atdepths where aqueous As is greatest (i.e., the depth range of 30to 40 m in the upper aquifer), with this sorption capacitydetermined considering the most labile fractions of solid phaseFe. One implication of this observation is that additional Asmobilized nearby or transported to these depths in the upperaquifer would likely remain in the aqueous phase, with limited
potential for mitigation by sorption to the solid phase.The correlation between As and Fe in extracted fractions,and microscale comapping of As and Fe in the sedimentsobserved with X-ray microprobe analysis provide evidence thatAs is associated with, at least in part, Fe or Fe-rich phases inboth aquifers. These phases may include ubiquitous Fe coatingsobserved, using SEM-EDS, on quartz, feldspars, and othergrains within sediment matrices. These phases could includeferrous or mixed-valence Fe solids; Fe extracted by 1 N HClwas found to comprise entirely Fe(II) in a few selected depthsin the upper aquifer, consistent with the suboxic to anoxicconditions measured, and magnetite was observed in densityand magnetic separations.
A role for Fe(III) oxyhydroxides in the upper aquifer can notbe ruled out, however, as related studies (Harvey et al., 2002)at this site have found the upper aquifer to be susceptible stillto As release upon introduction of labile organic matter, whichpresumably stimulated microbial respiration and possibly fur-ther reductive dissolution of Fe(III) solids to which the releasedAs was associated. Equilibrium geochemical modeling con-ducted in the present study indicates that only a very smallfraction (as little as 2.5%) of the Fe leached by oxalic acid fromthe sediments collected near the peak aqueous As depth (30 m),if present as an amorphous Fe(III) oxyhydroxide, could explainobserved levels of adsorbed and dissolved As and levels ofcompeting oxyanions silicate, phosphate and carbonate species,of which silicate was predicted to occupy the most sites. Note,though, that magnetite is substantially larger component of thesediment at this depth (80% of Fe leached by oxalic acid), andcould serve as the predominant sorbent.
In the lower aquifer (with aqueous As levels of 4 �g/L),Fe-bearing solids appear to comprise a greater proportion ofoxidized, crystalline Fe(III) based on comparison of color andsupported by extraction data. This suggests that Fe(III) oxyhy-droxides may be better preserved in the lower aquifer and thatsorption capacity may mitigate an influx of As into the aquifer.The lower aquifer does have similar reducing conditions, levelsof relatively mobile solid phase As, and concentrations ofphosphate and silicate as the upper aquifer, though, suggestingthat reductive dissolution of possible Fe(III) oxyhydroxide sor-bents and competitive adsorption should be considered forpossible future effects on As mobility in this aquifer also .
Acknowledgments— We gratefully acknowledge the assistance of theBangladesh Department of Public Health Engineering in locating afield site and arranging for a drill rig and crew to perform the corecollection and monitoring well installation for this study. We also wishto thank Steve Sutton and Matt Newville at Argonne National Lab forperforming the X-ray microprobe analyses. The manuscript benefitedgreatly from the suggestions and comments of Alexander van Geen andtwo other anonymous reviewers. This work was funded in part by theNational Science Foundation, grant EAR-0001098, National Instituteof Health grant P30ES02109, and the Alliance for Global Sustainabil-ity.
Associate editor: P. O’Day
REFERENCES
Ali M. A. and Dzombak D. A. (1996) Competitive sorption of simple
organic acids and sulfate on goethite. Environ. Sci. Technol. 30,1061–1071.
4556 C. H. Swartz et al.
Anawar H. M., Akai J., Mostofa K. M. G., Safiullah S., and Tareq S. M.(2002) Arsenic poisoning in groundwater: Health Risk and geo-chemical sources in Bangladesh. Environ. Int. 27, 597–604.
Appelo C. A., Van Der Weiden M. J. J., Tournassat C., and Charlet L.(2002) Surface complexation of ferrous iron and carbonate onferrihydrite and the mobilization of arsenic. Environ. Sci. Technol.36, 3096–3103.
Badruzzaman A. B. M., Ahmed M. F., Hossain M. D., Jalil M. A., andAli M. A. (1998) Arsenic contamination in groundwater in north-eastern Bangladesh. J. Civil Eng., IEB 26 (2), 129–140.
Banwart S. A. (1999) Reduction of iron(III) minerals by natural organicmatter in groundwater. Geochim. Cosmochim. Acta 63, 2919–2928.
Berg M., Tran H. C., Nguyen T. C., Pham H. V., Schertenleib R., andGiger W. (2001) Arsenic contamination of groundwater and drink-ing water in Vietnam: A human health threat. Environ. Sci. Tech-nol. 35, 2621–2626.
Bhattacharya P., Chatterjee D., and Jacks G. (1997) Occurrence ofarsenic-contaminated groundwater in alluvial aquifers from deltaplains, Eastern India: Options for safe drinking water supply. WaterRes. Develop. 13, 79–92.
Breit G., Foster A. L., Whitney J. W., Uddin N. Md., Yount J. C.,Welch A. H., Alam M. Md., Islam S. Md., Sutton S., and NewvilleM. (2001) Variable arsenic residence in sediment from easternBangladesh: clues to understanding arsenic cycling in the Bengaldelta. Abstract presented at International Conference on Arsenic inDrinking Water, hosted by Columbia University Superfund BasicResearch Program, Columbia University, November, 2001.
BGS & DPHE (British Geological Survey and Department of PublicHealth Engineering) (2001) Arsenic contamination of groundwaterin Bangladesh (eds. D. G. Kinniburgh and P. L. Smedley). BGSTechnical Report WC/00/19. British Geological Survey, Keyworth,UK.
Canfield D. E. (1989) Reactive iron in marine sediments. Geochim.Cosmochim. Acta 53, 619–632.
Canfield D. E. and Berner R. A. (1987) Dissolution and pyritization ofmagnetite in anoxic marine sediments. Geochim. Cosmochim. Acta51, 645–659.
Chadha D. K. and Ray S. (1999) High Incidence of Arsenic in Ground-water in West Bengal. Central Government Board, Ministry ofWater Resources, India.
Chin P. F. and Mills G. L. (1991) Kinetics and mechanisms of kaolinitedissolution: Effects of organic ligands. Chem. Geol. 90, 307–317.
Chowdhury T. R., Basu G. K., Mandal B. K., Biswas B. K., SamantaG., Chowdhury U. K., Chanda C. R., Lodh D., Roy S. L., SahaK. C., Roy S., Kabir S., Quamruzzaman Q., and Chakraborti D.(1999) Arsenic poisoning in the Ganges delta. Nature 401, 545–546.
Chowdhury U. K., Biswas B. K., Chowdhury T. R, Samanta G.,Mandal B. K., Basu G. K., Chanda C. R., Lodh D., Saha K. C.,Mukherjee S. K., Roy S., Kabir S., Quamruzzaman Q., andChakraborti D. (2000) Groundwater arsenic contamination in Ban-gladesh and West Bengal, India. Environ. Health Persp. 108, 393–397.
Cornell R. M. and Schindler P. W. (1987) Photochemical dissolution ofgoethite in acid/oxalate solution. Clays Clay Miner. 35, 347–352.
Cullen W. R. and Reimer K. J. (1989) Arsenic speciation in theenvironment. Chem. Rev. 89, 713–764.
Dixit S. and Hering J. G. (2003) Comparison of arsenic(V) and arseni-c(III) sorption onto iron oxide minerals: Implications for arsenicmobility. Environ. Sci. Technol. 37, 4182–4189.
Edwards M., Patel S., McNeill L., Chen H., Frey M., Eaton A. D.,Antweiler R. C., and Taylor H. E. (1998) Considerations in Asanalysis and speciation. J. AWWA 90, 103–113.
Foster A. L., Breit G. N., Welch A. H., Whitney J. W., Yount J. C.,Islam M. S., Alam M. M., Islam M. K., and Islam M. N. (2000)In-situ identification of arsenic species in soil and aquifer sedimentfrom Ramrail, Brahmanbaria, Bangladesh (abstract H21.D-01).Eos81 (48).
Fredrickson J. K., Zachara J. M., Kennedy D. W., Dong H., OnstottT. C., Hinman N. W., and Li S. M. (1998) Biogenic iron mineral-ization accompanying the dissimilatory reduction of hydrous ferric
oxide by a groundwater bacterium. Geochim. Cosmochim. Acta 62,3239–3257.Gibbs M. M. (1979) A simple method for the rapid determination ofiron in natural waters. Water Res. 13, 295–297.
Gruebel K. A., Davis J. A., and Leckie J. O. (1988) The feasibility ofusing sequential extraction techniques for arsenic and selenium insoils and sediments. Soil Sci. Soc. Am. J. 52, 390–397.
Harvey C. F., Swartz C. H., Badruzzaman A. B. M., Keon-Blute N., YuW., Ali A., Jay J., Beckie R., Niedan V., Brabander D., Oates P. M.,Ashfaque K. N., Islam S., Hemond H. F., and Ahmed M. F. (2002)Arsenic mobility and groundwater extraction in Bangladesh. Sci-ence 298, 1602–1606.
Huerta-Diaz M. A. and Morse J. W. (1992) Pyritization of trace metalsin anoxic marine sediments. Geochim. Cosmochim. Acta 56, 2681–2702.
Jakobsen R. and Postma D. (1999) Redox zoning, rates of sulfatereduction and interactions with Fe-reduction and methanogenesis ina shallow sandy aquifer, Rømø, Denmark. Geochim. Cosmochim.Acta 63, 137–151.
Karim M. M. (2000) Arsenic in groundwater and health problems inBangladesh. Water Res. 34, 304–310.
Keon N. E., Swartz C. H., Brabander D. J., Harvey C., and HemondH. F. (2001) Validation of an arsenic sequential extraction methodfor evaluating mobility in sediments. Environ. Sci. Technol. 35,2778–2784.
Lovley D. R. and Phillips E. J. P. (1986) Availability of ferric iron formicrobial reduction in bottom sediments of the freshwater tidalPotomac River. Appl. Environ. Microbiol. 52 (4), 751–757.
Manley E. P. and Evans L. J. (1986) Dissolution of feldspars bylow-molecular-weight aliphatic and aromatic acids. Soil Sci. 141,106–112.
Manning B. A. and Goldberg S. (1996) Modeling competitive adsorp-tion of arsenate with phosphate and molybdate on oxide minerals.Soil Sci. Soc. Am. J. 60, 121–131.
Mast M. A. and Drever J. I. (1987) The effect of oxalate on thedissolution rates of oligoclase and tremolite. Geochim. CosmochimActa 51, 2559–2568.
Mazumder G. D. N., Haque R., Ghosh N., De B. K., Santra A.,Chakraborti D., and Smith. A. H. (1998) Arsenic levels in drinkingwater and the prevalence of skin lesions in West Bengal, India. Int.J. Epidemiol. 27, 871–877.
McArthur J. M., Ravenscroft P., Safiullah S., and Thirlwall M. F.(2001) Arsenic in groundwater: Testing pollution mechanisms forsedimentary aquifers in Bangladesh. Water Resour. Res. 37, 109–117.
Morel F. M. M. and Hering J. G. (1993) Principles and Applications ofAquatic Chemistry. Wiley.
Nickson R., McArthur J., Burgess W., Ahmed K. M., Ravenscroft P.,and Rahman M. (1998) Arsenic poisoning of Bangladesh ground-water. Nature 395, 338.
Nickson R. T., McArthur J. M., Ravenscroft P., Burgess W. G., andAhmed K. M. (2000) Mechanism of arsenic release to groundwater,Bangladesh and West Bengal. Appl. Geochem. 15, 403–413.
Ostergren J. D., Brown G. E.Jr., Parks G. A., and Tingle T. N. (1999)Quantitative speciation of lead in selected mine tailings from Lead-ville, CO. Environ. Sci. Technol. 33, 1627–1636.
Panias D., Taxiarchou M., Paspaliaris I., and Kontopoulos A. (1996)Mechanisms of dissolution of iron oxides in aqueous oxalic acidsolutions. Hydrometallurgy 42, 257–265.
Rogers C. E., Brabander D. J., Barbour M. T., and Hemond H. F.(2002) Use of physical, chemical and biological indices to assessimpacts of contaminants and physical habitat alteration in urbanstreams. Environ. Toxicol. Chem. 21, 1156–1167.
Ryan J. N. and Gschwend P. M. (1991) Extraction of iron oxides fromsediments using reductive dissolution by titanium(III). Clays ClayMiner. 39, 509–518.
Shimada N. (1996) Geochemical conditions enhancing the solubiliza-tion of arsenic into groundwater in Japan. Appl. Organomet. Chem.10, 667–674.
Smedley P. L. and Kinniburgh D. G. (2002) A review of the source,behaviour, and distribution of arsenic in natural waters. Appl.Geochem. 17, 517–568.
Standard Methods for the Examination of Water and Wastewater
(1992) Am. Pub. Health. Assoc., Am. Wat. Works. Assoc., WaterEnviron. Fed.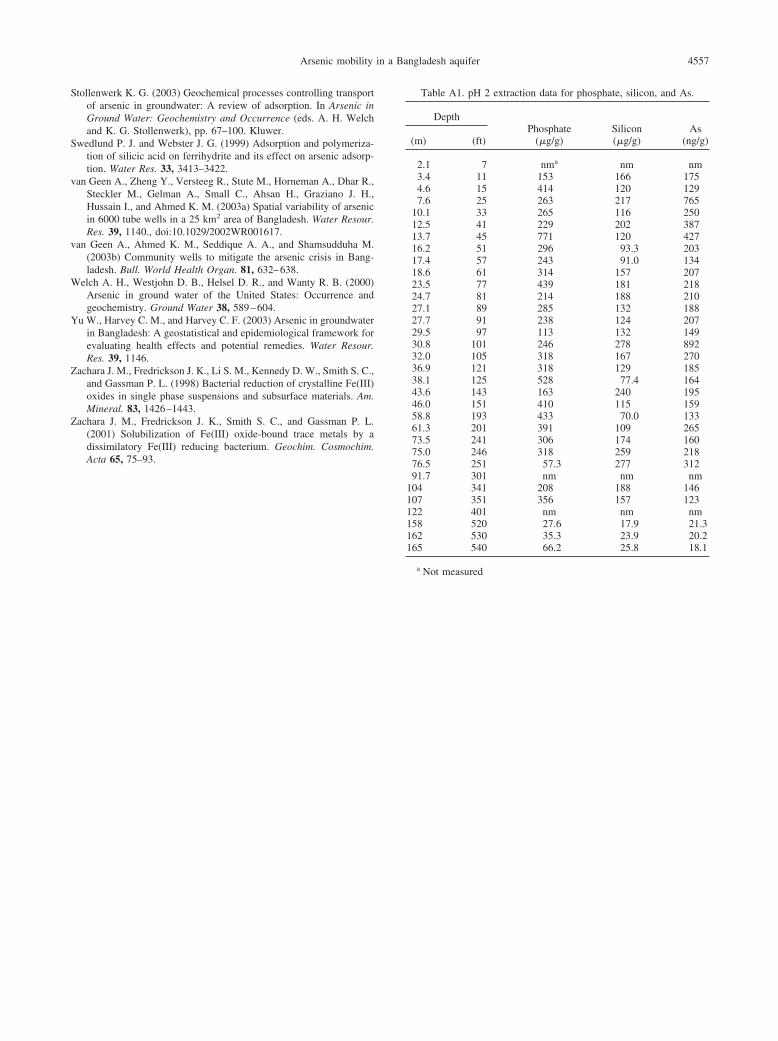
4557Arsenic mobility in a Bangladesh aquifer
Stollenwerk K. G. (2003) Geochemical processes controlling transportof arsenic in groundwater: A review of adsorption. In Arsenic inGround Water: Geochemistry and Occurrence (eds. A. H. Welchand K. G. Stollenwerk), pp. 67–100. Kluwer.
Swedlund P. J. and Webster J. G. (1999) Adsorption and polymeriza-tion of silicic acid on ferrihydrite and its effect on arsenic adsorp-tion. Water Res. 33, 3413–3422.
van Geen A., Zheng Y., Versteeg R., Stute M., Horneman A., Dhar R.,Steckler M., Gelman A., Small C., Ahsan H., Graziano J. H.,Hussain I., and Ahmed K. M. (2003a) Spatial variability of arsenicin 6000 tube wells in a 25 km2 area of Bangladesh. Water Resour.Res. 39, 1140., doi:10.1029/2002WR001617.
van Geen A., Ahmed K. M., Seddique A. A., and Shamsudduha M.(2003b) Community wells to mitigate the arsenic crisis in Bang-ladesh. Bull. World Health Organ. 81, 632–638.
Welch A. H., Westjohn D. B., Helsel D. R., and Wanty R. B. (2000)Arsenic in ground water of the United States: Occurrence andgeochemistry. Ground Water 38, 589–604.
Yu W., Harvey C. M., and Harvey C. F. (2003) Arsenic in groundwaterin Bangladesh: A geostatistical and epidemiological framework forevaluating health effects and potential remedies. Water Resour.Res. 39, 1146.
Zachara J. M., Fredrickson J. K., Li S. M., Kennedy D. W., Smith S. C.,and Gassman P. L. (1998) Bacterial reduction of crystalline Fe(III)oxides in single phase suspensions and subsurface materials. Am.Mineral. 83, 1426–1443.
Zachara J. M., Fredrickson J. K., Smith S. C., and Gassman P. L.(2001) Solubilization of Fe(III) oxide-bound trace metals by adissimilatory Fe(III) reducing bacterium. Geochim. Cosmochim.Acta 65, 75–93.
Table A1. pH 2 extraction data for phosphate, silicon, and As.
DepthPhosphate
(�g/g)Silicon(�g/g)
As(ng/g)(m) (ft)
2.1 7 nma nm nm3.4 11 153 166 1754.6 15 414 120 1297.6 25 263 217 765
10.1 33 265 116 25012.5 41 229 202 38713.7 45 771 120 42716.2 51 296 93.3 20317.4 57 243 91.0 13418.6 61 314 157 20723.5 77 439 181 21824.7 81 214 188 21027.1 89 285 132 18827.7 91 238 124 20729.5 97 113 132 14930.8 101 246 278 89232.0 105 318 167 27036.9 121 318 129 18538.1 125 528 77.4 16443.6 143 163 240 19546.0 151 410 115 15958.8 193 433 70.0 13361.3 201 391 109 26573.5 241 306 174 16075.0 246 318 259 21876.5 251 57.3 277 31291.7 301 nm nm nm
104 341 208 188 146107 351 356 157 123122 401 nm nm nm158 520 27.6 17.9 21.3162 530 35.3 23.9 20.2165 540 66.2 25.8 18.1
a Not measured