mineralogical and geochemical studies of carbonaceous
TRANSCRIPT

Mineralogical and Geochemical Studies of Carbonaceous Shale
Deposits from Egypt
Vorgelegt von
M.Sc.
Mostafa Gouda Mohamed AttiaTemraz
aus Ägypten
an der Fakultät VI
Bauingenieurwesen und Angewandte Geowissenschaften der Technischen Universität Berlin
zur Erlangung des akademischen Grades Doktor der Naturwissenschaften
-Dr. rer. nat.-
genehmigte Dissertation
Promotionsausschuss: Vorsitzender: Prof. Dr. H. Burkhardt Berichter: Prof. Dr. Wilhelm Dominik Berichter: Prof. Dr. Brian Horsfield Tag der wissenschaftlichen Aussprache: 29. März 2005
Berlin 2005 D 83

I
Zusammenfassung
Die vorliegende Arbeit konzentrierte sich auf die integrierte sedimentologische,
mineralogische und geochemische Analyse von kohlehaltigen Tonsteinabfolgen aus Ägypten.
Die Untersuchungen der Schwarzschiefer der Ataqa Formation des Karbon und der Safa
Formation des Jura im südlichen und nördlichen Sinai erlauben Rückschlüsse auf optimale
Bedingungen zur Zeit der Ablagerung. Die Dominanz an detritischem Kaolinit, die
Anreicherung an den chemisch immobilen Elementen SiO2, Al2O3 und TiO2 sowie die hohen
Werte im Chemischem Alterierungs-Index (CIA = Chemical Indix of Alteration), liefern
Hinweise auf eine intensive chemische Verwitterung der Ausgangsgesteine und auf tropische
bis subtropische, feuchtwarme Klimabedingungen im Hinterland. Das Auftreten von
Kohleflözen in der Ataqa Formation in Abu Zinema und in der Safa Formation in Al Maghara
(hier mit abbauwürdigen Kohleflözen) sowie das Fehlen von marinen Mikrofossilien weisen
auf eine Sedimentation unter kontinentalen bis lagunären Bedingungen hin.
Die Schwarzschiefer der Duwi Formation, des Dakhla Shale und des Esna Shale (Oberkreide
bis Tertiär) in Abu Tartur, im Nile Valley und in Quseir zeichnen sich durch einen sehr hohen
Anteil an detritischem Smektit aus. Kaolinit und Chlorit treten nur untergeordnet auf. Das
erhöhte Auftreten von Smektit belegt deutliche marine Einflüsse während der Ablagerung der
Sedimente in Südägypten im Vergleich zur Region des Sinai. Der Ursprung der Sedimente,
abgeleitet von granitischen bis basaltischen Ausgangsgesteinen und die Verwitterungs-
bedingungen im Hinterland waren in beidem Regionen gleich. Die Duwi Formation war unter
eingeschränkt flachmarinen Bindungen, vorwiegend in einem reduzierenden Milieu zur
Ablagerung gekommen. Die fortschreitende Campan-Maastricht Transgression wurde
unterbrochen durch eine mehrphasige intensive Aufarbeitung von Sedimenten und der
resultierenden Anreicherung von Phosphatlagen in dieser Formation. Charakterisch ist das
Fehlen von Mikrofossilien in der Duwi Formation, während reiche Foraminiferen-
Vergesellschaftungen im darüber liegenden Dakhla Shale und im Esna Shale das
Wiedereinsetzen und den Höhepunkt der Transgression unter offenmarinen Bedingungen
aufzeigen.
Die untersuchten Schwarzschiefer der Ataqa Formation (Karbon), der Safa Formation (Jura)
und der Duwi Formation (Oberkreide) zeigen deutliche Anreicherungen an organischer

II
Substanz (Total Organic Content, TOC). Im Dakhla Shale und im Esna Shale ist die
organische Substanz durch tiefgründige Verwitterung und Qxidation deutlich reduziert.
Alle untersuchten Schwarzschiefer-Proben sind immatur hinsichtlich einer Kohlen-
wasserstoffgenerierung mit niedrigen Werten in Hydrogen Potential (HI)-Index vom
Kerogen-Typus III.

III
Abstract The present investigations focus on an integrated sedimentological, mineralogical and
geochemical evaluation of the carbonaceous shales from Egypt.
The analysis of the black shales of the Ataqa Formation and the Safa Formation in both,
Southern and Northern Sinai, indicate improved depositional environmental condititions
during Carboniferous and Jurassic in Egypt. The dominance of detrital kaolinite, the
enrichment in chemically immobile elements SiO2, Al2O3 and TiO2 and high values of
Chemical Index of Alteration (CIA) suggest intensive chemical weathering of the source
rocks under tropical to subtropical humid climatic conditions. The occurrence of coal seams
within the Ataqa Formation in Abu Zinema and within the Safa Formation in Al Maghara
(here with mineable coal beds), as well as the absence of foraminifera in both formations
indicate their deposition in a continental lagoonal environment.
In the black and carbonaceous shales of Duwi Formation, Dakhla Shale and Esna Shale of
Upper Cretaceous and Lower Tertiary age in Abu Tartur, Nile Valley and Quseir, detrital
smectite is the dominant clay mineral in addition to minor kaolinite and chlorite contents. The
smectite content gives evidence of considerable marine influence during the sedimentary
processes in South Egypt in comparison to Sinai, whereas the origin of detrital sedimentary
input derived from granitic to basaltic source rock, and the weathering conditions were the
same for both areas. The Duwi Formation in Abu Tartur was deposited in a shallow and
restricted marine environment under prevailing reducing conditions. There, the
Campanian/Maastrichtian transgression was interrupted by multiple regressive phases which
caused intensive reworking of sediments and enrichment of the phosphate layers in this
formation. The Duwi Formation is characterized by absence of foraminifera, compared to the
abundance of foraminifera's assemblages in Dakhla and Esna shales which suggest open
marine environments and prograding marine transgression during the deposition of these
formations.
The studied shales show significant enrichment in organic matter in the black shale of Ataqa
and Safa formations of Carboniferous and Jurassic age and Duwi Formation of Cretaceous
age whereas the total organic carbon content (TOC) of Dakhla Shale and Esna Shale was
depleted by oxidation under surface conditions in outcrops. All studied shales are immature
for hydrocarbon generation with a fair hydrocarbon potential of kerogen type III.

IV
Acknowledgement
First and above all, I would like to express my great thanks to my God, for helping me to
accomplish this work.
I wish to express my sincere gratitude and appreciation to my academic supervisor Prof. Dr.
Wilhelm Dominik, Faculty of Civil Engineering and Applied Geosciences, Technical
University of Berlin for his supervision and guidance and for his encouragement. He
supervised this study and helped to direct the research toward success by numerous
discussions and informative reviews of reports and manuscripts.
This work would not have been possible without the most patient help and support of Dr.
Robert Bussert during the laboratory analyses and the preparation of the thesis. Special thanks
are due to Dr. Mathies for his help and achievement of my acceptance at the Institute of
Applied Geosciences. Special thanks are also due to all colleagues of the Institute, particularly
to Mrs. Lange, Mrs. Glowa and Mr.Thiel.
Personal appreciations are due to Prof. Dr. M. El Batanony, Manager of the Egyptian
Petroluem Research Institute (EPRI), Prof. Dr. A. Abu Elezz, Head of the Exploration
Department at EPRI and Prof. Dr. S. Awad, Ain Shams University.
My profound acknowledgement and thanks are due to the Government of Egypt for the
financial support. I would like to thank all colleagues of Exploration Department for their
help during the field seasons, particularly to Dr. A. Ahmed and Dr. I. Hasanein.
This thesis would never have been completed without the help and support of my mother and
the support of my wife, Dr. Mona Khalaf and my son dear Ahmed. They were an important
source of motivation. The great interest of my brothers Gamal, Khaled and Mohamed was
very helpful for the successful accomplishment of the study.

V
TABLE OF CONTENTS Zusammenfassung ................................................................................................................. I
Abstract ............................................................................................................................... III
Acknowledgement ................................................................................................................IV
Table of contents ................................................................................................................... V
List of Figures ......................................................................................................................IX
List of Tables ......................................................................................................................... X
1 Introduction ..................................................................................................................... 1
1.1 General geographical and geological setting of Egypt ................................................ 1
1.2 Location of the studied areas ....................................................................................... 2
1.2.1 Abu Zinema area in Southwest Sinai(Carboniferous) ..................................... 2
1.2.2 Al-Maghara coal mine in North Sinai (Jurassic) ............................................. 2
1.2.3 Abu Tartur phosphate mine in Western Desert (Cretaceous-Eocene) ............ 4
1.2.4 Esna-Idfu region in Nile Valley (Cretaceous-Eocene) .................................... 4
1.2.5 Qusier phosphate mine in the Red Sea coast (Cretaceous-Eocene) ................ 4
1.3 Distribution of carbonaceous shales in Egypt ............................................................. 5
1.4 Previous studies on black and carbonaceous shales in Egypt .................................... 6
1.5 Scope of the present work .......................................................................................... 6
2 Lithostratigraphy ............................................................................................................ 7
2.1 The area of Abu Zinema in Southwest Sinai (Carboniferous) ................................... 8 2.1.1 Um Bogma Formation (Lower Carboniferous) ................................................ 8
2.1.2 Ataqa Formation (Lower Carboniferous) ....................................................... 10
2.2 The area of Al-Maghara coal mine North Sinai (Jurassic) ....................................... 10
2.2.1 Mashaba Formation (Lower Jurassic) ............................................................ 11
2.2.2 Rajabiah Formation (Lower Jurassic) ............................................................ 11
2.2.3 Shusha Formation (Lower Jurassic) ............................................................... 11
2.2.4 Bir Maghara Formation (Middle Jurassic) ..................................................... 13
2.2.5 Safa Formation (Middle Jurassic) .................................................................. 13
2.2.6 Masajid Formation (Upper Jurassic) .............................................................. 13

VI
2.3 The area of Qusier phosphate mines in Red Sea coast (Cretaceous - Eocene) ......... 13
............................................................. (Pre-Campanian) ״Nubia Sandstone״ 2.3.1 15
2.3.2 Quseir Variegated Shale (Pre-Campanian) .................................................... 15
2.3.3 Duwi Formation (Campanian-Maastrichtian) ................................................. 16
2.3.4 Dakhla Shale (Danian–Lower Paleocene) .................................................... 17
2.3.5 Tarawan Chalk (Landanian-Late Paleocene) ................................................. 18
2.3.6 Esna Shale (Early Eocene) ........................................................................... 18
2.3.7 Thebes Formation (Early Eocene) .................................................................. 19
2.3.8 Nakheil Formation (Oligocene) ...................................................................... 19
3 Methods of Investigation ................................................................................................ 20
3.1 Mineralogical analysis ............................................................................................... 20
3.1.1 Separation of clay size fraction ..................................................................... 20
3.1.2 X-ray diffraction (XRD) ................................................................................ 20
3.1.3 Petrographic microscopy ............................................................................... 21
3.1.4 Scanning Electron Microscopy (SEM) ......................................................... 21
3.2 Geochemical analysis ................................................................................................ 21
3.2.1 X-ray Fluorescence (XRF) ............................................................................ 21
3.2.2 Determination of total organic carbon content (TOC) .................................. 22
3.2.3 Rock Eval pyrolysis ...................................................................................... 22
4 Mineralogy .................................................................................................................... 23
4.1 Clay mineralogy ........................................................................................................ 23
4.1.1 The importance of clay minerals ................................................................... 23
4.1.2 Structure and chemistry of clays ................................................................... 23
4.1.2.1 Smectite group minerals ....................................................................... 24
4.1.2.2 Kaolinite group minerals ...................................................................... 24
4.1.2.3 Chlorite group minerals ........................................................................ 24
4.1.2.4 Illite/Mica group minerals .................................................................... 25
4.2 Clay minerals in the studied shale samples ............................................................... 25
4.2.1 Smectite ......................................................................................................... 26
4.2.2 Kaolinite ........................................................................................................ 29

VII
4.2.3 Chlorite .......................................................................................................... 30
4.2.4 Illite ............................................................................................................... 32
4.3 Whole rock samples .................................................................................................. 33
4.3.1 Quartz ............................................................................................................ 33
4.3.2 Carbonates ..................................................................................................... 33
4.3.3 Sulphates ....................................................................................................... 33
4.3.4 Pyrite ............................................................................................................. 34
4.3.5 Carbonate fluorapatite ................................................................................... 34
5 Geochemistry ................................................................................................................. 36
5.1 Major and trace elements .......................................................................................... 37
5.1.1 Silica (SiO2) ................................................................................................... 40
5.1.2 Alumina (Al2O3) ............................................................................................ 41
5.1.3 Calcium (CaO) .............................................................................................. 41
5.1.4 Magnesium (MgO) ........................................................................................ 43
5.1.5 Iron Oxide (Fe2O3) ........................................................................................ 45
5.1.6 Titanium (TiO2) ............................................................................................. 45
5.1.7 Phosphorous (P2O5) ....................................................................................... 46
5.1.8 Sodium (Na2O) .............................................................................................. 47
5.1.9 Potassium (K2O) ............................................................................................ 47
5.1.10 Sulphate (SO3) ............................................................................................... 47
5.2 Distribution of significant trace elements .................................................................. 48
5.2.1 Vanadium ....................................................................................................... 48
5.2.2 Nickel ............................................................................................................. 48
5.2.3 Chromium ...................................................................................................... 50
5.2.4 Cobalt ............................................................................................................. 52
5.2.5 Strontium ....................................................................................................... 52
5.2.6 Zinc ................................................................................................................ 52
5.2.7 Copper ............................................................................................................ 53
5.2.8 Zirconium ...................................................................................................... 53
5.3 Discussion of chemical effects .................................................................................. 54
5.4 Weathering effects ..................................................................................................... 55
5.5 Provenance analysis for sedimentary rocks ............................................................... 56
5.6 Distribution of major and trace elements in phosphate rocks ................................... 59

VIII
6 Petrography and SEM investigations ......................................................................... 62
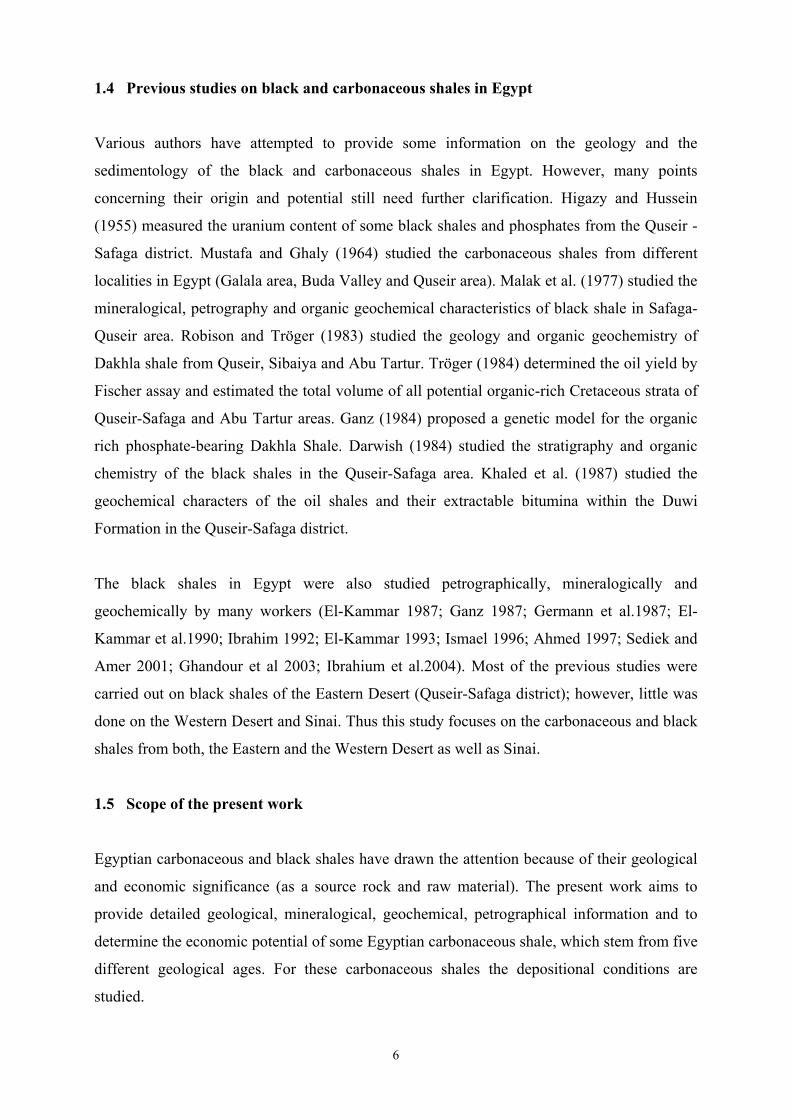
6.1 Organic matter-rich black shale facies .................................................................... 63
6.2 Foraminifera-rich shale facies ................................................................................. 65
6.3 Carbonate facies ...................................................................................................... 65
6.4 Phosphatic facies ..................................................................................................... 66
7 Organic Geochemistry ................................................................................................. 68
7.1 Total organic carbon (TOC) content ....................................................................... 68
7.2 Rock-Eval pyrolysis ................................................................................................ 70
7.2.1 Hydrocarbon source potentials .................................................................... 72
7.2.2 Determination of thermal maturity (Tmax) ................................................ 72
8 Summary and conclusions ........................................................................................... 73
9 References ..................................................................................................................... 75
10 Appendix ....................................................................................................................... 90
A Tables ...................................................................................................................... 91
B Figures .................................................................................................................. 102
C Plates ..................................................................................................................... 105

IX
List of Figures
Fig. 1: Location map of the study areas in Egypt.......................................................................3
Fig. 2: Stratigraphic column and regional distribution of the studied formations......................7
Fig. 3: Lithostratigraphic section of the Paleozoic in central Sinai showing the position of
Ataqa Formation (after Said 1990).................................................................................9
Fig. 4: Generalized lithostratigraphic column of Jurassic and Cretaceous rocks exposed at
Gebel Maghara (after Jenkins et al. 1982)....................................................................12
Fig. 5: Sedimentary sequences of Upper Cretaceous-Lower Tertiary rocks showing the
position of the samples in the studied areas...................................................................14
Fig. 6:Smectite average at the studied locations.......................................................................26
Fig. 7:Kaolinite average at the studied locations......................................................................29
Fig. 8: Chlorite average at the studied locations.......................................................................31
Fig. 9:Illite average at the studied locations.............................................................................32
Fig. 10: Major elements variation of the studied samples including 7 phosphate samples......37
Fig. 11: The relationships between SiO2 with Al2O3, TiO2, Zr & K2O and Al2O3 with TiO2
& K2O for the studied samples....................................................... ...........................42
Fig.12: The relationship between CaO with Na2O, P2O5, MgO, K2O, SiO2 & Al2O3 for the
studied samples............................................................................................................44
Fig.13: The relationship between TiO2 with Al2O3 and Zr for the studied samples.................46
Fig. 14: The relationships between V with Ni, Cr, Al2O3, clay & TOC and Ni with clay,
TOC & Al2O3 for the studied samples.........................................................................49
Fig. 15: The relationship between Cr with Zn, Al2O3, V, clay, Cu and TOC for the studied
samples........................................................................................................................51
Fig. 16: TiO2 / Al2O3 binary plot of the studied shale samples.................................................58
Fig. 17: Distribution of P2O5 in the studied phosphate samples...............................................59
Fig. 18: The relationship between P2O5 with TiO2, CaO & Al2O3 ..........................................61
Fig. 19: Stratigraphic position of the studied shales and composite TOC (%) profile ............69
Fig. 20: Van Krevelen-type plot of Rock-Eval data for the studied bulk samples...................71

X
List of Tables
Table 1: Average semi-quantitative clay mineralogy of the studied shales (by XRD)............25
Table 2: Comparison of chemical composition of the studied shales with published
average shales (1 to 4) and regional average composition (5 to 8).............................38
Table 3: The major and trace elements average of formations at the studied locations...........39
Table 4: The TOC and Rock-Eval results of the studied shales...............................................70

1
1. Introduction
Carbonaceous shales have a wide distribution on the Egyptian surface and in subsurface
sedimentary sequences e.g. in sediments of predominantly Carboniferous, Jurassic,
Cretaceous, Paleocene and Eocene age. The carbonaceous and black shales in Egypt gained
interest since five decades when the phosphorite deposits were discovered and exploited. The
phosphorites are intercalated with and capped by black shales that contain considerable
amounts of organic matter and are enriched in trace elements, which may be of economic
potential. The interest in the black shales all over the world in the last decades principally
stem from the widespread recognition that black shales are important source rocks for
petroleum or may be used as natural fuel resources. Various previous studies of the
carbonaceous shales in Egypt concentrated on an individual location or an individual
geological age. In this work the shales of the variety of Egyptian locations and stratigraphic
ages are investigated focusing on their mineralogical and geochemical characteristics.
1.1 General geographical and geological setting of Egypt
Egypt forms the north-eastern part of the African continent and is situated between latitudes
22° and 31° north. The country covers an area of about one million km2 and occupies nearly
one-thirtieth of the total area of Africa. The largest part of Egypt consists of desert, the so
called Western Desert, to the west of the Nile, the Eastern Desert, east of the Nile Valley and
the Sinai Peninsula, delineating the north-eastern extension of the Sahara.
The structural elements of the Precambrian of the north-eastern margin of the African Shield
(Arabian-Nubian massif) are the principal features that controlled the structural development
of Egypt (Said 1962). The reactivation of these elements during the Paleozoic resulted in the
development of large NNW–SSE striking interacratonic depressions (Klitzsch 1984).
From Late Precambrian to Mid-Cretaceous sediments all over Egypt were deposited in largely
shallow and nearshore marine environments, interbedded with continental (fluvial) and deltaic
sediments (Gindy 1983). At the end of the Lower Carboniferous, the post-Visean uplifting
was accompanied by E–W fault systems and affected a large part of the NE African plate. As
a result, most of the pre-Visean deposits were eroded from uplifted areas and were only
preserved in the western part of Egypt. Marine strata in the northern Gulf of Suez (Said 1962)
and fluvio-glacial sediments in the south were also encountered or preserved in the

2
Carboniferous (Klitzsch 1980, 1983a and 1983b). During the Permian and until the Lower or
Middle Jurassic, continental to shallow marine sediments covered the northern part of Egypt.
After the disintegration of the large continent ״Pangaea״ in Jurassic time, the old structural
patterns of Precambrian age, which had influence in the Early Paleozoic, were reactivated
(Schandelmeier et al. 1987). The result was a stepwise subsidence of the intracratonic
depocenters that gave rise to the formation of the Dakhla and Assiut basins (Hendriks et al.
1987). Until Early Cretaceous time, clastic sedimentation was predominant. Starting from the
Cenomanian and ending in the Senonian, the structural differentiation of the NE African plate
was increased and the major marine transgression of the Tethys, that deepened to the north
and advanced southwards, reached its maximum extension in the Lower Eocene. The Upper
Cretaceous sediments in southern Egypt consist of variegated shales upon which, (in the
intracratonic depocenters), a thick sedimentary succession follows. The sediments are of
shallow marine origin with some lateral and vertical lithological changes, in which the
phosphate deposits are intercalated.
1.2 Location of the studied areas
In this work 144 samples were selected from five different locations and different geological
ages to represent all the carbonaceous shales of Egypt (Fig.1).
1.2.1 Abu Zinema area in Southwest Sinai (Carboniferous)
In this location 12 samples were selected from the carbonaceous (black) shale located within
the middle part of sandstones of the Ataqa Formation of Carboniferous age at Bedaa–Um
Thora district (long. 33° 13' East and lat. 29° 3' North) in Southwest Sinai. The Paleozoic
sediments are exposed in the south-central parts of Sinai, primarily in the Um Bogma area
east of Abu Zinema and at Abu Durba.
1.2.2 Al-Maghara coal mine in North Sinai (Jurassic)
From Al-Maghara coal mine about 70 km south of the Mediterranean Sea at long. 33° 10' and
33° 35' E and latitudes 30° 35' and 30° 10' N. North Sinai, five samples of carbonaceous
(black) shale which is associated with the main coal bed of Safa Formation of the Jurassic
age (Al Far 1966), were collected.

3
Fig. 1: Location map of the study areas in Egypt.
M e d i t e r r a n e a n S e a
Saudi Arabia
Jordan
Liby
a
Israel
Cairo
R. N
i le
R e d S e a
30° E25° E
30° N
25° N
35° E
Suez
12 ° S
14 ° S
1 0 ° 1 0 ° 3 0 ° 5 0 °2 0 ° 4 0 °0 °2 0 °
3 0 °
2 0 °
1 0 °
1 0 °
2 0 °
3 0 °
0 °
0 200 km
Aswan
Sudan
Egypt
D e s e r t
E a s t e r n
D e s e r t
DakhlaOasis
34
5
Sinai
1
Quseir
2
Abu Zinema
EdfuAbu Tartur Area
G-Al Maghara

4
In North Sinai a complete Jurassic section is exposed at Gebel Al-Maghara. During the
Jurassic and Cretaceous periods there was no significant change in the depositional
framework. The Jurassic sequence below the Cretaceous at Gebel Al-Maghara can be divided
into six alternating continental and marine formations.
1.2.3 Abu Tartur phosphate mine in Western Desert (Cretaceous - Eocene)
The Abu Tartur phosphorites, which were first described by Hermina et al. (1961), are
situated in the middle latitudes of Egypt about 60 km to the west of El Kharga town (lat. 25°
26' N and long. 30° 02' E ). The Abu Tartur plateau forms an extended escarpment which
bounds the Dakhla–El Kharga depression to the north. The semi-oval plateau covers an area
of 1200 km2. It is covered by Early Tertiary limestones. From the long wall sector at Abu
Tartur phosphate mine 12 samples from the carbonaceous (black) shale of Duwi Formation
were collected. It is of Upper Campanian to Lower Maastrichtian age (Said 1962).
1.2.4 Esna-Idfu region in Nile Valley (Cretaceous - Eocene)
The Esna-Idfu region is situated east of the Nile Valley between latitude 25° 05' and 25° 30' N
and longitude 32° 30’ and 32° 50’ E. About 80 samples were collected to represent the
exposed rock units, as a composite section stratigraphically subdivided from top to base into:
Esna Formation Paleocene - L. Eocene
Tarawan Formation U. Palaeocene
Dakhla Shale Maastrichtian - Paleocene
Duwi Formation U. Campanian - L. Maastrichtian
Pre-Campanian ״Nubia Sandstone״
1.2.5 Qusier phosphate mine in the Red Sea coast (Cretaceous - Eocene)
The Qusier and Safaga areas are part of the Eastern Desert of Egypt at the Red Sea Coast, and
gained importance since five decades when the phosphate deposits of the Gebel Duwi Range
were discovered and exploited. The region extends in a northwest direction along the western
coast of the Red Sea from south of Qusier to Safaga, between latitude 25° 50' and 26° 67' N
and longitude 33° 45' and 34° 25' E, covering an area of about 500 km2.

5
At present, most of the mines in Quseir and Safaga are abandoned due to the low grade of the
remaining phosphate deposits, the current exploitation of phosphates from Abu Tartur
phosphate mine and the effect of international competition of Moroccan and Jordanian ores.
The phosphate in some mines is usually intercalated with and capped by shales. Typically, the
Egyptian phosphates are shallow marine deposits of a general Upper Cretaceous age. Their
maximum intensity of deposition was associated with a transgressive shoreline of the Late
Campanian or Early Maastrichtian Sea which encroached from North to South over the
northern slope of Africa. From Qusier phosphate mines 35 samples from Duwi and Dakhla
formations were collected.
1.3 Distribution of carbonaceous shales in Egypt
The black shales are widely distributed in Egypt in several horizons of different geologic
ages. No serious approach had been made to evaluate their geological as well as their
economic significance. This may have been due to the lack of interest in developing and using
these economically important deposits as a source of fuel, most probably due to the
competition of oil. Ball (1916) and Hume (1927) were the first authors who recorded in
outcrops Cenomanian marls and sandstones which contain hydrocarbons in the form of oil
and asphaltic matter at many localities, e.g. Wadi Abu Quda, Itala el-Zur and Nazzazat, Gulf
of Suez area.
Said (1962) mentioned that some carbonaceous shale bands containing plant remains of
Paleozoic age are recorded at Rod El Hammal, Wadi Araba. Oil shales were also reported
from Cabal Tanka, Wadi Matulla, North Ras Gharib, Abu Shaar, Judal, and Ras Dib. In the
Fayum region to the west of Gharaq and Wadi Maela, the Middle Eocene limestone is
bituminous. The middle chalky limestone to the east of Tura is distinctively bituminous. The oil shales are present in different Upper Cretaceous-Lower Tertiary formations: Duwi
Formation (Phosphate bearing rock), Dakhla Shale and Esna Shale in the region between
Safaga and Quseir in the Red sea coast. The Dakhla Shale possesses the horizon richest in
organic matter. The Dakhla Shale directly overlies the upper phosphate bed. The average
amount of oil yielded by Fischer assay from Cretaceous oil shale amounts to 20 - 45 gal/ton
(Robison and Tröger 1983; Tröger 1984). Black shales also occur in many localities in the
Western Desert. Among the important localities of oil shale is the one recorded in Abu Tartur
area which yield considerable amount of oil (Tröger 1984).
6
1.4 Previous studies on black and carbonaceous shales in Egypt
Various authors have attempted to provide some information on the geology and the
sedimentology of the black and carbonaceous shales in Egypt. However, many points
concerning their origin and potential still need further clarification. Higazy and Hussein
(1955) measured the uranium content of some black shales and phosphates from the Quseir -
Safaga district. Mustafa and Ghaly (1964) studied the carbonaceous shales from different
localities in Egypt (Galala area, Buda Valley and Quseir area). Malak et al. (1977) studied the
mineralogical, petrography and organic geochemical characteristics of black shale in Safaga-
Quseir area. Robison and Tröger (1983) studied the geology and organic geochemistry of
Dakhla shale from Quseir, Sibaiya and Abu Tartur. Tröger (1984) determined the oil yield by
Fischer assay and estimated the total volume of all potential organic-rich Cretaceous strata of
Quseir-Safaga and Abu Tartur areas. Ganz (1984) proposed a genetic model for the organic
rich phosphate-bearing Dakhla Shale. Darwish (1984) studied the stratigraphy and organic
chemistry of the black shales in the Quseir-Safaga area. Khaled et al. (1987) studied the
geochemical characters of the oil shales and their extractable bitumina within the Duwi
Formation in the Quseir-Safaga district.
The black shales in Egypt were also studied petrographically, mineralogically and
geochemically by many workers (El-Kammar 1987; Ganz 1987; Germann et al.1987; El-
Kammar et al.1990; Ibrahim 1992; El-Kammar 1993; Ismael 1996; Ahmed 1997; Sediek and
Amer 2001; Ghandour et al 2003; Ibrahium et al.2004). Most of the previous studies were
carried out on black shales of the Eastern Desert (Quseir-Safaga district); however, little was
done on the Western Desert and Sinai. Thus this study focuses on the carbonaceous and black
shales from both, the Eastern and the Western Desert as well as Sinai.
1.5 Scope of the present work
Egyptian carbonaceous and black shales have drawn the attention because of their geological
and economic significance (as a source rock and raw material). The present work aims to
provide detailed geological, mineralogical, geochemical, petrographical information and to
determine the economic potential of some Egyptian carbonaceous shale, which stem from five
different geological ages. For these carbonaceous shales the depositional conditions are
studied.

7
2 Lithostratigraphy In the following, the regional distribution of the different lithofacies types of the
carbonaceous shales of Carboniferous to Eocene age for the five locations will be discussed.
Fig. 2: Stratigraphic column and regional distribution of the studied formations.
Abu Tartur
AT
Al – Maghara
Mg
Abu Zinema
Az.
Esna-Idfu
N
Quseir
Q

8
2.1 The area of Abu Zinema in Southwest Sinai (Carboniferous)
The Paleozoic sediments are exposed in the southern central parts of the Sinai, primarily in
the Um Bogma area east of Abu Zinema and at Abu Durba (Fig. 3). These sediments have
been studied in detail by Abdallah and Adindani (1963), Hassan (1967), Weissbrod (1969),
Said (1980) and Issawi and Jux (1982). The lack of diagnostic fossils has made accurate
dating and correlation extremely difficult and additional confusion has been created by the
use of various formation names. The basal Cambro-Ordovician sequence comprises the
Araba, Naqus and Wadi Malik Formations of Issawi and Jux (1982), which are equivalent to
the Yam Suf Group and the Netafim Formation of Weissbrod (1969). These clastic sediments
were deposited on the peneplained surface of the pre-Cambrian basement and are dominated
by grits, siltstones, subarkoses and conglomerates, with few dolomite beds (Said 1990).
Issawi and Jux (1982) have interpreted some of the conglomerates to be of fluvioglacial
origin, suggesting that some of these sediments may be of Silurian age whilst the upper parts
are interpreted as Devonian. However, these age datings are not based on direct faunal
evidence and therefore may not be totally correct. These basal Paleozoic sediments were
deposited under fluvial paralic conditions and probably represent relics of a very large
sediment body which originally extended over a large area, but was deeply eroded before the
deposition of upper Paleozoic strata. The Carboniferous at southwest Sinai was divided from
base to top into two formations, the Um Bogma Formation and the Ataqa Formation.
2.1.1 Um Bogma Formation (Lower Carboniferous)
The Um Bogma Formation provides the first reliable date for the Paleozoic sequence in Sinai.
These marine carbonates are highly fossiliferous, especially in foraminifera, and have been
dated as Tournaisian-Visean (Said 1990). The Um Bogma Formation lies conformably over
nonfossiliferous sandstones which are generally believed to be of lower Paleozoic age.
Ferromanganese minerals within the basal part of the carbonates at Um Bogma have been
extensively mined for many years. South of Abu Durba the Um Bogma Formation is
represented by black marine shales (122 m thick) which have yielded a similar fauna
comparable to that of Um Bogma area.

9
Fig. 3: Lithostratigraphic section of the Paleozoic in central Sinai showing the position
of Ataqa Formation (after Said 1990)
LITHOLOGY THICKNESS
(METERS)SYS
TEM
AG
E
Per
mo-
Tria
s
FOR
MAT
ION
MAINFAUNA
AND FLORA
FACIES REMARKS
Qis
eib
Upp
erC
arbo
nife
rous
305(Approx.)
Fluvial-Paralic
Fluvial-Paralic190
Sigillaria Sp.Lepidodendron
Sp.Neoggerathia
Sp.
ForaminiferaBrachiopods
CoralsMollusca
Bituminous coaland kaolinitic layers
South of Abu Durbathe carbontea changeto black shales;Ferro-manganesemineralisation
Marine
Fluvial Brown-red.
Marine-Littoral
Marine
Fluvial
43
122 - 137
Trilobites
TraceFossils
Polymictconglomerates
CrystallineBasement
Tour
nais
ian-
Vis
ean
Ataq
aU
m B
ogm
a
Cam
bro-
Ord
ovic
ian
Pre-
Cam
bria
n
Studied Shale
Rod el Hamal, AbuDarag and AheimerFormations areabsent in Sinai
Fe Fe Fe
Limestone
Dolomites
Sands
Shale
Flat Pebble Conglomeratesor Quartz PebblesLignite
Basement

10
2.1.2 Ataqa Formation (Lower Carboniferous)
The Ataqa Formation is unconformable overlying the Um Bogma Formation and consists of
thick cross-bedded, very fine to fine grained sandstones. Visean flora and fauna have been
identified within these sediments by Horowitz (1973). Kaolinitic layers are present within the
Ataqa Formation and these are exploited commercially in the Wadi Abu Natash area. At Um
Bogma the Ataqa Formation contains bituminous coal seams and is capped by a basaltic sill.
Several carbonaceous shale beds (black shales) are located within the middle part of the
Carboniferous sandstones of the Ataqa Formation at Bedaa-Um Thora district. Upper
Carboniferous sediments were previously thought to be absent which they have described in
Sinai. However, Issawi and Jux (1982) have reported the presence of Upper Carboniferous
Aheimer Formation at Um Bogma.
2.2 The area of Al -Maghara coal mine North Sinai (Jurassic)
During the Jurassic period, north and central Sinai was a coastal plain and shallow shelf of
low relief, separating the continental Arabo-Nubian shield to the south from the deep marine
Tethyan Sea to the north. The most complete Jurassic sequence (1980 m) is exposed in
northern Sinai at Gebel Maghara, which is a large breached anticline with a gentle north flank
and a steep, often vertical or overturned, southern flank. Locally there are indications for a
reverse thrust fault is developed through the southern flank. Gebel Al-Maghara has been
subjected to many geological studies such as of Barthoux and Douville (1913), Shata (1951),
Arkell (1956), Al Far (1966), Barakat (1970) and Said ( 1962 &1990).
Al Far (1966) subdivided the Jurassic sequence below the Cretaceous at Gebel Al-Maghara
into six formations of 1.980 m total thickness:
Masajid Formation (575 m) Marine deposits Upper Jurassic
Safa Formation (215 m) Continental deposits Middle
Bir Maghara Formation (444 m) Marine deposits Middle Jurassic
Shusha Formation (272 m) Continental deposits Lower
Rajabiah Formation (293 m) Marine deposits Lower
Mashaba Formation (100 m) Continental deposits Lower Jurassic.
Mashaba, Shusha and Safa Formations are supposed to be of continental origin and represent
fossil plant bearing formations. Economically, significant coal seams have been found only

11
in the Safa Formation. The coal reserves are more than 40 million ton of sub-bituminous
coal. Said (1962 &1990) mentioned that in north Sinai the complete Jurassic section is
exposed at Gebel Maghara and during the Jurassic and Cretaceous periods there was no great
change in the depositional framework. The dominant rocks are limestones and dolomites.
The stratigraphic column at Gebel Maghara belongs to Jurassic and Cretaceous age (Fig. 4).
In the following, a lithofacies description from the base to the top of the succession is given.
2.2.1 Mashaba Formation (Lower Jurassic)
The lowermost Jurassic sediments exposed at Gebel Maghara belong to the Mashaba
Formation. These clastic sediments are of Liassic age and were deposited by north flowing
braided streams carrying detritus shed off the Arabian-Nubian massif. The dominance of
continental clastics was probably the result of a low eustatic sea level coupled with tectonic
uplift to the south. The thin basal fluvial sandstones containing large wood fragments are
succeeded by interbedded shallow marine carbonates and nearshore marine clastics of the
Rajabiah and Shusha formations. The carbonates are rich in lime mud having been poorly
winnowed in low energy environments. Rare interbeds of well-sorted oolitic limestone are
present, suggesting higher energy conditions, commonly with quartz sand grains indicating
proximity to the shoreline. The interbedding of carbonates and clastics might have been
caused simply by the shifting of different depositional facies across a low energy shelf (Said
1990). The Mashaba Formation consists of lime, clay and sandstone with a thickness of about
100 m. It is exposed at Wadi Sadd El-Mashaba at the base of the El-Maghara section.
2.2.2 Rajabiah Formation (Lower Jurassic)
The Rajabiah Formation is composed of a thickly bedded limestone with some marl and
sandstone interbeds. This formation is of Liassic age and its thickness attains about 293 m. It
is exposed at Wadi El-Mashaba and Wadi Rajabiah.
2.2.3 Shusha Formation (Lower Jurassic)
This formation consists of clastic sediments (sandstones) with thin carbonate intercalations.
The formation is of Liassic age and its thickness attains about 272 m. It is exposed around
Shusht Al-Maghara.

12
Fig. 4: Generalized lithostratigraphic column of Jurassic and Cretaceous rocks exposed
at Gebel Maghara (after Jenkins et al. 1982).
Shallowsubtidal
lagoon tointertidal
Moderalely agitated Lime WS - PS
719
AGE
Tertiary Eocene
FOR-MATION
THIC
KN
ESS,
MET
ERS
LITHOLOGY
DEPOSITIONALENVIRONMENT
FLU
VIA
L
PAR
ALI
CS
HA
LLO
WP
LATF
OR
MP
LATF
OR
MM
ARG
INO
PEN
SH
ELF
SLO
PE/
BAS
IN
REMARKSC
reta
ceou
s
?Alb
ian
- Cen
oman
ian?
Aptia
n - A
lbia
n
Unn
amed
Nubia
Good porosity in crystalline dolomite;some relict MS-WS texture withechinoderms,peloids forams; few possiblealgal laminates.
Shoal andrudistcomplex
Well-bedded, nonporous rudist WS-PS andoolite GS.
Paralic toshallowshelf orplatform
Fluvial
Interbedded nonporous bioclastic lime WS-GS,siltstones and occasionally porous sandstone
Porous sandstone
Shallowmoderate
Low energyshelf
Platform shoals andbuildups
Lime GS-PS with ooids, corals.Nonporous
Calcisiltite with spicules, nonporous
Bioherms of WS-GS contain corals, stroms;coarse calcspar; some vuggy porosity
Quiettomoderatelyagitatedplatform
Bioclastic time PS-WS with peloids, oncolites, green algae; generally nonporous
Upp
er J
urra
ssic
Cal
lovi
an-K
lmm
erid
gian
Cal
lovi
an-
Oxf
ordi
an
Mas
ajid
Fm
.
Bajo
cian
-Ba
thon
ian
Safa
Fm
.
Mid
dle
Jura
ssic
Baj
ocia
n-Ba
thon
ian
Bir
Mag
hara
Fm
.
Low
er J
uras
sic
Lias
sic
Shu
sha
Fm.
Raj
abia
hFm
.
MashabbaFm.
Lithology isschematicbased on
and
Paralic tomoderatelyagitatedshallow shelf
Occasionally porous sandstones andinterbedded lime GS to MS
Low energyshallow shelfto innerplatform:occasionalstrongagitation
Nonporous, oncolitic lime WS-MS and rareGS-PS interbedded with claystone andnonporous sandstone.
Paralic tofluvial
Nonporous oncolitic lime WSand oolitic sandstone.
Basal Cretaceous is thin, not exposed.
500
0m
20001980
1500
1300
500
0m
1 2
1 3
Studied ShaleBivalves
Corals Algal laminates
Oolites
Rudists Sandstone
Plant material
SiltstoneLimestones
Shale
DolomiteOncolites 2
1
3
Platform
platformto highenergy
after Al Far 1966
after Goldberg and Friedman, 1974
after Said 1962
Carbonate rock textures: MS-Mudstone, WS-Wackestone, PS-Packstone, GS-Grainstone

13
2.2.4 Bir Maghara Formation (Middle Jurassic)
The Middle Jurassic sediments at Gebel Maghara can be subdivided into a lower carbonate
unit (Bir Maghara Formation) and an upper clastic unit (Safa Formation) which attain a
thickness of approximately 701 m (Said 1990). The Bir Maghara Formation is exposed at Bir
Maghara and at Mowerib; it is of Bajocian-Bathonian age. Al Far (1966) divided the Bir
Maghara Formation into three members: the Mahl Member which consists of lime and clay
(type locality at Wadi Mahl), the Bir Member (located around Bir Maghara) consists of clay
with some limestone interbeds, and the Mowerib Member, which consists of lime, clay and
sandstone.
2.2.5 Safa Formation (Middle Jurassic)
The Safa Formation is composed of well bedded silty sandstones with some beds of
limestone, clay and marl. It is of Bathonian age and is exposed at Wadi El Safa and Wadi Al-
Maghara. It contains sub-bituminous coals near its base which are interpreted as having been
deposited in lakes or lagoons adjacent to the coastline (Said 1990).
2.2.6 Masajid Formation (Upper Jurassic)
The Upper Jurassic Masajid Formation is dominated by carbonates representing a southerly
marine transgression at the end of Bathonian–Callovian times. At Gebel Maghara these
carbonates are 680 m thick and consist of bioclastic, oncolitic, peloidal packstones and
wackstones and isolated bioherms (Al Far 1966).
2.3 The area of Qusier phosphate mines in Red Sea coast (Cretaceous –Eocene)
Geologically and stratigraphically the Abu Tartur area, Esna-Idfu region (Nile Valley) and
Qusier have similar sedimentary successions (Fig. 5).
The complex geology which characterizes the Qusier region is attributed to its confinement to
the boundary between the Arabian-Nubian massif and the Gulf of Suez rift. Faulting with a
dominant NW trend is the main feature in the region and forms complicated horsts and
grabens with outcropping basement rocks covering the major part of this region.

14
Fig. 5: Sedimentary sequences of Upper Cretaceous – Lower Tertiary rocks showing the
position of the samples in the studied areas.

15
The Upper Cretaceous and Lower Eocene sediments are preserved mostly in synclinal
structures. They form isolated hills. The sections in Qusier and Safaga areas were described
by many authors including Barron and Hume (1902), Ball (1913), Youssef (1957), Faris and
Hassan (1959), El Akkad and Dardir (1966), Abdel Razik (1967& 1972), Issawi et al. (1968
&1971), Hassaan et al. (1979), Mohammed (1982), Saad (1983), Philobbos et al. (1985),
Ramadan (1992) and Ismael (1996).
The stratigraphy of the exposed sedimentary rocks was described under the following rock
units according to Said (1962) from base to top as follows:
Nakheil Formation top
Thebes Formation
Esna Shale
Tarawan Chalk
Dakhla Shale
Duwi Formation
Quseir Variegated Shale
base ״Nubia Sandstone״
2.3.1 Nubia Sandstone (Pre-Campanian)
The term ״Nubia sandstone״ was first introduced to the Egyptian stratigraphy by Russegger
(1937), who used the term "Sandstein von Nubien" to designate nonfossiliferous sandstone
sections of Paleozoic or Mesozoic age. It is the oldest sedimentary unit and rests
unconformably over the basement complex. The bed occupies many of the topographic lows
in Qusier area (Said 1962). It consists mainly of well sorted, fine to coarse grained, brownish
to yellowish sandstone. The thickness of this unit is about 130 m in Qusier area (Issawi et al.
1968). According to Ward et al. (1979) and Van Houten et al. (1984), this unit can be divided
into three members. This unit is assigned of Pre-Campanian age (Issawi et. al.1968).
2.3.2 Qusier Variegated Shale (Pre-Campanian)
This formation was introduced by Ghorab (1956), who considered it as a separate formation
and named it "Quseir Variegated Shale". The variegated shale consists of multicoloured shale
(grey, brownish yellow, green, reddish, violet and blackish) alternating with yellowish
sandstone at Gebel Duwi. The Quseir Variegated Shale is considered by earlier authors

16
(Awad and Ghobrial 1965; Abdel Razik 1970; El Naggar and Ashor 1983) as a part of the
"Nubia Sandstone". The thickness of this unit is in the range of 70 m in Gebel Atshan (Said
1990). It is unfossiliferous, with the exception of rare plant remains, bone fragments and fish
teeth. Seward (1935) concluded that these plants must have grown in nearby places under a
humid tropical climate. The upper part of the Quseir Variegated Shale contains some
phosphate bands. These phosphate bands, which range between 10 – 20cm thicknesses, are
exposed within indurate sandstone in Gebel Duwi, while they are associated with shale in
Wasif section (Glenn 1980). Lithologically, the upper part of the Quseir Variegated Shale is
very similar to the shale lithofacies of the Duwi Formation (Glenn and Mansour 1979). The
age of this formation is regarded to be Pre-Campanian (Said 1962).
2.3.3 Duwi Formation (Campanian – Maastrichtian)
In 1900, Barron noted the presence of phosphate beds in the Eastern Desert. Youssef (1949
&1957) described the Duwi Formation and classified the exploited phosphate in Gebel Duwi
into three beds, the upper (Atshan bed), the middle (Duwi bed) and the lower (Hammadat
bed). Said (1962) extended the use of the term Duwi Formation to laminated gray clays and
chert phosphatic bands at Safaga and subdivided the whole section in the Red Sea area into
three members: Atshan or "A" member separated from the middle Duwi or "B" member by an
oyster limestone bed 6-16 m in thickness, and lower Abu Shegela or "C" member, separated
from the middle member by a shale unit of variable thickness (6-10 m).
The Duwi Formation in the Quseir-Safaga coastal region comprises a heterogeneous suite of
shallow marine rocks that lies stratigraphically above the Quseir Variegated Shale and below
the Dakhla Shale. The Duwi Formation consists of phosphorite, shale, siliceous claystone,
glauconitic sandstone, chert, dolostone, marl and reefal limestone (Glenn and Mansour 1979).
The Duwi Formation can be subdivided into three members, the lower "C" member, separated
from the middle member by variegated shale of non marine to marginal marine origin, similar
to those of the underlying Quseir Formation. In some places such as the Younis mine this
member comprises three beds separated from each other by shale beds. It ranges in thickness
from 20 cm to 1 m. In Zoug El Bohar mine the "C" member forms a lens that ranges in
thickness from 3 to 7 m. The phosphorites of the "C" member are characterized by medium to
coarse grains, reddish in colour and of friable consistence. This member is exploited in Abu
Shegala, Younis and Zoug El Bohar Mine. The middle "B" member is well developed at

17
Gebel Duwi. It is made up of three phosphate beds, separated by thin shale, marl, and
silicified limestone beds. Its thickness ranges from 20 to 90 cm and colour from gray, pale
gray to yellowish. An important marker in this member is a thick oyster limestone bed which
caps and intercalates this member. This member is exploited in Galal, Um Resifa and Zoug El
Bohar mines in Quseir area and in Rabbah mine in Safaga area. The upper member "A" is
made up of three phosphate beds separated by thin shale, chert and marl beds. It ranges in
thickness from 10-120 cm. The colour varies from pale white to pale gray. It is exploited in
Younis, Galal, Wadi El Anz and Um Resifa mines in Quseir area, Wasif and Rabbah mines in
Safaga area and "B" mine in Hamrawin area. The Duwi Formation in Quseir–Safaga region is
of Campanian age in its lower part and Maastrichtian in the upper part (Youssef 1957).
A Maastrichtian age is given for this formation by Youssef (1949, 1957), Said and Sabry
(1964), El Akkad and Dardir (1966) and Issawi et al. (1968, 1971). Dominik and Schaal
(1984) assigned the age of the Phosphate Formation (Duwi Formation) to Upper Campanian
to possibly Early Maastrichtian on the basis of ammonites and vertebrate remains. The
microflora content of drilled cores from the Younis mine puts a Maastrichtian age to the
upper part of the black shales which lay on top of the Duwi Formation. An Upper Campanian
to Early Maastrichtian age, therefore, may be assigned to the underlying Duwi Formation in
this area (Schrank and Ganz 1984).
2.3.4 Dakhla Shale (Danian – Lower Paleocene)
The term Dakhla Shale was first introduced by Said (1961) to describe 130 m of gray shale
becoming calcareous toward the top, exposed at Mut in the Dakhla Oasis, conformably
overlying the Duwi Formation and underlying the Tarawan Chalk. It consists of a series of
marls and shales which vary in thickness from one place to another. It is subdivided into two
members namely Beida Shale Member (10 m) at the top and Hamama Marl Member 27 m at
the base (Abdel Razik 1972). The lower member at Wasif is usually composed of argillaceous
gray or reddish limestone with gypsum veinlets, while at Gebel Duwi it is composed of
varicoloured (yellowish, white and brownish) marl. The upper member consists of gray to
green shale, yellowish in some parts, and fissle with gypsum veinlets. This member is
conformably overlain by the Tarawan Chalk. The contact is marked by an abrupt change from
gray shale with gypsum veinlets into brownish, reddish limestone and chalky white limestone.
The lower part of this formation is assigned to a Danian age, while the upper part is of lower
Paleocene age (Youssef 1957).

18
A notable feature of Quseir, lower Dakhla and Duwi Formation is the presence of black shale
within and above the phosphatic beds. Some of these shales are reported to have caught fire
(Shahin et al. 986). These shales often contain abundant foraminiferal tests, fish debris,
pecten, scattered pyrite grains and phosphatic grains. The average oil content of weathered
black shale samples is 19gal/t (Tröger 1984). Malak et al. (1977) suggested that these black
shales were deposited in stagnating, reducing, slightly alkaline water with an upper
oxygenated surface zone in which green algae lived and acted as the main source of organic
matter.
2.3.5 Tarawan Chalk (Landanian-Late Palaeocene)
The term "Tarawan Chalk" was first introduced by Awad and Ghobrial (1965) to describe 45
m of chalk exposed at Gebel Teir in the Kharga Oasis. The Tarawan Chalk is 3.10 m thick at
Wasif and 10 m thick at Gebel Duwi. It is conformably overlying the Dakhla Shale and
underlying the Esna Shale. The boundary between the Tarawan Chalk and the underlying and
overlying formations is marked by an abrupt change in lithology shown by compactness,
carbonate content and colour (Ramadan 1992). Tarawan Chalk consists of chalky limestone,
white, argillaceous in the lower part and chalky in the upper part. It is assigned to a Landenian
age (Issawi et. al 1968).
2.3.6 Esna Shale (Early Eocene)
Beadnell (1905) introduced the term "Esna Shale" to describe a succession of laminated green
and gray shaley clay at the locality Gebel Owenia, opposite Esna, northeast of Sebaiya. The
Esna Shale lies conformably over the Tarawan Chalk with sharp contact, marked by white
chalk limestone and is conformably overlain by the Thebes Formation, where the contact is
marked by pink argillaceous limestone bands. It measures 14 m in thickness in Wasif and 32
m at Gebel Duwi (Ramadan 1992).
According to Hassaan et al. (1979) the Esna Shale is subdivided into two members: a
calcareous shale member, consisting of gray to green, fissile and highly fossiliferous shale
with gypsum veinlets, and an argillaceous limestone member of whitish gray colour. This
Formation is assigned to the Upper Paleocene (Landinian) at the base and Lower Eocene
(Ypressian) at the top (Issawi 1972).

19
2.3.7 Thebes Formation (Early Eocene)
Said (1960) introduced the term "Thebes Formation" to describe the thick limestone section
which overlies the Esna Shale at the Thebes type section in Gebel Gurnah opposite Luxor. In
the study areas, it attains about 285 m in thickness in the Duwi range, about 250 m in
Hamadat and 166 m in Gebel Anz (Said 1990). It consists of thinly bedded limestone with
noticeable flint bands or flint nodules and chert concentrations, interbedded toward the top by
a marl bed.
Snavely et al. (1979) divided the Thebes Formation of Gebel Duwi into three "informal
members" representing different stages of deposition. The lower member rests conformably
on the Esna Shale and consists of about 40-60 m of laminated to thinly bedded limestone and
chalk as well as massive bioturbated chalk beds and chert bands. This member indicates a
deep water phase of a predominately pelagic depositional environment. The middle member
is made up of thinly bedded limestone and chalk, interbedded with nodular limestones,
intraformational conglomerates, reworked and benthonic foraminifera, lime sands and rare
chert. This unit is about 100 to 120 m thick according to Snavely et al. (1979) and about 200
m thick according to Strougo and Abu Nasr (1981). This heterogeneous accumulation of
carbonates is indicative of progressive shallowing and outward progradation of a shallow
water depositional environment. The upper member is thin (10 to 15 m thick), it present. It is
made up of fine grained limestone locally interbedded with oyster shells and shell hash. The
distribution of this member probably indicates a period of local uplift coupled with a period of
rapid sea level drop. This formation is assigned to the Early Eocene (Strougo and Abu Nasr
1981).
2.3.8 Nakheil Formation (Oligocene)
The Nakheil Formation was named by El Akkad and Dardir (1966). It is widely spread in the
Quseir – Safaga district and may reach a thickness of about 60 m or more. This formation is
made up of two types of deposits: very coarse breccias beds and fine grained lacustrine
deposits. The Nakheil Formation occupies the slopes of the Thebes Formation on the down
thrown side of the faults. It is closely associated with the early faulting which must have taken
place after the deposition of the Thebes Formation. The Nakheil Formation is nonfossiliferous
and assumed to be of Oligocene age (El Akkad and Dardir 1966).

20
3 Methods of investigation
The preparation of samples and the analyses of the samples were carried out in the
laboratories of the Institute of Applied Geosciences at the Faculty of Civil Engineering and
Applied Geosciences, Technical University of Berlin, Germany.
3.1 Mineralogical analysis
3.1.1 Separation of clay size fraction
From the original 144 samples, one hundred and one were chosen for powder XRD.
Depending on the XRD powder results the samples were selected for clay mineralogy and
XRF.
Fourty eight shale samples were analyzed by X-ray diffraction. The clay size fraction (less
than 2µm) was investigated in order to give information about the clay mineralogy of the
studied shales. About 25 g of the rock sample was soaked in distilled water after adding 5ml/l
of 0.1m. Na4P2O7.10H2O, and disintegrated with a shaker machine. The clay fraction (<2 µm)
was separated out from the sample by centrifugation. The <2 µm suspension was dried on
glass slides. The oriented mounts were run under three conditions:
i) In air dry state.
ii) After ethylene glycol treatment.
iii) After heating to 550º C for 1 hour.
3.1.2 X – ray Diffraction (XRD)
The bulk samples and the clay fractions were examined by a Philips X-ray diffractometer
PW1710, with Ni filtered CuKα radiation using 50 kV/30 mA. X-rays are electromagnetic radiation, produced when an electron beam hits a substance and
causes rapid deceleration of the electrons. In conventional diffraction, the X-ray tube is
arranged so that electrons strike a target which produces X-rays of known wavelengths, which
can be further filtered to produce radiation of a single wavelength which can be directed at the
sample in the diffractometer. The wavelength of X-rays ranges from 0.05 to 0.25 nm. The
sample is rotated in the beam so that crystallographic planes diffract X-rays as they reach the
appropriate angle. The relationship of X-ray wavelength to the angle of diffraction and the
characteristic lattice (or d) spacing of the mineral under examination forms the basis of all

21
X-ray diffraction (XRD) analysis and interpretation, and is known as Braggs Law (Dominic
et al. 1993).
3.1.3 Petrographic microscopy
Thin sections were made both from the shales and from associated phosphate samples for
mineralogical analysis with a petrographic microscope. The observed microfacies were
described, discussed, interpreted and photographed.
Examination of standard and polished-thin sections is the mainstay of microscopic
petrographic analysis. Because of the general softness of shales and mudstones, preparation of
appropriate thin-sections often poses a challenge. The difficulty of preparing good
petrographic thin sections of shales and mudstones is one of the reasons why acceptance and
application of thin section microscopy of this rock type has been long delayed (Schieber and
Zimmerle 1998)
3.1.4 Scanning Electron Microscopy (SEM)
Scanning Electron Microscopy (SEM) for selected samples of different lithofacies was
performed in order to diagnose and understand the microstructure and the diagenetic
relationships among the main constituents and the matrix of the studied sediments.
Identification of different minerals through SEM was facilitated by comparing their
characteristic morphologies with those shown in the SEM Petrology Atlas of Welton (1984).
Identification was verified by X-ray diffraction analysis when possible. SEM analyses were
carried out using a Scanning Electron Microscope Type S-2700 HITACHI.
3.2 Geochemical analysis
The present study includes major and trace element analysis of 55 carbonaceous shales from
Egypt. The samples were crushed by a crushing machine to reduce the rock aggregate to
<0.063µm particles. These samples were sieved to get the grain size fraction <0.063 µm.
3.2.1 X-ray Fluorescence (XRF)
The crushed samples were used to determine the major element composition by XRF.
Analyses were carried out with a Philips PW 1404 WD-XRF via program ״POWDER״.
Mixture of 6g of sample powder with 1.5g of ״HOECHST C-Wax״ homogenised in vibrating
device and pressed into Al-cups (40mm diameter) at 20t-pressure. Analysed major elements

22
were SiO2, TiO2, Al2O3, Fe2O3, MgO, CaO, Na2O, K2O, SO3 and P2O5. Trace elements
analysed were F, Ag, As, Ba, Bi, Br, Cd, Cl, Co, Cu, Cr, Cs, Ga, Hg, Mn, Mo, Ni, Pb, Rb,
Sb, Se, Sn, Sr, Th, U, V, W, Zn and Zr.
3.2.2 Determination of total organic carbon content (TOC)
The total organic carbon content was determined on each sample using a Hochtemperatur-
TOC/TNb-Analysator (Liqui TOC) after decarbonating. The analyeses were performed at the
TU, Berlin, Germany. Twenty-seven whole rock samples were analysed for TOC
concentrates. About 200 mg pulverised sample was used for this analysis. Carbonate was
removed by treatment with 10 % aqueous hydrochloric-acid. The residual materials were used
for the determination of TOC by combustion analysis of temperatures in excess of 850C°. The
evolved gas (CO2) was measured quantitatively and simultaneously by infrared detectors and
recorded as percentage of carbon.
3.2.3 Rock-Eval pyrolysis
The Rock-Eval pyrolysis was performed in the Applied Petroleum Technology AS, Norway.
The TOC and Rock-Eval were determined on each sample using a Rock-Eval 6 instrument.
The all procedures follow NIGOGA, 4th Edition.
The pyrolysis method is described in detail by Espitalie et al. (1977). For analysis 100 mg of
each rock sample was used. The sample was placed in the instrument and heated at a rate of
25°C/min in a helium stream from 250°C to 550°C. Free hydrocarbons contained in the rock
are expressed as an S1 peak; those released by the thermal breakdown of kerogen appear as an
S2 peak which is produced by pyrolysis between 300°C-550°C. The quantity of hydrocarbon
is measured by a flame ionisation detector (FID). Finally, an S3 peak representing CO2
produced from the kerogen appears as a reflection of the oxygen content of the organic
matter. The quantity of CO2 is registered by a thermal conductivity detector (TCD).
The method leads to the calculation or measurement of two kinds of parameters:
i) Hydrogen and oxygen indices, which can be related to the type and thermal evolution of the
organic matter. ii) The temperature at the maximum of the pyrolysis peak (S2 peak). This
temperature is related to the thermal maturity of the organic matter (Espitalie et al. 1977;
Peters, 1986).

23
4 Mineralogy
The identification of the mineralogical composition of shales can be easily approached
through the use of X-ray analysis.
The present chapter deals with the mineralogical composition of shales of Carboniferous age
from Abu Zinema in South Sinai, Jurassic age from Al-Maghara coal mine in North Sinai,
Cretaceous age from Abu Tartur phosphate mine in Western Desert, Cretaceous to Early
Eocene age from Esna-Idfu at Nile Valley and of Cretaceous age from Quseir phosphate
mines at the Red Sea coast. There are simple procedures for the semi-quantitative estimation of the clay mineral content.
They involve the measurement of the height of the (001) reflections above the background
with different correction factors used in this study or measurements of the peak areas (Johns
et al. 1954; Weaver 1958). The following is a brief description of the minerals identified by
means of X-ray diffraction analyses of the clay fraction and whole rock samples.
4.1 Clay Mineralogy
4.1.1 The importance of clay minerals
Clay minerals can be used as stratigraphic markers and environmental indicators. The type of
clay found in shale is a function of provenance and diagenetic history. Depositional envi-
ronment had a considerable influence on the clay mineralogy through early mineral
transformations in the basin of deposition (Russell 1970).
4.1.2 Structure and chemistry of clays
There are two basic building blocks common to clay mineral structures:
(i)- A sheet of silicate tetrahedra, consisting of two layers of oxygen atoms, and containing
silicon in four-fold (tetrahedral) coordination.
(ii)- An octahedral sheet, consisting of two layer of oxygen atoms or hydroxyl groups,
between which aluminium, magnesium or iron are bounded in six-fold coordination.
The structural units of clays therefore consists of either alternating tetrahedral and octahedral
sheets (OT or 1:1 structure), as in the kaolinite group of clay minerals; a sandwich of one
octahedral sheet between two tetrahedral sheets (TOT or 2:1 structure), as in illite and

24
smectite clay minerals or an arrangement in which the three-layer TOT units alternate with a
brucite layer (2:1:1 structure) as in chlorite.
The various clay minerals can be summarized as follows:
4.1.2.1 Smectite group minerals
These have a diocthedral or a trioctahedral 2:1 layer structure. Smectites nearly always occur
as fine-grained particles of clay size. The dioctahedral smectites are the phases which are
often intimately associated (interlayering) with the mica-like minerals (Velde 1992). The
main dioctahedral minerals are montmorillonite-beidellites (Al-rich) which are predominatly
octahedrally charged, and nontronites (Fe3+-rich).
4.1.2.2 Kaolinite group minerals
This group consists of uncharged, dioctahedral layer units with a 1:1 structure of 7 Å in
thickness. The individual mineral species considered are:
Kaolinite, which has varying degrees of crystallinity and a distinct, platy form; Dickite, which
is similar to kaolinite, but with a different stacking arrangement of the unit layers; Halloysite,
which consists of a poorly ordered arrangement of kaolinite-like units, with variable amounts
of water between the layers, generally between 0.6 to 4H2O per formula unit, and often with a
tabular form.
4.1.2.3 Chlorite group minerals
These are sometimes dioctahedral but usually trioctahedral with a 2:1:1 layer structure of 14
Å in thickness. The 2:1 layer is negatively charged because of ionic substitutions, and is
balanced by a positive charge on the interlayer hydroxide sheet. Chemically, the group is
extremely variable, but it should suffice to concentrate on only three types:
(i) Mg-rich chlorite (e.g. clinochlore) which is trioctahedral.
(ii) Fe-rich chlorite (e.g. chamosite) which is also trioctahedral.
(iii) Al-rich chlorite (e.g. sudoite) which is mainly dioctahedral.
Chlorite and kaolinite have very different structures and geological occurrences, but they
sometimes are present in natural mixtures. Chlorite has a basal series of diffraction peaks
superimposed or nearly superimposed on the members of the kaolinite 001 series. High-Fe
chlorites have weak odd-order reflections, so weak that the 001 peak is easily obscured or not

25
noticed, so the distinction between chlorite and kaolinite is most difficult when Fe-rich
chlorites are involved (Duane et al. 1997).
4.1.2.4 Illite/Mica group minerals
These have a di- or trioctahedral 2:1 layer structure of 10 Å in thickness. The structure is
charged due to ionic substitution in both the tetrahedral and octahedral sheets, and contains
interlayer non-exchangable cations (usually K+) that compensate for the charge deficit on the
unit layers. The chemistry of the various members of the group is variable.
4.2 Clay minerals in the studied shale samples
Smectite, kaolinite and chlorite in addition to illite are the most abundant clay minerals
encounted in the studied shale samples. The following is a discussion on the recognized clay
mineral associations. Representative profiles and the semi-quantitative results obtained are
shown in Appendix (Table 2 & 3 and Fig.1 to 5) and the following Table (Table 1).
Table 1: Average semi-quantitative clay mineralogy of the studied shales (by XRD)
Location Formation No. of
samples
Smectite
%
Kaolinite
%
Chlorite
%
Illite
%
Esna Shale 11 88 2 10 0
Dakhla
Shale
10 73 9 18 0
Nile Valley
Duwi 6 98 2 0 0
Quseire Mines Dakhla
and Duwi
11 80 20 0 0
Abu Tartur Mine Duwi 4 100 0 0 0
Al Maghara Mine Safa 3 traces 100 0 0
Abu Zinema Area Ataqa 3 0 87 0 13

26
4.2.1 Smectite
Smectite is the dominant constituent of the clay mineral content of the studied shales in the
Upper Cretaceous–Lower Tertiary sediments of Duwi Formation at Abu Tartur phosphate
mine, Duwi Formation and Dakhla Shale at Quseir phosphate mines and Duwi Formation,
Dakhla Shale and Esna Shale at Esna –Idfu at Nile Valley. The average content of smectite in
the samples ranges from 100 % at Abu Tartur phosphate mine to 80 % at Quseir phosphate
mine (Table 1); (Fig.6).
Fig. 6: Smectite average at studied locations
Terrigenous clay minerals are often transported great distances by wind and water before
being deposited on the seafloor. The composition and the characteristics of clay minerals in
well preserved sediments record the paleoclimatic and tectonic environments of their source
areas (Chamley 1989; Ehrmann et al.1992; Velde 1995). Climate has strong influence on rock
alteration, and clay minerals are often the main product of this process. For example, the
global pedogenic and climatic zonation is reflected in the latitudal distribution of certain clay
minerals (Chamley 1989). However, other factors than climate such as assemblage,
0
10
20
30
40
50
60
70
80
90
100
Nile Valley n=27
Quseir n=11
Abu Tartur n=4
Al Magharan=3
Abu Zineman=3
Studied locations
Sm
ectit
e %
n.a. n.a.

27
topography, transport and diagenetic changes can modify the original clay assemblage
(Yuretich et al. 1999). Clay minerals in marine sediments have been used to infer
paleoenvironmental conditions (Jeong and Yoon 2001). In continental weathering
environments, smectite and kaolinite are generally formed by active chemical weathering of
rocks under humid temperate to tropical climates (Weaver 1989). Smectite and kaolinite
occurrence in marine sediments was often ascribed to the chemical weathering in a warm
humid environment. Chamley (1989) stated that in temperate arid regions the neoformation of
smectite in vertisols often occurs simultaneously with negative transformations (e.g. open
illite, irregular mixed-layer) and the preservation of some parent-rock minerals. In arid
tropical areas smectite neoformation becomes exclusive. The pedogenic smectitization can
extend over the humid intertropical zone, if the drainge conditions are poor and prevent the
normal evacuation of ions. Smectite can also form diagenetically from illite, kaolinite, or
chlorite (Moore and Reynolds 1989).
The dominance of smectites in the Upper Cretaceous-Lower Tertiary sediments in South
Egypt has been described by Hendriks (1985, 1988), Hendriks et al. (1990), Ismael (1996)
and Ahmed (1997). The dominance of smectite in the studied samples is in agreement with
the obtained results from the other authors. The origin was believed by those authors to be
due to continental pedogenesis as well as marine neoformation. Terrestrial smectite developed
under warm and humid to seasonally humid conditions by the degradation of chlorite and
illite or by crystallization from ion-enriched hydrolytic solutions in badly-drained alkaline
soils. According to Moore and Reynolds (1997) there are two kinds of smectite, one produced
by the kind of weathering found in soils and one by neoformation such as in the alteration of
volcanic glass. Four main genetic hypotheses for the origin of smectite and mixed layer (I/S)
exist: (1) reworking of soils and enrichment by differential settling, (2) alteration of volcanic
material, (3) transformation of detritals, and (4) authigenesis (Chamley 1989; Thiry and
Jaquin 1993). The absence of any conceivable volcanic precursor, such as tuff or glass in the
studied shales indicates that smectite is mainly of a detrital origin. Smectite is the
predominant clay mineral in many lacustrine settings. For example, it makes up to 100% of
the shale minerals in some stratigraphic units of the Messel oil shale (Weber 1991). The
author suggested a warm/humid climate proven by the smectite which corresponds with the
existence of a diverse fauna and flora in south Egypt (Hendriks et al.1990). Discrete smectite
and mixed-layer illite/smectite (I/S) commonly forming from the weathering of ultrabasic or
very basic rocks which produce magnesium minerals (Surdam and Stanley 1979).

28
The main sources of the studied shales lie in the rugged tectonic belt which forms the
Precambrian basement complex and their weathering products in the South-Eastern Desert of
Egypt and the northern part of Sudan. These basement rocks are mainly an association of
metasediments, metavolcanics, metagabbros and serpentinites, constituting the ophiolitic
melange (Shackleton et al. 1980) that is interrupted by gneisses in structural highs. This
sequence is unconformably overlain by volcanics, and intruded by granite ranging in
composition from quartz diorite to alkali-feldspar granite. Primarily the detrital material is
carried to the shelf by streams and river system. Partially, however, aeolian transportation
may have played a minor role. The detritus encountering the shelf environment undergoes
further mechanical as well as chemical differentiation, and the transformation of detritus into
deeper marine sediments results in further chemical and mineralogical changes.
The smectite-kaolinite association in the studied shales does not suggest the formation of
kaolinite under the same conditions of smectite formation or the insitu formation of kaolinite
by chemical precipitation. Smectite formation is compatible with alkaline reducing
conditions, while kaolinite is generally thought to require acid conditions, and it may be
unstable in alkaline environments. The occurrence of smectite together with kaolinite and
chlorite indicates the alteration of feldspar in connection with an „arenization“ (Millot 1970)
of crystalline basement rocks in a warm and semi-arid climate. Hendriks et al. (1990) stated
that the clay mineral associations within the sedimentary succession of southern Egypt are
attributed to a terrestrial provenance. They suggest a warm and semi-arid climate on the
continent.
In the Duwi Formation at Abu Tartur phosphate mine, the abundance of smectite and the low
content or absence of illite and kaolinite refer to a deposition under fluvio-marine
environment. The presence of pyrite rombs indicates a reducing environment. These results
are in agreement with these obtained by Sediek and Amer (2001). Dakhla and Esna Shale at
Nile Valley section, Quseir phosphate mines, show an association of smectite with some
kaolinite and chlorite, indicating the detrital origin and deposition in open marine
environments. Generally, the clay mineral associations in the studied shales at Abu Tartur,
Nile valley and Quseir with its smectite dominance suggest a terrestrial provenance that had
not attained intensive weathering, a warm and semi-arid climate and the resulted materials
were carried by fluvial action, which finally interfered and admixed with marine
environments (marginal marine, low energy and reducing conditions of Duwi Formation and
open marine facies of Dakhla and Esna Shale).

29
4.2.2 Kaolinite
Kaolinite is the dominant clay mineral of the studied shales of Safa Formation at Al Maghara
coal mine and Abu Zinema. The average content of kaolinite in the shales of the 5 locations in
Safa Formation at Al Maghara coal mine, in the Ataqa Formation at Abu Zinema, in the Duwi
and Dakhla formations at Quseir phosphate mines and in the Duwi, Dahkla and Esna
formations at Nile Valley varies between 0 and 100 % (Fig. 7); see also (Table 1).
Fig. 7: Kaolinite average at the studied locations.
The origin of kaolinite in the studied shales has been interpreted for a long time as to be a
product of chemical weathering of feldspars. Kaolinite formation is favoured under tropical to
suptropical humid climatic conditions (Chamley 1989, Hallam et al. 1991). In addition to a
detrital origin, kaolinite may also develop by diagenetic processes due to the circulation of
acid solutions (Ghandour et al.2003).
The dominance of kaolinite in the studied shales of Safa Formation at Al Maghara coal mine
of Jurassic age immediately beneath the coal bed and the dominance of kaolinite also in the
bituminous black shale at Ataqa Formation at Abu Zinema area of Carboniferous age are in
0
10
20
30
40
50
60
70
80
90
100
Nile Valley n=27
Quseir n=11
Abu Tartur n=4
Al Maghara n=3
Abu Zineman=3
Studied locations
kaol
inite
%

30
agreement with the results obtained by El-Anbaawy and Youssef (1989), Abd El Hameed
1997) and Ghandour et al. (2003). The kaolinite in Safa Formation at Al Maghara coal mine is
interpreted to have been deposited in lakes or lagoons adjacent to the coastline (Said 1990).
Kaolinite formed as a result of extensive chemical weathering and leaching of rocks which
occur in the exposed granite-metamorphic basement area (granite intrusions ranging in
composition from quartzdiorite to alkali-feldspar granite) of South Sinai. Mostafa and Younes
(2001) stated that shales of Safa Formation at Al Maghara coal mine are generally immature
for oil generation. Generally, mudstones which are immature for oil generation contain
discrete minerals predominantly of detrital origin reflecting largely the character of parent
rocks (Lindgreen and Surlyk 2000). During diagenesis, the morphology of kaolinite changes
from vermicular or aggregates of books to individual blockier crystals (Ehrenberg et al.
1993). However, there is no SEM observation evidence for the role of diagenesis in the
formation of kaolinite in Safa Formation Ataqa Formation of Abu Zinema, i.e. the kaolinite is
of primary or detrital origin.
The origin of kaolinite in the Upper Cretaceous-Lower Tertiary sediments of southern Egypt
also was attributed by Gindy (1983) to the extensive chemical weathering and leaching of
rocks which occur especially in the exposed granite-metamorphic basement areas in the south
of Egypt and in northern Sudan. In the opinion of Hendriks et al. (1990) kaolinite in the
marine deposits of Upper Cretaceous-Lower Tertiary age are products of terrestrial
weathering and represent continental products of a warm and at least seasonally humid
climate, being eroded and transported toward the sea by rivers.
The amount of kaolinite in the shales of Upper Cretaceous-Lower Tertiary age Dakhla and
Esna Shale in the Nile Valley section and also in Duwi and Dakhla Shale at Quseir phosphate
mine is in agreement with the results obtained by Hendriks et al. (1990), Ismael (1996) and
Ahmed (1997). This kaolinite represents a continental weathering product at a warm and at
least seasonally humid climate, being eroded and transported towards the sea by rivers.
4.2.3 Chlorite
Chlorite is the second most abundant clay mineral in the samples of Dakhla and Esna Shale at
the Nile valley section. The average content of chlorite is 14 %. Chlorite varies between 0 and
14 % (Fig. 8); (see also Table 1). Chlorite has been interpreted to originate from the physical
weathering of sedimentary, metamorphic and basic source rocks under cold climates
(Ehrmann et al. 1992; Jeong and Yoon 2001).

31
Fig. 8: Chlorite average at the studied locations.
Chlorite reacts very sensitively in continental chemical alteration processes and is easily
transformed into smectite (Millot 1970). Walker (1993) concluded that most chlorites form
diagentically with burial especially in Mg-rich water in shales and slates, or can form directly
at temperatures well below 200°C.
The origin of chlorite in South Egypt was attributed by Hendriks et al. (1990) to be
exclusively of marine origin.The small amounts of chlorite in Dakhla and Esna Shale at Nile
Valley, which are rich in Ca and Mg and characterized by the dominance of smectite, may
indicate the neoformation of chlorite or may be formed by physical weathering. The main
sources of chlorite in the studied shales lie in the Precambrian basement complex in the
South-Eastern Desert of Egypt and the northern part of Sudan.
0
10
20
30
40
50
60
70
80
90
100
Nile Valley n=27
Quseir n=11
Abu Tartur n=4
Al Maghara n=3
Abu Zinema n=3
Studied locations
Chl
orite
%

32
4.2.4 Illite Illite was found to be a trace constituent only in the studied samples of Ataqa Formation
which is of Carboniferous age (at Abu Zinema area, south-west Sinai). Illite average content
is varies between 0 and 13 % (Fig. 9); (see also Table 1).
Fig. 9: Illite average at the studied locations.
Illite typically forms under conditions completely different from those under which kaolinite
and smectite are formed. Illite forms in soils with little chemical weathering, in cold and/or
dry climates and in areas of high relief where physical erosion is predominant (Ghandour et
al. 2003).
In the present study the presence of illite in the Ataqa Formation of Carboniferous age (South
Sinai) suggests the presence of mica in the source area. Mica have originated from felsic
rocks from south of Sinai.
0
10
20
30
40
50
60
70
80
90
100
Nile Valleyn=27
Quseir n=11
Abu Tartur n=4
Al Maghara n=3
Abu Zineman=3
studied locations
Illite %

33
4.3 Whole rock samples
The peak height of the identified minerals in bulk samples are measured from x-ray
diffractograms. The identified non-clay minerals are as follows:
4.3.1 Quartz
Quartz was found as an important non-clay mineral in all samples. Quartz varies from zero in
samples N59, N35 and Q6 to 86% in sample AZ1 in Appendix (Table 3).
4.3.2 Carbonates
The carbonate minerals detected by XRD are calcite and dolomite. Calcite was found in most
Nile Valley samples. It ranges from 0.0 % in black shale of Abu Tartur phosphate mine, Al-
Maghara coal mine and Abu Zinema samples to about 88 % in the Tarawan Chalk in Nile
Valley, sample N49. On the other hand dolomite was detected in a number of samples. It
reaches up to 81% sample N59. The presence of calcite and dolomite in the studied samples
from Duwi Formation, Dakhla and Esna Shale at both Quseir phosphate mines and Esna-Idfu
at Nile Valley in addition to the presence of foraminifers’ fossils may indicate the deposition
of these formations in a marine environment.
4.3.3 Sulphates
Anhydrite was found in most samples of the Nile valley section. It is absent in the samples of
Quseir phosphate mines, Abu Tartur phosphate mine, Al Maghara coal mine and Abu Zinema
area. The anhydrite content reaches up to 94% on sample N52. It was identified in the XRD
diffractograms by its characteristic lines at 3.50 Å and 2.85 Å.
Gypsum was identified in a number of samples by its characteristic lines at 7.56 Å, 3.06 Å
and 4.27 Å. It reaches a maximum value of 47% in sample Q6.
The evaporites form from saline-rich fluids–brines. Brines may be generated by concentration
of sea water, by evaporation or freezing, or as residual connate fluids in the subsurface (Selley
1988). Secondary brines can form where meteoric groundwater dissolves previously formed
evaporites.

34
Anhydrite and gypsum in the studied shales were probably precipitated primarily as metal
sulphides under reducing conditions when the shales were deposited. After the compaction of
shales and oxidation of sulphides to sulphates as a result, at least in part, of the biological
activity, the produced sulfates react with the calcic cement produced by weathering of
carbonate to form gypsum. These dissolved sulfates will be expelled by solution due to the
compaction of clays and concentrate along bedding planes as gypsiferous bands or streaks
which can be easily seen in the field.
4.3.4 Pyrite
Pyrite was only detected in the black shales of the Duwi Formation in Abu Tartur phosphate
mine. It reaches up to 6% in sample Tw.4. It was identified in the diffractograms by its
characteristic lines at 1.63 Å, 2.71 Å and 2.42 Å.
The presence of pyrite spheres and framboids as seen by the SEM (6.3) in Duwi Formation
indicate the prevalence of a reducing environment during the deposition. The presence of
pyrite spheres may be an indicator of shallow water, such as found on submarine swells or in
areas of nutrient upwelling in shelf settings (Schieber and Baird 2001). Pyrite forms in
sediments as a consequence of the bacterial reduction of sea water sulphate (Berner 1982).
Thus, the highly pyritic shales must have formed under euxinic conditions where H2S exists
above or at least at the sediment-water interface. The presence of H2S in turn will react with
Fe2+ which was probably delivered into the basin as colloidal material adsorbed on clay
minerals to form iron sulphide. By increasing activity of the hydrogen sulphide in presence of
iron and organic matter, a hydrophobic sulphide gel might have been formed (El-Dahhar
1987).
4.3.5 Carbonate fluorapatite
The phosphate minerals encountered in Quseir Safaga area, Abu Tartur mine and Nile valley
section are carbonate fluorapatite, which are traditionally called francolite. This mineral is
always the sole constituent of phosphorites in unweathered or only slightly weathered
sedimentary deposits, whatever their age or location (Prevot et al. 1989). The peak area under
the 2.79 Å is taken as the relative abundance of francolite. The amount of francolite ranges
from very high (about 78 % sample N.20) to low in others (about 14 % sample Q.4).

35
The Upper Cretaceous–Lower Tertiary boundary in Egypt, like in many other countries, is a
good example of the sedimentary association black shale – phosphate – chert – dolostone. The
contacts between these facies are either gradual or abrupt. This sedimentary succession is
believed to be deposited during the Late Cretaceous transgression of North Africa (Issawi
1972; Ward and McDonald 1979; Richerdson 1982).
The presence of francolite, calcite and dolomite in the shales at Nile Valley, Quseir phosphate
mines and Abu Tartur phosphate mine indicate their deposition in a marine environment.
The precipitation of phosphorites relates to the upwelling of nutrient-rich water (Selley 1988).
Germann et al. (1987) concluded that the origin of the Egyptian phosphorites can be attributed
to four distinct genetic phases, namely: primary enrichment, secondary concentration,
lithification and weathering. The primary enrichment phase under suboxic to anoxic oxygen
facies, during transgression produces phosphatic black shales. The secondary concentration
phase under oxic facies, but during regression produces phosphatic sands and black shales.
The lithification phase in an oxic/anoxic facies controlled by permeability, chemistry of the
host rocks and pore fluids, is producing calcareous, siliceous, clayey, phosphatic
phosphorites, and organic-rich clay-and siltstone. The weathering phase controlled by oxic,
warm-humid climate and produce limonitic, gypsiferous phosphorites with Fe-phosphates and
organic-poor clay-and siltstone.
The apatite formed under euxinic conditions at very low sedimentation rates that enabled
anaerobic microorganisms, present in pore water, to attack the organic matter and thus to
release PO43-. This acidic medium, in turn, will dissolve the enclosing sediments and as a
result, the soluble cations (e.g. Ca2+, Mg2+...etc) will be concentrated within the pore waters.
The presence of PO43-, in turn, will react with Ca2+ and Mg2+ to form primarily the less stable
mineral Staruvite (PO4(Mg)NH4).This transitory mineral is unstable under such conditions
and, thus, the produced solutions are normally rich in Mg. The Mg ions will participate in the
formation of more stable phases such as dolomite or high magnesian clays. The conditions
will thus become favourable for the formation of apatite in the low magnesium pore waters
(Prevot et al.1989).

36
5 Geochemistry The geochemistry is concerned primarily with quantitative analysis, which measures the
concentration of elements, compounds, isotopes or chemical species (e.g. Fe2+ as distinct from
Fe3+). In dealing with rocks, sediments and minerals, it is useful to distinguish between major
elements (those present at concentrations exceeding 1 % by mass, making up the main
minerals of the rock), minor elements (concentrations between 0.1 % and 1.0 %) and trace
elements (concentrations less than 0.1 %). In drawing these distinctions, one should recognise
that the same element may be a major element in one type of sample, e.g. sulphur in an ore
concentrate, but a trace element in another, e.g. sulphur in fresh basalt (Gill 1997).
The occurrence of characteristic fossils and gross lithologic aspects of a sediment have been
and still are the principal methods of environmental interpretation. However, the geochemical
distribution of certain major, minor and trace elements may provide direct information on the
depositional environment of the host sediments. It is emphasized, however, that it may be
misleading to attempt to use the absolute abundance values of a single element as an indicator
of the environment (Degens et al. 1957). Indications of the depositional environment can be
revealed by elements adsorbed on organic or inorganic materials from the surrounding waters.
The indicators can be incorporated into primary minerals or into organic substances forming
in these waters, or they can be incorporated into authigenic minerals growing within the
sediments during or shortly after their deposition (Cody 1971).
According to Degens et al. (1957) a good environmental indicator for marine or non-marine
sediments should be: 1) markedly affected by salinity changes; 2) relatively widespread; 3)
abundant enough to be detected and measured with a reasonable degree of precision;
4) formed or concentrated in the rock in which it is formed; and 5) relatively unaffected by
post-depositional changes. There is an abundance of literature with respect to trace elements,
whole rock composition, isotope ratios, exchangable cations and other methods used in
determining the environment of deposition. So far no technique has proved to be an “ideal“
indicator of paleosalinity (Walters et al. 1987).
The studied samples consists mainly of carbonaceous shale and associated phosphate,
limestone and marl sediments. The geochemical investigations were performed to investigate
mainly shale samples. Other associated sediments are represented in small numbers.

37
5.1 Major and trace elements
Major and trace elements on whole rock of 48 carbonaceous shale samples and seven samples
of the associated phosphate from the studied five locations were analysed by XRF. The results
of the XRF analysis of the samples are presented in Appendix (Table 4 & 5). The abundance
of major elements for all analysed samples is presented graphically in figure10.
The major constituents are SiO2, Al2O3, Fe2O3, CaO, MgO, TiO2, P2O5, Na2O, K2O, and SO3.
AZ = Abu Zinema area (Carboniferous).
Mg = Al Maghara coal mine (Jurassic).
AT = Abu Tartur phosphate mine (Cretaceous).
Q = Quseir phosphate mines (Cretaceous).
N = Nile Valley section (Cretaceous –Eocene).
Fig. 10: Major elements variation of the studied samples including 7 phosphate samples.
The major and trace elements composition of the carbonaceous shales in this study is
compared to published average shales in Table 2. In general, the bulk compositions of the
carbonaceous shales in the present study compares quite closely with the published average
shale compositions.
0
10
20
30
40
50
60
70
80
90
100
N 79 N 72 N 60 N 52 N 47 N 39 N 33 N 27 N 21 N 10 N 1 Q,7Q,18 Q,31 AT4
AT8Mg,1 AZ,1
AZ,8
Sam ple No. = 55
Maj
or e
lem
ents
[%]
S iO 2 A l2O 3 CaO M gO Fe2O 3 TiO 2 P2O 5 Na2O K2O SO 3

38
Table 2: Comparison of chemical composition of the studied shales with published average shales (1 to 4) and regional average composition (5 to 8). present study
n =48 1 2 3 4 5 6 7 8
SiO2 % 45.80 64.82 58.10 58.50 n.a. 8.50 6.92 35.44 52.50Al2O3 % 16.80 17.05 15.40 15.00 13.22 2.90 1.98 9.82 15.41TiO2 % 1.04 0.80 n.a. 0.77 0.33 0.10 0.15 0.43 0.71 Fe2O % 4.80 5.70 4.02 4.72 2.86 1.20 1.12 3.97 7.04 MgO % 1.40. 2.83 2.44 2.50 1.77 0.60 0.99 3.56 3.99 CaO % 5.12 3.51 3.11 3.10 2.10 32.30 40.70 18.30 4.36 Na2O % 0.75 1.13 1.30 1.30 0.94 n.a. 0.04 0.66 1.48 K2O % 0.84 3.97 3.24 3.10 2.41 n.a. 0.04 0.70 0.15 P2O5 % 0.62 0.15 n.a. 0.16 n.a. 1.80 1.89 3.34 1.48 Sr ppm 252 142 n.a. 300 200 940 1117 466 333 Ba ppm 99 636 n.a. 580 300 99 n.a. 143 116 V ppm 155 130 n.a. 130 150 78 78 639 205 Ni ppm 47 58 n.a. 68 50 136 594 124 57 Cr ppm 148 125 n.a. 90 100 256 305 277 136 Zn ppm 84 n.a. n.a. 95 300 271 322 578 169 Cu ppm 25 n.a. n.a. 45 70 83 60 56 42 Zr ppm 167 200 n.a. 160 n.a. n.a. n.a. 47 126 1= NASC (Gromet et al. 1984); 2= Average shale (Pettijohn 1975); 3= Average shales
(Turekian and Wedepohl 1961); 4= Average black shales (Vine and Tourtelot 1970); 5=
Average Israelian black shales (Ahmed 1997); 6= Average Jordanian black (oil) shales (Abed
and Amireh 1983); 7= Average Quseir and Safaga (Eastern Desert, Egypt) black shales
(Ismael 1996); 8= Average Abu Tartur (Western Desert, Egypt) black shales (Ahmed 1997).
n.a. = not available
The average of major and trace elements for the studied formations is shown in Table 3. The
major constituents are SiO2, Al2O3, Fe2O3, CaO, MgO, TiO2, P2O5, Na2O, K2O and SO3. The
trace elements measured are Sr, Ba, V, Ni, Cr, Zn, Cu, Zr, Rb, Cl and F.
The Dakhla Shale in Quseir mines shows the highest values for the trace elementsV, Ni, Cr,
Zn and Cu (1357, 71, 344, 757 and 116 ppm respectively) due to oxidation of the organic
matter in the in the Quseir mines (see chapter 5.2).

39
Table 3: The major and trace elements average of formations at the studied locations
Location Nile Valley Section Quseir Mines
Abu Tartur Mine
Al Maghara Mine
Abu Zinema
area Esna
Shale Tarawan
Chalk Dakhla Shale
Duwi Fm.
Varigated Shale
Dakhla Shale
Duwi Fm.
Safa Fm.
Ataqa Fm.
SiO2 % 41.52 12.53 42.29 44.70 52.53 36.20 51.10 48.86 51.58 Al2O3 % 14.51 5.77 18.20 10.20 17.00 10.00 15.83 26.21 17.03 CaO % 8.35 35.61 4.86 12.10 0.18 14.80 1.62 0.35 0.42 MgO % 2.61 0.63 1.54 1.10 1.32 1.70 2.70 0.78 0.30 Fe2O3 % 5.18 3.43 8.32 4.35 5.02 4.77 5.61 6.42 0.79 TiO2 % 0.66 0.30 0.82 0.70 1.29 0.50 0.80 2.12 0.95 P2O5 % 0.18 0.17 0.13 0.42 0.24 2.52 0.62 0.09 0.05 Na2O % 1.85 0.71 1.33 1.56 1.52 1.55 0.10 0.11 0.50 K2O % 0.82 0.26 0.61 0.80 2.03 0.70 1.10 0.93 0.69 SO3 % 0.26 3.15 0.34 0.50 0.26 0.50 2.10 0.47 1.21 Sr ppm 353 846 211 344 781 479 257 109 47 Ba ppm 145 53 81 201 163 90 84 87 108 V ppm 168 80 187 101 136 1357 175 158 128 Ni ppm 57 34 49 27 24 71 33 71 15 Cr ppm 171 149 183 100 105 344 115 196 75 Zn ppm 142 41 102 71 48 757 51 91 76 Cu ppm 22 12 21 26 31 116 23 25 25 Zr ppm 97 42 96 193 275 105 121 561 243 Rb ppm 44 12 25 26 61 30 27 40 27 Cl ppm 3006 720 2458 3123 2234 7217 63 109 2886 F ppm 1076 800 426 881 858 3292 472 36 800
On the following a discription and detailed discussion of the important and affective major
and trace elements in the geochemistry of the studied carbonaceous shale and associated
phosphate samples.

40
5.1.1 Silica (SiO2)
Silica is the dominant constituent of all studied shale samples. The average content of silica in
the samples is 45.80%. With exception of carbonate and phosphate samples, the silica
averages are 51.58%, 48.86 %, 51.10 %, 36.20 % and 45.30 % in Abu Zinema, Al Maghara,
Abu Tartur, Quseir and Nile Valley samples respectively.
Considerably higher average SiO2 contents exist in NASC and average shales of Pettijohn
(1975) is 64.82% and 58.50% respectively. The black shales of the neighbouring countries
contain much less SiO2 compared to the studied shales. In the Jordanian black shales the
average SiO2 is 6.92% (Abed and Amireh 1983) and 8.5% in the Israelian oil shales. Both
Jordanian and Israelian oil shales are also markedly depleted in Al2O3 and TiO2. This may
indicate a black argillaceous limestone rather than a proper black shale (Ahmed 1997). The
lower content of SiO2 in the studied shales from Quseir confirms the previous study by Ismael
(1996). This may be attributed to their enrichment in carbonate minerals. Silica tends to
decrease with the increase of carbonates. Therefore, a positive relation between silica and
argillaceous sediments on the one hand, a negative relation on the other hand can be expected
denoting the different environmental conditions of siliceous and calcareous sediments (Abdou
1989).
According to the Pearsons correlation coefficient (r) Appendix (Table 6a), the SiO2 is
positively correlated with Al2O3, TiO2 and K2O (r=0.59, 0.57 and 0.52 respectively).
Therefore SiO2 is considered to be dominantly terrigenous in origin which is shown in a
scatterplot of SiO2 with Al2O3, TiO2, Zr and K2O (Fig. 11). A part of the silica may be
attributed to a biogenic origin by silica secreting organisms, such as radiolaria or diatoms,
thus the SiO2 contents in Nile Valley and Quseir samples should be based on a biogenic origin.
Silica may also be precipitated as cement filling cavities. The SiO2 may occur as quartz
disseminated with kaolinite, or deposited with the tiny flakes of the clay minerals (Bain and
Smith 1987; Moore and Reynolds 1997).
Pettijohn (1975) stated that silica is present in shales as a part of the clay minerals, as
undecomposed detrital silicates and as free silica, both detrital quartz and biochemically
precipitated silica such as opal of radiolarians, diatoms, and spicules. The SiO2 content in the
studied shales correlates positively with Al2O3. This indicates that SiO2 is mainly present in
the studied shales as a part of the clay minerals and detrital silicates.

41
The SiO2/Al2O3 ratio of the studied samples is listed in Appendix (Table 4). Felix (1977)
reported that the SiO2/Al2O3 ratio for pure montmorillonite ranges from 2.80 to 3.31 while for
pure kaolinite it is about 1.18. With exception of the Al Maghara shale samples which
recorded SiO2/Al2O3 ratios somewhat similar to that of kaolinite (1.82, 1.88 and 1.89 for
sample Mg1, Mg3, and Mg5 respectively), this is confirmed by the XRD results. The
SiO2/Al2O3 ratio for samples from other locations varies between (1.93 and 5.33) higher than
that for pure kaolinite and also higher than that for pure montmorillonite. This may be
indicate that the clay mineralogy of these locations (Abu Tartur, Nile Valley and Quseir)
consists mainly of smectite and/or a mixture of smectite and kaolinite or chlorite. This has
also been confirmed by XRD. The abundance of Si, Al, Ti and K in shales may be perturbed
from parent material by weathering, transport and depositional processes (Nesbitt et al. 1980).
5.1.2 Alumina (Al2O3) High alumina contents are recorded in the argillaceous and clayey sediments. The average
content of alumina in the studied shales of the different localities (16.80%) is similar to that of
average shales of Pettijohn (1975) and NASC (15.40% and 17.05 % respectively), slightly
higher than that of the average black shales (13.22%) of Vine and Tourtelot (1970) but much
higher than the argillaceous black sediments of Jordanian (1.98%) and Israelian shales (2.90
%) (Ahmed 1997). With the exception of carbonate and phosphate samples, its averages are
17.03%, 26.21%, 15.83%, 10.00% and 15.00 % in Abu Zinema, Al Maghara, Abu Tartur, and
Quseir and Nile Valley samples respectively.
The Al2O3 concentration is thought to be a good measure of detrital influx. The positive
correlation between Al2O3 and both SiO2, TiO2, and Zr (r=0.59, 0.79 and 0.54 respectively)
and the positive trend in scatterplot of Al2O3 with both SiO2 and TiO2 (Fig.11) can be
explained by a terrigenous origin. This may be due to the presence of a considerable amount
of detrital clays. Generally the studied shales show coherence between silica and alumina
Appendix (Table 4) indicating that both molecules are carried mainly in the clay minerals.
5.1.3 Calcium (CaO) The average content of CaO in the studied mere shale samples is 5.12 %. With the exception
of carbonate and phosphate samples, its averages are 0.42%, 0.35%, 1.61%, 14.80 % and 6.38
% in Abu Zinema, Al Maghara, Abu Tartur, Quseir and Nile Valley respectively.

42
Fig. 11: The relationships between SiO2 with Al2O3, TiO2, Zr & K2O and Al2O3 with TiO2 & K2O for the studied samples
0
0,5
1
1,5
2
2,5
0 10 20 30 40 50 60 70
SiO2 [%]
TiO
2 [%
]
0
5
10
15
20
25
30
0 10 20 30 40 50 60 70
SiO2 [%]
Al 2O
3 [%
]
0
100
200
300
400
500
600
700
0 10 20 30 40 50 60 70
SiO2 [%]
Zr (p
pm)
0
0.5
1
1.5
2
2.5
3
3.5
0 10 20 30 40 50 60 70
SiO2 [%]
K2O
[%]
0
0,5
1
1,5
2
2,5
0 5 10 15 20 25 30
Al2O3 [%]
TiO
2 [%
]
0
0.5
1
1.5
2
2.5
3
3.5
0 5 10 15 20 25 30
Al2O3 [%]
K 2O
[%]

43
The mean value of CaO in the studied shales at Abu Zinema, Al Maghara and Abu Tartur is
relatively lower than that of average black shales 2.1 % of Vine and Tourtelot (1970) and
average shales 3.15 % of Pettijohn (1975), while the mean value of Nile Valley samples being
closely similar to NASC (3.56 %). The average content of CaO in Quseir shale samples in the
present study is 14.80 %, slightly similar to a value of 18.3 % by (Ismael 1996) in Quseir.
Jordanian and Israelian oil shales are more calcareous (40.7 % and 32.3 % CaO respectively,
Ahmed 1997). CaO shows a negative correlation with SiO2, Al2O3, TiO2 and K2O (r = -0.89,
-0.77, -0.63 and -0.50 respectively) (Fig.12). This reflects a different source of CaO and these
elements. CaO is considered to be dominantly of biochemical origin, while SiO2, Al2O3, TiO2
and K2O are of terrigenous origin. CaO may be used as marine indicator because, marine
shales often have considerably more calcium than non-marine ones (Refaat 1993). The
obtained data show that the shales at Abu Zinema, Al Maghara and the lower part of Nile
Valley section, which are considered as non-marine shales, have an average CaO lower than
those of the shales which are considered as the marine shales of Abu Tartur, Quseir and Nile
Valley Appendix (Table 4).
5.1.4 Magnesium (MgO) The average content of MgO in the studied shales samples is 1.40 %. Its averages are 0.30 %,
0.78 %, 2.70 %, 1.70 % and 1.70 % in Abu Zinema, Al Maghara, Abu Tartur, Quseir and Nile
Valley respectively. It is closely similar to those of average black shales Vine and Tourtelot
(1970), average shales of Pettijohn (1975), NASC shales, shales of Jordanian and Israelian oil
shales (1.17%, 2.5%, 2.85 %, 0.99 % and 0.6 % respectively).
MgO may be present as:
1- Octahedral and interlayer cation in the clay lattices. Mg2+ and Ca2+ substitute Al3+ in the
octahedral sites of smectite or illite for not more than 2.7 % (Weaver and Pollard 1973). Na+
and Mg2+ ions are the major exchange cations in marine smectite.
2- Mg2+ may substitute Ca2+ in early formed calcite in the form of dolomite and ferroan
dolomite. MgO shows a weak negative correlation with CaO (r = -0.15; see Fig.12) and
Appendix (Table 6a). This reflects a different source of both of the elements. The study of
thin sections indicates that Ca is of biogenic source and Mg of diagenetic origin by
dolomitization.

44
Fig. 12: The relationship between CaO with Na2O, P2O5, MgO, K2O, SiO2 & Al2O3
for the studied samples.
0
1
2
3
4
5
6
7
8
0 10 20 30 40 50
CaO [%]
Na 2
O [%
]
0
5
10
15
20
25
0 5 10 15 20 25 30 35 40 45 50
CaO [%]
P 2O
5 [%
]
0
1
2
3
4
5
6
7
8
0 10 20 30 40 50
CaO [%]
MgO
[%]
0
0,5
1
1,5
2
2,5
3
3,5
0 5 10 15 20 25 30 35 40 45 50
CaO [ %]
K2O
[%
]
0
5
10
15
20
25
30
0 5 10 15 20 25 30 35 40 45 50
CaO [%]
Al2O
3 [%
]
0
10
20
30
40
50
60
70
0 5 10 15 20 25 30 35 40 45 50
CaO [%]
SiO
2 [%
]

45
5.1.5 Iron Oxide (Fe2O3)
The average content of Fe2O3 in the studied shales samples is 4.80 %. Its averages are 0.79 %,
6.42 %, 5.61 %, 4.77 % and 5.72 % in Abu Zinema, Al Maghara, Abu Tartur, Quseir and Nile
valley respectively. With the exception of Abu Zenima shales, the recorded averages are
higher than those of average black shales of Vine and Tourtelot (1970), average shales of
Pettijohn (1975), Jordanian and Israelian oil shales (2.86 %, 4.72 %, 1.12 % and 1.20 %
respectively), and close to that of NASC (5.70 %).
Iron is present either in the structure of clay minerals and/or as an independent Fe-mineral
such as goethite. Sharma (1979) stated that in the marine environment, the hydroxides of iron
are carried as particles and colloids in suspension and therefore, tend to aggregate in the fine
fraction of sediments. The enrichment of Fe2O3 in the studied shales may be attributed to their
formation under more reducing conditions with a high input of non-reactive iron to the basin
(Ahmed 1997). There is a weak positive correlation between Fe2O3 and the SiO2, Al2O3,
MgO, TiO2, Na2O Appendix (Table 6a) and positive correlation between Fe2O3 and Ni. This
may be due to the association of Fe3+ with clay minerals.
5.1.6 Titanium (TiO2) The average titanium oxide content of the studied shale samples is 1.04 %, slightly higher
than that of average crustal shales of Turekian and Wedepohl (1961) and NASC ( 0.77 % and
0.78 %) and higher than the average black shales of Vine and Tourtelot (1970) (0.33 %). The
TiO2 content of the studied samples is much higher than those of Jordanian and Israelian oil
shales (0.15 % and 0.1 % respectively).
The strong positive correlation of TiO2 with Al2O3 and Zr (r=0.79 and 0.87) Appendix (Table
6a) and (Fig.13). This may suggest that Ti is essentially associated with clays and reflecting
its terrigenous origin. TiO2 is usually disseminated within the clays as discrete minerals, e.g.
rutile and anatase (Degens 1965). TiO2 shows a strong negative correlation with the marine
indicators or constituents e.g CaO and P2O5 (-0.63, -0.20) and weak negative correlation with
MgO and SO3 Appendix (Table 6a). This reflects the different sources of TiO2 and these
elements, and is indicating the detrital origin of TiO2.

46
Fig. 13: The relationship between TiO2 with Al2O3, and Zr for the studied samples.
5.1.7 Phosphorus (P2O5)
The studied shales show a wide range of phosphorus content. High amounts of phosphorus
are due to the presence of apatite or collophane. The mean value of P2O5 in the studied shales
is 0.62 %. This is higher than those of the average shales of Turekian and Wedepohl (1961)
and NASC (0.16 % and 0.11%) and lower than those of the Jordanian and Israelian oil shale
(1.89 % and 1.80 %). Shales samples collected from the phosphate mines have higher P2O5
content than those collected from the other locations.
0
5
10
15
20
25
30
0 0 ,5 1 1 ,5 2 2 ,5
T iO 2 [% ]
Al 2O
3[%]
0
100
200
300
400
500
600
700
0 0.5 1 1.5 2 2.5
TiO2 [%]
Zr [p
pm]

47
5.1.8 Sodium (Na2O)
The mean value of Na2O (0.75%) is slightly similar to that of average black shales 0.94 %of
Vine and Tourtelot (1970) and lower than those of average shales of Turekian and Wedepohl
(1961) and NASC (1.30 % and 1.15 % respectively), while it is higher than those of Jordanian
and Israelian oil shales (0.043 %). Na2O shows a negative correlation with SiO2, Al2O3, and
CaO. This may be due to the presence of Na2O in the form of water soluble salts (mainly
halite). Halite was detected by XRD analysis in some of the studied shale samples.
5.1.9 Potassium (K2O)
The average content of potassium in the studied shales (0.84 %) is lower than those of the
average black shales of Vine and Tourtelot (1970), the average shales of Turekian and
Wedepohl (1961) and the NASC shales (2.41 %, 3.10 % and 3.99 % respectively). This may
be due to the enrichment of clays in those shales mixed-layer, different to the studied shales,
where smectite clays dominate. The mean value of K2O is higher than those of Jordanian and
Israelian oil shales (0.042 % and 0.04 %). K2O shows a positive correlation with SiO2, Al2O3,
TiO2, Zr, Cu and Rb (r = 0.52, 0.28, 0.48, 0.35, 0.57 and 0.82 respectively). This indicates the
association of K2O with aluminosilicate phases.
The K2O content is in agreement with the results of the clay mineral investigations, because
the low content reflects the absence of or the low content of illite minerals (see chapter 4).
The weak negative correlation of K2O with SO3 (r = -0.11) in samples with less illite content
can be interpreted that potassium is preferentially adsorbed by clays (Millot 1970).
5.10 Sulphate (SO3)
The average content of SO3 in the studied shales (0.62 %) is higher than the content in
average shales (0.60 %) of Turekian and Wedepohl (1961). The high value of SO3 in the black
shale of Abu Tartur Phosphate mine may be due to the fact that SO3 primarily occurs in pyrite
and also may occur in gypsum. This corresponds to the results of the XRD and SEM analyses.
XRD shows pyrite in the Duwi Formation in Abu Tartur and gypsum in Dakhla and Esna
Shale. SEM study shows pyrite framboids in the Duwi Formation in Abu Tartur.

48
5.2 Distribution of significant trace elements
5.2.1 Vanadium
In the studied shales, vanadium attains an average concentration of 155 ppm and varies from
20 ppm to 3151 ppm. The average vanadium content in the studied samples is higher than
those of average shale (130 ppm) of Turekian and Wedepohl (1961) and also higher than
vanadium in average black shale (150 ppm) of Vine and Tourtelot (1970). It has been
suggested that some V may be complexed within the kerogene molecule. The high
concentrations of V in the inorganic fraction may be the result of oxidation and weathering of
the organic matter and the subsequent mobilization and concentration in host rocks (Riley and
Saxby 1983).
Vanadium shows a positive correlation with some of the other trace elements, such as Ni, and
Cr (r=0.46 and 0.52) Appendix (Table 6a) and (Fig.14). This association is considered to be
typically of organic matter (Krauskopf 1956; Gulbrandsen 1966; Cook 1972). Vanadium
shows positive correlation with Al2O3, TiO2, the clay fraction and also a positive correlation
with TOC (Fig.14). This indicates that vanadium is considered to be typically of organic
matter association rather hosted by detrital silicate minerals (Stow and Atkin1987).
In the calcitic samples, the vanadium content is lower than in the dolomitic ones. This is
mainly attributed to differences in the clay mineral content and not to the type of carbonates.
The highest value of vanadium in the present study was recorded in the calcareous shale
samples of Quseir mines at 3150 ppm. This is due to the oxidation and weathering of organic
matter in these samples and subsequent mobilization and concentration of vandium.
5.2.2 Nickel
The average Ni content in the studied samples is 47 ppm, lower than Ni in average shale 68
ppm of Turekian and Wedepohl (1961) and also slightly lower than Ni in average black shale
(50 ppm) of Vine and Tourtelot (1970). Nickel shows strong positive correlation with Cr and
Zn (r = 0.61and 0.64) Appendix (Table 6a). Nickel shows also positive correlation with TOC
and slightly positive correlation with Al2O3, TiO2 and clay fraction (Fig.14). This indicates an
association of these elements mainly with the organic matter and clay.

49
Fig. 14: The relationships between V with Ni, Cr, Al2O3, clay & TOC and Ni with clay, TOC & Al2O3 for the studied samples.
0
20
40
60
80
100
120
140
160
180
200
0 500 1000 1500 2000 2500 3000 3500
V [ppm]
Ni [
ppm
]
0
100
200
300
400
500
600
700
0 500 1000 1500 2000 2500 3000 3500
V [ppm]
Cr [
ppm
]
0
5
10
15
20
25
30
0 500 1000 1500 2000 2500 3000 3500
V [ppm]
Al2O
3 [%
]
0
10
20
30
40
50
60
70
80
90
100
0 500 1000 1500 2000 2500 3000 3500
V [ppm]
clay
[% ]
0
0.5
1
1.5
2
2.5
3
3.5
4
4.5
5
0 20 40 60 80 100 120 140 160 180
V [ppm]
TOC
[%]
0102030405060708090
100
0 50 100 150 200
Ni [ppm]
Cla
y [%
]
0
0.5
1
1.5
2
2.5
3
3.5
4
4.5
5
0 10 20 30 40 50 60 70 80 90
Ni [ppm]
TOC
[%]
0
5
10
15
20
25
30
0 50 100 150 200
Ni [ppm]
Al 2O
3[%]

50
Nickel, when present in significant quantities, originates from ultrabasic and basic rocks
(Shapiro and Breger 1968). Weathering of such rocks and mobilization by humic acids may
contribute to the high concentration of Ni in seawater. Turekian (1978) stated that, Ni is
abundant in deep marine sediments (up to 300 ppm) but much less so in coastal sediments (39
ppm). Average contents of Ni are also less than 100 ppm in shales, 50 ppm in the black shales
of the United States, 41 ppm in marine clays, 13 ppm in oil and only a few ppm in limestones.
Phosphate rocks have an average content of 50 ppm similar to those of black shales, but a
higher content than those of most other types of sediment. Nevertheless, Ni concentration in
sea water is the order of 0.5 to 2 ppm, follows the trend of that of the nutrients P and Si and
like the concentration of Zn, generally the Ni content is higher in reduced sulphidic areas
compared to oxygenated areas. Moreover, Ni is concentrated in trace amounts in all
organisms.
Brumsack (1980) found that the elements Ni, Cu, Zn and Fe are almost always associated
with sulphides and hence concluded that normal seawater is sufficient to account for the high
metal concentration in black shales: he further considered that despite of a definite correlation
of the metal organic carbon, the organic matter is not regarded to be responsible for heavy
metal concentrations.In the present study the low Ni content indicate that it associated with
organic matter.
5.2.3 Chromium
The average chromium content of the studied samples is 148 ppm. This is higher than the Cr
content in average shale (90 ppm) of Turekian and Wedepohl (1961) and also higher than Cr
in average black shale (100 ppm) of Vine and Tourtelot (1970). Cr shows a weak positive
correlation with Al2O, which may be due to the adsorption of Cr on the surface of clays or due
to the replacement of Al2O3 by Cr in clays. However, Cr may be adsorbed on iron and
manganese oxides, clays, apatites and organic matter (Prevot 1990).
Cr, V, Zn and Cu are always strongly intercorrelated (Fig. 15). There is a positive correlation
between Cr, V and Ni (r = 0.52, and 0.61) Appendix (Table 6a). This association indicate that
these elements are incorporated in organic matter and clay minerals. Cr shows also a positive
correlation with TOC and a slightly positive correlation with Al2O3 and the clay fraction
(Fig.15). This indicates an association of these elements mainly with the organic matter and
the incorporation into the clays fraction. Cr was presumably derived from a source dominated

51
0
200
400
600
800
1000
1200
1400
1600
1800
0 100 200 300 400 500 600 700
Cr [ppm]
Zn [p
pm]
0
500
1000
1500
2000
2500
3000
3500
0 100 200 300 400 500 600 700
Cr [ppm]
V [
ppm
]
0
50
100
150
200
250
300
0 100 200 300 400 500 600 700
Cr [ppm]
Cu
[ppm
]
0
5
10
15
20
25
30
0 100 200 300 400 500 600 700
Cr [ppm]
Al 2O
3
0
10
20
30
40
50
60
70
80
90
100
0 100 200 300 400 500 600 700
Cr [ppm]
Cla
y [%
]
0
0,5
1
1,5
2
2,5
3
3,5
4
4,5
5
0 50 100 150 200 250
Cr [ppm]
TOC
[%]
Fig. 15: The relationship between Cr with Zn, Al2O3, V, clay, Cu and TOC for the
studied samples.

52
by mafic volcanic rocks (Gill 1981). High Cr and Ni concentrations and the positive
correlation between the two elements have been used as an indicator of mafic and ultramafic
provenance for the sedimentary origin. The concentration of Cr and Ni in shales further
reflects the incorporation of Cr and Ni ions into clay particles during the weathering of
ultramafic rocks containing chromite and other Cr and Ni-bearing minerals (Garver et al
1994). The enrichment in Cr and Ni in the studied shales may indicate that mafic to ultramafic
components were among the basement complex, the sediments were derived from.
5.2.4 Cobalt The studied samples show Co contents less than 10 ppm, with the exception of Al Maghara
samples which recorded high values of Co (sample No. mg1, mg3 and mg5 with 29, 25 and
36 ppm respectively) and also a few samples from the Nile Valley section. The cobalt content
in the studied samples is lower than Co in average black shale (10 ppm) of Vine and Tourtelot
(1970). This indicates that cobalt is not significantly adsorbed nor incorporated into the clay
minerals or the organic matter admixed with the samples (Ismael 1996).
5.2.5 Strontium
Strontium is abundant in the studied shale samples. It ranges between 17 ppm and 1703 ppm
with an average of 252 ppm. This average is higher than the Sr content in the average black
shale (200 ppm) of Vine and Tourtelot (1970) and lower than the Sr content in both the
average shale (300 ppm) of Turekian and Wedepohl (1961) and the average Israelian black
shales (940 ppm) of Ahmed (1997) and the average Jordanian black shale (1117 ppm) of
Abed and Amireh (1983). Sr may be concentrated by non-calcareous plankton (Knauer and
Martin 1973), and especially aragonitic materials and shells, as well as by primary apatite in
bones and teeth of vertebrates. In the present study, with the exception of black shale of
Carboniferous and Jurassic age from Abu Zinema and Al Maghara, the studied shales show
high strontium values. This related to the association of Sr with CaO and organic matter.
5.2.6 Zinc
The average zinc content in the studied samples is 84 ppm. This average is lower than Zn in
average shale (95 ppm) of Turekian and Wedepohl (1961) and lowers than Zn in average
black shale (300 ppm) of Vine and Tourtelot (1970).

53
Like chromium, zinc shows a positive correlation with the Ni element (r =0.64) which may be
explained as related to organic matter. With its ionic radius of 0.83 Å, Zn is liable to replace
bivalent cations, such as Ca, Mg and Fe. Zn is reported to induce aragonite formation (Angus
et al. 1979), but 20 to 140 ppm of Zn could also coprecipitate with calcite (Pomerol 1984). Zn
is adsorbed on clay minerals and iron manganese oxides.
5.2.7 Copper
Copper is one of the elements which is indispensable to living organisms, however it becomes
very highly toxic at high concentrations. This explains its association with organic matter in
organic sediments but always in very moderate amounts. Black shales and bituminous clays
are rich in Cu with a content of about 90 ppm (Prevot 1990). The black shale of Abu Tartur
area contains moderate contents of Cu (23 ppm). This value is intermediate between those
reported for bituminous clays and shallow marine sediments (Ahmed 1997). Ismael (1996)
indicates that copper is somewhat enriched in the <2µm fraction of Quseir shales, thus
revealing its adsorption or incorporation into the clay minerals.
In the present study the average copper content is 25 ppm. This is lower than copper in the
average shale (45 ppm) of Turekian and Wedepohl (1961) and in the average blacke shale
(100 ppm) of Vine and Tourtelot (1970). Copper shows a positive correlation with Rb(r =
0.52). This indicates that copper is associated with organic matter and clay minerals..
5.2.8 Zirconium
Zirconium in the studied shale samples shows an average of 97 ppm. This average is lower
than the zirconium content in the average shale (160 ppm) of Turekian and Wedepohl (1961)
and higher than Zr in the average black shale (70 ppm) of Vine and Tourtelot (1970). It shows
high values in Abu Zinema, Al Maghara and Abu Tartur black shale samples (243 ppm,
561ppm and 121 ppm respectively). This indicates that Zr may be incorporated into organic
matter or adsorbed by clay minerals. Zirconium shows positive correlation with Al2O3 and
TiO2 (r=0.54 and 0.87 respectively). This is the result of the close association between these
elements and clays, and therefore reflects their terrigenous origin.

54
5.3 Discussion of chemical effects
Elemental concentrations in sediments result from the competing influences of provenance,
weathering, sorting, and sediment diagenesis (Quinby-Hunt et al., 1991). When comparing the
chemical composition of the classic shale composites, the studied shales show generally
enrichment of elements that are chemically immobile and are associated with terrigenous
influx, such as Al, Ti and Zr. Al and Ti which can survive throughout intensive chemical
weathering and diagenesis (Cullers 2000). Their concentration in sediments is used as a
measure of detrital input. The major constituents of the studied shale samples do not vary
greatly from one location to another. The SiO2, Al2O3 and TiO2 tent to form together the main
constituents of the studied shales and are normally related to clays. SiO2, Al2O3 and TiO2 are
well correlated in all samples. This indicates that the major constituents SiO2, Al2O3 and TiO2
of the studied shale samples are dominantly terrigenous in origin.
In the Gulf of Maxico, shales have K2O contents that increase systematically with depth from
2 to 4 wt % in the Paleocene-Eocene Wilcox Formation and from 2 to 5 wt% in the
Oligocene–Miocene Frio Anahnace succession (Bloch et al. 1998). Potter et al. (1980) has
shown the geochemical properties of shales change with time. Abdul Almanan (2002) stated a
significantly higher content of K2O in early Paleozoic shales, than in younger shales.
In the present study K2O varies only slightly from Paleozoic shales to Eocene shales, e.g.
between 0.26 for Tarawan Chalk to 2.03 for the Variegated Shale in Nile Valley. This is due
to the enrichment of smectite and kaolinite in the studied shales and therefore strictly related
to the mineralogy of the samples. Further it is noticed that K2O decreases with increasing of
carbonate content.
The black shales at Abu Zinema area of Carboniferous age and at Al Maghara coal mine of
Jurassic age are enriched in SiO2, Al2O3, TiO2, and Zr and depleted in the marine indicators
CaO and MgO. This seems to indicate that the shales at Abu Zinema area and Al Maghara
coal mine have been deposited under reducing conditions with non–calcareous planktons
input or under continental conditions. This is confirmed by their association with coal and
detrital kaolinite.
In the contrary the shales from the Abu Tartur phosphate mine, the Quseir phosphate mines
and the Nile Valley section were deposited in a marine environment, as given evidence for by

55
foraminifera, smectite, pyrite and their association with phosphate. The Abu Tartur and the
lower part of the Nile Valley samples are more argillaceous and depleted in CaO than those of
Quseir and Dakhla and Esna Shale at the Nile Valley, which might have been deposited in a
shallow marine environment with a high productivity of calcareous organic matter.
Numerous of investigators have used several trace elements, including B, Ga, V, Li, Ni, Rb,
as paleosalinity indicators for sediments especially of shales (Goldschmidt and Peters 1932;
Potter et al. 1963; Ohrdorf 1968; Dominik 1985; Schreier 1988). These studies showed that
Ba, Rb, Mg, Fe, and Ca are higher in marine shales, whereas Zr, Ti, Al, Ga, Li and Cr are
terrestrial indicators. Schultz et al. (1980) observed that Cr, Ni, Zn, Fe and P are significantly
more abundant in marine strata of Pierre Shale (Cretaceous) of the northern Great Plains.
Walters et al. (1987) observed a pattern of trace elements in the shale of the Dakota Sandstone
similar to pattern of terrestrial indicators described above.
In the present study the shale samples at Abu Tartur phosphate mine, Quseir phosphate mines
and Nile Valley section show higher contents of the trace elements Sr, Ba, V, Ni, Cr, Zn, Rb
than shale samples at Abu Zinema and Al Maghara. This indicates that the shale samples at
Abu Tartur phosphate mine, Quseir phosphate mines and Nile Valley section were deposited
in a marine environment.
5.4 Weathering effects
The chemical index of alteration (CIA) defined as CIA = 100 x Al2O3/ (Al2O3 + CaO + Na2O
+ K2O) have been established as a general indicator of the degree of weathering in any
provenance regions (Nesbitt and Young 1982). High values (i.e, 76-100) indicate intensive
chemical weathering in the source area whereas low values (i.e., 50 or less) indicate
unweathered source areas.
The CIA values for the studied shales Appendix (Table 4) indicate that the shale samples of
Ataqa Formation of the Carboniferous in Abu Zinema and of Safa Formation in Al Maghara
have experienced strong chemical weathering (CIA >90) at the source area. Further, the
depletion of Na and Ca reflects an intense chemical weathering of the source rocks. As Al2O3,
CaO, Na2O and K2O are related with (CIA) they exhibit variations between the investigated
samples reflecting variable climatic zones or rates of tectonic uplift in source areas. This
corresponds with the results of Ghandour et al. (2003) in Safa Formation and also with the

56
observations of Nyakairu and Koeberl (2001) who recorded high CIA values (87 to 96) and
low contents of alkali elements from kaolinitic rich sediments in Central Uganda.
For the calcite-enriched samples the CIA was not applied. The calcite-free samples of the
Duwi Formation, the Dakhla Shale and the Esna Shale in Abu Tartur, the Nile Valley and
Quseir show high CIA values (>76). This indicates moderate to intensive chemical
weathering in the source area. This is also confirmed by the dominance of smectite in these
formations. This proves the assumption that the area was located near the palaeoequator and
had experienced warm, wet, and tropical to subtropical conditions characterized by low
seasonality contrasts and predominantly chemical weathering, as also described by Tantawy
et al. (2001).
Also Rb/Sr ratios of sediments are a monitor of the degree of source-rock weathering
(McLennan et al. 1993). The studied shale samples of Upper Cretaceous-Lower Tertiary in
Quseir, Abu Tartur and Nile Valley have an average Rb/Sr ratio of 0.16. This value is lower
than that of the average upper continental crust of 0.32 and the average post-Achean
Australian shale of 0.8 (McLennan et al. 1983). This suggests that the degree of source area
weathering was moderate. On the other hand the studied shales of Carboniferous and Jurassic
age in Abu Zinema and Al Maghara have average Rb/Sr ratios of 0.49, indicate that the
degree of source area weathering was more intense compared to the younger sediments of
Cretaceous and Tertiary age.
5.5 Provenance analysis for sedimentary rocks
Cr and Ni High levels of Cr and Ni and strong positive correlations between the two
elements have been used by various authors (e.g., Hiscott 1984; Wrafter and Graham 1989
and Garver et al. 1994, 1996) to infer a mafic to ultramafic provenance of the sedimentary
rocks. The concentration of Cr and Ni in shales is further reflecting the incorporation of Cr
and Ni ions to clay particles during the weathering of ultramafic rocks containing chromite
and other Cr and Ni-bearing minerals (Garver et al.1996). The level of Cr enrichment in the
studied shales (weight average 148 ppm), its strong positive correlation with Ni (r = 0.61) and
the high Cr/Ni ratios of about 3.7 indicate that mafic to ultramafic components were the main
components among the basement complex source rocks.

57
Vanadium Stow and Atkin (1987) stated that V is enriched in organic rich shales deposited
under reducing conditions and might also be hosted by detrital silicate minerals.
The V/Cr ratio has been used as a paleo-oxygenation indicator in a number of studies. Values
of V/Cr >2 are thought to represent anoxic depositional conditions, whereas values below 2
are indicative of more oxidizing conditions (Dill et al. 1988). The studied shales of Egypt
have V/Cr values below 2 Appendix (Table 5), which may indicate that all of the studied
sediments were deposited under relatively oxidizing conditions with exception of the Duwi
Formation in Abu Tartur, which was deposited in a reducing environment.
TiO2/Al2O3 Brooks (1973, Spears and Kanaris (1976) found that the Carboniferous
sediments in England have high TiO2/Al2O3 ratios reflecting a strong correlation to the ratios
in the parent basalt. Amajor (1987) utilized the TiO2 versus Al2O3 binary plot to distinguish
between granitic and basaltic source rocks. In figure 16 the TiO2 versus Al2O3 binary diagram
for the studied samples, it is demonstrated that the provenance material varies from
predominantely granitic to mixed granitic basaltic rocks.

58
Fig. 16: TiO2 /Al2O3 binary plot of the studied shale samples.
(provenance field from Amajor, 1987)
5.6 Distribution of major and trace elements in phosphate rocks
0 10 20 30 40 50
0
0,5
1,0
1,5
2,0
2,5
Bas
alt Bas
alt+G
ranit
e
Granite
+Basalt
Granite
TiO
(%
)2
AI O (%)2 3
Nile Valley
Quseir
Abu Tartur
Al Maghara
Abu Zinema

59
The studied phosphate samples show P2O5 values ranging between 6.20 % in the cherty
phosphate in Quseir mine to 20 % in Abu Tartur mine and average 15.40 % (Fig. 17). In
Egypt, phosphate bearing strata of economic importance and associated shales of the Duwi
Formation are stretching from the Red Sea coast in Quseir over the Nile Valley into the
Western Desert in Abu Tartur. They belong to a marine transgressive sequence which started
on the top of predominantly fluvial Nubia Sandstone and grades into a sequence of an open
marine environment (Germann et al. 1987). The Campanian to Maastrichtian Duwi Formation
of a shallow marine origin (El-Ayyat and Kassab 2004) is overlain by shales, marls and
limestones of the Maastrichtian to Paleocene Dakhla Formation, the sediments reflecting
deposition under inner neritic to outer shelf conditions and repeated sea level changes
(Hendriks 1985; Tantawy et al. 2001).
Fig 17: Distribution of P2O5 in the studied phosphate samples.
Phosphorus in sediments exists mainly in three forms, authigenic minerals (Ruttenberg and
Berner 1993; Schuffert et al. 1994, 1998), in an organic form (Filipek and Owen 1981) and
adsorbed on sediment particles (Sundby et al. 1992; Jensen et al. 1995). Inorganic
phosphorus, which is synthesized authigenically in pore water, generally accounts for around
70 % of the total reactive phosphorus in marine sediments (Filippelli, 1997). Phosphorus in
0
5
10
15
20
25
N24 Q,31 Q,18 Q,2 AT,4 AT,8 AT,12
sample No.
P 2O
5 [%
]

60
organic matter accounts for 10-40 % of total phosphorus in coastal marine sediment
(Kamatani and Maeda 1989) but is preferentially was released during decomposition of the
organic matter (Ingall and Van Cappellen 1990). Dissolved reactive phosphate which is
released to pore water can be adsorbed on sediment particles; it is easily desorbed and
dissolved into pore water under anoxic conditions (Watanabe and Tsunogai 1984). Thus,
authigenic phosphorus minerals in sediments are the main sinks for phosphorus from the
ocean (Filippelli, 1997; Louchouarn et al.1997).
Marine phosphatogenesis and its characteristically P-C-Si-enriched sedimentary products are
intimately related to upwelling phenomena (Cook 1984; Slansky 1986). Upwelling of
nutrient-rich waters stimulates biomass productivity, and thus, biological preconcentration of
phosphorus, silica and carbon is affected. Analysis of regional and stratigraphical distribution
of phosphate and black-shale facies, and their sedimentological and geochemical properties
has led to the general description of a phosphatogenetic model based mainly on an upwelling
conception (Ganz 1984; Schröter 1986). The periods of particularly intensive and world-wide
phosphate enrichment, as e.g. the Upper Cretaceous-Lower Tertiary Span, coincide with
periods of warm-humid climatic conditions and related intensive chemical weathering
(Valeton 1983; Prasad 1983; Riggs 1984).
The strong positive correlation of P2O5 with CaO, Sr and F (r= 0.66, 0.93 and 0.95
respectively Appendix (Table 6b) and (Fig. 18) is interpreted to be due to the substitution of
both, the Sr and CaO within the carbonate-fluorapatite phase (Gulbrandsen 1966, 1970;
Bliskovsky et al.1967; Tooms et al.1969; Mcconnell 1973)
The high silica content in the cherty phosphate samples from both of Quseir and Nile Valley,
with average 14.11 % and 19.21% is indicating of biogenic origin, by diatoms (Germann et al.
1987). The vertebrate fauna of the Egyptian phosphorites (Dominik & Schaal 1984) is
characterized by the simultaneous occurrence of marine (mainly sharks and mosaaurs) and
freshwater inhabitants (e.g.Ceratodontides and other fish species). Germann et al. (1987)
stated that, from the paleoecological point of view, the depositional situation of the Late
Cretaceous phosphorites in Egypt is characterized by marginal marine conditions more or less
influenced by freshwater influx.
The trace elements V, Ni, Cr, Zn and Rb in the phosphate show averages of 43, 17, 48, 46 and
8 ppm lower than these of the overlain black shales. This indicates leaching processes

61
outgoing from the overlain black shales. The low average content of detrital terrigenous influx
Al2O3, TiO2 and Rb (Fig.18) and the association of the phosphate bed with oyster limestone
and diatom enrichment in Quseir and in the Nile Valley is indicating the marine origin of the
phosphates in the Eastern part of Egypt.
Fig. 18: The relationship between P2O5 with TiO2, CaO & Al2O3
0
5
1 0
1 5
2 0
2 5
0 0 . 5 1 1 . 5 2 2 . 5 3 3 . 5
A l 2 O 3 [ % ]
P 2O5 [%
]
0
5
1 0
1 5
2 0
2 5
0 5 1 0 1 5 2 0 2 5 3 0 3 5 4 0
C a O [ % ]
P 2O5 [
%]
0
5
1 0
1 5
2 0
2 5
0 0 .5 1 1 .5 2 2 . 5 3 3 .5
A l 2 O 3 [ % ]
P 2O5 [%
]

62
6- Petrography and SEM investigations
Mudrocks are fine-grained sedimentary rocks consisting mostly of silt and clay. Mudrocks
sometimes called argillite. Because of their small grain size, mudrocks are difficult to study,
even with the petrographic microscope. The are importance of the mudrocks is based on their
abundance, making up over 65% of all sedimentary rocks; further mudrocks are the source
rocks for petroleum and natural gas, and are sometimes valuable ore deposits.
Classification of mudrocks is mainly based on observations in the field or at the level of hand
specimen. The classification of mudrocks depends on the mudrock texture which includes, the
fissility or the lack of fissility, and laminations mainly based on the grain size of the minerals
making up the rock. The fissility of mudrock is depending on several factors, including the
abundance, the degree of preferred orientation, and the recrystallization of clay minerals.
Fissility is caused by the tendency of clay minerals to be deposited with their sheet structures
[(001) crystallographic planes] parallel to the depositional surface. A fissile rock tends to
break along sheet-like planes that are nearly parallel to the bedding planes.
The more clay minerals contained in the rock, the more likely the rock is to be fissile. Small
clay minerals tend to adhere to one another if they collide during transport. This tendency is
promoted by increased salinity of the water and the presence of organic matter in the water.
Adhesion of small mineral grains is referred to as flocculation. If the clay minerals flocculate,
then they are less likely to have a preferred orientation, and thus less likely to form rocks with
fissility. If the clay minerals recrystallize during diagenesis, they will tend to do so with a
preferred orientation with their (001) crystal planes oriented perpendicular to the maximum
principal stress direction. This process also results in slatey cleavage and foliation in
metamorphic rocks. If diagenesis occurs shortly after deposition, then it is likely that the
maximum principal stress direction will also be oriented perpendicular to the bedding planes.
The bioturbation of organisms within or on the surface of the sediment can disturb the
preferred orientation of clay minerals, and thus lead to a non-fissile rock.
Laminations are parallel layers less than 1 cm thick. Such laminations can represent
differences in grain size of the clastics in different laminae due to changes in current velocity
of the depositing medium, or could be due to changes in the organic content and oxidation
conditions at the site or time of deposition of the different layers.

63
Most mudstones fall into two classes in terms of their color. Gray to black color usually
indicates the presence of more than 1% organic matter in the form of carbon or some carbon
compound. Red, brown, yellow, and green colorations of mudrocks are a reflection of the
oxidation state of Fe in the sediments. Under oxidizing conditions most of the Fe will be Fe+3
and give the sediment a red coloration as in hematite.
The petrographical investigation in the present work is mainly concerned with defining the
mineralogical composition, texture, matrix and diagenesis which can be described and
observed under the polarizing microscope. Most of the studied shales are exceedingly uniform
in composition, relatively fissile and don't show bioturbation (burrows etc.). The Abu Zinema
samples of Carboniferous age, Al Maghara coal mine samples of Jurassic age and both Abu
Tartur phosphate mine and the lower part of Nile valley samples of Maastrichtian age are
almost completely lacking fossils, while Quseir phosphate mines and the upper part of the
Nile Valley section samples of Late Maastrichtian to Early Eocene age are rich in
foraminiferal tests.The petrographical investigations of the studied carbonaceous shales and
associated sediments reveal the following lithofacies:
6.1 Organic matter-rich black shale facies
This facies shows a dark gray to black colour. It is dominant in the black shale of Ataqa
Formation of Carboniferous age at Abu Zinema, Safa Formation of Jurassic age at Al
Maghara coal mine and Duwi Formation of Upper Cretaceous age at Abu Tartur phosphate
mine. In thin sections, Ataqa Formation samples are composed of silty to sandy claystone,
brownish in colour, carbonaceous, nonfissile, bioturbated, and nonfossiliferous. The quartz
grains are of silt size grading into fine sand, angular to subangular, and are poorly sorted
Appendix (Plate 1 A). This may reveal a rapid burial of the sediments during the time of
deposition in lakes or lagoons with prevailing reducing conditions which leads to preservation
of carbon and carbon compounds in rocks. The angular quartz grain shape in this facies
indicates a near source area. Safa Formation samples are composed mainly of brown
claystone, ferriginous, non fossiliferous, wisps of kerogen and dark organic matter filled
burrows, wavey laminae and bioturbation Appendix (Plate 1 B). The oriented texture and
disrupted shale lamination indicate bioturbation as the dominant fabric forming process
during the deposition of this facies (Neal et al. 1998). This may indicate that Safa Formation
was deposited in lagoons adjacent to the coastline. The black shale of Carboniferous and
Jurassic age of Ataqa Formation at Abu Zinema and of Safa Formation at Al Maghara coal

64
mine may have been deposited in reducing conditions. Reducing conditions usually occur in
stagnant water where little circulation takes place. This can occur in restricted aquatic
environments, like swamps, lakes or lagoons.
The SEM investigations show that kaolinite is the dominant clay mineral in the studied shales
of Ataqa Formation at Abu Zinema and of Safa Formation at Al Maghara coal mine as it was
also identified by XRD. The SEM observations show swirly textures with face to face
arrangement of coarse detrital kaolinite Appendix (Plate 2 A), suggesting a detrital origin
(Keller 1978; Manju et al 2001). Furthermore, kaolinite occurs as discrete, poorly crystallized
clasts with angular or irregular geometry, an indication that reworking has taken place
Appendix (Plate 2 B). The characteristic vermicular and booklet shape of authigenic kaolinite,
as well as the blocky crystals of diagenetic kaolinite, are completely absent.
In diagenesis, the morphology of kaolinite changes from vermicular or aggregates of books to
individual blockier crystals (Ehrenberg et al. 1993). In the studied shales there is no evidence
for the role of diagenesis in the formation of clay minerals.
In thin section it is shown that the Duwi Formation is composed of brownish, ferriginous,
nonfissil, nonfossiliferous, and massive claystone Appendix (Plate 3 A). The SEM
observations show that smectite is the dominant clay mineral in the studied shales of Abu
Tartur phosphate mine samples, Quseir phosphate mine samples and the Nile Valley section.
Generally, all the smectite group minerals are characterized by extremely fine-grained, poorly
defined particles, with diffuse outlines and curled edges. The montmorillonite particles can be
regarded as aggregates a foliated and lamellar aggregate structure also addressed as (papery
structure) (Plate 3 B). This may be the result of the expulsion of water and gas during the
compaction and oxidation of organic matter see also (Keller et al. 1986).
Pyrite is very dominant in the black shales of Abu Tartur phosphate mine samples. The pyrite
is found as disseminated particles, crystals, clusters globular framboids, irregular masses,
bands and small nodules. The most common forms of pyrite observed under the SEM are
framboidal and euhedral crystals or masses Appendix (Plate 4 A&B). These two textural
forms are related to the availability of iron within the sediment, which control the trace
element composition of these sediments. The formation of framboids can only be related to
the abundance of carbonaceous matter intimately mixed with the detrital iron and preserved
under the strongly anoxic stratified water column which is necessary for sulphide formation.
Moreover, the dominant occurrence of the framboids, particularly the clustered forms, in

65
organic-rich shales tends to indicate a biogenic origin as a consequence of the bacterial
reduction of seawater sulphate (Berner 1982). This process cannot take place in the presence
of dissolved oxgyen, because the bacteria that accomplish it are obligate anaerobes. In most
pelagic sediments either dissolved oxgyen is present, or there is so little reactive organic
matter that sulphate reduction does not take place and consequently, no pyrite forms (Berner
1981).
Thus, the studied highly pyritic shales from Abu Tartur must have formed under euxinic
conditions at which H2S exists above or at least at the sediment water interface. The presence
of H2S in turn, will react with Fe2+ which was probably delivered into the basin as colloidal
material adsorbed on clay minerals to form iron sulphide. By increasing activity of the
hydrogen sulphide in presence of iron and organic matter, a hydrophobic sulphide might have
been formed (El-Dahhar 1987). As a result of the biological activity, precipitation of sulphide
around bacteria in the gel will promote the development of pyrite globules rather than other
forms. Preservation of the framboids from further deformation is accomplished partly by
precipitation of an inorganic sheath-like envelope due to a slight increase of acidity (McBain
1954).
6.2 Foraminifera-rich shale facies
This facies is characterized by the presence of foraminifer's shells (Appendix, Plate 5 A&B).
This facies rarely shows any sedimentary structure other than bioturbation, and sometimes
microlamination; the latter is usually flexed around foraminiferal tests. This may reveal that
these foraminiferal tests were deposited in situ, in calm water conditions. The foraminifer’s
shells are scattered througout the matrix. The matrix is composed of clay (mainly smectite
and traces of kaolinite) and organic matter. Detrital quartz is relatively uncommon and iron
oxides may be present within the foraminifer’s tests and as pore fillings. This facies
characterises the Dakhla Shale samples at Quseir phosphate mines and both Dakhla and Esna
Shale at the Nile Valley section. The abundance of planktonic foraminifera in this facies gives
evidence of a marine environment of deposition.
6.3 Carbonate facies The carbonate lithofacies can be subdivided into bioclastic limestone and chalky limestone.
Bioclastic limestone usually caps the underlying shales and phosphatic rocks at Quseir
phosphate mines and Esna-Idfu at Nile valley. It consists mainly of oyster shell fragments,

66
and few foraminiferal tests embedded in a micritic, microsparitic or sparitic matrix
(Appendix, Plate 6 A) in Particular oyster limestone bed in Quseir is very rich in oyster
fossils. The depositional regime in the bioclastic subfacies is revealed by the presence of
micritic carbonate pellets and fossil fragments. This association may reflect a high energy
marine environment (Longmann1980).
The chalky limestone subfacies is mainly represented by the Tarawan Chalk which overlies
Dakhla Shale and underlies Esna Shale at the Nile Valley section. It is composed mainly of
chalky, fossiliferous limestones, of micritic, microsparitic or sparitic texture (Appendix, Plate
6 B). Foraminiferal tests are embedded in the micritic matrix and sometimes filled with iron
oxide (hematite).The presence of sparite in micritic ground mass in this subfacies reflects a
marine environment with normal salinity, low energy and a considerable distance from the
land mass (Dunham 1962).
6.4 Phosphatic facies
The term phosphorite is applied to rocks containing more than 18 % P2O5 (Kolodny1981;
Slansky 1986). The petrography of phosphate is based on three categories: grains (coated and
uncoated), biophases (bone fragments and fish teeth), and matrix. Apatite is the main
constituent in the phosphorite beds in Abu Tartur phosphate mine, Quseir phosphate mines
and in the Duwi Formation at the Nile Valley section. The apatite is represented by peloids
(coated and non-coated grains), microfossils, microsphere aggregates and sometimes as
megafossils, bone fragments and fish remnants (Appendix, Plate 7 A, B&C). Uncoated grains
are predominant and represent about 80% of the phosphatic grains. The grains are oval,
elongated or irregular shaped.
The coated grains represent about 10 % of the phosphatic grains. They are characterised by
inorganic or biogenic nuclei surrounded by a cortex, various layers of phosphatic coatings.
The biophases concentric mainly of bone fragments of different forms. The matix consists of
carbonate, silica or carbonate - silica matrix. Selley (1988) stated that the bulk of the worlds
bedded phosphates occur in the famous phosphate belt which stretches from Syria through the
Levant, Sinai, Egypt, Morocco and into Mauritania. These phosphates resulted from the
upwelling of oceanic currents from the Tethys onto the broad continental shelves along its
southern shore. The optimum depth for phosphate formation is 30–200m. Based on
morphological arguments, apatite particles in both modern and ancient phosphorite have been

67
interpreted as phosphatized bacteria. It is established that microorganisms participate in the
precipitation of a spectrum of minerals in aquatic environments (Simkiss and Wilbur 1989;
Mclean and Beveridge 1990). The studied phosphate samples show that the phosphatic beds
vary in composition from one area to the other. This may indicate a basically shallow water
depositional environment, which was influenced periodically by both marine conditions and
terrigenous influx.

68
7 Organic Geochemistry 7.1 Total organic carbon (TOC) content High primary production of coastal waters, a stratified water column, anoxic bottom waters,
low influx of clastic material (low dilution), and high supply of terrestrial organic matter may
promote the formation of organic carbon-rich sediments (Calvert and Petersen 1992; Meyers
1997). Favorable conditions for the formation of argillaceous, organic carbon-rich
sedimentary rocks, so-called black shales, are best known from the mid-Cretaceous where
most of our present–day petroleum reserves were generated (Larson 1991; Langrock et al.
2003). Geological evidence indicated that organic-rich sediments could be deposited even in
an open shelf until the early Paleozoic period, but they could be deposited only in a
hydrologically isolated basin afterwards (Klemme and Ulmishek 1991). This change in the
history of geological age is attributed to the evolution of benthic animals and bacteria
(Klemme and Ulmishek 1991) and/or the increase of dissolved oxygen in the ocean (Berner
and Canfield 1989).
The higher enrichment of organic matter in sediments is also one of the criteria for the
identification of oil and gas source rocks. Various recent reviews have been puplished on
preservation of organic-rich source beds (e.g. Brooks 1981; Daly and Edman 1989; Heydari et
al. 1997; Tissot and Welte 1984). Preservation of the organic matter is controlled by
conditions such as bottom water circulation rates, degree of oxygenation of bottom water,
deposition rates, supply rate of terrestrial organic matter from the continents, and productivity
in the surface water. Change in these factors creates highly variable quantities of organic
carbon.
The organic carbon analyses in the study consist of 27 shale samples from the five areas. The
total organic carbon (TOC) data for the analysed samples are given in figure19.
The amount of organic matter is variable from location to location according to the type of
shale and their characteristic attributes. The black shale samples from Ataqa Formation of
Carboniferous age recorded TOC values of 1.58 %, 1.65 % and 2.4 %. The Safa Formation
black shale samples of Jurassic age gave the highest values: 4.13 %, 4.36 % and 4.52 %.
These high TOC values of both formations may be related to the association of this black
shale with coal beds. On the other hand the black shale of Duwi Formation of Cretaceous age
which is associated with phosphate beds in Abu Tartur and Quseir show variable values
ranging from 0.41% to 1.84 % TOC in Abu Tartur and 2.29 % to 2.92 % TOC in Quseir.

69
Fig. 19: Stratigraphic position of the studied shales and compositeTOC (%) profile
(vertically not to be scaled)
Age Formation Locatoin S.No Lithology TOC (%)
Eoc
ene
Pale
ocen
eC
reta
ceou
sJu
rass
icC
arbo
nife
rous
Esna
Sha
leD
akhl
a Sh
ale
Duw
iSa
faAt
aqa
Esna
- Id
fu N
ileVa
lley
Qus
eir
phos
phat
em
ines
Esna
- Id
fuN
ile V
alle
yQ
usei
r pho
spha
tem
ines
Esna
- Id
fuN
ile V
alle
yAb
u Ta
rtur
phos
phat
e m
ine
Al M
agha
raco
al m
ine
north
Sin
ai
Abu
Zine
ma
sout
h Si
nai
Shal
e gr
eyca
lcar
eous
Shal
e br
owni
shca
lcar
eous
Sha
le
brow
nish
calc
areo
us
Blac
k sh
ale
bene
ath
phos
phat
e be
dBl
ack
shal
e be
neat
hph
osph
ate
bed
Cla
ysto
neBl
ack
shal
e be
neat
h co
albe
d
Blac
k sh
ale
N61
N71
N77
0.06
0.13
0.03
Q7
Q8
Q16
0.01
1.08
0.10N26
N32
N49
0.15
0.2
0.02
Q1
Q10
2.92
2.29
N1
N15
0.37
0.17
AT9 1.81AT10 0.69AT11 1.84AT5 0.86AT7 1.09AT1 0.67AT2 0.41AT3 0.61Mg5 4.52
Mg3 4.36
Mg1 4.13
AZ8 2.4
AZ5 1.65
AZ1 1.58
1 4TOC (%)

70
The obtained values in Dakhla Shale and Esna Shale from the Nile Valley show very low
values of less than 0.5%. This indicates the oxydization of organic matter in these formations
in the outcrops.
7.2 Rock-Eval pyrolysis Rock-Eval pyrolysis provides information on the quantity, type and thermal maturity of the
associated organic matter as well as its hydrocarbon potential. Details of the analytical
methods have been reported by Espitalie (1977), Tissot and Welte (1984) and Peters (1986).
In Table 4 Rock-Eval pyrolysis results for 10 bulk rock samples are listed.
Table 4: The TOC and Rock-Eval results of the studied shales
Loca
tion
APT
ID
S1 (m
g/g)
S2 (m
g/g)
S3 (m
g/g)
Tmax
(°C
)
PP (m
g/g)
PI (w
t rat
io)
HI (
mg
HC
/ g
TOC
)
OI (
mg
CO
2/
g TO
C)
TOC
(%)
AT10 23580 0.01 0.18 0.49 418 0.19 0.06 25 68 0.72
AT11 23581 0.03 0.91 1.41 431 0.94 0.03 44 68 2.06
AT7 23582 0.02 0.84 0.42 425 0.86 0.02 75 38 1.12
AT1 23583 0.03 0.25 0.43 424 0.28 0.10 37 64 0.67
AT3
Abu
Tar
tur
23584 0.01 0.09 0.35 418 0.10 0.09 15 57 0.61
Q1 23585 0.05 1.12 1.56 425 1.16 0.04 41 57 2.72
Q10 Qus
eir
23586 0.03 1.10 0.21 412 1.13 0.03 98 19 1.12
Mg1 23587 0.10 6.23 0.45 427 6.33 0.02 113 8 5.51
Mg3 23588 0.18 10.21 1.36 432 10.38 0.02 195 26 5.24
Mg5 Al M
agha
ra
23589 0.15 7.73 2.60 432 7.88 0.02 161 54 4.79
The hydrogen index (HI) vs. oxygen index (OI) diagram is shown in Figure 20 indicating the
main types of organic matter of the different formations. These indices can often be directly
related to the atomic can H/C and O/C ratios, and interpreted in the same way as a van
Krevelen diagram (Espitalie 1977; Tissot and Welte 1984). Most of the samples are scattered
in type III kerogen. Very low HI of 25 to 98 mg HC/g TOC and relatively low to medium OI
of 19 to 68 mg CO2/g TOC are observed for the Duwi Formation samples of Abu Tartur and
Quseir phosphate mines. On the other hand samples of Safa Formation of Al Maghara coal

71
mine show low HI of 113 to 195 mg HC/g TOC and very low OI of 8 to 54 mg CO2/g TOC.
These low HI values of less than195 mg HC/g TOC is due to bad preservation of organic
matter.
Fig. 20: Van Krevelen-type plot of Rock-Eval data for the studied bulk samples.
900
750
600
450
300
150
00 50 100 150 200
HYD
RO
GEN
IN
DE
X (
mg.
HC
/g T
OC
)
OXYGEN INDEX (mg. CO /g TOC)2
Abu Tartur
Quseir
Al Maghara
, , Kerogen types

72
7.2.1 Hydrocarbon source potentials
The hydrocarbon genetic potential (PP) in mg/g is determined from the sum of (S1+S2) peaks.
The PP values of the Duwi Formation in Abu Tartur range from 0.1 to 0.94 mg/g and 1.13 to
1.16 mg/g in Quseir. The Duwi Formation therefore displays values below typical average
hydrocarbon yields of source rocks >2.5 mg HC/g rock (Tissot and Welte 1984). Whereas the
samples of Safa Formation in Al Maghara coal mine show values in hydrocarbon yields of
6.33 to 10.88 mg/g rock.
7.2.2 Determination of thermal maturity (Tmax)
The determination of the degree of maturity of the sedimentary organic matter is an essential
parameter in order to characterise a petroleum source rock. It is the main cause of
hydrocarbon generation and transformation. The Tmax is the temperature at the maximum
point of the S2 peak, used in Rock-Eval pyrolysis. The studied samples of Duwi Formaion in
Abu Tartur and Quseir phosphate mines, as well as samples of Safa Formation in Al Maghara
coal mine are immature with Tmax values between 412-432 °C. This low Tmax value indicates
that the organic matter has not generated a substantial amount of hydrocarbon. This result is
in correspondance with the Tmax value of 428 °C obtained by Mostafa and Younes (2001) for
the Safa Formation in the Al Maghara coal mine.

73
8 Summary and Conclusions The present investigation comprises insights in the mineralogical and geochemical
composition of carbonaceous shales from the different geological ages and areas of Egypt.
The study is concerned mainly with:
1- the black shale of Ataqa Formation of Carboniferous age in Abu Zinema southwest Sinai,
2- the black shale of Safa Formation of Jurassic age in Al Maghara coal mine North Sinai,
3- the black shale of Duwi Formation of Upper Cretaceous age in Abu Tartur phosphate
mine, Western Desert,
4- the carbonaceous and black shales of Duwi Formation, Dakhla Shale and Esna Shale in
the Nile Valley area,
5- and the black and carbonaceous shales of Duwi Formation and Dakhla Shale in Quseir
phosphate mine at Red Sea coast
Mineralogically, the clay minerals of the Ataqa Formation are consisting predominantly of
kaolinite with a minor part of illite while the Safa Formation clays consist mainly of detrital
kaolinite. The clay minerals of the Duwi Formation in Abu Tartur consist mainly of smectite
in addition to different proportions of kaolinite in Quseir ad Nile Valley. The Dakhla and
Esna shales in Nile Valley consist predominately of smectite in addition to different
proportions of kaolinite and chlorite.
The chemical composition of the studied shales shows generally enrichment of elements that
are chemically immobile and associated with terrigenous influx, such as SiO2, Al2O3, and
TiO2. The Ataqa and Safa formations show enrichment of zirconium and depletion in CaO
which reveals the proximity to the land. On the other hand the studied shales in Abu Tartur,
Nile Valley and Quseir show enrichment of CaO.
The studied phosphate samples show enrichment in P2O5, CaO and flour, which reveal that
flour apatite is the main phosphate mineral in Egyptian phosphate. The low content of detrital
terrigenous influx SiO2, Al2O3, TiO2 and Rb, and the association of the phosphate beds with
oyster limestone and diatom enrichment in Quseir and in the Nile Valley is indicating the
deeper marine origin of the phosphates in the Eastern part of Egypt. The deposition of the
phosphatic beds associated with black shales clearly demonstrates a diachronous transgression
from the east to the west, starting in the Eastern desert during Lower campanian and
culminating in Upper Campanian and Lower Maastrichtian, covering both, the East and the
West, from Quseir, via the Nile Valley towards the Abu Tartur depositional centre.

74
The distribution of many trace elements has been affected by weathering. The studied shales
in Abu Tartur, Quseir and Nile Valley show higher contents of the trace elements Sr, Ba, V,
Ni, Cr, Zn, and Rb than shale samples from Abu Zinema and Al Maghara. The Dakhla Shale
in Quseir mine shows the highest enrichment of V, Ni, Cr, Zn, and Cu due to the oxidation
and weathering of organic matter and subsequent mobilization and concentration of these
trace elements. The low trace elements enrichment in the studied phosphate samples indicates
leaching processes outgoing from the overlain black shales.
Petrographically the study samples reveal the presence of four lithofacies namely;
1- Organic matter-rich black shale facies,
2- Foraminifera-rich shales facies,
3- Carbonate facies,
4- and phosphate facies.
The depletion of Ataqa Formation of Carboniferous age, Safa Formation of Jurassic age and
Duwi Formation, in foraminifera and their dark colour as well as the presence of pyrite
framboids in Duwi Formation reveal reducing environment of deposition.
The abundance of foraminifera in Dakhla Shale and Esna Shale in Quseir and the Nile Valley
give evidence for an oxidation environment of deposition in middle to inner shelf positions.
The phosphate samples in Abu Tartur show pelloids of P2O5 cemented by carbonate, while
the phosphates in the Nile Valley are cemented by silica, an indication for more open marine
conditions to the East.
The SEM micrographs show that the kaolinite in Ataqa and Safa formation is of swirly
textures with face to face arrangement of coarse detrital kaolinite.
The smectite in Duwi Formation in Abu Tartur show papery structure. The most common
forms of pyrite are framboidal and euhedral or masses. There are indications that the trace
elements composition of these sediments is influenced by pyrite.
The total organic carbon (TOC) analysis shows high values in the black shales of Safa
Formation of Jurassic in Al-Maghara, Ataqa Formation of Carboniferous in Abu Zinema and
Duwi Formation of Cretaceous in Abu Tartur ad Quseir. The obtained values in Dakhla Shale
and Esna Shale show very low values indicating the oxidation of organic matter in outcrop.
The Rock-Eval pyrolysis of the studied shales show that, most of the studied samples are of
type III kerogen with low hydrogen index HI due to bad preservation of organic matter. The
thermal maturity Tmax values of the studied shales indicate immature organic matter for
hydrocarbon generation.

75
9 References Abdallah, A. M. and A. Adindani (1963): Stratigraphy of upper Paleozoic rocks, western
side of Gulf of Suez. Geol. Surv. Egypt, Paper 25, 18pp.
Abd El-Hameed, A.T. (1997): Sedimentology and geochemistry of the subsurface Jurassic
Rocks in the North Western Desert, Egypt. Egyptian J. Geol. 41, 225-252.
Abdel Razik, T.M. (1967): Stratigraphy of the sedimentary cover of Anz Atshan South Duwi
District. Bull. Fac. Sci., Cairo Univ., No. 41, pp 153-179.
Abdel Razik, T.M. (1970): Geological microfacies studies on the Upper Cretaceous-Lower
Eocene Formation in East Qena area, Eastern Desert, U.A.R.: Ph.D. Thesis, Cairo
Uni., 422 pp.
Abdel Razik, T.M. (1972): Comparitive studies on the Upper Cretaceous Early Paleocene
sediments on the Red Sea Coast, Nile Valley and Western Desert, 8th Arab Petrol.
Cong. Algiers. Paper 71 (B-3), 23pp.
Abdou, N.M.F. (1989): Petrology and Geochemistry of some subsurface Cretaceous Rocks
in the Northern part of the Western Desert, Egypt. - M.Sc. Thesis, Al-Azhar Univ.
Cairo, Egypt.
Abdul Mannan (2002): Stratigraphic evolution and geochemistry of the Neogene Surma
Group, Surma Basin, Sylhet, Bangladesh. Ph.D. Thesis University of Oulu.Oulu
Finland 2002
Abed, A.M. and Amireh, B.S. (1983): Petrology and geochemistry of some Jordanian oil
shales from north Jordan. J. Petrol. Geol., 3, 261 – 274.
Ahmed H. A. (1997): Mineralogical and geochemical studies of the black shales intercalated
with phosphorite deposits at Abu Tartur area Western Desert, Egypt, M.Sc. thesis, Ain
Shams Uni. Cairo, Egypt, 284p.
Al Far, D.M. (1966): Geology and coal deposits of Gebel Maghara, north Sinai. Geol. Surv.
Egypt. Paper 37, 59pp.
Amajor, L.C. (1987): Major and trace elements geochemistry of Albin and Turonian shales
from the Southern Benue trough, Nigeria J. Afr. Earth Sci., 6, pp 633 – 461.
Angus, J.C., Raynor, J.B. and Robson, M. (1979): Reliability of experimental partition
coefficients in carbonate systems: evidence for inhomogeneous distribution of
impurity cations. Chem. Geol., Amsterdam, 27, 181-205.
Arkell, W.J. (1956): Jurassic geology of the world. Oliver & Boyd, London, 806pp.
Awad, G.H. and Ghobrial, M.G. (1965): Zonal stratigraphy of the Kharga Oasis, Geol.
Surv., U.A.R., paper No. 34, 77 pp.

76
Bain, D.C. and Smith, B.F.L. (1987): Chemical Analysis; In: A Handbook of Determinative
Methods in Clay Mineralogy, WIlSON, M.J. (Ed). pp 248-274.
Ball, J. (1913): A brief note on the phosphate deposits of Egypt. Geol. Surv. Rep., Cairo.
Ball, J. (1916): The geography and geology of west central Sinai, Egypt. Survey Dept., Cairo,
219 p.
Barakat, M.G. (1970): A stratigraphic review of the Jurassic formations in Egypt and their
oil potentialities.7th Arabian Petroleum Congress, Kuwait.
Barron, T. and Hume, W.F. (1902): Notes on geology of the Eastern Desert of Egypt, Dulau
and Co., London, 42 pp.
Barthoux, J.C. & H. Douville (1913): Le Jurassique dans le desert a l’isthme de Suez. C.R.
Soc. Geol. France 157: 265-268.
Beadnell, H.J.L. (1905): The relation of the Eocene and Cretaceous systems in the Esna-
Aswan streach of the Nile Valley. - Quart. J. Geol. Soc. London, V. 61, pp 667-676.
Berner, R.A. (1981): Authigenic mineral formation resulting from organic matter
decomposition in modern sediments. - Fortschr. Mineralogie, 59, 117 – 135.
Berner, R.A. (1982): Burial of organic carbon and pyrite sulfur in the modern ocean: its
geochemical and environmental significance. Am. J. Sci., 282, 451 – 473.
Berner, R.A. and Canfield, D.E. (1989): A new model for atmospheric oxygen over
Phanerozoic time. Am. Jour. Sci. 289,333-361.
Bliskovsky, V.Z., Yefimova, V.A. and Romanova, L.V. (1967): The strontium content of
phosphorites. Geochem. Int., 4, 1186-1190.
Bloch, J., Hutcheon, I.E., and Carital, P.D. (1998): Tertiary volcanic rocks and the
potassium content of Gulf Coast shales- The smoking gun. Geol. 26: 527-530.
Brooks, C.K. (1973): Rifting and doming in Southern East Greenland, Nature (London), V.
244, pp 23-24.
Brooks, J. (1981): Organic maturation of sedimentary organic matter and petroleum
exploration: a review. In: Brooks, J. (ed.), Organic maturation studies and fossil fuel
exploration, 1-37, London and New York (Acdemic Press).
Brumsack, H.J. (1980): Geochemistry of Cretaceous black shales from the Atlantic Ocean
(DSDP Legs 11, 14, 36 and 41). Chem. Geol., 31, 1-25.
Calvert, S.E., and T.F. Petersen (1992): Organic carbon accumulation and preservation in
marine sediments: How important is anoxia?, in Organic Matter: Productivity,
Accumulation, and Preservation in Recent and Ancient Sediments, edited by J. K.
whelan and J.W. Farrington, 533 pp., Columbia Univ. Press, New York.
Chamley, H. (1989): Clay Sedimentology. Heidelberg, Springer – Verlag, 623 p.

77
Cody, R.D. (1971): Adsorption and the reliability of trace elements as environment indicators
for shales. - J. Sed. Petrol., 41, 461-471, Tulsa.
Cook, P.J. (1972): Petrology and geochemistry of the phosphate deposits of northwest
Queensland, Australia. - Econ. Geol., 67, 1193-1213.
Cook, P.J. (1984): Spatial and temporal controls on the formation of phosphate deposites - a
review – In: NRIAGU, J.O. and MOORE, P.B. (eds.): Phosphate Minerals. - 242-274,
Berlin-Heidelberg-New York (Springer).
Cullers, R.L. (2000): The geochemistry of shales, siltstones and sandstones of
Pennsylvanian-Permian age, Colorado, USA: implications for provenance and
metamorphic studies. Lithos, 51, 181-203.
Daly, A.R. and Edman, J.D. (1989): Loss of organic carbon from source rocks during
thermal maturation. AAPG Bull., 71, 546, Tulsa.
Darwish, M. (1984): Optimistic hydrocarbon potentialities of the oil shales in the Quseir-
Safaga land stretch, Egypt. Bull. Fac. Sci., Zagazig Univ., Zagazig, 5, 409-419.
Degens, E.T. (1965): Geochemistry of sediments: A brief survey Prentice-hall, New Jersey.
Degens, E.T., Williams, E.G. and Keith, M.L. (1957): Environmental studies of
Carboniferous sediments, Part I. Geochemical criteria for differentiating marine from
fresh-water shales. - Am. Ass. Petrol. Geol. Bull., 41, 2427-2455, Tulsa.
Dill, H., Teschner, M. and Wehner, H. (1988): Petrography, inorganic and organic
geochemistry of Lower Permian carbonaceous fansequences ("Brandschiefer Series")
Fedral Republic of Germany: constraints to their paleogeography and assessment of
their source rock potential. Chem. Geol. 67, 307-325.
Dominic, E. and Andrew, R. (1993): Inorganic Geochemistry, Application to Petroleum
Geology – Text book
Dominik, W. (1985): Stratigraphie und Sedimentologie (Geochemie, Schwermineralanalyse)
der Oberkreide von Bahariya und ihre Korrelation zum Dakhla Becken (Western
Desert, Ägypten).- Berliner Geowiss. Abh. (A), 62, 173pp, Berlin.
Dominik, W. and Schaal, S. (1984): Notes on the stratigraphy of Cretaceous phosphorites
(Campanian) of the Western Desert, Egypt, Berl. Giowiss. Abh. (A), V 50, pp 153-
175.
Dunham, R. J. (1962): Classification of carbonate rocks according to depositional texture.
In: Ham (ed.) Classification of carbonate rocks. AAPG. Mem., 1 p. 108-121, Tulsa. Ehrenberg, S.N., Aagaard, P., Wilson, M. J., Fraser, A.R. and Duthie, D. M.. L. (1993):
Depth-dependent transformation of kaolinite to Dickite in sandstones of the
Norwegian continental shelf. - Clay Minerals 28, 325- 352.

78
Ehrmann, W.U., Melles, M., Kuhn, G., and Grobe, H. (1992): Significance of clay mineral
assemblages in the Antarctic Ocean: marine Geology, V. 107, p. 249-273.
El Akkad, S. and Dardir, A (1966): Geology and phosphate deposits of Wasif, Safaga area.
- Geol. Surv. and Min. Res. Egypt., Cairo. Paper No. 36, 35 pp.
El Kammar, A.M., Darwish, M., Phillip, G. and El Kammar, M.M. (1990): Composition
and origin of black shales from Quseir area, Red Sea coast, Egypt. J. Univ. Kuwait
(Science), 17, 177-190.
El Kammar, M.M. (1987): Stratigraphical and mineralogical studies on the black shale at
Quseir area, Red Sea Coast, Egypt. - M.Sc. Thesis, Cairo Univ., Cairo.
El Kammar, M.M. (1993): Organic and Inorganic Components of the Upper Cretaceous-
Lower Tertiary Black Shales from Egypt and Their Hydrocarbon Potentialities. -
Ph.D.Thesis, Cairo Univ., Egypt.
El Naggar, Z.R. and Ashor, M.M. (1983): Microstratigraphical analyses of the Late
Cretaceous Early Paleocene succession in Egypt, typfied by Dakhla Nile Valley and
Red Sea Coast section. - Proceeding of the first Jordanian Geological conf. pp 112-
180.
El-Anbaawy, M. and Youssef, M.H.M. (1989): Recognition of diagenetic clay mineral
composition in Jurassic rocks of Gebel El-Maghara area, North Sinai, Egypt. - Proc.
5th Phanerozoic Development Egypt Sympos.; pp 35-52, Al-Azhar Univ. Cairo, Egypt.
El-Ayyat M.A. and Kassab, S.A. (2004): Biostratinomy and facies analysis of the Upper
Cretaceous oyster strom shell beds of the Duwi Formation, Qusseir District, Red Sea
Region, Egypt. J. Afric., Earth Sci., 2004. 07. 024.
El-Dahhar, M.A. (1987): Diagenetic pyrite framboids in the phosphate deposits of Abu
Tartur area, Western Desert, Egypt. J. Afric., Earth Sci., 6, 807 –811.
Espitalie, J. Laporte, J.L., Madec, M., Marquis, F., Lelplat, P., Paulet, J. and Boutefeu,
A. (1977): Methode rapide de caracterisation des roches meres de leur potentiel
petrolier et de leur degre d, evolution-Inst. Fr. Petr. 32, 23-42, Paris.
Faris, M.I. and Hassan, M.Y. (1959): Report on the stratigraphy and fauna of the Upper
Cretaceous-Paleocene rocks of Um-El Huetat, Safaga area, Ain Shams Sci. Bull. No.
4, pp 191-207.
Felix, N.S. (1977): Physico-chemical studies on bentonites with special reference to Fayoum
Deposits, Ph.D. Thesis, Fac. of Sci., Cairo, Univ. Egypt.
Filipek, L.H. and Owen, R.M. (1981): Diagenetic controls of phosphorus in outer
continental-shelf sediments from the Gulf of Mexico. Chem. Geol. 33, 181-204.

79
Filippelli, G.M. (1997): Controls on phosphorus concentration and accumulation in oceanic
sediments. Mar. Geol. 139, 231-240.
Ganz, H. (1984): Organic geochemical and palynological studies of Dakhla Shale profile,
Southeast Egypt. Part B, Origin of the organic matter and its relation to phosphorite
formation. Berliner Geowiss. Abh (A), 50, 363-374.
Ganz, H. (1987): Geochemical evaluation of hydrocarbon source-rock characteristics and
facies analysis. Methods and applications. - Berliner Geowiss. Abh. (A), 75.3, 669-
690.
Garver, J.I., Royce, P.R. and Scott, T.J. (1994): The presence of ophiolites in tectonic
highlands as determined by chromium and nickel anomalies in synorogenic shales:
two examples from North America. Russian Geol. Geophys.35, 1-8.
Garver, J.I., Royce, P.R. and Smick, T.A. (1996): Chromium and nickel in shale of the
Taconic Foreland: A case study for the provenence of fine-grained sediments with an
ultramafic source. J. Sedim. Res., 66, 100-106.
Germann, K., Bock, W.D., Ganz, H., Schröter, T. and Tröger, U. (1987): depositional
conditions of Late Cretaceous phosphorites and black-shales in Egypt. - Berl.
Geowiss. Abh. (A), 75. 3, 629-668.
Ghandour, I.M., Harue, M. and Wataru, M. (2003): Mineralogical and chemical
characteristics of Bajocian-Bathonian shales, G. Al-Maghara, North Sinai, Egypt:
Climatic and environmental significance.Geochemical Journal, Vol. 37. pp.87-108,
2003.
Ghorab, M.A. (1956): A summary of proposed rock, stratigraphic classification for the
Upper Cretaceous rocks in Egypt. Read before the Geol. Soc. of Egypt. April 9th.
Gibbs, R.J. (1965): Error due to segregation in quantitative clay mineral X-ray diffraction
mounting techniques.- Amer. Mineral., 50, 741- 751, Washington.
Gill, J. (1981): Organic Andesites and Plate Tectonics. Springer-Verlag, Berlin, 390 pp. Gill, R. (1997): Modern analytical geochemisty. Wesley Longman, 329p.
Gindy, A.R. (1983): Factors controlling the clay mineralogy of Egyptian Phanerozoic
mudrocks and marls. Geol. Jb., B, 49, 3-25, Hannover.
Glenn, C.R. (1980): Stratigraphy, petrology and sedimentology of Duwi Formation Easteren
Desert, Egypt, M.Sc. Thesis, Calefornia, Santa Crruz.
Glenn, C.R. and Mansour, S.E.A. (1979): Reconstruction of the depositional and diagenetic
history of phosphorites and associated rocks of Duwi Formation (Late Cretaceous)
Eastern Desert, Egypt, Geol. Surv., VIX pp 388-407.

80
Goldschmidt, V.M. and Peters, O. (1932): Zur Geochemie des Bors, Teil I und II.- Nachr.
Ges. Wiss. Math. Physik, 402-407, 528-545, Gottingen.
Gromet, L.P., Dymek, R.F., Haskin, L.A. ad Korotev, R.L. (1984): The ״North American
Shale Composite״: Ist compilations, major and trace element characteristics.-
Geochim. Cosmochim. Acta, 48, 2469-2482, London.
Gulbrandsen, R.A. (1966): Chemical composition of phosphorites of the Phosphoria
Formation. - Geochim. Cosmochim. Acta, 30, 769-778.
Gulbrandsen, R.A. (1970): Relation of carbon dioxide content of Apatite of the Phosphoria
Formation to regional facies. - U.S.G.S. Prof. Pap., 700-B, B9 - B13.
Hallam, A., Grose, J.A. and Ruffell, A.H. (1991): Paleoclimatic significance of changes in
clay mineralogy across the Jurassic-Cretaceous boundary in England and France. -
Palaeogeog. Palaeoclimat. Palaeoecol., 81, 173-187.
Hassaan, M.M., El Kady, H.H and Hassan, M.M. (1979): Geochemical characteristics of
Esna Shale and Thebes limestone, Gebel El Gurnah, Egypt. - Abst. In; 5th Conf.
African Geol. Surv. Egypt, Cairo.
Hassan, A.A. (1967): A new Carboniferous occurrence in Abu Durba, Sinai, Egypt. 6th Arab
Petrol. Congr., Baghdad.
Hendriks, F. (1985): Upper Cretaceous to Lower Tertiary sedimentary environments and
clay mineral associations in the Kharga Oasis area (Egypt). N.Jb. Geol. Palaont. Mh.
10, 579-591 (Stuttgart).
Hendriks, F. (1988): Die Kreide und das Alttertiar in Südostägypten: Sedimentologie und
Tonmineralogie eines intrakratonalen Ablagerungsraumes - Berl. Geowiss. Abh. (A),
104, 129 p. Berlin.
Hendriks, F., Luger, P. and Strouhal, A. (1990): Early Tertiary Marine Palygorskite and
Sepiolite Neoformation in SE Egypt. - Z. dt geol. Ges., 141, 87-97.
Hendriks, F., Luger, P., Bowitz, J. and Kallenback, H. (1987): Evolution of depositional
environments of SE-Egypt during the Cretaceous and Lower Tertiary. - Berl. Geowiss.
Abh., (A), 75, 49 –82, Berlin.
Hermina, M.H., Ghobrial, M.G. and Issawi, B. (1961): The geology of the Dakhla Area. -
Geol. Surv. Egypt., 33 p., Cairo.
Heydari, E., Wade, W. J. and Anderson, L.C.(1997): Depositional environments, organic
carbon accumulation, and solar-forcing cyclicity in Smackover Formation lime
mudstones, Northern Gulf Coast. - AAPG Bull, 81, 760-774, Tulsa.
Higazy, R. and Hussein, A. (1955): Remarks on the uranium content of some black shales
and phosphates from Quseir and Safaga. - Proc. Egypt. Acad. Sci., 11, 63 –66.

81
Hiscott, R.N. (1984): Ophiolitic source rocks for Taconic-age flysch: Trace element
evidence. Geol. Soc. Amer. Bull. 95, 1261-1267.
Horowitz, A. (1973): Noeggerathia dickeri n sp. from the Carboniferous of Sinai. - Rev.
Paleobot. and Palyn. 15: 51-56.
Hume, W.F. (1927): The phosphate deposits in Egypt. - Surv. Dept., Egypt, paper no. 41,
20p.
Ibrahim, D.M., Abdel Aziz, D.A., Awad, S.A. and Abdel Monem, A.M. (2004): Utilization
of black shales in earthware recipes. - Ceramics International. V. 30, Issue 6, 2004, P
829-835.
Ibrahim, H.I. (1992): Geochemistry and Mineralogy of some Dakhla and Esna Shales South
of Egypt. - M.Sc. Thesis, Al-Azhar Univ. Cairo.
Ingall, E. D. and Van Cappellen, P. (1990): Relation between sedimentation rate and burial
of organic phosphorus and organic carbon in marine sediments. - Geochim.
Cosmochim. Acta, 54, 373-386.
Ismael, S.I. (1996): Mineralogical and geochemical studies of the black shales intercalated
with the phosphate deposits along the Red Sea coast, Egypt. - Ph.D. Thesis Ain Shams
Uni. Cairo, Egypt.
Issawi, B. (1972): Review of Upper Cretaceous-Lower Tertiary Stratigraphy in central and
southern Egypt. - Am. Assoc. Petrol. Geol. Bull., V. 56, No.8, pp 1448-1463.
Issawi, B. and U. Jux (1982): Contribution to the stratigraphy of the Paleozoic rocks in
Egypt. Geol. Surv. Egypt, Paper 64, 28pp
Issawi, B., El Hinnawi, M., Francis, M. and El Deftar, T. (1971): Geology of Safaga-
Quseir Coastal plain and Mohammed Rabah area. - Ann. Geol. Surv., Egypt, V. I., pp
1-19.
Issawi, B., El Hinnawi, M., Francis, M. and Mehanna, A. (1968): Contribution to the
structure and Phosphate deposits of Quseir area, Egypt, Geol. Surv., paper 50, pp 1-35.
Jenkins, D., J.C. Harms and T.W. Oesleby (1982): Mesozoic sediments of Gebel Maghara,
north Sinai, ARE. - 6th Petrol. Explor. Seminar, EGPC, Cairo.
Jensen, H.S., Mortensen, P. B., Andersen, F.O., Rasmussen, E. and Jensen, A. (1995):
Phosphorus in a coastal marine sediments, Aarhus Bay, Denmark. - Limnol. Oceanogr.
40, 908-917.
Jeong, G.Y. and Yoon, H.I. (2001): The origin of clay minerals in soils of King George
Island, South Shetland Islands, West Antarctica, and its implications for the clay-
mineral compositions of marine sediments. Journal of Sedimentary Research, Vol. 71,
No. 5, Septamber, 2001, p. 833-842.

82
Johns, W.D., Grim, R.E. and Bradley, W.F. (1954): Quantitative estimation of clay
minerals by diffraction methods. - J.Sed. Petrol., 24, 242-251, Tulsa.
Kamatani, A. and maeda, M. (1989): Distribution and budget of phosphorus in Tokyo Bay.
Chikyukagaku (Geochemistry) 23, 85-95.
Keller, W.D. (1978): Classification of kaolins exemplified by their texture in Scan Electron
Micrographs. Clays and Clay Minerals 26, 161-172.
Keller, W.D., Reynolds, R.C., JR., and Inoue, A. (1986): Morphology of clay minerals in
the smectite- to –illite conversion series by scanning electron microscopy. - Clays and
Clay Miner., 34, 187 –197.
Khaled, K.A., Abdel Ghany, A.R. and El-Fadly, A. (1987): Lateral variation of the
geochemical characteristics of some oil shale beds in Quseir-Safaga Environs, Eastern
Desert, Egypt. The Fourth Symposium on phanerozoic and Development in Egypt. Al-
Azhar University, Cairo, Egypt (Abstract).
Klemme, H.D. and Ulmishek, G.F. (1991): Effective Petroleum source rocks of the world:
stratigraphic distribution and controlling depositional factors. Amer. Assoc. Petrol.
Geol. Bull. 75, 1809-1851.
Klitzsch, E. (1980): Neue stratigraphische und paläogeographische Ergebnisse aus dem
Nordwest-Sudan.-Berl.geowiss. Abh., A. 20, 217-222, Berlin.
Klitzsch, E. (1983a): Paleozoic formations and a Carboniferous glaciation from the Gilf
Kebir-Abu Ras Area in south-western Egypt. - J. Afri. Earth Sci., 1, 1, 17-19, Oxford.
Klitzsch, E. (1983b): Geological Research In and Around Nubia. – Episodes, 3, 15- 19,
Ottawa, Ontario.
Klitzsch, E. (1984): Northwestern Sudan and bordering areas: geological development since
Cambrian time. - Berl. Geowiss. Abh., (A) 50, 23-45, Berlin.
Knauer, G.A. and Martin, J.H.(1973): Seasonal variation of Cd, Co, Mn, Pb ad Zn in water
and phytoplankton in Monterey bay, California.- Limnol. Oceanogr., Milwaukee, 18,
597- 604.
Kolodny, Y. (1981): Carbon isotopes ad depositional environment of high productivity
sedimentary sequence. The case of the Mishash - Ghareb Formation. - Israel Isr. J.
Earth. Sci. V. 29, pp 147-156.
Krauskopf, K.B. (1956): Factors controlling the concentration of the thirteen rare metals in
sea water. - Geochim. Cosmochim. Acta, 9, 1-3, London.
Langrock, U.R. Stein, M. Lipinski, and H.J. Brumsack (2003): Paleoenvironment and
sea–level change in the Early Cretaceous Barents Sea- Implications from near shore
marine sapropels. - Geo. Mar. Lett.

83
Larson, R. L. (1991): Geological consequence of superplumes, Geology, 19, 963-966.
Lindgreen, H. and Surlyk, F. (2000): Upper Permian-Lower Cretaceous clay mineralogy of
East Greenland: provenance, paleoclimate and volcanicity. Clay Minerals 35, 791-806.
Longmann, M.W. (1980): Carbonate diagenitic textures from surface diagenetic
environments. - AAPG. Bull., vol. 64, p. 461- 487.
Louchouarn, P., Lucotte, M., Duchemin, E. and deVernal, A. (1997): Early diagenetic
processes in recent sediments of the Gulf of St-Lawrence: phosphorus, carbon and iron
burial rates. Mar. Geol. 139, 181-2000.
Malak, E.K., Philobos, A. and Ashry, M.M. (1977): Some petrographical, mineralogical
and organic geochemical characteristics of black shales from Quseir and Safaga, Red
Sea Area, Egypt. Desert Inst. Bull. ARE, 27, 1 - 15.
Manju, C.S., Narayanan Nair, V. Lalithambika, M. (2001): Mineralogy, geochemistry and
utilization study of the Madayi kaolin deposits, North Kerala, India. - Clays and Clay
Minerals 49, 355- 369.
McBain, J.W. (1954): Colloidal Science. D. C.
Mcconnell, D. (1973): Apatite, its crystal chemistry, mineralogy, utilization, and geologic
and biologic occurrences. Springer – Verlag, Wien –New York, p. 111.
Mclean, R.J.C. and Beveridge, T.G. (1990): Metal-binding capacity of bacterial surfaces
and their ability to form mineralized aggregates. In: Microbial Mineral Recovery (Ed.
by H.HRLICH and C.L. BRIERLY), McGraw-Hill, New York, 185-222.
McLennan, S.M. (1993): Weathering and global denudation. J.Geol. 101, 295-303.
Meyers, P.A. (1997): Organic geochemical proxies of paleoceanographic, paleolimnologic,
and paleoclimatic processes, Organic Geochem, 27, 213-250.
Millot, G. (1970): Geology of Clays - Weathering in Sedimentology. – Geochemistry.
Springer, Heidelberg-Berlin – Masson, Paris – Chapman and Hall, London.
Mohammed, H.M. (1982): Lithostratigraphy, petrology and geochemistry of the Thebes
Formation in the Eastern Desert, Egypt. Ph.D. Thesis, Al Azhar Univ., 322pp.
Moore, D.M. and Reynolds, R.C. (1989): X-Ray diffraction and the Identification and
Analysis of Clay Minerals. – 332 pp., Oxford (Oxford University Press).
Moore, D.M. and Reynolds, R.C., Jr. (1997): X-Ray diffraction and the Identification and
Analysis of Clay Minerals. Oxford University Press, New York, 378 pp.
Mostafa, A.R. and Younes, M.A. (2001): Significance of organic matter in recording
paleoenvironmental conditions of the Safa Formation coal sequence, Maghara area,
North Sinai, Egypt. - Intern. J. Coal Geol. 47, 9-21.

84
Mustafa, A. and Ghaly, El. (1964): Survey of Quseir shales and other carbonaceous shales
in Egypt. J. Chem. Eng. Data, 9, 557 – 563, Cairo.
Neal R. O‘ Brien, Calton E. Brett and Martin J. (1998): Shale Fabric as a Clue to Sedimentary Processes – Example from the Williamson –Willowvale Shales
(Silurian), New York. Shale and Mudstone, V.II.- Schieber/ Zimmerle /Sethi
Stuttgart.
Nesbitt, H.W. and Young, G.M. (1982): Early Proterozoic climates and plate motions
inferred from major element chemistry of lutites. - Nature, V. 299, pp715-717.
Nesbitt, H.W., Markovics, G. and Price, R.C. (1980): Chemical processes affecting alkalies
and alkaline earths during continental weathering. Geochim. Cosmochim. Acta, 44, p
1695 –1766, London.
Nyakairu, G. W.A. and Koeberl, C. (2001): Mineralogical and chemical composition and
distribution of rare earth elements in clay-rich sediments from central Uganda,
Geochem. J.35, 13-28.
Ohrdorf, R. (1968): Ein Beitrag zur Geochemie des Lithium im Sedimentgestein.- Geochim.
Cosmochim. Acta, 32, p 191-208, London.
Peters, K.E. (1986): Guidelines for evaluating petroleum source rock using programmed
pyrolysis.- AAPG Bull., 70, 318-329 source rock using programmed pyrolysis.-
AAPG Bull., 70, 318-329, Tulsa., Tulsa.
Pettijohn, F.J. (1975): Sdimentary Rocks. - 3rd Ed., 628 pp., New York (Harper & Row).
Philobbos, E.R., Mansour, H.H. and El Haaddad, A. (1985): Petrology and origin of the
Quseir-Safaga evaporites, Red Sea Coastal area. - Appl. Sci. Bull. Fac. Sci., Egypt.
Pomerol, B. (1984): Geochimie des craies du bassin de Paris. Utilisation des elements traces
et des isotopes stables du carbone et de l’oxygen en sedimentolie et en
paleooceanographie. - These Sci., Paris 6, 531p.
Potter, P.E., Maynard, J.B. and Pryor, W.A. (1980): Sedimentology of Shale- 310 pp.,
New York (Springer).
Potter, P.E., Shimp, N.F. and Witters, J. (1963): Trace elements in marine and freshwater
argillaceous sediments. - Geochim. Cosmochim. Acta, 27, p 669-694, London.
Prasad, G. (1983): A review of the early Tertiary bauxite event in South America, Africa and
Indian. - J. Afri. Earth Sci., 1, ¾, 305 – 313, London.
Prevot, L. (1990): Geochemistry, Petrography, Genesis of Cretaceous-Eocene Phosphorites.
The Ganntour Deposit (Morocco): a type example. Ph.D. Thesis, University Louis
Pasteur, Strasbourg.

85
Prevot, L., El Faleh, E.M. and Lucas, J. (1989): Details on synthetic apatites formed
through bacterial mediation: Mineralogy and chemistry of the products. In: Apatite
and Phosphorites (Ed. by J.Lucas, P.J. Cook and L. Prevot). Sci. Geol. Bull.,
Strasbourg, 42, 237-254.
Quinby-Hunt, M.S., wilde, P. and Berry, W.B.N.(1991): The provenance of low-calcic
black shales. Mineralium Deposita 26, 113-121.
Ramadan, F.S. (1992): Petrological and geochemical studies of Upper Cretaceous-Lower
Tertiary sediments in Safaga Umm-Gheigh area Red Sea, Coast, Egypt, Ph. D. Thesis,
Fac. of Sci. Zagazig Univ.
Refaat, A.A. (1993): Facies Development of the Coniacian-Santonian Sediments along the
Gulf of Suez, Egypt. Ph.D.Thesis TU. Berlin, Germany.
Richerdson, M. (1982): A depositional Model for the Cretaceous Duwi (phosphate)
Formation, South of Quseir, Red Sea Coast, Egypt. - M.Sc. Thesis, University of
South Carolina.
Riggs, S.R. (1984): Paleoceanographic model of Neogene phosphorite deposition, U.S.
Atlantic continental margin. - Science, 223,123-131, Washington D.C.
Riley, K.W. and Saxby, J.H. (1983): Association of organic matter and vanadium in oil
shale from the Toolebuc Formation of the Eromanga Basin, Australia. Chem. Geol.,
37.
Robison, V.D. and Tröger, U. (1983): Geology and organic geochemistry of Dakhla Shale,
Egypt (Abstract). - AAPG Bull., 67, No. 3, p 542, Tulsa.
Russegger, J.R. (1937): Kriede and Sanstein; Einfluss Van Granit auh Letuztern Neues
Jahrb. Mineral., V.1, pp 665-669.
Russell, C.A. (1970): Geochemistry and halmyrolysis of clay minerals, Rio Ameca, Mexico:
Geochim. Cosmochim. Acta, V. 34, p. 893-907.
Ruttenberg, K.C. and Berner, R. A. (1993): Authigenic apatite formation and burial in
sediments from non-upwelling continental margin environments. - Geochim.
Cosmochim. Acta, 57, 991-1007.
Saad, M.H. (1983): Aeromanetic and gravity interpretation of Safaga area, Red Sea, Egypt,
M.Sc. Thesis Cairo Univ., 127pp.
Said, R. (1960): Planktonic foraminifera from the Thebes Formation Luxor, Egypt:
Micropaleontology, V. 6, pp277-286.
Said, R. (1961): Tectonic frame work of Egypt and its influence on the distribution of
foraminifera. Am. Assoc. Petrol. Geol. Bull ., V. 45, pp198-218.
Said, R. (1962): The Geology of Egypt. Elsevier, New York, 377 p.

86
Said, R. (1980): The Paleozoic of the Gulf of Suez. Internal Report, Conoco, Egypt.
Said, R. (1990): The Geology of Egypt. A.A. Balkema, Rotterdam, Netherlands 734 p.
Said, R. and Sabry, H. (1964): Planktonic foraminifera from the typical locality of the Esna
Shale in Egypt. - Micropaleontological, V. 10, pp 375-395.
Schandelmeier, H., Klitzsch, E., Hendriks, F. and Wycisk, P. (1987): Structural
development of North-East Africa since Precambrian Times. - Berl. Geowiss. Abh.,
(A), 75, 5-24, Berlin.
Schieber, J. and Baird, G. (2001): On the origin and significance of pyrite spheres in
Devonian black shale of North America. - J. of Sedimentary Research, Vol. 71, No. 1.,
2001, p.155-166.
Schieber, J. and Zimmerle, W. (1998): Petrography of Shales: A Survey of Technics. Shales
and Mudstones II. - E. Schweizerbartsche Verlagsbuchhandlung (Nägele u.
Obermiller), Stuttgart.
Schrank, E. and Ganz, H. (1984): Organic geochemical and palynological studies of Dakhla
Shale profile (Late Cretaceous) in Southeast Egypt. Part A: Succession of microflora
and depositrional environment. - Berliner Geowiss Abh (50).
Schreier, C. (1988): Geochemie und Mineralogie Oberkretazischer und alttertiärer Pelite Der
östlichen Wüste Ägyptens und ihre geologische Interpretation.- Berliner Geowiss.
Abh. (A), 97, 124pp., Berlin.
Schröter, T. (1986): Die lithofazielle Entwicklung der oberkretazischen Phosphatgesteine
Ägyptens – Ein Beitrag zur Genese der Tethys-Phosphorite der 0stsahara.- Berliner
Geowiss. Abh. (A), 67, 105 pp., Berlin.
Schuffert, J.D., Janke, R.A., Kastner, M., Leather, J., Sturz, A. and Wing, M.R. (1994):
Rate of formation of modern phosphorite of western Mexico. - Geochem. Cosmochim.
Acta 58, 5001-5010.
Schuffert, J.D., Kastner, M. and Janke, R.A. (1998): Carbon and phosphorus burial
asssociated with modern phosphorite formation. Mar. Geol. 146, 21-31.
Schultz, L.G., Tourtelot, H.A., Gill, J.R. and Boerngen, J.G. (1980): Composition and
properties of the Pierre Shale and equivalent rocks, northern Great Plains region. -
U.S. Geol. Surv. Prof. Pap., 1064-B, 114 pp., Washington.
Sediek, K.N. and Amer, A.M. (2001): Sedimentological and technological studies of Abu
Tartur black shales, Western Desert, Egypt. Physicochemical Problems of Mineral
Processing, 35 (2001), 141-152.
Selley, R.C. (1988): Applied Sedimentology. - Textbook. 446pp.

87
Seward, A.C. (1935): Leaves of dicotyledons from Nubian sandstone of Egypt, Geol., Surv.,
Egypt, Cairo, 21pp.
Shackleton, R.M., A.C. Ries, R.H. Graham and W.R. Fitches (1980): Late Precambrian
ophiolite melange in the Eastern Desert of Egypt. Nature 285: 472-474.
Shahin, A.N., Shehab, M. and Mansour, H. (1986): Organic geochemistry of Mohammed
Rabah mining area with special emphasis on potential flammable gas accumulations,
Geol. Soc. of Egypt annual convention, Cairo. Egypt.
Shapiro, L. and Breger, I.A. (Translators and Editors)(1968): Geochemistry of organic
substances by S.M. Manskaya and T.V. Drozdova. Pergamon Press, Oxford.
Sharma, G.D. (1979): The Alasken Shelf. Spriger-Verlag, New York.
Shata, A. (1951): The Jurassic of Egypt. Bull. Inst. Desert Egypte 1(2): 68-73.
Simkiss, K. and Wilbur, K.M. (1989): Biomineralization: Cell Biology and Mineral
Deposition. Academic Press, San Diego.
Slansky, M. (1986): Geology of sedimentary phosphates. – 210pp, New York, Amsterdam,
Oxford (Elsevier).
Snavely, P.D., Garrison, R.E. and Megvid, A.A. (1979): Stratigraphy and regional
depositional history of the Thebes Formation (Lower Eocene), Egypt. Ann. Geol.
Surv., Egypt. V. 9,pp 244-362.
Spears, D.A. & Kanaris – Sotirious, R. (1976): Titanium in some Carboniferous sediments
from Great Britain. - Geochim. Cosmochim., Acta, V. 40, pp345-351.
Stow, D.A. V. and Atkin, B. P. (1987): Sediment facies and geochemistry of Upper Jurassic
mudrocks in the central North Sea area. - Petroleum Geology of North West Europe
(Brooks J and Glennie K., eds.), 797-808, Graham and Trotman, London.
Strougo, A. and Abu Nasr, R. (1981): On the age of the Thebes Formation of Gebel Duwi,
Quseir area, Egypt, N. Jv. Geol. Palaont. Min., Stuttgart, pp 45-53.
Sundby, B., Gobeil, C., Silverberg, N. and Mucci, A. (1992): The phosphorus cycle in
coastal marine sediments. - Limnol. Oceanogr. 37, 1129-1145.
Surdam, R.C. and Stanley, K.O. (1979): Lacustrine sedimentation during the culminating
phase of Eocene Lake Gosiute, Wyoming (GreenRiver Formation). Geological Society
of American Bulletin, 90, 93-110.
Tantawy, A.A., Keller, G., Adatte, T., Stinnesbeck, W., Kassab, A. and Schulte, P.
(2001): Maastrichtian to Paleocene depositional environment of the Dakhla
Formation, Western Desert, Egypt: sedimentology, mineralogy, and integrated micro-
and macrofossil biostratigraphies. Cretaceous Research, V. 22, Issue 6, 795-827.

88
Thiry, M. and Jaquin, T. (1993): Clay mineral distribution related to rift activity, sea-level
changes and paleoceanography in the Cretaceous of the Atlantic Ocean. Clay
Minerals, 28, 61-84.
Tissot, B. P. and Welte, D.H. (1984): Petroleum formation and occurance- 699 pp., Second
Edition Berlin (Springer Verlag).
Tooms, J.S., Summerhayes, C.P. and Cronan, D.B. (1969): Geochemistry of marine
phosphate and manganese deposits. - Oceanogr. Mar. Biol. Annu. Rev. 7, 49 – 100.
Tröger, U. (1984): The oil shale potential of Egypt. Berliner Geowiss. Abh., (A), 50, 375-
380.
Turekian, K.K. (1968): Nikel. In: K.H. Wedepohl (Ed.), Handbook of Geochemistry.
Springer, Berlin, Vol. II/3, pp. 28-K-1-28-L-3.
Turekian, K.K. and Wedepohl, K.H. (1961): Distribution of the elements in some major
units of the earth,s crust.- Bull. Geol. Soc. Amer., 72, 175-192, Baltimore.
Valeton, I. (1993): Klimaperioden lateritischer Verwitterung und ihr Abbild in den
synchronen Sedimentationsräumen.– Zt.Dtsch. Geol. Gesell., 134, 413-452, Hannover.
Van Houten, F.B., Bhattacharyya, D.P. and Mansour, S.E.I. (1984): Cretaceous Nubia
formation and Correlative deposits, East Egypt., Major regressive transgresive
complex Bull. Geol. Soc. Am., V. 95, pp 397-405.
Velde, B. (1992): Introduction to Clay Minerals. – 198 p., London (Chapman & Hall)
Velde, B. (1995): Origin and Mineralogy of Clays. – 334 p., Berlin (Springer).
Vine, J.D. and Tourtelot, E.B. (1970): Geochemistry of black shales a summary report.
Econ. Geol., V. 65, pp 253 – 273. Walker, J.R. (1993): Chlorite polytype geothermometry: Clays and Clay minerals, 41, 260-
67.
Walters, L.J., Owen, D.E., Henley, A.L., Winsten, M.S. and Valek, K.W. (1987):
Depositional environments of the Dakota Sandstone and adjacent units in the San Juan
basin utilizing discriminant analysis of trace elements in shales.- J. Sed. Petrol., 57,
265-277, Tulsa.
Ward, C., Mc Donald, K.C. & Mansour, S.E.I. (1979): The Nubia Formation of the Quseir
Safaga area- Egypt, Geol., Surv., Egypt V. IX pp 420-431.
Watanabe, Y. and Tsunogai, S. (1984): Adsorption-desorption control of phosphate in
anoxic sediment of a coastal sea, Funka Bay, Japan. Mar.Chem. 15, 71-83.
Weaver, C.E. (1958): The effects and geologic significance of potassium fixation; by
expandable clay minerals derived from muscovite, biotite, chlorite, and volcanic
material-Am. Mineral., 43, 839-861, Washington.

89
Weaver, C.E. (1989): Clays, Mud, and Shales: Amsterdam, Elsevier, 819 p.
Weaver, C.E. and Pollard, L.D. (1973): The Chemistry of Clay Minerals. Elsevier,
Amsterdam.
Weber, J. (1991): Untersuchungen zur Tonmineralführung der Messel-Formation in der
Fundstätte Messel (Mittel-Eozä). Forsch.-Inst. Senckenberg, 139, 71-81.
Weissbrod, T. (1969): The Paleozoic of Israel and adjacent countries: Part II, The Paleozoic
outcrops in southwestern Sinai and their correlation with those of southern Israel. Bull.
Geol. Surv. Isr. 48: 1-32.
Welton, J.E. (1984): SEM Petrology Atlas.- AAPG Methods in Exploration Series, 4, 237 pp,
Tulsa.
Wrafter, J.P. and Graham, J. R. (1989): Ophiolitic detritus in the Ordovician sediments of
South Mayo. Ireland. J. Geol. Soc. London 146, 213-215.
Youssef, M. I. (1949): Stratigraphical studies in Quseir area Ph.D. Thesis, Alexandria, Univ.,
U.A.R.
Youssef, M. I. (1957): Upper Cretaceous rocks in Kosseir area. Bull. Inst.Desert Egypt. V., 7.
pp 35-54.
Yuretich, R., Melles, M., Sarata, B. and Grobe, H. (1999): Clay minerals in the sediments
of Lake Baikal: A useful climate proxy. Journal of Sedimentary Research, 69(3), 588-
596.

90
10 Appendix
Appendix A = Table 1 to Table 6b
Appendix B = XRD profiles
Appendix C = Plates of petrography and SEM
Notice:
N = Nile Valley (Esna-Idfu region)
Q = Quseir phosphate mine
AT = Abu Tartur phosphate mine
Mg = Al Maghara coal mine
b.d.l. = below detection limit
< = below

91
Table 1: Lithological description of the studied samples.
Sample No.
Description
N80 Limestone, white, compact, fossiliferous. N79 Limestone, as above. N78 Marl, green to light brownish, moderately compact, fractured fossiliferous, evaporitic. N77 Marl, as above N76 Limestone, light yellowish, slightly argillaceous, fossiliferous, compact. N75 Shale, , dark grey, calcareous compact, fractured with veins of evaporites. N74 Argillaceous limestone, yellowish, compact, silty in parts, fractured. N73 Shale, dark grey, calcareous, moderately hard, ferrugineous. N72 Marl, green to light brownish, moderately hard, ferrugineous, trace fossils. N71 Shale,dark grey, calcareous, moderately hard, silty in parts, ferrugineous, with veins of evaporites. N70 Claystone, greenish to yellowish, calcareous,compact, ferrugineous spots, evaporitic. N69 Shale, dark grey, grey to light brownish, calcareous, compact, silty in parts, veins of evaporites. N68 Shale, as above. N67 Shale, as above. N66 Shale, as above. N65 Shale, as above. N64 Shale,. as above. N63 Shale, as above. N62 Shale, as above. N61 Shale, as above. N60 Shale, as above. N59 Shale, marly, grey to yellowish, soft to moderate hardness, silty in parts, lamination, ferruginous. N58 Shale, marly, as above. N57 Claystone, grey to light brownish, calcareous, fractured, veins of evaporites. N56 Argillaceous limestone, moderately hard, silty in parts, fractured, evaporitic, ferrugineous spots. N55 Claystone, dark grey, calcareous, moderately hard, silty in parts, ferrugineous spots, evaporitic. N54 Claystone, grey, calcareous, moderately hard, silty in parts, ferrugineous spots, veins of evaporites. N53 Chalky limestone, white to yellowish, compact, fractured with veins of evaporites, silty in parts ,
fossiliferous. N52 Chalky limestone, as above. N51 Argillaceous limestone, grey to light grey, moderate to hard, veins of evaporites. N50 Argillaceous limestone, as above. N49 Marl, grey to dark grey, fossiliferous, ferrugineous spots, hard, evaporitic, Pecten shells. N48 Claystone, reddish, ferrugineous, calcareous, compact, fractured evaporitic. N47 Shale, black, dark grey, ferrugineous patches and spots between fissiles and through fractures,
evaporites, organic remains and traces of shells well preserved, silty in parts.. N46 Shale, as above. N45 Shale, as above. N44 Shale, as above. N43 Shale, as above. N42 Shale, dark grey, alternating with ferrugineous siltstone, brownish and reddish, fractured, evaporite
lamination between fissiles. N41 Shale, as above. N40 Shale, as above. N39 Claystone, grey to yellowish , calcareous, moderately hard, silty, in parts with gypsum laminae. N38 Shale, dark grey to brownish, soft hardness, alternating with gypsum lamination, fractured. N37 Shale, black, dark grey to brownish, moderately hard, fractured filled with ferrugineous, silty. N36 Shale, as above. N35 Claystone, grey to light brownish, moderately hard, ferrugineous spots and patches, calcareous,
large veins of evaporites. N34 Shale, black to grey, compact, calcareous, veins of evaporite, patches of ferrugineous through
fractures and between sheets. N33 Shale, black, moderately hard, fractured, ferrugineous patches, few evaporite, calcareous. N32 Shale, as above. N31 Shale, grey to brownish, calcareous , moderate to soft, veins of evaporites, ferrugineous .

92
Table 1: cont. Sample No.
Description
N30 Shale, as above N29 Shale, black to dark grey compact, ferrugineous patches evaporite, calcareous. N28 Shale, dark grey to brownish, moderately hard, less orites,ferruginous patches ad spots embedded. N27 Shale, as above. N26 Shale, black to grey, medium hard, fractured, ferrugineous patches, reddish to brownish veins of
evaporite,salts and calcareous. N25 Shale, grey with red hematitic siltstone as lenses and tubes, moderately hard, evaporite embedded
between shale, siltstone N24 Phosphat, yellow to light brownish, highly fossiliferous,less hardness, organic matter and bones
remains, cherty nodules. N23 Oyster limestone, greyish, very compact, fractures filled with calcite and rock fragments. N22 Argillaceous limestone, yellow, very compact, patches of organic matter. N21 Dolomitic limestone, grey, very compact. N20 Phosphate, yellow to light brownish, highly fossiliferous, less hardness, organic remain, highly
calcareous. N19 Conglomerate bed, light brownish , very compact, calcareous, phosphatic. N18 Sandstone, grey to light brownish, moderately hard, lamination of sand, silt and claystone,
fractured, evaporitic N17 Claystone, grey, medium hard, silty, fissiles, fractured,veins of evaporite. N16 Phosphate, brownish, to yellowish, compact, fossiliferous, ferrugineous, with sandy and chert
nodules. N15 Siltstone, grey, brown to yellowish, alternating with claystone, fissil,medium hard , ferrugineous
patches interbedded change the colour to yellowish, brownish. N14 Sandstone, yellow, moderately hard, ferrugineous. N13 Claystone, yellowish to light brown, silty, compact, fissil fractured with black patches of organic
matter and evaporites. N12 Phosphate bodies,with conglomerate and breccia, yellow to brownish, compact, ferrugineous. N11 Siltstone, brown to reddish surrounding the phosphate nodules. N10 Claystone/Siltstone, brownish to grey, medium hard, rare evaporites, slightly fissil. N9 Claystone, green,moderately hard, silty in parts, slightly fissiles with evaporites interclation N8 Siltstone, grey, yellowish, brownish lamination, moderately hard, sandy in parts, iron concreation,
ferrugineous,and few evaporites N7 Claystone, green, moderately hard, fractured with rare evaporites. N6 Siltstone, brownish, ferrugineous,calcareous, moderately hard, with embedded veinlets of
sandstone ,cross lamenated,vew evaporite laminae are interbedded also N5 Siltstone, green to brownish, moderately hard, slightly calcareous, sandy in parts, slightly fissiles. N4 Siltstone, reddish brown, ferrugineous moderately hard and with rare evaporites N3 Claystone, green to grey, silty in parts, with rare evaporites. N2 Siltstone, brownish, ferrugineous, sandy in parts. N1 Claystone,dark grey, silty in parts ,rare evaporites and ferrugineous spots. Q1 Shale, black, subfissil, highly carbonaceous, pyritic. Q2 Marl, yellowish brown ,compact. Q3 Phosphate, yellow to light brownish, highly fossiliferous, less hardness, organic matter and bone
remains, cherty nodules. Q4 Phosphate, silicified, yellow brownish, compact, organic matter, bone remains, cherty nodules. Q5 Oyster limestone, greyish, very compact, fractured. Q6 Shale, grey to yellowish, calcareous, micaceous, slightly fissiles. Q7 Shale, brownish, micaceous, fissile, gypsiferous, slightly calcareous. Q8 Shale, black to grey, compact, subfissile, alternated with gypsum laminae. Q9 Shale, as above. Q10 Shale, black, weathered. Q11 Shale, pale browen, fossiliferous, highly calcareous, fissile. Q12 Shale, as above. Q13 Shale, pale brown, fossiliferous, highly calcareous, fissile, gypsiferous. Q14 Shale, as above. Q15 Shale, pale brown, grey, fossiliferous, highly calcareous.

93
Table 1: cont. Sample No.
Description
Q16 Shale, as above. Q17 Shale, black, weathered. Q18 Phosphate, silicified, yellow to light brownish, organic matter and bone remains, cherty nodules. Q19 Phosphate, yellow to light brownish, compact, organic matter and bone remains. Q20 Marl, yellowish brown ,compact. Q21 Oyster limestone , greyish, very compact, fractured. Q22 Phosphate, yellow to light brownish, highly fossiliferous. Q23 Shale, pale brown, grey, fossiliferous (pecten), highly calcareous. Q24 Shale, as above. Q25 Shale, as above. Q26 Shale, as above. Q27 Shale, black, weathered. Q28 Shale, grey to greenish grey, fissile, gypsiferous, slightly compact. Q29 Shale, as above. Q30 Shale, as above. Q31 Phosphate, yellow, brownish, compact, organic matter and bones remains, highly calcareous. Q32 Shale, pale brown, grey, fossiliferous, highly calcareous. Q33 Shale, as above Q34 Shale, as above Q35 Shale, black, weathered. AT1 Shale, black, compact, subfissil, pyritic, slightly gypsiferous. AT2 Shale, as above AT3 Shale, as above AT4 Phosphate, black, calcareous, slightly compsct. AT5 Phosphate, black, calcareous, slightly compsct. AT6 Shale, as above AT7 Shale, as above AT8 Phosphate, black, calcareous, slightly compsct. AT9 Phosphate, black, calcareous, slightly compsct, fissile to sub fissile. AT10 Shale, as above AT11 Shale, as above AT12 Phosphate, black, calcareous, slightly compsct. Mg1 Shale, black, compact, highly carbonaceous, ferruginous. Mg2 Shale, as above Mg3 Shale, as above Mg4 Shale, as above Mg5 Shale, as above AZ1 Shale, black, gypsiferous, fissile, highly carbonaceous. AZ2 Shale, as above AZ3 Shale, as above AZ4 Shale, black, gypsiferous, fissile, highly carbonaceous. AZ5 Shale, as above AZ6 Shale, as above AZ7 Shale, as above AZ8 Shale, as above AZ9 Shale, as above AZ10 Shale, as above AZ11 Shale, as above AZ12 Shale, as above

94
Table ( 2 ): Semiquantitative mineralogical composition of clay fraction.
Age Formation Location S.No. Smectite Kaolinite Chlorite Illite N79 95 5 0 0 N78 90 0 10 0 N75 98 2 0 0 N73 95 0 5 0 N72 97 0 3 0 N71 95 5 0 0 N69 71 0 29 0 N66 70 0 30 0 N64 93 7 0 0 N60 62 Trace 38 0 N55 100 0 0 0 La
te M
aast
richt
ian
– Ea
rly
Eoce
ne
Esna
Sha
le
Avg. 88 2 10. 0 N47 93 7 0 0 N43 58 0 42 0 N41 55 0 45 0 N37 83 17 0 0 N35 35 0 65 0 N33 86 14 0 0 N31 68 Trace 32 0 N29 88 12 0 0 N27 78 22 Trace 0 N26 86 14 0 0 La
te M
aast
richt
ian-
Mid
dle
Pale
ocen
e
Dak
hla
Shal
e
Avg. 73 9 18. 0 N17 92 Trace 8 0 N15 85 0 15 0 N10 90 0 10 0 N9 70 Trace 30 0 N5 65 Trace 35 0 N1 98 2 0 0 C
ampa
nian
-M
aast
richt
ian
Var
iega
ted,
D
uwi
Nile
Val
ley
(Esn
a -I
dfu)
regi
on
Avg. 83. 0 16. 0 Q.1 98 2 0 0 Q.7 94 6 0 0 Q.9 33 67 0 0 Q.11 84 16 Trace 0 Q.14 88 12 0 0 Q16 92 8 0 0 Q.20 85 15 0 0 Q.23 94 6 0 0 Q.26 97 3 0 0 Q.32 80 20 0 0 Q.34 34 66 0 0
Maa
stric
htia
n
Duw
i and
Dak
hla
Qus
eir M
ines
Avg. 80 20. 0 0 AT.2 99 1 0 0 AT.5 100 0 0 0 AT.7 100 Trace 0 0 AT.9 100 Trace 0 0
Maa
stric
hti
an
Duw
i
Abu
Tar
tur
Min
e
Avg. 100 0 0 0 Mg.1 0 100 0 0 Mg.3 Trace 100 0 0 Mg.5 0 100 0 0
Mid
dle
Jura
ssic
Safa
Mag
hra
Min
e
Avg. 0 100 0 0 AZ.1 0 100 Trace Trace AZ.5 0 60 0 40 AZ.8 0 100 0 0
Car
boni
fer
ous
Ata
qa
Abu
Ze
nim
a
Avg. 0 87 0 13 Avg =average

95
Table ( 3): Semiquantitative mineralogical composition of bulk studied samples.
Age
Form
atio
n
Loca
tion
Sam
ple
No.
Qua
rtz
Feld
spar
e
Cal
cite
Dol
omite
Anh
ydrit
e F-
apat
ite
Iron
oxi
des
Hal
ite
Gyp
sum
Cla
y
N79 13 0 5 0 35 0 0 0 0 47 N78 5 0 25 1 1 0 0 9 0 59 N77 6 0 24 54 0 0 0 0 0 16 N75 12 0 0 0 0 0 0 0 0 88 N74 10 0 68 0 14 0 0 0 0 8 N73 9 0 0 0 0 0 0 0 0 91 N72 11 0 22 0 7 0 0 0 1 59 N71 8 0 0 0 12 0 0 0 0 80 N70 7 0 27 0 19 0 0 0 0 47 N69 8 0 26 0 3 0 0 0 0 63 N68 9 0 2 0 17 0 0 0 0 72 N67 8 0 0 3 16 0 6 0 0 67 N66 6 0 5 0 0 0 0 0 0 89 N65 6 0 39 0 1 0 0 0 0 54 N64 6 0 15 50 2 0 0 0 0 27 N63 8 0 37 0 16 0 0 0 0 39 N62 6 0 5 0 26 0 0 0 0 63 N60 10 0 0 0 0 0 0 0 0 90 N59 0 0 8 81 0 0 0 0 0 11 N58 8 0 13 0 4 0 0 0 0 75 N57 6 0 29 0 24 0 0 0 0 41 N56 5 0 79 0 10 0 0 0 0 6 N55 16 0 52 0 7 0 0 0 0 25
Esna
Sha
le
Avg. 8 21 8 9 0 0 0 0 53 N52 6 0 0 0 94 0 0 0 0 0 N50 3 0 56 0 41 0 0 0 0 0
Late
Pal
eoce
ne –
Ear
ly E
ocen
e
Tara
wan
Avg. 4.5 0 28 0 68 0 0 0 0 0 N49 7 0 88 0 0 0 0 0 0 5 N47 30 0 0 0 0 0 10 0 0 60 N46 23 0 0 0 7 0 0 0 0 70 N45 28 3 0 0 0 0 0 0 0 69 N44 17 0 0 0 29 0 0 13 0 41 N43 19 0 0 0 0 0 29 0 0 52
Mid
dle
Pale
ocen
e
N42 22 0 0 0 0 0 0 0 0 78 N41 20 5 3 0 0 0 0 0 0 72 N39 47 9 0 0 4 0 0 0 0 40 N37 7 0 0 0 44 0 5 0 0 44 N36 17 6 6 0 16 0 7 0 0 48 N35 0 0 0 0 84 0 0 0 0 16 N34 19 0 0 0 0 0 7 0 0 74 N33 23 3 0 0 0 0 0 0 0 74 N32 21 3 0 0 0 0 0 0 0 76 N31 14 1 0 0 0 0 0 0 0 85 N30 24 1 0 0 0 0 0 0 0 75 N29 16 3 0 0 0 0 39 0 0 42 N28 10 4 0 0 0 0 0 0 0 86 N27 17 0 42 3 0 0 2 0 3 33 N26 20 4 0 0 0 0 0 0 0 76
Late
Maa
stric
htia
n-
Dak
hla
S
hale
Avg. 19 2 7 0 9 0 5 0 0 60 N24 40 0 13 0 0 47 0 0 0 0 N21 5 0 95 0 0 0 0 0 0 0 N20 18 0 4 0 0 78 0 0 0 0 N17 4 0 0 76 0 0 0 0 2 18 N15 17 0 0 46 0 0 0 0 0 37 N13 33 4 0 0 10 0 16 0 1 36 N12 45 10 0 0 11 0 0 0 0 34 N10 53 31 0 0 0 0 0 0 0 16 N9 42 15 0 0 0 0 0 0 0 43 N7 64 5 0 0 13 0 0 0 0 18 N5 64 19 0 0 0 0 0 0 0 17 N1 75 15 0 0 0 0 0 0 0 10 C
ampa
nian
-
Maa
stric
htia
n
Var
iega
ted-
Duw
i
Nile
Val
ley
(Esn
a- Id
fu) r
egio
n
Avg. 33 8 9 10 2 10 1 0 0 19 Avg =average

96
Table ( 3 ): cont.
Age
Form
atio
n
Loca
tion
Sam
ple
No.
Qua
rtz
Feld
spar
e
Cal
cite
Dol
omite
Anh
ydrit
e F-
apat
ite
Iron
oxi
des
Pyrit
e
Gyp
sum
Cla
y
Q.1 33 0 0 0 0 0 0 2 1 64 Q.2 19 0 0 51 0 30 0 0 0 0 Q.4 47 0 0 12 0 14 0 0 0 0 Q.6 0 0 0 0 0 53 0 0 47 0 Q.9 14 0 52 0 0 0 0 0 34 0 Q.10 43 0 0 0 0 0 0 4 4 49 Q11 27 0 54 0 0 10 0 0 0 9 Q.14 18 0 61 0 0 0 8 0 0 13 Q.15 29 0 56 0 0 0 0 0 0 15 Q.16 30 0 56 0 0 0 0 0 0 14 Q.17 19 0 68 0 0 0 0 1 0 12 Q.19 9 0 0 51 0 40 0 0 0 0 Q.20 50 4 0 0 0 0 5 0 0 41 Q.21 3 0 83 14 0 0 0 0 0 0 Q22 6 0 54 0 0 40 0 0 0 0 Q.23 40 0 0 0 0 32 0 0 0 28 Q.26 20 0 38 0 0 0 0 0 0 42 Q.27 14 0 48 0 0 21 0 3 2 12 Q.31 8 0 40 0 0 52 0 0 0 0 Q.32 74 0 0 0 0 0 0 0 6 20
Late
Maa
stric
htia
n - M
iddl
e Pa
leoc
ene
Duw
i and
Dak
hla
Shal
e
Qus
eir
Min
es
Avg. 25 0 31 6 0 15 1 0 5 16 AT.1 13 0 0 0 0 0 0 3 0 84 AT.2 21 0 0 0 0 0 0 3 1 75 AT.3 23 0 0 0 0 0 0 6 1 70 AT.4 6 0 0 45 0 44 0 4 1 0 AT.5 11 0 0 0 0 0 0 4 1 84 AT.6 11 0 0 0 0 0 0 1 3 85 AT.7 12 0 0 0 0 0 0 4 1 83 AT.8 12 0 0 34 0 49 0 5 0 0 AT.9 73 0 0 0 0 0 0 5 0 22 AT.10 17 0 0 0 0 0 0 4 1 77 AT.11 60 0 0 0 0 0 0 1 0 39 AT.12 15 0 0 0 0 74 0 6 6 0
Late
Maa
stric
htia
n
Duw
i
Abu
Tar
tur M
ine
Avg. 23 0 0 7 0 14 0 4 1 52 Mg.1 35 0 0 0 0 0 4 1 0 60 Mg.2 39 0 0 0 0 0 1 1 0 59 Mg.3 49 0 0 0 0 0 0 4 0 47 Mg.4 46 0 0 0 0 0 0 0 0 54 Mg.5 43 0 0 0 0 0 0 0 0 57
Mid
dle
Jura
ssic
Safa
Al M
agha
ra
Min
e
Avg. 42 0 0 0 0 0 1 1 0 55 AZ.1 86 0 0 0 0 0 0 0 0 14 AZ.3 75 0 0 0 0 0 0 0 0 25 AZ.8 82 0 0 0 0 0 0 0 0 18 AZ.9 83 0 0 0 0 0 0 0 0 17 AZ.10 73 0 0 0 6 0 0 0 0 21 AZ.11 80 0 0 0 0 0 0 0 0 20
Car
boni
fero
us
Ata
qa
Abu
Zin
ema
Avg. 80 0 0 0 0 0 0 0 0 20
Avg =average

97
Table(4): Major element composition(wt %) of the studied samples.
Loca
tion
Form
atio
n
Sam
ple
No.
SiO2
[%] Al2O3 [%]
CaO [%]
MgO [%]
Fe2O3
[%] TiO2
[%] P2O5
[%] Na2O [%]
K2O [%]
SO3
[%] LOI [%]
Total[ %]
CIA
SiO2/ Al2O3
N79 47.93 16.85 1.02 2.55 7.97 0.86 0.085 1.68 1.16 0.72 19.0 99.21 81 2,84 N78 38.63 12.04 8.29 4.27 5.83 0.61 0.191 2.39 0.87 0.41 26.4 99.93 -- 3,21 N75 57.56 15.42 0.43 3.15 2.94 0.90 0.043 1.77 0.72 0.148 16.90 99.98 84 3,73 N72 46.53 13.39 8.68 4.03 5.50 0.62 0.227 1.39 1.00 0.128 18.50 99.99 -- 3,47 N69 41.20 16.50 7.99 2.17 6.16 0.75 0.096 1.22 0.91 0.195 22.70 99.89 -- 2,50 N66 46.08 20.51 1.38 1.88 6.01 0.84 0.068 1.31 0.93 0.120 20.80 99.92 85 2,25 N60 38.11 16.53 8.43 2.52 5.20 0.57 0.657 2.46 0.91 0.286 24.30 99.97 -- 2,31 N55 38.97 8.68 15.19 2.31 3.65 0.43 0.175 1.11 0.46 0.140 28.40 99.23 -- 4,03
Esna
N54 18.71 9.67 23.79 0.64 3.36 0.37 0.136 2.34 0.33 0.266 40.30 99.91 -- 1,93 N52 11.18 5.33 37.99 0.56 2.48 0.25 0.117 0.66 0.24 0.119 41.00 99.92 -- 2,10 Tarawan N50 13.88 6.22 33.23 0.70 4.38 0.25 0.234 0.77 0.28 6.2 33.80 100 -- 2,23 N49 20.34 9.33 28.62 0.90 3.95 0.41 0.212 1.11 0.46 0.126 34.50 99.95 -- 2,18 N47 42.78 18.13 0.08 1.40 15.25 0.81 0.144 1.51 0.75 1.032 18.00 99.88 89 2,36 N45 49.63 19.24 0.03 1.62 4.35 0.99 0.059 1.35 0.59 0.575 21.50 99.93 90 2,58 N43 37.46 16.53 0.01 1.66 9.11 0.84 0.102 1.50 0.72 0.313 31.70 98.95 87 2,27 N39 46.85 18.24 0.79 1.49 6.01 1.00 0.335 1.53 1.02 0.121 22.60 99.98 84 2,57 N37 44.11 22.34 0.36 1.26 4.70 0.96 0.054 0.86 0.47 0.050 24.80 99.96 93 1,97 N35 42.19 10.99 18.40 3.16 5.22 0.44 0.108 0.77 0.30 0.570 17.80 99.94 -- 3,90 N33 48.48 22.36 0.10 0.93 5.40 0.97 0.059 1.33 0.63 0.136 19.60 99.99 91 2,17 N31 45.54 21.57 0.10 0.93 8.75 0.91 0.094 1.54 0.59 0.134 19.80 99.65 90 2,11 N29 42.51 20.93 0.19 1.30 24.99 0.81 0.123 1.66 0.53 0.266 6.70 98.51 90 2,03 N27 38.02 15.86 9.29 2.80 6.08 0.79 0.262 1.70 0.65 0.668 23.82 99.94 58 2,40
Dak
hla
N26 48.95 22.94 0.28 1.07 6.12 0.98 0.065 1.13 0.66 0.142 17.08 100 92 2,13 N24 19.21 0.20 29.34 0.30 1.05 0.03 16.78 0.86 0.05 2.173 30.00 99.99 -- 96,05 N21 18.37 0.49 45.39 0.51 0.86 0.04 0.290 0.18 0.05 0.050 33.77 100 -- 37,49 N17 48.59 16.17 1.48 1.60 4.93 0.91 0.244 3.15 0.91 1.544 20.47 99.77 74 3,00 N15 53.75 11.44 0.60 1.31 3.71 0.83 0.453 1.68 1.09 0.075 25.00 99.93 77 4,70 N10 57.94 12.67 0.94 1.11 7.88 0.96 0.673 1.24 1.05 0.296 15.24 99.99 79 4,57 N9 49.85 18.44 0.24 1.22 4.56 1,28 0.202 1.38 1.55 0.137 21.10 99.95 85 2,70 N5 55.09 15.25 0.19 1.04 3.42 1.34 0.494 1.38 1.56 0.266 19.95 99.98 83 3,61
Nile
Val
ley
(Esn
a-Id
fu) r
egio
n
Duw
i
N1 52.66 17.42 0.13 1.71 7.09 1.27 0.041 1.81 2.98 0.394 14.49 99.99 78 3,02 Q.1 45.85 13.57 0.83 2.14 4.77 0.76 0.132 0.36 0.87 2.424 28.00 99.70 87 3,38 Q.2 15.10 0.24 23.40 7.59 2.14 0.03 6.219 0.36 0.05 0.929 42.20 98.25 -- 62,92 Q.7 25.45 7.16 12.33 2.01 5.87 0.44 5.817 7.05 0.83 0.229 32.00 99.16 -- 3,55 Q.11 37.73 8.83 17.03 1.74 4.88 0.44 3.317 1.16 0.64 0.132 22.28 98.17 -- 4,27 Q.16 35.39 8.79 21.53 1.41 3.92 0.46 2.600 0.69 0.64 0.136 23.34 98.90 -- 4,03 Q.18 23.08 0.30 28.15 0.62 0.14 0.03 17.75 0.57 0.05 0.662 27.96 99.31 -- 76,93 Q.20 49.75 11.81 1.52 1.74 4.88 0.69 0.513 0.44 0.81 0.050 27.40 99.60 81 4,21 Q.26 39.32 11.43 16.24 2.41 6.07 0.58 4.897 0.76 0.92 0.213 15.85 98.69 -- 3,44 Q.31 4.15 0.65 34.35 0.81 0.70 0.03 13.68 1.81 0.05 0.344 40.30 96.87 -- 6,38
Qus
eir p
hosp
hate
min
es
Duw
i and
Dak
hla
Q.34 19.89 8.55 33.82 0.71 3.00 0.40 0.423 0.38 0.46 0.288 31.70 99.62 -- 2,33 AT.2 46.81 14.60 1.18 2.17 5.51 0.78 0.127 0.06 1.39 1.154 26.14 99.92 85 3,21 AT.4 4.94 1.07 34.09 0.45 3.33 0.06 20.18 0.62 0.06 4.120 29.30 98.22 -- 4,62 AT.5 55.66 17.89 1.79 3.16 6.31 0.87 0.275 0.10 0.93 3.019 9.80 99.80 86 3,11 AT.7 52.04 16.70 1.85 2.95 6.41 0.82 0.322 0.14 0.88 3.394 14.25 99.75 85 3,12 AT.8 12.00 2.89 28.79 1.26 4.32 0.14 15.90 0.49 0.17 5.087 27.60 98.64 -- 4,15 AT.9 49.77 14.16 1.65 2.33 4.22 0.88 0.303 0.10 1.05 0.836 24.60 99.89 83 3,51 A
bu T
artu
r
Duw
i
AT.12 7.73 1.45 30.23 0.39 3.72 0.07 17.26 0.46 0.09 4.606 32.55 98.55 -- 5,33 Mg.1 47.01 25.88 0.37 0.90 8.70 1.97 0.093 0.11 0.93 0.543 13.25 99.75 95 1,82 Mg.3 49.80 26.43 0.34 0.77 4.28 2.15 0.088 0.11 1.02 0.277 14.50 99.76 95 1,88
Al Maghra
Saf
a
Mg.5 49.77 26.34 0.35 0.67 6.30 2.25 0.089 0.11 0.86 0.599 12.44 99.77 95 1,89 AZ.1 51.12 18.86 0.29 0.30 0.49 1.14 0.067 0.31 0.94 0.207 26.00 99.72 92 2,71 AZ.5 56.23 13.73 0.44 0.30 2.00 1.28 0.043 0.35 1.07 0,517 23.85 99.81 88 4,10 AZ.7 57.98 15.37 0.79 0.30 0.23 0.44 0.028 0.11 0.24 0.414 24.20 99.90 93 3,77 A
bu
Zine
ma
Ata
qa
AZ.8 41.02 20.16 0.16 0.30 0.47 0.94 0.064 1.26 0.51 3.714 30.40 98.99 91 2,03

98
Table(5): Trace element composition(ppm) of the studied samples.
Loca
tion
Form
atio
n
Sam
ple.
No.
Sr ppm
Ba ppm
V ppm
Ni ppm
Co ppm
Cr ppm
Zn ppm
Cu ppm
Zr ppm
Mn ppm
N79 289 150 180 46 10< 181 119 24 114 46< N78 309 100 160 47 13 150 141 13 90 289 N75 248 150 170 22 <10 171 58 22 133 <150 N72 362 120 226 93 <10 180 244 21 84 499 N69 331 150 196 65 10 197 160 28 110 185 N66 211 180 170 48 15 181 154 21 130 <150 N60 280 288 170 67 11 166 168 25 91 266 N55 428 95 140 78 10 127 159 31 71 131<
Esna
N54 719 70 110 44 <10 183 75 15 48 <150 N52 990 48 83 32 <10 154 43 13 <40 <150 Tarawan N50 703 59 77 36 <10 144 <40 11 44 <150 N49 784 62 140 45 <10 222 54 19 52 <150 N47 113 60 180 46 25 108 116 21 91 608 N45 109 69 190 33 9< 163 61 29 112 <150 N43 43 110 170 51 22 111 127 14 97 831 N39 158 140 250 46 12 265 90 25 173 <150 N37 263 97 170 34 <10 156 68 22 109 <150 N35 400 73 140 43 13 153 110 16 55 <150 N33 197 73 190 46 11 197 73 27 95 <150 N31 54 72 218 64 18 200 195 21 93 <150 N29 40 73 202 87 25 192 138 <10 87 1040 N27 299 74 197 52 <10 224 96 25 97 <150
Dak
hla
N26 82 77 210 45 13 215 101 29 97 <150 N24 1203 362 58 <12 <10 64 65 <10 <40 379 N21 208 83 55 <12 <10 50 <40 <10 <40 1770 N17 497 120 160 32 8< 174 82 34 99 <150 N15 250 264 86 26 <10 77 68 26 297 <150 N10 423 339 100 40 <10 100 96 32 336 359 N9 562 134 150 19 <10 117 <40 20 236 <150 N5 1703 219 100 14 <10 93 <40 22 372 <150
Nile
Val
ley
Duw
i
N1 78 140 160 41 12 107 65 53 219 <150 Q.1 76 92 110 41 20 81 69 27 138 195 Q.2 301 34 45 <12 <10 <30 <40 <10 <40 732 Q.7 470 72 1835 126 <10 379 1250 156 104 <150 Q.11 486 79 3151 186 <10 631 1600 243 93 <150 Q.16 513 93 2679 153 <10 414 1130 178 95 <150 Q.18 951 110 20 <12 <10 35 <40 <10 <40 152 Q.20 128 110 160 30 <10 123 135 25 146 <150 Q.26 649 98 1455 177 12 540 1040 154 105 <150 Q.31 895 53 20 18 <10 100 119 <10 <40 <150
Qus
eir P
hosp
hate
min
es
Duw
i and
Dak
hla
Q.34 1030 87 110 60 b.d.l. 240 61 31 55 <150 AT.2 207 110 130 26 12 100 66 16 165 <150 AT.4 1324 61 46 21 <10 <30 <40 <10 <40 556 AT.5 226 69 150 31 13 112 41 15 100 <150 AT.7 300 78 65 39 14 122 44 30 114 <150 AT.8 1398 64 44 16 10 <30 <40 12 <40 738 AT.9 296 79 130 36 10 124 53 30 106 <150 A
bu T
artu
r
Duw
i
AT12 1139 58 46 28 9< 58 <40 10 <40 660 Mg.1 110 90 160 68 29 197 92 23 537 785 Mg.3 113 100 160 67 25 194 84 30 575 272
Al Magahra Sa
fa
Mg.5 105 72 160 78 36 199 97 24 571 709 AZ.1 60 140 140 <12 <10 92 <40 37 239 b.d.l. AZ.5 62 140 130 <12 <10 87 <40 22 237 b.d.l. AZ.7 17 47 150 <12 <10 36 b.d.l. 12 215 b.d.l. A
bu
Zine
ma
Ata
qa
AZ.8 48 100 100 26 17 84 224 32 281 <150

99
Table(5): Cont.
Loca
tion
Form
atio
n
Sam
ple
No
Mo ppm,
Cd ppm
U ppm
Th ppm
Cs ppm
Pb ppm
Rb ppm
Cr/Ni Rb/Sr V/Cr
N79 <5 b.d.l. <5 <10 <8 <15 56 3,93 0,19 1,00 N78 <5 <5 <5 <10 <8 <15 49 3,19 0,16 1,05 N75 <5 <5 <5 <10 <8 <15 30 7,77 0,12 0,98 N72 <5 <5 <5 <10 <8 <15 59 1,94 0,16 1,26 N69 <5 <5 <5 <10 <8 <15 51 3,03 0,15 0,99 N66 <5 <5 <5 13 <8 <15 59 3,77 0,28 0,93 N60 <5 <5 7 <10 <8 <15 52 2,48 0,19 1,01 N55 <5 b.d.l. <5 <10 <8 <15 29 1,63 0,07 1,09
Esna
N54 b.d.l. <5 <5 <10 b.d.l. <15 16 4,16 0,02 0,62 N52 b.d.l. b.d.l. 6 <10 b.d.l. <15 12 4,81 0,01 0,54 Tarawan N50 <5 b.d.l. <5 <10 b.d.l. <15 12 4,00 0,02 0,53 N49 b.d.l. <5 <5 <10 <8 <15 19 4,93 0,02 0,61 N47 <5 <5 <5 <10 <8 16 24 2,35 0,21 1,70 N45 <5 b.d.l. <5 <10 <8 <15 26 4,94 0,24 1,16 N43 <5 <5 <5 <10 b.d.l. <15 30 2,18 0,70 1,56 N39 <5 <5 <5 <10 b.d.l. <15 41 5,76 0,26 0,93 N37 <5 <5 <5 <10. b.d.l. 16 19 4,59 0,07 1,07 N35 b.d.l. <5 <5 <10. b.d.l. <15 16 3,56 0,04 0,92 N33 <5 <5 <5 <10 <8 <15 25 4,28 0,13 0,98 N31 <5 <5 <5 <10 b.d.l. <15 27 3,13 0,50 1,09 N29 b.d.l. 382 380 <10 b.d.l. <15 27 2,21 0,68 1,05 N27 <5 <5 <5 <10 <8 <15 25 4,31 0,08 0,88
Dak
hla
N26 <5 <5 <5 11 b.d.l. <15 28 4,78 0,34 0,95 N24 <5 <5 51 b.d.l. b.d.l. <15 10 5,33 0,01 0,91 N21 b.d.l. <5 <5 <10 <8 <15 10 4,17 0,05 1,10 N17 <5 b.d.l. <5 <10 <8 <15 35 5,44 0,07 0,90 N15 <5 <5 <5 <10 b.d.l. <15 29 2,96 0,12 1,12 N10 <5 b.d.l. <5 <10 <8 66 29 2,50 0,07 1,04 N9 <5 <5 <5 <10 <8 <15 48 6,16 0,09 1,26 N5 b.d.l. 7 <5 <10 <8 <15 41 6,64 0,02 1,11
Nile
Val
ley
Duw
i
N1 <5 <5 b.d.l. <10 <8 <15 96 2,61 1,23 1,49 Q.1 <5 b.d.l. <5 <10 <8 <15 28 1,98 0,37 1,38 Q.2 9 b.d.l. 27 b.d.l. b.d.l. 15 10 2,50 0,03 1,50 Q.7 214 15 52 <10 <8 33 32 3,01 0,07 4,84 Q.11 474.2 47 41 <10 <8 20 31 3,39 0,06 4,99 Q.16 258 73 34 <10 <8 29 30 2,71 0,06 6,47 Q.18 b.d.l. b.d.l. 24 b.d.l. b.d.l. <15 10 2,92 0,01 0,57 Q.20 <5 <5 9 <10 b.d.l. <15 32 4,10 0,25 1,28 Q.26 302 40 44 <10 b.d.l. 30 40 3,05 0,06 2,69 Q.31 <5 7 27 b.d.l. b.d.l. <15 10 5,56 0,01 0,20 Q
usei
r pho
spha
te m
ines
Duw
i and
Dak
hla
Q.34 <5 b.d.l. 11 <10 b.d.l. <15 19 4,00 0,02 0,46 AT.2 <5 <5 <5 <10 <8 <15 23 3,61 0,15 1,32 AT.4 b.d.l. <5 21 <10 b.d.l. <15 <5 1,63 0,00 1,69 AT.5 <5 b.d.l. <5 <10 <8 <15 34 3,13 0,09 1,80 AT.7 <5 9 22 <10 b.d.l. <15 <5 3,44 0,08 1,61 AT.8 <5 b.d.l. <5 <10 <8 <15 27 2,07 0,01 1,12 AT.9 <5 b.d.l. <5 <10 b.d.l. <15 25 3,85 0,11 1,30 A
bu T
artu
r
Duw
i
AT.12 12 7 27 <10 b.d.l. <15 6 1,14 0,00 1,92 Mg.1 <5 <5 <5 19 <8 <15 39 2,90 0,35 0,81 Mg.3 <5 <5 5 16 <8 <15 44 2,90 0,39 0,83 A
l M
agh
ara
Safa
Mg.5 <5 <5 <5 13 <8 <15 37 2,55 0,35 0,78 AZ.1 <5 <5 <5 19 9 124 51 7,67 0,85 1,49 AZ.5 <5 b.d.l. <5 15 <8 95 30 7,25 0,48 1,46 AZ.7 <5 b.d.l. <5 <10 <8 b.d.l. 10 3,00 0,59 4,06 A
bu
Zine
ma
Ata
qa
AZ.8 <5 6 <5 14 <8 79 20 3,23 0,42 1,24

100
Table 6a: Pearsons correlation coefficient values of each pair of elements of the studied
shale samples
F 1.00
Cl
1.00
0.07
Rb
1-00
0.07
0.12
Zr
1.00
0.25
-0.1
0
-0.1
9
Cu
1.00
0.27
0.52
0.07
-0.0
5
Zn
1.00
0.06
-0.0
8
0.28
0.31
0.20
Cr
1.00
0.28
0.05
-0.0
8
0.10
-0.0
8
-0.2
3
Ni
1.00
0.61
0.64
0.03
0.04
0.24
-0.1
0
-0.0
7
V
1.00
0.46
0.52
0.37
0.18
-0.1
0
0.33
-0.0
7
-0.1
8
Ba
1.00
-0.0
2
-0.0
8
-0.1
7
0.14
0.29
0.27
0.41
0.21
0.48
Sr
1.00
0.12
-0.4
0
-0.1
2
0.10
-0.2
4
-0.1
3
-0.1
1
-0.1
4
-0.0
3
0.19
SO3
1.00
0.02
-0.2
3
-0.1
6
-0.1
4
-0.2
1
-0.0
8
0.01
-0.0
8
-0.2
4
-0.0
1
-0.0
5
K2O
1.00
-0.1
1
-0.0
3
0.41
0.16
-0.0
5
-0.1
3
-0.0
5
0.57
0.35
0.82
0.01
0.01
Na 2
O
1.00
0.12
-0.1
9
0.13
0.30
0.18
0.21
0.25
0.41
0.12
-0.3
1
0.28
0.59
0.12
P 2O
5
1.00
0.11
0.08
0.00
0.39
0.62
-0.2
1
-0.0
2
-0.0
8
0.02
0.05
0.00
-0.0
3
0.00
0.35
TiO
2
1.00
-0.2
0
-0.2
0
0.48
-0.1
2
-0.2
4
0.13
0.24
0.15
0.14
-0.2
7
0.38
0.87
0.41
-0.1
1
-0.3
5
Fe2O
3
1.00
0.13
-0.0
3
0.21
0.09
-0.0
5
-0.2
3
-0.0
6
0.46
0.54
0.27
0.30
-0.1
3
-0.0
6
0.12
0.07
-0.1
1
MgO
1.00
0.16
-0.1
9
-0.1
3
0.27
0.18
-0.0
3
-0.0
7
-0.0
8
0.44
0
0.28
0.11
0.34
0.00
-0.3
3
0.31
0.03
0.26
CaO
1.00
-0.1
5
-0.2
8
-0.6
3
0.14
-0.0
7
-0.5
0
0.09
0.49
-0.2
7
-0.5
3
0.00
-0.0
9
-0.1
6
-0.3
6
-0.4
3
-0.4
1
-0.1
3
0.13
AL 2
O3
1.00
-0.7
7
-0.0
7
0.33
0.79
-0.3
6
-0.0
3
0.28
-0.1
0
-0.4
5
0.00
0.61
0.29
0.30
0.21
0.33
0.54
0.35
-0.2
1
-0.3
6
SiO
2
1.00
0.59
-0.8
9
0.21
0.09
0.57
-0.0
2
-0.0
6
0.52
-0.1
4
-0.4
1
0.36
0.41
-0.1
3
-0.2
8
0.00
0.40
0.46
0.39
-0.0
7
0.02
SiO
2
AL 2
O3
CaO
MgO
Fe2O
3
TiO
2
P 2O
5
Na 2
O
K2O
SO3
Sr
Ba
V
Ni
Cr
Zn
Cu
Zr
Rb
Cl
F

101
Table 6b: Pearsons correlation coefficient of each pair of elements of the studied
phosphate samples
F 1.00
Cl
1.00
0.16
Rb
1.00
0.58
Zr
1.00
0.89
0.55
Cu
1.00
0.54
Zn
1.00
0.67
0.64
0.87
Cr
1.00
0.86
0.70
Ni
1.00
V
1.00
Ba
1.00
Sr
1.00
0.82
SO3
1.00
0.67
0.71
0.71
K2O
1.00
0.74
0.61
0.91
Na 2
O
1.00
0.88
0.93
0.79
P 2O
5
1.00
0.93
0.95
TiO
2
1.00
0.98
0.82
0.62
0.91
Fe2O
3
1.00
0.82
0.74
0.91
0.69
0.73
Mg
1.00
CaO
1.00
0.66
0.63
0.68
0.50
AL 2
O3
1.00
0.81
0.9ß
0.96
0.81
0.53
0.96
SiO
2
1.00
0.50
SiO
2
AL 2
O3
CaO
MgO
Fe2O
3
TiO
2
P 2O
5
Na 2
O
K2O
SO3
Sr
Ba
V
Ni
Cr
Zn
Cu
Zr
Rb
Cl
F

102
Appendix B
Fig.1: Representative profile of X-ray diffraction patterns for studied clays of Al Maghara coal mine
Fig.2: Representative profile of X-ray diffraction patterns for studied clays of Abu Tartur phosphate mine

103
Fig.3: Representative profile of X-ray diffraction patterns for the studied clays of Quseir phosphate mine
Fig.4: Representative profile of X-ray diffraction patterns for studied clays of Esna-Idfu, Nile Valley.

104
Fig.5: Representative profile of X-ray diffraction patterns for studied clays of Esna-Idfu, Nile Valley.
For abbreviations; Sm: smectite, K: kaolinite. Chl: chlorite, Qz: quartz.

105
Appendix C
Plate 1 Fig. A: Photomicrograph of black shale of Duwi Formation in Abu Tartur phosphate mine shows quartz grains, monocrystalline, moderately to well sorted grains. Fig. B: Photomicrograph of black shale of Safa Formation in Al Maghara coal mine shows wisps of organic matter. Plate 2 Fig. A: SEM micrograph shows swirl texture with face to face arrangement of coarse detrital kaolinite in black shale of Safa Formation in Al Maghara coal mine. Fig. B: SEM micrograph shows swirl texture with face to face arrangement of coarse detrital kaolinite and detrital platelets of kaolinite with irregular edges in black shale of Ataqa Formation in Abu Zinema. Plate 3 Fig. A: Photomicrograph of black shale of Duwi Formation in Abu Tartur phosphate mine shows silty claystone. Fig. B: SEM micrograph shows smectite particles, have expanded, flored "cornflak" or "Okal leaf" like structure, in Duwi Formation in Abu Tartur phosphate mine. Plate 4 Fig. A: SEM micrograph showing the agreggates of euhedral pyritic grains in Duwi Formation in Abu Tartur phosphate mine. Fig. B: SEM micrograph showing agreggates of framboids of pyrite. Plate 5 Fig. A: Photomicrograph showing highly foraminiferal shale in Dakhla Shale in Esna –Idfu, Nile Valley. Fig. B: Photomicrograph showing highly foraminiferal shale in Dakhla Shale in Quseir mines. Plate 6 Fig. A: Photomicrograph showing a micritic, microsparitic or sparitic matrix of the oyster limestone bed in Quseir mine. Fig. B: Photomicrograph showing micritic, microsparitic or sparitic, fossiliferous limestone of Tarawan Chalk in Esna-Idfu Nile Valley. Plate 7 Fig. A. Photomicrograph showing uncoated phosphate grains in Quseir phosphate mine Fig.B: SEM micrograph showing phosphate grains cemented by silica in Duwi Formation Esna –Idfu Nile Valley. Fig.C: SEM micrograph showing coated and uncoated phosphate grains cemented by calcite in Duwi Formation in Abu Tartur.

106
PLATE 1
A
B

107
PLATE 2
A
B

108
PLATE 3
A
B

109
PLATE 4
A
B

110
PLATE 5
A
B
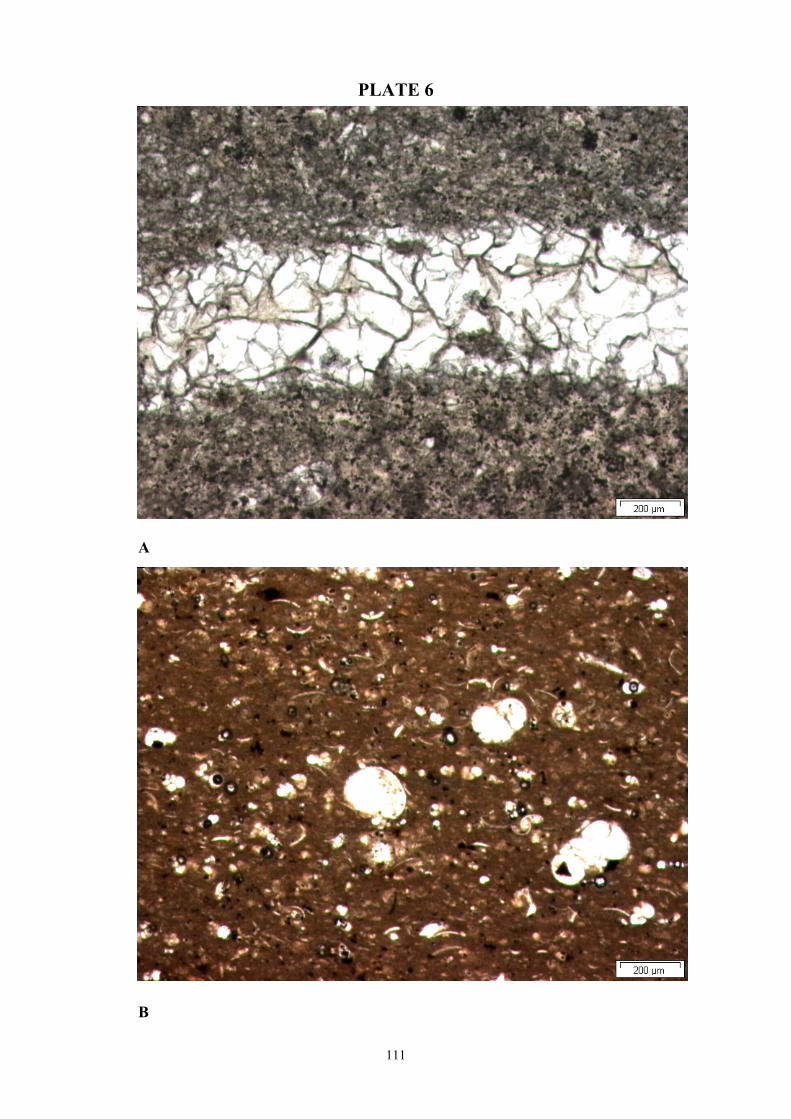
111
PLATE 6
A
B

112
PLATE 7
A
B

113
PLATE 7
C