subirrigation systems to minimize nitrate leaching
TRANSCRIPT
SUBIRRIGATION SYSTEMS TO MINIMIZE NITRATE LEACHING
By J. Wambua Kaluli,1 Chandra A. Madramootoo,2 Xiaomin Zhou,3 Angus F. MacKenzie,4
and Donald L. Smith5
ABSTRACT: Nitrate leaching from corn production systems and the subsequent contamination of ground andsurface waters is a major environmental problem. In field plots 75 m long by 15 m wide, the writers tested thehypothesis that subirrigation and intercropping will reduce leaching losses from cultivated corn and minimizewater pollution. Nitrate leaching under subirrigation at a depth of either 0.7 m or 0.8 m below the soil surfacewas compared with leaching under free drainage. The cropping systems investigated were corn (Zea mays L.)monoculture and corn intercropped with annual Italian ryegrass (Lolium multiflorum Lam. cv. Barmultra). Theeffects of three fertilizer application rates (0, 180, and 270 kg N ha21) on leaching were investigated in thefreely drained plots. The greatest annual loss of in tile drainage water (21.9 kg N ha21) occurred in2NO -N3
freely draining, monocropped plots fertilized with 270 kg N ha21. Monocropped plots fertilized with 270 kg Nha21, with subirrigation at 0.7 m depth, resulted in annual nitrate losses into tile drainage of 6.6 kg N ha21, 70%less than under free drainage. Annual soil denitrification rates (60 kg N ha21) with subirrigation at 0.7 m wereabout three-fold greater than under free drainage. Intercropping under free drainage resulted in a 50% reductionin tile drainage loss of compared with monocropping. Off-season (November 1, 1993, to May 31, 1994)2NO -N3
tile drainage losses of (7.8 kg N ha21) from freely draining monocropped plots accounted for 30% of2NO -N3
the annual tile drainage losses.
INTRODUCTION
A high nitrate concentration in surface water may2(NO )3
cause environmental problems such as eutrophication andmodify natural ecosystems (Keeny and Follett 1991). In hu-man blood, is reduced to nitrite which in turn2 2NO (NO ),3 2
converts blood hemoglobin to methemoglobin. This reducesthe capacity of blood to carry oxygen, in turn causing a blooddisorder known as methemoglobinemia or blue baby syndrome(Fletcher 1991).
Under a St. Jude sandy loam soil cropped to potatoes, Mad-ramootoo et al. (1992) measured levels of nitrate nitrogen
of up to 40 mg L21 in the drainage water, well above2(NO -N)3
the Canadian water quality guideline (10 mg L21) for2NO -N3
domestic water supplies. Using spatially separated field plotsin North Carolina, Gilliam et al. (1979) found that controlleddrainage reduced in drainage waters by up to 50%. In2NO -N3
lysimeter studies, Madramootoo et al. (1993) showed that awater table depth (WTD) ranging from 0.6 to 0.9 m maxi-mized soybean yield while minimizing nitrate losses. Kalitaand Kanwar (1993) measured maximum corn yields for WTDsof 0.6–1.0 m and observed that the use of 0.2–0.3 m WTDreduced corn yields because of waterlogging. Woodruff et al.(1984) showed that high water tables could lead to low fertil-
1Formerly, Grad. Student, Dept. of Agric. and Biosys. Engrg., Facu.of Agric. and Envir. Sci., Macdonald Campus of McGill Univ., 21111Lakeshore Rd., Sainte Anne-de-Bellevue, QC, Canada H9X 3V9.
2Prof., Dir. of Ctr. for Drainage Studies, Dept. of Agric. and Biosys.Engrg., Facu. of Agric. and Envir. Sci., Macdonald Campus of McGillUniv., 21111 Lakeshore Rd., Sainte Anne-de-Bellevue, QC, Canada H9X3V9.
3Postdoct. Fellow, Dept. of Plant Sci., Facu. of Agric. and Envir. Sci.,Macdonald Campus of McGill Univ., 21111 Lakeshore Rd., Sainte Anne-de-Bellevue, QC, Canada H9X 3V9.
4Professor Emeritus, Dept. of Natural Resour. Sci., Facu. of Agric. andEnvir. Sci., Macdonald Campus of McGill Univ., 21111 Lakeshore Rd.,Sainte Anne-de-Bellevue, QC, Canada H9X 3V9.
5New Sun Professor of Plant Sci., Dept. of Plant Sci., Facu. of Agric.and Envir. Sci., Macdonald Campus of McGill Univ., 21111 LakeshoreRd., Sainte Anne-de-Bellevue, QC, Canada H9X 3V9.
Note. Discussion open until September 1, 1999. To extend the closingdate one month, a written request must be filed with the ASCE Managerof Journals. The manuscript for this paper was submitted for review andpossible publication on July 24, 1997. This paper is part of the Journalof Irrigation and Drainage Engineering, Vol. 125, No. 2, March/April,1999. qASCE, ISSN 0733-9437/99/0002-0052–0058/$8.00 1 $.50 perpage. Paper No. 16279.
52 / JOURNAL OF IRRIGATION AND DRAINAGE ENGINEERING / MARCH
izer use efficiency, perhaps due to excessive loss of 2NO -N3
through denitrification.Research has shown that subsurface drainage enhances
leaching from the soil profile (Johnston et al. 1965;2NO -N3
Carter et al. 1971; Devitt et al. 1976; Evans et al. 1995). Watertable management is regarded as a best management practiceto reduce leaching (Madramootoo et al. 1993). During2NO -N3
subirrigation, supplemental water is supplied through subsur-face drainage pipes to raise the water table. The elevated watertable provides moisture via capillary rise to help satisfy plantevapotranspiration (ET) requirements. The subsequent reduc-ing conditions in the root zone enhance denitrification, therebyminimizing nitrate leaching (Meek et al. 1969, Kimmelshue etal. 1995, Kliewer and Gilliam 1995). Elevation of the watertable should be managed to provide moisture to the root zoneand at the same time ensure adequate soil aeration for cropgrowth (Benz et al. 1981).
Studies by Meisinger et al. (1991) and Lewan (1993),amongst others, have shown that ryegrass used as a nitrogencatch crop reduces levels in soil. Intercropping has2NO -N3
been shown to increase N-uptake and consequently reduceleaching (Keeny 1986). Intercropping could also in-2NO -N3
fluence the hydrology of an agricultural field through increasedevapotranspiration (ET), thus reducing soil moisture content.The presence of a higher population of roots in the soil profilecan also modify the soil structure and infiltration capacity.
The objectives of this field experiment were: (1) to inves-tigate the effects of subirrigation and intercropping on growingseason loss of through tile drainage and on root zone2NO -N3
denitrification rates; (2) to evaluate the impact of N fertilizerapplication rates on leaching and denitrification; and (3)2NO3
to evaluate the effect of subirrigation and intercropping on off-season loss of through tile drainage.2NO3
MATERIALS AND METHODS
Experimental Setup
A field study was conducted during the 1993 and 1994growing seasons on a 4.2 ha site located in Soulanges County,Quebec, about 30 km west of the Macdonald Campus of Mc-Gill University. Although the top soil was a well-drained Sou-langes sandy loam (fine, silty, mixed, nonacid, frigid Huma-quept), clay layers deeper in the soil profile impeded naturaldrainage. The surface topography was generally flat (average
/APRIL 1999
TABLE 1. Treatments Considered in Study
Treatmentacronym
(1)
Measured seasonalmean depth of
water table belowsoil surface
(m)(2)
Cropping system(3)
N fertilization(kg N ha21)
(4)
F1.0MN0 1.0 (free drainage) monocropped corn NoneF1.0MN180 1.0 (free drainage) monocropped corn 180F1.0MN270 1.0 (free drainage) monocropped corn 270F1.0IN270 1.0 (free drainage) intercropped corn 1
ryegrass270
S0.8MN270 0.8 (subirrigated) monocropped corn 270S0.8IN270 0.8 (subirrigated) intercropped corn 1
ryegrass270
S0.7MN270 0.7 (subirrigated) monocropped corn 270S0.7IN270 0.7 (subirrigated) intercropped corn 1
ryegrass270
slope <0.5%). Before 1991, the experimental site was underpasture; afterwards, it was under corn production.
A randomized complete block design with three WTDs, twocropping systems, and three N fertilization rates was used. Thedesign WTDs were free drainage (about 1.0 m WTD belowthe soil surface; F1.0) and subirrigation with design WTDs 0.75m and 0.5 m below the soil surface. Primarily because of lat-eral seepage, actual mean seasonal WTDs measured in thefield were deeper than the design WTD, 0.8 m (S0.8) and 0.7m (S0.7) below the soil surface for the two subirrigation treat-ments. The cropping system treatments consisted of mono-cropped corn and corn intercropped with ryegrass. Nitrogenfertilization rates were 0, 180, and 270 kg N ha21 (N0, N 180,and N270, respectively). The 180 kg N ha21 rate correspondedto what local farmers generally apply. The excessive N fertil-izer application for the 270 kg N ha21 treatment was used tofacilitate the evaluation of the effect of N application rate on
loss from the different plots. The characteristics of the2NO3
eight different treatments are summarized in Table 1.Three blocks and eight plots per block in a randomized
complete block design were used. Blocks were arranged fromeast to west, with block 1 at the eastern end, bordered to theeast by a 15 m strip of undrained land, followed by a 2.5-m-deep 3 3.0-m-wide surface drain, which collected runoff fromthe surrounding agricultural land. Blocks were separated by15-m-wide strips of undrained land. Individual plots were sep-arated by curtains of double thickness, 6 mil (0.6 mm) poly-ethylene sheeting installed to a depth of 1.5 m (Tait et al.1995). A centrally located 76 mm perforated drainage pipe,laid on a 0.3% slope, drained each plot. Each lateral pipedrained an area approximately 75 m long by 15 m wide. Drainflow from each pipe was directed to tipping buckets in heatedbuildings, allowing continuous drainage discharge measure-ments (Tait et al. 1995) and collection of water samples forflow weighted determinations.2NO -N3
Fertilization and Field Operations
The experimental field had been under monocropped cornsince 1991. On May 27, 1993, and May 31, 1994, corn wasplanted and fertilizer applied. At planting, all plots received141 kg K ha21 (supplied as K2O) and 52 kg P ha21, based onprior soil testing. In plots designed to receive N fertilizer, theP was supplied as ammonium phosphate (18-46-0), thus alsoproviding 47 kg N ha21. In plots designed to receive no N,phosphorus was supplied as triple superphosphate. For the 180and 270 kg N ha21 treatments, 133 or 233 kg N ha21 wereapplied, respectively, broadcast as ammonium nitrate (34-0-0)two weeks after planting (June 10, 1993, and June 21, 1994).Even though the seeding rate was the same in both years, poor
JOURNAL OF I
germination in 1993 resulted in a lower population density(Zhou et al. 1997b). The corn population density at harvestwas 63,000 and 71,000 plants ha21 in 1993 and 1994, respec-tively. Ryegrass was seeded at a rate of 28 kg ha21, approxi-mately one week after the corn was planted (June 4, 1993, andJune 9, 1994, respectively). On June 17, 1993, and June 20,1994, 1.52 kg active ingredient (a.i.) ha21 of atrazine (2-chloro-4-ethylamino-6-isopropylamino-1,3,5 triazine) was broadcastapplied for weed control on monocropped corn plots. For thecontrol of broad leaf weeds, 1.1 kg a.i. ha21 basagran [benta-zon; 3-(1-methyethyl)-(1H)-2,1,3-benzothiadiazin-4(3H)-one2,2-dioxide] with a surfactant, were applied.
Subirrigation
The subirrigation mechanism consisted of a water table con-trol chamber with an inlet float valve and a pipe connectingthe control chamber to the drainage lateral. An overflow pipefrom the control chamber was directed to a tipping bucket.This overflow pipe was set at an elevation of either 0.5 or 0.75m from the soil surface. However, because of lateral seepageand evapotranspiration, the actual mean seasonal WTDs mea-sured in the field were 0.7 m and 0.8 m, respectively. Subir-rigation water with no detectable , was obtained from2NO -N3
a 25-m-deep well. Control valves on drain outlets were usedto switch from the free drainage mode to subirrigation. In thesubirrigation mode, water moved from the control chamberinto the soil profile through the drainage line, until the WTDin the soil profile was the same as the elevation of the outletin the control chamber. If infiltrating rain water caused a risein water table above the design level, the excess would dis-charge to the tipping buckets for measurements.
Subirrigation was conducted from May 25, 1993, to October15, 1993, and from May 25, 1994, to October 15, 1994. Beforethe start of subirrigation each year, the average water tabledepth in all plots was about 0.8 m. In free drainage plots, theaverage water table elevation during the growing season was1.0 m and deeper. Water table controls were removed in thefall of each year, in order to drain the soil for crop harvesting.In both 1993 and 1994, corn was harvested during the secondweek of October, and the field was plowed in the first weekof November, incorporating all ryegrass and corn stover intothe soil.
Water Table and Tile Flow Monitoring
Perforated 12-mm-diameter polyethylene pipes with a geo-textile sleeve were installed vertically to a depth of 1.4 m ineach plot and served to monitor WTD. Each plot had twowater table wells located on the central axis. Between July andSeptember 1994, an extra set of wells was installed to a depthof 2.0 m in each plot in blocks 1 and 2; these wells were usedto monitor the concentration of below the drainage2NO -N3
pipes and to estimate deep seepage losses.The equipment for monitoring tile flow was operational
from September 1993. A 500 mL sample was collected foreach 500 L of drainage discharge, regardless of flow rate. Sam-ples were collected in 20 L bottles to form composite samples.Subsamples were collected into 20 mL bottles once a weekfrom the larger bottles. The 20 mL samples were filtered toremove suspended sediment and refrigerated at 47C until an-alyzed. To calculate the total loss of , its concentration2NO -N3
in drain flow was multiplied by the drainage volume for theperiod since the last collection of samples. Between July andOctober 1994, 20 mL water samples were withdrawn once aweek from the 2.0-m-deep wells with the help of a suctionhand-pump. They were treated in the same way as the draindischarge samples. The levels were measured colorimet-2NO3
rically [method modified from Keeney and Nelson (1982)] us-
RRIGATION AND DRAINAGE ENGINEERING / MARCH/APRIL 1999 / 53
ing an autoanalyzer (Quik Chem qAE, Lachat Instruments,Milwaukee, WI).
Measurement of Denitrification
Denitrification rates (kg N day21) were measured biweeklyfrom May 25, 1994, to Oct 12, 1994. Measurements were per-formed using the acetylene inhibition method (Aulakh et al.1982). Aluminum cylinders (60 mm i.d. 3 150 mm long),similar to those used by Liang (1992), were pushed into thesoil to collect soil samples from the top 0.15 m of the soilprofile. Each cylinder had small holes punched in the sides toallow gaseous diffusion. Cylinders were obtained from eachreplicate of the eight treatment combinations and placed in 2L plastic jars. To inhibit nitrification and prevent reduction ofN2O to nitrogen, pure acetylene was injected into each jar tobring the acetylene to 5% (v/v). Samples were subsequentlyincubated for 24 hours outdoors, under shade, providing sim-ilar temperature conditions to those in the field. Nitrous oxide(N2O) in the head space was measured by collecting 1 mL gassamples from the jars and injecting them into a 5870 Series-II Hewlett-Packard gas chromatography equipped with a Tra-cor electron capture linearizer and operated with a Tracor 63Nielectron-capture detector (Aulakh et al. 1982). The quantity ofN2O emission per jar was calculated using the known volumeof air inside the jar and N2O concentration. Total N lossthrough denitrification was calculated per area basis (kg Nha21). Preliminary experiments showed that over 90% of N2Oproduction from denitrification occurred in the top 0.15 m ofthe soil. This is likely attributable to (1) the organic carboncontent below the 0.15 m depth of the profile being 1% orless, whereas it was 5% in the surface layer; and (2) the factthat the majority of the from applied fertilizer was in the2NO3
surface layer. It was thus assumed that denitrification in thetop 0.15 m of the soil was highly representative of the overallrate of denitrification.
Water Balance
Rainfall was measured on site. Pan evaporation was mea-sured at Macdonald Campus using a class A evaporation pan.Evapotranspiration (ET) was calculated from pan evaporationdata, as follows:
ET = K K ET (1)c pan pan
where Kc = crop factor; and Kpan = pan factor. Using Food andAgriculture Organization guidelines (Doorenbos et al. 1979),monthly values of Kc and Kpan were estimated for May throughOctober. For both years, values of Kc were 0.3, 1.0, 0.8, 0.6,0.3, and 0.3, and values for Kpan were 0.75, 0.80, 0.80, 0.80,0.80, and 0.75, for May, June, July, August, September, andOctober, respectively.
A water balance was carried out in block 2 where soil mois-ture data were available from July to October. Deep seepagelosses were calculated for each treatment using averagemonthly irrigation and tile flow data for each water table treat-ment, based on the following equation:
P 1 I = DS 1 Q 1 ET 1 DS (2)t
where P = precipitation (mm); I = subirrigation water (mm);DS = change in soil moisture (mm); Qt = tile flow (mm); ET= evapotranspiration (mm) from cropped land; and DS = deepseepage (mm). Deep seepage was negatively correlated withET and positively correlated to the five-day antecedent averagedaily precipitation, calculated as the mean daily precipitationin the previous five days [(3)–(5)]. Equations expressing deepseepage as a function of five-day antecedent average daily pre-cipitation (FDAP) and ET had significant (a = 0.01) R2 valuesfor all WTDs.
54 / JOURNAL OF IRRIGATION AND DRAINAGE ENGINEERING / MARCH
2Seepage = 0.79 FDAP 2 0.6 ET 1 1.81 R = 0.56 (3)WTD=0.7 m
2Seepage = 0.77 FDAP 2 0.7 ET 1 1.23 R = 0.69 (4)WTD=0.8 m
2Seepage = 0.68 FDAP 2 1.1 ET R = 0.71 (5)WTD=1.0 m
These relationships were used to estimate deep seepage forperiods where data for a complete water balance were notavailable. The below the drains, multiplied by the2[NO -N]3
volume of water lost through deep seepage, gave the quantityof nitrogen lost through deep seepage.
Statistical Analysis
Drain flow quantity and levels therein were moni-2NO -N3
tored from September 1993 to December 1994. Analysis ofvariance was carried out to assess the impact of the treatmentson drain flow, nitrate concentration, and the total amount of
leached each month using the SAS procedure GLM2NO -N3
(General Linear Models) and analysis of repeated measures(SAS user’s guide 1985). The repeated measures option wasused to analyze monthly drain flow and seasonal average con-centration of nitrate N in drainage water. Orthogonal contrastswere employed to perform preplanned comparisons of fertil-izer rates and water table depths. When testing for N2NO -N3
fertilization rate effects, only the F1.0MN270, F1.0MN180, andF1.0MN0 treatments were considered. The F1.0MN180 andF1.0MN0 treatments were ignored when testing for the effectsof water table depth and cropping systems because the 0 and180 kg N ha21 fertilizer rates were only applied to the freedrainage monocropped plots. The writers did not have suffi-cient experimental plots to include more treatments. The sig-nificance criterion adopted was P # 0.05.
RESULTS AND DISCUSSION
Analysis of Tile Flow
Drain flow measurements commenced in September 1993;therefore, data for the fall of 1993 and for all of 1994 arepresented herein. The fall of 1993 exhibited higher drain flowthan the fall of 1994, because of greater precipitation in 1993(Fig. 1). In September, October, and November 1993, precip-itation was 52%, 256%, and 55% higher, respectively, than theprecipitation in the same months of 1994. Overall, precipita-tion during fall 1994 was only about 50% of the precipitationin fall 1993.
During both growing seasons, plots receiving a greater Nfertilizer application rate had a greater rate of drainage thanthose without fertilizer N (Table 2). Tile flow differences dueto fertilizer application rate started in August, after establish-ment of the corn (Fig. 1). Although the writers did not measureroot distribution, it appeared there was poorer root develop-ment in the plots without N fertilizer than in the highly fertil-ized plots. This is supported by the fact that, while no differ-ences in grain yield existed between any of the N180 and N270
treatments for any WTD, yield for the unfertilized treatmentwas significantly lower than for all other treatments. This, inturn, could cause differences in infiltration capacity and,hence, differences in drainage characteristics. Such differencescould, for example, be explained by greater macropore flowin the fertilized treatments than the unfertilized one.
During the growing season, the writers observed generallyless drainage in subirrigated plots than in freely draining plots(Fig. 1). For instance, in October 1993, the F1.0MN270 treatmentdischarged more tile flow (126.0 mm) than the S0.7MN270 andS0.8MN270 treatments, which discharged 27.4 and 41.8 mm, re-spectively. Similarly, Evans et al. (1995) showed a 30% re-duction in drain flow under controlled drainage, as comparedwith conventional drainage. However, the difference in drainflow over the growing season was usually less than 15%. In
/APRIL 1999
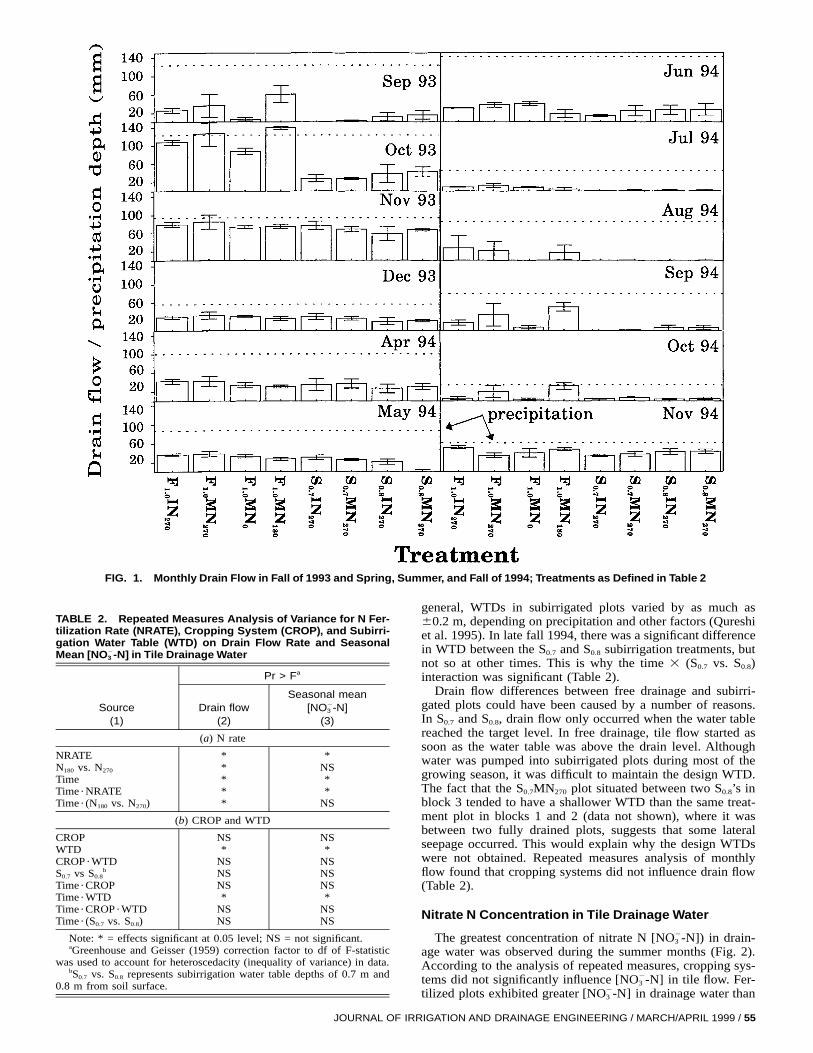
FIG. 1. Monthly Drain Flow in Fall of 1993 and Spring, Summer, and Fall of 1994; Treatments as Defined in Table 2
TABLE 2. Repeated Measures Analysis of Variance for N Fer-tilization Rate (NRATE), Cropping System (CROP), and Subirri-gation Water Table (WTD) on Drain Flow Rate and SeasonalMean in Tile Drainage Water2[NO -N]3
Source(1)
Pr > Fa
Drain flow(2)
Seasonal mean2[NO -N]3
(3)
(a) N rate
NRATE * *N180 vs. N270 * NSTime * *Time ?NRATE * *Time ? (N180 vs. N270) * NS
(b) CROP and WTD
CROP NS NSWTD * *CROP ?WTD NS NSS0.7 vs S0.8
b NS NSTime ?CROP NS NSTime ?WTD * *Time ?CROP ?WTD NS NSTime ? (S0.7 vs. S0.8) NS NS
Note: * = effects significant at 0.05 level; NS = not significant.aGreenhouse and Geisser (1959) correction factor to df of F-statistic
was used to account for heteroscedacity (inequality of variance) in data.bS0.7 vs. S0.8 represents subirrigation water table depths of 0.7 m and
0.8 m from soil surface.
JOURNAL OF IR
general, WTDs in subirrigated plots varied by as much as60.2 m, depending on precipitation and other factors (Qureshiet al. 1995). In late fall 1994, there was a significant differencein WTD between the S0.7 and S0.8 subirrigation treatments, butnot so at other times. This is why the time 3 (S0.7 vs. S0.8)interaction was significant (Table 2).
Drain flow differences between free drainage and subirri-gated plots could have been caused by a number of reasons.In S0.7 and S0.8, drain flow only occurred when the water tablereached the target level. In free drainage, tile flow started assoon as the water table was above the drain level. Althoughwater was pumped into subirrigated plots during most of thegrowing season, it was difficult to maintain the design WTD.The fact that the S0.7MN270 plot situated between two S0.8’s inblock 3 tended to have a shallower WTD than the same treat-ment plot in blocks 1 and 2 (data not shown), where it wasbetween two fully drained plots, suggests that some lateralseepage occurred. This would explain why the design WTDswere not obtained. Repeated measures analysis of monthlyflow found that cropping systems did not influence drain flow(Table 2).
Nitrate N Concentration in Tile Drainage Water
The greatest concentration of nitrate N in drain-2[NO -N])3
age water was observed during the summer months (Fig. 2).According to the analysis of repeated measures, cropping sys-tems did not significantly influence in tile flow. Fer-2[NO -N]3
tilized plots exhibited greater in drainage water than2[NO -N]3
RIGATION AND DRAINAGE ENGINEERING / MARCH/APRIL 1999 / 55
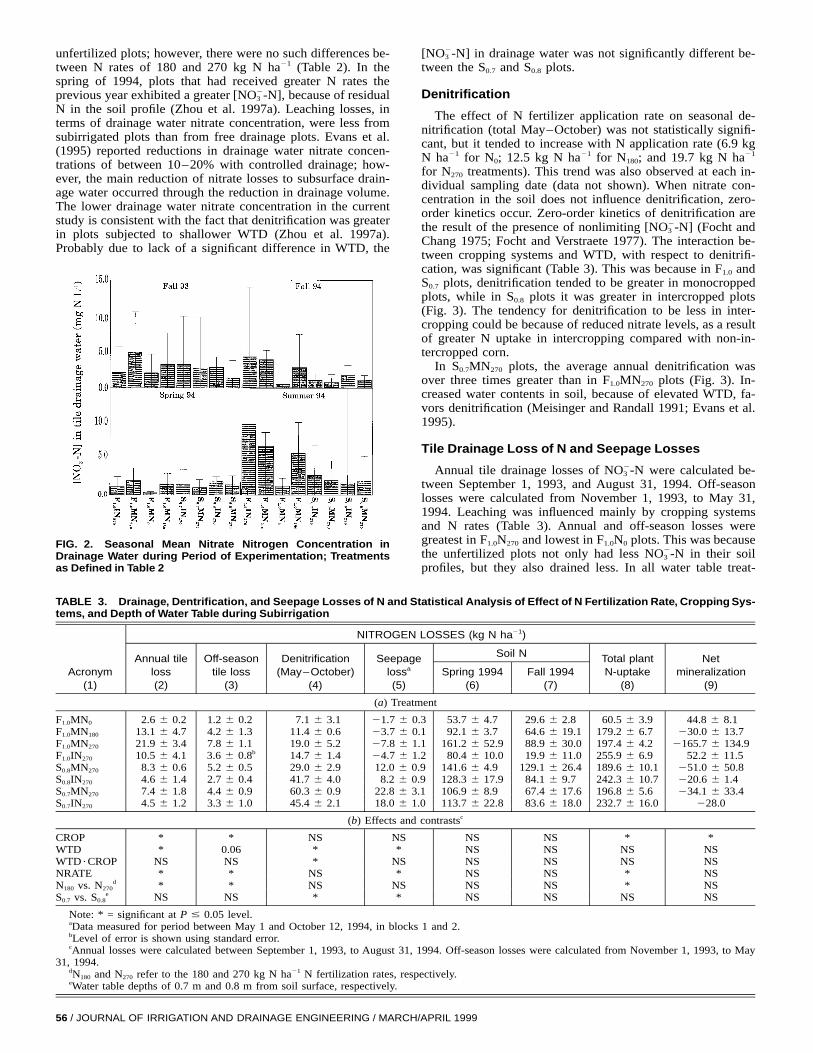
FIG. 2. Seasonal Mean Nitrate Nitrogen Concentration inDrainage Water during Period of Experimentation; Treatmentsas Defined in Table 2
unfertilized plots; however, there were no such differences be-tween N rates of 180 and 270 kg N ha21 (Table 2). In thespring of 1994, plots that had received greater N rates theprevious year exhibited a greater because of residual2[NO -N],3
N in the soil profile (Zhou et al. 1997a). Leaching losses, interms of drainage water nitrate concentration, were less fromsubirrigated plots than from free drainage plots. Evans et al.(1995) reported reductions in drainage water nitrate concen-trations of between 10–20% with controlled drainage; how-ever, the main reduction of nitrate losses to subsurface drain-age water occurred through the reduction in drainage volume.The lower drainage water nitrate concentration in the currentstudy is consistent with the fact that denitrification was greaterin plots subjected to shallower WTD (Zhou et al. 1997a).Probably due to lack of a significant difference in WTD, the
56 / JOURNAL OF IRRIGATION AND DRAINAGE ENGINEERING / MARC
in drainage water was not significantly different be-2[NO -N]3
tween the S0.7 and S0.8 plots.
Denitrification
The effect of N fertilizer application rate on seasonal de-nitrification (total May–October) was not statistically signifi-cant, but it tended to increase with N application rate (6.9 kgN ha21 for N0; 12.5 kg N ha21 for N180; and 19.7 kg N ha21
for N270 treatments). This trend was also observed at each in-dividual sampling date (data not shown). When nitrate con-centration in the soil does not influence denitrification, zero-order kinetics occur. Zero-order kinetics of denitrification arethe result of the presence of nonlimiting (Focht and2[NO -N]3
Chang 1975; Focht and Verstraete 1977). The interaction be-tween cropping systems and WTD, with respect to denitrifi-cation, was significant (Table 3). This was because in F1.0 andS0.7 plots, denitrification tended to be greater in monocroppedplots, while in S0.8 plots it was greater in intercropped plots(Fig. 3). The tendency for denitrification to be less in inter-cropping could be because of reduced nitrate levels, as a resultof greater N uptake in intercropping compared with non-in-tercropped corn.
In S0.7MN270 plots, the average annual denitrification wasover three times greater than in F1.0MN270 plots (Fig. 3). In-creased water contents in soil, because of elevated WTD, fa-vors denitrification (Meisinger and Randall 1991; Evans et al.1995).
Tile Drainage Loss of N and Seepage Losses
Annual tile drainage losses of were calculated be-2NO -N3
tween September 1, 1993, and August 31, 1994. Off-seasonlosses were calculated from November 1, 1993, to May 31,1994. Leaching was influenced mainly by cropping systemsand N rates (Table 3). Annual and off-season losses weregreatest in F1.0N270 and lowest in F1.0N0 plots. This was becausethe unfertilized plots not only had less in their soil2NO -N3
profiles, but they also drained less. In all water table treat-
TABLE 3. Drainage, Dentrification, and Seepage Losses of N and Statistical Analysis of Effect of N Fertilization Rate, Cropping Sys-tems, and Depth of Water Table during Subirrigation
Acronym(1)
NITROGEN LOSSES (kg N ha21)
Annual tileloss(2)
Off-seasontile loss
(3)
Denitrification(May–October)
(4)
Seepagelossa
(5)
Soil N
Spring 1994(6)
Fall 1994(7)
Total plantN-uptake
(8)
Netmineralization
(9)
(a) Treatment
F1.0MN0 2.6 6 0.2 1.2 6 0.2 7.1 6 3.1 21.7 6 0.3 53.7 6 4.7 29.6 6 2.8 60.5 6 3.9 44.8 6 8.1F1.0MN180 13.1 6 4.7 4.2 6 1.3 11.4 6 0.6 23.7 6 0.1 92.1 6 3.7 64.6 6 19.1 179.2 6 6.7 230.0 6 13.7F1.0MN270 21.9 6 3.4 7.8 6 1.1 19.0 6 5.2 27.8 6 1.1 161.2 6 52.9 88.9 6 30.0 197.4 6 4.2 2165.7 6 134.9F1.0IN270 10.5 6 4.1 3.6 6 0.8b 14.7 6 1.4 24.7 6 1.2 80.4 6 10.0 19.9 6 11.0 255.9 6 6.9 52.2 6 11.5S0.8MN270 8.3 6 0.6 5.2 6 0.5 29.0 6 2.9 12.0 6 0.9 141.6 6 4.9 129.1 6 26.4 189.6 6 10.1 251.0 6 50.8S0.8IN270 4.6 6 1.4 2.7 6 0.4 41.7 6 4.0 8.2 6 0.9 128.3 6 17.9 84.1 6 9.7 242.3 6 10.7 220.6 6 1.4S0.7MN270 7.4 6 1.8 4.4 6 0.9 60.3 6 0.9 22.8 6 3.1 106.9 6 8.9 67.4 6 17.6 196.8 6 5.6 234.1 6 33.4S0.7IN270 4.5 6 1.2 3.3 6 1.0 45.4 6 2.1 18.0 6 1.0 113.7 6 22.8 83.6 6 18.0 232.7 6 16.0 228.0
(b) Effects and contrastsc
CROP * * NS NS NS NS * *WTD * 0.06 * * NS NS NS NSWTD ?CROP NS NS * NS NS NS NS NSNRATE * * NS * NS NS * NSN180 vs. N270
d * * NS NS NS NS * NSS0.7 vs. S0.8
e NS NS * * NS NS NS NS
Note: * = significant at P # 0.05 level.aData measured for period between May 1 and October 12, 1994, in blocks 1 and 2.bLevel of error is shown using standard error.cAnnual losses were calculated between September 1, 1993, to August 31, 1994. Off-season losses were calculated from November 1, 1993, to May
31, 1994.dN180 and N270 refer to the 180 and 270 kg N ha21 N fertilization rates, respectively.eWater table depths of 0.7 m and 0.8 m from soil surface, respectively.
H/APRIL 1999
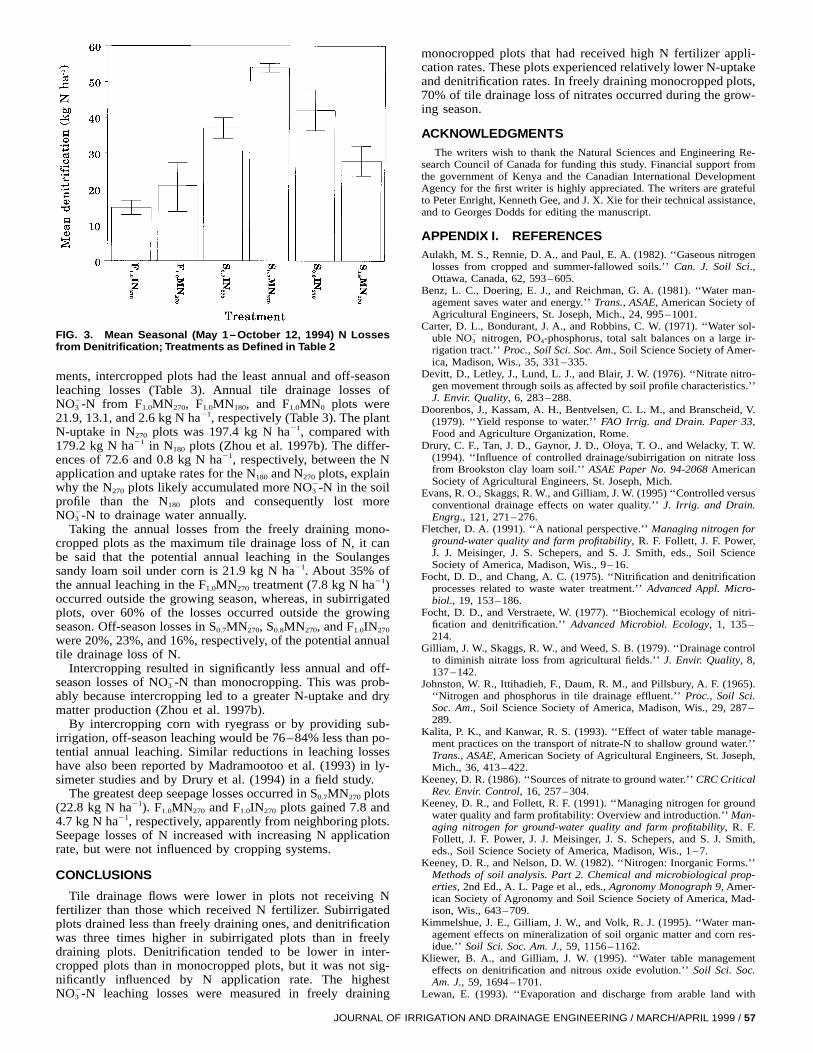
FIG. 3. Mean Seasonal (May 1–October 12, 1994) N Lossesfrom Denitrification; Treatments as Defined in Table 2
ments, intercropped plots had the least annual and off-seasonleaching losses (Table 3). Annual tile drainage losses of
from F1.0MN270, F1.0MN180, and F1.0MN0 plots were2NO -N3
21.9, 13.1, and 2.6 kg N ha21, respectively (Table 3). The plantN-uptake in N270 plots was 197.4 kg N ha21, compared with179.2 kg N ha21 in N180 plots (Zhou et al. 1997b). The differ-ences of 72.6 and 0.8 kg N ha21, respectively, between the Napplication and uptake rates for the N180 and N270 plots, explainwhy the N270 plots likely accumulated more in the soil2NO -N3
profile than the N180 plots and consequently lost moreto drainage water annually.2NO -N3
Taking the annual losses from the freely draining mono-cropped plots as the maximum tile drainage loss of N, it canbe said that the potential annual leaching in the Soulangessandy loam soil under corn is 21.9 kg N ha21. About 35% ofthe annual leaching in the F1.0MN270 treatment (7.8 kg N ha21)occurred outside the growing season, whereas, in subirrigatedplots, over 60% of the losses occurred outside the growingseason. Off-season losses in S0.7MN270, S0.8MN270, and F1.0IN270
were 20%, 23%, and 16%, respectively, of the potential annualtile drainage loss of N.
Intercropping resulted in significantly less annual and off-season losses of than monocropping. This was prob-2NO -N3
ably because intercropping led to a greater N-uptake and drymatter production (Zhou et al. 1997b).
By intercropping corn with ryegrass or by providing sub-irrigation, off-season leaching would be 76–84% less than po-tential annual leaching. Similar reductions in leaching losseshave also been reported by Madramootoo et al. (1993) in ly-simeter studies and by Drury et al. (1994) in a field study.
The greatest deep seepage losses occurred in S0.7MN270 plots(22.8 kg N ha21). F1.0MN270 and F1.0IN270 plots gained 7.8 and4.7 kg N ha21, respectively, apparently from neighboring plots.Seepage losses of N increased with increasing N applicationrate, but were not influenced by cropping systems.
CONCLUSIONS
Tile drainage flows were lower in plots not receiving Nfertilizer than those which received N fertilizer. Subirrigatedplots drained less than freely draining ones, and denitrificationwas three times higher in subirrigated plots than in freelydraining plots. Denitrification tended to be lower in inter-cropped plots than in monocropped plots, but it was not sig-nificantly influenced by N application rate. The highest
leaching losses were measured in freely draining2NO -N3
JOURNAL OF IR
monocropped plots that had received high N fertilizer appli-cation rates. These plots experienced relatively lower N-uptakeand denitrification rates. In freely draining monocropped plots,70% of tile drainage loss of nitrates occurred during the grow-ing season.
ACKNOWLEDGMENTSThe writers wish to thank the Natural Sciences and Engineering Re-
search Council of Canada for funding this study. Financial support fromthe government of Kenya and the Canadian International DevelopmentAgency for the first writer is highly appreciated. The writers are gratefulto Peter Enright, Kenneth Gee, and J. X. Xie for their technical assistance,and to Georges Dodds for editing the manuscript.
APPENDIX I. REFERENCESAulakh, M. S., Rennie, D. A., and Paul, E. A. (1982). ‘‘Gaseous nitrogen
losses from cropped and summer-fallowed soils.’’ Can. J. Soil Sci.,Ottawa, Canada, 62, 593–605.
Benz, L. C., Doering, E. J., and Reichman, G. A. (1981). ‘‘Water man-agement saves water and energy.’’ Trans., ASAE, American Society ofAgricultural Engineers, St. Joseph, Mich., 24, 995–1001.
Carter, D. L., Bondurant, J. A., and Robbins, C. W. (1971). ‘‘Water sol-uble nitrogen, PO4-phosphorus, total salt balances on a large ir-2NO3
rigation tract.’’ Proc., Soil Sci. Soc. Am., Soil Science Society of Amer-ica, Madison, Wis., 35, 331–335.
Devitt, D., Letley, J., Lund, L. J., and Blair, J. W. (1976). ‘‘Nitrate nitro-gen movement through soils as affected by soil profile characteristics.’’J. Envir. Quality, 6, 283–288.
Doorenbos, J., Kassam, A. H., Bentvelsen, C. L. M., and Branscheid, V.(1979). ‘‘Yield response to water.’’ FAO Irrig. and Drain. Paper 33,Food and Agriculture Organization, Rome.
Drury, C. F., Tan, J. D., Gaynor, J. D., Oloya, T. O., and Welacky, T. W.(1994). ‘‘Influence of controlled drainage/subirrigation on nitrate lossfrom Brookston clay loam soil.’’ ASAE Paper No. 94-2068 AmericanSociety of Agricultural Engineers, St. Joseph, Mich.
Evans, R. O., Skaggs, R. W., and Gilliam, J. W. (1995) ‘‘Controlled versusconventional drainage effects on water quality.’’ J. Irrig. and Drain.Engrg., 121, 271–276.
Fletcher, D. A. (1991). ‘‘A national perspective.’’ Managing nitrogen forground-water quality and farm profitability, R. F. Follett, J. F. Power,J. J. Meisinger, J. S. Schepers, and S. J. Smith, eds., Soil ScienceSociety of America, Madison, Wis., 9–16.
Focht, D. D., and Chang, A. C. (1975). ‘‘Nitrification and denitrificationprocesses related to waste water treatment.’’ Advanced Appl. Micro-biol., 19, 153–186.
Focht, D. D., and Verstraete, W. (1977). ‘‘Biochemical ecology of nitri-fication and denitrification.’’ Advanced Microbiol. Ecology, 1, 135–214.
Gilliam, J. W., Skaggs, R. W., and Weed, S. B. (1979). ‘‘Drainage controlto diminish nitrate loss from agricultural fields.’’ J. Envir. Quality, 8,137–142.
Johnston, W. R., Ittihadieh, F., Daum, R. M., and Pillsbury, A. F. (1965).‘‘Nitrogen and phosphorus in tile drainage effluent.’’ Proc., Soil Sci.Soc. Am., Soil Science Society of America, Madison, Wis., 29, 287–289.
Kalita, P. K., and Kanwar, R. S. (1993). ‘‘Effect of water table manage-ment practices on the transport of nitrate-N to shallow ground water.’’Trans., ASAE, American Society of Agricultural Engineers, St. Joseph,Mich., 36, 413–422.
Keeney, D. R. (1986). ‘‘Sources of nitrate to ground water.’’ CRC CriticalRev. Envir. Control, 16, 257–304.
Keeney, D. R., and Follett, R. F. (1991). ‘‘Managing nitrogen for groundwater quality and farm profitability: Overview and introduction.’’ Man-aging nitrogen for ground-water quality and farm profitability, R. F.Follett, J. F. Power, J. J. Meisinger, J. S. Schepers, and S. J. Smith,eds., Soil Science Society of America, Madison, Wis., 1–7.
Keeney, D. R., and Nelson, D. W. (1982). ‘‘Nitrogen: Inorganic Forms.’’Methods of soil analysis. Part 2. Chemical and microbiological prop-erties, 2nd Ed., A. L. Page et al., eds., Agronomy Monograph 9, Amer-ican Society of Agronomy and Soil Science Society of America, Mad-ison, Wis., 643–709.
Kimmelshue, J. E., Gilliam, J. W., and Volk, R. J. (1995). ‘‘Water man-agement effects on mineralization of soil organic matter and corn res-idue.’’ Soil Sci. Soc. Am. J., 59, 1156–1162.
Kliewer, B. A., and Gilliam, J. W. (1995). ‘‘Water table managementeffects on denitrification and nitrous oxide evolution.’’ Soil Sci. Soc.Am. J., 59, 1694–1701.
Lewan, E. (1993). ‘‘Evaporation and discharge from arable land with
RIGATION AND DRAINAGE ENGINEERING / MARCH/APRIL 1999 / 57
cropped or bare soils during winter. Measurements and simulations.’’Argric. and Forest Meteorology, 64, 131–159.
Liang, B. C. (1992). ‘‘A study of corn production and nitrogen cyclingin the plant-soil system,’’ PhD thesis, Dept. of Renewable Resour.,McGill Univ., Montreal, QC, Canada.
Madramootoo, C. A., Dodds, G. T., and Papadopoulos, A. (1993). ‘‘Ag-ronomic and environmental benefits of water table management.’’ J.Irrig. and Drain. Engrg., 119, 1052–1065.
Madramootoo, C. A., Wiyo, K. A., and Enright, P. (1992). ‘‘Nutrientlosses through tile drains from two potato fields.’’ Appl. Engrg. inAgric., 8, 639–646.
Meek, D. B., Grass, L. B., and MacKenzie, A. J. (1969). ‘‘Applied nitro-gen losses in relation to oxygen status of soils.’’ Proc., Soil Sci. Soc.Am., Madison, Wis., 33, 575–578.
Meisinger, J. J., Hargrove, W. L., Mikkelsen, R. L., Williams, J. R.,and Benson, V. W. (1991). ‘‘Effects of cover crops on ground-waterquality.’’ Cover Crops for Clean Water: Proc., Int. Conf., W. L. Har-grove, ed., Soil and Water Conservation Society, Ankeny, Iowa, 57–68.
Meisinger, J. J., and Randall, G. W. (1991). ‘‘Estimating nitrogen budgetsfor soil-crop systems.’’ Managing nitrogen for ground-water qualityand farm profitability, R. F. Follett, J. F. Power, J. J. Meisinger, J. S.Schepers, and S. J. Smith, eds., Soil Science Society of America, Mad-ison, Wis., 85–122.
Qureshi, S, Dodds, G. T., and Madramootoo, C. A. (1995). ‘‘Effect ofsubirrigation and intercropping of ryegrass in maize on soil moistureand water table levels in a sandy loam soil in Quebec.’’ CSAEPaper 95-118, Canadian Society of Agricultural Engineering, Ottawa,Canada.
SAS user’s guide: Statistics, Version 5. (1985). SAS Institute, Cary, N. C.Tait, R. K., Madramootoo, C. A., and Enright, P. (1995). ‘‘An instru-mented, field-scale research facility for drainage and water quality stud-ies.’’ Comp. and Electronics in Agr., 12, 131–145.
Woodruff, J. R., Ligon, J. T., and Smith, B. R. (1984). ‘‘Water tableinteraction with nitrogen rates in subirrigated corn.’’ Agron. J., 76,280–283.
Zhou, X., MacKenzie, A. F., Madramootoo, C. A., Kaluli, J. W.,and Smith, D. L. (1997a). ‘‘Management practices to conserve soilnitrate in maize production systems.’’ J. Envir. Quality, 26, 1369–1374.
Zhou, X., Madramootoo, C. A., MacKenzie, A. F., Kaluli, J. W., andSmith, D. L. (1997b). ‘‘Biomass production and nitrogen uptake bycorn-ryegrass system.’’ Agron. J., 89, 749–756.
58 / JOURNAL OF IRRIGATION AND DRAINAGE ENGINEERING / MARCH
APPENDIX II. NOTATION
The following symbols are used in this paper:
DS = deep seepage;ET = evapotranspiration;
FDAP = five-day antecedent average daily precipitation;F1.0 = freely drained plot with mean seasonal field-mea-
sured water table at approximately 1.0 m from soilsurface;
I = subirrigation water;K = potassium;Kc = crop factor for calculating ET from evaporation pan
data;Kpan = pan factor for calculating ET from evaporation pan
data;Ksat = saturated hydraulic conductivity;
N = nitrogen;N0 = plots receiving no nitrogen fertilization;
N180 = plots receiving 180 kg N ha21;N270 = plots receiving 270 kg N ha21;
2NO2 = nitrite;2NO3 = nitrate;
2NO -N3 = nitrate nitrogen;2[NO -N]3 = concentration of nitrate nitrogen;N2O = nitrous oxide;
P = phosphorus;P = precipitation;
tQ2 = drain flow;R = linear correlation coefficient;
S0.7 = subirrigated plot with mean seasonal field-measuredwater table at 0.7 m from soil surface;
S0.8 = subirrigated plot with mean seasonal field-measuredwater table at 0.8 m from soil surface;
WTD = water table depths(s);DS = change in soil moisture;usat = soil saturated moisture content;uwp = soil moisture content at wilting point; and
% org-C = percent organic carbon in soil.
/APRIL 1999