genetic divergence along the speciation continuum: the transition from host race to species in...
TRANSCRIPT
SPECIAL SECTION
doi:10.1111/evo.12209
GENETIC DIVERGENCE ALONG THESPECIATION CONTINUUM: THE TRANSITIONFROM HOST RACE TO SPECIES IN RHAGOLETIS(DIPTERA: TEPHRITIDAE)Thomas H. Q. Powell,1,2 Glen R. Hood,1 Mason O. Murphy,1 Jeffrey S. Heilveil,3,4 Stewart H. Berlocher,3
Patrik Nosil,5 and Jeffrey L. Feder1,6
1Department of Biological Sciences, University of Notre Dame, 290C Galvin Life Sciences Building, Notre Dame,
Indiana 465562E-mail: [email protected]
3Department of Entomology, University of Illinois at Urbana-Champaign, 320 Morrill Hall, Urbana, Illinois 618014Current address: Department of Biology, 115 Science I, SUNY College at Oneonta, Oneonta, New York 138205Department of Animal and Plant Sciences, University of Sheffield, Sheffield, S10 2TN, United Kingdom6Environmental Change Initiative and Advanced Diagnostics and Therapeutics, University of Notre Dame, Notre Dame,
Indiana 46556
Received August 27, 2012
Accepted June 28, 2013
Data Archived: Dryad doi:10.5061/dryad.mt2hk
Studies of related populations varying in their degrees of reproductive isolation can provide insights into speciation. Here, the
transition from partially isolated host races to more fully separated sibling species is investigated by comparing patterns of genetic
differentiation between recently evolved (!150 generations) apple and ancestral hawthorn-infesting populations of Rhagoletis
pomonella to their sister taxon, the undescribed flowering dogwood fly attacking Cornus florida. No fixed or diagnostic private
alleles differentiating the three populations were found at any of 23 microsatellites and 10 allozymes scored. Nevertheless,
allele frequency differences were sufficient across loci for flowering dogwood fly populations from multiple localities to form
a diagnosable genotypic cluster distinct from apple and hawthorn flies, indicative of species status. Genome-wide patterns
of differentiation were correlated between the host races and species pair comparisons along the majority of chromosomes,
suggesting that similar disruptive selection pressures affect most loci. However, differentiation was more pronounced, with some
additional regions showing elevated divergence, for the species pair comparison. Our results imply that Rhagoletis sibling species
such as the flowering dogwood fly represent host races writ large, with the transition to species status primarily resulting from
increased divergence of the same regions separating apple and hawthorn flies.
KEY WORDS: Divergence hitchhiking, genomic divergence, genome hitchhiking, latitudinal cline, speciation with gene flow.
“ . . . these . . . forms may still be only well-marked vari-eties; . . . but we have only to suppose that the steps in theprocess of modification to be more numerous or greater inamount, to convert these . . . forms into well-defined species.”
Darwin (1859), On the Origins of Species, p. 120
Much progress has been made in understanding speciation(Coyne and Orr 2004). Nevertheless, fundamental questions re-
main, especially when speciation occurs without geographic bar-riers to gene flow (Bolnick and Fitzpatrick 2007). Although in-sights have come into the mechanisms underlying reproductiveisolation, it is still unclear when during the divergence processpopulations may be considered species, as opposed to varietiesor races (Hey and Pihno 2012). Although advances have beenmade in resolving the genetic basis for reproductive isolation,
2 5 6 1C! 2013 The Author(s). Evolution C! 2013 The Society for the Study of Evolution.Evolution 67-9: 2561–2576
SPECIAL SECTION
the importance of standing variation versus new mutations and ofgenome structure in facilitating speciation remain to be resolved(Nosil and Feder 2012; Feder et al. 2013).
Analyses of genome-wide patterns of differentiation betweentaxa represent a powerful approach to addressing these ques-tions. By comparing related populations at different stages ofdivergence, inferences can be made concerning how genetic dif-ferentiation accumulates as speciation proceeds. Although thesepopulations do not represent a single evolutionary progression,it is reasonable to assume that most taxa will pass throughthese representative stages as they diverge. Many examinationsof the “speciation continuum” have focused on metrics of over-all genetic divergence rather than the genome-wide distributionof differentiation (Ayala et al. 1974; Avise and Smith 1977;Zimmerman et al. 1978; Nosil and Sandoval 2008; Seehausen2008; Berner et al. 2009; Hendry et al. 2009; Peccoud et al. 2009;Merrill et al. 2011). Here, we investigate patterns of differenti-ation in the genome of Rhagoletis pomonella (Walsh) (Diptera:Tephritidae) flies as they transition from partially reproductivelyisolated host races to more fully isolated sibling species. Specifi-cally, we compare patterns of microsatellite and allozyme differ-entiation between apple-infesting (Malus domestica Borkh.) andhawthorn-infesting (Crataegus spp. L.) host races of R. pomonellaand the flowering dogwood fly (dogwood fly hereafter), the sis-ter taxon of R. pomonella infesting the fruit of flowering dog-wood (Cornus florida L.). Apple, hawthorn, and dogwood fliesare closely related members of the R. pomonella species complex(Berlocher 1999, 2000), a model for speciation with gene flowfor phytophagous insects (Funk et al. 2002). The known naturalhistory and biology of these flies (see below) make them idealfor examining the nature of species, the genetic source of varia-tion fueling differentiation, and the role of genome structure inspeciation.
WHAT IS A SPECIES?
What constitutes a species has long been a topic of debate(Mayden 1997; Hey 2001; De Queiroz 2007; Hausdorf 2011).If genetic differentiation accumulates continuously during speci-ation with gene flow, then is there a threshold between ecologicalraces and species and how do existing species concepts apply tothis question? Here, we attempt to resolve the status of apple andhawthorn versus dogwood flies based on patterns of genomic dif-ferentiation in reference to two species concepts: (1) the biologicalspecies concept (BSC) that defines species based on reproductiveisolation (Mayr 1942, 1963, 2001; Coyne and Orr 2004); and (2)genic species concepts that consider reproductive isolation to bea characteristic of specific loci (Mallet 1995; Feder 1998; Wu2001). Originally, the BSC considered reproductive isolation tobe a characteristic of the genome due to extensive epistatic coad-aptation among loci precluding gene flow genome-wide (Mayr
1969). This view eventually softened such that Mayr (2001) laterconsider species to represent reproductive communities that werenot necessarily separated by complete barriers to gene flow acrossthe genome. This version of the BSC therefore converged to somedegree with more recent genic species concepts. In practice, boththe BSC and genic species concepts are usually implemented bydetermining whether populations form recognizable genotypicclusters in sympatry (Mallet 2008). Here, we examine whethersuch clusters can be distinguished using allele frequency differ-ences, as opposed to private or fixed variants, and discuss howclustering patterns may relate to host race versus species status inRhagoletis.
WHAT IS THE GENETIC SOURCE OF VARIATION
FUELING SPECIATION?
Whether standing variation or novel mutations are the primarysource of variation fueling divergence can have important con-sequences for the tempo of speciation with gene flow. Standingvariation may allow populations to rapidly colonize and adaptto novel habitats, spawning new incipient species (Barrett andSchluter 2008). In contrast, if de novo mutations are required,then ecological divergence may stall until the necessary mutationsarise and establish in populations. When populations are small andsurvival in a new environment requires adaptation along multipledimensions, the delay can limit diversification, especially whena degree of hard selection is acting. When multiple copies of apreadapted allele exist in the ancestral population, however, thereis a higher probability that the allele will establish in the novelhabitat and not be lost stochastically compared to a new mu-tation. Although theory predicts an important role for standingvariation in initiating speciation with gene flow (Hermisson andPennings 2005), empirical data on the issue are generally lack-ing. In addition, it is not clear why populations may possess andmaintain stores of standing variation adaptive to novel environ-ments (Schluter and Conte 2009). Here, we address the questionwhether derived populations of the R. pomonella infesting ap-ple and dogwood are largely defined by shifts in the frequenciesof preexisting alleles in the ancestral hawthorn population or bynovel mutations.
WHAT ROLE DOES GENOME STRUCTURE PLAY IN
SPECIATION WITH GENE FLOW?
Genome structure may play an important role in speciation withgene flow by mitigating the antagonism between selection and re-combination (Felsenstein 1981). One process by which this couldhappen has been termed “divergence hitchhiking” (DH) and in-volves local reductions in effective migration rates (me) betweenpopulations in gene regions physically linked to loci under di-vergent selection (Via and West 2008; Via 2009, 2012). Recenttheory has suggested, however, that the conditions for DH to be
2 5 6 2 EVOLUTION SEPTEMBER 2013

SPECIAL SECTION
effective in aiding the maintenance of existing differentiation andthe establishment of new mutations may be generally restrictedto short recombination distances (e.g., "1 cM) surrounding sitesunder strong selection (e.g., s = 0.5) (Feder and Nosil 2010;Feder et al. 2012a). These findings are consistent with classicwork on panmictic populations implying that hitchhiking effectsare essentially nonexistent at genetic distances r > s/10, and thatmost strong hitchhiking occurs for r # s/100 (Maynard-Smith andHaigh 1974; Wiehe and Stephan 1993).
Another process termed “genome hitchhiking” (GH) mayalso lessen the antagonism between selection and recombinationand facilitate speciation (Feder et al. 2012a). In the case ofGH, average me is reduced globally across the genome by thetotal of divergent selection acting on all loci throughout thegenome, rather than only locally by individual genes. As a result,differentiation is not restricted to isolated islands and divergencecan accumulate across the genome (Michel et al. 2010). It isimportant to note that heterogeneous patterns of differentiationare still expected under GH due to variation in selection strength,recombination rates, and local DH effects; however, patterns ofdivergence will become more homogenous as speciation proceedsand reductions in me become greater and more uniform across thegenome.
DH and GH make different and potentially testable predic-tions concerning patterns of divergence during speciation (Federet al. 2012a, 2013). These predictions, however, represent dif-ferent ends of a spectrum, and it is likely that both processescontribute to speciation. The key question is their relative impor-tance. A recent model of speciation with gene flow has proposedthat populations may go through four sequential stages in whichdirect selection on loci, DH, and GH assume differing relativeimportance in facilitating divergence (Feder et al. 2012b, 2013).Significant allele frequency differences have been observed be-tween the apple and hawthorn-infesting host races of R. pomonellafor a number of markers across the genome (Michel et al. 2010),implying that GH may be important, even in very recent casesof divergence (#150 generations). Here, we investigate whethergenomic differentiation is widespread and accentuated in the flow-ering dogwood fly, the sister taxon to apple and hawthorn flies, ina manner consistent with GH facilitating the transition from hostraces to sibling species.
THE R. POMONELLA SIBLING SPECIES COMPLEX
The R. pomonella species complex comprises a number of popu-lations spanning varying stages of speciation from partially repro-ductively isolated host races to reciprocally monophyletic species(Bush 1969; Berlocher et al. 1993; Berlocher 2000; Xie et al.2008). The outstanding feature of the complex is the contrastdisplayed between the species’ overlapping geographic distribu-tions (most are broadly sympatric in eastern North America) and
close morphological similarity compared to their distinct hostassociations (each species is a specialist on a different, nonover-lapping set of plants). This led Bush (1966) to propose that theR. pomonella complex radiated via a series of sympatric hostshifts. The recent shift of R. pomonella from its native hosthawthorn to introduced apple is a classic example of sympatrichost race formation. Although originally reported in the Hud-son Valley region of New York in the 1860s (Walsh 1867), thederived apple race is now present throughout the northeasternand midwestern United States (Bush 1966), where it co-occursand experiences gene flow from local, native hawthorn-infestingpopulations. Thus, the apple race cannot be characterized ashaving either a single derivation versus multiple origins, as ithas a complex history likely affected by elements of both pro-cesses. Other hypothesized cases of sympatric speciation includethe closely related sibling species R. mendax (host: blueberries),R. zephyria (host: snowberries), and the dogwood fly. Mitochon-drial sequence data suggest that together with R. pomonella,these three taxa form a clade of in-group species rooted by ahawthorn-infesting population of R. pomonella nr. from the Al-tiplano region of Mexico (Xie et al. 2007, 2008; Fig. 1). Nu-clear sequence data imply that over the last 1.5 Ma, severalcycles of allopatry and secondary contact have occurred be-tween the Mexican and U.S. hawthorn fly populations. One re-sult of this introgression was the establishment of adaptive lat-itudinal clines for diapause-related traits in the United States(Feder et al. 2003a). This standing life-history variation mayhave subsequently played a role in the formation of the in-groupR. pomonella taxa by facilitating host shifts onto phenologicallydistinct novel hosts (Feder et al. 2005).
Here, we concentrate on the undescribed dogwood fly thatallozyme studies suggested is the sister taxon to R. pomonella(Berlocher 1999, 2000). The current range of the dogwood fly iscontained entirely within that of hawthorn-infesting populationsof R. pomonella in the eastern United States (Fig. S1). Thedogwood fly’s host, C. florida, grows commonly throughoutmuch of eastern North American, and genetic diversity withinC. florida shows a continuous pattern of variation with littleevidence for previous isolation (Hadziabdic et al. 2010), implyingthat the dogwood fly has not been spatially subdivided in thepast. The dogwood fly is morphologically indistinguishable fromR. pomonella (Bush 1966), and shows little evidence for postzy-gotic or nonhost related prezygotic reproductive isolation (Smith1986). Rather, the dogwood fly is ecologically isolated fromR. pomonella by the same types of host-specific mating (Linnet al. 2005) and diapause (Dambroski and Feder 2007) adapta-tions separating the apple and hawthorn fly races (Feder et al.1994; Linn et al. 2003). The dogwood fly therefore representsa logical focus for investigation into the nature of species andgenomic patterns of differentiation, as all evidence implies that
EVOLUTION SEPTEMBER 2013 2 5 6 3

SPECIAL SECTION
Table 1. Host plant origin, location (latitude [N] and longitude [W] in degrees), data source (provided in the footnotes), year sampled,and number of individuals genotyped (n) for both microsatellite (µsat) and allozyme (allo) genotyping.
Source Year n Source Year n YearHost plant Location # Lat., Long. µsat µsat µsat allo allo allo µsat
Floweringdogwood
Cassopolis, Cass Co., MI 3 42.0, 85.97 New 2006 36 2006
Knollwood, St. Joseph Co., IN 4 41.75, 86.22 New 2010 40 2010I-57 rest stop, Union Co., IL 6 37.47, 89.13 New 2005 57 a 1989 29 2005Reelfoot Lake, Lake Co., TN 7 36.45, 89.3 New 2010 40 2010Kisatchie , Natchitoches Pr., LA 8 31.48, 93.1 New 2007 47 2007SFA For., Nacogdoches Co., TX 9 31.31, 94.46 New 2007 39 a 1989 35 2007Fairfield, Wayne Co., IL 38.43, 88.36 a 1981 76Carbondale, Jackson Co., IL 37.74, 89.22 a 1989 35W. Patman Lake, Bowie Co., TX 32.33, 89.3 a 1989 31Bogalusa, Washington Pr., LA 30.78, 89.85 a 1989 31LSU, E. Baton Rouge Pr., LA 30.40, 91.15 a 1989 35
Hawthorn Grant, Newaygo Co., MI 1 43.35, 85.9 b 2002 48 d 1987 414 2002Fennville, Allegan Co., MI 2 42.6, 86.15 b 2002 96 e 1987 38 2002Dowagiac, Cass Co., MI 3 41.88, 86.23 b 2002 49 e 1987 32 2002Urbana, Champaign Co., IL 5 40.08, 88.23 b 2002 46 e 1986 60 2002New Madrid Co., MO 7 36.53, 89.43 c 2008 41 f 1994 15 2008SFA For., Nacogdoches Co., TX 9 31.31, 94.46 New 2006 94 f 1985 60 2006Jackson Farm, Polk Co., TX 10 30.51, 95.00 New 2006 93 f 1989 34 2006
Apple Grant, Newaygo Co., MI 1 43.35, 85.9 b 2002 47 d 1987 672 2002Fennville, Allegan Co., MI 2 42.6, 86.15 b 2002 96 e 1987 30 2002Dowagiac, Cass Co., MI 3 41.88, 86.23 b 2002 47 e 1987 31 2002Urbana, Champaign Co., IL 5 40.08, 88.23 b 2002 48 e 1986 60 2002
a = Berlocher (1999); b = Michel et al. (2010); c = Cha et al. (2012); d = Feder et al. (1990); e = Feder and Bush (1989); f = Berlcoher and McPheron (1996).
IN = Indiana; IL = Illinois; LA = Louisiana; MI = Michigan; MO = Missouri; TN = Tennessee; TX = Texas.#Site designations shown in Figs. S1 and 4 maps (microsatellite populations only).
it represents the next stage of divergence beyond the apple andhawthorn host races.
Materials and MethodsSAMPLING OF FLIES
Flies were collected in the field as larvae in infested floweringdogwood, hawthorn, and apple fruit from 17 different sites in theeastern United States (Table 1; Fig. S1). These encompassed therange of latitudinal overlap between the apple and hawthorn hostraces of R. pomonella and the dogwood fly. Infested fruit weretransported to the laboratory where larvae were reared to adult-hood using standard Rhagoletis husbandry techniques (Neilsonand McAllan 1965). Upon eclosion, adult flies were stored at$80%C.
MICROSATELLITES AND ALLOZYMES
Twenty-three microsatellite loci were scored for a total of 967flies representing seven hawthorn- and four apple-infesting popu-lations of R. pomonella, and six dogwood fly populations (Table 1;
Fig. S1). The microsatellite markers were developed by Velezet al. (2006) and map to five of the six R. pomonella chromo-somes (the sixth dot chromosome currently lacks markers). Newmicrosatellite data for the dogwood fly and two southern hawthornpopulations were combined with previously published data for ap-ple and northern hawthorn populations from Michel et al. (2010)and Cha et al. (2012). See Supporting Information for genotypingmethods and details concerning data compilation between stud-ies. Previously published allozyme data were combined with themicrosatellite data for some analyses (see Table 1 for data sourcesand Supporting Information for details). A majority of the col-lecting sites scored for allozymes represent the same locationsscored for microsatellites (Table 1), although the collection yearsdiffered. These two classes of markers were chosen to allow directcomparisons to the previously published results of Michel et al.(2010). In addition, the high mutation rate of microsatellitemarkers may be particularly useful in studies of very re-cent or on-going divergence, as single nucleotide polymor-phism (SNP) differences may not have had sufficient time toaccumulate.
2 5 6 4 EVOLUTION SEPTEMBER 2013
SPECIAL SECTION
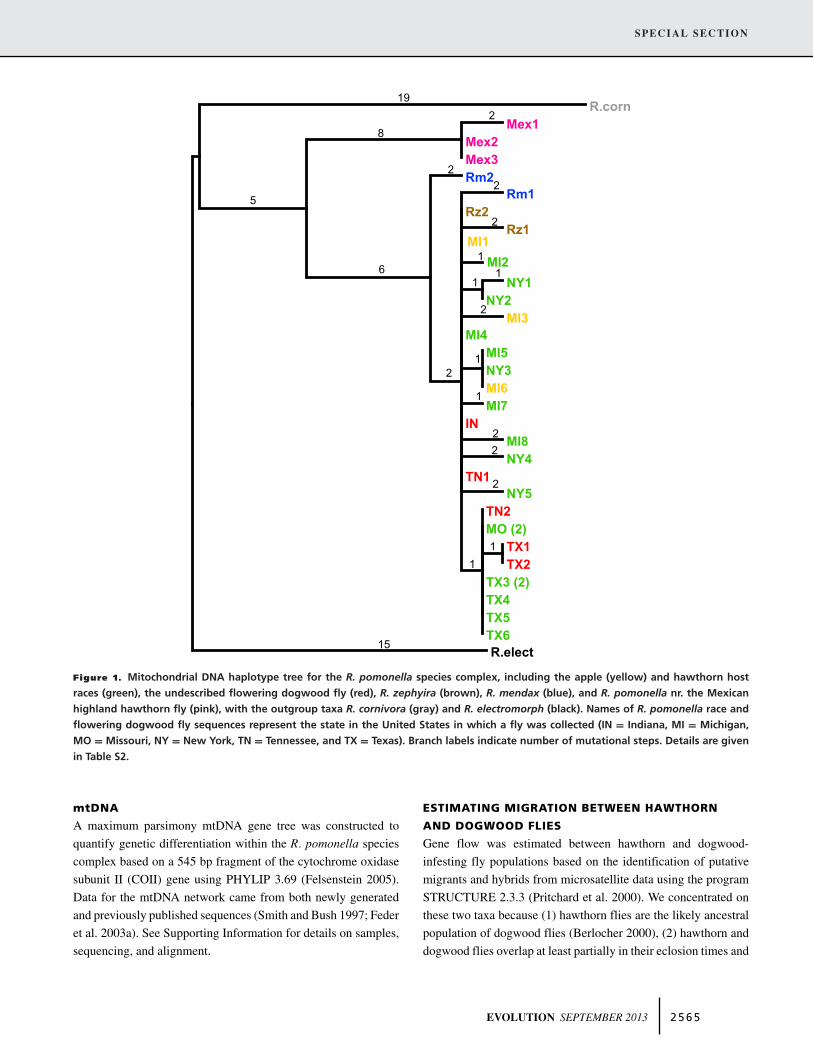
Figure 1. Mitochondrial DNA haplotype tree for the R. pomonella species complex, including the apple (yellow) and hawthorn hostraces (green), the undescribed flowering dogwood fly (red), R. zephyira (brown), R. mendax (blue), and R. pomonella nr. the Mexicanhighland hawthorn fly (pink), with the outgroup taxa R. cornivora (gray) and R. electromorph (black). Names of R. pomonella race andflowering dogwood fly sequences represent the state in the United States in which a fly was collected (IN = Indiana, MI = Michigan,MO = Missouri, NY = New York, TN = Tennessee, and TX = Texas). Branch labels indicate number of mutational steps. Details are givenin Table S2.
mtDNA
A maximum parsimony mtDNA gene tree was constructed toquantify genetic differentiation within the R. pomonella speciescomplex based on a 545 bp fragment of the cytochrome oxidasesubunit II (COII) gene using PHYLIP 3.69 (Felsenstein 2005).Data for the mtDNA network came from both newly generatedand previously published sequences (Smith and Bush 1997; Federet al. 2003a). See Supporting Information for details on samples,sequencing, and alignment.
ESTIMATING MIGRATION BETWEEN HAWTHORN
AND DOGWOOD FLIES
Gene flow was estimated between hawthorn and dogwood-infesting fly populations based on the identification of putativemigrants and hybrids from microsatellite data using the programSTRUCTURE 2.3.3 (Pritchard et al. 2000). We concentrated onthese two taxa because (1) hawthorn flies are the likely ancestralpopulation of dogwood flies (Berlocher 2000), (2) hawthorn anddogwood flies overlap at least partially in their eclosion times and
EVOLUTION SEPTEMBER 2013 2 5 6 5

SPECIAL SECTION
seasonal distributions as adults in the field, whereas apple and dog-wood flies generally do not (Berlocher 1999), strongly limitingthe potential for direct gene flow in the latter case, and (3) whileprevious mark recapture studies have estimated the gross migra-tion rate (#4–6% per generation) between apple and hawthornflies (Feder et al. 1994), observed frequency differences betweenthe races are insufficient to reliably identify putative migrantsbetween apple and hawthorn flies. Our strategy involved usingSTRUCTURE to infer the number of differentiated fly popula-tions existing on hawthorn and dogwood host plants. These resultswere then used in the program as a priori population assignmentsto identify putative parental migrant, F1 hybrid, and later gen-eration backcross genotypes within populations. An estimate ofinterhost gene flow was calculated as the frequency of individualspossessing a non-natal parental genotype plus half the frequencyof individuals classified as F1 hybrids (highest posterior proba-bility of having non-natal ancestry one generation back). For fulldetails of the analysis see the Supporting Information. It is im-portant to note that STRUCTURE was used in a narrow contextto detect migrants and hybrids between well-differentiated clus-ters. Moreover, analyses were confined to populations from thesame geographic region to minimizing the confounding effectsof latitudinal clines. The complex clinal nature of genetic varia-tion within the R. pomonella races (Feder and Bush 1989; Federet al. 2005; Michel et al. 2010) strongly limits the usefulnessof an overall STRUCTURE analysis including all populations.However, for completeness, such an analysis is presented in theSupporting Information. Discussion of the clustering of popula-tions in the Results and Discussion sections do not refer to resultsfrom STRUCTURE, but rather to the genetic distance networkdescribed below.
ANALYSIS OF GENETIC DIFFERENTIATION
To simplify analysis of the microsatellite data, we collapsed thevariation present at each locus down to two major allele classes,as previously described in Michel et al. (2010) for the apple andhawthorn host races. Our work on R. pomonella has indicated thatmajor allele classes exist for nuclear genes defined by patterns oflinkage disequilibrium among loci and latitudinal variation due,in part, to the presence of inversion polymorphisms and adaptivelatitudinal clines for life-history traits generated by past intro-gression between U.S. and Mexican populations of hawthorn flies(Feder et al. 2003a, 2005). Major allele classes were identified bytesting either exhaustive searches or 1,000,000 random combina-tions of alleles at a locus to identify the combination of variantsthat maximized latitudinal variation and linkage disequilibriumto flanking markers in the genome. See Michel et al. (2010)for analytical details. Resulting allele pools are described inTable S3.
To graphically depict the population structure of apple,hawthorn, and dogwood flies, a neighbor-joining network basedon Nei’s genetic distance D (Nei 1972) was constructed for themicrosatellites using PowerMarker (Liu and Muse 2005) andPHYLIP 3.69 (Felsenstein 2005). The major results did not dif-fer between networks constructed using either raw microsatel-lite allele frequencies or those pooled into the two major classes(Fig. S2), so we present the pooled network here. Bootstrap sup-port for the network was determined using 10,000 replicatesacross loci. In addition, individual microsatellite and allozymeloci were analyzed for host-associated differentiation and latitu-dinal variation by (1) Fisher exact tests, (2) F-statistics, (3) linearregression, and (4) generalized linear modeling (GLM). For theFisher exact tests and F-statistics, the analyses were performedfor pairs of populations infesting different host plants that co-occurred with one another at collecting sites or were in close ge-ographic proximate (<14 km) (see Table 1 for site designations;we refer to these as “local sites” hereafter). The GLM analysiswas performed in R, with allele frequencies modeled as quasib-inomial variables, latitude as a continuous factor, and host plantas a discrete factor. Host, latitude, and host & latitude interactioneffects were tested for statistical significance by F-tests. To as-sess whether patterns of genome differentiation were concordantbetween hawthorn/dogwood flies compared to hawthorn/appleflies, we performed regression analyses between locus-specificFST values, calculated as the means across the individual pairedpopulation FST values for each of the local sites within a hostcomparison (Table 1).
SIMULATION MODELING
Based on the results of the analyses described above, we con-ducted computer simulations to investigate the range of me andselection coefficients that could generate the patterns of differ-entiation observed among apple, hawthorn, and dogwood flies.We concentrated our analysis on a subset of five markers eachon chromosomes 1 and 2 that captured the range and major topo-logical features of genomic divergence seen among these flies.The simulations were based on the two-deme model describedby Feder et al. (2012a). Full modeling details are provided in theSupporting Information.
ResultsMITOCHONDRIAL SEQUENCE VARIATION
The single, most parsimonious gene tree for mtDNA haplotypesis shown in Figure 1 and displayed no homoplasy. There wasno evidence for host-related mtDNA differentiation among apple,hawthorn, and dogwood flies; no taxon formed a distinct matri-lineage (Fig. 1).
2 5 6 6 EVOLUTION SEPTEMBER 2013
SPECIAL SECTION
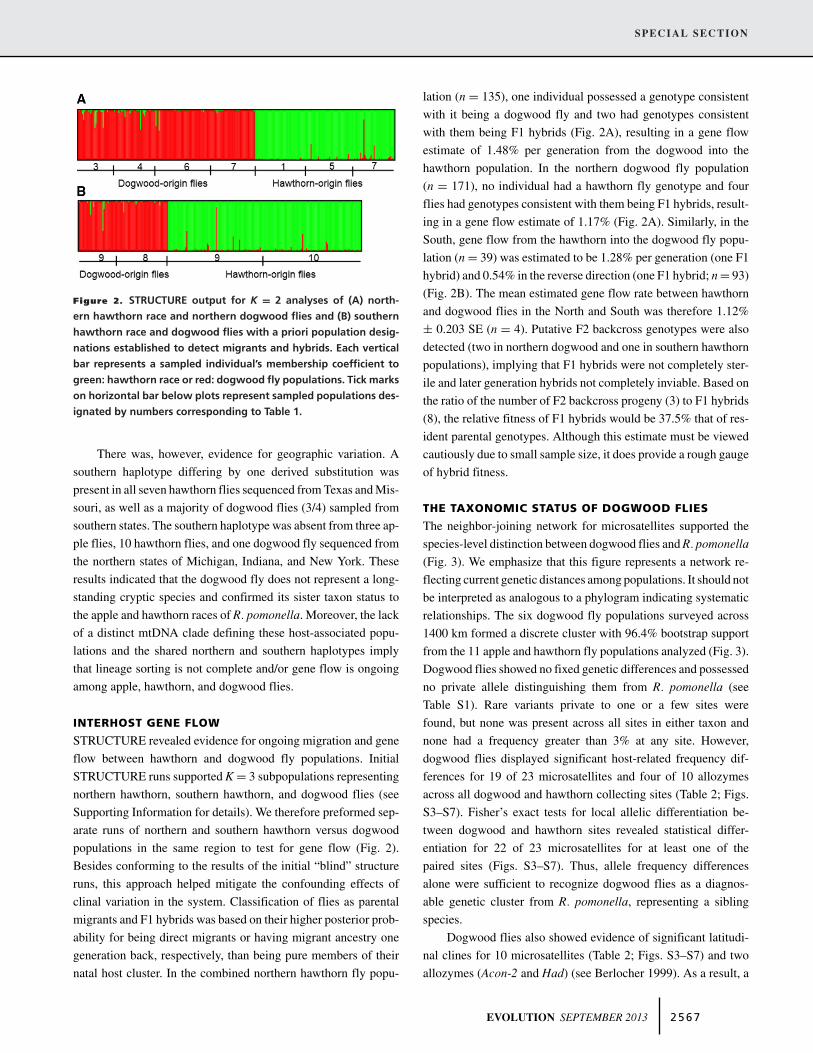
Figure 2. STRUCTURE output for K = 2 analyses of (A) north-ern hawthorn race and northern dogwood flies and (B) southernhawthorn race and dogwood flies with a priori population desig-nations established to detect migrants and hybrids. Each verticalbar represents a sampled individual’s membership coefficient togreen: hawthorn race or red: dogwood fly populations. Tick markson horizontal bar below plots represent sampled populations des-ignated by numbers corresponding to Table 1.
There was, however, evidence for geographic variation. Asouthern haplotype differing by one derived substitution waspresent in all seven hawthorn flies sequenced from Texas and Mis-souri, as well as a majority of dogwood flies (3/4) sampled fromsouthern states. The southern haplotype was absent from three ap-ple flies, 10 hawthorn flies, and one dogwood fly sequenced fromthe northern states of Michigan, Indiana, and New York. Theseresults indicated that the dogwood fly does not represent a long-standing cryptic species and confirmed its sister taxon status tothe apple and hawthorn races of R. pomonella. Moreover, the lackof a distinct mtDNA clade defining these host-associated popu-lations and the shared northern and southern haplotypes implythat lineage sorting is not complete and/or gene flow is ongoingamong apple, hawthorn, and dogwood flies.
INTERHOST GENE FLOW
STRUCTURE revealed evidence for ongoing migration and geneflow between hawthorn and dogwood fly populations. InitialSTRUCTURE runs supported K = 3 subpopulations representingnorthern hawthorn, southern hawthorn, and dogwood flies (seeSupporting Information for details). We therefore preformed sep-arate runs of northern and southern hawthorn versus dogwoodpopulations in the same region to test for gene flow (Fig. 2).Besides conforming to the results of the initial “blind” structureruns, this approach helped mitigate the confounding effects ofclinal variation in the system. Classification of flies as parentalmigrants and F1 hybrids was based on their higher posterior prob-ability for being direct migrants or having migrant ancestry onegeneration back, respectively, than being pure members of theirnatal host cluster. In the combined northern hawthorn fly popu-
lation (n = 135), one individual possessed a genotype consistentwith it being a dogwood fly and two had genotypes consistentwith them being F1 hybrids (Fig. 2A), resulting in a gene flowestimate of 1.48% per generation from the dogwood into thehawthorn population. In the northern dogwood fly population(n = 171), no individual had a hawthorn fly genotype and fourflies had genotypes consistent with them being F1 hybrids, result-ing in a gene flow estimate of 1.17% (Fig. 2A). Similarly, in theSouth, gene flow from the hawthorn into the dogwood fly popu-lation (n = 39) was estimated to be 1.28% per generation (one F1hybrid) and 0.54% in the reverse direction (one F1 hybrid; n = 93)(Fig. 2B). The mean estimated gene flow rate between hawthornand dogwood flies in the North and South was therefore 1.12%± 0.203 SE (n = 4). Putative F2 backcross genotypes were alsodetected (two in northern dogwood and one in southern hawthornpopulations), implying that F1 hybrids were not completely ster-ile and later generation hybrids not completely inviable. Based onthe ratio of the number of F2 backcross progeny (3) to F1 hybrids(8), the relative fitness of F1 hybrids would be 37.5% that of res-ident parental genotypes. Although this estimate must be viewedcautiously due to small sample size, it does provide a rough gaugeof hybrid fitness.
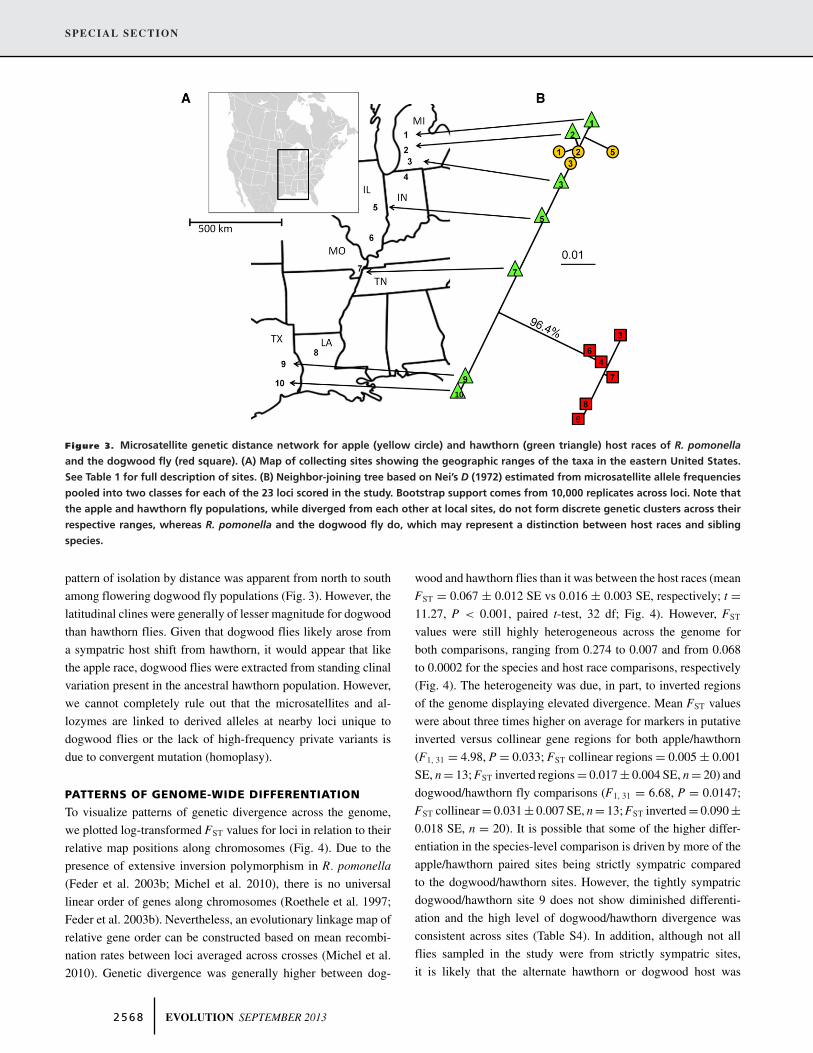
THE TAXONOMIC STATUS OF DOGWOOD FLIES
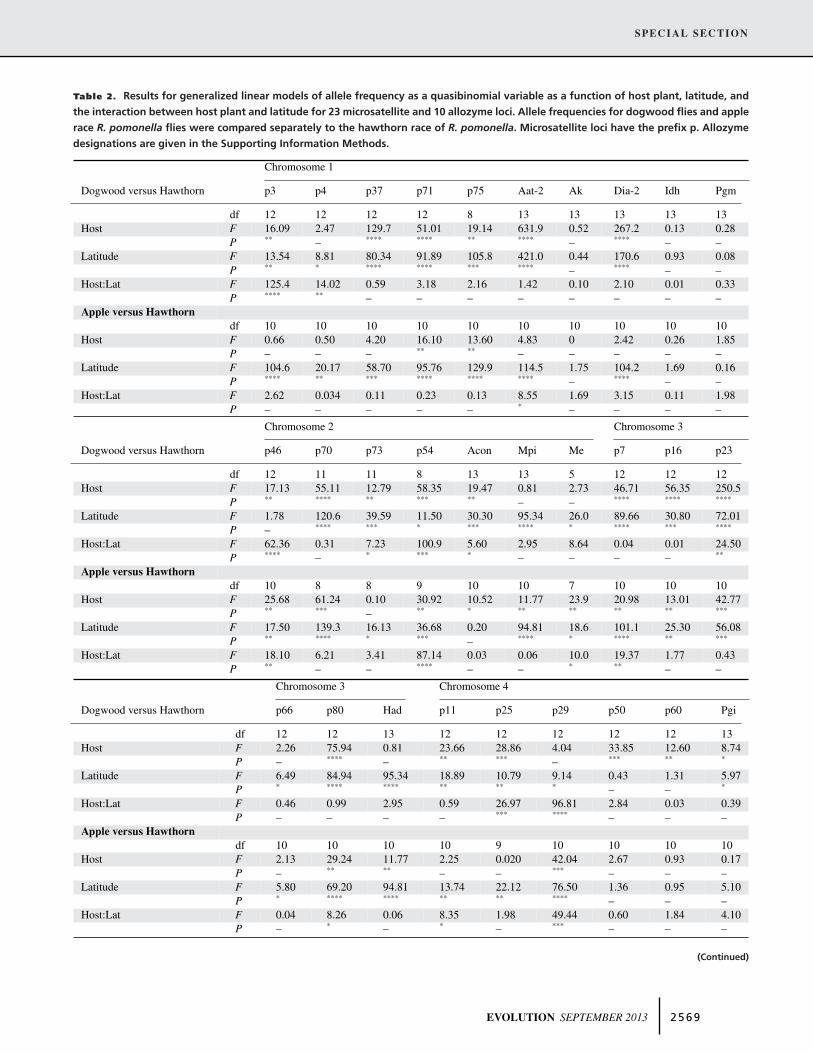
The neighbor-joining network for microsatellites supported thespecies-level distinction between dogwood flies and R. pomonella(Fig. 3). We emphasize that this figure represents a network re-flecting current genetic distances among populations. It should notbe interpreted as analogous to a phylogram indicating systematicrelationships. The six dogwood fly populations surveyed across1400 km formed a discrete cluster with 96.4% bootstrap supportfrom the 11 apple and hawthorn fly populations analyzed (Fig. 3).Dogwood flies showed no fixed genetic differences and possessedno private allele distinguishing them from R. pomonella (seeTable S1). Rare variants private to one or a few sites werefound, but none was present across all sites in either taxon andnone had a frequency greater than 3% at any site. However,dogwood flies displayed significant host-related frequency dif-ferences for 19 of 23 microsatellites and four of 10 allozymesacross all dogwood and hawthorn collecting sites (Table 2; Figs.S3–S7). Fisher’s exact tests for local allelic differentiation be-tween dogwood and hawthorn sites revealed statistical differ-entiation for 22 of 23 microsatellites for at least one of thepaired sites (Figs. S3–S7). Thus, allele frequency differencesalone were sufficient to recognize dogwood flies as a diagnos-able genetic cluster from R. pomonella, representing a siblingspecies.
Dogwood flies also showed evidence of significant latitudi-nal clines for 10 microsatellites (Table 2; Figs. S3–S7) and twoallozymes (Acon-2 and Had) (see Berlocher 1999). As a result, a
EVOLUTION SEPTEMBER 2013 2 5 6 7
SPECIAL SECTION
Figure 3. Microsatellite genetic distance network for apple (yellow circle) and hawthorn (green triangle) host races of R. pomonellaand the dogwood fly (red square). (A) Map of collecting sites showing the geographic ranges of the taxa in the eastern United States.See Table 1 for full description of sites. (B) Neighbor-joining tree based on Nei’s D (1972) estimated from microsatellite allele frequenciespooled into two classes for each of the 23 loci scored in the study. Bootstrap support comes from 10,000 replicates across loci. Note thatthe apple and hawthorn fly populations, while diverged from each other at local sites, do not form discrete genetic clusters across theirrespective ranges, whereas R. pomonella and the dogwood fly do, which may represent a distinction between host races and siblingspecies.
pattern of isolation by distance was apparent from north to southamong flowering dogwood fly populations (Fig. 3). However, thelatitudinal clines were generally of lesser magnitude for dogwoodthan hawthorn flies. Given that dogwood flies likely arose froma sympatric host shift from hawthorn, it would appear that likethe apple race, dogwood flies were extracted from standing clinalvariation present in the ancestral hawthorn population. However,we cannot completely rule out that the microsatellites and al-lozymes are linked to derived alleles at nearby loci unique todogwood flies or the lack of high-frequency private variants isdue to convergent mutation (homoplasy).
PATTERNS OF GENOME-WIDE DIFFERENTIATION
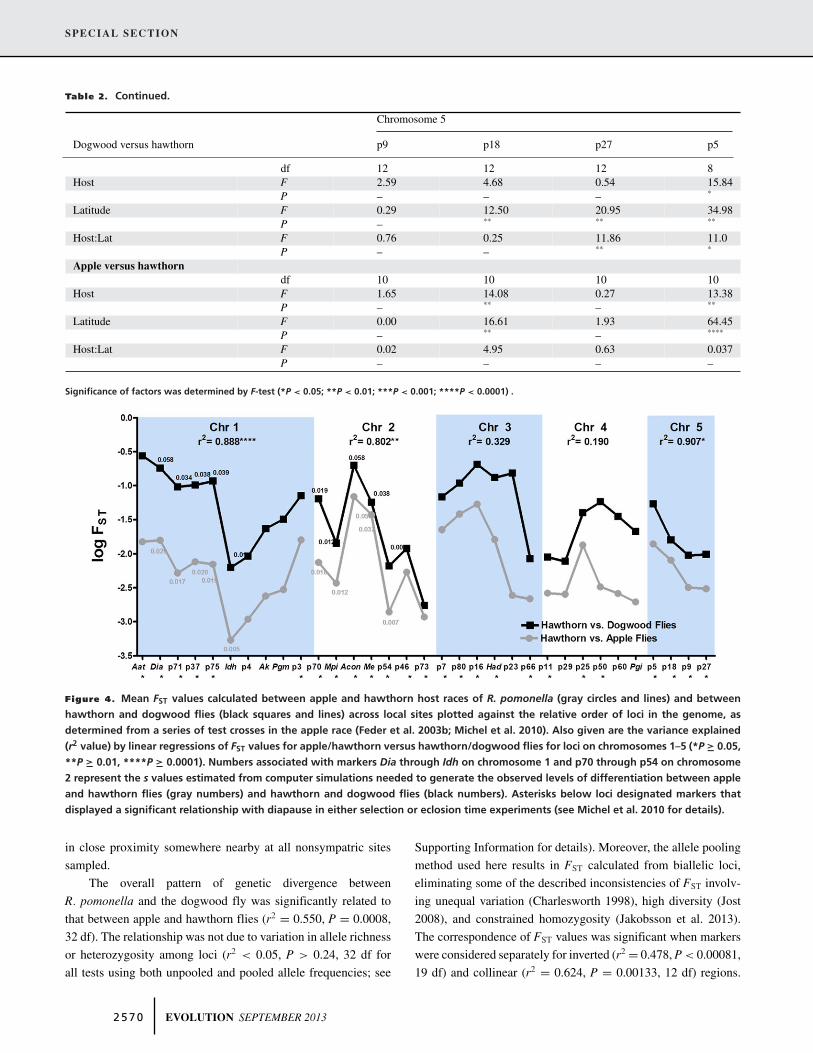
To visualize patterns of genetic divergence across the genome,we plotted log-transformed FST values for loci in relation to theirrelative map positions along chromosomes (Fig. 4). Due to thepresence of extensive inversion polymorphism in R. pomonella(Feder et al. 2003b; Michel et al. 2010), there is no universallinear order of genes along chromosomes (Roethele et al. 1997;Feder et al. 2003b). Nevertheless, an evolutionary linkage map ofrelative gene order can be constructed based on mean recombi-nation rates between loci averaged across crosses (Michel et al.2010). Genetic divergence was generally higher between dog-
wood and hawthorn flies than it was between the host races (meanFST = 0.067 ± 0.012 SE vs 0.016 ± 0.003 SE, respectively; t =11.27, P < 0.001, paired t-test, 32 df; Fig. 4). However, FST
values were still highly heterogeneous across the genome forboth comparisons, ranging from 0.274 to 0.007 and from 0.068to 0.0002 for the species and host race comparisons, respectively(Fig. 4). The heterogeneity was due, in part, to inverted regionsof the genome displaying elevated divergence. Mean FST valueswere about three times higher on average for markers in putativeinverted versus collinear gene regions for both apple/hawthorn(F1, 31 = 4.98, P = 0.033; FST collinear regions = 0.005 ± 0.001SE, n = 13; FST inverted regions = 0.017 ± 0.004 SE, n = 20) anddogwood/hawthorn fly comparisons (F1, 31 = 6.68, P = 0.0147;FST collinear = 0.031 ± 0.007 SE, n = 13; FST inverted = 0.090 ±0.018 SE, n = 20). It is possible that some of the higher differ-entiation in the species-level comparison is driven by more of theapple/hawthorn paired sites being strictly sympatric comparedto the dogwood/hawthorn sites. However, the tightly sympatricdogwood/hawthorn site 9 does not show diminished differenti-ation and the high level of dogwood/hawthorn divergence wasconsistent across sites (Table S4). In addition, although not allflies sampled in the study were from strictly sympatric sites,it is likely that the alternate hawthorn or dogwood host was
2 5 6 8 EVOLUTION SEPTEMBER 2013
SPECIAL SECTION
Table 2. Results for generalized linear models of allele frequency as a quasibinomial variable as a function of host plant, latitude, andthe interaction between host plant and latitude for 23 microsatellite and 10 allozyme loci. Allele frequencies for dogwood flies and applerace R. pomonella flies were compared separately to the hawthorn race of R. pomonella. Microsatellite loci have the prefix p. Allozymedesignations are given in the Supporting Information Methods.
Chromosome 1
Dogwood versus Hawthorn p3 p4 p37 p71 p75 Aat-2 Ak Dia-2 Idh Pgm
df 12 12 12 12 8 13 13 13 13 13Host F 16.09 2.47 129.7 51.01 19.14 631.9 0.52 267.2 0.13 0.28
P ** – **** **** ** **** – **** – –Latitude F 13.54 8.81 80.34 91.89 105.8 421.0 0.44 170.6 0.93 0.08
P ** * **** **** *** **** – **** – –Host:Lat F 125.4 14.02 0.59 3.18 2.16 1.42 0.10 2.10 0.01 0.33
P **** ** – – – – – – – –Apple versus Hawthorn
df 10 10 10 10 10 10 10 10 10 10Host F 0.66 0.50 4.20 16.10 13.60 4.83 0 2.42 0.26 1.85
P – – – ** ** – – – – –Latitude F 104.6 20.17 58.70 95.76 129.9 114.5 1.75 104.2 1.69 0.16
P **** ** *** **** **** **** – **** – –Host:Lat F 2.62 0.034 0.11 0.23 0.13 8.55 1.69 3.15 0.11 1.98
P – – – – – * – – – –
Chromosome 2 Chromosome 3
Dogwood versus Hawthorn p46 p70 p73 p54 Acon Mpi Me p7 p16 p23
df 12 11 11 8 13 13 5 12 12 12Host F 17.13 55.11 12.79 58.35 19.47 0.81 2.73 46.71 56.35 250.5
P ** **** ** *** ** – – **** **** ****
Latitude F 1.78 120.6 39.59 11.50 30.30 95.34 26.0 89.66 30.80 72.01P – **** *** * *** **** * **** *** ****
Host:Lat F 62.36 0.31 7.23 100.9 5.60 2.95 8.64 0.04 0.01 24.50P **** – * *** * – – – – **
Apple versus Hawthorndf 10 8 8 9 10 10 7 10 10 10
Host F 25.68 61.24 0.10 30.92 10.52 11.77 23.9 20.98 13.01 42.77P ** *** – ** * ** ** ** ** ***
Latitude F 17.50 139.3 16.13 36.68 0.20 94.81 18.6 101.1 25.30 56.08P ** **** * *** – **** * **** ** ***
Host:Lat F 18.10 6.21 3.41 87.14 0.03 0.06 10.0 19.37 1.77 0.43P ** – – **** – – * ** – –
Chromosome 3 Chromosome 4
Dogwood versus Hawthorn p66 p80 Had p11 p25 p29 p50 p60 Pgi
df 12 12 13 12 12 12 12 12 13Host F 2.26 75.94 0.81 23.66 28.86 4.04 33.85 12.60 8.74
P – **** – ** *** – *** ** *
Latitude F 6.49 84.94 95.34 18.89 10.79 9.14 0.43 1.31 5.97P * **** **** ** ** * – – *
Host:Lat F 0.46 0.99 2.95 0.59 26.97 96.81 2.84 0.03 0.39P – – – – *** **** – – –
Apple versus Hawthorndf 10 10 10 10 9 10 10 10 10
Host F 2.13 29.24 11.77 2.25 0.020 42.04 2.67 0.93 0.17P – ** ** – – *** – – –
Latitude F 5.80 69.20 94.81 13.74 22.12 76.50 1.36 0.95 5.10P * **** **** ** ** **** – – –
Host:Lat F 0.04 8.26 0.06 8.35 1.98 49.44 0.60 1.84 4.10P – * – * – *** – – –
(Continued)
EVOLUTION SEPTEMBER 2013 2 5 6 9
SPECIAL SECTION
Table 2. Continued.
Chromosome 5
Dogwood versus hawthorn p9 p18 p27 p5
df 12 12 12 8Host F 2.59 4.68 0.54 15.84
P – – – *
Latitude F 0.29 12.50 20.95 34.98P – ** ** **
Host:Lat F 0.76 0.25 11.86 11.0P – – ** *
Apple versus hawthorndf 10 10 10 10
Host F 1.65 14.08 0.27 13.38P – ** – **
Latitude F 0.00 16.61 1.93 64.45P – ** – ****
Host:Lat F 0.02 4.95 0.63 0.037P – – – –
Significance of factors was determined by F-test (*P < 0.05; **P < 0.01; ***P < 0.001; ****P < 0.0001) .
Figure 4. Mean FST values calculated between apple and hawthorn host races of R. pomonella (gray circles and lines) and betweenhawthorn and dogwood flies (black squares and lines) across local sites plotted against the relative order of loci in the genome, asdetermined from a series of test crosses in the apple race (Feder et al. 2003b; Michel et al. 2010). Also given are the variance explained(r2 value) by linear regressions of FST values for apple/hawthorn versus hawthorn/dogwood flies for loci on chromosomes 1–5 (*P " 0.05,**P " 0.01, ****P " 0.0001). Numbers associated with markers Dia through Idh on chromosome 1 and p70 through p54 on chromosome2 represent the s values estimated from computer simulations needed to generate the observed levels of differentiation between appleand hawthorn flies (gray numbers) and hawthorn and dogwood flies (black numbers). Asterisks below loci designated markers thatdisplayed a significant relationship with diapause in either selection or eclosion time experiments (see Michel et al. 2010 for details).
in close proximity somewhere nearby at all nonsympatric sitessampled.
The overall pattern of genetic divergence betweenR. pomonella and the dogwood fly was significantly related tothat between apple and hawthorn flies (r2 = 0.550, P = 0.0008,32 df). The relationship was not due to variation in allele richnessor heterozygosity among loci (r2 < 0.05, P > 0.24, 32 df forall tests using both unpooled and pooled allele frequencies; see
Supporting Information for details). Moreover, the allele poolingmethod used here results in FST calculated from biallelic loci,eliminating some of the described inconsistencies of FST involv-ing unequal variation (Charlesworth 1998), high diversity (Jost2008), and constrained homozygosity (Jakobsson et al. 2013).The correspondence of FST values was significant when markerswere considered separately for inverted (r2 = 0.478, P < 0.00081,19 df) and collinear (r2 = 0.624, P = 0.00133, 12 df) regions.
2 5 7 0 EVOLUTION SEPTEMBER 2013

SPECIAL SECTION
Thus, while elevated FST associated with reduced recombinationin rearrangements contributed to some of the concordance be-tween the host races and dogwood fly, inversions alone could notaccount for the relationship. These results imply that divergentselection pressures acting on loci may vary in a similar manneracross the genome. To better quantify the relative contributionsof inversions and divergent selection to the pattern, we performeda multiple regression analysis. As a predictor for the strength ofdivergent selection acting either directly or indirectly on loci inthe host races, we used the residuals generated from regressingapple/hawthorn fly FST values against the inverted/collinear statusof loci to control for the effect of rearrangements (note this ap-proach is similar to the chromosome center bias adjustment usedby Roesti et al. 2012). We also included as a categorical variablewhether a locus was located in an inverted or collinear region ofthe genome. Both the divergent selection and inversion terms weresignificant in the multiple regression, with divergent selection ex-plaining 44.9% of the total variance of FST between dogwood andhawthorn flies (P < 0.0001) and inversions 10.2% (P = 0.0144).
With respect to individual chromosomes, FST values for locion linkage groups 1, 2, and 5 significantly covaried between thehost races and dogwood fly (Fig. 4). Markers on chromosome1 generally displayed the greatest increases in FST for dogwoodflies compared to chromosomes 2 and 5. Within chromosome1, the allozymes Aat-2 and Dia-2 showed the largest increasesin FST. Levels of differentiation did not significantly covaryfor loci on chromosomes 3 and 4 (Fig. 4). This was principallydue to a subset of markers on chromosome 3 (Had and P23)and chromosome 4 (P50, P60, and Pgi) showing comparativelyelevated divergence (higher FST values) for the dogwood fly thanthe host races. When these loci were removed from regressions,the remaining loci showed significant relationships for bothchromosome 3 (r2 = 0.883, P < 0.018, 4 df) and chromosome 4(r2 = 0.997, P < 0.037, 2 df).
Thus, the pattern of divergence for the dogwood fly mayinvolve selection pressures across the genome that are generallycongruent to those differentiating the apple and hawthorn races,with the exception of two gene regions on chromosomes 3 and 4,and perhaps Aat-2 and Dia-2 on chromosome 1, where selectionmay be relatively more pronounced for dogwood flies. Indeed,eliminating Aat-2, Dia-2, Had, P23, P50, P60, and Pgi increasedthe correspondence of FST values between dogwood flies andthe host races (r2 = 0.677, P < 0.0001, 25 df), with divergentselection explaining 61.7% of the variance (P < 0.0001) andinversions 6.6% (P = 0.038) in the corresponding multipleregression analysis.
SIMULATION MODELING
Based on a gross migration rate m of 4% per generation betweenapple and hawthorn flies derived from mark-release-recapture
studies (Feder et al. 1994), Figure 4 gives the estimated selectioncoefficients s needed to produce the observed FST values for mark-ers along chromosomes 1 and 2 between the host races, assumingthat divergent selection is acting directly on these loci. Overall, weestimate that divergent selection reduces the effective gene flowrate (me) between hawthorn and apple fly populations to #2.7%per generation genome-wide for unlinked, neutral genes.
Without a direct estimate of gross migration betweenR. pomonella and dogwood fly populations, we calculated a con-servative proxy from our putative parental migrant/F1 identifica-tion analysis. The 1.12% gene flow estimate derived from thisanalysis was based on the genotypes of adult flies reared from in-fested fruit. Thus, this estimate encompassed the gross migrationrate of adult flies and selection on the immature stages of theiroffspring. If we consider the proportion of putative F2 backcrossto F1 hybrid flies (3/8 = 0.375) as providing a rough approxima-tion of the relative fitness of the offspring of migrant flies, thenthis suggests a gross migration rate (m) of #3% per generation be-tween dogwood and hawthorn fly populations. Figure 4 gives theestimated selection coefficients s needed to produce the observedFST values for markers along chromosomes 1 and 2 between dog-wood and hawthorn fly populations given a 3% gross migrationrate. For loci on chromosome 1, the s values for dogwood fliesneeded to be about twice those between the host races to generatethe observed level of differentiation, whereas for chromosome 2the s values only needed to be about 1% greater. The simula-tions predicted an effective gene flow rate (me) of 1.35% betweenhawthorn and dogwood flies per generation for unlinked, neutralgenes. This value is comparable to the 1.12% estimate from theSTRUCTURE analysis and exactly half the simulation estimateof 2.7% between the host races.
DiscussionThe results from the current study address three important issuesconcerning speciation with gene flow: (1) the nature of species, (2)the source of genetic variation fueling adaptive divergence, and(3) the role that genome structure plays in facilitating divergence.
THE NATURE OF SPECIES
Our findings suggest a criterion for differentiating host races fromsibling species in cases of de novo speciation with gene flowrelated to both the BSC and genic species concepts. Specifically,because dogwood fly populations form a distinct genetic cluster,they may be considered to represent a species. The implicationis that effective gene flow for a majority of the genome is higheramong geographically dispersed populations of dogwood fliesthan it is between locally co-occurring demes of these flies andR. pomonella. This range-wide clustering of populations differsfrom Mallet’s original genotypic clustering concept (1995) and
EVOLUTION SEPTEMBER 2013 2 5 7 1

SPECIAL SECTION
that proposed by Feder (1998). Both of these concepts are based onthe clustering of individuals at the local level. Under the previousclustering concepts, it may be possible to interpret the distributionof R. pomonella genotypes at a single hawthorn/apple site (Feder1998) as being indicative of species-level differences. However,as shown in Figure 3, on-going gene flow and clinal variationprevent the range-wide clustering of apple flies, despite the strongpotential for intrahost gene flow. Thus, situations with stronglocal clustering may lead to the diagnosis of many site-specificspecies pairs, but geographically distant populations adapted tosimilar habitats are not together evolving independently relativeto the populations associated with the alternative habitat. Range-wide population clustering reflects a shift in the relative strengthof interhabitat to intrahabitat migration, and may therefore bemore indicative of emerging evolutionary independence betweendifferentially adapted forms. The range in question here mustnecessarily be restricted to populations in contact. Species statusis inherently comparative between populations, and the potentialfor gene flow among allopatric demes cannot be meaningfullyassessed (Mayr 1995).
We emphasize that under this genetic clustering definitionthere is no sharp boundary demarcating species from races; thesestages form part of a continuum of divergence. The major differ-ence is that the magnitude of genetic differentiation for speciesis greater and more consistent across geography than it is forhost races. Indeed, despite forming a distinct genetic cluster, dog-wood flies are not distinguished by fixed allelic differences orprivate alleles at any locus surveyed. Rather, the dogwood fly isdifferentiated in a similar manner as the host races, by frequencydifferences of shared alleles. Thus, allele frequency differencesalone may be sufficient to distinguish species when the com-bination of reduced migration and divergent selection betweenpopulations adapted to different niches is strong enough for ge-netic clusters to be recognized across the geographic distributionof demes. This pattern will be most apparent in cases of specia-tion in primary contact with continuous gene flow, but it will alsoemerge in cases of secondary contact, once migration and selec-tion have reached equilibrium. This shift in population structuremay represent an important point along the path to complete evo-lutionary independence at the end of the speciation continuum.When this stage is reached, reproductive isolation likely has oris transitioning to become a characteristic of the whole genomeand not individual genes, similar to Mayr’s original casting of theBSC (1963), except due to divergent ecological selection and notnecessarily strong genome-wide epistasis.
THE SOURCES OF GENETIC VARIATION
Our results imply that standing variation may be an importantsource fueling formative stages of speciation with gene flow inthis system. We found no fixed differences or private alleles dis-
tinguishing apple, hawthorn, and dogwood flies. All three pop-ulations differed in the frequencies of shared alleles, many ofwhich correlate with diapause traits differentially adapting thelife history of flies to correspond to phenological differences infruiting times among host plants (Michel et al. 2010). Moreover,the majority of loci showing host-related differences also dis-play latitudinal clines coincident with geographic variation in thefruiting times of host plants (Table 2; Figs. S3–S7). Overall, theseclines are most pronounced for hawthorn flies (Fig. 3), consistentwith a mixed mode of biogeographic history at the base of thecomplex (Feder et al. 2005; Xie et al. 2007). Given that hawthornis the ancestral host plant both for the apple race and the dog-wood fly, the results imply that these latter two populations werederived, in large part, from standing life-history variation presentin latitudinal frequency clines in hawthorn flies. The dogwoodfly populations clustered in a mid-latitude location relative to themajor clinal pattern of hawthorns in the neighbor-joining network(Fig. 3). However, dogwood fly genotypes do not appear to bedrawn solely from this portion of the range of hawthorn flies.Rather, the clinal variation present within hawthorn-infestingR. pomonella provided a broad palette of diapause life-historyvariation, from which adaptive dogwood fly genotypes could bedrawn. This is evidenced by dogwood fly populations contain-ing allele frequencies similar to both the northern (e.g., see Figs.S1D, S2A, S3D) and southern (e.g., see Figs. S3A–C, S5A,B,S6C, S7A) ends of the hawthorn clines for different loci, as wellas strong host & latitude interactions (Table 2; e.g., see Figs. S3E,S4B, S6B, S7D).
Neither line of evidence (lack of private alleles or clines)is sufficient to completely rule out the possibility that dogwoodflies possess novel adaptive mutations. However, the observedpatterns are consistent with the co-option of standing geneticvariation being a major factor in the divergence of the dog-wood fly. Higher coverage sequencing studies of the dogwoodfly genome may eventually reveal private and near-fixed geneticdifferences. In addition, host recognition and performance genesmight also differ diagnostically for the dogwood fly, whereasdiapause-related genes may not. The current data do not discountthe potential role of novel mutations in the system. However, thesedata are consistent with the hypothesis that dogwood flies repre-sent a “polygenic species,” extracted by divergent selection fromlargely prestanding allelic variation at multiple loci throughout thegenome.
GENOME STRUCTURE AND SPECIATION
Our results imply that patterns of divergence in the R. pomonellagroup more closely resemble large genomic continents than oneor a few scattered islands of differentiation. Previously, Michelet al. (2010) documented that genetic differences between the ap-ple and hawthorn host races of R. pomonella was more widespread
2 5 7 2 EVOLUTION SEPTEMBER 2013

SPECIAL SECTION
than originally expected. Host-related differentiation was still het-erogeneous through the R. pomonella genome, influenced by theinteraction of the strength of divergent selection, migration, andrecombination. Structural features of the genome also contributedto differentiation; FST values were significantly higher betweenthe host races in inverted versus collinear regions of the genome.An important take home message from these findings was that ge-nomic regions showing relatively lower levels of differentiationdo not necessarily represent the baseline neutral expectation atmutation, migration, and drift equilibrium. Rather, the observeddifferentiation in these regions may still reflect the action of di-vergent natural selection, only less strongly so.
Here, we show that the pattern of widespread divergenceseen for the host races also extends to the species-level differ-entiation of the dogwood fly. Indeed, genome-wide divergencefor the dogwood fly roughly parallels on a locus-by-locus ba-sis that for the host races. The main differences are that (1) themagnitude of host-related divergence is higher for the dogwoodfly than between apple and hawthorn flies (FST values tend tobe elevated genome-wide), and (2) a few additional gene regionsshow a relatively greater level of divergence for the dogwoodfly (Fig. 4). These findings are more consistent with general pat-terns predicted for GH than DH. Specifically, during the pro-gression from races to sibling species, divergence did not appearto expand outward from isolated genomic islands of speciation,although much more fine scale data on differentiation of flank-ing regions adjacent to peaks is required to test this hypothesisrigorously. Instead, we see a general genome-wide elevation ofdivergence coupled with a few additional peaks arising that arenot evident in the host races, roughly as observed for races versusspecies pair of Heliconius butterflies (Nadeau et al. 2012). Ge-netic differentiation was still heterogeneous for dogwood flies;structural features of the genome associated with reduced recom-bination (chromosomal rearrangements) displayed higher meandivergence levels for the dogwood fly than collinear regions. How-ever, these rearrangements did not comprise isolated islands, andthe relative degree to which they were elevated in the dogwoodfly was similar to that seen for collinear regions. The overallpattern of divergence implies that genome-wide effective geneflow may be reduced sufficiently for differences to accumulatebetween host-associated populations of R. pomonella, even forgene regions experiencing modest intensities of divergent se-lection, the characteristic feature of GH. It is possible that ouranalysis missed some genomic regions that may constitute is-lands of particularly high divergence, given the modest densityof our marker coverage. However, the pattern of widespread sig-nificant differentiation, far above that expected by neutral migra-tion at many sites across the genome fits the predictions of GH,even if genomically local peaks of differentiation exist and wereundetected.
The widespread differentiation between the apple andhawthorn races reported by Michel et al. (2010) appeared to bedriven by multifarious selection acting throughout the genome.Fifteen independent genomic regions were found to respond toa diapause selection experiment and 13 showed significant as-sociations with eclosion time. The similarity in the topology ofdifferentiation for the dogwood fly (Fig. 4) is consistent with anunderlying similarity in selection regime. Adult eclosion phenol-ogy is a complex, multidimensional trait in Rhagoletis, involvingthe induction and termination of diapause (Dambroski and Feder2007), interactions among different environmental cues (Federet al. 2010), and widespread changes in gene expression (Raglandet al. 2011). We expect the phenological adaptation of dogwoodflies may share the same pathways involved in the adaptation ofthe apple race, and this may become clear once the molecularunderpinnings of diapause regulation are more fully elucidated inRhagoletis.
Comparisons involving other members of the R. pomonellaspecies complex may provide further insights into the processof speciation with gene flow. Evidence suggests that interhostmigration rates are lower for R. pomonella with the snowberryfly, R. zephyria, (<0.1%; Feder et al. 1999) and blueberry fly,R. mendax (no detectable migration; Feder et al. 1989), thanfor the R. pomonella host races and dogwood fly. However,mtDNA sequences still show minimal differentiation among theseflies (Fig. 1) (Smith and Bush 1997). Future studies involvingthese taxa will help elucidate how genomic differentiation buildsthrough the speciation continuum, as on-going gene flow beginsto have a negligible effect on divergence.
CONCLUSIONS
Our results imply that the dogwood fly is a sibling species toR. pomonella that essentially represents a host race writ large.The pattern of differentiation for the dogwood fly roughly paral-lels that between the apple and hawthorn host races except on agreater scale, implying increased ecological selection and lowereffective migration. In addition, the results suggest that speciationwith gene flow in the R. pomonella complex may involve incipienttaxa rapidly attaining a degree of genome-wide divergence and re-productive isolation following host plant shifting akin to the BSC.Attaining this state of highly reduced me across the genome mayallow new mutations of comparatively lower effect to establish inthe face of gene flow, fostering further evolutionary divergence.
It remains to be determined whether other model systemscontaining divergent populations with well-resolved natural his-tories spanning stages along the speciation continuum will displaysimilar patterns as manifested by R. pomonella flies. In this re-gard, R. pomonella could be unique with respect to the large storesof standing variation facilitating rapid divergence, although find-ings for stickleback (Jones et al. 2012) and Heliconius (Nadeau
EVOLUTION SEPTEMBER 2013 2 5 7 3

SPECIAL SECTION
et al. 2012) suggest otherwise. In contrast, other taxa may per-sist longer in earlier stages of speciation with gene flow. In thesecases, me may primarily be reduced locally in the genome aroundisolated and already diverged loci. Here, the evolution of furtherreproductive isolation may be more heavily dependent on DH,provided that most new mutations have only minor fitness effects.It also needs to be determined whether and how populations un-dergoing speciation with gene flow following secondary contactfit into the four stage scheme developed for de novo divergencein primary contact. Cline theory has suggested that a similar shiftfrom genomically local to genome-wide differentiation can occurfollowing secondary contact where reproductive isolation transi-tions from being primarily genic to a characteristic of the wholegenome (Barton 1983). Moreover, during the initial period ofallopatry, new adaptive variation could accumulate through thegenome in a manner that may be less likely to evolve de novo insympatry, resulting in an overall distribution of prestanding diver-gence conducive to the evolution of further differentiation follow-ing secondary contact. Regardless, advances in mass sequencingare now enabling whole genome scans of nonmodel organisms infine detail. Combining these surveys with selection experimentsand expression data on adaptive traits generating reproductive iso-lation will allow us to develop a richer understanding of both thepattern and process of speciation genomics.
ACKNOWLEDGMENTSWe thank Scott Egan, Kirsten Prior, and Greg Ragland for helpful in-sight, Dave Costello, Andrew Forbes, and Matt Michel for help withfield collections, and the editors and two anonymous reviewers for theirhelpful comments and criticism. This work was supported by a NationalScience Foundation grant to JLF and SHB and the University of NotreDame’s GLOBES IGERT program, Environmental Change Initiative, andprogram in Advanced Diagnostics & Therapeutics.
LITERATURE CITEDAvise, J., and M. Smith. 1977. Gene frequency comparisons between sunfish
(Centrarchidae) populations. Syst. Zool. 26:319–335.Ayala, F., M. Tracey, D. Hedgecock, and R. Richmond. 1974. Genetic differen-
tiation during speciation process in Drosophila. Evolution 28:576–592.Barrett, R. D. H., and D. Schluter. 2008. Adaptation from standing genetic
variation. Trends Ecol. Evol. 23:38–44.Barton, N. 1983. Multilocus clines. Evolution 37:454–471.Berlocher, S. 1999. Host race or species? Allozyme characterization of the
“flowering dogwood fly,” a member of the Rhagoletis pomonella com-plex. Heredity 83:652–662.
———. 2000. Radiation and divergence in the Rhagoletis pomonella speciesgroup: inferences from allozymes. Evolution 54:543–557.
Berlocher, S., and B. McPheron. 1996. Population structure of Rhagoletispomonella, the apple maggot fly. Heredity 77:83–99.
Berlocher, S., B. McPheron, J. Feder, and G. Bush. 1993. Genetic differentia-tion at allozyme loci in the Rhagoletis pomonella (Diptera, Tephritidae)species complex. Ann. Entomol. Soc. Am. 86:716–727.
Berner, D., A. C. Grandchamp, and A. P. Hendry. 2009. Variable progresstoward ecological speciation in parapatry: stickleback across eight lake-stream transitions. Evolution 63:1740–1753.
Bolnick, D. I., and B. M. Fitzpatrick. 2007. Sympatric speciation: models andempirical evidence. Annu. Rev. Ecol. Evol. Syst. 38:459–487.
Bush, G. L. 1966. The taxonomy, cytology, and evolution of the genus Rhago-letis in North America (Diptera: Tephritidae). Museum of ComparativeZoology, Cambridge, MA.
———. 1969. Sympatric host race formation and speciation in frugivorousflies of genus Rhagoletis (Diptera, Tephritidae). Evolution 23:237–251.
Cha, D. H., T. H. Q. Powell, J. L. Feder, and C. E. Linn. 2012. Geographicvariation in fruit volatiles emitted by the hawthorn Crataegus mollisand its consequences for host race formation in the apple maggot fly,Rhagoletis pomonella. Entomol. Exp. Appl. 143:254–268.
Charlesworth, B. 1998. Measures of divergence between populations and theeffect of forces that reduce variability. Mol. Biol. Evol. 15: 538–543.
Coyne, J. A., and H. A. Orr. 2004. Speciation. Sinauer Associates Inc, Sun-derland, MA.
Dambroski, H. R., and J. L. Feder. 2007. Host plant and latitude-relateddiapause variation in Rhagoletis pomonella: a test for multifaceted lifehistory adaptation on different stages of diapause development. J. Evol.Biol. 20:2101–2112.
Darwin, C. 1859. On the origin of species by means of natural selection. JohnMurray, London.
De Queiroz, K. 2007. Species concepts and species delimitation. Syst. Biol.56:879–886.
Feder, J. L. 1998. The apple maggot fly, Rhagoletis pomonella: flies in theface of conventional wisdom about speciation? Pp. 130–144 in S. H.Berlocher and D. J. Howard, eds. Endless forms: species and speciation.Oxford Univ. Press, Oxford, U.K.
Feder, J., and G. Bush. 1989. Gene-frequency clines for host races of Rhago-letis pomonella in the midwestern United States. Heredity 63:245–266.
Feder, J. L., and P. Nosil. 2010. The efficacy of divergence hitchhikingin generating genomic islands during ecological speciation. Evolution64:1729–1747.
Feder J. L., C. A. Chilcote, and G. L. Bush. 1989. Are the apple mag-got, Rhagoletis pomonella, and blueberry maggot, Rhagoletis mendax,distinct species? Implications for sympatric speciation. Entomol. Exp.Appl. 51:113–123.
———. 1990. Regional, local and microgeographic allele frequency variationbetween apple and hawthorn populations of Rhagoletis pomonella inwestern Michigan. Evolution 44:595–608.
Feder, J., S. Opp, B. Wlazlo, K. Reynolds, W. Go, and S. Spisak. 1994. Hostfidelity is an effective premating barrier between sympatric races. Proc.Natl. Acad. Sci. USA 91:7990–7994.
Feder, J. L., S. M. Williams, S. H. Berlocher, B. A. McPheron, and G. L.Bush. 1999. The population genetics of the apple maggot fly, Rhagoletispomonella and the snowberry maggot, R. zephyria: implications formodels of sympatric speciation. Entomol. Exp. Appl. 90:9–24.
Feder, J. L., S. H. Berlocher, J. B. Roethele, H. Dambroski, J. J. Smith,W. L. Perry, V. Gavrilovic, K. E. Filchak, J. Rull, and M. Aluja.2003a. Allopatric genetic origins for sympatric host-plant shifts andrace formation in Rhagoletis. Proc. Natl. Acad. Sci. USA 100:10314–10319.
Feder, J. L., J. B. Roethele, K. Filchak, J. Niedbalski, and J. Romero-Severson.2003b. Evidence for inversion polymorphism related to sympatric hostrace formation in the apple maggot fly, Rhagoletis pomonella. Genetics163:939–953.
Feder, J. L., X. F. Xie, J. Rull, S. Velez, A. Forbes, B. Leung, H. Dambroski,K. E. Filchak, and M. Aluja. 2005. Mayr, Dobzhansky, and Bush and thecomplexities of sympatric speciation in Rhagoletis. Proc. Natl. Acad.Sci. USA 102:6573–6580.
Feder, J. L., T. H. Q. Powell, K. Filchak, and B. Leung. 2010. The diapauseresponse of Rhagoletis pomonella to varying environmental conditions
2 5 7 4 EVOLUTION SEPTEMBER 2013

SPECIAL SECTION
and its significance for geographic and host plant-related adaptation.Entomol. Exp. Appl. 136: 31–44.
Feder, J. L., S. P. Egan, and P. Nosil. 2012a. The genomics of speciation-with-gene-flow. Trends Genet. 28:342–350.
Feder, J. L., R. Gejji, S. Yeaman, and P. Nosil. 2012b. Establishment of newmutations under divergence and genome hitchhiking. Philos. Trans. R.Soc. Lond. B 367:461–474.
Feder, J. L., S. M. Flaxman, S. P. Egan, and P. Nosil. 2013. Hybridizationand the buildup of genomic divergence during speciation. J. Evol. Biol.26:261–266. doi:10.1111/jeb.12009.
Felsenstein, J. 1981. Skepticism towards Santa Rosalia, or why are there sofew kinds of animals. Evolution 35:124–138.
———. 2005. PHYLIP (Phylogeny Inference Package) version 3.6. Dis-tributed by the author. Department of Genome Sciences, University ofWashington, Seattle.
Funk, D., K. Filchak, and J. Feder. 2002. Herbivorous insects: model systemsfor the comparative study of speciation ecology. Genetica 116:251–267.
Hadziabdic, D., B. M. Fitzpatrick, X. Wang, P. A. Wadl, T. A. Rinehart, B. H.Ownley, M. T. Windham, and R. N. Trigiano. 2010. Analysis of geneticdiversity in flowering dogwood natural stands using microsatellites: theeffects of dogwood anthracnose. Genetica 138:1047–1057.
Hausdorf, B. 2011. Progress toward a general species concept. Evolution65:923–931.
Hendry, A. P., D. I. Bolnick, D. Berner, and C. L. Peichel. 2009. Along thespeciation continuum in sticklebacks. J. Fish Biol. 75:2000–2036.
Hermisson, J., and P. S. Pennings. 2005. Soft sweeps: molecular popula-tion genetics of adaptation from standing genetic variation. Genetics169:2335–2352.
Hey, J. 2001. The mind of the species problem. Trends Ecol. Evol. 16:326–329.
Hey, J., and C. Pinho. 2012. Population genetics and objectivity in speciesdiagnosis. Evolution 66:1413–1429.
Jakobsson, M., M. D. Edge, and N. A. Rosenburg. 2013. The relationshipbetween FST and the frequency of the most frequent allele. Genetics193:515–528.
Jones, F. C., M. G. Grabherr, Y. F. Chan, F. Yingguang, P. Russel, E. Mauceli,J. Johnson, R. Swofford, M. Pirun, M. Zody, et al. 2012. The genomicbasis of adaptive evolution in threespine sticklebacks. Nature. 484:55–61.
Jost L. 2008. GST and its relatives do not measure differentiation. Mol. Ecol.17:4015–4026.
Linn, C., J. L. Feder, S. Nojima, H. R. Dambroski, S. H. Berlocher, andW. Roelofs. 2003. Fruit odor discrimination and sympatric host raceformation in Rhagoletis. Proc. Natl. Acad. Sci. USA 100:11490–11493.
Linn, C. E., H. Dambroski, S. Nojima, J. L. Feder, S. H. Berlocher, and W.L. Roelofs. 2005. Variability in response specificity of apple, hawthorn,and flowering dogwood-infesting Rhagoletis flies to host fruit volatileblends: implications for sympatric host shifts. Entomol. Exp. Appl.116:55–64.
Liu, K. J., and S. V. Muse. 2005. PowerMarker: an integrated analysis envi-ronment for genetic marker analysis. Bioinformatics 21:2128–2129.
Mallet, J. 1995. A species definition for the modern synthesis. Trends Ecol.Evol. 10:294–299.
———. 2008. Hybridization, ecological races and the nature of species: em-pirical evidence for the ease of speciation. Philos. Trans. R. Soc. Lond.B 363:2971–2986.
Mayden, R. L. 1997. A hierarchy of species concepts: the denouement inthe saga of the species problem. Pp. 381–424 in M. F. Claridge, H.A. Dawah, and M. R. Wilson, eds. Species the units of biodiversity.Chapman and Hall Ltd, London.
Maynard-Smith, J., and J. Haigh. 1974. The hitch-hiking effect of a favourablegene. Genet. Res. 23:23–35.
Mayr, E. 1942. Systematics and the origin of species. Columbia Univ. Press,New York.
———. 1963. Animal species and evolution. Harvard Univ. Press, Cambridge,MA.
———. 1969. Principles of systematic biology. McGraw-Hill, New York.———. 1995. Species, classification, and evolution. Pp. 6–12 in R. Arai,
M. Kato, and Y. Doi, eds. Biodiversity and evolution. National ScienceFoundation Museum, Tokyo.
———. 2001. What evolution is. Basic Books, New York.Merrill, R. M., Z. Gompert, L. M. Dembeck, M. R. Kronforst, W. O. McMillan,
and C. Jiggins. 2011. Mate preference across the speciation continuumin a clade of mimetic butterflies. Evolution 65:1489–1500.
Michel, A. P., S. Sim, T. H. Q. Powell, M. S. Taylor, P. Nosil, and J. L.Feder. 2010. Widespread genomic divergence during sympatric specia-tion. Proc. Natl. Acad. Sci. USA 107:9724–9729.
Nadeau, N. J., A. Whibley, R. T. Jones, J. W. Davey, K. K. Dasmahaptra, S.W. Baxter, M. A. Quail, M. Joron, R. F. French-Constant, M. L. Blaxter,et al. 2012. Genomic islands of divergence in hybridizing Heliconiousbutterflies identified by large-scale targeted sequencing. Philos. Trans.R. Soc. Lond. B 367:343–353.
Nei, M. 1972. Genetic distance between populations. Am. Nat. 106:283.Neilson, W., and J. Mcallan. 1965. Effects of mating on fecundity of apple
maggot Rhagoletis pomonella (Walsh). Can. Entomol. 97:276.Nosil, P., and J. L. Feder. 2012. Genomic divergence during speciation: causes
and consequences. Introduction. Philos. Trans. R. Soc. Lond. B 367:332–342.
Nosil, P., and C. P. Sandoval. 2008. Ecological niche dimensionality and theevolutionary diversification of stick insects. PLoS One 3: e1907.
Peccoud, J., A. Ollivier, M. Plantegenest, and J. C. Simon. 2009. A continuumof genetic divergence from sympatric host races to species in the peaaphid complex. Proc. Natl. Acad. Sci. USA 106:7495–7500.
Pritchard, J. K., M. Stephens, and P. Donnelly. 2000. Inference of populationstructure using multilocus genotype data. Genetics 155:945–959.
Ragland, G. J., S. P. Egan, J. L. Feder, S. H. Berlocher, and D. A. Hahn.2011. Developmental trajectories of gene expression reveal candidatesfor diapause termination: a key life-history transition in the apple maggotfly Rhagoletis pomonella. J. Exp. Biol. 214:3948–3959.
Roesti, M., A. P. Hendry, W. Salzburger, and D. Berner. 2012. Genomedivergence during evolutionary diversification as revealed in repli-cate lake-stream stickleback population pairs. Mol. Ecol. 21:2852–2862.
Roethele, J. B., J. L. Feder, S. H. Berlocher, M. E. Kreitman, and D. A.Lashkari. 1997. Toward a molecular genetic linkage map for the applemaggot fly (Diptera: Tephritidae): Comparison of alternative strategies.Ann. Entomol. Soc. Am. 90:470–479.
Schluter, D., and G. L. Conte. 2009. Genetics and ecological speciation. Proc.Natl. Acad. Sci. USA 106:9955–9962.
Seehausen, O. 2008. Progressive levels of trait divergence along the ‘speciationtransect’ in the Lake Victoria cichlid fish Pundamilia. Pp. 155–176 inR. Butlin, J. Bridle, and D. Schluter, eds. Speciation and patterns ofdiversity. Cambridge Univ. Press, Cambridge, U.K.
Smith, D. C. 1986. Genetics and reproductive isolation in Rhagoletis flies.Ph.D. diss., University of Illinois at Urbana-Champaign, Urbana, IL.
Smith, J. J., and G. L. Bush. 1997. Phylogeny of the genus Rhagoletis (Diptera:Tephritidae) inferred from DNA sequences of mitochondrial cytochromeoxidase II. Mol. Phylogenet. Evol. 7:33–43.
Velez, S., M. S. Taylor, M. A. F. Noor, N. F. Lobo, and J. L. Feder. 2006.Isolation and characterization of microsatellite loci from the apple
EVOLUTION SEPTEMBER 2013 2 5 7 5
SPECIAL SECTION
maggot fly Rhagoletis pomonella (Diptera: Tephritidae). Mol. Ecol.Notes 6:90–92.
Via, S. 2009. Natural selection in action during speciation. Proc. Natl. Acad.Sci. USA 106:9939–9946.
———. 2012. Divergence hitchhiking and the spread of genomic isola-tion during ecological speciation-with-gene-flow. Philos. Trans. R. Soc.Lond. B 367:451–460.
Via, S., and J. West. 2008. The genetic mosaic suggests a new role for hitch-hiking in ecological speciation. Mol. Ecol. 17:4334–4345.
Walsh, B. D. 1867. The apple-worm and the apple-maggot. Am. J. Hortic.2:338–243
Wiehe, T., and W. Stephan. 1993. Analysis of a genetic hitchhiking model,and its application to DNA polymorphism data from Drosophilamelanogaster. Mol. Biol. Evol. 10:842–854.
Wu, C. 2001. The genic view of the process of speciation. J. Evol. Biol.14:851–865.
Xie, X., J. Rull, A. P. Michel, S. Velez, A. A. Forbes, N. F. Lobo, M. Aluja,and J. L. Feder. 2007. Hawthorn-infesting populations of Rhagoletispomonella in Mexico and speciation mode plurality. Evolution 61:1091–1105.
Xie, X., A. P. Michel, D. Schwarz, J. Rull, S. Velez, A. A. Forbes, M. Aluja, andJ. L. Feder. 2008. Radiation and divergence in the Rhagoletis pomonellaspecies complex: inferences from DNA sequence data. J. Evol. Biol.21:900–913.
Zimmerman, E., C. Kilpatrick, and B. Hart. 1978. Genetics of speciation inrodent genus Peromyscus. Evolution 32:565–579.
Associate Editor: D. Fairbairn
Supporting InformationAdditional Supporting Information may be found in the online version of this article at the publisher’s website:
Table S1. (Uploaded to DRYAD) Microsatellite allele frequencies, heterozygosity (H), and allelic richness (A) for the 23 locianalyzed in study for 17 field sites, representing seven hawthorn- and four apple-infesting populations of R. pomonella, and sixflowering dogwood fly populations.Table S2. Collection location, reference, and Genbank accession number for flowering dogwood fly (dogwood), hawthorn raceR. pomonella (Rp_H), apple race R. pomonella (Rp_A), and outgroup taxa (R. electromopha and R. cornivora) sequences used inmtDNA gene tree.Table S3. Alleles included in one of two groups generated by Monte Carlo allele pooling method for each of 23 microsatelliteloci across five chromosomes (Chr.).Table S4. Pairwise FST values between all populations pairs, calculated across all microsatellite loci (lower triangle) and resultsof exact tests for allelic differentiation analyzed for all loci (upper triangle).Table S5. Mean FST values for 23 microsatellite and 10 allozyme loci calculated between apple and hawthorn host races ofR. pomonella (Host Races) and between hawthorn and dogwood flies (Species) across local sites.Figure S1. Map of overlapping distributions of the flowering dogwood fly and the hawthorn and apple races of R. pomonella inthe eastern United States with collection site designations.Figure S2. Neighbor-joining network for apple (yellow circle) and hawthorn (green triangle) host races of R. pomonella and theflowering dogwood fly (red square) based on Nei’s D (1972) estimated from unpooled microsatellite allele frequencies.Figures S3–S7. Allele frequencies across collecting sites for the apple-infesting (gray circles and lines) and hawthorn-infesting(black triangles and dashed lines) host races of R. pomonella and the flowering dogwood fly (black squares and line) for the 23microsatellite loci mapping to chromosomes 1 through 5 of the genome plotted against the latitude of populations.Figure S8. STRUCTURE output for K = 3 analysis of all 17 populations (Table 1) under the same parameters as the regionallysegregated K = 2 analyses presented in Figure 2.
2 5 7 6 EVOLUTION SEPTEMBER 2013