speciation in virgilia ( fabaceae ): allopatric divergence followed by introgression
TRANSCRIPT
P1. Syst. Evol. 201:57-73 (1996) mHant
Systematics and
Evolution © Springer-Verlag 1996 Printed in Austria
Speciation in Virgilia (Fabaceae): allopatric divergence followed by introgression?
MICHELLE VAN DER BANK, F. H. VAN DER BANK, and B . -E . VAN WYK
Received May 12, 1995; in revised version August 31, 1995
Key words: Fabaceae, Podalyrieae, Virgilia. - Biochemical genetics, electrophoresis, genetic distance, speciation.
Abstract: Levels of variation revealed by starch gel-electrophoresis were compared with morphological and chemical variation within and among the species and subspecies of Virgilia: V. oroboides subsp, oroboides, V. oroboides subsp, ferruginea and V. divaricata. The data sets exhibited concordance in that all point to a very close relationship between the taxa. Differences are mostly quantitative and an overlapping east-west gradient of character variation is indicated. Analysis of morphological and chemical characters showed that V. oroboides subsp, ferruginea and V. divaricata are relatively distinct, whereas allozyme analysis indicated a high degree of genetic similarity among popula- tions of these two taxa. The observed pattern of variation suggests relatively recent speci- ation with subsequent introgressive hybridisation resulting in a geographical and ecologi- cal gradient.
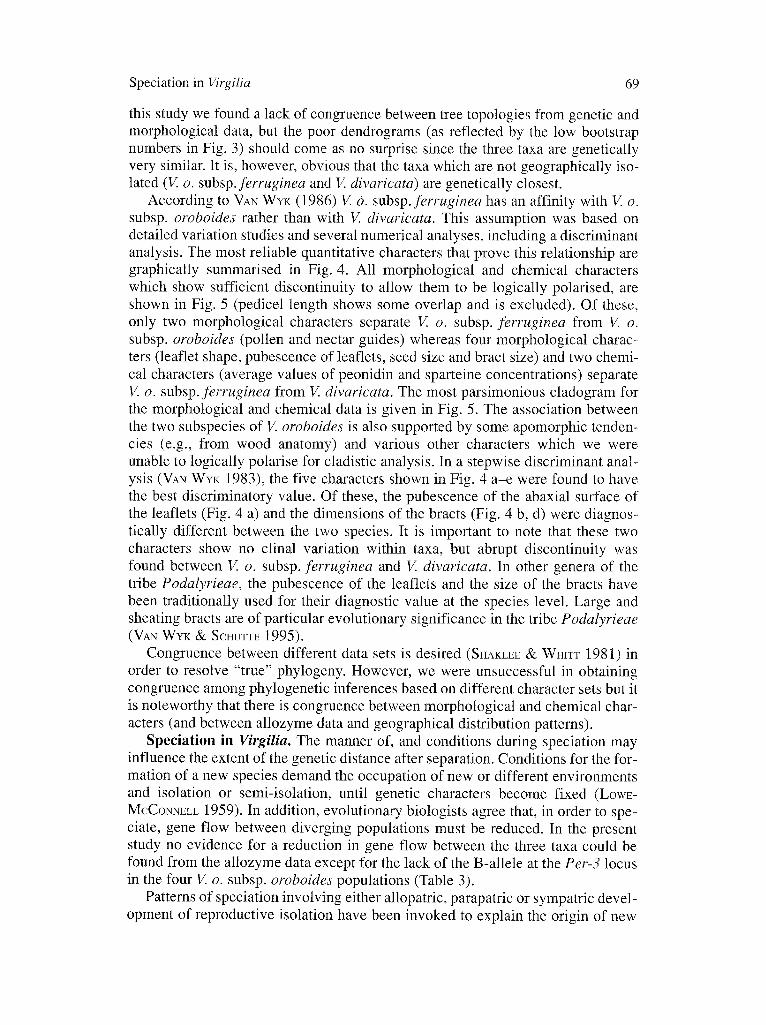
VirgiIia is a taxonomically isolated genus within the Fabaceae subfam. Papilio- noideae (tribe Podalyrieae) and is endemic to the south-western and southern coastal regions of South Africa. The genus had been treated for a considerable time as monotypic until a second species was described in 1934 (ADAMSON 1934). At present, three taxa are recognised, namely V. divaricata ADAMSON, V. oroboides (BERG.) SALTER subsp, oroboides, and V. oroboides (BERt.) SALTER subsp, ferrugi- nea B.-E. VAN WYK. The taxonomic revision by VAN WYK (1986) was based on an analysis of the considerable morphological variation that exists within the genus. Each taxon comprises a number of geographically isolated populations. Virgilia o. subsp, oroboides is limited to the south-western Cape coastal region, from the Cape Peninsula to Swellendam V. divaricata occurs in the southern and eastern Cape, from Knysna to Port Elizabeth and, V. o. subsp, ferruginea is geographical- ly intermediate between the other two taxa and occurs from Mossel Bay to George.
Limited morphological variation occurs within populations but distinct differ- ences between populations are common. The flowers and bark of V. o. subsp, fer- ruginea are similar to those of V. divaricata, but the general morphology is within the variation range found in V. o. subsp, oroboides (VAN WYK 1986). Alkaloid data (GRHNWALD & al. 1989, VEEN & al. 1991) show no qualitative differences between
58 M. VAN DER BANK & al.:
species and subspecies but the three taxa can be differentiated by quantitative dif- ferences in some alkaloids. VAN WYK (1986) postulated that V. o. subsp, ferrugi- nea may have originated as a hybrid between the other two species. However, the alkaloid patterns give no definite evidence for such a postulation, but confirms the affinity of subsp, ferruginea with oroboides rather than V. divaricata (VEZN & al. 1991).
Taxonomic schemes that are exclusively based on morphological data do not always reflect the true evolutionary relationships in taxa where relatively little morphological divergence has taken place, or in cases where taxa correspond as a result of convergent evolution. The motivation for this study was to determine if closely related species, such as V. o. subsp, oroboides and V. divaricata, which would generally be accepted as "good species" on morphological grounds, are indeed genetically isolated from one another. This would give a better idea of the evolution of Cape fynbos legumes within a species-rich area. The aims of this study were to explore the following ideas: 1) that the current taxonomy of Virgi- lia can be verified by an electrophoretic study (or that the taxa should be regarded as distinct species); 2) that speciation in Virgilia may reflect recent divergence along a geographical (and ecological) gradient, so that all three forms should best be considered as allopatric subspecies; and 3) that V. o. subsp, ferruginea is of hybrid origin and that introgression took place over a long period of time. We present an analysis of allozyme variation patterns among representatives of the Virgilia complex. These patterns are interpreted with reference to morphology, chemistry and geography.
Material and methods
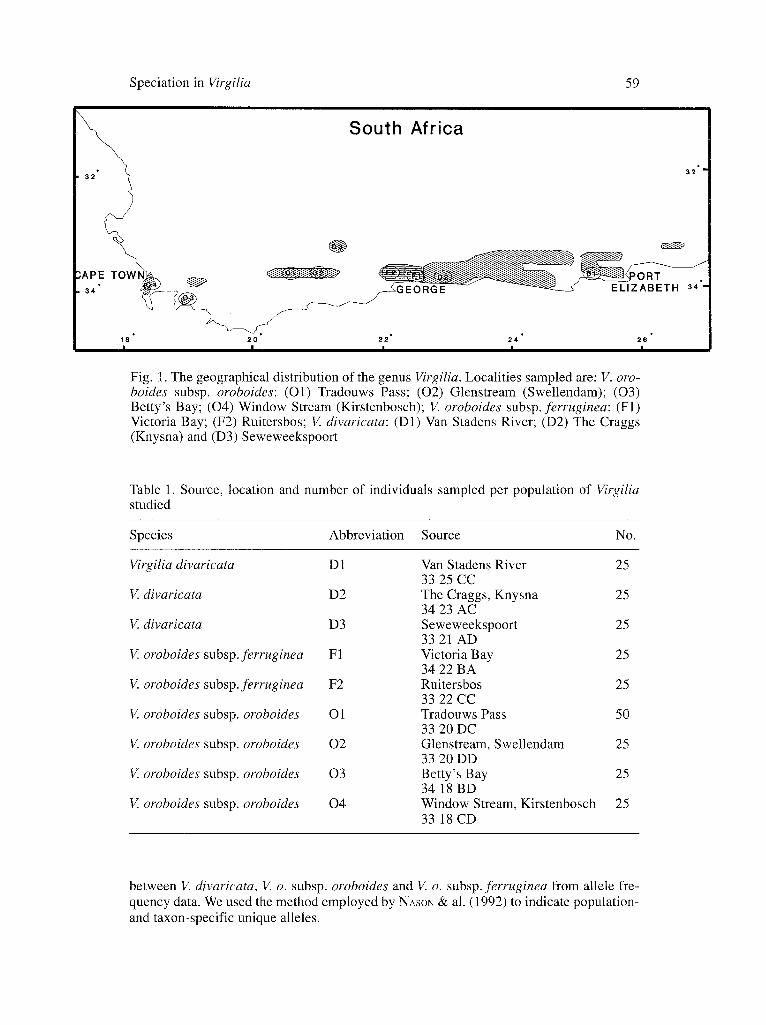
Leaf material of 250 individual plants were investigated from nine populations of Virgi- lia. The species and subspecies investigated in this study and their sources are denoted in Fig. 1 and Table 1.
Collection, tissue preparation, extraction buffers, electrophoresis, staining of gels, interpretation of results, locus nomenclature and statistical analysis follow VAN DER BANK & al. (1995a). The following buffer systems were used: CT - a continuous buffer (pH = 6.1) system (CLAYTON & TRETIAK 1972); MF - a continuous buffer (pH = 8.6) system (MARKZRT & FAULHABER 1965); PO - a discontinuous buffer (electrode pH = 8.2; gel pH = 8.7) system (PouLIK 1957); RW - a discontinuous buffer (electrode pH = 8.0; gel pH = 8.7) system (RID~WAY & al. 1970) and TC - a continuous tris, citric acid buffer (pH = 6.9) system (WHITT 1970).
The methods used to determine relationships between the species and subspecies con- sisted of a) interpreting electromorphs on gels in terms of Mendelian genetics, b) comput- ing allelic frequencies at various loci, c) converting allelic frequencies into a measure of genetic distance (D) and similarity (1) coefficients among species and populations. NEI's (1972, 1978) and NEt & al.'s (1983) genetic distances were used to produce phenograms using DISPAN (Copyright 1993 by TATSUYS OTA and the Pennsylvania State University, USA).
NH (1973) showed that the total gene diversity (heterozygosity of alleles pooled over all samples) could be partitioned into within- and between-populations. These relative contributions of diversity (to the total gene diversity) offer an indication of the extent of genetic differentiation that may be present among samples. The method of CHAKRABORTY al. (1982) was utilised in this investigation to analyse the gene diversity within and
Speciation in Virgilia 59
South Africa .
3 2
34" - - E L I Z A B E T H 34"
1 8 ° 2 0 2 2 ° 2 4 ° 2 6 °
I I I I I
Fig. 1. The geographical distribution of the genus Virgilia. Localities sampled are: V. ot"o- boides subsp, oroboides: (O1) Tradouws Pass; (02) Glenstream (Swellendam); (03) Betty's Bay; (04) Window Stream (Kirstenbosch); V. oroboides subsp, ferruginea: (F1) Victoria Bay; (F2) Ruitersbos; V. divaricata: (D1) Van Stadens River; (D2) The Craggs (Knysna) and (D3) Seweweekspoort
Table 1. Source, location and number of individuals sampled per population of VirgiIia studied
Species Abbreviation Source No.
Virgilia divaricata D 1
V. divaricata D2
V. divaricata D3
V. oroboides subsp, ferruginea F 1
V. oroboides subsp, ferruginea F2
V. oroboides subsp, oroboides O1
V. oroboides subsp, oroboides 02
V. oroboides subsp, oroboides 03
V. oroboides subsp, oroboides 04
Van Stadens River 25 33 25 CC The Craggs, Knysna 25 34 23 AC Seweweekspoort 25 33 21 AD Victoria Bay 25 34 22 BA Ruitersbos 25 33 22 CC Tradouws Pass 50 33 20 DC Glenstream, Swellendam 25 33 20 DD Betty's Bay 25 34 18 BD Window Stream, Kirstenbosch 25 33 18 CD
between V. divaricata, V. o. subsp, olvboides and V. o. subsp, ferruginea from allele fre- quency data. We used the method employed by NASON & al. (1992) to indicate population- and taxon-specific unique alleles.
60 M. VAN DER BANK 8Z al.:
Results
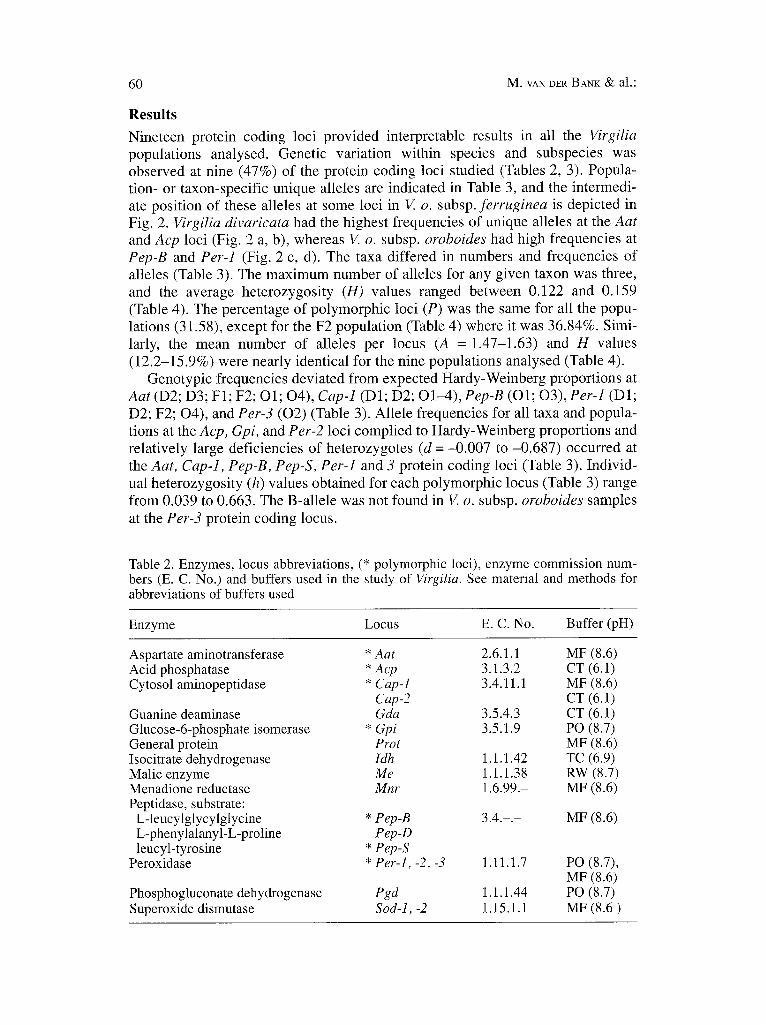
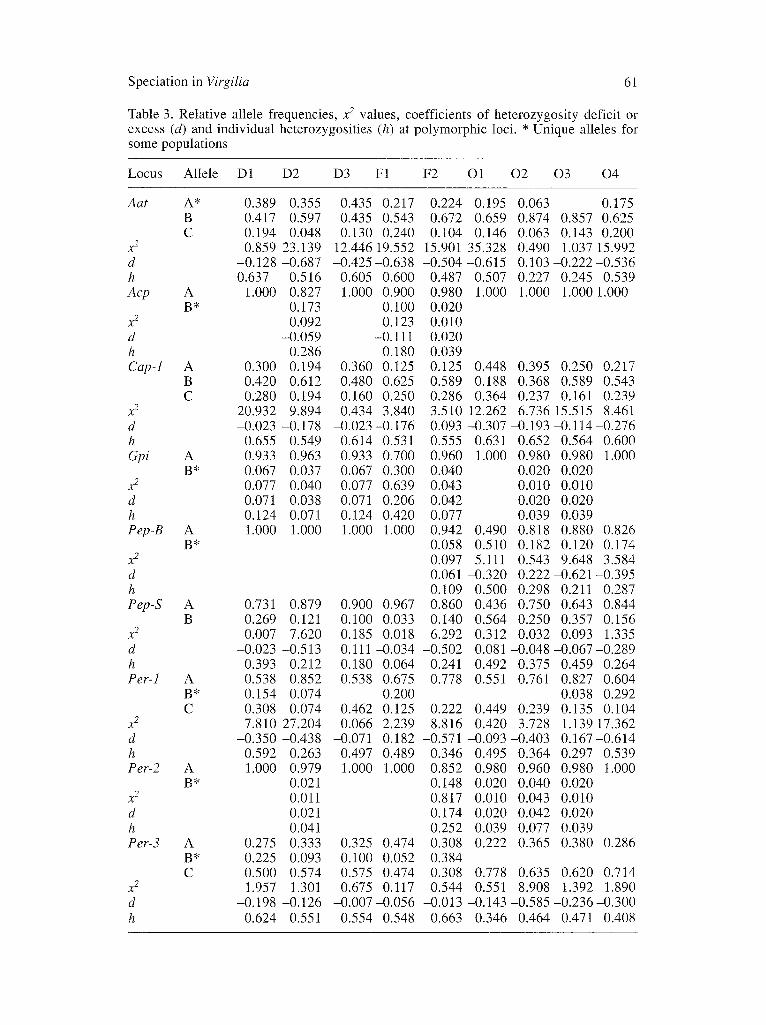
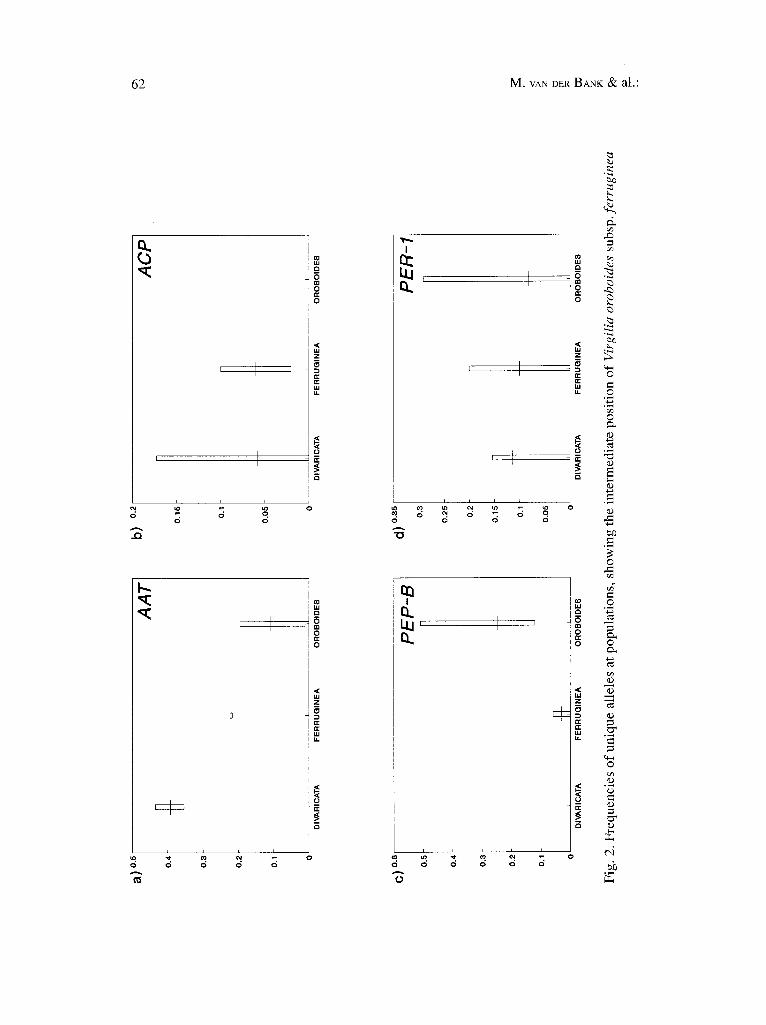
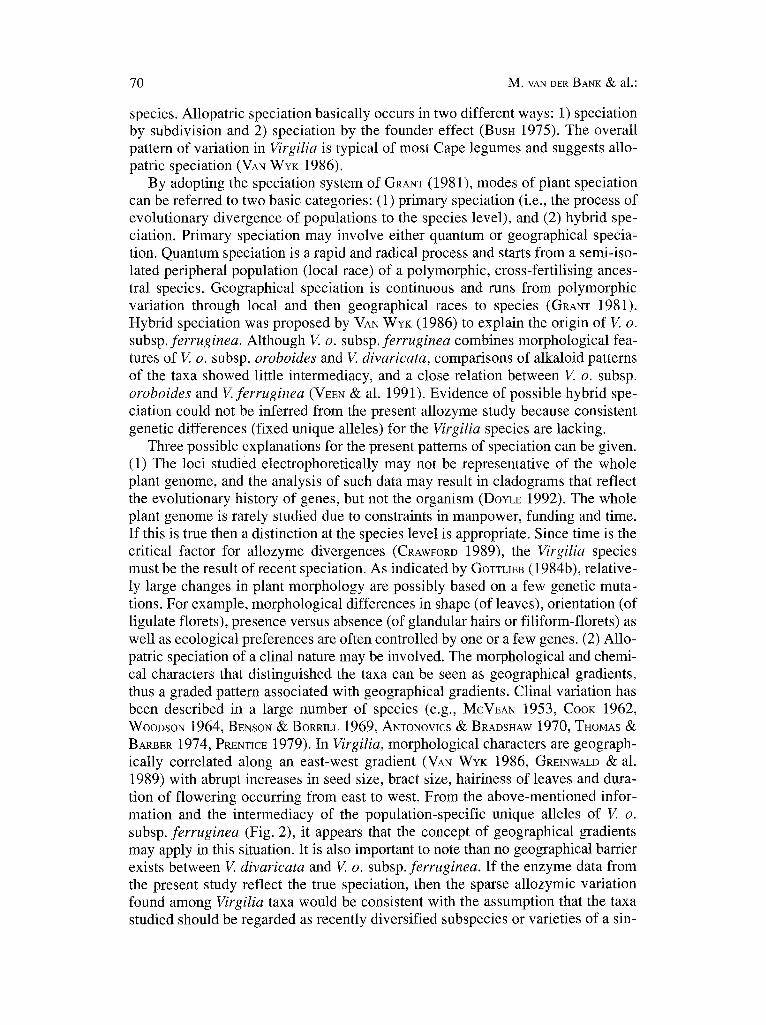
Nineteen protein coding loci provided interpretable results in atl the Virgilia populations analysed. Genetic variation within species and subspecies was observed at nine (47%) of the protein coding loci studied (Tables 2, 3). Popula- tion- or taxon-specific unique alleles are indicated in Table 3, and the intermedi- ate position of these alleles at some loci in V. o. subsp, ferruginea is depicted in Fig. 2. Virgilia divaricata had the highest frequencies of unique alleles at the Aat and Acp loci (Fig. 2 a, b), whereas V. o. subsp, oroboides had high frequencies at Pep-B and Per-1 (Fig. 2 c, d). The taxa differed in numbers and frequencies of alleles (Table 3). The maximum number of alleles for any given taxon was three, and the average heterozygosity (H) values ranged between 0.122 and 0.159 (Table 4). The percentage of polymorphic loci (P) was the same for all the popu- lations (31.58), except for the F2 population (Table 4) where it was 36.84%. Simi- larly, the mean number of alleles per locus (A = 1.47-1.63) and H values (12.2-15.9%) were nearly identical for the nine populations analysed (Table 4).
Genotypic frequencies deviated from expected Hardy-Weinberg proportions at Aat (D2; D3; F1; F2; O1; O4), Cap-1 (D1; D2; O1-4), Pep-B (O1; 03), Per-1 (D1; D2; F2; O4), and Per-3 (02) (Table 3). Allele frequencies for all taxa and popula- tions at the Acp, Gpi, and Per-2 loci complied to Hardy-Weinberg proportions and relatively large deficiencies of heterozygotes (d =-0 .007 to -0.687) occurred at the Aat, Cap-l, Pep-B, Pep-S, Per-1 and 3 protein coding loci (Table 3). Individ- ual heterozygosity (h) values obtained for each polymorphic locus (Table 3) range from 0.039 to 0.663. The B-allele was not found in V. o. subsp, oroboides samples at the Per-3 protein coding locus.
Table 2. Enzymes, locus abbreviations, (* polymorphic loci), enzyme commission num- bers (E. C. No.) and buffers used in the study of Virgilia. See material and methods for abbreviations of buffers used
Enzyme Locus E.C. No. Buffer (pH)
Aspartate aminotransferase Acid phosphatase Cytosol aminopeptidase
Guanine deaminase Glucose-6-phosphate isomerase General protein Isocitrate dehydrogenase Malic enzyme Menadione reductase Peptidase, substrate:
L-leucylglycylglycine L-phenylalanyl-L-proline leucyl-tyrosine
Peroxidase
Phosphogluconate dehydrogenase Superoxide dismutase
* Aat 2.6.1.1 MF (8.6) * Acp 3.1.3.2 CT (6.1) * Cap-1 3.4.11.1 MF (8.6)
Cap-2 CT (6.1) Gda 3.5.4.3 CT (6.1)
* Gpi 3.5.1.9 PO (8.7) Prot MF (8.6) Idh 1.1.1.42 TC (6.9) Me 1.1.1.38 RW (8.7) Mnr 1.6.99.- MF (8.6)
* Pep-B Pep-D
* Pep-S * Per-l, -2, -3
Pgd Sod-I, -2
3.4.-.- MF (8.6)
1.11.1.7 PO (8.7), MF (8.6)
1.1.1.44 PO (8.7) 1.15.1.1 MF (8.6)
Speciation in Virgilia 61
Table 3. Relative allele frequencies, x 2 values, coefficients of heterozygosity deficit or excess (d) and individual heterozygosities (h) at polymorphic loci. * Unique alleles for some populations
Locus Allele D1 D2 D3 F1 F2 O1 02 03 04
Aat A* 0.389 0.355 0.435 0.217 0.224 0.195 0.063 0.175 B 0.417 0.597 0.435 0.543 0.672 0.659 0.874 0.857 0.625 C 0.194 0.048 0.130 0.240 0.104 0.146 0.063 0.143 0.200
0.859 23.139 12.446 19.552 15.901 35.328 0.490 1.037 15.992 -0 .128-0 .687 - 0 . 4 2 5 - 0 . 6 3 8 - 0 . 5 0 4 - 0 . 6 1 5 0.103-0.222-0.536 0.637 0.516 0.605 0.600 0.487 0.507 0.227 0.245 0.539
A 1.000 0.827 1.000 0.900 0.980 1.000 1.000 1.0001.000 B* 0.173 0.100 0.020
x 2 0.092 0.123 0.010 d -0.059 -0.111 0.020 h 0.286 0.180 0.039 Cap-1 A 0.300 0.194 0.360 0.125 0.125 0.448 0.395 0.250 0.217
B 0.420 0.612 0.480 0.625 0.589 0.188 0.368 0.589 0.543 C 0.280 0.194 0.160 0.250 0.286 0.364 0.237 0.161 0.239
x 2 20.932 9.894 0.434 3.840 3.510 12.262 6.736 15.515 8.461 d -0.023 -0.178 -0.023-0.176 0.093 -0.307 -0.193 -0.114-0.276 h 0.655 0.549 0.614 0.531 0.555 0.631 0.652 0.564 0.600 Gpi A 0.933 0.963 0.933 0.700 0.960 1.000 0.980 0.980 1.000
B* 0.067 0.037 0.067 0.300 0.040 0.020 0.020 x 2 0.077 0.040 0.077 0.639 0.043 0.010 0.010 d 0.071 0.038 0.071 0.206 0.042 0.020 0.020 h 0.124 0.071 0.124 0.420 0.077 0.039 0.039 Pep-B A 1.000 1.000 1.000 1.000 0.942 0.490 0.818 0.880
B* 0.058 0.510 0.182 0.120 x 2 0.097 5.111 0.543 9.648 d 0.061-0.320 0.222-0.621 h 0.109 0.500 0.298 0.211 Pep-S A 0.860 0.436 0.750 0.643
B 0.140 0.564 0.250 0.357 x z 6.292 0.312 0.032 0.093 d -0.502 0.081 -0.048 -0.067 h 0.241 0.492 0.375 Per-1 0.778 0.551 0.761
x 2
d h AoR
Y d h Per-2
X 2
d h Per-3
az
d h
A B* C
A B*
A B* C
0.826 0.174 3.584
-0.395 0.287
0.731 0.879 0.900 0.967 0.844 0.269 0.121 0.100 0.033 0.156 0.007 7.620 0.185 0.018 1.335
-0.023 -0.513 0.111 -0.034 -0.289 0.393 0.212 0.180 0.064 0.459 0.264 0.538 0.852 0.538 0.675 0.827 0.604 0.154 0.074 0.200 0.038 0.292 0.308 0.074 0.462 0.125 0.222 0.449 0.239 0.135 0.104 7.810 27.204 0.066 2.239 8.816 0.420 3.728 1.13917.362
-0 .350-0 .438 -0.071 0 . 1 8 2 - 0 . 5 7 1 - 0 . 0 9 3 - 0 . 4 0 3 0.167-0.614 0.592 0.263 0.497 0.489 0.346 0.495 0.364 0.297 0.539 1.000 0.979 1.000 1.000 0.852 0.980 0.960 0.980 1.000
0.021 0.148 0.020 0.040 0.020 0.011 0.817 0.010 0.043 0.010 0.021 0.174 0.020 0.042 0.020 0.041 0.252 0.039 0.077 0.039
0.275 0.333 0.325 0.474 0.308 0.222 0.365 0.380 0.286 0.225 0.093 0.100 0.052 0.384 0.500 0.574 0.575 0.474 0.308 0.778 0.635 0.620 0.714 1.957 1.301 0.675 0.117 0.544 0.551 8.908 1.392 1.890
-0.198 -0.126 -0.007-0.056 -0.013 -0.143 -0.585 -0.236-0.300 0.624 0.551 0.554 0.548 0.663 0.346 0.464 0.471 0.408
6 2 M . VAN DER BANK & a l . :
a..
tO
o
i p i
d
I
|~
i
!
m
L I
, I ©
©
o
o ©
o"
o
i i i i i t
"0
!
i
d 6
0
i
i i i r
d ~ d
Speciation in Virgilia 63
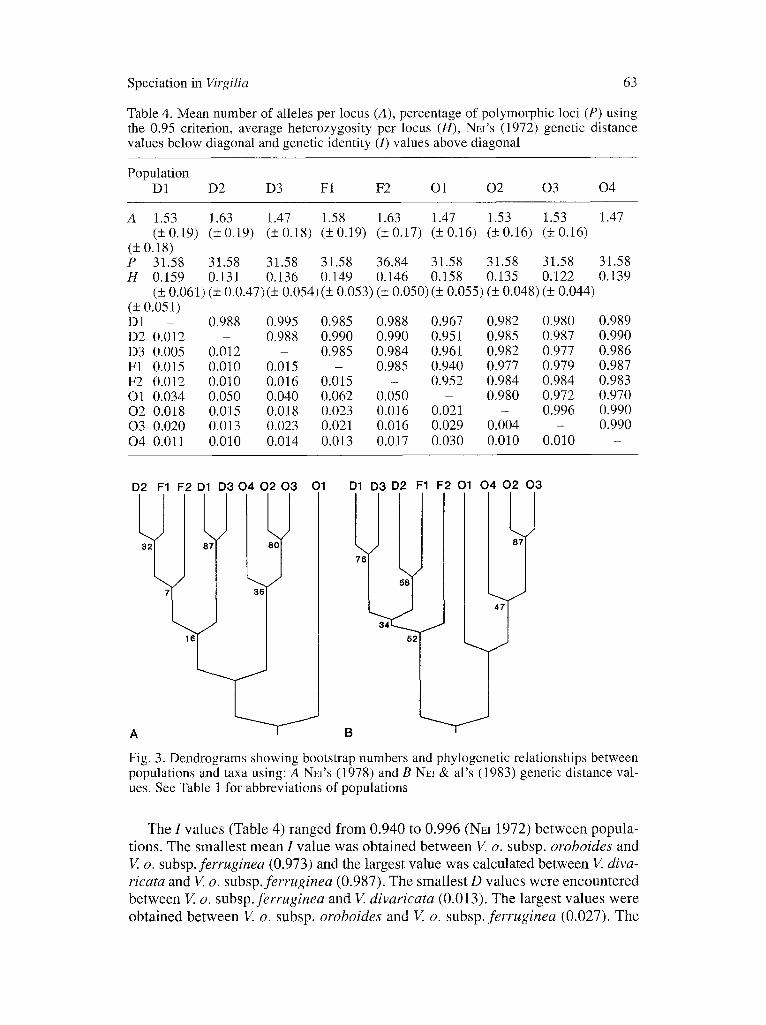
Table 4. Mean number of alleles per locus (A), percentage of polymorphic loci (P) using the 0.95 criterion, average heterozygosity per locus (H), NEI'S (1972) genetic distance values below diagonal and genetic identity (/) values above diagonal
Population D1 D2 D3 F1 F2 O1 02 03 04
A 1.53 1.63 1.47 1.58 1.63 1.47 1.53 1.53 1.47 (+0.19) (+0.19) (+0.18) (+0.19) (+0.17) (+0.16) (_+0.16) (+0.16)
(+0.18) P 31.58 31.58 31.58 31.58 36.84 31.58 31.58 31.58 31.58 H 0.159 0.131 0.136 0.149 0.146 0.158 0.135 0.122 0.139
(+ 0.061) (+ 0.0.47)(+ 0.054)(+ 0.053) (+ 0.050)(+ 0.055) (+ 0.048) (+ 0.044) (_+ 0.051) D1 - 0.988 0.995 0.985 0.988 0.967 0.982 0.980 0.989 D2 0.012 - 0.988 0.990 0.990 0.951 0.985 0.987 0.990 D3 0.005 0.012 - 0.985 0.984 0.961 0.982 0.977 0.986 F1 0.015 0.010 0.015 - 0.985 0.940 0.977 0.979 0.987 F2 0.012 0.010 0.016 0.015 - 0.952 0.984 0.984 0.983 O1 0.034 0.050 0.040 0.062 0.050 - 0.980 0.972 0.970 02 0.018 0.015 0.018 0.023 0.016 0.021 - 0.996 0.990 03 0.020 0.013 0.023 0.021 0.016 0.029 0.004 - 0.990 04 0.011 0.010 0.014 0.013 0.017 0.030 0.010 0.010 -
D2 F1 F2 D1 D 3 0 4 0 2 0 3 O1 D1
A B
! D3 D2 I=1 F2 O1 0 4 0 2 0 3
8~
58
34
/
Fig. 3. Dendrograms showing bootstrap numbers and phylogenetic relationships between populations and taxa using: A NEI'S (1978) and B NEI & al's (1983) genetic distance val- ues. See Table 1 for abbreviations of populations
The I values (Table 4) ranged from 0.940 to 0.996 (NEI 1972) between popula- tions. The smallest mean I value was obtained between V. o. subsp, oroboides and V. o. subsp, ferruginea (0.973) and the largest value was calculated between V. diva- ricata and V. o. subsp.ferruginea (0.987). The smallest D values were encountered between V. o. subsp.ferruginea and V. divaricata (0.013). The largest values were obtained between V. o. subsp, oroboides and V. o. subsp, ferruginea (0.027). The
64 M. VAN DER BANK • al.:
relative gene diversities (excluding monomorphic loci) within populations were 90.5% (+ 0.015) and 9.5% (+ 0.016) among populations. Dendrograms construct- ed using NH's (1972, 1978) and NEI & al.'s (1983) genetic distance values (Fig. 3 a and b, respectively) show the main groupings were: a) V. divaricata with V. o. subsp, ferruginea, and these taxa separated from b) V. o. subsp, oroboides.
Discussion
Genetic variation. Deviations of allele frequencies from expected Hardy-Wein- berg proportions occurred at Aat, Cap-l, Pep-B, Per-1 and 3 (Table 3) due to rel- atively large deficiencies of heterozygotes at these loci. Since heterozygote defi- ciencies were not observed at all the loci, nonrandom mating, gene flow and drift were probably not factors, since these processes should affect all loci equally and the observed deficiencies may be due to selection and/or mutations (SoLTIS & SOL- TIS 1988). Since Virgilia consists of highly localised populations (found in areas of about 1-5 hectare), the WAHLUND (1928) effect can be excluded. The polymorphic loci were not always polymorphic for every population, thus the value of h at sev- eral loci in some populations is zero, and where polymorphism occurred, h values ranged from 0.039 to 0.663 (Table 3). These values compare favourably with results for four populations of Aspalathus linearis (BuRM. f.) DAHLG.(0.039--0.595) reported by VAN DER BANK & al. (1995b).
Previous studies on 669 taxa reported P = 35%, A = 1.52, and H = 0.113 (see Gore: & HAMRICK 1991). The values obtained in the present study (P = 31.58-36.84%, A = 1.58-1.63, H = 0.149-0.146 for V. o. subsp.ferruginea; P = 31.58%, A = 1.47-1.63, H = 0.131-0.159 for V. divaricata and P = 31.58%, A = 1.47-1.53,/4 = 0.122-0.158 for V. o. subsp, oroboides) differ from these val- ues but fall within the range of means reported by HAMRICK (1979) for vascular plants (P = 22.0-75.3%, A = 1.35-2.56, H = 0.079-0.354). At the Per-3 locus, the V. o. subsp, oroboides populations lack the B-allele whereas the V. divaricata and F1 populations lack the B-allele at the Pep-B locus. This result suggests that V. o. subsp, oroboides is monophyletic, but that the V. divaricata and V. o. subsp, ferru- ginea populations are paraphyletic (but see discussion on introgression below).
Genetic differentiation. NEI'S (1972) I value is widely used to express genet- ic similarity between populations or species of plants. The mean I values ranged from 0.940 to 0.996 (Table 4) and it was slightly higher (I = 0.986) within each taxon than between taxa (I = 0.979). CRAWFORD (1983) reported high genetic simi- larities between conspecific populations with I values of more than 0.900 in the majority of comparisons. He suggested that the very high genetic identity values for subspecies or varieties of angiosperms were probably the result of either or both of the following: (1) recent divergence with insufficient time for divergence at isozyme loci, and (2) possible hybridisation between the taxa to prevent diver- gence.
(1) Recen t d ive rgence . GOTTLmB (1981) calculated the mean I value for 21 pairs of congeneric plant species at 0.67 (+ 0.04), 0.975 among populations of 13 self-fertilising species, and 0.956 for 14 outcrossers. This supports the view that populations of different species (congeneric populations) are considerably more genetically differentiated than conspecific populations (GorTLB 1981). In addition, LINHART ~: PREMOLI (1993) obtained a relationship between I values and
Speciation in Virgilia
a) Hairs per mm 2 en abaxial leaflet surface 350
300
250
200
150
100
50
0 i i DIVARICATA F E R R U G I N E A OROBOIDES
b) 14
12
10
8
6
4
2
0
65
Bract length
I I I
DIVARICATA F E R R U G I N E A OROBOIDE$
c) 16
Pedicel length
I 2 k I o] i i F
DIVARICATA F E R R U G I N E A OROBOIDES
d) 10
8
6
4
2
0 i
DIVARICATA
Bract width
I I
FERRUGINEA OROEIOIDES
e) 200
1 5 0
100
50
0
Pinna angle (degrees) f) Seed size (mg) 80
60
40
20
i i i o i i i
DIVARICATA F E R R U G I N E A OROBOIDE8 DIVARICATA F E R R U G I N E A OROBOIDES
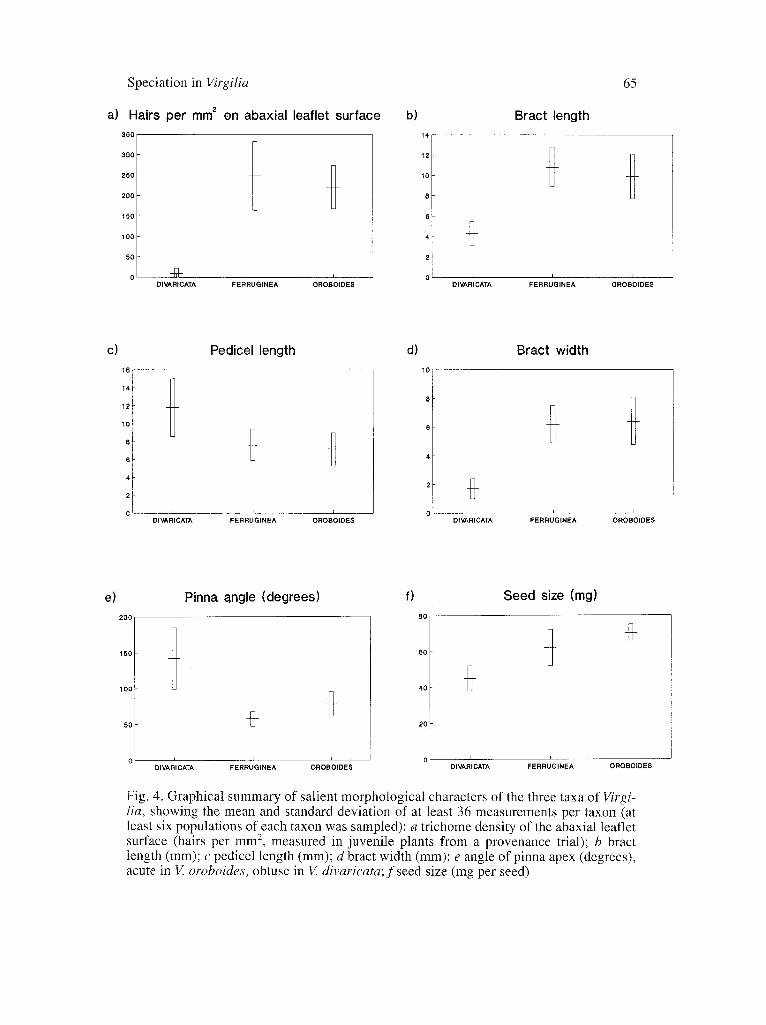
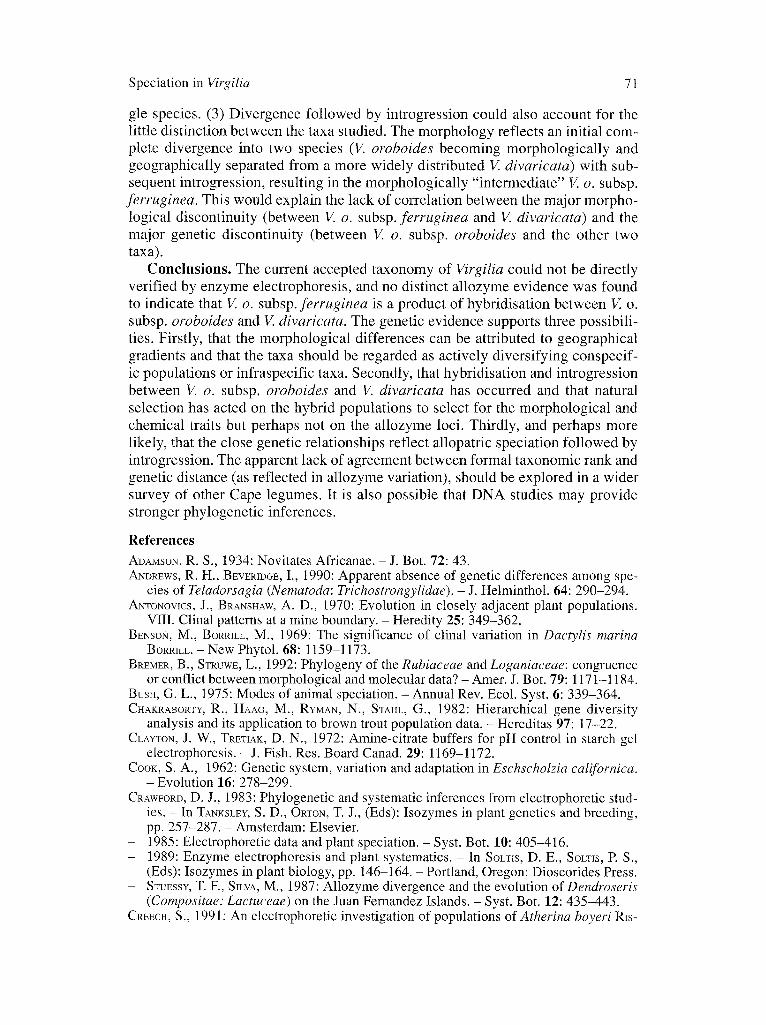
Fig. 4. Graphical summary of salient morphological characters of the three taxa of Virgi- Iia, showing the mean and standard deviation of at least 36 measurements per taxon (at least six populations of each taxon was sampled): a trichome density of the abaxial leaflet surface (hairs per mm 2, measured in juvenile plants from a provenance trial); b bract length (mm); c pedicel length (mm); d bract width (mm); e angle of pinna apex (degrees), acute in V. oroboides, obtuse in V. divaricata; f seed size (mg per seed)
66 M. VAN DER BANK & al.:
geographic distance. These authors found that populations which are geographi- cally adjacent are genetically more closely related to each other than to more dis- tant populations. For example, RICHTER & al. (1994) reported that the I value between two populations of Delphinium viridescens LEIBER~ was 1.00. These two populations are only separated by 0.5 km. However, we did not find an association between geographical distance and I values for the Virgilia populations studied. Good correlation of ! values were found between the current study and that of CRAWFORD (1983).
High genetic identities, as found between populations from different Virgilia species in the present study, are hitherto reported only in special situations. For example, high values were observed for species pairs from a number of genera believed to be related as progenitor-derivatives (CRAWFORD 1983, 1985, 1989; GOTTUEB 1984a). It was assumed that speciation in these cases has been recent to explain the minimal genetic differences between the species (GoTTUEB 1984a, STEBBINS 1986, CRAWmRD 1989). Other examples of consistently high genetic iden- tities have also been demonstrated for congeneric endemics (LowREY & CRAWFORD 1983, HELENURM & GANDERS 1985, SOLTIS 1985, CRAWFORD I~L al. 1987, W~TTER 1987, CRAWmRD 1989, HUBER & LEUCHTMANN 1992). However, allozyme analysis indicat- ed a high degree of genetic similarity among populations of Chenopodium neo- mexicanum STANDLEY and C. palmeri STANDLEY ( l = 0.974), but numerical analysis of morphological characters demonstrated that these two species are relatively dis- tinct (WALrERS 1988). Based on allozyme data from only eight isozymic loci WAL- TERS (1988) concluded that C. palmeri should be reduced to a variety of C. neo- mexicatum. The situation in Heuchera (SoLrls 1985) and Chenopodium seems to be of particular interest, because some parallells (e.g., the incongruency of mor- phological and molecular data) to the situation in Virgilia can be seen.
Another approach to determine relationships between taxa is by genetic differ- entiation values. The greatest amount of genetic variation in a species is derived from the within-population level of organisation (GRANT 1989). In the event of subspecies, where the degree of genetic differentiation is large (compared to that of conspecific populations), the within-population component of genetic variation will be much smaller than the between-population component (NH 1973). The val- ues obtained by gene diversity analysis, using allele frequency data from the present study, revealed that 95.5% of the total diversity originated from diversity within populations. This is an indication that the differences between the allelic frequencies of the samples are very small, and the values are what one would expect of different populations rather than different taxa. These allozyme similar- ities were also reflected by the small genetic distance between the taxa studied (Table 4).
Comparative studies using both electrophoretic and morphological data to dis- tinguish between species have often produced conflicting results (where morpho- logical data is more than often incongruent with molecular data). In this regard protein electrophoresis proved to be superior to delineate species boundaries (ANDREWS & BEVERIDGE 1990, CREECn 1991, GAJARDO • BEARDMORE 1993). FERGUSON (1980) believes that morphological and allozymic evidence are often discordant for three reasons: 1) either set of data may be incomplete, 2) convergent evolution of particular morphological characters, and 3) morphological and allozymic char-
Speciation in Virgilia
D I V A R I C A T A F E R R U G I N E A O R O B O I D E S
5
5 6 6
1
67
Characters
Species
Ca/purnia OROBOIDES FERRUGINEA DIVARICATA
4
6
M o r p h o l o g i c a l C h a r a c t e r s :
Leaflet shape (obtuse = O; acute = 1)
0 1 1
Pubescence of leaflets (:t: glabrous = O; densely hairy = 1)
0 1 1 0
Seed size (smali = O; large = 1)
0 1 1 0
Bract size (small = O; large = 1)
0 1 1 0
Pollen guide (absent = O; present = 1)
0 0 1 1
Nectar guide (+ absent = O; present = 1)
0 0 1
C h e m i c a l C h a r a c t e r s :
Anthocyanins (peonidine low; peonidin < cyanidine = O; peonidin high; peonidin > cyanidine = 1)
0 1 1 0
Sparteine (relatively high concentrations in twigs = O; low concentrations in twigs = 1)
0 1 1 0
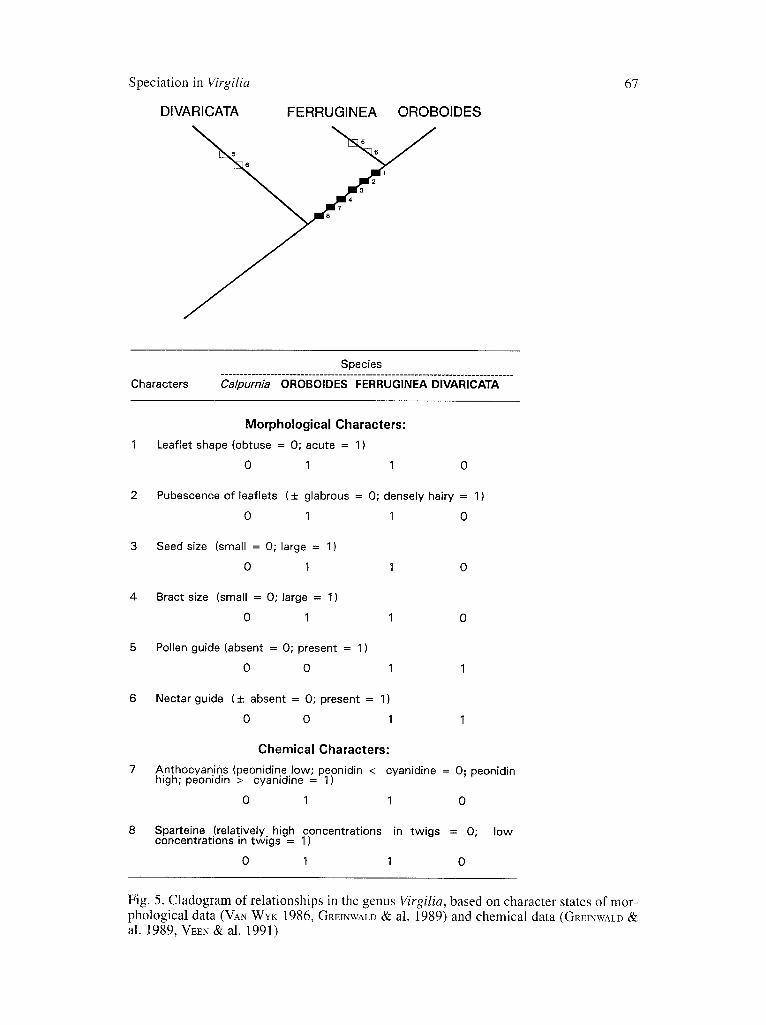
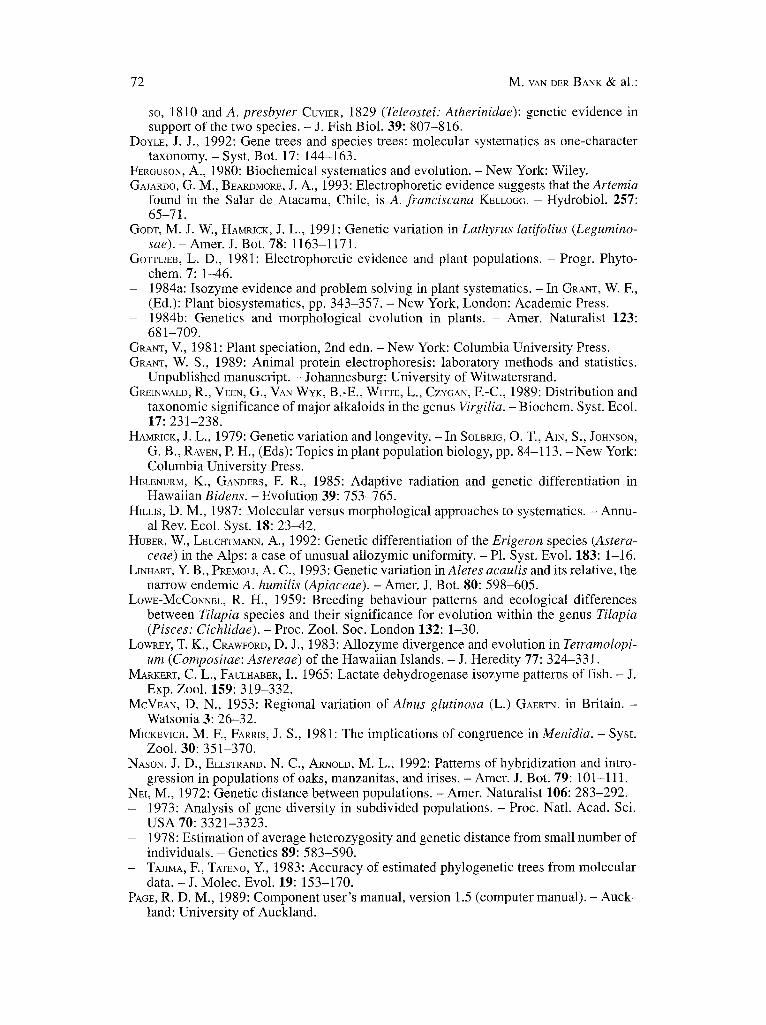
Fig. 5. Cladogram of relationships in the genus Virgilia, based on character states of mor- phological data (VAN WYK 1986, GREINWALD • al. 1989) and chemical data (GREINWALD & al. 1989, VEEN & al. 1991)
68 M. VAN DER BANK & al.:
acters which may evolve independently. He further states that allozymic and mor- phological evidence may only concur in cases where morphological evolution has been time dependent. Selective forces apparently have acted on the morphological phenotype of the three taxa of Virgilia, but evidently not enough time has elapsed for the accumulation of different allozyme alleles.
(2) H y b r i d i s a t i o n be t ween taxa p r even t i ng d ive rgence . Virgilia o. subsp, ferruginea populations share several salient morphological features with V. o. subsp, oroboides, but have flower colour characteristics (nectar guide and pol- len guide) in common with V. divaricata. Morphological and chemical evidence leave little doubt that the major discontinuity lies between V. divaricata and V. o. subsp, ferruginea, and not between the two subspecies of V. oroboides (see below). In contrast, geographical distribution (Fig. 1) and allozyme analyses (Table 3) indicate that V. o. subsp oroboides is distinct (all four populations lack the B-allele at the Per-3 locus). In addition to this apparent greater genetic discon- tinuity between the two subspecies, allozyme data (Fig. 2) showed V. o. subsp.fer- ruginea as an intermediate taxon. Population F1 of V. o. subsp, ferruginea is also geographically closer to V. divericata (Fig. 1), and lack the B-allele at the Pep-B locus (corresponding to the loss of this allele in V. divaricata). The F2 population also showed similar frequencies of unique alleles to those obtained in samples of V. o. subsp, oroboides at this locus, and at Aat, Acp, and Per-2 (Table 3, Fig. 2). However, since no locus was fixed for unique alleles in any of the taxa, we pro- pose that long-term introgression between typical V. oroboides and V. divaricata has resulted in a group of populations (now formally known as V. o. subsp, ferru- ginea), which have become genetically similar, regarding allozyme variability, to V. divaricata. If this is true, then populations near the boundary of the two distri- bution areas (the George-Knysna are) should genetically be more similar than adjacent populations of both species. The phenograms based on genetic distances (Fig. 3 a, b) show that populations F1 and D2 are indeed genetically similar.
Phylogenetic relationships. The most powerful approach in systematics avail- able at present is to analyse both molecular and morphological data. However, there are different opinions as to whether one should pool the data and run one combined analysis or run separate analyses and compare the results, e.g., by con- sensus. DOYLE (1992) suggests that molecular characters should be included in a combined analysis together with morphological data, and that molecular data should be coded as one multistate character. According to HILLIS (1987) and BRE- MER & STRUWE (1992) the resulting phylogeny might not be the same as the species phylogeny. The latter authors also suggest that discrepancies between the two data sets can never be identified if only a combined analysis is used. Several methods for dealing with different data sets have been proposed and discussed. HILLIS (1987) and SYTSMA (1990) presented different possibilities for comparing morpho- logical and molecular analyses: 1) combining the two data sets with equal weighting for each character; 2) analysing the two sets independently and con- structing a consensus tree; 3) generating a cladogram based on molecular charac- ters and secondarily overlaying the morphological characters; and finally 4) gen- erating a cladogram based on morphological characters and secondarily overlay- ing the molecular characters. If tree comparisons are chosen, then there are possibil- ities other than generating consensus trees (MICKEVICH • FARRIS 1981, PAGE 1989). In
Speciation in Virgilia 69
this study we found a lack of congruence between tree topologies from genetic and morphological data, but the poor dendrograms (as reflected by the low bootstrap numbers in Fig. 3) should come as no surprise since the three taxa are genetically very similar. It is, however, obvious that the taxa which are not geographically iso- lated (V. o. snbsp, ferruginea and V. divaricata) are genetically closest.
According to VAN WYK (1986) V. 0. subsp.ferruginea has an affinity with V. o. subsp, oroboides rather than with V. divaricata. This assumption was based on detailed variation studies and several numerical analyses, including a discriminant analysis. The most reliable quantitative characters that prove this relationship are graphically summarised in Fig. 4. All morphological and chemical characters which show sufficient discontinuity to allow them to be logically polarised, are shown in Fig. 5 (pedicel length shows some overlap and is excluded). Of these, only two morphological characters separate V. o. subsp, ferruginea from V. o. subsp, olvboides (pollen and nectar guides) whereas four morphological charac- ters (leaflet shape, pubescence of leaflets, seed size and bract size) and two chemi- cal characters (average values of peonidin and sparteine concentrations) separate V. o. subsp, ferruginea from V. divaricata. The most parsimonious cladogram for the morphological and chemical data is given in Fig. 5. The association between the two subspecies of V. oroboides is also supported by some apomorphic tenden- cies (e.g., from wood anatomy) and various other characters which we were unable to logically polarise for cladistic analysis. In a stepwise discriminant anal- ysis (VAN WYK 1983), the five characters shown in Fig. 4 a-e were found to have the best discriminatory value. Of these, the pubescence of the abaxial surface of the leaflets (Fig. 4 a) and the dimensions of the bracts (Fig. 4 b, d) were diagnos- tically different between the two species. It is important to note that these two characters show no clinal variation within taxa, but abrupt discontinuity was found between V. o. subsp, ferruginea and V. divaricata. In other genera of the tribe Podalyrieae, the pubescence of the leaflets and the size of the bracts have been traditionally used for their diagnostic value at the species level. Large and sheating bracts are of particular evolutionary significance in the tribe Podalyrieae (VAN WYK • NCHUTTE 1995).
Congruence between different data sets is desired (SHAKLEE & WH~TT 1981) in order to resolve "true" phylogeny. However, we were unsuccessful in obtaining congruence among phylogenetic inferences based on different character sets but it is noteworthy that there is congruence between morphological and chemical char- acters (and between allozyme data and geographical distribution patterns).
Speeiation in Virgilia. The manner of, and conditions during speciation may influence the extent of the genetic distance after separation. Conditions for the for- mation of a new species demand the occupation of new or different environments and isolation or semi-isolation, until genetic characters become fixed (LowE- McCoNNELL 1959). In addition, evolutionary biologists agree that, in order to spe- ciate, gene flow between diverging populations must be reduced. In the present study no evidence for a reduction in gene flow between the three taxa could be found from the allozyme data except for the lack of the B-allele at the Per-3 locus in the four V. o. subsp, oroboides populations (Table 3).
Patterns of speciation involving either allopatric, parapatric or sympatric devel- opment of reproductive isolation have been invoked to explain the origin of new
70 M. VAN DER BANK • al.:
species. Allopatric speciation basically occurs in two different ways: 1) speciation by subdivision and 2) speciation by the founder effect (Bust~ 1975). The overall pattern of variation in Virgilia is typical of most Cape legumes and suggests allo- patric speciation (VAN WYK 1986).
By adopting the speciation system of GRANT (1981), modes of plant speciation can be referred to two basic categories: (1) primary speciation (i.e., the process of evolutionary divergence of populations to the species level), and (2) hybrid spe- ciation. Primary speciation may involve either quantum or geographical specia- tion. Quantum speciation is a rapid and radical process and starts from a semi-iso- lated peripheral population (local race) of a polymorphic, cross-fertilising ances- tral species. Geographical speciation is continuous and runs from polymorphic variation through local and then geographical races to species (GRANT 1981). Hybrid speciation was proposed by VAN WYK (1986) to explain the origin of V. o. subsp, ferruginea. Although V. o. subsp, ferruginea combines morphological fea- tures of V. o. subsp, oroboides and V. divaricata, comparisons of alkaloid patterns of the taxa showed little intermediacy, and a close relation between V. o. subsp. oroboides and V. ferruginea (VEEN & al. 1991). Evidence of possible hybrid spe- ciation could not be inferred from the present allozyme study because consistent genetic differences (fixed unique alleles) for the Virgilia species are lacking.
Three possible explanations for the present patterns of speciation can be given. (1) The loci studied electrophoretically may not be representative of the whole plant genome, and the analysis of such data may result in cladograms that reflect the evolutionary history of genes, but not the organism (DOYLE 1992). The whole plant genome is rarely studied due to constraints in manpower, funding and time. If this is true then a distinction at the species level is appropriate. Since time is the critical factor for allozyme divergences (CRAwFORD 1989), the Virgilia species must be the result of recent speciation. As indicated by GOTTLIEB (1984b), relative- ly large changes in plant morphology are possibly based on a few genetic muta- tions. For example, morphological differences in shape (of leaves), orientation (of ligulate florets), presence versus absence (of glandular hairs or filiform-florets) as well as ecological preferences are often controlled by one or a few genes. (2) Allo- patric speciation of a clinal nature may be involved. The morphological and chemi- cal characters that distinguished the taxa can be seen as geographical gradients, thus a graded pattern associated with geographical gradients. Clinal variation has been described in a large number of species (e.g., McVEAN 1953, COOK 1962, WOODSON 1964, BENSON & BORRILL 1969, ANTONOVICS ~% BRADSHAW 1970, THOMAS ~¢
BARBER 1974, PRENTICE 1979). In Virgilia, morphological characters are geograph- ically correlated along an east-west gradient (VAN WYK 1986, GREINWALD ~¢ al. 1989) with abrupt increases in seed size, bract size, hairiness of leaves and dura- tion of flowering occurring from east to west. From the above-mentioned infor- mation and the intermediacy of the population-specific unique alleles of V. o. subsp, ferruginea (Fig. 2), it appears that the concept of geographical gradients may apply in this situation. It is also important to note than no geographical barrier exists between V. divaricata and V. o. subsp, ferruginea. If the enzyme data from the present study reflect the true speciation, then the sparse allozymic variation found among Virgilia taxa would be consistent with the assumption that the taxa studied should be regarded as recently diversified subspecies or varieties of a sin-
Speciation in Virgilia 71
gle species. (3) Divergence followed by introgression could also account for the little distinction between the taxa studied. The morphology reflects an initial com- plete divergence into two species (V. oroboides becoming morphologically and geographically separated from a more widely distributed V. divaricata) with sub- sequent introgression, resulting in the morphologically "intermediate" V. o. subsp. ferruginea. This would explain the lack of correlation between the major morpho- logical discontinuity (between V. o. subsp, ferruginea and V. divaricata) and the major genetic discontinuity (between V. o. subsp, oroboides and the other two taxa).
Conclusions. The current accepted taxonomy of Virgilia could not be directly verified by enzyme electrophoresis, and no distinct al lozyme evidence was found to indicate that V. o. subsp, ferruginea is a product of hybridisation between V. o. subsp, oroboides and V. divaricata. The genetic evidence supports three possibili- ties. Firstly, that the morphological differences can be attributed to geographical gradients and that the taxa should be regarded as actively diversifying conspecif- ic populations or infraspecific taxa. Secondly, that hybridisation and introgression between V. o. subsp, oroboides and V. divaricata has occurred and that natural selection has acted on the hybrid populations to select for the morphological and chemical traits but perhaps not on the al lozyme loci. Thirdly, and perhaps more likely, that the close genetic relationships reflect allopatric speciation followed by introgression. The apparent lack of agreement between formal taxonomic rank and genetic distance (as reflected in allozyme variation), should be explored in a wider survey of other Cape legumes. It is also possible that DNA studies may provide stronger phylogenetic inferences.
R e f e r e n c e s
ADAMSON, R. S., 1934: Novitates Africanae. - J. Bot. 72: 43. ANDREWS, R. H., BEVERD~E, I., 1990: Apparent absence of genetic differences among spe-
cies of Teladorsagia (Nematoda: Trichostlvngylidae). - J. Helminthol. 64: 290-294. ANTONOVICS, J., BRANSNAW, A. D., 1970: Evolution in closely adjacent plant populations.
VIII. Clinal patterns at a mine boundary. - Heredity 25: 349-362. BENSON, M., BORRmL, M., 1969: The significance of clinal variation in Dactylis marina
BoakmL - New Phytol. 68: 1159-1173. BREMER, B., SrR~'WE, L., 1992: Phylogeny of the Rubiaceae and Loganiaceae: congruence
or conflict between morphological and molecular data? - Amer. J. Bot. 79:1171-1184. BusH, G. L., 1975: Modes of animal speciation. - Annual Rev. Ecol. Syst. 6: 339-364. CHAKRABORTY, R., HAAG, M., RYMAN, N., STAHL, G., 1982: Hierarchical gene diversity
analysis and its application to brown trout population data. - Hereditas 97: 17-22. CLAYTON, J. W., TRETIAK, D. N., 1972: Amine-citrate buffers for pH control in starch gel
electrophoresis. - J . Fish. Res. Board Canad. 29:1169-1172. CooK, S. A., 1962: Genetic system, variation and adaptation in Eschscholzia californica.
- Evolution 16: 278-299. CRAWFORD, D. J., 1983: Phylogenetic and systematic inferences from electrophoretic stud-
ies. - In TANKSLEY, S. D., ORrON, T. J., (Eds): Isozymes in plant genetics and breeding, pp. 257-287. - Amsterdam: Elsevier.
- 1985: Electrophoretic data and plant speciation. - Syst. Bot. 10: 405-416. - 1989: Enzyme electrophoresis and plant systematics. - In SOLT~S, D. E., SoLrts, R S.,
(Eds): Isozymes in plant biology, pp. 146-164. - Portland, Oregon: Dioscorides Press. - STVESSY, T. E, SILVA, M., 1987: Allozyme divergence and the evolution of Dendroseris
(Compositae: Lactuceae) on the Juan Fernandez Islands. - Syst. Bot. 12: 435-443. CREECH, S., 1991: An electrophoretic investigation of populations of Atherina boyeri Ris-
72 M. VAN DER BANK & al.:
so, 1810 and A. presbyter CUVIER, 1829 (Teleostei: Atherinidae): genetic evidence in support of the two species. - J. Fish Biol. 39: 807-816.
DOYLE, J. J., 1992: Gene trees and species trees: molecular systematics as one-character taxonomy. - Syst. Bot. 17: 144-163.
FER~USON, A., 1980: Biochemical systematics and evolution. - New York: Wiley. GAJARDO, G. M., BEARDMORE, J. A., 1993: Electrophoretic evidence suggests that the Artemia
found in the Salar de Atacama, Chile, is A. franciscana KELLOGG. -- Hydrobiol. 257: 65-71.
GODT, M. J. W., HAMRICK, J. L., 1991: Genetic variation in Lathyrus latifolius (Legumino- s a e ) . - Amer. J. Bot. 78: 1163-1171.
GOTTLmB, L. D., 1981: Electrophoretic evidence and plant populations. - Progr. Phyto- chem. 7: 1-46.
- 1984a: Isozyme evidence and problem solving in plant systematics. - In GRANT, W. F., (Ed.): Plant biosystematics, pp. 343-357.- New York, London: Academic Press.
- 1984b: Genetics and morphological evolution in plants. - Amer. Naturalist 123: 681-709.
GRANT, V., 1981: Plant speciation, 2nd edn. - New York: Columbia University Press. GRANT, W. S., 1989: Animal protein electrophoresis: laboratory methods and statistics.
Unpublished manuscript. - Johannesburg: University of Witwatersrand. GREINWALD, R., VEEN, G., VAN WYK, B.-E., WrTTE, L., CZY~AN, E-C., 1989: Distribution and
taxonomic significance of major alkaloids in the genus Virgilia. - Biochem. Syst. Ecol. 17: 231-238.
HAMRICK, J. L., 1979: Genetic variation and longevity. - In SOLBRI~, O. T., AtN, S., JOHNSON, G. B., RAVEN, R H., (Eds): Topics in plant population biology, pp. 84-113. - New York: Columbia University Press.
HELENURM, K., GANDERS, F. R., 1985: Adaptive radiation and genetic differentiation in Hawaiian Bidens. - Evolution 39: 753-765.
HmktS, D. M., 1987: Molecular versus morphological approaches to systematics. - Annu- al Rev. Ecol. Syst. 18: 23-42.
HUBER, W., LEUCHTMANN, A., 1992: Genetic differentiation of the Erigeron species (Astera- ceae) in the Alps: a case of unusual allozymic uniformity. -P1. Syst. Evol. 183: 1-16.
LINnART, Y. B., PREMOLI, A. C., 1993: Genetic variation in Aletes acaulis and its relative, the narrow endemic A. humilis (Apiaceae). - Amer. J. Bot. 80: 598-605.
LowE-McCoNNEL, R. H., 1959: Breeding behaviour patterns and ecological differences between Tilapia species and their significance for evolution within the genus Tilapia (Pisces: Cichlidae). - Proc. Zool. Soc. London 132: 1-30.
LowRzY, T. K., CRAWFORD, D. J., 1983: Allozyme divergence and evolution in Tetramolopi- um (Compositae: Astereae) of the Hawaiian Islands. - J. Heredity 77:324-331.
MARKERT, C. L., FAULnABER, I., 1965: Lactate dehydrogenase isozyme patterns of fish. - J. Exp. Zool. 159: 319-332.
McVEAN, D, N., 1953: Regional variation of Alnus glutinosa (L.) GAERTN. in Britain. - Watsonia 3: 26-32.
MtCKEWCH, M. F., FARRtS, J. S., 1981: The implications of congruence in Menidia. - Syst. Zool. 30: 351-370.
NASON, J. D., ELLSTRAND, N. C., ARNOLD, M. L., 1992: Patterns of hybridization and intro- gression in populations of oaks, manzanitas, and irises. - Amer. J. Bot. 79:101-111.
NEt, M., 1972: Genetic distance between populations. - Amer. Naturalist 106: 283-292. - 1973: Analysis of gene diversity in subdivided populations. - Proc. Natl. Acad. Sci.
USA 70: 3321-3323. - 1978: Estimation of average heterozygosity and genetic distance from small number of
individuals. - Genetics 89: 583-590. -- TAJIMA, F., TATENO, g. , 1983: Accuracy of estimated phylogenetic trees from molecular
data. - J. Molec. Evol. 19: 153-170. PACE, R. D. M., 1989: Component user's manual, version 1.5 (computer manual). - Auck-
land: University of Auckland.
Speciation in Virgilia 73
POULIK, M. D., 1957: Starch gel electrophoresis in a discontinuous system of buffers. - Nature 180: 33-43.
PRENTICE, H. C., 1979: Numerical analysis of infraspecific variation in European Silene alba and S. dioica (Caryophylaceae).- Bot. J. Linn. Soc. 78: 181-212.
RICHTER, T. S., SOLTIS, R S., SOLTIS, D. E., 1994: Genetic variation within and among popu- lations of the narrow endemic Delphinium viridescens (Ranunculaceae). - Amer. J. Bot. 81: 1070-1076.
RIDOWAY, G., SHERBURNE, S. W., LEwis, R. D., 1970: Polymorphism in the esterases of Atlan- tic herring. -Trans. Amer. Fish. Soc. 99: 147-151.
SHAKLEE, J. B., WHITT, G. S., 1981: Lactate dehydrogenase isozymes of gadiform fishes: divergent patterns of gene expression indicate a heterogeneous taxon. - Copeia 1981: 564-578.
SOLTtS, D. E., 1985: Allozymic differentiation among Heuchera americana, H. parviflora, H. pubescens, and H. viIlosa (Saxifragaceae). - Syst. Bot. 10: 193-198.
SOLTIS, R S., SOLTlS, D. E., 1988: Estimated rates of intragametophytic selfing in lycopods. - Amer. J. Bot. 75: 248-256.
STEBBINS, G. L., 1986: Gene action and morphogenesis in plants. - In GUSTAFSON, J. P., STEBBINS, G. L., AYALA, F. J., (Eds): Genetics, development, and evolution, pp. 29-46. - New York, London: Plenum Press.
SYTSMA, K. J., 1990: DNA and morphology: inference of plant phylogeny. - Trends Ecol. Evol. 5: 104-110.
THOMAS, D. A., BARBER, H. N., 1974: Studies of leaf characteristics of a cline of Eucalyp- tus urnigera from Mount Wellington, Tasmania. II. Reflection, transmission and absorption of radiation. -Austral. J. Bot. 22: 701-707.
VAN DER BANK, H., VAN DER BANK, M., VAN WYK, B.-E., 1995a: Allozyme variation in Vir- gilia oroboides (Tribe Podalyrieae: Fabaceae). - Biochem. Syst. Ecol. 23: 47-52.
VAN DER BANK, M . , VAN WYK, B.-E., VAN DER BANK, H., 1995b: Biochemical genetic varia- tion in four wild populations of Aspalathus linearis (Rooibos tea). - Biochem. Syst. Ecol. 23: 257-262.
VAN WYK, B.-E., 1983: 'n Monografiese studie van die genus Virgil& POIR. -- M.Sc. thesis (in Afrikaans), University of Stellenbosch.
- 1986: A revision of the genus Virgilia (Fabaceae). - S. African J. Bot. 52: 347-353. - SCHUTTE, A. L., 1995: Phylogenetic relationships in the tribes Podalyrieae, Liparieae
and Crotalarieae. - In CRISP, M. D., DOYLE, J. J., (Eds): Advances in legume systemat- ics. Part 7. Phylogeny, pp. 283-308. - Kew: Royal Botanic Gardens.
VEER, a. , GREINWALD, R., WITTE, L., WRAY, V., CZYGAN, F.-C., 1991: Alkaloids of Virgilia divaricata and V. oroboides. - Phytochemistry 306:1891-1895.
WAHLUND, S., 1928: The combination of populations and the appearance of correlation examined from the standpoint of study of heredity. - Hereditas 11: 65-106.
WALTERS, T. W., 1988: Relationships between isozymic and morphologic variation in the diploids Chenopodium fremontii, C. neomexicanum, C. palmeri, and C. watsonii. - Amer. J. Bot. 75: 97-105.
WttlTT, G. S., 1970: Developmental genetics of the lactate dehydrogenase isozymes of f i sh . - J. Exp. Zool. 175: 1-35.
WITTER, M. S., 1987: Adaptive radiation and genetic differentiation in the Hawaiian silver- sword alliance (Compositae: Madiinae). - Amer. J. Bot. 74: 766.
WOODSON, R. E., Jr., 1964: The geography of flower color in Butterflyweed. - Evolution 18: 143-163.
Addresses of the authors: MICHELLE VAN DER BANK, B.-E. VAN WYK, Department of Bota- ny, Rand Afrikaans University, P.O. Box 524, Auckland Park, 2006, Johannesburg, Republic of South Africa. - F. H. VAN DER BANK, Research Unit for Aquatic and Terrestrial Ecosystems, Rand Afrikaans University, P.O. Box 524, Auckland Park, 2006, Johannes- burg, Republic of South Africa.
Accepted October 17, 1995 by F. EHRENDORFER