parapatric divergence of sympatric morphs in a salamander: incipient speciation on long island?
TRANSCRIPT
Parapatric divergence of sympatric morphs in asalamander: incipient speciation on Long Island?
M. CAITLIN FISHER-REID,† TAG N. ENGSTROM,‡ CAITLIN A. KUCZYNSKI ,
PATRICK R. STEPHENS§ and JOHN J. WIENS¶Department of Ecology and Evolution, Stony Brook University, Stony Brook, NY 11794-5245, USA
Abstract
Speciation is often categorized based on geographic modes (allopatric, parapatric or
sympatric). Although it is widely accepted that species can arise in allopatry and then
later become sympatrically or parapatrically distributed, patterns in the opposite direc-
tion are also theoretically possible (e.g. sympatric lineages or ecotypes becoming
parapatric), but such patterns have not been shown at a macrogeographic scale. Here,
we analyse genetic, climatic, ecological and morphological data and show that two
typically sympatric colour morphs of the salamander Plethodon cinereus (redback and
leadback) appear to have become parapatrically distributed on Long Island, New York,
with pure-redback populations in the west and pure-leadback populations in the east
(and polymorphic populations in between and on the mainland). In addition, the
pure-leadback populations in eastern Long Island are genetically, ecologically and
morphologically divergent from both mainland and other Long Island populations,
suggesting the possibility of incipient speciation. This parapatric separation seems to
be related to the different ecological preferences of the two morphs, preferences which
are present on the mainland and across Long Island. These results potentially support
the idea that spatial segregation of sympatric ecotypes may sometimes play an impor-
tant part in parapatric speciation.
Keywords: amphibians, biogeography, climate, morphology, Plethodontidae, speciation
Received 17 November 2012; revision received 31 May 2013; accepted 3 June 2013
Introduction
Allopatric speciation is widely considered the most
common geographic mode (Coyne & Orr 2004; Bolnick &
Fitzpatrick 2007). Thus, allopatric and parapatric sister
species are often assumed to have originated through
allopatric or parapatric speciation, as are species that are
partially sympatric (Coyne & Orr 2004). The possibility
that some currently allopatric or parapatric sister species
originated through initial divergence of lineages or eco-
types in sympatry has been suggested (e.g. Coyne 2007;
Nosil 2008) and important theoretical studies support
this view (e.g. Doebeli & Dieckmann 2000, 2003), but
with few empirical examples (e.g. Seehausen et al. 2008;
Ingram 2011). Spatial segregation of sympatric ecotypes
along an environmental gradient is a key component of
these models and examples. However, the empirical
examples involve different habitats at a relatively fine
spatial scale (Seehausen et al. 2008; Ingram 2011), and not
the macrogeographic scale over which species ranges are
usually considered. In some cases, small-scale patterns of
spatially segregated ecotypes could be explained by drift
or other stochastic factors, whereas large-scale, tempo-
rally stable patterns may be more difficult to explain.
Here, we address the possibility that sympatric ecotypes
within a species can become parapatrically distributed
and divergent at a relatively large spatial scale, through a
multifaceted analysis of the eastern red-backed salamander
Correspondence: M. Caitlin Fisher-Reid, Fax: 804-289-8233;
E-mail: [email protected]
Present addresses: †Department of Biology, University of Rich-
mond, Richmond, VA 23173, USA
‡Department of Biological Sciences, California State University,
Chico, CA 95929-0515, USA
§Odum School of Ecology, University of Georgia, Athens, GA
30602, USA
¶Department of Ecology and Evolution, University of Arizona,
Tucson, AZ 85721, USA
© 2013 John Wiley & Sons Ltd
Molecular Ecology (2013) 22, 4681–4694 doi: 10.1111/mec.12412
(Plethodon cinereus) on Long Island, New York (hereafter:
‘LI’).
Plethodon cinereus ranges from southern Canada to
northern North Carolina and typically occurs in two dis-
crete colour morphs: the redback morph and the lead-
back morph (Petranka 1998). The redback morph
(hereafter: ‘red’) has a broad orange to red dorsal stripe
and dark grey flanks, whereas the leadback morph
(hereafter: ‘lead’) is uniformly dark grey on the dorsum
and flanks (Petranka 1998). A third, entirely red morph
occurs sporadically in some populations (e.g. Tilley et al.
1982). Highton (1975) suggested that the colour morphs
are polygenic, with no intermediates, and showed that
genetic dominance of morphs varies by population, but
there has been no further work on their genetic basis.
The function of the red stripe is not entirely clear, but it
has been implicated in frequency-dependent selection
by predators (Fitzpatrick et al. 2009).
These two morphs are usually found in polymorphic
populations with frequencies of approximately 70% red
and 30% lead, but with red morphs found in much
higher proportions (90–100%) at higher elevations and
the northernmost parts of the species range (e.g. Lotter
& Scott 1977; Petranka 1998; Gibbs & Karraker 2006;
No€el & Lapointe 2010). On LI, however, these two col-
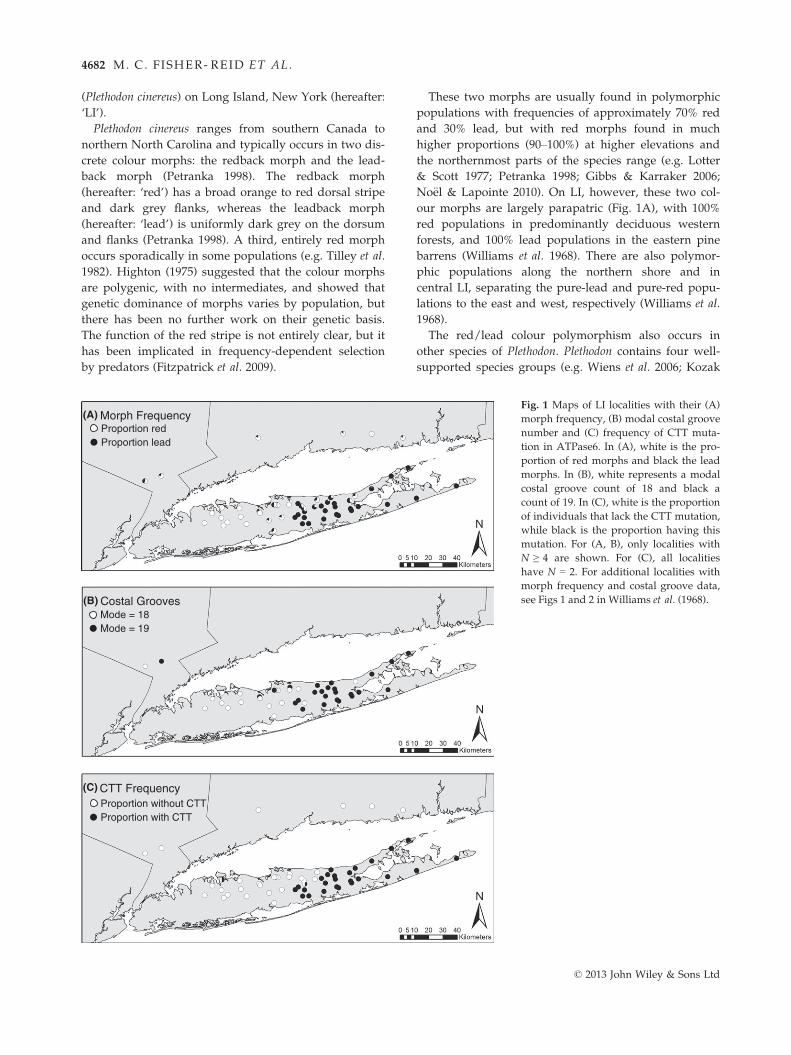
our morphs are largely parapatric (Fig. 1A), with 100%
red populations in predominantly deciduous western
forests, and 100% lead populations in the eastern pine
barrens (Williams et al. 1968). There are also polymor-
phic populations along the northern shore and in
central LI, separating the pure-lead and pure-red popu-
lations to the east and west, respectively (Williams et al.
1968).
The red/lead colour polymorphism also occurs in
other species of Plethodon. Plethodon contains four well-
supported species groups (e.g. Wiens et al. 2006; Kozak
Morph FrequencyProportion redProportion lead
Costal GroovesMode = 18Mode = 19
CTT FrequencyProportion without CTTProportion with CTT
(A)
(B)
(C)
Fig. 1 Maps of LI localities with their (A)
morph frequency, (B) modal costal groove
number and (C) frequency of CTT muta-
tion in ATPase6. In (A), white is the pro-
portion of red morphs and black the lead
morphs. In (B), white represents a modal
costal groove count of 18 and black a
count of 19. In (C), white is the proportion
of individuals that lack the CTT mutation,
while black is the proportion having this
mutation. For (A, B), only localities with
N ≥ 4 are shown. For (C), all localities
have N = 2. For additional localities with
morph frequency and costal groove data,
see Figs 1 and 2 in Williams et al. (1968).
© 2013 John Wiley & Sons Ltd
4682 M. C. FISHER- REID ET AL.
et al. 2009; Fisher-Reid & Wiens 2011), and eight other
species in three of these groups also have sympatric
red/lead colour morphs (e.g. P. vehiculum; Petranka
1998). These three groups also contain several appar-
ently monomorphic species (e.g. red: P. idahoensis, lead:
P. richmondi; Petranka 1998). These interspecific patterns
raise the possibility that fixation of colour morphs or
transitions between them might be related to speciation
(see below and Discussion).
On the mainland, these morphs differ in ways that
may be relevant to speciation. Lead individuals are rela-
tively drought and heat tolerant, whereas red individu-
als are drought intolerant and cold tolerant (e.g.
Williams et al. 1968; Lotter & Scott 1977; Moreno 1989;
Gibbs & Karraker 2006; Anthony et al. 2008; but see Pet-
ruzzi et al. 2006). In polymorphic populations from
Ohio, diet differences between colour morphs and mod-
erate assortative mating by colour morph have also
been documented (Anthony et al. 2008). Thus, the
colour morphs might be relevant to speciation not
because of the colours themselves, but rather because
different morphs are associated with different environ-
mental tolerances that could lead to occurrence in
divergent habitats and subsequently to speciation. How-
ever, the cause of the association between colour and
climate is currently unknown.
In this study, we test the hypothesis that the cur-
rently parapatric colour morphs of P. cinereus on LI
evolved from sympatric morphs that have become
spatially segregated along an environmental gradient.
We also test if these parapatric populations show eco-
logical, genetic and morphological differences sugges-
tive of incipient speciation. From these hypotheses, we
make six predictions. First, given a population-level
phylogeny, we predict that LI P. cinereus populations
will form a monophyletic group that is derived from
mainland populations where morphs occur in sympa-
try (i.e. a single population with sympatric morphs
invaded LI). Second, we predict that LI populations
will cluster as genetically separate from the mainland
and that pure-red and pure-lead populations on LI
will also form distinct genetic clusters. Third, we
expect to find a large-scale environmental gradient that
correlates with changes in morph frequency among
populations across the island. Fourth, given the eco-
physiological differences previously found between
sympatric morphs on the mainland (see above), we
expect geographic patterns in microclimate occurrence
to parallel those for macroclimate. Fifth, we expect that
predominantly red and lead populations on LI will
diverge in other morphological traits besides colour
(e.g. costal groove number; Williams et al. 1968). Sixth,
we expect reduced gene flow between populations
with divergent morph frequencies, and that, after
accounting for geographic distance, gene flow patterns
will be related to an environmental gradient.
Materials and methods
Study system and sampling
We collected specimens (for morphological data) and
tissue samples (for genetic data) from populations of
P. cinereus across LI (N = 61 localities) and adjacent
mainland areas (N = 21 localities; for all localities and
sample sizes see Table S1, Supporting information).
These localities were also used for GIS-based climatic
data. A subset of LI, Connecticut and New Jersey locali-
ties were used for microclimate measurements. This
strategy yielded a matched data set of localities for
which we had morphological, genetic, microclimatic
and macroclimatic data.
Genetic data
We analysed patterns of genetic differentiation in
P. cinereus using both mitochondrial (mtDNA) and
microsatellite DNA data. For a complete list of individ-
uals, localities and genetic data collected, see Table S2
(Supporting information).
One mitochondrial gene, ATPase6, was amplified
using standard PCR and sequencing protocols (see
Table S3 and Text S1, Supporting information for
primers, PCR conditions and methods). Variation in
ATPase6 was low, and so only 187 individuals from 72
localities (53 LI, 19 mainland) were sequenced. Each
locality was represented by 1–6 individuals (mode = 2).
Twelve of these P. cinereus individuals (seven LI,
five mainland) and five additional outgroups were
sequenced for cytochrome b (cytb) to assist in rooting
the mtDNA tree (see below; Table S2, Supporting
information).
Seven microsatellite loci were developed with the clon-
ing protocol outlined in Glenn & Schable (2005), using a
subset of LI P. cinereus (Table S2, Supporting informa-
tion). We targeted loci variable among LI populations
(but not necessarily differing between red and lead pop-
ulations). Microsatellites identified by Connors & Cabe
(2003) for P. cinereus showed little variation on LI and
were not used. Data were obtained for 233 individuals of
P. cinereus from 46 localities (31 LI, 15 mainland). Each
locality was represented by 2–7 individuals (mean = 5).
See Table S2 (Supporting information) for sampling
details, and Table S3 (Supporting information) for micro-
satellite primers, repeat motifs and PCR conditions. All
loci were checked for null alleles, deviation from Hardy–
Weinberg equilibrium, and linkage disequilibrium (see
Text S1; Data S1, Supporting information).
© 2013 John Wiley & Sons Ltd
PARAPATRIC DIVERGENCE IN A SALAMANDER 4683
Macroclimate data
Macroclimate data (Data S2, Supporting information)
were obtained for each georeferenced sampling locality
using ArcGIS 9.3. Nineteen variables from the World-
Clim database were extracted (Hijmans et al. 2005)
for 75 localities (58 LI, 17 mainland). These variables
summarize temperature and precipitation data from
weather stations from 1950 to 2000, spatially interpolated
to localities between weather stations, at a resolution of
approximately 1 km2.
Morph frequency data
Morph frequencies (i.e. % red individuals; Table S1,
Supporting information) were estimated for each local-
ity using the same specimens described above. Our esti-
mates are generally concordant with those of Williams
et al. (1968). Those authors had larger sample sizes and
sampled LI more broadly before much recent urbaniza-
tion (e.g. they have pure-red localities from southwest-
ern LI). The concordance between our two studies
suggests that morph frequencies are largely stable over
decadal time scales (but Gibbs & Karraker 2006 show
evidence of small, climate-related frequency shifts). We
only used localities with morph frequencies based on at
least four individuals (range: 4–25; mean: 11).
Microclimate data
Fine-scale environmental data (microclimate data here-
after) included soil moisture (%), soil pH, ground
temperature (°C), air temperature (°C) and air humidity
(% relative humidity). Data were collected weekly from
randomly selected localities, between March and
November during 2009–2011 (Data S3, Supporting infor-
mation). Each visit began between 13:00–15:00 hours
and lasted 1–2 hours. Five, nonoverlapping 20-m tran-
sects were conducted sequentially in forested areas with
a high density of cover objects (e.g. logs, rocks). Cover
objects within 2 m of the transect tape were searched
for salamanders. When a salamander was found, its
colour morph and microclimate data were recorded.
See Text S1 (Supporting information) for details on field
sampling methods (e.g. locality selection, sampling
frequency).
Morphometric data
Morphometric data were collected from 414 preserved
specimens from LI and the mainland (Data S4, Support-
ing information). Measured individuals had a total
length (snout-vent-length + tail length) ≥60 mm, to exclude
juveniles (adult total length approximately 65–125 mm;
Petranka 1998). Nine measurements were recorded for
each specimen (see Text S1, Supporting information).
Mitochondrial data analyses
A likelihood analysis of the combined mtDNA data
(ATPase6, cytb) was conducted using RAxML ver. 7.2.6
(Stamatakis 2006). Methodological details are described
in Text S2 (Supporting information). The mtDNA analy-
sis contained several outgroup species from the cinereus
group, and Ensatina eschscholtzii to root relationships
among P. cinereus populations and help identify a root
for the microsatellite tree (given the difficulty of ampli-
fying microsatellites across species). In the mtDNA tree
(Fig. S1, Supporting information), a clade of predomi-
nantly southeastern populations is sister to all other
P. cinereus populations. Therefore, the microsatellite tree
was rooted with Virginia populations, a decision further
supported by the fact that the putative sister species to
P. cinereus, P. shenandoah (Kozak et al. 2009; Fisher-Reid
& Wiens 2011; this study) is also endemic to Virginia
(Petranka 1998). However, rooting should have little
impact on our conclusions, as long as the root is not
within LI.
Microsatellite data analyses
First, to address monophyly of LI P. cinereus, a Fitch–
Margoliash tree was constructed using Cavalli-Sforza &
Edwards (1967) chord distances (DC) in Phylip ver. 3.69
(Felsenstein 2004). Populations (i.e. localities) were the
terminal units, with data from two to seven individuals
per locality (mean = 5). Takezaki & Nei (1996) showed
that DC was the best of seven distances when dealing
with highly variable markers like microsatellites. Clade
support was evaluated using 1000 bootstrap replicates.
Two Virginia localities of P. cinereus were used as
outgroups (see above).
In order to visualize the geographic origin of popula-
tions (LI vs. mainland) and the general morph frequency
category of populations (polymorphic, monomorphic
red, monomorphic lead), we reconstructed geographic
origin and morph category as two separate characters on
the microsatellite tree using maximum-likelihood in
Mesquite ver. 2.73 (Maddison & Maddison 2011). We used
the Mk two-rate model for geographic origin and Mk one-
rate model for morph frequency category (the latter is the
most straightforward model for three-state characters). We
acknowledge that character reconstruction methods are
designed for species and not populations (and not for geo-
graphic origins), but these analyses were used to visualize
the general patterns implied by the microsatellite data.
Additionally, to reduce biases from placing popula-
tions in discrete categories (i.e. polymorphic, fixed), we
© 2013 John Wiley & Sons Ltd
4684 M. C. FISHER- REID ET AL.
also conducted reconstructions treating locality morph
frequencies as a continuous trait (see Text S2, Supporting
information).
We conducted a Bayesian individual-based clustering
analysis of the microsatellite data using STRUCTURE
ver. 2.3.3 (Pritchard et al. 2000; Falush et al. 2003). This
provided an additional test of the genetic distinctness
of the mainland and LI populations, and red and lead
populations on LI. We used location priors, correlated
allele frequencies and a ‘no admixture’ model of ances-
try for the following reasons. First, our data are com-
posed of relatively few individuals per locality
(mode = 5) and markers (seven microsatellite loci), and
the use of location priors can assist STRUCTURE in
clustering without biasing analyses towards detecting
spurious structure (Hubisz et al. 2009; Pritchard et al.
2010). Second, we expect LI cinereus populations to
share some alleles due to common ancestry (in which
case correlated allele frequencies should be used; Falush
et al. 2003), given their very large population sizes
(Petranka 1998) and an mtDNA tree with little geo-
graphic substructuring (Fig. S1A, Supporting informa-
tion). Finally, the ‘no admixture’ model was selected
given that most P. cinereus on LI currently occur in
human-caused forest fragments, and are thus currently
isolated from each other (i.e. not likely to be experienc-
ing current genetic admixture; e.g. Jordan et al. 2009).
The number of distinct populations (K) supported
was estimated with STRUCTURE by comparing likeli-
hood scores using values of K from 1 to 15. Each K was
run for five replicates using a burn-in of 100 000 steps,
followed by 2 9 106 steps. Results were analysed using
Structure Harvester web version 0.6.92 (Earl & von-
Holdt 2011), which extracts the mean and standard
deviation of log likelihood [Ln P(K)] for each K, as well
as the DK metric of Evanno et al. (2005; the rate of
change of the likelihood function). Both mean Ln P(K)
and DK were used to determine the best K (Evanno
et al. 2005; Pritchard et al. 2010).
Macroclimatic data analyses
In order to test for a macroclimatic gradient on LI, we
performed a principal component analysis (PCA) on the
correlation matrix of the 19 climatic variables (Table S4,
Supporting information) using JMP ver. 9.0.2. PC 1 and
2, which together account for 64.69% of the variation in
climate, were plotted to visualize major climatic differ-
ences between localities. PC 1–3 each accounted for
more variation than expected by chance (broken stick;
Jackson 1993). These PC scores and select raw variables
(BIO1, annual mean temperature; BIO12, annual precip-
itation) were tested for correlation with locality morph
frequencies using Spearman’s rank correlation in R,
given the non-normality of the variables (Shapiro–Wilk
test).
Microclimatic data analyses
We tested for differences in microclimate between four
types of localities: (i) LI pure-red, (ii) LI pure-lead, (iii)
LI polymorphic and (iv) mainland. Field data for 26
localities (22 LI, four mainland) and 493 salamanders
(344 red, 149 lead) were pooled first by locality (all sala-
manders at a given locality across time), and then by
the four groups listed above. While not ideal (given
temporal variation), sampling was too limited across all
time scales at a given locality to remove temporal
effects (Data S3, Supporting information). Means of
microclimate variables were estimated for each group.
Importantly, these data represent microclimate for indi-
vidual salamanders. Therefore, microclimate data can
reflect individual preferences, because salamanders
actively select their microhabitat (Petranka 1998). Each
microclimatic variable was included in the following
statistical analyses, conducted in R: (i) LI pure-red vs.
LI pure-lead (Wilcoxon rank sum two-sample test); (ii)
LI pure-red vs. LI polymorphic vs. LI pure-lead (Krus-
kal–Wallis test); and (iii) LI pure-red vs. LI polymorphic
vs. LI pure-lead vs. mainland (Kruskal–Wallis test).
Again, given the non-normality of the data (Shapiro–
Wilk test), we used Spearman’s rank correlation to esti-
mate the relationship between-locality morph frequency
and the locality mean for each microclimate variable.
Morphological data analyses
We tested for differences between populations and
colour morphs by performing two PCAs on the correla-
tion matrix of the morphological data. The first PCA
included costal groove number plus eight morphologi-
cal variables (Text S1, Supporting information), whereas
the second excluded costal groove number. Costal
grooves are external indentations in the thoracic wall
that generally reflect vertebral number (Petranka 1998).
Costal groove number is problematic, as it exhibits a
limited range of values among these populations and is
therefore not truly continuous. In both PCAs, PC1 was
the only PC to account for more variation than expected
by chance (broken stick; Jackson 1993). However, as is
typical for morphology, PC1 appears to primarily reflect
size (i.e. loadings positive and similar in magnitude).
Thus, we included PC2, as a measure of shape. Mean
PC scores were estimated for each locality, and we
tested for a relationship between morphology (PC1 and
PC2, with and without costal grooves), and colour
morph frequency with Spearman’s rank correlation
(given non-normality; Shapiro–Wilk test).
© 2013 John Wiley & Sons Ltd
PARAPATRIC DIVERGENCE IN A SALAMANDER 4685
Spatial analyses
We compared pairwise FST values in order to test
whether or not LI populations were more genetically
divergent (i.e. had higher FST values) than mainland pop-
ulations over similar geographic distances. Initially, we
looked at a subset of mainland localities and the centres
of each group of LI localities (LI pure-red, LI pure-lead,
LI polymorphic). The LI groups were compared to seven
nearby mainland localities and arranged roughly in a
west–east line (i.e. in Connecticut, New York and New
Jersey; six are pictured in Fig. 1A). We estimated pair-
wise FST (Weir & Cockerham 1984) values using the
microsatellite data and GENEPOP on the Web (Raymond
& Rousset 1995; Rousset 2008). For this analysis, we esti-
mated the geographic midpoint location of LI pure-red,
LI polymorphic and LI pure-lead locality groups by aver-
aging the latitude and longitude for each group (Fig. S2,
Supporting information). These midpoints were used to
estimate the geographic distance in km. Next, we esti-
mated pairwise FST values and geographic distance
between all single localities and used these values as a
distance measure in a partial Mantel test with a group
membership matrix (LI pure-red, LI pure-lead, LI poly-
morphic, mainland). This analysis tests the hypothesis
that differences in group membership predict differences
in pairwise FST when accounting for geographic distance
(i.e. individuals from different localities in the same
group have lower FST than those in different groups; see
below). This analysis was also repeated with LI groups
only.
Finally, we conducted a series of single and partial
Mantel tests (Mantel 1967; Smouse et al. 1986; Legendre
& Legendre 1998) to examine if our predictor variables
(macroclimate, microclimate) predict variation in our
response variables (genetic distance, locality morph
frequency) while accounting for spatial autocorrelation.
We acknowledge that there have been important criti-
cisms of these widely used tests (e.g. Guillot & Rousset
2013), but we use them here because well-established
alternative methods are not yet available. Fortunately,
the significant patterns identified by these tests generally
match those found in our corresponding non-Mantel
analyses. Additionally, given the ability of P. cinereus to
rapidly disperse over very large geographic areas (e.g.
postglacial colonization of Canada), it is unlikely that the
patterns we find are explained by limits on dispersal due
to geographic distance alone.
These analyses were conducted both with LI and
mainland populations, and with LI populations alone.
Specifically, we tested the following five hypotheses
(sample sizes in Tables S9a–b, Supporting information),
while accounting for geographic distance between local-
ities: (i) differences in macroclimate between localities
predict differences in morph frequency; (ii) macrocli-
mate predicts genetic distance; (iii) microclimate pre-
dicts morph frequency; (iv) microclimate predicts
genetic distance; and (v) macroclimate predicts microcli-
mate. Because macroclimate and microclimate include
several variables of differing scales (e.g. temperature,
precipitation), each group of variables was first put
through a PCA of the correlation matrix, and a Euclid-
ean distance matrix (Text S2, Supporting information)
was then estimated from the PC scores (19 for macrocli-
mate, five for microclimate). Separate PCAs were
conducted for combined LI-mainland data (Table S4a,
Supporting information) and the LI data only
(Table S4b, Supporting information). Text S2 (Support-
ing information) contains a description of distance
matrices and their estimation.
All Mantel tests were conducted using PASSaGE ver.
2.0 (Rosenberg & Anderson 2011), with significance
determined using 10 000 permutations. Because each
hypothesis requires six statistical tests (three each,
single and partial Mantel tests), a sequential Bonferroni
correction (Rice 1989) was applied for each hypothesis.
Results
Microsatellite data analyses
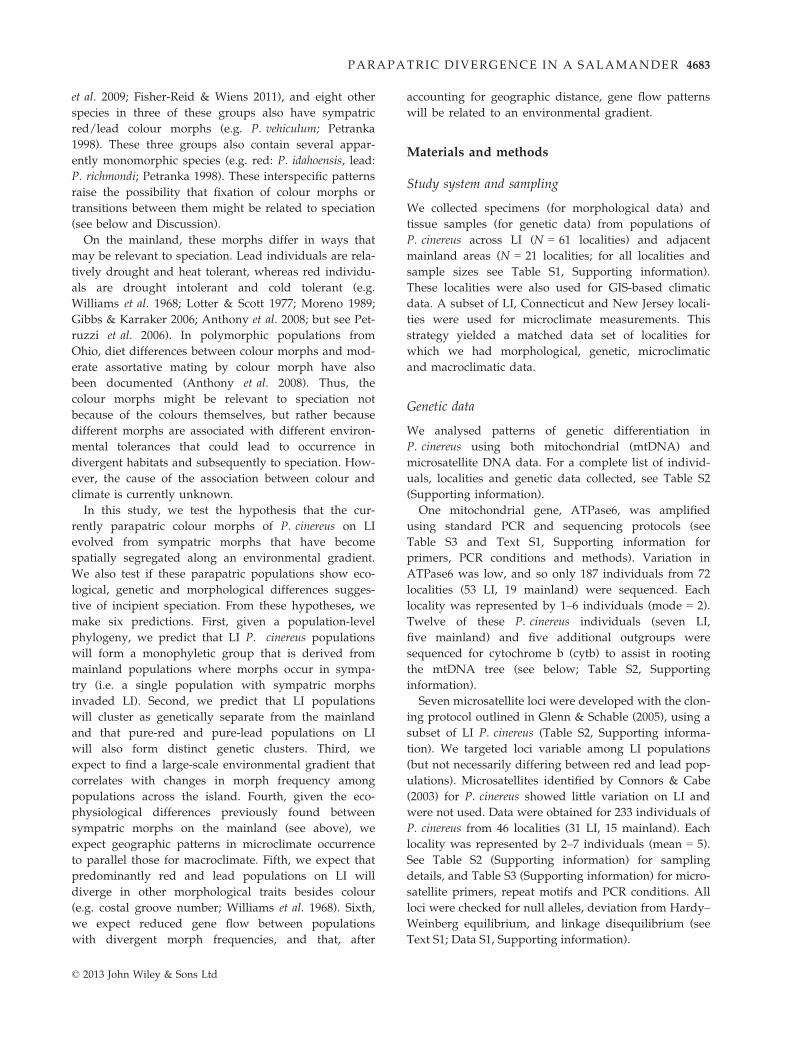
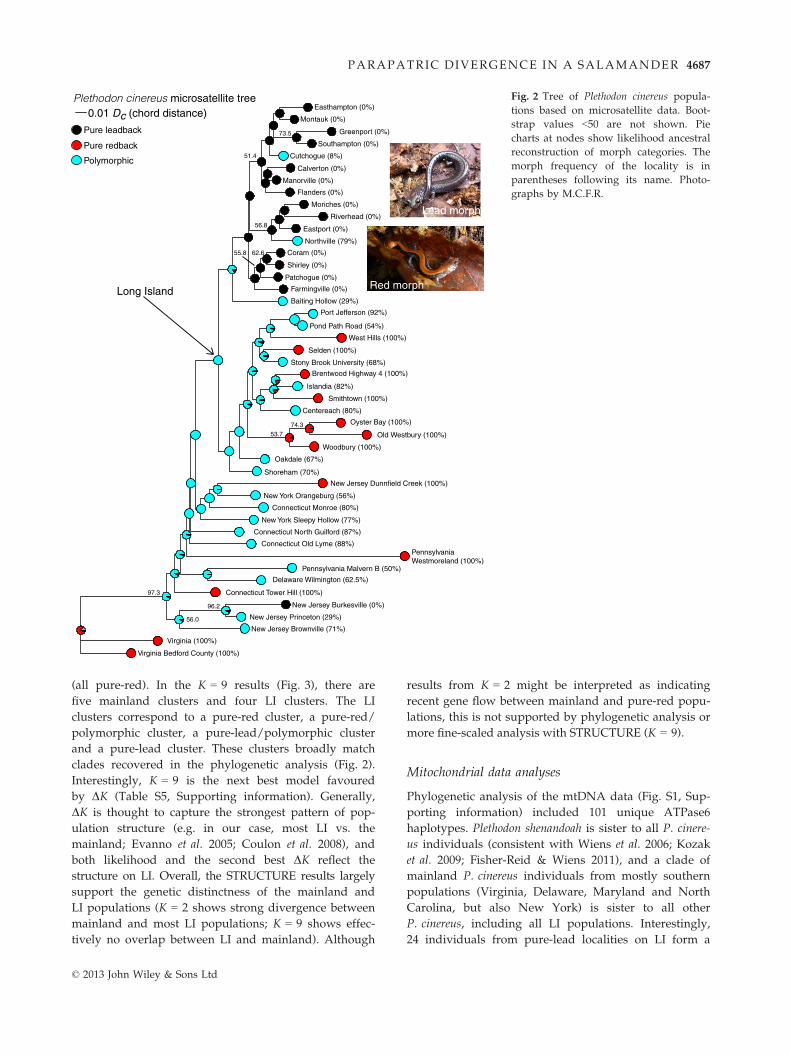
Phylogenetic analysis of the microsatellite data (Fig. 2)
shows that LI populations form a monophyletic group
nested within mainland populations, although the boot-
strap support is low. Likelihood reconstructions on the
microsatellite tree suggest that the ancestor of all LI
P. cinereus populations was polymorphic (i.e. sympatric
morphs) and that there was subsequent evolution of
pure-lead populations on eastern LI and pure-red popu-
lations on western LI (Fig. 2; Fig. S3, Supporting informa-
tion). Pure-lead populations appear to have evolved once
on LI (the clade of eastern LI populations) with possible
introgression with adjacent polymorphic populations on
the eastern north shore (Cutchogue, Northville). In con-
trast, pure-red populations appear to have evolved approx-
imately five times on western LI (Fig. 2). The designation
of some of these populations as pure-red may reflect
limited sampling (e.g. Brentwood Highway 4; N = 4).
However, a group of pure-red populations near Oyster
Bay (Old Westbury, Oyster Bay, Woodbury) is supported
by very large sample sizes (hundreds of specimens;
Williams et al. 1968; recent field visits).
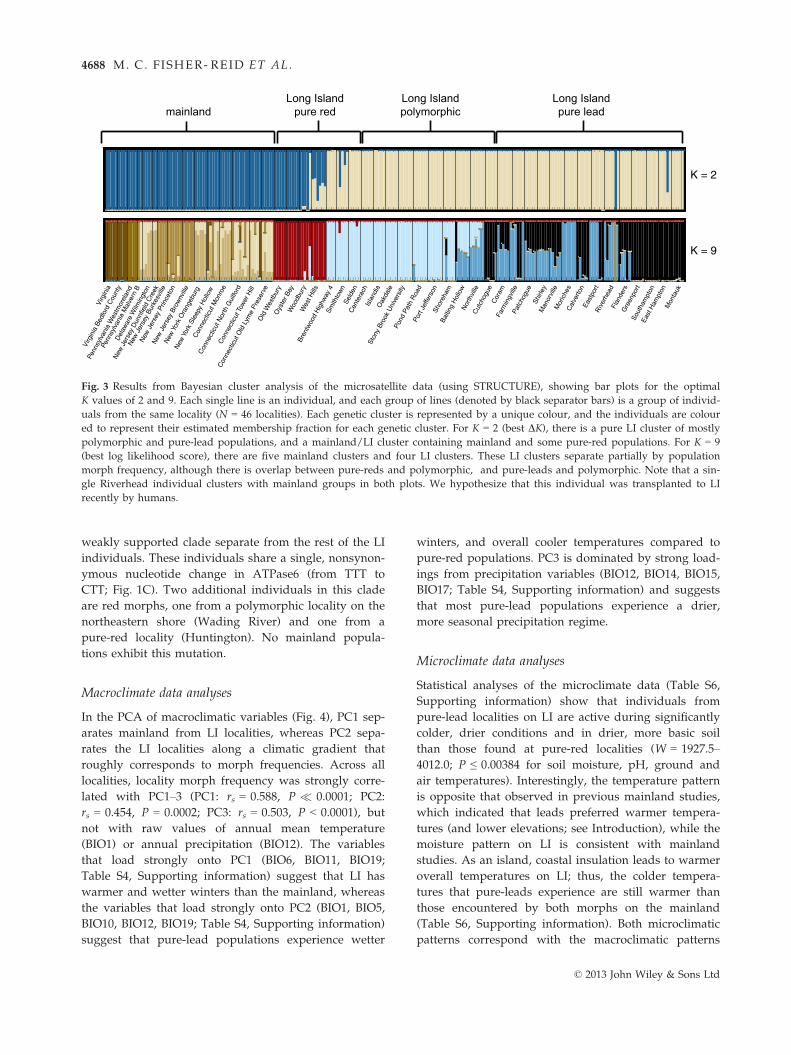
In the STRUCTURE analyses of the microsatellite
data, DK favours K = 2, whereas log likelihood
favours K = 9 (Table S5, Supporting information). The
results for K = 2 (Fig. 3) divide P. cinereus into one
exclusively LI cluster and a second cluster consisting
of all mainland populations and a few LI populations
© 2013 John Wiley & Sons Ltd
4686 M. C. FISHER- REID ET AL.
(all pure-red). In the K = 9 results (Fig. 3), there are
five mainland clusters and four LI clusters. The LI
clusters correspond to a pure-red cluster, a pure-red/
polymorphic cluster, a pure-lead/polymorphic cluster
and a pure-lead cluster. These clusters broadly match
clades recovered in the phylogenetic analysis (Fig. 2).
Interestingly, K = 9 is the next best model favoured
by DK (Table S5, Supporting information). Generally,
DK is thought to capture the strongest pattern of pop-
ulation structure (e.g. in our case, most LI vs. the
mainland; Evanno et al. 2005; Coulon et al. 2008), and
both likelihood and the second best DK reflect the
structure on LI. Overall, the STRUCTURE results largely
support the genetic distinctness of the mainland and
LI populations (K = 2 shows strong divergence between
mainland and most LI populations; K = 9 shows effec-
tively no overlap between LI and mainland). Although
results from K = 2 might be interpreted as indicating
recent gene flow between mainland and pure-red popu-
lations, this is not supported by phylogenetic analysis or
more fine-scaled analysis with STRUCTURE (K = 9).
Mitochondrial data analyses
Phylogenetic analysis of the mtDNA data (Fig. S1, Sup-
porting information) included 101 unique ATPase6
haplotypes. Plethodon shenandoah is sister to all P. cinere-
us individuals (consistent with Wiens et al. 2006; Kozak
et al. 2009; Fisher-Reid & Wiens 2011), and a clade of
mainland P. cinereus individuals from mostly southern
populations (Virginia, Delaware, Maryland and North
Carolina, but also New York) is sister to all other
P. cinereus, including all LI populations. Interestingly,
24 individuals from pure-lead localities on LI form a
Montauk (0%)
Easthampton (0%)
Southampton (0%)
Greenport (0%)
Cutchogue (8%)
Manorville (0%)
Calverton (0%)
Flanders (0%)
Riverhead (0%)
Moriches (0%)
Eastport (0%)
Northville (79%)
Shirley (0%)
Coram (0%)
Patchogue (0%)
Farmingville (0%)
Baiting Hollow (29%)
Pond Path Road (54%)
Port Jefferson (92%)
West Hills (100%)
Stony Brook University (68%)
Selden (100%)
Islandia (82%)
Brentwood Highway 4 (100%)
Smithtown (100%)
Centereach (80%)
Old Westbury (100%)
Oyster Bay (100%)
Woodbury (100%)
Oakdale (67%)
Shoreham (70%)
New York Orangeburg (56%)
New Jersey Dunnfield Creek (100%)
Connecticut Monroe (80%)
New York Sleepy Hollow (77%)
Connecticut North Guilford (87%)
Connecticut Old Lyme (88%)PennsylvaniaWestmoreland (100%)
Delaware Wilmington (62.5%)
Pennsylvania Malvern B (50%)
Connecticut Tower Hill (100%)
New Jersey Princeton (29%)
New Jersey Burkesville (0%)
New Jersey Brownville (71%)
Virginia Bedford County (100%)
Virginia (100%)
0.01 Dc (chord distance)
Long Island
Plethodon cinereus microsatellite tree
Pure leadback
Polymorphic
Pure redback73.5
51.4
56.8
62.655.8
74.3
53.7
97.3
56.0
96.2
Lead morph
Red morph
Fig. 2 Tree of Plethodon cinereus popula-
tions based on microsatellite data. Boot-
strap values <50 are not shown. Pie
charts at nodes show likelihood ancestral
reconstruction of morph categories. The
morph frequency of the locality is in
parentheses following its name. Photo-
graphs by M.C.F.R.
© 2013 John Wiley & Sons Ltd
PARAPATRIC DIVERGENCE IN A SALAMANDER 4687
weakly supported clade separate from the rest of the LI
individuals. These individuals share a single, nonsynon-
ymous nucleotide change in ATPase6 (from TTT to
CTT; Fig. 1C). Two additional individuals in this clade
are red morphs, one from a polymorphic locality on the
northeastern shore (Wading River) and one from a
pure-red locality (Huntington). No mainland popula-
tions exhibit this mutation.
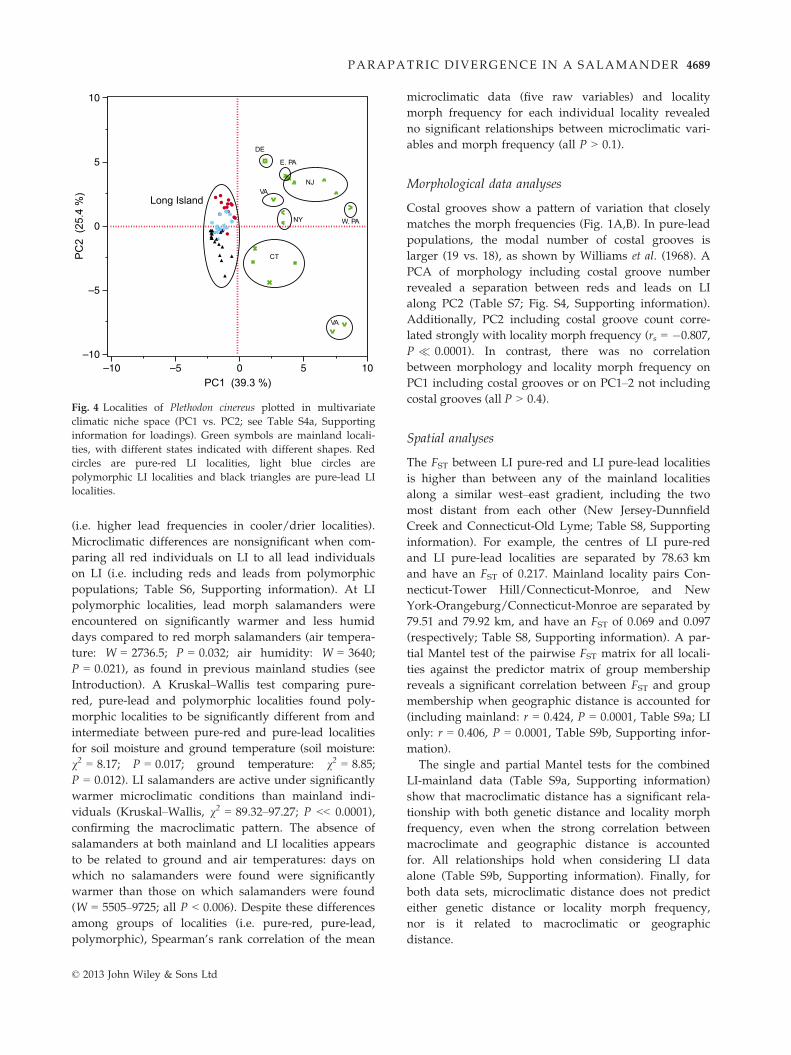
Macroclimate data analyses
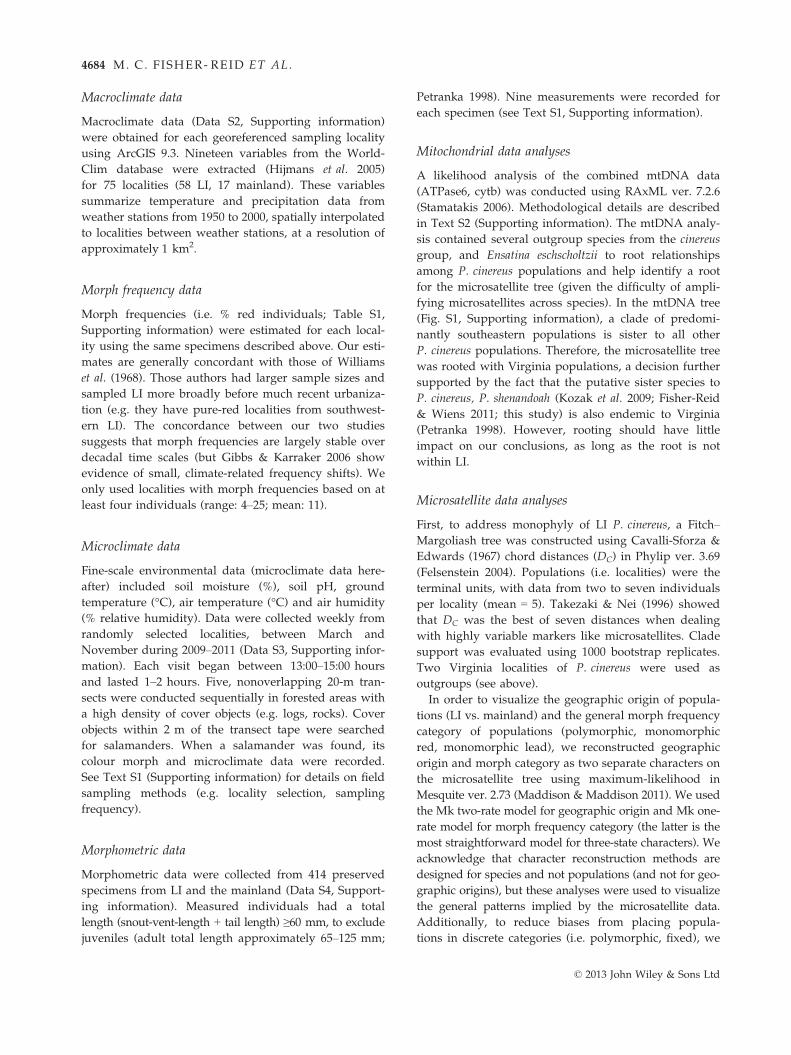
In the PCA of macroclimatic variables (Fig. 4), PC1 sep-
arates mainland from LI localities, whereas PC2 sepa-
rates the LI localities along a climatic gradient that
roughly corresponds to morph frequencies. Across all
localities, locality morph frequency was strongly corre-
lated with PC1–3 (PC1: rs = 0.588, P � 0.0001; PC2:
rs = 0.454, P = 0.0002; PC3: rs = 0.503, P < 0.0001), but
not with raw values of annual mean temperature
(BIO1) or annual precipitation (BIO12). The variables
that load strongly onto PC1 (BIO6, BIO11, BIO19;
Table S4, Supporting information) suggest that LI has
warmer and wetter winters than the mainland, whereas
the variables that load strongly onto PC2 (BIO1, BIO5,
BIO10, BIO12, BIO19; Table S4, Supporting information)
suggest that pure-lead populations experience wetter
winters, and overall cooler temperatures compared to
pure-red populations. PC3 is dominated by strong load-
ings from precipitation variables (BIO12, BIO14, BIO15,
BIO17; Table S4, Supporting information) and suggests
that most pure-lead populations experience a drier,
more seasonal precipitation regime.
Microclimate data analyses
Statistical analyses of the microclimate data (Table S6,
Supporting information) show that individuals from
pure-lead localities on LI are active during significantly
colder, drier conditions and in drier, more basic soil
than those found at pure-red localities (W = 1927.5–
4012.0; P ≤ 0.00384 for soil moisture, pH, ground and
air temperatures). Interestingly, the temperature pattern
is opposite that observed in previous mainland studies,
which indicated that leads preferred warmer tempera-
tures (and lower elevations; see Introduction), while the
moisture pattern on LI is consistent with mainland
studies. As an island, coastal insulation leads to warmer
overall temperatures on LI; thus, the colder tempera-
tures that pure-leads experience are still warmer than
those encountered by both morphs on the mainland
(Table S6, Supporting information). Both microclimatic
patterns correspond with the macroclimatic patterns
Virg
inia
Virg
inia
Bed
ford
Cou
nty
Penn
sylv
ania
Wes
tmor
elan
d
Penn
sylv
ania
Mal
vern
B
Del
awar
e W
ilmin
gton
New
Jer
sey
Dun
nfie
ld C
reek
New
Jer
sey
Burk
esvi
lle
New
Jer
sey
Prin
ceto
n
New
Jer
sey
Brow
nville
New
Yor
k O
rang
ebur
g
New
Yor
k Sl
eepy
Hol
low
Con
nect
icut
Mon
roe
Con
nect
icut
Nor
th G
uilfo
rd
Con
nect
icut
Tow
er H
ill
Con
nect
icut
Old
Lym
e Pr
eser
veO
ld W
estb
ury
Oys
ter B
ayW
oodb
ury
Wes
t Hills
Bren
twoo
d H
ighw
ay 4
Smith
tow
nSe
lden
Cen
tera
chIs
land
iaO
akda
le
Ston
y Br
ook
Uni
vers
ityPo
nd P
ath
Road
Port
Jeffe
rson
Shor
eham
Baitin
g Ho
llow
North
ville
Cora
mFa
rmin
gville
Patc
hogu
e
Calve
rton
East
port
Cutc
hogu
e
Gre
enpo
rtSo
utha
mpt
onEa
st H
ampt
onM
onta
uk
mainlandLong Island
pure redLong Islandpolymorphic
Long Islandpure lead
K = 2
K = 9
Shirl
eyM
anor
ville
Mor
iches
Rive
rhea
dFl
ande
rs
Fig. 3 Results from Bayesian cluster analysis of the microsatellite data (using STRUCTURE), showing bar plots for the optimal
K values of 2 and 9. Each single line is an individual, and each group of lines (denoted by black separator bars) is a group of individ-
uals from the same locality (N = 46 localities). Each genetic cluster is represented by a unique colour, and the individuals are colour
ed to represent their estimated membership fraction for each genetic cluster. For K = 2 (best DK), there is a pure LI cluster of mostly
polymorphic and pure-lead populations, and a mainland/LI cluster containing mainland and some pure-red populations. For K = 9
(best log likelihood score), there are five mainland clusters and four LI clusters. These LI clusters separate partially by population
morph frequency, although there is overlap between pure-reds and polymorphic, and pure-leads and polymorphic. Note that a sin-
gle Riverhead individual clusters with mainland groups in both plots. We hypothesize that this individual was transplanted to LI
recently by humans.
© 2013 John Wiley & Sons Ltd
4688 M. C. FISHER- REID ET AL.
(i.e. higher lead frequencies in cooler/drier localities).
Microclimatic differences are nonsignificant when com-
paring all red individuals on LI to all lead individuals
on LI (i.e. including reds and leads from polymorphic
populations; Table S6, Supporting information). At LI
polymorphic localities, lead morph salamanders were
encountered on significantly warmer and less humid
days compared to red morph salamanders (air tempera-
ture: W = 2736.5; P = 0.032; air humidity: W = 3640;
P = 0.021), as found in previous mainland studies (see
Introduction). A Kruskal–Wallis test comparing pure-
red, pure-lead and polymorphic localities found poly-
morphic localities to be significantly different from and
intermediate between pure-red and pure-lead localities
for soil moisture and ground temperature (soil moisture:
v2 = 8.17; P = 0.017; ground temperature: v2 = 8.85;
P = 0.012). LI salamanders are active under significantly
warmer microclimatic conditions than mainland indi-
viduals (Kruskal–Wallis, v2 = 89.32–97.27; P << 0.0001),
confirming the macroclimatic pattern. The absence of
salamanders at both mainland and LI localities appears
to be related to ground and air temperatures: days on
which no salamanders were found were significantly
warmer than those on which salamanders were found
(W = 5505–9725; all P < 0.006). Despite these differences
among groups of localities (i.e. pure-red, pure-lead,
polymorphic), Spearman’s rank correlation of the mean
microclimatic data (five raw variables) and locality
morph frequency for each individual locality revealed
no significant relationships between microclimatic vari-
ables and morph frequency (all P > 0.1).
Morphological data analyses
Costal grooves show a pattern of variation that closely
matches the morph frequencies (Fig. 1A,B). In pure-lead
populations, the modal number of costal grooves is
larger (19 vs. 18), as shown by Williams et al. (1968). A
PCA of morphology including costal groove number
revealed a separation between reds and leads on LI
along PC2 (Table S7; Fig. S4, Supporting information).
Additionally, PC2 including costal groove count corre-
lated strongly with locality morph frequency (rs = �0.807,
P � 0.0001). In contrast, there was no correlation
between morphology and locality morph frequency on
PC1 including costal grooves or on PC1–2 not including
costal grooves (all P > 0.4).
Spatial analyses
The FST between LI pure-red and LI pure-lead localities
is higher than between any of the mainland localities
along a similar west–east gradient, including the two
most distant from each other (New Jersey-Dunnfield
Creek and Connecticut-Old Lyme; Table S8, Supporting
information). For example, the centres of LI pure-red
and LI pure-lead localities are separated by 78.63 km
and have an FST of 0.217. Mainland locality pairs Con-
necticut-Tower Hill/Connecticut-Monroe, and New
York-Orangeburg/Connecticut-Monroe are separated by
79.51 and 79.92 km, and have an FST of 0.069 and 0.097
(respectively; Table S8, Supporting information). A par-
tial Mantel test of the pairwise FST matrix for all locali-
ties against the predictor matrix of group membership
reveals a significant correlation between FST and group
membership when geographic distance is accounted for
(including mainland: r = 0.424, P = 0.0001, Table S9a; LI
only: r = 0.406, P = 0.0001, Table S9b, Supporting infor-
mation).
The single and partial Mantel tests for the combined
LI-mainland data (Table S9a, Supporting information)
show that macroclimatic distance has a significant rela-
tionship with both genetic distance and locality morph
frequency, even when the strong correlation between
macroclimate and geographic distance is accounted
for. All relationships hold when considering LI data
alone (Table S9b, Supporting information). Finally, for
both data sets, microclimatic distance does not predict
either genetic distance or locality morph frequency,
nor is it related to macroclimatic or geographic
distance.
–10
–5
0
5
10
PC
2 (2
5.4
%)
–10 –5 0 5 10PC1 (39.3 %)
CT
NJ
VA
VA
NY
E. PA
W. PA
DE
Long Island
Fig. 4 Localities of Plethodon cinereus plotted in multivariate
climatic niche space (PC1 vs. PC2; see Table S4a, Supporting
information for loadings). Green symbols are mainland locali-
ties, with different states indicated with different shapes. Red
circles are pure-red LI localities, light blue circles are
polymorphic LI localities and black triangles are pure-lead LI
localities.
© 2013 John Wiley & Sons Ltd
PARAPATRIC DIVERGENCE IN A SALAMANDER 4689
Discussion
In this study, we tested the hypothesis that divergent
parapatrically distributed populations can arise through
geographic segregation of formerly sympatric ecotypes
along a large-scale environmental gradient. Through a
multifaceted analysis of P. cinereus salamanders, we
show that ecologically differentiated colour morphs that
are sympatric on the mainland appear to have become
parapatrically distributed on LI and that these para-
patric populations have further diverged genetically,
ecologically and morphologically. We suggest that the
divergence of pure-lead P. cinereus on eastern LI may
represent incipient speciation (although they are clearly
not separate species yet). Many other parapatrically dis-
tributed sets of populations and species may also arise
through geographic separation of sympatric ecotypes
along an environmental gradient. However, such cases
may easily be overlooked if the ecological and morpho-
logical differences between these ecotypes are subtle
(i.e. in our study, the ecotypes have clear differences in
colour, but different ecotypes within a species or popu-
lation might often lack such obvious morphological
markers).
We acknowledge that the scenario of parapatric dif-
ferentiation on LI is difficult to prove conclusively. Nev-
ertheless, this scenario is supported both by our genetic
data and by other lines of evidence. Under this scenario,
P. cinereus on LI are derived from an ancestrally poly-
morphic mainland population. Phylogenetic analysis of
our microsatellite data suggests that LI P. cinereus are
derived from a polymorphic mainland population
(Fig. 2), while STRUCTURE analysis of these data
shows that LI P. cinereus are largely distinct from main-
land populations (K = 9; Fig. 3). Thus, the microsatellite
results also support the idea that LI populations
diverged genetically after colonizing LI (Figs 2 and 3).
The scenario of parapatric segregation of sympatric
ecotypes is also supported by the well-known geologi-
cal history of LI. Long Island was formed by the reced-
ing Wisconsin ice sheet relatively recently (25–30 kyr
ago) and was likely only accessible to these salaman-
ders for a brief period in the last 10–15 kyr (Williams
et al. 1968). Thus, P. cinereus on LI must have arrived
recently from the mainland, and they are currently sur-
rounded by polymorphic mainland populations (Fig. 1;
Williams et al. 1968). As the glacier re-treated and sea
levels began to rise, P. cinereus is thought to have rap-
idly expanded its range from southern refugia (Bloom
1983; Petranka 1998). Individuals from polymorphic
southern populations on the exposed continental shelf
were likely forced to move north by the encroaching
Atlantic Ocean and became trapped on LI (Bloom 1983;
Lewis & Stone 1991; Stone et al. 2005). Importantly, sea
level has never been higher than it is now (Bloom &
Stuiver 1963); thus, the differentiation of populations
seen now most likely reflects responses to the current
environmental gradient, rather than allopatric differenti-
ation of populations on smaller islands.
The hypothesis of parapatric divergence is further
supported by evidence of an environmental gradient
across LI, along which populations have diverged
genetically and morphologically (Fig. 4; Table S9b, Sup-
porting information). Such gradients are key compo-
nents of previous models (Doebeli & Dieckmann 2000,
2003; Gavrilets 2004) and empirical studies (Seehausen
et al. 2008; Ingram 2011) of speciation via geographic
segregation of formerly sympatric ecotypes. Based on
PC2 and PC3, LI pure-lead populations occur in overall
colder and drier environments that also have warmer
and wetter winters. The overall temperature gradient is
striking in that mainland leads appear to prefer warmer
temperatures (e.g. Lotter & Scott 1977; Gibbs & Karraker
2006; Anthony et al. 2008). Petruzzi et al. (2006) found
divergent temperature tolerances (as measured by
maintenance metabolic rates) between morphs at differ-
ent localities, which suggests that temperature tolerance
may simply be more variable than moisture tolerances.
However, within polymorphic populations on LI, we
confirm that leads are active on warmer, less humid
days than reds (as in mainland populations), and we
note that pure-lead localities on LI have overall warmer
microclimates than mainland localities (Table S6, Sup-
porting information). The between-locality microclimat-
ic data largely confirm the macroclimatic patterns,
suggesting that morph-specific physiological tolerances
are likely. Interestingly, our results suggest that LI has
a unique climate and a unique climatic gradient (Fig. 4),
which may help explain why the pattern of pure-red
and pure-lead populations in close proximity does not
occur on the mainland (but pure-red populations do
occur in cooler areas).
Remarkably, the pattern on LI appears to be geo-
graphically replicated on the Delmarva peninsula (Dela-
ware-Maryland-Virginia; Highton 1977) and may have
similar ecological causes. Sampling by Highton (1977)
over a 20-year period yielded 177 localities with thor-
oughly estimated morph frequencies. As on LI, locali-
ties closer to the mainland are pure-red, whereas those
farthest from the mainland (southern end) are pure-lead,
with polymorphic populations in between. We extracted
climatic data for 176 of Highton’s (1977) localities
(excluding one imprecise locality; Data S5, Supporting
information) and tested for a correlation between
morph frequency and raw climatic variables, focusing on
climatic variables (defined in Table S4a, Supporting
information) loading strongly onto PC2 and PC3 (which
separate pure-red and lead LI populations; Table S4a,
© 2013 John Wiley & Sons Ltd
4690 M. C. FISHER- REID ET AL.
Supporting information). We found significant negative
correlations between the proportion of red individuals
and BIO1 and BIO10 (which load strongly on PC2; higher
red frequency in colder climates; BIO1: rs = �0.177,
P = 0.019; BIO10: rs = �0.229, P = 0.002), and significant
positive correlations between red frequency and BIO12,
BIO14 and BIO17 (loading strongly on PC3; higher lead
frequency in drier climates; BIO12: rs = 0.314, P � 0.001;
BIO14: rs = 0.379, P � 0.001; BIO17: rs = 0.276,
P < 0.001). Overall, the concordance of these results from
the Delmarva peninsula with those from LI further sug-
gests that the patterns on LI are related to ecological seg-
regation due to climate-related factors and not chance,
genetic drift, double colonization or other scenarios.
We suggest that LI P. cinereus might represent incipi-
ent speciation, especially the pure-lead populations on
eastern LI. Three lines of evidence support this hypoth-
esis: restricted gene flow, local adaptation and parallels
between the within-species pattern in P. cinereus and
between-species patterns in other Plethodon. First, as
described above, pure-lead populations on eastern LI
are more genetically different from other LI populations
than pairs of mainland localities that are far more geo-
graphically distant (Table S9, Supporting information).
The genetic distinctness of pure-lead eastern LI popula-
tions is also supported by the phylogenetic analysis of
the microsatellite data (Fig. 2). However, even in these
pure-lead populations, there is evidence for introgres-
sion with far eastern polymorphic LI populations (e.g.
Figs 2 and 3). Clearly, LI P. cinereus are not two distinct
species yet, although there is evidence for restricted
gene flow between pure-lead and other populations
(Table S9, Supporting information).
A second line of evidence for incipient speciation on
LI is that some data suggest local adaptation to differ-
ent environments, which could lead to further genetic
divergence. Individuals from pure-lead populations
tend to have more costal grooves (Fig. 1B; see also
Williams et al. 1968). Costal groove number correlates
with vertebral number, which is known to vary in
plethodontids and can have a strong genetic component
(Jockusch 1997). Jockusch (1997) and others (e.g. Wake
1966) hypothesized that increased vertebral number is
an adaptation for a fossorial lifestyle. Eastern LI (where
pure-lead populations occur) is dominated by pine
barrens with loose, sandy soil and individuals there
may benefit from being better adapted to burrowing
(Williams et al. 1968). Although we found little evidence
for divergence in other morphometric variables, pleth-
odontids generally show remarkably similar body
shapes across divergent microhabitats (Blankers et al.
2012). Additionally, individuals from pure-lead popula-
tions share a nonsynonymous change in ATPase6
(Fig. 1C), which (along with other changes) might be
related to metabolic differences between morphs and
populations (given metabolic differences previously
documented between morphs; Moreno 1989). The adap-
tive significance of both traits will need to be investi-
gated in future studies.
The third line of evidence for incipient speciation is
the parallel between within-species patterns in LI
P. cinereus and patterns of between-species divergence
among other Plethodon. Several other Plethodon species
are polymorphic for red/lead colour morphs, and sev-
eral others appear to be fixed for one morph or the
other (Petranka 1998; Anthony et al. 2008). This suggests
that the colour polymorphism may be associated with
speciation, although it seems unlikely to be driving spe-
ciation itself (see Fitzpatrick et al. 2009 for discussion of
colour polymorphism function). Based on this study
and others (e.g. Lotter & Scott 1977; Gibbs & Karraker
2006; Anthony et al. 2008), colour does appear to be
linked to climatic distributions in P. cinereus, and some
assortative mating by colour has been found (Anthony
et al. 2008). Divergent climatic distributions can drive
geographic isolation, adaptation and genetic divergence
between populations (as found here), especially if indi-
viduals of one incipient species cannot tolerate the
climatic conditions experienced by the other, and many
authors have suggested that this general process can
lead to speciation (e.g. Moritz et al. 2000; Kozak &
Wiens 2007; Sobel et al. 2010). Across plethodontids,
rates of species diversification (speciation—extinction)
are higher in clades with faster rates of climatic niche
evolution (Kozak & Wiens 2010). Interestingly, our pre-
liminary results examining realized climatic niches of
polymorphic and monomorphic Plethodon species
climatic data from Kozak & Wiens 2010; Fisher-Reid
et al. 2012 suggest that between-species patterns of
climatic distributions in monomorphic species do parallel
the within-species patterns observed in P. cinereus,
with pure-red species in cooler, wetter environments
(MC Fisher-Reid & JJ Wiens, unpublished). We empha-
size that we do not consider the colour morphs them-
selves to be likely drivers of speciation, but rather we
hypothesize that these colour morphs are somehow
associated with different environmental preferences and
tolerances that are then determined by less obvious
traits (such as physiology and behaviour).
We recognize that much additional work is needed
on this system. First, as discussed above, the relation-
ship between colour morphs, climate and speciation
could be examined across species. The physiological
tolerances of both P. cinereus morphs and those of other
species should also be studied in more detail (e.g. Moreno
1989; Petruzzi et al. 2006). Second, analysis of LI P. cine-
reus using data from next-generation sequencing could
provide clues to the causes of the apparent association
© 2013 John Wiley & Sons Ltd
PARAPATRIC DIVERGENCE IN A SALAMANDER 4691
between colour and climate (e.g. detecting loci under
selection, detecting associations of particular alleles
with particular habitats), and yield stronger support for
the relationships and origins of LI cinereus populations.
Third, behavioural tests could provide insights into the
evolution of prezygotic reproductive isolation. More
work is also needed to determine whether the existing
patterns of morph distribution and genetic divergence
are directly related to different climatic regimes, or
possibly to other factors that might be themselves
caused by differences in climate (e.g. occurrence in
deciduous forests vs. pine barrens, differences in
predation). Finally, if there is a speciation-driving
environmental gradient on LI, we might expect to find
similar, though perhaps morphologically cryptic,
patterns in other species distributed across the island
(Coyne & Orr 2004).
In conclusion, we have presented evidence for parap-
atric segregation of formerly sympatric morphs at a
large geographic scale in association with an environ-
mental gradient. Pure morph populations are divergent
ecologically, morphologically and genetically, suggest-
ing that this process might eventually lead to parapatric
speciation. This pattern of parapatric divergence of for-
merly sympatric ecotypes along an environmental gra-
dient may represent an early part of the process of
parapatric speciation (or range expansion) in many
other systems, but may be much harder to detect
because the different ecotypes are not as obvious as col-
our morphs in P. cinereus. This pattern of spatial segre-
gation of pre-existing ecotypes might also allow
parapatric speciation to happen more quickly, as the
presence of sympatric ecotypes with divergent toler-
ances may reduce the need to wait for new mutations
to allow invasion of a new environment.
Acknowledgements
We thank T. C. Glenn for assistance in developing microsatel-
lite loci. We thank E. Callender, A. Dunham, V. Rudolf and C.
Wolfe for help with initial fieldwork. We thank C. Wolfe
for help with initial aspects of the project, and S. Smith and
C. Ulloa for help with preliminary microclimatic data. We
thank many Stony Brook University undergraduates who
helped collect microclimate data: R. Ahmed, R. Bacchus, T.
Bonadonna, W. Chan, P. Davis, A. Golwala, C. Hiu, J. Hub-
bard, T. Leong, K. Leung, M. Liu, A. Ong, F. Shao, S. Woytash,
Q. Zheng and especially G. Cheang and A. Romano. Stony
Brook’s Fall 2010 BIO367 class and G. Cheang assisted in
microsatellite data collection. For comments on the manuscript,
we thank B. M. Fitzpatrick, J. S. Levinton, J. R. True, S. Spear
and anonymous reviewers. Funding was provided to MCFR by
the Gaige Award (American Society of Ichthyologists and
Herpetologists) and by the George Williams Award (Depart-
ment of Ecology and Evolution at Stony Brook). Additional
funding was provided by NSF EF 0334923 to JJW.
References
Anthony CD, Venesky MD, Hickerson C-AM (2008) Ecological
separation in a polymorphic terrestrial salamander. Journal of
Animal Ecology, 77, 646–653.
Blankers T, Adams DC, Wiens JJ (2012) Ecological radiation
with limited morphological diversification in salamanders.
Journal of Evolutionary Biology, 25, 634–646.Bloom AL (1983) Sea level and coastal morphology of the Uni-
ted States through the Late Wisconsin glacial maximum. In:
Late-Quaternary environments of the United States, Vol. 1. The
Late Pleistocene (ed. Porter SC), pp. 215–229. University of
Minnesota, Minneapolis, Minnesota.
Bloom AL, Stuiver M (1963) Submergence of the Connecticut
coast. Science, 139, 332–334.Bolnick DI, Fitzpatrick BM (2007) Sympatric speciation: models
and empirical evidence. Annual Review of Ecology, Evolution
and Systematics, 38, 459–487.
Cavalli-Sforza LL, Edwards AWF (1967) Phylogenetic analysis:
models and estimation procedures. American Journal of
Human Genetics, 19, 233–257.Connors LM, Cabe PR (2003) Isolation of dinucleotide micro-
satellite loci from red-backed salamander (Plethodon cinereus).
Molecular Ecology Notes, 3, 131–133.
Coulon A, Fitzpatrick JW, Bowman R et al. (2008) Congruent
population structure inferred from dispersal behaviour and
intensive genetic surveys of the threatened Florida scrub-jay
(Aphelocoma cœrulescens). Molecular Ecology, 17, 1685–1701.
Coyne JA (2007) Sympatric speciation. Current Biology, 17,
R787–R788.
Coyne JA, Orr HA (2004) Speciation. Sinauer Associates Inc,
Sunderland, Massachusetts.
Doebeli M, Dieckmann U (2000) Evolutionary branching and
sympatric speciation caused by different types of ecological
interactions. American Naturalist, 156, S77–S101.Doebeli M, Dieckmann U (2003) Speciation along environmen-
tal gradients. Nature, 421, 259–264.Earl DA, vonHoldt BM (2011) Structure Harvester: a website and
program for visualizing Structure output and implementing
the Evanno method. Conservation Genetics Research, 4, 359–361.
Evanno G, Regnaut S, Goudet J (2005) Detecting the number of
clusters of individuals using the software Structure: a simu-
lation study. Molecular Ecology, 14, 2611–2620.Falush D, Stephens M, Pritchard JK (2003) Inference of popula-
tion structure: extensions to linked loci and correlated allele
frequencies. Genetics, 164, 1567–1587.
Felsenstein J (2004) PHYLIP (Phylogeny Inference Package).
Distributed by the author, Department of Genome Sciences,
University of Washington, Seattle.
Fisher-Reid MC, Wiens JJ (2011) What are the consequences of
combining nuclear and mitochondrial data for phylogenetic
analysis? Lessons from Plethodon salamanders and 13 other
vertebrate clades. BMC Evolutionary Biology, 11, 300.
Fisher-Reid MC, Kozak KH, Wiens JJ (2012) How is the rate of
climatic-niche evolution related to climatic-niche breadth?
Evolution, 66, 3836–3851.
Fitzpatrick BM, Shook K, Izally R (2009) Frequency-dependent
selection by wild birds promotes polymorphism in model
salamanders. BMC Ecology, 9, 12.
Gavrilets S (2004) Fitness Landscapes and the Origin of Species.
Princeton University Press, Princeton, New Jersey.
© 2013 John Wiley & Sons Ltd
4692 M. C. FISHER- REID ET AL.
Gibbs JP, Karraker NE (2006) Effects of warming conditions in
eastern North American forests on red-backed salamander
morphology. Conservation Biology, 20, 913–917.
Glenn TC, Schable NA (2005) Isolating microsatellite DNA loci.
Methods in Enzymology, 395, 202–222.
Guillot G, Rousset F (2013) Dismantling the Mantel tests. Meth-
ods in Ecology and Evolution, 4, 336–344.
Highton R (1975) Geographic variation in genetic dominance of
the color morphs of the red-backed salamander, Plethodon
cinereus. Genetics, 80, 363–374.Highton R (1977) Comparison of microgeographic variation in
morphological and electrophoretic traits. Evolutionary Biology,
10, 397–436.
Hijmans RJ, Cameron SE, Parra JL, Jones PG, Jarvis A (2005)
Very high resolution interpolated climate surfaces for global
land areas. International Journal of Climatology, 25, 1965–1978.Hubisz MJ, Falush D, Stephens M, Pritchard JK (2009)
Inferring weak population structure with the assistance of
sample group information. Molecular Ecology Resources, 9,
1322–1332.Ingram T (2011) Speciation along a depth gradient in a marine
adaptive radiation. Proceedings of the Royal Society of London,
Series B, 278, 613–618.
Jackson DA (1993) Stopping rules in principal components
analysis: a comparison of heuristical and statistical
approaches. Ecology, 74, 2204–2214.Jockusch EL (1997) Geographic variation and phenotypic plas-
ticity of number of trunk vertebrae in slender salamanders,
Batrachoseps (Caudata: Plethodontidae). Evolution, 51, 1966–1982.
Jordan MA, Morris DA, Gibson SE (2009) The influence of
historical landscape change on genetic variation and popula-
tion structure of a terrestrial salamander (Plethodon cinereus).
Conservation Genetics, 10, 1647–1658.
Kozak KH, Wiens JJ (2007) Climatic zonation drives latitudinal
variation in speciation mechanisms. Proceedings of the Royal
Society of London, Series B, 274, 2995–3003.Kozak KH, Wiens JJ (2010) Accelerated rates of climatic-niche
evolution underlie rapid species diversification. Ecology
Letters, 13, 1378–1389.
Kozak KH, Mendyk RW, Wiens JJ (2009) Can parallel diversifi-
cation occur in sympatry? Repeated patterns of body-size
evolution in co-existing clades of North American salaman-
ders. Evolution, 63, 1769–1784.
Legendre P, Legendre L (1998) Numerical Ecology, 2nd English
edn. Elsevier Science B.V, Amsterdam.
Lewis RS, Stone JR (1991) Late Quaternary stratigraphy and
depositional history of the Long Island Sound basin: Con-
necticut and New York. Journal of Coastal Research SI11, 1–23.Lotter F, Scott NJ Jr (1977) Correlation between climate and
distribution of the color morphs of the salamander Plethodon
cinereus. Copeia, 1977, 681–690.
Maddison WP, Maddison DR (2011) Mesquite: A modular sys-
tem for evolutionary analysis. Version 2.75 http://mesquite-
project.org.
Mantel NA (1967) The detection of disease clustering and a
generalized regression approach. Cancer Research, 27, 209–220.
Moreno G (1989) Behavioral and physiological differentiation
between the color morphs of the salamander, Plethodon cine-
reus. Journal of Herpetology, 23, 335–341.
Moritz C, Patton JL, Schneider CJ, Smith TB (2000) Diversifica-
tion of rainforest faunas: an integrated molecular approach.
Annual Review of Ecology and Systematics, 31, 533–563.
No€el S, Lapointe F-J (2010) Urban conservation genetics: study
of a terrestrial salamander in the city. Biological Conservation,
143, 2823–2831.Nosil P (2008) Speciation with gene flow could be common.
Molecular Ecology, 17, 2103–2106.Petranka JW (1998) Salamanders of the United States and Canada.
Smithsonian Institution Press, Washington, District of
Columbia.
Petruzzi EE, Niewiarowski PH, Moore FB-G (2006) The role of
thermal niche selection in maintenance of a colour polymor-
phism in redback salamanders (Plethodon cinereus). Frontiers
in Zoology, 3, 10.
Pritchard JK, Stephens M, Donnelly P (2000) Inference of popu-
lation structure using multilocus genotype data. Genetics,
155, 945–959.Pritchard JK, Wen X, Falush D (2010) Documentation for struc-
ture software: Version 2.3.
Raymond M, Rousset F (1995) Genepop (version 1.2): popula-
tion genetics software for exact tests and ecumenicism. Jour-
nal of Heredity, 86, 248–249.
Rice WR (1989) Analyzing tables of statistical tests. Evolution,
43, 223–225.
Rosenberg MS, Anderson CD (2011) PASSaGE: pattern analy-
sis, spatial statistics, and geographic exegesis. Version 2.
Methods in Ecology and Evolution, 2, 229–232.
Rousset F (2008) Genepop’007: a complete reimplementation of
the Genpop software for Windows and Linux. Molecular
Ecology Resources, 8, 103–106.Seehausen O, Terai Y, Magalhaes IS et al. (2008) Speciation
through sensory drive in cichlid fish. Nature, 455, 620–626.Smouse PE, Long JC, Sokal RR (1986) Multiple regression and
correlation extensions of the Mantel Test of matrix corre-
spondence. Systematic Zoology, 35, 627–632.
Sobel JM, Chen GF, Watt LR, Schemske DW (2010) The biology
of speciation. Evolution, 64, 295–315.
Stamatakis A (2006) RAxML-VI-HPC: maximum likelihood-
based phylogenetic analyses with thousands of taxa and
mixed models. Bioinformatics, 22, 2688–2690.Stone JR, Schafer JP, London EH et al. (2005) Quaternary
geologic map of Connecticut and Long Island Sound basin.
United States Geological Survey Scientific Investigations
Map 2784.
Takezaki N, Nei M (1996) Genetic distances and reconstruction
of phylogenetic trees from microsatellite DNA. Genetics, 144,
389–399.
Tilley SG, Lundrigan BL, Brower LP (1982) Erythrism and
mimicry in the salamander Plethodon cinereus. Herpetologica,
38, 409–417.Wake DB (1966) Comparative osteology and evolution of the
lungless salamanders, family Plethodontidae. Memoirs South-
ern California Academy of Sciences, 4, 1–111.
Weir BS, Cockerham CC (1984) Estimating F-statistics for the
analysis of population structure. Evolution, 38, 1358–1370.
Wiens JJ, Engstrom TN, Chippindale PT (2006) Rapid diversifi-
cation, incomplete isolation, and the ‘speciation clock’ in
North American salamanders (genus Plethodon): testing the
hybrid swarm hypothesis of rapid radiation. Evolution, 60,
2585–2603.
© 2013 John Wiley & Sons Ltd
PARAPATRIC DIVERGENCE IN A SALAMANDER 4693
Williams EE, Highton R, Cooper DM (1968) Breakdown of
polymorphism of the red-backed salamander on Long Island.
Evolution, 22, 76–86.
This paper is part of M.C.F.R.’s Ph.D. dissertation on
speciation in salamanders. M.C.F.R. collected all micro-
climatic data, microsatellite data (with C.A.K.), con-
ducted all analyses and wrote the manuscript (with
J.J.W.). T.N.E. and J.J.W. conceived the project. J.J.W.,
T.N.E. and P.R.S. collected specimens. T.N.E. and
C.A.K. collected mtDNA data. C.A.K. developed the
microsatellite loci. All authors participated in fieldwork.
Supporting information
Additional supporting information may be found in the online
version of this article.
Data S1. Microsatellite and heterozygosity data.
Data S2. Macroclimatic data.
Data S3. Microclimatic data.
Data S4. Morphological data.
Data S5. Data from Delmarva Peninsula.
Text S1. Methodological details.
Text S2. Analytical details.
Table S1. Locality sampling information.
Table S2. Individual specimen information, GenBank accession
numbers.
Table S3. Primer information, PCR protocols.
Table S4. Macroclimate PCA results.
Table S5. STRUCTURE results.
Table S6. Microclimate statistical analyses.
Table S7. Morphology PCA results.
Table S8. FST, geographic distance for select populations.
Table S9. Mantel test results.
Fig. S1. Trees of mtDNA haplotypes.
Fig. S2. Map of geographic midpoints of salamander popula-
tion categories on LI.
Fig. S3. Ancestral reconstruction using locality morph fre-
quency as a continuous trait.
Fig. S4. PC1 vs. PC2 for morphological PCAs.
© 2013 John Wiley & Sons Ltd
4694 M. C. FISHER- REID ET AL.