finite element torsional buckling analysis of shafts with non
TRANSCRIPT
Finite element torsional buckling analysis of shaftswith non-concentric bores
W S Robotham¤, T H Hyde and E J WilliamsSchool of Mechanical, Materials, Manufacturing Engineering and Management, University of Nottingham, UK
Abstract: The demand for more powerful and efficient aeroengines results in the need to design improvedmain driveshafts. The design requirement may be to increase the torque capacity of the shafts, to reduce theouter diameter or to reduce the weight. Meeting these requirements tends to increase the likelihood of theshaft buckling and research was carried out to investigate the factors influencing the torsional buckling ofshaft sections in order to provide an improved analysis method applicable to typical gas turbine aeroengineshafts. This paper uses finite element analysis to examine the effect of bore concentricity on the elastic–plastic buckling of shafts subjected to pure torsional loading. Equations were developed to predict thebuckling torque for a range of shaft geometries and levels of bore eccentricity.
Keywords: buckling, shafts, non-concentric bores, finite element analysis
NOTATION
A, B factors for predictive equationsc eccentricityD mean diameter ˆ (o:d: ‡ i:d:)=2e eccentricity ratioE Young’s modulus of elasticityi.d. inner diameterL shaft section lengthMF material factoro.d. outer diametert mean wall thicknessTPEAK peak torque from predictive equations
î Poisson’s ratioóULT ultimate tensile stressóULT-6082-T6 ultimate tensile stress for 6082-T6 materialô nominal shear stressôMAX maximum shear stressôN normalized nominal shear stressôULT ultimate shear stress
1 INTRODUCTION
Future aeroengines will be required to produce higherthrusts, lower drag and further improvements in fuelefficiency. To achieve this, the main driveshafts musttransmit higher torques as well as operating at highertemperatures. This results in the need for high performancedriveshafts, which are smaller, lighter and thinner walled.
Aeroengine shafts are subjected to various combinationsof axial, bending and torsional loadings during flight, withthe torque being the major load. Thus, torsional stability isan important design consideration and it has been shownthat such shafts are sensitive to initial imperfections [1].The main cause of geometric imperfections is the variationin dimensions that results from the tolerances allowed inthe manufacturing processes. With thinner and smallerdiameter shafts, the normal levels of manufacturing varia-tions can be expected to be more significant whencalculating the buckling margin.
One type of manufacturing variation that can be found inshafts is non-concentricity along the bore. This is generallydue to overall set-up error and the difficulty in machiningbores over the long lengths associated with aeroenginedriveshafts.
This paper describes a finite element (FE) investigation(using ABAQUS Version 5.8, a non-linear FE softwarepackage) of the effects of non-concentric bores on theelastic–plastic buckling of shafts subjected to torsionalloading. Section 2 details the FE modelling and the resultsobtained, Section 3 describes the buckling predictionequations, Section 4 describes some tests to validate theapproach and Section 5 contains the conclusions reached.
279
The MS was received on 10 August 2000 and was accepted after revisionfor publication on 23 July 2001.¤Corresponding author: School of Mechanical, Materials, ManufacturingEngineering and Management, University of Nottingham, University Park,Nottingham NG7 2RD, UK.
G03000 # IMechE 2001 Proc Instn Mech Engrs Vol 215 Part G at PENNSYLVANIA STATE UNIV on March 5, 2016pig.sagepub.comDownloaded from
2 FINITE ELEMENT ANALYSIS
2.1 Finite element modelling
2.1.1 Geometry
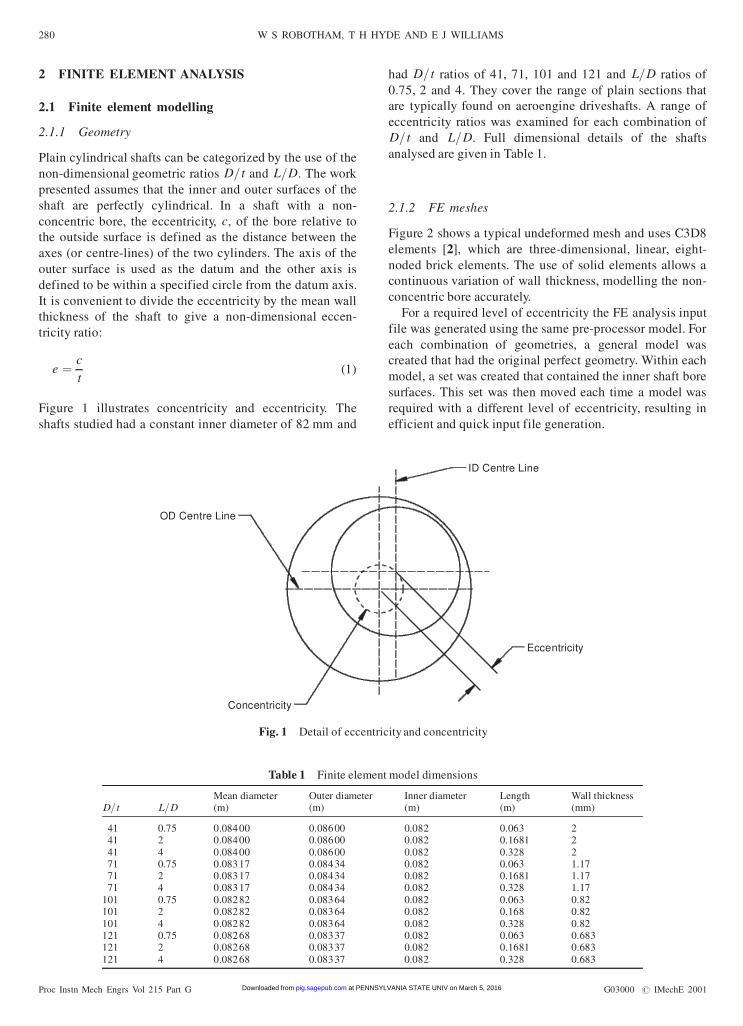
Plain cylindrical shafts can be categorized by the use of thenon-dimensional geometric ratios D= t and L=D. The workpresented assumes that the inner and outer surfaces of theshaft are perfectly cylindrical. In a shaft with a non-concentric bore, the eccentricity, c, of the bore relative tothe outside surface is defined as the distance between theaxes (or centre-lines) of the two cylinders. The axis of theouter surface is used as the datum and the other axis isdefined to be within a specified circle from the datum axis.It is convenient to divide the eccentricity by the mean wallthickness of the shaft to give a non-dimensional eccen-tricity ratio:
e ˆ ct
(1)
Figure 1 illustrates concentricity and eccentricity. Theshafts studied had a constant inner diameter of 82 mm and
had D= t ratios of 41, 71, 101 and 121 and L=D ratios of0.75, 2 and 4. They cover the range of plain sections thatare typically found on aeroengine driveshafts. A range ofeccentricity ratios was examined for each combination ofD= t and L=D. Full dimensional details of the shaftsanalysed are given in Table 1.
2.1.2 FE meshes
Figure 2 shows a typical undeformed mesh and uses C3D8elements [2], which are three-dimensional, linear, eight-noded brick elements. The use of solid elements allows acontinuous variation of wall thickness, modelling the non-concentric bore accurately.
For a required level of eccentricity the FE analysis inputfile was generated using the same pre-processor model. Foreach combination of geometries, a general model wascreated that had the original perfect geometry. Within eachmodel, a set was created that contained the inner shaft boresurfaces. This set was then moved each time a model wasrequired with a different level of eccentricity, resulting inefficient and quick input file generation.
Table 1 Finite element model dimensions
D=t L=DMean diameter(m)
Outer diameter(m)
Inner diameter(m)
Length(m)
Wall thickness(mm)
41 0.75 0.08400 0.08600 0.082 0.063 241 2 0.08400 0.08600 0.082 0.1681 241 4 0.08400 0.08600 0.082 0.328 271 0.75 0.08317 0.08434 0.082 0.063 1.1771 2 0.08317 0.08434 0.082 0.1681 1.1771 4 0.08317 0.08434 0.082 0.328 1.17
101 0.75 0.08282 0.08364 0.082 0.063 0.82101 2 0.08282 0.08364 0.082 0.168 0.82101 4 0.08282 0.08364 0.082 0.328 0.82121 0.75 0.08268 0.08337 0.082 0.063 0.683121 2 0.08268 0.08337 0.082 0.1681 0.683121 4 0.08268 0.08337 0.082 0.328 0.683
Eccentricity
ID Centre Line
OD Centre Line
Concentricity
Fig. 1 Detail of eccentricity and concentricity
Proc Instn Mech Engrs Vol 215 Part G G03000 # IMechE 2001
280 W S ROBOTHAM, T H HYDE AND E J WILLIAMS
at PENNSYLVANIA STATE UNIV on March 5, 2016pig.sagepub.comDownloaded from
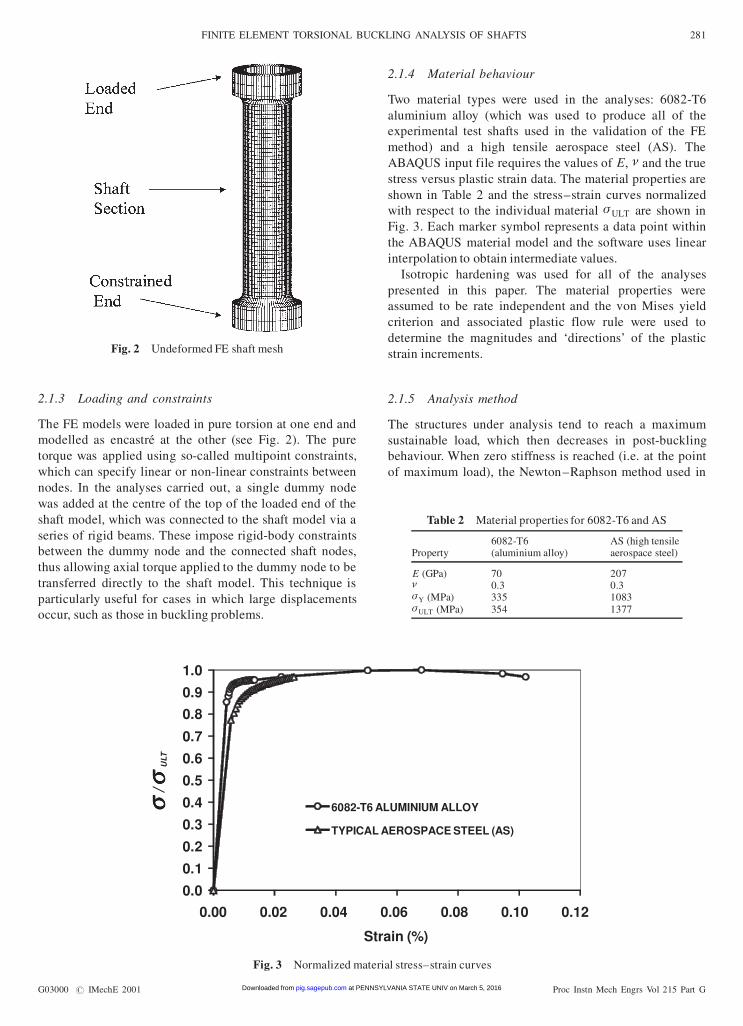
2.1.3 Loading and constraints
The FE models were loaded in pure torsion at one end andmodelled as encastre at the other (see Fig. 2). The puretorque was applied using so-called multipoint constraints,which can specify linear or non-linear constraints betweennodes. In the analyses carried out, a single dummy nodewas added at the centre of the top of the loaded end of theshaft model, which was connected to the shaft model via aseries of rigid beams. These impose rigid-body constraintsbetween the dummy node and the connected shaft nodes,thus allowing axial torque applied to the dummy node to betransferred directly to the shaft model. This technique isparticularly useful for cases in which large displacementsoccur, such as those in buckling problems.
2.1.4 Material behaviour
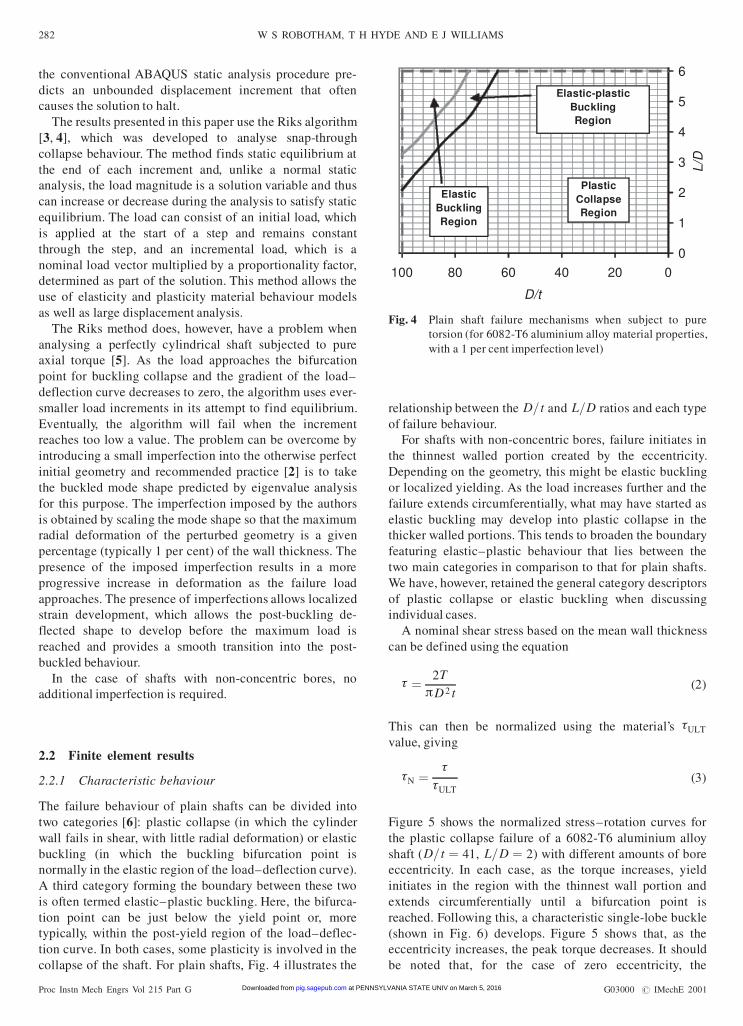
Two material types were used in the analyses: 6082-T6aluminium alloy (which was used to produce all of theexperimental test shafts used in the validation of the FEmethod) and a high tensile aerospace steel (AS). TheABAQUS input file requires the values of E, î and the truestress versus plastic strain data. The material properties areshown in Table 2 and the stress–strain curves normalizedwith respect to the individual material óULT are shown inFig. 3. Each marker symbol represents a data point withinthe ABAQUS material model and the software uses linearinterpolation to obtain intermediate values.
Isotropic hardening was used for all of the analysespresented in this paper. The material properties wereassumed to be rate independent and the von Mises yieldcriterion and associated plastic flow rule were used todetermine the magnitudes and ‘directions’ of the plasticstrain increments.
2.1.5 Analysis method
The structures under analysis tend to reach a maximumsustainable load, which then decreases in post-bucklingbehaviour. When zero stiffness is reached (i.e. at the pointof maximum load), the Newton–Raphson method used in
Fig. 2 Undeformed FE shaft mesh
0.0
0.1
0.2
0.3
0.4
0.5
0.6
0.7
0.8
0.9
1.0
0.00 0.02 0.04 0.06 0.08 0.10 0.12
Strain (%)
s sss/s sss
ULT
6082-T6 ALUMINIUM ALLOY
TYPICAL AEROSPACE STEEL (AS)
Fig. 3 Normalized material stress–strain curves
Table 2 Material properties for 6082-T6 and AS
Property6082-T6(aluminium alloy)
AS (high tensileaerospace steel)
E (GPa) 70 207î 0.3 0.3óY (MPa) 335 1083óULT (MPa) 354 1377
G03000 # IMechE 2001 Proc Instn Mech Engrs Vol 215 Part G
FINITE ELEMENT TORSIONAL BUCKLING ANALYSIS OF SHAFTS 281
at PENNSYLVANIA STATE UNIV on March 5, 2016pig.sagepub.comDownloaded from
the conventional ABAQUS static analysis procedure pre-dicts an unbounded displacement increment that oftencauses the solution to halt.
The results presented in this paper use the Riks algorithm[3, 4], which was developed to analyse snap-throughcollapse behaviour. The method finds static equilibrium atthe end of each increment and, unlike a normal staticanalysis, the load magnitude is a solution variable and thuscan increase or decrease during the analysis to satisfy staticequilibrium. The load can consist of an initial load, whichis applied at the start of a step and remains constantthrough the step, and an incremental load, which is anominal load vector multiplied by a proportionality factor,determined as part of the solution. This method allows theuse of elasticity and plasticity material behaviour modelsas well as large displacement analysis.
The Riks method does, however, have a problem whenanalysing a perfectly cylindrical shaft subjected to pureaxial torque [5]. As the load approaches the bifurcationpoint for buckling collapse and the gradient of the load–deflection curve decreases to zero, the algorithm uses ever-smaller load increments in its attempt to find equilibrium.Eventually, the algorithm will fail when the incrementreaches too low a value. The problem can be overcome byintroducing a small imperfection into the otherwise perfectinitial geometry and recommended practice [2] is to takethe buckled mode shape predicted by eigenvalue analysisfor this purpose. The imperfection imposed by the authorsis obtained by scaling the mode shape so that the maximumradial deformation of the perturbed geometry is a givenpercentage (typically 1 per cent) of the wall thickness. Thepresence of the imposed imperfection results in a moreprogressive increase in deformation as the failure loadapproaches. The presence of imperfections allows localizedstrain development, which allows the post-buckling de-flected shape to develop before the maximum load isreached and provides a smooth transition into the post-buckled behaviour.
In the case of shafts with non-concentric bores, noadditional imperfection is required.
2.2 Finite element results
2.2.1 Characteristic behaviour
The failure behaviour of plain shafts can be divided intotwo categories [6]: plastic collapse (in which the cylinderwall fails in shear, with little radial deformation) or elasticbuckling (in which the buckling bifurcation point isnormally in the elastic region of the load–deflection curve).A third category forming the boundary between these twois often termed elastic–plastic buckling. Here, the bifurca-tion point can be just below the yield point or, moretypically, within the post-yield region of the load–deflec-tion curve. In both cases, some plasticity is involved in thecollapse of the shaft. For plain shafts, Fig. 4 illustrates the
relationship between the D= t and L=D ratios and each typeof failure behaviour.
For shafts with non-concentric bores, failure initiates inthe thinnest walled portion created by the eccentricity.Depending on the geometry, this might be elastic bucklingor localized yielding. As the load increases further and thefailure extends circumferentially, what may have started aselastic buckling may develop into plastic collapse in thethicker walled portions. This tends to broaden the boundaryfeaturing elastic–plastic behaviour that lies between thetwo main categories in comparison to that for plain shafts.We have, however, retained the general category descriptorsof plastic collapse or elastic buckling when discussingindividual cases.
A nominal shear stress based on the mean wall thicknesscan be defined using the equation
ô ˆ 2TðD 2 t
(2)
This can then be normalized using the material’s ôULT
value, giving
ôN ˆ ôôULT
(3)
Figure 5 shows the normalized stress–rotation curves forthe plastic collapse failure of a 6082-T6 aluminium alloyshaft (D= t ˆ 41, L=D ˆ 2) with different amounts of boreeccentricity. In each case, as the torque increases, yieldinitiates in the region with the thinnest wall portion andextends circumferentially until a bifurcation point isreached. Following this, a characteristic single-lobe buckle(shown in Fig. 6) develops. Figure 5 shows that, as theeccentricity increases, the peak torque decreases. It shouldbe noted that, for the case of zero eccentricity, the
0
1
2
3
4
5
6
020406080100
D/t
L/D
ElasticBucklingRegion
Elastic-plasticBucklingRegion
PlasticCollapseRegion
Fig. 4 Plain shaft failure mechanisms when subject to puretorsion (for 6082-T6 aluminium alloy material properties,with a 1 per cent imperfection level)
Proc Instn Mech Engrs Vol 215 Part G G03000 # IMechE 2001
282 W S ROBOTHAM, T H HYDE AND E J WILLIAMS
at PENNSYLVANIA STATE UNIV on March 5, 2016pig.sagepub.comDownloaded from
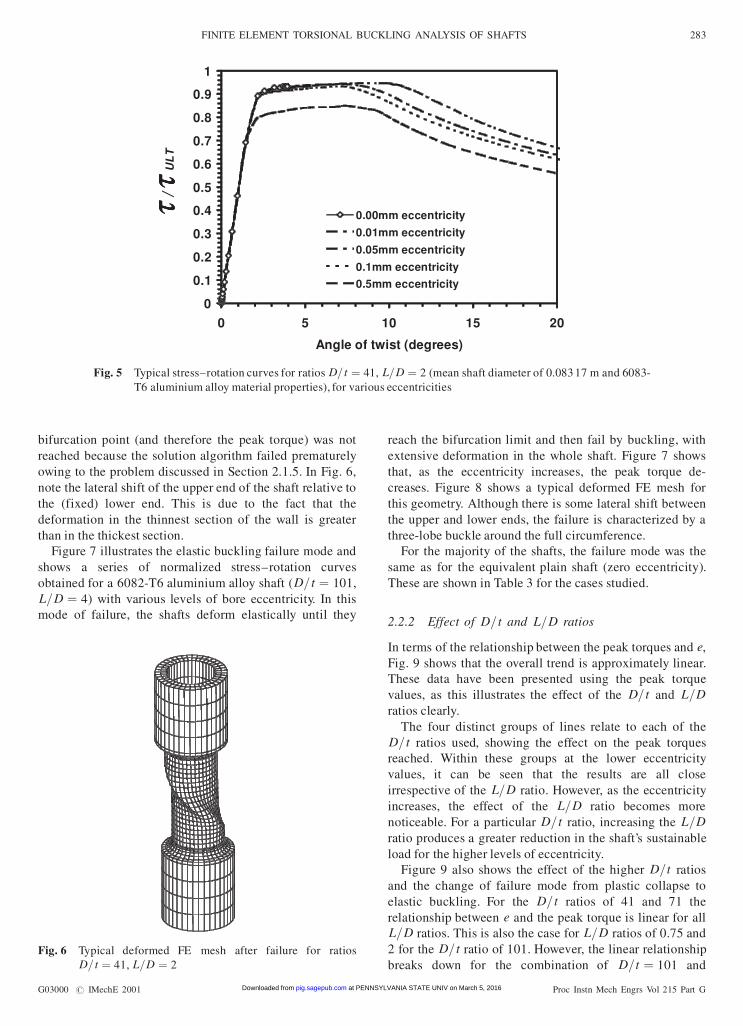
bifurcation point (and therefore the peak torque) was notreached because the solution algorithm failed prematurelyowing to the problem discussed in Section 2.1.5. In Fig. 6,note the lateral shift of the upper end of the shaft relative tothe (fixed) lower end. This is due to the fact that thedeformation in the thinnest section of the wall is greaterthan in the thickest section.
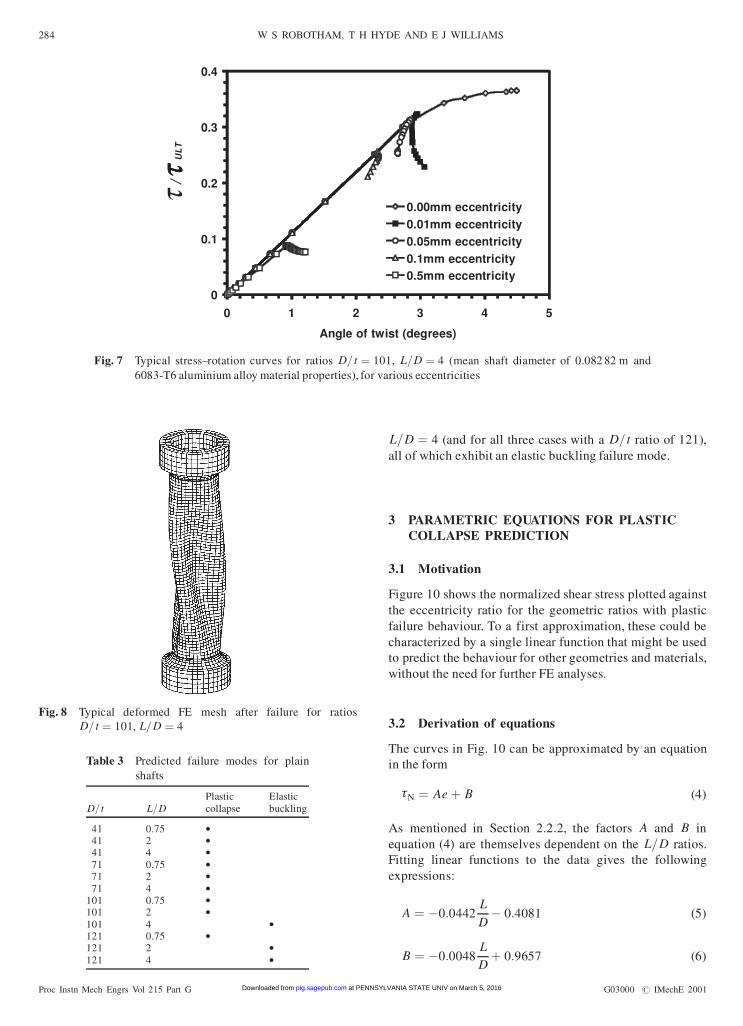
Figure 7 illustrates the elastic buckling failure mode andshows a series of normalized stress–rotation curvesobtained for a 6082-T6 aluminium alloy shaft (D= t ˆ 101,L=D ˆ 4) with various levels of bore eccentricity. In thismode of failure, the shafts deform elastically until they
reach the bifurcation limit and then fail by buckling, withextensive deformation in the whole shaft. Figure 7 showsthat, as the eccentricity increases, the peak torque de-creases. Figure 8 shows a typical deformed FE mesh forthis geometry. Although there is some lateral shift betweenthe upper and lower ends, the failure is characterized by athree-lobe buckle around the full circumference.
For the majority of the shafts, the failure mode was thesame as for the equivalent plain shaft (zero eccentricity).These are shown in Table 3 for the cases studied.
2.2.2 Effect of D= t and L=D ratios
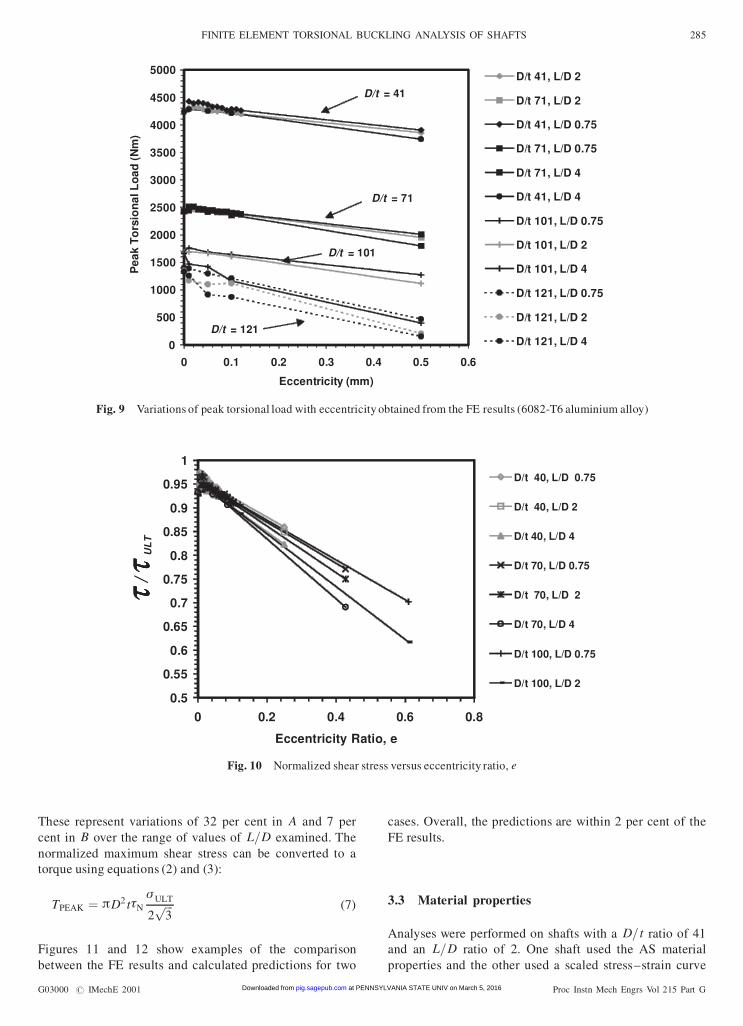
In terms of the relationship between the peak torques and e,Fig. 9 shows that the overall trend is approximately linear.These data have been presented using the peak torquevalues, as this illustrates the effect of the D= t and L=Dratios clearly.
The four distinct groups of lines relate to each of theD= t ratios used, showing the effect on the peak torquesreached. Within these groups at the lower eccentricityvalues, it can be seen that the results are all closeirrespective of the L=D ratio. However, as the eccentricityincreases, the effect of the L=D ratio becomes morenoticeable. For a particular D= t ratio, increasing the L=Dratio produces a greater reduction in the shaft’s sustainableload for the higher levels of eccentricity.
Figure 9 also shows the effect of the higher D=t ratiosand the change of failure mode from plastic collapse toelastic buckling. For the D= t ratios of 41 and 71 therelationship between e and the peak torque is linear for allL=D ratios. This is also the case for L=D ratios of 0.75 and2 for the D= t ratio of 101. However, the linear relationshipbreaks down for the combination of D=t ˆ 101 and
0
0.1
0.2
0.3
0.4
0.5
0.6
0.7
0.8
0.9
1
0 5 10 15 20
Angle of twist (degrees)
t ttt/t tttU
LT
0.00mm eccentricity
0.01mm eccentricity
0.05mm eccentricity
0.1mm eccentricity
0.5mm eccentricity
Fig. 5 Typical stress–rotation curves for ratios D= t ˆ 41, L=D ˆ 2 (mean shaft diameter of 0.08317 m and 6083-T6 aluminium alloy material properties), for various eccentricities
Fig. 6 Typical deformed FE mesh after failure for ratiosD= t ˆ 41, L=D ˆ 2
G03000 # IMechE 2001 Proc Instn Mech Engrs Vol 215 Part G
FINITE ELEMENT TORSIONAL BUCKLING ANALYSIS OF SHAFTS 283
at PENNSYLVANIA STATE UNIV on March 5, 2016pig.sagepub.comDownloaded from
L=D ˆ 4 (and for all three cases with a D= t ratio of 121),all of which exhibit an elastic buckling failure mode.
3 PARAMETRIC EQUATIONS FOR PLASTICCOLLAPSE PREDICTION
3.1 Motivation
Figure 10 shows the normalized shear stress plotted againstthe eccentricity ratio for the geometric ratios with plasticfailure behaviour. To a first approximation, these could becharacterized by a single linear function that might be usedto predict the behaviour for other geometries and materials,without the need for further FE analyses.
3.2 Derivation of equations
The curves in Fig. 10 can be approximated by an equationin the form
ôN ˆ Ae ‡ B (4)
As mentioned in Section 2.2.2, the factors A and B inequation (4) are themselves dependent on the L=D ratios.Fitting linear functions to the data gives the followingexpressions:
A ˆ ¡0:0442LD
¡ 0:4081 (5)
B ˆ ¡0:0048LD
‡ 0:9657 (6)
0
0.1
0.2
0.3
0.4
0 1 2 3 4 5
Angle of twist (degrees)
t/t tttU
LT
0.00mm eccentricity0.01mm eccentricity0.05mm eccentricity0.1mm eccentricity0.5mm eccentricity
Fig. 7 Typical stress–rotation curves for ratios D= t ˆ 101, L=D ˆ 4 (mean shaft diameter of 0.082 82 m and6083-T6 aluminium alloy material properties), for various eccentricities
Fig. 8 Typical deformed FE mesh after failure for ratiosD= t ˆ 101, L=D ˆ 4
Table 3 Predicted failure modes for plainshafts
D=t L=DPlasticcollapse
Elasticbuckling
41 0.75 ·41 2 ·41 4 ·71 0.75 ·71 2 ·71 4 ·
101 0.75 ·101 2 ·101 4 ·121 0.75 ·121 2 ·121 4 ·
Proc Instn Mech Engrs Vol 215 Part G G03000 # IMechE 2001
284 W S ROBOTHAM, T H HYDE AND E J WILLIAMS
at PENNSYLVANIA STATE UNIV on March 5, 2016pig.sagepub.comDownloaded from
These represent variations of 32 per cent in A and 7 percent in B over the range of values of L=D examined. Thenormalized maximum shear stress can be converted to atorque using equations (2) and (3):
TPEAK ˆ ðD2 tôNóULT
2���
3p (7)
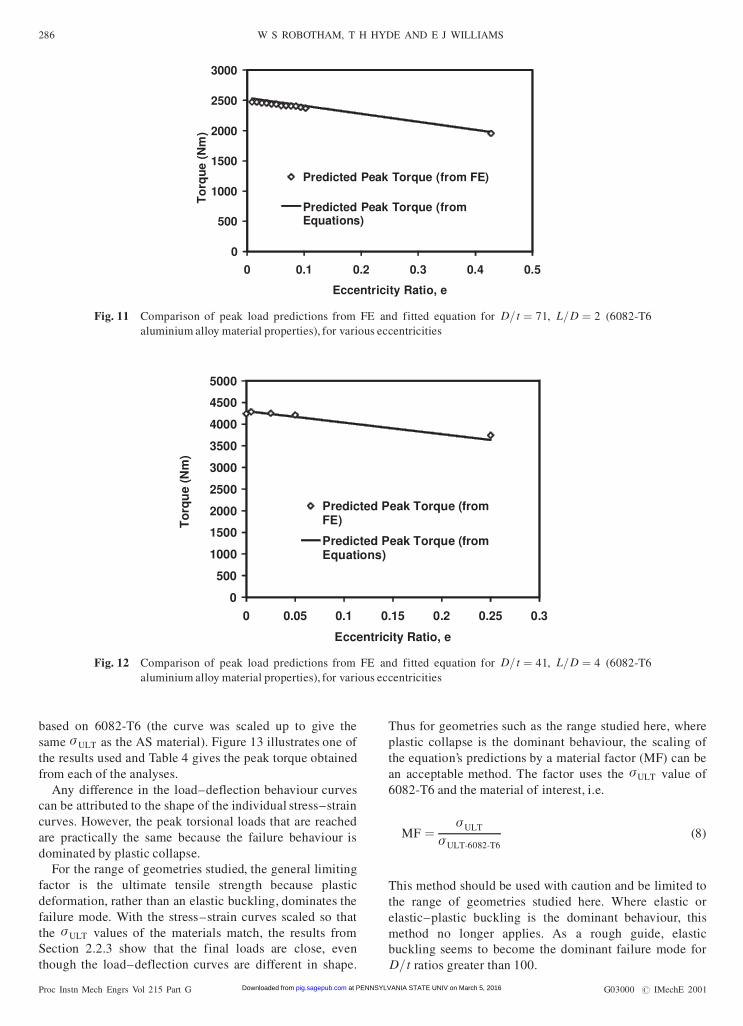
Figures 11 and 12 show examples of the comparisonbetween the FE results and calculated predictions for two
cases. Overall, the predictions are within 2 per cent of theFE results.
3.3 Material properties
Analyses were performed on shafts with a D= t ratio of 41and an L=D ratio of 2. One shaft used the AS materialproperties and the other used a scaled stress–strain curve
0
500
1000
1500
2000
2500
3000
3500
4000
4500
5000
0 0.1 0.2 0.3 0.4 0.5 0.6
Eccentricity (mm)
Pea
kT
ors
ion
alL
oad
(Nm
)
D/t 41, L/D 2
D/t 71, L/D 2
D/t 41, L/D 0.75
D/t 71, L/D 0.75
D/t 71, L/D 4
D/t 41, L/D 4
D/t 101, L/D 0.75
D/t 101, L/D 2
D/t 101, L/D 4
D/t 121, L/D 0.75
D/t 121, L/D 2
D/t 121, L/D 4
D/t = 41
D/t = 71
D/t = 101
D/t = 121
Fig. 9 Variations of peak torsional load with eccentricity obtained from the FE results (6082-T6 aluminium alloy)
0.5
0.55
0.6
0.65
0.7
0.75
0.8
0.85
0.9
0.95
1
0 0.2 0.4 0.6 0.8
Eccentricity Ratio, e
t ttt/t ttt U
LT
D/t 40, L/D 0.75
D/t 40, L/D 2
D/t 40, L/D 4
D/t 70, L/D 0.75
D/t 70, L/D 2
D/t 70, L/D 4
D/t 100, L/D 0.75
D/t 100, L/D 2
Fig. 10 Normalized shear stress versus eccentricity ratio, e
G03000 # IMechE 2001 Proc Instn Mech Engrs Vol 215 Part G
FINITE ELEMENT TORSIONAL BUCKLING ANALYSIS OF SHAFTS 285
at PENNSYLVANIA STATE UNIV on March 5, 2016pig.sagepub.comDownloaded from
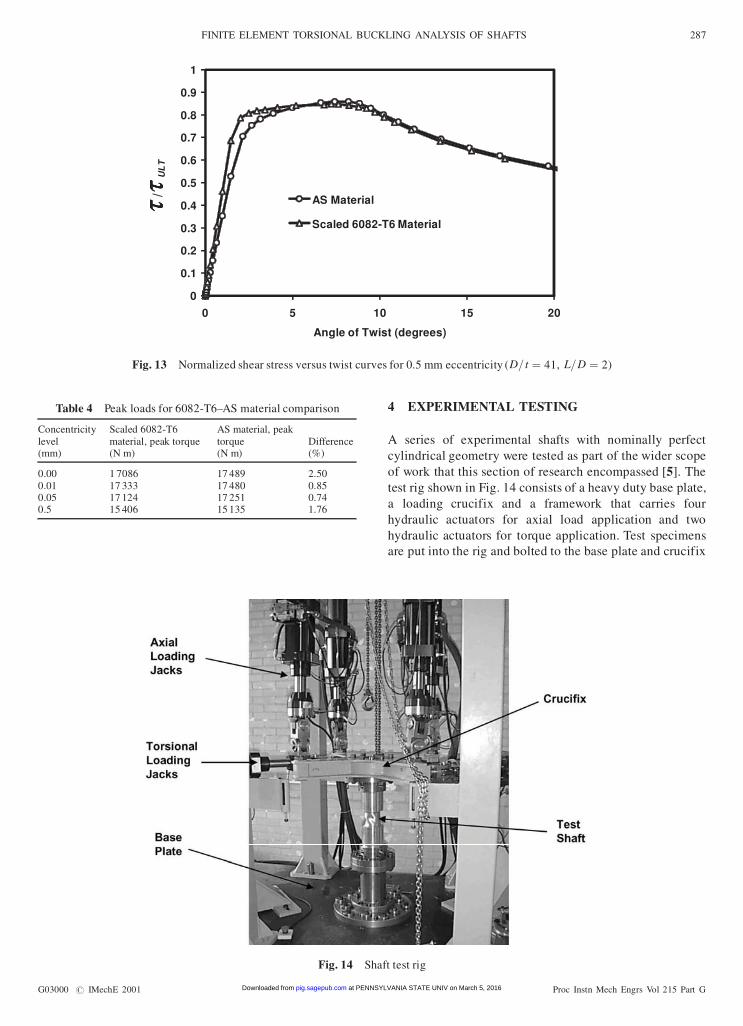
based on 6082-T6 (the curve was scaled up to give thesame óULT as the AS material). Figure 13 illustrates one ofthe results used and Table 4 gives the peak torque obtainedfrom each of the analyses.
Any difference in the load–deflection behaviour curvescan be attributed to the shape of the individual stress–straincurves. However, the peak torsional loads that are reachedare practically the same because the failure behaviour isdominated by plastic collapse.
For the range of geometries studied, the general limitingfactor is the ultimate tensile strength because plasticdeformation, rather than an elastic buckling, dominates thefailure mode. With the stress–strain curves scaled so thatthe óULT values of the materials match, the results fromSection 2.2.3 show that the final loads are close, eventhough the load–deflection curves are different in shape.
Thus for geometries such as the range studied here, whereplastic collapse is the dominant behaviour, the scaling ofthe equation’s predictions by a material factor (MF) can bean acceptable method. The factor uses the óULT value of6082-T6 and the material of interest, i.e.
MF ˆ óULT
óULT-6082-T6(8)
This method should be used with caution and be limited tothe range of geometries studied here. Where elastic orelastic–plastic buckling is the dominant behaviour, thismethod no longer applies. As a rough guide, elasticbuckling seems to become the dominant failure mode forD= t ratios greater than 100.
0
500
1000
1500
2000
2500
3000
0 0.1 0.2 0.3 0.4 0.5
Eccentricity Ratio, e
To
rqu
e(N
m)
Predicted Peak Torque (from FE)
Predicted Peak Torque (fromEquations)
Fig. 11 Comparison of peak load predictions from FE and fitted equation for D= t ˆ 71, L=D ˆ 2 (6082-T6aluminium alloy material properties), for various eccentricities
0
500
1000
1500
2000
2500
3000
3500
4000
4500
5000
0 0.05 0.1 0.15 0.2 0.25 0.3
Eccentricity Ratio, e
To
rqu
e(N
m)
Predicted Peak Torque (fromFE)
Predicted Peak Torque (fromEquations)
Fig. 12 Comparison of peak load predictions from FE and fitted equation for D= t ˆ 41, L=D ˆ 4 (6082-T6aluminium alloy material properties), for various eccentricities
Proc Instn Mech Engrs Vol 215 Part G G03000 # IMechE 2001
286 W S ROBOTHAM, T H HYDE AND E J WILLIAMS
at PENNSYLVANIA STATE UNIV on March 5, 2016pig.sagepub.comDownloaded from
4 EXPERIMENTAL TESTING
A series of experimental shafts with nominally perfectcylindrical geometry were tested as part of the wider scopeof work that this section of research encompassed [5]. Thetest rig shown in Fig. 14 consists of a heavy duty base plate,a loading crucifix and a framework that carries fourhydraulic actuators for axial load application and twohydraulic actuators for torque application. Test specimensare put into the rig and bolted to the base plate and crucifix
0
0.1
0.2
0.3
0.4
0.5
0.6
0.7
0.8
0.9
1
0 5 10 15 20
Angle of Twist (degrees)
tttt/tttt U
LT
AS Material
Scaled 6082-T6 Material
Fig. 13 Normalized shear stress versus twist curves for 0.5 mm eccentricity (D= t ˆ 41, L=D ˆ 2)
Table 4 Peak loads for 6082-T6–AS material comparison
Concentricitylevel(mm)
Scaled 6082-T6material, peak torque(N m)
AS material, peaktorque(N m)
Difference(%)
0.00 1 7086 17 489 2.500.01 17 333 17 480 0.850.05 17 124 17 251 0.740.5 15 406 15 135 1.76
Fig. 14 Shaft test rig
G03000 # IMechE 2001 Proc Instn Mech Engrs Vol 215 Part G
FINITE ELEMENT TORSIONAL BUCKLING ANALYSIS OF SHAFTS 287
at PENNSYLVANIA STATE UNIV on March 5, 2016pig.sagepub.comDownloaded from
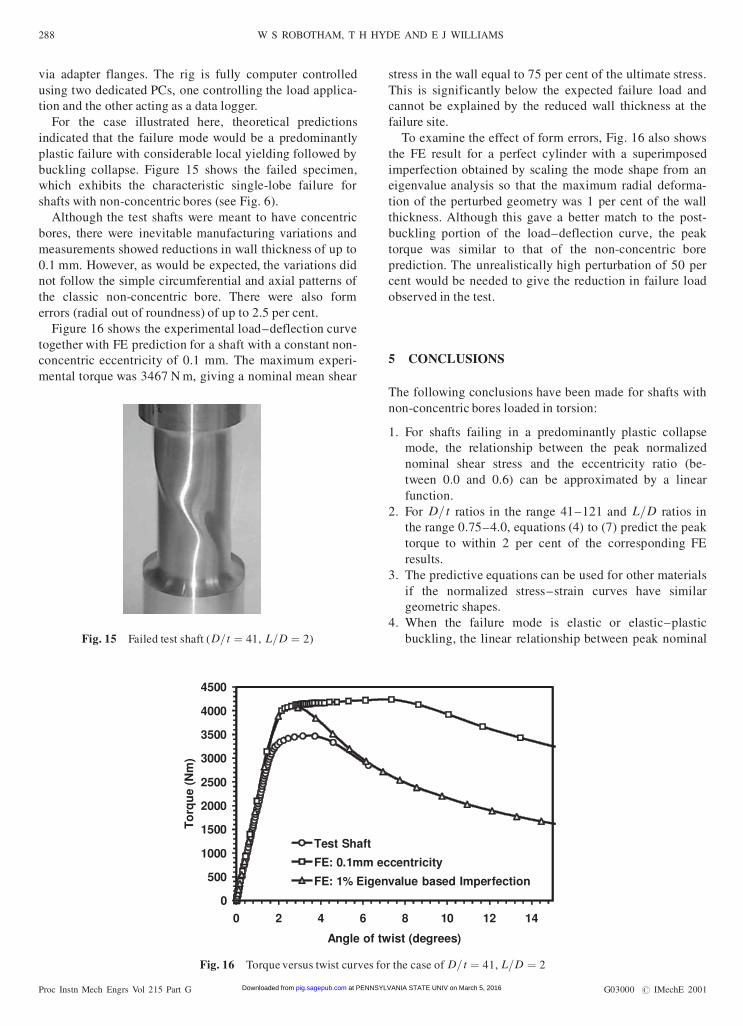
via adapter flanges. The rig is fully computer controlledusing two dedicated PCs, one controlling the load applica-tion and the other acting as a data logger.
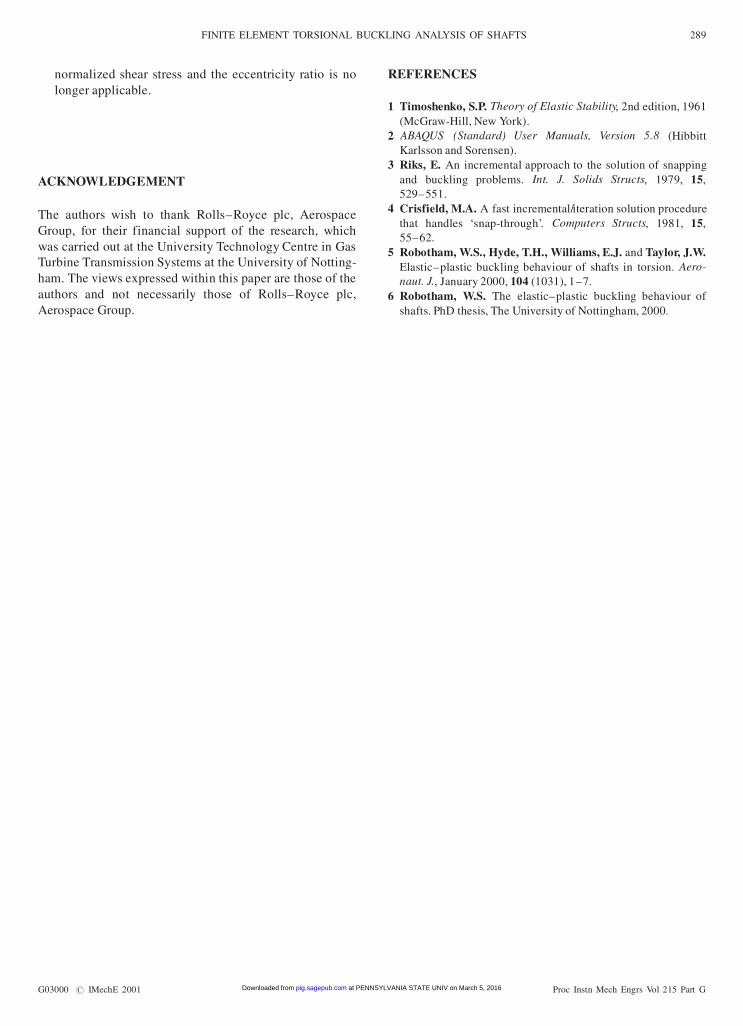
For the case illustrated here, theoretical predictionsindicated that the failure mode would be a predominantlyplastic failure with considerable local yielding followed bybuckling collapse. Figure 15 shows the failed specimen,which exhibits the characteristic single-lobe failure forshafts with non-concentric bores (see Fig. 6).
Although the test shafts were meant to have concentricbores, there were inevitable manufacturing variations andmeasurements showed reductions in wall thickness of up to0.1 mm. However, as would be expected, the variations didnot follow the simple circumferential and axial patterns ofthe classic non-concentric bore. There were also formerrors (radial out of roundness) of up to 2.5 per cent.
Figure 16 shows the experimental load–deflection curvetogether with FE prediction for a shaft with a constant non-concentric eccentricity of 0.1 mm. The maximum experi-mental torque was 3467 N m, giving a nominal mean shear
stress in the wall equal to 75 per cent of the ultimate stress.This is significantly below the expected failure load andcannot be explained by the reduced wall thickness at thefailure site.
To examine the effect of form errors, Fig. 16 also showsthe FE result for a perfect cylinder with a superimposedimperfection obtained by scaling the mode shape from aneigenvalue analysis so that the maximum radial deforma-tion of the perturbed geometry was 1 per cent of the wallthickness. Although this gave a better match to the post-buckling portion of the load–deflection curve, the peaktorque was similar to that of the non-concentric boreprediction. The unrealistically high perturbation of 50 percent would be needed to give the reduction in failure loadobserved in the test.
5 CONCLUSIONS
The following conclusions have been made for shafts withnon-concentric bores loaded in torsion:
1. For shafts failing in a predominantly plastic collapsemode, the relationship between the peak normalizednominal shear stress and the eccentricity ratio (be-tween 0.0 and 0.6) can be approximated by a linearfunction.
2. For D= t ratios in the range 41–121 and L=D ratios inthe range 0.75–4.0, equations (4) to (7) predict the peaktorque to within 2 per cent of the corresponding FEresults.
3. The predictive equations can be used for other materialsif the normalized stress–strain curves have similargeometric shapes.
4. When the failure mode is elastic or elastic–plasticbuckling, the linear relationship between peak nominalFig. 15 Failed test shaft (D=t ˆ 41, L=D ˆ 2)
0
500
1000
1500
2000
2500
3000
3500
4000
4500
0 2 4 6 8 10 12 14
Angle of twist (degrees)
To
rqu
e(N
m)
Test Shaft
FE: 0.1mm eccentricity
FE: 1% Eigenvalue based Imperfection
Fig. 16 Torque versus twist curves for the case of D= t ˆ 41, L=D ˆ 2
Proc Instn Mech Engrs Vol 215 Part G G03000 # IMechE 2001
288 W S ROBOTHAM, T H HYDE AND E J WILLIAMS
at PENNSYLVANIA STATE UNIV on March 5, 2016pig.sagepub.comDownloaded from
normalized shear stress and the eccentricity ratio is nolonger applicable.
ACKNOWLEDGEMENT
The authors wish to thank Rolls–Royce plc, AerospaceGroup, for their financial support of the research, whichwas carried out at the University Technology Centre in GasTurbine Transmission Systems at the University of Notting-ham. The views expressed within this paper are those of theauthors and not necessarily those of Rolls–Royce plc,Aerospace Group.
REFERENCES
1 Timoshenko, S.P. Theory of Elastic Stability, 2nd edition, 1961(McGraw-Hill, New York).
2 ABAQUS (Standard) User Manuals, Version 5.8 (HibbittKarlsson and Sorensen).
3 Riks, E. An incremental approach to the solution of snappingand buckling problems. Int. J. Solids Structs, 1979, 15,529–551.
4 Crisfield, M.A. A fast incremental/iteration solution procedurethat handles ‘snap-through’. Computers Structs, 1981, 15,55–62.
5 Robotham, W.S., Hyde, T.H., Williams, E.J. and Taylor, J.W.Elastic–plastic buckling behaviour of shafts in torsion. Aero-naut. J., January 2000, 104 (1031), 1–7.
6 Robotham, W.S. The elastic–plastic buckling behaviour ofshafts. PhD thesis, The University of Nottingham, 2000.
G03000 # IMechE 2001 Proc Instn Mech Engrs Vol 215 Part G
FINITE ELEMENT TORSIONAL BUCKLING ANALYSIS OF SHAFTS 289
at PENNSYLVANIA STATE UNIV on March 5, 2016pig.sagepub.comDownloaded from