final results on $\\nu_{\\mu} \\to \\nu_{\\tau}$ oscillation from the chorus experiment
TRANSCRIPT

EUROPEAN ORGANIZATION FOR NUCLEAR RESEARCH
CERN-PH-EP/2007-03418 October 2007
Final results on ����� ��� oscillation from theCHORUS experiment
E. Eskut, A. Kayis-Topaksu, G. Onengut
Cukurova University, Adana, Turkey
M.G. van Beuzekom, R. van Dantzig, M. de Jong, J. KonijnO. Melzer, R.G.C. Oldeman
�, E. Pesen, C.A.F.J. van der Poel
J.L. Visschers
NIKHEF, Amsterdam, The Netherlands
M. Guler, U. Kose, M. Serin-Zeyrek, R. Sever, P. Tolun, M.T. Zeyrek
METU, Ankara, Turkey
N. Armenise�, F. Cassol, M.G. Catanesi, M. De Serio, M.T. Muciaccia
E. Radicioni, P. Righini, S. Simone, L. Vivolo
Universita di Bari and INFN, Bari, Italy
A. Bulte, K. Winter
Humboldt Universitat, Berlin, Germany
M. Vander Donckt, B. Van de Vyver, P. Vilain, G. Wilquet
Inter-University Institute for High Energies (ULB-VUB) Brussels, Belgium
B. Saitta
Universita di Cagliari and INFN, Cagliari, Italy
E. Di Capua, C. Luppi
Universita di Ferrara and INFN, Ferrara, Italy
Y. Ishii, M. Kazuno, S. Ogawa, H. Shibuya
Toho University, Funabashi, Japan
Preprint submitted to Elsevier

J. Brunner, M. Chizhov, D. Cussans, M. Doucet, J.P. Fabre, W. FlegelI.R. Hristova
, T. Kawamura, D. Kolev
�, M. Litmaath, H. Meinhard
E. Niu, H. Øveras, J. Panman, I.M. Papadopoulos, S. Ricciardi�
A. Rozanov , D. Saltzberg
�, R. Tsenov
�, J.W.E. Uiterwijk
C. Weinheimer, H. Wong, P. Zucchelli
CERN, Geneva, Switzerland
J. Goldberg
Technion, Haifa, Israel
M. Chikawa
Kinki University, Higashiosaka, Japan
E. Arik, A.A. Mailov
Bogazici University, Istanbul, Turkey
J.S. Song, C.S. Yoon
Gyeongsang National University, Jinju, Korea
K. Kodama, N. Ushida
Aichi University of Education, Kariya, Japan
S. Aoki, T. Hara
Kobe University, Kobe, Japan
G. Brooijmans�, T. Delbar, D. Favart, G. Gregoire, J. Herin, S. Kalinin
���I. Makhlioueva
Universite Catholique de Louvain, Louvain-la-Neuve, Belgium
A. Artamonov, P. Gorbunov, V. Khovansky, V. Shamanov, I. Tsukerman
Institute for Theoretical and Experimental Physics, Moscow, Russian Federation
D. Bonekamper, N. Bruski, D. Frekers, D. Rondeshagen, T. Wolff
Westfalische Wilhelms-Universitat, Munster, Germany
2

K. Hoshino, J. Kawada, M. Komatsu, Y. Kotaka, T. KozakiM. Miyanishi, M. Nakamura, T. Nakano, K. Narita, K. Niu, K. Niwa
N. Nonaka, Y. Obayashi, O. Sato, T. Toshito
Nagoya University, Nagoya, Japan
S. Buontempo, A.G. Cocco, N. D’Ambrosio���
, G. De LellisG. De Rosa, F. Di Capua, A. Ereditato
���, G. Fiorillo, A. Marotta
M. Messina���
, P. Migliozzi, V. Palladino, L. Scotto Lavina, P. StrolinV. Tioukov
Universita Federico II and INFN, Naples, Italy
K. Nakamura, T. Okusawa
Osaka City University, Osaka, Japan
A. Capone, D. De Pedis, S. Di Liberto, U. Dore, P.F. LoverreL. Ludovici, A. Maslennikov, M.A. Mazzoni, G. Piredda, G. Rosa
R. Santacesaria, A. Satta��
, F.R. Spada
Universita La Sapienza and INFN, Rome, Italy
E. Barbuto, C. Bozza, G. Grella, G. Romano, C. SirignanoS. Sorrentino
Universita di Salerno and INFN, Salerno, Italy
Y. Sato, I. Tezuka
Utsunomiya University, Utsunomiya, Japan
Abstract
The final oscillation analysis of the complete set of data collected by CHORUS in theyears 1994–1997 is presented. Reconstruction algorithms of data extracted by electronicdetectors were improved and the data recorded in the emulsion target were analysed by newautomated scanning systems, allowing the use of a new method for event reconstruction inemulsion. CHORUS has applied these new techniques to the sample of 1996–1997 eventsfor which no muons were observed in the electronic detectors. Combining the new samplewith the data analysed in previous papers, the overall sensitivity of the experiment to the��� appearance is thus improved. In a two-neutrino mixing scheme, a 90% C.L. upper limitof ���������! �" �$#&%�'(%*),+.-0/21 is set for large 354 � , improving by a factor 1.5 the previouslypublished CHORUS result.
3

Key words: Oscillation, neutrino, Tau lepton appearancePACS: 14.60.Pq
1 Introduction
The CHORUS experiment was designed to search for 6 "87 6 � oscillations throughthe observation of charged-current interactions 6 �:9 7 � /�; followed by the de-cay of the
�lepton, directly observed in a nuclear emulsion target. The experiment
aimed at achieving maximum sensitivity on the effective mixing angle for values ofthe mass parameter <$= � larger than >@? eV �BA c 1 . This particular choice was based onthe hypothesis that the neutrino mass could contribute to the solution of the DarkMatter puzzle [1,2]. A short-baseline experiment in the CERN SPS Wide BandNeutrino Beam [3] was well suited for this search. Another experiment, NOMAD,used the same beam and searched for 6 � appearance using a purely electronic tech-nique [4].
The CHORUS experiment took data from 1994 to 1997. A first phase of data anal-ysis (‘Phase I’) was performed and no evidence for oscillations was found [5–7].Owing to several improvements in automated emulsion scanning and in the eventrecontruction, it was considered worthwhile to perform a new and more completeanalysis (‘Phase II’) of the data collected in the 1996–1997 period.
In this paper, we report the analysis performed on the events for which no muonswere observed in the electronic detector ( ? � events). In particular, a dedicatedsearch for decays into three charged hadrons was also performed. Combining thisnew sample with the data samples analysed and published in previous papers, i.e.with a muon observed in the electronic detector ( > � ) for the whole period of datataking and a small ? � sample collected in 1994–1995, leads to an improvement of
CNow at Universita di Cagliari, Cagliari, Italy.� Deceased.DNow at CERN, Switzerland.1 Now at DESY, Hamburg.EOn leave of absence and at St. Kliment Ohridski University of Sofia, Bulgaria.FNow at Rutherford Appleton Laboratory, Oxon, United Kingdom.GNow at CPPM CNRS-IN2P3, Marseille, France.HNow at University of California, Los Angeles, USA.INow at Columbia University, New York, USA.CKJNow at Rheinisch-Westfaelische Technische Hochschule, Aachen, Germany.CLCNow at Laboratorio Nazionale del Gran Sasso, Assergi, Italy.C � Now at Bern University, Bern, Switzerland.CKDNow at Universita di Roma Tor Vergata, Rome, Italy.
4

the CHORUS sensitivity to 6 "M7 6 � appearance by a factor 1.5 and to 6ON 7 6 �appearance by a factor 1.2.
Although it is now established that 6 "87 6 � oscillations occur at <$= �QP >@? / D , thispaper intends to show the capabilities of an hybrid emulsion experiment and thatthe goal for which CHORUS was designed has been reached.
2 The experimental setup
The CERN SPS Wide Band Neutrino Beam consists essentially of 6 " with a con-tamination of about 5.1% 6 " , 0.8% of 6RN , and 0.2% of 6TS , while the flux of 6 � isnegligible [8]. The average neutrino energy is 26 GeV, well above the
�production
threshold.
The CHORUS detector is a hybrid setup which combines a nuclear emulsion targetwith various electronic detectors such as trigger hodoscopes, a scintillating fibretracker system, a hadron spectrometer, electromagnetic and hadronic calorimeters,and a muon spectrometer [9].
Thanks to its micrometric granularity, nuclear emulsion allows a precise three-dimensional reconstruction of the neutrino interaction vertex as well as of the decayvertices of associated short-lived particles. It is a powerful detector technique to di-rectly observe
�decays which, in this experiment, occur on average at a distance
of >0UWV mm from the interaction vertex.
The scintillating fibre tracker system consists of two components: the target tracker(TT), which is the major tool for locating in the emulsion the region where a neu-trino interaction has occurred, and the diamond tracker (DT), a set of trackers as-sociated with the hadron spectrometer.
The hadron spectrometer measures the charge and momentum of charged parti-cles using an air-core magnet. The calorimeter is used to determine the energy ofelectromagnetic and hadronic showers. The magnetized iron muon spectrometerdetermines the charge and momentum of muons.
The emulsion target has an overall mass of 770 kg and is segmented into fourstacks. Each stack consists of eight modules with 36 plates of size 36 cm X 71 cm.Each plate has a 90
�m plastic base coated on both sides with a 350
�m emulsion
layer. Each stack is followed by three interface emulsion sheets having a 100�
memulsion layer on both sides of a 800
�m thick plastic base, and by a set of TT
planes. The TT predicts particle trajectories on the interface emulsion sheets witha precision of about 150
�m in position and 2 mrad in track angle.
The emulsion scanning is performed by computer-controlled, fully automated mi-
5

croscope stages equipped with a CCD camera and a read-out system called ‘trackselector’ [10,11]. The last generation of automated microscopes used in CHORUSexperiment is the UTS (‘Ultra Track Selector’) [12]. In order to recognize tracksegments in the emulsion, a series of tomographic images is taken by focusingat different depths in the emulsion layer. The digitized images at different levelsare shifted according to the predicted track angle and then added. The presence ofaligned grains forming a track is detected as a local peak in the grey-level of thesummed image. The track-finding efficiency is higher than 98% for track slopesless than 400 mrad [11].
3 The event reconstruction
The event reconstruction algorithms have been improved significantly with respectto the Phase I analysis described in detail in Ref. [7]. Here, we only summarize theessential points.
The event reconstruction starts with the pattern recognition in the electronic detec-tors. Tracks are found in the TT, in the calorimeter and in the muon spectrometer. Ifa muon is detected in the downstream detectors the event is classified as > � , other-wise it is called ? � . Vertices are reconstructed by the electronic detectors using thepoints of closest approach of the tracks in the TT immediately downstream from thetarget. The main vertex is the most upstream one and is selected if it contains eithera muon or a hadron surviving criteria which differed in the two phases
C 1 . Suchparticles or the muon are used as so-called ‘scan-back’ tracks. The impact pointsof the scan-back tracks are predicted on the most downstream interface emulsionsheets, to initiate their follow back in emulsion.
As in previous analyses the event reconstruction in emulsion starts with a procedurecalled ‘vertex location’. As a first step, all the tracks in the interface emulsion sheetswithin an area of 1 mm � centred on each scan-back track prediction are collected.
The correct association of emulsion tracks with TT tracks, both in position anddirection, requires a precise alignment of the interface emulsions with respect tothe fibre-trackers. The alignment parameters are obtained by finding the best matchbetween the full set of TT predicted tracks and the full set of collected emulsiontracks. Once an emulsion track is associated to a scan-back track, mainly on thebasis of their common direction, it is followed upstream from one emulsion plateto the next within a greatly reduced scanning area as the resolution improves. In theemulsion stacks, the scanning area reduces to a square of 50
�m side. The plate-C 1 In Phase I, -!Y events, at least one hadron with a momentum less than 20 GeV Z c was
required. In Phase II the most isolated hadron was selected regardless of its charge andmomentum.
6

to-plate alignment is first obtained by a coarse adjustment of reference marks, and,as the scanning procedure continues, is refined by aligning track maps measuredin subsequent plates. For this alignment we used tracks of particles generated byneutrino interactions during the whole data taking, of cosmic rays and of muonscoming from neighbouring beams. The scan-back procedure stops when a searchedtrack is not found in two consecutive plates. The most downstream one is definedas the ”vertex plate”. This procedure for locating the vertex has an efficiency of34% (Table 1).
Once the vertex plate is found, a new scanning technique is applied on the 1996–1997 data sample. Originally developed for the DONUT experiment [16], this tech-nique, called ‘NetScan’ [17], is described in detail in Ref. [13,18] together with theevent location procedure. Its application to the ? � sample is also described in thefollowing section
CKE.
3.1 The NetScan technique
Once the vertex plate is identified, the UTS performs a scan of the emulsion vol-ume around the vertex position, recording, for each event, all track segments within400 mrad with respect to the orthogonal direction of the plates. In each plate onlythe most upstream 100
�m part is scanned. The scanned volume is >[U]\ mm X:>[U]\ mm
wide and 6.3 mm long in the beam direction, corresponding to eight emulsionplates. This volume contains the vertex plate itself, the plate immediately upstream,and the six plates downstream the vertex plate. The plate upstream the vertex actsas a veto for passing through tracks. The six plates downstream from the vertex actas decay volume and are used to detect the tracks of the decay daughters. The scanarea is centred on the scan-back track stopping point.
The number of track segments (coming from particles induced by neutrino inter-actions, cosmic ray particles and muons from neighbouring beams) found in eachplate depends on the position of the NetScan volume with respect to the beam cen-tre and on average is ^�_0? .The task of the NetScan event reconstruction is to select the segments belonging tothe neutrino interaction under study, out of this large number of background tracksegments. To this end, a first plate–to–plate alignment is performed by compar-ing the pattern of segments in a plate with the corresponding pattern in the nextupstream plate. Each segment found in one plate is extrapolated to the next platewhere a matching segment is looked for within about 4
�m in position (3 ` of align-
ment resolution) and 20 mrad in angle. If none is found, the straight-line extrapo-lation is tried one plate further upstream.CKE
The NetScan technique has been used also for the +�Y data sample, mainly to search forcharmed particles decays [14,15].
7

A second and more accurate inter-plate alignment is performed using tracks passingthrough the entire volume after the connection of all matched segments. Thesetracks come from muons associated with the neutrino beam or with charged particlebeams in the same experimental area. After this fine alignment, the distribution ofthe residuals of the segment positions with respect to the fitted track has a standarddeviation width of about 0.45
�m.
After rejection of isolated track segments, typically about 400 tracks remain in thevolume. The majority of these are tracks (mainly Compton electrons and a -rays)with a momentum less than 100 MeV A c. These background tracks are rejected onthe basis of the b � of a straight-line fit to the track segments. The final step is therejection of the tracks not originating from the scan volume. After this filtering, theaverage number of remaining tracks is about 40. The number of connected tracksand the position and slope residuals provide a good measurement of the alignmentquality. About 84% of the events passes the quality cuts (‘NetScan acquisition ac-cepted’).
The reconstruction algorithm then tries to associate the tracks to vertices with a‘pair-based’ method: after selecting pairs of tracks having minimal distance lessthan 10
�m, a clustering among them is performed and vertex points are defined.
After this clustering, a track is attached to a vertex if its distance from the vertexpoint (called hereafter ‘impact parameter’) is less than 3
�m. At the end of the
procedure, one defines a primary vertex (and its associated tracks) and in case oneor more secondary vertices to which ‘daughter tracks’ are attached.
About 77% of the events, where the NetScan acquisition was accepted, have a ver-tex reconstructed in the NetScan volume. The loss is accounted for by the factthat a background track might have been selected for the scan-back procedure. Thenumbers of events at the various stages of the procedure are given in Table 1.
Table 1Results of the reconstruction of the -!Y sample
Stage of reconstruction number of events
Interface emulsion scanned 102544
Vertex plate found 35039
NetScan acquisition accepted 29404
Vertex reconstructed 22661
3.2 The decay search
Once tracks and vertices are reconstructed in the NetScan volume, a search fordecay topologies is performed. In Fig. 1 a sketch of a 6 � Monte Carlo event insidethe NetScan volume is shown: a 6 � (not drawn) interacts producing a
�lepton
8

and other particles. After three plates, the�
lepton decays producing one chargedparticle (kink topology, i.e. an observed abrupt change of direction in the track).
µ1500 m
1500 mµ
plate
8 6 5 4 3 2 1
base100 m scannedµ
ν
7: vertex
Fig. 1. The NetScan volume and a Monte Carlo event with one-prong (i.e. kink) c decay.
In the decay search an emulsion track is called a ‘TT-confirmed track’ if its trajec-tory matches that of a TT reconstructed track, or if it is connected to a sequence ofTT hits. A reconstructed vertex is a ‘TT-confirmed vertex’ if it contains at least oneTT-confirmed track.
The decay search is done in two stages:
i) an automated search on the whole sample;ii) a computer-assisted visual inspection on the sample selected in the previous
stage.
After the automated search, 754 events are selected as belonging to one of threecategories:
d Short decays. Events for which there is only one TT-confirmed vertex in theNetScan volume and at least one isolated TT-confirmed track having an impactparameter with the primary vertex inside the range efVgUW_ih�>@?[?Oj � m.d Long decays. Events with a one-prong decay topology (‘kink’) directly observedin the NetScan volume. This occurs when the parent track
�is observed in at least
one emulsion plate. The daughter track must be TT-confirmed and its minimaldistance to the parent track is required smaller than k � m. In case a primaryvertex is reconstructed, it is required to be TT-confirmed and the parent trackmust have an impact parameter less than l � m with this vertex.d Multiprong decays. Events in which NetScan reconstructs at least two vertices,the secondary vertices being candidates for multiprong
�decays. The quality of
the vertices is ranked according to the number of TT-confirmed tracks originatingfrom them and it is used as a parameter for the selection of multiprong decaytopology. The parent angle, in the case of a neutral particle decay deduced fromthe line connecting the primary and secondary vertices, should be within 400mrad from the beam direction.
9

The computer-assisted visual inspection aims at clearly establishing the topologyof the primary and secondary vertices. To avoid ambiguous topologies, the flightlength of the parent track is required to be larger than 25
�m. For vertices which
are not both TT-confirmed, a more stringent cut, which is a function of the flightlength of the assumed parent, is applied to remove the random association of twounrelated vertices.
An event is selected if one of the following topologies is detected:
d C1 : a track with a kink (interaction or decay) of at least 50 mradd C3 : a track with a three-prong (interaction or decay) topologyd V2 : a two-prong neutral interaction (or decay) is detected
The numbers of events observed in these topologies are shown in Table 2. Decaysof the
�lepton are characterized by either one or three charged particles in the
final state, C1 or C3. The events with a V2 topology will be used for backgroundcalculations.
Table 2-!Y events selected after visual inspection.
Topology number of events
C1 m@nC3 %poV2 n@n
3.3 Background evaluation
Physical processes that can mimic a�
decay are:
d decays of charmed charged particles like D q , D qr and s qt , if the primary� / is
not identified and the charge of the charmed particle is not determined;d white interactions, i.e. interactions of hadrons without any other visible activityat the vertex (recoil or Auger electrons);dvu decays which affect only the C1 topology.
The charmed particle contribution to the background has been evaluated from pro-duction cross-section of D q , D qr and s qt in neutrino interactions and their decaybranching fractions into one or three charged particles [19]. The rate of D
Jproduc-
tion in neutrino charged-current interactions has been measured in CHORUS [14].Using as the normalization the observed number of events with a V2 topology givenin Table 2, the number of one and three-prong decays from charm particles in the? � sample is given by
10

9*wTxzy{9}| ��~ ` q�`���� ~� � x� | � h
where � y > or l , ` q� A ` ��� y >0U]?[l*��?TU�>!k is the ratio of charged charm and DJ
cross-sections [19] and � | � , � � C and � � D are the efficiencies in detecting the specifictopology, including the branching ratios, computed by a Monte Carlo simulation:� � C A � | � y ?iUW_0����?iU]?[� , � � D A � | � y ?TUf��\���?iU]?[^ .The number of V2 events has been corrected to account for K
Jand s J decays [18].
This yields a prediction of 9 � C y _[ViU]_Q���TU]k and 9 � D y �[�8�{>[> .One-prong interactions without visible activity (‘white kinks’, WK) were gener-ated and processed through the full simulation chain assuming a hadron interactionlength � y _O� m [20]. In the > � sample, the ratio of three-prong to one-prong in-teractions, both with visible activity, was measured to be P >[>R� . This fraction wasassumed to be the same also in absence of recoil or Auger electrons [18].
The results are summarized in Table 3.
Table 3Expected background and observed data for C1 and C3 topologies in the -!Y sample.
Topology Charm White interactions Other decays Total BG Data-!Y C1 �R� ' ��� o0'�� � %�' n���� ' � +!'�+@+ � -['���% m �0' ����n '�- m@n-!Y C3 %@% � +@+ � ' ��� -['�� � % ��� +@+ %po
3.4 Maximum number of detectable�
We define 9����T � as the number of�
events that would be observed if their detectionefficiency and the oscillation probability would be equal to 1. It can be evaluatedas:
9 ���i � y¢¡�£�¤L¥i¦¨§�¤R© ~ ` ¤Lª[¦¨§�¤@©¬«2§y 9 �2�� �2� ~¬® ` ¤Lª!¯® ` ¤L¥p¯h
where £°¤ ¥ ¦¨§�¤@© is the neutrino flux, 9 �2� (93807) is the number of charged-current(CC) neutrino interaction events (used only for the flux determination) detectedin the 1996–1997 run for which NetScan acquisition is completed, and � �g� theirdetection efficiency. ® ` ¤ ª ¯ A ® ` ¤ ¥ ¯ is the ratio between the average total 6 " and 6 �CC cross-sections. Efficiencies have been calculated by Monte Carlo. We define�²±(³ t as the probability to locate a vertex and � r N ± as the reconstruction and selectionefficiencies for the various decay channels. For each topology, the number 9�´¶µ¸·� of
11

�events that would be observed if the oscillation probability would be equal to 1
is:
9 ´¶µ¸·� y{9 ���T � ~p¹�º¼»*½ º ~ � ±(³ tº ~ � r N ±º hwhere the index = runs over the various
�decay modes contributing to that topol-
ogy. Branching ratios, efficencies and 9,´¶µ¸·� are given in Table 4. Note that muonicdecays with a misidentified muon also contribute to the C1 topology.
Table 4c branching ratios, efficiencies and maximum detectable c events for C1 and C3 topologiesin the -!Y sample.
Topology Channel ¾5¿ÁÀÃÂÅÄÇÆ ±(³ t ÀÃÂÅÄ Æ r N ± ÀÃÂÈÄ É ´¶µ¸·�cÈÊÌË % n ' m � � '�� � -[' mÍ� �0' ��� -['�� �!�@�R�-!Y C1 cÈÊÏÎ + � '�o � �0' n�� -['�� � +!' ��� +!'�� + n@�@� n � � +cÈÊ Y + � '(% m ' n�� -['�� � % � � % �!�-!Y C3 cÈÊ � Ë + m ' � � m '�o � -['�oÐ%p�0'�+ � +!' m %@%@%p� %@%@%p�
3.5 Post-scan selection and final data sample
The signal to background ratio, hence the sensitivity to oscillation, can be improvedif, in addition to the topology, other information is used, such as:
d the angle between the parent track and the estimated direction of the hadronicshowerd the length of the parent trackd the mean angle of the daughter tracks with respect to the parent trackd when available, the momentum and charge of a daughter particle
The purpose of the ‘post-scan’ analysis is to maximize the sensitivity to oscillationby an optimum combination of this information. The optimization was performedon Monte Carlo simulated samples of signal and background events [18] and led tothe subdivision of the samples into different subclasses, depending on the observedtopology.
3.5.1 The C1 topology
For the C1 topology, the transverse momentum with respect to the parent directionis useful for the rejection of WK background.
12

Two methods are available for momentum measurements: either with the DT ofthe hadron spectrometer or from the multiple Coulomb scattering (MCS) in theemulsion. The DT also measures the particle charge. The MCS method is used ifno DT measurement is available and if the number of emulsion plates for the MCSmeasurement is greater than 6. The C1 sample has thus been divided into threesubclasses:
d momentum measurement from DT ( Ñ �TÒ ) which also yields a charge measure-ment of the sign of the charge which is important for the charm backgroundrejectiond momentum measurement from MCS ( Ñ � �2Ó )d no momentum measurement
The first category has the highest sensitivity to�
search and the strongest back-ground rejection. The events in which the daughter track has a positive charge arerejected. When the momentum is determined, a cut is applied on the transverse mo-mentum ( Ñ Ò�Ô _[\0? MeV A c) of the daughter kink. A momentum-dependent cut onthe flight length ( Õ×Ö ) is also applied. Fig. 2 shows a comparison between signal andbackground in the selected (I) and rejected (II) regions in the Õ�Ö versus Ñ plane.All decay vertices beyond 3 mm or with a parent momentum below 2 GeV A c wererejected because white kink interactions are likely to populate these regions. For amomentum between 2 GeV A c and 5 GeV A c step functions were used for simplicity.The effects of this selection on the background rejection and
�efficiency are shown
in Table 5.
Table 5Effect of the selection in flight length-momentum plane on the signal and background,without considering any other cut.
Physical process After rejection of events
WK +B� Âcharm ��% Âc m@�RÂ
In addition, the samples have been further subdivided into three <ÙØ ranges, where<ÙØ is defined as the angle in the transverse plane between the parent track andthe mean direction of the other primary tracks after exclusion of the one whichmakes the largest angle with the parent track (the track with a cross in Fig. 3). Acomparison between the distributions of <ÚØ in charm and
�samples is shown in
Fig. 4. The�
signal is characterized by a larger mean value of <ÙØ .
13

3.5.2 The C3 topology
For the C3 topology, the fraction of events for which the three daughter particleshave their momentum measured is too small to lead to a useful discrimination.Instead, use is made of the fact that the mean angle ®¸Û ¯ of the daughter tracksrelative to the parent is strongly correlated to the inverse of the Lorentz boost factorÜ . Thus, the product of the parent flight length Õ�Ö and ®¸Û ¯ is a good parameterto discriminate particles of different lifetimes (or apparent lifetime in the case ofwhite interactions). The C3 sample has been divided into “short Ý � ” and “long Ý � ”subsamples, separated by a cut value Õ�Ö ~ ®¸Û ¯�y V0\ � m. Fig. 5 shows a comparisonof the charm and
�samples: the short Ý � sample is enriched in
�decays. These
categories are further divided as above according to <ÙØ ranges. The sample mostsensitive to a
�signal corresponds to events with short Ý � and large <ÚØ .
Once the different categories are defined the same subdivision is applied to thecandidate events. This is done according to the ‘blind analysis’ prescriptions, inorder to minimize the possibility of biases in the experimental result.
Table 6 shows the number of simulated and observed events in C1 and C3 topolo-gies of the new ? � sample, together with data from the Phase I analysis whichconsist of two samples [7]:
d > � events from the 1994–1997 data taking. The background reduction is ob-tained by applying a cut on the transverse momentum ( ÑßÞ Ô _[\0? MeV A c) ofthe kink daughter. The kink must occur within five plates downstream from theneutrino interaction vertex plate. The estimated background is ?TU�> events andthe maximum number of 6 � events is 9 º¬àâá� y \0?i>!� (as reported in Table 2 of[7]). The background is much smaller than for the ? � sample because of the lowprobability of a wrong measurement of the charge in the muon spectrometer. Nocandidate is observed.d ? � one-prong events from the 1994–1995 data taking. Table 2 of [7] gives thebackground and the maximum number of 6 � oscillated events for the whole ? �1994–1997 sample. The 1996–1997 data has been reanalysed, as reported in thispaper. The 1994–1995 data correspond to an estimated background of ?TU]l eventsand a maximum number of 6 � oscillated events of 9 º¬à�á� y \0_0k . No candidate isobserved.
The errors on the expected background are evaluated by taking into account thelimited statistics of the Monte Carlo sample and the errors on cross-sections andbranching ratios.
14

4 Results
From the number of observed candidates, the expected background and the numberof signal events expected for full oscillation it is possible to compute, for eachsubsample of Table 6, the 90% C.L. upper limit on the 6 � appearance probabilityusing a frequentist statistical approach, the so-called Feldman and Cousins unifiedapproach [21].
To evaluate the sensitivity of the experiment, we have simulated a large number ofexperiments taking into account Poisson fluctuations of the expected background.The sensitivity is then defined as the average of the 90% C.L. upper limits on theappearance probability of all these ”experiments”.
The last two columns in Table 6 show the sensitivities ã " � of each subsample andan index � " � in decreasing order of sensitivity. The subsamples are then combined,with the same prescriptions used by the NOMAD Collaboration [4]. After includingthe 11th most sensitive subsample, the global sensitivity changes only at the percentlevel. Similarly for the 6pS 7 6 � search. In evaluating the global sensitivity, we thusconsider only the 11 most sensitive subsamples for both searches.
4.1 6 "Ð7 6 � oscillation
Fig. 6 (left) shows the distribution of the upper limits (at 90% C.L.) obtained bysimulating 800 experiments. The average value, ã y _gUf�äX�>@? /21 , corresponds tothe CHORUS sensitivity to 6 � appearance.
The 90% C.L. upper limit on the appearance probability obtained from the data is
Ñ ¦ 6 "È7 6 �R©°å _iUW_$Xæ>!? /21 hindicated by a vertical line in Fig. 6. It is in agreement with the expected sensitiv-ity. In fact, in absence of signal events the probability to obtain an upper limit of_iU]_äX�>@? /21 or lower is ����� , which means that the number of observed events iscompatible with the estimated background. The above result improves by a factor>[U]\ the previously published limit Ñ å lTU��ÙXç>@? /21 [7].
In a two-neutrino formalism, the above upper limit corresponds to the exclusionregion in the ( <$= � , è�é�ê � _ Û " � ) oscillation parameter plane shown in Fig.7 (left) andto the limit è�é�ê � _ Û " �Ðå ��U��ÙXç>@? /21 for large <$= � .The upper limit obtained by NOMAD [4] is more stringent than the CHORUS oneat large <ë= � , whereas for <$= � lower than V0? eV �BA c 1 the upper limit is improved
15

by CHORUS owing to its higher efficiencies at low neutrino energies.
4.2 6pS 7 6 � oscillation
The SPS neutrino beam contains a 0.8% 6OS contamination. Assuming that all ob-servable 6 � would originate from this contamination, the above result translates intoa limit on the 6pS 7 6 � appearance probability. The difference in energy betweenthe 6 " ( ® §�¤L¥p¯ P _0k GeV) and 6OS ( ® §�¤Lì.¯ P �2_ GeV) components leads to a differentshape of the exclusion plot in the oscillation parameter plane.
Fig. 6 (right) shows the upper limit distribution obtained by simulating 800 exper-iments. The average value, ã y _iU]\íXî>@? / � , corresponds to the sensitivity to the6pS 7 6 � appearance probability.
The 90% C.L. upper limit on the appearance probability obtained from the data is
Ñ ¦ 6pS 7 6 �R©°å _iUW_$Xç>@? / � hindicated by a vertical line in Fig. 6. In absence of signal events, the probabilityto obtain an upper limit of _iUW_ëX&>@? / � or lower is �[^�� . The above result improvesby a factor >[U]_ the previously published limit [7]. The improvement is smaller thanin the 6 "ï7 6 � case for two reasons. The first one is the variation of the expected6pS contamination provided by a new simulation of the beam (reduced by a factor0.85) [23]. Furthermore, in the 6 "Á7 6 � case the efficiency improved predomi-nantly at low neutrino energies and the harder 6[S spectrum makes this improvementless effective. This reason also explains the large difference in the limit relative toNOMAD. In a two-neutrino formalism, the above upper limit corresponds to theexclusion region in the ( <ë= � , è�é�ê � _ Û N � ) oscillation parameter plane shown in Fig.7(right) and to the limit è�éðê � _ Û S �Èå ��U��ëXç>@? / � for large <$= � .
5 Conclusions
The final result of the search for 6 � appearance with the CHORUS experiment hasbeen presented. A 90% C.L. upper limit of _iU]_ÚXñ>@? /21 was set for the appearanceprobability, improving by a factor 1.5 the previously published CHORUS result.In a two-neutrino mixing scheme, this result corresponds to the limit è�é�ê � _ Û " �,å��U��}Xä>!? /21 for large <$= � . With respect to previous CHORUS results, we have alsoimproved by a factor 1.2 the upper limit on the ( 6[S 7 6 � ) oscillation probability.
16

Acknowledgements
We gratefully acknowledge the help and support of the neutrino beam staff and ofthe numerous technical collaborators who contributed to the detector construction,operation, emulsion pouring, development, and scanning. The experiment has beenmade possible by grants from the Institut Interuniversitaire des Sciences Nucleair-es and the Interuniversitair Instituut voor Kernwetenschappen (Belgium), the IsraelScience Foundation (grant 328/94) and the Technion Vice President Fund for thePromotion of Research (Israel), CERN (Geneva, Switzerland), the German Bun-desministerium fur Bildung und Forschung (contract numbers 05 6BU11P and05 7MS12P) (Germany), the Institute of Theoretical and Experimental Physics(Moscow, Russia), the Istituto Nazionale di Fisica Nucleare (Italy), the Promotionand Mutual Aid Corporation for Private Schools of Japan and Japan Society for thePromotion of Science (Japan), the Korea Research Foundation Grant (KRF-2003-005-C00014) (Republic of Korea), the Foundation for Fundamental Research onMatter FOM and the National Scientific Research Organization NWO (The Neth-erlands), and the Scientific and Technical Research Council of Turkey (Turkey).We gratefully acknowledge their support.
References
[1] H. Harari, Phys. Lett. B216 (1989) 413.
[2] J. Ellis, J.L. Lopez and D.V. Nanopoulos, Phys. Lett. B292 (1992) 189.
[3] E. H. M. Heijne, CERN Yellow Report 83-06 (1983).
[4] P. Astier et al., NOMAD Collaboration, Nucl. Phys. B611 (2001) 3.
[5] E. Eskut et al., CHORUS Collaboration, Phys. Lett. B424 (1998) 202.
[6] E. Eskut et al., CHORUS Collaboration, Phys. Lett. B434 (1998) 205.
[7] E. Eskut et al., CHORUS Collaboration, Phys. Lett. B497 (2001) 8.
[8] B. Van de Vyver and P. Zucchelli, Nucl. Instr. and Meth. A385 (1997) 91.
[9] E. Eskut et al., CHORUS Collaboration, Nucl. Instr. and Meth. A401 (1997) 7.
[10] S. Aoki et al., Nucl. Instr. and Meth. B51 (1990) 466.
[11] T. Nakano, Ph.D. thesis, Nagoya University, Japan (1997).
[12] T. Nakano, Proc. Int. Europhysics Conf. on High Energy Physics, Budapest, Hungary(2001).
[13] M. Guler, Ph.D. thesis, METU, Ankara, Turkey (2000).
17

[14] G. Onengut et al., CHORUS Collaboration, Phys. Lett. B613 (2005) 105.
[15] G. Onengut et al., CHORUS Collaboration, Phys. Lett. B614 (2005) 155.
[16] K. Kodama et al., Nucl. Instr. and Meth. A493 (2002) 45.
[17] N. Nonaka, Ph.D. thesis, Nagoya University, Japan (2002).
[18] L. Scotto Lavina, Ph.D. thesis, Universita degli Studi di Napoli “Federico II” (2005).
[19] A. Kayis-Topaksu et al., CHORUS Collaboration, Phys. Lett. B626 (2005) 24.
[20] A. Satta, Ph.D. Thesis, University of Rome (2001).
[21] G.J. Feldman and R.D. Cousins, Phys. Rev. D57 (1998) 3873.
[22] M. Apollonio et al., CHOOZ Collaboration, Eur. Phys. J. C27 (2003) 331.
[23] I.I. Tsukerman, CHORUS internal note 2000010 (2002).
18

00.5
1
1.52
2.53
3.54
0 5 10 15
II
I
Charm
PDT (GeV)
LF
(mm
)
00.5
1
1.52
2.53
3.54
0 5 10 15
II
I
WK
PDT (GeV)
LF
(mm
)
00.5
1
1.52
2.53
3.54
0 5 10 15
II
I
τ
PDT (GeV)
LF
(mm
)
00.5
11.5
22.5
33.5
4
0 5 10 15
II
I
PMCS (GeV)
LF
(mm
)
00.5
11.5
22.5
33.5
4
0 5 10 15
II
I
PMCS (GeV)
LF
(mm
)
00.5
11.5
22.5
33.5
4
0 5 10 15
II
I
PMCS (GeV)
LF
(mm
)
Fig. 2. The flight length ò Ö versus daughter particle momentum computed for charm (left),white kink (centre) and c events (right). The momentum is evaluated by DT (top) or MCS(bottom). Only events in region I are selected.
19
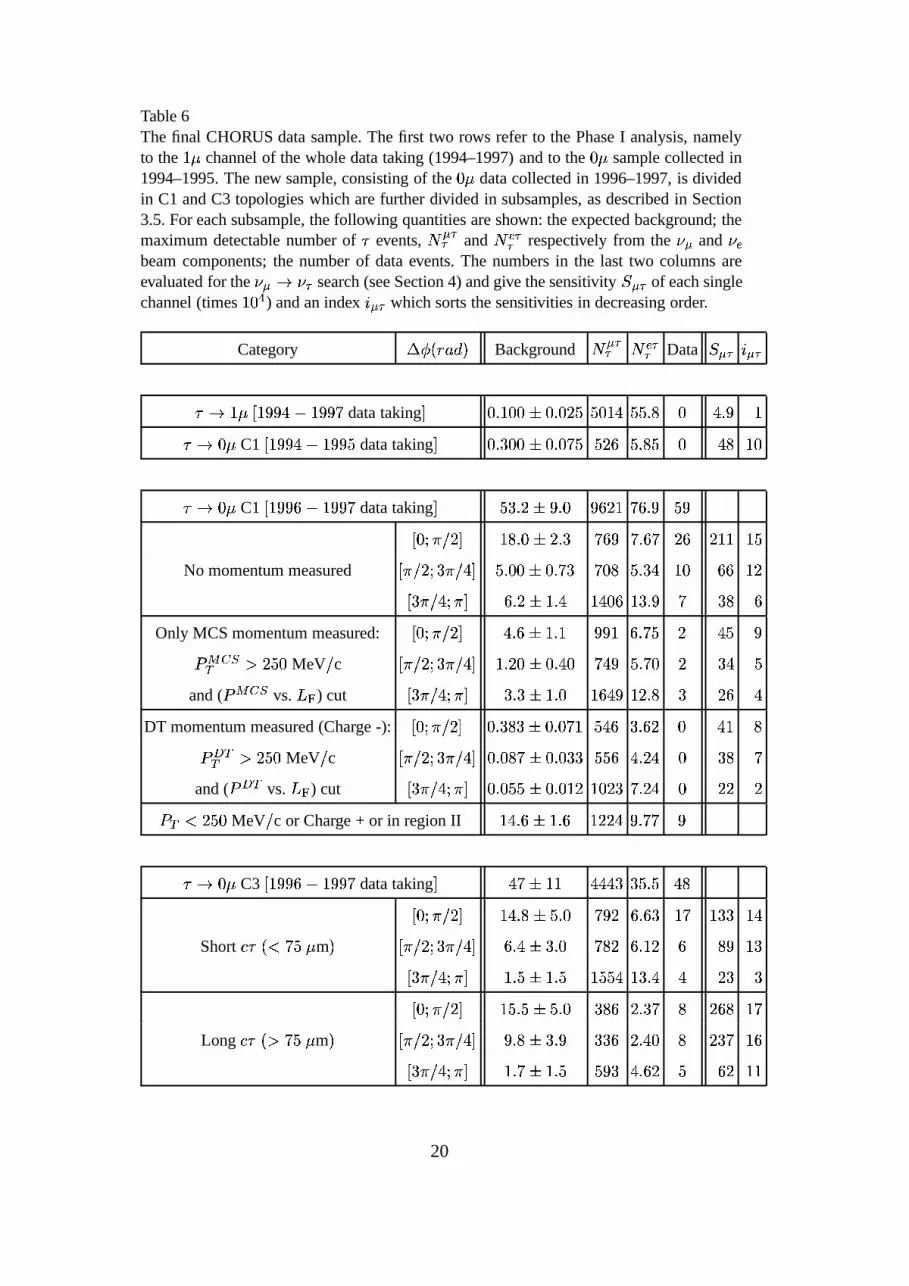
Table 6The final CHORUS data sample. The first two rows refer to the Phase I analysis, namelyto the +�Y channel of the whole data taking (1994–1997) and to the -!Y sample collected in1994–1995. The new sample, consisting of the -!Y data collected in 1996–1997, is dividedin C1 and C3 topologies which are further divided in subsamples, as described in Section3.5. For each subsample, the following quantities are shown: the expected background; themaximum detectable number of c events, É " �� and É S �� respectively from the � " and � Sbeam components; the number of data events. The numbers in the last two columns areevaluated for the � "5Ê ��� search (see Section 4) and give the sensitivity óô" � of each singlechannel (times +.-@1 ) and an index õ " � which sorts the sensitivities in decreasing order.
Category 3ÈözÀð÷@øOù[Ä Background É " �� É S �� Data óT" � õÃ" �c*Ê +�YMúW+ n@n %:�û+ n@nR� data taking ü -['�+.-@- � -['�- �@m m -�+�% m@m '�o - %�' n +cÈÊ -!Y C1 úW+ n@n %8�ý+ n@n@m data taking ü -['��!-@- � -['�- �!m m@� � m '�o m - %po +.-cÈÊ -!Y C1 úW+ n@n ���ý+ n@nR� data taking ü m �0' ���ûn '�- n � � + � �0' n m@nú -[þ�ÿ Z!� ü +Bo0'�- ��� '�� � � n � '�� � � � � +@+ + mNo momentum measured ú ÿ Z!� þâ�!ÿ Z % ü m '�-@- � -[' � � � -Ro m '���% +.- �@� + �ú(�!ÿ Z %�þ�ÿ ü �0' ��� +!'(% +�%R-R� +B�0' n � �@o �
Only MCS momentum measured: ú -[þ�ÿ Z!� ü %�'�� � +!'�+ n@n + �0' �!m � % m n��� w��Þ � �@m - MeV Z c ú ÿ Z!� þâ�!ÿ Z % ü +!' � - � -['(%R- � % n m ' � - � ��% m
and (��� w��
vs. ò Ö ) cut ú(�!ÿ Z %�þ�ÿ ü �0'�� � +!'�- +B��% n + � '�o � � � %DT momentum measured (Charge -): ú -[þ�ÿ Z!� ü -['��@o@� � -['�- � + m %p� �0'�� � - %2+ o
��� ÞÞ � �@m - MeV Z c ú ÿ Z!� þâ�!ÿ Z % ü -['�-Ro ��� -['�-R�@� m@m � %�' � % - �@o �and (
� � Þ vs. ò Ö ) cut ú(�!ÿ Z %�þ�ÿ ü -['�- m@m�� -['�-�+ � +.- � � � ' � % - �@� �� Þ # �@m - MeV Z c or Charge + or in region II +�%�'�� � +!'�� + �@� % n ' �@� ncÈÊ -!Y C3 úW+ n@n ���ý+ n@nR� data taking ü % ��� +@+ %@%@%p� � m ' m %po
ú -[þ�ÿ Z!� ü +�%�'�o ��m '�- �!n@� �0'��@� + � +B�@� +�%Short �c*À # �!m Y m Ä ú ÿ Z!� þâ�!ÿ Z % ü �0'(% � �0'�- � o � �0'�+ � � o n +B�
ú(�!ÿ Z %�þ�ÿ ü +!' m�� +!' m + m@m % +B�0'(% % � � �ú -[þ�ÿ Z!� ü + m ' m���m '�- �@o@� � '�� � o � �@o + �
Long �cÍÀ � �!m Y m Ä ú ÿ Z!� þâ�!ÿ Z % ü n '�o � �0' n �@�@� � '(%R- o � � � +B�ú(�!ÿ Z %�þ�ÿ ü +!' ��� +!' m m@n � %�'�� � m � � +@+
20

∆φ∆φD
White interactionCharm decay
∆φτ
h
µ
τ decay
Fig. 3. Definition of the angle 3Èö . The dashed line is the mean direction of the primarytracks, with the exclusion of the one which has the largest ö angle relative to the parentparticle. The 3Èö distribution is different for charm, white interaction or c events.
0
0.05
0.1
0.15
0.2
0.25
0 π/4 π/2 3π/4 π∆φ
Nor
mal
ized
eve
nts
Fig. 4. 3Èö distributions for simulated -!Y C1 events: comparison between �[� (solid line)and charmed events (dashed line). The area is normalized to 1. The vertical lines show theapplied cut dividing the events in three subsamples.
21

0
0.05
0.1
0.15
0.2
0.25
0.3
0 50 100 150 200 250 300 350 400 450 500LF*<θ> (µm)
Nor
mal
ized
eve
nts
Fig. 5. ò Ö� � � distribution for simulated -!Y C3 events: comparison between c (solid line)and charm (dashed line) decays. The area is normalized to 1. The vertical line shows theapplied cut ò Ö��� ���ñ�!m Y m dividing the events in two subsamples.
0
20
40
60
80
100
0 2 4 6 8 10Upper limit at 90% C.L. (10-4)
Num
ber
of e
xper
imen
ts
νµ→ντ
0
20
40
60
80
100
120
0 2 4 6 8 10Upper limit at 90% C.L. (10-2)
Num
ber
of e
xper
imen
ts
νe→ντ
Fig. 6. Upper limits obtained at 90% C.L. [21], in absence of signal events, for 800 simu-lated experiments with the CHORUS expected background. The average value correspondsto the sensitivity to � "5Ê ��� (left) and � S Ê ��� (right) appearance probability. The verticalline is the 90% C.L. upper limit obtained from the data.
22

sin22θµτ
∆m2 (e
V2 /c
4 )
CHORUS
NOMAD
νµ→ντ90% C.L.
10-1
1
10
10 2
10 3
10-4
10-3
10-2
10-1
1
sin22θeτ
∆m2 (e
V2 /c
4 )
CHORUS
NOMAD
CHOOZνe→ντ90% C.L.
1
10
10 2
10 3
10-2
10-1
1
Fig. 7. The CHORUS upper limit on ��������� (left) and ��������� (right) oscillation repre-sented in an exclusion plot in the oscillation parameter plane. CHORUS results are shownas solid lines and are compared with the last results of NOMAD [4] and CHOOZ [22].
23