a search for $\nu_{\mu} \rightarrow \nu_{\tau}$ oscillations using the nomad detector
TRANSCRIPT
EUROPEAN ORGANIZATION FOR NUCLEAR RESEARCH
CERN-EP/98-57
April 9 1998
A search for �� ! �� oscillations using the NOMADdetector
The NOMAD Collaboration
J. Altegoer6 C. Angelini17 P. Astier15 D. Autiero9 A. Baldisseri19 M. Baldo-Ceolin14 G. Ballocchi9
M. Banner15 S. Basa10 G. Bassompierre2 K. Benslama10 N. Besson19 I. Bird9;10 B. Blumenfeld3
F. Bobisut14 J. Bouchez19 S. Boyd21 A. Bueno4;24 S. Bunyatov7 L. Camilleri9 A. Cardini11
A. Castera15 P.W. Cattaneo16 V. Cavasinni17 A. Cervera-Villanueva9 G. Collazuol14
G. Conforto22 C. Conta16 M. Contalbrigo14 R. Cousins11 D. Daniels4 H. Degaudenzi10
T. Del Prete17 A. De Santo17 T. Dignan4 L. Di Lella9 E. do Couto e Silva9 I.J. Donnelly20;21
J. Dumarchez15 T. Fazio2 G.J. Feldman4 R. Ferrari16 D. Ferr�ere9 V. Flaminio17 M. Fraternali16
G. Fumagalliy16 J.-M. Gaillard2 P. Galumian10 E. Gangler9;15 A. Geiser9 D. Geppert6 D. Gibin14
S. Gninenko13 J.-J. Gomez-Cadenas1;9 J. Gosset19 C. G�o�ling6 M. Gouan�ere2 A. Grant9
G. Graziani8 A. Guglielmi14 C. Hagner19 J. Hernando1;26 D. Hubbard4 P. Hurst4 N. Hyett12
E. Iacopini8 C. Joseph10 F. Juget10 D. Kekez23 B. Khomenko9 M. Kirsanov13 O. Klimov7
J. Kokkonen9 A. Kovzelev13 V.E. Kuznetsov7 S. Lacaprara14 A. Lanza16 L. La Rotonda5
M. Laveder14 C. Lazzeroni17 A. Letessier-Selvon15 J.-M. Levy15 L. Linssen9 A. Ljubi�ci�c 23
J. Long3;27 A. Lupi8 E. Manola-Poggioli2;9 A. Marchionni8 F. Martelli22 X. M�echain19
J.-P. Mendiburu2 J.-P. Meyer19 M. Mezzetto14 S.R. Mishra4 G.F. Moorhead12 L. Mossuz2
P. N�ed�elec2;9 Yu. Nefedov7 C. Nguyen-Mau10 D. Orestano18 F. Pastore18 L.S. Peak21
E. Pennacchio22 J-P. Perroud10 H. Pessard2 R. Petti16 A. Placci9 H. Plothow-Besch9 A. Pluquet19
G. Polesello16 D. Pollmann6 B.G. Pope9 B. Popov7 C. Poulsen12 P. Rathouit19 G. Renzoni17
C. Roda9;17 A. Rubbia9;24 F. Salvatore16 D. Scannicchio16 K. Schahmaneche15 B. Schmidt6
A. Sconza14 M. Serrano15 M. Sevior12 D. Sillou2 F.J.P. Soler21 G. Sozzi10 D. Steele3;10 P. Ste�en9
M. Steininger10 U. Stiegler9 M. Stip�cevi�c 23 Th. Stolarczyk19 M. Tareb-Reyes10 G.N. Taylor12
V. Tereshchenko7 A. Toropin13 A.-M. Touchard15 S.N. Tovey9;12 M.-T. Tran10 E. Tsesmelis9
J. Ulrichs21 V. Uros15 L. Vacavant10 M. Valdata-Nappi5;25 V. Valuev7 F. Vannucci15
K.E. Varvell20;21 M. Veltri22 V. Vercesi16 D. Verkindt2 J.-M. Vieira10 T.Vinogradova11
M.-K. Vo19 S. Volkov13 F.V. Weber4;9 T. Weisse6 M. Werlen10 F.F. Wilson9 L.J. Winton12
B.D. Yabsley21 H. Zaccone19 and K. Zuber6
y deceased
to be published in Physics Letters B
i
Abstract
NOMAD is a neutrino oscillation experiment designed to search for �� appearance
in the CERN-SPS wide band �� beam. Signal detection relies on the identi�cation of
�� charged current interactions using kinematic criteria. The analysis of the 1995 data
sample yields no oscillation signal. Combining all studied � decay modes, a limit of
sin2 2��� < 4:2� 10�3 is obtained for large �m2 at the 90% con�dence level.
1Univ. of Massachusetts, Amherst, MA, USA2LAPP, Annecy, France3Johns Hopkins Univ., Baltimore, MD, USA4Harvard Univ., Cambridge, MA, USA5Univ. of Calabria and INFN, Cosenza, Italy6Dortmund Univ., Dortmund, Germany7JINR, Dubna, Russia8Univ. of Florence and INFN, Florence, Italy9CERN, Geneva, Switzerland10University of Lausanne, Lausanne, Switzerland11UCLA, Los Angeles, CA, USA12University of Melbourne, Melbourne, Australia13Inst. Nucl. Research, INR Moscow, Russia14Univ. of Padova and INFN, Padova, Italy15LPNHE, Univ. of Paris, Paris VI and VII, France16Univ. of Pavia and INFN, Pavia, Italy17Univ. of Pisa and INFN, Pisa, Italy18Roma Tre University/INFN, Rome, Italy19DAPNIA, CEA Saclay, France20ANSTO Sydney, Menai, Australia21Univ. of Sydney, Sydney, Australia22Univ. of Urbino, Urbino, and INFN Florence, Italy23Rudjer Bo�skovi�c Institute, Zagreb, Croatia24ETH Z�urich, Z�urich, Switzerland25Now at Univ. of Perugia, Perugia, Italy26Now at UCSC, Santa Cruz, CA, USA27Now at Univ. of Colorado, Boulder, CO, USA
ii
1 Introduction
The �eld of neutrino physics is rich in unsolved anomalies which could be ex-
plained by massive neutrinos and neutrino oscillations [1]. All experiments mea-
suring the ux of solar neutrinos observe a de�cit compared to the prediction
of solar models. The ratio of muon to electron events observed in atmospheric
neutrino interactions is measured by most experiments to be less than expected
from models of cosmic ray interactions in the atmosphere. The LSND experiment
has observed possible oscillation signals in the ��� � ��e and �� � �e channels [2].
Finally various astrophysical observations indicate the existence of non-luminous
matter in the universe, a prime candidate for which is the relic neutrinos from
the big bang provided their mass is a few eV/c2. These observations make the
search for neutrino oscillations a very worthwhile endeavour.
This letter describes a search for �� � �� oscillations in the predominantly ��CERN-SPS wide band beam using the appearance method. The experiment is
sensitive to the cosmologically relevant mass range [3] (�m2 > 1 eV2/c4) and to
mixing angles about an order of magnitude smaller than the best limit available
at the time of the NOMAD proposal [4] (sin22� < 5� 10�3 at high �m2), set by
the E531 experiment [5].Potential �� candidates are identi�ed through their charged current (CC)
interaction. NOMAD is designed to detect both the leptonic (e���e�� or ������� )
and hadronic (1-prong or 3-prong) decay modes of the produced ��. The ��interactions are recognized through kinematic criteria based on the isolation of
the � decay products from the remainder of the event and on the momentumimbalance in the transverse plane (missing pT ) induced by the momentum carriedaway by the �nal state neutrino(s) from � decay.
This method imposes stringent requirements on the design of the detector.Electrons and muons need to be well identi�ed to search for � 's in the leptonicmodes as well as for rejecting CC background as e�ciently as possible in the
� ! hadrons search. The energy of neutral particles and the momentum ofcharged particles needs to be measured as precisely as possible in order to have
good missing pT resolution.
2 The detector
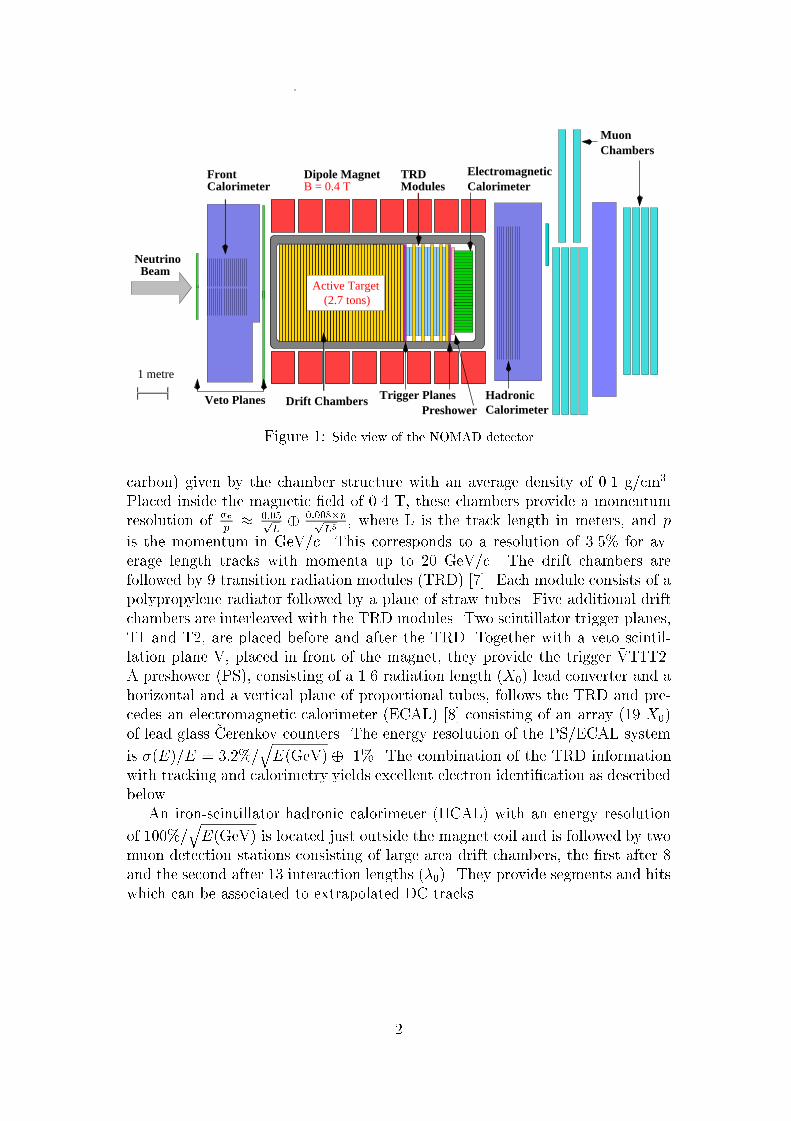
A side view of the NOMAD setup is shown in Fig. 1 and a detailed description of
the detector can be found elsewhere [6]. We describe brie y its main components.The NOMAD detector consists of a number of subdetectors most of which are
located in a dipole magnet with a �eld volume of 7:5� 3:5� 3:5 m3. The targetpart of the detector was designed to accommodate two con icting requirements:
to be as light as possible (low density and low atomic number materials) in order
to allow the precise measurement of charged particle momenta and to minimizeelectromagnetic showers and hadronic interactions, and to be as heavy as possible
in order to produce a signi�cant number of neutrino interactions.
This con ict was resolved using an active target (2.7 tons) of 44 3�3 m2 drift
chambers (DC) perpendicular to the beam axis, with the target mass (mainly
1
ChambersMuon
BeamActive Target
(2.7 tons)
Preshower
Neutrino
Veto Planes
1 metre
CalorimeterHadronic
ElectromagneticCalorimeterB = 0.4 T
FrontCalorimeter Modules
TRDDipole Magnet
Drift Chambers Trigger Planes
Figure 1: Side view of the NOMAD detector
carbon) given by the chamber structure with an average density of 0.1 g/cm3.Placed inside the magnetic �eld of 0.4 T, these chambers provide a momentumresolution of �p
p�
0:05pL�
0:008�ppL5
, where L is the track length in meters, and p
is the momentum in GeV/c. This corresponds to a resolution of 3.5% for av-erage length tracks with momenta up to 20 GeV/c. The drift chambers are
followed by 9 transition radiation modules (TRD) [7]. Each module consists of apolypropylene radiator followed by a plane of straw tubes. Five additional driftchambers are interleaved with the TRD modules. Two scintillator trigger planes,
T1 and T2, are placed before and after the TRD. Together with a veto scintil-lation plane V, placed in front of the magnet, they provide the trigger �VT1T2.A preshower (PS), consisting of a 1.6 radiation length (X0) lead converter and a
horizontal and a vertical plane of proportional tubes, follows the TRD and pre-cedes an electromagnetic calorimeter (ECAL) [8] consisting of an array (19 X0)
of lead glass �Cerenkov counters. The energy resolution of the PS/ECAL system
is �(E)=E = 3:2%=qE(GeV)� 1%. The combination of the TRD information
with tracking and calorimetry yields excellent electron identi�cation as described
below.
An iron-scintillator hadronic calorimeter (HCAL) with an energy resolution
of 100%=qE(GeV) is located just outside the magnet coil and is followed by two
muon detection stations consisting of large area drift chambers, the �rst after 8
and the second after 13 interaction lengths (�0). They provide segments and hits
which can be associated to extrapolated DC tracks.
2
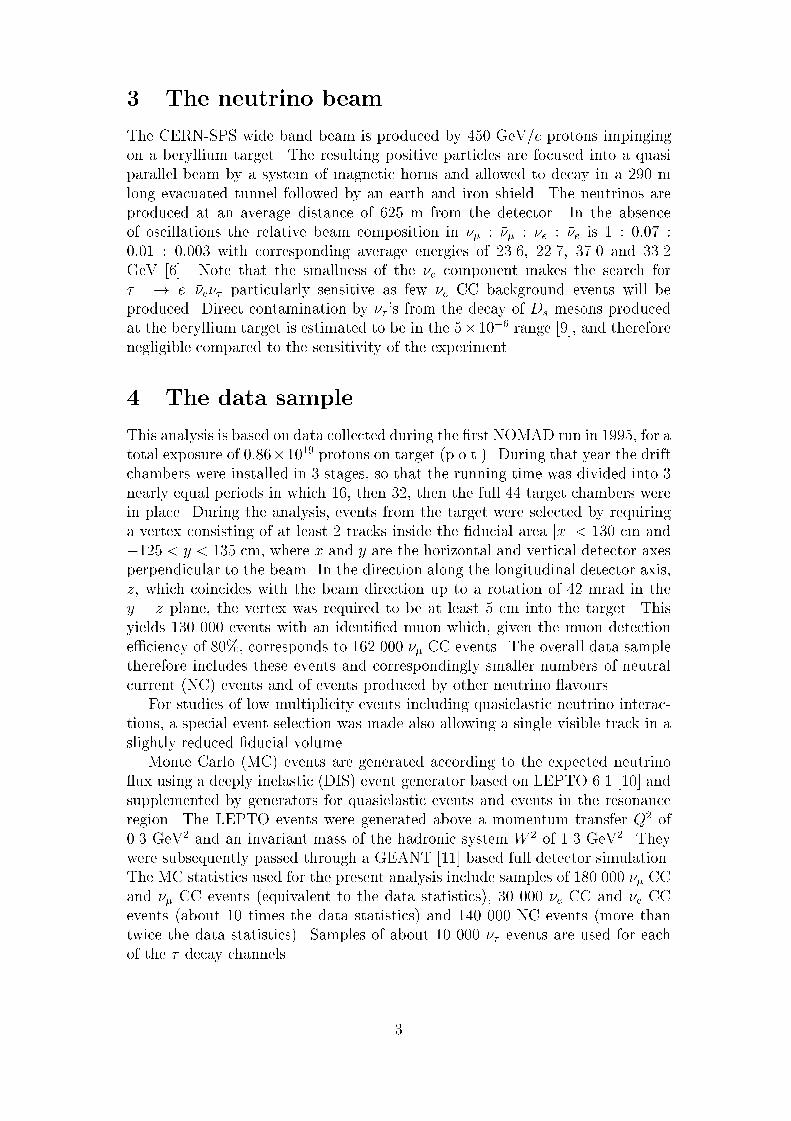
3 The neutrino beam
The CERN-SPS wide band beam is produced by 450 GeV/c protons impinging
on a beryllium target. The resulting positive particles are focused into a quasi
parallel beam by a system of magnetic horns and allowed to decay in a 290 m
long evacuated tunnel followed by an earth and iron shield. The neutrinos are
produced at an average distance of 625 m from the detector. In the absence
of oscillations the relative beam composition in �� : ��� : �e : ��e is 1 : 0:07 :
0:01 : 0:003 with corresponding average energies of 23.6, 22.7, 37.0 and 33.2
GeV [6]. Note that the smallness of the �e component makes the search for
�� ! e���e�� particularly sensitive as few �e CC background events will be
produced. Direct contamination by �� 's from the decay of Ds mesons produced
at the beryllium target is estimated to be in the 5�10�6 range [9], and therefore
negligible compared to the sensitivity of the experiment.
4 The data sample
This analysis is based on data collected during the �rst NOMAD run in 1995, for atotal exposure of 0:86�1019 protons on target (p.o.t.). During that year the driftchambers were installed in 3 stages, so that the running time was divided into 3
nearly equal periods in which 16, then 32, then the full 44 target chambers werein place. During the analysis, events from the target were selected by requiringa vertex consisting of at least 2 tracks inside the �ducial area jxj < 130 cm and
�125 < y < 135 cm, where x and y are the horizontal and vertical detector axesperpendicular to the beam. In the direction along the longitudinal detector axis,
z, which coincides with the beam direction up to a rotation of 42 mrad in they � z plane, the vertex was required to be at least 5 cm into the target. Thisyields 130 000 events with an identi�ed muon which, given the muon detection
e�ciency of 80%, corresponds to 162 000 �� CC events. The overall data sampletherefore includes these events and correspondingly smaller numbers of neutral
current (NC) events and of events produced by other neutrino avours.
For studies of low multiplicity events including quasielastic neutrino interac-tions, a special event selection was made also allowing a single visible track in a
slightly reduced �ducial volume.
Monte Carlo (MC) events are generated according to the expected neutrino
ux using a deeply inelastic (DIS) event generator based on LEPTO 6.1 [10] and
supplemented by generators for quasielastic events and events in the resonance
region. The LEPTO events were generated above a momentum transfer Q2 of
0.3 GeV2 and an invariant mass of the hadronic system W 2 of 1.3 GeV2. Theywere subsequently passed through a GEANT [11] based full detector simulation.
The MC statistics used for the present analysis include samples of 180 000 �� CC
and ��� CC events (equivalent to the data statistics), 30 000 �e CC and ��e CCevents (about 10 times the data statistics) and 140 000 NC events (more thantwice the data statistics). Samples of about 10 000 �� events are used for each
of the � decay channels.
3
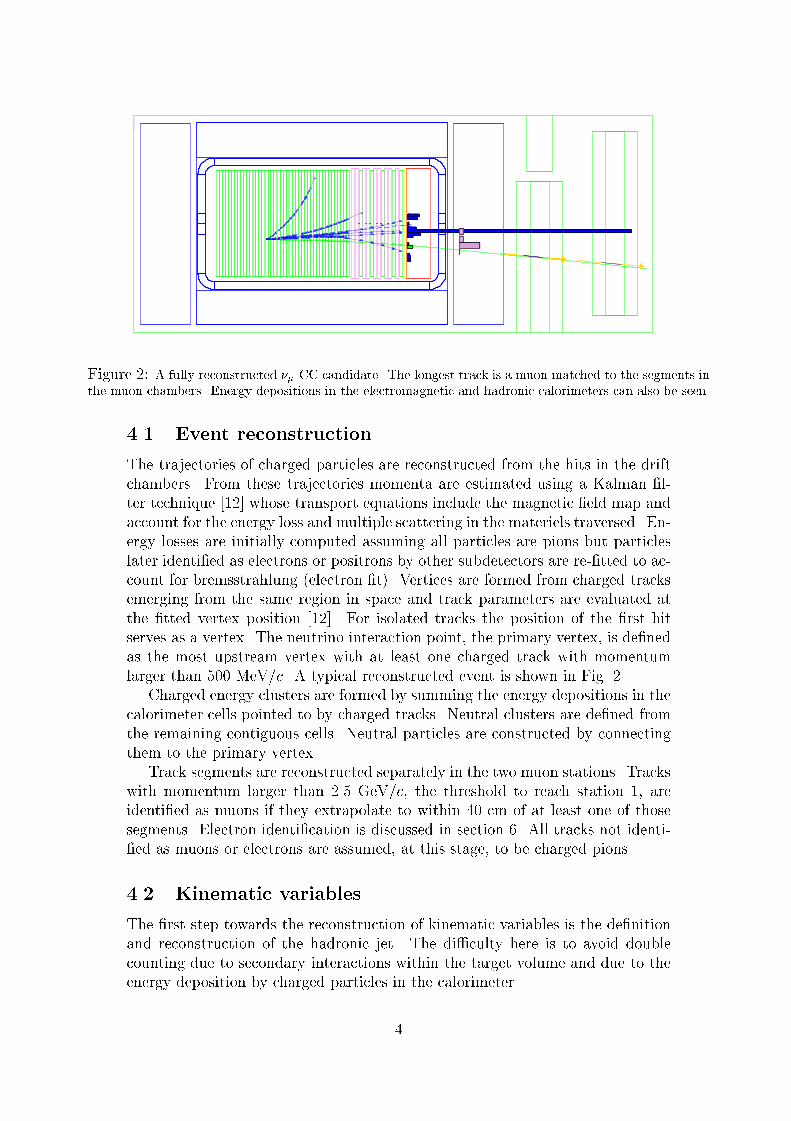
Figure 2: A fully reconstructed ��-CC candidate. The longest track is a muon matched to the segments inthe muon chambers. Energy depositions in the electromagnetic and hadronic calorimeters can also be seen.
4.1 Event reconstruction
The trajectories of charged particles are reconstructed from the hits in the driftchambers. From these trajectories momenta are estimated using a Kalman �l-ter technique [12] whose transport equations include the magnetic �eld map and
account for the energy loss and multiple scattering in the materiels traversed. En-ergy losses are initially computed assuming all particles are pions but particles
later identi�ed as electrons or positrons by other subdetectors are re-�tted to ac-count for bremsstrahlung (electron �t). Vertices are formed from charged tracksemerging from the same region in space and track parameters are evaluated at
the �tted vertex position [12]. For isolated tracks the position of the �rst hitserves as a vertex. The neutrino interaction point, the primary vertex, is de�nedas the most upstream vertex with at least one charged track with momentum
larger than 500 MeV/c. A typical reconstructed event is shown in Fig. 2.Charged energy clusters are formed by summing the energy depositions in the
calorimeter cells pointed to by charged tracks. Neutral clusters are de�ned from
the remaining contiguous cells. Neutral particles are constructed by connecting
them to the primary vertex.
Track segments are reconstructed separately in the two muon stations. Trackswith momentum larger than 2.5 GeV/c, the threshold to reach station 1, are
identi�ed as muons if they extrapolate to within 40 cm of at least one of those
segments. Electron identi�cation is discussed in section 6. All tracks not identi-�ed as muons or electrons are assumed, at this stage, to be charged pions.
4.2 Kinematic variables
The �rst step towards the reconstruction of kinematic variables is the de�nition
and reconstruction of the hadronic jet. The di�culty here is to avoid double
counting due to secondary interactions within the target volume and due to the
energy deposition by charged particles in the calorimeter.
4
The particles included in the hadronic jet are:
� Charged hadrons associated to the primary vertex. Only the momentum
measured in the DC is used, and associated charged clusters are discarded.
� Neutral clusters in the electromagnetic calorimeter.
� V0's (pairs of oppositely charged tracks making a secondary vertex due to
K0's, �'s and photon conversions) pointing to the primary vertex.
� Charged hadrons belonging to a secondary vertex with no incoming charged
track, i.e. compatible with the interaction of a neutral hadron (n, K0
L).
� Single charged particles if they extrapolate back linearly to the primary
vertex (asymmetric photon conversions).
The hadronic jet formed in this way is measured with an energy resolution of
about 25%. It can then be combined with the measured lepton(s), if any, to
obtain the kinematic quantities of the event.
The sample of identi�ed �� CC event candidates, where ideally all �nal state
particles can be detected, is used to assess the reconstruction of the kinematic
variables in the data sample over the full kinematical range. Satisfactory agree-
ment with Monte Carlo expectations is observed in most variables [13]. Theseinclude Q2, W 2, the Bjorken variables xB and yB, and the total visible energyEvis (an approximation to the incident neutrino energy). The transverse vari-
ables, measured in a plane perpendicular to the beam, are however the mostsensitive to the detailed simulations of the events. In particular, the transverse
missing momentum, pmT , which results from the di�erence between the recon-structed hadronic jet and muon transverse momenta, is a direct measure of theresolution of the reconstruction of the hadronic jet. In the data pmT has an aver-
age value of 820 MeV/c compared to 620 MeV/c in the Monte Carlo simulation.This discrepancy of 200 MeV/c, which is to be compared to an average muontransverse momentum of 1.6 GeV/c, well reproduced by the Monte Carlo, in-
dicates that the hadronic jet reconstruction resolution is underestimated in the
simulation. At this stage, the simulation includes a smearing introduced by the
initial state nucleon Fermi motion (160 MeV/c on average) and the full detec-tor simulation takes into account the contributions from the detector resolutions
(300 MeV/c on average), from reconstruction ine�ciencies in the various sub-
detectors (450 MeV/c on average) and from undetected neutrals escaping thecalorimeter (250 MeV/c on average). Additional e�ects, which can contribute to
the hadronic jet resolution, are currently under study. A more re�ned nuclearmodel which includes the simulation of intranuclear cascades and other e�ects
due to the nuclear target is being introduced. A more detailed simulation of
the response of the drift chambers is being obtained from a careful study of highstatistics data. Preliminary results indicate that these e�ects, when included, im-prove the agreement between the data sample and the simulation. However, for
the purpose of the analyses presented in this paper, a method has been developed
that makes use of the data sample to correct the estimates of the backgrounds
and signal e�ciencies which are a�ected by these discrepancies.
5
4.3 The data simulator
For all the expected � signals and a large fraction of the expected backgrounds the
signal and background e�ciencies for cuts involving the hadronic system can be
obtained from the data themselves. This is achieved by starting from a measured
�� CC event, removing the identi�ed muon (track and energy deposition), and
replacing it by another lepton `.
If ` is a neutrino, one obtains fake neutral current events which at these
energies, up to charge e�ects in the hadronic system, simulate actual neutral
current events.
If ` is an electron, a sample of fake �e CC events with about 100 times the
statistics of the data is obtained after corrections for the relative �e=�� ux and
the e=� e�ciency.
Finally, if ` is a � , followed by a simulation of � decay into the channel being
studied, a large sample of fake � signal events is generated.
All these samples are collectively referred to as the data simulator (DS). The
same procedure can also be applied to reconstructed �� CC MC events (Monte
Carlo simulator, MCS). A comparison of the result of the MCS to the standardMC yields a powerful cross check of the validity of the muon replacement proce-
dure and the corrections applied, and an estimate of the corresponding systematicuncertainty. On the other hand, a comparison of the DS to the MCS gives a di-rect measure of the e�ect of the di�erences in the hadronic system between the
data and the MC, since the leptonic e�ciencies are well reproduced.All signal and background e�ciencies, except for ��CC events, are obtained
through the formula
� =�MC � �DS
�MCS
; (1)
which implies that e�ciencies for lepton reconstruction and an approximate es-timate of hadron reconstruction are obtained from the Monte Carlo (�MC), whilethe e�ect of the hadronic jet di�erences between the data and the MC, which
are the main cause of the missing pT discrepancy, is taken into account throughthe ratio �DS=�MCS. This way of calculating e�ciencies will be referred to as the
data simulator method. It has been checked that e�ciencies obtained through
this method are indeed stable with respect to variations of the Monte Carlo input(nuclear e�ects, fragmentation, detector resolution functions) within the quoted
uncertainty.
5 � appearance search
In principle, NOMAD is sensitive to a � appearance search in all � decay channels,
leptonic and hadronic. The basic concept of the oscillation search in each channelis to use the various MC and data simulator samples to de�ne a set of cuts that
reduce the background to an acceptable level and optimize the sensitivity to�� ! �� oscillations. All quoted signal and background e�ciencies are obtained
by the data simulator method, with the exception of the �� CC contribution for
which this is not possible. The � ! ��� channel, which could contribute about10% to the total sensitivity [14], is dominated by the �� CC background. In view
6
of the intrinsic di�culty of the evaluation of the systematic uncertainty on this
background, this channel is not included in the results presented in this paper.
5.1 Sources of background
A charged current �� interaction is recognizable due to two e�ects of the unob-
served neutrino(s) from the decay of the � . The �rst e�ect is a missing pT larger
than expected in standard CC events but lower than in NC events and correlated
in direction with the charged � decay products. The second e�ect is an underes-
timate of the leptonic fraction of the �nal state energy. In addition, the visible
decay products of the � are more isolated from the recoil jet than fragments of
the hadron jet being mistakenly identi�ed as � decay products.
In the hadronic decay channels the NC and CC backgrounds must be sup-
pressed kinematically. In addition, the CC background must be reduced through
an e�cient lepton veto. In the electron channel the dominant background arises
from mismeasured �e CC events, which must again be reduced by kinematical
cuts, while most of the NC background is removed by tight lepton quality and
moderate isolation cuts.Backgrounds from NC and �e CC events and all signal e�ciencies can be
controlled by comparing the MC, MCS, and DS samples. For all channels thesimulation of the processes yielding background to the � search is checked by
comparing the estimates of these processes in kinematic regions where no sig-nal is expected. Moreover, because of the small ��� component of the beam,essentially no ��� and hence no �+ are expected in the data. The estimates for
some backgrounds (e.g. NC) can therefore be checked further by performing ananalysis in the �+ channel. Note that more positive than negative background isexpected from these sources because of the more favourable charge con�guration.
5.2 General analysis strategy
The general analysis procedure followed for all � decay channels can be summa-rized as follows.
A set of event quality cuts is applied based on the charge balance at the
primary vertex and the momentum errors. This removes at most 15% of the
events.For each channel, two separate analyses are carried out: one using events with
� 1 tracks at the primary vertex in addition to the � decay products (the DIS
analysis) and the other using events with 0 or 1 or 2 additional tracks (the low
multiplicity analysis). Since events with 1 or 2 additional tracks can enter bothanalyses a cut on the hadronic momentum, ph, is applied to make the two studies
complementary. The choice of the cut (ph > 1:5 GeV/c for the DIS analysis andph < 1:5 GeV/c for the low multiplicity analysis) is intended to enrich the low
multiplicity sample in quasi-elastic and resonance events.The visible decay products (Xv) of potential � candidates are identi�ed. If a
primary lepton (muon or electron) is reconstructed, Xv is taken to be that lepton
and the event is used for the � ! � or � ! e analysis (Xv = � or e). If no lepton
candidates are found, the event is considered for the � ! hadron channels. Xv is
7
then taken to be a charged hadron for the one prong analysis (Xv = �), a ���0
combination for the � analysis (Xv = ���0) or a suitable 3-hadron combination
for the 3-prong analysis (Xv = 3�).
5.3 De�nition of variables
The following kinematic variables are de�ned and used to separate the signal
from the background:
� pmT , de�ned as j~pXv
T +~phT j and interpreted as a measurement of the transverse
momentum of the neutrino(s) from � decay.
� pXv
T and �Xv , the transverse component of ~pXv and angle in the laboratory
of the decay product with respect to the beam direction.
� the transverse mass, MT , given by M2
T = 4pXv
T pmT sin2(�Xvm=2), where �Xvm
is the angle in the transverse plane between the visible and invisible � decay
products. For true � events, MT � m� , up to detector resolution e�ects.
� QT , the component of ~pXv perpendicular to the total visible momentum
vector (including Xv). Large QT implies that Xv is well isolated from theremaining hadronic jet.
� QLep, the component of ~pXv perpendicular to the hadronic jet direction(excluding Xv). Its function is very similar to QT , but it is more useful
when the momentum of the recoil jet, ph, is small.
� �Xvh, the angle between the hadronic jet and Xv.
� �Xvh, �mh, the angles in the transverse plane between the hadronic recoil
vector and the visible and invisible decay product, respectively [15].
� Ratios of linear combinations of pmT , pXv
T , and phT , equivalent to functions ofthe previous two angles described.
For some channels, combinations of these and other variables are used to builda likelihood ratio. The likelihood functions entering this ratio are approximated
by the product of one or two dimensional probability density functions of these
variables. As is common practice, the logarithm of this ratio has been used.
The actual set of variables used for each decay channel will be described whereappropriate.
5.4 � e�ciency
For each channel the � e�ciency is obtained using the data simulator methodoutlined above. The values quoted are calculated relative to the number of events
with � 1 additional tracks for the DIS analysis and � 2 additional tracks for the
low multiplicity analysis. The quoted uncertainties include uncertainties in thesimulation of the hadronic system and the statistical uncertainty of the MonteCarlo and data simulator samples used. The cuts and procedures speci�c to the
analysis of each channel are presented in the following sections.
8
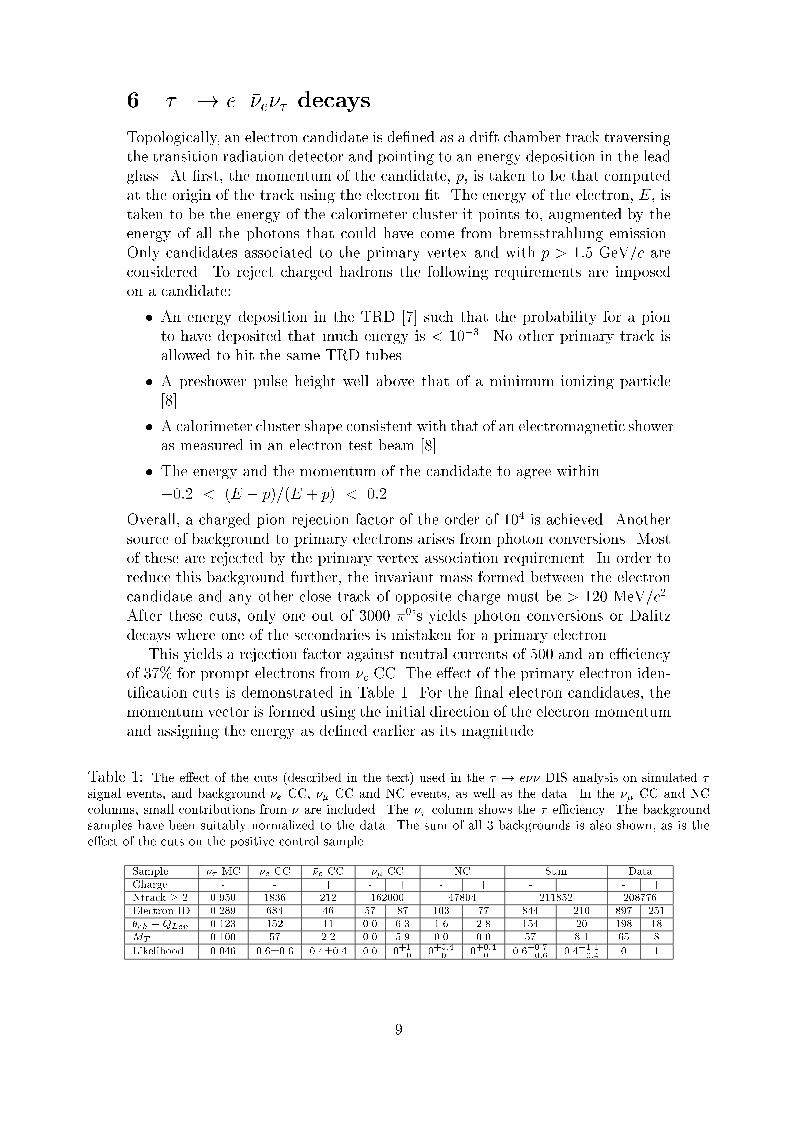
6 �� ! e���e�� decays
Topologically, an electron candidate is de�ned as a drift chamber track traversing
the transition radiation detector and pointing to an energy deposition in the lead
glass. At �rst, the momentum of the candidate, p, is taken to be that computed
at the origin of the track using the electron �t. The energy of the electron, E, is
taken to be the energy of the calorimeter cluster it points to, augmented by the
energy of all the photons that could have come from bremsstrahlung emission.
Only candidates associated to the primary vertex and with p > 1:5 GeV/c are
considered. To reject charged hadrons the following requirements are imposed
on a candidate:
� An energy deposition in the TRD [7] such that the probability for a pion
to have deposited that much energy is < 10�3. No other primary track is
allowed to hit the same TRD tubes.
� A preshower pulse height well above that of a minimum ionizing particle
[8].
� A calorimeter cluster shape consistent with that of an electromagnetic showeras measured in an electron test beam [8].
� The energy and the momentum of the candidate to agree within
�0:2 < (E � p)=(E + p) < 0:2.
Overall, a charged pion rejection factor of the order of 104 is achieved. Another
source of background to primary electrons arises from photon conversions. Mostof these are rejected by the primary vertex association requirement. In order toreduce this background further, the invariant mass formed between the electron
candidate and any other close track of opposite charge must be > 120 MeV/c2.After these cuts, only one out of 3000 �0's yields photon conversions or Dalitz
decays where one of the secondaries is mistaken for a primary electron.This yields a rejection factor against neutral currents of 500 and an e�ciency
of 37% for prompt electrons from �e CC. The e�ect of the primary electron iden-
ti�cation cuts is demonstrated in Table 1. For the �nal electron candidates, themomentum vector is formed using the initial direction of the electron momentumand assigning the energy as de�ned earlier as its magnitude.
Table 1: The e�ect of the cuts (described in the text) used in the � ! e�� DIS analysis on simulated �
signal events, and background �e CC, �� CC and NC events, as well as the data. In the �� CC and NCcolumns, small contributions from �� are included. The �� column shows the � e�ciency. The backgroundsamples have been suitably normalized to the data. The sum of all 3 backgrounds is also shown, as is thee�ect of the cuts on the positive control sample.
Sample �� MC �e CC ��e CC �� CC NC Sum Data
Charge - - + - + - + - + - +
Ntrack � 2 0.950 1836 212 162000 47804 211852 208776
Electron ID 0.289 684 46 57 87 103 77 844 210 897 251
�eh �QLep 0.123 152 11 0.0 6.3 1.6 2.8 154 20 198 18
MT 0.100 57 2.2 0.0 5.9 0.0 0.0 57 8.1 65 8
Likelihood 0.046 0.6�0.6 0.4�0.4 0.0 0+1
�00+0:4
�00+0:4
�00.6
+0:7
�0:60.4
+1:1
�0:40 1
9
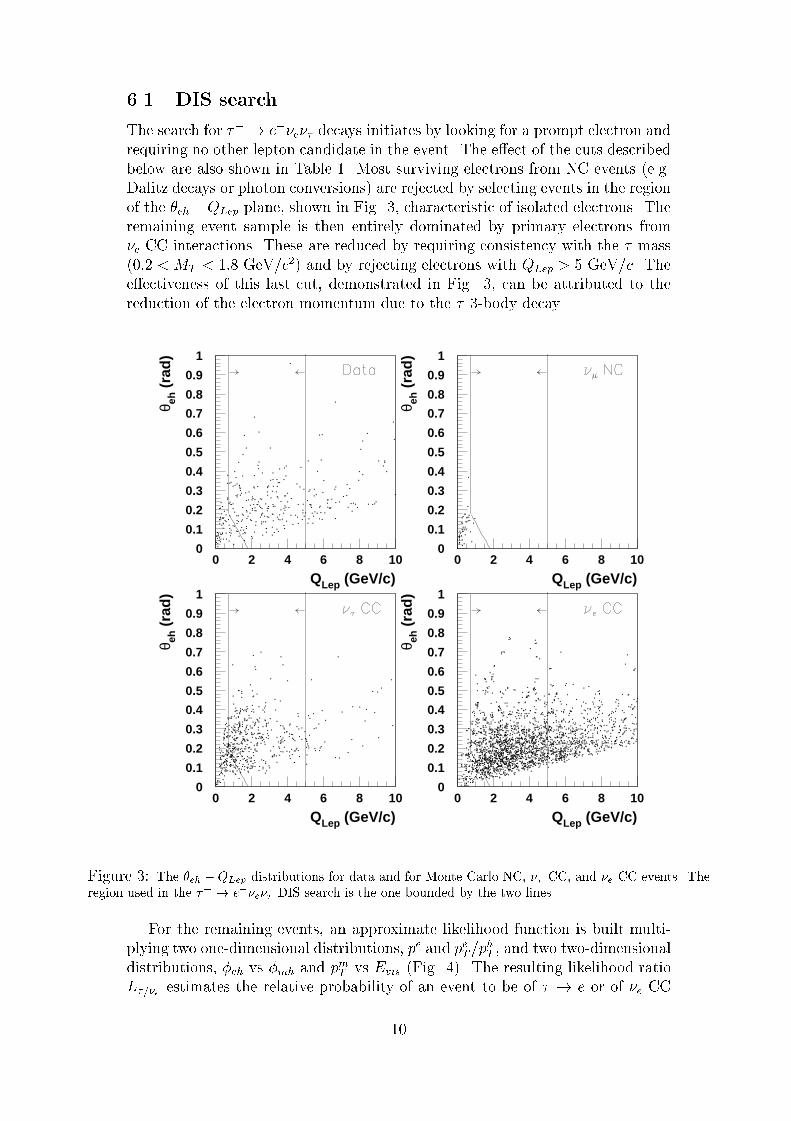
6.1 DIS search
The search for �� ! e���e�� decays initiates by looking for a prompt electron and
requiring no other lepton candidate in the event. The e�ect of the cuts described
below are also shown in Table 1. Most surviving electrons from NC events (e.g.
Dalitz decays or photon conversions) are rejected by selecting events in the region
of the �eh�QLep plane, shown in Fig. 3, characteristic of isolated electrons. The
remaining event sample is then entirely dominated by primary electrons from
�e CC interactions. These are reduced by requiring consistency with the � mass
(0:2 < MT < 1:8 GeV/c2) and by rejecting electrons with QLep > 5 GeV/c. The
e�ectiveness of this last cut, demonstrated in Fig. 3, can be attributed to the
reduction of the electron momentum due to the � 3-body decay.
QLep (GeV/c)
θ eh (
rad)
QLep (GeV/c)
θ eh (
rad)
QLep (GeV/c)
θ eh (
rad)
QLep (GeV/c)
θ eh (
rad)
0
0.1
0.2
0.3
0.4
0.5
0.6
0.7
0.8
0.9
1
0 2 4 6 8 100
0.1
0.2
0.3
0.4
0.5
0.6
0.7
0.8
0.9
1
0 2 4 6 8 10
0
0.1
0.2
0.3
0.4
0.5
0.6
0.7
0.8
0.9
1
0 2 4 6 8 100
0.1
0.2
0.3
0.4
0.5
0.6
0.7
0.8
0.9
1
0 2 4 6 8 10
Figure 3: The �eh �QLep distributions for data and for Monte Carlo NC, �� CC, and �e CC events. Theregion used in the �� ! e
���e�� DIS search is the one bounded by the two lines.
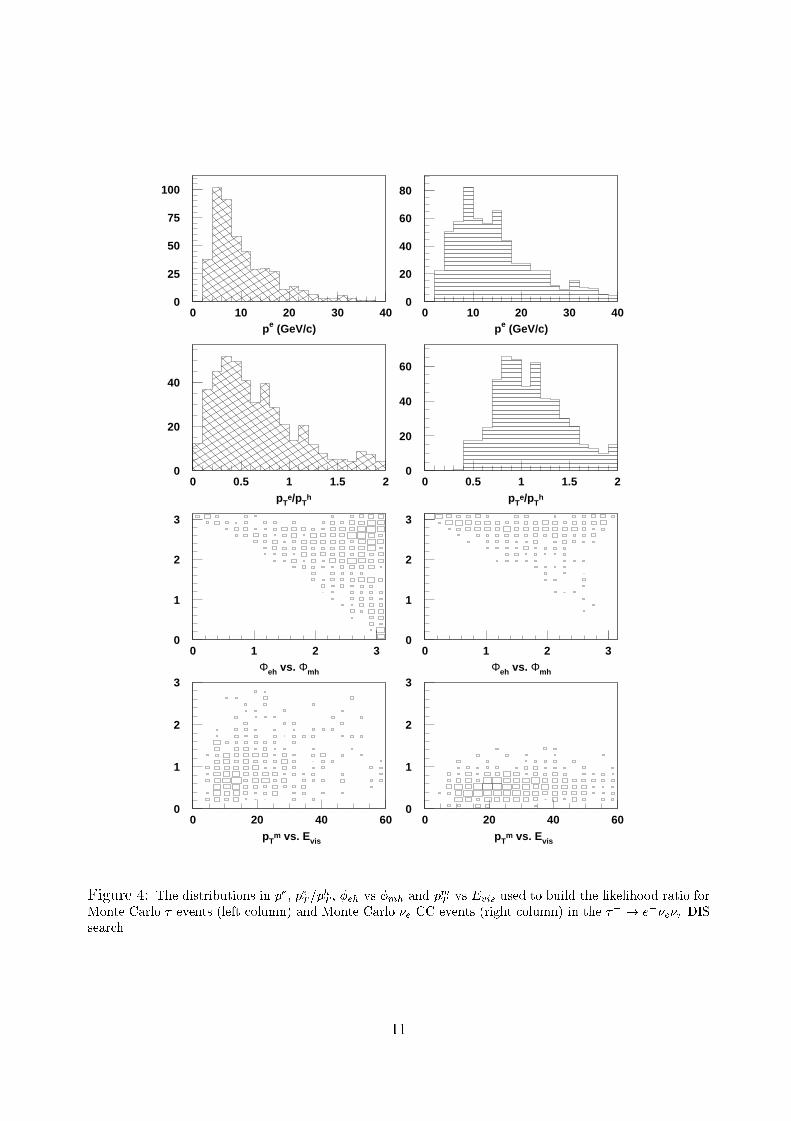
For the remaining events, an approximate likelihood function is built multi-plying two one-dimensional distributions, pe and peT=p
hT , and two two-dimensional
distributions, �eh vs �mh and pmT vs Evis (Fig. 4). The resulting likelihood ratioL�=�e estimates the relative probability of an event to be of � ! e or of �e CC
10
pe (GeV/c) pe (GeV/c)
pTe/pT
h pTe/pT
h
Φeh vs. Φmh Φeh vs. Φmh
pTm vs. Evis pT
m vs. Evis
0
25
50
75
100
0 10 20 30 400
20
40
60
80
0 10 20 30 40
0
20
40
0 0.5 1 1.5 20
20
40
60
0 0.5 1 1.5 2
0
1
2
3
0 1 2 30
1
2
3
0 1 2 3
0
1
2
3
0 20 40 600
1
2
3
0 20 40 60
Figure 4: The distributions in pe, peT =p
hT , �eh vs �mh and p
mT vs Evis used to build the likelihood ratio for
Monte Carlo � events (left column) and Monte Carlo �e CC events (right column) in the �� ! e���e�� DIS
search.
11
log likelihood Ratio
num
ber
of e
vent
s
0
2
4
6
8
10
12
14
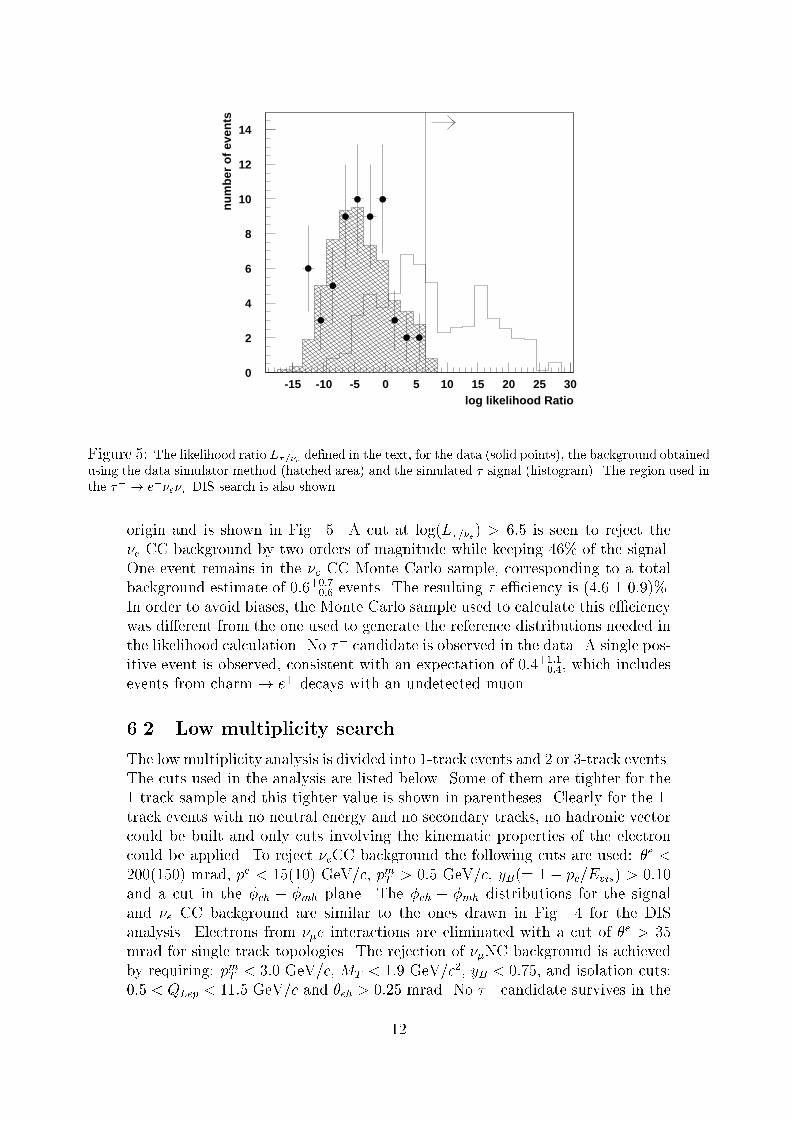
-15 -10 -5 0 5 10 15 20 25 30
Figure 5: The likelihood ratio L�=�e de�ned in the text, for the data (solid points), the background obtainedusing the data simulator method (hatched area) and the simulated � signal (histogram). The region used inthe �� ! e
���e�� DIS search is also shown.
origin and is shown in Fig. 5. A cut at log(L�=�e) > 6:5 is seen to reject the
�e CC background by two orders of magnitude while keeping 46% of the signal.One event remains in the �e CC Monte Carlo sample, corresponding to a totalbackground estimate of 0:6+0:7�0:6 events. The resulting � e�ciency is (4:6� 0:9)%.
In order to avoid biases, the Monte Carlo sample used to calculate this e�ciencywas di�erent from the one used to generate the reference distributions needed in
the likelihood calculation. No �� candidate is observed in the data. A single pos-itive event is observed, consistent with an expectation of 0:4+1:1�0:4, which includes
events from charm ! e+ decays with an undetected muon.
6.2 Low multiplicity search
The low multiplicity analysis is divided into 1-track events and 2 or 3-track events.The cuts used in the analysis are listed below. Some of them are tighter for the1-track sample and this tighter value is shown in parentheses. Clearly for the 1-
track events with no neutral energy and no secondary tracks, no hadronic vector
could be built and only cuts involving the kinematic properties of the electroncould be applied. To reject �eCC background the following cuts are used: �e <
200(150) mrad, pe < 15(10) GeV/c, pmT > 0:5 GeV/c, yB(= 1� pe=Evis) > 0:10
and a cut in the �eh � �mh plane. The �eh � �mh distributions for the signal
and �e CC background are similar to the ones drawn in Fig. 4 for the DIS
analysis. Electrons from ��e interactions are eliminated with a cut of �e > 35
mrad for single track topologies. The rejection of ��NC background is achieved
by requiring: pmT < 3:0 GeV/c, MT < 1:9 GeV/c2, yB < 0:75, and isolation cuts:
0:5 < QLep < 11:5 GeV/c and �eh > 0:25 mrad. No �� candidate survives in the
12
data for a � e�ciency of (3:4�0:6)% in the low multiplicity events. The expected
background is 0:5+0:6�0:2 events coming mostly from events in the one-track sample.
One �+ candidate is observed with an expected background of 1:1 � 0:7.
7 �� ! h�(n�0)�� decays
In the search for oscillations in the �� ! h��� (+n�0) decay channel, the fol-
lowing requirements are applied to hadrons in order to ensure that they are not
mismeasured muons or electrons:
� No associated raw muon chamber hits in at least one projection.
� Energy deposition in the ECAL and HCAL inconsistent with a minimum
ionizing particle.
� Energy deposition in the TRD, the PS and/or the ECAL inconsistent with
an electron.
Throughout the rest of this paper the h� (��; K�) are referred to as �� for
simplicity.
7.1 DIS search
For the DIS analysis the event selection requirements imposed are:
� a leading primary track with negative charge (�� candidate) capable ofreaching the muon detector with momentum p� > 3 GeV/c.
� no track with pT > 0:8 GeV/c, well isolated from the hadronic jet, that
could have escaped muon or electron detection.
These cuts eliminate most of the background from ��, ��� and �e CC events.Their e�ect and that of subsequent cuts on the data and on all the simulatedevent samples is shown in Table 2. A cut of pmT < 2.0 GeV/c reduces the NC
background and a cut on the transverse mass of MT < 2.5 GeV/c2 retains onlyevents that are kinematically consistent with � decay.
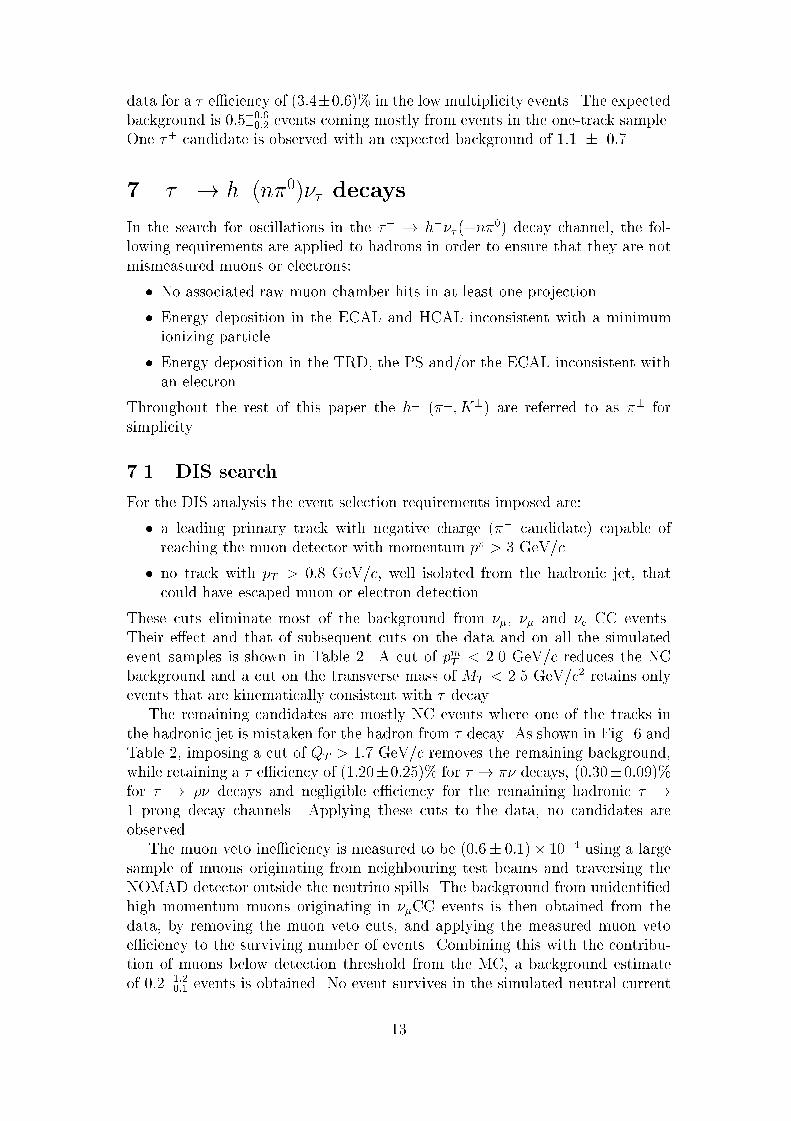
The remaining candidates are mostly NC events where one of the tracks in
the hadronic jet is mistaken for the hadron from � decay. As shown in Fig. 6 andTable 2, imposing a cut of QT > 1:7 GeV/c removes the remaining background,
while retaining a � e�ciency of (1:20�0:25)% for � ! �� decays, (0:30�0:09)%
for � ! �� decays and negligible e�ciency for the remaining hadronic � !
1 prong decay channels. Applying these cuts to the data, no candidates are
observed.The muon veto ine�ciency is measured to be (0:6� 0:1)� 10�4 using a large
sample of muons originating from neighbouring test beams and traversing the
NOMAD detector outside the neutrino spills. The background from unidenti�edhigh momentum muons originating in ��CC events is then obtained from the
data, by removing the muon veto cuts, and applying the measured muon vetoe�ciency to the surviving number of events. Combining this with the contribu-
tion of muons below detection threshold from the MC, a background estimate
of 0:2+1:2�0:1 events is obtained. No event survives in the simulated neutral current
13
1
10
10 2
10 3
0 0.5 1 1.5 2 2.5 3QT (GeV)
Figure 6: The QT distribution in the DIS analysis for the data (solid points), the background (solid line)and the simulated �
�
! ��
�� signal (dashed line)
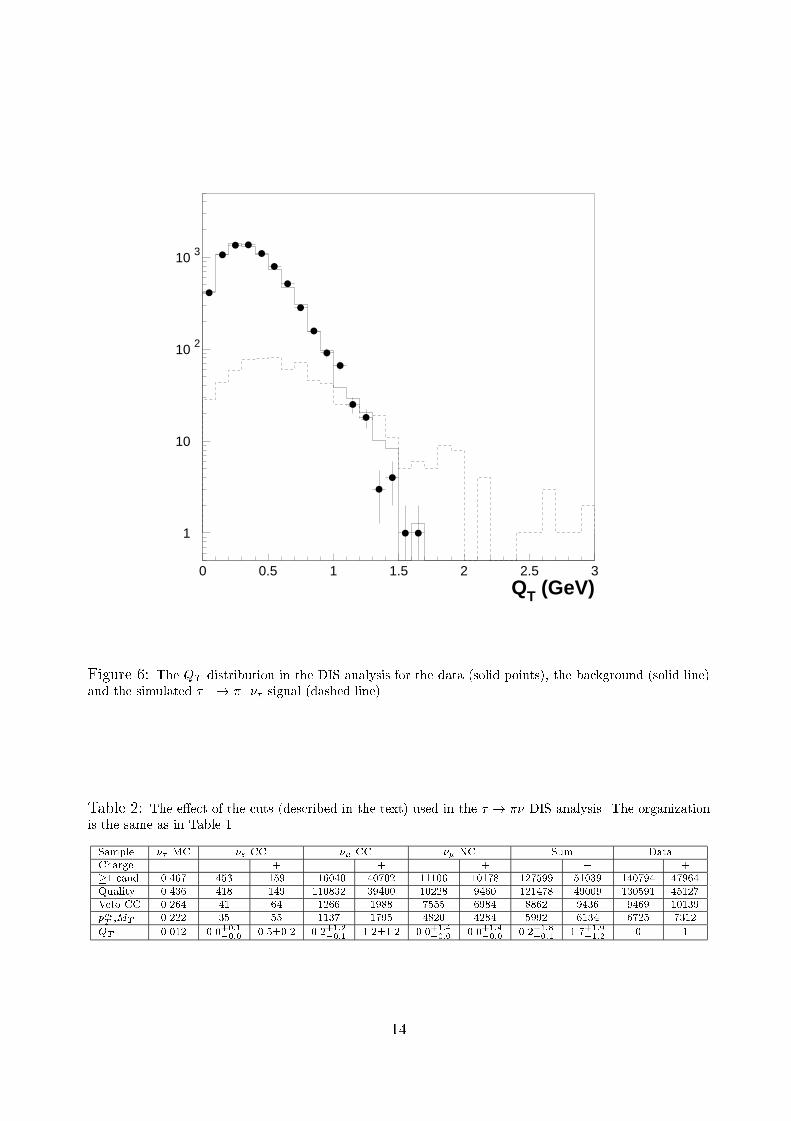
Table 2: The e�ect of the cuts (described in the text) used in the � ! �� DIS analysis. The organizationis the same as in Table 1.
Sample �� MC �e CC �� CC �� NC Sum Data
Charge - - + - + - + - + - +
�1 cand 0.467 453 159 116040 40702 11106 10178 127599 51039 140794 47964
Quality 0.436 418 149 110832 39400 10228 9460 121478 49009 130591 45127
Veto CC 0.264 41 64 1266 1988 7555 6984 8862 9436 9469 10139
pmT,MT 0.222 35 55 1137 1795 4820 4284 5992 6134 6725 7312
QT 0.012 0.0+0:1
�0:00.5�0.2 0.2
+1:2
�0:11.2�1.2 0.0
+1:4
�0:00.0
+1:4
�0:00.2
+1:8
�0:11.7
+1:9
�1:20 1
14
and �eCC samples, leading to background estimates from these sources of 0:0+1:4�0:0and 0:0+0:1�0:0, respectively. The total expected background is then 0:2+1:8�0:1 events.Application of the same procedure to �+ candidates yields 1 event for 1:7+1:9�1:2expected.
Because of the hard QT cut applied to the single �� candidate in this analysis
the � ! �� events selected here are di�erent from those selected by the dedicated
�� ! ���0 analysis described in section 8. The sensitivities to the � ! ��
channel of the two analyses are therefore additive.
7.2 Low multiplicity search
In the low multiplicity analysis the candidate pion is taken to be the track sat-
isfying the largest number of the following criteria: highest momentum, largest
��h and largest QLep. In order to select events with the topology characteristic
of quasielastic and resonance events, a cut on W 2�m2
p � 1.5 GeV2/c4, where mp
is the proton mass, is applied. A cut 0.5 � p�T � 1.2 GeV/c preferentially selects
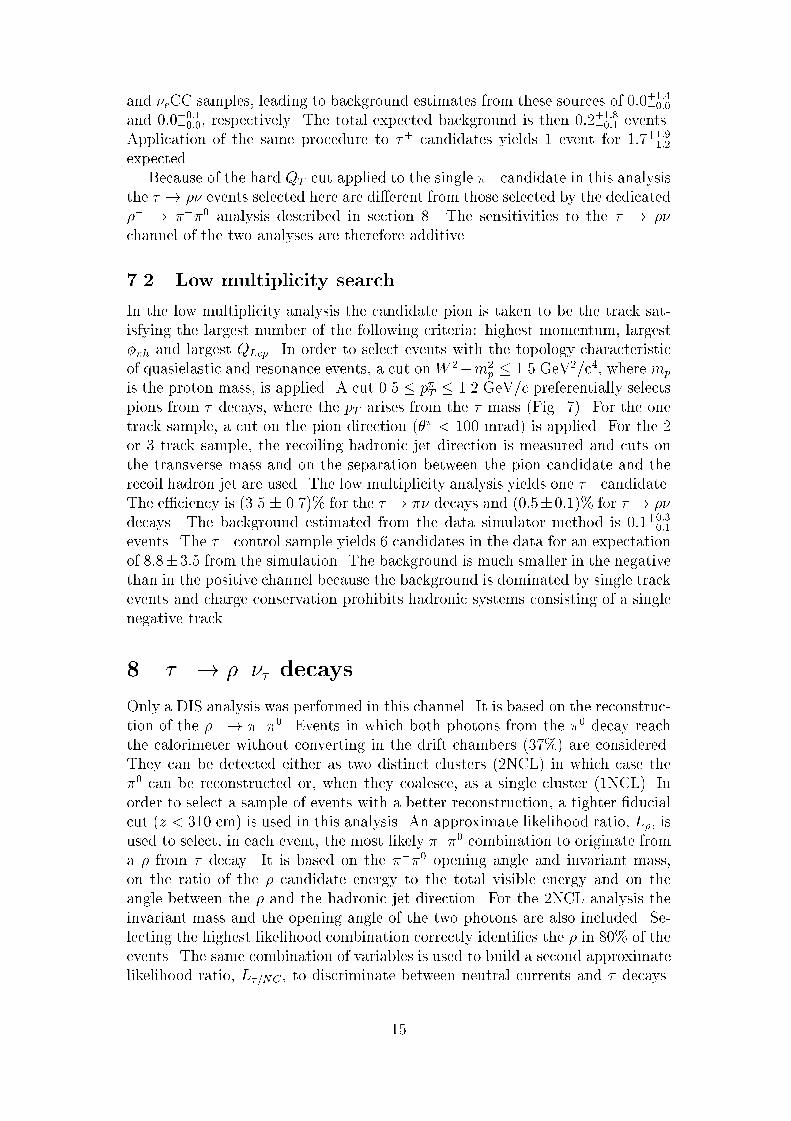
pions from � decays, where the pT arises from the � mass (Fig. 7). For the one
track sample, a cut on the pion direction (�� < 100 mrad) is applied. For the 2or 3 track sample, the recoiling hadronic jet direction is measured and cuts on
the transverse mass and on the separation between the pion candidate and therecoil hadron jet are used. The low multiplicity analysis yields one �� candidate.
The e�ciency is (3.5 � 0.7)% for the � ! �� decays and (0:5�0:1)% for � ! ��
decays. The background estimated from the data simulator method is 0:1+0:3�0:1events. The �+ control sample yields 6 candidates in the data for an expectation
of 8:8�3:5 from the simulation. The background is much smaller in the negativethan in the positive channel because the background is dominated by single trackevents and charge conservation prohibits hadronic systems consisting of a single
negative track.
8 �� ! ���� decays
Only a DIS analysis was performed in this channel. It is based on the reconstruc-
tion of the �� ! ���0. Events in which both photons from the �0 decay reachthe calorimeter without converting in the drift chambers (37%) are considered.
They can be detected either as two distinct clusters (2NCL) in which case the
�0 can be reconstructed or, when they coalesce, as a single cluster (1NCL). In
order to select a sample of events with a better reconstruction, a tighter �ducialcut (z < 310 cm) is used in this analysis. An approximate likelihood ratio, L�, is
used to select, in each event, the most likely ���0 combination to originate from
a � from � decay. It is based on the ���0 opening angle and invariant mass,on the ratio of the � candidate energy to the total visible energy and on the
angle between the � and the hadronic jet direction. For the 2NCL analysis the
invariant mass and the opening angle of the two photons are also included. Se-lecting the highest likelihood combination correctly identi�es the � in 80% of the
events. The same combination of variables is used to build a second approximatelikelihood ratio, L�=NC , to discriminate between neutral currents and � decays.
15
0
10
20
0 0.2 0.4 0.6 0.8 1 1.2 1.4
PTπ (GeV/c)
0
1
2
3
4
0 0.2 0.4 0.6 0.8 1 1.2 1.4
PTπ (GeV/c)
0
1
2
3
4
0 0.2 0.4 0.6 0.8 1 1.2 1.4
PTπ (GeV/c)
Figure 7: The p�T distribution in the low multiplicity analysis for the �� ! ��
�� and NC Monte Carlosamples and for the data, after application of all other cuts.
16
Cuts on the transverse plane variables, on Q�T > 1:5 GeV/c and on log(L�=NC)
> 2:2 achieve this result.
Unidenti�ed leptons in charged current events can result in a background as
they can combine with a �0 to simulate a � from a � decay. The ��CC background
is reduced by requiring that the two highest pT tracks in the event as well as the
�� candidate do not miss the muon chambers and are inconsistent with being
a muon both in the muon chambers and in the calorimeters. Background from
�eCC events is reduced by requiring that the �� candidate deposit less than
15 GeV in the lead glass and that the two highest pT tracks are not identi�ed as
electrons in the TRD.
The e�ciency is calculated to be (0:8�0:2)%. No candidate event is observed
in the data for an estimated background of 0:5+2:1�0:3. Applying the same analysis
to �+ candidates yields 2 events with an expectation of 3:7+1:6�1:5.
9 �� ! ���+���� decays
The search for �� ! �� oscillations using the ��! ���+���� decay channel [16]
has the feature of providing additional kinematical constraints compared to the
one-prong channels, since most of these decays occur via the a1 resonance andleave little energy for the associated neutrino.
9.1 DIS search
Two approximate likelihood ratios are formed, both built from the mass of the3� system (\a1" mass), the masses of the �+�� subsystems (\�" mass), the ratioof the energy of the 3� system to the total visible energy (yB), the maximum
(lab) opening angle among the three pions (�max), and an isolation variable (�isol)equal to the smallest angle between any of the three candidate decay products
and any of the remaining hadrons. The �rst likelihood ratio, L3�, is used to selectthe most likely 3� combination to be the � decay in a given event, and picks theright combination in 73% of all simulated � ! 3� events, and in 100% of the
events surviving all other cuts. The second variable L�=NC estimates the relative
probability for the selected combination to come from a � as opposed to a random
combination from a neutral current event. Only events with log(L�=NC) > 2 are
retained. The e�ect of this cut and of the other cuts used in this analysis is shownin Table 3. The number of neutral current events is reduced by an isolation
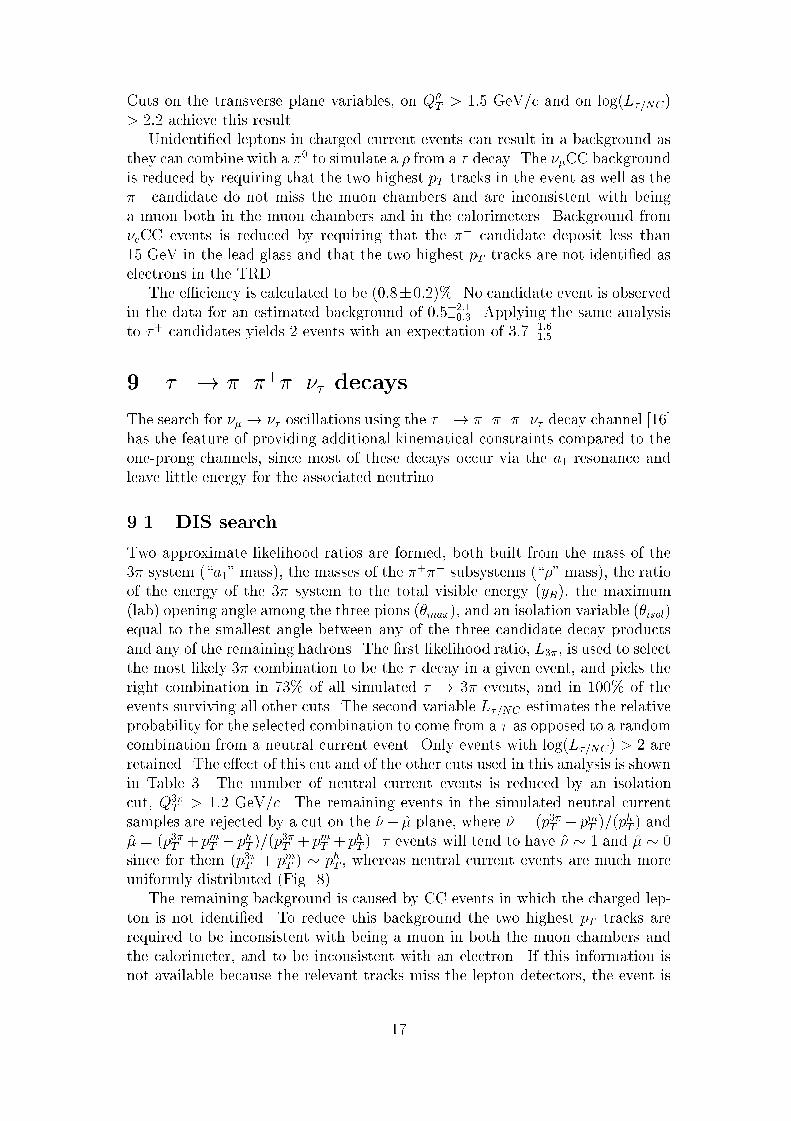
cut, Q3�T > 1:2 GeV/c. The remaining events in the simulated neutral current
samples are rejected by a cut on the �̂� �̂ plane, where �̂ = (p3�T � pmT )=(phT ) and
�̂ = (p3�T + pmT � phT )=(p3�T + pmT + phT ). � events will tend to have �̂ � 1 and �̂ � 0
since for them (p3�T + pmT ) � phT , whereas neutral current events are much moreuniformly distributed (Fig. 8).
The remaining background is caused by CC events in which the charged lep-
ton is not identi�ed. To reduce this background the two highest pT tracks arerequired to be inconsistent with being a muon in both the muon chambers and
the calorimeter, and to be inconsistent with an electron. If this information isnot available because the relevant tracks miss the lepton detectors, the event is
17
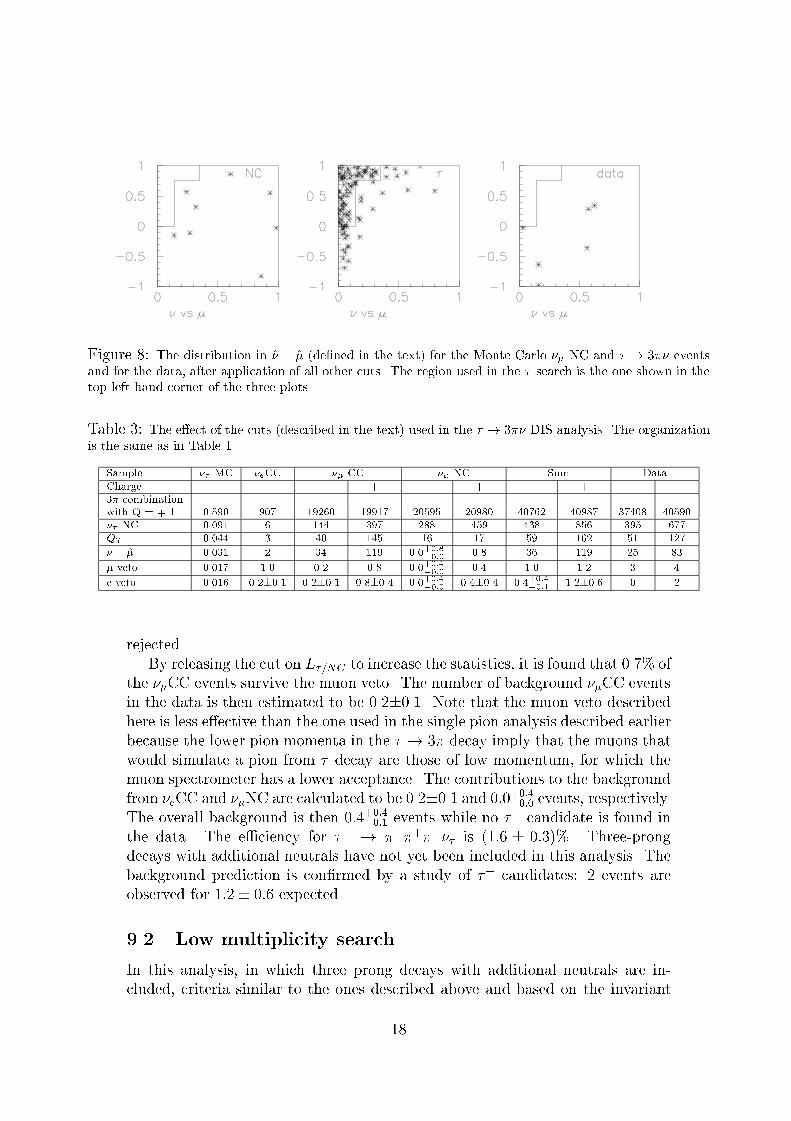
Figure 8: The distribution in �̂ � �̂ (de�ned in the text) for the Monte Carlo �� NC and � ! 3�� eventsand for the data, after application of all other cuts. The region used in the � search is the one shown in thetop left hand corner of the three plots.
Table 3: The e�ect of the cuts (described in the text) used in the � ! 3�� DIS analysis. The organizationis the same as in Table 1.
Sample �� MC �eCC �� CC �� NC Sum Data
Charge - - - + - + - + - +
3� combination
with Q = � 1 0.590 907 19260 19917 20595 20980 40762 40987 37408 40590
�� NC 0.091 6 144 397 288 459 438 856 395 677
QT 0.044 3 40 145 16 17 59 162 51 127
�̂ � �̂ 0.031 2 34 119 0.0+0:8
�0:00.8 36 119 25 83
� veto 0.017 1.0 0.2 0.8 0.0+0:4
�0:00.4 1.0 1.2 3 4
e veto 0.016 0.2�0.1 0.2�0.1 0.8�0.4 0.0+0:4
�0:00.4�0.4 0.4
+0:4
�0:11.2�0.6 0 2
rejected.
By releasing the cut on L�=NC to increase the statistics, it is found that 0.7% of
the ��CC events survive the muon veto. The number of background ��CC eventsin the data is then estimated to be 0.2�0.1. Note that the muon veto described
here is less e�ective than the one used in the single pion analysis described earlier
because the lower pion momenta in the � ! 3� decay imply that the muons that
would simulate a pion from � decay are those of low momentum, for which themuon spectrometer has a lower acceptance. The contributions to the backgroundfrom �eCC and ��NC are calculated to be 0.2�0.1 and 0:0+0:4�0:0 events, respectively.The overall background is then 0:4+0:4�0:1 events while no �
� candidate is found in
the data. The e�ciency for �� ! ���+���� is (1:6 � 0:3)%. Three-prong
decays with additional neutrals have not yet been included in this analysis. The
background prediction is con�rmed by a study of �+ candidates: 2 events areobserved for 1:2� 0:6 expected.
9.2 Low multiplicity search
In this analysis, in which three prong decays with additional neutrals are in-cluded, criteria similar to the ones described above and based on the invariant
18
mass and topology of the 3� system and on the transverse mass are used to select
the most likely 3� combination and to reject the NC and CC background. No
candidate is observed in the data for an e�ciency of (2.0 � 0.3)% and an ex-
pected background of 0:4+0:6�0:4. The same analysis applied to �+ candidates yields
14 events for an expectation of 11� 4.
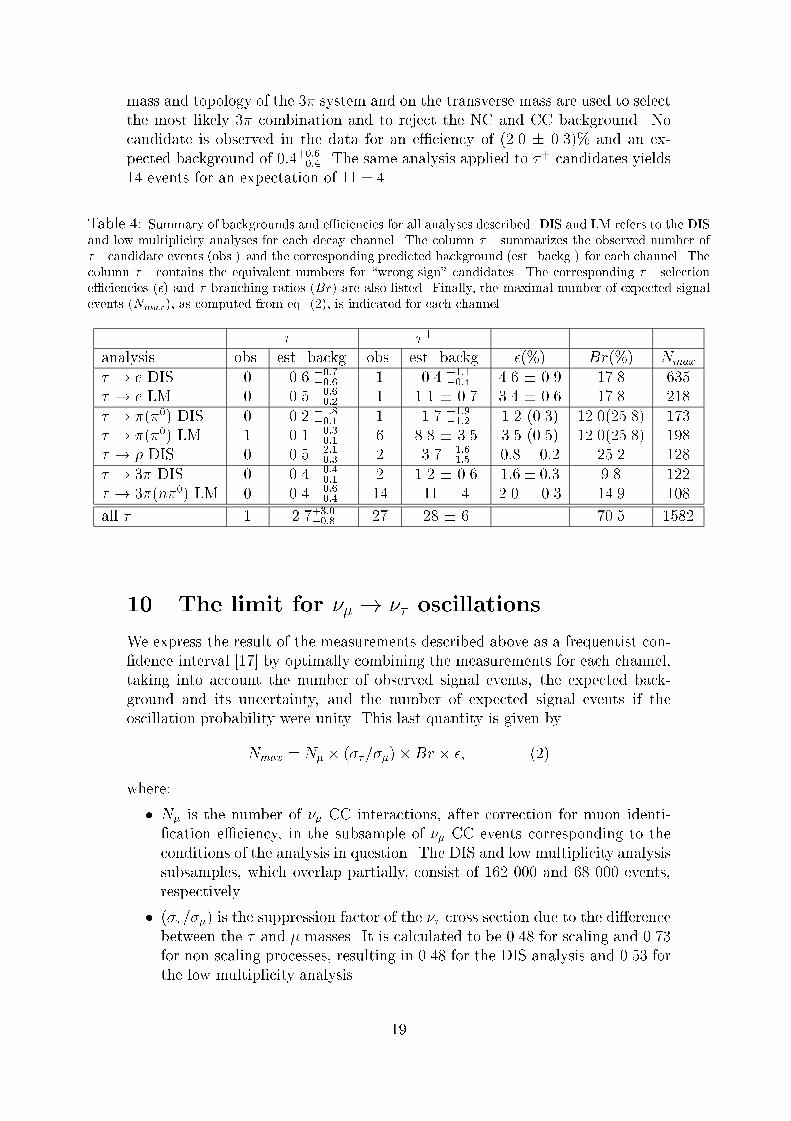
Table 4: Summary of backgrounds and e�ciencies for all analyses described. DIS and LM refers to the DISand low multiplicity analyses for each decay channel. The column �
� summarizes the observed number of�� candidate events (obs.) and the corresponding predicted background (est. backg.) for each channel. Thecolumn �
+ contains the equivalent numbers for \wrong sign" candidates. The corresponding �� selectione�ciencies (�) and � branching ratios (Br) are also listed. Finally, the maximal number of expected signalevents (Nmax), as computed from eq. (2), is indicated for each channel.
�� �+
analysis obs. est. backg. obs. est. backg. �(%) Br(%) Nmax
� ! e DIS 0 0.6 +0:7�0:6 1 0.4 +1:1
�0:4 4.6 � 0.9 17.8 635� ! e LM 0 0.5 +0:6
�0:2 1 1.1 � 0.7 3.4 � 0.6 17.8 218
� ! �(�0) DIS 0 0.2 +1:8�0:1 1 1.7 +1:9
�1:2 1.2 (0.3) 12.0(25.8) 173
� ! �(�0) LM 1 0.1 +0:3�0:1 6 8.8 � 3.5 3.5 (0.5) 12.0(25.8) 198
� ! � DIS 0 0.5 +2:1�0:3 2 3.7 +1:6
�1:5 0:8� 0:2 25.2 128
� ! 3� DIS 0 0.4 +0:4�0:1 2 1.2 � 0.6 1:6� 0:3 9.8 122
� ! 3�(n�0) LM 0 0.4 +0:6�0:4 14 11 � 4 2.0 � 0.3 14.9 108
all � 1 2.7+3:0�0:8 27 28 � 6 70.5 1582
10 The limit for �� ! �� oscillations
We express the result of the measurements described above as a frequentist con-�dence interval [17] by optimally combining the measurements for each channel,taking into account the number of observed signal events, the expected back-
ground and its uncertainty, and the number of expected signal events if the
oscillation probability were unity. This last quantity is given by
Nmax = N� � (��=��)�Br � �; (2)
where:
� N� is the number of �� CC interactions, after correction for muon identi-�cation e�ciency, in the subsample of �� CC events corresponding to the
conditions of the analysis in question. The DIS and low multiplicity analysissubsamples, which overlap partially, consist of 162 000 and 68 000 events,
respectively.
� (��=��) is the suppression factor of the �� cross section due to the di�erence
between the � and � masses. It is calculated to be 0.48 for scaling and 0.73for non-scaling processes, resulting in 0.48 for the DIS analysis and 0.53 for
the low multiplicity analysis.
19
� Br is the branching ratio and � is the selection e�ciency for the � decay
channel in question.
These quantities are summarized in Table 4. The systematic uncertainty on Nmax
is about 15%, resulting mostly from the uncertainty on the e�ciency calculations.
The e�ect of this systematic uncertainty on the limit calculation is negligible in
the frequentist approach [18].
To construct the con�dence interval, we follow the procedures of ref. [17],
replacing the likelihood ratio with a generalized form [19] to account for the
uncertainties in the background estimation. The resulting 90% con�dence level
upper limit corresponds to 3.3 events and thus leads to an upper limit on the
oscillation probability of
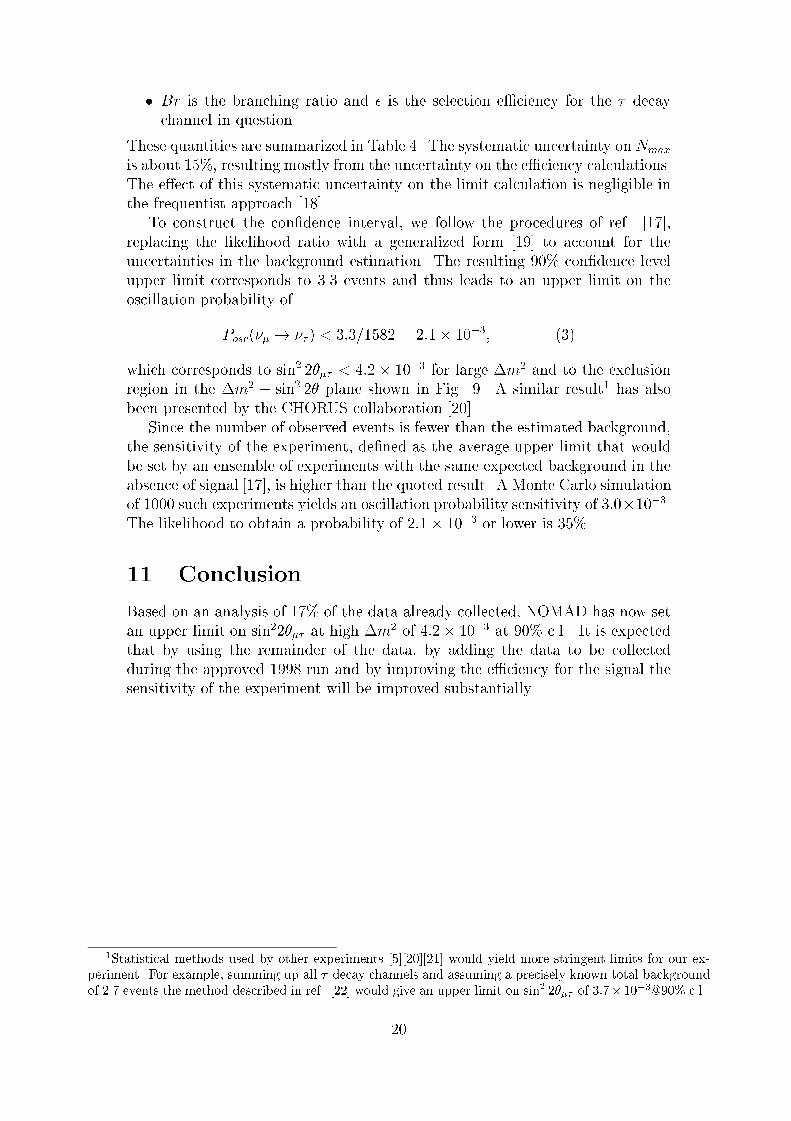
Posc(�� ! �� ) < 3:3=1582 = 2:1� 10�3; (3)
which corresponds to sin2 2��� < 4:2� 10�3 for large �m2 and to the exclusion
region in the �m2� sin2 2� plane shown in Fig. 9. A similar result1 has also
been presented by the CHORUS collaboration [20].
Since the number of observed events is fewer than the estimated background,the sensitivity of the experiment, de�ned as the average upper limit that would
be set by an ensemble of experiments with the same expected background in theabsence of signal [17], is higher than the quoted result. A Monte Carlo simulationof 1000 such experiments yields an oscillation probability sensitivity of 3:0�10�3.The likelihood to obtain a probability of 2:1� 10�3 or lower is 35%.
11 Conclusion
Based on an analysis of 17% of the data already collected, NOMAD has now setan upper limit on sin22��� at high �m2 of 4:2� 10�3 at 90% c.l.. It is expectedthat by using the remainder of the data, by adding the data to be collected
during the approved 1998 run and by improving the e�ciency for the signal the
sensitivity of the experiment will be improved substantially.
1Statistical methods used by other experiments [5][20][21] would yield more stringent limits for our ex-periment. For example, summing up all � decay channels and assuming a precisely known total backgroundof 2.7 events the method described in ref. [22] would give an upper limit on sin2 2��� of 3:7�10�3@90% c.l..
20
10-1
1
10
10 2
10 3
10-3
10-2
10-1
1
sin2 2θ
∆m2 (
eV2 )
E531
CHARM IICCFR
NOMAD
CHORUS
CDHS
νµ → ντ
90% C.L.
Figure 9: The �m2� sin2 2� plane. The region excluded by NOMAD at 90% c.l. (solid line) is shown
together with limits set by other experiments [5][20][21].
21
Acknowledgments
We are thankful to the management and sta� of CERN and of all participating
institutes for their vigorous support of the experiment and in particular to the
CERN accelerator and beam-line sta� for the magni�cent performance of the
neutrino beam. The following funding agencies have contributed to this pro-
gramme:
Australian Research Council (ARC) and Department of Industry, Science,
and Technology (DIST), Australia; Institut National de Physique Nucl�eaire et
des Particules (IN2P3), Commissariat �a l'Energie Atomique (CEA), Minist�ere de
l'Education Nationale, de l'Enseignement sup�erieur et de la Recherche, France;
Bundesministerium f�ur Bildung und Forschung (BMBF, contract 05 6DO52),
Germany; Istituto Nazionale di Fisica Nucleare (INFN), Italy; Russian Foun-
dation for Fundamental Research (grant 96-02-18562), Institute for Nuclear Re-
search of the Russian Academy of Sciences, Russia; Fonds National Suisse de
la Recherche Scienti�que, Switzerland; Department of Energy, National Science
Foundation (grant PHY-9526278), the Sloan and the Cottrell Foundations, USA.
Thanks are also due to our secretarial sta�, Jane Barney, Marie-Anne Huber
and Rachel Phillips and to the following people who have worked with the col-laboration on the preparation and the data collection stages of NOMAD: M. An-freville, M. Authier, A. Beer, V. Bonaiti, A. Cavestro, O. Clou�e, C. D�etraz,
L. Dumps, C. Engster, G. Gallay, W. Huta, E. Lessmann, J. Mulon, J.P. Pass�e-rieux, P. Petitpas, J. Poinsignon, C. Sobczynski, S. Souli�e, L. Visentin, P. Wicht.
References
[1] See, for instance, M. Nakahata, Neutrino Masses and Oscillations, Plenarytalk at the International Europhysics Conference on High Energy Physics,
Jerusalem, Israel, 19-26 August 1997.
[2] LSND Collaboration, C. Athanassopoulos et al., Phys. Rev. C 54, 2685(1996);
LSND Collaboration, C. Athanassopoulos et al., Phys. Rev. Lett. 77, 3082
(1996);
LSND Collaboration, C. Athanassopoulos et al., LA-UR-97-1998, UCRHEP-
E191, submitted to Phys. Rev. C.
[3] H. Harari, Phys.Lett. B 216 (1989) 413;
J. Ellis, J.L. Lopez and D.V. Nanopoulos, Phys. Lett. B 292 (1992) 189.
[4] NOMAD Collaboration, P. Astier et al., CERN-SPSLC/91-21 (1991);Addendum 1, CERN-SPSLC/91-48 (1991);
Addendum 2, CERN-SPSLC/91-53 (1991).
[5] E531 Collaboration, N. Ushida et al., Phys. Rev. Lett. 57 (1986) 2897.
[6] NOMAD Collaboration, J. Altegoer et al., Nucl. Instr. and Meth. A 404
(1998) 96.
22
[7] G. Bassompierre et al., Nucl. Instr. and Meth. A 403 (1998) 363;
G. Bassompierre et al., LAPP-EXP-97-06 (1997), submitted to Nucl. Instr.
and Meth.
[8] D. Autiero et al., Nucl. Instr. and Meth. A 372 (1996) 556;
D. Autiero et al., Nucl. Instr. and Meth. A 373 (1996) 358;
D. Autiero et al., Nucl. Instr. and Meth. A 387 (1997) 352.
[9] M.C. Gonzales-Garcia, J.J. Gomez-Cadenas, Phys. Rev. D 55 (1997) 1297;
B. Van de Vijver and P. Zucchelli, Nucl. Instr. and Meth. A 385 (1997) 91.
[10] G. Ingelman, The LUND MC for Deep Inelastic Lepton-Nucleon Scattering,
LEPTO 6.1, Physics at HERA, October 1991;
T. Sj�ostrand, Computer Physics Commun. 39 (1986) 347;
H.U. Bengtsson and T. Sj�ostrand, JETSET, Computer Physics Commun.
43 (1987) 367.
[11] The NOMAD simulation program is based on GEANT 3.21, CERN Program
Library Long Writeup W5013.
[12] R. Fr�uhwirth, Nucl. Instr. and Meth. A 262 (1987) 444, and referencestherein.
[13] B. Schmidt, Ph.D. thesis, University of Dortmund, 1997.
[14] V. Valuev (NOMAD Collaboration), proceedings of the International Euro-physics Conference on High Energy Physics, Jerusalem, Israel, 19-26 August
1997, to be published;J. Long, Ph.D. thesis, Johns Hopkins University, Baltimore, Maryland, USA,1997.
[15] C. Albright et al., Phys. Lett. B 84 (1979) 123.
[16] J.A. Hernando-Morata, Ph.D. thesis, University of Valencia, 1997
[17] G.J. Feldman and R.D. Cousins, Phys. Rev. D 57 (1998) 3873.
[18] R.D. Cousins, V.L. Highland, Nucl. Instr. and Meth. A 320 (1992) 331.
[19] M.G. Kendall and A. Stuart, The Advanced Theory of Statistics, Vol. 2,Inference and Relationship 3rd Ed. (Hafner Publishing, New York, 1973), p.
234, Eq. 24.4.
[20] CHORUS Collaboration, E. Eskut et al., CERN-PPE/97-149, submitted toPhys. Lett. B.
[21] CHARM-II Collaboration, M. Gruwe et al., Phys. Lett. B 309 (1993) 463;
CCFR Collaboration, K.S. McFarland et al., Phys. Rev. Lett. 75 (1995)
3993;
CDHS Collaboration, F. Dydak et al., Phys. Lett. B 134 (1984) 281.
[22] O. Helene, Nucl. Instr. and Meth. 212 (1983) 319.
23