a study of strange particle production in νμ charged current interactions in the nomad experiment
TRANSCRIPT

A Study of Strange Particle Production
in νµ Charged Current Interactions
in the NOMAD Experiment
NOMAD Collaboration
P. Astier n D. Autiero h A. Baldisseri r M. Baldo-Ceolin m
M. Banner n G. Bassompierre a K. Benslama i N. Besson r
I. Bird h,i B. Blumenfeld b F. Bobisut m J. Bouchez r S. Boyd t
A. Bueno c,x S. Bunyatov f L. Camilleri h A. Cardini j
P.W. Cattaneo o V. Cavasinni p A. Cervera-Villanueva h,v
R. Challis k A. Chukanov f G. Collazuol m G. Conforto h,u
C. Conta o M. Contalbrigo m R. Cousins j D. Daniels c
H. Degaudenzi i T. Del Prete p A. De Santo h T. Dignan c
L. Di Lella h E. do Couto e Silva h J. Dumarchez n M. Ellis t
T. Fazio a G.J. Feldman c R. Ferrari o D. Ferrere h V. Flaminio p
M. Fraternali o J.-M. Gaillard a E. Gangler h,n A. Geiser e,h
D. Geppert e D. Gibin m S. Gninenko h,l A. Godley s,t
J.-J. Gomez-Cadenas h,v J. Gosset r C. Goßling e M. Gouanere a
A. Grant h G. Graziani g A. Guglielmi m C. Hagner r
J. Hernando v D. Hubbard c P. Hurst c N. Hyett k E. Iacopini g
C. Joseph i F. Juget i N. Kent k M. Kirsanov l O. Klimov f
J. Kokkonen h A. Kovzelev l,o A. Krasnoperov a,f D. Kustov f
V. Kuznetsov f,h S. Lacaprara m C. Lachaud n B. Lakic w
A. Lanza o L. La Rotonda d M. Laveder m A. Letessier-Selvon n
J.-M. Levy n L. Linssen h A. Ljubicic w J. Long b A. Lupi g
A. Marchionni g F. Martelli u X. Mechain r J.-P. Mendiburu a
J.-P. Meyer r M. Mezzetto m S.R. Mishra c,s G.F. Moorhead k
D. Naumov f P. Nedelec a Yu. Nefedov f C. Nguyen-Mau i
D. Orestano q F. Pastore q L.S. Peak t E. Pennacchio u
H. Pessard a R. Petti h,o A. Placci h G. Polesello o D. Pollmann e
A. Polyarush l B. Popov f,n C. Poulsen k J. Rico x P. Riemann e
C. Roda h,p A. Rubbia h,x F. Salvatore o K. Schahmaneche n
Preprint submitted to Elsevier Preprint 19 November 2001

B. Schmidt e,h T. Schmidt e M. Sevior k D. Sillou a F.J.P. Soler h,t
G. Sozzi i D. Steele b,i U. Stiegler h M. Stipcevic w
Th. Stolarczyk r M. Tareb-Reyes i G.N. Taylor k
V. Tereshchenko f A. Toropin l A.-M. Touchard n S.N. Tovey h,k
M.-T. Tran i E. Tsesmelis h J. Ulrichs t L. Vacavant i
M. Valdata-Nappi d,1 V. Valuev f,j F. Vannucci n K.E. Varvell t
M. Veltri u V. Vercesi o G. Vidal-Sitjes h J.-M. Vieira i
T. Vinogradova j F.V. Weber c,h T. Weisse e F.F. Wilson h
L.J. Winton k B.D. Yabsley t H. Zaccone r K. Zuber e
P. Zuccon m
aLAPP, Annecy, FrancebJohns Hopkins Univ., Baltimore, MD, USA
cHarvard Univ., Cambridge, MA, USAdUniv. of Calabria and INFN, Cosenza, Italy
eDortmund Univ., Dortmund, GermanyfJINR, Dubna, Russia
gUniv. of Florence and INFN, Florence, ItalyhCERN, Geneva, Switzerland
iUniversity of Lausanne, Lausanne, SwitzerlandjUCLA, Los Angeles, CA, USA
kUniversity of Melbourne, Melbourne, AustralialInst. Nucl. Research, INR Moscow, RussiamUniv. of Padova and INFN, Padova, Italy
nLPNHE, Univ. of Paris VI and VII, Paris, FranceoUniv. of Pavia and INFN, Pavia, Italy
pUniv. of Pisa and INFN, Pisa, ItalyqRoma Tre University and INFN, Rome, Italy
rDAPNIA, CEA Saclay, FrancesUniv. of South Carolina, Columbia, SC, USA
tUniv. of Sydney, Sydney, AustraliauUniv. of Urbino, Urbino, and INFN Florence, Italy
vIFIC, Valencia, SpainwRudjer Boskovic Institute, Zagreb, Croatia
xETH Zurich, Zurich, Switzerland
2

A study of strange particle production in νµ charged current in-teractions has been performed using the data from the NOMADexperiment. Yields of neutral strange particles (K0
s , Λ, Λ) havebeen measured. Mean multiplicities are reported as a function ofthe event kinematic variables Eν , W 2 and Q2 as well as of thevariables describing particle behaviour within a hadronic jet: xF ,z and p2
T . Decays of resonances and heavy hyperons with identi-fied K0
s and Λ in the final state have been analyzed. Clear signalscorresponding to K?±, Σ?±, Ξ− and Σ0 have been observed.
Key words: neutrino interactions, strange particle production
1 Now at Univ. of Perugia and INFN, Perugia, Italy
3

1 INTRODUCTION
The production of strange particles in neutrino interactions can provide atesting ground for the quark-parton as well as for hadronization models. Neu-tral strange particles can be reliably identified using the V 0-like signature oftheir decays (K0
s → π+π−, Λ → pπ− and Λ → pπ+) in contrast to most otherhadrons which require particle identification hardware. It is noteworthy thatall previous investigations of strange particle production by neutrinos havecome from bubble chamber experiments [1–25]. No other technique has so faryielded results on this subject. However, previous bubble chamber experimentswith (anti)neutrino beams suffered from the low statistics of their V 0 samples.
The NOMAD experiment [26] has collected a large number of neutrino in-teractions with a reconstruction quality similar to that of bubble chamberexperiments. The order of magnitude increase in statistics can be used to im-prove our knowledge of strange particle production in neutrino interactions. Inthis paper we present measurements of the yields of neutral strange particles(K0
s , Λ and Λ), as well as the yields of K?±, Σ?±, Ξ− and Σ0 in νµ chargedcurrent (CC) interactions. These results are compared to the predictions ofthe NOMAD Monte Carlo (MC) simulation program.
The results of the present analysis are the measurements of:
(i) the production properties of neutral strange particles in νµ CC interac-tions. This study will allow tuning of the parameters of the MC simula-tion programs in order to correctly reproduce the production of strangeparticles by neutrinos;
(ii) the contribution of strange resonances and heavy hyperons to the totalnumber of observed K0
s , Λ and Λ. This will allow a quantitative theoreticalinterpretation of the Λ and Λ polarization measurements in νµ CC deepinelastic scattering (DIS) reported in our previous articles [27,28].
4

2 EXPERIMENTAL PROCEDURE
2.1 The NOMAD experiment
The main goal of the NOMAD experiment [26] was the search for νµ → ντ
oscillations in a wide-band neutrino beam from the CERN SPS. The maincharacteristics of the beam are given in Table 1. This search uses kinematiccriteria to identify ντ CC interactions [29] and requires a very good qualityof event reconstruction similar to that of bubble chamber experiments. Thishas indeed been achieved by the NOMAD detector, and, moreover, the largedata sample collected during four years of data taking (1995-1998) allows fora detailed study of neutrino interactions. The full data sample from the NO-MAD experiment corresponding to about 1.3 million νµ CC interactions inthe detector fiducial volume is used in the present analysis. The data are com-pared to the results of a Monte Carlo simulation based on modified versionsof LEPTO 6.1 [30] and JETSET 7.4 [31] generators for neutrino interactions(with Q2 and W 2 cutoff parameters removed) and on a GEANT [32] basedprogram for the detector response. Strange particle production is describedby the set of default parameters in JETSET. To define the parton contentof the nucleon for the cross-section calculation we have used the GRV-HOparametrization [33] of the parton density functions available in PDFLIB [34].The above description of the MC will be referred to as the default MC. For theanalysis reported below we used a MC sample consisting of about 3 millionevents.
Table 1The CERN SPS neutrino beam composition at the position of the NOMAD detector(as predicted by the beam simulation program [35]).
Neutrino Flux CC interactions in NOMAD
flavours 〈Eν〉 [GeV] rel.abund. 〈Eν〉 [GeV] rel.abund.
νµ 24.2 1 45.3 1
νµ 18.5 0.0637 40.9 0.0244
νe 36.6 0.0102 57.1 0.0153
νe 28.7 0.0025 49.9 0.0015
5

ChambersMuon
Beam
Neutrino
V8
CalorimeterHadronic
1 meter
PreshowerModulesTRD
Dipole Magnet⊗ B = 0.4 T
Trigger Planes
ElectromagneticCalorimeterDrift Chambers
CalorimeterFront
Veto planes
x
y
z⊗
Fig. 1. A sideview of the NOMAD detector.
2.2 The NOMAD detector
For a study of strange particle production the tracking capabilities of a detec-tor are of paramount importance. The NOMAD detector (Fig. 1) is especiallywell suited for this. It consists of an active target of 44 drift chambers, with atotal fiducial mass of 2.7 tons, located in a 0.4 Tesla dipole magnetic field. Thedrift chambers (DC) [36], made of low Z material (mainly carbon) serve thedual role of a nearly isoscalar target for neutrino interactions and of the track-ing medium. The average density of the drift chamber volume is 0.1 g/cm3,very close to that of liquid hydrogen. These drift chambers provide an over-all efficiency for charged particle reconstruction of better than 95% and amomentum resolution which can be parametrized as
σp
p=
0.05√L⊕ 0.008 · p√
L5,
where the track length L is in metres and the track momentum p is in GeV/c.This amounts to a resolution of approximately 3.5% in the momentum rangeof interest (less than 10 GeV/c). Reconstructed tracks are used to determinethe event topology (the assignment of tracks to vertices), to reconstruct thevertex position and the track parameters at each vertex and, finally, to identifythe vertex type (primary, secondary, V 0, etc.). A transition radiation detec-tor [37] is used for electron identification. The pion rejection achieved forisolated tracks is 103 with a 90% electron identification efficiency. A lead-glasselectromagnetic calorimeter [38] located downstream of the tracking region
provides an energy resolution of 3.2%/√
E[GeV] ⊕ 1% for electromagnetic
6

showers and is essential to measure the total energy flow in neutrino interac-tions. In addition, an iron absorber and a set of muon chambers located afterthe electromagnetic calorimeter are used for muon identification, providing amuon detection efficiency of 97% for momenta greater than 5 GeV/c.
The large statistics of the data combined with the good quality of event recon-struction in the NOMAD detector allows a detailed study of strange particleproduction in neutrino interactions to be performed.
2.3 Event selection and V 0 identification procedure
The NOMAD experiment has collected 1.3×10⁶ νµ CC events and has observedan unprecedented number of neutral strange particle decays. Such a decay ap-pears in the detector as a V 0-like vertex: two tracks of opposite charge emerg-ing from a common vertex separated from the primary neutrino interactionvertex (Fig. 2). The V 0-like signature is expected also for photon conversions.
Fig. 2. A reconstructed data event containing 3 V 0 vertices identified as K0s decays
by our identification procedure. The scale on this plot is given by the size of thevertex boxes (3× 3 cm2).
The selection procedure for the νµ CC event sample used in this analysis hasbeen described in [27].
Since the NOMAD detector is unable to distinguish (anti)protons from pi-ons in the momentum range relevant to this analysis, our V 0 identificationprocedure relies on the kinematic properties of a V 0 decay.
For the V 0 identification a kinematic fit method has been used as describedin [27,39]. This fit has been performed for three decay hypotheses: K0
s → π+π−,Λ → pπ−, Λ → pπ+ and for the hypothesis of a photon conversion to e+e−.The output of the kinematic fits applied to a given V 0 vertex consists of four
7

values of χ2V 0 describing the goodness of these fits. Different regions in the
four-dimensional χ2V 0 space populated by particles identified as K0
s , Λ and Λhave been selected. Identified V 0 are of two types:
– uniquely identified V 0, which, in the four-dimensional χ2V 0 space described
above, populate regions in which decays of only a single particle type arepresent;
– ambiguously identified V 0, which populate regions in which decays of differ-ent particle types are present.
The treatment of ambiguities aims at selecting a given V 0 decay with the high-est efficiency and the lowest background contamination from other V 0 types.An optimum compromise between high statistics of the identified V 0 sampleand well understood background contamination is the aim of our identifica-tion strategy. The MC simulation program has been used to define the criteriafor the kinematic V 0 selection and to determine the purity of the final K0
s , Λand Λ samples. We selected a sample consisting of more than 90% of uniquelyidentified V 0. Results are reported in Table 2.
Table 2Efficiency (ε) and purity (P ) for each selected V 0 category. Numbers of identifiedneutral strange particles in the data are also shown in the last column.
V 0 ε (%) P (%) Data
K0s 22.1 ± 0.1 97.2 ± 0.1 15074
Λ 16.4 ± 0.1 95.9 ± 0.1 8087
Λ 18.6 ± 0.5 89.7 ± 0.7 649
The total V 0 sample in our data contains 15074 identified K0s , 8087 identified Λ
and 649 identified Λ decays, representing significantly larger numbers than inprevious (anti)neutrino experiments performed with bubble chambers [1–25].
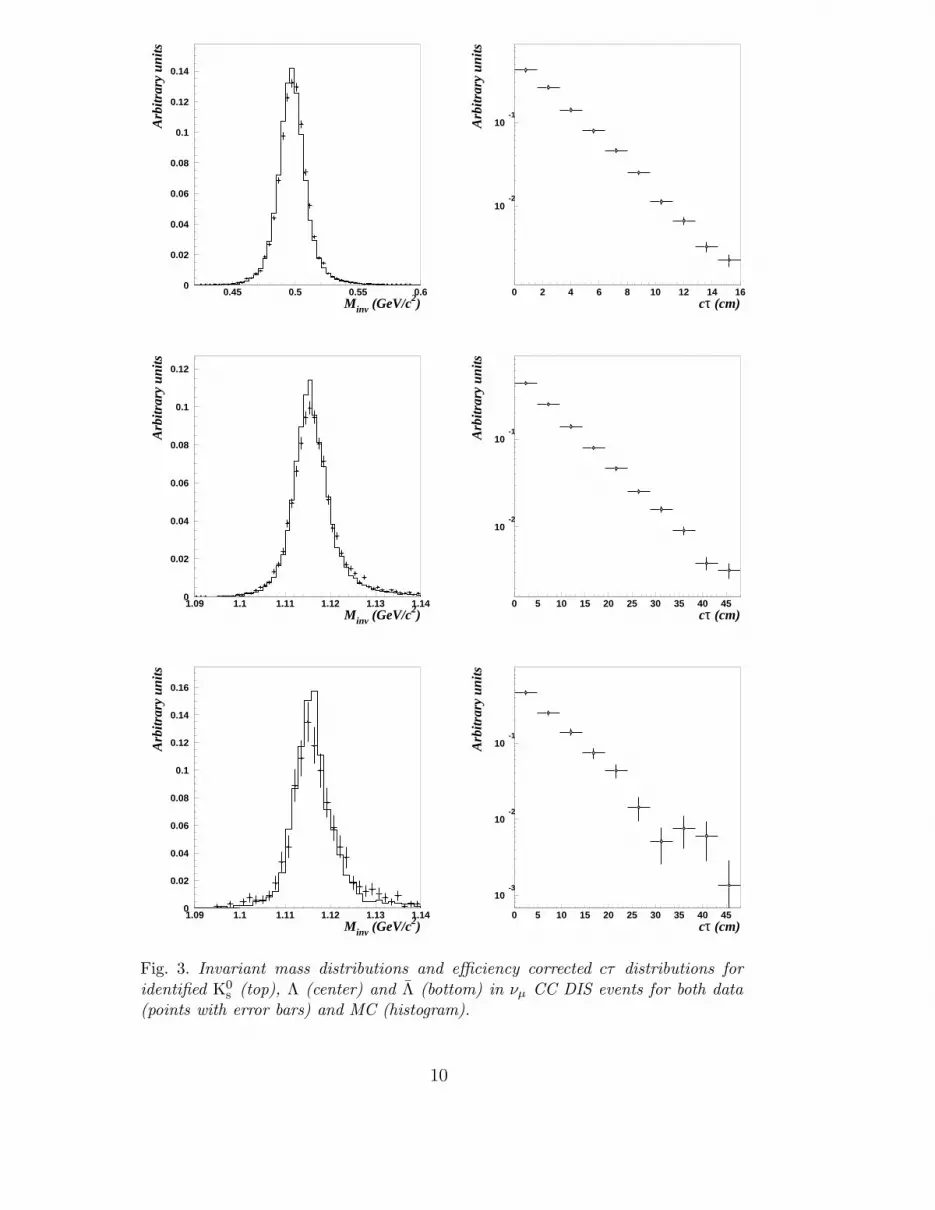
Fig. 3 shows the invariant mass and cτ distributions for identified K0s , Λ and
Λ. The measured mass and the lifetime of identified neutral strange particlesare in agreement with the world averages [40]. The corresponding results aregiven in Tables 3 and 4.
The efficiencies and purities reported in Table 2 are momentum dependent.However, we have checked that they are applicable to the data because the mo-menta distributions of identified V 0 and of their decay products are identicalin the data and MC simulation.
In the rest of this paper we will always present efficiency corrected distribu-tions.
8

Table 3Measured V 0 mass and resolution (in MeV/c2) for both MC and data.
V 0 MC Data PDG [40]
Mass Resolution Mass Resolution Mass
K0s 497.9 ± 0.1 11.0 ± 0.1 497.9 ± 0.1 11.3 ± 0.1 497.672 ± 0.031
Λ 1 115.7 ± 0.02 4.0 ± 0.03 1 116.0 ± 0.05 4.45 ± 0.05 1115.683 ± 0.006
Λ 1 116.0 ± 0.1 4.1 ± 0.1 1 116.3 ± 0.1 4.8 ± 0.2 1115.683 ± 0.006
Table 4Measured cτ (in cm) for a given V 0 type for both MC and data.
V 0 MC Data PDG [40]
K0s 2.60 ± 0.01 2.72 ± 0.03 2.6786
Λ 7.91 ± 0.02 8.07 ± 0.12 7.89
Λ 7.82 ± 0.06 7.33 ± 0.33 7.89
9
0
0.02
0.04
0.06
0.08
0.1
0.12
0.14
0.45 0.5 0.55 0.6Minv (GeV/c2)
Arb
itrar
y un
its
10-2
10-1
0 2 4 6 8 10 12 14 16cτ (cm)
Arb
itrar
y un
its
0
0.02
0.04
0.06
0.08
0.1
0.12
1.09 1.1 1.11 1.12 1.13 1.14Minv (GeV/c2)
Arb
itrar
y un
its
10-2
10-1
0 5 10 15 20 25 30 35 40 45cτ (cm)
Arb
itrar
y un
its
0
0.02
0.04
0.06
0.08
0.1
0.12
0.14
0.16
1.09 1.1 1.11 1.12 1.13 1.14Minv (GeV/c2)
Arb
itrar
y un
its
10-3
10-2
10-1
0 5 10 15 20 25 30 35 40 45cτ (cm)
Arb
itrar
y un
its
Fig. 3. Invariant mass distributions and efficiency corrected cτ distributions foridentified K0
s (top), Λ (center) and Λ (bottom) in νµ CC DIS events for both data(points with error bars) and MC (histogram).
10

3 YIELDS OF NEUTRAL STRANGE PARTICLES
We have studied the production rates of neutral strange particles (K0s , Λ, Λ)
in νµ CC interactions. The particles can be produced at the primary vertexand also from secondary interactions of primary particles with the detectormaterial. Neutral strange particles produced via resonance or heavier hyperondecays are classified as primary V 0. We applied a correction obtained fromthe Monte Carlo to the yields of neutral strange particles in the data in orderto extract the yields at the primary vertex.
3.1 Integral yields of neutral strange particles
The measured yield per νµ CC interaction for each V 0 type is defined as:
TV 0 = ξ · NV 0
NνµCC
, (1)
where NV 0 is the number of reconstructed and identified V 0 in the numberNνµCC of reconstructed νµ CC events and ξ is a correction factor calculatedas:
ξ =PV 0 × ενµCC
εV 0 × Br(V 0 → h+h−),
where ενµCC = (85.30 ± 0.02)% is the efficiency (reconstruction and identi-fication) of νµ CC events in the fiducial volume, and εV 0 is the global V 0
efficiency which takes into account the contribution from particles producedin the fiducial volume, but decaying outside. PV 0 is the purity of the final
V 0 sample, and Br(V 0 → h+h−) is the branching ratio for a given V 0 typedecaying to a pair of charged hadrons.
Table 5Integral yields of primary V 0 in νµ CC interactions in both the data and in thedefault MC. The errors are only statistical.
V 0 type TDATA
V 0 (%) TMC
V 0 (%) TMC
V 0 /TDATA
V 0
K0s 6.76± 0.06 9.50 ± 0.02 1.40± 0.01
Λ 5.04± 0.06 8.10 ± 0.02 1.61± 0.02
Λ 0.37± 0.02 0.60 ± 0.01 1.62± 0.03
Table 5 shows the overall inclusive production rates for K0s , Λ and Λ in νµ
CC interactions compared to the MC predictions. Note that the productionrates in the default MC are a factor of 1.4 to 1.6 higher than in the data. This
11

could be explained in part by the choice of the LEPTO [30] and JETSET [31]parameters in the NOMAD event generator. We have to emphasize that theso-called ss suppression factor (PARJ(2) parameter in JETSET) - defined asthe ratio of the probability γs of producing an ss pair to the probability γu (γd)of producing a uu (dd) pair in the fragmentation chain - was set to its defaultvalue of 0.3 in the default NOMAD MC production 2 . However, this parameterwas measured to be about 0.2 in previous bubble chamber experiments: forexample, the values obtained by the BEBC WA21 Collaboration [41] in aneutrino beam similar to ours are 0.200± 0.022(stat)± 0.010(sys) for νp and0.207 ± 0.018(stat) ± 0.020(sys) for νp interactions. Moreover, later resultsfrom OPAL (0.245) [42], DELPHI (0.23) [43], E665 (0.2) [44], ZEUS [45] andH1 [46] collaborations support a value close to 0.2 for this parameter.
Table 6Numbers of νµ CC events with a specified combination of observed neutral strangeparticle decays for both the default MC and data. X indicates the hadronic systemaccompanying the observed V 0.
Number of observed events
Channel MC Data MC/DATA
ΛX 11686 7778 1.50 ± 0.02
K0sX 18971 14228 1.33 ± 0.01
ΛX 831 594 1.40 ± 0.07
K0sK
0sX 485 284 1.7 ± 0.1
ΛK0sX 617 247 2.5 ± 0.2
ΛΛX 98 40 2.5 ± 0.4
K0s ΛX 24 15 1.6 ± 0.5
ΛΛX 19 10 1.9 ± 0.7
ΛK0sK0
sX 7 2 3.4 ± 2.6
K0sK
0sK
0sX 2 4 0.6 ± 0.4
However, the problem of the inaccurate description of neutral strange particleproduction in the MC is a more complex one. This is illustrated in Table 6,where we give the observed numbers of νµ CC events for 10 exclusive multi-V 0
channels in the data compared to the default MC predictions. The number ofMC events in Table 6 is renormalized to the same number of νµ CC eventsas in the data. From this comparison one can conclude that it is not possible
2 The value 0.3 has been suggested by the authors of JETSET as the default forthis parameter.
12

to rescale just a single parameter (the ss suppression factor) in order to de-scribe the neutral strange particle production observed in the data. Rather,the discrepancy is due to a combination of several parameters which describethe probability that an s(s)-quark appears as a meson/baryon(antibaryon),the probability that a strange meson/baryon(antibaryon) appears electricallyneutral, etc. A tuning of the JETSET parameters to reproduce the yields ofneutral strange particles observed in the NOMAD data is a subject of ananalysis currently in progress.
The integral yields reported in Table 5 can be compared to previous measure-ments summarized in Table 7. The K0
s rates from Table 5 have been convertedinto K0(= K0 + K0) rates by multiplying by a factor of 2.
For completeness we have recalculated the integral overall yields taking intoaccount contributions from both primary and secondary V 0. These results aregiven in Table 7 and denoted by a star (?). Our overall yields are consistentwith the results of the ν-Ne experiment [19] performed in a similar neutrinobeam. However, our primary yields of K0
s and Λ are about 30% lower and theprimary yield of Λ is ∼20% lower.
3.2 Yields of neutral strange particles as a function of kinematic variables
To investigate neutral strange particle production mechanisms we have mea-sured the average K0
s , Λ and Λ yields as a function of the neutrino energy Eν ,the invariant effective mass squared W 2 of the hadronic system, the invariantsquare of the four-momentum transfer from the neutrino to the target Q2, andthe Bjorken scaling variable xBj .
The yields of K0s , Λ and Λ are shown in Fig. 4. The Λ yield shows a behaviour
which is almost independent of Eν , W 2 and Q2 after a sharp initial rise. Itdrops at large values of xBj . On the other hand, the yield of K0
s rises steadilywith Eν and W 2, reaches a plateau at large Q2 and falls with increasing xBj .Similar observations have been made by previous experiments, but with largerstatistical uncertainties. The Λ yields as a function of kinematic variables aremeasured for the first time in a neutrino experiment. In general they show abehaviour similar to that of the K0
s . However, as expected, clear W 2 and Eν
thresholds are present in the Λ production.
The ratios of yields for K0s/Λ and Λ/Λ are presented in Fig. 5.
13

Table 7Inclusive yields of neutral strange particles in νµ CC interactions measured in thisanalysis and in previous bubble chamber experiments. NK , NΛ and NΛ are the ob-served numbers of K0
s , Λ and Λ, respectively. K0 stands for K0 + K0. See text forexplanation of a star (?).
Reaction 〈Eν〉 NK0s
K0 rate NΛ Λ rate NΛ Λ rate
[Ref] (GeV) (%) (%) (%)
NOMAD45 15075
13.52 ± 0.128087
5.04 ± 0.06649
0.37 ± 0.02
NOMAD? 18.22 ± 0.16 6.66 ± 0.08 0.45 ± 0.02
ν - Ne [19] 46 2279 16.8± 1.2 1843 6.5 ± 0.5 93 0.46 ± 0.08
ν - p [24] 51 831 19.0± 0.9 491 5.2 ± 0.3 27 0.34 ± 0.07
ν - Ne [25] 150 502 40.8± 4.8 285 12.7 ± 1.4 27 1.5 ± 0.5
ν - p [11] 43 359 17.5± 0.9 180 4.5 ± 0.4 13 0.3 ± 0.1
ν - Ne [12] 103 203 23.0± 1.7 98 5.7 ± 0.7
ν - n [14] 62 234 20.8± 1.6 157 7.1 ± 0.7
ν - p [14] 62 154 17.7± 1.6 77 4.3 ± 0.6
ν - n [17] 62 20.5± 1.1 6.6 ± 0.7
ν - p [17] 62 17.4± 1.2 4.4 ± 0.5
ν - A [21] ∼10 82 7.1 ± 0.8 76 3.1 ± 0.4
ν - p [10] ∼45 23 15± 4
ν - p [15] ∼50 7.0 ± 0.8
ν - n [15] ∼50 7.0 ± 1.2
3.3 Comparison with LUND model predictions
The measured yields of K0s , Λ and Λ particles are compared in Figs. 6, 7, 8
to the predictions of the default NOMAD MC simulation (see section 2.1).A reasonable agreement in shapes is observed, while the discrepancy in theoverall normalization is about a factor of 1.3 to 1.5.
The kinematic variables Eν , W 2, Q2 and xBj are not independent. So, forexample, discrepancies between the data and MC at high W 2 are reflected indiscrepancies at low xBj .
14

10-4
10-3
10-2
10-1
1
20 40 60 80 100 120 140 160 180 200Eν (GeV)
Mul
tiplic
ity
Legend: ▲ K 0
S ▼ Λ--
● Λ
10-4
10-3
10-2
10-1
1
20 40 60 80 100 120 140 160 180 200W2 (GeV2/c4)
Mul
tiplic
ity
Legend: ▲ K 0
S ▼ Λ--
● Λ
10-4
10-3
10-2
10-1
1
20 40 60 80 100 120 140Q2 (GeV2/c2)
Mul
tiplic
ity
Legend: ▲ K 0
S ▼ Λ--
● Λ
10-4
10-3
10-2
10-1
1
0 0.1 0.2 0.3 0.4 0.5 0.6 0.7 0.8 0.9 1xBj
Mul
tiplic
ity
Legend: ▲ K 0
S ▼ Λ--
● Λ
Fig. 4. Measured yields of the K0s , Λ and Λ as a function of Eν, W 2, Q2 and xBj .
15

10-3
10-2
10-1
1
20 40 60 80 100 120 140 160 180 200Eν (GeV)
Legend: ▲ K 0
S /Λ--
▼ Λ/Λ
10-3
10-2
10-1
1
20 40 60 80 100 120 140 160 180 200W2 (GeV2/c4)
Legend: ▲ K 0
S /Λ--
▼ Λ/Λ
10-3
10-2
10-1
1
20 40 60 80 100 120 140Q2 (GeV2/c2)
Legend: ▲ K 0
S /Λ--
▼ Λ/Λ
10-3
10-2
10-1
1
0 0.1 0.2 0.3 0.4 0.5 0.6 0.7 0.8 0.9 1xBj
Legend: ▲ K 0
S /Λ--
▼ Λ/Λ
Fig. 5. Ratios of measured yields for K0s/Λ and Λ/Λ as a function of Eν, W 2, Q2
and xBj .
16

0
0.05
0.1
0.15
0.2
50 100 150 200Eν (GeV)
Mul
tiplic
ity
0
0.5
1
1.5
50 100 150 200Eν (GeV)
Rat
io M
C/D
AT
A
0
0.1
0.2
0.3
50 100 150 200W2 (GeV2/c4)
Mul
tiplic
ity
0
0.5
1
1.5
2
50 100 150 200W2 (GeV2/c4)
Rat
io M
C/D
AT
A
0
0.1
0.2
50 100 150Q2 (GeV2/c2)
Mul
tiplic
ity
0
0.5
1
1.5
2
50 100 150Q2 (GeV2/c2)
Rat
io M
C/D
AT
A
0
0.05
0.1
0 0.2 0.4 0.6 0.8 1xBj
Mul
tiplic
ity
0
1
2
0 0.2 0.4 0.6 0.8 1xBj
Rat
io M
C/D
AT
A
Fig. 6. Yields in the default MC (histogram) and in the data (points with error bars)for K0
s as a function of Eν, W 2, Q2 and xBj . The MC/Data ratios and their fit toa constant are also shown.
17

0
0.025
0.05
0.075
0.1
50 100 150 200Eν (GeV)
Mul
tiplic
ity
0
0.5
1
1.5
2
50 100 150 200Eν (GeV)
Rat
io M
C/D
AT
A
0
0.05
0.1
0.15
50 100 150 200W2 (GeV2/c4)
Mul
tiplic
ity
0
0.5
1
1.5
2
50 100 150 200W2 (GeV2/c4)
Rat
io M
C/D
AT
A
0
0.05
0.1
0.15
50 100 150Q2 (GeV2/c2)
Mul
tiplic
ity
0
1
2
50 100 150Q2 (GeV2/c2)
Rat
io M
C/D
AT
A
0
0.025
0.05
0.075
0.1
0 0.2 0.4 0.6 0.8 1xBj
Mul
tiplic
ity
0
0.5
1
1.5
2
0 0.2 0.4 0.6 0.8 1xBj
Rat
io M
C/D
AT
A
Fig. 7. Yields in the default MC (histogram) and in the data (points with error bars)for Λ as a function of Eν, W 2, Q2 and xBj . The MC/Data ratios and their fit to aconstant are also shown.
18

0
0.005
0.01
0.015
0.02
50 100 150 200Eν (GeV)
Mul
tiplic
ity
0
1
2
50 100 150 200Eν (GeV)
Rat
io M
C/D
AT
A
0
0.01
0.02
0.03
0.04
50 100 150 200W2 (GeV2/c4)
Mul
tiplic
ity
0
0.5
1
1.5
2
50 100 150 200W2 (GeV2/c4)
Rat
io M
C/D
AT
A
0
0.01
0.02
0.03
50 100 150Q2 (GeV2/c2)
Mul
tiplic
ity
0
1
2
3
50 100 150Q2 (GeV2/c2)
Rat
io M
C/D
AT
A
0
0.002
0.004
0.006
0.008
0 0.2 0.4 0.6 0.8 1xBj
Mul
tiplic
ity
0
2
4
6
8
0 0.2 0.4 0.6 0.8 1xBj
Rat
io M
C/D
AT
A
Fig. 8. Yields in the default MC (histogram) and in the data (points with error bars)for Λ as a function of Eν, W 2, Q2 and xBj . The MC/Data ratios and their fit to aconstant are also shown.
19

4 PRODUCTION PROPERTIES
We have also performed a detailed analysis of kinematic quantities describingthe behaviour of neutral strange particles (K0
s , Λ and Λ) inside the hadronicjet. This study allows an investigation of the dynamics of fragmentation. Thedifferences in the production properties of K0
s , Λ and Λ are seen most clearlyhere. The following distributions are of interest: xF = 2p∗L/W (Feynman-x isthe longitudinal momentum fraction in the hadronic center of mass system),the transverse momentum squared, p2
T , of a particle with respect to the current(hadronic jet) direction and the fraction z = Elab(V
0)/Elab(all hadrons) ofthe total hadronic energy carried away by the neutral strange particle in thelaboratory system.
4.1 xF distributions
0
0.05
0.1
0.15
0.2
0.25
0.3
-1.5 -1 -0.5 0 0.5 1 1.5xF
Arb
itrar
y un
its
Fig. 9. Efficiency corrected xF distribu-tion for K0
s mesons.
0
0.02
0.04
0.06
0.08
0.1
0.12
0.14
0.16
0.18
-1.5 -1 -0.5 0 0.5 1 1.5xF
Arb
itrar
y un
its
Fig. 10. Efficiency corrected xF distribu-tion for Λ hyperons.
The efficiency corrected xF distributions observed in the data for neutralstrange particles are shown in Figs. 9, 10, 11. These distributions indicatethat Λ are produced mainly in the target fragmentation region (xF < 0),while K0
s are peaked in the central region with an asymmetry in the forwarddirection. Λ are produced in the central xF region (|xF | < 0.5). One wayto quantify differences in the xF distributions is to define an asymmetry pa-rameter A = (NF − NB)/(NF + NB), where NF and NB are the numbers ofparticles produced forward and backward, respectively, in the hadronic centreof mass. The asymmetry parameters A and mean values of xF in both dataand MC are listed in Table 8. They are consistent with previous measure-ments [11,12,14,19,23–25]. The observed disagreement between data and MCis probably due to the fact that the MC simulation does not properly describe
20

0
0.05
0.1
0.15
0.2
0.25
0.3
-1.5 -1 -0.5 0 0.5 1 1.5xF
Arb
itrar
y un
its
Fig. 11. Efficiency corrected xF distribution for Λ hyperons.
the relative contributions of different V 0 production mechanisms.
Table 8Mean values 〈xF 〉 and asymmetry parameters A of the xF distributions for K0
s , Λ,Λ in both MC and data.
V 0 MC DATA
〈xF 〉 A 〈xF 〉 A
K0s 0.055 ± 0.001 0.152 ± 0.002 0.064 ± 0.001 0.256 ± 0.004
Λ −0.296 ± 0.001 −0.649 ± 0.002 −0.295 ± 0.002 −0.589 ± 0.004
Λ 0.006 ± 0.002 −0.03± 0.01 0.04 ± 0.004 0.18 ± 0.02
4.2 z distributions
Efficiency corrected z distributions for K0s , Λ and Λ are shown in Figs. 12,
13, 14. A turn-over at small values of z can be seen for Λ hyperons, but notfor K0
s and Λ. A turn-over at small values of z for K0s and Λ was observed in
some of the previous neutrino experiments [8,11,14,21] and was not observedin others [10,12]. We note that uncorrected z distributions show such a turn-over for all V 0 types in our experiment as well, due to a less efficient V 0
reconstruction at low momenta.
Below we study separately z distributions of neutral strange particles producedat xF < 0 (see § 4.2.1) and at xF > 0 (see § 4.2.2). Detailed information onthe mean values of z distributions for both data and MC is given in Table 9.
21

10-3
10-2
10-1
0 0.1 0.2 0.3 0.4 0.5 0.6 0.7 0.8 0.9 1zV
Arb
itrar
y un
its
Fig. 12. Efficiency corrected z distribu-tion for K0
s .
10-2
10-1
0 0.1 0.2 0.3 0.4 0.5 0.6 0.7 0.8 0.9 1zV
Arb
itrar
y un
its
Fig. 13. Efficiency corrected z distribu-tions for Λ.
10-3
10-2
10-1
0 0.1 0.2 0.3 0.4 0.5 0.6 0.7 0.8 0.9 1zV
Arb
itrar
y un
its
Fig. 14. Efficiency corrected z distributions for Λ.
4.2.1 z distributions in the target fragmentation region
The efficiency corrected z distributions of K0s , Λ and Λ measured in the tar-
get fragmentation region are shown in Fig. 15 (left). One can see that the zdistribution of K0
s mesons has a maximum at z → 0 and decreases faster atlarger z (compared with Fig. 12) and that the K0
s mesons produced in thetarget fragmentation region carry in general a small fraction of the hadronicjet energy. Λ hyperons are believed to be produced mostly from the remnantdi-quark fragmentation and the shape of the z distribution is similar to thatshown in Fig. 13. The turn-over in the z distribution is observed for Λ hyperonsproduced in the target fragmentation region.
22

Table 9Mean values of z distributions for K0
s , Λ, Λ measured for the full sample and forxF < 0 and xF > 0 regions in both MC and data.
V 0 full sample xF < 0 xF > 0
K0s
MC 0.218 ± 0.001 0.092 ± 0.001 0.312 ± 0.001
DATA 0.226 ± 0.001 0.105 ± 0.001 0.299 ± 0.001
ΛMC 0.227 ± 0.001 0.179 ± 0.001 0.462 ± 0.003
DATA 0.250 ± 0.002 0.206 ± 0.001 0.434 ± 0.005
ΛMC 0.215 ± 0.003 0.139 ± 0.002 0.296 ± 0.004
DATA 0.242 ± 0.005 0.147 ± 0.005 0.308 ± 0.008
4.2.2 z distributions in the current fragmentation region
The efficiency corrected z distributions of K0s , Λ and Λ measured in the current
fragmentation region are shown in Fig. 15 (right). This kinematical regionis interesting because of the u or d (anti)quark fragmentation into Λ or Λhyperons. All three z distributions show similar behaviour but with differentmean values of z. The z distribution of Λ hyperons at xF > 0 is drasticallydifferent from that in the target fragmentation region. This is evidence forthe fragmentation of the outgoing u quark into a Λ hyperon. In fact, the zdistribution of Λ in the current fragmentation region is a measure of the DΛ
u (z)fragmentation function (normalized to unity in Fig. 15). The z distribution ofΛ hyperons is sensitive to the DΛ
d (z) fragmentation function with a possible
contribution from the DΛu (z) process. One can see that it is harder than the
one measured in the target fragmentation region.
4.3 Discussion
There are different mechanisms responsible for K0s , Λ and Λ production in
the neutrino CC DIS process which are expected to give different xF and zdistributions for these particles.
– The xF distribution of K0s mesons produced promptly in the W+d → u pro-
cess that requires at least two quark-antiquark pairs to be created (dd andss) is expected to be central. A contribution from heavier strange particledecays (mainly from K?+) produced from the fragmentation of the outgo-ing u quark can result in a forward xF distribution for K0
s mesons. Also K0s
mesons from a fragmentation of the outgoing (anti)quark in W+d → c → sand W+u → d processes are expected to be produced in the forward xF
23

region and to carry a larger fraction of the jet energy.– Λ hyperons can be produced from the fragmentation of the nucleon di-quark
remnant promptly and via the decay of heavier strange baryons at xF < 0.Λ hyperons can be produced also at xF > 0 from the outgoing u quarkfragmentation.
– The production of Λ hyperons in neutrino scattering from a valence quarkrequires three quark-antiquark pairs to be created (uu, dd and ss) and isexpected to populate the central region of the xF distribution. There couldalso be a contribution from the outgoing antiquark fragmentation into a Λhyperon (in the W+u → d → Λ process) which can produce these baryonsin the forward xF region.
4.4 p2T distributions
The efficiency corrected p2T distributions of K0
s , Λ and Λ in the data are pre-sented in Figs. 16, 17, 18. They show an exponential behaviour of the formCexp(−B · p2
T ) in the region p2T . 0.5 (GeV2/c2) and a deviation from this
dependence at higher p2T. We measured the slope parameter B in the region
0 < p2T < 0.5 GeV2/c2 for each V 0 category in three kinematic regions: all xF ,
xF < 0 and xF > 0. The results are listed in Table 10. The values of the slopeparameter found in different xF regions are similar, except for Λ hyperons.
Table 10The slope parameter B(GeV/c)−2 of the p2
T distribution for K0s , Λ, Λ measured
separately for the full sample and for xF < 0 and xF > 0 regions in both MC andin data.
V 0 MC DATA
full sample xF < 0 xF > 0 full sample xF < 0 xF > 0
K0s 5.72 ± 0.03 5.61 ± 0.04 5.79 ± 0.03 5.21± 0.10 5.40± 0.21 5.15± 0.11
Λ 4.35 ± 0.03 4.30 ± 0.03 4.58 ± 0.06 4.12± 0.13 4.18± 0.15 4.07± 0.27
Λ 3.89 ± 0.10 4.10 ± 0.13 3.70 ± 0.14 4.42± 0.47 6.59± 0.74 3.30± 0.64
4.5 〈p2T 〉 versus xF distributions
We have also studied the dependence of the average 〈p2T 〉 on xF for K0
s , Λ andΛ (see Figs. 19, 20, 21). For the first time in a neutrino experiment the goodquality of event reconstruction combined with the large statistics of the data
24

collected allows the study of these distributions for neutral strange particles 3 .The observed discrepancy between the data and simulated events in the regionxF & 0.3 could be attributed to the absence of QCD effects in our Monte Carlosimulation program: the so-called soft-gluon effect could change the leadingparticle (xF → 1) behaviour inside the hadronic jet since the forward scatteredquark is strongly accelerated and is therefore expected to radiate gluons, thusbroadening the forward p2
T distribution. It has also been verified that thereis no accumulation of misidentified V 0 in the region where the disagreementbetween the MC simulation and the data is observed.
3 Similar distributions obtained for charged particles in bubble chamber neutrinoexperiments [47] have been used to tune Monte Carlo simulation programs.
25

10-4
10-3
10-2
10-1
1
0 0.1 0.2 0.3 0.4 0.5 0.6 0.7 0.8 0.9 1zV
Arb
itrar
y un
its
10-3
10-2
10-1
0 0.1 0.2 0.3 0.4 0.5 0.6 0.7 0.8 0.9 1zV
Arb
itrar
y un
its
10-3
10-2
10-1
0 0.1 0.2 0.3 0.4 0.5 0.6 0.7 0.8 0.9 1zV
Arb
itrar
y un
its
10-2
10-1
0 0.1 0.2 0.3 0.4 0.5 0.6 0.7 0.8 0.9 1zV
Arb
itrar
y un
its
10-3
10-2
10-1
1
0 0.1 0.2 0.3 0.4 0.5 0.6 0.7 0.8 0.9 1zV
Arb
itrar
y un
its
10-3
10-2
10-1
0 0.1 0.2 0.3 0.4 0.5 0.6 0.7 0.8 0.9 1zV
Arb
itrar
y un
its
Fig. 15. Efficiency corrected z distributions for xF < 0 (left) and for xF > 0 (right)for K0
s (top), Λ (centre) and Λ (bottom).
26

10-2
10-1
1
0 0.2 0.4 0.6 0.8 1 1.2 1.4p
T
2 (GeV2/c2)
Arb
itrar
y un
its
Fig. 16. Efficiency corrected p2T distribu-
tion for K0s .
10-2
10-1
0 0.2 0.4 0.6 0.8 1 1.2 1.4p
T
2 (GeV2/c2)
Arb
itrar
y un
its
Fig. 17. Efficiency corrected p2T distribu-
tion for Λ.
10-2
10-1
0 0.2 0.4 0.6 0.8 1 1.2 1.4p
T
2 (GeV2/c2)
Arb
itrar
y un
its
Fig. 18. Efficiency corrected p2T distribution for Λ.
27

0
0.05
0.1
0.15
0.2
0.25
0.3
0.35
-0.8 -0.6 -0.4 -0.2 0 0.2 0.4 0.6 0.8xF
p T
2 (G
eV2 /c
2 )
Fig. 19. Efficiency corrected 〈p2T 〉 versus
xF distribution for K0s in data (points
with error bars) and MC (histogram).
0
0.05
0.1
0.15
0.2
0.25
0.3
0.35
-0.8 -0.6 -0.4 -0.2 0 0.2 0.4 0.6 0.8xF
p T
2 (G
eV2 /c
2 )
Fig. 20. Efficiency corrected 〈p2T 〉 ver-
sus xF distribution for Λ in data (pointswith error bars) and MC (histogram).
0
0.05
0.1
0.15
0.2
0.25
0.3
0.35
0.4
-0.6 -0.4 -0.2 0 0.2 0.4 0.6xF
p T
2 (G
eV2 /c
2 )
Fig. 21. Efficiency corrected 〈p2T 〉 versus xF distribution for Λ in data (points with
error bars) and MC (histogram).
28

5 STRANGE RESONANCES AND HEAVIER HYPERONS
Apart from many good physics reasons a study of the production of resonancesand heavy hyperons is also of great importance for tuning the LUND modelparameters and for the theoretical interpretation of the Λ and Λ polariza-tion measurements reported in our previous articles [27,28]. This is essentialbecause Λ hyperons originating from the decays Σ? → Λπ, Σ0 → Λγ andΞ → Λπ inherit a polarization from the parent particles and this polariza-tion is different from that of a directly produced Λ. Information about Σ0, Ξ,Σ?, Ξ? and K? yields can be obtained from an analysis of their decays intochannels containing identified neutral strange particles [39,48].
Previous bubble chamber experiments with (anti)neutrino beams suffered froma lack of statistics. For example, the BEBC WA21 Collaboration [24] reportedthe observation of 149 ± 29 K?+, 42 ± 19 K?−, 134 ± 19 Σ?+ and less than10 Σ?− in νµp CC interactions, while the Fermilab 15-ft bubble chamber E380Collaboration [19] found 94± 25 Σ0 and 4 Ξ− in νµNe CC events.
5.1 A procedure for signal extraction
Our aim was to extract the fraction of neutral strange particles which aredecay products of resonances and heavier hyperons from the correspondinginvariant mass distributions. To construct such distributions we combine theneutral strange particle with all possible charged tracks (of appropriate sign)emerging from the primary vertex except those identified as muons or elec-trons. We have also studied the (Λ γ) combinations, where photons are iden-tified as conversions in the detector fiducial volume via our V 0 identificationprocedure. The resulting distributions are fitted by a function describing boththe combinatorial background and the resonance signal.
The combinatorial background (BG) can be approximated by any function ofthe form:
BG = Pn(m−Mth) · Tail(m), (2)
where Pn(m−Mth) is a polynomial of order n vanishing at m = Mth, Mth =MV 0 + mπ, and Tail(m) is any function vanishing at m → ∞ faster than Pn
increases.
We have chosen the following BG parametrization:
BG = a1∆a2e−(a3∆+a4∆2), (3)
where ∆ = m−Mth.
29

For a resonance signal the standard relativistic Breit-Wigner (BW) func-tion [49] is used:
BW (m) =Γ
(m2 −M20 )2 + M2
0 Γ2
(m
q
), with Γ = Γ0
(q
q0
)M0
m(4)
where M0, Γ0 are the resonance mass and width, respectively, and q is themomentum of the decay product in the resonance rest frame (q0 correspondsto M0).
Finally, we have fitted the invariant mass distributions by:
dN
dm= BG(∆) + a5BW ′(m), (5)
for all combinations except (Λ π−), where two peaks due to Σ∗− → Λπ− andΞ− → Λπ− decays are expected. Here BW ′(m) is the Breit-Wigner functionof equation (4) normalized to unity. Such a fit is valid in all cases when theexperimental mass resolution is small compared with the natural width of theresonance.
Similarly, for the (Λ π−) case we have used
dN
dm= BG(∆) + a5BW ′
Σ∗−(m) + a6BW ′Ξ−(m) (6)
where the invariant mass resolution is used for the width Γ0 in the Breit-Wigner function corresponding to the Ξ− decay. In the above formulae a1 toa6 are parameters of the fit.
In such an approach using the HESSE and MINOS procedures of MINUIT [50],the parameter a5(a6) gives the number of signal events with the correspondingerror which takes into account possible correlations between different param-eters.
As a consistency check we have also tried an alternative approach which wasto fit the invariant mass distributions with:
dN
dm= (1 + a5BW (m))BG(∆), (7)
and, similarly, with
dN
dm= (1 + a5BWΣ∗−(m) + a6BWΞ−(m))BG(∆), (8)
and extracted the corresponding number of signal events.
The results obtained using these two approaches were found to be similar. Inwhat follows we present our results using the first method.
30

5.2 Results
The yields of resonances and heavy hyperons have been studied in differentkinematic regions and for neutrino interactions on different target nucleons.
In NOMAD it is to some extent possible to separate neutrino interactions onthe neutrons and protons by imposing a cut on the sum of charges (Qtot) ofall the outgoing tracks at the primary neutrino interaction vertex.
We select νp events requiring Qtot ≥ 1. According to the MC simulation, in thisproton-like sample 76% of the events are true νp interactions. The νn eventsare selected by the requirement Qtot ≤ 0. The purity of the correspondingneutron-like sample is about 85%.
Since the hadron production mechanisms in the target and in the currentfragmentation regions are expected to be different, it is important to studyseparately the yields of resonances and heavy hyperons at xF < 0 and xF > 0.Such a study is also necessary for a correct theoretical interpretation of the Λ(Λ) polarization measurements reported in our previous papers [27,28].
In the following we denote as MC(pred.) the true number of heavy strange par-ticles reconstructed in the MC, and MC(meas.) the number of heavy strangeparticles extracted from the MC sample using our fitting procedure. Bothquantities are normalized to the number of νµ CC events in the data.
Note that MC(pred.) and MC(meas.) can be slightly different due to limita-tions of the signal extraction procedure described in section 5.1. The thresholdand smearing effects in the invariant mass distributions are at the origin of thisdiscrepancy. The ratio MC(pred.)/MC(meas.) will therefore be used to correctthe yields of heavy strange particles extracted from the data (see section 5.3).
The following resonances and heavier hyperons have been studied in thepresent analysis.
5.2.1 K?±
The fitted (K0s π±) invariant mass distributions are shown in Fig. 22 for both
MC and data samples. Detailed information on the number of extracted K?±
events and the K?±/K0s ratio is given in Tables 11 and 12. For the K?± mass
and width we have used 891.66 MeV and 50.8 MeV respectively. The q0 valueis 291 MeV/c [40].
It is interesting to note a more abundant K?+ than K?− production in νµ
CC DIS. This can be explained by the fact that the outgoing u quark can
31

0
500
1000
1500
2000
2500
0.6 0.7 0.8 0.9 1 1.1 1.2 1.3 1.4 1.5
M(K0π+) (GeV/c2)
0
100
200
300
400
500
600
700
0.6 0.7 0.8 0.9 1 1.1 1.2 1.3 1.4 1.5
M(K0π+) (GeV/c2)
0
200
400
600
800
1000
1200
0.6 0.7 0.8 0.9 1 1.1 1.2 1.3 1.4 1.5
M(K0π-) (GeV/c2)
0
50
100
150
200
250
300
350
0.6 0.7 0.8 0.9 1 1.1 1.2 1.3 1.4 1.5
M(K0π-) (GeV/c2)
Fig. 22. K0sπ
+ (top) and K0sπ
− (bottom) invariant mass distributions for both MC(left) and data (right). The solid lines are the results of the fit, while the dotted linesdescribe the background term. In the MC plots the additional histograms refer to thereconstructed true heavy strange particles.
fragment directly into a K?+, while both u and s quarks needed to produce aK?− meson have to be created in the fragmentation process.
One can see that there is a significant difference between K?± yields in thedefault MC simulation and the NOMAD data (about a factor of 2).
5.2.2 Σ?±
For the Σ?± mass and width we have taken the values from [40]: m(Σ?+)=1382.8MeV, Γ(Σ?+)=35.8 MeV, m(Σ?−)=1387.2 MeV, Γ(Σ?−)=39.4 MeV. The q0
value is 208 MeV/c.
32

Table 11K?+ → K0
sπ+ summary
N(K?+) full sample K0s fragmentation region type of target nucleon
xF < 0 xF > 0 νp νn
DATA 2036 ± 121 315± 56 1731 ± 108 1006 ± 87 1032 ± 84
MC(meas.) 5373 ± 104 726± 47 4744 ± 93 1963 ± 67 3516 ± 80
MC(pred.) 5953 886 5067 2206 3748
N(K?+)/N(K0s ) uncorrected
DATA (%) 13.5 ± 0.8 9.7 ± 1.7 14.6 ± 0.9 15.7 ± 1.4 11.9 ± 1.0
MC (%) 27.3 ± 0.5 14.5± 0.9 31.6 ± 0.6 29.0 ± 1.0 26.5 ± 0.6
Table 12K?− → K0
sπ− summary
N(K?−) full sample K0s fragmentation region type of target nucleon
xF < 0 xF > 0 νp νn
DATA 1146 ± 89 288± 44 865 ± 78 377± 52 775 ± 73
MC(meas.) 2304 ± 74 639± 38 1664 ± 63 729± 39 1576 ± 63
MC(pred.) 2467 723 1743 734 1733
N(K?−)/N(K0s ) uncorrected
DATA (%) 7.6± 0.6 8.9 ± 1.3 7.3± 0.7 5.9 ± 0.8 8.9± 0.8
MC (%) 11.5 ± 0.4 12.7± 0.8 11.1 ± 0.4 10.8 ± 0.6 11.9 ± 0.5
The fitted invariant mass distributions for (Λ π±) combinations in both MCand data samples are shown in Fig. 23. Detailed information on the numberof extracted Σ?± events and the Σ?±/Λ ratio is given in Tables 13 and 14.
A striking difference between the Σ?± yields in the default MC simulation andin the NOMAD data (a factor of about 3 or even larger) is observed.
5.2.3 Ξ−
For the Ξ− mass we have used 1321.32 MeV [40], for the width the experi-mental resolution of 10 MeV has been taken. The q0 value is 139 MeV/c.
The bottom plots in Fig. 23 show evidence for Ξ− → Λπ− decays. Detailedinformation on the number of extracted Ξ− events and the Ξ−/Λ ratio is givenin Table 15.
33

0
200
400
600
800
1000
1200
1400
1.1 1.2 1.3 1.4 1.5 1.6 1.7 1.8 1.9 2
M(Λ0π+) (GeV/c2)
0
100
200
300
400
500
1.1 1.2 1.3 1.4 1.5 1.6 1.7 1.8 1.9 2
M(Λ0π+) (GeV/c2)
0
100
200
300
400
500
1.1 1.2 1.3 1.4 1.5 1.6 1.7 1.8 1.9 2
M(Λ0π-) (GeV/c2)
0
50
100
150
200
250
1.1 1.2 1.3 1.4 1.5 1.6 1.7 1.8 1.9 2
M(Λ0π-) (GeV/c2)
Fig. 23. Λπ+ (top) and Λπ− (bottom) invariant mass distributions for both MC(left) and data (right). The solid lines are the results of the fit, while the dottedlines describe the background term. In the MC plots the additional histograms referto the reconstructed true heavy strange particles.
5.2.4 Σ0
For the Σ0 mass we have taken the value from [40]: m(Σ0)=1192.6 MeV, whilefor the width the experimental resolution of 9 MeV has been used. The q0
value is 74 MeV/c. The Σ0 peak has been fitted by a Gaussian function.
Fig. 24 shows the fitted invariant mass distributions for (Λ γ) combinationsin both Monte Carlo and data samples. The corresponding photons have beenreconstructed as conversions in the DC fiducial volume and identified by ourV 0 identification procedure. The quality of the photon reconstruction is illus-trated by the (γγ) invariant mass distributions shown in Fig. 25 for both MCand data: a peak corresponding to the π0 signal is evident.
34

Table 13Σ?+ → Λπ+ summary
N(Σ?+) full sample Λ fragmentation region type of target nucleon
xF < 0 xF > 0 νp νn
DATA 416± 80 358 ± 65 63± 47 297± 61 120± 51
MC(meas.) 2070 ± 68 1427 ± 57 649± 37 1321 ± 49 754± 46
MC(pred.) 1783 1254 529 1150 634
N(Σ?+)/N(Λ) uncorrected
DATA (%) 5.2 ± 1.0 6.4 ± 1.2 2.5 ± 1.9 8.6 ± 1.8 2.6 ± 1.1
MC (%) 17.0± 0.6 15.9 ± 0.6 20.6± 1.2 32.6± 1.2 9.3 ± 0.6
Table 14Σ?− → Λπ− summary
N(Σ?−) full sample Λ fragmentation region type of target nucleon
xF < 0 xF > 0 νp νn
DATA 206± 63 121 ± 51 93± 37 100 ± 35 111 ± 52
MC(meas.) 551± 48 410 ± 42 145 ± 25 18± 22 528 ± 43
MC(pred.) 489 362 126 33 456
N(Σ?−)/N(Λ) uncorrected
DATA (%) 2.6± 0.8 2.2± 0.9 3.7± 1.5 2.9 ± 1.0 2.4± 1.1
MC (%) 4.5± 0.4 4.6± 0.5 4.6± 0.8 0.4 ± 0.5 6.5± 0.5
A summary of the number of extracted Σ0 events and the Σ0/Λ ratio is givenin Table 16.
5.3 Yields of strange resonances and heavy hyperons
The integral yields of strange resonances and heavy hyperons produced in νµ
CC are computed multiplying the results of the fits by the ratio MC(pred.)/MC(meas.).
The results are presented in Table 17 as fractions of V 0 produced by heavystrange particles and resonances.
35

Table 15Ξ− → Λπ− summary
N(Ξ−) full sample Λ fragmentation region type of target nucleon
xF < 0 xF > 0 νp νn
DATA 42± 30 21± 24 18± 17 54± 18 −11± 24
MC(meas.) 43± 18 33± 15 13 ± 9 9± 8 36± 16
MC(pred.) 60 47 15 14 47
N(Ξ−)/N(Λ) uncorrected
DATA (%) 0.5± 0.4 0.4 ± 0.4 0.7 ± 0.7 1.6 ± 0.5 −0.2± 0.5
MC (%) 0.4± 0.2 0.4 ± 0.2 0.4 ± 0.3 0.2 ± 0.2 0.4 ± 0.2
0
50
100
150
200
250
1.1 1.15 1.2 1.25 1.3 1.35 1.4 1.45 1.5
M(Λ0γ) (GeV/c2)
0
10
20
30
40
50
1.1 1.15 1.2 1.25 1.3 1.35 1.4 1.45 1.5
M(Λ0γ) (GeV/c2)
Fig. 24. Λγ invariant mass distributions for both MC (left) and data (right). The MCplot shows the expected signal peak and background contributions from Ξ0 → Λπ0
and Σ?0 → Λπ0 decays with only one reconstructed photon.
5.4 Discussion
The results of our study confirm discrepancies reported earlier [14] in the de-scription of the strange resonances and heavy hyperon production in neutrinointeractions by the LUND model with default parameters [30,31]. These re-sults could be potentially used to tune the MC parameters responsible forthe fragmentation into strange particles. Moreover, an additional analysis ofevents with multiple production of neutral strange particles could be veryuseful in this respect. Such an analysis is currently in progress.
36

0
500
1000
1500
2000
2500
3000
0 0.1 0.2 0.3 0.4 0.5 0.6 0.7
M(γγ) (GeV/c2)
Ent
ries
0
100
200
300
400
500
600
0 0.1 0.2 0.3 0.4 0.5 0.6 0.7
M(γγ) (GeV/c2)
Ent
ries
Fig. 25. γγ invariant mass distributions for MC (left) and data (right). Both photonshave been reconstructed as conversions in the DC fiducial volume and identified byour V 0 identification procedure. A clear peak corresponding to the π0 signal is visiblein both distributions. The parameters P6 and P7 show the mass and the width of theGaussian function after the fit.
Table 16Σ0 → Λγ summary
N(Σ0) full sample Λ fragmentation region type of target nucleon
xF < 0 xF > 0 νp νn
DATA 29± 10 17± 9 16± 7 16± 7 13± 7
MC(meas.) 82± 12 50± 9 37± 8 19± 7 61± 10
MC(pred.) 80 57 22 22 57
N(Σ0)/N(Λ) uncorrected
DATA (%) 0.4± 0.1 0.3 ± 0.2 0.7 ± 0.3 0.5± 0.2 0.3± 0.2
MC (%) 0.7± 0.1 0.6 ± 0.1 1.2 ± 0.3 0.5± 0.2 0.8± 0.1
Table 17Corrected fractions (in %) of observed K0
s and Λ decays that originate from thedecays of strange resonances and heavy hyperons in the NOMAD data compared tothe default MC predictions.
K?+ → K0sπ
+ K?− → K0sπ
− Σ?+ → Λπ+ Σ?− → Λπ− Σ0 → Λγ Ξ− → Λπ−
DATA 15.5 ± 0.9 8.7± 0.7 5.8± 1.1 2.6± 0.8 7.3± 2.4 1.9± 1.7
MC 31.4 13.1 16.6 3.9 12.7 1.5
37

6 CONCLUSION
We have reported the results of a study of strange particle production in νµ
CC interactions using the data from the NOMAD experiment. Our analysisis based on a sample of νµ CC events containing 15074 identified K0
s , 8087identified Λ and 649 identified Λ decays. This V 0 sample represents at leasta factor of 5 increase in statistics compared to previous (anti)neutrino exper-iments performed with bubble chambers. Yields of neutral strange particles(K0
s , Λ, Λ) have been measured in this analysis as a function of kinematicvariables. For Λ production such measurements are performed for the firsttime in a neutrino experiment. The decays of resonances and heavy hyperonswith identified K0
s and Λ in the final state have been analyzed. Clear signalscorresponding to K?±, Σ?±, Ξ− and Σ0 have been observed. This study is po-tentially interesting for the tuning of Monte Carlo simulation programs and isalso of special importance for a quantitative theoretical interpretation of theΛ and Λ polarization measurements reported earlier [27,28].
38

Acknowledgements
We gratefully acknowledge the CERN SPS accelerator and beam-line stafffor the magnificent performance of the neutrino beam. We also thank thetechnical and secretarial staff of the collaborating institutes. The experimentwas supported by the following funding agencies: Australian Research Council(ARC) and Department of Industry, Science, and Resources (DISR), Aus-tralia; Institut National de Physique Nucleaire et Physique des Particules(IN2P3), Commissariat a l’Energie Atomique (CEA), France; Bundesminis-terium fur Bildung und Forschung (BMBF, contract 05 6DO52), Germany;Istituto Nazionale di Fisica Nucleare (INFN), Italy; Joint Institute for NuclearResearch and Institute for Nuclear Research of the Russian Academy of Sci-ences, Russia; Fonds National Suisse de la Recherche Scientifique, Switzerland;Department of Energy, National Science Foundation (grant PHY-9526278),the Sloan and the Cottrell Foundations, USA.
39

References
[1] S.J.Barish et al., Phys. Rev. Lett. 33 (1974) 1446
[2] H.Deden et al., Phys. Lett. B58 (1975) 361
[3] J.P.Berge et al., [E45 Collaboration], Phys. Rev. Lett. 36 (1976) 127
[4] H.Deden et al., Phys. Lett. B67 (1977) 474
[5] J.P.Berge et al., [E45 Collaboration], Phys. Rev. D18 (1978) 1359
[6] O.Erriquez et al., Nucl. Phys. B140 (1978) 123
[7] V.V.Ammosov et al., Nucl. Phys. B162 (1980) 205
[8] N.J.Baker et al., [E427 Collaboration], Phys. Rev. D24 (1981) 2779
[9] V.V.Ammosov et al., Nucl. Phys. B177 (1981) 365
[10] R.Brock et al., [E31 Collaboration], Phys. Rev. D25 (1982) 1753
[11] H.Grassler et al., Nucl. Phys. B194 (1982) 1
[12] P.Bosetti et al., [WA47 Collaboration], Nucl. Phys. B209 (1982) 29
[13] D.Son et al., Phys. Rev. Lett. 49 (1982) 1128, 49 (1982) 1800 (erratum)
[14] D.Allasia et al., [WA25 Collaboration], Nucl. Phys. B224 (1983) 1
[15] C.C.Chang et al., Phys. Rev. D27 (1983) 2776
[16] D.Son et al., Phys. Rev. D28 (1983) 2129
[17] D.Allasia et al., [WA25 Collaboration], Phys. Lett. B154 (1985) 231
[18] G.T.Jones et al., [WA21 Collaboration], Z. Phys. C28 (1985) 23
[19] N.J.Baker et al., [E380 Collaboration], Phys. Rev. D34 (1986) 1251
[20] W.A.Mann et al., Phys. Rev. D34 (1986) 2545
[21] V.V.Ammosov et al., [SKAT Collaboration], Z. Phys. C30 (1986) 183
[22] V.V.Ammosov et al., Z. Phys. C36 (1987) 377
[23] S.Willocq et al., [WA59 Collaboration], Z. Phys. C53 (1992) 207
[24] G.T.Jones et al., [WA21 Collaboration], Z. Phys. C57 (1993) 197
[25] D.DeProspo et al., [E632 Collaboration], Phys. Rev. D50 (1994) 6691
[26] J.Altegoer et al., [NOMAD Collaboration], Nucl. Instr. and Meth. A404 (1998)96
[27] P.Astier et al., [NOMAD Collaboration], Nucl. Phys. B588 (2000) 3
40

[28] P.Astier et al., [NOMAD Collaboration], Nucl. Phys. B605 (2001) 3
[29] J.Altegoer et al., [NOMAD Collaboration], Phys. Lett. B431 (1998) 219P.Astier et al., [NOMAD Collaboration], Phys. Lett. B453 (1999) 169P.Astier et al., [NOMAD Collaboration], Phys. Lett. B483 (2000) 387P.Astier et al., [NOMAD Collaboration], Nucl. Phys. B611 (2001) 3
[30] G.Ingelman, LEPTO version 6.1, “The Lund Monte Carlo for Deep InelasticLepton-Nucleon Scattering”, TSL-ISV-92-0065 (1992)G.Ingelman, A.Edin, J.Rathsman, LEPTO version 6.5, Comp. Phys. Comm.101 (1997) 108, [hep-ph/9605286]
[31] T.Sjostrand, “PYTHIA 5.7 and JETSET 7.4: physics and manual”, LU-TP-95-20 (1995), [hep-ph/9508391]T.Sjostrand, Comp. Phys. Comm 39 (1986) 347, 43 (1987) 367
[32] GEANT : Detector Description and Simulation Tool, CERN ProgrammingLibrary Long Writeup W5013, GEANT version 3.21
[33] M.Gluck, E.Reya, A.Vogt, Z. Phys. C53 (1992) 127
[34] H.Plothow-Besch, Comp. Phys. Comm. 75 (1993) 396
[35] P.Astier et al., [NOMAD Collaboration], “Prediction of neutrino fluxes in theNOMAD experiment”, paper in preparation
[36] M.Anfreville et al., “The drift chambers of the NOMAD experiment”,hep-ex/0104012, to be published in Nucl. Instr. and Meth.
[37] G.Bassompierre et al., Nucl. Instr. and Meth. A403 (1998) 363;G.Bassompierre et al., Nucl. Instr. and Meth. A411 (1998) 63
[38] D.Autiero et al., Nucl. Instr. and Meth. A373 (1996) 358;D.Autiero et al., Nucl. Instr. and Meth. A387 (1997) 352;D.Autiero et al., Nucl. Instr. and Meth. A411 (1998) 285
[39] D.V.Naumov, PhD Thesis, JINR, Dubna, Russia, 2001, in Russian
[40] Review of Particle Properties, Eur. Phys. J. C15 (2000)
[41] G.T.Jones et al., [WA21 Collaboration], Z. Phys. C27 (1985) 43
[42] P.D.Acton et al., [OPAL Collaboration], Z. Phys. C56 (1992) 521
[43] P.Abreu et al., [DELPHI Collaboration], Z. Phys. C65 (1995) 587
[44] M.R.Adams et al., [E665 Collaboration], Z. Phys. C61 (1994) 539
[45] M.Derrick et al., [ZEUS Collaboration], Z. Phys. C68 (1995) 29
[46] S.Aid et al., [H1 Collaboration], Nucl. Phys. B480 (1996) 3
[47] P.C.Bosetti et al., [WA21 & WA47 Collaboration], Z. Phys. C46 (1990) 377G.T.Jones et al., [WA21 Collaboration], Z. Phys. C25 (1984) 121
41

[48] C.Lachaud, PhD Thesis, Universite Denis Diderot (Paris 7), May 2000, inFrench
[49] J.D.Jackson, Nuovo Cimento 34 (1964) 1644
[50] MINUIT package, CERN Program Library Long Writeup D506 (1994)
42