quest for the dynamics of νμ→ντ conversion
TRANSCRIPT
arX
iv:h
ep-p
h/00
1009
2v2
4 J
un 2
001
IFUSP-DFN/056-2000
Quest for the dynamics of νµ → ντ conversion
A. M. Gago1,2 ∗, E. M. Santos1 †, W. J. C. Teves1 ‡ and R. Zukanovich Funchal1 §
1 Instituto de Fısica, Universidade de Sao Paulo, C. P. 66.318, 05315-970
Sao Paulo, Brazil2 Seccion Fısica, Departamento de Ciencias, Pontificia Universidad Catolica del Peru,
Apartado 1761
Lima, Peru
Abstract
We perform a quantitative analysis of the capability of K2K, MINOS,
OPERA and a neutrino factory in a muon collider to discriminate the
standard mass induced vacuum oscillation from the pure decoherence
solution to the atmospheric neutrino problem and thereby contribute
to unravel the dynamics that governs the observed νµ disappearance.
Typeset using REVTEX
∗Email address: [email protected]
†Email address: [email protected]
‡Email address: [email protected]
§Email address: [email protected]
1
I. INTRODUCTION
Two years ago, the Super-Kamiokande (SuperK) atmospheric neutrino data as-tonished the world giving the first compelling evidence in favor of νµ → ντ oscil-lation [1]. This incredible result has since been confirmed by other atmosphericneutrino experiments [2,3], as well as by the preliminary K2K νµ disappearanceexperiment result [4], making unquestionable the fact that neutrinos suffer flavorconversion.
Naively, one may think that proves neutrinos have non-zero mass and that thenext challenge for experimentalists is simply to determine the neutrino mass squareddifferences and the texture of the neutrino mixing matrix. Indeed, if the dynamicsof neutrino flavor change is mass induced in the standard way [5], this is obviouslythe next logical step. Unfortunately, this is not an established fact.
Although the atmospheric neutrino data collected up to now allow one to definiteexclude some energy dependencies for the νµ → ντ conversion probability [6], someinteresting possibilities, such as neutrino decay [7] and pure quantum decoherence [8]are capable of explaining the data comparably well to the standard mass inducedoscillation mechanism. This in spite of the fact that the dynamics behind neutrinodecay and pure decoherence give rise to a νµ survival probability monotonicallydecreasing with the neutrino energy while the mass induced mechanism leads toa harmonic probability of oscillation. We therefore believe that another importantexperimental task should be to unravel the nature of the flavor changing mechanism.We have to point out that the neutrino decay scenario is also mass induced, butthroughout this paper when we allude to the mass induced mechanism, we will bereferring to the standard neutrino flavor oscillation scenario.
Many, if not all, of the proposed future neutrino long baseline experiments weredesigned to measure νµ → ντ oscillations in order to pin down the oscillation pa-rameters having in mind the standard mass induced oscillation mechanism. It isimportant to verify their real capabilities to discriminate among different flavorchanging dynamics.
The purpose of this paper is to investigate to what extent K2K and the nextgeneration neutrino oscillation experiments will be able to discriminate the massinduced νµ → ντ oscillation solution [9] to the atmospheric neutrino problem (ANP),from the recently proposed pure decoherence one [8]. We do not investigate in thispaper the decay mechanism, since it implies in the existence of sterile neutrinos,giving rise to a richer phenomenology, this study will be reported elsewhere [10].
The outline of the paper is as follows. In Sec. II, we briefly review the massinduced and the pure decoherence mechanisms of flavor conversion. In Sec. III, wedefine the statistical significance tests we will use in order to quantify the separationbetween the two ANP solutions. In Sec. IV, we discuss the power of discriminationof the mass induced oscillation solution to the ANP from the dissipative one atK2K [11], MINOS [12], OPERA [13] and a possible neutrino factory in a muoncollider [14]. Finally, in Sec. V, we present our conclusions.
2
II. REVIEW OF THE FORMALISM
The time evolution of neutrinos created at a given flavor νµ by weak interactions,as of any quantum state, can be described using the density matrix formalism bythe Liouville equation [15]. If we add an extra term L[ρµ] to the Liouville equation,quantum states can develop dissipation and irreversibility [15,16]. The generalizedLiouville equation for ρµ(t) can then be written as [15]
dρµ(t)
dt= −ı[H, ρµ(t)] + L[ρµ(t)], (1)
where the effective hamiltonian H is, in vacuum, given by
H =
[
∆ 00 −∆
]
, (2)
where ∆ = (m22 − m2
1)/4Eν , we have already considered ultra-relativistic neutrinosof energy Eν and the irrelevant global phase has been subtracted out. We assumehere oscillation only between νµ and ντ in a two generation scheme.
The most general parametrization for L[ρ] contains six real parameters whichare not independent if one assumes the complete positivity condition [15]. In one ofthe simplest situation, which in fact physically arises when the weak coupling limitcondition is satisfied, only one of the parameter, γ, has to be considered. In thislimit, Eq. (1) can be solved to calculate the [15]
P (νµ → ντ ) =1
2sin2 2θ [1 − e−2γL cos(2∆L)], (3)
the probability of finding the neutrino produced in the flavor state νµ in the flavorstate ντ after traveling a distance L under the influence of quantum dissipationdriven by the parameter γ.
When γ = 0, we get the usual mass induced oscillation (MIO) probability in twogeneration. The survival probability, in this case, is the standard one
P (νµ → ντ ) =1
2sin2 2θ [1 − cos(2∆L)]. (4)
On the other hand, if neutrinos are massless or degenerate (∆m2 = 0) andweak interaction eigenstates are equal to mass eigenstates, even though standardoscillations cannot occur, flavor conversion can still take place through the pure de-coherence mechanism (PDM) [17]. Explicitly, the neutrino flavor change probability,in the simplest case where a single decoherence parameter is considered, becomes
P (νµ → ντ ) =1
2[1 − e−2γL]. (5)
We will assume here for PDM that γ = γ0(Eν/GeV)−1, where γ0 is a constantgiven in GeV. This Ansatz may be motivated by the assumption that the exponentin Eq. (5) behaves like a scalar under Lorentz transformations [8].
3
Note that here we will be studying both MIO and PDM in a two generationframework since this is enough to explain well the atmospheric neutrino data.Notwithstanding, one may wonder about the contribution from electron neutrinos.If PDM really takes place in nature, it should in fact involve all three neutrino fla-vors. We can have some insight on what can happen in this case. From the results ofRefs. [17,18] on the limits on PDM from SN 1987A data, and with the Ansatz above,we expect the decoherence parameter that accompany the νµ → νe conversion to besmaller than 10−39 GeV. This means that for the energies and distances of the longbaseline experiments we will study here, this effect should be completely negligible.Nevertheless, a complete study of the PDM with three neutrino generations shouldin fact be performed to confirm this assumption.
III. STATISTICAL SIGNIFICANCE TEST
In order to define the capability of an experiment to discriminate mass inducedνµ → ντ oscillation from pure decoherence, we define the number of standard devi-ations of separation between MIO and PDM as nσ =
√χ2 where
χ2(γ0, sin2 2θ, ∆m2) = 2[NPDM(γ0) − NMIO(sin2 2θ, ∆m2)]
+ 2NMIO(sin2 2θ, ∆m2) ln
(
NMIO(sin2 2θ, ∆m2)
NPDM(γ0)
)
, (6)
is the confidence level according to the procedure proposed by the Particle DataBook [19]. Here, NPDM(γ0) is the total number of events theoretically expected ifPDM is the solution to the ANP and NMIO(sin2 2θ, ∆m2) is the total number ofevents that can be observed by the experiment as a function of the two parametersinvolved in the MIO mechanism.
For each experiment we have studied, we have computed two different types ofcontour level curves.
First, we fix NPDM = NPDM(γbest0 ), at the number corresponding to γ0 = γbest
0 =0.6 × 10⁻²¹ GeV, the best-fit point of the PDM solution to the ANP [8] and varythe MIO parameters in the interval 1 × 10⁻³ eV2 ≤ ∆m2 ≤ 2 × 10⁻² eV2 and0.8 ≤ sin2 2θ ≤ 1 consistent with the atmospheric neutrino data. In this way, weobtain curves of fixed nσ in the plane sin2 2θ × ∆m2.
Second, we fix sin2 2θ = 1 and vary the PDM parameter γ0 in the interval0.25 × 10−21 GeV ≤ γ0 ≤ 1.1 × 10⁻²¹ GeV, as well as the MIO parameter ∆m2 inthe interval 1 × 10⁻³ eV2 ≤ ∆m2 ≤ 2 × 10⁻² eV2. The upper limit of the rangein γ0 is the one allowed by the CHORUS/NOMAD data [8,17], the lower limit wasestimated by using γ0 ∼ 2.54×10⁻¹⁹×(∆m2/eV2) GeV, with ∆m2 = 1.0×10⁻³ eV2.Like this, we can get curves of fixed nσ in the plane γ0 × ∆m2. This allows us toextend our conclusions beyond the best-fit value of the PDM solution to the ANP.
4
IV. PDM VERSUS MIO
We have investigated the capability of K2K [11,20,21] and the next generationneutrino oscillation experiments MINOS [12], OPERA [13,22] and a neutrino factoryin a muon collider [14], to discriminate the PDM solution to the ANP with γ0 ∼0.6 × 10⁻²¹ GeV 1, using the ansatz γ = γ0(Eν/GeV)−1, given in Ref. [8], from thetraditional one due to νµ → ντ MIO in vacuum with ∆m2 ∼ (1.1− 7.8) × 10−3 eV2
and sin2 2θ >∼ 0.84 [9]. We recall that the best-fit point for the MIO solution to theANP is at (sin2 2θ, ∆m2) = (1.0, 3.0 × 10⁻³ eV2) [9].
We would like to point out that the decoherence solution to the ANP is opento two different readings: either it can be viewed as an effect of pure decoherenceor as a combination of quantum decoherence plus vacuum oscillation driven by∆m2 <∼ 10−6 eV2 with sin2 2θ ∼ 1. In the first case, there is a single free parameter(γ0) and the flavor change probability is given by Eq. (5), in the second, there aretwo free parameters (γ0 and sin2 2θ) since the probability will be given by Eq. (3)with cos(2∆L) → 1.
We now present and discuss the results of our study.
A. K2K
In Ref. [8], K2K was cited as a possible experiment to test the novel decoher-ence solution to the ANP. This possibility would be very appealing for K2K is anexperiment which is currently taking data.
In order to verify this, we have calculated the expected number of events in K2Kfor the goal of the experiment, i.e. 1020 protons on target (POT) [4], for threehypotheses: no flavor conversion, mass induced νµ → ντ oscillation with parametersconsistent with SuperK atmospheric neutrino results [9] and the pure decoherencesolution to the ANP [8].
K2K is a νµ → νµ disappearance experiment, where the muon neutrinos that havean average energy of 1.4 GeV are produced by the KEK accelerator, first measuredafter traveling 300 m by the Near Detector, which is a 1 kton water Cherenkovdetector, and finally measured by the Far Detector (FD), the SuperK 22.5 ktonwater Cherenkov detector localized at 250 km from the target. This experiment,which has started taking data last year and has currently accumulated 2.29 × 10¹⁹
POT, seems to be confirming νµ → νµ disappearance as expected by the atmosphericneutrino results [9].
The expected number of events in the FD can be computed as follows
NFD = R N theoFD , (7)
1We remark that in our notation 2γ0 corresponds to γ0 of Ref. [8].
5
where R is the ratio between the number of observed over the number of expectedevents in the Near Detector, we have used the fact that R ∼ 0.84 from Ref. [20],and N theo
FD is the theoretical expectation that can be calculated as
N theoFD = η nFD
∫
ΦFD(E)σ(E)P (νµ → νµ)dE, (8)
where E is the neutrino energy, ΦFD(E) is the νµ flux distribution at the Far De-tector, σ(E) is the total neutrino interaction cross section taken from Ref. [23] andnFD is the number of active targets in the FD. Also, we have introduced a normal-ization factor η which was fixed to 0.65 in order to get the same expected numberof νµ events as K2K for null oscillation. The shape of ΦFD(E), was taken from Ref.[11], but the total flux has been renormalized to account for the number quoted inTable 1 of Ref. [20]. The survival probability P (νµ → νµ) = 1 − P (νµ → ντ ) in twogenerations, with P (νµ → ντ ) either equal to zero (for no νµ → ντ conversion), tothe usual two generation MIO probability (Eq. (4)) or the PDM flavor conversionprobability (Eq. (5)).
We first perform the calculation of the total number of expected events, NFD,in the absence of any flavor change and for oscillation with sin2 2θ = 1 and ∆m2 =3×10⁻³ eV2, 5×10⁻³ eV2 and 7×10⁻³ eV2 for 2.29 ×10¹⁹ POT. These results, whichagree quite well with the K2K estimations presented in Ref. [4], are summarized inTable I. Thus we are confident that our numbers are reasonable and we can proceedto estimate the total number of events expected in the FD when K2K reaches 1020
POT for vacuum oscillation and decoherence. These numbers are also reported inTable I. From this, we can see that the mass induced oscillation and the decoherenceeffect at their best-fit values imply, for the goal of the K2K experiment, values for thetotal number of νµ events which are statistically compatible, hence the two solutionswill be indistinct at K2K.
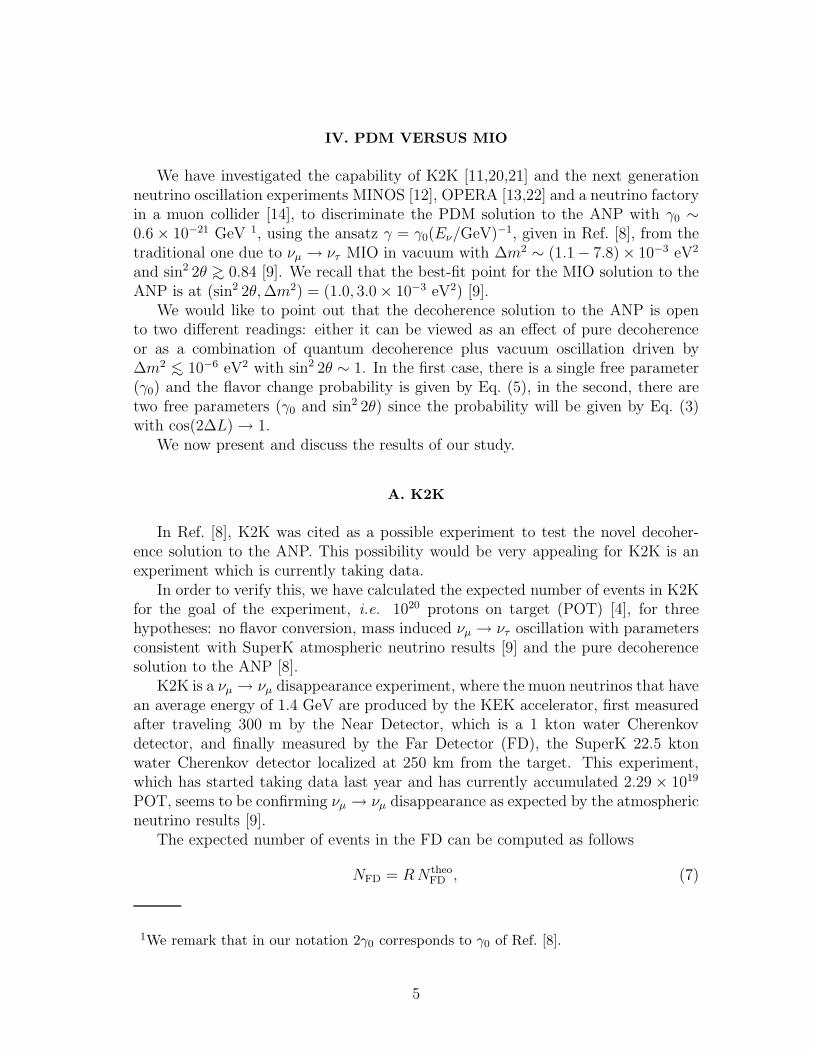
One may wonder about the energy distribution of the K2K events,which, in principle, could be used to discriminate the solutions. Weshow, in Fig. 1, the Monte Carlo simulated reconstructed neutrino spec-trum for one ring µ-like events at SuperK taken from Ref. [21] for ∆m2 =0.0015 eV2, 0.0028 eV2, 0.005 eV2 and 0.01 eV2 and sin2 2θ = 1, as well as our esti-mation of the distortion expected for the best-fit point of the PDM solution to theANP. The latter was done simply by multiplying the bin content for no oscillationby the average PDM survival probability in the bin.
From Fig. 1, we see that if one takes into account only the statistic error, com-pletely disregarding the systematic one, the curves are already virtually indistin-guishable so that one unfortunately can hardly hope to discriminate between thesetwo solutions with the K2K data. It is important to remark that the actual spec-trum is currently under study, so what we present here can be viewed as a tendencywhich indicates that, even if one compares only the shape for the best-fit values ofthe two solutions, this type of discrimination will be very difficult in K2K.
In Figs. 2 and 3, we show the result of the statistical significance tests for K2K,as proposed in Sec. III. These curves were calculated with the total number of
6

events NFD and, although this is not directly related to what is plotted in Fig. 1,it takes us basically to the same conclusion, i.e. for data compatible with 2.2 ×10⁻³ eV2 ≤ ∆m2 ≤ 4.0×10⁻³ eV2 the maximal separation between the two solutionscannot exceed ∼ 2 σ if γ0 = γbest
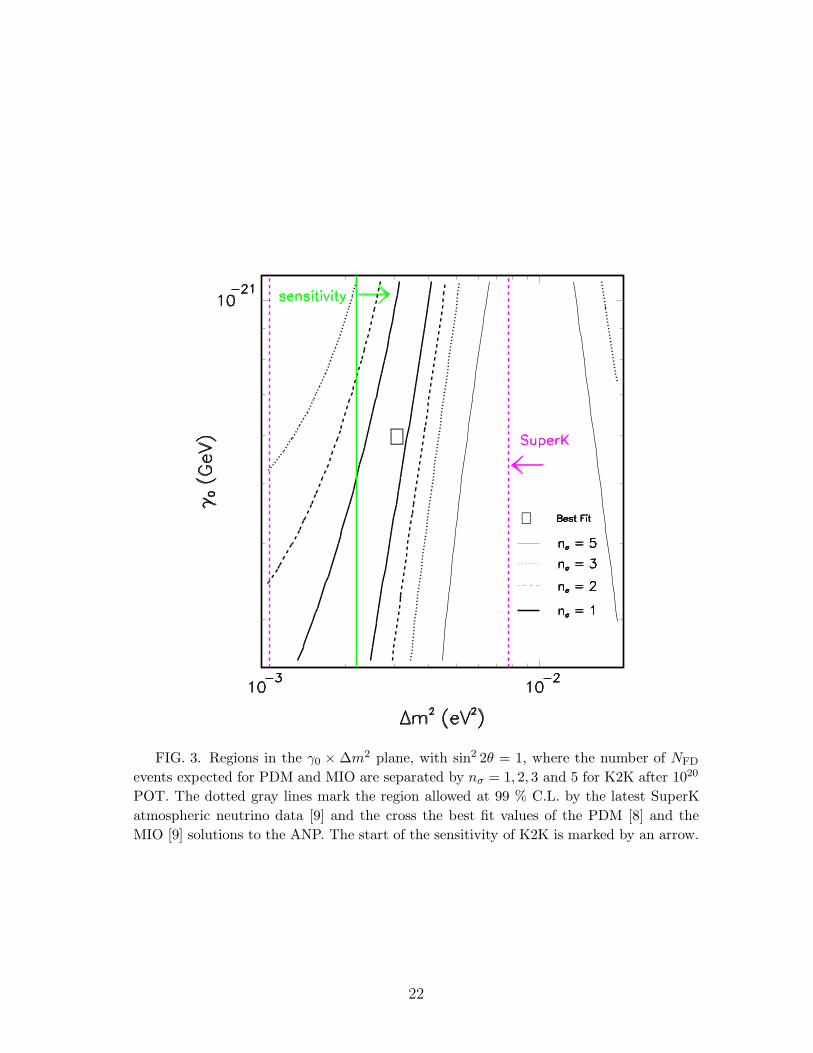
0 . We see in Fig. 3 that for data consistent with2.2× 10−3 eV2 ≤ ∆m2 ≤ 3.5× 10⁻³ eV2 the separation is always less than 3 σ, ∀γ0.A separation of 5 or more σ can only be achieved if the data is compatible with∆m2 >∼ 7×10⁻³ eV2. We also see that the point which correspond to the best-fit ofthe MIO and the PDM solutions is inside the nσ <∼ 1 region. Therefore, we concludethat it will be rather difficult to disentangle the two ANP solutions before the arrivalof the next generation neutrino experiments.
B. MINOS
The MINOS experiment [12] is part of the Fermilab NuMI Project. The neutrinoswhich constitute the MINOS beam will be the result of the decay of pions and kaonsthat will be produced by the 120 GeV proton high intensity beam extracted fromthe Fermilab Main Injector. There will be two MINOS detectors, one located atFermilab (the near detector) and another located in the Soudan mine in Minnesota,about 732 km away (the far detector of 5.4 kton).
According to Ref. [24], MINOS will be able to measure independently the ratesand the energy spectra for muonless (0µ) and single muon (1µ) events, which arerelated to the neutral current (nc) and charged current (cc) reactions. Three differentneutrino energy regions are possible: low (Eν ∼ 3 GeV), medium (Eν ∼ 7 GeV)and high (Eν ∼ 15 GeV). For MINOS to operate as a ντ appearance experimenteither the high or medium energy beam is required, since one must be above the τthreshold of 3.1 GeV.
We have studied here two different observables that can be measured in MINOS: the 1µ-event energy spectrum and the 0µ/1µ event ratio. The three different beampossibilities were investigated.
The expected number of 1µ-events in MINOS, dN1µ, can be calculated using [25]
dN1µ
dEν
(Eν) =dNcc
dEν
(Eν) [1 − P (νµ → ντ )] + P (νµ → ντ ) η(Eν) Br(τ → µ) , (9)
where η(Eν) = σντ−cc(Eν)/σνµ−cc(Eν), is the ratio of the cc-cross section for ντ overthe cc-cross section for νµ, Br(τ → µ) is the branching ratio of the tau leptonic decayto muon (18%), dNcc/dEν is the energy spectrum for νµ cc-events in the MINOSfar detector in the case of no flavor change [24] and P (νµ → ντ ) is the probabilityof νµ → ντ conversion.
There are two different ways a muon can be produced; either by the survivingνµ which interact with the detector (first term of Eq. (9)) or by the contributionfrom taus generated by ντ interactions in the detector, after νµ → ντ conversion,followed by τ → νµντµ decay (second term of Eq. (9)). In both cases, the events
7
must trigger the detector and be identified as muons to count as 1µ-events. Here,we have not considered the possible contamination from neutral current events andthe trigger and identification efficiencies were supposed to be 100%.
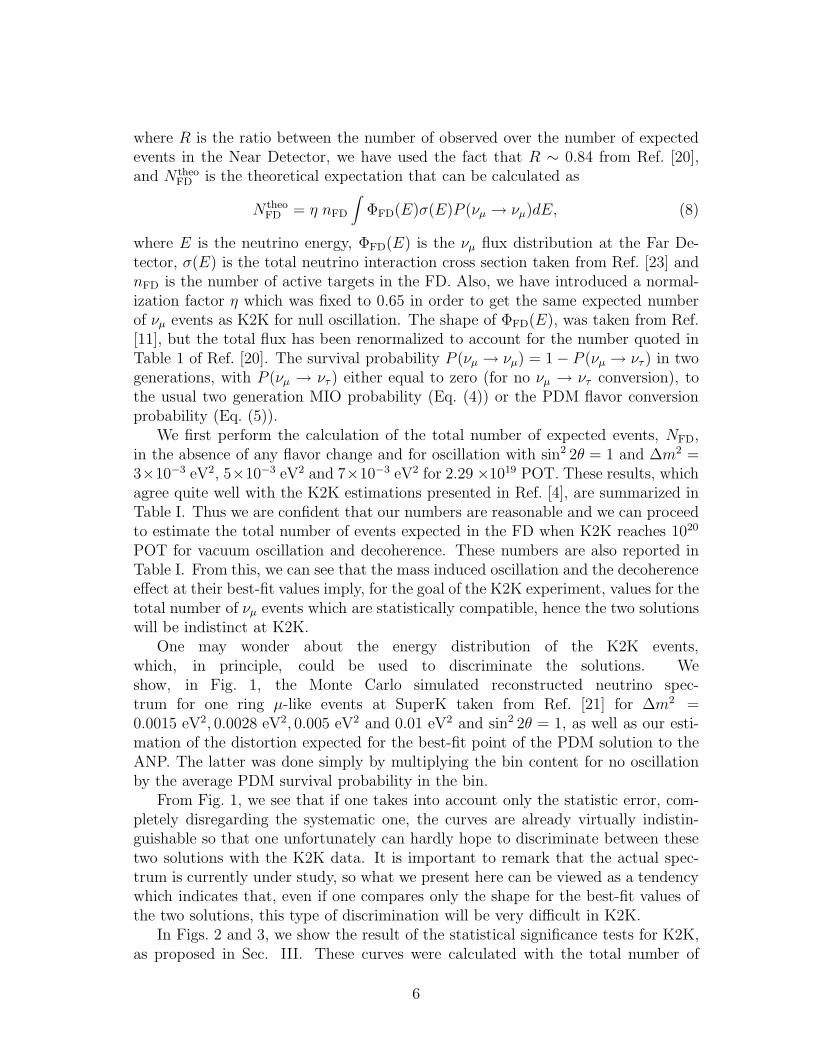
In Fig. 4, we present the 1µ-event energy distribution expected at MINOS forno flavor change and the best-fit parameters of the MIO and of the PDM solutionsto the ANP for 10 kton year (∼ 2 years of running). We can observe that if thefinal choice of beam is the low energy configuration, MINOS will be in the samefooting of K2K, meaning that discrimination between solutions will be extremelydisfavored due to low statistics. In the event of the choice fall on the medium or thehigh energy beam, discrimination will become more likely due to higher statistics.
We show in Fig. 5 the result of the statistical significance test in the ∆m2×sin2 2θplane, for the three beam setups. We see that for ∆m2 = 3 × 10⁻³ eV2, PDM andMIO are separated by less than 2 σ (low), more than 3 σ (medium) and morethan 5 σ (high), ∀ sin2 2θ in the range compatible with SuperK atmospheric data,confirming our previous conclusions on Fig. 4.
We can further point out that, considering the 99 % C.L. sin2 2θ × ∆m2 regionallowed by the SuperK data [9], the two solutions will be indistinguishable within 3σ for 1.7 × 10⁻³ eV2 <∼ ∆m2 <∼ 5.3 × 10⁻³ eV2 in the low energy configuration, for3.0 × 10−3 eV2 <∼ ∆m2 <∼ 4.3 × 10⁻³ eV2 in the medium energy configuration andfor 4.2 × 10⁻³ eV2 <∼ ∆m2 <∼ 6.2 × 10⁻³ eV2 in the high energy configuration.
In Fig. 6, we show the statistical significance test in the plane γ0 ×∆m2 for thethree energy possibilities. The point which correspond to the best-fit of the MIOand the PDM solutions is inside the nσ <∼ 1 region for low, the nσ <∼ 2 region formedium and only for the high energy case it falls into the nσ >∼ 5 region. Here it isagain demonstrated that the medium and high energy setups are preferable to thelow one if the issue is to discriminate the two mechanisms.
We have also computed the ratio R0µ/1µ that should be expected in MINOS as afunction of the free parameters of the flavor changing hypothesis. This ratio has theadvantage that it does not require the understanding of the relative fluxes at thenear and far detectors, it is also quite sensitive to neutrino flavor conversion sincewhen they occur not only 1µ-events are depleted but 0µ-events are enhanced. Thisratio can be written as [25]
R0µ/1µ =
∫
dN0µ(Eν)∫
dN1µ(Eν). (10)
The number of expected 0µ-events can be calculated as
dN0µ
dEν(Eν) = [
dNnc
dEν(Eν) +
dNcc
dEν(Eν)P (νµ → ντ ) η(Eν) (1 − Br(τ → µ))], (11)
where we again supposed no contamination and the trigger and identification ef-ficiencies to be 100%. We can infer dNnc/dEν , the expected energy spectrum forνµ nc-events in the MINOS far detector in the case of no flavor change, using theapproximation
8
dNnc
dEν(Eν) ∼
dNcc
dEν(Eν)
σνµ−nc(Eν)
σνµ−cc(Eν). (12)
The cross sections σνµ−cc, σντ−cc were taken from Ref. [26] and σνµ−nc from Ref.[23].
In Table II, we show our estimation of this ratio for no νµ → ντ conversion,mass induced oscillation for several values of ∆m2 and PDM with γ0 = γbest
0 forthe medium and high energy beam. For the low energy beam this test is ineffectivesince, in this case, MINOS will work essentially like a νµ disappearance experiment.For the medium and high energy beams, the ratio predicted for the best-fit valuesof the parameters of the two solutions seem to be well separated. Nevertheless onehas to take these results carefully, in a real experimental situation, experimentalefficiencies, event contamination, resolution and systematic errors can substanciallyaffect 0µ-event observables.
C. CERN-to-Gran Sasso Neutrino Oscillation Experiments
The new CERN neutrino beam to Gran Sasso is a facility that will direct aνµ beam to the Gran Sasso Laboratory in Italy, at 732 km from CERN. Such abeam together with the massive detectors ICANOE/OPERA [22] in Gran Sassowill constitute a powerful tool for long baseline neutrino oscillation searches. Thenumber of protons on target is expected to be 4.5 ×10¹⁹ per year, the νµ beam willhave an average energy of 17 GeV, the fractions νe/νµ, νµ/νµ and ντ/νµ in the beamare expected to be as low as 0.8%, 2% and 10−7, respectively [27]. The number of νµ
charged current events per protons on target and kton, without neutrino oscillation,is calculated to be 4.7 × 10⁻¹⁷, for 1 GeV ≤ Eν ≤ 30 GeV [27]. These experimentsare supposed to start taking data around 2005 and may be used to try to distinguishthe two ANP solutions.
We have investigated the capability of these detectors, in particular OPERA,working in the νµ → ντ appearance mode, to elucidate which is the correct solutionto the ANP. We have obtained the expected number of ντ events, Nτ , that will bemeasured by OPERA, considering a pure νµ beam, using the following expression
Nτ = A∫
φνµ(E) × P (νµ → ντ ) ×
∑
i=l,h
Br(τ → i) × σντ−cc(E) × ǫi(E) dE, (13)
where φνµis the flux of νµ at the Gran Sasso detector and σντ−cc is the charged
current cross section for ντ , both taken from Ref. [26]. The number of active targetsA can be calculated as A = Cn ×Md ×NA ×109×Np ×Ny where Md is the detectormass in kton, NA × 109 is the number of nucleons per kton (where NA = 6.02× 10²³
is the Avogadro’s number), Ny is the number of years of data taking and Np is thenumber of protons on target per year and Cn = 0.879 is normalization constant thatwe need to introduce in order to be able to reproduce the numbers presented in
9
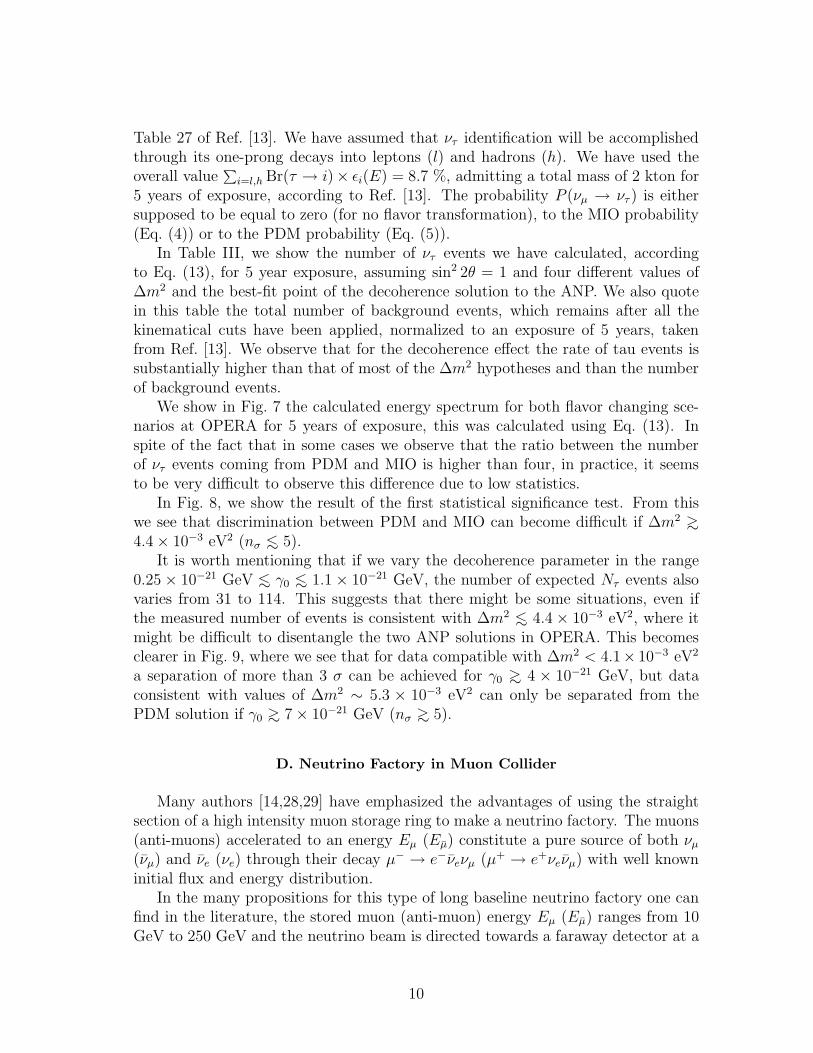
Table 27 of Ref. [13]. We have assumed that ντ identification will be accomplishedthrough its one-prong decays into leptons (l) and hadrons (h). We have used theoverall value
∑
i=l,h Br(τ → i)× ǫi(E) = 8.7 %, admitting a total mass of 2 kton for5 years of exposure, according to Ref. [13]. The probability P (νµ → ντ ) is eithersupposed to be equal to zero (for no flavor transformation), to the MIO probability(Eq. (4)) or to the PDM probability (Eq. (5)).
In Table III, we show the number of ντ events we have calculated, accordingto Eq. (13), for 5 year exposure, assuming sin2 2θ = 1 and four different values of∆m2 and the best-fit point of the decoherence solution to the ANP. We also quotein this table the total number of background events, which remains after all thekinematical cuts have been applied, normalized to an exposure of 5 years, takenfrom Ref. [13]. We observe that for the decoherence effect the rate of tau events issubstantially higher than that of most of the ∆m2 hypotheses and than the numberof background events.
We show in Fig. 7 the calculated energy spectrum for both flavor changing sce-narios at OPERA for 5 years of exposure, this was calculated using Eq. (13). Inspite of the fact that in some cases we observe that the ratio between the numberof ντ events coming from PDM and MIO is higher than four, in practice, it seemsto be very difficult to observe this difference due to low statistics.
In Fig. 8, we show the result of the first statistical significance test. From thiswe see that discrimination between PDM and MIO can become difficult if ∆m2 >∼4.4 × 10⁻³ eV2 (nσ <∼ 5).
It is worth mentioning that if we vary the decoherence parameter in the range0.25 × 10−21 GeV <∼ γ0 <∼ 1.1 × 10⁻²¹ GeV, the number of expected Nτ events alsovaries from 31 to 114. This suggests that there might be some situations, even ifthe measured number of events is consistent with ∆m2 <∼ 4.4 × 10⁻³ eV2, where itmight be difficult to disentangle the two ANP solutions in OPERA. This becomesclearer in Fig. 9, where we see that for data compatible with ∆m2 < 4.1× 10⁻³ eV2
a separation of more than 3 σ can be achieved for γ0 >∼ 4 × 10⁻²¹ GeV, but dataconsistent with values of ∆m2 ∼ 5.3 × 10⁻³ eV2 can only be separated from thePDM solution if γ0 >∼ 7 × 10⁻²¹ GeV (nσ >∼ 5).
D. Neutrino Factory in Muon Collider
Many authors [14,28,29] have emphasized the advantages of using the straightsection of a high intensity muon storage ring to make a neutrino factory. The muons(anti-muons) accelerated to an energy Eµ (Eµ) constitute a pure source of both νµ
(νµ) and νe (νe) through their decay µ− → e−νeνµ (µ+ → e+νeνµ) with well knowninitial flux and energy distribution.
In the many propositions for this type of long baseline neutrino factory one canfind in the literature, the stored muon (anti-muon) energy Eµ (Eµ) ranges from 10GeV to 250 GeV and the neutrino beam is directed towards a faraway detector at a
10
distance corresponding to an oscillation baseline L varying from 730 km to 10 000km.
Here we have explored the neutrino factory as a disappearance νµ → νµ exper-iment. We will explicitly discuss the case when negative muons are stored in thering, a similar calculation can be performed when positive muons are the ones whichdecay producing neutrinos. The relevant observable is the total number of µ thatcan be detected when µ is the produced charged lepton in the beam, i.e. the numberof “same sign muons” that we will denote here by Nµ. We define Nµ, for unpolarizedmuons (see Appendix), as
Nµ = nµMd109NA
m2µπ
E3µ
L2
∫ 1
Eth/Eµ
h0(x)ǫµ(xEµ)
σνµ−cc(xEµ)
Eµ[1 − P (νµ → ντ )]
+σντ−cc(xEµ)
Eµ
Br(τ → µ) P (νµ → ντ )
dx, (14)
where Eµ is the muon source energy, x = Eν/Eµ, Md is the detector mass in ktons,nµ number of useful µ decays, 109NA is the number of nucleons in a kton and mµ isthe mass of the muon. The function h0 contain the νµ energy spectrum normalized to1 explicitly given in the Appendix. The charged current interaction cross sectionsper nucleon σνµ−cc and σντ−cc can be found in Ref. [26]. This number has twocontributions, one from the νµ produced in the decay that survive and arrive at thedetector interacting with it producing a final µ, another from the ντ that is producedby the flavor conversion mechanism and interact in the detector via charge currentproducing τ , which subsequently decays to µ with a branching ratio Br(τ → µ).We have calculated the above integral from Eth = 3 GeV to ensure good detectionefficiency [31], so that we can consider the µ detection efficiency ǫµ to be 100 %,independent of energy.
The muon beam is expected to have an average angular divergence of theO(0.1 mµ/Eµ). It was pointed out in Ref. [29] that this effect is about 10 % sowe have multiplied our calculated number of events by 0.9 to account for this. Thecontribution of the background to the number of muons observed in the detector,that includes muons from charm decays produced by charged current and neutralcurrent interactions in the detector, has been neglected on account that this wouldbe a small global contribution.
Since the final configuration of such a facility is still not defined, we have triedto estimate the optimum configuration in order to maximize the difference betweenmass induced νµ → νµ survival probability and pure decoherence. As observed inRef. [8], at the best-fit point of the MIO and PDM solutions, the argument of thecosine, in the MIO case, and the argument of the exponential, in the PDM case, canbe viewed to be approximately the same. Explicitly,
P (νµ → νµ) ≃1
2[1 + cos(X)] (MIO) , (15)
11
P (νµ → νµ) ≃1
2[1 + e−X ] (PDM) , (16)
where
X = βL
Eν, (17)
with β = 2.54 ∆m2 ∼ 1.0×10¹⁹ γ0, ∆m2 given in eV2, γ0 in GeV and β in GeV/km.So that we can maximize the difference between the probabilities simply by findingthe values of X, which maximize the function
F (X) = | cos(X) − e−X |. (18)
This means that one has to numerically solve for X the transcendental equation
e−X − sin(X) = 0, (19)
with the condition cos(X) > −e−X .Once we find the spectrum of solutions X we can apply Eq. (17) to find the
optimal distance Lopt by choosing a value for Eµ and fixing Eν at the average valueof the observable neutrino energy, i.e. 〈Eν〉 = 0.7 Eµ [30], with β = 6.1 × 10⁻³
GeV/km, the best-fit value of Ref. [8]. We have calculated the maximal differencebetween the two survival probabilities for Eµ = 10 GeV, 20 GeV, 30 GeV and 50GeV as a function of L, but only kept the cases where this difference reaches about50 %. This was obtained for Lopt = 3096 km, 6192 km, 9289 km and Eµ = 10 GeV,20 GeV and 30 GeV, respectively.
Note that using this criteria, we are looking for a maximum in the absolute dif-ference between the survival probabilities (O(0.5)), which is a very strong conditionthat we impose in order to detect and distinguish the signal of νµ disappearance.Since this depends on the number of muon decays, which is big, this ensures thatthe signal will be quite sizable experimentally. We have seen before (see for instanceFig.7), that there are cases of L/E where the absolute difference in the survivalprobabilities is small while the ratio P (νµ → ντ )(PDM)/P (νµ → ντ )(MIO) is big,but since the statistics is poor this ratio is an ambiguous observable to establish thedifference between PDM and MIO.
Using Eq. (14) we have estimated the neutrino event rate, for the three differenthypotheses: no flavor conversion, MIO and PDM.
We addressed a few optimal configurations so that our conclusions may be usefulin planning real experimental setups. For each optimal situation, we have performedour calculation for two possible scenarios: (1) a total of 1.6×10²⁰ µ decays per yearwith a detector of 10 kton; (2) a total of 2.0×10²⁰ µ decays per year with a detectorof 40 kton. Since the event rate is proportional to E3
µ/L2 (see Eq. (14)), the most
conservative configuration is the one with Lopt = 3096 km and Eµ = 10 GeV. Ourresults are summarized in Table IV. It is clear that one can distinguish among allthe studied hypotheses, even in the most modest scenario (1).
12
An even more conclusive result can be obtained by looking at the energy dis-tribution dNµ/dEν (see Eq. (A10)) for charged current µ events. We show, in Fig.10, our predictions, for five years of data taking, assuming 2.0 ×10²⁰ µ decays peryear, Eµ = 10 GeV, L = 3096 km for null oscillation, the best-fit point of the PDMsolution to the ANP and four different values of ∆m2 which are consistent with theMIO solution to the ANP. We see that in the majority of cases a distinct signal willbe observed, making it possible to establish which of the flavor changing hypothesesis the correct one.
Although we have optimized the setup parameters in order to maximize theseparation between the two ANP solutions at their best-fit point, we also havechecked that even if we allow γ0 to vary around the best-fit value, i.e. 0.25 ×10⁻²¹ GeV <∼ γ0 <∼ 1.1 × 10⁻²¹ GeV, we will get an energy spectrum which willalways increase monotonically with the neutrino energy, in this range these curveswill all coinciding up to 4 GeV, after that if γ0 < 0.6 × 10⁻²¹ GeV the growth willbe slightly slower than what is shown in Fig. 10, for γ0 = 0.6 × 10⁻²¹ GeV and ifγ0 > 0.6 × 10⁻²¹ GeV the curves will be steeper approaching the one for no flavorchange.
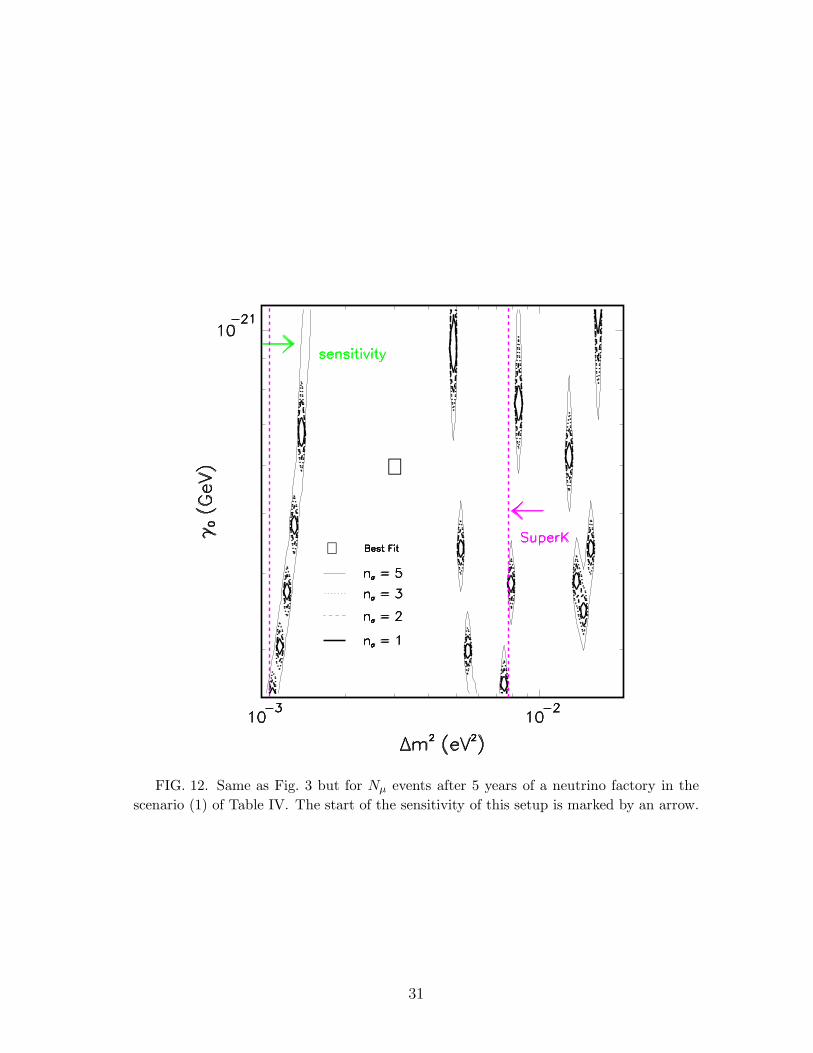
In Fig. 11, we show the statistical significance test for 5 years of data taking in theplane ∆m2 × sin2 2θ assuming the most conservative of the optimal configurations.From this figure, we see that for most of the MIO parameter space the two solutionscan be well discriminated. This conclusion is further confirmed by Fig. 12, wherethe statistical significance test was performed letting γ0 vary. Here we note thatfor data compatible with 1.5 × 10⁻³ eV2 <∼ ∆m2 <∼ 4.8 × 10⁻³ eV2 a very clearseparation is possible ∀γ0. It seems that unless the data prefers lower values of∆m2 <∼ 1.5×10⁻³ eV2 or a few isolated islands in the plane γ0×∆m2, in which casea clear separation between the two solutions might be compromised, decoherenceand mass induced oscillation will present a very distinct signature of their dynamics.Fortunately, for ∆m2 <∼ 1.5 × 10⁻³ eV2 and for ∆m2 >∼ 5.0 × 10⁻³ eV2 a clear cutbetween the two solutions can be accomplished respectively by the OPERA and theMINOS (medium) experiments, as we have discussed in Sec. IVC and IVB.
V. CONCLUSIONS
We have discussed the perspectives of future experiments of distinguishing theMIO solution to the ANP from the PDM one. This is specially important sinceit will be very difficult for NOMAD and CHORUS to achieve a sensitivity in theνµ → ντ mode to directly exclude/confirm the latter solution [17].
Our study on discriminating these two ANP solutions permitted us to arrive atthe following general conclusions: K2K and probably MINOS will not be able toshed much light on the dynamics which promotes νµ → ντ conversion, OPERA anda neutrino factory in a muon collider are more suitable for this job.
From the statistical significance tests we have performed, considering positivediscrimination only if nσ >∼ 5, we can say the following. K2K cannot discriminate
13

PDM from MIO if the data is compatible with 2.2×10⁻³eV2 <∼ ∆m2 <∼ 4.5×10⁻³eV2,∀γ0. In fact, this almost covers the entire parameter space allowed by the SuperKatmospheric data at 99% C.L., as can be seen in Fig. 2. MINOS, in the low energybeam configuration, cannot separate the two solutions if the data is compatiblewith 1.1 × 10⁻³eV2 <∼ ∆m2 <∼ 5.2 × 10⁻³eV2, ∀γ0; in the medium energy beamconfiguration if 3.0 × 10⁻³eV2 <∼ ∆m2 <∼ 4.0 × 10⁻³eV2, ∀γ0; in the high energybeam configuration if 4.8 × 10⁻³ eV2 <∼ ∆m2 <∼ 5.1 × 10⁻³eV2, ∀γ0. Running withthe low energy setup, MINOS will be very similar to K2K, and certainly will notbe able do discriminate the solutions, see Figs. 5 and 6. For the high energy setupMINOS will be more selective and similar to OPERA. OPERA, after 5 years, willonly not disentangle PDM from MIO if the data is compatible with 5.9×10⁻³eV2 <∼∆m2 <∼ 6.7×10⁻³eV2, ∀γ0. This corresponds to the upper corner of the SuperK 99%C.L. region, see Fig. 8. A neutrino factory with Eµ = 10 GeV, L = 3096 km and 1.6×10²⁰ µ− decays per year, with a detector of 10 kton after 5 years of data taking willstill not be able to discriminate the two solutions if the data prefers a small island inthe plane sin2 2θ×∆m2, at ∆m2 ∼ 1.5×10⁻³ eV2 and sin2 2θ ∼ 0.95, see Fig. 11. Onthe other hand, if the data is compatible with 1.5× 10⁻³eV2 <∼ ∆m2 <∼ 5× 10⁻³eV2
the separation between PDM and MIO will be extremely clear, ∀γ0. This typeof facility, it seems, will be the only one able to measure spectral distortions and,thereby, directly test if neutrino flavor change is indeed an oscillation phenomenon.
In any case, the combination of the results of all these proposed experiments willmost certainly unravel the dynamics of neutrino conversion in νµ → ντ mode, if onlyactive neutrinos exist in nature.
There is a proposed atmospheric neutrino experiment, MONOLITH [32], which,in principle, could distinguish PDM from MIO through the observation of the firstoscillation minimum. Here we have only investigated the capabilities of acceleratorneutrino experiments which we believe have to be performed in order to completelyratify the mechanism behind neutrino flavor change.
ACKNOWLEDGMENTS
We thank GEFAN for valuable discussions and useful comments. This workwas supported by Conselho Nacional de Desenvolvimento Cientıfico e Tecnologico(CNPq) and by Fundacao de Amparo a Pesquisa do Estado de Sao Paulo (FAPESP).
14
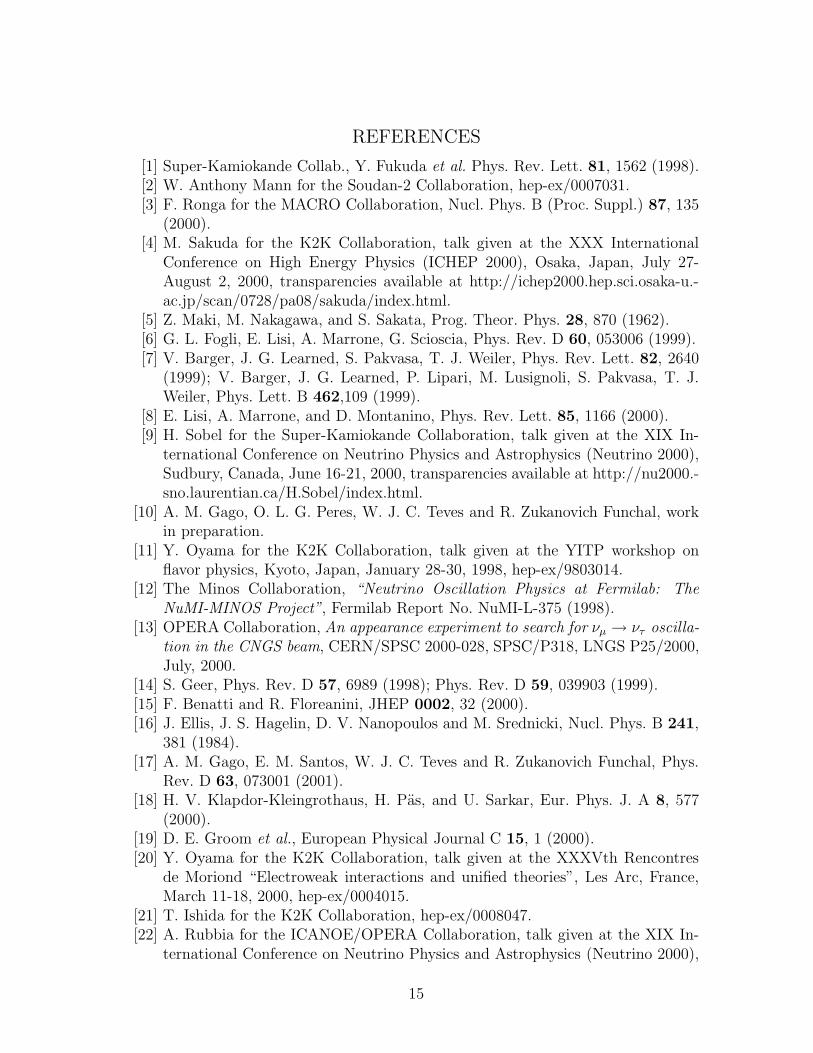
REFERENCES
[1] Super-Kamiokande Collab., Y. Fukuda et al. Phys. Rev. Lett. 81, 1562 (1998).[2] W. Anthony Mann for the Soudan-2 Collaboration, hep-ex/0007031.[3] F. Ronga for the MACRO Collaboration, Nucl. Phys. B (Proc. Suppl.) 87, 135
(2000).[4] M. Sakuda for the K2K Collaboration, talk given at the XXX International
Conference on High Energy Physics (ICHEP 2000), Osaka, Japan, July 27-August 2, 2000, transparencies available at http://ichep2000.hep.sci.osaka-u.-ac.jp/scan/0728/pa08/sakuda/index.html.
[5] Z. Maki, M. Nakagawa, and S. Sakata, Prog. Theor. Phys. 28, 870 (1962).[6] G. L. Fogli, E. Lisi, A. Marrone, G. Scioscia, Phys. Rev. D 60, 053006 (1999).[7] V. Barger, J. G. Learned, S. Pakvasa, T. J. Weiler, Phys. Rev. Lett. 82, 2640
(1999); V. Barger, J. G. Learned, P. Lipari, M. Lusignoli, S. Pakvasa, T. J.Weiler, Phys. Lett. B 462,109 (1999).
[8] E. Lisi, A. Marrone, and D. Montanino, Phys. Rev. Lett. 85, 1166 (2000).[9] H. Sobel for the Super-Kamiokande Collaboration, talk given at the XIX In-
ternational Conference on Neutrino Physics and Astrophysics (Neutrino 2000),Sudbury, Canada, June 16-21, 2000, transparencies available at http://nu2000.-sno.laurentian.ca/H.Sobel/index.html.
[10] A. M. Gago, O. L. G. Peres, W. J. C. Teves and R. Zukanovich Funchal, workin preparation.
[11] Y. Oyama for the K2K Collaboration, talk given at the YITP workshop onflavor physics, Kyoto, Japan, January 28-30, 1998, hep-ex/9803014.
[12] The Minos Collaboration, “Neutrino Oscillation Physics at Fermilab: The
NuMI-MINOS Project”, Fermilab Report No. NuMI-L-375 (1998).[13] OPERA Collaboration, An appearance experiment to search for νµ → ντ oscilla-
tion in the CNGS beam, CERN/SPSC 2000-028, SPSC/P318, LNGS P25/2000,July, 2000.
[14] S. Geer, Phys. Rev. D 57, 6989 (1998); Phys. Rev. D 59, 039903 (1999).[15] F. Benatti and R. Floreanini, JHEP 0002, 32 (2000).[16] J. Ellis, J. S. Hagelin, D. V. Nanopoulos and M. Srednicki, Nucl. Phys. B 241,
381 (1984).[17] A. M. Gago, E. M. Santos, W. J. C. Teves and R. Zukanovich Funchal, Phys.
Rev. D 63, 073001 (2001).[18] H. V. Klapdor-Kleingrothaus, H. Pas, and U. Sarkar, Eur. Phys. J. A 8, 577
(2000).[19] D. E. Groom et al., European Physical Journal C 15, 1 (2000).[20] Y. Oyama for the K2K Collaboration, talk given at the XXXVth Rencontres
de Moriond “Electroweak interactions and unified theories”, Les Arc, France,March 11-18, 2000, hep-ex/0004015.
[21] T. Ishida for the K2K Collaboration, hep-ex/0008047.[22] A. Rubbia for the ICANOE/OPERA Collaboration, talk given at the XIX In-
ternational Conference on Neutrino Physics and Astrophysics (Neutrino 2000),
15

Sudbury, Canada, June 16-21, 2000, transparencies available at http://nu2000.-sno.laurentian.ca/A.Rubbia/index.html; hep-ex/0008071.
[23] The charged and neutral current cross sections were taken from M.D. Messier, Ph. D. thesis, Boston University, 1999, available athttp://hep.bu.edu/∼messier/thesis.
[24] The MINOS Collaboration, P. Adamson et al., Fermilab Report No. NuMI-L-337 (1998).
[25] The Minos Collaboration, K. R. Langenbach and M. C. Goodman, FermilabReport No. NuMI-L-75 (1995).
[26] The charged current cross sections for νµ and ντ can be obtained in form of atable from http://www.cern.ch/NGS.
[27] ICANOE Collaboration, ICANOE, A proposal for a CERN-GS long base-
line and atmospheric neutrino oscillation experiment, INFN/AE-99-17,CERN/SPSC 99-25, SPSC/P314, August, 1999, see http://pcnometh4.cern.-ch/publications.html.
[28] A. De Rujula, M. B. Gavela, and P. Hernandez, Nucl. Phys. B 547, 21 (1999).[29] V. Barger, S. Geer, and K. Whisnant, Phys. Rev. D 61, 053004 (2000).[30] V. Barger, S. Geer, R. Raja, and K. Whisnant, Phys. Rev. D 62, 013004 (2000).[31] M. Freund, M. Lindner, S. T. Petcov, A. Romanino, Nucl. Phys. B 578, 27
(2000).[32] K. Hoepfner for the MONOLITH Collaboration, Nucl. Phys. B (Proc. Suppl.)
87, 192 (2000).
16
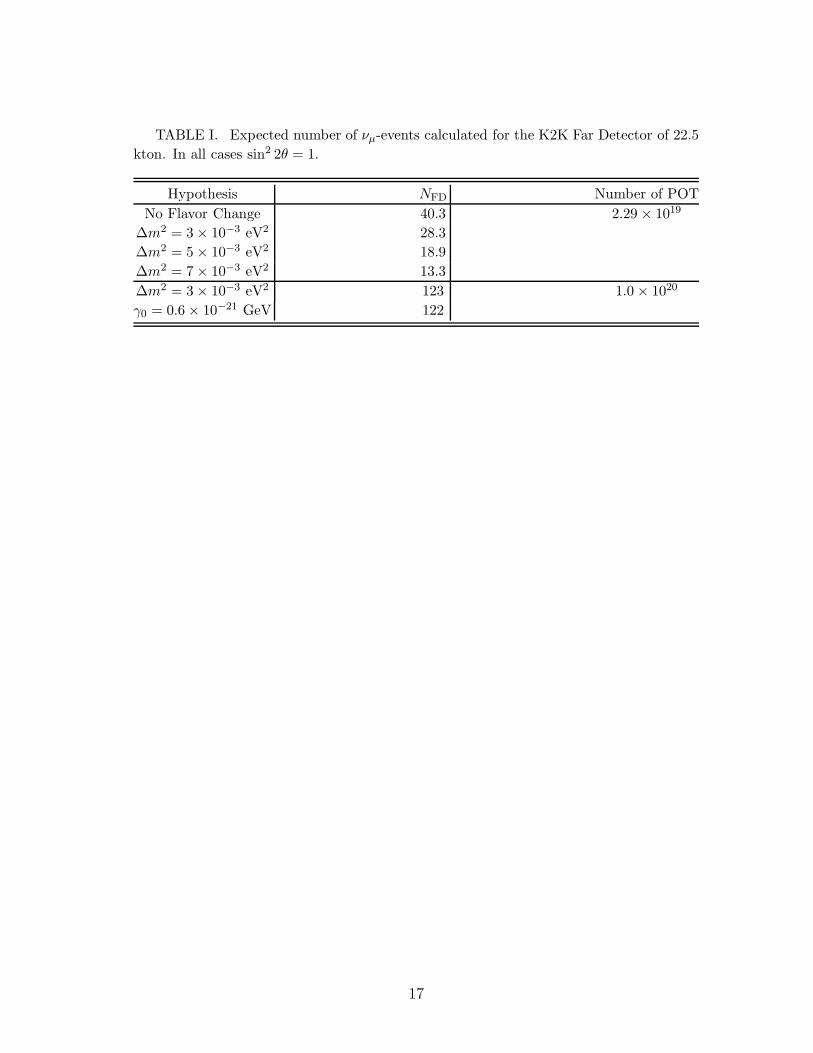
TABLE I. Expected number of νµ-events calculated for the K2K Far Detector of 22.5
kton. In all cases sin2 2θ = 1.
Hypothesis NFD Number of POT
No Flavor Change 40.3 2.29 × 10¹⁹
∆m2 = 3 × 10⁻³ eV2 28.3
∆m2 = 5 × 10⁻³ eV2 18.9
∆m2 = 7 × 10⁻³ eV2 13.3
∆m2 = 3 × 10⁻³ eV2 123 1.0 × 10²⁰
γ0 = 0.6 × 10⁻²¹ GeV 122
17

TABLE II. Expected ratio R0µ/1µ in MINOS for 10 kton year exposure. The error is
only statistical. In all cases sin2 2θ = 1.
Medium Energy Beam
Hypothesis R0µ/1µ
No Flavor Change 0.33 ± 0.01
∆m2 = 1.5 × 10⁻³ eV2 0.35 ± 0.01
∆m2 = 3.0 × 10⁻³ eV2 0.41 ± 0.01
∆m2 = 4.5 × 10⁻³ eV2 0.52 ± 0.01
∆m2 = 6.0 × 10⁻³ eV2 0.71 ± 0.01
γ0 = 0.6 × 10⁻²¹ GeV 0.47 ± 0.01
High Energy Beam
Hypothesis R0µ/1µ
No Flavor Change 0.314 ± 0.004
∆m2 = 1.5 × 10⁻³ eV2 0.320 ± 0.004
∆m2 = 3.0 × 10⁻³ eV2 0.340 ± 0.004
∆m2 = 4.5 × 10⁻³ eV2 0.380 ± 0.005
∆m2 = 6.0 × 10⁻³ eV2 0.430 ± 0.005
γ0 = 0.6 × 10⁻²¹ GeV 0.413 ± 0.005
TABLE III. Expected number of ντ -events calculated for OPERA assuming 5 year
exposure, using 8.7% for the total τ selection efficiency. In all MIO cases sin2 2θ = 1.
Hypothesis Nτ
∆m2 = 1.5 × 10⁻³ eV2 4
∆m2 = 3.0 × 10⁻³ eV2 16
∆m2 = 4.5 × 10⁻³ eV2 36
∆m2 = 6.0 × 10⁻³ eV2 62
γ0 = 0.6 × 10⁻²¹ GeV 69
Total Background ∼ 0.6 events [13]
18
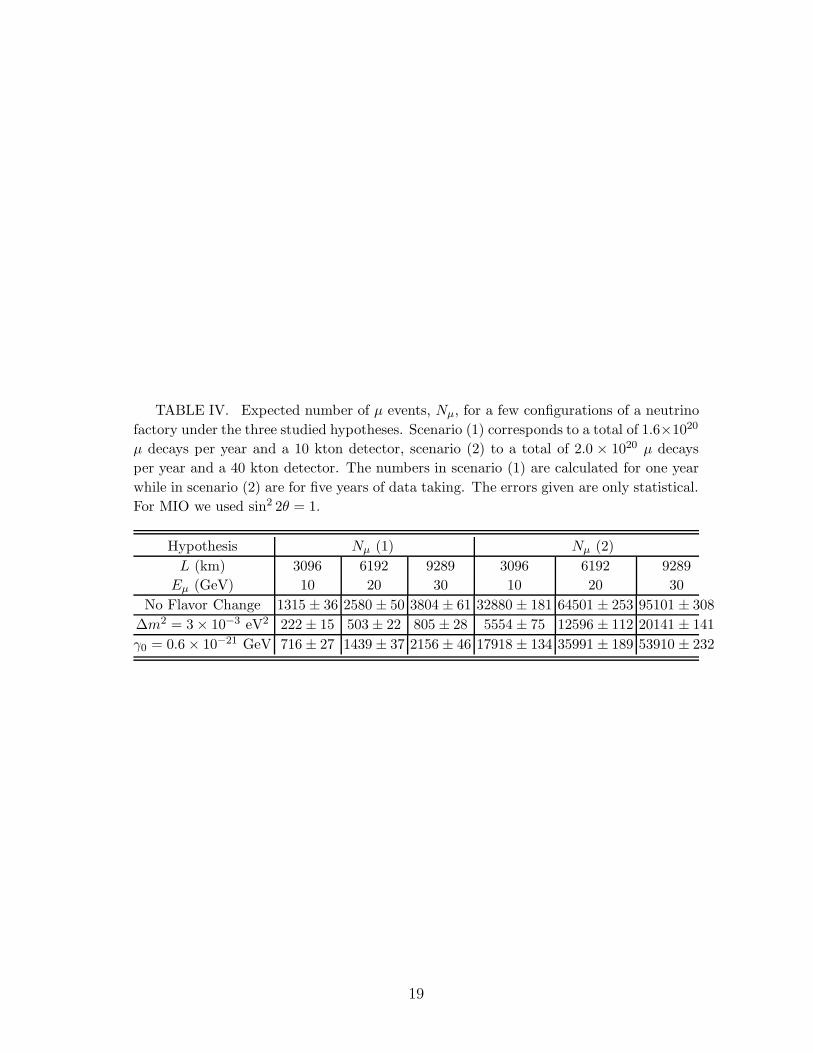
TABLE IV. Expected number of µ events, Nµ, for a few configurations of a neutrino
factory under the three studied hypotheses. Scenario (1) corresponds to a total of 1.6×10²⁰
µ decays per year and a 10 kton detector, scenario (2) to a total of 2.0 × 10²⁰ µ decays
per year and a 40 kton detector. The numbers in scenario (1) are calculated for one year
while in scenario (2) are for five years of data taking. The errors given are only statistical.
For MIO we used sin2 2θ = 1.
Hypothesis Nµ (1) Nµ (2)
L (km) 3096 6192 9289 3096 6192 9289
Eµ (GeV) 10 20 30 10 20 30
No Flavor Change 1315 ± 36 2580 ± 50 3804 ± 61 32880 ± 181 64501 ± 253 95101 ± 308
∆m2 = 3 × 10⁻³ eV2 222 ± 15 503 ± 22 805 ± 28 5554 ± 75 12596 ± 112 20141 ± 141
γ0 = 0.6 × 10⁻²¹ GeV 716 ± 27 1439 ± 37 2156 ± 46 17918 ± 134 35991 ± 189 53910 ± 232
19
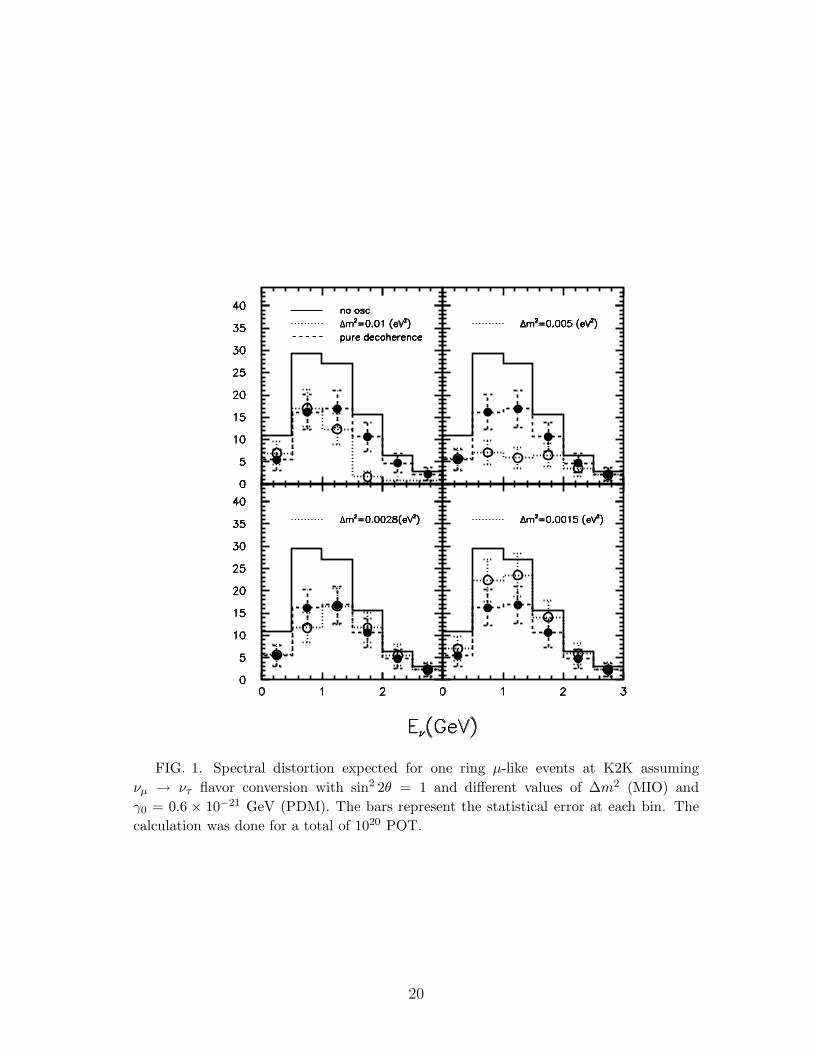
FIG. 1. Spectral distortion expected for one ring µ-like events at K2K assuming
νµ → ντ flavor conversion with sin2 2θ = 1 and different values of ∆m2 (MIO) and
γ0 = 0.6 × 10⁻²¹ GeV (PDM). The bars represent the statistical error at each bin. The
calculation was done for a total of 1020 POT.
20
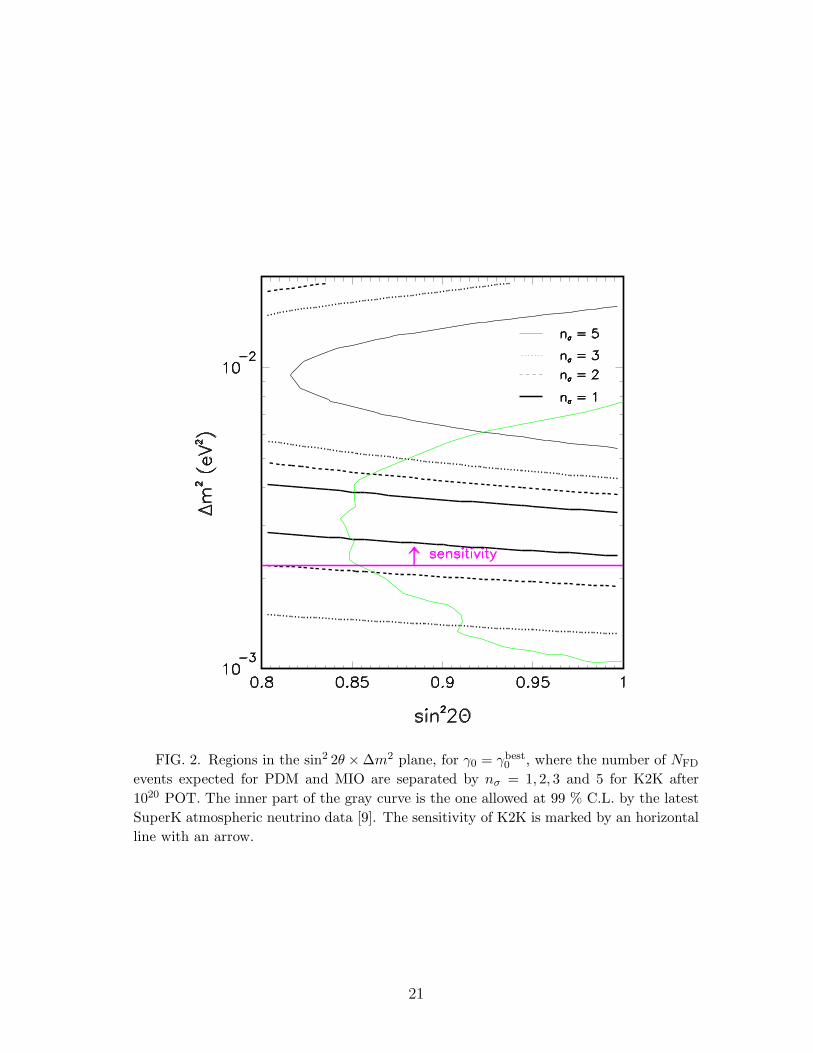
FIG. 2. Regions in the sin2 2θ × ∆m2 plane, for γ0 = γbest0 , where the number of NFD
events expected for PDM and MIO are separated by nσ = 1, 2, 3 and 5 for K2K after
1020 POT. The inner part of the gray curve is the one allowed at 99 % C.L. by the latest
SuperK atmospheric neutrino data [9]. The sensitivity of K2K is marked by an horizontal
line with an arrow.
21
⊗
⊗
FIG. 3. Regions in the γ0 × ∆m2 plane, with sin2 2θ = 1, where the number of NFD
events expected for PDM and MIO are separated by nσ = 1, 2, 3 and 5 for K2K after 1020
POT. The dotted gray lines mark the region allowed at 99 % C.L. by the latest SuperK
atmospheric neutrino data [9] and the cross the best fit values of the PDM [8] and the
MIO [9] solutions to the ANP. The start of the sensitivity of K2K is marked by an arrow.
22
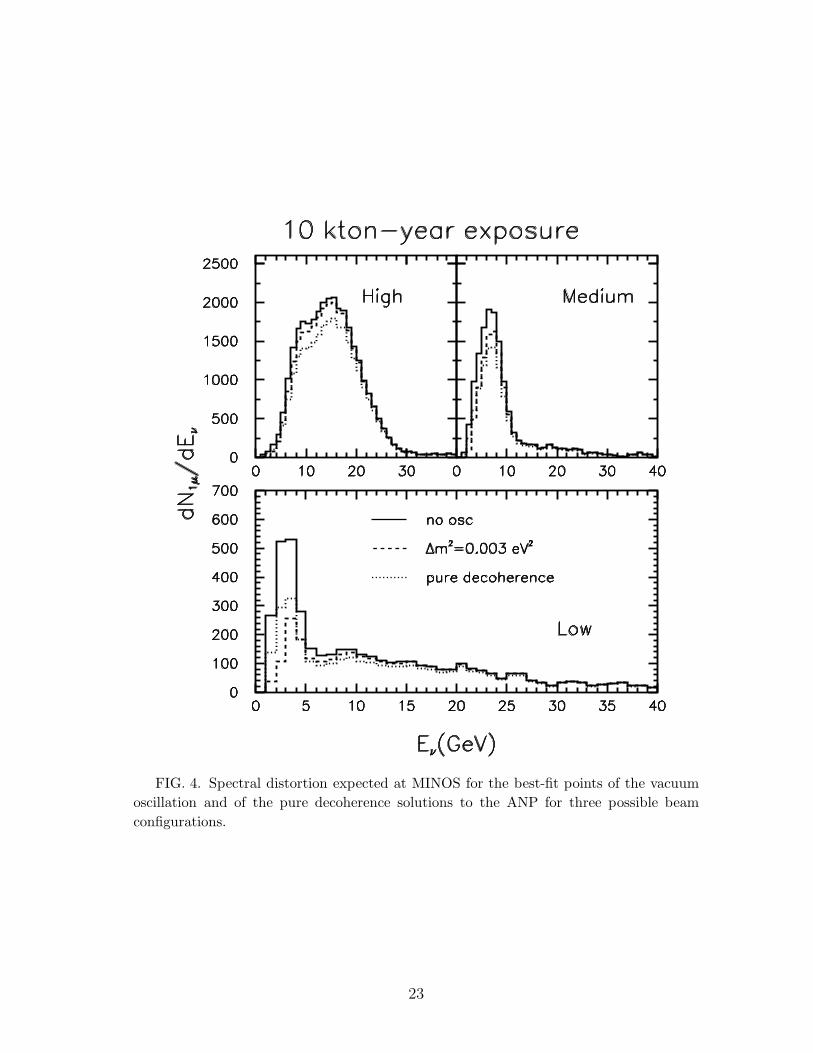
FIG. 4. Spectral distortion expected at MINOS for the best-fit points of the vacuum
oscillation and of the pure decoherence solutions to the ANP for three possible beam
configurations.
23
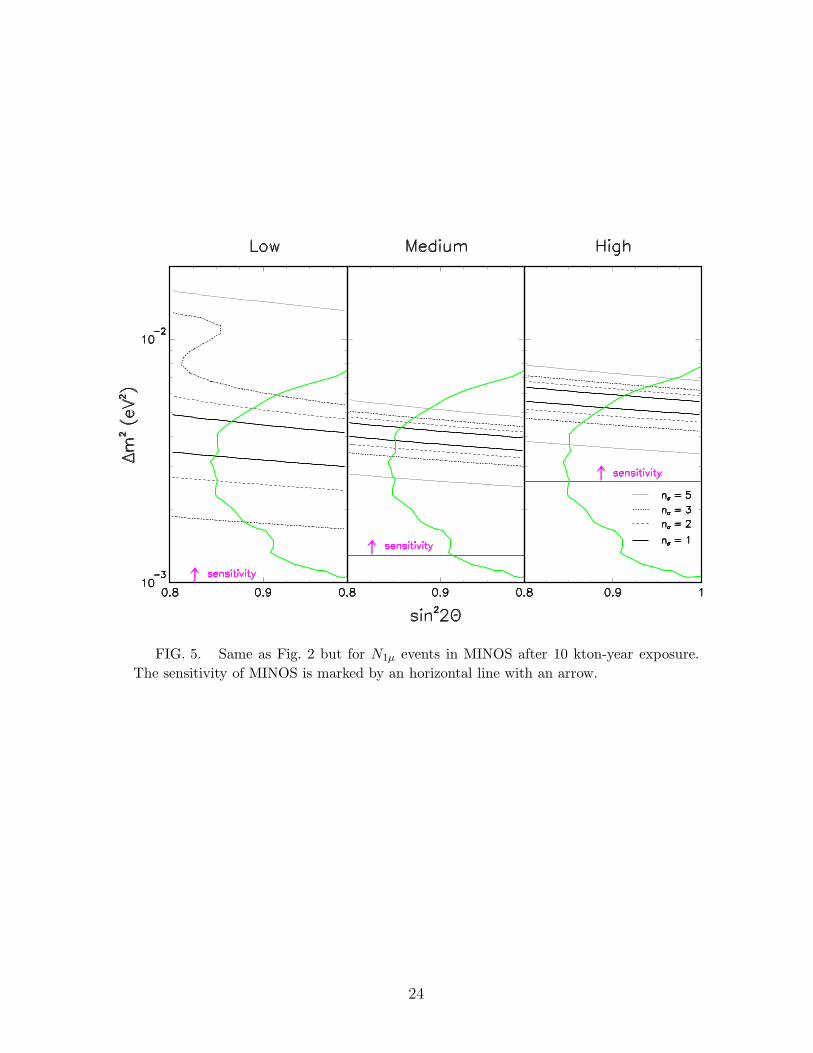
FIG. 5. Same as Fig. 2 but for N1µ events in MINOS after 10 kton-year exposure.
The sensitivity of MINOS is marked by an horizontal line with an arrow.
24

⊗ ⊗ ⊗
⊗
FIG. 6. Same as Fig. 3 but for N1µ events in MINOS after 10 kton-year exposure. The
sensitivity of MINOS is marked by a vertical continuous line with an arrow.
25
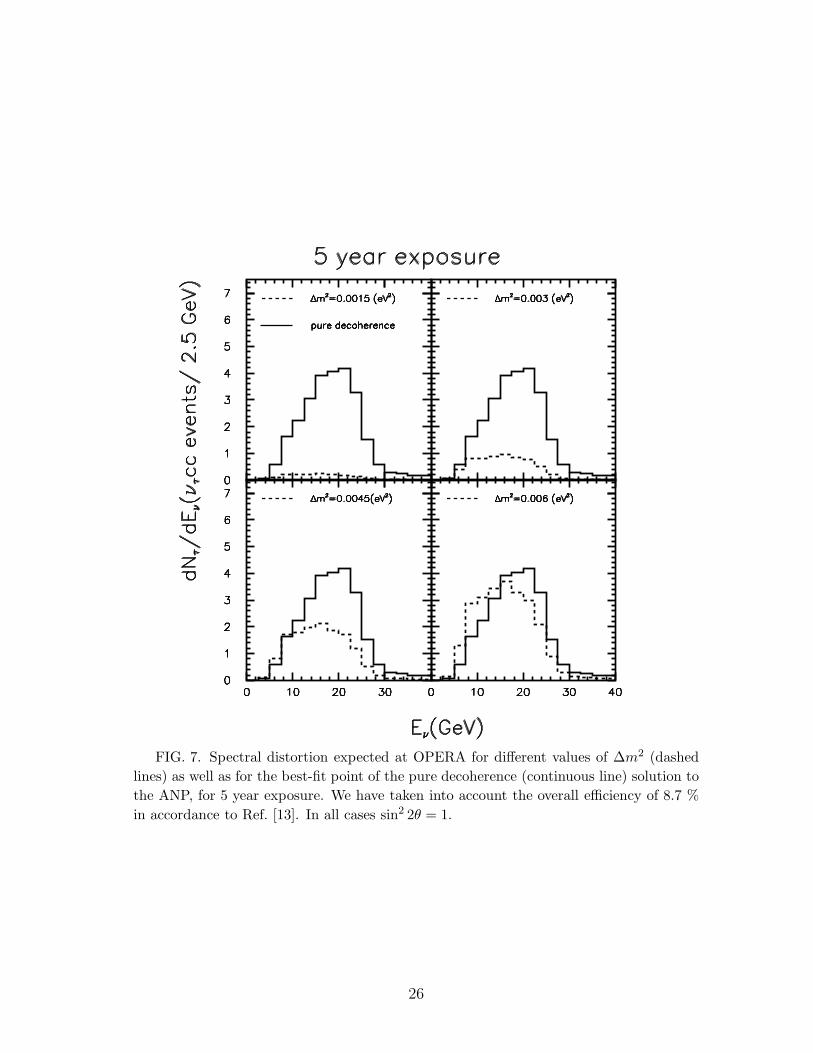
FIG. 7. Spectral distortion expected at OPERA for different values of ∆m2 (dashed
lines) as well as for the best-fit point of the pure decoherence (continuous line) solution to
the ANP, for 5 year exposure. We have taken into account the overall efficiency of 8.7 %
in accordance to Ref. [13]. In all cases sin2 2θ = 1.
26
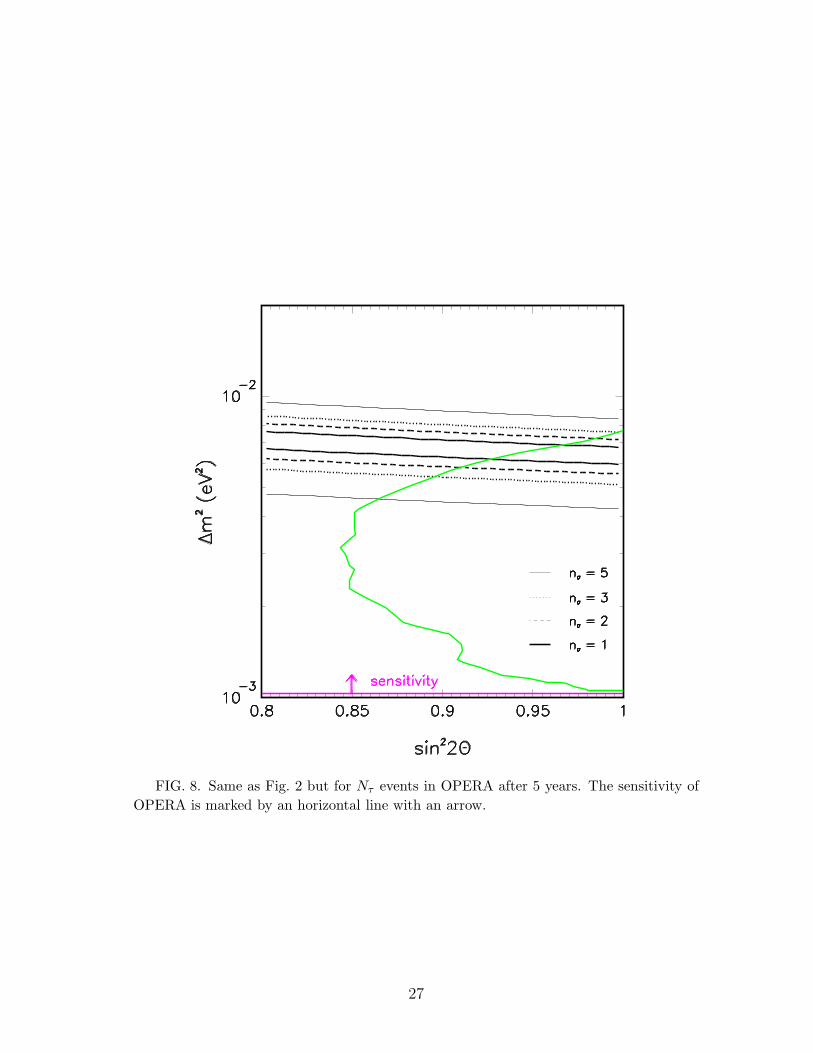
FIG. 8. Same as Fig. 2 but for Nτ events in OPERA after 5 years. The sensitivity of
OPERA is marked by an horizontal line with an arrow.
27

⊗⊗
FIG. 9. Same as Fig. 3 but for Nτ events in OPERA after 5 years. The sensitivity of
OPERA is marked by an arrow.
28
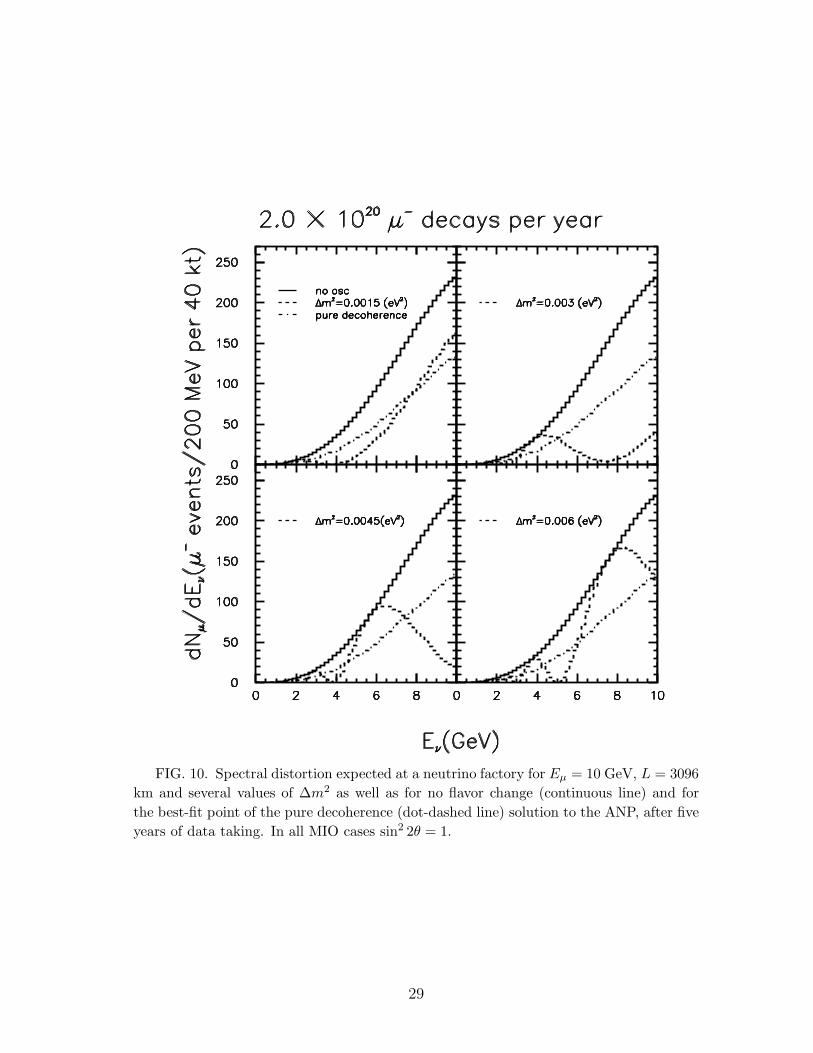
FIG. 10. Spectral distortion expected at a neutrino factory for Eµ = 10 GeV, L = 3096
km and several values of ∆m2 as well as for no flavor change (continuous line) and for
the best-fit point of the pure decoherence (dot-dashed line) solution to the ANP, after five
years of data taking. In all MIO cases sin2 2θ = 1.
29
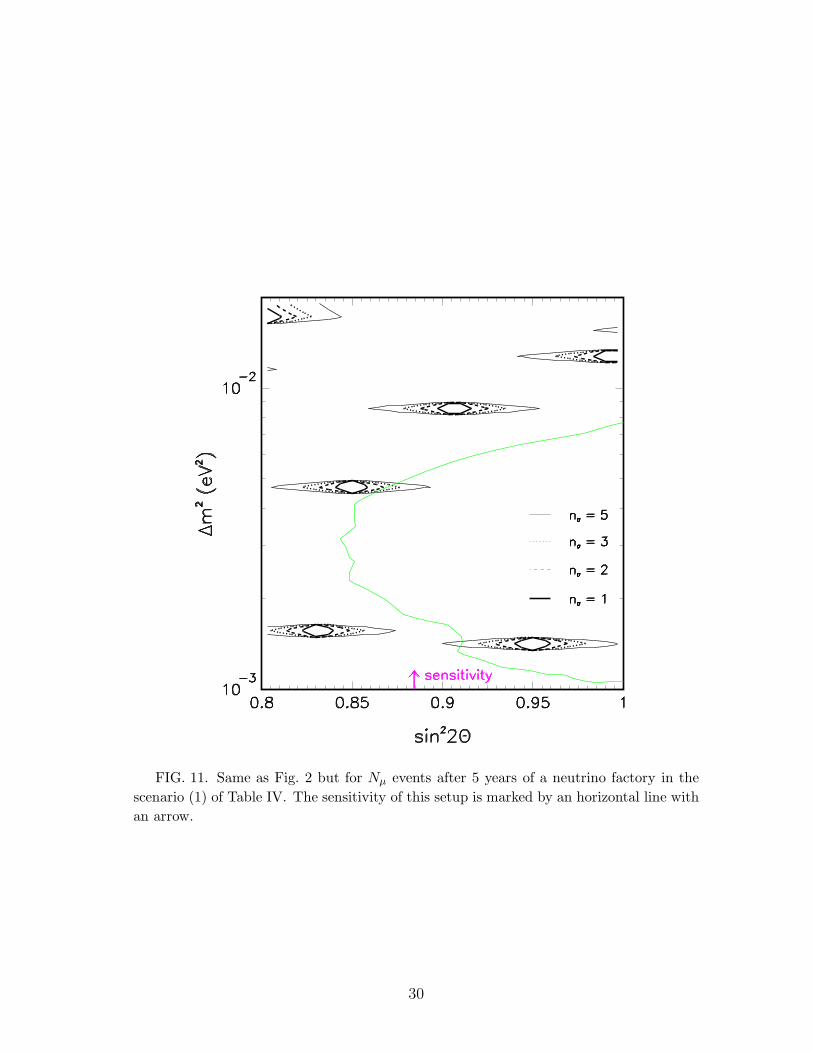
FIG. 11. Same as Fig. 2 but for Nµ events after 5 years of a neutrino factory in the
scenario (1) of Table IV. The sensitivity of this setup is marked by an horizontal line with
an arrow.
30
⊗
⊗
FIG. 12. Same as Fig. 3 but for Nµ events after 5 years of a neutrino factory in the
scenario (1) of Table IV. The start of the sensitivity of this setup is marked by an arrow.
31
APPENDIX:
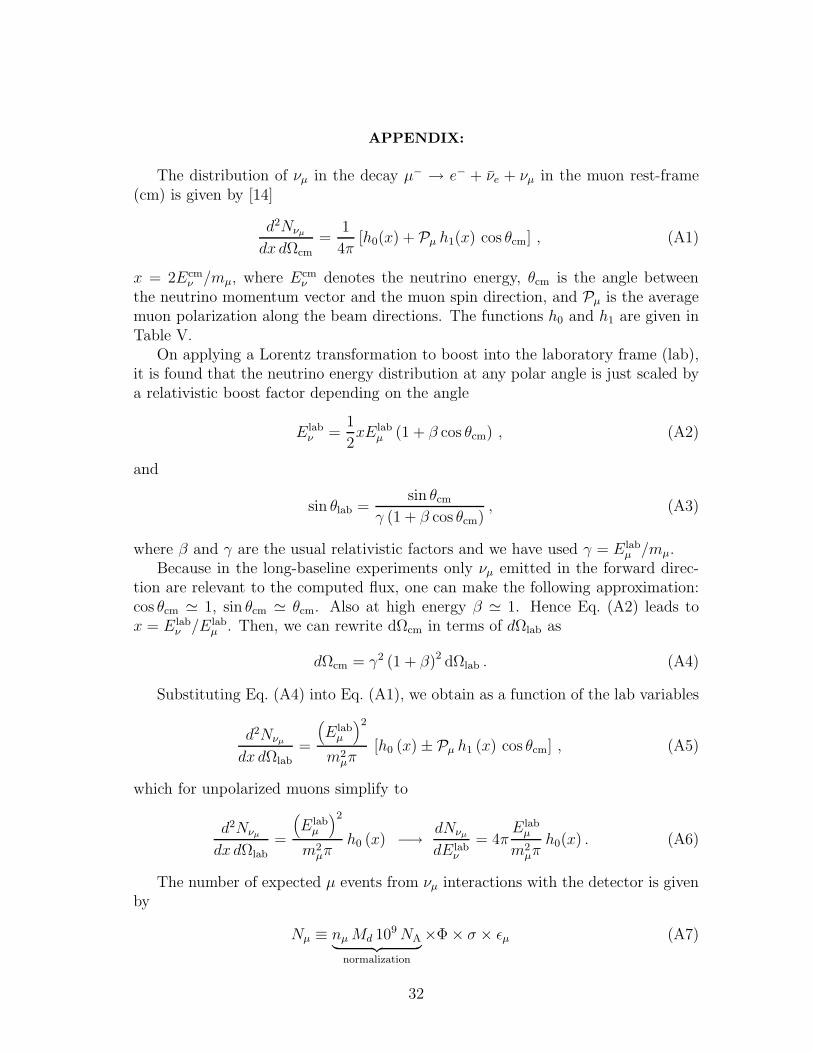
The distribution of νµ in the decay µ− → e− + νe + νµ in the muon rest-frame(cm) is given by [14]
d2Nνµ
dx dΩcm
=1
4π[h0(x) + Pµ h1(x) cos θcm] , (A1)
x = 2Ecmν /mµ, where Ecm
ν denotes the neutrino energy, θcm is the angle betweenthe neutrino momentum vector and the muon spin direction, and Pµ is the averagemuon polarization along the beam directions. The functions h0 and h1 are given inTable V.
On applying a Lorentz transformation to boost into the laboratory frame (lab),it is found that the neutrino energy distribution at any polar angle is just scaled bya relativistic boost factor depending on the angle
Elabν =
1
2xElab
µ (1 + β cos θcm) , (A2)
and
sin θlab =sin θcm
γ (1 + β cos θcm), (A3)
where β and γ are the usual relativistic factors and we have used γ = Elabµ /mµ.
Because in the long-baseline experiments only νµ emitted in the forward direc-tion are relevant to the computed flux, one can make the following approximation:cos θcm ≃ 1, sin θcm ≃ θcm. Also at high energy β ≃ 1. Hence Eq. (A2) leads tox = Elab
ν /Elabµ . Then, we can rewrite dΩcm in terms of dΩlab as
dΩcm = γ2 (1 + β)2 dΩlab . (A4)
Substituting Eq. (A4) into Eq. (A1), we obtain as a function of the lab variables
d2Nνµ
dx dΩlab
=
(
Elabµ
)2
m2µπ
[h0 (x) ± Pµ h1 (x) cos θcm] , (A5)
which for unpolarized muons simplify to
d2Nνµ
dx dΩlab
=
(
Elabµ
)2
m2µπ
h0 (x) −→ dNνµ
dElabν
= 4πElab
µ
m2µπ
h0(x) . (A6)
The number of expected µ events from νµ interactions with the detector is givenby
Nµ ≡ nµ Md 109 NA︸ ︷︷ ︸
normalization
×Φ × σ × ǫµ (A7)
32
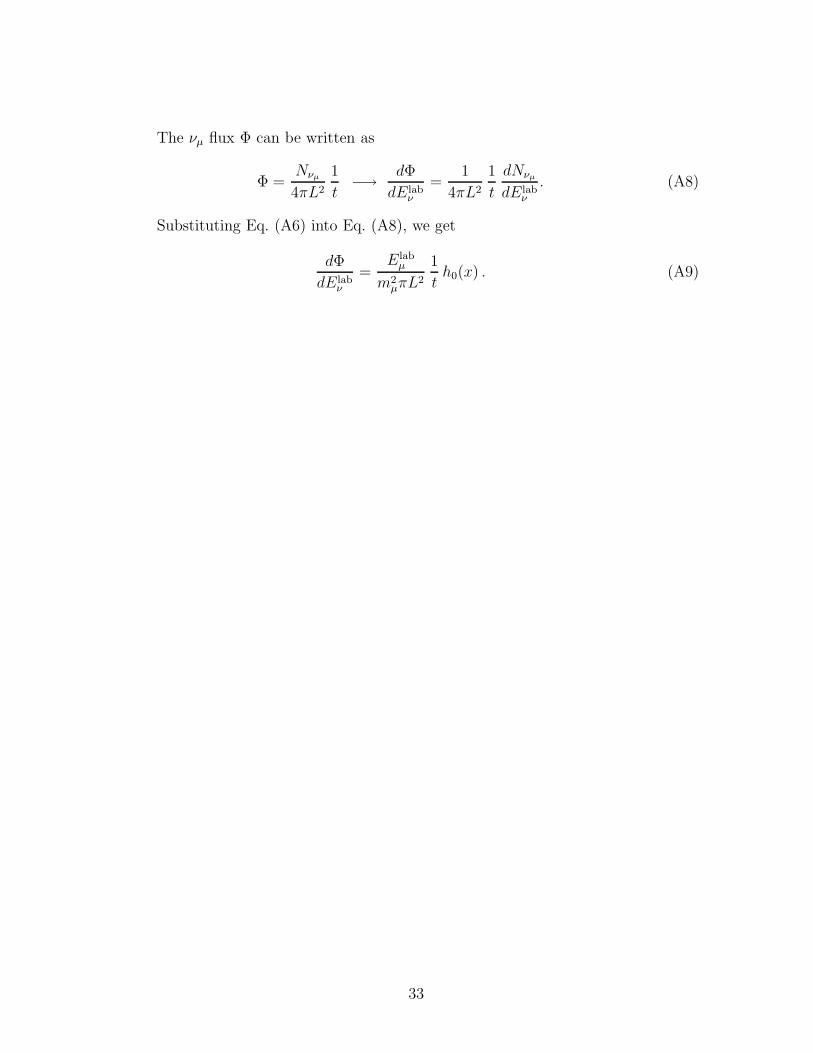
The νµ flux Φ can be written as
Φ =Nνµ
4πL2
1
t−→ dΦ
dElabν
=1
4πL2
1
t
dNνµ
dElabν
. (A8)
Substituting Eq. (A6) into Eq. (A8), we get
dΦ
dElabν
=Elab
µ
m2µπL2
1
th0(x) . (A9)
33
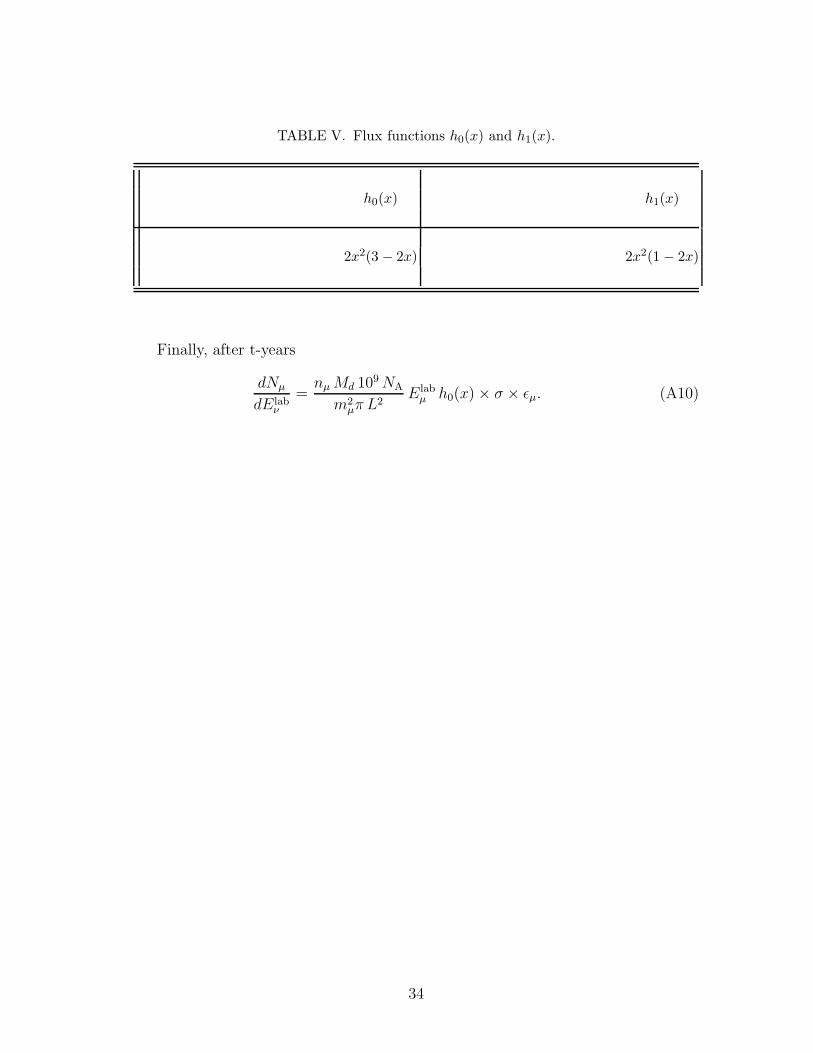
TABLE V. Flux functions h0(x) and h1(x).
h0(x) h1(x)
2x2(3 − 2x) 2x2(1 − 2x)
Finally, after t-years
dNµ
dElabν
=nµ Md 109 NA
m2µπ L2
Elabµ h0(x) × σ × ǫµ. (A10)
34